UNITED STATES
SECURITIES AND EXCHANGE COMMISSION
Washington, D.C. 20549
FORM 10-K
(Mark One)
| | | | | |
| ☒ | ANNUAL REPORT PURSUANT TO SECTION 13 OR 15(d) OF THE SECURITIES EXCHANGE ACT OF 1934 |
For the fiscal year ended December 31, 2024
OR
| | | | | |
| ☐ | TRANSITION REPORT PURSUANT TO SECTION 13 OR 15(d) OF THE SECURITIES EXCHANGE ACT OF 1934 |
For the transition period from to
Commission file number 001-41862
Hamilton Insurance Group, Ltd.
(Exact name of registrant as specified in its charter)
| | | | | | | | | | | |
| Bermuda | | 98-1153847 |
| (State or other jurisdiction of incorporation or organization) | | (I.R.S. Employer Identification No.) |
| Wellesley House North, 1st Floor, 90 Pitts Bay Road Pembroke HM 08 Bermuda | |
| (Address of Principal Executive Offices and Zip Code) | |
(441) 405-5200
Registrant's telephone number, including area code
Securities registered pursuant to Section 12(b) of the Act:
| | | | | | | | |
| Title of each class | Trading Symbol(s) | Name of each exchange on which registered |
| Class B common shares, par value $0.01 per share | HG | New York Stock Exchange |
Securities registered pursuant to Section 12(g) of the Act: None
(Title of Class)
Indicate by check mark if the registrant is a well-known seasoned issuer, as defined in Rule 405 of the Securities Act.
Yes x No o
Indicate by check mark if the registrant is not required to file reports pursuant to Section 13 or Section 15(d) of the Act.
Yes o No x
Indicate by check mark whether the registrant: (1) has filed all reports required to be filed by Section 13 or 15(d) of the Securities Exchange Act of 1934 during the preceding 12 months (or for such shorter period that the registrant was required to file such reports); and (2) has been subject to such filing requirements for the past 90 days.
Yes No
Indicate by check mark whether the registrant has submitted electronically and posted on its corporate web site, if any, every Interactive Data File required to be submitted and posted pursuant to Rule 405 of Regulation S-T (§232.405 of this chapter) during the preceding 12 months (or for such shorter period that the registrant was required to submit and post such files).
Yes No
Indicate by check mark whether the registrant is a large accelerated filer, an accelerated filer, a non-accelerated filer, or a smaller reporting company. See the definitions of “large accelerated filer,” “accelerated filer” and “smaller reporting company” in Rule 12b-2 of the Exchange Act. (Check one):
| | | | | | | | | | | |
| Large accelerated filer | | Accelerated filer | |
| Non-accelerated filer | | Smaller reporting company | ☐ |
| | Emerging growth company | ☐ |
If an emerging growth company, indicate by check mark if the registrant has elected not to use the extended transition period for complying with any new or revised financial accounting standards provided pursuant to Section 13(a) of the Exchange Act.
Indicate by check mark whether the registrant has filed a report on and attestation to its management's assessment of the effectiveness of its internal control over financial reporting under Section 404(b) of the Sarbanes-Oxley Act (15 U.S.C. 7262(b)) by the registered public accounting firm that prepared or issued its audit report.
If securities are registered pursuant to Section 12(b) of the Act, indicate by check mark whether the financial statements of the registrant included in the filing reflect the correction of an error to previously issued financial statements.
☐
Indicate by check mark whether any of those error corrections are restatements that required a recovery analysis of incentive-based compensation received by any of the registrant’s executive officers during the relevant recovery period pursuant to §240.10D-1(b).
☐
Indicate by check mark whether the registrant is a shell company (as defined in Rule 12b-2 of the Act).
Yes ☐ No
The aggregate market value of the registrant’s Class B common shares held by non-affiliates, computed by reference to the closing price on the New York Stock Exchange (the “NYSE”) as of the last business day of the registrant’s most recently completed second fiscal quarter, June 30, 2024, was approximately $597.1 million. There is currently no established trading market for the registrant’s Class A or Class C common shares.
The number of shares outstanding of the registrant’s Class B common shares, $0.01 par value per share, was 64,620,239 as of February 20, 2025.
Documents Incorporated by Reference
Portions of the registrant’s definitive proxy statement for the 2025 Annual General Meeting of Shareholders are incorporated by reference into Part III of this report. Such Proxy Statement will be filed with the Securities and Exchange Commission within 120 days of the registrant’s fiscal year ended December 31, 2024.
Hamilton Insurance Group, Ltd.
Table of Contents
SPECIAL NOTE REGARDING FORWARD-LOOKING STATEMENTS
This Annual Report on Form 10-K of Hamilton Insurance Group, Ltd. for the year ended December 31, 2024 ("Annual Report" or "Form 10-K") includes "forward looking statements" pursuant to the safe harbor provisions of the U.S. Private Securities Litigation Reform Act of 1995. Forward-looking statements can be identified by the use of terms such as "believes," "expects," "may," "will," "target," "should," "could," "would," "seeks," "intends," "plans," "contemplates," "estimates," or "anticipates," or similar expressions which concern our strategy, plans, projections or intentions. These forward-looking statements appear in a number of places throughout this Annual Report and relate to matters such as our industry, growth strategy, goals and expectations concerning our market position, future operations, margins, profitability, capital expenditures, liquidity and capital resources and other financial and operating information. By their nature, forward-looking statements: speak only as of the date they are made; are not statements of historical fact or guarantees of future performance; and are subject to risks, uncertainties, assumptions, or changes in circumstances that are difficult to predict or quantify. Our expectations, beliefs, and projections are expressed in good faith and we believe there is a reasonable basis for them. However, there can be no assurance that management’s expectations, beliefs and projections will be achieved and actual results may vary materially from what is expressed in or indicated by the forward-looking statements.
There are a number of risks, uncertainties, and other important factors that could cause our actual results to differ materially from the forward-looking statements contained herein. Such risks, uncertainties, and other important factors include, among others, the risks, uncertainties and factors set forth in "Risk Factors" and "Management’s Discussion and Analysis of Financial Condition and Results of Operations" included in this Annual Report and the following:
•challenges from competitors, including those arising from industry consolidation and technological advancements;
•unpredictable catastrophic events, global climate change and/or emerging claim and coverage issues;
•our ability, or those of the third parties on which we rely, to ensure reserves are adequate to cover actual losses and to accurately evaluate underwriting risk, models, assessments and/or pricing of risks;
•our ability to defend our intellectual property rights, including our proprietary technology platforms, to comply with our obligations under our license and technology agreements or to license rights to technology or data on reasonable terms;
•the impact of risks associated with human error, fraud, model uncertainties, cybersecurity threats such as cyber-attacks and security breaches and our reliance on third-party information technology ("IT") systems that can fail or need replacement;
•our ability to secure necessary credit facilities, or additional types of credit, on favorable terms or at all;
•our limited financial and operating flexibility due to the covenants in our existing credit facilities;
•our exposure to the credit risk of the intermediaries on which we rely;
•our failure to pay claims in a timely manner or the need to sell investments under unfavorable conditions to meet liquidity requirements;
•downgrades, potential downgrades or other negative actions by rating agencies;
•our ability to manage risks associated with macroeconomic conditions resulting from geopolitical and global economic events, including current or anticipated military conflicts, public health crises, terrorism, sanctions, rising energy prices, inflation and interest rates and other global events;
•the cyclical nature of the insurance and reinsurance business, which may cause the pricing and terms for our products to decline;
•our results of operations potentially fluctuating significantly from period to period and not being indicative of our long-term prospects;
•our ability to execute our strategy and to modify our business and strategic plan without shareholder approval;
•our dependence on key executives, including the potential loss of Bermudian personnel, and our ability to attract qualified personnel, particularly in very competitive hiring conditions;
•foreign operational risk such as foreign currency risk and political risk;
•our ability to identify and execute opportunities for growth, to complete transactions as planned or realize the anticipated benefits of any acquisitions or other investments;
•our management of alternative reinsurance platforms on behalf of investors in entities managed by Hamilton Strategic Partnerships;
•our inability to control the allocations to, and/or the performance of, the Two Sigma Hamilton Fund, LLC (“TS Hamilton Fund”) investment portfolio and our limited ability to withdraw our capital accounts;
•the impact of risks from conflicts of interest among Two Sigma Principals, LLC (the "Managing Member"), Two Sigma Investments, LP (“Two Sigma”) and their respective affiliates affecting our business;
•the historical performance of Two Sigma not being indicative of the future results of the TS Hamilton Fund’s investment portfolio and/or of our future results;
•the impacts of risks associated with our investment strategy, including that such risks are greater than those faced by our competitors;
•our potentially becoming subject to U.S. federal income taxation, Bermuda taxation or other taxes as a result of a change of tax laws or otherwise;
•the potential characterization of us and/or any of our subsidiaries as a passive foreign investment company, or PFIC;
•our potentially becoming subject to U.S. withholding and information reporting requirements under the U.S. Foreign Account Tax Compliance Act, or FATCA, provisions;
•our ability to compete effectively in a heavily regulated industry in light of new domestic or international laws and regulations, including accounting practices, and the impact of new interpretations of current laws and regulations;
•the suspension or revocation of our subsidiaries’ insurance licenses;
•significant legal, governmental or regulatory proceedings;
•our insurance and reinsurance subsidiaries’ ability to pay dividends and other distributions to us being restricted by law;
•challenges related to compliance with the applicable laws, rules and regulations related to being a public company, which is expensive and time consuming;
•the limited ability of investors to influence corporate matters due to our multiple class common share structure and the voting provisions of our Bye-laws;
•the risk that anti-takeover provisions in our Bye-laws could discourage, delay, or prevent a change in control, even if the change in control would be beneficial to our shareholders;
•the difficulties investors may face in protecting their interests and serving process or enforcing judgments against us in the United States; and
•our current strategy does not include paying cash dividends on our Class B common shares in the near term.
There may be other factors that could cause our actual results to differ materially from the forward-looking statements, including factors disclosed under the sections entitled "Risk Factors" and "Management’s Discussion and Analysis of Financial Condition and Results of Operations" in this Annual Report. You should evaluate all forward-looking statements made herein in the context of these risks and uncertainties.
You should read this information completely and with the understanding that actual future results may be materially different from expectations. We caution you that the risks, uncertainties, and other factors referenced above may not contain all of the risks, uncertainties and other factors that are important to you. In addition, we cannot assure you that we will realize the results, benefits, or developments that we expect or anticipate or, even if substantially realized, that they will result in the consequences or affect us or our business in the way expected. All forward-looking statements contained herein apply only as of the date hereof and are expressly qualified in their entirety by these cautionary statements. We undertake no obligation to publicly update or revise any forward-looking statements to reflect subsequent events or circumstances.
Available Information
We encourage investors and others to frequently visit our website, www.hamiltongroup.com, including our Investor Relations web pages www.investors.hamiltongroup.com. Information found on, or accessible through, our website is not a part of, and is not incorporated into this Annual Report. Copies of our annual reports on Form 10-K, quarterly reports on Form 10-Q, current reports on Form 8-K, and amendments to these reports filed or furnished pursuant to Section 13(a) or 15(d) of the Exchange Act, are available, free of charge, on our website as soon as reasonably practicable after we file such material electronically with, or furnish it to, the Securities and Exchange Commission (the "SEC"). The SEC also maintains a website that contains our SEC filings. The address of the site is www.sec.gov.
Part I
BUSINESS
In this Annual Report, references to "Hamilton," "Hamilton Group," the "Company," "we," "us" and "our" refer to Hamilton Insurance Group, Ltd., together with its consolidated subsidiaries, unless the context requires otherwise. Certain defined terms used through this Annual Report are included in the "Glossary of Selected Terms" attached hereto. Amounts in this Annual Report are presented in U.S. dollars, unless otherwise noted. Certain amounts presented in tables are subject to rounding adjustments and, as a result, the totals in such tables may not sum.
Our Company
Overview of Our Business
We are a global specialty insurance and reinsurance company founded in Bermuda in 2013. We harness multiple drivers to create shareholder value. These include diverse underwriting operations supported by proprietary technology and a team of over 600 full-time employees, a strong balance sheet, and a unique investment management relationship with Two Sigma. We operate globally, with underwriting operations in London, Dublin, Bermuda and across the United States. We are led by an entrepreneurial and experienced management team that has grown premiums written from $571 million for the year ended November 30, 2018 to $2.4 billion for the year ended December 31, 2024, while also significantly reducing our combined ratio. The combined effects of organic premium growth, our 2019 strategic acquisition, new market developments and continuous platform cost optimization leave us well positioned to capitalize on the continuing attractive market conditions across the lines of business written by our established and scaled underwriting platforms.
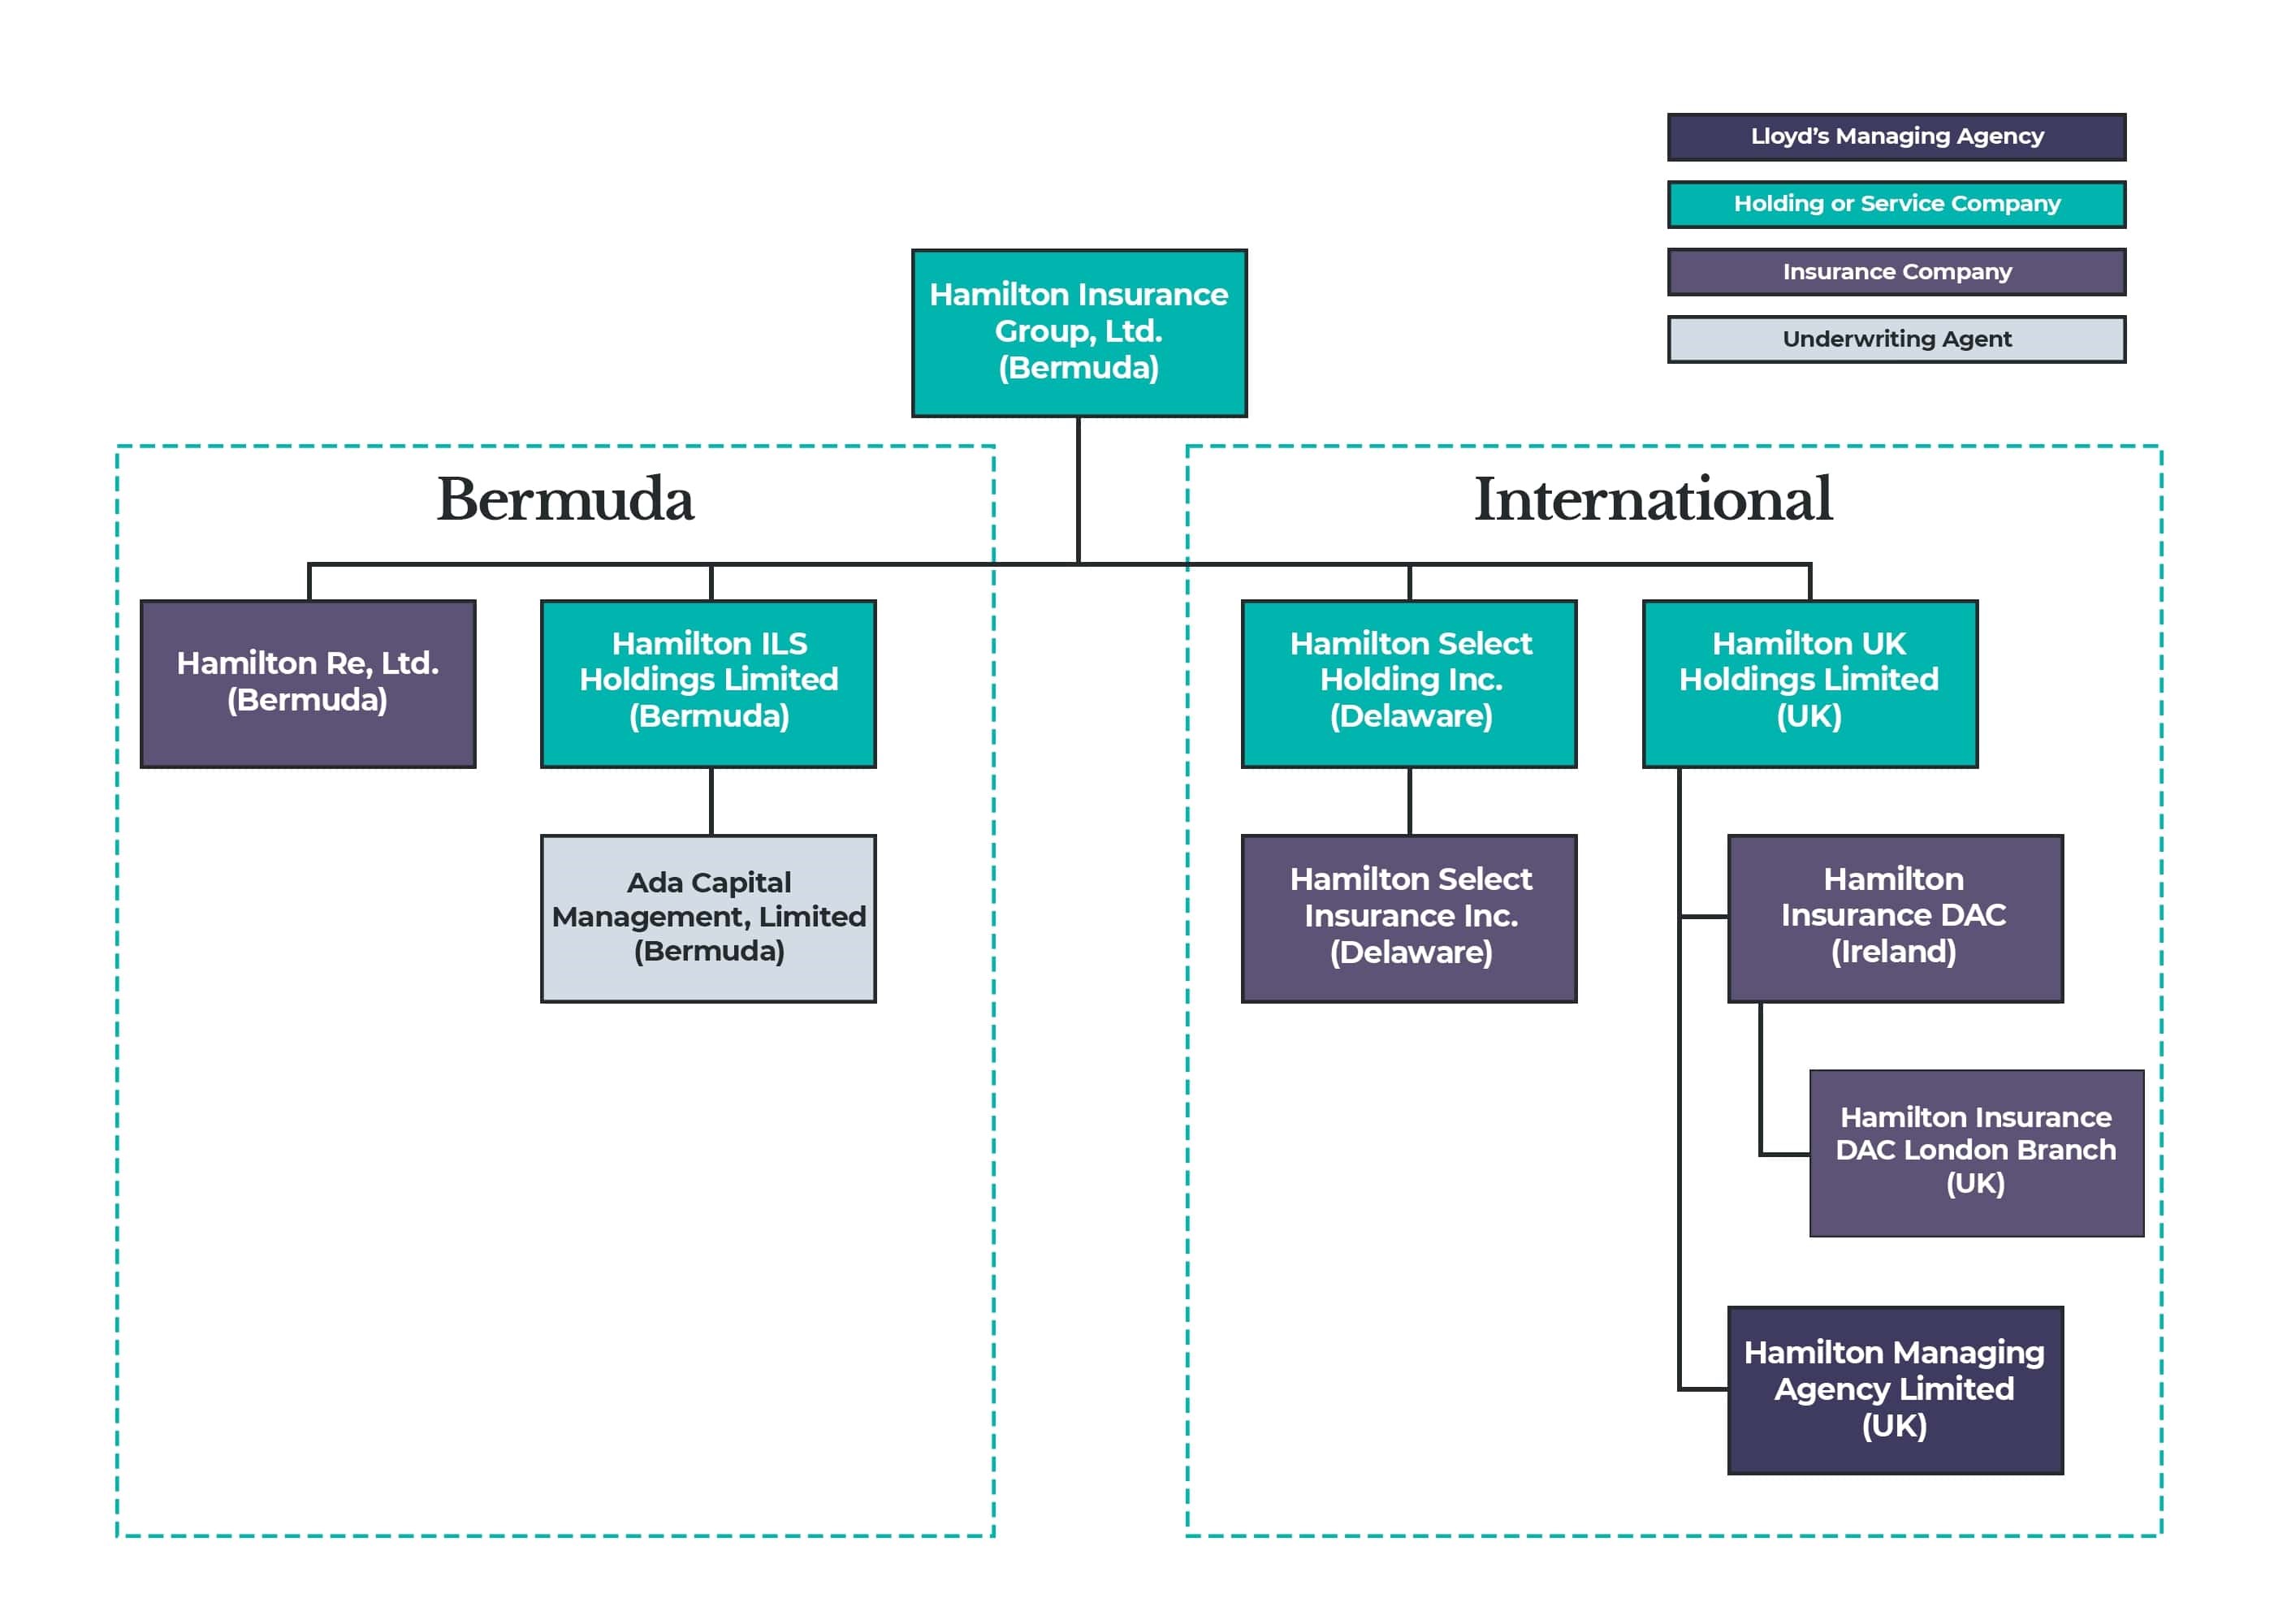
We operate three principal underwriting platforms (Hamilton Global Specialty, Hamilton Select and Hamilton Re) that are categorized into two reporting business segments (International and Bermuda):
•International: Accounting for 54% of gross premiums written for the year ended December 31, 2024, our International segment consists of business written out of our Lloyd’s syndicate and subsidiaries based in the United Kingdom, Ireland, and the United States, and includes the Hamilton Global Specialty and Hamilton Select platforms.
•Hamilton Global Specialty focuses predominantly on commercial specialty and casualty insurance for medium to large-sized accounts and specialty reinsurance products written by Lloyd’s Syndicate 4000 and Hamilton Insurance DAC ("HIDAC"). Syndicate 4000, a leading Lloyd’s syndicate, generates a significant portion of premium from the U.S. Excess & Surplus ("U.S. E&S") market and has ranked among the most profitable and least volatile syndicates at Lloyd’s over the last 10 years.
•Hamilton Select, our U.S. domestic E&S carrier, writes casualty insurance for small to mid-sized clients in the hard-to-place niche of the U.S. E&S market. We believe it presents meaningful and profitable growth opportunities in the near-to-long term, further expanding our footprint in the U.S. E&S market.
•Our International segment had gross premiums written of $662 million, $892 million, $933 million, $1,106 million and $1,308 million for the years ended November 30, 2020, November 30, 2021 and December 31, 2022 through December 31, 2024, respectively, with a corresponding combined ratio of 111%, 108%, 97%, 95% and 96% for the same periods.
•Bermuda: Accounting for 46% of gross premiums written for the year ended December 31, 2024, our Bermuda segment consists of the Hamilton Re platform, made up of Hamilton Re and Hamilton Re US. Hamilton Re writes property, casualty and specialty reinsurance business on a global basis and also offers high excess Bermuda market specialty insurance products, predominantly for large U.S. commercial risks. Hamilton Re US writes casualty and specialty reinsurance business on a global basis.
•Our Bermuda segment had gross premiums written of $425 million, $554 million, $713 million, $846 million and $1,114 million for the years ended November 30, 2020, November 30, 2021 and December 31, 2022 through December 31, 2024, respectively, with a corresponding combined ratio of 111%, 104%, 110%, 85% and 87% for the same periods.
Our evolution into a specialty insurance and reinsurance company reached a significant turning point in 2018 with the hiring of Pina Albo, our CEO, and the start of our strategic transformation ("Strategic Transformation"). Ms. Albo is a 30+ year veteran in the insurance industry, having served as a member of the Board of Executive Management at Munich Re, where she had a 25-year career, as well as serving on the Board of Reinsurance Group of America, Incorporated (a Fortune 500 public company) and being appointed in 2023 for a two-year term as the first female Chair of the Association of Bermuda Insurers and Reinsurers. The Strategic Transformation commenced in 2018, when we set a new strategy and business priorities, and was propelled by the appointment of a management team focused on employing rigorous risk selection and creating sustainable underwriting profitability. The Strategic Transformation also included enhancing underwriting governance, re-underwriting and repositioning our business to increase the focus on casualty and specialty insurance and reinsurance lines, decreasing volatility, and investing in business-enabling technology. The Strategic Transformation was accelerated in 2019 when we acquired Pembroke Managing Agency and related entities, which included Pembroke Managing Agency (subsequently renamed Hamilton Managing Agency) and related entities, Lloyd’s Syndicate 4000 and Ironshore Europe DAC (subsequently renamed Hamilton Insurance DAC, or HIDAC). This acquisition doubled and diversified our premium base, increased our underwriting expertise and operational capabilities, and provided us with a fully-scaled Lloyd’s platform. As a result of the strategic actions taken in the context of the Strategic Transformation, we have grown premiums written from $571 million for the year ended November 30, 2018 to $2.4 billion for the year ended December 31, 2024, reduced our combined ratio, optimized the portfolio mix by increasing the contribution from specialty insurance, and strengthened our balance sheet. While the Strategic Transformation is complete, we continuously review our portfolio to optimize underwriting returns and opportunities and drive additional benefits by regular collaboration with our Group Underwriting Committee ("GUC"). Consequently, we believe Hamilton is well-positioned to deliver growth and profitability in the continuing attractive market environment and across all market cycles.
Our proprietary technology has been a critical part of our Strategic Transformation by enabling the growth of our business and the execution of our strategy. This technology includes a catastrophe modeling and risk accumulation tool (Hamilton Analytics and Risk Platform or "HARP"), a global underwriting submission system ("Timeflow"), and a business intelligence and management information system ("Hamilton Insights"), as described further below under Marketing and Distribution of our International and Bermuda Businesses - Technology and Data. We are not burdened by legacy systems and have a modernized, cloud-based core platform which has enabled us to design and implement our proprietary systems to be a competitive advantage for our business.
The growth of our business is supported by a strong balance sheet. As of December 31, 2024, Hamilton had total assets of $7.8 billion, total cash and invested assets of $4.8 billion and shareholders’ equity of $2.3 billion. Our total cash and invested assets of $4.8 billion includes $2.9 billion of securities in our fixed maturity trading portfolio and short-term investments, altogether consisting of 61% of our total cash and invested assets, with an average credit rating of Aa2 and of which 100% are investment grade. See "Management’s Discussion and Analysis of Financial Condition and Results of Operations—Financial Condition, Liquidity and Capital Resources—Cash and Investments" for further detail by investment class. We also enjoy a low debt-to-capital ratio of 6.1% at December 31, 2024, which we believe provides us with meaningful financial flexibility to execute our strategy. The Company has demonstrated its ability to withstand catastrophe and other significant loss events across changing market cycles and we believe it is well placed to take advantage of the current hard market conditions. Our prudent reserving approach fortifies our financial position and has resulted in reserve releases (i.e. decreasing reserves for loss occurrence) every year since our inception.1
Our Lloyd’s syndicate benefits from financial strength ratings of "A+" (Superior) from A.M. Best and "AA-" from each of S&P Global, Kroll Bond Rating Agency ("KBRA") and Fitch Ratings Inc. ("Fitch"), all of which are Nationally Recognized Statistical Rating Organizations ("NRSROs") as defined under the Securities Exchange Act of 1934 as amended, (the "Exchange Act"). Hamilton Re holds an "A" (Excellent) rating from A.M. Best, an "A" rating from KBRA, and an "A-" (Strong) rating from Fitch. HIDAC holds an "A" (Excellent) rating from A.M. Best, and an "A-" (Strong) rating from Fitch. Hamilton Select Insurance Inc. ("Hamilton Select") holds an "A-" (Excellent) rating from A.M. Best. We believe these ratings demonstrate the financial strength of our insurance and reinsurance platforms and facilitate our ability to capitalize on new opportunities with our policyholders, cedants and distribution partners.
1 Excluding the U.S. GAAP accounting impact of a loss portfolio transfer purchased in 2020.
Unique Investment Management Relationship with Two Sigma
Our diversified underwriting model is complemented by a unique and long-term investment management relationship with Two Sigma. Founded in 2001, Two Sigma aims to consistently generate alpha in liquid global markets across a range of conditions using a disciplined, scientific approach and managed approximately $65 billion of assets across affiliates at December 31, 2024. Driven by a differentiated application of technology and data science, Two Sigma has over 1,700 employees across affiliates, including an experienced and diverse team of employees in research and development.
Two Sigma manages $1.9 billion of our assets as of December 31, 2024 via our investment in the TS Hamilton Fund. The portion of our total invested assets managed by Two Sigma has declined from 80% in 2018 to 39% in 2024 and is expected to continue to decline naturally as our underwriting platforms and fixed income portfolio grow. The TS Hamilton Fund is a dedicated fund-of-one managed by Two Sigma with exposures to certain Two Sigma macro and equity strategies.2 The TS Hamilton Fund has been designed to provide low-correlated absolute returns, primarily by combining multiple hedged and leveraged systematic investment strategies with proprietary risk management investment optimization and execution techniques. The TS Hamilton Fund invests in a broad set of financial instruments and is primarily focused on liquid strategies in global equity, foreign exchange ("FX") markets, exchange-listed and over-the-counter ("OTC") options (and their underlying instruments) and other derivatives. This liquidity profile fits well with our business, while also providing the benefit of access to a dedicated fund-of-one.
Two Sigma has broad discretion to allocate our invested assets to different opportunities. At December 31, 2024, its investments include Two Sigma Futures Portfolio, LLC ("FTV"), Two Sigma Spectrum Portfolio, LLC ("STV") and Two Sigma Equity Spectrum Portfolio, LLC ("ESTV"). The TS Hamilton Fund’s trading and investment activities are not limited to these systematic (and certain non-systematic) investment strategies and proprietary risk management, investment, optimization and execution techniques (collectively, the "Techniques") and the TS Hamilton Fund is permitted to pursue any investment strategy and/or Technique that Two Sigma determines in its sole discretion to be appropriate for the TS Hamilton Fund from time to time. In any given period, the performance of these individual portfolios may vary materially; however, the performance and risk profile of the TS Hamilton Fund is monitored in the aggregate at the overall fund level, rather than at the individual portfolio level. This is consistent with the manner in which investment management fees and performance incentive allocations are determined (i.e., fees and performance incentives are determined by the overall performance of the fund, rather than the performance of each portfolio).
We entered into a Commitment Agreement effective July 1, 2023 with Two Sigma for an initial three-year period (the "Initial Term") and for rolling three-year periods thereafter (each such three-year period the "Commitment Period"), subject to certain circumstances, with the current Commitment Period ending on June 30, 2027. The Commitment Period consists of a three-year rolling term that automatically renews on an annual basis unless Hamilton Re or the Managing Member provide advance notice of non-renewal. Although not necessarily indicative of future results, the TS Hamilton Fund produced returns, net of investment management fees and performance incentive allocations, of 16.3%, 7.6% and 4.6% for the years ended December 31, 2024, 2023 and 2022, respectively. Hamilton pays arm’s-length management and incentive fees under this agreement. See “Risk Factors—Risks Related to Our Investment Strategy—We do not have control over the TS Hamilton Fund” for more information.
2 For the avoidance of doubt, Two Sigma serves as the investment manager of the TS Hamilton Fund. The Company is not a client of Two Sigma pursuant to the Investment Act of 1940, as amended.
Our Sustainability Principles
Good corporate citizenship underscores everything we do. Our sustainability approach is based on being a responsible corporate and global citizen.
We apply a four-pillar philosophy across all areas of our business:
1.Accountability: We focus on employing equitable governance and oversight in an effort to ensure the best outcome for all of our stakeholders.
2.Social Impact: We have an inclusive culture underpinned by teamwork and collaboration. Our Diversity, Equity and Inclusion Committee is comprised of employee representatives from each of our key locations, across functions and seniority. We also have a diverse management team, with two of our three underwriting platform CEOs being female. In addition, 45% of our Group Executive team are female, including our Group CEO.
3.Underwriting: We are supportive of companies that are involved in the transition to alternative energy sources such as renewable energy, including wind and solar, and have embedded sustainability-specific underwriting guidelines in our operations.
4.Investments: We strive to deploy our invested capital responsibly with established guidelines that are regularly monitored to align with our corporate values. Our investment managers are guided by the United Nations Principles for Responsible Investment.
Our Competitive Strengths
We believe that our corporate tagline, "In good company" embodies who we are as an organization. As a good corporate citizen, we strive to ensure that everyone we interact with – our clients and business partners, our people, our shareholders and the communities we serve – feel they are in good company with Hamilton. Our promise is enhanced by the strengths of our differentiated business model, which include:
Scaled, diversified, and global specialty insurance and reinsurance operations
The scale we have built since our inception provides significant competitive advantages in the global markets we serve. We have grown our book both organically when market conditions have been attractive, through product expansion, increased participation and increasing client and broker channel distribution; and inorganically, through the 2019 strategic acquisition of Pembroke Managing Agency and related entities, which included Pembroke Managing Agency (subsequently renamed Hamilton Managing Agency), Lloyd’s Syndicate 4000 and Ironshore Europe DAC (subsequently renamed Hamilton Insurance DAC) in 2019.
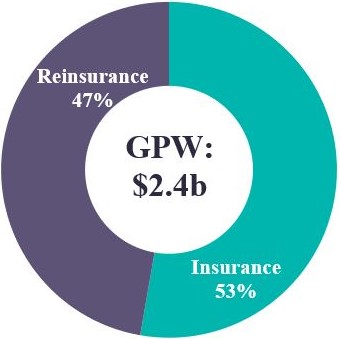
Our business mix is well-balanced between insurance and reinsurance, and is diversified across geographies, risks, clients and products, with a majority of our business coming from specialty and casualty lines. Since 2018, our portfolio has evolved from 32% to 53% insurance, with reinsurance declining from 68% to 47% (in each case, based on premium volume). For the year ended December 31, 2024, we recorded $2.4 billion of gross premiums written through our three principal underwriting platforms, with access to key markets around the world.
We believe that the scale and breadth of our book of business, our multiple underwriting platforms and our product offerings allow us to dynamically respond to and manage market cycles, thus providing for more consistent underwriting performance and reduced volatility. We expect Hamilton Select will continue to add business diversification and growth in the profitable, hard-to-place niche of the U.S. E&S market. Hamilton Global Specialty and Hamilton Re also expect to continue providing growth prospects in the U.S. E&S market. Overall, we believe our disciplined approach to scale, risk assessment, and diversification enables us to deliver on our goal of long-term profitability.
Disciplined and data-driven underwriting approach
Our underwriting platforms are each led by teams of experienced underwriters who are specialized in their product areas and able to set terms and conditions across several lines of business. Their expertise is supplemented by our strong technical tools, which provide the insights that enable our underwriters to intelligently price and structure our products and portfolio, maintain diversification, and in turn deliver attractive risk-adjusted profitability. Our underwriters adhere to a disciplined underwriting philosophy and guidelines, seeking to underwrite only profitable risks. Our underwriters regularly review their books of business to ensure they are growing in the most profitable areas and restructure or non-renew underperforming accounts, thus optimizing our business portfolio. They benefit from quarterly discussions with our GUC, which also reviews underwriting results, suggests strategic portfolio shifts, reviews risk appetites and tolerances for new and existing products and considers emerging risks and mitigation strategies in collaboration with our underwriting and executive leadership. Our review and risk selection processes are enhanced by our business intelligence and global management information system, Hamilton Insights, which provides real-time data and self-service report generation to help inform underwriting decisions. Examples of the portfolio enhancing measures undertaken in the context of our Strategic Transformation since 2018 include: the launching of Hamilton Select and Hamilton Re US; the expansion of credit and surety reinsurance, the growth of our professional insurance lines; our purchase of loss portfolio transfer coverage (the "LPT") with a third party reinsurer in 2020 with respect to certain casualty risks for Lloyd’s Year of Account ("YOA") in 2016, 2017 and 2018; and the exit/remediation of certain unprofitable lines of business (e.g., agriculture). The platforms have benefited from group-wide, third-party best practice reviews commissioned by our GUC and the fact that variable compensation is tied primarily to underwriting profitability.
We actively manage our risk exposure on a centralized basis, in order to allocate capital efficiently and optimize our returns. For example, we monitor tolerances for natural catastrophe risks utilizing probable maximum loss modelling results ("PMLs") for multiple regions and perils and we have appropriately managed our PMLs during the varying market cycles.
Our methodical and disciplined approach to underwriting, bolstered by our experienced underwriting talent, collaboration with our GUC, strong analytics platforms, and the actions taken as part of the Strategic Transformation, have resulted in a reduction in our combined ratio by 33.9 percentage points since 2018. Our combined ratio for the year ended December 31, 2024, was 91.3%. Additionally, the combined ratio for our International segment for the year ended December 31, 2024 was 95.6% and the combined ratio for our Bermuda segment for the year ended December 31, 2024 was 87.0%.
Proprietary technology infrastructure
Underpinning our business are sophisticated proprietary technology and analytics platforms. Unburdened by legacy systems, our technological capabilities enable operational efficiencies as we continue to scale, and allow for nimble decision-making in a competitive marketplace.
We have built proprietary systems including HARP, a catastrophe modeling and portfolio accumulation management platform used for all our natural catastrophe-exposed risks. Reflecting decades of industry experience, HARP enables precise modifications and loads to be applied to vendor catastrophe model results to produce the Hamilton View of Risk ("HVR"), the basis upon which all of our catastrophe modeling and accumulation management is conducted. HARP produces rapid management information and portfolio analytics to aid decision-making, and supports structural features such as reinstatement premium protections, cascading layers and trailing deductibles that many third-party systems are unable to handle. We believe HARP is one of the most sophisticated and user-friendly risk and exposure management systems in the industry.
The HVR enables us to manage natural catastrophe risk on a consistent basis, including pricing, underwriting, reserving, planning, capital modelling and accumulation management decisions. We believe that the HVR is materially complete and appropriate to the current risk landscape. We accomplish this through vendor catastrophe models that serve as a baseline and our proprietary tools - the mainstay of which is HARP - which allow us to make a number of significant adjustments, and our model intelligence team that evaluates models and recommends changes. The HVR utilizes a long-term trend in its baseline and adjusts it to consider a combination of short-term variability such as warm sea-surface temperature, non-modeled perils, secondary uncertainty and severity loads (such as missing exposures, loss adjustment expenses, and potential model miss). In aggregate, the HVR produces loss estimates materially in excess of those provided by the baseline vendor models, but nonetheless may not be predictive of catastrophic events.
Our proprietary suite of technology also includes Timeflow (a global underwriting submission system), which enables us to digitize our submission intake process and orchestrate data entry across multiple systems and Hamilton Insights (our business intelligence and management information system), which is used by underwriters to gain insights to our business and make informed decisions.
Differentiated asset management capabilities with Two Sigma to further enhance returns
We have a unique asset management strategy as our investment-grade fixed income investment portfolio is complemented by our separate portfolio managed by Two Sigma within the TS Hamilton Fund. Our ability to generate positive risk-adjusted yields through our complementary investment portfolios differentiates us from our peers who generally only have traditional investment allocations, concentrated primarily in investment-grade, long-only fixed income securities.
The TS Hamilton Fund is designed to provide low-correlated absolute returns and high liquidity. Two Sigma seeks to control risk systematically through the use of proprietary portfolio management and risk management systems and techniques. Our current allocation to the TS Hamilton Fund is 39% of our invested assets. Separately, our fixed income portfolio consists of traditional investment-grade fixed income securities which are conservative, fixed maturity and short-term investments (average rating of "Aa3" and duration of 3.4 years at December 31, 2024) which is managed by two third-party investment managers. We believe that this balanced approach and unique access to the TS Hamilton Fund allows us to optimize our investment returns and drive additional shareholder returns that complement our underwriting operations.
Strong balance sheet with significant financial flexibility
As of December 31, 2024, we had consolidated GAAP shareholders’ equity of $2.3 billion, with limited intangibles. Our financial leverage ratio was 6.1% at December 31, 2024. Our capital position is enhanced by a highly liquid investment strategy, with assets in the TS Hamilton Fund diversified across investment strategies, instruments and thousands of positions in liquid global markets. As of December 31, 2024, over 99% of the TS Hamilton Fund positions are level 1 assets as classified by ASC 820.
Our balance sheet is supported by our robust reserve position, which is above the estimate of our external actuarial selected indications.
Our Lloyd’s syndicate benefits from financial strength ratings of "A+" (Superior) from A.M. Best and "AA-" from each of S&P Global, KBRA and Fitch, all of which are NRSROs as defined under the "Exchange Act". Hamilton Re holds an "A" (Excellent) rating from A.M. Best, an "A" rating from KBRA, and an "A-" (Strong) rating from Fitch. HIDAC holds an "A" (Excellent) rating from A.M. Best, and an "A-" (Strong) rating from Fitch. Hamilton Select holds an "A-" (Excellent) rating from A.M. Best. Maintaining strong ratings helps us demonstrate our financial strength to our policyholders, cedants and distribution partners and continues to unlock business.
Highly entrepreneurial and experienced leadership team fostering a distinctive and attractive culture
We consider ourselves a magnet for talent at all levels. Our executive officers are highly qualified and have an average of more than 20 years of relevant experience in insurance and reinsurance. We are led by our Chief Executive Officer, Pina Albo, who has over 30 years of industry experience and was previously a member of the Board of Executive Management of Munich Re, and the first North American woman to hold such a role. Several of our executive officers have long histories of working together at other organizations and have held senior management positions at large, established carriers. Members of our executive and management team have joined us from a number of reputable carriers such as AIG, AXIS, Chubb, CNA, Everest, Kinsale, Munich Re, Partner Re and Renaissance Re.
Our corporate tag-line, "In good company", underpins our employee value proposition and embodies our inclusive, entrepreneurial, and collaborative culture which drives our success in recruitment, development and retention of leading industry talent.
Our Strategy
We are a global specialty insurance and reinsurance company enhanced by data and technology, focused on producing sustainable underwriting profitability and delivering significant shareholder value. We intend to keep growing our diverse book of business by responding to changing market conditions, prudently managing our capital, and driving sustainable shareholder returns. The key pillars of our strategy include:
Prudently managing capital across different underwriting cycles
We seek to prudently manage our capital with the objective of effectively navigating different market conditions and generating strong underwriting margins throughout all market cycles. Our scaled and diversified platforms and product offerings and our broad industry relationships provide significant opportunity to underwrite our chosen classes of property, casualty and specialty insurance and reinsurance as market opportunities arise. Leveraging our disciplined underwriting approach, balance sheet strength and flexibility, and real-time technology prowess, we can respond dynamically to capture opportunities as markets evolve.
We believe the current market conditions for insurance and reinsurance remain strong for all of our underwriting platforms. Given our broad product offering and recent A.M. Best upgrade to an "A" rating, we believe Hamilton Re is particularly well positioned to increase our writings across various lines of business, participate in attractive program structures and benefit from more favorable terms and conditions as a result of access to business that was not previously available to us. In addition, subsequent to the A.M. Best upgrade, Hamilton Re entered into credit, bond and political risk reinsurance, a very attractive business which is well diversified against the rest of the portfolio. Hamilton Global Specialty continues to capitalize on strong market conditions across its specialty insurance and reinsurance offerings and has recently expanded its offering in Property D&F, which remains an attractively priced line in which we see good opportunity. We have also entered new lines of business where we see opportunity, such as the recent addition of marine hull. Hamilton Select is also benefiting from the increased flow of business and attractive market conditions in the U.S. E&S market where it is focused.
We believe our approach to managing capital across market cycles will allow us to produce profitable underwriting results, grow our capital and fund the continued growth of our business with our own resources. Our prudent approach to capital management may also allow us to return excess capital to investors over time, which may take the form of ordinary dividends, special dividends or share buybacks.
Driving sustainable underwriting profitability
One of our key strategic priorities is to produce sustainable underwriting profitability across the business we write and we believe we are well-positioned to do so following the Strategic Transformation. Our data-driven and disciplined underwriting processes position us to intelligently price and structure our products and our business portfolio. Our experienced underwriting, actuarial and catastrophe modeling teams rely on our strong technical tools and insights to help inform underwriting decisions and drive additional benefits by regular collaboration with our GUC.
We maintain trusted and long-standing relationships with our clients and brokers, who we believe will continue to provide us with increased access to attractive business. Our disciplined underwriting approach has resulted in a reduction in our combined ratio by 33.9 percentage points since 2018. We expect to continue to leverage our robust underwriting processes, highly experienced teams, broad access to clients and brokers and real time analytics to address our clients’ needs and to garner attractive opportunities across all our underwriting platforms.
Pursuing disciplined and opportunistic growth of Hamilton platforms
We see growth opportunities in both the insurance and reinsurance markets in which we operate and intend to pursue disciplined growth across all our underwriting platforms. In recent years the U.S. E&S market has benefited from a strong rate environment and increased submissions as business has shifted into the non-admitted market from the admitted market. Non-admitted insurers are able to cover unique and hard-to-place risks because they have flexibility of rate and form and can accommodate the unique needs of insureds who are unable to obtain coverage from admitted carriers.
We access the attractive U.S. E&S market via all three of our underwriting platforms.
•Hamilton Global Specialty writes U.S. E&S business on both its Lloyd’s and HIDAC platforms. It is an established specialty insurance market with specialized underwriting talent and strong broker and client relationships across the casualty, specialty and property insurance lines, and is well positioned for growth in this market.
•Hamilton Re is both an insurer and reinsurer of U.S. E&S insurance business, positioning this platform well for growth, given the strong market conditions.
•Hamilton Select further increases our access to the U.S. E&S insurance market. Hamilton Select plans to grow in the hard-to-place niche of the U.S. E&S market focused on small to medium sized risks, a segment which is expected to produce profitable results in all market cycles. Hamilton Select has a leadership and underwriting team with extensive experience in its chosen niche and also benefits from extensive distribution relationships in this market segment.
We believe the access our three underwriting platforms have to U.S. E&S insurance business will allow us to build a robust and diversified book of business and achieve our profitable growth objectives throughout various market cycles.
Reinsurance business continues to offer a particularly attractive opportunity given the strong rating environment for several of the classes we write at this time in the cycle and this, in addition to our A.M. Best "A" rating upgrade, is expected to accelerate growth opportunities in the near term, particularly with key clients. A number of factors, including economic and social inflation, combined with the frequency and severity of natural catastrophe events in recent years, resulted in a supply/demand imbalance that created the strongest market conditions seen in decades. In addition, we have the benefit of an A.M. Best upgrade to "A", providing ample opportunity for us to grow with key clients.
Generating strong risk-adjusted returns for shareholders
Our strong, sustainable underwriting operations are complemented by our unique investment portfolio, which consists of the TS Hamilton Fund and our investment grade fixed income portfolio, which is currently benefiting from strong interest rates. We plan to continue to optimize our investment portfolio through a balanced allocation of invested assets and maintain the flexibility to adjust this allocation as needed. We believe our strategy of disciplined underwriting growth, balanced with our investment platform, will drive our ability to create shareholder value.
Our Business
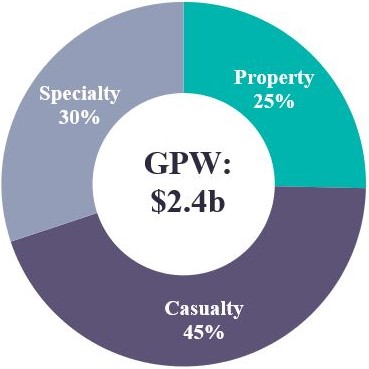
We operate three principal underwriting platforms categorized into two reporting business segments: International and Bermuda. Our three underwriting platforms, with dedicated and experienced leadership, provide us with access to diversified and profitable key markets around the world. Across these global operations, we generated $2.4 billion of gross premiums written for the year ended December 31, 2024.
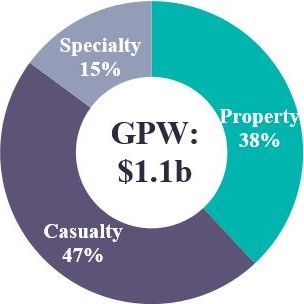
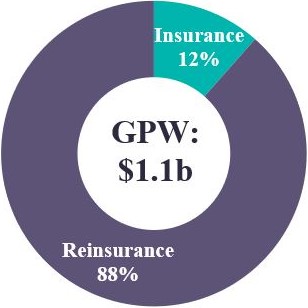
The following charts represent our gross premiums written by reporting segment, insurance and reinsurance mix, and class of business for the year ended December 31, 2024.
| | | | | | | | |
Gross Premiums Written: By Segment | Gross Premiums Written: Insurance / Reinsurance | Gross Premiums Written: Class of Business |
| | |
Our Products
The table below presents gross premiums written in each of our reporting segments for each of the most recent three years.
| | | | | | | | | | | | | | | | | |
| For the Years Ended December 31, |
| ($ in thousands) | 2024 | | 2023 | | 2022 |
| International | $ | 1,308,460 | | | $ | 1,105,522 | | | $ | 933,241 | |
| Bermuda | 1,114,122 | | | 845,516 | | | 713,432 | |
| Total gross premiums written | $ | 2,422,582 | | | $ | 1,951,038 | | | $ | 1,646,673 | |
International comprises 54% of the total 2024 gross premiums written and includes Hamilton Managing Agency Limited (“HMA”), as managing agent to Hamilton Syndicate 4000 (wholly aligned syndicate), HIDAC, and Hamilton Select.
Bermuda comprises 46% of the total 2024 gross premiums written and includes Hamilton Re and Hamilton Re US.
International
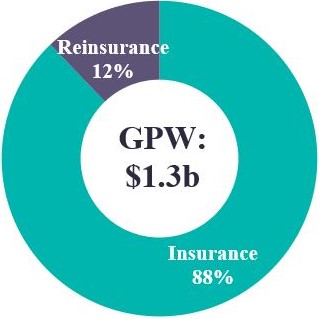
Our International segment includes both the Hamilton Global Specialty and Hamilton Select platforms. Hamilton Global Specialty focuses predominantly on commercial specialty and casualty insurance and reinsurance products for medium to large-sized accounts and specialty reinsurance for a variety of global insurance companies. Its business is distributed via Lloyd’s Syndicate 4000 and HIDAC in Ireland. Hamilton Select, our U.S. domestic E&S carrier, writes casualty insurance for small to mid-sized commercial clients in the hard-to-place niche of the U.S. E&S market. Across the International segment, insurance business made up approximately 88% of gross premiums written, while specialty reinsurance makes up approximately 12% for the year ended December 31, 2024.
The portfolio of business written within our International segment is broadly diversified with low volatility and focuses on medium to large-sized accounts. The 2025 syndicate business forecast approved by Lloyd’s gives Syndicate 4000 capacity of £635 million. In addition to the capacity at Lloyd’s, Hamilton Global Specialty writes business using its Irish subsidiary company, HIDAC. Hamilton Select, our U.S. E&S platform, also operates under our International segment and focuses on small to mid-sized hard-to-place accounts.
| | | | | |
Gross Premiums Written: Class of Business | Gross Premiums Written: Insurance / Reinsurance |
| |
Our International segment includes:
| | | | | | | | | | | | | | | | | |
| For the Years Ended December 31, |
| ($ in thousands) | 2024 | | 2023 | | 2022 |
| Property | $ | 190,369 | | | $ | 134,450 | | | $ | 127,424 | |
| Casualty | 554,413 | | | 490,465 | | | 463,397 | |
| Specialty | 563,678 | | | 480,607 | | | 342,420 | |
| Total gross premiums written | $ | 1,308,460 | | | $ | 1,105,522 | | | $ | 933,241 | |
| | | | | | | | | | | | | | | | | |
| For the Years Ended December 31, |
| ($ in thousands) | 2024 | | 2023 | | 2022 |
| Insurance | | | | | |
| Fixed | $ | 523,810 | | | $ | 468,749 | | | $ | 370,653 | |
| Proportional | 625,665 | | | 522,769 | | | 466,987 | |
| Total insurance | $ | 1,149,475 | | | $ | 991,518 | | | $ | 837,640 | |
| Reinsurance |
| |
| |
|
| XOL | $ | 55,478 | | | $ | 38,842 | | | $ | 27,488 | |
| Proportional | 103,507 | | | 75,162 | | | 68,113 | |
| Total reinsurance | 158,985 | | | 114,004 | | | 95,601 | |
| Total gross premiums written | $ | 1,308,460 | | | $ | 1,105,522 | | | $ | 933,241 | |
Property Lines
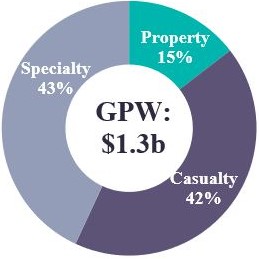
Property business written by our International segment accounted for 15% of gross premiums written for the year ended December 31, 2024. The property book is predominantly made up of U.S. E&S insurance business with a weighting in favor of the industrial and commercial sectors, binding authority business, comprising non-standard commercial and residential risks, and specialist sectors, including terrorism, power generation, engineering and nuclear risks. The property insurance book is written on both a direct and facultative basis, as well as through a specialist property binders division. The property products include:
Property (Direct & Facultative): We offer all risks coverage, business interruption, machinery breakdown, natural perils, and physical loss or damage. This is a global account with a concentration of business in North America. The balance of business is written in Australasia, Latin America, the Middle East and South Africa.
Property Binders: We target small and medium-sized enterprises low-hazard commercial portfolios, mostly low attritional coastal appetite, personal lines business, excluding habitational risk, difference in conditions – flood and earthquake portfolios and specialty financial institution lines including mortgage impairment and lender-placed property. The portfolio is predominantly written for risks across the United States/North America.
Casualty Lines
Casualty business within our International segment accounted for 42% of gross premiums written for the year ended December 31, 2024. Our casualty products include:
Financial Lines: Our financial lines book targets corporate entities rather than retail exposure. We write a diversified portfolio across a broad range of financial institutions including asset managers, funds, building societies, financial exchanges, retail and commercial banks, private equity/venture capital firms, stockbrokers, private banks, development banks, merchant/investment banks, insurance companies and trust companies. This is a global account with a concentration of business in the United Kingdom, the United States, Canada, the Caribbean, Australia and a key presence in emerging markets.
Professional Lines: Our professional lines book covers both international and U.S. professional indemnity, medical malpractice and directors & officers (“D&O”). We target a diversified portfolio for which the cornerstone is a strong international PI account supported by carefully selected commercial D&O. Key areas include specialist engineers, lawyers and miscellaneous business. We deliver our professional lines through a mixture of multi-class facilities for small businesses or via bespoke products designed for more specialized risks, such as auction houses, protection & indemnity ("P&I") club managers and classification societies. This is a global account with a concentration of business in the United Kingdom, United States, Canada and the Caribbean.
Environmental: We help manage risks in the areas of pollution liability aimed at safeguarding business owners from pollution claims arising from a variety of environmental threats related to liability from managing, leasing or owning real estate assets, professional liability, contractors’ pollution liability, commercial general liability, and manuscript solutions. With our global presence, we have the capability to underwrite cross-border transactions and deals and the ability to underwrite risks in various international jurisdictions including Canada, the United Kingdom, Europe, Asia, Latin American and the Caribbean.
Excess Casualty: Our industry class offering is broad and includes medium to large companies. We also provide cover for U.S. construction companies for both practice and project-specific policies over a wider range of construction from mid-size commercial projects through to major infrastructure projects. We target U.S.-domiciled entities with U.S. and global exposures.
Mergers & Acquisitions: Our mergers & acquisitions book offers warranty and indemnity insurance, which covers unknown and unforeseen loss arising from breaches of the warranties under an acquisition agreement, as well as contingent risk insurance, which covers known and quantifiable loss arising out of specific (low-risk) issues identified during a transaction diligence process. We work with private equity houses, financial institutions, global corporates and management teams of all sizes and have broad appetite for all target companies, business or assets. We have a global presence and capabilities to underwrite cross-border transactions and deals with operations in various international jurisdictions. At present, our focus is on U.K., European and Asia Pacific targets. A typical transaction enterprise value for primary terms is between approximately $70 million and $700 million.
Cyber: Our cyber book is global and focused on financial institutions, utilities, retailers and the healthcare and hospitality industries. It includes cyber liability, as well as optional coverage, including technology errors and omissions, payment card industry fines and penalties, cybercrime and fraudulent instruction. Our cyber liability provides affirmative coverage for hardware and software replacement costs, voluntary shutdown and ransom events. Optional coverage includes: technology errors and omissions, payment card industry fines and penalties, cybercrime, telephone fraud and electronic fraudulent instruction. Expert underwriting enables us to cover a diverse and wide-ranging spread of industries and territories with a particular focus on financial institutions, utilities, retailers and the healthcare and hospitality industries. We provide global coverage with a concentration of business in the United States, Europe and the Middle East.
U.S. Energy: We help manage risks in the areas of excess liability coverage for a minimum attachment of $5 million for upstream energy, select midstream energy, downstream energy and renewable energy. We target classes such as contracting/servicing, engineering/consulting, down hole exposures and manufacturing/distributors and rentals. This class only underwrites energy-oriented risk in the United States.
Specialty Lines
Specialty business within our International segment accounted for 43% of gross premiums written for the year ended December 31, 2024. Our specialty products include:
Accident & Health (A&H): Our A&H book includes individual and group accidental death and disability, worldwide excess of loss, medical expenses and kidnap and ransom cover. The book is split into three parts: personal accident (“PA”), PA catastrophe, and medical expense reimbursement. We also write sports and non-sports coverage in various locations around the world. The A&H team is a recognized market leader and provides protection for both groups and individuals covering a broad variety of trades, company sizes and a diverse spread of occupational classes. This is a global account with a concentration of business in the United Kingdom, the United States, Canada and the Caribbean and a significant presence in the European Union.
Political Risk/ Political Violence (PR/PV): Our PR/PV book includes cover for confiscation and contract frustration, trade credit and war and terrorism, and it is written on a worldwide basis. We offer protection against frustration of, or default on, contracts with governments, state-owned entities and private entities, and protection for overseas investments or simpler assets operated abroad against risks of confiscation and political violence and for risks of currency inconvertibility and non-transfer in remitting funds. We target financial institutions and banks, overseas investors, traders, exporters, telecommunications companies, drilling/oil companies and contractors/infrastructure projects. This is a global account, except for territories subject to sanctions.
Fine Art & Specie: Our fine art & specie book includes a variety of fine art & specie risks and high value cargo. Fine art risks include private and corporate collections, museums, exhibitions, galleries, auction houses and musical instruments. Specie risks include bullion, excess vault, safe deposit boxes, excess securities investor protection corporation/Canadian investor protection fund and mining risks. High value cargo includes classic car collections, specialist motor, motor sport and wine collections. We write such business on a worldwide basis via a selective number of specialist partners and also through Hamilton’s consortium which writes on behalf of third-party capital, providing additional capacity as required.
Marine/Energy: Our marine and energy book includes both traditional marine liability and energy liability. This product area includes international onshore and offshore energy business. Coverage is provided on an excess basis to a broad range of operations such as marine (vessel operators and charterers, ship repairers, terminal operators, port authorities and pollution) and energy (on and offshore, upstream and midstream operators, drilling contractors, service contractors and pipeline operators). This is a worldwide book, with a focus on North America and Europe.
War & Terrorism: We underwrite predominantly physical loss or damage and business interruption for the following: terrorism and sabotage, riots, strikes, civil commotion, malicious damage, full political perils, terrorism liability, aviation war liability, marine war and cargo war, and events coverage due to a terrorism act or threat. We cater to business sectors across the spectrum including real estate, retail, banks and finance, hospitality and leisure, construction, manufacturing, power utilities, energy, specie and fine art, schools and educational institutions, telecommunications, transportation, marine and cargo, and municipalities. We underwrite such business on a worldwide basis and also lead a consortium for U.S.-based terrorism business with over half a billion dollars of capacity.
Kidnap & Ransom: We started this class of business in 2021 with a dedicated team with over 45 years’ combined underwriting experience. We offer coverage for the following types of events: kidnap, extortion, detention, disappearance, hostage crisis, product extortion, threat, virtual kidnap, business interruption, child abduction, political evacuation and repatriation, workplace violence, and product extortion recall and destruction. We partner with Crisis24 which has 30 years of experience and infrastructure in 45 countries, and Holman Fenwick Willan LLP, an international law firm widely recognized as the leading global law firm managing and resolving incidents in complex and hostile environments. We underwrite such business on a worldwide basis.
Space: We cover mainly GEO communication satellites but also imaging and weather satellites and cargo missions to the International Space Station. The business is 80% launch and 20% in orbit. We target satellites, covering their entire lifespan from launch to in-orbit testing and during their commercial exploitation. These include telecommunication satellites in geostationary orbit as well as observation, navigation, meteorological, scientific and government satellites.
Upstream Energy: We specialize in onshore and offshore oil and gas exploration and production (“E&P”). We offer package-based policies including first-party property damage, operators’ extra expense, third-party liability and business interruption. We also consider the specialist areas of the Gulf of Mexico named windstorm and construction business. Our target market includes a wide range of operators within the upstream energy sector. This includes E&P companies of all sizes, state oil companies, multinationals and independent operators. Our target scope also extends to both drilling and service contractors within the oil and gas industry. This is a global account with a concentration of business in the key offshore oil and gas regions including the North Sea, Gulf of Mexico, Asia Pacific, Australasia and offshore West Africa.
Surety Reinsurance: We focus on the Latin American market with facultative surety bonds, proportional and non-proportional treaties. We are a facultative reinsurer, not limited to inwards reinsurance treaty relationships, and can consider regional principals and complex contracts.
Treaty Reinsurance: We target marine treaty, energy treaty with upstream, midstream and downstream available, war and terror treaty, aviation treaty and ancillary interests. We offer all forms of pro rata and excess of loss treaty. This is a global account with a worldwide remit, with key exposures in the United States, Europe and Japan.
Hamilton Select
As a U.S. domestic non-admitted carrier, Hamilton Select can restrict coverage and thereby limit exposure to loss by either excluding coverage or providing a sub-limit on coverage. As coverage is not available in the standard market, non-admitted carriers may be able to charge premiums exceeding the standard market broad coverage risk charge for a narrower scope of coverage. The starting basis for non-admitted policy forms and rates are typically the admitted market policy forms and rates. The non-admitted market coverage form is typically modified to address the specific risk characteristics of accounts that are pushed out of the admitted market, and the pricing is adjusted to reflect the elevated risk potential. The non-admitted market policy wording is typically modified to further restrict and limit coverage, and the pricing is surcharged to account for the elevated risk for these distressed commercial accounts.
Hamilton Select offers the following products in the United States to small to mid-sized hard-to-place and distressed accounts:
Allied Medical: We offer coverage for long-term care facilities such as independent living and assisted living, social services such as adoption and foster care, counseling, drug & alcohol rehab, adult day care, shelters and halfway houses, group homes for people with developmental or physical disabilities, and miscellaneous healthcare facilities, such as home health care, staffing (non-physician), physical therapy, hospice agencies and cannabis dispensaries.
Management Liability: We write primary and excess private company and not-for-profit directors' and officers' liability, employment practices liability and fiduciary liability for diverse types of operations.
Medical Professionals: Our risk appetite includes physicians/surgeons, dentists and other medical providers such as chiropractors, podiatrists, nurse practitioners, and physicians’ assistants. Accounts falling into this space typically include those providers that have had licensing issues, substance abuse issues, adverse loss history, patient boundary/ethics issues, have been non-renewed due to practice/services offered or have had gaps in coverage.
Professional Liability: The clients we target include architects, engineers, accountants, insurance agents, lawyers, and real estate professionals, who work across a wide variety of industries. Professional liability insurance protects against claims related to professional negligence.
Excess Casualty: We write supported or unsupported excess over general liability, employers’ liability, automobile liability, liquor liability, incidental foreign liability, owners and contractors protective liability (“OCP”) and more. Our risk appetite includes contractors, products manufacturing / importing, and various other areas including restaurants/bars/nightclubs, entertainment, security firms and hospitality (bakeries and shops).
General Liability: We write general liability including products/completed operations for a broad selection of owners, landlords, and tenants liability (“OL&T”)/premises-driven risks. Our risk appetite includes habitational, hospitality, lessor’s risk only, and mercantile & other classes.
Products Liability & Contractors: We will write general liability or products liability on an occurrence and claims-made form for a broad selection of risks. Our products liability risks include manufacturers, importers, and distributors of commercial, industrial and consumer goods. Our contractors liability risks include commercial, residential, and industrial operations on a practice policy, project specific, or OCP form.
Small Business Casualty: We focus on a broad selection of industries from construction to OL&T risks. Our target classes include general and trade contractors, as well as premises-driven accounts including real estate, hospitality, and habitational businesses.
Bermuda
Our Bermuda segment encompasses the Hamilton Re platform on which we write property, casualty and specialty reinsurance business on a global basis as well as high excess casualty and property insurance products, predominantly to large U.S.-based commercial clients. Hamilton Re US writes casualty and specialty reinsurance business predominantly for U.S.-domiciled insurers. Reinsurance business accounted for 88% of gross premiums written for the year ended December 31, 2024, while insurance business accounted for 12%. Our reinsurance business is written on either a proportional or on an excess of loss basis.
| | | | | |
Gross Premiums Written: Class of Business | Gross Premiums Written: Insurance / Reinsurance |
| |
Our Bermuda segment includes:
| | | | | | | | | | | | | | | | | |
| For the Years Ended December 31, |
| ($ in thousands) | 2024 | | 2023 | | 2022 |
| Property | $ | 423,747 | | | $ | 318,297 | | | $ | 309,051 | |
| Casualty | 524,711 | | | 402,731 | | | 262,795 | |
| Specialty | 165,664 | | | 124,488 | | | 141,586 | |
| Total gross premiums written | $ | 1,114,122 | | | $ | 845,516 | | | $ | 713,432 | |
| | | | | | | | | | | | | | | | | |
| For the Years Ended December 31, |
| ($ in thousands) | 2024 | | 2023 | | 2022 |
| Insurance | | | | | |
| Fixed | $ | 128,309 | | | $ | 120,973 | | | $ | 99,838 | |
| Proportional | — | | — | | — |
| Total insurance | $ | 128,309 | | | $ | 120,973 | | | $ | 99,838 | |
| Reinsurance | | | | | |
| XOL | $ | 498,868 | | | $ | 394,914 | | | $ | 367,349 | |
| Proportional | 486,945 | | | 329,629 | | | 246,245 | |
| Total reinsurance | $ | 985,813 | | | $ | 724,543 | | | $ | 613,594 | |
| Total gross premiums written | $ | 1,114,122 | | | $ | 845,516 | | | $ | 713,432 | |
Property Lines
Our property business includes property reinsurance, comprised of excess of loss and proportional reinsurance, which generally covers natural and man-made catastrophes. We also write property insurance, which is predominantly provided to large U.S. commercial companies. Property business written by Hamilton Re accounted for 38% of gross premiums written for the year ended December 31, 2024. Hamilton Re’s property insurance business provides both insurance and facultative coverage for business interruption, machinery breakdown, natural perils, and physical loss or damage globally, and predominantly to large U.S.-based commercial clients. Key property products include:
Property Reinsurance: The property reinsurance business provides proportional, aggregate, excess of loss and retro products which generally cover natural and man-made catastrophes. We provide a worldwide territorial scope and offer capacity with reinstatable or single-shot limits.
Property Insurance: We offer all-risks coverage, business interruption, machinery breakdown, natural perils, and physical loss or damage, predominantly to large U.S.-based commercial risks. The cover is written globally, with a concentration of business in North America.
Casualty Lines
Our casualty business in our Bermuda segment is written by both Hamilton Re and Hamilton Re US and accounted for 47% of gross premiums written for the year ended December 31, 2024. It is comprised of both insurance and reinsurance business. Casualty insurance business is written in Bermuda only and exclusively on an excess of loss basis. This cover is generally provided to large U.S. commercial companies, rail companies, energy companies and financial institutions on a worldwide basis. Casualty reinsurance business is written on a proportional and excess of loss basis covering worldwide exposures. The lines of business offered for casualty reinsurance include general liability, umbrella/excess liability, D&O, errors & omissions and environmental.
Casualty Reinsurance
Casualty reinsurance is written by both the Bermuda and U.S. teams and is written on a proportional and excess of loss basis covering worldwide exposures. Cover provided includes:
General Liability: We protect a wide variety of general liability covers including premises, products completed operations and liquor liability. We offer treaty capacity globally on a proportional and excess of loss basis.
Umbrella & Excess Casualty: We protect umbrella and excess casualty programs written on occurrence, claims-made or integrated-occurrence bases. We offer treaty capacity globally on a proportional and excess of loss basis.
Professional Liability: We protect a wide variety of professional lines, including directors' and officers' liability, employment practices liability, lawyers’ professional liability, and errors and omissions liability. We offer treaty capacity on pro rata and excess of loss bases. Our coverage is worldwide.
Workers’ Compensation & Employers’ Liability: We protect workers’ compensation and employers’ liability cover globally on both a proportional and excess of loss basis.
Personal Motor: We protect motor liability, property damage and personal accident for all types of motor policies. We offer treaty capacity on proportional, excess of loss or retrocessional basis. Our current emphasis is in the United Kingdom.
Commercial Auto: We offer commercial auto reinsurance to protect motor liability, property damage and personal accident liability for commercial vehicles. We provide treaty capacity on a proportional and excess of loss basis, predominantly in North America.
Healthcare: Our product protects programs such as medical malpractice, hospital professional liability, long-term care, managed care, errors and omissions, and physicians’ liability. We offer cover globally on both a proportional and excess of loss basis, with limited reinstatements.
Multiline: We provide reinsurance for any combination of general liability, motor/auto, professional lines, healthcare, umbrella and excess casualty, and workers’ compensation/employers’ liability. We will also consider programs that support business that forms part of our property and specialty lines. We offer treaty capacity globally on both a proportional basis and excess of loss basis, with a preference for limited reinstatements.
Casualty Insurance
The casualty insurance business provides cover on an excess of loss basis only.
Excess Casualty: Excess liability insurance is written on a worldwide excess of loss basis, supporting a wide range of industries, including, but not limited to, chemicals, construction, consumer goods, energy, food and beverage, hospitality, manufacturing – consumer and industrial, OL&T, rail and transportation, retail, and utilities.
Financial Lines Insurance: The financial lines insurance is predominantly directors and officers, errors and omissions, employment practices liability and transactional liability cover provided predominantly to financial institutions and large U.S. commercial companies on a worldwide excess of loss basis.
Specialty Reinsurance
Our specialty business is reinsurance only, made up of several sub-classes. Specialty business accounted for 15% of gross premiums written for the year ended December 31, 2024. The book is comprised of reinsurance only and covers several sub-classes written on both a proportional and excess of loss basis. Key specialty products include:
Aviation & Space: Our aviation & space book covers airline, airport, aerospace, satellite launches and orbits, and general aviation risks globally on a proportional, excess of loss or retrocessional basis.
Marine & Energy: Our marine & energy book covers a broad portfolio of global marine and energy risks, including marine hull, marine liability including international group, cargo, and upstream, midstream and downstream energy risks which are on a proportional, excess of loss or retrocessional basis.
Crisis Management: Our crisis management book covers risks associated with war, terrorism and political violence. We also have the capacity to offer risks associated with contingency, piracy and kidnap and ransom cover. Our products can be provided globally on a proportional or excess of loss basis.
Mortgage: We provide excess of loss reinsurance predominantly to government-sponsored entities of U.S. residential mortgages.
Financial Risks: Financial risks reinsurance includes political risk, trade credit, surety, mortgage and other credit-related products. We offer proportional, excess of loss, stop loss or retrocessional capacity on a worldwide basis.
Accident & Health: We offer coverage for personal accident, life and travel portfolios on a risk and catastrophe basis. Our global coverage can be structured on a proportional or excess of loss basis.
Multiline: We offer multiline reinsurance coverage across multiple specialty lines – generally marine and energy, aviation and crisis management covers. We offer coverage globally on a proportional, excess of loss or retrocessional basis.
Marketing and Distribution of our International and Bermuda Businesses
The knowledge, experience and relationships of our senior management team provide us with global access to insurance and reinsurance brokers, agents and clients. We believe we have strong market relationships with the world’s top insurance and reinsurance brokers and agents, including Marsh McLennan, Aon, Arthur J Gallagher and a number of U.S., Bermuda and London market wholesale brokers. We also have close relationships with a number of mid-tier and smaller specialty brokers. Some of our products, such as those in our A&H account, are also distributed through managing general agents ("MGAs") and managing general underwriters ("MGUs"). We believe our distribution relationships are differentiated and strengthened by the knowledge and experience of our senior management team and the long history of industry partnerships they have developed over many years. These relationships facilitate our strategic expansion into additional lines of business that we find attractive and consistent with our core strengths and expertise.
Hamilton writes insurance business on a non-admitted (U.S. E&S) basis through wholesale brokers, surplus lines brokers and reinsurance brokers.
Gross premiums written by broker, showing individually where premiums were 10% or more of the total in any of the last three years, were as follows:
| | | | | | | | | | | | | | | | | |
| For the Years Ended December 31, |
| 2024 | | 2023 | | 2022 |
| Marsh McLennan | 24 | % | | 24 | % | | 25 | % |
| Aon | 17 | % | | 17 | % | | 18 | % |
| Arthur J Gallagher | 13 | % | | 12 | % | | 8 | % |
| All others/direct | 46 | % | | 47 | % | | 49 | % |
| Total | 100 | % | | 100 | % | | 100 | % |
The International segment, excluding Hamilton Select, includes a variety of business across many clients on a worldwide basis, which provides us with a broad spread of risk. We are not dependent on any single client for our business and have a wide variety of distribution channels. These distribution channels include our MGA in the United States, HMGA Americas, third-party coverholders and both Lloyd’s and non-Lloyd’s brokers.
Our International segment includes business from several large national and international brokers and a number of smaller specialized brokers. With respect to our International segment, our 10 largest brokers (by amount of gross premium written for the Company) accounted for an aggregate of approximately 55% of our gross premiums written in 2024, with the largest broker, Marsh McLennan, accounting for approximately 10% of our gross premiums written. The second largest broker, Arthur J Gallagher, accounted for approximately 7% of our gross premiums written.
Our Bermuda segment business is accessed through wholesale and reinsurance brokers. With respect to our Bermuda segment, our largest broker (by amount of gross premium written for the Company), Marsh McLennan, accounted for approximately 41% of gross premiums written in 2024. The second-largest broker, Aon, accounted for approximately 30% of our gross premiums written.
Reinsurance
We strategically purchase reinsurance and retrocession from third parties. This enhances our business by protecting capital and reducing our exposure to volatility from adverse claims events (either large single events or an accumulation of events). As at January 1, 2025, based upon HVR, we estimate that our modeled 100-Year Occurrence Exceedance Probability for Atlantic Hurricanes in Florida would produce a net loss to Hamilton of $202.1 million, and our modeled 250-Year Occurrence Exceedance Probability for U.S. Mainland Earthquakes in California would produce a net loss to Hamilton of $277.8 million, or 8.7% and 11.9% of shareholders equity, respectively.
Our pricing and accumulation management in respect of natural catastrophe exposures is managed within our proprietary platform, HARP, and is performed using the HVR. The HVR incorporates bespoke frequency and severity adjustments at various levels of granularity, which in aggregate represents a material load over and above the loss exposure produced from the unadjusted vendor models that we use. The adjustments include allowance for the potential for increased frequency and severity of natural catastrophe events over time, as well as for several other factors that could cause us to be exposed to increasing claims trends from natural catastrophes. See "––Our Competitive Strengths––Proprietary technology infrastructure" for additional information on the HVR.
Our reinsurance purchases include a variety of quota share and excess of loss treaties and facultative placements, depending on the class of business. In 2024, we ceded 26% of premium from the International segment and 15% from the Bermuda segment.
We carefully manage our counterparty credit risk by selecting outwards partners of adequate financial strength. For the outwards program placed for 2024, all of the effective outwards limit is ceded to reinsurers and retrocessionaires with a credit rating of "A-" (Excellent) by A.M. Best (or an equivalent rating by S&P Global), or better, or who are collateralized.
Reserves
The estimated reserve for losses and loss adjustment expenses ("loss reserves") represents management’s best estimate of the unpaid portion of the Company’s ultimate liability for losses and loss adjustment expenses for insured and reinsured events that have occurred at or before the balance sheet date, based on its assessment of facts and circumstances known at that particular point in time. Loss reserves reflect both claims that have been reported to the Company ("case reserves") and claims that have been incurred but not reported to the Company ("IBNR").
Loss reserves are complex estimates, not an exact calculation of liabilities. Management reviews loss reserve estimates at each quarterly reporting date and considers all significant facts and circumstances known at that particular point in time. As additional experience and other data becomes available and/or laws and legal interpretations change, management may adjust previous estimates. Adjustments are recognized in the period in which they are determined and may impact that period's underwriting results either favorably (when current estimates are lower than previous estimates) or unfavorably (when current estimates are higher than previous estimates).
Investments
Our investment strategy is focused on delivering a combination of stable investment income and low-correlated absolute returns. The goal is to produce a total return throughout all market cycles while maintaining appropriate liquidity and credit quality to support our underwriting activities and meet the requirements of customers, rating agencies and regulators.
We maintain two segregated investment portfolios: a fixed maturity and short-term investment portfolio and an investment in the TS Hamilton Fund. The investment portfolio allocation as at December 31, 2024, is 50% in fixed income and short-term investments, 39% in the TS Hamilton Fund and 11% in cash and cash equivalents.
The fixed income portfolio is structured to focus primarily on the preservation of capital and the availability of liquidity to meet our claims obligations. The strategy is to maintain a portfolio that is well-diversified across market sectors and to generate attractive returns on a risk-adjusted basis over time. This portfolio is also used to provide security for our credit facilities. The fixed income investment portfolio is managed by two external investment managers - DWS Investment Management Americas, Inc. ("DWS") and Conning Asset Management Limited ("Conning"). There are no provisions in the investment management agreements with DWS and Conning that would prevent the Company’s ability to liquidate its holdings in the fixed income portfolios if additional liquidity were required. The agreements each contain standard commercial terms related to fixed income portfolio management and customary fees. Subject to the investment objectives, restrictions and guidelines, DWS and Conning are appointed as the discretionary manager of all cash, securities and other assets within the respective portfolios. The agreement with DWS is effective until canceled by either party with not less than 30 days’ prior written notice to the other party. The agreements with Conning are effective until canceled by the Company with not less than 30 days’ or 60 days’ prior written notice to Conning, depending on the specific portfolios under management, or by Conning with not less than 90 days’ prior written notice to the Company.
The TS Hamilton Fund was developed as a highly customized set of exposures to certain macro and equity strategies and designed to provide an uncorrelated market return profile with moderate volatility and high liquidity, while governed by a rigorous and proprietary risk management framework.
The Investment Committee of our Board of Directors establishes our investment policy and guidelines. The Investment Committee monitors our investment results and performance against our investment objectives, guidelines, benchmarks, and risk appetite contained in the investment policy. Our investment policy contains guidelines on permitted assets and prohibited asset classes, minimum criteria for credit quality, duration benchmarks, liquidity requirements and sustainability parameters.
We manage interest rate risk by structuring our fixed income portfolio so that the economic impact of an interest rate shift on the portfolio is comparable to the corresponding impact on the related liabilities. We believe that duration matching of our financial assets and underwriting liabilities mitigates the overall interest rate risk on an economic basis.
Claims
We have experienced claims teams embedded within each underwriting platform, consisting of over 45 in-house claims professionals, many of whom are attorneys. Most of our claims are handled by our in-house claims team, but third-party administrators are also utilized in certain instances, for example, in the handling of certain legacy business lines.
Effective claims management allows for timely and accurate review, processing and payment of valid claims, a directive which is at the heart of the contracts entered into between Hamilton and its policyholders. Further, effective claims management ensures we do not pay claims which are not covered or excluded, all of which contributes to the preservation of Hamilton’s capital base and overall level of service provided by Hamilton.
The key responsibilities of the claims teams include:
•The management of individual claims, which includes processing, analyzing, establishing case reserves and paying valid claims under the insurance and reinsurance contracts entered into by Hamilton. This can include the appointment of third-party experts such as forensic accountants, adjusters or consultants.
•Leading the process of collecting and coordinating relevant information to enable the estimation of catastrophe losses and, in conjunction with the actuarial and underwriting teams, continue to regularly monitor and update these estimates.
•The management of coverage disputes, including the appointment of outside experts where appropriate.
•For the reinsurance claims team, regular audits of many of our larger cedants' claims departments.
•Reporting to management on a regular basis and regularly reviewing outstanding claims in coordination with our underwriting and actuarial teams.
Competition
The property, casualty and specialty business consists of many markets and sub-markets around the world. Each market is characterized by distinct customer needs and products and services to meet those needs, as well as specific economic and structural features. We face competition in our underwriting divisions from other insurers, reinsurers and MGAs. Competition is based on many factors, including pricing, coverage and structural terms, general reputation, financial strength, relationships with brokers, ratings assigned by independent rating agencies, response times including speed of claims payment and the experience and reputation of the members of the underwriting and claims teams. Given the diversity of our product offerings, our competition is broad and certain competitors may be specific to only a subset of our product offerings. Some of our competitors include American Financial Group, Inc.; Arch Capital Group Ltd; AXIS Capital Holdings Limited; Beazley plc; Cincinnati Financial Corporation; Everest; The Hanover Insurance Group, Inc.; Hiscox Ltd; James River Group Holdings, Ltd; Kinsale Capital Group, Inc.; Lancashire Holdings Limited; Markel Corporation; Palomar Holdings, Inc.; RLI Corp; RenaissanceRe Holdings Ltd.; Skyward Specialty Insurance Group, Inc.; various Lloyd’s syndicates and W.R. Berkley Corporation.
Technology and Data
Our proprietary technology platform and the digitization of our operations enhances the operational efficiency and data analytic insights across our business as we scale. Our technology team is comprised of professionals with experience in insurance and financial markets technology, and with significant digital transformation experience. This team is led by our Hamilton Group Chief Technology Officer, who has worked in both start-up and large data analytics companies, bringing strong leadership experience in innovation, agile culture enablement, and digital transformation.
Our proprietary systems include:
•HARP is our proprietary catastrophe modeling and portfolio accumulation management platform for all catastrophe-exposed risks. HARP supports structural features that many off-the-shelf platforms are unable to handle, such as reinstatement premium protections, cascading layers, and trailing deductibles. We believe HARP is one of the most sophisticated and user-friendly risk management systems in the industry. It enables us to provide much appreciated rapid turnaround to our brokers. Additionally, having our own internally developed platform, with a dedicated team, means we can enhance and update HARP as required, in-house.
•Timeflow is our global underwriting submission and orchestration system utilized across all of our business. This system benefits from integrated robotic process automation, which has enabled our underwriting and underwriting operations teams to digitize our submission process in a rapid fashion. This has enabled us to significantly improve our quote response time to brokers across the Hamilton Group by reducing manual steps involved in submission processing and duplicate data entry.
•Hamilton Insights is our key management information system. It is a self-service, real-time portal, allowing teams across Hamilton to seamlessly access data and customize reports in order to help inform decision-making. The data can be filtered by many categories, including distributor, customer segment, line of business, cedant, specific industry, individual underwriter, and specific risk features, amongst other things and provides key underwriting performance metrics.
In addition, Hamilton has implemented modern back-office core systems which improve efficiency such as Sequel Eclipse/claims, SICS and Imageright. These core systems are integrated with our proprietary systems to enable straight through processing and Sarbanes-Oxley Act of 2002 (the "Sarbanes-Oxley Act" or "SOX") compliance, as well as enabling us to scale our business without a proportionate increase in operational costs. These back-office core systems adhere to cyber compliance and disaster recovery standards in a hybrid setup across the cloud and a datacenter.
While we have certain registered rights in connection with our brand, we rely on a combination of common law rights, trade secrets, contractual arrangements, proprietary methodologies, and licensed intellectual property to support our business operations. See “Risk Factors—Risks Related to Our Business and Industry—We may fail, or be unable, to obtain, maintain, protect, defend or enforce our intellectual property rights, including for our proprietary technology platforms, data and brand, or we may be sued by third parties for alleged infringement, misappropriation or other violation of their intellectual property or proprietary rights” for more information.
Regulation
The business of reinsurance and insurance is regulated in all countries in which we operate, although the degree and type of regulation varies significantly from one jurisdiction to another. As a holding company, the Company is generally not directly subject to such regulations, but its various insurance and reinsurance operating subsidiaries are subject to regulation, as described as follows:
Bermuda Insurance Regulation
Insurance Regulation Generally
The Insurance Act 1978 of Bermuda and related regulations, as amended (the "Insurance Act"), regulate the insurance businesses of our Bermuda operating companies, and provide that no person may carry on any insurance business in or from within Bermuda unless registered as an insurer under the Insurance Act by the Bermuda Monetary Authority ("BMA"). The BMA, in deciding whether to grant registration, has broad discretion to act as it thinks fit in the public interest. The BMA is required by the Insurance Act to determine whether the applicant is a fit and proper body to be engaged in insurance business and, in particular, whether it has, or has available to it, adequate knowledge and expertise to operate an insurance business.
The Insurance Act does not distinguish between insurers and reinsurers: companies are registered under the Insurance Act as “insurers.” The Insurance Act uses the defined term "insurance business" to include reinsurance.
The continued registration of an applicant as an insurer is subject to the applicant complying with the terms of its registration and such other conditions as the BMA may impose from time to time. The Insurance Act also grants to the BMA powers to supervise, investigate and intervene in the affairs of insurance companies.
Our Bermuda-licensed insurance operating subsidiaries include Hamilton Re, which is registered as a Class 4 general business insurer and Ada Capital Management Limited ("ACML") which is registered as an insurance agent (collectively, the "Bermuda Operating Companies").
The Insurance Act imposes solvency and liquidity standards on Bermuda insurance companies, as well as auditing and reporting requirements, and grants the BMA powers to supervise, investigate, require information and demand the production of documents and intervene in the affairs of regulated companies.
As a holding company, the Company is not directly regulated as an insurer under the Insurance Act. However, our Bermuda Operating Companies are subject to various requirements under Bermuda law depending on their classification under the Insurance Act.
Bermuda registered insurers are generally prohibited from declaring or paying any dividends if in breach of the required minimum solvency margin or minimum liquidity ratio, or if the declaration or payment of such dividend would cause such a breach. Further, an insurer that fails to comply with its enhanced capital requirement is also prohibited from declaring and paying any dividends until the failure has been rectified. Hamilton Re is also subject to additional restrictions which apply to the payment of dividends and a reduction in total statutory capital and surplus over applicable thresholds.
From time to time, the Bermuda Operating Companies may apply for, and be granted, certain modifications to, or exemptions from, regulatory requirements which may otherwise apply to them.
The BMA acts as our group supervisor and has designated Hamilton Re as the “designated insurer” in respect of the Hamilton Group. Therefore, Hamilton Group is subject to the BMA’s group supervision and solvency rules which cover assessing the financial situation and solvency position of Hamilton Group and/or its members and regulating intra-group transactions, risk concentration, governance procedures, risk management and regulatory reporting and disclosure. See “Group Supervision” below for further discussion. The BMA has certain powers of investigation and intervention, relating to Bermuda-licensed entities and their holding companies, subsidiaries and other affiliates, including the power to cancel a Bermuda-licensed entity’s registration, which it may exercise in the interest of such an insurer’s policyholders or if there is any risk of insolvency or a breach of the Insurance Act or the license conditions of a Bermuda-licensed entity.
The European Parliament recognizes Bermuda’s regulatory regime as achieving Solvency II Directive 2009 (2009/138/EC) equivalence for its commercial insurers and insurance groups. Bermuda’s regulatory regime and the United Kingdom’s prudential regime were maintained following the United Kingdom’s transition out of the EU.
Certain significant aspects of the Bermuda insurance regulatory framework are set forth below, focusing only on our primary Class 4 insurer, Hamilton Re, which is subject to the strictest regulation.
Classification of Insurers
The Insurance Act distinguishes between insurers carrying on long-term business, insurers carrying on general business, insurers carrying on special purpose business, and insurers carrying on general business in an innovative or innovative and experimental manner. There are six general business classifications (Classes 1, 2, 3, 3A, 3B and 4), five long-term business classifications (Classes A, B, C, D and E), two classifications of insurers carrying on special purpose business (Special Purpose Insurer and Collateralized Insurer), two innovative classifications (Class IIGB and IILT), and two innovative and experimental classifications (Class IGB and ILT).
Classification as a Class 4 Insurer; Minimum Paid Up Share Capital
A body corporate is registrable as a Class 4 insurer where (a) it has at the time of its application for registration, or will have before it carries on insurance business, total statutory capital and surplus of not less than $100 million; and (b) it intends to carry on general insurance business including excess liability business or property catastrophe reinsurance business. Hamilton Re is required to maintain fully paid up share capital of at least $1 million.
Principal Representative, Principal Office and Head Office
As a Class 4 insurer, Hamilton Re is required to maintain a principal office and to appoint and maintain a principal representative in Bermuda. For the purposes of the Insurance Act, the principal office of Hamilton Re is located at Wellesley House North, 1st Floor, 90 Pitts Bay Road, Pembroke, HM 08, Bermuda and Athena Tolosa, the Chief Financial Officer of Hamilton Re, serves as its principal representative.
Without a reason acceptable to the BMA, an insurer may not terminate the appointment of its principal representative, and the principal representative may not cease to act as such, unless 30 days’ notice in writing to the BMA is given of the intention to do so.
The principal representative must notify the BMA forthwith upon reaching a view that there is a likelihood of the insurer becoming insolvent, or upon becoming aware that a reportable “event” has occurred, or is believed to have occurred. Examples of a reportable “event” include a failure by the insurer to comply substantially with a condition imposed upon it by the BMA relating to a solvency margin or a liquidity or other ratio, a significant loss reasonably likely to cause the insurer to fail to comply with its enhanced capital requirement (discussed below) and the occurrence of a “material change” (as such term is defined under the Insurance Act). Within 14 days of such notification to the BMA, the principal representative must furnish the BMA with a written report setting out all the particulars of the case that are available to the principal representative.
Where there has been a significant loss which is reasonably likely to cause the insurer to fail to comply with its enhanced capital requirement, the principal representative must also furnish the BMA with a capital and solvency return reflecting an enhanced capital requirement prepared using post-loss data within 45 days of notifying the BMA regarding the loss.
Furthermore, where a notification has been made to the BMA regarding a material change, the principal representative has 30 days from the date of such notification to furnish the BMA with unaudited interim statutory financial statements in relation to such period as the BMA may require, together with a general business solvency certificate in respect of those statements.
In addition, each Class 4 insurer must maintain its head office in Bermuda. In determining whether an insurer satisfies this requirement, the BMA considers, among other things, the following factors: (i) where the underwriting, risk management and operational decision-making of the insurer occurs; (ii) whether the presence of senior executives who are responsible for, and involved in, the decision-making related to the insurance business of the insurer are located in Bermuda; and (iii) where meetings of the board of directors of the insurer occur. In making its determination, the BMA may also give regard to (i) the location where management of the insurer meets to effect policy decisions of the insurer, (ii) the residence of the officers, insurance managers or employees of the insurer, and (iii) the residence of one or more directors of the insurer in Bermuda.
Independent Approved Auditor
Hamilton Re has appointed Ernst & Young Ltd. as its independent auditor. The independent auditor will audit and report on Hamilton Re’s GAAP or international financial reporting standards ("IFRS") financial statements (as defined below) and audit its statutory financial statements, each of which is required to be filed annually with the BMA, as described below.
Loss Reserve Specialist
As a Class 4 insurer, Hamilton Re is required to appoint an individual approved by the BMA to be its loss reserve specialist. In order to qualify as an approved loss reserve specialist, the applicant must be an individual qualified to provide an opinion in accordance with the requirements of the Insurance Act and the BMA must be satisfied that the individual is fit and proper to hold such an appointment.
As a Class 4 insurer, Hamilton Re is required to submit annually an opinion of its approved loss reserve specialist with its capital and solvency return in respect of its total general business insurance technical provisions (i.e., the aggregate of its net premium provisions, net loss and loss expense provisions and risk margin, as each is reported in the insurer’s statutory economic balance sheet). The loss reserve specialist’s opinion must state, among other things, whether or not the aggregate amount of technical provisions shown in the statutory economic balance sheet as at the end of the relevant financial year (i) meets the requirements of the Insurance Act and (ii) makes reasonable provision for the total technical provisions of the insurer under the terms of its insurance contracts and agreements.
Annual Audited Financial Statements
Hamilton Re must prepare and submit, on an annual basis, audited GAAP or IFRS financial statements and audited statutory financial statements. The Insurance Act prescribes rules for the preparation and substance of statutory financial statements (which include, in statutory form, a balance sheet, income statement, a statement of capital and surplus and notes thereto). The statutory financial statements include detailed information and analysis regarding premiums, claims, reinsurance and investments of the insurer. Hamilton Re is also required to prepare and submit to the BMA financial statements which have been prepared under generally accepted accounting principles in the United States or international financial reporting standards (“GAAP or IFRS financial statements”). The insurer’s annual GAAP or IFRS financial statements and the auditor’s report thereon, and the statutory financial statements are required to be filed with the BMA within four months from the end of the relevant financial year (unless specifically extended with the approval of the BMA). The statutory financial statements do not form part of the public records maintained by the BMA, but the GAAP or IFRS financial statements are available for public inspection.
Annual Statutory Financial Return and Annual Capital and Solvency Return
As a Class 4 insurer, Hamilton Re is required to file with the BMA an annual statutory financial return no later than four months after its financial year end (unless specifically extended with the approval of the BMA). The statutory financial return includes, among other matters, the statutory financial statements of the insurer and the calculations for the Class 4 insurer’s minimum solvency margin and liquidity ratio.
In addition, each year Hamilton Re is required to file with the BMA a capital and solvency return along with its annual statutory financial return. The prescribed form of capital and solvency return comprises the Class 4 insurer’s Bermuda Solvency Capital Requirement ("BSCR") model or an approved internal capital model in lieu thereof (more fully described below), various schedules and the opinion of the loss reserve specialist.
Neither the statutory financial return nor the capital and solvency return is available for public inspection.
Declaration of Compliance
At the time of filing its statutory financial statements, a Class 4 insurer is also required to deliver to the BMA a declaration of compliance, in such form and with such content as may be prescribed by the BMA, declaring whether or not the Class 4 insurer has, with respect to the preceding financial year: (i) complied with all requirements of the minimum criteria applicable to it; (ii) complied with the minimum margin of solvency as at its financial year end; (iii) complied with the applicable enhanced capital requirements as at its financial year end; (iv) observed any limitations, restrictions or conditions imposed upon issuance of its license, if applicable; and (v) complied with the minimum liquidity ratio for general business as at its financial year end. The declaration of compliance is required to be signed by two directors of the Class 4 insurer and if the Class 4 insurer has failed to comply with any of the requirements referenced in clauses (i) through (v) above, the Class 4 insurer will be required to provide the BMA with particulars of such failure in writing. A Class 4 insurer shall be liable to civil penalty by way of a fine for failure to comply with a duty imposed on it in connection with the delivery of the declaration of compliance.
Public Disclosures
All commercial insurers and insurance groups are required to prepare and file with the BMA, and also publish on their website, a Financial Condition Report, which provides, among other things, measures governing the business operations, corporate governance framework and solvency and financial performance of the insurer/insurance group. The BMA has discretion to approve modifications and exemptions to the public disclosure rules, on application by the insurer if, among other things, the BMA is satisfied that the disclosure of certain information will result in a competitive disadvantage or compromise confidentiality obligations of the insurer. We have received approval from the BMA to file a consolidated group Financial Condition Report, inclusive of Hamilton Re.
Non-insurance Business
No Class 4 insurer may engage in non-insurance business, unless that non-insurance business is ancillary to the insurance business carried on by the insurer. Non-insurance business means any business other than insurance business and includes carrying on investment business, managing an investment fund as operator, carrying on business as a fund administrator, carrying on banking business, underwriting debt or securities or otherwise engaging in investment banking, engaging in commercial or industrial activities and carrying on the business of management, sales or leasing of real property.
Minimum Liquidity Ratio
The Insurance Act provides a minimum liquidity ratio for general business insurers. A Class 4 insurer engaged in general business is required to maintain a minimum liquidity ratio to the value of its relevant assets at not less than 75% of the amount of its relevant liabilities. Relevant assets include cash and time deposits, quoted investments, unquoted bonds and debentures, first liens on real estate, investment income due and accrued, accounts and premiums receivable, reinsurance balances receivable, funds held by ceding reinsurers and any other assets which the BMA, on application in any particular case made to it with reasons, accepts in that case. There are certain categories of assets which, unless specifically permitted by the BMA, do not automatically qualify as relevant assets, such as unquoted equity securities, investments in and advances to affiliates and real estate and collateral loans. The relevant liabilities are total general business insurance reserves and total other liabilities less deferred income tax and sundry liabilities (by interpretation, those not specifically defined) and letters of credit and guarantees.
Minimum Solvency Margin and Enhanced Capital Requirements
The Insurance Act provides that all general business insurers’ statutory assets must exceed their statutory limits by an amount greater than or equal to their prescribed minimum solvency margin ("MSM"). The MSM that must be maintained by a Class 4 insurer is the greater of (i) U.S. $100 million, (ii) 50% of net premiums written (with a credit for reinsurance ceded not exceeding 25% of gross premiums), (iii) 15% of net aggregate loss and loss expense provisions and other reinsurance reserves, or (iv) 25% of the ECR (as defined below) as reported at the end of the relevant year. Additional regulations apply to the determination of the types of capital instruments that may be used to satisfy the solvency requirements.
Hamilton Re is also required to maintain available statutory economic capital and surplus at a level equal to or in excess of its enhanced capital requirement ("ECR"), which is established by reference to either the BSCR model or an approved internal capital model. The BMA has also implemented the economic balance sheet ("EBS") framework, which is used as the basis to determine an insurer’s ECR. Under the EBS framework, assets and liabilities are mainly assessed and included on the EBS at fair value, with the insurer’s U.S. GAAP balance sheet serving as a starting point. The model also requires insurers to estimate insurance technical provisions, which consist of the insurer’s insurance-related balances valued based on best-estimate cash flows, adjusted to reflect the time value of money, with the addition of a risk margin to reflect the uncertainty in the underlying cash flows. The ECR shall at all times equal or exceed the Class 4 insurer’s MSM and may be adjusted in circumstances where the BMA concludes that the insurer’s risk profile deviates significantly from the assumptions underlying its ECR on the insurer’s assessment of its risk management policies and practices used to calculate the ECR applicable to it.
The BSCR model is a risk-based capital model which provides a method for determining a Class 4 insurer’s capital requirements (statutory economic capital and surplus) by taking into account the risk characteristics of different aspects of the Class 4 insurer’s business. The BSCR formula establishes capital requirements for 10 categories of risk: fixed income investment risk, equity investment risk, interest rate/liquidity risk, currency risk, concentration risk, premium risk, reserve risk, credit risk, catastrophe risk and operational risk. For each category, the capital requirement is determined by applying risk factors to asset, premium, reserve, creditor, PML and operation items, with higher risk factors applied to items with greater underlying risk and lower factors for less risky items.
While not specifically referred to in the Insurance Act, the BMA has also established a target capital level ("TCL") applicable to Class 4 insurers, equal to 120% of its ECR. While Class 4 insurers are not currently required to maintain their statutory capital and surplus at this level, the TCL serves as an early warning tool for the BMA. Failure to maintain statutory capital at least equal to the TCL will likely result in increased regulatory oversight.
Any Class 4 insurer which at any time fails to meet its MSM requirements must, upon becoming aware of such failure, immediately notify the BMA and, within 14 days thereafter, file a written report with the BMA containing particulars of the circumstances that gave rise to the failure and setting out its plan detailing specific actions to be taken and the expected time frame in which the company intends to rectify the failure.
Any Class 4 insurer which at any time fails to meet the enhanced capital requirement applicable to it shall upon becoming aware of that failure, or of having reason to believe that such a failure has occurred, immediately notify the BMA in writing and within 14 days of such notification file with the BMA a written report containing particulars of the circumstances leading to the failure; and a plan detailing the manner, specific actions to be taken and time within which the insurer intends to rectify the failure, and within 45 days of becoming aware of that failure, or of having reason to believe that such a failure has occurred, furnish the BMA with (i) unaudited statutory economic balance sheets and unaudited interim statutory financial statements prepared in accordance with GAAP covering such period as the BMA may require; (ii) the opinion of a loss reserve specialist in relation to total general business insurance technical provisions as set out in the statutory economic balance sheet, where applicable; (iii) a general business solvency certificate in respect of the financial statements; and (iv) a capital and solvency return reflecting an enhanced capital requirement prepared using post failure data where applicable.
Eligible Capital
To enable the BMA to better assess the quality of the Class 4 insurer’s capital resources, a Class 4 insurer is required to disclose the makeup of its capital in accordance with the "3-tiered eligible capital system." Under this system, all of the Class 4 insurer’s capital instruments will be classified as either basic or ancillary capital, which in turn will be classified into one of three tiers based on their "loss absorbency" characteristics. Highest quality capital will be classified as Tier 1 Capital; lesser quality capital will be classified as either Tier 2 Capital or Tier 3 Capital. Under this regime, up to certain specified percentages of Tier 1, Tier 2, and Tier 3 Capital may be used to support the Class 4 insurer’s MSM, ECR and TCL.
The characteristics of the capital instruments that must be satisfied to qualify as Tier 1, Tier 2 and Tier 3 Capital are set out in the Insurance (Eligible Capital) Rules 2012 and any amendments thereto. Under these rules, Tier 1, Tier 2 and Tier 3 Capital may, until January 1, 2026, include capital instruments that do not satisfy the requirement that the instrument be non-redeemable or settled only with the issuance of an instrument of equal or higher quality upon a breach, or if it would cause a breach, of the ECR.
Where the BMA has previously approved the use of certain instruments for capital purposes, the BMA’s consent will need to be obtained if such instruments are to remain eligible for use in satisfying the MSM and the ECR.
Insurance Code of Conduct
All Bermuda insurers are required to comply with the BMA’s Insurance Code of Conduct (the "Insurance Code"), which establishes the duties, requirements and standards to be complied with to ensure each insurer implements sound corporate governance, risk management and internal controls. The BMA will assess an insurer’s compliance with the Insurance Code in a proportional manner relative to the nature, scale and complexity of its business. Failure to comply with the requirements of the Insurance Code will be taken into account by the BMA in determining whether an insurer is conducting its business in a sound and prudent manner as prescribed by the Insurance Act, may result in the BMA exercising its powers of intervention and investigation (see below) and will be a factor in calculating the operational risk charge under the insurer’s BSCR or approved internal model.
Cancellation of Insurer’s Registration
An insurer’s registration may be cancelled by the BMA at the request of the insurer or on certain grounds specified in the Insurance Act. Failure by the insurer to comply with its obligations under the Insurance Act or, if the BMA believes that the insurer has not been carrying on business in accordance with sound insurance principles, would be examples of such grounds.
Restrictions on Dividends and Distributions
A Class 4 insurer is prohibited from declaring or paying a dividend if it is in breach of its MSM or minimum liquidity ratio or if the declaration or payment of such dividend would cause such a breach. Where an insurer fails to meet its MSM or minimum liquidity ratio on the last day of any financial year, it will be prohibited from declaring or paying any dividends during the next financial year without the approval of the BMA. Further, any insurer that fails to comply with its ECR is also prohibited from declaring and paying any dividends until the failure has been rectified.
In addition, a Class 4 insurer is prohibited from declaring or paying in any financial year dividends of more than 25% of its total statutory capital and surplus (as shown on its previous financial year’s statutory balance sheet) unless it files (at least seven days before payment of such dividends) with the BMA an affidavit signed by at least two directors (one of whom must be a Bermuda resident director if any of the insurer’s directors are resident in Bermuda) and the insurer’s principal representative stating that it will continue to meet its solvency margin and minimum liquidity ratio. Where such an affidavit is filed, it shall be available for public inspection at the offices of the BMA.
Reduction of Capital
No Class 4 insurer may reduce its total statutory capital by 15% or more, as set out in its previous year’s financial statements, unless it has received the prior approval of the BMA. Total statutory capital consists of the insurer’s paid-in share capital, its contributed surplus (sometimes called additional paid-in capital) and any other fixed capital designated by the BMA as statutory capital (such as letters of credit).
A Class 4 insurer seeking to reduce its total statutory capital by 15% or more, as set out in its previous year’s financial statements, is also required to submit an affidavit signed by at least two directors (one of whom must be a Bermuda resident director if any of the insurer’s directors is resident in Bermuda) and the insurer’s principal representative stating that the proposed reduction will not cause the insurer to fail its relevant margins and such other information as the BMA may require. Where such an affidavit is filed, it shall be available for public inspection at the offices of the BMA.
Fit and Proper Controllers
The BMA maintains supervision over the controllers (as defined herein) of all registered insurers in Bermuda. For so long as shares of the Company are listed on the NYSE or another recognized stock exchange, the Insurance Act requires that the BMA be notified in writing within 45 days of any person becoming, or ceasing to be, a controller.
A controller includes (i) the managing director of the registered insurer or its parent company; (ii) the chief executive of the registered insurer or of its parent company; (iii) a shareholder controller (as defined below); and (iv) any person in accordance with whose directions or instructions the directors of the registered insurer or of its parent company are accustomed to act. The BMA may object to a controller and require the controller to reduce its shareholdings and direct, among other things, that voting rights attached to the shares shall not be exercisable.
The definition of shareholder controller is set out in the Insurance Act but generally refers to (i) a person who holds 10% or more of the shares carrying rights to vote at a shareholders’ meeting of the registered insurer or its parent company, (ii) a person who is entitled to exercise 10% or more of the voting power at any shareholders’ meeting of such registered insurer or its parent company, or (iii) a person who is able to exercise significant influence over the management of the registered insurer or its parent company by virtue of its shareholding or its entitlement to exercise, or control the exercise of the voting power at any shareholders’ meeting.
A shareholder controller that owns 10% or more but less than 20% of the shares as described above is defined as a 10% shareholder controller; a shareholder controller that owns 20% or more but less than 33% of the shares as described above is defined as a 20% shareholder controller; a shareholder controller that owns 33% or more but less than 50% of the shares as described above is defined as a 33% shareholder controller; and a shareholder controller that owns 50% or more of the shares as described above is defined as a 50% shareholder controller.
Where the shares of the registered insurer, or the shares of its parent company, are traded on a recognized stock exchange, and a person becomes a 10%, 20%, 33% or 50% shareholder controller of the insurer, that person shall, within 45 days, notify the BMA in writing that he has become such a controller. In addition, a person who is a shareholder controller of a Class 4 insurer whose shares or the shares of its parent company (if any) are traded on a recognized stock exchange must serve on the BMA a notice in writing that he has reduced or disposed of his holding in the insurer where the proportion of voting rights in the insurer held by him will have reached or has fallen below 10%, 20%, 33% or 50%, as the case may be, not later than 45 days after such disposal.
Where the shares of an insurer, or the shares of its parent company, are not traded on a recognized stock exchange (i.e., private companies), the Insurance Act prohibits a person from becoming a shareholder controller unless he has first served on the BMA notice in writing stating that he intends to become such a controller and the BMA has either, before the end of 45 days following the date of notification, provided that notice to the proposed controller that it does not object to his becoming such a controller or the full 45 days has elapsed without the BMA serving an objection. Where neither the shares of the insurer nor the shares of its parent company (if any) are traded on a recognized stock exchange, the Insurance Act prohibits a person who is a shareholder controller of a Class 4 insurer from reducing or disposing of his holdings where the proportion of voting rights held by the shareholder controller in the insurer will reach or fall below 10%, 20%, 33% or 50%, as the case may be, unless that shareholder controller has served on the BMA a notice in writing stating that he intends to reduce or dispose of such holding.
Any person who contravenes the Insurance Act by failing to give notice or knowingly becoming a shareholder controller of any description before the required 45 days has elapsed is guilty of an offense and liable to a fine of $25,000.
Notification by Registered Person of Change of Controllers and Officers
All registered insurers are required to give written notice to the BMA of the fact that a person has become, or ceased to be, a controller or officer of the registered insurer within 45 days of becoming aware of such fact. An officer in relation to a registered insurer means a director, chief executive or senior executive performing duties of underwriting, actuarial, risk management, compliance, internal audit, finance or investment matters.
The BMA may issue a notice of objection to any person who is a controller of any description where it appears that such person is not, or is no longer, a fit and proper person to be a controller of the registered entity. Before issuing a notice of objection, the BMA is required to serve upon the person concerned a preliminary written notice stating the BMA’s intention to issue formal notice of objection. Upon receipt of the preliminary written notice, the person served may, within 28 days, file written representations with the BMA which shall be taken into account by the BMA in making its final determination. Any person who continues to be a controller of any description after having received a notice of objection shall be guilty of an offense and shall be liable on summary conviction to a fine of $25,000 (and a continuing fine of $500 per day for each day that the offense is continuing) or, if convicted on indictment, to a fine of $100,000 and/or two years in prison.
Notification of Material Changes
All registered insurers are required to give notice to the BMA of their intention to effect a material change within the meaning of the Insurance Act. For the purposes of the Insurance Act, the following changes are material: (i) the transfer or acquisition of insurance business being part of a scheme falling under section 25 of the Insurance Act or section 99 of the Companies Act 1981 of Bermuda (the “Companies Act”), (ii) the amalgamation with or acquisition of another firm, (iii) engaging in unrelated business that is retail business, (iv) the acquisition of a controlling interest in an undertaking that is engaged in non-insurance business which offers services and products to persons who are not affiliates of the insurer, (v) outsourcing all or substantially all of the company’s actuarial, risk management, compliance or internal audit functions, (vi) outsourcing all or a material part of an insurer’s underwriting activity, (vii) the transfer other than by way of reinsurance of all or substantially all of a line of business, (viii) the expansion into a material new line of business, (ix) the sale of an insurer, and (x) outsourcing of an officer’s role.
No registered insurer shall take any steps to give effect to a material change unless it has first served notice on the BMA that it intends to effect such material change and before the end of 30 days, either the BMA has notified such company in writing that it has no objection to such change or that period has lapsed without the BMA having issued a notice of objection.
Disclosure of Information
In addition to powers under the Insurance Act to investigate the affairs of an insurer, the BMA may require certain information from an insurer (or certain other persons) to be produced to the BMA. Further, the BMA has been given powers to assist other regulatory authorities, including foreign insurance regulatory authorities, with their investigations involving insurance companies in Bermuda if it is satisfied that the assistance being requested is in connection with the discharge of regulatory responsibilities and that such cooperation is in the public interest.
Insurance Agent Reporting Requirements
The BMA’s Insurance Brokers and Insurance Agents Code of Conduct requires insurance agents to file an insurance agents return, which requires, among other matters, details around directors and officers of the insurance agent, services provided by the agent and details of the insurers for which the agent has been appointed. In addition, under the Insurance Act, insurance agents are required to notify the BMA of certain events, such as failure to comply with a condition imposed upon them by the BMA or the occurrence of a cyber reporting event.
Group Supervision
The BMA acts as group supervisor of our group of insurance and reinsurance companies (the "Regulatory Group") and has designated Hamilton Re as the designated insurer for group supervisory and solvency purposes ("Designated Insurer"). As the Designated Insurer, Hamilton Re is required to facilitate compliance by the Regulatory Group with group insurance solvency and supervision rules.
As group supervisor, the BMA performs a number of supervisory functions, including (i) coordinating the gathering and dissemination of information which is of importance for the supervisory task of other competent authorities; (ii) carrying out a supervisory review and assessment of the Regulatory Group; (iii) carrying out an assessment of the Regulatory Group’s compliance with the rules on solvency, risk concentration, intra-group transactions and good governance procedures; (iv) planning and coordinating, with other competent authorities, supervisory activities in respect of the Regulatory Group, both as a going concern and in emergency situations; (v) coordinating any enforcement action that may need to be taken against the Regulatory Group or any of its members; and (vi) planning and coordinating meetings of colleges of supervisors (consisting of insurance regulators) in order to facilitate the carrying out of the functions described above.
In carrying out its functions, the BMA makes rules for (i) assessing the financial situation and the solvency position of the Regulatory Group and/or its members and (ii) regulating intra-group transactions, risk concentration, governance procedures, risk management and regulatory reporting and disclosure.
Group Solvency and Group Supervision
The current supervision and solvency rules (together, "Group Rules") apply to the Regulatory Group so long as the BMA remains our group supervisor. Through the Group Rules, the BMA may take action which affects the Company. A summary of the Group Rules is set forth below.
Approved Group Actuary
Hamilton Re, as Designated Insurer, is responsible for ensuring that the Regulatory Group appoints an individual approved by the BMA to be the group actuary who is qualified to provide an opinion on the Regulatory Group’s technical provisions.
Annual Group Financial Statements
The Regulatory Group is required to prepare and submit, on an annual basis, consolidated financial statements (including notes to the financial statements) prepared in accordance with either GAAP or IFRS. The group financial statements must be audited annually by the Regulatory Group’s approved auditor who is required to prepare an auditor’s report thereon in accordance with generally accepted auditing standards. In addition, the Regulatory Group must prepare statutory financial statements (which include, in statutory form, a balance sheet, an income statement, a statement of capital and surplus, and notes thereto). The Designated Insurer is required to file with the BMA the statutory financial statements and the audited GAAP or IFRS financial statements for the Regulatory Group with the BMA within five months from the end of the relevant financial year (unless specifically extended).
Annual Insurance Group Statutory Financial Return
The Regulatory Group is required to prepare an annual Group Statutory Financial Return consisting of (i) an insurance group solvency certificate, (ii) particulars of ceded reinsurance comprising the top 10 unaffiliated reinsurers for which the group has the highest recoverable balances and any reinsurer with recoverable balances exceeding 15% of the insurance group’s statutory capital and surplus, (iii) any adjustments to the group financial statements to produce the economic balance sheet (i.e., a reconciliation), (iv) a list of non-insurance financial regulated entities owned by the group, and (v) particulars of qualifying members of the group as defined within the Group Rules. The annual insurance Group Statutory Financial Return must be submitted to the BMA by the Designated Insurer within five months after the financial year end (unless specifically extended).
Annual Insurance Group Capital and Solvency Return
The Regulatory Group is required to prepare an annual Insurance Group Capital and Solvency Return which includes the Group Solvency Self-Assessment ("GSSA"), Group BSCR and associated Schedules, including an annual opinion of the Group Actuary on the EBS technical provisions. The Group Capital and Solvency Return must be submitted to the BMA by the Designated Insurer within five months after the financial year end (unless specifically extended). The Designated Insurer must keep a copy of the Regulatory Group’s financial statements (together with the notes to those statements and the auditor’s report thereon), statutory financial statements and the Group Statutory Financial Return at its principal office for a period of five years.
The GSSA assesses the quality and quantity of capital required to adequately cover the risks to which the insurance group is exposed. In particular, the GSSA should, among other things, include consideration of the relationship between risk management, the quality and quantity of capital resources, the impact of risk mitigation techniques and diversification and correlation effects between material risks; describe the Regulatory Group’s risk appetite; be forward-looking; include appropriate stress and scenario testing and adequately reflect all assets and liabilities, material off-balance sheet arrangements, material intragroup transactions, relevant managerial practices, systems and controls and a valuation basis that is aligned with the risk characteristics and business model of the group.
Quarterly Group Financial Return
The Designated Insurer is required to file Quarterly Financial Returns for the Regulatory Group with the BMA on or before the last day of the months of May, August and November of each year. The quarterly Group Financial Return consists of (i) quarterly unaudited (consolidated) group financial statements in respect of its business for each financial quarter (which must not reflect a financial position that exceeds two months), (ii) a list and details of material intra-group transactions and risk concentrations, details surrounding all intra-group reinsurance and retrocession arrangements and other intra-group risk transfer insurance business arrangements, and details of the 10 largest exposures to unaffiliated counterparties and any other unaffiliated counterparty exposures or series of linked unaffiliated counterparty exposures exceeding 10% of the Regulatory Group’s statutory capital and surplus, (iii) Enhanced Capital Requirement ratio, (iv) Group Commercial Solvency Self-Assessment, (v) Total Quoted Bonds and Unquoted Bonds by BSCR rating, and (vi) details of the catastrophe events that occurred during the reporting period (if applicable).
Public Disclosures
All insurance groups are required to prepare and file with the BMA, and also publish on their website, a Financial Condition Report. An insurance group that does not have a website must furnish to the public a copy of the Financial Condition Report within 10 days of receipt of a request to do so made in writing. The Designated Insurer must keep copies of the Financial Condition Report at its head office for a period of five years beginning from the filing date.
Group Minimum Solvency Margin and Group Enhanced Capital Requirement
The Regulatory Group is also required to maintain available statutory economic capital and surplus in an amount that is at least equal to or exceeds the value of its group ECR (the "Group ECR"), provided that the Group ECR shall at all times be an amount equal to or exceeding the group minimum solvency margin (the "Group MSM"). The BMA has established a group target capital level equal to 120% of Group ECR. In addition, under the tiered capital requirements, all of the Regulatory Group’s capital instruments will be classified as either basic or ancillary capital which in turn will be classified into one of three tiers based on their "loss absorbency" characteristics. Highest quality capital will be classified Tier 1 Capital, and lesser quality capital will be classified as either Tier 2 or Tier 3 Capital. A minimum threshold of Tier 1 Capital and maximum thresholds of Tier 2 and Tier 3 Capital used to satisfy the Group MSM and Group ECR requirements are specified under the rules. Under these rules, Tier 1, Tier 2 and Tier 3 Capital may, until January 1, 2026, include capital instruments that do not satisfy the requirement that the instrument be nonredeemable or settled only with the issuance of an instrument of equal or higher quality upon a breach, or if it would cause a breach, of the ECR.
Group Governance
The Group Rules require the Board of Directors of the Company (the "Parent Board") to establish and effectively implement corporate governance policies and procedures, which must be periodically reviewed to ensure they continue to support the overall organizational strategy of the Regulatory Group. In particular, the Parent Board must:
•ensure that operational and oversight responsibilities of the group are clearly defined and documented and that the reporting of material deficiencies and fraudulent activities are transparent and devoid of conflicts of interest;
•establish systems for identifying, on a risk-sensitive basis, those policies and procedures that must be reviewed annually and those policies and procedures that must be reviewed at other regular intervals;
•establish a risk management and internal controls framework and ensure that it is assessed regularly and such assessment is reported to the Parent Board, the chief executive officer and senior executives;
•establish and maintain sound accounting and financial reporting procedures and practices for the Regulatory Group; and
•establish and keep under review group functions relating to actuarial, compliance, internal audit and risk management functions which must address certain specific requirements as set out in the Group Rules.
Designated Insurer Notification Obligations
The Designated Insurer must notify the BMA upon reaching a view that there is a likelihood of the Regulatory Group or any member of the Regulatory Group becoming insolvent or that a reportable "event" has, to the Designated Insurer’s knowledge, occurred or is believed to have occurred. Examples of a reportable "event" include a failure by the Regulatory Group or any member of the Regulatory Group to comply substantially with a requirement imposed upon it under the Group Rules relating to its solvency position, governance and risk management or supervisory reporting and disclosures; failure by the Designated Insurer to comply with a direction given to it under the Insurance Act in respect of the group or any of its members; a criminal conviction imposed upon any member of the Regulatory Group whether in Bermuda or abroad; material breaches of any statutory requirements by any member of the Regulatory Group located outside of Bermuda that could lead to supervisory or enforcement action by a competent authority; or a significant loss that is reasonably likely to cause the Regulatory Group to be unable to comply with its Group ECR. Within 30 days of such notification to the BMA, the Designated Insurer must furnish the BMA with a written report setting out all the particulars of the case that are available to it and within 45 days it must furnish a Regulatory Group capital and solvency return that reflects the Group ECR that has been prepared using post-loss data and unaudited interim financial statements for such period as the BMA shall require together with a declaration of solvency in respect thereof. The Designated Insurer must also notify the BMA in writing within 14 days of becoming aware that a requirement of the Group Rules conflicts with the laws of another jurisdiction where a member of the Regulatory Group operates.
The Designated Insurer is required to notify the BMA if any member of the Regulatory Group effects a material change within the meaning of the Insurance Act within 30 days of such material change taking effect. In addition, the Designated Insurer is required to give written notice to the BMA of the fact that a person has become, or ceased to be, a controller or officer of the parent company of the Regulatory Group within 45 days of becoming aware of such fact.
The following events constitute material changes that must be notified to the BMA: (i) the amalgamation with or acquisition of another firm, (ii) engaging in unrelated business that is retail business, (iii) the acquisition of a controlling interest in an undertaking that is engaged in non-insurance business which offers services and products to persons who are not affiliates, (iv) outsourcing all or substantially all of the actuarial, risk management, compliance or internal audit functions, (v) outsourcing all or a material part of underwriting activities, (vi) the transfer other than by way of reinsurance of all or substantially all of a line of business, and (vii) the expansion into a material new line of business.
If it appears to the BMA that the Designated Insurer is in breach of any provision of the Insurance Act or the Group Rules, the BMA may give the Designated Insurer such directions as appear to the BMA to be desirable for safeguarding the interests of policyholders and potential policyholders of the Regulatory Group.
Supervision, Investigation, Intervention and Disclosure
The BMA may, by notice in writing served on a registered person or a Designated Insurer, require the registered person or a Designated Insurer to provide such information and/or documentation as the BMA may reasonably require with respect to matters that are likely to be material to the performance of its supervisory functions under the Insurance Act. In addition, it may require such person’s auditor, underwriter, accountant or any other person with relevant professional skill to prepare a report on any aspect pertaining thereto. In the case of a report, the person so appointed shall immediately give the BMA written notice of any fact or matter of which he becomes aware or which indicates to him that any condition attaching to his registration under the Insurance Act is not or has not or may not be or may not have been fulfilled and that such matters are likely to be material to the performance of its functions under the Insurance Act. If it appears to the BMA to be desirable in the interests of the clients of a registered person or relevant insurance group, the BMA may also exercise these powers in relation to subsidiaries, parent companies and other affiliates of the registered person or designated insurer.
If the BMA deems it necessary to protect the interests of the policyholders or potential policyholders of an insurer or insurance group, it may appoint one or more competent persons to investigate and report on the nature, conduct or state of the insurer’s or the insurance group’s business, or any aspect thereof, or the ownership or control of the insurer or insurance group. If the person so appointed thinks it necessary for the purposes of his investigation, he may also investigate the business of any person who is, or has been at any relevant time, a member of the insurance group or of a partnership of which the person being investigated is a member. In this regard, it shall be the duty of every person who is or was a controller, officer, employee, agent, banker, auditor, accountant, barrister and attorney or insurance manager to produce to the person appointed such documentation as he may reasonably require for purposes of his investigation, and to attend and answer questions relevant to the investigation and to otherwise provide such assistance as may be necessary in connection therewith.
Where the BMA suspects that a person has failed to properly register under the Insurance Act or that a registered person or designated insurer has failed to comply with a requirement of the Insurance Act or that a person is not, or is no longer, a fit and proper person to perform functions in relation to a regulated activity, it may, by notice in writing, carry out an investigation into such person (or any other person connected thereto). In connection therewith, the BMA may require every person who is or was a controller, officer, employee, agent, banker, auditor, accountant, barrister and attorney or insurance manager to make a report and produce such documents in his care, custody and control and to attend before the BMA to answer questions relevant to the BMA’s investigation and to take such actions as the BMA may direct. The BMA may also enter any premises for the purposes of carrying out its investigation and may petition the court for a warrant if it believes a person has failed to comply with a notice served on him or there are reasonable grounds for suspecting the completeness of any information or documentation produced in response to such notice or that its directions will not be complied with or that any relevant documents would be removed, tampered with or destroyed.
If it appears to the BMA that the business of the registered insurer is being conducted in a way that there is a significant risk of the insurer becoming insolvent or being unable to meet its obligations to policyholders, or that the insurer is in breach of the Insurance Act or any conditions imposed upon its registration, or the minimum criteria stipulated in the Insurance Act is not or has not been fulfilled in respect of a registered insurer, or that a person has become a controller without providing the BMA with the appropriate notice or in contravention of a notice of objection, or the registered insurer is in breach of its ECR, or that a designated insurer is in breach of any provision of the Insurance Act or the regulations or rules applicable to it, the BMA may issue such directions as it deems desirable for safeguarding the interests of policyholders or potential policyholders of the insurer or the insurance group. The BMA may, among other things, direct an insurer, for itself and in its capacity as designated insurer of the insurance group of which it is a member, (1) not to effect further contracts of insurance, or any contract of insurance of a specified description, (2) to limit the aggregate premiums to be written by it during the specified period, (3) not to vary any insurance contract if the effect would be to increase the insurer’s liabilities, (4) not to make certain investments, (5)
to realize certain investments, (6) not to declare or pay any dividends or other distributions or to restrict the making of such payments, (7) not to enter into specified transactions with any specified person or persons of a specified class, (8) to provide such written particulars relating to the financial circumstances of the insurer as the BMA thinks fit, (9) (as an individual insurer only and not in its capacity as designated insurer) to obtain the opinion of a loss reserve specialist and submit it to the BMA and/or (10) to remove a controller or officer.
The BMA has the power to assist other regulatory authorities, including foreign insurance regulatory authorities, with their investigations involving insurance and reinsurance companies in Bermuda if it is satisfied that the assistance being requested is in connection with the discharge of regulatory responsibilities and that such cooperation is in the public interest. The grounds for disclosure by the BMA to a foreign regulatory authority without consent of the insurer are limited and the Insurance Act provides for sanctions for breach of the statutory duty of confidentiality.
Corporate Income Tax Act
On December 27, 2023, Bermuda enacted the Corporate Income Tax Act 2023 (the “CIT Act”), which will impose corporate income tax on certain Bermuda-based entities for fiscal years beginning on or after January 1, 2025. Subject to certain exceptions, if the entity is a member of a multi-national enterprise (“MNE”) group that has entities in more than one jurisdiction and that has consolidated revenues of at least 750 million euros for two of the four previous fiscal years beginning on or after January 1, 2025 (regardless of any assurance given pursuant to the Exempted Undertakings Tax Protection Act 1966), corporate income tax will be chargeable at a rate of 15% of the net taxable income of the Bermuda constituent entities in the MNE group less applicable tax credits. Although we believe that we can currently utilize certain exemptions to the tax obligations under the CIT Act, we cannot guarantee that the Company will not face tax liabilities in the future. For more details, please refer to the section titled "Risk Factors––Risks Related to Taxation––Bermuda Tax Risk.”
Economic Substance Act
In December 2018, the Economic Substance Act 2018 (the "ESA") came into effect in Bermuda. Under the provisions of the ESA, every Bermuda registered entity other than an entity which is resident for tax purposes in certain jurisdictions outside of Bermuda that carries on one or more "relevant activities" referred to in the ESA, and from which it earns gross revenue, must satisfy economic substance requirements by maintaining a substantial economic presence in Bermuda. Under the ESA, insurance or holding entity activities (both as defined in the ESA and Economic Substance Regulations 2018) are relevant activities. To the extent that the ESA applies to any of our entities registered in Bermuda, we will be required to demonstrate compliance with economic substance requirements by filing an annual economic substance declaration with the Registrar of Companies in Bermuda. Any entity that must satisfy economic substance requirements but fails to do so could face automatic disclosure to competent authorities in the E.U. of the information filed by the entity with the Bermuda Registrar of Companies in connection with the economic substance requirements and may also face financial penalties, restriction or regulation of its business activities and/or may be struck off as a registered entity in Bermuda.
Cyber Code and Reporting Events
In October 2020, the BMA issued the Insurance Sector Operational Cyber Risk Management Code of Conduct ("Cyber Code") which applies to all registered insurers, insurance managers and intermediaries (e.g., agents, brokers, insurance marketplace providers). The Cyber Code establishes duties, requirements, standards, procedures and principles to be complied with in relation to operational cyber risk management and is designed to promote the stable and secure management of information technology systems of regulated entities. The Cyber Code defines a cyber reporting event as being any act that results in the unauthorized access to, disruption or misuse of the electronic systems or information stored on such systems of a licensed undertaking, including any breach of security leading to the loss or unlawful destruction or unauthorized disclosure of or access to such systems or information, where (i) a cyber reporting event has the likelihood of adversely impacting policyholders or clients; (ii) an insurer has reached a view that there is a likelihood that loss of its system availability will have an adverse impact on its insurance business; (iii) an insurer has reached the view that there is a likelihood that the integrity of its information or data has been compromised and may have an adverse impact on its insurance business; (iv) an insurer has become aware that there is a likelihood that there has been unauthorized access to its information systems whereby such access would have an adverse impact on its insurance business; or (v) an event has occurred for which a notice is required to be provided to a regulatory body or governmental agency. Cyber reporting events are only reportable to the BMA where the event results in a significant adverse impact to the regulated entity’s operations, its policyholders or clients.
Certain Other Bermuda Law Considerations
All Bermuda companies must comply with the provisions of the Companies Act regulating the payment of dividends and making of distributions from contributed surplus. A company is prohibited from declaring or paying a dividend, or making a distribution out of contributed surplus, if there are reasonable grounds for believing that (i) the company is, or would after the payment be, unable to pay its liabilities as they become due; or (ii) the realizable value of the company’s assets would be less than its liabilities.
Under the Company’s Bye-laws, each common share is entitled to dividends if, and when, dividends are declared by the Board of Directors, subject to any preferred dividend rights of the holders of any preference shares. Issued share capital is the aggregate par value of the company’s issued shares, and the share premium account is the aggregate amount paid for issued shares over and above their par value. Share premium accounts may be reduced in certain limited circumstances. In addition, the Companies Act regulates return of capital, reduction of capital and any purchase or redemption of shares by the Company.
Although the Company is incorporated in Bermuda, it has been designated as a non-resident of Bermuda for exchange control purposes by the BMA. Pursuant to its non-resident status, the Company may engage in transactions in currencies other than the Bermuda Dollar, and there are no restrictions on its ability to transfer funds (other than funds denominated in Bermuda Dollars) in and out of Bermuda or to pay dividends to non-residents who are holders of its common shares in currencies other than the Bermuda Dollar.
Under Bermuda law, exempted companies are companies formed for the purpose of conducting business outside Bermuda from a principal place in Bermuda. All Bermuda exempted companies are exempt from certain Bermuda laws restricting the percentage of share capital that may be held by non-Bermudians. However, exempted companies may not, without the express authorization of the Bermuda legislation or under a license or consent granted by the Bermuda Minister, participate in certain business transactions, including (i) the acquisition or holding of land in Bermuda (except that held by way of lease or tenancy agreement which is required for their business and held for a term not exceeding 50 years or which is used to provide accommodation or recreational facilities for their officers and employees and held with the consent of the Bermuda Minister, for a term not exceeding 21 years); (ii) the taking of mortgages on land in Bermuda to secure an amount in excess of BD$50,000; (iii) the acquisition of any bonds or debentures secured by any land in Bermuda, other than bonds or debentures issued by the Bermuda government or a public authority; or (iv) the carrying on of business of any kind for which they are not licensed in Bermuda, except in certain limited circumstances such as doing business with another exempted undertaking in furtherance of their business (as the case may be) carried on outside Bermuda.
Specific permission is required from the BMA, pursuant to the provisions of the Exchange Control Act 1972 and related regulations, for all issuances and transfers of securities of Bermuda companies, other than in cases where the BMA has granted a general permission. The BMA, in its notice to the public dated June 1, 2005, has granted general permission for the issue and subsequent transfer of any securities from and/or to a non-resident of Bermuda where any equity securities of such company (which includes the Class B common shares) are listed on an appointed stock exchange, for so long as any equity securities of the company remain so listed. The NYSE has been appointed as an appointed stock exchange under Bermuda law and therefore the specific permission of the BMA is not required to be obtained prior to the issuance or transfer of the Class B common shares.
Bermuda Work Permit Considerations
Under Bermuda law, only persons who are Bermudians, spouses of Bermudians, holders of a permanent resident’s certificate, naturalized British Overseas Territory Citizens or persons who are exempt pursuant to the Incentives for Job Makers Act 2011, as amended (“exempted persons”) may engage in gainful occupation in Bermuda without an appropriate governmental work permit. Work permits may be granted or extended by the Bermuda government upon showing that, after proper public advertisement in most cases, no Bermudian (or otherwise exempted person) is available who meets the minimum standard requirements for the advertised position. A waiver from advertising is automatically granted in respect of any chief executive officer position and other chief officer positions. Waivers from advertising can also be granted where the applicant is uniquely qualified, the position would not exist in Bermuda if not for the expatriate, the success of the business would be detrimentally affected if the applicant were to leave the business or the expatriate is integral and key to income generation by brokering deals or attracting/retaining clients.
Bermuda Data Protection Legislation
As of January 1, 2025, the Company has certain duties and obligations under the Personal Information Protection Act 2016 of Bermuda ("PIPA") concerning the use in Bermuda of an individual's personal information. PIPA is based on internationally accepted principles of privacy and data protection. Oversight and enforcement of PIPA is the responsibility of the Office of the Privacy Commissioner of Bermuda. A breach of PIPA by the Company could lead to inquiry or enforcement actions by the Privacy Commissioner, suits for civil remedies by individuals brought in a Court of competent jurisdiction, or in criminal prosecutions brought by the Government of Bermuda either as summary or indictable offenses.
U.S. Insurance Regulation
State Regulation
Hamilton Select is subject to extensive regulation and supervision by the State of Delaware, its state of domicile, as well as to varying regulation in those states in which it does business. The purpose of such regulation and supervision is primarily to provide safeguards for policyholders, rather than to protect the interests of shareholders. In general, the insurance laws of the various states establish regulatory agencies with broad administrative powers, including the power to grant or revoke operating licenses and regulate trade practices, investments, premium rates, deposits of securities, the form and content of financial statements and insurance policies, dividend limitations, cancellation and non-renewal of policies, accounting practices and the maintenance of specified reserves and capital for the protection of policyholders. From time to time, states consider and/or enact laws that may alter or increase state authority to regulate insurance companies and insurance holding companies. States also consider and/or enact laws that impact the competitive environment and marketplace for property-casualty insurance.
However, the regulation of E&S business differs from the regulation of admitted business. The admitted market is subject to more state regulation than the E&S market, particularly with regard to rate and form filing requirements, restrictions on the ability to exit lines of business, premium tax payments and membership in various state associations, such as guaranty funds. Nevertheless, Hamilton Select is subject to the surplus lines regulation and reporting requirements of the jurisdictions in which it is eligible to write E&S insurance and strict regulations apply to surplus lines placements under the laws of every state. The regulation of E&S insurance may undergo changes in the future.
Insurance Holding Company Regulation
We operate as an insurance holding company and are subject to state statutes and regulations governing insurance holding company systems that are generally based on the National Association of Insurance Commissioner’s ("NAIC") Insurance Holding Company System Regulatory Act and Insurance Holding Company System Model Regulation (together, the "Model Holding Company Act and Regulation"). These vary from jurisdiction to jurisdiction, but generally require controlled insurance companies (i.e., insurers that are subsidiaries of insurance holding companies) to register with, and periodically furnish information to, state regulatory authorities concerning capital structure, ownership, financial condition, intercompany transactions and general business operations. Delaware, the state in which Hamilton Select is domiciled, has enacted laws to implement these requirements.
State insurance holding company laws and regulations impose standards on certain transactions between related companies, which include, amongst other requirements, that all transactions be fair and reasonable, that an insurer’s surplus (as regards policyholders) be reasonable and adequate in relation to its liabilities and that expenses and payments be allocated to the appropriate party in accordance with customary accounting practices. These transactions between related companies include certain transfers of assets, loans, reinsurance agreements, service agreements, dividend payments by insurance companies and certain other material transactions.
State insurance holding company laws, including those of Delaware, require the ultimate controlling person of a U.S. insurer to submit annually, to the lead state of the insurance holding company system, an enterprise risk report. The report must identify the material risks within the insurance holding company system that could pose enterprise risk to the insurer (i.e., activities, circumstances or events involving one or more affiliates of an insurer that, if not remedied properly, are likely to have a material adverse effect upon the financial condition or liquidity of the insurer or its insurance holding company system as a whole).
The NAIC has developed a group capital calculation tool that uses a risk-based capital aggregation methodology for all entities in an insurance holding company system. The goal is to provide U.S. regulators with a method to aggregate the available capital and the minimum capital of each entity in a group in a way that applies to all companies regardless of their structure. The group capital calculation has been adopted by the majority of states, including Delaware, based on the NAIC’s adoption of amendments to the Model Holding Company Act and Regulation providing language for states to use to enable the group capital calculation. We anticipate that such amendments to state insurance holding company laws and regulations adopting the group capital calculation will be broadly adopted in the future because they are subject to an NAIC accreditation standard effective January 1, 2026.
Holding company laws also authorize state insurance commissioners to act as group-wide supervisors for a defined class of internationally active insurance groups. All states, including Delaware, have adopted changes to their holding company laws enhancing group-wide supervision in this manner.
Risk Management and Own Risk and Solvency Assessment
All states, including Delaware, have adopted the NAIC’s Risk Management and Own Risk and Solvency Assessment Model Act (“ORSA Model Act”). The ORSA Model Act requires insurers to maintain a risk management framework and regularly, no less than annually, conduct an Own Risk Solvency Assessment. The ORSA Model Act also requires an insurance holding company system’s Chief Risk Officer to annually submit to the lead state insurance regulator an Own Risk and Solvency Assessment Summary Report, which is a confidential high-level summary of an insurer or insurance group’s Own Risk Solvency Assessment.
Dividend Restrictions
The Delaware laws and regulations limit the aggregate amount of dividends or other distributions that Hamilton Select may declare or pay within any 12-month period without advance regulatory approval.
Investment Regulation
Investments by Hamilton Select are subject to Delaware laws which require diversification of its investment portfolio and limits on the amount of investments in certain categories, and must comply with applicable laws and regulations prescribing the kind, quality and concentration of investments. Failure to comply with these laws and regulations would cause non-conforming investments to be treated as non-admitted assets for purposes of measuring statutory surplus and, in some instances, would require Hamilton Select to sell those investments.
Quarterly and Annual Financial Reporting
Hamilton Select is required to file quarterly and annual reports with the Delaware Department of Insurance and with the NAIC using statutory accounting practices, which differ from U.S. generally accepted accounting principles. Its business and accounts are subject to examination by such agencies at any time.
Risk-Based Capital
The state insurance regulators utilize a risk-based capital formula to help assess the capital adequacy of insurance companies and identify insurers that are in, or are perceived as approaching, financial difficulty. This model establishes minimum capital needs based on the risks applicable to the operations of the individual insurer. The risk-based capital requirements for property-casualty insurance companies measure three major areas of risk: asset risk, credit risk and underwriting risk. Companies having less statutory surplus than required by the risk-based capital requirements are subject to varying degrees of regulatory scrutiny and intervention, depending on the severity of the inadequacy.
Insurance Regulatory Information System
The NAIC also has developed a set of 13 financial ratios for each ratio for property and casualty insurers referred to as the Insurance Regulatory Information System ("IRIS"). On the basis of statutory financial statements filed with state insurance regulators, the NAIC annually calculates these IRIS ratios to assist state insurance regulators in monitoring the financial condition of insurance companies. The NAIC has established an acceptable range for each of the IRIS financial ratios and specifies "Unusual Values" for each ratio. Departure from the Unusual Values on four or more of the ratios can lead to inquiries from individual state insurance commissioners as to certain aspects of an insurer's business.
In 2024, Hamilton Select reported three Unusual Values being (i) change in net premium written, (ii) two-year overall operating ratio and (iii) change in adjusted policyholders' surplus. These Unusual Values were primarily driven by the start-up nature of Hamilton Select as they were primarily related to both the growth in premium written and start-up costs relating to personnel and IT spend. These IRIS ratios are expected to fall within the "Usual Value" range in future years as Hamilton Select moves out of its start-up phase.
Innovation and Technology
As a result of increased innovation and use of technology in the insurance sector, the NAIC and insurance regulators have been focusing on the industry's use of “big data” techniques, such as artificial intelligence, machine learning and automated decision-making. In December 2023, the NAIC adopted the Model Bulletin on the Use of Artificial Intelligence Systems by Insurers (the “AI Bulletin”). The AI Bulletin may be adopted and issued by state regulators to licensed insurers. In addition to affirming that the use of artificial intelligence must comply with existing state law, the AI Bulletin sets forth regulators’ expectations on how insurers will develop, acquire and use artificial intelligence technologies. As of February 1, 2025, twenty one states and the District of Columbia have adopted the AI bulletin and four states, California, Colorado, New York and Texas, have issued their own guidance or regulations concerning the use of AI by insurers. For example, in July 2024, the New York Department of Financial Services (“NYDFS”) issued Insurance Circular Letter No.7 (2024) titled “Use of Artificial Intelligence Systems and External Consumer Data and Information Sources in Insurance Underwriting and Pricing,” which is intended to provide guidance to insurers on the responsible use of AI and external consumer data in underwriting and pricing decisions.
In addition, in 2024 the NAIC established the Third-Party Data and Models (H) Task Force which is charged with developing a framework for the regulatory oversight of third-party data and predictive models. Their focus includes evaluating existing frameworks, discussing goals for future regulatory structures and considering the development of new model laws or modifications to existing ones. The NAIC's Big Data and Artificial Intelligence (H) Working Group has a new workstream that is evaluating AI-use outcomes and how well the current regulatory framework addresses potential harms from the use of AI. The goal is to determine whether additional tools, resources and education are needed to effectuate the goals of the AI Bulletin (see above). In 2025, the working group will also consider developing an overall AI regulatory framework that could be incorporated into an NAIC regulatory handbook.
The NAIC and state insurance regulators are also focused on addressing unfair discrimination by insurers in the use of consumer data and technology, and certain states have passed laws or are considering action targeting unfair discrimination practices. For instance, in 2021 Colorado enacted a law which prohibits insurers from using external consumer data and information sources ("ECDIS"), as well as algorithms or predictive models that use ECDIS, in a way that unfairly discriminates based on race, color, national or ethnic origin, religion, sex, sexual orientation, disability, gender identity or gender expression. The Colorado Division of Insurance promulgated a regulation pursuant to such law, effective as of November 2023, which applies to all life insurers authorized to operate in Colorado and mandates the establishment of a risk-based governance and risk management framework designed to ensure that the use of ECDIS, algorithms and predictive models does not result or potentially result in unfair discrimination.
Cybersecurity, Privacy and Information Security Regulation
We are subject to laws and regulations relating to the collection, use, processing, and protection of personal information. We are also subject to laws and regulations governing the security of information systems and the information stored therein. In response to the growing threat of cyber-attacks in the insurance industry, certain jurisdictions have adopted laws and regulations requiring new or enhanced data protection and cybersecurity measures, which, among other things, require insurance companies to establish, implement and maintain data and cybersecurity programs, including written policies and procedures. For example, in 2017, the NAIC adopted the Insurance Data Security Model Law (the “Cybersecurity Model Law”), intended to serve as model legislation for states to enact in order to govern cybersecurity and data protection practices of insurers and other entities licensed or registered under state insurance laws, and to protect the confidentiality, integrity and availability of information systems. The Cybersecurity Model Law establishes standards for data security, the investigation of cybersecurity events involving the unauthorized access to or misuse of certain nonpublic information, and the reporting obligations regarding cybersecurity events to insurance commissioners. As of February 1, 2025, the Cybersecurity Model Law, or a form thereof, had been adopted by twenty six states. Certain states have adopted their own cybersecurity regulations, such as New York in November 2023 when the NYDFS adopted an amendment to its Part 500 Cybersecurity Regulation which imposes additional certification obligations, enhanced governance requirements, new audit requirements, additional technology and business continuity requirements, enhanced security control and training requirements and new notification obligations.
In addition, certain lawmakers and regulators have enacted or are considering laws and regulations related to privacy and data security. For instance, the NAIC is proposing revisions to the Privacy of Consumer Financial and Health Information Model Regulation in order to address emerging privacy concerns and ensure that consumer information is adequately protected in the marketplace. The proposed amendments would expand the definition of nonpublic personal information; add consumer rights to request access, correction and deletion of nonpublic personal information; and add requirements for contracts with third-party service providers. The NAIC has set a deadline of December 31, 2025 to finalize the amendments to the model regulation. A number of states have also adopted data privacy legislation and regulation. California adopted the California Consumer Privacy Act of 2018 ("CCPA"), as amended by the California Privacy Rights Act ("CPRA") in 2022. The CCPA imposes a number of requirements on businesses that collect the personal information of California consumers, including requirements that provide individuals with certain rights to their personal information and make mandatory disclosures regarding how the businesses use and disclose consumers’ personal information, establishes a private right of action in some cases if consumers’ personal information is subject to a data breach as a result of the businesses’ violation of the duty to implement and maintain reasonable security practices and creates the California Privacy Protection Agency which is charged with drafting and adopting regulations in furtherance of the CCPA and enforcing the CCPA, as amended by the CPRA. Similar consumer privacy legislation has been enacted in other states such as Virginia, Colorado, Connecticut and Utah. While these laws generally do not apply to entities or data subject to the Gramm-Leach-Bliley Act, certain portions of our business may be subject to such requirements.
Various state legislatures, government agencies and self-regulatory bodies, as well as the U.S. federal government, are expected to continue to consider additional laws, regulations and guidelines relating to privacy and other aspects of customer information and to protecting the ongoing confidentiality, availability and integrity of personal information, sensitive non-public information and information systems. These continued changes in the U.S. privacy and cybersecurity regulatory landscape will require additional compliance investment, including changes to policies, procedures, information systems and operations.
Credit for Reinsurance
State insurance laws permit U.S. insurance companies, as ceding insurers, to take financial statement credit for business that is ceded, so long as the assuming reinsurer satisfies the state’s credit for reinsurance laws. There are several ways that the credit for reinsurance laws may be satisfied by an assuming reinsurer, including by being licensed in the state, being accredited in the state or maintaining certain types of qualifying collateral.
Under Dodd-Frank Wall Street Reform and Consumer Protection Act of 2010 (the "Dodd-Frank Act"), which established the Federal Insurance Office (the "FIO") within the U.S. Department of the Treasury (the "Treasury"), the FIO has preemption authority over state insurance laws that conflict with certain international agreements such as state credit for reinsurance laws that result in non-U.S. reinsurers subject to such agreements being treated less favorably than U.S. reinsurers. The NAIC previously adopted amendments to its Credit for Reinsurance Model Law to satisfy the substantive and timing requirements of such Covered Agreements (as further defined below), which amendments have been enacted by all states. Under the Covered Agreements, reinsurance collateral requirements no longer apply to qualifying EU and U.K. reinsurers. The amended Credit for Reinsurance Model Law also extends the zero reinsurance collateral provisions in the Covered Agreements to qualified reinsurers domiciled in U.S. jurisdictions that are accredited by the NAIC and to non-U.S. jurisdictions that have not entered into a covered agreement with the United States but which the NAIC has identified as “reciprocal jurisdictions” pursuant to the NAIC Qualified Jurisdiction Process.
Climate Change and Financial Risks
The NAIC and state insurance regulators continue to evaluate issues related to the management of climate risk. In 2022, the NAIC adopted a new standard for insurance companies to report their climate-related risks as part of its annual Climate Risk Disclosure Survey, which applies to insurers that meet the reporting threshold of $100 million in U.S. direct premium and are licensed in one of the participating jurisdictions. In addition, pursuant to the FIO’s statutory authority under the Dodd-Frank Act, as discussed above under "Federal Regulation," the FIO is assessing how the insurance sector may mitigate climate risks and help achieve national climate-related goals. In June 2023, the FIO released a report titled Insurance Supervision and Regulation of Climate-Related Risks urging insurance regulators to adopt climate-related risk-monitoring guidance in order to enhance their regulation and supervision of insurers and in March 2024 the NAIC adopted its inaugural National Climate Resilience Strategy for Insurance, which aims to enhance risk reduction efforts by state insurance regulators, ensuring that insurance remains available and reliable for communities facing climate-related risks.
At the state level, California has adopted climate disclosure and financial reporting legislation, the Climate Corporate Data Accountability Act and the Climate Related Financial Risk Act, which will require reporting from large U.S. public and private companies doing business in California on greenhouse gas emissions and biennial climate-related financial risk reports. In addition, the SEC has released proposed rule changes on climate-related disclosure which would require registrants, including public issuers such as us, to include certain climate-related disclosures in registration statements and periodic reports. The SEC has issued a stay in the implementation of these rules due to ongoing legal challenges, however, the SEC will likely issue a new effective date once the litigation is resolved if the new rules survive the legal challenges.
Diversity and Corporate Governance
The NAIC and state insurance regulators also continue to evaluate issues related to diversity within the insurance industry, such as the diversity of an insurer’s board of directors and management. For instance, the NAIC is examining practices in the insurance industry in order to determine how barriers are created that disadvantage or discriminate against people of color or historically underrepresented groups.
Federal Regulation
The U.S. federal government generally does not directly regulate the insurance industry except for certain areas of the market, such as insurance for flood, nuclear and terrorism risks. However, the federal government has undertaken initiatives or considered legislation in several areas that may impact the insurance industry. The U.S. federal government’s oversight of the insurance industry was expanded under the Dodd-Frank Act, which established the FIO. Although the FIO does not have general supervisory or regulatory authority over the business of insurance, it has preemption authority over state insurance laws that conflict with certain international agreements, as discussed below. The FIO also has authority to monitor all aspects of the insurance sector and the extent to which traditionally underserved communities and consumers have access to affordable non-health insurance products, and to represent the United States on prudential aspects of international insurance matters, including at the International Association of Insurance Supervisors.
The Dodd-Frank Act authorizes the Treasury and the Office of the U.S. Trade Representative to enter into international agreements of mutual recognition regarding the prudential regulation of insurance or reinsurance. The United States entered into such covered agreements with the European Union in September 2017 (the "EU Covered Agreement") and with the United Kingdom in December 2018 (the "UK Covered Agreement," together with the EU Covered Agreement, the "Covered Agreements"). The Covered Agreements address three areas of prudential supervision: reinsurance, group supervision and the exchange of information. Issues relating to the Covered Agreements are discussed further under "—State Regulation—Credit for Reinsurance" above.
Lloyd’s Regulation
General. The operations of Syndicate 4000 and Syndicate 1947 are managed by HMA, which is subject to regulation and supervision of the Prudential Regulation Authority ("PRA"), the Financial Conduct Authority ("FCA") and the Council of Lloyd’s. HMA is the managing agent for Syndicate 4000 and Hamilton Corporate Member Limited is a Lloyd’s corporate member that provides underwriting capacity to Syndicate 4000. The FCA and PRA both regulate insurers, insurance intermediaries and Lloyd’s itself. Lloyd’s establishes its own bye-laws and regulations, including requirements made under those bye-laws for all managing agents to maintain that are designed to meet applicable regulatory requirements.
Solvency Requirements. Underwriting capacity of a member of Lloyd’s must be supported by providing a deposit (referred to as "Funds at Lloyd’s") in the form of cash, securities or letters of credit in an amount determined in accordance with Lloyd’s requirements and the Solvency II legislative regime. The amount of such deposit is calculated for each member through the completion of a prescribed capital adequacy exercise. Under these requirements, Lloyd’s must demonstrate that each member has sufficient assets to meet its underwriting liabilities plus a required solvency margin, and adjustments to a syndicate’s Funds at Lloyd’s may be required at any time.
Intervention Powers. The Council of Lloyd’s has wide discretionary powers to regulate members’ underwriting at Lloyd’s. It may, for instance, change the basis on which syndicate expenses are allocated or vary the Funds at Lloyd’s or the investment criteria applicable to the provision of Funds at Lloyd’s. Exercising any of these powers might affect the return on an investment of the corporate member in a given underwriting year. Further, the annual business plans of a syndicate are subject to the review and approval by Lloyd’s.
Each member of Lloyd’s is required to contribute a percentage of that member’s underwriting capacity for the relevant year of account to the Lloyd’s central fund (the "Central Fund"). If a member of Lloyd’s is unable to pay its debts to policyholders, such debts may be payable by the Central Fund, which in many respects acts as an equivalent to a state guaranty fund in the U.S. If Lloyd’s determines that the Central Fund needs to be increased, it has the power to assess premium levies on current Lloyd’s members. The Council of Lloyd’s has discretion to call or assess up to an additional 5% of a member’s underwriting capacity in any one year as a Central Fund contribution. Our syndicate capacity for the 2025 underwriting year is £635 million of gross premiums written.
Lloyd’s Brussels. Lloyd’s Brussels is authorized and regulated by the National Bank of Belgium ("NBB") and regulated by the Financial Services Market Authority ("FSMA"). Lloyd’s Brussels is an authorized insurance company licensed to write non-life risks across the EEA and the U.K. and also maintains 19 branches across Europe. The use of Lloyd’s Brussels provides HMA with access to the European market to write non-life insurance risks.
Principles for Doing Business at Lloyd’s (the "Principles"). Replacing the Lloyd’s Minimum Standards (the previous regime which set out the Lloyd’s regulatory requirements for Lloyd’s managing agents) and effective from the third quarter of 2022, the Principles set out the fundamental responsibilities expected of all managing agents, including HMA and is the basis against which Lloyd’s will review and categorize all syndicates and managing agents in terms of their capacity and performance.
Irish Regulation
HIDAC is regulated by the Central Bank of Ireland ("CBI") pursuant to the Insurance Acts 1909 to 2018 (as amended), the Central Bank Acts 1942 to 2018 and all statutory instruments relating to insurance made or adopted under the European Communities Acts 1972 to 2012, including the European Union (Insurance and Reinsurance) Regulations, 2015 (as amended) and the Solvency II regime. HIDAC is required to maintain the Minimum Capital Requirement ("MCR") and the Solvency Capital Requirement ("SCR") at all times. Capital requirements are calculated by reference to Solvency II definitions. If an entity falls below the MCR or SCR, the CBI is authorized to take action to restore the financial position of the subsidiary. In addition, HIDAC's UK branch is subject to regulation and supervision of the PRA and the FCA.
Human Capital Resources
We strive to be a magnet for talent, attracting, developing, and retaining professionals and providing them with an environment in which they can thrive and share in the success of our growing and vibrant business.
Employees. We have over 600 permanent employees who consistently show high levels of engagement and share our values - aligning with our stated objective of being a magnet for talent.
Work Environment. We maintain a collaborative, entrepreneurial culture and are committed to welcoming and respecting differences to encourage diverse perspectives.
Talent Development. We support the learning and development of our employees and provide opportunities to further their education and professional development.
Fostering an Inclusive Culture. We are dedicated to initiatives that continuously nurture a welcoming, fair, and supportive environment for all Hamilton employees.
Compensation Practices. We offer and maintain a competitive benefits package designed to support the well-being of our employees, including, but not limited to, medical insurance, a 401(k) plan (or equivalent in our various locations), paid time off, life insurance and wellness support, including employee assistance programs.
Our Organizational Structure and Corporate History
We are a Bermuda-headquartered company, whose subsidiaries and syndicates underwrite insurance and reinsurance risks on a global basis through two reporting segments, International and Bermuda. Within the reporting segments, we operate three principal underwriting platforms: Hamilton Global Specialty, Hamilton Select and Hamilton Re. We closed our initial public offering on November 14, 2023 in which we sold 6,250,000 Class B common shares and 8,750,000 existing Class B common shares were sold by the Company's shareholders. An additional 1,500,000 existing Class B common shares were subsequently sold by the Company's shareholders pursuant to the exercise of the underwriters’ option.
International
Our London operations are comprised of HMA, a Lloyd’s managing agency, which manages our wholly aligned Syndicate 4000. Syndicate 4000 operates in the Lloyd’s market and underwrites property, casualty and specialty insurance and specialty reinsurance business on a subscription basis. Syndicate 3334, which was managed by HMA, was closed by way of a reinsurance to close into Syndicate 4000 at the end of December 31, 2021.
On August 20, 2019, Hamilton completed the acquisition of Pembroke Managing Agency that expanded our existing London operations and created our Irish footprint.
Prior to the acquisition, Hamilton Underwriting Limited ("HUL"), a former Lloyd’s managing agent, managed Lloyd’s Syndicate 3334. Following the acquisition, the acquired Lloyd’s managing agent was renamed HMA. In 2020, HUL was deregistered, Syndicate 3334 was placed into run-off, and all renewal business was written into the acquired Syndicate 4000. HMA is responsible for the management of the wholly-aligned Syndicate 4000 and a managed third-party syndicate.
Our Dublin operations consist of HIDAC, a Dublin-based insurer with a U.K. branch and extensive licensing in the United States, including excess and surplus lines and reinsurance licenses in all 50 states.
HMGA Americas is licensed throughout the United States, and underwrites on behalf of Hamilton Group’s London, Dublin and Bermuda operations (solely in respect of Hamilton Re US), providing access from the United States to the Lloyd’s market, the Hamilton Group’s rated Irish carrier and the Hamilton Group’s Bermuda balance sheet, respectively.
Hamilton Select, a U.S. domestic excess and surplus lines carrier, was incorporated in Delaware on September 2, 2021 and is licensed to write excess and surplus lines in all 50 states. Hamilton Select’s certificate of authority was issued on December 20, 2021.
Hamilton Global Specialty’s principal place of business is located at 8 Fenchurch Place, London EC3M 4AJ, United Kingdom and our telephone number is +44 (0) 20-3595-1111. HIDAC’s principal place of business is 2 Shelbourne Building, Crampton Avenue, Ballsbridge, Dublin 4, D04 W3V6, Ireland and our telephone number is +353 1 232 1900. Hamilton Select’s principal place of business is 5101 Cox Road, Suite 200, Glen Allen, VA 23060, United States and our telephone number is +1 (804) 905-9977.
Bermuda
Our Bermuda operations are led by Hamilton Re, a registered Class 4 insurer incorporated in Bermuda. Hamilton Re writes property, casualty, and specialty insurance and reinsurance business on a global basis. Hamilton Re has been able to secure and passport both certified reinsurer and reciprocal jurisdiction reinsurer status in various U.S. states, including our lead state of Delaware. Obtaining certified reinsurer status allows cedants the option to accept a reduced amount of collateral for reinsurers, while obtaining reciprocal jurisdiction reinsurer status allows cedants the option of eliminating reinsurance collateral requirements.
Hamilton Re US was formed pursuant to an arrangement between Hamilton Re and its Bermuda-incorporated affiliate, Hamilton ILS Holdings Limited ("Hamilton ILS"). The Company treats Hamilton Re US as a U.S. corporation for U.S. tax purposes and has filed an election for it to be treated as such with the U.S. Internal Revenue Service ("IRS"), and profits allocated to it are subject to applicable U.S. taxation. HMGA Americas is authorized to underwrite U.S. property, casualty and specialty reinsurance on behalf of Hamilton Re, solely in respect of Hamilton Re US.
ACML, an insurance agent incorporated and regulated in Bermuda, is authorized to underwrite on behalf of Ada Re, Ltd. ("Ada Re"). Ada Re is a non-consolidated special purpose insurer funded by investors and formed to provide fully collateralized reinsurance and retrocession to both the wholly owned operating platforms of Hamilton Re and third-party cedants.
Hamilton Re’s principal place of business is located at Wellesley House North, 1st Floor, 90 Pitts Bay Road, Pembroke HM 08 Bermuda and our telephone number is +1 (441) 405-5200.
Our organizational structure is set forth below. Each entity is wholly owned by its immediate parent, unless indicated otherwise.
Facilities
Our primary executive offices are located in Pembroke, Bermuda and London, United Kingdom. In addition, we lease office space in Dublin, Ireland; Richmond, Virginia; Miami, Florida; and New York, New York.
Item 1A. Risk Factors
Risk Factors Summary
Our business is subject to a number of risks, including risks that could prevent us from achieving our business objectives or financial goals or that otherwise could adversely affect our business, results of operations, financial condition and liquidity, that you should carefully consider. These risks are discussed more fully in “Risk Factors” below. These risks include the following:
•challenges from competitors, including those arising from industry consolidation and technological advancements;
•unpredictable catastrophic events, global climate change and/or emerging claim and coverage issues;
•our ability, or those of the third parties on which we rely, to ensure reserves are adequate to cover actual losses and to accurately evaluate underwriting risk, models, assessments and/or pricing of risks;
•our ability to defend our intellectual property rights, including our proprietary technology platforms, to comply with our obligations under our license and technology agreements or to license rights to technology or data on reasonable terms;
•the impact of risks associated with human error, fraud, model uncertainties, cybersecurity threats such as cyber-attacks and security breaches and our reliance on third-party IT systems that can fail or need replacement;
•our ability to secure necessary credit facilities, or additional types of credit, on favorable terms or at all;
•our limited financial and operating flexibility due to the covenants in our existing credit facilities;
•our exposure to the credit risk of the intermediaries on which we rely;
•our failure to pay claims in a timely manner or the need to sell investments under unfavorable conditions to meet liquidity requirements;
•downgrades, potential downgrades or other negative actions by rating agencies;
•our ability to manage risks associated with macroeconomic conditions resulting from geopolitical and global economic events, including current or anticipated military conflicts, public health crises, terrorism, sanctions, rising energy prices, inflation and interest rates and other global events;
•the cyclical nature of the insurance and reinsurance business, which may cause the pricing and terms for our products to decline;
•our results of operations potentially fluctuating significantly from period to period and not being indicative of our long-term prospects;
•our ability to execute our strategy and to modify our business and strategic plan without shareholder approval;
•our dependence on key executives, including the potential loss of Bermudian personnel, and our ability to attract qualified personnel, particularly in very competitive hiring conditions;
•foreign operational risk such as foreign currency risk and political risk;
•our ability to identify and execute opportunities for growth, to complete transactions as planned or realize the anticipated benefits of any acquisitions or other investments;
•our management of alternative reinsurance platforms on behalf of investors in entities managed by Hamilton Strategic Partnerships;
•our inability to control the allocations to, and/or the performance of, the TS Hamilton Fund investment portfolio and our limited ability to withdraw our capital accounts;
•the impact of risks from conflicts of interest among the Managing Member, Two Sigma and their respective affiliates affecting our business;
•the historical performance of Two Sigma not being indicative of the future results of the TS Hamilton Fund’s investment portfolio and/or of our future results;
•the impacts of risks associated with our investment strategy, including that such risks are greater than those faced by our competitors;
•our potentially becoming subject to U.S. federal income taxation, Bermuda taxation or other taxes as a result of a change of tax laws or otherwise;
•the potential characterization of us and/or any of our subsidiaries as a PFIC;
•our potentially becoming subject to U.S. withholding and information reporting requirements under FATCA provisions;
•our ability to compete effectively in a heavily regulated industry in light of new domestic or international laws and regulations, including accounting practices, and the impact of new interpretations of current laws and regulations;
•the suspension or revocation of our subsidiaries’ insurance licenses;
•significant legal, governmental or regulatory proceedings;
•our insurance and reinsurance subsidiaries’ ability to pay dividends and other distributions to us being restricted by law;
•challenges related to compliance with the applicable laws, rules and regulations related to being a public company, which is expensive and time consuming;
•the limited ability of investors to influence corporate matters due to our multiple class common share structure and the voting provisions of our Bye-laws;
•the risk that anti-takeover provisions in our Bye-laws could discourage, delay, or prevent a change in control, even if the change in control would be beneficial to our shareholders;
•the difficulties investors may face in protecting their interests and serving process or enforcing judgments against us in the United States; and
•our current strategy does not include paying cash dividends on our Class B common shares in the near term.
Risk Factors
Investing in Hamilton involves risk. In deciding whether to invest in Hamilton, you should carefully consider the following risk factors. Any of these risk factors could have a significant or material adverse effect on our businesses, results of operations, financial condition or liquidity. They could also cause significant fluctuations and volatility in the trading price of our securities. Readers should not consider any descriptions of these factors to be a complete set of all potential risks that could affect Hamilton. These factors should be considered carefully together with the other information contained in this report, including our financial statements, and the other reports and materials filed by us with the SEC. Further, many of these risks are interrelated and could occur under similar business and economic conditions, and the occurrence of certain of them may in turn cause the emergence or exacerbate the effect of others. Such a combination of risks could materially increase the severity of the impact of these risks on our businesses, results of operations, financial condition and liquidity above and beyond a risk’s singular impact. The risk factors described below are not necessarily presented in order of importance. This Annual Report also contains forward-looking statements and estimates that involve risks and uncertainties. Our actual results could differ materially from those anticipated in the forward-looking statements as a result of specific factors, including the risks and uncertainties described below. See “Special Note Regarding Forward-Looking Information.”
Risks Related to Our Business and Industry
We operate in a highly competitive environment.
Competition and consolidation in the insurance and reinsurance industry could adversely impact us. We compete with major U.S. and non-U.S. insurers and reinsurers, some of which have greater financial, marketing and management resources than we do. In addition, pension funds, endowments, investment banks, investment managers, hedge funds and other capital markets participants have been active in the insurance and reinsurance market, either through the formation of insurance and reinsurance companies or the use of other financial products intended to compete with traditional insurance and reinsurance. We may also face competition from non-traditional competitors, as well as start-up companies and others seeking access to this industry.
We expect competition to continue to increase over time. It is possible that new or alternative capital could cause reductions in prices of our products or reduce the duration or amplitude of attractive portions of market cycles. New entrants or existing competitors, which may include government-sponsored funds or other vehicles, may attempt to replicate all or part of our business model and provide further competition in the markets in which we participate. The tax policies of the countries where our customers operate, as well as government-sponsored or -backed insurance companies and catastrophe funds, may also affect the demand for insurance and reinsurance, sometimes significantly.
Along with increased competition, there has also been significant consolidation in the insurance and reinsurance industry over the last several years, including among our competitors, customers and brokers. These consolidated enterprises may try to use their enhanced market power or better capitalization to negotiate price reductions for our products and services or obtain a larger market share through increased line sizes. If competitive pressures decrease the prices for our products, we would generally expect to reduce our future underwriting activities, resulting in lower premium volume and profitability. Insurance and reinsurance intermediaries may also continue to consolidate, potentially adversely impacting our ability to access business and distribute our products.
As the insurance industry consolidates, we expect competition for customers to become more intense, and sourcing and properly servicing each customer to become even more important. We could incur greater expenses relating to customer acquisition and retention, further reducing our operating margins. In addition, insurance companies that merge may be able to spread their risks across a consolidated, larger capital base so that they require less reinsurance. Any of the foregoing could adversely affect our business or results of operations.
Modern innovation is also leading to increased competition, with traditional insurance companies and newer market participants increasingly focusing on the use of technological and digital advancements (including AI, digital platforms and data analytics) to optimize underwriting, claims processing, customer engagement and risk management. If our competitors adopt or develop technologies, including the application of AI in our industry, more effectively or efficiently than we do, they may be able to offer more competitive pricing, faster claims handling, and superior customer experiences, gaining significant market share at our expense. We will also need to continue to invest significant time and resources in new technologies and new ways to deliver our products and services in order to maintain a competitive position, which may divert management’s attention from other business concerns and lead to significant costs associated with such an investment. There is also no guarantee that such an investment will result in the anticipated cost savings, revenue growth, or any competitive advantages.
We also derive a significant portion of our business through a limited number of insurance and reinsurance intermediaries, such as managing general agents, general agents and reinsurance brokers. Some of our competitors have higher financial strength ratings, offer a larger variety of products, set lower prices for insurance coverage, offer higher commissions and/or have had longer-term relationships with the brokers we use than we have. This may adversely impact our ability to attract and retain brokers to sell our insurance products or brokers may increasingly promote products offered by other companies. The failure or inability of brokers to market our insurance products successfully, or the loss of all or a substantial portion of the business provided by these brokers, could have a material adverse impact on our business, financial condition and results of operations.
Our losses and loss expense reserves may be inadequate to cover our actual losses.
We devote significant focus, attention and resources to assess the risks related to our businesses as accurately as we can. We establish losses and loss adjustment expenses, or LAE, reserves for the best estimate of the ultimate payment of all claims that have been incurred, or could be incurred in the future, and the related costs of adjusting those claims, as of the date of our financial statements. These values are unknown within our industry, so these items within our financial statements are always based on estimates, and our ultimate liability will almost certainly be greater, or less than, our estimate.
As part of the reserving process, we review historical data and consider the impact of such factors as:
•claims inflation, which is the sustained increase in cost of raw materials, labor, medical services and other components of claims costs;
•claims development patterns by line of business, as well as frequency and severity trends;
•pricing for our products;
•legislative activity;
•social and economic patterns; and
•litigation, judicial and regulatory trends.
These variables are affected by both internal and external events that could increase our exposure to losses, and we continually monitor our loss reserves using new information on reported claims and a variety of statistical techniques and modeling simulations. This process assumes that past experience, adjusted for the effects of current developments, anticipated trends and market conditions, is an appropriate basis for predicting future events. There is, however, no precise method for evaluating the impact of any specific factor on the adequacy of loss reserves, and actual results may deviate, perhaps substantially, from our reserve estimates. For instance, the following uncertainties may have an impact on the adequacy of our reserves:
•When a claim is received, it may take considerable time to appreciate fully the extent of the covered loss suffered by the insured, and consequently, estimates of loss associated with specific claims can increase over time as new information emerges, which could cause the reserves for the claim to become inadequate;
•Court enforcement of new theories of liability;
•Changing jury sentiment;
•Deterioration or volatility in the financial markets, economic events, general economic conditions and other external factors may result in an increase in the number of claims and/or severity of the claims reported. In addition, elevated inflationary conditions would, among other things, cause loss costs to increase; or
•If claims were to become more frequent, even if we had no liability for those claims, the cost of evaluating such potential claims could escalate beyond the amount of the reserves we have established. As we enter new lines of business, or as a result of new theories of claims, we may encounter an increase in claims frequency and greater claims handling costs than we had anticipated.
In addition to the Company’s internal reserving process, an independent actuarial review is carried out semi-annually by a leading independent actuarial consulting firm in order to provide additional insight into the reserving process, specific industry trends and the overall level of the Company’s loss reserves. Management reviews the information provided in the independent actuarial review in determining its own best estimate of reserves.
If any of our reserves should prove to be inadequate, we will be required to increase our reserves resulting in a reduction in our net income and shareholders’ equity in the period in which the deficiency is identified. Future loss experience substantially in excess of established reserves could also have a material adverse effect on our future earnings and liquidity and/or our financial rating.
Unpredictable catastrophic events could adversely affect our results of operations and financial condition.
We write reinsurance contracts and insurance policies that cover unpredictable catastrophic events. These include natural catastrophes and other disasters, such as hurricanes, earthquakes, windstorms, floods, wildfires, and severe winter weather. We have exposure to major earthquakes and windstorms mainly in the United States, Europe, Japan, Australia and New Zealand. Catastrophes can also include man-made disasters, such as terrorist attacks and other destructive acts, war, political unrest, explosions, cyber-attacks, nuclear, biological, chemical or radiological events and infrastructure failures. We are also exposed to losses caused by these types of catastrophic events in lines of business beyond property, such as in marine and energy, aviation, crisis management, satellite, trade credit, political violence, political risk, accident and health as well as other specialty and casualty classes, including from pandemic risk.
The extent of catastrophe losses is a function of both the severity of the event and total amount of insured exposure affected by the event. We expect that increases in the value and concentration of insured property or insured employees, the effects of inflation, changes in weather patterns, such as climate change, and increased terrorism could increase the future frequency and/or severity of claims from catastrophic events. Claims from catastrophic events could materially adversely affect our cash flows and results of operations and financial condition. Our ability to write new reinsurance contracts and insurance policies could also be impacted as a result of corresponding reductions in our capital levels.
Although we attempt to manage our exposure to such events through a multitude of approaches, including geographic diversification, geographic limits, individual policy limits, exclusions or limitations from coverage, purchase of reinsurance and expansion of supportive collateralized capacity, the availability of these management tools may be dependent on market factors and, to the extent available, may not respond in the way that we expect.
Our most material natural catastrophe accumulation risks are from Atlantic Hurricanes and U.S Mainland Earthquakes. As at January 1, 2025, our modeled 100-Year Occurrence Exceedance Probability for Atlantic Hurricanes in Florida was $202.1 million and our modeled 250-Year Occurrence Exceedance Probability for U.S. Mainland Earthquakes in California was $277.8 million. Our biggest concentration of exposure to U.S. Mainland Earthquakes is in California, while our exposure to Atlantic Hurricanes is material in many regions, including Florida, other Gulf Coast states, as well as the Mid-Atlantic and Northeastern regions of the U.S. In terms of man-made catastrophe exposure, we have experienced losses related to the conflict between Russia and Ukraine and the ongoing conflict in the Middle East has the potential to continue to escalate into an event that could impact our cash flows and results of operations.
Global climate change may have a material adverse effect on our operating results and financial condition if we do not adequately assess and price for any increased frequency and severity of catastrophes resulting from these environmental factors.
There is widespread consensus in the scientific community that there is a long-term upward trend in global air and sea temperatures which is likely to increase the severity and frequency of severe weather events over the coming decades. Rising sea levels are also expected to add to the risks associated with coastal flooding in many geographical areas. Large-scale climate change could also increase both the frequency and severity of natural catastrophes and our loss costs associated with property damage and business interruption due to storms, floods, wildfires (including in California) and other weather-related events. In addition, global climate change could impair our ability to predict the costs associated with future weather events and could also give rise to new environmental liability claims in the energy, manufacturing and other industries we serve.
Given the scientific uncertainties involved in predicting the effects of climate cycles and global climate change on the frequency and severity of natural catastrophes and the lack of adequate predictive tools, we may not be able to adequately model the associated exposures and potential losses in connection with such catastrophes which could have a material adverse effect on our business, financial condition or operating results.
Our business could be materially adversely affected if we do not accurately assess our underwriting risk.
Our profitability is dependent on our ability to accurately assess the risks associated with the business we underwrite. We rely on the experience of our underwriting staff in assessing those risks, the accuracy of pricing tools and the clarity of our contract wording. If we misunderstand and/or inadequately quantify the nature and extent of the risks, we may fail to establish appropriate premium rates which could adversely affect our future financial results. In addition, our employees, including members of management and underwriters, make decisions and choices in the ordinary course of business that involve exposing us to risk. Such challenges of assessing risk and pricing premiums are often increased in our U.S. E&S business lines, where there may be more limited historical claims and underwriting data than in admitted insurance markets.
Aside from the specific risks around accumulating events for natural and non-natural perils discussed above, an inadequate assessment of underwriting risk could arise from an incorrect estimation of past and/or future inflationary trends, claims practices, or other factors, including social factors. We underwrite many lines of business across all underwriting platforms where the volume of relevant claims data is insufficient to accurately estimate the cost of future claims, and therefore underwriting and/or actuarial judgment is frequently applied. The risk of mispricing underwriting risk is heightened in many of our lines due to this limited data. For example, data is often limited in many of our insurance and reinsurance lines across all underwriting platforms where policies are protecting low frequency and high severity events. Another example is that the U.S. E&S business that we write often has more limited relevant data for pricing than in admitted insurance markets.
Given the inherent uncertainty of our models, and of the exposure data that we rely upon to parameterize our models, the usefulness of such models as a tool to evaluate risk is subject to a high degree of uncertainty. Furthermore, it is likely that our models do not conceive of all possible exposures and accumulations that could arise from our underwriting operation. Therefore, we could experience actual losses that are materially different than our modelled estimates, and our financial results may be adversely impacted, perhaps significantly.
We use many models to simulate possible claims outcomes within our business, including pricing models, reserving models, accumulation models, natural catastrophe models and man-made catastrophe models.
For natural catastrophe risk, similar to our peers, we use third-party vendor analytic and modeling capabilities, including global property catastrophe models from Verisk, and Risk Management Solutions Inc., or RMS, and our own proprietary models, including our catastrophe modeling and portfolio management platform, known as HARP to calculate expected PMLs from various natural catastrophe scenarios. The models are dependent upon many broad economic and scientific assumptions, with examples including storm surge (the water that is pushed toward the shore by the force of a windstorm), demand surge (the localized increase in prices of goods and services that often follows a catastrophe) and zone density (the percentage of insured perils that would be affected in a region by a catastrophe). Third-party modeling software also does not provide information for all territories or perils (e.g., tsunami) in and for which we write business. Natural catastrophe modeling is inherently uncertain due to process risk (i.e., the probability and magnitude of the underlying event) and parameter risk (i.e., the probability of making inaccurate model assumptions).
For man-made catastrophe risk, third-party vendor analytics and models are typically less developed, and we use a wide range of external and internal models and insights. Similar to natural catastrophe models, we are dependent upon broad economic, scientific and policy coverage assumptions within these models, which leads to material inherent uncertainties in the accuracy of the modelled representation of claims outcomes.
We use these models and software to help us control risk accumulation, inform management and other stakeholders of capital requirements and to improve the risk/return profile or minimize the amount of capital required to cover the risks in each reinsurance contract in our overall portfolio of reinsurance contracts. We use best endeavors to understand the limitations of models, and the materiality of those models is communicated and incorporated within our decision-making. However, given the inherent uncertainty of modeling techniques and the limited data available to calibrate the models, it is possible the models prove inadequate, and we may not accurately address a variety of matters that could impact certain of our coverages. This includes the risk that we experience unanticipated and unmodelled loss accumulations, and that we suffer actual losses that are materially different from our probable maximum loss estimates or other modelled representation of claims outcomes.
A material proportion of our business relies on the assessment and pricing of individual risks by third parties.
We authorize MGAs, general agents, coverholders and other producers to write business on our behalf from time to time within the underwriting authorities that we prescribe. We rely on the underwriting controls of these agents, coverholders and producers to write business within the underwriting authorities we provide. Although we monitor our underwriting on an ongoing basis, our monitoring efforts may not be adequate and our agents, coverholders and producers may exceed their underwriting authorities or otherwise breach obligations owed to us. There is also the risk that we may be held responsible for obligations that arise from the acts or omissions of third parties if they are deemed to have acted on our behalf. In addition, our agents, coverholders, producers, insureds or other third parties may commit fraud or otherwise breach their obligation to us. To the extent that our agents, coverholders, producers, insureds or other third parties exceed their authorities, commit fraud or otherwise breach obligations owed to us, our operating results and financial condition may be materially adversely affected.
Our reliance on third-party assessment and pricing of individual risk extends to our reinsurance treaty business. Similar to other reinsurers, we do not separately evaluate each of the individual risks assumed under most reinsurance treaties. We are therefore largely dependent on the original underwriting decisions made by ceding companies. We are subject to the risk that the ceding companies may not have adequately evaluated the risks to be reinsured and that the premiums ceded to us may not adequately compensate us for the risks we assume and the losses we may incur. As a result of this reliance on ceding companies, our operating results and financial condition may be materially adversely affected.
Emerging claim and coverage issues, or other litigation, could adversely affect us.
Unanticipated developments in the law as well as changes in social conditions could potentially result in unexpected claims for coverage under our insurance and reinsurance contracts, such as those developments that impose additional coverage obligations on us beyond our underwriting intent, or to increases in the number or size of claims to which we are subject.
For example, we believe our property results have been adversely impacted over recent periods by increasing primary claims-level fraud and abuses, as well as other forms of social inflation, and that these trends may continue, particularly in certain U.S. jurisdictions in which we focus, including California, Florida and Texas.
With respect to our casualty and specialty operations, these legal and social changes and their impact may not become apparent for some time after their occurrence. A recent example in the industry was losses arising out of a pandemic illness, which most insurers had not anticipated or had attempted to contractually exclude. Moreover, irrespective of the clarity and inclusiveness of policy language, we cannot be certain that a court or arbitration panel will enforce policy language or not issue a ruling adverse to us. Our exposure to these uncertainties could be exacerbated by the increased willingness of some market participants to dispute insurance and reinsurance contract and policy wording. Alternatively, potential efforts by us to exclude such exposures could, if successful, reduce the market’s acceptance of our related products. The full effects of these and other unforeseen emerging claim and coverage issues are extremely hard to predict. As a result, the full extent of our liability under our coverages may not be known for many years after a contract is issued. Furthermore, we expect that our exposure to this uncertainty may grow as our "long-tail" casualty reserves grow, because within some of these policies claims can be made for many years, making them more susceptible to these trends than our traditional property or catastrophe business, which is typically more "short-tail." While we continually seek to improve the effectiveness of our contracts and claims capabilities, we may fail to mitigate our exposure to these growing uncertainties.
We, or agents we have appointed, may act based on inaccurate or incomplete information regarding the accounts we underwrite, or such agents may exceed their authority or commit fraud when binding policies on our behalf.
We, and our managing general agents, general agents and other agents who have the ability to bind our policies, rely on information provided by insureds or their representatives when underwriting insurance policies. While we may make inquiries to validate or supplement the information provided, we may make underwriting decisions based on incorrect or incomplete information. It is possible that we will misunderstand the nature or extent of the activities or facilities and the corresponding extent of the risks that we insure because of our reliance on inadequate or inaccurate information. If any such agents exceed their authority or engage in fraudulent activities, our financial condition and results of operations could be materially adversely affected.
Operational risks, including human errors, the inherent uncertainty of models, and dependency on third party information technology systems and applications, which can fail or become unavailable or needs to be replaced, are inherent in our business.
Operational risks and losses can result from many sources, including fraud, errors by employees or third-party service providers, failure to document transactions properly or to obtain proper internal authorization, failure to comply with regulatory requirements or failures with respect to our or our service providers’ information technology systems. Instances of fraud, illegal acts, errors, failure to document transactions properly or to obtain proper internal authorization, misuse of customer or proprietary information or failure to comply with regulatory requirements or our internal policies may result in losses and/or reputational damage.
We also have licensed certain systems, data and technology from third parties. We cannot be certain that we will continue to have access to such systems, data and technology, or that of comparable service providers. Further, we cannot guarantee that our technology or applications, or the systems or technology we have licensed from third parties, will continue to operate as intended. In addition, we cannot be certain that we would be able to replace our current service providers without slowing our underwriting response time. As our operations evolve, we will need to continue to make investments in new and enhanced systems and technology, and we may encounter difficulties in integrating these new technologies into our business. A major defect or failure in our internal controls or information technology and application systems could result in interruption to our underwriting processes, management distraction, harm to our reputation, a loss or delay of revenues, increased regulatory scrutiny or risk of litigation, or increased expense.
We are subject to cybersecurity risks, including cyber-attacks, security breaches and other similar incidents with respect to our and our service providers’ information technology systems, which could result in regulatory scrutiny, legal liability or reputational harm, and we may incur increasing costs to minimize those risks.
Cybersecurity threats and incidents have increased in recent years in frequency, levels of persistence, sophistication and intensity, heightening our cyber-related risks. Our business depends on the proper functioning and availability of our information technology platform, including communications and data processing systems, our proprietary systems, and systems of our third-party service providers. We are also required to effect electronic transmissions with third parties, including brokers, clients, service providers and others with whom we do business, as well as with our Board. In addition, we collect, store and otherwise process personal information (including sensitive personal information) of our clients, employees and service providers. Despite implementing what we believe to be reasonable security measures, we cannot guarantee that the controls and
procedures we or third parties have in place to protect or recover our respective systems and the information stored on such systems will be effective or sufficiently rapid to avoid harm to our business.
Cybersecurity threats are evolving in nature and becoming increasingly difficult to detect. These threats come from various sources, including organized criminal groups, hackers, terrorists, nation states and their supporters. These threats include, among other things, computer viruses, worms, malware, ransomware, denial of service attacks, defective software, credential stuffing, social engineering, phishing attacks, human error, fraud, theft, malfeasance or improper access by employees or service providers, and other similar threats. Cyber-attacks, security breaches, and other similar incidents, including with respect to third-party systems that have access to or process our, our clients’ or our employees’ personal, proprietary and confidential information, could expose us to a risk of loss, disclosure or misuse of such information, litigation and enforcement action, potential liability and reputational harm. In addition, cybersecurity incidents, such as ransomware attacks, that impact the availability, integrity, confidentiality, reliability, speed, accuracy or other proper functioning of our systems could have a significant impact on our operations and financial results. We may not anticipate, detect or adequately remediate all cyber-attacks, security breaches or other similar incidents in a timely manner. While management is not aware of any cyber-attack, security breach or other similar incident that has had a material effect on our operations, financial condition or reputation, there can be no assurances that such an incident that could have a material impact on us will not occur in the future.
In addition to the risks posed by traditional cybersecurity threats, the growing use of AI-based solutions introduces new vulnerabilities, such as adversarial attacks, data poisoning and manipulation of automated decision-making models. AI-based solutions are increasingly being used in the insurance industry, including by us, and we expect to use other systems and tools that incorporate AI-based technologies in the future. The use of AI by our employees or third parties on which we rely could lead to the public disclosure of confidential information (including personal data or proprietary information) in contravention of our internal policies, data protection or other applicable laws, or contractual requirements. The misuse of AI could also result in unauthorized access and use of personal data of our employees, customers or other third parties, thereby causing harm to our reputation, subjecting us to legal liability under laws that protect personal data and subject us to increasing costs, any of which could adversely affect our business, financial conditions and results of operations. See "–––The use or anticipated use of AI technologies, including generative AI, by us or third parties, may increase or create new operational risks" below.
Although we maintain processes, policies, procedures and technical safeguards designed to protect the security and privacy of personal, proprietary and confidential information, we cannot eliminate the risk of human error or guarantee our safeguards against employee, service provider or third-party malfeasance. It is possible that the measures we implement may not prevent improper access to, disclosure of or misuse of personal, proprietary or confidential information. Moreover, while we generally perform cybersecurity due diligence on our key service providers, we cannot ensure the cybersecurity measures they take will be sufficient to protect any information we share with them. Due to applicable laws, regulations, rules, standards and contractual obligations, we may be held responsible for cyber-attacks, security breaches or other similar incidents attributed to our service providers as they relate to the information we share with them. This could cause harm to our reputation, create legal exposure, or subject us to liability under laws that protect personal data, resulting in increased costs or loss of revenue.
Any cybersecurity incident, including system failure, cyber-attacks, security breaches, disruption by malware or other damage, with respect to our or our service providers’ information technology systems, could interrupt or delay our operations, result in a violation of applicable cybersecurity, privacy, data protection or other laws, regulations, rules, standards or contractual obligations, damage our reputation, cause a loss of customers or expose sensitive customer data, give rise to civil litigation, injunctions, damages, monetary fines or other penalties, subject us to additional regulatory scrutiny or notification obligations, and/or increase our compliance costs, any of which could adversely affect our business, financial conditions and results of operations.
Further, the cybersecurity, privacy and data protection regulatory environment is evolving, and it is likely that the costs of complying with new or developing regulatory requirements will increase. For example, we operate in a number of jurisdictions with strict cybersecurity, privacy, data protection and other related laws, regulations, rules and standards, which could be violated in the event of a significant cyber-attack, security breach or other similar incident affecting personal, proprietary or confidential information or in the event of noncompliance by our personnel with such obligations. For more information on risks related to the cybersecurity, privacy and data protection regulatory environment, see the section titled "––Risks Related to Regulation––Our business is subject to cybersecurity, privacy and data protection laws, regulations, rules, standards and contractual obligations in the jurisdictions in which we operate, which can increase the cost of doing business, compliance risks and potential liability."
We cannot ensure that any limitations of liability provisions in our agreements with clients, service providers and other third parties with which we do business would be enforceable or adequate or otherwise protect us from any liabilities or damages with respect to any particular claim in connection with a cyber-attack, security breach or other similar incident. In addition, while we maintain insurance that would mitigate the financial loss under such scenarios, providing what we believe to be appropriate policy limits, terms and conditions, we cannot guarantee that our insurance coverage will be adequate for all financial and non-financial consequences from a cybersecurity event, that insurance will continue to be available to us on economically reasonable terms, or at all, or that our insurer will not deny coverage as to any future claim.
The use or anticipated use of AI technologies, including generative AI, by us or third parties, may increase or create new operational risks.
AI technologies offer numerous potential benefits, such as creating or increasing operational efficiencies, and we expect the use of AI and generative AI by us, third parties on our behalf, and other market actors, including our competitors, to increase. However, the deployment of such technologies also poses certain risks, including that they may be misused, or the models or datasets on which the models are trained may be flawed or otherwise may function in an unexpected manner. The relative newness of the technology, the speed at which it is being adopted, and the paucity of laws, regulations or standards expressly and specifically governing its use increases these risks. Any such misuse could expose us to legal or regulatory risk, damage customer relationships or cause reputational harm.
We may fail, or be unable, to obtain, maintain, protect, defend or enforce our intellectual property rights, including for our proprietary technology platforms, data and brand, or we may be sued by third parties for alleged infringement, misappropriation or other violation of their intellectual property or proprietary rights.
Our success and ability to compete depend in part on our intellectual property, which includes our rights in our brand, our data, and our proprietary technology used in certain parts of our business. We primarily rely on copyright and trade secret laws, and confidentiality agreements, invention assignment agreements and other contractual arrangements with our employees, customers, service providers, partners and others, to protect our intellectual property rights. However, the steps we take to protect our intellectual property may be inadequate to deter infringement, misappropriation or other violation of our intellectual property, and may not be sufficient to ensure the validity of our intellectual property. Litigation brought to protect or enforce our intellectual property rights could be costly, time-consuming and distracting to management, and we may not prevail. Our efforts to enforce our intellectual property rights may be met with defenses, counterclaims and countersuits attacking the validity, enforceability and scope of our intellectual property rights. Our failure to secure, protect and enforce our intellectual property rights could adversely affect our brand and adversely impact our business and our competitiveness in the marketplace.
Although we have certain registered rights in connection with our brand, such as our domain name, www.hamiltongroup.com, we also have unregistered rights in certain trademarks and trade names and it may be harder for us to rely on any such unregistered rights to prevent third parties from copying or using our trademarks or trade names without our permission. If we lose the ability to use trademarks or trade names, whether due to a trademark claim, the failure to renew the applicable registration, or any other cause, we may be forced to market our services under a new name, which could diminish our brand or cause us to incur significant expenses to purchase rights to the name in question. We may also be unable to prevent third parties from acquiring and using names that are similar to ours or that otherwise decrease the value of our brand, and we have identified unaffiliated third parties operating in the insurance industry using names that are similar to our name. If potential future customers are unable to distinguish our products and services from those of other companies, or if we are otherwise unable to establish brand recognition, we may not be able to compete effectively and our business may be adversely affected.
While we take steps to protect our intellectual property, we cannot be certain that the steps we have taken will be sufficient or effective to prevent the unauthorized access, use, copying, reverse engineering, infringement, misappropriation or other violation of our intellectual property, including by third parties who may use our intellectual property to develop products, services or technology that compete with ours. We also cannot guarantee that we have entered into confidentiality agreements with each party that may have or has had access to our trade secrets or proprietary technology or that we have executed adequate invention assignment agreements with all employees or third parties involved in the development of our intellectual property, including the proprietary technology used in certain parts of our business. In addition, we may be unable to detect the unauthorized use of our intellectual property rights. Policing unauthorized use of our intellectual property is difficult, expensive and time-consuming, and we may be required to spend significant resources to monitor and protect our intellectual property rights.
Our success depends also in part on our not infringing on, misappropriating or otherwise violating the intellectual property rights of others. Our competitors, as well as a number of other entities and individuals, may own or claim to own intellectual property relating to our industry or the Company. In the future, third parties may claim that we are infringing on, misappropriating or otherwise violating their intellectual property rights, and we may be found to be infringing on, misappropriating or otherwise violating such rights. Any claims or litigation could cause us to incur significant expenses and, if successfully asserted against us, could require that we pay substantial damages, legal fees, settlement payments, ongoing royalty payments or other costs or damages, including treble damages if we are found to have willfully infringed certain types of intellectual property. Successful challenges against us also could prevent us from using certain technology or offering our products or services, require us to purchase costly licenses from third parties, which may not be available on commercially reasonable terms, or at all, or require that we comply with other unfavorable terms. Even if a license is available to us, it could be non-exclusive, thereby giving our competitors and other third parties access to the same technology licensed to us, and we may be required to pay significant upfront fees, milestone payments or royalties, which could increase our operating expenses. Any litigation, with or without merit, could be costly and time-consuming and divert the attention of our management and key personnel from our business operations. Moreover, other companies, including our competitors, may have the capacity to dedicate substantially greater resources to enforce their intellectual property rights and to defend claims that may be brought against them. Any of the foregoing could adversely affect our business, financial condition and results of operations.
If we fail to comply with our obligations under license or technology agreements with third parties, or if we cannot license rights to use technology or data on reasonable terms, we could be required to pay damages, lose license rights that are critical to our business or be unable to commercialize new products and services in the future.
We license from third parties certain intellectual property, technology and data that are important to our business and, in the future, we may enter into additional agreements that provide us with licenses to valuable intellectual property, technology or data. If we fail to comply with any of our obligations under our license or technology agreements with third parties, we may be required to pay damages and the licensor may have the right to terminate the license. Termination by the licensor (or other applicable counterparty) may cause us to lose valuable rights and could disrupt our operations and harm our reputation. Our business may suffer if any current or future licenses or other grants of rights to us terminate, if the licensors (or other applicable counterparties) fail to abide by the terms of the license or other applicable agreement, if the licensors fail to enforce the licensed intellectual property against infringing third parties or if the licensed intellectual property rights are found to be invalid or unenforceable.
In the future, we may identify additional third-party intellectual property, technology and data we need, including to develop and offer new products and services. However, such licenses may not be available on acceptable terms or at all. Further, third parties from whom we currently license intellectual property, technology and data could refuse to renew our agreements upon their expiration or could impose additional terms and fees that we otherwise would not deem acceptable requiring us to obtain the intellectual property or technology from another third party, if any is available, or to pay increased licensing fees or be subject to additional restrictions on our use of such third party intellectual property or technology. Defense of any lawsuit or failure to obtain any of these licenses on favorable terms could prevent us from commercializing products or services, which could have a material adverse effect on our competitive position, business, financial condition and results of operations.
Increased public attention to environmental, social and governance matters may expose us to negative public perception, cause reputational harm, impose additional costs on our business or impact our share price.
In recent years, there has been an increased focus from shareholders, business partners, cedants, regulators, politicians, and the public in general on environmental, social and governance, or ESG, matters, including greenhouse gas emissions, carbon footprint and climate-related risks, renewable energy, fossil fuels, diversity, equity and inclusion, responsible sourcing and supply chain, human rights, and social responsibility. Although attention is being directed towards publicly-traded companies regarding sustainability matters, the trend in this respect is somewhat uncertain. Consequently, a failure, or perceived failure, to respond to investor or customer expectations related to sustainability concerns, including negative perceptions regarding the scope or sufficiency and transparency of our sustainability approach and reporting on sustainability matters, could cause harm to our business and reputation. For example, our insureds and investment portfolio include a wide variety of industries, including potentially controversial industries. Damage to our reputation as a result of our provision of policies to certain insureds or investments relating to certain industries could result in decreased demand for our insurance products and could have a material adverse effect on our business, operational results and financial results, as well as require additional resources to rebuild our reputation, competitive position and brand strength. Additionally, while we strive to manage our invested capital in a manner consistent with publicly-established sustainability guidelines, we may not meet certain shareholders’ criteria for such investments or the performance of such investments may be adversely impacted by laws (including certain U.S. state laws) that
limit or discourage government-affiliated asset managers from ESG-driven investments or differ from what it may have been if not managed in a manner consistent with sustainability guidelines.
Conversely, our focus on climate-related initiatives and sustainability strategies may divert significant resources and management attention from other core business activities, potentially impacting our financial performance and competitiveness and growth. Excessive prioritization of climate goals could lead to increased capital expenditures, higher operational costs, or investment in unproven technologies. Additionally, a rigid alignment with climate policies may reduce our flexibility to respond to other market demands or regulatory shifts, creating strategic imbalances. If customer preferences, investor priorities, or regulatory frameworks evolve in ways that diminish the perceived importance of our climate efforts, or if expected benefits from sustainability investments do not materialize, our business, reputation, and profitability could be adversely affected.
We may not successfully alleviate risk through reinsurance arrangements. Additionally, we may not collect all amounts due from our reinsurers under our existing reinsurance arrangements.
As part of our risk management, we are reliant on the purchase of reinsurance for our own account from third parties, including retrocession coverage (i.e., the reinsurance of reinsurance). However, the availability and cost of reinsurance is subject to market conditions beyond our control. As a result, we may not be able or willing to obtain sufficient reinsurance and are subject to the risk that the coverage provided by our reinsurance arrangements may be inadequate to cover our future liabilities. As a result, we may not be able to successfully alleviate risk through these arrangements, which could have a material adverse effect on our results of operations and financial condition.
Purchasing reinsurance does not relieve us of our underlying obligations to policyholders or ceding companies, so any inability to collect amounts due from reinsurers could adversely affect our financial condition and results of operations. We face the risk of not collecting amounts due from reinsurers if they choose to withhold payment due to disputes or other factors beyond our control. Additionally, reinsurers may become unable to pay amounts owed to us if their financial condition deteriorates. While we regularly review the financial condition of our reinsurers and currently believe their condition is strong, it is possible that one or more of our reinsurers could be adversely affected by future significant losses or economic events, causing them to be unable or unwilling to fulfill their obligations to us.
Our results of operations may fluctuate significantly from period to period and may not be indicative of our long-term prospects.
Our results of operations may fluctuate significantly from period to period. These fluctuations result from a variety of factors, including the fluctuations of the reinsurance and insurance market in response to supply and demand changes, the volume and mix of reinsurance and insurance products that we write, loss experience on our reinsurance and insurance liabilities, the performance of our investment portfolio and our ability to assess and implement our risk management strategy effectively. In particular, we seek to underwrite products and make investments to achieve long-term results. In addition, our premiums are prone to significant volatility due to various factors, including the timing of contract inception, as well as our differentiated strategy and capabilities which position us to pursue potentially non-recurring bespoke or large solutions for clients. In addition, after a large catastrophic event or circumstance, we may record significant amounts of reinstatement premium, which can cause quarterly, non-recurring fluctuations in both our written and earned premiums. Any of the foregoing may increase the volatility of our short-term, financial results relative to our long-term prospects.
The insurance and reinsurance business is historically cyclical and the pricing and terms for our products may decline, which would affect our profitability and ability to maintain or grow premiums.
The insurance and reinsurance industry has historically been cyclical by product and market. We cannot assure investors that premium rates will not decrease in future, and if demand for our products falls or the supply of competing capacity rises, our prospects for potential growth may be adversely affected. In particular, we might lose existing customers or suffer a decline in business during shifting market cycles, which we might not regain when industry conditions improve.
We may be adversely impacted by inflation.
Our operations, like those of other insurers and reinsurers, are susceptible to the effects of both economic and social inflation because premiums are established before the ultimate amounts of losses and loss adjustment expenses are known. Although we consider the potential effects of inflation when setting premium rates, our premiums may not fully offset the effects of inflation and may essentially result in our underpricing the risks we insure and reinsure. Our reserve for losses and loss adjustment expenses includes assumptions about future payments for settlement of claims and claims-handling expenses, such as the value of replacing property and associated labor costs for the property business we write and litigation costs. To the extent inflation causes costs to increase above reserves established for claims, we will be required to increase our loss reserves with a corresponding reduction in our net income in the period in which the deficiency is identified, which may have a material adverse effect on our financial condition or results of operations. Unanticipated higher inflation could also lead to higher interest rates, which would negatively impact the value of our fixed income securities and potentially other investments.
In recent years, we have experienced an increase in loss costs as a result of relatively high inflation in several locations in which we have exposure. We have seen high inflation in many components of our claims payments, across all lines. While we frequently analyze these trends based on the most relevant data available to us and adjust pricing, reserving and business assumptions accordingly, there is a risk that our inflation assumptions and forecasts prove to be insufficient, or that the impact of those inflation drivers upon our future claim payments is inconsistent with our assumptions, and this risk could negatively impact our future earnings.
Risks Related to Liquidity, Capital and Credit
Our external financial strength credit ratings could be downgraded.
Third-party rating agencies assess and rate the claims-paying ability of insurers and reinsurers based upon criteria established by the rating agencies. Maintaining a strong credit rating with a reputable rating agency is critical to our business as these ratings are often a key factor in the decision by an insured or a broker/intermediary whether to place business with a particular insurance or reinsurance provider. We consider A.M. Best to be the key rating agency for the insurance and reinsurance industries and an “A-” (Excellent) financial strength rating from A.M. Best has been the minimum rating required for access to key parts of Hamilton Group’s target market in recent years. Hamilton Re holds an "A" (Excellent) rating with a "Stable" outlook from A.M. Best, as upgraded on April 30, 2024, an "A" rating from KBRA with a "Stable" outlook, affirmed on July 23, 2024, and an "A-" (Strong) rating from Fitch with a "Stable" outlook, published on July 2, 2024. HIDAC holds an "A" (Excellent) rating with a "Stable" outlook from A.M. Best, as upgraded on April 30, 2024, and an "A-" (Strong) rating from Fitch with a "Stable" outlook, assigned on February 7, 2025. Hamilton Select holds an "A-" (Excellent) rating with a "Stable" outlook from A.M. Best, affirmed on March 14, 2024.
Any downgrades of our credit ratings, including related to changes in rating agency methodologies, could adversely affect our ability to sell products and services, make it more difficult for us to enter into new reinsurance contracts or obtain reinsurance on reasonable terms or otherwise execute our business plan. As a result, any such downgrade could have a material adverse effect on our business, financial condition, results of operations and prospects.
We may require additional capital in the future, which may not be available or may only be available on unfavorable terms.
Our future capital requirements depend on many factors, including our ability to write new business successfully and to establish premium rates and reserves at levels sufficient to cover losses. To the extent that our available funds are insufficient to fund future operating requirements and cover claim losses, we may need to raise additional funds through financings or curtail our growth. Many factors will affect the amount and timing of our capital needs, including our growth rate and profitability, our claims experience, and the availability of reinsurance, market disruptions, and other unforeseeable developments. If we need to raise additional capital, equity or debt financing may not be available at all or may be available only on terms that are not favorable to us. In the case of equity financings, dilution to our shareholders could result. In the case of debt financings, we may be subject to covenants that restrict our ability to freely operate our business. If we cannot obtain adequate capital on favorable terms or at all, we may not have sufficient funds to implement our operating plans and our business, financial condition or results of operations could be materially adversely affected.
The covenants in our debt agreements limit our financial and operational flexibility, which could have an adverse effect on our financial condition.
We have incurred indebtedness and may incur additional indebtedness in the future. Our indebtedness primarily consists of letters of credit and a revolving credit facility. The agreements governing our indebtedness contain covenants that limit our ability and the ability of some of our subsidiaries to make particular types of investments or other restricted payments, sell or place a lien on our or their respective assets, merge or consolidate. Some of these agreements also require us or our subsidiaries to maintain specific financial ratios or contain cross-defaults to our other indebtedness. Under certain circumstances, if we or our subsidiaries fail to comply with these covenants or meet these financial ratios, the lenders could declare a default and demand immediate repayment of all amounts owed to them or, where applicable, cancel their commitments to lend or issue letters of credit or, where the reimbursement obligations are unsecured, require us to pledge collateral or, where the reimbursement obligations are secured, require us to pledge additional or a different type of collateral.
Our inability to obtain the necessary credit facilities could affect our ability to offer reinsurance in certain markets.
Hamilton Re is not licensed or admitted as an insurer or reinsurer in any jurisdiction other than Bermuda. Because the United States and some other jurisdictions do not permit insurance companies to take credit on their statutory financial statements for reinsurance obtained from unlicensed or non-admitted insurers unless appropriate security mechanisms are in place, our reinsurance clients in these jurisdictions typically require Hamilton Re to provide letters of credit or other collateral. Our credit facilities are used to post letters of credit. However, if our credit facilities are not sufficient or if we are unable to renew our credit facilities or arrange for other types of security on commercially affordable terms, Hamilton Re could be limited in its ability to write business for some of our clients.
Our reliance on intermediaries subjects us to their credit risk.
In accordance with industry practice, we generally pay amounts owed on claims under our insurance and reinsurance contracts to intermediaries, including agents and brokers, and these intermediaries, in turn, pay these amounts to the clients that have purchased insurance or reinsurance from us. In some jurisdictions, if an intermediary fails to make such payment, we may remain liable to the insured or ceding insurer for the deficiency. Likewise, in certain jurisdictions, when the insured or ceding company pays the premiums for these contracts to intermediaries for payment to us, these premiums are considered to have been paid and the insured or ceding company will no longer be liable to us for those amounts, whether or not we have actually received the premiums from the intermediary. Consequently, we assume a degree of credit risk associated with our insurance and reinsurance intermediaries.
Our business may be adversely affected if we fail to pay claims in an accurate and timely manner.
We must accurately, and in a timely manner, evaluate and pay claims that are made under our policies. Many factors affect our ability to pay claims accurately and timely, including the training and experience of our claims representatives, the effectiveness of our management, and our ability to develop or select and implement appropriate procedures and systems to support our claims functions and other factors. Our failure to pay claims accurately and timely could lead to regulatory and administrative actions or material litigation, undermine our reputation in the marketplace and materially and adversely affect our business, financial condition, results of operations, and prospects.
In addition, for some business, we rely on third-party administrators, or TPAs, to manage claims on our behalf. If we do not manage our TPAs effectively, or if our TPAs are unable to effectively handle our volume of claims, our ability to handle an increasing workload could be adversely affected. In addition to potentially requiring that growth be slowed in the affected markets, our business could suffer from decreased quality of claims work, which, in turn, could adversely affect our operating margins.
We could be forced to sell investments to meet our liquidity requirements.
We invest the premiums we receive from our insureds until they are needed to pay policyholder claims. Consequently, we seek to manage the duration of our investment portfolio based on the duration of our losses and LAE reserves to provide sufficient liquidity and avoid having to liquidate investments to fund claims. Many of the risks we face, including, but not limited to, exposure to catastrophic events, inadequate reserves or investment losses, could potentially result in the need to sell investments to fund these liabilities. Depending on various economic or market factors, we may not be able to sell our investments at favorable prices or at all. Sales that do occur could result in significant realized losses depending on the conditions of the general market, interest rates and credit issues with individual securities.
Risks Related to Our Strategy
We may not be able to execute our strategy as planned or at all. In addition, we may from time to time modify our business and strategic plan without shareholder approval and these changes could adversely affect us and our financial condition.
There can be no guarantee that we will be successful in accomplishing the tasks necessary to execute our proposed strategy, or that we will be able to execute the strategy within the time frame or in the manner outlined. If we are unable to execute our strategy, our business, financial condition and results of operations could be materially and adversely affected.
In addition, our management has the authority to change our business and strategic plan, including our underwriting guidelines, without any notice to our shareholders and without shareholder approval. As a result, we may make significant changes to our operations which could result in our pursuing a strategy or implementing a business initiative that may be materially different from our current approach. The risks associated with such changes, including risks related to developing or enhancing our operations, controls and other infrastructure may not have an impact on our publicly reported results until many years after implementation. Our failure to effectively carry out any such changes to our business plans may have an adverse effect on our long-term results of operations and financial condition.
We depend on our key personnel to manage our business effectively and they may be difficult to replace.
Our performance substantially depends on the efforts and abilities of our management team and other executive officers and key employees. Furthermore, much of our competitive advantage is based on the expertise, experience and know-how of our key management personnel. We do not have fixed-term employment agreements with many of our key employees or key person life insurance and the loss of one or more of these key employees could adversely affect our business, results of operations and financial condition. Our success also depends on the ability to hire and retain additional personnel. Additionally, we may face increased costs if, as a result of the competitive market and inflationary pressures, we must offer and pay a greater level of remuneration to attract or replace certain critical employees or hire contractors to fill highly skilled roles while vacant. Difficulty in hiring or retaining personnel could adversely affect our results of operations and financial condition.
Our ability to execute our business strategy is also dependent on our ability to attract and retain a staff of qualified underwriters and service personnel. The location of our global headquarters in Bermuda may impede our ability to recruit and retain highly skilled employees in that jurisdiction for the roles that need to be resident in Bermuda. Under Bermuda law, non-Bermudians (other than spouses of Bermudians, holders of permanent residents’ certificates, naturalized British overseas territory citizens or persons who are exempted pursuant to the Incentives for Job Makers Act 2011, as amended) may not engage in any gainful occupation in Bermuda without a valid government work permit. Some members of our senior management are working in Bermuda under work permits that will expire over the next several years. The Bermuda government could refuse to extend these work permits, and no assurances can be given that any work permit will be issued or, if issued, renewed upon the expiration of the relevant term. If any of our senior officers or key contributors were not permitted to remain in Bermuda, or if we experienced delays or failures in obtaining permits for a number of our professional staff, our operations could be disrupted and our financial performance could be adversely affected.
In connection with the implementation of our corporate strategies, we face risks associated with the acquisition or disposition of businesses, the entry into new lines of business, the integration of acquired businesses and the growth and development of these businesses.
In pursuing our corporate strategy, we may acquire other businesses or dispose of or exit businesses we currently own. The success of this strategy is dependent upon our ability to identify appropriate acquisition and disposition targets, negotiate transactions and obtain financing on favorable terms, complete transactions and, in the case of acquisitions, successfully integrate them into our existing businesses. If a proposed transaction is not consummated, the time and resources spent in researching it could adversely result in missed opportunities to locate and acquire other businesses. If acquisitions are made, there can be no assurance that we will realize the anticipated benefits of such acquisitions, including, but not limited to, revenue growth, operational efficiencies or expected synergies. If we dispose of or otherwise exit certain businesses, there can be no assurance that we will not incur certain disposition related charges, or that we will be able to reduce overhead related to the divested assets.
From time to time, either through acquisitions or internal development, we may enter new lines of business or offer new products and services within existing lines of business. These new lines of business or new products and services may present additional risks, particularly in instances where the markets are not fully developed. Such risks include the investment of significant time and resources; the possibility that these efforts will not be successful; the possibility that the marketplace does not accept our products or services, or that we are unable to retain clients that adopt our new products or services; and the risk of additional liabilities associated with these efforts. In addition, many of the businesses that we acquire and develop will likely have significantly smaller scales of operations prior to the implementation of our growth strategy. If we are not able to manage the growing complexity of these businesses, including improving, refining or revising our systems and operational practices, and enlarging the scale and scope of the businesses, our business may be adversely affected. Other risks include developing knowledge of and experience in the new business, integrating the acquired business into our systems and culture, recruiting professionals and developing and capitalizing on new relationships with experienced market participants. External factors, such as compliance with new or revised regulations, competitive alternatives and shifting market preferences may also impact the successful implementation of a new line of business. Failure to manage these risks in the acquisition or development of new businesses could materially and adversely affect our business, financial condition and results of operations.
We have significant foreign insurance and reinsurance that exposes us to certain additional risks, including foreign currency risks and political risks.
Through our multinational insurance and reinsurance exposures, we conduct business in a variety of foreign (non-U.S.) currencies, the principal exposures being the British pound sterling, the Euro, the Japanese yen and the Canadian Dollar. As a result, a portion of our assets, liabilities, revenues and expenses are denominated in currencies other than our functional currency, the U.S. Dollar, and are therefore subject to foreign currency risks. Significant changes in foreign exchange rates may adversely affect our results of operations and financial condition. Our foreign exposures are also subject to legal, political and operational risks that may be greater than those present in the United States. As a result, our exposures to these foreign risks could fluctuate.
We are exposed to risks in connection with our management of alternative reinsurance platforms on behalf of investors in entities managed by Hamilton Strategic Partnerships.
Certain of our subsidiaries that are engaged in the management of alternative reinsurance platforms as part of our Hamilton Strategic Partnerships division may owe certain legal duties and obligations to third-party investors (including reporting obligations) and are subject to a variety of often complex laws and regulations relating to the management of those structures. Although we continually monitor our policies and procedures to ensure compliance, a faulty judgment, simple error or mistake or other failure of our personnel to adhere to established policies and procedures could result in our failure to comply with applicable laws or regulations which could result in significant liabilities, penalties or other losses and significantly harm our business and results of operations.
In addition, our third-party capital investors provide significant capital investment in respect of these entities and the loss or alteration of this capital support could be detrimental to our financial condition and results of operations. Moreover, we can provide no assurance that we may be able to attract and raise additional third-party capital for our existing managed entities or for potential new managed entities and therefore we may forgo existing and/or potential attractive fee income and other income-generating opportunities. Furthermore, we may decide to return to our investors all or a portion of the third-party capital held by these entities as collateral prior to the maturity specified in the terms of the particular underlying transactional documents. As
return of capital to our investors is final, if we release collateral early we may not have sufficient collateral to pay any future claims associated with such losses in the event losses are significantly larger than we anticipated.
Risks Related to Our Investment Strategy
Our business, prospects, financial condition or results of operations may be adversely affected by reductions in the aggregate value of our investment portfolio.
Our operating results depend in part on the performance of our investment portfolio, including our investment in the TS Hamilton Fund. Our capital is invested by professional investment management firms, including by Two Sigma through its management of the TS Hamilton Fund. A material portion of our investment assets are managed by Two Sigma through the TS Hamilton Fund, as further described herein, and we derive a significant portion of our income from our investment in the TS Hamilton Fund. As a result, we have significant exposure to the investments in the TS Hamilton Fund, as well as to our other investment assets.
Our investments are subject to a variety of financial and capital market risks including, but not limited to, changes in interest rates, credit spreads, equity and commodity prices, foreign currency exchange rates, increasing market volatility and risks inherent to particular securities. Prolonged and severe disruptions in the public debt and equity markets, including, among other things, volatility of interest rates, widening of credit spreads, bankruptcies, defaults, significant ratings downgrades, geopolitical instability, and a decline in equity or commodity markets, may cause significant losses in our investment portfolio. Market volatility can make it difficult to value certain securities if their trading becomes infrequent. Depending on market conditions, we could incur substantial additional realized and unrealized investment losses in future periods. This could have a material effect on certain of our investments.
For instance, our investment portfolio (and, specifically, the valuations of investment assets it holds) has been, and is likely to continue to be, adversely affected as a result of market valuations impacted by significant events such as the COVID-19 pandemic and any other public health crisis, the Ukraine conflict and other global economic and geopolitical uncertainty regarding their outcomes. These include changes in interest rates, declining credit quality of particular investments, reduced liquidity, fluctuating commodity prices, international sanctions, and related financial market impacts from the sudden, continued slowdown in global economic conditions generally. Further, extreme market volatility may leave us unable to react to market events in a prudent manner consistent with our historical practices in dealing with more orderly markets.
Separately, the occurrence of large claims may force us to liquidate securities or other investments at an inopportune time, which may cause us to realize capital losses. Large investment losses could decrease our asset base and thereby affect our ability to underwrite new business. Additionally, such losses could have a material adverse impact on our shareholders’ equity, business and financial strength and debt ratings.
The aggregate performance of our investment portfolio also depends to a significant extent on the ability of our investment managers, including Two Sigma in the management of the TS Hamilton Fund, to select and manage appropriate investments. As a result, we are also exposed to operational risks which may include, but are not limited to, a failure of these investment managers to perform their services in a manner consistent with product mandates or our investment guidelines, technological and staffing deficiencies, inadequate disaster recovery plans, interruptions or impaired business operations.
As discussed further below, we are contractually required to maintain an investment in the TS Hamilton Fund pursuant to the Commitment Agreement, which represents a material portion of our investment portfolio, and which Commitment Agreement remains in effect in accordance with its terms even if the TS Hamilton Fund incurs substantial losses or otherwise does not meet our investment objectives.
We maintain a fixed income portfolio which could be impacted by interest rate and credit risk.
We maintain a portfolio of more traditional investment assets, primarily composed of investment-grade fixed income securities, that are managed by third-party professionals other than Two Sigma through its management of the TS Hamilton Fund. The fair market value of our fixed maturities and short-term investments trading portfolio at December 31, 2024 was $2.4 billion.
This fixed investment portfolio is subject to risks associated with potential declines in credit quality related to specific issuers or specific industries and a general weakening of the economy, which are typically reflected through credit spreads. Credit spread is the additional yield on fixed income securities and loans above the risk-free rate, typically referenced as the yield on U.S. treasury securities, that market participants require to compensate them for assuming credit, liquidity and/or prepayment risks. Credit spreads vary in response to the market’s perception of risk and liquidity in a specific issuer or specific sector. Additionally, credit spreads are influenced by the credit ratings, and the reliability of those ratings, published by external rating agencies. Although we have the ability to use derivative financial instruments to manage these risks, the effectiveness of such instruments varies with liquidity and other conditions that may impact derivative and bond markets. Adverse economic conditions or other factors could cause declines in the quality and valuation of our investment portfolios that would result in realized and unrealized losses. The concentration of our investment portfolios in any particular issuer, industry, collateral type, group of related industries, geographic sector or risk type could have an adverse effect on our investment portfolios and consequently on our results of operations and financial condition.
In addition, a rising interest rate environment, an increase in credit spreads or a decrease in liquidity could have an adverse effect on the value of our fixed income investment portfolio by decreasing the fair values of the fixed income securities. Longer-term assets may also be sold and reinvested in shorter-term assets that may have lower yields in anticipation of or in response to rising interest rates. Alternatively, a decline in market interest rates could have an adverse effect on investment income as we invest cash in new investments that may earn less than the portfolio’s average yield. In a low interest rate environment, borrowers may prepay or redeem securities more quickly than expected as they seek to refinance at lower rates. Sustained low interest rates could also lead to purchases of longer-term or riskier assets in order to obtain adequate investment yields, which could also result in a duration gap when compared to the duration of liabilities. Although we attempt to take measures to manage the risks of investing in changing interest rate environments, we may not be able to mitigate interest rate or credit spread sensitivity effectively.
We do not have control over the TS Hamilton Fund.
As discussed above, we maintain a significant investment in the TS Hamilton Fund, which is an investment fund managed by Two Sigma. Specifically, under the Commitment Agreement, Hamilton Re is required to maintain an investment in the TS Hamilton Fund in an amount up to the lesser of (i) $1.8 billion or (ii) 60% of Hamilton Insurance Group’s net tangible assets (such lesser amount, the “Minimum Commitment Amount”) for the Initial Term and each Commitment Period thereafter, unless a notice of non-renewal is provided in accordance with the Commitment Agreement.
Pursuant to the Commitment Agreement, we may reduce the Minimum Commitment Amount or terminate the Commitment Agreement in certain circumstances. Subject to certain conditions, Hamilton Re is permitted to withdraw all or any portion of its capital account (A)(i) if non-routine circumstances result in the full depletion in its cash and cash equivalents for its day-to-day operations, (ii) it would be materially detrimental to it to delay making a withdrawal, and (iii) it cannot access any working capital or letter of credit facility it has; or (B) to the extent such withdrawal is required to prevent a downgrading or negative ratings action by A.M. Best with respect to Hamilton Re, to the extent based on a significant concern principally related to the continued management of our investment assets in the TS Hamilton Fund, or an order or direction from the BMA, and in the case of clause (B), only upon a resolution of our board of directors that (x) we have taken commercially reasonable efforts to avoid such withdrawal and that such a withdrawal is required to address the negative ratings action or BMA direction, and (y) that it is necessary to maintain Hamilton Re’s A.M. Best ratings of A- (financial strength) and a- (issuer credit rating) or to comply with such BMA direction, as the case may be, in order to continue its business operations. Hamilton Re or Two Sigma may also terminate the Commitment Agreement in the event of, among other things: (i) a transfer of voting interests in excess of 25% of Two Sigma (other than to affiliates or persons related to Two Sigma), to the extent such transfer results in a change of control or management of Two Sigma, (ii) certain dispositions or issuances of a material (i.e., 5% or greater) or non-passive position in the public equity of Hamilton Insurance Group or Hamilton Re by a Two Sigma competitor, (iii) a material change to Hamilton Insurance Group’s, Hamilton Re’s or Two Sigma’s business, including with respect to Two Sigma the cessation of management of a trading entity, or the return of a majority of client capital attributable to a trading entity, (iv) David Siegel or John Overdeck ceasing to be involved in the management of Two Sigma, or (v) a change in law that is reasonably expected to have a material adverse effect on Hamilton Re or Two Sigma.
The Managing Member is subject to the same Commitment Period, and has exclusive control over the management, operations and policies of the TS Hamilton Fund under the TS Hamilton Fund Limited Liability Company Agreement, dated July 1, 2023, as amended from time to time (the “LLCA”), including the authority to undertake on behalf of the TS Hamilton Fund all actions that, in its sole judgment, are necessary or desirable to carry out its duties and responsibilities.
These broad rights of the Managing Member include the power to delegate its authority under the LLCA. Pursuant to an amended and restated investment management agreement, dated July l, 2023, between the TS Hamilton Fund and Two Sigma (the “TS Hamilton Fund IMA”), the Managing Member has granted to Two Sigma the authority to direct the investments of the TS Hamilton Fund and other day-to-day business of the TS Hamilton Fund. Hamilton Re has no right to remove the Managing Member and does not have any right to participate in the management and conduct of the TS Hamilton Fund. Neither the Company nor Hamilton Re are a party to the TS Hamilton Fund IMA.
The revised investment management agreement with Two Sigma requires TS Hamilton Fund to incur a management fee of 2.5% of the non-managing members' equity in the net asset value of the TS Hamilton Fund per annum. Under the terms of the revised LLCA, the Managing Member is entitled to an incentive allocation equal to 30% of TS Hamilton Fund’s net profits, subject to high watermark provisions, and adjusted for withdrawals and any incentive allocation to the Managing Member. However, in the event there is a net loss during a quarter and a net profit during any subsequent quarter, the Managing Member is entitled to a modified incentive allocation whereby the regular incentive allocation will be reduced by 50% until subsequent cumulative net profits are credited in an amount equal to 200% of the previously allocated net losses.
The Managing Member is also entitled to receive an additional incentive allocation as of the end of each fiscal year (or on any date Hamilton Re withdraws all or a portion of its capital), in an amount equal to 25% of the Excess Profits. “Excess Profits” for any given fiscal year (or other such accounting period) means the net profits over 10% for such fiscal year, net of management fees and expenses and gross of incentive allocations, but only after recouping previously unrecouped net losses. To the extent Hamilton Re contributes capital other than at the beginning of a fiscal year or withdraws capital other than at the end of a fiscal year, the additional incentive allocation hurdle with respect to such capital is prorated.
| | | | | | | | | | | | | | | | | | | | |
| | For the Years Ended December 31, |
| ($ in thousands) | | 2024 | | 2023 | | 2022 |
| Management fees | | $ | 46,910 | | | $ | 45,184 | | | $ | 53,103 | |
| | | | | | |
| Incentive fees | | 132,492 | | | 21,546 | | | 68,409 | |
| Additional incentive fees | | 80,194 | | — | | — |
| Total incentive fees | | 212,686 | | | 21,546 | | | 68,409 | |
| | | | | | |
| Total | | $ | 259,596 | | | $ | 66,730 | | | $ | 121,152 | |
| | | | | | |
The TS Hamilton Fund invests in various commingled investment vehicles. We are not Two Sigma’s “client” under the U.S. Investment Advisers Act of 1940, as amended, and Two Sigma does not manage capital invested in the TS Hamilton Fund by reference to our investment guidelines. Our investment guidelines relating to assets managed outside of the TS Hamilton Fund currently focus on investment primarily in fixed maturity and cash products. Depending on current and future events and market conditions and their impact on our investments, the investment guidelines are subject to change.
The TS Hamilton Fund is not, and is not expected to be, registered as an “investment company” under the 1940 Act or any comparable regulatory requirements. Therefore, investors in the TS Hamilton Fund, including Hamilton Re, do not and will not have the benefit of the protections afforded by such registration and regulation.
We face risks associated with our reliance on Two Sigma, as investment manager of the TS Hamilton Fund.
The success of the TS Hamilton Fund's investments is dependent on the ability of Two Sigma, and more specifically, on the
other employees acting as the TS Hamilton Fund’s portfolio managers and book managers, to develop and implement investment strategies that achieve the TS Hamilton Fund's investment objective. If any of David M. Siegel or John A. Overdeck (collectively, the “Two Sigma Key Persons”), the portfolio managers or the book managers ceases to be involved in the management of Two Sigma or the TS Hamilton Fund, the TS Hamilton Fund could be adversely affected. There is no prohibition on any Two Sigma Key Person, portfolio manager or book manager resigning. In addition, the portfolio managers, the Two Sigma Key Persons and the book managers have material responsibilities within Two Sigma that are completely separate from their duties to the TS Hamilton Fund. There is no prohibition on an expansion or change to such other responsibilities. We have no special withdrawal rights if any of the Two Sigma Key Persons, the portfolio managers and/or the book managers were to cease to be involved in the management of the Managing Member and/or Two Sigma, or materially reduce their duties with respect to the TS Hamilton Fund; rather we would have the right to withdraw only in accordance with the withdrawal provisions detailed in the LLCA.
In recent years there have been a variety of management and governance challenges at Two Sigma and its related entities. In particular, the management committee of Two Sigma and its related entities has been unable to reach agreement on a number of topics including defining top executives’ roles and responsibilities, internal team organization, corporate governance, and succession planning. In an effort to resolve these challenges, both David M. Siegel and John A. Overdeck stepped down as co-chief executive officers of Two Sigma, but continue to serve as Co-Chairmen. There is no assurance that this change will solve these challenges, specifically in light of the fact that both Two Sigma Key Persons continue to serve as Co-Chairmen. These disagreements could continue to affect Two Sigma’s ability to retain or attract employees (including very senior employees) and could continue to impact the ability of employees to fully implement key research, engineering, or corporate business initiatives. If such disagreement were to continue, Two Sigma’s ability to achieve the TS Hamilton Fund mandate could be impacted over time.
The TS Hamilton Fund faces operational risks from Two Sigma’s management of the TS Hamilton Fund, including from misconduct by employees or service providers of Two Sigma, which could result in material losses to the TS Hamilton Fund and, by extension, the Company.
The TS Hamilton Fund is exposed to operational risks from Two Sigma and its employees and service providers, including from potential non-compliance with policies and regulations, employee misconduct, negligence and fraud, each of which could result in material losses to the TS Hamilton Fund. In recent years, a number of investment managers and other financial institutions have suffered material losses due to, for example, the actions of traders executing unauthorized trades or other employee misconduct.
It is not always possible to deter or fully prevent employee misconduct and the precautions Two Sigma takes to prevent and detect this activity may not always be effective. Any impact from the incident described above or other similar operational risks may result in material losses to the TS Hamilton Fund and, by extension, the Company.
The TS Hamilton Fund’s investment portfolio and its performance depends on the ability of its investment manager, Two Sigma, to select and manage appropriate investments.
Pursuant to the TS Hamilton Fund IMA, the Managing Member has granted Two Sigma discretion and authority to make all investment decisions on behalf of the TS Hamilton Fund, including the power to purchase, acquire, hold, invest, reinvest, sell or otherwise dispose of the TS Hamilton Fund’s interests in certain trading entities managed by Two Sigma for the purposes of implementing the TS Hamilton Fund’s investment objectives.
The trading strategies that Two Sigma utilizes on behalf of the TS Hamilton Fund at any time may encompass a variety of systematic and certain non-systematic investment strategies and proprietary risk management, investment, optimization and execution techniques (collectively, the "Techniques"), both directly and derivatively, all of which may be based on any combination of systematic and discretionary analysis as determined by Two Sigma in its sole discretion. Our investment in the TS Hamilton Fund is subject to all of the risks associated with the purchase and sale of complex leveraged instruments, including without limitation, the difficulty of accurately predicting price movements in particular investment positions and the difficulty of assessing the impact that an unpredictable multitude of economic and other events may have on prices or the value of investments. Two Sigma utilizes a variety of speculative trading strategies which, if unsuccessful, could result in a complete loss of our investment in the TS Hamilton Fund. The TS Hamilton Fund’s trading and investment activities are not limited to
these strategies and Techniques and the TS Hamilton Fund is permitted to pursue any investment strategy and/or Technique that Two Sigma determines in its sole discretion to be appropriate for the TS Hamilton Fund from time to time. We cannot assure shareholders as to how assets will be allocated to different investment opportunities, including long and short positions and derivatives trading, which could increase the level of risk associated with investment in the TS Hamilton Fund. The performance of our investment in the TS Hamilton Fund depends fundamentally on the ability of Two Sigma to select and manage appropriate investments for the TS Hamilton Fund’s investment portfolio. We cannot assure investors that Two Sigma will be successful in meeting the TS Hamilton Fund’s investment objectives.
Irrespective of Two Sigma’s ability to manage the TS Hamilton Fund, our investment in the TS Hamilton Fund is highly speculative, entails substantial risks and is subject to various conflicts of interest. There is no guarantee, assurance or representation that the investment objectives of the TS Hamilton Fund will be achieved or that our investment in the TS Hamilton Fund will not result in significant losses, which consequently could significantly and negatively affect our business, results of operations and financial condition.
In addition, under the LLCA (subject to the terms of the Commitment Agreement), the Managing Member has the authority to dismiss from employment any and all agents, managers, consultants, advisors and other persons, including Two Sigma. If the Managing Member chooses to dismiss Two Sigma as the TS Hamilton Fund’s investment manager or to engage another investment manager following the expiration of its term, there is no assurance that the Managing Member will find or hire a suitable replacement. If the Managing Member were to hire a suitable replacement, there is no guarantee that any such replacement would provide the TS Hamilton Fund with comparable or better investment results than those that Two Sigma may provide to the TS Hamilton Fund or than those that Two Sigma has provided in the past to us.
The TS Hamilton Fund is required to indemnify and hold harmless the Managing Member and Two Sigma under certain circumstances pursuant to the LLCA or the TS Hamilton Fund IMA. As a result, in general, we do not expect to have recourse to Two Sigma for our losses and the value of capital accounts of Hamilton Re in the TS Hamilton Fund could be reduced in the event that Two Sigma (or its affiliates) incur losses, all of which could have a material and adverse impact on our financial conditions and results of operations.
We have a limited ability to withdraw our capital from the TS Hamilton Fund, and our investment in the TS Hamilton Fund is an illiquid investment.
In light of the fact that the Commitment Agreement and the LLCA limit our ability to withdraw our capital from the TS Hamilton Fund, and that there is no secondary market for interests in the TS Hamilton Fund, an investment in the TS Hamilton Fund is an illiquid investment. Hamilton Re is required to maintain the lesser of (a) $1.8 billion or (b) 60% of Hamilton Insurance Group’s net tangible assets in the TS Hamilton Fund for the Commitment Period, subject to certain circumstances and the liquidity options described below, with the Commitment Period ending on June 30, 2027. The Commitment Period will automatically renew for a new three-year Commitment Period unless Hamilton Re or the Managing Member provide advance notice of non-renewal prior to the one-year anniversary of the commencement of a Commitment Period.
The Managing Member may, in its discretion, but is not required to, permit or require Hamilton Re to withdraw all or any portion of its capital account(s) at other times or waive or reduce certain notice periods or allow a notice to be revoked. The Managing Member may also upon five days’ notice, compel the withdrawal of any portion of Hamilton Re’s direct or indirect investment in the TS Hamilton Fund in excess of the Minimum Commitment Amount and may withdraw all or any portion of its capital account at any time. However, Hamilton Re is permitted to withdraw all or any portion of its capital account if (A)(i) non-routine circumstances result in the full depletion in its cash and cash equivalents for its day-to-day operations, (ii) it would be materially detrimental to it to delay making a withdrawal, and (iii) it cannot access any working capital or letter of credit facility it has; or (B) such withdrawal is required to prevent a downgrading by A.M. Best or an order from the BMA, as described above under “––We do not have control over the TS Hamilton Fund.”
Additionally, because the Commitment Agreement requires that we invest a certain amount of capital in the TS Hamilton Fund and the LLCA does not permit us to replace the Managing Member or require that the Managing Member replace Two Sigma as the investment manager of the TS Hamilton Fund, we have limited flexibility to change our investment strategy or manage our investments outside of the TS Hamilton Fund or with a different investment manager, which could have a negative impact on our returns.
Should the TS Hamilton Fund be terminated by the Managing Member, all assets will be liquidated in accordance with the terms set out in the LLCA and we will no longer receive returns in connection with this investment. If the TS Hamilton Fund is terminated, there can be no assurance that we will be able to replace Two Sigma as our investment manager or achieve investment results comparable or better than those achieved by the TS Hamilton Fund. See also “—We do not have control over the TS Hamilton Fund” above.
The Managing Member, Two Sigma and their respective affiliates have potential conflicts of interest that could adversely affect us.
The structure and operations of Two Sigma and its affiliates (and, by extension, how the TS Hamilton Fund and the trading entities the TS Hamilton Fund utilizes are constructed, managed and advised) give rise to a number of actual and potential conflicts of interest which may adversely affect us.
Two Sigma and its affiliates currently manage, and expect to continue to manage, other client and proprietary accounts, some of which have objectives that overlap with the objective of the TS Hamilton Fund, including investment vehicles that are owned primarily or entirely by Two Sigma proprietary capital. Two Sigma’s interests will at times conflict with our interests, which may potentially adversely affect our and the TS Hamilton Fund’s investment opportunities and returns.
Further, the Commitment Agreement provides that none of Two Sigma, the Managing Member or TS Hamilton Fund are responsible for any performance of their obligations thereunder to the extent such obligations would reasonably conflict with their fiduciary duties to other clients or investors in such clients or are reasonably expected to result in materially adverse legal or regulatory risk, as determined in any such party’s sole discretion on the advice of its internal or external counsel.
Two Sigma and its affiliates engage in other business ventures and investment opportunities that will not be allocated equitably among us and such other business ventures.
Two Sigma and its affiliates participate in various financial activities and have created multiple products that employ overlapping or substantially similar strategies and/or compete for limited trading and investment opportunities but are designed to achieve materially different expected risk-reward profiles. Two Sigma and its affiliates engage in a wide-range of investment and other financial activities, many of which are not offered to the TS Hamilton Fund. As Two Sigma and its affiliates continue to grow, they will need to continue to balance the following challenges: (i) a desire to increase the amount of proprietary capital invested; (ii) an increasingly diverse and numerous investor base; (iii) greater variation in the mandates and fee structures among the TS Hamilton Fund and the other Two Sigma clients; (iv) a shifting regulatory landscape; and (v) managing a larger and more diverse set of strategies and Techniques. Portfolios managed by Two Sigma affiliates will have material adverse impacts on each other and the trading in such portfolios will continue to reduce returns in other portfolios. As a result, Two Sigma’s offerings and expansions (and those of its affiliates) are expected to have a negative effect on the TS Hamilton Fund. Two Sigma and its affiliates are not and cannot be free from conflicts of interest in balancing these and related considerations.
Additionally, decisions made by Two Sigma on behalf of the TS Hamilton Fund have the potential to vary materially from the decisions made by Two Sigma and its affiliates on behalf of other clients, including during times of market stress and during liquidation events. Because Two Sigma or its affiliates employ the same or substantially similar strategies on behalf of many of their respective clients and because such clients often trade the same or similar instruments, the decisions made by Two Sigma or its affiliates, as applicable, on behalf of any individual client are likely to have a material impact on other clients. This impact is likely to be exacerbated during times of market stress and/or during liquidation events. For example, to the extent that Two Sigma decides to liquidate or “delever” all or any portion of another client’s portfolio for any reason, such liquidation or deleveraging is likely to adversely affect positions held by the TS Hamilton Fund or the TS Hamilton Fund’s ability to liquidate or delever the same or similar positions, whether or not Two Sigma has made the independent decision to liquidate or delever the TS Hamilton Fund’s portfolios.
The historical performance of Two Sigma (including the TS Hamilton Fund) should not be considered as indicative of the future results of the TS Hamilton Fund’s investment portfolio or of our future results.
The historical returns of the funds managed by Two Sigma (including the TS Hamilton Fund) are not necessarily indicative of future results. Results for the TS Hamilton Fund’s investment portfolio could differ materially from the results of other funds managed by Two Sigma. In addition, even if the TS Hamilton Fund’s investment portfolio generates investment income in a given period, our overall performance could be adversely affected by losses generated by our insurance and reinsurance operations or other market dynamics. Poor performance of the TS Hamilton Fund’s investment portfolio would cause a decline in our revenue and would therefore have a negative effect on our financial performance.
The risks associated with Two Sigma’s strategy in managing the TS Hamilton Fund’s investment portfolio could be substantially greater than the investment risks faced by other reinsurers with whom we compete.
We have a significant amount of financial exposure to the investment in the TS Hamilton Fund. As a result, our operating results depend materially on the performance of the TS Hamilton Fund’s investment portfolio. In addition, the TS Hamilton Fund’s investments are made through various commingled investment vehicles that are managed on behalf of multiple Two Sigma clients, and not structured in relation to our specific financial objectives or anticipated insurance and reinsurance liabilities. To the extent we are required to fund these or other liabilities in meaningful amounts and/or unexpectedly, we could be forced to liquidate investments at a significant loss or at prices that are not optimal, which could significantly and adversely affect our financial results.
The risks associated with Two Sigma’s investment strategy could be substantially greater than the risks associated with traditional investment strategies employed by many insurers and reinsurers with whom we compete. Two Sigma specializes in process-driven, systematic investment management generally implemented by performing quantitative analysis to build mathematical strategies that rely on patterns inferred from historical prices and other data in evaluating prospective investments. These strategies are implemented by employing the Techniques. Quantitative strategies and Techniques cannot fully match the complexity of the financial markets and therefore sudden unanticipated changes in underlying market conditions can significantly impact their performance. Further, as market dynamics shift over time, a previously highly successful strategy or Technique tends to become outdated, and Two Sigma, as the TS Hamilton Fund’s investment manager, may not recognize that fact before substantial losses are incurred. Even without becoming a completely outdated strategy or Technique, a given strategy’s or Technique’s effectiveness may decay in an unpredictable fashion for any number of reasons, including, but not
limited to, an increase in the amount of assets managed, the sharing of such strategy or Technique with other clients or affiliates, the use of similar strategies or Techniques by other market participants and/or market dynamic shifts over time. Moreover, there are likely to be an increasing number of market participants who rely on strategies and Techniques that are similar to those used by Two Sigma, which may result in a substantial number of market participants taking the same action with respect to an investment and some of these market participants may be substantially larger than the TS Hamilton Fund. Should one or more of these other market participants begin to divest themselves of one or more positions, a “crisis correlation,” independent of any fundamentals and similar to the crises that occurred or could occur, thereby causing the TS Hamilton Fund to suffer material, or even total, losses.
Two Sigma relies on the use of technology and on data from third-party and other sources to make its forecasts and/or trading decisions, which could materially adversely affect our future results.
The Techniques and related analytics utilized by Two Sigma in managing the TS Hamilton Fund are fundamentally dependent on technology, including hardware, software and telecommunications systems. The data gathering and processing, research, forecasting, portfolio construction, order execution, trade allocation, risk management, operational, back office and accounting systems, among others, utilized by Two Sigma are all highly automated and computerized. Such automation and computerization is dependent upon an extensive amount of licensed software and third-party hardware and software. Such dependencies have and will likely continue to increase over time. The Two Sigma-licensed software and third-party hardware and software are known to have errors, omissions, imperfections and malfunctions, referred to as coding errors. Such coding errors in third-party hardware and software are generally entirely outside of the control of Two Sigma. Coding errors can and do occur and will result in, among other things, the execution of unanticipated trades, the failure to execute anticipated trades, the failure to properly allocate trades, the failure to properly gather, organize and/or process available or accurate data, the generation of erroneous and/or incomplete model forecasts, the failure to take certain hedging or risk reducing actions and/or the taking of actions which increase certain risk(s), all of which can and do have adverse (and materially adverse) effects on the TS Hamilton Fund and its returns. Two Sigma’s reliance on technology may expose the TS Hamilton Fund to other risks
associated with the use of technology, such as software or hardware malfunction, security breach, virus or other operational risks.
Two Sigma is highly reliant on the gathering, cleaning, culling, mapping and analyzing of large amounts of both market and non-traditional (i.e., alternative) data from third-party and other sources in making its forecasts and/or trading decisions. It is not possible or practicable, however, to factor all relevant, available data into forecasts and/or trading decisions. Two Sigma will use its discretion to determine what data to gather with respect to any strategy or Technique and what subset of that data the strategies and Techniques it will take into account to produce forecasts which have an impact on ultimate trading decisions. There is no guarantee that any specific data or type of data will be utilized in generating forecasts or making investment and trading decisions on behalf of the TS Hamilton Fund, nor is there any guarantee that the data actually utilized in generating forecasts or making investment and trading decisions on behalf of the TS Hamilton Fund will be (i) the most accurate data available or (ii) free of errors.
Two Sigma will from time to time change its processes due to external and internal factors, which may lead to unpredictable outcomes.
There can be no guarantee that any of the numerous processes developed by Two Sigma to perform various functions for the TS Hamilton Fund (including, without limitation, processes related to data gathering, research, forecasting, portfolio construction, order execution, trade allocation, risk management, compliance, operations and accounting) will not change over time or, in some cases, may cease altogether (such changes or cessations, “Process Changes”). Except as restricted by rule, regulation, requirement or law, Two Sigma may make Process Changes in its sole and absolute discretion and without notifying the TS Hamilton Fund. Two Sigma may make Process Changes due to (i) external factors such as, without limitation, changes in law or legal/regulatory guidance, changes to industry practice, market factors or changes to external costs, (ii) internal factors such as, without limitation, personnel changes, changes to proprietary technology, security concerns or updated cost/benefit analyses or (iii) any combination of the foregoing. The effects of process changes are inherently unpredictable and sometimes do lead to unexpected outcomes which could have an adverse impact on the TS Hamilton Fund.
Effects of Process Changes are inherently unpredictable and may lead to unexpected outcomes which could ultimately have an adverse impact on the TS Hamilton Fund. In addition, certain Process Changes, for example certain Process Changes made due to changes in law or legal/regulatory guidance, may be made despite Two Sigma’s belief that such Process Changes will have an adverse impact on the TS Hamilton Fund.
In managing the TS Hamilton Fund’s investment portfolio, Two Sigma will trade on margin and use other forms of financial leverage, which could potentially adversely affect our results.
Two Sigma employs substantial leverage on behalf of the TS Hamilton Fund. Such leverage is achieved by borrowing funds from U.S. and non-U.S. brokers, banks, dealers and other lenders, purchasing or selling instruments on margin or with collateral and using options, futures, forward contracts, swaps and various other forms of derivatives and other instruments which have substantial embedded leverage.
If the TS Hamilton Fund can no longer utilize margin or post collateral under such lending arrangements, it could be required to liquidate a significant portion of its portfolio, and trading would be constrained, adversely affecting the TS Hamilton Fund’s performance.
Trading on leverage may result in greater risks, exposures, interest charges and costs, which may be explicit (e.g., in the case of loans) or implicit (e.g., in the case of many derivative instruments) and such charges or costs could be substantial. The use of leverage, both through direct borrowing and through the investment in various types of instruments across a wide variety of asset classes, can substantially increase the market exposure (and market risk) to which the TS Hamilton Fund is subject. Specifically, if the value of the TS Hamilton Fund’s portfolio fell below the margin or collateral level required by a prime broker or dealer, the prime broker or dealer would require additional margin deposits or collateral amounts. If the TS Hamilton Fund were unable to satisfy such a margin or collateral call by a prime broker or dealer, the prime broker or dealer could liquidate the TS Hamilton Fund’s positions in its account with the prime broker or for which the dealer is the counterparty and cause the TS Hamilton Fund to incur significant losses. The failure to satisfy a margin or collateral call, or the occurrence of other material defaults under margin, collateral or other financing agreements, could trigger cross-defaults under the TS Hamilton Fund’s agreements with other brokers, dealers, lenders, clearing firms or other counterparties, multiplying the adverse impact to the TS Hamilton Fund. In addition, because the use of leverage will allow the TS Hamilton Fund control of or exposure to positions worth significantly more than the margin or collateral posted for such positions, the amount that the TS
Hamilton Fund may lose in the event of adverse price movements will be high in relation to the amount of this margin or collateral amount, and could exceed the value of the assets of the TS Hamilton Fund. Trading of futures, forward contracts, equity swaps and other derivatives, for example, generally involves little or no margin deposit or collateral requirement and therefore provides substantial implicit leverage. Accordingly, relatively small price movements in these instruments (and others) can result in immediate and substantial losses.
In the event of a sudden decrease in the value of the TS Hamilton Fund’s assets, the TS Hamilton Fund might not be able to liquidate assets quickly enough to satisfy its margin or collateral requirements. In that event, the TS Hamilton Fund would become subject to claims of financial intermediaries that extended “margin” loans or counterparty credit. Such claims could exceed the value of the assets of the TS Hamilton Fund. Trading of futures generally involves little or no margin deposit requirement and therefore provides substantial leverage. Accordingly, relatively small price movements in these instruments (and others) can result in immediate and substantial losses to the TS Hamilton Fund.
The banks, dealers, and counterparties (including prime brokers, futures commission merchants and central clearing houses) that provide financing to the TS Hamilton Fund can apply essentially discretionary margin, haircut, financing and collateral valuation policies. Changes by banks, dealers and counterparties in any of the foregoing may result in large margin calls, loss of financing and forced liquidations of positions at disadvantageous times or prices. There can be no assurance that the TS Hamilton Fund will be able to secure or maintain adequate financing.
Volatile markets could harm the performance of the TS Hamilton Fund’s investment portfolio, and as a result our liquidity and financial condition.
The prices of securities and other instruments can be highly volatile. Price movements of instruments in which the TS Hamilton Fund trades are influenced by, among other things, interest rates, changing supply and demand relationships, increased risk of default (by government and private issuers, service providers and counterparties), inability to purchase and sell assets or otherwise settle transactions, trade, fiscal, monetary and exchange control programs and policies of governments, and national and international political and economic events and policies.
In addition, governments from time to time intervene, directly and by regulation, in certain markets. Such intervention often is intended directly to influence prices and can, together with other factors, cause all of such markets to move rapidly in the same direction because of, among other things, interest rate fluctuations. The TS Hamilton Fund is also subject to the risk of the failure of any of the exchanges on which its positions trade or of their clearinghouses and subject to the risk of failure of its counterparties in the case of over-the-counter positions.
Challenging market, economic and geopolitical conditions can result in material losses within the TS Hamilton Fund, which could materially and adversely impact our financial condition.
Two Sigma’s use of hedging and derivative transactions in executing trades for the TS Hamilton Fund’s account may not be successful, which could materially adversely affect the TS Hamilton Fund’s and our investment results.
Two Sigma employs hedging for portions of the TS Hamilton Fund by taking long and short positions in related instruments. Hedging against a decline in the value of a portfolio position does not eliminate fluctuations in the values of such portfolio positions or prevent losses if the values of such positions decline, but establishes other positions designed to gain from those same developments, thus seeking to moderate the decline in the value of such portfolio position. Such hedging transactions also limit the opportunity for gain if the value of the portfolio position should increase. In the event of an imperfect correlation between a position in a hedging instrument and the portfolio position that it is intended to protect, the desired protection may not be obtained, and the TS Hamilton Fund may be exposed to risk of loss. In addition, it is not possible to hedge fully or perfectly against any risk, and hedging entails its own costs. Positions which would typically serve as hedges could actually move in the same direction as the instruments they were initially attempting to hedge, adding further risk (and losses) to the TS Hamilton Fund. Two Sigma may determine not to hedge against certain risks, and certain risks exist that cannot be hedged.
The TS Hamilton Fund is expected to engage in short selling, which would expose it to the potential for large losses.
The TS Hamilton Fund’s investment program includes a significant amount of short selling. Short selling transactions expose the TS Hamilton Fund to the risk of loss in an amount greater than the initial investment, and such losses can increase rapidly and without effective limit. Short sales can, in certain circumstances, substantially increase the impact of adverse price movements on the TS Hamilton Fund’s portfolio. A short sale of an instrument involves the risk of a theoretically unlimited loss from a theoretically unlimited increase in the market price of the instrument, which could result in an inability to cover the short position. In addition, there can be no assurance that securities or other instruments necessary to cover a short position will be available for purchase. There is the risk that the instruments borrowed by the TS Hamilton Fund in connection with a short sale would need to be returned to the lender on short notice. If such request for return of instruments occurs at a time when other short sellers of the subject instrument are receiving similar requests, a “short squeeze” can occur, wherein the TS Hamilton Fund might be compelled, at the most disadvantageous time, to replace the borrowed instruments previously sold short with purchases on the open market, possibly at prices significantly in excess of the proceeds received earlier in originally selling the instruments short. Purchasing instruments to close out the short position can itself cause the price of the instruments to rise further, thereby exacerbating any loss.
Increased regulation or scrutiny of alternative investment advisors and certain trading methods such as short selling could affect Two Sigma’s ability to manage the TS Hamilton Fund’s investment portfolio or affect our business reputation.
The regulatory environment for investment managers is evolving, and changes in the regulation of managers could adversely affect the ability of Two Sigma to effect transactions in the TS Hamilton Fund’s investment portfolio that utilize leverage or to pursue its trading strategies in managing the TS Hamilton Fund’s investments. Two Sigma is regularly involved in trading activities that involve a number of U.S. and foreign securities law regimes. Violations of any such law (or allegations of such violations) could directly or indirectly result in severe restrictions on Two Sigma’s activities and, indirectly, do damage to the TS Hamilton Fund’s investment portfolio or the reputation of Two Sigma and, indirectly, the Company. In addition, the securities and futures markets are subject to comprehensive statutes, regulations and margin requirements. The SEC, other regulators and self-regulatory organizations and exchanges are authorized to take extraordinary actions in the event of market emergencies. The regulation of derivatives transactions and funds that engage in such transactions is an evolving area of law and is subject to modification by government and judicial action. Any future regulatory change could have a significant negative impact on our financial condition and results of operations.
For example, Two Sigma routinely engages in short selling for the TS Hamilton Fund’s account in managing its investments. Short sale transactions have been subject to increased regulatory scrutiny, including the imposition of restrictions on short selling certain securities and reporting requirements. Two Sigma’s ability to execute a short selling strategy in managing the TS Hamilton Fund’s investment portfolio may be materially and adversely impacted by temporary or new permanent rules, interpretations, prohibitions, and restrictions adopted in response to these adverse market events. Temporary restrictions or prohibitions on short selling activity may be imposed by regulatory authorities with little or no advance notice and may impact prior and future trading activities of the TS Hamilton Fund’s investment portfolio. Additionally, the SEC, its non-U.S. counterparts, other governmental authorities or self-regulatory organizations may at any time promulgate permanent rules or interpretations consistent with such temporary restrictions or that impose additional or different permanent or temporary limitations or prohibitions. The SEC might impose different limitations or prohibitions on short selling from those imposed by various non-U.S. regulatory authorities. These different regulations, rules or interpretations might have different effective periods.
Regulatory authorities could, from time to time, impose restrictions that adversely affect the TS Hamilton Fund’s ability to borrow certain securities in connection with short sale transactions. In addition, traditional lenders of securities are often less likely to lend securities under certain market conditions. As a result, Two Sigma may not be able to effectively pursue a short selling strategy due to a limited supply of securities available for borrowing. The TS Hamilton Fund may also incur additional costs in connection with short sale transactions effected in its investment portfolio, including in the event that Two Sigma is required to enter into a borrowing arrangement for the TS Hamilton Fund’s account in advance of any short sales. Moreover, the ability to continue to borrow a security is not guaranteed and our account will be subject to strict delivery requirements. The inability to deliver securities within the required time frame may subject us to mandatory close out by the executing broker-dealer. A mandatory close out may subject us to unintended costs and losses. Certain action or inaction by third parties, such as executing broker-dealers or clearing broker-dealers, may materially impact our ability to effect short sale transactions in the TS Hamilton Fund’s investment portfolio.
Risks Relating to Taxation—U.S. Tax Risks
For purposes of this discussion, the term “U.S. Person” means: (i) an individual citizen or resident of the United States, (ii) a partnership or corporation, created in or organized under the laws of the United States, or organized under the laws of any political subdivision thereof, (iii) an estate the income of which is subject to U.S. federal income taxation regardless of its source, or (iv) a trust if either (x) a court within the United States is able to exercise primary supervision over the administration of such trust and one or more U.S. Persons have the authority to control all substantial decisions of such trust, or (y) the trust has a valid election in effect under applicable U.S. Treasury Regulations to be treated as a U.S. Person for U.S. federal income tax purposes or (z) any other person or entity that is treated for U.S. federal income tax purposes as if it were one of the foregoing. For purposes of this discussion, the term “U.S. Holder” means a U.S. Person other than a partnership who beneficially owns Class B common shares.
Changes in U.S. federal income or other tax laws or the interpretation of tax laws could adversely impact the Company’s tax liability.
The Tax Cuts and Jobs Act (the “2017 Act”) included certain provisions intended to eliminate certain perceived tax advantages of companies (including insurance companies) that have legal domiciles outside the United States, but have certain U.S. connections, and U.S. Persons investing in such companies. Among other things, the 2017 Act revised the rules applicable to passive foreign investment companies (“PFICs”) and controlled foreign corporations (“CFCs”) in ways that could affect the timing or amount of U.S. federal income taxes imposed on certain investors that are U.S. Persons and included a base erosion anti-abuse tax (the “BEAT”) that could make affiliate reinsurance between U.S. taxpaying and other non-U.S. members of the Company economically unfeasible. Further, it is possible that other legislation could be introduced and enacted by the current Congress or future Congresses that could have an adverse impact on the Company, the Company’s operations, or U.S. Holders. Additionally, tax laws and interpretations regarding whether a company is engaged in a U.S. trade or business or whether a company is a CFC or a PFIC or has related person insurance income (“RPII”) are subject to change, possibly on a retroactive basis. The U.S. Treasury Department recently issued final and proposed regulations intended to clarify the application of the insurance income exception to the classification of a non-U.S. insurer as a PFIC and provide guidance on a range of issues relating to PFICs, and recently issued proposed regulations that would expand the scope of the RPII rules. New regulations or pronouncements interpreting or clarifying such rules may be forthcoming as well. The Company cannot be certain if, when or in what form such regulations or pronouncements may be provided and whether such guidance will have a retroactive effect.
The Company and/or its non-U.S. subsidiaries may become subject to U.S. federal income taxation.
A non-U.S. corporation that is engaged in the conduct of a U.S. trade or business will be subject to U.S. federal income tax as described below, unless entitled to the benefits of an applicable tax treaty. Whether a trade or business is being conducted in the United States is an inherently factual determination. As the Internal Revenue Code of 1986, as amended (the “Code”), regulations and court decisions fail to definitively identify activities that constitute being engaged in a trade or business in the United States, the Company cannot be certain that the IRS will not contend successfully that, in addition to the Designated Corporate Members and HIDAC (as defined and discussed below in Certain Tax Considerations), the Company and/or its non-U.S. subsidiaries are or will be engaged in a trade or business in the U.S. A non-U.S. corporation deemed to be so engaged would be subject to U.S. income tax at regular corporate rates on the portion of its income that is treated as effectively connected with the conduct of that U.S. trade or business (“ECI”), as well as the branch profits tax on its dividend equivalent amount (generally, the ECI (with certain adjustments) deemed withdrawn from the United States), unless the corporation is entitled to relief under the permanent establishment provision of an applicable tax treaty. Any such U.S. federal income taxation could result in substantial tax liabilities and could have a material adverse effect on the results of operation of the Company and its non-U.S. subsidiaries.
Non-U.S. corporations not engaged in a trade or business in the United States are nonetheless subject to U.S. income tax imposed by withholding on certain “fixed or determinable annual or periodic gains, profits and income” derived from sources within the United States (such as dividends and certain interest on investments), subject to exemption under the Code or reduction by applicable treaties.
The United States also imposes an excise tax on insurance and reinsurance premiums (“FET”) paid to non-U.S. insurers or reinsurers that are not eligible for the benefits of a U.S. income tax treaty that provides for an exemption from the FET with respect to risks (i) of a U.S. entity or individual, located wholly or partially within the United States and (ii) of a non-U.S. entity or individual engaged in a trade or business in the United States, located within the United States. The rates of tax are 4% for property casualty insurance premiums and 1% for reinsurance premiums.
U.S. Holders will be subject to adverse tax consequences if the Company is considered a PFIC for U.S. federal income tax purposes.
In general, a non-U.S. corporation will be a PFIC during a given year if (i) 75% or more of its gross income constitutes “passive income” (the “75% test”) or (ii) 50% or more of its assets produce (or are held for the production of) passive income (the “50% test”). If the Company were characterized as a PFIC during a given year, each U.S. Holder would be subject to a penalty tax at the time of the taxable disposition at a gain of, or receipt of an “excess distribution” with respect to their shares, unless such person is a 10% U.S. Shareholder (as defined below) subject to tax under the CFC rules or such person made a “qualified electing fund” (“QEF”) election or, if the Class B common shares are treated as “marketable stock” in such year, such person made a mark-to-market election. In addition, if the Company were considered a PFIC, upon the death of any U.S. individual owning shares such individual’s heirs or estate would not be entitled to a “step-up” in the basis of the shares that might otherwise be available under U.S. federal income tax laws. In addition, a distribution paid by the Company to U.S. Holders that is characterized as a dividend and is not characterized as an excess distribution would not be eligible for reduced rates of tax as qualified dividend income if the Company were considered a PFIC in the taxable year in which such dividend is paid or in the preceding taxable year. A U.S. Person that is a shareholder in a PFIC may also be subject to additional information reporting requirements, including the filing of an IRS Form 8621.
For the above purposes, passive income generally includes interest, dividends, annuities and other investment income. The PFIC rules provide that income derived in the active conduct of an insurance business by a qualifying insurance corporation is not treated as passive income (the “insurance income exception”). The PFIC provisions also contain a look-through rule under which a non-U.S. corporation will be treated, for purposes of determining whether it is a PFIC, as if it “received directly its proportionate share of the income…” and as if it “held its proportionate share of the assets…” of any other corporation in which it owns at least 25% of the value of the stock (the “look-through rule”). Under the look-through rule, the Company should be deemed to own its proportionate share of the assets and to have received its proportionate share of the income of its non-U.S. insurance subsidiaries for purposes of the 75% test and the 50% test. However, the 2017 Act limits the insurance income exception to a non-U.S. insurance company that is a qualifying insurance corporation that would be taxable as an insurance company if it were a U.S. corporation and maintains insurance liabilities of more than 25% of such company’s assets for a taxable year (the “25% Test”) or maintains insurance liabilities that at least equal or exceed 10% of its assets, is predominantly engaged in an insurance business and satisfies a facts-and-circumstances test that requires a showing that the failure to exceed the 25% threshold is due to runoff-related or rating-related circumstances (the “10% Test,” and together with the 25% Test, the
“Reserve Test”). The Company believes that the Company's non-U.S. insurance subsidiaries have met this Reserve Test and will continue to do so in the foreseeable future, in which case the Company would not be expected to be a PFIC, although no assurance may be given that the Reserve Test will be met by the Company's non-U.S. insurance subsidiaries in future years.
Further, the Treasury Department recently issued final and proposed regulations intended to clarify the application of the insurance income exception to the classification of a non-U.S. insurer as a PFIC and provide guidance on a range of issues relating to PFICs, including the application of the look-through rule, the treatment of income and assets of certain U.S. insurance subsidiaries for purposes of the look-through rule and the extension of the look-through rule to 25%-or-more-owned partnerships (the “2021 Regulations”). The 2021 Regulations define insurance liabilities for purposes of the Reserve Test, and tighten the Reserve Test as well as place a statutory cap on insurance liabilities, and provide guidance on the runoff-related and rating-related circumstances for purposes of the 10% Test. The 2021 Regulations, which set forth in proposed form certain requirements that must be met to satisfy the “active conduct of an insurance business” test, also propose that a non-U.S. insurer with no or a nominal number of employees that relies exclusively or almost exclusively upon independent contractors (other than related entities) to perform its core functions will not be treated as engaged in the active conduct of an insurance business.
Further, for purposes of applying the 10% Test, the 2021 Regulations: (i) generally limit the rating-related circumstances exception to a non-U.S. corporation: (a) if more than half of such corporation’s net written premiums for the applicable period are derived from insuring catastrophic risk, or (b) providing certain other insurance coverage that the Company is not expected to engage in, and (ii) reduce a corporation’s insurance liabilities by the amount of any reinsurance recoverable relating to such liability. The Company believes that, based on the implementation of its business plan and the application of the look-through rule and the exceptions set out under Section 1297 of the Code, none of the income and assets of the Company's non-U.S. insurance company subsidiaries should be treated as passive pursuant to the 25% Test, and thus the Company should not be characterized as a PFIC under current law for the current taxable year or for foreseeable future years, but because of the legal uncertainties, as well as factual uncertainties with respect to the Company’s planned operations, there is a risk that the Company will be characterized as a PFIC for U.S. federal income tax purposes. In addition, because of the legal uncertainties relating to how the 2021 Regulations will be interpreted and the form in which the proposed 2021 Regulations may be finalized, no
assurance can be given that the Company will not qualify as a PFIC under final IRS guidance or any future regulatory proposal or interpretation that may be subsequently introduced and promulgated. If the Company is considered a PFIC, it could have material adverse tax consequences for an investor that is subject to U.S. federal income taxation. Investors should consult their tax advisors as to the effects of the PFIC rules and the possibility of making a “protective” QEF election or “mark-to-market” election.
U.S. Holders of 10% or more of the Company’s Class B common shares may be subject to U.S. income taxation under the CFC rules.
Each 10% U.S. Shareholder of a non-U.S. corporation that is a CFC during a taxable year and that owns shares in the CFC, directly or indirectly through non-U.S. entities, on the last day of the non-U.S. corporation’s taxable year that the non-U.S. corporation is a CFC, generally must include in its gross income for U.S. federal income tax purposes its pro rata share of the CFC’s “subpart F income,” and global intangible low taxed income (“GILTI”), even if the subpart F income or GILTI is not distributed. A non-U.S. corporation is considered a CFC if 10% U.S. Shareholders own (directly, indirectly through non-U.S. entities or by attribution by application of the constructive ownership rules of Section 958(b) of the Code (i.e., “constructively”)) more than 50% of the total combined voting power of all classes of stock of such non-U.S. corporation, or more than 50% of the total value of all stock of such corporation. For purposes of taking into account insurance income, which is a category of subpart F income, a CFC also includes a non-U.S. corporation that earns insurance income in which more than 25% of the total combined voting power of all classes of stock or more than 25% of the total value of all stock is owned by 10% U.S. Shareholders on any day of the taxable year of such corporation, if the gross amount of premiums or other consideration for the reinsurance or the issuing of insurance or annuity contracts exceeds 75% of the gross amount of all premiums or other consideration in respect of all risks. A 10% U.S. Shareholder is a U.S. Person who owns (directly, indirectly through non-U.S. entities or constructively) at least 10% of the total combined voting power or value of all classes of stock of the non-U.S. corporation.
The Company believes that because of the anticipated dispersion of ownership of the Company's Class B common shares no U.S. Holder of the Company should be treated as owning (directly, indirectly through non-U.S. entities or constructively) 10% or more of the total voting power or value of the Hamilton Group. However, because the Company's Class B common shares may not be as widely dispersed as the Company believes due to, for example, the application of certain ownership attribution rules, no assurance may be given that a U.S. Person who owns directly, indirectly or constructively, the Company's Class B common shares will not be characterized as a 10% U.S. Shareholder, in which case such U.S. Holder may be subject to taxation under the CFC rules.
U.S. Persons who own or are treated as owning Class B common shares may be subject to U.S. income taxation at ordinary income rates on their proportionate share of RPII of the Company's non-U.S. subsidiaries.
If (i) a non-U.S. subsidiary of the Company is 25% or more owned (by vote or value) directly, indirectly through non-U.S. entities or constructively by U.S. Persons that hold shares of the Company directly or indirectly through foreign entities, (ii) the RPII (determined on a gross basis) of the non-U.S. subsidiary were to equal or exceed 20% of the non-U.S. subsidiary’s gross insurance income in any taxable year and (iii) direct or indirect insureds (and persons related to those insureds) own directly or indirectly through entities 20% or more of the voting power or value of the non-U.S. subsidiary, then a U.S. Person who owns any shares of the non-U.S. subsidiary (directly or indirectly through non-U.S. entities, including by holding Class B common shares) on the last day of the taxable year would be required to include in its income for U.S. federal income tax purposes such person’s pro rata share of the non-U.S. subsidiary’s RPII for the entire taxable year, determined as if such RPII were distributed proportionately only to U.S. Persons at that date regardless of whether such income is distributed, in which case the U.S. Person’s investment could be materially adversely affected. Generally, RPII is any “insurance income” (as defined below) attributable to policies of insurance or reinsurance with respect to which the person (directly or indirectly) insured is an “RPII shareholder” (as defined below) or a related person to such RPII shareholder. The amount of RPII earned by the non-U.S. subsidiary (generally, premium and related investment income from the direct or indirect insurance or reinsurance of any RPII Shareholder or any person related to such RPII Shareholder) will depend on a number of factors, including the identity of persons directly or indirectly insured or reinsured by the non-U.S. subsidiary. The Company believes that the direct or indirect insureds of the Company's non-U.S. subsidiaries (and related persons), whether or not U.S. Persons, currently do not directly or indirectly own 20% or more of either the voting power or value of the shares of the Company or its non-U.S. subsidiaries and the Company does not expect this to be the case in any taxable year for the foreseeable future (the “20% Ownership Exception”). Additionally, the Company does not expect the gross RPII of any non-U.S. subsidiary of the Company to equal or exceed 20% of its gross insurance income in any taxable year for the foreseeable future (the “20% Gross Income Exception”), but cannot be certain that this will be the case because some of the factors which determine the extent of RPII may be beyond the Company’s control. Further, recently proposed regulations could, if finalized in their current form, substantially expand the definition of RPII to include insurance income of the Company's non-U.S. subsidiaries with respect to certain affiliate reinsurance transactions. If these proposed regulations are finalized in their current form, it could limit the Company’s ability to execute affiliate reinsurance transactions that would otherwise be undertaken for non-tax business reasons in the future and could increase the risk that the 20% Gross Income Exception would not be met for one or more of the Company's non-U.S. subsidiaries in a particular taxable year, which could result in such RPII being taxable to U.S. Persons that own or are treated as owning Class B common shares. Investors are urged to consult their tax advisors with respect to these rules.
U.S. tax-exempt organizations that own Class B common shares may recognize unrelated business taxable income.
U.S. tax-exempt entities will be required to treat certain subpart F insurance income, including RPII, that is includable in income by the tax-exempt entity as unrelated business taxable income. Investors that are U.S. tax-exempt entities are urged to consult their tax advisors as to the potential impact of the unrelated business taxable income provisions of the Code.
U.S. Holders who dispose of Class B common shares may be subject to U.S. federal income taxation at the rates applicable to dividends on a portion of such disposition.
Subject to the discussion above relating to the potential application of PFIC rules, Code Section 1248 may apply to a disposition of Class B common shares. Code Section 1248 provides that if a U.S. Person sells or exchanges stock in a non-U.S. corporation and such person owned, directly, indirectly through certain non-U.S. entities or constructively, 10% or more of the voting power of the corporation at any time during the five-year period ending on the date of disposition when the corporation was a CFC, any gain from the sale or exchange of the shares will be treated as a dividend to the extent of the CFC’s earnings and profits (determined under U.S. federal income tax principles) during the period that the shareholder held the shares and while the corporation was a CFC (with certain adjustments). The Company believes that because of the anticipated dispersion of ownership of the Company's Class B common shares, no U.S. Holder of the Class B common shares should be treated as owning (directly, indirectly through non-U.S. entities or constructively) 10% or more of the total voting power of the Hamilton Group; to the extent that this is the case, the application of Code Section 1248 under the regular CFC rules should not apply to dispositions of the Class B common shares. However, because the Class B common shares may not be as widely dispersed as the Company believes due to, for example, the application of certain ownership attribution rules, no assurance may be given that a U.S. Holder will not be characterized as owning, directly, indirectly through certain non-U.S. entities or constructively, 10% or more of the voting power of the Hamilton Group, in which case such U.S. Holder may be subject to Code Section 1248 rules.
Additionally, Code Section 1248, in conjunction with the RPII rules, also applies to the sale or exchange of shares in a non-U.S. corporation if the non-U.S. corporation would be treated as a CFC for RPII purposes regardless of whether the shareholder owns, directly, indirectly through certain non-U.S. entities or constructively, 10% or more of the voting power of such non-U.S. corporation or the 20% Gross Income Exception or 20% Ownership Exception applies. Existing proposed regulations do not address whether Code Section 1248 would apply if a non-U.S. corporation is not a CFC but the non-U.S. corporation has a subsidiary that would be treated as a CFC for RPII purposes. The Company believes, however, that this application of Code Section 1248 under the RPII rules should not apply to dispositions of Class B common shares because it will not be directly engaged in the insurance business. The Company cannot be certain, however, that the IRS will not interpret the proposed regulations in a contrary manner or that the Treasury Department will not amend the proposed regulations to provide that these rules will apply to dispositions of Class B common shares. Investors are urged to consult their tax advisors regarding the effects of these rules on a disposition of Class B common shares.
Dividends from the Company, if any, may not satisfy the requirements for “qualified dividend income,” and therefore may not be eligible for the reduced rates of U.S. federal income tax applicable to such income.
Non-corporate U.S. Holders, including individuals, generally will be subject to U.S. federal income taxation at a current maximum rate of 37% (not including the Medicare contribution tax) upon their receipt of dividend income from the Company, if any, unless such dividends constitute “qualified dividend income” or QDI (as defined in the Code). QDI received by non-corporate U.S. Holders meeting certain holding requirements from domestic corporations or “qualified foreign corporations” is subject to tax at long-term capital gains rates (up to a maximum of 20%, not including the Medicare contribution tax). Any dividends paid by the Company generally may constitute QDI if (i) the Class B common shares are readily tradeable on an established securities market in the United States, and (ii) the Company is not treated as a PFIC for the taxable year such dividends are paid and the preceding taxable year. Under current U.S. Treasury Department guidance, the Class B common shares would be treated as readily tradeable on an established securities market if they are listed on the NYSE, as the Class B common shares are. However, there can be no assurance that our Class B common shares will continue to be listed on the NYSE or that the Company will not be treated as a PFIC for any taxable year. Investors are advised to consult their own tax advisors with respect to the application of these rules.
Information regarding a U.S. Holder’s identity may be reported to the relevant tax authority to ensure compliance with the U.S. Foreign Account Tax Compliance Act (“FATCA”) and similar regimes.
Under FATCA, the United States imposes a withholding tax of 30% on U.S.-source interest, dividends and certain other types of income which are received by a foreign financial institution (“FFI”), unless such FFI enters into an agreement with the IRS to obtain certain information as to the identity of the direct and indirect owners of accounts in such institution. Withholding on U.S.-source interest, dividends and certain other types of income applies currently, and proposed U.S. Treasury Regulations provide that this withholding will not apply to gross proceeds from any sale or other distribution of property that can produce U.S.-source interest or dividends and premiums on insurance contracts that do not have a cash value. Alternatively, a 30% withholding tax may be imposed on the above payments to certain passive non-financial foreign entities (“NFFE”) which do not (i) certify to each respective withholding agent that they have no “substantial U.S. owners” (i.e., a U.S. 10% direct or indirect shareholder), or (ii) provide such withholding agent with certain information as to the identity of such substantial U.S. owners. The Company believes and intends to take the position that the Company will be an NFFE, and not an FFI, although no assurance can be given that the IRS would not assert, or that a court would not uphold, a different characterization of the Hamilton Group.
The United Kingdom has signed an intergovernmental agreement, or an IGA, with the United States (the “U.K. IGA”), Ireland has signed an IGA with the United States (the “Irish IGA”), and Bermuda has signed a Model 2 IGA with the United States (the “Bermuda IGA”) directing Bermuda FFIs to enter into agreements with the IRS to comply with FATCA. The Company and its non-U.S. subsidiaries intend to comply with the U.K. IGA, Irish IGA, and Bermuda IGA and/or FATCA, as applicable. Each of the Company and its non-U.S. subsidiaries will report all necessary information regarding substantial U.S. owners to the relevant authority. Any substantial U.S. owner will be required to use commercially reasonable best efforts to provide such identifying information, subject to reasonable confidentiality provisions that do not prohibit the disclosure of information reasonably required by the Company, as is required to enable it to comply. Shareholders who fail to provide such information could be subject to (i) a forced sale of their Class B common shares; or (ii) a redemption of their Class B common shares. Should the Company determine that the Company is an FFI, the Company will report all necessary information regarding all U.S. Holders of the Class B common shares.
Risks Relating to Taxation—U.K. Tax Risks
Changes to the U.K. corporate tax treatment of the Company could adversely impact the Company’s tax liability.
As a general rule, a non-U.K. incorporated company will only be subject to U.K. corporation tax if it either (i) carries on a trade in the United Kingdom through a permanent establishment in the United Kingdom (in which case the profits attributable to that permanent establishment are subject to U.K. corporation tax at a current rate of 25%) or (ii) is centrally managed and controlled from the United Kingdom (in which case the company will be treated as a U.K. resident and its worldwide profits (and the apportioned income of any subsidiary caught by the U.K. “controlled foreign company” regime) will be subject to U.K. corporation tax). Central management and control for this purpose refers to the strategic decision-making functions of the company.
Assuming that the Company acts solely as a group holding company and is not engaged in any insurance or reinsurance, or other, trade, it is not expected to be treated as carrying on a trade in the United Kingdom through a permanent establishment. The directors of the Company intend that it should operate its business in such a way that it is not centrally managed and controlled in the United Kingdom.
In relation to other non-U.K. incorporated subsidiaries of the Hamilton Group, their directors intend to operate their respective businesses in such a manner that they (i) are not centrally managed and controlled in the United Kingdom and (ii) do not carry on a trade through a permanent establishment in the U.K. (with the exception of HIDAC), which has a U.K. branch and pays U.K. corporation tax on its U.K. profits).
Nevertheless, because neither case law nor U.K. statute definitively lists the activities that constitute trading in the United Kingdom through a permanent establishment, His Majesty’s Revenue and Customs, or HMRC, might contend successfully that the Company or any of its non-U.K. incorporated subsidiaries are trading in the United Kingdom through a permanent establishment in the United Kingdom. If this were to be the case (other than with respect to the U.K. branch of HIDAC), the results of the Company’s operations could be materially adversely affected.
The United Kingdom has no comprehensive income tax treaty with Bermuda. There are circumstances in which companies that are neither resident in the United Kingdom nor entitled to the protection afforded by a double tax treaty between the United Kingdom and the jurisdiction in which they are resident may be exposed to income tax in the United Kingdom (other than by deduction or withholding) on the profits of a trade carried on in the United Kingdom even if that trade is not carried on through a permanent establishment. This risk is relevant for Hamilton Re as it carries on a (re)insurance trade and is resident for tax purposes in Bermuda. However, the directors of each Bermuda resident subsidiary of the Company intend to operate their respective businesses in such a manner that they will not be primarily liable to a charge to income tax in the United Kingdom.
Nevertheless, HMRC might contend that a Bermuda resident subsidiary of the Company is carrying out a trade in the United Kingdom and if this were to be the case, the Company’s operations could be materially adversely affected.
The application of the United Kingdom’s Diverted Profits Tax could adversely impact the Company’s tax liability.
Diverted profits tax, or DPT, may apply in a situation where (i) an entity carries on activity in the United Kingdom in connection with the business of a non-U.K. resident company in circumstances where that entity does not constitute a U.K. permanent establishment of the non-U.K. company, (ii) it is reasonable to assume that their activities are designed to ensure that the non-U.K. resident company does not carry on a trade in the United Kingdom and (iii) one of the main purposes of the arrangements is the avoidance of U.K. corporation tax. DPT is charged at a higher rate than U.K. corporation tax and will remain at a higher rate following the increase in line with the U.K. corporation tax rate on April 1, 2023. If it applies, the results of the Company’s operations could be materially adversely affected.
Provided there are no material changes in circumstances which impact a DPT charge during 2025, the Company will not notify HMRC of a potential liability to DPT for the current year.
U.K. transfer pricing regime and similar provisions could adversely impact the Company’s tax liability.
Any adverse adjustment under the U.K. transfer pricing regime, the anti-avoidance regime governing the transfer of corporate profits could adversely impact the Company’s tax liability.
The reinsurance arrangements between Hamilton Re and the Designated Corporate Members (as defined below) together with any other inter-company agreements involving U.K. resident subsidiaries of the Company or HIDAC London Branch are subject to the U.K. transfer pricing regime. Consequently, if the reinsurance or other services pursuant to these agreements are found not to be on arm’s-length terms and, as a result, a U.K. tax advantage is being obtained, an adjustment will be required to compute U.K. taxable profits for the relevant U.K. group entities, as if the reinsurance or other provision were on arm’s-length terms.
Under section 1305A Corporation Tax Act 2009, where any payment between group companies is, in substance, a payment of all or a significant part of the profits of the business of the payer company, and the main purpose or one of the main purposes is to secure a tax advantage for any person, the payer’s profits are calculated for U.K. corporation tax purposes as if the profit transfer had not occurred. According to the Technical Note published by HMRC on 19 March 2014, where a company has entered into reinsurance arrangements within a group (for example, quota share reinsurance) as part of ordinary commercial arrangements, this would not normally fall within the scope of this measure. This includes cases where the profitability of the ceding company is a factor taken into account in arriving at the premium to be paid. However, since each case will depend on its own facts, HMRC may successfully contend that certain intra-group reinsurance arrangements are caught by section 1305A Corporation Tax Act 2009, in which case there could be an adverse impact on the Company’s economic performance.
Changes to the United Kingdom’s domestic legislation regarding the imposition of interest withholding tax could adversely impact the Company’s tax liability.
The United Kingdom imposes a withholding tax on the payment of interest to certain persons including overseas companies. There are a number of exclusions from the requirement to make a deduction in respect of tax, including the “Quoted Eurobond Exemption,” which applies in respect of certain listed debt securities. The Company currently relies on this exemption and any changes to that regime could have an adverse effect on the Company’s tax liability.
Risks Relating to Taxation––Bermuda Tax Risks
We may become subject to additional tax compliance in Bermuda and other countries should Bermuda be reinstated on the EU’s list of non-cooperative jurisdictions for tax purposes.
The Council of the European Union temporarily added Bermuda to the list of non-cooperative jurisdictions for tax purposes from March 2019 to May 2019, when Bermuda adopted economic substance legislation that the Council of the European Union deemed compliant with its requirements. The Council of the European Union also temporarily added Bermuda to its “grey list” from February 2022 until October 2022. The “grey list” is a list of jurisdictions that have made sufficient commitments to reform their tax practices but remain subject to close monitoring while they are executing on their commitments.
Bermuda taxation applicable to the Company.
The Government of Bermuda has recently passed the Corporate Income Tax Act 2023, conforming to the OECD BEPS Pillar 2 framework, which will impose corporate income tax on certain Bermuda-based entities for fiscal years beginning on or after January 1, 2025. The Corporate Income Tax Act 2023 will apply to any entity incorporated or formed in Bermuda, or that has a permanent place of business in Bermuda, if that entity is a member of an "In Scope MNE Group" (i.e. a group of entities related through ownership and control that has an annual revenue of 750 million euros or more in a fiscal year, pursuant to the consolidated financial statements of the ultimate parent entity, in at least two of the four fiscal years immediately preceding the fiscal year beginning on or after January 1, 2025, and such group includes at least one entity located in a jurisdiction that is not the parent entity's jurisdiction). The Corporate Income Tax Act 2023 could, if applicable to the Company, have a material adverse effect on the Company's financial condition and results of operations.
The Corporate Income Tax Act 2023 provides an exemption (for up to five years) from the tax charging provisions of the legislation for "MNE Groups" with a limited international footprint. This exemption is only available to an "MNE Group" (i) that has constituent entities located in five or fewer jurisdictions outside the "reference jurisdiction" (ii) that has, with respect to all constituent entities in all jurisdictions except the "reference jurisdiction," less than EUR 50 million in tangible assets, and
(iii) no parent entity is required to apply an income inclusion rule ("IIR") with respect to a constituent entity of the "MNE Group" located in Bermuda. The Company intends to operate in a way that will satisfy these requirements with a view to qualifying for the exemption until January 1, 2030. If the Company does not continually qualify for the exemption described above during the five-year period, the Company could, prior to January 1, 2030, become subject to the tax charging provisions of the Corporate Income Tax Act 2023 which could have a material adverse effect on the Company’s financial condition and results of operations.
Prior to the enactment of Bermuda's corporate income tax legislation, the Company obtained from the Bermuda Minister of Finance under the Exempted Undertaking Tax Protection Act 1966, as amended, an assurance that, in the event that Bermuda enacts legislation imposing tax computed on profits, income, any capital asset, gain or appreciation, or any tax in the nature of estate duty or inheritance, the imposition of any such tax shall not be applicable to the Company or any of its operations or its shares, debentures or other obligations, until March 31, 2035. This assurance is subject to the proviso that it is not to be construed so as to prevent the application of any tax or duty to such persons as are ordinarily resident in Bermuda or to prevent the application of any tax payable in accordance with the provisions of the Bermuda Land Tax Act 1967, as amended, or otherwise payable in relation to any property leased to the Company. Given the limited duration of the Bermuda Minister’s assurance, it cannot be certain that the Company (or any of its Bermuda incorporated subsidiaries) will not be subject to any Bermuda tax after March 31, 2035.
Notwithstanding the Exempted Undertakings Tax Protection Act 1966 or the assurance to the Company issued thereunder, beginning January 1, 2025, with respect to Bermuda entities in scope of Bermuda's corporate income tax legislation, liability for tax pursuant to such corporate income tax legislation shall apply notwithstanding any assurance given pursuant to the Exempted Undertakings Tax Protection Act 1966. Any assurance issued prior to January 1, 2024, will be subject to the application of the Corporate Income Tax Act 2023 and the imposition of any tax pursuant thereto. Any assurance issued after January 1, 2024 shall not apply to the imposition of any tax pursuant to the Corporate Income Tax Act 2023. The Company pays annual Bermuda government fees. In addition, all entities employing individuals in Bermuda are required to pay a payroll tax and there are other sundry taxes payable, directly or indirectly, to the Bermuda government.
Risks Relating to Taxation – OECD BEPS Pillar 2
The application of the OECD BEPS Pillar 2 framework could adversely impact the Company’s tax liability.
On July 11, 2023, the U.K. passed legislation conforming to the OECD BEPS Pillar 2 framework which is effective for U.K. domiciled entities beginning on January 1, 2024. The legislation generally requires that U.K. domiciled entities pay a top-up tax for subsidiary companies in non-U.K. jurisdictions whose effective tax rate is less than 15%, Income Inclusion Rule (“IIR”) and a top-up tax for UK domiciled entities whose effective rate is less than 15%, Qualified Domestic Top-up Tax (“QDMTT”). On December 18, 2023, Ireland passed similar conforming legislation, effective January 1, 2024, which is substantially similar to the U.K. legislation. The Irish legislation also included a provision, effective January 1, 2025, that generally requires a top-up tax be paid by Irish entities on related non-Irish entities of a consolidated group that are not already subject to a top-up tax pursuant to the IIR and QDMTT, and have not achieved a minimum tax rate of 15%, Under Tax Payment Rule (“UTPR”). The law includes a provision that exempts consolidated groups from the UTPR until January 1, 2030 so long as they operate in six or less jurisdictions and have less than EUR 50 million in tangible assets. The U.K. passed legislation during 2024, effective January 1, 2025. The effect of the UTPR to Hamilton Group could be to require the Group’s Irish and U.K. entities to pay a top-up tax to Ireland and/or the U.K., respectively, pursuant to an allocation formula prescribed in the applicable legislation unless the Group is eligible for the respective exemption under that jurisdiction's legislation. The exemption is similar to the exemption allowed in Bermuda and accordingly, Hamilton Group intends to meet the exemption requirements for the entirety of the five years and be exempt from applying the UTPR to its Bermuda entities until January 1, 2030. However, no assurance can be made that the Company will meet the requirement in all applicable jurisdictions in future years and could become subject to the UTPR if it does not achieve a 15% effective tax rate, inclusive of any corporate income taxes paid to Bermuda. The Bermuda corporate income tax is expected to limit Hamilton Group’s exposure to UTPR. On January 15th, 2025, the OECD issued additional guidance relating to the calculation of tax liabilities pursuant to the UTPR. Specifically, it provides that the reductions of tax due to the economic transition adjustment (“ETA”) allowed under Bermuda tax law will be limited for calculating the UTPR. The ETA is a provision in the Bermuda law which was intended to provide a fair and equitable transition into the tax regime. As prescribed in the Bermuda law, a fair value calculation of Hamilton Group’s Bermuda assets and liabilities (including certain intangible assets not included in the GAAP balance sheet) was conducted as of September 30, 2023 and to the extent the fair value exceeded the book value, a deferred tax asset (“DTA”) was booked on the Bermuda balance sheet. The DTA is expected to reduce Hamilton Group’s Bermuda tax liability in future years when it becomes subject to the Bermuda Corporate Income Tax regime. The OECD guidance provides that taxable income used to calculate UTPR top-up tax shall only allow for 20% of the total DTA recorded as part of the ETA adjustment and may only recognize this over a two-year period (2025 and 2026). When Hamilton Group becomes subject to the UTPR on its Bermuda earnings, it is possible that it will incur a top-up tax liability if the Bermuda constituent entities do not achieve a 15% minimum effective tax rate.
Risks Related to Regulation
The regulatory framework under which we operate, and potential changes thereto could have a material adverse effect on our business.
Our activities are subject to extensive regulation under the laws and regulations of the United States, the United Kingdom, Ireland and Bermuda, and the other jurisdictions in which we operate. Our operations in each of these jurisdictions are subject to varying degrees of regulation and supervision. The laws and regulations of the jurisdictions in which our insurance and reinsurance subsidiaries are domiciled require, among other things, that these subsidiaries maintain minimum levels of statutory capital, surplus and liquidity, meet solvency standards, submit to periodic examinations of their financial condition and restrict payments of dividends, distributions and reductions of capital in certain circumstances. Statutes, regulations and policies that our insurance and reinsurance subsidiaries are subject to may also restrict the ability of these subsidiaries to write insurance and reinsurance policies, make certain investments and distribute funds.
Although we devote a significant amount of time to ensure compliance with various regulatory requirements, there remains uncertainty as to the impact that certain regulations and legislation could have on us. Such impacts could constrain our ability to move capital between subsidiaries or require additional capital be provided to subsidiaries in certain jurisdictions, which may adversely impact our profitability. In addition, while we currently have excess capital and surplus under applicable capital adequacy requirements, future changes in such requirements or similar regulations may have a material adverse effect on our business, financial condition or results of operations.
One specific supervisor of relevance is Lloyd’s of London, which supervises Syndicate 4000 and Syndicate 1947 (a third-party under HMA’s management). The operations of Syndicate 4000 and 1947 are supervised by Lloyd’s, with the Lloyd’s Franchise
Board being required to approve Syndicate business plans, including maximum underwriting capacity, and may require changes to any business plan presented to it or additional capital to be provided to support underwriting. Lloyd’s also imposes various charges and assessments on its member companies. If Lloyd’s were to require material changes in the Syndicates’ business plans, or if charges and assessments payable by Syndicate 4000 to Lloyd’s were to increase significantly, these events could have an adverse effect on our ability to successfully execute our business strategy.
In addition to the foregoing, our reinsurance and insurance operating subsidiaries may face challenges in maintaining necessary licenses and permits in existing and new territories, potentially at significant costs. We are also subject to a wide variety of laws and regulations, such as insurance and financial industry regulations, economic and trade sanctions, money laundering regulations, and anti-corruption laws, which may increase the costs of regulatory compliance, limit or restrict our ability to do business or engage in certain regulated activities, or subject us to the possibility of regulatory actions or proceedings.
Despite having compliance frameworks in place, full adherence to all laws and regulations cannot be guaranteed and our failure to comply could result in investigations, sanctions, fines, license loss, reputational damage, and other sanctions. Changes in laws or regulatory interpretations could require substantial compliance costs, impacting our operations. Jurisdictions also have the discretion to interpret, amend, grant, renew, or revoke necessary licenses and approvals, potentially affecting our business activities. Furthermore, it is possible that individual jurisdiction or cross-border regulatory developments could adversely differentiate Bermuda, the jurisdiction in which we are subject to group supervision, or could exclude Bermuda-based companies from benefits such as market access, mutual recognition or reciprocal rights made available to other jurisdictions, which could adversely impact us. Any such development could significantly and negatively affect our operations.
Our business is subject to certain laws and regulations relating to sanctions and foreign corrupt practices, the violation of which could adversely affect our operations.
We must comply with all applicable economic sanctions and anti-bribery laws and regulations of the United States and non-U.S. jurisdictions where we operate, including Bermuda, the U.K., Ireland and the EU. U.S. laws and regulations that may be applicable to us, including economic trade sanctions, laws and regulations administered by the Office of Foreign Assets Control, or OFAC, as well as certain laws administered by the U.S. Department of State. The sanctions laws and regulations of non-U.S. jurisdictions in which we operate may differ to some degree from those of the United States and these differences may additionally expose us to sanctions violations. These laws and regulations are complex, frequently changing, and increasing in number, and they may impose additional prohibitions or compliance obligations on our dealings in certain countries and territories.
In addition, we are subject to the Foreign Corrupt Practices Act of 1977 and other anti-bribery laws such as the Irish Criminal Justice (Corruption Offences) Act, the Bermuda Bribery Act and the U.K. Bribery Act, that generally prohibit corrupt payments or improper gifts to non-U.S. governments or officials. It is possible that an employee or intermediary could fail to comply with applicable laws and regulations. In such event, we could be exposed to civil penalties, criminal penalties and other sanctions, including fines or other punitive actions. In addition, such violations could damage our business and our reputation. Such criminal or civil sanctions, penalties, other sanctions, and damage to our business and reputation could adversely affect our financial condition and results of operations.
Our business is subject to cybersecurity, privacy and data protection laws, rules and regulations in the jurisdictions in which we operate, which can increase the cost of doing business, compliance risks and potential liability.
We are subject to complex and evolving cybersecurity, privacy and data protection laws, rules and regulations (“Privacy and Information Security Laws”) across multiple jurisdictions. The variety of applicable Privacy and Information Security Laws exposes us to heightened regulatory scrutiny and requires us to incur significant technical, legal and other expenses in an effort to ensure and maintain compliance and will continue to impact our business in the future by increasing legal, operational and compliance costs.
Our compliance efforts are further complicated by the fact that Privacy and Information Security Laws around the world are rapidly evolving, may be subject to uncertain or inconsistent interpretations and enforcement, and may conflict among various jurisdictions. Just within the United States, there are numerous federal, state and local cybersecurity, privacy and data protection laws, regulations and rules governing the collection, sharing, use, retention, disclosure, security, transfer, storage and other processing of personal information, including federal and state cybersecurity, privacy and data protection laws, data breach notification laws, and data disposal laws. Similar laws and regulations have been passed in other jurisdictions in which we operate, such as Bermuda and the EU. The rapidly evolving and often conflicting Privacy and Information Security Laws create
compliance challenges which could lead to increased regulatory scrutiny, litigation, requirements to modify or cease certain operations or practices, the expenditure of substantial costs, time and other resources.
Any failure or perceived failure to comply with our privacy policies, or applicable cybersecurity, privacy and data protection laws, regulations, rules, standards or contractual obligations, or any compromise of security that results in unauthorized access to, or unauthorized loss, destruction, use, modification, acquisition, disclosure, release or transfer of personal information, may lead to significant fines, judgments, awards, penalties, sanctions, reputational harm, increased regulatory scrutiny, litigation, requirements to modify or cease certain operations or practices, the expenditure of substantial costs, time and other resources, proceedings or actions against us, governmental investigations, enforcement actions, or other liability. Any of the foregoing could distract our management and technical personnel, increase our costs of doing business, and ultimately result in the imposition of liability, any of which could have a material adverse effect on our business, financial condition and results of operations.
New laws and regulations may affect our ability to compete effectively.
We are subject to extensive and evolving regulations in all the markets in which we operate. Changes in laws and regulations, including, but not limited to, those relating to solvency standards, capital requirements, data privacy and cybersecurity and climate-related disclosures could materially affect our business, financial condition, and results of operations. The adoption of new laws or amendments to existing regulations may increase compliance costs, limit our ability to introduce new products, restrict underwriting or pricing practices, or require modifications to our existing policies and systems. Additionally, inconsistent regulatory approaches across jurisdictions may create operational complexity and increase the risk of non-compliance. If we fail to comply with new or amended laws, we could face fines, penalties, reputational harm, or other adverse effects that could significantly impact our business performance.
In particular, as the insurance industry is experiencing an increased reliance on the use of AI technologies, specifically in the areas of underwriting, claims processing, and customer service, there have been increases in regulatory scrutiny on such techniques. As a result, regulatory authorities at both domestic and international levels may seek to impose stricter requirements on transparency, explainability, and non-discriminatory decision-making. Certain state and federal lawmakers, insurance regulators, and advisory groups are developing, or have developed, regulations or guidance applicable to insurance companies that use artificial intelligence, “big data” techniques, machine learning and predictive models in their operations. Compliance with such laws, the EU’s proposed AI Act or other potential U.S. federal and state regulations could necessitate changes in our models, increase operational costs, or limit the deployment of certain automated processes. Failure to adequately address these regulations could also result in enforcement actions, fines, reputational harm, and adverse impacts on our financial condition and business operations.
In addition, as we are incorporated in Bermuda and have certain operating companies which are domiciled in Bermuda any changes in Bermuda law and regulation may have an adverse impact on our operations, such as the imposition of tax liability, increased regulatory supervision or changes in regulation. In addition, we are subject to changes in the political environment in Bermuda, which could make it difficult to operate in, or attract talent to, Bermuda. In addition, Bermuda, which is currently an overseas territory of the United Kingdom, may consider changes to its relationship with the United Kingdom in the future. These changes could adversely affect Bermuda or the international reinsurance market focused there.
Our failure to adequately address any of these regulations could result in enforcement actions, fines, reputational harm, and adverse impacts on our financial condition and business operations. It is difficult to predict the impact laws and regulations adopted in certain jurisdictions may have on the financial markets generally or our business and it is possible such laws and regulations may significantly alter our business practices. See “Business—Regulation" above.
Changes in accounting practices and future pronouncements may materially affect our reported financial results.
Developments in accounting practices may require us to incur considerable additional expenses to comply, particularly if we are required to prepare information relating to prior periods for comparative purposes or to apply the new requirements retroactively. The impact of changes in current accounting practices and future pronouncements cannot be predicted but may affect the calculation of net income, shareholders’ equity and other relevant financial statement line items.
Our insurance subsidiaries are required to comply with statutory accounting principles, or SAP. SAP and various components of SAP are subject to constant review by the National Association of Insurance Commissioners, or NAIC, and its task forces and committees, as well as state insurance departments, in an effort to address emerging issues and otherwise improve financial reporting. Various proposals are pending before committees and task forces of the NAIC, some of which, if enacted and adopted on a state level, could have negative effects on insurance industry participants. The NAIC continuously examines existing laws and regulations. We cannot predict whether or in what form such reforms will be enacted and, if so, whether the enacted reforms will positively or negatively affect us.
We may be subject to significant legal, governmental or regulatory proceedings.
In the normal course of our business, we are subject to regulatory and governmental investigations and civil actions, litigation and other forms of dispute resolution in various jurisdictions. Additionally, from time to time, various regulatory and governmental agencies review the transactions and practices of us and our subsidiaries and in connection with industry-wide and other inquiries into, among other matters, the business practices of current and former operating insurance company subsidiaries. Such investigations, inquiries or examinations may develop into administrative, civil or criminal proceedings or enforcement actions, including class-actions, in which remedies could include fines, penalties, restitution, remedial actions, enhanced supervision or alterations in our business practices, and could result in additional expenses, limitations on certain business activities and reputational damage. For a discussion of certain legal proceedings, see Note 15, Commitments and Contingencies to the audited consolidated financial statements.
We are a holding company with no direct operations, and our insurance and reinsurance subsidiaries’ ability to pay dividends and other distributions to us is restricted by law.
Hamilton Group is an insurance holding company with no business operations of its own and is a legal entity separate from our subsidiaries. Therefore our ability to pay corporate operating expenses, to make interest and principal payments due on outstanding debt and other obligations, to pay taxes and to make other investments is largely dependent on dividends, other distributions, and other permitted payments from our subsidiaries, Hamilton Re, Hamilton UK Holdings Limited and Hamilton UK Holdings II Limited (collectively with HMA, “Hamilton U.K.”), HIDAC and Hamilton Select. The payment of dividends, other distributions or other permitted payments by these subsidiaries is subject to local corporate and regulatory restrictions. Each of Hamilton Re, Hamilton U.K., HIDAC, and Hamilton Select must comply with their respective Bermuda, U.K., Ireland, and Delaware regulations, which require maintaining specific levels of capital and surplus. Dividend payments are further limited to that part of available policyholder surplus that is derived from net profits on our business.
The insurance regulators have broad powers to prevent the reduction of capital and surplus to inadequate levels, and there is no assurance that dividends up to the maximum amounts calculated under any applicable formula would be permitted. Moreover, insurance regulators that have jurisdiction over the payment of dividends by our insurance subsidiaries may in the future adopt provisions more restrictive than those currently in effect. The inability of Hamilton Group to receive such dividends, distributions or other payments from our subsidiaries due to regulatory or other reasons, could have a material adverse effect on our business, results of operations, financial condition and liquidity and restrict our ability to meet our obligations.
Risks Related to our Status as a Public Company and Ownership of Our Class B Common Share
Fulfilling our obligations incident to being a public company is expensive and time consuming.
As a public company, we are subject to the reporting, accounting and corporate governance requirements of the Exchange Act, the Sarbanes-Oxley Act and the NYSE which impose certain compliance requirements, costs and obligations upon us. The expenses associated with being a public company include those related to auditing, accounting and legal fees, investor relations, directors’ fees and director and officer liability insurance costs, registrar and transfer agent fees and listing fees, as well as other expenses. For example, the Exchange Act requires us to file annual, quarterly and current reports with respect to our business and financial condition within specified time periods and to prepare a proxy statement with respect to our annual meeting of shareholders. The Sarbanes-Oxley Act requires that we maintain effective disclosure controls and procedures, and internal controls over financial reporting. The NYSE requires that we comply with various corporate governance requirements. To maintain and improve the effectiveness of our disclosure controls and procedures and internal controls over financial reporting and comply with the Exchange Act and the NYSE requirements, significant resources and management oversight are required. This may divert management’s attention from other business concerns and lead to significant costs associated with compliance, which could have a material adverse effect on us and the price of our Class B common shares.
These reporting, accounting and corporate governance rules and regulations have increased our legal and financial compliance costs and have increased the time our employees spend such tasks. These laws and regulations could also make it more difficult or costly for us to obtain certain types of insurance, including director and officer liability insurance, and we may be forced to accept reduced policy limits and coverage or incur substantially higher costs to obtain the same or similar coverage. These laws and regulations could also make it more difficult for us to attract and retain qualified persons to serve on our Board of Directors or its committees or as our executive officers. Advocacy efforts by stockholders and third parties may also prompt even more changes in governance and reporting requirements. We cannot predict or estimate the amount of additional costs we may incur or the timing of these costs. Furthermore, if we are unable to satisfy our obligations as a public company, we could be subject to delisting of our common shares, fines, sanctions and other regulatory action, and potentially civil litigation. Any such action could harm our reputation and the confidence of investors in, and clients of, our Company and could negatively affect our business and cause the price of our Class B common shares to decline.
There are provisions in our Bye-laws that may reduce the voting rights of the Class B common shares.
Our Bye-laws generally provide that the Class A and Class B shareholders have one vote per common share held by them and are entitled to vote together as a single class on all matters on which shareholders are entitled to vote generally, except as otherwise required by law or by our Bye-laws to vote as separate classes. For example, only holders of our Class B common shares may vote for the election or removal of directors, other than for directors who are appointed by certain shareholders pursuant to the Shareholders Agreement and our Bye-laws. Our Bye-laws provide a mechanism under which we shall, before a vote of the shareholders on any matter, in certain circumstances reallocate a proportion of the voting rights held by or attributed to certain shareholders among other shareholders so as to ensure that those certain shareholders and their affiliates are not deemed to own shares possessing voting power comprising more than 9.5% of the total combined voting power conferred by the common shares (or, in the case of holders of our Class B common shares when voting as a class (for example, in respect of the election or removal of directors other than for directors who are appointed by certain shareholders pursuant to the Shareholders Agreement and our Bye-laws), such voting power may be reduced to a maximum of 14.92% of the total combined voting power, calculated by multiplying (a) 9.5% and (b) the quotient reached by dividing (x) the total number of directors by (y) the number of directors elected by holders of Class B common shares, to avoid certain adverse tax, legal or regulatory consequences (each, “a share voting limitation violation”). Under these provisions, some shareholders may have the right to exercise their voting rights limited to less than one vote per common share that they own. Moreover, these provisions could have the effect of reducing the voting power of some shareholders who would not otherwise be subject to the limitation by virtue of their direct Class B common share ownership. We are not obligated to provide notice to a shareholder of any adjustment to its voting power that results (or may result) from the application of the voting cutback.
In addition, our Board of Directors may, in its absolute discretion, make adjustments to the voting power of its shares to the extent necessary or advisable in order (i) to prevent (or reduce the magnitude of) a share voting limitation violation and (ii) to avoid adverse tax, legal or regulatory consequences to the Company, any subsidiary of the Company or any shareholder or its affiliates.
The multiple class structure of our common shares may limit investors’ ability to influence corporate matters.
Each Class A common share and Class B common share is generally entitled to one vote per share as outlined above, while our Class C common shares have no voting rights, except as otherwise required by law. Our Class C common shares will automatically convert into shares of our Class B common shares, on a share-for-share basis, upon future transfers (unless transferred to a permitted transferee as provided in our Bye-laws). In addition, our Bye-laws provide that, upon request from a holder of Class C common shares to the Company and upon approval of such request by our Board of Directors, such Class C common shares shall be redesignated as Class B common shares. If holders of our non-voting Class C common shares effectuate transfers that result in conversion of Class C common shares to Class B common shares or if Class C common shares are redesignated as Class B common shares upon request from a holder of Class C common shares and approved by our Board of Directors, this will have the effect of decreasing the voting power of the holders of our Class B common shares, which may limit the ability of holders of Class B common shares to influence corporate matters.
Anti-takeover provisions in our Bye-laws could delay management changes or limit share price.
As the Company is incorporated under the laws of Bermuda, it is subject to Bermuda law. The English Takeover Code (the “Takeover Code”) will not apply to the Company. Subject to limited exceptions, Bermuda law does not contain any provisions similar to those applicable in other jurisdictions which are designed to regulate the way in which takeovers are conducted. It is therefore possible that an offeror may gain control of the Company in circumstances where non-selling shareholders do not receive, or are not given the opportunity to receive, the benefit of any control premium paid to selling shareholders. The Bye-laws contain certain anti-takeover provisions, although these will not provide the full protections afforded by the Takeover Code. These provisions provide for:
•requiring advance notice for shareholder proposals and nominations for persons to serve as directors and placing limitations on shareholders to submit resolutions to a shareholder vote and requisition special general meetings;
•a large number of authorized but unissued shares which may be issued by the Board of Directors without further shareholder action;
•requiring majority of the Board of Directors voting in the affirmative and directors representing less than fifteen percent of the entire Board of Directors voting in opposition to enter into or consummate any transaction or series of transactions involving a merger, amalgamation, consolidation, exchange, scheme of arrangement, recapitalization or similar business combination transaction, other than any merger or consolidation solely between or among any two or more of the Company’s wholly-owned subsidiaries that are not material subsidiaries; and
•requiring majority of the Board of Directors voting in the affirmative and directors representing less than fifteen percent of the entire Board of Directors voting in opposition to enter into or consummate any transaction or series of transactions involving any sale, pledge, transfer or other disposition of all or substantially all of the consolidated assets of the Company and its subsidiaries.
These provisions in our Bye-laws may discourage takeover offers which would be considered favorable and that could in turn adversely affect the value of the Class B common shares. Even in the absence of a takeover attempt, these provisions may adversely affect the value of the Class B common shares if they are viewed as discouraging takeover attempts in the future.
Investors may have difficulties in serving process or enforcing judgments against us in the United States.
We are incorporated under the laws of Bermuda and a substantial portion of our assets are located outside the United States. As a result, it may not be possible to enforce court judgments of U.S. courts, including judgments predicated upon civil liability provisions of the U.S. federal securities law. For enforcement of any judgment against the Company or its directors or officers, or for the settlement of any dispute, it may be necessary to institute legal proceedings outside the United States, and no assurances can be given that any such proceedings can be initiated. No claim may be brought in Bermuda against the Company or its directors and officers in the first instance for violation of U.S. federal securities laws. If such proceedings are initiated, there may be doubt as to the enforceability in non-U.S. jurisdictions, either in original actions or for enforcement of judgments of U.S. courts, for liabilities predicated upon U.S. federal securities laws.
Because we have no current plans to pay cash dividends on our Class B common shares for the foreseeable future, investors may not receive any return on investment unless they sell their Class B common shares for a price greater than that which they paid for such shares.
We have not declared or paid any cash dividends on our Class B common shares, and we do not intend to pay any cash dividends in the foreseeable future. We expect to retain future earnings, if any, to fund the development and growth of our business. Any decision to declare and pay dividends in the future will be made at the sole discretion of our Board of Directors and will depend on, among others, our results of operations, financial condition, cash requirements, contractual restrictions pursuant to our debt agreements, our indebtedness, restrictions imposed by applicable law and other factors that our Board of Directors may deem relevant, including, but not limited to, applicable law. In addition, our ability to pay dividends may be limited by covenants of any existing and future outstanding indebtedness we or our subsidiaries incur. As a result, the only way for investors to receive a return on an investment in our Class B common shares is to sell their shares for a price greater than that which they paid for such shares, which may never occur. Investors seeking immediate cash dividends should not purchase our Class B common shares.
Members of the Board of Directors may be permitted to participate in decisions in which they have interests that are different from those of the shareholders.
Under Bermuda law, directors are not required to recuse themselves from voting on matters in which they have an interest. The Company’s directors may have interests that are different from, or in addition to, the interests of the shareholders. So long as the directors disclose their interests in a matter under consideration by the Board of Directors in accordance with Bermuda law, they may be entitled to count towards the quorum, participate in the deliberation on and vote in respect of that matter.
Shareholders may have more difficulty protecting their interests than shareholders in other jurisdictions.
The rights of shareholders under Bermuda law are not as extensive as the rights of shareholders under legislation or judicial precedent in many other jurisdictions. Class actions and derivative actions are generally not available to shareholders under Bermuda law. However, Bermuda courts ordinarily would be expected to follow English case law precedent, which would permit a shareholder to commence an action in the name of a company to remedy a wrong done to a company where the act complained of is alleged to be beyond the corporate power of a company, is illegal or would result in the violation of that company’s memorandum of association or bye-laws. Furthermore, consideration would be given by a Bermuda court to acts that are alleged to constitute a fraud against the minority shareholders or where an act requires the approval of a greater percentage of the Company’s shareholders than actually approved it. The winning party in such an action generally would be able to recover a portion of attorneys’ fees incurred in connection with such action. The Bye-laws provide that holders of our common shares waive all claims or rights of action that they might have, individually or in the Company’s right, against any director or officer for any act or failure to act in the performance of such director’s or officer’s duties, except with respect to any fraud or dishonesty of such director or officer.
Item 1B. Unresolved Staff Comments
None.
Item 1C. Cybersecurity
Managing risk related to cybersecurity is a top priority for Hamilton, and we concentrate on assessing, identifying, and managing material risks associated with “cybersecurity threats,” as such term is defined in Item 106(a) of Regulation S-K. Both our management and Board of Directors recognize the importance of developing, implementing and maintaining appropriate cybersecurity measures and, as described below, are actively involved in cybersecurity and overall enterprise risk management.
Cybersecurity Risk Management and Strategy
We maintain a cybersecurity risk management program that is an important part of, and integrated into, our enterprise risk management function. The program is designed to assess, identify, manage and protect our information systems and data from unauthorized access, use, disclosure, disruption, modification or destruction. Identifying, assessing, and managing cybersecurity risk shares common methodologies, reporting channels and governance processes that apply across our risk management process, including other legal, compliance, strategic, operational and financial risk areas.
We have implemented and maintain several safeguards and processes designed to identify cybersecurity risks and protect our information systems from cybersecurity threats. For example, we have implemented internal IT general controls such as data encryption, monitoring, data storage, identity / authentication controls and anti-malware and anti-virus solutions. We also routinely conduct internal IT audits around our cybersecurity posture as well as scenario-based cybersecurity risk assessments to ensure the right controls are in place to address identified risks. To protect against, detect, and respond to cybersecurity incidents, we, among other things, require our employees to undergo annual cybersecurity awareness training, monitor emerging laws and regulations related to data protection and information security and utilize a variety of multilayered technical tools to conduct proactive privacy and cybersecurity vulnerability assessments of our systems and applications, including scanning for and resolving open tickets. Additionally, to stay current on cybersecurity matters affecting the insurance industry and the marketplace in general, our Chief Information Security Officer & Global Head of IT Operations ("CISO") is an active member of the ISC2 organization and regularly participates in cybersecurity-focused conferences and forums, including serving on the Chief Information Security Officers Committee of Lloyd’s Market Association.
Senior management, including our Chief Technology Officer & Chief Data Officer ("CTO") and our CISO, in coordination with our legal and compliance teams, are responsible for implementing our cybersecurity risk management program, as well as being involved in all aspects of incident response and breach management processes. These processes involve six stages: 1) detection, 2) analysis, 3) containment, 4) eradication, 5) recovery, and 6) notification. Security events and data incidents are evaluated for severity and impact on our operations, business, and data, and our response is prioritized accordingly. Our security team collaborates with stakeholders across the Company and forms strategies for addressing identified issues. This involves regularly testing, as part of our business continuity and disaster recovery strategies, our ability to restore our systems if they are impacted by a cybersecurity event or incident. In addition, as part of the foregoing processes, we annually engage third-party advisors to perform penetration tests against our infrastructure.
As part of our risk management program, we also assess third-party risks, including risks posed by vendors, suppliers, and other business partners. Cybersecurity practices and risks are evaluated when selecting third-party service providers and when negotiating contractual provisions related to security and privacy, including information security audit rights. Specifically, before engaging new critical IT vendors, we require them to complete questionnaires concerning their IT and security processes, controls, and certifications. The responses in these questionnaires are then reviewed by our CISO and assessed against a checklist of minimum requirements that must be met for Hamilton to consider the service provider to be a vendor of trust whose services may be used by our organization. Thereafter, we annually follow up with approved vendors for updated certifications.
As discussed above, we maintain an incident response plan to address cybersecurity incidents, which identifies key stakeholders, defines escalation processes and sets the thresholds above which our cybersecurity, legal and crisis management teams will inform senior management as well as our Board of Directors of a cybersecurity incident. For cybersecurity incidents below these crisis thresholds, we maintain subordinate incident response plans and standard operating procedures used by our security incident response team. Although we identify and respond to small security events and risks as a normal part of our cybersecurity risk management processes, to date, we are not aware of any direct or third-party cybersecurity incidents or otherwise identified any ongoing or previous risks from cybersecurity threats that have materially affected or are reasonably likely to materially affect Hamilton, including its business strategy, results of operations, or financial condition.
While there have been no material cybersecurity incidents that have affected Hamilton for the period covered by this annual report, there can be no guarantee that (i) our policies and procedures will be properly followed in every instance or that those policies and procedures will be effective or (ii) that there will not be incidents in the future or that they will not materially affect us, including our strategy, results of operations, or financial condition. For a further discussion of the risks associated with cybersecurity threats see "Risk Factors—Risks Related to Our Business and Industry—We are subject to cybersecurity risks, including cyber-attacks, security breaches and other similar incidents with respect to our and our service providers’ information technology systems, which could result in regulatory scrutiny, legal liability or reputational harm, and we may incur increasing costs to minimize those risks” and "Risk Factors—Risks Related to Regulation—Our business is subject to cybersecurity, privacy and data protection laws, rules and regulations in the jurisdictions in which we operate, which can increase the cost of doing business, compliance risks and potential liability."
Cybersecurity Board Oversight and Governance
Cybersecurity is important to our Board of Directors and management. On a quarterly basis, our CISO reports on cybersecurity matters to a risk committee comprised of a cross-functional management team (“Risk Committee”). He has reported on, among other things, cybersecurity risks and incidents, a business continuity and disaster recovery exercise, completed and ongoing cyber audits, security metrics and key performance indicators, penetration testing results and remediation progress, the status of Hamilton’s data governance program, and cyber insurance coverage. The Risk Committee escalates important issues identified in these reports to our Audit Committee, to which our full Board of Directors, while having ultimate responsibility for risk management oversight generally, has delegated primary oversight of cybersecurity risks. In addition to quarterly reports to the Risk Committee, senior management, including our CTO and CISO, are responsible for directly reporting to the Audit Committee on cybersecurity matters. This includes reporting, on a quarterly basis and as significant matters arise, about existing and new cybersecurity risks, how management is addressing and/or mitigating those risks, cybersecurity and data privacy incidents (if any), and status on key information security initiatives. The Audit Committee convenes prior to each quarterly Board meeting to discuss cybersecurity risks and other information security matters. The Audit Committee also periodically reviews our processes and policies for managing material risks from cybersecurity threats. Any material risks, cybersecurity incidents or other matters are subsequently discussed with the full Board at the Board meeting.
The members of senior management involved in managing our material risks from cybersecurity threats have extensive cybersecurity and IT experience. For example, prior to joining Hamilton, over the past two and a half decades, our CTO has held leadership roles in the areas of software development, IT governance, IT operations, and security operations, ranging from executive director to chief technology officer. This experience spanned various companies, including an expert network/knowledge broker, an educational publishing company, a financial data vendor, a media conglomerate, and an investment bank. Among other things, he has provided leadership in building out global technology platforms, which have operated with multi-jurisdictional cybersecurity policies. He holds a Bachelor of Science degree in electronics and communications engineering, holds a Master’s degree in computer science, is a Certified Information Systems Security Professional and serves as a director on the board of ACORD, which is an organization responsible for setting digital standards for insurance and reinsurance companies globally.
Our CISO has two decades of professional experience in various senior roles, such as Linux information systems engineer, Senior Network Engineer, Director of IT, Senior Leader Infrastructure Engineering and VP/CTO, within the financial services industry. He holds a Bachelor’s degree in computer and network science and an electronics engineering degree.
Item 2. Properties
We lease office space in Bermuda, which houses our headquarters and principal executive offices, as well as in other locations throughout the U.S., U.K. and Ireland. We believe that our current office space is sufficient for us to conduct our operations, although our needs may change in the future. To date, the cost of acquiring and maintaining our office space has not been material to us as a whole.
Item 3. Legal Proceedings
The information required by this Item relating to legal proceedings is incorporated herein by reference to information included in Note 15, Commitments and Contingencies of the accompanying notes to our accompanying audited consolidated financial statements.
Item 4. Mine Safety Disclosures
None.
Part II
Item 5. Market for Registrant's Common Equity, Related Stockholder Matters and Issuer Purchases of Equity Securities
Market Information and Number of Holders
Our Class B common shares began trading on the NYSE under the symbol "HG" on November 13, 2023. Prior to that time, there was no public market for our common shares. As of February 20, 2025, there were approximately 2, 154 and 3 holders of record of our Class A, B and C common shares, respectively. These figures do not represent the actual number of beneficial owners of our common shares because shares are frequently held in "street name" by securities dealers and other financial institutions on behalf of our shareholders. Our Class A and Class C common shares are not listed or traded on any securities exchange and there is currently no established public trading market for our Class A or C common shares.
Dividends
We have not declared or paid any dividends on any class of our common shares to date. We anticipate that we will retain our future earnings to finance the further development and expansion of our business and do not intend to declare or pay cash dividends in the foreseeable future. Any future determination to pay dividends will be at the discretion of our Board of Directors, subject to applicable laws, and will depend on our financial condition, results of operations, capital requirements, general business conditions and future agreements and financing instruments, business prospects, and such other factors that our Board of Directors deems relevant. Our ability to pay cash dividends on our Class B common shares may also be limited by the terms of the existing (or future) agreements governing our indebtedness as well as any future debt securities we may issue.
Performance Graph
The following graph compares the cumulative total shareholder return on our Class B common shares from November 13, 2023 to December 31, 2024, to the cumulative total return, assuming reinvestment of dividends, of (1) S&P 500 Composite Stock Index ("S&P 500") and (2) the S&P 500 Property & Casualty Insurance Index ("S&P 500 P&C"). The share price performance presented below is not necessarily indicative of future results.
Issuer Repurchases of Equity Securities
Set forth below is information regarding securities issued or granted by us during the period covered by this Annual Report on Form 10-K that were not registered under the Securities Act.
| | | | | | | | | | | | | | | | | | | | | | | | | | | | | | | | | | | | | | | | | | | | |
| | Shares purchased under publicly announced repurchase program(1) | | Other shares purchased(2) | | Total shares purchased | | Maximum $ amount still available under repurchase program |
| ($ in thousands, except per share information) | | Shares | | Average price per share | | Shares | | Average price per share | | Shares | | Average price per share | |
| Available for repurchase | | | | | | | | | | | | | | $ | 139,998 | |
| October 1 - 31, 2024 | | — | | | $ | — | | | — | | | $ | — | | | — | | | $ | — | | | $ | 139,998 | |
| November 1 - 30, 2024 | | 251,595 | | | $ | 18.56 | | | 500,195 | | | $ | 17.80 | | | 751,790 | | | $ | 18.05 | | | $ | 135,328 | |
| December 1 - 31, 2024 | | 704,169 | | | $ | 19.01 | | | — | | | $ | — | | | 704,169 | | | $ | 19.01 | | | $ | 121,942 | |
| Total | | 955,764 | | | | | 500,195 | | | | | 1,455,959 | | | | | $ | 121,942 | |
(1) On August 7, 2024, the Board of Directors authorized the repurchase of the Company's common shares in the aggregate amount of $150 million (the “Authorization”). The Company may repurchase shares through open market repurchases and/or privately negotiated transactions. The Authorization will expire when the Company has repurchased the full value of shares authorized, unless terminated earlier by the Board of Directors. To the extent there is any repurchase activity under the Authorization, it is disclosed in Note 11, Share Capital. Repurchases under the Authorization totaled $18.1 million for the quarter ended December 31, 2024.
(2) Other shares purchased represents common shares repurchased and cancelled in respect of withholding tax obligations on vested awards.
Item 6. Reserved
Item 7. Management's Discussion and Analysis of Financial Condition and Results of Operations
The following discussion and analysis should be read in conjunction with the "Selected Consolidated Financial Data" and our audited consolidated financial statements and related notes thereto included in the Group's Annual Report on Form 10-K (the "Form 10-K"). In addition to historical information, this discussion contains forward-looking statements that involve risks, uncertainties and assumptions that could cause actual results to differ materially from management’s expectations. Factors that could cause such differences are discussed in the sections entitled "Special Note Regarding Forward-Looking Statements" and "Risk Factors" in the Form 10-K. We do not undertake any obligation to update any forward-looking statements or other statements we may make in the following discussion or elsewhere in this document even though these statements may be affected by events or circumstances occurring after the forward-looking statements or other statements were made.
Index To Management's Discussion and Analysis of Financial Condition and Results of Operations
Overview
We are a global specialty insurance and reinsurance company founded in Bermuda in 2013, enhanced by data and technology, focused on producing sustainable underwriting profitability and delivering significant shareholder value. We intend to continue growing our diverse book of business by responding to changing market conditions, prudently managing our capital, and driving sustainable shareholder returns.
We harness multiple drivers to create shareholder value, including diverse underwriting operations supported by proprietary technology and a team of over 600 full-time employees, a strong balance sheet, and a unique investment management relationship with Two Sigma. We operate globally, with underwriting operations in London, Dublin, Bermuda and across the United States.
We operate three principal underwriting platforms (Hamilton Global Specialty, Hamilton Select and Hamilton Re) that are categorized into two reporting business segments (International and Bermuda):
•International: International consists of business written out of our Lloyd’s syndicate and subsidiaries based in the United Kingdom, Ireland, and the United States, and includes the Hamilton Global Specialty and Hamilton Select platforms.
•Hamilton Global Specialty focuses predominantly on commercial specialty and casualty insurance for medium to large-sized accounts and specialty reinsurance products written by Lloyd’s Syndicate 4000 and HIDAC. Syndicate 4000, a leading Lloyd’s syndicate, generates a significant portion of premium from the U.S. E&S market and has ranked among the most profitable and least volatile syndicates at Lloyd’s over the last 10 years.
•Hamilton Select, our U.S. domestic E&S carrier, writes casualty insurance for small to mid-sized clients in the hard-to-place niche of the U.S. E&S market. We believe it presents meaningful and profitable growth opportunities in the near-to-long term, further expanding our footprint in the U.S. E&S market.
•Bermuda: Bermuda consists of the Hamilton Re platform, made up of Hamilton Re and Hamilton Re US. Hamilton Re writes property, casualty and specialty reinsurance business on a global basis and also offers high excess Bermuda market specialty insurance products, predominantly for large U.S. commercial risks. Hamilton Re US writes casualty and specialty reinsurance business on a global basis.
We seek to prudently manage our capital with the objective of effectively navigating different market conditions and generating strong underwriting margins throughout all market cycles. Our scaled and diversified platforms and product offerings, and our broad industry relationships provide significant opportunity to underwrite our chosen classes of property, casualty and specialty insurance and reinsurance as market opportunities arise. Leveraging our disciplined underwriting approach, balance sheet strength and flexibility and real-time technology prowess, we can respond dynamically to capture opportunities as markets evolve.
One of our key strategic priorities is sustainable underwriting profitability across the business we write. Our data-driven and disciplined underwriting processes position us to intelligently price and structure our products and our business portfolio. We maintain trusted and long-standing relationships with our clients and brokers, who we believe will continue to provide us with increased access to attractive business.
We see growth opportunities in both the insurance and reinsurance markets in which we operate and intend to pursue disciplined growth across our underwriting platforms. In recent years the E&S market has benefited from a strong rate environment and increased submissions as business has shifted into the non-admitted market from the admitted market. Non-admitted insurers are able to cover unique and hard-to-place risks because they have flexibility of rate and form and can accommodate the unique needs of insureds who are unable to obtain coverage from admitted carriers. We believe the access our three underwriting platforms have to U.S. E&S insurance business will allow us to build a robust and diversified book of business and achieve our profitable growth objectives throughout various market cycles.
Reinsurance business continues to offer a particularly attractive opportunity given the strong rating environment and discipline in the market and is expected to accelerate growth opportunities for us in the near term in many areas. A number of factors, including economic and social inflation and the frequency and severity of natural catastrophe events created the strongest market conditions seen in decades. We are a recognized market with deep client and broker relationships, low counter-party credit concentration with many of our insurance partners and a recent rating upgrade to "A" from A.M. Best, providing ample headroom for us to grow. We are well positioned to deploy capital quickly, efficiently and profitably through writing more reinsurance business, as well as retaining more of our own business.
Our strong, sustainable underwriting operations are complemented by our unique investment portfolio, which consists of the Two Sigma Hamilton Fund, LLC ("TS Hamilton Fund" or "TSHF"), and our investment grade fixed income portfolio, which is currently benefiting from strong interest rates. We plan to continue to optimize our investment portfolio through a balanced allocation of invested assets and maintain the flexibility to adjust this allocation as needed. We believe our strategy of disciplined underwriting growth, balanced with our investment platform, will drive our ability to create shareholder value.
We have a unique and long-term investment management relationship with Two Sigma. Founded in 2001, Two Sigma is a premier investment manager with a strong track record, driven by a differentiated application of technology and data science. The TS Hamilton Fund is a dedicated fund-of-one managed by Two Sigma with exposures to certain Two Sigma macro and equity strategies and is designed to provide low-correlated absolute returns, primarily by combining multiple hedged and leveraged systematic investment strategies with proprietary risk management investment optimization and execution techniques. The TS Hamilton Fund invests in a broad set of financial instruments and is primarily focused on liquid strategies in global equity, FX markets, exchange-listed and over the counter options (and their underlying instruments) and other derivatives. This liquidity profile fits well with our business, while also providing the benefit of access to a dedicated fund-of-one.
Two Sigma has broad discretion to allocate invested assets to different opportunities. At December 31, 2024, its investments include Two Sigma Futures Portfolio, LLC ("FTV"), Two Sigma Spectrum Portfolio, LLC ("STV") and Two Sigma Equity Spectrum Portfolio, LLC ("ESTV"). The TS Hamilton Fund’s trading and investment activities are not limited to these strategies and techniques and the TS Hamilton Fund is permitted to pursue any investment strategy and/or technique that Two Sigma determines in its sole discretion to be appropriate for the TS Hamilton Fund from time to time.
Effects of Inflation
Historically, inflation has not had a material effect on the Company’s consolidated results of operations. However, over the last several years, global economic inflation has increased, and there is a risk that it will remain elevated for an extended period. Inflation is subject to many macroeconomic factors beyond our control, including global banking policy, political risks and supply chain issues. An inflationary economy may result in higher losses and loss adjustment expenses, negatively impact the performance of our fixed income security investment portfolio, or increase our operating expenses, among other unfavorable effects. The ultimate effects of an inflationary or deflationary period are subject to high uncertainty and cannot be accurately estimated until the actual costs are known.
In the wake of a catastrophe loss there is a risk of specific inflationary pressures in the local economy, which is considered in our catastrophe loss models. Similarly, the Company incorporates the anticipated effects of inflation in our ultimate estimate of the reserves for unpaid losses and loss adjustment expenses on certain long-tail lines of business. As with general economic inflation, the actual effects of inflation on reserves for losses and loss adjustment expenses and results of operations cannot be accurately known until all of the underlying claims are ultimately settled.
Taxes
On December 27, 2023, the Bermuda Government enacted a 15% corporate income tax that generally became effective for Bermuda domiciled entities on or after January 1, 2025. The legislation defers the effective date until January 1, 2030 for so long as the consolidated group operates in six or fewer jurisdictions, has less than €50 million in tangible assets and none of its Bermuda entities are subject to the Income Inclusion Rule in any other jurisdiction. The act is a response to the OECD Pillar 2 worldwide minimum tax that would otherwise require a top-up tax be paid on Bermuda-sourced income to non-Bermuda jurisdictions such that a 15% minimum effective tax rate ("ETR") is achieved for Hamilton Group’s Bermuda entities. Hamilton Group expects to be exempt from the worldwide minimum tax until January 1, 2030, pursuant to an exemption similar to that available in Bermuda. The act includes a provision referred to as the economic transition adjustment (“ETA”), which is intended to provide a fair and equitable transition into the tax regime. As of December 31, 2024, the Company holds a deferred tax asset of $35.4 million on its balance sheet related to the ETA.
On January 15, 2025, the OECD issued additional guidance related to the calculation of income subject to taxation under Pillar 2. Specifically, it provided that for purposes of calculating Pillar 2 taxes, a deduction for the ETA will not be allowed in years after 2026. Accordingly, when Hamilton Group becomes subject to Pillar 2 taxation on its Bermuda earnings, expected in 2030, it is possible that a top-up tax liability will arise to the extent that it does not achieve a 15% minimum ETR on its Bermuda taxable earnings, excluding the ETA deduction. If Hamilton were to incur a Pillar 2 top-up tax on its Bermuda earnings, the liability would be recorded in the period and jurisdiction in which it is incurred.
SELECTED CONSOLIDATED FINANCIAL DATA
References to the current year in this document refer to the calendar year ended December 31, 2024. In 2022, the Company changed its fiscal year from November 30 to December 31. The following tables set forth our selected consolidated financial data and other financial information at the end of and for each of the years in the five-year period ended December 31, 2024. The selected consolidated financial data should be read in conjunction with our consolidated audited financial statements and related notes thereto and the other information in this Form 10-K.
Results of Operations
| | | | | | | | | | | | | | | | | | | | | | | | | | | | | | | |
| ($ in thousands, except per share amounts) | For the Years Ended | | |
| December 31, | | November 30, | | |
| 2024 | | 2023 | | 2022 | | 2021 | | 2020 | | |
| Gross premiums written | $ | 2,422,582 | | | $ | 1,951,038 | | | $ | 1,646,673 | | | $ | 1,446,551 | | | $ | 1,086,540 | | | |
| Net premiums written | 1,921,169 | | | 1,480,438 | | | 1,221,864 | | | 1,085,428 | | | 729,323 | | | |
| Net premiums earned | 1,734,729 | | | 1,318,533 | | | 1,143,714 | | | 942,549 | | | 707,461 | | | |
| Net realized and unrealized gains (losses) on investments | 511,407 | | | 209,610 | | | 93,348 | | | 352,193 | | | 5,701 | | | |
Net investment income (loss)(1) | 63,267 | | | 30,456 | | | (21,487) | | | (43,217) | | | (38,600) | | | |
| Total net realized and unrealized gains (losses) on investments and net investment income (loss) | 574,674 | | | 240,066 | | | 71,861 | | | 308,976 | | | (32,899) | | | |
| | | | | | | | | | | |
| | | | | | | | | | | |
Third party fee income(2) | 23,752 | | | 18,234 | | | 11,631 | | | 21,022 | | | 15,625 | | | |
| Losses and loss adjustment expenses | 1,010,173 | | | 714,603 | | | 758,333 | | | 640,560 | | | 505,269 | | | |
| Acquisition costs | 388,931 | | | 309,148 | | | 271,189 | | | 229,213 | | | 168,327 | | | |
Other underwriting expenses(3) | 210,013 | | | 183,165 | | | 157,540 | | | 149,822 | | | 126,869 | | | |
Underwriting income (loss)(4) | 149,364 | | | 129,851 | | | (31,717) | | | (56,024) | | | (77,379) | | | |
| Net income (loss) | 613,158 | | | 280,287 | | | (29,935) | | | 249,839 | | | (185,517) | | | |
Net income (loss) attributable to non-controlling interest (5) | 212,729 | | | 21,560 | | | 68,064 | | | 61,660 | | | 24,930 | | | |
| Net income (loss) attributable to common shareholders | $ | 400,429 | | | $ | 258,727 | | | $ | (97,999) | | | $ | 188,179 | | | $ | (210,447) | | | |
| | | | | | | | | | | |
| Diluted income (loss) per share attributable to common shareholders | $ | 3.67 | | | $ | 2.44 | | | $ | (0.95) | | | $ | 1.82 | | | $ | (2.05) | | | |
| Combined ratio | 91.3 | % | | 90.1 | % | | 102.8 | % | | 106.0 | % | | 110.9 | % | | |
Return on average common shareholders'
equity | 18.3 | % | | 13.9 | % | | (5.7) | % | | 11.1 | % | | (12.4) | % | | |
(1) Net investment income (loss) is presented net of investment management fees.
(2) Third party fee income is a non-GAAP financial measure as defined in Item 10(e) of SEC Regulation S-K. The reconciliation to other income (loss), the most comparable GAAP financial measure, also included other income (loss), excluding third party fee income of $Nil, $0.4 million and $(0.3) million for the years ended December 31, 2024, 2023 and 2022, respectively, and less than $0.1 million for each of the years ended November 30, 2021 and 2020. Refer to 'Management’s Discussion and Analysis of Financial Condition and Results of Operations—Non-GAAP Measures' for further details.
(3) Other underwriting expenses is a non-GAAP financial measure as defined in Item 10(e) of SEC Regulation S-K. The reconciliation to general and administrative expenses, the most comparable GAAP financial measure, also included corporate expenses of $61.1 million, $76.7 million, $20.1 million, $22.5 million and $22.9 million for the years ended December 31, 2024, 2023 and 2022, and November 30, 2021 and 2020, respectively. Refer to 'Management’s Discussion and Analysis of Financial Condition and Results of Operations—Non-GAAP Measures' for further details.
(4) Underwriting income (loss) is a non-GAAP financial measure as defined in Item 10(e) of SEC Regulation S-K. Refer to 'Management’s Discussion and Analysis of Financial Condition and Results of Operations—Non-GAAP Measures' for further details.
(5) Refer to 'Management’s Discussion and Analysis of Financial Condition and Results of Operations—Consolidated Results of Operations - Corporate and Other' for further details.
SELECTED CONSOLIDATED FINANCIAL DATA
Balance Sheet Data
| | | | | | | | | | | | | | | | | | | | | | | | | | | | | |
| ($ in thousands, except shares and per share amounts) | As At |
| December 31, | | November 30, |
| 2024 | | 2023 | | 2022 | | 2021 | | 2020 |
| | | | | | | | | |
| | | | | | | | | |
| | | | | | | | | |
| | | | | | | | | |
| Total investments | $ | 3,814,353 | | $ | 3,111,616 | | $ | 2,286,323 | | $ | 2,464,622 | | $ | 2,174,586 |
| Cash and cash equivalents | 996,493 | | 794,509 | | 1,076,420 | | 797,793 | | 642,838 |
| Total investments and cash and cash equivalents | 4,810,846 | | 3,906,125 | | 3,362,743 | | 3,262,415 | | 2,817,424 |
| | | | | | | | | |
| Total assets | 7,796,033 | | 6,671,355 | | 5,818,965 | | 5,611,607 | | 4,905,363 |
| Reserve for losses and loss adjustment expenses | 3,532,491 | | 3,030,037 | | 2,856,275 | | 2,379,027 | | 2,054,628 |
| Unearned premiums | 1,122,277 | | 911,222 | | 718,188 | | 620,994 | | 479,529 |
| Term loan, net of issuance costs | 149,945 | | 149,830 | | 149,715 | | 149,875 | | 149,682 |
| Total shareholders' equity | $ | 2,328,709 | | $ | 2,047,850 | | $ | 1,664,183 | | $ | 1,787,445 | | $ | 1,596,750 |
| | | | | | | | | |
| Common shares outstanding | 101,466,997 | | 110,225,103 | | 103,087,859 | | 102,540,769 | | 102,454,307 |
| Tangible book value per common share | $ | 22.03 | | $ | 17.75 | | $ | 15.30 | | $ | 16.29 | | $ | 14.46 |
| | | | | | | | | |
| Book value per common share | $ | 22.95 | | $ | 18.58 | | $ | 16.14 | | $ | 17.43 | | $ | 15.58 |
| | | | | | | | | |
Summary of Critical Accounting Estimates
The accompanying audited consolidated financial statements have been prepared in accordance with U.S. GAAP and include certain amounts that are inherently uncertain and judgmental in nature. As a result, management is required to make best estimates and assumptions that affect the reported amounts.
The following discussion addresses those accounting policies and estimates that we believe are most critical to our operations and require the most difficult, subjective and complex judgment. Actual events that differ significantly from the underlying assumptions and estimates used in these statements may result in materially favorable or unfavorable adjustments to prior estimates that affect our results of operations, financial condition and liquidity. The sensitivity estimates that follow are based on the Company’s assessment of reasonably likely outcomes.
These critical accounting estimates should be read in conjunction with the notes to the accompanying audited consolidated financial statements, including Note 2, Summary of Significant Accounting Policies, for a full understanding of the Company’s accounting policies.
Reserve for Losses and Loss Adjustment Expenses
Overview
The estimated reserve for losses and loss adjustment expenses ("loss reserves") represents management’s best estimate of the unpaid portion of the Company’s ultimate liability for losses and loss adjustment expenses for insured and reinsured events that have occurred at or before the balance sheet date, based on its assessment of facts and circumstances known at that particular point in time. Loss reserves reflect both claims that have been reported to the Company ("case reserves") and claims that have been incurred but not reported to the Company ("IBNR").
Loss reserves are complex estimates, not an exact calculation of liabilities. Management reviews loss reserve estimates at each quarterly reporting date and considers all significant facts and circumstances known at that particular point in time. As additional experience and other data becomes available and/or laws and legal interpretations change, management may adjust previous estimates. Adjustments are recognized in the period in which they are determined and may impact that period's underwriting results either favorably (when current estimates are lower than previous estimates) or unfavorably (when current estimates are higher than previous estimates).
Gross loss reserves for each of the reportable segments, segregated between case reserves and IBNR, by reserve class, are shown below:
| | | | | | | | | | | | | | | | | | | | | | | | | | | | | | | | | | | |
| As at December 31, |
| 2024 | | 2023 |
| ($ in thousands) | International | | Bermuda | | Total | | International | | Bermuda | | Total |
| Case reserves: | | | | | | | | | | | |
| Property | $ | 61,009 | | | $ | 109,347 | | | $ | 170,356 | | | $ | 65,161 | | | $ | 162,480 | | | $ | 227,641 | |
| Casualty | 166,247 | | | 160,135 | | | 326,382 | | | 226,749 | | | 173,903 | | | 400,652 | |
| Specialty | 158,855 | | | 45,994 | | | 204,849 | | | 147,825 | | | 49,814 | | | 197,639 | |
| | | | | | | | | | | |
| Total case reserves | 386,111 | | | 315,476 | | | 701,587 | | | 439,735 | | | 386,197 | | | 825,932 | |
| IBNR: | | | | | | | | | | | |
| Property | 113,291 | | | 249,870 | | | 363,161 | | | 106,044 | | | 154,093 | | | 260,137 | |
| Casualty | 966,258 | | | 713,129 | | | 1,679,387 | | | 784,796 | | | 550,048 | | | 1,334,844 | |
| Specialty | 462,518 | | | 288,566 | | | 751,084 | | | 366,895 | | | 215,807 | | | 582,702 | |
| | | | | | | | | | | |
| Total IBNR | 1,542,067 | | | 1,251,565 | | | 2,793,632 | | | 1,257,735 | | | 919,948 | | | 2,177,683 | |
| | | | | | | | | | | |
| Total other | 29,501 | | | 7,771 | | | 37,272 | | | 19,952 | | | 6,470 | | | 26,422 | |
| Total reserves | $ | 1,957,679 | | | $ | 1,574,812 | | | $ | 3,532,491 | | | $ | 1,717,422 | | | $ | 1,312,615 | | | $ | 3,030,037 | |
Case Reserves
With respect to insurance business, the Company is generally notified of losses by brokers and/or insureds. The Company’s claims personnel use this and other relevant information to estimate ultimate covered losses arising from the claim, including the cost of claims adjustment administration and settlement, including any legal or other fees. These estimates reflect the judgment of the Company’s claims personnel based on their experience and knowledge, the nature of the specific claim and, where appropriate, the advice of legal counsel, third party claims administrators and loss adjusters. In syndicated markets, such as Lloyd’s, the Company’s case reserves may also be based in part on information provided by the lead insurer.
With respect to reinsurance business, the Company is typically notified of losses by brokers and/or ceding companies. For excess of loss contracts, the Company is typically notified of insured losses on specific contracts in the form of an individual loss notification and records a case reserve for the estimated ultimate liability arising from the claim. For contracts written on a proportional basis, the Company typically receives aggregated claims information in the form of a loss bordereaux and records a case reserve for the estimated ultimate liability arising from the claim based on that information. Proportional reinsurance contracts typically require that losses in excess of pre-defined amounts be separately notified so that the Company can adequately evaluate them. The Company’s claims department evaluates each specific loss notification received and, based on their knowledge and experience, may record additional case reserves when a ceding company’s reserve for a claim is considered inadequate. The Company also undertakes cedant audits, using outsourced legal and industry experience where necessary. This allows the Company to review different cedants’ claims handling practices, understand the level of prudence employed by different cedants and ensure that reserves are consistent with exposures, adequately established, and properly reported in a timely manner.
IBNR
IBNR estimates are necessary due to the potential development on reported claims and the reporting time lag between when a loss event occurs and when it is actually reported (the "reporting lag"). Reporting lags may arise from a number of factors, including but not limited to the nature of the loss, the use of intermediaries and the complexity of the claims adjusting process. The lack of specific information means the Company must make estimates. IBNR is calculated by deducting incurred losses (i.e. paid losses and case reserves) from management’s best estimate of the ultimate losses. Unlike case reserves, which are established at the contract level, IBNR reserves are generally established at an aggregate level and cannot be identified as reserves for a particular loss event or contract.
Reserving Methodology
When conducting actuarial analysis, management organizes the Company’s recorded reserves into exposure groupings based on reasonably homogeneous loss development characteristics, underwriting years and reserving classes. Management periodically reviews the exposure groupings and may make changes to the groupings over time as the Company’s business changes.
The actuarial methodologies used to perform the quarterly reserving analysis that determines our estimate of the ultimate reserve for losses and loss adjustment expenses for each exposure group include:
•Initial expected loss ratio ("IELR") method: The IELR method calculates an estimate of ultimate losses by applying an estimated loss ratio to an estimate of ultimate earned premium for each underwriting year. The estimated loss ratio may be based on pricing information and/or industry data and/or historical claims experience revalued to the year under review;
•Bornhuetter-Ferguson method: The Bornhuetter-Ferguson method uses as a starting point an assumed IELR and blends in the loss ratio, which is implied by the claims experience to date using benchmark loss development patterns on paid claims data or reported claims data. Although the method tends to provide less volatile indications at early stages of development and reflects changes in the external environment, it can be slow to react to emerging loss development and may, if the IELR proves to be inaccurate, produce loss estimates which take longer to converge with the final settlement value of loss; and
•Loss development method: The loss development method uses actual loss data and the historical development profiles on older underwriting years to project more recent, less developed years to their ultimate position.
Our actuaries may use other approaches in addition to those described, and supplement these methods with judgement where they deem appropriate, depending upon the characteristics of the class of business and available data.
For certain significant events, such as natural catastrophes or large man-made catastrophic events, traditional actuarial methods may not be suitable for estimating losses for reasons that may include lack of claims data or the existence of additional risks related to the specific event circumstances. For example, the estimates of loss reserves related to hurricanes and earthquakes can be affected by factors including, but not limited to, the inability to access portions of impacted areas, infrastructure disruptions, the complexity of the loss scenario, legal and regulatory uncertainties, complexities involved in estimating business interruption losses and additional living expenses, the impact of demand surge, fraud, and the limitations on available information. For hurricanes, additional complex coverage factors may include determining whether damage was caused by flooding or wind, evaluating general liability and pollution exposures and mold damage. Other recent examples include possible claims arising from the COVID-19 pandemic and the Ukraine conflict, where additional risks included material uncertainties around whether insured loss events had occurred, the timing of such events, and uncertainty over how contract wording applies in the case of insurance and reinsurance policies.
The timing of events can also affect the level of information available to the Company to estimate loss reserves for that reporting period, and therefore the reserving methods adopted. For example, for events occurring near the end of a reporting period, greater reliance may be placed on information derived from catastrophe models, and, where available and relevant, additional quantitative and qualitative exposure analyses, reports and communications of ground up losses from ceding companies, and development patterns for historically similar events. Due to the inherent uncertainty in estimating losses from such events, these estimates are subject to variability, which increases with the severity and complexity of the underlying event.
In addition to the Company’s quarterly reserving process, an independent actuarial review is carried out semi-annually by a leading independent actuarial consulting firm in order to provide additional insight into the reserving process, specific industry trends and the overall level of the Company’s loss reserves. Management reviews the information provided in the independent actuarial review in determining its own best estimate of reserves.
Management believes that it is prudent in its reserving assumptions and methodologies. However, we cannot be certain that our ultimate loss payments will not vary, perhaps materially, from the initial estimates made. We note that the process of estimating required reserves, by its very nature, involves uncertainty and therefore the ultimate claims may fall outside the actuarial range. The level of uncertainty can be influenced by many factors, including but not limited to unknown future in-claim value inflation, the existence of coverage with long duration reporting patterns, changes in the speed of claims data being received and processed, contractual uncertainties for unusual claim events, as well as the other factors previously discussed.
If we determine that adjustments to an earlier estimate are appropriate, such adjustments are recorded in the reporting period in which they are identified and may have a significant favorable or unfavorable impact on that period’s results of operations. We regularly review and update these estimates using the most current information available.
Management’s Best Estimate
The Company’s recorded reserves at each reporting date reflect management’s best estimate of the ultimate reserve for losses and loss adjustment expenses at that date. Management completes quarterly reserve studies for each exposure group for its International and Bermuda segments. Management analyzes significant variances between internal and external actuarial estimates, as well as any relevant additional market, underwriting or claims data that may be available and relevant for setting management’s best estimate of ultimate reserves. As a result of these considerations, the selected reserve estimate may be higher or lower than the external actuarial indicated estimate.
The Company’s best estimates are point estimates within a range of reasonable actuarial estimates. To provide an indication of the possible size of this range, in the following table we have compared the point estimate for net losses and loss adjustment expenses recorded by each reportable segment with a range of reasonable actuarial estimates:
| | | | | | | | | | | | | | | | | |
| December 31, 2024 |
| ($ in thousands) | Recorded Point Estimate | | High | | Low |
| International | $ | 1,074,752 | | | $ | 1,168,861 | | | $ | 884,535 | |
| Bermuda | 1,286,699 | | | $ | 1,439,099 | | | $ | 1,068,048 | |
| Net reserve for losses and loss adjustment expenses | $ | 2,361,451 | | | | | |
It is important to note that the "High" and "Low" estimates above are not intended to be "worst-case" or "best-case" scenarios, and it is possible that final settlements of the reserves for these losses and loss adjustment expenses could fall outside of these ranges.
It is not appropriate to add together the ranges of each reportable segment in an effort to determine a high and low range around the Company’s total reserve for losses and loss adjustment expenses.
Prior Year Reserve Development
Prior year reserve development arises from changes to estimates for losses and loss adjustment expenses related to loss events that occurred in previous periods. Favorable prior year reserve development indicates that current estimates are lower than previous estimates, while unfavorable prior year reserve development indicates that current estimates are higher than previous estimates. The following table presents net prior year reserve development by reportable segment:
| | | | | | | | | | | | | | | | | |
| Net (favorable) unfavorable prior year reserve development |
| ($ in thousands) | International | | Bermuda | | Total |
| Year ended December 31, 2024 | $ | (10,555) | | | $ | (9,884) | | | $ | (20,439) | |
| Year ended December 31, 2023 | (22,498) | | | 6,881 | | | (15,617) | |
| Year ended December 31, 2022 | $ | (26,833) | | | $ | 6,230 | | | $ | (20,603) | |
For a detailed discussion of net (favorable) unfavorable prior year reserve development by reportable segment for the years ended December 31, 2024, 2023 and 2022 see Results of Operations.
Claim Tail Analysis
One of the key selection characteristics for loss exposure groupings is the historical duration of the claims settlement process. Business in which claims are reported and settled relatively quickly are commonly referred to as short-tail lines, for example, property classes. On the other hand, business in which claims tend to take longer to be reported and settled are commonly referred to as long-tail lines, for example, casualty classes.
Although estimates of ultimate losses for short-tail business are usually inherently more certain than for medium and long-tail business, significant judgment is still required. Additionally, the inherent uncertainties relating to catastrophe events add further complexity to potential exposure estimation. Further, the Company uses MGAs and other producers for certain business, which can delay the receipt of loss information.
Although the Company uses similar actuarial methodologies for both short-tail and long-tail lines in respect of non-headline loss events, the faster reporting of experience for the short-tail lines allows management to have greater confidence in its estimates of ultimate losses for short-tail lines at an earlier stage than for long-tail lines. As a result, the Company’s estimates of ultimate losses for shorter tail lines, with the exception of loss estimates for headline loss events, generally exhibit less volatility than those for the longer tail lines. For longer tail lines, management utilizes exposure-based methods to estimate the Company’s ultimate losses, especially for immature years. For both short and long-tail lines, management supplements these general approaches with analytically based judgments.
Sensitivity Analysis
While management believes that the reserve for losses and loss adjustment expenses at December 31, 2024 is adequate, new information, events or circumstances may result in ultimate losses that are materially greater or less than initially recorded.
The tables below summarize, by reportable segment, the effect of reasonably likely scenarios on the key actuarial assumptions used to estimate the Company’s reserve for losses and loss adjustment expenses at December 31, 2024. The scenarios shown in the tables illustrate the effect of:
•changes to the expected loss ratio selections used at December 31, 2024, which represent loss ratio point increases or decreases to the expected loss ratios used. A higher expected loss ratio results in a higher ultimate loss estimate, and vice versa; and
•changes to the loss development patterns used in the Company’s reserving process at December 31, 2024, which represent claims reporting that is either slower or faster than the reporting patterns used. Accelerating a loss reporting pattern (i.e. shortening the claim tail) results in lower ultimate losses, as the estimated proportion of losses already incurred would be higher, and vice versa.
Management believes that the illustrated sensitivities are indicative of the materiality of these key actuarial assumptions to management’s best estimate of losses and loss adjustment expense reserves. The degree of stress applied to the expected loss ratio and loss development patterns were selected to be illustrative, and should not be considered to be "best case" or "worst case" for these assumptions. As such, it is important to recognize that future variations may be more or less than the amounts shown in the following table.
The effect of reasonably likely changes in the two key assumptions used to estimate the gross reserve for losses and loss adjustment expenses was as follows:
| | | | | | | | | | | | | | | | | | | | | | | |
| ($ in thousands) | Sensitivity of Gross Reserve for Losses and Loss Adjustment Expenses |
| As at December 31, 2024 |
| Assumptions | Higher Expected Loss Ratios | | Slower Loss Development Patterns | | Lower
Expected Loss Ratios | | Faster Loss Development Patterns |
| Reserving class selected assumptions: | | | | | | | |
| Property | 5 | % | | +1 Q | | (5) | % | | -1 Q |
| Casualty | 5 | % | | +2 Q | | (5) | % | | -2 Q |
| Specialty | 5 | % | | +1 Q | | (5) | % | | -1 Q |
| | | | | | | |
| International Segment | | | | | | | |
| Increase (decrease) in loss reserves: | | | | | | | |
| Property | $ | 4,525 | | | $ | 7,290 | | | $ | (4,479) | | | $ | (8,238) | |
| Casualty | 36,542 | | | 80,675 | | | (36,015) | | | (68,305) | |
| Specialty | 20,918 | | | 33,690 | | | (20,122) | | | (31,066) | |
| | | | | | | |
| Bermuda Segment | | | | | | | |
| Increase (decrease) in loss reserves: | | | | | | | |
| Property | $ | 22,768 | | | $ | 6,377 | | | $ | (23,912) | | | $ | (5,507) | |
| Casualty | 59,870 | | | 17,154 | | | (63,160) | | | (17,793) | |
| Specialty | 16,639 | | | 4,206 | | | (16,632) | | | (3,342) | |
The results show the cumulative increase (decrease) in loss reserves across all years. Each of the impacts set forth is estimated individually, without consideration for any correlation among key assumptions or among reserve classes. Therefore, it would be inappropriate to take each of the amounts and add them together in an attempt to estimate total volatility. Additionally, it is noted that in some instances, for example, the projection of catastrophe estimates, development patterns are not appropriate as more bespoke techniques are used.
Premiums Written and Earned
Gross Premiums Written
Revenues primarily consist of insurance and reinsurance premiums generated by the Company’s underwriting operations. Recognition of gross premiums written varies by policy or contract type.
For a portion of the Company’s insurance business, which comprises 53% of total gross premiums written, a fixed premium specified in the policy is recorded when the policy incepts. This premium may be adjusted if underlying insured values change. Management actively monitors underlying insured values and any resulting premium adjustments are recognized in the period in which they are determined. Gross premiums written on a fixed premium basis accounted for 26.9%, 30.2% and 28.6% of the Company’s gross premiums written for the years ended December 31, 2024, 2023 and 2022, respectively. Some of this business is written through MGAs, third parties granted authority to bind risks on the Company’s behalf in accordance with defined underwriting guidelines.
The remainder of the Company’s insurance business is written on a line slip or proportional basis, where the Company assumes an agreed proportion of the premiums and losses of a particular risk or group of risks along with other unrelated insurers. As premiums for this business are not identified in the policy, estimated premiums are recorded at the inception of the policy based on information provided by clients through brokers. Management reviews these premium estimates on a quarterly basis and any premium estimate adjustments are recognized in the period in which they are determined. Gross premiums written on a line slip or proportional basis accounted for 25.8%, 26.8% and 28.4% of the Company’s gross premiums written for the years ended December 31, 2024, 2023 and 2022, respectively.
The Company’s reinsurance business, which comprises 47% of total gross premiums written, generally provides cover to cedants on an excess of loss or on a proportional basis. In most cases, cedants seek protection for business that they have not yet written when they enter into agreements and therefore cedants must estimate the underlying premiums that they will cede to the Company.
For proportional reinsurance contracts, the Company shares proportionally in both the premiums and losses of the cedant and pays the cedant a commission to cover the cedant’s acquisition costs. Gross premiums written are recognized on a quarterly basis as the underlying contracts incept over the term of the contract, based on estimates received from ceding companies. Management reviews these premium estimates on a quarterly basis and evaluates their reasonability in light of actual premiums reported by the cedants and brokers, supplemented by the Company’s own estimates based on experience and familiarity with each market.
As a result of this review process, any adjustments to premium estimates are recognized in the period in which they are determined. Changes in premium estimates could be material to gross premiums written in the period. Changes in premium estimates could also be material to net premiums earned in the period in which they are determined as any adjustment may be substantially or fully earned. Gross premiums written for proportional reinsurance contracts, including adjustments to premium estimates established in prior years, accounted for 24.4%, 20.7% and 19.0% of the Company’s gross premiums written for the years ended December 31, 2024, 2023 and 2022, respectively.
For excess of loss reinsurance contracts, the Company is typically exposed to loss events in excess of a predetermined dollar amount or loss ratio and receives a fixed or an initial minimum deposit premium. For excess of loss reinsurance contracts, minimum deposit premiums are generally considered to be the best estimate of premiums at the inception of the contract. The minimum deposit premium is typically adjusted at the end of the contract period to reflect changes in the underlying risks in force during the contract period. Any adjustments to minimum or deposit premiums are recognized in the period in which they are determined. Gross premiums written for excess of loss reinsurance contracts accounted for 22.9%, 22.3% and 24.0% of the Company’s gross premiums written for the years ended December 31, 2024, 2023 and 2022, respectively.
Many of the Company’s excess of loss reinsurance contracts also include provisions for automatic reinstatement of coverage in the event of a loss that has exhausted the initial amount of cover provided. Reinstatement premiums are recognized as written premium when a loss event occurs where coverage limits for the remaining life of the contract are reinstated under the contract.
Net Premiums Earned
Premiums are earned evenly over the period in which the Company is exposed to the underlying risk. Changes in circumstances subsequent to contract inception can impact the term of each earning period. For example, when exposure limits for a contract are reached, any associated unearned premiums are recognized as fully earned.
Fixed premium insurance policies and excess of loss reinsurance contracts are generally written on a "losses occurring" or "claims made" basis. Consequently, premiums are earned evenly over the contract term, which is typically 12 months.
Line slip or proportional insurance policies and proportional reinsurance contracts are generally written on a "risks attaching" basis, covering claims that relate to the underlying policies written during the terms of these contracts. As the underlying business incepts throughout the contract term, which is typically one year, and the underlying business typically has a one-year coverage period, these premiums are generally earned over a 24-month period.
Ceded Reinsurance and Unpaid losses and Loss Adjustment Expenses Recoverable
Overview
In the normal course of business, the Company seeks to reduce the potential amount of loss arising from claim events by reinsuring certain levels of risk with other reinsurers. On a consolidated basis, reinsurance premiums ceded represented 20.7%, 24.1% and 25.8% of gross premiums written for the years ended December 31, 2024, 2023 and 2022, respectively.
Ceded reinsurance contracts do not relieve the Company of its primary obligation to policyholders. In the event that the Company’s reinsurers are unable to meet their obligations under these reinsurance agreements or are able to successfully challenge losses ceded by the Company under the contracts, the Company will not be able to realize the full value of the unpaid losses and loss adjustment expenses recoverable balance and will be liable for such defaulted amounts.
The Company enters into proportional or quota share treaties, whereby the Company cedes a portion of its premiums and losses related to a certain class or classes of business to a reinsurer, and into excess of loss or facultative reinsurance agreements, whereby the Company is reinsured for a specific event or exposure, often for amounts in excess of a predetermined dollar amount.
The Company’s reinsurance business also obtains reinsurance whereby another reinsurer contractually agrees to indemnify it for all or a portion of the reinsurance risks underwritten. Such arrangements, where one reinsurer provides reinsurance to another reinsurer, are usually referred to as retrocessional reinsurance arrangements and help to reduce exposure to large losses and manage risk. In addition, the Company’s reinsurance business participates in “common account” retrocessional arrangements for certain pro rata treaties. Such arrangements reduce the effect of individual or aggregate losses to all companies participating on such treaties, including the reinsurers and the ceding company.
On February 6, 2020, the Company entered into a loss portfolio transfer agreement (the "LPT"), under which the insurance liabilities arising from certain casualty risks for the Lloyd's Years of Account ("YOA") 2016, 2017 and 2018 were retroceded to a third party in exchange for total premium of $72.1 million. This transaction was accounted for as retroactive reinsurance under which cumulative ceded losses exceeding the LPT premium are recognized as a deferred gain liability and amortized into income over the settlement period of the ceded reserves in proportion to cumulative losses collected over the estimated ultimate reinsurance recoverable. The amount of the deferral is recalculated each reporting period based on updated ultimate loss estimates. Consequently, cumulative adverse development subsequent to the signing of the LPT may result in significant losses from operations until periods when the deferred gain is recognized as a benefit to earnings.
In December 2023, Hamilton Group sponsored a new industry loss index-triggered catastrophe bond through the issuance of Series 2024-1 Class A Principal-at-Risk Variable Rate Notes by Bermuda-domiciled Easton Re Ltd. ("Easton Re"), which provide the Company's operating platforms with multi-year risk transfer capacity of $200 million to protect against named storm risk in the United States and earthquake risk in the United States and Canada. The risk period for Easton Re is from January 1, 2024 to December 31, 2026.
Estimation methodology
Amounts for unpaid losses and loss adjustment expenses recoverable from reinsurers are estimated in a manner consistent with the reserve for losses and loss adjustment expenses associated with the related assumed business and the contractual terms of the reinsurance agreement. Estimating unpaid losses and loss adjustment expenses recoverable can be more subjective than estimating the underlying reserve for losses and loss adjustment expenses, discussed above. In particular, unpaid losses and loss adjustment expenses recoverable may be affected by deemed inuring reinsurance, industry losses reported by various statistical reporting services, and the magnitude of the Company’s recorded IBNR reserves, amongst other factors. Amounts for unpaid losses and loss adjustment expenses recoverable are recorded as assets, predicated on the reinsurers’ ability to meet their obligations under the reinsurance agreements.
The majority of the balance that the Company has estimated and accrued as unpaid losses and loss adjustment expenses recoverable will not be due for collection until some point in the future. The amounts recoverable that will ultimately be collected are subject to uncertainty due to the ultimate ability and willingness of reinsurers to pay the Company’s claims at a future point in time, for reasons including insolvency or elective run-off, contractual dispute and various other reasons.
To help mitigate these risks, the Company maintains a list of approved reinsurers, performs credit risk assessments for potential new reinsurers, regularly monitors the financial condition of approved reinsurers with consideration for events which may have a material impact on their creditworthiness and monitors concentrations of credit risk. This assessment considers a wide range of individual attributes, including a review of the counterparty’s financial strength, industry position and other qualitative factors. If reinsurers do not meet certain specified requirements, they are required to provide the Company with collateral.
Fair Value of Investments
Fixed maturity and short-term investments trading portfolio
The Company elects the fair value option for its fixed maturities and short-term investments trading portfolio and certain other investments and recognizes the changes in net realized and unrealized gains (losses) on investments in its consolidated statements of operations.
The fair value of a financial instrument is the amount that would be received to sell an asset or paid to transfer a liability in an orderly transaction between market participants at the measurement date (the "exit price"). Instruments that the Company owns are marked to bid prices.
Fair value measurement accounting guidance also establishes a fair value hierarchy that prioritizes the inputs to the respective valuation techniques used to measure fair value. The hierarchy gives the highest priority to unadjusted quoted prices in active markets for identical assets or liabilities (Level 1 measurements) and the lowest priority to unobservable inputs (Level 3 measurements). An asset or liability’s classification within the fair value hierarchy is based on the lowest level of significant input to its valuation. The three levels of the fair value hierarchy are:
•Level 1 - Inputs that reflect unadjusted quoted prices in active markets for identical assets or liabilities that the Company has the ability to access at the measurement date;
•Level 2 - Inputs other than quoted prices included within Level 1 that are observable for the asset or liability either directly or indirectly, including inputs in markets that are not considered to be active; and
•Level 3 - Inputs that are both significant to the fair value measurement and unobservable.
The Company’s fixed maturities and short-term investments trading portfolio is primarily priced using pricing services, such as index providers and pricing vendors, as well as broker quotations. In general, the pricing vendors provide pricing for a high volume of liquid securities that are actively traded. For securities that do not trade on an exchange, the pricing services generally utilize market data and other observable inputs in matrix pricing models to determine prices. Observable inputs include benchmark yields, reported trades, broker-dealer quotes, issuer spreads, bids, offers, reference data and industry and economic events. Index pricing generally relies on market traders as the primary source for pricing; however, models are also utilized to provide prices for all index eligible securities. The models use a variety of observable inputs such as benchmark yields, transactional data, dealer runs, broker-dealer quotes and corporate actions. Prices are generally verified using third party data. Securities which are priced by an index provider are generally included in the index. In general, broker-dealers value securities through their trading desks based on observable inputs. The methodologies used include mapping securities based on trade data, bids or offers, observed spreads, and performance on newly issued securities. Broker-dealers also determine valuations by observing secondary trading of similar securities. Prices obtained from broker quotations are considered non-binding; however, they are based on observable inputs and by observing secondary trading of similar securities obtained from active, non-distressed markets. The Company considers these Level 2 inputs as they are corroborated with other market observable inputs.
All of the Company’s fixed maturities and short-term investments in its trading portfolio are considered to be valued using Level 2 inputs in the fair value hierarchy. See Note 4, Fair Value in the accompanying audited consolidated financial statements for further detail.
Consolidated Results of Operations
The following is a comparison of selected data for our consolidated results of operations:
| | | | | | | | | | | | | | | | | | | | | |
| For the Years Ended December 31, | | | | |
| ($ in thousands, except per share amounts) | 2024 | | 2023 | | 2022 | | | | |
| Gross premiums written | $ | 2,422,582 | | | $ | 1,951,038 | | | $ | 1,646,673 | | | | | |
| Net premiums written | $ | 1,921,169 | | | $ | 1,480,438 | | | $ | 1,221,864 | | | | | |
| Net premiums earned | $ | 1,734,729 | | | $ | 1,318,533 | | | $ | 1,143,714 | | | | | |
Third party fee income(1) | 23,752 | | | 18,234 | | | 11,631 | | | | | |
| | | | | | | | | |
| Claims and Expenses | | | | | | | | | |
| Losses and loss adjustment expenses | 1,010,173 | | | 714,603 | | | 758,333 | | | | | |
| Acquisition costs | 388,931 | | | 309,148 | | | 271,189 | | | | | |
Other underwriting expenses(2) | 210,013 | | | 183,165 | | | 157,540 | | | | | |
Underwriting income (loss)(3) | 149,364 | | | 129,851 | | | (31,717) | | | | | |
| | | | | | | | | |
| Net realized and unrealized gains (losses) on investments | 511,407 | | | 209,610 | | | 93,348 | | | | | |
Net investment income (loss)(4) | 63,267 | | | 30,456 | | | (21,487) | | | | | |
Total net realized and unrealized gains (losses) on investments and net investment income (loss) | 574,674 | | | 240,066 | | | 71,861 | | | | | |
| | | | | | | | | |
| | | | | | | | | |
Other income (loss), excluding third party fee income(1) | — | | | 397 | | | (315) | | | | | |
| Net foreign exchange gains (losses) | (3,231) | | | (6,185) | | | 6,137 | | | | | |
Corporate expenses(2) | 61,111 | | | 76,691 | | | 20,142 | | | | | |
| Impairment of goodwill | — | | | — | | | 24,082 | | | | | |
| Amortization of intangible assets | 15,520 | | | 10,783 | | | 12,832 | | | | | |
| Interest expense | 22,616 | | | 21,434 | | | 15,741 | | | | | |
| Income tax expense (benefit) | 8,402 | | | (25,066) | | | 3,104 | | | | | |
| Net income (loss) | 613,158 | | | 280,287 | | | (29,935) | | | | | |
Net income (loss) attributable to non-controlling interest(5) | 212,729 | | | 21,560 | | | 68,064 | | | | | |
| Net income (loss) attributable to common shareholders | $ | 400,429 | | | $ | 258,727 | | | $ | (97,999) | | | | | |
| Diluted income (loss) per share attributable to common shareholders | $ | 3.67 | | | $ | 2.44 | | | $ | (0.95) | | | | | |
| | | | | | | | | |
| Key Ratios | | | | | | | | | |
| Attritional loss ratio - current year | 53.1 | % | | 52.2 | % | | 51.8 | % | | | | |
| Attritional loss ratio - prior year development | 0.0 | % | | (0.8) | % | | (0.3) | % | | | | |
| Catastrophe loss ratio - current year | 6.3 | % | | 3.2 | % | | 16.3 | % | | | | |
| Catastrophe loss ratio - prior year development | (1.2) | % | | (0.4) | % | | (1.5) | % | | | | |
| Loss and loss adjustment expense ratio | 58.2 | % | | 54.2 | % | | 66.3 | % | | | | |
| Acquisition cost ratio | 22.4 | % | | 23.4 | % | | 23.7 | % | | | | |
| Other underwriting expense ratio | 10.7 | % | | 12.5 | % | | 12.8 | % | | | | |
| Combined ratio | 91.3 | % | | 90.1 | % | | 102.8 | % | | | | |
| | | | | | | | | |
| Return on average common shareholders' equity | 18.3 | % | | 13.9 | % | | (5.7) | % | | | | |
The following table summarizes book value per share and balance sheet data:
| | | | | | | | | | | | | | | | | |
| As at December 31, |
| Book Value | 2024 | | 2023 | | 2022 |
| Tangible book value per common share | $ | 22.03 | | | $ | 17.75 | | | $ | 15.30 | |
| Change in tangible book value per common share | 24.1 | % | | 16.0 | % | | (4.1) | % |
| Book value per common share | $ | 22.95 | | | $ | 18.58 | | | $ | 16.14 | |
| | | | | |
| | | | | |
| Change in book value per common share | 23.5 | % | | 15.1 | % | | (5.6) | % |
| | | | | |
| Balance Sheet Data | | | | | |
| Total assets | $ | 7,796,033 | | | $ | 6,671,355 | | $ | 5,818,965 |
| Total shareholders' equity | $ | 2,328,709 | | | $ | 2,047,850 | | $ | 1,664,183 |
(1) Third party fee income is a non-GAAP financial measure as defined in Item 10(e) of SEC Regulation S-K. The reconciliation to other income (loss), the most comparable GAAP financial measure, also included other income (loss), excluding third party fee income of $Nil, $0.4 million and $(0.3) million for the years ended December 31, 2024, 2023 and 2022, respectively. Refer to 'Management’s Discussion and Analysis of Financial Condition and Results of Operations—Non-GAAP Measures' for further details.
(2) Other underwriting expenses is a non-GAAP financial measure as defined in Item 10(e) of SEC Regulation S-K. The reconciliation to general and administrative expenses, the most comparable GAAP financial measure, also included corporate expenses of $61.1 million, $76.7 million, and $20.1 million for the years ended December 31, 2024, 2023 and 2022, respectively. Refer to 'Management’s Discussion and Analysis of Financial Condition and Results of Operations—Non-GAAP Measures' for further details.
(3) Underwriting income (loss) is a non-GAAP financial measure as defined in Item 10(e) of SEC Regulation S-K. Refer to 'Management’s Discussion and Analysis of Financial Condition and Results of Operations—Non-GAAP Measures' for further details.
(4) Net investment income (loss) is presented net of investment management fees.
(5) Refer to 'Management’s Discussion and Analysis of Financial Condition and Results of Operations—Consolidated Results of Operations—Corporate and Other' for further details.
Operating Highlights
The following significant items impacted the consolidated results of operations for the years ended December 31, 2024, 2023 and 2022:
Gross premiums written Gross premiums written were $2.4 billion, $2.0 billion and $1.6 billion for the years ended December 31, 2024, 2023 and 2022, respectively. The increase in gross premiums written for the year ended December 31, 2024 compared to the year ended December 31, 2023 was primarily driven by our casualty reinsurance, property reinsurance, specialty reinsurance and casualty insurance business. The growth was a result of new business, increased participations on existing business and a strong rate environment across multiple classes of business. The increase in gross premiums written for the year ended December 31, 2023 compared to the year ended December 31, 2022 was primarily driven by expansion into additional classes, notably casualty reinsurance and specialty insurance, increased participation on existing business and rate increases across multiple classes of business.
Underwriting results The combined ratio was 91.3% and 90.1% for the years ended December 31, 2024 and 2023, respectively. The modest increase was driven by an increase in the catastrophe loss ratio and attritional loss ratio, partially offset by a decrease in the other underwriting expense ratio and acquisition cost ratio. The decrease in the combined ratio from 102.8% for the year ended December 31, 2022 to 90.1% for the year ended December 31, 2023 was driven by lower catastrophe losses as described further below under Losses and Loss Adjustment Expenses.
Losses and Loss Adjustment Expenses
| | | | | | | | | | | | | | | | | | | | | | | | | | | | | | | | | | | | | | |
| ($ in thousands) | | Current
year | | % of net premiums earned | | Prior year development | | % of net premiums earned | | Losses and loss adjustment expenses | | % of net premiums earned |
| December 31, 2024 | | | | | | | | | | | | |
| Attritional losses | | $ | 921,739 | | | 53.1 | % | | $ | 818 | | | 0.0 | % | | $ | 922,557 | | | 53.1 | % |
| Catastrophe losses | | 108,873 | | | 6.3 | % | | (21,257) | | | (1.2) | % | | 87,616 | | | 5.1 | % |
| Total | | $ | 1,030,612 | | | 59.4 | % | | $ | (20,439) | | | (1.2) | % | | $ | 1,010,173 | | | 58.2 | % |
| | | | | | | | | | | | |
| December 31, 2023 | | | | | | | | | | | | |
| Attritional losses | | $ | 688,144 | | | 52.2 | % | | $ | (10,443) | | | (0.8) | % | | $ | 677,701 | | | 51.4 | % |
| Catastrophe losses | | 42,076 | | | 3.2 | % | | (5,174) | | | (0.4) | % | | 36,902 | | | 2.8 | % |
| Total | | $ | 730,220 | | | 55.4 | % | | $ | (15,617) | | | (1.2) | % | | $ | 714,603 | | | 54.2 | % |
| | | | | | | | | | | | |
| | | | | | | | | | | | |
| | | | | | | | | | | | |
| | | | | | | | | | | | |
| | | | | | | | | | | | |
| | | | | | | | | | | | |
| December 31, 2022 | | | | | | | | | | | | |
| Attritional losses | | $ | 592,676 | | | 51.8 | % | | $ | (3,216) | | | (0.3) | % | | $ | 589,460 | | | 51.5 | % |
| Catastrophe losses | | 186,260 | | | 16.3 | % | | (17,387) | | | (1.5) | % | | 168,873 | | | 14.8 | % |
| Total | | $ | 778,936 | | | 68.1 | % | | $ | (20,603) | | | (1.8) | % | | $ | 758,333 | | | 66.3 | % |
| | | | | | | | | | | | |
| | | | | | | | | | | | |
| | | | | | | | | | | | |
| | | | | | | | | | | | |
| | | | | | | | | | | | |
| | | | | | | | | | | | |
| | | | | | | | | | | | |
| | | | | | | | | | | | |
| | | | | | | | | | | | |
| | | | | | | | | | | | |
| | | | | | | | | | | | |
Attritional loss ratio - current year for the year ended December 31, 2024 was 53.1%, compared to 52.2% for the year ended December 31, 2023, an increase of 0.9 percentage points. The increase was primarily driven by losses of $37.9 million, or 2.2 points, arising from the Francis Scott Key Baltimore Bridge collapse, which impacted our insurance and reinsurance classes in both our International and Bermuda segments. The attritional loss ratio - current year for the year ended December 31, 2023 was 52.2% compared to 51.8% for the year ended December 31, 2022, an increase of 0.4 percentage points. The modest increase was attributable to certain large loss events in our specialty classes impacting both our International and Bermuda segments.
Attritional loss ratio - prior year for the year ended December 31, 2024 was flat at 0.0%, compared to a favorable 0.8% for the year ended December 31, 2023, an increase of 0.8 percentage points. The increase was primarily driven by unfavorable development in both International and Bermuda casualty and specialty classes, largely offset by favorable development in both International and Bermuda property classes. In addition, casualty business protected by the LPT discussed in Note 7, Reinsurance, benefited from favorable development in the underlying reserves of $15.3 million, which was partially offset by a change in the deferred gain of $9.4 million, for a total net positive earnings impact of $5.9 million. The attritional loss ratio - prior year for the year ended December 31, 2023 was a favorable 0.8% compared to a favorable 0.3% for the year ended December 31, 2022, a decrease of 0.5 percentage points. The decrease was primarily driven by favorable development in both the Bermuda and International specialty classes and International property classes, partially offset by unfavorable development in Bermuda property classes and casualty classes in both our Bermuda and International segments. In addition, casualty business protected by the LPT benefited from $4.2 million in amortization of the associated deferred gain and favorable development in the underlying reserves of $0.8 million, for a total net positive earnings impact of $5.0 million. See Note 7, Reinsurance, in the accompanying audited consolidated financial statements for further discussion of the LPT.
Catastrophe losses - current and prior year development were $87.6 million, $36.9 million and $168.9 million for the years ended December 31, 2024, 2023 and 2022, respectively. Catastrophe losses for the year ended December 31, 2024 were driven by Hurricane Helene ($52.6 million), Hurricane Milton ($37.8 million), the Calgary hailstorms ($12.9 million), and Hurricane Debby ($5.6 million), partially offset by favorable prior year development of $21.3 million. Catastrophe losses for the year ended December 31, 2023 were driven by the Hawaii wildfires ($12.0 million), the wind and thunderstorm events which impacted states in both the Southern and Midwest U.S. during March 2023 ($11.0 million), severe convective storms in June 2023 ($7.6 million), Hurricane Idalia ($6.5 million), and the Vermont floods ($5.0 million), partially offset by favorable prior year development of $5.2 million. Catastrophe losses - current and prior year development for the year ended December 31, 2022 were driven by the Ukraine conflict ($79.6 million), Hurricane Ian ($77.5 million), Australian East Coast floods ($16.6 million), KwaZulu-Natal floods ($8.3 million), and Typhoon Nanmadol ($4.3 million), partially offset by favorable prior year development of $17.4 million.
Total Net Realized and Unrealized Gains (Losses) on Investments and Net Investment Income (Loss)
| | | | | | | | | | | | | | | | | |
| For the Years Ended December 31, |
| ($ in thousands) | 2024 | | 2023 | | 2022 |
Total net realized and unrealized gains (losses) on investments and net investment income (loss) - TSHF(1) | $ | 487,186 | | | $ | 143,655 | | | $ | 145,238 | |
| Total net realized and unrealized gains (losses) on investments and net investment income (loss) - other | 87,488 | | | 96,411 | | | (73,377) | |
| $ | 574,674 | | | $ | 240,066 | | | $ | 71,861 | |
| | | | | |
| Net income (loss) attributable to non-controlling interest - TSHF | $ | 212,729 | | | $ | 21,560 | | | $ | 68,064 | |
| | | | | |
(1) Prior to non-controlling interest performance incentive allocation
Total net realized and unrealized gains (losses) on investments and net investment income (loss) - TSHF, prior to non-controlling interest, returned income of $487.2 million, $143.7 million and $145.2 million for the years ended December 31, 2024, 2023 and 2022, respectively. This includes the fund's returns, net of investment management fees.
Net investment income, net of non-controlling interest - TSHF, returned income of $274.5 million, $122.1 million and $77.2 million for the years ended December 31, 2024, 2023 and 2022, respectively. This includes the fund's returns, net of investment management fees and performance incentive allocations. The aggregate incentive allocation to which the investment manager is entitled is included in "Net income (loss) attributable to non-controlling interests" in our GAAP financial statements.
TS Hamilton Fund produced returns, net of investment management fees and performance incentive allocations, of 16.3%, 7.6% and 4.6% for the years ended December 31, 2024, 2023 and 2022, respectively.
For the year ended December 31, 2024, gains in TS Hamilton Fund were led by single name U.S. equities trading in STV. The TS Hamilton Fund also saw positive contributions to gains from non-U.S. equities trading in ESTV. In ESTV, gains were experienced in all underlying regions. The TS Hamilton Fund also experienced gains from macroeconomic trading in FTV. In FTV, gains were led by equities, credit, and fixed income.
For the year ended December 31, 2023, TS Hamilton Fund generated positive returns in single name equities trading in STV and ESTV, partially offset by losses in macroeconomic trading in FTV. In single name equities trading, STV and ESTV both made positive contributions. Within ESTV, trading was most profitable in Europe, followed by East Asia and Pan-America, while China experienced losses. Within FTV, losses were driven by commodities, fixed income, and equities, partially offset by gains in currencies and credit.
For the year ended December 31, 2022, TS Hamilton Fund generated positive returns in single name equities trading in STV, partially offset by losses in macroeconomic trading in FTV. Gains were led by U.S. single name equities in STV, followed by non-U.S. equities in ESTV. In macroeconomic activities, FTV generated positive results in equities trading, partially offset by losses from fixed income trading, commodities trading, and currencies trading.
Total net realized and unrealized gains (losses) on investments and net investment income (loss) - other returned income of $87.5 million and $96.4 million and a loss of $73.4 million for the years ended December 31, 2024, 2023 and 2022, respectively. During the year ended December 31, 2024, the fixed maturity securities trading portfolio produced positive returns as the result of investment yield, partially offset by unrealized losses, primarily arising from U.S. treasury interest rate increases. During the year ended December 31, 2023, the fixed maturity securities trading portfolio produced positive returns as the rate of rising interest rates slowed and reinvested funds generated higher yields. During the year ended December 31, 2022, the negative mark-to-market impact of rising U.S. treasury interest rates and other macroeconomic factors offset investment yield, giving rise to non-credit related net investment losses.
Segment Information
We have determined our reportable business segments based on the information used by management in assessing performance and allocating resources to underwriting operations. We have identified two reportable business segments - International and Bermuda. Each of our identified reportable segments has a Chief Executive Officer who is responsible for the overall profitability of their segment and who regularly reports and is directly accountable to the chief operating decision maker ("CODM"): the Chief Executive Officer of the consolidated group. The CODM's responsibilities include providing leadership to all levels of employees; developing culture, values, and ethos; setting the Company's strategy, vision and direction; and overall responsibility for the success and profitability of the Company, including evaluating segment performance.
The CODM evaluates reportable segment performance based on the segment's respective underwriting income or loss. Underwriting income or loss is calculated as net premiums earned less losses and loss adjustment expenses, acquisition costs, and other underwriting expenses, net of third party fee income. General and administrative expenses not incurred by the reportable segments are included in corporate and other expenses as part of the reconciliation of net underwriting income or loss to net income or loss attributable to common shareholders. As we do not manage our assets by reportable segment, investment income and assets are not allocated to reportable segments.
Our core business is underwriting and our underwriting results are reflected in our reportable segments: (1) International, which is comprised of property, casualty, and specialty insurance and reinsurance classes of business originating from the Company’s London, Dublin, and Hamilton Select operations; and (2) Bermuda, which is comprised of property, casualty, and specialty insurance and reinsurance classes of business originating from Hamilton Re, Bermuda and Hamilton Re US and subsidiaries. We consider many factors, including the nature of each segment’s products, client types, production sources, distribution methods and the regulatory environment, in determining the aggregated operating segments.
Corporate includes net realized and unrealized gains (losses) on investments, net investment income (loss), other income (loss) not incurred by the reportable segments, net foreign exchange gains (losses), general and administrative expenses not incurred by the reportable segments, impairment of goodwill, amortization of intangible assets, interest expense, and income tax expense (benefit).
International Segment
| | | | | | | | | | | | | | | | | | | | | | | |
| For the Years Ended December 31, | | |
| ($ in thousands) | 2024 | | 2023 | | 2022 | | | | | | |
| Gross premiums written | $ | 1,308,460 | | | $ | 1,105,522 | | | $ | 933,241 | | | | | | | |
| Net premiums written | $ | 969,605 | | | $ | 770,399 | | | $ | 635,773 | | | | | | | |
| Net premiums earned | $ | 886,934 | | | $ | 703,508 | | | $ | 623,047 | | | | | | | |
| Third party fee income | 16,317 | | | 9,685 | | | 11,430 | | | | | | | |
| | | | | | | | | | | |
| Claims and Expenses | | | | | | | | | | | |
| Losses and loss adjustment expenses | 498,023 | | | 362,137 | | | 335,484 | | | | | | | |
| Acquisition costs | 216,971 | | | 186,698 | | | 170,571 | | | | | | | |
| Other underwriting expenses | 148,824 | | | 127,402 | | | 108,239 | | | | | | | |
| Underwriting income (loss) | $ | 39,433 | | | $ | 36,956 | | | $ | 20,183 | | | | | | | |
| | | | | | | | | | | |
| Attritional losses - current year | $ | 474,665 | | | $ | 373,949 | | | $ | 317,199 | | | | | | | |
| Attritional losses - prior year development | (3,354) | | | (24,415) | | | (29,800) | | | | | | | |
| Catastrophe losses - current year | 33,913 | | | 10,686 | | | 45,118 | | | | | | | |
| Catastrophe losses - prior year development | (7,201) | | | 1,917 | | | 2,967 | | | | | | | |
| Losses and loss adjustment expenses | $ | 498,023 | | | $ | 362,137 | | | $ | 335,484 | | | | | | | |
| | | | | | | | | | | |
| Attritional loss ratio - current year | 53.5 | % | | 53.2 | % | | 50.9 | % | | | | | | |
| Attritional loss ratio - prior year development | (0.4) | % | | (3.5) | % | | (4.8) | % | | | | | | |
| Catastrophe loss ratio - current year | 3.9 | % | | 1.5 | % | | 7.2 | % | | | | | | |
| Catastrophe loss ratio - prior year development | (0.8) | % | | 0.3 | % | | 0.5 | % | | | | | | |
| Losses and loss adjustment expense ratio | 56.2 | % | | 51.5 | % | | 53.8 | % | | | | | | |
| Acquisition cost ratio | 24.5 | % | | 26.5 | % | | 27.4 | % | | | | | | |
| Other underwriting expense ratio | 14.9 | % | | 16.7 | % | | 15.5 | % | | | | | | |
| Combined ratio | 95.6 | % | | 94.7 | % | | 96.7 | % | | | | | | |
Gross Premiums Written
| | | | | | | | | | | | | | | | | | | | | | | |
| For the Years Ended December 31, | | | | | | |
| ($ in thousands) | 2024 | | 2023 | | 2022 | | | | | | |
| Property | $ | 190,369 | | | $ | 134,450 | | | $ | 127,424 | | | | | | | |
| Casualty | 554,413 | | | 490,465 | | | 463,397 | | | | | | | |
| Specialty | 563,678 | | | 480,607 | | | 342,420 | | | | | | | |
| | | | | | | | | | | |
| Total | $ | 1,308,460 | | | $ | 1,105,522 | | | $ | 933,241 | | | | | | | |
Gross premiums written increased by $202.9 million, or 18.4%, from $1.1 billion for the year ended December 31, 2023 to $1.3 billion for the year ended December 31, 2024, primarily driven by growth in both new and existing business and improved pricing in casualty and property insurance classes and specialty reinsurance and insurance classes.
Gross premiums written increased by $172.3 million, or 18.5%, from $933.2 million for the year ended December 31, 2022 to $1.1 billion for the year ended December 31, 2023, primarily driven by growth and improved pricing across specialty insurance classes, with additional contributions from growth in casualty insurance and specialty reinsurance classes and hardening rates on property insurance classes.
Net Premiums Earned
| | | | | | | | | | | | | | | | | |
| For the Years Ended December 31, |
| ($ in thousands) | 2024 | | 2023 | | 2022 |
| Property | $ | 149,318 | | | $ | 104,789 | | $ | 111,134 |
| Casualty | 319,536 | | | 269,921 | | 248,588 |
| Specialty | 418,080 | | | 328,798 | | 263,325 |
| | | | | |
| Total | $ | 886,934 | | | $ | 703,508 | | | $ | 623,047 | |
Net premiums earned increased by $183.4 million, or 26.1%, from $703.5 million for the year ended December 31, 2023 to $886.9 million for the year ended December 31, 2024. The increase was driven by growth in our specialty, casualty and property insurance classes, in addition to growth in the specialty reinsurance class. Specialty insurance growth was primarily driven by accident & health, fine art & specie, political violence, and marine & energy; casualty insurance growth was primarily driven by U.S. excess and surplus lines, professional lines, and cyber, partially offset by a decrease in mergers & acquisitions; property insurance growth was primarily driven by property binders and D&F; and specialty reinsurance growth was primarily driven by surety reinsurance and treaty reinsurance.
Net premiums earned increased by $80.5 million, or 12.9%, from $623.0 million for the year ended December 31, 2022 to $703.5 million for the year ended December 31, 2023, reflecting growth in our specialty insurance business, primarily as the result of increases in political risks and political violence from our war and terror product, as well as growth in marine and personal accident lines, and growth in our casualty insurance business, including professional lines.
Third Party Fee Income
| | | | | | | | | | | | | | | | | |
| For the Years Ended December 31, |
| ($ in thousands) | 2024 | | 2023 | | 2022 |
| Third party fee income | $ | 16,317 | | | $ | 9,685 | | | $ | 11,430 | |
Third party fee income increased by $6.6 million, or 68.5%, from $9.7 million for the year ended December 31, 2023 to $16.3 million for the year ended December 31, 2024. The increase was primarily due to favorable terms of a renewed syndicate management arrangement and an increase in consortium fees.
Third party fee income decreased by $1.7 million or 15.3%, from $11.4 million for the year ended December 31, 2022 to $9.7 million for the year ended December 31, 2023. The decrease was primarily driven by a reduction in the number of third party syndicates under management and the discontinuation of certain consortium arrangements.
Losses and Loss Adjustment Expenses
| | | | | | | | | | | | | | | | | | | | | | | | | | | | | | | | | | | | | | | | |
| ($ in thousands) | | Current
year | | % of net premiums earned | | Prior year development | | % of net premiums earned | | Losses and loss adjustment expenses | | % of net premiums earned | | |
| December 31, 2024 | | | | | | | | | | | | | | |
| Attritional losses | | $ | 474,665 | | | 53.5 | % | | $ | (3,354) | | | (0.4) | % | | $ | 471,311 | | | 53.1 | % | | |
| Catastrophe losses | | 33,913 | | | 3.9 | % | | (7,201) | | | (0.8) | % | | $ | 26,712 | | | 3.1 | % | | |
| Total | | $ | 508,578 | | | 57.4 | % | | $ | (10,555) | | | (1.2) | % | | $ | 498,023 | | | 56.2 | % | | |
| | | | | | | | | | | | | | |
| December 31, 2023 | | | | | | | | | | | | | | |
| Attritional losses | | $ | 373,949 | | | 53.2 | % | | $ | (24,415) | | | (3.5) | % | | $ | 349,534 | | | 49.7 | % | | |
| Catastrophe losses | | 10,686 | | | 1.5 | % | | 1,917 | | | 0.3 | % | | 12,603 | | | 1.8 | % | | |
| Total | | $ | 384,635 | | | 54.7 | % | | $ | (22,498) | | | (3.2) | % | | $ | 362,137 | | | 51.5 | % | | |
| | | | | | | | | | | | | | |
| December 31, 2022 | | | | | | | | | | | | | | |
| Attritional losses | | $ | 317,199 | | | 50.9 | % | | $ | (29,800) | | | (4.8) | % | | $ | 287,399 | | | 46.1 | % | | |
| Catastrophe losses | | 45,118 | | | 7.2 | % | | 2,967 | | | 0.5 | % | | 48,085 | | | 7.7 | % | | |
| Total | | $ | 362,317 | | | 58.1 | % | | $ | (26,833) | | | (4.3) | % | | $ | 335,484 | | | 53.8 | % | | |
Year Ended December 31, 2024 versus Year Ended December 31, 2023
The loss ratio for the year ended December 31, 2024 was 56.2%, compared to 51.5% for the year ended December 31, 2023, an increase of 4.7 percentage points. The increase was primarily driven by higher current year catastrophe and attritional losses and a lower contribution from favorable prior year development.
Attritional loss ratio - current year for the year ended December 31, 2024 was 53.5% compared to 53.2% for the year ended December 31, 2023, an increase of 0.3 percentage points. The increase was primarily driven by losses of $11.8 million, or 1.3 points, arising from the Baltimore Bridge collapse.
Attritional loss ratio - prior year for the year ended December 31, 2024 was a favorable 0.4% compared to a favorable 3.5% for the year ended December 31, 2023, an increase of 3.1 percentage points. The favorable attritional loss ratio - prior year for the year ended December 31, 2024 was primarily driven by favorable development in our property insurance and reinsurance classes, partially offset by unfavorable development in specialty insurance classes, impacted by two large losses, and casualty insurance, impacted by one specific large loss. In addition, casualty business protected by the LPT discussed in Note 7, Reinsurance, benefited from favorable development in the underlying reserves of $15.3 million, which was partially offset by a change in the deferred gain of $9.4 million, for a total net positive earnings impact of $5.9 million.
Catastrophe losses - current year and prior year of $26.7 million for the year ended December 31, 2024 were driven by Hurricane Helene ($19.6 million), Hurricane Milton ($12.8 million), and Hurricane Debby ($1.5 million), partially offset by favorable prior year development of $7.2 million. Catastrophe losses - current year and prior year of $12.6 million for the year ended December 31, 2023 were driven by the Vermont floods ($4.5 million), Hurricane Idalia ($2.9 million), Hawaii wildfires ($2.8 million), and other wind events ($0.5 million), in addition to unfavorable prior year development of $1.9 million.
Year Ended December 31, 2023 versus Year Ended December 31, 2022
The loss ratio for the year ended December 31, 2023 was 51.5%, compared to 53.8% for the year ended December 31, 2022, a decrease of 2.3 percentage points. The decrease was primarily driven by a lower level of catastrophe losses for the year ended December 31, 2023.
Attritional loss ratio - current year for the year ended December 31, 2023 was 53.2% compared to 50.9% for the year ended December 31, 2022, an increase of 2.3 percentage points. The increase in the current year attritional loss ratio primarily arose from three specific large losses in our specialty classes compared to fewer comparable events in the prior year.
Attritional loss ratio - prior year for the year ended December 31, 2023 was a favorable 3.5% compared to a favorable 4.8% for the year ended December 31, 2022, an increase of 1.3 percentage points. We experienced favorable prior year development for the year ended December 31, 2023 of $24.4 million, primarily driven by property and specialty classes. This compared to favorable prior year development for the year ended December 31, 2022 of $29.8 million across most classes of business. In addition, casualty business protected by the LPT benefited from $4.2 million in amortization of the associated deferred gain and favorable development in the underlying reserves of $0.8 million, for a total net positive earnings impact of $5.0 million. See Note 7, Reinsurance, for further discussion of the LPT.
Catastrophe losses - current year and prior year of $12.6 million for the year ended December 31, 2023 were driven by the Vermont floods ($4.5 million), Hurricane Idalia ($2.9 million), Hawaii wildfires ($2.8 million), and other wind events ($0.5 million), in addition to unfavorable prior year development of $1.9 million. Catastrophe losses - current year and prior year of $48.1 million for the year ended December 31, 2022 were primarily driven by the Ukraine conflict ($22.5 million), Hurricane Ian ($15.3 million), the KwaZulu-Natal floods ($4.6 million), and the Australian East Coast floods ($2.7 million), in addition to unfavorable prior year development of $3.0 million.
Acquisition Costs
| | | | | | | | | | | | | | | | | | | | | | | | | | | | | | | | | | | | | | | | | | | | | | | | | | | | | | |
| ($ in thousands) | Acquisition Costs | | % of Net Premiums Earned | | | | | | | | | | | |
| For the Years Ended December 31, | | For the Years Ended December 31, | | | | | | | | | | | |
| 2024 | | 2023 | | 2022 | | 2024 | | 2023 | | 2022 | | '24 vs '23 point r | | '23 vs '22 point r | | | | | | | |
| Property | $ | 48,623 | | | $ | 34,968 | | | $ | 39,606 | | | 32.6% | | 33.4% | | 35.6% | | (0.8) | | (2.2) | | | | | | | |
| Casualty | 46,401 | | | 49,994 | | | 53,768 | | | 14.5% | | 18.5% | | 21.6% | | (4.0) | | (3.1) | | | | | | | |
| Specialty | 121,947 | | | 101,736 | | | 77,197 | | | 29.2% | | 30.9% | | 29.3% | | (1.7) | | 1.6 | | | | | | | |
| | | | | | | | | | | | | | | | | | | | | | |
| Total | $ | 216,971 | | | $ | 186,698 | | | $ | 170,571 | | | 24.5% | | 26.5% | | 27.4% | | (2.0) | | (0.9) | | | | | | | |
The acquisition cost ratio for the year ended December 31, 2024 was 24.5%, compared to 26.5% for the year ended December 31, 2023, a decrease of 2.0 percentage points. The decrease was primarily driven by specialty, casualty and property insurance classes as a result of a change in business mix, reduced profit commission costs and favorable ceded commission income.
The acquisition cost ratio for the year ended December 31, 2023 was 26.5% compared to 27.4% for the year ended December 31, 2022, a decrease of 0.9 percentage points. The decrease was primarily driven by higher volumes of business written in casualty insurance and property insurance classes that benefit from favorable overriding commission offset or lower acquisition costs, and other changes in the business mix.
Other Underwriting Expenses and Other Underwriting Expense Ratios
| | | | | | | | | | | | | | | | | |
| For the Years Ended December 31, |
| ($ in thousands) | 2024 | | 2023 | | 2022 |
| Other underwriting expenses | $ | 148,824 | | $ | 127,402 | | $ | 108,239 |
| Other underwriting expense ratio | 14.9 | % | | 16.7 | % | | 15.5 | % |
Other underwriting expenses are general and administrative costs incurred by our reportable segments.
Other underwriting expenses were $148.8 million for the year ended December 31, 2024, an increase of $21.4 million, or 16.8%, compared to $127.4 million for the year ended December 31, 2023. The increase was primarily driven by increases in headcount as we continued to build out underwriting teams supporting the corresponding increase in premium volume, and certain growth related professional and IT costs.
Other underwriting expenses were $127.4 million for the year ended December 31, 2023, an increase of $19.2 million, or 17.7%, compared to $108.2 million for the year ended December 31, 2022. The increase was primarily driven by increases in headcount as we built out underwriting teams supporting the corresponding increase in premium volume and certain variable performance based compensation costs.
The other underwriting expense ratios for the years ended December 31, 2024, 2023 and 2022 remained stable over the same period at 14.9%, 16.7% and 15.5%, respectively, as a result of the growth in our premium base.
Bermuda Segment
| | | | | | | | | | | | | | | | | | | | | | | |
| | | | | | | |
| For the Years Ended December 31, | | |
| ($ in thousands) | 2024 | | 2023 | | 2022 | | | | | | |
| Gross premiums written | $ | 1,114,122 | | | $ | 845,516 | | | $ | 713,432 | | | | | | | |
| Net premiums written | $ | 951,564 | | | $ | 710,039 | | | $ | 586,091 | | | | | | | |
| Net premiums earned | $ | 847,795 | | | $ | 615,025 | | | $ | 520,667 | | | | | | | |
| Third party fee income | 7,435 | | | 8,549 | | | 201 | | | | | | | |
| | | | | | | | | | | |
| Claims and Expenses | | | | | | | | | | | |
| Losses and loss adjustment expenses | 512,150 | | | 352,466 | | | 422,849 | | | | | | | |
| Acquisition costs | 171,960 | | | 122,450 | | | 100,618 | | | | | | | |
| Other underwriting expenses | 61,189 | | | 55,763 | | | 49,301 | | | | | | | |
| Underwriting income (loss) | $ | 109,931 | | | $ | 92,895 | | | $ | (51,900) | | | | | | | |
| | | | | | | | | | | |
| Attritional losses - current year | $ | 447,074 | | | $ | 314,195 | | | $ | 275,477 | | | | | | | |
| Attritional losses - prior year development | 4,172 | | | 13,972 | | | 26,584 | | | | | | | |
| Catastrophe losses - current year | 74,960 | | | 31,390 | | | 141,142 | | | | | | | |
| Catastrophe losses - prior year development | (14,056) | | | (7,091) | | | (20,354) | | | | | | | |
| Losses and loss adjustment expenses | $ | 512,150 | | | $ | 352,466 | | | $ | 422,849 | | | | | | | |
| | | | | | | | | | | |
| Attritional loss ratio - current year | 52.7 | % | | 51.1 | % | | 52.9 | % | | | | | | |
| Attritional loss ratio - prior year development | 0.5 | % | | 2.3 | % | | 5.1 | % | | | | | | |
| Catastrophe loss ratio - current year | 8.9 | % | | 5.1 | % | | 27.1 | % | | | | | | |
| Catastrophe loss ratio - prior year development | (1.7) | % | | (1.2) | % | | (3.9) | % | | | | | | |
| Losses and loss adjustment expense ratio | 60.4 | % | | 57.3 | % | | 81.2 | % | | | | | | |
| Acquisition cost ratio | 20.3 | % | | 19.9 | % | | 19.3 | % | | | | | | |
| Other underwriting expense ratio | 6.3 | % | | 7.7 | % | | 9.4 | % | | | | | | |
| Combined ratio | 87.0 | % | | 84.9 | % | | 109.9 | % | | | | | | |
Gross Premiums Written
| | | | | | | | | | | | | | | | | | | | | | | |
| For the Years Ended December 31, | | |
| ($ in thousands) | 2024 | | 2023 | | 2022 | | | | | | |
| Property | $ | 423,747 | | | $ | 318,297 | | | $ | 309,051 | | | | | | | |
| Casualty | 524,711 | | | 402,731 | | | 262,795 | | | | | | | |
| Specialty | 165,664 | | | 124,488 | | | 141,586 | | | | | | | |
| | | | | | | | | | | |
| Total | $ | 1,114,122 | | | $ | 845,516 | | | $ | 713,432 | | | | | | | |
Gross premiums written increased by $268.6 million, or 31.8%, from $845.5 million for the year ended December 31, 2023 to $1.1 billion for the year ended December 31, 2024. The increase was primarily driven by new business, expanded participations and rate increases in casualty and property reinsurance classes. Specialty reinsurance also increased, primarily driven by new business and non-recurring reinstatement premiums.
Gross premiums written increased by $132.1 million or 18.5% from $713.4 million for the year ended December 31, 2022 to $845.5 million for the year ended December 31, 2023. The increase was driven by new business, volume growth and rate increases in casualty reinsurance and property insurance classes of business, partially offset by non-recurring specialty reinsurance reinstatement premiums recorded in the prior year and the strategic decision to exit certain property reinsurance business.
Net Premiums Earned
| | | | | | | | | | | | | | | | | |
| For the Years Ended December 31, |
| ($ in thousands) | 2024 | | 2023 | | 2022 |
| Property | $ | 308,444 | | | $ | 220,659 | | | $ | 233,426 | |
| Casualty | 413,993 | | | 290,035 | | | 175,647 | |
| Specialty | 125,358 | | | 104,331 | | | 111,594 | |
| | | | | |
| Total | $ | 847,795 | | | $ | 615,025 | | | $ | 520,667 | |
Net premiums earned increased by $232.8 million, or 37.8% from $615.0 million for the year ended December 31, 2023 to $847.8 million for the year ended December 31, 2024, primarily driven by new business, volume growth and rate increases in our casualty and property reinsurance classes. The most significant drivers of this increase were general liability, professional lines and property treaty and quota share classes.
Net premiums earned increased by $94.4 million, or 18.1%, from $520.7 million for the year ended December 31, 2022 to $615.0 million for the year ended December 31, 2023, reflecting growth in net premiums written in our casualty reinsurance classes, driven by continued growth across the majority of our casualty reinsurance classes, primarily general liability and professional liability. This was partially offset by strategic withdrawals from certain property reinsurance classes of business and non-recurring reinstatement premiums recorded in the prior year.
Third Party Fee Income
| | | | | | | | | | | | | | | | | |
| For the Years Ended December 31, |
| ($ in thousands) | 2024 | | 2023 | | 2022 |
| Third party fee income (expense) | $ | 7,435 | | | $ | 8,549 | | | $ | 201 | |
Third party fee income of $7.4 million for the year ended December 31, 2024 decreased by $1.1 million or 13.0%, compared to $8.5 million for the year ended December 31, 2023 and was generated by certain performance based management fees recognized by Ada Capital Management Limited for services provided to Ada Re, Ltd.
Third party fee income of $8.5 million for the year ended December 31, 2023 increased by $8.3 million, compared to $0.2 million for the year ended December 31, 2022. The increase was primarily driven by certain performance based management fees recognized by Ada Capital Management Limited for services provided to Ada Re, Ltd.
Losses and Loss Adjustment Expenses
| | | | | | | | | | | | | | | | | | | | | | | | | | | | | | | | | | | | |
| ($ in thousands) | Current
year | | % of net premiums earned | | Prior year development | | % of net premiums earned | | Losses and loss adjustment expenses | | % of net premiums earned | |
| December 31, 2024 | | | | | | | | | | | | |
| Attritional losses | $ | 447,074 | | | 52.7 | % | | $ | 4,172 | | | 0.5 | % | | $ | 451,246 | | | 53.2 | % | |
| Catastrophe losses | 74,960 | | | 8.9 | % | | (14,056) | | | (1.7) | % | | 60,904 | | | 7.2 | % | |
| Total | $ | 522,034 | | | 61.6 | % | | $ | (9,884) | | | (1.2) | % | | $ | 512,150 | | | 60.4 | % | |
| | | | | | | | | | | | |
| December 31, 2023 | | | | | | | | | | | | |
| Attritional losses | $ | 314,195 | | | 51.1 | % | | $ | 13,972 | | | 2.3 | % | | $ | 328,167 | | | 53.4 | % | |
| Catastrophe losses | 31,390 | | | 5.1 | % | | (7,091) | | | (1.2) | % | | 24,299 | | | 3.9 | % | |
| Total | $ | 345,585 | | | 56.2 | % | | $ | 6,881 | | | 1.1 | % | | $ | 352,466 | | | 57.3 | % | |
| | | | | | | | | | | | |
| December 31, 2022 | | | | | | | | | | | | |
| Attritional losses | $ | 275,477 | | | 52.9 | % | | $ | 26,584 | | | 5.1 | % | | $ | 302,061 | | | 58.0 | % | |
| Catastrophe losses | 141,142 | | | 27.1 | % | | (20,354) | | | (3.9) | % | | 120,788 | | | 23.2 | % | |
| Total | $ | 416,619 | | | 80.0 | % | | $ | 6,230 | | | 1.2 | % | | $ | 422,849 | | | 81.2 | % | |
Year Ended December 31, 2024 versus Year Ended December 31, 2023
The loss ratio for the year ended December 31, 2024 was 60.4%, compared to 57.3% for the year ended December 31, 2023, an increase of 3.1 percentage points. The increase was primarily driven by both a higher current year catastrophe loss ratio and current year attritional loss ratio, partially offset by a favorable prior year development loss ratio.
Attritional loss ratio - current year for the year ended December 31, 2024 was 52.7% compared to 51.1% for the year ended December 31, 2023, an increase of 1.6 percentage points. The increase was primarily driven by losses of $26.1 million, or 3.1 points, arising from the Baltimore Bridge collapse.
Attritional loss ratio - prior year for the year ended December 31, 2024 was an unfavorable 0.5% compared to an unfavorable 2.3% for the year ended December 31, 2023, a decrease of 1.8 percentage points. The unfavorable attritional loss ratio - prior year for the year ended December 31, 2024 was primarily driven by unfavorable development in certain casualty reinsurance classes, partially offset by favorable development in property reinsurance and insurance classes. This compared to unfavorable attritional loss prior year development for the year ended December 31, 2023 of $14.0 million, primarily driven by unfavorable development in property and casualty classes of business, partially offset by favorable development in specialty classes of business.
Catastrophe losses - current year and prior year of $60.9 million for the year ended December 31, 2024 were driven by Hurricane Helene ($33.0 million), Hurricane Milton ($25.0 million), the Calgary hailstorms ($12.9 million), and Hurricane Debby ($4.1 million), partially offset by favorable prior year development of $14.1 million. Catastrophe losses - current year and prior year of $24.3 million for the year ended December 31, 2023 were primarily driven by wind and thunderstorm events which impacted states in both the Southern and Midwest U.S. during March 2023 ($11.0 million), the Hawaii wildfires ($9.2 million), severe convective storms in June 2023 ($7.1 million), Hurricane Idalia ($3.6 million) and various flood events ($0.5 million), partially offset by favorable prior year development of $7.1 million.
Year Ended December 31, 2023 versus Year Ended December 31, 2022
The loss ratio for the year ended December 31, 2023 was 57.3%, compared to 81.2% for the year ended December 31, 2022, a decrease of 23.9 percentage points. The decrease was primarily driven by a lower level of catastrophe losses in the current year.
Attritional loss ratio - current year for the year ended December 31, 2023 was 51.1% compared to 52.9% for the year ended December 31, 2022, a decrease of 1.8 percentage points. The decrease in the current year attritional loss ratio was primarily driven by a generally lower level of current year attritional losses, partially offset by certain specific losses affecting casualty and property insurance and casualty and specialty reinsurance classes.
Attritional loss ratio - prior year for the year ended December 31, 2023 was an unfavorable 2.3% compared to an unfavorable 5.1% for the year ended December 31, 2022, a decrease of 2.8 percentage points. We experienced unfavorable prior year development for the year ended December 31, 2023 of $14.0 million, primarily driven by unfavorable development in property and casualty classes of business, partially offset by favorable development in specialty classes of business. This compared to unfavorable attritional loss prior year development for the year ended December 31, 2022 of $26.6 million, primarily driven by unfavorable development across discontinued casualty classes of business.
Catastrophe losses - current year and prior year of $24.3 million for the year ended December 31, 2023 were primarily driven by wind and thunderstorm events which impacted states in both the Southern and Midwest U.S. during March 2023 ($11.0 million), the Hawaii wildfires ($9.2 million), severe convective storms in June 2023 ($7.1 million), Hurricane Idalia ($3.6 million) and various flood events ($0.5 million), partially offset by favorable prior year development of $7.1 million. Catastrophe losses - current year and prior year of $120.8 million for the year ended December 31, 2022 were primarily driven by Hurricane Ian ($62.2 million), the Ukraine conflict ($57.1 million), Australian East Coast floods ($13.9 million), Typhoon Nanmadol ($4.3 million) and KwaZulu-Natal floods ($3.7 million), partially offset by favorable prior year development of $20.4 million.
Acquisition Costs
| | | | | | | | | | | | | | | | | | | | | | | | | | | | | | | | | | | | | | | | | | | | | | | | | | | | | | |
| Acquisition Costs | | % of Net Premiums Earned | | | | | | | | | | | |
| For the Years Ended December 31, | | For the Years Ended December 31, | | | | | | | | | | | |
| ($ in thousands) | 2024 | | 2023 | | 2022 | | 2024 | | 2023 | | 2022 | | '24 vs '23 point r | | '23 vs '22 point r | | | | | | | |
| Property | $ | 38,896 | | | $ | 26,947 | | | $ | 36,686 | | | 12.6% | | 12.2% | | 15.7% | | 0.4 | | (3.5) | | | | | | | |
| Casualty | 103,388 | | | 68,615 | | | 35,643 | | | 25.0% | | 23.7% | | 20.3% | | 1.3 | | 3.4 | | | | | | | |
| Specialty | 29,676 | | | 26,888 | | | 28,289 | | | 23.7% | | 25.8% | | 25.3% | | (2.1) | | 0.5 | | | | | | | |
| | | | | | | | | | | | | | | | | | | | | | |
| Total | $ | 171,960 | | | $ | 122,450 | | | $ | 100,618 | | | 20.3% | | 19.9% | | 19.3% | | 0.4 | | 0.6 | | | | | | | |
The acquisition cost ratio for the year ended December 31, 2024 increased to 20.3%, compared to 19.9% for the year ended December 31, 2023. The modest increase was primarily driven by a change in the mix of business, including more proportional business written in our casualty reinsurance and property reinsurance classes.
The acquisition cost ratio for the year ended December 31, 2023 increased to 19.9%, compared to 19.3% for the year ended December 31, 2022, reflecting the impact of higher reinstatement premiums earned by specialty reinsurance classes in the prior period and a change in business mix in casualty insurance and reinsurance classes.
Other Underwriting Expenses and Other Underwriting Expense Ratios
| | | | | | | | | | | | | | | | | |
| For the Years Ended December 31, |
| ($ in thousands) | 2024 | | 2023 | | 2022 |
| Other underwriting expenses | $ | 61,189 | | | $ | 55,763 | | | $ | 49,301 | |
| Other underwriting expense ratio | 6.3 | % | | 7.7 | % | | 9.4 | % |
Other underwriting expenses are general and administrative costs incurred by our reportable segments.
Other underwriting expenses were $61.2 million for the year ended December 31, 2024, an increase of $5.4 million, or 9.7%, compared to $55.8 million for the year ended December 31, 2023. The increase was primarily driven by an increase in salary and compensation costs, an increased headcount as we continued to build out underwriting teams supporting the corresponding increase in premium volume, and professional fees.
Other underwriting expenses were $55.8 million for the year ended December 31, 2023, an increase of $6.5 million, or 13.1%, compared to $49.3 million for the year ended December 31, 2022. The increase was primarily driven by increases in certain variable performance based compensation costs.
The other underwriting expense ratios for the years ended December 31, 2024, 2023 and 2022 decreased over the same period at 6.3%, 7.7% and 9.4% as a result of the growth in premium base and certain performance based management fees recognized by Ada Capital Management Limited for services provided to Ada Re, Ltd.
Corporate and Other
Total Net Realized and Unrealized Gains (Losses) on Investments and Net Investment Income (Loss)
The components of total net realized and unrealized gains (losses) on investments and net investment income (loss) are as follows:
| | | | | | | | | | | | | | | | | |
| For the Years Ended December 31, |
| ($ in thousands) | 2024 | | 2023 | | 2022 |
Total net realized and unrealized gains (losses) on investments and net investment income (loss) - TSHF(1) | $ | 487,186 | | | $ | 143,655 | | | $ | 145,238 | |
| Total net realized and unrealized gains (losses) on investments and net investment income (loss) - other | 87,488 | | | 96,411 | | | (73,377) | |
| $ | 574,674 | | | $ | 240,066 | | | $ | 71,861 | |
| | | | | |
| Net income (loss) attributable to non-controlling interest - TSHF | $ | 212,729 | | | $ | 21,560 | | | $ | 68,064 | |
| | | | | |
(1) Prior to non-controlling interest performance incentive allocation
Total net realized and unrealized gains (losses) on investments and net investment income (loss) - TSHF, prior to non-controlling interest, returned income of $487.2 million, $143.7 million and $145.2 million for the years ended December 31, 2024, 2023 and 2022, respectively. This includes the fund's returns, net of investment management fees.
Net investment income, net of non-controlling interest - TSHF, returned income of $274.5 million, $122.1 million and $77.2 million for the years ended December 31, 2024, 2023 and 2022, respectively. This includes the fund's returns, net of investment management fees and performance incentive allocations. The aggregate incentive allocation to which the investment manager is entitled is included in "Net income (loss) attributable to non-controlling interests" in our GAAP financial statements.
TS Hamilton Fund produced returns, net of investment management fees and performance incentive allocations, of 16.3%, 7.6% and 4.6% for each of the years ended December 31, 2024, 2023 and 2022, respectively.
For the year ended December 31, 2024, gains in TS Hamilton Fund were led by single name U.S. equities trading in STV. The TS Hamilton Fund also saw positive contributions to gains from non-U.S. equities trading in ESTV. In ESTV, gains were experienced in all underlying regions. The TS Hamilton Fund also experienced gains from macroeconomic trading in FTV. In FTV, gains were led by equities, credit, and fixed income.
For the year ended December 31, 2023, TS Hamilton Fund generated positive returns in single name equities trading in STV and ESTV, partially offset by losses in macroeconomic trading in FTV. In single name equities trading, STV and ESTV both made positive contributions. Within ESTV, trading was most profitable in Europe, followed by East Asia and Pan-America, while China experienced losses. Within FTV, losses were driven by commodities, fixed income, and equities, partially offset by gains in currencies and credit.
For the year ended December 31, 2022, TS Hamilton Fund generated positive returns in single name equities trading in STV, partially offset by losses in macroeconomic trading in FTV. Gains were led by U.S. single name equities in STV, followed by non-U.S. equities in ESTV. In macroeconomic activities, FTV generated positive results in equities trading, partially offset by losses from fixed income trading, commodities trading, and currencies trading.
Total net realized and unrealized gains (losses) on investments and net investment income (loss) - other returned income of $87.5 million and $96.4 million and a loss of $73.4 million for the years ended December 31, 2024, 2023 and 2022, respectively. During the year ended December 31, 2024, the fixed maturity securities trading portfolio produced positive returns as the result of investment yield, partially offset by unrealized losses, primarily arising from U.S. treasury interest rate increases. During the year ended December 31, 2023, the fixed maturity securities trading portfolio produced positive returns as the rate of rising interest rates slowed and reinvested funds generated higher yields. During the year ended December 31, 2022, the negative mark-to-market impact of rising U.S. Treasury interest rates and other macroeconomic factors offset investment yield, giving rise to non-credit related net investment losses.
Other Income (Loss)
| | | | | | | | | | | | | | | | | |
| For the Years Ended December 31, |
| ($ in thousands) | 2024 | | 2023 | | 2022 |
| Other income (loss), excluding third party fee income | $ | — | | | $ | 397 | | | $ | (315) | |
Other income (loss), excluding third party fee income, consists of varying insignificant items in each period.
Net Foreign Exchange Gains (Losses)
| | | | | | | | | | | | | | | | | |
| For the Years Ended December 31, |
| ($ in thousands) | 2024 | | 2023 | | 2022 |
| Net foreign exchange gains (losses) | $ | (3,231) | | | $ | (6,185) | | | $ | 6,137 | |
Our functional currency is the U.S. Dollar. We may conduct routine underwriting operations or invest a portion of our cash and other investable assets in currencies other than U.S. Dollars. Consequently, we may incur foreign exchange gains and losses in our results of operations.
Foreign exchange losses of $3.2 million and $6.2 million and gains of $6.1 million for the years ended December 31, 2024, 2023 and 2022, respectively, were primarily driven by the remeasurement of insurance-related assets and liabilities denominated in British Pounds, Euro, Japanese Yen, and Australian and Canadian Dollars.
Corporate Expenses
| | | | | | | | | | | | | | | | | |
| For the Years Ended December 31, |
| ($ in thousands) | 2024 | | 2023 | | 2022 |
| Corporate expenses | $ | 61,111 | | | $ | 76,691 | | | $ | 20,142 | |
| | | | | |
| | | | | |
Corporate expenses for the years ended December 31, 2024, 2023 and 2022, were $61.1 million, $76.7 million and $20.1 million, respectively, and typically consist of certain executive and Board compensation costs and professional fees.
Corporate expenses for the year ended December 31, 2024 were $61.1 million compared to $76.7 million for the year ended December 31, 2023, a decrease of $15.6 million. The decrease was primarily driven by $9.2 million of Value Appreciation Pool ("VAP") expense recorded for the year ended December 31, 2024, compared to $30.4 million of VAP expense recorded for the year ended December 31, 2023, partially offset by certain variable performance based compensation costs, an increased headcount and an increase in professional fees and insurance costs associated with operating as a public company.
Corporate expenses for the year ended December 31, 2023 were $76.7 million compared to $20.1 million for the year ended December 31, 2022, an increase of $56.6 million. The increase was primarily driven by $30.4 million of share based compensation expense related to the VAP. An additional $4.2 million of expense was recorded as an adjustment to retained earnings in "Share compensation expense" in the second quarter of 2023, for a total year to date VAP expense of $34.5 million at December 31, 2023. The remainder of the increase was primarily driven by certain variable performance based compensation costs.
Impairment of Goodwill
| | | | | | | | | | | | | | | | | |
| For the Years Ended December 31, |
| ($ in thousands) | 2024 | | 2023 | | 2022 |
| Impairment of goodwill | $ | — | | | $ | — | | | $ | 24,082 | |
In the years ended December 31, 2024, 2023 and 2022, the Company recorded impairment charges of $Nil, $Nil and $24.1 million, respectively, primarily arising from the annual goodwill impairment assessment. As of December 31, 2024 and 2023, there was $Nil goodwill recorded on the balance sheet.
Amortization of Intangible Assets
| | | | | | | | | | | | | | | | | |
| For the Years Ended December 31, |
| ($ in thousands) | 2024 | | 2023 | | 2022 |
| Amortization of intangible assets | $ | 15,520 | | | $ | 10,783 | | | $ | 12,832 | |
Amortization of intangible assets of $15.5 million, $10.8 million and $12.8 million for the years ended December 31, 2024, 2023 and 2022, respectively, relates to internally developed software and intangible assets acquired in a business combination. The increase in amortization expense is primarily driven by the incremental expense associated with additional technology projects.
Interest Expense
| | | | | | | | | | | | | | | | | |
| For the Years Ended December 31, |
| ($ in thousands) | 2024 | | 2023 | | 2022 |
| Interest expense | $ | 22,616 | | | $ | 21,434 | | | $ | 15,741 | |
Interest expense of $22.6 million, $21.4 million and $15.7 million for the years ended December 31, 2024, 2023 and 2022, respectively, relates to interest payments and certain administrative fees associated with our term loan and letter of credit facilities. The movement in interest expense is primarily driven by the increase in the Secured Overnight Financing Rate ("SOFR"), which underlies the floating rate associated with the term loan.
Income Tax Expense (Benefit)
| | | | | | | | | | | | | | | | | |
| For the Years Ended December 31, |
| ($ in thousands) | 2024 | | 2023 | | 2022 |
| Income tax expense (benefit) | $ | 8,402 | | | $ | (25,066) | | | $ | 3,104 | |
The Company's subsidiaries and branches operate in jurisdictions that are subject to tax, specifically, the United Kingdom, Ireland and the United States. Our effective income tax rate may therefore fluctuate significantly, depending on the relative contribution of each jurisdiction to pre-tax income or loss within the Company in any given period.
Hamilton Group and its Bermuda domiciled subsidiaries were not subject to income tax in Bermuda in 2023 and prior. On December 27, 2023, Bermuda enacted a 15% corporate income tax that generally became effective on January 1, 2025. The legislation defers the effective tax date until 2030 for Bermuda companies that meet certain requirements. The Company expects to meet those requirements to remain exempt until 2030. The legislation included a provision referred to as the economic transition adjustment, which is intended to provide a fair and equitable transition into the tax regime with respect to which the Company has recorded a deferred tax asset.
Income tax expense of $8.4 million for the year ended December 31, 2024 is primarily driven by withholding taxes on investment income from TS Hamilton Fund and income tax expense on earnings from our London, Dublin, and U.S. operations, partially offset by a decrease in valuation allowance.
Income tax benefit of $25.1 million for the year ended December 31, 2023 is primarily driven by the economic transition adjustment discussed above, partially offset by withholding taxes on investment income from the TS Hamilton Fund and income tax expense on earnings from our U.K. operations which was offset by a decrease in valuation allowance.
Income tax expense of $3.1 million for the year ended December 31, 2022, is primarily driven by withholding taxes on investment income from the TS Hamilton Fund and an increase in valuation allowance, partially offset by an income tax benefit from losses in our U.K., U.S. and Ireland operations.
Key Operating and Financial Metrics
The Company has identified the following metrics as key measures of the Company’s performance:
Book Value per Common Share
Management believes that book value is an important indicator of value provided to common shareholders and aligns the Company’s and most investors’ long term objectives. We calculate book value per common share as total common shareholders’ equity divided by the total number of common shares outstanding at the point in time.
| | | | | | | | | | | | | | | | | | | | |
| As at December 31, | | |
| ($ in thousands, except for share and per share amounts) | 2024 | | 2023 | | | | | | | | | |
| Closing common shareholders' equity | $ | 2,328,709 | | | $ | 2,047,850 | | | | | | | | | | |
| Closing common shares outstanding | 101,466,997 | | | 110,225,103 | | | | | | | | | | |
| Book value per common share | $ | 22.95 | | | $ | 18.58 | | | | | | | | | | |
Book value per common share was $22.95 at December 31, 2024, a $4.37 or 23.5% increase from the Company’s book value per common share of $18.58 at December 31, 2023. The increase was primarily driven by the Company’s net income attributable to common shareholders of $400.4 million and the accretive impact of share repurchases (see Note 11, Share Capital in the accompanying audited consolidated financial statements for further details).
Tangible Book Value per Common Share
Management believes that tangible book value is an important indicator of value provided to common shareholders and aligns the Company’s and most investors’ long term objectives. We calculate tangible book value per common share as total common shareholders’ equity less intangible assets, divided by the total number of common shares outstanding at the point in time.
| | | | | | | | | | | | | | | | | | | | |
| As at December 31, | | |
| ($ in thousands, except for share and per share amounts) | 2024 | | 2023 | | | | | | | | | |
| Closing common shareholders' equity | $ | 2,328,709 | | | $ | 2,047,850 | | | | | | | | | | |
| Intangible assets | 93,121 | | | 90,996 | | | | | | | | | | |
| Closing common shareholders' equity, less intangible assets | $ | 2,235,588 | | | $ | 1,956,854 | | | | | | | | | | |
| | | | | | | | | | | | |
| Closing common shares outstanding | 101,466,997 | | | 110,225,103 | | | | | | | | | | |
| Tangible book value per common share | $ | 22.03 | | | $ | 17.75 | | | | | | | | | | |
Tangible book value per common share was $22.03 at December 31, 2024, a $4.28 or 24.1% increase from the Company’s tangible book value per common share of $17.75 at December 31, 2023. The increase in tangible book value per common share was primarily driven by the Company’s net income attributable to common shareholders and the accretive impact of share repurchases (see Note 11, Share Capital in the accompanying audited consolidated financial statements for further details).
Return on Average Common Shareholders' Equity
Management believes that return on average common shareholders’ equity or ("ROACE") is an important indicator of the Company’s profitability and financial efficiency. We calculate it by dividing net income (loss) attributable to common shareholders by average common shareholders' equity for the corresponding period.
| | | | | | | | | | | | | | | | | |
| For the Years Ended December 31, |
| ($ in thousands) | 2024 | | 2023 | | 2022 |
| Net income (loss) attributable to common shareholders | 400,429 | | | 258,727 | | | (97,999) | |
| Average common shareholders' equity for the period | 2,188,280 | | | 1,856,017 | | | 1,708,392 | |
| | | | | |
| | | | | |
| Return on average common shareholders' equity | 18.3 | % | | 13.9 | % | | (5.7) | % |
| | | | | |
| | | | | |
ROACE was 18.3% for the year ended December 31, 2024, compared to 13.9% for the year ended December 31, 2023. The increase was primarily driven by the higher net income attributable to common shareholders for the year ended December 31, 2024.
ROACE was 13.9% for the year ended December 31, 2023, compared to (5.7)% for the year ended December 31, 2022. The increase was primarily driven by the higher net income attributable to common shareholders for the year ended December 31, 2023.
Non-GAAP Measures
We present our results of operations in a way that we believe will be the most meaningful and useful to investors, analysts, rating agencies and others who use our financial information to evaluate our performance. Some of the measurements are considered non-GAAP financial measures under SEC rules and regulations. In this Form 10-K, we present underwriting income (loss), a non-GAAP financial measure as defined in Item 10(e) of SEC Regulation S-K. We believe that non-GAAP financial measures, which may be defined and calculated differently by other companies, help explain and enhance the understanding of our results of operations. However, these measures should not be viewed as a substitute for those determined in accordance with U.S. GAAP. Where appropriate, reconciliations of our non-GAAP measures to the most comparable GAAP figures are included below.
Underwriting Income (Loss)
We calculate underwriting income (loss) on a pre-tax basis as net premiums earned less losses and loss adjustment expenses, acquisition costs and other underwriting expenses (net of third party fee income). We believe that this measure of our performance focuses on the core fundamental performance of the Company’s reportable segments in any given period and is not distorted by investment market conditions, corporate expense allocations or income tax effects.
The table below reconciles underwriting income (loss) to net income (loss), the most comparable GAAP financial measure:
| | | | | | | | | | | | | | | | | | | | | |
| For the Years Ended December 31, | | | | |
| ($ in thousands) | 2024 | | 2023 | | 2022 | | | | |
| Underwriting income (loss) | $ | 149,364 | | | $ | 129,851 | | | $ | (31,717) | | | | | |
| Total net realized and unrealized gains (losses) on investments and net investment income (loss) | 574,674 | | | 240,066 | | | 71,861 | | | | | |
| | | | | | | | | |
| Other income (loss), excluding third party fee income | — | | | 397 | | | (315) | | | | | |
| Net foreign exchange gains (losses) | (3,231) | | | (6,185) | | | 6,137 | | | | | |
| Corporate expenses | (61,111) | | | (76,691) | | | (20,142) | | | | | |
| Impairment of goodwill | — | | | — | | | (24,082) | | | | | |
| Amortization of intangible assets | (15,520) | | | (10,783) | | | (12,832) | | | | | |
| Interest expense | (22,616) | | | (21,434) | | | (15,741) | | | | | |
| Income tax (expense) benefit | (8,402) | | | 25,066 | | | (3,104) | | | | | |
| Net income (loss), prior to non-controlling interest | $ | 613,158 | | | $ | 280,287 | | | $ | (29,935) | | | | | |
| | | | | | | | | |
Third Party Fee Income
Third party fee income includes income that is incremental and/or directly attributable to our underwriting operations. It is primarily comprised of fees earned by the International segment for management services provided to third party syndicates and consortia and by the Bermuda segment for performance based management fees generated by our third party capital manager, Ada Capital Management Limited. We believe that this measure is a relevant component of our underwriting income (loss).
The table below reconciles third party fee income to other income (loss), the most comparable GAAP financial measure:
| | | | | | | | | | | | | | | | | | | | | |
| For the Years Ended December 31, | | | | |
| ($ in thousands) | 2024 | | 2023 | | 2022 | | | | |
| Third party fee income | $ | 23,752 | | | $ | 18,234 | | | $ | 11,631 | | | | | |
| Other income (loss), excluding third party fee income | — | | | 397 | | | (315) | | | | | |
| Other income (loss) | $ | 23,752 | | | $ | 18,631 | | | $ | 11,316 | | | | | |
Other Underwriting Expenses
Other underwriting expenses include those general and administrative expenses that are incremental and/or directly attributable to our underwriting operations. While this measure is presented in Note 9, Segment Reporting, it is considered a non-GAAP financial measure when presented elsewhere.
Corporate expenses include holding company costs necessary to support our reportable segments. As these costs are not incremental and/or directly attributable to our underwriting operations, these costs are excluded from other underwriting expenses, and therefore, underwriting income (loss). General and administrative expenses, the most comparable GAAP financial measure to other underwriting expenses, also includes corporate expenses.
The following table reconciles other underwriting expenses to general and administrative expenses, the most comparable GAAP financial measure:
| | | | | | | | | | | | | | | | | | | | | |
| For the Years Ended December 31, | | | | |
| ($ in thousands) | 2024 | | 2023 | | 2022 | | | | |
| Other underwriting expenses | $ | 210,013 | | | $ | 183,165 | | | $ | 157,540 | | | | | |
| Corporate expenses | 61,111 | | | 76,691 | | | 20,142 | | | | | |
| General and administrative expenses | $ | 271,124 | | | $ | 259,856 | | | $ | 177,682 | | | | | |
Other Underwriting Expense Ratio
Other Underwriting Expense Ratio is a measure of the other underwriting expenses (net of third party fee income) incurred by the Company and is expressed as a percentage of net premiums earned.
Loss Ratio
Attritional Loss Ratio – current year is the attritional losses incurred by the company relating to the current year divided by net premiums earned.
Attritional Loss Ratio – prior year development is the attritional losses incurred by the company relating to prior years divided by net premiums earned.
Catastrophe Loss Ratio – current year is the catastrophe losses incurred by the company relating to the current year divided by net premiums earned.
Catastrophe Loss Ratio – prior year development is the catastrophe losses incurred by the company relating to prior years divided by net premiums earned.
Combined Ratio
Combined Ratio is a measure of our underwriting profitability and is expressed as the sum of the loss and loss adjustment expense ratio, acquisition cost ratio and other underwriting expense ratio. A combined ratio under 100% indicates an underwriting profit, while a combined ratio over 100% indicates an underwriting loss.
Financial Condition, Liquidity and Capital Resources
Financial Condition
Investment Philosophy
The Company maintains two segregated investment portfolios: a fixed maturities and short-term investments trading portfolio and an investment in Two Sigma Hamilton Fund ("TS Hamilton Fund").
The Company's high quality and liquid fixed maturities and short-term investments portfolio is structured to focus primarily on the preservation of capital and the availability of liquidity to meet the Company’s claims obligations, to be well diversified across market sectors, and to generate relatively attractive returns on a risk-adjusted basis over time. The Company’s investments are subject to market-wide risks and fluctuations, as well as to risks inherent in particular securities.
The Company also invests in TS Hamilton Fund, a Delaware limited liability company. Hamilton Re has a commitment with TS Hamilton Fund to maintain an amount up to the lesser of (i) $1.8 billion or (ii) 60% of Hamilton Insurance Group’s net tangible assets in TS Hamilton Fund, such lesser amount, the "Minimum Commitment Amount", for a three-year period (the "Initial Term") and for rolling three-year periods thereafter (each such three-year period the "Commitment Period"), subject to certain circumstances and the liquidity options described below, with the Commitment Period ending on June 30, 2027. The Commitment Period consists of a 3-year rolling term that automatically renews on an annual basis unless Hamilton Re or the Managing Member provide advance notice of non-renewal. Two Sigma is a United States Securities and Exchange Commission registered investment adviser specializing in quantitative analysis. The TS Hamilton Fund investment strategy is focused on delivering non-market correlated investment income and total return through all market cycles while maintaining appropriate portfolio liquidity and credit quality to meet the requirements of customers, rating agencies and regulators.
Cash and Investments
At December 31, 2024 and 2023, total cash and investments was $4.9 billion and $4.0 billion, respectively. However, a significant portion of the total cash and investments balances held were invested in TS Hamilton Fund as collateral for the investments held by the underlying trading vehicles, as shown in the tables under the "TS Hamilton Fund" discussion.
| | | | | | | | | | | | | | | | | | | | | | | | |
| As at December 31, | |
| ($ in thousands) | 2024 | | 2023 | |
| Fixed maturity investments, at fair value | $ | 2,377,862 | | | 49 | % | | $ | 1,831,268 | | | 46 | % | |
| Short-term investments, at fair value | 497,110 | | | 10 | % | | 428,878 | | | 11 | % | |
| 2,874,972 | | | 59 | % | | 2,260,146 | | | 57 | % | |
| Investments in Two Sigma Funds, at fair value | 939,381 | | | 19 | % | | 851,470 | | | 21 | % | |
| Total investments | 3,814,353 | | | 78 | % | | 3,111,616 | | | 78 | % | |
| Cash and cash equivalents | 996,493 | | | 20 | % | | 794,509 | | | 20 | % | |
| Restricted cash and cash equivalents | 104,359 | | | 2 | % | | 106,351 | | | 2 | % | |
| Total cash | 1,100,852 | | | 22 | % | | 900,860 | | | 22 | % | |
| Total cash & investments | $ | 4,915,205 | | | 100 | % | | $ | 4,012,476 | | | 100 | % | |
| | | | | | | | |
Total cash and investments increased from $4.0 billion at December 31, 2023 to $4.9 billion at December 31, 2024. The increase was primarily driven by positive investment returns on both the fixed maturities and short-term investments trading portfolio and the TS Hamilton Fund, for the year ended December 31, 2024. The Company also continued to deploy more cash into the fixed maturity trading portfolio to take advantage of higher U.S. treasury interest rates. The TS Hamilton Fund represents $2.0 billion and $1.8 billion of the total cash and investments at December 31, 2024 and 2023, respectively.
Fixed Maturity and Short-term Investments - Trading
The Company’s fixed maturity trading portfolio and short-term investments are as follows:
| | | | | | | | | | | | | | | | | | | | | | | |
| December 31, 2024 |
| ($ in thousands) | Amortized Cost | | Gross Unrealized Gains | | Gross Unrealized Losses | | Fair
Value |
| Fixed maturities: | | | | | | | |
| U.S. government treasuries | $ | 724,785 | | | $ | 611 | | | $ | (14,293) | | | $ | 711,103 | |
| U.S. states, territories and municipalities | 13,533 | | | 25 | | | (327) | | | 13,231 | |
| Non-U.S. sovereign governments and supranationals | 70,435 | | | 454 | | | (3,362) | | | 67,527 | |
| Corporate | 1,153,612 | | | 6,484 | | | (17,036) | | | 1,143,060 | |
| Residential mortgage-backed securities - Agency | 288,760 | | | 160 | | | (16,309) | | | 272,611 | |
| Residential mortgage-backed securities - Non-agency | 17,432 | | | 6 | | | (684) | | | 16,754 | |
| | | | | | | |
| Commercial mortgage-backed securities - Non-agency | 40,363 | | | 72 | | | (749) | | | 39,686 | |
| Other asset-backed securities | 113,997 | | | 249 | | | (356) | | | 113,890 | |
| Total fixed maturities | 2,422,917 | | | 8,061 | | | (53,116) | | | 2,377,862 | |
| Short-term investments | 495,630 | | | 1,484 | | | (4) | | | 497,110 | |
| | | | | | | |
| | | | | | | |
| Total | $ | 2,918,547 | | | $ | 9,545 | | | $ | (53,120) | | | $ | 2,874,972 | |
| | | | | | | | | | | | | | | | | | | | | | | |
| December 31, 2023 |
| ($ in thousands) | Amortized Cost | | Gross Unrealized Gains | | Gross Unrealized Losses | | Fair
Value |
| Fixed maturities: | | | | | | | |
| U.S. government treasuries | $ | 717,134 | | | $ | 5,137 | | | $ | (14,021) | | | $ | 708,250 | |
| U.S. states, territories and municipalities | 4,656 | | | — | | | (286) | | | 4,370 | |
| Non-U.S. sovereign governments and supranationals | 55,662 | | | 2,175 | | | (1,591) | | | 56,246 | |
| Corporate | 877,493 | | | 8,443 | | | (22,060) | | | 863,876 | |
| Residential mortgage-backed securities - Agency | 180,661 | | | 435 | | | (12,583) | | | 168,513 | |
| Residential mortgage-backed securities - Non-agency | 5,639 | | | 16 | | | (671) | | | 4,984 | |
| | | | | | | |
| Commercial mortgage-backed securities - Non-agency | 11,473 | | | — | | | (1,050) | | | 10,423 | |
| Other asset-backed securities | 14,781 | | | 20 | | | (195) | | | 14,606 | |
| Total fixed maturities | 1,867,499 | | | 16,226 | | | (52,457) | | | 1,831,268 | |
| Short-term investments | 427,437 | | | 1,441 | | | — | | | 428,878 | |
| | | | | | | |
| | | | | | | |
| Total | $ | 2,294,936 | | | $ | 17,667 | | | $ | (52,457) | | | $ | 2,260,146 | |
The fair value of the Company’s fixed maturity trading portfolio and short-term investments increased from $2.3 billion at December 31, 2023 to $2.9 billion at December 31, 2024, due to increases in both the fixed maturity trading portfolio and the short-term investments held by TS Hamilton Fund.
Short-term investments at December 31, 2024 and 2023 of $497.1 million and $428.9 million, respectively, include $496.0 million and $428.9 million, respectively, held within TS Hamilton Fund. The cash and short-term investment balances within TS Hamilton Fund are not managed by the Company, nor can they be removed from TS Hamilton Fund as they support the underlying investment strategies within the three trading vehicles. The balance may fluctuate significantly from period to period as a result of movements in the underlying funds. See discussion below for further details on assets within TS Hamilton Fund.
The fair values and weighted-average credit ratings of our fixed maturity trading portfolio and short-term investments by type were as follows:
| | | | | | | | | | | | | | | | | | | | | | | | | | | | | | | | | | | | | |
| As at December 31, | | |
| 2024 | | 2023 | | |
| ($ in thousands) | Fair Value | | % of Total | | Weighted average credit rating | | Fair Value | | % of Total | | Weighted average credit rating | | |
| Fixed maturities: | | | | | | | | | | | | | |
| U.S. government treasuries | $ | 711,103 | | | 25 | % | | Aaa | | $ | 708,250 | | | 31 | % | | Aaa | | |
| U.S. states, territories and municipalities | 13,231 | | | 0 | % | | Aa2 | | 4,370 | | | 0 | % | | Aa2 | | |
| Non-U.S. sovereign governments and supranationals | 67,527 | | | 2 | % | | Aa1 | | 56,246 | | | 2 | % | | Aa2 | | |
| Corporate | 1,143,060 | | | 41 | % | | A3 | | 863,876 | | | 39 | % | | A3 | | |
| Residential mortgage-backed securities - Agency | 272,611 | | | 9 | % | | Aaa | | 168,513 | | | 7 | % | | Aaa | | |
| Residential mortgage-backed securities - Non-agency | 16,754 | | | 1 | % | | Aaa | | 4,984 | | | 0 | % | | Aaa | | |
| | | | | | | | | | | | | |
| Commercial mortgage-backed securities - Non-agency | 39,686 | | | 1 | % | | Aaa | | 10,423 | | | 1 | % | | Aa1 | | |
| Other asset-backed securities | 113,890 | | | 4 | % | | Aaa | | 14,606 | | | 1 | % | | Aaa | | |
| Total fixed maturities | 2,377,862 | | | 83 | % | | Aa3 | | 1,831,268 | | | 81 | % | | Aa3 | | |
| Short-term investments | 497,110 | | | 17 | % | | Aaa | | 428,878 | | | 19 | % | | Aaa | | |
| Total fixed maturities and short-term investments | $ | 2,874,972 | | | 100 | % | | Aa2 | | $ | 2,260,146 | | | 100 | % | | Aa2 | | |
| | | | | | | | | | | | | |
| Fixed maturity and short-term investments credit quality summary: | | | | | | | | | | | | | |
| Investment grade | | | 100 | % | | | | | | 100 | % | | | | |
| Non-investment grade | | | 0 | % | | | | | | 0 | % | | | | |
| Total | | | 100 | % | | | | | | 100 | % | | | | |
The average credit quality, the average yield to maturity and the expected average duration of the Company’s fixed maturities and short-term investments trading portfolio, excluding short-term investments held by the TS Hamilton Fund, were as follows:
| | | | | | | | | | | | | |
| As at December 31, | | |
| 2024 | | 2023 | | |
| Average credit quality | Aa3 | | Aa3 | | |
| Average yield to maturity | 4.7% | | 4.5% | | |
| Expected average duration (in years) | 3.4 | | 3.3 | | |
At December 31, 2024 and 2023, approximately 100% of the Company’s fixed maturities and short-term investments trading portfolio was rated investment grade (Baa2 or higher) by third party rating services. There were no non-investment grade securities in the fixed maturities and short-term investments trading portfolio. The average credit quality of the Company’s fixed maturities and short-term investments trading portfolio, excluding short-term investments held by the TS Hamilton Fund, at December 31, 2024 and 2023 was Aa3.
The average yield to maturity on the Company’s fixed maturities and short-term investments trading portfolio increased to 4.7% at December 31, 2024 from 4.5% at December 31, 2023.
The expected average duration of the Company’s fixed maturities and short-term investments trading portfolio increased modestly to 3.4 years at December 31, 2024 from 3.3 years at December 31, 2023.
TS Hamilton Fund
Although Two Sigma has broad discretion to allocate invested assets to different opportunities, the current strategy is focused on highly diversified liquid positions in global equities, futures and foreign exchange markets. Through its investments in Two Sigma Futures Portfolio, LLC ("FTV"), Two Sigma Spectrum Portfolio, LLC ("STV") and Two Sigma Equity Spectrum Portfolio, LLC ("ESTV"), we seek to achieve absolute dollar denominated returns on a substantial capital base primarily by combining multiple hedged and leveraged systematic investment strategies with proprietary risk management and execution techniques. These systematic strategies include, but are not limited to, technical and statistically-based, fundamental-based, event-based, market condition-based and spread-based strategies as well as contributor-based and/or sentiment-based strategies and blended strategies.
•FTV primarily utilizes systematic strategies to gain broad macro exposure to FX, fixed income, equity and credit indices and commodities, predominantly by trading futures, spots, forwards, options, swaps, cash bonds and exchange traded products.
•STV primarily utilizes systematic strategies to trade U.S.-listed equity securities and related instruments and derivatives.
•ESTV primarily utilizes systematic strategies to trade non-U.S.-listed equity securities and related instruments and derivatives.
At December 31, 2024, the Company owns a 14.3%, 17.8% and 9.8% interest in each of the FTV, STV and ESTV funds, respectively.
Effective January 1, 2025, the Company amended its existing investment in Two Sigma Funds to include an allocation to the following portfolios: Two Sigma Absolute Return Portfolio, LLC ("ATV"), Two Sigma Horizon Portfolio, LLC ("HTV"), Two Sigma Navigator Portfolio, LLC ("NTV"), and Two Sigma Kuiper Portfolio, LLC ("KTV").
•ATV primarily utilizes a global equity market neutral systematic strategy, predominantly trading equity securities, equity-related derivatives, and foreign exchange contracts.
•KTV primarily utilizes non-systematic, discretionary strategies that combine human discretion with quantitative analysis to trade futures, futures options, foreign currency spot, forward and option contracts, exchange-traded products ("ETPs") and ETP options, debt securities, and various types of derivatives and other instruments.
•HTV utilizes systematic strategies and non-systematic, discretionary strategies to trade futures, futures options, foreign currency spot, forward and option contracts, ETPs and ETP options, debt securities, and various types of derivatives and other instruments.
•NTV utilizes non-systematic, discretionary macro strategies that combine human discretion with quantitative analysis for purposes of trading globally across various asset classes.
TS Hamilton Fund invests in Two Sigma Funds ("Two Sigma Funds"), which are stated at their estimated fair values, which generally represent the Company’s proportionate interest in the members’ equity of the Two Sigma Funds as reported by the respective funds based on the net asset value ("NAV") provided by the fund administrator. The Company accounts for its investment in Two Sigma Funds under the variable interest model at NAV as a practical expedient for fair value in the consolidated balance sheets.
The Company’s investments in Two Sigma Funds are as follows:
| | | | | | | | | | | | | | | | | | | | | | | | | | | | | | | | | | | | |
| | December 31, 2024 | | December 31, 2023 |
| ($ in thousands) | | Cost | | Net
Unrealized Gains (Losses) | | Fair
Value | | Cost | | Net
Unrealized Gains (Losses) | | Fair
Value |
| Two Sigma Futures Portfolio, LLC (FTV) | | $ | 308,061 | | | $ | (15,520) | | | $ | 292,541 | | | $ | 433,911 | | | $ | (38,105) | | | $ | 395,806 | |
| Two Sigma Spectrum Portfolio, LLC (STV) | | 360,997 | | | 102,267 | | | 463,264 | | | 193,299 | | | 88,228 | | | 281,527 | |
| Two Sigma Equity Spectrum Portfolio, LLC (ESTV) | | 136,565 | | | 47,011 | | | 183,576 | | | 142,981 | | | 31,156 | | | 174,137 | |
| Total | | $ | 805,623 | | | $ | 133,758 | | | $ | 939,381 | | | $ | 770,191 | | | $ | 81,279 | | | $ | 851,470 | |
| | | | | | | | | | | | |
The increase in the total fair value of the Company’s investments in Two Sigma Funds from $851.5 million at December 31, 2023 to $939.4 million at December 31, 2024 is primarily driven by investment gains and collateral management within TS Hamilton Fund. The total net assets managed in TS Hamilton Fund represent our investment in and exposure to Two Sigma Funds’ investment strategies. However, as part of Two Sigma’s collateral management processes, any capital not required to be held within one of the specific trading vehicles is held in cash or short-term investments within TS Hamilton Fund as shown in the following table. The cash and short-term investment balances are not managed by the Company, nor can they be removed from TS Hamilton Fund as they support the underlying investment strategies within the three trading vehicles.
The following table represents the total assets and total liabilities of TS Hamilton Fund. Creditors or beneficial interest holders of TS Hamilton Fund have no recourse to the general credit of the Company as the Company’s obligation is limited to the amount of its committed investment.
| | | | | | | | | | | | |
| December 31, | |
| ($ in thousands) | 2024 | | 2023 | |
| Assets | | | | |
| Cash and cash equivalents | $ | 578,230 | | | $ | 479,255 | | |
| Short-term investments | 496,008 | | | 428,878 | | |
| Investments in Two Sigma Funds, at fair value | 939,381 | | | 851,470 | | |
| Receivables for investments sold | 73,322 | | | 41,087 | | |
| Interest and dividends receivable | 945 | | | 966 | | |
| Total assets | 2,087,886 | | 1,801,656 | |
| | | | |
| Liabilities | | | | |
| Payable for investments purchased | 100,469 | | | 62,440 | | |
| | | | |
| Withdrawal payable | 100,420 | | | 6,480 | | |
| Accounts payable and accrued expenses | 233 | | | 191 | | |
| Total liabilities | 201,122 | | 69,111 | |
| Total net assets managed by TS Hamilton Fund | $ | 1,886,764 | | $ | 1,732,545 | |
Total net assets in TS Hamilton Fund were $1.9 billion and $1.7 billion at December 31, 2024 and 2023, respectively.
Liquidity and Capital Resources
Liquidity
Liquidity is a measure of a company’s ability to generate cash flows sufficient to meet the short-term and long-term cash requirements of its business operations. The Company manages liquidity at the holding company and operating subsidiary level.
Management believes that its significant cash flows from operations and high quality liquid investment portfolio will provide sufficient liquidity for the foreseeable future. At December 31, 2024 and 2023, total unrestricted cash and cash equivalents were $996.5 million and $794.5 million, respectively, and total restricted cash and cash equivalents were $104.4 million and $106.4 million, respectively.
Holding Company
As a holding company, Hamilton Insurance Group, Ltd. has no operations of its own and its assets consist primarily of investments in its subsidiaries. Accordingly, Hamilton Insurance Group, Ltd.’s future cash flows depend on the availability of dividends or other statutorily permissible distributions, such as returns of capital, from its subsidiaries. The ability to pay such dividends and/or distributions is limited by the applicable laws and regulations of the various countries and states in which the Company’s subsidiaries operate (refer to Note 17, Statutory Requirements in the accompanying audited consolidated financial statements for further details), as well as the need to maintain capital levels to adequately support insurance and reinsurance operations, and to preserve financial strength ratings issued by independent rating agencies.
During the years ended December 31, 2024, 2023 and 2022, Hamilton Insurance Group, Ltd. received $197.5 million, $44.0 million, and $137.0 million, respectively, of distributions from its subsidiaries. Hamilton Insurance Group, Ltd.’s primary use of funds is interest payments on debt and credit facilities, common share repurchases, capital investments in subsidiaries, and payment of corporate operating expenses. Common share repurchases may be conducted through open market repurchases and/or privately negotiated transactions. See Note 11, Share Capital in the accompanying audited consolidated financial statements for further detail of common share repurchases in the year ended December 31, 2024. Management believes the dividend distribution capacity of Hamilton Insurance Group, Ltd.’s subsidiaries, which was estimated at $547.0 million at December 31, 2024, will provide Hamilton Insurance Group, Ltd. with sufficient liquidity for the foreseeable future.
Operating Subsidiaries
Hamilton Insurance Group, Ltd.’s operating subsidiaries primarily derive cash from the net inflow of premiums less claim payments related to underwriting activities and from net investment income. Historically, these cash receipts have been sufficient to fund the operating expenses of these subsidiaries, as well as to fund dividend payments to Hamilton Insurance Group, Ltd. The subsidiaries’ remaining cash flows are generally invested into the investment portfolio and used to fund common share repurchases or acquisitions.
The operating subsidiaries’ insurance and reinsurance business inherently provides liquidity, as premiums are received in advance (sometimes substantially in advance) of the time losses are paid. However, the amount of cash required to fund loss payments can fluctuate significantly from period to period, due to the low frequency and high severity nature of certain types of business written. As such, cash flows from operating activities may vary significantly between periods.
The payment of dividends by operating subsidiaries is, under certain circumstances, limited by the applicable laws and regulations in the various jurisdictions in which the subsidiaries operate. In addition, insurance laws require the insurance subsidiaries to maintain certain measures of solvency and liquidity. Management believes that each of the Company’s insurance subsidiaries and branches exceeded the minimum solvency, capital and surplus requirements in their applicable jurisdictions at December 31, 2024. Certain of the subsidiaries and branches are required to file Financial Condition Reports ("FCR"), with their regulators, which provide details on solvency and financial performance. Where required, these FCRs are posted on the Company’s website.
The regulations governing the Company’s principal operating subsidiaries’ ability to pay dividends and to maintain certain measures of solvency and liquidity are discussed in Note 17, Statutory Requirements in the Company's audited consolidated financial statements as included in this Form 10-K.
Consolidated Cash Flows
Consolidated cash flows from operating, investing and financing activities were as follows:
| | | | | | | | | | | | | | | | | |
| For the Years Ended December 31, |
| ($ in thousands) | 2024 | | 2023 | | 2022 |
| Total cash provided by (used in): | | | | | |
| Operating activities | $ | 759,303 | | | $ | 283,155 | | | $ | 190,927 | |
| Investing activities | (184,160) | | | (652,088) | | | 133,102 | |
| Financing activities | (362,688) | | | 59,016 | | | (69,617) | |
| Effect of exchange rate changes on cash | (12,463) | | | 3,574 | | | (11,335) | |
| Net increase (decrease) in cash and cash equivalents | $ | 199,992 | | | $ | (306,343) | | | $ | 243,077 | |
Net cash provided by (used in) operating activities was $759.3 million, $283.2 million and $190.9 million for the years ended December 31, 2024, 2023, and 2022, respectively. Cash inflows from insurance and reinsurance operations typically include premiums, net of acquisition costs, and reinsurance recoverables. Cash outflows principally include payments of losses and loss expenses, payments of premiums to reinsurers and operating expenses. Cash provided by operating activities fluctuates due to timing differences between the collection of premiums and reinsurance recoverables and the payment of losses and loss adjustment expenses, and the payment of premiums to reinsurers.
Net cash provided by (used in) investing activities was $(184.2) million, $(652.1) million and $133.1 million in the years ended December 31, 2024, 2023 and 2022, respectively, primarily driven by the timing of investing activities and the net proceeds of both turnover and new investment in our fixed maturity and short-term investments.
Net cash provided by (used in) financing activities was $(362.7) million, $59.0 million and $(69.6) million for the years ended December 31, 2024, 2023 and 2022, respectively. Net cash used in financing activities for the year ended December 31, 2024 was primarily driven by incentive allocations paid to TS Hamilton Fund and share repurchases. See Note 11, Share Capital in the accompanying audited consolidated financial statements for further detail of common share repurchases in the year ended December 31, 2024. Net cash provided by financing activities for the year ended December 31, 2023 was primarily driven by the proceeds of shares issued in connection with the Company's Initial Public Offering ("IPO"), partially offset by incentive allocations paid to TS Hamilton Fund. Net cash used in financing activities for the year ended December 31, 2022 was primarily driven by incentive allocations paid to TS Hamilton Fund.
The Company believes that annual positive cash flows from operating activities will be sufficient to cover claims payments, absent a series of additional large catastrophic losses. However, should claim payment obligations accelerate beyond the Company’s ability to fund payments from operating cash flows, the Company would utilize cash and cash equivalent balances and/or liquidate a portion of the Company’s fixed maturities and short-term investments trading portfolio and/or access certain credit facilities. The Company’s fixed maturities and short-term investments trading portfolio is heavily weighted towards conservative, high quality and highly liquid securities.
In addition, if necessary, the Company generally has two options related to liquidating a portion of the investment portfolio in the TS Hamilton Fund, subject to Hamilton Re’s minimum investment commitment, which are as follows:
•Monthly liquidity - Subject to certain conditions, Hamilton Re may request a whole or partial withdrawal of its capital account, no later than fifteen days prior to the end of a calendar month, effective as of the last day of such calendar month.
•Daily liquidity - Subject to certain limited circumstances, including the need to meet obligations pursuant to Hamilton Re’s underwriting operations, Hamilton Re may request a withdrawal of all or a portion of its capital account upon at least one business day’s written notice of such withdrawal request date to the Managing Member. Claim payments pertaining to any such large catastrophic event would be paid out over a period spanning many months.
Management expects that, if necessary, the full value of cash, fixed income and short-term investments at December 31, 2024 could be available in one to three business days under normal market conditions, except for $470.6 million of restricted cash and investments which primarily support the Company’s obligations in regulatory jurisdictions where it operates as a non-admitted carrier (refer to Note 3, Investments in the accompanying audited consolidated financial statements) and $301.2 million of restricted cash and investments which primarily support the Company’s letter of credit facilities (refer to Note 10, Debt and Credit Facilities in the accompanying audited consolidated financial statements).
Capital Resources
Management monitors the Company’s capital adequacy on a regular basis and seeks to adjust its capital according to the needs of the business. In particular, the Company requires capital sufficient to meet or exceed the capital adequacy ratios established by rating agencies for maintenance of appropriate financial strength ratings and the capital adequacy tests performed by regulatory authorities. From time to time, rating agencies and regulatory authorities may make changes in their models and methodologies, which could increase the amount of capital the Company requires. The Company may seek to raise additional capital or return capital to shareholders through some combination of common share repurchases and cash dividends. In the normal course of operations, management may from time to time evaluate additional share or debt issuances given prevailing market conditions and capital management strategies. In addition, the Company enters into agreements with financial institutions to obtain letter of credit facilities for the benefit of its operating subsidiaries to support their business operations. Management believes that the Company holds sufficient capital to allow it to take advantage of market opportunities and to maintain its financial strength ratings and comply with various local statutory regulations.
The following table summarizes our consolidated total capital:
| | | | | | | | | | | |
| As at December 31, |
| ($ in thousands) | 2024 | | 2023 |
| Shareholders' equity | $ | 2,328,709 | | | $ | 2,047,850 | |
| | | |
The Company’s consolidated shareholders' equity was $2.3 billion at December 31, 2024, an increase of 13.7% compared to $2.0 billion at December 31, 2023. The primary driver of the increase in total capital was the Company's net income attributable to common shareholders of $400.4 million for the year ended December 31, 2024, partially offset by share repurchases (see Note 11, Share Capital in the accompanying audited consolidated financial statements for further details).
Debt
On June 23, 2022, the Company renewed its unsecured $150 million term loan credit arrangement, as amended from time to time (the "Facility"), with various lenders as arranged by Wells Fargo Securities, LLC. All or a portion of the loan issued under the Facility bears interest at either (a) the Base Rate plus the Applicable Margin or (b) the Adjusted Term Secured Overnight Financing Rate ("SOFR") plus the Applicable Margin, at the Company's discretion. In the event of default, an additional 2% interest in excess of (a) or (b) will be levied, not to exceed the highest rate permissible under applicable law, and certain types of loans may not be available for borrowing by the Company under the Facility. The Facility matures on June 23, 2025, unless accelerated pursuant to the terms of the Facility, and it contains usual and customary representations, warranties, conditions and covenants for bank loan facilities of this type. The Facility also contains certain financial covenants which cap the ratio of consolidated debt to capital and require that the Company maintain a certain minimum consolidated net worth. The net worth requirement is recalculated effective as of the end of each fiscal quarter. As of December 31, 2024, the Company was in compliance with all covenants.
The following table presents the gross outstanding loan balance, loan fair value and unamortized loan issuance costs:
| | | | | | | | | | | |
| December 31, |
| ($ in thousands) | 2024 | | 2023 |
| Outstanding loan balance | $ | 150,000 | | | $ | 150,000 | |
| Loan fair value | 150,463 | | | 150,981 | |
| Unamortized loan issuance costs | $ | 55 | | | $ | 170 | |
Debt issuance costs are amortized over the period during which the Facility is outstanding, as an offset to investment income. The Company amortized debt issuance costs of $0.1 million or less in each of the years ended December 31, 2024, 2023 and 2022.
Common Shares
The Company’s authorized and issued share capital is comprised as follows:
| | | | | | | | | | | |
| ($ in thousands, except share information) | | | |
| Authorized: | | | |
| Common shares of $0.01 par value each (2024 and 2023: 150,000,000) | | | |
| | | |
| | | |
| | | |
| December 31, |
| Issued, outstanding and fully paid: | 2024 | | 2023 |
| Class A common shares (2024: 17,820,078 and 2023: 28,644,807) | $ | 178 | | | $ | 286 | |
| Class B common shares (2024: 64,271,249 and 2023: 56,036,067) | 643 | | | 560 | |
| Class C common shares (2024: 19,375,670 and 2023: 25,544,229) | 194 | | | 255 | |
| Total | $ | 1,015 | | | $ | 1,101 | |
On May 8, 2024, the Company entered into an agreement to repurchase 9.1 million Class A common shares at $12.00 per share (the "Share Repurchase"). The total purchase price was $109.5 million. The common shares purchased by the Company were cancelled following the repurchase transaction.
On August 7, 2024, the Board of Directors authorized a repurchase of the Company's common shares in the aggregate amount of $150 million (the “Authorization”), under which the Company may repurchase shares through open market repurchases and/or privately negotiated transactions. The Authorization will expire when the Company has repurchased the full value of shares authorized, unless terminated earlier by the Board of Directors. For the year ended December 31, 2024, 1.5 million Class B common shares at an aggregate cost of $28.1 million and an average price of $18.89 per common share were repurchased and cancelled and $121.9 million remained available for purchase under the Authorization.
In general, holders of Class A common shares and Class B common shares have one vote for each common share held while the Class C common shares have no voting rights, except as required by law. However, each holder of Class A common shares and Class B common shares is limited to voting (directly, indirectly or constructively, as determined for U.S. federal income tax purposes) that number of common shares equal to 9.5% of the total combined voting power of all classes of shares of the Company (or, in the case of a class vote by the holders of our Class B common shares, such as in respect of the election or removal of directors other than for directors who are appointed by certain shareholders pursuant to the Shareholders Agreement and our Bye-laws, a maximum of 14.92% of the total combined voting power, calculated by multiplying (a) 9.5% and (b) the quotient of dividing (x) the total number of directors by (y) the number of directors elected by holders of Class B common shares). In addition, the Board of Directors may, in its absolute discretion, limit a shareholder’s voting rights when it deems it appropriate to do so to avoid certain material adverse tax, legal or regulatory consequences to the Company, any subsidiary of the Company, or any direct or indirect shareholder or its affiliates.
On September 13, 2024, 1.7 million Class A common shares were converted into Class C common shares at the request of the Class A Members and as approved by the Board.
During the year ended December 31, 2024, 7.9 million Class C common shares were converted into Class B common shares at the request of the respective Class C Members and as approved by the Board.
Credit Facilities
The Company has several available letter of credit facilities and a revolving loan facility provided by commercial banks. The letter of credit facilities are utilized to provide collateral to reinsureds of Hamilton Re and its affiliates to the extent required under insurance and reinsurance agreements and to support capital requirements at Lloyd’s.
On December 5, 2018 and December 27, 2018, Hamilton Re, Ltd. entered into a Master Agreement for Issuance of Payment Instruments and a Facility Letter for Issuance of Payment Instruments respectively, with CitiBank Europe Plc ("CitiBank Europe"), under which CitiBank Europe agreed to provide an uncommitted secured letter of credit facility for the issuance of standby letters of credit or similar instruments in multiple currencies. On November 15, 2024, letter of credit capacity under this facility was increased to $250 million. At all times during which it is a party to the facility, Hamilton Re is obligated to pledge to CitiBank Europe cash and/or securities with a value that equals or exceeds the aggregate face amount of its then-outstanding letters of credit. The Master Agreement contains events of default customary for facilities of this type. In the facility letter, Hamilton Re makes representations and warranties that are customary for facilities of this type and agrees that it will comply with certain informational and other undertakings.
On June 23, 2022, Hamilton Group and Hamilton Re amended and restated their unsecured credit agreement with a syndication of lenders (the "Unsecured Facility"). Under the Unsecured Facility, the lenders have agreed to provide up to an aggregate of $415 million of letter of credit capacity for Hamilton Re, up to $150 million of which may be utilized for revolving loans to be issued to Hamilton Group. At December 31, 2024, there were no loan amounts outstanding under this facility. Margin rates reflect contractually agreed rates, which are based on Hamilton Re’s current Financial Strength Rating as assigned by A.M. Best. As of April 30, 2024, letters of credit issued under the facility bear interest at a rate of 137.5 basis points (previously 150 basis points), while revolving loans if issued are subject to a fee of SOFR plus a margin of 162.5 basis points (previously 185 basis points). To the extent such loans are issued, the available letter of credit capacity shall decrease proportionally, such that the aggregate credit exposure for the lenders under the credit agreement is $415 million. Amounts unutilized under the facility are subject to a fee of 17.5 basis points (previously 22.5 basis points). Capacity is provided by Wells Fargo, National Association, Truist Bank, BMO Harris Bank N.A., Commerzbank AG, New York Branch, HSBC Bank USA, N. A., and Barclays Bank PLC. Unless renewed or otherwise terminated in accordance with its terms, the Unsecured Facility is scheduled to terminate on June 23, 2025.
On August 12, 2024, Hamilton Re and HIDAC amended their committed letter of credit facility agreement with Bank of Montreal ("BMO"), with the Company as guarantor, under which BMO agreed to make available a secured letter of credit facility of $50 million for a term that will expire on August 13, 2025. The facility bears a fee of 40 basis points for letters of credit issued and 15 basis points on any unutilized portion of the facility.
On October 25, 2024, Hamilton Re amended its letter of credit facility agreement with UBS AG ("UBS") under which UBS and certain of its affiliates agreed to make available to Hamilton Re a secured letter of credit facility of $100 million for a term that will expire on October 25, 2025. The facility bears a fee of 140 basis points on the total available capacity.
In addition, on October 28, 2024, Hamilton Re amended the unsecured letter of credit facility agreement that it utilizes to provide Funds at Lloyd's ("FAL") ("FAL LOC Facility") to support the FAL requirements of Syndicate 4000. Capacity is provided by Barclays Bank PLC, ING Bank N.V., London Branch, and Bank of Montreal, London Branch. The FAL LOC Facility of $230 million was renewed for an additional one year term that expires on October 28, 2025. The facility bears a fee of 162.5 basis points on the borrowed amount.
The Company’s obligations under its credit facilities require the Company, Hamilton Re and the other parties thereto to comply with various financial and reporting covenants. All applicable entities were in compliance with all such covenants at December 31, 2024.
Certain of the Company's credit facilities are secured by pledged interests in the TS Hamilton Fund or the Company's fixed income security portfolio or cash. The Company’s credit facilities and associated securities pledged, were as follows:
| | | | | | | |
| ($ in thousands) | December 31,
2024 | | |
| | | |
| | | |
| | | |
| Available letter of credit and revolving loan facilities - commitments | $ | 1,045,000 | | |
| Available letter of credit and revolving loan facilities - in use | 789,993 | | |
| | | |
| Security pledged under letter of credit and revolving loan facilities: | | | |
| Pledged interests in TS Hamilton Fund | $ | 230,833 | | |
| Pledged interests in fixed income portfolio | 296,464 | | |
| Cash | 4,713 | | |
Financial Strength Ratings
The Company’s principal insurance and reinsurance operating subsidiaries are assigned financial strength ratings from internationally recognized rating agencies A.M. Best, Fitch Ratings and Kroll Bond Rating Agency. These ratings are publicly announced, and are available directly from the agencies' websites.
Financial strength ratings represent the independent opinions of the rating agencies as to the relative creditworthiness of a company and its capacity to meet the obligations of its insurance and reinsurance contracts. Independent ratings are one of the important factors that establish a competitive position in insurance and reinsurance markets. These ratings are based on factors considered by the rating agencies to be relevant to policyholders, agents and intermediaries and are not directed toward the protection of investors. Ratings are not recommendations to buy, sell or hold securities.
On March 14, 2024, A.M. Best, an NRSRO, affirmed the Financial Strength Rating of "A-" (Excellent) and the Long-Term Issuer Credit Ratings ("ICR") of "a-" (Excellent) of Hamilton Select. The rating outlook is "Stable".
On April 30, 2024, A.M. Best, an NRSRO, upgraded the Financial Strength Rating to "A" (Excellent) from "A-" (Excellent) and the ICR of "a" (Excellent) from "a-" (Excellent) of Hamilton Re and HIDAC, each a wholly owned subsidiary of Hamilton Insurance Group. The outlook on these ratings was revised to "Stable" from "Positive", also on April 30, 2024.
On July 2, 2024, Fitch, an NRSRO, published Hamilton Re’s Issuer Financial Strength Rating of "A-" (Strong) and Hamilton Insurance Group’s Issuer Default Rating of "BBB+". The rating outlook is "Stable".
On July 23, 2024, Kroll Bond Rating Agency, ("KBRA"), an NRSRO, affirmed the insurance financial strength rating of "A" of Hamilton Re and the "BBB+" issuer rating of Hamilton Insurance Group. The outlook on these ratings was changed to "Stable" from "Positive", also on July 23, 2024.
On August 7, 2024, A.M. Best increased its financial strength rating of the Lloyd's market from "A" to "A+" with a stable outlook. Our Lloyd’s syndicate benefits from financial strength ratings of "A+" (Superior) from A.M. Best and "AA-" from each of S&P Global, KBRA and Fitch. All outlooks on these ratings are "Stable".
On February 7, 2025, Fitch Ratings ("Fitch"), a Nationally Recognized Statistical Rating Organization ("NRSRO"), assigned an Issuer Financial Strength Rating of "A-" (Strong) to HIDAC. The rating outlook is "Stable".
Reserve for Losses and Loss Adjustment Expenses
Reserve for unpaid losses and loss adjustment expenses
The Company establishes loss reserves using actuarial models, historical insurance industry loss ratio experience and loss development patterns to estimate its ultimate liability of all losses and loss adjustment expenses incurred with respect to premiums earned on the contracts at a given point in time. Loss reserves do not represent an exact calculation of the liability. Estimates of ultimate liabilities are contingent on many future events and the eventual actual outcome of these events may be substantially different from the assumptions underlying the reserve estimates. The Company believes that the recorded reserve for losses and loss adjustment expenses represents management’s best estimate of the cost to settle the ultimate liabilities based on information available at December 31, 2024.
See Critical Accounting Estimates — Reserve for Losses and Loss Adjustment Expenses for a detailed discussion of losses and loss adjustment expenses.
See Note 8, Reserve for Losses and Loss Adjustment Expenses in the accompanying audited consolidated financial statements for the reconciliation of the gross and net reserve for losses and loss adjustment expenses and for a discussion of prior year reserve development.
Paid and unpaid losses and loss adjustment expenses recoverable
In the normal course of business, the Company seeks to reduce the potential amount of loss arising from claim events by reinsuring certain levels of risk with other reinsurers. See Critical Accounting Estimates – Ceded reinsurance and unpaid losses and loss adjustment expenses recoverable in the accompanying audited consolidated financial statements and related notes thereto included in this Form 10-K for a detailed discussion of the Company’s risks related to ceded reinsurance agreements and the Company’s process to evaluate the financial condition of its reinsurers.
Contractual Obligations and Commitments
Contractual obligations and commitments by period due were:
| | | | | | | | | | | | | | | | | | | | | | | | | | | | | | | | |
| ($ in thousands) | | Payment Due by Year |
| December 31, 2024 | | Total | | Less than 1 year | | 1-3 years | | 3-5 years | | More than 5 years |
Debt(1) | | $ | 150,000 | | | $ | 150,000 | | | $ | — | | | $ | — | | | $ | — | |
Estimated interest payments(1) | | 6,971 | | | 6,971 | | | — | | | — | | | — | |
| Total debt obligations | | 156,971 | | | 156,971 | | | — | | | — | | | — | |
Losses and loss adjustment expenses(2) | | 3,532,491 | | | 1,092,273 | | | 1,186,015 | | | 564,689 | | | 689,514 | |
Operating lease obligations(3) | | 10,138 | | | 2,431 | | | 5,680 | | | 1,909 | | | 118 | |
| Total | | $ | 3,699,600 | | | $ | 1,251,675 | | | $ | 1,191,695 | | | $ | 566,598 | | | $ | 689,632 | |
(1) Estimated debt payments have been calculated in the above table with reference to the interest rate in effect at December 31, 2024. Refer to Note 10, Debt and Credit Facilities in the accompanying audited consolidated financial statements for further details.
(2) Losses and loss adjustment expenses are presented gross of estimated recoveries. The amount and timing of associated cash flows are subject to significant judgement based on the best information currently available and actual settlement may vary significantly from the estimates presented above. Refer to Critical Accounting Estimates, Losses and Loss Adjustment Expenses for further detail.
(3) Refer to Note 15, Commitments and Contingencies in our audited consolidated financial statements for further detail on our lease commitments.
Transactions with Related Parties
The discussion of transactions with related parties is included in Note 16, Related Party Transactions in the accompanying audited consolidated financial statements.
Item 7A. Quantitative and Qualitative Disclosures About Market Risk
Qualitative and Quantitative Disclosures About Market Risk
Overview
We believe the Company’s exposure to market related risk arises primarily from interest rate risk, credit spread risk, foreign currency risk and inflation.
We performed a sensitivity analysis to estimate the effects that market risk exposures could have on the future earnings, fair values or cash flows at December 31, 2024 and 2023. Although this exercise focuses on identifying risk exposures that only impact the market value of assets, it is important to recognize that these risks are significantly mitigated by the Company’s investment strategy, which is designed to result in an economic valuation of assets and liabilities that is generally offsetting.
The sensitivity analysis performed at December 31, 2024 and 2023 presents hypothetical changes in cash flows, earnings and fair values of market sensitive instruments which were held by the Company on those dates in response to changes in valuation inputs selected by the Company. This risk management discussion and the estimated amounts generated from the following sensitivity analysis represent forward-looking statements of market risk assuming certain future market conditions occur. Actual future results may differ materially from these projections due to actual developments in the global financial markets that are inconsistent with our current assumptions. The analysis methods used by the Company to assess and mitigate risk should not be considered indicators of future events of losses.
Interest Rate Risk
The fair value of our fixed maturity and short-term investments trading portfolio, excluding TS Hamilton Fund, fluctuates with changes in interest rates. As a result, the Company is exposed to interest rate risk with respect to both our overall net economic asset position, and from an accounting standpoint, as the assets are carried at fair value.
We manage interest rate risk by structuring our fixed maturity and short-term investments portfolio so that the economic impact of a general interest rate shift on the portfolio is comparable to the corresponding impact on the related liabilities. The Company believes that duration matching our financial assets and underwriting liabilities mitigates the overall interest rate risk on an economic basis. While this matching of duration reduces the economic impact of interest rate changes on the Company, changes in interest rates do impact our shareholders’ equity because our liabilities are carried at their nominal value, and are not adjusted for changes in interest rates.
The following tables summarize the aggregate hypothetical increase (decrease) in the fair value of the Company’s fixed maturity trading portfolio and short-term investments from an immediate parallel shift in the treasury yield curve, assuming credit spreads remain constant, and reflecting the use of an immediate time horizon, since this presents the worst-case scenario:
| | | | | | | | | | | | | | | | | | | | | | | | | | | | | |
| ($ in thousands) | Interest Rate Shift in Basis Points |
| December 31, 2024 | -100 | | -50 | | Base | | 50 | | 100 |
Fair value of fixed income securities and
short-term investments | $2,961,034 | | $2,917,688 | | $2,874,972 | | $2,831,836 | | $2,789,189 |
| | | | | | | | | |
| | | | | | | | | |
| Percentage change in fair value | 3.0% | | 1.5% | | —% | | (1.5)% | | (3.0)% |
| Net increase (decrease) in fair value | $86,062 | | $42,716 | | $— | | $(43,136) | | $(85,783) |
| | | | | | | | | | | | | | | | | | | | | | | | | | | | | |
| ($ in thousands) | Interest Rate Shift in Basis Points |
| December 31, 2023 | -100 | | -50 | | Base | | 50 | | 100 |
Fair value of fixed income securities and
short-term investments | $2,323,482 | | $2,291,642 | | $2,260,146 | | $2,228,959 | | $2,197,980 |
| | | | | | | | | |
| | | | | | | | | |
| Percentage change in fair value | 2.8% | | 1.4% | | —% | | (1.4)% | | (2.8)% |
| Net increase (decrease) in fair value | $63,336 | | $31,496 | | $— | | $(31,187) | | $(62,166) |
Credit Spread Risk
The Company considers the impact of credit spread movements on the fair value of our fixed maturity and short-term investments trading portfolio. As credit spreads widen, the fair value of our fixed maturity and short-term investments trading portfolio decreases, and vice versa.
The following tables summarize the aggregate hypothetical increase (decrease) in the fair value of the Company’s fixed maturity trading portfolio and short-term investments from an immediate parallel shift in credit spreads, assuming the treasury yield curve remains constant, reflecting the use of an immediate time horizon since this presents the worst-case scenario:
| | | | | | | | | | | | | | | | | | | | | | | | | | | | | |
| ($ in thousands) | Credit Spread Shift in Basis Points |
| December 31, 2024 | -100 | | -50 | | Base | | 50 | | 100 |
Fair value of fixed income securities and
short-term investments | $2,930,844 | | $2,902,803 | | $2,874,972 | | $2,846,318 | | $2,817,766 |
| | | | | | | | | |
| | | | | | | | | |
| Percentage change in fair value | 1.9% | | 1.0% | | —% | | (1.0)% | | (2.0)% |
| Net increase (decrease) in fair value | $55,872 | | $27,831 | | $— | | $(28,654) | | $(57,206) |
| | | | | | | | | | | | | | | | | | | | | | | | | | | | | |
| ($ in thousands) | Credit Spread Shift in Basis Points |
| December 31, 2023 | -100 | | -50 | | Base | | 50 | | 100 |
Fair value of fixed income securities and
short-term investments | $2,295,013 | | $2,277,611 | | $2,260,146 | | $2,242,600 | | $2,224,888 |
| | | | | | | | | |
| | | | | | | | | |
| Percentage change in fair value | 1.5% | | 0.8% | | —% | | (0.8)% | | (1.6)% |
| Net increase (decrease) in fair value | $34,867 | | $17,465 | | $— | | $(17,546) | | $(35,258) |
Investment in Two Sigma Funds
At December 31, 2024, we hold investments in the following Two Sigma Funds: FTV, STV and ESTV. Our investments in these Two Sigma Funds are stated at their estimated fair values, which generally represent the Company’s proportionate interest in the members’ equity of the Two Sigma Funds as reported by the respective funds based on the NAV provided by the fund administrator. The Company accounts for its investment in Two Sigma Funds under the variable interest model at NAV as a practical expedient for fair value in the consolidated balance sheets. Increases or decreases in such fair value are recorded within net realized and unrealized gains (losses) on investments in the Company’s consolidated statements of operations. The Company records contributions and withdrawals related to its investments in the funds on the transaction date.
Assuming a hypothetical 10% and 30% increase or decrease in the value of our investments in Two Sigma Funds as of December 31, 2024, the carrying value of these investments would have increased or decreased by approximately $93.9 million and $281.8 million, pre-tax, respectively. Assuming the same hypothetical 10% and 30% increase or decrease as of December 31, 2023, the carrying value of our investments in Two Sigma Funds would have increased or decreased by approximately $85.1 million and $255.4 million, pre-tax, respectively.
Foreign Currency Risk
The Company’s functional currency for consolidated reporting is the U.S. Dollar. We routinely write business in currencies other than U.S. Dollars and invest a portion of our cash and investments in those currencies. All of the Company’s operating entities have U.S. Dollar functional currencies. As a result, we may experience foreign exchange gains and losses in our audited consolidated financial statements.
The Company is primarily impacted by the foreign currency risk exposures from its underwriting operations and fixed maturity and short-term investments trading portfolio, and may, from time to time, enter into foreign currency forward and option contracts to minimize the effect of fluctuating foreign currencies on the value of non-U.S. Dollar denominated assets and liabilities. Generally, the Company will match its projected non-U.S. Dollar foreign currency underwriting related assets and liabilities with investments and cash in the same currencies to manage our exposure to foreign currency fluctuations and reduce the volatility of foreign exchange gains and losses on our results of operations.
See Note 2(k) Foreign Exchange in the accompanying audited consolidated financial statements for additional information.
The following table summarizes the estimated effects that a hypothetical 10% movement in the value of the U.S. Dollar against select foreign currencies would have had on the carrying value of our net assets:
| | | | | | | | | | | | | | | | | | | | | | | | | |
| December 31, |
| 2024 | | 2023 |
| ($ in millions) | -10% | | | | +10% | | -10% | | +10% |
| | | | | | | | | |
| | | | | | | | | |
| GBP | $ | (2.0) | | | | | $ | 2.0 | | | $ | 3.5 | | | $ | (3.5) | |
| JPY | (0.7) | | | | | 0.7 | | | (0.2) | | | 0.2 | |
| EUR | (6.3) | | | | | 6.3 | | | (1.5) | | | 1.5 | |
| CAD | (2.6) | | | | | 2.6 | | | (2.7) | | | 2.7 | |
| AUD | $ | (1.0) | | | | | $ | 1.0 | | | $ | (1.6) | | | $ | 1.6 | |
Effects of Inflation
Historically, inflation has not had a material effect on the Company’s consolidated results of operations. However, over the last several years, global economic inflation has increased, and there is a risk that it will remain elevated for an extended period. Inflation is subject to many macroeconomic factors beyond our control, including global banking policy, political risks and supply chain issues. An inflationary economy may result in higher losses and loss adjustment expenses, negatively impact the performance of our fixed income security investment portfolio, or increase our operating expenses, among other unfavorable effects. The ultimate effects of an inflationary or deflationary period are subject to high uncertainty and cannot be accurately estimated until the actual costs are known.
In the wake of a catastrophe loss there is a risk of specific inflationary pressures in the local economy, which is considered in our catastrophe loss models. Similarly, the Company incorporates the anticipated effects of inflation in our ultimate estimate of the reserves for unpaid losses and loss adjustment expenses on certain long-tail lines of business. As with general economic inflation, the actual effects of inflation on reserves for losses and loss adjustment expenses and results of operations cannot be accurately known until all of the underlying claims are ultimately settled.
For a discussion of the impact of increases and decreases in interest rates on the Company’s fixed maturity and short-term investments trading portfolio, see both Interest Rate Risk and Credit Spread Risk as discussed under Item 7A. Quantitative and Qualitative Disclosures About Market Risk.
Recent Accounting Pronouncements
At December 31, 2024, there were no recently issued accounting pronouncements that have not yet been adopted that management expects would have a material impact on the Company’s results of operations, financial condition or liquidity. See Note 2(r), Recent Accounting Pronouncements in the accompanying audited consolidated financial statements.
Item 8. Financial Statements and Supplementary Data
Reference is made to Item 15 of this Report for the accompanying audited consolidated financial statements of Hamilton Insurance Group, Ltd. and the Notes thereto, as well as the Schedules to the accompanying audited consolidated financial statements.
Item 9. Changes in and Disagreements With Accountants on Accounting and Financial Disclosures
None.
Item 9A. Controls and Procedures
Evaluation of Disclosure Controls and Procedures
Under the supervision and with the participation of our management, including our Chief Executive Officer and Chief Financial Officer, we have evaluated the effectiveness of the design and operation of our disclosure controls and procedures, as defined in Rules 13a-15(b) and 15d-15(b) of the Exchange Act, as of the end of the period covered by this report. Based upon that evaluation, our management, including our Chief Executive Officer and Chief Financial Officer, concluded that, at December 31, 2024, our disclosure controls and procedures were effective to provide reasonable assurance that information required to be disclosed in Company reports filed or submitted under the Exchange Act is (i) recorded, processed, summarized and reported within the time periods specified in the SEC rules and forms and (ii) accumulated and communicated to our management, including our Chief Executive Officer and Chief Financial Officer, as appropriate to allow timely decisions regarding required disclosure.
Management’s Annual Report on Internal Control Over Financial Reporting
Our management is responsible for establishing and maintaining effective internal control over financial reporting as defined in Rules 13a-15(f) and 15d-15(f) under the Exchange Act, as amended. Our internal control over financial reporting was designed to provide reasonable assurance regarding the reliability of financial reporting and the preparation of financial statements for external purposes in accordance with U.S. generally accepted accounting principles and to reflect management’s judgments and estimates concerning effects of events and transactions that are accounted for or disclosed.
Our internal control over financial reporting includes those policies and procedures that: (1) pertain to the maintenance of records that, in reasonable detail, accurately and fairly reflect our transactions and the dispositions of our assets; (2) provide reasonable assurance that transactions are recorded as necessary to permit preparation of financial statements in accordance with generally accepted accounting principles, and that our receipts and expenditures are being made only in accordance with authorizations of our management and directors; and (3) provide reasonable assurance regarding prevention or timely detection of unauthorized acquisition, use or disposition of our assets that could have a material effect on our financial statements.
There are inherent limitations to the effectiveness of any controls. Our Board and management, including our Chief Executive Officer and Chief Financial Officer, do not expect that our disclosure controls and procedures or internal control over financial reporting will prevent all errors and all fraud. Controls, no matter how well conceived and operated, can provide only reasonable, not absolute, assurance that the objectives of the controls are met. Further, we believe that the design of controls must reflect appropriate resource constraints, and the benefits of controls must be considered relative to their costs. Because of the inherent limitations in controls, no evaluation of controls can provide absolute assurance that all control issues and instances of fraud, if any, within the Company have been detected.
Management, with the participation of the Chief Executive Officer and Chief Financial Officer, assessed our internal control over financial reporting as of December 31, 2024 using the criteria set forth by the Committee of Sponsoring Organizations of the Treadway Commission (COSO) in Internal Control-Integrated Framework (2013). Based on this assessment, management concluded that the Company’s internal control over financial reporting was effective as of December 31, 2024.
Ernst & Young Ltd, the independent registered public accountants who audited our consolidated financial statements included in this Form 10-K, audited our internal control over financial reporting as of December 31, 2024 and their attestation report on our internal control over financial reporting is included herein.
Changes in Internal Control Over Financial Reporting
There have not been any changes in the Company’s internal control over financial reporting (as such term is defined in Rules 13a-15(f) and 15d-15(f) under the Exchange Act) during the quarter ended December 31, 2024 that have materially affected, or are reasonably likely to materially affect, the Company’s internal control over financial reporting.
Report of Independent Registered Public Accounting Firm
To the Shareholders and the Board of Directors of
Hamilton Insurance Group, Ltd.
Opinion on Internal Control Over Financial Reporting
We have audited Hamilton Insurance Group, Ltd. and subsidiaries’ internal control over financial reporting as of December 31, 2024, based on criteria established in Internal Control-Integrated Framework issued by the Committee of Sponsoring Organizations of the Treadway Commission (2013 framework) (the COSO criteria). In our opinion, Hamilton Insurance Group, Ltd. and subsidiaries (the Company) maintained, in all material respects, effective internal control over financial reporting as of December 31, 2024, based on the COSO criteria.
We also have audited, in accordance with the standards of the Public Company Accounting Oversight Board (United States) (PCAOB), the consolidated balance sheets of the Company as of December 31, 2024 and 2023, the related consolidated statements of operations and comprehensive income (loss), shareholders’ equity and cash flows for each of the three years in the period ended December 31, 2024, and the related notes and schedules and our report dated February 27, 2025 expressed an unqualified opinion thereon.
Basis for Opinion
The Company’s management is responsible for maintaining effective internal control over financial reporting and for its assessment of the effectiveness of internal control over financial reporting included in the accompanying Management’s Annual Report on Internal Control Over Financial Reporting. Our responsibility is to express an opinion on the Company’s internal control over financial reporting based on our audit. We are a public accounting firm registered with the PCAOB and are required to be independent with respect to the Company in accordance with the U.S. federal securities laws and the applicable rules and regulations of the Securities and Exchange Commission and the PCAOB.
We conducted our audit in accordance with the standards of the PCAOB. Those standards require that we plan and perform the audit to obtain reasonable assurance about whether effective internal control over financial reporting was maintained in all material respects.
Our audit included obtaining an understanding of internal control over financial reporting, assessing the risk that a material weakness exists, testing and evaluating the design and operating effectiveness of internal control based on the assessed risk, and performing such other procedures as we considered necessary in the circumstances. We believe that our audit provides a reasonable basis for our opinion.
Definition and Limitations of Internal Control Over Financial Reporting
A company’s internal control over financial reporting is a process designed to provide reasonable assurance regarding the reliability of financial reporting and the preparation of financial statements for external purposes in accordance with generally accepted accounting principles. A company’s internal control over financial reporting includes those policies and procedures that (1) pertain to the maintenance of records that, in reasonable detail, accurately and fairly reflect the transactions and dispositions of the assets of the company; (2) provide reasonable assurance that transactions are recorded as necessary to permit preparation of financial statements in accordance with generally accepted accounting principles, and that receipts and expenditures of the company are being made only in accordance with authorizations of management and directors of the company; and (3) provide reasonable assurance regarding prevention or timely detection of unauthorized acquisition, use, or disposition of the company’s assets that could have a material effect on the financial statements.
Because of its inherent limitations, internal control over financial reporting may not prevent or detect misstatements. Also, projections of any evaluation of effectiveness to future periods are subject to the risk that controls may become inadequate because of changes in conditions, or that the degree of compliance with the policies or procedures may deteriorate.
/s/ Ernst & Young Ltd.
Hamilton, Bermuda
February 27, 2025
Item 9B. Other Information
Securities Trading Plans of Directors and Executive Officers
During the fiscal quarter ended December 31, 2024, the following directors and officers adopted, modified or terminated a “Rule 10b5-1 trading arrangement” or “non-Rule 10b5-1 trading arrangement,” as those terms are defined in Regulation S-K, Item 408:
On November 12, 2024, Mr. Adrian Daws, Chief Executive Officer Hamilton Global Specialty and an officer of the Company as defined in Rule 16a-1(f) of the Securities Exchange Act of 1934, adopted a Rule 10b5-1 trading arrangement for the sale of securities of the Company’s common shares. Mr. Daws’ Rule 10b5-1 trading arrangement, which has a plan end date of September 2, 2025, provides for the sale of up to 24,000 Class B common shares pursuant to the terms of the plan and is intended to satisfy the affirmative defense conditions of Rule 10b5-1(c) under the Exchange Act.
On December 31, 2024, Ms. Megan Graves, Chief Executive Officer Hamilton Re, Ltd. and an officer of the Company as defined in Rule 16a-1(f) of the Securities Exchange Act of 1934, adopted a Rule 10b5-1 trading arrangement for the sale of securities of the Company’s common shares. Ms. Graves’ Rule trading arrangement, which has a plan end date of September 15, 2025, provides for the sale of up to 153,449 Class B common shares pursuant to the terms of the plan and is intended to satisfy the affirmative defense conditions of Rule 10b5-1(c) under the Exchange Act.
Item 9C. Disclosure Regarding Foreign Jurisdiction that Prevent Inspections
None.
Part III
Item 10. Directors, Executive Officers and Corporate Governance
We have adopted an insider trading policy (“Insider Trading Policy”) governing the purchase, sale and other disposition of our securities by our directors, officers, employees, contractors, consultants, advisors and certain of their respective related persons or entities. We believe our Insider Trading Policy is reasonably designed to promote compliance with insider trading laws, rules and regulations and applicable NYSE listing standards. A copy of our Insider Trading Policy is filed as Exhibit 19 to this Annual Report on Form 10-K.
The remaining information required by this Item relating to our directors, executive officers and corporate governance shall be incorporated herein by reference to information found in our Proxy Statement for the Annual General Meeting of Shareholders. We intend to file our Proxy Statement no later than 120 days after the close of the fiscal year.
Item 11. Executive Compensation
The information required by this Item relating to executive compensation is incorporated herein by reference to information included in our Proxy Statement for the 2025 Annual General Meeting of Shareholders. We intend to file our Proxy Statement no longer than 120 days after the close of the fiscal year.
Item 12. Security Ownership of Certain Beneficial Owners and Management and Related Stockholder Matters
The information required by this Item relating to security ownership of certain beneficial owners and management and securities authorized for issuance under equity compensation plans is incorporated herein by reference to information included in our Proxy Statement for the 2025 Annual General Meeting of Shareholders. We intend to file our Proxy Statement no longer than 120 days after the close of the fiscal year.
Item 13. Certain Relationships and Related Transactions, and Director Independence
The information required by this Item relating to certain relationships and related transactions and director independence is incorporated herein by reference to information included in our Proxy Statement for the 2025 Annual General Meeting of Shareholders. We intend to file our Proxy Statement no longer than 120 days after the close of the fiscal year.
Item 14. Principal Accounting Fees and Services
The information required by this Item relating to principal accountant fees and services is incorporated herein by reference to information included in our Proxy Statement for the 2025 Annual General Meeting of Shareholders. We intend to file our Proxy Statement no longer than 120 days after the close of the fiscal year.
Part IV
Item 15. Exhibits and Financial Statement Schedules
Financial Statements
The accompanying audited consolidated financial statements of Hamilton Insurance Group, Ltd. and related notes thereto are listed in the accompanying Index to the Consolidated Financial Statements and are filed as part of this Form 10-K.
Financial Statement Schedules
The Schedules to the accompanying audited consolidated financial statements of Hamilton Insurance Group, Ltd. are listed in the accompanying Index to Schedules to the Consolidated Financial Statements and are filed as a part of this Form 10-K.
Exhibit Index
| | | | | | | | |
| Exhibit No. | | Description |
| 3.1 | | |
| 3.2 | | |
| 3.3 | | |
| 3.3.1 | | |
| 4.1 | | |
| 4.2 | | |
| 4.3 | | |
| 10.1 | | |
| 10.2† | | |
| 10.3† | | |
| 10.3.1† | | |
| 10.3.2† | | |
| 10.4† | | |
| 10.5† | | |
| 10.5.1† | | |
| 10.6† | | |
| 10.6.1† | | |
| 10.7† | | |
| 10.7.1† | | |
| 10.8*† | | |
| | | | | | | | |
| 10.8.1† | | |
| 10.9*† | | |
| 10.9.1*† | | |
| 10.10 | | |
| 10.11 | | |
| 10.12 | | |
| 10.13 | | Letter of Credit, dated as of August 13, 2021, among Hamilton Re, Ltd., Hamilton Insurance Designated Activity Company, Hamilton Insurance Group, Ltd. and Bank of Montreal, as amended by that certain First Amendment to Letter of Credit Agreement, dated as of August 11, 2023 (incorporated by reference to Exhibit 10.16 of Hamilton Insurance Group, Ltd.’s Registration Statement on Form S-1 (File No. 333-275000) filed on October 16, 2023) |
| 10.14 | | Second Amendment, dated as of August 12, 2024, to the Letter of Credit, dated as of August 13, 2021, among Hamilton Re, Ltd., Hamilton Insurance Designated Activity Company, Hamilton Insurance Group, Ltd. and Bank of Montreal (incorporated by reference to Exhibit 10.1 to Hamilton Insurance Group, Ltd.’s Current Report on Form 8-K filed on August 12, 2024) |
| 10.15 | | |
| 10.15.1 | | |
| 10.15.2 | | |
| 10.15.3 | | |
| 10.15.4 | | |
| 10.15.5 | | |
| 10.15.6 | | |
| 10.15.7 | | |
| 10.15.8* | | |
| 10.15.9 | | |
| 10.15.10 | | |
| 10.15.11 | | |
| | | | | | | | |
| 10.15.12 | | |
| 10.15.13 | | |
| 10.16 | | |
| 10.17 | | |
| 10.18 | | |
| 10.19 | | |
| 10.20 | | |
| 10.21 | | |
| 10.22 | | |
| 19* | | |
| 21* | | |
| 23* | | |
| 31.1* | | |
| 31.2* | | |
| 32.1* | | |
| 32.2* | | |
| 97 | | |
| | |
| | |
| | |
| | |
| | |
| | |
| | |
| | |
| | |
| | |
| | |
| | |
| | |
| | |
| | |
| | |
| | |
| | |
| | |
| | |
| | |
| | |
| | |
| | |
| * | | Filed herewith |
| † | | Management contract or compensatory plan or arrangement |
| | | | | | | | |
| 101.INS | | Inline XBRL Instance Document (the instance document does not appear in the Interactive Data File because its XBRL tags are embedded within the Inline XBRL document) |
| 101.SCH | | Inline XBRL Taxonomy Extension Schema Document |
| 101.CAL | | Inline XBRL Taxonomy Extension Calculation Linkbase Document |
| 101.LAB | | Inline XBRL Taxonomy Extension Label Linkbase Document |
| 101.PRE | | Inline XBRL Taxonomy Extension Presentation Linkbase Document |
| 101.DEF | | Inline XBRL Taxonomy Extension Definition Linkbase Document |
| 104 | | Cover Page Interactive Data File
(embedded within the Inline XBRL document and included in Exhibit 101) |
Item 16. Form 10-K Summary
None.
Signatures
Pursuant to the requirements of Section 13 or 15(d) of the Securities Exchange Act of 1934, the registrant has duly caused this Annual Report on Form 10-K to be signed on its behalf by the undersigned, thereunto duly authorized on February 27, 2025.
| | | | | | | | |
| | | HAMILTON INSURANCE GROUP, LTD. |
| | | (Registrant) |
| | | | |
| | | |
| | | /s/ Giuseppina Albo |
| | | Giuseppina Albo |
| | | Chief Executive Officer |
| | | |
| | | |
| | | |
| | | |
| | | |
Pursuant to the requirements of the Securities Exchange Act of 1934, this report has been signed below by the following persons on behalf of the registrant and in the capacities indicated on February 27, 2025.
| | | | | | | | |
| | |
| By: | | /s/ Giuseppina Albo |
| | Giuseppina Albo |
| | Chief Executive Officer and Director |
| | (Principal Executive Officer) |
| | |
| By: | | /s/ Craig Howie |
| | Craig Howie |
| | Group Chief Financial Officer |
| | (Principal Financial Officer) |
| | |
| By: | | /s/ Brian Deegan |
| | Brian Deegan |
| | Group Chief Accounting Officer |
| | (Principal Accounting Officer) |
| | |
| By: | | /s/ David A. Brown |
| | David A. Brown |
| | Director |
| | |
| By: | | /s/ H. Hawes Bostic, III |
| | H. Hawes Bostic, III |
| | Director |
| | |
| By: | | /s/ Bradley Cooper |
| | Bradley Cooper |
| | Director |
| | |
| By: | | /s/ William C. Freda |
| | William C. Freda |
| | Director |
| | |
| By: | | /s/ John J. Gauthier |
| | John J. Gauthier |
| | Director |
| | | | | | | | |
| | |
| By: | | /s/ Anu Karna |
| | Anu Karna |
| | Director |
| | |
| By: | | /s/ Stephen W. Pacala |
| | Stephen W. Pacala |
| | Director |
| | |
| By: | | /s/ Neil Patterson |
| | Neil Patterson |
| | Director |
| | |
| By: | | /s/ Marvin Pestcoe |
| | Marvin Pestcoe |
| | Director |
| | |
| By: | | /s/ Everard Barclay Simmons |
| | Everard Barclay Simmons |
| | Director |
| | |
| By: | | /s/ Therese Vaughan |
| | Therese Vaughan |
| | Director |
| | | | | | | | |
| GLOSSARY OF SELECTED TERMS |
| ACML | | Ada Capital Management Limited, our wholly owned subsidiary that provides underwriting agency services to Ada Re. |
| Acquisition expenses | | The aggregate expenses incurred by a company that relate directly to acquiring business, including broker commissions and other costs paid to distribution partners. |
| Ada Re | | Ada Re, Ltd. is a non-consolidated Bermuda special purpose insurer funded by investors and formed to provide fully collateralized natural catastrophe reinsurance and retrocession cover to both Hamilton Re and third-party cedants. |
| Attritional losses and loss ratio – current year and prior year development | | Attritional Loss Ratio – current year is the attritional losses incurred by the company relating to the current year divided by net premium earned. Attritional Loss Ratio – prior year development is the attritional losses incurred by the company relating to prior years divided by net premium earned. Attritional losses and loss ratio – current year and prior year development are non-GAAP financial measures as defined in Item 10(e) of SEC Regulation S-K. Refer to “Basis of Presentation—Presentation of Financial Information–Non-GAAP Financial Measures” for further details. |
| Book value per common share | | Book value per common share is calculated by dividing total shareholders’ equity attributable to common shareholders by the number of common shares outstanding. |
| BMA | | Bermuda Monetary Authority. |
| Bordereaux | | A report prepared by an insurance company for a reinsurance company detailing either the policies that are covered by the reinsurance contract or the claims that are being submitted for payment under a reinsurance contract. These are usually for quota share treaties and are generally prepared on a quarterly basis. |
| Broker | | An intermediary who negotiates contracts of insurance or reinsurance, receiving a commission for placement and other services rendered, between (1) a policyholder and a primary insurer, on behalf of the policyholder, (2) a primary insurer and reinsurer, on behalf of the primary insurer, or (3) a reinsurer and a retrocessionaire, on behalf of the reinsurer. |
| Bye-laws | | The Company's fourth amended and restated bye-laws. |
| Capacity | | The amount of potential claims exposure that an insurer or reinsurer chooses to place at risk, or the dollar amount of exposure, that an insurer or reinsurer is willing or able to place at risk. Capacity may apply to a single risk, a program, a line of business or an entire book of business. Capacity may be constrained by legal restrictions, corporate restrictions, or indirect financial restrictions such as capital adequacy requirements. |
| Case reserves | | Loss reserves, established with respect to specific, individual reported claims that have not yet been paid. |
| Casualty Lines | | Types of insurance or reinsurance that is primarily concerned with the losses caused by injuries to third persons and their property (in other words, persons other than the policyholder) and the legal liability imposed on the policyholder resulting therefrom. Also referred to as liability reinsurance. It includes, but is not limited to workers’ compensation, automobile liability and general liability. |
| Catastrophe losses | | A large loss, typically involving multiple claimants and includes both natural catastrophes such as earthquakes, hurricanes, tsunamis, hailstorms, severe winter weather, floods, wildfires, tornadoes, and manmade disasters such as explosions and fire. Catastrophe losses may also arise from acts of war, acts of terrorism and political instability. |
| Catastrophe loss ratio – current year and prior year development | | Catastrophe Loss Ratio – current year is the catastrophe losses incurred by the company relating to the current year divided by net premium earned. Catastrophe Loss Ratio – prior year development is the catastrophe losses incurred by the company relating to prior years divided by net premium earned. Catastrophe losses and loss ratio – current year and prior year development are non-GAAP financial measures as defined in Item 10(e) of SEC Regulation S-K. Refer to “Basis of Presentation—Presentation of Financial Information—Non-GAAP Financial Measures” for further details. |
| CBI | | Central Bank of Ireland. |
| Cede; cedant; ceding company | | When a party reinsures some or all of its liability with another, it “cedes” business and is referred to as the “ceding company” or “cedant.” |
| | | | | | | | |
| Claim | | Request by an insured or reinsured for indemnification by an insurance or reinsurance company for loss incurred from an insured peril or event. |
| Claims Frequency | | The number of claims notified of during a given coverage period. |
| Class of Business | | Class of business includes property, casualty, and specialty business. |
| Collateralized Reinsurance | | A form of reinsurance in which the party assuming the risk is required to post collateral in order to cover any potential claim obligation. This allows non-traditional reinsurers, such as unrated carriers, to participate in the reinsurance market. |
| Combined Ratio | | Combined ratio is a measure of our underwriting profitability and is expressed as the sum of the losses and loss adjustment expense ratio, acquisition cost ratio and other underwriting expense ratio. A combined ratio under 100% indicates an underwriting profit, while a combined ratio over 100% indicates an underwriting loss. |
| Demand surge | | The temporary inflation of costs for building materials and labor resulting from increased demand for rebuilding services in the aftermath of a catastrophe. |
| Direct Insurance | | Direct Insurance means an insurance contract between an insurance company and a policyholder. |
| Excess of loss reinsurance | | Reinsurance which indemnifies the reinsured against that portion of losses and loss adjustment expenses incurred on the underlying policies in excess of a specified dollar or percentage loss ratio amount. Also known as non-proportional reinsurance. |
| Exclusions | | A listing of specific types of coverage or loss that are not covered by a given insurance, reinsurance or retrocession contract. |
| E&S | | Excess & Surplus lines. |
| Facultative Insurance | | Reinsurance in which the cedant cedes, and the reinsurer assumes, all or part of the risk under a single insurance contract. Facultative reinsurance is negotiated separately for each insurance contract that is reinsured and is usually intended to cover individual risks not covered by their reinsurance policies because of the limits involved or because the risk is unusual. |
| Gross premiums earned | | The portion of gross premiums written during or prior to a given period that was actually recognized as income revenue under U.S. GAAP accounting during such period. |
| Gross premiums written | | Total premiums for assumed insurance, reinsurance or retrocession cover that was contractually agreed to during a given period. |
| Incurred but not reported (IBNR) | | Expected payments for losses relating to insured events that have occurred but have not been reported to the reporting entity as of the statement date. As a practical matter, IBNR may include losses that have been reported to the reporting entity but have not yet been entered to the claims system or bulk provisions. Bulk provisions are reserves included with other IBNR reserves to reflect deficiencies in known case reserves. |
| Hamilton Group | | The Company and its subsidiaries and affiliates. |
| Hamilton ILS | | Hamilton ILS Holdings Limited, a Bermuda-based affiliate of Hamilton Re and the direct parent of Ada Capital Management Limited. |
| Hamilton Re | | Hamilton Re, Ltd., our Bermuda-based wholly-owned subsidiary that is regulated by the BMA and licensed to write property, casualty, and specialty insurance and reinsurance. |
| Hamilton Re US | | An arrangement between Hamilton Re and Hamilton ILS pursuant to which certain U.S. casualty and specialty reinsurance risks are written on the books of Hamilton Re. |
| Hamilton Select | | Hamilton Select Insurance Inc., our wholly-owned U.S. domestic-based E&S carrier that is authorized to market and sell E&S products in all 50 states. |
| Hamilton Strategic Partnerships | | Hamilton’s third-party capital business, comprised of Ada Re and Hamilton Managing Agency Limited, solely in its capacity as managing agent for Lloyd’s Syndicate 1947. |
| HIDAC | | Hamilton Insurance Designated Activity Company, a Dublin-based insurer regulated by the CBI with a U.K. branch and a registered alien insurer with the NAIC affording access to write E&S business in all 50 states. |
| HMA or Hamilton Managing Agency | | Hamilton Managing Agency Limited, our Lloyd’s Managing Agent that manages syndicates including Hamilton Syndicate 4000 (wholly aligned syndicate). |
| | | | | | | | |
| HMGA Americas | | Hamilton Managing General Agency Americas, LLC, our wholly-owned U.S. subsidiary that has authority to write certain U.S. property, casualty, and specialty insurance and reinsurance on behalf of Hamilton Re, Lloyd’s Syndicate 4000 and HIDAC. |
| HUL | | Hamilton Underwriting Limited, a former Lloyd’s managing agent that managed Lloyd’s Syndicate 3334. |
| IELR | | Initial expected loss ratio. |
| Lead | | In some insurance markets, the brokers find takers for insurance risks on the market and establish the policy terms with a leading underwriter, who also takes on a substantial share of the risk. The broker then looks for further cover providers, known as following underwriters, who accept the terms established by the leading underwriter and accept a share of the risk. When a leading underwriter establishes the policy terms, it is called the “lead.” |
| Line of business | | Insurance or reinsurance line of business such as property, general liability, professional liability, automobile liability, or workers’ compensation. |
| Long tail | | Types of insurance or reinsurance contracts under which claims tend to take a relatively long time to be reported and/or settle. Examples include several types of casualty lines. |
| Loss adjustment expenses | | The expenses involved in settling claims, including legal and other fees, and the portion of general expenses allocated to claim settlement costs. Also known as claim adjustment expenses. |
| Loss and loss adjustment expense reserves/loss reserves | | Liabilities established by insurers and reinsurers to reflect the estimated costs of claim payments and the related expenses that the insurer or reinsurer will ultimately be required to pay in respect of insurance or reinsurance policies it has issued. Loss and loss adjustment expense reserves consist of “case reserves,” or reserves established with respect to individual reported claims, and “IBNR reserves.” |
| Loss portfolio transfer | | A reinsurance contract or agreement in which an insurer cedes policies that have expired, often ones that have already incurred losses, to a reinsurer. |
| Loss and Loss Adjustment Expense Ratio | | A financial ratio calculated by dividing net losses and loss expenses by net premiums. |
| Losses occurring | | Contracts that cover claims arising from loss events that occur during the term of the reinsurance contract, although not necessarily reported during the term of the contract. |
| Managing Member | | Two Sigma Principals, LLC., the managing member of the TS Hamilton Fund. |
| NAIC | | National Association of Insurance Commissioners. |
| Net premiums earned | | The portion of net premiums written during or prior to a given period that was actually recognized as income during such period. |
| Net premiums written | | Gross premiums written for a given period less premiums ceded to reinsurers and retrocessionaires during such period. |
| Other underwriting expense ratio | | A ratio calculated by dividing non-acquisition expenses by net premiums. Examples of non-acquisition expenses include personnel costs, legal and professional fees, IT, travel and entertainment and communication costs. It also includes certain income items such as third-party fee income. |
| Personal lines | | Types of insurance or reinsurance written for individuals or families, rather than for businesses. |
| Premiums | | Premiums represent the cost of insurance that is paid by the policyholder or cedant to the insurer or the reinsurer for the risk being assumed. |
| Property catastrophe reinsurance | | Contracts that are typically “natural catastrophe” in nature, meaning they protect against losses from earthquakes and hurricanes, as well as other natural catastrophes such as tornadoes, wildfires, winter storms, and floods (where the contract specifically provides for coverage). Losses on these contracts typically stem from direct property damage and business interruption. |
| Property lines | | |
| Property reinsurance | | Types of insurance or reinsurance which provide coverage to a person with an insurable interest in tangible property for that person’s property loss, damage or loss of use caused by an insured peril. |
| Proportional reinsurance/Pro rata reinsurance/ Quota share reinsurance | | In proportional/pro rata/quota share treaty reinsurance, the reinsurer assumes a proportional share of the original premiums and losses incurred by the insurance company. |
| | | | | | | | |
| Reinstatement premiums | | The premium charged for the restoration of the reinsurance limit of an excess of loss contract to its full amount after payment by the reinsurer of losses as a result of an occurrence. |
| Reinsurance | | An arrangement in which an insurance company, the reinsurer, agrees to indemnify another insurance or reinsurance company, commonly referred to as the ceding company or cedant, for all or a portion of the insurance or reinsurance risks underwritten by the ceding company under one or more policies. Reinsurance does not legally discharge the primary insurer from its liability with respect to its obligations to the insured. |
| Retention | | Specific amount of loss that the ceding company or insured retains before the reinsurance limit applies. |
| Retrocession; retrocessional coverage | | A transaction whereby a reinsurer cedes to another reinsurer, commonly referred to as the retrocessionaire, all or part of the reinsurance that the first reinsurer has assumed. Retrocessional reinsurance does not legally discharge the ceding reinsurer from its liability with respect to its obligations to the reinsured. |
| Return on average common shareholders’ equity or ROACE | | Calculated by dividing net income (loss) attributable to common shareholders by average common shareholders’ equity for the same period. Average common shareholders’ equity is the arithmetic mean of opening and closing total common shareholders’ equity for the stated periods. |
| | |
| Short-tail | | Types of insurance or reinsurance contracts under which claims tend to take a relatively short time to be reported and/or settle. Examples include several types of property lines. |
| Specialty Insurance | | Types of insurance and reinsurance that provide coverage for risks that are often unusual or difficult to place and do not fit the underwriting criteria of standard commercial products carriers. |
| Specialty Lines (of Business) | | Include lines of business other than property or casualty, such as marine and energy, aviation, political violence and war and terror. |
| Submission | | An unprocessed application for insurance, reinsurance or retrocessional coverage forwarded to an insurer, reinsurer or retrocessionaire by a broker or intermediary on behalf of such prospective ceding insurer, reinsurer or retrocessionaire. |
| Tangible book value | | Calculated as total common shareholders' equity less goodwill and intangible assets as at the same date. |
| Tangible book value per common share | | Calculated by dividing tangible book value (as defined above) by the total number of common shares outstanding at the same date. |
| Treaty reinsurance | | The reinsurance of a specified type or category of risks defined in a reinsurance agreement (a “treaty”) between the primary insurer or other reinsured and a reinsurer. Typically, in treaty reinsurance, the primary insurer or reinsured is obligated to offer and the reinsurer is obligated to accept a specified portion of all of that type or category of risk originally written by the primary insurer or reinsured. A treaty is generally valid for a period of one year and contains common contract terms along with a specific risk definition, data on limit and retention, and provisions for premium and duration. |
| Two Sigma | | Two Sigma Investments, LP, an investment manager. |
| TS Hamilton Fund | | Two Sigma Hamilton Fund, LLC, a dedicated investment fund managed by Two Sigma for the Hamilton Group. |
| Underwriter | | An employee of an insurance or reinsurance company who examines, accepts or rejects risks and classifies accepted risks in order to charge an appropriate premium for each accepted risk. |
| Underwriting | | The insurer’s or reinsurer’s process of reviewing submissions for insurance or reinsurance coverage, deciding whether to accept all or part of the coverage requested and determining the applicable premiums. |
| Underwriting income (loss) | | A non-GAAP financial measure as defined in Item 10(e) of SEC Regulation S-K. The reconciliation to net income (loss), the most comparable GAAP financial measure, is presented in “Management's Discussion and Analysis of Financial Condition and Results of Operations—Consolidated Results of Operations.” Refer also to “Basis of Presentation—Presentation of Financial Information—Non-GAAP Financial Measures” for further details. |
| Unearned premium | | The portion of premiums written that is allocable to the unexpired portion of the policy term. |
Index to the Consolidated Financial Statements
Report of Independent Registered Public Accounting Firm
To the Shareholders and the Board of Directors of
Hamilton Insurance Group, Ltd.
Opinion on the Financial Statements
We have audited the accompanying consolidated balance sheets of Hamilton Insurance Group, Ltd. (the Company) as of December 31, 2024, and 2023, the related consolidated statements of operations and comprehensive income (loss), shareholders’ equity and cash flows for each of the three years in the period ended December 31, 2024, and the related notes (collectively referred to as the “consolidated financial statements”). In our opinion, the consolidated financial statements present fairly, in all material respects, the financial position of the Company at December 31, 2024 and 2023, and the results of its operations and its cash flows for each of the three years in the period ended December 31, 2024, in conformity with U.S. generally accepted accounting principles.
We also have audited, in accordance with the standards of the Public Company Accounting Oversight Board (United States) (PCAOB), the Company’s internal control over financial reporting as of December 31, 2024, based on criteria established in Internal Control-Integrated Framework issued by the Committee of Sponsoring Organizations of the Treadway Commission (2013 framework), and our report dated February 27, 2025 expressed an unqualified opinion thereon.
Basis for Opinion
These financial statements are the responsibility of the Company’s management. Our responsibility is to express an opinion on the Company’s financial statements based on our audits. We are a public accounting firm registered with the PCAOB and are required to be independent with respect to the Company in accordance with the U.S. federal securities laws and the applicable rules and regulations of the Securities and Exchange Commission and the PCAOB.
We conducted our audits in accordance with the standards of the PCAOB. Those standards require that we plan and perform the audit to obtain reasonable assurance about whether the financial statements are free of material misstatement, whether due to error or fraud. Our audits included performing procedures to assess the risks of material misstatement of the financial statements, whether due to error or fraud, and performing procedures that respond to those risks. Such procedures included examining, on a test basis, evidence regarding the amounts and disclosures in the financial statements. Our audits also included evaluating the accounting principles used and significant estimates made by management, as well as evaluating the overall presentation of the financial statements. We believe that our audits provide a reasonable basis for our opinion.
Critical Audit Matter
The critical audit matter communicated below is a matter arising from the current period audit of the financial statements that was communicated or required to be communicated to the audit committee and that: (1) relates to accounts or disclosures that are material to the financial statements and (2) involved our especially challenging, subjective or complex judgments. The communication of the critical audit matter does not alter in any way our opinion on the consolidated financial statements, taken as a whole, and we are not, by communicating the critical audit matter below, providing a separate opinion on the critical audit matter or on the account or disclosures to which it relates.
| | | | | |
| Valuation of Losses Incurred but not Reported |
Description of the Matter | As disclosed in Notes 2 and 8 of the consolidated financial statements, reserves for losses and loss adjustment expenses includes reserves for unpaid reported losses (Case reserves) and for losses incurred but not reported (IBNR reserves). At December 31, 2024, IBNR reserves represented a significant portion of the $3,532 million of reserves for losses and loss adjustment expenses. There is significant uncertainty inherent in determining management’s estimate of ultimate losses and loss adjustment expenses which is used to establish IBNR reserves. Management estimates its IBNR reserves for large events based upon discussions with brokers and cedants, use of proprietary loss modelling and pricing software, estimates of market loss and market share and experience from historical large events. IBNR reserves for attritional losses are established using actuarial loss reserving techniques. These techniques include the loss development factor method, Bornheutter Ferguson method, the Initial Expected Loss Ratio method, and other techniques. These techniques rely on estimates of paid and reported loss development patterns and estimates of the loss ratio at the inception of the contract. The Company’s actuaries may use other approaches in addition to those described and supplement these methods with judgment depending upon the characteristics of the class of business and available data. Inherent in the estimates of ultimate losses and loss adjustment expenses are expected trends in claim severity and frequency, the expected duration of the respective claims development period, inadequacies in the data provided by industry participants, the potential for further reporting lags, significant uncertainty as it relates to legal issues under the relevant terms of insurance and reinsurance contracts and other factors, which may vary significantly as claims are settled.
Auditing management’s estimate for IBNR reserves was complex and required the involvement of our actuarial specialists due to the high degree of subjectivity inherent in management’s methods and assumptions used in the calculations which have a significant effect on the valuation of IBNR reserves.
|
| How We Addressed the Matter in Our Audit | We obtained an understanding, evaluated the design and tested the operating effectiveness of the relevant controls over the estimation process for IBNR reserves. This included, among others, evaluating management’s controls over the actuarial methods and assumptions selected to determine their recorded estimate. To test IBNR reserves, our procedures included, among others, the involvement of actuarial specialists to assist with the evaluation of the Company’s selection of significant actuarial methods and assumptions used in their analysis and a comparison of those methods used in prior periods and those used in the industry. We independently calculated a range of reasonable reserve estimates including performing independent projections and compared the range of reserve estimates to the Company’s recorded loss and loss adjustment expense reserves. |
/s/ Ernst & Young Ltd.
We have served as the Company’s auditor since 2013.
Hamilton, Bermuda
February 27, 2025
Hamilton Insurance Group, Ltd.
Consolidated Balance Sheets
| | | | | | | | | | | |
| December 31, |
| ($ in thousands, except share information) | 2024 | | 2023 |
| Assets | | | |
Fixed maturity investments, at fair value (amortized cost 2024: $2,422,917; 2023: $1,867,499) | $ | 2,377,862 | | | $ | 1,831,268 | |
| Short-term investments, at fair value (amortized cost 2024: $495,630; 2023: $427,437) | 497,110 | | | 428,878 | |
| Investments in Two Sigma Funds, at fair value (cost 2024: $805,623; 2023: $770,191) | 939,381 | | | 851,470 | |
| Total investments | 3,814,353 | | | 3,111,616 | |
| Cash and cash equivalents | 996,493 | | | 794,509 | |
| Restricted cash and cash equivalents | 104,359 | | | 106,351 | |
| Premiums receivable | 771,707 | | | 658,363 | |
| Paid losses recoverable | 134,406 | | | 145,202 | |
| Deferred acquisition costs | 208,985 | | | 156,895 | |
| Unpaid losses and loss adjustment expenses recoverable | 1,171,040 | | | 1,161,077 | |
| Receivables for investments sold | 74,006 | | | 42,419 | |
| Prepaid reinsurance | 218,921 | | | 194,306 | |
| Intangible assets | 93,121 | | | 90,996 | |
| Other assets | 208,642 | | | 209,621 | |
| Total assets | $ | 7,796,033 | | | $ | 6,671,355 | |
| | | |
| Liabilities, non-controlling interest, and shareholders’ equity | | | |
| Liabilities | | | |
| Reserve for losses and loss adjustment expenses | $ | 3,532,491 | | | $ | 3,030,037 | |
| Unearned premiums | 1,122,277 | | | 911,222 | |
| Reinsurance balances payable | 261,275 | | | 272,310 | |
| Payables for investments purchased | 115,427 | | | 66,606 | |
| | | |
| Term loan, net of issuance costs | 149,945 | | | 149,830 | |
| Accounts payable and accrued expenses | 185,361 | | | 186,887 | |
| Payables to related parties | 100,420 | | | 6,480 | |
| Total liabilities | 5,467,196 | | | 4,623,372 | |
| | | |
| Non-controlling interest – TS Hamilton Fund | 128 | | | 133 | |
| | | |
| Shareholders’ equity | | | |
| Common shares: | | | |
Class A, authorized (2024: 26,944,807 and 2023: 28,644,807), par value $0.01; issued and outstanding (2024: 17,820,078 and 2023: 28,644,807) | 178 | | | 286 | |
Class B, authorized (2024: 80,205,911 and 2023: 72,337,352), par value $0.01; issued and outstanding (2024: 64,271,249 and 2023: 56,036,067) | 643 | | | 560 | |
Class C, authorized (2024: 19,375,670 and 2023: 25,544,229), par value $0.01; issued and outstanding (2024: 19,375,670 and 2023: 25,544,229) | 194 | | | 255 | |
| Additional paid-in capital | 1,163,609 | | | 1,249,817 | |
| Accumulated other comprehensive loss | (4,441) | | | (4,441) | |
| Retained earnings | 1,168,526 | | | 801,373 | |
| Total shareholders’ equity | 2,328,709 | | | 2,047,850 | |
| | | |
| Total liabilities, non-controlling interest, and shareholders’ equity | $ | 7,796,033 | | | $ | 6,671,355 | |
| | | |
| | | |
See accompanying notes to the consolidated financial statements.
Hamilton Insurance Group, Ltd.
Consolidated Statements of Operations and Comprehensive Income (Loss)
| | | | | | | | | | | | | | | | | |
| Years Ended December 31, |
| ($ in thousands, except per share information) | 2024 | | 2023 | | 2022 |
| Revenues | | | | | |
| Gross premiums written | $ | 2,422,582 | | | $ | 1,951,038 | | | $ | 1,646,673 | |
| Reinsurance premiums ceded | (501,413) | | | (470,600) | | | (424,809) | |
| Net premiums written | 1,921,169 | | | 1,480,438 | | | 1,221,864 | |
| | | | | |
| Net change in unearned premiums | (186,440) | | | (161,905) | | | (78,150) | |
| Net premiums earned | 1,734,729 | | | 1,318,533 | | | 1,143,714 | |
| | | | | |
| Net realized and unrealized gains (losses) on investments | 511,407 | | | 209,610 | | | 93,348 | |
| Net investment income (loss) | 63,267 | | | 30,456 | | | (21,487) | |
| Total net realized and unrealized gains (losses) on investments and net investment income (loss) | 574,674 | | | 240,066 | | | 71,861 | |
| | | | | |
| | | | | |
| Other income (loss) | 23,752 | | | 18,631 | | | 11,316 | |
| Net foreign exchange gains (losses) | (3,231) | | | (6,185) | | | 6,137 | |
| Total revenues | 2,329,924 | | | 1,571,045 | | | 1,233,028 | |
| | | | | |
| Expenses | | | | | |
| Losses and loss adjustment expenses | 1,010,173 | | | 714,603 | | | 758,333 | |
| Acquisition costs | 388,931 | | | 309,148 | | | 271,189 | |
| General and administrative expenses | 271,124 | | | 259,856 | | | 177,682 | |
| Impairment of goodwill | — | | | — | | | 24,082 | |
| Amortization of intangible assets | 15,520 | | | 10,783 | | | 12,832 | |
| Interest expense | 22,616 | | | 21,434 | | | 15,741 | |
| Total expenses | 1,708,364 | | | 1,315,824 | | | 1,259,859 | |
| | | | | |
| Income (loss) before income tax | 621,560 | | | 255,221 | | | (26,831) | |
| Income tax expense (benefit) | 8,402 | | | (25,066) | | | 3,104 | |
| Net income (loss) | 613,158 | | | 280,287 | | | (29,935) | |
| | | | | |
| Net income (loss) attributable to non-controlling interest | 212,729 | | | 21,560 | | | 68,064 | |
| | | | | |
| Net income (loss) and other comprehensive income (loss) attributable to common shareholders | $ | 400,429 | | | $ | 258,727 | | | $ | (97,999) | |
| | | | | |
| Per share data | | | | | |
| Basic income (loss) per share attributable to common shareholders | $ | 3.81 | | | $ | 2.47 | | | $ | (0.95) | |
| Diluted income (loss) per share attributable to common shareholders | $ | 3.67 | | | $ | 2.44 | | | $ | (0.95) | |
See accompanying notes to the consolidated financial statements.
Hamilton Insurance Group, Ltd.
Consolidated Statements of Shareholders' Equity
| | | | | | | | | | | | | | | | | |
| Years Ended December 31, |
| ($ in thousands) | 2024 | | 2023 | | 2022 |
| Common shares | | | | | |
| Balance, beginning of year | $ | 1,101 | | | $ | 1,030 | | | $ | 1,025 | |
| Issuance of common shares | 26 | | | 73 | | | 7 | |
| Repurchases of common shares | (112) | | | (2) | | | (2) | |
| Balance, end of year | 1,015 | | | 1,101 | | | 1,030 | |
| | | | | |
| Additional paid-in capital | | | | | |
| Balance, beginning of year | 1,249,817 | | | 1,120,242 | | | 1,110,248 | |
| Issuance of common shares | 370 | | | 82,924 | | | 308 | |
| Repurchases of common shares | (116,962) | | | (1,896) | | | (1,098) | |
| Share compensation expense | 30,384 | | | 48,547 | | | 10,784 | |
| | | | | |
| Balance, end of year | 1,163,609 | | | 1,249,817 | | | 1,120,242 | |
| | | | | |
| Accumulated other comprehensive income (loss) | | | | | |
| | | | | |
| | | | | |
| Balance, beginning and end of year | (4,441) | | | (4,441) | | | (4,441) | |
| | | | | |
| | | | | |
| Retained earnings | | | | | |
| Balance, beginning of year | 801,373 | | | 547,352 | | | 645,769 | |
| Net income (loss) | 613,158 | | | 280,287 | | | (29,935) | |
| Net income (loss) attributable to non-controlling interest | (212,729) | | | (21,560) | | | (68,064) | |
| Share compensation expense | — | | | (4,169) | | | — | |
| Repurchases of common shares | (33,276) | | | (537) | | | (418) | |
| Balance, end of year | 1,168,526 | | | 801,373 | | | 547,352 | |
| | | | | |
| Total shareholders’ equity | $ | 2,328,709 | | | $ | 2,047,850 | | | $ | 1,664,183 | |
See accompanying notes to the consolidated financial statements.
Hamilton Insurance Group, Ltd.
Consolidated Statements of Cash Flows
| | | | | | | | | | | | | | | | | |
| Years Ended December 31, |
| ($ in thousands) | 2024 | | 2023 | | 2022 |
| Operating activities | | | | | |
| Net income (loss) | $ | 613,158 | | | $ | 280,287 | | | $ | (29,935) | |
| Adjustments to reconcile net income (loss) to net cash provided by (used in) operating activities: | | | | | |
| Depreciation and amortization | 16,466 | | | 12,410 | | | 14,994 | |
| | | | | |
| | | | | |
| Share compensation expense | 30,384 | | | 44,378 | | | 10,784 | |
| Net realized (gains) losses on investments | (468,068) | | | (84,513) | | | (258,653) | |
| Change in net unrealized (gains) losses on investments | (43,339) | | | (125,097) | | | 165,305 | |
| Impairment of goodwill | — | | | — | | | 24,082 | |
| | | | | |
| | | | | |
| | | | | |
| Other items | 3,831 | | | (6,529) | | | 12,494 | |
| Change in: | | | | | |
| Premiums receivable | (113,344) | | | (135,693) | | | (60,397) | |
| Paid losses recoverable | 10,796 | | | (54,547) | | | (11,408) | |
| Deferred acquisition costs | (52,090) | | | (41,748) | | | (16,323) | |
| Prepaid reinsurance | (24,615) | | | (29,993) | | | (11,764) | |
| Unpaid losses and loss adjustment expenses recoverable | (9,963) | | | 16,786 | | | (65,320) | |
| | | | | |
| Other assets | 1,158 | | | (42,669) | | | (41,894) | |
| Reserve for losses and loss adjustment expenses | 502,454 | | | 173,762 | | | 440,784 | |
| Unearned premiums | 211,055 | | | 193,034 | | | 96,733 | |
| Reinsurance balances payable | (11,035) | | | 27,990 | | | (42,476) | |
| Accounts payable and accrued expenses and other | 92,455 | | | 55,297 | | | (36,079) | |
| Net cash provided by (used in) operating activities | 759,303 | | | 283,155 | | | 190,927 | |
| | | | | |
| Investing activities | | | | | |
| Proceeds from redemptions from Two Sigma Funds | 2,874,348 | | | 2,591,705 | | | 2,592,289 | |
| Contributions to Two Sigma Funds | (2,481,159) | | | (2,554,888) | | | (2,464,902) | |
| | | | | |
| | | | | |
| Purchases of fixed maturity investments | (1,929,974) | | | (1,221,576) | | | (705,144) | |
Proceeds from sales, redemptions and maturity of fixed maturity investments | 1,381,128 | | | 688,978 | | | 420,702 | |
| Purchases of short-term investments | (1,831,596) | | | (1,506,241) | | | (1,551,834) | |
| Proceeds from sales of short-term investments | 1,804,670 | | | 1,389,409 | | | 1,843,007 | |
| Change in receivables for investments sold | (31,587) | | | (42,048) | | | (345) | |
| Change in payables for investments purchased | 48,821 | | | 18,511 | | | 12,920 | |
| | | | | |
| | | | | |
| | | | | |
| | | | | |
| Other | (18,811) | | | (15,938) | | | (13,591) | |
| Net cash provided by (used in) investing activities | (184,160) | | | (652,088) | | | 133,102 | |
| | | | | |
| Financing activities | | | | | |
| Issuance of common shares | 26 | | | 73 | | | 7 | |
| Repurchases of common shares | (150,350) | | | (2,435) | | | (1,518) | |
| Contribution of additional paid-in capital | 370 | | | 82,924 | | | 308 | |
| Term loan, net of issuance costs | — | | | — | | | (345) | |
| | | | | |
| | | | | |
| | | | | |
| Withdrawal of non-controlling interest | (212,734) | | | (21,546) | | | (68,069) | |
| Net cash provided by (used in) financing activities | (362,688) | | | 59,016 | | | (69,617) | |
| | | | | |
| Effect of exchange rate changes on cash and cash equivalents and restricted cash and cash equivalents | (12,463) | | | 3,574 | | | (11,335) | |
| | | | | |
| Net increase (decrease) in cash and cash equivalents and restricted cash and cash equivalents | 199,992 | | | (306,343) | | | 243,077 | |
| Cash and cash equivalents and restricted cash and cash equivalents, beginning of period | 900,860 | | | 1,207,203 | | | 964,126 | |
| Cash and cash equivalents and restricted cash and cash equivalents, end of period | $ | 1,100,852 | | | $ | 900,860 | | | $ | 1,207,203 | |
| | | | | |
| Net income taxes paid | $ | 10,662 | | | $ | 4,211 | | | $ | 9,971 | |
| Interest paid | $ | 22,419 | | | $ | 21,608 | | | $ | 15,655 | |
See accompanying notes to the consolidated financial statements.
Hamilton Insurance Group, Ltd.
Notes to the Consolidated Financial Statements
1. Organization
Hamilton Insurance Group, Ltd. ("Hamilton Group", the "Group" or the "Company"), the ultimate group holding company, was incorporated on September 4, 2013, under the laws of Bermuda. On November 14, 2023, the Company consummated an initial public offering ("IPO") of its Class B common shares, which are listed on the NYSE.
Our Bermuda operations are led by Hamilton Re, Ltd. ("Hamilton Re"), a registered Class 4 insurer incorporated in Bermuda. Hamilton Re writes property, casualty, and specialty insurance and reinsurance on a global basis.
Hamilton Re US is a tax partnership that was formed pursuant to an arrangement between Hamilton Re and its Bermuda-incorporated affiliate, Hamilton ILS Holdings Limited. The tax partnership is treated as a U.S. corporation for U.S. tax purposes and is registered with the U.S. Internal Revenue Service, such that underwriting and investment income derived from capital allocated to Hamilton Re US are subject to U.S. taxation.
Ada Capital Management Limited ("ACML"), a wholly owned insurance agent incorporated and regulated in Bermuda, is authorized to underwrite on behalf of Ada Re, Ltd. ("Ada Re").
Our London operations are comprised of Hamilton Managing Agency Limited ("HMA"), a Lloyd’s managing agency, which manages our wholly aligned Syndicate 4000 and a third-party funded Lloyd’s Syndicate. Syndicate 4000 operates in the Lloyd’s market and underwrites property, casualty, and specialty insurance and reinsurance business on a subscription basis.
Our Dublin operations are comprised of Hamilton Insurance Designated Activity Company ("HIDAC"), a Dublin-based insurer with a U.K. branch and extensive licensing in the United States, including excess and surplus lines and reinsurance in all 50 states.
Hamilton Managing General Agency Americas LLC ("HMGA Americas") is licensed throughout the United States and underwrites on behalf of the Group's London, Dublin and Bermuda operations solely in respect of Hamilton Re US, providing access from the U.S. to the Lloyd's market, the Group's rated Irish carrier and the Group's Bermuda balance sheet, respectively.
Hamilton Select Insurance Inc. ("Hamilton Select") is a U.S. domestic excess and surplus lines carrier incorporated in Delaware and authorized to write excess and surplus business in all 50 states.
Two Sigma Hamilton Fund, LLC ("TS Hamilton Fund"), is a Delaware limited liability company. In 2013, Hamilton Re entered into a limited liability company agreement with TS Hamilton Fund and Two Sigma Principals, LLC (the "Managing Member") as the managing member of TS Hamilton Fund. Effective July 1, 2023, Hamilton Re has committed to an investment in TS Hamilton Fund in an amount up to the lesser of (i) $1.8 billion or (ii) 60% of Hamilton Group’s net tangible assets (previously equal to a minimum of 95% of the consolidated net tangible assets of Hamilton Group). TS Hamilton Fund has engaged Two Sigma Investments, LP ("Two Sigma"), a related party Delaware limited partnership, to serve as its investment manager. Two Sigma is a United States Securities and Exchange Commission registered investment adviser specializing in quantitative analysis (see Note 3, Investments for further details).
Unconsolidated Related Parties
Ada Re is a special purpose insurer funded by third party investors and formed to provide fully collateralized reinsurance and retrocession to both Hamilton Group and third party cedants.
Easton Re has issued an industry loss index-triggered catastrophe bond that provides the Company's operating platforms with multi-year risk transfer capacity to protect against named storm risk in the United States and earthquake risk in the United States and Canada. See Note 7, Reinsurance, for further details.
Hamilton Insurance Group, Ltd.
Notes to the Consolidated Financial Statements
2. Summary of Significant Accounting Policies
a.Basis of Presentation
These audited consolidated financial statements have been prepared in accordance with accounting principles generally accepted in the United States ("GAAP") and include the accounts of Hamilton Group, Hamilton Re, Hamilton U.K. Holdings Limited, Hamilton Select, HMGA Americas, ACML, and TS Hamilton Fund (collectively the "Company"). All significant intercompany transactions and balances have been eliminated on consolidation. Certain comparative information has been reclassified to conform to the current year presentation.
b.Use of Estimates
The preparation of financial statements in conformity with GAAP requires management to make estimates and assumptions that affect the reported and disclosed amounts of assets and liabilities and disclosure of contingent assets and liabilities at the date of the financial statements and the reported amounts of revenues and expenses during the reporting period. Actual results could differ from those estimates. The major estimates recorded in the Company’s financial statements include, but are not limited to, premiums written, provisions for estimated future credit losses, the reserve for losses and loss adjustment expenses and the fair value of investments.
c.Fair Value Measurements
Details on assets and liabilities that have been included under the requirements of authoritative guidance on fair value
measurements to illustrate the bases for determining the fair values of these items held by the Company are included in Note 4, Fair Value and each respective section of this significant accounting policies note.
Where the Company has elected to account for certain of its assets and liabilities at fair value in accordance with FASB ASC Topic Fair Value Measurements and Disclosures, the Company recognizes the change in unrealized gains and losses arising from changes in fair value in its statements of operations. See Note 2j, Investments for further detail.
d.Premiums and Acquisition Costs
Premiums written and ceded on a losses occurring basis are earned pro-rata over the terms of the related contracts and policies. For contracts written on a risks-attaching basis, premiums written and ceded are earned over the terms of the underlying contracts and policies. Premiums written and ceded include estimates based on information received from insureds, brokers and ceding companies, and any subsequent differences arising on such estimates are recorded in the periods in which they are determined. The portion of the premiums written and ceded applicable to the unexpired terms of the underlying contracts and policies are recorded as unearned premiums and prepaid reinsurance premiums, respectively. Amounts are computed by pro-rata methods based on statistical data or reports received from insureds, brokers or ceding companies. Reinstatement premiums are estimated after the occurrence of a significant loss and are recorded in accordance with the contract terms based upon paid losses and case reserves. Reinstatement premiums are earned when written.
Acquisition expenses are costs that vary with, and are directly related to, the successful acquisition of new or renewal business and consist principally of commissions, brokerage and premium tax expenses. These costs are deferred and amortized over the periods in which the related premiums are earned. Deferred acquisition costs are limited to their estimated realizable value based on the related unearned premiums. Anticipated losses and loss adjustment expenses, based on historical and current experience, and anticipated net investment income related to the premiums are considered in determining the recoverability of deferred acquisition costs.
e.Concentrations of Credit Risk
Financial instruments that potentially subject the Company to concentrations of credit risk consist primarily of fixed maturity and short-term investments, cash and cash equivalents, premiums receivable and reinsurance balances recoverable. Cash and cash equivalents are held with financial institutions of high credit quality, and fixed maturity and short-term investments primarily consist of U.S. government, U.S. government agencies, and high credit quality issuers of corporate and debt securities. The Company limits the amount of credit exposure with any one financial institution or issuer and believe that no significant concentration of credit risk exists with respect to cash and investments.
Hamilton Insurance Group, Ltd.
Notes to the Consolidated Financial Statements
f.Reinsurance
In the normal course of business, the Company seeks to reduce the potential amount of loss arising from claims events by reinsuring certain levels of risk with other reinsurers. Ceded reinsurance contracts do not relieve the Company of its primary obligation to policyholders. Prepaid reinsurance represents the portion of premiums ceded to reinsurers applicable to the unexpired coverage terms of the reinsurance contracts in place. Amounts recoverable from reinsurers are estimated based on the terms and conditions of the reinsurance contracts, in a manner consistent with the underlying liabilities insured or reinsured by the Company. If the Company determines that adjustments to earlier estimates are appropriate, such adjustments are recorded in the periods in which they are determined. Amounts recoverable from reinsurers are recorded net of an allowance for expected credit losses. See Note 7, Reinsurance, for further details.
Retroactive reinsurance agreements are reinsurance agreements under which a reinsurer agrees to reimburse the Company as a result of past insurable events. For these agreements, the excess of the amounts ultimately collectible under the agreement over the consideration paid is recognized as a deferred gain liability which is amortized into income as a reduction of losses and loss adjustment expenses over the estimated ceded reserve settlement period. The amount of the deferred gain is recalculated each period based on actual loss payments and updated estimates of ultimate losses. If cumulative adverse development occurs subsequent to signing of a retroactive reinsurance agreement, it may result in significant losses from operations until periods when the recalculated deferred gain is recognized as a benefit to earnings. If the consideration paid for a retroactive reinsurance agreement exceeds the ultimate losses collectible under the agreement, the net loss on the retroactive reinsurance agreement is immediately recognized in income.
g.Credit Loss Provisions
The Company routinely evaluates its premiums receivable and paid and unpaid losses recoverable for potential specific credit or collection issues that might indicate an impairment. Premiums receivable and paid and unpaid losses recoverable are presented net of the resulting credit provisions, with the corresponding debits offset against gross premiums written or losses and loss adjustment expenses, as applicable, in the consolidated statement of operations and comprehensive income (loss).
The method for calculating the best estimate of losses depends on the size, nature, and risk characteristics of the related underwriting receivable. Such an estimate requires consideration of historical loss experience, current economic conditions, and judgments about the probable effects of relevant observable data, including historical information, counterparty financial strength ratings and the extent of collateralization. The underlying assumptions, estimates and assessments are updated periodically to reflect the Company's view of current conditions. Changes in estimates may significantly affect the allowance and provision for losses. It is possible that the Company's actual credit loss experience will differ materially from current estimates. Adjustments, if any, are recorded in earnings in the periods in which they become known. See Note 7, Reinsurance, for further details.
h.Reserve for Losses and Loss Adjustment Expenses
The reserve for losses and loss adjustment expenses includes reserves for unpaid reported losses and for losses incurred but not reported ("IBNR"). The reserve for unpaid reported losses and loss adjustment expenses is established by management based on reports from insureds, brokers and ceding companies and represents the estimated ultimate cost of events or conditions that have been reported to or specifically identified by the Company. The reserve for IBNR losses and loss adjustment expenses is established by management based on estimates of ultimate losses and loss adjustment expenses.
Inherent in the estimates of ultimate losses and loss adjustment expenses are expected trends in claim severity and frequency, the expected duration of the respective claims development period, inadequacies in the data provided by industry participants, the potential for further reporting lags, significant uncertainty as it relates to legal issues under the relevant terms of insurance and reinsurance contracts, and other factors, which may vary significantly as claims are settled. Accordingly, ultimate losses and loss adjustment expenses may differ materially from the amounts recorded in the financial statements. These estimates are reviewed regularly and, as experience develops and new information becomes known, the reserves are adjusted as necessary. Such adjustments, if any, are recorded in earnings in the periods in which they become known. See Note 8, Reserve for Losses and Loss Adjustment Expenses, for further details.
Hamilton Insurance Group, Ltd.
Notes to the Consolidated Financial Statements
i.Cash and Cash Equivalents and Restricted Cash and Cash Equivalents
Cash and cash equivalents include money market funds and highly liquid short-term deposits and securities with maturities of 90 days or less at the time of purchase. Money market funds are classified as Level 1 as these instruments are considered actively traded; however, certificates of deposit are classified as Level 2.
Restricted cash and cash equivalents typically relates to funds held in trust supporting a portion of the Lloyd's capital requirements and other underwriting obligations. See Note 3, Investments, for further details.
j.Investments
Investments - Trading
The Company elects the fair value option for its fixed maturity investments, short-term investments and certain other invested assets (excluding those that are accounted for using specialized investment company accounting as noted below). All changes in the fair value of investments are recorded within net realized and unrealized gains (losses) on investments in the consolidated statements of operations. See Note 4, Fair Value, for further details.
All investment transactions are recorded on a trade-date basis and are valued using pricing data received from third parties. Realized gains or losses on sales of investments are determined on a weighted average basis. Investment income is recognized when earned and includes interest and dividend income, recorded as of the ex-dividend date, together with the amortization of premium and discount on fixed maturities and short-term investments computed using the effective yield method. Net investment income includes related investment expenses.
Short-Term Investments
Short-term investments comprise securities with a maturity greater than three months but less than one year from the date of purchase.
Investments in Two Sigma Funds
TS Hamilton Fund invests in Two Sigma Funds ("Two Sigma Funds"), which are stated at their estimated fair values, which generally represent the Company’s proportionate interest in the members’ equity of the Two Sigma Funds as reported by the respective funds based on the net asset value ("NAV") provided by the fund administrator. The Company accounts for its investment in Two Sigma Funds under the variable interest model at NAV as a practical expedient for fair value in the consolidated balance sheets. Increases or decreases in such fair values are recorded within net realized and unrealized gains (losses) on investments in the consolidated statements of operations. Realized gains or losses upon any withdrawals of investments in the Two Sigma Funds are calculated using the weighted average method. The assets and liabilities of the Two Sigma Funds are recorded at fair value, or at amounts approximating fair value. The Company records contributions and withdrawals related to its investments in the Two Sigma Funds on the transaction date.
The specialized investment company accounting, as described above, is retained in the Company’s audited consolidated financial statements upon consolidation of TS Hamilton Fund.
k.Foreign Exchange
Monetary assets and liabilities denominated in foreign currencies are revalued into the functional currency of each entity using the exchange rates in effect at the balance sheet date, with the resulting foreign exchange gains and losses included in earnings. Revenues and expenses denominated in foreign currencies are revalued at the exchange rates in effect on the transaction date.
The Company’s reporting currency as at December 31, 2024 is the U.S. Dollar ("USD"). The functional currency of the Company's U.K. subsidiaries changed from GBP to USD on January 1, 2017. The accumulated other comprehensive loss recorded prior to the change in functional currency will remain on the balance sheet until such time as the U.K. operations are sold, or substantially liquidated.
Hamilton Insurance Group, Ltd.
Notes to the Consolidated Financial Statements
l.Share Based Compensation
The Company issues restricted stock units, performance stock units and warrants and may issue other equity-based awards to its employees. Compensation cost is measured at the grant date fair value and expensed over the period for which the employee is required to provide services in exchange for the award. For awards subject to graded vesting, the awards are separated into vesting tranches, which are amortized over their respective vesting periods. Forfeitures are recognized as they occur.
See Note 12, Share Incentive Plans, for further details of the accounting treatment for the Value Appreciation Pool ("VAP").
m.Intangible Assets
The Company accounts for goodwill and other intangible assets that arise from business combinations in accordance with FASB ASC Topic Intangibles - Goodwill and Other. A purchase price that is in excess of the fair value of the net assets acquired arising from a business combination is recorded as goodwill or other intangible assets, according to their nature. Goodwill and other intangible assets with indefinite useful lives are not amortized. Other intangible assets with a finite life are amortized over the estimated useful lives of the assets. All recorded goodwill was written down in the year ended December 31, 2022, primarily as a result of the annual impairment assessment, and the Company has no recorded goodwill at December 31, 2024 or 2023.
The Company's indefinite lived intangible assets are tested for impairment on an annual basis or more frequently if events or changes in circumstances warrant. Finite lived intangible assets are reviewed for indicators of impairment on an annual basis or more frequently if events or changes in circumstances indicate that the carrying amount may not be recoverable and tested for impairment if appropriate. If indefinite lived intangible assets are impaired, they are written down to their estimated fair value with a corresponding expense recorded in the Company's consolidated statement of operations.
As part of the annual impairment test of finite lived intangible assets, the Company has the option to first assess qualitative factors to determine whether it's necessary to perform a quantitative impairment test. Under this option, the Company would not be required to calculate the fair value of a reporting unit unless the Company determines, based on its qualitative assessment, that it is more likely than not that a reporting unit's fair value is less than its carrying amount. If finite lived intangible assets are impaired, they are written down to their estimated fair value with a corresponding expense recorded in the Company's consolidated statement of operations.
n.Variable Interest Entities
The Company accounts for variable interest entities ("VIE") in accordance with GAAP guidance, which requires the consolidation of all VIEs by the primary beneficiary: the investor that has the power to direct the activities of the VIE and will absorb a majority of the VIE’s expected losses or residual returns. The Company determines whether it is the primary beneficiary of a VIE by performing an analysis that principally considers: (i) the VIE’s purpose and design, including the risks the VIE was designed to create and pass through to its variable interest holders; (ii) the VIE’s capital structure; (iii) the terms between the VIE and its variable interest holders and other parties involved with the VIE; (iv) which variable interest holders have the power to direct the activities of the VIE that most significantly impact the VIE’s economic performance; (v) which variable interest holders have the obligation to absorb losses or the right to receive benefits from the VIE that could potentially be significant to the VIE; and (vi) related party relationships. The Company reassesses its initial evaluation of an entity as a VIE upon the occurrence of certain reconsideration events. The Company also reassesses its determination of whether the Company is the primary beneficiary of a VIE upon changes in facts and circumstances that could potentially alter the Company’s assessment.
o.Non-Controlling Interest
The share classes related to the redeemable non-controlling interest portion of TS Hamilton Fund are not considered liabilities in accordance with GAAP and have redemption features that are not solely within the control of TS Hamilton Fund. Therefore, the redeemable non-controlling interest in TS Hamilton Fund is presented in the mezzanine section on the Company’s consolidated balance sheets. The net income or loss attributable to non-controlling interest is presented separately in the Company’s consolidated statements of operations. See Note 5, Variable Interest Entities, for further details.
Hamilton Insurance Group, Ltd.
Notes to the Consolidated Financial Statements
p.Earnings Per Share
The Company calculates earnings per share in accordance with FASB ASC Topic Earnings per Share. Basic earnings per share are based on weighted average common shares outstanding during the period and exclude any dilutive effects of restricted stock units and warrants. Diluted earnings per share includes the estimated impact under the Treasury Stock method where all dilutive restricted stock grants to vest and all dilutive warrants to be exercised during the period.
q.Income Taxes
The Company records deferred income taxes that reflect the tax effect of the temporary differences between the carrying amounts of assets and liabilities for financial reporting purposes and their respective tax bases. The effect on deferred tax assets and liabilities of a change in tax rates is recognized in earnings in the fiscal period that includes the enactment date. A valuation allowance against deferred tax assets is recorded if it is not more likely than not that all, or some portion, of the benefits related to deferred tax assets will be realized. The valuation allowance assessment considers tax planning strategies, where applicable.
r.Recent Accounting Pronouncements
Recently Adopted Accounting Pronouncements
In November 2023, the FASB issued ASU 2023-07 Segment Reporting, which enhances the qualitative and quantitative disclosures related to reportable segments. The Company adopted this guidance for the year ended December 31, 2024 and it did not have a material impact on the Company’s results of operations, financial position, cash flows or disclosures.
Recently Issued Accounting Pronouncements
In December 2023, the FASB issued ASU 2023-09 Income Taxes, which enhances the quantitative annual disclosures related to tax rate reconciliations and income taxes paid and requires additional qualitative discussion of applicable tax jurisdictions and the nature of certain reconciling items. The guidance is effective for annual periods beginning after December 15, 2024. Early adoption is permitted. This guidance will not have a material impact on the Company's results of operations, financial position, or cash flows.
In November 2024, the FASB issued ASU 2024-03 Disaggregation of Income Statement Expenses, which enhances the quantitative and qualitative disclosures related to specified information about certain costs and expenses. The guidance is effective for annual periods beginning after December 15, 2026. Early adoption is permitted. The Company is currently evaluating the impact of this guidance.
Hamilton Insurance Group, Ltd.
Notes to the Consolidated Financial Statements
3. Investments
Fixed Maturity and Short-Term Investments - Trading
The Company’s fixed maturity and short-term investments are as follows:
| | | | | | | | | | | | | | | | | | | | | | | |
| December 31, 2024 |
| ($ in thousands) | Amortized Cost | | Gross Unrealized Gains | | Gross Unrealized Losses | | Fair Value |
| Fixed maturities: | | | | | | | |
| U.S. government treasuries | $ | 724,785 | | | $ | 611 | | | $ | (14,293) | | | $ | 711,103 | |
| U.S. states, territories and municipalities | 13,533 | | | 25 | | | (327) | | | 13,231 | |
| Non-U.S. sovereign governments and supranationals | 70,435 | | | 454 | | | (3,362) | | | 67,527 | |
| Corporate | 1,153,612 | | | 6,484 | | | (17,036) | | | 1,143,060 | |
| Residential mortgage-backed securities - Agency | 288,760 | | | 160 | | | (16,309) | | | 272,611 | |
| Residential mortgage-backed securities - Non-agency | 17,432 | | | 6 | | | (684) | | | 16,754 | |
| | | | | | | |
| Commercial mortgage-backed securities - Non-agency | 40,363 | | | 72 | | | (749) | | | 39,686 | |
| Other asset-backed securities | 113,997 | | | 249 | | | (356) | | | 113,890 | |
| Total fixed maturities | 2,422,917 | | | 8,061 | | | (53,116) | | | 2,377,862 | |
| Short-term investments | 495,630 | | | 1,484 | | | (4) | | | 497,110 | |
| Total | $ | 2,918,547 | | | $ | 9,545 | | | $ | (53,120) | | | $ | 2,874,972 | |
| | | | | | | | | | | | | | | | | | | | | | | |
| December 31, 2023 |
| ($ in thousands) | Amortized Cost | | Gross Unrealized Gains | | Gross Unrealized Losses | | Fair Value |
| Fixed maturities: | | | | | | | |
| U.S. government treasuries | $ | 717,134 | | | $ | 5,137 | | | $ | (14,021) | | | $ | 708,250 | |
| U.S. states, territories and municipalities | 4,656 | | | — | | | (286) | | | 4,370 | |
| Non-U.S. sovereign governments and supranationals | 55,662 | | | 2,175 | | | (1,591) | | | 56,246 | |
| Corporate | 877,493 | | | 8,443 | | | (22,060) | | | 863,876 | |
| Residential mortgage-backed securities - Agency | 180,661 | | | 435 | | | (12,583) | | | 168,513 | |
| Residential mortgage-backed securities - Non-agency | 5,639 | | | 16 | | | (671) | | | 4,984 | |
| | | | | | | |
| Commercial mortgage-backed securities - Non-agency | 11,473 | | | — | | | (1,050) | | | 10,423 | |
| Other asset-backed securities | 14,781 | | | 20 | | | (195) | | | 14,606 | |
| Total fixed maturities | 1,867,499 | | | 16,226 | | | (52,457) | | | 1,831,268 | |
| Short-term investments | 427,437 | | | 1,441 | | | — | | | 428,878 | |
| Total | $ | 2,294,936 | | | $ | 17,667 | | | $ | (52,457) | | | $ | 2,260,146 | |
Hamilton Insurance Group, Ltd.
Notes to the Consolidated Financial Statements
Contractual Maturities Summary
The following table presents contractual maturities of fixed maturity securities. Expected maturities will differ from contractual maturities because borrowers may have the right to call or prepay obligations with or without call or prepayment penalties.
| | | | | | | | | | | |
| December 31, 2024 |
| ($ in thousands) | Amortized Cost | | Fair Value |
| Due less than one year | $ | 191,976 | | | $ | 190,229 | |
| Due after one through five years | 1,438,250 | | | 1,419,173 | |
| Due after five through ten years | 327,869 | | | 321,983 | |
| Due after ten years | 4,270 | | | 3,536 | |
| Mortgage-backed securities | 346,555 | | | 329,051 | |
| Asset-backed securities | 113,997 | | | 113,890 | |
| Total | $ | 2,422,917 | | | $ | 2,377,862 | |
Investments in Two Sigma Funds
The Company’s investments in Two Sigma Funds are as follows:
| | | | | | | | | | | | | | | | | | | | | | | | | | | | | | | | | | | |
| December 31, 2024 | | December 31, 2023 |
| ($ in thousands) | Cost | | Net Unrealized Gains (Losses) | | Fair Value | | Cost | | Net Unrealized Gains (Losses) | | Fair Value |
| Two Sigma Futures Portfolio, LLC (FTV) | $ | 308,061 | | | $ | (15,520) | | | $ | 292,541 | | | $ | 433,911 | | | $ | (38,105) | | | $ | 395,806 | |
| Two Sigma Spectrum Portfolio, LLC (STV) | 360,997 | | | 102,267 | | | 463,264 | | | 193,299 | | | 88,228 | | | 281,527 | |
Two Sigma Equity Spectrum Portfolio, LLC (ESTV) | 136,565 | | | 47,011 | | | 183,576 | | | 142,981 | | | 31,156 | | | 174,137 | |
| Total | $ | 805,623 | | | $ | 133,758 | | | $ | 939,381 | | | $ | 770,191 | | | $ | 81,279 | | | $ | 851,470 | |
The Company, through its investments in FTV, STV and ESTV, seeks to achieve absolute dollar-denominated returns on a substantial capital base, primarily by combining multiple hedged and leveraged systematic investment strategies with proprietary risk management and execution techniques. These systematic strategies include, but are not limited to, technical and statistically-based, fundamental-based, event-based, market condition-based and spread-based strategies as well as contributor-based and/or sentiment-based strategies and blended strategies.
•FTV primarily utilizes systematic strategies to gain broad macro exposure to FX, fixed income, equity and credit indices and commodities, predominantly by trading futures, spots, forwards, options, swaps, cash bonds and exchange traded products.
•STV primarily utilizes systematic strategies to trade U.S.-listed equity securities and related instruments and derivatives.
•ESTV primarily utilizes systematic strategies to trade non-U.S.-listed equity securities and related instruments and derivatives.
At December 31, 2024, the Company owns a 14.3%, 17.8% and 9.8% interest in each of the FTV, STV and ESTV funds, respectively.
Hamilton Insurance Group, Ltd.
Notes to the Consolidated Financial Statements
The following table summarizes certain investments of FTV, STV and ESTV where TS Hamilton Fund’s proportionate share of the fair value of the investment represents more than 5% of TS Hamilton Fund’s members’ equity:
| | | | | | | | | | | | | | | | | |
| December 31, 2024 |
| ($ in thousands) | Principal / Shares (1) | | Fair Value (1) | | % of Members' Equity |
| Goldman Sachs Financial Square Treasury Obligations Fund | 111,926 | | | $ | 111,926 | | | 5.9 | % |
| Morgan Stanley Institutional Liquidity Funds Treasury Portfolio | 109,471 | | | $ | 109,471 | | | 5.8 | % |
| JP Morgan U.S. Treasury Plus Money Market Fund - Capital | 101,940 | | | $ | 101,940 | | | 5.4 | % |
| U.S. Treasury Securities, 0.0000% - 4.6250%, due 1/9/2025 - 11/15/2054 | 2,105,796 | | | $ | 2,086,814 | | | 110.6 | % |
| Invesco Treasury Portfolio Money Market Fund | 96,844 | | | $ | 96,844 | | | 5.1 | % |
| U.S. Treasury Securities, 4.0000% - 4.6250%, due 12/31/2026 - 11/15/2054 | (241,100) | | | $ | (236,974) | | | (12.6) | % |
| | | | | |
| | | | | |
(1) Values represent TS Hamilton Fund’s proportionate share of the aggregate of FTV, STV and ESTV total holdings.
Two Sigma and the Managing Member are related parties to the Company as described further in Note 1, Organization. Effective July 1, 2023, a revised investment management agreement with Two Sigma requires TS Hamilton Fund to incur a management fee of 2.5% of the non-managing members' equity in the net asset value of the TS Hamilton Fund per annum (previously 3%). The management fee for the years ended December 31, 2024, 2023 and 2022 was $46.9 million, $45.2 million and $53.1 million, respectively.
Under the terms of the revised limited liability company agreement between Hamilton Re and the Managing Member, the Managing Member remains entitled to an incentive allocation equal to 30% of TS Hamilton Fund’s net profits, subject to high watermark provisions, and adjusted for withdrawals and any incentive allocation to the Managing Member. In the event there is a net loss during a quarter and a net profit during any subsequent quarter, the Managing Member is entitled to a modified incentive allocation whereby the regular incentive allocation will be reduced by 50% until subsequent cumulative net profits are credited in an amount equal to 200% of the previously allocated net losses. The Managing Member is also entitled to receive a revised additional incentive allocation as of the end of each fiscal year (or on any date Hamilton Re withdraws all or a portion of its capital), in an amount equal to 25% of the Excess Profits (previously 20%). "Excess Profits" for any given fiscal year (or other such accounting period) means the net profits over 10% for such fiscal year (previously 15%), net of management fees and expenses and gross of incentive allocations, but only after recouping previously unrecouped net losses. To the extent Hamilton Re contributes capital other than at the beginning of a fiscal year or withdraws capital other than at the end of a fiscal year, the additional incentive allocation hurdle with respect to such capital is prorated. The aggregate incentive allocation (inclusive of the additional incentive allocation) for the years ended December 31, 2024, 2023 and 2022 was $212.7 million, $21.5 million and $68.0 million, respectively.
Hamilton Re has a commitment with TS Hamilton Fund to maintain an amount up to the lesser of (i) $1.8 billion or
(ii) 60% of Hamilton Insurance Group’s net tangible assets in TS Hamilton Fund, such lesser amount, the "Minimum Commitment Amount", for a three-year period (the "Initial Term") and for rolling three-year periods thereafter (each such three-year period the "Commitment Period"), subject to certain circumstances and the liquidity options described below, with the Commitment Period ending on June 30, 2027. The Commitment Period consists of a 3-year rolling term that automatically renews on an annual basis unless Hamilton Re or the Managing Member provide advance notice of non-renewal.
The TS Hamilton Fund generally has two liquidity options, subject to Hamilton Re’s minimum investment commitment, which are as follows:
•Monthly liquidity - Subject to certain conditions, Hamilton Re may request a whole or partial withdrawal of its capital account, no later than fifteen days prior to the end of a calendar month, effective as of the last day of such calendar month.
•Daily liquidity - Subject to certain limited circumstances, including the need to meet obligations pursuant to Hamilton Re’s underwriting operations, Hamilton Re may request a withdrawal of all or a portion of its capital account upon at least one business day’s written notice of such withdrawal request date to the Managing Member.
Hamilton Insurance Group, Ltd.
Notes to the Consolidated Financial Statements
At its discretion, the Managing Member may permit or require Hamilton Re to withdraw all or any portion of its respective capital account at other times, or waive or reduce certain notice periods, or allow a notice to be revoked. The Managing Member may withdraw all or any portion of its capital account at any time.
Total Net Realized and Unrealized Gains (Losses) on Investments and Net Investment Income (Loss)
The components of total net realized and unrealized gains (losses) on investments and net investment income (loss) are as follows:
| | | | | | | | | | | | | | | | | |
| Years Ended December 31, |
| ($ in thousands) | 2024 | | 2023 | | 2022 |
| Net realized and unrealized gains (losses) on investments: | | | | | |
| Net realized gains (losses) on investments | $ | 468,068 | | | $ | 84,513 | | | $ | 258,653 | |
| Change in net unrealized gains (losses) on investments | 43,339 | | | 125,097 | | | (165,305) | |
| Net realized and unrealized gains (losses) on investments | 511,407 | | | 209,610 | | | 93,348 | |
| | | | | |
| Net investment income (loss): | | | | | |
| Fixed maturities | 81,872 | | | 47,970 | | | 22,375 | |
| Short-term investments | 67 | | | 295 | | | 155 | |
| TS Hamilton Fund | 12,373 | | | 16,084 | | | 10,395 | |
| Cash and cash equivalents | 17,006 | | | 12,523 | | | 2,634 | |
| Other | 2,293 | | | 1,580 | | | (1,397) | |
| Interest and other | 113,611 | | | 78,452 | | | 34,162 | |
| | | | | |
| Management fees | (49,102) | | | (47,049) | | | (54,581) | |
| Other expenses | (1,242) | | | (947) | | | (1,068) | |
| Net investment income (loss) | 63,267 | | | 30,456 | | | (21,487) | |
| | | | | |
| Total net realized and unrealized gains (losses) on investments and net investment income (loss) | $ | 574,674 | | | $ | 240,066 | | | $ | 71,861 | |
Net Realized Gains (Losses) on Investments
The components of net realized gains (losses) on investments are as follows:
| | | | | | | | | | | | | | | | | |
| Years Ended December 31, |
| ($ in thousands) | 2024 | | 2023 | | 2022 |
| Fixed maturities and short-term investments | $ | (2,307) | | | $ | (16,628) | | | $ | (14,968) | |
| TS Hamilton Fund | 470,091 | | | 100,930 | | | 266,630 | |
| Other | 284 | | | 211 | | | 6,991 | |
| Net realized gains (losses) on investments | $ | 468,068 | | | $ | 84,513 | | | $ | 258,653 | |
Hamilton Insurance Group, Ltd.
Notes to the Consolidated Financial Statements
Net Unrealized Gains (Losses) on Investments
The components of net unrealized gains (losses) on investments are as follows:
| | | | | | | | | | | | | | | | | |
| Years Ended December 31, |
| ($ in thousands) | 2024 | | 2023 | | 2022 |
| Fixed maturities and short-term investments | $ | (8,908) | | | $ | 52,751 | | | $ | (87,254) | |
| TS Hamilton Fund | 52,247 | | | 72,346 | | | (78,051) | |
| | | | | |
| Net unrealized gains (losses) on investments | $ | 43,339 | | | $ | 125,097 | | | $ | (165,305) | |
Pledged Assets
At December 31, 2024 and 2023, pledged investments at fair value were comprised of $245.3 million and $232.2 million, respectively, securing a portion of the capital requirements for business written at Lloyd's, $89.1 million and $54.1 million, respectively, held in trust accounts for the benefit of U.S. state regulatory authorities and $31.9 million and $37.2 million, respectively, securing other underwriting obligations. In addition, certain investments were pledged as security for letter of credit facilities as described further in Note 10, Debt and Credit Facilities.
At December 31, 2024 and 2023, restricted cash and cash equivalents balances were comprised of $101.8 million and $97.4 million, respectively, securing other underwriting obligations, $1.1 million and $7.2 million, respectively, securing a portion of the capital requirements for business written at Lloyd's, $1.5 million and $1.5 million, respectively, in trust accounts for the benefit of regulatory authorities, and $Nil and $0.3 million, respectively, of escrow funds.
Total cash and cash equivalents and restricted cash and cash equivalents of $1.1 billion presented in the statement of cash flows was comprised of cash and cash equivalents of $996.5 million and restricted cash and cash equivalents of $104.4 million on the balance sheet at December 31, 2024. Total cash and cash equivalents and restricted cash and cash equivalents of $900.9 million presented in the statement of cash flows was comprised of cash and cash equivalents of $794.5 million and restricted cash and cash equivalents of $106.4 million on the balance sheet at December 31, 2023.
4. Fair Value
Financial Instruments Subject to Fair Value Measurements
Accounting guidance over fair value measurements requires that a fair value measurement reflect the assumptions market participants would use in pricing an asset or liability based on the best information available. Assumptions include the risks inherent in a particular valuation technique (such as a pricing model) and/or the risks inherent in the inputs to the model. The fair value of a financial instrument is the amount that would be received to sell an asset or paid to transfer a liability in an orderly transaction between market participants at the measurement date (the "exit price"). Instruments that the Company owns are marked to bid prices.
Basis of Fair Value Measurements
Fair value measurement accounting guidance also establishes a fair value hierarchy that prioritizes the inputs to the respective valuation techniques used to measure fair value. The hierarchy gives the highest priority to unadjusted quoted prices in active markets for identical assets or liabilities (Level 1 measurements) and the lowest priority to unobservable inputs (Level 3 measurements). An asset or liability’s classification within the fair value hierarchy is based on the lowest level of significant input to its valuation. The three levels of the fair value hierarchy are:
•Level 1 - Inputs that reflect unadjusted quoted prices in active markets for identical assets or liabilities that the Company has the ability to access at the measurement date;
•Level 2 - Inputs other than quoted prices included within Level 1 that are observable for the asset or liability either directly or indirectly, including inputs in markets that are not considered to be active; and
•Level 3 - Inputs that are both significant to the fair value measurement and unobservable.
Hamilton Insurance Group, Ltd.
Notes to the Consolidated Financial Statements
Assets Recorded at Fair Value - Fixed Maturity and Short-term Investments
The following section describes the valuation methodologies used to determine the fair value of the Company’s fixed maturity and short-term investments by asset class:
•U.S. government treasuries: fair value based on observable market inputs such as quoted prices, reported trades, quoted prices for similar issuances and benchmark yields;
•U.S. states, territories and municipalities: fair value based on observable market inputs such as quoted market prices, quoted prices for similar securities, benchmark yields and credit spreads;
•Non-U.S. sovereign governments and supranationals: fair value based on observable market inputs such as quoted market prices, quoted prices for similar securities and models with observable inputs such as benchmark yields and credit spreads, and then, where applicable, converted to U.S. Dollars using an exchange rate from a nationally recognized source;
•Corporate: fair value based on observable market inputs such as quoted market prices, quoted prices for similar securities, benchmark yields and credit spreads;
•Asset-backed and mortgage-backed securities: fair value based on observable inputs such as quoted prices, reported trades, quoted prices for similar issuances or benchmark yields and cash flow models using observable inputs such as prepayment speeds, collateral performance and default spreads; and
•Short-term investments: fair value based on observable market inputs such as quoted prices, reported trades, quoted prices for similar issuances and benchmark yields.
The following table presents the financial instruments measured at fair value on a recurring basis:
| | | | | | | | | | | | | | | | | | | | | | | |
| December 31, 2024 |
| ($ in thousands) | Level 1 | | Level 2 | | Level 3 | | Total |
| Fixed maturities: | | | | | | | |
| U.S. government treasuries | $ | — | | | $ | 711,103 | | | $ | — | | | $ | 711,103 | |
| U.S. states, territories and municipalities | — | | | 13,231 | | | — | | | 13,231 | |
| Non-U.S. sovereign governments and supranationals | — | | | 67,527 | | | — | | | 67,527 | |
| Corporate | — | | | 1,143,060 | | | — | | | 1,143,060 | |
| Residential mortgage-backed securities - Agency | — | | | 272,611 | | | — | | | 272,611 | |
| Residential mortgage-backed securities - Non-agency | — | | | 16,754 | | | — | | | 16,754 | |
| | | | | | | |
| Commercial mortgage-backed securities - Non-agency | — | | | 39,686 | | | — | | | 39,686 | |
| Other asset-backed securities | — | | | 113,890 | | | — | | | 113,890 | |
| Total fixed maturities | — | | | 2,377,862 | | | — | | | 2,377,862 | |
| Short-term investments | — | | | 497,110 | | | — | | | 497,110 | |
| | | | | | | |
| | | | | | | |
| Total | $ | — | | | $ | 2,874,972 | | | $ | — | | | $ | 2,874,972 | |
Hamilton Insurance Group, Ltd.
Notes to the Consolidated Financial Statements
| | | | | | | | | | | | | | | | | | | | | | | |
| December 31, 2023 |
| ($ in thousands) | Level 1 | | Level 2 | | Level 3 | | Total |
| Fixed maturities: | | | | | | | |
| U.S. government treasuries | $ | — | | | $ | 708,250 | | | $ | — | | | $ | 708,250 | |
| U.S. states, territories and municipalities | — | | | 4,370 | | | — | | | 4,370 | |
| Non-U.S. sovereign governments and supranationals | — | | | 56,246 | | | — | | | 56,246 | |
| Corporate | — | | | 863,876 | | | — | | | 863,876 | |
| Residential mortgage-backed securities - Agency | — | | | 168,513 | | | — | | | 168,513 | |
| Residential mortgage-backed securities - Non-agency | — | | | 4,984 | | | — | | | 4,984 | |
| | | | | | | |
| Commercial mortgage-backed securities - Non-agency | — | | | 10,423 | | | — | | | 10,423 | |
| Other asset-backed securities | — | | | 14,606 | | | — | | | 14,606 | |
| Total fixed maturities | — | | | 1,831,268 | | | — | | | 1,831,268 | |
| Short-term investments | — | | | 428,878 | | | — | | | 428,878 | |
| Total | $ | — | | | $ | 2,260,146 | | | $ | — | | | $ | 2,260,146 | |
The carrying values of cash and cash equivalents, restricted cash and cash equivalents, accrued investment income, receivables for investments sold, certain other assets, payables for investments purchased, and certain other liabilities approximate their fair values.
5. Variable Interest Entities
TS Hamilton Fund
TS Hamilton Fund meets the definition of a variable interest entity ("VIE") principally because the Managing Member does not hold substantive equity at risk in the entity but controls all of the decision making authority over it. Therefore, the Company assessed its ownership in the VIE to determine if it is the primary beneficiary. The Managing Member is a related party to the Company and collectively they hold all of the variable interest. The Company performed an assessment of all relevant facts and circumstances and determined that it is the entity within the related party group for whom substantially all of the activities of the VIE are conducted. As a result, the Company concluded that it is the primary beneficiary of TS Hamilton Fund.
Activity in the non-controlling interest of TS Hamilton Fund was as follows:
| | | | | | | | | | | | | | | | | |
| Years Ended December 31, |
| ($ in thousands) | 2024 | | 2023 | | 2022 |
| Balance - beginning of year | $ | 133 | | | $ | 119 | | | $ | 124 | |
| | | | | |
| Withdrawals | (212,734) | | | (21,546) | | | (68,069) | |
| Equity in earnings | 43 | | | 14 | | | 14 | |
| Incentive allocation | 212,686 | | | 21,546 | | | 68,050 | |
| Balance - end of year | $ | 128 | | | $ | 133 | | | $ | 119 | |
Hamilton Insurance Group, Ltd.
Notes to the Consolidated Financial Statements
The following table presents the total assets and total liabilities of TS Hamilton Fund. Creditors or beneficial interest holders of TS Hamilton Fund have no recourse to the general credit of the Company as the Company’s obligation is limited to the amount of its committed investment.
| | | | | | | | | | | |
| December 31, |
| ($ in thousands) | 2024 | | 2023 |
| Assets | | | |
| Cash and cash equivalents | $ | 578,230 | | | $ | 479,255 | |
| Short-term investments | 496,008 | | | 428,878 | |
| Investments in Two Sigma Funds, at fair value | 939,381 | | | 851,470 | |
| Receivables for investments sold | 73,322 | | | 41,087 | |
| Interest and dividends receivable | 945 | | | 966 | |
| Total assets | 2,087,886 | | 1,801,656 |
| | | |
| Liabilities | | | |
| Payable for investments purchased | 100,469 | | | 62,440 | |
| | | |
| Withdrawal payable | 100,420 | | | 6,480 | |
| Accounts payable and accrued expenses | 233 | | | 191 | |
| Total liabilities | 201,122 | | 69,111 |
| Total net assets managed by TS Hamilton Fund | $ | 1,886,764 | | $ | 1,732,545 |
6. Goodwill and Intangible Assets
The following table provides a summary of the Company's goodwill and intangible assets:
| | | | | | | | | | | | | | | | | | | | | | | |
| ($ in thousands) | Goodwill | | Intangible Assets
Subject to Amortization | | Intangible Assets not Subject to Amortization | | Total |
| | | | | | | |
| | | | | | | |
| | | | | | | |
| | | | | | | |
| | | | | | | |
| | | | | | | |
| Net balance, December 31, 2022 | $ | — | | | $ | 49,750 | | | $ | 37,208 | | | $ | 86,958 | |
| Plus: additions | — | | | 14,821 | | | — | | | 14,821 | |
| | | | | | | |
| Less: amortization | — | | | (10,783) | | | — | | | (10,783) | |
| | | | | | | |
| | | | | | | |
| Net balance, December 31, 2023 | — | | | 53,788 | | | 37,208 | | | 90,996 | |
| Plus: additions | — | | | 17,645 | | | — | | | 17,645 | |
| | | | | | | |
| Less: amortization | — | | | (15,520) | | | — | | | (15,520) | |
| | | | | | | |
| | | | | | | |
| Net balance, December 31, 2024 | $ | — | | | $ | 55,913 | | | $ | 37,208 | | | $ | 93,121 | |
| | | | | | | |
| Gross balance, December 31, 2024 | $ | — | | | $ | 106,681 | | | $ | 37,208 | | | $ | 143,889 | |
| Accumulated amortization | — | | | (50,768) | | | — | | | (50,768) | |
| | | | | | | |
| | | | | | | |
| Net balance, December 31, 2024 | $ | — | | | $ | 55,913 | | | $ | 37,208 | | | $ | 93,121 | |
As at December 31, 2024, there was no goodwill recorded on the balance sheet. In the year ended December 31, 2022, the Company conducted its annual evaluation of recorded goodwill for impairment using both a market model and an income model and concluded that the associated reporting units’ fair value did not exceed their carrying value, and consequently recorded an impairment to goodwill of $24.1 million in the International segment. Impairment charges are recorded in the consolidated statement of operations for the year ended December 31, 2022 in the line "Impairment of goodwill".
Hamilton Insurance Group, Ltd.
Notes to the Consolidated Financial Statements
The following tables present the components of intangible assets:
| | | | | | | | | | | | | | | | | |
| December 31, 2024 |
| ($ in thousands) | Gross Balance | | Accumulated Amortization and Impairment | | Net Balance |
| | | | | |
| | | | | |
| Intangible assets subject to amortization | | | | | |
| Coverholder and broker relationships | $ | 44,515 | | | $ | (23,707) | | | $ | 20,808 | |
| Internally developed software | 62,166 | | | (27,061) | | | 35,105 | |
| | | | | |
| | | | | |
| | | | | |
| Intangible assets not subject to amortization | | | | | |
| Lloyd's syndicate capacity | 35,583 | | | — | | | 35,583 | |
| Licenses | 1,625 | | | — | | | 1,625 | |
| $ | 143,889 | | | $ | (50,768) | | | $ | 93,121 | |
| | | | | | | | | | | | | | | | | |
| December 31, 2023 |
| ($ in thousands) | Gross Balance | | Accumulated Amortization and Impairment | | Net Balance |
| | | | | |
| | | | | |
| Intangible assets subject to amortization | | | | | |
| Coverholder and broker relationships | $ | 44,515 | | | $ | (19,255) | | | $ | 25,260 | |
| Internally developed software | 44,519 | | | (15,991) | | | 28,528 | |
| | | | | |
| | | | | |
| | | | | |
| Intangible assets not subject to amortization | | | | | |
| Lloyd's syndicate capacity | 35,583 | | | — | | | 35,583 | |
| Licenses | 1,625 | | | — | | | 1,625 | |
| $ | 126,242 | | | $ | (35,246) | | | $ | 90,996 | |
The Company's finite-lived intangible assets are amortized on a straight-line basis over their useful lives. As of December 31, 2024, the estimated weighted average amortization period by class consisted of coverholder and broker relationships (10 years) and internally developed software (5 years). Costs incurred to renew or extend the assets' useful lives are expensed straight-line over the remaining life of the related asset or asset class. The weighted-average amortization period is 2.5 years and the estimated amortization expense for each of the five succeeding fiscal years and thereafter related to these assets is as follows:
| | | | | |
| ($ in thousands) | Estimated Amortization Expense |
| Year Ending December 31, |
| 2025 | $ | 15,656 | |
| 2026 | 13,551 | |
| 2027 | 12,353 | |
| 2028 | 9,463 | |
| 2029 | 4,890 | |
| |
| Total | $ | 55,913 | |
Intangible assets not subject to amortization consist of Lloyd's syndicate capacity and insurance licenses. The Company did not recognize any impairment losses as a result of the annual impairment review of indefinite-lived assets for the years ended December 31, 2024, 2023 or 2022.
Hamilton Insurance Group, Ltd.
Notes to the Consolidated Financial Statements
7. Reinsurance
The Company purchases reinsurance and other protection to manage its risk portfolio and to reduce its exposure to large losses. The Company currently has in place contracts that provide for recovery of a portion of certain loss and loss adjustment expenses, generally in excess of various retentions or on a proportional basis. Amounts recoverable under reinsurance contracts are recorded as assets. The Company remains liable to the extent that any reinsurance company fails to meet its obligations.
The following tables set forth the effect of reinsurance and retrocessional activity on premiums written and earned and on losses and loss adjustment expenses incurred:
| | | | | | | | | | | | | | | | | |
| Premiums Written |
| Years Ended December 31, |
| ($ in thousands) | 2024 | | 2023 | | 2022 |
| Assumed | $ | 1,144,798 | | | $ | 838,547 | | | $ | 709,194 | |
| Direct | 1,277,784 | | | 1,112,491 | | | 937,479 | |
| Ceded | (501,413) | | | (470,600) | | | (424,809) | |
| Net | $ | 1,921,169 | | | $ | 1,480,438 | | | $ | 1,221,864 | |
| | | | | | | | | | | | | | | | | |
| Premiums Earned |
| Years Ended December 31, |
| ($ in thousands) | 2024 | | 2023 | | 2022 |
| Assumed | $ | 1,030,595 | | | $ | 742,378 | | | $ | 670,272 | |
| Direct | 1,180,932 | | | 1,016,762 | | | 886,488 | |
| Ceded | (476,798) | | | (440,607) | | | (413,046) | |
| Net | $ | 1,734,729 | | | $ | 1,318,533 | | | $ | 1,143,714 | |
| | | | | | | | | | | | | | | | | |
| Losses and Loss Adjustment Expenses |
| Years Ended December 31, |
| ($ in thousands) | 2024 | | 2023 | | 2022 |
| Gross losses and loss adjustment expenses | $ | 1,290,131 | | | $ | 972,347 | | | $ | 1,133,469 | |
| Losses and loss adjustment expenses ceded | (279,958) | | | (257,744) | | | (375,136) | |
| Net | $ | 1,010,173 | | | $ | 714,603 | | | $ | 758,333 | |
Allowance for Expected Credit Losses
Premiums receivable, paid losses recoverable, and unpaid losses and loss adjustment expenses recoverable comprise the Company's most significant credit exposures not carried at fair value. The Company has not historically experienced significant credit losses. In determining an allowance for these assets, the Company considers historical information in combination with counterparty financial strength ratings and the extent to which balances are collateralized. The Company assesses the risk of future default by evaluating current market conditions for the likelihood of default and calculates its provision for current expected credit losses under the probability of default and loss given default methodology.
Premiums Receivable
Premiums receivable are estimated based on policy terms and reports received from the underlying counterparties, supplemented by management's judgment. Due to the nature of the (re)insurance business, the Company routinely receives reports and premiums subsequent to the inception of the coverage period. At December 31, 2024, the Company’s premiums receivable balance, net of credit provisions of $3.0 million, was $771.7 million. At December 31, 2023, the Company’s premiums receivable balance, net of credit provisions of $3.0 million, was $658.4 million.
Hamilton Insurance Group, Ltd.
Notes to the Consolidated Financial Statements
The following table provides a roll forward of the provision for current expected credit losses of the Company's premiums receivable:
| | | | | | | | | | | | | | | | | |
| Years Ended December 31, |
| ($ in thousands) | 2024 | | 2023 | | 2022 |
| Beginning balance | $ | 3,000 | | | $ | 2,856 | | | $ | 2,165 | |
| Increase (decrease) in allowance | (7) | | | 144 | | | 691 | |
| Ending balance | $ | 2,993 | | | $ | 3,000 | | | $ | 2,856 | |
Reinsurance Balances Recoverable
Reinsurance balances recoverable is comprised of amounts due from reinsurers based on the claim liabilities associated with the reinsured policy. The Company accrues amounts due from reinsurers based on estimated ultimate contract losses. At December 31, 2024, the Company’s paid and unpaid reinsurance recoverable balances net of credit provisions were $134.4 million and $1.2 billion, respectively, with a total corresponding provision for current expected credit losses of $1.5 million. At December 31, 2023, the Company’s paid and unpaid reinsurance recoverable balances net of credit provisions were $145.2 million and $1.2 billion, respectively, with a total corresponding provision for current expected credit losses of $0.7 million.
The following table provides a roll forward of the provision for current expected credit losses of the Company's reinsurance recoverable:
| | | | | | | | | | | | | | | | | |
| Years Ended December 31, |
| ($ in thousands) | 2024 | | 2023 | | 2022 |
| Beginning balance | $ | 687 | | | $ | 777 | | | $ | 616 | |
| Increase (decrease) in allowance | 782 | | | (90) | | | 161 | |
| Ending balance | $ | 1,469 | | | $ | 687 | | | $ | 777 | |
The distribution of the Company’s paid losses recoverable and unpaid losses and loss adjustment expenses recoverable as categorized by major rating agencies were as follows:
| | | | | | | | | | | | | | |
| | December 31, |
| Classification | | 2024 | | 2023 |
| Collateralized | | 23.7 | % | | 28.5 | % |
| A- or better | | 76.2 | % | | 71.0 | % |
| Below A- | | 0.1 | % | | 0.5 | % |
| Total | | 100.0 | % | | 100.0 | % |
At December 31, 2024 and 2023, the three largest balances by reinsurer accounted for 22%, 19% and 13%, and 27%, 20% and 12%, respectively, of paid losses recoverable and unpaid losses and loss adjustment expenses recoverable.
Loss Portfolio Transfer
On February 6, 2020, the Company entered into a loss portfolio transfer agreement (the "LPT"), under which the insurance liabilities arising from certain casualty risks for the Lloyd's Years of Account ("YOA") 2016, 2017 and 2018 were retroceded to a third party in exchange for total premium of $72.1 million. This transaction was accounted for as retroactive reinsurance under which cumulative ceded losses exceeding the LPT premium are recognized as a deferred gain liability and amortized into income over the settlement period of the ceded reserves in proportion to cumulative losses collected over the estimated ultimate reinsurance recoverable. The amount of the deferral is recalculated each reporting period based on updated ultimate loss estimates. Consequently, cumulative adverse development subsequent to the signing of the LPT may result in significant losses from operations until periods when the deferred gain is recognized as a benefit to earnings.
Hamilton Insurance Group, Ltd.
Notes to the Consolidated Financial Statements
At December 31, 2024 and 2023, the balance of reinsurance recoverable on unpaid losses due under this LPT was $23.7 million and $49.8 million, respectively. Amortization of the deferred gain was an expense of $9.4 million for the year ended December 31, 2024 and income of $4.2 million and $1.9 million for the years ended December 31, 2023 and 2022, respectively, which was recorded through losses and loss adjustment expenses in accordance with the actual loss payments and updated estimates of ultimate losses of the subject business.
Catastrophe Bond Reinsurance
In December 2023, Hamilton Group sponsored an industry loss index-triggered catastrophe bond through the issuance of Series 2024-1 Class A Principal-at-Risk Variable Rate Notes by Bermuda-domiciled Easton Re Ltd. ("Easton Re"), which provide the Company's operating platforms with multi-year risk transfer capacity of $200 million to protect against named storm risk in the United States and earthquake risk in the United States and Canada. The risk period for Easton Re is from January 1, 2024 to December 31, 2026. The Company recorded reinsurance premiums ceded of $14.6 million during the year ended December 31, 2024.
In December 2020, Hamilton Group sponsored an industry loss index-triggered catastrophe bond through the issuance of Series 2020-1 Class A Principal-at-Risk Variable Rate Notes by Singapore-domiciled Easton Re Pte, Ltd. (also "Easton Re"). Easton Re provided the Company's operating platforms with multi-year risk transfer capacity of $150 million to protect against named storm and earthquake risk in the United States. The risk period for Easton Re was from January 1, 2021 to December 31, 2023. The Company recorded reinsurance premiums ceded $7.2 million and $6.3 million during the years ended December 31, 2023 and 2022, respectively.
Hamilton Insurance Group, Ltd.
Notes to the Consolidated Financial Statements
8. Reserve for Losses and Loss Adjustment Expenses
The following table presents a reconciliation of unpaid losses and loss adjustment expenses ("LAE"):
| | | | | | | | | | | | | | | | | |
| Years Ended December 31, |
| ($ in thousands) | 2024 | | 2023 | | 2022 |
| Gross unpaid losses and loss adjustment expenses, beginning of year | $ | 3,030,037 | | | $ | 2,856,275 | | | $ | 2,415,491 | |
| Reinsurance recoverable on unpaid losses | 1,161,077 | | | 1,177,863 | | | 1,112,543 | |
| Net unpaid losses and loss adjustment expenses, beginning of year | 1,868,960 | | | 1,678,412 | | | 1,302,948 | |
| | | | | |
| Net losses and loss adjustment expenses incurred in respect of losses occurring in: | | | | | |
| Current year | 1,030,612 | | | 730,220 | | | 778,936 | |
| Prior years | (20,439) | | | (15,617) | | | (20,603) | |
| Total incurred | 1,010,173 | | | 714,603 | | | 758,333 | |
| | | | | |
| Net losses and loss adjustment expenses paid in respect of losses occurring in: | | | | | |
| Current year | 58,726 | | | 62,811 | | | 61,649 | |
| Prior years | 458,040 | | | 501,987 | | | 315,537 | |
| Total paid | 516,766 | | | 564,798 | | | 377,186 | |
| | | | | |
| | | | | |
| | | | | |
| | | | | |
| Foreign currency revaluation and other | (916) | | | 40,743 | | | (5,683) | |
| Net unpaid losses and loss adjustment expenses, end of year | 2,361,451 | | | 1,868,960 | | | 1,678,412 | |
| Reinsurance recoverable on unpaid losses | 1,171,040 | | | 1,161,077 | | | 1,177,863 | |
| Gross unpaid losses and loss adjustment expenses, end of year | $ | 3,532,491 | | | $ | 3,030,037 | | | $ | 2,856,275 | |
Net favorable prior year development of $20.4 million for the year ended December 31, 2024, was comprised of $21.2 million of favorable prior year development on catastrophe losses, partially offset by $0.8 million of unfavorable prior year development on attritional losses. See below for further details:
•Net favorable development of $37.5 million on property contracts, primarily driven by favorable prior year development on catastrophe losses and overall lower than expected claims development across various classes; partially offset by
•Net unfavorable development of $14.2 million on casualty contracts, primarily driven by higher than expected claims development across certain classes and unfavorable development of one specific large loss;
•Net unfavorable development of $8.8 million on specialty contracts, primarily driven by two specific large losses; and
•In addition, casualty business protected by the LPT discussed in Note 7, Reinsurance, benefited from favorable development in the underlying reserves of $15.3 million, which was partially offset by a change in the deferred gain of $9.4 million, for a total net positive earnings impact of $5.9 million.
Net favorable prior year development of $15.6 million for the year ended December 31, 2023 was comprised of $10.4 million and $5.2 million of favorable prior year development on attritional and catastrophe losses, respectively. See below for further details:
•Net favorable development of $18.6 million on specialty contracts, driven by lower loss estimates across various classes; partially offset by
•Net unfavorable development of $4.6 million on property contracts, primarily driven by higher than expected claims related to Winterstorm Elliott and development on certain attritional claims, including claims arising from exited classes of business;
•Net unfavorable development of $3.4 million on casualty contracts, reflecting modest unfavorable development on certain classes of business; and
Hamilton Insurance Group, Ltd.
Notes to the Consolidated Financial Statements
•In addition, casualty business protected by the LPT discussed in Note 7, Reinsurance, benefited from $4.2 million in amortization of the associated deferred gain and favorable development in the underlying reserves of $0.8 million, for a total net positive earnings impact of $5.0 million.
Net favorable prior year development of $20.6 million for the year ended December 31, 2022 was comprised of $17.4 million and $3.2 million of favorable prior year development on catastrophe and attritional losses, respectively. See below for further details:
•Net favorable development of $36.9 million on specialty contracts, driven by reductions in loss estimates across multiple classes;
•Net favorable development of $0.4 million on property contracts, related to $9.5 million of favorable development on Hurricane Ida that was partially offset by $7.0 million of unfavorable attritional loss development and $2.1 million of unfavorable development on various other catastrophes; partially offset by
•Net unfavorable development of $23.7 million on casualty contracts, primarily related to discontinued business; and
•In addition, casualty business protected by the LPT discussed in Note 7, Reinsurance, recorded favorable gross development which was partially offset by amortization of the associated deferred gain, resulting in a net positive earnings impact of $7.0 million.
Reinsurance recoverable on unpaid losses related to the LPT discussed in Note 7, Reinsurance was recognized in the reconciliation of beginning and ending gross and net loss and LAE reserves.
Acquisition Costs
The Company amortized acquisition costs of $388.9 million, $309.1 million and $271.2 million for the years ended December 31, 2024, 2023 and 2022, respectively.
Baltimore Bridge
Our net reserves for losses and loss adjustment expenses related to the Francis Scott Key Baltimore Bridge collapse on March 26, 2024 are subject to significant uncertainty. As at December 31, 2024 and 2023, our net recorded reserves
totaled $34.8 million and $Nil, respectively.
Ukraine Conflict
Our net reserves for losses and loss adjustment expenses related to the ongoing Ukraine conflict are also subject to significant uncertainty. As at December 31, 2024 and 2023, our net recorded reserves totaled $63.2 million and $64.9 million, respectively.
Covid-19
Our Covid-19 losses are also subject to significant uncertainty. As at December 31, 2024 and 2023, our net recorded reserves relating to Covid-19 totaled $13.3 million and $14.1 million, respectively.
While the Company believes, based on current facts and circumstances, that its estimates of net reserves for losses and loss adjustment expenses are adequate for losses and loss adjustment expenses that have been incurred at December 31, 2024, the Company will continue to monitor its assumptions as new information becomes available and will adjust its estimate of net reserves for losses and loss adjustment expenses as appropriate. Actual ultimate losses for these events may differ materially from the Company's current estimates.
Hamilton Insurance Group, Ltd.
Notes to the Consolidated Financial Statements
Reserving
The Company's reserve for losses and loss adjustment expenses consists of case reserves and IBNR reserves. Case reserves are reserves for reported losses and loss adjustment expenses that have not yet been settled. IBNR are reserves for incurred but not reported losses and loss adjustment expenses, and include reserves for reported losses in excess of case reserves.
Case Reserves
For reinsurance business, the Company typically receives loss notifications from its cedants in the form of loss bordereaux or individual loss notifications. These notifications generally include varying amounts of information about the nature and quantum of the loss, including paid amounts and estimates of outstanding loss. The Company records the estimates of outstanding loss from its cedants as case reserves. Typically there is a timing lag between the cedant establishing a reserve and notifying the loss to the Company. In addition, different cedants have different claims handling practices which result in case reserve estimates that vary in the level of embedded prudence.
For insurance business, the Company records a case reserve for the estimated amount of settlement. This amount is based on the judgment of the Company’s claims team and takes into account the class of business, nature of the claim and, if appropriate, the advice of specialist legal counsel and external loss adjusters, and includes the estimated expenses of settling the claim, such as legal and other fees. The Company may sometimes use third party claims administrators to handle claims and set case reserves, within defined authority levels and service level agreements. In syndicated markets such as Lloyd’s, the Company’s case reserve will be based in part on information provided by the lead insurer, where the Company is not an agreement party. Any adjustments to case reserves are accounted for as changes in estimates and recorded in the period in which such changes are identified.
IBNR Reserves
The Company establishes IBNR reserves for large events based on a number of different factors, including discussions with brokers and cedants, proprietary loss modelling and pricing software, estimates of market loss and market share, experience from historical large events and other information that can guide the estimates of loss reserves. The Company's actuaries may use other approaches in addition to those described, and supplement these methods with judgement where they deem appropriate, depending upon the characteristics of the class of business and available data. These estimates are reviewed periodically as new information emerges.
IBNR reserves for attritional losses are established using actuarial loss reserving techniques. These techniques include the loss development factor method, Bornheutter Ferguson method, the Initial Expected Loss Ratio method, and other techniques. These techniques rely on estimates of paid and reported loss development patterns and estimates of the loss ratio at the inception of the contract. The Company’s actuaries review the estimates of IBNR reserves on a quarterly basis and adjust the estimates as new information becomes available. Any such adjustments are accounted for as changes in estimates and recorded in the periods in which they become known.
To establish IBNR reserves for attritional losses, contracts are grouped into cohorts, or reserving classes, that have similar coverage, inception period and loss reporting characteristics. The paid and reported losses for these reserving classes are tracked over time against expectations and against the actuarial loss reserving indications and IBNR reserve selected for each cohort.
Claims Development and Frequency
For incurred and paid accident year claims denominated in foreign currency, the Company used the current year-end balance sheet foreign exchange rate for all periods provided, thereby eliminating the effects of changes in foreign currency translation rates from the incurred and paid accident year claims development information included in the following tables.
In determining the cumulative number of reported claims, the Company measures claim counts on its insurance business by individual claimant where information is available. The claim counts include all claims reported where the Company has identified a potential liability for the claim even if there is no existing reserve. Reinsurance business is typically written under either proportional (quota share arrangements) or non-proportional arrangements (excess of loss or other facultative covers).
Hamilton Insurance Group, Ltd.
Notes to the Consolidated Financial Statements
The Company typically does not have direct access to claim frequency information underlying its assumed quota share arrangements, given the nature of that business. In addition, multiple claims are often aggregated by the ceding company before being reported to the Company. The Company generally does not use claim frequency information in the determination of loss reserves or for other internal purposes relating to proportional business. In addition, the nature, size, terms and conditions of contracts entered into by the Company may change from one accident year to the next and the quantum of contractual or policy limits, and accordingly, the potential amount of losses and loss adjustment expenses associated with a reported claim, can range from nominal to significant, and therefore the Company does not believe providing claims frequency information is practicable as it relates to its proportional business.
The Company has developed claims frequency information associated with its non-proportional reinsurance contracts. In determining claims frequency for its excess-of-loss reinsurance contracts, claims counts include all claims reported by each insured where a reserve for losses and loss adjustment expenses has been recorded. The Company has assumed that claims below the loss layer of a contract are excluded; if an insured's claim impacts multiple layers of a contract, the Company considers each impact to be a separate claim, and for an insured loss impacting more than one operating subsidiary, each impact is considered a separate claim.
Claims Development
The information provided herein about incurred and paid accident year claims development, net of reinsurance, for the periods ended prior to December 31, 2024 and the annual percentage payouts of incurred claims by age, net of reinsurance, is presented as supplementary information. The following tables show the paid and incurred loss development by broad classification based on groupings of contracts that are similar in coverage and duration:
Hamilton Insurance Group, Ltd.
Notes to the Consolidated Financial Statements
International Property
($ in thousands, except claim count)
| | | | | | | | | | | | | | | | | | | | | | | | | | | | | | | | | | | | | | | | | | | | | | | | | | | | | | | | | | | | | | | | | | | | | | | | | | |
| | Incurred Losses and Allocated Loss Adjustment Expenses, Net of Reinsurance | | | | |
| | For the years ended | | As of December 31, 2024 |
| | November 30, | | December 31, | | IBNR (1) | | Cumulative Number of Reported Claims |
Accident
year | | 2015 (unaudited) | | 2016 (unaudited) | | 2017 (unaudited) | | 2018 (unaudited) | | 2019 (unaudited) | | 2020 (unaudited) | | 2021 (unaudited) | | 2022 (unaudited) | | 2023 (unaudited) | | 2024 | | |
| 2015 | | $1 | | $1 | | $1 | | $— | | $— | | $— | | $— | | $— | | $— | | $— | | $— | | 2 | |
| 2016 | | | | 7,527 | | 6,551 | | 6,212 | | 6,351 | | 6,011 | | 7,155 | | 7,261 | | 7,349 | | 7,306 | | 27 | | 903 |
| 2017 | | | | | | 38,379 | | 42,986 | | 44,911 | | 41,819 | | 41,260 | | 41,224 | | 41,230 | | 40,456 | | (974) | | 1,166 |
| 2018 | | | | | | | | 24,037 | | 26,191 | | 24,873 | | 24,537 | | 24,542 | | 24,466 | | 23,869 | | 114 | | 1,122 | |
| 2019 | | | | | | | | | | 32,695 | | 33,895 | | 36,609 | | 36,672 | | 36,687 | | 34,824 | | 411 | | 1,436 | |
| 2020 | | | | | | | | | | | | 134,743 | | 144,201 | | 143,676 | | 143,418 | | 142,802 | | 5,261 | | 2,236 | |
| 2021 | | | | | | | | | | | | | | 113,813 | | 124,917 | | 121,907 | | 117,228 | | 3,371 | | 1,566 | |
| 2022 | | | | | | | | | | | | | | | | 81,324 | | 74,560 | | 68,686 | | 4,035 | | 1,077 | |
| 2023 | | | | | | | | | | | | | | | | | | 53,085 | | 48,480 | | 10,278 | | 681 | |
| 2024 | | | | | | | | | | | | | | | | | | | | 73,513 | | 55,074 | | 598 | |
| | | | | | | | | | | | | | | | | | Total | | $557,164 | | $77,597 | | 10,787 |
| (1) | | Total of incurred but not reported liabilities plus expected development on reported claims | | | | |
| | | | | | | | | | | | | | | | | | | | | | | | |
| | Cumulative Paid Losses and Allocated Loss Adjustment Expenses, Net of Reinsurance | | | | |
| | For the years ended | | | | |
| | November 30, | | December 31, | | | | |
Accident
year | | 2015 (unaudited) | | 2016 (unaudited) | | 2017 (unaudited) | | 2018 (unaudited) | | 2019 (unaudited) | | 2020 (unaudited) | | 2021 (unaudited) | | 2022 (unaudited) | | 2023 (unaudited) | | 2024 | | | | |
| 2015 | | $— | | $— | | $— | | $— | | $— | | $— | | $— | | $— | | $— | | $— | | | | |
| 2016 | | | | 171 | | 3,428 | | 4,567 | | 6,668 | | 7,049 | | 6,891 | | 7,003 | | 7,277 | | 7,277 | | | | |
| 2017 | | | | | | 9,249 | | 29,283 | | 34,363 | | 40,193 | | 39,984 | | 40,832 | | 40,900 | | 41,333 | | | | |
| 2018 | | | | | | | | 1,322 | | 12,036 | | 17,340 | | 20,053 | | 20,905 | | 21,964 | | 23,603 | | | | |
| 2019 | | | | | | | | | | 8,307 | | 21,106 | | 20,940 | | 25,818 | | 32,942 | | 34,066 | | | | |
| 2020 | | | | | | | | | | | | 24,365 | | 90,859 | | 115,587 | | 132,191 | | 136,041 | | | | |
| 2021 | | | | | | | | | | | | | | 23,564 | | 63,784 | | 101,064 | | 112,184 | | | | |
| 2022 | | | | | | | | | | | | | | | | 9,996 | | 46,856 | | 57,551 | | | | |
| 2023 | | | | | | | | | | | | | | | | | | 5,502 | | 29,362 | | | | |
| 2024 | | | | | | | | | | | | | | | | | | | | 5,071 | | | | |
| | | | | | | | | | | | | | | | | | Total | | $446,488 | | | | |
| | | | | | | | | | | | |
| Liabilities for unpaid losses and loss adjustment expenses, net of reinsurance | | $110,676 | | | | |
| | | | | | | | | | | | | | | | | | | | | | | | |
| | | | | | | | | | | | | | | | | | | | | | | | |
| | Average Annual Percentage Payout of Incurred Losses by Age, Net of Reinsurance(1) | | | | | | |
| Years | | 1
(unaudited) | | 2
(unaudited) | | 3
(unaudited) | | 4
(unaudited) | | 5
(unaudited) | | 6
(unaudited) | | 7
(unaudited) | | 8
(unaudited) | | 9
(unaudited) | | | | | | |
| | 16 | % | | 44 | % | | 19 | % | | 12 | % | | 5 | % | | 3 | % | | 3 | % | | 1 | % | | 0 | % | | | | | | |
| (1) | | Unaudited supplementary information is a weighted average derived from the incurred losses and allocated loss adjustment expenses, net of reinsurance triangle and cumulative paid losses and allocated loss adjustment expenses, net of reinsurance triangle. | | | | |
| | | | | | | | | | | | | | | | | | | | | | | | |
| | | | | | | | | | |
Hamilton Insurance Group, Ltd.
Notes to the Consolidated Financial Statements
International Casualty
($ in thousands, except claim count)
The following table discloses losses incurred, losses paid and claims data excluding the impact of the loss portfolio transfer discussed in further detail in Note 7, Reinsurance.
| | | | | | | | | | | | | | | | | | | | | | | | | | | | | | | | | | | | | | | | | | | | | | | | | | | | | | | | | | | | | | | | | | | | | | | | | | |
| | Incurred Losses and Allocated Loss Adjustment Expenses, Net of Reinsurance | | | | |
| | For the years ended | | As of December 31, 2024 |
| | November 30, | | December 31, | | IBNR (1) | | Cumulative Number of Reported Claims |
Accident
year | | 2015 (unaudited) | | 2016 (unaudited) | | 2017 (unaudited) | | 2018 (unaudited) | | 2019 (unaudited) | | 2020 (unaudited) | | 2021 (unaudited) | | 2022 (unaudited) | | 2023 (unaudited) | | 2024 | | |
| 2015 | | $— | | $— | | $— | | $— | | $— | | $— | | $— | | $— | | $— | | $— | | $— | | — |
| 2016 | | | | 171 | | | 278 | | | 243 | | | 342 | | 342 | | 342 | | 388 | | 367 | | 166 | | — | | 32 |
| 2017 | | | | | | 648 | | | 5,187 | | | 7,354 | | 6,332 | | 5,857 | | 5,121 | | 5,079 | | 4,579 | | 328 | | 73 | |
| 2018 | | | | | | | | 697 | | | 5,890 | | 5,686 | | 4,941 | | 4,351 | | 4,453 | | 4,300 | | 110 | | 554 | |
| 2019 | | | | | | | | | | 19,882 | | 19,199 | | 18,867 | | 18,112 | | 16,817 | | 15,846 | | 704 | | 2,704 |
| 2020 | | | | | | | | | | | | 28,692 | | 24,123 | | 17,870 | | 19,426 | | 19,265 | | 2,451 | | 3,641 | |
| 2021 | | | | | | | | | | | | | | 101,549 | | 109,013 | | 107,024 | | 106,824 | | 69,619 | | 3,602 | |
| 2022 | | | | | | | | | | | | | | | | 144,543 | | 145,030 | | 149,180 | | 87,661 | | 3,912 | |
| 2023 | | | | | | | | | | | | | | | | | | 145,783 | | 147,005 | | 108,769 | | 5,639 | |
| 2024 | | | | | | | | | | | | | | | | | | | | 198,705 | | 182,784 | | 3,909 | |
| | | | | | | | | | | | | | | | | | Total | | $645,870 | | $452,426 | | 24,066 |
| (1) | | Total of incurred but not reported liabilities plus expected development on reported claims | | | | |
| | | | | | | | | | | | | | | | | | | | | | | | |
| | Cumulative Paid Losses and Allocated Loss Adjustment Expenses, Net of Reinsurance | | | | |
| | For the years ended | | | | |
| | November 30, | | December 31, | | | | |
Accident
year | | 2015 (unaudited) | | 2016 (unaudited) | | 2017 (unaudited) | | 2018 (unaudited) | | 2019 (unaudited) | | 2020 (unaudited) | | 2021 (unaudited) | | 2022 (unaudited) | | 2023 (unaudited) | | 2024 | | | | |
| 2015 | | $— | | $— | | $— | | $— | | $— | | $— | | $— | | $— | | $— | | $— | | | | |
| 2016 | | | | — | | — | | 82 | | — | | — | | — | | — | | — | | — | | | | |
| 2017 | | | | | | — | | 22 | | 629 | | 2,285 | | 2,406 | | 3,964 | | 4,043 | | 4,046 | | | | |
| 2018 | | | | | | | | 35 | | 439 | | 2,266 | | 3,167 | | 3,800 | | 4,011 | | 4,066 | | | | |
| 2019 | | | | | | | | | | 177 | | 2,719 | | 6,813 | | 13,332 | | 14,992 | | 15,131 | | | | |
| 2020 | | | | | | | | | | | | 3,363 | | 8,420 | | 12,480 | | 16,706 | | 16,813 | | | | |
| 2021 | | | | | | | | | | | | | | 795 | | 11,243 | | 20,079 | | 30,286 | | | | |
| 2022 | | | | | | | | | | | | | | | | 3,240 | | 9,452 | | 27,217 | | | | |
| 2023 | | | | | | | | | | | | | | | | | | 5,240 | | 19,429 | | | | |
| 2024 | | | | | | | | | | | | | | | | | | | | 4,749 | | | | |
| | | | | | | | | | | | | | | | | | Total | | $121,737 | | | | |
| Liabilities for unpaid losses and loss adjustment expenses, net of reinsurance | | $524,133 | | | | |
| | | | | | | | | | | | | | | | | | | | | | | | |
| | Average Annual Percentage Payout of Incurred Losses by Age, Net of Reinsurance(1) | | | | | | |
| Years | | 1
(unaudited) | | 2
(unaudited) | | 3
(unaudited) | | 4
(unaudited) | | 5
(unaudited) | | 6
(unaudited) | | 7
(unaudited) | | 8
(unaudited) | | 9
(unaudited) | | | | | | |
| | 3 | % | | 9 | % | | 12 | % | | 16 | % | | 6 | % | | 8 | % | | 1 | % | | 0 | % | | 0 | % | | | | | | |
| (1) | | Unaudited supplementary information is a weighted average derived from the incurred losses and allocated loss adjustment expenses, net of reinsurance triangle and cumulative paid losses and allocated loss adjustment expenses, net of reinsurance triangle. | | | | |
| | | | | | | | | | | | | | | | | | | | | | | | |
| | | | | | | | | | | | | | |
Hamilton Insurance Group, Ltd.
Notes to the Consolidated Financial Statements
International Specialty
($ in thousands, except claim count)
| | | | | | | | | | | | | | | | | | | | | | | | | | | | | | | | | | | | | | | | | | | | | | | | | | | | | | | | | | | | | | | | | | | | | | | | | | |
| | Incurred Losses and Allocated Loss Adjustment Expenses, Net of Reinsurance | | | | |
| | For the years ended | | As of December 31, 2024 |
| | November 30, | | December 31, | | IBNR (1) | | Cumulative Number of Reported Claims |
Accident
year | | 2015 (unaudited) | | 2016 (unaudited) | | 2017 (unaudited) | | 2018 (unaudited) | | 2019 (unaudited) | | 2020 (unaudited) | | 2021 (unaudited) | | 2022 (unaudited) | | 2023 (unaudited) | | 2024 | | |
| 2015 | | $— | | $93 | | $138 | | $218 | | $212 | | $144 | | $149 | | $94 | | $100 | | $101 | | $— | | 65 |
| 2016 | | | | 2,534 | | | 4,771 | | | 5,383 | | | 5,232 | | 5,370 | | 3,668 | | 3,367 | | 3,325 | | 4,427 | | 504 | | 766 |
| 2017 | | | | | | 22,378 | | | 17,430 | | | 16,943 | | 15,256 | | 22,030 | | 25,397 | | 27,714 | | 31,279 | | 2,277 | | 1,300 |
| 2018 | | | | | | | | 31,724 | | | 30,606 | | 29,176 | | 33,129 | | 37,834 | | 42,995 | | 42,921 | | (287) | | 1,617 | |
| 2019 | | | | | | | | | | 108,035 | | 109,971 | | 104,017 | | 97,777 | | 95,702 | | 95,306 | | 5,405 | | 2,852 |
| 2020 | | | | | | | | | | | | 119,790 | | 116,242 | | 106,774 | | 105,314 | | 105,310 | | 4,426 | | 2,943 | |
| 2021 | | | | | | | | | | | | | | 124,844 | | 136,998 | | 138,471 | | 140,697 | | 10,573 | | 3,073 | |
| 2022 | | | | | | | | | | | | | | | | 129,423 | | 119,581 | | 121,981 | | 15,941 | | 2,864 | |
| 2023 | | | | | | | | | | | | | | | | | | 178,429 | | 178,984 | | 68,974 | | 2,529 | |
| 2024 | | | | | | | | | | | | | | | | | | | | 221,168 | | 201,273 | | 1,580 | |
| | | | | | | | | | | | | | | | | | Total | | $942,174 | | $309,086 | | 19,589 |
| (1) | | Total of incurred but not reported liabilities plus expected development on reported claims | | | | |
| | | | | | | | | | | | | | | | | | | | | | | | |
| | Cumulative Paid Losses and Allocated Loss Adjustment Expenses, Net of Reinsurance | | | | |
| | For the years ended | | | | |
| | November 30, | | December 31, | | | | |
Accident
year | | 2015 (unaudited) | | 2016 (unaudited) | | 2017 (unaudited) | | 2018 (unaudited) | | 2019 (unaudited) | | 2020 (unaudited) | | 2021 (unaudited) | | 2022 (unaudited) | | 2023 (unaudited) | | 2024 | | | | |
| 2015 | | $— | | $16 | | $62 | | $119 | | $147 | | $150 | | $150 | | $94 | | $94 | | $94 | | | | |
| 2016 | | | | 248 | | 2,141 | | 4,000 | | 3,098 | | 3,446 | | 3,600 | | 3,265 | | 3,265 | | 3,874 | | | | |
| 2017 | | | | | | 2,427 | | 8,992 | | 16,986 | | 21,763 | | 21,256 | | 23,043 | | 25,858 | | 28,928 | | | | |
| 2018 | | | | | | | | 2,054 | | 17,155 | | 30,652 | | 30,839 | | 35,614 | | 40,792 | | 43,177 | | | | |
| 2019 | | | | | | | | | | 14,076 | | 59,152 | | 77,532 | | 78,807 | | 86,733 | | 89,858 | | | | |
| 2020 | | | | | | | | | | | | 12,218 | | 53,425 | | 84,864 | | 94,657 | | 100,757 | | | | |
| 2021 | | | | | | | | | | | | | | 9,743 | | 45,838 | | 67,950 | | 105,231 | | | | |
| 2022 | | | | | | | | | | | | | | | | 9,001 | | 41,596 | | 77,303 | | | | |
| 2023 | | | | | | | | | | | | | | | | | | 17,943 | | 72,227 | | | | |
| 2024 | | | | | | | | | | | | | | | | | | | | 10,319 | | | | |
| | | | | | | | | | | | | | | | | | Total | | $531,768 | | | | |
| Liabilities for unpaid losses and loss adjustment expenses, net of reinsurance | | $410,406 | | | | |
| | | | | | | | | | | | | | | | | | | | | | | | |
| | Average Annual Percentage Payout of Incurred Losses by Age, Net of Reinsurance(1) | | | | | | |
| Years | | 1
(unaudited) | | 2
(unaudited) | | 3
(unaudited) | | 4
(unaudited) | | 5
(unaudited) | | 6
(unaudited) | | 7
(unaudited) | | 8
(unaudited) | | 9
(unaudited) | | | | | | |
| | 8 | % | | 32 | % | | 24 | % | | 12 | % | | 7 | % | | 6 | % | | 6 | % | | 8 | % | | 13 | % | | | | | | |
| (1) | | Unaudited supplementary information is a weighted average derived from the incurred losses and allocated loss adjustment expenses, net of reinsurance triangle and cumulative paid losses and allocated loss adjustment expenses, net of reinsurance triangle. | | | | |
| | | | | | | | | | | | | | | | | | | | | | | | |
| | | | | | | | | | | | | | | | | | | | | | | | |
| | | | | | | | | | | | | | | | | | | | | | | | |
Hamilton Insurance Group, Ltd.
Notes to the Consolidated Financial Statements
Bermuda Property
($ in thousands, except claim count)
| | | | | | | | | | | | | | | | | | | | | | | | | | | | | | | | | | | | | | | | | | | | | | | | | | | | | | | | | | | | | | | | | | | | | | | | | | | | |
| | Incurred Losses and Allocated Loss Adjustment Expenses, Net of Reinsurance | | | | | | |
| | For the years ended | | As of December 31, 2024 | | |
| | November 30, | | December 31, | | IBNR (1) | | Cumulative Number of Reported Claims | | |
Accident
year | | 2015 (unaudited) | | 2016 (unaudited) | | 2017 (unaudited) | | 2018 (unaudited) | | 2019 (unaudited) | | 2020 (unaudited) | | 2021 (unaudited) | | 2022 (unaudited) | | 2023 (unaudited) | | 2024 | | | | |
| 2015 | | $29,519 | | $17,011 | | $12,643 | | $12,184 | | $7,821 | | $6,492 | | $6,467 | | $6,439 | | $5,667 | | $6,705 | | $— | | 41 | | |
| 2016 | | | | 56,248 | | 38,658 | | 37,476 | | 35,938 | | 35,120 | | 36,340 | | 35,652 | | 35,132 | | 35,011 | | — | | 107 | | |
| 2017 | | | | | | 100,603 | | 98,094 | | 93,332 | | 81,032 | | 79,484 | | 83,413 | | 83,603 | | 82,467 | | 898 | | 272 | | |
| 2018 | | | | | | | | 62,057 | | 80,131 | | 77,845 | | 78,132 | | 73,819 | | 70,675 | | 69,594 | | 371 | | 241 | | |
| 2019 | | | | | | | | | | 14,775 | | 44,540 | | 56,265 | | 57,939 | | 57,631 | | 56,413 | | 2,010 | | 141 | | |
| 2020 | | | | | | | | | | | | 112,056 | | 120,840 | | 126,275 | | 126,583 | | 127,579 | | 5,620 | | 295 | | |
| 2021 | | | | | | | | | | | | | | 144,924 | | 161,604 | | 157,881 | | 150,283 | | 8,385 | | 205 | | |
| 2022 | | | | | | | | | | | | | | | | 181,052 | | 209,797 | | 199,762 | | 37,648 | | 232 | | |
| 2023 | | | | | | | | | | | | | | | | | | 102,739 | | 100,047 | | 45,914 | | 79 | | |
| 2024 | | | | | | | | | | | | | | | | | | | | 168,850 | | 118,912 | | 92 | | |
| | | | | | | | | | | | | | | | | | Total | | $996,711 | | $219,758 | | 1,705 | | |
| (1) | | Total of incurred but not reported liabilities plus expected development on reported claims | | | | | | |
| | | | | | | | | | | | | | | | | | | | | | | | | | |
| | Cumulative Paid Losses and Allocated Loss Adjustment Expenses, Net of Reinsurance | | | | | | |
| | For the years ended | | | | | | |
| | November 30, | | December 31, | | | | | | |
Accident
year | | 2015 (unaudited) | | 2016 (unaudited) | | 2017 (unaudited) | | 2018 (unaudited) | | 2019 (unaudited) | | 2020 (unaudited) | | 2021 (unaudited) | | 2022 (unaudited) | | 2023 (unaudited) | | 2024 | | | | | | |
| 2015 | | $1,775 | | $4,664 | | $5,163 | | $5,297 | | $5,417 | | $5,608 | | $5,630 | | $5,646 | | $5,647 | | $6,700 | | | | | | |
| 2016 | | | | 12,840 | | 25,596 | | 29,623 | | 31,685 | | 32,882 | | 33,985 | | 34,609 | | 34,741 | | 34,823 | | | | | | |
| 2017 | | | | | | 24,533 | | 90,864 | | 71,190 | | 82,940 | | 71,795 | | 75,524 | | 78,356 | | 79,097 | | | | | | |
| 2018 | | | | | | | | 12,631 | | 71,557 | | 85,660 | | 67,547 | | 65,583 | | 67,410 | | 67,938 | | | | | | |
| 2019 | | | | | | | | | | 2,401 | | 32,433 | | 38,002 | | 46,504 | | 49,705 | | 51,248 | | | | | | |
| 2020 | | | | | | | | | | | | 13,253 | | 48,246 | | 75,445 | | 104,870 | | 113,365 | | | | | | |
| 2021 | | | | | | | | | | | | | | 16,080 | | 71,293 | | 106,089 | | 130,528 | | | | | | |
| 2022 | | | | | | | | | | | | | | | | 35,261 | | 109,215 | | 137,313 | | | | | | |
| 2023 | | | | | | | | | | | | | | | | | | 26,199 | | 38,728 | | | | | | |
| 2024 | | | | | | | | | | | | | | | | | | | | 24,366 | | | | | | |
| | | | | | | | | | | | | | | | | | Total | | $684,106 | | | | | | |
| | | | | | Outstanding liabilities for accident year 2014 and prior, net of reinsurance | | $33 | | | | | | |
| | | | | | Liabilities for unpaid losses and loss adjustment expenses, net of reinsurance | | $312,638 | | | | | | |
| | | | | | | | | | | | | | | | | | | | | | | | | | |
| | Average Annual Percentage Payout of Incurred Losses by Age, Net of Reinsurance(1) | | | | | | | | |
| Years | | 1 (unaudited) | | 2 (unaudited) | | 3 (unaudited) | | 4 (unaudited) | | 5 (unaudited) | | 6 (unaudited) | | 7 (unaudited) | | 8 (unaudited) | | 9 (unaudited) | | | | | | | | |
| | 17 | % | | 42 | % | | 13 | % | | 11 | % | | 0 | % | | 3 | % | | 2 | % | | 1 | % | | 0 | % | | | | | | | | |
| (1) | | Unaudited supplementary information is a weighted average derived from the incurred losses and allocated loss adjustment expenses, net of reinsurance triangle and cumulative paid losses and allocated loss adjustment expenses, net of reinsurance triangle. | | | | | | |
| | | | | | | | | | | | | | | | | | | | | | | | | | |
| | | | | | | | | | | | | | | | |
Hamilton Insurance Group, Ltd.
Notes to the Consolidated Financial Statements
Bermuda Casualty
($ in thousands, except claim count)
| | | | | | | | | | | | | | | | | | | | | | | | | | | | | | | | | | | | | | | | | | | | | | | | | | | | | | | | | | | | | | | | | | | | | | | | | | |
| | Incurred Losses and Allocated Loss Adjustment Expenses, Net of Reinsurance | | | | |
| | For the years ended | | As of December 31, 2024 |
| | November 30, | | December 31, | | IBNR (1) | | Cumulative Number of Reported Claims |
Accident
year | | 2015 (unaudited) | | 2016 (unaudited) | | 2017 (unaudited) | | 2018 (unaudited) | | 2019 (unaudited) | | 2020 (unaudited) | | 2021 (unaudited) | | 2022 (unaudited) | | 2023 (unaudited) | | 2024 | | |
| 2015 | | $19,729 | | $18,378 | | $31,552 | | $30,313 | | $38,585 | | $39,331 | | $50,570 | | $49,546 | | $41,677 | | $41,378 | | $7,888 | | 38 |
| 2016 | | | | 44,749 | | 49,876 | | 54,253 | | 54,619 | | 56,863 | | 56,353 | | 60,342 | | 54,997 | | 57,154 | | 4,682 | | 7 |
| 2017 | | | | | | 84,754 | | 96,345 | | 101,443 | | 105,558 | | 113,594 | | 126,190 | | 137,924 | | 139,565 | | 9,057 | | 39 |
| 2018 | | | | | | | | 101,397 | | 115,594 | | 123,114 | | 121,692 | | 131,717 | | 133,476 | | 142,520 | | 14,967 | | 34 |
| 2019 | | | | | | | | | | 85,454 | | 96,207 | | 101,614 | | 100,758 | | 105,390 | | 98,242 | | 22,097 | | 18 |
| 2020 | | | | | | | | | | | | 81,925 | | 84,493 | | 88,400 | | 88,632 | | 88,992 | | 26,122 | | 21 |
| 2021 | | | | | | | | | | | | | | 69,766 | | 79,096 | | 80,015 | | 79,183 | | 40,792 | | 7 |
| 2022 | | | | | | | | | | | | | | | | 110,317 | | 110,095 | | 107,522 | | 75,580 | | 3 |
| 2023 | | | | | | | | | | | | | | | | | | 169,608 | | 171,462 | | 127,989 | | 30 |
| 2024 | | | | | | | | | | | | | | | | | | | | 268,201 | | 247,492 | | 3 |
| | | | | | | | | | | | | | | | | | Total | | $1,194,219 | | $576,666 | | 200 |
| (1) | | Total of incurred but not reported liabilities plus expected development on reported claims | | | | |
| | | | | | | | | | | | | | | | | | | | | | | | |
| | Cumulative Paid Losses and Allocated Loss Adjustment Expenses, Net of Reinsurance | | | |
| | For the years ended | | | | |
| | November 30, | | December 31, | | | | |
Accident
year | | 2015 (unaudited) | | 2016 (unaudited) | | 2017 (unaudited) | | 2018 (unaudited) | | 2019 (unaudited) | | 2020 (unaudited) | | 2021 (unaudited) | | 2022 (unaudited) | | 2023 (unaudited) | | 2024 | | | | |
| 2015 | | $708 | | $2,111 | | $3,569 | | $11,246 | | $16,953 | | $18,828 | | $25,671 | | $34,198 | | $30,726 | | $37,260 | | | | |
| 2016 | | | | 1,541 | | 5,169 | | 12,678 | | 20,504 | | 27,103 | | 35,482 | | 39,381 | | 41,115 | | 44,726 | | | | |
| 2017 | | | | | | 3,792 | | 10,961 | | 22,829 | | 50,471 | | 70,548 | | 91,855 | | 106,013 | | 117,341 | | | | |
| 2018 | | | | | | | | 3,782 | | 22,800 | | 50,903 | | 66,889 | | 70,939 | | 87,677 | | 105,495 | | | | |
| 2019 | | | | | | | | | | 3,965 | | 11,094 | | 23,445 | | 36,161 | | 53,528 | | 58,930 | | | | |
| 2020 | | | | | | | | | | | | 5,417 | | 14,495 | | 19,713 | | 35,047 | | 49,768 | | | | |
| 2021 | | | | | | | | | | | | | | 1,934 | | 4,523 | | 11,255 | | 26,962 | | | | |
| 2022 | | | | | | | | | | | | | | | | 696 | | 4,744 | | 14,565 | | | | |
| 2023 | | | | | | | | | | | | | | | | | | 2,025 | | 21,821 | | | | |
| 2024 | | | | | | | | | | | | | | | | | | | | 8,203 | | | | |
| | | | | | | | | | | | | | | | | | Total | | $485,071 | | | | |
| | | | Outstanding liabilities for accident year 2014 and prior, net of reinsurance | | $524 | | | | |
| | | | Liabilities for unpaid losses and loss adjustment expenses, net of reinsurance | | $709,672 | | | | |
| | | | | | | | | | | | | | | | | | | | | | | | |
| | Average Annual Percentage Payout of Incurred Losses by Age, Net of Reinsurance(1) | | | | | | |
| Years | | 1 (unaudited) | | 2 (unaudited) | | 3 (unaudited) | | 4 (unaudited) | | 5 (unaudited) | | 6 (unaudited) | | 7 (unaudited) | | 8 (unaudited) | | 9
(unaudited) | | | | | | |
| | 3 | % | | 8 | % | | 11 | % | | 16 | % | | 12 | % | | 11 | % | | 11 | % | | 9 | % | | 0 | % | | | | | | |
| (1) | | Unaudited supplementary information is a weighted average derived from the incurred losses and allocated loss adjustment expenses, net of reinsurance triangle and cumulative paid losses and allocated loss adjustment expenses, net of reinsurance triangle. | | | | |
| | | | | | | | | | | | | | | | | | | | | | | | |
| | | | | | | | | | | | | | |
Hamilton Insurance Group, Ltd.
Notes to the Consolidated Financial Statements
Bermuda Specialty
($ in thousands, except claim count)
| | | | | | | | | | | | | | | | | | | | | | | | | | | | | | | | | | | | | | | | | | | | | | | | | | | | | | | | | | | | | | | | | | | | | | | | | | |
| | Incurred Losses and Allocated Loss Adjustment Expenses, Net of Reinsurance | | | | |
| | For the years ended | | As of December 31, 2024 |
| | November 30, | | December 31, | | IBNR (1) | | Cumulative Number of Reported Claims |
Accident
year | | 2015 (unaudited) | | 2016 (unaudited) | | 2017 (unaudited) | | 2018 (unaudited) | | 2019 (unaudited) | | 2020 (unaudited) | | 2021 (unaudited) | | 2022 (unaudited) | | 2023 (unaudited) | | 2024 | | |
| 2015 | | $27,712 | | $26,686 | | $19,342 | | $19,237 | | $17,466 | | $16,820 | | $15,383 | | $15,672 | | $15,288 | | $15,277 | | $16 | | 39 |
| 2016 | | | | 38,154 | | 34,835 | | 28,913 | | 23,171 | | 19,826 | | 16,850 | | 15,846 | | 15,851 | | 15,684 | | 565 | | 58 |
| 2017 | | | | | | 57,528 | | 44,156 | | 36,230 | | 29,590 | | 24,470 | | 26,820 | | 27,334 | | 26,216 | | 735 | | 74 |
| 2018 | | | | | | | | 58,551 | | 52,420 | | 48,323 | | 45,096 | | 38,658 | | 39,920 | | 40,386 | | 953 | | 89 |
| 2019 | | | | | | | | | | 62,075 | | 56,189 | | 48,874 | | 49,114 | | 48,508 | | 49,857 | | 5,280 | | 109 |
| 2020 | | | | | | | | | | | | 63,176 | | 56,807 | | 52,195 | | 54,645 | | 54,586 | | 3,468 | | 116 |
| 2021 | | | | | | | | | | | | | | 53,732 | | 46,023 | | 35,610 | | 33,499 | | 8,721 | | 33 |
| 2022 | | | | | | | | | | | | | | | | 117,538 | | 114,225 | | 111,565 | | 73,277 | | 76 |
| 2023 | | | | | | | | | | | | | | | | | | 62,095 | | 70,783 | | 49,590 | | 28 |
| 2024 | | | | | | | | | | | | | | | | | | | | 82,306 | | 72,328 | | 4 |
| | | | | | | | | | | | | | | | | | Total | | $500,159 | | $214,933 | | 626 |
| (1) | | Total of incurred but not reported liabilities plus expected development on reported claims | | | | |
| | | | | | | | | | | | | | | | | | | | | | | | |
| | Cumulative Paid Losses and Allocated Loss Adjustment Expenses, Net of Reinsurance | | | | |
| | For the years ended | | | | |
| | November 30, | | December 31, | | | | |
Accident
year | | 2015 (unaudited) | | 2016 (unaudited) | | 2017 (unaudited) | | 2018 (unaudited) | | 2019 (unaudited) | | 2020 (unaudited) | | 2021 (unaudited) | | 2022 (unaudited) | | 2023 (unaudited) | | 2024 | | | | |
| 2015 | | $3,330 | | $8,638 | | $13,136 | | $13,115 | | $14,192 | | $14,397 | | $14,432 | | $14,767 | | $14,832 | | $14,911 | | | | |
| 2016 | | | | 2,938 | | 8,661 | | 5,632 | | 10,814 | | 13,116 | | 13,589 | | 13,810 | | 14,413 | | 14,603 | | | | |
| 2017 | | | | | | 2,217 | | 10,194 | | 14,114 | | 16,417 | | 17,726 | | 22,638 | | 24,384 | | 24,267 | | | | |
| 2018 | | | | | | | | 7,607 | | 19,326 | | 25,826 | | 28,223 | | 27,789 | | 33,653 | | 36,457 | | | | |
| 2019 | | | | | | | | | | 6,373 | | 20,505 | | 29,083 | | 36,472 | | 45,062 | | 42,679 | | | | |
| 2020 | | | | | | | | | | | | 9,160 | | 25,585 | | 32,653 | | 43,226 | | 47,047 | | | | |
| 2021 | | | | | | | | | | | | | | 3,862 | | 7,248 | | 15,938 | | 19,114 | | | | |
| 2022 | | | | | | | | | | | | | | | | 3,465 | | 17,086 | | 29,008 | | | | |
| 2023 | | | | | | | | | | | | | | | | | | 5,028 | | 14,233 | | | | |
| 2024 | | | | | | | | | | | | | | | | | | | | 4,706 | | | | |
| | | | | | | | | | | | | | | | | | Total | | $247,025 | | | | |
| | | | | | | | | | | | | | | | |
| | | | | | | | | | Outstanding liabilities for accident year 2014 and prior, net of reinsurance | | $218 | | | | |
| | | | | | | | | | Liabilities for unpaid losses and loss adjustment expenses, net of reinsurance | | $253,352 | | | | |
| | | | | | | | | | | | | | | | | | | | | | | | |
| | | | | | | | | | | | | | | | | | | | | | | | |
| | Average Annual Percentage Payout of Incurred Losses by Age, Net of Reinsurance(1) | | | | | | |
| Years | | 1 (unaudited) | | 2 (unaudited) | | 3 (unaudited) | | 4 (unaudited) | | 5 (unaudited) | | 6 (unaudited) | | 7 (unaudited) | | 8 (unaudited) | | 9 (unaudited) | | | | | | |
| | 10 | % | | 21 | % | | 14 | % | | 13 | % | | 8 | % | | 6 | % | | 5 | % | | 1 | % | | 1 | % | | | | | | |
| (1) | | Unaudited supplementary information is a weighted average derived from the incurred losses and allocated loss adjustment expenses, net of reinsurance triangle and cumulative paid losses and allocated loss adjustment expenses, net of reinsurance triangle. | | | | |
| | | | | | | | | | | | | | | | | | | | | | | | |
| | | | | | | | | | | | | | |
Hamilton Insurance Group, Ltd.
Notes to the Consolidated Financial Statements
Reconciliation
| | | | | | | | |
| | December 31, |
| ($ in thousands) | 2024 |
| Net outstanding liabilities | |
| International - Property | $ | 110,676 | |
| International - Casualty | 524,133 | |
| International - Specialty | 410,406 | |
| Bermuda - Property | 312,638 | |
| Bermuda - Casualty | 709,672 | |
| Bermuda - Specialty | 253,352 | |
| Liabilities for unpaid losses and loss adjustment expenses, net of reinsurance | 2,320,877 | |
| | |
| Reinsurance recoverable on unpaid claims | |
| International - Property | 63,625 | |
| International - Casualty | 608,333 | |
| International - Specialty | 210,968 | |
| Bermuda - Property | 44,045 | |
| Bermuda - Casualty | 161,778 | |
| Bermuda - Specialty | 82,291 | |
| Total reinsurance recoverable on unpaid claims | 1,171,040 | |
| | |
| Other insurance lines | 3,302 | |
| Unallocated loss adjustment expenses | 37,272 | |
| |
| | 40,574 | |
| | |
| Total gross liability for unpaid losses and loss adjustment expenses | $ | 3,532,491 | |
Hamilton Insurance Group, Ltd.
Notes to the Consolidated Financial Statements
9. Segment Reporting
The Company has determined its reportable business segments based on the information used by management in assessing performance and allocating resources to underwriting operations and has identified two reportable business segments - International and Bermuda. Each of the Company's identified reportable segments has a Chief Executive Officer who is responsible for the overall profitability of their segment and who regularly reports and is directly accountable to the chief operating decision maker ("CODM"): the Chief Executive Officer of the consolidated group. The CODM's responsibilities include providing leadership to all levels of employees; developing culture, values, and ethos; setting the Company's strategy, vision and direction; and overall responsibility for the success and profitability of the Company, including evaluating segment performance.
The CODM evaluates reportable segment performance based on the segments' respective underwriting income or loss. Underwriting income or loss is calculated as net premiums earned less losses and loss adjustment expenses, acquisition costs, and other underwriting expenses, net of third party fee income. General and administrative expenses not incurred by the reportable segments are included in corporate and other expenses as part of the reconciliation of net underwriting income or loss to net income or loss attributable to common shareholders. As the Company does not manage its assets by reportable segment, investment income and assets are not allocated to reportable segments.
The Company's core business is underwriting and its underwriting results are reflected in its reportable segments: (1) International, which is comprised of property, casualty and specialty insurance and reinsurance classes of business originating from the Company’s London, Dublin, and Hamilton Select operations; and (2) Bermuda, which is comprised of property, casualty, and specialty insurance and reinsurance classes of business originating from Hamilton Re, Bermuda and Hamilton Re US and subsidiaries. The Company considers many factors, including the nature of each segment’s products, client types, production sources, distribution methods and the regulatory environment, in determining the aggregated operating segments.
Corporate includes net realized and unrealized gains (losses) on investments, net investment income (loss), other income (loss) not incurred by the reportable segments, net foreign exchange gains (losses), general and administrative expenses not incurred by the reportable segments, impairment of goodwill, amortization of intangible assets, interest expense, and income tax expense (benefit).
Hamilton Insurance Group, Ltd.
Notes to the Consolidated Financial Statements
| | | | | | | | | | | | | | | | | | | | | | | |
| ($ in thousands) | | | | | | | |
| For the Year Ended December 31, 2024 | International | | Bermuda | | Corporate | | Total |
| Gross premiums written | $ | 1,308,460 | | | $ | 1,114,122 | | | $ | — | | | $ | 2,422,582 | |
| Net premiums written | $ | 969,605 | | | $ | 951,564 | | | $ | — | | | $ | 1,921,169 | |
| Net premiums earned | $ | 886,934 | | | $ | 847,795 | | | $ | — | | | $ | 1,734,729 | |
| Third party fee income | 16,317 | | | 7,435 | | | — | | | 23,752 | |
| Losses and loss adjustment expenses | 498,023 | | | 512,150 | | | — | | | 1,010,173 | |
| Acquisition costs | 216,971 | | | 171,960 | | | — | | | 388,931 | |
| Other underwriting expenses | 148,824 | | | 61,189 | | | — | | | 210,013 | |
| Underwriting income (loss) | $ | 39,433 | | | $ | 109,931 | | | $ | — | | | $ | 149,364 | |
| Net realized and unrealized gains (losses) on investments | | | | | 511,407 | | | 511,407 | |
| Net investment income (loss) | | | | | 63,267 | | | 63,267 | |
| | | | | | | |
| | | | | | | |
| Net foreign exchange gains (losses) | | | | | (3,231) | | | (3,231) | |
| Corporate expenses | | | | | (61,111) | | | (61,111) | |
| | | | | | | |
| Amortization of intangible assets | | | | | (15,520) | | | (15,520) | |
| Interest expense | | | | | (22,616) | | | (22,616) | |
| Income (loss) before income tax | | | | | | | 621,560 | |
| Income tax (expense) benefit | | | | | (8,402) | | | (8,402) | |
| Net income (loss) | | | | | | | 613,158 | |
| Net income (loss) attributable to non-controlling interest | | | | | 212,729 | | | 212,729 | |
| Net income (loss) attributable to common shareholders | | | | | | | $ | 400,429 | |
| | | | | | | |
| Key Ratios | | | | | | | |
| Attritional loss ratio - current year | 53.5 | % | | 52.7 | % | | | | 53.1 | % |
| Attritional loss ratio - prior year development | (0.4) | % | | 0.5 | % | | | | 0.0 | % |
| Catastrophe loss ratio - current year | 3.9 | % | | 8.9 | % | | | | 6.3 | % |
| Catastrophe loss ratio - prior year development | (0.8) | % | | (1.7) | % | | | | (1.2) | % |
| Loss and loss adjustment expense ratio | 56.2 | % | | 60.4 | % | | | | 58.2 | % |
| Acquisition cost ratio | 24.5 | % | | 20.3 | % | | | | 22.4 | % |
| Other underwriting expense ratio | 14.9 | % | | 6.3 | % | | | | 10.7 | % |
| Combined ratio | 95.6 | % | | 87.0 | % | | | | 91.3 | % |
Hamilton Insurance Group, Ltd.
Notes to the Consolidated Financial Statements
| | | | | | | | | | | | | | | | | | | | | | | |
| ($ in thousands) | | | | | | | |
| For the Year Ended December 31, 2023 | International | | Bermuda | | Corporate | | Total |
| Gross premiums written | $ | 1,105,522 | | | $ | 845,516 | | | $ | — | | | $ | 1,951,038 | |
| Net premiums written | $ | 770,399 | | | $ | 710,039 | | | $ | — | | | $ | 1,480,438 | |
| Net premiums earned | $ | 703,508 | | | $ | 615,025 | | | $ | — | | | $ | 1,318,533 | |
| Third party fee income | 9,685 | | | 8,549 | | | — | | | 18,234 | |
| Losses and loss adjustment expenses | 362,137 | | | 352,466 | | | — | | | 714,603 | |
| Acquisition costs | 186,698 | | | 122,450 | | | — | | | 309,148 | |
| Other underwriting expenses | 127,402 | | | 55,763 | | | — | | | 183,165 | |
| Underwriting income (loss) | $ | 36,956 | | | $ | 92,895 | | | $ | — | | | $ | 129,851 | |
| Net realized and unrealized gains (losses) on investments | | | | | 209,610 | | | 209,610 | |
| Net investment income (loss) | | | | | 30,456 | | | 30,456 | |
| | | | | | | |
| Other income (loss), excluding third party fee income | | | | | 397 | | | 397 | |
| Net foreign exchange gains (losses) | | | | | (6,185) | | | (6,185) | |
| Corporate expenses | | | | | (76,691) | | | (76,691) | |
| | | | | | | |
| Amortization of intangible assets | | | | | (10,783) | | | (10,783) | |
| Interest expense | | | | | (21,434) | | | (21,434) | |
| Income (loss) before income tax | | | | | | | 255,221 | |
| Income tax (expense) benefit | | | | | 25,066 | | | 25,066 | |
| Net income (loss) | | | | | | | 280,287 | |
| Net income (loss) attributable to non-controlling interest | | | | | 21,560 | | | 21,560 | |
| Net income (loss) attributable to common shareholders | | | | | | | $ | 258,727 | |
| | | | | | | |
| Key Ratios | | | | | | | |
| Attritional loss ratio - current year | 53.2 | % | | 51.1 | % | | | | 52.2 | % |
| Attritional loss ratio - prior year development | (3.5) | % | | 2.3 | % | | | | (0.8) | % |
| Catastrophe loss ratio - current year | 1.5 | % | | 5.1 | % | | | | 3.2 | % |
| Catastrophe loss ratio - prior year development | 0.3 | % | | (1.2) | % | | | | (0.4) | % |
| Loss and loss adjustment expense ratio | 51.5 | % | | 57.3 | % | | | | 54.2 | % |
| Acquisition cost ratio | 26.5 | % | | 19.9 | % | | | | 23.4 | % |
| Other underwriting expense ratio | 16.7 | % | | 7.7 | % | | | | 12.5 | % |
| Combined ratio | 94.7 | % | | 84.9 | % | | | | 90.1 | % |
Hamilton Insurance Group, Ltd.
Notes to the Consolidated Financial Statements
| | | | | | | | | | | | | | | | | | | | | | | |
| ($ in thousands) | | | | | | | |
| For the Year Ended December 31, 2022 | International | | Bermuda | | Corporate | | Total |
| Gross premiums written | $ | 933,241 | | | $ | 713,432 | | | $ | — | | | $ | 1,646,673 | |
| Net premiums written | $ | 635,773 | | | $ | 586,091 | | | $ | — | | | $ | 1,221,864 | |
| Net premiums earned | $ | 623,047 | | | $ | 520,667 | | | $ | — | | | $ | 1,143,714 | |
| Third party fee income | 11,430 | | | 201 | | | — | | | 11,631 | |
| Losses and loss adjustment expenses | 335,484 | | | 422,849 | | | — | | | 758,333 | |
| Acquisition costs | 170,571 | | | 100,618 | | | — | | | 271,189 | |
| Other underwriting expenses | 108,239 | | | 49,301 | | | — | | | 157,540 | |
| Underwriting income (loss) | $ | 20,183 | | | $ | (51,900) | | | $ | — | | | $ | (31,717) | |
| Net realized and unrealized gains (losses) on investments | | | | | 93,348 | | | 93,348 | |
| Net investment income (loss) | | | | | (21,487) | | | (21,487) | |
| | | | | | | |
| Other income (loss), excluding third party fee income | | | | | (315) | | | (315) | |
| Net foreign exchange gains (losses) | | | | | 6,137 | | | 6,137 | |
| Corporate expenses | | | | | (20,142) | | | (20,142) | |
| Impairment of goodwill | | | | | (24,082) | | | (24,082) | |
| Amortization of intangible assets | | | | | (12,832) | | | (12,832) | |
| Interest expense | | | | | (15,741) | | | (15,741) | |
| Income (loss) before income tax | | | | | | | (26,831) | |
| Income tax (expense) benefit | | | | | (3,104) | | | (3,104) | |
| Net income (loss) | | | | | | | (29,935) | |
| Net income (loss) attributable to non-controlling interest | | | | | 68,064 | | | 68,064 | |
| Net income (loss) attributable to common shareholders | | | | | | | $ | (97,999) | |
| | | | | | | |
| Key Ratios | | | | | | | |
| Attritional loss ratio - current year | 50.9 | % | | 52.9 | % | | | | 51.8 | % |
| Attritional loss ratio - prior year development | (4.8) | % | | 5.1 | % | | | | (0.3) | % |
| Catastrophe loss ratio - current year | 7.2 | % | | 27.1 | % | | | | 16.3 | % |
| Catastrophe loss ratio - prior year development | 0.5 | % | | (3.9) | % | | | | (1.5) | % |
| Loss and loss adjustment expense ratio | 53.8 | % | | 81.2 | % | | | | 66.3 | % |
| Acquisition cost ratio | 27.4 | % | | 19.3 | % | | | | 23.7 | % |
| Other underwriting expense ratio | 15.5 | % | | 9.4 | % | | | | 12.8 | % |
| Combined ratio | 96.7 | % | | 109.9 | % | | | | 102.8 | % |
The following table presents gross premiums written by the geographical location of the Company's subsidiaries:
| | | | | | | | | | | | | | | | | |
| Years Ended December 31, |
| ($ in thousands) | 2024 | | 2023 | | 2022 |
| International | | | | | |
| Lloyd's of London | $ | 792,830 | | | $ | 677,415 | | | $ | 561,432 | |
| Ireland | 399,061 | | | 349,896 | | | 345,088 | |
| U.S. | 116,569 | | | 78,211 | | | 26,721 | |
| Total International | 1,308,460 | | | 1,105,522 | | | 933,241 | |
| Bermuda | 1,114,122 | | | 845,516 | | | 713,432 | |
| Total | $ | 2,422,582 | | | $ | 1,951,038 | | | $ | 1,646,673 | |
| | | | | |
| | | | | |
Hamilton Insurance Group, Ltd.
Notes to the Consolidated Financial Statements
10. Debt and Credit Facilities
Debt
On June 23, 2022, Hamilton Group renewed its unsecured $150 million term loan credit arrangement, as amended from time to time (the "Facility"), with various lenders as arranged by Wells Fargo Securities, LLC. All or a portion of the loan issued under the Facility bears interest at either (a) the Base Rate plus the Applicable Margin or (b) the Adjusted Term Secured Overnight Financing Rate ("SOFR") plus the Applicable Margin, at Hamilton Group's discretion. In the event of default, an additional 2% interest in excess of (a) or (b) will be levied, not to exceed the highest rate permissible under applicable law, and certain types of loans may not be available for borrowing by Hamilton Group under the Facility. The Facility matures on June 23, 2025, unless accelerated pursuant to the terms of the Facility, and it contains usual and customary representations, warranties, conditions and covenants for bank loan facilities of this type. The Facility also contains certain financial covenants which cap the ratio of consolidated debt to capital and require that Hamilton Group maintain a certain minimum consolidated net worth. The net worth requirement is recalculated effective as of the end of each fiscal quarter. As of December 31, 2024, the Company was in compliance with all covenants.
The following table presents the gross outstanding loan balance, loan fair value and unamortized loan issuance costs:
| | | | | | | | | | | |
| December 31, |
| ($ in thousands) | 2024 | | 2023 |
| Outstanding loan balance | $ | 150,000 | | | $ | 150,000 | |
| Loan fair value | 150,463 | | | 150,981 | |
| Unamortized loan issuance costs | $ | 55 | | | $ | 170 | |
Debt issuance costs are amortized over the period during which the Facility is outstanding, as an offset to net investment income (loss). The Company amortized debt issuance costs of $0.1 million or less in each of the years ended December 31, 2024, 2023 and 2022. The Company’s debt is classified as Level 3 within the fair value hierarchy because it is valued using an income approach, which utilizes a discounted cash flow technique that considers the credit profile of the Company.
Credit Facilities
The Company has several available letter of credit facilities and a revolving loan facility provided by commercial banks. The letter of credit facilities are utilized to provide collateral to reinsureds of Hamilton Re and its affiliates to the extent required under insurance and reinsurance agreements and to support capital requirements at Lloyd’s.
On December 5, 2018 and December 27, 2018, Hamilton Re entered into a Master Agreement for Issuance of Payment Instruments and a Facility Letter for Issuance of Payment Instruments respectively, with CitiBank Europe Plc ("CitiBank Europe"), under which CitiBank Europe agreed to provide an uncommitted secured letter of credit facility for the issuance of standby letters of credit or similar instruments in multiple currencies. On November 15, 2024, letter of credit capacity under this facility was increased to $250 million. At all times during which it is a party to the facility, Hamilton Re is obligated to pledge to CitiBank Europe cash and/or securities with a value that equals or exceeds the aggregate face amount of its then-outstanding letters of credit. The Master Agreement contains events of default customary for facilities of this type. In the facility letter, Hamilton Re makes representations and warranties that are customary for facilities of this type and agrees that it will comply with certain informational and other undertakings.
Hamilton Insurance Group, Ltd.
Notes to the Consolidated Financial Statements
On June 23, 2022, Hamilton Group and Hamilton Re amended and restated their unsecured credit agreement with a syndication of lenders (the "Unsecured Facility"). Under the Unsecured Facility, the lenders have agreed to provide up to an aggregate of $415 million of letter of credit capacity for Hamilton Re, up to $150 million of which may be utilized for revolving loans to be issued to Hamilton Group. At December 31, 2024, there were no loan amounts outstanding under this facility. Margin rates reflect contractually agreed rates, which are based on Hamilton Re’s current Financial Strength Rating as assigned by A.M. Best. As of April 30, 2024, letters of credit issued under the facility bear interest at a rate of 137.5 basis points (previously 150 basis points), while revolving loans if issued are subject to a fee of SOFR plus a margin of 162.5 basis points (previously 185 basis points). To the extent such loans are issued, the available letter of credit capacity shall decrease proportionally, such that the aggregate credit exposure for the lenders under the credit agreement is $415 million. Amounts unutilized under the facility are subject to a fee of 17.5 basis points (previously 22.5 basis points). Capacity is provided by Wells Fargo, National Association, Truist Bank, BMO Harris Bank N.A., Commerzbank AG, New York Branch, HSBC Bank USA, N. A., and Barclays Bank PLC. Unless renewed or otherwise terminated in accordance with its terms, the Unsecured Facility is scheduled to terminate on June 23, 2025.
On August 12, 2024, Hamilton Re and HIDAC amended their committed letter of credit facility agreement with Bank of Montreal ("BMO"), with Hamilton Group as guarantor, under which BMO agreed to make available a secured letter of credit facility of $50 million for a term that will expire on August 13, 2025. The facility bears a fee of 40 basis points for letters of credit issued and 15 basis points on any unutilized portion of the facility.
Effective October 25, 2024, Hamilton Re amended its letter of credit facility agreement with UBS AG ("UBS") under which UBS and certain of its affiliates agreed to make available to Hamilton Re a secured letter of credit facility of $100 million for a term that will expire on October 25, 2025. The facility bears a fee of 140 basis points on the total available capacity.
In addition, on October 28, 2024, Hamilton Re amended the unsecured letter of credit facility agreement that it utilizes to provide Funds at Lloyd's ("FAL") ("FAL LOC Facility") to support the FAL requirements of Syndicate 4000. Capacity is provided by Barclays Bank PLC, ING Bank N.V., London Branch, and Bank of Montreal, London Branch. The FAL LOC Facility of $230 million was renewed for an additional one year term that expires on October 28, 2025. The facility bears a fee of 162.5 basis points on the borrowed amount.
The Company’s obligations under its credit facilities require Hamilton Group, Hamilton Re and the other parties thereto to comply with various financial and reporting covenants. All applicable entities were in compliance with all such covenants at December 31, 2024.
Certain of the Company's credit facilities are secured by pledged interests in the TS Hamilton Fund, the Company's fixed income security portfolio, or cash. The Company’s credit facilities and associated securities pledged, were as follows:
| | | | | | | |
| ($ in thousands) | December 31,
2024 | | |
| | | |
| | | |
| | | |
| Available letter of credit and revolving loan facilities - commitments | $ | 1,045,000 | | |
| Available letter of credit and revolving loan facilities - in use | 789,993 | | |
| | | |
| Security pledged under letter of credit and revolving loan facilities: | | | |
| Pledged interests in TS Hamilton Fund | $ | 230,833 | | |
| Pledged interests in fixed income portfolio | 296,464 | | |
| Cash | 4,713 | | |
The Company has recognized interest expense related to the above debt and credit facilities of $22.6 million, $21.4 million and $15.7 million for the years ended December 31, 2024, 2023 and 2022, respectively.
Hamilton Insurance Group, Ltd.
Notes to the Consolidated Financial Statements
11. Share Capital
Authorized and Issued
Hamilton Group’s share capital is comprised as follows:
| | | | | | | | | | | |
| ($ in thousands, except share information) | | | |
| Authorized: | | | |
| Common shares of $0.01 par value each (2024 and 2023: 150,000,000) | | | |
| December 31, |
| Issued, outstanding and fully paid: | 2024 | | 2023 |
| Class A common shares (2024: 17,820,078 and 2023: 28,644,807) | $ | 178 | | | $ | 286 | |
| Class B common shares (2024: 64,271,249 and 2023: 56,036,067) | 643 | | | 560 | |
| Class C common shares (2024: 19,375,670 and 2023: 25,544,229) | 194 | | | 255 | |
| Total | $ | 1,015 | | | $ | 1,101 | |
The following is a summary of the activity related to common shares authorized:
| | | | | | | | | | | | | | | | | | | | | | | | | | | | | |
| Class A | | Class B | | Class C | | Unclassified | | Total |
| Balance - December 31, 2021 | 53,793,690 | | | 46,898,612 | | | 34,307,698 | | | — | | | 135,000,000 | |
| | | | | | | | | |
| Share class conversions | 200,000 | | | 3,582,072 | | | (3,782,072) | | | — | | | — | |
| | | | | | | | | |
| | | | | | | | | |
| | | | | | | | | |
| | | | | | | | | |
| Balance - December 31, 2022 | 53,993,690 | | | 50,480,684 | | | 30,525,626 | | | — | | | 135,000,000 | |
| Increase in authorized share capital | — | | | 15,000,000 | | | — | | | — | | | 15,000,000 | |
| Share class conversions | (25,348,883) | | | 6,856,668 | | | (4,981,397) | | | 23,473,612 | | | — | |
| | | | | | | | | |
| | | | | | | | | |
| | | | | | | | | |
| | | | | | | | | |
| Balance - December 31, 2023 | 28,644,807 | | | 72,337,352 | | | 25,544,229 | | | 23,473,612 | | | 150,000,000 | |
| | | | | | | | | |
| Share class conversions | (1,700,000) | | | 7,868,559 | | | (6,168,559) | | | — | | | — | |
| | | | | | | | | |
| | | | | | | | | |
| | | | | | | | | |
| | | | | | | | | |
| Balance - December 31, 2024 | 26,944,807 | | | 80,205,911 | | | 19,375,670 | | | 23,473,612 | | | 150,000,000 | |
Hamilton Insurance Group, Ltd.
Notes to the Consolidated Financial Statements
The following is a summary of the activity related to common shares issued and outstanding:
| | | | | | | | | | | | | | | | | | | | | | | |
| Class A | | Class B | | Class C | | Total |
| Balance - December 31, 2021 | 30,320,078 | | | 37,935,266 | | | 34,307,698 | | | 102,563,042 | |
| Share class conversions | 200,000 | | | 3,582,072 | | | (3,782,072) | | | — | |
| | | | | | | |
| Vesting of awards | — | | | 580,935 | | | — | | | 580,935 | |
| | | | | | | |
| Employee and director share purchases | — | | | 22,750 | | | — | | | 22,750 | |
| Director share awards granted | — | | | 25,805 | | | — | | | 25,805 | |
| Share repurchases | — | | | (104,673) | | | — | | | (104,673) | |
| Balance - December 31, 2022 | 30,520,078 | | | 42,042,155 | | | 30,525,626 | | | 103,087,859 | |
| Share class conversions | (1,875,271) | | | 6,856,668 | | | (4,981,397) | | | — | |
| IPO shares issued | — | | | 6,250,000 | | | — | | | 6,250,000 | |
| Vesting of awards | — | | | 735,013 | | | — | | | 735,013 | |
| Exercise of warrants | — | | | 271,097 | | | — | | | 271,097 | |
| | | | | | | |
| Director share awards granted | — | | | 44,892 | | | — | | | 44,892 | |
| Share repurchases | — | | | (163,758) | | | — | | | (163,758) | |
| Balance - December 31, 2023 | 28,644,807 | | | 56,036,067 | | | 25,544,229 | | | 110,225,103 | |
| Share class conversions | (1,700,000) | | | 7,868,559 | | | (6,168,559) | | | — | |
| | | | | | | |
| Vesting of awards | — | | | 2,291,495 | | | — | | | 2,291,495 | |
| Exercise of warrants | — | | | 245,779 | | | — | | | 245,779 | |
| | | | | | | |
| Director share awards granted | — | | | 20,383 | | | — | | | 20,383 | |
| Share repurchases | (9,124,729) | | | (2,191,034) | | | — | | | (11,315,763) | |
| Balance - December 31, 2024 | 17,820,078 | | | 64,271,249 | | | 19,375,670 | | | 101,466,997 | |
On May 8, 2024, the Company entered into an agreement to repurchase 9.1 million Class A common shares at $12.00 per share. The total purchase price was $109.5 million. The common shares purchased by the Company were cancelled following the repurchase transaction.
On August 7, 2024, the Board of Directors authorized a repurchase of the Company's common shares in the aggregate amount of $150.0 million (the "Authorization"), under which the Company may repurchase shares through open market repurchases and/or privately negotiated transactions. The Authorization will expire when the Company has repurchased the full value of shares authorized, unless terminated earlier by the Board of Directors. For the year ended December 31, 2024, 1.5 million Class B common shares at an aggregate cost of $28.1 million and an average price of $18.89 per common share were repurchased and cancelled and $121.9 million remained available for purchase under the Authorization.
In general, holders of Class A common shares and Class B common shares have one vote for each common share held while the Class C common shares have no voting rights, except as required by law. However, each holder of Class A common shares and Class B common shares is limited to voting (directly, indirectly or constructively, as determined for U.S. federal income tax purposes) that number of common shares equal to 9.5% of the total combined voting power of all classes of shares of the Company (or, in the case of a class vote by the holders of our Class B common shares, such as in respect of the election or removal of directors other than for directors who are appointed by certain shareholders pursuant to the Shareholders Agreement and our Bye-laws, a maximum of 14.92% of the total combined voting power, calculated by multiplying (a) 9.5% and (b) the quotient of dividing (x) the total number of directors by (y) the number of directors elected by holders of Class B common shares). In addition, the Board of Directors may, in its absolute discretion, limit a shareholder’s voting rights when it deems it appropriate to do so to avoid certain material adverse tax, legal or regulatory consequences to the Company, any subsidiary of the Company, or any direct or indirect shareholder or its affiliates.
Hamilton Insurance Group, Ltd.
Notes to the Consolidated Financial Statements
The Company Bye-laws provide for the automatic redesignation of shares upon any transfer, whether or not for value, from (i) Class A common shares to Class B common shares and from (ii) Class C common shares to Class B common shares. Upon notice from a Class A Member to the Company that certain Class B common shares are held by a Class A Member or a Permitted Transferee thereof, if so requested by the Class A Member and upon approval by a Simple Majority of the Board, such Class B common shares shall convert automatically into the same number of Class A common shares. The number of authorized and issued Class B common shares shall be reduced by the aggregate number of such issued Class B common shares so converted and the number of authorized and issued Class A common shares shall be correspondingly increased by the same amount. Upon notice from a Class A Member and/or Class B Member to the Company and upon approval by a Simple Majority of the Board, such consent not to be unreasonably withheld or unduly delayed, such Class A common shares and/or Class B common shares shall be redesignated as Class C common shares. In such instance, the authorized and issued number of Class A common shares and/or Class B common shares shall be reduced by the aggregate number of such shares so converted and the number of Class C common shares shall be correspondingly increased by the same amount. Upon notice from a Class C Member to the Company and upon approval of a Simple Majority of the Board, such consent not to be unreasonably withheld or unduly delayed, such Class C common shares shall be redesignated Class B common shares. In such instance, the authorized and issued number of Class C common shares shall be reduced by the aggregate number of such Class C common shares so converted and the number of authorized and issued Class B common shares shall be correspondingly increased by the same amount.
On September 13, 2024, 1.7 million Class A common shares were converted into Class C common shares at the request of the Class A Members and as approved by the Board.
During the year ended December 31, 2024, 7.9 million Class C common shares were converted into Class B common shares at the request of the respective Class C Members and as approved by the Board.
Hamilton Insurance Group, Ltd.
Notes to the Consolidated Financial Statements
12. Share Incentive Plans
The Company is authorized to issue restricted stock units ("RSUs"), performance stock units ("PSUs"), restricted stock awards ("RSAs"), options (including incentive stock options and non-qualified stock options), stock appreciation rights, stock bonus awards, other stock based awards, or any combination thereof to its employees and directors under the 2023 Equity Incentive Plan, which was adopted by the Board of Directors and approved by the shareholders in connection with the Company's IPO. The 2023 Equity Incentive Plan became effective upon the completion of the IPO and replaced the 2013 Equity Incentive Plan. No new awards will be granted under the 2013 Equity Incentive Plan.
The total number of Class B common shares available for issuance under the 2023 Equity Incentive Plan may be increased on the first day of each fiscal year for a period of not more than nine years, commencing on the first day of the second fiscal year following the date on which the 2023 Equity Incentive Plan is adopted in an amount equal to the lesser of (i) two percent (2%) of the outstanding Class B common shares on the last day of the immediately preceding fiscal year, and (ii) such number of Class B common shares as determined by the Company's Board of Directors (or a committee thereof) in its discretion. As of December 31, 2024, 6,690,374 Class B common shares are available for issuance of awards of all types.
Separately, the Value Appreciation Pool ("VAP") is a long-term incentive compensation plan that rewarded employees with 10% of the increase in the multiple of the Company's estimated fair market value to GAAP shareholders' equity between the December 1, 2020 VAP inception date and the Company's Initial Public Offering on November 10, 2023.
The following table presents the compensation expense recognized relating to each award type:
| | | | | | | | | | | | | | | | | |
| Years Ended December 31, |
| ($ in thousands) | 2024 | | 2023 | | 2022 |
| Share based compensation expense: | | | | | |
| RSUs | $ | 12,933 | | | $ | 11,358 | | | $ | 10,884 | |
| VAP RSUs | 9,210 | | | 30,352 | | | — | |
| PSUs | 8,241 | | | 2,668 | | | (100) | |
| | | | | |
| | | | | |
| | | | | |
| Total share based compensation expense: | 30,384 | | | 44,378 | | | 10,784 | |
| Tax benefit | (1,750) | | | (1,251) | | | (1,074) | |
| Share based compensation expense, net of taxes: | $ | 28,634 | | | $ | 43,127 | | | $ | 9,710 | |
The following table presents the unrecognized compensation expense relating to each award type and the weighted-average period in years over which it is expected to be recognized.
| | | | | | | | | | | |
| December 31, 2024 |
($ in thousands, except for weighted-average recognition period) | Unrecognized Share Based Compensation Expense | | Weighted-Average Recognition Period
(in years) |
| Unrecognized share based compensation expense: | | | |
| RSUs | $ | 9,998 | | | 1.2 |
| VAP RSUs | 3,134 | | | 0.9 |
| PSUs | 9,666 | | | 1.7 |
| | | |
| | | |
| Total unrecognized share based compensation expense: | $ | 22,798 | | | |
The aggregate fair value of vested awards for the years ended December 31, 2024, 2023 and 2022 was $38.6 million, $10.1 million, and $8.6 million, respectively.
Hamilton Insurance Group, Ltd.
Notes to the Consolidated Financial Statements
Restricted Stock Units
The grant date fair value of restricted stock awards is established at the fair market value of the Company’s Class B common shares on the date of grant. During the years ended December 31, 2024, 2023 and 2022, the Company granted employees RSUs with a total estimated fair value of $14.5 million, $14.2 million, and $11.8 million, respectively, which generally vest over a three-year period. During the year ended December 31, 2024, the Company granted non-employee directors RSUs with a total fair value of $1.4 million, which vest over a one-year period.
The following table presents a roll forward of the Company’s RSUs based on expected vesting:
| | | | | | | | | | | |
| Year Ended December 31, 2024 |
| Number of RSUs | | Weighted-Average Grant Date Fair Value |
| Balance, beginning of year | 1,660,978 | | | $14.06 |
| Granted | 1,078,711 | | | $14.67 |
| Vested | (719,836) | | | $13.94 |
| Forfeited | (65,457) | | | $14.20 |
| Balance, end of year | 1,954,396 | | | $14.43 |
Value Appreciation Pool Restricted Stock Units
The VAP, which was granted by a then nonpublic company, was initially measured as a liability award at intrinsic value and no compensation cost was recorded over the period December 1, 2020 to March 31, 2023. On May 15, 2023, the Company became a public business entity and the VAP was remeasured at fair value. The fair value of the compensation cost was estimated at each reporting date and expensed over the period for which the employee is required to provide services in exchange for the award, with any changes recorded in compensation expense by a cumulative catch-up adjustment.
The Company consummated an IPO of its Class B common shares and, on November 10, 2023, closed its first day of trading. In accordance with the Compensation Committee's decision that the VAP award would be settled in shares if triggered by an IPO, the VAP became subject to equity award accounting. The VAP RSUs vest in two tranches, subject to continued service: 50% on each of the first and second anniversaries of the November 10, 2023 trigger event. Participants who leave prior to vesting forfeit any previously unsettled portion of their awards.
The Company recorded a compensation expense of $9.2 million and $34.5 million, for the years ended December 31, 2024 and 2023, respectively. Of the total expense recognized for the year ended December 31, 2023, $4.2 million was recorded as an adjustment to retained earnings in "Share compensation expense" in the second quarter of 2023.
The following table presents a roll forward of the Company’s VAP RSUs based upon expected vesting:
| | | | | | | | | | | |
| Year Ended December 31, 2024 |
| Number of
VAP RSUs | | Weighted-Average Grant Date Fair Value |
| Balance, beginning of year | 3,147,507 | | | $15.32 |
| | | |
| Vested | (1,530,234) | | | $15.32 |
| Forfeited | (88,464) | | | $15.32 |
| Balance, end of year | 1,528,809 | | | $15.32 |
Hamilton Insurance Group, Ltd.
Notes to the Consolidated Financial Statements
Performance Stock Units
During the year ended December 31, 2024, the Company granted PSUs that vest over three years and entitle participants to between 0-200% of the target award. Settlement of the PSUs is subject to achievement of defined performance metrics and to each participant's continued employment through each vesting date.
During the years ended December 31, 2023 and 2022, the Company granted PSUs that vest on the third January 1st following their grant dates and entitle participants to between 0-200% of the target award. All other significant terms and conditions are consistent with the PSUs described above.
Prior to August 7, 2024, the PSU performance payout calculation was subject to specified adjustments and was ultimately adjustable at the discretion of the Compensation Committee. The fair value of awards with performance conditions was remeasured at each reporting period with any changes in the expected outcome of the performance conditions recorded in compensation expense by a cumulative adjustment to apply the revised estimate. On August 7, 2024, the Compensation Committee formally ceded their discretion over the ultimate settlement of the PSUs and a grant date fair value of $15.47 was established for all PSU awards outstanding at that date.
The following table presents a roll forward of the Company's PSUs based upon expected vesting:
| | | | | | | |
| Year Ended December 31, 2024 |
| Number of PSUs | | |
| Balance, beginning of year | 444,339 | | | |
| Granted | 289,804 | | | |
| Vested | (41,418) | | | |
| | | |
| Change in performance factor | 610,723 | | | |
| Balance, end of year | 1,303,448 | | | |
Warrants
The Company's remaining outstanding and exercisable warrants were issued in 2014, had a 10-year term and were fully exercised during the year ended December 31, 2024. Each warrant entitled the holder to purchase one common share of Hamilton Group at an exercise price of $10.00. The following table presents a summary of the Company's outstanding and exercisable warrants:
| | | | | | | | | | | | | | | | | | | | | | | | | | | | | |
| (Intrinsic value in $ in thousands) | Year Ended December 31, 2024 |
Warrants Outstanding and Exercisable | Number of Warrants | | Weighted-Average Exercise Price | | Weighted-Average Grant Date Fair Value | | Total Intrinsic Value | | Weighted-Average Remaining Contractual Term |
| At December 31, 2022 | 1,152,500 | | | $ | 10.00 | | | $ | 4.44 | | | $ | 4,287 | | | 1.3 |
| Exercised | (342,500) | | | $ | 10.00 | | | $ | 4.27 | | | $ | 2,398 | | | |
| At December 31, 2023 | 810,000 | | | $ | 10.00 | | | $ | 4.52 | | | $ | 4,010 | | | 0.3 |
| Exercised | (810,000) | | | $ | 10.00 | | | $ | 4.52 | | | $ | 4,140 | | | |
| At December 31, 2024 | — | | | $ | — | | | $ | — | | | $ | — | | | 0.0 |
Board of Directors' Fees
The Company settled a portion of its board of directors fees in shares at each director's option. Expense relating to stock-settled directors' fees for the years ended December 31, 2024, 2023 and 2022 was $0.6 million, $0.6 million, and $0.7 million, respectively.
Hamilton Insurance Group, Ltd.
Notes to the Consolidated Financial Statements
13. Earnings Per Share
The following table sets forth the computation of basic and diluted income (loss) per common share:
| | | | | | | | | | | | | | | | | |
| Years Ended December 31, |
| ($ in thousands, except share and per share information) | 2024 | | 2023 | | 2022 |
| Numerator: | | | | | |
| Net income (loss) attributable to common shareholders | $ | 400,429 | | | $ | 258,727 | | | $ | (97,999) | |
| | | | | |
| Denominator: | | | | | |
| Weighted average common shares outstanding - basic | 105,133 | | | 104,563 | | | 103,062 | |
| Effect of dilutive securities | 3,968 | | | 1,640 | | | — | |
| Weighted average common shares outstanding - diluted | 109,101 | | | 106,203 | | | 103,062 | |
| | | | | |
| Basic income (loss) per share attributable to common shareholders | $ | 3.81 | | | $ | 2.47 | | | $ | (0.95) | |
| Diluted income (loss) per share attributable to common shareholders | $ | 3.67 | | | $ | 2.44 | | | $ | (0.95) | |
| | | | | |
For the years ended December 31, 2024, 2023 and 2022, common shares available for issuance under share based compensation plans of Nil, 0.4 million, and 3.0 million, respectively, were excluded from the calculation of diluted income (loss) per share because the assumed exercise or issuance of such shares would be anti-dilutive.
Hamilton Insurance Group, Ltd.
Notes to the Consolidated Financial Statements
14. Income Taxes
Hamilton Group and its Bermuda domiciled subsidiaries were not subject to income tax in Bermuda in 2023 and prior. On December 27, 2023, Bermuda enacted a 15% corporate income tax that generally became effective on January 1, 2025. The legislation defers the effective date until 2030 for Bermuda companies that meet certain requirements. Hamilton Group expects to meet the requirements to remain exempt until 2030. The legislation includes a provision referred to as the economic transition adjustment, which is intended to provide a fair and equitable transition into the tax regime. As of December 31, 2024, the Company holds a deferred tax asset of $35.4 million relating to economic transition adjustment on its balance sheet, which it expects to utilize to reduce future taxes paid. The Company expects to incur increased taxes beginning in 2030.
Hamilton Group has global subsidiaries and branches that are subject to tax in the jurisdictions in which they operate. The jurisdictions in which Hamilton Group’s subsidiaries and branches are currently subject to tax are the United Kingdom, Ireland and the United States. The Company and some of its subsidiaries file income tax returns in the U.S. federal jurisdiction, various U.S. states, and certain foreign jurisdictions.
Income (loss) before taxes by tax jurisdiction is as follows:
| | | | | | | | | | | | | | | | | |
| Years Ended December 31, |
| ($ in thousands) | 2024 | | 2023 | | 2022 |
| Jurisdiction | | | | | |
| Domestic: | | | | | |
| Bermuda | $ | 581,915 | | | $ | 247,113 | | | $ | 66,823 | |
| Foreign: | | | | | |
| United States | 9,122 | | | (2,263) | | | (23,540) | |
| United Kingdom | 32,249 | | | 12,362 | | | (67,213) | |
| Ireland | (1,726) | | | (1,991) | | | (2,901) | |
| | | | | |
| Income (loss) before income tax | $ | 621,560 | | | $ | 255,221 | | | $ | (26,831) | |
Income tax expense (benefit) consists of the following components:
| | | | | | | | | | | | | | | | | |
| Years Ended December 31, |
| ($ in thousands) | 2024 | | 2023 | | 2022 |
| Current income tax expense (benefit) | | | | | |
| Bermuda | $ | 9,276 | | | $ | 10,376 | | | $ | 2,625 | |
| United States | 652 | | | 537 | | | 1,818 | |
| United Kingdom | 91 | | | 61 | | | 48 | |
| Ireland | (111) | | | 92 | | | (122) | |
| Total current tax expense (benefit) | 9,908 | | | 11,066 | | | 4,369 | |
| | | | | |
| Deferred income tax expense (benefit) | | | | | |
| Bermuda | (375) | | | (35,063) | | | — | |
| United States | — | | | — | | | 705 | |
| United Kingdom | (1,027) | | | (1,087) | | | (1,927) | |
| Ireland | (104) | | | 18 | | | (43) | |
| Total deferred tax expense (benefit) | (1,506) | | | (36,132) | | | (1,265) | |
| Total income tax expense (benefit) | $ | 8,402 | | | $ | (25,066) | | | $ | 3,104 | |
Hamilton Insurance Group, Ltd.
Notes to the Consolidated Financial Statements
The following table presents a reconciliation of taxes calculated using the 0% Bermudian statutory rate (the tax rate at which the majority of Hamilton Group's worldwide operations are taxed) to the income tax expense (benefit) on pre-tax income (loss):
| | | | | | | | | | | | | | | | | |
| Years Ended December 31, |
| ($ in thousands) | 2024 | | 2023 | | 2022 |
| Expected tax provision at Bermuda statutory tax rate of 0% | $ | — | | | $ | — | | | $ | — | |
| Permanent differences: | | | | | |
| Taxes on earnings subject to rate other than Bermuda statutory rate | 9,762 | | | 2,182 | | | (18,077) | |
| Change in valuation allowance | (12,496) | | | (3,567) | | | 17,060 | |
| Impairment of goodwill | — | | | — | | | 4,161 | |
| Other permanent adjustments | (318) | | | (42) | | | (112) | |
| Other prior year adjustments | 2,234 | | | 376 | | | 28 | |
| Tax rate changes | — | | | 273 | | | (2,655) | |
| Withholding tax | 9,381 | | | 10,377 | | | 2,625 | |
| Bermuda economic transition adjustment | — | | | (35,063) | | | — | |
| State income tax | (161) | | | 398 | | | 74 | |
| Total income tax expense (benefit): | $ | 8,402 | | | $ | (25,066) | | | $ | 3,104 | |
Net income tax (refunds) payments, primarily comprised of withholding taxes on investment income from TS Hamilton Fund, totaled $10.7 million, $4.2 million and $10.0 million for the years ended December 31, 2024, 2023 and 2022, respectively.
Deferred tax assets and liabilities are valued at the tax rate at which they are expected to be realized. In June 2021, the U.K. enacted a tax rate of 25% with an effective date of April 1, 2023, an increase from the previous corporation tax rate of 19%. Accordingly, for the year ended November 30, 2021, the Company revalued all of its U.K. deferred tax assets and liabilities that were expected to reverse after December 31, 2023. Revaluations of U.K. deferred tax assets and liabilities were recognized until January 1, 2024, when both the current and deferred tax rates were 25%. The revaluation of the deferred tax assets resulted in a tax expense (benefit) of $0.0 million, $0.3 million and $(2.7) million for the years ended December 31, 2024, 2023 and 2022, respectively. The financial statement impact of the rate changes were offset in each period by a valuation allowance, resulting in a related net tax expense (benefit) after valuation allowance of $Nil, $0.1 million, and $(0.2) million for the years ended December 31, 2024, 2023 and 2022, respectively.
Hamilton Insurance Group, Ltd.
Notes to the Consolidated Financial Statements
Deferred taxes reflect the net tax effects of temporary differences between the carrying amounts of assets and liabilities for financial reporting purposes and the amounts for tax purposes. The following table presents Hamilton Group’s significant deferred tax assets and liabilities:
| | | | | | | | | | | |
| December 31, |
| ($ in thousands) | 2024 | | 2023 |
| Deferred tax assets: | | | |
| U.K. net operating loss carryforwards | $ | 45,590 | | | $ | 50,845 | |
| U.S. net operating loss carryforwards | 3,255 | | | 7,121 | |
| Ireland net operating loss carryforwards | 218 | | | 275 | |
| Bermuda intangible assets | 28,875 | | | 28,500 | |
| Reserve for losses and loss adjustment expenses | 9,198 | | | 7,935 | |
| Unearned premium reserve | 5,486 | | | 4,384 | |
| Share based compensation | 5,213 | | | 7,524 | |
| Foreign tax credit | 1,949 | | | 925 | |
| Capital loss carryforward | 1,733 | | | 419 | |
| U.K. deferred interest | 685 | | | 5,278 | |
| | | |
| Deferred acquisition costs | 547 | | | (1,540) | |
| Loss portfolio transfer | 263 | | | 2,356 | |
| Other | 2,763 | | | 1,609 | |
| Total deferred tax assets | 105,775 | | | 115,631 | |
| Deferred tax liabilities: | | | |
| U.K. intangible assets | (14,233) | | | (15,364) | |
| Fixed assets | (3,520) | | | (2,573) | |
| | | |
| Lloyd's deferred taxable income | (3,340) | | | — | |
| Other | (446) | | | (2,468) | |
| Total deferred tax liabilities | (21,539) | | | (20,405) | |
| Net deferred tax asset (liability) before valuation allowance | 84,236 | | | 95,226 | |
| Valuation allowance | (63,032) | | | (75,528) | |
| Net deferred tax asset (liability) | $ | 21,204 | | | $ | 19,698 | |
Hamilton Group records a valuation allowance against deferred tax assets if it becomes more likely than not that all or a portion of a deferred tax asset will not be realized. Changes in valuation allowances from period to period are included in income tax expense (benefit) in the period of change. When evaluating the Company’s ability to realize the benefit of its deferred tax assets and liabilities, the Company considers the relevant impact of all available positive and negative evidence, including historical operating results and forecasts of future taxable income. A significant piece of objectively verifiable negative evidence considered in the Company’s evaluation is a three-year cumulative pre-tax loss. Based on all available evidence, management has concluded that a valuation allowance of $63.0 million should be recorded against all deferred tax assets in the U.K., the U.S. and Ireland, net of any reversing tax liabilities, as of December 31, 2024. Future realization of the Company’s deferred tax asset will ultimately depend on the existence of objectively verifiable positive evidence including sufficient taxable income of the appropriate character (ordinary income versus capital gains) within the applicable carry-forward periods provided under the tax law.
Hamilton Insurance Group, Ltd.
Notes to the Consolidated Financial Statements
The Company had the following net operating loss carry-forwards, inclusive of cumulative currency translation adjustments:
| | | | | | | | | | | | | | | | | | | | |
| ($ in thousands) | | December 31, 2024 |
| Tax jurisdiction | | Losses Carried Forward | | Tax
Effect | | Expiration |
| Bermuda | | $ | — | | | $ | — | | | n/a |
| Ireland | | 1,742 | | | 218 | | | No expiry |
| United States | | 15,501 | | | 3,255 | | | 2042-2044 |
| United Kingdom | | $ | 182,360 | | | $ | 45,590 | | | No expiry |
Recognition of the benefit of a given tax position is based upon whether a company determines that it is more likely than not that a tax position will be sustained upon examination based upon the technical merits of the position. At December 31, 2024, the Company believes that it has no uncertain tax positions that, if challenged on technical merits, would cause a material effect on the Company's audited consolidated financial statements.
Hamilton Group classifies all interest and penalties on income taxes as part of income tax expense (benefit). During the years ended December 31, 2024, 2023 and 2022, the Company did not recognize any interest income or expense. There was no accrued interest as of December 31, 2024. With few exceptions, Hamilton Group is no longer subject to tax examinations by U.S. federal or state examinations before 2021 or non-U.S. tax examinations before 2020.
15. Commitments and Contingencies
Concentrations of Credit Risks
Credit risk arises out of the failure of a counterparty to perform according to the terms of the contract. Instruments which potentially subject the Company to concentration of credit risk consist primarily of fixed maturity and short-term investments, cash and cash equivalents, premiums receivable and reinsurance balances recoverable. The Company limits the amount of credit exposure to any one financial institution and, except for the securities of the U.S. Government and U.S. Government related entities, none of the Company’s fixed maturity and short-term investments exceeded 10% of shareholders’ equity at December 31, 2024. The Company evaluates the financial condition of its reinsurers, whom primarily consist of highly rated reinsurers and may require collateralization of those recoverable balances. See Note 2g, Credit Loss Provisions and Note 7, Reinsurance, for further details.
Hamilton Insurance Group, Ltd.
Notes to the Consolidated Financial Statements
Operating Leases
The Company leases office space under operating leases in Bermuda, the United States, the United Kingdom, and Ireland. These leases expire at various dates through 2030, with a weighted average lease term of 2.5 years. As a result of the Company's adoption of ASU 2016-02 Leases, the balance sheet reflects a $9.1 million and $6.9 million right of use asset in "Other assets" and a discounted lease liability of $9.2 million and $6.7 million in "Accounts payable and accrued expenses", as at December 31, 2024 and 2023, respectively. The discounted lease liability was calculated with reference to weighted average discount rates of 5.30% and 3.75% as at December 31, 2024 and 2023, respectively. Leases including renewal options are recorded on the balance sheet when management is reasonably certain the options will be exercised. Operating lease expense for the years ended December 31, 2024, 2023 and 2022 was $3.4 million, $3.8 million and $3.8 million, respectively.
Future minimum lease payments under the leases are expected to be as follows:
| | | | | | | | |
| ($ in thousands) | | Minimum Lease Payments |
| Year ended December 31, | |
| 2025 | | $ | 2,431 | |
| 2026 | | 2,977 | |
| 2027 | | 2,703 | |
| 2028 | | 1,262 | |
| 2029 | | 647 | |
| Thereafter | | 118 | |
| Total undiscounted lease liabilities | | 10,138 | |
| Less: present value discount | | (966) | |
| Total recorded lease liability at present value | | $ | 9,172 | |
Lloyd's Capital Requirements
Lloyd’s bases the capital funding requirements of the Company's corporate member, Hamilton Corporate Member Limited ("HCML"), on their latest approved Economic Capital Assessments which are determined by reference to their business plans, internal capital models, and actual performance, among other factors, as well as any other relevant corporate member obligations or receivables. Capital is in the form of Funds at Lloyd's ("FAL") which is generally available to settle the obligations of the corporate members.
Syndicate 4000 is solely supported by HCML. The Company's operations consist of a managing agent, Hamilton Managing Agency Limited, which manages the affairs of Syndicate 4000 on behalf of HCML.
The total available capital in support of the capital requirements for Syndicate 4000 is comprised of the following FAL:
| | | | | |
| ($ in thousands) | December 31,
2024 |
| Unsecured LOC capacity | $ | 230,000 | |
| Fixed income securities | 245,254 | |
| Cash | 1,082 | |
| Total | $ | 476,336 | |
Indemnifications
In the ordinary course of its business, the Company may enter into contracts or agreements that contain indemnifications. Future events could occur that lead to the execution of these provisions against the Company. Management currently believes that the likelihood of such an event is remote.
Hamilton Insurance Group, Ltd.
Notes to the Consolidated Financial Statements
Litigation and Regulatory Matters
The Company is subject to legal and regulatory investigations in the ordinary course of business. As at December 31, 2024, the Company was not a party to any material legal proceeding or investigation which is expected to have a material adverse effect on our results of operations, financial condition or liquidity.
16. Related Party Transactions
Ada Capital Management Limited
In 2020, the Company established ACML, an insurance agent authorized to underwrite on behalf of Ada Re, as more fully described in Note 1, Organization. The following tables summarize the impact of transactions with Ada Re:
| | | | | | | | | | | | | | | | | |
| Years Ended December 31, |
| ($ in thousands) | 2024 | | 2023 | | 2022 |
| Reinsurance premiums ceded | $ | (21,584) | | | $ | (19,524) | | | $ | (11,999) | |
| | | | | |
| Net premiums earned | (21,585) | | | (21,744) | | | (9,780) | |
| Other income (loss) | 7,434 | | | 8,549 | | | 201 | |
| Losses and loss adjustment expenses | 7,676 | | | 8,702 | | | 5,719 | |
| Acquisition costs | 5,126 | | | 5,125 | | | 1,769 | |
| | | | | |
| Net gain (loss) on related party reinsurance | $ | (1,349) | | | $ | 632 | | | $ | (2,091) | |
| | | | | | | | | | | |
| December 31, |
| ($ in thousands) | 2024 | | 2023 |
| Paid losses recoverable | $ | 2,278 | | | $ | 4,319 | |
| | | |
| Unpaid losses and loss adjustment expenses recoverable | 13,262 | | | 11,149 | |
| | | |
| Other assets | 970 | | | 8,765 | |
| Reinsurance balances payable | $ | 1,670 | | | $ | 3,759 | |
Hamilton Insurance Group, Ltd.
Notes to the Consolidated Financial Statements
17. Statutory Requirements
The Company is subject to the laws and statutory requirements of each jurisdiction in which the Company and its subsidiaries operate. These laws establish the Company's applicable minimum required statutory capital and surplus requirements and govern its ability to pay dividends. The minimum required statutory capital and surplus is the amount of statutory capital and surplus necessary to satisfy regulatory requirements based on the Company’s current operations. The difference between statutory financial statements and statements prepared in accordance with GAAP varies by jurisdiction; however, the primary difference is that statutory financial statements generally do not reflect goodwill or intangible assets.
Group
The Bermuda Monetary Authority ("BMA") is the Company's group supervisor and its group capital and solvency requirements determine the minimum capital thresholds that Hamilton Group must meet. Hamilton Group is dependent on dividends from its subsidiaries to pay its operating and financing expenses.
The actual and minimum required statutory capital and surplus for the Company’s principal operating subsidiaries by regulatory jurisdiction were as follows:
| | | | | | | | | | | | | | | | | | | | | | | | | | | | | | | | | | | | | | | | | | | | | | | |
| Bermuda (1) | | United Kingdom (2) | | Ireland (3) | | United States(4) |
| As at December 31, |
| ($ in thousands) | 2024 | | 2023 | | 2024 | | 2023 | | 2024 | | 2023 | | 2024 | | 2023 |
| Required statutory capital and surplus | $ | 739,605 | | | $ | 579,916 | | | $ | 125,232 | | | $ | 129,995 | | | $ | 77,269 | | | $ | 68,643 | | | $ | 33,780 | | | $ | 23,410 | |
| Actual statutory capital and surplus | $ | 2,168,031 | | | $ | 1,882,833 | | | $ | 624,596 | | | $ | 539,016 | | | $ | 139,446 | | | $ | 127,082 | | | $ | 58,017 | | | $ | 53,988 | |
____________
(1) Minimum statutory capital and surplus at December 31, 2024 for the Bermuda operating subsidiary is required to be maintained at the greater of a minimum solvency margin ("MSM"), as disclosed in the table above, and the Enhanced Capital Requirement ("ECR"), where applicable.
(2) Minimum statutory capital and surplus at December 31, 2024 for the U.K. operating entities is determined by reference to the entities' Solvency Capital Requirement and the Solvency II capital regime. U.K. operations are subject to Lloyd’s requirements where underwriting members hold acceptable FAL and/or Syndicates hold acceptable Funds In Syndicate ("FIS") for their own account, in support of the total actual statutory capital and surplus amount. Actual statutory capital and surplus is comprised of an Economic Capital Assessment ("ECA"), derived from an approved Solvency II basis Internal model, less any accumulated trading surpluses or plus any accumulated trading deficits, as calculated on a Solvency II basis.
(3) The Company's Irish operations are subject to the Solvency II regime, which requires insurance companies to hold assets that cover at least the best estimate of insurance liabilities, a risk margin, plus a risk-based Solvency Capital Requirement designed to protect against extreme stress events.
(4) Minimum statutory capital and surplus at December 31, 2024 for U.S. operating subsidiaries is determined with reference to the Company Action Level Risk-Based Capital requirements.
The statutory net income (loss) for the Company’s principal operating subsidiaries by regulatory jurisdiction was as follows:
| | | | | | | | | | | | | | | | | |
| Years Ended December 31, |
| ($ in thousands) | 2024 | | 2023 | | 2022 |
| Bermuda | $ | 432,769 | | | $ | 270,309 | | | $ | 1,993 | |
| United Kingdom | 61,879 | | | 59,778 | | | 25,470 | |
| Ireland | 8,069 | | | (1,911) | | | (32,331) | |
| United States | $ | (12,512) | | | $ | (13,250) | | | $ | (9,962) | |
Bermuda Operations
Hamilton Re is subject to the requirements of the Insurance Act 1978, amendments thereto and Related Regulations of Bermuda (the "Insurance Act"). As a Class 4 (re)insurer, Hamilton Re must maintain capital at the greater of their MSM and their ECR, which are established by reference to the Bermuda Solvency Capital Requirement ("BSCR") model. The Insurance Act also requires Hamilton Re to maintain certain measures of solvency and liquidity.
Independent of the Insurance Act, the BMA has also established a target capital level ("TCL") for Class 4 (re)insurers, equal to 120% of their ECR. The TCL serves as an early warning tool for the BMA and failure to maintain statutory capital at least equal to the TCL will likely result in increased regulatory oversight. Hamilton Re's actual capital and surplus levels exceed the TCL at December 31, 2024.
Hamilton Insurance Group, Ltd.
Notes to the Consolidated Financial Statements
Hamilton Re's BSCR for the year ended December 31, 2024 must be filed with the BMA by April 30, 2025. As a result, the required statutory capital and surplus disclosed as of December 31, 2024 is based on the MSM. At December 31, 2024, the actual statutory capital and surplus of Hamilton Re was $2.2 billion and the MSM was $739.6 million.
Hamilton Re received approval from the BMA to treat its investment in TS Hamilton Fund as a "Relevant Asset" for the purpose of computing its "Liquidity Ratio" (under which relevant assets must be maintained at not less than 75% of relevant liabilities) in respect of 2024. Hamilton Re is in compliance with the Liquidity Ratio at December 31, 2024.
Under the Insurance Act, Hamilton Re is restricted as to the payment of dividends and/or distributions for amounts greater than 25% of the prior year’s statutory capital and surplus. In addition, before reducing its total statutory capital by 15% or more (as set out in its previous year's statutory financial statements), as a Class 4 Bermuda insurance subsidiary, Hamilton Re must apply to the BMA for permission to do so. For the year ended December 31, 2024, Hamilton Re had capacity to pay dividends of $470.7 million without prior approval under Bermuda law, of which $184.5 million of dividends were paid during the year. It is estimated that Hamilton Re will have capacity to pay dividends of $542.0 million in 2025.
United Kingdom Operations
A U.K. company’s ability to propose and pay dividends is dependent upon U.K. law and may require the approval of a local regulatory body where a minimum capital requirement applies.
As discussed in Note 15, Commitments and Contingencies, Lloyd’s bases the capital funding requirements of the Company's corporate members on their latest approved Economic Capital Assessments. As of December 31, 2024, actual levels of solvency, liquidity, and capital were in compliance with the Lloyd's requirements.
Following distributions received from Hamilton Syndicate 4000, profits arising in HCML are available for distribution subject to U.K. law. Profits arising in HMA, which is subject to Lloyds' oversight and regulation by both the Prudential Regulation Authority ("PRA") and the Financial Conduct Authority ("FCA"), are available for distribution subject to U.K. law and the preservation of a minimum capital requirement calculated with reference to Lloyd's capital tests.
The PRA regulatory requirements impose no explicit restrictions on the U.K. subsidiaries' ability to pay a dividend, but the Company must notify the PRA 28 days prior to any proposed dividend payment. Dividends may only be distributed from profits available for distribution. It is estimated that Hamilton's U.K. subsidiaries will have capacity to pay dividends of $5.0 million in 2025.
Ireland Operations
HIDAC is regulated by the Central Bank of Ireland ("CBI") pursuant to the Insurance Acts 1909 to 2018 (as amended), the Central Bank Acts 1942 to 2018 and all statutory instruments relating to insurance made or adopted under the European Communities Acts 1972 to 2012, including the European Union (Insurance and Reinsurance) Regulations, 2015 (as amended) and the Solvency II regime. HIDAC is required to maintain the Minimum Capital Requirement ("MCR") and the Solvency Capital Requirement ("SCR") at all times. Capital requirements are calculated by reference to Solvency II definitions. If an entity falls below the MCR or SCR, the CBI is authorized to take action to restore the financial position of the subsidiary. HIDAC was at all times in compliance with these requirements for the year ended December 31, 2024.
The amount of dividends that HIDAC is permitted to distribute is restricted to accumulated realized profits that have not been capitalized or distributed, less accumulated realized losses that have not been written off. The solvency and capital requirements must still be met subsequent to any distribution. As at December 31, 2024, HIDAC did not have retained profits available for distribution.
United States Operations
The Company’s U.S. insurance subsidiary is registered in Delaware and subject to restrictions on statutory net income and statutory surplus as determined in accordance with the relevant statutory accounting requirements established by the National Association of Insurance Commissioners, subject to state modifications thereof. They are also required to file annual statements with insurance regulatory authorities prepared in accordance with statutory accounting principles prescribed or permitted by such authorities. The U.S. insurance subsidiary is also generally required to maintain minimum levels of solvency and liquidity as determined by law and regulation, comply with regulatory capital requirements and licensing rules.
Hamilton Insurance Group, Ltd.
Notes to the Consolidated Financial Statements
Delaware law provides that an insurance company which is a member of an insurance holding company system and is domiciled in the state shall not pay dividends without giving prior notice to the Insurance Commissioner of Delaware and may not pay dividends without the approval of the Insurance Commissioner if the value of the proposed dividend, together with all other dividends and distributions made in the preceding twelve months, exceeds the greater of (1) 10% of statutory surplus or (2) net income, not including realized capital gains, each as reported in the prior year’s statutory annual statement. In addition, no dividend may be paid in excess of unassigned earned surplus. As at December 31, 2024, the Company's U.S. insurance subsidiary did not have retained profits available for distribution.
18. Subsequent Events
California Wildfires
The Company estimates that losses from the California wildfires, net of reinsurance and reinstatement premiums, will be in the range of $120 million to $150 million, based on an insured industry loss range of $35 billion to $45 billion. The level of uncertainty within the Company’s loss estimates is increased by the recent occurrence of the event and the preliminary nature of the information available, among other factors. The estimated losses for this event will be reported in the Company’s first quarter 2025 financial results.
Index to Schedules to the Consolidated Financial Statements
| | | | | | | | |
| | Page |
| |
| I | | |
| II | | |
| III | | |
| IV | | |
| V | | |
| VI | | |
| | |
| Schedules other than those listed above are omitted because they are not applicable. |
Report of Independent Registered Public Accounting Firm
To the Shareholders and the Board of Directors of
Hamilton Insurance Group, Ltd.
We have audited the consolidated financial statements of Hamilton Insurance Group, Ltd. (the Company) as of December 31, 2024, and 2023, for each of the three years in the period ended December 31, 2024, and have issued our report thereon dated February 27, 2025, included elsewhere in this Form 10-K. Our audits of the consolidated financial statements included the financial statement schedules I to VI of this Form 10-K (the “schedules”). These schedules are the responsibility of the Company’s management. Our responsibility is to express an opinion on the Company’s schedules, based on our audits.
In our opinion, the schedules present fairly, in all material respects, the information set forth therein when considered in conjunction with the consolidated financial statements.
/s/ Ernst & Young Ltd.
Hamilton, Bermuda
February 27, 2025
SCHEDULE I
HAMILTON INSURANCE GROUP, LTD. AND SUBSIDIARIES
SUMMARY OF INVESTMENTS
OTHER THAN INVESTMENTS IN RELATED PARTIES
(THOUSANDS OF UNITED STATES DOLLARS)
| | | | | | | | | | | | | | | | | |
| ($ in thousands) | December 31, 2024 |
| Type of investment | Cost or
Amortized Cost | | Fair
Value | | Amount at which shown in the balance sheet |
| Fixed maturities: | | | | | |
| Bonds: | | | | | |
| U.S. government treasuries | $ | 724,785 | | | $ | 711,103 | | | $ | 711,103 | |
| U.S. states, territories and municipalities | 13,533 | | | 13,231 | | | 13,231 | |
| Non-U.S. sovereign governments and supranationals | 70,435 | | | 67,527 | | | 67,527 | |
| Corporate | 1,153,612 | | | 1,143,060 | | | 1,143,060 | |
| Residential mortgage-backed securities - Agency | 288,760 | | | 272,611 | | | 272,611 | |
| Residential mortgage-backed securities - Non-agency | 17,432 | | | 16,754 | | | 16,754 | |
| Commercial mortgage-backed securities - Non-agency | 40,363 | | | 39,686 | | | 39,686 | |
| Other asset-backed securities | 113,997 | | | 113,890 | | | 113,890 | |
| Total fixed maturities | $ | 2,422,917 | | | 2,377,862 | | | 2,377,862 | |
| | | | | |
| | | | | |
| | | | | |
| | | | | |
| | | | | |
| | | | | |
| | | | | |
| | | | | |
| | | | | |
| | | | | |
| Investments in Two Sigma Funds | | | 939,381 | | | 939,381 | |
| Short-term investments | | | 497,110 | | | 497,110 | |
| Total investments | | | $ | 3,814,353 | | | $ | 3,814,353 | |
SCHEDULE II
HAMILTON INSURANCE GROUP, LTD. (PARENT COMPANY)
CONDENSED FINANCIAL INFORMATION OF REGISTRANT(1)
CONDENSED STATEMENTS OF OPERATIONS AND COMPREHENSIVE INCOME
(THOUSANDS OF UNITED STATES DOLLARS)
| | | | | | | | | | | |
| ($ in thousands) | December 31, 2024 | | December 31, 2023 |
| Assets | | | |
| Cash and cash equivalents | $ | 13,624 | | | $ | 24,898 | |
| Investment in subsidiaries | 2,358,386 | | | 2,077,926 | |
| Intercompany loan receivable | 113,423 | | | 113,423 | |
| Interest receivable on intercompany loan | 5,555 | | | 5,555 | |
| | | |
| Other assets | 5,036 | | | 4,821 | |
| Total assets | $ | 2,496,024 | | | $ | 2,226,623 | |
| | | |
| Liabilities and Shareholders' Equity | | | |
| Liabilities | | | |
| Due to subsidiaries | $ | 11,785 | | | $ | 25,201 | |
| Term loan payable | 149,945 | | | 149,830 | |
| Accounts payable and accrued liabilities | 5,585 | | | 3,742 | |
| Total liabilities | 167,315 | | | 178,773 | |
| | | |
| Shareholders' Equity | | | |
| Common shares | | | |
| Class A | 178 | | | 286 | |
| Class B | 643 | | | 560 | |
| Class C | 194 | | | 255 | |
| Additional paid-in capital | 1,163,609 | | | 1,249,817 | |
| Accumulated other comprehensive loss | (4,441) | | | (4,441) | |
| Retained earnings | 1,168,526 | | | 801,373 | |
| Total shareholders' equity | 2,328,709 | | | 2,047,850 | |
| Total liabilities and shareholders' equity | $ | 2,496,024 | | | $ | 2,226,623 | |
(1) The condensed financial information should be read in conjunction with the consolidated U.S. GAAP financial statements and notes thereto.
SCHEDULE II
HAMILTON INSURANCE GROUP, LTD. (PARENT COMPANY)
CONDENSED FINANCIAL INFORMATION OF REGISTRANT – CONTINUED(1)
CONDENSED STATEMENTS OF OPERATIONS AND COMPREHENSIVE INCOME
(THOUSANDS OF UNITED STATES DOLLARS)
| | | | | | | | | | | | | | | | | |
| Years Ended December 31, |
| ($ in thousands) | 2024 | | 2023 | | 2022 |
| Revenues | | | | | |
| Intercompany loan interest | $ | 7,393 | | | $ | 7,296 | | | $ | 6,784 | |
| Net foreign exchange gains (losses) | 8 | | | 24 | | | (131) | |
| Other income (loss) | 633 | | | 626 | | | 65 | |
| Total revenues | 8,034 | | | 7,946 | | | 6,718 | |
| | | | | |
| Expenses | | | | | |
| General and administrative expenses | 55,011 | | | 52,280 | | | 20,524 | |
| Interest expense | 16,352 | | | 15,500 | | | 9,858 | |
| Total expenses | 71,363 | | | 67,780 | | | 30,382 | |
| | | | | |
| | | | | |
| | | | | |
| Net income (loss) before equity in earnings of subsidiaries | (63,329) | | | (59,834) | | | (23,664) | |
| Equity in earnings of subsidiaries | 266,261 | | | 274,538 | | | (211,335) | |
| Dividend income | 197,497 | | | 44,023 | | | 137,000 | |
| Net income (loss) attributable to common shareholders | $ | 400,429 | | | $ | 258,727 | | | $ | (97,999) | |
(1) The condensed financial information should be read in conjunction with the consolidated U.S. GAAP financial statements and notes thereto.
SCHEDULE II
HAMILTON INSURANCE GROUP, LTD. (PARENT COMPANY)
CONDENSED FINANCIAL INFORMATION OF REGISTRANT – CONTINUED(1)
CONDENSED STATEMENTS OF CASH FLOWS
(THOUSANDS OF UNITED STATES DOLLARS)
| | | | | | | | | | | | | | | | | |
| Years Ended December 31, |
| ($ in thousands) | 2024 | | 2023 | | 2022 |
| Cash flows provided by (used in) operating activities | | | | | |
| Net income (loss) attributable to common shareholders | $ | 400,429 | | | $ | 258,727 | | | $ | (97,999) | |
| Less: dividend income and equity in earnings of subsidiaries | (463,758) | | | (318,561) | | | 74,335 | |
| Net income (loss) before equity in earnings of subsidiaries | (63,329) | | | (59,834) | | | (23,664) | |
| | | | | |
| Adjustments to reconcile net income (loss) to net cash provided by (used in) operating activities | | | | | |
| | | | | |
| Other operating inflows (outflows) | 18,927 | | | 63,035 | | | 7,033 | |
| Net cash provided by (used) in operating activities | (44,402) | | | 3,201 | | | (16,631) | |
| | | | | |
| Cash flows provided by (used in) investing activities | | | | | |
| | | | | |
| | | | | |
| Other investing inflows (outflows) | (216) | | | (146) | | | (706) | |
| Dividends from subsidiaries | 197,497 | | | 44,023 | | | 137,000 | |
| Capital contributions to subsidiaries | (14,199) | | | (113,350) | | | (118,839) | |
| Net cash provided by (used in) investing activities | 183,082 | | | (69,473) | | | 17,455 | |
| | | | | |
| Cash flows provided by (used in) financing activities | | | | | |
| Other financing inflows (outflows) | — | | | — | | | (345) | |
| Repurchase of common shares | (150,350) | | | (2,435) | | | (1,518) | |
| Issuance of common shares | 396 | | | 82,997 | | | 315 | |
| Net cash provided by (used in) financing activities | (149,954) | | | 80,562 | | | (1,548) | |
| | | | | |
| Net increase (decrease) in cash and cash equivalents | (11,274) | | | 14,290 | | | (724) | |
| Cash and cash equivalents, beginning of period | 24,898 | | | 10,608 | | | 11,332 | |
| Cash and cash equivalents, end of period | $ | 13,624 | | | $ | 24,898 | | | $ | 10,608 | |
(1) The condensed financial information should be read in conjunction with the consolidated U.S. GAAP financial statements and notes thereto.
SCHEDULE III
HAMILTON INSURANCE GROUP, LTD. AND SUBSIDIARIES
SUPPLEMENTARY INSURANCE INFORMATION
(THOUSANDS OF UNITED STATES DOLLARS)
| | | | | | | | | | | | | | | | | | | | | | | | | | | | | | | | | | | | | | | | | | | | | | | | | | | | | | | |
| December 31, 2024 | | | | Year Ended December 31, 2024 |
| ($ in thousands) | Deferred policy acquisition costs | | Future policy benefits, losses, claims and
loss adjustment expenses | | Unearned premiums | | | | Net premiums earned | | Total net realized and unrealized gains (losses) on investments and net investment income (loss)1 | | Benefits, claims, losses, and settlement expenses | | Amortization of deferred policy acquisition costs | | Other operating expenses | | Net premiums written |
| International | $ | 110,032 | | | $ | 1,957,679 | | | $ | 650,287 | | | | | $ | 886,934 | | | | | $ | 498,023 | | | $ | 216,971 | | | $ | 148,824 | | | $ | 969,605 | |
| Bermuda | 98,953 | | | 1,574,812 | | | 471,990 | | | | | 847,795 | | | | | 512,150 | | | 171,960 | | | 61,189 | | | 951,564 | |
| Total | $ | 208,985 | | | $ | 3,532,491 | | | $ | 1,122,277 | | | | | $ | 1,734,729 | | | $ | 574,674 | | | $ | 1,010,173 | | | $ | 388,931 | | | $ | 210,013 | | | $ | 1,921,169 | |
| | | | | | | | | | | | | | | | | | | |
| December 31, 2023 | | | | Year Ended December 31, 2023 |
| ($ in thousands) | Deferred policy acquisition costs | | Future policy benefits, losses, claims and
loss adjustment expenses | | Unearned premiums | | | | Net premiums earned | | Total net realized and unrealized gains (losses) on investments and net investment income (loss)1 | | Benefits, claims, losses, and settlement expenses | | Amortization of deferred policy acquisition costs | | Other operating expenses | | Net premiums written |
| International | $ | 84,983 | | | $ | 1,717,422 | | | $ | 547,629 | | | | | $ | 703,508 | | | | | $ | 362,137 | | | $ | 186,698 | | | $ | 127,402 | | | $ | 770,399 | |
| Bermuda | 71,912 | | | 1,312,615 | | | 363,593 | | | | | 615,025 | | | | | 352,466 | | | 122,450 | | | 55,763 | | | 710,039 | |
| Total | $ | 156,895 | | | $ | 3,030,037 | | | $ | 911,222 | | | | | $ | 1,318,533 | | | $ | 239,855 | | | $ | 714,603 | | | $ | 309,148 | | | $ | 183,165 | | | $ | 1,480,438 | |
| | | | | | | | | | | | | | | | | | | |
| | | | | | | | | | | | | | | | | | | |
| | | | | | | | | | | | | | | | | | | |
| | | | | | | | | | | | | | | | | | | |
| December 31, 2022 | | | | Year Ended December 31, 2022 |
| ($ in thousands) | Deferred policy acquisition costs | | Future policy benefits, losses, claims and
loss adjustment expenses | | Unearned premiums | | | | Net premiums earned | | Total net realized and unrealized gains (losses) on investments and net investment income (loss)1 | | Benefits, claims, losses, and settlement expenses | | Amortization of deferred policy acquisition costs | | Other operating expenses | | Net premiums written |
| International | $ | 68,257 | | | $ | 1,582,410 | | | $ | 453,254 | | | | | $ | 623,047 | | | | | $ | 335,484 | | | $ | 170,571 | | | $ | 108,239 | | | $ | 635,773 | |
| Bermuda | 46,890 | | | 1,273,865 | | | 264,934 | | | | | 520,667 | | | | | 422,849 | | | 100,618 | | | 49,301 | | | 586,091 | |
| Total | $ | 115,147 | | | $ | 2,856,275 | | | $ | 718,188 | | | | | $ | 1,143,714 | | | $ | 64,870 | | | $ | 758,333 | | | $ | 271,189 | | | $ | 157,540 | | | $ | 1,221,864 | |
| | | | | | | | | | | | | | | | | | | |
| | | | | | | | | | | | | | | | | | | |
(1) The Company does not manage its investments by reportable segment and therefore total net realized and unrealized gains (losses) on investments and net investment income (loss) is not allocated to each reportable segment.
SCHEDULE IV
HAMILTON INSURANCE GROUP, LTD. AND SUBSIDIARIES
REINSURANCE
(THOUSANDS OF UNITED STATES DOLLARS)
| | | | | | | | | | | | | | | | | | | | | | | | | | | | | |
| ($ in thousands) | Gross premiums earned | | Ceded to other companies | | Assumed from other companies | | Net
premiums earned | | Percentage of amount assumed to net |
| Year ended December 31, 2024 | | | | | | | | | |
| Premiums earned | $ | 1,180,932 | | | $ | 476,798 | | | $ | 1,030,595 | | | $ | 1,734,729 | | | 59 | % |
| Year ended December 31, 2023 | | | | | | | | | |
| Premiums earned | 1,016,762 | | | 440,607 | | | 742,378 | | | 1,318,533 | | | 56 | % |
| Year ended December 31, 2022 | | | | | | | | | |
| Premiums earned | 886,488 | | | 413,046 | | | 670,272 | | | 1,143,714 | | | 59 | % |
SCHEDULE V
HAMILTON INSURANCE GROUP, LTD. AND SUBSIDIARIES
VALUATION AND QUALIFYING ACCOUNTS
| | | | | | | | | | | | | | | | | | | | | | | | | | |
| ($ in thousands) | | Opening Balance | | Additions | | Deductions | | Closing Balance |
| December 31, 2024 | | | | | | | | |
Allowance for expected credit losses(1) | | $ | 3,687 | | | $ | 782 | | | $ | (7) | | | $ | 4,462 | |
| December 31, 2023 | | | | | | | | |
Allowance for expected credit losses(1) | | 3,633 | | | 54 | | | — | | | 3,687 | |
| December 31, 2022 | | | | | | | | |
Allowance for expected credit losses(1) | | — | | | 3,633 | | | — | | | 3,633 | |
| | | | | | | | |
| | | | | | | | |
(1) Deducted from Premiums Receivable and Paid and Unpaid losses and loss adjustment expenses recoverable.
SCHEDULE VI
HAMILTON INSURANCE GROUP, LTD. AND SUBSIDIARIES
SUPPLEMENTAL INSURANCE INFORMATION CONCERNING
PROPERTY-CASUALTY INSURANCE OPERATIONS
(THOUSANDS OF UNITED STATES DOLLARS)
| | | | | | | | | | | | | | | | | | | | | | | | | | | | | | | | | | | | | | |
($ in thousands)
Affiliation with Registrant | | Deferred policy
acquisition costs | | Reserves for unpaid claims and claim adjustments expenses | | Discount, if any, deducted | | Unearned premiums | | Net premiums earned | | Total net realized and unrealized gains (losses) on investments and net investment income (loss) |
| Consolidated subsidiaries | | | | | | | | | | | | |
| Year ended December 31, 2024 | | $ | 208,985 | | | $ | 3,532,491 | | | $ | — | | | $ | 1,122,277 | | | $ | 1,734,729 | | | $ | 574,674 | |
| Year ended December 31, 2023 | | 156,895 | | | 3,030,037 | | | — | | | 911,222 | | | 1,318,533 | | | 240,066 | |
| Year ended December 31, 2022 | | 115,147 | | | 2,856,275 | | | — | | | 718,188 | | | 1,143,714 | | | 71,861 | |
| | | | | | | | | | | | | | | | | | | | | | | | | | | | | | | | | | |
| | Claims and claims adjustment expenses incurred related to | | | | | | | | |
($ in thousands)
Affiliation with Registrant | | Current Year | | Prior Year | | Amortization of deferred policy acquisition costs | | Paid claims and claim adjusted expenses | | Net premiums written | | |
| Consolidated subsidiaries | | | | | | | | | | | | |
| Year ended December 31, 2024 | | $ | 1,030,612 | | | $ | (20,439) | | | $ | 388,931 | | | $ | 516,766 | | | $ | 1,921,169 | | | |
| Year ended December 31, 2023 | | 730,220 | | | (15,617) | | | 309,148 | | | 564,798 | | | 1,480,438 | | | |
| Year ended December 31, 2022 | | 778,936 | | | (20,603) | | | 271,189 | | | 377,186 | | | 1,221,864 | | | |