Exhibit (c)(2)
Project Maple
Discussion Materials
January 21, 2018
Morgan Stanley
Project Maple
Table of Contents
Section 1 Market Update
Section 2 Review of Maple Management Forecasts Section 3 Financial Analysis Appendix A PoS Adjusted Financials Appendix BNon-PoS Adjusted Financials Appendix C Assumptions Details Appendix D Financial Analysis Reference Materials
2
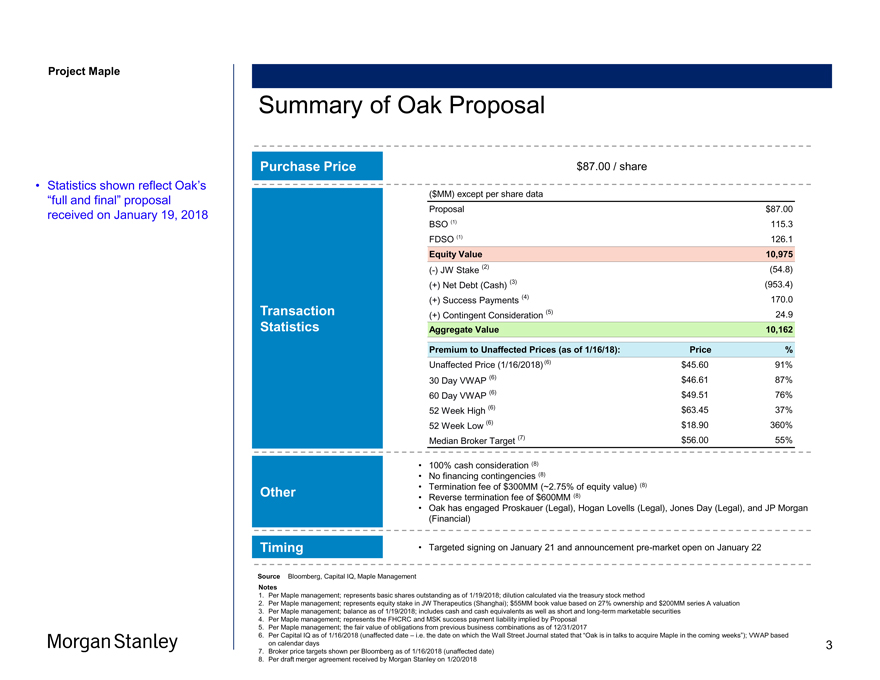
Project Maple Statistics shown reflect Oak’s “full and final” proposal received on January 19, 2018 Summary of Oak Proposal Purchase Price Transaction Statistics Other Timing $87.00 / share ($MM) except per share data Proposal $87.00 BSO (1) 115.3 FDSO (1) 126.1 Equity Value 10,975 (-) JW Stake (2) (54.8) (+) Net Debt (Cash) (3) (953.4) (+) Success Payments (4) 170.0 (+) Contingent Consideration (5) 24.9 Aggregate Value 10,162 Premium to Unaffected Prices (as of 1/16/18): Price % Unaffected Price (1/16/2018) (6) $45.60 91% 30 Day VWAP (6) $46.61 87% 60 Day VWAP (6) $49.51 76% 52 Week High (6) $63.45 37% 52 Week Low (6) $18.90 360% Median Broker Target (7) $56.00 55% • 100% cash consideration (8) • No financing contingencies (8) • Termination fee of $300MM (~2.75% of equity value) (8) • Reverse termination fee of $600MM (8) • Oak has engaged Proskauer (Legal), Hogan Lovells (Legal), Jones Day (Legal), and JP Morgan (Financial) • Targeted signing on January 21 and announcementpre-market open on January 22 Source Bloomberg, Capital IQ, Maple Management Notes 1. Per Maple management; represents basic shares outstanding as of 1/19/2018; dilution calculated via the treasury stock method 2. Per Maple management; represents equity stake in JW Therapeutics (Shanghai); $55MM book value based on 27% ownership and $200MM series A valuation 3. Per Maple management; balance as of 1/19/2018; includes cash and cash equivalents as well as short and long-term marketable securities 4. Per Maple management; represents the FHCRC and MSK success payment liability implied by Proposal 5. Per Maple management; the fair value of obligations from previous business combinations as of 12/31/2017 6. Per Capital IQ as of 1/16/2018 (unaffected date – i.e. the date on which the Wall Street Journal stated that “Oak is in talks to acquire Maple in the coming weeks”); VWAP based on calendar days 7. Broker price targets shown per Bloomberg as of 1/16/2018 (unaffected date) 8. Per draft merger agreement received by Morgan Stanley on 1/20/2018 3
Project Maple
Section 1
Market Update
4
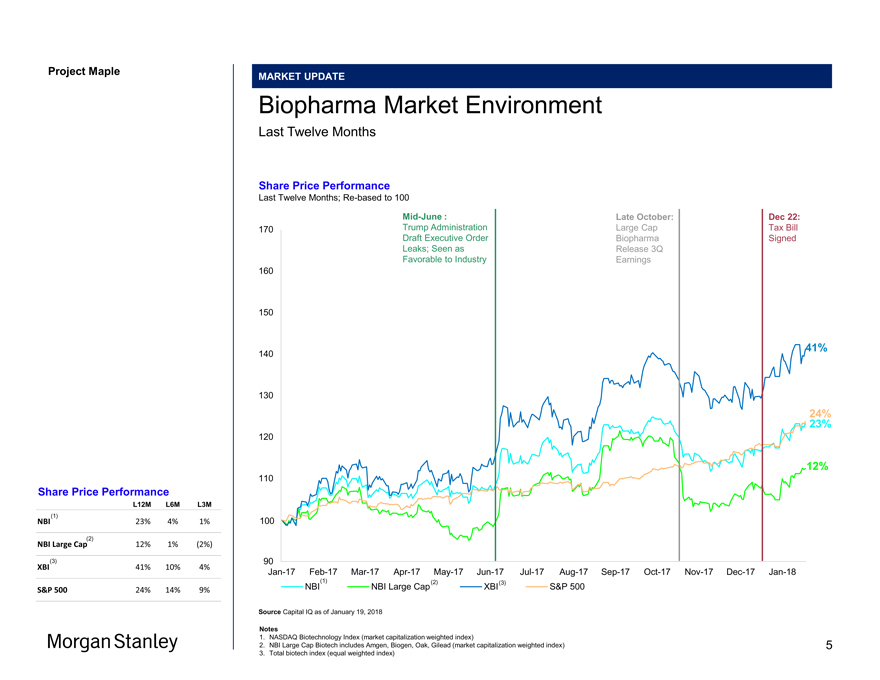
Project Maple Maple Board MARKET UPDATE Biopharma Market Environment Last Twelve Months Share Price Performance Last Twelve Months;Re-based to 100Mid-June : Late October: Dec 22: 170 Trump Administration Large Cap Tax Bill Draft Executive Order Biopharma Signed Leaks; Seen as Release 3Q Favorable to Industry Earnings 160 150 41% 140 130 23% 24% 120 12% 110 100 90Jan-17Feb-17Mar-17Apr-17May-17Jun-17Jul-17Aug-17Sep-17Oct-17Nov-17Dec-17Jan-18 (1) (2) (3) NBI NBI Large Cap XBI S&P 500 Source Capital IQ as of January 19, 2018 Notes 1. NASDAQ Biotechnology Index (market capitalization weighted index) 2. NBI Large Cap Biotech includes Amgen, Biogen, Oak, Gilead (market capitalization weighted index) 3. Total biotech index (equal weighted index) Share Price Performance L12M L6M L3M NBI(1) 23% 4% 1% NBI Large Cap(2) 12% 1% (2%) XBI(3) 41% 10% 4% S&P 500 24% 14% 9% Morgan Stanley 5
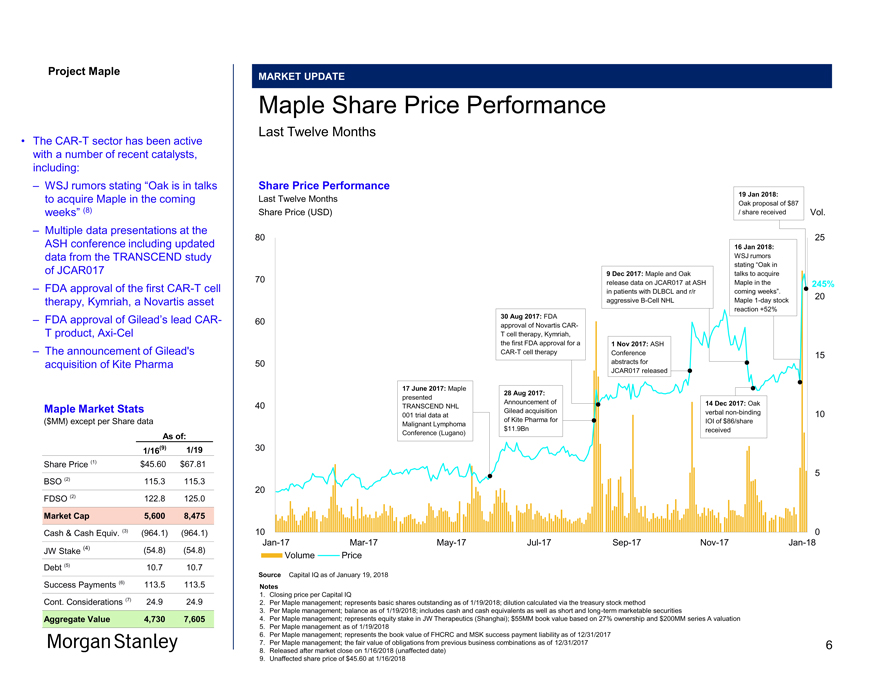
Project Maple MARKET UPDATE Maple Share Price Performance Last Twelve Months Share Price Performance 19 Jan 2018: Last Twelve Months Oak proposal of $87 Share Price (USD) / share received Vol. 80 25 16 Jan 2018: WSJ rumors stating “Oak in 9 Dec 2017: Maple and Oak talks to acquire 70 release data on JCAR017 at ASH Maple in the 245% in patients with DLBCL and r/r coming weeks”. 20 aggressiveB-Cell NHL Maple1-day stock reaction +52% 30 Aug 2017: FDA 60 approval of Novartis CART cell therapy, Kymriah, the first FDA approval for a 1 Nov 2017: ASHCAR-T cell therapy Conference 15 50 abstracts for JCAR017 released 17 June 2017: Maple 28 Aug 2017: presented Announcement of 14 Dec 2017: Oak 40 TRANSCEND NHL Gilead acquisition verbalnon-binding 10 001 trial data at of Kite Pharma for IOI of $86/share Malignant Lymphoma $11.9Bn received Conference (Lugano) 30 5 20 10 0Jan-17Mar-17May-17Jul-17Sep-17Nov-17Jan-18 Volume Price Source Capital IQ as of January 19, 2018 Notes 1. Closing price per Capital IQ 2. Per Maple management; represents basic shares outstanding as of 1/19/2018; dilution calculated via the treasury stock method 3. Per Maple management; balance as of 1/19/2018; includes cash and cash equivalents as well as short and long-term marketable securities 4. Per Maple management; represents equity stake in JW Therapeutics (Shanghai); $55MM book value based on 27% ownership and $200MM series A valuation 5. Per Maple management as of 1/19/2018 6. Per Maple management; represents the book value of FHCRC and MSK success payment liability as of 12/31/2017 7. Per Maple management; the fair value of obligations from previous business combinations as of 12/31/2017 8. Released after market close on 1/16/2018 (unaffected date) 9. Unaffected share price of $45.60 at 1/16/2018 • TheCAR-T sector has been active with a number of recent catalysts, including: – WSJ rumors stating “Oak is in talks to acquire Maple in the coming weeks” (8) – Multiple data presentations at the ASH conference including updated data from the TRANSCEND study of JCAR017 – FDA approval of the firstCAR-T cell therapy, Kymriah, a Novartis asset – FDA approval of Gilead’s leadCAR- T product,Axi-Cel – The announcement of Gilead’s acquisition of Kite Pharma Maple Market Stats ($MM) except per Share data As of: 1/16(9) 1/19 Share Price (1) $45.60 $67.81 BSO (2) 115.3 115.3 FDSO (2) 122.8 125.0 Market Cap 5,600 8,475 Cash & Cash Equiv. (3) (964.1) (964.1) JW Stake (4) (54.8) (54.8) Debt (5) 10.7 10.7 Success Payments (6) 113.5 113.5 Cont. Considerations (7) 24.9 24.9 Aggregate Value 4,730 7,605 Morgan Stanley 6
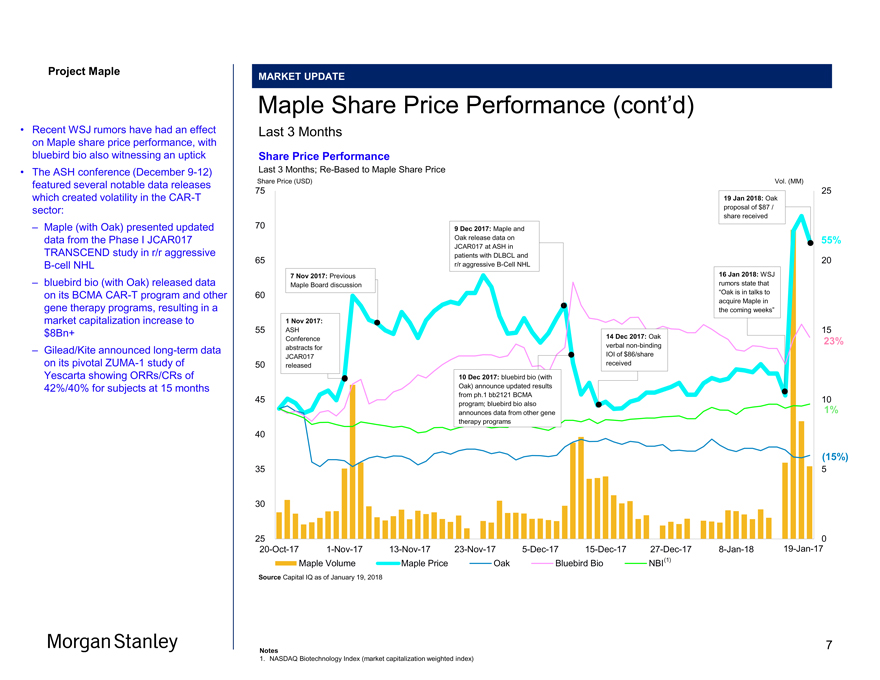
Project Maple Maple Board Discussion MARKET UPDATE Maple Share Price Performance (cont’d) Last 3 Months Share Price Performance Last 3 Months;Re-Based to Maple Share Price Share Price (USD) Vol. (MM) 75 25 19 Jan 2018: Oak proposal of $87 / share received 70 9 Dec 2017: Maple and Oak release data on 55% JCAR017 at ASH in patients with DLBCL and 65 20 r/r aggressiveB-Cell NHL 7 Nov 2017: Previous 16 Jan 2018: WSJ Maple Board discussion rumors state that 60 “Oak is in talks to acquire Maple in the coming weeks” 1 Nov 2017: 55 ASH 15 Conference 14 Dec 2017: Oak 23% abstracts for verbalnon-binding JCAR017 IOI of $86/share 50 released received 10 Dec 2017: bluebird bio (with Oak) announce updated results from ph.1 bb2121 BCMA 45 10 program; bluebird bio also announces data from other gene 1% therapy programs 40 (15%) 35 5 30 25 020-Oct-171-Nov-1713-Nov-1723-Nov-175-Dec-1715-Dec-1727-Dec-178-Jan-1819-Jan-17 Maple Volume Maple Price Oak Bluebird Bio NBI(1) Source Capital IQ as of January 19, 2018 • Recent WSJ rumors have had an effect on Maple share price performance, with bluebird bio also witnessing an uptick • The ASH conference (December9-12) featured several notable data releases which created volatility in theCAR-T sector: – Maple (with Oak) presented updated data from the Phase I JCAR017 TRANSCEND study in r/r aggressiveB-cell NHL – bluebird bio (with Oak) released data on its BCMACAR-T program and other gene therapy programs, resulting in a market capitalization increase to $8Bn+ – Gilead/Kite announced long-term data on its pivotalZUMA-1 study of Yescarta showing ORRs/CRs of 42%/40% for subjects at 15 months Morgan Stanley Notes 1. NASDAQ Biotechnology Index (market capitalization weighted index) 7
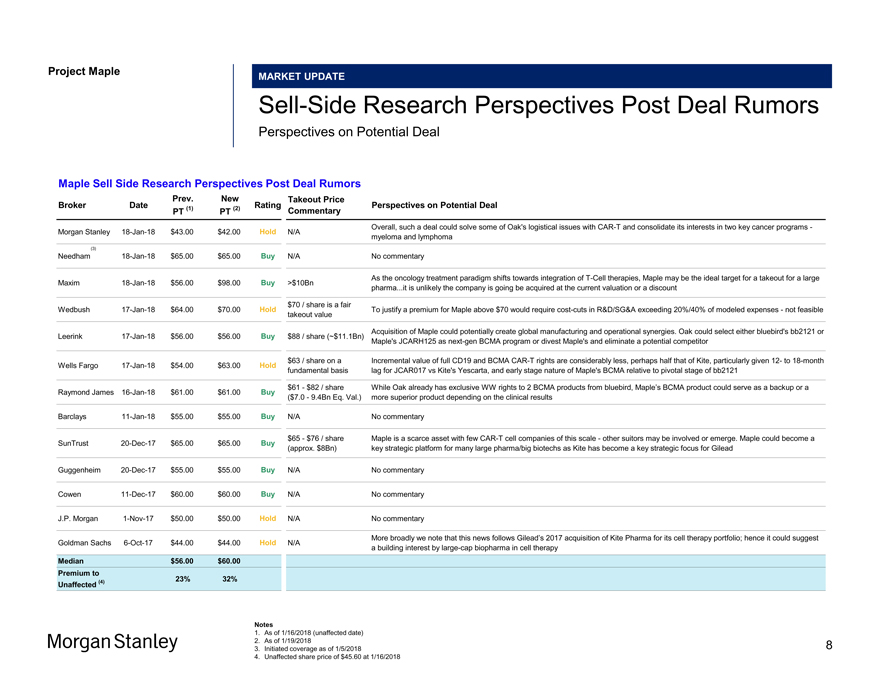
Project Maple Maple Board Discussion Materials v34.pptx\20 JAN 2018\11:33 MARKET UPDATE Sell-Side Research Perspectives Post Deal Rumors Perspectives on Potential Deal Maple Sell Side Research Perspectives Post Deal Rumors Prev. New Takeout Price Broker Date (1) (2) Rating Perspectives on Potential Deal PT PT Commentary Overall, such a deal could solve some of Oak’s logistical issues withCAR-T and consolidate its interests in two key cancer programs—Morgan Stanley18-Jan-18 $43.00 $42.00 Hold N/A myeloma and lymphoma (3) Needham18-Jan-18 $65.00 $65.00 Buy N/A No commentary As the oncology treatment paradigm shifts towards integration ofT-Cell therapies, Maple may be the ideal target for a takeout for a large Maxim18-Jan-18 $56.00 $98.00 Buy >$10Bn pharma...it is unlikely the company is going be acquired at the current valuation or a discount $70 / share is a fair Wedbush17-Jan-18 $64.00 $70.00 Hold To justify a premium for Maple above $70 would require cost-cuts in R&D/SG&A exceeding 20%/40% of modeled expenses—not feasible takeout value Acquisition of Maple could potentially create global manufacturing and operational synergies. Oak could select either bluebird’s bb2121 or Leerink17-Jan-18 $56.00 $56.00 Buy $88 / share (~$11.1Bn) Maple’s JCARH125 asnext-gen BCMA program or divest Maple’s and eliminate a potential competitor $63 / share on a Incremental value of full CD19 and BCMACAR-T rights are considerably less, perhaps half that of Kite, particularly given12- to18-month Wells Fargo17-Jan-18 $54.00 $63.00 Hold fundamental basis lag for JCAR017 vs Kite’s Yescarta, and early stage nature of Maple’s BCMA relative to pivotal stage of bb2121 $61—$82 / share While Oak already has exclusive WW rights to 2 BCMA products from bluebird, Maple’s BCMA product could serve as a backup or a Raymond James16-Jan-18 $61.00 $61.00 Buy ($7.0—9.4Bn Eq. Val.) more superior product depending on the clinical results Barclays11-Jan-18 $55.00 $55.00 Buy N/A No commentary $65—$76 / share Maple is a scarce asset with fewCAR-T cell companies of this scale—other suitors may be involved or emerge. Maple could become a SunTrust20-Dec-17 $65.00 $65.00 Buy (approx. $8Bn) key strategic platform for many large pharma/big biotechs as Kite has become a key strategic focus for Gilead Guggenheim20-Dec-17 $55.00 $55.00 Buy N/A No commentary Cowen11-Dec-17 $60.00 $60.00 Buy N/A No commentary J.P. Morgan1-Nov-17 $50.00 $50.00 Hold N/A No commentary More broadly we note that this news follows Gilead’s 2017 acquisition of Kite Pharma for its cell therapy portfolio; hence it could suggest Goldman Sachs6-Oct-17 $44.00 $44.00 Hold N/A a building interest bylarge-cap biopharma in cell therapy Median $56.00 $60.00 Premium to (4) 23% 32% Unaffected Notes 1. As of 1/16/2018 (unaffected date) 2. As of 1/19/2018 3. Initiated coverage as of 1/5/2018 4. Unaffected share price of $45.60 at 1/16/2018 Morgan Stanley 8
Maple Board Discussion Materials v34.pptx\20 JAN 2018\11:33 AM\9
Project Maple
Section 2
Review of Maple Management Forecasts
9
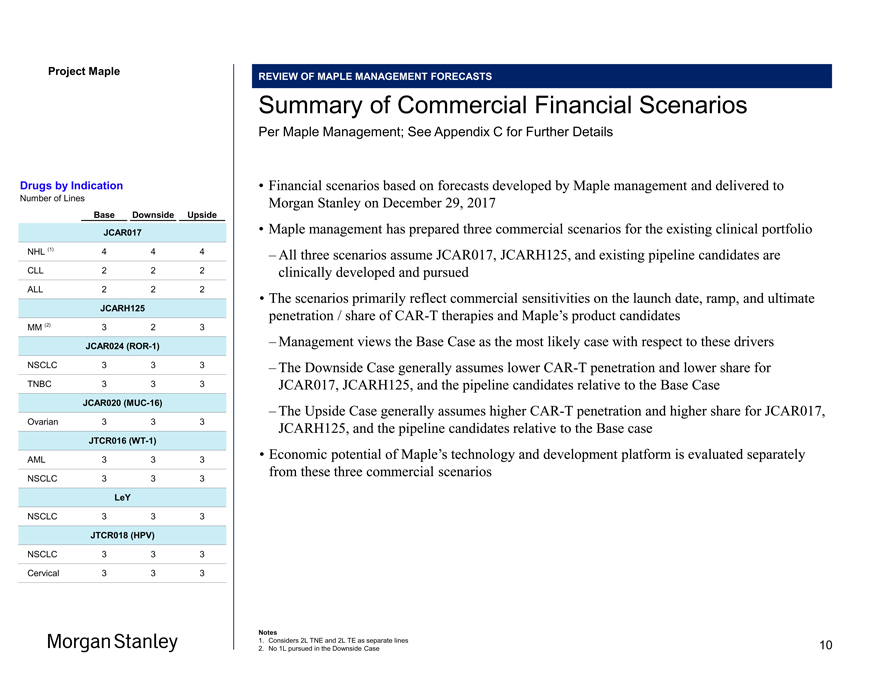
Project Maple Maple Board Discussion Materials v34.pptx\20 JAN REVIEW OF MAPLE MANAGEMENT FORECASTS Summary of Commercial Financial Scenarios Per Maple Management; See Appendix C for Further Details • Financial scenarios based on forecasts developed by Maple management and delivered to Morgan Stanley on December 29, 2017 • Maple management has prepared three commercial scenarios for the existing clinical portfolio – All three scenarios assume JCAR017, JCARH125, and existing pipeline candidates are clinically developed and pursued • The scenarios primarily reflect commercial sensitivities on the launch date, ramp, and ultimate penetration / share ofCAR-T therapies and Maple’s product candidates – Management views the Base Case as the most likely case with respect to these drivers – The Downside Case generally assumes lowerCAR-T penetration and lower share for JCAR017, JCARH125, and the pipeline candidates relative to the Base Case – The Upside Case generally assumes higherCAR-T penetration and higher share for JCAR017, JCARH125, and the pipeline candidates relative to the Base case • Economic potential of Maple’s technology and development platform is evaluated separately from these three commercial scenarios Notes 1. Considers 2L TNE and 2L TE as separate lines 2. No 1L pursued in the Downside Case Drugs by Indication Number of Lines Base Downside Upside JCAR017 NHL (1) 4 4 4 CLL 2 2 2 ALL 2 2 2 JCARH125 MM (2) 3 2 3 JCAR024(ROR-1) NSCLC 3 3 3 TNBC 3 3 3 JCAR020(MUC-16) Ovarian 3 3 3 JTCR016(WT-1) AML 3 3 3 NSCLC 3 3 3 LeY NSCLC 3 3 3 JTCR018 (HPV) NSCLC 3 3 3 Cervical 3 3 3 10
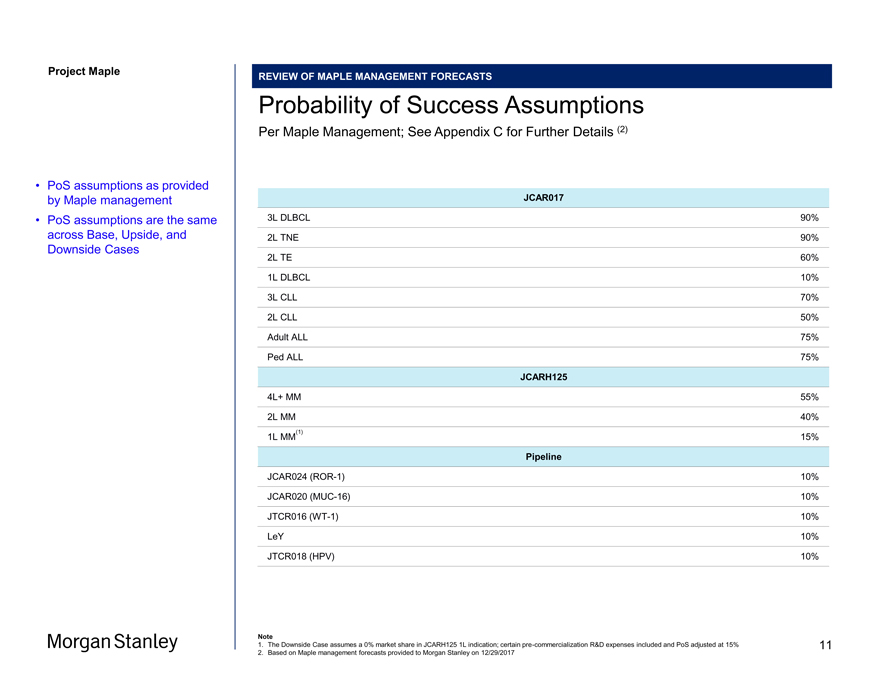
Project Maple REVIEW OF MAPLE MANAGEMENT FORECASTS Probability of Success Assumptions Per Maple Management; See Appendix C for Further Details (2) JCAR017 3L DLBCL 90% 2L TNE 90% 2L TE 60% 1L DLBCL 10% 3L CLL 70% 2L CLL 50% Adult ALL 75% Ped ALL 75% JCARH125 4L+ MM 55% 2L MM 40% (1) 1L MM 15% Pipeline JCAR024(ROR-1) 10% JCAR020(MUC-16) 10% JTCR016(WT-1) 10% LeY 10% JTCR018 (HPV) 10% Note 1. The Downside Case assumes a 0% market share in JCARH125 1L indication; certainpre-commercialization R&D expenses included and PoS adjusted at 15% 2. Based on Maple management forecasts provided to Morgan Stanley on 12/29/2017 • PoS assumptions as provided by Maple management • PoS assumptions are the same across Base, Upside, and Downside Cases 11
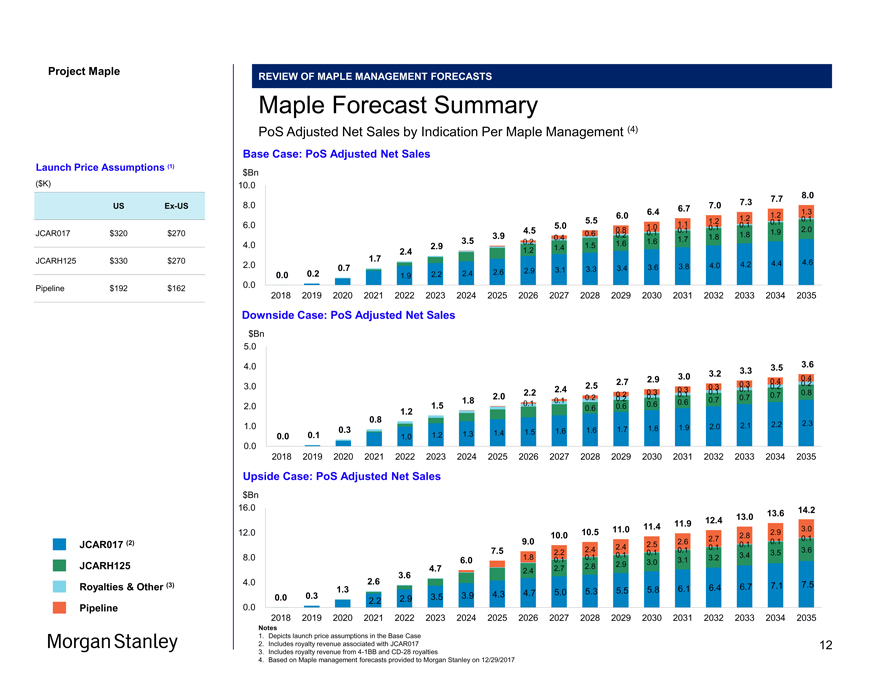
Project Maple REVIEW OF MAPLE MANAGEMENT FORECASTS Maple Forecast Summary PoS Adjusted Net Sales by Indication Per Maple Management (4) Base Case: PoS Adjusted Net Sales $Bn 10.0 7.7 8.0 8.0 7.0 7.3 6.4 6.7 1.2 1.3 6.0 1.2 0.1 5.5 1.1 1.2 0.1 6.0 5.0 1.0 0.1 0.1 4.5 0.8 0.1 0.1 1.9 2.0 3.9 0.6 0.2 1.8 3.5 0.4 1.7 1.8 4.0 0.2 1.6 1.6 2.9 1.4 1.5 2.4 1.2 1.7 4.6 2.0 3.8 4.0 4.2 4.4 0.7 2.9 3.1 3.3 3.4 3.6 0.0 0.2 2.2 2.4 2.6 1.9 0.0 2018 2019 2020 2021 2022 2023 2024 2025 2026 2027 2028 2029 2030 2031 2032 2033 2034 2035 Downside Case: PoS Adjusted Net Sales $Bn 5.0 4.0 3.5 3.6 3.2 3.3 2.9 3.0 0.4 2.7 0.3 0.4 0.2 3.0 2.4 2.5 0.3 0.1 0.2 2.2 0.3 0.3 0.1 0.8 2.0 0.2 0.2 0.1 0.1 0.7 0.7 1.8 0.1 0.2 0.7 1.5 0.1 0.6 0.6 2.0 0.6 0.6 0.8 1.2 1.0 2.0 2.1 2.2 2.3 0.3 1.6 1.7 1.8 1.9 1.3 1.4 1.5 1.6 0.0 0.1 1.0 1.2 0.0 2018 2019 2020 2021 2022 2023 2024 2025 2026 2027 2028 2029 2030 2031 2032 2033 2034 2035 Upside Case: PoS Adjusted Net Sales $Bn 16.0 14.2 13.0 13.6 11.9 12.4 11.0 11.4 3.0 12.0 10.0 10.5 2.8 2.9 2.7 0.1 0.1 9.0 2.5 2.6 0.1 7.5 2.4 2.4 0.1 0.1 3.6 2.2 0.1 0.1 3.4 3.5 8.0 6.0 1.8 0.1 0.1 3.1 3.2 2.9 3.0 4.7 2.7 2.8 2.4 3.6 4.0 2.6 7.5 1.3 6.1 6.4 6.7 7.1 4.7 5.0 5.3 5.5 5.8 0.0 0.3 3.5 3.9 4.3 2.2 2.9 0.0 2018 2019 2020 2021 2022 2023 2024 2025 2026 2027 2028 2029 2030 2031 2032 2033 2034 2035 Notes 1. Depicts launch price assumptions in the Base Case 2. Includes royalty revenue associated with JCAR017 3. Includes royalty revenue from4-1BB andCD-28 royalties 4. Based on Maple management forecasts provided to Morgan Stanley on 12/29/2017 Launch Price Assumptions (1) ($K) USEx-US JCAR017 $320 $270 JCARH125 $330 $270 Pipeline $192 $162 JCAR017 (2) JCARH125 Royalties & Other (3) Pipeline 12
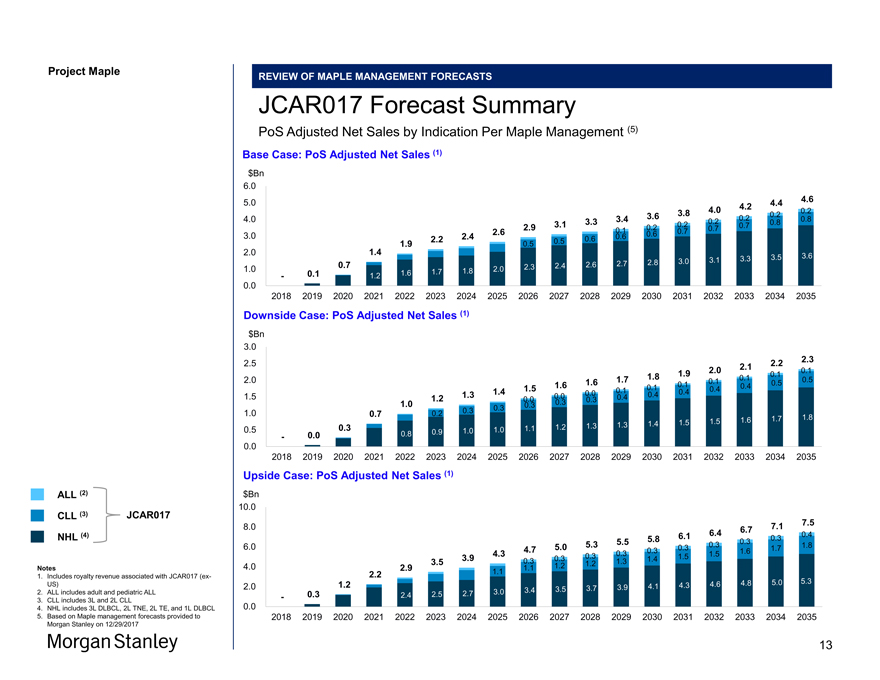
Project Maple REVIEW OF MAPLE MANAGEMENT FORECASTS JCAR017 Forecast Summary PoS Adjusted Net Sales by Indication Per Maple Management (5) Base Case: PoS Adjusted Net Sales (1) $Bn 6.0 5.0 4.2 4.4 4.6 3.8 4.0 0.2 3.6 0.2 4.0 3.3 3.4 0.2 0.2 0.8 3.1 0.2 0.7 0.8 2.9 0.1 0.2 0.7 2.6 0.6 0.7 3.0 2.2 2.4 0.6 0.6 1.9 0.5 0.5 2.0 1.4 3.3 3.5 3.6 2.8 3.0 3.1 0.7 2.3 2.4 2.6 2.7 1.0 1.7 1.8 2.0 — 0.1 1.2 1.6 0.0— 2018 2019 2020 2021 2022 2023 2024 2025 2026 2027 2028 2029 2030 2031 2032 2033 2034 2035 Downside Case: PoS Adjusted Net Sales (1) $Bn 3.0 2.2 2.3 2.5 2.1 0.1 1.9 2.0 1.8 0.1 2.0 1.7 0.1 0.5 1.6 1.6 0.1 0.1 0.5 1.5 0.1 0.4 0.4 1.4 0.0 0.1 0.4 1.5 1.2 1.3 0.0 0.4 0.4 0.0 0.3 0.3 1.0 0.3 0.3 0.3 1.0 0.7 0.2 1.6 1.7 1.8 1.4 1.5 1.5 0.3 1.2 1.3 1.3 0.5 1.0 1.0 1.1 0.0 0.8 0.9 — 0.0— 2018 2019 2020 2021 2022 2023 2024 2025 2026 2027 2028 2029 2030 2031 2032 2033 2034 2035 Upside Case: PoS Adjusted Net Sales (1) $Bn 10.0 7.1 7.5 8.0 6.7 6.1 6.4 0.4 5.8 0.3 5.3 5.5 0.3 0.3 6.0 5.0 0.3 1.7 1.8 4.7 0.3 0.3 1.6 4.3 0.3 1.5 1.5 3.9 0.3 0.3 1.3 1.4 3.5 1.2 1.2 4.0 2.9 1.1 2.2 1.1 1.2 4.6 4.8 5.0 5.3 2.0 3.7 3.9 4.1 4.3 3.0 3.4 3.5 — 0.3 2.4 2.5 2.7 0.0 2018 2019 2020 2021 2022 2023 2024 2025 2026 2027 2028 2029 2030 2031 2032 2033 2034 2035 ALL (2) CLL (3) JCAR017 NHL (4) Notes 1. Includes royalty revenue associated with JCAR017(ex-US) 2. ALL includes adult and pediatric ALL 3. CLL includes 3L and 2L CLL 4. NHL includes 3L DLBCL, 2L TNE, 2L TE, and 1L DLBCL 5. Based on Maple management forecasts provided to Morgan Stanley on 12/29/2017 13
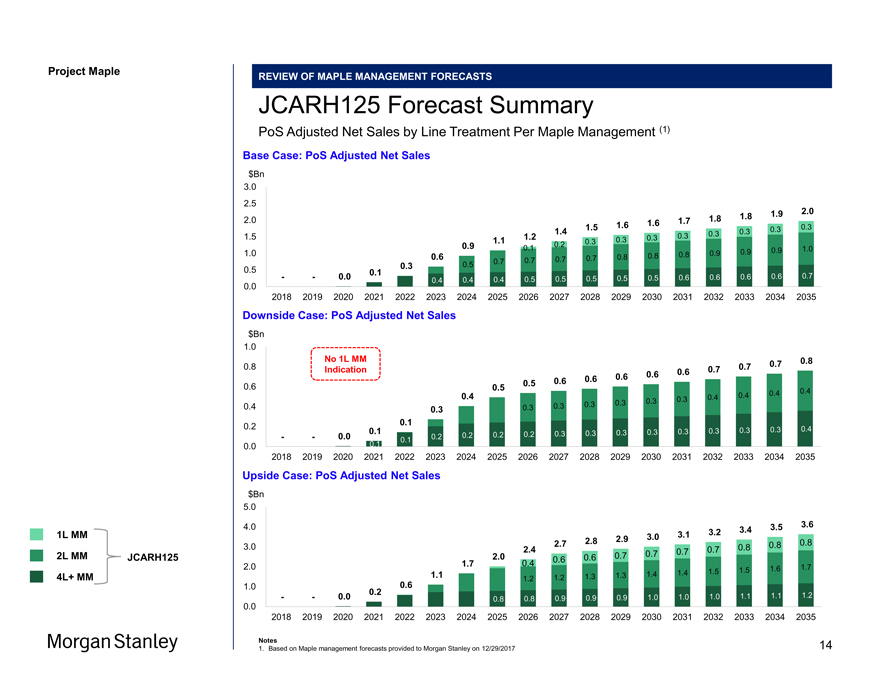
Project Maple Maple Board Discussion REVIEW OF MAPLE MANAGEMENT FORECASTS JCARH125 Forecast Summary PoS Adjusted Net Sales by Line Treatment Per Maple Management (1) Base Case: PoS Adjusted Net Sales $Bn 3.0 2.5 2.0 1.8 1.9 2.0 1.7 1.8 1.6 1.6 1.5 0.3 0.3 1.4 0.3 0.3 1.5 1.2 0.3 0.3 1.1 0.3 0.3 0.9 0.2 0.1 0.9 1.0 1.0 0.8 0.9 0.9 0.6 0.7 0.8 0.8 0.7 0.7 0.7 0.3 0.5 0.5 0.1 — — 0.0 0.5 0.5 0.5 0.5 0.6 0.6 0.6 0.6 0.7 0.0 0.4 0.4 0.4 0.5 — — 2018 2019 2020 2021 2022 2023 2024 2025 2026 2027 2028 2029 2030 2031 2032 2033 2034 2035 Downside Case: PoS Adjusted Net Sales $Bn 1.0 No 1L MM 0.8 0.8 0.7 0.7 Indication 0.6 0.7 0.6 0.6 0.6 0.6 0.6 0.5 0.5 0.4 0.4 0.4 0.4 0.3 0.4 0.3 0.3 0.3 0.4 0.3 0.3 0.3 0.1 0.2 0.3 0.4 0.1 0.3 0.3 0.3 0.3 0.3 0.3 — — 0.0 0.2 0.2 0.2 0.2 0.3 0.1 0.0— — 0.1 2018 2019 2020 2021 2022 2023 2024 2025 2026 2027 2028 2029 2030 2031 2032 2033 2034 2035 Upside Case: PoS Adjusted Net Sales $Bn 5.0 4.0 3.5 3.6 3.2 3.4 3.0 3.1 2.8 2.9 0.8 3.0 2.7 0.8 0.8 2.4 0.7 0.7 2.0 0.6 0.7 0.7 0.4 0.6 2.0 1.7 1.7 1.5 1.5 1.6 1.1 1.3 1.4 1.4 1.2 1.2 1.3 1.0 0.6 0.2 1.2 — — 0.0 0.8 0.8 0.9 0.9 0.9 1.0 1.0 1.0 1.1 1.1 0.0 2018 2019 2020 2021 2022 2023 2024 2025 2026 2027 2028 2029 2030 2031 2032 2033 2034 2035 Notes 1. Based on Maple management forecasts provided to Morgan Stanley on 12/29/2017 1L MM 2L MM JCARH125 4L+ MM 14
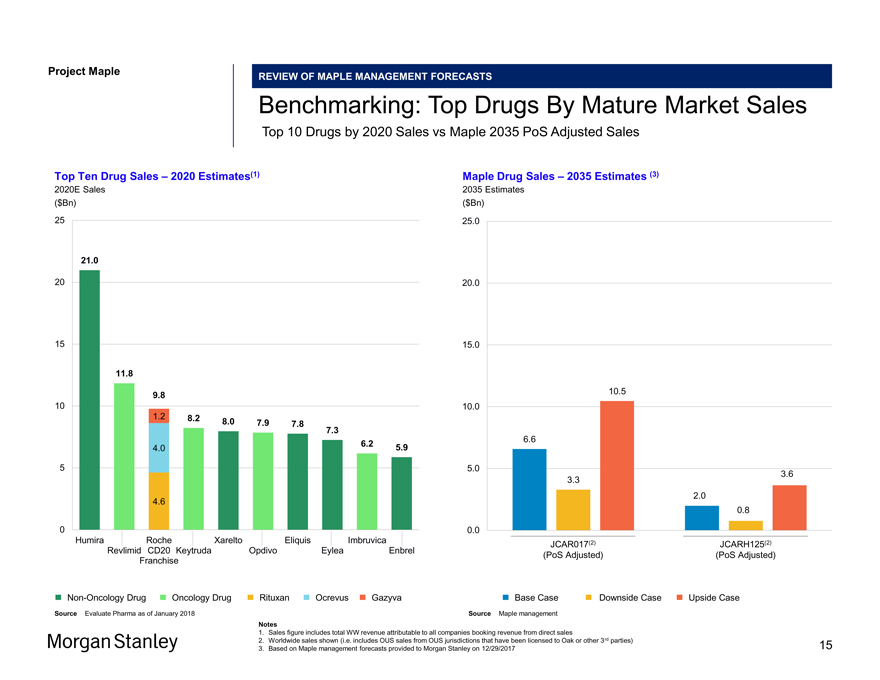
Project Maple Maple Board Discussion Materials v34.pptx\20 JAN 2018\11:33 REVIEW OF MAPLE MANAGEMENT FORECASTS Benchmarking: Top Drugs By Mature Market Sales Top 10 Drugs by 2020 Sales vs Maple 2035 PoS Adjusted Sales Top Ten Drug Sales – 2020 Estimates(1) 2020E Sales ($Bn) 25 21.0 20 15 11.8 9.8 10 1.2 8.2 8.0 7.9 7.8 7.3 6.2 5.9 4.0 5 4.6 0 Humira Roche Xarelto Eliquis Imbruvica Revlimid CD20 Keytruda Opdivo Eylea Enbrel FranchiseNon-Oncology Drug Oncology Drug Rituxan Ocrevus Gazyva Source Evaluate Pharma as of January 2018 Maple Drug Sales – 2035 Estimates (3) 2035 Estimates ($Bn) 25.0 20.0 15.0 10.5 10.0 6.6 5.0 3.6 3.3 2.0 0.8 0.0 JCAR017(2) JCARH125(2) (PoS Adjusted) (PoS Adjusted) Base Case Downside Case Upside Case Source Maple management 1. Sales figure includes total WW revenue attributable to all companies booking revenue from direct sales 2. Worldwide sales shown (i.e. includes OUS sales from OUS jurisdictions that have been licensed to Oak or other 3rd parties) 3. Based on Maple management forecasts provided to Morgan Stanley on 12/29/2017 15
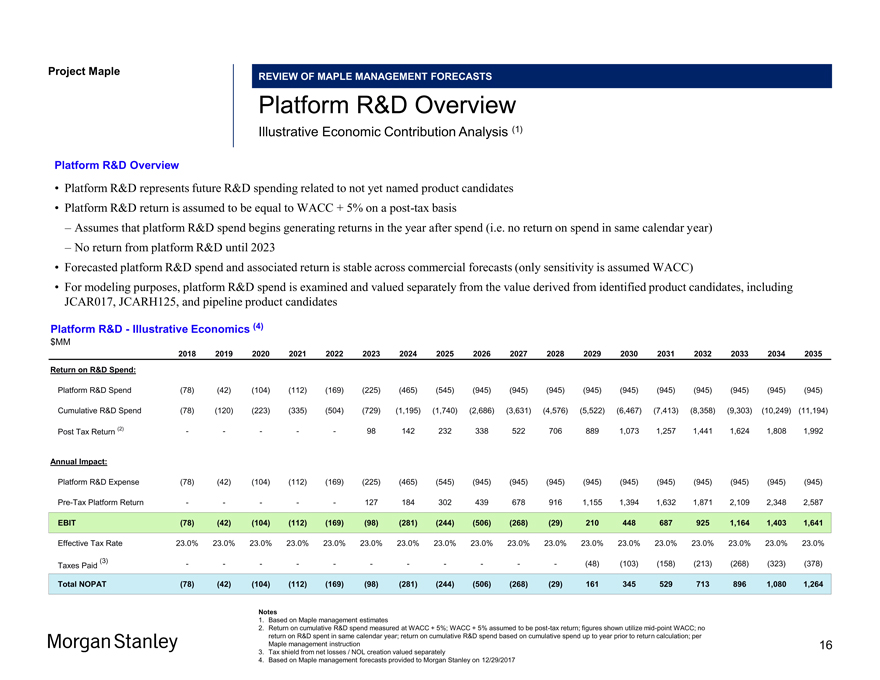
Project Maple REVIEW OF MAPLE MANAGEMENT FORECASTS Platform R&D Overview Illustrative Economic Contribution Analysis (1) Platform R&D Overview • Platform R&D represents future R&D spending related to not yet named product candidates • Platform R&D return is assumed to be equal to WACC + 5% on apost-tax basis – Assumes that platform R&D spend begins generating returns in the year after spend (i.e. no return on spend in same calendar year) – No return from platform R&D until 2023 • Forecasted platform R&D spend and associated return is stable across commercial forecasts (only sensitivity is assumed WACC) • For modeling purposes, platform R&D spend is examined and valued separately from the value derived from identified product candidates, including JCAR017, JCARH125, and pipeline product candidates Platform R&D—Illustrative Economics (4) $MM 2018 2019 2020 2021 2022 2023 2024 2025 2026 2027 2028 2029 2030 2031 2032 2033 2034 2035 Return on R&D Spend: Platform R&D Spend (78) (42) (104) (112) (169) (225) (465) (545) (945) (945) (945) (945) (945) (945) (945) (945) (945) (945) Cumulative R&D Spend (78) (120) (223) (335) (504) (729) (1,195) (1,740) (2,686) (3,631) (4,576) (5,522) (6,467) (7,413) (8,358) (9,303) (10,249) (11,194) Post Tax Return (2) — ——98 142 232 338 522 706 889 1,073 1,257 1,441 1,624 1,808 1,992 Annual Impact: Platform R&D Expense (78) (42) (104) (112) (169) (225) (465) (545) (945) (945) (945) (945) (945) (945) (945) (945) (945) (945)Pre-Tax Platform Return — ——127 184 302 439 678 916 1,155 1,394 1,632 1,871 2,109 2,348 2,587 EBIT (78) (42) (104) (112) (169) (98) (281) (244) (506) (268) (29) 210 448 687 925 1,164 1,403 1,641 Effective Tax Rate 23.0% 23.0% 23.0% 23.0% 23.0% 23.0% 23.0% 23.0% 23.0% 23.0% 23.0% 23.0% 23.0% 23.0% 23.0% 23.0% 23.0% 23.0% (3) — — — — ——(48) (103) (158) (213) (268) (323) (378) Taxes Paid Total NOPAT (78) (42) (104) (112) (169) (98) (281) (244) (506) (268) (29) 161 345 529 713 896 1,080 1,264 Notes 1. Based on Maple management estimates 2. Return on cumulative R&D spend measured at WACC + 5%; WACC + 5% assumed to bepost-tax return; figures shown utilizemid-point WACC; no return on R&D spent in same calendar year; return on cumulative R&D spend based on cumulative spend up to year prior to return calculation; per Maple management instruction 3. Tax shield from net losses / NOL creation valued separately 4. Based on Maple management forecasts provided to Morgan Stanley on 12/29/2017 16
Maple Board Discussion Materials v34.pptx\20 JAN 2018\11:33 AM\17
Project Maple
Section 3
Financial Analysis
17
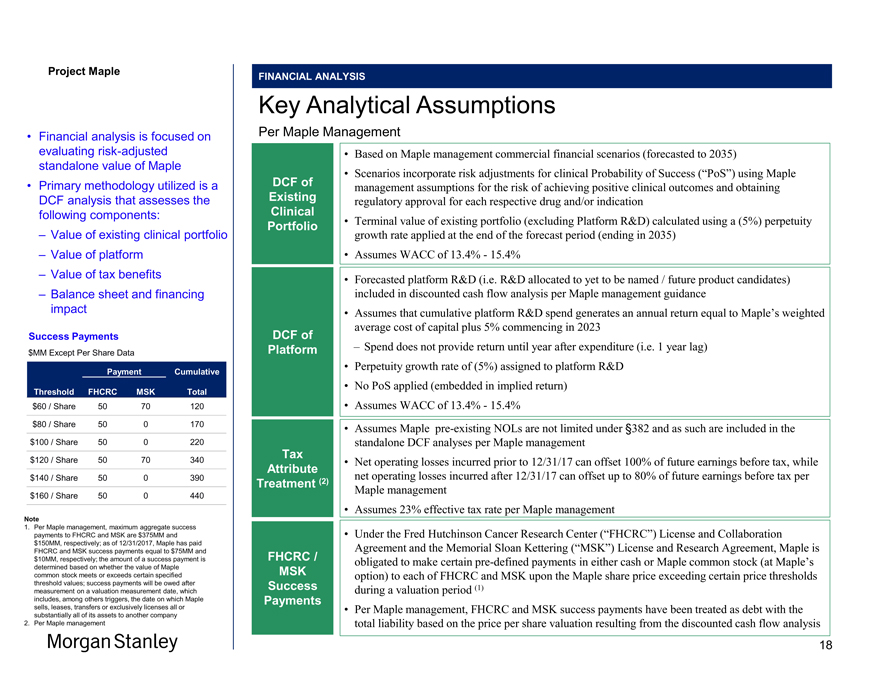
Project Maple FINANCIAL ANALYSIS Key Analytical Assumptions Per Maple Management • Based on Maple management commercial financial scenarios (forecasted to 2035) • Scenarios incorporate risk adjustments for clinical Probability of Success (“PoS”) using Maple DCF of management assumptions for the risk of achieving positive clinical outcomes and obtaining Existing regulatory approval for each respective drug and/or indication Clinical Portfolio • Terminal value of existing portfolio (excluding Platform R&D) calculated using a (5%) perpetuity growth rate applied at the end of the forecast period (ending in 2035) • Assumes WACC of 13.4%—15.4% • Forecasted platform R&D (i.e. R&D allocated to yet to be named / future product candidates) included in discounted cash flow analysis per Maple management guidance • Assumes that cumulative platform R&D spend generates an annual return equal to Maple’s weighted average cost of capital plus 5% commencing in 2023 DCF of Platform – Spend does not provide return until year after expenditure (i.e. 1 year lag) • Perpetuity growth rate of (5%) assigned to platform R&D • No PoS applied (embedded in implied return) • Assumes WACC of 13.4%—15.4% • Assumes Maplepre-existing NOLs are not limited under §382 and as such are included in the standalone DCF analyses per Maple management Tax • Net operating losses incurred prior to 12/31/17 can offset 100% of future earnings before tax, while Attribute net operating losses incurred after 12/31/17 can offset up to 80% of future earnings before tax per Treatment (2) Maple management • Assumes 23% effective tax rate per Maple management • Under the Fred Hutchinson Cancer Research Center (“FHCRC”) License and Collaboration Agreement and the Memorial Sloan Kettering (“MSK”) License and Research Agreement, Maple is FHCRC / obligated to make certainpre-defined payments in either cash or Maple common stock (at Maple’s MSK option) to each of FHCRC and MSK upon the Maple share price exceeding certain price thresholds Success during a valuation period (1) Payments • Per Maple management, FHCRC and MSK success payments have been treated as debt with the total liability based on the price per share valuation resulting from the discounted cash flow analysis • Financial analysis is focused on evaluating risk-adjusted standalone value of Maple • Primary methodology utilized is a DCF analysis that assesses the following components: – Value of existing clinical portfolio – Value of platform – Value of tax benefits – Balance sheet and financing impact Success Payments $MM Except Per Share Data Payment Cumulative Threshold FHCRC MSK Total $60 / Share 50 70 120 $80 / Share 50 0 170 $100 / Share 50 0 220 $120 / Share 50 70 340 $140 / Share 50 0 390 $160 / Share 50 0 440 Note 1. Per Maple management, maximum aggregate success payments to FHCRC and MSK are $375MM and $150MM, respectively; as of 12/31/2017, Maple has paid FHCRC and MSK success payments equal to $75MM and $10MM, respectively; the amount of a success payment is determined based on whether the value of Maple common stock meets or exceeds certain specified threshold values; success payments will be owed after measurement on a valuation measurement date, which includes, among others triggers, the date on which Maple sells, leases, transfers or exclusively licenses all or substantially all of its assets to another company 2. Per Maple management 18
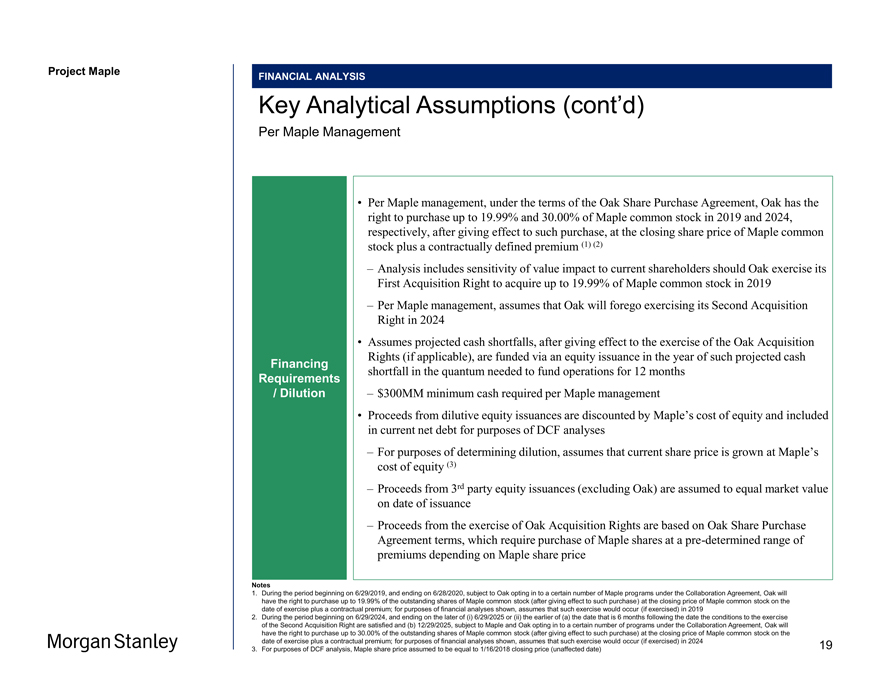
Project Maple FINANCIAL ANALYSIS Key Analytical Assumptions (cont’d) Per Maple Management • Per Maple management, under the terms of the Oak Share Purchase Agreement, Oak has the right to purchase up to 19.99% and 30.00% of Maple common stock in 2019 and 2024, respectively, after giving effect to such purchase, at the closing share price of Maple common stock plus a contractually defined premium (1) (2) – Analysis includes sensitivity of value impact to current shareholders should Oak exercise its First Acquisition Right to acquire up to 19.99% of Maple common stock in 2019 – Per Maple management, assumes that Oak will forego exercising its Second Acquisition Right in 2024 • Assumes projected cash shortfalls, after giving effect to the exercise of the Oak Acquisition Rights (if applicable), are funded via an equity issuance in the year of such projected cash Financing shortfall in the quantum needed to fund operations for 12 months Requirements / Dilution – $300MM minimum cash required per Maple management • Proceeds from dilutive equity issuances are discounted by Maple’s cost of equity and included in current net debt for purposes of DCF analyses – For purposes of determining dilution, assumes that current share price is grown at Maple’s cost of equity (3) – Proceeds from 3rd party equity issuances (excluding Oak) are assumed to equal market value on date of issuance – Proceeds from the exercise of Oak Acquisition Rights are based on Oak Share Purchase Agreement terms, which require purchase of Maple shares at apre-determined range of premiums depending on Maple share price Notes 1. During the period beginning on 6/29/2019, and ending on 6/28/2020, subject to Oak opting in to a certain number of Maple programs under the Collaboration Agreement, Oak will have the right to purchase up to 19.99% of the outstanding shares of Maple common stock (after giving effect to such purchase) at the closing price of Maple common stock on the date of exercise plus a contractual premium; for purposes of financial analyses shown, assumes that such exercise would occur (if exercised) in 2019 2. During the period beginning on 6/29/2024, and ending on the later of (i) 6/29/2025 or (ii) the earlier of (a) the date that is 6 months following the date the conditions to the exercise of the Second Acquisition Right are satisfied and (b) 12/29/2025, subject to Maple and Oak opting in to a certain number of programs under the Collaboration Agreement, Oak will have the right to purchase up to 30.00% of the outstanding shares of Maple common stock (after giving effect to such purchase) at the closing price of Maple common stock on the date of exercise plus a contractual premium; for purposes of financial analyses shown, assumes that such exercise would occur (if exercised) in 2024 3. For purposes of DCF analysis, Maple share price assumed to be equal to 1/16/2018 closing price (unaffected date) 19
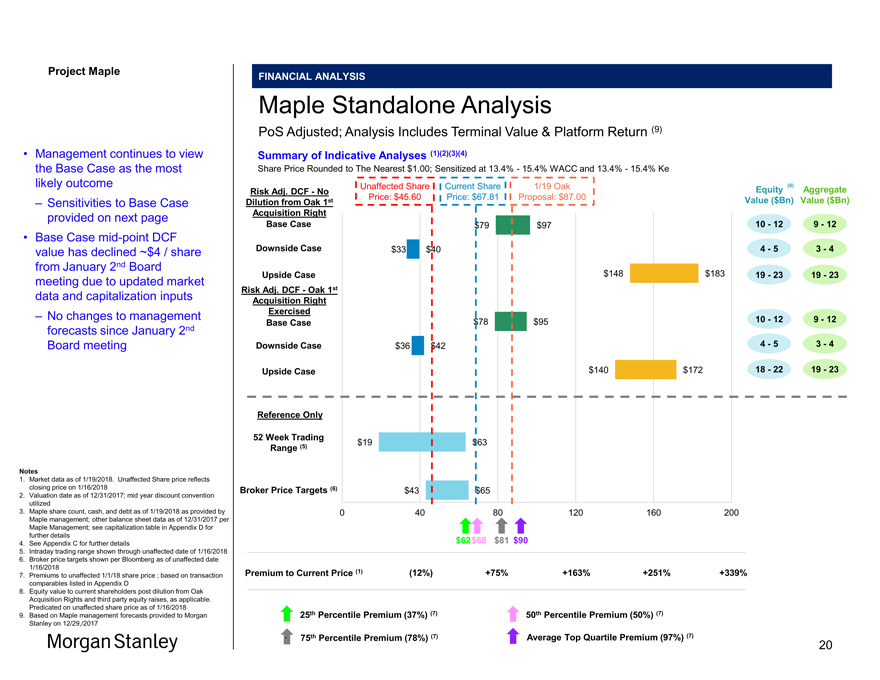
Project Maple Maple Board FINANCIAL ANALYSIS Maple Standalone Analysis PoS Adjusted; Analysis Includes Terminal Value & Platform Return (9) Summary of Indicative Analyses (1)(2)(3)(4) Share Price Rounded to The Nearest $1.00; Sensitized at 13.4%—15.4% WACC and 13.4%—15.4% Ke Risk Adj. DCF—No Unaffected Share Current Share 1/19 Oak Equity (8) Aggregate Price: $45.60 Price: $67.81 Proposal: $87.00 Dilution from Oak 1st Value ($Bn) Value ($Bn) Acquisition Right Base Case $79 $97 10—12 9—12 Downside Case $33 $40 4—5 3—4 Upside Case $148 $183 19—23 19—23 Risk Adj. DCF—Oak 1st Acquisition Right Exercised Base Case $78 $95 10—12 9—12 Downside Case $36 $42 4—5 3—4 Upside Case $140 $172 18—22 19—23 Reference Only 52 Week Trading $19 $63 Range (5) Broker Price Targets (6) $43 $65 0 40 80 120 160 200 $62 $68 $81 $90 Premium to Current Price (1) (12%) +75% +163% +251% +339% 25th Percentile Premium (37%) (7) 50th Percentile Premium (50%) (7) ` 75th Percentile Premium (78%) (7) Average Top Quartile Premium (97%) (7) • Management continues to view the Base Case as the most likely outcome – Sensitivities to Base Case provided on next page • Base Casemid-point DCF value has declined ~$4 / share from January 2nd Board meeting due to updated market data and capitalization inputs – No changes to management forecasts since January 2nd Board meeting Notes 1. Market data as of 1/19/2018. Unaffected Share price reflects closing price on 1/16/2018 2. Valuation date as of 12/31/2017; mid year discount convention utilized 3. Maple share count, cash, and debt as of 1/19/2018 as provided by Maple management; other balance sheet data as of 12/31/2017 per Maple Management; see capitalization table in Appendix D for further details 4. See Appendix C for further details 5. Intraday trading range shown through unaffected date of 1/16/2018 6. Broker price targets shown per Bloomberg as of unaffected date 1/16/2018 7. Premiums to unaffected 1/1/18 share price ; based on transaction comparables listed in Appendix D 8. Equity value to current shareholders post dilution from Oak Acquisition Rights and third party equity raises, as applicable. Predicated on unaffected share price as of 1/16/2018 9. Based on Maple management forecasts provided to Morgan Stanley on 12/29,/2017 20
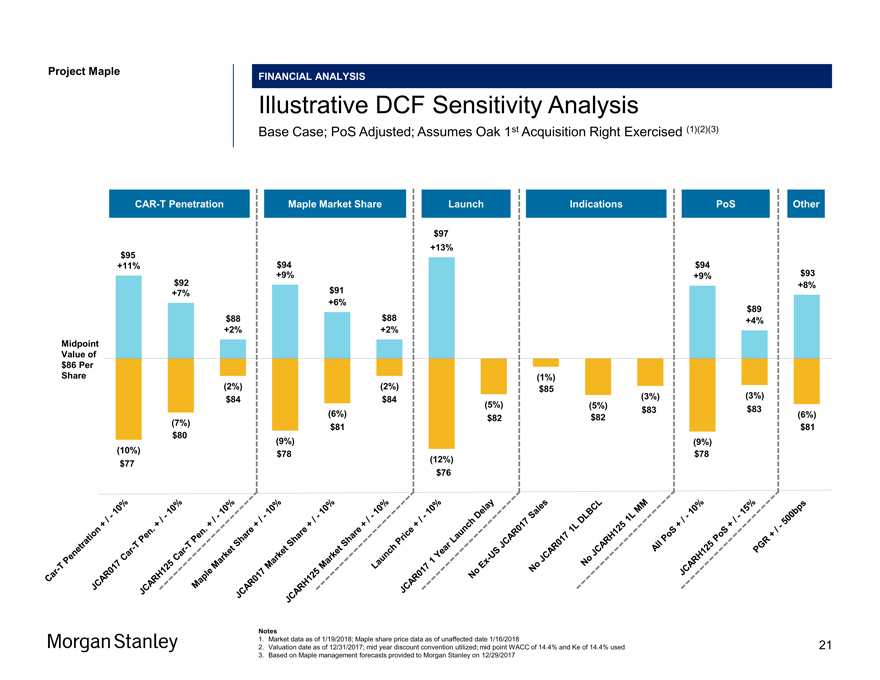
Project Maple Maple Board Discussion Materials FINANCIAL ANALYSIS Illustrative DCF Sensitivity Analysis Base Case; PoS Adjusted; Assumes Oak 1st Acquisition Right Exercised (1)(2)(3)CAR-T Penetration Maple Market Share Launch Indications PoS Other $97 $95 +13% +11% $94 $94 +9% +9% $93 $92 $91 +8% +7% +6% $89 $88 $88 +4% +2% +2% Midpoint Value of $86 Per Share (1%) (2%) (2%) $85 $84 (3%) (3%) $84 (5%) (5%) $83 $83 (6%) $82 (6%) $82 (7%) 80 $81 $81 $ (9%) (9%) (10%) $78 $78 10% (12%) $77 10%- $76 10% -/ 10%— / + 10% -/ + - 10%/ + / - + . / + Sales 15% . Year + Share—Pen 10% 1 MM / Share - Pen DLBCL + T / T—1L -Share + 1L 10% Car Market— PoS Car Market Lagged JCAR017 / 500bps Price +— Market US / Penetration —+ T —Ex JCAR017JCARH125 PoS JCAR017 Launch PGR Car JCARH125 Maple JCAR017 JCARH125 JCAR017 No No No All JCARH125 Notes 1. Market data as of 1/19/2018; Maple share price data as of unaffected date 1/16/2018 2. Valuation date as of 12/31/2017; mid year discount convention utilized; mid point WACC of 14.4% and Ke of 14.4% used 3. Based on Maple management forecasts provided to Morgan Stanley on 12/29/2017 21
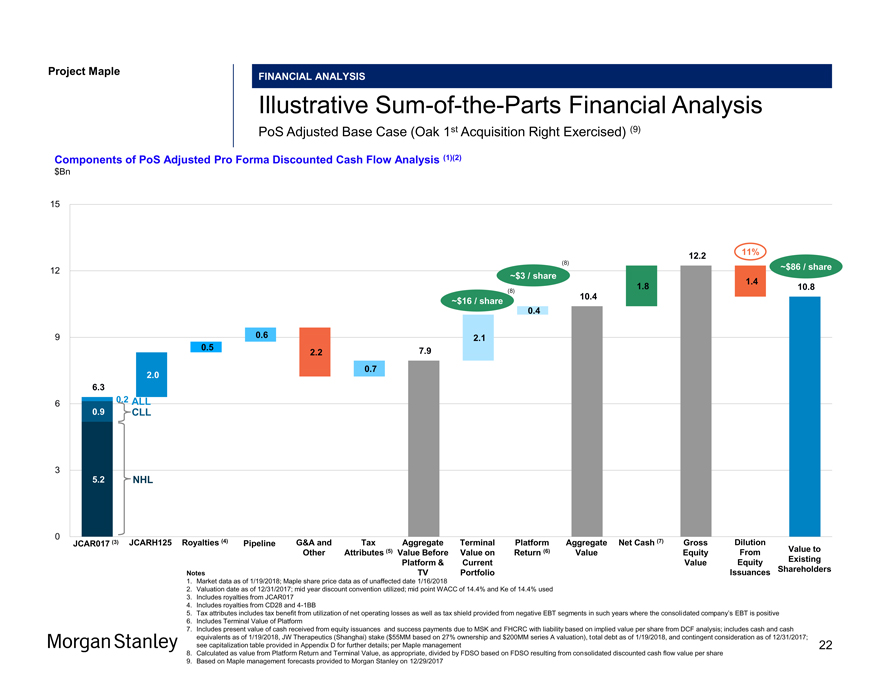
Project Maple Maple Board Discussion Materials v34.pptx\20 JAN 2018\11:33 FINANCIAL ANALYSIS IllustrativeSum-of-the-Parts Financial Analysis PoS Adjusted Base Case (Oak 1st Acquisition Right Exercised) (9) Components of PoS Adjusted Pro Forma Discounted Cash Flow Analysis (1)(2) $Bn 15 12.2 11% (8) ~$86 / sh 12 ~$3 / share 1.4 1.8 10.8 (8) 10.4 ~$16 / share 0.4 9 0.6 2.1 0.5 7.9 2.2 0.7 2.0 6.3 0.2 ALL 6 0.9 CLL 3 5.2 NHL 0 JCAR017 (3) JCARH125 Royalties (4) Pipeline G&A and Tax Aggregate Terminal Platform Aggregate Net Cash (7) Gross Dilution Other Attributes (5) Value Before Value on Return (6) Value Equity From Value to Platform & Current Value Equity Existing Issuances Shareholders Notes TV Portfolio Issuances Shareholders Notes TV Portfolio 1. Market data as of 1/19/2018; Maple share price data as of unaffected date 1/16/2018 2. Valuation date as of 12/31/2017; mid year discount convention utilized; mid point WACC of 14.4% and Ke of 14.4% used 3. Includes royalties from JCAR017 4. Includes royalties from CD28 and4-1BB 5. Tax attributes includes tax benefit from utilization of net operating losses as well as tax shield provided from negative EBT segments in such years where the consolidated company’s EBT is positive 6. Includes Terminal Value of Platform 7. Includes present value of cash received from equity issuances and success payments due to MSK and FHCRC with liability based on implied value per share from DCF analysis; includes cash and cash equivalents as of 1/19/2018, JW Therapeutics (Shanghai) stake ($55MM based on 27% ownership and $200MM series A valuation), total debt as of 1/19/2018, and contingent consideration as of 12/31/2017; see capitalization table provided in Appendix D for further details; per Maple management 22 8. Calculated as value from Platform Return and Terminal Value, as appropriate, divided by FDSO based on FDSO resulting from consolidated discounted cash flow value per share 9. Based on Maple management forecasts provided to Morgan Stanley on 12/29/2017
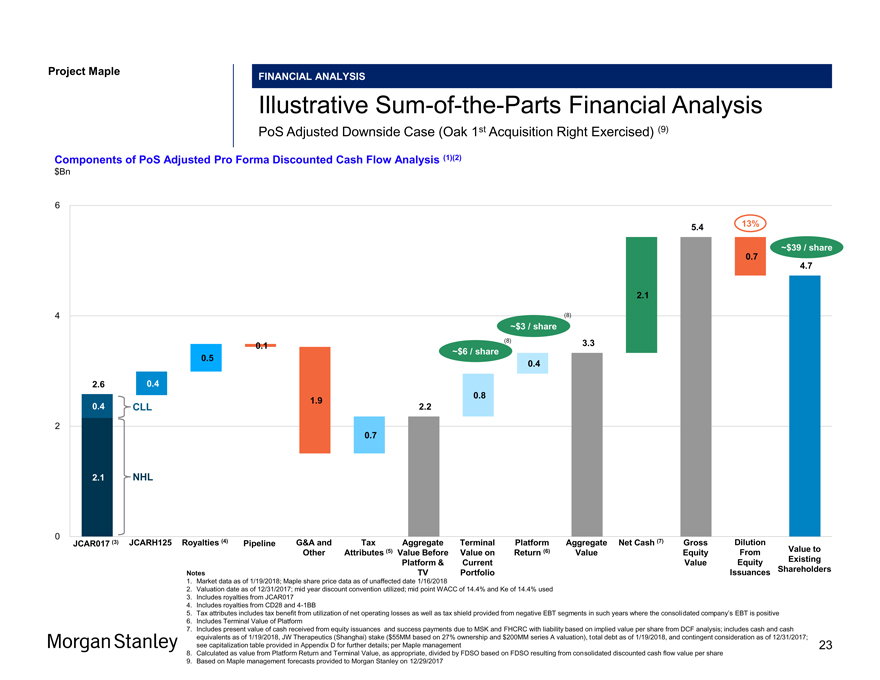
Project Maple Maple Board Discussion Materials v34.pptx\20 JAN FINANCIAL ANALYSIS IllustrativeSum-of-the-Parts Financial Analysis PoS Adjusted Downside Case (Oak 1st Acquisition Right Exercised) (9) Components of PoS Adjusted Pro Forma Discounted Cash Flow Analysis (1)(2) $Bn 6 5.4 13% ~$39 / share 0.7 4.7 2.1 4 (8) ~$3 / share (8) 3.3 0.1 ~$6 / share 0.5 0.4 2.6 0.4 0.8 1.9 0.4 CLL 2.2 2 0.7 2.1 NHL 0 JCAR017 (3) JCARH125 Royalties (4) Pipeline G&A and Tax Aggregate Terminal Platform Aggregate Net Cash (7) Gross Dilution Other Attributes (5) Value Before Value on Return (6) Value Equity From Value to Platform & Current Value Equity Existing Issuances Shareholders Notes TV Portfolio 1. Market data as of 1/19/2018; Maple share price data as of unaffected date 1/16/2018 Issuances Shareholders Notes TV Portfolio 1. Market data as of 1/19/2018; Maple share price data as of unaffected date 1/16/2018 2. Valuation date as of 12/31/2017; mid year discount convention utilized; mid point WACC of 14.4% and Ke of 14.4% used 3. Includes royalties from JCAR017 4. Includes royalties from CD28 and4-1BB 5. Tax attributes includes tax benefit from utilization of net operating losses as well as tax shield provided from negative EBT segments in such years where the consolidated company’s EBT is positive 6. Includes Terminal Value of Platform 7. Includes present value of cash received from equity issuances and success payments due to MSK and FHCRC with liability based on implied value per share from DCF analysis; includes cash and cash equivalents as of 1/19/2018, JW Therapeutics (Shanghai) stake ($55MM based on 27% ownership and $200MM series A valuation), total debt as of 1/19/2018, and contingent consideration as of 12/31/2017; see capitalization table provided in Appendix D for further details; per Maple management 23 8. Calculated as value from Platform Return and Terminal Value, as appropriate, divided by FDSO based on FDSO resulting from consolidated discounted cash flow value per share 9. Based on Maple management forecasts provided to Morgan Stanley on 12/29/2017
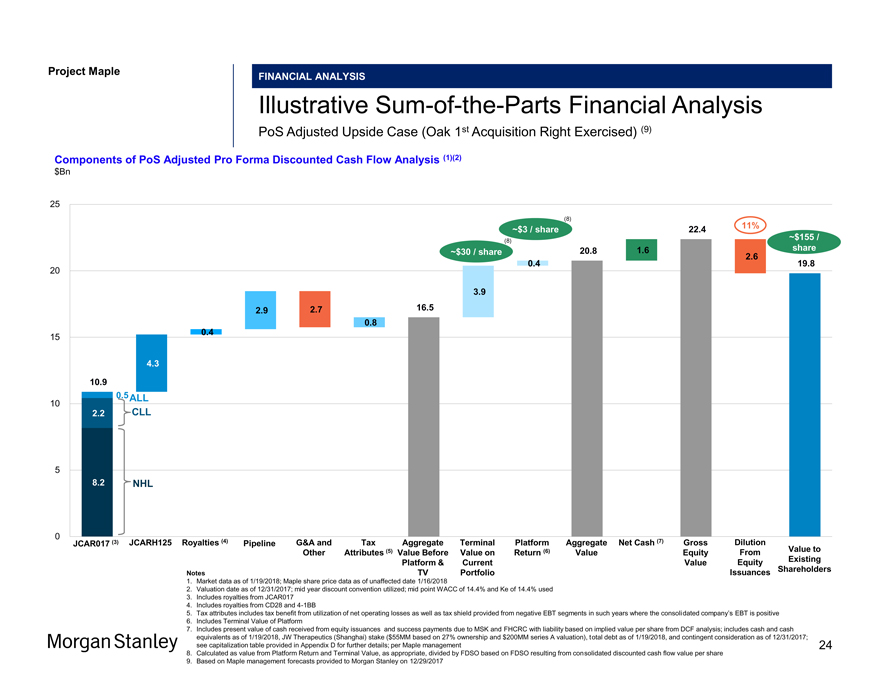
Project Maple Maple Board Discussion Materials v34.pptx\20 JAN FINANCIAL ANALYSIS IllustrativeSum-of-the-Parts Financial Analysis PoS Adjusted Upside Case (Oak 1st Acquisition Right Exercised) (9) Components of PoS Adjusted Pro Forma Discounted Cash Flow Analysis (1)(2) $Bn 25 (8) 11% ~$3 / share 22.4 ~$155 / (8) share ~$30 / share 20.8 1.6 2.6 0.4 19.8 20 3.9 2.9 2.7 16.5 0.8 0.4 15 4.3 10.9 10 0.5 ALL 2.2 CLL 5 8.2 NHL 0 JCAR017 (3) JCARH125 Royalties (4) Pipeline G&A and Tax Aggregate Terminal Platform Aggregate Net Cash (7) Gross Dilution Other Attributes (5) Value Before Value on Return (6) Value Equity From Value to Platform & Current Value Equity Existing Issuances Shareholders Notes TV Portfolio Notes TV Portfolio Issuances 1. Market data as of 1/19/2018; Maple share price data as of unaffected date 1/16/2018 2. Valuation date as of 12/31/2017; mid year discount convention utilized; mid point WACC of 14.4% and Ke of 14.4% used 3. Includes royalties from JCAR017 4. Includes royalties from CD28 and4-1BB 5. Tax attributes includes tax benefit from utilization of net operating losses as well as tax shield provided from negative EBT segments in such years where the consolidated company’s EBT is positive 6. Includes Terminal Value of Platform 7. Includes present value of cash received from equity issuances and success payments due to MSK and FHCRC with liability based on implied value per share from DCF analysis; includes cash and cash equivalents as of 1/19/2018, JW Therapeutics (Shanghai) stake ($55MM based on 27% ownership and $200MM series A valuation), total debt as of 1/19/2018, and contingent consideration as of 12/31/2017; see capitalization table provided in Appendix D for further details; per Maple management 24 8. Calculated as value from Platform Return and Terminal Value, as appropriate, divided by FDSO based on FDSO resulting from consolidated discounted cash flow value per share 9. Based on Maple management forecasts provided to Morgan Stanley on 12/29/2017
Maple Board Discussion Materials v34.pptx\20 JAN 2018\11:33 AM\25
Project Maple
Appendix A
PoS Adjusted Financials
25

Project Maple POS ADJUSTED FINANCIALS Maple Financial Summary Base Case; PoS Adjusted; Per Maple Management (2) Projections – PoS Adjusted Base Case $MM unless otherwise Noted 2018 2019 2020 2021 2022 2023 2024 2025 2026 2027 2028 2029 2030 2031 2032 2033 2034 2035 Income Statement JCAR017 US Revenue — 133 654 1,388 1,816 2,045 2,206 2,466 2,732 2,897 3,053 3,217 3,390 3,573 3,766 3,969 4,183 4,408 JCAR017Ex-US Royalty — — 6 49 120 159 171 176 190 204 207 208 210 211 212 214 215 217 JCARH125 Net Revenue — — 8 131 325 604 929 1,094 1,206 1,368 1,489 1,557 1,619 1,683 1,751 1,823 1,898 1,9774-1BB Royalty Revenue 5 8 13 20 26 33 38 41 45 49 52 55 28 — — — —-CD-28 Royalty Revenue 7 21 52 87 86 79 83 92 98 101 105 109 113 118 123 128 133 138 JCAR024(ROR-1) — — — — — — 5 14 38 63 110 162 197 221 232 240 248 257 JCAR020(MUC-16) — — — — — — 6 17 41 64 91 117 133 144 149 154 158 163 JTCR016(WT-1) — — — — — — 9 28 86 149 246 348 413 458 479 496 513 532 LeY — — — — — — 5 16 39 61 103 149 180 202 212 220 228 236 JTCR018 (HPV) — — — — — — 1 4 13 23 44 67 83 93 97 99 102 105 Total Net Sales 12 162 732 1,675 2,373 2,919 3,454 3,948 4,487 4,979 5,498 5,990 6,365 6,703 7,021 7,341 7,678 8,033 COGS — (42) (179) (383) (530) (639) (747) (711) (792) (862) (937) (1,004) (1,056) (1,103) (1,141) (1,178) (1,217) (1,258) Total Gross Profit 12 120 553 1,292 1,844 2,280 2,707 3,237 3,695 4,117 4,561 4,986 5,309 5,600 5,880 6,163 6,461 6,774 % Margin 100% 74% 76% 77% 78% 78% 78% 82% 82% 83% 83% 83% 83% 84% 84% 84% 84% 84% R&D—JCAR017 & JCARH125 (152) (194) (152) (166) (40) (25) (20) (20) (20) (20) (20) (20) (20) (20) (20) (20) (20) (20) R&D—Pipeline — — — — (177) (219) (42) (112) (70) (70) (10) (10) (10) (10) (10) (10) (10) (10) SG&A (207) (316) (416) (473) (492) (516) (541) (567) (589) (612) (636) (661) (687) (715) (743) (773) (803) (835) EBIT (347) (390) (15) 653 1,135 1,520 2,104 2,538 3,016 3,415 3,895 4,295 4,592 4,857 5,108 5,361 5,628 5,910 Margin n.m. (241%) (2.0%) 39.0% 47.8% 52.1% 60.9% 64.3% 67.2% 68.6% 70.9% 71.7% 72.1% 72.5% 72.8% 73.0% 73.3% 73.6% (1) (78) (42) (104) (112) (169) (98) (281) (244) (506) (268) (29) 210 448 687 925 1,164 1,403 1,641 Other Income (Expense) Cash Taxes — — — (25) (44) (286) (419) (528) (577) (724) (889) (1,036) (1,159) (1,275) (1,388) (1,501) (1,617) (1,737) Net Income Incl. NOL Adj. (425) (432) (119) 517 921 1,136 1,404 1,767 1,933 2,424 2,977 3,469 3,881 4,268 4,646 5,024 5,414 5,814 Capex (60) (50) (20) (20) (10) (10) (10) (30) (30) (20) (20) (10) (10) (10) (10) (10) (10) (10) Depreciation and Amortization 10 10 10 10 10 10 10 10 10 10 10 10 10 10 10 10 10 10 â^† in Net Working Capital (1) (15) (58) (100) (81) (73) (95) (133) (159) (124) (137) (130) (90) (68) (48) (44) (47) (49) Equity Issuance — 1,250 — — — — — — — — — — — — — — — —Ending Cash Balance 488 1,251 1,065 1,472 2,312 3,375 4,684 6,298 8,051 10,340 13,170 16,509 20,300 24,500 29,098 34,078 39,445 45,210 Note 1. Per Maple management; represents net of annual platform R&D and return on cumulative platform R&D at WACC + 5% on apost-tax basis,mid-point 26 WACC shown;grossed-up to reflectpre-tax figures; no PoS adjustment applied 2. Based on Maple management forecasts provided to Morgan Stanley on 12/29/2017
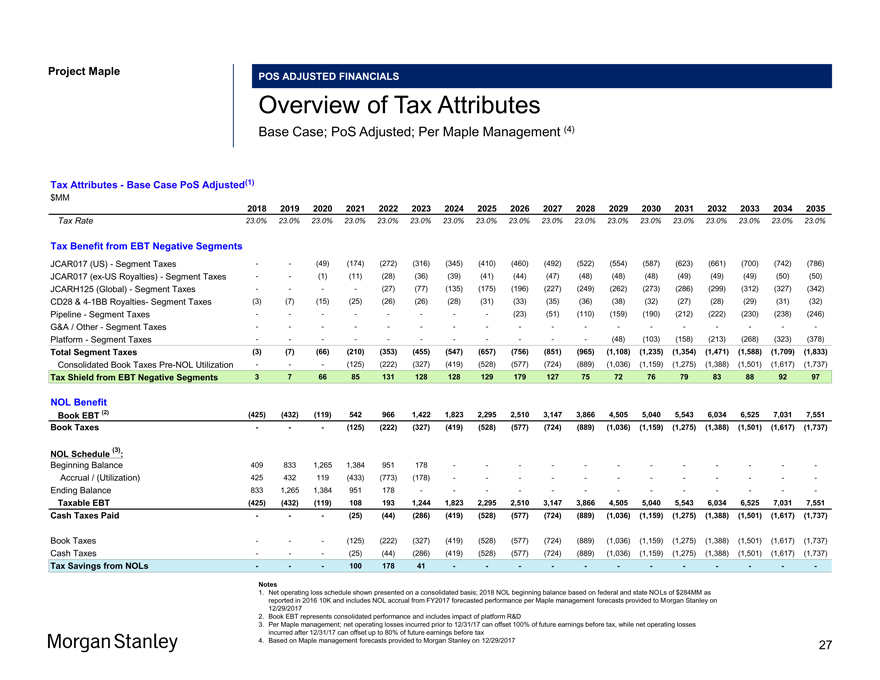
Project Maple POS ADJUSTED FINANCIALS Overview of Tax Attributes Base Case; PoS Adjusted; Per Maple Management (4) Tax Attributes—Base Case PoS Adjusted(1) $MM 2018 2019 2020 2021 2022 2023 2024 2025 2026 2027 2028 2029 2030 2031 2032 2033 2034 2035 Tax Rate 23.0% 23.0% 23.0% 23.0% 23.0% 23.0% 23.0% 23.0% 23.0% 23.0% 23.0% 23.0% 23.0% 23.0% 23.0% 23.0% 23.0% 23.0% Tax Benefit from EBT Negative Segments JCAR017 (US)—Segment Taxes — (49) (174) (272) (316) (345) (410) (460) (492) (522) (554) (587) (623) (661) (700) (742) (786) JCAR017(ex-US Royalties)—Segment Taxes — (1) (11) (28) (36) (39) (41) (44) (47) (48) (48) (48) (49) (49) (49) (50) (50) JCARH125 (Global)—Segment Taxes — — (27) (77) (135) (175) (196) (227) (249) (262) (273) (286) (299) (312) (327) (342) CD28 &4-1BB Royalties- Segment Taxes (3) (7) (15) (25) (26) (26) (28) (31) (33) (35) (36) (38) (32) (27) (28) (29) (31) (32) Pipeline—Segment Taxes — — — — (23) (51) (110) (159) (190) (212) (222) (230) (238) (246) G&A / Other—Segment Taxes — — — — — — — — — Platform—Segment Taxes — — — — ——(48) (103) (158) (213) (268) (323) (378) Total Segment Taxes (3) (7) (66) (210) (353) (455) (547) (657) (756) (851) (965) (1,108) (1,235) (1,354) (1,471) (1,588) (1,709) (1,833) Consolidated Book TaxesPre-NOL Utilization ——(125) (222) (327) (419) (528) (577) (724) (889) (1,036) (1,159) (1,275) (1,388) (1,501) (1,617) (1,737) Tax Shield from EBT Negative Segments 3 7 66 85 131 128 128 129 179 127 75 72 76 79 83 88 92 97 NOL Benefit Book EBT (2) (425) (432) (119) 542 966 1,422 1,823 2,295 2,510 3,147 3,866 4,505 5,040 5,543 6,034 6,525 7,031 7,551 Book Taxes ——(125) (222) (327) (419) (528) (577) (724) (889) (1,036) (1,159) (1,275) (1,388) (1,501) (1,617) (1,737) (3) NOL Schedule : Beginning Balance 409 833 1,265 1,384 951 178 — — — — — — Accrual / (Utilization) 425 432 119 (433) (773) (178) — — — — — —Ending Balance 833 1,265 1,384 951 178 — — — — — ——Taxable EBT (425) (432) (119) 108 193 1,244 1,823 2,295 2,510 3,147 3,866 4,505 5,040 5,543 6,034 6,525 7,031 7,551 Cash Taxes Paid ——(25) (44) (286) (419) (528) (577) (724) (889) (1,036) (1,159) (1,275) (1,388) (1,501) (1,617) (1,737) Book Taxes ——(125) (222) (327) (419) (528) (577) (724) (889) (1,036) (1,159) (1,275) (1,388) (1,501) (1,617) (1,737) Cash Taxes ——(25) (44) (286) (419) (528) (577) (724) (889) (1,036) (1,159) (1,275) (1,388) (1,501) (1,617) (1,737) Tax Savings from NOLs ——100 178 41 — — — — — — Notes 1. Net operating loss schedule shown presented on a consolidated basis; 2018 NOL beginning balance based on federal and state NOLs of $284MM as reported in 2016 10K and includes NOL accrual from FY2017 forecasted performance per Maple management forecasts provided to Morgan Stanley on 12/29/2017 2. Book EBT represents consolidated performance and includes impact of platform R&D 3. Per Maple management; net operating losses incurred prior to 12/31/17 can offset 100% of future earnings before tax, while net operating losses incurred after 12/31/17 can offset up to 80% of future earnings before tax 4. Based on Maple management forecasts provided to Morgan Stanley on 12/29/2017 27
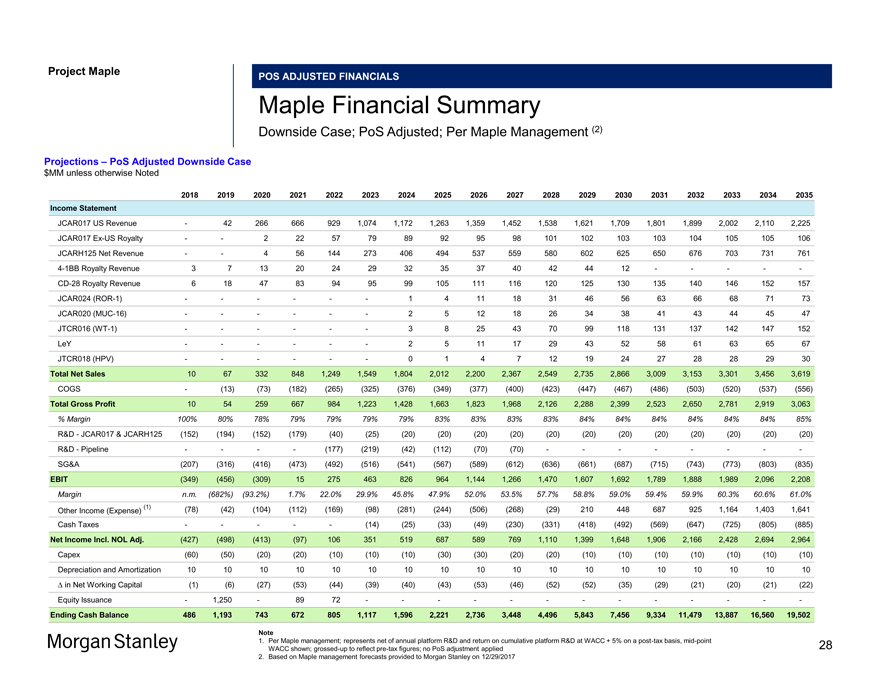
Project Maple POS ADJUSTED FINANCIALS Maple Financial Summary Downside Case; PoS Adjusted; Per Maple Management (2) Projections – PoS Adjusted Downside Case $MM unless otherwise Noted 2018 2019 2020 2021 2022 2023 2024 2025 2026 2027 2028 2029 2030 2031 2032 2033 2034 2035 Income Statement JCAR017 US Revenue — 42 266 666 929 1,074 1,172 1,263 1,359 1,452 1,538 1,621 1,709 1,801 1,899 2,002 2,110 2,225 JCAR017Ex-US Royalty — — 2 22 57 79 89 92 95 98 101 102 103 103 104 105 105 106 JCARH125 Net Revenue — — 4 56 144 273 406 494 537 559 580 602 625 650 676 703 731 7614-1BB Royalty Revenue 3 7 13 20 24 29 32 35 37 40 42 44 12 — — — —-CD-28 Royalty Revenue 6 18 47 83 94 95 99 105 111 116 120 125 130 135 140 146 152 157 JCAR024(ROR-1) — — — — — — 1 4 11 18 31 46 56 63 66 68 71 73 JCAR020(MUC-16) — — — — — — 2 5 12 18 26 34 38 41 43 44 45 47 JTCR016(WT-1) — — — — — — 3 8 25 43 70 99 118 131 137 142 147 152 LeY — — — — — — 2 5 11 17 29 43 52 58 61 63 65 67 JTCR018 (HPV) — — — — — — 0 1 4 7 12 19 24 27 28 28 29 30 Total Net Sales 10 67 332 848 1,249 1,549 1,804 2,012 2,200 2,367 2,549 2,735 2,866 3,009 3,153 3,301 3,456 3,619 COGS — (13) (73) (182) (265) (325) (376) (349) (377) (400) (423) (447) (467) (486) (503) (520) (537) (556) Total Gross Profit 10 54 259 667 984 1,223 1,428 1,663 1,823 1,968 2,126 2,288 2,399 2,523 2,650 2,781 2,919 3,063 % Margin 100% 80% 78% 79% 79% 79% 79% 83% 83% 83% 83% 84% 84% 84% 84% 84% 84% 85% R&D—JCAR017 & JCARH125 (152) (194) (152) (179) (40) (25) (20) (20) (20) (20) (20) (20) (20) (20) (20) (20) (20) (20) R&D—Pipeline — — — — (177) (219) (42) (112) (70) (70) — — — — — — —-SG&A (207) (316) (416) (473) (492) (516) (541) (567) (589) (612) (636) (661) (687) (715) (743) (773) (803) (835) EBIT (349) (456) (309) 15 275 463 826 964 1,144 1,266 1,470 1,607 1,692 1,789 1,888 1,989 2,096 2,208 Margin n.m. (682%) (93.2%) 1.7% 22.0% 29.9% 45.8% 47.9% 52.0% 53.5% 57.7% 58.8% 59.0% 59.4% 59.9% 60.3% 60.6% 61.0% (1) (78) (42) (104) (112) (169) (98) (281) (244) (506) (268) (29) 210 448 687 925 1,164 1,403 1,641 Other Income (Expense) Cash Taxes — — — — — (14) (25) (33) (49) (230) (331) (418) (492) (569) (647) (725) (805) (885) Net Income Incl. NOL Adj. (427) (498) (413) (97) 106 351 519 687 589 769 1,110 1,399 1,648 1,906 2,166 2,428 2,694 2,964 Capex (60) (50) (20) (20) (10) (10) (10) (30) (30) (20) (20) (10) (10) (10) (10) (10) (10) (10) Depreciation and Amortization 10 10 10 10 10 10 10 10 10 10 10 10 10 10 10 10 10 10 â^† in Net Working Capital (1) (6) (27) (53) (44) (39) (40) (43) (53) (46) (52) (52) (35) (29) (21) (20) (21) (22) Equity Issuance — 1,250 — 89 72 — — — — — — — — — — — — —Ending Cash Balance 486 1,193 743 672 805 1,117 1,596 2,221 2,736 3,448 4,496 5,843 7,456 9,334 11,479 13,887 16,560 19,502 Note 1. Per Maple management; represents net of annual platform R&D and return on cumulative platform R&D at WACC + 5% on apost-tax basis,mid-point WACC shown;grossed-up to reflectpre-tax figures; no PoS adjustment applied 2. Based on Maple management forecasts provided to Morgan Stanley on 12/29/2017 28
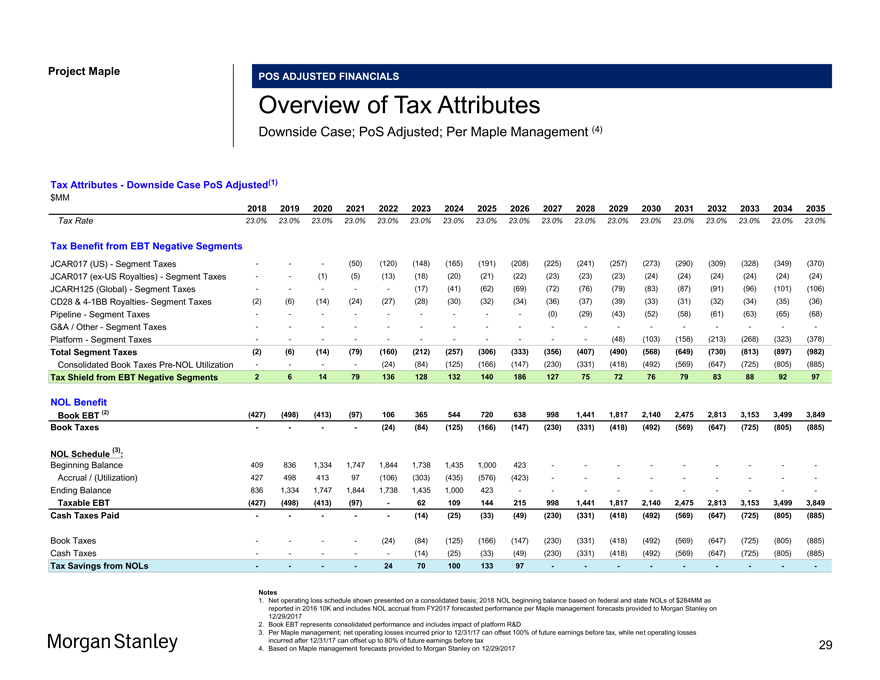
Project Maple POS ADJUSTED FINANCIALS Overview of Tax Attributes Downside Case; PoS Adjusted; Per Maple Management (4) Tax Attributes—Downside Case PoS Adjusted(1) $MM 2018 2019 2020 2021 2022 2023 2024 2025 2026 2027 2028 2029 2030 2031 2032 2033 2034 2035 Tax Rate 23.0% 23.0% 23.0% 23.0% 23.0% 23.0% 23.0% 23.0% 23.0% 23.0% 23.0% 23.0% 23.0% 23.0% 23.0% 23.0% 23.0% 23.0% Tax Benefit from EBT Negative Segments JCAR017 (US)—Segment Taxes ——(50) (120) (148) (165) (191) (208) (225) (241) (257) (273) (290) (309) (328) (349) (370) JCAR017(ex-US Royalties)—Segment Taxes — (1) (5) (13) (18) (20) (21) (22) (23) (23) (23) (24) (24) (24) (24) (24) (24) JCARH125 (Global)—Segment Taxes — ——(17) (41) (62) (69) (72) (76) (79) (83) (87) (91) (96) (101) (106) CD28 &4-1BB Royalties- Segment Taxes (2) (6) (14) (24) (27) (28) (30) (32) (34) (36) (37) (39) (33) (31) (32) (34) (35) (36) Pipeline—Segment Taxes — — — ——(0) (29) (43) (52) (58) (61) (63) (65) (68) G&A / Other—Segment Taxes — — — — — — — — — Platform—Segment Taxes — — — — ——(48) (103) (158) (213) (268) (323) (378) Total Segment Taxes (2) (6) (14) (79) (160) (212) (257) (306) (333) (356) (407) (490) (568) (649) (730) (813) (897) (982) Consolidated Book TaxesPre-NOL Utilization — — (24) (84) (125) (166) (147) (230) (331) (418) (492) (569) (647) (725) (805) (885) Tax Shield from EBT Negative Segments 2 6 14 79 136 128 132 140 186 127 75 72 76 79 83 88 92 97 NOL Benefit Book EBT (2) (427) (498) (413) (97) 106 365 544 720 638 998 1,441 1,817 2,140 2,475 2,813 3,153 3,499 3,849 Book Taxes — — (24) (84) (125) (166) (147) (230) (331) (418) (492) (569) (647) (725) (805) (885) (3) NOL Schedule : Beginning Balance 409 836 1,334 1,747 1,844 1,738 1,435 1,000 423 — — — — -Accrual / (Utilization) 427 498 413 97 (106) (303) (435) (576) (423) — — — — -Ending Balance 836 1,334 1,747 1,844 1,738 1,435 1,000 423 — — — — — Taxable EBT (427) (498) (413) (97)—62 109 144 215 998 1,441 1,817 2,140 2,475 2,813 3,153 3,499 3,849 Cash Taxes Paid — ——(14) (25) (33) (49) (230) (331) (418) (492) (569) (647) (725) (805) (885) Book Taxes — — (24) (84) (125) (166) (147) (230) (331) (418) (492) (569) (647) (725) (805) (885) Cash Taxes — ——(14) (25) (33) (49) (230) (331) (418) (492) (569) (647) (725) (805) (885) Tax Savings from NOLs — — 24 70 100 133 97 — — — —— Notes 1. Net operating loss schedule shown presented on a consolidated basis; 2018 NOL beginning balance based on federal and state NOLs of $284MM as reported in 2016 10K and includes NOL accrual from FY2017 forecasted performance per Maple management forecasts provided to Morgan Stanley on 12/29/2017 2. Book EBT represents consolidated performance and includes impact of platform R&D 3. Per Maple management; net operating losses incurred prior to 12/31/17 can offset 100% of future earnings before tax, while net operating losses incurred after 12/31/17 can offset up to 80% of future earnings before tax 4. Based on Maple management forecasts provided to Morgan Stanley on 12/29/2017 29
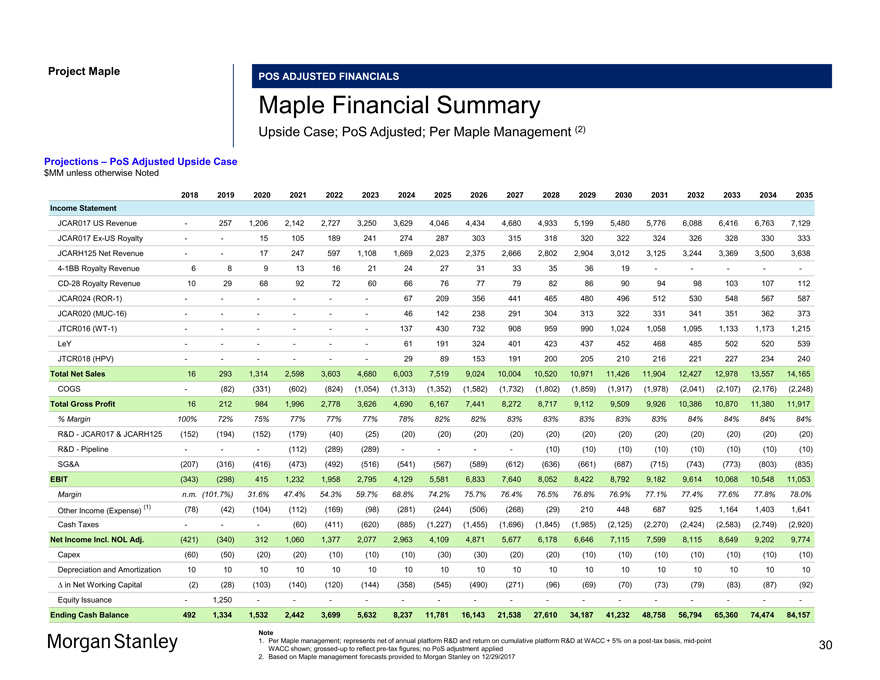
Project Maple POS ADJUSTED FINANCIALS Maple Financial Summary Upside Case; PoS Adjusted; Per Maple Management (2) Projections – PoS Adjusted Upside Case $MM unless otherwise Noted 2018 2019 2020 2021 2022 2023 2024 2025 2026 2027 2028 2029 2030 2031 2032 2033 2034 2035 Income Statement JCAR017 US Revenue — 257 1,206 2,142 2,727 3,250 3,629 4,046 4,434 4,680 4,933 5,199 5,480 5,776 6,088 6,416 6,763 7,129 JCAR017Ex-US Royalty — — 15 105 189 241 274 287 303 315 318 320 322 324 326 328 330 333 JCARH125 Net Revenue — — 17 247 597 1,108 1,669 2,023 2,375 2,666 2,802 2,904 3,012 3,125 3,244 3,369 3,500 3,6384-1BB Royalty Revenue 6 8 9 13 16 21 24 27 31 33 35 36 19 — — — —-CD-28 Royalty Revenue 10 29 68 92 72 60 66 76 77 79 82 86 90 94 98 103 107 112 JCAR024(ROR-1) — — — — — — 67 209 356 441 465 480 496 512 530 548 567 587 JCAR020(MUC-16) — — — — — — 46 142 238 291 304 313 322 331 341 351 362 373 JTCR016(WT-1) — — — — — — 137 430 732 908 959 990 1,024 1,058 1,095 1,133 1,173 1,215 LeY — — — — — — 61 191 324 401 423 437 452 468 485 502 520 539 JTCR018 (HPV) — — — — — — 29 89 153 191 200 205 210 216 221 227 234 240 Total Net Sales 16 293 1,314 2,598 3,603 4,680 6,003 7,519 9,024 10,004 10,520 10,971 11,426 11,904 12,427 12,978 13,557 14,165 COGS — (82) (331) (602) (824) (1,054) (1,313) (1,352) (1,582) (1,732) (1,802) (1,859) (1,917) (1,978) (2,041) (2,107) (2,176) (2,248) Total Gross Profit 16 212 984 1,996 2,778 3,626 4,690 6,167 7,441 8,272 8,717 9,112 9,509 9,926 10,386 10,870 11,380 11,917 % Margin 100% 72% 75% 77% 77% 77% 78% 82% 82% 83% 83% 83% 83% 83% 84% 84% 84% 84% R&D—JCAR017 & JCARH125 (152) (194) (152) (179) (40) (25) (20) (20) (20) (20) (20) (20) (20) (20) (20) (20) (20) (20) R&D—Pipeline — — — (112) (289) (289) — — — — (10) (10) (10) (10) (10) (10) (10) (10) SG&A (207) (316) (416) (473) (492) (516) (541) (567) (589) (612) (636) (661) (687) (715) (743) (773) (803) (835) EBIT (343) (298) 415 1,232 1,958 2,795 4,129 5,581 6,833 7,640 8,052 8,422 8,792 9,182 9,614 10,068 10,548 11,053 Margin n.m. (101.7%) 31.6% 47.4% 54.3% 59.7% 68.8% 74.2% 75.7% 76.4% 76.5% 76.8% 76.9% 77.1% 77.4% 77.6% 77.8% 78.0% (1) (78) (42) (104) (112) (169) (98) (281) (244) (506) (268) (29) 210 448 687 925 1,164 1,403 1,641 Other Income (Expense) Cash Taxes — — — (60) (411) (620) (885) (1,227) (1,455) (1,696) (1,845) (1,985) (2,125) (2,270) (2,424) (2,583) (2,749) (2,920) Net Income Incl. NOL Adj. (421) (340) 312 1,060 1,377 2,077 2,963 4,109 4,871 5,677 6,178 6,646 7,115 7,599 8,115 8,649 9,202 9,774 Capex (60) (50) (20) (20) (10) (10) (10) (30) (30) (20) (20) (10) (10) (10) (10) (10) (10) (10) Depreciation and Amortization 10 10 10 10 10 10 10 10 10 10 10 10 10 10 10 10 10 10 â^† in Net Working Capital (2) (28) (103) (140) (120) (144) (358) (545) (490) (271) (96) (69) (70) (73) (79) (83) (87) (92) Equity Issuance — 1,250 — — — — — — — — — — — — — — — —Ending Cash Balance 492 1,334 1,532 2,442 3,699 5,632 8,237 11,781 16,143 21,538 27,610 34,187 41,232 48,758 56,794 65,360 74,474 84,157 Note 1. Per Maple management; represents net of annual platform R&D and return on cumulative platform R&D at WACC + 5% on apost-tax basis,mid-point WACC shown;grossed-up to reflectpre-tax figures; no PoS adjustment applied 2. Based on Maple management forecasts provided to Morgan Stanley on 12/29/2017 30
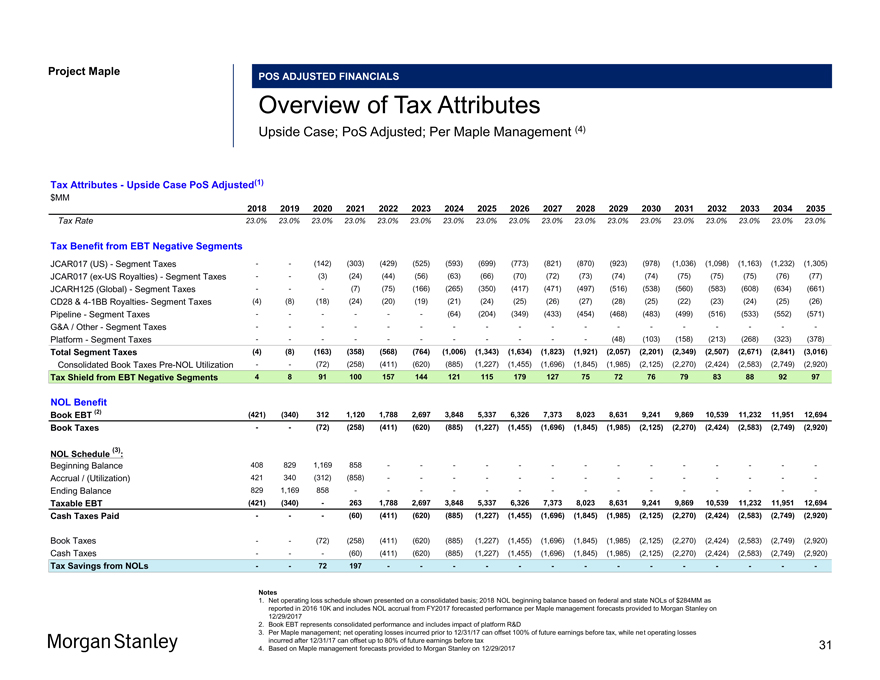
Project Maple POS ADJUSTED FINANCIALS Overview of Tax Attributes Upside Case; PoS Adjusted; Per Maple Management (4) Tax Attributes—Upside Case PoS Adjusted(1) $MM 2018 2019 2020 2021 2022 2023 2024 2025 2026 2027 2028 2029 2030 2031 2032 2033 2034 2035 Tax Rate 23.0% 23.0% 23.0% 23.0% 23.0% 23.0% 23.0% 23.0% 23.0% 23.0% 23.0% 23.0% 23.0% 23.0% 23.0% 23.0% 23.0% 23.0% Tax Benefit from EBT Negative Segments JCAR017 (US)—Segment Taxes — (142) (303) (429) (525) (593) (699) (773) (821) (870) (923) (978) (1,036) (1,098) (1,163) (1,232) (1,305) JCAR017(ex-US Royalties)—Segment Taxes — (3) (24) (44) (56) (63) (66) (70) (72) (73) (74) (74) (75) (75) (75) (76) (77) JCARH125 (Global)—Segment Taxes ——(7) (75) (166) (265) (350) (417) (471) (497) (516) (538) (560) (583) (608) (634) (661) CD28 &4-1BB Royalties- Segment Taxes (4) (8) (18) (24) (20) (19) (21) (24) (25) (26) (27) (28) (25) (22) (23) (24) (25) (26) Pipeline—Segment Taxes — — — (64) (204) (349) (433) (454) (468) (483) (499) (516) (533) (552) (571) G&A / Other—Segment Taxes — — — — — — — — — Platform—Segment Taxes — — — — ——(48) (103) (158) (213) (268) (323) (378) Total Segment Taxes (4) (8) (163) (358) (568) (764) (1,006) (1,343) (1,634) (1,823) (1,921) (2,057) (2,201) (2,349) (2,507) (2,671) (2,841) (3,016) Consolidated Book TaxesPre-NOL Utilization — (72) (258) (411) (620) (885) (1,227) (1,455) (1,696) (1,845) (1,985) (2,125) (2,270) (2,424) (2,583) (2,749) (2,920) Tax Shield from EBT Negative Segments 4 8 91 100 157 144 121 115 179 127 75 72 76 79 83 88 92 97 NOL Benefit Book EBT (2) (421) (340) 312 1,120 1,788 2,697 3,848 5,337 6,326 7,373 8,023 8,631 9,241 9,869 10,539 11,232 11,951 12,694 Book Taxes — (72) (258) (411) (620) (885) (1,227) (1,455) (1,696) (1,845) (1,985) (2,125) (2,270) (2,424) (2,583) (2,749) (2,920) (3) NOL Schedule : Beginning Balance 408 829 1,169 858 — — — — — — —Accrual / (Utilization) 421 340 (312) (858) — — — — — — —Ending Balance 829 1,169 858 — — — — — — ——Taxable EBT (421) (340)—263 1,788 2,697 3,848 5,337 6,326 7,373 8,023 8,631 9,241 9,869 10,539 11,232 11,951 12,694 Cash Taxes Paid ——(60) (411) (620) (885) (1,227) (1,455) (1,696) (1,845) (1,985) (2,125) (2,270) (2,424) (2,583) (2,749) (2,920) Book Taxes — (72) (258) (411) (620) (885) (1,227) (1,455) (1,696) (1,845) (1,985) (2,125) (2,270) (2,424) (2,583) (2,749) (2,920) Cash Taxes ——(60) (411) (620) (885) (1,227) (1,455) (1,696) (1,845) (1,985) (2,125) (2,270) (2,424) (2,583) (2,749) (2,920) Tax Savings from NOLs — 72 197 — — — — — — — Notes 1. Net operating loss schedule shown presented on a consolidated basis; 2018 NOL beginning balance based on federal and state NOLs of $284MM as reported in 2016 10K and includes NOL accrual from FY2017 forecasted performance per Maple management forecasts provided to Morgan Stanley on 12/29/2017 2. Book EBT represents consolidated performance and includes impact of platform R&D 3. Per Maple management; net operating losses incurred prior to 12/31/17 can offset 100% of future earnings before tax, while net operating losses incurred after 12/31/17 can offset up to 80% of future earnings before tax 4. Based on Maple management forecasts provided to Morgan Stanley on 12/29/2017 31
Maple Board Discussion Materials v34.pptx\20 JAN 2018\11:33 AM\32
Project Maple
Appendix B
Non-PoS Adjusted Financials
32
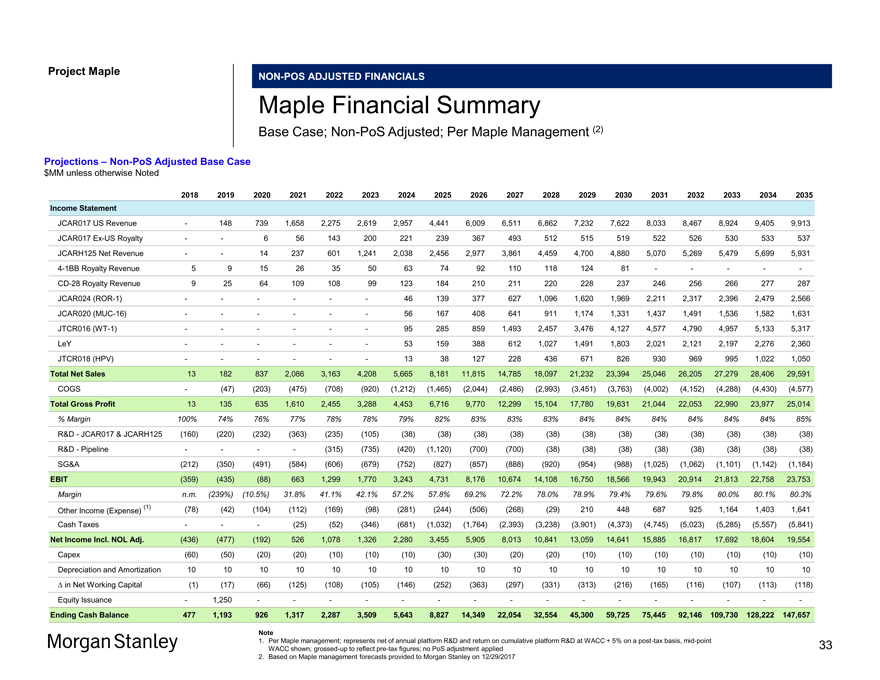
Project MapleNON-POS ADJUSTED FINANCIALS Maple Financial Summary Base Case;Non-PoS Adjusted; Per Maple Management (2) Projections –Non-PoS Adjusted Base Case $MM unless otherwise Noted 2018 2019 2020 2021 2022 2023 2024 2025 2026 2027 2028 2029 2030 2031 2032 2033 2034 2035 Income Statement JCAR017 US Revenue — 148 739 1,658 2,275 2,619 2,957 4,441 6,009 6,511 6,862 7,232 7,622 8,033 8,467 8,924 9,405 9,913 JCAR017Ex-US Royalty — — 6 56 143 200 221 239 367 493 512 515 519 522 526 530 533 537 JCARH125 Net Revenue — — 14 237 601 1,241 2,038 2,456 2,977 3,861 4,459 4,700 4,880 5,070 5,269 5,479 5,699 5,9314-1BB Royalty Revenue 5 9 15 26 35 50 63 74 92 110 118 124 81 — — — —-CD-28 Royalty Revenue 9 25 64 109 108 99 123 184 210 211 220 228 237 246 256 266 277 287 JCAR024(ROR-1) — — — — — — 46 139 377 627 1,096 1,620 1,969 2,211 2,317 2,396 2,479 2,566 JCAR020(MUC-16) — — — — — — 56 167 408 641 911 1,174 1,331 1,437 1,491 1,536 1,582 1,631 JTCR016(WT-1) — — — — — — 95 285 859 1,493 2,457 3,476 4,127 4,577 4,790 4,957 5,133 5,317 LeY — — — — — — 53 159 388 612 1,027 1,491 1,803 2,021 2,121 2,197 2,276 2,360 JTCR018 (HPV) — — — — — — 13 38 127 228 436 671 826 930 969 995 1,022 1,050 Total Net Sales 13 182 837 2,086 3,163 4,208 5,665 8,181 11,815 14,785 18,097 21,232 23,394 25,046 26,205 27,279 28,406 29,591 COGS — (47) (203) (475) (708) (920) (1,212) (1,465) (2,044) (2,486) (2,993) (3,451) (3,763) (4,002) (4,152) (4,288) (4,430) (4,577) Total Gross Profit 13 135 635 1,610 2,455 3,288 4,453 6,716 9,770 12,299 15,104 17,780 19,631 21,044 22,053 22,990 23,977 25,014 % Margin 100% 74% 76% 77% 78% 78% 79% 82% 83% 83% 83% 84% 84% 84% 84% 84% 84% 85% R&D—JCAR017 & JCARH125 (160) (220) (232) (363) (235) (105) (38) (38) (38) (38) (38) (38) (38) (38) (38) (38) (38) (38) R&D—Pipeline — — — — (315) (735) (420) (1,120) (700) (700) (38) (38) (38) (38) (38) (38) (38) (38) SG&A (212) (350) (491) (584) (606) (679) (752) (827) (857) (888) (920) (954) (988) (1,025) (1,062) (1,101) (1,142) (1,184) EBIT (359) (435) (88) 663 1,299 1,770 3,243 4,731 8,176 10,674 14,108 16,750 18,566 19,943 20,914 21,813 22,758 23,753 Margin n.m. (239%) (10.5%) 31.8% 41.1% 42.1% 57.2% 57.8% 69.2% 72.2% 78.0% 78.9% 79.4% 79.6% 79.8% 80.0% 80.1% 80.3% (1) (78) (42) (104) (112) (169) (98) (281) (244) (506) (268) (29) 210 448 687 925 1,164 1,403 1,641 Other Income (Expense) Cash Taxes — — — (25) (52) (346) (681) (1,032) (1,764) (2,393) (3,238) (3,901) (4,373) (4,745) (5,023) (5,285) (5,557) (5,841) Net Income Incl. NOL Adj. (436) (477) (192) 526 1,078 1,326 2,280 3,455 5,905 8,013 10,841 13,059 14,641 15,885 16,817 17,692 18,604 19,554 Capex (60) (50) (20) (20) (10) (10) (10) (30) (30) (20) (20) (10) (10) (10) (10) (10) (10) (10) Depreciation and Amortization 10 10 10 10 10 10 10 10 10 10 10 10 10 10 10 10 10 10 â^† in Net Working Capital (1) (17) (66) (125) (108) (105) (146) (252) (363) (297) (331) (313) (216) (165) (116) (107) (113) (118) Equity Issuance — 1,250 — — — — — — — — — — — — — — — —Ending Cash Balance 477 1,193 926 1,317 2,287 3,509 5,643 8,827 14,349 22,054 32,554 45,300 59,725 75,445 92,146109,730128,222147,657 Note 1. Per Maple management; represents net of annual platform R&D and return on cumulative platform R&D at WACC + 5% on apost-tax basis,mid-point WACC shown;grossed-up to reflectpre-tax figures; no PoS adjustment applied 2. Based on Maple management forecasts provided to Morgan Stanley on 12/29/2017 33
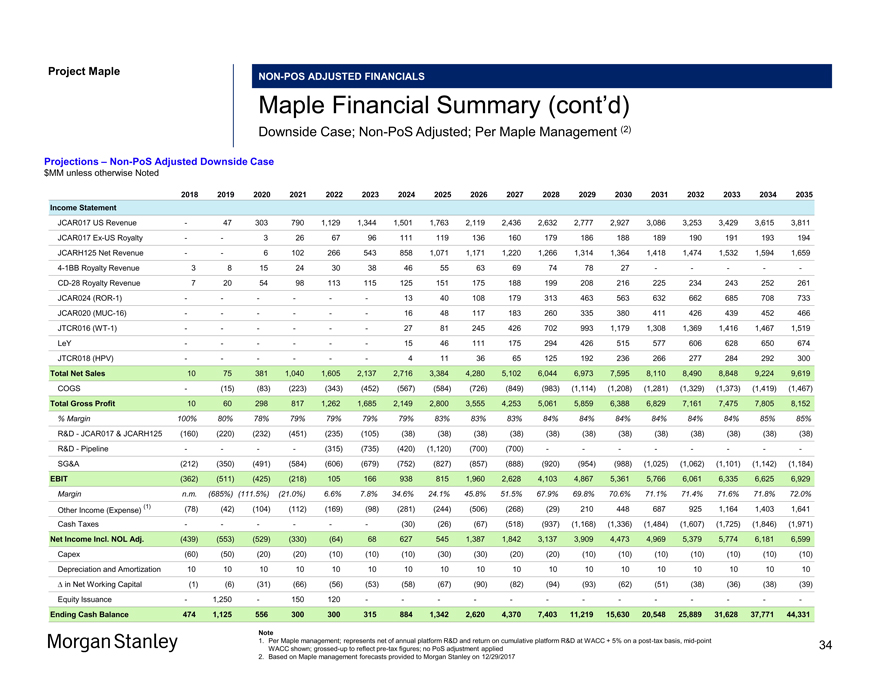
Project MapleNON-POS ADJUSTED FINANCIALS Maple Financial Summary (cont’d) Downside Case;Non-PoS Adjusted; Per Maple Management (2) Projections –Non-PoS Adjusted Downside Case $MM unless otherwise Noted 2018 2019 2020 2021 2022 2023 2024 2025 2026 2027 2028 2029 2030 2031 2032 2033 2034 2035 Income Statement JCAR017 US Revenue — 47 303 790 1,129 1,344 1,501 1,763 2,119 2,436 2,632 2,777 2,927 3,086 3,253 3,429 3,615 3,811 JCAR017Ex-US Royalty — — 3 26 67 96 111 119 136 160 179 186 188 189 190 191 193 194 JCARH125 Net Revenue — — 6 102 266 543 858 1,071 1,171 1,220 1,266 1,314 1,364 1,418 1,474 1,532 1,594 1,6594-1BB Royalty Revenue 3 8 15 24 30 38 46 55 63 69 74 78 27 — — — —-CD-28 Royalty Revenue 7 20 54 98 113 115 125 151 175 188 199 208 216 225 234 243 252 261 JCAR024(ROR-1) — — — — — — 13 40 108 179 313 463 563 632 662 685 708 733 JCAR020(MUC-16) — — — — — — 16 48 117 183 260 335 380 411 426 439 452 466 JTCR016(WT-1) — — — — — — 27 81 245 426 702 993 1,179 1,308 1,369 1,416 1,467 1,519 LeY — — — — — — 15 46 111 175 294 426 515 577 606 628 650 674 JTCR018 (HPV) — — — — — — 4 11 36 65 125 192 236 266 277 284 292 300 Total Net Sales 10 75 381 1,040 1,605 2,137 2,716 3,384 4,280 5,102 6,044 6,973 7,595 8,110 8,490 8,848 9,224 9,619 COGS — (15) (83) (223) (343) (452) (567) (584) (726) (849) (983) (1,114) (1,208) (1,281) (1,329) (1,373) (1,419) (1,467) Total Gross Profit 10 60 298 817 1,262 1,685 2,149 2,800 3,555 4,253 5,061 5,859 6,388 6,829 7,161 7,475 7,805 8,152 % Margin 100% 80% 78% 79% 79% 79% 79% 83% 83% 83% 84% 84% 84% 84% 84% 84% 85% 85% R&D—JCAR017 & JCARH125 (160) (220) (232) (451) (235) (105) (38) (38) (38) (38) (38) (38) (38) (38) (38) (38) (38) (38) R&D—Pipeline — — — — (315) (735) (420) (1,120) (700) (700) — — — — — — —-SG&A (212) (350) (491) (584) (606) (679) (752) (827) (857) (888) (920) (954) (988) (1,025) (1,062) (1,101) (1,142) (1,184) EBIT (362) (511) (425) (218) 105 166 938 815 1,960 2,628 4,103 4,867 5,361 5,766 6,061 6,335 6,625 6,929 Margin n.m. (685%) (111.5%) (21.0%) 6.6% 7.8% 34.6% 24.1% 45.8% 51.5% 67.9% 69.8% 70.6% 71.1% 71.4% 71.6% 71.8% 72.0% (1) (78) (42) (104) (112) (169) (98) (281) (244) (506) (268) (29) 210 448 687 925 1,164 1,403 1,641 Other Income (Expense) Cash Taxes — — — — — — (30) (26) (67) (518) (937) (1,168) (1,336) (1,484) (1,607) (1,725) (1,846) (1,971) Net Income Incl. NOL Adj. (439) (553) (529) (330) (64) 68 627 545 1,387 1,842 3,137 3,909 4,473 4,969 5,379 5,774 6,181 6,599 Capex (60) (50) (20) (20) (10) (10) (10) (30) (30) (20) (20) (10) (10) (10) (10) (10) (10) (10) Depreciation and Amortization 10 10 10 10 10 10 10 10 10 10 10 10 10 10 10 10 10 10 â^† in Net Working Capital (1) (6) (31) (66) (56) (53) (58) (67) (90) (82) (94) (93) (62) (51) (38) (36) (38) (39) Equity Issuance — 1,250 — 150 120 — — — — — — — — — — — — —Ending Cash Balance 474 1,125 556 300 300 315 884 1,342 2,620 4,370 7,403 11,219 15,630 20,548 25,889 31,628 37,771 44,331 Note 1. Per Maple management; represents net of annual platform R&D and return on cumulative platform R&D at WACC + 5% on apost-tax basis,mid-point WACC shown;grossed-up to reflectpre-tax figures; no PoS adjustment applied 2. Based on Maple management forecasts provided to Morgan Stanley on 12/29/2017 34
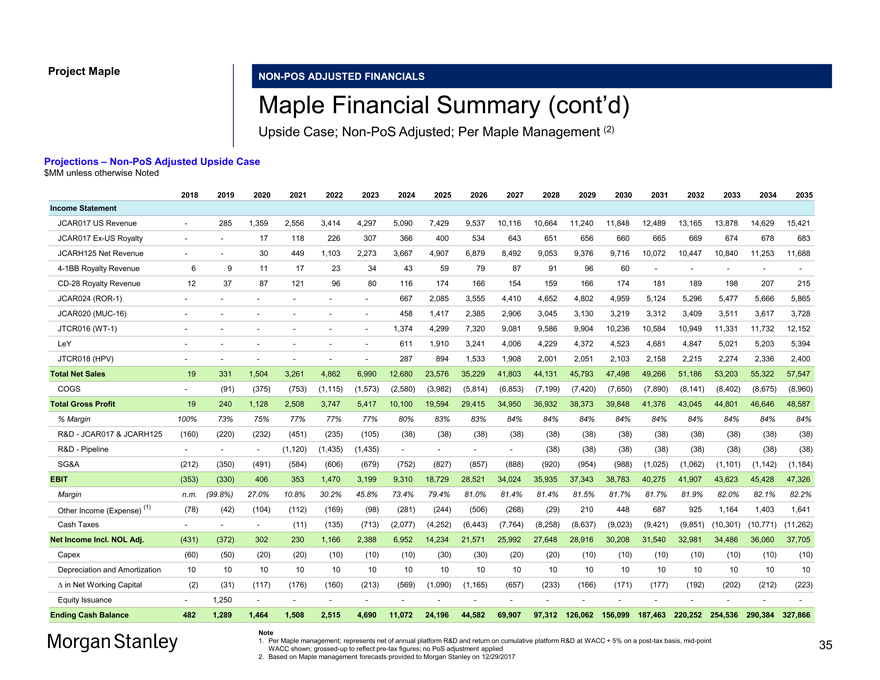
Project MapleNON-POS ADJUSTED FINANCIALS Maple Financial Summary (cont’d) Upside Case;Non-PoS Adjusted; Per Maple Management (2) Projections –Non-PoS Adjusted Upside Case $MM unless otherwise Noted 2018 2019 2020 2021 2022 2023 2024 2025 2026 2027 2028 2029 2030 2031 2032 2033 2034 2035 Income Statement JCAR017 US Revenue — 285 1,359 2,556 3,414 4,297 5,090 7,429 9,537 10,116 10,664 11,240 11,848 12,489 13,165 13,878 14,629 15,421 JCAR017Ex-US Royalty — — 17 118 226 307 366 400 534 643 651 656 660 665 669 674 678 683 JCARH125 Net Revenue — — 30 449 1,103 2,273 3,667 4,907 6,879 8,492 9,053 9,376 9,716 10,072 10,447 10,840 11,253 11,6884-1BB Royalty Revenue 6 9 11 17 23 34 43 59 79 87 91 96 60 — — — —-CD-28 Royalty Revenue 12 37 87 121 96 80 116 174 166 154 159 166 174 181 189 198 207 215 JCAR024(ROR-1) — — — — — — 667 2,085 3,555 4,410 4,652 4,802 4,959 5,124 5,296 5,477 5,666 5,865 JCAR020(MUC-16) — — — — — — 458 1,417 2,385 2,906 3,045 3,130 3,219 3,312 3,409 3,511 3,617 3,728 JTCR016(WT-1) — — — — — — 1,374 4,299 7,320 9,081 9,586 9,904 10,236 10,584 10,949 11,331 11,732 12,152 LeY — — — — — — 611 1,910 3,241 4,006 4,229 4,372 4,523 4,681 4,847 5,021 5,203 5,394 JTCR018 (HPV) — — — — — — 287 894 1,533 1,908 2,001 2,051 2,103 2,158 2,215 2,274 2,336 2,400 Total Net Sales 19 331 1,504 3,261 4,862 6,990 12,680 23,576 35,229 41,803 44,131 45,793 47,498 49,266 51,186 53,203 55,322 57,547 COGS — (91) (375) (753) (1,115) (1,573) (2,580) (3,982) (5,814) (6,853) (7,199) (7,420) (7,650) (7,890) (8,141) (8,402) (8,675) (8,960) Total Gross Profit 19 240 1,128 2,508 3,747 5,417 10,100 19,594 29,415 34,950 36,932 38,373 39,848 41,376 43,045 44,801 46,646 48,587 % Margin 100% 73% 75% 77% 77% 77% 80% 83% 83% 84% 84% 84% 84% 84% 84% 84% 84% 84% R&D—JCAR017 & JCARH125 (160) (220) (232) (451) (235) (105) (38) (38) (38) (38) (38) (38) (38) (38) (38) (38) (38) (38) R&D—Pipeline — — — (1,120) (1,435) (1,435) — — — — (38) (38) (38) (38) (38) (38) (38) (38) SG&A (212) (350) (491) (584) (606) (679) (752) (827) (857) (888) (920) (954) (988) (1,025) (1,062) (1,101) (1,142) (1,184) EBIT (353) (330) 406 353 1,470 3,199 9,310 18,729 28,521 34,024 35,935 37,343 38,783 40,275 41,907 43,623 45,428 47,326 Margin n.m. (99.8%) 27.0% 10.8% 30.2% 45.8% 73.4% 79.4% 81.0% 81.4% 81.4% 81.5% 81.7% 81.7% 81.9% 82.0% 82.1% 82.2% (1) (78) (42) (104) (112) (169) (98) (281) (244) (506) (268) (29) 210 448 687 925 1,164 1,403 1,641 Other Income (Expense) Cash Taxes — — — (11) (135) (713) (2,077) (4,252) (6,443) (7,764) (8,258) (8,637) (9,023) (9,421) (9,851) (10,301) (10,771) (11,262) Net Income Incl. NOL Adj. (431) (372) 302 230 1,166 2,388 6,952 14,234 21,571 25,992 27,648 28,916 30,208 31,540 32,981 34,486 36,060 37,705 Capex (60) (50) (20) (20) (10) (10) (10) (30) (30) (20) (20) (10) (10) (10) (10) (10) (10) (10) Depreciation and Amortization 10 10 10 10 10 10 10 10 10 10 10 10 10 10 10 10 10 10 â^† in Net Working Capital (2) (31) (117) (176) (160) (213) (569) (1,090) (1,165) (657) (233) (166) (171) (177) (192) (202) (212) (223) Equity Issuance — 1,250 — — — — — — — — — — — — — — — —Ending Cash Balance 482 1,289 1,464 1,508 2,515 4,690 11,072 24,196 44,582 69,907 97,312126,062156,099187,463220,252254,536290,384327,866 Note 1. Per Maple management; represents net of annual platform R&D and return on cumulative platform R&D at WACC + 5% on apost-tax basis,mid-point WACC shown;grossed-up to reflectpre-tax figures; no PoS adjustment applied 2. Based on Maple management forecasts provided to Morgan Stanley on 12/29/2017 35
Maple Board Discussion Materials v34.pptx\20 JAN 2018\11:33 AM\36
Project Maple
Appendix C
Assumptions Details
36
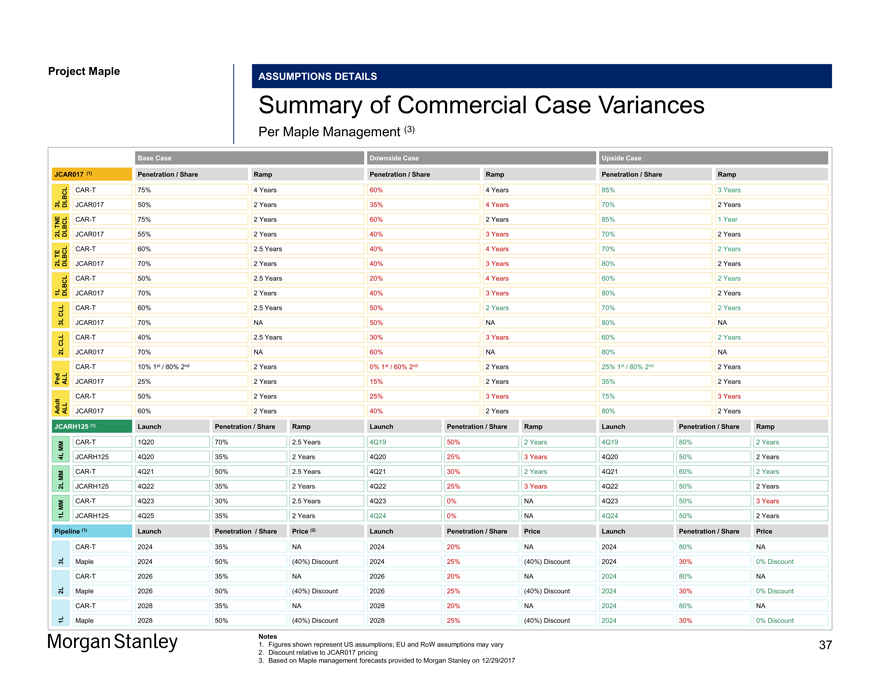
Project Maple Maple Board Discussion ASSUMPTIONS DETAILS Summary of Commercial Case Variances Per Maple Management (3) Base Case Downside Case Upside Case JCAR017 (1) Penetration / Share Ramp Penetration / Share Ramp Penetration / Share RampCAR-T 75% 4 Years 60% 4 Years 85% 3 Years 3L DLBCL JCAR017 50% 2 Years 35% 4 Years 70% 2 Years TNECAR-T 75% 2 Years 60% 2 Years 85% 1 Year 2L DLBCL JCAR017 55% 2 Years 40% 3 Years 70% 2 Years TECAR-T 60% 2.5 Years 40% 4 Years 70% 2 Years 2L DLBCL JCAR017 70% 2 Years 40% 3 Years 80% 2 YearsCAR-T 50% 2.5 Years 20% 4 Years 60% 2 Years 1L DLBCL JCAR017 70% 2 Years 40% 3 Years 80% 2 Years CLLCAR-T 60% 2.5 Years 50% 2 Years 70% 2 Years 3L JCAR017 70% NA 50% NA 80% NA CLLCAR-T 40% 2.5 Years 30% 3 Years 60% 2 Years 2L JCAR017 70% NA 60% NA 80% NACAR-T 10% 1st / 80% 2nd 2 Years 0% 1st / 60% 2nd 2 Years 25% 1st / 80% 2nd 2 Years Ped ALL JCAR017 25% 2 Years 15% 2 Years 35% 2 YearsCAR-T 50% 2 Years 25% 3 Years 75% 3 Years Adult ALL JCAR017 60% 2 Years 40% 2 Years 80% 2 Years JCARH125 (1) Launch Penetration / Share Ramp Launch Penetration / Share Ramp Launch Penetration / Share Ramp MMCAR-T 1Q20 70% 2.5 Years 4Q19 50% 2 Years 4Q19 80% 2 Years 4L JCARH125 4Q20 35% 2 Years 4Q20 25% 3 Years 4Q20 50% 2 Years MMCAR-T 4Q21 50% 2.5 Years 4Q21 30% 2 Years 4Q21 60% 2 Years 2L JCARH125 4Q22 35% 2 Years 4Q22 25% 3 Years 4Q22 50% 2 Years MMCAR-T 4Q23 30% 2.5 Years 4Q23 0% NA 4Q23 50% 3 Years 1L JCARH125 4Q25 35% 2 Years 4Q24 0% NA 4Q24 50% 2 Years Pipeline (1) Launch Penetration / Share Price (2) Launch Penetration / Share Price Launch Penetration / Share PriceCAR-T 2024 35% NA 2024 20% NA 2024 80% NA 3L Maple 2024 50% (40%) Discount 2024 25% (40%) Discount 2024 30% 0% DiscountCAR-T 2026 35% NA 2026 20% NA 2024 80% NA 2L Maple 2026 50% (40%) Discount 2026 25% (40%) Discount 2024 30% 0% DiscountCAR-T 2028 35% NA 2028 20% NA 2024 80% NA 1L Maple 2028 50% (40%) Discount 2028 25% (40%) Discount 2024 30% 0% Discount Notes 1. Figures shown represent US assumptions; EU and RoW assumptions may vary 2. Discount relative to JCAR017 pricing 3. Based on Maple management forecasts provided to Morgan Stanley on 12/29/2017 37
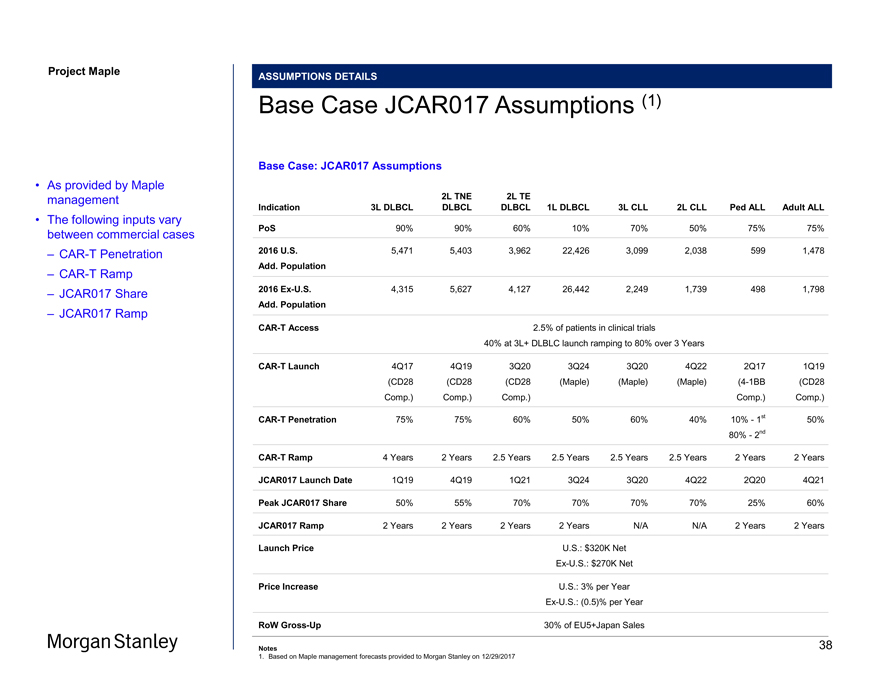
Project Maple ASSUMPTIONS DETAILS Base Case JCAR017 Assumptions (1) Base Case: JCAR017 Assumptions 2L TNE 2L TE Indication 3L DLBCL DLBCL DLBCL 1L DLBCL 3L CLL 2L CLL Ped ALL Adult ALL PoS 90% 90% 60% 10% 70% 50% 75% 75% 2016 U.S. 5,471 5,403 3,962 22,426 3,099 2,038 599 1,478 Add. Population 2016Ex-U.S. 4,315 5,627 4,127 26,442 2,249 1,739 498 1,798 Add. PopulationCAR-T Access 2.5% of patients in clinical trials 40% at 3L+ DLBLC launch ramping to 80% over 3 YearsCAR-T Launch 4Q17 4Q19 3Q20 3Q24 3Q20 4Q22 2Q17 1Q19 (CD28 (CD28 (CD28 (Maple) (Maple) (Maple)(4-1BB (CD28 Comp.) Comp.) Comp.) Comp.) Comp.)CAR-T Penetration 75% 75% 60% 50% 60% 40% 10%—1st 50% 80%—2ndCAR-T Ramp 4 Years 2 Years 2.5 Years 2.5 Years 2.5 Years 2.5 Years 2 Years 2 Years JCAR017 Launch Date 1Q19 4Q19 1Q21 3Q24 3Q20 4Q22 2Q20 4Q21 Peak JCAR017 Share 50% 55% 70% 70% 70% 70% 25% 60% JCAR017 Ramp 2 Years 2 Years 2 Years 2 Years N/A N/A 2 Years 2 Years Launch Price U.S.: $320K NetEx-U.S.: $270K Net Price Increase U.S.: 3% per YearEx-U.S.: (0.5)% per Year RoWGross-Up 30% of EU5+Japan Sales Notes 1. Based on Maple management forecasts provided to Morgan Stanley on 12/29/2017 • As provided by Maple management • The following inputs vary between commercial cases –CAR-T Penetration –CAR-T Ramp – JCAR017 Share – JCAR017 Ramp 38
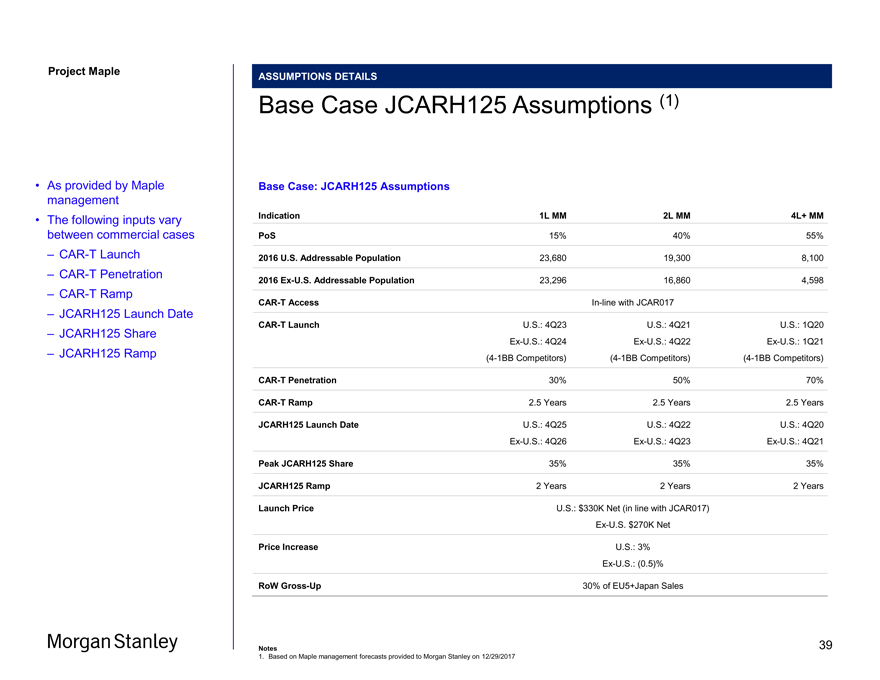
Project Maple Maple Board ASSUMPTIONS DETAILS Base Case JCARH125 Assumptions (1) Base Case: JCARH125 Assumptions Indication 1L MM 2L MM 4L+ MM PoS 15% 40% 55% 2016 U.S. Addressable Population 23,680 19,300 8,100 2016Ex-U.S. Addressable Population 23,296 16,860 4,598CAR-T AccessIn-line with JCAR017CAR-T Launch U.S.: 4Q23 U.S.: 4Q21 U.S.: 1Q20Ex-U.S.: 4Q24Ex-U.S.: 4Q22Ex-U.S.: 1Q21(4-1BB Competitors)(4-1BB Competitors)(4-1BB Competitors)CAR-T Penetration 30% 50% 70%CAR-T Ramp 2.5 Years 2.5 Years 2.5 Years JCARH125 Launch Date U.S.: 4Q25 U.S.: 4Q22 U.S.: 4Q20Ex-U.S.: 4Q26Ex-U.S.: 4Q23Ex-U.S.: 4Q21 Peak JCARH125 Share 35% 35% 35% JCARH125 Ramp 2 Years 2 Years 2 Years Launch Price U.S.: $330K Net (in line with JCAR017)Ex-U.S. $270K Net Price Increase U.S.: 3%Ex-U.S.: (0.5)% RoWGross-Up 30% of EU5+Japan Sales • As provided by Maple management • The following inputs vary between commercial cases –CAR-T Launch –CAR-T Penetration –CAR-T Ramp – JCARH125 Launch Date – JCARH125 Share – JCARH125 Ramp Notes 1. Based on Maple management forecasts provided to Morgan Stanley on 12/29/2017 39
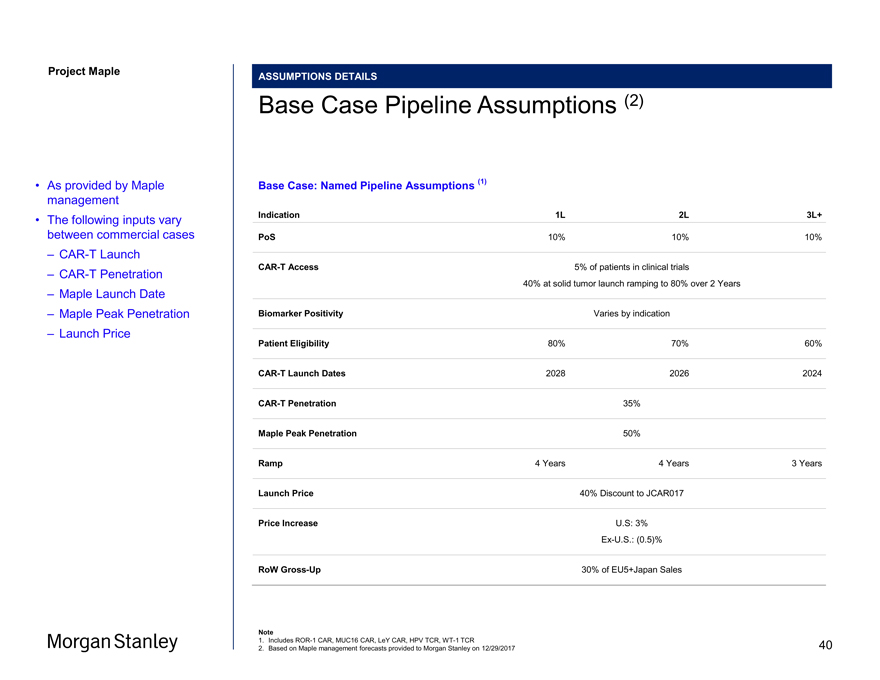
Project Maple ASSUMPTIONS DETAILS Base Case Pipeline Assumptions (2) Base Case: Named Pipeline Assumptions (1) Indication 1L 2L 3L+ PoS 10% 10% 10%CAR-T Access 5% of patients in clinical trials 40% at solid tumor launch ramping to 80% over 2 Years Biomarker Positivity Varies by indication Patient Eligibility 80% 70% 60%CAR-T Launch Dates 2028 2026 2024CAR-T Penetration 35% Maple Peak Penetration 50% Ramp 4 Years 4 Years 3 Years Launch Price 40% Discount to JCAR017 Price Increase U.S: 3%Ex-U.S.: (0.5)% RoWGross-Up 30% of EU5+Japan Sales Note 1. IncludesROR-1 CAR, MUC16 CAR, LeY CAR, HPV TCR,WT-1 TCR 2. Based on Maple management forecasts provided to Morgan Stanley on 12/29/2017 • As provided by Maple management • The following inputs vary between commercial cases –CAR-T Launch –CAR-T Penetration – Maple Launch Date – Maple Peak Penetration – Launch Price 40
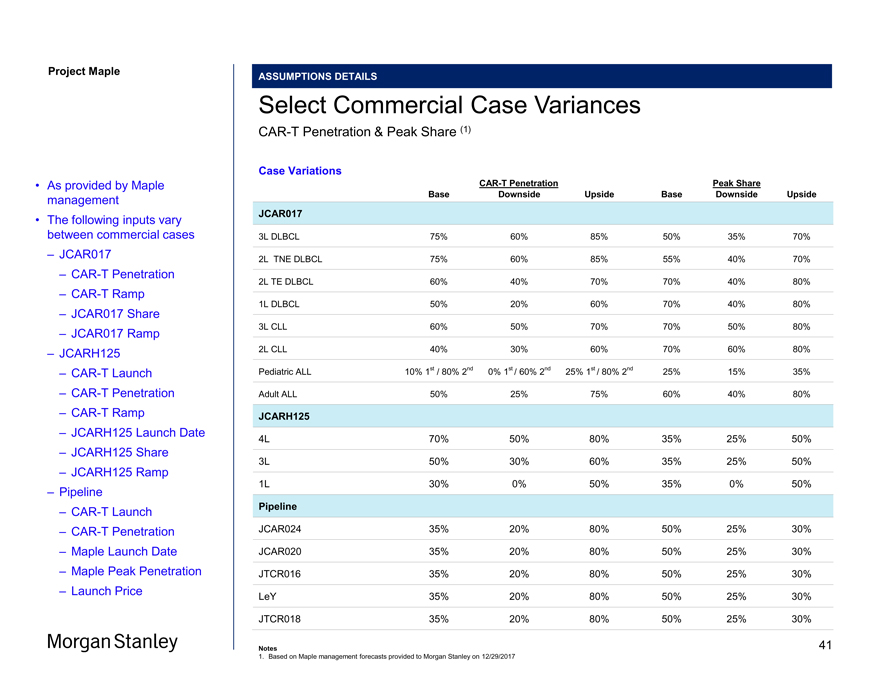
Project Maple ASSUMPTIONS DETAILS Select Commercial Case VariancesCAR-T Penetration & Peak Share (1) Case VariationsCAR-T Penetration Peak Share Base Downside Upside Base Downside Upside JCAR017 3L DLBCL 75% 60% 85% 50% 35% 70% 2L TNE DLBCL 75% 60% 85% 55% 40% 70% 2L TE DLBCL 60% 40% 70% 70% 40% 80% 1L DLBCL 50% 20% 60% 70% 40% 80% 3L CLL 60% 50% 70% 70% 50% 80% 2L CLL 40% 30% 60% 70% 60% 80% Pediatric ALL 10% 1st / 80% 2nd 0% 1st / 60% 2nd 25% 1st / 80% 2nd 25% 15% 35% Adult ALL 50% 25% 75% 60% 40% 80% JCARH125 4L 70% 50% 80% 35% 25% 50% 3L 50% 30% 60% 35% 25% 50% 1L 30% 0% 50% 35% 0% 50% Pipeline JCAR024 35% 20% 80% 50% 25% 30% JCAR020 35% 20% 80% 50% 25% 30% JTCR016 35% 20% 80% 50% 25% 30% LeY 35% 20% 80% 50% 25% 30% JTCR018 35% 20% 80% 50% 25% 30% Notes 1. Based on Maple management forecasts provided to Morgan Stanley on 12/29/2017 • As provided by Maple management • The following inputs vary between commercial cases – JCAR017 –CAR-T Penetration –CAR-T Ramp – JCAR017 Share – JCAR017 Ramp – JCARH125 –CAR-T Launch –CAR-T Penetration –CAR-T Ramp – JCARH125 Launch Date – JCARH125 Share – JCARH125 Ramp – Pipeline –CAR-T Launch –CAR-T Penetration – Maple Launch Date – Maple Peak Penetration – Launch Price 41

Maple Board Discussion Materials v34.pptx\20 JAN 2018\11:33 AM\42
Project Maple
Appendix D
Financial Analysis Reference Materials
42
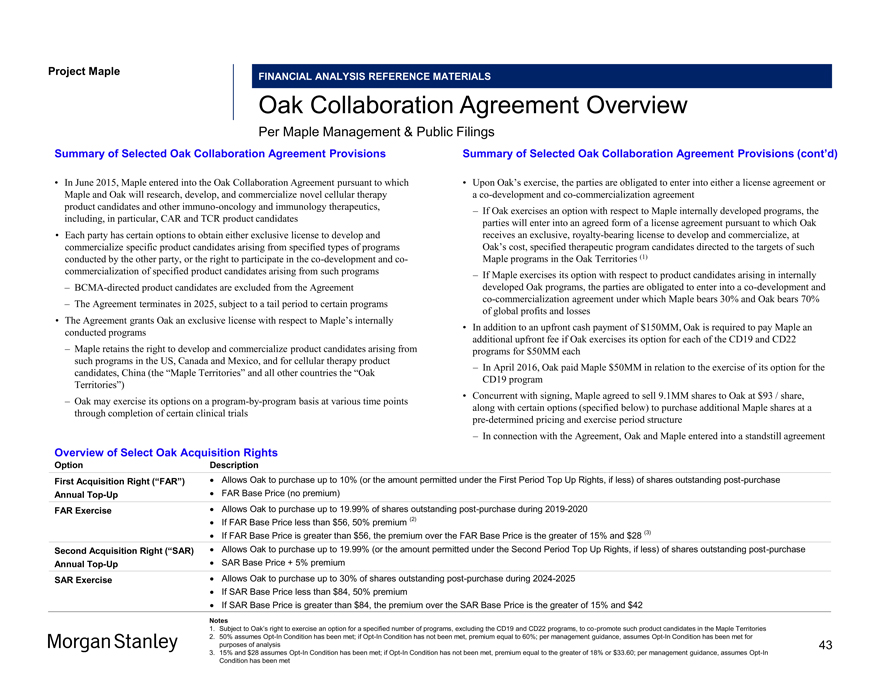
Project Maple Maple Board FINANCIAL ANALYSIS REFERENCE MATERIALS Oak Collaboration Agreement Overview Per Maple Management & Public Filings Summary of Selected Oak Collaboration Agreement Provisions • In June 2015, Maple entered into the Oak Collaboration Agreement pursuant to which Maple and Oak will research, develop, and commercialize novel cellular therapy product candidates and other immuno-oncology and immunology therapeutics, including, in particular, CAR and TCR product candidates • Each party has certain options to obtain either exclusive license to develop and commercialize specific product candidates arising from specified types of programs conducted by the other party, or the right to participate in theco-development andco-commercialization of specified product candidates arising from such programs – BCMA-directed product candidates are excluded from the Agreement – The Agreement terminates in 2025, subject to a tail period to certain programs • The Agreement grants Oak an exclusive license with respect to Maple’s internally conducted programs – Maple retains the right to develop and commercialize product candidates arising from such programs in the US, Canada and Mexico, and for cellular therapy product candidates, China (the “Maple Territories” and all other countries the “Oak Territories”) – Oak may exercise its options on aprogram-by-program basis at various time points through completion of certain clinical trials Summary of Selected Oak Collaboration Agreement Provisions (cont’d) • Upon Oak’s exercise, the parties are obligated to enter into either a license agreement or aco-development andco-commercialization agreement – If Oak exercises an option with respect to Maple internally developed programs, the parties will enter into an agreed form of a license agreement pursuant to which Oak receives an exclusive, royalty-bearing license to develop and commercialize, at Oak’s cost, specified therapeutic program candidates directed to the targets of such Maple programs in the Oak Territories (1) – If Maple exercises its option with respect to product candidates arising in internally developed Oak programs, the parties are obligated to enter into aco-development andco-commercialization agreement under which Maple bears 30% and Oak bears 70% of global profits and losses • In addition to an upfront cash payment of $150MM, Oak is required to pay Maple an additional upfront fee if Oak exercises its option for each of the CD19 and CD22 programs for $50MM each – In April 2016, Oak paid Maple $50MM in relation to the exercise of its option for the CD19 program • Concurrent with signing, Maple agreed to sell 9.1MM shares to Oak at $93 / share, along with certain options (specified below) to purchase additional Maple shares at apre-determined pricing and exercise period structure – In connection with the Agreement, Oak and Maple entered into a standstill agreement Overview of Select Oak Acquisition Rights Option Description First Acquisition Right (“FAR”) • Allows Oak to purchase up to 10% (or the amount permitted under the First Period Top Up Rights, if less) of shares outstanding post-purchase Base Price (no premium) AnnualTop-Up • FAR FAR Exercise • Allows Oak to purchase up to 19.99% of shares outstanding post-purchase during 2019-2020 • If FAR Base Price less than $56, 50% premium (2) • If FAR Base Price is greater than $56, the premium over the FAR Base Price is the greater of 15% and $28 (3) Second Acquisition Right (“SAR) • Allows Oak to purchase up to 19.99% (or the amount permitted under the Second Period Top Up Rights, if less) of shares outstanding post-purchase AnnualTop-Up • SAR Base Price + 5% premium SAR Exercise • Allows Oak to purchase up to 30% of shares outstanding post-purchase during 2024-2025 • If SAR Base Price less than $84, 50% premium • If SAR Base Price is greater than $84, the premium over the SAR Base Price is the greater of 15% and $42 Notes 1. Subject to Oak’s right to exercise an option for a specified number of programs, excluding the CD19 and CD22 programs, toco-promote such product candidates in the Maple Territories 2. 50% assumesOpt-In Condition has been met; ifOpt-In Condition has not been met, premium equal to 60%; per management guidance, assumesOpt-In Condition has been met for purposes of analysis 3. 15% and $28 assumesOpt-In Condition has been met; ifOpt-In Condition has not been met, premium equal to the greater of 18% or $33.60; per management guidance, assumesOpt-In Condition has been met 43
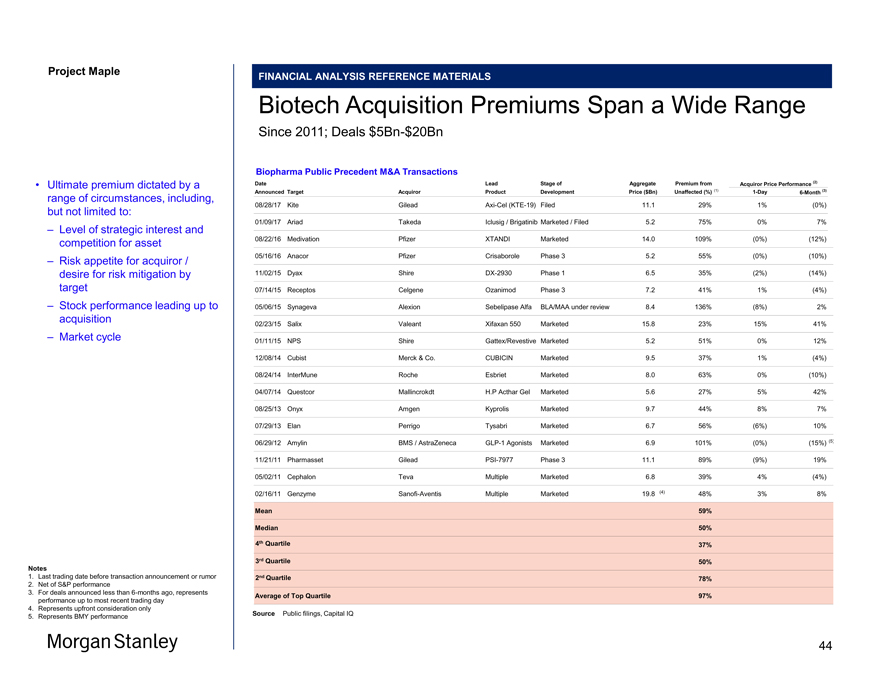
Project Maple Maple Board Discussion Materials v34.pptx\20 JAN 2018\11:33 FINANCIAL ANALYSIS REFERENCE MATERIALS Biotech Acquisition Premiums Span a Wide Range Since 2011; Deals$5Bn-$20Bn Biopharma Public Precedent M&A Transactions Date Lead Stage of Aggregate Premium from Acquiror Price Performance (2) Announced Target Acquiror Product Development Price ($Bn) Unaffected (%) (1)1-Day6-Month (3) 08/28/17 Kite GileadAxi-Cel(KTE-19) Filed 11.1 29% 1% (0%) 01/09/17 Ariad Takeda Iclusig / Brigatinib Marketed / Filed 5.2 75% 0% 7% 08/22/16 Medivation Pfizer XTANDI Marketed 14.0 109% (0%) (12%) 05/16/16 Anacor Pfizer Crisaborole Phase 3 5.2 55% (0%) (10%) 11/02/15 Dyax ShireDX-2930 Phase 1 6.5 35% (2%) (14%) 07/14/15 Receptos Celgene Ozanimod Phase 3 7.2 41% 1% (4%) 05/06/15 Synageva Alexion Sebelipase Alfa BLA/MAA under review 8.4 136% (8%) 2% 02/23/15 Salix Valeant Xifaxan 550 Marketed 15.8 23% 15% 41% 01/11/15 NPS Shire Gattex/Revestive Marketed 5.2 51% 0% 12% 12/08/14 Cubist Merck & Co. CUBICIN Marketed 9.5 37% 1% (4%) 08/24/14 InterMune Roche Esbriet Marketed 8.0 63% 0% (10%) 04/07/14 Questcor Mallincrokdt H.P Acthar Gel Marketed 5.6 27% 5% 42% 08/25/13 Onyx Amgen Kyprolis Marketed 9.7 44% 8% 7% 07/29/13 Elan Perrigo Tysabri Marketed 6.7 56% (6%) 10% 06/29/12 Amylin BMS / AstraZenecaGLP-1 Agonists Marketed 6.9 101% (0%) (15%) (5) 11/21/11 Pharmasset GileadPSI-7977 Phase 3 11.1 89% (9%) 19% 05/02/11 Cephalon Teva Multiple Marketed 6.8 39% 4% (4%) 02/16/11 Genzyme Sanofi-Aventis Multiple Marketed 19.8 (4) 48% 3% 8% Mean 59% Median 50% 1st 4th Quartile uartile 37% 2nd 3rd Quartile uartile 50% 3rd 2nd Quartile uartile 78% Average of Top Quartile 97% Source Public filings, Capital IQ • Ultimate premium dictated by a range of circumstances, including, but not limited to: – Level of strategic interest and competition for asset – Risk appetite for acquiror / desire for risk mitigation by target – Stock performance leading up to acquisition – Market cycle Notes 1. Last trading date before transaction announcement or rumor 2. Net of S&P performance 3. For deals announced less than6-months ago, represents performance up to most recent trading day 4. Represents upfront consideration only 5. Represents BMY performance 44
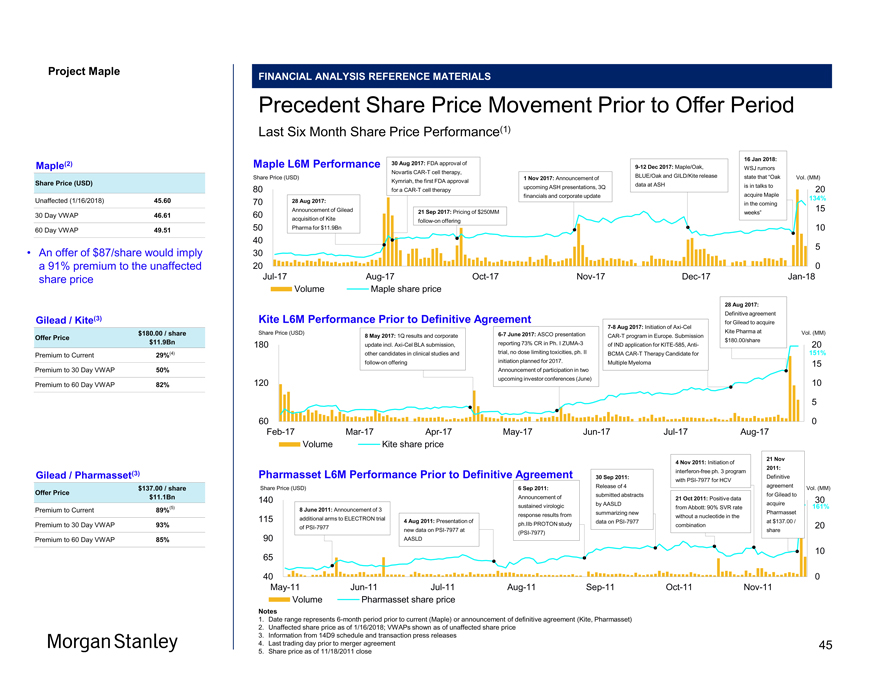
Project Maple Maple Board Discussion Materials v34.pptx\20 JAN FINANCIAL ANALYSIS REFERENCE MATERIALS Precedent Share Price Movement Prior to Offer Period Last Six Month Share Price Performance(1) 16 Jan 2018: Maple L6M Performance 30 Aug 2017: FDA approval of NovartisCAR-T cell therapy,9-12 Dec 2017: Maple/Oak, WSJ rumors Share Price (USD) Kymriah, the first FDA approval 1 Nov 2017: Announcement of BLUE/Oak and GILD/Kite release state that “Oak Vol. (MM) data at ASH is in talks to upcoming ASH presentations, 3Q 80 for aCAR-T cell therapy acquire Maple 20 28 Aug 2017: financials and corporate update 134% 70 in the coming 15 Announcement of Gilead 21 Sep 2017: Pricing of $250MM 60 weeks” acquisition of Kitefollow-on offering 50 Pharma for $11.9Bn 10 40 5 30 20 0Jul-17Aug-17Oct-17Nov-17Dec-17Jan-18 Volume Maple share price 28 Aug 2017: Definitive agreement Kite L6M Performance Prior to Definitive Agreement for Gilead to acquire7-8 Aug 2017: Initiation ofAxi-Cel Share Price (USD) Kite Pharma at Vol. (MM) 8 May 2017: 1Q results and corporate6-7 June 2017: ASCO presentationCAR-T program in Europe. Submission $180.00/share 180 update incl.Axi-Cel BLA submission, reporting 73% CR in Ph. IZUMA-3 of IND application forKITE-585, Anti- 20 other candidates in clinical studies and trial, no dose limiting toxicities, ph. II BCMACAR-T Therapy Candidate for 151%follow-on offering initiation planned for 2017. Multiple Myeloma 15 Announcement of participation in two 120 upcoming investor conferences (June) 10 5 60 0Feb-17Mar-17Apr-17May-17Jun-17Jul-17Aug-17 Volume Kite share price 21 Nov 4 Nov 2011: Initiation of 2011: Pharmasset L6M Performance Prior to Definitive Agreement interferon-free ph. 3 program 30 Sep 2011: Definitive withPSI-7977 for HCV Share Price (USD) Release of 4 agreement Vol. (MM) 6 Sep 2011: submitted abstracts for Gilead to 140 Announcement of 21 Oct 2011: Positive data 30 by AASLD acquire sustained virologic from Abbott: 90% SVR rate 161% 8 June 2011: Announcement of 3 summarizing new Pharmasset response results from without a nucleotide in the 115 additional arms to ELECTRON trial 4 Aug 2011: Presentation of data onPSI-7977 at $137.00 / ph.IIb PROTON study combination 20 ofPSI-7977 new data onPSI-7977 at share(PSI-7977) 90 AASLD 10 65 40 0May-11Jun-11Jul-11Aug-11Sep-11Oct-11Nov-11 Volume Pharmasset share price Notes 1. Date range represents6-month period prior to current (Maple) or announcement of definitive agreement (Kite, Pharmasset) 2. Unaffected share price as of 1/16/2018; VWAPs shown as of unaffected share price 3. Information from 14D9 schedule and transaction press releases 4. Last trading day prior to merger agreement 5. Share price as of 11/18/2011 close Maple(2) Share Price (USD) Unaffected (1/16/2018) 45.60 30 Day VWAP 46.61 60 Day VWAP 49.51 • An offer of $87/share would imply a 91% premium to the unaffected share price Gilead / Kite(3) $180.00 / share Offer Price $11.9Bn Premium to Current 29%(4) Premium to 30 Day VWAP 50% Premium to 60 Day VWAP 82% Gilead / Pharmasset(3) $137.00 / share Offer Price $11.1Bn Premium to Current 89%(5) Premium to 30 Day VWAP 93% Premium to 60 Day VWAP 85% 45
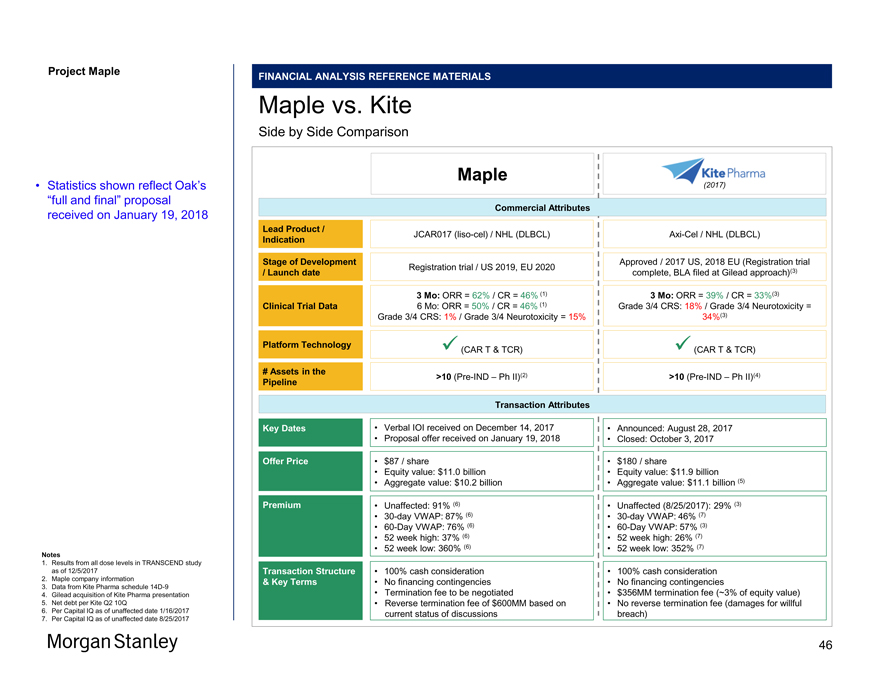
Project Maple FINANCIAL ANALYSIS REFERENCE MATERIALS Maple vs. Kite Side by Side Comparison Maple (2017) Commercial Attributes Lead Product / JCAR017(liso-cel) / NHL (DLBCL)Axi-Cel / NHL (DLBCL) Indication Stage of Development Approved / 2017 US, 2018 EU (Registration trial Registration trial / US 2019, EU 2020 / Launch date complete, BLA filed at Gilead approach)(3) 3 Mo: ORR = 62% / CR = 46% (1) 3 Mo: ORR = 39% / CR = 33%(3) Clinical Trial Data 6 Mo: ORR = 50% / CR = 46% (1) Grade 3/4 CRS: 18% / Grade 3/4 Neurotoxicity = Grade 3/4 CRS: 1% / Grade 3/4 Neurotoxicity = 15% 34%(3) Platform Technology ✓ (CAR T & TCR) ✓ (CAR T & TCR) # Assets in the Pipeline >10(Pre-IND – Ph II)(2) >10(Pre-IND – Ph II)(4) Transaction Attributes Key Dates • Verbal IOI received on December 14, 2017 • Announced: August 28, 2017 • Proposal offer received on January 19, 2018 • Closed: October 3, 2017 Offer Price • $87 / share • $180 / share • Equity value: $11.0 billion • Equity value: $11.9 billion • Aggregate value: $10.2 billion • Aggregate value: $11.1 billion (5) Premium • Unaffected: 91% (6) • Unaffected (8/25/2017): 29% (3) •30-day VWAP: 87% (6) •30-day VWAP: 46% (7) •60-Day VWAP: 76% (6) •60-Day VWAP: 57% (3) • 52 week high: 37% (6) • 52 week high: 26% (7) • 52 week low: 360% (6) • 52 week low: 352% (7) Transaction Structure • 100% cash consideration • 100% cash consideration & Key Terms • No financing contingencies • No financing contingencies • Termination fee to be negotiated • $356MM termination fee (~3% of equity value) • Reverse termination fee of $600MM based on • No reverse termination fee (damages for willful current status of discussions breach) • Statistics shown reflect Oak’s “full and final” proposal received on January 19, 2018 Notes 1. Results from all dose levels in TRANSCEND study as of 12/5/2017 2. Maple company information 3. Data from Kite Pharma schedule14D-9 4. Gilead acquisition of Kite Pharma presentation 5. Net debt per Kite Q2 10Q 6. Per Capital IQ as of unaffected date 1/16/2017 7. Per Capital IQ as of unaffected date 8/25/2017 46
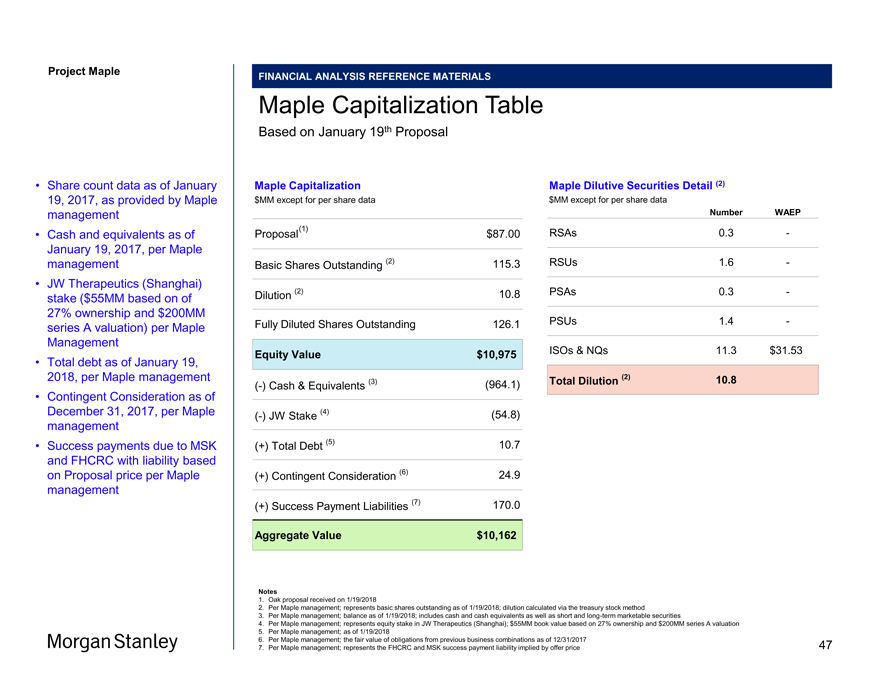
Project Maple FINANCIAL ANALYSIS REFERENCE MATERIALS Maple Capitalization Table Based on January 19th Proposal Maple Capitalization $MM except for per share data (1) Proposal $87.00 Basic Shares Outstanding (2) 115.3 Dilution (2) 10.8 Fully Diluted Shares Outstanding 126.1 Equity Value $10,975 (-) Cash & Equivalents (3) (964.1) (-) JW Stake (4) (54.8) (+) Total Debt (5) 10.7 (+) Contingent Consideration (6) 24.9 (+) Success Payment Liabilities (7) 170.0 Aggregate Value $10,162 Maple Dilutive Securities Detail (2) $MM except for per share data Number WAEP RSAs 0.3 -RSUs 1.6 -PSAs 0.3 -PSUs 1.4 -ISOs & NQs 11.3 $31.53 Total Dilution (2) 10.8 Notes 1. Oak proposal received on 1/19/2018 2. Per Maple management; represents basic shares outstanding as of 1/19/2018; dilution calculated via the treasury stock method 3. Per Maple management; balance as of 1/19/2018; includes cash and cash equivalents as well as short and long-term marketable securities 4. Per Maple management; represents equity stake in JW Therapeutics (Shanghai); $55MM book value based on 27% ownership and $200MM series A valuation 5. Per Maple management; as of 1/19/2018 6. Per Maple management; the fair value of obligations from previous business combinations as of 12/31/2017 7. Per Maple management; represents the FHCRC and MSK success payment liability implied by offer price • Share count data as of January 19, 2017, as provided by Maple management • Cash and equivalents as of January 19, 2017, per Maple management • JW Therapeutics (Shanghai) stake ($55MM based on of 27% ownership and $200MM series A valuation) per Maple Management • Total debt as of January 19, 2018, per Maple management • Contingent Consideration as of December 31, 2017, per Maple management • Success payments due to MSK and FHCRC with liability based on Proposal price per Maple management 47
Project Maple Disclaimer We have prepared this document solely for informational purposes. You should not definitively rely upon it or use it to form the definitive basis for any decision, contract, commitment or action whatsoever, with respect to any proposed transaction or otherwise. You and your directors, officers, employees, agents and affiliates must hold this document and any oral information provided in connection with this document in strict confidence and may not communicate, reproduce, distribute or disclose it to any other person, or refer to it publicly, in whole or in part at any time except with our prior written consent. If you are not the intended recipient of this document, please delete and destroy all copies immediately. We have prepared this document and the analyses contained in it based, in part, on certain assumptions and information obtained by us from the recipient, its directors, officers, employees, agents, affiliates and/or from other sources. Our use of such assumptions and information does not imply that we have independently verified or necessarily agree with any of such assumptions or information, and we have assumed and relied upon the accuracy and completeness of such assumptions and information for purposes of this document. Neither we nor any of our affiliates, or our or their respective officers, employees or agents, make any representation or warranty, express or implied, in relation to the accuracy or completeness of the information contained in this document or any oral information provided in connection herewith, or any data it generates and accept no responsibility, obligation or liability (whether direct or indirect, in contract, tort or otherwise) in relation to any of such information. We and our affiliates and our and their respective officers, employees and agents expressly disclaim any and all liability which may be based on this document and any errors therein or omissions therefrom. Neither we nor any of our affiliates, or our or their respective officers, employees or agents, make any representation or warranty, express or implied, that any transaction has been or may be effected on the terms or in the manner stated in this document, or as to the achievement or reasonableness of future projections, management targets, estimates, prospects or returns, if any. Any views or terms contained herein are based on financial, economic, market and other conditions prevailing as of the date of this document and are therefore subject to change. We undertake no obligation or responsibility to update any of the information contained in this document. Past performance does not guarantee or predict future performance. We have (i) assumed that any forecasted financial information contained herein reflects the best available estimates of future financial performance, and (ii) not made any independent valuation or appraisal of the assets or liabilities of any company involved in any proposed transaction, nor have we been furnished with any such valuations or appraisals. The purpose of this document is to provide the recipient with an explanation of the basis upon which Morgan Stanley is issuing a financial opinion letter in relation to the proposed transaction. This document should be read in conjunction with and is subject to the terms of such financial opinion. This document supersedes any previous documents or presentations delivered by Morgan Stanley to the recipient in connection with the proposed transaction. This document and the information contained herein do not constitute an offer to sell or the solicitation of an offer to buy any security, commodity or instrument or related derivative, nor do they constitute an offer or commitment to lend, syndicate or arrange a financing, underwrite or purchase or act as an agent or advisor or in any other capacity with respect to any transaction, or commit capital, or to participate in any trading strategies, and do not constitute legal, regulatory, accounting or tax advice to the recipient. We recommend that the recipient seek independent third party legal, regulatory, accounting and tax advice regarding the contents of this document. This document is not a research report and was not prepared by the research department of Morgan Stanley or any of its affiliates. Notwithstanding anything herein to the contrary, each recipient hereof (and their employees, representatives, and other agents) may disclose to any and all persons, without limitation of any kind from the commencement of discussions, the U.S. federal and state income tax treatment and tax structure of the proposed transaction and all materials of any kind (including opinions or other tax analyses) that are provided relating to the tax treatment and tax structure. For this purpose, “tax structure” is limited to facts relevant to the U.S. federal and state income tax treatment of the proposed transaction and does not include information relating to the identity of the parties, their affiliates, agents or advisors. This document is provided by Morgan Stanley & Co. LLC and/or certain of its affiliates, which may include Morgan Stanley Realty Incorporated, Morgan Stanley Senior Funding, Inc., Morgan Stanley Bank, N.A., Morgan Stanley & Co. International plc, Morgan Stanley & Co. Limited, Morgan Stanley Bank International (Milan Branch), Morgan Stanley Saudi Arabia, Morgan Stanley South Africa (PTY) Limited, Morgan Stanley Securities Limited, Morgan Stanley Bank AG, Morgan Stanley MUFG Securities Co., Ltd, Mitsubishi UFJ Morgan Stanley Securities Co., Ltd, Morgan Stanley India Company Private Limited, Morgan Stanley Asia Limited, Morgan Stanley Australia Limited, Morgan Stanley Asia (Singapore) Pte., Morgan Stanley Services Limited, Morgan Stanley & Co. International plc, Seoul Branch, Morgan Stanley Canada Limited and/or Morgan Stanley, SV, SAU. Unless governing law permits otherwise, you must contact an authorized Morgan Stanley entity in your jurisdiction regarding this document or any of the information contained herein. © Morgan Stanley and/or certain of its affiliates. All rights reserved. 48