Exhibit (c)(3)
Project Maple Board Discussion Materials v72.pptx\03 NOV 2017\10:28 PM\1
Project Maple
Discussion Materials
7 November 2017
Project Maple Board Discussion Materials v72.pptx\03 NOV 2017\10:28 PM\2
Project Maple
Table of Contents
Section 1 Market Update
Section 2 Review of Maple Management Forecasts Section 3 Preliminary Financial Analysis Section 4 Tactical Considerations Appendix A PoS Adjusted Financials Appendix BNon-PoS Adjusted Financials Appendix C Assumptions Details Appendix D Financial Analysis Reference Materials Appendix E Partial Purchase Reference Materials
2
Project Maple Board Discussion Materials v72.pptx\03 NOV 2017\10:28 PM\3
Project Maple
Meeting Objectives
1 • Brief Public Market Update
2 • Review Maple Management Forecast and Assumptions 3 • Discuss Preliminary Standalone Financial Analysis 4 • Review Potential Tactical Responses and Next Steps
3
Project Maple Board Discussion Materials v72.pptx\03 NOV 2017\10:28 PM\4
Project Maple
Section 1
Market Update
4
Project Maple Board Discussion Materials v72.pptx\03 NOV 2017\10:28 PM\5
Project Maple
MARKET UPDATE
Maple Share Price Performance
Last Twelve Months
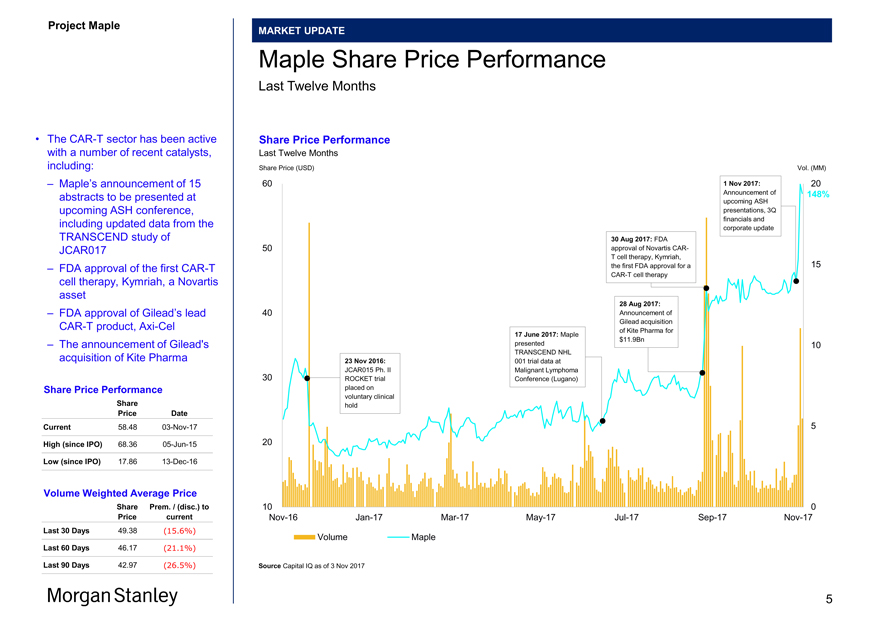
• TheCAR-T sector has been active Share Price Performance with a number of recent catalysts, Last Twelve Months
including: Share Price (USD) Vol. (MM)
– Maple’s announcement of 15 60 1 Nov 2017: 20 abstracts to be presented at Announcement of 148%
upcoming ASH
upcoming ASH conference, presentations, 3Q
financials and
including updated data from the
corporate update
TRANSCEND study of 30 Aug 2017: FDA
JCAR017 50 approval of Novartis CAR-
T cell therapy, Kymriah, 15
– FDA approval of the firstCAR-T the first FDA approval for a
CAR-T cell therapy
cell therapy, Kymriah, a Novartis asset
28 Aug 2017:
– FDA approval of Gilead’s lead 40 Announcement of
CAR-T product,Axi-Cel Gilead acquisition
of Kite Pharma for
17 June 2017: Maple $11.9Bn
– The announcement of Gilead’s presented 10
TRANSCEND NHL
acquisition of Kite Pharma 23 Nov 2016: 001 trial data at
JCAR015 Ph. II Malignant Lymphoma
30 ROCKET trial Conference (Lugano)
Share Price Performance placed on
Share voluntary clinical hold
Price Date
Current 58.4803-Nov-17 5
High (since IPO) 68.3605-Jun-15 20
Low (since IPO) 17.8613-Dec-16
Volume Weighted Average Price
Share Prem. / (disc.) to 10 0
Price currentNov-16Jan-17Mar-17May-17Jul-17Sep-17Nov-17
Last 30 Days 49.38 (15.6%)
Volume Maple
Last 60 Days 46.17 (21.1%)
Last 90 Days 42.97 (26.5%) Source Capital IQ as of 3 Nov 2017
5
Project Maple Board Discussion Materials v72.pptx\03 NOV 2017\10:28 PM\6
Project Maple
MARKET UPDATE
Biopharma Market Environment
Last Twelve Months
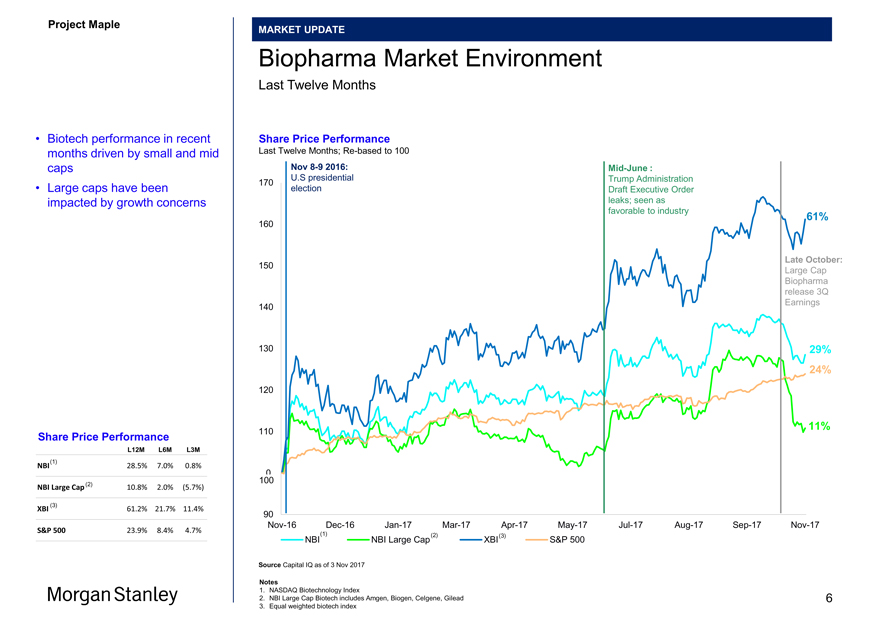
• Biotech performance in recent Share Price Performance
months driven by small and mid Last Twelve Months;Re-based to 100 caps Nov8-9 2016:Mid-June :
U.S presidential Trump Administration 170
• Large caps have been election Draft Executive Order
impacted by growth concerns leaks; seen as
favorable to industry
61%
160
Late October:
150
Large Cap Biopharma release 3Q Earnings 140
130 29% 24%
120
11%
110
Share Price Performance
L12M L6M L3M
(1)
NBI 28.5% 7.0% 0.8% 0 100
NBI Large Cap (2) 10.8% 2.0% (5.7%)
(3)
XBI 61.2% 21.7% 11.4%
90
Nov-16Dec-16Jan-17Mar-17Apr-17May-17Jul-17Aug-17Sep-17Nov-17
S&P 500 23.9% 8.4% 4.7%
(1) (2) (3)
NBI NBI Large Cap XBI S&P 500
Source Capital IQ as of 3 Nov 2017
Notes
1. NASDAQ Biotechnology Index
2. NBI Large Cap Biotech includes Amgen, Biogen, Celgene, Gilead 6
3. Equal weighted biotech index

Project Maple Board Discussion Materials v72.pptx\03 NOV 2017\10:28 PM\7
Project Maple
Section 2
Review of Maple Management Forecasts
7
Project Maple Board Discussion Materials v72.pptx\03 NOV 2017\10:28 PM\8
Project Maple
REVIEW OF MAPLE MANAGEMENT FORECASTS
Summary of Commercial Financial Scenarios
Per Maple Management; See Appendix C for Further Details
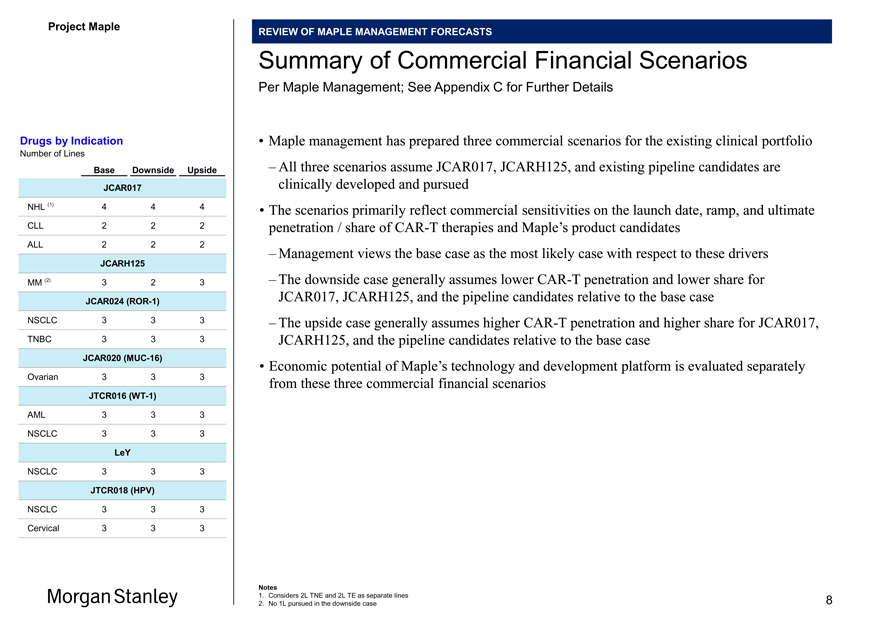
Drugs by Indication • Maple management has prepared three commercial scenarios for the existing clinical portfolio
Number of Lines
Base Downside Upside – All three scenarios assume JCAR017, JCARH125, and existing pipeline candidates are JCAR017 clinically developed and pursued NHL (1) 4 4 4 • The scenarios primarily reflect commercial sensitivities on the launch date, ramp, and ultimate
CLL 2 2 2 penetration / share ofCAR-T therapies and Maple’s product candidates
ALL 2 2 2
– Management views the base case as the most likely case with respect to these drivers
JCARH125
MM (2) 3 2 3 – The downside case generally assumes lowerCAR-T penetration and lower share for JCAR024(ROR-1) JCAR017, JCARH125, and the pipeline candidates relative to the base case
NSCLC 3 3 3 – The upside case generally assumes higherCAR-T penetration and higher share for JCAR017, TNBC 3 3 3 JCARH125, and the pipeline candidates relative to the base case
JCAR020(MUC-16)
• Economic potential of Maple’s technology and development platform is evaluated separately
Ovarian 3 3 3 from these three commercial financial scenarios
JTCR016(WT-1)
AML 3 3 3 NSCLC 3 3 3
LeY
NSCLC 3 3 3
JTCR018 (HPV)
NSCLC 3 3 3
Cervical 3 3 3
Notes
1. Considers 2L TNE and 2L TE as separate lines 8
2. No 1L pursued in the downside case
Project Maple Board Discussion Materials v72.pptx\03 NOV 2017\10:28 PM\17
Project Maple
REVIEW OF MAPLE MANAGEMENT FORECASTS
Probability of Success Assumptions
Per Maple Management; See Appendix C for Further Details
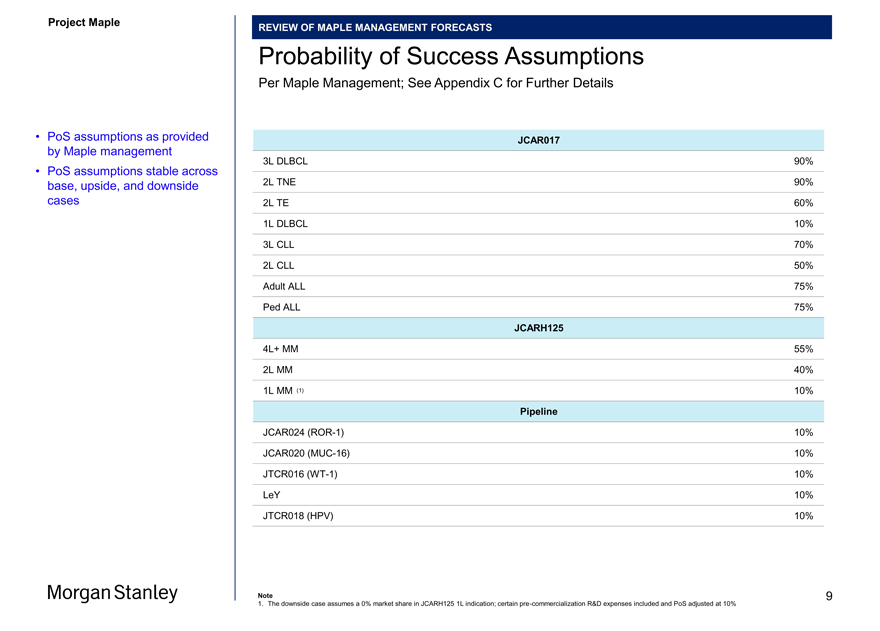
• PoS assumptions as provided JCAR017 by Maple management
• PoS assumptions stable across 3L DLBCL 90% base, upside, and downside 2L TNE 90%
cases 2L TE 60%
1L DLBCL 10%
3L CLL 70%
2L CLL 50% Adult ALL 75% Ped ALL 75%
JCARH125
4L+ MM 55%
2L MM 40%
1L MM (1) 10%
Pipeline
JCAR024(ROR-1) 10% JCAR020(MUC-16) 10% JTCR016(WT-1) 10% LeY 10% JTCR018 (HPV) 10%
Note 9
1. The downside case assumes a 0% market share in JCARH125 1L indication; certainpre-commercialization R&D expenses included and PoS adjusted at 10%
Project Maple Board Discussion Materials v72.pptx\03 NOV 2017\10:28 PM\9
Project Maple
REVIEW OF MAPLE MANAGEMENT FORECASTS
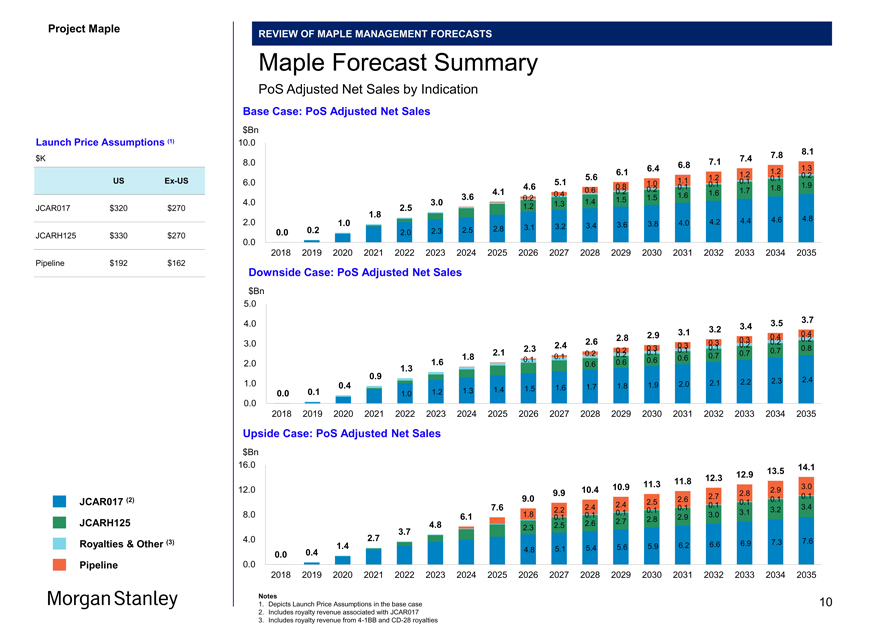
Maple Forecast Summary
PoS Adjusted Net Sales by Indication
Base Case: PoS Adjusted Net Sales $Bn
Launch Price Assumptions (1) 10.0 $K 7.8 8.1
7.1 7.4
8.0 6.8
6.4 1.3
6.1 1.2 1.2
5.6 1.2 0.1 0.2 USEx-US 6.0 5.1 1.0 1.1 0.1
4.6 0.8 0.1 0.1 1.9
0.6 0.2 1.7 1.8
4.1 0.4 0.2 1.6
3.6 0.2 1.5 1.6
4.0 3.0 1.4 1.5
2.5 1.2 1.3
JCAR017 $320 $270
1.8
4.4 4.6 4.8
2.0 1.0 3.6 3.8 4.0 4.2
2.8 3.1 3.2 3.4
0.0 0.2 2.0 2.3 2.5
JCARH125 $330 $270
0.0
2018 2019 2020 2021 2022 2023 2024 2025 2026 2027 2028 2029 2030 2031 2032 2033 2034 2035
Pipeline $192 $162 Downside Case: PoS Adjusted Net Sales $Bn
5.0
4.0 3.5 3.7
3.2 3.4
2.9 3.1 0.4
2.8 0.3 0.4 0.2
3.0 2.6 0.3 0.2 0.2
2.3 2.4 0.3 0.3 0.1 0.8
2.1 0.2 0.2 0.1 0.1 0.7 0.7
1.8 0.1 0.2 0.7
0.1 0.6 0.6
2.0 1.6 0.6 0.6
0.9 1.3
2.2 2.3 2.4
1.0 0.4 1.8 1.9 2.0 2.1
1.4 1.5 1.6 1.7
0.0 0.1 1.0 1.2 1.3
0.0
2018 2019 2020 2021 2022 2023 2024 2025 2026 2027 2028 2029 2030 2031 2032 2033 2034 2035
Upside Case: PoS Adjusted Net Sales $Bn
16.0 14.1
12.9 13.5 11.8 12.3 10.9 11.3 3.0 12.0 9.9 10.4 2.8 2.9
9.0 2.6 2.7 0.1 0.1
JCAR017 (2) 2.5 0.1
7.6 2.4 2.4 0.1 0.1 3.4
2.2 0.1 0.1 3.1 3.2
8.0 6.1 1.8 0.1 0.1 2.9 3.0
2.7 2.8
JCARH125 4.8 2.5 2.6
2.3
3.7
4.0 2.7 7.6
Royalties & Other (3) 1.4 6.2 6.6 6.9 7.3
5.1 5.4 5.6 5.9
0.4 4.8
0.0
Pipeline 0.0
2018 2019 2020 2021 2022 2023 2024 2025 2026 2027 2028 2029 2030 2031 2032 2033 2034 2035
Notes
1. Depicts Launch Price Assumptions in the base case 10
2. Includes royalty revenue associated with JCAR017
3. Includes royalty revenue from4-1BB andCD-28 royalties
Project Maple Board Discussion Materials v72.pptx\03 NOV 2017\10:28 PM\10
Project Maple
REVIEW OF MAPLE MANAGEMENT FORECASTS
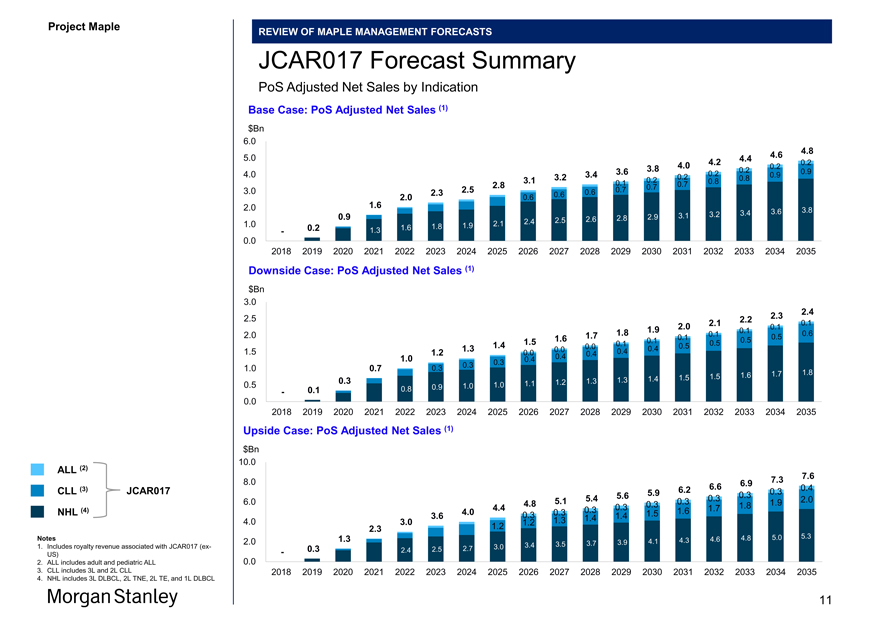
JCAR017 Forecast Summary
PoS Adjusted Net Sales by Indication
Base Case: PoS Adjusted Net Sales (1) $Bn
6.0
4.8
5.0 4.2 4.4 4.6 0.2
3.8 4.0 0.2
3.6 0.2 0.9
4.0 3.2 3.4 0.2 0.2 0.9
3.1 0.2 0.8 0.8
2.8 0.1 0.7
3.0 2.5 0.7 0.7
2.3 0.6 0.6
1.6 2.0 0.6
2.0 3.8
3.2 3.4 3.6
0.9 2.8 2.9 3.1
2.4 2.5 2.6
1.0 1.8 1.9 2.1
- 0.2 1.3 1.6
0.0—
2018 2019 2020 2021 2022 2023 2024 2025 2026 2027 2028 2029 2030 2031 2032 2033 2034 2035
Downside Case: PoS Adjusted Net Sales (1) $Bn
3.0
2.4
2.5 2.1 2.2 2.3 0.1
1.9 2.0 0.1
1.8 0.1 0.6
2.0 1.7 0.1 0.1 0.5
1.5 1.6 0.1 0.5
1.4 0.1 0.5 0.5
1.3 0.0 0.0 0.4
1.5 1.2 0.0 0.4 0.4
1.0 0.4 0.4
0.3 0.3
1.0 0.7 0.3
1.6 1.7 1.8
1.4 1.5 1.5
0.3 1.2 1.3 1.3
0.5 1.0 1.0 1.1
0.1 0.8 0.9
-
0.0—
2018 2019 2020 2021 2022 2023 2024 2025 2026 2027 2028 2029 2030 2031 2032 2033 2034 2035
Upside Case: PoS Adjusted Net Sales (1) $Bn 10.0
ALL (2)
7.3 7.6
8.0 6.9
CLL (3) JCAR017 6.2 6.6 0.4
5.9 0.3 0.3
5.4 5.6 0.3 2.0
6.0 4.8 5.1 0.3 0.3 1.9
4.4 0.3 1.7 1.8 NHL (4) 4.0 0.3 0.3 1.5 1.6
3.6 0.3 1.4 1.4
4.0 3.0 1.2 1.3
2.3 1.2
Notes 1.3 4.6 4.8 5.0 5.3
2.0 3.7 3.9 4.1 4.3
1. Includes royalty revenue associated with JCAR017(ex- 3.0 3.4 3.5
US) — 0.3 2.4 2.5 2.7
2. ALL includes adult and pediatric ALL 0.0
3. CLL includes 3L and 2L CLL 2018 2019 2020 2021 2022 2023 2024 2025 2026 2027 2028 2029 2030 2031 2032 2033 2034 2035
4. NHL includes 3L DLBCL, 2L TNE, 2L TE, and 1L DLBCL
11
Project Maple Board Discussion Materials v72.pptx\03 NOV 2017\10:28 PM\11
Project Maple
REVIEW OF MAPLE MANAGEMENT FORECASTS
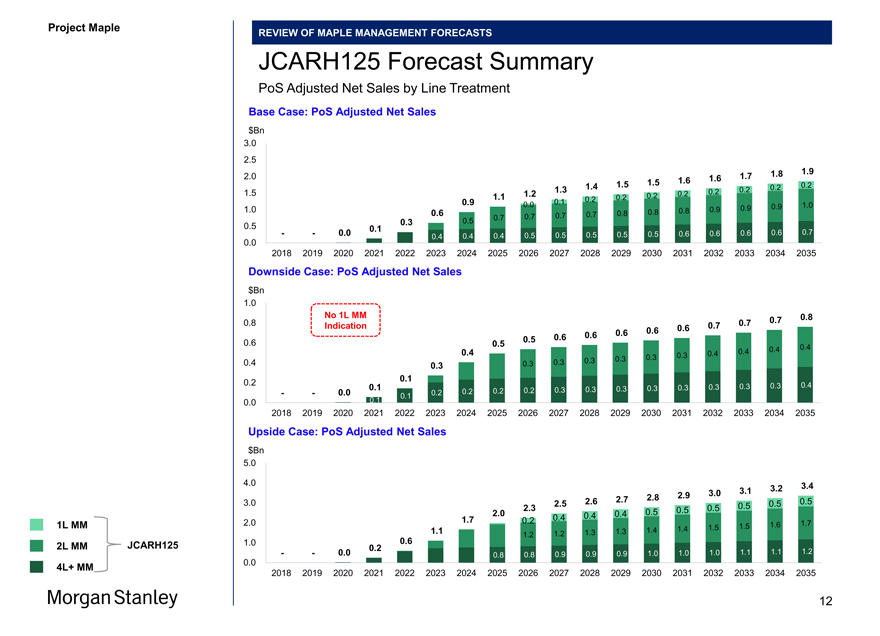
JCARH125 Forecast Summary
PoS Adjusted Net Sales by Line Treatment
Base Case: PoS Adjusted Net Sales $Bn
3.0
2.5
1.8 1.9
2.0 1.6 1.7
1.5 1.6
1.4 1.5 0.2 0.2
1.5 1.3 0.2 0.2
1.1 1.2 0.2 0.2
0.2 0.2
0.9 0.0 0.1 1.0
1.0 0.9 0.9 0.9
0.6 0.8 0.8 0.8
0.3 0.5 0.7 0.7 0.7 0.7
0.5 0.1
- — 0.0 0.5 0.5 0.5 0.5 0.6 0.6 0.6 0.6 0.7
0.0 0.4 0.4 0.4 0.5
- —
2018 2019 2020 2021 2022 2023 2024 2025 2026 2027 2028 2029 2030 2031 2032 2033 2034 2035
Downside Case: PoS Adjusted Net Sales $Bn
1.0
No 1L MM 0.8
0.8 0.7 0.7
Indication 0.6 0.7
0.6 0.6
0.6 0.6
0.6 0.5
0.5 0.4
0.4 0.4 0.4
0.3 0.4
0.3 0.3 0.3
0.4 0.3 0.3 0.3
0.1
0.2 0.3 0.4
0.1 0.3 0.3 0.3 0.3 0.3 0.3
- — 0.0 0.2 0.2 0.2 0.2 0.3
0.1
0.0— — 0.1
2018 2019 2020 2021 2022 2023 2024 2025 2026 2027 2028 2029 2030 2031 2032 2033 2034 2035
Upside Case: PoS Adjusted Net Sales $Bn
5.0
4.0 3.4
3.1 3.2
2.9 3.0
2.6 2.7 2.8 0.5
3.0 2.5 0.5 0.5
2.3 0.5 0.5
2.0 0.4 0.4 0.5
1.7 0.2 0.4
1L MM 2.0 1.5 1.6 1.7
1.1 1.4 1.4 1.5
1.2 1.2 1.3 1.3
JCARH125 1.0 0.6
2L MM 0.2
- — 0.0 0.9 0.9 0.9 1.0 1.0 1.0 1.1 1.1 1.2
0.0 0.8 0.8
4L+ MM
2018 2019 2020 2021 2022 2023 2024 2025 2026 2027 2028 2029 2030 2031 2032 2033 2034 2035
12
Project Maple Board Discussion Materials v72.pptx\03 NOV 2017\10:28 PM\12
Project Maple
REVIEW OF MAPLE MANAGEMENT FORECASTS
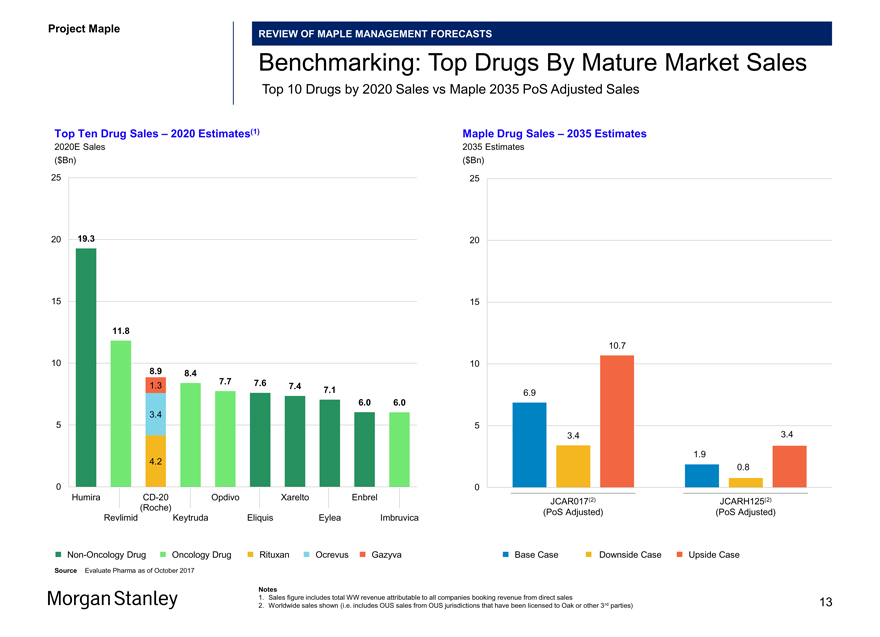
Benchmarking: Top Drugs By Mature Market Sales
Top 10 Drugs by 2020 Sales vs Maple 2035 PoS Adjusted Sales
Top Ten Drug Sales – 2020 Estimates(1) Maple Drug Sales – 2035 Estimates
2020E Sales 2035 Estimates
($Bn) ($Bn)
25 25
20 19.3 20
15 15
11.8
10.7
10 8.9 10
8.4 7.7
1.3 7.6 7.4
7.1 6.9
6.0 6.0
3.4
5 5
3.4 3.4
4.2 1.9
0.8
0 0
HumiraCD-20 Opdivo Xarelto Enbrel (2) (2) JCAR017 JCARH125 (Roche) (PoS Adjusted) (PoS Adjusted) Revlimid Keytruda Eliquis Eylea Imbruvica
Non-Oncology Drug Oncology Drug Rituxan Ocrevus Gazyva Base Case Downside Case Upside Case
Source Evaluate Pharma as of October 2017
Notes
1. Sales figure includes total WW revenue attributable to all companies booking revenue from direct sales
2. Worldwide sales shown (i.e. includes OUS sales from OUS jurisdictions that have been licensed to Oak or other 3rd parties) 13
Project Maple Board Discussion Materials v72.pptx\03 NOV 2017\10:28 PM\13
Project Maple
REVIEW OF MAPLE MANAGEMENT FORECASTS
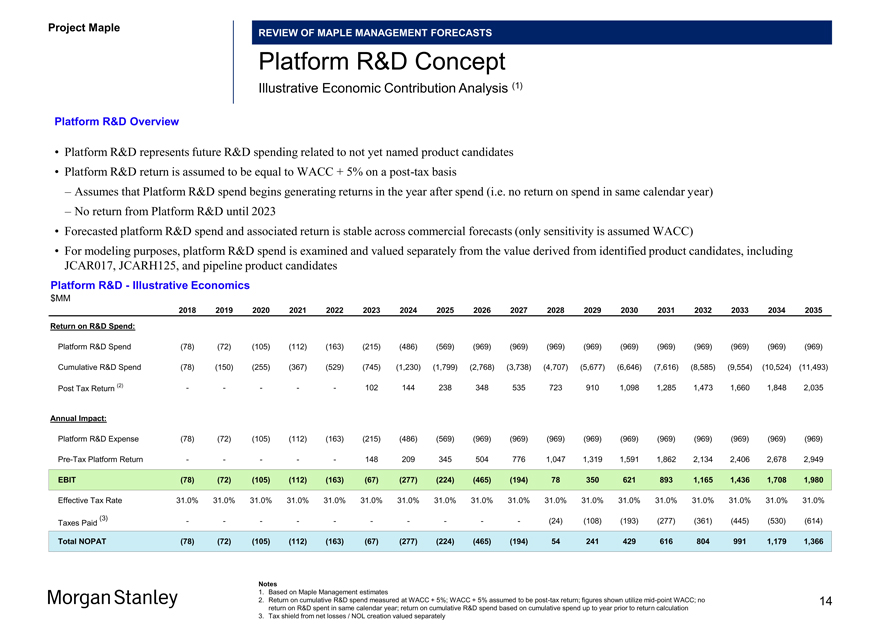
Platform R&D Concept
Illustrative Economic Contribution Analysis (1)
Platform R&D Overview
• Platform R&D represents future R&D spending related to not yet named product candidates
• Platform R&D return is assumed to be equal to WACC + 5% on apost-tax basis
– Assumes that Platform R&D spend begins generating returns in the year after spend (i.e. no return on spend in same calendar year)
– No return from Platform R&D until 2023
• Forecasted platform R&D spend and associated return is stable across commercial forecasts (only sensitivity is assumed WACC)
• For modeling purposes, platform R&D spend is examined and valued separately from the value derived from identified product candidates, including JCAR017, JCARH125, and pipeline product candidates
Platform R&D—Illustrative Economics $MM
2018 2019 2020 2021 2022 2023 2024 2025 2026 2027 2028 2029 2030 2031 2032 2033 2034 2035
Return on R&D Spend:
Platform R&D Spend (78) (72) (105) (112) (163) (215) (486) (569) (969) (969) (969) (969) (969) (969) (969) (969) (969) (969) Cumulative R&D Spend (78) (150) (255) (367) (529) (745) (1,230) (1,799) (2,768) (3,738) (4,707) (5,677) (6,646) (7,616) (8,585) (9,554) (10,524) (11,493) Post Tax Return (2) — ——102 144 238 348 535 723 910 1,098 1,285 1,473 1,660 1,848 2,035
Annual Impact:
Platform R&D Expense (78) (72) (105) (112) (163) (215) (486) (569) (969) (969) (969) (969) (969) (969) (969) (969) (969) (969)
Pre-Tax Platform Return — ——148 209 345 504 776 1,047 1,319 1,591 1,862 2,134 2,406 2,678 2,949
EBIT (78) (72) (105) (112) (163) (67) (277) (224) (465) (194) 78 350 621 893 1,165 1,436 1,708 1,980
Effective Tax Rate 31.0% 31.0% 31.0% 31.0% 31.0% 31.0% 31.0% 31.0% 31.0% 31.0% 31.0% 31.0% 31.0% 31.0% 31.0% 31.0% 31.0% 31.0%
(3) — — — — — (24) (108) (193) (277) (361) (445) (530) (614) Taxes Paid
Total NOPAT (78) (72) (105) (112) (163) (67) (277) (224) (465) (194) 54 241 429 616 804 991 1,179 1,366
Notes
1. Based on Maple Management estimates
2. Return on cumulative R&D spend measured at WACC + 5%; WACC + 5% assumed to bepost-tax return; figures shown utilizemid-point WACC; no 14 return on R&D spent in same calendar year; return on cumulative R&D spend based on cumulative spend up to year prior to return calculation
3. Tax shield from net losses / NOL creation valued separately
Project Maple
Section 3
Preliminary Financial Analysis
15
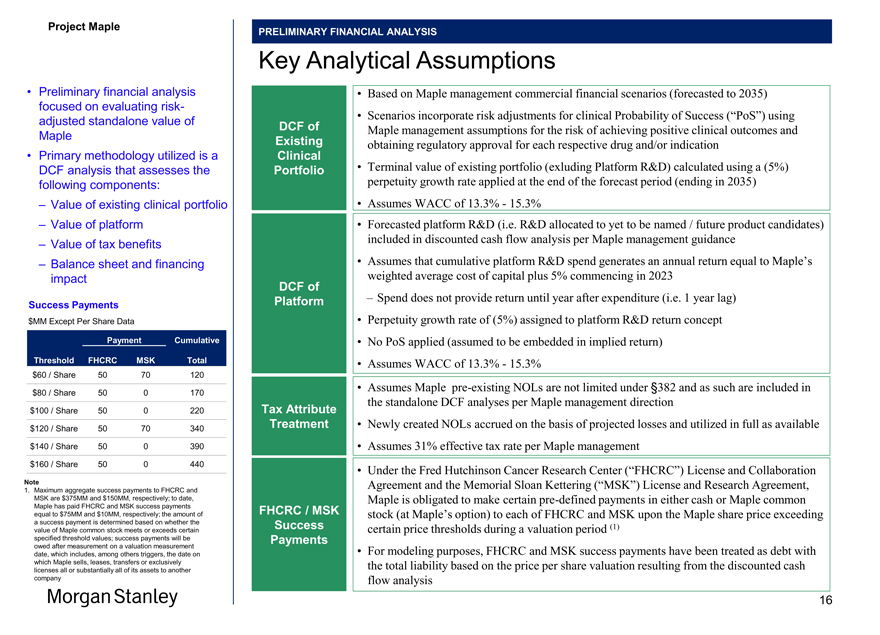
Project Maple Board Discussion Materials v72.ppt x\03 NOV 2017\10:28 PM\15 Project Maple PRELIMINARY FINANCIAL ANALYSIS Key Analytical Assumptions Preliminary financial analysis Based on Maple management commercial financial scenarios (forecasted to 2035) focused on evaluating risk- Scenarios incorporate risk adjustments for clinical Probability of Success (“PoS”) using adjusted standalone value of DCF of Maple management assumptions for the risk of achieving positive clinical outcomes and Maple Existing Primary methodology utilized is a Clinical obtaining regulatory approval for each respective drug and/or indication DCF analysis that assesses the Portfolio Terminal value of existing portfolio (exluding Platform R&D) calculated using a (5%) following components: perpetuity growth rate applied at the end of the forecast period (ending in 2035) – Value of existing clinical portfolio Assumes WACC of 13.3%—15.3% – Value of platform Forecasted platform R&D (i.e. R&D allocated to yet to be named / future product candidates) – Value of tax benefits included in discounted cash flow analysis per Maple management guidance – Balance sheet and financing Assumes that cumulative platform R&D spend generates an annual return equal to Maple’s impact DCF of weighted average cost of capital plus 5% commencing in 2023 Platform – Spend does not provide return until year after expenditure (i.e. 1 year lag) Success Payments $MM Except Per Share Data Perpetuity growth rate of (5%) assigned to platform R&D return concept Payment Cumulative No PoS applied (assumed to be embedded in implied return) Threshold FHCRC MSK Total Assumes WACC of 13.3%—15.3%, $60 / Share 50 70 120 Assumes Maple pre-existing NOLs are not limited under §382 and as such are included in $80 / Share 50 0 170 the standalone DCF analyses per Maple management direction $100 / Share 50 0 220 Tax Attribute $120 / Share 50 70 340 Treatment Newly created NOLs accrued on the basis of projected losses and utilized in full as available $140 / Share 50 0 390 Assumes 31% effective tax rate per Maple management $160 / Share 50 0 440 Under the Fred Hutchinson Cancer Research Center (“FHCRC”) License and Collaboration Note Agreement and the Memorial Sloan Kettering (“MSK”) License and Research Agreement, 1. Maximum aggregate success payments to FHCRC and MSK are $375MM and $150MM, respectively; to date, Maple is obligated to make certainpre-defined payments in either cash or Maple common Maple has paid FHCRC and MSK success payments FHCRC / MSK equal to $75MM and $10MM, respectively; the amount of stock (at Maple’s option) to each of FHCRC and MSK upon the Maple share price exceeding a success payment is determined based on whether the Success (1) value of Maple common stock meets or exceeds certain certain price thresholds during a valuation period specified threshold values; success payments will be Payments owed after measurement on a valuation measurement For modeling purposes, FHCRC and MSK success payments have been treated as debt with date, which includes, among others triggers, the date on which Maple sells, leases, transfers or exclusively the total liability based on the price per share valuation resulting from the discounted cash licenses all or substantially all of its assets to another company flow analysis 16
Project Maple Board Discussion Materials v72.pptx\03 NOV 2017\10:28 PM\16
Project Maple
PRELIMINARY FINANCIAL ANALYSIS
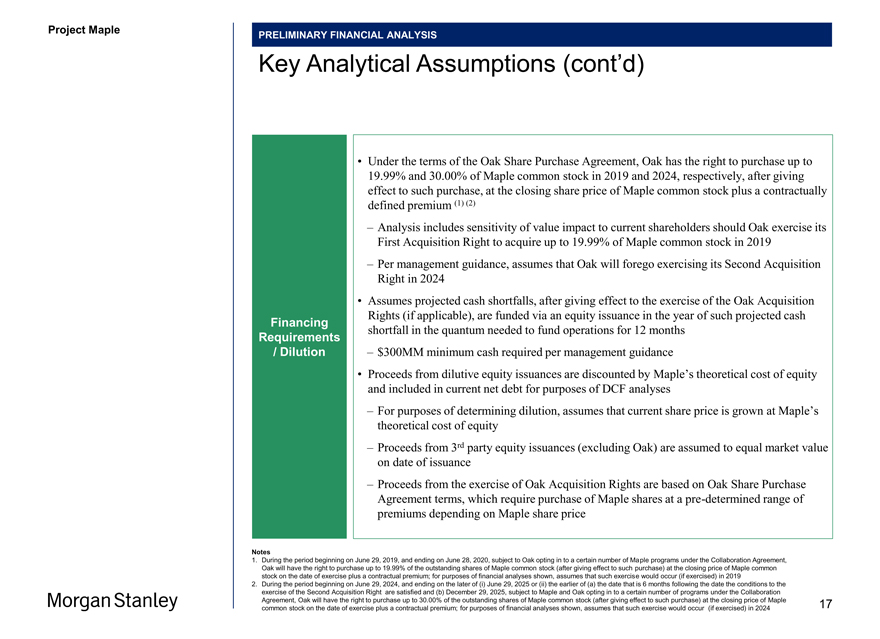
Key Analytical Assumptions (cont’d)
• Under the terms of the Oak Share Purchase Agreement, Oak has the right to purchase up to 19.99% and 30.00% of Maple common stock in 2019 and 2024, respectively, after giving effect to such purchase, at the closing share price of Maple common stock plus a contractually defined premium (1) (2)
– Analysis includes sensitivity of value impact to current shareholders should Oak exercise its First Acquisition Right to acquire up to 19.99% of Maple common stock in 2019
– Per management guidance, assumes that Oak will forego exercising its Second Acquisition Right in 2024
• Assumes projected cash shortfalls, after giving effect to the exercise of the Oak Acquisition Rights (if applicable), are funded via an equity issuance in the year of such projected cash
Financing shortfall in the quantum needed to fund operations for 12 months
Requirements
/ Dilution – $300MM minimum cash required per management guidance
• Proceeds from dilutive equity issuances are discounted by Maple’s theoretical cost of equity and included in current net debt for purposes of DCF analyses
– For purposes of determining dilution, assumes that current share price is grown at Maple’s theoretical cost of equity
– Proceeds from 3rd party equity issuances (excluding Oak) are assumed to equal market value on date of issuance
– Proceeds from the exercise of Oak Acquisition Rights are based on Oak Share Purchase Agreement terms, which require purchase of Maple shares at apre-determined range of premiums depending on Maple share price
Notes
1. During the period beginning on June 29, 2019, and ending on June 28, 2020, subject to Oak opting in to a certain number of Maple programs under the Collaboration Agreement, Oak will have the right to purchase up to 19.99% of the outstanding shares of Maple common stock (after giving effect to such purchase) at the closing price of Maple common stock on the date of exercise plus a contractual premium; for purposes of financial analyses shown, assumes that such exercise would occur (if exercised) in 2019
2. During the period beginning on June 29, 2024, and ending on the later of (i) June 29, 2025 or (ii) the earlier of (a) the date that is 6 months following the date the conditions to the exercise of the Second Acquisition Right are satisfied and (b) December 29, 2025, subject to Maple and Oak opting in to a certain number of programs under the Collaboration
Agreement, Oak will have the right to purchase up to 30.00% of the outstanding shares of Maple common stock (after giving effect to such purchase) at the closing price of Maple 17 common stock on the date of exercise plus a contractual premium; for purposes of financial analyses shown, assumes that such exercise would occur (if exercised) in 2024
Project Maple Board Discussion Materials v72.pptx\03 NOV 2017\10:28 PM\18
Project Maple
PRELIMINARY FINANCIAL ANALYSIS
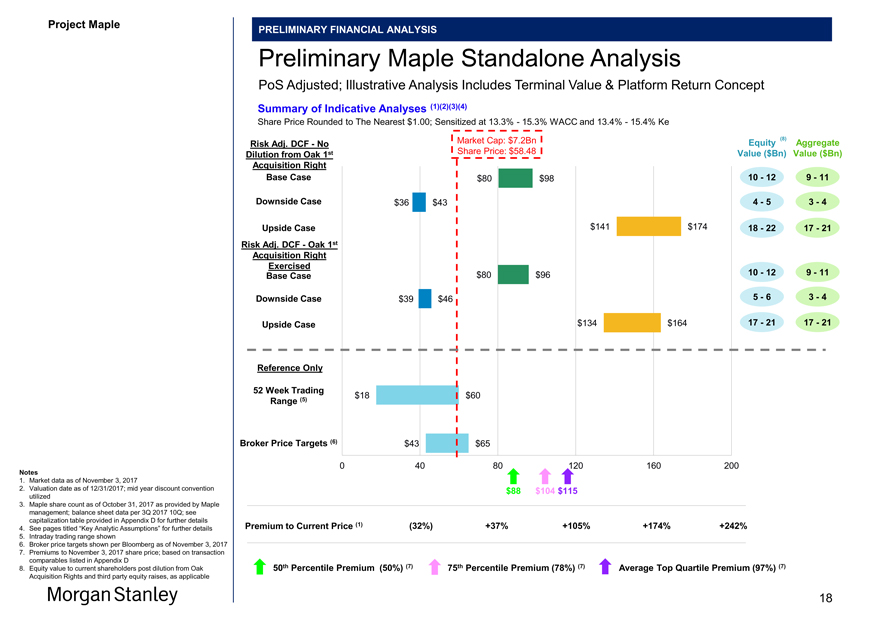
Preliminary Maple Standalone Analysis
PoS Adjusted; Illustrative Analysis Includes Terminal Value & Platform Return Concept
Summary of Indicative Analyses (1)(2)(3)(4)
Share Price Rounded to The Nearest $1.00; Sensitized at 13.3%—15.3% WACC and 13.4%—15.4% Ke
Market Cap: $7.2Bn Equity (8) Aggregate
Risk Adj. DCF—No
Dilution from Oak 1st Share Price: $58.48 Value ($Bn) Value ($Bn) Acquisition Right Base Case $80 $98 10—12 9—11
Downside Case $36 $43 4—5 3—4
Upside Case $141 $174 18—22 17—21 Risk Adj. DCF—Oak 1st Acquisition Right Exercised Base Case $80 $96 10—12 9—11 Downside Case $39 $46 5—6 3—4
Upside Case $134 $164 17—21 17—21
Reference Only
52 Week Trading
$18 $60
Range (5)
Broker Price Targets (6) $43 $65
Notes 0 40 80 120 160 200
1. Market data as of November 3, 2017
2. Valuation date as of 12/31/2017; mid year discount convention $88 $104 $115 utilized
3. Maple share count as of October 31, 2017 as provided by Maple management; balance sheet data per 3Q 2017 10Q; see capitalization table provided in Appendix D for further details
Premium to Current Price (1) (32%) +37% +105% +174% +242%
4. See pages titled “Key Analytic Assumptions” for further details
5. Intraday trading range shown
6. Broker price targets shown per Bloomberg as of November 3, 2017
7. Premiums to November 3, 2017 share price; based on transaction comparables listed in Appendix D th (7) th (7) (7)
8. Equity value to current shareholders post dilution from Oak 50 Percentile Premium (50%) 75 Percentile Premium (78%) Average Top Quartile Premium (97%)
Acquisition Rights and third party equity raises, as applicable
18
Project Maple Board Discussion Materials v72.pptx\03 NOV 2017\10:28 PM\19
Project Maple
PRELIMINARY FINANCIAL ANALYSIS
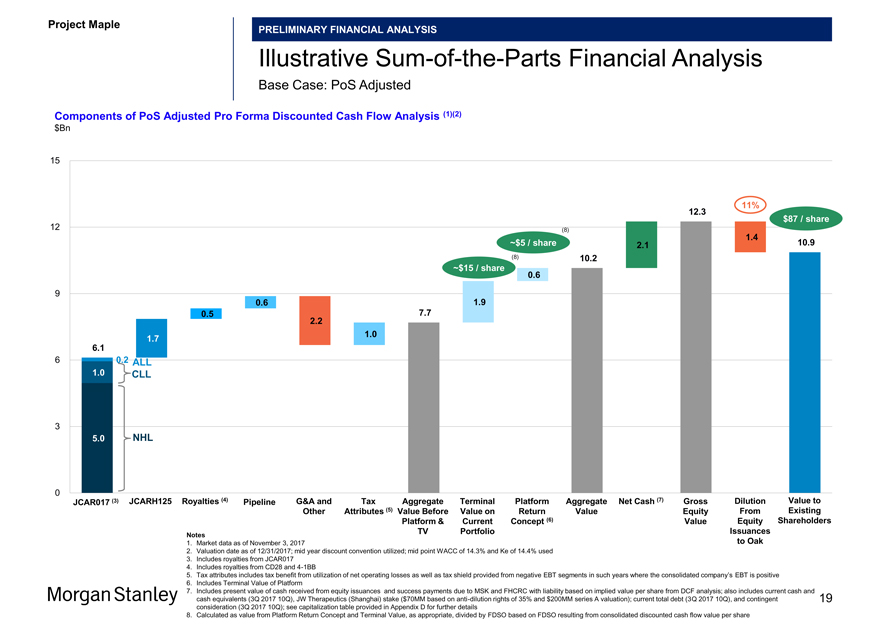
IllustrativeSum-of-the-Parts Financial Analysis
Base Case: PoS Adjusted
Components of PoS Adjusted Pro Forma Discounted Cash Flow Analysis (1)(2) $Bn
15
11% 12.3
12 $87 / share
(8)
1.4
~$5 / share 2.1 10.9 (8) 10.2
~$15 / share
0.6
9
0.6 1.9
0.5 2.2 7.7
1.0
1.7
6.1
6 0.2 ALL
1.0 CLL
3
5.0 NHL
0
JCAR017 (3) JCARH125 Royalties (4) Pipeline G&A and Tax Aggregate Terminal Platform Aggregate Net Cash (7) Gross Dilution Value to Other Attributes (5) Value Before Value on Return Value Equity From Existing Platform & Current Concept (6) Value Equity Shareholders TV Portfolio Issuances
Notes
1. Market data as of November 3, 2017 to Oak
2. Valuation date as of 12/31/2017; mid year discount convention utilized; mid point WACC of 14.3% and Ke of 14.4% used
3. Includes royalties from JCAR017
4. Includes royalties from CD28 and4-1BB
5. Tax attributes includes tax benefit from utilization of net operating losses as well as tax shield provided from negative EBT segments in such years where the consolidated company’s EBT is positive
6. Includes Terminal Value of Platform
7. Includes present value of cash received from equity issuances and success payments due to MSK and FHCRC with liability based on implied value per share from DCF analysis; also includes current cash and cash equivalents (3Q 2017 10Q), JW Therapeutics (Shanghai) stake ($70MM based on anti-dilution rights of 35% and $200MM series A valuation); current total debt (3Q 2017 10Q), and contingent 19 consideration (3Q 2017 10Q); see capitalization table provided in Appendix D for further details
8. Calculated as value from Platform Return Concept and Terminal Value, as appropriate, divided by FDSO based on FDSO resulting from consolidated discounted cash flow value per share
19
Project Maple Board Discussion Materials v72.pptx\03 NOV 2017\10:28 PM\20
Project Maple
PRELIMINARY FINANCIAL ANALYSIS
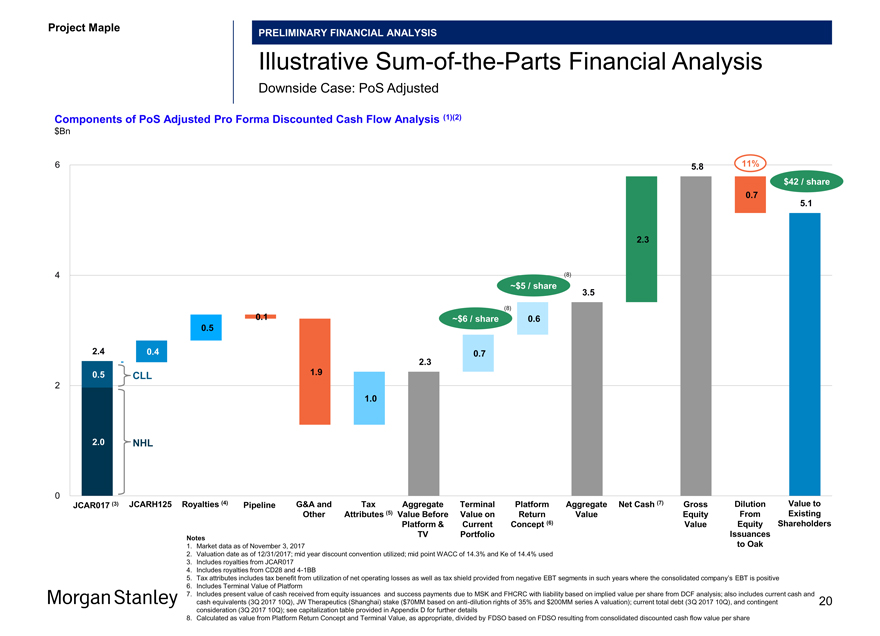
IllustrativeSum-of-the-Parts Financial Analysis
Downside Case: PoS Adjusted
Components of PoS Adjusted Pro Forma Discounted Cash Flow Analysis (1)(2) $Bn
6 5.8 11%
$42 / share
0.7 5.1
2.3
4 (8)
~$5 / share
3.5
(8)
0.1 ~$6 / share 0.6
0.5
2.4 0.4 0.7
- 2.3
0.5 CLL 1.9
2
1.0
2.0 NHL
0
JCAR017 (3) JCARH125 Royalties (4) Pipeline G&A and Tax Aggregate Terminal Platform Aggregate Net Cash (7) Gross Dilution Value to Other Attributes (5) Value Before Value on Return Value Equity From Existing Platform & Current Concept (6) Value Equity Shareholders TV Portfolio Issuances
Notes
1. Market data as of November 3, 2017 to Oak
2. Valuation date as of 12/31/2017; mid year discount convention utilized; mid point WACC of 14.3% and Ke of 14.4% used
3. Includes royalties from JCAR017
4. Includes royalties from CD28 and4-1BB
5. Tax attributes includes tax benefit from utilization of net operating losses as well as tax shield provided from negative EBT segments in such years where the consolidated company’s EBT is positive
6. Includes Terminal Value of Platform
7. Includes present value of cash received from equity issuances and success payments due to MSK and FHCRC with liability based on implied value per share from DCF analysis; also includes current cash and cash equivalents (3Q 2017 10Q), JW Therapeutics (Shanghai) stake ($70MM based on anti-dilution rights of 35% and $200MM series A valuation); current total debt (3Q 2017 10Q), and contingent 20 consideration (3Q 2017 10Q); see capitalization table provided in Appendix D for further details
8. Calculated as value from Platform Return Concept and Terminal Value, as appropriate, divided by FDSO based on FDSO resulting from consolidated discounted cash flow value per share
Project Maple Board Discussion Materials v72.pptx\03 NOV 2017\10:28 PM\21
Project Maple
PRELIMINARY FINANCIAL ANALYSIS
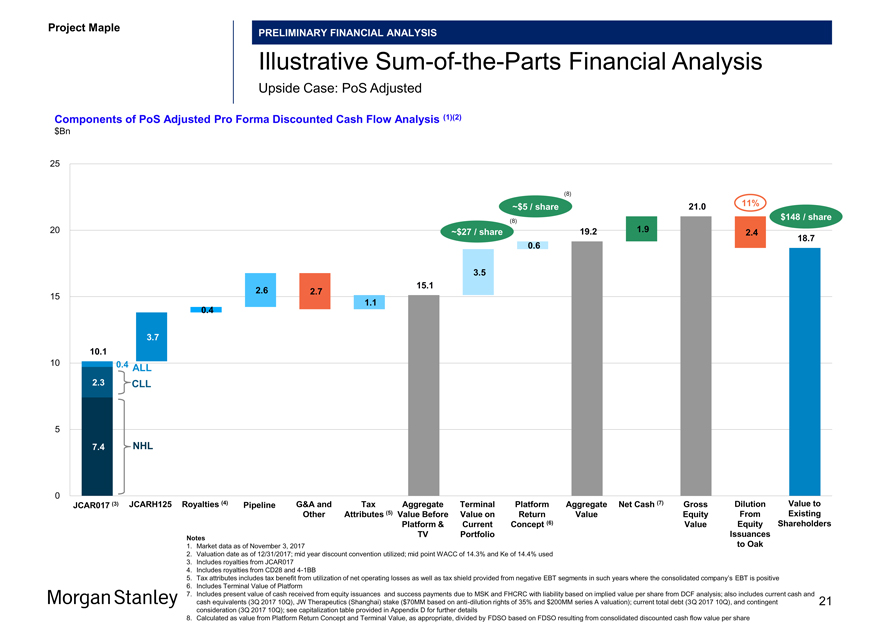
IllustrativeSum-of-the-Parts Financial Analysis
Upside Case: PoS Adjusted
Components of PoS Adjusted Pro Forma Discounted Cash Flow Analysis (1)(2) $Bn
25
(8)
~$5 / share 21.0 11% $148 / share
(8)
20 ~$27 / share 19.2 1.9 2.4
0.6 18.7
3.5 15.1
2.6 2.7
15
0.4 1.1
3.7 10.1
10 0.4
ALL
2.3 CLL
5
7.4 NHL
0
JCAR017 (3) JCARH125 Royalties (4) Pipeline G&A and Tax Aggregate Terminal Platform Aggregate Net Cash (7) Gross Dilution Value to Other Attributes (5) Value Before Value on Return Value Equity From Existing Platform & Current Concept (6) Value Equity Shareholders TV Portfolio Issuances
Notes
1. Market data as of November 3, 2017 to Oak
2. Valuation date as of 12/31/2017; mid year discount convention utilized; mid point WACC of 14.3% and Ke of 14.4% used
3. Includes royalties from JCAR017
4. Includes royalties from CD28 and4-1BB
5. Tax attributes includes tax benefit from utilization of net operating losses as well as tax shield provided from negative EBT segments in such years where the consolidated company’s EBT is positive
6. Includes Terminal Value of Platform
7. Includes present value of cash received from equity issuances and success payments due to MSK and FHCRC with liability based on implied value per share from DCF analysis; also includes current cash and cash equivalents (3Q 2017 10Q), JW Therapeutics (Shanghai) stake ($70MM based on anti-dilution rights of 35% and $200MM series A valuation); current total debt (3Q 2017 10Q), and contingent 21 consideration (3Q 2017 10Q); see capitalization table provided in Appendix D for further details
8. Calculated as value from Platform Return Concept and Terminal Value, as appropriate, divided by FDSO based on FDSO resulting from consolidated discounted cash flow value per share
Project Maple Board Discussion Materials v72.pptx\03 NOV 2017\10:28 PM\22
Project Maple
PRELIMINARY FINANCIAL ANALYSIS
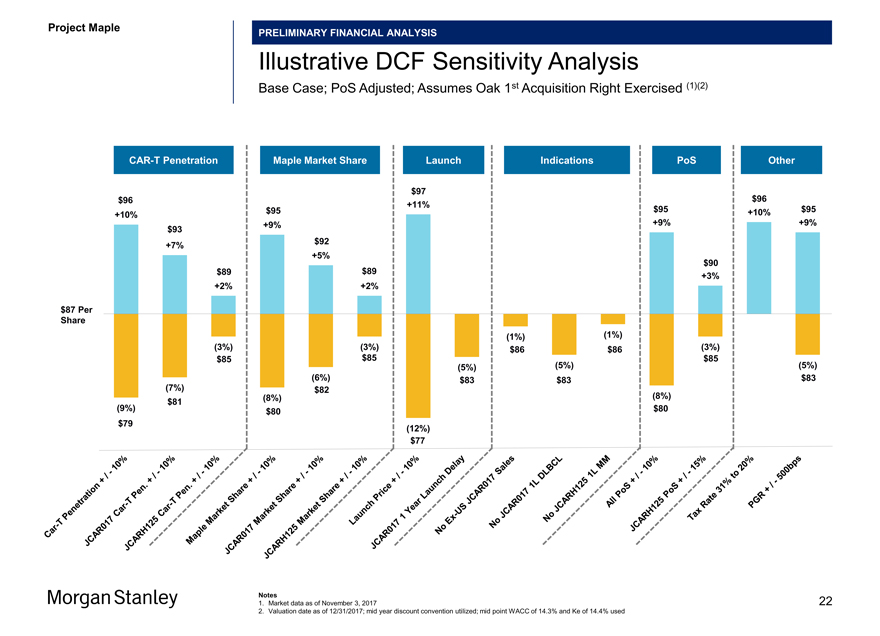
Illustrative DCF Sensitivity Analysis
Base Case; PoS Adjusted; Assumes Oak 1st Acquisition Right Exercised (1)(2)
CAR-T Penetration Maple Market Share Launch Indications PoS Other
$97 $96 $96 +11%
$95 $95 +10% $95 +10% +9% +9% +9% $93 $92 +7% +5% $90
$89 $89
+3% +2% +2%
$87 Per Share
(1%) (1%)
(3%) (3%) $86 $86 (3%)
$85 $85 (5%) $85 (5%) (5%) (6%) $83 $83 $83 (7%) $82 (8%) (8%) $81 (9%) $80 $80 10% $79 10%- (12%) 10% -/ 10%— / +
10%
/
- + $77
-
10%/ + /
- .
+
/ + Sales 15%
. Year
+ Share—Pen 10% 1 MM / Share
- 20% Pen DLBCL + T / T—1L to Share +
- 1L
10%
Car Market— PoS Car Market Lagged JCAR017
/ 31% 500bps Price +— Market US / Penetration
- + T Rate
- Ex JCAR017 JCARH125 PoS
JCARH125 Maple JCAR017 JCARH125 JCAR017 No NoNo JCARH125 Tax PGR Car JCAR017 Launch All
Notes 22
1. Market data as of November 3, 2017
2. Valuation date as of 12/31/2017; mid year discount convention utilized; mid point WACC of 14.3% and Ke of 14.4% used
Project Maple Board Discussion Materials v72.pptx\03 NOV 2017\10:28 PM\23
Project Maple
PRELIMINARY FINANCIAL ANALYSIS
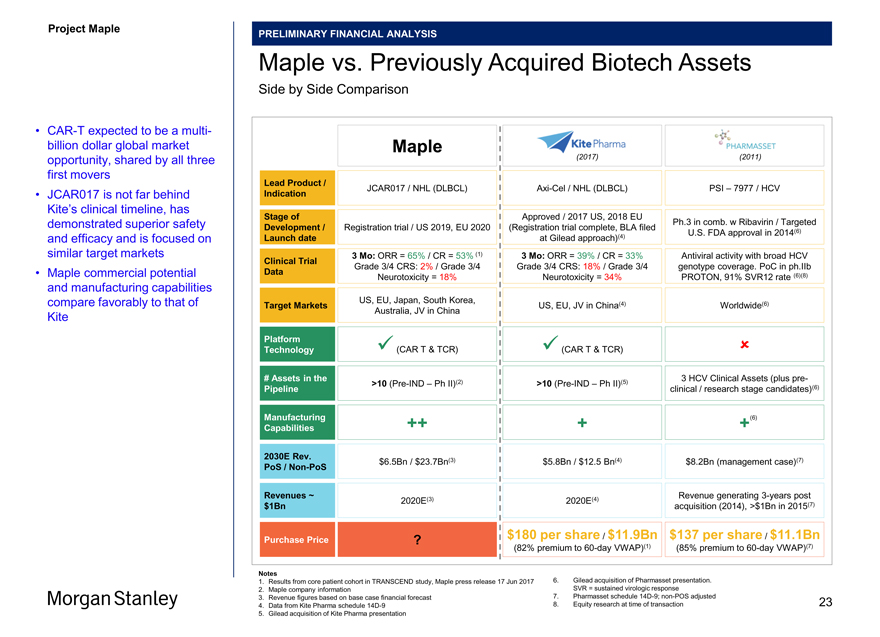
Maple vs. Previously Acquired Biotech Assets
Side by Side Comparison
•CAR-T expected to be a multi-billion dollar global market Maple opportunity, shared by all three (2017) (2011) first movers
Lead Product /
JCAR017 / NHL (DLBCL)Axi-Cel / NHL (DLBCL) PSI – 7977 / HCV
• JCAR017 is not far behind Indication
Kite’s clinical timeline, has
Stage of Approved / 2017 US, 2018 EU demonstrated superior safety Ph.3 in comb. w Ribavirin / Targeted Development / Registration trial / US 2019, EU 2020 (Registration trial complete, BLA filed Launch date at Gilead approach)(4) U.S. FDA approval in 2014(6)
and efficacy and is focused on
similar target markets Clinical Trial 3 Mo: ORR = 65% / CR = 53% (1) 3 Mo: ORR = 39% / CR = 33% Antiviral activity with broad HCV Grade 3/4 CRS: 2% / Grade 3/4 Grade 3/4 CRS: 18% / Grade 3/4 genotype coverage. PoC in ph.IIb
• Maple commercial potential Data
Neurotoxicity = 18% Neurotoxicity = 34% PROTON, 91% SVR12 rate (6)(8)
and manufacturing capabilities
US, EU, Japan, South Korea, compare favorably to that of Target Markets Australia, JV in China US, EU, JV in China(4) Worldwide(6)
Kite
Platform 
Technology  (CAR T & TCR)  (CAR T & TCR)
# Assets in the 3 HCV Clinical Assets (plus pre-Pipeline >10(Pre-IND – Ph II)(2) >10(Pre-IND – Ph II)(5) clinical / research stage candidates)(6)
Manufacturing ++ + +(6) Capabilities
2030E Rev.
PoS /Non-PoS $6.5Bn / $23.7Bn(3) $5.8Bn / $12.5 Bn(4) $8.2Bn (management case)(7)
Revenues ~ Revenue generating3-years post $1Bn 2020E(3) 2020E(4) acquisition (2014), >$1Bn in 2015(7)
Purchase Price $180 per share / $11.9Bn $137 per share / $11.1Bn
(82% premium to60-day VWAP)(1) (85% premium to60-day VWAP)(7)
Notes
1. Results from core patient cohort in TRANSCEND study, Maple press release 17 Jun 2017 6. Gilead acquisition of Pharmasset presentation.
2. Maple company information SVR = sustained virologic response
3. Revenue figures based on base case financial forecast 7. Pharmasset schedule14D-9;non-POS adjusted 23
4. Data from Kite Pharma schedule14D-9 8. Equity research at time of transaction
5. Gilead acquisition of Kite Pharma presentation
Project Maple Board Discussion Materials v72.pptx\03 NOV 2017\10:28 PM\24
Project Maple
PRELIMINARY FINANCIAL ANALYSIS
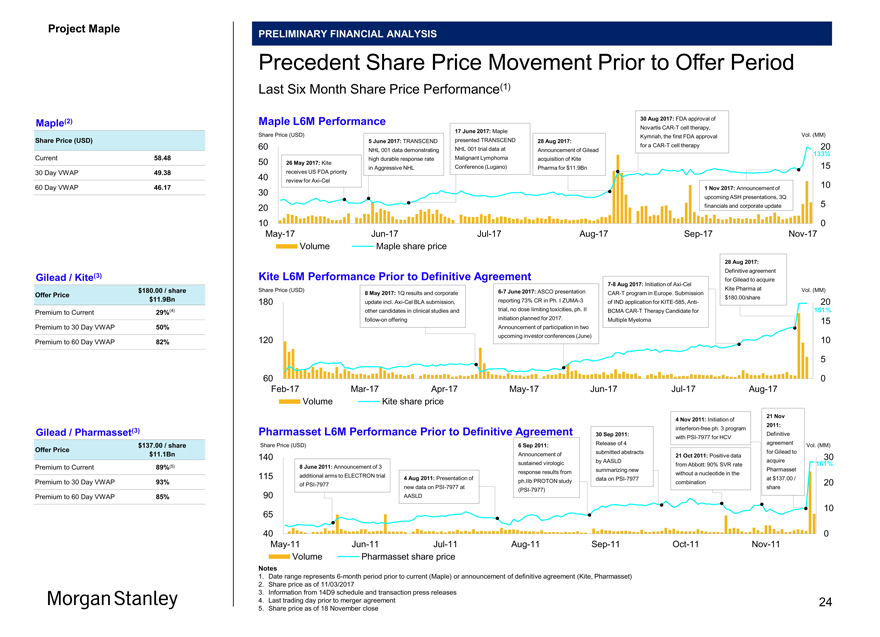
Precedent Share Price Movement Prior to Offer Period
Last Six Month Share Price Performance(1)
Maple(2) Maple L6M Performance 30 Aug 2017: FDA approval of
NovartisCAR-T cell therapy,
17 June 2017: Maple
Share Price (USD) Share Price (USD) presented TRANSCEND Kymriah, the first FDA approval Vol. (MM)
5 June 2017: TRANSCEND 28 Aug 2017:
60 for aCAR-T cell therapy 20 NHL 001 data demonstrating NHL 001 trial data at Announcement of Gilead
133%
Current 58.48 50 26 May 2017: Kite high durable response rate Malignant Lymphoma acquisition of Kite
30 Day VWAP 49.38 receives US FDA priority in Aggressive NHL Conference (Lugano) Pharma for $11.9Bn 15 40 review forAxi-Cel 10
60 Day VWAP 46.17 1 Nov 2017: Announcement of
30
upcoming ASH presentations, 3Q 5 20 financials and corporate update
10 0May-17Jun-17Jul-17Aug-17Sep-17Nov-17 Volume Maple share price
28 Aug 2017:
Definitive agreement
Gilead / Kite(3) Kite L6M Performance Prior to Definitive Agreement
7-8 Aug 2017: Initiation ofAxi-Cel for Gilead to acquire $180.00 / share Share Price (USD) Kite Pharma at Vol. (MM)
8 May 2017: 1Q results and corporate6-7 June 2017: ASCO presentationCAR-T program in Europe. Submission
Offer Price $180.00/share $11.9Bn 180 update incl.Axi-Cel BLA submission, reporting 73% CR in Ph. IZUMA-3 of IND application forKITE-585, Anti- 20 (4) other candidates in clinical studies and trial, no dose limiting toxicities, ph. II BCMACAR-T Therapy Candidate for 151%
Premium to Current 29%follow-on offering initiation planned for 2017. Multiple Myeloma 15 Premium to 30 Day VWAP 50% Announcement of participation in two Premium to 60 Day VWAP 82% 120 upcoming investor conferences (June) 10
5
60 0Feb-17Mar-17Apr-17May-17Jun-17Jul-17Aug-17 Volume Kite share price
21 Nov
4 Nov 2011: Initiation of
2011:
Gilead / Pharmasset(3) Pharmasset L6M Performance Prior to Definitive Agreement interferon-free ph. 3 program
30 Sep 2011: Definitive withPSI-7977 for HCV
Share Price (USD) Release of 4 agreement Vol. (MM) $137.00 / share 6 Sep 2011:
Offer Price submitted abstracts for Gilead to $11.1Bn 140 Announcement of 21 Oct 2011: Positive data 30 by AASLD acquire sustained virologic from Abbott: 90% SVR rate 161%
Premium to Current 89%(5) 8 June 2011: Announcement of 3 summarizing new Pharmasset response results from without a nucleotide in the 115 additional arms to ELECTRON trial
4 Aug 2011: Presentation of data onPSI-7977 at $137.00 /
Premium to 30 Day VWAP 93% ph.IIb PROTON study combination 20 ofPSI-7977 new data onPSI-7977 at share(PSI-7977)
Premium to 60 Day VWAP 85% 90 AASLD
10 65
40 0May-11Jun-11Jul-11Aug-11Sep-11Oct-11Nov-11 Volume Pharmasset share price
Notes
1. Date range represents6-month period prior to current (Maple) or announcement of definitive agreement (Kite, Pharmasset)
2. Share price as of 11/03/2017
3. Information from 14D9 schedule and transaction press releases
4. Last trading day prior to merger agreement 24
5. Share price as of 18 November close
Project Maple Board Discussion Materials v72.pptx\03 NOV 2017\10:28 PM\25
Project Maple
Section 4
Tactical Considerations
25
Project Maple Board Discussion Materials v72.pptx\03 NOV 2017\10:28 PM\26
Project Maple
TACTICAL CONSIDERATIONS
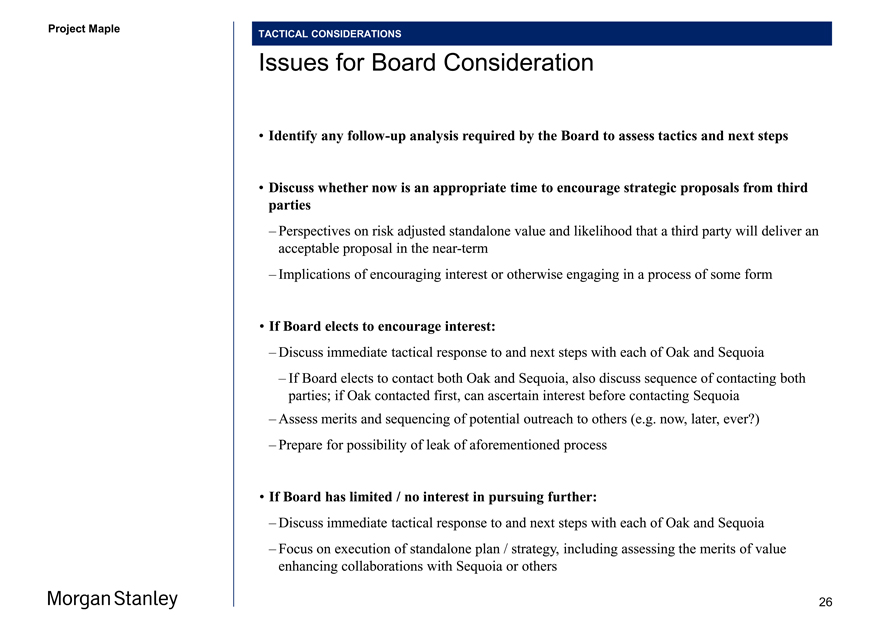
Issues for Board Consideration
• Identify anyfollow-up analysis required by the Board to assess tactics and next steps
• Discuss whether now is an appropriate time to encourage strategic proposals from third parties
– Perspectives on risk adjusted standalone value and likelihood that a third party will deliver an acceptable proposal in the near-term
– Implications of encouraging interest or otherwise engaging in a process of some form
• If Board elects to encourage interest:
– Discuss immediate tactical response to and next steps with each of Oak and Sequoia
– If Board elects to contact both Oak and Sequoia, also discuss sequence of contacting both parties; if Oak contacted first, can ascertain interest before contacting Sequoia
– Assess merits and sequencing of potential outreach to others (e.g. now, later, ever )
– Prepare for possibility of leak of aforementioned process
• If Board has limited / no interest in pursuing further:
– Discuss immediate tactical response to and next steps with each of Oak and Sequoia
– Focus on execution of standalone plan / strategy, including assessing the merits of value enhancing collaborations with Sequoia or others
26
Project Maple Board Discussion Materials v72.pptx\03 NOV 2017\10:28 PM\27
Project Maple
TACTICAL CONSIDERATIONS
Review of Potential Tactical Responses
Illustrative Messaging Themes
1 2
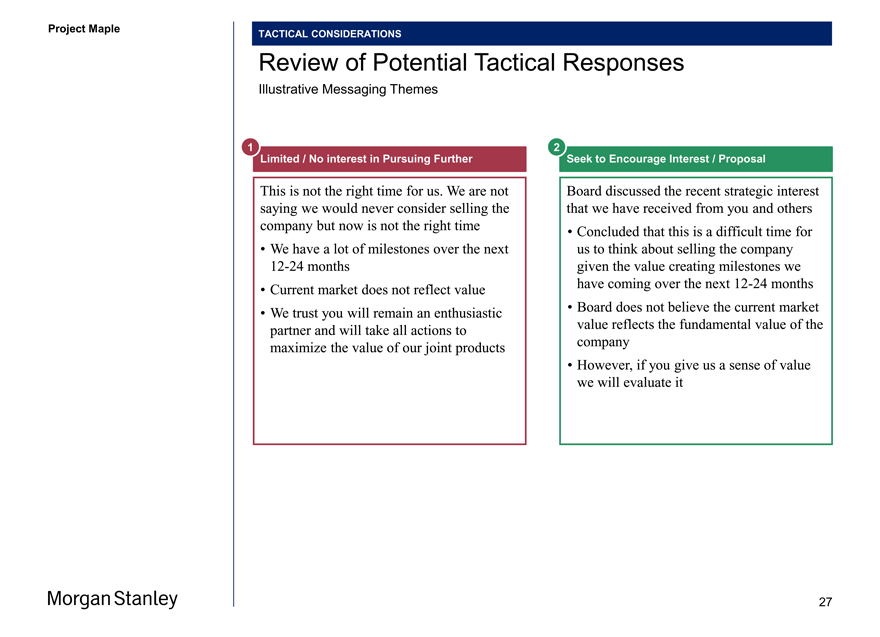
Limited / No interest in Pursuing Further Seek to Encourage Interest / Proposal
This is not the right time for us. We are not Board discussed the recent strategic interest saying we would never consider selling the that we have received from you and others company but now is not the right time • Concluded that this is a difficult time for
• We have a lot of milestones over the next us to think about selling the company12-24 months given the value creating milestones we have coming over the next12-24 months
• Current market does not reflect value
• We trust you will remain an enthusiastic • Board does not believe the current market partner and will take all actions to value reflects the fundamental value of the maximize the value of our joint products company
• However, if you give us a sense of value we will evaluate it
27
Project Maple Board Discussion Materials v72.pptx\03 NOV 2017\10:28 PM\28
Project Maple
TACTICAL CONSIDERATIONS
Potential Near-term Process Alternatives
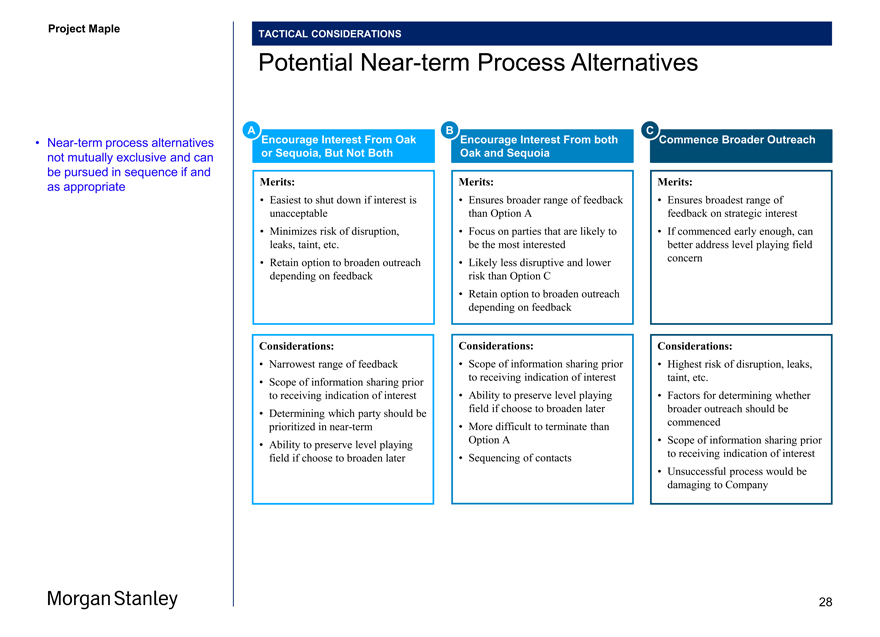
A Encourage Interest From Oak B Encourage Interest From both C Commence Broader Outreach
• Near-term process alternatives or Sequoia, But Not Both Oak and Sequoia not mutually exclusive and can be pursued in sequence if and Merits: Merits: Merits: as appropriate
• Easiest to shut down if interest is • Ensures broader range of feedback • Ensures broadest range of unacceptable than Option A feedback on strategic interest
• Minimizes risk of disruption, • Focus on parties that are likely to • If commenced early enough, can leaks, taint, etc. be the most interested better address level playing field
• Retain option to broaden outreach • Likely less disruptive and lower concern depending on feedback risk than Option C
• Retain option to broaden outreach depending on feedback
Considerations: Considerations: Considerations:
• Narrowest range of feedback • Scope of information sharing prior • Highest risk of disruption, leaks, to receiving indication of interest taint, etc.
• Scope of information sharing prior to receiving indication of interest • Ability to preserve level playing • Factors for determining whether field if choose to broaden later broader outreach should be
• Determining which party should be prioritized in near-term • More difficult to terminate than commenced
Option A • Scope of information sharing prior
• Ability to preserve level playing field if choose to broaden later • Sequencing of contacts to receiving indication of interest
• Unsuccessful process would be damaging to Company
28
Project Maple Board Discussion Materials v72.pptx\03 NOV 2017\10:28 PM\29
Project Maple
TACTICAL CONSIDERATIONS
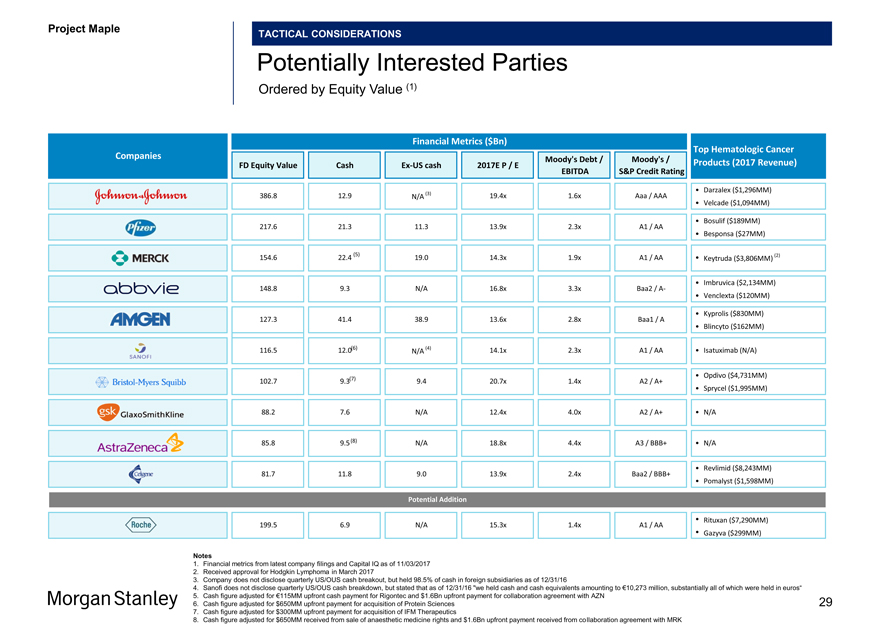
Potentially Interested Parties
Ordered by Equity Value (1)
Financial Metrics ($Bn) Top Hematologic Cancer Companies Moody’s Debt / Moody’s / FD Equity Value CashEx-US cash 2017E P / E Products (2017 Revenue) EBITDA S&P Credit Rating
• Darzalex ($1,296MM) 386.8 12.9 (3) 19.4x 1.6x Aaa / AAA
N/A • Velcade ($1,094MM) 217.6 21.3 11.3 13.9x 2.3x A1 / AA • Bosulif ($189MM)
• Besponsa ($27MM)
(5) (2)
154.6 22.4 19.0 14.3x 1.9x A1 / AA • Keytruda ($3,806MM)
148.8 9.3 N/A 16.8x 3.3x Baa2 /A- • Imbruvica ($2,134MM)
• Venclexta ($120MM)
127.3 41.4 38.9 13.6x 2.8x Baa1 / A • Kyprolis ($830MM)
• Blincyto ($162MM)
116.5 12.0(6) (4) 14.1x 2.3x A1 / AA • Isatuximab (N/A) N/A
• Opdivo ($4,731MM) 102.7 9.3(7) 9.4 20.7x 1.4x A2 / A+
• Sprycel ($1,995MM) 88.2 7.6 N/A 12.4x 4.0x A2 / A+ • N/A
85.8 9.5(8) N/A 18.8x 4.4x A3 / BBB+ • N/A
81.7 11.8 9.0 13.9x 2.4x Baa2 / BBB+ • Revlimid ($8,243MM)
• Pomalyst ($1,598MM)
Potential Addition
199.5 6.9 N/A 15.3x 1.4x A1 / AA • Rituxan ($7,290MM)
• Gazyva ($299MM)
Notes
1. Financial metrics from latest company filings and Capital IQ as of 11/03/2017
2. Received approval for Hodgkin Lymphoma in March 2017
3. Company does not disclose quarterly US/OUS cash breakout, but held 98.5% of cash in foreign subsidiaries as of 12/31/16
4. Sanofi does not disclose quarterly US/OUS cash breakdown, but stated that as of 12/31/16 “we held cash and cash equivalents amounting to €10,273 million, substantially all of which were held in euros“
5. Cash figure adjusted for €115MM upfront cash payment for Rigontec and $1.6Bn upfront payment for collaboration agreement with AZN
6. Cash figure adjusted for $650MM upfront payment for acquisition of Protein Sciences 29
7. Cash figure adjusted for $300MM upfront payment for acquisition of IFM Therapeutics
8. Cash figure adjusted for $650MM received from sale of anaesthetic medicine rights and $1.6Bn upfront payment received from collaboration agreement with MRK
Project Maple Board Discussion Materials v72.pptx\03 NOV 2017\10:28 PM\30
Project Maple
Appendix A
PoS Adjusted Financials
30
Project Maple Board Discussion Materials v72.pptx\03 NOV 2017\10:28 PM\31
Project Maple
POS ADJUSTED FINANCIALS
Maple Financial Summary
Base Case; PoS Adjusted
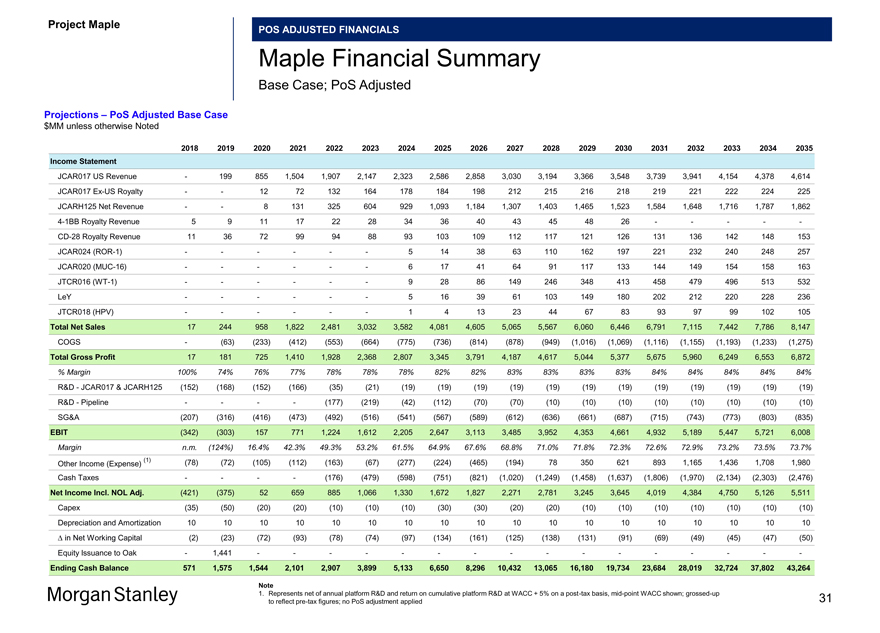
Projections – PoS Adjusted Base Case $MM unless otherwise Noted
2018 2019 2020 2021 2022 2023 2024 2025 2026 2027 2028 2029 2030 2031 2032 2033 2034 2035 Income Statement
JCAR017 US Revenue — 199 855 1,504 1,907 2,147 2,323 2,586 2,858 3,030 3,194 3,366 3,548 3,739 3,941 4,154 4,378 4,614 JCAR017Ex-US Royalty — — 12 72 132 164 178 184 198 212 215 216 218 219 221 222 224 225 JCARH125 Net Revenue — — 8 131 325 604 929 1,093 1,184 1,307 1,403 1,465 1,523 1,584 1,648 1,716 1,787 1,8624-1BB Royalty Revenue 5 9 11 17 22 28 34 36 40 43 45 48 26 — — — —-CD-28 Royalty Revenue 11 36 72 99 94 88 93 103 109 112 117 121 126 131 136 142 148 153 JCAR024(ROR-1) — — — — — — 5 14 38 63 110 162 197 221 232 240 248 257 JCAR020(MUC-16) — — — — — — 6 17 41 64 91 117 133 144 149 154 158 163 JTCR016(WT-1) — — — — — — 9 28 86 149 246 348 413 458 479 496 513 532 LeY — — — — — — 5 16 39 61 103 149 180 202 212 220 228 236 JTCR018 (HPV) — — — — — — 1 4 13 23 44 67 83 93 97 99 102 105 Total Net Sales 17 244 958 1,822 2,481 3,032 3,582 4,081 4,605 5,065 5,567 6,060 6,446 6,791 7,115 7,442 7,786 8,147 COGS — (63) (233) (412) (553) (664) (775) (736) (814) (878) (949) (1,016) (1,069) (1,116) (1,155) (1,193) (1,233) (1,275) Total Gross Profit 17 181 725 1,410 1,928 2,368 2,807 3,345 3,791 4,187 4,617 5,044 5,377 5,675 5,960 6,249 6,553 6,872
% Margin 100% 74% 76% 77% 78% 78% 78% 82% 82% 83% 83% 83% 83% 84% 84% 84% 84% 84%
R&D—JCAR017 & JCARH125 (152) (168) (152) (166) (35) (21) (19) (19) (19) (19) (19) (19) (19) (19) (19) (19) (19) (19) R&D—Pipeline — — — — (177) (219) (42) (112) (70) (70) (10) (10) (10) (10) (10) (10) (10) (10) SG&A (207) (316) (416) (473) (492) (516) (541) (567) (589) (612) (636) (661) (687) (715) (743) (773) (803) (835) EBIT (342) (303) 157 771 1,224 1,612 2,205 2,647 3,113 3,485 3,952 4,353 4,661 4,932 5,189 5,447 5,721 6,008
Margin n.m. (124%) 16.4% 42.3% 49.3% 53.2% 61.5% 64.9% 67.6% 68.8% 71.0% 71.8% 72.3% 72.6% 72.9% 73.2% 73.5% 73.7%
(1) (78) (72) (105) (112) (163) (67) (277) (224) (465) (194) 78 350 621 893 1,165 1,436 1,708 1,980 Other Income (Expense)
Cash Taxes — — — — (176) (479) (598) (751) (821) (1,020) (1,249) (1,458) (1,637) (1,806) (1,970) (2,134) (2,303) (2,476) Net Income Incl. NOL Adj. (421) (375) 52 659 885 1,066 1,330 1,672 1,827 2,271 2,781 3,245 3,645 4,019 4,384 4,750 5,126 5,511 Capex (35) (50) (20) (20) (10) (10) (10) (30) (30) (20) (20) (10) (10) (10) (10) (10) (10) (10) Depreciation and Amortization 10 10 10 10 10 10 10 10 10 10 10 10 10 10 10 10 10 10 â^† in Net Working Capital (2) (23) (72) (93) (78) (74) (97) (134) (161) (125) (138) (131) (91) (69) (49) (45) (47) (50) Equity Issuance to Oak — 1,441 — — — — — — — — — — — — — — — -
Ending Cash Balance 571 1,575 1,544 2,101 2,907 3,899 5,133 6,650 8,296 10,432 13,065 16,180 19,734 23,684 28,019 32,724 37,802 43,264
Note
1. Represents net of annual platform R&D and return on cumulative platform R&D at WACC + 5% on apost-tax basis,mid-point WACC shown;grossed-up 31 to reflectpre-tax figures; no PoS adjustment applied
Project Maple Board Discussion Materials v72.pptx\03 NOV 2017\10:28 PM\32
Project Maple
POS ADJUSTED FINANCIALS
Overview of Tax Attributes
Base Case; PoS Adjusted
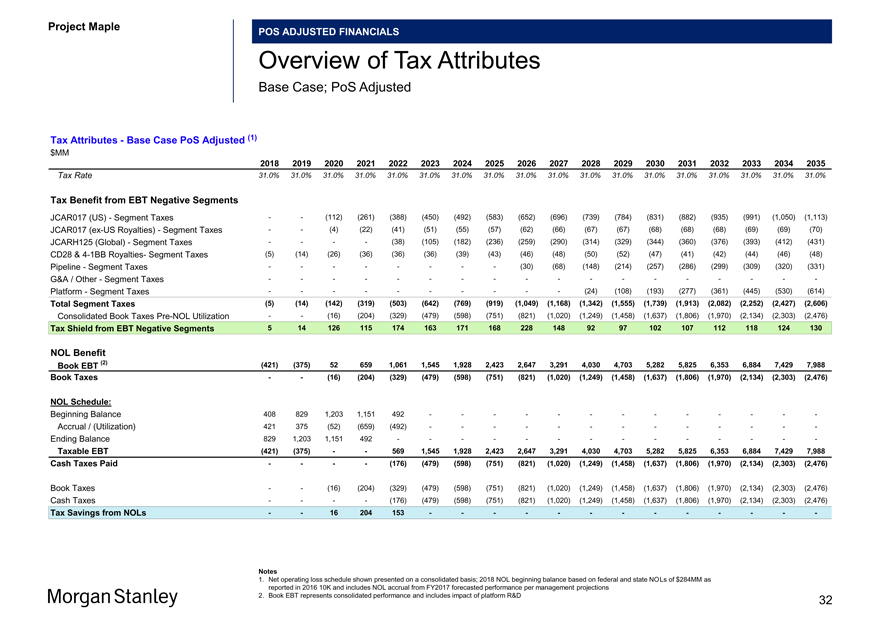
Tax Attributes—Base Case PoS Adjusted (1) $MM
2018 2019 2020 2021 2022 2023 2024 2025 2026 2027 2028 2029 2030 2031 2032 2033 2034 2035
Tax Rate 31.0% 31.0% 31.0% 31.0% 31.0% 31.0% 31.0% 31.0% 31.0% 31.0% 31.0% 31.0% 31.0% 31.0% 31.0% 31.0% 31.0% 31.0%
Tax Benefit from EBT Negative Segments
JCAR017 (US)—Segment Taxes — (112) (261) (388) (450) (492) (583) (652) (696) (739) (784) (831) (882) (935) (991) (1,050) (1,113) JCAR017(ex-US Royalties)—Segment Taxes — (4) (22) (41) (51) (55) (57) (62) (66) (67) (67) (68) (68) (68) (69) (69) (70) JCARH125 (Global)—Segment Taxes — — (38) (105) (182) (236) (259) (290) (314) (329) (344) (360) (376) (393) (412) (431) CD28 &4-1BB Royalties- Segment Taxes (5) (14) (26) (36) (36) (36) (39) (43) (46) (48) (50) (52) (47) (41) (42) (44) (46) (48) Pipeline—Segment Taxes — — — — (30) (68) (148) (214) (257) (286) (299) (309) (320) (331)
G&A / Other—Segment Taxes — — — — — — — — —
Platform—Segment Taxes — — — — — (24) (108) (193) (277) (361) (445) (530) (614)
Total Segment Taxes (5) (14) (142) (319) (503) (642) (769) (919) (1,049) (1,168) (1,342) (1,555) (1,739) (1,913) (2,082) (2,252) (2,427) (2,606)
Consolidated Book TaxesPre-NOL Utilization — (16) (204) (329) (479) (598) (751) (821) (1,020) (1,249) (1,458) (1,637) (1,806) (1,970) (2,134) (2,303) (2,476)
Tax Shield from EBT Negative Segments 5 14 126 115 174 163 171 168 228 148 92 97 102 107 112 118 124 130
NOL Benefit
Book EBT (2) (421) (375) 52 659 1,061 1,545 1,928 2,423 2,647 3,291 4,030 4,703 5,282 5,825 6,353 6,884 7,429 7,988 Book Taxes — (16) (204) (329) (479) (598) (751) (821) (1,020) (1,249) (1,458) (1,637) (1,806) (1,970) (2,134) (2,303) (2,476)
NOL Schedule:
Beginning Balance 408 829 1,203 1,151 492 — — — — — — -Accrual / (Utilization) 421 375 (52) (659) (492) — — — — — — -Ending Balance 829 1,203 1,151 492 — — — — — — —
Taxable EBT (421) (375) — 569 1,545 1,928 2,423 2,647 3,291 4,030 4,703 5,282 5,825 6,353 6,884 7,429 7,988 Cash Taxes Paid — — (176) (479) (598) (751) (821) (1,020) (1,249) (1,458) (1,637) (1,806) (1,970) (2,134) (2,303) (2,476)
Book Taxes — (16) (204) (329) (479) (598) (751) (821) (1,020) (1,249) (1,458) (1,637) (1,806) (1,970) (2,134) (2,303) (2,476) Cash Taxes — — (176) (479) (598) (751) (821) (1,020) (1,249) (1,458) (1,637) (1,806) (1,970) (2,134) (2,303) (2,476)
Tax Savings from NOLs — 16 204 153 — — — — — — -
Notes
1. Net operating loss schedule shown presented on a consolidated basis; 2018 NOL beginning balance based on federal and state NOLs of $284MM as reported in 2016 10K and includes NOL accrual from FY2017 forecasted performance per management projections
2. Book EBT represents consolidated performance and includes impact of platform R&D 32
Project Maple Board Discussion Materials v72.pptx\03 NOV 2017\10:28 PM\33
Project Maple
POS ADJUSTED FINANCIALS
Maple Financial Summary
Downside Case; PoS Adjusted
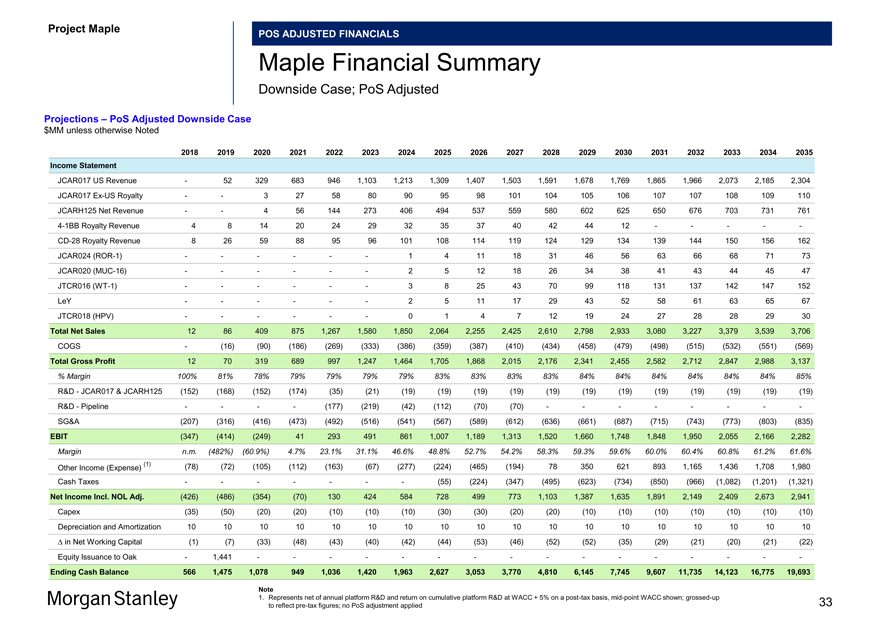
Projections – PoS Adjusted Downside Case $MM unless otherwise Noted
2018 2019 2020 2021 2022 2023 2024 2025 2026 2027 2028 2029 2030 2031 2032 2033 2034 2035 Income Statement
JCAR017 US Revenue — 52 329 683 946 1,103 1,213 1,309 1,407 1,503 1,591 1,678 1,769 1,865 1,966 2,073 2,185 2,304 JCAR017Ex-US Royalty — — 3 27 58 80 90 95 98 101 104 105 106 107 107 108 109 110 JCARH125 Net Revenue — — 4 56 144 273 406 494 537 559 580 602 625 650 676 703 731 7614-1BB Royalty Revenue 4 8 14 20 24 29 32 35 37 40 42 44 12 — — — —-CD-28 Royalty Revenue 8 26 59 88 95 96 101 108 114 119 124 129 134 139 144 150 156 162 JCAR024(ROR-1) — — — — — — 1 4 11 18 31 46 56 63 66 68 71 73 JCAR020(MUC-16) — — — — — — 2 5 12 18 26 34 38 41 43 44 45 47 JTCR016(WT-1) — — — — — — 3 8 25 43 70 99 118 131 137 142 147 152 LeY — — — — — — 2 5 11 17 29 43 52 58 61 63 65 67 JTCR018 (HPV) — — — — — — 0 1 4 7 12 19 24 27 28 28 29 30 Total Net Sales 12 86 409 875 1,267 1,580 1,850 2,064 2,255 2,425 2,610 2,798 2,933 3,080 3,227 3,379 3,539 3,706 COGS — (16) (90) (186) (269) (333) (386) (359) (387) (410) (434) (458) (479) (498) (515) (532) (551) (569) Total Gross Profit 12 70 319 689 997 1,247 1,464 1,705 1,868 2,015 2,176 2,341 2,455 2,582 2,712 2,847 2,988 3,137
% Margin 100% 81% 78% 79% 79% 79% 79% 83% 83% 83% 83% 84% 84% 84% 84% 84% 84% 85%
R&D—JCAR017 & JCARH125 (152) (168) (152) (174) (35) (21) (19) (19) (19) (19) (19) (19) (19) (19) (19) (19) (19) (19) R&D—Pipeline — — — — (177) (219) (42) (112) (70) (70) — — — — — — —-SG&A (207) (316) (416) (473) (492) (516) (541) (567) (589) (612) (636) (661) (687) (715) (743) (773) (803) (835) EBIT (347) (414) (249) 41 293 491 861 1,007 1,189 1,313 1,520 1,660 1,748 1,848 1,950 2,055 2,166 2,282
Margin n.m. (482%) (60.9%) 4.7% 23.1% 31.1% 46.6% 48.8% 52.7% 54.2% 58.3% 59.3% 59.6% 60.0% 60.4% 60.8% 61.2% 61.6%
(1) (78) (72) (105) (112) (163) (67) (277) (224) (465) (194) 78 350 621 893 1,165 1,436 1,708 1,980 Other Income (Expense)
Cash Taxes — — — — — — — (55) (224) (347) (495) (623) (734) (850) (966) (1,082) (1,201) (1,321) Net Income Incl. NOL Adj. (426) (486) (354) (70) 130 424 584 728 499 773 1,103 1,387 1,635 1,891 2,149 2,409 2,673 2,941 Capex (35) (50) (20) (20) (10) (10) (10) (30) (30) (20) (20) (10) (10) (10) (10) (10) (10) (10) Depreciation and Amortization 10 10 10 10 10 10 10 10 10 10 10 10 10 10 10 10 10 10 â^† in Net Working Capital (1) (7) (33) (48) (43) (40) (42) (44) (53) (46) (52) (52) (35) (29) (21) (20) (21) (22) Equity Issuance to Oak — 1,441 — — — — — — — — — — — — — — — -
Ending Cash Balance 566 1,475 1,078 949 1,036 1,420 1,963 2,627 3,053 3,770 4,810 6,145 7,745 9,607 11,735 14,123 16,775 19,693
Note
1. Represents net of annual platform R&D and return on cumulative platform R&D at WACC + 5% on apost-tax basis,mid-point WACC shown;grossed-up 33 to reflectpre-tax figures; no PoS adjustment applied

Project Maple Board Discussion Materials v72.pptx\03 NOV 2017\10:28 PM\34
Project Maple
POS ADJUSTED FINANCIALS
Overview of Tax Attributes
Downside Case; PoS Adjusted
Tax Attributes—Downside Case PoS Adjusted (1) $MM
2018 2019 2020 2021 2022 2023 2024 2025 2026 2027 2028 2029 2030 2031 2032 2033 2034 2035
Tax Rate 31.0% 31.0% 31.0% 31.0% 31.0% 31.0% 31.0% 31.0% 31.0% 31.0% 31.0% 31.0% 31.0% 31.0% 31.0% 31.0% 31.0% 31.0%
Tax Benefit from EBT Negative Segments
JCAR017 (US)—Segment Taxes ——(71) (165) (206) (232) (268) (292) (316) (338) (360) (383) (408) (433) (460) (489) (520) JCAR017(ex-US Royalties)—Segment Taxes — (1) (8) (18) (25) (28) (29) (30) (31) (32) (33) (33) (33) (33) (33) (34) (34) JCARH125 (Global)—Segment Taxes — ——(25) (56) (83) (93) (98) (102) (107) (112) (118) (123) (129) (136) (143) CD28 &4-1BB Royalties- Segment Taxes (4) (11) (23) (33) (37) (39) (41) (44) (47) (49) (51) (53) (45) (43) (45) (47) (48) (50) Pipeline—Segment Taxes — — — ——(0) (40) (58) (70) (79) (82) (85) (88) (91)
G&A / Other—Segment Taxes — — — — — — — — —
Platform—Segment Taxes — — — — — (24) (108) (193) (277) (361) (445) (530) (614)
Total Segment Taxes (4) (11) (24) (113) (220) (294) (357) (425) (463) (495) (588) (720) (836) (957) (1,078) (1,200) (1,325) (1,451)
Consolidated Book TaxesPre-NOL Utilization — — (40) (132) (181) (243) (224) (347) (495) (623) (734) (850) (966) (1,082) (1,201) (1,321)
Tax Shield from EBT Negative Segments 4 11 24 113 180 163 176 183 238 148 92 97 102 107 112 118 124 130
NOL Benefit
Book EBT (2) (426) (486) (354) (70) 130 424 584 783 724 1,120 1,598 2,010 2,369 2,741 3,115 3,491 3,874 4,262 Book Taxes — — (40) (132) (181) (243) (224) (347) (495) (623) (734) (850) (966) (1,082) (1,201) (1,321)
NOL Schedule:
Beginning Balance 409 834 1,320 1,674 1,745 1,615 1,190 606 — — — — —Accrual / (Utilization) 426 486 354 70 (130) (424) (584) (606) — — — — —Ending Balance 834 1,320 1,674 1,745 1,615 1,190 606 — — — — — -
Taxable EBT (426) (486) (354) (70) ——177 724 1,120 1,598 2,010 2,369 2,741 3,115 3,491 3,874 4,262 Cash Taxes Paid — — ——(55) (224) (347) (495) (623) (734) (850) (966) (1,082) (1,201) (1,321)
Book Taxes — — (40) (132) (181) (243) (224) (347) (495) (623) (734) (850) (966) (1,082) (1,201) (1,321) Cash Taxes — — ——(55) (224) (347) (495) (623) (734) (850) (966) (1,082) (1,201) (1,321)
Tax Savings from NOLs — — 40 132 181 188 — — — — —
Notes
1. Net operating loss schedule shown presented on a consolidated basis; 2018 NOL beginning balance based on federal and state NOLs of $284MM as reported in 2016 10K and includes NOL accrual from FY2017 forecasted performance per management projections
2. Book EBT represents consolidated performance and includes impact of platform R&D 34
Project Maple Board Discussion Materials v72.pptx\03 NOV 2017\10:28 PM\35
Project Maple
POS ADJUSTED FINANCIALS
Maple Financial Summary
Upside Case; PoS Adjusted
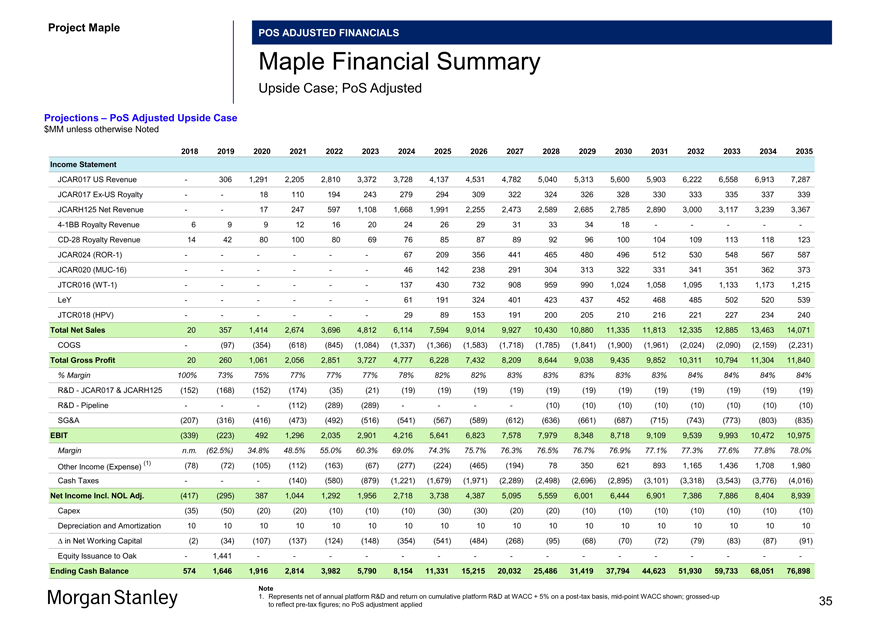
Projections – PoS Adjusted Upside Case $MM unless otherwise Noted
2018 2019 2020 2021 2022 2023 2024 2025 2026 2027 2028 2029 2030 2031 2032 2033 2034 2035 Income Statement
JCAR017 US Revenue — 306 1,291 2,205 2,810 3,372 3,728 4,137 4,531 4,782 5,040 5,313 5,600 5,903 6,222 6,558 6,913 7,287 JCAR017Ex-US Royalty — — 18 110 194 243 279 294 309 322 324 326 328 330 333 335 337 339 JCARH125 Net Revenue — — 17 247 597 1,108 1,668 1,991 2,255 2,473 2,589 2,685 2,785 2,890 3,000 3,117 3,239 3,3674-1BB Royalty Revenue 6 9 9 12 16 20 24 26 29 31 33 34 18 — — — —-CD-28 Royalty Revenue 14 42 80 100 80 69 76 85 87 89 92 96 100 104 109 113 118 123 JCAR024(ROR-1) — — — — — — 67 209 356 441 465 480 496 512 530 548 567 587 JCAR020(MUC-16) — — — — — — 46 142 238 291 304 313 322 331 341 351 362 373 JTCR016(WT-1) — — — — — — 137 430 732 908 959 990 1,024 1,058 1,095 1,133 1,173 1,215 LeY — — — — — — 61 191 324 401 423 437 452 468 485 502 520 539 JTCR018 (HPV) — — — — — — 29 89 153 191 200 205 210 216 221 227 234 240
Total Net Sales 20 357 1,414 2,674 3,696 4,812 6,114 7,594 9,014 9,927 10,430 10,880 11,335 11,813 12,335 12,885 13,463 14,071 COGS — (97) (354) (618) (845) (1,084) (1,337) (1,366) (1,583) (1,718) (1,785) (1,841) (1,900) (1,961) (2,024) (2,090) (2,159) (2,231)
Total Gross Profit 20 260 1,061 2,056 2,851 3,727 4,777 6,228 7,432 8,209 8,644 9,038 9,435 9,852 10,311 10,794 11,304 11,840
% Margin 100% 73% 75% 77% 77% 77% 78% 82% 82% 83% 83% 83% 83% 83% 84% 84% 84% 84%
R&D—JCAR017 & JCARH125 (152) (168) (152) (174) (35) (21) (19) (19) (19) (19) (19) (19) (19) (19) (19) (19) (19) (19) R&D—Pipeline — — — (112) (289) (289) — — — — (10) (10) (10) (10) (10) (10) (10) (10) SG&A (207) (316) (416) (473) (492) (516) (541) (567) (589) (612) (636) (661) (687) (715) (743) (773) (803) (835) EBIT (339) (223) 492 1,296 2,035 2,901 4,216 5,641 6,823 7,578 7,979 8,348 8,718 9,109 9,539 9,993 10,472 10,975
Margin n.m. (62.5%) 34.8% 48.5% 55.0% 60.3% 69.0% 74.3% 75.7% 76.3% 76.5% 76.7% 76.9% 77.1% 77.3% 77.6% 77.8% 78.0%
(1) (78) (72) (105) (112) (163) (67) (277) (224) (465) (194) 78 350 621 893 1,165 1,436 1,708 1,980 Other Income (Expense) Cash Taxes — — — (140) (580) (879) (1,221) (1,679) (1,971) (2,289) (2,498) (2,696) (2,895) (3,101) (3,318) (3,543) (3,776) (4,016)
Net Income Incl. NOL Adj. (417) (295) 387 1,044 1,292 1,956 2,718 3,738 4,387 5,095 5,559 6,001 6,444 6,901 7,386 7,886 8,404 8,939 Capex (35) (50) (20) (20) (10) (10) (10) (30) (30) (20) (20) (10) (10) (10) (10) (10) (10) (10) Depreciation and Amortization 10 10 10 10 10 10 10 10 10 10 10 10 10 10 10 10 10 10 â^† in Net Working Capital (2) (34) (107) (137) (124) (148) (354) (541) (484) (268) (95) (68) (70) (72) (79) (83) (87) (91) Equity Issuance to Oak — 1,441 — — — — — — — — — — — — — — — -
Ending Cash Balance 574 1,646 1,916 2,814 3,982 5,790 8,154 11,331 15,215 20,032 25,486 31,419 37,794 44,623 51,930 59,733 68,051 76,898
Note
1. Represents net of annual platform R&D and return on cumulative platform R&D at WACC + 5% on apost-tax basis,mid-point WACC shown;grossed-up 35 to reflectpre-tax figures; no PoS adjustment applied
Project Maple Board Discussion Materials v72.pptx\03 NOV 2017\10:28 PM\36
Project Maple
POS ADJUSTED FINANCIALS
Overview of Tax Attributes
Upside Case; PoS Adjusted
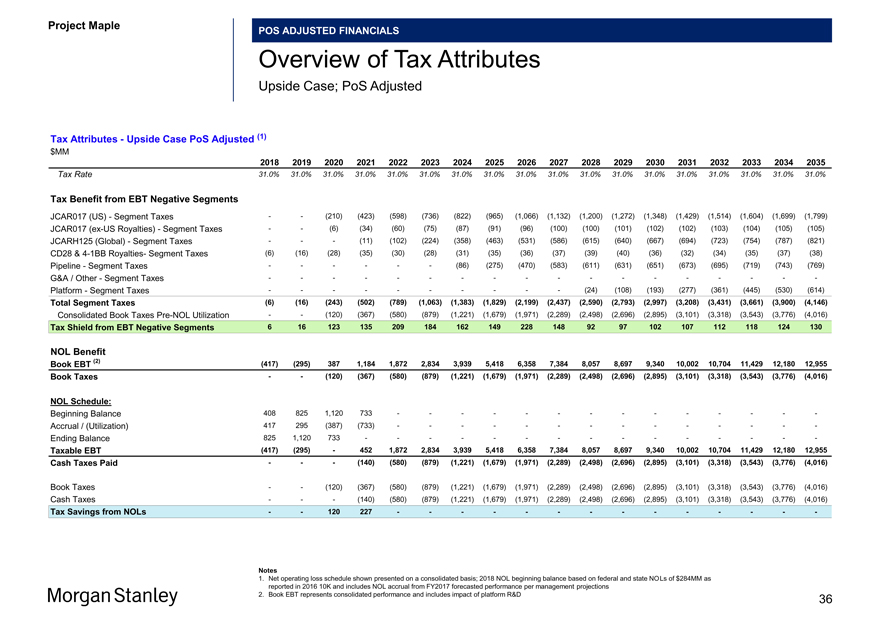
Tax Attributes—Upside Case PoS Adjusted (1) $MM
2018 2019 2020 2021 2022 2023 2024 2025 2026 2027 2028 2029 2030 2031 2032 2033 2034 2035
Tax Rate 31.0% 31.0% 31.0% 31.0% 31.0% 31.0% 31.0% 31.0% 31.0% 31.0% 31.0% 31.0% 31.0% 31.0% 31.0% 31.0% 31.0% 31.0%
Tax Benefit from EBT Negative Segments
JCAR017 (US)—Segment Taxes — (210) (423) (598) (736) (822) (965) (1,066) (1,132) (1,200) (1,272) (1,348) (1,429) (1,514) (1,604) (1,699) (1,799) JCAR017(ex-US Royalties)—Segment Taxes — (6) (34) (60) (75) (87) (91) (96) (100) (100) (101) (102) (102) (103) (104) (105) (105) JCARH125 (Global)—Segment Taxes ——(11) (102) (224) (358) (463) (531) (586) (615) (640) (667) (694) (723) (754) (787) (821) CD28 &4-1BB Royalties- Segment Taxes (6) (16) (28) (35) (30) (28) (31) (35) (36) (37) (39) (40) (36) (32) (34) (35) (37) (38) Pipeline—Segment Taxes — — — (86) (275) (470) (583) (611) (631) (651) (673) (695) (719) (743) (769)
G&A / Other—Segment Taxes — — — — — — — — —
Platform—Segment Taxes — — — — — (24) (108) (193) (277) (361) (445) (530) (614)
Total Segment Taxes (6) (16) (243) (502) (789) (1,063) (1,383) (1,829) (2,199) (2,437) (2,590) (2,793) (2,997) (3,208) (3,431) (3,661) (3,900) (4,146)
Consolidated Book TaxesPre-NOL Utilization — (120) (367) (580) (879) (1,221) (1,679) (1,971) (2,289) (2,498) (2,696) (2,895) (3,101) (3,318) (3,543) (3,776) (4,016)
Tax Shield from EBT Negative Segments 6 16 123 135 209 184 162 149 228 148 92 97 102 107 112 118 124 130
NOL Benefit
Book EBT (2) (417) (295) 387 1,184 1,872 2,834 3,939 5,418 6,358 7,384 8,057 8,697 9,340 10,002 10,704 11,429 12,180 12,955 Book Taxes — (120) (367) (580) (879) (1,221) (1,679) (1,971) (2,289) (2,498) (2,696) (2,895) (3,101) (3,318) (3,543) (3,776) (4,016)
NOL Schedule:
Beginning Balance 408 825 1,120 733 — — — — — — —Accrual / (Utilization) 417 295 (387) (733) — — — — — — —Ending Balance 825 1,120 733 — — — — — — — -
Taxable EBT (417) (295)—452 1,872 2,834 3,939 5,418 6,358 7,384 8,057 8,697 9,340 10,002 10,704 11,429 12,180 12,955 Cash Taxes Paid ——(140) (580) (879) (1,221) (1,679) (1,971) (2,289) (2,498) (2,696) (2,895) (3,101) (3,318) (3,543) (3,776) (4,016)
Book Taxes — (120) (367) (580) (879) (1,221) (1,679) (1,971) (2,289) (2,498) (2,696) (2,895) (3,101) (3,318) (3,543) (3,776) (4,016) Cash Taxes ——(140) (580) (879) (1,221) (1,679) (1,971) (2,289) (2,498) (2,696) (2,895) (3,101) (3,318) (3,543) (3,776) (4,016)
Tax Savings from NOLs — 120 227 — — — — — — —
Notes
1. Net operating loss schedule shown presented on a consolidated basis; 2018 NOL beginning balance based on federal and state NOLs of $284MM as reported in 2016 10K and includes NOL accrual from FY2017 forecasted performance per management projections
2. Book EBT represents consolidated performance and includes impact of platform R&D 36
Project Maple Board Discussion Materials v72.pptx\03 NOV 2017\10:28 PM\37
Project Maple
Appendix B
Non-PoS Adjusted Financials
37
Project Maple Board Discussion Materials v72.pptx\03 NOV 2017\10:28 PM\38
Project Maple
NON-POS ADJUSTED FINANCIALS
Maple Financial Summary
Base Case;Non-PoS Adjusted
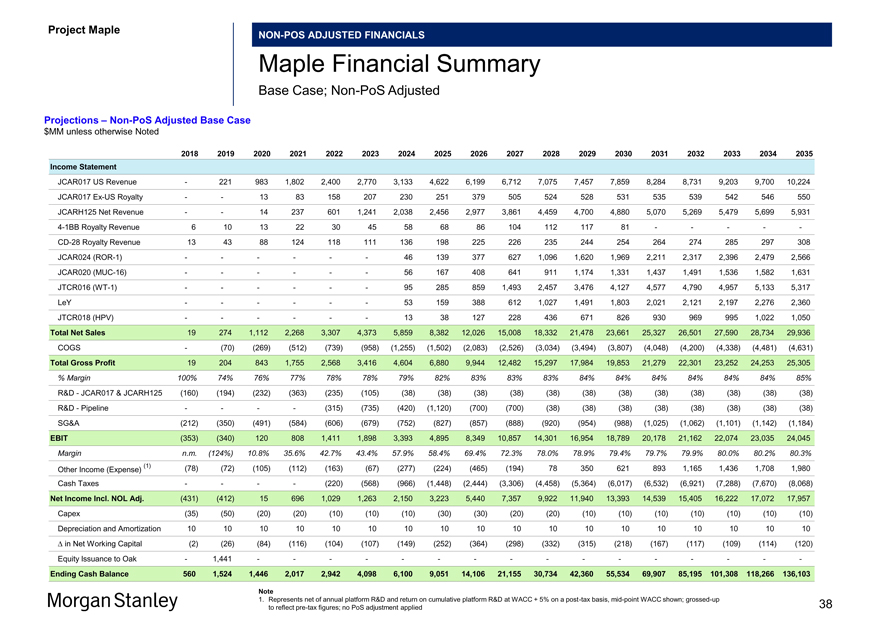
Projections –Non-PoS Adjusted Base Case $MM unless otherwise Noted
2018 2019 2020 2021 2022 2023 2024 2025 2026 2027 2028 2029 2030 2031 2032 2033 2034 2035 Income Statement
JCAR017 US Revenue — 221 983 1,802 2,400 2,770 3,133 4,622 6,199 6,712 7,075 7,457 7,859 8,284 8,731 9,203 9,700 10,224 JCAR017Ex-US Royalty — — 13 83 158 207 230 251 379 505 524 528 531 535 539 542 546 550 JCARH125 Net Revenue — — 14 237 601 1,241 2,038 2,456 2,977 3,861 4,459 4,700 4,880 5,070 5,269 5,479 5,699 5,9314-1BB Royalty Revenue 6 10 13 22 30 45 58 68 86 104 112 117 81 — — — —-CD-28 Royalty Revenue 13 43 88 124 118 111 136 198 225 226 235 244 254 264 274 285 297 308 JCAR024(ROR-1) — — — — — — 46 139 377 627 1,096 1,620 1,969 2,211 2,317 2,396 2,479 2,566 JCAR020(MUC-16) — — — — — — 56 167 408 641 911 1,174 1,331 1,437 1,491 1,536 1,582 1,631 JTCR016(WT-1) — — — — — — 95 285 859 1,493 2,457 3,476 4,127 4,577 4,790 4,957 5,133 5,317 LeY — — — — — — 53 159 388 612 1,027 1,491 1,803 2,021 2,121 2,197 2,276 2,360 JTCR018 (HPV) — — — — — — 13 38 127 228 436 671 826 930 969 995 1,022 1,050
Total Net Sales 19 274 1,112 2,268 3,307 4,373 5,859 8,382 12,026 15,008 18,332 21,478 23,661 25,327 26,501 27,590 28,734 29,936 COGS — (70) (269) (512) (739) (958) (1,255) (1,502) (2,083) (2,526) (3,034) (3,494) (3,807) (4,048) (4,200) (4,338) (4,481) (4,631) Total Gross Profit 19 204 843 1,755 2,568 3,416 4,604 6,880 9,944 12,482 15,297 17,984 19,853 21,279 22,301 23,252 24,253 25,305
% Margin 100% 74% 76% 77% 78% 78% 79% 82% 83% 83% 83% 84% 84% 84% 84% 84% 84% 85%
R&D—JCAR017 & JCARH125 (160) (194) (232) (363) (235) (105) (38) (38) (38) (38) (38) (38) (38) (38) (38) (38) (38) (38) R&D—Pipeline — — — — (315) (735) (420) (1,120) (700) (700) (38) (38) (38) (38) (38) (38) (38) (38) SG&A (212) (350) (491) (584) (606) (679) (752) (827) (857) (888) (920) (954) (988) (1,025) (1,062) (1,101) (1,142) (1,184)
EBIT (353) (340) 120 808 1,411 1,898 3,393 4,895 8,349 10,857 14,301 16,954 18,789 20,178 21,162 22,074 23,035 24,045
Margin n.m. (124%) 10.8% 35.6% 42.7% 43.4% 57.9% 58.4% 69.4% 72.3% 78.0% 78.9% 79.4% 79.7% 79.9% 80.0% 80.2% 80.3%
(1) (78) (72) (105) (112) (163) (67) (277) (224) (465) (194) 78 350 621 893 1,165 1,436 1,708 1,980 Other Income (Expense) Cash Taxes — — — — (220) (568) (966) (1,448) (2,444) (3,306) (4,458) (5,364) (6,017) (6,532) (6,921) (7,288) (7,670) (8,068) Net Income Incl. NOL Adj. (431) (412) 15 696 1,029 1,263 2,150 3,223 5,440 7,357 9,922 11,940 13,393 14,539 15,405 16,222 17,072 17,957 Capex (35) (50) (20) (20) (10) (10) (10) (30) (30) (20) (20) (10) (10) (10) (10) (10) (10) (10) Depreciation and Amortization 10 10 10 10 10 10 10 10 10 10 10 10 10 10 10 10 10 10 â^† in Net Working Capital (2) (26) (84) (116) (104) (107) (149) (252) (364) (298) (332) (315) (218) (167) (117) (109) (114) (120) Equity Issuance to Oak — 1,441 — — — — — — — — — — — — — — — -
Ending Cash Balance 560 1,524 1,446 2,017 2,942 4,098 6,100 9,051 14,106 21,155 30,734 42,360 55,534 69,907 85,195101,308118,266136,103
Note
1. Represents net of annual platform R&D and return on cumulative platform R&D at WACC + 5% on apost-tax basis,mid-point WACC shown;grossed-up 38 to reflectpre-tax figures; no PoS adjustment applied
Project Maple
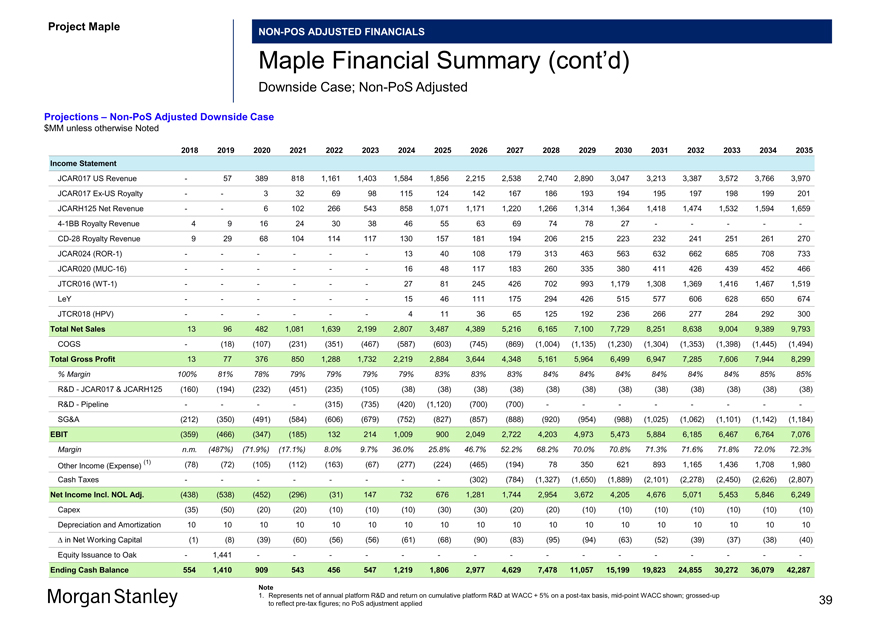
NON-POS ADJUSTED FINANCIALS
Maple Financial Summary (cont’d)
Downside Case;Non-PoS Adjusted
Projections –Non-PoS Adjusted Downside Case $MM unless otherwise Noted
2018 2019 2020 2021 2022 2023 2024 2025 2026 2027 2028 2029 2030 2031 2032 2033 2034 2035 Income Statement
JCAR017 US Revenue — 57 389 818 1,161 1,403 1,584 1,856 2,215 2,538 2,740 2,890 3,047 3,213 3,387 3,572 3,766 3,970 JCAR017Ex-US Royalty — — 3 32 69 98 115 124 142 167 186 193 194 195 197 198 199 201 JCARH125 Net Revenue — — 6 102 266 543 858 1,071 1,171 1,220 1,266 1,314 1,364 1,418 1,474 1,532 1,594 1,6594-1BB Royalty Revenue 4 9 16 24 30 38 46 55 63 69 74 78 27 — — — —-CD-28 Royalty Revenue 9 29 68 104 114 117 130 157 181 194 206 215 223 232 241 251 261 270 JCAR024(ROR-1) — — — — — — 13 40 108 179 313 463 563 632 662 685 708 733 JCAR020(MUC-16) — — — — — — 16 48 117 183 260 335 380 411 426 439 452 466 JTCR016(WT-1) — — — — — — 27 81 245 426 702 993 1,179 1,308 1,369 1,416 1,467 1,519 LeY — — — — — — 15 46 111 175 294 426 515 577 606 628 650 674 JTCR018 (HPV) — — — — — — 4 11 36 65 125 192 236 266 277 284 292 300 Total Net Sales 13 96 482 1,081 1,639 2,199 2,807 3,487 4,389 5,216 6,165 7,100 7,729 8,251 8,638 9,004 9,389 9,793 COGS — (18) (107) (231) (351) (467) (587) (603) (745) (869) (1,004) (1,135) (1,230) (1,304) (1,353) (1,398) (1,445) (1,494) Total Gross Profit 13 77 376 850 1,288 1,732 2,219 2,884 3,644 4,348 5,161 5,964 6,499 6,947 7,285 7,606 7,944 8,299
% Margin 100% 81% 78% 79% 79% 79% 79% 83% 83% 83% 84% 84% 84% 84% 84% 84% 85% 85%
R&D—JCAR017 & JCARH125 (160) (194) (232) (451) (235) (105) (38) (38) (38) (38) (38) (38) (38) (38) (38) (38) (38) (38) R&D—Pipeline — — — — (315) (735) (420) (1,120) (700) (700) — — — — — — —-SG&A (212) (350) (491) (584) (606) (679) (752) (827) (857) (888) (920) (954) (988) (1,025) (1,062) (1,101) (1,142) (1,184) EBIT (359) (466) (347) (185) 132 214 1,009 900 2,049 2,722 4,203 4,973 5,473 5,884 6,185 6,467 6,764 7,076
Margin n.m. (487%) (71.9%) (17.1%) 8.0% 9.7% 36.0% 25.8% 46.7% 52.2% 68.2% 70.0% 70.8% 71.3% 71.6% 71.8% 72.0% 72.3%
(1) (78) (72) (105) (112) (163) (67) (277) (224) (465) (194) 78 350 621 893 1,165 1,436 1,708 1,980 Other Income (Expense)
Cash Taxes — — — — — — — — (302) (784) (1,327) (1,650) (1,889) (2,101) (2,278) (2,450) (2,626) (2,807) Net Income Incl. NOL Adj. (438) (538) (452) (296) (31) 147 732 676 1,281 1,744 2,954 3,672 4,205 4,676 5,071 5,453 5,846 6,249 Capex (35) (50) (20) (20) (10) (10) (10) (30) (30) (20) (20) (10) (10) (10) (10) (10) (10) (10) Depreciation and Amortization 10 10 10 10 10 10 10 10 10 10 10 10 10 10 10 10 10 10 â^† in Net Working Capital (1) (8) (39) (60) (56) (56) (61) (68) (90) (83) (95) (94) (63) (52) (39) (37) (38) (40) Equity Issuance to Oak — 1,441 — — — — — — — — — — — — — — — -
Ending Cash Balance 554 1,410 909 543 456 547 1,219 1,806 2,977 4,629 7,478 11,057 15,199 19,823 24,855 30,272 36,079 42,287
Note
1. Represents net of annual platform R&D and return on cumulative platform R&D at WACC + 5% on apost-tax basis,mid-point WACC shown;grossed-up 39 to reflectpre-tax figures; no PoS adjustment applied
Project Maple Board Discussion Materials v72.pptx\03 NOV 2017\10:28 PM\40
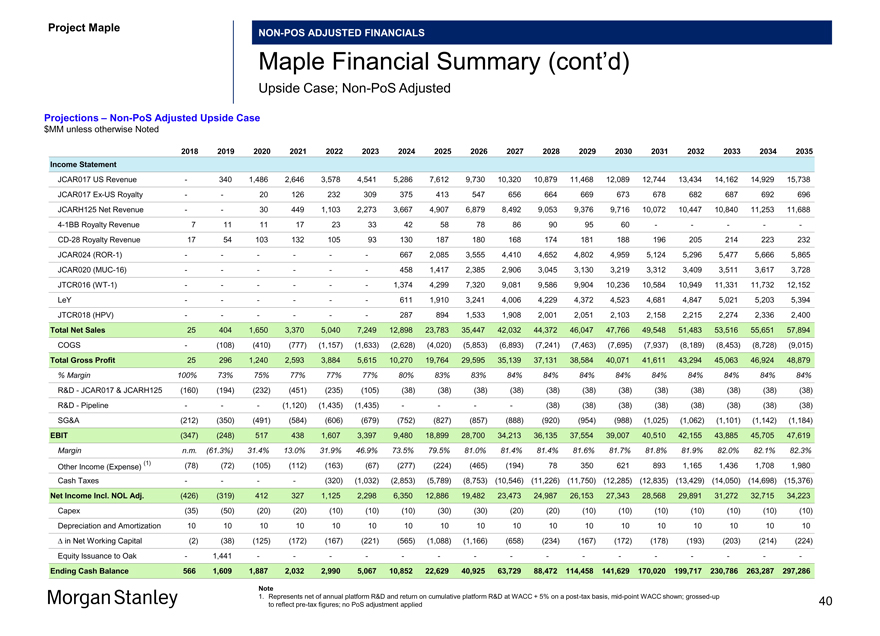
Project Maple
NON-POS ADJUSTED FINANCIALS
Maple Financial Summary (cont’d)
Upside Case;Non-PoS Adjusted
Projections –Non-PoS Adjusted Upside Case $MM unless otherwise Noted
2018 2019 2020 2021 2022 2023 2024 2025 2026 2027 2028 2029 2030 2031 2032 2033 2034 2035 Income Statement
JCAR017 US Revenue — 340 1,486 2,646 3,578 4,541 5,286 7,612 9,730 10,320 10,879 11,468 12,089 12,744 13,434 14,162 14,929 15,738 JCAR017Ex-US Royalty — — 20 126 232 309 375 413 547 656 664 669 673 678 682 687 692 696 JCARH125 Net Revenue — — 30 449 1,103 2,273 3,667 4,907 6,879 8,492 9,053 9,376 9,716 10,072 10,447 10,840 11,253 11,6884-1BB Royalty Revenue 7 11 11 17 23 33 42 58 78 86 90 95 60 — — — —-CD-28 Royalty Revenue 17 54 103 132 105 93 130 187 180 168 174 181 188 196 205 214 223 232 JCAR024(ROR-1) — — — — — — 667 2,085 3,555 4,410 4,652 4,802 4,959 5,124 5,296 5,477 5,666 5,865 JCAR020(MUC-16) — — — — — — 458 1,417 2,385 2,906 3,045 3,130 3,219 3,312 3,409 3,511 3,617 3,728 JTCR016(WT-1) — — — — — — 1,374 4,299 7,320 9,081 9,586 9,904 10,236 10,584 10,949 11,331 11,732 12,152 LeY — — — — — — 611 1,910 3,241 4,006 4,229 4,372 4,523 4,681 4,847 5,021 5,203 5,394 JTCR018 (HPV) — — — — — — 287 894 1,533 1,908 2,001 2,051 2,103 2,158 2,215 2,274 2,336 2,400
Total Net Sales 25 404 1,650 3,370 5,040 7,249 12,898 23,783 35,447 42,032 44,372 46,047 47,766 49,548 51,483 53,516 55,651 57,894 COGS — (108) (410) (777) (1,157) (1,633) (2,628) (4,020) (5,853) (6,893) (7,241) (7,463) (7,695) (7,937) (8,189) (8,453) (8,728) (9,015) Total Gross Profit 25 296 1,240 2,593 3,884 5,615 10,270 19,764 29,595 35,139 37,131 38,584 40,071 41,611 43,294 45,063 46,924 48,879
% Margin 100% 73% 75% 77% 77% 77% 80% 83% 83% 84% 84% 84% 84% 84% 84% 84% 84% 84%
R&D—JCAR017 & JCARH125 (160) (194) (232) (451) (235) (105) (38) (38) (38) (38) (38) (38) (38) (38) (38) (38) (38) (38) R&D—Pipeline — — — (1,120) (1,435) (1,435) — — — — (38) (38) (38) (38) (38) (38) (38) (38) SG&A (212) (350) (491) (584) (606) (679) (752) (827) (857) (888) (920) (954) (988) (1,025) (1,062) (1,101) (1,142) (1,184)
EBIT (347) (248) 517 438 1,607 3,397 9,480 18,899 28,700 34,213 36,135 37,554 39,007 40,510 42,155 43,885 45,705 47,619
Margin n.m. (61.3%) 31.4% 13.0% 31.9% 46.9% 73.5% 79.5% 81.0% 81.4% 81.4% 81.6% 81.7% 81.8% 81.9% 82.0% 82.1% 82.3%
(1) (78) (72) (105) (112) (163) (67) (277) (224) (465) (194) 78 350 621 893 1,165 1,436 1,708 1,980 Other Income (Expense) Cash Taxes — — — — (320) (1,032) (2,853) (5,789) (8,753) (10,546) (11,226) (11,750) (12,285) (12,835) (13,429) (14,050) (14,698) (15,376) Net Income Incl. NOL Adj. (426) (319) 412 327 1,125 2,298 6,350 12,886 19,482 23,473 24,987 26,153 27,343 28,568 29,891 31,272 32,715 34,223 Capex (35) (50) (20) (20) (10) (10) (10) (30) (30) (20) (20) (10) (10) (10) (10) (10) (10) (10) Depreciation and Amortization 10 10 10 10 10 10 10 10 10 10 10 10 10 10 10 10 10 10 â^† in Net Working Capital (2) (38) (125) (172) (167) (221) (565) (1,088) (1,166) (658) (234) (167) (172) (178) (193) (203) (214) (224) Equity Issuance to Oak — 1,441 — — — — — — — — — — — — — — — -
Ending Cash Balance 566 1,609 1,887 2,032 2,990 5,067 10,852 22,629 40,925 63,729 88,472114,458141,629170,020199,717230,786263,287297,286
Note
1. Represents net of annual platform R&D and return on cumulative platform R&D at WACC + 5% on apost-tax basis,mid-point WACC shown;grossed-up 40 to reflectpre-tax figures; no PoS adjustment applied
Project Maple Board Discussion Materials v72.pptx\03 NOV 2017\10:28 PM\41
Project Maple
Appendix C
Assumptions Details
41
Project Maple Board Discussion Materials v72.pptx\03 NOV 2017\10:28 PM\42
Project Maple
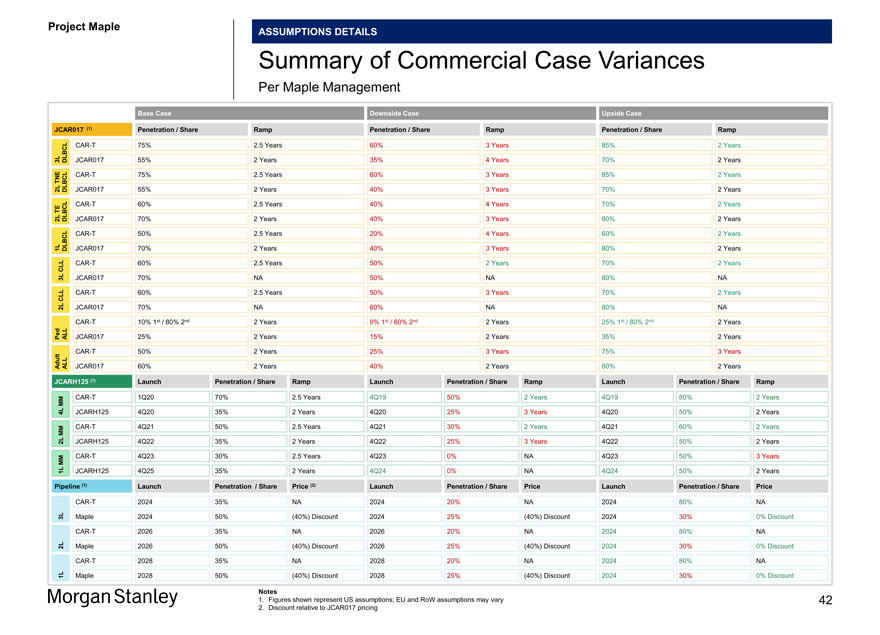
ASSUMPTIONS DETAILS
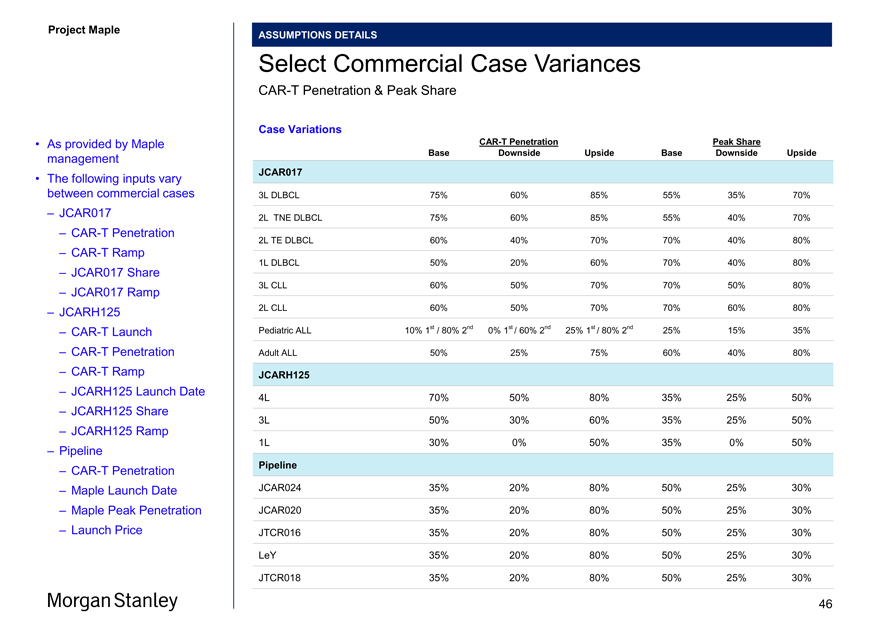
Summary of Commercial Case Variances
Per Maple Management
Base Case Downside Case Upside Case
JCAR017 (1) Penetration / Share Ramp Penetration / Share Ramp Penetration / Share Ramp
CAR-T 75% 2.5 Years 60% 3 Years 85% 2 Years
3L DLBCL JCAR017 55% 2 Years 35% 4 Years 70% 2 Years TNECAR-T 75% 2.5 Years 60% 3 Years 85% 2 Years
2L DLBCL JCAR017 55% 2 Years 40% 3 Years 70% 2 Years TECAR-T 60% 2.5 Years 40% 4 Years 70% 2 Years
2L DLBCL JCAR017 70% 2 Years 40% 3 Years 80% 2 YearsCAR-T 50% 2.5 Years 20% 4 Years 60% 2 Years
1L DLBCL JCAR017 70% 2 Years 40% 3 Years 80% 2 Years CLLCAR-T 60% 2.5 Years 50% 2 Years 70% 2 Years
3L JCAR017 70% NA 50% NA 80% NA
CLLCAR-T 60% 2.5 Years 50% 3 Years 70% 2 Years
2L JCAR017 70% NA 60% NA 80% NACAR-T 10% 1st / 80% 2nd 2 Years 0% 1st / 60% 2nd 2 Years 25% 1st / 80% 2nd 2 Years Ped ALL JCAR017 25% 2 Years 15% 2 Years 35% 2 YearsCAR-T 50% 2 Years 25% 3 Years 75% 3 Years Adult ALL JCAR017 60% 2 Years 40% 2 Years 80% 2 Years
JCARH125 (1) Launch Penetration / Share Ramp Launch Penetration / Share Ramp Launch Penetration / Share Ramp
MMCAR-T 1Q20 70% 2.5 Years 4Q19 50% 2 Years 4Q19 80% 2 Years
4L JCARH125 4Q20 35% 2 Years 4Q20 25% 3 Years 4Q20 50% 2 Years MMCAR-T 4Q21 50% 2.5 Years 4Q21 30% 2 Years 4Q21 60% 2 Years
2L JCARH125 4Q22 35% 2 Years 4Q22 25% 3 Years 4Q22 50% 2 Years MMCAR-T 4Q23 30% 2.5 Years 4Q23 0% NA 4Q23 50% 3 Years
1L JCARH125 4Q25 35% 2 Years 4Q24 0% NA 4Q24 50% 2 Years
Pipeline (1) Launch Penetration / Share Price (2) Launch Penetration / Share Price Launch Penetration / Share Price
CAR-T 2024 35% NA 2024 20% NA 2024 80% NA
3L Maple 2024 50% (40%) Discount 2024 25% (40%) Discount 2024 30% 0% DiscountCAR-T 2026 35% NA 2026 20% NA 2024 80% NA
2L Maple 2026 50% (40%) Discount 2026 25% (40%) Discount 2024 30% 0% DiscountCAR-T 2028 35% NA 2028 20% NA 2024 80% NA
1L Maple 2028 50% (40%) Discount 2028 25% (40%) Discount 2024 30% 0% Discount
Notes
1. Figures shown represent US assumptions; EU and RoW assumptions may vary 42
2. Discount relative to JCAR017 pricing
Project Maple Board Discussion Materials v72.pptx\03 NOV 2017\10:28 PM\43
Project Maple
ASSUMPTIONS DETAILS
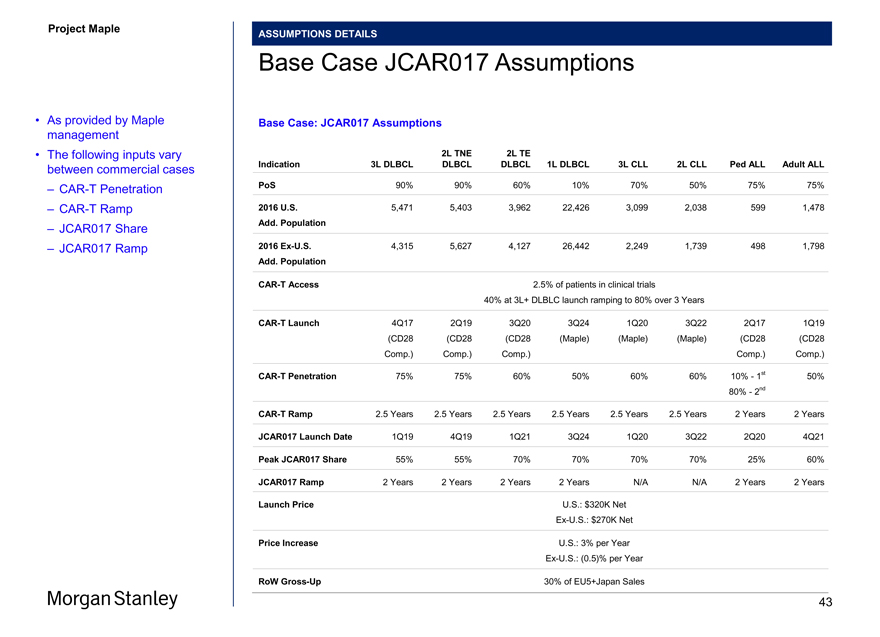
Base Case JCAR017 Assumptions
• As provided by Maple Base Case: JCAR017 Assumptions management
• The following inputs vary 2L TNE 2L TE
between commercial cases Indication 3L DLBCL DLBCL DLBCL 1L DLBCL 3L CLL 2L CLL Ped ALL Adult ALL
–CAR-T Penetration PoS 90% 90% 60% 10% 70% 50% 75% 75%
–CAR-T Ramp 2016 U.S. 5,471 5,403 3,962 22,426 3,099 2,038 599 1,478
– JCAR017 Share Add. Population
– JCAR017 Ramp 2016Ex-U.S. 4,315 5,627 4,127 26,442 2,249 1,739 498 1,798
Add. Population
CAR-T Access 2.5% of patients in clinical trials
40% at 3L+ DLBLC launch ramping to 80% over 3 Years
CAR-T Launch 4Q17 2Q19 3Q20 3Q24 1Q20 3Q22 2Q17 1Q19 (CD28 (CD28 (CD28 (Maple) (Maple) (Maple) (CD28 (CD28 Comp.) Comp.) Comp.) Comp.) Comp.)
CAR-T Penetration 75% 75% 60% 50% 60% 60% 10%—1st 50% 80%—2nd
CAR-T Ramp 2.5 Years 2.5 Years 2.5 Years 2.5 Years 2.5 Years 2.5 Years 2 Years 2 Years JCAR017 Launch Date 1Q19 4Q19 1Q21 3Q24 1Q20 3Q22 2Q20 4Q21 Peak JCAR017 Share 55% 55% 70% 70% 70% 70% 25% 60% JCAR017 Ramp 2 Years 2 Years 2 Years 2 Years N/A N/A 2 Years 2 Years
Launch Price U.S.: $320K NetEx-U.S.: $270K Net
Price Increase U.S.: 3% per YearEx-U.S.: (0.5)% per Year
RoWGross-Up 30% of EU5+Japan Sales
43
Project Maple Board Discussion Materials v72.pptx\03 NOV 2017\10:28 PM\44
Project Maple
ASSUMPTIONS DETAILS
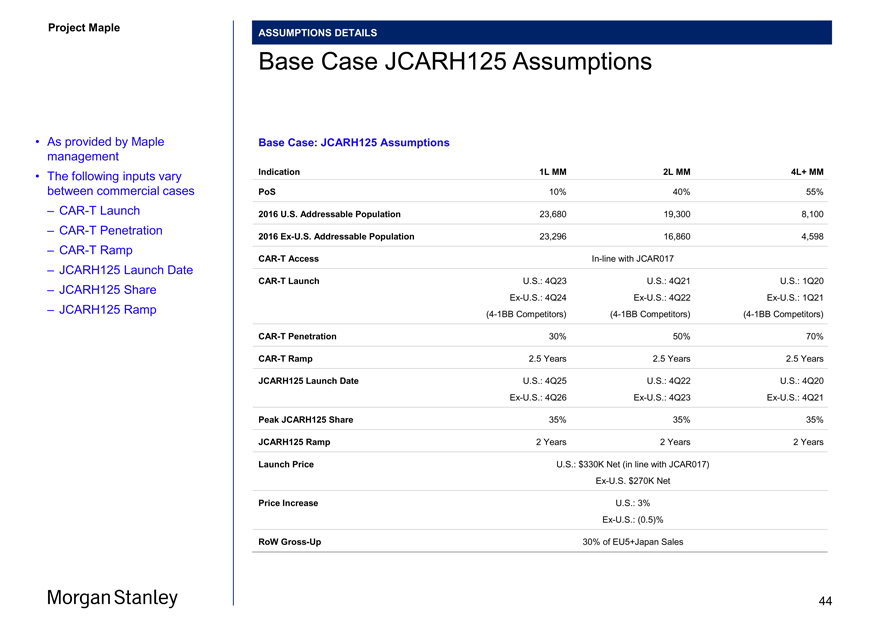
Base Case JCARH125 Assumptions
• As provided by Maple Base Case: JCARH125 Assumptions management
• The following inputs vary Indication 1L MM 2L MM 4L+ MM
between commercial cases PoS 10% 40% 55%
–CAR-T Launch 2016 U.S. Addressable Population 23,680 19,300 8,100
–CAR-T Penetration
2016Ex-U.S. Addressable Population 23,296 16,860 4,598
–CAR-T RampCAR-T AccessIn-line with JCAR017
– JCARH125 Launch Date
CAR-T Launch U.S.: 4Q23 U.S.: 4Q21 U.S.: 1Q20
– JCARH125 Share
Ex-U.S.: 4Q24Ex-U.S.: 4Q22Ex-U.S.: 1Q21
– JCARH125 Ramp(4-1BB Competitors)(4-1BB Competitors)(4-1BB Competitors)
CAR-T Penetration 30% 50% 70%
CAR-T Ramp 2.5 Years 2.5 Years 2.5 Years
JCARH125 Launch Date U.S.: 4Q25 U.S.: 4Q22 U.S.: 4Q20Ex-U.S.: 4Q26Ex-U.S.: 4Q23Ex-U.S.: 4Q21
Peak JCARH125 Share 35% 35% 35%
JCARH125 Ramp 2 Years 2 Years 2 Years
Launch Price U.S.: $330K Net (in line with JCAR017)Ex-U.S. $270K Net
Price Increase U.S.: 3%
Ex-U.S.: (0.5)%
RoWGross-Up 30% of EU5+Japan Sales
44
Project Maple Board Discussion Materials v72.pptx\03 NOV 2017\10:28 PM\45
Project Maple
ASSUMPTIONS DETAILS
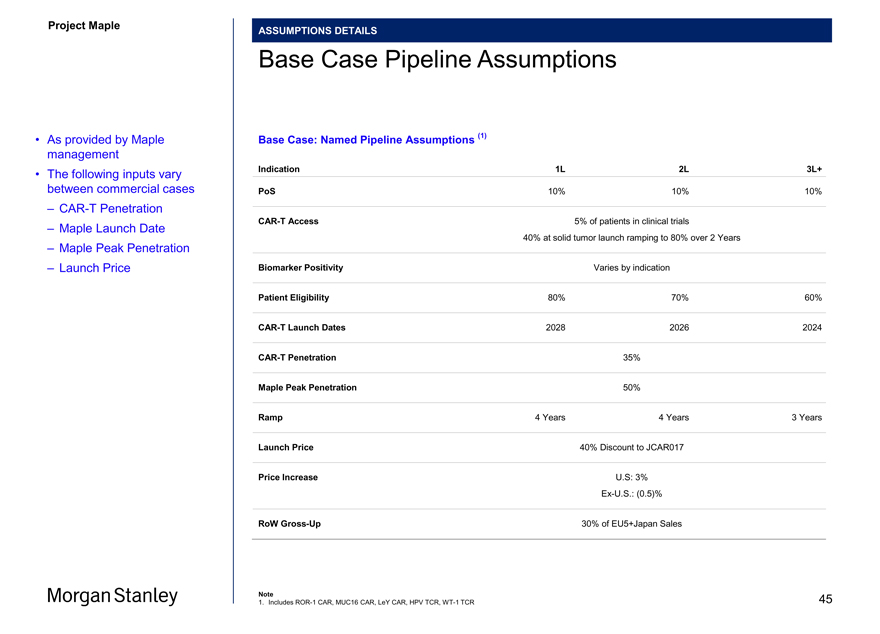
Base Case Pipeline Assumptions
• As provided by Maple Base Case: Named Pipeline Assumptions (1) management
• The following inputs vary Indication 1L 2L 3L+ between commercial cases PoS 10% 10% 10%
–CAR-T Penetration
CAR-T Access 5% of patients in clinical trials
– Maple Launch Date 40% at solid tumor launch ramping to 80% over 2 Years
– Maple Peak Penetration
– Launch Price Biomarker Positivity Varies by indication
Patient Eligibility 80% 70% 60%CAR-T Launch Dates 2028 2026 2024CAR-T Penetration 35% Maple Peak Penetration 50%
Ramp 4 Years 4 Years 3 Years
Launch Price 40% Discount to JCAR017
Price Increase U.S: 3%
Ex-U.S.: (0.5)%
RoWGross-Up 30% of EU5+Japan Sales
Note 45
1. IncludesROR-1 CAR, MUC16 CAR, LeY CAR, HPV TCR,WT-1 TCR
Project Maple
ASSUMPTIONS DETAILS
Select Commercial Case Variances
CAR-T Penetration & Peak Share
Case Variations
• As provided by MapleCAR-T Penetration Peak Share
Base Downside Upside Base Downside Upside
management
JCAR017
• The following inputs vary
between commercial cases 3L DLBCL 75% 60% 85% 55% 35% 70%
– JCAR017 2L TNE DLBCL 75% 60% 85% 55% 40% 70%
–CAR-T Penetration
2L TE DLBCL 60% 40% 70% 70% 40% 80%
–CAR-T Ramp
– JCAR017 Share 1L DLBCL 50% 20% 60% 70% 40% 80%
3L CLL 60% 50% 70% 70% 50% 80%
– JCAR017 Ramp
– JCARH125 2L CLL 60% 50% 70% 70% 60% 80%
–CAR-T Launch Pediatric ALL 10% 1st / 80% 2nd 0% 1st / 60% 2nd 25% 1st / 80% 2nd 25% 15% 35%
–CAR-T Penetration Adult ALL 50% 25% 75% 60% 40% 80%
–CAR-T Ramp JCARH125
– JCARH125 Launch Date
4L 70% 50% 80% 35% 25% 50%
– JCARH125 Share 3L 50% 30% 60% 35% 25% 50%
– JCARH125 Ramp
1L 30% 0% 50% 35% 0% 50%
– Pipeline
–CAR-T Penetration Pipeline
– Maple Launch Date JCAR024 35% 20% 80% 50% 25% 30%
– Maple Peak Penetration JCAR020 35% 20% 80% 50% 25% 30%
– Launch Price JTCR016 35% 20% 80% 50% 25% 30% LeY 35% 20% 80% 50% 25% 30%
JTCR018 35% 20% 80% 50% 25% 30%
46
Project Maple Board Discussion Materials v72.pptx\03 NOV 2017\10:28 PM\47
Project Maple
Appendix D
Financial Analysis Reference Materials
47
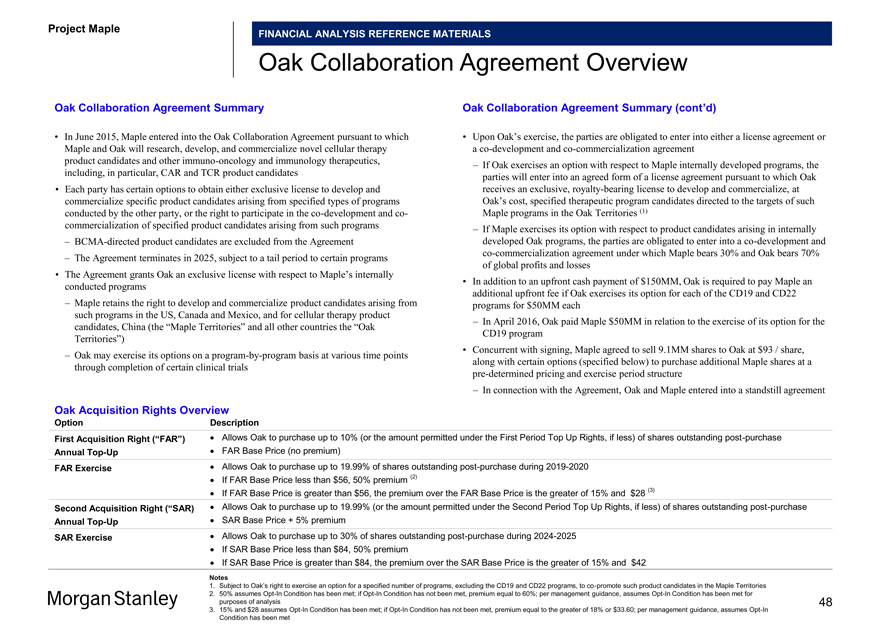
Project Maple Board Discussion Materials v72.pptx\03 NOV 2017\10:28 PM\48
Project Maple
FINANCIAL ANALYSIS REFERENCE MATERIALS
Oak Collaboration Agreement Overview
Oak Collaboration Agreement Summary Oak Collaboration Agreement Summary (cont’d)
• In June 2015, Maple entered into the Oak Collaboration Agreement pursuant to which • Upon Oak’s exercise, the parties are obligated to enter into either a license agreement or Maple and Oak will research, develop, and commercialize novel cellular therapy aco-development andco-commercialization agreement product candidates and other immuno-oncology and immunology therapeutics,
– If Oak exercises an option with respect to Maple internally developed programs, the including, in particular, CAR and TCR product candidates parties will enter into an agreed form of a license agreement pursuant to which Oak
• Each party has certain options to obtain either exclusive license to develop and receives an exclusive, royalty-bearing license to develop and commercialize, at commercialize specific product candidates arising from specified types of programs Oak’s cost, specified therapeutic program candidates directed to the targets of such conducted by the other party, or the right to participate in theco-development andco- Maple programs in the Oak Territories (1) commercialization of specified product candidates arising from such programs – If Maple exercises its option with respect to product candidates arising in internally
– BCMA-directed product candidates are excluded from the Agreement developed Oak programs, the parties are obligated to enter into aco-development andco-commercialization agreement under which Maple bears 30% and Oak bears 70%
– The Agreement terminates in 2025, subject to a tail period to certain programs of global profits and losses
• The Agreement grants Oak an exclusive license with respect to Maple’s internally
• In addition to an upfront cash payment of $150MM, Oak is required to pay Maple an conducted programs additional upfront fee if Oak exercises its option for each of the CD19 and CD22
– Maple retains the right to develop and commercialize product candidates arising from programs for $50MM each such programs in the US, Canada and Mexico, and for cellular therapy product
– In April 2016, Oak paid Maple $50MM in relation to the exercise of its option for the candidates, China (the “Maple Territories” and all other countries the “Oak
CD19 program
Territories”)
• Concurrent with signing, Maple agreed to sell 9.1MM shares to Oak at $93 / share,
– Oak may exercise its options on aprogram-by-program basis at various time points along with certain options (specified below) to purchase additional Maple shares at a through completion of certain clinical trialspre-determined pricing and exercise period structure
– In connection with the Agreement, Oak and Maple entered into a standstill agreement
Oak Acquisition Rights Overview
Option Description
First Acquisition Right (“FAR”) · Allows Oak to purchase up to 10% (or the amount permitted under the First Period Top Up Rights, if less) of shares outstanding post-purchase AnnualTop-Up · FAR Base Price (no premium) FAR Exercise · Allows Oak to purchase up to 19.99% of shares outstanding post-purchase during 2019-2020 · If FAR Base Price less than $56, 50% premium (2) · If FAR Base Price is greater than $56, the premium over the FAR Base Price is the greater of 15% and $28 (3) Second Acquisition Right (“SAR) · Allows Oak to purchase up to 19.99% (or the amount permitted under the Second Period Top Up Rights, if less) of shares outstanding post-purchase AnnualTop-Up · SAR Base Price + 5% premium SAR Exercise · Allows Oak to purchase up to 30% of shares outstanding post-purchase during 2024-2025 · If SAR Base Price less than $84, 50% premium · If SAR Base Price is greater than $84, the premium over the SAR Base Price is the greater of 15% and $42
Notes
1. Subject to Oak’s right to exercise an option for a specified number of programs, excluding the CD19 and CD22 programs, toco-promote such product candidates in the Maple Territories
2. 50% assumesOpt-In Condition has been met; ifOpt-In Condition has not been met, premium equal to 60%; per management guidance, assumesOpt-In Condition has been met for purposes of analysis 48
3. 15% and $28 assumesOpt-In Condition has been met; ifOpt-In Condition has not been met, premium equal to the greater of 18% or $33.60; per management guidance, assumesOpt-In Condition has been met
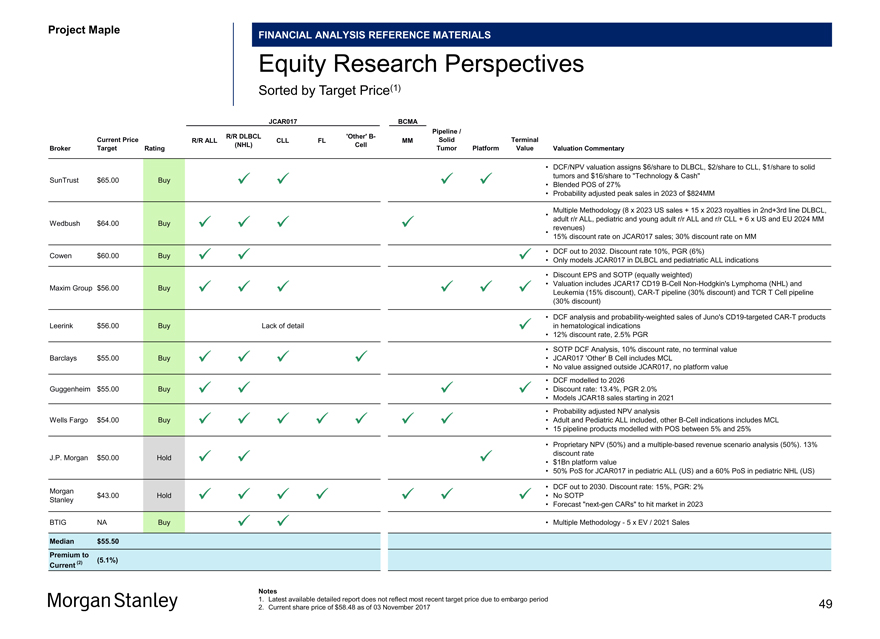
Project Maple Board Discussion Materials v72.pptx\03 NOV 2017\10:28 PM\49
Project Maple
FINANCIAL ANALYSIS REFERENCE MATERIALS
Equity Research Perspectives
Sorted by Target Price(1)
JCAR017 BCMA
Pipeline / R/R DLBCL ‘Other’ B-
Current Price R/R ALL CLL FL MM Solid Terminal (NHL) Cell
Broker Target Rating Tumor Platform Value Valuation Commentary
• DCF/NPV valuation assigns $6/share to DLBCL, $2/share to CLL, $1/share to solid tumors and $16/share to “Technology & Cash” SunTrust $65.00 Buy
• Blended POS of 27%
• Probability adjusted peak sales in 2023 of $824MM
Multiple Methodology (8 x 2023 US sales + 15 x 2023 royalties in 2nd+3rd line DLBCL,
• adult r/r ALL, pediatric and young adult r/r ALL and r/r CLL + 6 x US and EU 2024 MM
Wedbush $64.00 Buy revenues)
•
15% discount rate on JCAR017 sales; 30% discount rate on MM
• DCF out to 2032. Discount rate 10%, PGR (6%) Cowen $60.00 Buy
• Only models JCAR017 in DLBCL and pediatriatic ALL indications
• Discount EPS and SOTP (equally weighted)
• Valuation includes JCAR17 CD19B-CellNon-Hodgkin’s Lymphoma (NHL) and Maxim Group $56.00 Buy Leukemia (15% discount),CAR-T pipeline (30% discount) and TCR T Cell pipeline (30% discount)
• DCF analysis and probability-weighted sales of Juno’s CD19-targetedCAR-T products Leerink $56.00 Buy Lack of detail  in hematological indications
• 12% discount rate, 2.5% PGR
• SOTP DCF Analysis, 10% discount rate, no terminal value Barclays $55.00 Buy • JCAR017 ‘Other’ B Cell includes MCL
• No value assigned outside JCAR017, no platform value
• DCF modelled to 2026
Guggenheim $55.00 Buy • Discount rate: 13.4%, PGR 2.0%
• Models JCAR18 sales starting in 2021
• Probability adjusted NPV analysis
Wells Fargo $54.00 Buy • Adult and Pediatric ALL included, otherB-Cell indications includes MCL
• 15 pipeline products modelled with POS between 5% and 25%
• Proprietary NPV (50%) and a multiple-based revenue scenario analysis (50%). 13% discount rate J.P. Morgan $50.00 Hold
• $1Bn platform value
• 50% PoS for JCAR017 in pediatric ALL (US) and a 60% PoS in pediatric NHL (US)
• DCF out to 2030. Discount rate: 15%, PGR: 2% Morgan $43.00 Hold • No SOTP
Stanley
• Forecast“next-gen CARs” to hit market in 2023 BTIG NA Buy • Multiple Methodology—5 x EV / 2021 Sales
Median $55.50 Premium to (2) (5.1%) Current
Notes
1. Latest available detailed report does not reflect most recent target price due to embargo period 49
2. Current share price of $58.48 as of 03 November 2017
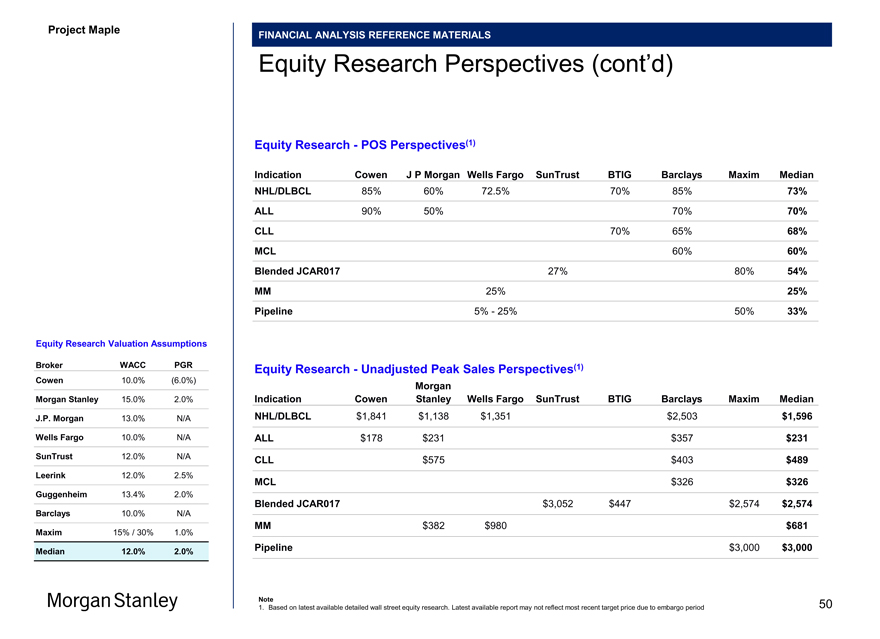
Project Maple Board Discussion Materials v72.pptx\03 NOV 2017\10:28 PM\50
Project Maple
FINANCIAL ANALYSIS REFERENCE MATERIALS
Equity Research Perspectives (cont’d)
Equity Research—POS Perspectives(1)
Indication Cowen J P Morgan Wells Fargo SunTrust BTIG Barclays Maxim Median NHL/DLBCL 85% 60% 72.5% 70% 85% 73%
ALL 90% 50% 70% 70% CLL 70% 65% 68% MCL 60% 60% Blended JCAR017 27% 80% 54% MM 25% 25% Pipeline 5%—25% 50% 33%
Equity Research Valuation Assumptions
Broker WACC PGR Equity Research—Unadjusted Peak Sales Perspectives(1)
Cowen 10.0% (6.0%)
Morgan
Morgan Stanley 15.0% 2.0% Indication Cowen Stanley Wells Fargo SunTrust BTIG Barclays Maxim Median
J.P. Morgan 13.0% N/A NHL/DLBCL $1,841 $1,138 $1,351 $2,503 $1,596 Wells Fargo 10.0% N/A ALL $178 $231 $357 $231
SunTrust 12.0% N/A CLL $575 $403 $489
Leerink 12.0% 2.5%
MCL $326 $326
Guggenheim 13.4% 2.0%
Blended JCAR017 $3,052 $447 $2,574 $2,574
Barclays 10.0% N/A
MM $382 $980 $681
Maxim 15% / 30% 1.0%
Median 12.0% 2.0% Pipeline $3,000 $3,000
Note 50
1. Based on latest available detailed wall street equity research. Latest available report may not reflect most recent target price due to embargo period
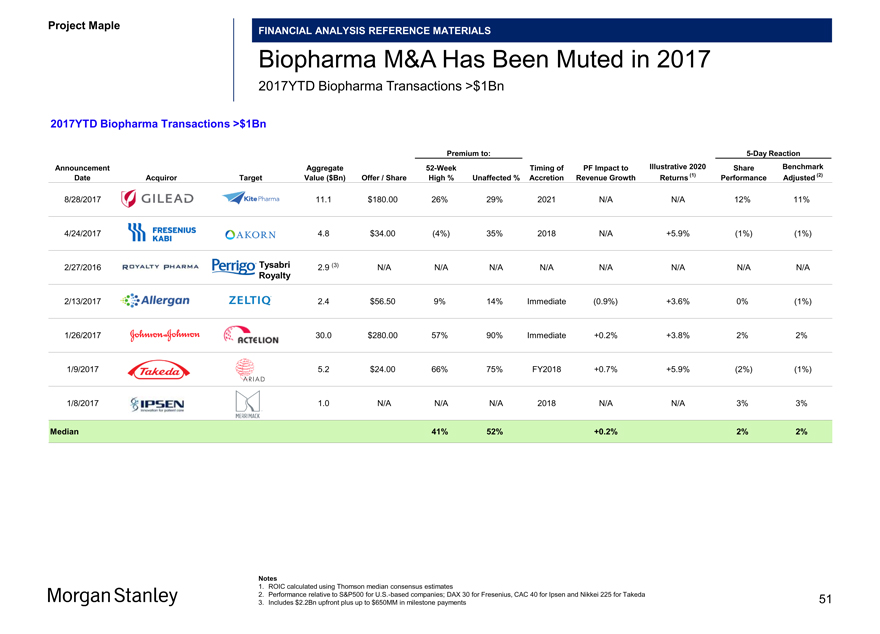
Project Maple Board Discussion Materials v72.pptx\03 NOV 2017\10:28 PM\51
Project Maple
FINANCIAL ANALYSIS REFERENCE MATERIALS
Biopharma M&A Has Been Muted in 2017
2017YTD Biopharma Transactions >$1Bn
2017YTD Biopharma Transactions >$1Bn
Premium to:5-Day Reaction Announcement Aggregate52-Week Timing of PF Impact to Illustrative 2020 Share Benchmark Date Acquiror Target Value ($Bn) Offer / Share High % Unaffected % Accretion Revenue Growth Returns (1) Performance Adjusted (2)
8/28/2017 11.1 $180.00 26% 29% 2021 N/A N/A 12% 11%
4/24/2017 4.8 $34.00 (4%) 35% 2018 N/A +5.9% (1%) (1%)
2/27/2016 Tysabri 2.9 (3) N/A N/A N/A N/A N/A N/A N/A N/A
Royalty
2/13/2017 2.4 $56.50 9% 14% Immediate (0.9%) +3.6% 0% (1%) 1/26/2017 30.0 $280.00 57% 90% Immediate +0.2% +3.8% 2% 2% 1/9/2017 5.2 $24.00 66% 75% FY2018 +0.7% +5.9% (2%) (1%)
1/8/2017 1.0 N/A N/A N/A 2018 N/A N/A 3% 3%
Median 41% 52% +0.2% 2% 2%
calculated using Thomson median consensus estimates mance relative to S&P500 for U.S.-based companies; DAX 30 for Fresenius, CAC 40 for Ipsen and Nikkei 225 for Takeda 51
3. Includes $2.2Bn upfront plus up to $650MM in milestone payments
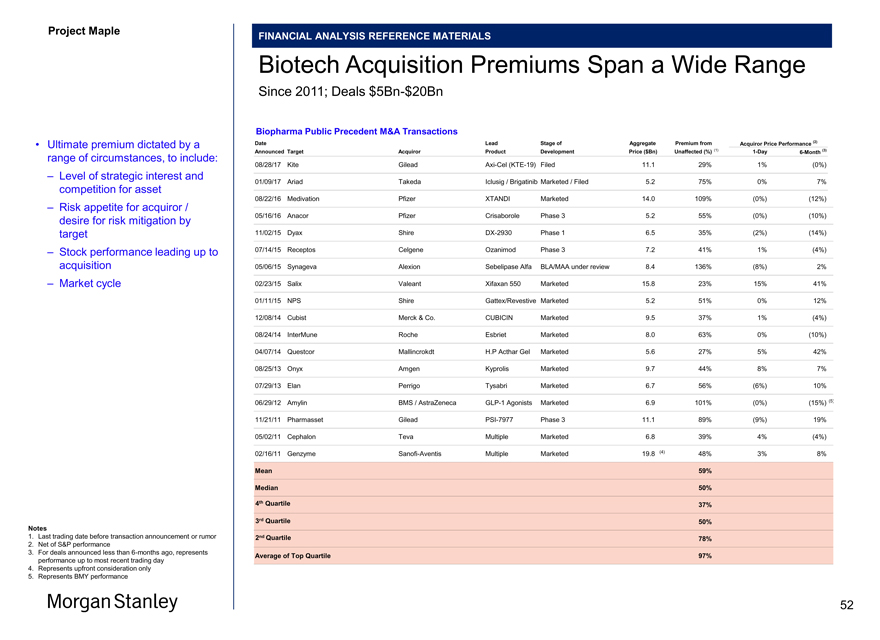
Project Maple Board Discussion Materials v72.pptx\03 NOV 2017\10:28 PM\52
Project Maple
FINANCIAL ANALYSIS REFERENCE MATERIALS
Biotech Acquisition Premiums Span a Wide Range
Since 2011; Deals$5Bn-$20Bn
Biopharma Public Precedent M&A Transactions
• Ultimate premium dictated by a Date Lead Stage of Aggregate Premium from Acquiror Price Performance (2) Announced Target Acquiror Product Development Price ($Bn) Unaffected (%) (1)1-Day6-Month (3) range of circumstances, to include: 08/28/17 Kite GileadAxi-Cel(KTE-19) Filed 11.1 29% 1% (0%)
– Level of strategic interest and
01/09/17 Ariad Takeda Iclusig / Brigatinib Marketed / Filed 5.2 75% 0% 7%
competition for asset
– Risk appetite for acquiror / 08/22/16 Medivation Pfizer XTANDI Marketed 14.0 109% (0%) (12%) desire for risk mitigation by 05/16/16 Anacor Pfizer Crisaborole Phase 3 5.2 55% (0%) (10%) target 11/02/15 Dyax ShireDX-2930 Phase 1 6.5 35% (2%) (14%)
– Stock performance leading up to 07/14/15 Receptos Celgene Ozanimod Phase 3 7.2 41% 1% (4%) acquisition 05/06/15 Synageva Alexion Sebelipase Alfa BLA/MAA under review 8.4 136% (8%) 2%
– Market cycle 02/23/15 Salix Valeant Xifaxan 550 Marketed 15.8 23% 15% 41% 01/11/15 NPS Shire Gattex/Revestive Marketed 5.2 51% 0% 12%
12/08/14 Cubist Merck & Co. CUBICIN Marketed 9.5 37% 1% (4%) 08/24/14 InterMune Roche Esbriet Marketed 8.0 63% 0% (10%) 04/07/14 Questcor Mallincrokdt H.P Acthar Gel Marketed 5.6 27% 5% 42% 08/25/13 Onyx Amgen Kyprolis Marketed 9.7 44% 8% 7% 07/29/13 Elan Perrigo Tysabri Marketed 6.7 56% (6%) 10% 06/29/12 Amylin BMS / AstraZenecaGLP-1 Agonists Marketed 6.9 101% (0%) (15%) (5) 11/21/11 Pharmasset GileadPSI-7977 Phase 3 11.1 89% (9%) 19% 05/02/11 Cephalon Teva Multiple Marketed 6.8 39% 4% (4%) 02/16/11 Genzyme Sanofi-Aventis Multiple Marketed 19.8 (4) 48% 3% 8%
Mean 59% Median 50% 1st 4th Quartile uartile 37%
2nd 3rd Quartile uartile 50% Notes
1. Last trading date before transaction announcement or rumor 3rd 2nd Quartile uartile 78%
2. Net of S&P performance
3. For deals announced less than6-months ago, represents
Average of Top Quartile 97% performance up to most recent trading day
4. Represents upfront consideration only
5. Represents BMY performance
52
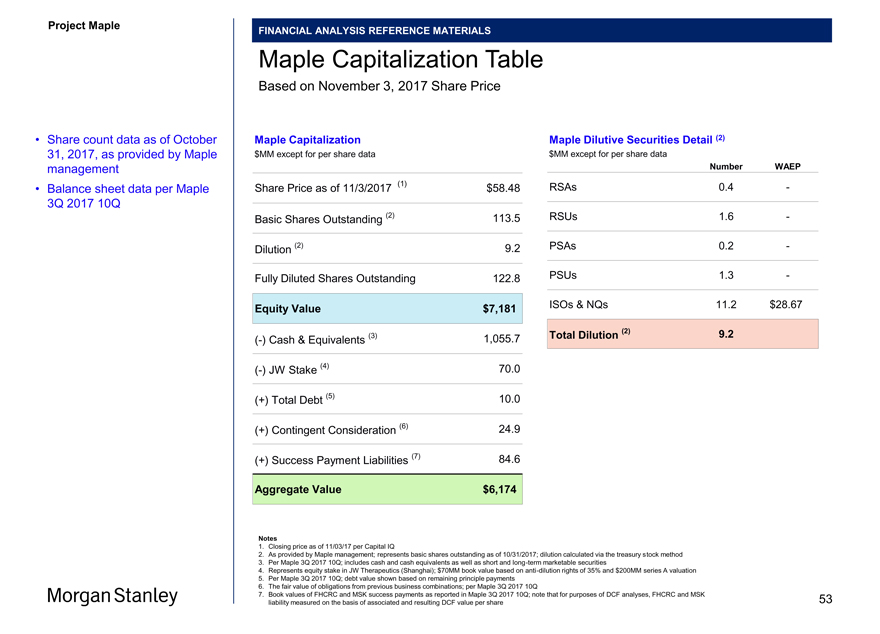
Project Maple Board Discussion Materials v72.pptx\03 NOV 2017\10:28 PM\53
Project Maple
FINANCIAL ANALYSIS REFERENCE MATERIALS
Maple Capitalization Table
Based on November 3, 2017 Share Price
• Share count data as of October Maple Capitalization Maple Dilutive Securities Detail (2)
31, 2017, as provided by Maple $MM except for per share data $MM except for per share data management Number WAEP
• Balance sheet data per Maple Share Price as of 11/3/2017 (1) $58.48 RSAs 0.4 -
3Q 2017 10Q
Basic Shares Outstanding (2) 113.5 RSUs 1.6 -
Dilution (2) 9.2 PSAs 0.2 -Fully Diluted Shares Outstanding 122.8 PSUs 1.3 -
Equity Value $7,181 ISOs & NQs 11.2 $28.67
(2) 9.2
(-) Cash & Equivalents (3) 1,055.7 Total Dilution (-) JW Stake (4) 70.0 (+) Total Debt (5) 10.0 (+) Contingent Consideration (6) 24.9 (+) Success Payment Liabilities (7) 84.6
Aggregate Value $6,174
Notes
1. Closing price as of 11/03/17 per Capital IQ
2. As provided by Maple management; represents basic shares outstanding as of 10/31/2017; dilution calculated via the treasury stock method
3. Per Maple 3Q 2017 10Q; includes cash and cash equivalents as well as short and long-term marketable securities
4. Represents equity stake in JW Therapeutics (Shanghai); $70MM book value based on anti-dilution rights of 35% and $200MM series A valuation
5. Per Maple 3Q 2017 10Q; debt value shown based on remaining principle payments
6. The fair value of obligations from previous business combinations; per Maple 3Q 2017 10Q
7. Book values of FHCRC and MSK success payments as reported in Maple 3Q 2017 10Q; note that for purposes of DCF analyses, FHCRC and MSK 53 liability measured on the basis of associated and resulting DCF value per share
Project Maple
Appendix E
Partial Purchase Reference Materials
54
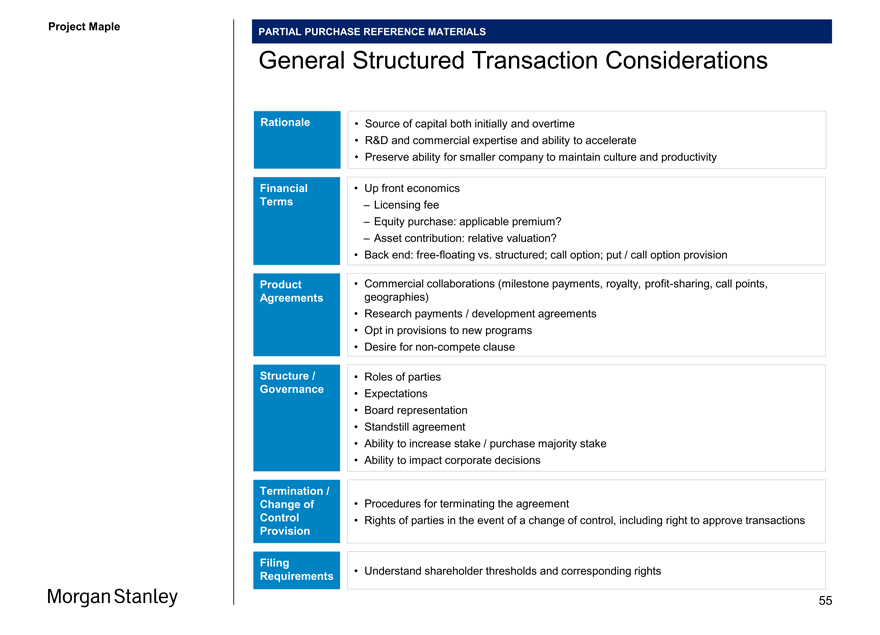
Project Maple
PARTIAL PURCHASE REFERENCE MATERIALS
General Structured Transaction Considerations
Rationale • Source of capital both initially and overtime
• R&D and commercial expertise and ability to accelerate
• Preserve ability for smaller company to maintain culture and productivity
Financial • Up front economics Terms – Licensing fee
– Equity purchase: applicable premium
– Asset contribution: relative valuation
• Back end: free-floating vs. structured; call option; put / call option provision
Product • Commercial collaborations (milestone payments, royalty, profit-sharing, call points, Agreements geographies)
• Research payments / development agreements
• Opt in provisions to new programs
• Desire fornon-compete clause
Structure / • Roles of parties Governance • Expectations
• Board representation
• Standstill agreement
• Ability to increase stake / purchase majority stake
• Ability to impact corporate decisions
Termination /
Change of • Procedures for terminating the agreement
Control • Rights of parties in the event of a change of control, including right to approve transactions
Provision
Filing
• Understand shareholder thresholds and corresponding rights
Requirements
55
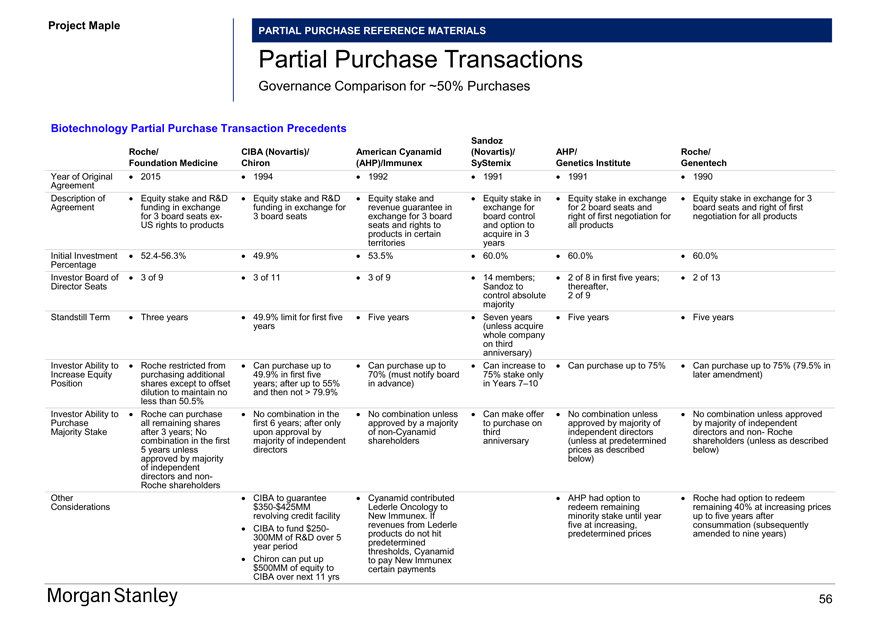
Project Maple Board Discussion Materials v72.pptx\03 NOV 2017\10:28 PM\56
Project Maple
PARTIAL PURCHASE REFERENCE MATERIALS
Partial Purchase Transactions
Governance Comparison for ~50% Purchases
Biotechnology Partial Purchase Transaction Precedents
Sandoz
Roche/ CIBA (Novartis)/ American Cyanamid (Novartis)/ AHP/ Roche/ Foundation Medicine Chiron (AHP)/Immunex SyStemix Genetics Institute Genentech
Year of Original · 2015 · 1994 · 1992 · 1991 · 1991 · 1990 Agreement
Description of · Equity stake and R&D · Equity stake and R&D · Equity stake and · Equity stake in · Equity stake in exchange · Equity stake in exchange for 3 Agreement funding in exchange funding in exchange for revenue guarantee in exchange for for 2 board seats and board seats and right of first for 3 board seatsex- 3 board seats exchange for 3 board board control right of first negotiation for negotiation for all products US rights to products seats and rights to and option to all products products in certain acquire in 3 territories years Initial Investment ·52.4-56.3% · 49.9% · 53.5% · 60.0% · 60.0% · 60.0% Percentage Investor Board of · 3 of 9 · 3 of 11 · 3 of 9 · 14 members; · 2 of 8 in first five years; · 2 of 13 Director Seats Sandoz to thereafter, control absolute 2 of 9 majority Standstill Term · Three years · 49.9% limit for first five · Five years · Seven years · Five years · Five years years (unless acquire whole company on third anniversary) Investor Ability to · Roche restricted from · Can purchase up to · Can purchase up to · Can increase to · Can purchase up to 75% · Can purchase up to 75% (79.5% in Increase Equity purchasing additional 49.9% in first five 70% (must notify board 75% stake only later amendment) Position shares except to offset years; after up to 55% in advance) in Years 7–10 dilution to maintain no and then not > 79.9% less than 50.5% Investor Ability to · Roche can purchase · No combination in the · No combination unless · Can make offer · No combination unless · No combination unless approved Purchase all remaining shares first 6 years; after only approved by a majority to purchase on approved by majority of by majority of independent Majority Stake after 3 years; No upon approval by ofnon-Cyanamid third independent directors directors andnon- Roche combination in the first majority of independent shareholders anniversary (unless at predetermined shareholders (unless as described 5 years unless directors prices as described below) approved by majority below) of independent directors andnon-Roche shareholders Other · CIBA to guarantee · Cyanamid contributed · AHP had option to · Roche had option to redeem Considerations$350-$425MM Lederle Oncology to redeem remaining remaining 40% at increasing prices revolving credit facility New Immunex. If minority stake until year up to five years after · CIBA to fund$250- revenues from Lederle five at increasing, consummation (subsequently 300MM of R&D over 5 products do not hit predetermined prices amended to nine years) year period predetermined can put thresholds, Cyanamid · Chiron up to pay New Immunex $500MM of equity to certain payments CIBA over next 11 yrs
56
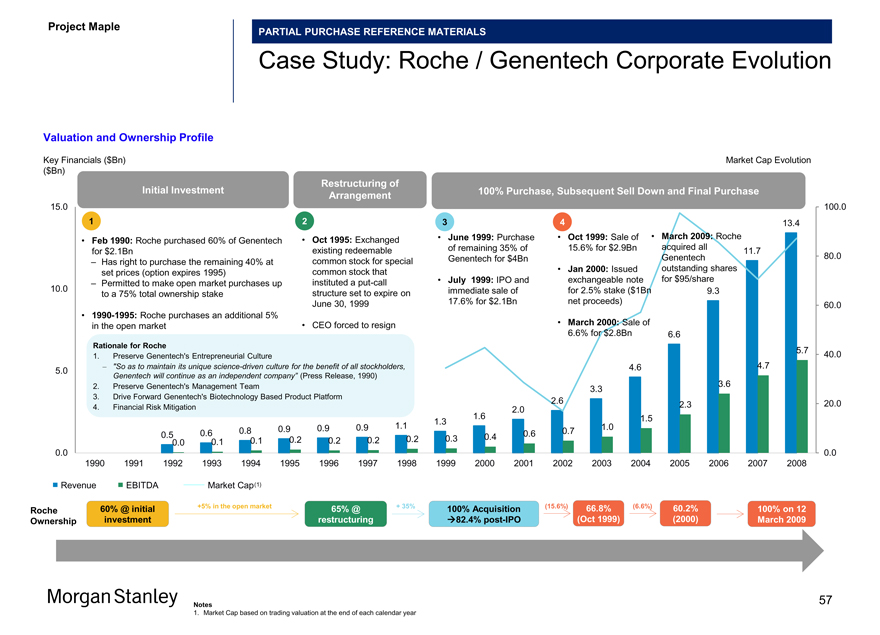
Project Maple Board Discussion Materials v72.pptx\03 NOV 2017\10:28 PM\57
Project Maple
PARTIAL PURCHASE REFERENCE MATERIALS
Case Study: Roche / Genentech Corporate Evolution
Valuation and Ownership Profile
Key Financials ($Bn) Market Cap Evolution
($Bn)
Restructuring of
Initial Investment 100% Purchase, Subsequent Sell Down and Final Purchase Arrangement
15.0 100.0
1 2 3 4 13.4
• Oct 1995: Exchanged • June 1999: Purchase • Oct 1999: Sale of • March 2009: Roche
• Feb 1990: Roche purchased 60% of Genentech existing redeemable of remaining 35% of 15.6% for $2.9Bn acquired all for $2.1Bn 11.7
Genentech for $4Bn Genentech 80.0
– Has right to purchase the remaining 40% at common stock for special common stock that • Jan 2000: Issued outstanding shares set prices (option expires 1995) instituted aput-call • July 1999: IPO and exchangeable note for $95/share
– Permitted to make open market purchases up
10.0 immediate sale of for 2.5% stake ($1Bn 9.3 to a 75% total ownership stake structure set to expire on 17.6% for $2.1Bn net proceeds)
June 30, 1999 60.0
• 1990-1995: Roche purchases an additional 5% • March 2000: Sale of in the open market • CEO forced to resign 6.6% for $2.8Bn
6.6
Rationale for Roche
5.7
1. Preserve Genentech’s Entrepreneurial Culture 40.0
– “So as to maintain its unique science-driven culture for the benefit of all stockholders, 4.6 4.7
5.0
Genentech will continue as an independent company” (Press Release, 1990)
2. Preserve Genentech’s Management Team 3.6
3.3
3. Drive Forward Genentech’s Biotechnology Based Product Platform
2.6 2.3 20.0
4. Financial Risk Mitigation 2.0
1.6 1.5 1.3 0.9 0.9 0.9 1.1 1.0 0.6 0.8 0.6 0.7 0.5 0.3 0.4 0.0 0.1 0.1 0.2 0.2 0.2 0.2
0.0 0.0 1990 1991 1992 1993 1994 1995 1996 1997 1998 1999 2000 2001 2002 2003 2004 2005 2006 2007 2008
Revenue EBITDA Market Cap(1)
60% @ initial +5% in the open market 65% @ + 35% 100% Acquisition (15.6%) 66.8% (6.6%) 60.2% 100% on 12 Roche Ownership investment restructuring ïƒ 82.4%post-IPO (Oct 1999) (2000) March 2009
Notes 57
1. Market Cap based on trading valuation at the end of each calendar year
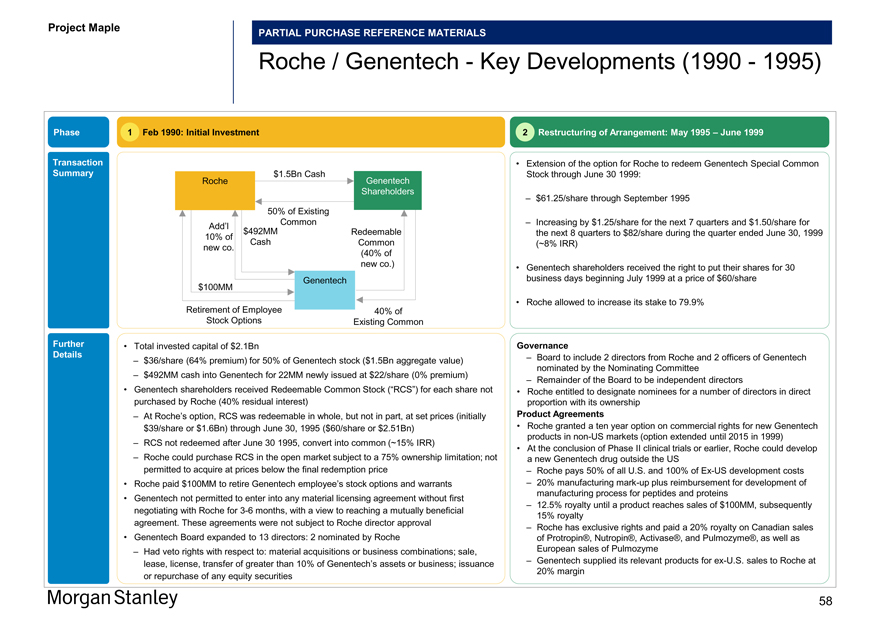
Project Maple Board Discussion Materials v72.pptx\03 NOV 2017\10:28 PM\58
Project Maple
PARTIAL PURCHASE REFERENCE MATERIALS
Roche / Genentech—Key Developments (1990—1995)
Phase 1 Feb 1990: Initial Investment 2 Restructuring of Arrangement: May 1995 – June 1999
Transaction • Extension of the option for Roche to redeem Genentech Special Common Summary Roche $1.5Bn Cash Genentech Stock through June 30 1999: Shareholders
– $61.25/share through September 1995 50% of Existing
Common – Increasing by $1.25/share for the next 7 quarters and $1.50/share for
Add’l $492MM Redeemable the next 8 quarters to $82/share during the quarter ended June 30, 1999 10% of Cash Common (~8% IRR) new co.
(40% of new co.) • Genentech shareholders received the right to put their shares for 30 Genentech business days beginning July 1999 at a price of $60/share $100MM
Retirement of Employee • Roche allowed to increase its stake to 79.9% 40% of Stock Options Existing Common
Further
• Total invested capital of $2.1Bn Governance
Details – Board to include 2 directors from Roche and 2 officers of Genentech
– $36/share (64% premium) for 50% of Genentech stock ($1.5Bn aggregate value) nominated by the Nominating Committee
– $492MM cash into Genentech for 22MM newly issued at $22/share (0% premium)
– Remainder of the Board to be independent directors
• Genentech shareholders received Redeemable Common Stock (“RCS”) for each share not • Roche entitled to designate nominees for a number of directors in direct purchased by Roche (40% residual interest) proportion with its ownership
– At Roche’s option, RCS was redeemable in whole, but not in part, at set prices (initially Product Agreements $39/share or $1.6Bn) through June 30, 1995 ($60/share or $2.51Bn) • Roche granted a ten year option on commercial rights for new Genentech products innon-US markets (option extended until 2015 in 1999)
– RCS not redeemed after June 30 1995, convert into common (~15% IRR)
• At the conclusion of Phase II clinical trials or earlier, Roche could develop
– Roche could purchase RCS in the open market subject to a 75% ownership limitation; not a new Genentech drug outside the US permitted to acquire at prices below the final redemption price – Roche pays 50% of all U.S. and 100% ofEx-US development costs
• Roche paid $100MM to retire Genentech employee’s stock options and warrants – 20% manufacturingmark-up plus reimbursement for development of manufacturing process for peptides and proteins
• Genentech not permitted to enter into any material licensing agreement without first
– 12.5% royalty until a product reaches sales of $100MM, subsequently negotiating with Roche for3-6 months, with a view to reaching a mutually beneficial 15% royalty agreement. These agreements were not subject to Roche director approval
– Roche has exclusive rights and paid a 20% royalty on Canadian sales
• Genentech Board expanded to 13 directors: 2 nominated by Roche of Protropin®, Nutropin®, Activase®, and Pulmozyme®, as well as
– Had veto rights with respect to: material acquisitions or business combinations; sale, European sales of Pulmozyme lease, license, transfer of greater than 10% of Genentech’s assets or business; issuance – Genentech supplied its relevant products forex-U.S. sales to Roche at 20% margin or repurchase of any equity securities
58
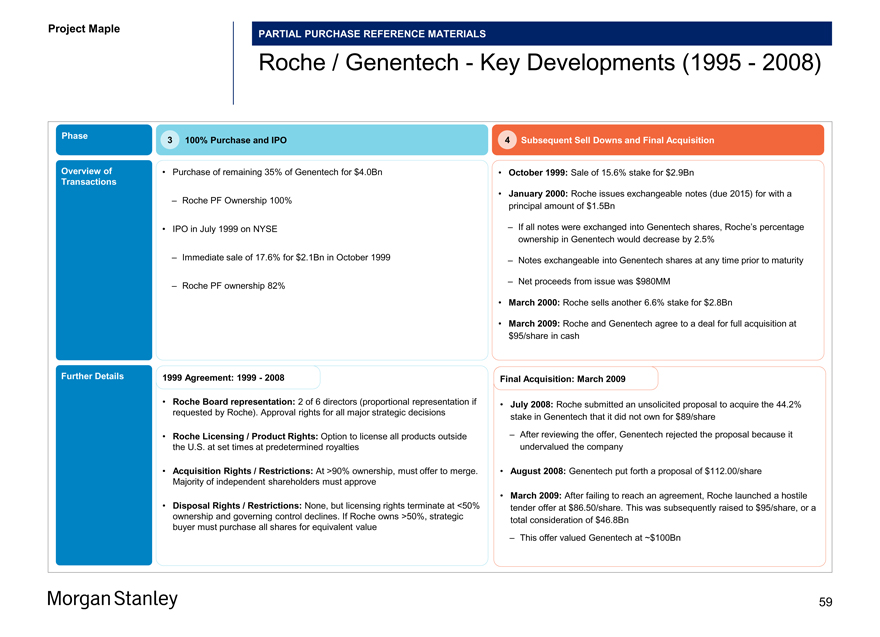
Project Maple Board Discussion Materials v72.pptx\03 NOV 2017\10:28 PM\59
Project Maple
PARTIAL PURCHASE REFERENCE MATERIALS
Roche / Genentech—Key Developments (1995—2008)
Phase
3 100% Purchase and IPO 4 Subsequent Sell Downs and Final Acquisition
Overview of • Purchase of remaining 35% of Genentech for $4.0Bn • October 1999: Sale of 15.6% stake for $2.9Bn
Transactions
• January 2000: Roche issues exchangeable notes (due 2015) for with a
– Roche PF Ownership 100% principal amount of $1.5Bn
• IPO in July 1999 on NYSE – If all notes were exchanged into Genentech shares, Roche’s percentage ownership in Genentech would decrease by 2.5%
– Immediate sale of 17.6% for $2.1Bn in October 1999 – Notes exchangeable into Genentech shares at any time prior to maturity
– Net proceeds from issue was $980MM
– Roche PF ownership 82%
• March 2000: Roche sells another 6.6% stake for $2.8Bn
• March 2009: Roche and Genentech agree to a deal for full acquisition at $95/share in cash
Further Details 1999 Agreement: 1999—2008 Final Acquisition: March 2009
• Roche Board representation: 2 of 6 directors (proportional representation if • July 2008: Roche submitted an unsolicited proposal to acquire the 44.2% requested by Roche). Approval rights for all major strategic decisions stake in Genentech that it did not own for $89/share
• Roche Licensing / Product Rights: Option to license all products outside – After reviewing the offer, Genentech rejected the proposal because it the U.S. at set times at predetermined royalties undervalued the company
• Acquisition Rights / Restrictions: At >90% ownership, must offer to merge. • August 2008: Genentech put forth a proposal of $112.00/share Majority of independent shareholders must approve
• March 2009: After failing to reach an agreement, Roche launched a hostile
• Disposal Rights / Restrictions: None, but licensing rights terminate at <50% tender offer at $86.50/share. This was subsequently raised to $95/share, or a ownership and governing control declines. If Roche owns >50%, strategic total consideration of $46.8Bn buyer must purchase all shares for equivalent value
– This offer valued Genentech at ~$100Bn
59
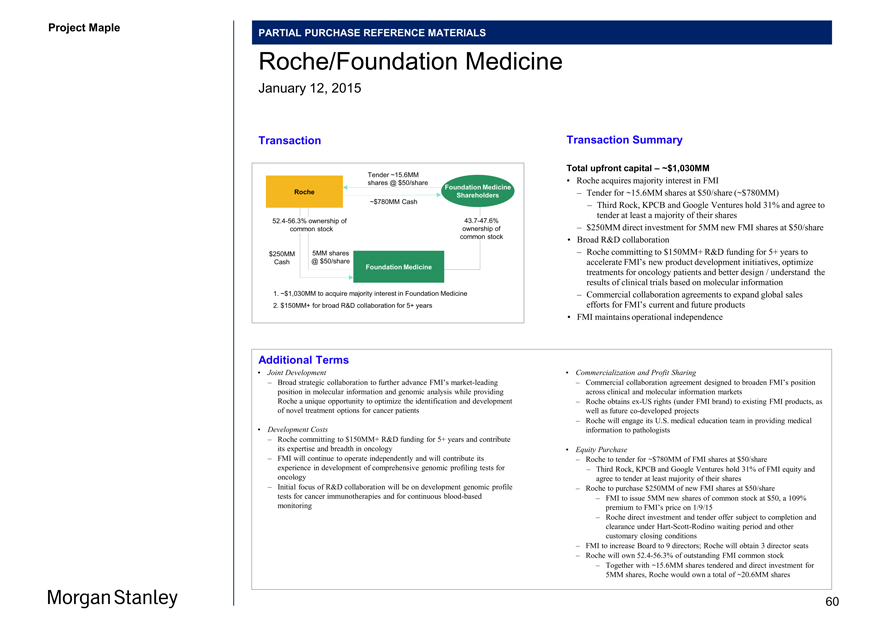
Project Maple
PARTIAL PURCHASE REFERENCE MATERIALS
Roche/Foundation Medicine
January 12, 2015
Transaction Transaction Summary
Tender ~15.6MM Total upfront capital – ~$1,030MM
• Roche acquires majority interest in FMI
shares @ $50/share
Foundation Medicine
Roche – Tender for ~15.6MM shares at $50/share (~$780MM)
Shareholders
~$780MM Cash – Third Rock, KPCB and Google Ventures hold 31% and agree to tender at least a majority of their shares52.4-56.3% ownership of43.7-47.6% – $250MM direct investment for 5MM new FMI shares at $50/share
common stock ownership of
common stock • Broad R&D collaboration $250MM 5MM shares – Roche committing to $150MM+ R&D funding for 5+ years to Cash @ $50/share accelerate FMI’s new product development initiatives, optimize
Foundation Medicine
treatments for oncology patients and better design / understand the results of clinical trials based on molecular information
1. ~$1,030MM to acquire majority interest in Foundation Medicine – Commercial collaboration agreements to expand global sales
2. $150MM+ for broad R&D collaboration for 5+ years efforts for FMI’s current and future products
• FMI maintains operational independence
Additional Terms
• Joint Development • Commercialization and Profit Sharing
– Broad strategic collaboration to further advance FMI’s market-leading – Commercial collaboration agreement designed to broaden FMI’s position position in molecular information and genomic analysis while providing across clinical and molecular information markets Roche a unique opportunity to optimize the identification and development – Roche obtainsex-US rights (under FMI brand) to existing FMI products, as of novel treatment options for cancer patients well as futureco-developed projects
– Roche will engage its U.S. medical education team in providing medical
• Development Costs information to pathologists
– Roche committing to $150MM+ R&D funding for 5+ years and contribute its expertise and breadth in oncology • Equity Purchase
– FMI will continue to operate independently and will contribute its – Roche to tender for ~$780MM of FMI shares at $50/share experience in development of comprehensive genomic profiling tests for – Third Rock, KPCB and Google Ventures hold 31% of FMI equity and oncology agree to tender at least majority of their shares
– Initial focus of R&D collaboration will be on development genomic profile – Roche to purchase $250MM of new FMI shares at $50/share tests for cancer immunotherapies and for continuous blood-based – FMI to issue 5MM new shares of common stock at $50, a 109% monitoring premium to FMI’s price on 1/9/15
– Roche direct investment and tender offer subject to completion and clearance under Hart-Scott-Rodino waiting period and other customary closing conditions
– FMI to increase Board to 9 directors; Roche will obtain 3 director seats
– Roche will own52.4-56.3% of outstanding FMI common stock
– Together with ~15.6MM shares tendered and direct investment for 5MM shares, Roche would own a total of ~20.6MM shares
60
Project Maple Board Discussion Materials v72.pptx\03 NOV 2017\10:28 PM\61
Project Maple
Disclaimer
We have prepared this document solely for informational purposes. You should not definitively rely upon it or use it to form the definitive basis for any decision, contract, commitment or action whatsoever, with respect to any proposed transaction or otherwise. You and your directors, officers, employees, agents and affiliates must hold this document and any oral information provided in connection with this document in strict confidence and may not communicate, reproduce, distribute or disclose it to any other person, or refer to it publicly, in whole or in part at any time except with our prior written consent. If you are not the intended recipient of this document, please delete and destroy all copies immediately.
We have prepared this document and the analyses contained in it based, in part, on certain assumptions and information obtained by us from the recipient, its directors, officers, employees, agents, affiliates and/or from other sources. Our use of such assumptions and information does not imply that we have independently verified or necessarily agree with any of such assumptions or information, and we have assumed and relied upon the accuracy and completeness of such assumptions and information for purposes of this document. Neither we nor any of our affiliates, or our or their respective officers, employees or agents, make any representation or warranty, express or implied, in relation to the accuracy or completeness of the information contained in this document or any oral information provided in connection herewith, or any data it generates and accept no responsibility, obligation or liability (whether direct or indirect, in contract, tort or otherwise) in relation to any of such information. We and our affiliates and our and their respective officers, employees and agents expressly disclaim any and all liability which may be based on this document and any errors therein or omissions therefrom. Neither we nor any of our affiliates, or our or their respective officers, employees or agents, make any representation or warranty, express or implied, that any transaction has been or may be effected on the terms or in the manner stated in this document, or as to the achievement or reasonableness of future projections, management targets, estimates, prospects or returns, if any. Any views or terms contained herein are preliminary only, and are based on financial, economic, market and other conditions prevailing as of the date of this document and are therefore subject to change. We undertake no obligation or responsibility to update any of the information contained in this document. Past performance does not guarantee or predict future performance.
We have (i) assumed that any forecasted financial information contained herein reflects the best available estimates of future financial performance, and (ii) not made any independent valuation or appraisal of the assets or liabilities of any company involved in any proposed transaction, nor have we been furnished with any such valuations or appraisals.
The purpose of this document is to provide the recipient with a preliminary valuation for discussion purposes in connection with the proposed transaction.
This document and the information contained herein do not constitute an offer to sell or the solicitation of an offer to buy any security, commodity or instrument or related derivative, nor do they constitute an offer or commitment to lend, syndicate or arrange a financing, underwrite or purchase or act as an agent or advisor or in any other capacity with respect to any transaction, or commit capital, or to participate in any trading strategies, and do not constitute legal, regulatory, accounting or tax advice to the recipient. We recommend that the recipient seek independent third party legal, regulatory, accounting and tax advice regarding the contents of this document. This document does not constitute and should not be considered as any form of financial opinion or recommendation by us or any of our affiliates. This document is not a research report and was not prepared by the research department of Morgan Stanley or any of its affiliates.
Notwithstanding anything herein to the contrary, each recipient hereof (and their employees, representatives, and other agents) may disclose to any and all persons, without limitation of any kind from the commencement of discussions, the U.S. federal and state income tax treatment and tax structure of the proposed transaction and all materials of any kind (including opinions or other tax analyses) that are provided relating to the tax treatment and tax structure. For this purpose, “tax structure” is limited to facts relevant to the U.S. federal and state income tax treatment of the proposed transaction and does not include information relating to the identity of the parties, their affiliates, agents or advisors.
This document is provided by Morgan Stanley & Co. LLC and/or certain of its affiliates, which may include Morgan Stanley Realty Incorporated, Morgan Stanley Senior Funding, Inc., Morgan Stanley Bank, N.A., Morgan Stanley & Co. International plc, Morgan Stanley & Co. Limited, Morgan Stanley Bank International (Milan Branch), Morgan Stanley Saudi Arabia, Morgan Stanley South Africa (PTY) Limited, Morgan Stanley Securities Limited, Morgan Stanley Bank AG, Morgan Stanley MUFG Securities Co., Ltd, Mitsubishi UFJ Morgan Stanley Securities Co., Ltd, Morgan Stanley India Company Private Limited, Morgan Stanley Asia Limited, Morgan Stanley Australia Limited, Morgan Stanley Asia (Singapore) Pte., Morgan Stanley Services Limited, Morgan Stanley & Co. International plc, Seoul Branch, Morgan Stanley Canada Limited and/or Morgan Stanley, SV, SAU. Unless governing law permits otherwise, you must contact an authorized Morgan Stanley entity in your jurisdiction regarding this document or any of the information contained herein.
© Morgan Stanley and/or certain of its affiliates. All rights reserved. 61