UNITED STATES
SECURITIES AND EXCHANGE COMMISSION
Washington, D.C. 20549
FORM N-CSR
CERTIFIED SHAREHOLDER REPORT OF REGISTERED MANAGEMENT INVESTMENT COMPANIES
Investment Company Act file number 811-22926
Innovator ETFs Trust II
(Exact name of registrant as specified in charter)
109 North Hale Street
Wheaton, IL 60187
(Address of principal executive offices) (Zip code)
Chapman and Cutler LLP
111 West Monroe Street
Chicago, IL 60603
(Name and address of agent for service)
800-208-5212
Registrant's telephone number, including area code
Date of fiscal year end: October 31, 2021
Date of reporting period: April 30, 2021
Item 1. Reports to Stockholders.
TABLE OF CONTENTS
Letter to Shareholders | 1 |
Fund Performance | 4 |
Expense Example | 8 |
Schedules of Investments | 10 |
Statements of Assets and Liabilities | 17 |
Statements of Operations | 18 |
Statements of Changes in Net Assets | 19 |
Financial Highlights | 21 |
Notes to Financial Statements | 23 |
Trustees and Officers | 40 |
Additional Information | 42 |
INNOVATOR ETFs TRUST II
Letter to Shareholders (Unaudited)
Dear Valued Shareholders,
The following shareholder letter covers the period ended April 30, 2021.
What a difference a year makes. This time last year, the stock market was struggling to get out of a bear market. Millions of Americans were losing their jobs. The country was in lockdown due to the pandemic, and people had to wear masks in public at all times. The outlook for the economy was dire and the nation was sorely divided over the presidential election.
Today, the severe impact of Covid is fading away. The stock market has not only recovered but has soared to new heights. The economy has rebounded, growing over the last three quarters at its fastest pace in 70 years. And there was a peaceful, albeit slightly extended, transition of power in the White House.
Life is getting back to normal – of a sort – even if there are longer-lasting changes to the post-Covid world.
In 2020, we were pleased to see that Innovator ETFs performed true to design by mitigating the declines of a bear market. Thank you for staying with us as market uncertainty tested the resiliency of our ETFs.
Looking ahead, we see the potential of a lower-return environment, signaled by historically high equity market valuations and continued low bond yields. Our Defined Outcome ETFs seek to continue to buffer client portfolios on the downside while letting them stay invested in equities.
Innovator Laddered Fund of S&P 500 Power Buffer ETFs (BUFF)
We are pleased to report that BUFF provided upside exposure to investors’ portfolios while substantially minimizing market volatility and drawdowns in the last six months. Volatile market conditions and changing economic forecasts have demonstrated the value of buffering portfolios against an uncertain future while maintaining exposure to the potential growth of equities. The laddered strategy of BUFF also seeks to provide investors constant diversified buffered exposure to the S&P 500 and locks in new caps during monthly series resets while decreasing market losses and smoothing out the equities ride overall.
INNOVATOR ETFs TRUST II
Letter to Shareholders (Unaudited) (Continued)
Innovator S&P Investment Grade Preferred ETF (EPRF)
EPRF continued to be the only ETF in the market designed to offer exposure to 100% investment-grade, U.S.-listed preferred shares. In addition to EPRF’s standards for higher credit quality, we believe its monthly distributions and equal-weighting methodology enable it to pursue a high-quality portfolio in choppy markets and a compelling portfolio diversifier.
As always, all of us at Innovator thank you for your patronage. We will continue to work hard to earn your trust and support.
Looking forward to even better times,
Bruce Bond
Chief Executive Officer
The views in this report were those of the Fund’s CEO as of April 30, 2021 and may not reflect his views on the date that this report is first published or anytime thereafter. These views are intended to assist shareholders in understanding their investments and do not constitute investment advice.
Investing involves risks. Principal loss is possible.
EPRF Risks
Investing involves risks. Principal loss is possible. The fund invests in preferred securities which may be subject to many of the risks associated with debt securities, including interest rate risk. The fund invests in equity securities which may be subject to volatile price fluctuations. Investment grade refers to the quality of a company's credit. To be considered an investment grade issue, the company must be rated at 'BBB' or higher by Standard and Poor's or Moody's. Anything below this 'BBB' rating is considered non-investment grade. S&P and Moody’s study the financial condition of an entity to ascertain its creditworthiness. The credit
ratings reflect the rating agency’s opinion of the holdings financial condition and histories. For information on the rating agencies methodology, visit http://www.standardandpoors.com or https://www.moodys.com
INNOVATOR ETFs TRUST II
Letter to Shareholders (Unaudited) (Continued)
Because the fund is non-diversified and can invest a greater portion of its assets in securities of individual issuers than a diversified fund, changes in the market value of a single investment could cause greater fluctuations in share price.
BUFF Risks
The Fund may have characteristics unlike many other traditional investment products and may not be suitable for all investors. For more information regarding whether an investment in the Fund is right for you, please see “Investor Suitability” in the prospectus.
Investing involves risks, and loss of principal is possible. The Fund may have characteristics unlike many other traditional investment products and may not be suitable for all investors. For more information regarding whether an investment in the Fund is right for you, please see “Investor Suitability” in the prospectus.
The Fund, in accordance with the Refinitiv Laddered Power Buffer Strategy Index, will be continuously invested in a laddered portfolio of the twelve Underlying ETFs. The index is rebalanced semi-annually such that each Underlying ETF will constitute 1/12 of the Index portfolio before fees and expenses. Each Underlying ETF seeks to match the performance of the SPDR S&P 500 ETF Trust (SPY) or the S&P 500 Price Index up to a specified cap, while buffering against a 15% loss over the course of an approximately one-year time period that begins on the first trading day of the month indicated in the Underlying ETF’s name when the fund enters into its FLEX Option positions and ends on the market’s closure on the last trading day of the month immediately preceding the month indicated its name when those FLEX Options expire. There is no guarantee that the defined outcome strategy of an Underlying ETF in any given Outcome Period will be achieved.
This material must be accompanied by a prospectus. Read carefully before investing.
Innovator ETFs are distributed by Foreside Fund Services, LLC.
INNOVATOR S&P INVESTMENT GRADE PREFERRED ETF
Fund Performance
April 30, 2021 (Unaudited)
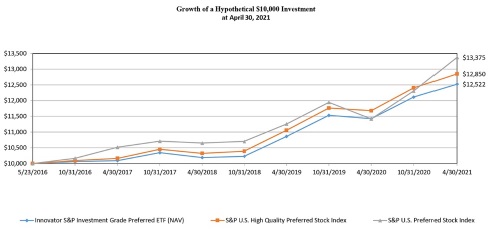
The following chart compares the value of a hypothetical $10,000 investment in the Innovator S&P Investment Grade Preferred ETF from its inception (May 23, 2016) to April 30, 2021 as compared with the S&P U.S. High Quality Preferred Stock Index and the S&P U.S. Preferred Stock Index.
| | | Average Annual Total Returns As of April 30, 2021 | |
| | | 1 Year | | | 3 Years | | | Since Inception(a) | |
Innovator S&P Investment Grade Preferred ETF | | | | | | | | | | | | |
NAV Return | | | 9.61 | % | | | 7.12 | % | | | 4.66 | % |
Market Return | | | 8.01 | % | | | 7.23 | % | | | 4.60 | % |
S&P U.S. High Quality Preferred Stock Index | | | 10.03 | % | | | 7.57 | % | | | 5.21 | % |
S&P U.S. Preferred Stock Index | | | 17.15 | % | | | 7.89 | % | | | 6.07 | % |
(a) | Inception date is May 23, 2016. |
Performance data quoted represents past performance and does not guarantee future results. The investment return and principal value of an investment will fluctuate so that an investor’s shares, when redeemed, may be worth more or less than their original cost. Current performance of the Fund may be lower or higher than the performance quoted. As of the latest prospectus, the net expense ratio of the Fund was 0.47%. For the most recent month-end performance, please visit the Fund’s website at innovatoretfs.com.
INNOVATOR S&P INVESTMENT GRADE PREFERRED ETF
Fund Performance
April 30, 2021 (Unaudited) (Continued)
The line graph and performance table do not reflect the deduction of taxes that a shareholder may pay on fund distributions or the redemption of Fund shares. Returns shown for the Fund, S&P U.S. High Quality Preferred Stock Index and S&P U.S. Preferred Stock Index include the reinvestment of all dividends, if any.
The S&P U.S. High Quality Preferred Stock Index is designed to provide exposure to U.S. - listed preferred stocks that meet a minimum size, liquidity, type of issuance, and quality criteria.
The S&P U.S. Preferred Stock Index generally represents the U.S. preferred stock market.
The Fund’s portfolio holdings may differ significantly from the securities held in the relevant index and, unlike an exchange-traded fund, the performance of an unmanaged index does not reflect deductions for transaction costs, taxes, management fees or other expenses.
You cannot invest directly in an index.
Premium/Discount Information:
Information regarding the differences between the price of the Fund’s shares on the secondary market and the Fund’s net asset value is available at innovatoretfs.com/EPRF.
INNOVATOR LADDERED FUND OF S&P 500® POWER BUFFER ETFs
Fund Performance
April 30, 2021 (Unaudited)
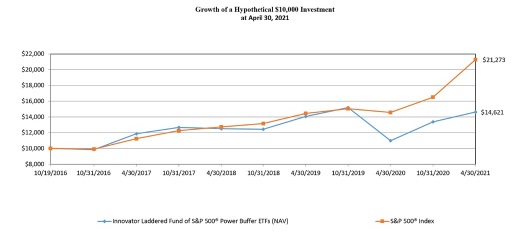
The following chart compares the value of a hypothetical $10,000 investment in the Innovator Laddered Fund of S&P 500® Power Buffer ETFs from its inception (October 19, 2016) to April 30, 2021 as compared with the S&P 500® Index.
| | | Average Annual Total Returns As of April 30, 2021 | | |
| | | 1 Year | | | 3 Years | | | Since Inception(a) | | |
Innovator Laddered Fund of S&P 500® Power Buffer ETFs | | | | | | | | | | |
NAV Return | | | 33.05 | % | | | 5.34 | % | | | 8.75 | % | |
Market Return | | | 33.10 | % | | | 5.40 | % | | | 8.80 | % | |
S&P 500® Index | | | 45.98 | % | | | 18.67 | % | | | 18.14 | % | |
Refinitiv Laddered Power Buffer Strategy Index (b) | | | N/A | | | | N/A | | | | 9.02 | % | (c) |
(a) | Inception date is October 19, 2016. |
(b) | The Fund began tracking the Refinitiv Laddered Power Buffer Strategy Index on August 11, 2020. |
(c) | Since Inception return is cumulative and from the date the Fund began tracking the Refinitiv Laddered Power Buffer Strategy Index, August 11, 2020. |
Performance data quoted represents past performance and does not guarantee future results. The investment return and principal value of an investment will fluctuate so that an investor’s shares, when redeemed, may be worth more or less than their original cost. Current performance of the Fund may be lower or higher than the performance quoted. As of the latest prospectus, the net expense ratio of the Fund was 0.99%. This expense ratio includes acquired fund fees and expenses of 0.79%. For the most recent performance, please visit the Fund’s website at innovatoretfs.com.
INNOVATOR LADDERED FUND OF S&P 500® POWER BUFFER ETFs
Fund Performance
April 30, 2021 (Unaudited) (Continued)
The line graph and performance table do not reflect the deduction of taxes that a shareholder may pay on fund distributions or the redemption of Fund shares. Returns shown for the Fund, Refinitiv Laddered Power Buffer Strategy Index and S&P 500® Index include the reinvestment of all dividends, if any.
The Refinitiv Laddered Power Buffer Strategy Index is equally weighted in the shares of the twelve Innovator S&P 500® Power Buffer ETFs which each respectively seek to provide a defined outcome based upon the performance of the S&P 500® Index – Price Return over the course of an approximately one-year time period that begins on the first trading day of the month indicated in the respective ETF’s name. Each Innovator S&P 500® Power Buffer ETF seeks to provide an upside return that is capped for an applicable outcome period and a measure of downside protection from losses for such outcome period. The Index seeks to provide “laddered” investing in the twelve Innovator S&P 500® Power Buffer ETFs. Laddered investing refers to investments in several similar securities that have different reset dates, with the goal of mitigating timing risks associated with investing in a single investment.
The S&P 500® Index is an unmanaged, capitalization-weighted index generally representative of the U.S. market for large capitalization stocks.
The Fund’s portfolio holdings may differ significantly from the securities held in the relevant index and, unlike an exchange-traded fund, the performance of an unmanaged index does not reflect deductions for transaction costs, taxes, management fees or other expenses.
You cannot invest directly in an index.
Premium/Discount Information:
Information regarding the differences between the price of the Fund’s shares on the secondary market and the Fund’s net asset value is available at innovatoretfs.com/BUFF.
INNOVATOR ETFs TRUST II
Expense Example
For the Period Ended April 30, 2021 (Unaudited)
As a shareholder of the Funds you incur two types of costs: (1) ongoing costs, including management fees and other Fund expenses; and (2) transaction costs including brokerage commissions on the purchase and sale of Fund shares. This example is intended to help you understand your ongoing costs (in dollars) of investing in the Funds and to compare these costs with the ongoing costs of investing in other funds.
The example is based on an investment of $1,000 invested at the beginning of the period and held for the entire period from November 1, 2020 to April 30, 2021 for each Fund.
Actual Expenses
The first line under each Fund in the following table provides information about actual account values and actual expenses. You may use the information in this line, together with the amount you invested, to estimate the expenses that you paid over the period. Simply divide your account value by $1,000 (for example, an $8,600 account value divided by $1,000 = 8.6), then multiply the result by the number in the first line for the Funds under the heading entitled “Expenses Paid During Period” to estimate the expenses you paid on your account during this period.
INNOVATOR ETFs TRUST II
Expense Example
For the Period Ended April 30, 2021 (Unaudited) (Continued)
Hypothetical Example for Comparison Purposes
The second line under each Fund in the following table provides information about hypothetical account values and hypothetical expenses based on the Funds’ actual expense ratio and an assumed rate of return of 5% per year before expenses, which is not the respective Fund’s actual return. The hypothetical account values and expenses may not be used to estimate the actual ending account balance or expenses you paid for the period. You may use this information to compare the ongoing costs of investing in the Funds and other funds. To do so, compare this 5% hypothetical example with the 5% hypothetical examples that appear in the shareholder reports of the other funds.
Please note that the expenses shown in the table are meant to highlight your ongoing costs only and do not reflect any transactional costs, such as brokerage commissions on the purchases and sales of Fund shares. Therefore, the second line under the Funds in the table is useful in comparing ongoing Fund costs only and will not help you determine the relative total costs of owning different funds. In addition, if these transactional costs were included, your costs would have been higher.
| | | | | | | | | | | Expenses | | | Annualized | |
| | | Beginning | | | Ending | | | Paid | | | Expense Ratio | |
| | | Account
Value | | | Account
Value | | | During the Period (a) | | | for the
Period | |
Innovator S&P Investment Grade Preferred ETF (NAV) | | | | | | | | | | | | | | | 0.47 | % |
Actual | | $ | 1,000.00 | | | $ | 1,033.80 | | | $ | 2.37 | | | | | |
Hypothetical | | �� | 1,000.00 | | | | 1,022.46 | | | | 2.36 | | | | | |
Innovator Laddered Fund of S&P 500® Power Buffer ETFs (NAV) | | | | | | | | | | | | | | | 0.20 | % |
Actual | | | 1,000.00 | | | | 1,092.80 | | | | 1.04 | | | | | |
Hypothetical | | | 1,000.00 | | | | 1,023.80 | | | | 1.00 | | | | | |
(a) | Expenses are equal to the Fund’s annualized expense ratio, multiplied by the average account value over the period, multiplied by 181/365 (to reflect the six month period). |
INNOVATOR S&P INVESTMENT GRADE PREFERRED ETF
Schedule of Investments
April 30, 2021 (Unaudited)
| | | Shares | | | Value | |
PREFERRED STOCKS - 101.17% (a) | | | | | | | | |
Banks - 30.19% | | | | | | | | |
Bank of America Corp., Series 02, 3.000% to 5/28/2021 then 3-Month Libor + 0.650% | | | 21,716 | | | $ | 478,404 | |
Bank of America Corp., Series 4, 4.000% to 5/28/2021 then 3-Month Libor + 0.750% | | | 18,315 | | | | 472,344 | |
Bank of America Corp., Series 5, 4.000% to 5/21/2021 then 3-Month Libor + 0.500% (b) | | | 18,737 | | | | 478,168 | |
Bank of America Corp., Series E, 4.000% to 5/17/2021 then 3-Month Libor + 0.350% | | | 18,693 | | | | 472,933 | |
Bank of America Corp., Series GG, 6.000% (b) | | | 17,218 | | | | 474,012 | |
Bank of America Corp., Series HH, 5.875% (b) | | | 17,267 | | | | 472,770 | |
Bank of America Corp., Series KK, 5.375% | | | 17,338 | | | | 480,783 | |
Bank of America Corp., Series LL, 5.000% | | | 17,669 | | | | 481,657 | |
Bank of America Corp., Series NN, 4.375% | | | 18,719 | | | | 475,275 | |
Bank of America Corp., Series PP, 4.125% (b) | | | 18,880 | | | | 477,286 | |
Cullen/Frost Bankers, Inc., Series B, 4.450% (b) | | | 206,361 | | | | 5,229,188 | |
First Citizens BancShares, Inc./NC, Series A, 5.375% | | | 192,052 | | | | 5,160,437 | |
First Republic Bank/CA, Series J, 4.700% | | | 66,635 | | | | 1,725,847 | |
First Republic Bank/CA, Series K, 4.125% (b) | | | 68,975 | | | | 1,720,926 | |
First Republic Bank/CA, Series L, 4.250% (b) | | | 67,283 | | | | 1,729,173 | |
Fulton Financial Corp., Series A, 5.125% | | | 199,288 | | | | 5,149,602 | |
JPMorgan Chase & Co., Series AA, 6.100% | | | 33,761 | | | | 854,153 | |
JPMorgan Chase & Co., Series BB, 6.150% | | | 33,616 | | | | 851,157 | |
JPMorgan Chase & Co., Series DD, 5.750% | | | 31,692 | | | | 861,389 | |
JPMorgan Chase & Co., Series EE, 6.000% (b) | | | 31,301 | | | | 863,595 | |
JPMorgan Chase & Co., Series GG, 4.750% | | | 32,369 | | | | 848,715 | |
JPMorgan Chase & Co., Series JJ, 4.550% | | | 33,761 | | | | 877,786 | |
Northern Trust Corp., Series E, 4.700% (b) | | | 191,982 | | | | 5,204,633 | |
State Street Corp., Series D, 5.900% to 03/15/2024 then 3-Month Libor + 3.108% (b) | | | 91,906 | | | | 2,595,425 | |
State Street Corp., Series G, 5.350% to 03/15/2026 then 3-Month Libor + 3.709% (b) | | | 88,941 | | | | 2,598,856 | |
The PNC Financial Services Group, Inc., Series P, 6.125% to 05/01/2022 then 3-Month Libor + 4.067% (b) | | | 193,414 | | | | 5,071,315 | |
The accompanying notes are an integral part of these financial statements.
INNOVATOR S&P INVESTMENT GRADE PREFERRED ETF
Schedule of Investments
April 30, 2021 (Unaudited) (Continued)
| | | Shares | | | Value | |
Truist Financial Corp., Series H, 5.625% | | | 51,140 | | | | 1,294,865 | |
Truist Financial Corp., Series I, 4.000% to 6/15/2021 then 3-Month Libor + 0.530% | | | 50,015 | | | | 1,296,389 | |
Truist Financial Corp., Series O, 5.200% (b) | | | 47,037 | | | | 1,310,451 | |
Truist Financial Corp., Series R, 4.750% | | | 49,860 | | | | 1,322,287 | |
US Bancorp., Series B, 3.500% to 7/15/2021 then 3-Month Libor + 0.600% (b) | | | 42,821 | | | | 1,040,550 | |
US Bancorp., Series F, 6.500% to 01/15/2022 then 3-Month Libor + 4.468% | | | 39,874 | | | | 1,037,521 | |
US Bancorp., Series K, 5.500% (b) | | | 37,488 | | | | 1,045,540 | |
US Bancorp., Series L, 3.750% | | | 43,395 | | | | 1,049,291 | |
US Bancorp., Series M, 4.000% | | | 41,668 | | | | 1,039,200 | |
Wells Fargo & Co., Series O, 5.125% | | | 200,212 | | | | 5,189,495 | |
| | | | | | | | 61,731,418 | |
Capital Markets - 10.25% | | | | | | | | |
Ares Management Corp., Series A, 7.000% | | | 201,692 | | | | 5,122,977 | |
Highland Income Fund, Series A, 5.375% | | | 200,821 | | | | 5,241,427 | |
KKR & Co., Inc., Series A, 6.750% | | | 100,807 | | | | 2,581,667 | |
KKR & Co., Inc., Series C, 6.000%, 09/15/2023 (b) | | | 37,781 | | | | 2,832,819 | |
Oaktree Capital Group LLC, Series A, 6.625% | | | 96,997 | | | | 2,599,520 | |
Oaktree Capital Group LLC, Series B, 6.550% | | | 96,383 | | | | 2,592,703 | |
| | | | | | | | 20,971,113 | |
Diversified Financial Services - 5.07% | | | | | | | | |
Apollo Global Management, Inc., Series A, 6.375% | | | 99,530 | | | | 2,591,761 | |
Apollo Global Management, Inc., Series B, 6.375% (b) | | | 96,276 | | | | 2,584,048 | |
The Charles Schwab Corp., Series C, 6.000% | | | 102,118 | | | | 2,588,691 | |
The Charles Schwab Corp., Series D, 5.950% | | | 101,997 | | | | 2,603,984 | |
| | | | | | | | 10,368,484 | |
Electric - 12.63% | | | | | | | | |
Alabama Power Co., Series A, 5.000% | | | 195,530 | | | | 5,197,188 | |
Brookfield Infrastructure Partners LP, Series 13, 5.125% | | | 202,559 | | | | 5,207,792 | |
The accompanying notes are an integral part of these financial statements.
INNOVATOR S&P INVESTMENT GRADE PREFERRED ETF
Schedule of Investments
April 30, 2021 (Unaudited) (Continued)
| | | Shares | | | Value | |
Brookfield Renewable Partners LP, Series 17, 5.250% | | | 197,240 | | | | 5,189,384 | |
Duke Energy Corp., 5.125%, 01/15/2073 (b) | | | 197,994 | | | | 5,145,864 | |
PPL Capital Funding, Inc., Series B, 5.900%, 04/30/2073 | | | 199,904 | | | | 5,097,552 | |
| | | | | | | | 25,837,780 | |
Insurance - 27.76% | | | | | | | | |
Aegon NV, Series 1, 4.000% to 6/15/2021 then 3-Month Libor + 0.875% | | | 204,477 | | | | 5,150,776 | |
American International Group, Inc., Series A, 5.850% | | | 186,860 | | | | 5,181,628 | |
Arch Capital Group Ltd., Series E, 5.250% | | | 100,651 | | | | 2,555,529 | |
Arch Capital Group Ltd., Series F, 5.450% (b) | | | 98,583 | | | | 2,572,030 | |
Athene Holding Ltd., Series A, 6.350% to 06/30/2029 then 3-Month USD Libor + 4.253% | | | 44,980 | | | | 1,283,279 | |
Athene Holding Ltd., Series B, 5.625% | | | 48,699 | | | | 1,281,271 | |
Athene Holding Ltd., Series C, 6.375% to 09/30/2025 then Five-Year Treasury Constant Maturity + 5.970% (b) | | | 45,678 | | | | 1,286,292 | |
Athene Holding Ltd., Series D, 4.875% | | | 51,424 | | | | 1,295,885 | |
Axis Capital Holdings Ltd., Series E, 5.500% | | | 201,300 | | | | 5,123,085 | |
MetLife, Inc., Series A, 4.000% to 6/15/2021 then 3-Month Libor + 1.000% | | | 66,970 | | | | 1,700,368 | |
MetLife, Inc., Series E, 5.625% (b) | | | 62,716 | | | | 1,730,334 | |
MetLife, Inc., Series F, 4.750% | | | 65,202 | | | | 1,717,421 | |
PartnerRe Ltd., Series H, 7.250% | | | 67,499 | | | | 1,707,725 | |
PartnerRe Ltd., Series I, 5.875% | | | 67,579 | | | | 1,708,397 | |
PartnerRe Ltd., Series J, 4.875% | | | 65,078 | | | | 1,727,170 | |
Prudential PLC, 6.500% (b) | | | 95,320 | | | | 2,621,300 | |
Prudential PLC, 6.750% (b) | | | 92,828 | | | | 2,559,268 | |
RenaissanceRe Holdings Ltd., Series E, 5.375% | | | 101,877 | | | | 2,588,695 | |
RenaissanceRe Holdings Ltd., Series F, 5.750% (b) | | | 94,314 | | | | 2,616,270 | |
The Allstate Corp., 5.100% to 01/15/2023 then 3-Month Libor + 3.165%, 01/15/2053 (b) | | | 65,387 | | | | 1,757,603 | |
The accompanying notes are an integral part of these financial statements.
INNOVATOR S&P INVESTMENT GRADE PREFERRED ETF
Schedule of Investments
April 30, 2021 (Unaudited) (Continued)
| | | Shares | | | Value | |
The Allstate Corp., Series H. 5.100% (b) | | | 63,805 | | | | 1,742,515 | |
The Allstate Corp., Series I, 4.750% (b) | | | 64,835 | | | | 1,723,963 | |
The Hartford Financial Services Group, Inc., 7.875% to 04/15/2022 then 3-Month Libor + 5.596%, 04/15/2042 (b) | | | 95,637 | | | | 2,543,944 | |
The Hartford Financial Services Group, Inc., Series G, 6.000% (b) | | | 92,365 | | | | 2,583,449 | |
| | | | | | | | 56,758,197 | |
Real Estate Investment Trusts - 12.71% | | | | | | | | |
Federal Realty Investment Trust, Series C, 5.000% (b) | | | 195,973 | | | | 5,216,800 | |
Kimco Realty Corp., Series L, 5.125% | | | 98,284 | | | | 2,579,955 | |
Kimco Realty Corp., Series M, 5.250% | | | 97,251 | | | | 2,590,767 | |
National Retail Properties, Inc., Series F, 5.200% | | | 200,134 | | | | 5,163,457 | |
PS Business Parks, Inc., Series W, 5.200% | | | 50,502 | | | | 1,301,942 | |
PS Business Parks, Inc., Series X, 5.250% | | | 49,555 | | | | 1,323,119 | |
PS Business Parks, Inc., Series Y, 5.200% (b) | | | 49,254 | | | | 1,307,694 | |
PS Business Parks, Inc., Series Z, 4.875% (b) | | | 48,372 | | | | 1,306,528 | |
Public Storage, Series C, 5.125% (b) | | | 15,576 | | | | 395,630 | |
Public Storage, Series D, 4.950% | | | 15,711 | | | | 398,588 | |
Public Storage, Series E, 4.900% | | | 15,401 | | | | 397,346 | |
Public Storage, Series F, 5.150% (b) | | | 15,179 | | | | 404,672 | |
Public Storage, Series G, 5.050% | | | 15,133 | | | | 400,873 | |
Public Storage, Series H, 5.600% | | | 14,251 | | | | 403,588 | |
Public Storage, Series I, 4.875% (b) | | | 14,790 | | | | 407,612 | |
Public Storage, Series J, 4.700% (b) | | | 14,713 | | | | 402,989 | |
Public Storage, Series K, 4.750% (b) | | | 14,474 | | | | 401,943 | |
Public Storage, Series L, 4.625% | | | 14,644 | | | | 392,313 | |
Public Storage, Series M, 4.125% (b) | | | 15,307 | | | | 399,207 | |
Public Storage, Series N, 3.875% (b) | | | 15,767 | | | | 398,905 | |
Public Storage, Series O, 3.900% (b) | | | 15,378 | | | | 401,366 | |
| | | | | | | | 25,995,294 | |
Savings & Loans - 2.56% | | | | | | | | |
Washington Federal, Inc., Series A, 4.875% | | | 202,956 | | | | 5,224,087 | |
TOTAL PREFERRED STOCKS (Cost $204,900,389) | | | | | | | 206,886,373 | |
The accompanying notes are an integral part of these financial statements.
INNOVATOR S&P INVESTMENT GRADE PREFERRED ETF
Schedule of Investments
April 30, 2021 (Unaudited) (Continued)
INVESTMENTS PURCHASED WITH PROCEEDS FROM SECURITIES LENDING - 10.78% | | Units | | | | | |
Mount Vernon Liquid Assets Portfolio, LLC, 0.11% (c) | | | 22,047,529 | | | | 22,047,529 | |
TOTAL INVESTMENTS PURCHASED WITH PROCEEDS FROM SECURITIES LENDING (Cost $22,047,529) | | | | | | | 22,047,529 | |
| | | | | | | | | |
SHORT TERM INVESTMENTS - 0.85% | | | | | | | | |
Money Market Deposit Account - 0.85% | | Principal Amount | | | | | |
U.S. Bank Money Market Deposit Account, 0.003% (d) | | $ | 1,739,361 | | | | 1,739,361 | |
TOTAL SHORT TERM INVESTMENTS (Cost $1,739,361) | | | | | | | 1,739,361 | |
| | | | | | | | | |
Total Investments (Cost $228,687,279) - 112.80% | | | | | | | 230,673,263 | |
Liabilities in Excess of Other Assets - (12.80)% | | | | | | | (26,183,342 | ) |
TOTAL NET ASSETS - 100.00% | | | | | | $ | 204,489,921 | |
Asset Type | | % of Net Assets | |
Preferred Stocks | | | 101.17 | % |
Investments Purchased with Proceeds From Securities Lending | | | 10.78 | |
Short Term Investments | | | 0.85 | |
Total Investments | | | 112.80 | |
Liabilities in Excess of Other Assets | | | (12.80 | ) |
Net Assets | | | 100.00 | % |
Percentages are stated as a percent of net assets. |
| |
USD – United States Dollar |
Libor – London Interbank Offered Rate |
| (a) | Securities with no stated maturity date are perpetual in nature. |
| (b) | All or a portion of this security is on loan as of April 30, 2021. The total value of securities on loan is $21,420,497, or 10.48% of net assets. See Note 6. |
| (c) | Represents annualized seven-day yield as of the end of the reporting period. |
| (d) | The Money Market Deposit Account (the “MMDA”) is a short-term investment vehicle in which the Fund holds cash balances. The MMDA will bear interest at a variable rate that is determined based on conditions and may change daily and by any amount. The rate shown is as of April 30, 2021. |
The accompanying notes are an integral part of these financial statements.
INNOVATOR LADDERED FUND OF S&P 500® POWER BUFFER ETFs
Schedule of Investments
April 30, 2021 (Unaudited)
| | | Shares | | | Value | |
AFFILIATED EXCHANGE TRADED FUNDS - 99.98% (a) | | | | | | | | |
Innovator S&P 500® Power Buffer ETF - January | | | 143,208 | | | $ | 4,582,656 | |
Innovator S&P 500® Power Buffer ETF - February | | | 163,750 | | | | 4,591,550 | |
Innovator S&P 500® Power Buffer ETF - March (b) | | | 152,325 | | | | 4,590,146 | |
Innovator S&P 500® Power Buffer ETF - April (b) | | | 163,827 | | | | 4,595,347 | |
Innovator S&P 500® Power Buffer ETF - May | | | 158,386 | | | | 4,583,691 | |
Innovator S&P 500® Power Buffer ETF - June | | | 149,225 | | | | 4,578,999 | |
Innovator S&P 500® Power Buffer ETF - July (b) | | | 155,614 | | | | 4,585,945 | |
Innovator S&P 500® Power Buffer ETF - August | | | 157,325 | | | | 4,586,826 | |
Innovator S&P 500® Power Buffer ETF - September | | | 157,460 | | | | 4,587,597 | |
Innovator S&P 500® Power Buffer ETF - October (b) | | | 158,991 | | | | 4,574,171 | |
Innovator S&P 500® Power Buffer ETF - November | | | 152,938 | | | | 4,592,744 | |
Innovator S&P 500® Power Buffer ETF - December | | | 152,175 | | | | 4,595,685 | |
TOTAL EXCHANGE TRADED FUNDS (Cost $52,658,448) | | | | | | | 55,045,357 | |
INVESTMENTS PURCHASED WITH PROCEEDS FROM SECURITIES LENDING - 9.01% | | Units | | | | | |
Mount Vernon Liquid Assets Portfolio, LLC, 0.11% (c) | | | 4,959,575 | | | | 4,959,575 | |
TOTAL INVESTMENTS PURCHASED WITH PROCEEDS FROM SECURITIES LENDING (Cost $4,959,575) | | | | | | | 4,959,575 | |
SHORT TERM INVESTMENTS - 0.03% | | | | | | | | |
Money Market Deposit Account - 0.03% | | Principal Amount | | | | | |
U.S. Bank Money Market Deposit Account, 0.003% (d) | | $ | 16,809 | | | | 16,809 | |
TOTAL SHORT TERM INVESTMENTS (Cost $16,809) | | | | | | | 16,809 | |
| | | | | | | | | |
Total Investments (Cost $57,634,832) - 109.02% | | | | | | | 60,021,741 | |
Liabilities in Excess of Other Assets - (9.02)% | | | | | | | (4,965,514 | ) |
TOTAL NET ASSETS - 100.00% | | | | | | $ | 55,056,227 | |
The accompanying notes are an integral part of these financial statements.
INNOVATOR LADDERED FUND OF S&P 500® POWER BUFFER ETFs
Schedule of Investments
April 30, 2021 (Unaudited) (Continued)
Asset Type | | % of Net Assets | |
Affiliated Exchange Traded Funds | | | 99.98 | % |
Investments Purchased with Proceeds From Securities Lending | | | 9.01 | |
Short Term Investments | | | 0.03 | |
Total Investments | | | 109.02 | |
Liabilities in Excess of Other Assets | | | (9.02 | ) |
Net Assets | | | 100.00 | % |
Percentages are stated as a percent of net assets. |
|
(a) | Non-income producing security. |
(b) | All or a portion of this security is on loan as of April 30, 2021. The total value of securities on loan is $4,836,567, or 8.78% of net assets. See Note 6. |
(c) | Represents annualized seven-day yield as of the end of the reporting period. |
(d) | The Money Market Deposit Account (the “MMDA”) is a short-term investment vehicle in which the Fund holds cash balances. The MMDA will bear interest at a variable rate that is determined based on conditions and may change daily and by any amount. The rate shown is as of April 30, 2021. |
The accompanying notes are an integral part of these financial statements.
INNOVATOR ETFs TRUST II
Statements of Assets and Liabilities
April 30, 2021
(Unaudited)
| | | | Innovator S&P Investment Grade Preferred ETF | | | Innovator Laddered Fund of S&P 500® Power Buffer ETFs | |
| | Assets: | | | | | | | | |
| | Investments, at value (a) | | $ | 230,673,263 | (b) | | $ | 4,976,384 | |
| | Investments in affiliates, at value (c) | | | - | | | | 55,045,357 | (b) |
| | Dividends and interest receivable | | | 196,652 | | | | - | |
| | Receivable for investments sold | | | 1,202,658 | | | | - | |
| | Securities lending income receivable | | | 19,524 | | | | 2,807 | |
| | Total Assets | | | 232,092,097 | | | | 60,024,548 | |
| | | | | | | | | | |
| | Liabilities: | | | | | | | | |
| | Payable for fund shares redeemed | | | 1,210,015 | | | | - | |
| | Payable to Adviser | | | 78,569 | | | | 8,746 | |
| | Distribution payable | | | 850,000 | | | | - | |
| | Payable for investments purchased | | | 3,416,063 | | | | - | |
| | Payable for collateral upon return of securities loaned | | | 22,047,529 | | | | 4,959,575 | |
| | Total Liabilities | | | 27,602,176 | | | | 4,968,321 | |
| | Net Assets | | $ | 204,489,921 | | | $ | 55,056,227 | |
| | | | | | | | | | |
| | Net Assets Consist of: | | | | | | | | |
| | Capital stock | | $ | 205,207,543 | | | $ | 90,526,702 | |
| | Total distributable earnings/(accumulated deficit) | | | (717,622 | ) | | | (35,470,475 | ) |
| | Net Assets | | $ | 204,489,921 | | | $ | 55,056,227 | |
| | | | | | | | | | |
| | Net Asset Value: | | | | | | | | |
| | Net assets | | $ | 204,489,921 | | | $ | 55,056,227 | |
| | Shares of beneficial interest outstanding (unlimited shares without par authorized) | | | 8,450,000 | | | | 1,600,000 | |
| | Net asset value price per share | | $ | 24.20 | | | $ | 34.41 | |
| | | | | | | | | | |
(a) | Cost of investments | | $ | 228,687,279 | | | $ | 4,976,384 | |
(b) | Including securities on loan at a value of | | | 21,420,497 | | | | 4,836,567 | |
(c) | Cost of investments in affiliates | | | - | | | | 52,658,448 | |
The accompanying notes are an integral part of these financial statements.
INNOVATOR ETFs TRUST II
Statements of Operations
For the Period Ended April 30, 2021
(Unaudited)
| | | Innovator S&P Investment Grade Preferred ETF | | | Innovator Laddered Fund of S&P 500® Power Buffer ETFs | |
Investment Income: | | | | | | | | |
Dividends | | $ | 4,376,622 | | | $ | - | |
Interest | | | 33 | | | | 1 | |
Securities lending income, net | | | 67,557 | | | | 16,664 | |
Total Investment Income | | | 4,444,212 | | | | 16,665 | |
| | | | | | | | | |
Expenses: | | | | | | | | |
Investment advisory fee | | | 406,704 | | | | 44,555 | |
Total Expenses | | | 406,704 | | | | 44,555 | |
Net Investment Income/(Loss) | | | 4,037,508 | | | | (27,890 | ) |
| | | | | | | | | |
Realized & Unrealized Gain/(Loss): | | | | | | | | |
Net realized gain/(loss) on: | | | | | | | | |
Investments | | | (486,910 | ) | | | - | |
Redemptions sold in-kind on investments | | | 327,665 | | | | - | |
Redemptions sold in-kind on affiliates | | | - | | | | 800,057 | |
Investments in affiliates | | | - | | | | 5,385 | |
Net change in unrealized appreciation/(depreciation) on: | | | | | | | | |
Investments | | | 1,281,934 | | | | - | |
Investments in affiliates | | | - | | | | 2,788,659 | |
Net Realized and Unrealized Gain/(Loss) | | | 1,122,689 | | | | 3,594,101 | |
Net Increase/(Decrease) in Net Assets Resulting From Operations | | $ | 5,160,197 | | | $ | 3,566,211 | |
The accompanying notes are an integral part of these financial statements.
INNOVATOR ETFs TRUST II
Statements of Changes in Net Assets
|
|
|
|
Operations: |
Net investment income/(loss) |
Net realized gain/(loss) |
Net change in unrealized appreciation/(depreciation) |
Net Increase/(Decrease) in Net Assets Resulting from Operations |
| |
Distributions to Shareholders: |
Net distributions to shareholders |
| |
Capital Share Transactions: |
Proceeds from shares sold |
Cost of shares redeemed |
Transaction fees (see Note 5) |
Net Increase/(Decrease) in Net Assets from Capital Share Transactions |
Total Increase/(Decrease) in Net Assets |
| |
Net Assets: |
Beginning of period |
End of period |
| |
Change in Shares Outstanding: |
Shares sold |
Shares redeemed |
Net Increase/(Decrease) |
The accompanying notes are an integral part of these financial statements.
INNOVATOR ETFs TRUST II
Statements of Changes in Net Assets
Innovator S&P Investment Grade Preferred ETF | | | | Innovator Laddered Fund of S&P 500® Power
Buffer ETFs | |
Period Ended | | | Year Ended | | | | Period Ended | | | Year Ended | |
April 30, 2021 | | | October 31, 2020 | | | | April 30, 2021 | | | October 31, 2020 | |
(Unaudited) | | | | | | | | (Unaudited) | | | | | |
| | | | | | | | | | | | | | | | |
$ | 4,037,508 | | | $ | 2,119,100 | | | | $ | (27,890 | ) | | $ | 2,238,705 | |
| | (159,245 | ) | | | (429,531 | ) | | | | 805,442 | | | | (11,725,355 | ) |
| | 1,281,934 | | | | 326,874 | | | | | 2,788,659 | | | | (18,792,864 | ) |
| | 5,160,197 | | | | 2,016,443 | | | | | 3,566,211 | | | | (28,279,514 | ) |
| | | | | | | | | | | | | | | | |
| | | | | | | | | | | | | | | | |
| | (4,656,036 | ) | | | (2,310,148 | ) | | | | - | | | | (2,311,942 | ) |
| | | | | | | | | | | | | | | | |
| | | | | | | | | | | | | | | | |
| | 81,498,160 | | | | 110,597,780 | | | | | 43,018,210 | | | | 148,299,135 | |
| | (4,827,665 | ) | | | (2,276,755 | ) | | | | (19,866,430 | ) | | | (226,832,050 | ) |
| | - | | | | 12 | | | | | - | | | | - | |
| | 76,670,495 | | | | 108,321,037 | | | | | 23,151,780 | | | | (78,532,915 | ) |
$ | 77,174,656 | | | $ | 108,027,332 | | | | $ | 26,717,991 | | | $ | (109,124,371 | ) |
| | | | | | | | | | | | | | | | |
| | | | | | | | | | | | | | | | |
$ | 127,315,265 | | | $ | 19,287,933 | | | | $ | 28,338,236 | | | $ | 137,462,607 | |
$ | 204,489,921 | | | $ | 127,315,265 | | | | $ | 55,056,227 | | | $ | 28,338,236 | |
| | | | | | | | | | | | | | | | |
| | | | | | | | | | | | | | | | |
| | 3,350,000 | | | | 4,600,000 | | | | | 1,300,000 | | | | 4,400,000 | |
| | (200,000 | ) | | | (100,000 | ) | | | | (600,000 | ) | | | (7,250,000 | ) |
| | 3,150,000 | | | | 4,500,000 | | | | | 700,000 | | | | (2,850,000 | ) |
The accompanying notes are an integral part of these financial statements.
INNOVATOR ETFs TRUST II
Financial Highlights
| | | Per Share Operating Performance (For a share outstanding throughout each period) | |
| | | | | | | Investment Operations: | | | Capital Share Transactions: | | | | Distributions Paid to Shareholders: | |
| | | Net Asset Value, Beginning of Period | | | Net investment income/
(loss) (c) | | | Net realized and unrealized gain/(loss) | | | | Total From Investment Operations | | | Transaction fees (see Note 5) | | | | Paid from net investment income | | | Paid from return of capital | | | Total Distributions Paid | |
Innovator S&P Investment Grade Preferred ETF | | | | | | | | | | | | | | | | | | | | | | | | | | | | | | | | | | |
For the period ended 4/30/2021 (Unaudited) | | $ | 24.02 | | | | 0.56 | | | | 0.25 | | | | | 0.81 | | | | - | | | | | (0.63 | ) | | | - | | | | (0.63 | ) |
For the year ended 10/31/2020 | | $ | 24.11 | | | | 1.23 | | | | (0.07 | ) | | | | 1.16 | | | | - | | (k) | | | (1.25 | ) | | | - | | | | (1.25 | ) |
For the period 4/1/2019 (h) - 10/31/2019 | | $ | 23.18 | | | | 0.67 | | | | 0.93 | | | | | 1.60 | | | | - | | | | | (0.67 | ) | | | - | | | | (0.67 | ) |
For the year ended 3/31/2019 | | $ | 23.38 | | | | 1.18 | | | | (0.18 | ) | | | | 1.00 | | | | - | | | | | (1.20 | ) | | | - | | | | (1.20 | ) |
For the year ended 3/31/2018 | | $ | 24.06 | | | | 1.29 | | | | (0.57 | ) | | | | 0.72 | | | | - | | | | | (1.36 | ) | | | (0.04 | ) | | | (1.40 | ) |
For the period 5/23/2016 (f) - 3/31/2017 | | $ | 25.07 | | | | 1.21 | | | | (1.17 | ) | | | | 0.04 | | | | - | | | | | (1.05 | ) | | | - | | | | (1.05 | ) |
| | | | | | | | | | | | | | | | | | | | | | | | | | | | | | | | | | | |
Innovator Laddered Fund of S&P 500® Power Buffer ETFs | | | | | | | | | | | | | | | | | | | | | | | | | | | | | | | | | | |
For the period ended 4/30/2021 (Unaudited) | | $ | 31.49 | | | | (0.02 | ) | | | 2.94 | | | | | 2.92 | | | | - | | | | | - | | | | - | | | | - | |
For the year ended 10/31/2020 | | $ | 36.66 | | | | 0.81 | | | | (5.26 | ) | | | | (4.45 | ) | | | - | | | | | (0.72 | ) | | | - | | | | (0.72 | ) |
For the period 10/1/2019 (d) - 10/31/2019 | | $ | 36.81 | | | | 0.02 | | | | (0.17 | ) | | | | (0.15 | ) | | | - | | | | | - | | | | - | | | | - | |
For the year ended 9/30/2019 | | $ | 31.55 | | | | 0.66 | | | | 5.29 | | | | | 5.95 | | | | - | | | | | (0.69 | ) | | | - | | | | (0.69 | ) |
For the year ended 9/30/2018 | | $ | 31.23 | | | | 0.47 | | | | 0.32 | | (i) | | | 0.79 | | | | - | | | | | (0.47 | ) | | | - | | | | (0.47 | ) |
For the period 10/19/2016 (f) - 9/30/2017 | | $ | 25.36 | | | | 0.47 | | | | 5.82 | | | | | 6.29 | | | | - | | | | | (0.42 | ) | | | - | | | | (0.42 | ) |
(a) | Annualized for periods less than one year. |
(b) | Not annualized for periods less than one year. |
(c) | Net investment income/(loss) per share has been calculated based on average shares outstanding during the period. |
(d) | The period ended October 31, 2019 consists of one month due to the Fund's fiscal year end change. See Note 1. |
(e) | Excludes in-kind transactions associated with creations and redemptions of the Funds. |
(f) | Commencement of operations. |
(g) | The ratio of net expenses to average net assets includes tax expense of 0.01%. |
(h) | The period ended October 31, 2019 consists of seven months due to the Fund's fiscal year end change. See Note 1. |
(i) | Net realized and unrealized gain/(loss) per share includes balancing amounts necessary to reconcile the change in net asset value per share for the period, and may not reconcile with the aggregate gain/(loss) in the Statement of Operations due to: transactions for the period. |
(j) | The ratio of net expenses to average net assets includes interest expense fees of 0.03%. |
(k) | Amount represents less than $0.01 per share. |
(l) | Does not include the impact of the expenses of the underlying funds in which the Funds invest. |
(m) | Recognition of net investment income by the Funds are affected by the timing of the declaration of dividends by the underlying investment companies in which the Funds invest. This ratio does not include net investment income of the underlying investment companies in which the Funds invest. |
The accompanying notes are an integral part of these financial statements.
INNOVATOR ETFs TRUST II
Financial Highlights
| | | | Ratios/Supplemental Data: | |
| | | | | | | | | | | | | | | | Ratio to Average Net Assets of: (a) | | | | | |
Change in Net Asset Value for the Period | | | Net Asset Value, End of Period | | | Total return (b) | | | Net assets, end of period (000) | | | Expenses (l) | | | | Net investment income/(loss) (m) | | | Portfolio turnover rate (b)(e) | |
| | | | | | | | | | | | | | | | | | | | | | | | | | | |
| 0.18 | | | $ | 24.20 | | | | 3.38 | % | | $ | 204,490 | | | | 0.47 | % | | | | 4.67 | % | | | 20 | % |
| (0.09 | ) | | $ | 24.02 | | | | 5.04 | % | | $ | 127,315 | | | | 0.47 | % | | | | 5.15 | % | | | 58 | % |
| 0.93 | | | $ | 24.11 | | | | 6.93 | % | | $ | 19,288 | | | | 0.47 | % | | | | 4.75 | % | | | 34 | % |
| (0.20 | ) | | $ | 23.18 | | | | 4.54 | % | | $ | 13,911 | | | | 0.47 | % | | | | 5.12 | % | | | 58 | % |
| (0.68 | ) | | $ | 23.38 | | | | 2.98 | % | | $ | 19,870 | | | | 0.47 | % | | | | 5.39 | % | | | 67 | % |
| (1.01 | ) | | $ | 24.06 | | | | 0.18 | % | | $ | 12,030 | | | | 0.48 | % | (g) | | | 5.86 | % | | | 171 | % |
| | | | | | | | | | | | | | | | | | | | | | | | | | | |
| | | | | | | | | | | | | | | | | | | | | | | | | | | |
| 2.92 | | | $ | 34.41 | | | | 9.28 | % | | $ | 55,056 | | | | 0.20 | % | | | | (0.13 | )% | | | 1 | % |
| (5.17 | ) | | $ | 31.49 | | | | (11.93 | )% | | $ | 28,338 | | | | 0.47 | % | | | | 2.47 | % | | | 750 | % |
| (0.15 | ) | | $ | 36.66 | | | | (0.42 | )% | | $ | 137,463 | | | | 0.49 | % | | | | 0.63 | % | | | 0 | % |
| 5.26 | | | $ | 36.81 | | | | 19.11 | % | | $ | 136,195 | | | | 0.49 | % | | | | 2.00 | % | | | 44 | % |
| 0.32 | | | $ | 31.55 | | | | 2.55 | % | | $ | 162,484 | | | | 0.52 | % | (j) | | | 1.47 | % | | | 667 | % |
| 5.87 | | | $ | 31.23 | | | | 24.88 | % | | $ | 134,301 | | | | 0.49 | % | | | | 1.66 | % | | | 179 | % |
The accompanying notes are an integral part of these financial statements.
Notes to Financial Statements (Unaudited)
1. ORGANIZATION
Innovator ETFs Trust II (the “Trust”) was organized as a Massachusetts business trust on December 17, 2013, and is registered with the Securities and Exchange Commission (“SEC”) under the Investment Company Act of 1940, as amended (the “1940 Act”) as an open-end management investment company. The Trust currently consists of two operational series, which are covered in this report. Effective April 1, 2018, the Trust changed from Elkhorn ETF Trust to Innovator ETFs Trust II. As a result, the Elkhorn S&P High Quality Preferred ETF and the Elkhorn Lunt Low Vol/High Beta Tactical ETF Funds’ names were changed to the Innovator S&P High Quality Preferred ETF (“EPRF”) and the Innovator Lunt Low Vol/High Beta Tactical ETF (“LVHB”), respectively (the “Funds”). Effective July 16, 2018, EPRF’s name was changed from Innovator S&P High Quality Preferred ETF to Innovator S&P Investment Grade Preferred ETF. Effective August 11, 2020, LVHB’s name and ticker were changed from Innovator Lunt Low Vol/High Beta Tactical ETF (LVHB) to Innovator Laddered Fund of S&P 500® Power Buffer ETFs (BUFF). EPRF and BUFF commenced operations on May 23, 2016 and October 19, 2016, respectively.
The Funds are exchange traded funds that offer one class of shares, do not charge a sales load, do not have a redemption fee and currently do not charge a 12b-1 fee to their shareholders. The Funds list and principally trade their shares on Cboe BZX Exchange, Inc. (“Cboe BZX” or the “Exchange”). The Funds seek investment results that generally correspond (before fees and expenses) to the price and yield of the S&P U.S. High Quality Preferred Stock Index (EPRF) and Refinitiv Laddered Power Buffer Strategy Index (BUFF), respectively. BUFF seeks to achieve its investment objective by investing primarily in other Innovator ETFs (Affiliated Fund of Fund structure) that themselves seek investment results corresponding to their own respective underlying indexes. In addition to its own fees and expenses, BUFF will pay indirectly a proportional share of the fees and expenses of the underlying Innovator ETFs in which it invests, including advisory and administration fees (Acquired Fund Fees and Expenses). Prior to August 11, 2020, BUFF sought investment results that generally corresponded, before fees and expenses, to the Lunt Capital U.S. Large Cap Equity Rotation Index.
Notes to Financial Statements (Unaudited) (Continued)
On March 21, 2019, the Board of Trustees approved a change in the Funds’ fiscal year end from March 31 (EPRF) and September 30 (LVHB) to October 31, effective April 1, 2019 and October 1, 2019, respectively.
The Funds are investment companies and accordingly follow the investment company accounting and reporting guidance of the Financial Accounting Standards Board (“FASB”) Accounting Standards Codification (“ASC”) Topic 946 “Financial Services — Investment Companies”.
2. SIGNIFICATANT ACCOUNTING POLICIES
The following is a summary of significant accounting policies consistently followed by the Trust in the preparation of its financial statements. These policies are in conformity with accounting principles generally accepted in the United States of America (“U.S. GAAP”).
Valuation:
The net asset values (“NAV”) of the Funds are determined as of the close of regular trading on the NYSE (normally 4:00 p.m. ET). If the NYSE closes early on a valuation day, the Funds shall determine NAV as of that time.
Portfolio securities generally shall be valued utilizing prices provided by independent pricing services. The Trust’s Pricing Committee (“Pricing Committee”) is responsible for establishing valuation of portfolio securities and other instruments held by the Funds in accordance with the Trust’s valuation procedures.
Notes to Financial Statements (Unaudited) (Continued)
Common stocks, preferred stocks, exchange traded funds and other equity securities listed on any national or foreign exchange (excluding the NASDAQ National Market (“NASDAQ”) and the London Stock Exchange Alternative Investment Market (“AIM”)) are generally valued at the last sale price on the exchange on which they are principally traded or, for NASDAQ and AIM securities, the official closing price. Securities traded on more than one securities exchange are valued at the last sale price or official closing price, as applicable, at the close of the exchange representing the principal market for such securities. Securities traded in the over-the-counter market are valued at the mean of the bid and the asked price, if available, and otherwise at their closing bid price. Redeemable securities issued by open-end investment companies shall be valued at the investment company’s applicable net asset value, with the exception of exchange-traded open-end investment companies which are priced as equity securities. Units of Mount Vernon Liquid Assets Portfolio, LLC are not traded on an exchange and are valued at the investment company’s net asset value per share as provided by the underlying fund’s administrator. Fixed income securities, swaps, currency-, credit- and commodity-linked notes, and other similar instruments will be valued using a pricing service. Fixed income securities having a remaining maturity of 60 days or less when purchased will be valued at cost adjusted for amortization of premiums and accretion of discounts, provided the Pricing Committee has determined that the use of amortized cost is an appropriate reflection of fair value given market and issuer specific conditions existing at the time of the determination. Deposit accounts are valued at acquisition cost. Foreign securities and other assets denominated in foreign currencies are translated into U.S. dollars at the exchange rate of such currencies against the U.S. dollar as provided by the pricing service. All assets denominated in foreign currencies will be converted into U.S. dollars at the exchange rates in effect at the time of valuation. Restricted securities (with the exception of Rule 144A Securities for which market quotations are available) will normally be valued at fair value as determined by the Pricing Committee.
Notes to Financial Statements (Unaudited) (Continued)
If no quotation can be obtained from a pricing service, then the Pricing Committee will then attempt to obtain one or more broker quotes for the security. If no quotation is available from either a pricing service or one or more brokers or if the Pricing Committee has reason to question the reliability or accuracy of a quotation supplied or the use of amortized cost, the value of any portfolio security held by the Funds for which reliable market quotations are not readily available will be determined by the Pricing Committee in a manner that most appropriately reflects fair market value of the security on the valuation date. The use of a fair valuation method may be appropriate if, for example: (i) market quotations do not accurately reflect fair value of an investment; (ii) an investment’s value has been materially affected by events occurring after the close of the exchange or market on which the investment is principally traded (for example, a foreign exchange or market); (iii) a trading halt closes an exchange or market early; or (iv) other events result in an exchange or market delaying its normal close.
Fair valuation measurement:
FASB established a framework for measuring fair value in accordance with U.S. GAAP. Under ASC, Fair Value Measurement (“ASC 820”), various inputs are used in determining the value of the Funds’ investments. The inputs or methodology used for valuing securities are not necessarily an indication of the risk associated with investing in those securities. The three Levels of inputs of the fair value hierarchy are defined as follows:
Level 1 — Unadjusted quoted prices in active markets for identical assets or liabilities that the Funds have the ability to access.
Level 2 — Observable inputs other than quoted prices included in Level 1 that are observable for the asset or liability, either directly or indirectly. These inputs may include quoted prices for the identical instrument on an inactive market, prices for similar securities, interest rates, prepayment speeds, credit risk, yield curves, default rates and similar data.
Level 3 — Unobservable inputs for the asset or liability, to the extent relevant observable inputs are not available; representing the Funds’ own assumptions about the assumptions a market participant would use in valuing the asset or liability, and would be based on the best information available.
Notes to Financial Statements (Unaudited) (Continued)
The availability of observable inputs can vary from security to security and is affected by a wide variety of factors, including, for example, the type of security, whether the security is new and not yet established in the marketplace, the liquidity of markets, and other characteristics particular to the security. To the extent that valuation is based on models or inputs that are less observable or unobservable in the market, the determination of fair value requires more judgment. Accordingly, the degree of judgment exercised in determining fair value is greatest for instruments categorized in Level 3.
The inputs used to measure fair value may fall into different levels of the fair value hierarchy. In such cases, for disclosure purposes, the level in the fair value hierarchy within which the fair value measurement falls in its entirety, is determined based on the lowest level input that is significant to the fair value measurement in its entirety.
The following table summarizes valuation of the Funds’ investments under the fair value hierarchy levels as of April 30, 2021:
EPRF | | | | | | | | | | | | | | | | |
| | | Level 1 | | | Level 2 | | | Level 3 | | | Total | |
Assets | | | | | | | | | | | | | | | | |
Preferred Stocks | | $ | 206,886,373 | | | $ | - | | | $ | - | | | $ | 206,886,373 | |
Investments Purchased with Proceeds From Securities Lending | | | - | | | | 22,047,529 | | | | - | | | | 22,047,529 | |
Short Term Investments | | | 1,739,361 | | | | - | | | | - | | | | 1,739,361 | |
Total Assets | | $ | 208,625,734 | | | $ | 22,047,529 | | | $ | - | | | $ | 230,673,263 | |
BUFF | | | | | | | | | | | | | | | | |
| | | Level 1 | | | Level 2 | | | Level 3 | | | Total | |
Assets | | | | | | | | | | | | | | | | |
Affiliated Exchange Traded Funds | | $ | 55,045,357 | | | $ | - | | | $ | - | | | $ | 55,045,357 | |
Investments Purchased with Proceeds From Securities Lending | | | - | | | | 4,959,575 | | | | - | | | | 4,959,575 | |
Short Term Investments | | | 16,809 | | | | - | | | | - | | | | 16,809 | |
Total Assets | | $ | 55,062,166 | | | $ | 4,959,575 | | | $ | - | | | $ | 60,021,741 | |
Notes to Financial Statements (Unaudited) (Continued)
See the Schedules of Investments for the investments detailed by industry classification.
There were no level 3 investments held by the Funds during the period ended April 30, 2021.
Use of Estimates:
In preparing financial statements in conformity with U.S. GAAP, management is required to make estimates and assumptions that affect the reported amounts of assets and liabilities and disclosure of contingent assets and liabilities as of the date of the financial statements and the reported amounts of increases and decreases in net assets from operations during the reporting period. Actual results could differ from these estimates.
Guarantees and Indemnifications:
In the normal course of business, the Trust may enter into a contract with service providers that contain general indemnification clauses. The Trust’s maximum exposure under these arrangements is unknown as this would involve future claims against the Trust that have not yet occurred. Based on experience, the Trust expects the risk of loss to be remote.
Tax Information:
The Funds are treated as separate entities for federal income tax purposes. The Funds intend to qualify as regulated investment companies (“RICs”) under Subchapter M of the Internal Revenue Code of 1986, as amended (the “Internal Revenue Code”). To qualify and remain eligible for the special tax treatment accorded to RICs, the Funds must meet certain annual income and quarterly asset diversification requirements and must distribute annually at least 90% of the sum of (i) its investment company taxable income (which includes dividends, interest and net short-term capital gains) and (ii) certain net tax-exempt income, if any. If so qualified, the Funds will not be subject to federal income tax to the extent the Funds distribute substantially all of their net investment income and capital gains to shareholders.
Notes to Financial Statements (Unaudited) (Continued)
Management evaluates the Funds’ tax positions to determine if the tax positions taken meet the minimum recognition threshold in connection with accounting for uncertainties in income tax positions taken or expected to be taken for the purposes of measuring and recognizing tax liabilities in the financial statements. Tax benefits associated with an uncertain tax position can be recognized only when the position is “more likely than not” to be sustained assuming examination by taxing authorities. Interest and penalties related to income taxes would be recorded as tax expense in the Statements of Operations. During the period ended April 30, 2021, the Funds did not incur any interest or penalties. The Funds’ federal income tax returns are subject to examination by the Internal Revenue Service (IRS) for a period of three fiscal years after they are filed. State and local tax returns may be subject to examination for an additional fiscal year depending on the jurisdiction. As of April 30, 2021, the Funds did not have a liability for any unrecognized tax benefits. As of April 30, 2021, the Funds have no examinations in progress and management is not aware of any tax positions for which it is reasonably possible that the amounts of unrecognized tax benefits will significantly change in the next twelve months. The Funds are subject to examination by U.S. Federal tax authorities for all tax years since inception.
U.S. GAAP requires that certain components of net assets be reclassified between distributable earnings/(accumulated deficit) and additional paid-in capital. These reclassifications have no effect on net assets or net asset value per share. For the year ended October 31, 2020, the Funds made the following permanent book-to-tax reclassifications primarily related to redemption in-kind transactions and non-deductible expenses:
| | | Distributable Earnings/ | | | Paid-In | |
| | | (Accumulated Deficit) | | | Capital | |
EPRF | | $ | 13,887 | | | $ | (13,887 | ) |
BUFF | | | (3,319,531 | ) | | | 3,319,531 | |
Distributions to Shareholders:
Distributions to shareholders are recorded on the ex-dividend date. BUFF intends to pay out dividends from its net investment income, if any, annually. EPRF intends to pay out dividends from its net investment income, if any, monthly. Distributions of net realized capital gains, if any, will be declared and paid at least annually by the Funds. The Funds may periodically make reclassifications among certain of its capital accounts as a result of the recognition and characterization of certain income and capital gain distributions determined annually in accordance with federal tax regulations which may differ from U.S. GAAP. Distributions that exceed earnings and profits for tax purposes are reported as a return of capital.
Notes to Financial Statements (Unaudited) (Continued)
Investment Transactions and Investment Income:
Investment transactions are recorded on the trade date. The Trust determines the gain or loss realized from investment transactions on the basis of identified cost. Dividend income, if any, is recognized on the ex-dividend date or, in the case of foreign securities, as soon as the Funds are informed of the ex-dividend dates. Withholding taxes on foreign dividends have been accounted for in accordance with the applicable country’s tax rules and rate. Interest income, including accretion of discounts and amortization of premiums is recognized on an accrual basis using the effective yield method.
Distributions received from investments in master limited partnerships (“MLPs”), closed-end funds, real estate investment trusts (“REITs”) and royalty trusts are comprised of ordinary income, capital gains and return of capital. For financial statement purposes, estimates are used to characterize these distributions received as return of capital, capital gains or ordinary income. Such estimates are based on historical information available from each MLP, closed-end fund, REIT or royalty trust and other industry sources. These estimates may subsequently be revised and reflected on the Form 1099 received by shareholders based on information received for the security after its tax reporting periods are concluded, as the actual character of these distributions is not known until after the fiscal year end. The distributions received from MLPs, REITs, closed-end funds, and royalty trust securities that have been classified as income and capital gains are included in dividend income and net realized gain/(loss) on investments, respectively, on the Statements of Operations. The distributions received that are classified as return of capital reduce the cost of investments on the Statements of Assets and Liabilities.
Notes to Financial Statements (Unaudited) (Continued)
3. INVESTMENT ADVISOR AND OTHER AFFILIATES
Innovator Capital Management, LLC (the “Adviser”) acts as investment adviser to the Funds pursuant to an investment advisory agreement between the Trust and the Adviser with respect to the Funds (“Advisory Agreement”) and, pursuant to the Advisory Agreement, is responsible for the day-to-day management of the Funds. Pursuant to the Advisory Agreement between the Trust and the Adviser with respect to EPRF and BUFF, EPRF pays monthly the Adviser a unitary fee calculated daily based on the average daily net assets of the Fund at the annual rate of 0.47%, and BUFF pays monthly the Adviser a unitary fee calculated daily based on the average daily net assets of the Fund at the annual rate of 0.20%. Prior to August 11, 2020, BUFF paid monthly the Adviser a unitary fee calculated daily based on the average daily net assets of the Fund at the annual rate of 0.49%. During the term of the Advisory Agreement, the Adviser pays all expenses of EPRF and BUFF (“Fund Expenses”), including the cost of transfer agency, custody, fund administration, legal, audit, and other services and license fees, except for the fees paid under the Advisory Agreement, interest, taxes, brokerage commissions and other expenses connected with the execution of portfolio transactions, distribution and service fees payable pursuant to a Rule 12b-1 plan, if any, and extraordinary expenses.
Penserra Capital Management LLC (the “Sub-Adviser”) acts as sub-adviser to the Funds pursuant to a sub-advisory agreement between the Adviser and the Sub-Adviser with respect to the Funds (“Sub-Advisory Agreement”) and, pursuant to the Sub-Advisory Agreement, is responsible for execution of the Sub-Adviser’s strategy for each of the Funds. The Sub-Adviser is responsible for the day-to-day management of the Funds’ portfolios. Pursuant to the Sub-Advisory Agreement between the Adviser and the Sub-Adviser, the Adviser pays the Sub-Adviser a fee, based on the Funds’ average daily net assets, for the services and facilities it provides payable on a monthly basis.
Certain trustees and officers of the Trust are affiliated with the Adviser. Trustee compensation is paid for by the Adviser.
Notes to Financial Statements (Unaudited) (Continued)
4. INVESTMENT TRANSACTIONS
For the period ended April 30, 2021, the cost of purchases and proceeds from sales of investment securities, other than in-kind purchases and sales and short-term investments were as follows:
| | | Purchases | | | Sales | |
| | | U.S.
Governement | | | Other | | | U.S.
Governement | | | Other | |
EPRF | | $ | - | | | $ | 37,933,277 | | | $ | - | | | $ | 35,181,626 | |
BUFF | | | - | | | | 434,182 | | | | - | | | | 432,927 | |
For the period ended April 30, 2021, in-kind transactions associated with creations and redemptions were as follows:
| | | In-Kind | | | In-Kind | |
| | | Creations | | | Redemptions | |
EPRF | | $ | 80,985,410 | | | $ | 4,797,897 | |
BUFF | | | 42,989,928 | | | | 19,853,100 | |
Net capital gains or losses resulting from in-kind redemptions are excluded for the Funds’ taxable gains and are not distributed to shareholders.
5. CREATION AND REDEMPTION TRANSACTIONS
There were an unlimited number of shares of beneficial interest (without par value) authorized by the Trust. Individual shares of the Funds may only be purchased and sold at market prices on the Exchange through a broker-dealer. Such transactions may be subject to customary commission rates imposed by the broker-dealer, and market prices for the Funds’ shares may be at, above or below its NAV depending on the premium or discount at which the Funds’ shares trade.
Notes to Financial Statements (Unaudited) (Continued)
The Funds issue and redeem shares on a continuous basis at NAV only in blocks of 50,000 shares, called “Creation Units.” Creation Units are issued and redeemed principally in-kind for securities included in a specified universe. Once created, shares generally trade in the secondary market at market prices that change throughout the day in amounts less than a Creation Unit. Except when aggregated in Creation Units, shares are not redeemable securities of the Funds. Shares of the Funds may only be purchased or redeemed by certain financial institutions (“Authorized Participants”). An Authorized Participant is either (i) a broker-dealer or other participant in the clearing process through the Continuous Net Settlement System of the National Securities Clearing Corporation or (ii) a DTC participant and, in each case, must have executed a Participant Agreement with the Distributor. A fixed transaction fee is applicable to each transaction regardless of the number of units purchased or sold in the transaction. EPRF and BUFF each charge a $500 transaction fee on creations and redemptions of the respective Fund. The Funds may permit Authorized Participants to substitute cash in lieu of delivering securities in-kind, in which case the Authorized Participant may be assessed additional fees to cover the cost of purchasing securities. Each Fund, subject to approval by the Board of Trustees, may adjust transaction fees from time to time based upon actual experience. Additional fees received by the Funds, if any, are disclosed as Transaction Fees on the Statements of Changes in Net Assets. Most retail investors do not qualify as Authorized Participants nor have the resources to buy and sell whole Creation Units. Therefore, they are unable to purchase or redeem the shares directly from the Funds. Rather, most retail investors may purchase shares in the secondary market with the assistance of a broker and are subject to customary brokerage commissions or fees.
Notes to Financial Statements (Unaudited) (Continued)
6. SECURITIES LENDING
The Funds may lend up to 331/3% of the value of the securities in their portfolios to brokers, dealers and financial institutions (but not individuals) under terms of participation in a securities lending program administered by the securities lending agent. The Trust has entered into a Securities Lending Agreement (“SLA”) with U.S. Bank, N.A., the Funds’ custodian (the “Agent”). Under the terms of the SLA, the Funds may lend securities to certain broker-dealers and banks in exchange for collateral in the amount of at least 102% of the value of U.S. securities loaned or at least 105% of the value of non-U.S. securities loaned, marked to market daily. The collateral can be received in the form of cash collateral and/or non-cash collateral. Non-cash collateral can include U.S. Government Securities and letters of credit. The cash collateral is invested in the Mount Vernon Liquid Assets Portfolio, LLC (“Mount Vernon”), as noted in the Funds’ Schedules of Investments. Mount Vernon seeks to maximize current income to the extent consistent with the preservation of capital and liquidity; and to maintain a stable NAV of $1.00. Mount Vernon has an overnight and continuous maturity. The market value of the loaned securities is determined daily at the close of business of the Funds and any additional required collateral is delivered to the Funds on the next business day. The Funds continue to benefit from interest or dividends on the securities loaned and may also earn a return from the collateral. The Funds pay various fees in connection with the investment of cash collateral. The Funds pay the Agent fees based on the investment income received from securities lending activities. Although risk is mitigated by the collateral, the Funds could experience a delay in recovering their securities and possible loss of income or value if the borrower fails to return them. In the event of a borrower’s material default, the Agent shall take all actions the Agent deems appropriate to liquidate the collateral, purchase replacement securities at the Agents’ expense, or pay the Funds an amount equal to the market value of the loaned securities, subject to certain limitations.
As of April 30, 2021, the values of the securities on loan, cash collateral received and fees and interest earned were as follows:
| | | Value of Securities
on Loan | | | Cash Collateral
Received | | | Fees and Interest
Earned | |
EPRF | | $ | 21,420,497 | | | $ | 22,047,529 | | | $ | 67,557 | |
BUFF | | | 4,836,567 | | | | 4,959,575 | | | | 16,664 | |
Due to the absence of a master netting agreement related to the Funds’ participation in securities lending, no additional offsetting disclosures have been made on behalf of the Funds for the total borrowings listed above.
Notes to Financial Statements (Unaudited) (Continued)
7. FEDERAL INCOME TAX INFORMATION
At October 31, 2020, the cost of investments and net unrealized appreciation/(depreciation) for federal income tax purposes were as follows:
| | | EPRF | | | BUFF | |
| | | | | | | | | |
Cost of Portfolio | | $ | 129,684,485 | | | $ | 28,837,247 | |
Gross Unrealized Appreciation | | $ | 1,842,745 | | | $ | 19,424 | |
Gross Unrealized Depreciation | | | (1,493,476 | ) | | | (422,211 | ) |
Net Unrealized Appreciation/(Depreciation) | | $ | 349,269 | | | $ | (402,787 | ) |
The differences between book basis and tax basis cost on investments and net unrealized appreciation/(depreciation) are primarily attributable to wash sale loss deferrals and differences in the tax treatment of partnership and trust preferred securities.
At October 31, 2020, the components of distributable earnings/(accumulated deficit) on a tax basis were as follows:
| | | EPRF | | | BUFF | |
| | | | | | | | | |
Accumulated Capital and Other Losses | | $ | (1,422,632 | ) | | $ | (38,633,899 | ) |
Distributions Payable | | | (503,500 | ) | | | — | |
Undistributed Net Ordinary Income | | | 355,080 | | | | — | |
Unrealized Appreciation/(Depreciation) on Investments | | | 349,269 | | | | (402,787 | ) |
Total Distributable Earnings/(Accumulated Deficit) | | $ | (1,221,783 | ) | | $ | (39,036,686 | ) |
Certain qualified late year ordinary losses incurred after December 31, and within the current taxable year, are deemed to arise on the first business day of the next taxable year. During the fiscal year ended October 31, 2020, the Funds did not elect to defer qualified late year ordinary losses.
Notes to Financial Statements (Unaudited) (Continued)
At October 31, 2020, for federal income tax purposes, the Funds had capital loss carryforwards available to offset future capital gains for an unlimited period as indicated below:
| | | EPRF | | | BUFF | |
| | | | | | | | | |
Indefinite Short-Term | | $ | 1,162,286 | | | $ | 38,633,899 | |
Indefinite Long-Term | | | 260,346 | | | | — | |
To the extent that these loss carryforwards are utilized, capital gains so offset will not be distributed to shareholders.
The tax character of the distributions paid by the Funds during the fiscal periods ended October 31, 2020 and October 31, 2019 were as follows:
| | | EPRF | | | BUFF | |
| | | October 31, 2020 | | | October 31, 2019 | | | October 31, 2020 | | | October 31, 2019 | |
Distributions paid from: | | | | | | | | | | | | | | | | |
Net Ordinary Income | | $ | 2,310,148 | | | $ | 389,500 | | | $ | 2,311,942 | | | $ | 661,168 | |
Net Long-Term Capital Gains | | | — | | | | — | | | | — | | | | — | |
Return of Capital | | | — | | | | — | | | | — | | | | — | |
Total Distributions Paid | | $ | 2,310,148 | | | $ | 389,500 | | | $ | 2,311,942 | | | $ | 661,168 | |
Notes to Financial Statements (Unaudited) (Continued)
8. TRANSACTIONS WITH AFFILIATES
BUFF had the following transactions during the period ended April 30, 2021 with affiliated companies:
| | | | | | | | | | | | | | | | | | | Period Ended April 30, 2021 | |
Security Name | | Value as of November 1, 2020 | | | Purchases | | | Sales | | | Value as of April 30, 2021 | | | Share Balance | | | Dividend Income | | | Net Realized Gain (Loss) on Sale of Shares | | | Net Change in Unrealized Appreciation (Depreciation) | |
Innovator S&P 500® Power Buffer ETF – January | | $ | 2,357,456 | | | $ | 3,585,456 | | | $ | 1,707,016 | | | $ | 4,582,656 | | | | 143,208 | | | $ | - | | | $ | 73,035 | | | $ | 273,725 | |
Innovator S&P 500® Power Buffer ETF – February | | | 2,350,097 | | | | 3,586,931 | | | | 1,757,706 | | | | 4,591,550 | | | | 163,750 | | | | - | | | | 64,022 | | | $ | 348,206 | |
Innovator S&P 500® Power Buffer ETF – March | | | 2,363,506 | | | | 3,561,806 | | | | 1,685,532 | | | | 4,590,146 | | | | 152,325 | | | | - | | | | 49,792 | | | $ | 300,574 | |
Innovator S&P 500® Power Buffer ETF – April | | | 2,369,140 | | | | 3,655,031 | | | | 1,629,925 | | | | 4,595,347 | | | | 163,827 | | | | - | | | | 36,884 | | | $ | 164,217 | |
Innovator S&P 500® Power Buffer ETF – May | | | 2,357,790 | | | | 3,669,365 | | | | 1,639,918 | | | | 4,583,691 | | | | 158,386 | | | | - | | | | 50,340 | | | $ | 146,114 | |
Innovator S&P 500® Power Buffer ETF – June | | | 2,360,063 | | | | 3,662,471 | | | | 1,644,582 | | | | 4,578,999 | | | | 149,225 | | | | - | | | | 52,437 | | | $ | 148,610 | |
Innovator S&P 500® Power Buffer ETF – July | | | 2,352,088 | | | | 3,641,928 | | | | 1,647,864 | | | | 4,585,945 | | | | 155,614 | | | | - | | | | 56,308 | | | $ | 183,485 | |
Innovator S&P 500® Power Buffer ETF – August | | | 2,349,686 | | | | 3,610,000 | | | | 1,656,595 | | | | 4,586,826 | | | | 157,325 | | | | - | | | | 67,205 | | | $ | 216,530 | |
Innovator S&P 500® Power Buffer ETF – September | | | 2,346,649 | | | | 3,617,088 | | | | 1,765,211 | | | | 4,587,597 | | | | 157,460 | | | | - | | | | 77,483 | | | $ | 311,588 | |
Innovator S&P 500® Power Buffer ETF – October | | | 2,352,210 | | | | 3,595,328 | | | | 1,698,562 | | | | 4,574,171 | | | | 158,991 | | | | - | | | | 98,601 | | | $ | 226,594 | |
Innovator S&P 500® Power Buffer ETF – November | | | 2,395,584 | | | | 3,649,756 | | | | 1,761,049 | | | | 4,592,744 | | | | 152,938 | | | | - | | | | 107,955 | | | $ | 200,498 | |
Innovator S&P 500® Power Buffer ETF – December | | | 2,358,904 | | | | 3,588,948 | | | | 1,692,065 | | | | 4,595,685 | | | | 152,175 | | | | - | | | | 71,380 | | | $ | 268,518 | |
Notes to Financial Statements (Unaudited) (Continued)
9. NEW ACCOUNTING PRONOUNCEMENT
In March 2020, FASB issued Accounting Standards Update (“ASU”) 2020-04, Reference Rate Reform (Topic 848): Facilitation of the Effects of Reference Rate Reform on Financial Reporting (“ASU 2020-04”). The main objective of the new guidance is to provide relief to companies that will be impacted by the expected change in benchmark interest rates at the end of 2021, when participating banks will no longer be required to submit London Interbank Offered Rate (“LIBOR”) quotes by the United Kingdom’s Financial Conduct Authority. The new guidance allows companies to, provided the only change to existing contracts are a change to an approved benchmark interest rate, account for modifications as a continuance of the existing contract without additional analysis. In addition, derivative contracts that qualified for hedge accounting prior to modification, will be allowed to continue to receive such treatment, even if critical terms change due to a change in the benchmark interest rate. For new and existing contracts, the Funds may elect to apply the amendments as of March 12, 2020 through December 31, 2022. Management is currently assessing the impact of the ASU’s adoption to the Funds’ financial statements and various filings.
10. COVID-19
The recent global outbreak of COVID-19 has disrupted economic markets and the prolonged economic impact is uncertain. The operational and financial performance of the issuers of securities in which the Funds invest depend on future developments, including the duration and spread of the outbreak, and such uncertainty may in turn impact the value of the Funds’ investments.
Notes to Financial Statements (Unaudited) (Continued)
11. SUBSEQUENT EVENT
Management has evaluated the impact of all subsequent events of the Funds through the date of the financial statements were issued, and has determined that there were no subsequent events requiring recognition or disclosure in the financial statements.
INNOVATOR ETFs TRUST II
Trustees and Officers (Unaudited)
Name, Address and Year of Birth | Position
with the Trust | Length of Time Served* | Principal
Occupation(s) During Past 5 Years | Number of Portfolios
in Fund Complex(a) Overseen by
Trustee
or Officer | Other Directorships Held by
Trustee or Officer in
the Past Five
Years |
Independent Trustees |
Mark Berg 109 N. Hale Street Wheaton, IL 60187 Year of Birth: 1971
| Trustee | Since 2018 | Founding Principal and Chief Executive Officer (2019-present), Founding Principal and President (2001-2019), Timothy Financial Counsel, Inc. | 70 | None |
Joe Stowell 109 N. Hale Street Wheaton, IL 60187 Year of Birth: 1968 | Trustee | Since 2018 | Chief Operating Officer, Woodmen Valley Chapel (2015-present); Executive Vice President and Chief Operating Officer, English Language Institute/China (2007-2015). | 70 | Board of Advisors, Westmont College |
Brian J. Wildman 109 N. Hale Street Wheaton, IL 60187 Year of Birth: 1963 | Trustee | Since 2018 | President, Timothy Financial Counsel, Inc. (2019-present); Executive Vice President, Consumer Banking (2016-2019), Chief Risk Officer (2013-2016), MB Financial Bank. | 70 | Missionary Furlough Homes, Inc. (since 2008); MB Financial Bank (2003- 2019). |
INNOVATOR ETFs TRUST II
Trustees and Officers (Unaudited) (Continued)
Interested Trustee & Officer |
H. Bruce Bond (b) 109 N. Hale Street Wheaton, IL 60187 Year of Birth: 1963
| Interested Trustee, President and Principal Executive Officer | Since 2017 | Chief Executive Officer, Innovator Capital Management, LLC (2017-present). | 70 | None |
Officers |
John W. Southard 109 N. Hale Street Wheaton, IL 60187 Year of Birth: 1969 | Vice President, Treasurer and Principal Financial Accounting Officer | Since 2017 | Chief Investment Officer, Innovator Capital Management, LLC (2017-present); Director and Co-Founder, T2 Capital Management, LLC (2010-present). | 70 | Independent Trustee, ETF Managers Group, LLC (2012-2018) |
Kevin Gustafson 109 N. Hale Street Wheaton, IL 60187 Year of Birth: 1965 | Chief Compliance Officer and Anti-Money Laundering Officer | Since 2020 | Chief Compliance Officer, Innovator Capital Management LLC (2019 - present); General Counsel, Innovator Capital Management LLC (2019 - present); Chief Compliance Officer, General Counsel and Chief Risk Officer, Americas, Eastspring Investments, Inc. (2012 - 2019). | 70 | None |
* | The Funds’ Trustees serve for an indefinite term until their resignation, death or removal. The Funds’ officers are elected annually by the Board and serve at the Board’s pleasure. |
(a) | The Fund Complex includes Innovator ETFs Trust II, and each series of Innovator ETFs Trust I. |
(b) | H. Bruce Bond is deemed to be an interested person of the Trust (as defined in the 1940 Act) because of his affiliation with the Adviser. |
The Statement of Additional Information includes additional information about the Trustees and is available upon request, without charge, by calling 1-877-386-3890.
INNOVATOR ETFs TRUST II
Additional Information (Unaudited)
1. INFORMATION ABOUT PROSPECTUS
This report has been prepared for shareholders and may be distributed to others only if preceded or accompanied by a current prospectus. Investors should consider the investment objective and policies, risk considerations, charges and ongoing expenses of an investment carefully before investing. The prospectus contains this and other information relevant to an investment in the respective Fund. Please read the Prospectus carefully before investing. A copy of the Prospectus may be obtained without charge by writing to the Trust’s Distributor, or by calling toll free at 1-800-208-5212 or visiting www.innovatoretfs.com.
2. PROXY VOTING POLICIES AND PROCEDURE
The Trust’s Proxy Voting Policies and Procedures are available without charge, upon request, by calling 1-877-386-3890 and on the SEC’s website at www.sec.gov. Information relating to how each Fund voted proxies relating to portfolio securities held during each year ended June 30 is also available on the SEC’S website at www.sec.gov.
3. INFORMATION ABOUT PORTFOLIO SECURITIES
Each Funds’ complete schedule of portfolio holdings for the first and third quarters is filed with the SEC on Form N-Q or Part F of Form N-PORT (beginning with filings after March 31, 2020). The Trust’s Form N-Q or Part F of Form N-PORT is available without charge, upon request, by calling 1-877-386-3890, or on the SEC’s website at www.sec.gov. The Trust’s Form N-Q or Part F of Form N-PORT may be reviewed and copied at the SEC’s Public Reference Room in Washington, DC. Information on the operation of the Public Reference Room may be obtained by calling 1-800-SEC-0330.
4. HOUSEHOLD DELIVERY OF SHAREHOLDER DOCUMENTS
In order to reduce expenses, the Trust delivers one copy of an annual/semiannual report, prospectus and/or proxy statement on behalf of two or more shareholders at a shared address (householding). If you do not wish to participate in householding, please indicate this preference on your new account application (if you are opening a new account) or call 1-877-FUND890 (877-386- 3890) to change the status of your existing account. You may change your status at any time.
INNOVATOR ETFs TRUST II
Additional Information (Unaudited) (Continued)
5. ELECTRONIC DELIVERY OF SHAREHOLDER DOCUMENTS
You may choose to receive a Fund’s prospectus and annual and semi–annual reports electronically. To sign up for electronic delivery, visit www.icsdelivery.com and select the first letter of your brokerage firm’s name. Then, select your brokerage institution from the list that follows, fill out the appropriate information and provide an e–mail address where you would like your information sent. If your brokerage firm is not listed, electronic delivery may not be available. Please contact your brokerage firm or financial adviser.
6. TAX INFORMATION
For the fiscal year ended October 31, 2020, certain dividends paid by the Funds may be subject to a maximum tax rate of 23.8%, as provided for by the Jobs and Growth Tax Relief Reconciliation Act of 2003.
The following table lists the percentages of dividend income distributed for the taxable year ended October 31, 2020, that were designated as qualified dividend income under the Jobs and Growth Tax Relief Reconciliation Act of 2003 and qualify for the corporate dividends received deduction, respectively:
| | | % of Dividend Income Distributed | |
Fund | | Qualified Dividend Income | | | Corporate Dividends Received Deduction | |
EPRF | | | 72.72 | % | | | 62.68 | % |
BUFF | | | 69.97 | | | | 69.97 | |
For the taxable year ended October 31, 2020, the Funds didn’t pay any ordinary income distributions that were designated as short-term capital gain distributions under Internal Revenue Section 871(k)2(c).
INVESTMENT ADVISOR
Innovator Capital Management, LLC
109 North Hale Street
Wheaton, IL 60187
INVESTMENT SUB-ADVISOR
Penserra Capital Management, LLC
140 Broadway, 26th Floor
New York, NY 10005
DISTRIBUTOR
Foreside Fund Services, LLC
Three Canal Plaza, Suite 100 Portland, ME 04101
ADMINISTRATOR, FUND ACCOUNTANT & TRANSFER AGENT
U.S. Bancorp Fund Services, LLC
615 East Michigan Street
Milwaukee, WI 53202
CUSTODIAN
U.S. Bank, N.A.
1555 North RiverCenter Drive, Suite 302
Milwaukee, WI 53212
LEGAL COUNSEL
Chapman and Cutler LLP
111 West Monroe Street,
Chicago, Illinois 60603
INDEPENDENT REGISTERED PUBLIC ACCOUNTING FIRM
Cohen & Company, Ltd.
1350 Euclid Avenue, Suite 800
Cleveland, Ohio 44115
Item 2. Code of Ethics.
Not applicable for semi-annual reports.
Item 3. Audit Committee Financial Expert.
Not applicable for semi-annual reports.
Item 4. Principal Accountant Fees and Services.
Not applicable for semi-annual reports.
Item 5. Audit Committee of Listed Registrants.
Not applicable to registrants who are not listed issuers (as defined in Rule 10A-3 under the Securities Exchange Act of 1934).
The registrant is an issuer as defined in Rule 10A-3 under the Securities Exchange Act of 1934, (the “Act”) and has a separately-designated standing audit committee established in accordance with Section 3(a)(58)(A) of the Act. The independent members of the committee consisting of the entire Board, are as follows: Brian Wildman, Joe Stowell and Mark Berg.
Item 6. Investments.
(a) | Schedule of Investments is included as part of the report to shareholders filed under Item 1 of this Form. |
Item 7. Disclosure of Proxy Voting Policies and Procedures for Closed-End Management Investment Companies.
Not applicable to open-end investment companies.
Item 8. Portfolio Managers of Closed-End Management Investment Companies.
Not applicable to open-end investment companies.
Item 9. Purchases of Equity Securities by Closed‑End Management Investment Company and Affiliated Purchasers.
Not applicable to open-end investment companies.
Item 10. Submission of Matters to a Vote of Security Holders.
There have been no material changes to the procedures by which shareholders may recommend nominees to the registrant’s board of trustees.
Item 11. Controls and Procedures.
(a) | The Registrant’s Principal Executive Officer and Principal Financial Officer have reviewed the Registrant's disclosure controls and procedures (as defined in Rule 30a-3(c) under the Investment Company Act of 1940 (the “Act”)) as of a date within 90 days of the filing of this report, as required by Rule 30a-3(b) under the Act and Rules 13a-15(b) or 15d‑15(b) under the Securities Exchange Act of 1934. Based on their review, such officers have concluded that the disclosure controls and procedures are effective in ensuring that information required to be disclosed in this report is appropriately recorded, processed, summarized and reported and made known to them by others within the Registrant and by the Registrant’s service provider. |
(b) | There were no changes in the Registrant's internal control over financial reporting (as defined in Rule 30a-3(d) under the Act) that occurred during the period covered by this report that have materially affected, or are reasonably likely to materially affect, the Registrant's internal control over financial reporting. |
Item 12. Disclosure of Securities Lending Activities for Closed-End Management Investment Companies
Not applicable to open-end investment companies.
Item 13. Exhibits.
(a) | (1) Any code of ethics or amendment thereto, that is the subject of the disclosure required by Item 2, to the extent that the registrant intends to satisfy Item 2 requirements through filing an exhibit. Not Applicable |
(2) A separate certification for each principal executive officer and principal financial officer pursuant to Section 302 of the Sarbanes-Oxley Act of 2002. Filed herewith.
(3) Any written solicitation to purchase securities under Rule 23c‑1 under the Act sent or given during the period covered by the report by or on behalf of the registrant to 10 or more persons. Not applicable to open-end investment companies.
(4) Change in the registrant’s independent public accountant. There was no change in the registrant’s independent public accountant for the period covered by this report.
SIGNATURES
Pursuant to the requirements of the Securities Exchange Act of 1934 and the Investment Company Act of 1940, the registrant has duly caused this report to be signed on its behalf by the undersigned, thereunto duly authorized.
(Registrant) Innovator ETFs Trust II
By (Signature and Title)* /s/ Bruce Bond
Bruce Bond, Principal Executive Officer
Date 06/29/2021
Pursuant to the requirements of the Securities Exchange Act of 1934 and the Investment Company Act of 1940, this report has been signed below by the following persons on behalf of the registrant and in the capacities and on the dates indicated.
By (Signature and Title)* /s/ Bruce Bond
Bruce Bond, Principal Executive Officer
Date 06/29/2021
By (Signature and Title)* /s/John Southard
John Southard, Principal Financial Officer
Date 06/29/2021
* Print the name and title of each signing officer under his or her signature.