UNITED STATES
SECURITIES AND EXCHANGE COMMISSION
Washington, D.C. 20549
SCHEDULE 14A
Proxy Statement Pursuant to Section 14(a) of the
Securities Exchange Act of 1934
Filed by the Registrant ☐ Filed by a Party other than the Registrant ☒
Check the appropriate box:
| ☐ | Preliminary Proxy Statement | |
| ☐ | Confidential, for Use of the Commission Only (as permitted by Rule14a-6(e)(2)) | |
| ☐ | Definitive Proxy Statement | |
| ☐ | Definitive Additional Materials | |
| ☒ | Soliciting Material Pursuant to§240.14a-12 | |
EQT CORPORATION
(Name of the Registrant as Specified In Its Charter)
Toby Z. Rice
Derek A. Rice
(Name of Person(s) Filing Proxy Statement, if other than the Registrant)
Payment of Filing Fee (Check the appropriate box):
| ☒ | No fee required. | |||
| ☐ | Fee computed on table below per Exchange Act Rules14a-6(i)(1) and0-11. | |||
| (1) | Title of each class of securities to which transaction applies:
| |||
| (2) | Aggregate number of securities to which transaction applies:
| |||
| (3) | Per unit price or other underlying value of transaction computed pursuant to Exchange Act Rule0-11 (set forth the amount on which the filing fee is calculated and state how it was determined):
| |||
| (4) | Proposed maximum aggregate value of transaction:
| |||
| (5) | Total fee paid:
| |||
| ☐ | Fee paid previously with preliminary materials. | |||
| ☐ | Check box if any part of the fee is offset as provided by Exchange Act Rule0-11(a)(2) and identify the filing for which the offsetting fee was paid previously. Identify the previous filing by registration statement number, or the Form or Schedule and the date of its filing. | |||
| (1) | Amount Previously Paid:
| |||
| (2) | Form, Schedule or Registration Statement No.:
| |||
| (3) | Filing Party:
| |||
| (4) | Date Filed:
| |||
This filing contains a letter sent from Toby Z. Rice and Derek A. Rice to the Board of Directors of EQT Corporation, dated December 10, 2018.
* * *
Team Rice – Realizing EQT’s Potential
December 10, 2018
Board of Directors
EQT Corporation
EQT Plaza
625 Liberty Avenue, Suite 1700
Pittsburgh, PA 15222
Dear Members of the Board:
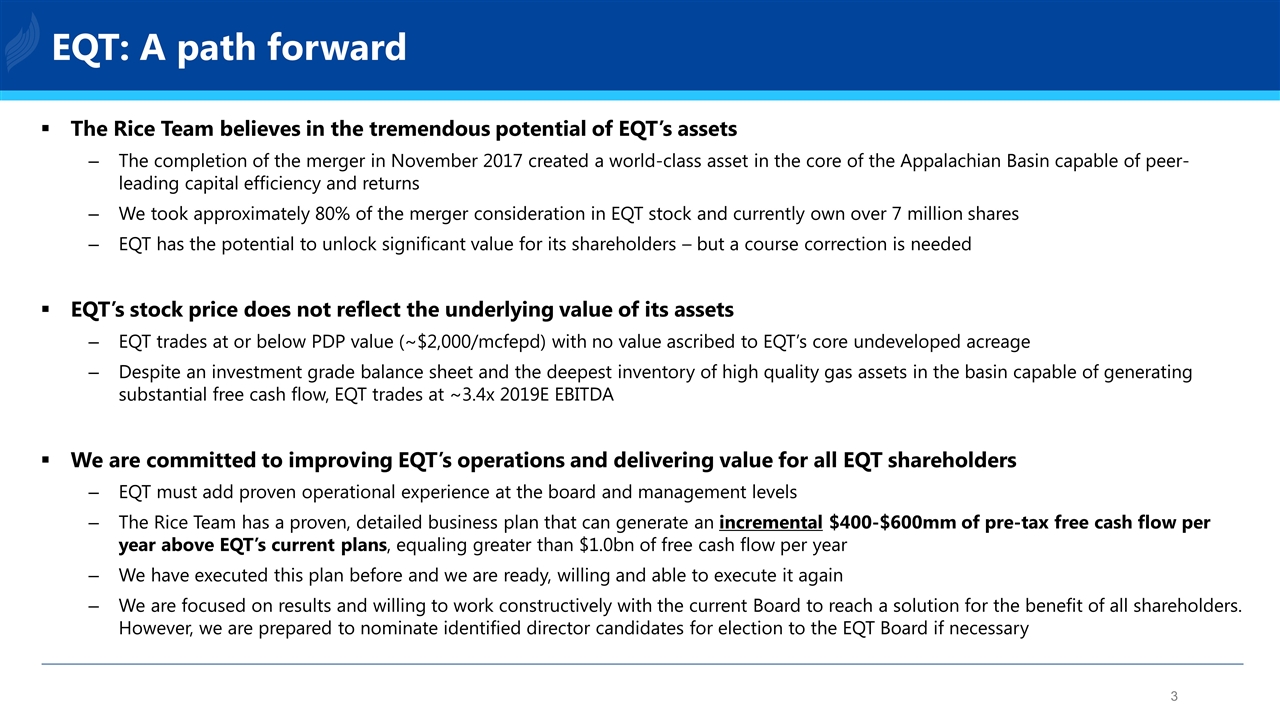
The completion of the merger in November 2017 between EQT Corporation (NYSE: EQT) (“EQT”) and the company we founded, Rice Energy Inc. (“RICE”), created a world-class asset in the core of the Appalachian Basin, setting the table for peer-leading capital efficiency and returns. Our belief in the tremendous potential of EQT’s assets was underscored by the fact that we took approximately 80% of the merger consideration in EQT stock. As of today, the Rice family owns over 7 million shares of EQT.
The Rice Team continues to believe strongly in the potential of EQT’s assets, but unfortunately the Company’s operational performance has translated into a severely depressed stock price that is not reflective of the underlying value of the assets. EQT trades at or below PDP value, with no value ascribed to EQT’s core undeveloped acreage. EQT’s valuation metrics of ~3.4x 2019E EBITDA and ~$2,000/mcfepd represent a significant discount to Appalachian peers, notwithstanding the fact that EQT has the deepest inventory of high-quality natural gas assets in the basin.
EQT has the potential to unlock significant value for all its shareholders, but, to deliver the results this asset base deserves, a course correction is needed. EQT must add proven operational experience to the Board and senior management team – in particular, individuals with experience in large-scale operational planning.
The Rice team has a demonstrated track record of delivering basin-leading results on the exact same assets that EQT is operating today. With the proper authority and Board support, our team is willing to oversee the transformation needed to achieve these results. We have executed on it before, and we are ready, willing and able to execute on it again.
The Rice team is fully aligned with all EQT shareholders and committed to improving EQT’s operations and delivering value for all EQT shareholders and employees. We have a proven, detailed business plan to generate anincremental$400-$600 million ofpre-tax free cash flow per year above EQT’s current plans, equaling greater than $1.0 billion of free cash flow per year. This plan would match EQT’s current five-year production goals but generate twice the cash flow for shareholders. A detailed presentation outlining this plan can be found atwww.eqtpathforward.com.
Team Rice – Realizing EQT’s Potential
Over the past few weeks, in response to repeated outreach by a range of EQT investors asking for our assistance, we engaged in private dialogue with Chairman Jim Rohr and CEO Rob McNally to express our concerns and propose solutions, which included, among other things, inserting Toby Rice into the organization with proper authority and support to oversee operations. Unfortunately, given the lack of reciprocal engagement – and EQT pushing forward with establishing its 2019 operational plan and budget – it has become apparent that they are unwilling to make the changes needed.
We are focused on results and willing to work constructively with the current Board to reach a solution for the benefit of all shareholders. However, if we do not arrive at a mutually agreeable outcome that materially benefits all long-term shareholders, we have identified director candidates and will nominate them for election to the EQT Board at the 2019 Annual Meeting.
Respectfully,
 |  | |
| Toby Z. Rice | Derek A. Rice | |
For Investor Inquiries:
Kyle Derham
kyle@teamrice.com
For Media Inquiries:
Sard Verbinnen & Co
Jim Barron:212-687-8080
Frances Jeter:832-680-5120
Enclosure
Realizing EQT’s Potential, dated as of December 10, 2018.http://www.eqtpathforward.com/
IMPORTANT INFORMATION
Toby Z. Rice and Derek A. Rice, as well as certain of their affiliates, may file a proxy statement with the U.S. Securities and Exchange Commission (“SEC”) to solicit proxies from stockholders of EQT for use at EQT’s 2019 annual meeting of stockholders. TOBY Z. RICE AND DEREK A. RICE STRONGLY ADVISE ALL SECURITY HOLDERS OF EQT TO READ ANY SUCH PROXY STATEMENT IF AND WHEN IT BECOMES AVAILABLE BECAUSE IT WILL CONTAIN IMPORTANT INFORMATION. Any such proxy statement, if and when filed, and any other relevant documents will be available at no charge on the SEC’s website at http://www.sec.gov/.
PARTICIPANT INFORMATION
In accordance with Rule14a-12(a)(1)(i) under the Securities Exchange Act of 1934, as amended, the following persons are, or may be deemed to be, participants in the potential proxy solicitation: Toby Z. Rice and Derek A. Rice. Toby Z. Rice holds a total of 400,000 shares of common stock, both directly and indirectly, in EQT, and Derek A. Rice holds a total of 272,651 shares of common stock, both directly and indirectly, in EQT. In addition, Toby Z. Rice and Derek A. Rice are potential beneficiaries of the Rice Energy 2016 Irrevocable Trust, which holds a total of 5,676,000 shares of EQT’s common stock.
Realizing EQT’s Potential December 10, 2018
Disclaimer IMPORTANT INFORMATION Toby Z. Rice and Derek A. Rice, as well as certain of their affiliates, may file a proxy statement with the U.S. Securities and Exchange Commission (“SEC”) to solicit proxies from stockholders of EQT for use at EQT’s 2019 annual meeting of stockholders. TOBY Z. RICE AND DEREK A. RICE STRONGLY ADVISE ALL SECURITY HOLDERS OF EQT TO READ ANY SUCH PROXY STATEMENT IF AND WHEN IT BECOMES AVAILABLE BECAUSE IT WILL CONTAIN IMPORTANT INFORMATION. Any such proxy statement, if and when filed, and any other relevant documents will be available at no charge on the SEC’s website at http://www.sec.gov/. PARTICIPANT INFORMATION In accordance with Rule 14a-12(a)(1)(i) under the Securities Exchange Act of 1934, as amended, the following persons are, or may be deemed to be, participants in the potential proxy solicitation: Toby Z. Rice and Derek A. Rice. Toby Z. Rice holds a total of 400,000 shares of common stock, both directly and indirectly, in EQT, and Derek A. Rice holds a total of 272,651 shares of common stock, both directly and indirectly, in EQT. In addition, Toby Z. Rice and Derek A. Rice are potential beneficiaries of the Rice Energy 2016 Irrevocable Trust, which holds a total of 5,676,000 shares of EQT’s common stock. This presentation has been prepared by Toby Rice, Derek Rice and other former members of the Rice Energy leadership team (collectively, the “Rice Team”). To the extent such information includes estimates and forecasts of future financial performance, those projections have been prepared using publicly available information and the Rice Team has assumed that such publicly available information is accurate. No representation or warranty, express or implied, is made as to the accuracy or completeness of these materials and the information included herein and nothing contained herein is, or shall be relied upon as, a representation or warranty, whether as to the past, the present, or the future. The Rice Team assumes no obligation to correct, update, or otherwise revise these materials. These materials do not purport to contain all of the information that may be required to evaluate, and do not constitute a recommendation with respect to any matter. Any recipient of these materials should conduct its own independent analysis of the information contained or referred to herein. Forward-Looking Statements This presentation contains forward-looking statements concerning plans, objectives, goals, strategies, future events or performance, and underlying assumptions and other statements, which are other than statements of historical facts. Any forward-looking statements, opinions, financial projections or estimates are included for informational purposes only and are provided in good faith but, by their nature, involve significant elements of subjective analysis and judgment. Any statements that express or involve discussions with respect to predictions, estimates, forecasts, opinions, expectations, beliefs, plans, projections, objectives, assumptions or future events or performance are not statements of historical fact and are “forward-looking statements.” Other important factors could cause actual results to differ from the statements, opinions, financial projections or estimates contained herein. Non-GAAP Financial Measures Within this presentation, the Rice Team makes reference to certain non-GAAP financial measures. These non-GAAP measures are not prepared in accordance with generally accepted accounting principles. These non-GAAP measures are provided because they are commonly used as standard metrics by the investment community and the oil and gas industry. The non-GAAP measures referenced in this presentation may be determined or calculated differently by other members of the investment community and the oil and gas industry and may not be comparable to similarly titled measures.
EQT: A path forward The Rice Team believes in the tremendous potential of EQT’s assets The completion of the merger in November 2017 created a world-class asset in the core of the Appalachian Basin capable of peer-leading capital efficiency and returns We took approximately 80% of the merger consideration in EQT stock and currently own over 7 million shares EQT has the potential to unlock significant value for its shareholders – but a course correction is needed EQT’s stock price does not reflect the underlying value of its assets EQT trades at or below PDP value (~$2,000/mcfepd) with no value ascribed to EQT’s core undeveloped acreage Despite an investment grade balance sheet and the deepest inventory of high quality gas assets in the basin capable of generating substantial free cash flow, EQT trades at ~3.4x 2019E EBITDA We are committed to improving EQT’s operations and delivering value for all EQT shareholders EQT must add proven operational experience at the board and management levels The Rice Team has a proven, detailed business plan that can generate an incremental $400-$600mm of pre-tax free cash flow per year above EQT’s current plans, equaling greater than $1.0bn of free cash flow per year We have executed this plan before and we are ready, willing and able to execute it again We are focused on results and willing to work constructively with the current Board to reach a solution for the benefit of all shareholders. However, we are prepared to nominate identified director candidates for election to the EQT Board if necessary
The Issue: EQT’s Operational Performance
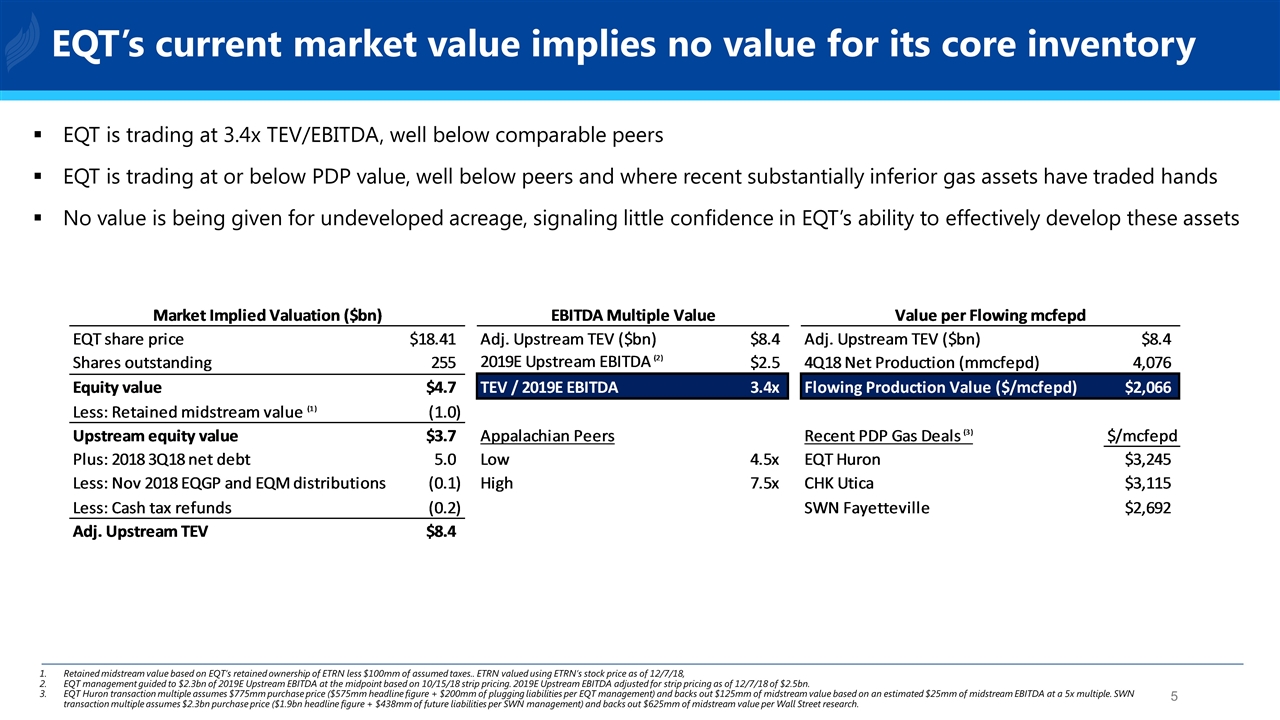
EQT is trading at 3.4x TEV/EBITDA, well below comparable peers EQT is trading at or below PDP value, well below peers and where recent substantially inferior gas assets have traded hands No value is being given for undeveloped acreage, signaling little confidence in EQT’s ability to effectively develop these assets Retained midstream value based on EQT’s retained ownership of ETRN less $100mm of assumed taxes.. ETRN valued using ETRN’s stock price as of 12/7/18, EQT management guided to $2.3bn of 2019E Upstream EBITDA at the midpoint based on 10/15/18 strip pricing. 2019E Upstream EBITDA adjusted for strip pricing as of 12/7/18 of $2.5bn. EQT Huron transaction multiple assumes $775mm purchase price ($575mm headline figure + $200mm of plugging liabilities per EQT management) and backs out $125mm of midstream value based on an estimated $25mm of midstream EBITDA at a 5x multiple. SWN transaction multiple assumes $2.3bn purchase price ($1.9bn headline figure + $438mm of future liabilities per SWN management) and backs out $625mm of midstream value per Wall Street research. EQT’s current market value implies no value for its core inventory
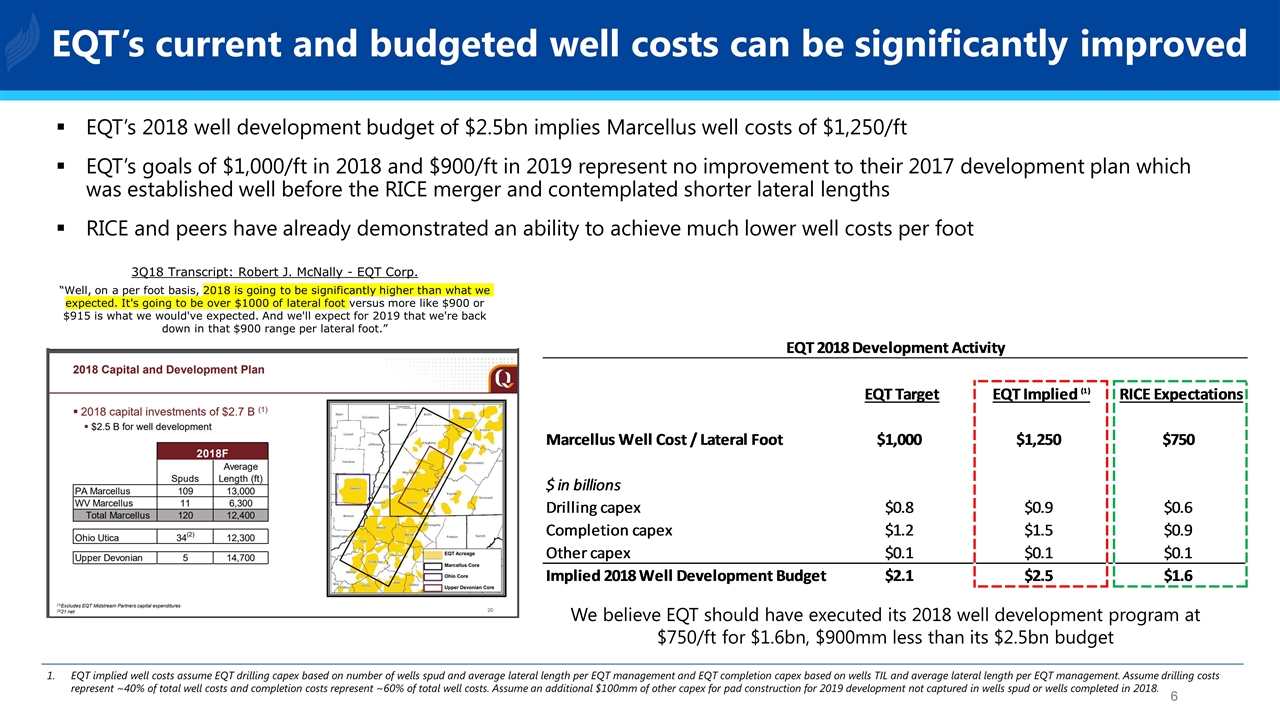
EQT’s 2018 well development budget of $2.5bn implies Marcellus well costs of $1,250/ft EQT’s goals of $1,000/ft in 2018 and $900/ft in 2019 represent no improvement to their 2017 development plan which was established well before the RICE merger and contemplated shorter lateral lengths RICE and peers have already demonstrated an ability to achieve much lower well costs per foot EQT implied well costs assume EQT drilling capex based on number of wells spud and average lateral length per EQT management and EQT completion capex based on wells TIL and average lateral length per EQT management. Assume drilling costs represent ~40% of total well costs and completion costs represent ~60% of total well costs. Assume an additional $100mm of other capex for pad construction for 2019 development not captured in wells spud or wells completed in 2018. 3Q18 Transcript: Robert J. McNally - EQT Corp. “Well, on a per foot basis, 2018 is going to be significantly higher than what we expected. It's going to be over $1000 of lateral foot versus more like $900 or $915 is what we would've expected. And we'll expect for 2019 that we're back down in that $900 range per lateral foot.” EQT’s current and budgeted well costs can be significantly improved We believe EQT should have executed its 2018 well development program at $750/ft for $1.6bn, $900mm less than its $2.5bn budget
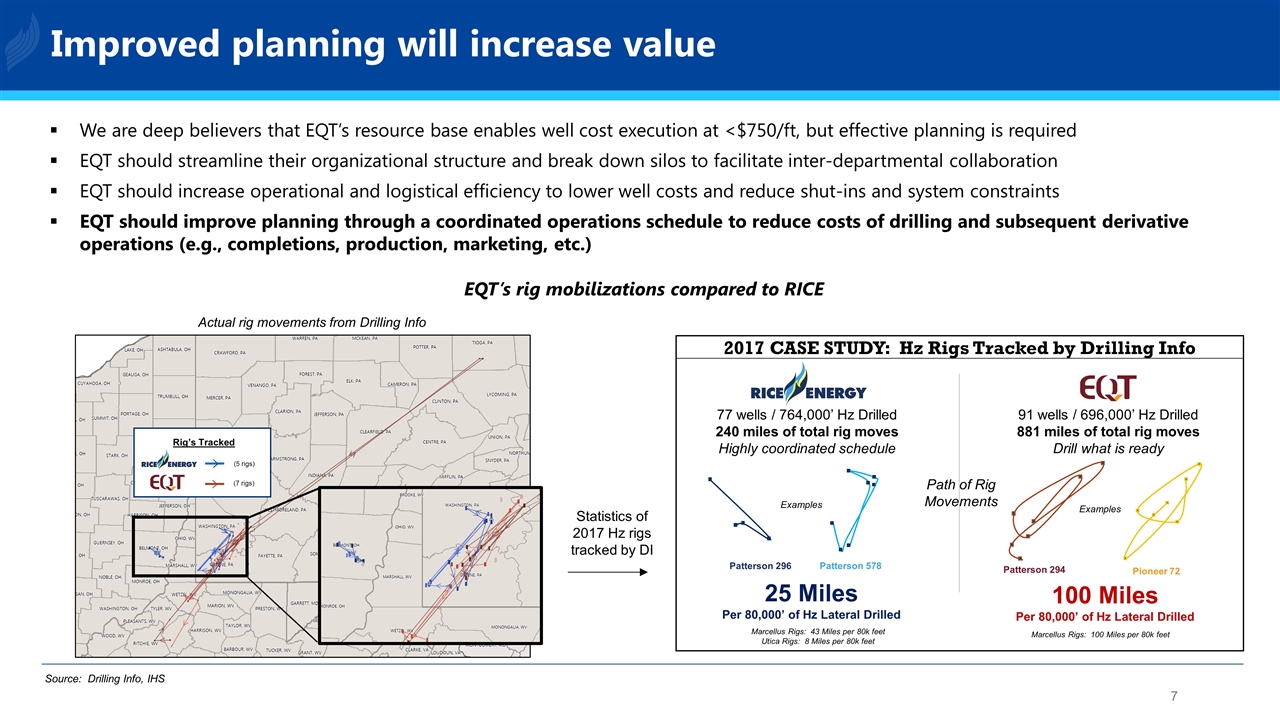
We are deep believers that EQT’s resource base enables well cost execution at <$750/ft, but effective planning is required EQT should streamline their organizational structure and break down silos to facilitate inter-departmental collaboration EQT should increase operational and logistical efficiency to lower well costs and reduce shut-ins and system constraints EQT should improve planning through a coordinated operations schedule to reduce costs of drilling and subsequent derivative operations (e.g., completions, production, marketing, etc.) Actual rig movements from Drilling Info 2017 CASE STUDY: Hz Rigs Tracked by Drilling Info 77 wells / 764,000’ Hz Drilled 240 miles of total rig moves Highly coordinated schedule 91 wells / 696,000’ Hz Drilled 881 miles of total rig moves Drill what is ready 25 Miles Per 80,000’ of Hz Lateral Drilled 100 Miles Per 80,000’ of Hz Lateral Drilled EQT’s rig mobilizations compared to RICE Source: Drilling Info, IHS Improved planning will increase value Marcellus Rigs: 43 Miles per 80k feet Utica Rigs: 8 Miles per 80k feet Marcellus Rigs: 100 Miles per 80k feet Statistics of 2017 Hz rigs tracked by DI Rig’s Tracked (5 rigs) (7 rigs) Patterson 296 Patterson 578 Patterson 294 Pioneer 72 Path of Rig Movements Examples Examples
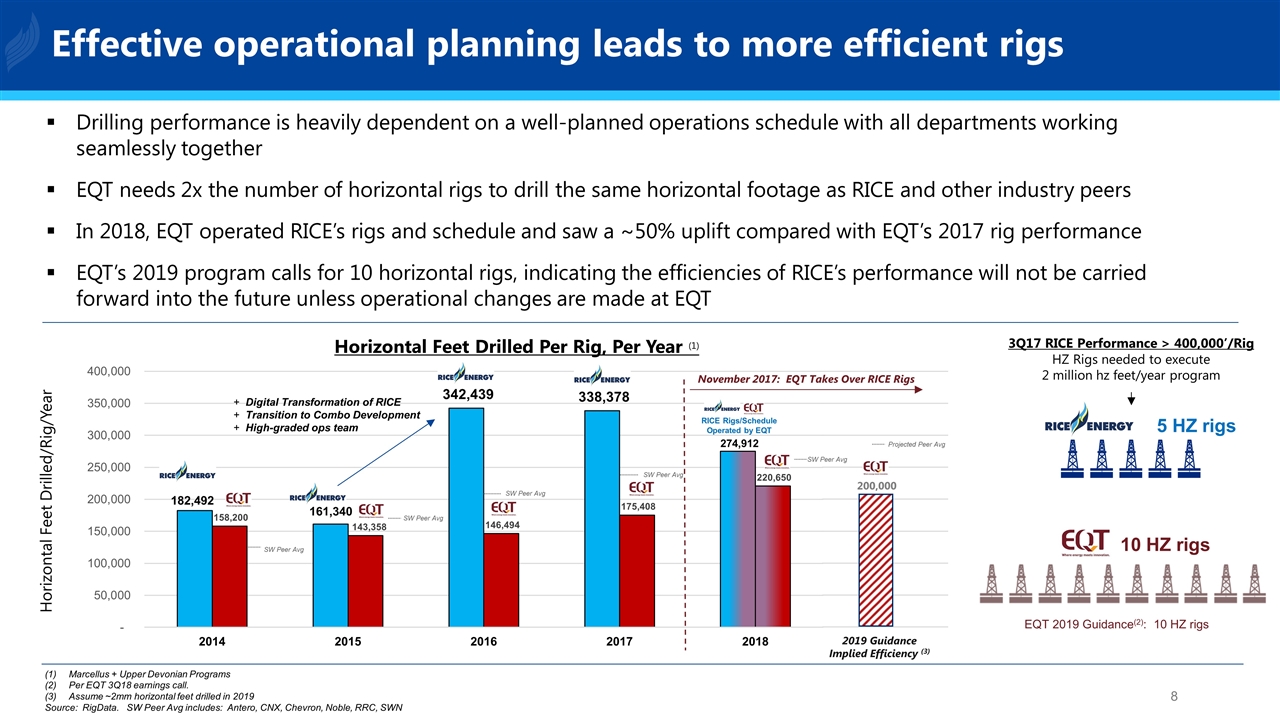
Drilling performance is heavily dependent on a well-planned operations schedule with all departments working seamlessly together EQT needs 2x the number of horizontal rigs to drill the same horizontal footage as RICE and other industry peers In 2018, EQT operated RICE’s rigs and schedule and saw a ~50% uplift compared with EQT’s 2017 rig performance EQT’s 2019 program calls for 10 horizontal rigs, indicating the efficiencies of RICE’s performance will not be carried forward into the future unless operational changes are made at EQT 3Q17 RICE Performance > 400,000’/Rig HZ Rigs needed to execute 2 million hz feet/year program 5 HZ rigs 10 HZ rigs Horizontal Feet Drilled Per Rig, Per Year (1) EQT 2019 Guidance(2): 10 HZ rigs Horizontal Feet Drilled/Rig/Year Marcellus + Upper Devonian Programs Per EQT 3Q18 earnings call. Assume ~2mm horizontal feet drilled in 2019 Source: RigData. SW Peer Avg includes: Antero, CNX, Chevron, Noble, RRC, SWN November 2017: EQT Takes Over RICE Rigs 2019 Guidance Implied Efficiency (3) RICE Rigs/Schedule Operated by EQT Digital Transformation of RICE Transition to Combo Development High-graded ops team 200,000 SW Peer Avg SW Peer Avg SW Peer Avg Projected Peer Avg SW Peer Avg SW Peer Avg Effective operational planning leads to more efficient rigs
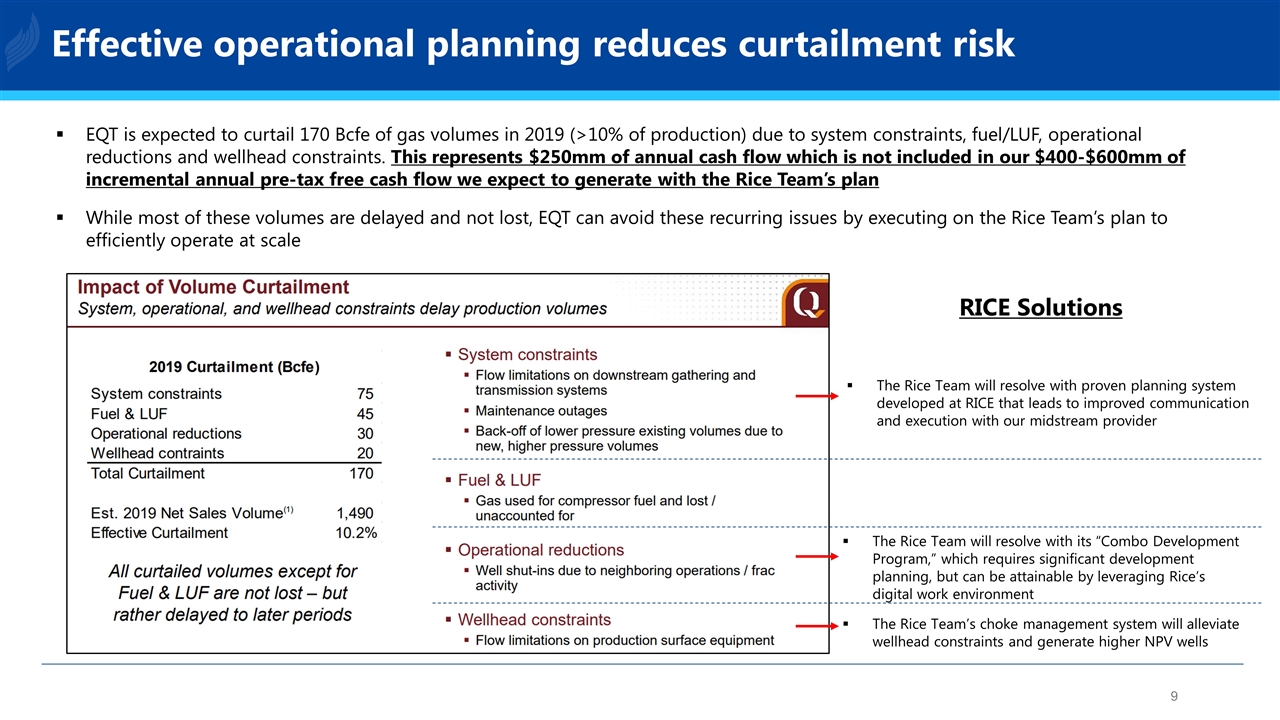
EQT is expected to curtail 170 Bcfe of gas volumes in 2019 (>10% of production) due to system constraints, fuel/LUF, operational reductions and wellhead constraints. This represents $250mm of annual cash flow which is not included in our $400-$600mm of incremental annual pre-tax free cash flow we expect to generate with the Rice Team’s plan While most of these volumes are delayed and not lost, EQT can avoid these recurring issues by executing on the Rice Team’s plan to efficiently operate at scale RICE Solutions The Rice Team will resolve with proven planning system developed at RICE that leads to improved communication and execution with our midstream provider The Rice Team will resolve with its “Combo Development Program,” which requires significant development planning, but can be attainable by leveraging Rice’s digital work environment The Rice Team’s choke management system will alleviate wellhead constraints and generate higher NPV wells Effective operational planning reduces curtailment risk
The Opportunity: Proven Team Executing a Known Asset
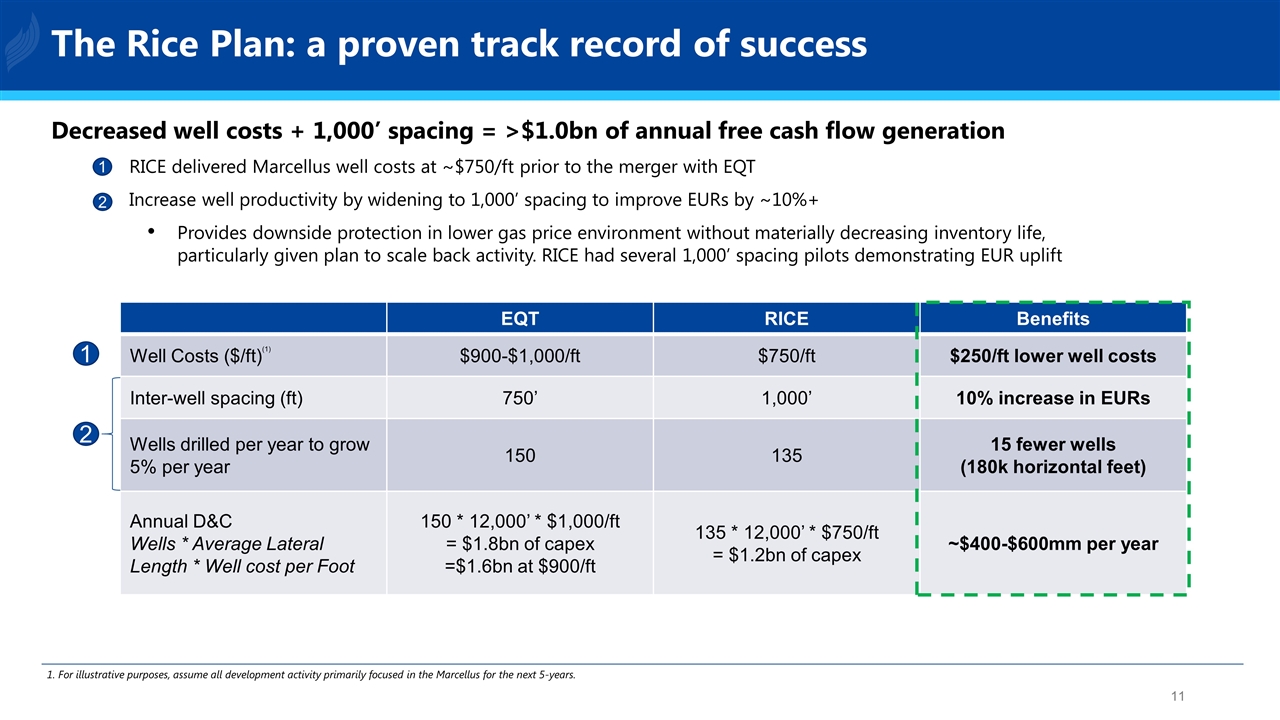
The Rice Plan: a proven track record of success Decreased well costs + 1,000’ spacing = >$1.0bn of annual free cash flow generation RICE delivered Marcellus well costs at ~$750/ft prior to the merger with EQT Increase well productivity by widening to 1,000’ spacing to improve EURs by ~10%+ Provides downside protection in lower gas price environment without materially decreasing inventory life, particularly given plan to scale back activity. RICE had several 1,000’ spacing pilots demonstrating EUR uplift EQT RICE Benefits Well Costs ($/ft)(1) $900-$1,000/ft $750/ft $250/ft lower well costs Inter-well spacing (ft) 750’ 1,000’ 10% increase in EURs Wells drilled per year to grow 5% per year 150 135 15 fewer wells (180k horizontal feet) Annual D&C Wells * Average Lateral Length * Well cost per Foot 150 * 12,000’ * $1,000/ft = $1.8bn of capex =$1.6bn at $900/ft 135 * 12,000’ * $750/ft = $1.2bn of capex ~$400-$600mm per year 1 2 1 2 1. For illustrative purposes, assume all development activity primarily focused in the Marcellus for the next 5-years.
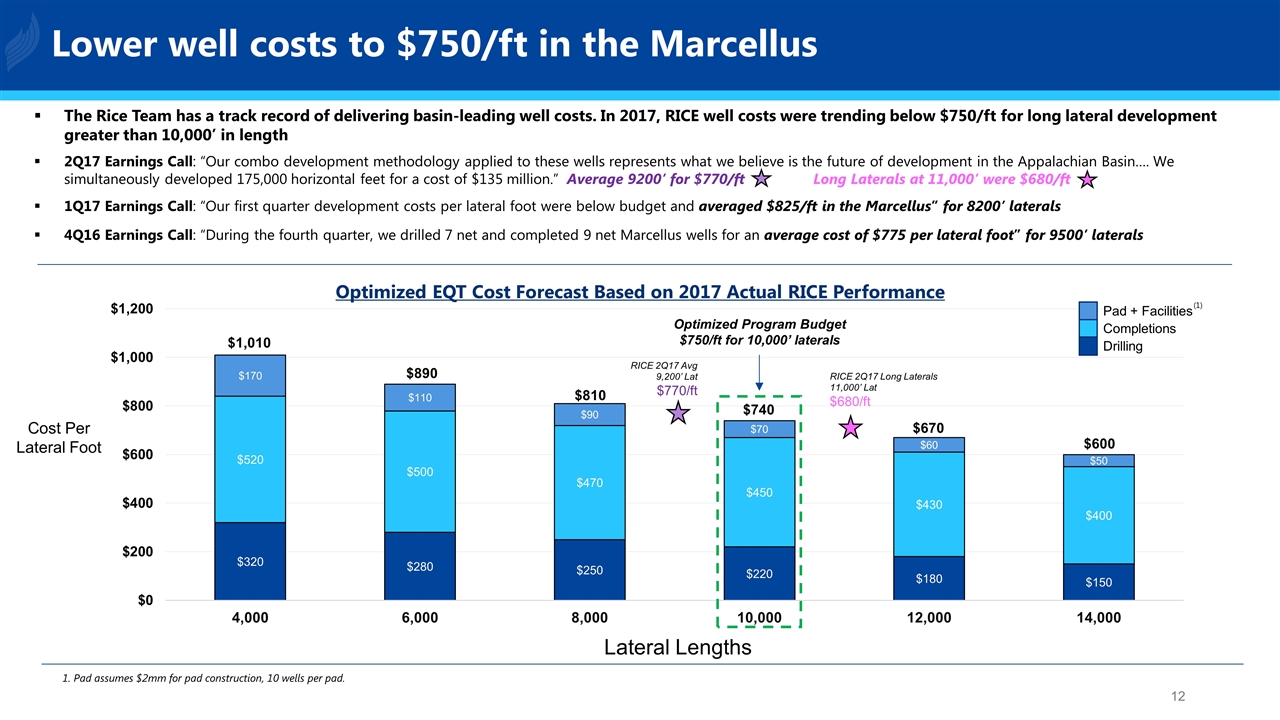
Lower well costs to $750/ft in the Marcellus 1. Pad assumes $2mm for pad construction, 10 wells per pad. Optimized EQT Cost Forecast Based on 2017 Actual RICE Performance Optimized Program Budget $750/ft for 10,000’ laterals The Rice Team has a track record of delivering basin-leading well costs. In 2017, RICE well costs were trending below $750/ft for long lateral development greater than 10,000’ in length 2Q17 Earnings Call: “Our combo development methodology applied to these wells represents what we believe is the future of development in the Appalachian Basin…. We simultaneously developed 175,000 horizontal feet for a cost of $135 million.” Average 9200’ for $770/ft Long Laterals at 11,000’ were $680/ft 1Q17 Earnings Call: “Our first quarter development costs per lateral foot were below budget and averaged $825/ft in the Marcellus” for 8200’ laterals 4Q16 Earnings Call: “During the fourth quarter, we drilled 7 net and completed 9 net Marcellus wells for an average cost of $775 per lateral foot” for 9500’ laterals RICE 2Q17 Avg 9,200’ Lat $770/ft RICE 2Q17 Long Laterals 11,000’ Lat $680/ft Lateral Lengths Cost Per Lateral Foot Pad + Facilities Completions Drilling (1)
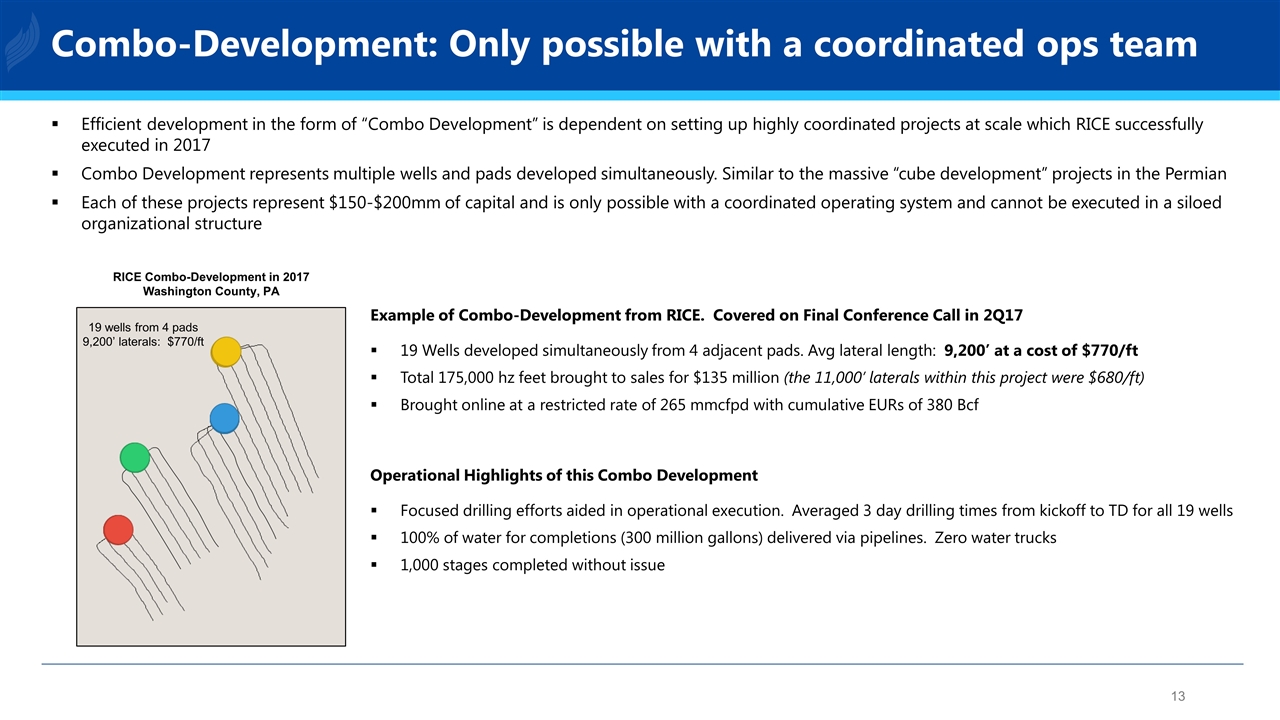
Example of Combo-Development from RICE. Covered on Final Conference Call in 2Q17 19 Wells developed simultaneously from 4 adjacent pads. Avg lateral length: 9,200’ at a cost of $770/ft Total 175,000 hz feet brought to sales for $135 million (the 11,000’ laterals within this project were $680/ft) Brought online at a restricted rate of 265 mmcfpd with cumulative EURs of 380 Bcf Operational Highlights of this Combo Development Focused drilling efforts aided in operational execution. Averaged 3 day drilling times from kickoff to TD for all 19 wells 100% of water for completions (300 million gallons) delivered via pipelines. Zero water trucks 1,000 stages completed without issue Efficient development in the form of “Combo Development” is dependent on setting up highly coordinated projects at scale which RICE successfully executed in 2017 Combo Development represents multiple wells and pads developed simultaneously. Similar to the massive “cube development” projects in the Permian Each of these projects represent $150-$200mm of capital and is only possible with a coordinated operating system and cannot be executed in a siloed organizational structure RICE Combo-Development in 2017 Washington County, PA 19 wells from 4 pads 9,200’ laterals: $770/ft Combo-Development: Only possible with a coordinated ops team
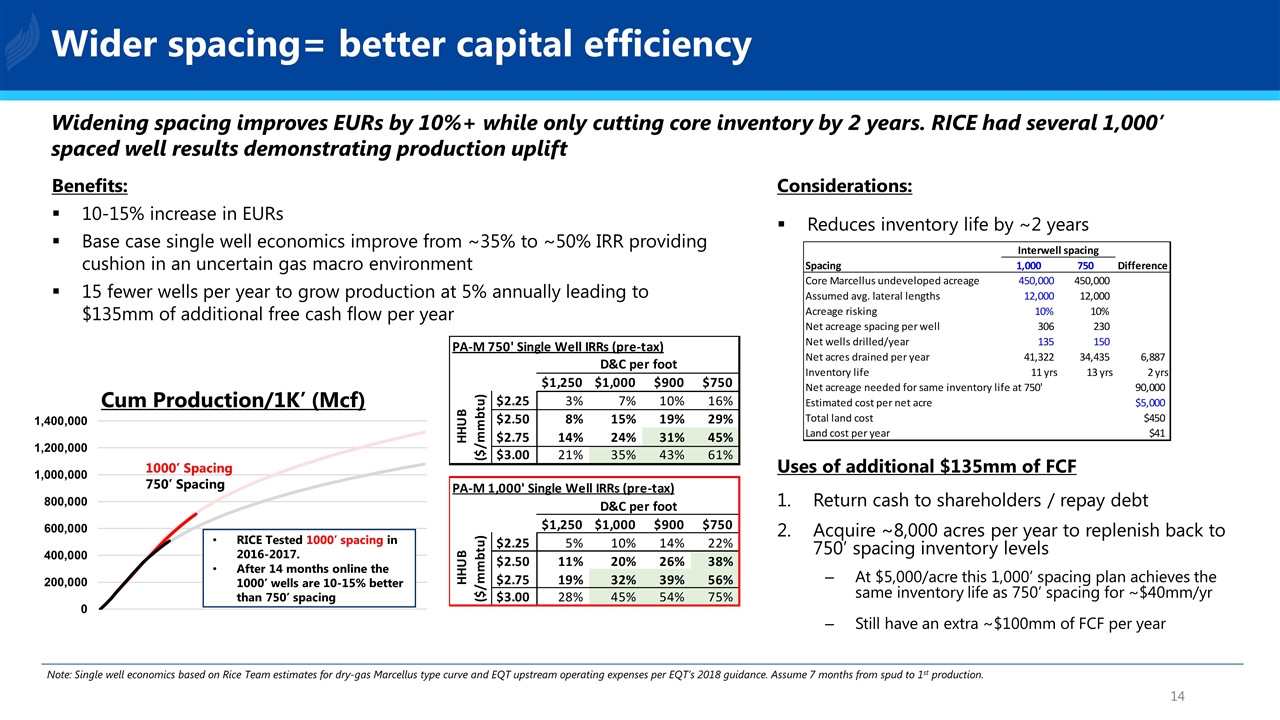
Cum Production/1K’ (Mcf) 1000’ Spacing 750’ Spacing RICE Tested 1000’ spacing in 2016-2017. After 14 months online the 1000’ wells are 10-15% better than 750’ spacing Considerations: Reduces inventory life by ~2 years Benefits: 10-15% increase in EURs Base case single well economics improve from ~35% to ~50% IRR providing cushion in an uncertain gas macro environment 15 fewer wells per year to grow production at 5% annually leading to $135mm of additional free cash flow per year Uses of additional $135mm of FCF Return cash to shareholders / repay debt Acquire ~8,000 acres per year to replenish back to 750’ spacing inventory levels At $5,000/acre this 1,000’ spacing plan achieves the same inventory life as 750’ spacing for ~$40mm/yr Still have an extra ~$100mm of FCF per year Widening spacing improves EURs by 10%+ while only cutting core inventory by 2 years. RICE had several 1,000’ spaced well results demonstrating production uplift Note: Single well economics based on Rice Team estimates for dry-gas Marcellus type curve and EQT upstream operating expenses per EQT’s 2018 guidance. Assume 7 months from spud to 1st production. Wider spacing= better capital efficiency
Realizing EQT’s Potential: Next steps The Rice Team is committed to improving EQT’s operations and delivering value for all EQT shareholders EQT must add proven operational experience to the board and senior management team The Rice Team has a track record of delivering basin-leading well costs We have a clear plan that we have executed before, and we are ready, willing and able to execute it again With the proper authority and Board support, our team will oversee the transformation needed to achieve these types of results We are focused on results and willing to work constructively with the current Board to reach a solution for the benefit of all shareholders. However, we are prepared to nominate identified director candidates for election to the EQT Board if necessary
Contact information For Investor Inquiries: Kyle Derham kyle@teamrice.com For Media Inquiries: Sard Verbinnen & Co Jim Barron: 212-687-8080 Frances Jeter: 832-680-5120