UNITED STATES
SECURITIES AND EXCHANGE COMMISSION
WASHINGTON, D.C. 20549
FORM N-CSR
CERTIFIED SHAREHOLDER REPORT OF REGISTERED
MANAGEMENT INVESTMENT COMPANIES
Investment Company Act File Number: 811-22930
USCF ETF TRUST
(Exact name of registrant as specified in charter)
1999 Harrison Street, Suite 1530, Oakland, California 94612
(Address of principal executive offices)(Zip code)
USCF Advisers LLC
Mr. Stuart P. Crumbaugh
1999 Harrison Street, Suite 1530
Oakland, California 94612
(Name and address of Agent for service)
Registrant’s telephone number, including area code: 510.522.9600
Date of fiscal year end: June 30
Date of reporting period: June 30, 2016
ITEM 1. REPORT TO SHAREHOLDERS
The following is a copy of the Registrant’s annual report transmitted to shareholders pursuant to Rule 30e-1 under the Investment Company Act of 1940, as amended (the “1940 Act”)(17 CFR 270.30e-1).
| • | Equal Weighting – The Index is equally weighted, which enables diversification and ensures no one company is over-weighted in the holdings.* |
| • | Monthly rebalancing – The Index is updated each month, adding one new stock and removing the oldest. The fund is rebalanced to reflect these changes to the Index. This methodology provides structure to both the stock purchasing and selling process. |
| • | Transparent and liquid – The funds’ holdings are posted each day on its website. The ETF structure allows investors to trade throughout the day, and use “stock-like” order flexibility including market, limit, stop and stop-limit orders. |
The Stock Split Index Fund allows investors to access a portfolio of companies whose stocks have recently split, in an easy-to-trade ETF. The 2 for 1 IndexTM is based on the model portfolio of the stocks of companies that have recently split as published each month in the “2 for 1 Newsletter” (the “Newsletter”). The Newsletter is an investment newsletter that publishes research and analysis, including a model portfolio, on U.S. listed stocks that have recently split, or announced a split. It has been published monthly since 1996.
* Diversification does not eliminate the risk of experiencing investment losses.
USCF ETF TRUST
TABLE OF CONTENTS
STOCK SPLIT ADVANTAGE
The Stock Split Index Fund (TOFR), which started trading on September 15, 2014, now has seven quarters of history as of the end of June 2016. TOFR is the first ETF of its kind. It adds an important alternative to an ETF sub-category focused on corporate actions such as buying back stock, spinning off businesses, raising dividends, or – in TOFR’s case – splitting stock. All of these actions allow management to send a positive signal about their company’s prospects to the investment community. Prior to TOFR’s launch, no other ETF or mutual fund covered stock splits. Asset managers may have overlooked the stock split anomaly because the mere implementation of a stock split has no economic impact on corporations or their shareholders. However, research has shown that stocks that have split tend to outperform the broader market for as long as three years after a stock split announcement1.
Looking back over these past seven quarters provides some idea of whether stock splits actually impact performance – whether positive, negative or not meaningful. If investing in stocks that have split has a meaningful benefit, then over time, TOFR should reflect a performance advantage.
Here is how TOFR’s total return (based on its net asset value) compares to S&P 500 total return for the past seven quarters:
| TOFR | S&P500 | |||||||
| Q4 2014 | 7.26 | % | 4.93 | % | ||||
| Q1 2015 | 3.20 | % | 0.95 | % | ||||
| Q2 2015 | 1.16 | % | 0.28 | % | ||||
| Q3 2015 | (4.88 | )% | (6.44 | )% | ||||
| Q4 2015 | 1.02 | % | 7.04 | % | ||||
| Q1 2016 | 4.88 | % | 1.35 | % | ||||
| Q2 2016 | (0.25 | )% | 2.46 | % | ||||
TOFR outperformed the S&P 500 during five of the last seven quarters. Overall, since inception, TOFR has a cumulative return of 10.47% versus 9.88% for the S&P 500.
In addition, TOFR’s benchmark, the 2 for 1 IndexTM, compares very favorably with the various rules based indexes that cover the other corporate actions, such as the Beacon Spinoff Index, Morningstar U.S. Dividend Growth Index, and the S&P 500 Buyback Index.
Although TOFR only has seven quarters of history, the 2 for 1 IndexTM traces its history to 1996. TOFR’s managers seek to track the Index through its ups and downs with the conviction that investing in stock splits can provide Investors an advantage in outperforming the broader indexes. For further information about the Index, please see www.2for1index.com.
1 What Do Stock Splits Really Signal? David L. Ikenberry, Graeme Rankine and Earl K. Stice The Journal of Financial and Quantitative Analysis Vol. 31, No. 3 (Sep., 1996), pp. 357–375 DOI: 10.2307/2331396 Stable URL: http://www.jstor.org/stable/2331396
| 2 | Annual Report June 30, 2016 |
PERFORMANCE HIGHLIGHTS
For the 12 months ending June 30, 2016, TOFR’s total return was 0.53%. For the 6 months ending June 30, 2016, TOFR’s total return was 4.62%. Since the ETF’s inception on September 15, 2014, the annualized total return for TOFR was 5.72%. On a market- price basis, TOFR’s total returns were (3.09)%, 0.38%, and 3.68% respectively. Because of low asset levels and low trading volume, TOFR’s shares have historically traded at a larger premium or discount to NAV than might otherwise be the case if assets or trading volume were higher. As assets grow, it is expected that market price will more closely track NAV; however, TOFR was trading at a discount to its Net Asset Value (“NAV”) as of the end of June. By comparison, the S&P 500 total returns were 4.02%, 3.84%, and 5.43% respectively.
Over the past fiscal year, the Materials, Consumer Staples, and Consumer Discretionary sectors were the largest detractors to the 2 for 1 Index’sTM performance. Utilities and Industrials sectors were the most positive contributors to performance.
The 2 for 1 IndexTM does not target any specific market capitalization or sector. The 2 for 1 IndexTM selects holdings from a universe of companies that have enacted a stock split or announced a stock split within the past 6 months. Individual stock selection is the key to the 2 for 1 Index’sTM performance of the 2 for 1 IndexTM and thus, the performance of TOFR. Stocks that had the biggest negative impact on the 2 for 1 Index’sTM performance were CF Industries Holdings, Inc. (manufactures fertilizer), Magna International, Inc. (manufactures automotive systems), and Apple, Inc. On the flip side, the biggest positive impactors were Open Text Corp. (portal software producer), New Jersey Resources Corp. (New Jersey utility), and ITC Holdings (electric transmission).
Thank you for your interest in TOFR. As always, we welcome any questions you may have.
Andrew F Ngim
Portfolio Manager
The 2 for 1 Index® contains approximately 30 companies which trade on major US Stock exchanges. Companies eligible for inclusion in the index have all announced a 2 for 1 (or higher) stock split within the 6 months prior to selection for the index.
Definitions:
Beacon Spinoff Index: The Index is comprised of approximately 40 securities selected, based on investment and other criteria, from a broad universe of U.S.-traded stocks, American depositary receipts and master limited partnerships. The universe of companies eligible for inclusion in the Index includes companies that have been spun-off within the past two years (but not more recently than six months prior to the applicable rebalancing date), without limitations on market capitalization (including micro-cap securities), but which are primarily small- and mid-cap companies with capitalizations under $10.0 billion.
Morningstar U .S . Dividend Growth Index: The index is designed to provide exposure to U.S.-based securities with history of uninterrupted dividend growth. The index is a subset of the Morningstar US Market Index, a broad market index representing 97% of U.S. equity market capitalization. It is a benchmark consisting of securities that: pay qualified dividends, are screened for a minimum of five years of uninterrupted annual dividend growth and have a significant margin to continue growing dividends.
S&P 500 Buyback Index: The S&P 500® Buyback Index is designed to measure the performance of the top 100 stocks with the highest buyback ratios in the S&P 500.
S&P 500 TR Index: The total return index tracks both the capital gains of a group of stocks over time and assumes that any cash distributions, such as dividends, are reinvested back into the index.
It is not possible to invest directly in an index.
Past performance is not a guarantee of future results.
| 3 |
COMPARISON OF CHANGE IN VALUE OF $10,000 INVESTMENT IN THE USCF ETF TRUST – STOCK SPLIT INDEX FUND (TOFR), THE 2 FOR 1 INDEX®1 AND S&P 500 INDEX®2 FROM SEPTEMBER 15, 2014 (INCEPTION DATE)* TO JUNE 30, 2016 .
The following graph depicts the performance of Stock Split Index Fund vs . the 2 For 1 Index®1 and S&P 500 Index®2
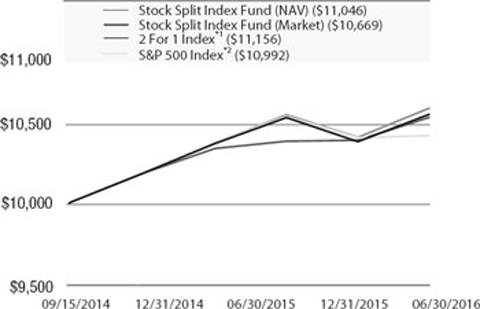
| One Year Return | Annualized Since Inception Return | Inception Date | ||||||||||
| Stock Split Index Fund (NAV) | 0.53 | % | 5.72 | % | 9/15/2014 | |||||||
| Stock Split Index Fund (Market) | (3.09 | )% | 3.68 | % | 9/15/2014 | |||||||
| 2 For 1 Index®1 | 1.09 | % | 6.30 | % | 9/15/2014 | |||||||
| S&P 500 Index®2 | 4.02 | % | 5.43 | % | 9/15/2014 | |||||||
| * | The inception date is the date the first shares were purchased to meet the outstanding shares required for listing on the NYSE Arca, Inc. TOFR was listed on the NYSE Arca, Inc. on September 16, 2014, which is referred throughout this annual report as the “Listing Date”. | |
| 1 | The 2 For 1 Index is an equally-weighted index, rebalanced monthly, comprised of companies listed on a U.S. stock exchange (“U.S. Exchange”), such as the New York Stock Exchange (“NYSE”) and NASDAQ Global Market, that have recently undergone a stock split of two new shares for every one existing share (or, in some cases, an exchange ratio of greater than two shares for one share). Under normal market circumstances, the Index will consist of 30 stocks. | |
| 2 | The Standard & Poor’s (S&P) 500 Index is an unmanaged index consisting of 500 stocks chosen for market size, liquidity, and industry group representation. It is a market-weighted index (stock price times number of shares outstanding) with each stock’s weight in the Index proportionate to its market value. |
The performance shown represents past performance. Past performance is no guarantee of future results and current performance may be higher or lower than the performance shown. Return calculations assume the reinvestment of distributions and do not reflect taxes that a shareholder would pay on Fund distributions or on the redemption of Fund shares. Performance figures reflect voluntary fee waivers and/or expense reimbursements. In the absence of voluntary fee waivers and/or expense reimbursements, the total return would have been lower. Principal value and investments returns will fluctuate and investors’ shares, when redeemed, may be worth more or less than the original cost.
| 4 | Annual Report June 30, 2016 |
As a shareholder of the Stock Split Index Fund (the “Fund”), a series of the USCF ETF Trust (the “Trust”), you may incur two potential types of costs: (1) transaction costs, such as brokerage commission purchases and sales of your Fund shares, and (2) ongoing costs, including management fees and other Fund expenses. The following examples are intended to help you understand your ongoing costs (in dollars) of investing in a Fund and to compare these costs with the ongoing costs of investing in other funds. The examples are based on an investment of $1,000 invested at the beginning of the period and held for the entire period from January 1, 2016 until June 30, 2016.
Actual Return. The first line of the table below provides information about actual account values and actual expenses. You may use the information in this line, together with the amount you invested, to estimate the expenses that you paid over the period. Simply divide your account value by $1,000 (for example, $8,600 account value divided by $1,000 = 8.6), then multiply the result by the number in the first line under the heading “Expenses Paid During the Period” to estimate the expenses you paid on your account during this period.
Hypothetical 5% Return. The second line of the table below provides information about hypothetical account values and hypothetical expenses based on the Fund’s actual expense ratio and an assumed rate of return of 5% per year before expenses, which is not the Fund’s actual return. The hypothetical account values and expenses may not be used to estimate the actual ending account balance or expenses you paid for the period. You may use this information to compare ongoing costs of investing in a Fund and other exchange traded funds. To do so, compare this 5% hypothetical example with the 5% hypothetical examples that appear in the shareholder reports of the other funds.
The expenses shown in the table are meant to highlight ongoing costs only and do not reflect any transaction fees, such as brokerage commission paid on purchases and sales of Fund shares. Therefore, the second line of the table is useful in comparing ongoing costs only, and may not help you determine the relative total costs of owning different funds.
USCF ETF TRUST – STOCK SPLIT INDEX FUND
| Beginning Account Value 1/1/16 | Ending Account Value 6/30/16 | Expenses Paid During Period 1/1/16 to 6/30/16 (a) | Annualized Expense Ratio | |||||||||||||
| Actual Fund Return | $ | 1,000.00 | $ | 1,046.20 | $ | 2.80 | 0.55 | % | ||||||||
| Hypothetical Fund Return (5% return before expenses) | $ | 1,000.00 | $ | 1,022.13 | $ | 2.77 | 0.55 | % | ||||||||
| (a) | Expenses (net of fee waivers and/or expense reimbursements) are equal to the Fund’s annualized expense ratio multiplied by the average account value over the period, multiplied by the number of days (182 days) in the most recent fiscal half- year, then divided by 366 (to reflect the one-half year period). |
| 5 |
USCF ETF TRUST – STOCK SPLIT INDEX FUND
SCHEDULE OF INVESTMENTS
AT JUNE 30, 2016
| % of Total Net Assets | Shares | Market Value | ||||||||||
| Common Stocks | 99.8 | % | ||||||||||
| Auto Components | 6.1 | % | ||||||||||
| Gentex Corp./MI | 3.2 | % | 7,618 | $ | 117,698 | |||||||
| Magna International, Inc. | 2.9 | % | 3,113 | 109,173 | ||||||||
| 226,871 | ||||||||||||
| Banks | 9.7 | % | ||||||||||
| First Business Financial Services, Inc. | 3.3 | % | 5,156 | 121,012 | ||||||||
| Home BancShares, Inc./AR | 3.1 | % | 5,932 | 117,394 | ||||||||
| Toronto-Dominion Bank (The) | 3.3 | % | 2,825 | 121,277 | ||||||||
| 359,683 | ||||||||||||
| Chemicals | 6.0 | % | ||||||||||
| CF Industries Holdings, Inc | 2.8 | % | 4,411 | 106,305 | ||||||||
| PPG Industries, Inc. | 3.2 | % | 1,138 | 118,523 | ||||||||
| 224,828 | ||||||||||||
| Diversified Telecommunication Services | 3.7 | % | ||||||||||
| Nippon Telegraph & Telephone Corp. ADR | 3.7 | % | 2,887 | 135,920 | ||||||||
| Electric Utilities | 3.4 | % | ||||||||||
| Alliant Energy Corp | 3.4 | % | 3,171 | 125,889 | ||||||||
| Electronic Equipment, Instruments & Components | 3.3 | % | ||||||||||
| Amphenol Corp. - Class A | 3.3 | % | 2,117 | 121,368 | ||||||||
| Food Products | 10.4 | % | ||||||||||
| Cal-Maine Foods, Inc. | 3.6 | % | 3,038 | 134,644 | ||||||||
| Hain Celestial Group, Inc. (The)(a) | 3.3 | % | 2,444 | 121,589 | ||||||||
| Hormel Foods Corp | 3.5 | % | 3,560 | 130,296 | ||||||||
| 386,529 | ||||||||||||
| Gas Utilities | 3.5 | % | ||||||||||
| New Jersey Resources Corp | 3.5 | % | 3,358 | 129,451 | ||||||||
| Health Care Providers & Services | 7.0 | % | ||||||||||
| DaVita HealthCare Partners, Inc.(a) | 3.4 | % | 1,628 | 125,877 | ||||||||
| Ensign Group, Inc. (The) | 3.6 | % | 6,321 | 132,804 | ||||||||
| 258,681 | ||||||||||||
The accompanying notes are an integral part of the financial statements.
| 6 | Annual Report June 30, 2016 |
USCF ETF TRUST – STOCK SPLIT INDEX FUND
SCHEDULE OF INVESTMENTS
AT JUNE 30, 2016 (continued)
| % of Total Net Assets | Shares | Market Value | ||||||||||
| Hotels, Restaurants & Leisure | 3.4 | % | ||||||||||
| Starbucks Corp. | 3.4 | % | 2,227 | $ | 127,206 | |||||||
| Insurance | 10.0 | % | ||||||||||
| Allied World Assurance Co. Holdings AG | 3.3 | % | 3,511 | 123,377 | ||||||||
| AmTrust Financial Services, Inc. | 3.2 | % | 4,921 | 120,564 | ||||||||
| RLI Corp. | 3.5 | % | 1,915 | 131,714 | ||||||||
| 375,655 | ||||||||||||
| Machinery | 3.3 | % | ||||||||||
| Mueller Industries, Inc. | 3.3 | % | 3,839 | 122,387 | ||||||||
| Pharmaceuticals, Biotechnology & Life Sciences | 3.5 | % | ||||||||||
| AstraZeneca PLC ADR | 3.5 | % | 4,340 | 131,024 | ||||||||
| Professional Services | 3.4 | % | ||||||||||
| Exponent, Inc. | 3.4 | % | 2,178 | 127,217 | ||||||||
| Road & Rail | 6.6 | % | ||||||||||
| Canadian National Railway Co. | 3.3 | % | 2,094 | 123,672 | ||||||||
| Union Pacific Corp. | 3.3 | % | 1,400 | 122,150 | ||||||||
| 245,822 | ||||||||||||
| Software | 3.3 | % | ||||||||||
| Open Text Corp. | 3.3 | % | 2,045 | 120,982 | ||||||||
| Specialty Retail | 3.3 | % | ||||||||||
| Tractor Supply Co. | 3.3 | % | 1,333 | 121,543 | ||||||||
| Technology Hardware, Storage & Peripherals | 3.3 | % | ||||||||||
| Apple, Inc. | 3.3 | % | 1,297 | 123,993 | ||||||||
| Textiles, Apparel & Luxury Goods | 6.6 | % | ||||||||||
| Columbia Sportswear Co. | 3.2 | % | 2,095 | 120,546 | ||||||||
| NIKE, Inc - Class B | 3.4 | % | 2,269 | 125,249 | ||||||||
| 245,795 | ||||||||||||
| Total Common Stocks (Cost $3,946,362) | 99.8 | % | 3,710,844 | |||||||||
The accompanying notes are an integral part of the financial statements.
| 7 |
USCF ETF TRUST – STOCK SPLIT INDEX FUND
SCHEDULE OF INVESTMENTS
AT JUNE 30, 2016 (continued)
| % of Total Net Assets | Shares | Market Value | ||||||||||
| Short-Term Investment | 0.1 | % | ||||||||||
| Time Deposit | 0.1 | % | ||||||||||
| Brown Brothers Harriman & Co., 0.13% due 07/01/2016 | 0.1 | % | $ | 1,995 | $ | 1,995 | ||||||
| Total Short-Term Investment | ||||||||||||
| (Cost $1,995) | 0.1 | % | 1,995 | |||||||||
| Total Investments | ||||||||||||
| (Cost $3,948,357)(b) | 99.9 | % | 3,712,839 | |||||||||
| Other Assets in Excess of Liabilities | 0.1 | % | 3,673 | |||||||||
| Total Net Assets | 100.0 | % | $ | 3,716,512 | ||||||||
ADR – American Depositary Receipts
| (a) | Non income producing security. |
| (b) | The aggregate cost of investments for tax purposes was $3,958,043. The net unrealized depreciation was $245,204 which consisted of aggregate gross unrealized appreciation of $167,511 and aggregate gross unrealized depreciation of $412,715. |
| Summary of Investments by Country^ | ||||
| United States | 76.6 | % | ||
| Canada | 12.8 | |||
| Japan | 3.7 | |||
| United Kingdom | 3.5 | |||
| Switzerland | 3.3 | |||
| Short-Term Investments | 0.1 | |||
| 100.0 | % | |||
| Summary of Investments by Sector^ | ||||
| Financials | 19.8 | % | ||
| Consumer Discretionary | 19.4 | |||
| Industrials | 13.3 | |||
| Health Care | 10.5 | |||
| Consumer Staples | 10.4 | |||
| Information Technology | 9.9 | |||
| Utilities | 6.9 | |||
| Materials | 6.0 | |||
| Telecommunication Services | 3.7 | |||
| Short-Term Investment | 0.1 | |||
| 100.0 | % |
^ As a percentage of total investments. All stocks are listed on U.S. Exchanges.
The accompanying notes are an integral part of the financial statements.
| 8 | Annual Report June 30, 2016 |
USCF ETF TRUST – STOCK SPLIT INDEX FUND
STATEMENT OF ASSETS AND LIABILITIES
JUNE 30, 2016
| Assets: | ||||
| Investments, at Market Value | $ | 3,712,839 | ||
| Receivables: | ||||
| From Manager | 59,439 | |||
| Dividends | 4,821 | |||
| Total Assets | 3,777,099 | |||
| Liabilities: | ||||
| Payables: | ||||
| Accrued Management Fees | 1,676 | |||
| Accrued Administrative Agency Fees | 31,310 | |||
| Accrued Miscellaneous Expenses | 27,601 | |||
| Total Liabilities | 60,587 | |||
| Total Net Assets | $ | 3,716,512 | ||
| Net Assets Consist of: | ||||
| Capital Paid In | $ | 3,829,398 | ||
| Accumulated Undistributed Net Investment Income | 17,283 | |||
| Accumulated Net Realized Gain (Loss) on Investments | 105,349 | |||
| Net Unrealized Appreciation (Depreciation) on Investments | (235,518 | ) | ||
| Total Net Assets | $ | 3,716,512 | ||
| Net Asset Value Per Share | ||||
| Total Net Assets | $ | 3,716,512 | ||
| Shares of Beneficial Interest Outstanding (Unlimited Shares of $0.001 Par Value Authorized) | 240,000 | |||
| Net Asset Value | $ | 15.49 | ||
| Investments, at cost | $ | 3,948,357 | ||
The accompanying notes are an integral part of the financial statements.
| 9 |
USCF ETF TRUST – STOCK SPLIT INDEX FUND
STATEMENT OF OPERATIONS
FOR THE YEAR ENDED JUNE 30, 2016
| Investment Income: | ||||
| Dividend Income (less net foreign withholding tax $3,269) | $ | 95,740 | ||
| Interest Income | 17 | |||
| Total Investment Income | 95,757 | |||
| Expenses: | ||||
| Management Fees | 26,096 | |||
| Administrative Agency Fees | 135,529 | |||
| Directors Fees | 45,001 | |||
| Professional Fees | 48,601 | |||
| Shareholder Reporting Fees | 23,999 | |||
| Miscellaneous Expenses | 15,826 | |||
| Total Expenses | 295,052 | |||
| Less Fees Waived (Note 3) | (268,956 | ) | ||
| Net Expenses | 26,096 | |||
| Net Investment Income (Loss) | 69,661 | |||
| Realized and Unrealized Gain (Loss) on Investments: | ||||
| Net Realized Gain (Loss) on Investments | 379,793 | |||
| Net Change in Unrealized Appreciation (Depreciation) on Investments | (444,955 | ) | ||
| Net Change in Realized and Unrealized Gain (Loss) on Investments | (65,162 | ) | ||
| Net Increase (Decrease) in Net Assets Resulting from Operations | $ | 4,499 | ||
The accompanying notes are an integral part of the financial statements.
| 10 | Annual Report June 30, 2016 |
USCF ETF TRUST – STOCK SPLIT INDEX FUND
STATEMENTS OF CHANGES IN NET ASSETS
FOR THE YEAR ENDED JUNE 30, 2016 AND
THE PERIOD ENDED JUNE 30, 2015*
| For the Year Ended June 30, 2016 | For the Period Ended June 30, 2015* | |||||||
| Operations: | ||||||||
| Net Investment Income (Loss) | $ | 69,661 | $ | 62,140 | ||||
| Net Realized Gain (Loss) on Investments | 379,793 | 122,019 | ||||||
| Net Change in Unrealized Appreciation (Depreciation) on Investments | (444,955 | ) | 209,437 | |||||
| Net Increase (Decrease) in Net Assets Resulting from Operations | 4,499 | 393,596 | ||||||
| Distributions to Shareholders from: | ||||||||
| Net Investment Income | (69,512 | ) | (59,329 | ) | ||||
| Capital Gains | (204,237 | ) | — | |||||
| Total Distributions to Shareholders | (273,749 | ) | (59,329 | ) | ||||
| Shareholder Transactions: | ||||||||
| Proceeds from Shares Sold | 642,593 | 4,868,328 | ||||||
| Shares Issued as Reinvestment of Dividends and Distributions | — | — | ||||||
| Cost of Shares Redeemed | (1,533,850 | ) | (425,576 | ) | ||||
| Net Increase (Decrease) in Net Assets from Shares Transactions | (891,257 | ) | 4,442,752 | |||||
| Net Increase (Decrease) in Net Assets | (1,160,507 | ) | 4,777,019 | |||||
| Net Assets: | ||||||||
| Beginning of Period | 4,877,019 | 100,000 | ||||||
| End of Period1 | $ | 3,716,512 | $ | 4,877,019 | ||||
| 1 Includes Accumulated Undistributed Net Investment Income (Loss) of: | $ | 17,283 | $ | — | ||||
| Changes in Shares Outstanding: | ||||||||
| Shares Outstanding, Beginning of Period | 300,000 | 6,667 | * | |||||
| Shares Issued | 40,000 | 320,000 | ||||||
| Shares Issued in Reinvestment of Dividends and Distributions | — | — | ||||||
| Shares Redeemed | (100,000 | ) | (26,667 | ) | ||||
| Shares Outstanding, End of Period | 240,000 | 300,000 | ||||||
| * Inception Date, September 15, 2014. | ||||||||
The accompanying notes are an integral part of the financial statements.
| 11 |
USCF ETF TRUST – STOCK SPLIT INDEX FUND
FINANCIAL HIGHLIGHTS
SELECTED DATA FOR A SHARE OF COMMON STOCK OUTSTANDING THROUGHOUT THE PERIOD INDICTED:
| For the Year Ended June 30, 2016 | For the Period Ended June 30, 2015* | |||||||
| Net Asset Value, Beginning of Period | $ | 16.26 | $ | 15.00 | ||||
| Income (Loss) from Operations: | ||||||||
| Net Investment Income (Loss)(a) | 0.23 | 0.23 | ||||||
| Net Realized and Unrealized Gain (Loss) | (0.18 | ) | 1.25 | |||||
| Total Income (Loss) from Operations | 0.05 | 1.48 | ||||||
| Less Distributions From: | ||||||||
| Net Investment Income | (0.22 | ) | (0.22 | ) | ||||
| Capital Gains | (0.60 | ) | — | |||||
| Total Distributions | (0.82 | ) | (0.22 | ) | ||||
| Net Asset Value, End of Period | $ | 15.49 | $ | 16.26 | ||||
| Total Return(b) | 0.53 | % | 9.88 | % | ||||
| Net Assets, End of Period (thousands) | $ | 3,717 | $ | 4,877 | ||||
| Ratios of Average Net Assets: | ||||||||
| Gross Expenses | 6.22 | % | 4.66 | %** | ||||
| Net Expenses | 0.55 | % | 0.55 | %** | ||||
| Net Investment Income (Loss) | 1.47 | % | 1.87 | %** | ||||
| Portfolio Turnover Rate(c) | 60 | % | 57 | % | ||||
| * | Inception Date, September 15, 2014. |
| ** | Annualized. |
| (a) | Per share amounts have been calculated using the average shares method. |
| (b) | Total Return may reflect fee waivers and/or expense reimbursements and assume reinvestment of dividend distribution. In the absence of fee waivers and/or expense reimbursements, the total return would have been lower. Past performance is no guarantee of future results. |
| (c) | Portfolio turnover rate is not annualized for periods less than one year and does not include securities received or delivered from processing creations or redemptions. |
The accompanying notes are an integral part of the financial statements.
| 12 | Annual Report June 30, 2016 |
USCF ETF TRUST – STOCK SPLIT INDEX FUND
NOTES TO FINANCIAL STATEMENTS
JUNE 30, 2016
1) ORGANIZATION
USCF ETF Trust (the “Trust”) was organized as a Delaware statutory trust on November 8, 2013, as amended and restated on June 16, 2014. The Trust is authorized to have multiple series or portfolios, and may establish additional series or portfolios in the future. The Trust is an open-end management investment company, registered under the Investment Company Act of 1940, as amended (the “1940 Act”). The Fund issues shares of beneficial interest with $0.001 par value.
The Stock Split Index Fund (the “Fund”) is currently the only operational series of the Trust. The Fund is an exchange-traded fund (“ETF”) that seeks to track the price and yield performance, before fees and expenses, of the 2 For 1 Index® (the “Index”). The Fund employs a “passive management” – or indexing – investment approach designed to track the performance of the Index. The Fund generally uses a replication strategy to achieve its investment objective, meaning, it generally will invest in substantially all of the securities in the Index in approximately the same proportion as the Index. Under normal market conditions, the Fund generally invests substantially all, but at least 80% of its total assets in the securities comprising the Index. In addition, the Fund may invest in cash and cash equivalents or money market instruments. The Fund commenced operations on September 15, 2014 (the “Inception Date”). The Fund was listed on the NYSE Arca, Inc. (“NYSE Arca”) on September 16, 2014 (the “Listing Date”).
2) SIGNIFICANT ACCOUNTING POLICIES
The accompanying financial statements were prepared in accordance with Generally Accepted Accounting Principles in the United States of America (“GAAP”), which require the use of estimates and assumptions made by management. These may affect the reported amounts of assets and liabilities and disclosure of contingent assets and liabilities at the date of the financial statements and the reported amounts of increases and decreases in net assets from operations during the reporting period. Actual results could differ from those estimates. The following is a summary of significant accounting policies consistently followed by the Fund in preparation of its financial statements.
Basis of Presentation
The financial statements have been prepared in conformity with GAAP as detailed in the Financial Accounting Standards Board’s (“FASB”) Accounting Standards Codification.
| 13 |
The Fund is an investment company and follows the accounting and reporting guidance in FASB Topic 946.
Security Valuation
Investments in securities are carried at market value. All equity securities that are traded on a national securities exchange are valued at the last sale price at the time of the close of the New York Stock Exchange (“NYSE”). If on a particular day an exchange-listed security does not trade, then the mean between the closing bids and asked prices will be used. In the case of securities listed on more than one national securities exchange, the last quoted sale, up to the time of valuation, on the exchange on which the security is principally traded will be/is used. If there were no sales on that exchange, the last quoted sale on the other exchange will be/is used.
For securities that are traded on the NASDAQ, the NASDAQ Official Closing Price (e.g., the NASDAQ Closing Cross price, if available) is used. All non-NASDAQ equity securities that are not traded on a listed exchange are valued at the last sale price at the close of the NYSE. If a non-exchange listed security does not trade on a particular day, or if a last sales price or NASDAQ Official Closing Price is not available, then the mean between the closing bid and asked price will be used.
Securities having a remaining maturity of 60 days or less are valued at amortized cost, which approximates market value.
The cost of securities sold is determined on the identified cost basis. When market quotations are not readily available or when events occur that make established valuation methods unreliable, securities of the Fund may be valued at fair value determined in good faith by or under the direction of the Board of Trustees.
Security transactions are recorded on the dates the transactions are entered, which is the trade date.
Fair Value Measurement
The Fund utilizes various methods to measure the fair value of most of its investments on a recurring basis. GAAP establishes a hierarchy that prioritizes inputs to valuation methods. The three levels of inputs are:
Level 1 – Unadjusted quoted prices in active markets for identical assets or liabilities that the Fund has the ability to access.
Level 2 – Observable inputs other than quoted prices included in Level 1 that are observable for the asset or liability, either directly or indirectly. These inputs may include quoted prices for the identical instrument or an inactive market, prices for similar instruments, interest rates, prepayment speeds, credit risk, yield curves, default rates and similar data.
| 14 | Annual Report June 30, 2016 |
Level 3 – Unobservable inputs for the asset or liability, to the extent relevant observable inputs are not available, representing the Fund’s own assumptions about the assumptions a market participant would use in valuing the asset or liability, and would be based on the best information available.
The availability of observable inputs can vary from security to security and is affected by a wide variety of factors, including, for example, the type of security, whether the security is new and not yet established in the marketplace, the liquidity of markets, and other characteristics particular to the security. To the extent that valuation is based on models or inputs that are less observable or unobservable in the market, the determination of fair value requires more judgment. Accordingly, the degree of judgment exercised in determining fair value is greatest for instruments categorized in Level 3.
The inputs used to measure fair value may fall into different levels of the fair value hierarchy. In such cases for disclosure purposes, the level in the fair value hierarchy within which the fair value measurement falls in its entirety, is determined based on the lowest level input that is significant to the fair value measurement in its entirety.
The following table summarizes the valuation of securities at June 30, 2016 using the fair value hierarchy:
| Investments, at value | Total | Level 1 | Level 2 | Level 3 | ||||||||||||
| Common Stocks: | ||||||||||||||||
| Auto Components | $ | 226,871 | $ | 226,871 | $ | — | $ | — | ||||||||
| Banks | 359,683 | 359,683 | — | — | ||||||||||||
| Chemicals | 224,828 | 224,828 | — | — | ||||||||||||
| Diversified Telecommunication Services | 135,920 | 135,920 | — | — | ||||||||||||
| Electric Utilities | 125,889 | 125,889 | — | — | ||||||||||||
| Electronic Equipment, Instruments & Components | 121,368 | 121,368 | — | — | ||||||||||||
| Food Products | 386,529 | 386,529 | — | — | ||||||||||||
| Gas Utilities | 129,451 | 129,451 | — | — | ||||||||||||
| Health Care Providers & Services | 258,681 | 258,681 | — | — | ||||||||||||
| Hotels, Restaurants & Leisure | 127,206 | 127,206 | — | — | ||||||||||||
| Insurance | 375,655 | 375,655 | — | — | ||||||||||||
| Machinery | 122,387 | 122,387 | — | — | ||||||||||||
| Pharmaceuticals, Biotechnology & Life Sciences | 131,024 | 131,024 | — | — | ||||||||||||
| 15 |
| Investments, at value | Total | Level 1 | Level 2 | Level 3 | ||||||||||||
| Professional Services | $ | 127,217 | $ | 127,217 | $ | — | $ | — | ||||||||
| Road & Rail | 245,822 | 245,822 | — | — | ||||||||||||
| Software | 120,982 | 120,982 | — | — | ||||||||||||
| Specialty Retail | 121,543 | 121,543 | — | — | ||||||||||||
| Technology Hardware, Storage & Peripherals | 123,993 | 123,993 | — | — | ||||||||||||
| Textiles, Apparel & Luxury Goods | 245,795 | 245,795 | — | — | ||||||||||||
| Short-Term Investment: | ||||||||||||||||
| Time Deposit | 1,995 | — | 1,995 | — | ||||||||||||
| Total Investments, at value | $ | 3,712,839 | $ | 3,710,844 | $ | 1,995 | $ | — | ||||||||
For the year ended June 30, 2016, the Fund did not have any transfers between Level 1, Level 2 and Level 3 securities.
Income
Dividend income is recorded on the ex-dividend date, as soon as information is available to the Fund. Distributions to shareholders, which are determined in accordance with income tax regulations, are also recorded on the ex-dividend date. Interest income is recorded as earned. Discounts and premiums on securities purchased are amortized over the life of the respective securities.
As of and during the year ended June 30, 2016, the Fund did not have a liability for any unrecognized tax benefits in the accompanying financial statements. The Fund files income tax returns in the U.S. federal jurisdiction and Delaware.
The Fund follows ASC 740 “Income Taxes”, which requires that the financial statements effects of a tax position taken or expected to be taken in a tax return be recognized in the financial statements when it is more likely than not, based on the technical merits, that the position will be sustained upon examination. Management has concluded that the Fund has taken no uncertain tax positions that require adjustment to the financial statements.
Federal and Other Taxes
It is the Trust’s policy to comply with the federal income and excise tax requirements of the Internal Revenue Code of 1986, as amended, applicable to regulated investment companies. Accordingly, the Fund intends to distribute substantially all of its income and net realized gains on investments, if any, to shareholders each year. Therefore, no federal income tax provision is required in the Funds’ financial statements. Under the applicable foreign tax laws, a withholding tax may be imposed on interest, dividends and capital gains at various rates.
GAAP requires that certain components of net assets be adjusted to reflect permanent differences between financial and tax reporting. These reclassifications have no effect on net assets or NAV per share. The following permanent differences as of June 30, 2016, attributable to realized gains (losses) from in-kind redemptions, were reclassified to the following accounts:
| 16 | Annual Report June 30, 2016 |
| Capital Paid In | $ | 134,563 | ||
| Undistributed (Distribution in Excess) Net Investment Income | $ | 17,134 | ||
| Undistributed (Accumulated) Net Realized Gain (Loss) | $ | (151,697 | ) |
Management has reviewed the tax positions and has concluded that no liability for unrecognized tax benefits should be recorded related to uncertain tax positions taken on returns filed for open tax years or expected to be taken with the 2015 tax returns. Each Fund’s federal tax returns for the prior three fiscal years remain subject to examination by the Internal Revenue Service.
Dividends and Distributions
Dividends and distributions to shareholders are paid on a quarterly basis. Dividends and distributions are recorded on the ex-dividend date. Income dividends and capital gains distributions are determined in accordance with federal tax regulations and may differ from those determined in accordance with GAAP. To the extent these differences are permanent, such amounts are reclassified within the capital accounts based on their federal tax basis treatment; temporary differences do not require such reclassification.
Indemnification
The Trust will indemnify its officers and trustees for certain liabilities that may arise from the performance of their duties to the Trust. Additionally, in the normal course of business, the Trust enters into contracts that contain a variety of representations and warranties and which provide general indemnities. The Fund’s maximum exposure under these arrangements is unknown, as this would involve future claims that may be made against the Fund that have not yet occurred. However, the Trust expects the risk of loss due to these warranties and indemnities to be remote.
Other
The Fund follows industry practice and records security transactions on the trade date. Dividend income is recognized on the ex-dividend date, and interest income is recognized on an accrual basis. Discounts and premiums on securities purchased are amortized over the lives of the respective securities.
3) INVESTMENT ADVISORY AND OTHER AGREEMENTS
Investment Adviser
USCF Advisers LLC (the “Adviser”) is the investment adviser to the Fund and as such has overall responsibility for the general management and administration of the Trust. Pursuant to the Investment Advisory Agreement, the Adviser provides an investment program for the Fund and manages the investment of its assets.
| 17 |
The Adviser has arranged for custody, distribution, fund administration, transfer agency and all other non-distribution related services necessary for the Fund to operate. The Adviser bears all of its own costs associated with providing these advisory services and the expenses of the members of the Board of Trustees who are affiliated with the Adviser. The Adviser may make payments from its own resources to broker-dealers and other financial institutions in connection with the sale of Fund shares. As compensation for its services and its assumption of certain expenses, the Fund pays the Adviser a management fee, which is calculated daily and paid monthly, equal to 0.55% of the Fund’s average daily net assets. For the year ended June 30, 2016, the Adviser earned $26,096.
The Adviser has entered into an Expense Limitation Agreement with the Fund under which it has agreed to waive or reduce its fees and to assume other expenses of the Fund, if necessary, in an amount that limits “Total Annual Fund Operating Expenses” (exclusive of interest, taxes, brokerage commissions and other expenses that are capitalized in accordance with GAAP, dividend, interest and brokerage expenses paid, acquired fund fees and expenses, if any, extraordinary expenses, if any, and payments, if any, under the Rule 12b-1 Plan) to not more than 0.55% of the average daily net assets for the Fund for the period from the Fund’s inception until October 31, 2017.
The Adviser may terminate the Expense Limitation Agreement at any time after October 31, 2017, but upon not less than 90 days’ notice to the Fund. The terms of the Expense Limitation Agreement may be revised upon renewal, if renewed. The Adviser is permitted to recoup from the Fund previously waived fees or reimbursed expenses for three years from the fiscal year in which fees were waived or expenses reimbursed, as long as such recoupment does not cause such Fund’s operating expenses to exceed the expense cap that was applicable during the period in which the fees were waived or expenses were reimbursed.
As of June 30, 2016, the recoupment amount of the expenses to the Adviser is as follows:
| Accrued in Fiscal Year: | Amount Eligible: | Amount Recouped: | Amount Expires: | |||||||||
| 2015 | $ | 97,322 | $ | — | 2018 | |||||||
| 2016 | $ | 268,956 | $ | — | 2019 | |||||||
Administrator, Custodian and Transfer Agent
Brown Brothers Harriman & Company (“BBH”), serves as the administrator, custodian and transfer agent for the Fund. Under the Administrative Agency Agreement with the Trust, BBH performs certain administrative, accounting, transfer agency and dividend disbursing services for the Fund and prepares certain SEC reports filed with the U.S. Securities and Exchange Commission (“SEC”) on behalf of the Trust and the Fund. Under the Custodian Agreement with the Trust, BBH maintains in separate accounts: cash, securities and other assets of the Fund; keeps all necessary accounts and records, and provides other services. BBH is required, upon the order of the Trust, to deliver securities held by BBH and to make payments for securities purchased by the Trust for the Fund. As compensation for the foregoing services, BBH receives certain out-of-pocket costs, transaction fees, and asset-based fees, which are charged to the Fund.
| 18 | Annual Report June 30, 2016 |
Buying and Selling Fund Shares
Shares are issued and redeemed by the Trust only in large blocks of shares (“Creation Baskets” and “Redemption Baskets”, respectively). Currently Creation Baskets and Redemption Baskets generally consist of blocks of 50,000 shares (20,000 shares prior to January 15, 2016) or multiples thereof at net asset value. Such transactions are generally permitted on an in-kind basis, with a balancing cash component to equate the transaction to the net asset value per share of the Fund on the transaction date. Only entities who have entered into an authorized participant agreement (an “Authorized Participant”) with the Distributor will be permitted to purchase and redeem shares directly from the Trust. An Authorized Participant who wishes to create a Creation Basket or redeem a Redemption Basket at net asset value is subject to a standard transaction fee of $350 on the date of such creation or redemption, regardless of the number of Creation Baskets or Redemption Baskets created or redeemed on that day.
Distributor
ALPS Distributors, Inc. (the “Distributor”) is the distributor of Creation Units of shares of the Trust. The Distributor has entered into a Distribution Agreement with the Trust pursuant to which it distributes shares of the Fund in creation basket aggregations. The Distributor is a broker-dealer registered under the Securities Exchange Act of 1934, as amended, and a member of the Financial Industry Regulatory Authority. Fees under the Distribution Agreement are paid by the Adviser. The Adviser may, from time to time and from its own resources, make other distribution-related payments to the Distributor or other persons.
Licensing Agreement
The Index Provider for the Fund is Neil Macneale, Inc. (the “Index Provider”). The Index Provider is not affiliated with the Fund, the Trust, the Adviser or the Distributor. The Adviser has entered into a license agreement with the Index Provider to use the Index. Fees under the Licensing Agreement are charged to the Adviser.
4) INVESTMENT TRANSACTIONS – PURCHASES AND SALES
During the year ended June 30, 2016, the aggregate cost of purchases and proceeds from sales of investments (excluding short-term investments and in-kind transactions) were $2,793,509 and $2,998,042, respectively.
| 19 |
5) DISTRIBUTIONS AND TAXES
It is the Fund’s policy to qualify as a regulated investment company by complying with the requirements of the Internal Revenue Code of 1986, as amended, applicable to regulated investment companies and by distributing substantially all of its earnings to shareholders. Therefore, no federal income tax provision is required.
Income distributions and capital gain distributions are determined in accordance with tax regulations, which may differ from GAAP.
6) BENEFICIAL OWNERSHIP
Certain owners of the Adviser are also owners and/or trustees of the Fund. These individuals may receive benefits from any management fees paid to the Adviser.
Shareholders holding more than 5% of the Fund’s outstanding shares as of June 30, 2016 constituted 83.62% of the Fund. As of June 30, 2016, there was no beneficial ownership, either directly or indirectly, of more than 25% of the voting securities of the Fund, which would create a presumption of control of the Fund, under Section 2(a)(9) of the 1940 Act.
7) DIVIDEND AND TAX COMPONENTS OF CAPITAL
The tax character of distributions paid during the fiscal year ended June 30, 2016, were from Ordinary Income and Capital Gains in the amounts of $69,512 and $204,237, respectively.
As of June 30, 2016, the components of accumulated earnings on a tax basis were as follows:
| Undistributed Ordinary Income – Net | $ | 50,493 | ||
| Undistributed Long-Term Capital Gains – Net | 81,825 | |||
| Other Book/Tax Temporary Differences | (9,686 | ) | ||
| Unrealized Appreciation (Depreciation) | (235,518 | ) | ||
| Total Accumulated Earnings/(Losses) – Net | $ | (112,886 | ) |
The difference between book-basis and tax-basis unrealized appreciation (depreciation) is attributable to the tax deferral of losses on wash sales.
8) CAPITAL LOSS CARRY FORWARD
Under the Regulated Investment Company Modernization Act of 2010 (the “Act”), the Funds are permitted to carry forward capital losses incurred in taxable years beginning after December 22, 2010, for an unlimited period. However, any losses incurred during those future taxable years will be required to be utilized prior to the losses incurred in preenactment taxable years. As a result of this, preenactment capital loss carryforwards may be more likely to expire unused.
| 20 | Annual Report June 30, 2016 |
As of June 30, 2016, the Fund did not generate net capital loss carryforwards.
9) TRUSTEES FEES
The Trust compensates each Trustee who is not an employee of the Adviser. Total Trustees’ fees are allocated to the Fund. Prior to the Fund’s commencement of operations, no payments were made to the Trustees during the organization of the Fund. Such payments were made as part of the organization and offering costs of the Fund, which were borne by the Adviser.
10) CASH MANAGEMENT TRANSACTIONS
The Fund subscribes to BBH Cash Management Service (“CMS”). The BBH CMS is an investment product that automatically sweeps the Fund’s cash balances into overnight offshore time deposits with either BBH’s Grand Cayman branch or branches of preapproved world class commercial banks. This fully automated program allows the Fund to earn interest on cash balances.
Excess cash invested with deposit institutions domiciled outside of the United States, as with any offshore deposit, may be subject to sovereign actions in the jurisdiction including, but not limited to, freeze, seizure, or diminution. The Fund bears the risk associated with the repayment of principal and payment of interest on such instruments by the institution with which the deposit is ultimately placed. Balances in the BBH CMS are accounted for on a cost basis, which approximates market value.
11) SUBSEQUENT EVENTS
The Fund has evaluated the need for disclosure and/or adjustments resulting from subsequent events through the date the financial statements were issued. Based on this evaluation, no adjustments were required to the financial statements.
12) QUARTERLY PORTFOLIO HOLDINGS INFORMATION
The Fund files its complete schedule of portfolio holdings with the SEC for the first and third quarters of each fiscal year on Form N-Q within 60 days after the end of the period. Copies of the Fund’s Form N-Q are available without charge, upon request, by contacting the Fund at 1.800.920.0259 and on the SEC’s website at www.sec.gov. You may also review and copy Form N-Q may be obtained, after paying a duplicating fee, by electronic request at the following e-mail address: publicinfo@sec.gov, or by writing the SEC’s Public Reference Section, Washington, D.C. 20549-1520.
| 21 |
REPORT OF INDEPENDENT REGISTERED PUBLIC ACCOUNTING FIRM
To the Shareholders and
Board of Trustees of
USCF ETF Trust
We have audited the accompanying statement of assets and liabilities of Stock Split Index Fund (the initial series of the USCF ETF Trust) (the “Fund”), including the schedule of investments, as of June 30, 2016, and the related statement of operations for the year then ended, and the statements of changes in net assets and financial highlights for the year ended June 30, 2016 and the period ended June 30, 2015. These financial statements and financial highlights are the responsibility of the Fund’s management. Our responsibility is to express an opinion on these financial statements and financial highlights based on our audits.
We conducted our audits in accordance with standards of the Public Fund Accounting Oversight Board (United States). Those standards require that we plan and perform the audits to obtain reasonable assurance about whether the financial statements and financial highlights are free of material misstatement. The Fund is not required to have, nor were we engaged to perform, an audit of its internal control over financial reporting. Our audits included consideration of internal control over financial reporting as a basis for designing audit procedures that are appropriate in the circumstances, but not for the purpose of expressing an opinion on the effectiveness of the Fund’s internal control over financial reporting. Accordingly, we express no such opinion. An audit also includes examining, on a test basis, evidence supporting the amounts and disclosures in the financial statements, assessing the accounting principles used and significant estimates made by management, as well as evaluating the overall financial statement presentation. Our procedures included confirmation of securities owned as of June 30, 2016 by correspondence with the custodian and brokers. We believe that our audits provide a reasonable basis for our opinion.
In our opinion, the financial statements and financial highlights referred to above present fairly, in all material respects, the financial position of Stock Split Index Fund as of June 30, 2016, the results of its operations for the year then ended, and its changes in net assets and financial highlights for the year ended June 30, 2016 and the period ended June 30, 2015, in conformity with accounting principles generally accepted in the United States of America.

Greenwood Village, Colorado
August 24, 2016
| 22 | Annual Report June 30, 2016 |
ADDITIONAL INFORMATION
(UNAUDITED)
Members of the Board and Officers of the Trust
Set forth below are the names, ages, position with the Trust, term of office, and the principal occupations and other directorships for a minimum of the last five years, of each of the persons currently serving as members of the Board and as Executive Officers of the Trust. Also included below is the term of office for each of the Executive Officers of the Trust. The members of the Board serve as Trustees for the life of the Trust or until retirement, removal, or their office is terminated pursuant to the Trust’s Declaration of Trust and Trust Agreement.
The Chairman of the Board, Nicholas D. Gerber, and Management Trustees, Andrew F Ngim and Stuart P. Crumbaugh are interested persons of the Trust as that term is defined under Section 2(a)(19) of the 1940 Act (“Interested Trustees”) because of their affiliation with the Adviser.
Messrs. Thomas E. Gard, Jeremy Henderson, John D. Schwartz, and H. Abram Wilson, and their immediate family members have no affiliation or business connection with the Adviser or the Fund’s principal underwriter or any of their affiliated persons and do not own any stock or other securities issued by the Adviser or the Fund’s principal underwriter. These Trustees are not Interested Persons of the Trust and are referred to herein as “Independent Trustees.”
The following tables present information about the Trustees and Officers. The Statement of Additional Information has additional information about the Trustees and is available without charge, upon request, by contacting the Fund at 1(800) 920-0259, or visiting: www.uscfinvestments.com.
| 23 |
Independent Trustees
| Name and Age(1) | Position(s) Held with Trust | Term of Office and Length of Time Served(2) | Principal Occupation(s) During Past 5 Years | Number of Portfolios in Fund Complex Overseen by Trustee(3) | Other Directorships Held by Trustee (Past 5 Years) | |||||
| Thomas E. Gard Age: 57 | Independent Trustee | May 2015 to Present | Partner of Armanino LLP from 1995 to Present; Member of Armanino Executive Committee from 2001 to 2015; and Partner in Charge of Armanino LLP Audit Department December from 2004 to 2013. | One | None | |||||
| Jeremy Henderson Age: 59 | Independent Trustee | Since Inception | Managing Director of Societe Generale from 1991 to 2007. Mr. Henderson has been retired from 2007 to Present. | One | None | |||||
| John D. Schwartz Age: 48 | Independent Trustee | Since Inception | President of Sam CLAR Office Furniture from 1996 to Present. | One | None | |||||
| H. Abram Wilson Age: 69 | Independent Trustee | Since Inception | San Ramon City, CA Councilmember from 1999 to 2011, including Mayor of San Ramon City, CA from 2002 to 2009. Mr. Wilson has been retired from 2011 to Present. | One | None |
| 24 | Annual Report June 30, 2016 |
Interested Trustees and Officers of the Trust
| Name and Age(1) | Position(s) Held with Trust | Term of Office and Length of Time Served(2) | Principal Occupation(s) During Past 5 Years | Number of Portfolios in Fund Complex Overseen by Trustee(3) | Other Directorships Held by Trustee (Past 5 Years) | |||||
| Nicholas D. Gerber(4) Age: 53 | Chairman and Trustee | Since Inception | Chairman of the Board of Managers for USCF Advisers LLC (“USCF Advisers”) from June 2013 to Present; President of USCF Advisers from June 2013 to June 2015 and Vice President of USCF Advisers from June 2015 to Present; Management Director of the United States Commodity Funds LLC (“USCF”) from May 2005 to Present; President and CEO of USCF from June 2005 to June 2015 and Vice President of USCF from June 2015 to Present; Chief Executive Officer, President and Secretary of Concierge Technologies, Inc. from January 2015 to Present; and Portfolio manager of the Ameristock Mutual Fund, Inc. a mutual fund registered under the 1940 Act, from August 1995 to January 2013. | One | Management Director of USCF, which is the sponsor of a family of commodity pools whose shares are registered under the Securities Act of 1933. Chief Executive Officer, President and Secretary, Chairman of the Board of Concierge Technologies, Inc. from January 2015 to Present. | |||||
| John P. Love Age: 44 | President and Chief Executive Officer (Principal Executive Officer) | December 2015 to Present | President of USCF Advisers from June 2015 to Present; President and Chief Executive Officer of USCF from June 2015 to Present; Senior Portfolio Manager of USCF from March 2010 to May 18, 2015; and Portfolio manager of USCF from April 2006 to March 2010. | N/A | N/A | |||||
| Stuart P. Crumbaugh(4) Age: 52 | Chief Financial Officer (Principal Accounting and Principal Financial Officer), Treasurer, Secretary and Trustee | May 2015 to Present | Chief Financial Officer (Principal Accounting Officer), Treasurer and Secretary of USCF Advisers and USCF from April 2015 to Present; Vice President Finance and Chief Financial Officer of Sikka Software Corporation from March 2014 to April 2015; Vice President, Corporate Controller and Treasurer of Auction.com, LLC from December 2012 to December 2013; Chief Financial Officer of IP Infusion Inc., from March 2011 to September 2012; and Consultant from January 2010 to February 2011. | One | Independent Trustee of USCF ETF Trust from Inception to February 2015. |
| 25 |
| Name and Age(1) | Position(s) Held with Trust | Term of Office and Length of Time Served(2) | Principal Occupation(s) During Past 5 Years | Number of Portfolios in Fund Complex Overseen by Trustee(3) | Other Directorships Held by Trustee (Past 5 Years) | |||||
| Andrew F Ngim(4) Age: 56 | Trustee and Portfolio Manager | Trustee from Inception to February 2015 and May 2015 to Present; Portfolio Manager from Inception to Present | Board of Managers, Assistant Secretary and Assistant Treasurer of USCF Advisers from June 2013 to Present; Management Director of USCF from May 2005 to Present; Treasurer of USCF from 2005 to February 2012; Portfolio Manager for the United States Commodity Index Funds Trust from January 2013 to Present; Ameristock Corporation’s Managing Director from January 1999 to January 2013; and co-portfolio manager of Ameristock Mutual Fund, Inc. from January 2000 to January 2013. | One | Management Director of USCF, which is the sponsor of a family of commodity pools whose shares are registered under the Securities Act of 1933. | |||||
| Carolyn M. Yu Age: 57 | Chief Legal Officer, Assistant Secretary, Chief Compliance Officer and AML Officer | Chief Legal Officer and Assistant Secretary from May 2015 to Present; Chief Compliance Officer from February 2015 to Present; AML Officer since Inception | General Counsel of USCF from May 2015 to Present; Chief Compliance Officer of USCF from February 2013 to Present; Associate Counsel of USCF from August 2011 to June 2015; Assistant Chief Compliance Officer of USCF ETF Trust from June 2014 to February 2015; and Branch Chief of the Securities Enforcement Branch for the State of Hawaii, Department of Commerce and Consumer Affairs from 2008 to 2011. | N/A | N/A |
| (1) | The address of each Trustee and officer is c/o USCF ETF Trust, 1999 Harrison Street, Suite 1530, Oakland, California 94612. |
| (2) | The Trustees and Officers serve until their successors are duly elected and qualified. |
| (3) | As of the date of this report, the Fund is the only registered investment company advised by USCF Advisers LLC or any affiliated person. |
| (4) | Messrs. Gerber, Love, Crumbaugh and Ngim are “interested persons” of the Trust (as that term is defined in the 1940 Act) because of their affiliation with the Adviser. |
| 26 | Annual Report June 30, 2016 |

Investment Adviser
USCF Advisers LLC
1999 Harrison Street, Suite 1530
Oakland, California 94612
Administrator, Custodian and Transfer Agent
Brown Brothers Harriman & Company
50 Post Office Square
Boston, Massachusetts 02110-1548
Distributor
ALPS Distributors, Inc.
1290 Broadway, Suite 1100
Denver, Colorado 80203
Independent Registered Public Accounting Firm
Spicer Jeffries LLP
5251 S. Quebec Street, Suite 200
Greenwood Village, Colorado 80111
Trustees
Nicholas D. Gerber
Stuart P. Crumbaugh
Andrew F Ngim
Jeremy Henderson
John D. Schwartz
H. Abram Wilson
Thomas Gard
| 27 |
Proxy Voting Information
A description of the policies and procedures that the Adviser uses to determine how to vote proxies relating to portfolio securities of the Fund is available without charge by contacting the Fund at 1.800.920.0259, on the Fund’s website at www.uscfinvestments.com, and on the SEC’s website at www.sec.gov. Information regarding how the Fund voted such proxies during the 12 month period ended June 30, 2016 is also available without charge by calling the Fund and on the SEC’s website at www.sec.gov.
Premium/Discount Information
Information about the differences between the daily market price on the secondary markets for shares of the Fund and the Fund’s net asset value may be found on the Fund’s website at www.uscfinvestments.com.
ALPS Distributors, Inc .
Must be accompanied or preceded by a current prospectus which contains more information on fees, risks and expenses. Please read the prospectus carefully before investing or sending money.
| 28 | Annual Report June 30, 2016 |

ITEM 2. CODE OF ETHICS.
As of the period ended June 30, 2016 (the “Reporting Period”), the Registrant has adopted a code of ethics that applies to the Registrant’s principal executive officer, principal financial officer, principal accounting officer, controller or persons performing similar functions. During the Reporting Period, there were no changes to, amendments to, or waivers from any provision of the code of ethics. A copy of this code of ethics may also be obtained upon request, free of charge, by calling (510) 522-9600 and is also available on the Registrant’s website at www.uscfinvestments.com.
ITEM 3. AUDIT COMMITTEE FINANCIAL EXPERT.
The Registrant’s Board of Trustees has determined that Mr. Thomas E. Gard possesses the attributes identified in Instruction (b) of Item 3 of Form N-CSR and has designated Mr. Gard as the Registrant’s “audit committee financial expert.” Mr. Gard qualifies as an “independent” Trustee, meaning that he is not an “interested person” of the Registrant (as that term is defined in Section 2(a)(19) of the 1940 Act) and he does not accept directly or indirectly, any consulting, advisory, or other compensatory fee from the Registrant (except in his capacity as a Board or committee member).
ITEM 4. PRINCIPAL ACCOUNTANT FEES AND SERVICES.
(a) Audit Fees
The aggregate fees billed for each of the last two fiscal years ended June 30, 2016, and June 30, 2015 for professional services rendered by the principal accountant for the audit of the Registrant’s annual financial statements or services that are normally provided by the accountant in connection with statutory and regulatory filings or engagements for that fiscal year were $13,500 in 2016 and $12,500 in 2015.
(b) Audit Related Fees
The aggregate fees billed for each of the last two fiscal years ended June 30, 2016, and June 30, 2015, for assurance and related services rendered to the Registrant by the principal accountant that are reasonably related to the performance of the audit of the Registrant’s financial statements and are not reported under paragraph (a) of this Item were $11,500 in 2016 and $10,500 in 2015.
(c) Tax Fees
The aggregate fees billed for each of the last two fiscal years ended June 30, 2016 and June 20, 2015 for professional services rendered to the Registrant by the principal accountant for tax compliance, tax advice and tax planning were $2,000 in 2016 and $2,000 in 2015. These services consisted of (i) review or preparation of U.S. federal, state, local and excise tax returns; (ii) U.S. federal, state and local entity tax planning, advice and assistance regarding statutory, regulatory or administrative developments, and (iii) tax advice regarding tax qualification.
(d) All Other Fees
The aggregate fees billed for each of the last two fiscal years ended June 30, 2016, and June 30, 2015, for products and services provided by the principal accountant, other than the services reported in paragraphs (a) through (c) of this Item were $0 for 2016 and $0 for 2015.
(e)(1) Pursuant to the Registrant’s Audit Committee Charter that has been adopted by the audit committee, the audit committee shall approve all audit and permissible non-audit services to be provided to the Registrant and all permissible non-audit services to be provided to its investment adviser or any entity controlling, controlled by or under common control with the investment adviser that provides ongoing services to the Registrant if the engagement relates directly to the operations and financial reporting of the Registrant.
(e)(2) The percentage of services described paragraphs (b) through (d) of this Item that were approved by the audit committee pursuant to paragraph (c)(7)(i)(C) of Rule 2-01 of Regulation S-X, with respect to: Audit-Related Fees were 85% for 2016 and 84% for 2015; Tax Fees were 15% for 2016 and 16% for 2015; and Other Fees were 0% for 2016 and 0% for 2015.
(f) Not applicable.
(g) The aggregate non-audit fees billed by the Registrant’s accountant for services rendered to the Registrant, and rendered to the Registrant’s investment adviser (not including any sub-adviser whose role is primarily portfolio management and is subcontracted with or overseen by another investment adviser), and any entity controlling, controlled by, or under common control with the investment adviser that provides ongoing services to the Registrant for each of the last two fiscal years of the Registrant were $0 for 2016 and in $0 2015.
(h) The Registrant’s audit committee has considered whether the provision of non-audit services that were rendered to the Registrant’s investment adviser (not including any subadviser whose role is primarily portfolio management and is subcontracted with or overseen by another investment adviser), and any entity controlling, controlled by, or under common control with the investment adviser that provides ongoing services to the Registrant that were not pre-approved pursuant to paragraph (c)(7)(ii) of Rule 2-01 of Regulation S-X is compatible with maintaining the principal accountant’s independence.
ITEM 5. AUDIT COMMITTEE OF LISTED REGISTRANTS.
| (a) | The Registrant has a separately designated Audit Committee established in accordance with Section 3(a)(58)(A) of the Securities Exchange Act of 1934, as amended, which consists of independent trustees of the Registrant. The Audit Committee members are Jeremy Henderson, John Schwartz, H. Abram Wilson and Thomas E. Gard. |
| (b) | Not applicable. |
ITEM 6. SCHEDULE OF INVESTMENTS.
| (a) | The Schedule of Investments is included as part of the report to shareholders filed under Item 1 of this Form N-CSR. |
| (b) | Not applicable. |
ITEM 7. DISCLOSURE OF PROXY VOTING POLICIES AND PROCEDURES FOR CLOSED-END MANAGEMENT INVESTMENT COMPANIES.
Not Applicable.
ITEM 8. Portfolio Managers of Closed-End Management Investment Companies.
Not Applicable.
ITEM 9. PURCHASES OF EQUITY SECURITIES BY CLOSED-END MANAGEMENT INVESTMENT COMPANIES AND AFFILIATED PURCHASERS.
Not Applicable.
ITEM 10. SUBMISSION OF MATTERS TO A VOTE OF SECURITY HOLDERS.
There have been no changes to the procedures by which shareholders may recommend nominees to the Registrant’s Board of Trustees that would require disclosure herein.
ITEM 11. CONTROLS AND PROCEDURES.
| (a) | The Registrant’s principal executive officer and principal financial officer have concluded that the Registrant’s disclosure controls and procedures (as defined in Rule 30a-3(c) under the 1940 Act) are effective based on their evaluation of these controls and procedures as of a date within 90 days of the filing date of this document. |
| (b) | There was no change in the registrant’s internal control over financial reporting (as defined in Rule 30a-3(d) under the 1940 Act) during the period covered by this report that has material affected, or is reasonably likely to materially affect, the registrant’s internal control over financial reporting. |
ITEM 12. EXHIBITS.
(a)(1) Not Applicable.
(a)(2) Certifications of the Registrant’s principal executive officer and principal financial officer pursuant to Rule 30a-2(a) under the 1940 Act and Section 302 of the Sarbanes-Oxley Act of 2002 are attached hereto.
(a)(3) Not Applicable.
(b) Certifications of the Registrant’s principal executive officer and principal financial officer pursuant to Rule 30a-2(b) under the 1940 Act and Section 906 of the Sarbanes-Oxley Act of 2002 are attached hereto.
SIGNATURES
Pursuant to the requirements of the Securities Exchange Act of 1934 and the Investment Company Act of 1940, the Registrant has duly caused this Report to be signed on its behalf by the undersigned, thereunto duly authorized.
| USCF ETF Trust | ||
| By: | /s/ John P. Love | |
| John P. Love | ||
| Title: | President and Chief Executive Officer (Principal Executive Officer) | |
| Date: | August 30, 2016 | |
Pursuant to the requirements of the Securities Exchange Act of 1934 and the Investment Company Act of 1940, this report has been signed below by the following persons on behalf of the Registrant and in the capacities and on the dates indicated.
| By: | /s/ John P. Love | |
| John P. Love | ||
| Title: | President and Chief Executive Officer (Principal Executive Officer) | |
| Date: | August 30, 2016 |
| By: | /s/ Stuart P. Crumbaugh | |
| Stuart P. Crumbaugh | ||
| Title: | Treasurer and Chief Financial Officer (Principal Financial Officer) | |
| Date: | August 30, 2016 | |