UNITED STATES
SECURITIES AND EXCHANGE COMMISSION
WASHINGTON, D.C. 20549
FORM N-CSR
CERTIFIED SHAREHOLDER REPORT OF REGISTERED
MANAGEMENT INVESTMENT COMPANIES
Investment Company Act File Number: 811-22930
USCF ETF TRUST
(Exact name of registrant as specified in charter)
1999 Harrison Street, Suite 1530, Oakland, California 94612
(Address of principal executive offices)(Zip code)
USCF Advisers LLC
Mr. Stuart P. Crumbaugh
1999 Harrison Street, Suite 1530
Oakland, California 94612
(Name and address of Agent for service)
Registrant’s telephone number, including area code: 510.522.9600
Date of fiscal year end: June 30
Date of reporting period: June 30, 2018
ITEM 1. REPORT TO SHAREHOLDERS
The following is a copy of the Registrant’s annual report transmitted to shareholders pursuant to Rule 30e-1 under the Investment Company Act of 1940, as amended (the “1940 Act”)(17 CFR 270.30e-1).

USCF ETF TRUST
TABLE OF CONTENTS
USCF SUMMERHAVEN SHPEI INDEX FUND (“BUY”)
USCF SUMMERHAVEN SHPEN INDEX FUND (“BUYN”)
Welcome to the inaugural commentary for two new and innovative exchange-traded funds (“ETFs”). Each of the ETF’s, USCF SummerHaven SHPEI Index Fund (“BUY”) and USCF SummerHaven SHPEN Index Fund (“BUYN”), is benchmarked to an index that attempts to replicate the long-term (i.e., 10 years or more) return characteristics of diversified private equity allocations and includes publicly-traded companies that possess characteristics similar to the companies that private equity firms have historically selected for investment, as well as companies that the index provider believes private equity firms are likely to select for investment in the future. Working with SummerHaven Investment Management, LLC as the subadvisor for BUY and BUYN, the funds were launched at the end of November 2017 and track indexes created by SummerHaven Index Management, LLC (“SHIM”) that are based on the academic works of Harvard professor Erik Stafford.
Over twelve years ago, USCF launched a first of its kind exchange-traded product that expanded access to the commodities futures market from Wall Street to main street. Over the years, we have brought other first to market investment products to main street. These two funds continue that tradition. In this case, the goal is to bring Private Equity (“PE”) like returns, previously reserved to high net worth individuals, to everyone. Not only do BUY and BUYN seek PE like returns, but they are also offered in the convenience of an ETF where investors have the liquidity to trade in and out of shares when they want. With 0.95% unitary expense fee, BUY and BUYN is an attractive alternative to other investment vehicles that have portfolio characteristics similar to that of BUY and BUYN.
BUY and BUYN do not invest in shares of illiquid, privately held companies but instead invest in public traded companies that have similar characteristics to characteristics that PE firms are attracted to. Some of those characteristics encompass enterprise value to earnings before interest, tax, depreciation, and amortization (“EV/EBITDA”), market capitalization, shares available, and profitability. The portfolio for each of BUY and BUYN is rebalanced once a year. The primary difference between BUY and BUYN are the universe of stocks that each fund selects from. BUY selects from a wide range of about 3,000 U.S. companies from all sectors. At the end of June 2018, the portfolio was comprised of 293 stocks. It began with 300 stocks of which about 3% of the original stocks were acquired by other companies. BUYN is more focused and only selects from about 600 U.S. companies that are in selected industries such as energy, basic materials, industrials, and consumer cyclical and non-cyclicals. At the end of June 2018, the portfolio was comprised of 77 stocks. At inception, BUYN began with 78 stocks and about 4% of the original stocks in the portfolio were acquired over time.
| 2 | Annual Report June 30, 2018 |
BUY and BUYN do not have a long track record yet. During the seven months during which BUY has been public, BUY had total return of 9.77%. The benchmark for BUY is the SummerHaven Private Equity Strategy IndexSM (“SHPEI”). The total return of SHPEI was 10.31% for the same seven month time period. For comparison sake, the S&P 500 total return during that same time period was about 3.78%. No one industry or sector was responsible for BUY’s performance. The largest contributors to BUY’s performance include weight loss company Medifast Inc., fashion accessory company Fossill Group Inc., and financial services company, Enova International.
During the seven months during which BUYN has been public, BUYN had total return of 10.59%. The benchmark for BUYN is SummerHaven Private Equity Natural Resources Strategy IndexSM (“SHPEN”). The total return of SHPEN was 10.57% for the same seven month time period. The largest contributors to BUYN performance include oil and gas exploration companies California Resources Corp., Whiting Petroleum Corp., and Penn Virginia Corp.
There is no assurance that the investment process will consistently lead to successful investing for each fund.
These funds are new and have a limited operating history.
It is not possible to invest in an index.
Past performance is no guarantee of future results.
The performance shown represents past performance. Past performance is no guarantee of future results and current performance may be higher or lower than the performance shown. Return calculations assume the reinvestment of distributions and do not reflect taxes that a shareholder would pay on BUY and BUYN distributions or on the redemption of BUY and BUYN shares. Principal value and investments returns will fluctuate and investors’ shares, when redeemed, may be worth more or less than the original cost. Net expenses for BUY and BUYN are 0.95% and 0.95%, respectively.
| 3 |
Important Considerations:
Investing in the BUY and BUYN involves risks, including the possible loss of principal. BUY and BUYN are new funds with limited operating history and may not attract sufficient assets to achieves their investment objective.
The market value of shares of common stock can be volatile and change quickly. There is no guarantee that each fund’s objective will be met. Fund concentration generally leads to greater price volatility. Foreign investing involves special risks such as currency fluctuations and political uncertainty. Investment in small companies generally experience greater price volatility.
Past performance does not guarantee future results.
An investor may lose all or substantially all of an investment. These risks could result in large fluctuations in the price of a particular Fund’s respective shares. Funds that focus on a single sector generally experience greater volatility. For further discussion of these and additional risks associated with an investment in the Funds, please read the respective Fund Prospectus before investing.
BUY and BUYN shares are not individually redeemable. Individual investors must buy and sell BUY and BUYN shares in the secondary market through their brokerage firm. Brokerage commissions may apply and will reduce returns.
| 4 | Annual Report June 30, 2018 |
USCF SUMMERHAVEN DYNAMIC COMMODITY STRATEGY NO K-1 FUND (“SDCI”)
Welcome to the inaugural commentary for the USCF SummerHaven Dynamic Commodity Strategy No K-1 Fund (“SDCI”). SDCI began trading on the NYSE Arca on May 2, 2018. SDCI is an actively-managed ETF that uses the 3rd generation commodity index from SummerHaven Index Management LLC, the SummerHaven Dynamic Commodity Index (the “Index”), as its benchmark. The Index is also used by the USCF Commodity Strategy Fund, which is an actively managed mutual fund that uses the Index as its benchmark, and the United States Commodity Index Fund (“USCI”), which is an exchange-traded product that takes a passive investment approach and tracks the Index.
SDCI does not have a long track record yet. For the period from 5/2/2018 to 6/29/2018, SDCI had total return of -0.17%. The total return of the Index, which is SDCI’s benchmark, for the same time period was 0.05%. The largest contributors to SDCI’s performance for the period from 5/2/2018 to 6/29/2018 were the Energy and Livestock sectors.
The Index used by SDCI is a 3rd generation commodity index. 1st generation indices provided exposure to commodity futures based on each contract’s importance to the global economy. This they did – and continue to do – well. However, since these early indices were designed purely to represent the market, they left some investable opportunities on the table. Furthermore, some of these early indices are heavily weighted towards the energy sector. 2nd generation indices introduced some systematic innovations which led to minor improvements.
3rd generation strategies take advantage of the unique attributes of commodity markets. For example, commodities have very low correlation with one another, unlike the stocks in an equity index which tend to move together the majority of the time. While crude oil and gasoline may move together, there’s no reason that crude, cocoa, and cotton should. In fact, there are just as many reasons for these contracts to move apart than together. If we can identify those commodities that have a higher probability of outperforming over time, and reject commodities with a higher probability of underperforming, then we’ve found a very compelling way to participate in commodity markets for the long-term. That’s exactly what SDCI attempts to provide.
Based on years of historical research, SDCI uses fundamental signals to diversify its holdings in all the main commodity sectors – energy, industrial metals, precious metals, agriculture: livestock, softs, and grains. SDCI’s portfolio is reconstituted each month so that it continues to take advantage of the opportunities in the various commodities sectors.
Sometimes, 1st and 2nd generation commodity strategies will beat the SDCITR, particularly if other indexes/funds have a heavier weight to energy when energy does well. Over the long run, SDCI, which uses SDCITR as its benchmark, is designed to give investors dynamic exposure. Put another way, SDCI seeks to give you commodity exposure in a SMART way.
| 5 |
There is no assurance that the investment process will consistently lead to successful investing for each fund.
These funds are new and have a limited operating history.
It is not possible to invest in an index.
Past performance is no guarantee of future results.
The performance shown represents past performance. Past performance is no guarantee of future results and current performance may be higher or lower than the performance shown. Return calculations assume the reinvestment of distributions and do not reflect taxes that a shareholder would pay on SDCI distributions or on the redemption of SDCI shares. Principal value and investments returns will fluctuate and investors’ shares, when redeemed, may be worth more or less than the original cost. Net expense ratio for SDCI is 0.80%.
Important Considerations:
Commodity and futures trading is highly speculative and generally volatile and is not suitable for all investors.
Investing in the SDCI involves risks, including the possible loss of principal. The SDCI is a new fund with limited operating history and may not attract sufficient assets to achieves its investment objective. Commodities contain a heightened risk including market and price movements that are outside the SDCI’s control and may be influenced by weather and climate conditions, livestock disease, war, terrorism, political conflicts and economic event, interest rates, currency exchange rates, U.S. and non-U.S. government regulation and taxation. Investing in derivatives, including futures and swaps, entails risks relating to liquidity, counterparty, leverage and credit that may reduce return and increase volatility. Investments held in U.S. government securities and money market instruments can suffer losses. The SDCI is exposed to non-diversification risk which results from the SDCI’s direct or indirect investment in commodities and futures contracts that are economically identical or substantially similar. For more information about these and other risks including correlation and specific risks regarding each commodity sector and the investment in the Subsidiary, please read the SDCI’s prospectus.
The SDCI is unmanaged and does not reflect the deduction of any fees, expenses or taxes; individuals cannot invest directly in an Index.
This investment is not suitable for all investors. Funds that focus on a single sector generally experience greater volatility.
| 6 | Annual Report June 30, 2018 |
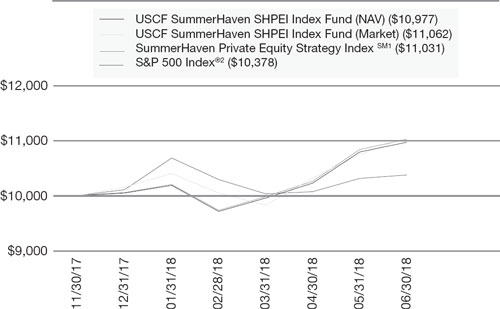
COMPARISON OF CHANGE IN VALUE OF $10,000 INVESTMENT IN USCF
SUMMERHAVEN SHPEI INDEX FUND (“BUY”), THE SUMMERHAVEN PRIVATE
EQUITY STRATEGY INDEXSM1 (“SHPEI”) AND S&P 500 INDEX®2 FROM
NOVEMBER 30, 2017 (INCEPTION DATE)* TO JUNE 30, 2018.
The following graph depicts the performance of USCF SummerHaven SHPEI Index Fund (Net Asset Value and Market Value) vs. the SummerHaven Private Equity Strategy IndexSM1 and S&P 500 Index®2
| Since Inception Return (11/30/2017) | ||||
| USCF SummerHaven SHPEI Index Fund (NAV) | 9.77 | % | ||
| USCF SummerHaven SHPEI Index Fund (Market Value) | 10.62 | % | ||
| SummerHaven Private Equity Strategy IndexSM1 | 10.31 | % | ||
| S&P 500 Index®2 | 3.78 | % | ||
| * | The inception date is the date the first shares were purchased to meet the outstanding shares required for listing on the NYSE Arca, Inc. BUY was listed on the NYSE Arca, Inc. on December 1, 2017. |
| 7 |
| 1 | The SummerHaven Private Equity Strategy Index (“SHPEI”) attempts to replicate the long-term (i.e., 10 years or more) return characteristics of diversified private equity allocations. SHPEI is designed to include publicly-traded companies that possess characteristics similar to the companies that private equity firms have historically selected for investment, as well as companies that SummerHaven Index Management, LLC (“SHIM”), as the index provider believes private equity firms are likely to select for investment in the future. However, SHPEI does not include, and the Fund does not invest in, private equity funds or private equity of companies. SHPEI is constructed using a proprietary methodology that favors companies with low enterprise value to earnings before interest, taxes, depreciation, and amortization (“EV /EBITDA”) ratios; low net equity issuance; low market capitalization; and moderate profitability. From a universe of approximately 3,000 U.S. companies, SHIM applies proprietary screens to determine an investable universe. SHPEI includes the greater of 200 companies or 20% of such investable universe. SHPEI is equally-weighted and rebalanced annually. |
| 2 | The Standard & Poor’s (“S&P”) 500 Index is an unmanaged index consisting of 500 stocks chosen for market size, liquidity, and industry group representation. It is a market-weighted index (stock price times number of shares outstanding) with each stock’s weight in the Index proportionate to its market value. |
The performance shown represents past performance. Past performance is no guarantee of future results and current performance may be higher or lower than the performance shown. Return calculations assume the reinvestment of distributions and do not reflect taxes that a shareholder would pay on distributions or on the sale of shares. Principal value and investments returns will fluctuate and investors’ shares, when sold, may be worth more or less than the original cost. To obtain the most recent month-end performance data visit www.uscfinvestments.com or call 1-800-920-0259.
The Fund’s NAV is calculated by dividing the value of the Fund’s total assets less total liabilities by the number of shares outstanding. Share price returns are based on closing prices for the Fund and do not represent the returns an investor would receive if shares were traded at other times.
Shares of ETFs are bought and sold at market price (not NAV) and are not individually redeemed from the Fund. Brokerage commissions apply and will reduce returns. Market returns are based upon the midpoint of the bid/ask spread at 4:00 p.m. Eastern time (when NAV is normally determined for most ETFs), and do not represent the returns you would receive if you traded shares at other times.
| 8 | Annual Report June 30, 2018 |
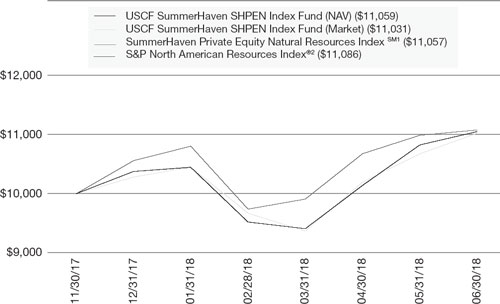
COMPARISON OF CHANGE IN VALUE OF $10,000 INVESTMENT IN USCF
SUMMERHAVEN SHPEN INDEX FUND (“BUYN”), THE SUMMERHAVEN PRIVATE
EQUITY NATURAL RESOURCES INDEXSM1 (“SHPEN”) AND S&P NORTH AMERICAN
NATURAL RESOURCES INDEX®2 FROM NOVEMBER 30, 2017
(INCEPTION DATE)* TO JUNE 30, 2018.
The following graph depicts the performance of USCF SummerHaven SHPEN Index Fund (Net Asset Value and Market Value) vs. the SummerHaven Private Equity Natural Resources IndexSM1 and S&P North American Resources Index®2
| Since Inception Return (11/30/2017) | ||||
| USCF SummerHaven SHPEN Index Fund (NAV) | 10.59 | % | ||
| USCF SummerHaven SHPEN Index Fund (Market Value) | 10.31 | % | ||
| SummerHaven Private Equity Natural Resources IndexSM1 | 10.57 | % | ||
| S&P North American Natural Resources Index®2 | 10.86 | % | ||
| * | The inception date is the date the first shares were purchased to meet the outstanding shares required for listing on the NYSE Arca, Inc. BUYN was listed on the NYSE Arca, Inc. on December 1, 2017. |
| 9 |
| 1 | The SummerHaven Private Equity Natural Resources Index (“SHPEN”) attempts to replicate the long-term return (i.e., return over 10 years or longer) of diversified natural resources private equity allocations. SHPEN is designed to include publicly-traded companies that possess characteristics similar to the companies that private equity firms focusing on natural resources have historically selected for investment, as well as companies that SummerHaven Index Management, LLC (“SHIM”), as the index provider believes private equity firms focusing on natural resource investments are likely to select for investment in the future. However, SHPEN does not include, and the Fund does not invest in, private equity funds or private equity of companies. The Fund does not invest directly in natural resource commodities. SHPEN is constructed using a proprietary methodology that favors companies with low enterprise value to earnings before interest, taxes, depreciation, and amortization (“EV / EBITDA”) ratios; low net equity issuance; low market capitalization; and moderate profitability. Proprietary screens are applied to a universe of approximately 600 U.S. companies to determine an investable universe. SHPEN includes the greater of 80 companies or 40% of such investable universe. SHPEN is equally-weighted and rebalanced annually. |
| 2 | The S&P North American Natural Resources Index provides investors with a benchmark that represents U.S. traded securities that are classified under the GICS® energy and materials sector excluding the chemicals industry; and steel sub-industry. |
The performance shown represents past performance. Past performance is no guarantee of future results and current performance may be higher or lower than the performance shown. Return calculations assume the reinvestment of distributions and do not reflect taxes that a shareholder would pay on distributions or on the sale of shares. Principal value and investments returns will fluctuate and investors’ shares, when sold, may be worth more or less than the original cost. To obtain the most recent month-end performance data visit www.uscfinvestments.com or call 1-800-920-0259.
The Fund’s NAV is calculated by dividing the value of the Fund’s total assets less total liabilities by the number of shares outstanding. Share price returns are based on closing prices for the Fund and do not represent the returns an investor would receive if shares were traded at other times.
Shares of ETFs are bought and sold at market price (not NAV) and are not individually redeemed from the Fund. Brokerage commissions apply and will reduce returns. Market returns are based upon the midpoint of the bid/ask spread at 4:00 p.m. Eastern time (when NAV is normally determined for most ETFs), and do not represent the returns you would receive if you traded shares at other times.
| 10 | Annual Report June 30, 2018 |
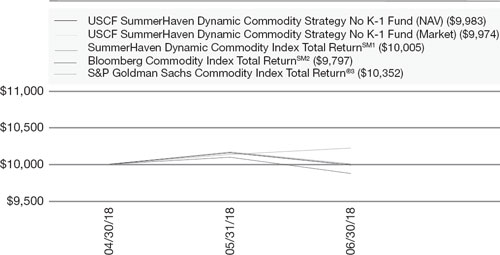
COMPARISON OF CHANGE IN VALUE OF $10,000 INVESTMENT IN USCF
SUMMERHAVEN DYNAMIC COMMODITY STRATEGY NO K-1 FUND (“SDCI”),
SUMMERHAVEN DYNAMIC COMMODITY INDEX TOTAL RETURNSM1,
BLOOMBERG COMMODITY INDEX TOTAL RETURNSM2 AND S&P GOLDMAN
SACHS COMMODITY INDEX TOTAL RETURN®3 FROM MAY 2, 2018 (INCEPTION DATE)
* TO JUNE 30, 2018.
The following graph shows the value as of June 30, 2018 of a $10,000 investment made on May 1, 2018 (commencement of operations). For comparative purposes, the performance of USCF SummerHaven Dynamic Commodity Strategy No K-1 Fund (Net Asset Value and Market Value), the SummerHaven Dynamic Commodity Index Total ReturnSM1 (“SDCITR”) and the performance of Bloomberg Commodity Index Total ReturnSM2 and S&P Goldman Sachs Commodity Index Total Return®3 are shown.
| Since Inception Return (5/2/2018) | ||||
| USCF SummerHaven Dynamic Commodity Strategy No K-1 Fund (NAV) | (0.17 | )% | ||
| USCF SummerHaven Dynamic Commodity Strategy No K-1 Fund (Market Value) | (0.26 | )% | ||
| SummerHaven Dynamic Commodity Index Total ReturnSM1 | 0.05 | % | ||
| Bloomberg Commodity Index Total ReturnSM2 | (2.03 | )% | ||
| S&P Goldman Sachs Commodity Index Total Return®3 | 3.52 | % | ||
| * | The inception date is the date the first shares were purchased to meet the outstanding shares required for listing on the NYSE Arca, Inc. SDCI was listed on the NYSE Arca, Inc. on May 3, 2018. |
| 11 |
| 1 | The SummerHaven Dynamic Commodity Index Total ReturnSM (“SDCITR”) is an index designed to reflect the performance of a fully margined and collateralized portfolio of exchange-traded commodities futures contracts. The total return of the SDCITR is based upon the market price movements of its component futures contracts and the return on the hypothetical investments used to collateralize those futures contracts. At any time, the SDCITR is comprised of 14 commodity futures contracts (the “Component Futures Contracts”), weighted equally by notional amount, selected each month based upon a universe of 27 eligible commodities and futures contracts for those commodities. The eligible futures contracts are traded on the Futures Exchanges in major industrialized countries, and typically have active and liquid markets. As of June 30, 2018, the universe of eligible commodities, categorized into six commodity sectors, including: energy, precious metals, industrial metals, grains, softs, and livestock. The SDCITR is rules-based and reconstituted and rebalanced monthly using quantitative formulas, subject to the constraint that each of the six commodity sectors above must be represented by at least one Component Futures Contract. |
| 2 | The Bloomberg Commodity Index Total ReturnSM (“BCOM”) is an index that tracks the performance of 22 broadly diversified commodity futures contracts. Prior to July 1, 2014, BCOM was known as the Dow Jones-UBS Commodity Index. |
| 3 | The S&P Goldman Sachs Commodity Index Total Return® (“SPGSCI”) is a composite index representing the unleveraged, long-only performance of a diversified group of commodity futures contracts. The returns are calculated on a fully collateralized basis with full reinvestment. |
The performance shown represents past performance. Past performance is no guarantee of future results and current performance may be higher or lower than the performance shown. Return calculations assume the reinvestment of distributions and do not reflect taxes that a shareholder would pay on distributions or on the sale of shares. Principal value and investments returns will fluctuate and investors’ shares, when sold, may be worth more or less than the original cost. To obtain the most recent month-end performance data visit www.uscfinvestments.com or call 1-800-920-0259.
The Fund’s NAV is calculated by dividing the value of the Fund’s total assets less total liabilities by the number of shares outstanding. Share price returns are based on closing prices for the Fund and do not represent the returns an investor would receive if shares were traded at other times.
Shares of ETFs are bought and sold at market price (not NAV) and are not individually redeemed from the Fund. Brokerage commissions apply and will reduce returns. Market returns are based upon the midpoint of the bid/ask spread at 4:00 p.m. Eastern time (when NAV is normally determined for most ETFs), and do not represent the returns you would receive if you traded shares at other times.
| 12 | Annual Report June 30, 2018 |
As a shareholder of the USCF SummerHaven SHPEI Index Fund, the USCF SummerHaven SHPEN Index Fund and the USCF SummerHaven Dynamic Commodity Strategy No K-1 Fund (each a “Fund” and collectively, the “Funds”), each a series of the USCF ETF Trust (the “Trust”), you may incur two potential types of costs: (1) transaction costs, such as brokerage commissions, for purchasing and selling your Fund shares, and (2) ongoing costs, including management fees and other Fund expenses. The following examples are intended to help you understand your ongoing costs (in dollars) of investing in a Fund and to compare these costs with the ongoing costs of investing in other funds. The examples are based on an investment of $1,000 invested at the beginning of the period and held for the entire period from January 1, 2018 until June 30, 2018 for BUY and BUYN, and from May 2, 2018* for SDCI until June 30, 2018.
Actual Return. The table below provides information about actual account values and actual expenses. You may use the information in this table, together with the amount you invested, to estimate the expenses that you paid over the period. Simply divide your account value by $1,000 (for example, $8,600 account value divided by $1,000 = 8.6), then multiply the result by the number under the heading “Actual Expenses Paid During the Period” to estimate the expenses you paid on your account during this period.
Hypothetical 5% Return. The table below provides information about hypothetical account values and hypothetical expenses based on each Fund’s actual expense ratio and an assumed rate of return of 5% per year before expenses, which is not the Fund’s actual return. The hypothetical account values and expenses may not be used to estimate the actual ending account balance or expenses you paid for the period. You may use this information to compare ongoing costs of investing in the Fund and other exchange-traded funds. To do so, compare this 5% hypothetical example with the 5% hypothetical examples that appear in the shareholder reports of the other funds.
The expenses shown in the table are meant to highlight ongoing costs only and do not reflect any transaction fees, such as brokerage commission paid on purchases and sales of Fund shares. Therefore, the number under the heading “Hypothetical Expenses paid during the period” is useful in comparing ongoing costs only, and may not help you determine the relative total costs of owning different funds.
| 13 |
USCF ETF TRUST
| Fund | Beginning Account Value 1/1/18* | Actual Ending Account Value 6/30/18 | Hypothetical Ending Account Value 6/30/18 | Actual Expenses Paid During the Period | Hypothetical Expenses Paid During the Period | Annualized Expense Ratio | ||||||||||||||||||
| USCF SummerHaven SHPEI Index Fund | $ | 1,000.00 | $ | 1,092.20 | $ | 1,020.08 | $ | 4.93 | (a) | $ | 4.76 | (a) | 0.95 | % | ||||||||||
| USCF SummerHaven SHPEN Index Fund | 1,000.00 | 1,065.80 | 1,020.08 | 4.87 | (a) | 4.76 | (a) | 0.95 | % | |||||||||||||||
| USCF SummerHaven Dynamic Commodity Strategy No K-1 Fund | 1,000.00 | 998.30 | 1,006.78 | 1.30 | (b) | 1.30 | (b) | 0.80 | % | |||||||||||||||
| * | USCF SummerHaven Dynamic Commodity Strategy No K-1 Fund’s inception date, May 2, 2018. |
| (a) | Expenses (net of fee waivers and/or expense reimbursements) are equal to the Funds’ annualized expense ratio multiplied by the average account value over the period, multiplied by the number of days (181 days) in the most recent fiscal half-year, then divided by 365 (to reflect the one-half year period). |
| (b) | Expenses (net of fee waivers and/or expense reimbursements) are equal to the Fund’s annualized expense ratio multiplied by the average account value over the period, multiplied by the number of days (59 days) in the most recent fiscal half-year, then divided by 365 (to reflect the one-half year period). |
| 14 | Annual Report June 30, 2018 |
USCF ETF TRUST – USCF SUMMERHAVEN SHPEI INDEX FUND
SCHEDULE OF INVESTMENTS
AT JUNE 30, 2018
| % of Total Net Assets | Shares | Market Value | ||||||||||
| Common Stocks | 99.8 | % | ||||||||||
| Aerospace & Defense | 0.8 | % | ||||||||||
| AAR Corp. | 0.3 | % | 210 | $ | 9,763 | |||||||
| Ducommun, Inc.(a) | 0.3 | % | 242 | 8,008 | ||||||||
| Triumph Group, Inc. | 0.2 | % | 236 | 4,625 | ||||||||
| 22,396 | ||||||||||||
| Airlines | 0.6 | % | ||||||||||
| Hawaiian Holdings, Inc. | 0.2 | % | 165 | 5,932 | ||||||||
| SkyWest, Inc. | 0.4 | % | 212 | 11,003 | ||||||||
| 16,935 | ||||||||||||
| Apparel | 2.6 | % | ||||||||||
| Crocs, Inc.(a) | 0.7 | % | 1,037 | 18,262 | ||||||||
| Delta Apparel, Inc.(a) | 0.2 | % | 369 | 7,140 | ||||||||
| Iconix Brand Group, Inc.(a) | 0.0 | % | 1,225 | 715 | ||||||||
| Michael Kors Holdings Ltd.(a) | 0.6 | % | 234 | 15,584 | ||||||||
| Perry Ellis International, Inc.(a) | 0.4 | % | 423 | 11,493 | ||||||||
| Superior Uniform Group, Inc. | 0.3 | % | 348 | 7,207 | ||||||||
| Weyco Group, Inc. | 0.4 | % | 283 | 10,301 | ||||||||
| 70,702 | ||||||||||||
| Auto Manufacturers | 0.6 | % | ||||||||||
| Blue Bird Corp.(a) | 0.4 | % | 452 | 10,102 | ||||||||
| Wabash National Corp. | 0.2 | % | 357 | 6,662 | ||||||||
| 16,764 | ||||||||||||
| Auto Parts & Equipment | 2.3 | % | ||||||||||
| Commercial Vehicle Group, Inc.(a) | 0.2 | % | 901 | 6,613 | ||||||||
| Cooper Tire & Rubber Co. | 0.2 | % | 215 | 5,655 | ||||||||
| Lear Corp. | 0.4 | % | 52 | 9,662 | ||||||||
| Miller Industries, Inc. | 0.3 | % | 313 | 7,997 | ||||||||
| Superior Industries International, Inc. | 0.3 | % | 395 | 7,071 | ||||||||
| Tenneco, Inc. | 0.2 | % | 128 | 5,627 | ||||||||
| Tower International, Inc. | 0.4 | % | 361 | 11,480 | ||||||||
| Visteon Corp.(a) | 0.3 | % | 72 | 9,305 | ||||||||
| 63,410 | ||||||||||||
| Banks | 10.5 | % | ||||||||||
| American National Bankshares, Inc. | 0.3 | % | 208 | 8,320 | ||||||||
| Bank of Commerce Holdings | 0.3 | % | 700 | 8,925 | ||||||||
| C&F Financial Corp. | 0.4 | % | 156 | 9,758 | ||||||||
| Capital City Bank Group, Inc. | 0.3 | % | 373 | 8,814 | ||||||||
| Chemung Financial Corp. | 0.4 | % | 189 | 9,471 | ||||||||
The accompanying notes are an integral part of the financial statements.
| 15 |
USCF ETF TRUST – USCF SUMMERHAVEN SHPEI INDEX FUND
SCHEDULE OF INVESTMENTS
AT JUNE 30, 2018 (continued)
| % of Total Net Assets | Shares | Market Value | ||||||||||
| Banks (continued) | 10.5 | % | ||||||||||
| Civista Bancshares, Inc. | 0.3 | % | 369 | $ | 8,945 | |||||||
| Evans Bancorp, Inc. | 0.3 | % | 186 | 8,575 | ||||||||
| Farmers & Merchants Bancorp, Inc. | 0.4 | % | 255 | 10,289 | ||||||||
| Farmers Capital Bank Corp. | 0.4 | % | 198 | 10,316 | ||||||||
| Fidelity Southern Corp. | 0.3 | % | 335 | 8,512 | ||||||||
| First Community Bancshares, Inc. | 0.3 | % | 282 | 8,985 | ||||||||
| First Financial Corp. | 0.3 | % | 167 | 7,573 | ||||||||
| First Guaranty Bancshares, Inc. | 0.3 | % | 324 | 8,430 | ||||||||
| Independent Bank Corp. | 0.4 | % | 365 | 9,307 | ||||||||
| MBT Financial Corp. | 0.3 | % | 776 | 8,264 | ||||||||
| National Bankshares, Inc. | 0.3 | % | 189 | 8,770 | ||||||||
| National Commerce Corp.(a) | 0.3 | % | 191 | 8,843 | ||||||||
| Northrim BanCorp, Inc. | 0.4 | % | 256 | 10,125 | ||||||||
| OFG Bancorp. | 0.4 | % | 784 | 11,015 | ||||||||
| Ohio Valley Banc Corp. | 0.4 | % | 208 | 10,910 | ||||||||
| Old Point Financial Corp. | 0.3 | % | 233 | 6,724 | ||||||||
| Parke Bancorp, Inc. | 0.3 | % | 379 | 8,963 | ||||||||
| Peoples Bancorp of North Carolina, Inc. | 0.3 | % | 269 | 8,616 | ||||||||
| Preferred Bank. | 0.3 | % | 134 | 8,236 | ||||||||
| Shore Bancshares, Inc. | 0.3 | % | 462 | 8,787 | ||||||||
| Sierra Bancorp. | 0.3 | % | 323 | 9,122 | ||||||||
| SmartFinancial, Inc.(a) | 0.3 | % | 307 | 7,908 | ||||||||
| Southern First Bancshares, Inc.(a) | 0.3 | % | 210 | 9,282 | ||||||||
| Two River Bancorp. | 0.3 | % | 437 | 8,360 | ||||||||
| United Security Bancshares. | 0.3 | % | 805 | 9,016 | ||||||||
| Unity Bancorp, Inc. | 0.4 | % | 434 | 9,874 | ||||||||
| Walker & Dunlop, Inc. | 0.3 | % | 148 | 8,236 | ||||||||
| 287,271 | ||||||||||||
| Building Materials | 1.9 | % | ||||||||||
| American Woodmark Corp.(a) | 0.3 | % | 78 | 7,141 | ||||||||
| Armstrong Flooring, Inc.(a) | 0.2 | % | 438 | 6,149 | ||||||||
| Gibraltar Industries, Inc.(a) | 0.3 | % | 234 | 8,775 | ||||||||
| Griffon Corp. | 0.2 | % | 372 | 6,622 | ||||||||
| Patrick Industries, Inc.(a) | 0.3 | % | 154 | 8,755 | ||||||||
| Universal Forest Products, Inc. | 0.4 | % | 271 | 9,924 | ||||||||
| US Concrete, Inc.(a) | 0.2 | % | 96 | 5,040 | ||||||||
| 52,406 | ||||||||||||
| Chemicals | 1.8 | % | ||||||||||
| A Schulman, Inc. | 0.4 | % | 254 | 11,303 | ||||||||
| Ashland Global Holdings, Inc. | 0.4 | % | 116 | 9,069 | ||||||||
| Innophos Holdings, Inc. | 0.3 | % | 182 | 8,663 | ||||||||
The accompanying notes are an integral part of the financial statements.
| 16 | Annual Report June 30, 2018 |
USCF ETF TRUST – USCF SUMMERHAVEN SHPEI INDEX FUND
SCHEDULE OF INVESTMENTS
AT JUNE 30, 2018 (continued)
| % of Total Net Assets | Shares | Market Value | ||||||||||
| Chemicals (continued) | 1.8 | % | ||||||||||
| KMG Chemicals, Inc. | 0.4 | % | 152 | $ | 11,215 | |||||||
| Rayonier Advanced Materials, Inc. | 0.3 | % | 500 | 8,545 | ||||||||
| 48,795 | ||||||||||||
| Coal | 1.1 | % | ||||||||||
| Hallador Energy Co. | 0.2 | % | 948 | 6,769 | ||||||||
| Peabody Energy Corp. | 0.5 | % | 297 | 13,507 | ||||||||
| SunCoke Energy, Inc.(a) | 0.4 | % | 718 | 9,621 | ||||||||
| 29,897 | ||||||||||||
| Commercial Services | 9.4 | % | ||||||||||
| American Public Education, Inc.(a) | 0.5 | % | 352 | 14,819 | ||||||||
| AMN Healthcare Services, Inc.(a) | 0.4 | % | 212 | 12,423 | ||||||||
| Avis Budget Group, Inc.(a) | 0.3 | % | 265 | 8,612 | ||||||||
| Barrett Business Services, Inc. | 0.5 | % | 132 | 12,747 | ||||||||
| BG Staffing, Inc. | 0.4 | % | 434 | 10,090 | ||||||||
| Brink’s Co. (The) | 0.3 | % | 110 | 8,773 | ||||||||
| Cambium Learning Group, Inc.(a) | 0.6 | % | 1,556 | 17,349 | ||||||||
| Capella Education Co. | 0.3 | % | 88 | 8,686 | ||||||||
| Collectors Universe, Inc. | 0.2 | % | 318 | 4,687 | ||||||||
| CRA International, Inc. | 0.4 | % | 215 | 10,941 | ||||||||
| Cross Country Healthcare, Inc.(a) | 0.3 | % | 637 | 7,166 | ||||||||
| Ennis, Inc. | 0.3 | % | 419 | 8,527 | ||||||||
| Hackett Group, Inc. (The) | 0.3 | % | 491 | 7,890 | ||||||||
| Heidrick & Struggles International, Inc. | 0.5 | % | 358 | 12,530 | ||||||||
| Insperity, Inc. | 0.8 | % | 218 | 20,765 | ||||||||
| K12, Inc.(a) | 0.3 | % | 440 | 7,203 | ||||||||
| LSC Communications, Inc. | 0.2 | % | 386 | 6,045 | ||||||||
| ManpowerGroup, Inc. | 0.2 | % | 66 | 5,680 | ||||||||
| Medifast, Inc. | 1.1 | % | 192 | 30,751 | ||||||||
| Resources Connection, Inc. | 0.3 | % | 568 | 9,599 | ||||||||
| SP Plus Corp.(a) | 0.3 | % | 247 | 9,188 | ||||||||
| Vectrus, Inc.(a) | 0.3 | % | 229 | 7,058 | ||||||||
| Viad Corp. | 0.3 | % | 162 | 8,789 | ||||||||
| Willdan Group, Inc.(a) | 0.3 | % | 242 | 7,495 | ||||||||
| 257,813 | ||||||||||||
| Computers | 1.2 | % | ||||||||||
| Syntel, Inc.(a) | 0.5 | % | 471 | 15,114 | ||||||||
| Teradata Corp.(a) | 0.4 | % | 272 | 10,921 | ||||||||
| Unisys Corp.(a) | 0.3 | % | 600 | 7,740 | ||||||||
| 33,775 | ||||||||||||
The accompanying notes are an integral part of the financial statements.
| 17 |
USCF ETF TRUST – USCF SUMMERHAVEN SHPEI INDEX FUND
SCHEDULE OF INVESTMENTS
AT JUNE 30, 2018 (continued)
| % of Total Net Assets | Shares | Market Value | ||||||||||
| Distribution & Wholesale | 1.6 | % | ||||||||||
| Essendant, Inc. | 0.3 | % | 568 | $ | 7,509 | |||||||
| Fossil Group, Inc.(a) | 0.8 | % | 825 | 22,168 | ||||||||
| Huttig Building Products, Inc.(a) | 0.2 | % | 1,132 | 5,377 | ||||||||
| Veritiv Corp.(a) | 0.3 | % | 183 | 7,292 | ||||||||
| 42,346 | ||||||||||||
| Diversified Financial Services | 2.9 | % | ||||||||||
| Altisource Portfolio Solutions SA(a) | 0.4 | % | 365 | 10,647 | ||||||||
| Enova International, Inc.(a) | 0.6 | % | 481 | 17,580 | ||||||||
| Greenhill & Co., Inc. | 0.4 | % | 389 | 11,048 | ||||||||
| Investment Technology Group, Inc. | 0.3 | % | 368 | 7,699 | ||||||||
| PHH Corp.(a) | 0.2 | % | 559 | 6,071 | ||||||||
| Piper Jaffray Cos | 0.3 | % | 118 | 9,068 | ||||||||
| Waddell & Reed Financial, Inc. - Class A | 0.3 | % | 394 | 7,080 | ||||||||
| World Acceptance Corp.(a) | 0.4 | % | 98 | 10,879 | ||||||||
| 80,072 | ||||||||||||
| Electrical Component & Equipment | 1.0 | % | ||||||||||
| Insteel Industries, Inc. | 0.3 | % | 233 | 7,782 | ||||||||
| Powell Industries, Inc. | 0.3 | % | 241 | 8,394 | ||||||||
| SPX Corp.(a) | 0.4 | % | 288 | 10,095 | ||||||||
| 26,271 | ||||||||||||
| Electronics | 3.4 | % | ||||||||||
| AVX Corp. | 0.3 | % | 463 | 7,255 | ||||||||
| Benchmark Electronics, Inc. | 0.2 | % | 236 | 6,879 | ||||||||
| CyberOptics Corp.(a) | 0.2 | % | 342 | 5,951 | ||||||||
| Jabil, Inc. | 0.3 | % | 264 | 7,302 | ||||||||
| KEMET Corp.(a) | 0.4 | % | 495 | 11,954 | ||||||||
| Kimball Electronics, Inc.(a) | 0.3 | % | 422 | 7,723 | ||||||||
| Sanmina Corp.(a) | 0.2 | % | 196 | 5,743 | ||||||||
| Stoneridge, Inc.(a) | 0.7 | % | 515 | 18,097 | ||||||||
| Tech Data Corp.(a) | 0.2 | % | 72 | 5,913 | ||||||||
| ZAGG, Inc.(a) | 0.6 | % | 916 | 15,847 | ||||||||
| 92,664 | ||||||||||||
| Energy-Alternate Sources | 1.4 | % | ||||||||||
| Green Plains, Inc. | 0.3 | % | 407 | 7,448 | ||||||||
| Renewable Energy Group, Inc.(a) | 0.4 | % | 651 | 11,620 | ||||||||
| REX American Resources Corp.(a) | 0.2 | % | 80 | 6,478 | ||||||||
| TPI Composites, Inc.(a) | 0.5 | % | 420 | 12,281 | ||||||||
| 37,827 | ||||||||||||
The accompanying notes are an integral part of the financial statements.
| 18 | Annual Report June 30, 2018 |
USCF ETF TRUST – USCF SUMMERHAVEN SHPEI INDEX FUND
SCHEDULE OF INVESTMENTS
AT JUNE 30, 2018 (continued)
| % of Total Net Assets | Shares | Market Value | ||||||||||
| Engineering & Construction | 2.9 | % | ||||||||||
| Aegion Corp. - Class A(a) | 0.3 | % | 342 | $ | 8,807 | |||||||
| Argan, Inc. | 0.2 | % | 122 | 4,996 | ||||||||
| Comfort Systems USA, Inc. | 0.4 | % | 216 | 9,893 | ||||||||
| Dycom Industries, Inc.(a) | 0.3 | % | 84 | 7,939 | ||||||||
| Fluor Corp. | 0.3 | % | 171 | 8,341 | ||||||||
| IES Holdings, Inc.(a) | 0.3 | % | 439 | 7,353 | ||||||||
| MYR Group, Inc.(a) | 0.3 | % | 258 | 9,149 | ||||||||
| NV5 Global, Inc.(a) | 0.5 | % | 187 | 12,959 | ||||||||
| Orion Group Holdings, Inc.(a) | 0.3 | % | 1,059 | 8,747 | ||||||||
| 78,184 | ||||||||||||
| Entertainment | 1.2 | % | ||||||||||
| National CineMedia, Inc. | 0.3 | % | 1,095 | 9,198 | ||||||||
| Pinnacle Entertainment, Inc.(a) | 0.5 | % | 396 | 13,357 | ||||||||
| RCI Hospitality Holdings, Inc. | 0.4 | % | 328 | 10,381 | ||||||||
| 32,936 | ||||||||||||
| Environmental Control | 0.2 | % | ||||||||||
| CECO Environmental Corp. | 0.2 | % | 804 | 4,937 | ||||||||
| Food | 1.7 | % | ||||||||||
| Dean Foods Co. | 0.2 | % | 519 | 5,455 | ||||||||
| Fresh Del Monte Produce, Inc. | 0.3 | % | 149 | 6,638 | ||||||||
| Pilgrim’s Pride Corp.(a) | 0.3 | % | 363 | 7,307 | ||||||||
| SpartanNash Co. | 0.3 | % | 299 | 7,630 | ||||||||
| United Natural Foods, Inc.(a) | 0.3 | % | 219 | 9,343 | ||||||||
| Weis Markets, Inc. | 0.3 | % | 162 | 8,641 | ||||||||
| 45,014 | ||||||||||||
| Forest Products & Paper | 0.1 | % | ||||||||||
| Clearwater Paper Corp.(a) | 0.1 | % | 165 | 3,812 | ||||||||
| Gas | 0.3 | % | ||||||||||
| RGC Resources, Inc. | 0.3 | % | 271 | 7,908 | ||||||||
| Healthcare-Services | 2.9 | % | ||||||||||
| American Renal Associates Holdings, Inc.(a) | 0.2 | % | 432 | 6,813 | ||||||||
| Civitas Solutions, Inc.(a) | 0.3 | % | 439 | 7,199 | ||||||||
| Community Health Systems, Inc.(a) | 0.1 | % | 805 | 2,673 | ||||||||
| LifePoint Health, Inc.(a) | 0.2 | % | 118 | 5,758 | ||||||||
The accompanying notes are an integral part of the financial statements.
| 19 |
USCF ETF TRUST – USCF SUMMERHAVEN SHPEI INDEX FUND
SCHEDULE OF INVESTMENTS
AT JUNE 30, 2018 (continued)
| % of Total Net Assets | Shares | Market Value | ||||||||||
| Healthcare-Services (continued) | 2.9 | % | ||||||||||
| Magellan Health, Inc.(a) | 0.4 | % | 104 | $ | 9,979 | |||||||
| Molina Healthcare, Inc.(a) | 0.4 | % | 106 | 10,382 | ||||||||
| Providence Service Corp. (The)(a) | 0.4 | % | 156 | 12,254 | ||||||||
| Tenet Healthcare Corp.(a) | 0.5 | % | 407 | 13,663 | ||||||||
| WellCare Health Plans, Inc.(a) | 0.4 | % | 42 | 10,342 | ||||||||
| 79,063 | ||||||||||||
| Home Builders | 0.4 | % | ||||||||||
| LGI Homes, Inc.(a) | 0.4 | % | 184 | 10,622 | ||||||||
| Home Furnishings | 0.8 | % | ||||||||||
| Flexsteel Industries, Inc. | 0.2 | % | 136 | 5,426 | ||||||||
| Hooker Furniture Corp. | 0.3 | % | 184 | 8,630 | ||||||||
| Sleep Number Corp.(a) | 0.3 | % | 254 | 7,371 | ||||||||
| 21,427 | ||||||||||||
| Household Products & Wares | 0.5 | % | ||||||||||
| ACCO Brands Corp. | 0.3 | % | 659 | 9,127 | ||||||||
| CSS Industries, Inc. | 0.2 | % | 295 | 4,986 | ||||||||
| 14,113 | ||||||||||||
| Housewares | 0.5 | % | ||||||||||
| Libbey, Inc. | 0.3 | % | 979 | 7,959 | ||||||||
| Lifetime Brands, Inc. | 0.2 | % | 412 | 5,212 | ||||||||
| 13,171 | ||||||||||||
| Insurance | 2.8 | % | ||||||||||
| American Financial Group, Inc. | 0.3 | % | 76 | 8,157 | ||||||||
| Argo Group International Holdings Ltd. | 0.3 | % | 145 | 8,432 | ||||||||
| Hallmark Financial Services, Inc.(a) | 0.3 | % | 708 | 7,066 | ||||||||
| HCI Group, Inc. | 0.2 | % | 167 | 6,942 | ||||||||
| Heritage Insurance Holdings, Inc. | 0.4 | % | 642 | 10,702 | ||||||||
| Investors Title Co. | 0.3 | % | 40 | 7,386 | ||||||||
| Kingstone Cos., Inc. | 0.3 | % | 497 | 8,399 | ||||||||
| Safety Insurance Group, Inc. | 0.3 | % | 110 | 9,394 | ||||||||
| Validus Holdings Ltd. | 0.4 | % | 148 | 10,005 | ||||||||
| 76,483 | ||||||||||||
| Internet | 0.6 | % | ||||||||||
| ePlus, Inc.(a) | 0.3 | % | 98 | 9,222 | ||||||||
| FTD Cos, Inc.(a) | 0.1 | % | 404 | 1,874 | ||||||||
The accompanying notes are an integral part of the financial statements.
| 20 | Annual Report June 30, 2018 |
USCF ETF TRUST – USCF SUMMERHAVEN SHPEI INDEX FUND
SCHEDULE OF INVESTMENTS
AT JUNE 30, 2018 (continued)
| % of Total Net Assets | Shares | Market Value | ||||||||||
| Internet (continued) | 0.6 | % | ||||||||||
| Rubicon Project, Inc. (The)(a) | 0.2 | % | 1,576 | $ | 4,492 | |||||||
| 15,588 | ||||||||||||
| Investment Companies | 0.3 | % | ||||||||||
| B. Riley Financial, Inc. | 0.3 | % | 409 | 9,223 | ||||||||
| Iron & Steel | 1.0 | % | ||||||||||
| Ryerson Holding Corp.(a) | 0.4 | % | 882 | 9,835 | ||||||||
| Shiloh Industries, Inc.(a) | 0.2 | % | 756 | 6,577 | ||||||||
| Steel Dynamics, Inc. | 0.4 | % | 216 | 9,925 | ||||||||
| 26,337 | ||||||||||||
| Leisure Time | 0.6 | % | ||||||||||
| MCBC Holdings, Inc.(a) | 0.4 | % | 394 | 11,406 | ||||||||
| Vista Outdoor, Inc.(a) | 0.2 | % | 352 | 5,453 | ||||||||
| 16,859 | ||||||||||||
| Lodging | 0.3 | % | ||||||||||
| Century Casinos, Inc.(a) | 0.3 | % | 1,054 | 9,222 | ||||||||
| Machinery-Diversified | 1.1 | % | ||||||||||
| Briggs & Stratton Corp. | 0.2 | % | 327 | 5,759 | ||||||||
| Chart Industries, Inc.(a) | 0.5 | % | 221 | 13,631 | ||||||||
| Hurco Cos, Inc. | 0.4 | % | 231 | 10,337 | ||||||||
| 29,727 | ||||||||||||
| Media | 1.0 | % | ||||||||||
| Gannett Co., Inc. | 0.4 | % | 919 | 9,833 | ||||||||
| TEGNA, Inc. | 0.2 | % | 544 | 5,902 | ||||||||
| tronc, Inc.(a) | 0.4 | % | 624 | 10,783 | ||||||||
| 26,518 | ||||||||||||
| Metal Fabricate & Hardware | 1.2 | % | ||||||||||
| Eastern Co. (The) | 0.3 | % | 255 | 7,153 | ||||||||
| Global Brass & Copper Holdings, Inc. | 0.3 | % | 257 | 8,057 | ||||||||
| LB Foster Co. - Class A(a) | 0.3 | % | 374 | 8,583 | ||||||||
| Park-Ohio Holdings Corp. | 0.3 | % | 204 | 7,609 | ||||||||
| 31,402 | ||||||||||||
| Mining | 0.4 | % | ||||||||||
| Alcoa Corp.(a) | 0.4 | % | 226 | 10,595 | ||||||||
The accompanying notes are an integral part of the financial statements.
| 21 |
USCF ETF TRUST – USCF SUMMERHAVEN SHPEI INDEX FUND
SCHEDULE OF INVESTMENTS
AT JUNE 30, 2018 (continued)
| % of Total Net Assets | Shares | Market Value | ||||||||||
| Miscellaneous Manufacturer | 1.3 | % | ||||||||||
| American Railcar Industries, Inc. | 0.3 | % | 215 | $ | 8,488 | |||||||
| Core Molding Technologies, Inc. | 0.2 | % | 350 | 4,998 | ||||||||
| FreightCar America, Inc. | 0.3 | % | 466 | 7,824 | ||||||||
| GP Strategies Corp.(a) | 0.2 | % | 290 | 5,104 | ||||||||
| Trinseo SA | 0.3 | % | 108 | 7,663 | ||||||||
| 34,077 | ||||||||||||
| Office & Business Equipment | 0.3 | % | ||||||||||
| Eastman Kodak Co.(a) | 0.1 | % | 858 | 3,261 | ||||||||
| Pitney Bowes, Inc. | 0.2 | % | 516 | 4,422 | ||||||||
| 7,683 | ||||||||||||
| Oil & Gas | 8.3 | % | ||||||||||
| Adams Resources & Energy, Inc. | 0.3 | % | 187 | 8,041 | ||||||||
| Archrock, Inc. | 0.3 | % | 702 | 8,424 | ||||||||
| Contango Oil & Gas Co.(a) | 0.3 | % | 1,207 | 6,856 | ||||||||
| CVR Energy, Inc. | 0.5 | % | 356 | 13,169 | ||||||||
| Diamond Offshore Drilling, Inc.(a) | 0.6 | % | 734 | 15,311 | ||||||||
| Ensco PLC - Class A | 0.4 | % | 1,589 | 11,536 | ||||||||
| Era Group, Inc.(a) | 0.4 | % | 854 | 11,059 | ||||||||
| Exterran Corp.(a) | 0.3 | % | 288 | 7,211 | ||||||||
| Gulf Island Fabrication, Inc. | 0.2 | % | 711 | 6,399 | ||||||||
| Helix Energy Solutions Group, Inc.(a) | 0.4 | % | 1,448 | 12,062 | ||||||||
| HollyFrontier Corp. | 0.7 | % | 289 | 19,776 | ||||||||
| Matrix Service Co.(a) | 0.6 | % | 841 | 15,432 | ||||||||
| Murphy USA, Inc.(a) | 0.3 | % | 106 | 7,875 | ||||||||
| Oceaneering International, Inc. | 0.3 | % | 348 | 8,860 | ||||||||
| QEP Resources, Inc.(a) | 0.4 | % | 850 | 10,421 | ||||||||
| Rowan Cos. PLC - Class A(a) | 0.4 | % | 749 | 12,149 | ||||||||
| SEACOR Holdings, Inc.(a) | 0.5 | % | 236 | 13,516 | ||||||||
| Southwestern Energy Co.(a) | 0.3 | % | 1,354 | 7,176 | ||||||||
| Unit Corp.(a) | 0.4 | % | 435 | 11,119 | ||||||||
| Whiting Petroleum Corp.(a) | 0.7 | % | 376 | 19,823 | ||||||||
| 226,215 | ||||||||||||
| Packaging & Containers | 0.3 | % | ||||||||||
| UFP Technologies, Inc.(a) | 0.3 | % | 283 | 8,731 | ||||||||
The accompanying notes are an integral part of the financial statements.
| 22 | Annual Report June 30, 2018 |
USCF ETF TRUST – USCF SUMMERHAVEN SHPEI INDEX FUND
SCHEDULE OF INVESTMENTS
AT JUNE 30, 2018 (continued)
| % of Total Net Assets | Shares | Market Value | ||||||||||
| Pharmaceuticals | 0.9 | % | ||||||||||
| Endo International PLC(a) | 0.2 | % | 665 | $ | 6,271 | |||||||
| Natural Grocers by Vitamin Cottage, Inc.(a) | 0.5 | % | 990 | 12,613 | ||||||||
| Natural Health Trends Corp. | 0.2 | % | 270 | 6,755 | ||||||||
| 25,639 | ||||||||||||
| Retail | 17.5 | % | ||||||||||
| Abercrombie & Fitch Co. - Class A | 0.8 | % | 870 | 21,298 | ||||||||
| American Eagle Outfitters, Inc. | 0.6 | % | 694 | 16,135 | ||||||||
| Asbury Automotive Group, Inc.(a) | 0.3 | % | 134 | 9,186 | ||||||||
| Barnes & Noble Education, Inc.(a) | 0.2 | % | 882 | 4,974 | ||||||||
| Bassett Furniture Industries, Inc. | 0.2 | % | 203 | 5,593 | ||||||||
| Bed Bath & Beyond, Inc. | 0.2 | % | 272 | 5,420 | ||||||||
| Big 5 Sporting Goods Corp. | 0.2 | % | 675 | 5,130 | ||||||||
| Big Lots, Inc. | 0.3 | % | 164 | 6,852 | ||||||||
| BJ’s Restaurants, Inc. | 0.5 | % | 216 | 12,960 | ||||||||
| Bojangles’, Inc.(a) | 0.3 | % | 505 | 7,272 | ||||||||
| Boot Barn Holdings, Inc.(a) | 0.9 | % | 1,221 | 25,336 | ||||||||
| Brinker International, Inc. | 0.4 | % | 212 | 10,091 | ||||||||
| Buckle, Inc. (The) | 0.5 | % | 477 | 12,831 | ||||||||
| Build-A-Bear Workshop, Inc.(a) | 0.2 | % | 727 | 5,525 | ||||||||
| Caleres, Inc. | 0.4 | % | 297 | 10,214 | ||||||||
| Carrols Restaurant Group, Inc.(a) | 0.3 | % | 640 | 9,504 | ||||||||
| Chico’s FAS, Inc. | 0.3 | % | 909 | 7,399 | ||||||||
| Children’s Place, Inc. (The) | 0.3 | % | 72 | 8,698 | ||||||||
| Citi Trends, Inc. | 0.4 | % | 381 | 10,455 | ||||||||
| Container Store Group, Inc. (The)(a) | 0.4 | % | 1,384 | 11,639 | ||||||||
| DineEquity, Inc. | 0.5 | % | 181 | 13,539 | ||||||||
| Francesca’s Holdings Corp.(a) | 0.2 | % | 787 | 5,942 | ||||||||
| GameStop Corp. - Class A | 0.2 | % | 371 | 5,405 | ||||||||
| Gap, Inc. (The) | 0.4 | % | 362 | 11,725 | ||||||||
| Genesco, Inc.(a) | 0.4 | % | 249 | 9,885 | ||||||||
| GNC Holdings, Inc. - Class A(a) | 0.1 | % | 1,003 | 3,531 | ||||||||
| Hibbett Sports, Inc.(a) | 0.3 | % | 403 | 9,229 | ||||||||
| J Alexander’s Holdings, Inc.(a) | 0.3 | % | 699 | 7,794 | ||||||||
| Kirkland’s, Inc.(a) | 0.3 | % | 818 | 9,522 | ||||||||
| Kohl’s Corp | 0.6 | % | 208 | 15,163 | ||||||||
| Macy’s, Inc. | 0.5 | % | 367 | 13,737 | ||||||||
| Nathan’s Famous, Inc. | 0.4 | % | 118 | 11,104 | ||||||||
| Nordstrom, Inc. | 0.3 | % | 166 | 8,595 | ||||||||
| PC Connection, Inc. | 0.4 | % | 296 | 9,827 | ||||||||
| PCM, Inc.(a) | 0.2 | % | 391 | 5,924 | ||||||||
| Pier 1 Imports, Inc. | 0.1 | % | 1,659 | 3,948 | ||||||||
| Potbelly Corp.(a) | 0.3 | % | 624 | 8,081 | ||||||||
The accompanying notes are an integral part of the financial statements.
| 23 |
USCF ETF TRUST – USCF SUMMERHAVEN SHPEI INDEX FUND
SCHEDULE OF INVESTMENTS
AT JUNE 30, 2018 (continued)
| % of Total Net Assets | Shares | Market Value | ||||||||||
| Retail (continued) | 17.5 | % | ||||||||||
| Regis Corp.(a) | 0.5 | % | 782 | $ | 12,934 | |||||||
| Ruth’s Hospitality Group, Inc. | 0.4 | % | 372 | 10,435 | ||||||||
| Shoe Carnival, Inc. | 0.5 | % | 416 | 13,499 | ||||||||
| Sportsman’s Warehouse Holdings, Inc.(a) | 0.3 | % | 1,554 | 7,956 | ||||||||
| Tailored Brands, Inc. | 0.7 | % | 765 | 19,523 | ||||||||
| Urban Outfitters, Inc.(a) | 0.7 | % | 444 | 19,780 | ||||||||
| Vera Bradley, Inc.(a) | 0.4 | % | 831 | 11,667 | ||||||||
| Zoe’s Kitchen, Inc.(a) | 0.2 | % | 683 | 6,666 | ||||||||
| Zumiez, Inc.(a) | 0.6 | % | 642 | 16,082 | ||||||||
| 478,005 | ||||||||||||
| Savings & Loans | 2.1 | % | ||||||||||
| Charter Financial Corp. | 0.4 | % | 428 | 10,336 | ||||||||
| Greene County Bancorp, Inc. | 0.4 | % | 296 | 10,034 | ||||||||
| Home Bancorp, Inc. | 0.3 | % | 182 | 8,472 | ||||||||
| Provident Financial Holdings, Inc. | 0.3 | % | 412 | 7,861 | ||||||||
| Riverview Bancorp, Inc. | 0.3 | % | 1,092 | 9,217 | ||||||||
| Timberland Bancorp, Inc. | 0.4 | % | 301 | 11,239 | ||||||||
| 57,159 | ||||||||||||
| Semiconductors | 1.0 | % | ||||||||||
| Alpha & Omega Semiconductor Ltd.(a) | 0.2 | % | 455 | 6,479 | ||||||||
| Cirrus Logic, Inc.(a) | 0.2 | % | 118 | 4,523 | ||||||||
| Cohu, Inc. | 0.4 | % | 448 | 10,980 | ||||||||
| Ultra Clean Holdings, Inc.(a) | 0.2 | % | 361 | 5,993 | ||||||||
| 27,975 | ||||||||||||
| Software | 0.5 | % | ||||||||||
| Avid Technology, Inc.(a) | 0.3 | % | 1,496 | 7,779 | ||||||||
| Donnelley Financial Solutions, Inc.(a) | 0.2 | % | 346 | 6,010 | ||||||||
| 13,789 | ||||||||||||
| Telecommunications | 1.0 | % | ||||||||||
| Preformed Line Products Co. | 0.5 | % | 165 | 14,649 | ||||||||
| RigNet, Inc.(a) | 0.2 | % | 447 | 4,604 | ||||||||
| Spok Holdings, Inc. | 0.3 | % | 462 | 6,953 | ||||||||
| 26,206 | ||||||||||||
| Textiles | 0.2 | % | ||||||||||
| Culp, Inc. | 0.2 | % | 237 | 5,818 | ||||||||
The accompanying notes are an integral part of the financial statements.
| 24 | Annual Report June 30, 2018 |
USCF ETF TRUST – USCF SUMMERHAVEN SHPEI INDEX FUND
SCHEDULE OF INVESTMENTS
AT JUNE 30, 2018 (continued)
| % of Total Net Assets | Shares | Market Value | ||||||||||
| Transportation | 2.2 | % | ||||||||||
| Air Transport Services Group, Inc.(a) | 0.3 | % | 338 | $ | 7,635 | |||||||
| ArcBest Corp. | 0.6 | % | 363 | 16,589 | ||||||||
| Radiant Logistics, Inc.(a) | 0.2 | % | 1,473 | 5,760 | ||||||||
| Teekay Corp. | 0.3 | % | 1,164 | 9,021 | ||||||||
| Universal Logistics Holdings, Inc. | 0.5 | % | 517 | 13,571 | ||||||||
| YRC Worldwide, Inc.(a) | 0.3 | % | 643 | 6,462 | ||||||||
| 59,038 | ||||||||||||
| Trucking & Leasing | 0.3 | % | ||||||||||
| Willis Lease Finance Corp.(a) | 0.3 | % | 292 | 9,224 | ||||||||
| Total Common Stocks | ||||||||||||
| (Cost $2,495,419) | 99.8 | % | 2,722,044 | |||||||||
| Total Investments | ||||||||||||
| (Cost $2,495,419)(b) | 99.8 | % | 2,722,044 | |||||||||
| Other Assets in Excess of Liabilities | 0.2 | % | 6,726 | |||||||||
| Total Net Assets | 100.0 | % | $ | 2,728,770 | ||||||||
| (a) | Non income producing security. |
| (b) | The aggregate cost of investments for tax purposes was $2,495,419. The net unrealized appreciation was $226,625, which consisted of aggregate gross unrealized appreciation of $373,900 and aggregate gross unrealized depreciation of $(147,275). |
| Summary of Investments by Country^ | ||||
| United States | 97.0 | % | ||
| Bermuda | 1.0 | |||
| United Kingdom | 1.0 | |||
| Puerto Rico | 0.4 | |||
| Luxembourg | 0.4 | |||
| Ireland | 0.2 | |||
| 100.0 | % | |||
| Summary of Investments by Sector^ | ||||
| Consumer Cyclical | 29.3 | % | ||
| Financial | 18.7 | |||
| Industrial | 16.5 | |||
| Consumer Non-cyclical | 15.5 | |||
| Energy | 10.8 | |||
| Basic Materials | 3.3 | |||
| Technology | 3.1 | |||
| Communications | 2.5 | |||
| Utilities | 0.3 | |||
| 100.0 | % | |||
| ^ | As a percentage of total investments. All stocks are listed on U.S. Exchanges. |
The accompanying notes are an integral part of the financial statements
| 25 |
USCF ETF TRUST – USCF SUMMERHAVEN SHPEN INDEX FUND
SCHEDULE OF INVESTMENTS
AT JUNE 30, 2018
| % of Total Net Assets | Shares | Market Value | ||||||||||
| Common Stocks | 100.0 | % | ||||||||||
| Auto Manufacturers | 2.2 | % | ||||||||||
| Blue Bird Corp.(a) | 1.3 | % | 1,651 | $ | 36,900 | |||||||
| Wabash National Corp. | 0.9 | % | 1,299 | 24,239 | ||||||||
| 61,139 | ||||||||||||
| Auto Parts & Equipment | 7.9 | % | ||||||||||
| Commercial Vehicle Group, Inc.(a) | 0.9 | % | 3,288 | 24,134 | ||||||||
| Cooper Tire & Rubber Co. | 0.7 | % | 784 | 20,619 | ||||||||
| Douglas Dynamics, Inc. | 1.6 | % | 903 | 43,344 | ||||||||
| Goodyear Tire & Rubber Co. (The) | 0.7 | % | 799 | 18,609 | ||||||||
| Meritor, Inc.(a) | 1.2 | % | 1,629 | 33,509 | ||||||||
| Miller Industries, Inc. | 1.0 | % | 1,126 | 28,769 | ||||||||
| Spartan Motors, Inc. | 1.8 | % | 3,295 | 49,754 | ||||||||
| 218,738 | ||||||||||||
| Beverages | 1.1 | % | ||||||||||
| Farmer Brothers Co.(a) | 1.1 | % | 966 | 29,511 | ||||||||
| Building Materials | 2.3 | % | ||||||||||
| Boise Cascade Co. | 1.6 | % | 1,023 | 45,728 | ||||||||
| US Concrete, Inc.(a) | 0.7 | % | 362 | 19,005 | ||||||||
| 64,733 | ||||||||||||
| Chemicals | 2.7 | % | ||||||||||
| CF Industries Holdings, Inc. | 1.6 | % | 997 | 44,267 | ||||||||
| Landec Corp.(a) | 1.1 | % | 2,023 | 30,142 | ||||||||
| 74,409 | ||||||||||||
| Coal | 3.9 | % | ||||||||||
| Hallador Energy Co. | 0.9 | % | 3,477 | 24,826 | ||||||||
| Peabody Energy Corp. | 1.8 | % | 1,094 | 49,755 | ||||||||
| SunCoke Energy, Inc.(a) | 1.2 | % | 2,629 | 35,229 | ||||||||
| 109,810 | ||||||||||||
| Energy-Alternate Sources | 3.4 | % | ||||||||||
| Green Plains, Inc. | 1.0 | % | 1,491 | 27,285 | ||||||||
| Renewable Energy Group, Inc.(a) | 1.5 | % | 2,383 | 42,537 | ||||||||
| REX American Resources Corp.(a) | 0.9 | % | 296 | 23,967 | ||||||||
| 93,789 | ||||||||||||
The accompanying notes are an integral part of the financial statements.
| 26 | Annual Report June 30, 2018 |
USCF ETF TRUST – USCF SUMMERHAVEN SHPEN INDEX FUND
SCHEDULE OF INVESTMENTS
AT JUNE 30, 2018 (continued)
| % of Total Net Assets | Shares | Market Value | ||||||||||
| Food | 6.4 | % | ||||||||||
| Calavo Growers, Inc. | 1.4 | % | 414 | $ | 39,806 | |||||||
| Dean Foods Co. | 0.7 | % | 1,909 | 20,064 | ||||||||
| Fresh Del Monte Produce, Inc. | 0.9 | % | 548 | 24,413 | ||||||||
| Ingredion, Inc. | 1.0 | % | 242 | 26,789 | ||||||||
| Lifeway Foods, Inc.(a) | 0.6 | % | 3,086 | 15,523 | ||||||||
| Pilgrim’s Pride Corp.(a) | 0.9 | % | 1,314 | 26,451 | ||||||||
| Sanderson Farms, Inc. | 0.9 | % | 246 | 25,867 | ||||||||
| 178,913 | ||||||||||||
| Forest Products & Paper | 3.9 | % | ||||||||||
| Clearwater Paper Corp.(a) | 0.5 | % | 604 | 13,953 | ||||||||
| Domtar Corp. | 1.3 | % | 760 | 36,282 | ||||||||
| Neenah Paper, Inc. | 1.1 | % | 360 | 30,546 | ||||||||
| PH Glatfelter Co. | 1.0 | % | 1,471 | 28,817 | ||||||||
| 109,598 | ||||||||||||
| Iron & Steel | 8.7 | % | ||||||||||
| AK Steel Holding Corp.(a) | 0.7 | % | 4,652 | 20,190 | ||||||||
| Allegheny Technologies, Inc.(a) | 1.5 | % | 1,621 | 40,720 | ||||||||
| Commercial Metals Co. | 1.1 | % | 1,447 | 30,546 | ||||||||
| Reliance Steel & Aluminum Co. | 1.2 | % | 395 | 34,578 | ||||||||
| Ryerson Holding Corp.(a) | 1.3 | % | 3,241 | 36,137 | ||||||||
| Steel Dynamics, Inc. | 1.3 | % | 801 | 36,806 | ||||||||
| United States Steel Corp. | 1.6 | % | 1,261 | 43,820 | ||||||||
| 242,797 | ||||||||||||
| Machinery-Diversified | 1.0 | % | ||||||||||
| Alamo Group, Inc. | 1.0 | % | 311 | 28,102 | ||||||||
| Metal Fabricate & Hardware | 1.2 | % | ||||||||||
| Olympic Steel, Inc. | 1.2 | % | 1,575 | 32,146 | ||||||||
| Mining | 3.3 | % | ||||||||||
| Alcoa Corp.(a) | 1.4 | % | 834 | 39,098 | ||||||||
| Smart Sand, Inc.(a) | 0.8 | % | 4,034 | 21,421 | ||||||||
| United States Lime & Minerals, Inc. | 1.1 | % | 358 | 30,036 | ||||||||
| 90,555 | ||||||||||||
The accompanying notes are an integral part of the financial statements.
| 27 |
USCF ETF TRUST – USCF SUMMERHAVEN SHPEN INDEX FUND
SCHEDULE OF INVESTMENTS
AT JUNE 30, 2018 (continued)
| % of Total Net Assets | Shares | Market Value | ||||||||||
| Miscellaneous Manufacturers | 2.1 | % | ||||||||||
| American Railcar Industries, Inc. | 1.1 | % | 789 | $ | 31,150 | |||||||
| FreightCar America, Inc. | 1.0 | % | 1,702 | 28,576 | ||||||||
| 59,726 | ||||||||||||
| Oil & Gas | 43.0 | % | ||||||||||
| Adams Resources & Energy, Inc. | 1.1 | % | 687 | 29,541 | ||||||||
| Archrock, Inc. | 1.1 | % | 2,544 | 30,528 | ||||||||
| Bonanza Creek Energy, Inc.(a) | 1.4 | % | 1,007 | 38,135 | ||||||||
| Bristow Group, Inc.(a) | 2.2 | % | 4,348 | 61,350 | ||||||||
| California Resources Corp.(a) | 6.2 | % | 3,796 | 172,490 | ||||||||
| Contango Oil & Gas Co.(a) | 0.9 | % | 4,362 | 24,776 | ||||||||
| CVR Energy, Inc. | 1.7 | % | 1,312 | 48,531 | ||||||||
| Diamond Offshore Drilling, Inc.(a) | 2.0 | % | 2,695 | 56,218 | ||||||||
| Ensco PLC - Class A | 1.5 | % | 5,871 | 42,624 | ||||||||
| Era Group, Inc.(a) | 1.5 | % | 3,133 | 40,572 | ||||||||
| Exterran Corp.(a) | 1.0 | % | 1,062 | 26,592 | ||||||||
| Gulf Island Fabrication, Inc. | 0.8 | % | 2,597 | 23,373 | ||||||||
| Helix Energy Solutions Group, Inc.(a) | 1.6 | % | 5,260 | 43,816 | ||||||||
| HollyFrontier Corp. | 2.6 | % | 1,063 | 72,741 | ||||||||
| Matrix Service Co.(a) | 2.0 | % | 3,067 | 56,279 | ||||||||
| Murphy Oil Corp. | 1.4 | % | 1,148 | 38,768 | ||||||||
| Nabors Industries Ltd. | 0.9 | % | 3,832 | 24,563 | ||||||||
| Penn Virginia Corp.(a) | 2.3 | % | 767 | 65,111 | ||||||||
| Oceaneering International, Inc. | 1.1 | % | 1,258 | 32,029 | ||||||||
| QEP Resources, Inc.(a) | 1.4 | % | 3,072 | 37,663 | ||||||||
| Rowan Cos. PLC - Class A(a) | 1.6 | % | 2,762 | 44,800 | ||||||||
| SEACOR Holdings, Inc.(a) | 1.8 | % | 868 | 49,710 | ||||||||
| Southwestern Energy Co.(a) | 0.9 | % | 4,979 | 26,389 | ||||||||
| Unit Corp.(a) | 1.4 | % | 1,572 | 40,180 | ||||||||
| Whiting Petroleum Corp.(a) | 2.6 | % | 1,356 | 71,488 | ||||||||
| 1,198,267 | ||||||||||||
| Packaging & Containers | 3.2 | % | ||||||||||
| Bemis Co., Inc. | 0.9 | % | 620 | 26,170 | ||||||||
| Graphic Packaging Holding Co. | 1.1 | % | 2,078 | 30,152 | ||||||||
| UFP Technologies, Inc.(a) | 1.2 | % | 1,033 | 31,868 | ||||||||
| 88,190 | ||||||||||||
The accompanying notes are an integral part of the financial statements.
| 28 | Annual Report June 30, 2018 |
USCF ETF TRUST – USCF SUMMERHAVEN SHPEN INDEX FUND
SCHEDULE OF INVESTMENTS
AT JUNE 30, 2018 (continued)
| % of Total Net Assets | Shares | Market Value | ||||||||||
| Transportation | 3.7 | % | ||||||||||
| Frontline Ltd.(a) | 1.0 | % | 4,979 | $ | 29,077 | |||||||
| International Seaways, Inc.(a) | 1.0 | % | 1,268 | 29,342 | ||||||||
| Nordic American Tankers Ltd. | 0.5 | % | 4,725 | 12,663 | ||||||||
| Teekay Corp. | 1.2 | % | 4,284 | 33,201 | ||||||||
| 104,283 | ||||||||||||
| Total Common Stocks (Cost $2,530,053) | 100.0 | % | 2,784,706 | |||||||||
| Total Investments (Cost $2,530,053)(b) | 100.0 | % | 2,784,706 | |||||||||
| Other Assets in Excess of Liabilities | 0.0 | % | 142 | |||||||||
| Total Net Assets | 100.0 | % | $ | 2,784,848 | ||||||||
| (a) | Non income producing security. |
| (b) | The aggregate cost of investments for tax purposes was $2,530,053. The net unrealized appreciation was $254,653, which consisted of aggregate gross unrealized appreciation of $456,794 and aggregate gross unrealized depreciation of $(202,141). |
| Summary of Investments by Country^ | ||||
| United States | 95.8 | % | ||
| United Kingdom | 1.5 | |||
| Norway | 1.5 | |||
| Bermuda | 1.2 | |||
| 100.0 | % | |||
| Summary of Investments by Sector^ | ||||
| Energy | 50.3 | % | ||
| Basic Materials | 18.6 | |||
| Industrials | 13.5 | |||
| Consumer Cyclical | 10.1 | |||
| Consumer Non-Cyclical | 7.5 | |||
| 100.0 | % | |||
| ^ | As a percentage of total investments. All stocks are listed on U.S. Exchanges. |
The accompanying notes are an integral part of the financial statements.
| 29 |
USCF ETF TRUST – USCF SUMMERHAVEN DYNAMIC COMMODITY STRATEGY NO K-1 FUND
CONSOLIDATED SCHEDULE OF INVESTMENTS
AT JUNE 30, 2018
Besides the following listed futures contracts, treasury bills and time deposit of the Fund and it’s wholly-owned subsidiary, there were no additional investments held by the Fund at June 30, 2018.
The following futures contracts of the Fund’s wholly-owned subsidiary were open at June 30, 2018 (see Security Valuation in the Notes to Financial Statements):
| Number of Contracts | Notional Amount | Expiration Date | Value/ Unrealized Gain (Loss) on Open Commodity Contracts | % of Total Net Assets | ||||||||||||||||
| Open Futures Contracts - Long | ||||||||||||||||||||
| Foreign Contracts | ||||||||||||||||||||
| LME Aluminum Futures LA August 2018 contracts | 10 | $ | 538,718 | Aug-18 | $ | (6,999 | ) | (0.1 | )% | |||||||||||
| LME Zinc Futures LX August 2018 contracts | 9 | 682,203 | Aug-18 | (38,167 | ) | (0.4 | )% | |||||||||||||
| LME Lead Futures LL September 2018 contracts | 11 | 672,564 | Sep-18 | (9,677 | ) | (0.1 | )% | |||||||||||||
| LME Nickel Futures LN November 2018 contracts | 8 | 676,959 | Nov-18 | 40,239 | 0.5 | % | ||||||||||||||
| ICE-US Gas Oil Futures QS December 2018 contracts | 10 | 639,000 | Dec-18 | 37,000 | 0.4 | % | ||||||||||||||
| ICE Brent Crude Oil Futures CO February 2019 contracts | 8 | 569,060 | Dec-18 | 48,540 | 0.5 | % | ||||||||||||||
| 56 | 3,778,504 | 70,936 | 0.8 | % | ||||||||||||||||
| United States Contracts | ||||||||||||||||||||
| CME Live Cattle Futures LC August 2018 contracts | 15 | 613,640 | Aug-18 | 26,710 | 0.3 | % | ||||||||||||||
| CBOT Soybean Meal Futures SM October 2018 contracts | 19 | 726,840 | Oct-18 | (99,270 | ) | (1.1 | )% | |||||||||||||
| CME Lean Hogs Futures LH October 2018 contracts | 25 | 608,580 | Oct-18 | (10,830 | ) | (0.1 | )% | |||||||||||||
| COMEX Gold Futures GC October 2018 contracts | 5 | 630,740 | Oct-18 | (640 | ) | 0.0 | %* | |||||||||||||
| NYMEX RBOB Gasoline Futures RB December 2018 contracts | 8 | 633,011 | Nov-18 | 29,916 | 0.3 | % | ||||||||||||||
| ICE-US Cotton #2 Futures CT December 2018 contracts | 15 | 596,890 | Dec-18 | 32,510 | 0.4 | % | ||||||||||||||
| ICE-US Cocoa Futures CC December 2018 contracts | 24 | 673,080 | Dec-18 | (65,640 | ) | (0.8 | )% | |||||||||||||
| NYMEX WTI Crude Oil Futures CL March 2019 contracts | 9 | 581,680 | Feb-19 | 26,360 | 0.3 | % | ||||||||||||||
The accompanying notes are an integral part of the financial statements.
| 30 | Annual Report June 30, 2018 |
USCF ETF TRUST – USCF SUMMERHAVEN DYNAMIC COMMODITY STRATEGY NO K-1 FUND
CONSOLIDATED SCHEDULE OF INVESTMENTS
AT JUNE 30, 2018 (continued)
| Number of Contracts | Notional Amount | Expiration Date | Value/ Unrealized Gain (Loss) on Open Commodity Contracts | % of Total Net Assets | ||||||||||||||||
| United States Contracts (continued) | ||||||||||||||||||||
| NYMEX Heating Oil Futures HO April 2019 contracts | 7 | $ | 639,505 | Mar-19 | $ | 9,618 | 0.1 | % | ||||||||||||
| 127 | 5,703,966 | (51,266 | ) | (0.6 | )% | |||||||||||||||
| Open Futures Contracts - Short** | ||||||||||||||||||||
| Foreign Contracts | ||||||||||||||||||||
| LME Lead Futures LL September 2018 contracts | 11 | (664,180 | ) | Sep-18 | (2,720 | ) | 0.0 | %* | ||||||||||||
| LME Nickel Futures LN November 2018 contracts | 1 | (91,650 | ) | Nov-18 | 1,975 | 0.0 | %* | |||||||||||||
| 12 | (755,830 | ) | (745 | ) | 0.0 | %* | ||||||||||||||
| Total Open Futures Contracts*** | 195 | $ | 8,726,640 | $ | 18,925 | 0.2 | % | |||||||||||||
| Principal Amount | Market Value | % of Total Net Assets | ||||||||||
| Cash Equivalents | ||||||||||||
| United States Treasury Obligations | ||||||||||||
| U.S. Treasury Bills: | ||||||||||||
| 1.85%, 8/09/2018 | $ | 100,000 | $ | 99,800 | 1.1 | % | ||||||
| 1.88%, 8/16/2018 | 100,000 | 99,760 | 1.1 | % | ||||||||
| 1.89%, 8/23/2018 | 350,000 | 349,031 | 4.0 | % | ||||||||
| 1.91%, 9/06/2018 | 50,000 | 49,823 | 0.6 | % | ||||||||
| 1.90%, 9/20/2018 | 250,000 | 248,937 | 2.8 | % | ||||||||
| 2.03%, 11/08/2018 | 300,000 | 297,828 | 3.4 | % | ||||||||
| 2.05%, 11/15/2018 | 300,000 | 297,682 | 3.4 | % | ||||||||
| 2.07%, 11/23/2018 | 500,000 | 495,872 | 5.7 | % | ||||||||
| 2.09%, 12/06/2018 | 300,000 | 297,275 | 3.4 | % | ||||||||
| 2.09%, 12/20/2018 | 500,000 | 495,055 | 5.6 | % | ||||||||
| Total Treasury Obligations (Cost $2,731,063) | $ | 2,731,063 | 31.1 | % | ||||||||
| United States - Money Market Funds | ||||||||||||
| Goldman Sachs Financial Square Funds - Government Fund - Class FS | 2,450,000 | 2,450,000 | 27.9 | % | ||||||||
| Morgan Stanley Institutional Liquidity Funds - Government Portfolio | 1,200,000 | 1,200,000 | 13.7 | % | ||||||||
| Total Money Market Funds (Cost $3,650,000) | $ | 3,650,000 | 41.6 | % | ||||||||
The accompanying notes are an integral part of the financial statements.
| 31 |
USCF ETF TRUST – USCF SUMMERHAVEN DYNAMIC COMMODITY STRATEGY NO K-1 FUND
CONSOLIDATED SCHEDULE OF INVESTMENTS
AT JUNE 30, 2018 (continued)
| Face Amount | Market Value | % of Total Net Assets | ||||||||||
| Time Deposits | ||||||||||||
| ANZ National Bank, 1.27% due 07/02/2018 | $ | 23,321 | $ | 23,321 | 0.3 | % | ||||||
| Brown Brothers Harriman & Co., 1.27% due 07/02/2018 | 17,517 | 17,517 | 0.2 | % | ||||||||
| Total Time Deposits (Cost $40,838) | $ | 40,838 | 0.5 | % | ||||||||
| Total Cash Equivalents (Cost $6,421,901) | $ | 6,421,901 | 73.2 | % | ||||||||
| Short-Term Investments | ||||||||||||
| United States Treasury Obligations | ||||||||||||
| U.S. Treasury Bills: | ||||||||||||
| 2.07%, 1/03/2019 | 100,000 | 98,943 | 1.1 | % | ||||||||
| 2.07%, 1/31/2019 | 300,000 | 296,362 | 3.4 | % | ||||||||
| 2.18%, 2/28/2019 | 300,000 | 295,674 | 3.4 | % | ||||||||
| 2.19%, 3/28/2019 | 300,000 | 295,174 | 3.4 | % | ||||||||
| 2.25%, 4/25/2019 | 300,000 | 294,512 | 3.3 | % | ||||||||
| 2.29%, 5/23/2019 | 500,000 | 489,858 | 5.6 | % | ||||||||
| Total United States Treasury Obligations (Cost $1,770,523) | $ | 1,770,523 | 20.2 | % | ||||||||
| Total Short-Term Investments (Cost $1,770,523) | $ | 1,770,523 | 20.2 | % | ||||||||
| Total Investments (Cost $8,192,424)(a) | $ | 8,211,349 | 93.6 | % | ||||||||
| Other Assets in Excess of Liabilities | 562,851 | 6.4 | % | |||||||||
| Total Net Assets | $ | 8,774,200 | 100.0 | % | ||||||||
| * | Position represents less than 0.05%. |
| ** | All short contracts are offset by the same number of Futures Contracts in the corresponding long positions and are acquired solely for the purpose of reducing a long position (e.g., due to a redemption or to reflect a rebalancing of the SDCI). |
| *** | Collateral amounted to $858,316 on open futures contracts. |
| (a) | The aggregate cost of investments for tax purposes was $8,192,424. |
| Summary of Investments by Country^ | ||||
| United States | 98.6 | % | ||
| United Kingdom | 0.9 | |||
| Short-Term Investments | 0.5 | |||
| Total | 100.0 | % | ||
| ^ | As a percentage of total investments. |
The accompanying notes are an integral part of the financial statements.
| 32 | Annual Report June 30, 2018 |
USCF ETF TRUST
STATEMENTS OF ASSETS AND LIABILITIES
JUNE 30, 2018
| USCF SummerHaven SHPEI Index Fund | USCF SummerHaven SHPEN Index Fund | |||||||
| Assets: | ||||||||
| Investments, at Market Value | $ | 2,722,044 | $ | 2,784,706 | ||||
| Cash | 11,646 | 5,746 | ||||||
| Receivables: | ||||||||
| Dividends | 1,353 | 675 | ||||||
| Total Assets | 2,735,043 | 2,791,127 | ||||||
| Liabilities: | ||||||||
| Payables: | ||||||||
| Accrued Management Fees | 6,273 | 6,279 | ||||||
| Total Liabilities | 6,273 | 6,279 | ||||||
| Total Net Assets | $ | 2,728,770 | $ | 2,784,848 | ||||
| Net Assets Consist of: | ||||||||
| Capital Paid In | $ | 2,494,309 | $ | 2,519,549 | ||||
| Accumulated Net Realized Gain (Loss) on Investments | 7,836 | 10,646 | ||||||
| Net Unrealized Appreciation (Depreciation) on Investments | 226,625 | 254,653 | ||||||
| Total Net Assets | $ | 2,728,770 | $ | 2,784,848 | ||||
| Net Asset Value Per Share | ||||||||
| Total Net Assets | $ | 2,728,770 | $ | 2,784,848 | ||||
| Shares of Beneficial Interest Outstanding (Unlimited Shares of $0.001 Par Value Authorized) | 100,000 | 100,000 | ||||||
| Net Asset Value | $ | 27.29 | $ | 27.85 | ||||
| Investments, at Cost | $ | 2,495,419 | $ | 2,530,053 | ||||
The accompanying notes are an integral part of the financial statements.
| 33 |
USCF ETF TRUST – USCF SUMMERHAVEN DYNAMIC COMMODITY STRATEGY NO K-1 FUND
CONSOLIDATED STATEMENT OF ASSETS AND LIABILITIES
JUNE 30, 2018
| Assets: | ||||
| Investments, at Market Value: | ||||
| Cash and Cash Equivalents | $ | 6,421,901 | ||
| Short-Term Investments | 1,770,523 | |||
| Net Unrealized Appreciation (Depreciation) on Open Futures Contracts | 18,925 | |||
| 8,211,349 | ||||
| Cash | 568,286 | |||
| Receivables: | ||||
| Dividends and Interest Receivable | 5,788 | |||
| Total Assets | 8,785,423 | |||
| Liabilities: | ||||
| Payables: | ||||
| Accrued Management Fees | 11,021 | |||
| Other Liabilities | 202 | |||
| Total Liabilities | 11,223 | |||
| Total Net Assets | $ | 8,774,200 | ||
| Net Assets Consist of: | ||||
| Capital Paid In | $ | 8,789,550 | ||
| Accumulated Net Realized Gain (Loss) on Futures Contracts | (34,275 | ) | ||
| Net Unrealized Appreciation (Depreciation) on Open Futures Contracts | 18,925 | |||
| Total Net Assets | $ | 8,774,200 | ||
| Net Asset Value Per Share: | ||||
| Total Net Assets | $ | 8,774,200 | ||
| Shares of Beneficial Interest Outstanding (Unlimited Shares of $0.001 Par Value Authorized) | 400,000 | |||
| Net Asset Value | $ | 21.94 | ||
| Investments, at Cost | $ | 8,192,424 |
The accompanying notes are an integral part of the financial statements.
| 34 | Annual Report June 30, 2018 |
USCF ETF TRUST
STATEMENTS OF OPERATIONS
FOR THE PERIOD ENDED JUNE 30, 2018*
| USCF SummerHaven SHPEI Index Fund | USCF SummerHaven SHPEN Index Fund | |||||||
| Investment Income: | ||||||||
| Dividend Income (less net foreign withholding tax $26 and $0, respectively) | $ | 22,197 | $ | 15,709 | ||||
| Interest Income | 12 | — | ||||||
| Total Investment Income | 22,209 | 15,709 | ||||||
| Expenses: | ||||||||
| Management Fee | 14,170 | 14,317 | ||||||
| Total Expenses | 14,170 | 14,317 | ||||||
| Net Investment Income (Loss) | 8,039 | 1,392 | ||||||
| Realized and Unrealized Gain (Loss) on Investments: | ||||||||
| Net Realized Gain (Loss) on Investments | 7,836 | 10,770 | ||||||
| Net Change in Unrealized Appreciation (Depreciation) on Investments | 226,625 | 254,653 | ||||||
| Net Change in Realized and Unrealized Gain (Loss) on Investments | 234,461 | 265,423 | ||||||
| Net Increase in Net Assets Resulting from Operations | $ | 242,500 | $ | 266,815 | ||||
| * | Inception Date, November 30, 2017. |
The accompanying notes are an integral part of the financial statements.
| 35 |
USCF ETF TRUST – USCF SUMMERHAVEN DYNAMIC COMMODITY STRATEGY NO K-1 FUND
CONSOLIDATED STATEMENT OF OPERATIONS
FOR THE PERIOD ENDED JUNE 30, 2018*
| Investment Income: | ||||
| Dividend Income (less net foreign withholding tax $0) | $ | 9,645 | ||
| Interest Income | 10,546 | |||
| Total Investment income | 20,191 | |||
| Expenses: | ||||
| Management Fees | 11,021 | |||
| Total Expenses | 11,021 | |||
| Net Investment Income (Loss) | 9,170 | |||
| Realized and Unrealized Gain (Loss) on Investments: | ||||
| Net Realized Gain (Loss) on Futures Contracts | (94,841 | ) | ||
| Net Change in Unrealized Appreciation (Depreciation) on Open Futures Contracts | 18,925 | |||
| Net Change in Realized and Unrealized Gain (Loss) on Futures Contracts | (75,916 | ) | ||
| Net Increase (Decrease) in Net Assets Resulting from Operations | $ | (66,746 | ) |
| * | Inception Date, May 2, 2018. |
The accompanying notes are an integral part of the financial statements.
| 36 | Annual Report June 30, 2018 |
USCF ETF TRUST
STATEMENTS OF CHANGES IN NET ASSETS
FOR THE PERIOD ENDED JUNE 30, 2018*
| USCF SummerHaven SHPEI Index Fund | USCF SummerHaven SHPEN Index Fund | |||||||
| Operations: | ||||||||
| Net Investment Income (Loss) | $ | 8,039 | $ | 1,392 | ||||
| Net Realized Gain (Loss) on Investments | 7,836 | 10,770 | ||||||
| Net Changes in Unrealized Appreciation (Depreciation) on Investments | 226,625 | 254,653 | ||||||
| Net Increase (Decrease) in Net Assets Resulting from Operations | 242,500 | 266,815 | ||||||
| Distributions to Shareholders from: | ||||||||
| Net Investment Income | (8,149 | ) | (1,516 | ) | ||||
| Total Distributions to Shareholders | (8,149 | ) | (1,516 | ) | ||||
| Shareholder Transactions: | ||||||||
| Proceeds from Shares Sold | 2,494,422 | 2,519,552 | ||||||
| Shares Issued as Reinvestment of Dividends and Distributions | — | — | ||||||
| Cost of Shares Redeemed | (28 | ) | (28 | ) | ||||
| Net Increase (Decrease) in Net Assets from Shares Transactions | 2,494,394 | 2,519,524 | ||||||
| Net Increase (Decrease) in Net Assets | 2,728,745 | 2,784,823 | ||||||
| Net Assets: | ||||||||
| Beginning of Period | 25 | 25 | ||||||
| End of Period1 | $ | 2,728,770 | $ | 2,784,848 | ||||
| 1Includes Accumulated Undistributed Net Investment Income (Loss) of: | $ | — | $ | — | ||||
| Changes in Shares Outstanding: | ||||||||
| Shares Outstanding, Beginning of Period | 1 | * | 1 | * | ||||
| Shares Issued | 100,000 | 100,000 | ||||||
| Shares Issued in Reinvestment of Dividends and Distributions | — | — | ||||||
| Shares Redeemed | (1 | ) | (1 | ) | ||||
| Shares Outstanding, End of Period | 100,000 | 100,000 | ||||||
| * | Inception Date, November 30, 2017. |
The accompanying notes are an integral part of the financial statements.
| 37 |
USCF ETF TRUST – USCF SUMMERHAVEN DYNAMIC COMMODITY STRATEGY NO K-1 FUND
CONSOLIDATED STATEMENT OF CHANGES IN NET ASSETS
FOR THE PERIOD ENDED JUNE 30, 2018*
| Operations: | ||||
| Net Investment Income (Loss) | $ | 9,170 | ||
| Net Realized Gain (Loss) on Futures Contracts | (94,841 | ) | ||
| Net Change in Unrealized Appreciation (Depreciation) on Futures Contracts | 18,925 | |||
| Net Increase (Decrease) in Net Assets Resulting from Operations | (66,746 | ) | ||
| Distributions to Shareholders from: | ||||
| Net Investment Income | (8,760 | ) | ||
| Total Distributions to Shareholders | (8,760 | ) | ||
| Shareholder Transactions: | ||||
| Proceeds from Shares Sold | 8,849,703 | |||
| Shares Issued as Reinvestment of Dividends and Distributions | — | |||
| Cost of Shares Redeemed | (22 | ) | ||
| Net Increase (Decrease) in Net Assets from Shares Transactions | 8,849,681 | |||
| Net Increase (Decrease) in Net Assets | 8,774,175 | |||
| Net Assets: | ||||
| Beginning of Period | 25 | |||
| End of Period1 | $ | 8,774,200 | ||
| 1Includes Accumulated Undistributed Net Investment Income (Loss) of: | $ | — | ||
| Changes in Shares Outstanding: | ||||
| Shares Outstanding, Beginning of Period | 1 | * | ||
| Shares Issued | 400,000 | |||
| Shares Issued in Reinvestment of Dividends and Distributions | — | |||
| Shares Redeemed | (1 | ) | ||
| Shares Outstanding, End of Period | 400,000 |
* Inception Date, May 2, 2018.
The accompanying notes are an integral part of the financial statements.
| 38 | Annual Report June 30, 2018 |
USCF ETF TRUST
FOR THE PERIOD ENDED JUNE 30, 2018*
SELECTED DATA FOR A SHARE OF COMMON STOCK OUTSTANDING THROUGHOUT THE PERIOD INDICATED:
| USCF SummerHaven SHPEI Index Fund | USCF SummerHaven SHPEN Index Fund | |||||||
| Net Asset Value, Beginning of Period | $ | 24.94 | $ | 25.20 | ||||
| Income (Loss) from Operations: | ||||||||
| Net Investment Income (Loss)(a) | 0.08 | 0.01 | ||||||
| Net Realized and Unrealized Gain (Loss) | 2.35 | 2.66 | ||||||
| Total Income (Loss) from Operations | 2.43 | 2.67 | ||||||
| Less Distributions From: | ||||||||
| Net Investment Income (Loss) | (0.08 | ) | (0.02 | ) | ||||
| Capital Gains | — | — | ||||||
| Total Distributions | (0.08 | ) | (0.02 | ) | ||||
| Net Assets Value, End of Period | $ | 27.29 | $ | 27.85 | ||||
| Total Return(b) | 9.77 | % | 10.59 | % | ||||
| Net Assets, End of Period (thousands) | $ | 2,729 | $ | 2,785 | ||||
| Ratios of Average Net Assets: | ||||||||
| Net Expenses | 0.95 | %** | 0.95 | %** | ||||
| Net Investment Income (Loss) | 0.54 | %** | 0.09 | %** | ||||
| Portfolio Turnover Rate(c) | 3 | % | 1 | % | ||||
| * | Inception Date, November 30, 2017. |
| ** | Annualized. |
| (a) | Per share amounts have been calculated using the weighted average shares method. |
| (b) | Total Return may reflect fee waivers and/or expense reimbursements and assume reinvestment of dividend distribution. In the absence of fee waivers and/or expense reimbursements, the total return would have been lower. Past performance is no guarantee of future results. |
| (c) | Portfolio turnover rate is not annualized for periods less than one year and does not include securities received or delivered from processing creations or redemptions. |
The accompanying notes are an integral part of the financial statements.
| 39 |
USCF ETF TRUST – USCF SUMMERHAVEN DYNAMIC COMMODITY STRATEGY NO K-1 FUND
CONSOLIDATED FINANCIAL HIGHLIGHTS
FOR THE PERIOD ENDED JUNE 30, 2018*
SELECTED DATA FOR A SHARE OF COMMON STOCK OUTSTANDING THROUGHOUT THE PERIOD INDICATED:
| Net Asset Value, Beginning of Period | $ | 22.00 | ||
| Income (Loss) from Operations: | ||||
| Net Investment Income (Loss)(a) | 0.02 | |||
| Net Realized and Unrealized Gain (Loss) | (0.06 | ) | ||
| Total Income (Loss) from Operations | (0.04 | ) | ||
| Less Distributions From: | ||||
| Net Investment Income (Loss) | (0.02 | ) | ||
| Capital Gains | — | |||
| Total Distributions | (0.02 | ) | ||
| Net Asset Value, End of Period | $ | 21.94 | ||
| Total Return(b) | (0.17 | )% | ||
| Net Assets, End of Period (thousands) | $ | 8,774 | ||
| Ratios of Average Net Assets: | ||||
| Net Expenses | 0.80 | %** | ||
| Net Investment Income (Loss) | 0.67 | %** | ||
| Portfolio Turnover Rate(c) | 19 | % |
| * | Inception Date, May 2, 2018. |
| ** | Annualized. |
| (a) | Per share amounts have been calculated using the average shares method. |
| (b) | Total Return may reflect fee waivers and/or expense reimbursements and assume reinvestment of dividend distribution. In the absence of fee waivers and/or expense reimbursements, the total return would have been lower. Past performance is no guarantee of future results. |
| (c) | Portfolio turnover rate is not annualized for periods less than one year and does not include securities received or delivered from processing creations or redemptions. |
The accompanying notes are an integral part of the financial statements.
| 40 | Annual Report June 30, 2018 |
USCF ETF TRUST
NOTES TO FINANCIAL STATEMENTS
JUNE 30, 2018
NOTE 1 – ORGANIZATION
The USCF ETF Trust (the “Trust”) was organized as a Delaware statutory trust in accordance with a Declaration of Trust dated November 6, 2013. The Declaration of Trust was amended and restated on June 16, 2014. The Trust is authorized to have multiple segregated series or portfolios. The Trust is an open-end management investment company registered under the Investment Company Act of 1940 (the “1940 Act”). The Trust currently consists of three investment portfolios, each of which is an exchange-traded fund (“ETF”): the USCF SummerHaven SHPEI Index Fund (“BUY”), the USCF SummerHaven SHPEN Index Fund (“BUYN”) and the USCF SummerHaven Dynamic Commodity Strategy No K-1 Fund (“SDCI”) (each a “Fund” and collectively, the “Funds”). BUY and BUYN commenced operations on November 30, 2017. BUY and BUYN were listed on the NYSE Arca Equity, Inc. (“NYSE Arca”) on December 1, 2017. SDCI commenced operations on May 2, 2018. SDCI was listed on NYSE Arca on May 3, 2018. Other series or portfolios may be added to the Trust in the future. USCF Advisers LLC serves as the investment adviser to the Funds (the “Adviser”). The Adviser has been registered as an investment adviser with the Securities Exchange Commission (the “SEC”) since July 1, 2014 and is a wholly-owned subsidiary of Wainwright Holdings, Inc. SummerHaven Investment Management, LLC (the “Sub-Adviser”) serves as the sub-adviser to BUY, BUYN and to the USCF Cayman Commodity 2 (the “Subsidiary”), a wholly-owned subsidiary of SDCI. The Adviser was also the investment adviser for the Stock Split Index Fund (“TOFR”) and the USCF Restaurant Leaders Fund (“MENU”), each of which was a series of the USCF ETF Trust, until October 2017, when both funds liquidated all of their assets and distributed cash pro rata to all remaining shareholders.
NOTE 2 – SIGNIFICANT ACCOUNTING POLICIES
The accompanying financial statements were prepared in accordance with U.S. Generally Accepted Accounting Principles (“GAAP”), which require the use of estimates and assumptions made by management. These may affect the reported amounts of assets and liabilities and disclosure of contingent assets and liabilities at the date of the financial statements and the reported amounts of increases and decreases in net assets from operations during the reporting period. Actual results could differ from those estimates. The following is a summary of significant accounting policies consistently followed by the Funds in preparation of their financial statements.
Basis of Presentation
The financial statements have been prepared in conformity with GAAP as detailed in the Financial Accounting Standards Board’s (“FASB”) Accounting Standards Codification (“ASC”). The Funds are investment companies and follow the accounting and reporting guidance in FASB Topic 946.
| 41 |
Calculation of Net Asset Value
The Net Asset Value (“NAV”) of a Fund’s shares is calculated each day the national securities exchanges are open for trading. The NAV for BUY and BUYN is calculated as of the close of regular trading on NYSE Arca, generally 4:00 p.m. New York time. For SDCI, the NAV is generally calculated at 2:30 p.m. Eastern Time (for each Fund, its “NAV Calculation Time”). If regular trading on NYSE Arca closes earlier than 2:30 p.m. Eastern Time on a given day, the NAV of the SDCI’s shares will be calculated as of that earlier time. NAV per share is calculated by dividing the Fund’s net assets by the number of the Fund’s outstanding shares.
In calculating its NAV, a Fund generally values its assets on the basis of market quotations, last sale prices, or estimates of value furnished by a pricing service or brokers who make markets in such instruments. Debt obligations with maturities of 60 days or less are valued at amortized cost.
Fair value pricing is used by a Fund when reliable market valuations are not readily available or are not deemed to reflect current market values. Securities that may be valued using “fair value” pricing may include, but are not limited to, securities for which there are no current market quotations or whose issuer is in default or bankruptcy, securities subject to corporate actions (such as mergers or reorganizations), securities subject to non-U.S. investment limits or currency controls, and securities affected by “significant events.” An example of a significant event is an event, occurring after the close of the market in which a security trades but before a Fund’s next NAV Calculation Time that may materially affect the value of the Fund’s investment (e.g., government action, natural disaster, or significant market fluctuation). When fair-value pricing is employed, the prices of securities used by a Fund to calculate its NAV may differ from quoted or published prices for the same securities.
The value of the SDCI’s assets that trade in markets outside the United States may fluctuate on days that foreign markets are open (which may include non-Business Days). As such, the value of the SDCI’s investments may change on days when you will not be able to purchase or redeem SDCI shares.
Security Valuation
i. Treasuries
SDCI may invest in U.S. government obligations. U.S. government obligations include U.S. Treasury obligations and securities issued or guaranteed by various agencies of the U.S. government, or by various instrumentalities which have been established or sponsored by the U.S. government. U.S. Treasury obligations are backed by the “full faith and credit” of the U.S. government. Securities issued or guaranteed by U.S. federal agencies and U.S. government sponsored instrumentalities may or may not be backed by the full faith and credit of the U.S. government.
| 42 | Annual Report June 30, 2018 |
Investments in securities are carried at market value. All equity securities that are traded on a national securities exchange are valued at the last sale price at the time of the close of the New York Stock Exchange (“NYSE”). If on a particular day an exchange-listed security does not trade, then the mean between the closing bids and asked prices will be used. In the case of securities listed on more than one national securities exchange, the last quoted sale, up to the time of valuation, on the exchange on which the security is principally traded will be used. If there were no sales on that exchange, the last quoted sale on the other exchange will be used.
For securities that are traded on the NASDAQ, the NASDAQ Official Closing Price (e.g., the NASDAQ Closing Cross price, if available) is used. All non-NASDAQ equity securities that are not traded on a listed exchange are valued at the last sale price at the close of the NYSE. If a non-exchange listed security does not trade on a particular day, or if a last sales price or NASDAQ Official Closing Price is not available, then the mean between the closing bid and asked price will be used.
Securities having a remaining maturity of 60 days or less are valued at amortized cost, which approximates market value.
The cost of securities sold is determined on the identified cost basis. When market quotations are not readily available or when events occur that make established valuation methods unreliable, securities of the Funds may be valued at fair value determined in good faith by or under the direction of the Board of Trustees (the “Board”).
Security transactions are recorded on the dates the transactions are entered, which is the trade date.
ii. Fair Value Measurement
The Funds utilize various methods to measure the fair value of most of their investments on a recurring basis. GAAP establishes a hierarchy that prioritizes inputs to valuation methods. The three levels of inputs are:
Level 1 – Unadjusted quoted prices in active markets for identical assets or liabilities that the Funds have the ability to access.
Level 2 – Observable inputs other than quoted prices included in Level 1 that are observable for the asset or liability, either directly or indirectly. These inputs may include quoted prices for the identical instrument or an inactive market, prices for similar instruments, interest rates, prepayment speeds, credit risk, yield curves, default rates and similar data.
| 43 |
Level 3 – Unobservable inputs for the asset or liability, to the extent relevant observable inputs are not available, representing the Funds’ own assumptions about the assumptions a market participant would use in valuing the asset or liability, and would be based on the best information available.
The availability of observable inputs can vary from security to security and is affected by a wide variety of factors, including, for example, the type of security, whether the security is new and not yet established in the marketplace, the liquidity of markets, and other characteristics particular to the security. To the extent that valuation is based on models or inputs that are less observable or unobservable in the market, the determination of fair value requires more judgment. Accordingly, the degree of judgment exercised in determining fair value is greatest for instruments categorized in Level 3.
The inputs used to measure fair value may fall into different levels of the fair value hierarchy. In such cases for disclosure purposes, the level in the fair value hierarchy within which the fair value measurement falls in its entirety, is determined based on the lowest level input that is significant to the fair value measurement in its entirety.
The following tables summarize the valuation of securities at June 30, 2018 for the Funds, using the fair value hierarchy:
BUY
| Investments, at fair value | Total | Level 1 | Level 2 | Level 3 | ||||||||||||
| Common Stocks: | ||||||||||||||||
| Aerospace & Defense | $ | 22,396 | $ | 22,396 | $ | — | $ | — | ||||||||
| Airlines | 16,935 | 16,935 | — | — | ||||||||||||
| Apparel | 70,702 | 70,702 | — | — | ||||||||||||
| Auto Manufacturers | 16,764 | 16,764 | — | — | ||||||||||||
| Auto Parts & Equipment | 63,410 | 63,410 | — | — | ||||||||||||
| Banks | 287,271 | 287,271 | — | — | ||||||||||||
| Building Materials | 52,406 | 52,406 | — | — | ||||||||||||
| Chemicals | 48,795 | 48,795 | — | — | ||||||||||||
| Coal | 29,897 | 29,897 | — | — | ||||||||||||
| Commercial Services | 257,813 | 257,813 | — | — | ||||||||||||
| Computers | 33,775 | 33,775 | — | — | ||||||||||||
| Distribution & Wholesale | 42,346 | 42,346 | — | — | ||||||||||||
| Diversified Financial Services | 80,072 | 80,072 | — | — | ||||||||||||
| Electrical Component & Equipment | 26,271 | 26,271 | — | — | ||||||||||||
| Electronics | 92,664 | 92,664 | — | — | ||||||||||||
| Energy-Alternate Sources | 37,827 | 37,827 | — | — | ||||||||||||
| Engineering & Construction | 78,184 | 78,184 | — | — | ||||||||||||
| Entertainment | 32,936 | 32,936 | — | — | ||||||||||||
| Environmental Control | 4,937 | 4,937 | — | — | ||||||||||||
| Food | 45,014 | 45,014 | — | — | ||||||||||||
| Forest Products & Paper | 3,812 | 3,812 | — | — | ||||||||||||
| 44 | Annual Report June 30, 2018 |
| Investments, at fair value (continued) | Total | Level 1 | Level 2 | Level 3 | ||||||||||||
| Gas | $ | 7,908 | $ | 7,908 | $ | — | $ | — | ||||||||
| Healthcare-Services | 79,063 | 79,063 | — | — | ||||||||||||
| Home Builders | 10,622 | 10,622 | — | — | ||||||||||||
| Home Furnishings | 21,427 | 21,427 | — | — | ||||||||||||
| Household Products & Wares | 14,113 | 14,113 | — | — | ||||||||||||
| Housewares | 13,171 | 13,171 | — | — | ||||||||||||
| Insurance | 76,483 | 76,483 | — | — | ||||||||||||
| Internet | 15,588 | 15,588 | — | — | ||||||||||||
| Investment Companies | 9,223 | 9,223 | — | — | ||||||||||||
| Iron & Steel | 26,337 | 26,337 | — | — | ||||||||||||
| Leisure Time | 16,859 | 16,859 | — | — | ||||||||||||
| Lodging | 9,222 | 9,222 | — | — | ||||||||||||
| Machinery-Diversified | 29,727 | 29,727 | — | — | ||||||||||||
| Media | 26,518 | 26,518 | — | — | ||||||||||||
| Metal Fabricate & Hardware | 31,402 | 31,402 | — | — | ||||||||||||
| Mining | 10,595 | 10,595 | — | — | ||||||||||||
| Miscellaneous Manufacturer | 34,077 | 34,077 | — | — | ||||||||||||
| Office & Business Equipment | 7,683 | 7,683 | — | — | ||||||||||||
| Oil & Gas | 226,215 | 226,215 | — | — | ||||||||||||
| Packaging & Containers | 8,731 | 8,731 | — | — | ||||||||||||
| Pharmaceuticals | 25,639 | 25,639 | — | — | ||||||||||||
| Retail | 478,005 | 478,005 | — | — | ||||||||||||
| Savings & Loans | 57,159 | 57,159 | — | — | ||||||||||||
| Semiconductors | 27,975 | 27,975 | — | — | ||||||||||||
| Software | 13,789 | 13,789 | — | — | ||||||||||||
| Telecommunications | 26,206 | 26,206 | — | — | ||||||||||||
| Textiles | 5,818 | 5,818 | — | — | ||||||||||||
| Transportation | 59,038 | 59,038 | — | — | ||||||||||||
| Trucking & Leasing | 9,224 | 9,224 | — | — | ||||||||||||
| Total Investments, at fair value | $ | 2,722,044 | $ | 2,722,044 | $ | — | $ | — | ||||||||
BUYN
| Investments, at fair value | Total | Level 1 | Level 2 | Level 3 | ||||||||||||
| Common Stocks: | ||||||||||||||||
| Auto Manufacturers | $ | 61,139 | $ | 61,139 | $ | — | $ | — | ||||||||
| Auto Parts & Equipment | 218,738 | 218,738 | — | — | ||||||||||||
| Beverages | 29,511 | 29,511 | — | — | ||||||||||||
| Building Materials | 64,733 | 64,733 | — | — | ||||||||||||
| Chemicals | 74,409 | 74,409 | — | — | ||||||||||||
| Coal | 109,810 | 109,810 | — | — | ||||||||||||
| Energy-Alternate Sources | 93,789 | 93,789 | — | — | ||||||||||||
| Food | 178,913 | 178,913 | — | — | ||||||||||||
| 45 |
| Investments, at fair value (continued) | Total | Level 1 | Level 2 | Level 3 | ||||||||||||
| Forest Products & Paper | $ | 109,598 | $ | 109,598 | $ | — | $ | — | ||||||||
| Iron & Steel | 242,797 | 242,797 | — | — | ||||||||||||
| Machinery-Diversified | 28,102 | 28,102 | — | — | ||||||||||||
| Metal Fabricate & Hardware | 32,146 | 32,146 | — | — | ||||||||||||
| Mining | 90,555 | 90,555 | — | — | ||||||||||||
| Miscellaneous Manufacturers | 59,726 | 59,726 | — | — | ||||||||||||
| Oil & Gas | 1,198,267 | 1,198,267 | — | — | ||||||||||||
| Packaging & Containers | 88,190 | 88,190 | — | — | ||||||||||||
| Transportation | 104,283 | 104,283 | — | — | ||||||||||||
| Total Investments, at fair value | $ | 2,784,706 | $ | 2,784,706 | $ | — | $ | — | ||||||||
SDCI
| Investments | Total | Level 1 | Level 2 | Level 3 | ||||||||||||
| Cash Equivalents: | ||||||||||||||||
| Time Deposits | $ | 40,838 | $ | 40,838 | $ | — | $ | — | ||||||||
| United States - Money Market Funds | 3,650,000 | 3,650,000 | — | — | ||||||||||||
| United States Treasury Obligations | 2,731,063 | 2,731,063 | — | — | ||||||||||||
| Total Cash Equivalents, at fair value | $ | 6,421,901 | $ | 6,421,901 | $ | — | $ | — | ||||||||
| Short-Term Investments: | ||||||||||||||||
| United States Treasury Obligations | $ | 1,770,523 | $ | 1,770,523 | $ | — | $ | — | ||||||||
| Total Short-Term Investment, at fair value | $ | 1,770,523 | $ | 1,770,523 | $ | — | $ | — | ||||||||
| Exchange-Traded Futures Contracts: | ||||||||||||||||
| Foreign Contacts | $ | 70,191 | $ | 70,191 | $ | — | $ | — | ||||||||
| United States Contracts | (51,266 | ) | (51,266 | ) | — | — | ||||||||||
| Total Exchange-Traded Futures Contracts | $ | 18,925 | $ | 18,925 | $ | — | $ | — | ||||||||
| Total Investments | $ | 8,211,349 | $ | 8,211,349 | $ | — | $ | — | ||||||||
For the period ended June 30, 2018, the Funds did not have any transfers between Level 1, Level 2 and Level 3 securities.
SDCI adopted the provisions of Accounting Standards Codification 815 – Derivatives and Hedging, which require presentation of qualitative disclosures about objectives and strategies for using derivatives, quantitative disclosures about fair value amounts and gains and losses on derivatives.
| Fair Value of Derivative Instruments | ||||||
| Derivatives not Accounted for as Hedging Instruments | Consolidated Statement of Assets and Liabilities | Fair Value At June 30, 2018 | ||||
| Open Futures Contracts | Assets | $ | 18,925 | |||
| 46 | Annual Report June 30, 2018 |
The Effect of Derivative Instruments on the Consolidated Statement of Operations
| For the period ended June 30, 2018* | ||||||||||
| Derivatives not Accounted for as Hedging Instruments | Location of Gain (Loss) on Derivatives Recognized in Income | Realized Gain (Loss) on Derivatives Recognized in Income | Change in Unrealized Gain (Loss) on Derivatives Recognized in Income | |||||||
| Open Futures Contracts | Net Realized Gain (Loss) on Futures Contracts | $ | (94,841 | ) | ||||||
| Net Change in Unrealized Appreciation (Depreciation) on Open Futures Contracts | $ | 18,925 | ||||||||
| * | Inception Date, May 2, 2018. |
Income
Dividend income is recorded on the ex-dividend date, as soon as information is available to the Funds. Distributions to shareholders, which are determined in accordance with income tax regulations, are also recorded on the ex-dividend date. Interest income is recorded as earned. Discounts and premiums on securities purchased are amortized over the life of the respective securities.
As of and during the period ended June 30, 2018, the Funds did not have a liability for any unrecognized tax benefits in the accompanying financial statements. The Funds file income tax returns in the U.S. federal jurisdiction and Delaware.
The Funds follow ASC 740 “Income Taxes”, which requires that the financial statements effects of a tax position taken or expected to be taken in a tax return be recognized in the financial statements when it is more likely than not, based on the technical merits, that the position will be sustained upon examination. Management has concluded that the Funds have taken no uncertain tax positions that require adjustment to the financial statements.
Federal and Other Taxes
It is the Trust’s policy to comply with the federal income and excise tax requirements of the Internal Revenue Code of 1986, as amended, applicable to regulated investment companies. Accordingly, the Funds intend to distribute substantially all of their income and net realized gains on investments, if any, to shareholders each year. Therefore, no federal income tax provision is required in the Funds’ financial statements. Under the applicable foreign tax laws, a withholding tax may be imposed on interest, dividends and capital gains at various rates.
| 47 |
GAAP requires that certain components of net assets be adjusted to reflect permanent differences between financial and tax reporting. These reclassifications have no effect on net assets or NAV per share. The following permanent differences as of June 30, 2018, attributable to adjustments from the Subsidiary, were reclassified to the following accounts:
| BUY* | BUYN* | SDCI** | ||||||||||
| Capital Paid In | $ | (110 | ) | $ | — | $ | (60,156 | ) | ||||
| Undistributed (Distribution in Excess) Net Investment Income | $ | 110 | $ | 124 | $ | (410 | ) | |||||
| Undistributed (Accumulated) Net Realized Gain (Loss) | $ | — | $ | (124 | ) | $ | 60,566 | |||||
| * | Inception date, November 30, 2017. |
| ** | Inception date, May 2, 2018. |
Management has reviewed the tax positions and has concluded that no liability for unrecognized tax benefits should be recorded related to uncertain tax positions taken on returns filed for open tax years or expected to be taken with the 2017 tax returns. Each Fund’s federal tax returns for the prior three fiscal years remain subject to examination by the Internal Revenue Service.
Dividends and Distributions
Each Fund intends to pay out dividends on a quarterly basis. Nonetheless, each Fund may not make a dividend payment every quarter. Each Fund intends to distribute its net realized capital gains, if any, to investors annually. Each Fund may occasionally be required to make supplemental distributions at some other time during the year. Distributions in cash may be reinvested automatically in additional whole shares only if the broker through whom you purchased shares makes such option available. Your broker is responsible for distributing the income and capital gain distributions to you.
For federal income tax purposes, distributions of investment income are generally taxable as ordinary income or qualified dividend income to the extent of a Fund’s current and accumulated earnings and profits. Taxes on distributions of capital gains (if any) are determined by how long a Fund owned the investments that generated them, rather than how long you have owned your Fund shares. Sales of assets held by a Fund for more than one year generally result in long-term capital gains and losses, and sales of assets held by such Fund for one year or less generally result in short-term capital gains and losses. Distributions of a Fund’s net capital gain (the excess of realized net long-term capital gains over realized net short-term capital losses) that are properly reported by such Fund as capital gain dividends (“Capital Gain Dividends”) will be taxable as long-term capital gains. For non-corporate shareholders, long-term capital gains are generally subject to tax at reduced maximum rates. Distributions of short-term capital gain will be taxable as ordinary income. Distributions of investment income properly reported by a Fund as “qualified dividend income” are generally taxed to non-corporate shareholders at the same rates applicable to long-term capital gains, provided holding periods and other requirements are met by the Fund and the shareholder. Distributions in excess of a Fund’s current and accumulated earnings and profits will first be treated as a non-taxable return of capital to the extent of a shareholder’s basis in the shares, and thereafter, as gain from the sale of shares. A shareholder’s basis in its shares will be reduced by the amount of any distribution treated as a non-taxable return of capital.
| 48 | Annual Report June 30, 2018 |
In general, distributions are subject to federal income tax for the year in which they are paid. Certain distributions paid in January, however, may be treated as paid on December 31 of the prior year. Distributions are generally taxable even if they are paid from income or gains earned by a Fund before your investment (and thus were included in the price you paid for your shares).
Distributions (other than Capital Gain Dividends and dividends properly reported by us as interest-related dividends or short-term capital gain dividends) paid to individual shareholders that are neither citizens nor residents of the U.S. or to foreign entities will generally be subject to a U.S. withholding tax at the rate of 30%, unless a lower treaty rate applies.
The Trust (or financial intermediaries, such as brokers, through which shareholders own Fund shares) generally is required to withhold and remit to the U.S. Treasury a percentage of the taxable distributions and sale or redemption proceeds paid to any shareholder who fails to properly furnish a correct taxpayer identification number, who has under-reported dividend or interest income, or who fails to certify that he, she or it is not subject to such withholding. In addition, even if shareholders have provided appropriate certifications to the intermediary through which they hold shares, such withholding may apply if the intermediary is a foreign intermediary unless such foreign intermediary either enters into an agreement with the Internal Revenue Service regarding reporting or is located in a jurisdiction that has entered into an Intergovernmental Agreement with the Internal Revenue Service and such foreign intermediary is in compliance with the terms of such intergovernmental agreement and any enabling legislation or administrative actions.
Indemnification
The Trust will indemnify its officers and trustees for certain liabilities that may arise from the performance of their duties to the Trust. Additionally, in the normal course of business, the Trust enters into contracts that contain a variety of representations and warranties and which provide general indemnities. The Funds’ maximum exposure under these arrangements is unknown, as this would involve future claims that may be made against the Funds that have not yet occurred. However, the Trust expects the risk of loss due to these warranties and indemnities to be remote.
| 49 |
NOTE 3 – RISKS
The Funds’ risks include, but are not limited, to the following:
i. Cayman Subsidiary
The Subsidiary is an exempted company incorporated under the laws of the Cayman Islands and is a wholly-owned subsidiary of SDCI. The Subsidiary allows SDCI to gain exposure to certain types of commodity-linked derivative instruments and satisfy regulated investment company (“RIC”) tax requirements. SDCI is the sole shareholder of the Subsidiary and it is intended that SDCI will remain the sole shareholder and will continue to control the Subsidiary.
By investing in the Subsidiary, SDCI will be indirectly exposed to the risks associated with the Subsidiary’s investments. SDCI may invest up to 25% of its total assets in the Subsidiary. The accompanying Schedule of Investments and Financial Statements include the positions and accounts of the Subsidiary. All inter-fund balances and transactions, if any, have been eliminated in consolidation.
As of June 30, 2018, SDCI and the Subsidiary net assets were as follows:
| Total Net Assets | Subsidiary Net Assets | % of Fund Represented by Subsidiary’s Net Assets | ||||||||
| $ 8,774,200 | $ 1,798,407 | 20.5% | ||||||||
Market Risk. The trading prices of equity securities fluctuate, sometimes rapidly and unpredictably, in response to a variety of factors. These factors include events impacting the entire market or a specific market segment. The market value of portfolio holdings can be volatile and change quickly. Each Fund’s net asset value (“NAV”) and market price, like market prices generally, may fluctuate significantly. As a result, an investor could lose money over short or long periods of time, including the possible loss of the entire principal amount of an investment.
Liquidity Risk. The Funds may not always be able to liquidate its investments at the desired price or time (or at all) or at prices approximating those at which the Funds currently value them. It may be difficult for the Funds to value illiquid holdings accurately. Unexpected market illiquidity may cause major losses at any time or from time to time.
Premium or Discount to NAV Risk. As with all exchange-traded funds (“ETFs”), Fund shares may be bought and sold in the secondary market at market prices. Although it is expected that the market price of the shares of a Fund will approximate the Fund’s NAV, there may be times when the market price and the NAV vary significantly, particularly in times of market stress. Thus, an investor may pay significantly more (or less) than NAV when buying shares of a Fund in the secondary market, or receive significantly more (or less) than NAV when selling those shares in the secondary market. A premium or discount to NAV may be reflected in the spread between “bid” and “ask” prices that are quoted during the course of a trading day. If an investor purchases Fund shares at a time when the market price is at a premium to the NAV of the Fund’s shares, or sells at a time when the market price is at a discount to the NAV of the Fund’s shares, an investor may sustain losses.
| 50 | Annual Report June 30, 2018 |
Fluctuation of NAV Risk. The market prices of each Fund’s shares will generally fluctuate in accordance with changes in NAV as well as the relative supply of and demand for each Fund’s shares on NYSE Arca. The Adviser cannot predict whether each Fund’s shares will trade below, at, or above NAV.
Secondary Market Risk. Although each Fund’s shares are listed for trading on NYSE Arca and may be listed or traded on U.S. and non-U.S. stock exchanges other than NYSE Arca, there can be no assurance that an active trading market for such shares will develop or be maintained. Investors buying or selling Fund shares in the secondary market will pay brokerage commissions or other charges imposed by brokers and will incur the cost of the difference between “bid” and “ask” prices of the Fund’s shares.
New Fund Risk. As new funds, there can be no assurance that the Funds will grow to or maintain an economically viable size.
Correlation to Private Equity Returns Risk. The return of BUY and BUYN or its corresponding Index may not match or achieve a high degree of correlation with the return of investments in private equity funds or direct investments in private equity due to assumptions in SHIM’s proprietary methodology that prove to be incorrect or asymmetries between investments in public equity versus private equity, such as the limited liquidity (or illiquidity), infrequency of valuations, and estimated valuations associated with private equity investments.
Private Equity Investing Risk. BUY seeks to generate returns that mimic the returns of U.S. private equity funds, as measured by SHPEI. Because investing in private equity often carries a high degree of risk, the returns of private equity funds may be subject to greater volatility than the returns of funds that invest in larger, more established public companies. BUYN seeks to generate returns that mimic the returns of U.S. private equity funds that focus on natural resource investments, as measured by SHPEN. Similarly, BUY and BUYN’s returns may experience greater volatility than funds that invest in larger, more established public companies. BUY and BUYN do not invest in private equity funds nor do they invest directly in private equity of companies.
Derivatives Risk. The value of a derivative instrument, such as SDCI’s investments in Commodity Interests, depends largely on (and is derived from) an underlying asset (or a reference rate or index). Derivative instruments such as cash-settled options, forward contracts, options on futures contracts, cleared swap contracts, swap contracts other than cleared swap contracts, and other options and swaps, collectively with the Component Futures Contracts, are called the “Commodity Interests”. Derivatives create leverage risk because they do not require payment up front equal to the economic exposure created by owning the derivative. As a result, an adverse change in the value of the underlying asset of a derivative could result in SDCI sustaining a loss that is substantially greater than the amount invested in the derivative, which may make SDCI’s returns more volatile and increase the risk of loss. SDCI may not be able to close out a derivative transaction at a favorable time or price. Derivatives may also be harder to value, less tax efficient, and subject to changing government regulation that could impact SDCI’s ability to use certain derivatives or their cost. Also, derivatives used to gain or limit exposure to a particular market segment may not provide the expected benefits, particularly during adverse market conditions. These risks are greater for SDCI than most other ETFs because SDCI will implement its investment strategy primarily through investments in Commodity Interests, which are derivative instruments.
| 51 |
Commodities Risk. Exposure to the commodities markets through investments in Commodity Interests may subject SDCI to greater volatility than investments in traditional securities. The risks and hazards that are inherent in commodity production may cause the price of commodities to fluctuate widely. Significant changes in the value of commodities may lead to volatility in SDCI’s NAV and market price.
Commodities Tax Risk. SDCI intends to qualify as a RIC under subchapter M of the Internal Revenue Code (the “Code”). If it qualifies as a RIC and satisfies certain minimum distribution requirements, SDCI will not be subject to fund-level U.S. federal income tax on income and gains that it timely distributes to shareholders. To qualify as a RIC, SDCI must satisfy certain source-of-income requirements. As discussed above, SDCI intends to gain exposure to the commodities market primarily through its investment in the Subsidiary. SDCI believes based on current law that its taxable income from the Subsidiary will be qualifying income for purposes of the RIC source-of-income requirements. If the income of SDCI from the Subsidiary is treated as non-qualifying income, SDCI might fail to qualify as a RIC and be subject to federal income tax at the fund level. Such adverse effects could also, among other consequences, limit SDCI’s ability to pursue its investment strategy. SDCI seeks to manage its investments in the Subsidiary and in Commodity Interests as necessary to maintain its qualifications as a RIC.
Cash Transaction Risk. Creation and redemption transactions are expected to generally settle through payments of cash and/or fixed income securities, which will cause SDCI to incur certain costs, such as brokerage costs, that it would not incur if it made in-kind redemptions.
NOTE 4 – INVESTMENT ADVISORY AND OTHER AGREEMENTS
Investment Adviser
The Adviser serves as the investment adviser to each Fund pursuant to an investment advisory agreement between the Trust and the Adviser. For SDCI, the Adviser also serves as investment adviser to the Subsidiary pursuant to a separate investment advisory agreement. The Sub-Adviser serves as the sub-adviser to BUY and BUY and to the Subsidiary pursuant to a sub-advisory agreement. The advisory and sub-advisory agreements for BUY and BUYN were approved by the Board at a September 22, 2017 meeting. The advisory and sub-advisory agreements for SDCI were approved by the Board at an April 9, 2018 meeting.
| 52 | Annual Report June 30, 2018 |
Management Fees
Each Fund pays the Adviser a unitary management fee as compensation for its services and its assumption of Fund expenses. The Adviser is responsible for all expenses of the Fund except expenses for taxes and governmental fees; brokerage fees; commissions and other transaction expenses; costs of borrowing money, including interest expenses; securities lending expenses; extraordinary expenses (such as litigation and indemnification expenses); and fees and expenses of any independent legal counsel. The Adviser may voluntarily waive any portion of its management fee from time to time, and may discontinue or modify any such voluntary limitations in the future at its discretion. The following table lists the total management fee paid by each Fund.
| Fund | Management Fee | |||
| BUY | 0.95 | % | ||
| BUYN | 0.95 | % | ||
| SDCI | 0.80 | % | ||
The Sub-Adviser receives a management fee equal to a percentage of the Fund’s average daily net assets for the services it provides to each Fund. The Sub-Adviser’s fees are calculated daily and paid monthly by the Adviser out of its management fees. The following table lists the sub-advisory fees paid to the Sub-Adviser.
| Fund | Sub-Adviser Fee | |||
| BUY | 0.06 | % | ||
| BUYN | 0.06 | % | ||
| SDCI | 0.06 | % | ||
The Adviser and the Sub-Adviser (subject to the Adviser’s oversight) supervise and manage the investment portfolio of each Fund and direct the purchase and sale of each Fund’s investments.
Administrator, Custodian and Transfer Agent
Brown Brothers Harriman & Company (“BBH”) serves as the administrator, custodian and transfer agent for the Funds. Under the Administrative Agency Agreement with the Trust, BBH performs certain administrative, accounting, transfer agency and dividend disbursing services for the Funds and prepares certain reports filed with the U.S. Securities and Exchange Commission (“SEC”) on behalf of the Trust and the Funds. Under the Custodian Agreement with the Trust, BBH maintains in separate accounts: cash, securities and other assets of the Funds; keeps all necessary accounts and records, and provides other services. BBH is required, upon the order of the Trust, to deliver securities held by BBH and to make payments for securities purchased by the Trust for the Funds.
| 53 |
Buying and Selling Fund Shares
The Funds are Exchange-Traded Funds. This means that shares of the Funds may only be purchased and sold on a national securities exchange, such as NYSE Arca, through a broker-dealer. The price of the Fund’s shares is based on market price. Because Fund shares trade at market prices rather than NAV, shares may trade at a price greater than NAV (premium) or less than NAV (discount).
Each Fund issues and redeems shares at NAV only in large blocks of shares (“Creation Baskets” and “Redemption Baskets,” respectively), which only certain institutions or large investors (typically, market makers or other broker-dealers) that have entered into an agreement with ALPS Distributors, Inc. (the “Distributor”) may purchase or redeem. Such institutions and large investors are referred to herein as “Authorized Participants” or “APs.” Currently, Creation Baskets and Redemption Baskets generally consist of 50,000 shares, though this may change from time to time. Authorized Participants are required to pay a transaction fee of $350 to compensate the Fund for brokerage and transaction expenses when purchasing Creation Baskets or redeeming Redemption Baskets.
SDCI generally issues and redeems Creation Baskets and Redemption Baskets in exchange for a designated amount of cash. BUY and BUYN generally issue and redeem Creation Baskets and Redemption Baskets in exchange for a portfolio of securities closely approximating the holdings of the BUY and BUYN and/or a designated amount of cash. To the extent that an Authorized Participant purchases a Creation Basket with cash or redeems a Redemption Basket for cash, the Authorized Participant will be subject to an additional charge no greater than 5.0%.
Distributor
The Distributor serves as the distributor of Creation Baskets and Redemption Baskets for the Funds on an agency basis. The Distributor does not maintain a secondary market in shares.
The Distributor is the distributor of the Trust. The Distributor has entered into a Distribution Agreement with the Trust pursuant to which it distributes shares of the Funds in Creation Basket aggregations. The Distributor is a broker-dealer registered under the Securities Exchange Act of 1934, as amended, and a member of the Financial Industry Regulatory Authority. Fees under the Distribution Agreement are paid by the Adviser. The Adviser may, from time to time and from its own resources, make other distribution-related payments to the Distributor or other persons.
| 54 | Annual Report June 30, 2018 |
Licensing Agreement
SHIM, an affiliate of the Sub-Adviser for BUY, BUYN and the Subsidiary, owns and maintains SHPEI, SHPEN and SDCITR (collectively, the “Indexes”). The Adviser and SHIM have entered into a licensing agreement (the “Licensing Agreement”) for the Trust’s use of the Indexes, for which the Adviser pays SHIM a licensing fee. The licensing fee is separate from the fees paid to the Sub-Adviser for sub-advisory services provided to the Fund and Subsidiary.
Investors cannot be assured of the continuation of the licensing agreement between SHIM and the Adviser for use of the Indexes. Should the agreement between SHIM and the Adviser be terminated, the Adviser and the Board will consider available alternatives, including finding replacement indexes or liquidating the Funds. Termination of the licensing agreement may have an adverse effect on the performance and NAV of the Funds’ shares.
NOTE 5 – INVESTMENT TRANSACTIONS – PURCHASES AND SALES
During the period ended June 30, 2018, the aggregate cost of purchases and proceeds from sales of investments (excluding short-term investments and in-kind transactions) were as follows:
| Fund | Purchases | Sales | ||||||
| BUY* | $ | 65,690 | $ | 71,572 | ||||
| BUYN* | 33,259 | 34,625 | ||||||
| SDCI** | 5,872,330 | 1,000,000 | ||||||
| * | Inception date, November 30, 2017. |
| ** | Inception date, May 2, 2018. |
NOTE 6 – DISTRIBUTIONS AND TAXES
It is the policy of the Funds to qualify as regulated investment companies by complying with the requirements of the Internal Revenue Code of 1986, as amended, applicable to regulated investment companies and by distributing substantially all of their earnings to shareholders. Therefore, no federal income tax provision is required.
Income distributions and capital gain distributions are determined in accordance with tax regulations, which may differ from GAAP.
| 55 |
NOTE 7 – BENEFICIAL OWNERSHIP
Certain owners of the Adviser are also owners and/or trustees of the Funds. These individuals may receive benefits from any management fees paid to the Adviser.
NOTE 8 – DIVIDEND AND TAX COMPONENTS OF CAPITAL
The tax character of distributions paid during the fiscal period ended June 30, 2018, were from Ordinary Income and Capital Gains in the amounts as follows:
| Fund | Ordinary Income | Capital Gains | ||||||
| BUY* | $ | 8,149 | $ | — | ||||
| BUYN* | 1,392 | — | ||||||
| SDCI** | 8,760 | — | ||||||
| * | Inception date, November 30, 2017. |
| ** | Inception date, May 2, 2018. |
As of June 30, 2018, the components of accumulated earnings on a tax basis were as follows:
| BUY* | BUYN* | SDCI** | ||||||||||
| Undistributed Ordinary Income - Net | $ | 7,836 | $ | 10,646 | $ | — | ||||||
| Undistributed Long-Term Capital Gains - Net | — | — | — | |||||||||
| Other Book/Tax Temporary Differences | — | — | (34,275 | ) | ||||||||
| Unrealized Appreciation (Depreciation) | 226,625 | 254,653 | 18,925 | |||||||||
| Total Accumulated Earnings/(Losses) - Net | $ | 234,461 | $ | 265,299 | $ | (15,350 | ) | |||||
| * | Inception date, November 30, 2017. |
| ** | Inception date, May 2, 2018. |
The difference between book-basis and tax-basis unrealized appreciation (depreciation) is attributable to the tax deferral of losses on wash sales.
NOTE 9 – CAPITAL LOSS CARRY FORWARD
Under the Regulated Investment Company Modernization Act of 2010 (the “Act”), the Funds are permitted to carry forward capital losses incurred in taxable years beginning after December 22, 2010, for an unlimited period. However, any losses incurred during those future taxable years will be required to be utilized prior to the losses incurred in pre-enactment taxable years. As a result of this, pre-enactment capital loss carryforwards may be more likely to expire unused.
As of June 30, 2018, none of the Funds generated a net capital loss carryforward.
| 56 | Annual Report June 30, 2018 |
NOTE 10 – TRUSTEES FEES
The Trust compensates each Trustee who is not an “interested person” of the Trust as defined in the 1940 Act. The Adviser, as a result of each Fund’s unitary management fee, pays for such compensation. The Trustees who are “interested persons” of the Trust do not receive any Trustees’ fees.
NOTE 11 – CASH MANAGEMENT TRANSACTIONS
The Funds subscribe to BBH Cash Management Service (“CMS”). The BBH CMS is an investment product that automatically sweeps the Funds’ cash balances into overnight offshore time deposits with either BBH Grand Cayman branch or branches of pre-approved world class commercial banks. This fully automated program allows the Funds to earn interest on cash balances.
Excess cash invested with deposit institutions domiciled outside of the United States, as with any offshore deposit, may be subject to sovereign actions in the jurisdiction including, but not limited to, freeze, seizure, or diminution. The Funds bear the risk associated with the repayment of principal and payment of interest on such instruments by the institution with which the deposit is ultimately placed. Balances in the BBH CMS are accounted for on a cost basis, which approximates market value.
NOTE 12 – SUBSEQUENT EVENTS
The Funds have evaluated the need for disclosure and/or adjustments resulting from subsequent events through the date the financial statements were issued. Based on this evaluation, no adjustments were required to the financial statements.
| 57 |
REPORT OF INDEPENDENT REGISTERED PUBLIC ACCOUNTING FIRM
To the Shareholders and
Board of Trustees of
USCF ETF Trust
Opinion on the Financial Statements
We have audited the accompanying statements of assets and liabilities of the USCF SummerHaven SHPEI Index Fund (“BUY”), the USCF SummerHaven SHPEN Index Fund (“BUYN”), and the consolidated statement of assets and liabilities of the SummerHaven Dynamic Commodity Strategy No K-1 Fund and Subsidiary (“SDCI”) (each a series of the USCF ETF Trust, the “Trust”, and collectively, the “Funds”), including the schedules of investments and consolidated schedule of investments as of June 30, 2018, and the related statements of operations, changes in net assets, and financial highlights for the period from inception (November 30, 2017) through June 30, 2018 (BUY, BUYN), and the related consolidated statements of operations, changes in net assets, and financial highlights for the period from inception (May 2, 2018) through June 30, 2018 (SDCI), and the related notes and schedules (collectively referred to as the financial statements).
In our opinion, the financial statements referred to above present fairly, in all material respects, the financial position of the Funds as of June 30, 2018, and the results of their operations, changes in net assets, and financial highlights for the period from inception (November 30, 2017) through June 30, 2018 (BUY, BUYN) and for the period from inception (May 2, 2018) through June 30, 2018 (SDCI), in conformity with accounting principles generally accepted in the United States of America.
Basis for Opinion
The Trust’s management is responsible for these financial statements. Our responsibility is to express an opinion on the Trust’s financial statements based on our audits. We are a public accounting firm registered with the Public Company Accounting Oversight Board (United States) (PCAOB) and are required to be independent with respect to the Trust in accordance with the U.S. federal securities laws and the applicable rules and regulations of the Securities and Exchange Commission and the PCAOB.
We conducted our audits in accordance with the standards of the PCAOB. Those standards require that we plan and perform the audits to obtain reasonable assurance about whether the financial statements are free of material misstatement, whether due to error or fraud. The Trust is not required to have, nor were we engaged to perform, an audit of its internal control over financial reporting. As part of our audits, we are required to obtain an understanding of internal control over financial reporting, but not for the purpose of expressing an opinion on the effectiveness of the Trust’s internal control over financial reporting. Accordingly, we express no such opinion.
| 58 | Annual Report June 30, 2018 |
Our audits of the financial statements included performing procedures to assess the risks of material misstatement of the financial statements, whether due to error or fraud, and performing procedures that respond to those risks. Such procedures included examining, on a test basis, evidence regarding the amounts and disclosures in the financial statements. Our audits also included evaluating the accounting principles used and significant estimates made by management, as well as evaluating the overall presentation of the financial statements. Our audits also included performing such other procedures as we considered necessary in the circumstances. We believe that our audits provide a reasonable basis for our opinion.
/s/ Spicer Jeffries LLP
We have served as the Trust’s auditor since 2014.
Denver, Colorado
August 27, 2018
| 59 |
APPROVAL OF INVESTMENT ADVISORY AGREEMENTS
Approval of the Investment Advisory Agreement Appointing USCF Advisers LLC (the “Adviser”) the Adviser as Investment Adviser to the Funds
In considering the approval of (1) the Advisory Agreement between USCF Advisers LLC (the “Adviser”) and the Trust on behalf of the USCF SummerHaven Dynamic Commodity Strategy No K-1 Fund (the “Fund”), (2) the Advisory Agreement between the Adviser and the Fund’s wholly-owned subsidiary incorporated in the Cayman Islands, the USCF Cayman Commodity 2 (the “Subsidiary”), and (3) the Sub-Advisory Agreement between the Adviser and SummerHaven Investment Management, LLC (the “Sub-Adviser”) on behalf of the Subsidiary (collectively, the “Investment Advisory Agreements”), the Board took into consideration all the materials provided prior to and during the meeting of the Board on April 9, 2018 (the “Meeting”), the presentations made during the meeting, and the comprehensive discussions during the Meeting. In its separate consideration of each Investment Advisory Agreement, the Board, including the Trustees who are not interested persons of the Trust (the “Independent Trustees”), as the term “interested person” is defined in Section 2(a)(19) of the Investment Company Act of 1940 (the “1940 Act”), did not identify any single factor as all-important or controlling.
Nature, Extent and Quality of Services. The Board examined the nature, extent and quality of the services to be provided by each of the Adviser and the Sub-Adviser to the Fund and/or the Subsidiary under the Investment Advisory Agreements. The Board considered the presentations and written information given to the Board in connection with the Meeting, including the Investment Advisory Agreements and information provided by the Adviser and the Sub-Adviser in response to the Board’s requests for information. The Board considered the Adviser’s and the Sub-Adviser’s business operations; the Adviser’s and the Sub-Adviser’s investment management process; the Adviser’s and the Sub-Adviser’s experience advising affiliated funds and other accounts; the experience and capability of the Adviser’s and the Sub-Adviser’s senior management and other key personnel; the Adviser’s and the Sub-Adviser’s overall financial strength; and the quality of the Adviser’s and the Sub-Adviser’s compliance program. In addition to investment management services, the Board also considered the nature, extent, and quality of administrative, compliance, and legal services that would be provided, and had been provided to affiliated funds by the Adviser and the Sub-Adviser. The Board concluded that the nature, extent and quality of the services provided by the Adviser and the Sub-Adviser under the Investment Advisory Agreements would benefit the Fund and the shareholders of the Fund.
Investment Performance. With respect to performance, the Fund did not have a history of operations at the time of the Meeting for the Board to consider. However, the Board discussed how the investment strategy of the Fund was similar to the investment strategy of other funds managed by the Adviser and the Sub-Adviser and the Board reviewed the performance of those funds. The Board also reviewed the historical performance of the index that would serve as the Fund’s benchmark.
| 60 | Annual Report June 30, 2018 |
Fees and Expenses. The Board reviewed the proposed advisory fee schedule for the Fund. The Board compared the proposed advisory fee to the advisory fee of other funds managed by the Adviser and other funds with similar investment strategies. The Board discussed that the proposed fee is a unitary fee and would cover the Adviser’s and Sub-Adviser’s management fees as well as other associated expenses. The Board also discussed the differences between a unitary fee structure and an expense limitation agreement and how unitary fee arrangements are more common in the exchange traded fund marketplace. In addition, it was noted to the Board that distribution related costs would be paid from the Adviser’s own profits as well as the costs related to the licensing agreement linked to the Adviser’s use of certain names and marks, and other commodity indexes owned, calculated, maintained, and/or published by the Sub-Adviser’s affiliate. After further discussion, the Board concluded that the Fund’s proposed advisory fee, proposed sub-advisory fee, as well as the overall projected expense ratio, were acceptable considering the quality of the services the Fund and the Subsidiary expect to receive from each of the Adviser and Sub-Adviser and the level of fees paid by similar funds.
Economies of Scale. The Board considered whether economies of scale exist with respect to the management of the Fund. The Board reviewed the benefits and efficiencies of the product structure as it relates to achieving economies of scale, negotiating agreements, designing systems and integrating with existing operational support models noting that the Fund and the Subsidiary investment structure are substantially similar to another product managed by the Adviser.
Profitability. The Board considered the anticipated profits to be realized by the Adviser and the Sub-Adviser in connection with the operation of the Fund, and whether the amount of profit would be a fair entrepreneurial profit for the management of the Fund. The Board also considered the estimated operating expenses of the Fund. The Board concluded that the Adviser’s and the Sub-Adviser’s expected level of profitability from its relationship with the Fund was not excessive.
Collateral Benefits. The Board considered whether the Adviser, the Sub-Adviser or their affiliates may receive other benefits as a result of the Adviser’s and Sub-Adviser’s proposed relationship with the Fund. The Board considered portfolio trading practices, noting that the Adviser and the Sub-Adviser are not affiliated with any broker-dealer that would execute portfolio transactions on behalf of the Fund and would not receive the benefit of research provided by any such broker-dealer. The Board considered that the Adviser and Sub-Adviser are not affiliated with any of the Fund’s primary service providers, and therefore will not benefit from those contractual relationships. The Board acknowledged that an affiliate of the Sub-Adviser will receive fees under the Licensing Agreement between the Adviser and the affiliate, and that the Adviser relies on that agreement to use names and marks in connection with the Fund. Despite this collateral benefit for the Sub-Adviser and its affiliates arising from the Sub-Adviser’s relationship with the Fund, the Board concluded that the proposed fee to be paid to the Sub-Adviser was reasonable in relation to the nature, extent, and quality of services to be provided. As such, the Board concluded that the Adviser, the Sub-Adviser or its affiliates would not receive collateral benefits that would materially affect the reasonableness of the proposed advisory fees under the Investment Advisory Agreements.
| 61 |
Conclusion. Having requested and received such information from the Adviser and the Sub-Adviser as the Board believed to be reasonably necessary to evaluate the terms of each of the Investment Advisory Agreements, the Board, including the Independent Trustees, concluded that each of the advisory fee and sub-advisory fee is reasonable and, in light of the matters that the Trustees have considered to be relevant in the exercise of their reasonable judgment, approved the Investment Advisory Agreements.
| 62 | Annual Report June 30, 2018 |
ADDITIONAL INFORMATION (UNAUDITED)
Members of the Board and Officers of the Trust
Set forth below are the names, ages, positions with the Trust, terms of office, and the principal occupations and other directorships for a minimum of the last five years, of each of the persons currently serving as members of the Board and as Executive Officers of the Trust. Also included below is the term of office for each of the Executive Officers of the Trust. The members of the Board serve as Trustees for the life of the Trust or until retirement, removal, or their office is terminated pursuant to the Trust’s Declaration of Trust and Trust Agreement.
The Chairman of the Board, Nicholas D. Gerber, and Management Trustees, Andrew F Ngim and Stuart P. Crumbaugh are interested persons of the Trust as that term is defined under Section 2(a)(19) of the 1940 Act (“Interested Trustees”) because of their affiliation with the Adviser.
Messrs. Thomas E. Gard, Jeremy Henderson, John D. Schwartz, and H. Abram Wilson, and their immediate family members have no affiliation or business connection with the Adviser or the Funds’ principal underwriter or any of their affiliated persons and do not own any stock or other securities issued by the Adviser or the Funds’ principal underwriter. These Trustees are not Interested Persons of the Trust and are referred to herein as “Independent Trustees.”
The following tables present information about the Trustees and Officers. The Statement of Additional Information has additional information about the Trustees and is available without charge, upon request, by contacting the Funds at 1(800) 920-0259, or visiting: www.uscfinvestments.com.
| 63 |
Independent Trustees
| Name and Age(1) | Position(s) Held with Trust | Term of Office and Length of Time Served(2) | Principal Occupation(s) During Past 5 Years | Number of Portfolios In Fund Complex Overseen by Trustee | Other Directorships Held by Trustee (Past 5 Years) | |||||
| Thomas E. Gard Year of Birth: 1959 | Independent Trustee | Since 2015 | Partner of Armanino LLP from 1995 to Present; Member of Armanino Executive Committee from 2001 to 2015; and Partner in Charge of Armanino LLP Audit Department December from 2004 to 2013. | Four | N/A | |||||
| Jeremy Henderson Year of Birth: 1956 | Independent Trustee | Since 2014 | Retired from 2007 to Present; Managing Director of Societe Generale from 1991 to 2007. | Four | N/A | |||||
| John D. Schwartz Year of Birth: 1968 | Independent Trustee | Since 2014 | President of Sam CLAR Office Furniture from 1996 to Present. | Four | N/A | |||||
| H. Abram Wilson Year of Birth: 1946 | Independent Trustee | Since 2014 | San Ramon City, CA Councilmember from 1999 to 2011, including Mayor of San Ramon City, CA from 2002 to 2009. Mr. Wilson has been retired from 2011 to Present. | Four | N/A |
| 64 | Annual Report June 30, 2018 |
Interested Trustees and Officers of the Trust
| Name and Age(1) | Position(s) Held with Trust | Term of Office and Length of Time Served(2) | Principal Occupation(s) During Past 5 Years | Number of Portfolios In Fund Complex Overseen by Trustee | Other Directorships Held by Trustee (Past 5 Years) | |||||
| Nicholas D. Gerber(3) Year of Birth: 1962 | Chairman and Trustee | Since 2014 | Chairman of the Board of Directors of United States Commodity Funds LLC, which is the sponsor of a family of commodity pools whose shares are registered under the Securities Act of 1933 (“USCF”) since 2005; President and Chief Executive Officer of USCF from 2005 through June 2015; Serves on Board of Managers of USCF Advisers LLC (“USCF Advisers”) since June 2014 and President and Chief Executive Officer of USCF Advisers from June 2014 to June 2015; Vice President of USCF since June 2015; Chief Executive Officer, President and Secretary of Concierge Technologies, Inc. (“Concierge”) since January 2015; Co-founded Ameristock Corporation in March 1995, a registered investment adviser under the Investment Advisers Act of 1940 from March 1995 until January 2013; and Portfolio Manager of the Ameristock Mutual Fund, Inc. a mutual fund registered under the 1940 Act, from August 1995 to January 2013. | Four | Management Director of USCF. Chairman of the Board of Concierge since January 26, 2015. |
| 65 |
| Name and Age(1) | Position(s) Held with Trust | Term of Office and Length of Time Served(2) | Principal Occupation(s) During Past 5 Years | Number of Portfolios In Fund Complex Overseen by Trustee | Other Directorships Held by Trustee (Past 5 Years) | |||||
| John P. Love Year of Birth: 1971 | President (Principal Executive Officer) | Since 2015 | Chief Executive Officer and President of USCF since June 2015 and Management Director of USCF since October 2016; Senior Portfolio Manager of USCF from March 2010 to June 2015; Portfolio Manager of USCF from April 2006 to March 2010; President of USCF Advisers since June 2015 and serves on Board of Managers of USCF Advisers since November 2016. | N/A | Management Director of USCF, since October 2016. Director of Wainwright Holdings Inc. since December 2016. | |||||
| Stuart P. Crumbaugh(3) Year of Birth: 1963 | Chief Financial Officer (Principal Accounting and Principal Financial Officer), Treasurer and Trustee | CFO and Treasurer since May 2015; Secretary from May 2015 to October 2016; Independent Trustee of USCF ETF Trust from inception to February 2015 and Interested Trustee since February 2015 | Chief Financial Officer of Concierge since December 2017. Chief Financial Officer (Principal Accounting Officer), Treasurer and Secretary of USCF Advisers and USCF since June 2015 and May 2015, respectively; Vice President Finance and Chief Financial Officer of Sikka Software Corporation from April 2014 to April 2015; Vice President, Corporate Controller and Treasurer of Auction.com, LLC from December 2012 to December 2013; Chief Financial Officer of IP Infusion Inc. from March 2011 to September 2012; Consultant from January 2010 to February 2011. | Four | N/A |
| 66 | Annual Report June 30, 2018 |
| Name and Age(1) | Position(s) Held with Trust | Term of Office and Length of Time Served(2) | Principal Occupation(s) During Past 5 Years | Number of Portfolios In Fund Complex Overseen by Trustee | Other Directorships Held by Trustee (Past 5 Years) | |||||
| Andrew F Ngim(3) Year of Birth: 1960 | Trustee, Vice President, Secretary, and Portfolio Manager | Trustee from 2014 to February 2015 and May 2015 to Present; Secretary since October 2016 | Co-founded USCF in 2005 and has served as a Management Director since May 2005 and Chief Operating Officer since August 2016; Portfolio Manager for the United States Commodity Index Funds Trust since January 2013; Treasurer of USCF from June 2005 to February 2012; Assistant Secretary and Assistant Treasurer of USCF Advisers since June 2013; Prior to and concurrent with his services to USCF, from January 1999 to January 2013, Mr. Ngim served as Managing Director for Ameristock Corporation which he co-founded in March 1995 and was Co-Portfolio manager of Ameristock Mutual Fund, Inc. from January 2000 to January 2013; Portfolio Manager for USCF ETF Trust since 2014. | Four | Management Director of USCF since May 2005. |
| 67 |
| Name and Age(1) | Position(s) Held with Trust | Term of Office and Length of Time Served(2) | Principal Occupation(s) During Past 5 Years | Number of Portfolios In Fund Complex Overseen by Trustee | Other Directorships Held by Trustee (Past 5 Years) | |||||
| Carolyn M. Yu Year of Birth: 1958 | Chief Compliance Officer and AML Officer | Chief Legal Officer from May 2015 to April 2018; Chief Compliance Officer, since February 2015; AML Officer since 2014 | General Counsel of Concierge since November 2017. Chief Compliance Officer of USCF since February 2013; General Counsel of USCF from May 2015 to April 2018 and Assistant General Counsel of USCF from August 2011 through April 2015; from May 2015 to April 2018, Ms. Yu served as Chief Legal Officer of USCF Advisers and serves as Chief Compliance Officer of USCF Advisers since May 2015; Associate Counsel, Assistant Chief Compliance Officer of USCF ETF Trust from June 2014 to February 2015; Branch Chief – Securities Enforcement Branch for the State of Hawaii, Department of Commerce and Consumer Affairs 2008 - 2011. | N/A | N/A | |||||
| Daphne G. Frydman Year of Birth: 1974 | Chief Legal Officer; Assistant Secretary | Chief Legal Officer since May 2018; Assistant Secretary since 2016. | General Counsel of USCF and USCF Advisers since May 2018; Deputy General Counsel of USCF from May 2016 to April 2018; Assistant Secretary since October 2016; Partner at Sutherland Asbill & Brennan LLP from January 2011 to April 2016; and counsel and associate at the same from 2009 to 2010 and from 2001 to 2008, respectively. | N/A | N/A |
| (1) | The address of each Trustee and officer is c/o USCF ETF Trust, 1999 Harrison Street, Suite 1530, Oakland, California 94612. |
| (2) | The Trustees and Officers serve until their successors are duly elected and qualified. |
| (3) | Messrs. Gerber, Crumbaugh and Ngim are “interested persons” of the Trust (as that term is defined in the 1940 Act) because of their affiliation with the Adviser. |
| 68 | Annual Report June 30, 2018 |
Investment Adviser
USCF Advisers LLC
1999 Harrison Street, Suite 1530
Oakland, California 94612
Administrator, Custodian and Transfer Agent
Brown Brothers Harriman & Company
50 Post Office Square
Boston, Massachusetts 02110-1548
Distributor
ALPS Distributors, Inc.
1290 Broadway, Suite 1100
Denver, Colorado 80203
Independent Registered Public Accounting Firm
Spicer Jeffries LLP
4601 DTC Boulevard, Suite 700
Denver, Colorado 80237
Trustees
Nicholas D. Gerber
Stuart P. Crumbaugh
Andrew F Ngim
Jeremy Henderson
John D. Schwartz
H. Abram Wilson
Thomas Gard
Proxy Voting Information
A description of the policies and procedures that the Adviser uses to determine how to vote proxies relating to portfolio securities of the Funds is available without charge by contacting the Funds at 1.800.920.0259, on the Funds’ website at www.uscfinvestments.com and on the SEC’s website at www.sec.gov. Information regarding how the Funds voted such proxies since inception to the period ended June 30, 2018 is also available without charge by calling the Funds and on the SEC’s website at www.sec.gov.
Premium/Discount Information
Information about the differences between the daily market price on the secondary markets for shares of the Funds and the Funds’ net asset value may be found on the Funds’ website at www.uscfinvestments.com.
ALPS Distributors, Inc.
An investment in a Fund must be accompanied or preceded by a current prospectus which contains more information on fees, risks and expenses. Please read the prospectus carefully before investing or sending money.
ITEM 2. CODE OF ETHICS.
As of the period ended June 30, 2018 (the “Reporting Period”), the Registrant has adopted a code of ethics that applies to the Registrant’s principal executive officer, principal financial officer, principal accounting officer, controller or persons performing similar functions. During the Reporting Period, there were no changes to, amendments to, or waivers from any provision of the code of ethics. A copy of this code of ethics may also be obtained upon request, free of charge, by calling (510) 522-9600 and is also available on the Registrant’s website at www.uscfinvestments.com.
ITEM 3. AUDIT COMMITTEE FINANCIAL EXPERT.
The Registrant’s Board of Trustees has determined that Mr. Thomas E. Gard possesses the attributes identified in Instruction (b) of Item 3 of Form N-CSR and has designated Mr. Gard as the Registrant’s “audit committee financial expert.” Mr. Gard qualifies as an “independent” Trustee, meaning that he is not an “interested person” of the Registrant (as that term is defined in Section 2(a)(19) of the 1940 Act) and he does not accept directly or indirectly, any consulting, advisory, or other compensatory fee from the Registrant (except in his capacity as a Board or committee member).
ITEM 4. PRINCIPAL ACCOUNTANT FEES AND SERVICES.
(a) Audit Fees
The aggregate fees billed for each of the last two fiscal years ended June 30, 2018, and June 30, 2017 for professional services rendered by the principal accountant for the audit of the Registrant’s annual financial statements or services that are normally provided by the accountant in connection with statutory and regulatory filings or engagements for that fiscal year were $45,000 in 2018 and $21,000 in 2017.
(b) Audit Related Fees
The aggregate fees billed for each of the last two fiscal years ended June 30, 2018, and June 30, 2017, for assurance and related services rendered to the Registrant by the principal accountant that are reasonably related to the performance of the audit of the Registrant’s financial statements and are not reported under paragraph (a) of this Item were $0 in 2018 and $0 in 2017.
(c) Tax Fees
The aggregate fees billed for each of the last two fiscal years ended June 30, 2018 and June 20, 2017 for professional services rendered to the Registrant by the principal accountant for tax compliance, tax advice and tax planning were $2,500 in 2018 and $4,000 in 2017. These services consisted of (i) review or preparation of U.S. federal, state, local and excise tax returns; (ii) U.S. federal, state and local entity tax planning, advice and assistance regarding statutory, regulatory or administrative developments, and (iii) tax advice regarding tax qualification.
(d) All Other Fees
The aggregate fees billed for each of the last two fiscal years ended June 30, 2018, and June 30, 2017, for products and services provided by the principal accountant, other than the services reported in paragraphs (a) through (c) of this Item were $0 for 2018 and $0 for 2017.
(e)(1) Pursuant to the Registrant’s Audit Committee Charter that has been adopted by the audit committee, the audit committee shall approve all audit and permissible non-audit services to be provided to the Registrant and all permissible non-audit services to be provided to its investment adviser or any entity controlling, controlled by or under common control with the investment adviser that provides ongoing services to the Registrant if the engagement relates directly to the operations and financial reporting of the Registrant.
(e)(2) The percentage of services described in paragraphs (b) through (d) of this Item that were approved by the audit committee pursuant to paragraph (c)(7)(i)(C) of Rule 2-01 of Regulation S-X, with respect to: Audit-Related Fees were 0% for 2018 and 0% for 2017; Tax Fees were 5% for 2018 and 16% for 2017; and all Other Fees were 0% for 2018 and 0% for 2017.
(f) Not applicable.
(g) The aggregate non-audit fees billed by the Registrant’s accountant for services rendered to the Registrant, and rendered to the Registrant’s investment adviser (not including any sub-adviser whose role is primarily portfolio management and is subcontracted with or overseen by another investment adviser), and any entity controlling, controlled by, or under common control with the investment adviser that provides ongoing services to the Registrant for each of the last two fiscal years of the Registrant were $0 for 2018 and $0 for 2017.
(h) The Registrant’s audit committee has considered whether the provision of non-audit services that were rendered to the Registrant’s investment adviser (not including any sub-adviser whose role is primarily portfolio management and is subcontracted with or overseen by another investment adviser), and any entity controlling, controlled by, or under common control with the investment adviser that provides ongoing services to the Registrant that were not pre-approved pursuant to paragraph (c)(7)(ii) of Rule 2-01 of Regulation S-X is compatible with maintaining the principal accountant’s independence.
ITEM 5. AUDIT COMMITTEE OF LISTED REGISTRANTS.
| (a) | The Registrant has a separately designated audit committee established in accordance with Section 3(a)(58)(A) of the Securities Exchange Act of 1934, as amended, which consists of independent trustees of the Registrant. The audit committee members are Jeremy Henderson, John D. Schwartz, H. Abram Wilson and Thomas E. Gard. |
| (b) | Not applicable. |
ITEM 6. INVESTMENTS.
| (a) | The Schedule of Investments is included as part of the report to shareholders filed under Item 1 of this Form N-CSR. |
| (b) | Not applicable. |
ITEM 7. DISCLOSURE OF PROXY VOTING POLICIES AND PROCEDURES FOR CLOSED-END MANAGEMENT INVESTMENT COMPANIES.
Not applicable.
ITEM 8. Portfolio Managers of Closed-End Management Investment Companies.
Not applicable.
ITEM 9. PURCHASES OF EQUITY SECURITIES BY CLOSED-END MANAGEMENT INVESTMENT COMPANIES AND AFFILIATED PURCHASERS.
Not applicable.
ITEM 10. SUBMISSION OF MATTERS TO A VOTE OF SECURITY HOLDERS.
There have been no changes to the procedures by which shareholders may recommend nominees to the Registrant’s Board of Trustees that would require disclosure herein.
ITEM 11. CONTROLS AND PROCEDURES.
| (a) | The Registrant’s principal executive officer and principal financial officer have concluded that the Registrant’s disclosure controls and procedures (as defined in Rule 30a-3(c) under the 1940 Act) are effective based on their evaluation of these controls and procedures as of a date within 90 days of the filing date of this document. |
| (b) | There was no change in the Registrant’s internal control over financial reporting (as defined in Rule 30a-3(d) under the 1940 Act) during the period covered by this report that has materially affected, or is reasonably likely to materially affect, the Registrant’s internal control over financial reporting. |
ITEM 12. DISCLOSURE OF SECURITIES LENDING ACTIVITIES FOR CLOSED-END MANAGEMENT INVESTMENT COMPANIES.
Not Applicable.
ITEM 13. EXHIBITS.
(a)(1) Not applicable.
(a)(2) Certifications of the Registrant’s principal executive officer and principal financial officer pursuant to Rule 30a-2(a) under the 1940 Act and Section 302 of the Sarbanes-Oxley Act of 2002 are attached hereto.
(a)(3) Not applicable.
(a)(4) Not applicable.
(b) Certifications of the Registrant’s principal executive officer and principal financial officer pursuant to Rule 30a-2(b) under the 1940 Act and Section 906 of the Sarbanes-Oxley Act of 2002 are attached hereto.
SIGNATURES
Pursuant to the requirements of the Securities Exchange Act of 1934 and the Investment Company Act of 1940, the Registrant has duly caused this report to be signed on its behalf by the undersigned, thereunto duly authorized.
| USCF ETF Trust | ||
| By: | /s/ John P. Love | |
| John P. Love | ||
| Title: | President and Chief Executive Officer (Principal Executive Officer) | |
| Date: | September 4, 2018 | |
Pursuant to the requirements of the Securities Exchange Act of 1934 and the Investment Company Act of 1940, this report has been signed below by the following persons on behalf of the Registrant and in the capacities and on the dates indicated.
| By: | /s/ John P. Love | |
| John P. Love | ||
| Title: | President and Chief Executive Officer (Principal Executive Officer) | |
| Date: | September 4, 2018 |
| By: | /s/ Stuart P. Crumbaugh | |
| Stuart P. Crumbaugh | ||
| Title: | Treasurer and Chief Financial Officer (Principal Financial Officer) | |
| Date: | September 4, 2018 |