UNITED STATES
SECURITIES AND EXCHANGE COMMISSION
Washington, D.C. 20549
FORM N-CSR
CERTIFIED SHAREHOLDER REPORT OF REGISTERED MANAGEMENT INVESTMENT COMPANIES
Investment Company Act file number 811-22930
�� USCF ETF Trust
(Exact name of registrant as specified in charter)
1850 Mt. Diablo Blvd., Suite 640
Walnut Creek, CA 94596
(Address of principal executive offices) (Zip code)
USCF Advisers LLC
Mr. Stuart Crumbaugh
1850 Mt. Diablo Blvd., Suite 640
Walnut Creek, CA 94596
(Name and address of agent for service)
Registrant’s telephone number, including area code: 510-522-9600
Date of fiscal year end: June 30
Date of reporting period: June 30, 2020
Form N-CSR is to be used by management investment companies to file reports with the Commission not later than 10 days after the transmission to stockholders of any report that is required to be transmitted to stockholders under Rule 30e-1 under the Investment Company Act of 1940 (17 CFR 270.30e-1). The Commission may use the information provided on Form N-CSR in its regulatory, disclosure review, inspection, and policymaking roles.
A registrant is required to disclose the information specified by Form N-CSR, and the Commission will make this information public. A registrant is not required to respond to the collection of information contained in Form N-CSR unless the Form displays a currently valid Office of Management and Budget (“OMB”) control number. Please direct comments concerning the accuracy of the information collection burden estimate and any suggestions for reducing the burden to Secretary, Securities and Exchange Commission, 100 F Street, NE, Washington, DC 20549. The OMB has reviewed this collection of information under the clearance requirements of 44 U.S.C. § 3507.
Item 1. Reports to Stockholders.
| (a) | The following is a copy of the report transmitted to shareholders pursuant to Rule 30e-1 under the Investment Company Act of 1940 (17 CFR 270.30e-1). |
 |
| Beginning on January 1, 2021, as permitted by regulations adopted by the U.S. Securities and Exchange Commission, paper copies of the Funds’ shareholder reports will no longer be sent by mail, unless you specifically request paper copies of the reports from your financial intermediary, such as a broker-dealer or bank. Instead, the reports will be made available on a website, and you will be notified by mail each time a report is posted and provided with a website link to access the report. |
| If you already elected to receive shareholder reports electronically, you will not be affected by this change and you need not take any action. Please contact your financial intermediary to elect to receive shareholder reports and other Fund communications electronically. |
| You may elect to receive all future reports in paper free of charge. Please contact your financial intermediary to inform them that you wish to continue receiving paper copies of your shareholder reports and for details about whether your election to receive reports in paper will apply to all funds held with your financial intermediary. |
USCF ETF TRUST
TABLE OF CONTENTS
USCF SUMMERHAVEN SHPEI INDEX FUND (“BUY”)
The USCF SummerHaven SHPEI Index Fund (“BUY”) is a novel private equity (PE) replication product designed to bring private equity-like long-term performance to the general public. BUY does not use leverage and features much lower fees compared to traditional PE investments. In addition, BUY is an ETF, a product structure that gives investors liquidity convenience without the lockup periods traditional PE funds require. BUY does not invest in private equity funds or the private equity of companies.
BUY is based on research by Harvard professor Erik Stafford, who demonstrated that public equities could be used to replicate the long-term return characteristics of a diversified private equity (“PE”) allocation. This is achieved via a proprietary methodology that systematically selects publicly-traded securities with characteristics similar to firms that have historically been acquired by private equity funds.
PE managers commonly use a ratio of enterprise value (EV) to earnings before interest, taxes, depreciation, and amortization (EBITDA) to measure the attractiveness of investments. Low EV/EBITDA companies are more attractive because they are trading “cheaply” and may offer higher growth potential as a result. BUY’s scoring system selects equities that have similar or lower EV/EBITDA ratios compared to traditional private equity deals.
PE managers also look for companies with moderate profitability, low net equity issuance, and low market capitalization. BUY does the same. The ETF’s universe consists of approximately 3,000 U.S. companies from micro-, small-, and mid-cap categories.
While BUY is not limited to investing in small-cap value stocks, it does tend to skew towards smaller capitalization stocks with a value orientated bent. For the twelve months ended June 30, 2020, BUY was down -17.01% (gross of dividends) compared to a decline of -17.48% for the Russell 2000 Value index (gross of dividends). For the six months ended June 30, 2020, BUY was down -22.38% (gross of dividends) compared to a decline of -23.50% for the Russell 2000 Value index (gross of dividends).
BUY rose between August and the end of 2019, then declined 40% alongside the broad equity market in Q1 2020 as a result of market gyrations in response to the COVID-19 economic lockdown. BUY has since recovered almost 30% (gross of dividends) for the three month period ended June 30, 2020.
For the six months ended June 30, 2020, when COVID-19 impacted markets, BUY was underweighted to mid-cap equities and over-weighted to small-cap equities relative to the Russell 2000 Value index. The best performing sectors in BUY’s portfolio were Consumer Staples, Utilities, and Energy. The worst performing sectors were Communications, Health Care, and Technology. The best performing holdings in the fund were Smith & Wesson, Stamps.com, Green Dot, United Natural Foods, and Vista Outdoor. The worst performing holdings in the fund were Briggs & Stratton, Hallmark Financial Services, Gannet, Tailored Brands, and Carter Bank.
| 2 | Annual Report June 30, 2020 |
For the fiscal year ended June 30, 2020, BUY was underweighted to mid-cap equities and over-weighted to small cap equities relative to the Russell 2000 Value index. The best performing sectors were Consumer Staples, Information Technology, and Real Estate. The worst performing sectors were Energy, Communications, and Financials. The best performing holdings were Stamps.com, Smith & Wesson, and United Natural Foods. The worst performing holdings were Unit Corp, Acorda Therapeutics, FTS International, Meritage Homes, and Gannett.
Small cap stocks and value stocks, separately and together, have underperformed large cap and growth stocks for most of the last decade, especially over the last five years. The amount of time these categories have been out-of-favor relative to large cap and growth is unusual and subject to mean reversion at some point in the future. While it is impossible to predict when a rotation to small cap and/or value orientation might occur, such a shift in investor preferences would be a positive tailwind for BUY.
Regardless of broad equity trends, BUY’s objective is to offer investors an exposure that aims to mimic the long-term return profile of PE net of fees.
Past performance is no guarantee of future results.
There is no assurance that the investment process will consistently lead to successful investing for each fund.
It is not possible to invest in an index.
Important Considerations:
The market value of shares of common stock can be volatile and change quickly. There is no guarantee that each fund’s objective will be met. Fund concentration generally leads to greater price volatility. Foreign investing involves special risks such as currency fluctuations and political uncertainty. Investment in small companies generally experience greater price volatility.
An investor may lose all or substantially all of an investment. These risks could result in large fluctuations in the price of a particular fund’s respective shares. Funds that focus on a single sector generally experience greater volatility. For further discussion of these and additional risks associated with an investment in BUY, please read the respective fund’s prospectus before investing.
| 3 |
USCF SUMMERHAVEN DYNAMIC COMMODITY STRATEGY NO K-1 FUND (“SDCI”)
The USCF SummerHaven Dynamic Commodity Strategy No K-1 Fund (“SDCI”) uses the same index for its benchmark as the United States Commodity Index Fund (“USCI”) and has the benefit of not requiring a K-1 tax form. SDCI launched in 2018. The SummerHaven Dynamic Commodity Total Return Index (“SDCITR”) has a ten-year track record. The index outperformed the S&P Goldman Sachs Commodity Total Return Index (“GSCITR”) and underperformed the Bloomberg Commodity Index (“BCOMTR”) during the fiscal year ended June 30, 2020. However, USCF believes that SDCI’s rules based methodology offers the potential for long-term outperformance relative to traditional commodity indices like GSCITR and BCOMTR.
SDCI is an innovative approach to commodity investing that uses fundamental signals about underlying physical markets to create an active portfolio for commodity futures investors. SDCI reflects the performance of a fully collateralized portfolio of 14 commodity futures, selected each month from a universe of 27 eligible commodities based on observable price signals, subject to a diversification requirement across major commodity sectors. The commodity sectors for SDCI include Precious Metals, Industrial Metals, Energy and agricultural products such as Livestock, Softs, and Grains.
For the twelve months ended June 30, 2020, SDCI’s net asset value fell -28.20%. Broad commodity benchmarks also declined. For example BCOMTR was down -17.38% and the GSCITR was down -33.90% for the twelve months ended June 30, 2020.
The losses over the last 12 month period are largely a result of the COVID-19 pandemic and the resulting global economic lockdown, which broadly impacted all asset classes. SDCITR exhibited less volatility (17.35%) than GSCITR (34.33%). This was largely due to the fact that SDCI had a lower weight to energy which was particularly volatile during the COVID-19 pandemic. In Q2 2020, the only energy commodity held by SDCI was natural gas, which was less impacted by COVID-19 than crude oil and other petroleum based commodities. However, crude oil staged a remarkable recovery in May and June, which SDCI did not benefit from due to its lack of other energy holdings besides natural gas.
While the impact from COVID-19 on commodities was substantial and unprecedented, there are several factors that could lead broad commodities higher in coming years.
First, inflation may be on the horizon. Commodities tend to rise when inflation rises. From 2008 to 2014, to soften the damage of the Global Financial Crisis (GFC), the U.S. government injected a staggering total of $3.7 trillion through its quantitative easing program. Increasing money supply and economic expansion typically led to higher inflation in the past, and many investors expected such coming out of the GFC. However, contrary to expectations, inflation gradually declined in the years following 2009. Investments that offer inflation protection, such as private natural resources, commodities equities, and commodity futures underperformed stocks and bonds.
| 4 | Annual Report June 30, 2020 |
As a result of the COVID-19 pandemic, inflation has remained weak. The Consumer Price Index (CPI) declined dramatically from January through May, before rising moderately in June. Further disinflation is possible in the near-term as consumer and business expenditures remain under pressure. However, this is only part of the story.
Governments around the world are again unleashing massive amounts of monetary and fiscal stimulus to prop up their economies. For example, the U.S. government has taken an unprecedented monetary response. The money supply (M2) is up 19% year-on-year as of June 29, 2020. The balance sheet of the Federal Reserve has increased from $4.1 trillion as of January 2020 to $7.1 trillion as of June 2020.
Since the Global Financial Crisis and the deflationary decade that followed, many investors became complacent about inflation and positioned their portfolios away from assets that protect against inflation such as commodity futures. This positioning reflects the view that future inflation is likely to remain very low. However, investors should be aware that, as discussed below, the COVID-19 pandemic is unlike the GFC, and the current economic conditions are unlike those in 2008. An elevated risk of inflation could be painful for unprepared investors.
Second, the COVID-19 pandemic impacted both demand for commodities and supply of commodities. There are some critical differences between the current COVID-19 pandemic and the 2008 GFC. The lockdowns imposed by many regions as a result of the COVID-19 pandemic have destroyed the supply chain in key commodities. Commodity demand also has been impacted. In a typical recession, the supply side contracts in response to declining demand. This time around, as a result of lockdowns, supply in some sectors are contracting independent of demand disruption. Meat processing plants have temporarily shut down across US. Global mining giants Rio Tinto and Anglo American have reported production slowdowns due to coronavirus-related restrictions. Codelco, the world’s largest copper mining company, has suspended contract work at its projects and mines in Chile. According to Codelco, this suspension affects 30% of its worldwide contractors. Chile is the world’s largest copper producer, and the nation declared a constitutional state of catastrophe for 90 days starting March 18, 2020. Peru, the world’s second largest copper producer, has announced a national quarantine, resulting in a year-to-date decline in production of 54% as of April 2020. Modern global economies have never seen supply drop so sharply across so many industries.
Third, commodities tend to surge after a recession. The business cycle dating committee of National Bureau of Economic Research has determined that the US entered a recession in March 2020, as a result of various economic lockdowns in over 100 countries. While recessions are associated with declining economic activity and downward pressure on commodity prices, recoveries tend to support commodity prices. Additionally, and as described above, the economic shock from the COVID-19 pandemic is distinct from any other recession in recent memory because of the mix of supply destruction and unprecedented, concerted efforts by global governments to stimulate demand. And, once again, the combination of low supply and limited demand reduction can be a recipe for inflation.
| 5 |
Fourth, commodities tend to rise when the dollar falls. The astonishing and rapidly implemented stimulus measures described above have put pressure on the dollar. After a decade of strong dollar performance, confidence in fiat currencies, including the dollar, is weakening. Depending on the relative demand for dollars relative to other currencies, it is conceivable that the dollar could fall further.
Commodities offer diversification from stocks and bonds, high correlation to inflation, and long-term returns similar to stocks. SDCI may be well positioned to benefit from coming tailwinds as demand recovers, supply is under pressure, and inflation may be knocking at the door.
Past performance is no guarantee of future results.
There is no assurance that the investment process will consistently lead to successful investing for each fund.
It is not possible to invest in an index.
Important Considerations:
Commodity and futures trading is highly speculative and generally volatile and is not suitable for all investors.
Investing in SDCI involves risks, including the possible loss of principal. Commodities contain a heightened risk including market and price movements that are outside SDCI’s control and may be influenced by weather and climate conditions, livestock disease, war, terrorism, political conflicts and economic event, interest rates, currency exchange rates, U.S. and non-U.S. government regulation and taxation. Investing in derivatives, including futures and swaps, entails risks relating to liquidity, counterparty, leverage and credit that may reduce return and increase volatility. Investments held in U.S. government securities and money market instruments can suffer losses. SDCI is exposed to non-diversification risk which results from SDCI’s direct or indirect investment in commodities and futures contracts that are economically identical or substantially similar. For more information about these and other risks including correlation and specific risks regarding each commodity sector and the investment in the Subsidiary, please read SDCI’s prospectus.
| 6 | Annual Report June 30, 2020 |
COMPARISON OF CHANGE IN VALUE OF $10,000 INVESTMENT IN USCF SUMMERHAVEN SHPEI INDEX FUND (“BUY”), THE SUMMERHAVEN PRIVATE EQUITY STRATEGY INDEXSM1 (“SHPEI”) AND S&P 500 INDEX®2 FROM NOVEMBER 30, 2017 (INCEPTION DATE)* TO JUNE 30, 2020.
The following graph depicts the performance of USCF SummerHaven SHPEI Index Fund (Net Asset Value and Market Value) vs. the SummerHaven Private Equity Strategy IndexSM1 and S&P 500 Index®2.
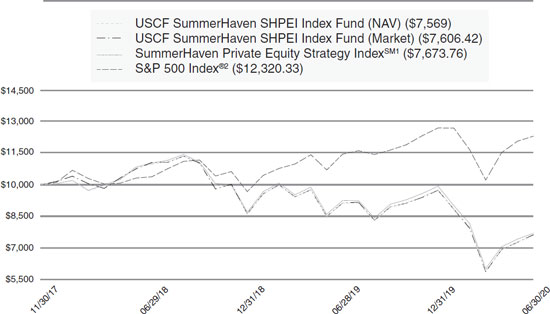
| One Year Return | Annualized Since Inception Return (11/30/2017) | |||||||
| USCF SummerHaven SHPEI Index Fund (NAV) | –17.01 | % | –10.23 | % | ||||
| USCF SummerHaven SHPEI Index Fund (Market Value) | –16.64 | % | –10.05 | % | ||||
| SummerHaven Private Equity Strategy IndexSM1 | –16.97 | % | –9.74 | % | ||||
| S&P 500 Index®2 | 7.51 | % | 8.41 | % | ||||
| * | The inception date is the date the fund started accruing expenses and commenced operations. Shares of BUY were listed on the NYSE Arca, Inc. on December 1, 2017. |
| 1 | The SummerHaven Private Equity Strategy IndexSM (“SHPEI”) attempts to replicate the long-term (i.e., 10 years or more) return characteristics of diversified private equity allocations. SHPEI is designed to include publicly-traded companies that possess characteristics similar to the companies that private equity firms have historically selected for investment, as well as companies that SummerHaven Index Management, LLC (“SHIM”), as the index provider believes private equity firms are likely to select for investment in the future. However, SHPEI does not include, and the Fund does not invest in, private equity funds or private equity of companies. SHPEI is constructed using a proprietary methodology that favors companies with low enterprise value to earnings before interest, taxes, depreciation, and amortization (“EV /EBITDA”) ratios; low net equity issuance; low market capitalization; and moderate profitability. From a universe of approximately 3,000 U.S. companies, SHIM applies proprietary screens to determine an investable universe. SHPEI includes the greater of 200 companies or 20% of such investable universe. SHPEI is equally-weighted and rebalanced annually. |
| 7 |
| 2 | The Standard & Poor’s (“S&P”) 500 Index is an unmanaged index consisting of 500 stocks chosen for market size, liquidity, and industry group representation. It is a market-weighted index (stock price times number of shares outstanding) with each stock’s weight in the Index proportionate to its market value. |
The performance shown represents past performance. Past performance is no guarantee of future results and current performance may be higher or lower than the performance shown. Return calculations assume the reinvestment of distributions and do not reflect taxes that a shareholder would pay on distributions or on the sale of shares. Principal value and investments returns will fluctuate and investors’ shares, when sold, may be worth more or less than the original cost. To obtain the most recent month-end performance data visit www.uscfinvestments.com or call 1-800-920-0259.
The Fund’s net asset value (“NAV”) is calculated by dividing the value of the Fund’s total assets less total liabilities by the number of shares outstanding. Share price returns are based on closing prices for the Fund and do not represent the returns an investor would receive if shares were traded at other times.
Shares of ETFs are bought and sold at market price (not NAV) and are not individually redeemed from the Fund. Brokerage commissions apply and will reduce returns. Market returns are based upon the midpoint of the bid/ask spread at 4:00 p.m. Eastern time (when NAV is normally determined for most ETFs), and do not represent the returns you would receive if you traded shares at other times.
| 8 | Annual Report June 30, 2020 |
COMPARISON OF CHANGE IN VALUE OF $10,000 INVESTMENT IN USCF SUMMERHAVEN DYNAMIC COMMODITY STRATEGY NO K-1 FUND (“SDCI”), SUMMERHAVEN DYNAMIC COMMODITY INDEX TOTAL RETURNSM1, BLOOMBERG COMMODITY INDEX TOTAL RETURNSM2 AND S&P GOLDMAN SACHS COMMODITY INDEX TOTAL RETURN®3 FROM MAY 2, 2018 (INCEPTION DATE)* TO JUNE 30, 2020.
The following graph shows the value as of June 30, 2020 of a $10,000 investment made on May 1, 2018 (commencement of operations). For comparative purposes, the performance of USCF SummerHaven Dynamic Commodity Strategy No K-1 Fund (Net Asset Value and Market Value), the SummerHaven Dynamic Commodity Index Total ReturnSM1 (“SDCITR”) and the performance of Bloomberg Commodity Index Total ReturnSM2 and S&P Goldman Sachs Commodity Index Total Return®3 are shown.
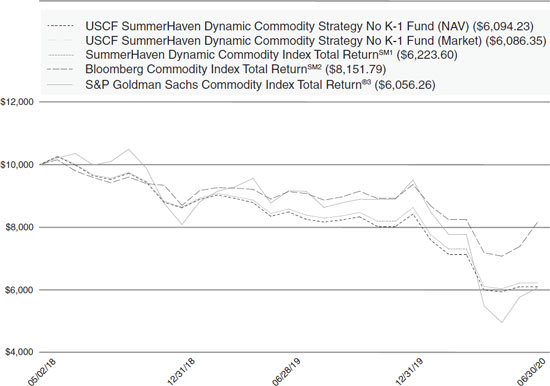
| One Year Return | Annualized Since Inception Return (5/2/2018) | |||||||
| USCF SummerHaven Dynamic Commodity Strategy No K-1 Fund (NAV) | –28.20 | % | –20.48 | % | ||||
| USCF SummerHaven Dynamic Commodity Strategy No K-1 Fund (Market Value) | –28.25 | % | –20.50 | % | ||||
| SummerHaven Dynamic Commodity Index Total ReturnSM1 | –27.46 | % | –19.68 | % | ||||
| Bloomberg Commodity Index Total ReturnSM2 | –17.38 | % | –12.19 | % | ||||
| S&P Goldman Sachs Commodity Index Total Return®3 | –33.90 | % | –20.68 | % | ||||
| 9 |
| * | The inception date is the date the fund started accruing expenses and commenced operations. Shares of SDCI were listed on the NYSE Arca, Inc. on May 3, 2018. |
| 1 | The SummerHaven Dynamic Commodity Index Total ReturnSM (“SDCITR”) is an index designed to reflect the performance of a fully margined and collateralized portfolio of exchange-traded commodities futures contracts. The total return of the SDCITR is based upon the market price movements of its component futures contracts and the return on the hypothetical investments used to collateralize those futures contracts. At any time, the SDCITR is comprised of 14 commodity futures contracts (the “Component Futures Contracts”), weighted equally by notional amount, selected each month based upon a universe of 27 eligible commodities and futures contracts for those commodities. The eligible futures contracts are traded on the Futures Exchanges in major industrialized countries, and typically have active and liquid markets. As of June 30, 2020, the universe of eligible commodities, categorized into six commodity sectors, including: energy, precious metals, industrial metals, grains, softs, and livestock. The SDCITR is rules-based and reconstituted and rebalanced monthly using quantitative formulas, subject to the constraint that each of the six commodity sectors above must be represented by at least one Component Futures Contract. |
| 2 | The Bloomberg Commodity Index Total ReturnSM (“BCOM”) is an index that tracks the performance of 22 broadly diversified commodity futures contracts. Prior to July 1, 2014, BCOM was known as the Dow Jones-UBS Commodity Index. |
| 3 | The S&P Goldman Sachs Commodity Index Total Return® (“SPGSCI”) is a composite index representing the unleveraged, long-only performance of a diversified group of commodity futures contracts. The returns are calculated on a fully collateralized basis with full reinvestment. |
The performance shown represents past performance. Past performance is no guarantee of future results and current performance may be higher or lower than the performance shown. Return calculations assume the reinvestment of distributions and do not reflect taxes that a shareholder would pay on distributions or on the sale of shares. Principal value and investments returns will fluctuate and investors’ shares, when sold, may be worth more or less than the original cost. To obtain the most recent month-end performance data visit www.uscfinvestments.com or call 1-800-920-0259.
The Fund’s NAV is calculated by dividing the value of the Fund’s total assets less total liabilities by the number of shares outstanding. Share price returns are based on closing prices for the Fund and do not represent the returns an investor would receive if shares were traded at other times.
Shares of ETFs are bought and sold at market price (not NAV) and are not individually redeemed from the Fund. Brokerage commissions apply and will reduce returns. Market returns are based upon the midpoint of the bid/ask spread at 4:00 p.m. Eastern time (when NAV is normally determined for most ETFs), and do not represent the returns you would receive if you traded shares at other times.
| 10 | Annual Report June 30, 2020 |
As a shareholder of one or more of the USCF SummerHaven SHPEI Index Fund and the USCF SummerHaven Dynamic Commodity Strategy No K-1 Fund (each a “Fund” and collectively, the “Funds”), each of which is a series of the USCF ETF Trust (the “Trust”), you may incur two potential types of costs: (1) transaction costs, such as brokerage commissions, for purchasing and selling your Fund shares, and (2) ongoing costs, including management fees and other Fund expenses. The following examples are intended to help you understand your ongoing costs (in dollars) of investing in a Fund and to compare these costs with the ongoing costs of investing in other funds. The examples are based on an investment of $1,000 invested at the beginning of the period and held for the entire period from January 1, 2020 until June 30, 2020.
Actual Return. The table below provides information about actual account values and actual expenses. You may use the information in this table, together with the amount you invested, to estimate the expenses that you paid over the period. Simply divide your account value by $1,000 (for example, $8,600 account value divided by $1,000 = 8.6), then multiply the result by the number under the heading “Actual Expenses Paid During the Period” to estimate the expenses you paid on your account during this period.
Hypothetical 5% Return. The table below provides information about hypothetical account values and hypothetical expenses based on each Fund’s actual expense ratio and an assumed rate of return of 5% per year before expenses, which is not the Fund’s actual return. The hypothetical account values and expenses may not be used to estimate the actual ending account balance or expenses you paid for the period. You may use this information to compare ongoing costs of investing in the Fund and other exchange-traded funds. To do so, compare this 5% hypothetical example with the 5% hypothetical examples that appear in the shareholder reports of the other funds.
The expenses shown in the table are meant to highlight ongoing costs only and do not reflect any transaction fees, such as brokerage commission paid on purchases and sales of Fund shares. Therefore, the number under the heading “Hypothetical Expenses Paid During the Period” is useful in comparing ongoing costs only, and may not help you determine the relative total costs of owning different funds.
| 11 |
| Fund | Beginning Account Value 1/1/20 | Ending Account Value 6/30/20 | Annualized Expense Ratio | Expenses Paid During the Period Per $1,000(a) | ||||||||||||
| USCF SummerHaven SHPEI Index Fund | ||||||||||||||||
| Actual | $ | 1,000.00 | $ | 776.20 | 0.80 | % | $ | 3.53 | ||||||||
| Hypothetical (5% return before expenses) | $ | 1,000.00 | $ | 1,020.89 | 0.80 | % | $ | 4.02 | ||||||||
| USCF SummerHaven Dynamic Commodity Strategy No K-1 Fund | ||||||||||||||||
| Actual | $ | 1,000.00 | $ | 720.70 | 0.60 | % | $ | 2.57 | ||||||||
| Hypothetical (5% return before expenses) | $ | 1,000.00 | $ | 1,021.88 | 0.60 | % | $ | 3.02 | ||||||||
| (a) | Expenses (net of fee waivers and/or expense reimbursements) are equal to the Funds’ annualized expense ratio multiplied by the average account value over the period, multiplied by the number of days (182 days) in the most recent fiscal half-year, then divided by 366 (to reflect the one-half year period). |
| 12 | Annual Report June 30, 2020 |
USCF ETF TRUST
USCF SUMMERHAVEN SHPEI INDEX FUND
CONDENSED SCHEDULE OF INVESTMENTS
AT JUNE 30, 2020
| % of Total Net Assets | Shares | Market Value | ||||||||||
| Common Stocks | 100.3 | % | ||||||||||
| Auto Parts & Equipment | 4.0 | % | ||||||||||
| Visteon Corp.(a) | 0.6 | % | 71 | $ | 4,863 | |||||||
| Other Auto Parts & Equipment(b) | 3.4 | % | 24,812 | |||||||||
| 29,675 | ||||||||||||
| Biotechnology | 1.0 | % | ||||||||||
| Arena Pharmaceuticals, Inc.(a) | 0.6 | % | 71 | 4,470 | ||||||||
| Other Biotechnology(b) | 0.4 | % | �� | 3,069 | ||||||||
| 7,539 | ||||||||||||
| Building Materials | 2.7 | % | ||||||||||
| Boise Cascade Co. | 0.6 | % | 116 | 4,363 | ||||||||
| Builders FirstSource, Inc.(a) | 0.6 | % | 209 | 4,326 | ||||||||
| Masonite International Corp.(a) | 0.6 | % | 59 | 4,589 | ||||||||
| Other Building Materials(b) | 0.9 | % | 6,907 | |||||||||
| 20,185 | ||||||||||||
| Commercial Services | 4.9 | % | ||||||||||
| Green Dot Corp. – Class A(a) | 0.5 | % | 82 | 4,025 | ||||||||
| Other Commercial Services(b) | 4.4 | % | 32,503 | |||||||||
| 36,528 | ||||||||||||
| Electronics | 5.1 | % | ||||||||||
| Atkore International Group, Inc.(a) | 0.5 | % | 146 | 3,993 | ||||||||
| Tech Data Corp.(a) | 0.7 | % | 35 | 5,072 | ||||||||
| TTM Technologies, Inc.(a) | 0.6 | % | 350 | 4,151 | ||||||||
| Other Electronics(b) | 3.3 | % | 24,704 | |||||||||
| 37,920 | ||||||||||||
| Engineering & Construction | 3.5 | % | ||||||||||
| IES Holdings, Inc.(a) | 0.6 | % | 190 | 4,402 | ||||||||
| VSE Corp. | 0.5 | % | 127 | 3,986 | ||||||||
| Other Engineering & Construction(b) | 2.4 | % | 17,775 | |||||||||
| 26,163 | ||||||||||||
| Food | 3.0 | % | ||||||||||
| Natural Grocers by Vitamin Cottage, Inc. | 0.7 | % | 343 | 5,104 | ||||||||
| SpartanNash Co. | 0.9 | % | 312 | 6,630 | ||||||||
| United Natural Foods, Inc.(a) | 0.9 | % | 364 | 6,628 | ||||||||
| Weis Markets, Inc. | 0.5 | % | 84 | 4,210 | ||||||||
| 22,572 | ||||||||||||
The accompanying notes are an integral part of the financial statements.
| 13 |
USCF ETF TRUST
USCF SUMMERHAVEN SHPEI INDEX FUND
CONDENSED SCHEDULE OF INVESTMENTS
AT JUNE 30, 2020 (continued)
| % of Total Net Assets | Shares | Market Value | ||||||||||
| Forest Products & Paper | 1.3 | % | ||||||||||
| Clearwater Paper Corp.(a) | 0.8 | % | 171 | $ | 6,178 | |||||||
| Other Forest Products & Paper(b) | 0.5 | % | 3,791 | |||||||||
| 9,969 | ||||||||||||
| Healthcare-Services | 1.1 | % | ||||||||||
| Molina Healthcare, Inc.(a) | 0.8 | % | 33 | 5,873 | ||||||||
| Other Healthcare-Services(b) | 0.3 | % | 2,463 | |||||||||
| 8,336 | ||||||||||||
| Insurance | 3.4 | % | ||||||||||
| HCI Group, Inc. | 0.5 | % | 89 | 4,110 | ||||||||
| Investors Title Co. | 0.5 | % | 32 | 3,882 | ||||||||
| Other Insurance(b) | 2.4 | % | 17,574 | |||||||||
| 25,566 | ||||||||||||
| Internet | 2.2 | % | ||||||||||
| ePlus, Inc.(a) | 0.5 | % | 59 | 4,170 | ||||||||
| Stamps.com, Inc.(a) | 1.7 | % | 68 | 12,491 | ||||||||
| 16,661 | ||||||||||||
| Iron & Steel | 1.2 | % | ||||||||||
| Commercial Metals Co. | 0.5 | % | 190 | 3,876 | ||||||||
| Other Iron & Steel(b) | 0.7 | % | 4,800 | |||||||||
| 8,676 | ||||||||||||
| Leisure Time | 1.3 | % | ||||||||||
| Vista Outdoor, Inc.(a) | 0.8 | % | 405 | 5,852 | ||||||||
| Other Leisure Time(b) | 0.5 | % | 3,505 | |||||||||
| 9,357 | ||||||||||||
| Media | 0.7 | % | ||||||||||
| Tribune Publishing Co. | 0.6 | % | 423 | 4,226 | ||||||||
| Other Media(b) | 0.1 | % | 818 | |||||||||
| 5,044 | ||||||||||||
| Miscellaneous Manufacturing | 2.0 | % | ||||||||||
| Smith & Wesson Brands, Inc.(a) | 1.1 | % | 388 | 8,350 | ||||||||
| Other Miscellaneous Manufacturing(b) | 0.9 | % | 6,632 | |||||||||
| 14,982 | ||||||||||||
| Oil & Gas | 4.6 | % | ||||||||||
| CNX Resources Corp.(a) | 0.6 | % | 490 | 4,238 | ||||||||
The accompanying notes are an integral part of the financial statements.
| 14 | Annual Report June 30, 2020 |
USCF ETF TRUST
USCF SUMMERHAVEN SHPEI INDEX FUND
CONDENSED SCHEDULE OF INVESTMENTS
AT JUNE 30, 2020 (continued)
| % of Total Net Assets | Shares | Market Value | ||||||||||
| Oil & Gas (continued) | ||||||||||||
| Murphy USA, Inc.(a) | 0.8 | % | 52 | $ | 5,855 | |||||||
| Other Oil & Gas(b) | 3.2 | % | 24,051 | |||||||||
| 34,144 | ||||||||||||
| Pharmaceuticals | 1.8 | % | ||||||||||
| Collegium Pharmaceutical, Inc.(a) | 0.6 | % | 272 | 4,760 | ||||||||
| Lannett Co., Inc.(a) | 0.6 | % | 570 | 4,138 | ||||||||
| Other Pharmaceuticals(b) | 0.6 | % | 4,680 | |||||||||
| 13,578 | ||||||||||||
| Retail | 11.4 | % | ||||||||||
| Big Lots, Inc. | 0.7 | % | 129 | 5,418 | ||||||||
| BMC Stock Holdings, Inc.(a) | 0.6 | % | 170 | 4,274 | ||||||||
| Citi Trends, Inc. | 0.6 | % | 220 | 4,448 | ||||||||
| GMS, Inc.(a) | 0.5 | % | 157 | 3,861 | ||||||||
| MarineMax, Inc.(a) | 0.6 | % | 208 | 4,657 | ||||||||
| PC Connection, Inc. | 0.6 | % | 92 | 4,265 | ||||||||
| PetMed Express, Inc. | 1.1 | % | 229 | 8,162 | ||||||||
| Shoe Carnival, Inc. | 0.5 | % | 136 | 3,981 | ||||||||
| Zumiez, Inc.(a) | 0.5 | % | 146 | 3,997 | ||||||||
| Other Retail(b) | 5.7 | % | 42,157 | |||||||||
| 85,220 | ||||||||||||
| Savings & Loans | 1.5 | % | ||||||||||
| First Capital, Inc. | 0.5 | % | 56 | 3,890 | ||||||||
| Other Savings & Loans(b) | 1.0 | % | 7,588 | |||||||||
| 11,478 | ||||||||||||
| Semiconductors | 5.1 | % | ||||||||||
| Alpha & Omega Semiconductor Ltd.(a) | 0.6 | % | 407 | 4,428 | ||||||||
| Amkor Technology, Inc.(a) | 0.8 | % | 479 | 5,896 | ||||||||
| Axcelis Technologies, Inc.(a) | 0.9 | % | 240 | 6,684 | ||||||||
| Diodes, Inc.(a) | 0.6 | % | 94 | 4,766 | ||||||||
| Photronics, Inc.(a) | 0.6 | % | 409 | 4,552 | ||||||||
| Synaptics, Inc.(a) | 0.8 | % | 105 | 6,313 | ||||||||
| Ultra Clean Holdings, Inc.(a) | 0.8 | % | 247 | 5,590 | ||||||||
| 38,229 | ||||||||||||
| Transportation | 4.8 | % | ||||||||||
| Marten Transport Ltd. | 0.6 | % | 192 | 4,831 | ||||||||
| Saia, Inc.(a) | 0.9 | % | 61 | 6,782 | ||||||||
| Werner Enterprises, Inc. | 0.6 | % | 100 | 4,353 | ||||||||
The accompanying notes are an integral part of the financial statements.
| 15 |
USCF ETF TRUST
USCF SUMMERHAVEN SHPEI INDEX FUND
CONDENSED SCHEDULE OF INVESTMENTS
AT JUNE 30, 2020 (concluded)
| % of Total Net Assets | Shares | Market Value | ||||||||||
| Transportation (continued) | ||||||||||||
| XPO Logistics, Inc.(a) | 0.5 | % | 52 | $ | 4,017 | |||||||
| Other Transportation(b) | 2.2 | % | 16,138 | |||||||||
| 36,121 | ||||||||||||
| Miscellaneous(c) | 33.7 | % | 251,925 | |||||||||
| Total Common Stocks (Cost $1,078,060) | 100.3 | % | 749,868 | |||||||||
| Total Investments (Cost $1,078,060) | 100.3 | % | 749,868 | |||||||||
| Liabilities in Excess of Other Assets | (0.3 | )% | (2,550 | ) | ||||||||
| Total Net Assets | 100.0 | % | $ | 747,318 | ||||||||
| (a) | Non-income producing security. |
| (b) | Industry classifications and or positions included individually represent less than 1% of total net assets and are not included in the top 50 holdings of the Fund, which may also include non-income producing securities. |
| (c) | Miscellaneous classifications represents industries and position less than 1% of total net assets and are not included in the top 50 holdings of the Fund, which may also include non-income producing securities. |
| Summary of Investments by Country^ | ||||
| United States | 99.7 | % | ||
| Luxembourg | 0.3 | |||
| 100.0 | % | |||
| Summary of Investments by Sector^ | ||||
| Industrial | 23.5 | % | ||
| Financial | 21.0 | |||
| Consumer, Cyclical | 20.3 | |||
| Consumer, Non-cyclical | 13.1 | |||
| Technology | 7.0 | |||
| Energy | 7.0 | |||
| Basic Materials | 4.5 | |||
| Communications | 3.6 | |||
| 100.0 | % |
^ As a percentage of total investments. All stocks are listed on U.S. Exchanges.
The accompanying notes are an integral part of the financial statements.
| 16 | Annual Report June 30, 2020 |
USCF ETF TRUST
USCF SUMMERHAVEN DYNAMIC COMMODITY STRATEGY NO K-1 FUND
CONSOLIDATED SCHEDULE OF INVESTMENTS
AT JUNE 30, 2020
Besides the following listed commodity futures contracts, treasury bills and money market funds of the Fund and its wholly-owned subsidiary, there were no additional investments held by the Fund at June 30, 2020.
The following commodity futures contracts of the Fund’s wholly-owned subsidiary were open at June 30, 2020 (see Security Valuation in the Notes to Financial Statements):
| Number of Contracts | Notional Amount | Expiration Date | Fair Value/ Unrealized Gain (Loss) on Open Commodity Contracts | % of Total Net Assets | ||||||||||||||||
| Open Commodity Futures Contracts – Long | ||||||||||||||||||||
| Foreign Contracts | ||||||||||||||||||||
| LME Zinc Futures, July 2020 contracts | 4 | $ | 195,411 | Jul-20 | $ | 8,414 | 0.3 | % | ||||||||||||
| LME Tin Futures, August 2020 contracts | 9 | 734,356 | Aug-20 | 20,699 | 0.8 | % | ||||||||||||||
| LME Nickel Futures, December 2020 contracts | 6 | 447,800 | Dec-20 | 14,936 | 0.6 | % | ||||||||||||||
| 19 | 1,377,567 | 44,049 | 1.7 | % | ||||||||||||||||
| United States Contracts | ||||||||||||||||||||
| ICE Cocoa Futures, September 2020 contracts | 8 | 213,960 | Sep-20 | (39,080 | ) | (1.5 | )% | |||||||||||||
| CME Copper Futures, September 2020 contracts | 3 | 181,600 | Sep-20 | 23,037 | 0.9 | % | ||||||||||||||
| CME Silver Futures, September 2020 contracts | 2 | 178,620 | Sep-20 | 7,750 | 0.3 | % | ||||||||||||||
| ICE Sugar#11 Futures, September 2020 contracts | 14 | 185,069 | Oct-20 | 2,464 | 0.1 | % | ||||||||||||||
| NYMEX Platinum Futures, October 2020 contracts | 5 | 217,680 | Oct-20 | (4,880 | ) | (0.2 | )% | |||||||||||||
| ICE Cotton No. 2 Futures, December 2020 contracts | 6 | 179,455 | Dec-20 | 3,185 | 0.1 | % | ||||||||||||||
| CBOT Soybean Oil Futures, December 2020 contracts | 11 | 187,506 | Dec-20 | 2,640 | 0.1 | % | ||||||||||||||
| ICE Coffee C Futures, December 2020 contracts | 5 | 193,181 | Dec-20 | 787 | 0.0 | %* | ||||||||||||||
| NYMEX Natural Gas Futures, December 2020 contracts | 7 | 190,320 | Jan-21 | 11,490 | 0.4 | % | ||||||||||||||
The accompanying notes are an integral part of the financial statements.
| 17 |
USCF ETF TRUST
USCF SUMMERHAVEN DYNAMIC COMMODITY STRATEGY NO K-1 FUND
CONSOLIDATED SCHEDULE OF INVESTMENTS
AT JUNE 30, 2020 (continued)
| Number of Contracts | Notional Amount | Expiration Date | Fair Value/ Unrealized Gain (Loss) on Open Commodity Contracts | % of Total Net Assets | ||||||||||||||||
| United States Contracts (continued) | ||||||||||||||||||||
| CME Cattle Feeder Futures, January 2021 contracts | 3 | $ | 203,038 | Jan-21 | $ | (1,400 | ) | 0.0 | %* | |||||||||||
| COMEX Gold 100 OZ Futures, February 2021 contracts | 1 | 170,590 | Feb-21 | 12,160 | 0.5 | % | ||||||||||||||
| CBOT Soybean Futures, March 2021 contracts | 4 | 169,875 | Mar-21 | 5,875 | 0.2 | % | ||||||||||||||
| 69 | 2,270,894 | 24,028 | 0.9 | % | ||||||||||||||||
| Open Commodity Futures Contracts - Short** | ||||||||||||||||||||
| Foreign Contracts | ||||||||||||||||||||
| LME Zinc Futures, July 2020 contracts | 4 | (204,142 | ) | Jul-20 | 318 | 0.0 | %* | |||||||||||||
| LME Tin Futures, August 2020 contracts | 7 | (560,530 | ) | Aug-20 | (26,735 | ) | (1.0 | )% | ||||||||||||
| LME Nickel Futures, December 2020 contracts | 4 | (306,530 | ) | Dec-20 | (1,961 | ) | (0.1 | )% | ||||||||||||
| 15 | (1,071,202 | ) | (28,378 | ) | (1.1 | )% | ||||||||||||||
| Total Open Commodity Futures Contracts*** | 103 | $ | 2,577,259 | $ | 39,699 | 1.5 | % | |||||||||||||
The accompanying notes are an integral part of the financial statements.
| 18 | Annual Report June 30, 2020 |
USCF ETF TRUST
USCF SUMMERHAVEN DYNAMIC COMMODITY STRATEGY NO K-1 FUND
CONSOLIDATED SCHEDULE OF INVESTMENTS
AT JUNE 30, 2020 (concluded)
| Principal Amount | Market Value | % of Total Net Assets | ||||||||||
| Cash Equivalents | ||||||||||||
| United States Treasury Obligations | ||||||||||||
| U.S. Treasury Bills: | ||||||||||||
| 1.52%, 7/09/2020 | $ | 50,000 | $ | 49,983 | 1.9 | % | ||||||
| 1.52%, 8/13/2020 | 100,000 | 99,820 | 3.8 | % | ||||||||
| Total Treasury Obligations (Cost $149,803) | $ | 149,803 | 5.7 | % | ||||||||
| United States – Money Market Funds | ||||||||||||
| Dreyfus Institutional Preferred Government Money Market Fund – Institutional Share Class, 0.10%(a) | 26,323 | 26,322 | 1.0 | % | ||||||||
| Goldman Sachs Financial Square Funds – Government Fund – Class FS, 0.15%(a) | 1,260,248 | 1,260,249 | 47.8 | % | ||||||||
| RBC U.S. Government Money Market Fund – Institutional Share Class, 0.10%(a) | 800,252 | 800,252 | 30.4 | % | ||||||||
| Total Money Market Funds (Cost $2,086,823) | $ | 2,086,823 | 79.2 | % | ||||||||
| Total Cash Equivalents (Cost $2,236,626) | $ | 2,236,626 | 84.9 | % | ||||||||
| Total Investments (Cost $2,236,626) | $ | 2,276,325 | 86.4 | % | ||||||||
| Other Assets in Excess of Liabilities | 357,989 | 13.6 | % | |||||||||
| Total Net Assets | $ | 2,634,314 | 100.0 | % | ||||||||
| * | Position represents less than 0.05%. |
| ** | All short contracts are offset by long positions in commodity futures contracts and are acquired solely for the purpose of reducing a long position (e.g., due to a redemption or to reflect a rebalancing of the SDCI). |
| *** | Collateral amounted to $308,092 on open commodity futures contracts. |
| (a) | Reflects the 7-day yield at June 30, 2020. |
| Summary of Investments by Country^ | ||||
| United States | 99.3 | % | ||
| United Kingdom | 0.7 | |||
| 100.0 | % |
^ As a percentage of total investments. All securities are listed on U.S. Exchanges.
The accompanying notes are an integral part of the financial statements.
| 19 |
USCF ETF TRUST
USCF SUMMERHAVEN SHPEI INDEX FUND
STATEMENT OF ASSETS AND LIABILITIES
JUNE 30, 2020
| Assets: | ||||
| Investments, at Market Value | $ | 749,868 | ||
| Cash | 24,360 | |||
| Receivables: | ||||
| Dividends | 5,584 | |||
| Other Assets | 211 | |||
| Total Assets | 780,023 | |||
| Liabilities: | ||||
| Payables: | ||||
| Accrued Management Fees | 32,705 | |||
| Total Liabilities | 32,705 | |||
| Total Net Assets | $ | 747,318 | ||
| Net Assets Consist of: | ||||
| Capital Paid In | $ | 1,406,179 | ||
| Total Distributable Earnings (Loss) | (658,861 | ) | ||
| Total Net Assets | $ | 747,318 | ||
| Net Asset Value Per Share: | ||||
| Total Net Assets | $ | 747,318 | ||
| Shares of Beneficial Interest Outstanding (Unlimited Shares of $0.001 Par Value Authorized) | 50,000 | |||
| Net Asset Value | $ | 14.95 | ||
| Investments, at Cost | $ | 1,078,060 | ||
The accompanying notes are an integral part of the financial statements.
| 20 | Annual Report June 30, 2020 |
USCF ETF TRUST
USCF SUMMERHAVEN DYNAMIC COMMODITY STRATEGY NO K-1 FUND
CONSOLIDATED STATEMENT OF ASSETS AND LIABILITIES
JUNE 30, 2020
| Assets: | ||||
| Investments, at Market Value: | ||||
| Cash and Cash Equivalents | $ | 2,236,626 | ||
| Net Unrealized Appreciation (Depreciation) on Open Commodity Futures Contracts | 39,699 | |||
| Cash | 360,027 | |||
| Receivables: | ||||
| Dividends and Interest | 223 | |||
| Other Assets | 676 | |||
| Total Assets | 2,637,251 | |||
| Liabilities: | ||||
| Payables: | ||||
| Accrued Management Fees | 2,937 | |||
| Total Liabilities | 2,937 | |||
| Total Net Assets | $ | 2,634,314 | ||
| Net Assets Consist of: | ||||
| Capital Paid In | $ | 2,623,478 | ||
| Total Distributable Earnings (Loss) | 10,836 | |||
| Total Net Assets | $ | 2,634,314 | ||
| Net Asset Value Per Share: | ||||
| Total Net Assets | $ | 2,634,314 | ||
| Shares of Beneficial Interest Outstanding (Unlimited Shares of $0.001 Par Value Authorized) | 200,000 | |||
| Net Asset Value | $ | 13.17 | ||
| Investments, at Cost | $ | 2,236,626 |
The accompanying notes are an integral part of the financial statements.
| 21 |
USCF ETF TRUST
USCF SUMMERHAVEN SHPEI INDEX FUND
STATEMENT OF OPERATIONS
FOR THE YEAR ENDED JUNE 30, 2020
| Investment Income: | ||||
| Dividend Income (less net foreign withholding tax $1,201) | $ | 391,215 | ||
| Total Investment Income | 391,215 | |||
| Expenses: | ||||
| Management Fees | 198,640 | |||
| Total Expenses | 198,640 | |||
| Less Fees Waived (Note 4) | (31,157 | ) | ||
| Net Expenses | 167,483 | |||
| Net Investment Income (Loss) | 223,732 | |||
| Realized and Unrealized Gain (Loss) on Investments: | ||||
| Net Realized Gain (Loss) on Investments | (2,623,437 | ) | ||
| Net Change in Unrealized Appreciation (Depreciation) on Investments | 111,291 | |||
| Net Change in Realized and Unrealized Gain (Loss) on Investments | (2,512,146 | ) | ||
| Net Increase (Decrease) in Net Assets Resulting from Operations | $ | (2,288,414 | ) |
The accompanying notes are an integral part of the financial statements.
| 22 | Annual Report June 30, 2020 |
USCF ETF TRUST
USCF SUMMERHAVEN DYNAMIC COMMODITY STRATEGY NO K-1 FUND
CONSOLIDATED STATEMENT OF OPERATIONS
FOR THE YEAR ENDED JUNE 30, 2020
| Investment Income: | ||||
| Dividend Income (less net foreign withholding tax $0) | $ | 32,711 | ||
| Interest Income | 36,764 | |||
| Total Investment Income | 69,475 | |||
| Expenses: | ||||
| Management Fees | 37,195 | |||
| Brokerage commissions | 6,500 | |||
| Total Expenses | 43,695 | |||
| Less Fees Waived (Note 4) | (8,128 | ) | ||
| Net Expenses | 35,567 | |||
| Net Investment Income (Loss) | 33,908 | |||
| Realized and Unrealized Gain (Loss) on Investments: | ||||
| Net Realized Gain (Loss) on Commodity Futures Contracts | (1,624,675 | ) | ||
| Net Change in Unrealized Appreciation (Depreciation) on Commodity Futures Contracts | 60,033 | |||
| Net Change in Realized and Unrealized Gain (Loss) on Commodity Futures Contracts | (1,564,642 | ) | ||
| Net Increase (Decrease) in Net Assets Resulting from Operations | $ | (1,530,734 | ) |
The accompanying notes are an integral part of the financial statements.
| 23 |
USCF ETF TRUST
USCF SUMMERHAVEN SHPEI INDEX FUND
STATEMENTS OF CHANGES IN NET ASSETS
| For the Year Ended June 30, | ||||||||
| 2020 | 2019 | |||||||
| Operations: | ||||||||
| Net Investment Income (Loss) | $ | 223,732 | $ | 11,886 | ||||
| Net Realized Gain (Loss) on Investments | (2,623,437 | ) | 174,059 | |||||
| Net Changes in Unrealized Appreciation (Depreciation) on Investments | 111,291 | (666,107 | ) | |||||
| Net Increase (Decrease) in Net Assets Resulting from Operations | (2,288,414 | ) | (480,162 | ) | ||||
| Distributions to Shareholders from: | ||||||||
| Net Investment Income | (224,636 | ) | (11,869 | ) | ||||
| Capital Gains | — | (265,277 | ) | |||||
| Total Distributions to Shareholders | (224,636 | ) | (277,146 | ) | ||||
| Shareholder Transactions: | ||||||||
| Proceeds from Shares Sold | 23,683,891 | — | ||||||
| Shares Issued as Reinvestment of Dividends and Distributions | — | — | ||||||
| Cost of Shares Redeemed | (22,394,985 | ) | — | |||||
| Net Increase (Decrease) in Net Assets from Shares Transactions | 1,288,906 | — | ||||||
| Net Increase (Decrease) in Net Assets | (1,224,144 | ) | (757,308 | ) | ||||
| Net Assets: | ||||||||
| Beginning of Year | 1,971,462 | 2,728,770 | ||||||
| End of Year | $ | 747,318 | $ | 1,971,462 | ||||
| Changes in Shares Outstanding: | ||||||||
| Shares Outstanding, Beginning of Year | 100,000 | 100,000 | ||||||
| Shares Issued | 1,350,000 | — | ||||||
| Shares Issued in Reinvestment of Dividends and Distributions | — | — | ||||||
| Shares Redeemed | (1,400,000 | ) | — | |||||
| Shares Outstanding, End of Year | 50,000 | 100,000 | ||||||
The accompanying notes are an integral part of the financial statements.
| 24 | Annual Report June 30, 2020 |
USCF ETF TRUST
USCF SUMMERHAVEN DYNAMIC COMMODITY STRATEGY NO K-1 FUND
CONSOLIDATED STATEMENTS OF CHANGES IN NET ASSETS
| For the Year Ended June 30, | ||||||||
| 2020 | 2019 | |||||||
| Operations: | ||||||||
| Net Investment Income (Loss) | $ | 33,908 | $ | 65,196 | ||||
| Net Realized Gain (Loss) on Commodity Futures Contracts | (1,624,675 | ) | (1,007,940 | ) | ||||
| Net Changes in Unrealized Appreciation (Depreciation) on Commodity Futures Contracts | 60,033 | (62,069 | ) | |||||
| Net Increase (Decrease) in Net Assets Resulting from Operations | (1,530,734 | ) | (1,004,813 | ) | ||||
| Distributions to Shareholders from: | ||||||||
| Net Investment Income | (31,428 | ) | (48,818 | ) | ||||
| Capital Gains | — | — | ||||||
| Total Distributions to Shareholders | (31,428 | ) | (48,818 | ) | ||||
| Shareholder Transactions: | ||||||||
| Proceeds from Shares Sold | 1,826,792 | — | ||||||
| Cost of Shares Redeemed | (1,321,701 | ) | (4,029,184 | ) | ||||
| Net Increase (Decrease) in Net Assets from Shares Transactions | 505,091 | (4,029,184 | ) | |||||
| Net Increase (Decrease) in Net Assets | (1,057,071 | ) | (5,082,815 | ) | ||||
| Net Assets: | ||||||||
| Beginning of Year | 3,691,385 | 8,774,200 | ||||||
| End of Year | $ | 2,634,314 | $ | 3,691,385 | ||||
| Changes in Shares Outstanding: | ||||||||
| Shares Outstanding, Beginning of Year | 200,000 | 400,000 | ||||||
| Shares Issued | 100,000 | — | ||||||
| Shares Issued in Reinvestment of Dividends and Distributions | — | — | ||||||
| Shares Redeemed | (100,000 | ) | (200,000 | ) | ||||
| Shares Outstanding, End of Year | 200,000 | 200,000 | ||||||
The accompanying notes are an integral part of the financial statements.
| 25 |
USCF ETF TRUST
USCF SUMMERHAVEN SHPEI INDEX FUND
FINANCIAL HIGHLIGHTS
SELECTED DATA FOR A SHARE OF COMMON STOCK OUTSTANDING THROUGHOUT THE PERIOD INDICATED:
| For the | ||||||||||||
| Period Ended | ||||||||||||
| For the Year Ended June 30, | June 30, | |||||||||||
| 2020 | 2019 | 2018* | ||||||||||
| Net Asset Value, Beginning of Period | $ | 19.71 | $ | 27.29 | $ | 24.94 | ||||||
| Income (Loss) from Operations: | ||||||||||||
| Net Investment Income (Loss)(a) | 0.19 | 0.12 | 0.08 | |||||||||
| Net Realized and Unrealized Gain (Loss) | (3.58 | ) | (4.93 | ) | 2.35 | |||||||
| Total Income (Loss) from Operations | (3.39 | ) | (4.81 | ) | 2.43 | |||||||
| Less Distributions From: | ||||||||||||
| Net Investment Income (Loss) | (1.37 | ) | (0.12 | ) | (0.08 | ) | ||||||
| Capital Gains | — | (2.65 | ) | — | ||||||||
| Total Distributions | (1.37 | ) | (2.77 | ) | (0.08 | ) | ||||||
| Net Assets Value, End of Period | $ | 14.95 | $ | 19.71 | $ | 27.29 | ||||||
| Total Return(b) | (17.01 | )% | (16.91 | )% | 9.77 | % | ||||||
| Net Assets, End of Period (thousands) | $ | 747 | $ | 1,971 | $ | 2,729 | ||||||
| Ratios of Average Net Assets: | ||||||||||||
| Gross Expenses | 0.95 | %(c) | 0.95 | % | 0.95 | %(d) | ||||||
| Net Expenses | 0.80 | %(c) | 0.95 | % | 0.95 | %(d) | ||||||
| Net Investment Income (Loss) | 1.07 | % | 0.51 | % | 0.54 | %(d) | ||||||
| Portfolio Turnover Rate(e) | 3 | % | 75 | % | 3 | % | ||||||
| * | Inception Date, November 30, 2017. |
| (a) | Per share amounts have been calculated using the average shares method. |
| (b) | Total Return reflects fee waivers and/or expense reimbursements and assume reinvestment of dividend distribution. In the absence of fee waivers and/or expense reimbursements, the total return would have been lower. Past performance is no guarantee of future results. |
| (c) | Effective August 15, 2019, USCF Advisers, LLC (“the Adviser”) contractually agreed through October 31, 2020 to waive 0.15% of its management fees. |
| (d) | Annualized. |
| (e) | Portfolio turnover rate is not annualized for periods less than one year and does not include securities received or delivered from processing creations or redemptions. |
The accompanying notes are an integral part of the financial statements.
| 26 | Annual Report June 30, 2020 |
USCF ETF TRUST
USCF SUMMERHAVEN DYNAMIC COMMODITY STRATEGY NO K-1 FUND
CONSOLIDATED FINANCIAL HIGHLIGHTS
SELECTED DATA FOR A SHARE OF COMMON STOCK OUTSTANDING THROUGHOUT THE PERIOD INDICATED:
| For the Period Ended | ||||||||||||
| For the Year Ended June 30, | June 30, | |||||||||||
| 2020 | 2019 | 2018* | ||||||||||
| Net Asset Value, Beginning of Period | $ | 18.46 | $ | 21.94 | $ | 22.00 | ||||||
| Income (Loss) from Operations: | ||||||||||||
| Net Investment Income (Loss)(a) | 0.12 | 0.26 | 0.02 | |||||||||
| Net Realized and Unrealized Gain (Loss) | (5.31 | ) | (3.54 | ) | (0.06 | ) | ||||||
| Total Income (Loss) from Operations | (5.19 | ) | (3.28 | ) | (0.04 | ) | ||||||
| Less Distributions From: | ||||||||||||
| Net Investment Income (Loss) | (0.10 | ) | (0.20 | ) | (0.02 | ) | ||||||
| Capital Gains | — | — | — | |||||||||
| Total Distributions | (0.10 | ) | (0.20 | ) | (0.02 | ) | ||||||
| Net Assets Value, End of Period | $ | 13.17 | $ | 18.46 | $ | 21.94 | ||||||
| Total Return(b) | (28.20 | )% | (14.98 | )% | (0.17 | )% | ||||||
| Net Assets, End of Period (thousands) | $ | 2,634 | $ | 3,691 | $ | 8,774 | ||||||
| Ratios of Average Net Assets: | ||||||||||||
| Gross Expenses | 0.94 | %(c) | 0.80 | % | 0.80 | %(d) | ||||||
| Net Expenses | 0.77 | %(c) | 0.80 | % | 0.80 | %(d) | ||||||
| Net Investment Income (Loss) | 0.73 | % | 1.27 | % | 0.67 | %(d) | ||||||
| Portfolio Turnover Rate(e) | 0 | % | 123 | % | 19 | % | ||||||
| * | Inception Date, May 2, 2018. |
| (a) | Per share amounts have been calculated using the average shares method. |
| (b) | Total Return reflects fee waivers and/or expense reimbursements and assume reinvestment of dividend distribution. In the absence of fee waivers and/or expense reimbursements, the total return would have been lower. Past performance is no guarantee of future results. |
| (c) | Effective August 15, 2019, USCF Advisers, LLC (“the Adviser”) contractually agreed through October 31, 2020 to waive 0.20% of its management fees. |
| (d) | Annualized. |
| (e) | Portfolio turnover rate is not annualized for periods less than one year and does not include securities received or delivered from processing creations or redemptions. |
The accompanying notes are an integral part of the financial statements.
| 27 |
USCF ETF TRUST
NOTES TO FINANCIAL STATEMENTS
JUNE 30, 2020
NOTE 1 – ORGANIZATION
The USCF ETF Trust (the “Trust”) was organized as a Delaware statutory trust in accordance with a Declaration of Trust dated November 6, 2013. The Declaration of Trust was amended and restated on June 16, 2014. The Trust is authorized to have multiple segregated series or portfolios. The Trust is an open-end management investment company registered under the Investment Company Act of 1940 (the “1940 Act”). The Trust currently consists of two investment portfolios, each of which is an exchange-traded fund (“ETF”): the USCF SummerHaven SHPEI Index Fund (“BUY”) and the USCF SummerHaven Dynamic Commodity Strategy No K-1 Fund (“SDCI”) (each a “Fund” and collectively, the “Funds”). BUY commenced operations on November 30, 2017. Shares of BUY were listed on the NYSE Arca Equity, Inc. (“NYSE Arca”) on December 1, 2017. SDCI commenced operations on May 2, 2018. Shares of SDCI were listed on NYSE Arca on May 3, 2018. Other series or portfolios may be added to the Trust in the future. The Adviser serves as the investment adviser to each of the Funds. The Adviser has been registered as an investment adviser with the Securities Exchange Commission (the “SEC”) since July 1, 2014 and is a wholly-owned subsidiary of Wainwright Holdings, Inc. SummerHaven Investment Management, LLC (the “Sub-Adviser”) serves as the sub-adviser to BUY and to the USCF Cayman Commodity 2 (the “Subsidiary”), a wholly-owned subsidiary of SDCI.
NOTE 2 – SIGNIFICANT ACCOUNTING POLICIES
The accompanying financial statements were prepared in accordance with U. S. Generally Accepted Accounting Principles (“GAAP”), which require the use of estimates and assumptions made by management. These may affect the reported amounts of assets and liabilities and disclosure of contingent assets and liabilities at the date of the financial statements and the reported amounts of increases and decreases in net assets from operations during the reporting period. Actual results could differ from those estimates. The following is a summary of significant accounting policies consistently followed by the Funds in preparation of their financial statements.
Basis of Presentation
The financial statements have been prepared in conformity with GAAP as detailed in the Financial Accounting Standards Board’s (“FASB”) Accounting Standards Codification (“ASC”). The Funds are investment companies and follow the accounting and reporting guidance in FASB Topic 946.
| 28 | Annual Report June 30, 2020 |
Calculation of Net Asset Value
The Net Asset Value (“NAV”) of a Fund’s shares is calculated each day the national securities exchanges are open for trading. The NAV for BUY is calculated as of the close of regular trading on NYSE Arca, generally 4:00 p.m. New York time. For SDCI, the NAV is generally calculated at 2:30 p.m. Eastern Time. For each Fund, the time at which its NAV is calculated as described herein is it’s “NAV Calculation Time”. If regular trading on NYSE Arca closes earlier than 2:30 p.m. Eastern Time on a given day, the NAV of the SDCI’s shares will be calculated as of that earlier time. NAV per share is calculated by dividing the Fund’s net assets by the number of the Fund’s outstanding shares.
In calculating its NAV, a Fund generally values its assets on the basis of market quotations, last sale prices, or estimates of value furnished by a pricing service or brokers who make markets in such instruments. Debt obligations with maturities of 60 days or less are valued at amortized cost.
Fair value pricing is used by a Fund when reliable market valuations are not readily available or are not deemed to reflect current market values. Securities that may be valued using “fair value” pricing may include, but are not limited to, securities for which there are no current market quotations or whose issuer is in default or bankruptcy, securities subject to corporate actions (such as mergers or reorganizations), securities subject to non-U.S. Investment limits or currency controls, and securities affected by “significant events.” An example of a significant event is an event, occurring after the close of the market in which a security trades but before a Fund’s next NAV Calculation Time that may materially affect the value of the Fund’s investment (e.g., government action, natural disaster, or significant market fluctuation). When fair-value pricing is employed, the prices of securities used by a Fund to calculate its NAV may differ from quoted or published prices for the same securities.
The value of the SDCI’s assets that trade in markets outside the United States may fluctuate on days that foreign markets are open (which may include non-Business Days). As such, the value of the SDCI’s investments may change on days when you will not be able to purchase or redeem SDCI shares.
Security Valuation
i. Securities
Investments by any Fund in securities are carried at market value. All equity securities that are traded on a national securities exchange are valued at the last sale price at the time of the close of the New York Stock Exchange (“NYSE”). If on a particular day an exchange-listed security does not trade, then the mean between the closing bids and asked prices will be used. In the case of securities listed on more than one national securities exchange, the last quoted sale, up to the time of valuation, on the exchange on which the security is principally traded will be used. If there were no sales on that exchange, the last quoted sale on the other exchange will be used.
| 29 |
For securities held by any Fund that are traded on the NASDAQ, the NASDAQ Official Closing Price (e.g., the NASDAQ Closing Cross price, if available) is used. All non- NASDAQ equity securities that are not traded on a listed exchange are valued at the last sale price at the close of the NYSE. If a non-exchange listed security does not trade on a particular day, or if a last sales price or NASDAQ Official Closing Price is not available, then the mean between the closing bid and asked price will be used.
Securities having a remaining maturity of 60 days or less are valued at amortized cost, which approximates market value.
The cost of securities sold is determined on the identified cost basis. When market quotations are not readily available or when events occur that make established valuation methods unreliable, securities of the Funds may be valued at fair value determined in good faith by or under the direction of the Board of Trustees (the “Board”).
Security transactions are recorded on the dates the transactions are entered, which is the trade date.
ii. Treasuries
SDCI also may invest in U.S. government obligations. U.S. government obligations include U.S. Treasury obligations and securities issued or guaranteed by various agencies of the U.S. government, or by various instrumentalities which have been established or sponsored by the U.S. government. U.S. Treasury obligations are backed by the “full faith and credit” of the U.S. government. Securities issued or guaranteed by U.S. federal agencies and U.S. government sponsored instrumentalities may or may not be backed by the full faith and credit of the U.S. government.
iii. Fair Value Measurement
The Funds utilize various methods to measure the fair value of most of their investments on a recurring basis. GAAP establishes a hierarchy that prioritizes inputs to valuation methods. The three levels of inputs are:
Level 1 – Unadjusted quoted prices in active markets for identical assets or liabilities that the Funds have the ability to access.
Level 2 – Observable inputs other than quoted prices included in Level 1 that are observable for the asset or liability, either directly or indirectly. These inputs may include quoted prices for the identical instrument or an inactive market, prices for similar instruments, interest rates, prepayment speeds, credit risk, yield curves, default rates and similar data.
Level 3 – Unobservable inputs for the asset or liability, to the extent relevant observable inputs are not available; representing the Funds’ own assumptions about the assumptions a market participant would use in valuing the asset or liability, and would be based on the best information available.
| 30 | Annual Report June 30, 2020 |
The availability of observable inputs can vary from security to security and is affected by a wide variety of factors, including, for example, the type of security, whether the security is new and not yet established in the marketplace, the liquidity of markets, and other characteristics particular to the security. To the extent that valuation is based on models or inputs that are less observable or unobservable in the market, the determination of fair value requires more judgment. Accordingly, the degree of judgment exercised in determining fair value is greatest for instruments categorized in Level 3.
The inputs used to measure fair value may fall into different levels of the fair value hierarchy. In such cases for disclosure purposes, the level in the fair value hierarchy within which the fair value measurement falls in its entirety, is determined based on the lowest level input that is significant to the fair value measurement in its entirety.
The following tables summarize the valuation of securities at June 30, 2020 for the Funds, using the fair value hierarchy:
BUY
| Investments, at fair value | Total | Level 1 | Level 2 | Level 3 | ||||||||||||
| Common Stocks: | ||||||||||||||||
| Advertising | $ | 1,515 | $ | 1,515 | $ | — | $ | — | ||||||||
| Agriculture | 1,955 | 1,955 | — | — | ||||||||||||
| Airlines | 3,531 | 3,531 | — | — | ||||||||||||
| Apparel | 5,084 | 5,084 | — | — | ||||||||||||
| Auto Manufacturers | 5,072 | 5,072 | — | — | ||||||||||||
| Auto Parts & Equipment | 29,675 | 29,675 | — | — | ||||||||||||
| Banks | 98,251 | 98,251 | — | — | ||||||||||||
| Beverages | 1,409 | 1,409 | — | — | ||||||||||||
| Biotechnology | 7,539 | 7,539 | — | — | ||||||||||||
| Building Materials | 20,185 | 20,185 | — | — | ||||||||||||
| Chemicals | 13,432 | 13,432 | — | — | ||||||||||||
| Coal | 4,542 | 4,542 | — | — | ||||||||||||
| Commercial Services | 36,528 | 36,528 | — | — | ||||||||||||
| Computers | 7,399 | 7,399 | — | — | ||||||||||||
| Cosmetics & Personal Care | 3,459 | 3,459 | — | — | ||||||||||||
| Distribution & Wholesale | 6,734 | 6,734 | — | — | ||||||||||||
| Diversified Financial Services | 18,223 | 18,223 | — | — | ||||||||||||
| Electrical Components & Equipment | 2,899 | 2,899 | — | — | ||||||||||||
| Electronics | 37,920 | 37,920 | — | — | ||||||||||||
| Energy-Alternate Sources | 3,585 | 3,585 | — | — | ||||||||||||
| Engineering & Construction | 26,163 | 26,163 | — | — | ||||||||||||
| Food | 22,572 | 22,572 | — | — | ||||||||||||
| Forest Products & Paper | 9,969 | 9,969 | — | — | ||||||||||||
| Hand & Machine Tools | 2,433 | 2,433 | — | — | ||||||||||||
| Healthcare-Services | 8,336 | 8,336 | — | — | ||||||||||||
| Home Furnishings | 7,778 | 7,778 | — | — | ||||||||||||
| 31 |
| Investments, at fair value (continued) | Total | Level 1 | Level 2 | Level 3 | ||||||||||||
| Household Products & Wares | $ | 3,145 | $ | 3,145 | $ | — | $ | — | ||||||||
| Insurance | 25,566 | 25,566 | — | — | ||||||||||||
| Internet | 16,661 | 16,661 | — | — | ||||||||||||
| Iron & Steel | 8,676 | 8,676 | — | — | ||||||||||||
| Leisure Time | 9,357 | 9,357 | — | — | ||||||||||||
| Machinery-Construction & Mining | 7,886 | 7,886 | — | — | ||||||||||||
| Machinery-Diversified | 6,477 | 6,477 | — | — | ||||||||||||
| Media | 5,044 | 5,044 | — | — | ||||||||||||
| Metal Fabricate & Hardware | 16,617 | 16,617 | — | — | ||||||||||||
| Mining | 1,778 | 1,778 | — | — | ||||||||||||
| Miscellaneous Manufacturing | 14,982 | 14,982 | — | — | ||||||||||||
| Oil & Gas | 34,144 | 34,144 | — | — | ||||||||||||
| Oil & Gas Services | 9,810 | 9,810 | — | — | ||||||||||||
| Pharmaceuticals | 13,578 | 13,578 | — | — | ||||||||||||
| Real Estate | 3,794 | 3,794 | — | — | ||||||||||||
| Retail | 85,220 | 85,220 | — | — | ||||||||||||
| Savings & Loans | 11,478 | 11,478 | — | — | ||||||||||||
| Semiconductors | 38,229 | 38,229 | — | — | ||||||||||||
| Software | 6,973 | 6,973 | — | — | ||||||||||||
| Telecommunications | 3,551 | 3,551 | — | — | ||||||||||||
| Transportation | 36,121 | 36,121 | — | — | ||||||||||||
| Trucking & Leasing | 4,593 | 4,593 | — | — | ||||||||||||
| Total Investments, at fair value | $ | 749,868 | $ | 749,868 | $ | — | $ | — | ||||||||
SDCI
| Total | Level 1 | Level 2 | Level 3 | |||||||||||||
| Investments, at fair value | ||||||||||||||||
| Cash Equivalents: | ||||||||||||||||
| United States Treasury Obligations | $ | 149,803 | $ | 149,803 | $ | — | $ | — | ||||||||
| United States Money Market Funds | 2,086,823 | 2,086,823 | — | — | ||||||||||||
| Total Cash Equivalents, at fair value | $ | 2,236,626 | $ | 2,236,626 | $ | — | $ | — | ||||||||
| Exchange-Traded Futures Contracts: | ||||||||||||||||
| Foreign Contracts | $ | 15,671 | $ | 15,671 | $ | — | $ | — | ||||||||
| United States Contracts | 24,028 | 24,028 | — | — | ||||||||||||
| Total Exchange-Traded Futures Contracts | $ | 39,699 | $ | 39,699 | $ | — | $ | — | ||||||||
| Total Investments, at fair value | $ | 2,276,325 | $ | 2,276,325 | $ | — | $ | — | ||||||||
SDCI adopted the provisions of Accounting Standards Codification 815 – Derivatives and Hedging, which require presentation of qualitative disclosures about objectives and strategies for using derivatives, quantitative disclosures about fair value amounts and gains and losses on derivatives.
| 32 | Annual Report June 30, 2020 |
| Fair Value of Derivative Instruments | ||||||
| Derivatives not Accounted for as Hedging Instruments | Consolidated Statement of Assets and Liabilities | Fair Value at June 30, 2020 | ||||
| Open Commodity Futures Contracts | Assets | $ | 39,699 | |||
The Effect of Derivative Instruments on the Consolidated Statements of Operations
| Year Ended June 30, 2020 | ||||||||||
| Derivatives not Accounted for as Hedging Instruments | Location of Gain (Loss) on Derivatives Recognized in Income | Realized Gain (Loss) on Derivatives Recognized in Income | Change in Unrealized Gain (Loss) on Derivatives Recognized in Income | |||||||
| Open Commodity Futures Contracts | Net Realized Gain (Loss) on Commodity Futures Contracts | $ | (1,624,675 | ) | ||||||
| Net Change in Unrealized Appreciation (Depreciation) on Open Commodity Futures Contracts | $ | 60,033 | ||||||||
Income
Dividend income is recorded on the ex-dividend date, as soon as information is available to the Funds. Distributions to shareholders, which are determined in accordance with income tax regulations, are also recorded on the ex-dividend date. Interest income is recorded as earned. Discounts and premiums on securities purchased are amortized over the life of the respective securities.
As of and during the year ended June 30, 2020, the Funds did not have a liability for any unrecognized tax benefits in the accompanying financial statements. The Funds file income tax returns in the U.S. federal jurisdiction and Delaware.
The Funds follow ASC 740 “Income Taxes”, which requires that the financial statements effects of a tax position taken or expected to be taken in a tax return be recognized in the financial statements when it is more likely than not, based on the technical merits, that the position will be sustained upon examination. Management has concluded that the Funds have taken no uncertain tax positions that require adjustment to the financial statements.
Federal and Other Taxes
It is the Trust’s policy to comply with the federal income and excise tax requirements of the Internal Revenue Code of 1986, as amended, applicable to regulated investment companies. Accordingly, the Funds intend to distribute substantially all of their income and net realized gains on investments, if any, to shareholders each year. Therefore, no federal income tax provision is required in the Funds’ financial statements. Under the applicable foreign tax laws, a withholding tax may be imposed on interest, dividends and capital gains at various rates.
| 33 |
GAAP requires that certain components of net assets be adjusted to reflect permanent differences between financial and tax reporting. These reclassifications have no effect on net assets or NAV per share. The following permanent differences as of June 30, 2020, attributable to adjustments from the Subsidiary, were reclassified to the following accounts:
| BUY | SDCI | |||||||
| Capital Paid In | $ | (2,377,036 | ) | $ | (1,622,159 | ) | ||
| Undistributed (Distribution in Excess) Net Investment Income | 1,617 | (2,516 | ) | |||||
| Undistributed (Accumulated) Net Realized Gain (Loss) | 2,375,419 | 1,624,675 | ||||||
Management has reviewed the tax positions and has concluded that no liability for unrecognized tax benefits should be recorded related to uncertain tax positions taken on returns filed for open tax years or expected to be taken with the 2019 tax returns. Each Fund’s federal tax returns for the prior three fiscal years remain subject to examination by the Internal Revenue Service.
Dividends and Distributions
Each Fund intends to pay out dividends on a quarterly basis. Nonetheless, each Fund may not make a dividend payment every quarter. Each Fund intends to distribute its net realized capital gains, if any, to investors annually. Each Fund may occasionally be required to make supplemental distributions at some other time during the year. Distributions in cash may be reinvested automatically in additional whole shares only if the broker through whom you purchased shares makes such option available. Your broker is responsible for distributing the income and capital gain distributions to you.
For federal income tax purposes, distributions of investment income are generally taxable as ordinary income or qualified dividend income to the extent of a Fund’s current and accumulated earnings and profits. Taxes on distributions of capital gains (if any) are determined by how long a Fund owned the investments that generated them, rather than how long you have owned your Fund shares. Sales of assets held by a Fund for more than one year generally result in long-term capital gains and losses, and sales of assets held by such Fund for one year or less generally result in short-term capital gains and losses. Distributions of a Fund’s net capital gain (the excess of realized net long-term capital gains over realized net short-term capital losses) that are properly reported by such Fund as capital gain dividends (“Capital Gain Dividends”) will be taxable as long-term capital gains. For non-corporate shareholders, long-term capital gains are generally subject to tax at reduced maximum rates. Distributions of short-term capital gain will be taxable as ordinary income. Distributions of investment income properly reported by a Fund as “qualified dividend income” are generally taxed to non-corporate shareholders at the same rates applicable to long-term capital gains, provided holding periods and other requirements are met by the Fund and the shareholder. Distributions in excess of a Fund’s current and accumulated earnings and profits will first be treated as a non-taxable return of capital to the extent of a shareholder’s basis in the shares, and thereafter, as gain from the sale of shares. A shareholder’s basis in its shares will be reduced by the amount of any distribution treated as a non-taxable return of capital.
| 34 | Annual Report June 30, 2020 |
In general, distributions are subject to federal income tax for the year in which they are paid. Certain distributions paid in January, however, may be treated as paid on December 31 of the prior year. Distributions are generally taxable even if they are paid from income or gains earned by a Fund before your investment (and, thus, were included in the price you paid for your shares).
Distributions (other than Capital Gain Dividends and dividends properly reported by us as interest-related dividends or short-term capital gain dividends) paid to individual shareholders that are neither citizens nor residents of the U.S. or to foreign entities will generally be subject to a U.S. withholding tax at the rate of 30%, unless a lower treaty rate applies.
The Trust (or financial intermediaries, such as brokers, through which shareholders own Fund shares) generally is required to withhold and remit to the U.S. Treasury a percentage of the taxable distributions and sale or redemption proceeds paid to any shareholder who fails to properly furnish a correct taxpayer identification number, who has under-reported dividend or interest income, or who fails to certify that he, she or it is not subject to such withholding. In addition, even if shareholders have provided appropriate certifications to the intermediary through which they hold shares, such withholding may apply if the intermediary is a foreign intermediary unless such foreign intermediary either enters into an agreement with the Internal Revenue Service regarding reporting or is located in a jurisdiction that has entered into an Intergovernmental Agreement with the Internal Revenue Service and such foreign intermediary is in compliance with the terms of such intergovernmental agreement and any enabling legislation or administrative actions.
Indemnification
The Trust will indemnify its officers and trustees for certain liabilities that may arise from the performance of their duties to the Trust. Additionally, in the normal course of business, the Trust enters into contracts that contain a variety of representations and warranties and which provide general indemnities. The Funds’ maximum exposure under these arrangements is unknown, as this would involve future claims that may be made against the Funds that have not yet occurred. However, the Trust expects the risk of loss due to these warranties and indemnities to be remote.
| 35 |
NOTE 3 – RISKS
The Funds’ risks include, but are not limited, to the following:
i. Cayman Subsidiary
With respect to an investment in SDCI, there is additional risk related to the Subsidiary. The Subsidiary is an exempted company incorporated under the laws of the Cayman Islands and is a wholly-owned subsidiary of SDCI. The Subsidiary allows SDCI to gain exposure to certain types of commodity-linked derivative instruments and satisfy regulated investment company (“RIC”) tax requirements. SDCI is the sole shareholder of the Subsidiary and it is intended that SDCI will remain the sole shareholder and will continue to control the Subsidiary.
By investing in the Subsidiary, SDCI will be indirectly exposed to the risks associated with the Subsidiary’s investments. SDCI may invest up to 25% of its total assets in the Subsidiary. The accompanying Consolidated Schedule of Investments and Consolidated Financial Statements include the positions and accounts of the Subsidiary. All inter-fund balances and transactions, if any, have been eliminated in consolidation.
As of June 30, 2020, SDCI and the Subsidiary net assets were as follows:
| Total Net Assets | Subsidiary Net Assets | % of Fund Represented by Subsidiary’s Net Assets | ||||||||
| $ 2,634,314 | $ 541,180 | 21% | ||||||||
Market Risk. The trading prices of equity securities fluctuate, sometimes rapidly and unpredictably, in response to a variety of factors. These factors include events impacting the entire market or a specific market segment. The market value of portfolio holdings can be volatile and change quickly. Each Fund’s NAV and market price, like market prices generally, may fluctuate significantly. As a result, an investor could lose money over short or long periods of time, including the possible loss of the entire principal amount of an investment.
Liquidity Risk. The Funds may not always be able to liquidate its investments at the desired price or time (or at all) or at prices approximating those at which the Funds currently value them. It may be difficult for the Funds to value illiquid holdings accurately. Unexpected market illiquidity may cause major losses at any time or from time to time.
Premium or Discount to NAV Risk. As with all exchange-traded funds (“ETFs”), Fund shares may be bought and sold in the secondary market at market prices. Although it is expected that the market price of the shares of a Fund will approximate the Fund’s NAV, there may be times when the market price and the NAV vary significantly, particularly in times of market stress. Thus, an investor may pay significantly more (or less) than NAV when buying shares of a Fund in the secondary market, or receive significantly more (or less) than NAV when selling those shares in the secondary market. A premium or discount to NAV may be reflected in the spread between “bid” and “ask” prices that are quoted during the course of a trading day. If an investor purchases Fund shares at a time when the market price is at a premium to the NAV of the Fund’s shares, or sells at a time when the market price is at a discount to the NAV of the Fund’s shares, an investor may sustain losses.
| 36 | Annual Report June 30, 2020 |
Fluctuation of NAV Risk. The market prices of each Fund’s shares will generally fluctuate in accordance with changes in NAV as well as the relative supply of and demand for each Fund’s shares on NYSE Arca. The Adviser cannot predict whether each Fund’s shares will trade below, at, or above NAV.
Secondary Market Risk. Although each Fund’s shares are listed for trading on NYSE Arca and may be listed or traded on U.S. and non-U.S. stock exchanges other than NYSE Arca, there can be no assurance that an active trading market for such shares will develop or be maintained. Investors buying or selling Fund shares in the secondary market will pay brokerage commissions or other charges imposed by brokers and will incur the cost of the difference between “bid” and “ask” prices of the Fund’s shares.
New Fund Risk. As new funds, there can be no assurance that the Funds will grow to or maintain an economically viable size.
Correlation to Private Equity Returns Risk. The return of BUY or the Fund’s corresponding Index may not match or achieve a high degree of correlation with the return of investments in private equity funds or direct investments in private equity due to assumptions in SHIM’s proprietary methodology that prove to be incorrect or asymmetries between investments in public equity versus private equity, such as the limited liquidity (or illiquidity), infrequency of valuations, and estimated valuations associated with private equity investments.
Private Equity Investing Risk. BUY seeks to generate returns that mimic the returns of U.S. private equity funds, as measured by SHPEI. Because investing in private equity often carries a high degree of risk, the returns of private equity funds may be subject to greater volatility than the returns of funds that invest in larger, more established public companies. Similarly, BUY’s returns may experience greater volatility than funds that invest in larger, more established public companies. BUY does not invest in private equity funds nor does it invest directly in private equity of companies.
Derivatives Risk. The value of a derivative instrument, such as SDCI’s investments in Commodity Interests (as defined below), depends largely on (and is derived from) an underlying asset (or a reference rate or index). Derivative instruments such as cash-settled options, forward contracts, options on futures contracts, cleared swap contracts, swap contracts other than cleared swap contracts, and other options and swaps, collectively with the Component Futures Contracts, are called the “Commodity Interests”. Derivatives create leverage risk because they do not require payment up front equal to the economic exposure created by owning the derivative. As a result, an adverse change in the value of the underlying asset of a derivative could result in SDCI sustaining a loss that is substantially greater than the amount invested in the derivative, which may make SDCI’s returns more volatile and increase the risk of loss. SDCI may not be able to close out a derivative transaction at a favorable time or price. Derivatives may also be harder to value, less tax efficient, and subject to changing government regulation that could impact SDCI’s ability to use certain derivatives or their cost. Also, derivatives used to gain or limit exposure to a particular market segment may not provide the expected benefits, particularly during adverse market conditions. These risks are greater for SDCI than most other ETFs because SDCI will implement its investment strategy primarily through investments in Commodity Interests, which are derivative instruments.
| 37 |
Commodities Risk. Exposure to the commodities markets through investments in Commodity Interests may subject SDCI to greater volatility than investments in traditional securities. The risks and hazards that are inherent in commodity production may cause the price of commodities to fluctuate widely. Significant changes in the value of commodities may lead to volatility in SDCI’s NAV and market price.
Commodities Tax Risk. SDCI intends to qualify as a RIC under subchapter M of the Internal Revenue Code (the “Code”). If it qualifies as a RIC and satisfies certain minimum distribution requirements, SDCI will not be subject to fund-level U.S. federal income tax on income and gains that it timely distributes to shareholders. To qualify as a RIC, SDCI must satisfy certain source-of-income requirements. As discussed above, SDCI intends to gain exposure to the commodities market primarily through its investment in the Subsidiary. SDCI believes based on current law that its taxable income from the Subsidiary will be qualifying income for purposes of the RIC source-of-income requirements. If the income of SDCI from the Subsidiary is treated as non-qualifying income, SDCI might fail to qualify as a RIC and be subject to federal income tax at the fund level. Such adverse effects could also, among other consequences, limit SDCI’s ability to pursue its investment strategy. SDCI seeks to manage its investments in the Subsidiary and in Commodity Interests as necessary to maintain its qualifications as a RIC.
Cash Transaction Risk. Creation and redemption transactions are expected to generally settle through payments of cash and/or fixed income securities, which will cause SDCI to incur certain costs, such as brokerage costs, that it would not incur if it made in-kind redemptions.
COVID-19 Risk. A novel strain of coronavirus (COVID-19) outbreak was declared a pandemic by the World Health Organization on March 11, 2020. The situation is evolving with various cities and countries around the world responding in different ways to address the outbreak. There are direct and indirect economic effects developing for various industries and individual companies throughout the world. Management will continue to monitor the impact COVID-19 has on the Funds and reflect the consequences as appropriate in the Funds’ accounting and financial reporting. The recent pandemic spread of the novel coronavirus and related geopolitical events could lead to increased market volatility, disruption to U.S. and world economies and markets and may have significant adverse effects on the Funds and their investments.
| 38 | Annual Report June 30, 2020 |
NOTE 4 – INVESTMENT ADVISORY AND OTHER AGREEMENTS
Investment Adviser
The Adviser serves as the investment adviser to each Fund pursuant to an investment advisory agreement between the Trust and the Adviser. For SDCI, the Adviser also serves as investment adviser to the Subsidiary pursuant to a separate investment advisory agreement. The Board approved and renewed these advisory agreements most recently at a meeting held on August 7, 2019. The Sub-Adviser serves as the sub-adviser to BUY, and to the Subsidiary, pursuant to a sub-advisory agreement. The Board approved and renewed these sub-advisory agreements at a meeting held on May 7, 2020.
Management Fees
Each Fund pays the Adviser a unitary management fee as compensation for its services and its assumption of Fund expenses. The Adviser is responsible for all expenses of the Funds except expenses for taxes and governmental fees; brokerage fees; commissions and other transaction expenses; costs of borrowing money, including interest expenses; securities lending expenses; extraordinary expenses (such as litigation and indemnification expenses); and fees and expenses of any independent legal counsel. The Adviser may voluntarily waive any portion of its management fee from time to time, and may discontinue or modify any such voluntary limitations in the future at its discretion. The following table lists the total management fee paid by each Fund.
| Fund | Management Fee | |||
| BUY | 0.95 | % | ||
| SDCI | 0.80 | % | ||
At a meeting of the Board on August 7, 2019, the Board approved an agreement between the Adviser and the Trust pursuant to which the Adviser waives 0.15% and 0.20% of the management fees payable by BUY and SDCI, respectively. The agreement became effective on August 15, 2019. The agreement will remain in effect through October 31, 2020, and may be renewed by the Adviser in its sole discretion thereafter. The agreement may be amended or terminated only by the agreement of the Board and the Adviser, and will terminate automatically with respect to any Fund in the event of the termination of the Investment Advisory Agreement between the Adviser and such Fund. Amounts waived are not subject to recoupment by the Adviser.
The Sub-Adviser receives a management fee equal to a percentage of the Fund’s average daily net assets for the services it provides to each Fund. The Sub-Adviser’s fees are calculated daily and paid monthly by the Adviser out of its management fees. The following table lists the sub-advisory fees paid to the Sub-Adviser.
| 39 |
| Fund | Sub-Advisor Fee | |||
| BUY | 0.06 | % | ||
| SDCI | 0.06 | % | ||
The Adviser and the Sub-Adviser (subject to the Adviser’s oversight) supervise and manage the investment portfolio of each Fund and direct the purchase and sale of each Fund’s investments.
Administrator, Custodian and Transfer Agent
The Bank of New York Mellon (“BNY Mellon”) serves as the administrator, custodian and transfer agent for the Funds. Under the Administrative Agency Agreement with the Trust, BNY Mellon performs certain administrative, accounting, transfer agency and dividend disbursing services for the Funds and prepares certain reports filed with the U.S. Securities and Exchange Commission (“SEC”) on behalf of the Trust and the Funds. Under the Custodian Agreement with the Trust, BNY Mellon maintains in separate accounts: cash, securities and other assets of the Funds; keeps all necessary accounts and records, and provides other services. BNY Mellon is required, upon the order of the Trust, to deliver securities held by BNY Mellon and to make payments for securities purchased by the Trust for the Funds.
Brown Brothers Harriman and Co. (“BBH&Co.”) served as Administrator, Custodian, Transfer Agent and Fund Accounting Agent until it was replaced by BNY Mellon on April 1, 2020.
Buying and Selling Fund Shares
The Funds are ETFs. This means that shares of the Funds may only be purchased and sold on a national securities exchange, such as NYSE Arca, through a broker-dealer. The price of the Fund’s shares is based on market price. Because Fund shares trade at market prices rather than NAV, shares may trade at a price greater than NAV (premium) or less than NAV (discount).
Each Fund issues and redeems shares at NAV only in large blocks of shares (“Creation Baskets” and “Redemption Baskets,” respectively), which only certain institutions or large investors (typically, market makers or other broker-dealers) that have entered into an agreement with ALPS Distributors, Inc. (the “Distributor”) may purchase or redeem. Such institutions and large investors are referred to herein as “Authorized Participants” or “APs.” Currently, Creation Baskets and Redemption Baskets generally consist of 50,000 shares, though this may change from time to time. Authorized Participants are required to pay a transaction fee of $350 to compensate the Fund for brokerage and transaction expenses when purchasing Creation Baskets or redeeming Redemption Baskets.
| 40 | Annual Report June 30, 2020 |
SDCI generally issues and redeems Creation Baskets and Redemption Baskets in exchange for a designated amount of cash. BUY generally issues and redeems Creation Baskets and Redemption Baskets in exchange for a portfolio of securities closely approximating the holdings of the BUY and/or a designated amount of cash. For BUY, to the extent that an Authorized Participant purchases a Creation Basket with cash or redeems a Redemption Basket for cash, the Authorized Participant will be subject to an additional charge no greater than 5.0%.
Distributor
The Distributor serves as the distributor of Creation Baskets and Redemption Baskets for the Funds on an agency basis. The Distributor does not maintain a secondary market in shares.
The Distributor is the distributor of the Trust. The Distributor has entered into a Distribution Agreement with the Trust pursuant to which it distributes shares of the Funds in Creation Basket aggregations. The Distributor is a broker-dealer registered under the Securities Exchange Act of 1934, as amended, and a member of the Financial Industry Regulatory Authority. Fees under the Distribution Agreement are paid by the Adviser. The Adviser may, from time to time and from its own resources, make other distribution-related payments to the Distributor or other persons.
Licensing Agreements
SHIM, an affiliate of the Sub-Adviser for BUY and the Subsidiary, owns and maintains the SHPEI and SDCITR (collectively, the “Indexes”). The Adviser and SHIM have entered into one or more licensing agreements (the “Licensing Agreements”) for the Trust’s use of the Indexes, for which the Adviser pays SHIM licensing fees. The licensing fees are separate from the fees paid to the Sub-Adviser for sub-advisory services provided to BUY and the Subsidiary.
Investors cannot be assured of the continuation of the Licensing Agreements between SHIM and the Adviser for use of the Indexes. Should the Licensing Agreements between SHIM and the Adviser be terminated, the Adviser and the Board will consider available alternatives, including finding replacement indexes or liquidating the Funds. Termination of the Licensing Agreements may have an adverse effect on the performance and NAV of the Funds’ shares.
| 41 |
NOTE 5 – INVESTMENT TRANSACTIONS – PURCHASES AND SALES
During the year ended June 30, 2020, the aggregate cost of purchases and proceeds from sales of investments (excluding short-term investments and in-kind transactions) were as follows:
| Fund | Purchases | Sales | In-Kind Creations | In-Kind Redemptions | ||||||||||||
| BUY | $ | 25,058,622 | $ | 493,264 | $ | — | $ | 22,140,230 | ||||||||
| SDCI | 187,742 | 187,742 | — | — | ||||||||||||
NOTE 6 – DISTRIBUTIONS AND TAXES
It is the policy of the Funds to qualify as regulated investment companies by complying with the requirements of the Internal Revenue Code of 1986, as amended, applicable to regulated investment companies and by distributing substantially all of their earnings to shareholders. Therefore, no federal income tax provision is required.
Income distributions and capital gain distributions are determined in accordance with tax regulations, which may differ from GAAP.
NOTE 7 – BENEFICIAL OWNERSHIP
Certain owners of the Adviser are also owners and/or trustees of the Funds. These individuals may receive benefits from any management fees paid to the Adviser.
NOTE 8 – DIVIDEND AND TAX COMPONENTS OF CAPITAL
The tax character of distributions paid during the fiscal year ended June 30, 2020, were from Ordinary Income and Capital Gains in the amounts as follows:
| Fund | Ordinary Income | Capital Gains | ||||||
| BUY | $ | 224,636 | $ | — | ||||
| SDCI | 31,428 | — | ||||||
As of June 30, 2020, the components of accumulated earnings on a tax basis were as follows:
| BUY | SDCI | |||||||
| Undistributed Ordinary Income – Net | $ | — | $ | — | ||||
| Capital Loss Carryforwards | (225,230 | ) | — | |||||
| Other Book/Tax Temporary Differences | — | — | ||||||
| Unrealized Appreciation (Depreciation) | (433,631 | ) | 10,836 | |||||
| Total Accumulated Earnings/(Losses) – Net | $ | (658,861 | ) | $ | 10,836 | |||
| 42 | Annual Report June 30, 2020 |
NOTE 9 – CAPITAL LOSS CARRY FORWARD
As of June 30, 2020, the Funds listed below had net capital loss carryforwards for Federal income tax purposes which are available for offset against future taxable net capital gains. Accordingly, no capital gain distributions are expected to be paid to shareholders of these Funds until future net capital gains have been realized in excess of the available capital loss carryforwards. These loss carryforward amounts are as follows:
| Utilized in Current Year | Short-Term With No Expiration | Long-Term With No Expiration | ||||||||||
| BUY | $ | — | $ | 107,993 | $ | 117,237 | ||||||
| SDCI | — | — | — | |||||||||
NOTE 10 – TAX COST OF INVESTMENTS
As of June 30, 2020, the aggregate cost of investments for federal income tax purposes, the net unrealized appreciation or depreciation and the aggregated gross unrealized appreciation (depreciation) on investments were as follows:
| Fund | Aggregate Tax Cost | Net Unrealized Appreciation (Depreciation) | Aggregate Gross Unrealized Appreciation | Aggregate Gross Unrealized (Depreciation) | ||||||||||||
| BUY | $ | 1,183,499 | $ | (433,631 | ) | $ | 31,868 | $ | (465,499 | ) | ||||||
| SDCI | 2,236,626 | — | — | — | ||||||||||||
NOTE 11 – TRUSTEES FEES
The Trust compensates each Trustee who is not an “interested person” of the Trust as defined in the 1940 Act. The Adviser, as a result of each Fund’s unitary management fee, pays for such compensation. The Trustees who are “interested persons” of the Trust do not receive any Trustees’ fees.
NOTE 12 – NEW ACCOUNTING PRONOUNCEMENT
In August 2018, the FASB issued Accounting Standards Update (“ASU”) No. 2018-13, which changes certain fair value measurement disclosure requirements. The new ASU, in addition to other modifications and additions, removes the requirement to disclose the amount and reasons for transfers between Level 1 and Level 2 of the fair value hierarchy, and the Trust’s policy for the timing of transfers between levels. The amendments are effective for financial statements issued for fiscal years beginning after December 15, 2019, and interim periods within those fiscal years. Management has evaluated the implications of certain provisions of the ASU and has determined that there will be no material impacts to the financial statements.
| 43 |
NOTE 13 – SUBSEQUENT EVENTS
The Funds have evaluated the need for disclosure and/or adjustments resulting from subsequent events through the date the financial statements were issued. Based on this evaluation, no adjustments were required to the financial statements.
| 44 | Annual Report June 30, 2020 |
REPORT OF INDEPENDENT REGISTERED PUBLIC ACCOUNTING FIRM
To the Shareholders and
Board of Trustees of
USCF ETF Trust
Opinion on the Financial Statements
We have audited the accompanying statement of assets and liabilities of the USCF SummerHaven SHPEI Index Fund (“BUY”) and the consolidated statement of assets and liabilities of the SummerHaven Dynamic Commodity Strategy No K-1 Fund and Subsidiary (“SDCI”) (each a series of the USCF ETF Trust, the “Trust”, and collectively, the “Funds”), including the condensed schedule of investments (BUY) and consolidated schedule of investments (SDCI) as of June 30, 2020, and the related statements of operations for the year ended June 30, 2020, changes in net assets for the years ended June 30, 2020 and 2019, and financial highlights for the years ended June 30, 2020 and 2019 and the period from inception (November 30, 2017) through June 30, 2018 (BUY), and the related consolidated statements of operations for the year ended June 30, 2020, changes in net assets for the years ended June 30, 2020 and 2019, and financial highlights for the years ended June 30, 2020 and 2019 and the period from inception (May 2, 2018) through June 30, 2018 (SDCI), and the related notes and schedules (collectively referred to as the financial statements).
In our opinion, the financial statements and financial highlights referred to above present fairly, in all material respects, the financial position of the Funds as of June 30, 2020, and the results of their operations for the year ended June 30, 2020, changes in net assets for the years ended June 30, 2020 and 2019, and financial highlights for the years ended June 30, 2020 and 2019 and the period from inception (November 30, 2017) through June 30, 2018 (BUY) and for the years ended June 30, 2020 and 2019 and the period from inception (May 2, 2018) through June 30, 2018 (SDCI), in conformity with accounting principles generally accepted in the United States of America.
Basis for Opinion
These financial statements and financial highlights are the responsibility of the Trust’s management. Our responsibility is to express an opinion on the Trust’s financial statements and financial highlights based on our audits. We are a public accounting firm registered with the Public Company Accounting Oversight Board (United States) (PCAOB) and are required to be independent with respect to the Trust in accordance with the U.S. federal securities laws and the applicable rules and regulations of the Securities and Exchange Commission and the PCAOB.
| 45 |
We conducted our audits in accordance with the standards of the PCAOB. Those standards require that we plan and perform the audits to obtain reasonable assurance about whether the financial statements are free of material misstatement, whether due to error or fraud. The Trust is not required to have, nor were we engaged to perform, an audit of its internal control over financial reporting. As part of our audits, we are required to obtain an understanding of internal control over financial reporting, but not for the purpose of expressing an opinion on the effectiveness of the Trust’s internal control over financial reporting. Accordingly, we express no such opinion.
Our audits included performing procedures to assess the risks of material misstatement of the financial statements and financial highlights, whether due to error or fraud, and performing procedures that respond to those risks. Such procedures included examining, on a test basis, evidence regarding the amounts and disclosures in the financial statements and financial highlights. Our procedures included confirmation of securities owned as of June 30, 2020, by correspondence with the custodian. Our audits also included evaluating the accounting principles used and significant estimates made by management, as well as evaluating the overall presentation of the financial statements and financial highlights. We believe that our audits provide a reasonable basis for our opinion.
/s/ Spicer Jeffries LLP
We have served as the Trust’s auditor since 2014.
Denver, Colorado
August 26, 2020
| 46 | Annual Report June 30, 2020 |
APPROVAL OF INVESTMENT SUB-ADVISORY AGREEMENTS
Board Evaluation and Approval of Interim and New Sub-Advisory Agreements with SummerHaven Investment Management LLC
At a special meeting of the Board of Trustees (the “Board”) of USCF ETF Trust (the “Trust”) held on January 10, 2020 (the “Special Meeting”), the Board, including the Trustees who are not “interested persons” (as defined in the Investment Company Act of 1940, as amended (the “1940 Act”)) (the “Independent Trustees”), unanimously approved (i) an interim Sub-Advisory Agreement by and between USCF Advisers LLC (the “Adviser”) and SummerHaven Investment Management LLC (“SummerHaven”) on behalf of the USCF SummerHaven SHPEI Index Fund (“BUY” or the “Fund”) and (ii) an interim Sub-Advisory Agreement by and between the Adviser and SummerHaven on behalf of the wholly-owned subsidiary (the “Subsidiary”) of the USCF SummerHaven Dynamic Commodity Strategy No K-1 Fund (“SDCI”) (each, an “Interim Sub-Advisory Agreement” and collectively, the “Interim Sub-Advisory Agreements”), with each Interim Sub-Advisory Agreement to remain in effect until May 29, 2020 or the date on which a new sub-advisory agreement is entered into between the relevant parties, whichever occurred first.
With the exception of the effective and termination dates, the terms and conditions, including fee rates, of each Interim Sub-Advisory Agreement is identical to those of its predecessor sub-advisory agreement, which had been entered into at the inception of the Fund and the Subsidiary, as applicable. The Interim Sub-Advisory Agreements were necessary because, on December, 31, 2019, one of the owners of SummerHaven left the company to pursue other business activities and surrendered his interest in SummerHaven to the other owners. This resulted in a technical change in control as defined under the 1940 Act and an automatic termination of each of the sub-advisory agreements then in place.
The Board discussed its ability to rely on Rule 15a-4(b)(1) under the 1940 Act to allow the Board to approve an interim agreement having a duration of up to 150 days from the date of termination of the original agreement. The Board reviewed the information provided by SummerHaven prior to the Special Meeting. The Board considered the recommendation of the Adviser that the Interim Sub-Advisory Agreements be approved to allow for SummerHaven to provide uninterrupted services to BUY and the Subsidiary. The Board also considered the Adviser’s belief that the departure of the former partial owner of SummerHaven would not result in a change in the nature, extent or quality of services provided to BUY and the Subsidiary by SummerHaven. Having requested and received such information from the Adviser and SummerHaven as the Board believed to be reasonably necessary to evaluate the terms of the Interim Sub-Advisory Agreements, the Board, including the Independent Trustees, approved the Interim Sub-Advisory Agreements.
| 47 |
At a meeting of the Board of the Trust held on May 7, 2020 (the “Meeting”), the Board, including the Independent Trustees, unanimously approved (i) a new Sub-Advisory Agreement by and between the Adviser and SummerHaven on behalf of BUY and (ii) a new Sub-Advisory Agreement by and between the Adviser and SummerHaven on behalf of the Subsidiary (each, a “Sub-Advisory Agreement” and collectively, the “Sub-Advisory Agreements”), with each Sub-Advisory Agreement to remain in effect for an initial period of two years. With the exception of the effective dates, the terms and conditions, including fee rates, of the Sub-Advisory Agreements are identical to those of the prior investment sub-advisory agreements, which terminated effective December 31, 2019 and those of the Interim Sub-Advisory Agreements. The following summary details the factors considered by the Board and the conclusions that formed the basis for the Board’s approval of the Sub-Advisory Agreements.
In approving the Sub-Advisory Agreements, the Board considered the overall fairness of the Sub-Advisory Agreements and whether each Sub-Advisory Agreement was in the best interest of the Fund and or Subsidiary, as applicable. The Board noted that it had received and reviewed, including at its May 7, 2020 meeting, materials from SummerHaven, including comparative performance information, the performance of each of BUY and SDCI since its inception and certain financial information. The Board also noted that it received assurances from the Adviser and SummerHaven that the change in ownership at SummerHaven had not resulted in a change in the nature or quality of the services provided to the Fund or the Subsidiary. Additionally, the Board noted that it had previously received and reviewed, including at its prior meetings, substantial information regarding SummerHaven and the services to be provided to the Funds in connection with the Board’s approval of the prior sub-advisory agreements. In this regard, the Trustees reviewed a detailed due diligence response/questionnaire from SummerHaven, as well as information concerning SummerHaven and its organization, comparative performance and fees, compliance program and financial condition. The Board also noted that the Independent Trustees had met in executive session prior to the commencement of the Board meeting to discuss, among other items, the reengagement of SummerHaven as a sub-adviser to the Fund and the Subsidiary. The Board concluded that it had received adequate information to make a reasonable determination with respect to the approval of the Sub-Advisory Agreements.
The Board’s conclusions are based on the comprehensive consideration of all information presented to it and did not identify any single factor as all-important or controlling.
Nature, Extent and Quality of Services
The Board examined the nature, extent, and quality of the services provided and to be provided by the SummerHaven under the Sub-Advisory Agreements. The Board considered the written information provided to the Board prior to and during the Meeting, including information provided by the Adviser and SummerHaven in response to the Board’s requests for information. The Board considered the Sub-Adviser’s operations and the services provided to Fund and the Subsidiary, including trading, administrative, compliance, and marking support services. The Board considered the Sub-Adviser’s experience advising other accounts; the experience and capability of the Sub-Adviser’s senior management and other key personnel; the Sub-Adviser’s overall financial strength; and the quality of the Sub-Adviser’s compliance program. The Board considered that the Sub-Adviser was registered with the SEC as an investment adviser and that the Sub-Adviser had substantial experience as a Commodity Pool Operator. The Board concluded that the nature, extent, and quality of the services to be provided by the Sub-Adviser under the Sub-Advisory Agreements would benefit the Fund and the Subsidiary and the shareholders of each of BUY and SDCI.
| 48 | Annual Report June 30, 2020 |
Investment Performance
With respect to performance, the Board considered the performance of each of BUY and SDCI, as well as the manner in which SummerHaven managed the commodity positions of the Subsidiary. The Board considered the performance of the other accounts managed by SummerHaven with similar investment strategies. With respect to BUY, the Board concluded that the Fund was performing as expected in connection with its benchmark index. With respect to the SDCI Subsidiary, the Board concluded that the SDCI Subsidiary was performing as expected within the fund structure of SDCI and as compared to SDCI’s benchmark index.
Fees and Expenses
The Board reviewed the fees to be paid to SummerHaven for its services under the Sub-Advisory Agreements. The Board took into account that neither the Funds nor the SDCI Subsidiary would pay any fees to the Sub-Adviser directly, and that the fees paid to SummerHaven would be paid from the unitary management fees paid to the Adviser. The Board also noted that the Adviser also paid a SummerHaven affiliate a fee for licensing and services related to each index used as a benchmark by SDCI and BUY. The Board concluded that the sub-advisory fees were acceptable in light of the quality of the services that the Fund and the Subsidiary had received and expect to receive from the Sub-Adviser.
Economies of Scale
The Board considered whether SummerHaven would realize economies of scale with respect to the services provided to BUY or the SDCI Subsidiary. It was the consensus of the Board that based on the size of the Funds, economies of scale was not a relevant consideration at this time.
Profitability
The Board considered the anticipated profits realized, and that may be realized, by SummerHaven under the Sub-Advisory Agreements, and whether the amount of profit is a fair entrepreneurial profit for the services provided under the Sub-Advisory Agreements. When evaluating SummerHaven’s estimated profitability, the Board noted that the Sub-Advisory Agreements were negotiated at arms-length by the Adviser. The Board concluded that the SummerHaven expected level of profitability from its relationship with the Trust was not excessive.
| 49 |
Collateral Benefits
The Board considered whether SummerHaven or its affiliates may receive other benefits as a result of the Sub-Adviser’s relationship with the Trust. The Board acknowledged that an affiliate of SummerHaven receives fees under a licensing agreement with the Adviser, and that the Adviser relies on that agreement to use names and marks in connection with BUY and SDCI. Despite this collateral benefit for SummerHaven and its affiliates arising from the Sub-Adviser’s relationship with the Trust, the Board concluded that the fees to be paid to SummerHaven were reasonable in relation to the nature, extent, and quality of services to be provided.
Conclusion
Having requested and received such information from the Adviser and SummerHaven as the Board believed to be reasonably necessary to evaluate the terms of the Sub-Advisory Agreements, the Board, including the Independent Trustees, concluded that the fees to be paid to the SummerHaven were reasonable and, in light of the matters that the Trustees considered to be relevant in the exercise of their reasonable judgment, approved the Sub-Advisory Agreements.
| 50 | Annual Report June 30, 2020 |
ADDITIONAL INFORMATION (unaudited)
Members of the Board and Officers of the Trust
Set forth below are the names, ages, positions with the Trust, terms of office, and the principal occupations and other directorships for a minimum of the last five years, of each of the persons currently serving as members of the Board and as Executive Officers of the Trust. Also included below is the term of office for each of the Executive Officers of the Trust. The members of the Board serve as Trustees for the life of the Trust or until retirement, removal, or their office is terminated pursuant to the Trust’s Declaration of Trust and Trust Agreement.
The Chairman of the Board, Nicholas D. Gerber, and Management Trustees, Andrew F Ngim and Stuart P. Crumbaugh are interested persons of the Trust as that term is defined under Section 2(a)(19) of the 1940 Act (“Interested Trustees”) because of their affiliation with the Adviser.
Messrs. Thomas E. Gard, Jeremy Henderson, John D. Schwartz, and H. Abram Wilson, and their immediate family members have no affiliation or business connection with the Adviser or the Funds’ principal underwriter or any of their affiliated persons and do not own any stock or other securities issued by the Adviser or the Funds’ principal underwriter. These Trustees are not Interested Persons of the Trust and are referred to herein as “Independent Trustees.”
The following tables present information about the Trustees and Officers. The Statement of Additional Information has additional information about the Trustees and is available without charge, upon request, by contacting the Funds at 1(800) 920-0259, or visiting: www.uscfinvestments.com.
| 51 |
Independent Trustees
| Name and Age(1) | Position(s) Held with Trust | Term of Office and Length of Time Served(2) | Principal Occupation(s) During Past 5 Years | Number of Portfolios in Fund Complex Overseen by Trustee | Other Directorships Held by Trustee (Past 5 Years) | |||||
| Thomas E. Gard Year of Birth: 1959 | Independent Trustee | Since 2015 | Partner of Armanino LLP from 1995 to 2019; Member of Armanino Executive Committee from 2001 to 2015; and Partner in Charge of Armanino LLP Audit Department December from 2004 to 2013. Mr. Gard has been retired from 2019 to Present. | Two | None | |||||
| Jeremy Henderson Year of Birth: 1956 | Independent Trustee | Since 2014 | Chief Operating Officer, North Island LLC from 2017 to present; Retired from 2007 to 2017; Managing Director of Societe Generale from 1991 to 2007. | Two | None | |||||
| John D. Schwartz Year of Birth: 1968 | Independent Trustee | Since 2014 | President of Sam CLAR Office Furniture from 1996 to Present. | Two | None | |||||
| H. Abram Wilson Year of Birth: 1946 | Independent Trustee | Since 2014 | San Ramon City, CA Councilmember from 1999 to 2011, including Mayor of San Ramon City, CA from 2002 to 2009. Mr. Wilson has been retired from 2011 to Present. | Two | None |
| 52 | Annual Report June 30, 2020 |
Interested Trustees and Officers of the Trust
| Name and Age(1) | Position(s) Held with Trust | Term of Office and Length of Time Served(2) | Principal Occupation(s) During Past 5 Years | Number of Portfolios in Fund Complex Overseen by Trustee | Other Directorships Held by Trustee (Past 5 Years) | |||||
| Nicholas D. Gerber(3) Year of Birth: 1962 | Chairman and Trustee | Since 2014 | Management Director of United States Commodity Funds LLC, which is the sponsor of a family of commodity pools whose shares are registered under the Securities Act of 1933 (“USCF”) since 2005; Chairman of the Board of Directors of USCF from 2005 to 2019; President and Chief Executive Officer of USCF from 2005 to June 2015; Serves on Board of Managers of USCF Advisers LLC (“USCF Advisers”) since June 2014 and President and Chief Executive Officer of USCF Advisers from June 2014 to June 2015; Vice President of USCF since June 2015; Chief Executive Officer, President and Secretary of Concierge Technologies, Inc. (“Concierge”) since January 2015; Co-founded Ameristock Corporation in March 1995, a registered investment adviser under the Investment Advisers Act of 1940 from March 1995 until January 2013; and Portfolio Manager of the Ameristock Mutual Fund, Inc. a mutual fund registered under the 1940 Act, from August 1995 to January 2013. | Two | Management Director of USCF. Chairman of the Board of Concierge since January 26, 2015. |
| 53 |
| Name and Age(1) | Position(s) Held with Trust | Term of Office and Length of Time Served(2) | Principal Occupation(s) During Past 5 Years | Number of Portfolios in Fund Complex Overseen by Trustee | Other Directorships Held by Trustee (Past 5 Years) | |||||
| John P. Love Year of Birth: 1971 | President (Principal Executive Officer) | Since 2015 | Chief Executive Officer and President of USCF since June 2015; Management Director of USCF since October 2016 and Chairman of the Board of Directors of USCF since 2019; Senior Portfolio Manager of USCF from March 2010 to June 2015; Portfolio Manager of USCF from April 2006 to March 2010; President of USCF Advisers since June 2015 and serves on Board of Managers of USCF Advisers since November 2016. | N/A | N/A | |||||
| Stuart P. Crumbaugh(3) Year of Birth: 1963 | Chief Financial Officer (Principal Accounting and Principal Financial Officer), Treasurer and Trustee | CFO and Treasurer since May 2015; Secretary from May 2015 to October 2016; Independent Trustee of USCF ETF Trust from inception to February 2015 and Interested Trustee since February 2015 | Chief Financial Officer of Concierge since December 2017. Chief Financial Officer (Principal Accounting Officer), Treasurer and Secretary of USCF Advisers and USCF since June 2015 and May 2015, respectively; Vice President Finance and Chief Financial Officer of Sikka Software Corporation from April 2014 to April 2015; Vice President, Corporate Controller and Treasurer of Auction.com, LLC from December 2012 to December 2013; Chief Financial Officer of IP Infusion Inc. from March 2011 to September 2012; Consultant from January 2010 to February 2011. | Two | N/A |
| 54 | Annual Report June 30, 2020 |
| Name and Age(1) | Position(s) Held with Trust | Term of Office and Length of Time Served(2) | Principal Occupation(s) During Past 5 Years | Number of Portfolios in Fund Complex Overseen by Trustee | Other Directorships Held by Trustee (Past 5 Years) | |||||
| Andrew F Ngim(3) Year of Birth: 1960 | Trustee, Vice President, Secretary, and Portfolio Manager | Trustee from 2014 to February 2015 and May 2015 to Present; Secretary since October 2016 | Co-founded USCF in 2005 and has served as a Management Director since May 2005 and Chief Operating Officer since August 2016; Portfolio Manager for the United States Commodity Index Funds Trust since January 2013; Treasurer of USCF from June 2005 to February 2012; Assistant Secretary and Assistant Treasurer of USCF Advisers since June 2013; Prior to and concurrent with his services to USCF, from January 1999 to January 2013, Mr. Ngim served as Managing Director for Ameristock Corporation which he co-founded in March 1995 and was Co-Portfolio manager of Ameristock Mutual Fund, Inc. from January 2000 to January 2013; Portfolio Manager for USCF ETF Trust since 2014. | Two | Management Director of USCF since May 2005. | |||||
| 55 |
| Name and Age(1) | Position(s) Held with Trust | Term of Office and Length of Time Served(2) | Principal Occupation(s) During Past 5 Years | Number of Portfolios in Fund Complex Overseen by Trustee | Other Directorships Held by Trustee (Past 5 Years) | |||||
| Carolyn M. Yu Year of Birth: 1958 | Chief Compliance Officer and AML Officer | Chief Legal Officer from May 2015 to April 2018; Chief Compliance Officer, since February 2015; AML Officer since 2014 | Chief Compliance Officer of USCF since February 2013; General Counsel of USCF from May 2015 to April 2018 and Assistant General Counsel of USCF from August 2011 to April 2015; from May 2015 to April 2018, Ms. Yu served as Chief Legal Officer of USCF Advisers and serves as Chief Compliance Officer of USCF Advisers since May 2015; Associate Counsel, Assistant Chief Compliance Officer of USCF ETF Trust from June 2014 to February 2015; General Counsel of Concierge from November 2017 through December 2018; Branch Chief – Securities Enforcement Branch for the State of Hawaii, Department of Commerce and Consumer Affairs 2008 - 2011. | N/A | N/A | |||||
| Daphne G. Frydman Year of Birth: 1974 | Chief Legal Officer; Assistant Secretary | Chief Legal Officer since May 2018; Assistant Secretary since 2016. | General Counsel of USCF and USCF Advisers since May 2018; Deputy General Counsel of USCF from May 2016 to April 2018; Assistant Secretary since October 2016; Partner at Sutherland Asbill & Brennan LLP from January 2011 to April 2016; and counsel and associate at the same from 2009 to 2010 and from 2001 to 2008, respectively. | N/A | N/A |
| (1) | The address of each Trustee and officer is c/o USCF ETF Trust, 1850 Mt. Diablo Boulevard, Suite 640, Walnut Creek, California 94596. |
| (2) | The Trustees and Officers serve until their successors are duly elected and qualified. |
| (3) | Messrs. Gerber, Crumbaugh and Ngim are “interested persons” of the Trust (as that term is defined in the 1940 Act) because of their affiliation with the Adviser. |
| 56 | Annual Report June 30, 2020 |
Investment Adviser
USCF Advisers, LLC
1850 Mt. Diablo Boulevard, Suite 640
Walnut Creek, California 94596
Administrator, Custodian and Transfer Agent
The Bank of New York Mellon
240 Greenwich Street
New York, New York 10286
Distributor
ALPS Distributors, Inc.
1290 Broadway, Suite 1100
Denver, Colorado 80203
Independent Registered Public Accounting Firm
Spicer Jeffries LLP
4601 DTC Boulevard, Suite 700
Denver, Colorado 80237
Trustees
Nicholas D. Gerber
Stuart P. Crumbaugh
Andrew F Ngim
Jeremy Henderson
John D. Schwartz
H. Abram Wilson
Thomas Gard
Proxy Voting Information
A description of the policies and procedures that the Adviser uses to determine how to vote proxies relating to portfolio securities of the Funds is available without charge by contacting the Funds at 1.800.920.0259, on the Funds’ website at www.uscfinvestments.com and on the SEC’s website at www.sec.gov. Information regarding how the Funds voted such proxies since inception to the year ended June 30, 2020 is also available without charge by calling the Funds and on the SEC’s website at www.sec.gov.
Premium/Discount Information
Information about the differences between the daily market price on the secondary markets for shares of the Funds and the Funds’ net asset value may be found on the Funds’ website at www.uscfinvestments.com.
ALPS Distributors, Inc.
An investment in a Fund must be accompanied or preceded by a current prospectus which contains more information on fees, risks and expenses. Please read the prospectus carefully before investing or sending money.
Item 1. Reports to Stockholders (cont.).
| (b) | Not applicable. |
| (a) | As of the period ended June 30, 2020 (the “Reporting Period”), the Registrant has adopted a code of ethics that applies to the Registrant’s principal executive officer, principal financial officer, principal accounting officer, controller or persons performing similar functions, regardless of whether these individuals are employed by the registrant or a third party. |
| (c) | During the Reporting Period, there have been no amendments, during the period covered by this report, to a provision of the code of ethics that applies to the Registrant’s principal executive officer, principal financial officer, principal accounting officer or controller, or persons performing similar functions, regardless of whether these individuals are employed by the Registrant or a third party, and that relates to any element of the code of ethics description. |
| (d) | During the Reporting Period, the Registrant has not granted any waivers, including an implicit waiver, from a provision of the code of ethics that applies to the Registrant’s principal executive officer, principal financial officer, principal accounting officer or controller, or persons performing similar functions, regardless of whether these individuals are employed by the Registrant or a third party, that relates to one or more of the items set forth in paragraph (b) of this item’s instructions. |
Item 3. Audit Committee Financial Expert.
The Registrant’s Board of Trustees has determined that Mr. Thomas E. Gard is qualified to serve as an audit committee financial expert serving on the Registrant’s audit committee and that he is “independent,” as defined by Item 3 of Form N-CSR.
Item 4. Principal Accountant Fees and Services.
| (a) | Audit Fees |
The aggregate fees billed for each of the last two fiscal years ended June 30, 2020, and June 30, 2019 for professional services rendered by the principal accountant for the audit of the Registrant’s annual financial statements or services that are normally provided by the accountant in connection with statutory and regulatory filings or engagements for that fiscal year were $33,000 in 2020 and $45,000 in 2019.
| (b) | Audit Related Fees |
The aggregate fees billed for each of the last two fiscal years ended June 30, 2020, and June 30, 2019, for assurance and related services rendered to the Registrant by the principal accountant that are reasonably related to the performance of the audit of the Registrant’s financial statements and are not reported under paragraph (a) of this Item were $0 in 2020 and $0 in 2019.
| (c) | Tax Fees |
The aggregate fees billed for each of the last two fiscal years ended June 30, 2020, and June 30, 2019 for professional services rendered to the Registrant by the principal accountant for tax compliance, tax advice and tax planning were $2,000 in 2020 and $2,500 in 2019. These services consisted of (i) review or preparation of U.S. federal, state, local and excise tax returns; (ii) U.S. federal, state and local entity tax planning, advice and assistance regarding statutory, regulatory or administrative developments, and (iii) tax advice regarding tax qualification.
| (d) | All Other Fees |
The aggregate fees billed for each of the last two fiscal years ended June 30, 2019, and June 30, 2018, for products and services provided by the principal accountant, other than the services reported in paragraphs (a) through (c) of this Item were $0 in 2020 and $0 in 2019.
| (e)(1) | Pursuant to the Registrant’s Audit Committee Charter that has been adopted by the audit committee, the audit committee shall approve all audit and permissible non-audit services to be provided to the Registrant and all permissible non-audit services to be provided to its investment adviser or any entity controlling, controlled by or under common control with the investment adviser that provides ongoing services to the Registrant if the engagement relates directly to the operations and financial reporting of the Registrant. |
| (e)(2) | The percentage of services described in paragraphs (b) through (d) of this Item that were approved by the audit committee pursuant to paragraph (c)(7)(i)(C) of Rule 2-01 of Regulation S-X, with respect to: Audit-Related Fees were 0% for 2020 and 0% for 2019; Tax Fees were 5.7% for 2020 and 5.3% for 2019; and all Other Fees were 0% for 2020 and 0% for 2019. |
| (f) | The percentage of hours expended on the principal accountant’s engagement to audit the Registrant’s financial statements for the most recent fiscal year that were attributed to work performed by persons other than the principal accountant’s full-time, permanent employees was less than fifty percent. |
| (g) | The aggregate non-audit fees billed by the Registrant’s accountant for services rendered to the Registrant, and rendered to the Registrant’s investment adviser (not including any sub-adviser whose role is primarily portfolio management and is subcontracted with or overseen by another investment adviser), and any entity controlling, controlled by, or under common control with the investment adviser that provides ongoing services to the Registrant for each of the last two fiscal years of the Registrant were $0 for 2020 and $0 for 2019. |
| (h) | The Registrant’s audit committee has considered whether the provision of non-audit services that were rendered to the Registrant’s investment adviser (not including any sub-adviser whose role is primarily portfolio management and is subcontracted with or overseen by another investment adviser), and any entity controlling, controlled by, or under common control with the investment adviser that provides ongoing services to the Registrant that were not pre-approved pursuant to paragraph (c)(7)(ii) of Rule 2-01 of Regulation S-X is compatible with maintaining the principal accountant’s independence. |
Item 5. Audit Committee of Listed Registrants.
| (a) | The Registrant has a separately designated audit committee established in accordance with Section 3(a)(58)(A) of the Securities Exchange Act of 1934, as amended, which consists of independent trustees of the Registrant. The audit committee members are Jeremy Henderson, John D. Schwartz, H. Abram Wilson and Thomas E. Gard. |
| (b) | Not applicable. |
Item 6. Investments.
| (a) | The Schedule of Investments in securities of unaffiliated issuers as of the close of the Reporting Period is included as part of the report to shareholders filed under Item 1 of this Form N-CSR. |
| (b) | Not applicable. |
Item 7. Disclosure of Proxy Voting Policies and Procedures for Closed-End Management Investment Companies.
Not applicable.
Item 8. Portfolio Managers of Closed-End Management Investment Companies.
Not applicable.
Item 9. Purchases of Equity Securities by Closed-End Management Investment Company and Affiliated Purchasers.
Not applicable.
Item 10. Submission of Matters to a Vote of Security Holders.
There have been no material changes to the procedures by which the shareholders may recommend nominees to the Registrant’s Board of Trustees, where those changes were implemented after the registrant last provided disclosure in response to the requirements of Item 407(c)(2)(iv) of Regulation S-K (17 CFR 229.407) (as required by Item 22(b)(15) of Schedule 14A (17 CFR 240.14a-101)), or this Item.
Item 11. Controls and Procedures.
| (a) | The Registrant’s principal executive and principal financial officers, or persons performing similar functions, have concluded that the registrant’s disclosure controls and procedures (as defined in Rule 30a-3(c) under the Investment Company Act of 1940, as amended (the “1940 Act”) (17 CFR 270.30a-3(c))) are effective, as of a date within 90 days of the filing date of the report that includes the disclosure required by this paragraph, based on their evaluation of these controls and procedures required by Rule 30a-3(b) under the 1940 Act (17 CFR 270.30a-3(b)) and Rules 13a-15(b) or 15d-15(b) under the Securities Exchange Act of 1934, as amended (17 CFR 240.13a-15(b) or 240.15d-15(b)). |
| (b) | There were no changes in the Registrant’s internal control over financial reporting (as defined in Rule 30a-3(d) under the 1940 Act (17 CFR 270.30a-3(d))) that occurred during the period covered by this report that has materially affected, or is reasonably likely to materially affect, the registrant’s internal control over financial reporting. |
Item 12. Disclosure of Securities Lending Activities for Closed-End Management Investment Companies.
Not applicable.
Item 13. Exhibits.
| (a)(1) | Code of ethics that is the subject of disclosure required by Item 2 of this Form N-CSR is attached hereto. |
| (a)(2) | Certifications pursuant to Rule 30a-2(a) under the 1940 Act and Section 302 of the Sarbanes-Oxley Act of 2002 are attached hereto. |
| (a)(3) | Not applicable. |
| (a)(4) | Not applicable. |
| (b) | Certifications pursuant to Rule 30a-2(b) under the 1940 Act and Section 906 of the Sarbanes-Oxley Act of 2002 are attached hereto. |
SIGNATURES
Pursuant to the requirements of the Securities Exchange Act of 1934 and the Investment Company Act of 1940, the registrant has duly caused this report to be signed on its behalf by the undersigned, thereunto duly authorized.
| (Registrant) | USCF ETF Trust |
| By (Signature and Title)* | /s/ John P. Love | |
| John P. Love, President and Chief Executive Officer (Principal Executive Officer) |
| Date | 9/2/2020 |
Pursuant to the requirements of the Securities Exchange Act of 1934 and the Investment Company Act of 1940, this report has been signed below by the following persons on behalf of the registrant and in the capacities and on the dates indicated.
| By (Signature and Title)* | /s/ John P. Love | |
| John P. Love, President and Chief Executive Officer (Principal Executive Officer) |
| Date | 9/2/2020 |
| By (Signature and Title)* | /s/ Stuart P. Crumbaugh | |
| Stuart P.Crumbaugh, Treasurer and Chief Financial Officer (Principal Financial Officer) |
| Date | 9/2/2020 |
* Print the name and title of each signing officer under his or her signature.