UNITED STATES SECURITIES AND EXCHANGE COMMISSION
WASHINGTON, D.C. 20549
FORM N-CSR
CERTIFIED SHAREHOLDER REPORT OF REGISTERED
MANAGEMENT INVESTMENT COMPANIES
Investment Company Act File Number: 811-22930
USCF ETF TRUST
(Exact name of registrant as specified in charter)
1999 Harrison Street, Suite 1530, Oakland, California 94612
(Address of principal executive offices)(Zip code)
USCF Advisers LLC
Mr. Stuart P. Crumbaugh
1999 Harrison Street, Suite 1530
Oakland, California 94612
(Name and address of agent for service)
Registrant’s telephone number, including area code: (510) 522-9600
Date of fiscal year end: June 30
Date of reporting period: December 31, 2017
Form N-CSR is to be used by management investment companies to file reports with the Commission not later than 10 days after the transmission to stockholders of any report that is required to be transmitted to stockholders under Rule 30e-1 under the Investment Company Act of 1940 (17 CFR 270.30e-1). The Commission may use the information provided on Form N-CSR in its regulatory, disclosure review, inspection, and policymaking roles.
A registrant is required to disclose the information specified by Form N-CSR, and the Commission will make this information public. A registrant is not required to respond to the collection of information contained in Form N-CSR unless the Form displays a currently valid Office of Management and Budget (“OMB”) control number. Please direct comments concerning the accuracy of the information collection burden estimate and any suggestions for reducing the burden to Secretary, Securities and Exchange Commission, 450 Fifth Street, NW, Washington, DC 20549-0609. The OMB has reviewed this collection of information under the clearance requirements of 44 U.S.C. § 3507.
ITEM 1. REPORT TO SHAREHOLDERS.
The following is a copy of the report to shareholders pursuant to Rule 30e-1 under the Investment Company Act of 1940 (17 CFR 270.30e-1).

USCF ETF TRUST
TABLE OF CONTENTS
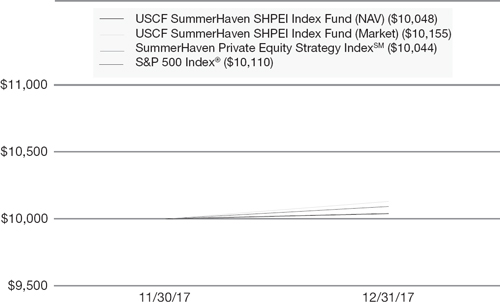
COMPARISON OF CHANGE IN VALUE OF $10,000 INVESTMENT IN USCF SUMMERHAVEN SHPEI INDEX FUND (BUY), THE SUMMERHAVEN PRIVATE EQUITY STRATEGY INDEXSM (SHPEI) AND S&P 500 INDEX® FROM NOVEMBER 30, 2017 (INCEPTION DATE)* TO DECEMBER 31, 2017.
The following graph depicts the performance of USCF SummerHaven SHPEI Index Fund (Net Asset Value and Market Value) vs. the SummerHaven Private Equity Strategy IndexSM1 and S&P 500 Index®2
| | | Since | |
| | | Inception Return | |
| | | (11/30/2017) | |
| USCF SummerHaven SHPEI Index Fund (NAV) | | | 0.48 | % |
| USCF SummerHaven SHPEI Index Fund (Market Value) | | | 1.55 | % |
| SummerHaven Private Equity Strategy IndexSM | | | 0.44 | % |
| S&P 500 Index® | | | 1.10 | % |
| * | The inception date is the date the first shares were purchased to meet the outstanding shares required for listing on the NYSE Arca, Inc. BUY was listed on the NYSE Arca, Inc. on December 1, 2017. |
| 2 | Semi-Annual Report December 31, 2017 |
| 1 | The SummerHaven Private Equity Strategy Index (SHPEI) attempts to replicate the long-term (i.e., 10 years or more) return characteristics of diversified private equity allocations. SHPEI is designed to include publicly-traded companies that possess characteristics similar to the companies that private equity firms have historically selected for investment, as well as companies that SummerHaven Index Management, LLC (SHIM), as the index provider believes private equity firms are likely to select for investment in the future. However, SHPEI does not include, and the Fund does not invest in, private equity funds or private equity of companies. SHPEI is constructed using a proprietary methodology that favors companies with low enterprise value to earnings before interest, taxes, depreciation, and amortization (EV/EBITDA) ratios; low net equity issuance; low market capitalization; and moderate profitability. From a universe of approximately 3,000 U.S. companies, SHIM applies proprietary screens to determine an investable universe. SHPEI includes the greater of 200 companies or 20% of such investable universe. SHPEI is equally- weighted and rebalanced annually. |
| 2 | The Standard & Poor’s (S&P) 500 Index is an unmanaged index consisting of 500 stocks chosen for market size, liquidity, and industry group representation. It is a market-weighted index (stock price times number of shares outstanding) with each stock’s weight in the Index proportionate to its market value. |
The performance shown represents past performance. Past performance is no guarantee of future results and current performance may be higher or lower than the performance shown. Return calculations assume the reinvestment of distributions and do not reflect taxes that a shareholder would pay on Fund distributions or on the redemption of Fund shares. Performance figures reflect voluntary fee waivers and/or expense reimbursements. In the absence of voluntary fee waivers and/or expense reimbursements, the total return would have been lower. Principal value and investments returns will fluctuate and investors’ shares, when redeemed, may be worth more or less than the original cost.
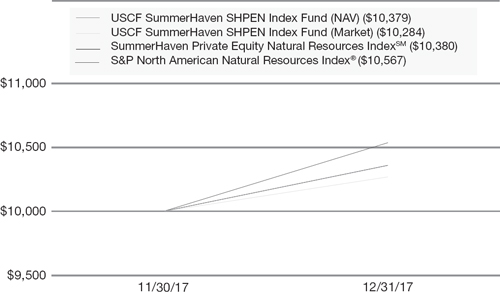
COMPARISON OF CHANGE IN VALUE OF $10,000 INVESTMENT IN USCF SUMMERHAVEN SHPEN INDEX FUND (BUYN), THE SUMMERHAVEN PRIVATE EQUITY NATURAL RESOURCES INDEXSM (SHPEN) AND S&P NORTH AMERICAN NATURAL RESOURCES INDEX® FROM NOVEMBER 30, 2017 (INCEPTION DATE)* TO DECEMBER 31, 2017.
The following graph depicts the performance of USCF SummerHaven SHPEN Index Fund (Net Asset Value and Market Value) vs. the SummerHaven Private Equity Natural Resources IndexSM1 and S&P North American Natural Resources Index®2
| | | Since | |
| | | Inception Return | |
| | | (11/30/2017) | |
| USCF SummerHaven SHPEN Index Fund (NAV) | | | 3.79 | % |
| USCF SummerHaven SHPEN Index Fund (Market Value) | | | 2.84 | % |
| SummerHaven Private Equity Natural Resources IndexSM | | | 3.80 | % |
| S&P North American Natural Resources Index® | | | 5.67 | % |
| * | The inception date is the date the first shares were purchased to meet the outstanding shares required for listing on the NYSE Arca, Inc. BUYN was listed on the NYSE Arca, Inc. on December 1, 2017. |
| 4 | Semi-Annual Report December 31, 2017 |
| 1 | The SummerHaven Private Equity Natural Resources Index (SHPEN) attempts to replicate the long-term return (i.e., return over 10 years or longer) of diversified natural resources private equity allocations. SHPEN is designed to include publicly- traded companies that possess characteristics similar to the companies that private equity firms focusing on natural resources have historically selected for investment, as well as companies that SummerHaven Index Management, LLC (SHIM), as the index provider believes private equity firms focusing on natural resource investments are likely to select for investment in the future. However, SHPEN does not include, and the Fund does not invest in, private equity funds or private equity of companies. The Fund does not invest directly in natural resource commodities. SHPEN is constructed using a proprietary methodology that favors companies with low enterprise value to earnings before interest, taxes, depreciation, and amortization (EV/EBITDA) ratios; low net equity issuance; low market capitalization; and moderate profitability. Proprietary screens are applied to a universe of approximately 600 U.S. companies to determine an investable universe. SHPEN includes the greater of 80 companies or 40% of such investable universe. The Index SHPEN is equally-weighted and rebalanced annually. |
| | |
| 2 | The S&P North American Natural Resources Index provides investors with a benchmark that represents U.S. traded securities that are classified under the GICS® energy and materials sector excluding the chemicals industry; and steel sub-industry. |
The performance shown represents past performance. Past performance is no guarantee of future results and current performance may be higher or lower than the performance shown. Return calculations assume the reinvestment of distributions and do not reflect taxes that a shareholder would pay on Fund distributions or on the redemption of Fund shares. Performance figures reflect voluntary fee waivers and/or expense reimbursements. In the absence of voluntary fee waivers and/or expense reimbursements, the total return would have been lower. Principal value and investments returns will fluctuate and investors’ shares, when redeemed, may be worth more or less than the original cost.
DISCLOSURE OF FUND EXPENSES (unaudited)
As a shareholder of the USCF SummerHaven SHPEI Index Fund or the USCF SummerHaven SHPEN Index Fund (each a “Fund” and collectively, the “Funds”), both series of the USCF ETF Trust (the “Trust”), you may incur two potential types of costs: (1) transaction costs, such as brokerage commission purchases and sales of your Fund shares, and (2) ongoing costs, including management fees and other Funds expenses. The following examples are intended to help you understand your ongoing costs (in dollars) of investing in a Fund and to compare these costs with the ongoing costs of investing in other funds. The examples are based on an investment of $1,000 invested at the beginning of the period and held for the entire period from November 30, 2017* until December 31, 2017.
Actual Return. The table below provides information about actual account values and actual expenses. You may use the information in this table, together with the amount you invested, to estimate the expenses that you paid over the period. Simply divide your account value by $1,000 (for example, $8,600 account value divided by $1,000 = 8.6), then multiply the result by the number under the heading “Actual Expenses Paid During the Period” to estimate the expenses you paid on your account during this period.
Hypothetical 5% Return. The table below provides information about hypothetical account values and hypothetical expenses based on each Fund’s actual expense ratio and an assumed rate of return of 5% per year before expenses, which is not the Fund’s actual return. The hypothetical account values and expenses may not be used to estimate the actual ending account balance or expenses you paid for the period. You may use this information to compare ongoing costs of investing in the Fund and other exchange traded funds. To do so, compare this 5% hypothetical example with the 5% hypothetical examples that appear in the shareholder reports of the other funds.
The expenses shown in the table are meant to highlight ongoing costs only and do not reflect any transaction fees, such as brokerage commission paid on purchases and sales of Fund shares. Therefore, the number under the heading “Hypothetical Expenses paid during the period” is useful in comparing ongoing costs only, and may not help you determine the relative total costs of owning different funds.
| 6 | Semi-Annual Report December 31, 2017 |
USCF ETF TRUST
| Fund | | Beginning
Account
Value
11/30/17* | | | Actual
Ending
Account
Value
12/31/17 | | | Hypothetical
Ending
Account
Value
12/31/17 | | | Actual
Expenses
Paid
During
the
Period (a) | | | Hypothetical
Expenses
Paid
During the
Period (a) | | | Annualized
Expense
Ratio | |
| USCF SummerHaven SHPEI Index Fund | | $ | 1,000.00 | | | $ | 1,004.80 | | | $ | 1,008.26 | | | $ | 0.81 | | | $ | 0.81 | | | | 0.95 | % |
| USCF SummerHaven SHPEN Index Fund | | | 1,000.00 | | | | 1,037.70 | | | | 1,041.27 | | | | 0.82 | | | | 0.82 | | | | 0.95 | % |
| * | Inception date, November 30, 2017. |
| (a) | Expenses (net of fee waivers and/or expense reimbursements) are equal to the Fund’s annualized expense ratio multiplied by the average account value over the period, multiplied by the number of days (31 days) in the most recent fiscal half-year, then divided by 365 (to reflect the one-half year period). |
USCF ETF TRUST – USCF SUMMERHAVEN SHPEI INDEX FUND
SCHEDULE OF INVESTMENTS
AT DECEMBER 31, 2017 (unaudited)
| | | % of Total | | | | | | Market | |
| | | Net Assets | | | Shares | | | Value | |
| Common Stocks | | | 99.8 | % | | | | | | | | |
| Aerospace & Defense | | | 1.2 | % | | | | | | | | |
| AAR Corp. | | | 0.3 | % | | | 205 | | | $ | 8,054 | |
| Ducommun, Inc.(a) | | | 0.3 | % | | | 235 | | | | 6,686 | |
| Triumph Group, Inc. | | | 0.3 | % | | | 232 | | | | 6,310 | |
| Vectrus, Inc.(a) | | | 0.3 | % | | | 222 | | | | 6,849 | |
| | | | | | | | | | | | 27,899 | |
| Air Freight & Logistics | | | 0.6 | % | | | | | | | | |
| Air Transport Services Group, Inc.(a) | | | 0.3 | % | | | 328 | | | | 7,590 | |
| Radiant Logistics, Inc.(a) | | | 0.3 | % | | | 1,428 | | | | 6,569 | |
| | | | | | | | | | | | 14,159 | |
| Airlines | | | 0.7 | % | | | | | | | | |
| Hawaiian Holdings, Inc. | | | 0.3 | % | | | 162 | | | | 6,456 | |
| SkyWest, Inc. | | | 0.4 | % | | | 206 | | | | 10,939 | |
| | | | | | | | | | | | 17,395 | |
| Auto Components | | | 2.7 | % | | | | | | | | |
| Cooper Tire & Rubber Co. | | | 0.3 | % | | | 211 | | | | 7,459 | |
| Lear Corp. | | | 0.4 | % | | | 52 | | | | 9,186 | |
| Shiloh Industries, Inc.(a) | | | 0.2 | % | | | 738 | | | | 6,052 | |
| Stoneridge, Inc.(a) | | | 0.5 | % | | | 501 | | | | 11,453 | |
| Superior Industries International, Inc. | | | 0.2 | % | | | 384 | | | | 5,702 | |
| Tenneco, Inc. | | | 0.3 | % | | | 128 | | | | 7,493 | |
| Tower International, Inc. | | | 0.4 | % | | | 352 | | | | 10,754 | |
| Visteon Corp.(a) | | | 0.4 | % | | | 72 | | | | 9,010 | |
| | | | | | | | | | | | 67,109 | |
| Banks | | | 9.8 | % | | | | | | | | |
| American National Bankshares, Inc. | | | 0.3 | % | | | 205 | | | | 7,852 | |
| Bank of Commerce Holdings | | | 0.3 | % | | | 678 | | | | 7,797 | |
| C&F Financial Corp. | | | 0.4 | % | | | 154 | | | | 8,932 | |
| Capital City Bank Group, Inc. | | | 0.3 | % | | | 364 | | | | 8,350 | |
| Chemung Financial Corp. | | | 0.4 | % | | | 185 | | | | 8,899 | |
| Civista Bancshares, Inc. | | | 0.3 | % | | | 358 | | | | 7,876 | |
| Evans Bancorp, Inc. | | | 0.3 | % | | | 183 | | | | 7,668 | |
| Farmers & Merchants Bancorp, Inc. | | | 0.4 | % | | | 247 | | | | 10,078 | |
| Farmers Capital Bank Corp. | | | 0.3 | % | | | 195 | | | | 7,508 | |
| Fidelity Southern Corp. | | | 0.3 | % | | | 328 | | | | 7,150 | |
| First Community Bancshares, Inc. | | | 0.3 | % | | | 274 | | | | 7,872 | |
| First Financial Corp. | | | 0.3 | % | | | 164 | | | | 7,437 | |
| First Guaranty Bancshares, Inc. | | | 0.3 | % | | | 314 | | | | 7,850 | |
The accompanying notes are an integral part of the financial statements.
| 8 | Semi-Annual Report December 31, 2017 |
USCF ETF TRUST – USCF SUMMERHAVEN SHPEI INDEX FUND
SCHEDULE OF INVESTMENTS
AT DECEMBER 31, 2017 (unaudited) (continued)
| | | % of Total | | | | | | Market | |
| | | Net Assets | | | Shares | | | Value | |
| Banks (continued) | | | 9.8 | % | | | | | | | | |
| Independent Bank Corp./MI | | | 0.3 | % | | | 356 | | | $ | 7,957 | |
| MBT Financial Corp. | | | 0.3 | % | | | 758 | | | | 8,035 | |
| National Bankshares, Inc. | | | 0.3 | % | | | 185 | | | | 8,408 | |
| National Commerce Corp.(a) | | | 0.3 | % | | | 187 | | | | 7,527 | |
| Northrim Bancorp, Inc. | | | 0.3 | % | | | 248 | | | | 8,395 | |
| OFG Bancorp | | | 0.3 | % | | | 764 | | | | 7,182 | |
| Ohio Valley Banc Corp. | | | 0.3 | % | | | 204 | | | | 8,242 | |
| Old Point Financial Corp. | | | 0.3 | % | | | 225 | | | | 6,694 | |
| Parke Bancorp, Inc. | | | 0.3 | % | | | 336 | | | | 6,905 | |
| Peoples Bancorp of North Carolina, Inc. | | | 0.3 | % | | | 260 | | | | 7,979 | |
| Preferred Bank | | | 0.3 | % | | | 134 | | | | 7,877 | |
| Shore Bancshares, Inc. | | | 0.3 | % | | | 451 | | | | 7,532 | |
| Sierra Bancorp | | | 0.3 | % | | | 314 | | | | 8,340 | |
| SmartFinancial, Inc.(a) | | | 0.3 | % | | | 302 | | | | 6,553 | |
| Southern First Bancshares, Inc.(a) | | | 0.4 | % | | | 205 | | | | 8,456 | |
| Two River Bancorp | | | 0.3 | % | | | 424 | | | | 7,687 | |
| United Security Bancshares | | | 0.4 | % | | | 780 | | | | 8,580 | |
| Unity Bancorp, Inc. | | | 0.3 | % | | | 422 | | | | 8,335 | |
| | | | | | | | | | | | 245,953 | |
| Building Products | | | 2.4 | % | | | | | | | | |
| American Woodmark Corp.(a) | | | 0.4 | % | | | 78 | | | | 10,160 | |
| Armstrong Flooring, Inc.(a) | | | 0.3 | % | | | 428 | | | | 7,242 | |
| Gibraltar Industries, Inc.(a) | | | 0.3 | % | | | 228 | | | | 7,524 | |
| Griffon Corp. | | | 0.3 | % | | | 358 | | | | 7,285 | |
| Insteel Industries, Inc. | | | 0.3 | % | | | 226 | | | | 6,400 | |
| Patrick Industries, Inc.(a) | | | 0.4 | % | | | 153 | | | | 10,626 | |
| Universal Forest Products, Inc. | | | 0.4 | % | | | 265 | | | | 9,969 | |
| | | | | | | | | | | | 59,206 | |
| Capital Markets | | | 1.9 | % | | | | | | | | |
| B. Riley Financial, Inc. | | | 0.3 | % | | | 398 | | | | 7,204 | |
| Donnelley Financial Solutions, Inc.(a) | | | 0.3 | % | | | 338 | | | | 6,588 | |
| Greenhill & Co., Inc. | | | 0.3 | % | | | 378 | | | | 7,371 | |
| Investment Technology Group, Inc. | | | 0.3 | % | | | 358 | | | | 6,892 | |
| Piper Jaffray Cos. | | | 0.4 | % | | | 118 | | | | 10,178 | |
| Waddell & Reed Financial, Inc. - Class A | | | 0.3 | % | | | 382 | | | | 8,534 | |
| | | | | | | | | | | | 46,767 | |
The accompanying notes are an integral part of the financial statements.
USCF ETF TRUST – USCF SUMMERHAVEN SHPEI INDEX FUND
SCHEDULE OF INVESTMENTS
AT DECEMBER 31, 2017 (unaudited) (continued)
| | | % of Total | | | | | | Market | |
| | | Net Assets | | | Shares | | | Value | |
| Chemicals | | | 2.4 | % | | | | | | | | |
| A Schulman, Inc. | | | 0.4 | % | | | 247 | | | $ | 9,201 | |
| Ashland Global Holdings, Inc. | | | 0.3 | % | | | 116 | | | | 8,259 | |
| Core Molding Technologies, Inc. | | | 0.3 | % | | | 346 | | | | 7,508 | |
| Innophos Holdings, Inc. | | | 0.3 | % | | | 178 | | | | 8,318 | |
| KMG Chemicals, Inc. | | | 0.4 | % | | | 150 | | | | 9,912 | |
| Rayonier Advanced Materials, Inc. | | | 0.4 | % | | | 485 | | | | 9,918 | |
| Trinseo SA | | | 0.3 | % | | | 108 | | | | 7,841 | |
| | | | | | | | | | | | 60,957 | |
| Commercial Services & Supplies | | | 2.5 | % | | | | | | | | |
| ACCO Brands Corp.(a) | | | 0.3 | % | | | 644 | | | | 7,857 | |
| Brink’s Co. (The) | | | 0.3 | % | | | 110 | | | | 8,657 | |
| CECO Environmental Corp. | | | 0.2 | % | | | 780 | | | | 4,001 | |
| Ennis, Inc. | | | 0.3 | % | | | 404 | | | | 8,383 | |
| Essendant, Inc. | | | 0.2 | % | | | 555 | | | | 5,145 | |
| LSC Communications, Inc. | | | 0.2 | % | | | 378 | | | | 5,727 | |
| Pitney Bowes, Inc. | | | 0.2 | % | | | 505 | | | | 5,646 | |
| SP Plus Corp.(a) | | | 0.4 | % | | | 241 | | | | 8,941 | |
| Viad Corp. | | | 0.4 | % | | | 160 | | | | 8,864 | |
| | | | | | | | | | | | 63,221 | |
| Construction & Engineering | | | 3.3 | % | | | | | | | | |
| Aegion Corp.–Class A(a) | | | 0.3 | % | | | 334 | | | | 8,494 | |
| Argan, Inc. | | | 0.2 | % | | | 122 | | | | 5,490 | |
| Chicago Bridge & Iron Co. NV | | | 0.3 | % | | | 434 | | | | 7,005 | |
| Comfort Systems USA, Inc. | | | 0.4 | % | | | 211 | | | | 9,210 | |
| Dycom Industries, Inc.(a) | | | 0.4 | % | | | 84 | | | | 9,360 | |
| Fluor Corp. | | | 0.3 | % | | | 168 | | | | 8,677 | |
| IES Holdings, Inc.(a) | | | 0.3 | % | | | 426 | | | | 7,348 | |
| MYR Group, Inc.(a) | | | 0.4 | % | | | 249 | | | | 8,897 | |
| NV5 Global, Inc.(a) | | | 0.4 | % | | | 183 | | | | 9,909 | |
| Orion Group Holdings, Inc.(a) | | | 0.3 | % | | | 1,032 | | | | 8,081 | |
| | | | | | | | | | | | 82,471 | |
| Construction Materials | | | 0.3 | % | | | | | | | | |
| US Concrete, Inc.(a) | | | 0.3 | % | | | 96 | | | | 8,030 | |
| | | | | | | | | | | | | |
| Consumer Finance | | | 0.6 | % | | | | | | | | |
| Enova International, Inc.(a) | | | 0.3 | % | | | 466 | | | | 7,083 | |
| World Acceptance Corp.(a) | | | 0.3 | % | | | 98 | | | | 7,911 | |
| | | | | | | | | | | | 14,994 | |
The accompanying notes are an integral part of the financial statements.
| 10 | Semi-Annual Report December 31, 2017 |
USCF ETF TRUST – USCF SUMMERHAVEN SHPEI INDEX FUND
SCHEDULE OF INVESTMENTS
AT DECEMBER 31, 2017 (unaudited) (continued)
| | | % of Total | | | | | | Market | |
| | | Net Assets | | | Shares | | | Value | |
| Containers & Packaging | | | 0.3 | % | | | | | | | | |
| UFP Technologies, Inc.(a) | | | 0.3 | % | | | 274 | | | $ | 7,617 | |
| | | | | | | | | | | | | |
| Distributors | | | 0.3 | % | | | | | | | | |
| Weyco Group, Inc. | | | 0.3 | % | | | 274 | | | | 8,143 | |
| | | | | | | | | | | | | |
| Diversified Consumer Services | | | 2.1 | % | | | | | | | | |
| American Public Education, Inc.(a) | | | 0.3 | % | | | 342 | | | | 8,567 | |
| Cambium Learning Group, Inc.(a) | | | 0.3 | % | | | 1,528 | | | | 8,679 | |
| Capella Education Co. | | | 0.3 | % | | | 88 | | | | 6,811 | |
| Collectors Universe, Inc. | | | 0.4 | % | | | 310 | | | | 8,878 | |
| K12, Inc.(a) | | | 0.3 | % | | | 428 | | | | 6,805 | |
| Regis Corp.(a) | | | 0.5 | % | | | 762 | | | | 11,704 | |
| | | | | | | | | | | | 51,444 | |
| Electrical Equipment | | | 1.6 | % | | | | | | | | |
| General Cable Corp. | | | 0.5 | % | | | 457 | | | | 13,527 | |
| Powell Industries, Inc. | | | 0.3 | % | | | 234 | | | | 6,704 | |
| Preformed Line Products Co. | | | 0.5 | % | | | 162 | | | | 11,510 | |
| TPI Composites, Inc.(a) | | | 0.3 | % | | | 408 | | | | 8,348 | |
| | | | | | | | | | | | 40,089 | |
| Electronic Equipment, Instruments & Components | | | 2.8 | % | | | | | | | | |
| AVX Corp. | | | 0.3 | % | | | 447 | | | | 7,733 | |
| Benchmark Electronics, Inc.(a) | | | 0.3 | % | | | 229 | | | | 6,664 | |
| ePlus, Inc.(a) | | | 0.3 | % | | | 98 | | | | 7,369 | |
| Jabil, Inc. | | | 0.3 | % | | | 255 | | | | 6,694 | |
| KEMET Corp.(a) | | | 0.3 | % | | | 481 | | | | 7,244 | |
| Kimball Electronics, Inc.(a) | | | 0.3 | % | | | 412 | | | | 7,519 | |
| PC Connection, Inc. | | | 0.3 | % | | | 290 | | | | 7,601 | |
| PCM, Inc.(a) | | | 0.1 | % | | | 382 | | | | 3,782 | |
| Sanmina Corp.(a) | | | 0.3 | % | | | 193 | | | | 6,369 | |
| Tech Data Corp.(a) | | | 0.3 | % | | | 72 | | | | 7,054 | |
| | | | | | | | | | | | 68,029 | |
| Energy Equipment & Services | | | 5.1 | % | | | | | | | | |
| Archrock, Inc. | | | 0.3 | % | | | 682 | | | | 7,161 | |
| Diamond Offshore Drilling, Inc.(a) | | | 0.5 | % | | | 712 | | | | 13,236 | |
| Ensco PLC - Class A | | | 0.4 | % | | | 1,550 | | | | 9,161 | |
| Era Group, Inc.(a) | | | 0.4 | % | | | 828 | | | | 8,901 | |
The accompanying notes are an integral part of the financial statements.
USCF ETF TRUST – USCF SUMMERHAVEN SHPEI INDEX FUND
SCHEDULE OF INVESTMENTS
AT DECEMBER 31, 2017 (unaudited) (continued)
| | | % of Total | | | | | | Market | |
| | | Net Assets | | | Shares | | | Value | |
| Energy Equipment & Services (continued) | | | 5.1 | % | | | | | | | | |
| Exterran Corp.(a) | | | 0.3 | % | | | 280 | | | $ | 8,803 | |
| Gulf Island Fabrication, Inc. | | | 0.4 | % | | | 686 | | | | 9,210 | |
| Helix Energy Solutions Group, Inc.(a) | | | 0.4 | % | | | 1,412 | | | | 10,646 | |
| Matrix Service Co.(a) | | | 0.6 | % | | | 815 | | | | 14,507 | |
| Oceaneering International, Inc. | | | 0.3 | % | | | 338 | | | | 7,145 | |
| RigNet, Inc.(a) | | | 0.3 | % | | | 434 | | | | 6,488 | |
| Rowan Cos. PLC - Class A(a) | | | 0.4 | % | | | 728 | | | | 11,400 | |
| SEACOR Holdings, Inc.(a) | | | 0.4 | % | | | 231 | | | | 10,677 | |
| Unit Corp.(a) | | | 0.4 | % | | | 422 | | | | 9,284 | |
| | | | | | | | | | | | 126,619 | |
| Food & Staples Retailing | | | 1.3 | % | | | | | | | | |
| Natural Grocers by Vitamin Cottage, Inc.(a) | | | 0.3 | % | | | 962 | | | | 8,591 | |
| SpartanNash Co. | | | 0.3 | % | | | 294 | | | | 7,844 | |
| United Natural Foods, Inc.(a) | | | 0.4 | % | | | 215 | | | | 10,593 | |
| Weis Markets, Inc. | | | 0.3 | % | | | 160 | | | | 6,622 | |
| | | | | | | | | | | | 33,650 | |
| Food Products | | | 0.9 | % | | | | | | | | |
| Dean Foods Co. | | | 0.2 | % | | | 504 | | | | 5,826 | |
| Fresh Del Monte Produce, Inc. | | | 0.3 | % | | | 148 | | | | 7,055 | |
| Pilgrim’s Pride Corp.(a) | | | 0.4 | % | | | 354 | | | | 10,995 | |
| | | | | | | | | | | | 23,876 | |
| Gas Utilities | | | 0.3 | % | | | | | | | | |
| RGC Resources, Inc. | | | 0.3 | % | | | 263 | | | | 7,122 | |
| | | | | | | | | | | | | |
| Health Care Providers & Services | | | 3.2 | % | | | | | | | | |
| American Renal Associates Holdings, Inc.(a) | | | 0.3 | % | | | 422 | | | | 7,343 | |
| AMN Healthcare Services, Inc.(a) | | | 0.4 | % | | | 207 | | | | 10,195 | |
| Civitas Solutions, Inc.(a) | | | 0.3 | % | | | 428 | | | | 7,319 | |
| Community Health Systems, Inc.(a) | | | 0.1 | % | | | 782 | | | | 3,331 | |
| Cross Country Healthcare, Inc.(a) | | | 0.3 | % | | | 619 | | | | 7,898 | |
| LifePoint Health, Inc.(a) | | | 0.2 | % | | | 118 | | | | 5,876 | |
| Magellan Health, Inc.(a) | | | 0.4 | % | | | 104 | | | | 10,041 | |
| Molina Healthcare, Inc.(a) | | | 0.3 | % | | | 106 | | | | 8,128 | |
| Providence Service Corp. (The)(a) | | | 0.4 | % | | | 154 | | | | 9,138 | |
| Tenet Healthcare Corp.(a) | | | 0.2 | % | | | 396 | | | | 6,003 | |
| WellCare Health Plans, Inc.(a) | | | 0.3 | % | | | 42 | | | | 8,447 | |
| | | | | | | | | | | | 83,719 | |
The accompanying notes are an integral part of the financial statements.
| 12 | Semi-Annual Report December 31, 2017 |
USCF ETF TRUST – USCF SUMMERHAVEN SHPEI INDEX FUND
SCHEDULE OF INVESTMENTS
AT DECEMBER 31, 2017 (unaudited) (continued)
| | | % of Total | | | | | | Market | |
| | | Net Assets | | | Shares | | | Value | |
| Hotels, Restaurants & Leisure | | | 4.7 | % | | | | | | | | |
| BJ’s Restaurants, Inc. | | | 0.3 | % | | | 210 | | | $ | 7,644 | |
| Bojangles’, Inc.(a) | | | 0.2 | % | | | 487 | | | | 5,746 | |
| Brinker International, Inc. | | | 0.3 | % | | | 207 | | | | 8,040 | |
| Carrols Restaurant Group, Inc.(a) | | | 0.3 | % | | | 625 | | | | 7,594 | |
| Century Casinos, Inc.(a) | | | 0.4 | % | | | 1,028 | | | | 9,386 | |
| DineEquity, Inc. | | | 0.4 | % | | | 178 | | | | 9,030 | |
| Fogo De Chao, Inc.(a) | | | 0.3 | % | | | 570 | | | | 6,612 | |
| J Alexander’s Holdings, Inc.(a) | | | 0.3 | % | | | 674 | | | | 6,538 | |
| Nathan’s Famous, Inc. | | | 0.3 | % | | | 118 | | | | 8,909 | |
| Pinnacle Entertainment, Inc.(a) | | | 0.5 | % | | | 382 | | | | 12,503 | |
| Potbelly Corp.(a) | | | 0.3 | % | | | 609 | | | | 7,491 | |
| RCI Hospitality Holdings, Inc. | | | 0.4 | % | | | 320 | | | | 8,953 | |
| Ruth’s Hospitality Group, Inc. | | | 0.3 | % | | | 360 | | | | 7,794 | |
| Zoe’s Kitchen, Inc.(a) | | | 0.4 | % | | | 666 | | | | 11,135 | |
| | | | | | | | | | | | 117,375 | |
| Household Durables | | | 2.9 | % | | | | | | | | |
| Bassett Furniture Industries, Inc. | | | 0.3 | % | | | 199 | | | | 7,482 | |
| CSS Industries, Inc. | | | 0.3 | % | | | 290 | | | | 8,071 | |
| Flexsteel Industries, Inc. | | | 0.2 | % | | | 136 | | | | 6,362 | |
| Hooker Furniture Corp. | | | 0.3 | % | | | 181 | | | | 7,683 | |
| LGI Homes, Inc.(a) | | | 0.5 | % | | | 181 | | | | 13,580 | |
| Libbey, Inc. | | | 0.3 | % | | | 948 | | | | 7,129 | |
| Lifetime Brands, Inc. | | | 0.3 | % | | | 402 | | | | 6,633 | |
| ZAGG, Inc.(a) | | | 0.7 | % | | | 901 | | | | 16,623 | |
| | | | | | | | | | | | 73,563 | |
| Insurance | | | 2.9 | % | | | | | | | | |
| American Financial Group, Inc. | | | 0.3 | % | | | 76 | | | | 8,249 | |
| Argo Group International Holdings Ltd. | | | 0.3 | % | | | 126 | | | | 7,768 | |
| Hallmark Financial Services, Inc.(a) | | | 0.3 | % | | | 690 | | | | 7,197 | |
| HCI Group, Inc. | | | 0.2 | % | | | 164 | | | | 4,904 | |
| Heritage Insurance Holdings, Inc. | | | 0.4 | % | | | 626 | | | | 11,281 | |
| Investors Title Co. | | | 0.3 | % | | | 40 | | | | 7,934 | |
| Kingstone Cos., Inc. | | | 0.4 | % | | | 483 | | | | 9,080 | |
| Safety Insurance Group, Inc. | | | 0.4 | % | | | 110 | | | | 8,844 | |
| Validus Holdings Ltd. | | | 0.3 | % | | | 146 | | | | 6,850 | |
| | | | | | | | | | | | 72,107 | |
The accompanying notes are an integral part of the financial statements.
USCF ETF TRUST – USCF SUMMERHAVEN SHPEI INDEX FUND
SCHEDULE OF INVESTMENTS
AT DECEMBER 31, 2017 (unaudited) (continued)
| | | % of Total | | �� | | | | Market | |
| | | Net Assets | | | Shares | | | Value | |
| Internet & Direct Marketing Retail | | | 0.4 | % | | | | | | | | |
| FTD Cos., Inc.(a) | | | 0.1 | % | | | 396 | | | $ | 2,847 | |
| HSN, Inc. | | | 0.3 | % | | | 201 | | | | 8,110 | |
| | | | | | | | | | | | 10,957 | |
| | | | | | | | | | | | | |
| IT Services | | | 1.3 | % | | | | | | | | |
| Hackett Group, Inc. (The) | | | 0.3 | % | | | 479 | | | | 7,525 | |
| Syntel, Inc.(a) | | | 0.4 | % | | | 463 | | | | 10,644 | |
| Teradata Corp.(a) | | | 0.4 | % | | | 265 | | | | 10,192 | |
| Unisys Corp.(a) | | | 0.2 | % | | | 586 | | | | 4,776 | |
| | | | | | | | | | | | 33,137 | |
| | | | | | | | | | | | | |
| Leisure Products | | | 0.5 | % | | | | | | | | |
| MCBC Holdings, Inc.(a) | | | 0.3 | % | | | 382 | | | | 8,488 | |
| Vista Outdoor, Inc.(a) | | | 0.2 | % | | | 342 | | | | 4,983 | |
| | | | | | | | | | | | 13,471 | |
| | | | | | | | | | | | | |
| Machinery | | | 5.2 | % | | | | | | | | |
| American Railcar Industries, Inc. | | | 0.3 | % | | | 209 | | | | 8,703 | |
| Blue Bird Corp.(a) | | | 0.3 | % | | | 436 | | | | 8,676 | |
| Briggs & Stratton Corp. | | | 0.3 | % | | | 316 | | | | 8,017 | |
| Chart Industries, Inc.(a) | | | 0.4 | % | | | 217 | | | | 10,169 | |
| Commercial Vehicle Group, Inc.(a) | | | 0.4 | % | | | 873 | | | | 9,332 | |
| Eastern Co. (The) | | | 0.3 | % | | | 247 | | | | 6,459 | |
| FreightCar America, Inc. | | | 0.3 | % | | | 450 | | | | 7,686 | |
| Global Brass & Copper Holdings, Inc. | | | 0.3 | % | | | 249 | | | | 8,242 | |
| Hardinge, Inc. | | | 0.4 | % | | | 611 | | | | 10,644 | |
| Hurco Cos, Inc. | | | 0.4 | % | | | 225 | | | | 9,495 | |
| LB Foster Co. - Class A(a) | | | 0.4 | % | | | 360 | | | | 9,774 | |
| Miller Industries, Inc. | | | 0.3 | % | | | 304 | | | | 7,843 | |
| Park-Ohio Holdings Corp. | | | 0.4 | % | | | 199 | | | | 9,144 | |
| SPX Corp.(a) | | | 0.4 | % | | | 282 | | | | 8,852 | |
| Wabash National Corp. | | | 0.3 | % | | | 344 | | | | 7,465 | |
| | | | | | | | | | | | 130,501 | |
| | | | | | | | | | | | | |
| Media | | | 1.8 | % | | | | | | | | |
| Gannett Co., Inc. | | | 0.4 | % | | | 893 | | | | 10,350 | |
| National CineMedia, Inc. | | | 0.3 | % | | | 1,056 | | | | 7,244 | |
The accompanying notes are an integral part of the financial statements.
| 14 | Semi-Annual Report December 31, 2017 |
USCF ETF TRUST – USCF SUMMERHAVEN SHPEI INDEX FUND
SCHEDULE OF INVESTMENTS
AT DECEMBER 31, 2017 (unaudited) (continued)
| | | % of Total | | | | | | Market | |
| | | Net Assets | | | Shares | | | Value | |
| Media (continued) | | | 1.8 | % | | | | | | | | |
| TEGNA, Inc. | | | 0.3 | % | | | 533 | | | $ | 7,505 | |
| Time, Inc. | | | 0.4 | % | | | 563 | | | | 10,387 | |
| tronc, Inc.(a) | | | 0.4 | % | | | 609 | | | | 10,712 | |
| | | | | | | | | | | | 46,198 | |
| | | | | | | | | | | | | |
| Metals & Mining | | | 1.5 | % | | | | | | | | |
| Alcoa Corp.(a) | | | 0.5 | % | | | 221 | | | | 11,905 | |
| Ryerson Holding Corp.(a) | | | 0.3 | % | | | 856 | | | | 8,902 | |
| Steel Dynamics, Inc. | | | 0.4 | % | | | 213 | | | | 9,187 | |
| SunCoke Energy, Inc.(a) | | | 0.3 | % | | | 698 | | | | 8,369 | |
| | | | | | | | | | | | 38,363 | |
| | | | | | | | | | | | | |
| Multiline Retail | | | 1.5 | % | | | | | | | | |
| Big Lots, Inc. | | | 0.4 | % | | | 162 | | | | 9,096 | |
| Kohl’s Corp. | | | 0.4 | % | | | 205 | | | | 11,117 | |
| Macy’s, Inc. | | | 0.4 | % | | | 360 | | | | 9,068 | |
| Nordstrom, Inc. | | | 0.3 | % | | | 164 | | | | 7,770 | |
| | | | | | | | | | | | 37,051 | |
| | | | | | | | | | | | | |
| Oil, Gas & Consumable Fuels | | | 4.6 | % | | | | | | | | |
| Adams Resources & Energy, Inc. | | | 0.3 | % | | | 183 | | | | 7,960 | |
| Contango Oil & Gas Co.(a) | | | 0.2 | % | | | 1,177 | | | | 5,544 | |
| CVR Energy, Inc. | | | 0.5 | % | | | 348 | | | | 12,959 | |
| Green Plains, Inc. | | | 0.3 | % | | | 396 | | | | 6,673 | |
| Hallador Energy Co. | | | 0.2 | % | | | 923 | | | | 5,621 | |
| HollyFrontier Corp. | | | 0.6 | % | | | 280 | | | | 14,342 | |
| Peabody Energy Corp.(a) | | | 0.5 | % | | | 288 | | | | 11,338 | |
| QEP Resources, Inc.(a) | | | 0.3 | % | | | 824 | | | | 7,886 | |
| Renewable Energy Group, Inc.(a) | | | 0.3 | % | | | 631 | | | | 7,446 | |
| REX American Resources Corp.(a) | | | 0.3 | % | | | 80 | | | | 6,623 | |
| Southwestern Energy Co.(a) | | | 0.3 | % | | | 1,314 | | | | 7,332 | |
| Teekay Corp. | | | 0.4 | % | | | 1,130 | | | | 10,532 | |
| Whiting Petroleum Corp.(a) | | | 0.4 | % | | | 364 | | | | 9,639 | |
| | | | | | | | | | | | 113,895 | |
| | | | | | | | | | | | | |
| Paper & Forest Products | | | 0.3 | % | | | | | | | | |
| Clearwater Paper Corp.(a) | | | 0.3 | % | | | 162 | | | | 7,355 | |
The accompanying notes are an integral part of the financial statements.
USCF ETF TRUST – USCF SUMMERHAVEN SHPEI INDEX FUND
SCHEDULE OF INVESTMENTS
AT DECEMBER 31, 2017 (unaudited) (continued)
| | | % of Total | | | | | | Market | |
| | | Net Assets | | | Shares | | | Value | |
| Personal Products | | | 0.7 | % | | | | | | | | |
| Medifast, Inc. | | | 0.5 | % | | | 189 | | | $ | 13,194 | |
| Natural Health Trends Corp. | | | 0.2 | % | | | 264 | | | | 4,010 | |
| | | | | | | | | | | | 17,204 | |
| | | | | | | | | | | | | |
| Pharmaceuticals | | | 0.2 | % | | | | | | | | |
| Endo International PLC(a) | | | 0.2 | % | | | 652 | | | | 5,053 | |
| | | | | | | | | | | | | |
| Professional Services | | | 3.0 | % | | | | | | | | |
| Barrett Business Services, Inc. | | | 0.3 | % | | | 132 | | | | 8,513 | |
| BG Staffing, Inc. | | | 0.3 | % | | | 426 | | | | 6,790 | |
| CRA International, Inc. | | | 0.4 | % | | | 210 | | | | 9,439 | |
| GP Strategies Corp.(a) | | | 0.3 | % | | | 282 | | | | 6,542 | |
| Heidrick & Struggles International, Inc. | | | 0.4 | % | | | 352 | | | | 8,642 | |
| Insperity, Inc. | | | 0.5 | % | | | 213 | | | | 12,216 | |
| ManpowerGroup, Inc. | | | 0.3 | % | | | 66 | | | | 8,323 | |
| Resources Connection, Inc. | | | 0.3 | % | | | 557 | | | | 8,606 | |
| Willdan Group, Inc.(a) | | | 0.2 | % | | | 235 | | | | 5,626 | |
| | | | | | | | | | | | 74,697 | |
| | | | | | | | | | | | | |
| Real Estate Management & Development | | | 0.4 | % | | | | | | | | |
| Altisource Portfolio Solutions SA(a) | | | 0.4 | % | | | 352 | | | | 9,856 | |
| | | | | | | | | | | | | |
| Road & Rail | | | 1.8 | % | | | | | | | | |
| ArcBest Corp. | | | 0.5 | % | | | 352 | | | | 12,584 | |
| Avis Budget Group, Inc.(a) | | | 0.4 | % | | | 259 | | | | 11,365 | |
| Universal Logistics Holdings, Inc. | | | 0.5 | % | | | 501 | | | | 11,899 | |
| YRC Worldwide, Inc.(a) | | | 0.4 | % | | | 628 | | | | 9,030 | |
| | | | | | | | | | | | 44,878 | |
| | | | | | | | | | | | | |
| Semiconductors & Semiconductor Equipment | | | 1.4 | % | | | | | | | | |
| Alpha & Omega Semiconductor Ltd. (a) | | | 0.3 | % | | | 442 | | | | 7,231 | |
| Cirrus Logic, Inc.(a) | | | 0.2 | % | | | 118 | | | | 6,119 | |
| Cohu, Inc. | | | 0.4 | % | | | 438 | | | | 9,614 | |
| CyberOptics Corp.(a) | | | 0.2 | % | | | 334 | | | | 5,010 | |
| Ultra Clean Holdings, Inc.(a) | | | 0.3 | % | | | 350 | | | | 8,082 | |
| | | | | | | | | | | | 36,056 | |
The accompanying notes are an integral part of the financial statements.
| 16 | Semi-Annual Report December 31, 2017 |
USCF ETF TRUST – USCF SUMMERHAVEN SHPEI INDEX FUND
SCHEDULE OF INVESTMENTS
AT DECEMBER 31, 2017 (unaudited) (continued)
| | | % of Total | | | | | | Market | |
| | | Net Assets | | | Shares | | | Value | |
| Software | | | 0.1 | % | | | | | | | | |
| Rubicon Project, Inc. (The)(a) | | | 0.1 | % | | | 1,540 | | | $ | 2,880 | |
| | | | | | | | | | | | | |
| Specialty Retail | | | 11.1 | % | | | | | | | | |
| Abercrombie & Fitch Co. - Class A | | | 0.6 | % | | | 856 | | | | 14,920 | |
| American Eagle Outfitters, Inc. | | | 0.5 | % | | | 678 | | | | 12,746 | |
| Asbury Automotive Group, Inc.(a) | | | 0.3 | % | | | 134 | | | | 8,576 | |
| Barnes & Noble Education, Inc.(a) | | | 0.3 | % | | | 861 | | | | 7,095 | |
| Bed Bath & Beyond, Inc. | | | 0.2 | % | | | 270 | | | | 5,937 | |
| Big 5 Sporting Goods Corp. | | | 0.2 | % | | | 666 | | | | 5,062 | |
| Boot Barn Holdings, Inc.(a) | | | 0.8 | % | | | 1,191 | | | | 19,783 | |
| Buckle, Inc. (The) | | | 0.4 | % | | | 466 | | | | 11,067 | |
| Build-A-Bear Workshop, Inc.(a) | | | 0.3 | % | | | 718 | | | | 6,606 | |
| Caleres, Inc. | | | 0.4 | % | | | 288 | | | | 9,642 | |
| Chico’s FAS, Inc. | | | 0.3 | % | | | 893 | | | | 7,876 | |
| Children’s Place, Inc. (The) | | | 0.4 | % | | | 72 | | | | 10,465 | |
| Citi Trends, Inc. | | | 0.4 | % | | | 370 | | | | 9,790 | |
| Container Store Group, Inc. (The)(a) | | | 0.3 | % | | | 1,352 | | | | 6,408 | |
| Francesca’s Holdings Corp.(a) | | | 0.2 | % | | | 778 | | | | 5,687 | |
| GameStop Corp. - Class A | | | 0.3 | % | | | 364 | | | | 6,534 | |
| Gap, Inc. (The) | | | 0.5 | % | | | 354 | | | | 12,057 | |
| Genesco, Inc.(a) | | | 0.3 | % | | | 247 | | | | 8,028 | |
| GNC Holdings, Inc. - Class A(a) | | | 0.1 | % | | | 991 | | | | 3,657 | |
| Hibbett Sports, Inc.(a) | | | 0.3 | % | | | 394 | | | | 8,038 | |
| Kirkland’s, Inc.(a) | | | 0.4 | % | | | 796 | | | | 9,524 | |
| Murphy USA, Inc.(a) | | | 0.3 | % | | | 106 | | | | 8,518 | |
| Pier 1 Imports, Inc. | | | 0.3 | % | | | 1,631 | | | | 6,752 | |
| Shoe Carnival, Inc. | | | 0.4 | % | | | 410 | | | | 10,968 | |
| Sleep Number Corp.(a) | | | 0.4 | % | | | 249 | | | | 9,360 | |
| Sportsman’s Warehouse Holdings, Inc.(a) | | | 0.4 | % | | | 1,534 | | | | 10,140 | |
| Tailored Brands, Inc. | | | 0.7 | % | | | 744 | | | | 16,242 | |
| Urban Outfitters, Inc.(a) | | | 0.6 | % | | | 434 | | | | 15,216 | |
| Zumiez, Inc.(a) | | | 0.5 | % | | | 626 | | | | 13,036 | |
| | | | | | | | | | | | 279,730 | |
The accompanying notes are an integral part of the financial statements.
USCF ETF TRUST – USCF SUMMERHAVEN SHPEI INDEX FUND
SCHEDULE OF INVESTMENTS
AT DECEMBER 31, 2017 (unaudited) (continued)
| | | % of Total | | | | | | Market | |
| | | Net Assets | | | Shares | | | Value | |
| Technology Hardware, Storage & Peripherals | | | 0.4 | % | | | | | | | | |
| Avid Technology, Inc.(a) | | | 0.3 | % | | | 1,462 | | | $ | 7,880 | |
| Eastman Kodak Co.(a) | | | 0.1 | % | | | 837 | | | | 2,595 | |
| | | | | | | | | | | | 10,475 | |
| Textiles, Apparel & Luxury Goods | | | 3.2 | % | | | | | | | | |
| Crocs, Inc.(a) | | | 0.5 | % | | | 1,014 | | | | 12,817 | |
| Culp, Inc. | | | 0.3 | % | | | 231 | | | | 7,738 | |
| Delta Apparel, Inc.(a) | | | 0.3 | % | | | 362 | | | | 7,312 | |
| Fossil Group, Inc.(a) | | | 0.2 | % | | | 806 | | | | 6,263 | |
| Iconix Brand Group, Inc.(a) | | | 0.1 | % | | | 1,210 | | | | 1,561 | |
| Michael Kors Holdings Ltd. (a) | | | 0.6 | % | | | 229 | | | | 14,416 | |
| Perry Ellis International, Inc.(a) | | | 0.4 | % | | | 414 | | | | 10,367 | |
| Superior Uniform Group, Inc. | | | 0.4 | % | | | 340 | | | | 9,081 | |
| Vera Bradley, Inc.(a) | | | 0.4 | % | | | 827 | | | | 10,073 | |
| | | | | | | | | | | | 79,628 | |
| Thrifts & Mortgage Finance | | | 2.5 | % | | | | | | | | |
| Charter Financial Corp. | | | 0.3 | % | | | 416 | | | | 7,297 | |
| Greene County Bancorp, Inc. | | | 0.4 | % | | | 286 | | | | 9,324 | |
| Home Bancorp, Inc. | | | 0.3 | % | | | 178 | | | | 7,693 | |
| PHH Corp.(a) | | | 0.2 | % | | | 543 | | | | 5,593 | |
| Provident Financial Holdings, Inc. | | | 0.3 | % | | | 400 | | | | 7,360 | |
| Riverview Bancorp, Inc. | | | 0.4 | % | | | 1,066 | | | | 9,242 | |
| Timberland Bancorp, Inc. | | | 0.3 | % | | | 292 | | | | 7,753 | |
| Walker & Dunlop, Inc.(a) | | | 0.3 | % | | | 146 | | | | 6,935 | |
| | | | | | | | | | | | 61,197 | |
| Trading Companies & Distributors | | | 0.8 | % | | | | | | | | |
| Huttig Building Products, Inc.(a) | | | 0.3 | % | | | 1,106 | | | | 7,355 | |
| Veritiv Corp.(a) | | | 0.2 | % | | | 180 | | | | 5,202 | |
| Willis Lease Finance Corp.(a) | | | 0.3 | % | | | 284 | | | | 7,091 | |
| | | | | | | | | | | | 19,648 | |
| | | | | | | | | | | | | |
| Wireless Telecommunication Services | | | 0.3 | % | | | | | | | | |
| Spok Holdings, Inc. | | | 0.3 | % | | | 450 | | | | 7,043 | |
The accompanying notes are an integral part of the financial statements.
| 18 | Semi-Annual Report December 31, 2017 |
USCF ETF TRUST – USCF SUMMERHAVEN SHPEI INDEX FUND
SCHEDULE OF INVESTMENTS
AT DECEMBER 31, 2017 (unaudited) (continued)
| | | % of Total | | | | | | Market | |
| | | Net Assets | | | Shares | | | Value | |
Total Common Stocks
(Cost $2,491,120) | | | 99.8 | % | | | | | | $ | 2,500,787 | |
| | | | | | | | | | | | | |
Total Investments
(Cost $2,491,120)(b) | | | 99.8 | % | | | | | | | 2,500,787 | |
| Other Assets in Excess of Liabilities | | | 0.2 | % | | | | | | | 5,459 | |
| Total Net Assets | | | 100.0 | % | | | | | | $ | 2,506,246 | |
| (a) | Non income producing security. |
| (b) | The aggregate cost of investments for tax purposes was $2,491,120. The net unrealized appreciation was $9,667 which consisted of aggregate gross unrealized appreciation of $86,996 and aggregate gross unrealized depreciation of $77,329. |
Summary of Investments by Country^ | | | | |
| United States | | | 96.9 | % |
| Bermuda | | | 1.0 | |
| United Kingdom | | | 0.9 | |
| Luxembourg | | | 0.4 | |
| Puerto Rico | | | 0.3 | |
| Netherlands | | | 0.3 | |
| Ireland | | | 0.2 | |
| | | | 100.0 | % |
| Summary of Investments by Sector^ | | | | |
| Consumer Discretionary | | | 31.4 | % |
| Industrials | | | 23.0 | |
| Financials | | | 17.6 | |
| Energy | | | 9.6 | |
| Information Technology | | | 6.0 | |
| Materials | | | 4.9 | |
| Health Care | | | 3.5 | |
| Consumer Staples | | | 3.0 | |
| Real Estate | | | 0.4 | |
| Utilities | | | 0.3 | |
| Telecommunication Services | | | 0.3 | |
| | | | 100.0 | % |
| | | | | |
| ^ As a percentage of total investments. All stocks are listed on U.S. Exchanges. |
The accompanying notes are an integral part of the financial statements.
USCF ETF TRUST – USCF SUMMERHAVEN SHPEN INDEX FUND
SCHEDULE OF INVESTMENTS
AT DECEMBER 31, 2017 (unaudited)
| | | % of Total | | | | | | Market | |
| | | Net Assets | | | Shares | | | Value | |
| Common Stocks | | | 100.0 | % | | | | | | | | |
| Auto Components | | | 2.1 | % | | | | | | | | |
| Cooper Tire & Rubber Co. | | | 1.1 | % | | | 784 | | | $ | 27,714 | |
| Goodyear Tire & Rubber Co. (The) | | | 1.0 | % | | | 786 | | | | 25,396 | |
| | | | | | | | | | | | 53,110 | |
| Chemicals | | | 1.6 | % | | | | | | | | |
| CF Industries Holdings, Inc. | | | 1.6 | % | | | 980 | | | | 41,689 | |
| | | | | | | | | | | | | |
| Construction Materials | | | 2.1 | % | | | | | | | | |
| United States Lime & Minerals, Inc. | | | 1.0 | % | | | 352 | | | | 27,139 | |
| US Concrete, Inc.(a) | | | 1.1 | % | | | 356 | | | | 29,779 | |
| | | | | | | | | | | | 56,918 | |
| Containers & Packaging | | | 3.4 | % | | | | | | | | |
| Bemis Co., Inc. | | | 1.1 | % | | | 610 | | | | 29,152 | |
| Graphic Packaging Holding Co. | | | 1.2 | % | | | 2,044 | | | | 31,580 | |
| UFP Technologies, Inc.(a) | | | 1.1 | % | | | 1,016 | | | | 28,245 | |
| | | | | | | | | | | | 88,977 | |
| Energy Equipment & Services | | | 21.6 | % | | | | | | | | |
| Archrock, Inc. | | | 1.0 | % | | | 2,544 | | | | 26,712 | |
| Bristow Group, Inc. | | | 2.2 | % | | | 4,348 | | | | 58,568 | |
| Diamond Offshore Drilling, Inc.(a) | | | 1.9 | % | | | 2,650 | | | | 49,264 | |
| Ensco PLC - Class A | | | 1.3 | % | | | 5,776 | | | | 34,136 | |
| Era Group, Inc.(a) | | | 1.3 | % | | | 3,082 | | | | 33,132 | |
| Exterran Corp.(a) | | | 1.3 | % | | | 1,044 | | | | 32,823 | |
| Gulf Island Fabrication, Inc. | | | 1.3 | % | | | 2,554 | | | | 34,287 | |
| Helix Energy Solutions Group, Inc.(a) | | | 1.5 | % | | | 5,260 | | | | 39,660 | |
| Matrix Service Co.(a) | | | 2.1 | % | | | 3,016 | | | | 53,685 | |
| Nabors Industries Ltd. | | | 1.0 | % | | | 3,770 | | | | 25,749 | |
| Oceaneering International, Inc. | | | 1.0 | % | | | 1,258 | | | | 26,594 | |
| Rowan Cos. PLC - Class A(a) | | | 1.6 | % | | | 2,716 | | | | 42,533 | |
| SEACOR Holdings, Inc.(a) | | | 1.5 | % | | | 854 | | | | 39,472 | |
| Smart Sand, Inc.(a) | | | 1.3 | % | | | 4,034 | | | | 34,934 | |
| Unit Corp.(a) | | | 1.3 | % | | | 1,572 | | | | 34,584 | |
| | | | | | | | | | | | 566,133 | |
| Food Products | | | 10.4 | % | | | | | | | | |
| Calavo Growers, Inc. | | | 1.3 | % | | | 414 | | | | 34,942 | |
| Dean Foods Co. | | | 0.8 | % | | | 1,878 | | | | 21,710 | |
| Farmer Brothers Co.(a) | | | 1.2 | % | | | 950 | | | | 30,542 | |
The accompanying notes are an integral part of the financial statements.
| 20 | Semi-Annual Report December 31, 2017 |
USCF ETF TRUST – USCF SUMMERHAVEN SHPEN INDEX FUND
SCHEDULE OF INVESTMENTS
AT DECEMBER 31, 2017 (unaudited) (continued)
| | | % of Total | | | | | | Market | |
| | | Net Assets | | | Shares | | | Value | |
| Food Products (continued) | | | 10.4 | % | | | | | | | | |
| Fresh Del Monte Produce, Inc. | | | 1.0 | % | | | 548 | | | $ | 26,123 | |
| Ingredion, Inc. | | | 1.3 | % | | | 242 | | | | 33,832 | |
| Landec Corp.(a) | | | 1.0 | % | | | 1,990 | | | | 25,074 | |
| Lifeway Foods, Inc.(a) | | | 0.9 | % | | | 3,036 | | | | 24,288 | |
| Pilgrim’s Pride Corp.(a) | | | 1.6 | % | | | 1,314 | | | | 40,813 | |
| Sanderson Farms, Inc. | | | 1.3 | % | | | 246 | | | | 34,140 | |
| | | | | | | | | | | | 271,464 | |
| Machinery | | | 13.1 | % | | | | | | | | |
| Alamo Group, Inc. | | | 1.3 | % | | | 306 | | | | 34,538 | |
| American Railcar Industries, Inc. | | | 1.2 | % | | | 776 | | | | 32,313 | |
| Blue Bird Corp.(a) | | | 1.2 | % | | | 1,624 | | | | 32,318 | |
| Commercial Vehicle Group, Inc.(a) | | | 1.3 | % | | | 3,234 | | | | 34,571 | |
| Douglas Dynamics, Inc. | | | 1.3 | % | | | 888 | | | | 33,566 | |
| FreightCar America, Inc. | | | 1.1 | % | | | 1,674 | | | | 28,592 | |
| Meritor, Inc.(a) | | | 1.5 | % | | | 1,602 | | | | 37,583 | |
| Miller Industries, Inc. | | | 1.1 | % | | | 1,126 | | | | 29,051 | |
| Spartan Motors, Inc. | | | 2.0 | % | | | 3,240 | | | | 51,030 | |
| Wabash National Corp. | | | 1.1 | % | | | 1,278 | | | | 27,733 | |
| | | | | | | | | | | | 341,295 | |
| Metals & Mining | | | 13.5 | % | | | | | | | | |
| AK Steel Holding Corp.(a) | | | 1.0 | % | | | 4,574 | | | | 25,889 | |
| Alcoa Corp.(a) | | | 1.7 | % | | | 820 | | | | 44,173 | |
| Allegheny Technologies, Inc.(a) | | | 1.5 | % | | | 1,594 | | | | 38,479 | |
| Commercial Metals Co. | | | 1.2 | % | | | 1,422 | | | | 30,317 | |
| Olympic Steel, Inc. | | | 1.3 | % | | | 1,548 | | | | 33,267 | |
| Reliance Steel & Aluminum Co. | | | 1.3 | % | | | 388 | | | �� | 33,287 | |
| Ryerson Holding Corp.(a) | | | 1.3 | % | | | 3,186 | | | | 33,134 | |
| Steel Dynamics, Inc. | | | 1.3 | % | | | 788 | | | | 33,986 | |
| SunCoke Energy, Inc.(a) | | | 1.2 | % | | | 2,584 | | | | 30,982 | |
| United States Steel Corp. | | | 1.7 | % | | | 1,240 | | | | 43,636 | |
| | | | | | | | | | | | 347,150 | |
| Oil, Gas & Consumable Fuels | | | 25.8 | % | | | | | | | | |
| Adams Resources & Energy, Inc. | | | 1.1 | % | | | 676 | | | | 29,406 | |
| Bonanza Creek Energy, Inc.(a) | | | 1.0 | % | | | 990 | | | | 27,314 | |
| California Resources Corp.(a) | | | 2.8 | % | | | 3,796 | | | | 73,794 | |
| Contango Oil & Gas Co.(a) | | | 0.8 | % | | | 4,362 | | | | 20,545 | |
The accompanying notes are an integral part of the financial statements.
| USCF ETF TRUST – USCF SUMMERHAVEN SHPEN INDEX FUND | | | | | | | | | |
| SCHEDULE OF INVESTMENTS | | | | | | | | | |
| AT DECEMBER 31, 2017 (unaudited) (continued) | | | | | | | | | |
| | | | | | | | | | |
| | % of Total | | | | | | Market | |
| | | Net Assets | | | Shares | | | Value | |
| Oil, Gas & Consumable Fuels (continued) | | | 25.8 | % | | | | | | | | |
| CVR Energy, Inc. | | | 1.8 | % | | | 1,290 | | | $ | 48,040 | |
| Frontline Ltd. | | | 0.9 | % | | | 4,898 | | | | 22,482 | |
| Gener8 Maritime, Inc.(a) | | | 1.3 | % | | | 4,958 | | | | 32,822 | |
| Green Plains, Inc. | | | 0.9 | % | | | 1,466 | | | | 24,702 | |
| Hallador Energy Co. | | | 0.8 | % | | | 3,420 | | | | 20,828 | |
| HollyFrontier Corp. | | | 2.0 | % | | | 1,046 | | | | 53,576 | |
| International Seaways, Inc.(a) | | | 0.9 | % | | | 1,268 | | | | 23,407 | |
| Murphy Oil Corp. | | | 1.4 | % | | | 1,148 | | | | 35,645 | |
| Nordic American Tankers Ltd. | | | 0.4 | % | | | 4,646 | | | | 11,429 | |
| Peabod1p4y Energy Corp.(a) | | | 1.6 | % | | | 1,076 | | | | 42,362 | |
| Penn Virginia Corp.(a) | | | 1.1 | % | | | 754 | | | | 29,489 | |
| QEP Resources, Inc.(a) | | | 1.1 | % | | | 3,072 | | | | 29,399 | |
| Renewable Energy Group, Inc.(a) | | | 1.1 | % | | | 2,344 | | | | 27,659 | |
| REX American Resources Corp.(a) | | | 0.9 | % | | | 296 | | | | 24,506 | |
| Southwestern Energy Co.(a) | | | 1.0 | % | | | 4,898 | | | | 27,331 | |
| Teekay Corp. | | | 1.5 | % | | | 4,214 | | | | 39,274 | |
| Whiting Petroleum Corp.(a) | | | 1.4 | % | | | 1,356 | | | | 35,907 | |
| | | | | | | | | | | | 679,917 | |
| Paper & Forest Products | | | 6.4 | % | | | | | | | | |
| Boise Cascade Co. | | | 1.5 | % | | | 1,006 | | | | 40,139 | |
| Clearwater Paper Corp.(a) | | | 1.1 | % | | | 604 | | | | 27,422 | |
| Domtar Corp. | | | 1.4 | % | | | 748 | | | | 37,041 | |
| Neenah Paper, Inc. | | | 1.2 | % | | | 360 | | | | 32,634 | |
| PH Glatfelter Co. | | | 1.2 | % | | | 1,446 | | | | 31,002 | |
| | | | | | | | | | | | 168,238 | |
| Total Common Stocks | | | | | | | | | | | | |
| (Cost $2,520,610) | | | 100.0 | % | | | | | | | 2,614,891 | |
| Total Investments | | | | | | | | | | | | |
| (Cost $2,520,610)(b) | | | 100.0 | % | | | | | | | 2,614,891 | |
| Other Assets in Excess of Liabilities | | | 0.0 | %* | | | | | | | 293 | |
| Total Net Assets | | | 100.0 | % | | | | | | $ | 2,615,184 | |
| (a) | Non income producing security. |
| (b) | The aggregate cost of investments for tax purposes was $2,520,610. The net unrealized appreciation was $94,281 which consisted of aggregate gross unrealized appreciation of $163,246 and aggregate gross unrealized depreciation of $68,965. |
The accompanying notes are an integral part of the financial statements.
| 22 | Semi-Annual Report December 31, 2017 |
| USCF ETF TRUST – USCF SUMMERHAVEN SHPEN INDEX FUND | | | |
| SCHEDULE OF INVESTMENTS | | | |
| AT DECEMBER 31, 2017 (unaudited) (continued) | | | |
| | | | |
| Summary of Investments by Country^ | | | | |
| United States | | | 95.9 | % |
| Bermuda | | | 1.5 | |
| United Kingdom | | | 1.3 | |
| Norway | | | 1.3 | |
| | | | 100.0 | % |
| | | | | |
| Summary of Investments by Sector^ | | | | |
| Energy | | | 47.6 | % |
| Materials | | | 26.9 | |
| Industrials | | | 13.1 | |
| Consumer Staples | | | 10.4 | |
| Consumer Discretionary | | | 2.0 | |
| | | | 100.0 | % |
^ As a percentage of total investments. All stocks are listed on U.S. Exchanges.
* Position represents less than 0.05%.
The accompanying notes are an integral part of the financial statements.
| USCF ETF TRUST | | | | | | |
| STATEMENTS OF ASSETS AND LIABILITIES | | | | | | |
| DECEMBER 31, 2017 (unaudited) | | | | | | |
| | | | | | | |
| | | USCF SummerHaven | | | USCF SummerHaven | |
| | | SHPEI Index Fund | | | SHPEN Index Fund | |
| Assets: | | | | | | | | |
| Investments, at Market Value | | $ | 2,500,787 | | | $ | 2,614,891 | |
| Cash | | | 5,356 | | | | 1,386 | |
| Receivables: | | | | | | | | |
| Dividends | | | 2,119 | | | | 957 | |
| Total Assets | | | 2,508,262 | | | | 2,617,234 | |
| | | | | | | | | |
| Liabilities: | | | | | | | | |
| Payables: | | | | | | | | |
| Accrued Management Fees | | | 2,016 | | | | 2,050 | |
| Total Liabilities | | | 2,016 | | | | 2,050 | |
| Total Net Assets | | $ | 2,506,246 | | | $ | 2,615,184 | |
| | | | | | | | | |
| Net Assets Consist of: | | | | | | | | |
| Capital Paid In | | $ | 2,494,367 | | | $ | 2,519,569 | |
| Accumulated Undistributed Net Investment Income (Loss) | | | 2,135 | | | | 1,135 | |
| Accumulated Net Realized Gain (Loss) on Investments | | | 77 | | | | 199 | |
| Net Unrealized Appreciation (Depreciation) on Investments | | | 9,667 | | | | 94,281 | |
| Total Net Assets | | $ | 2,506,246 | | | $ | 2,615,184 | |
| | | | | | | | | |
| Net Asset Value Per Share | | | | | | | | |
| Total Net Assets | | $ | 2,506,246 | | | $ | 2,615,184 | |
| Shares of Beneficial Interest Outstanding (Unlimited Shares of $0.001 Par Value Authorized) | | | 100,001 | | | | 100,001 | |
| Net Asset Value | | $ | 25.06 | | | $ | 26.15 | |
| Investments, at Cost | | $ | 2,491,120 | | | $ | 2,520,610 | |
The accompanying notes are an integral part of the financial statements.
| 24 | Semi-Annual Report December 31, 2017 |
| USCF ETF TRUST | | | | | | |
| STATEMENTS OF OPERATIONS | | | | | | |
| FOR THE PERIOD ENDED DECEMBER 31, 2017* (unaudited) | | | | | | |
| | | | | | | |
| | | USCF SummerHaven | | | USCF SummerHaven | |
| | | SHPEN Index Fund | | | SHPEI Index Fund | |
| Investment Income: | | | | | | | | |
| Dividend Income (less net foreign withholding tax $5 and $0, respectively) | | $ | 4,152 | | | $ | 3,186 | |
| Total Investment Income | | | 4,152 | | | | 3,186 | |
| | | | | | | | | |
| Expenses: | | | | | | | | |
| Management Fees | | | 2,017 | | | | 2,051 | |
| Total Expenses | | | 2,017 | | | | 2,051 | |
| Net Investment Income (Loss) | | | 2,135 | | | | 1,135 | |
| | | | | | | | | |
| Realized and Unrealized Gain (Loss) on Investments: | | | | | | | | |
| Net Realized Gain (Loss) on Investments | | | 77 | | | | 199 | |
| Net Change in Unrealized Appreciation (Depreciation) on Investments | | | 9,667 | | | | 94,281 | |
| Net Realized and Change in Unrealized Gain (Loss) on Investments | | | 9,744 | | | | 94,480 | |
| Net Increase (Decrease) in Net Assets Resulting from Operations | | $ | 11,879 | | | $ | 95,615 | |
| | | | | | | | | |
| * Inception Date, November 30, 2017. | | | | | | | | |
The accompanying notes are an integral part of the financial statements.
| USCF ETF TRUST | | | | | | |
| STATEMENTS OF CHANGES IN NET ASSETS | | | | | | |
| FOR THE PERIOD ENDED DECEMBER 31, 2017* (unaudited) | | | | | | |
| | | | | | | |
| | | USCF SummerHaven | | | USCF SummerHaven | |
| | | SHPEI Index Fund | | | SHPEN Index Fund | |
| Operations: | | | | | | | | |
| Net Investment Income (Loss) | | $ | 2,135 | | | $ | 1,135 | |
| Net Realized Gain (Loss) on Investments | | | 77 | | | | 199 | |
| Net Change in Unrealized Appreciation (Depreciation) on Investments | | | 9,667 | | | | 94,281 | |
| Net Increase (Decrease) in Net Assets Resulting from Operations | | | 11,879 | | | | 95,615 | |
| | | | | | | | | |
| Shareholder transactions: | | | | | | | | |
| Proceeds from Shares Sold | | | 2,494,342 | | | | 2,519,544 | |
| Net Increase (Decrease) in Net Assets from Shares Transactions | | | 2,494,342 | | | | 2,519,544 | |
| Net Increase (Decrease) in Net Assets | | | 2,506,221 | | | | 2,615,159 | |
| | | | | | | | | |
| Net Assets: | | | | | | | | |
| Beginning of Period | | | 25 | | | | 25 | |
| End of Period1 | | $ | 2,506,246 | | | $ | 2,615,184 | |
| 1 Includes Accumulated Undistributed Net Investment Income (Loss) of: | | $ | 2,135 | | | $ | 1,135 | |
| | | | | | | | | |
| Changes in Shares outstanding: | | | | | | | | |
| Shares Outstanding, Beginning of Period | | | 1 | * | | | 1 | * |
| Shares Issued | | | 100,000 | | | | 100,000 | |
| Shares Issued in Reinvestment of Dividends and Distributions | | | — | | | | — | |
| Shares Redeemed | | | — | | | | — | |
| Shares Outstanding, End of Period | | | 100,001 | | | | 100,001 | |
| | | | | | | | | |
| * Inception Date, November 30, 2017. | | | | | | | | |
The accompanying notes are an integral part of the financial statements.
| 26 | Semi-Annual Report December 31, 2017 |
| USCF ETF TRUST FINANCIAL HIGHLIGHTS |
| FOR THE PERIOD ENDED DECEMBER 31, 2017* (unaudited) |
| |
| SELECTED DATA FOR A SHARE OF COMMON STOCK OUTSTANDING |
| THROUGHOUT THE PERIOD INDICATED: |
| | | | | | | |
| | | USCF SummerHaven | | | USCF SummerHaven | |
| | | SHPEI Index Fund | | | SHPEN Index Fund | |
| Net Asset Value, Beginning of Period Income (Loss) from Operations: | | $ | 24.94 | | | $ | 25.20 | |
| Net Investment Income (Loss)(a) | | | 0.02 | | | | 0.01 | |
| Net Realized and Unrealized Gain (Loss) | | | 0.10 | | | | 0.94 | |
| Total Income (Loss) from Operations | | | 0.12 | | | | 0.95 | |
| Net Asset Value, End of Period | | $ | 25.06 | | | $ | 26.15 | |
| | | | | | | | | |
| Total Return(b) | | | 0.48 | % | | | 3.77% | |
| Net Assets, End of Period (thousands) Ratios of Average Net Assets: | | $ | 2,506 | | | $ | 2,615 | |
| Net Expenses | | | 0.95 | %** | | | 0.95 | %** |
| Net Investment Income (Loss) | | | 1.01 | %** | | | 0.53 | %** |
| Portfolio Turnover Rate(c) | | | 0 | %*** | | | 0 | %*** |
| * | Inception Date, November 30, 2017. |
| *** | Percentage represents less than 0.5%. |
| (a) | Per share amounts have been calculated using the weighted average shares method. |
| (b) | Total Return may reflect fee waivers and/or expense reimbursements and assume reinvestment of dividend distribution. In the absence of fee waivers and/or expense reimbursements, the total return would have been lower. Past performance is no guarantee of future results. |
| (c) | Portfolio turnover rate is not annualized for periods of less than one year and does not include securities received or delivered from processing creations or redemptions. |
The accompanying notes are an integral part of the financial statements.
USCF ETF TRUST
NOTES TO FINANCIAL STATEMENTS
DECEMBER 31, 2017 (unaudited)
1) ORGANIZATION
The USCF ETF Trust (the “Trust”) was organized as a Delaware statutory trust in accordance with a Declaration of Trust dated November 6, 2013. The Declaration of Trust was amended and restated on June 16, 2014. The Trust is authorized to have multiple segregated series or portfolios. The Trust is an open-end management investment company registered under the Investment Company Act of 1940 (the “1940 Act”). The Trust currently consists of two investment portfolios: the USCF SummerHaven SHPEI Index Fund (“BUY”) and USCF SummerHaven SHPEN Index Fund (“BUYN”) (each a “Fund” and collectively, the “Funds”). BUY and BUYN commenced operations on November 30, 2017. The Funds were listed on the NYSE Arca Equity, Inc. (“NYSE Arca”) on December 1, 2017. Other series or portfolios may be added to the Trust in the future. USCF Advisers LLC serves as the investment adviser to the Funds (the “Adviser”). The Adviser has been registered as an investment adviser with the Securities Exchange Commission (the “SEC”) since July 1, 2014 and is a wholly-owned subsidiary of Wainwright Holdings, Inc. SummerHaven Investment Management, LLC (the “Sub-Adviser”) serves as the sub-adviser to the Funds. The Adviser was also the investment adviser for the Stock Split Index Fund (“TOFR”) and the USCF Restaurant Leaders Fund (“MENU”), each of which was a series of the USCF ETF Trust, until October 2017, when both funds liquidated all of their assets and distributed cash pro rata to all remaining shareholders.
2) SIGNIFICANT ACCOUNTING POLICIES
The accompanying financial statements were prepared in accordance with U.S. Generally Accepted Accounting Principles (“GAAP”), which require the use of estimates and assumptions made by management. These may affect the reported amounts of assets and liabilities and disclosure of contingent assets and liabilities at the date of the financial statements and the reported amounts of increases and decreases in net assets from operations during the reporting period. Actual results could differ from those estimates. The following is a summary of significant accounting policies consistently followed by the Funds in preparation of their financial statements.
Basis of Presentation
The financial statements have been prepared in conformity with GAAP as detailed in the Financial Accounting Standards Board’s (“FASB”) Accounting Standards Codification (“ASC”). The Funds are investment companies and follow the accounting and reporting guidance in FASB Topic 946.
| 28 | Semi-Annual Report December 31, 2017 |
Calculation of NAV
The Net Asset Value (“NAV”) of a Fund’s shares is calculated each day the national securities exchanges are open for trading as of the close of regular trading on NYSE Arca, generally 4:00 p.m. New York time (the “NAV Calculation Time”). NAV per share is calculated by dividing the Fund’s net assets by the number of the Fund’s outstanding shares.
In calculating its NAV, a Fund generally values its assets on the basis of market quotations, last sale prices, or estimates of value furnished by a pricing service or brokers who make markets in such instruments. Debt obligations with maturities of 60 days or less are valued at amortized cost.
Fair value pricing is used by a Fund when reliable market valuations are not readily available or are not deemed to reflect current market values. Securities that may be valued using “fair value” pricing may include, but are not limited to, securities for which there are no current market quotations or whose issuer is in default or bankruptcy, securities subject to corporate actions (such as mergers or reorganizations), securities subject to non-U.S. investment limits or currency controls, and securities affected by “significant events.” An example of a significant event is an event, occurring after the close of the market in which a security trades but before a Fund’s next NAV Calculation Time that may materially affect the value of the Fund’s investment (e.g., government action, natural disaster, or significant market fluctuation). When fair-value pricing is employed, the prices of securities used by a Fund to calculate its NAV may differ from quoted or published prices for the same securities.
Security Valuation
Investments in securities are carried at market value. All equity securities that are traded on a national securities exchange are valued at the last sale price at the time of the close of the New York Stock Exchange (“NYSE”). If on a particular day an exchange-listed security does not trade, then the mean between the closing bids and asked prices will be used. In the case of securities listed on more than one national securities exchange, the last quoted sale, up to the time of valuation, on the exchange on which the security is principally traded will be/is used. If there were no sales on that exchange, the last quoted sale on the other exchange will be/is used.
For securities that are traded on the NASDAQ, the NASDAQ Official Closing Price (e.g., the NASDAQ Closing Cross price, if available) is used. All non-NASDAQ equity securities that are not traded on a listed exchange are valued at the last sale price at the close of the NYSE. If a non-exchange listed security does not trade on a particular day, or if a last sales price or NASDAQ Official Closing Price is not available, then the mean between the closing bid and asked price will be used.
Securities having a remaining maturity of 60 days or less are valued at amortized cost, which approximates market value.
The cost of securities sold is determined on the identified cost basis. When market quotations are not readily available or when events occur that make established valuation methods unreliable, securities of the Funds may be valued at fair value determined in good faith by or under the direction of the Board of Trustees.
Security transactions are recorded on the dates the transactions are entered, which is the trade date.
Fair Value Measurement
The Funds utilize various methods to measure the fair value of most of their investments on a recurring basis. GAAP establishes a hierarchy that prioritizes inputs to valuation methods. The three levels of inputs are:
Level 1 - Unadjusted quoted prices in active markets for identical assets or liabilities that the Funds have the ability to access.
Level 2 - Observable inputs other than quoted prices included in Level 1 that are observable for the asset or liability, either directly or indirectly. These inputs may include quoted prices for the identical instrument or an inactive market, prices for similar instruments, interest rates, prepayment speeds, credit risk, yield curves, default rates and similar data.
Level 3 - Unobservable inputs for the asset or liability, to the extent relevant observable inputs are not available, representing the Funds’ own assumptions about the assumptions a market participant would use in valuing the asset or liability, and would be based on the best information available.
The availability of observable inputs can vary from security to security and is affected by a wide variety of factors, including, for example, the type of security, whether the security is new and not yet established in the marketplace, the liquidity of markets, and other characteristics particular to the security. To the extent that valuation is based on models or inputs that are less observable or unobservable in the market, the determination of fair value requires more judgment. Accordingly, the degree of judgment exercised in determining fair value is greatest for instruments categorized in Level 3.
The inputs used to measure fair value may fall into different levels of the fair value hierarchy. In such cases for disclosure purposes, the level in the fair value hierarchy within which the fair value measurement falls in its entirety, is determined based on the lowest level input that is significant to the fair value measurement in its entirety.
| 30 | Semi-Annual Report December 31, 2017 |
The following tables summarize the valuation of securities at December 31, 2017 for the Funds, using the fair value hierarchy:
| BUY | | | | | | | | | | | | |
| | | | | | | | | | | | | |
| Investments, at value | | Total | | | Level 1 | | | Level 2 | | | Level 3 | |
| Common Stocks: | | | | | | | | | | | | | | | | |
| Aerospace & Defense | | $ | 27,899 | | | $ | 27,899 | | | $ | — | | | $ | — | |
| Air Freight & Logistics | | | 14,159 | | | | 14,159 | | | | — | | | | — | |
| Airlines | | | 17,395 | | | | 17,395 | | | | — | | | | — | |
| Auto Components | | | 67,109 | | | | 67,109 | | | | — | | | | — | |
| Banks | | | 245,953 | | | | 245,953 | | | | — | | | | — | |
| Building Products | | | 59,206 | | | | 59,206 | | | | — | | | | — | |
| Capital Markets | | | 46,767 | | | | 46,767 | | | | — | | | | — | |
| Chemicals | | | 60,957 | | | | 60,957 | | | | — | | | | — | |
| Commercial Services & Supplies | | | 63,221 | | | | 63,221 | | | | — | | | | — | |
| Construction & Engineering | | | 82,471 | | | | 82,471 | | | | — | | | | — | |
| Construction Materials | | | 8,030 | | | | 8,030 | | | | — | | | | — | |
| Consumer Finance | | | 14,994 | | | | 14,994 | | | | — | | | | — | |
| Containers & Packaging | | | 7,617 | | | | 7,617 | | | | — | | | | — | |
| Distributors | | | 8,143 | | | | 8,143 | | | | — | | | | — | |
| Diversified Consumer Services | | | 51,444 | | | | 51,444 | | | | — | | | | — | |
| Electrical Equipment | | | 40,089 | | | | 40,089 | | | | — | | | | — | |
| Electronic Equipment, Instruments & Components | | | 68,029 | | | | 68,029 | | | | — | | | | — | |
| Energy Equipment & Services | | | 126,619 | | | | 126,619 | | | | — | | | | — | |
| Food & Staples Retailing | | | 33,650 | | | | 33,650 | | | | — | | | | — | |
| Food Products | | | 23,876 | | | | 23,876 | | | | — | | | | — | |
| Gas Utilities | | | 7,122 | | | | 7,122 | | | | — | | | | — | |
| Health Care Providers & Services | | | 83,719 | | | | 83,719 | | | | — | | | | — | |
| Hotels, Restaurants & Leisure | | | 117,375 | | | | 117,375 | | | | — | | | | — | |
| Household Durables | | | 73,563 | | | | 73,563 | | | | — | | | | — | |
| Insurance | | | 72,107 | | | | 72,107 | | | | — | | | | — | |
| Internet & Direct Marketing Retail | | | 10,957 | | | | 10,957 | | | | — | | | | — | |
| IT Services | | | 33,137 | | | | 33,137 | | | | — | | | | — | |
| Leisure Products | | | 13,471 | | | | 13,471 | | | | — | | | | — | |
| Machinery | | | 130,501 | | | | 130,501 | | | | — | | | | — | |
| Media | | | 46,198 | | | | 46,198 | | | | — | | | | — | |
| Metals & Mining | | | 38,363 | | | | 38,363 | | | | — | | | | — | |
| Multiline Retail | | | 37,051 | | | | 37,051 | | | | — | | | | — | |
| Oil, Gas & Consumable Fuels | | | 113,895 | | | | 113,895 | | | | — | | | | — | |
| Paper & Forest Products | | | 7,355 | | | | 7,355 | | | | — | | | | — | |
| Personal Products | | | 17,204 | | | | 17,204 | | | | — | | | | — | |
| Pharmaceuticals | | | 5,053 | | | | 5,053 | | | | — | | | | — | |
| Professional Services | | | 74,697 | | | | 74,697 | | | | — | | | | — | |
| Investments, at value | | Total | | | Level 1 | | | Level 2 | | | Level 3 | |
| Real Estate Management &Development | | $ | 9,856 | | | $ | 9,856 | | | $ | — | | | $ | — | |
| Road & Rail | | | 44,878 | | | | 44,878 | | | | — | | | | — | |
| Semiconductors & Semiconductor | | | 36,056 | | | | 36,056 | | | | — | | | | — | |
| Equipment | | | | | | | | | | | | | | | | |
| Software | | | 2,880 | | | | 2,880 | | | | — | | | | — | |
| Specialty Retail | | | 279,730 | | | | 279,730 | | | | — | | | | — | |
| Technology Hardware, Storage & Peripherals | | | 10,475 | | | | 10,475 | | | | — | | | | — | |
| Textiles, Apparel & Luxury Goods | | | 79,628 | | | | 79,628 | | | | — | | | | — | |
| Thrifts & Mortgage Finance | | | 61,197 | | | | 61,197 | | | | — | | | | — | |
| Trading Companies & Distributors | | | 19,648 | | | | 19,648 | | | | — | | | | — | |
| Wireless Telecommunication Services | | | 7,043 | | | | 7,043 | | | | — | | | | — | |
| Total Investments, at value | | $ | 2,500,787 | | | $ | 2,500,787 | | | $ | — | | | $ | — | |
| BUYN | | | | | | | | | | | | |
| | | | | | | | | | | | | |
| Investments, at value | | Total | | | Level 1 | | | Level 2 | | | Level 3 | |
| Common Stocks: | | | | | | | | | | | | | | | | |
| Auto Components | | $ | 53,110 | | | $ | 53,110 | | | $ | — | | | $ | — | |
| Chemicals | | | 41,689 | | | | 41,689 | | | | — | | | | — | |
| Construction Materials | | | 56,918 | | | | 56,918 | | | | — | | | | — | |
| Containers & Packaging | | | 88,977 | | | | 88,977 | | | | — | | | | — | |
| Energy Equipment & Services | | | 566,133 | | | | 566,133 | | | | — | | | | — | |
| Food Products | | | 271,464 | | | | 271,464 | | | | — | | | | — | |
| Machinery | | | 341,295 | | | | 341,295 | | | | — | | | | — | |
| Metals & Mining | | | 347,150 | | | | 347,150 | | | | — | | | | — | |
| Oil, Gas & Consumable Fuels | | | 679,917 | | | | 679,917 | | | | — | | | | — | |
| Paper & Forest Products | | | 168,238 | | | | 168,238 | | | | — | | | | — | |
| Total Investments, at value | | $ | 2,614,891 | | | $ | 2,614,891 | | | $ | — | | | $ | — | |
For the period ended December 31, 2017, the Funds did not have any transfers between Level 1, Level 2 and Level 3 securities.
Income
Dividend income is recorded on the ex-dividend date, as soon as information is available to the Funds. Distributions to shareholders, which are determined in accordance with income tax regulations, are also recorded on the ex-dividend date. Interest income is recorded as earned. Discounts and premiums on securities purchased are amortized over the life of the respective securities.
| 30 | Semi-Annual Report December 31, 2017 |
As of and during the period ended December 31, 2017, the Funds did not have a liability for any unrecognized tax benefits in the accompanying financial statements. The Funds file income tax returns in the U.S. federal jurisdiction and Delaware.
The Funds follow ASC 740 “Income Taxes”, which requires that the financial statements effects of a tax position taken or expected to be taken in a tax return be recognized in the financial statements when it is more likely than not, based on the technical merits, that the position will be sustained upon examination. Management has concluded that the Funds have taken no uncertain tax positions that require adjustment to the financial statements.
Federal and Other Taxes
It is the Trust’s policy to comply with the federal income and excise tax requirements of the Internal Revenue Code of 1986, as amended, applicable to regulated investment companies. Accordingly, the Funds intend to distribute substantially all of their income and net realized gains on investments, if any, to shareholders each year. Therefore, no federal income tax provision is required in the Funds’ financial statements. Under the applicable foreign tax laws, a withholding tax may be imposed on interest, dividends and capital gains at various rates.
Management has reviewed the tax positions and has concluded that no liability for unrecognized tax benefits should be recorded related to uncertain tax positions taken on returns filed for open tax years or expected to be taken with the 2017 tax returns. Each Fund’s federal tax returns for the prior three fiscal years remain subject to examination by the Internal Revenue Service.
Dividends and Distributions
Each Fund intends to pay out dividends on a quarterly basis. Nonetheless, each Fund may not make a dividend payment every quarter. Each Fund intends to distribute its net realized capital gains, if any, to investors annually. Each Fund may occasionally be required to make supplemental distributions at some other time during the year. Distributions in cash may be reinvested automatically in additional whole shares only if the broker through whom you purchased shares makes such option available. Your broker is responsible for distributing the income and capital gain distributions to you.
For federal income tax purposes, distributions of investment income are generally taxable as ordinary income or qualified dividend income to the extent of a Fund’s current and accumulated earnings and profits. Taxes on distributions of capital gains (if any) are determined by how long a Fund owned the investments that generated them, rather than how long you have owned your Fund shares. Sales of assets held by a Fund for more than one year generally result in long-term capital gains and losses, and sales of assets held by such Fund for one year or less generally result in short-term capital gains and losses. Distributions of a Fund’s net capital gain (the excess of realized net long-term capital gains over realized net short-term capital losses) that are properly reported by such Fund as capital gain dividends (“Capital Gain Dividends”) will be taxable as long-term capital gains. For noncorporate shareholders, long-term capital gains are generally subject to tax at reduced maximum rates. Distributions of short-term capital gain will be taxable as ordinary income. Distributions of investment income properly reported by a Fund as “qualified dividend income” are generally taxed to noncorporate shareholders at the same rates applicable to long-term capital gains, provided holding periods and other requirements are met by the Fund and the shareholder. Distributions in excess of a Fund’s current and accumulated earnings and profits will first be treated as a non-taxable return of capital to the extent of a shareholder’s basis in the shares, and thereafter, as gain from the sale of shares. A shareholder’s basis in its shares will be reduced by the amount of any distribution treated as a non-taxable return of capital.
In general, distributions are subject to federal income tax for the year in which they are paid. Certain distributions paid in January, however, may be treated as paid on December 31 of the prior year. Distributions are generally taxable even if they are paid from income or gains earned by a Fund before your investment (and thus were included in the price you paid for your shares).
Distributions (other than Capital Gain Dividends and dividends properly reported by us as interest-related dividends or short-term capital gain dividends) paid to individual shareholders that are neither citizens nor residents of the U.S. or to foreign entities will generally be subject to a U.S. withholding tax at the rate of 30%, unless a lower treaty rate applies.
The Trust (or financial intermediaries, such as brokers, through which shareholders own Fund shares) generally is required to withhold and remit to the U.S. Treasury a percentage of the taxable distributions and sale or redemption proceeds paid to any shareholder who fails to properly furnish a correct taxpayer identification number, who has under-reported dividend or interest income, or who fails to certify that he, she or it is not subject to such withholding. In addition, even if shareholders have provided appropriate certifications to the intermediary through which they hold shares, such withholding may apply if the intermediary is a foreign intermediary unless such foreign intermediary either enters into an agreement with the Internal Revenue Service regarding reporting or is located in a jurisdiction that has entered into an Intergovernmental Agreement with the Internal Revenue Service and such foreign intermediary is in compliance with the terms of such intergovernmental agreement and any enabling legislation or administrative actions.
Indemnification
The Trust will indemnify its officers and trustees for certain liabilities that may arise from the performance of their duties to the Trust. Additionally, in the normal course of business, the Trust enters into contracts that contain a variety of representations and warranties and which provide general indemnities. The Funds’ maximum exposure under these arrangements is unknown, as this would involve future claims that may be made against the Funds that have not yet occurred. However, the Trust expects the risk of loss due to these warranties and indemnities to be remote.
| 34 | Semi-Annual Report December 31, 2017 |
Other
The Funds follow industry practice and record security transactions on the trade date. Dividend income is recognized on the ex-dividend date, and interest income is recognized on an accrual basis. Discounts and premiums on securities purchased are amortized over the lives of the respective securities.
3) PRINCIPAL RISKS OF INVESTING IN THE FUNDS
You can lose money on your investment in a Fund. The principal risks of investing in the Funds are summarized below.
Market Risk. The trading prices of equity securities fluctuate, sometimes rapidly and unpredictably, in response to a variety of factors. These factors include events impacting the entire market or a specific market segment. The market value of portfolio holdings can be volatile and change quickly. Each Fund’s net asset value (“NAV”) and market price, like market prices generally, may fluctuate significantly. As a result, an investor could lose money over short or long periods of time, including the possible loss of the entire principal amount of an investment.
Passive Investment Risk. BUY and BUYN do not attempt to outperform SHPEI or SHPEN, as applicable, or take defensive positions in declining markets.
Correlation to Index Risk. As with all index funds, the performance of each Fund may not closely track the performance of its applicable Index for a variety of reasons. The return of each Fund or its corresponding Index may not match or achieve a high degree of correlation with the return of investments in private equity funds or direct investments in private equity.
Correlation to Private Equity Returns Risk. The return of each Fund or its corresponding Index may not match or achieve a high degree of correlation with the return of investments in private equity funds or direct investments in private equity due to assumptions in SHIM’s proprietary methodology that prove to be incorrect or asymmetries between investments in public equity versus private equity, such as the limited liquidity (or illiquidity), infrequency of valuations, and estimated valuations associated with private equity investments.
Private Equity Investing Risk. BUY seeks to generate returns that mimic the returns of U.S. private equity funds, as measured by SHPEI. Because investing in private equity often carries a high degree of risk, the returns of private equity funds may be subject to greater volatility than the returns of funds that invest in larger, more established public companies. BUYN seeks to generate returns that mimic the returns of U.S. private equity funds that focus on natural resource investments, as measured by SHPEN. Similarly, the Funds’ returns may experience greater volatility than funds that invest in larger, more established public companies. The Funds do not invest in private equity funds nor do they invest directly in private equity of companies.
Micro-, Small-, and Mid-Capitalization Risk. The securities of micro-, small-, and mid-capitalization companies may be more volatile and may involve more risk than the securities of larger companies because such smaller companies generally have a higher risk of failure. The Funds may experience difficulty in liquidating positions in smaller companies at favorable prices or times. Some securities of smaller companies may be illiquid. These risks are greater when investing in micro- and small-capitalization companies. Returns on investments in securities of smaller companies could be lower than the returns on investments in securities of larger companies.
Licensing Risk. The Funds rely on licenses that permit each Fund to use SHPEI or SHPEN, as applicable, and associated trade names and marks (the “Intellectual Property”) in connection with the name and investment strategies of the relevant Fund. Such licenses may be terminated by the licensor and, as a result, the Fund may lose its ability to use the Intellectual Property.
Industry Concentration Risk. To the extent that the Indexes are concentrated in or significantly exposed to a particular industry or sector, the Funds will be more susceptible to loss due to adverse occurrences affecting that industry or sector. In such case, each Fund will be subject to the risk that economic, political, or other conditions that have a negative impact on that industry or sector may adversely affect each Fund to a greater extent than if each Fund’s assets were invested in a wider variety of industries or sectors.
Liquidity Risk. The Funds may not always be able to liquidate its investments at the desired price or time (or at all) or at prices approximating those at which the Funds currently value them. It may be difficult for the Funds to value illiquid holdings accurately. Unexpected market illiquidity may cause major losses at any time or from time to time.
Premium or Discount to NAV Risk. As with all exchange-traded funds (“ETFs”), Fund shares may be bought and sold in the secondary market at market prices. Although it is expected that the market price of the shares of a Fund will approximate the Fund’s NAV, there may be times when the market price and the NAV vary significantly, particularly in times of market stress. Thus, an investor may pay significantly more (or less) than NAV when buying shares of a Fund in the secondary market, or receive significantly more (or less) than NAV when selling those shares in the secondary market. A premium or discount to NAV may be reflected in the spread between “bid” and “ask” prices that are quoted during the course of a trading day. If an investor purchases Fund shares at a time when the market price is at a premium to the NAV of the Fund’s shares, or sells at a time when the market price is at a discount to the NAV of the Fund’s shares, an investor may sustain losses.
| 36 | Semi-Annual Report December 31, 2017 |
Fluctuation of NAV Risk. The market prices of each Fund’s shares will generally fluctuate in accordance with changes in NAV as well as the relative supply of and demand for each Fund’s shares on NYSE Arca. The Adviser cannot predict whether each Fund’s shares will trade below, at, or above NAV.
Secondary Market Risk. Although each Fund’s shares are listed for trading on NYSE Arca and may be listed or traded on U.S. and non-U.S. stock exchanges other than NYSE Arca, there can be no assurance that an active trading market for such shares will develop or be maintained. Investors buying or selling Fund shares in the secondary market will pay brokerage commissions or other charges imposed by brokers and will incur the cost of the difference between “bid” and “ask” prices of the Fund’s shares.
New Fund Risk. As new funds, there can be no assurance that the Funds will grow to or maintain an economically viable size.
Newly Created Index Risk. SHPEI and SHPEN are newly created and have a limited history of performance. As such, it is uncertain how closely SHPEI and SHPEN may be able to track the performance of an actual portfolio of the constituent securities that comprise the applicable index.
New Sub-Adviser Risk. Although the principals of the Sub-Adviser (as defined below) and the portfolio managers of the Funds have experience managing investments in the past, the Sub-Adviser is a newly-registered investment adviser and has no previous experience managing investments for an ETF or any other investment company, which may limit the Sub-Adviser’s effectiveness.
4) INVESTMENT ADVISORY AND OTHER AGREEMENTS
Investment Adviser
The Adviser serves as investment adviser to each Fund pursuant to an investment advisory agreement between the Trust and the Adviser (the “Advisory Agreement”). The Sub-Adviser serves as the sub-adviser to each Fund pursuant to a sub-advisory agreement between the Adviser and the Sub-Adviser (the “Sub-Advisory Agreement”).
The Advisory Agreement and the Sub-Advisory Agreement were approved by the Board at the September 22, 2017 meeting of the Board.
Management Fees
Each Fund pays the Adviser a unitary management fee as compensation for its services and its assumption of Fund expenses. The Adviser is responsible for all expenses of the Fund except expenses for taxes and governmental fees; brokerage fees; commissions and other transaction expenses; costs of borrowing money, including interest expenses; securities lending expenses; extraordinary expenses (such as litigation and indemnification expenses); and fees and expenses of any independent legal counsel. The Adviser may voluntarily waive any portion of its management fee from time to time, and may discontinue or modify any such voluntary limitations in the future at its discretion. The following table lists the total management fee paid by each Fund.
| Fund | | Management Fee | |
| BUY | | | 0.95 | % |
| BUYN | | | 0.95 | % |
The Sub-Adviser receives a management fee equal to a percentage of the Fund’s average daily net assets for the services it provides to each Fund. The Sub-Adviser’s fees are calculated daily and paid monthly by the Adviser out of its management fees. The following table lists the sub-advisory fees paid to the Sub-Adviser.
| Fund | | Sub-Advisory Fee | |
| BUY | | | 0.06 | % |
| BUYN | | | 0.06 | % |
The Adviser and the Sub-Adviser (subject to the Adviser’s oversight) supervise and manage the investment portfolio of each Fund and direct the purchase and sale of each Fund’s investments.
Administrator, Custodian and Transfer Agent
Brown Brothers Harriman & Company (“BBH”) serves as the administrator, custodian and transfer agent for the Funds. Under the Administrative Agency Agreement with the Trust, BBH performs certain administrative, accounting, transfer agency and dividend disbursing services for the Funds and prepares certain reports filed with the U.S. Securities and Exchange Commission (“SEC”) on behalf of the Trust and the Funds. Under the Custodian Agreement with the Trust, BBH maintains in separate accounts: cash, securities and other assets of the Funds; keeps all necessary accounts and records, and provides other services. BBH is required, upon the order of the Trust, to deliver securities held by BBH and to make payments for securities purchased by the Trust for the Funds. As compensation for the foregoing services, BBH receives certain out-of-pocket costs, transaction fees, and asset-based fees, which are charged to the Funds.
| 38 | Semi-Annual Report December 31, 2017 |
Buying and Selling Fund Shares
The Funds are Exchange Traded Funds. This means that shares of the Funds may only be purchased and sold on a national securities exchange, such as NYSE Arca, through a broker-dealer. The price of the Fund’s shares is based on market price. Because Fund shares trade at market prices rather than NAV, shares may trade at a price greater than NAV (premium) or less than NAV (discount).
Each Fund issues and redeems shares at NAV only in large blocks of shares (“Creation Baskets” and “Redemption Baskets,” respectively), which only certain institutions or large investors (typically, market makers or other broker-dealers) that have entered into an agreement with ALPS Distributors, Inc. (the “Distributor”) may purchase or redeem. Such institutions and large investors are referred to herein as “Authorized Participants” or “APs.” Currently, Creation Baskets and Redemption Baskets generally consist of 50,000 shares, though this may change from time to time. Authorized Participants are required to pay a transaction fee of $350 to compensate the Fund for brokerage and transaction expenses when purchasing Creation Baskets or redeeming Redemption Baskets.
The Funds generally issue and redeem Creation Baskets and Redemption Baskets in exchange for a portfolio of securities closely approximating the holdings of the Fund and/or a designated amount of cash. To the extent that an Authorized Participant purchases a Creation Basket with cash or redeems a Redemption Basket for cash, the Authorized Participant will be subject to an additional charge no greater than 5.0%.
Distributor
ALPS Distributors, Inc., 1290 Broadway, Suite 1100, Denver, CO 80203, serves as the distributor of Creation Baskets and Redemption Baskets for the Funds on an agency basis. The Distributor does not maintain a secondary market in shares.
ALPS Distributors, Inc. (the “Distributor”) is the distributor of the Trust. The Distributor has entered into a Distribution Agreement with the Trust pursuant to which it distributes shares of the Funds in Creation Basket aggregations. The Distributor is a broker-dealer registered under the Securities Exchange Act of 1934, as amended, and a member of the Financial Industry Regulatory Authority. Fees under the Distribution Agreement are paid by the Adviser. The Adviser may, from time to time and from its own resources, make other distribution-related payments to the Distributor or other persons.
Licensing Agreement
SummerHaven Index Management, LLC (“SHIM”), an affiliate of the Funds, owns and maintains SHPEI and SHPEN (collectively, the “Indexes”). The Adviser and SHIM have entered into a licensing agreement (the “Licensing Agreement”) for the Trust’s use of the Indexes, for which the Adviser pays SHIM a licensing fee. The licensing fee is separate from the fees paid to the Sub-Adviser for sub-advisory services provided to the Funds.
Investors cannot be assured of the continuation of the licensing agreement between SHIM and the Adviser for use of the Indexes. Should the agreement between SHIM and the Adviser be terminated, the Adviser and the Board will consider available alternatives, including finding replacement indexes or liquidating the Funds. Termination of the licensing agreement may have an adverse effect on the performance and NAV of the Funds’ shares.
5) INVESTMENT TRANSACTIONS – PURCHASES AND SALES
During the period ended December 31, 2017, the aggregate cost of purchases and proceeds from sales of investments (excluding short-term investments and in-kind transactions) were as follows:
| Fund* | | Purchases | | | Sales | |
| BUY | | $ | 8,232 | | | $ | 10,652 | |
| BUYN | | $ | 1,258 | | | $ | 1,495 | |
* Inception date, November 30, 2017.
6) DISTRIBUTIONS AND TAXES
It is the policy of the Funds to qualify as regulated investment companies by complying with the requirements of the Internal Revenue Code of 1986, as amended, applicable to regulated investment companies and by distributing substantially all of their earnings to shareholders. Therefore, no federal income tax provision is required.
Income distributions and capital gain distributions are determined in accordance with tax regulations, which may differ from GAAP.
7) BENEFICIAL OWNERSHIP
Certain owners of the Adviser are also owners and/or trustees of the Funds. These individuals may receive benefits from any management fees paid to the Adviser.
| 40 | Semi-Annual Report December 31, 2017 |
8) TRUSTEE FEES
The Trust compensates each Trustee who is not an “interested person” of the Trust as defined in the 1940 Act. The Adviser, as a result of each Fund’s unitary management fee, pays for such compensation. The Trustees who are “interested persons” of the Trust do not receive any Trustees’ fees.
9) SUBSEQUENT EVENTS
The Funds have evaluated the need for disclosure and/or adjustments resulting from subsequent events through the date the financial statements were issued. Based on this evaluation, no adjustments were required to the financial statements.
10) QUARTERLY PORTFOLIO HOLDINGS INFORMATION
The Funds file their complete schedule of portfolio holdings with the SEC for the first and third quarters of each fiscal year on Form N-Q within 60 days after the end of the period. Copies of the Funds’ Form N-Q are available without charge, upon request, by contacting the Funds at 1.800.920.0259 and on the SEC’s website at www.sec.gov. You may also receive a copy of Form N-Q, after paying a duplicating fee, by electronic request at the following e-mail address: publicinfo@sec.gov, or by writing to the SEC’s Public Reference Section, Washington, D.C. 20549-1520.
APPROVAL OF INVESTMENT ADVISORY AGREEMENTS
Approval of the Investment Advisory Agreement Appointing USCF Advisers LLC (the “Adviser”) the Adviser as Investment Adviser to the Funds
In considering the approval of the Investment Advisory Agreement between the Trust and the Adviser on behalf of the Funds, the Board took into account all the materials provided prior to and during the meeting of the Board on September 22, 2017 (the “Meeting”), the presentations made during the Meeting, and the comprehensive discussions during the Meeting. In its consideration of the Investment Advisory Agreement, the Board—including the Trustees who are not interested persons of the Trust (the “Independent Trustees”), as the term “interested person” is defined in Section 2(a)(19) of the 1940 Act—did not identify any single factor as all-important or controlling.
Nature, Extent, and Quality of Services. The Board examined the nature, extent, and quality of the services to be provided by the Adviser to the Funds under the Investment Advisory Agreement. The Board considered the written information provided to the Board prior to and during the Meeting, including information provided by the Adviser in response to the Board’s requests for information. The Board also considered the presentation given by the Adviser at the Meeting, during which the Adviser discussed its business and the proposed operations of the Funds. The Board took into account the Adviser’s investment management process; the Adviser’s experience advising other series of the Trust; the experience and capability of the Adviser’s senior management and other key personnel, including the proposed portfolio manager for each Fund from the Adviser; the Adviser’s overall financial strength; and the quality of the Adviser’s compliance program. In addition to investment management services, the Board also considered the nature, extent, and quality of administrative, compliance, and legal services that would be provided by the Adviser to the Funds under the Investment Advisory Agreement and other agreements. The Board concluded that the nature, extent, and quality of the services to be provided by the Adviser under the Investment Advisory Agreement would benefit the Funds and the future shareholders of the Funds.
Investment Performance. With respect to performance, the Funds did not have a history of operations at the time of the Meeting for the Board to consider. In the future, the Board intends to review the performance of the Funds from several perspectives as part of the Board’s deliberations in connection with Section 15(c) of the 1940 Act. In particular, the Board will consider how well each Fund achieved its stated objectives. In addition, the Board plans to compare each Fund’s performance with other funds with similar investment objectives and policies but with different advisers. The Board also plans to compare the performance of each Fund with appropriate market indices and published fund averages.
| 42 | Semi-Annual Report December 31, 2017 |
Fees and Expenses. The Board reviewed the proposed advisory fee schedule for the Funds. The Board compared the proposed advisory fee to the advisory fee of other funds managed by the Adviser and other funds with similar investment strategies managed by other advisers. The Board discussed that the proposed fee is a unitary fee and would cover the Adviser’s and the Sub-Adviser’s management fees as well as other Fund expenses. The Board also discussed the differences between a unitary fee structure and an expense limitation agreement and how unitary fee arrangements are more and more common in the ETF space. In addition, it was noted by the Board that distribution-related costs would be paid from the Adviser’s (or the Sub-Adviser’s) own profits, as well as the costs related to the Licensing Agreement between the Adviser and SHIM, an affiliate of the Sub-Adviser, authorizing the Adviser’s use of certain names and marks, and other commodity indexes owned, calculated, maintained, and/or published by SHIM. The Board also confirmed that certain consulting costs associated with the research by Mr. Stafford of Harvard Business School for SHPEI and SHPEN would be paid by the Sub-Adviser from its own profits. After further discussion, the Board concluded that each Fund’s proposed advisory fee, as well as the overall projected expense ratio, was acceptable considering the quality of the services the Funds expect to receive from the Adviser and Sub-Adviser and the level of fees paid by similar funds.
Economies of Scale. The Board considered whether there would be economies of scale with respect to the management of the Funds. It was the consensus of the Board that since the Funds had not yet begun operations, and based on the anticipated size of the Funds for the initial two-year term of the Investment Advisory Agreement, economies of scale was not a relevant consideration at the time of the Meeting.
Profitability. The Board considered the anticipated profits to be realized by the Adviser in connection with the operation of each Fund, and whether the amount of profit would be a fair entrepreneurial profit for the management of each Fund. The Board also considered the estimated operating expenses of the Funds, and how the Funds’ operating expenses would impact the Adviser’s profitability in light of the proposed unitary fee structures. The Board concluded that the Adviser’s expected level of profitability from its relationship with each Fund was not excessive.
Collateral Benefits. The Board considered whether the Adviser or its affiliates may receive other benefits as a result of the Adviser’s proposed relationship with the Funds. The Board considered that the Adviser was not affiliated with any of the proposed service providers of the Funds, and therefore would not benefit from those contractual relationships. The Board also considered portfolio trading practices, noting that the Adviser was not affiliated with any broker-dealer that would execute portfolio transactions on behalf of the Funds and would not receive the benefit of research provided by any such broker-dealer. The Board noted that the Funds’ relationship with the Adviser would likely help the Funds enter into service agreements on more favorable terms than would otherwise be available. As such, the Board concluded that the Adviser and its affiliates would not receive collateral benefits that would materially affect the reasonableness of the proposed advisory fees under the Investment Advisory Agreement.
Conclusion. Having requested and received such information from the Adviser as the Board believed to be reasonably necessary to evaluate the terms of the proposed Investment Advisory Agreement, the Board, including the Independent Trustees, concluded that the advisory fee is reasonable and, in light of the matters that the Trustees have considered to be relevant in the exercise of their reasonable judgment, approved the Investment Advisory Agreement.
Approval of the Sub-Advisory Agreement for the Funds Appointing SummerHaven as the Sub-Adviser
In considering the approval of the Sub-Advisory Agreement between the Adviser and the Sub-Adviser on behalf of the Funds, the Board took into account all the materials provided prior to and during the Meeting, the presentations made during the Meeting, and the comprehensive discussions during the Meeting. In its consideration of the Sub-Advisory Agreement, the Board, including the Independent Trustees, did not identify any single factor as all-important or controlling.
Nature, Extent, and Quality of Services. The Board examined the nature, extent, and quality of the services to be provided by the Sub-Adviser to the Funds under the Sub-Advisory Agreement. The Board considered the written information provided to the Board prior to and during the Meeting, including information provided by the Sub-Adviser in response to the Board’s requests for information. The Board considered the investment advisory and other services to be provided to the Funds by the Sub-Adviser; the Sub-Adviser’s business operations; the Sub-Adviser’s experience advising funds affiliated with the Trust and other accounts; the experience and capability of the Sub-Adviser’s senior management and other key personnel, including the proposed portfolio managers for each Fund from the Sub-Adviser; the Sub-Adviser’s overall financial strength; and the quality of the Sub-Adviser’s compliance program. The Board noted that the Sub-Adviser was newly registered as an investment adviser with the SEC, but noted that the Sub-Adviser had substantial experience as a commodity pool operator. The Board concluded that the nature, extent, and quality of the services provided by the Sub-Adviser under the Sub-Advisory Agreement would benefit each Fund and each Fund’s future shareholders.
Investment Performance. With respect to performance, the Funds did not have a history of operations at the time of the Meeting for the Board to consider. Nonetheless, the Board noted that the Sub-Adviser would be primarily responsible for the day-to-day management of the Fund and its investment performance. As such, the Board considered the manner in which the Sub-Adviser proposed to manage the Funds, academic literature regarding the Funds’ proposed investment approach, the background and experience of the Sub-Adviser’s portfolio managers, and the retention of Mr. Stafford of Harvard Business School (on whose work the Funds’ investment approach is based) by the Sub-Adviser to consult on the Funds’ strategies. The Board concluded that based on the experience of the Sub-Adviser and the Sub-Adviser’s proposed portfolio managers, including the extensive background of Mr. Stafford and the consulting support that he will provide, that the Sub-Adviser has a reasonable expectation of delivering acceptable performance.
| 44 | Semi-Annual Report December 31, 2017 |
Fees and Expenses. The Board reviewed the proposed fees to be paid to the Sub-Adviser for its services to the Funds. The Board compared the proposed sub-advisory fees to the fees of other accounts managed by the Sub-Adviser with similar investment strategies. The Board discussed how the Adviser’s proposed advisory fee is a unitary fee and would cover the Adviser’s and Sub-Adviser’s management fees as well as other Fund expenses. The Board again noted that any distribution-related costs would be paid from the Sub-Adviser’s (or the Adviser’s) own profits, as well as certain consulting costs associated with the research by Mr. Stafford of Harvard Business School. After extensive discussion with the Board on fees and expenses, the Board concluded that the sub-advisory fees were acceptable in light of the quality of the services the Funds expect to receive from the Sub-Adviser.
Economies of Scale. The Board considered whether there will be economies of scale in respect of the management of the Funds. It was the consensus of the Board that since the Funds had not yet begun operations, and based on the anticipated size of the Funds for the initial two-year term of the Sub-Advisory Agreement, economies of scale was not a relevant consideration at the time of the Meeting.
Profitability. The Board considered the anticipated profits to be realized by the Sub-Adviser in connection with the Sub-Advisory Agreement with respect to each Fund, and whether the amount of profit is a fair entrepreneurial profit for the management services to be provided. When evaluating the Sub-Adviser’s estimated profitability, the Board noted that the Sub-Advisory Agreement was negotiated at arms-length by the Adviser. When considering the Sub-Adviser’s estimated profitability, the Board took into account the fee to be paid by the Adviser to SHIM pursuant to the Licensing Agreement. The Board concluded that the Sub-Adviser’s expected level of profitability from its relationship with the Trust was not excessive.
Collateral Benefits. The Board considered whether the Sub-Adviser or its affiliates may receive other benefits as a result of the Sub-Adviser’s proposed relationship with the Trust. The Board acknowledged that SHIM, an affiliate of the Sub-Adviser, receives fees under the Licensing Agreement between the Adviser and SHIM, and that the Adviser relies on that agreement to use names and marks in connection with the Funds. Despite this collateral benefit for the Sub-Adviser and its affiliates arising from the Sub-Adviser’s relationship with the Trust, the Board concluded that the proposed fee to be paid to the Sub-Adviser was reasonable in relation to the nature, extent, and quality of services to be provided.
Conclusion. Having requested and received such information from the Sub-Adviser as the Board believed to be reasonably necessary to evaluate the terms of the proposed Sub-Advisory Agreement, the Board, including the Independent Trustees, concluded that the fee to be paid to the Sub-Adviser was reasonable and, in light of the matters that the Trustees have considered to be relevant in the exercise of their reasonable judgment, approved the Sub-Advisory Agreement.
Investment Adviser USCF Advisers LLC 1999 Harrison Street, Suite 1530 Oakland, California 94612 Administrator, Custodian and Transfer Agent Brown Brothers Harriman & Company 50 Post Office Square Boston, Massachusetts 02110-1548 Distributor ALPS Distributors, Inc. 1290 Broadway, Suite 1100 Denver, Colorado 80203 Independent Registered Public Accounting Firm Spicer Jeffries LLP 5251 S. Quebec Street, Suite 200 Greenwood Village, Colorado 80111 Trustees Nicholas D. Gerber Stuart P. Crumbaugh Andrew F Ngim Jeremy Henderson John D. Schwartz H. Abram Wilson Thomas Gard |
Proxy Voting Information
A description of the policies and procedures that the Adviser uses to determine how to vote proxies relating to portfolio securities of the Funds is available without charge by contacting the Funds at 1.800.920.0259, on the Funds’ website at www. uscfinvestments.com and on the SEC’s website at www. sec. gov. Information regarding how the Funds voted such proxies since inception to the period ended December 31, 2017 is also available without charge by calling the Funds and on the SEC’s website at www.sec.gov.
Premium/Discount Information
Information about the differences between the daily market price on the secondary markets for shares of the Fund and the Fund’s net asset value may be found on the Funds’ website at www. uscfinvestments.com.
ALPS Distributors, Inc.
An Investment in a Fund must be accompanied or preceded by a current prospectus which contains more information on fees, risks and expenses. Please read the prospectus carefully before investing or sending money.

ITEM 2. CODE OF ETHICS.
Not applicable to semi-annual report.
ITEM 3. AUDIT COMMITTEE FINANCIAL EXPERT.
Not applicable to semi-annual report.
ITEM 4. PRINCIPAL ACCOUNTANT FEES AND SERVICES.
Not applicable to semi-annual report.
ITEM 5. AUDIT COMMITTEE OF LISTED REGISTRANTS.
Not applicable to semi-annual report.
ITEM 6. INVESTMENTS.
| (a) | A Schedule of Investments in securities of unaffiliated issuers as of the close of the Reporting Period is included as part of the report to shareholders filed under Item 1 of this Form N-CSR. |
ITEM 7. DISCLOSURE OF PROXY VOTING POLICIES AND PROCEDURES FOR CLOSED-END MANAGEMENT INVESTMENT COMPANIES.
Not Applicable.
ITEM 8. PORTFOLIO MANAGERS OF CLOSED-END MANAGEMENT INVESTMENT COMPANIES.
Not Applicable.
ITEM 9. PURCHASES OF EQUITY SECURITIES BY CLOSED-END MANAGEMENT INVESTMENT COMPANIES AND AFFILIATED PURCHASERS.
Not Applicable.
ITEM 10. SUBMISSION OF MATTERS TO A VOTE OF SECURITY HOLDERS.
There have been no changes to the procedures by which shareholders may recommend nominees to the Registrant’s Board of Trustees that would require disclosure herein.
ITEM 11. CONTROLS AND PROCEDURES.
(a) The Registrant’s principal executive officer and principal financial officer, or persons performing similar functions, have concluded that the Registrant’s disclosure controls and procedures (as defined in Rule 30a-3(c) under the Investment Company Act of 1940, as amended (17 CFR 270.30a-3(c)) were effective, as of a date within 90 days of the filing date of this report, based on their evaluation of these disclosure controls and procedures as required by Rule 30a-3(b) under the Investment Company Act of 1940, as amended (17 CFR 270.30a-3(b)), and Rules 13a-15(b) or 15d-15(b) under the Securities Exchange Act of 1934, as amended (17 CFR 240.13a-15(b) or 240.15d-15(b)).
(b) There was no change in the Registrant’s internal control over financial reporting (as defined in Rule 30a-3(d) under the Investment Company Act of 1940, as amended (17 CFR 270.30a-3(d)), that occurred during the period covered by this report that has materially affected, or is reasonably likely to materially affect, the Registrant’s internal control over financial reporting.
ITEM 12. DISCLOSURE OF SECURITIES LENDING ACTIVITIES FOR CLOSED-END MANAGEMENT INVESTMENT COMPANIES.
Not Applicable.
ITEM 13. EXHIBITS.
(a)(1) Not applicable to semi-annual report.
(a)(2) The certifications required by Rule 30a-2(a) under the Investment Company Act of 1940, as amended, are attached hereto as Exhibit 99.CERT.
(a)(3) Not applicable.
(b) The certifications required by Rule 30a-2(b) under the Investment Company Act of 1940, as amended, are attached hereto as Exhibit 99.906.CERT.
SIGNATURES
Pursuant to the requirements of the Securities Exchange Act of 1934 and the Investment Company Act of 1940, the Registrant has duly caused this report to be signed on its behalf by the undersigned, thereunto duly authorized.
| | USCF ETF TRUST |
| | | |
| | By: | /s/ John P. Love |
| | Name: | John P. Love |
| | Title: | President |
| | | (Principal Executive Officer) |
| | | |
| | Date: | March 12, 2018 |
Pursuant to the requirements of the Securities Exchange Act of 1934 and the Investment Company Act of 1940, this report has been signed below by the following persons on behalf of the Registrant and in the capacities and on the dates indicated.
| | By: | /s/ John P. Love |
| | Name: | John P. Love |
| | Title: | President |
| | | (Principal Executive Officer) |
| | | |
| | Date: | March 12, 2018 |
| | | |
| | By: | /s/ Stuart P Crumbaugh |
| | Name: | Stuart P. Crumbaugh |
| | Title: | Chief Financial Officer |
| | | (Principal Financial Officer) |
| | | |
| | Date: | March 12, 2018 |