UNITED STATES
SECURITIES AND EXCHANGE COMMISSION
WASHINGTON, D.C. 20549
FORM N-CSR
CERTIFIED SHAREHOLDER REPORT OF REGISTERED
MANAGEMENT INVESTMENT COMPANIES
Investment Company Act File Number: 811-22930
USCF ETF TRUST
(Exact name of registrant as specified in charter)
1999 Harrison Street, Suite 1530, Oakland, California 94612
(Address of principal executive offices)(Zip code)
USCF Advisers LLC
Mr. Howard Mah
1999 Harrison Street, Suite 1530
Oakland, California 94612
(Name and address of agent for service)
Registrant’s telephone number, including area code: 510.522.9600
Date of fiscal year end: June 30
Date of reporting period: December 31, 2014
Explanatory Note: The Registrant is filing this amendment to its Form N-CSRS for the period that ended December 31, 2014, originally filed with the Securities and Exchange Commission on February 24, 2014 (Accession Number 0001193125-15-060162), to amend Item 1, “Reports to Shareholders.” The propose of this amendment to Item 1 is to supplement the Semi-Annual Report for the Stock Split Index Fund to include material inadvertently omitted.
Item 1 – Reports to Shareholders
The following is a copy of the report to shareholders pursuant to Rule 30e-1 under the Investment Company Act of 1940
(17 CFR 270.30e-1).

SEMI-ANNUAL REPORT
12.31.2014
USCF ETF TRUST
USCF ETF TRUST
TABLE OF CONTENTS
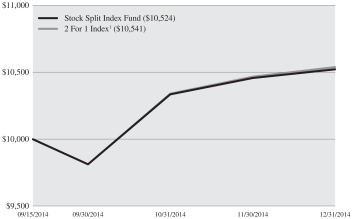
COMPARISON OF CHANGE IN VALUE OF $10,000 INVESTMENT IN THE USCF ETF TRUST – STOCK SPLIT INDEX FUND (TOFR) AND THE 2 FOR 1 INDEX. FROM SEPTEMBER 15, 2014 (INCEPTION DATE)* TO DECEMBER 31, 2014.
The following graph depicts the performance of Stock Split Index Fund vs. the 2 For 1 Index1
| | | | | | | | |
| | | Since
Inception
Return | | | Since
Inception
Date | |
Stock Split Index Fund | | | 5.24 | % | | | 9/15/2014 | |
2 For 1 Index | | | 5.41 | % | | | 9/15/2014 | |
| * | The inception date is the date the first shares were purchased to meet the outstanding shares required for listing on the NYSE Arca, Inc. TOFR was listed on the NYSE Arca, Inc. on September 16, 2014, which is referred throughout this semi-annual report as the “Listing Date”. |
| 1 | The 2 For 1 Index is an equally-weighted index, rebalanced monthly, comprised of companies listed on a U.S. stock exchange (“U.S. Exchange”), such as the New York Stock Exchange (“NYSE”) and NASDAQ Global Market, that have recently undergone a stock split of two new shares for every one existing share (or, in some cases, an exchange ratio of greater than two shares for one share). Under normal market circumstances, the Index will consist of 30 stocks. |
The performance shown represents past performance. Past performance is no guarantee of future results and current performance may be higher or lower than the performance shown. Performance figures reflect voluntary fee waivers and/or expense reimbursements. In the absence of voluntary fee waivers and/or expense reimbursements, the total return would have been lower. Principal value and investments returns will fluctuate and investors’ shares, when redeemed, may be worth more or less than the original cost.
DISCLOSURE OF FUND EXPENSES (UNAUDITED)
As a shareholder of the Stock Split Index Fund (the “Fund”), a series of the USCF ETF Trust (the “Trust”), you may incur two potential types of costs: (1) transaction costs, such as brokerage commission purchases and sales of your Fund shares, and (2) ongoing costs, including management fees and other Fund expenses. The following examples are intended to help you understand your ongoing costs (in dollars) of investing in a Fund and to compare these costs with the ongoing costs of investing in other funds. The examples are based on an investment of $1,000 invested at the beginning of the period and held for the entire period from September 15, 2014 (the Inception Date) until December 31, 2014.
Actual Return. The first line of the table below provides information about actual account values and actual expenses. You may use the information in this line, together with the amount you invested, to estimate the expenses that you paid over the period. Simply divide your account value by $1,000 (for example, $8,600 account value divided by $1,000 = 8.6), then multiply the result by the number in the first line under the heading “Expenses Paid During the Period” to estimate the expenses you paid on your account during this period.
Hypothetical 5% Return. The second line of the table below provides information about hypothetical account values and hypothetical expenses based on the Fund’s actual expense ratio and an assumed rate of return of 5% per year before expenses, which is not the Fund’s actual return. The hypothetical account values and expenses may not be used to estimate the actual ending account balance or expenses you paid for the period. You may use this information to compare ongoing costs of investing in a Fund and other exchange traded funds. To do so, compare this 5% hypothetical example with the 5% hypothetical examples that appear in the shareholder reports of the other funds.
The expenses shown in the table are meant to highlight ongoing costs only and do not reflect any transaction fees, such as brokerage commission paid on purchases and sales of Fund shares. Therefore, the second line of the table is useful in comparing ongoing costs only, and may not help you determine the relative total costs of owning different funds.
USCF ETF TRUST – STOCK SPLIT INDEX FUND
| | | | | | | | | | | | |
| | | Beginning
Account Value
9/15/14* | | | Ending
Account Value
12/31/14 | | | Expenses Paid
During Period
9/15/14 to
12/31/14(a) | |
Actual Fund Return | | $ | 1,000.00 | | | $ | 1,052.40 | | | $ | 1.65 | |
Hypothetical Fund Return (5% return before expenses) | | $ | 1,000.00 | | | $ | 1,013.05 | | | $ | 1.62 | |
| (a) | Expenses (net of fee waivers and/or expense reimbursements) are equal to each Fund’s respective annualized expense ratio multiplied by the average account value over the period, multiplied by the number of days (107 days) in the most recent fiscal half-year, then divided by 365 (to reflect the one-half year period). |
| * | Commencement of operations (Fund Inception Date), September 15, 2014. |
| | |
| 2 | | Semi-Annual Report December 31, 2014 |
USCF ETF TRUST – STOCK SPLIT INDEX FUND
Schedule of Investments (unaudited)
At December 31, 2014
| | | | | | | | | | | | |
| | | % of Total
Net Assets | | | Shares | | | Market Value | |
Common Stocks | | | 99.5 | % | | | | | | | | |
Banks | | | 6.7 | % | | | | | | | | |
Home BancShares, Inc./AR | | | 3.3 | % | | | 4,246 | | | $ | 136,551 | |
Toronto-Dominion Bank/The | | | 3.4 | % | | | 2,884 | | | | 137,798 | |
| | | | | | | | | | | | |
| | | | | | | | | | | 274,349 | |
| | | | | | | | | | | | |
Building Products | | | 3.3 | % | | | | | | | | |
AO Smith Corp. | | | 3.3 | % | | | 2,411 | | | | 136,005 | |
| | | | | | | | | | | | |
Capital Markets | | | 3.3 | % | | | | | | | | |
Franklin Resources, Inc. | | | 3.3 | % | | | 2,411 | | | | 133,497 | |
| | | | | | | | | | | | |
Chemicals | | | 10.1 | % | | | | | | | | |
Cytec Industries, Inc. | | | 3.3 | % | | | 2,926 | | | | 135,093 | |
Stepan Co. | | | 3.4 | % | | | 3,469 | | | | 139,038 | |
Tronox Ltd. - Class A | | | 3.4 | % | | | 5,830 | | | | 139,220 | |
| | | | | | | | | | | | |
| | | | | | | | | | | 413,351 | |
| | | | | | | | | | | | |
Diversified Telecommunication Services | | | 3.2 | % | | | | | | | | |
TELUS Corp. | | | 3.2 | % | | | 3,615 | | | | 130,285 | |
| | | | | | | | | | | | |
Electric Utilities | | | 3.3 | % | | | | | | | | |
ITC Holdings Corp. | | | 3.3 | % | | | 3,346 | | | | 135,279 | |
| | | | | | | | | | | | |
Electrical Equipment | | | 3.4 | % | | | | | | | | |
AZZ, Inc. | | | 3.4 | % | | | 2,922 | | | | 137,100 | |
| | | | | | | | | | | | |
Electronic Equipment, Instruments & Components | | | 3.3 | % | | | | | | | | |
Amphenol Corp. - Class A | | | 3.3 | % | | | 2,484 | | | | 133,664 | |
| | | | | | | | | | | | |
Food Products | | | 6.6 | % | | | | | | | | |
Cal-Maine Foods, Inc. | | | 3.2 | % | | | 3,352 | | | | 130,828 | |
Hain Celestial Group, Inc. (The)(a) | | | 3.4 | % | | | 2,354 | | | | 137,215 | |
| | | | | | | | | | | | |
| | | | | | | | | | | 268,043 | |
| | | | | | | | | | | | |
Health Care Equipment & Supplies | | | 3.2 | % | | | | | | | | |
West Pharmaceutical Services, Inc. | | | 3.2 | % | | | 2,465 | | | | 131,237 | |
| | | | | | | | | | | | |
Health Care Providers & Services | | | 3.3 | % | | | | | | | | |
DaVita HealthCare Partners, Inc.(a) | | | 3.3 | % | | | 1,769 | | | | 133,984 | |
| | | | | | | | | | | | |
| | | | | | | | | | | | |
| | | % of Total
Net Assets | | | Shares | | | Market Value | |
Household Products | | | 3.2 | % | | | | | | | | |
Colgate-Palmolive Co. | | | 3.2 | % | | | 1,897 | | | $ | 131,253 | |
| | | | | | | | | | | | |
Insurance | | | 9.9 | % | | | | | | | | |
Allied World Assurance Co. Holdings AG | | | 3.3 | % | | | 3,583 | | | | 135,867 | |
ProAssurance Corp. | | | 3.1 | % | | | 2,744 | | | | 123,892 | |
RLI Corp. | | | 3.5 | % | | | 2,891 | | | | 142,815 | |
| | | | | | | | | | | | |
| | | | | | | | | | | 402,574 | |
| | | | | | | | | | | | |
Machinery | | | 3.3 | % | | | | | | | | |
Mueller Industries, Inc. | | | 3.3 | % | | | 3,917 | | | | 133,726 | |
| | | | | | | | | | | | |
Oil, Gas & Consumable Fuels | | | 10.3 | % | | | | | | | | |
Holly Energy Partners LP(b) | | | 3.3 | % | | | 4,446 | | | | 132,980 | |
Magellan Midstream Partners LP(b) | | | 3.4 | % | | | 1,683 | | | | 139,116 | |
Plains All American Pipeline LP(b) | | | 3.6 | % | | | 2,840 | | | | 145,749 | |
| | | | | | | | | | | | |
| | | | | | | | | | | 417,845 | |
| | | | | | | | | | | | |
Road & Rail | | | 6.8 | % | | | | | | | | |
Canadian National Railway Co. | | | 3.4 | % | | | 2,016 | | | | 138,923 | |
Union Pacific Corp. | | | 3.4 | % | | | 1,147 | | | | 136,642 | |
| | | | | | | | | | | | |
| | | | | | | | | | | 275,565 | |
| | | | | | | | | | | | |
Software | | | 3.2 | % | | | | | | | | |
Open Text Corp. | | | 3.2 | % | | | 2,277 | | | | 132,658 | |
| | | | | | | | | | | | |
Specialty Retail | | | 3.2 | % | | | | | | | | |
Tractor Supply Co. | | | 3.2 | % | | | 1,661 | | | | 130,920 | |
| | | | | | | | | | | | |
Technology Hardware, Storage & Peripherals | | | 3.2 | % | | | | | | | | |
Apple, Inc. | | | 3.2 | % | | | 1,191 | | | | 131,463 | |
| | | | | | | | | | | | |
Textiles, Apparel & Luxury Goods | | | 3.2 | % | | | | | | | | |
Columbia Sportswear Co. | | | 3.2 | % | | | 2,939 | | | | 130,903 | |
| | | | | | | | | | | | |
Water Utilities | | | 3.5 | % | | | | | | | | |
American States Water Co. | | | 3.5 | % | | | 3,770 | | | | 141,978 | |
| | | | | | | | | | | | |
Total Common Stocks
(Cost $3,919,531) | | | 99.5 | % | | | | | | | 4,055,679 | |
| | | | | | | | | | | | |
| | |
| 4 | | Semi-Annual Report December 31, 2014 |
| | | | | | | | | | | | |
| | | % of Total
Net Assets | | | Face Amount | | | Market Value | |
Short-Term Investment | | | 0.2 | % | | | | | | | | |
Time Deposit | | | 0.2 | % | | | | | | | | |
Brown Brothers Harriman & Co.,
0.03% due 01/02/2015 | | | 0.2 | % | | $ | 6,991 | | | $ | 6,991 | |
| | | | | | | | | | | | |
Total Time Deposit
(Cost $6,991) | | | 0.2 | % | | | 6,991 | | | | 6,991 | |
| | | | | | | | | | | | |
Total Short-Term Investment
(Cost $6,991) | | | 0.2 | % | | | 6,991 | | | | 6,991 | |
| | | | | | | | | | | | |
Total Investments
(Cost $3,926,522)(c) | | | 99.7 | % | | | | | | | 4,062,670 | |
| | | | | | | | | | | | |
Other Assets in Excess of Liabilities | | | 0.3 | % | | | | | | | 10,673 | |
| | | | | | | | | | | | |
Total Net Assets | | | 100.0 | % | | | | | | $ | 4,073,343 | |
| | | | | | | | | | | | |
| (a) | Non income producing security. |
| (b) | Master Limited Partners Holding |
| (c) | The aggregate cost of investments for tax purposes was $3,926,522. The net unrealized appreciation was $136,148 which consisted of aggregate gross unrealized appreciation of $225,363 and aggregate gross unrealized depreciation of $(89,215). |
| | | | |
Summary of Investments by Country1 | | | |
United States | | | 83.2 | % |
Canada | | | 13.3 | |
Switzerland | | | 3.3 | |
Short-Term Investments | | | 0.2 | |
| | | | |
| | | 100.0 | % |
| | | | |
| 1 | As a percentage of total investments. |
USCF ETF TRUST – STOCK SPLIT INDEX FUND
Statement of Assets and Liabilities
December 31, 2014 (unaudited)*
| | | | |
Assets: | | | | |
Investments, at Market Value | | $ | 4,062,670 | |
Receivables: | | | | |
From Manager | | | 30,781 | |
Dividends | | | 12,590 | |
| | | | |
Total Assets | | | 4,106,041 | |
| | | | |
Liabilities: | | | | |
Payables: | | | | |
Accrued Management Fee | | | 1,917 | |
Accrued Tax Expense | | | 8,794 | |
Accrued Distribution (Rule 12b-1) Fee | | | 14,658 | |
Accrued Other Expenses | | | 7,329 | |
| | | | |
Total Liabilities | | | 32,698 | |
| | | | |
Total Net Assets | | $ | 4,073,343 | |
| | | | |
Net Assets Consist of: | | | | |
Capital Paid In | | $ | 3,903,497 | |
Accumulated Undistributed Net Investment Income | | | 1,338 | |
Accumulated Net Realized Gain on Investments | | | 32,360 | |
Net Unrealized Appreciation on Investments | | | 136,148 | |
| | | | |
Total Net Assets | | $ | 4,073,343 | |
| | | | |
Net Asset Value Per Share | | | | |
Total Net Assets | | $ | 4,073,343 | |
Shares of beneficial interest outstanding (unlimited shares of $0.001 par value authorized) | | | 260,000 | |
Net Asset Value | | $ | 15.67 | |
Investments, at cost | | $ | 3,926,522 | |
| * | Inception Date, September 15, 2014. |
The accompanying notes are an integral part of the financial statements.
| | |
| 6 | | Semi-Annual Report December 31, 2014 |
USCF ETF TRUST – STOCK SPLIT INDEX FUND
Statement of Operations
For the period ended December 31, 2014 (unaudited)*
| | | | |
Investment Income: | | | | |
Dividend income (less net foreign withholding tax $476) | | $ | 36,730 | |
Interest income | | | 3 | |
Other income | | | 1,400 | |
| | | | |
Total Investment Income | | | 38,133 | |
| | | | |
Expenses: | | | | |
Management Fee | | | 5,889 | |
Transfer Agent Fee | | | 8,794 | |
Distribution (Rule 12b-1) fees | | | 14,658 | |
Other Expenses | | | 7,330 | |
| | | | |
Total Expenses | | | 36,671 | |
| | | | |
Less Fees Waived (Note 3) | | | (30,782 | ) |
| | | | |
Net Expenses | | | 5,889 | |
| | | | |
Net Investment Income (Loss) | | | 32,244 | |
| | | | |
| |
Realized and Unrealized Gain (Loss) on Investments: | | | | |
Net Realized Gain (Loss) on Investments | | | 32,360 | |
Net Change in Unrealized Appreciation (Depreciation) on Investments | | | 136,148 | |
| | | | |
Net Change in Realized and Unrealized Gain (Loss) on Investments | | | 168,508 | |
| | | | |
Net Increase in Net Assets Resulting from Operations | | $ | 200,752 | |
| | | | |
| * | Inception Date, September 15, 2014. |
The accompanying notes are an integral part of the financial statements.
USCF ETF TRUST – STOCK SPLIT INDEX FUND
Statement of Changes in Net Assets
For the period ended December 31, 2014 (unaudited)*
| | | | |
Operations: | | | | |
Net Investment Income (Loss) | | $ | 32,244 | |
Net Realized Gain (Loss) on Investments | | | 32,360 | |
Net Change in Unrealized Appreciation (Depreciation) on Investments | | | 136,148 | |
| | | | |
Net Increase in Net Assets Resulting from Operations | | | 200,752 | |
| | | | |
Distributions to Shareholders from: | | | | |
Net investment income | | | (30,906 | ) |
Capital Gains | | | — | |
| | | | |
Total distributions to shareholders | | | (30,906 | ) |
| | | | |
Shareholder transactions: | | | | |
Proceeds from Shares Sold | | | 3,903,654 | |
Shares Issued as Reinvestment of Dividends and Distributions | | | — | |
Cost of Shares Redeemed | | | (100,157 | ) |
| | | | |
Net Increase in Net Assets from Shares Transactions | | | 3,803,497 | |
| | | | |
Net Increase in Net Assets | | | 3,973,343 | |
| | | | |
Net Assets: | | | | |
Beginning of period | | | 100,000 | |
| | | | |
End of period1 | | $ | 4,073,343 | |
| | | | |
1 Includes Accumulated Undistributed Net Investment Income (Loss) of: | | $ | 1,338 | |
| | | | |
Changes in Shares outstanding: | | | | |
Shares Outstanding, Beginning of Period* | | | 6,667 | |
Shares Issued | | | 260,000 | |
Shares Issued in Reinvestment of Dividends and Distributions | | | — | |
Shares Redeemed | | | (6,667 | ) |
| | | | |
Shares Outstanding, End of Period | | | 260,000 | |
| | | | |
| * | Inception Date, September 15, 2014. |
The accompanying notes are an integral part of the financial statements.
| | |
| 8 | | Semi-Annual Report December 31, 2014 |
USCF ETF TRUST – STOCK SPLIT INDEX FUND
FINANCIAL HIGHLIGHTS
Selected Data for a Share of Common Stock Outstanding Throughout the Period Indicted:
| | | | |
| | | For the Period Ended
December 31, 2014* | |
Net Asset Value, Beginning of Period | | $ | 15.00 | |
| | | | |
Income (Loss) from Operations: | | | | |
Net Investment Income(a) | | | 0.13 | |
Net realized and unrealized gain (loss) | | | 0.66 | |
| | | | |
Total Income (Loss) from operations | | | 0.79 | |
| | | | |
Less Distributions From: | | | | |
Net Investment Income | | | (0.12 | ) |
Capital Gains | | | — | |
| | | | |
Total Distributions | | | (0.12 | ) |
| | | | |
Net Asset Value, End of Period | | $ | 15.67 | |
| | | | |
Total Return(b) | | | 5.24 | % |
Net Assets, End of Period (thousands) | | $ | 4,073 | |
Ratios of Average Net Assets: | | | | |
Gross Expenses | | | 3.42 | %* |
Net Expenses | | | 0.55 | %* |
Net Investment Income | | | 3.01 | %* |
Portfolio Turnover Rate(c) | | | 18 | % |
| (a) | Per share amounts have been calculated using the average shares method. |
| (b) | Total Return may reflect fee waivers and/or expense reimbursements and assume reinvestment of dividend distribution. In the absence of fee waivers and/or expense reimbursements, the total return would have been lower. Past performance is no guarantee of future results. |
| (c) | Portfolio turnover rate is not annualized for periods less than one year and does not include securities received or delivered from processing creations or redemptions. |
| * | Inception Date, September 15, 2014. |
The accompanying notes are an integral part of the financial statements.
USCF ETF TRUST – STOCK SPLIT INDEX FUND
Notes to Financial Statements
December 31, 2014
1) ORGANIZATION
The USCF ETF Trust (the “Trust”) currently consists of one separate investment portfolio or series of the Trust, the Stock Split Index Fund (the “Fund”). The Fund is an exchange-traded fund (“ETF”) that seeks to track the price and yield performance, before fees and expenses, of the 2 For 1 Index (the “Index”). The Fund employs a “passive management” – or indexing – investment approach designed to track the performance of the Index. The Fund generally uses a replication strategy to achieve its investment objective, meaning, it generally will invest in substantially all of the securities in the Index in approximately the same proportion as the Index. Under normal market conditions, the Fund generally invests substantially all, but at least 80% of its total assets in the securities comprising the Index. In addition, the Fund may invest in cash and cash equivalents or money market instruments. The Fund commenced operations on September 15, 2014 (the “Inception Date”). The Fund was listed on the NYSE Arca, Inc. (“NYSE Arca”) on September 16, 2014 (the “Listing Date”).
The Trust was organized as a Delaware statutory trust on November 8, 2013, as amended and restated on June 16, 2014. The Trust is authorized to have multiple series or portfolios, and may establish additional series or portfolios in the future. The Trust is an open-end management investment company, registered under the Investment Company Act of 1940, as amended (the “1940 Act”). The Fund issues shares of beneficial interest with $0.001 par value.
2) SIGNIFICANT ACCOUNTING POLICIES
The accompanying financial statements were prepared in accordance with accounting principles generally accepted in the United States of America, which require the use of estimates and assumptions made by management. These may affect the reported amounts of assets and liabilities and disclosure of contingent assets and liabilities at the date of the financial statements and the reported amounts of increases and decreases in net assets from operations during the reporting period. Actual results could differ from those estimates. The following is a summary of significant accounting policies consistently followed by the Fund in preparation of its financial statements.
Basis of Presentation
The financial statements have been prepared in conformity with GAAP as detailed in the Financial Accounting Standards Board’s (“FASB”) Accounting Standards
| | |
| 10 | | Semi-Annual Report December 31, 2014 |
Codification. The Fund an investment company and follows the accounting and reporting guidance in FASB Topic 946.
Security Valuation
Investments in securities are carried at market value. All equity securities that are traded on a national securities exchange are valued at the last sale price at the time of the close of the New York Stock Exchange (NYSE). If on a particular day an exchange-listed security does not trade, then the mean between the closing bids and asked prices will be used. In the case of securities listed on more than one national securities exchange, the last quoted sale, up to the time of valuation, on the exchange on which the security is principally traded will be/is used. If there were no sales on that exchange, the last quoted sale on the other exchange will be/is used.
For securities that are traded on the NASDAQ, the NASDAQ Official Closing Price (e.g., the NASDAQ Closing Cross price, if available) is used. All non-NASDAQ equity securities that are not traded on a listed exchange are valued at the last sale price at the close of the NYSE. If a non-exchange listed security does not trade on a particular day, or if a last sales price or Official Closing Price is not available, then the mean between the closing bid and asked price will be used.
Securities having a remaining maturity of 60 days or less are valued at amortized cost, which approximates market value.
The cost of securities sold is determined on the identified cost basis. When market quotations are not readily available or when events occur that make established valuation methods unreliable, securities of the Fund may be valued at fair value determined in good faith by or under the direction of the Board of Trustees.
Security transactions are recorded on the dates the transactions are entered, which is the trade date.
Fair Value Measurement
The Fund utilizes various methods to measure the fair value of most of its investments on a recurring basis. Accounting principles general accepted in the United States establish a hierarchy that prioritizes inputs to valuation methods. The three levels of inputs are:
Level 1 – Unadjusted quoted prices in active markets for identical assets or liabilities that the Fund has the ability to access.
Level 2 – Observable inputs other than quoted prices included in Level 1 that are observable for the asset or liability, either directly or indirectly. These inputs may
include quoted prices for the identical instrument or an inactive market, prices for similar instruments, interest rates, prepayment speeds, credit risk, yield curves, default rates and similar data.
Level 3 – Unobservable inputs for the asset or liability, to the extent relevant observable inputs are not available, representing the Fund’s own assumptions about the assumptions a market participant would use in valuing the asset or liability, and would be based on the best information available.
The availability of observable inputs can vary from security to security and is affected by a wide variety of factors, including, for example, the type of security, whether the security is new and not yet established in the marketplace, the liquidity of markets, and other characteristics particular to the security. To the extent that valuation is based on models or inputs that are less observable or unobservable in the market, the determination of fair value requires more judgment. Accordingly, the degree of judgment exercised in determining fair value is greatest for instruments categorized in Level 3.
The inputs used to measure fair value may fall into different levels of the fair value hierarchy. In such cases for disclosure purposes, the level in the fair value hierarchy within which the fair value measurement falls in its entirety, is determined based on the lowest level input that is significant to the fair value measurement in its entirety.
The following table summarizes the valuation of securities at December 31, 2014 using the fair value hierarchy:
| | | | | | | | | | | | | | | | |
| Investments, at value | | Total | | | Level I | | | Level II | | | Level III | |
Common Stocks: | | | | | | | | | | | | | | | | |
Banks | | $ | 274,349 | | | $ | 274,349 | | | $ | — | | | $ | — | |
Building Products | | | 136,005 | | | | 136,005 | | | | — | | | | — | |
Capital Markets | | | 133,497 | | | | 133,497 | | | | — | | | | — | |
Chemicals | | | 413,351 | | | | 413,351 | | | | — | | | | — | |
Diversified Telecommunication Services | | | 130,285 | | | | 130,285 | | | | — | | | | — | |
Electric Utilities | | | 135,279 | | | | 135,279 | | | | — | | | | — | |
Electrical Equipment | | | 137,100 | | | | 137,100 | | | | — | | | | — | |
Electronic Equipment, Instruments & Components | | | 133,664 | | | | 133,664 | | | | — | | | | — | |
Food Products | | | 268,043 | | | | 268,043 | | | | — | | | | — | |
Health Care Equipment & Supplies | | | 131,237 | | | | 131,237 | | | | — | | | | — | |
Health Care Providers & Services | | | 133,984 | | | | 133,984 | | | | — | | | | — | |
Household Products | | | 131,253 | | | | 131,253 | | | | — | | | | — | |
Insurance | | | 402,574 | | | | 402,574 | | | | — | | | | — | |
Machinery | | | 133,726 | | | | 133,726 | | | | — | | | | — | |
| | |
| 12 | | Semi-Annual Report December 31, 2014 |
| | | | | | | | | | | | | | | | |
| Investments, at value | | Total | | | Level I | | | Level II | | | Level III | |
Oil, Gas & Consumable Fuels | | $ | 417,845 | | | $ | 417,845 | | | $ | — | | | $ | — | |
Road & Rail | | | 275,565 | | | | 275,565 | | | | — | | | | — | |
Software | | | 132,658 | | | | 132,658 | | | | — | | | | — | |
Specialty Retail | | | 130,920 | | | | 130,920 | | | | — | | | | — | |
Technology Hardware, Storage & Peripherals | | | 131,463 | | | | 131,463 | | | | — | | | | — | |
Textiles, Apparel & Luxury Goods | | | 130,903 | | | | 130,903 | | | | — | | | | — | |
Water Utilities | | | 141,978 | | | | 141,978 | | | | — | | | | — | |
Short-Term Investment: | | | | | | | | | | | | | | | | |
Time Deposit | | | 6,991 | | | | — | | | | 6,991 | | | | — | |
| | | | | | | | | | | | | | | | |
Total Investments, at value | | $ | 4,062,670 | | | $ | 4,055,679 | | | $ | 6,991 | | | $ | — | |
| | | | | | | | | | | | | | | | |
For the period ended December 31, 2014, the Fund did not have any transfers between Level 1, Level 2, and Level 3 securities.
Income
Dividend income is recorded on the ex-dividend date, as soon as information is available to the Fund. Distributions to shareholders, which are determined in accordance with income tax regulations, are also recorded on the ex-dividend date. Interest income is recorded as earned. Discounts and premiums on securities purchased are amortized over the life of the respective securities.
As of and during the period ended December 31, 2014, the Fund did not have a liability for any unrecognized tax benefits in the accompanying financial statements. The Fund files income tax returns in the U.S. federal jurisdiction and Delaware.
The Fund follows ASC 740 “Income Taxes”, which requires that the financial statements effects of a tax position taken or expected to be taken in a tax return be recognized in the financial statements when it is more likely than not, based on the technical merits, that the position will be sustained upon examination. Management has concluded that the Fund has taken no uncertain tax positions that require adjustment to the financial statements.
Federal and Other Taxes
It is the Trust’s policy to comply with the federal income and excise tax requirements of the Internal Revenue Code of 1986, as amended, applicable to regulated investment companies. Accordingly, each Fund intends to distribute substantially all of its income and net realized gains on investments, if any, to shareholders each year. Therefore, no federal income tax provision is required in the Funds’ financial statements. Under the
applicable foreign tax laws, a withholding tax may be imposed on interest, dividends and capital gains at various rates.
Management has reviewed the tax positions and has concluded that no liability for unrecognized tax benefits should be recorded related to uncertain tax positions taken on returns filed for open tax years or expected to be taken in 2014 tax returns. Each Fund’s federal tax returns for the prior three fiscal years remain subject to examination by the Internal Revenue Service.
Dividends and Distributions
Dividends and distributions to shareholders are paid on a quarterly basis, with the exception of the quarter ended September 30, 2014, which was suspended due to the Fund beginning operations on September 15, 2014 (Inception Date). Dividends and distributions are recorded on the ex-dividend date. Income dividends and capital gains distributions are determined in accordance with federal tax regulations and may differ from those determined in accordance with U.S. GAAP. To the extent these differences are permanent, such amounts are reclassified within the capital accounts based on their federal tax basis treatment; temporary differences do not require such reclassification.
Indemnification
The Trust will indemnify its officers and trustees for certain liabilities that may arise from the performance of their duties to the Trust. Additionally, in the normal course of business, the Trust enters into contracts that contain a variety of representations and warranties and which provide general indemnities. The Fund’s maximum exposure under these arrangements is unknown, as this would involve future claims that may be made against the Fund that have not yet occurred. However, the Trust expects the risk of loss due to these warranties and indemnities to be remote.
Other
The Fund follows industry practice and records security transactions on the trade date. Dividend income is recognized on the ex-dividend date, and interest income is recognized on an accrual basis. Discounts and premiums on securities purchased are amortized over the lives of the respective securities.
| | |
| 14 | | Semi-Annual Report December 31, 2014 |
3) INVESTMENT ADVISORY AND OTHER AGREEMENTS
Investment Adviser
USCF Advisers LLC (the “Adviser”) is the investment adviser to the Fund and as such has overall responsibility for the general management and administration of the Trust. Pursuant to the Investment Advisory Agreement, the Adviser provides an investment program for the Fund and manages the investment of its assets.
The Adviser has arranged for custody, distribution, fund administration, transfer agency and all other non-distribution related services necessary for the Fund to operate. The Adviser bears all of its own costs associated with providing these advisory services and the expenses of the members of the Board of Trustees who are affiliated with the Adviser. The Adviser may make payments from its own resources to broker-dealers and other financial institutions in connection with the sale of Fund shares. As compensation for its services and its assumption of certain expenses, the Fund pays the Adviser a management fee, which is calculated daily and paid monthly, equal to 0.55% of the Fund average daily net assets. For the period ended December 31, 2014, the Adviser earned $5,888.81.
The Adviser has entered into an Expense Limitation Agreement with the Fund under which it has agreed to waive or reduce its fees and to assume other expenses of the Fund, if necessary, in an amount that limits Total Annual Fund Operating Expenses (exclusive of interest, taxes, brokerage commissions and other expenses that are capitalized in accordance with generally accepted accounting principles, dividend, interest and brokerage expenses paid, acquired fund fees and expenses, if any, extraordinary expenses, if any, and payments, if any, under the Rule 12b-1 Plan) to not more than 0.55% of the average daily net assets for the Fund for the period from September 15, 2014 until December 31, 2015.
Administrator, Custodian and Transfer Agent
Brown Brothers Harriman & Company (“BBH”), serves as the administrator, custodian and transfer agent for the Fund. Under the Administrative Agency Agreement with the Trust, BBH performs certain administrative, accounting, transfer agency and dividend disbursing services for the Fund and prepares certain SEC reports on behalf of the Trust and the Fund. Under the Custodian Agreement with the Trust, BBH maintains in separate accounts: cash, securities and other assets of the Fund; keeps all necessary accounts and records, and provides other services. BBH is required, upon the order of the Trust, to deliver securities held by BBH and to make payments for securities purchased by the Trust for the Fund. As compensation for the foregoing services, BBH receives certain out-of-pocket costs, transaction fees, and asset-based fees, which are paid by the Fund.
Distributor
ALPS Distributors, Inc. (the “Distributor”) is the distributor of Creation Units of shares of the Trust. The Distributor has entered into a Distribution Agreement with the Trust pursuant to which it distributes shares of the Fund in creation basket aggregations. The Distributor is a broker-dealer registered under the Securities Exchange Act of 1934 and a member of the Financial Industry Regulatory Authority (“FINRA”). Fees under the Distribution Agreement are also paid by the Fund. The Adviser may, from time to time and from its own resources, make other distribution-related payments to the Distributor or other persons.
Licensing Agreement
The Index Provider for the Fund is Neil Macneale, Inc. (the “Index Provider”). The Index Provider is not affiliated with the Fund, the Trust, the Adviser or the Distributor. The Adviser has entered into a license agreement with the Index Provider to use the Index. Fees under the Licensing Agreement are paid by the Fund.
4) INVESTMENT TRANSACTIONS – PURCHASES AND SALES
During the period ended December 31, 2014, the aggregate cost of purchases and proceeds from sales of investments (excluding short-term investments) were $4,578,838 and $691,667, respectively.
5) CAPITAL
Shares are issued and redeemed by the Trust only in Creation Baskets and Redemption Baskets in blocks of 20,000 shares or multiples thereof at net asset value. Such transactions are generally permitted on an in-kind basis, with a balancing cash component to equate the transaction to the net asset value per share of the Fund on the transaction date. An investor who wishes to create a Creation Basket or redeem a Redemption Basket at net asset value is subject to a standard transaction fee of $350 on the date of such creation or redemption, regardless of the number of Creation Baskets or Redemption Baskets created or redeemed on that day.
6) DISTRIBUTIONS AND TAXES
It is the Fund’s policy to qualify as a regulated investment company by complying with the requirements of the Internal Revenue Code of 1986, as amended, applicable to regulated investment companies and by distributing substantially all of its earnings to shareholders. Therefore, no federal income tax provision is required.
Income distributions and capital gain distributions are determined in accordance with tax regulations, which may differ from generally accepted accounting principles.
| | |
| 16 | | Semi-Annual Report December 31, 2014 |
7) BENEFICIAL OWNERSHIP
Certain owners of the Adviser are also owners and/or trustees of the Fund. These individuals may receive benefits from any management fees paid to the Adviser.
Shareholders holding more than 5% of the Fund’s outstanding shares as of December 31, 2014 constituted 83.9% of the Fund. As of December 31, 2014, there was no beneficial ownership, either directly or indirectly, of more than 25% of the voting securities of the Fund which would create a presumption of control of the Fund, under Section 2(a)(9) of the 1940 Act.
8) TRUSTEES FEES
The Trust compensates each Trustee who is not an employee of the Adviser. Total Trustees’ fees are allocated to the Fund. Prior to the Fund’s commencement of operations, no payments were made to the Trustees during the organization of the Fund. Such payments were made as part of the organization and offering costs of the Fund, which were borne by the Adviser.
9) CASH MANAGEMENT TRANSACTIONS
The Fund subscribes to BBH Cash Management Service (“CMS”). The BBH CMS is an investment product that automatically sweeps the Fund’s cash balances into overnight offshore time deposits with either BBH Grand Cayman branch or branches of pre-approved world class commercial banks. This fully automated program allows the Fund to earn interest on cash balances.
Excess cash invested with deposit institutions domiciled outside of the United States, as with any offshore deposit, may be subject to sovereign actions in the jurisdiction including, but not limited to, freeze, seizure, or diminution. The Fund bears the risk associated with the repayment of principal and payment of interest on such instruments by the institution with which the deposit is ultimately placed. Balances in the BBH CMS are accounted for on a cost basis, which approximates market value.
10) SUBSEQUENT EVENTS
The Fund has evaluated the need for disclosure and/or adjustments resulting from subsequent events through the date the financial statements were issued. Based on this evaluation, no adjustments were required to the financial statements.
11) PORTFOLIO HOLDINGS (unaudited)
The Fund files its complete schedule of portfolio holdings with the Securities and Exchange Commission (the “Commission”) for the first and third quarters of each fiscal year on Form N-Q within 60 days after the end of the period. Copies of the Fund’s Form N-Q are available without charge, upon request, by contacting the Fund at 1.866.909.9473 and on the Commission’s website at www.sec.gov. You may also review and copy Form N-Q may be obtained, after paying a duplicating fee, by electronic request at the following e-mail address: publicinfo@sec.gov, or by writing the Commission’s Public Reference Section, Washington, D.C. 20549-1520.
| | |
| 18 | | Semi-Annual Report December 31, 2014 |
APPROVAL OF INVESTMENT ADVISORY AGREEMENT
At an “in-person” meeting held on June 9-10, 2014 (the “Meeting”) in San Francisco, CA, the Board of Trustees (the “Board”) of USCF ETF Trust (the “Trust”), including the trustees who are not “interested persons” of the Trust as defined in Section 2(a)(19) of the Investment Company Act of 1940, as amended (the “Independent Trustees”), discussed issues pertaining to the proposed approval of the investment advisory agreement (the “Advisory Agreement”) between the Trust, on behalf of the Stock Split Index Fund (the “Fund”), and USCF Advisers LLC (the “Adviser”) with representatives from the Adviser and with legal counsel. This information formed the primary basis for the Board’s determinations. During the Meeting, the Board received an oral presentation giving an overview of the Adviser and the biographical experience of the principals and portfolio managers, and reviewed a memorandum from legal counsel that detailed the duties and responsibilities of the Trustees with respect to their consideration of the Advisory Agreement. The Board also considered and reviewed the advisory agreement materials distributed in advance of, and during, the Meeting, including the Advisory Agreement and Expense Limitation Agreement and an analysis that provided expense ratio information in comparison to peer registered investment companies.
The Board, including a majority of the Independent Trustees, determined that approval of the Advisory Agreement was in the best interests of the Fund. In reaching this decision, the Board considered all factors it believed relevant, including (1) the nature and quality of the services; (2) the cost to the Adviser of providing the services and, accordingly, the profitability of the services to the Adviser; (3) the extent to which the Adviser realizes economies of scale as the Fund grows larger; (4) “fall-out” benefits from non-Fund business realized by the Adviser or its affiliates in connection with its activities on behalf of the Fund (such as sales of non-Fund products by the Adviser’s affiliates); (5) comparative fee structures of other advisers; and (6) the trustees’ process in evaluating the fee structure. The Board, including the Independent Trustees, did not identify any single factor or group of factors as all important or controlling and considered all factors together.
With respect to the nature and quality of the services to be provided by the Adviser under the Advisory Agreement, the Board considered and reviewed information concerning the services proposed to be provided under the Advisory Agreement, the proposed investment objective of the index for the Fund, information describing the Adviser’s current organization and the background and experience of the Adviser’s management persons. The Board also considered the performance history of the 2 for 1 Index, which is the index that the Fund tracks. Based upon their review, the Board concluded that the Adviser was qualified to manage the Fund and oversee the services to be provided by other service providers and that the services to be provided by the Adviser to the Fund were expected to be satisfactory.
With respect to the costs of services to be provided and profits to be realized by the Adviser, the Board considered the resources involved in managing the Fund as well as the fee structure in place for the Fund. The Board noted that because the Fund was newly organized, the Adviser represented that profitability information was not yet determinable. However, based upon the fee structure in place for the Fund, the Board understood that the Adviser did not expect to profit from the Fund for approximately twenty-four months after the Fund’s launch. The Board considered that the Adviser would cover many of the start-up costs associated with the Fund.
The Board also reviewed information provided by the Adviser showing the proposed advisory fee for the Fund as compared to those of a peer group of ETFs provided by the Adviser. The Board noted the services to be provided by the Adviser for the annual advisory fee of 0.55% of the Fund’s average daily net assets. The Board also concluded that the Fund had an expense limitation agreement in place with the Adviser so that for the contracted period the Fund cannot pay more in expenses than 0.55% of the Fund’s average daily net assets. The Board noted that the expense limitation does not cover interest, taxes, brokerage commissions, expenses related to shorts sales, other expenditures which are capitalized in accordance with generally accepted accounting principles, other extraordinary expenses not incurred in the ordinary course of business, and amounts, if any, payable pursuant to a plan adopted in accordance with Rule 12b-1 under the Investment Company Act of 1940, as amended. The Board considered that the Fund’s expense ratio was expected to be within a range of the expense ratios of the peer group of ETFs provided by the Adviser. The Board concluded that the Fund’s advisory fee was reasonable given the nature, extent and anticipated quality of the services to be provided under the Advisory Agreement and the fee structure that would be in place.
The Board considered the extent to which economies of scale would be realized as the Fund grows and whether fee levels reflect a reasonable sharing of such economies of scale for the benefit of Fund investors. Because the Fund was newly organized, the Board determined to review economies of scale in the future when the Fund had attracted assets.
Given all the information available to it and considering all material factors, the Board concluded that the Advisory Agreement was fair and reasonable and it was unanimously approved.
| | |
| 20 | | Semi-Annual Report December 31, 2014 |
Investment Adviser
USCF Advisers LLC
1999 Harrison Street, Suite 1530
Oakland, California 94612
Administrator, Custodian and Transfer Agent
Brown Brothers Harriman & Company
50 Post Office Square
Boston, Massachusetts 02110-1548
Distributor
ALPS Distributors, Inc.
1290 Broadway, Suite 1100
Denver, Colorado 80203
Independent Registered Public Accounting Firm
Spicer Jeffries LLP
Greenwood, Colorado
Trustees
Stuart P. Crumbaugh
Nicholas D. Gerber
Jeremy Henderson
Howard Mah
Andrew F. Ngim
John D. Schwartz
H. Abram Wilson
A description of the policies and procedures that the Adviser uses to determine how to vote proxies relating to portfolio securities of the Fund is available without charge by calling 1.866.909.9473 and by the Commission’s website at www.sec.gov. Information regarding how the Fund voted such proxies during the period of Inception Date to the period ended December 31, 2014 is also available without charge on the Commission’s website at www.sec.gov.
ALPS Distributors, Inc.
Must be accompanied or preceded by a current prospectus which contains more information on fees, risks and expenses. Please read the prospectus carefully before investing or sending money.
Item 2. Code of Ethics
Not applicable to semi-annual report.
Item 3. Audit Committee Financial Expert.
Not applicable to semi-annual report.
Item 4. Principal Accountant Fees and Services.
Not applicable to semi-annual report.
Item 5. Audit Committee of Listed Registrants.
Not applicable to registrants who are not listed issuers (as defined in Rule 10A-3 under the Securities Exchange Act of 1934).
Item 6. Schedule of Investments
Schedule of Investments as of December 31, 2014, is included as part of the report to shareholders filed under Item 1 of this form.
Item 7. Disclosure of Proxy Voting Policies and Procedures for Closed-End Management Investment Companies.
Not applicable.
Item 8. Portfolio Managers of Closed-End Management Investment Companies.
Not applicable.
Item 9. Purchases of Equity Securities by Closed-End Management Investment Company and Affiliated Purchasers.
Not applicable.
Item 10. Submission of Matters to Vote of Security Holders.
None.
Item 11. Controls and Procedures.
| | (a) | the registrant’s principal executive officer and principal financial officer have concluded that the Registrant’s disclosure controls and procedures (as defined in Rule 30a-3(c) under the Investment Company Act of 1940, as amended) are effective based on their evaluation of these controls and procedures as of a date within 90 days of the filing date of this document. |
| | (b) | There was no change in the registrant’s internal control over financial reporting (as defined in Rule 30a-3(d) under the Investment Company Act of 1940, as amended) during the period covered by this report that has material affected, or is reasonably likely to materially affect, the registrant’s internal control over financial reporting. |
Item 12. Exhibits.
(a)(1) Not applicable to semi-annual report.
(a)(2) The certification required by Rule 30a-2(a) under the Investment Company Act of 1940 is attached hereto as Exhibit 99.
(a)(3) Not applicable.
(b) The certification required by Rule 30a-2(b) under the Investment Company Act of 1940 is attached as Exhibit 99.1.
SIGNATURES
Pursuant to the requirements of the Securities Exchange Act of 1934 and the Investment Company Act of 1940, the registrant has duly caused this report to be signed on its behalf by the undersigned, thereunto duly authorized.
| | |
| USCF ETF TRUST |
| |
| By: | | /s/ Nicholas D. Gerber |
| Title: | | President |
| | (Principal Executive Officer) |
| Date: | | March 4, 2015 |
Pursuant to the requirements of the Securities Exchange Act of 1934 and the Investment Company Act of 1940, this report has been signed below by the following persons on behalf of the registrant and in the capacities and on the dates indicated.
| | |
| By: | | /s/ Nicholas D. Gerber |
| Title: | | President |
| | (Principal Executive Officer) |
| |
| Date: | | March 4, 2015 |
| |
| By: | | /s/ Howard Mah |
| Title: | | Principal Financial Officer |
| |
| Date: | | March 4, 2015 |