UNITED STATES
SECURITIES AND EXCHANGE COMMISSION
WASHINGTON, D.C. 20549
FORM N-CSR
CERTIFIED SHAREHOLDER REPORT OF REGISTERED
MANAGEMENT INVESTMENT COMPANIES
| 811-22933 | ||
| (Investment Company Act file number) | ||
| Griffin Institutional Access Real Estate Fund | ||
| (Exact name of registrant as specified in charter) | ||
Griffin Capital Plaza 1520 Grand Avenue El Segundo, CA 90245 | ||
| (Address of principal executive offices) (Zip code) | ||
| ALPS Fund Services, Inc. 1290 Broadway, Suite 1100 | ||
| Denver, CO 80203 | ||
| (Name and address of agent for service) | ||
Copy to:
Terrence O. Davis, Esq.
Holland & Knight
1201 West Peachtree Street, N.W.
Suite 2000
Atlanta, GA 30309
Registrant’s telephone number, including area code: | (404) 817-8500 |
Date of fiscal year end: | September 30 |
| Date of reporting period: | October 1, 2014 – March 31, 2015 |
Item 1. Reports to Stockholders.
table of contents
| Shareholder Letter | 1 | |
| Portfolio Update | 8 | |
| Disclosure of Fund Expenses | 10 | |
| Portfolio of Investments | 11 | |
| Statement of Assets and Liabilities | 14 | |
| Statement of Operations | 15 | |
| Statements of Changes in Net Assets | 16 | |
| Financial Highlights | 17 | |
| Notes to Financial Statements | 18 | |
| Additional Information | 23 |
GRIFFIN INSTITUTIONAL ACCESS REAL ESTATE FUND | SEMI-ANNUAL REPORT 2015 |  |
Dear Fellow Shareholders:
We are pleased to present the Griffin Institutional Access Real Estate Fund (“GIREX” or the “Fund”) semi-annual report. Over the past six months, we have continued to grow the Fund, and as of March 31, 2015, we surpassed $80 million in assets under management. We are happy to report that we have deployed this capital into institutional real estate funds and a diversified set of publicly traded real estate securities. We have continued to deliver returns comprised of income and appreciation with moderate volatility and low correlation to the broad markets, in line with our stated objectives. From inception(1) through March 31, 2015, the Fund generated a total return of 8.04%(2) with a standard deviation of only 1.65%.(3) GIREX pays quarterly distributions to shareholders; our most recent distribution paid to shareholders of record as of March 23, 2015, was $0.33456 representing a 5.10% annualized yield.
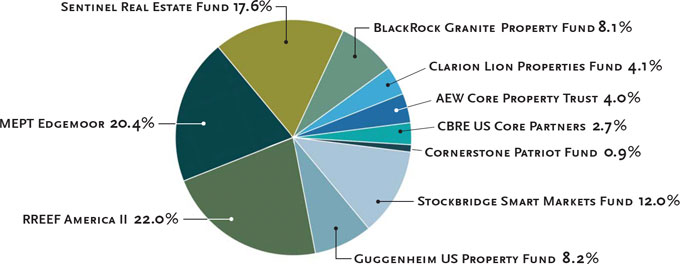
As of April 1, 2015, we have added three new private equity real estate securities managed by Cornerstone Real Estate Advisers, Stockbridge Real Estate and Guggenheim Partners, bringing the total number of private institutional real estate holdings to ten representing over $40.84 billion of real estate and 588 assets.(4) These new funds are diversified by asset type and geography and will further enhance our abilities to deliver strong risk adjusted returns to our shareholders.
| • AEW Core Property Trust | • Guggenheim US Property Fund |
| • BlackRock Granite Property Fund | • MEPT Edgemoor |
| • CBRE US Core Partners | • RREEF America II |
| • Clarion Lion Properties Fund | • Sentinel Real Estate Fund |
| • Cornerstone Patriot Fund | • Stockbridge Smart Markets Fund |
| PORTFOLIO ALLOCATION* |
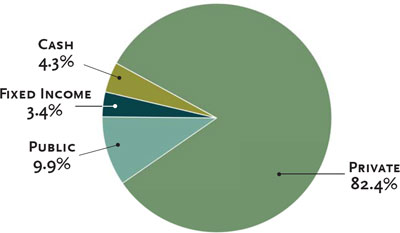
* As of 4/1/15.
1
GRIFFIN INSTITUTIONAL ACCESS REAL ESTATE FUND | SEMI-ANNUAL REPORT 2015 | |
(Shareholder Letter continued)
The GIREX portfolio composition is determined through both a quantitative and qualitative analysis to determine the optimal mix of securities for our shareholders. Over the past six months ended March 31, 2015, we have remained overweight to institutional private real estate funds, relative to our long-term target allocation of 70%, largely due to the strong risk-adjusted return proposition of core private real estate at this point in the cycle. We anticipate this favorable environment for core private real estate to persist throughout 2015. A constant theme for the remainder of 2015 within the real estate investing community will be the search for net operating income (NOI) growth as total returns will be driven largely by increases in income. We believe that core real estate provides a good opportunity to capture this growth. Generally speaking, our underlying institutional core private equity funds invest in Class A assets, buildings located within core markets that include above-average rents and high-quality tenants. These assets are located in supply constrained markets which are seeing strong rental rate growth as sector fundamentals continue to improve.
Federal reserve (Fed) policy remains at the epicenter of many macroeconomic discussions as we move further into 2015. Market anticipation of key rate increases has contributed to the volatility of yield sensitive instruments such as publicly traded Real Estate Investment Trusts (REITs) over the past several quarters. We believe this will be a persistent theme until we move through this adjustment period and interest rates move closer towards long-term averages. During the first quarter of 2015, the public real estate sector generated a 3.9%(5) total return. January saw particularly strong performance as the benchmark rose 6.6% on tailwinds from strong capital flows and fundamental improvement. Strengthening employment data delivered during February signaled to the market that the Fed may raise rates sooner than expected which led a REIT selloff where the MSCI US REIT index lost 3.8% in one month. The Fund avoided much of this volatility by remaining underweight publicly traded REITs relative its long term target allocation. We will continue to closely monitor the public REIT market for buying opportunities as prices approach net asset value and earnings multiples dip below their long-term average.
We are pleased with our growth and performance to date. Alongside our experienced sub-advisors, we will monitor both the public and private real estate markets to determine the mix of real estate securities which, in our opinion, will optimize risk adjusted returns for our shareholders. We believe that the overall commercial real estate market remains healthy and has continued to benefit from strengthening economic fundamentals. The Fund is well positioned to capture this growth and may serve as a hedge to rising rates and volatility within a mixed asset portfolio.
Thank you for your investment in and support of the Griffin Institutional Access Real Estate Fund.
Sincerely,

Randy I. Anderson, Ph.D. CRE
Portfolio Manager
Griffin Institutional Access Real Estate Fund
Portfolio Manager
Griffin Institutional Access Real Estate Fund
(1) GIREX Inception date: June 30, 2014.
(2) Source: ALPS Fund Services 6/30/14- 3/31/15 (excluding sales load).
(3) Source: Bloomberg daily trailing 6 month annualized standard deviation.
(4) Gross asset value as of March 31, 2015.
(5) Source: Bloomberg MSCI US REIT index.
2
GRIFFIN INSTITUTIONAL ACCESS REAL ESTATE FUND | SEMI-ANNUAL REPORT 2015 | |

The Fund’s investment objective is to generate a return comprised of both current income and capital appreciation with moderate volatility and low correlation to the broader markets. To achieve this goal GIREX diversifies its holdings by property type, allocation and fund managers.
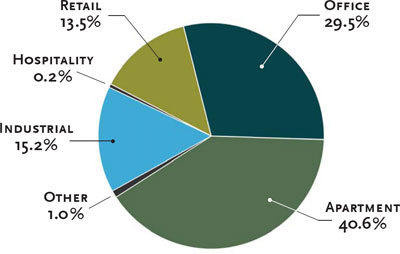
| SECTOR DIVERSIFICATION |
| GEOGRAPHIC DIVERSIFICATION |
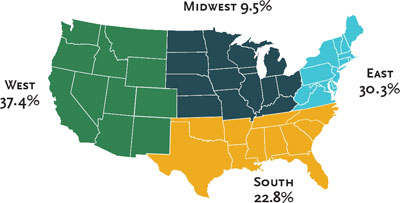
Allocation, Sector, and Geographic Diversification are subject to change. Diversification does not eliminate the risk of experiencing investment losses. The charts represent the diversification by sector and geography of the private fund holdings as of 4/1/15.
3
GRIFFIN INSTITUTIONAL ACCESS REAL ESTATE FUND | SEMI-ANNUAL REPORT 2015 | |

 | Sentinel Real Estate Fund (“SREF”) is a multi-family focused, core private REIT that emphasizes acquisitions of stabilized assets with in-place income with the goal of providing a substantial portion of investor returns in the form of distributed cash. |  | BlackRock Granite Property Fund (“The Granite Fund”) is a diversified core private REIT with an investment objective to provide current income with the potential for long term capital appreciation. The Granite Fund aims to beat its stated benchmark, the NFI-ODCE, while producing real estate returns and liquidity appropriate for a core fund. |
 | RREEF America II is a core private REIT that provides an average risk exposure to the core real estate market, but does so with significantly different allocations than the Index – heavily overweight to industrial assets and the West. |  | Clarion Lion Properties Fund is a core private REIT with interests in a diversified portfolio of primarily institutional quality real estate assets and related investments located throughout the U.S. The investment objective is to provide a strong income return with potential for long-term capital appreciation. |
 | Bentall Kennedy Multi-Employer Property Trust (“MEPT”) is a diversified core private REIT that is focused on generating a stable income component, but pursues a moderately aggressive core strategy overall. MEPT employs moderate leverage and utilizes higher levels of development than its peers to generate alpha. |  | Core Property Trust (“CPT”) is an open-end core fund that seeks to invest in high quality assets located in top-tier markets with a heavy emphasize on income, liquidity and strong long term fundamentals. CPT uses a research-based approach to target markets with high barriers to entry – physical, governmental, or economic – in addition to population and job growth potential. |
 | U.S. Core Partners (“CBRE Core Fund”) is an open-end core fund that purchases and operates high-quality, income-producing office, industrial, retail, and multi-family assets in select major U.S. metropolitan markets that exhibit strong growth demographics. CBRE Core Fund looks to offer a strong, long-term investment opportunity seeking attractive risk-adjusted returns within the core real estate sector. |  | The Smart Markets Fund is an open-end core fund that aims to capture performance in excess of the ODCE Index by acquiring assets in “Smart Markets” characterized by educated, stable and fast-growing employment bases. The Smart Market Fund’s target market strategy is based on the principle that real estate demand is dependent on jobs which are increasingly being created where there are educated work forces in the U.S. |
 | GRE U.S. Property Fund L.P. (“USPF”) is an open-end real estate fund consisting of a diversified portfolio of institutional quality, income producing assets broadly allocated by property type and geographic location. USPF employs a core plus strategy intertwined with a disciplined risk management process in seeking to achieve its performance objectives. |  | The Patriot Fund is a U.S. open-end, diversified core fund that focuses on the four traditional property types and hotels. The Patriot Fund is managed with an emphasis on research, targeting “barrier” markets, which are perceived to reduce the risk of oversupply and offer potential for outsized rent growth and appreciation. |
4
GRIFFIN INSTITUTIONAL ACCESS REAL ESTATE FUND | SEMI-ANNUAL REPORT 2015 | |

| Aon Hewitt Investment Consulting |  |
The Fund’s Private Allocation Sub-Advisor, Aon Hewitt Investment Consulting, an Aon Company, provides investment consulting services to over 480 clients in North America with total client assets worldwide of approximately $4.5 trillion, including more than $1.7 trillion in the U.S. as of December 31, 2014. More than 270 investment consulting professionals in the U.S. advise institutional investors such as corporations, public organizations, union associations, health systems, endowments, and foundations.
| CenterSquare Investment Management |  |
The Fund’s Public Allocation Sub-Advisor, CenterSquare Investment Management, a BNY Mellon Company, is focused exclusively on real estate and structured to provide attractive investment performance to institutional real estate investors. CenterSquare’s team of REIT experts has been a trusted advisor to endowments, pension plans and corporate clients. The firm currently manages $8.4 billion across a variety of real estate strategies as of December 31, 2014.
Griffin Capital Advisor along with CenterSquare Investment Management have designed a public market strategy in line with the objectives of the Fund with a focus on identifying public real estate securities whose current prices are below their intrinsic values. CenterSquare Investment Management has been managing real estate securities portfolios since 1995 across multiple strategies and market cycles.
5
GRIFFIN INSTITUTIONAL ACCESS REAL ESTATE FUND | SEMI-ANNUAL REPORT 2015 | |

Investors in GIREX should understand that the net asset value (“NAV”) of GIREX will fluctuate, which may result in a loss of the principal amount invested. The Fund is new and has a limited operating history. GIREX is a closed-end interval fund that provides liquidity to shareholders quarterly between five percent and 25 percent of its outstanding shares at net asset value.
By investing in the Fund, a shareholder will not be deemed to be an investor in any underlying fund and will not have the ability to exercise any rights attributable to an investor in any such underlying fund related to their investment.
The views and information discussed in this commentary are as of the date of publication, are subject to change, and may not reflect the writer’s current views. The views expressed represent an assessment of market conditions at a specific point in time, are opinions only and should not be relied upon as investment advice regarding a particular investment or markets in general. Such information does not constitute a recommendation to buy or sell specific securities or investment vehicles. It should not be assumed that any investment will be profitable or will equal the performance of the fund(s) or any securities or any sectors mentioned herein. The subject matter contained herein has been derived from several sources believed to be reliable and accurate at the time of compilation. Griffin Capital Securities, Inc. does not accept any liability for losses either direct or consequential caused by the use of this information.
Alpha is the measure of the performance of a portfolio after adjusting for risk. Alpha is calculated by comparing the volatility of the portfolio and comparing it to some benchmark. The alpha is the excess return of the portfolio over the benchmark.
Correlation is a statistical measure of how an index moves in relation to another index or model portfolio. A correlation ranges from -1 to 1. A correlation of 1 means the two indexes have moved in lockstep with each other. A correlation of -1 means the two indexes have moved in exactly the opposite direction.
The Dow Jones Industrial Average is a price-weighted average of 30 significant stocks traded on the New York Stock Exchange and Nasdaq.
The MSCI US REIT index (RMZ) is a free float-adjusted market capitalization index that is comprised of equity REITs. The index is based on MSCI USA Investable Market Index (IMI) its parent index which captures large, mid and small caps securities. With 139 constituents, it represents about 99% of US REITs excluding mortgage REITs and selected Specialized REITs.
The NFI-ODCE, short for NCREIF Fund Index-Open End Diversified Core Equity, is the first of the NCREIF Fund Database products and is an index of investment returns reporting on both a historical and current basis the results of 33 open-end commingled funds pursuing a core investment strategy, some of which have performance histories dating back to the 1970s. The NFI-ODCE Index is capitalization-weighted and is reported gross of fees. Measurement is time-weighted. NCREIF will calculate the overall aggregated Index return.
The S&P 500 is an index based on market cap of the 500 largest companies having stock listed on the NYSE or NASDAQ.
You cannot invest directly in an index. Index performance does not represent actual Fund or portfolio performance. A fund or portfolio may differ significantly from the securities included in the index. Index performance assumes reinvestment of dividends but does not reflect any management fees, transaction costs or other expenses that would be incurred by a fund or portfolio, or brokerage commissions on transactions in fund shares. Such fees, expenses, and commissions could reduce returns.
6
Page Intentionally Left Blank
| Griffin Institutional Access Real Estate Fund | Portfolio Update |
| March 31, 2015 (Unaudited) |
Performance(for the period ended March 31, 2015) | |||
| 6 Month | Since Inception* | Total Expense Ratio | |
| Griffin Institutional Access Real Estate Fund – Without Load | 6.29% | 8.04% | 6.80% |
| Griffin Institutional Access Real Estate Fund – With Load** | 0.18% | 1.81% | |
| Barclays Capital U.S. Aggregate Bond Index | 3.43% | 3.60% | |
S&P 500® Total Return Index | 5.93% | 7.12% |
| * | Fund’s inception date is June 30, 2014. |
| ** | Adjusted for initial maximum sales charge of 5.75%. |
The S&P 500® Total Return Index is an unmanaged index of 500 common stocks chosen for market size, liquidity and industry group representation. It is a market-value weighted index. The index is not actively managed and does not reflect any deduction for fees, expenses or taxes.
The Barclays Capital U.S. Aggregate Bond Index is a market value-weighted index of investment grade fixed-rated debt issues, including government, corporate, asset-backed and mortgage-backed securities with a maturity of one year or more.
Indexes are not actively managed and do not reflect deduction for fees, expenses or taxes. An investor cannot invest directly into an index.
The returns shown above do not reflect the deduction of taxes a shareholder would pay on Fund distributions or redemption of Fund shares.
The Fund is new and has a limited operating history.
The performance data quoted above represents past performance. Past performance is not a guarantee of future results. Investment return and value of the Fund shares will fluctuate so that an investor’s shares, when sold or redeemed, may be worth more or less than their original cost. Performance may be lower or higher than performance data quoted. Fund performance current to the most recent month-end is available by calling 1-888-926-2688 or by visiting www.griffincapital.com.
The maximum sales charge is 5.75%. Purchases of $1,000,001 or more may be subject to a 1.00% contingent deferred sales charge on shares redeemed during the first 365 days after their purchase. The Fund’s investment adviser has contractually agreed to waive its fees and to pay or absorb the ordinary annual operating expenses of the Fund (including offering expenses, but excluding taxes, interest, brokerage commissions, acquired fund fees and expenses and extraordinary expenses), to the extent that they exceed 1.91% per annum of the Fund’s average daily net assets, at least until June 30, 2016. Without the waiver the expenses would be 6.80%. Please review the Fund’s Prospectus for more details regarding the Fund’s fees and expenses. No assurances can be given that the Fund will pay a dividend in the future; or, if any such dividend is paid, the amount or rate of the dividend.
Performance of $10,000 Initial Investment (for the period ended March 31, 2015)
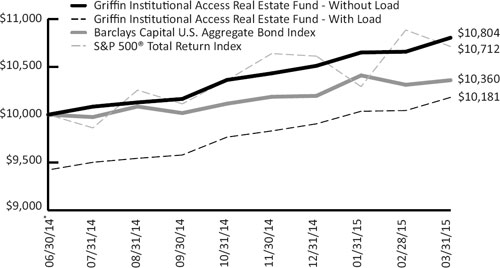
The graph shown above represents historical performance of a hypothetical investment of $10,000 in the Fund since inception. Past performance does not guarantee future results. All returns reflect reinvested dividends, but do not reflect the deduction of taxes that a shareholder would pay on Fund distributions or the redemption of Fund shares.
| 8 | 1.888.926.2688 | www.griffincapital.com |
| Griffin Institutional Access Real Estate Fund | Portfolio Update |
| March 31, 2015 (Unaudited) |
Sector Allocation (as a % of Net Assets)* | |
| Private Investment Funds | 65.70% |
| Public Traded Funds | 9.38% |
| Fixed Income | 3.50% |
| Financial | 0.50% |
| Communications | 0.10% |
| Consumer, Cyclical | 0.05% |
| Other | 20.77% |
| TOTALS | 100.00% |
Portfolio Composition (as a % of Net Assets)* | |
| Real Estate Investment Trusts | 75.08% |
| Open-End Funds | 3.50% |
| Common Stocks | 0.65% |
| Other Assets in Excess of Liabilities | 20.77% |
| TOTALS | 100.00% |
| * | Holdings are subject to change. Tables present indicative values only. |
| Semi-Annual Report | March 31, 2015 | 9 |
| Griffin Institutional Access Real Estate Fund | Disclosure of Fund Expenses |
| March 31, 2015 (Unaudited) |
As a shareholder of the Fund, you incur two types of costs: (1) transaction costs, including applicable redemption fees; and (2) ongoing costs, including management fees and other Fund expenses. The following example is intended to help you understand your ongoing costs (in dollars) of investing in the Fund and to compare these costs with the ongoing costs of investing in other mutual funds. The example is based on an investment of $1,000 invested on October 1, 2014 and held through March 31, 2015.
Actual Expenses. The first line of the table below provides information about actual account values and actual expenses. You may use the information in this line, together with the amount you invested, to estimate the expenses that you paid over the period. Simply divide your account value by $1,000 (for example, an $8,600 account value divided by $1,000 = 8.6), then multiply the result by the number in the first line under the heading “Expenses Paid During Period” to estimate the expenses you paid on your account during this period.
Hypothetical Example for Comparison Purposes. The second line of the table below provides information about hypothetical account values and hypothetical expenses based on the Fund’s actual expense ratio and an assumed rate of return of 5% per year before expenses, which is not the Fund’s actual return. The hypothetical account values and expenses may not be used to estimate the actual ending account balance or expenses you paid for the period. You may use this information to compare the ongoing costs of investing in the Fund and other mutual funds. To do so, compare this 5% hypothetical example with the 5% hypothetical examples that appear in the shareholder reports of the other mutual funds. Please note that the expenses shown in the table are meant to highlight your ongoing Fund costs only and do not reflect any transactional costs, such as redemption fees. Therefore, the second line of the table below is useful in comparing ongoing costs only and may not help you determine the relative total costs of owning different funds. In addition, if these transactional costs were included, your costs would have been higher.
Beginning Account Value October 1, 2014 | Ending Account Value March 31, 2015(a) | Net Expense | Expense Paid During PeriodMarch 31, 2015(c) | |||||||||||||
| Griffin Institutional Access Real Estate Fund | ||||||||||||||||
| Actual | $ | 1,000.00 | $ | 1,062.90 | 1.91 | % | $ | 9.82 | ||||||||
| Hypothetical (5% return before expenses) | $ | 1,000.00 | $ | 1,015.41 | 1.91 | % | $ | 9.60 | ||||||||
(a) | Ending account value is net of expense ratio. |
(b) | Annualized, based on the Fund’s most recent fiscal half year expenses. |
(c) | Expenses are equal to the Fund’s annualized net expense ratio multiplied by the average account value over the period, multiplied by the number of days in the most recent fiscal half year (182), divided by 365. |
| 10 | 1.888.926.2688 | www.griffincapital.com |
| Griffin Institutional Access Real Estate Fund | Portfolio of Investments |
| March 31, 2015 (Unaudited) |
| Value | ||||||||
| Description | Shares | (Note 2) | ||||||
| REAL ESTATE INVESTMENT TRUSTS (75.08%) | ||||||||
| Private Investment Funds (65.70%)* | ||||||||
| AEW Core Property Trust | 3,031 | $ | 2,682,096 | |||||
| BlackRock Granite Property Fund | 33 | 2,682,626 | ||||||
| CBRE US Core Partners | 1,594,149 | 1,832,933 | ||||||
| Clarion Lion Properties Fund | 2,309 | 2,755,127 | ||||||
| Cornerstone Patriot Fund LP | 2,354 | 256,352 | ||||||
| Deutsche Wealth & Asset Management RREEF America II | 129,885 | 13,250,879 | ||||||
| Guggenheim US Property Fund | 1,000 | 2,779,772 | ||||||
| MEPT Edgemoor LP Fund | 4,282 | 6,802,403 | ||||||
| Sentinel Real Estate Fund LP | 156 | 11,939,196 | ||||||
| Stockbridge Smart Markets Fund | 6,357 | 8,230,120 | ||||||
| 53,211,504 | ||||||||
Public Traded Funds (9.38%)(a) | ||||||||
| AvalonBay Communities, Inc. | 1,730 | 301,453 | ||||||
| Aviv REIT, Inc. | 800 | 29,200 | ||||||
| Boston Properties, Inc. | 2,180 | 306,246 | ||||||
| Brandywine Realty Trust | 9,100 | 145,418 | ||||||
| Camden Property Trust | 790 | 61,723 | ||||||
| Chesapeake Lodging Trust | 2,500 | 84,575 | ||||||
| CubeSmart | 2,810 | 67,862 | ||||||
| CyrusOne, Inc. | 2,200 | 68,464 | ||||||
| DDR Corp. | 6,410 | 119,354 | ||||||
| Digital Realty Trust, Inc. | 1,260 | 83,110 | ||||||
| Duke Realty Corp. | 5,140 | 111,898 | ||||||
| Empire State Realty Trust, Inc., Class A | 3,340 | 62,825 | ||||||
Equity Commonwealth(b) | 2,160 | 57,348 | ||||||
| Equity Residential | 2,520 | 196,207 | ||||||
| Essex Property Trust, Inc. | 1,420 | 326,458 | ||||||
| Excel Trust, Inc. | 2,890 | 40,518 | ||||||
| Federal Realty Investment Trust | 340 | 50,051 | ||||||
| General Growth Properties, Inc. | 11,590 | 342,485 | ||||||
| Health Care REIT, Inc. | 4,750 | 367,459 | ||||||
| Highwoods Properties, Inc. | 2,180 | 99,800 | ||||||
| Host Hotels & Resorts, Inc. | 11,220 | 226,420 | ||||||
| Hudson Pacific Properties, Inc. | 6,600 | 219,054 | ||||||
| Kilroy Realty Corp. | 1,770 | 134,821 | ||||||
| Kimco Realty Corp. | 4,390 | 117,872 | ||||||
| Kite Realty Group Trust | 1,960 | 55,213 | ||||||
| Liberty Property Trust | 5,240 | 187,068 | ||||||
| Macerich Co. | 500 | 42,165 | ||||||
| Mack‐Cali Realty Corp. | 580 | 11,182 | ||||||
| National Health Investors, Inc. | 610 | 43,316 | ||||||
| National Retail Properties, Inc. | 1,030 | 42,199 | ||||||
| Omega Healthcare Investors, Inc. | 1,700 | 68,969 | ||||||
| Paramount Group, Inc. | 2,130 | 41,109 | ||||||
| Parkway Properties, Inc. | 2,240 | 38,864 | ||||||
| Pebblebrook Hotel Trust | 840 | 39,119 | ||||||
| Physicians Realty Trust | 2,010 | 35,396 | ||||||
| Prologis, Inc. | 5,160 | 224,770 | ||||||
| PS Business Parks, Inc. | 1,280 | 106,291 | ||||||
| Public Storage | 1,690 | 333,167 | ||||||
| Semi-Annual Report | March 31, 2015 | 11 |
| Griffin Institutional Access Real Estate Fund | Portfolio of Investments |
| March 31, 2015 (Unaudited) |
| Value | ||||||||
| Description | Shares | (Note 2) | ||||||
| Public Traded Funds (continued) | ||||||||
| Ramco‐Gershenson Properties Trust | 4,360 | $ | 81,096 | |||||
| Regency Centers Corp. | 1,160 | 78,926 | ||||||
| Retail Opportunity Investments Corp. | 7,140 | 130,662 | ||||||
| Rexford Industrial Realty, Inc. | 3,310 | 52,331 | ||||||
| RLJ Lodging Trust | 1,090 | 34,128 | ||||||
| Simon Property Group, Inc. | 3,150 | 616,265 | ||||||
| SL Green Realty Corp. | 770 | 98,853 | ||||||
| Sovran Self Storage, Inc. | 1,180 | 110,849 | ||||||
| Spirit Realty Capital, Inc. | 8,200 | 99,056 | ||||||
| STAG Industrial, Inc. | 2,530 | 59,506 | ||||||
| STORE Capital Corp. | 4,170 | 97,370 | ||||||
Strategic Hotels & Resorts, Inc.(b) | 7,990 | 99,316 | ||||||
| Sunstone Hotel Investors, Inc. | 6,760 | 112,689 | ||||||
| Tanger Factory Outlet Centers, Inc. | 990 | 34,818 | ||||||
| UDR, Inc. | 8,600 | 292,658 | ||||||
| Ventas, Inc. | 4,840 | 353,417 | ||||||
| Vornado Realty Trust | 2,450 | 274,400 | ||||||
| Washington Real Estate Investment Trust | 3,120 | 86,206 | ||||||
| 7,601,995 | ||||||||
TOTAL REAL ESTATE INVESTMENT TRUSTS (Cost $57,699,484) | 60,813,499 | |||||||
OPEN‐END FUNDS (3.50%)(a) | ||||||||
| Fixed Income (3.50%) | ||||||||
| Goldman Sachs Strategic Income Fund, Institutional Class | 281,595 | 2,832,842 | ||||||
TOTAL OPEN‐END FUNDS (Cost $2,927,447) | 2,832,842 | |||||||
COMMON STOCKS (0.65%)(a) | ||||||||
| Communications (0.10%) | ||||||||
| Equinix, Inc. | 350 | 81,498 | ||||||
| Consumer, Cyclical (0.05%) | ||||||||
| Starwood Hotels & Resorts Worldwide, Inc. | 490 | 40,915 | ||||||
| Financial (0.50%) | ||||||||
| American Tower Corp. | 700 | 65,905 | ||||||
| CBL & Associates Properties, Inc. | 3,900 | 77,220 | ||||||
| HCP, Inc. | 2,370 | 102,407 | ||||||
| QTS Realty Trust, Inc., Class A | 1,290 | 46,969 | ||||||
| Taubman Centers, Inc. | 1,060 | 81,758 | ||||||
| Urban Edge Properties | 1,370 | 32,469 | ||||||
| 406,728 | ||||||||
TOTAL COMMON STOCKS (Cost $520,546) | 529,141 | |||||||
| 12 | 1.888.926.2688 | www.griffincapital.com |
| Griffin Institutional Access Real Estate Fund | Portfolio of Investments |
| March 31, 2015 (Unaudited) |
| Value | ||||
| Description | (Note 2) | |||
TOTAL INVESTMENTS (79.23%) (Cost $61,147,477) | $ | 64,175,482 | ||
| Other Assets In Excess Of Liabilities (20.77%) | 16,828,520 | |||
| NET ASSETS (100.00%) | $ | 81,004,002 | ||
| (a) | Security held as collateral for outstanding Line of Credit. At March 31, 2015, outstanding collateral amounted to $10,884,752. |
| (b) | Non-income producing security. |
Common Abbreviations:
LP - Limited Partnerships
REIT - Real Estate Investment Trust
| * | Additional Information on Investments in Private Investment Funds: |
| Unfunded | |||||||||||
| Redemption | Redemption Notice | Commitments as of | |||||||||
| Value | Security | Frequency | (Days) | March 31, 2015 | |||||||
| $ | 2,682,096 | AEW Core Property Trust | Quarterly | 45 | $ | 600,000 | |||||
| 2,682,626 | BlackRock Granite Property Fund | Quarterly | 60 | 0 | |||||||
| 1,832,933 | CBRE US Core Partners | Quarterly | 60 | 3,200,000 | |||||||
| 2,755,127 | Clarion Lion Properties Fund | Quarterly | 90 | 0 | |||||||
| 256,352 | Cornerstone Patriot Fund LP | Quarterly | 30 | 1,375,000 | |||||||
| 13,250,879 | Deutsche Wealth & Asset Management RREEF America II | Quarterly | 45 | 3,060,000 | |||||||
| 2,779,772 | Guggenheim US Property Fund | Quarterly | 90 | 0 | |||||||
| 6,802,403 | MEPT Edgemoor LP Fund | Quarterly | N/A** | 0 | |||||||
| 11,939,196 | Sentinel Real Estate Fund LP | Quarterly | N/A** | 0 | |||||||
| 8,230,120 | Stockbridge Smart Markets Fund | Quarterly | 45 | 12,000,000 | |||||||
| ** | Written notice required for redemption, no minimum timeline required. |
See Notes to Financial Statements.
| Semi-Annual Report | March 31, 2015 | 13 |
| Griffin Institutional Access Real Estate Fund | Statement of Assets and Liabilities |
| March 31, 2015 (Unaudited) |
| ASSETS | ||||
| Investments, at value | $ | 64,175,482 | ||
| Cash | 16,577,938 | |||
| Receivable for investments sold | 3,299,801 | |||
| Receivable for shares sold | 2,517,683 | |||
| Dividend receivable | 391,505 | |||
| Prepaid offering costs (Note 2) | 92,823 | |||
| Prepaid expenses and other assets | 173,728 | |||
| Total Assets | 87,228,960 | |||
| LIABILITIES | ||||
| Payable for investments purchased | 11,416 | |||
| Shareholder servicing fees payable (Note 3) | 16,218 | |||
| Line of Credit Payable (Note 6) | 6,000,817 | |||
| Line of Credit Interest Payable (Note 6) | 408 | |||
| Administration fees payable (Note 3) | 21,228 | |||
| Transfer agency fees payable (Note 3) | 14,130 | |||
| Payable due to Adviser | 78,576 | |||
| Chief compliance officer fees payable (Note 3) | 13,038 | |||
| Legal fees payable | 40,931 | |||
| Audit and tax fees payable | 9,972 | |||
| Accrued expenses and other liabilities | 18,224 | |||
| Total Liabilities | 6,224,958 | |||
| NET ASSETS | $ | 81,004,002 | ||
| NET ASSETS CONSIST OF | ||||
| Paid‐in capital | $ | 79,084,469 | ||
| Accumulated net investment loss | (1,265,141 | ) | ||
| Accumulated net realized gain on investments | 156,669 | |||
| Net unrealized appreciation on investments | 3,028,005 | |||
| NET ASSETS | $ | 81,004,002 | ||
| INVESTMENTS, AT COST | $ | 61,147,477 | ||
| PRICING OF SHARES | ||||
Net asset value, and redemption price per share(a) | $ | 26.02 | ||
| Net assets | $ | 81,004,002 | ||
| Shares of beneficial interest outstanding (unlimited number of shares, no par value common stock authorized) | 3,113,270 | |||
| Maximum offering price per share ((NAV/0.9425), based on maximum sales charge of 5.75% of the offering price) | $ | 27.61 | ||
| (a) | Redemption price per share may be reduced for any applicable contingent deferred sales charge. For a description of a possible sales charge, please see (Note 1). |
See Notes to Financial Statements.
| 14 | 1.888.926.2688 | www.griffincapital.com |
| Griffin Institutional Access Real Estate Fund | Statement of Operations |
| For the Six Months Ended March 31, 2015 (Unaudited) |
| INVESTMENT INCOME | ||||
| Dividend income | $ | 824,351 | ||
| Total Investment Income | 824,351 | |||
| EXPENSES | ||||
| Investment advisory fees (Note 3) | 377,460 | |||
| Administrative fees (Note 3) | 64,460 | |||
| Transfer agency fees (Note 3) | 18,417 | |||
| Legal fees | 60,453 | |||
| Audit and tax fees | 9,973 | |||
| Reports to shareholders and printing fees | 18,337 | |||
| Insurance fees | 86,653 | |||
| Custody fees | 15,597 | |||
| Chief compliance officer fees (Note 3) | 21,721 | |||
| Interest Expense (Note 6) | 1,224 | |||
| Trustees’ fees (Note 3) | 16,405 | |||
| Offering costs (Note 2) | 165,017 | |||
| Other expenses | 6,301 | |||
| Total Expenses | 862,018 | |||
| Less: Fees waived/expenses reimbursed by adviser (Note 3) | (380,162 | ) | ||
| Net Expenses | 481,856 | |||
| Net Investment Income | 342,495 | |||
| Net realized gain on investments | 64,461 | |||
| Net change in unrealized appreciation on investments | 2,338,676 | |||
| NET REALIZED AND UNREALIZED GAIN ON INVESTMENTS | 2,403,137 | |||
| NET INCREASE IN NET ASSETS RESULTING FROM OPERATIONS | $ | 2,745,632 | ||
See Notes to Financial Statements.
| Semi-Annual Report | March 31, 2015 | 15 |
| Griffin Institutional Access Real Estate Fund | Statements of Changes in Net Assets |
| For the Period | ||||||||
| For the Six | June 30, 2014 | |||||||
| Months Ended | (Commencement of | |||||||
| March 31, 2015 | Operations) to | |||||||
| (Unaudited) | September 30, 2014 | |||||||
| OPERATIONS: | ||||||||
| Net investment income | $ | 342,495 | $ | 9,714 | ||||
| Net realized gain on investments | 64,461 | 3,161 | ||||||
| Net change in unrealized appreciation on investments | 2,338,676 | 689,329 | ||||||
| Net Increase in Net Assets Resulting from Operations | 2,745,632 | 702,204 | ||||||
| DISTRIBUTIONS TO SHAREHOLDERS: | ||||||||
| From net investment income | (1,545,202 | ) | — | |||||
| From net realized gain on investments | — | (11,284 | ) | |||||
| From tax return of capital | — | (295,706 | ) | |||||
| Total Distributions to Shareholders | (1,545,202 | ) | (306,990 | ) | ||||
| BENEFICIAL INTEREST TRANSACTIONS: | ||||||||
| Shares sold | 42,590,698 | 35,045,816 | ||||||
| Distributions reinvested | 1,368,038 | 303,841 | ||||||
| Shares redeemed | (35 | ) | — | |||||
| Net Increase in Net Assets Derived from Beneficial Interest Transactions | 43,958,701 | 35,349,657 | ||||||
| Net increase in net assets | 45,159,131 | 35,744,871 | ||||||
| NET ASSETS: | ||||||||
| Beginning of period | 35,844,871 | 100,000 | ||||||
| End of period * | $ | 81,004,002 | $ | 35,844,871 | ||||
| *Including accumulated net investment loss of: | $ | (1,265,141 | ) | $ | (62,434 | ) | ||
| Other Information | ||||||||
| BENEFICIAL INTEREST TRANSACTIONS: | ||||||||
| Beginning shares | 1,416,230 | 4,000 | ||||||
| Shares sold | 1,644,066 | 1,400,124 | ||||||
| Distributions reinvested | 52,975 | 12,106 | ||||||
| Shares redeemed | (1 | ) | — | |||||
| Net increase in shares outstanding | 1,697,040 | 1,412,230 | ||||||
| Ending shares | 3,113,270 | 1,416,230 | ||||||
See Notes to Financial Statements.
| 16 | 1.888.926.2688 | www.griffincapital.com |
| Griffin Institutional Access Real Estate Fund | Financial Highlights |
| For a Share Outstanding Throughout the Periods Presented |
| For the Period | ||||||||
| For the | June 30, 2014 | |||||||
| Six Months Ended | (Commencement of | |||||||
| March 31, 2015 | Operations) to | |||||||
| (Unaudited) | September 30, 2014 | |||||||
| Net asset value, beginning of period | $ | 25.31 | $ | 25.00 | ||||
| INCOME FROM INVESTMENT OPERATIONS: | ||||||||
Net investment income(a) | 0.18 | 0.01 | ||||||
| Net realized and unrealized gain | 1.19 | 0.60 | ||||||
| Total from investment operations | 1.37 | 0.61 | ||||||
| DISTRIBUTIONS: | ||||||||
| From net investment income | (0.66 | ) | (0.01 | ) | ||||
| From net realized gain on investments | — | (0.01 | ) | |||||
| Total distributions | (0.66 | ) | (0.30 | ) | ||||
| Net increase in net asset value | 0.71 | 0.31 | ||||||
| Net asset value, end of period | $ | 26.02 | $ | 25.31 | ||||
TOTAL RETURN(b) | 6.29 | % | 2.46 | % | ||||
| RATIOS/SUPPLEMENTAL DATA: | ||||||||
| Net assets, end of period (000s) | $ | 81,004 | $ | 35,845 | ||||
Ratio of expenses to average net assets excluding fee waivers and reimbursements(c) | 3.43 | %(d)(e) | 6.77 | %(d) | ||||
Ratio of expenses to average net assets including fee waivers and reimbursements(c) | 1.91 | %(d)(e) | 1.91 | %(d) | ||||
Ratio of net investment income to average net assets(c)(f) | 1.39 | %(d) | 0.15 | %(d) | ||||
Portfolio turnover rate(g) | 18 | % | 7 | % | ||||
| (a) | Calculated using the average shares method. |
| (b) | Total returns are for the period indicated and have not been annualized and do not reflect the impact of sales charges. Total returns would have been lower had certain expenses not been waived during the period. Returns shown do not reflect the deduction of taxes that a shareholder would pay on Fund distributions or the redemption of Fund shares. |
| (c) | The ratios of expenses to average net assets and net investment income to average net assets do not reflect the expenses of the underlying investment companies in which the Fund invests. |
| (d) | Annualized. |
| (e) | Amount includes the effect of the interest expense associated with the Fund’s Line of Credit. |
| (f) | Recognition of net investment income is affected by the timing and declaration of dividends by the underlying investment companies in which the Fund invests. |
| (g) | Portfolio turnover rate for periods less than one full year have not been annualized. |
See Notes to Financial Statements.
| Semi-Annual Report | March 31, 2015 | 17 |
| Griffin Institutional Access Real Estate Fund | Notes to Financial Statements |
| March 31, 2015 (Unaudited) |
1. ORGANIZATION
The Griffin Institutional Access Real Estate Fund (the “Fund”) is registered under the Investment Company Act of 1940, as amended (the “1940 Act”), as a non-diversified, closed-end management investment company. The Fund engages in a continuous offering of shares and operates as an interval fund that offers quarterly repurchases of shares at net asset value. The Fund’s investment adviser is Griffin Capital Advisor, LLC (the “Adviser”). The investment objective of the Fund is to generate a return comprised of both current income and capital appreciation with moderate volatility and low correlation to the broader markets. The Fund pursues its investment objective by strategically investing across private institutional real estate investment funds as well as a diversified set of public real estate securities.
The Fund was organized as a statutory trust on November 5, 2013 and under the laws of the State of Delaware. The Fund had no operations from that date to May 21, 2014, other than those relating to organizational matters and the registration of its shares under applicable securities laws. The Adviser purchased 4,000 initial shares at $25.00 per share on May 21, 2014, and the Fund commenced operations on June 30, 2014. The Fund is authorized to issue an unlimited number of shares with no par value.
The Fund shares are offered subject to a maximum sales charge of 5.75% of the offering price. Purchases of $1,000,001 or more may be subject to a 1.00% contingent deferred sales charge on shares redeemed during the first 365 days after their purchase.
2. SIGNIFICANT ACCOUNTING POLICIES
The following is a summary of significant accounting policies followed by the Fund in preparation of its financial statements. These policies are in conformity with accounting principles generally accepted in the United States of America (“GAAP”). The Fund is considered an investment company for financial reporting purposes under GAAP. The preparation of financial statements requires management to make estimates and assumptions that affect the reported amounts of assets and liabilities and disclosure of contingent assets and liabilities at the date of the financial statements and the reported amounts of income and expenses for the period. Actual results could differ from those estimates.
Security Valuation – Securities listed on an exchange are valued at the last reported sale price at the close of the regular trading session of the primary exchange or market on which they are traded, on the business day the value is being determined, or in the case of securities listed on NASDAQ at the NASDAQ Official Closing Price (“NOCP”). In the absence of a sale such securities shall be valued at the last bid price for securities held long and the last ask price for securities held short, or if a closing bid or ask price, as applicable, is not available, at either the exchange or system-defined closing price on the exchange or system in which such securities are principally traded. Short-term investments that mature in 60 days or less are valued at amortized cost, provided such valuations represent fair value.
Valuation of Fund of Funds – The Fund may invest in portfolios of open-end investment companies and exchange-traded funds (the “Underlying Funds”). The Underlying Funds value securities in their portfolios for which market quotations are readily available at their market values (generally the last reported sale price) and all other securities and assets at their fair value to the methods established by the board of directors of the Underlying Funds. Open-ended funds are valued at their respective net asset values as reported by such investment companies.
When price quotations for certain securities are not readily available, or if the available quotations are not believed to be reflective of market value by the Adviser, those securities will be valued at “fair value” as determined in good faith by the Fair Value Pricing Committee (the “Pricing Committee”) using procedures adopted by and under the supervision of the Fund’s Board of Trustees (the “Trustees”). There can be no assurance that the Fund could purchase or sell a portfolio security at the price used to calculate the Fund’s Net Asset Value (“NAV”).
Fair valuation procedures may be used to value a substantial portion of the assets of the Fund. The Fund may use the fair value of a security to calculate its NAV when, for example, (1) a portfolio security is not traded in a public market or the principal market in which the security trades is closed, (2) trading in a portfolio security is suspended and not resumed prior to the normal market close, (3) a portfolio security is not traded in significant volume for a substantial period, or (4) the Adviser determines that the quotation or price for a portfolio security provided by a broker-dealer or independent pricing service is inaccurate.
Valuation of Private REITS – The Fund may invest a significant portion of its assets in Private Real Estate Investment Trusts (“Private REITs”). The Private REITs measure their investment assets at fair value and report a NAV per share on a calendar quarter basis. In accordance with Accounting Standards Codification (“ASC”) 820, the Fund has elected to apply the practical expedient and to value its investments in Private REITs at their respective NAVs at each quarter. For non-calendar quarter-end days, the Pricing Committee estimates the fair value of each Private REIT by adjusting the most recent NAV for each REIT by the change in a proprietary benchmark that the Pricing Committee has deemed to be representative of the entire Private REIT market. In the event that a price is not provided by the Private REIT, the fair valuation procedures will be followed. As of March 31, 2015, all of the Fund’s investments in Private REITs were valued at the respective NAVs of the Private REITs.
| 18 | 1.888.926.2688 | www.griffincapital.com |
| Griffin Institutional Access Real Estate Fund | Notes to Financial Statements |
| March 31, 2015 (Unaudited) |
Fair Value Measurements –A three-tier hierarchy has been established to classify fair value measurements for disclosure purposes. Inputs refer broadly to the assumptions that market participants would use in pricing the asset or liability, including assumptions about risk. Inputs may be observable or unobservable. Observable inputs are inputs that reflect the assumptions market participants would use in pricing the asset or liability that are developed based on market data obtained from sources independent of the reporting entity. Unobservable inputs are inputs that reflect the reporting entity’s own assumptions about the assumptions market participants would use in pricing the asset or liability that are developed based on the best information available. In accordance with the authoritative guidance on fair value measurements and disclosure under GAAP, the Fund discloses fair value of its investments in a hierarchy that prioritizes the inputs to valuation techniques used to measure the fair value.
Various inputs are used in determining the value of the Fund’s investments as of the reporting period end. These inputs are categorized in the following hierarchy under applicable financial accounting standards:
Level 1 – | Unadjusted quoted prices in active markets for identical, unrestricted assets or liabilities that the Fund has the ability to access at the measurement date; |
Level 2 – | Quoted prices which are not active, quoted prices for similar assets or liabilities in active markets or inputs other than quoted prices that are observable (either directly or indirectly) for substantially the full term of the asset or liability at the measurement date; and |
Level 3 – | Significant unobservable prices or inputs (including the Fund’s own assumptions in determining the fair value of investments) where there is little or no market activity for the asset or liability at the measurement date. |
The availability of observable inputs can vary from security to security and is affected by a wide variety of factors, including, for example, the type of security, whether the security is new and not yet established in the marketplace, the liquidity of markets and other characteristics particular to the security. To the extent that valuation is based on models or inputs that are less observable or unobservable in the market, the determination of fair value requires more judgment. Accordingly, the degree of judgment exercised in determining fair value is greatest for instruments categorized in Level 3.
An investment level within the fair value hierarchy is based on the lowest level input, individually or in the aggregate, that is significant to fair value measurement. The valuation techniques used by the Fund to measure fair value during the period ended March 31, 2015 maximized the use of observable inputs and minimized the use of unobservable inputs.
The inputs or methodologies used for valuing securities are not necessarily an indication of the risk or liquidity associated with investing in those securities. The following is a summary of the inputs used in valuing the Fund’s investments as of March 31, 2015:
| Investments in Securities at Value* | Level 1 - Quoted Prices | Level 2 - Other Significant Observable Inputs | Level 3 - Significant Unobservable Inputs | Total | ||||||||||||
| Real Estate Investment Trusts | ||||||||||||||||
| Private Investment Funds | $ | — | $ | 53,211,504 | $ | — | $ | 53,211,504 | ||||||||
| Public Traded Funds | 7,601,995 | — | — | 7,601,995 | ||||||||||||
| Open-End Funds | 2,832,842 | — | — | 2,832,842 | ||||||||||||
| Common Stocks | 529,141 | — | — | 529,141 | ||||||||||||
| Total | $ | 10,963,978 | $ | 53,211,504 | $ | — | $ | 64,175,482 | ||||||||
| * | See Portfolio of Investments for industry classifications. |
There were no transfers between Levels 1, 2 and 3 during the period ended March 31, 2015. For the period ended March 31, 2015, the Fund did not have unobservable inputs (level 3) used in determining fair value.
Investment Transactions – Investment security transactions are accounted for on trade date. Gains and losses on securities sold are determined on a specific identification basis.
Investment Income – Interest income is accrued and recorded on a daily basis including amortization of premiums, accretion of discounts and income earned from money market funds. Interest is not accrued on securities that are in default. Dividend income is recorded on the ex-dividend date.
| Semi-Annual Report | March 31, 2015 | 19 |
| Griffin Institutional Access Real Estate Fund | Notes to Financial Statements |
| March 31, 2015 (Unaudited) |
Exchange-Traded Funds (“ETFs”) – The Fund may invest in ETFs, which are funds whose shares are traded on a national exchange. ETFs may be based on underlying equity or fixed income securities, as well as commodities or currencies. ETFs do not sell individual shares directly to investors and only issue their shares in large blocks known as “creation units.” The investor purchasing a creation unit then sells the individual shares on a secondary market. Although similar diversification benefits may be achieved through an investment in another investment company, ETFs generally offer greater liquidity and lower expenses. Because an ETF incurs its own fees and expenses, shareholders of the Fund investing in an ETF will indirectly bear those costs. The Fund will also incur brokerage commissions and related charges when purchasing or selling shares of an ETF. Unlike typical investment company shares, which are valued once daily, shares in an ETF may be purchased or sold on a securities exchange throughout the trading day at market prices that are generally close to the NAV of the ETF.
Distributions to Shareholders – Dividends from net investment income, if any, will be declared and paid quarterly. Distributions of net realized capital gains, if any, will be declared and paid annually. Income and capital gains distributions are determined in accordance with income tax regulations, which may differ from GAAP. Distributions to shareholders are recorded on the ex-dividend date.
Indemnification – The Fund indemnifies its Officers and Trustees for certain liabilities that may arise from the performance of their duties to the Fund. Additionally, in the normal course of business, the Fund enters into contracts that contain a variety of representations and warranties and which provide general indemnities. The Fund’s maximum exposure under these arrangements is unknown, as this would involve future claims that may be made against the Fund that have not yet occurred. However, based on industry experience, the Fund expects the risk of loss due to these warranties and indemnities to be remote.
Offering Costs – Offering costs incurred by the Fund of $342,333 were treated as deferred charges until operations commenced and are being amortized over a 12-month period using the straight line method. Unamortized amounts are included in prepaid offering costs in the Statement of Assets and Liabilities.
Federal Income Taxes –The Fund intends to comply with the requirements of Subchapter M of the Internal Revenue Code applicable to regulated investment companies and will distribute all of its taxable income, if any, to shareholders. Accordingly, no provision for federal income taxes is required in the financial statements.
The Fund recognizes the tax benefits of uncertain tax positions only when the position is “more likely than not” to be sustained assuming examination by tax authorities. Management has reviewed the tax positions and has concluded that no liability for unrecognized tax benefits should be recorded related to uncertain tax positions expected to be taken in the Fund’s 2015 returns.
3. ADVISORY FEES, ADMINISTRATION FEES AND OTHER AGREEMENTS
Investment Advisory
Pursuant to the Investment Advisory Agreement with the Fund (“Advisory Agreement”), the Adviser is entitled to an investment advisory fee, computed daily and payable monthly of 1.50% of the average daily net assets of the Fund.
The Adviser and the Fund have entered into an expense limitation and reimbursement agreement (the “Expense Limitation Agreement”) under which the Adviser has agreed contractually to waive its fees and to pay or absorb the ordinary annual operating expenses of the Fund (including organizational and offering expenses, but excluding taxes, interest, brokerage commissions, acquired fund fees and expenses and extraordinary expenses), to the extent that they exceed 1.91% per annum of the Fund’s average daily net assets (the “Expense Limitation”). In consideration of the Adviser’s agreement to limit the Fund’s expenses, the Fund has agreed to repay the Adviser in the amount of any fees waived and Fund expenses paid or absorbed, subject to the limitations that: (1) the reimbursement for fees and expenses will be made only if payable not more than three years from the end of the fiscal year in which they were incurred; and (2) the reimbursement may not be made if it would cause the Expense Limitation to be exceeded.
During the period ended March 31, 2015, the fee waivers and/or reimbursements were as follows:
Fees Waived/ Reimbursed By | ||||
| Advisor | ||||
| Griffin Institutional Access Real Estate Fund | $ | 380,162 | ||
| 20 | 1.888.926.2688 | www.griffincapital.com |
| Griffin Institutional Access Real Estate Fund | Notes to Financial Statements |
| March 31, 2015 (Unaudited) |
As of September 30, 2014, the balance of recoupable expenses for the Fund was as follows:
| Fund | Expires May 21, 2017 | Expires September 30, 2017 | ||||||
| Griffin Institutional Access Real Estate Fund | $ | 153,980 | * | $ | 316,121 | |||
| * | $46,993 of additional Organizational Expenses were recorded subsequent to the May 21, 2014 Seed Audit Financial Statements. |
Sub-advisory services were provided to the Fund pursuant to agreements between the Adviser and both Aon Hewitt Investment Consulting, Inc. (formerly doing business as Hewitt EnnisKnupp, Inc.) and CenterSquare Investment Management, Inc. (the “Sub-Advisers”). Under the terms of the sub-advisory agreements, the Adviser compensates the Sub-Advisers based on a portion of the Fund’s average daily net assets which they had been allocated to manage.
Fund Administration and Accounting Fees and Expenses
ALPS Fund Services, Inc. serves as the Fund’s administrator and accounting agent (the “Administrator”). The Administrator is also reimbursed by the Fund for certain out of pocket expenses.
Transfer Agent
DST Systems Inc. serves as transfer, dividend paying and shareholder servicing agent for the Fund (the “Transfer Agent”).
Compliance Services
Cipperman Compliance Services, LLC provides a Chief Compliance Officer to the Fund as well as related compliance services pursuant to a consulting agreement between Cipperman Compliance Services, LLC and the Fund.
Distributor
The Fund has entered into a Distribution Agreement with ALPS Distributors, Inc. (the “Distributor”) to provide distribution services to the Fund. The Distributor serves as principal underwriter of shares of the Fund. Under the Shareholder Services Plan, the Fund may pay 0.25% per year of its average daily net assets for such services. For the period ended March 31, 2015, the Fund did not incur any shareholder servicing fees.
The Distributor acts as the Fund’s principal underwriter in a continuous public offering of the Fund’s shares. The Distributor is an affiliate of the Administrator and the Transfer Agent. For the period ended March 31, 2015, the Distributor received $201,320 in underwriting commissions for sales of the Fund’s shares, of which $0 was retained by the principal underwriter or other affiliated broker-dealers.
Officer and Trustee Compensation
Each Trustee who is not affiliated with the Fund or the Adviser will receive a quarterly fee of $2,500, as well as reimbursement for any reasonable expenses incurred attending the meetings. None of the Fund’s executive officers receives compensation from the Fund.
Certain Trustees and officers of the Fund are also officers of the Adviser.
4. PURCHASES AND SALES OF INVESTMENT SECURITIES
The cost of purchases and proceeds from the sale of securities, other than short-term securities, for the period ended March 31, 2015 were as follows:
| Fund | Purchases of Securities | Proceeds from Sales of Securities | ||||||
| Griffin Institutional Access Real Estate Fund | $ | 38,280,719 | $ | 7,244,461 | ||||
5. TAX BASIS INFORMATION
Distributions are determined in accordance with federal income tax regulations, which differ from GAAP, and, therefore, may differ significantly in amount or character from net investment income and realized gains for financial reporting purposes. Financial reporting records are adjusted for permanent book/tax differences to reflect tax character but are not adjusted for temporary differences.
| Semi-Annual Report | March 31, 2015 | 21 |
| Griffin Institutional Access Real Estate Fund | Notes to Financial Statements |
| March 31, 2015 (Unaudited) |
The tax character of distributions paid for the period ended September 30, 2014 were as follows:
| Fund | Ordinary Income | Long-Term Capital Gain | Return of Capital | |||||||||
| Griffin Institutional Access Real Estate Fund | $ | — | $ | 11,284 | $ | 295,706 | ||||||
As of March 31, 2015, net unrealized appreciation/(depreciation) of investments based on the federal tax cost was as follows:
Gross Appreciation | Gross Depreciation | Cost of Investments | ||||||||||||||
| (excess of value | (excess of tax cost | Net Unrealized | for Income Tax | |||||||||||||
| Fund | over tax cost) | over value) | Appreciation | Purposes | ||||||||||||
| Griffin Institutional Access Real Estate Fund | $ | 3,389,390 | $ | (169,813 | ) | $ | 3,219,577 | $ | 60,955,905 | |||||||
The difference between book basis and tax basis net unrealized appreciation is primarily attributable to the investments in partnerships, wash sales and certain other investments.
The Fund elects to defer to the year endeding September 30, 2015, capital losses recognized during the period June 30, 2014 (Commencement of Operations) through September 30, 2014, in the amount of $7,881.
The Fund elects to defer to the period ending September 30, 2015, late year ordinary losses in the amount of $62,434.
6. LINE OF CREDIT
The Fund has a secured bank line of credit through BNP Paribas Prime Brokerage International, Ltd. (the “Bank”) for purpose of investment purchases subject to the limitations of the 1940 Act for borrowings.
Borrowings under this arrangement bear interest at the Bank’s 3 month LIBOR plus 95 basis points at the time of borrowing. During the period ended March 31, 2015, the Fund incurred $1,224 of interest expense related to the borrowings. Average borrowings and the average interest rate for the days the line of credit was outstanding during the period ended March 31, 2015 were $6,000,272 and 1.22%, respectively. The largest outstanding borrowing during the period ended March 31, 2015 was $6,000,817. As of March 31, 2015, the Fund had $6,000,817 of outstanding borrowings.
As collateral security for the Bank line of credit, the Fund grants the Bank a first position security interest in and lien on all securities of any kind or description held by the Fund in the pledge account. As of March 31, 2015, the Fund had $10,884,752 in securities pledged as collateral for its line of credit.
7. REPURCHASE OFFERS
The Fund is an interval fund and, as such, has adopted a fundamental policy to make quarterly repurchase offers, at net asset value, of no less than 5% of the Fund’s shares outstanding. There is no guarantee that shareholders will be able to sell all of the shares they desire to sell in a quarterly repurchase offer, although each shareholder will have the right to require the Fund to purchase at least 5% of such shareholder’s shares in each quarterly repurchase. Liquidity will be provided to shareholders only through the Fund’s quarterly repurchases. Shareholders will be notified in writing of each quarterly repurchase offer and the date the repurchase offer ends (the “Repurchase Request Deadline”). Shares will be repurchased at the NAV per share determined as of the close of regular trading on the NYSE no later than the 14th day after the Repurchase Request Deadline, or the next business day if the 14th day is not a business day (each a “Repurchase Pricing Date”). The total amount of shares repurchased during the period ended March 31, 2105 are reflected as shares redeemed on the Statements of Changes in Net Assets.
8. SUBSEQUENT EVENTS
Subsequent events after the date of the Statement of Assets and Liabilities have been evaluated through the date the financial statements were issued. The Fund completed a quarterly repurchase offer on May 5, 2015, which resulted in 11,297 of Fund shares being repurchased for $292,678.
Management has determined that there were no other subsequent events to report through the issuance of the financial statements.
| 22 | 1.888.926.2688 | www.griffincapital.com |
| Griffin Institutional Access Real Estate Fund | Additional Information |
| March 31, 2015 (Unaudited) |
1. PROXY VOTING POLICIES AND VOTING RECORD
A description of the policies and procedures that the Fund uses to vote proxies relating to portfolio securities is available without charge upon request by calling toll-free 888-926-2688, or on the Securities and Exchange Commission’s (“SEC”) website at http://www.sec.gov. Information regarding how the Fund voted proxies relating to portfolio securities during the most recent 12-month period ended June 30th is available without charge upon request by calling toll-free 888-926-2688, or on the SEC’s website at http://www.sec.gov.
2. QUARTERLY PORTFOLIO HOLDINGS
The Fund files a complete listing of portfolio holdings for the Fund with the SEC as of the first and third quarters of each fiscal year on Form N-Q. The filings are available upon request by calling 888-926-2688. Furthermore, you may obtain a copy of the filing on the SEC’s website at http://www.sec.gov. The Fund’s Form N-Q may also be reviewed and copied at the SEC’s Public Reference Room in Washington, D.C., and information on the operation of the Public Reference Room may be obtained by calling 1-800-SEC-0330.
| Semi-Annual Report | March 31, 2015 | 23 |

Item 2. Code of Ethics.
Not applicable to this semi-annual report.
Item 3. Audit Committee Financial Expert.
Not applicable to this semi-annual report.
Item 4. Principal Accountant Fees and Services.
Not applicable to this semi-annual report.
Item 5. Audit Committee of Listed Registrants.
Not applicable to the registrant.
Item 6. Investments.
| (a) | The Schedule of Investments is included as part of the Report to Stockholders filed under Item 1 of this report. |
| (b) | Not applicable to the registrant. |
Item 7. Disclosure of Proxy Voting Policies and Procedures for Closed-End Management Investment Companies.
Not applicable to this semi-annual report.
Item 8. Portfolio Managers of Closed-End Management Investment Companies.
| (a) | Not applicable to this semi-annual report. |
| (b) | Not applicable. |
Item 9. Purchases of Equity Securities by Closed-End Management Investment Company and Affiliated Purchasers.
Not applicable to the registrant.
Item 10. Submission of Matters to a Vote of Security Holders.
The registrant has not adopted procedures by which shareholders may recommend nominees to the registrant’s Board of Trustees.
Item 11. Controls and Procedures.
| (a) | Based on an evaluation of the registrant’s disclosure controls and procedures (as defined in Rule 30a-3(c) under the 1940 Act), the registrant’s principal executive officer and principal financial officer have concluded that the registrant’s disclosure controls and procedures are effective as of a date within 90 days of the filing date of this report. |
| (b) | There were no significant changes in the registrant’s internal control over financial reporting that occurred during the registrant’s last fiscal half-year that have materially affected, or are reasonably likely to materially affect, the registrant’s internal control over financial reporting. |
Item 12. Exhibits.
| (a)(1) | Not applicable to this semi-annual report. |
| (a)(2) | Certifications required by Item 12(a)(2) of Form N-CSR are filed herewith as Exhibit 99.CERT. |
| (a)(3) | Not applicable to the registrant. |
| (b) | Certifications required by Item 12(b) of Form N-CSR are filed herewith as Exhibit 99.906CERT. |
SIGNATURES
Pursuant to the requirements of the Securities Exchange Act of 1934 and the Investment Company Act of 1940, the registrant has duly caused this report to be signed on its behalf by the undersigned, thereunto duly authorized.
| GRIFFIN INSTITUTIONAL ACCESS REAL ESTATE FUND | ||
| By: | /s/ Kevin Shields | |
| Kevin Shields | ||
| President (Principal Executive Officer) | ||
Date: June 3, 2015
Pursuant to the requirements of the Securities Exchange Act of 1934 and the Investment Company Act of 1940, this report has been signed below by the following persons on behalf of the registrant and in the capacities and on the dates indicated.
By (Signature and Title)
| By: | /s/ Kevin Shields | |
| Kevin Shields | ||
| President (Principal Executive Officer) | ||
Date: June 3, 2015
By (Signature and Title)
| By: | /s/ Joseph Miller | |
| Joseph Miller | ||
| Treasurer (Principal Financial Officer) | ||
Date: June 3, 2015