
| Shareholder Letter | 1 |
| Portfolio Update | 9 |
| Portfolio of Investments | 11 |
| Statement of Assets and Liabilities | 14 |
| Statement of Operations | 15 |
| Statements of Changes in Net Assets | 16 |
| Statement of Cash Flows | 18 |
| Financial Highlights | 19 |
| Notes to Financial Statements | 27 |
| Additional Information | 34 |
| GRIFFIN INSTITUTIONAL ACCESS REAL ESTATE FUND | SEMI-ANNUAL REPORT 2017 |  |
| • AEW Core Property Trust | • MEPT Edgemoor |
| • American Core Realty Fund | • MetLife Commercial Mortgage Income Fund |
• Barings Core Property Fund4 | • Morgan Stanley Prime Property Fund |
| • BlackRock Granite Property Fund | • Prudential PRISA |
| • CBRE US Core Partners | • RREEF America REIT II |
| • Clarion Lion Industrial Trust | • Sentinel Real Estate Fund |
| • Clarion Lion Properties Fund | • Stockbridge Smart Markets Fund |
| • Guggenheim US Property Fund | • UBS Trumbull Property Fund |
| • Heitman America Real Estate Trust | • USAA US Government Building Fund |
1 | The United Kingdom’s decision to leave the European Union is commonly referred to as “Brexit.” |
2 | Source: Morningstar Direct. |
3 | Source: NCREIF Property Index Trends Report, Q1 2017. |
4 | Formerly known as the Cornerstone Patriot Fund. |
| GRIFFIN INSTITUTIONAL ACCESS REAL ESTATE FUND | SEMI-ANNUAL REPORT 2017 | |
PORTFOLIO ALLOCATION5 (unaudited)


5 | As of 4/3/17 based on market value. Allocation and holdings are subject to change. |
6 | Source: Morningstar Direct. One basis point is equal to 1/100th of 1%, or 0.01%. |
| GRIFFIN INSTITUTIONAL ACCESS REAL ESTATE FUND | SEMI-ANNUAL REPORT 2017 | |
SECTOR DIVERSIFICATION (unaudited)

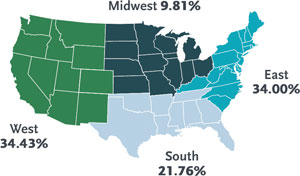
GEOGRAPHIC DIVERSIFICATION (unaudited)
| GRIFFIN INSTITUTIONAL ACCESS REAL ESTATE FUND | SEMI-ANNUAL REPORT 2017 | |

| PRIVATE FUND ALLOCATION | % |
| Clarion Lion Properties Fund | 15.99% |
| Prudential PRISA | 15.29% |
| Morgan Stanley Prime Property Fund | 13.83% |
| UBS Trumbull Property Fund | 7.67% |
| Clarion Lion Industrial Trust | 5.61% |
| MEPT Edgemoor | 5.45% |
| Guggenheim US Property Fund | 4.68% |
| Sentinel Real Estate Fund | 4.45% |
| Stockbridge Smart Markets Fund | 4.14% |
| American Core Realty Fund | 3.71% |
| USAA US Government Building Fund | 3.65% |
| AEW Core Property Trust | 3.64% |
| BlackRock Granite Property Fund | 3.15% |
| CBRE US Core Partners | 3.15% |
| Heitman America Real Estate Trust | 2.83% |
Barings Core Property Fund7 | 1.48% |
| RREEF America REIT II | 0.94% |
| MetLife Commercial Mortgage Income Fund | 0.34% |
7 | Formerly known as the Cornerstone Patriot Fund. |
| GRIFFIN INSTITUTIONAL ACCESS REAL ESTATE FUND | SEMI-ANNUAL REPORT 2017 | |
 | Core Property Trust (“CPT”) is an open-end core fund that seeks to invest in high quality assets located in top-tier markets with a heavy emphasize on income, liquidity and strong long term fundamentals. CPT uses a research-based approach to target markets with high barriers to entry – physical, governmental, or economic – in addition to population and job growth potential. |  | Bentall Kennedy Multi-Employer Property Trust (“MEPT”) Edgemoor is an open-end, core real estate private equity fund that invests in a portfolio of institutional-quality real estate assets in the U.S. MEPT Edgemoor’s investment strategy is focused on maintaining stable income, building a diversified modern portfolio, using moderate leverage, and providing superior liquidity. The fund upholds a strong commitment to the principles of Responsible Property Investing. |
 | The American Core Realty Fund is a diversified open-end commingled fund that invests primarily in high quality core income-producing office, industrial, retail, and multi-family properties. The Core Fund focuses its investment activity throughout the United States in major metropolitan markets that are innovation hubs containing high concentrations of our nation’s globally competitive industries and that benefit from highly educated/professional human capital. |  | MetLife Commercial Mortgage Income Fund is a perpetual life, open-end, commercial mortgage debt fund that consists of commercial mortgage loans. The Fund seeks to provide consistent current income, attractive risk-adjusted returns and preservation of principal. The Fund seeks to achieve its investment objective by creating a portfolio of institutional-quality loans originated by MetLife Investment Management Real Estate’s existing platform, using its investment underwriting guidelines and risk management processes and policies and anticipates being broadly diversified by property type, geography, borrower and loan type. |
 | The Barings Core Property Fund8 is a U.S. open-end, diversified core fund that focuses on the four traditional property types and hotels. The Fund is managed with an emphasis on research, targeting “barrier” markets, which are perceived to reduce the risk of oversupply and offer potential for outsized rent growth and appreciation. |  | Morgan Stanley Prime Property Fund is an open-end core fund with a focus on office, retail, multifamily, industrial, self storage and hotel properties located in major real estate markets throughout the United States. |
 | BlackRock Granite Property Fund (“The Granite Fund”) is a diversified core private REIT with an investment objective to provide current income with the potential for long term capital appreciation. The Granite Fund aims to beat its stated benchmark, the NFI-ODCE, while producing real estate returns and liquidity appropriate for a core fund. |  | PRISA is organized as a perpetual life, open-ended, commingled fund to invest primarily in core, well-leased, operating real estate assets located in the United States, with an emphasis on income. PRISA is Prudential Real Estate Investors (“PREI”) flagship fund, and represents one of the oldest and largest U.S. core real estate funds available in the marketplace. |
 | U.S. Core Partners (“CBRE Core Fund”) is an open-end core fund that purchases and operates high-quality, income-producing office, industrial, retail, and multi-family assets in select major U.S. metropolitan markets that exhibit strong growth demographics. |  | RREEF America REIT II is a core private REIT that provides an average risk exposure to the core real estate market, but does so with significantly different allocations than the Index – heavily overweight to industrial assets and the West. |
 | Clarion Lion Industrial Trust (the “Fund”) is a private REIT focused on the industrial property sector in North America. The Fund invests primarily in big-box warehouse and distribution centers, with an emphasis on large, core industrial markets throughout the United States. |  | Sentinel Real Estate Fund is a multi-family focused, core private REIT that emphasizes acquisitions of stabilized assets with in-place income with the goal of providing a substantial portion of investor returns in the form of distributed cash. |
 | Clarion Lion Properties Fund is a core private REIT with interests in a diversified portfolio of primarily institutional quality real estate assets and related investments located throughout the U.S. The investment objective is to provide a strong income return with potential for long-term capital appreciation. |  | The Smart Markets Fund is an open-end core fund that aims to capture performance in excess of the ODCE Index by acquiring assets in “Smart Markets” characterized by educated, stable and fast-growing employment bases. The Smart Market Fund’s target market strategy is based on the principle that real estate demand is dependent on jobs which are increasingly being created where there are educated work forces in the U.S. |
 | GRE U.S. Property Fund L.P. (“USPF”) is an open-end real estate fund consisting of a diversified portfolio of institutional quality, income producing assets broadly allocated by property type and geographic location. USPF employs a core plus strategy intertwined with a disciplined risk management process in seeking to achieve its performance objectives. |  | Trumbull Property Fund is an open-end, diversified Core fund focusing on the four main property types, with a small exposure to hotels. The Fund focuses on top markets for high-quality Core, institutional real estate assets. |
 | Heitman America Real Estate Trust (“HART”) is an open-end core commingled fund. HART’s core strategy encompasses stabilized investments with low to moderate leverage and seeks to objectively minimize risk through diversification in property type, geographic location, and tenant composition. |  | USAA US Government Building Fund seeks to provide investors with attractive, risk-adjusted returns generated by the acquisition, build to suit development and operation of buildings located in the United States and leased or intended to be leased to U.S. federal, state and local governments and government agencies and departments. |
8 | Formerly known as the Cornerstone Patriot Fund. |
GRIFFIN INSTITUTIONAL ACCESS REAL ESTATE FUND | SEMI-ANNUAL REPORT 2017 | |
| Aon Hewitt Investment Consulting |  |
| CenterSquare Investment Management |  |
GRIFFIN INSTITUTIONAL ACCESS REAL ESTATE FUND | SEMI-ANNUAL REPORT 2017 | |
GRIFFIN INSTITUTIONAL ACCESS REAL ESTATE FUND | SEMI-ANNUAL REPORT 2017 | |
| PERIOD ENDING | NAV RETURN | TOTAL RETURN | CUMULATIVE TOTAL RETURN |
| 06/30/2014 | N/A | N/A | N/A |
| 09/30/2014 | 0.44% | 1.65% | 1.65% |
| 12/31/2014 | 2.11% | 3.40% | 5.10% |
| 03/31/2015 | 0.98% | 2.28% | 7.50% |
| 06/30/2015 | -1.24% | 0.06% | 7.56% |
| 09/30/2015 | 1.13% | 2.47% | 10.21% |
| 12/31/2015 | 1.01% | 2.34% | 12.79% |
| 03/31/2016 | 1.00% | 2.33% | 15.42% |
| 06/30/2016 | 0.95% | 2.28% | 18.05% |
| 09/30/2016 | -0.04% | 1.28% | 19.57% |
| 12/30/2016 | -0.26% | 1.05% | 20.83% |
| 03/31/2017 | -0.15% | 1.17% | 22.24% |
9 | Source: Morningstar Direct. |
| Griffin Institutional Access Real Estate Fund | Portfolio Update |
March 31, 2017 (Unaudited)
| 6 Month | 1 Year | Since Inception | Inception Date | Total Expense Ratio | |
| Griffin Institutional Access Real Estate Fund– A– Without Load | 2.24% | 5.51% | 7.59% | 6/30/14 | 2.42% |
| Griffin Institutional Access Real Estate Fund– A– With Load* | ‐3.63% | ‐0.57% | 5.29% | 6/30/14 | |
S&P 500® Total Return Index | 10.12% | 17.17% | 9.31% | 6/30/14 | |
| Bloomberg Barclays U.S. Aggregate Bond Index | ‐2.18% | 0.44% | 2.18% | 6/30/14 | |
| Griffin Institutional Access Real Estate Fund – C– Without Load | 1.85% | 4.71% | 5.75% | 8/7/15 | 3.17% |
| Griffin Institutional Access Real Estate Fund – C– With Load** | 0.85% | 3.72% | 5.75% | 8/7/15 | |
| Griffin Institutional Access Real Estate Fund – I – NAV | 2.35% | 5.79% | 6.78% | 8/7/15 | 2.17% |
| Griffin Institutional Access Real Estate Fund ‐ M ‐ NAV | N/A | N/A | 2.62% | 11/16/16 | 2.92% |
| * | Adjusted for initial maximum sales charge of 5.75%. |
| ** | Adjusted for contingent deferred sales charge of 1.00%. |
| Semi-Annual Report | March 31, 2017 | 9 |
| Griffin Institutional Access Real Estate Fund | Portfolio Update |
March 31, 2017 (Unaudited)

| Private Investment Funds | 88.41% |
| Publicly Traded Securities | 11.53% |
| Other | 0.06% |
| TOTALS | 100.00% |
| Real Estate Investment Trusts | 99.94% |
| Other Assets in Ecess Of Liabilities | 0.06% |
| TOTALS | 100.00% |
| * | Holdings are subject to change. Tables present indicative values only. |
| 10 | 1.888.926.2688 | www.griffincapital.com |
| Griffin Institutional Access Real Estate Fund | Portfolio of Investments |
March 31, 2017 (Unaudited)
| Description | Shares | Value (Note 2) | ||||||
| REAL ESTATE INVESTMENT TRUSTS (99.94%) | ||||||||
| Private Investment Funds (88.41%)*(a) | ||||||||
| AEW Core Property Trust | 54,208 | $ | 52,760,699 | |||||
| American Core Realty Fund LLC | 445 | 53,957,905 | ||||||
| Barings Core Property Fund LP | 174,965 | 21,580,086 | ||||||
| BlackRock Granite Property Fund | N/A | 45,754,955 | ||||||
| CBRE US Core Partners | 34,285,915 | 45,474,244 | ||||||
| Clarion Lion Industrial Trust | 43,058 | 67,181,479 | ||||||
| Clarion Lion Properties Fund LP | 154,381 | 213,257,941 | ||||||
| Guggenheim US Property Fund | N/A | 60,167,324 | ||||||
| Heitman America Real Estate Trust | 20,399 | 23,873,529 | ||||||
| MEPT Edgemoor LP Fund | 41,281 | 78,582,636 | ||||||
| MetLife Commercial Mortgage Income Fund LP | 2,262 | 2,301,543 | ||||||
| Morgan Stanley Prime Property Fund | 9,566 | 167,574,123 | ||||||
| Prudential PRISA LP | 152,384 | 221,041,085 | ||||||
| RREEF America REIT II | 117,651 | 13,640,797 | ||||||
| Sentinel Real Estate Fund LP | 766 | 64,356,920 | ||||||
| Stockbridge Smart Markets Fund | 40,997 | 59,973,949 | ||||||
| UBS Trumbull Property Fund | 10,269 | 110,352,663 | ||||||
| USAA US Government Building Fund LLC | N/A | 53,155,660 | ||||||
| 1,354,987,538 | ||||||||
| Publicly Traded Securities (11.53%) | ||||||||
| Alexandria Real Estate Equities, Inc.(a) | 20,230 | 2,235,820 | ||||||
| American Assets Trust, Inc. (a) | 37,870 | 1,584,481 | ||||||
| American Homes 4 Rent, Class A(a) | 75,910 | 1,742,894 | ||||||
| Apartment Investment & Management Co., Class A | 70,160 | 3,111,596 | ||||||
| AvalonBay Communities, Inc.(a) | 46,040 | 8,452,944 | ||||||
| Boston Properties, Inc.(a) | 58,830 | 7,789,680 | ||||||
| Brixmor Property Group, Inc.(a) | 67,010 | 1,438,035 | ||||||
| Chesapeake Lodging Trust | 56,520 | 1,354,219 | ||||||
| Colony Starwood Homes(a) | 132,300 | 4,491,585 | ||||||
| Cousins Properties, Inc. | 159,050 | 1,315,344 | ||||||
| CubeSmart(a) | 205,980 | 5,347,241 | ||||||
| CyrusOne, Inc.(a) | 79,350 | 4,084,145 | ||||||
| DDR Corp.(a) | 181,770 | 2,277,578 | ||||||
| Digital Realty Trust, Inc.(a) | 8,750 | 930,913 | ||||||
| Douglas Emmett, Inc.(a) | 118,900 | 4,565,760 | ||||||
| Duke Realty Corp.(a) | 154,040 | 4,046,631 | ||||||
| Education Realty Trust, Inc.(a) | 70,470 | 2,878,700 | ||||||
| Equinix, Inc.(a) | 22,830 | 9,140,447 | ||||||
| Equity Residential(a) | 51,710 | 3,217,396 | ||||||
| Essex Property Trust, Inc.(a) | 13,830 | 3,202,060 | ||||||
| First Industrial Realty Trust, Inc.(a) | 68,450 | 1,822,824 | ||||||
| General Growth Properties, Inc.(a) | 154,920 | 3,591,046 | ||||||
| HCP, Inc.(a) | 232,790 | 7,281,671 | ||||||
| Healthcare Trust of America, Inc., Class A(a) | 99,740 | 3,137,820 | ||||||
| Highwoods Properties, Inc.(a) | 43,480 | 2,136,172 | ||||||
| Hilton Worldwide Holdings, Inc.(a) | 44,210 | 2,584,517 | ||||||
| Host Hotels & Resorts, Inc.(a) | 249,190 | 4,649,885 | ||||||
| Hudson Pacific Properties, Inc.(a) | 68,030 | 2,356,559 | ||||||
| Invitation Homes, Inc.(a)(b) | 65,390 | 1,427,464 | ||||||
| Kimco Realty Corp.(a) | 143,890 | 3,178,530 | ||||||
| Macerich Co.(a) | 42,480 | 2,735,712 | ||||||
| Semi-Annual Report | March 31, 2017 | 11 |
| Griffin Institutional Access Real Estate Fund | Portfolio of Investments |
| Description | Shares | Value (Note 2) | ||||||
| Publicly Traded Securities (continued) | ||||||||
| Mack-Cali Realty Corp.(a) | 70,560 | $ | 1,900,886 | |||||
| Park Hotels & Resorts, Inc.(a) | 69,120 | 1,774,310 | ||||||
| Parkway, Inc.(a) | 91,920 | 1,828,289 | ||||||
| Prologis, Inc.(a) | 139,190 | 7,221,177 | ||||||
| PS Business Parks, Inc.(a) | 12,920 | 1,482,699 | ||||||
| Public Storage(a) | 27,910 | 6,109,778 | ||||||
| Regency Centers Corp.(a) | 66,890 | 4,440,827 | ||||||
| Simon Property Group, Inc.(a) | 70,540 | 12,134,996 | ||||||
| SL Green Realty Corp.(a) | 18,610 | 1,984,198 | ||||||
| STAG Industrial, Inc.(a) | 87,220 | 2,182,244 | ||||||
| STORE Capital Corp.(a) | 163,820 | 3,912,022 | ||||||
| Sunstone Hotel Investors, Inc.(a) | 145,730 | 2,234,041 | ||||||
| UDR, Inc.(a) | 123,870 | 4,491,526 | ||||||
| Ventas, Inc.(a) | 27,020 | 1,757,381 | ||||||
| VEREIT, Inc.(a) | 211,560 | 1,796,144 | ||||||
| Vornado Realty Trust(a) | 62,670 | 6,286,428 | ||||||
| Weingarten Realty Investors(a) | 67,960 | 2,269,184 | ||||||
| Welltower, Inc.(a) | 66,720 | 4,725,110 | ||||||
| 176,640,909 | ||||||||
TOTAL REAL ESTATE INVESTMENT TRUSTS (Cost $1,473,792,243) | 1,531,628,447 | |||||||
TOTAL INVESTMENTS (99.94%) (Cost $1,473,792,243) | $ | 1,531,628,447 | ||||||
| Other Assets In Excess Of Liabilities (0.06%) | 932,552 | |||||||
| NET ASSETS (100.00%) | $ | 1,532,560,999 | ||||||
(a) | A portion of these securities are held as collateral for the outstanding Line(s) of Credit. At March 31, 2017, outstanding collateral amounted to $1,436,883,636. |
(b) | Non-income producing security. |
| Common Abbreviations: | ||
| LLC | - | Limited Liability Corporation |
| LP | - | Limited Partnerships |
| REIT | - | Real Estate Investment Trust |
| 12 | 1.888.926.2688 | www.griffincapital.com |
| Griffin Institutional Access Real Estate Fund | Portfolio of Investments |
* | Additional Information on Investments in Private Investment Funds: |
| Value | Security | Redemption Frequency | Redemption Notice (Days) | Unfunded Commitments as of March 31, 2017 | ||||||||||
| $ | 52,760,699 | AEW Core Property Trust | Quarterly | 45 | $ | 0 | ||||||||
| 53,957,905 | American Core Realty Fund LLC | Quarterly | 10 | 0 | ||||||||||
| 21,580,086 | Barings Core Property Fund LP | Quarterly | 30 | 0 | ||||||||||
| 45,754,955 | BlackRock Granite Property Fund | Quarterly | 60 | 0 | ||||||||||
| 45,474,244 | CBRE US Core Partners | Quarterly | 60 | 0 | ||||||||||
| 67,181,479 | Clarion Lion Industrial Trust | Quarterly | 90 | 15,000,000 | ||||||||||
| 213,257,941 | Clarion Lion Properties Fund LP | Quarterly | 90 | 0 | ||||||||||
| 60,167,324 | Guggenheim US Property Fund | Quarterly | 90 | 7,500,000 | ||||||||||
| 23,873,529 | Heitman America Real Estate Trust | Quarterly | 90 | 17,070,732 | ||||||||||
| 78,582,636 | MEPT Edgemoor LP Fund | Quarterly | N/A** | 0 | ||||||||||
| 2,301,543 | MetLife Commercial Mortgage Income Fund LP | Quarterly | 90 | 7,702,117 | ||||||||||
| 167,574,123 | Morgan Stanley Prime Property Fund | Quarterly | 90 | 55,000,000 | ||||||||||
| 221,041,085 | Prudential PRISA LP | Quarterly | 90 | 0 | ||||||||||
| 13,640,797 | RREEF America REIT II | Quarterly | 45 | 0 | ||||||||||
| 64,356,920 | Sentinel Real Estate Fund LP | Quarterly | N/A** | 0 | ||||||||||
| 59,973,949 | Stockbridge Smart Markets Fund | Quarterly | 45 | 0 | ||||||||||
| 110,352,663 | UBS Trumbull Property Fund | Quarterly | 60 | 0 | ||||||||||
| 53,155,660 | USAA US Government Building Fund LLC | Quarterly | 60 | 0 | ||||||||||
** | Written notice required for redemption, no minimum timeline required. |
See Notes to Financial Statements.
| Semi-Annual Report | March 31, 2017 | 13 |
| Griffin Institutional Access Real Estate Fund | Statement of Assets and Liabilities |
March 31, 2017 (Unaudited)
| ASSETS | ||||
| Investments, at value | $ | 1,531,628,447 | ||
| Cash | 111,656,285 | |||
| Receivable for investments sold | 2,318,181 | |||
| Receivable for shares sold | 8,318,705 | |||
| Dividends receivable | 8,508,265 | |||
| Prepaid expenses and other assets | 182,064 | |||
| Total Assets | 1,662,611,947 | |||
| LIABILITIES | ||||
| Payable for investments purchased | 12,229,100 | |||
| Shareholder servicing fees payable (Note 3) | 428,689 | |||
| Lines of credit payable (Note 6) | 114,500,000 | |||
| Lines of credit interest payable (Note 6) | 112,332 | |||
| Investment advisory fees payable (Note 3) | 1,786,495 | |||
| Administration fees payable (Note 3) | 55,662 | |||
| Transfer agency fees payable (Note 3) | 181,204 | |||
| Distribution fees payable (Note 3) | 257,589 | |||
| Chief compliance officer fees payable (Note 3) | 4,616 | |||
| Trustees' fees payable (Note 3) | 1,923 | |||
| Legal fees payable | 68,557 | |||
| Audit and tax fees payable | 10,221 | |||
| Accrued expenses and other liabilities | 414,560 | |||
| Total Liabilities | 130,050,948 | |||
| NET ASSETS | $ | 1,532,560,999 | ||
| NET ASSETS CONSIST OF | ||||
| Paid-in capital | $ | 1,488,540,544 | ||
| Accumulated net investment loss | (36,565,667 | ) | ||
| Accumulated net realized gain on investments | 22,749,918 | |||
| Net unrealized appreciation on investments | 57,836,204 | |||
| NET ASSETS | $ | 1,532,560,999 | ||
| INVESTMENTS, AT COST | $ | 1,473,792,243 | ||
| PRICING OF SHARES | ||||
| Class A: | ||||
| Net asset value, and redemption price per share | $ | 26.52 | ||
| Net assets | $ | 609,265,575 | ||
| Shares of beneficial interest outstanding (unlimited number of shares, no par value common stock authorized) | 22,976,768 | |||
| Maximum offering price per share ((NAV/0.9425), based on maximum sales charge of 5.75% of the offering price) | $ | 28.14 | ||
| Class C: | ||||
| Net asset value, offering and redemption price per share(a) | $ | 26.21 | ||
| Net assets | $ | 392,398,494 | ||
| Shares of beneficial interest outstanding (unlimited number of shares, no par value common stock authorized) | 14,972,707 | |||
| Class I: | ||||
| Net asset value, offering and redemption price per share | $ | 26.63 | ||
| Net assets | $ | 509,869,627 | ||
| Shares of beneficial interest outstanding (unlimited number of shares, no par value common stock authorized) | 19,146,555 | |||
| Class M:(b) | ||||
| Net asset value, offering and redemption price per share | $ | 26.47 | ||
| Net assets | $ | 21,027,303 | ||
| Shares of beneficial interest outstanding (unlimited number of shares, no par value common stock authorized) | 794,444 | |||
(a) | Redemption price per share may be reduced for any applicable contingent deferred sales charge. For a description of a possible sales charge, please see (Note 1). |
(b) | The Fund’s Class M shares commenced operations on November 17, 2016. |
| 14 | 1.888.926.2688 | www.griffincapital.com |
| Griffin Institutional Access Real Estate Fund | Statement of Operations |
| INVESTMENT INCOME | ||||
| Dividend income | $ | 26,361,870 | ||
| Total Investment Income | 26,361,870 | |||
| EXPENSES | ||||
| Investment advisory fees (Note 3) | 10,025,663 | |||
| Administrative fees (Note 3) | 300,249 | |||
| Transfer agency fees (Note 3) | 528,800 | |||
| Shareholder servicing fees: | ||||
| Class A | 700,460 | |||
| Class C | 430,208 | |||
| Distribution fees: | ||||
| Class C | 1,290,624 | |||
| Class M(a) | 14,543 | |||
| Legal fees | 106,051 | |||
| Audit and tax fees | 10,221 | |||
| Reports to shareholders and printing fees | 393,695 | |||
| SEC registration fees | 58,182 | |||
| Insurance fees | 93,013 | |||
| Custody fees | 41,795 | |||
| Chief compliance officer fees (Note 3) | 37,461 | |||
| Interest expense (Note 6) | 2,561,395 | |||
| Trustees' fees (Note 3) | 81,272 | |||
| Other expenses | 73,829 | |||
| Total Expenses | 16,747,461 | |||
| Less: Fees waived/expenses reimbursed by adviser (Note 3) | (646,764 | ) | ||
| Net Expenses | 16,100,697 | |||
| Net Investment Income | 10,261,173 | |||
| Net realized gain on investments | 8,287,260 | |||
| Net change in unrealized appreciation on investments | 11,611,575 | |||
| NET REALIZED AND UNREALIZED GAIN ON INVESTMENTS | 19,898,835 | |||
| NET INCREASE IN NET ASSETS RESULTING FROM OPERATIONS | $ | 30,160,008 | ||
(a) | The Fund’s Class M shares commenced operations on November 17, 2016. |
| Semi-Annual Report | March 31, 2017 | 15 |
| Griffin Institutional Access Real Estate Fund | Statements of Changes in Net Assets |
| For the Six Months Ended March 31, 2017 (Unaudited) | For the Year Ended September 30, 2016 | |||||||
| OPERATIONS: | ||||||||
| Net investment income | $ | 10,261,173 | $ | 5,401,480 | ||||
| Net realized gain on investments | 8,287,260 | 3,153,910 | ||||||
| Net change in unrealized appreciation on investments | 11,611,575 | 40,349,143 | ||||||
| Net Increase in Net Assets Resulting from Operations | 30,160,008 | 48,904,533 | ||||||
| DISTRIBUTIONS TO SHAREHOLDERS: | ||||||||
| Class A | ||||||||
| From net investment income | (15,390,731 | ) | (142,287 | ) | ||||
| From net realized gain on investments | – | (2,129,606 | ) | |||||
| From return of capital | – | (16,174,402 | ) | |||||
| Class C | ||||||||
| From net investment income | (9,554,976 | ) | (71,354 | ) | ||||
| From net realized gain on investments | – | (1,067,958 | ) | |||||
| From return of capital | – | (8,111,165 | ) | |||||
| Class I | ||||||||
| From net investment income | (12,120,524 | ) | (90,876 | ) | ||||
| From net realized gain on investments | – | (1,360,135 | ) | |||||
| From return of capital | – | (10,330,255 | ) | |||||
| Class M(a) | ||||||||
| From net investment income | (238,025 | ) | – | |||||
| Total Distributions to Shareholders | (37,304,256 | ) | (39,478,038 | ) | ||||
| BENEFICIAL INTEREST TRANSACTIONS: | ||||||||
| Class A | ||||||||
| Shares sold | 124,316,195 | 385,193,252 | ||||||
| Distributions reinvested | 9,109,770 | 11,402,155 | ||||||
| Shares redeemed | (31,793,337 | ) | (22,628,626 | ) | ||||
| Class C | ||||||||
| Shares sold | 97,817,938 | 285,953,911 | ||||||
| Distributions reinvested | 5,943,287 | 6,045,082 | ||||||
| Shares redeemed | (10,775,444 | ) | (3,685,588 | ) | ||||
| Class I | ||||||||
| Shares sold | 169,252,190 | 282,293,973 | ||||||
| Distributions reinvested | 7,262,483 | 7,758,745 | ||||||
| Shares redeemed | (19,053,175 | ) | (13,771,640 | ) | ||||
| Class M(a) | ||||||||
| Shares sold | 20,926,803 | – | ||||||
| Distributions reinvested | 222,138 | – | ||||||
| Net Increase in Net Assets Derived from Beneficial Interest Transactions | 373,228,848 | 938,561,264 | ||||||
| Net increase in net assets | 366,084,600 | 947,987,759 | ||||||
| NET ASSETS: | ||||||||
| Beginning of period | 1,166,476,399 | 218,488,640 | ||||||
| End of period * | $ | 1,532,560,999 | $ | 1,166,476,399 | ||||
| *Including accumulated net investment loss of: | $ | (36,565,667 | ) | $ | (9,522,584 | ) | ||
| 16 | 1.888.926.2688 | www.griffincapital.com |
| Griffin Institutional Access Real Estate Fund | Statements of Changes in Net Assets |
| For the Six Months Ended March 31, 2017 (Unaudited) | For the Year Ended September 30, 2016 | |||||||
| Other Information | ||||||||
| BENEFICIAL INTEREST TRANSACTIONS: | ||||||||
| Class A | ||||||||
| Beginning shares | 19,159,502 | 5,038,709 | ||||||
| Shares sold | 4,668,103 | 14,539,008 | ||||||
| Distributions reinvested | 344,481 | 431,493 | ||||||
| Shares redeemed | (1,195,318 | ) | (849,708 | ) | ||||
| Net increase in shares outstanding | 3,817,266 | 14,120,793 | ||||||
| Ending shares | 22,976,768 | 19,159,502 | ||||||
| Class C | ||||||||
| Beginning shares | 11,443,448 | 521,984 | ||||||
| Shares sold | 3,711,513 | 10,830,507 | ||||||
| Distributions reinvested | 227,206 | 229,888 | ||||||
| Shares redeemed | (409,460 | ) | (138,931 | ) | ||||
| Net increase in shares outstanding | 3,529,259 | 10,921,464 | ||||||
| Ending shares | 14,972,707 | 11,443,448 | ||||||
| Class I | ||||||||
| Beginning shares | 13,251,197 | 2,851,754 | ||||||
| Shares sold | 6,335,173 | 10,623,295 | ||||||
| Distributions reinvested | 273,587 | 293,041 | ||||||
| Shares redeemed | (713,402 | ) | (516,893 | ) | ||||
| Net increase in shares outstanding | 5,895,358 | 10,399,443 | ||||||
| Ending shares | 19,146,555 | 13,251,197 | ||||||
| Class M(a) | ||||||||
| Beginning shares | – | – | ||||||
| Shares sold | 786,027 | – | ||||||
| Distributions reinvested | 8,417 | – | ||||||
| Net increase in shares outstanding | 794,444 | – | ||||||
| Ending shares | 794,444 | – | ||||||
(a) | The Fund’s Class M shares commenced operations on November 17, 2016. |
| Semi-Annual Report | March 31, 2017 | 17 |
| Griffin Institutional Access Real Estate Fund | Statement of Cash Flows |
For the Six | ||||
| Cash Flow from Operating Activities: | ||||
| Net increase in net assets resulting from operations | $ | 30,160,008 | ||
| Adjustments to reconcile net increase in net assets resulting from operations to net cash used in operating activities: | ||||
| Purchase of investments | (429,388,791 | ) | ||
| Proceeds from sales | 86,038,788 | |||
| Net realized gain on investments | (8,287,260 | ) | ||
| Net change in unrealized appreciation on investments | (11,611,575 | ) | ||
| (Increase)/Decrease in assets: | ||||
| Dividends receivable | (1,385,857 | ) | ||
| Prepaid expenses and other assets | (10,580 | ) | ||
| Increase/(Decrease) in liabilities: | ||||
| Lines of credit interest payable | 8,534 | |||
| Shareholder servicing fees payable | 83,239 | |||
| Transfer agency fees payable | 29,223 | |||
| Investment advisory fees payable | 741,882 | |||
| Distribution fees payable | 80,153 | |||
| Administration fees payable | 9,631 | |||
| Trustees' fees payable | 231 | |||
| Chief compliance officer fees payable | 4,616 | |||
| Legal fees payable | 5,950 | |||
| Audit and tax fees payable | (10,279 | ) | ||
| Accrued expenses and other liabilities | 210,054 | |||
| Net cash used in operating activities | (333,322,033 | ) | ||
| Cash Flows from Financing Activities: | ||||
| Cash provided by lines of credit | (100,000,000 | ) | ||
| Proceeds from shares sold | 412,113,314 | |||
| Payment on shares redeemed | (61,621,956 | ) | ||
| Cash distributions paid | (14,766,578 | ) | ||
| Net cash provided by financing activities | 235,724,780 | |||
| Net decrease in cash & cash equivalents | (97,597,253 | ) | ||
| Cash & cash equivalents, beginning of period | 209,253,538 | |||
| Cash & cash equivalents, end of period | $ | 111,656,285 | ||
| Non-cash financing activities not included herein consist of reinvestment of distributions of: | $ | 22,537,678 | ||
| Cash paid for interest on lines of credit during the period was: | $ | 2,552,861 | ||
| 18 | 1.888.926.2688 | www.griffincapital.com |
| Griffin Institutional Access Real Estate Fund – Class A | Financial Highlights |
For a Share Outstanding Throughout the Periods Presented
| For the Six Months Ended March 31, 2017 (Unaudited) | For the Year Ended September 30, 2016 | For the Year Ended September 30, 2015 | For the Period Ended September 30, 2014(a) | |||||||||||||
| Net asset value, beginning of period | $ | 26.63 | $ | 25.97 | $ | 25.31 | $ | 25.00 | ||||||||
| INCOME FROM INVESTMENT OPERATIONS: | ||||||||||||||||
| Net investment income(b) | 0.22 | 0.24 | 0.09 | 0.01 | ||||||||||||
| Net realized and unrealized gain | 0.37 | 1.81 | 1.90 | 0.60 | ||||||||||||
| Total from investment operations | 0.59 | 2.05 | 1.99 | 0.61 | ||||||||||||
| DISTRIBUTIONS: | ||||||||||||||||
| From net investment income | (0.70 | ) | (0.02 | ) | – | – | ||||||||||
| From net realized gain on investments | – | (0.32 | ) | (0.32 | ) | (0.01 | ) | |||||||||
| Return of capital | – | (1.05 | ) | (1.01 | ) | (0.29 | ) | |||||||||
| Total distributions(c)(i) | (0.70 | ) | (1.39 | ) | (1.33 | ) | (0.30 | ) | ||||||||
| Net increase/(decrease) in net asset value | (0.11 | ) | 0.66 | 0.66 | 0.31 | |||||||||||
| Net asset value, end of period | $ | 26.52 | $ | 26.63 | $ | 25.97 | $ | 25.31 | ||||||||
| TOTAL RETURN(d) | 2.24 | % | 8.07 | % | 8.03 | % | 2.46 | % | ||||||||
| RATIOS/SUPPLEMENTAL DATA: | ||||||||||||||||
| Net assets, end of period (000s) | $ | 609,266 | $ | 510,251 | $ | 130,847 | $ | 35,845 | ||||||||
| Ratios to Average Net Assets (including interest expense) | ||||||||||||||||
| Ratio of expenses to average net assets excluding fee waivers and reimbursements(e) | 2.39 | %(f) | 2.41 | % | 2.82 | % | N/A | |||||||||
| Ratio of expenses to average net assets including fee waivers and reimbursements(e) | 2.29 | %(f) | 2.23 | % | 1.94 | % | N/A | |||||||||
| Ratio of net investment income to average net assets(e)(g) | 1.65 | %(f) | 0.92 | % | 0.35 | % | N/A | |||||||||
| Ratios to Average Net Assets (excluding interest expense) | ||||||||||||||||
| Ratio of expenses to average net assets excluding fee waivers and reimbursements(e) | 2.01 | %(f) | 2.09 | % | 2.79 | % | 6.77 | %(f) | ||||||||
| Ratio of expenses to average net assets including fee waivers and reimbursements(e) | 1.91 | %(f) | 1.91 | % | 1.91 | % | 1.91 | %(f) | ||||||||
| Ratio of net investment income to average net assets excluding fee waivers and reimbursements(e)(g) | 1.93 | %(f) | 1.05 | % | 0.38 | % | 0.15 | %(f) | ||||||||
| Portfolio turnover rate(h) | 6 | % | 8 | % | 29 | % | 7 | % | ||||||||
| (a) | The Fund's Class A shares commenced operations on June 30, 2014. |
| (b) | Calculated using the average shares method. |
(c) | Total distributions during a calendar year generally will be made from the Fund’s net investment income, net realized gains on investments and net unrealized gains on investments, if any. The portion of distributions paid not attributable to net investment income or net realized gains on investments, if any, is distributed from the Fund’s assets and is treated by shareholders as a nontaxable distribution (“Return of Capital”) for tax purposes. Return of capital is a tax concept, not an economic concept. The tax character of the Fund’s distributions, in isolation, does not reveal much information about whether the distributions are supported by the Fund’s returns. Reported distributions from net investment income and realized gains on investments are not an indication as to whether or not the Fund’s distributions are supported by the Fund’s returns. A Fund can have distributions from net investment income and realized capital gains in years in which it incurs an economic loss due to unrealized losses not being recognized for tax purposes. A common method in which to determine if the Fund’s distributions are supported by economic returns is to examine the Fund’s Net Asset Value (“ NAV”) over the course of a year. If the Fund’s NAV has increased, the Fund will have economically earned more than it has distributed, regardless of whether such distributions are reported as being from net investment income, net realized gains on investments or return of capital. If a Fund’s NAV decreases, the Fund will have distributed more than it has economically earned or it will have incurred an economic loss. |
| Semi-Annual Report | March 31, 2017 | 19 |
| Griffin Institutional Access Real Estate Fund – Class A | Financial Highlights |
For a Share Outstanding Throughout the Periods Presented
| (d) | Total returns are for the period indicated and have not been annualized. Total returns would have been lower had certain expenses not been waived during the period. Returns shown do not reflect the deduction of taxes that a shareholder would pay on Fund distributions or the redemption of Fund shares. |
| (e) | The ratios of expenses to average net assets and net investment income to average net assets do not reflect the expenses of the underlying investment companies in which the Fund invests. |
| (f) | Annualized. |
| (g) | Recognition of net investment income is affected by the timing and declaration of dividends by the underlying investment companies in which the Fund invests. |
| (h) | Portfolio turnover rate for periods less than one full year have not been annualized and is calculated at the Fund level. |
(i) | The Fund has substantial investments in real estate investment trusts, or REITs, which are generally not subject to federal income taxes. Distributions that the Fund receives from REITs can be classified as ordinary income, capital gain income or return of capital by the REITs that make these distributions to the Fund. However, it is not possible for the Fund to characterize distributions received from REITs during interim periods because the REIT issuers do not report their tax characterizations until after year end. Final characterization of the Fund’s 2017 distributions to its common shareholders is also dependent upon the size or timing of the Fund’s securities transactions prior to year-end. Therefore, it is likely that some portion of the Fund’s 2017 investment income and distributions to its common shareholders will be re-characterized as long term capital gain and return of capital for financial statement and U.S. federal income tax purposes subsequent to year end and reflected accordingly in the Fund’s year-end financial statements. |
| 20 | 1.888.926.2688 | www.griffincapital.com |
| Griffin Institutional Access Real Estate Fund – Class C | Financial Highlights |
For a Share Outstanding Throughout the Periods Presented
| For the Six Months Ended March 31, 2017 (Unaudited) | For the Year Ended September 30, 2016 | For the Period Ended September 30, 2015(a) | ||||||||||
| Net asset value, beginning of period | $ | 26.42 | $ | 25.95 | $ | 26.20 | ||||||
| INCOME FROM INVESTMENT OPERATIONS: | ||||||||||||
| Net investment income(b) | 0.12 | 0.04 | 0.00 | (c) | ||||||||
| Net realized and unrealized gain | 0.36 | 1.82 | 0.09 | |||||||||
| Total from investment operations | 0.48 | 1.86 | 0.09 | |||||||||
| DISTRIBUTIONS: | ||||||||||||
| From net investment income | (0.69 | ) | (0.03 | ) | – | |||||||
| From net realized gain on investments | – | (0.32 | ) | – | ||||||||
| Return of capital | – | (1.04 | ) | (0.34 | ) | |||||||
| Total distributions(d)(k) | (0.69 | ) | (1.39 | ) | (0.34 | ) | ||||||
| Net increase/(decrease) in net asset value | (0.21 | ) | 0.47 | (0.25 | ) | |||||||
| Net asset value, end of period | $ | 26.21 | $ | 26.42 | $ | 25.95 | ||||||
| TOTAL RETURN(e) | 1.85 | % | 7.30 | % | 0.34 | % | ||||||
| RATIOS/SUPPLEMENTAL DATA: | ||||||||||||
| Net assets, end of period (000s) | $ | 392,398 | $ | 302,319 | $ | 13,547 | ||||||
| Ratios to Average Net Assets (including interest expense) | ||||||||||||
| Ratio of expenses to average net assets excluding fee waivers and reimbursements(f) | 3.14 | %(g) | 3.18 | % | 3.32 | %(g) | ||||||
| Ratio of expenses to average net assets including fee waivers and reimbursements(f) | 3.04 | %(g) | 2.98 | % | 2.69 | %(g) | ||||||
| Ratio of net investment income to average net assets(f)(h) | 0.90 | %(g) | 0.17 | % | 0.00 | %(g)(i) | ||||||
| Ratios to Average Net Assets (excluding interest expense) | ||||||||||||
| Ratio of expenses to average net assets excluding fee waivers and reimbursements(f) | 2.76 | %(g) | 2.86 | % | 3.29 | %(g) | ||||||
| Ratio of expenses to average net assets including fee waivers and reimbursements(f) | 2.66 | %(g) | 2.66 | % | 2.66 | %(g) | ||||||
| Ratio of net investment income to average net assets excluding fee waivers and reimbursements(f)(h) | 1.18 | %(g) | 0.29 | % | 0.03 | %(g) | ||||||
| Portfolio turnover rate(j) | 6 | % | 8 | % | 29 | % | ||||||
| (a) | The Fund's Class C shares commenced operations on August 10, 2015. |
| (b) | Calculated using the average shares method. |
| (c) | Less than $0.005 per share. |
| (d) | Total distributions during a calendar year generally will be made from the Fund’s net investment income, net realized gains on investments and net unrealized gains on investments, if any. The portion of distributions paid not attributable to net investment income or net realized gains on investments, if any, is distributed from the Fund’s assets and is treated by shareholders as a nontaxable distribution (“Return of Capital”) for tax purposes. Return of capital is a tax concept, not an economic concept. The tax character of the Fund’s distributions, in isolation, does not reveal much information about whether the distributions are supported by the Fund’s returns. Reported distributions from net investment income and realized gains on investments are not an indication as to whether or not the Fund’s distributions are supported by the Fund’s returns. A Fund can have distributions from net investment income and realized capital gains in years in which it incurs an economic loss due to unrealized losses not being recognized for tax purposes. A common method in which to determine if the Fund’s distributions are supported by economic returns is to examine the Fund’s Net Asset Value (“ NAV”) over the course of a year. If the Fund’s NAV has increased, the Fund will have economically earned more than it has distributed, regardless of whether such distributions are reported as being from net investment income, net realized gains on investments or return of capital. If a Fund’s NAV decreases, the Fund will have distributed more than it has economically earned or it will have incurred an economic loss. |
| Semi-Annual Report | March 31, 2017 | 21 |
| Griffin Institutional Access Real Estate Fund – Class C | Financial Highlights |
For a Share Outstanding Throughout the Periods Presented
| (e) | Total returns are for the period indicated and have not been annualized. Total returns would have been lower had certain expenses not been waived during the period. Returns shown do not reflect the deduction of taxes that a shareholder would pay on Fund distributions or the redemption of Fund shares. |
| (f) | The ratios of expenses to average net assets and net investment income to average net assets do not reflect the expenses of the underlying investment companies in which the Fund invests. |
(g) | Annualized. |
| (h) | Recognition of net investment income is affected by the timing and declaration of dividends by the underlying investment companies in which the Fund invests. |
(i) | Less than 0.005%. |
| (j) | Portfolio turnover rate for periods less than one full year have not been annualized and is calculated at the Fund level. |
(k) | The Fund has substantial investments in real estate investment trusts, or REITs, which are generally not subject to federal income taxes. Distributions that the Fund receives from REITs can be classified as ordinary income, capital gain income or return of capital by the REITs that make these distributions to the Fund. However, it is not possible for the Fund to characterize distributions received from REITs during interim periods because the REIT issuers do not report their tax characterizations until after year end. Final characterization of the Fund’s 2017 distributions to its common shareholders is also dependent upon the size or timing of the Fund’s securities transactions prior to year-end. Therefore, it is likely that some portion of the Fund’s 2017 investment income and distributions to its common shareholders will be re-characterized as long term capital gain and return of capital for financial statement and U.S. federal income tax purposes subsequent to year end and reflected accordingly in the Fund’s year-end financial statements. |
| 22 | 1.888.926.2688 | www.griffincapital.com |
| Griffin Institutional Access Real Estate Fund – Class I | Financial Highlights |
For a Share Outstanding Throughout the Periods Presented
| For the Six Months Ended March 31, 2017 (Unaudited) | For the Year Ended September 30, 2016 | For the Period Ended September 30, 2015(a) | ||||||||||
| Net asset value, beginning of period | $ | 26.71 | $ | 25.98 | $ | 26.20 | ||||||
| INCOME FROM INVESTMENT OPERATIONS: | ||||||||||||
| Net investment income(b) | 0.25 | 0.31 | 0.03 | |||||||||
| Net realized and unrealized gain | 0.37 | 1.82 | 0.09 | |||||||||
| Total from investment operations | 0.62 | 2.13 | 0.12 | |||||||||
| DISTRIBUTIONS: | ||||||||||||
| From net investment income | (0.70 | ) | (0.03 | ) | – | |||||||
| From net realized gain on investments | – | (0.32 | ) | – | ||||||||
| Return of capital | – | (1.05 | ) | (0.34 | ) | |||||||
| Total distributions(c)(i) | (0.70 | ) | (1.40 | ) | (0.34 | ) | ||||||
| Net increase/(decrease) in net asset value | (0.08 | ) | 0.73 | (0.22 | ) | |||||||
| Net asset value, end of period | $ | 26.63 | $ | 26.71 | $ | 25.98 | ||||||
| TOTAL RETURN(d) | 2.35 | % | 8.35 | % | 0.46 | % | ||||||
| RATIOS/SUPPLEMENTAL DATA: | ||||||||||||
| Net assets, end of period (000s) | $ | 509,870 | $ | 353,907 | $ | 74,095 | ||||||
| Ratios to Average Net Assets (including interest expense) | ||||||||||||
| Ratio of expenses to average net assets excluding fee waivers and reimbursements(e) | 2.14 | %(f) | 2.17 | % | 2.20 | %(f) | ||||||
| Ratio of expenses to average net assets including fee waivers and reimbursements(e) | 2.04 | %(f) | 1.98 | % | 1.69 | %(f) | ||||||
| Ratio of net investment income to average net assets(e)(g) | 1.90 | %(f) | 1.16 | % | 0.71 | %(f) | ||||||
| Ratios to Average Net Assets (excluding interest expense) | ||||||||||||
| Ratio of expenses to average net assets excluding fee waivers and reimbursements(e) | 1.76 | %(f) | 1.85 | % | 2.17 | %(f) | ||||||
| Ratio of expenses to average net assets including fee waivers and reimbursements(e) | 1.66 | %(f) | 1.66 | % | 1.66 | %(f) | ||||||
| Ratio of net investment income to average net assets excluding fee waivers and reimbursements(e)(g) | 2.18 | %(f) | 1.30 | % | 0.74 | %(f) | ||||||
| Portfolio turnover rate(h) | 6 | % | 8 | % | 29 | % | ||||||
| (a) | The Fund's Class I shares commenced operations on August 10, 2015. |
| (b) | Calculated using the average shares method. |
| (c) | Total distributions during a calendar year generally will be made from the Fund’s net investment income, net realized gains on investments and net unrealized gains on investments, if any. The portion of distributions paid not attributable to net investment income or net realized gains on investments, if any, is distributed from the Fund’s assets and is treated by shareholders as a nontaxable distribution (“Return of Capital”) for tax purposes. Return of capital is a tax concept, not an economic concept. The tax character of the Fund’s distributions, in isolation, does not reveal much information about whether the distributions are supported by the Fund’s returns. Reported distributions from net investment income and realized gains on investments are not an indication as to whether or not the Fund’s distributions are supported by the Fund’s returns. A Fund can have distributions from net investment income and realized capital gains in years in which it incurs an economic loss due to unrealized losses not being recognized for tax purposes. A common method in which to determine if the Fund’s distributions are supported by economic returns is to examine the Fund’s Net Asset Value (“ NAV”) over the course of a year. If the Fund’s NAV has increased, the Fund will have economically earned more than it has distributed, regardless of whether such distributions are reported as being from net investment income, net realized gains on investments or return of capital. If a Fund’s NAV decreases, the Fund will have distributed more than it has economically earned or it will have incurred an economic loss. |
| Semi-Annual Report | March 31, 2017 | 23 |
| Griffin Institutional Access Real Estate Fund – Class I | Financial Highlights |
For a Share Outstanding Throughout the Periods Presented
| (d) | Total returns are for the period indicated and have not been annualized. Total returns would have been lower had certain expenses not been waived during the period. Returns shown do not reflect the deduction of taxes that a shareholder would pay on Fund distributions or the redemption of Fund shares. |
| (e) | The ratios of expenses to average net assets and net investment income to average net assets do not reflect the expenses of the underlying investment companies in which the Fund invests. |
| (f) | Annualized. |
| (g) | Recognition of net investment income is affected by the timing and declaration of dividends by the underlying investment companies in which the Fund invests. |
| (h) | Portfolio turnover rate for periods less than one full year have not been annualized and is calculated at the Fund level. |
(i) | The Fund has substantial investments in real estate investment trusts, or REITs, which are generally not subject to federal income taxes. Distributions that the Fund receives from REITs can be classified as ordinary income, capital gain income or return of capital by the REITs that make these distributions to the Fund. However, it is not possible for the Fund to characterize distributions received from REITs during interim periods because the REIT issuers do not report their tax characterizations until after year end. Final characterization of the Fund’s 2017 distributions to its common shareholders is also dependent upon the size or timing of the Fund’s securities transactions prior to year-end. Therefore, it is likely that some portion of the Fund’s 2017 investment income and distributions to its common shareholders will be re-characterized as long term capital gain and return of capital for financial statement and U.S. federal income tax purposes subsequent to year end and reflected accordingly in the Fund’s year-end financial statements. |
| 24 | 1.888.926.2688 | www.griffincapital.com |
| Griffin Institutional Access Real Estate Fund – Class M | Financial Highlights |
For a Share Outstanding Throughout the Periods Presented
| For the Period Ended March 31, 2017 (Unaudited)(a) | ||||
| Net asset value, beginning of period | $ | 26.48 | ||
| INCOME FROM INVESTMENT OPERATIONS: | ||||
| Net investment income(b) | 0.10 | |||
| Net realized and unrealized gain | 0.59 | |||
| Total from investment operations | 0.69 | |||
| DISTRIBUTIONS: | ||||
| From net investment income | (0.70 | ) | ||
| Total distributions(c)(i) | (0.70 | ) | ||
| Net increase/(decrease) in net asset value | (0.01 | ) | ||
| Net asset value, end of period | $ | 26.47 | ||
| TOTAL RETURN(d) | 2.62 | % | ||
| RATIOS/SUPPLEMENTAL DATA: | ||||
| Net assets, end of period (000s) | $ | 21,027 | ||
| Ratios to Average Net Assets (including interest expense) | ||||
| Ratio of expenses to average net assets excluding fee waivers and reimbursements(e) | 2.86 | %(f) | ||
| Ratio of expenses to average net assets including fee waivers and reimbursements(e) | 2.79 | %(f) | ||
| Ratio of net investment income to average net assets(e)(g) | 1.01 | %(f) | ||
| Ratios to Average Net Assets (excluding interest expense) | ||||
| Ratio of expenses to average net assets excluding fee waivers and reimbursements(e) | 2.48 | %(f) | ||
| Ratio of expenses to average net assets including fee waivers and reimbursements(e) | 2.41 | %(f) | ||
| Ratio of net investment income to average net assets excluding fee waivers and reimbursements(e)(g) | 1.32 | %(f) | ||
| Portfolio turnover rate(h) | 6 | % | ||
| (a) | The Fund’s Class M shares commenced operations on November 17, 2016. |
| (b) | Calculated using the average shares method. |
| (c) | Total distributions during a calendar year generally will be made from the Fund’s net investment income, net realized gains on investments and net unrealized gains on investments, if any. The portion of distributions paid not attributable to net investment income or net realized gains on investments, if any, is distributed from the Fund’s assets and is treated by shareholders as a nontaxable distribution (“Return of Capital”) for tax purposes. Return of capital is a tax concept, not an economic concept. The tax character of the Fund’s distributions, in isolation, does not reveal much information about whether the distributions are supported by the Fund’s returns. Reported distributions from net investment income and realized gains on investments are not an indication as to whether or not the Fund’s distributions are supported by the Fund’s returns. A Fund can have distributions from net investment income and realized capital gains in years in which it incurs an economic loss due to unrealized losses not being recognized for tax purposes. A common method in which to determine if the Fund’s distributions are supported by economic returns is to examine the Fund’s Net Asset Value (“ NAV”) over the course of a year. If the Fund’s NAV has increased, the Fund will have economically earned more than it has distributed, regardless of whether such distributions are reported as being from net investment income, net realized gains on investments or return of capital. If a Fund’s NAV decreases, the Fund will have distributed more than it has economically earned or it will have incurred an economic loss. |
| (d) | Total returns are for the period indicated and have not been annualized. Total returns would have been lower had certain expenses not been waived during the period. Returns shown do not reflect the deduction of taxes that a shareholder would pay on Fund distributions or the redemption of Fund shares. |
| (e) | The ratios of expenses to average net assets and net investment income to average net assets do not reflect the expenses of the underlying investment companies in which the Fund invests. |
| (f) | Annualized. |
| (g) | Recognition of net investment income is affected by the timing and declaration of dividends by the underlying investment companies in which the Fund invests. |
| (h) | Portfolio turnover rate for periods less than one full year have not been annualized and is calculated at the Fund level. |
| Semi-Annual Report | March 31, 2017 | 25 |
| Griffin Institutional Access Real Estate Fund – Class M | Financial Highlights |
For a Share Outstanding Throughout the Periods Presented
(i) | The Fund has substantial investments in real estate investment trusts, or REITs, which are generally not subject to federal income taxes. Distributions that the Fund receives from REITs can be classified as ordinary income, capital gain income or return of capital by the REITs that make these distributions to the Fund. However, it is not possible for the Fund to characterize distributions received from REITs during interim periods because the REIT issuers do not report their tax characterizations until after year end. Final characterization of the Fund’s 2017 distributions to its common shareholders is also dependent upon the size or timing of the Fund’s securities transactions prior to year-end. Therefore, it is likely that some portion of the Fund’s 2017 investment income and distributions to its common shareholders will be re-characterized as long term capital gain and return of capital for financial statement and U.S. federal income tax purposes subsequent to year end and reflected accordingly in the Fund’s year-end financial statements. |
| 26 | 1.888.926.2688 | www.griffincapital.com |
| Griffin Institutional Access Real Estate Fund | Notes to Financial Statements |
1. ORGANIZATION
The Griffin Institutional Access Real Estate Fund (the “Fund”) is registered under the Investment Company Act of 1940, as amended (the “1940 Act”), as a non-diversified, closed-end management investment company. The Fund engages in a continuous offering of shares and operates as an interval fund that offers quarterly repurchases of shares at net asset value. The Fund’s investment adviser is Griffin Capital Advisor, LLC (the “Adviser”). The investment objective of the Fund is to generate a return comprised of both current income and capital appreciation with moderate volatility and low correlation to the broader markets. The Fund pursues its investment objective by strategically investing across private institutional real estate investment funds as well as a diversified set of public real estate securities.
The Fund was organized as a statutory trust on November 5, 2013 and under the laws of the State of Delaware. The Fund commenced operations on June 30, 2014, and is authorized to issue an unlimited number of shares with no par value.
The Fund currently offers Class A, Class C, Class I and Class M shares. Class A shares commenced operations on June 30, 2014, Class C and Class I shares commenced operations on August 10, 2015 and Class M shares commenced operations on November 17, 2016. Class A shares are offered subject to a maximum sales charge of 5.75% of the offering price. Class C, Class I and Class M shares are offered at net asset value. Class C shares may be subject to a 1.00% contingent deferred sales charge on shares redeemed during the first 365 days after their purchase. Each class represents an interest in the same assets of the Fund and classes are identical except for differences in their sales charge structures and ongoing service and distribution charges. All classes of shares have equal voting privileges except that each class has exclusive voting rights with respect to its service and/or distribution plans. The Fund’s income, expenses (other than class specific distribution fees) and realized and unrealized gains and losses are allocated proportionately each day based upon the relative net assets of each class.
2. SIGNIFICANT ACCOUNTING POLICIES
The following is a summary of significant accounting policies followed by the Fund in preparation of its financial statements. These policies are in conformity with accounting principles generally accepted in the United States of America (“GAAP”). The Fund is considered an investment company following accounting and reporting guidance in Accounting Standards Codification (“ASC”) Topic 946 – Financial Services – Investment Companies. The preparation of financial statements requires management to make estimates and assumptions that affect the reported amounts of assets and liabilities and disclosure of contingent assets and liabilities at the date of the financial statements and the reported amounts of income and expenses for the period. Actual results could differ from those estimates.
Security Valuation – Securities listed on an exchange are valued at the last reported sale price at the close of the regular trading session of the primary exchange or market on which they are traded, on the business day the value is being determined, or in the case of securities listed on NASDAQ at the NASDAQ Official Closing Price (“NOCP”). In the absence of a sale such securities shall be valued at the last bid price for securities held long and the last ask price for securities held short, or if a closing bid or ask price, as applicable, is not available, at either the exchange or system-defined closing price on the exchange or system in which such securities are principally traded. Short-term investments that mature in 60 days or less are valued at amortized cost, provided such valuations represent fair value.
Valuation of Fund of Funds – The Fund may invest in portfolios of open-end investment companies and exchange-traded funds (the “Underlying Funds”). The Underlying Funds value securities in their portfolios for which market quotations are readily available at their market values (generally the last reported sale price) and all other securities and assets at their fair value to the methods established by the board of directors of the Underlying Funds. Open-ended funds are valued at their respective net asset values as reported by such investment companies.
When price quotations for certain securities are not readily available, or if the available quotations are not believed to be reflective of market value by the Adviser, those securities will be valued at “fair value” as determined in good faith by the Valuation Committee using procedures adopted by and under the supervision of the Fund’s Board of Trustees (the “Trustees”). There can be no assurance that the Fund could purchase or sell a portfolio security at the price used to calculate the Fund’s Net Asset Value (“NAV”).
Fair valuation procedures may be used to value a substantial portion of the assets of the Fund. The Fund may use the fair value of a security to calculate its NAV when, for example, (1) a portfolio security is not traded in a public market or the principal market in which the security trades is closed, (2) trading in a portfolio security is suspended and not resumed prior to the normal market close, (3) a portfolio security is not traded in significant volume for a substantial period, or (4) the Adviser determines that the quotation or price for a portfolio security provided by a broker-dealer or independent pricing service is inaccurate.
Valuation of Private REITS – The Fund may invest a significant portion of its assets in Private Real Estate Investment Trusts (“Private REITs”). The Private REITs measure their investment assets at fair value and report a NAV per share on a calendar quarter basis. In accordance with Accounting Standards Codification (“ASC”) 820, the Fund has elected to apply the practical expedient and to value its investments in Private REITs at their respective NAVs at each quarter. For non-calendar quarter-end days, the Valuation Committee estimates the fair value of each Private REIT by adjusting the most recent NAV for each Private REIT by the change in a proprietary Index that the Valuation Committee has deemed to be representative of the entire Private REIT market. In the event that a price is not provided by the Private REIT, the fair valuation procedures will be followed. As of March 31, 2017, all of the Fund’s investments in Private REITs were valued at the respective NAVs of the Private REITs.
| Semi-Annual Report | March 31, 2017 | 27 |
| Griffin Institutional Access Real Estate Fund | Notes to Financial Statements |
Fair Value Measurements – A three-tier hierarchy has been established to classify fair value measurements for disclosure purposes. Inputs refer broadly to the assumptions that market participants would use in pricing the asset or liability, including assumptions about risk. Inputs may be observable or unobservable. Observable inputs are inputs that reflect the assumptions market participants would use in pricing the asset or liability that are developed based on market data obtained from sources independent of the reporting entity. Unobservable inputs are inputs that reflect the reporting entity’s own assumptions about the assumptions market participants would use in pricing the asset or liability that are developed based on the best information available. In accordance with the authoritative guidance on fair value measurements and disclosure under GAAP, the Fund discloses fair value of its investments in a hierarchy that prioritizes the inputs to valuation techniques used to measure the fair value.
Various inputs are used in determining the value of the Fund’s investments as of the reporting period end. These inputs are categorized in the following hierarchy under applicable financial accounting standards:
Level 1 – | Unadjusted quoted prices in active markets for identical, unrestricted assets or liabilities that the Fund has the ability to access at the measurement date; |
Level 2 – | Quoted prices which are not active, quoted prices for similar assets or liabilities in active markets or inputs other than quoted prices that are observable (either directly or indirectly) for substantially the full term of the asset or liability at the measurement date; and |
Level 3 – | Significant unobservable prices or inputs (including the Fund’s own assumptions in determining the fair value of investments) where there is little or no market activity for the asset or liability at the measurement date. |
The availability of observable inputs can vary from security to security and is affected by a wide variety of factors, including, for example, the type of security, whether the security is new and not yet established in the marketplace, the liquidity of markets and other characteristics particular to the security. To the extent that valuation is based on models or inputs that are less observable or unobservable in the market, the determination of fair value requires more judgment. Accordingly, the degree of judgment exercised in determining fair value is greatest for instruments categorized in Level 3.
An investment level within the fair value hierarchy is based on the lowest level input, individually or in the aggregate, that is significant to fair value measurement. The valuation techniques used by the Fund to measure fair value during the six months ended March 31, 2017 maximized the use of observable inputs and minimized the use of unobservable inputs.
The inputs or methodologies used for valuing securities are not necessarily an indication of the risk or liquidity associated with investing in those securities. The following is a summary of the inputs used in valuing the Fund’s investments as of March 31, 2017:
| Investments in Securities at Value | Level 1 - Quoted Prices | Level 2 - Other Significant Observable Inputs | Level 3 - Significant Unobservable Inputs | Total | ||||||||||||
| Real Estate Investment Trusts | ||||||||||||||||
| Private Investment Funds (Measured at net asset value)(a) | $ | – | $ | – | $ | – | $ | 1,354,987,538 | ||||||||
| Publicly Traded Securities | 176,640,909 | – | – | 176,640,909 | ||||||||||||
| Total | $ | 176,640,909 | $ | – | $ | – | $ | 1,531,628,447 | ||||||||
(a) | In accordance with Subtopic 820-10, certain investments that are measured at fair value using the net asset value per share (or its equivalent) practical expedient have not been classified in the fair value hierarchy. The fair value amounts presented in this table are intended to permit reconciliation of the fair value hierarchy to the amounts presented in the Statement of Assets and Liabilities. |
There were no transfers between Levels 1, 2 and 3 during the six months ended March 31, 2017. It is the Fund’s policy to recognize transfers between levels at the end of the reporting period.
For the six months ended March 31, 2017, the Fund did not have unobservable inputs (Level 3) used in determining fair value.
| 28 | 1.888.926.2688 | www.griffincapital.com |
| Griffin Institutional Access Real Estate Fund | Notes to Financial Statements |
Investment Transactions – Investment security transactions are accounted for on trade date. Gains and losses on securities sold are determined on a specific identification basis.
Investment Income – Interest income is accrued and recorded on a daily basis including amortization of premiums, accretion of discounts and income earned from money market funds. Interest is not accrued on securities that are in default. Dividend income is recorded on the ex-dividend date.
Exchange-Traded Funds (“ETFs”) – The Fund may invest in ETFs, which are funds whose shares are traded on a national exchange. ETFs may be based on underlying equity or fixed income securities, as well as commodities or currencies. ETFs do not sell individual shares directly to investors and only issue their shares in large blocks known as “creation units.” The investor purchasing a creation unit then sells the individual shares on a secondary market. Although similar diversification benefits may be achieved through an investment in another investment company, ETFs generally offer greater liquidity and lower expenses. Because an ETF incurs its own fees and expenses, shareholders of the Fund investing in an ETF will indirectly bear those costs. The Fund will also incur brokerage commissions and related charges when purchasing or selling shares of an ETF. Unlike typical investment company shares, which are valued once daily, shares in an ETF may be purchased or sold on a securities exchange throughout the trading day at market prices that are generally close to the NAV of the ETF.
Concentration of Credit Risk – The Fund places its cash with one banking institution, which is insured by Federal Deposit Insurance Corporation (“FDIC”). The FDIC limit is $250,000. At various times throughout the year, the amount on deposit may exceed the FDIC limit and subject the Fund to a credit risk. The Fund does not believe that such deposits are subject to any unusual risk associated with investment activities.
Industry Concentration – If a Fund has significant investments in the securities of issuers within a particular industry, any development affecting that industry will have a greater impact on the value of the net assets of the Fund than would be the case if the Fund did not have significant investments in that industry. In addition, this may increase the risk of loss in the Fund and increase the volatility of the Fund’s net asset value per share. Occasionally, market conditions, regulatory changes or other developments may negatively impact this industry, and therefore the value of the Fund’s portfolio will be adversely affected. As of March 31, 2017, the Fund had 99.94% of the value of its net assets invested within the Real Estate industry.
Distributions to Shareholders – Dividends from net investment income, if any, will be declared and paid quarterly. Distributions of net realized capital gains, if any, will be declared and paid annually. Income and capital gains distributions are determined in accordance with income tax regulations, which may differ from GAAP. Distributions to shareholders are recorded on the ex-dividend date.
Indemnification – The Fund indemnifies its Officers and Trustees for certain liabilities that may arise from the performance of their duties to the Fund. Additionally, in the normal course of business, the Fund enters into contracts that contain a variety of representations and warranties and which provide general indemnities. The Fund’s maximum exposure under these arrangements is unknown, as this would involve future claims that may be made against the Fund that have not yet occurred. However, based on industry experience, the Fund expects the risk of loss due to these warranties and indemnities to be remote.
Federal Income Taxes – The Fund intends to continue to comply with the requirements of Subchapter M of the Internal Revenue Code applicable to regulated investment companies and will distribute all of its taxable income, if any, to shareholders. Accordingly, no provision for federal income taxes is required in the financial statements.
The Fund recognizes the tax benefits of uncertain tax positions only when the position is “more likely than not” to be sustained assuming examination by tax authorities. Management has reviewed the tax positions and has concluded that no liability for unrecognized tax benefits should be recorded related to uncertain tax positions taken in the Fund’s 2016 returns or expected to be taken in the Fund’s 2017 returns.
| Semi-Annual Report | March 31, 2017 | 29 |
| Griffin Institutional Access Real Estate Fund | Notes to Financial Statements |
3. ADVISORY FEES, ADMINISTRATION FEES AND OTHER AGREEMENTS
Investment Advisory
Pursuant to the Investment Advisory Agreement with the Fund (“Advisory Agreement”), the Adviser is entitled to an investment advisory fee, computed daily and payable monthly of 1.50% of the average daily net assets of the Fund.
The Adviser and the Fund have entered into an expense limitation and reimbursement agreement (the “Expense Limitation Agreement”) under which the Adviser has agreed contractually to waive its fees and to pay or absorb the ordinary annual operating expenses of the Fund (including organizational and offering expenses, but excluding taxes, interest, brokerage commissions, acquired fund fees and expenses and extraordinary expenses) at least until February 1, 2018, so that the total annual operating expenses of the Fund do not exceed 1.91% per annum of Class A average daily net assets, 2.66% per annum of Class C average daily net assets, 1.66% per annum of Class I average daily net assets and 2.41% per annum of Class M average daily net assets (the “Expense Limitations”). The agreement can be extended at the discretion of the Adviser and the Trustees. In consideration of the Adviser’s agreement to limit the Fund’s expenses, the Fund has agreed to repay the Adviser in the amount of any fees waived and Fund expenses paid or absorbed, subject to the limitations that: (1) the reimbursement for fees and expenses will be made only if payable not more than three years from the end of the fiscal year in which they were incurred; and (2) the reimbursement may not be made if it would cause the Expense Limitations to be exceeded.
During the six months ended March 31, 2017, the fee waiver was as follows:
| Fees Waived By Advisor | ||||
| Griffin Institutional Access Real Estate Fund | $ | 646,764 | ||
As of September 30, 2016, the balance of recoupable expenses for the Fund was as follows:
| Fund | Expires May 21, 2017 | Expires September 30, 2017 | Expires September 30, 2018 | Expires September 30, 2019 | ||||||||||||
| Griffin Institutional Access Real Estate Fund | $ | 153,980 | * | $ | 316,121 | $ | 757,224 | $ | 1,230,007 | |||||||
* | $46,993 of additional Organizational Expenses were recorded subsequent to the May 21, 2014 Seed Audit Financial Statements. |
Sub-advisory services were provided to the Fund pursuant to agreements between the Adviser and both Aon Hewitt Investment Consulting, Inc. (formerly doing business as Hewitt EnnisKnupp, Inc.) and CenterSquare Investment Management, Inc. (the “Sub-Advisers”). Under the terms of the sub-advisory agreements, the Adviser compensates the Sub-Advisers based on a portion of the Fund’s average daily net assets which they had been allocated to manage.
Fund Administration and Accounting Fees and Expenses
ALPS Fund Services, Inc. serves as the Fund’s administrator and accounting agent (the “Administrator”) and receives customary fees from the Fund for such services. The Administrator is also reimbursed by the Fund for certain out of pocket expenses.
Transfer Agent
DST Systems, Inc. serves as transfer, dividend paying and shareholder servicing agent for the Fund (the “Transfer Agent”).
Compliance Services
Cipperman Compliance Services, LLC provides a Chief Compliance Officer to the Fund as well as related compliance services pursuant to a consulting agreement between Cipperman Compliance Services, LLC and the Fund.
Distributor
The Fund has entered into a Distribution Agreement with ALPS Distributors, Inc. (the “Distributor”) to provide distribution services to the Fund. The Distributor serves as principal underwriter of shares of the Fund. Under the Distribution Agreement the Class C and Class M shares will pay to the Distributor a Distribution Fee that will accrue at an annual rate equal to 0.75% of the Fund’s average daily net assets attributable to Class C and Class M shares, payable on a quarterly basis. For the six months ended March 31, 2017, Class C and Class M shares incurred distribution fees of $1,290,624 and $14,543, respectively. Class A and Class I shares are not currently subject to a Distribution Fee. Under the Shareholder Services Plan, the Class A and Class C shares may pay up to 0.25% per year of their average daily net assets for such services. Class I and Class M shares are not currently subject to a shareholder services fee. For the six months ended March 31, 2017, Class A and Class C shares incurred shareholder servicing fees of $700,460 and $430,208, respectively.
| 30 | 1.888.926.2688 | www.griffincapital.com |
| Griffin Institutional Access Real Estate Fund | Notes to Financial Statements |
The Distributor acts as the Fund’s principal underwriter in a continuous public offering of the Fund’s shares. The Distributor is an affiliate of the Administrator and the Transfer Agent. For the six months ended March 31, 2017, the Distributor received $593,137 in underwriting commissions for sales of the Fund’s Class A shares, of which $0 was retained by the principal underwriter or other affiliated broker-dealers.
Officer and Trustee Compensation
Effective October 1, 2016, each Trustee who is not affiliated with the Trust or Adviser receives an annual retainer of $50,000, paid quarterly, as well as reimbursement for any reasonable expenses incurred attending the meetings and $500 per non-interested Trustee per each special telephonic meeting (exclusive of one special telephonic meeting per year and any telephonic meeting to review the agenda of any upcoming meeting of the Board). The chairperson of the Audit Committee receives an additional annual retainer of $10,000. None of the Fund’s executive officers receive compensation from the Fund.
Prior to October 1, 2016, each Trustee who is not affiliated with the Fund or the Adviser received a quarterly fee of $5,000, as well as reimbursement for any reasonable expenses incurred attending the meetings, and $500 per each special telephonic meeting. None of the Fund’s executive officers receives compensation from the Fund.
Certain Trustees and officers of the Fund are also officers of the Adviser and are not paid by the Fund for serving in such capacities.
4. PURCHASES AND SALES OF INVESTMENT SECURITIES
The cost of purchases and proceeds from the sale of securities, other than short-term securities, for the six months ended March 31, 2017 were as follows:
| Purchases of Securities | Proceeds from Sales of Securities | |||||||
| $ | 429,673,930 | $ | 88,055,206 | |||||
5. TAX BASIS INFORMATION
Distributions are determined in accordance with federal income tax regulations, which differ from GAAP, and, therefore, may differ significantly in amount or character from net investment income and realized gains for financial reporting purposes. Financial reporting records are adjusted for permanent book/tax differences to reflect tax character but are not adjusted for temporary differences. The amounts and characteristics of tax basis distributions and composition of distributable earnings/(accumulated losses) are finalized at fiscal year-end. Accordingly, tax basis balances have not been determined as of the date of the semi-annual.
The tax character of distributions paid for the year ended September 30, 2016 were as follows:
| Fund | Ordinary Income | Long-Term Capital Gain | Return of Capital | |||||||||
| 2016 | $ | 2,980,925 | $ | 1,881,291 | $ | 34,615,822 | ||||||
As of March 31, 2017, net unrealized appreciation/(depreciation) of investments based on the federal tax cost was as follows:
| Gross Appreciation (excess of value over tax cost) | Gross Depreciation (excess of tax cost over value) | Net Unrealized Appreciation | Cost of Investments for Income Tax Purposes | |||||||||||||
| Griffin Institutional Access Real Estate Fund | $ | 83,301,205 | $ | (8,579,946 | ) | $ | 74,721,259 | $ | 1,456,907,188 | |||||||
The difference between book basis and tax basis net unrealized appreciation is primarily attributable to the investments in partnerships, wash sales and certain other investments.
The Fund elects to defer to the period ending September 30, 2017, late year ordinary losses in the amount of $9,522,584.
| Semi-Annual Report | March 31, 2017 | 31 |
| Griffin Institutional Access Real Estate Fund | Notes to Financial Statements |
6. LINE OF CREDIT
The Fund has entered into secured bank lines of credit through BNP Paribas Prime Brokerage International, Ltd. (“BNP”) and Credit Suisse (“Credit Suisse”) (collectively the “Banks”) for the purpose of investment purchases subject to the limitations of the 1940 Act for borrowings.
Borrowings under the BNP arrangement bear interest at the 3 month LIBOR plus 95 basis points at the time of borrowing. During the six months ended March 31, 2017, the Fund incurred $498,029 of interest expense related to the BNP borrowings. Average borrowings and the average interest rate for the days the BNP line of credit was outstanding during the six months ended March 31, 2017 were $51,291,781 and 1.94%, respectively. The largest outstanding borrowing during the six months ended March 31, 2017 relating to BNP was $80,104,116. As of March 31, 2017, the Fund had $70,000,000 of outstanding borrowings relating to BNP.
Borrowings under the Credit Suisse arrangement bear interest at the 3 month LIBOR plus 250 basis points at the time of borrowing. During the six months ended March 31, 2017, the Fund incurred $1,713,091 of interest expense related to the Credit Suisse borrowings. The unused amount under the Credit Suisse arrangement bears interest at 90 basis points. During the six months ended March 31, 2017, the Fund incurred $350,275 of interest expense related to the unused amount. Average borrowings and the average interest rate for the days the Credit Suisse line of credit was outstanding during the six months ended March 31, 2017 were $98,565,934 and 3.47%, respectively. The largest outstanding borrowing during the six months ended March 31, 2017 relating to Credit Suisse was $199,500,000. As of March 31, 2017, the Fund had $44,500,000 of outstanding borrowings and $155,500,000 unused outstanding relating to Credit Suisse.
As collateral for the lines of credit, the Fund grants the Banks a first position security interest in and lien on securities of any kind or description held by the Fund in the pledge accounts. As of March 31, 2017, the Fund had $1,436,883,636 of the private and public securities pledged as collateral for its lines of credit.
7. REPURCHASE OFFERS
The Fund is an interval fund and, as such, has adopted a fundamental policy to make quarterly repurchase offers, at net asset value, of no less than 5% of the Fund’s shares outstanding. There is no guarantee that shareholders will be able to sell all of the shares they desire to sell in a quarterly repurchase offer, although each shareholder will have the right to require the Fund to purchase at least 5% of such shareholder’s shares in each quarterly repurchase. Liquidity will be provided to shareholders only through the Fund’s quarterly repurchases. Shareholders will be notified in writing of each quarterly repurchase offer and the date the repurchase offer ends (the “Repurchase Request Deadline”). Shares will be repurchased at the NAV per share determined as of the close of regular trading on the NYSE no later than the 14th day after the Repurchase Request Deadline, or the next business day if the 14th day is not a business day (each a “Repurchase Pricing Date”).
During the six months ended March 31, 2017, the Fund completed two quarterly repurchase offers. In these offers, the Fund offered to repurchase up to 5% of the number of its outstanding shares as of the Repurchase Pricing Dates. The result of those repurchase offers were as follows:
| Repurchase Offer #1 | Repurchase Offer #2 | |
| Commencement Date | September 30, 2016 | December 28, 2016 |
| Repurchase Request Deadline | November 7, 2016 | February 6, 2017 |
| Repurchase Pricing Date | November 7, 2016 | February 6, 2017 |
| Amount Repurchased | $26,882,981 | $34,738,975 |
| Shares Repurchased | 1,014,984 | 1,303,196 |
8. recent accounting pronouncement
In December 2016, the Financial Accounting Standards Board ("FASB") issued Accounting Standards Update (“ASU”) 2016-19, “Technical Corrections and Improvements.” It includes an update to Accounting Standards Codification Topic 820 (“Topic 820”), Fair Value Measurement. The update to Topic 820 clarifies the difference between a valuation approach and a valuation technique. It also requires disclosure when there has been a change in either or both a valuation approach and/or a valuation technique. The changes related to Topic 820 are effective for annual reporting periods, including interim periods within those annual periods, beginning after December 15, 2016. Management is currently evaluating the impact of the ASU to the financial statements.
| 32 | 1.888.926.2688 | www.griffincapital.com |
| Griffin Institutional Access Real Estate Fund | Notes to Financial Statements |
9. securities and exchange commission regulations
On October 13, 2016, the Securities and Exchange Commission amended Regulation S-X, which will require standardized, enhanced disclosure about derivatives in investment company financial statements, as well as other amendments. The compliance date for the amendments to Regulation S-X is August 1, 2017. Management is currently evaluating the impact to the financial statements and disclosures.
10. SUBSEQUENT EVENTS
Subsequent events after the date of the Statement of Assets and Liabilities have been evaluated through the date the financial statements were issued.
Effective April 25, 2017, Class L Shares of the Fund commenced operations.
The Fund completed a quarterly repurchase offer on May 4, 2017 which resulted in 1,681,941 of Fund shares being repurchased for $44,588,607.
Management has determined that there were no other subsequent events to report through the issuance of these financial statements.
| Semi-Annual Report | March 31, 2017 | 33 |
| Griffin Institutional Access Real Estate Fund | Additional Information |
March 31, 2017 (Unaudited)
1. PROXY VOTING POLICIES AND VOTING RECORD
A description of the policies and procedures that the Fund uses to vote proxies relating to portfolio securities is available without charge upon request by calling toll-free 888-926-2688, or on the Securities and Exchange Commission’s (“SEC”) website at http://www.sec.gov. Information regarding how the Fund voted proxies relating to portfolio securities during the most recent 12-month period ended June 30th is available without charge upon request by calling toll-free 888-926-2688, or on the SEC’s website at http://www.sec.gov.
2. QUARTERLY PORTFOLIO HOLDINGS
The Fund files a complete listing of portfolio holdings for the Fund with the SEC as of the first and third quarters of each fiscal year on Form N-Q. The filings are available upon request by calling 888-926-2688. Furthermore, you may obtain a copy of the filing on the SEC’s website at http://www.sec.gov. The Fund’s Form N-Q may also be reviewed and copied at the SEC’s Public Reference Room in Washington, D.C., and information on the operation of the Public Reference Room may be obtained by calling 1-800-SEC-0330.
| 34 | 1.888.926.2688 | www.griffincapital.com |

| (a) | The Schedule of Investments is included as part of the Report to Stockholders filed under Item 1 of this report. |
| (b) | Not applicable to the registrant. |
| (a) | Not applicable. |
| (b) | Not applicable. |
| (a) | Based on an evaluation of the registrant’s disclosure controls and procedures (as defined in Rule 30a-3(c) under the 1940 Act), the registrant’s principal executive officer and principal financial officer have concluded that the registrant’s disclosure controls and procedures are effective as of a date within 90 days of the filing date of this report. |
| (b) | There were no significant changes in the registrant’s internal control over financial reporting that occurred during the registrant’s last fiscal half-year that have materially affected, or are reasonably likely to materially affect, the registrant’s internal control over financial reporting. |
| (a)(1) | Not applicable. |
| (a)(2) | Certifications required by Item 12(a)(2) of Form N-CSR are filed herewith as Exhibit 99.CERT. |
| (a)(3) | Not applicable to the registrant. |
| (b) | Certifications required by Item 12(b) of Form N-CSR are filed herewith as Exhibit 99.906CERT. |
By: | /s/ Kevin Shields | |
Kevin Shields | ||
President (Principal Executive Officer) | ||
Date: | June 8, 2017 |
By (Signature and Title) | ||
By: | /s/ Kevin Shields | |
Kevin Shields | ||
President (Principal Executive Officer) | ||
Date: | June 8, 2017 | |
By (Signature and Title) | ||
By: | /s/ Joseph Miller | |
Joseph Miller | ||
Treasurer (Principal Financial Officer) | ||
Date: | June 8, 2017 | |