UNITED STATES
SECURITIES AND EXCHANGE COMMISSION
WASHINGTON, D.C. 20549
FORM N-CSR
CERTIFIED SHAREHOLDER REPORT OF REGISTERED
MANAGEMENT INVESTMENT COMPANIES
811-22933
(Investment Company Act file number)
Griffin Institutional Access Real Estate Fund
(Exact name of registrant as specified in charter)
Griffin Capital Plaza
1520 Grand Avenue
El Segundo, CA 90245
(Address of principal executive offices)
(310) 469-6100
Registrant’s telephone number, including area code
ALPS Fund Services, Inc.
1290 Broadway, Suite 1100
Denver, CO 80203
(Name and address of agent for service)
Copy to:
Terrence O. Davis, Esq.
Greenberg Traurig, LLP
Terminus 200
3333 Piedmont Road, NE, Suite 2500
Atlanta, GA 30305
Date of fiscal year end: September 30
Date of reporting period: October 1, 2017 – September 30, 2018
Item 1. Reports to Stockholders.
Table of Contents
| Shareholder Letter | 1 |
| Portfolio Update | 15 |
| Portfolio of Investments | 17 |
| Statement of Assets and Liabilities | 20 |
| Statement of Operations | 21 |
| Statements of Changes in Net Assets | 22 |
| Statement of Cash Flows | 25 |
| Financial Highlights | 26 |
| Notes to Financial Statements | 36 |
| Report of Independent Registered Public Accounting Firm | 43 |
| Additional Information | 44 |
| Trustees’ Consideration and Approval of Renewal of Advisory Agreements | 45 |
| Trustees and Officers | 48 |
| GRIFFIN INSTITUTIONAL ACCESS REAL ESTATE FUND | 1 |
| ANNUAL REPORT 2018 |
Dear Fellow Shareholders,
We are pleased to present the Griffin Institutional Access® Real Estate Fund (the “Fund”) annual report. Since the last annual report, the Fund has grown to over $2.6 billion in assets under management. Additionally, the Fund celebrated its four-year anniversary on June 30, 2018.
We greatly appreciate the support of our shareholders and broker-dealer partners, and we will remain true to the Fund’s stated objective of delivering returns comprised of income and appreciation with moderate volatility and low correlation to the broader markets. From inception through September 30, 2018, the Fund’s Class A shares have generated a(n):
| ● | Total cumulative return of 34.31% and 7.19% annualized1 |
| ● | Sharpe Ratio of 3.161 |
| ● | Standard deviation of 2.07%, which is less than that of the Bloomberg Barclays U.S. Aggregate Bond Index (2.73%)1 |
| ● | Alpha of 5.541, 2 |
| ● | Beta of 0.071, 2 |
The U.S. economy continued to exhibit strength through the third quarter, with U.S. gross domestic product (GDP) growing by 3.5%.3 We believe this above-trend growth was primarily driven by fiscal stimulus, namely tax reform. Additionally, labor markets remained robust, with the overall unemployment rate hovering near a 50-year low of 3.7% as of October 2018.3 However, despite a solid macro-economic backdrop, the relatively calm investing environment we observed in 2017 has been replaced by higher levels of volatility within the broad markets. Some economists blame this volatility on a hawkish tone from the Fed, trade wars, and other significant geopolitical risks. While we find truth in these statements, we believe that high equity valuations combined with moderating global growth—and even domestic growth expectations—are largely responsible for volatility in the equity markets. Recent earnings results seem to support this theory. Throughout 2018, companies with earnings and sales beats experienced large sell-offs related to tepid forward guidance that did not support the in-place multiples. As such, we believe diversification and allocation to defensive strategies will likely serve investors well moving forward.
Griffin Institutional Access Real Estate Fund strategically invests in a portfolio of both public and private income-generating real estate securities, with a focus on core real estate strategies. The underlying assets are institutional, predominantly located in major metropolitan markets, and operated by top managers with low leverage. We continue to believe that core properties located in top real estate markets with well-diversified economies will provide strong underlying income, which we feel will be the key driver of returns over the next several years. In addition, we increased the Fund’s portfolio allocations to private real estate debt securities that offer the potential for strong income and downside protection. As of September 30, 2018, these private debt investments include:
Past performance is no guarantee of future results. All metrics are based on load waived Class A shares and does not reflect a maximum sales charge of 5.75% for Class A shares. If the data reflected the deduction of such fees, the performance would be lower. The Fund offers five share classes: GIREX - Class A, GCREX - Class C, GRIFX - Class I, GLREX - Class L, and GMREX - Class M. For more information on the differences in share classes, refer to the applicable prospectus, which can be found at: www.griffincapital.com.
| 2 | GRIFFIN INSTITUTIONAL ACCESS REAL ESTATE FUND |
ANNUAL REPORT 2018
| ● | Brookfield Senior Mezzanine Real Estate Finance Fund |
| ● | Heitman Core Real Estate Debt Income Trust |
| ● | MetLife Commercial Mortgage Income Fund |
| ● | PGIM Real Estate U.S. Debt Fund |
| ● | Trawler Capital Management Commercial Real Estate Credit Fund |
Although we remain overweight to private real estate relative to our long-term target, we increased the Fund’s allocation to publicly traded real estate over the past year, as market volatility during the first quarter of 2018 provided opportunities to invest at substantial discounts to net asset value (NAV). This strategy translated into strong returns for the Fund, as publicly traded real estate investment trusts (REITs) generated a 13.88% return since their low on February 8, 2018 through the end of September.4 Anecdotally, the U.S. 10-year Treasury surpassed the 3% threshold for the first time during this tightening cycle on April 24, 2018. Upon crossing this resistance level on April 24th, REITs generated a 13.11% return through September 30th,4 providing further evidence that interest rates are not the only driver of REIT performance.
Real estate fundamentals were strong throughout the year. Overall occupancy remains roughly 282 basis points (bps) above the 20-year historical average5, driven by demand from a steadily growing economy and relatively tepid growth in new supply for most core markets. U.S. cap rates look attractive on a relative basis with cross-border transactions increasing 55.5% year over year.6
The industrial sector has been the best performing real estate sector, driven primarily by a shortage of distribution facilities that are well located near high population areas to serve the growing demand for next-day shipping. In fact, industrial vacancy rates reached an all-time low of 3.06% at the end of the third quarter.5 This figure is 451 bps lower than the 20-year historical average for this sector.5
Griffin Institutional Access Real Estate Fund is a closed-end interval fund. Limited liquidity is provided to shareholders only through the Fund’s quarterly repurchase offers for no less than 5% and no more than 25% of the Fund’s shares outstanding at net asset value. The Fund is suitable only for investors who can bear the risks associated with the limited liquidity of the Fund and should be viewed as a long-term investment. There is no secondary market for the Fund’s shares and none is expected to develop.
| GRIFFIN INSTITUTIONAL ACCESS REAL ESTATE FUND | 3 |
| ANNUAL REPORT 2018 |
Additionally, demographic trends continue to support the demand for multifamily properties. Evidence of the growing preference to rent can be found within the homeownership rate, which is currently at 64% and near the 50-year low of 63%.3 Further, we believe the homeownership rate may drift lower, as home affordability has become more challenging. These factors have led to favorable fundamentals in most of our target markets, where new supply continues to be met with high demand. Additionally, as we begin to see increased levels of inflation, rents in multifamily properties can be adjusted more frequently relative to other asset types, thereby offering investors the potential for a steady, inflation-adjusted return.
We are proud of the Fund’s performance and will continue to focus on durable income generation from core assets located in top real estate markets. As we look ahead into 2019, we believe that diversification, prudent portfolio construction and risk-management will be critical in navigating through an environment with increased levels of volatility. Together with our experienced sub-advisers, we will continue to work to create value for our shareholders.
On behalf of the entire Griffin Capital Team, we thank you for your continued support.
Sincerely,

Randy I. Anderson, Ph.D., CRE
Portfolio Manager
Griffin Institutional Access Real Estate Fund
| 4 | GRIFFIN INSTITUTIONAL ACCESS REAL ESTATE FUND |
ANNUAL REPORT 2018
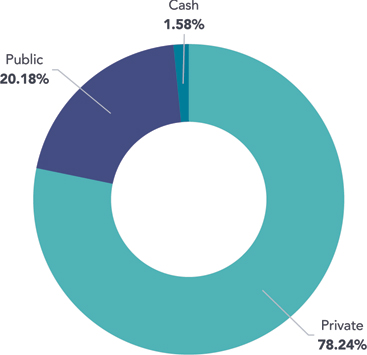
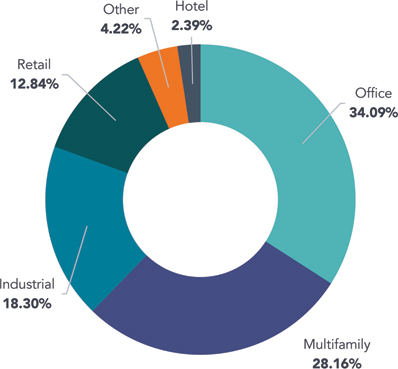
PRIVATE FUND DIVERSIFICATION (UNAUDITED)
The Fund’s investment objective is to generate a return comprised of both current income and capital appreciation with moderate volatility and low correlation to the broader markets. To achieve this goal the Fund diversifies its holdings by property type, geography and fund managers.
| Overall Portfolio Allocation | Sector Diversification | |
 | 
|
| Geographic Diversification |
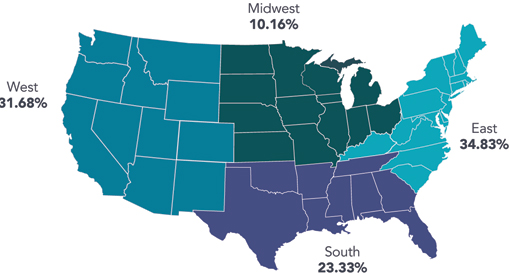 |
Allocation, Sector, Geographic Diversification, and holdings are subject to change. Diversification does not eliminate the risk of experiencing investment losses. The charts represent the diversification by sector and geography of the private fund holdings as of 10/1/18. Based on market value.
| GRIFFIN INSTITUTIONAL ACCESS REAL ESTATE FUND | 5 |
| ANNUAL REPORT 2018 |
PRIVATE FUND ALLOCATION (UNAUDITED)
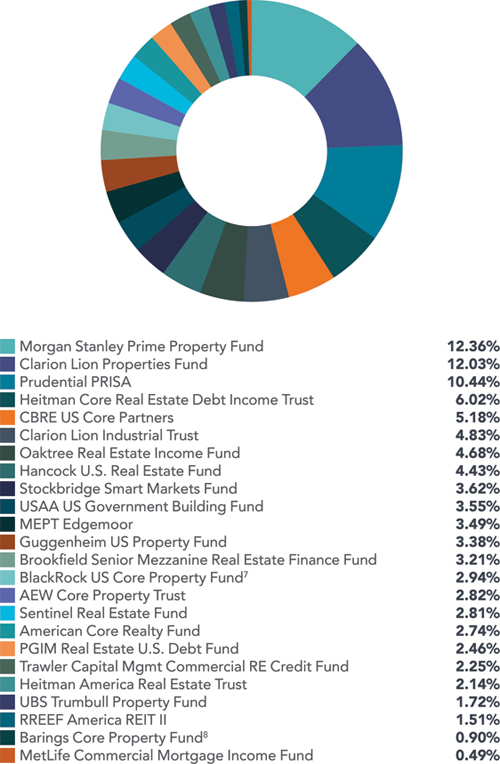
Holdings are subject to change without notice.
| 6 | GRIFFIN INSTITUTIONAL ACCESS REAL ESTATE FUND |
ANNUAL REPORT 2018
PRIVATE FUND SUMMARIES (UNAUDITED)
 | AEW Core Property Trust is an open-end core fund that seeks to invest in high quality assets located in top-tier markets with a heavy emphasize on income, liquidity and strong long term fundamentals. AEW Core Property Trust uses a research-based approach to target markets with high barriers to entry – physical, governmental, or economic – in addition to population and job growth potential. |
 | The American Core Realty Fund is a diversified open-end commingled fund that invests primarily in high quality core income-producing office, industrial, retail, and multifamily properties. The American Core Realty Fund focuses its investment activity throughout the United States in major metropolitan markets that are innovation hubs containing high concentrations of our nation’s globally competitive industries and that benefit from highly educated/professional human capital. |
 | The Barings Core Property Fund8 is a U.S. open-end, diversified core fund that focuses on the four traditional property types and hotels. The Barings Core Property Fund is managed with an emphasis on research, targeting “barrier” markets, which are perceived to reduce the risk of oversupply and offer potential for outsized rent growth and appreciation. |
 | BlackRock US Core Property Fund7 is a diversified core private REIT with an investment objective to provide current income with the potential for long term capital appreciation. The BlackRock US Core Property Fund aims to beat its stated benchmark, the NFI-ODCE, while producing real estate returns and liquidity appropriate for a core fund. |
 | Brookfield Senior Mezzanine Real Estate Finance Fund is an open-end senior real estate debt fund focused on providing primarily floating rate financing secured by commercial property primarily located in the U.S. and secured by generally well-leased/light transitional collateral commercial real estate properties that generate significant cash flow. Brookfield Senior Mezzanine Real Estate Finance Fund will primarily focus on creating investment positions by originating floating rate whole loans, syndicating the first mortgage and retaining the mezzanine exposure. |
 | CBRE U.S. Core Partners is an open-end core fund that purchases and operates high-quality, income-producing office, industrial, retail, and multifamily assets in select major U.S. metropolitan markets that exhibit strong growth demographics |
 | Clarion Lion Industrial Trust is a private REIT focused on the industrial property sector in North America. Clarion Lion Industrial Trust invests primarily in big-box warehouse and distribution centers, with an emphasis on large, core industrial markets throughout the United States. |
 | Clarion Lion Properties Fund is a core private REIT with interests in a diversified portfolio of primarily institutional quality real estate assets and related investments located throughout the U.S. The investment objective is to provide a strong income return with potential for long-term capital appreciation. |
 | GRE U.S. Property Fund L.P. is an open-end real estate fund consisting of a diversified portfolio of institutional quality, income producing assets broadly allocated by property type and geographic location. GRE U.S. Property Fund L.P. employs a core plus strategy intertwined with a disciplined risk management process in seeking to achieve its performance objectives. |
 | The Hancock U.S. Real Estate Fund is a U.S. open-end core-plus fund that will target properties located in major U.S. markets, with the objective of preserving capital while delivering a combination of income and long-term capital appreciation. The Hancock U.S. Real Estate Fund will target an allocation of 60% core-plus assets and 40% core investments. |
 | Heitman America Real Estate Trust is an open-end core commingled fund. Heitman America Real Estate Trust’s core strategy encompasses stabilized investments with low to moderate leverage and seeks to objectively minimize risk through diversification in property type, geographic location, and tenant composition. |
 | Heitman Core Real Estate Debt Income Trust is an open-ended, commingled fund, that originates and services first mortgage loans secured by income-producing U.S. commercial real estate. Heitman Core Real Estate Debt Income Trust will seek to originate senior debt financing to high-quality real estate operators in both primary and specialty property sectors. |
Holdings are subject to change without notice.
| GRIFFIN INSTITUTIONAL ACCESS REAL ESTATE FUND | 7 |
| ANNUAL REPORT 2018 |
 | Bentall Kennedy Multi-Employer Property Trust (“MEPT”) Edgemoor is an open-end, core real estate private equity fund that invests in a portfolio of institutional-quality real estate assets in the U.S. MEPT Edgemoor’s investment strategy is focused on maintaining stable income, building a diversified modern portfolio, using moderate leverage, and providing superior liquidity. Bentall Kennedy MEPT Edgemoor upholds a strong commitment to the principles of Responsible Property Investing. |
 | MetLife Commercial Mortgage Income Fund is a perpetual life, open-end, commercial mortgage debt fund that consists of commercial mortgage loans. MetLife Commercial Mortgage Income Fund seeks to provide consistent current income, attractive risk-adjusted returns and preservation of principal. MetLife Commercial Mortgage Income Fund seeks to achieve its investment objective by creating a portfolio of institutional-quality loans originated by MetLife Investment Management Real Estate’s existing platform, using its investment underwriting guidelines and risk management processes and policies and anticipates being broadly diversified by property type, geography, borrower and loan type. |
 | Morgan Stanley Prime Property Fund is an open-end core fund with a focus on office, retail, multifamily, industrial, self storage and hotel properties located in major real estate markets throughout the United States. |
 | Oaktree Real Estate Fund is an open-ended fund that targets investments in commercial real estate, primarily office, multifamily and industrial assets. Oaktree Real Estate Fund intends to create value by investing in assets that require modest leasing and capital expenditures. |
 | PGIM Real Estate U.S. Debt Fund is an open-end debt fund that seeks to originate and service first mortgage and subordinate debt, fixed and floating rate loans, secured by stable income producing properties or properties exhibiting light transitional characteristics. PGIM Real Estate U.S. Debt Fund will focus on the four main property types in the top 30 MSAs and intends to provide secure income returns from investing in a low risk, low volatility portfolio of real estate debt, with a focus on capital preservation and stability of income. |
 | PRISA is organized as a perpetual life, open-ended, commingled fund to invest primarily in core, well-leased, operating real estate assets located in the United States, with an emphasis on income. PRISA is Prudential Real Estate Investors (“PREI”) flagship fund, and represents one of the oldest and largest U.S. core real estate funds available in the marketplace. |
 | RREEF America REIT II is a core private REIT that provides an average risk exposure to the core real estate market, but does so with significantly different allocations than the index – heavily overweight to industrial assets and the West. |
 | Sentinel Real Estate Fund is a multifamily focused, core private REIT that emphasizes acquisitions of stabilized assets with in-place income with the goal of providing a substantial portion of investor returns in the form of distributed cash. |
 | The Smart Markets Fund is an open-end core fund that aims to capture performance in excess of the ODCE Index by acquiring assets in “Smart Markets” characterized by educated, stable and fast-growing employment bases. The Smart Market Fund’s target market strategy is based on the principle that real estate demand is dependent on jobs which are increasingly being created where there are educated work forces in the U.S. |
 | Trawler Capital Management Commercial Real Estate Credit Fund intends to focus primarily on investing in a diversified portfolio of primarily U.S. commercial real estate debt investments, generally within the mezzanine position of the capital stack. Trawler Capital Management Commercial Real Estate Credit Fund will focus on building and maintaining a portfolio of assets that are intended to provide strong risk adjusted returns in all cycles, with emphasis on stable cash flows. |
 | UBS Trumbull Property Fund is an open-end, diversified Core fund focusing on the four main property types, with a small exposure to hotels. UBS Trumbull Property Fund focuses on top markets for high-quality Core, institutional real estate assets. |
 | USAA US Government Building Fund seeks to provide investors with attractive, risk-adjusted returns generated by the acquisition, build to suit development and operation of buildings located in the United States and leased or intended to be leased to U.S. federal, state and local governments and government agencies and departments. |
Holdings are subject to change without notice.
| 8 | GRIFFIN INSTITUTIONAL ACCESS REAL ESTATE FUND |
ANNUAL REPORT 2018
FUND SUB-ADVISERS (UNAUDITED)
| Aon Hewitt Investment Consulting |  |
The Fund’s Private Allocation Sub-Adviser, Aon Hewitt Investment Consulting, Inc., an Aon Company, provides investment consulting services to over 480 clients in North America with total client assets worldwide of $3.3 trillion, including $2.5 trillion in the U.S. as of June 30, 2018. Approximately 370 investment consulting professionals in the U.S. advise institutional investors such as corporations, public organizations, union associations, health systems, endowments, and foundations.
| CenterSquare Investment Management |  |
The Fund’s Public Allocation Sub-Adviser, CenterSquare Investment Management LLC (“CenterSquare”), is focused exclusively on real estate and structured to provide attractive investment performance to institutional real estate investors. CenterSquare’s team of REIT experts have been a trusted advisor to endowments, pension plans and corporate clients. The firm manages $10 billion across a variety of real estate strategies as of September 30, 2018.
Griffin Capital Advisor, LLC along with CenterSquare Investment Management have designed a public market strategy in line with the objectives of the Fund with a focus on identifying public real estate securities whose current prices are below their intrinsic values. CenterSquare Investment Management has been managing real estate securities portfolios since 1995 across multiple strategies and market cycles.
| GRIFFIN INSTITUTIONAL ACCESS REAL ESTATE FUND | 9 |
| ANNUAL REPORT 2018 |
GLOSSARY (UNAUDITED)
Alpha: A measure of risk-adjusted return implying how much a fund/manager outperformed its benchmark, given its risk profile.
Annualized Return: Calculated by annualizing cumulative return (i.e., adjusting it for a period of one year). Annualized return includes capital appreciation and assumes a reinvestment of dividends and distributions.
Basis Point: One basis point is equal to 1/100th of 1%, or 0.01%.
Beta: A measure of systematic risk (volatility), or the sensitivity of a fund to movements in a benchmark. A beta of 1 implies that you can expect the movement of a fund’s return series to match that of the benchmark used to measure beta. A value of less than 1 implies that the fund is less volatile than the index.
Bloomberg Barclays U.S. Aggregate Bond Index: Measures the performance of the U.S. investment grade bond market.
Correlation: A statistical measure of how two securities move in relation to each other. A correlation ranges from -1 to 1. A positive correlation of 1 implies that as one security moves, either up or down, the other security will move in lockstep, in the same direction. A negative correlation of -1 indicates that the securities will move in the opposite direction. If the correlation is 0, the movements of the securities are said to have no correlation; they are completely random.
Cumulative Return: The compound return of an investment. It includes capital appreciation and assumes a reinvestment of dividends and distributions.
FTSE NAREIT U.S. Equity REIT Index: Designed to present investors with a comprehensive family of REIT performance indexes that spans the commercial real estate space across the U.S. economy. The index series provides investors with exposure to all investment and property sectors. In addition, the more narrowly focused property sector and sub-sector indexes provide the facility to concentrate commercial real estate exposure in more selected markets. The FTSE NAREIT Equity REITs index contains all Equity REITs not designated as Timber REITs or Infrastructure REITs.
Leverage: The use of various financial instruments, including credit lines and options, to attempt to enhance returns without increasing investment.
| 10 | GRIFFIN INSTITUTIONAL ACCESS REAL ESTATE FUND |
ANNUAL REPORT 2018
NASDAQ: An electronic stock market listing over 5,000 companies. The NASDAQ stock market comprises two separate markets, namely the Nasdaq National Market, which trades large, active securities and the NASDAQ Smallcap Market that trades emerging growth companies.
National Council of Real Estate Investment Fiduciaries (NCREIF): A member-driven, not-for-profit association that improves private real estate investment industry knowledge by providing transparent and consistent data, performance measurement, analytics, standards and education.
NCREIF Fund Index-Open End Diversified Core Equity (NFI-ODCE): An index of investment returns reporting on both a historical and current basis the results of 36 open-end commingled funds pursuing a core investment strategy, some of which have performance histories dating back to the 1970s. The NFI-ODCE Index is capitalization-weighted and is reported gross of fees. Measurement is time-weighted.
NCREIF Property Index (NPI): A quarterly, unleveraged composite total return for private commercial real estate properties held for investment purposes only. All properties in the NPI have been acquired, at least in part, on behalf of tax-exempt institutional investors and held in a fiduciary environment.
Net Asset Value (NAV): Represents a fund’s per-share price. NAV is calculated by dividing a fund’s total net assets by its number of shares outstanding.
Net Operating Income (NOI): A calculation used to analyze real estate investments that generate income. Net operating income equals all revenue from the property minus necessary operating expenses.
S&P 500: An index based on market cap of the 500 largest companies having stock listed on the New York Stock Exchange (NYSE) or NASDAQ.
Sharpe Ratio: Measures risk-adjusted returns by calculating the excess return (above the risk free rate) per unit of risk (standard deviation). The higher the ratio, the better the risk-adjusted returns. The average 3 month U.S. Treasury T-bill auction was used as the risk free rate in this material.
Standard Deviation: Measures the average deviations of a return series from its mean, and is often used as a measure of volatility/risk. A large standard deviation implies that there have been large swings in the return series of the manager.
| GRIFFIN INSTITUTIONAL ACCESS REAL ESTATE FUND | 11 |
| ANNUAL REPORT 2018 |
IMPORTANT DISCLOSURES (UNAUDITED)
This is neither an offer to sell nor a solicitation to purchase any security. Investors should carefully consider the investment objectives, risks, charges and expense of Griffin Institutional Access® Real Estate Fund (the “Fund”). This and other important information about the Fund is contained in the prospectus, which can be obtained by contacting your financial advisor or visiting www.griffincapital.com. Please read the prospectus carefully before investing.
All Morningstar calculations and metrics are based on monthly data. CALCULATIONS AND METRICS REFLECT A LOAD WAIVED, CLASS A SHARE (GRIFFIN INSTITUTIONAL ACCESS REAL ESTATE FUND). Investors of the load waived Class A share do not pay a front-end sales charge/load.
You cannot invest directly in an index. Index performance does not represent actual Fund or portfolio performance. A fund or portfolio may differ significantly from the securities included in the index. Index performance assumes reinvestment of dividends but does not reflect any management fees, transaction costs or other expenses that would be incurred by a fund or portfolio, or brokerage commissions on transactions in fund shares. Such fees, expenses, and commissions could reduce returns.
Past performance is not a guarantee of future results. Investing in the Fund involves risks, including the risk that you may receive little or no return on your investment or that you may lose part or all of your investment. The ability of the Fund to achieve its investment objective depends, in part, on the ability of the Adviser to allocate effectively the assets of the Fund among the various securities and investments in which the Fund invests. There can be no assurance that the actual allocations will be effective in achieving the Fund’s investment objective or delivering positive returns. Investors will pay offering expenses and, with regard to those share classes that impose a front-end sales load, a sales load of up to 5.75%. An investor will need to receive a total return at least in excess of these expenses to receive an actual return on the investment.
The Fund is a closed-end interval fund, the shares have no history of public trading, nor is it intended that the shares will be listed on a public exchange at this time. No secondary market is expected to develop for the Fund’s shares. Limited liquidity is provided to shareholders only through the Fund’s quarterly repurchase offers for no less than 5% and no more than 25% of the Fund’s shares outstanding at net asset value. There is no guarantee that an investor will be able to sell all the shares that the investor desires to sell in the repurchase offer. The investment return and principal value of an investment will fluctuate so that an investor’s shares, when redeemed, may be worth more or less than the original cost. Due to these restrictions, an investor should consider an investment in the Fund to be of limited liquidity. The Fund is suitable only for investors who can bear the risks associated with the limited liquidity of the Fund and should be viewed as a long-term investment. Investing in the Fund is speculative and involves a high degree of risk, including the risks associated with leverage and the risk of a substantial loss of investment. There is no guarantee that the investment strategies will work under all market conditions.
Investors in the Fund should understand that the net asset value (“NAV”) of the Fund will fluctuate, which may result in a loss of the principal amount invested. The Fund’s investments may be negatively affected by the broad investment environment and capital markets in which the Fund invests, including the real estate market, the debt market and/or the equity securities market. The value of the Fund’s investments will increase or decrease based on changes in the prices of the investments it holds. This will cause the value of the Fund’s shares to increase or decrease. The Fund is “non-diversified” under the Investment Company Act of 1940 since changes in the financial condition or market value of a single issuer may cause a greater fluctuation in the Fund’s net asset value than in a “diversified” fund. Diversification does not eliminate the risk of experiencing investment losses. Holdings are subject to change without notice. The Fund is not intended to be a complete investment program.
The Fund’s investment in private investment funds will require it to bear a pro rata share of the vehicles’ expenses, including management and performance fees. Also, once an investment is made in a private investment fund, neither the Adviser nor any sub-adviser will be able to exercise control over investment decisions made by the private investment fund. The Fund will not invest in real estate directly, but, because the Fund will concentrate its investments in securities of REITs and other real estate industry issuers, its portfolio will be significantly impacted by the performance of the real estate market and may experience more volatility and be exposed to greater risk than a more diversified portfolio. The value of companies engaged in the real estate industry is affected by: (i) changes in general economic and market conditions; (ii) changes in the value of real estate properties; (iii) risks related to local economic conditions, overbuilding and increased competition; (iv) increases in property taxes and operating expenses; (v) changes in zoning laws; (vi) casualty and condemnation losses; (vii) variations in rental income, neighborhood values or the appeal of property to tenants; (viii) the availability of financing and (ix) changes in interest rates and leverage. By investing in the Fund, a shareholder will not be deemed to be an investor in any underlying fund and will not have the ability to exercise any rights attributable to an investor in any such underlying fund related to their investment.
| 12 | GRIFFIN INSTITUTIONAL ACCESS REAL ESTATE FUND |
ANNUAL REPORT 2018
The Fund’s distribution policy is to make quarterly distributions to shareholders. All or a portion of a distribution may consist of a return of capital. Please refer to the Fund’s most recent Section 19(a) notice, available at www. griffincapital.com, for additional information regarding the composition of distributions. Shareholders should not assume that the source of a distribution from the Fund is net profit. Although such distributions are not currently taxable, such distributions will have the effect of lowering a shareholder’s tax basis in the shares which will result in a higher tax liability when the shares are sold, even if they have not increased in value, or, in fact, have lost value. Distributions are not guaranteed.
The Fund is advised by Griffin Capital Advisor, LLC (“GCA”), GCA is registered as an investment adviser with the U.S. Securities and Exchange Commission (the “SEC”) pursuant to the provisions of the Investment Advisers Act of 1940, as amended (the “Advisers Act”). GCA is an indirect majority-owned subsidiary of Griffin Capital Company, LLC. The Fund’s private real estate funds allocation is sub-advised by Aon Hewitt Investment Consulting (“Aon”), an Aon Company. Aon is registered as an investment adviser with the SEC pursuant to the provisions of the Advisers Act. The Fund’s public real estate securities allocation is sub-advised by CenterSquare Investment Management, LLC (“CenterSquare”). CenterSquare is an investment adviser registered with the SEC pursuant to the provisions of the Advisers Act. Registration with the SEC does not constitute an endorsement by the SEC nor does it imply a certain level of skill or training.
The inception date of the Fund’s Class A shares was 6/30/2014. As of September 30, 2018, the Fund’s load waived Class A shares returned 7.19% (annualized) since inception (source: Morningstar Direct). The maximum sales charge is 5.75% for Class A shares and 4.25% for Class L shares. Class C shareholders may be subject to a contingent deferred sales charge equal to 1.00% of the original purchase price of Class C shares redeemed during the first 365 days after their purchase. Performance reflects the reinvestment of dividends and distributions. Due to financial statement adjustments, returns may differ. Performance data quoted represents past performance. Past performance is no guarantee of future results and investment returns and principal value of the Fund will fluctuate so that shares, when redeemed, may be worth more or less than their original cost. Current performance may be lower or higher than performance data quoted. Visit www.griffincapital.com for current performance. The total gross expense ratio is 2.30% for Class A, 3.05% for Class C, 2.04% for Class I, 2.46% for Class L, and 2.73% for Class M. The Fund has contractually agreed to waive its fees to the extent that they exceed 1.91% for Class A, 2.66% for Class C, 1.66% for Class I, 2.16% for Class L, and 2.41% for Class M until February 1, 2019. Without the waiver, the expenses would have been higher. The Fund’s return does not reflect the deduction of all fees and if the Fund return reflected the deduction of such fees, the performance would be lower.
This annual report may contain certain forward-looking statements. Such forward-looking statements can generally be identified by our use of forward-looking terminology such as “may,” “will,” “expect,” “intend,” “anticipate,” “estimate,” “believe,” “continue,” or other similar words. Because such statements include risks, uncertainties and contingencies, actual results may differ materially from the expectations, intentions, beliefs, plans or predictions of the future expressed or implied by such forward-looking statements. These risks, uncertainties and contingencies include, but are not limited to: uncertainties relating to changes in general economic and real estate conditions; uncertainties relating to the implementation of our investment strategy; uncertainties relating to capital proceeds; and other risk factors as outlined in our prospectus, annual report and semi-annual report filed with the Securities and Exchange Commission (the “SEC”).
The views and information discussed in this commentary are as of the date of publication, are subject to change, and may not reflect the writer’s current views. The views expressed represent an assessment of market conditions at a specific point in time, are opinions only and should not be relied upon as investment advice regarding a particular investment or markets in general. Such information does not constitute a recommendation to buy or sell specific securities or investment vehicles. It should not be assumed that any investment will be profitable or will equal the performance of the fund(s) or any securities or any sectors mentioned herein. The subject matter contained herein has been derived from several sources believed to be reliable and accurate at the time of compilation. Griffin Capital Securities, LLC and Griffin Capital Advisor, LLC do not accept any liability for losses either direct or consequential caused by the use of this information.
During the fiscal year ending September 30, 2018, the Fund paid distributions of $119,048,567 to its investors, consisting of distributions of $48,254,533 paid in cash and $70,794,034 that was reinvested through the Fund’s distribution reinvestment program.
| GRIFFIN INSTITUTIONAL ACCESS REAL ESTATE FUND | 13 |
| ANNUAL REPORT 2018 |
During that period, the Fund received cash from dividends and distributions from the Fund’s underlying investments totaling $77,177,500, and from realized gains on its investments totaling $11,126,483, and paid cash fees and expenses of $48,841,407.
The Fund’s stated investment objective is to generate a return comprised of both income and capital appreciation with moderate volatility and low correlation to the broader markets. Thus, the Fund expects to generate a total return comprised of both dividend income and appreciation less the fees and expenses of the Fund. Since inception, a portion of the Fund’s total return was comprised of unrealized appreciation representing an increase in the value of its underlying securities, which had not been realized through a sale or other capital transaction. Distributions are determined to be economically earned if the total return of the Fund less fees and expenses of the Fund exceeds the distributions paid, and to the extent that the Fund makes distributions in excess of its total return, less fees and expenses of the Fund, the NAV will decline.
The Fund’s most recent annualized distribution rate as of September 30, 2018 was 5.22%. Distributions paid may exceed and, from time to time, have exceeded the Fund’s total return less fees and expenses of the Fund during some periods due to changes in market conditions affecting components of the Fund’s total return, including unrealized appreciation. Please reference the performance table below to view the Fund’s historical returns. Additionally, the Fund’s performance can always be found on the Griffin Capital website (www.griffincapital.com). The following chart presents the quarterly changes to the NAV, total return, and cumulative total return for load waived Class A shares since inception.1
| Period Ending | NAV Return | Total Return | Cumulative Total Return |
| 6/30/14 | N/A | N/A | N/A |
| 9/30/14 | 0.44% | 1.65% | 1.65% |
| 12/31/14 | 2.11% | 3.40% | 5.10% |
| 3/31/15 | 0.98% | 2.28% | 7.50% |
| 6/30/15 | -1.24% | 0.06% | 7.56% |
| 9/30/15 | 1.13% | 2.47% | 10.21% |
| 12/31/15 | 1.01% | 2.34% | 12.79% |
| 3/31/16 | 1.00% | 2.33% | 15.42% |
| 6/30/16 | 0.95% | 2.28% | 18.05% |
| 9/30/16 | -0.04% | 1.28% | 19.57% |
| 12/31/16 | -0.26% | 1.05% | 20.83% |
| 3/31/17 | -0.15% | 1.17% | 22.24% |
| 6/30/17 | 0.26% | 1.59% | 24.18% |
| 9/30/17 | 0.00% | 1.32% | 25.83% |
| 12/31/17 | 0.90% | 2.33% | 28.64% |
| 3/31/18 | -0.97% | 0.34% | 29.08% |
| 6/30/18 | 1.24% | 2.58% | 32.41% |
| 9/30/18 | 0.11% | 1.43% | 34.31% |
| 14 | GRIFFIN INSTITUTIONAL ACCESS REAL ESTATE FUND |
ANNUAL REPORT 2018
ENDNOTES
| 1. | Data source: Morningstar Direct for the period of 6/30/14 – 9/30/18. Performance reflects the reinvestment of dividends and distributions. Due to financial statement adjustments, returns may differ. Past performance is not a guarantee of future results. A glossary of terms can be found on page 9. |
| 2. | Benchmark S&P 500. |
| 3. | Source: Bloomberg. |
| 4. | Source: FTSE NAREIT Equity REITs Total Return Index. |
| 5. | Source: NCREIF NPI Trends Report, as of 9/30/18. One basis point is equal to 1/100th of 1%, or 0.01%. |
| 6. | Clarion Partners Research. |
| 7. | Formerly known as the BlackRock Granite Property Fund. |
| 8. | Formerly known as the Cornerstone Patriot Fund. |
| Griffin Institutional Access Real Estate Fund | Portfolio Update |
September 30, 2018 (Unaudited)
Performance (for the periods ended September 30, 2018)
| 1 Year | 3 Year | Since Inception | Inception Date | Total Expense Ratio | |
| Griffin Institutional Access Real Estate Fund – A – Without Load | 6.54% | 6.69% | 7.20% | 6/30/14 | 2.30% |
| Griffin Institutional Access Real Estate Fund – A – With Load* | 0.40% | 4.61% | 5.71% | 6/30/14 | |
| Griffin Institutional Access Real Estate Fund – C – Without Load | 5.76% | 5.91% | 5.74% | 8/7/15 | 3.05% |
| Griffin Institutional Access Real Estate Fund – C – With Load** | 4.76% | 5.91% | 5.74% | 8/7/15 | |
| Griffin Institutional Access Real Estate Fund – I – NAV | 6.81% | 6.97% | 6.78% | 8/7/15 | 2.04% |
| Griffin Institutional Access Real Estate Fund – M – NAV | 6.03% | N/A | 6.24% | 11/16/16 | 2.73% |
| Griffin Institutional Access Real Estate Fund – L – Without Load | 6.30% | N/A | 6.31% | 4/24/17 | 2.46% |
| Griffin Institutional Access Real Estate Fund – L – With Load*** | 1.79% | N/A | 3.14% | 4/24/17 | |
| S&P 500® Total Return Index | 17.91% | 17.31% | 12.06% | 6/30/14 | |
| Bloomberg Barclays U.S. Aggregate Bond Index | -1.22% | 1.31% | 1.65% | 6/30/14 |
| * | Adjusted for initial maximum sales charge of 5.75%. |
| ** | Adjusted for contingent deferred sales charge of 1.00%. |
| *** | Adjusted for initial maximum sales charge of 4.25%. |
The S&P 500® Total Return Index is an unmanaged index of 500 common stocks chosen for market size, liquidity and industry group representation. It is a market-value weighted index. The index is not actively managed and does not reflect any deduction for fees, expenses or taxes.
The Bloomberg Barclays U.S. Aggregate Bond Index (formerly known as the Barclays Capital U.S. Aggregate Bond Index) is a market value-weighted index of investment grade fixed-rated debt issues, including government, corporate, asset-backed and mortgage-backed securities with a maturity of one year or more.
Indexes are not actively managed and do not reflect deduction for fees, expenses or taxes. An investor cannot invest directly into an index.
The returns shown above do not reflect the deduction of taxes a shareholder would pay on Fund distributions or redemption of Fund shares. The returns shown are net of applicable share class fees.
The performance data quoted above represents past performance. Past performance is not a guarantee of future results. Investment return and value of the Fund shares will fluctuate so that an investor’s shares, when sold or redeemed, may be worth more or less than their original cost. Performance may be lower or higher than performance data quoted. Fund performance current to the most recent month-end is available by calling 1-888-926-2688 or by visiting www.griffincapital.com.
Class A shares are offered subject to a maximum sales charge of 5.75% of the offering price. Class C, Class I and Class M shares are offered at net asset value. Class L shares are offered subject to a maximum sales charge of 4.25% of the offering cost. Class C shares may be subject to a 1.00% contingent deferred sales charge on shares redeemed during the first 365 days after their purchase. The Fund’s investment adviser has contractually agreed to waive its fees and to pay or absorb the ordinary annual operating expenses of the Fund (including offering expenses, but excluding taxes, interest, brokerage commissions, acquired fund fees and expenses and extraordinary expenses), to the extent that they exceed 1.91%, 2.66%, 1.66%, 2.41% and 2.16% per annum of the Fund’s average daily net assets attributable to Class A, Class C, Class I, Class M and Class L shares, respectively. The Expense Limitation Agreement will remain in effect at least until February 1, 2019, for Class A, C, I, L and M shares, unless and until the Board approves its modification or termination. Without the waiver the expenses would be 2.30%, 3.05%, 2.04%, 2.73% and 2.46% for Class A, Class C, Class I, Class M and Class L, respectively per the Fund’s most recent prospectus. Please review the Fund’s Prospectus for more details regarding the Fund’s fees and expenses. No assurances can be given that the Fund will pay a dividend in the future; or, if any such dividend is paid, the amount or rate of the dividend.
| Annual Report | September 30, 2018 | 15 |
| Griffin Institutional Access Real Estate Fund | Portfolio Update |
September 30, 2018 (Unaudited)
Performance of $10,000 Initial Investment (as of September 30, 2018)
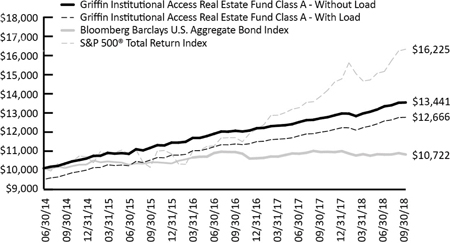
The graph shown above represents historical performance of a hypothetical investment of $10,000 in the Fund since inception. Past performance does not guarantee future results. All returns reflect reinvested dividends, but do not reflect the deduction of taxes that a shareholder would pay on Fund distributions or the redemption of Fund shares.
Sector Allocation (as a % of Net Assets)*
| Private Investment Funds | 75.57% |
| Publicly Traded Securities | 20.18% |
| Other | 4.25% |
| TOTALS | 100.00% |
Portfolio Composition (as a % of Net Assets)*
| Real Estate Investment Trusts | 95.75% |
| Other Assets in Excess Of Liabilities | 4.25% |
| TOTALS | 100.00% |
| * | Holdings are subject to change. Tables present indicative values only. |
| 16 | 1.888.926.2688 | www.griffincapital.com |
| Griffin Institutional Access Real Estate Fund | Portfolio of Investments |
September 30, 2018
| Description | Shares | Value (Note 2) | ||||||
| REAL ESTATE INVESTMENT TRUSTS (95.75%) | ||||||||
| Private Investment Funds (75.57%)*(a) | ||||||||
| AEW Core Property Trust | 54,208 | $ | 54,929,683 | |||||
| American Core Realty Fund, LP | 445 | 55,648,815 | ||||||
| Barings Core Property Fund, LP | 139,016 | 18,128,862 | ||||||
| BlackRock US Core Property Fund | N/A | 55,981,738 | ||||||
| Brookfield Senior Mezzanine Real Estate Finance Fund | 63,507 | 64,498,933 | ||||||
| CBRE U.S. Core Partners, LP | 69,536,378 | 97,908,096 | ||||||
| Clarion Lion Industrial Trust | 54,291 | 100,455,786 | ||||||
| Clarion Lion Properties Fund, LP | 161,778 | 240,604,116 | ||||||
| GRE U.S. Property Fund L.P. | N/A | 68,457,743 | ||||||
| Hancock U.S. Real Estate Fund L.P. | 72,747 | 91,574,954 | ||||||
| Heitman America Real Estate Trust, L.P. | 34,986 | 43,410,392 | ||||||
| Heitman Core Real Estate Debt Income Trust, L.P. | 94,987 | 97,554,676 | ||||||
| MEPT Edgemoor LP | 33,699 | 71,018,094 | ||||||
| MetLife Commercial Mortgage Income Fund, LP | 9,816 | 10,041,024 | ||||||
| Morgan Stanley Prime Property Fund | 13,432 | 250,768,723 | ||||||
| Oaktree Real Estate Income Fund, L.P. | N/A | 87,529,209 | ||||||
| PGIM Real Estate US Debt Fund L.P. | 46,553 | 50,092,190 | ||||||
| PRISA LP | 130,551 | 212,306,743 | ||||||
| RREEF America REIT II, Inc. | 248,080 | 30,669,266 | ||||||
| Sentinel Real Estate Fund, LP | 650 | 56,863,480 | ||||||
| Stockbridge Smart Markets Fund | 47,709 | 73,504,951 | ||||||
| TCM CRE Credit Fund LP | 45,807 | 45,883,066 | ||||||
| UBS Trumbull Property Fund | 3,105 | 34,654,923 | ||||||
| USAA US Government Building Fund LLC | N/A | 72,160,401 | ||||||
| 1,984,645,864 | ||||||||
| Publicly Traded Securities (20.18%)(a) | ||||||||
| Alexandria Real Estate Equities, Inc. | 120,450 | 15,151,406 | ||||||
| American Homes 4 Rent, Class A | 612,220 | 13,401,496 | ||||||
| Americold Realty Trust | 212,440 | 5,315,249 | ||||||
| Apartment Investment & Management Co., Class A | 120,730 | 5,327,815 | ||||||
| AvalonBay Communities, Inc. | 143,650 | 26,022,197 | ||||||
| Boston Properties, Inc. | 153,030 | 18,836,462 | ||||||
| Brandywine Realty Trust | 248,890 | 3,912,551 | ||||||
| Camden Property Trust | 173,140 | 16,200,710 | ||||||
| Chesapeake Lodging Trust | 162,150 | 5,200,151 | ||||||
| Cousins Properties, Inc. | 787,120 | 6,997,497 | ||||||
| CubeSmart | 447,120 | 12,756,334 | ||||||
| CyrusOne, Inc. | 234,110 | 14,842,574 | ||||||
| Duke Realty Corp. | 278,960 | 7,914,095 | ||||||
| Equinix, Inc. | 72,040 | 31,185,395 | ||||||
| Essex Property Trust, Inc. | 25,100 | 6,192,421 | ||||||
| Extra Space Storage, Inc. | 108,030 | 9,359,719 | ||||||
| Federal Realty Investment Trust | 41,690 | 5,272,534 | ||||||
| HCP, Inc. | 464,800 | 12,233,536 | ||||||
| Healthcare Trust of America, Inc., Class A | 505,810 | 13,489,953 | ||||||
| Highwoods Properties, Inc. | 213,890 | 10,108,441 | ||||||
| Hilton Worldwide Holdings, Inc. | 106,120 | 8,572,374 | ||||||
| Hudson Pacific Properties, Inc. | 191,740 | 6,273,733 | ||||||
| Invitation Homes, Inc. | 391,740 | 8,974,763 | ||||||
| Iron Mountain, Inc. | 358,880 | 12,388,538 | ||||||
| Annual Report | September 30, 2018 | 17 |
| Griffin Institutional Access Real Estate Fund | Portfolio of Investments |
September 30, 2018
| Description | Shares | Value (Note 2) | ||||||
| Publicly Traded Securities (continued) | ||||||||
| JBG SMITH Properties | 73,580 | $ | 2,709,951 | |||||
| Kilroy Realty Corp. | 216,105 | 15,492,567 | ||||||
| Liberty Property Trust | 189,059 | 7,987,743 | ||||||
| Macerich Co. | 173,510 | 9,593,368 | ||||||
| Mack-Cali Realty Corp. | 372,550 | 7,920,413 | ||||||
| Mid-America Apartment Communities, Inc. | 35,401 | 3,546,472 | ||||||
| Park Hotels & Resorts, Inc. | 325,210 | 10,673,392 | ||||||
| Pebblebrook Hotel Trust | 80,310 | 2,920,875 | ||||||
| Prologis, Inc. | 516,375 | 35,005,060 | ||||||
| Public Storage | 31,490 | 6,349,329 | ||||||
| Realty Income Corp. | 136,420 | 7,760,934 | ||||||
| Regency Centers Corp. | 196,650 | 12,717,356 | ||||||
| Simon Property Group, Inc. | 200,370 | 35,415,397 | ||||||
| STAG Industrial, Inc. | 216,170 | 5,944,675 | ||||||
| STORE Capital Corp. | 231,480 | 6,432,829 | ||||||
| Sun Communities, Inc. | 132,220 | 13,425,619 | ||||||
| Sunstone Hotel Investors, Inc. | 704,520 | 11,525,947 | ||||||
| Taubman Centers, Inc. | 33,290 | 1,991,741 | ||||||
| Tier REIT, Inc. | 111,057 | 2,676,474 | ||||||
| UDR, Inc. | 295,930 | 11,964,450 | ||||||
| Urban Edge Properties | 133,940 | 2,957,395 | ||||||
| Ventas, Inc. | 291,910 | 15,874,066 | ||||||
| VEREIT, Inc. | 1,364,330 | 9,905,036 | ||||||
| VICI Properties, Inc. | 347,660 | 7,516,409 | ||||||
| Weingarten Realty Investors | 193,100 | 5,746,656 | ||||||
| 529,984,098 | ||||||||
| TOTAL REAL ESTATE INVESTMENT TRUSTS | ||||||||
| (Cost $2,320,365,786) | 2,514,629,962 | |||||||
| TOTAL INVESTMENTS (95.75%) | ||||||||
| (Cost $2,320,365,786) | $ | 2,514,629,962 | ||||||
| Other Assets In Excess Of Liabilities (4.25%) | 111,568,264 | |||||||
| NET ASSETS (100.00%) | $ | 2,626,198,226 | ||||||
| (a) | A portion of these securities is held as collateral for the outstanding Line(s) of Credit. At September 30, 2018 outstanding collateral amounted to $2,359,900,723. |
Common Abbreviations:
| LLC | - Limited Liability Company |
| LP | - Limited Partnerships |
| REIT | - Real Estate Investment Trust |
| 18 | 1.888.926.2688 | www.griffincapital.com |
| Griffin Institutional Access Real Estate Fund | Portfolio of Investments |
September 30, 2018
| * | Additional Information on Investments in Private Investment Funds: |
| Value | Security | Redemption Frequency | Redemption Notice (Days) | Unfunded Commitments as of September 30, 2018 | ||||||||||
| $ | 54,929,683 | AEW Core Property Trust | Quarterly | 45 | $ | 2,000,000 | ||||||||
| 55,648,815 | American Core Realty Fund, LP | Quarterly | 10 | 0 | ||||||||||
| 18,128,862 | Barings Core Property Fund, LP | Quarterly | 30 | 0 | ||||||||||
| 55,981,738 | BlackRock US Core Property Fund | Quarterly | 60 | 0 | ||||||||||
| 64,498,933 | Brookfield Senior Mezzanine Real Estate Finance Fund | Quarterly | 90 | 10,218,484 | ||||||||||
| 97,908,096 | CBRE U.S. Core Partners, LP | Quarterly | 60 | 7,500,000 | ||||||||||
| 100,455,786 | Clarion Lion Industrial Trust | Quarterly | 90 | 0 | ||||||||||
| 240,604,116 | Clarion Lion Properties Fund, LP | Quarterly | 90 | 0 | ||||||||||
| 68,457,743 | GRE U.S. Property Fund L.P. | Quarterly | 90 | 0 | ||||||||||
| 91,574,954 | Hancock U.S. Real Estate Fund L.P. | Quarterly | 60 | 2,407,860 | ||||||||||
| 43,410,392 | Heitman America Real Estate Trust, L.P. | Quarterly | 90 | 0 | ||||||||||
| 97,554,676 | Heitman Core Real Estate Debt Income Trust, L.P. | Quarterly | 90 | 38,129,876 | ||||||||||
| 71,018,094 | MEPT Edgemoor LP | Quarterly | N/A** | 0 | ||||||||||
| 10,041,024 | MetLife Commercial Mortgage Income Fund, LP | Quarterly | 90 | 0 | ||||||||||
| 250,768,723 | Morgan Stanley Prime Property Fund | Quarterly | 90 | 0 | ||||||||||
| 87,529,209 | Oaktree Real Estate Income Fund, L.P. | Quarterly | 90 | 0 | ||||||||||
| 50,092,190 | PGIM Real Estate US Debt Fund L.P. | Quarterly | 90 | 25,000,000 | ||||||||||
| 212,306,743 | PRISA LP | Quarterly | 90 | 0 | ||||||||||
| 30,669,266 | RREEF America REIT II, Inc. | Quarterly | 45 | 0 | ||||||||||
| 56,863,480 | Sentinel Real Estate Fund, LP | Quarterly | N/A** | 0 | ||||||||||
| 73,504,951 | Stockbridge Smart Markets Fund | Quarterly | 45 | 0 | ||||||||||
| 45,883,066 | TCM CRE Credit Fund LP | Quarterly | 90 | 29,142,500 | ||||||||||
| 34,654,923 | UBS Trumbull Property Fund | Quarterly | 60 | 0 | ||||||||||
| 72,160,401 | USAA US Government Building Fund LLC | Quarterly | 60 | 0 | ||||||||||
| ** | Written notice required for redemption, no minimum timeline required. |
See Notes to Financial Statements.
| Annual Report | September 30, 2018 | 19 |
| Griffin Institutional Access Real Estate Fund | Statement of Assets and Liabilities |
September 30, 2018
| ASSETS | ||||
| Investments, at value (Cost $2,320,365,786) | $ | 2,514,629,962 | ||
| Cash | 102,773,734 | |||
| Receivable for investments sold | 708,918 | |||
| Receivable for shares sold | 10,201,419 | |||
| Dividends receivable | 16,899,471 | |||
| Prepaid expenses and other assets | 142,667 | |||
| Total Assets | 2,645,356,171 | |||
| LIABILITIES | ||||
| Payable for investments purchased | 12,873,057 | |||
| Shareholder servicing fees payable (Note 3) | 431,389 | |||
| Lines of credit interest payable (Note 6) | 60,278 | |||
| Investment advisory fees payable (Note 3) | 3,150,518 | |||
| Administration fees payable (Note 3) | 77,183 | |||
| Transfer agency fees payable (Note 3) | 183,029 | |||
| Distribution fees payable (Note 3) | 535,248 | |||
| Chief compliance officer fees payable (Note 3) | 16,146 | |||
| Legal fees payable | 55,141 | |||
| Audit and tax fees payable | 20,500 | |||
| Custody fees payable | 13,685 | |||
| Accrued expenses and other liabilities | 1,741,771 | |||
| Total Liabilities | 19,157,945 | |||
| NET ASSETS | $ | 2,626,198,226 | ||
| NET ASSETS CONSIST OF | ||||
| Paid-in capital | $ | 2,388,821,833 | ||
| Total distributable earnings | 237,376,393 | |||
| NET ASSETS | $ | 2,626,198,226 | ||
| PRICING OF SHARES | ||||
| Class A: | ||||
| Net asset value | $ | 26.94 | ||
| Net assets | $ | 714,880,477 | ||
| Shares of beneficial interest outstanding (unlimited number of shares, no par value common stock authorized) | 26,532,652 | |||
| Maximum offering price per share ((NAV/0.9425), based on maximum sales charge of 5.75% of the offering price) | $ | 28.58 | ||
| Class C: | ||||
| Net asset value and offering | $ | 26.33 | ||
| Net assets | $ | 470,710,558 | ||
| Shares of beneficial interest outstanding (unlimited number of shares, no par value common stock authorized) | 17,875,089 | |||
| Class I: | ||||
| Net asset value and offering | $ | 27.16 | ||
| Net assets | $ | 992,272,240 | ||
| Shares of beneficial interest outstanding (unlimited number of shares, no par value common stock authorized) | 36,533,117 | |||
| Class M: | ||||
| Net asset value and offering | $ | 26.70 | ||
| Net assets | $ | 402,481,893 | ||
| Shares of beneficial interest outstanding (unlimited number of shares, no par value common stock authorized) | 15,075,805 | |||
| Class L: | ||||
| Net asset value | $ | 26.87 | ||
| Net assets | $ | 45,853,058 | ||
| Shares of beneficial interest outstanding (unlimited number of shares, no par value common stock authorized) | 1,706,333 | |||
| Maximum offering price per share ((NAV/0.9575), based on maximum sales charge of 4.25% of the offering price) | $ | 28.06 | ||
See Notes to Financial Statements.
| 20 | 1.888.926.2688 | www.griffincapital.com |
| Griffin Institutional Access Real Estate Fund | Statement of Operations |
For the Year Ended September 30, 2018
| INVESTMENT INCOME | ||||
| Dividend income | $ | 77,177,500 | ||
| Total Investment Income | 77,177,500 | |||
| EXPENSES | ||||
| Investment advisory fees (Note 3) | 32,810,675 | |||
| Administrative fees (Note 3) | 818,790 | |||
| Transfer Agency fees (Note 3) | 1,002,964 | |||
| Shareholder servicing fees (Note 3): | ||||
| Class A | 1,669,429 | |||
| Class C | 1,131,142 | |||
| Class L | 74,298 | |||
| Distribution fees (Note 3): | ||||
| Class C | 3,393,426 | |||
| Class M | 1,807,676 | |||
| Class L | 74,298 | |||
| Legal fees | 257,427 | |||
| Audit and tax fees | 20,500 | |||
| Reports to shareholders and printing fees | 435,319 | |||
| SEC registration fees | 148,377 | |||
| State registration fees | 255,732 | |||
| Insurance fees | 149,695 | |||
| Custody fees | 63,669 | |||
| Chief compliance officer fees (Note 3) | 115,089 | |||
| Interest expense (Note 6) | 4,342,272 | |||
| Trustees' fees (Note 3) | 169,911 | |||
| Other expenses | 35,261 | |||
| Total Expenses | 48,775,950 | |||
| Fees waived/expenses reimbursed by Adviser (Note 3) | (305,759 | ) | ||
| Expense recoupment of previously waived fees | 371,216 | |||
| Net Expenses | 48,841,407 | |||
| Net Investment Income | 28,336,093 | |||
| Net realized gain on investments | 11,126,483 | |||
| Net change in unrealized appreciation on investments | 99,575,298 | |||
| NET REALIZED AND UNREALIZED GAIN ON INVESTMENTS | 110,701,781 | |||
| NET INCREASE IN NET ASSETS RESULTING FROM OPERATIONS | $ | 139,037,874 | ||
See Notes to Financial Statements.
| Annual Report | September 30, 2018 | 21 |
| Griffin Institutional Access Real Estate Fund | Statements of Changes in Net Assets |
| For the Year Ended September 30, 2018 | For the Year Ended September 30, 2017 | |||||||
| OPERATIONS: | ||||||||
| Net investment income | $ | 28,336,093 | $ | 14,259,928 | ||||
| Net realized gain on investments | 11,126,483 | 19,838,311 | ||||||
| Net change in unrealized appreciation on investments | 99,575,298 | 48,464,249 | ||||||
| Net Increase in Net Assets Resulting from Operations | 139,037,874 | 82,562,488 | ||||||
| DISTRIBUTIONS TO SHAREHOLDERS: | ||||||||
| Class A(a) | ||||||||
| From distributable earnings | (5,037,625 | ) | (6,848,613 | ) | ||||
| From return of capital | (30,404,087 | ) | (25,210,604 | ) | ||||
| Class C(b) | ||||||||
| From distributable earnings | (3,392,197 | ) | (4,475,890 | ) | ||||
| From return of capital | (20,473,275 | ) | (16,476,313 | ) | ||||
| Class I(c) | ||||||||
| From distributable earnings | (6,215,713 | ) | (5,971,437 | ) | ||||
| From return of capital | (37,514,323 | ) | (21,981,611 | ) | ||||
| Class M(d)(e) | ||||||||
| From distributable earnings | (2,028,005 | ) | (530,084 | ) | ||||
| From return of capital | (12,239,827 | ) | (1,951,307 | ) | ||||
| Class L(f)(g) | ||||||||
| From distributable earnings | (247,820 | ) | (37,171 | ) | ||||
| From return of capital | (1,495,695 | ) | (136,832 | ) | ||||
| Total Distributions to Shareholders | (119,048,567 | ) | (83,619,862 | ) | ||||
| BENEFICIAL INTEREST TRANSACTIONS: | ||||||||
| Class A | ||||||||
| Shares sold | $ | 199,774,191 | $ | 190,098,368 | ||||
| Distributions reinvested | 20,061,998 | 18,693,887 | ||||||
| Shares redeemed | (107,606,031 | ) | (79,904,929 | ) | ||||
| Shares transferred out | (43,800,663 | ) | – | |||||
| Class C | ||||||||
| Shares sold | 80,918,179 | 162,942,200 | ||||||
| Distributions reinvested | 14,155,699 | 12,883,938 | ||||||
| Shares redeemed | (69,672,473 | ) | (30,405,914 | ) | ||||
| Shares transferred out | (1,341,871 | ) | – | |||||
| Class I | ||||||||
| Shares sold | 362,907,525 | 349,727,528 | ||||||
| Distributions reinvested | 23,585,133 | 16,495,478 | ||||||
| Shares redeemed | (108,533,370 | ) | (63,786,421 | ) | ||||
| Shares transferred in | 46,165,081 | – | ||||||
| Class M(d) | ||||||||
| Shares sold | 277,294,524 | 115,309,100 | ||||||
| Distributions reinvested | 11,829,030 | 2,149,790 | ||||||
| Shares redeemed | (4,533,021 | ) | (51,485 | ) | ||||
| Shares transferred out | (245,332 | ) | – | |||||
| Class L(f) | ||||||||
| Shares sold | 32,893,891 | 13,746,285 | ||||||
| Distributions reinvested | 1,162,174 | 127,969 | ||||||
| Shares redeemed | (1,472,707 | ) | (642 | ) | ||||
| Shares transferred out | (777,215 | ) | – | |||||
| Net Increase in Net Assets Derived from Beneficial Interest Transactions | 732,764,742 | 708,025,152 | ||||||
| Net increase in net assets | 752,754,049 | 706,967,778 | ||||||
| NET ASSETS: | ||||||||
| Beginning of period | 1,873,444,177 | 1,166,476,399 | ||||||
| End of period | $ | 2,626,198,226 | $ | 1,873,444,177 | (h) | |||
See Notes to Financial Statements.
| 22 | 1.888.926.2688 | www.griffincapital.com |
| Griffin Institutional Access Real Estate Fund | Statements of Changes in Net Assets |
| For the Year Ended September 30, 2018 | For the Year Ended September 30, 2017 | |||||||
| Other Information | ||||||||
| BENEFICIAL INTEREST TRANSACTIONS: | ||||||||
| Class A | ||||||||
| Beginning shares | 23,993,905 | 19,159,502 | ||||||
| Shares sold | 7,438,877 | 7,129,758 | ||||||
| Distributions reinvested | 751,778 | 705,540 | ||||||
| Shares redeemed | (4,016,984 | ) | (3,000,895 | ) | ||||
| Shares transferred out | (1,634,924 | ) | – | |||||
| Net increase in shares outstanding | 2,538,747 | 4,834,403 | ||||||
| Ending shares | 26,532,652 | 23,993,905 | ||||||
| Class C | ||||||||
| Beginning shares | 16,965,585 | 11,443,448 | ||||||
| Shares sold | 3,072,264 | 6,182,708 | ||||||
| Distributions reinvested | 541,187 | 492,485 | ||||||
| Shares redeemed | (2,652,957 | ) | (1,153,056 | ) | ||||
| Shares transferred out | (50,990 | ) | – | |||||
| Net increase in shares outstanding | 909,504 | 5,522,137 | ||||||
| Ending shares | 17,875,089 | 16,965,585 | ||||||
| Class I | ||||||||
| Beginning shares | 24,552,452 | 13,251,197 | ||||||
| Shares sold | 13,418,915 | 13,067,182 | ||||||
| Distributions reinvested | 877,058 | 619,692 | ||||||
| Shares redeemed | (4,025,849 | ) | (2,385,619 | ) | ||||
| Shares transferred in | 1,710,541 | – | ||||||
| Net increase in shares outstanding | 11,980,665 | 11,301,255 | ||||||
| Ending shares | 36,533,117 | 24,552,452 | ||||||
| Class M(d) | ||||||||
| Beginning shares | 4,409,450 | – | ||||||
| Shares sold | 10,399,098 | 4,330,031 | ||||||
| Distributions reinvested | 445,985 | 81,351 | ||||||
| Shares redeemed | (169,693 | ) | (1,932 | ) | ||||
| Shares transferred out | (9,035 | ) | – | |||||
| Net increase in shares outstanding | 10,666,355 | 4,409,450 | ||||||
| Ending shares | 15,075,805 | 4,409,450 | ||||||
| Class L(f) | ||||||||
| Beginning shares | 519,193 | – | ||||||
| Shares sold | 1,226,796 | 514,387 | ||||||
| Distributions reinvested | 43,581 | 4,830 | ||||||
| Shares redeemed | (54,499 | ) | (24 | ) | ||||
| Shares transferred out | (28,738 | ) | – | |||||
| Net increase in shares outstanding | 1,187,140 | 519,193 | ||||||
| Ending shares | 1,706,333 | 519,193 | ||||||
| (a) | For the prior year ended September 30, 2017, Total Distributions (other than return of capital) consisted of Net Investment Income of $0, and Net Realized Gains of $6,848,613. |
| (b) | For the prior year ended September 30, 2017, Total Distributions (other than return of capital) consisted of Net Investment Income of $0, and Net Realized Gains of $4,475,890. |
| (c) | For the prior year ended September 30, 2017, Total Distributions (other than return of capital) consisted of Net Investment Income of $0, and Net Realized Gains of $5,971,437. |
| (d) | The Fund’s Class M shares commenced operations on November 17, 2016. |
See Notes to Financial Statements.
| Annual Report | September 30, 2018 | 23 |
| Griffin Institutional Access Real Estate Fund | Statements of Changes in Net Assets |
| (e) | For the prior year ended September 30, 2017, Total Distributions (other than return of capital) consisted of Net Investment Income of $0, and Net Realized Gains of $1,951,307. |
| (f) | The Fund’s Class L shares commenced operations on April 25, 2017. |
| (g) | For the prior year ended September 30, 2017, Total Distributions (other than return of capital) consisted of Net Investment Income of $0, and Net Realized Gains of $37,171. |
| (h) | Including accumulated net investment loss of $(19,027,488) for the year ended September 30, 2017. |
See Notes to Financial Statements.
| 24 | 1.888.926.2688 | www.griffincapital.com |
| Griffin Institutional Access Real Estate Fund | Statement of Cash Flows |
| For the Year Ended September 30, 2018 | ||||
| Cash Flow from Operating Activities: | ||||
| Net increase in net assets resulting from operations | $ | 139,037,874 | ||
| Adjustments to reconcile net increase in net assets resulting from operations to net cash used in operating activities: | ||||
| Purchase of investments | (865,487,205 | ) | ||
| Proceeds from sales | 341,004,212 | |||
| Net realized gain on investments | (11,126,483 | ) | ||
| Net change in unrealized appreciation on investments | (99,575,298 | ) | ||
| (Increase)/Decrease in assets: | ||||
| Dividends receivable | (5,816,052 | ) | ||
| Prepaid expenses and other assets | (56,742 | ) | ||
| Increase/(Decrease) in liabilities: | ||||
| Lines of credit interest payable | (86,574 | ) | ||
| Shareholder servicing fees payable | 58,905 | |||
| Transfer agency fees payable | (6,379 | ) | ||
| Investment advisory fees payable | 1,000,125 | |||
| Distribution fees payable | 139,478 | |||
| Administration fees payable | 15,634 | |||
| Custody fees payable | 13,685 | |||
| Trustees' fees payable | (1,112 | ) | ||
| Chief compliance officer fees payable | 9,075 | |||
| Legal fees payable | (13,830 | ) | ||
| Accrued expenses and other liabilities | 752,777 | |||
| Net cash used in operating activities | (500,137,910 | ) | ||
| Cash Flows from Financing Activities: | ||||
| Net cash used in lines of credit | (69,500,000 | ) | ||
| Proceeds from shares sold | 953,858,259 | |||
| Payment on shares redeemed | (291,817,602 | ) | ||
| Cash distributions paid | (48,254,533 | ) | ||
| Net cash provided by financing activities | 544,286,124 | |||
| Net increase in cash & cash equivalents | 44,148,214 | |||
| Cash & cash equivalents, beginning of year | 58,625,520 | |||
| Cash & cash equivalents, end of year | $ | 102,773,734 | ||
| Non-cash financing activities not included herein consist of reinvestment of distributions of: | $ | 70,794,034 | ||
| Cash paid for interest on lines of credit during the year was: | $ | 4,428,846 | ||
See Notes to Financial Statements.
| Annual Report | September 30, 2018 | 25 |
| Griffin Institutional Access Real Estate Fund – Class A | Financial Highlights |
For a Share Outstanding Throughout the Periods Presented
| For the Year Ended September 30, 2018 | For the Year Ended September 30, 2017 | For the Year Ended September 30, 2016 | For the Year Ended September 30, 2015 | For the Period Ended September 30, 2014(a) | ||||||||||||||||
| Net asset value, beginning of period | $ | 26.65 | $ | 26.63 | $ | 25.97 | $ | 25.31 | $ | 25.00 | ||||||||||
| INCOME FROM INVESTMENT OPERATIONS: | ||||||||||||||||||||
| Net investment income(b) | 0.38 | 0.28 | 0.24 | 0.09 | 0.01 | |||||||||||||||
| Net realized and unrealized gain | 1.32 | 1.14 | 1.81 | 1.90 | 0.60 | |||||||||||||||
| Total from investment operations | 1.70 | 1.42 | 2.05 | 1.99 | 0.61 | |||||||||||||||
| DISTRIBUTIONS: | ||||||||||||||||||||
| From net investment income | – | – | (0.02 | ) | – | – | ||||||||||||||
| From net realized gain on investments | (0.20 | ) | (0.30 | ) | (0.32 | ) | (0.32 | ) | (0.01 | ) | ||||||||||
| Return of capital | (1.21 | ) | (1.10 | ) | (1.05 | ) | (1.01 | ) | (0.29 | ) | ||||||||||
| Total distributions(c) | (1.41 | ) | (1.40 | ) | (1.39 | ) | (1.33 | ) | (0.30 | ) | ||||||||||
| Net increase in net asset value | 0.29 | 0.02 | 0.66 | 0.66 | 0.31 | |||||||||||||||
| Net asset value, end of period | $ | 26.94 | $ | 26.65 | $ | 26.63 | $ | 25.97 | $ | 25.31 | ||||||||||
| TOTAL RETURN(d) | 6.54 | % | 5.47 | % | 8.07 | % | 8.03 | % | 2.46 | % | ||||||||||
| RATIOS/SUPPLEMENTAL DATA: | ||||||||||||||||||||
| Net assets, end of period (000s) | $ | 714,880 | $ | 639,448 | $ | 510,251 | $ | 130,847 | $ | 35,845 | ||||||||||
| Ratios to Average Net Assets (including interest expense) | ||||||||||||||||||||
| Ratio of expenses to average net assets excluding fee waivers and reimbursements/recoupment of previously waived fees(e) | 2.11 | % | 2.29 | % | 2.41 | % | 2.82 | % | N/A | |||||||||||
| Ratio of expenses to average net assets including fee waivers and reimbursements/recoupment of previously waived fees(e) | 2.11 | % | 2.23 | % | 2.23 | % | 1.94 | % | N/A | |||||||||||
| Ratio of net investment income to average net assets(e)(f) | 1.41 | % | 1.06 | % | 0.92 | % | 0.35 | % | N/A | |||||||||||
| Ratios to Average Net Assets (excluding interest expense) | ||||||||||||||||||||
| Ratio of expenses to average net assets excluding fee waivers and reimbursements/recoupment of previously waived fees(e) | 1.91 | % | 1.97 | % | 2.09 | % | 2.79 | % | 6.77 | %(g) | ||||||||||
| Ratio of expenses to average net assets including fee waivers and reimbursements/recoupment of previously waived fees(e) | 1.91 | % | 1.91 | % | 1.91 | % | 1.91 | % | 1.91 | %(g) | ||||||||||
| Ratio of net investment income to average net assets excluding fee waivers and reimbursements(e)(f) | 1.61 | % | 1.31 | % | 1.05 | % | 0.38 | % | 0.15 | %(g) | ||||||||||
| Portfolio turnover rate | 15 | % | 11 | % | 8 | % | 29 | % | 7 | %(h) | ||||||||||
| (a) | The Fund's Class A shares commenced operations on June 30, 2014. |
| (b) | Calculated using the average shares method. |
See Notes to Financial Statements.
| 26 | 1.888.926.2688 | www.griffincapital.com |
| Griffin Institutional Access Real Estate Fund – Class A | Financial Highlights |
For a Share Outstanding Throughout the Periods Presented
| (c) | Total distributions during a calendar year generally will be made from the Fund’s net investment income, net realized gains on investments and net unrealized gains on investments, if any. The portion of distributions paid not attributable to net investment income or net realized gains on investments, if any, is distributed from the Fund’s assets and is treated by shareholders as a nontaxable distribution (“Return of Capital”) for tax purposes. Return of capital is a tax concept, not an economic concept. The tax character of the Fund’s distributions, in isolation, does not reveal much information about whether the distributions are supported by the Fund’s returns. Reported distributions from net investment income and realized gains on investments are not an indication as to whether or not the Fund’s distributions are supported by the Fund’s returns. A Fund can have distributions from net investment income and realized capital gains in years in which it incurs an economic loss due to unrealized losses not being recognized for tax purposes. A common method in which to determine if the Fund’s distributions are supported by economic returns is to examine the Fund’s Net Asset Value (“NAV”) over the course of a year. If the Fund’s NAV has increased, the Fund will have economically earned more than it has distributed, regardless of whether such distributions are reported as being from net investment income, net realized gains on investments or return of capital. If a Fund’s NAV decreases, the Fund will have distributed more than it has economically earned or it will have incurred an economic loss. |
| (d) | Total returns are for the period indicated and have not been annualized and do not reflect the impact of sales charge. Total returns would have been lower had certain expenses not been waived during the period. Returns shown do not reflect the deduction of taxes that a shareholder would pay on Fund distributions or the redemption of Fund shares. |
| (e) | The ratios of expenses to average net assets and net investment income to average net assets do not reflect the expenses of the underlying private real estate funds in which the Fund invests which typically range from 0.80% to 1.00% on an annual basis. However, the Fund invests in each underlying private real estate investment fund based upon the net asset value of each such fund which reflects the costs of investing in the applicable fund, including the management fee of the underlying fund and other operating expenses. The net asset value of each underlying private real estate investment fund is incorporated into the ratios described above. |
| (f) | Recognition of net investment income is affected by the timing and declaration of dividends by the underlying investment companies in which the Fund invests. |
| (g) | Annualized. |
| (h) | Portfolio turnover rate for periods less than one full year has not been annualized and is calculated at the Fund level. |
See Notes to Financial Statements.
| Annual Report | September 30, 2018 | 27 |
| Griffin Institutional Access Real Estate Fund – Class C | Financial Highlights |
For a Share Outstanding Throughout the Periods Presented
| For the Year Ended September 30, 2018 | For the Year Ended September 30, 2017 | For the Year Ended September 30, 2016 | For the Period Ended September 30, 2015(a) | |||||||||||||
| Net asset value, beginning of period | $ | 26.24 | $ | 26.42 | $ | 25.95 | $ | 26.20 | ||||||||
| INCOME FROM INVESTMENT OPERATIONS: | ||||||||||||||||
| Net investment income(b) | 0.17 | 0.08 | 0.04 | 0.00 | (c) | |||||||||||
| Net realized and unrealized gain | 1.31 | 1.12 | 1.82 | 0.09 | ||||||||||||
| Total from investment operations | 1.48 | 1.20 | 1.86 | 0.09 | ||||||||||||
| DISTRIBUTIONS: | ||||||||||||||||
| From net investment income | – | – | (0.03 | ) | – | |||||||||||
| From net realized gain on investments | (0.20 | ) | (0.30 | ) | (0.32 | ) | – | |||||||||
| Return of capital | (1.19 | ) | (1.08 | ) | (1.04 | ) | (0.34 | ) | ||||||||
| Total distributions(d) | (1.39 | ) | (1.38 | ) | (1.39 | ) | (0.34 | ) | ||||||||
| Net increase/(decrease) in net asset value | 0.09 | (0.18 | ) | 0.47 | (0.25 | ) | ||||||||||
| Net asset value, end of period | $ | 26.33 | $ | 26.24 | $ | 26.42 | $ | 25.95 | ||||||||
| TOTAL RETURN(e) | 5.76 | % | 4.68 | % | 7.30 | % | 0.34 | % | ||||||||
| RATIOS/SUPPLEMENTAL DATA: | ||||||||||||||||
| Net assets, end of period (000s) | $ | 470,711 | $ | 445,191 | $ | 302,319 | $ | 13,547 | ||||||||
| Ratios to Average Net Assets (including interest expense) | ||||||||||||||||
| Ratio of expenses to average net assets excluding fee waivers and reimbursements/recoupment of previously waived fees(f) | 2.86 | % | 3.04 | % | 3.18 | % | 3.32 | %(g) | ||||||||
| Ratio of expenses to average net assets including fee waivers and reimbursements/recoupment of previously waived fees(f) | 2.86 | % | 2.98 | % | 2.98 | % | 2.69 | %(g) | ||||||||
| Ratio of net investment income to average net assets(f)(h) | 0.66 | % | 0.30 | % | 0.17 | % | 0.00 | %(g)(i) | ||||||||
| Ratios to Average Net Assets (excluding interest expense) | ||||||||||||||||
| Ratio of expenses to average net assets excluding fee waivers and reimbursements/recoupment of previously waived fees(f) | 2.66 | % | 2.72 | % | 2.86 | % | 3.29 | %(g) | ||||||||
| Ratio of expenses to average net assets including fee waivers and reimbursements/recoupment of previously waived fees(f) | 2.66 | % | 2.66 | % | 2.66 | % | 2.66 | %(g) | ||||||||
| Ratio of net investment income to average net assets excluding fee waivers and reimbursements(f)(h) | 0.86 | % | 0.56 | % | 0.29 | % | 0.03 | %(g) | ||||||||
| Portfolio turnover rate | 15 | % | 11 | % | 8 | % | 29 | %(j) | ||||||||
| (a) | The Fund's Class C shares commenced operations on August 10, 2015. |
| (b) | Calculated using the average shares method. |
| (c) | Less than $0.005 per share. |
See Notes to Financial Statements.
| 28 | 1.888.926.2688 | www.griffincapital.com |
| Griffin Institutional Access Real Estate Fund – Class C | Financial Highlights |
For a Share Outstanding Throughout the Periods Presented
| (d) | Total distributions during a calendar year generally will be made from the Fund’s net investment income, net realized gains on investments and net unrealized gains on investments, if any. The portion of distributions paid not attributable to net investment income or net realized gains on investments, if any, is distributed from the Fund’s assets and is treated by shareholders as a nontaxable distribution (“Return of Capital”) for tax purposes. Return of capital is a tax concept, not an economic concept. The tax character of the Fund’s distributions, in isolation, does not reveal much information about whether the distributions are supported by the Fund’s returns. Reported distributions from net investment income and realized gains on investments are not an indication as to whether or not the Fund’s distributions are supported by the Fund’s returns. A Fund can have distributions from net investment income and realized capital gains in years in which it incurs an economic loss due to unrealized losses not being recognized for tax purposes. A common method in which to determine if the Fund’s distributions are supported by economic returns is to examine the Fund’s Net Asset Value (“NAV”) over the course of a year. If the Fund’s NAV has increased, the Fund will have economically earned more than it has distributed, regardless of whether such distributions are reported as being from net investment income, net realized gains on investments or return of capital. If a Fund’s NAV decreases, the Fund will have distributed more than it has economically earned or it will have incurred an economic loss. |
| (e) | Total returns are for the period indicated and have not been annualized and do not reflect the impact of sales charge. Total returns would have been lower had certain expenses not been waived during the period. Returns shown do not reflect the deduction of taxes that a shareholder would pay on Fund distributions or the redemption of Fund shares. |
| (f) | The ratios of expenses to average net assets and net investment income to average net assets do not reflect the expenses of the underlying private real estate funds in which the Fund invests which typically range from 0.80% to 1.00% on an annual basis. However, the Fund invests in each underlying private real estate investment fund based upon the net asset value of each such fund which reflects the costs of investing in the applicable fund, including the management fee of the underlying fund and other operating expenses. The net asset value of each underlying private real estate investment fund is incorporated into the ratios described above. |
| (g) | Annualized. |
| (h) | Recognition of net investment income is affected by the timing and declaration of dividends by the underlying investment companies in which the Fund invests. |
| (i) | Less than 0.005%. |
| (j) | Portfolio turnover rate for periods less than one full year has not been annualized and is calculated at the Fund level. |
See Notes to Financial Statements.
| Annual Report | September 30, 2018 | 29 |
| Griffin Institutional Access Real Estate Fund – Class I | Financial Highlights |
For a Share Outstanding Throughout the Periods Presented
| For the Year Ended September 30, 2018 | For the Year Ended September 30, 2017 | For the Year Ended September 30, 2016 | For the Period Ended September 30, 2015(a) | |||||||||||||
| Net asset value, beginning of period | $ | 26.80 | $ | 26.71 | $ | 25.98 | $ | 26.20 | ||||||||
| INCOME FROM INVESTMENT OPERATIONS: | ||||||||||||||||
| Net investment income(b) | 0.45 | 0.35 | 0.31 | 0.03 | ||||||||||||
| Net realized and unrealized gain | 1.33 | 1.15 | 1.82 | 0.09 | ||||||||||||
| Total from investment operations | 1.78 | 1.50 | 2.13 | 0.12 | ||||||||||||
| DISTRIBUTIONS: | ||||||||||||||||
| From net investment income | – | – | (0.03 | ) | – | |||||||||||
| From net realized gain on investments | (0.20 | ) | (0.30 | ) | (0.32 | ) | – | |||||||||
| Return of capital | (1.22 | ) | (1.11 | ) | (1.05 | ) | (0.34 | ) | ||||||||
| Total distributions(c) | (1.42 | ) | (1.41 | ) | (1.40 | ) | (0.34 | ) | ||||||||
| Net increase/(decrease) in net asset value | 0.36 | 0.09 | 0.73 | (0.22 | ) | |||||||||||
| Net asset value, end of period | $ | 27.16 | $ | 26.80 | $ | 26.71 | $ | 25.98 | ||||||||
| TOTAL RETURN(d) | 6.81 | % | 5.75 | % | 8.35 | % | 0.46 | % | ||||||||
| RATIOS/SUPPLEMENTAL DATA: | ||||||||||||||||
| Net assets, end of period (000s) | $ | 992,272 | $ | 657,954 | $ | 353,907 | $ | 74,095 | ||||||||
| Ratios to Average Net Assets (including interest expense) | ||||||||||||||||
| Ratio of expenses to average net assets excluding fee waivers and reimbursements/recoupment of previously waived fees(e) | 1.86 | % | 2.04 | % | 2.17 | % | 2.20 | %(f) | ||||||||
| Ratio of expenses to average net assets including fee waivers and reimbursements/recoupment of previously waived fees(e) | 1.86 | % | 1.97 | % | 1.98 | % | 1.69 | %(f) | ||||||||
| Ratio of net investment income to average net assets(e)(g) | 1.67 | % | 1.31 | % | 1.16 | % | 0.71 | %(f) | ||||||||
| Ratios to Average Net Assets (excluding interest expense) | ||||||||||||||||
| Ratio of expenses to average net assets excluding fee waivers and reimbursements/recoupment of previously waived fees(e) | 1.66 | % | 1.73 | % | 1.85 | % | 2.17 | %(f) | ||||||||
| Ratio of expenses to average net assets including fee waivers and reimbursements/recoupment of previously waived fees(e) | 1.66 | % | 1.66 | % | 1.66 | % | 1.66 | %(f) | ||||||||
| Ratio of net investment income to average net assets excluding fee waivers and reimbursements(e)(g) | 1.87 | % | 1.55 | % | 1.30 | % | 0.74 | %(f) | ||||||||
| Portfolio turnover rate | 15 | % | 11 | % | 8 | % | 29 | %(h) | ||||||||
| (a) | The Fund's Class I shares commenced operations on August 10, 2015. |
| (b) | Calculated using the average shares method. |
See Notes to Financial Statements.
| 30 | 1.888.926.2688 | www.griffincapital.com |
| Griffin Institutional Access Real Estate Fund – Class I | Financial Highlights |
For a Share Outstanding Throughout the Periods Presented
| (c) | Total distributions during a calendar year generally will be made from the Fund’s net investment income, net realized gains on investments and net unrealized gains on investments, if any. The portion of distributions paid not attributable to net investment income or net realized gains on investments, if any, is distributed from the Fund’s assets and is treated by shareholders as a nontaxable distribution (“Return of Capital”) for tax purposes. Return of capital is a tax concept, not an economic concept. The tax character of the Fund’s distributions, in isolation, does not reveal much information about whether the distributions are supported by the Fund’s returns. Reported distributions from net investment income and realized gains on investments are not an indication as to whether or not the Fund’s distributions are supported by the Fund’s returns. A Fund can have distributions from net investment income and realized capital gains in years in which it incurs an economic loss due to unrealized losses not being recognized for tax purposes. A common method in which to determine if the Fund’s distributions are supported by economic returns is to examine the Fund’s Net Asset Value (“NAV”) over the course of a year. If the Fund’s NAV has increased, the Fund will have economically earned more than it has distributed, regardless of whether such distributions are reported as being from net investment income, net realized gains on investments or return of capital. If a Fund’s NAV decreases, the Fund will have distributed more than it has economically earned or it will have incurred an economic loss. |
| (d) | Total returns are for the period indicated and have not been annualized and do not reflect the impact of sales charge. Total returns would have been lower had certain expenses not been waived during the period. Returns shown do not reflect the deduction of taxes that a shareholder would pay on Fund distributions or the redemption of Fund shares. |
| (e) | The ratios of expenses to average net assets and net investment income to average net assets do not reflect the expenses of the underlying private real estate funds in which the Fund invests which typically range from 0.80% to 1.00% on an annual basis. However, the Fund invests in each underlying private real estate investment fund based upon the net asset value of each such fund which reflects the costs of investing in the applicable fund, including the management fee of the underlying fund and other operating expenses. The net asset value of each underlying private real estate investment fund is incorporated into the ratios described above. |
| (f) | Annualized. |
| (g) | Recognition of net investment income is affected by the timing and declaration of dividends by the underlying investment companies in which the Fund invests. |
| (h) | Portfolio turnover rate for periods less than one full year has not been annualized and is calculated at the Fund level. |
See Notes to Financial Statements.
| Annual Report | September 30, 2018 | 31 |
| Griffin Institutional Access Real Estate Fund – Class M | Financial Highlights |
For a Share Outstanding Throughout the Periods Presented
| For the Year Ended September 30, 2018 | For the Period Ended September 30, 2017(a) | |||||||
| Net asset value, beginning of period | $ | 26.54 | $ | 26.48 | ||||
| INCOME FROM INVESTMENT OPERATIONS: | ||||||||
| Net investment income(b) | 0.25 | 0.13 | ||||||
| Net realized and unrealized gain | 1.31 | 1.33 | ||||||
| Total from investment operations | 1.56 | 1.46 | ||||||
| DISTRIBUTIONS: | ||||||||
| From net realized gain on investments | (0.20 | ) | (0.30 | ) | ||||
| Return of capital | (1.20 | ) | (1.10 | ) | ||||
| Total distributions(c) | (1.40 | ) | (1.40 | ) | ||||
| Net increase/(decrease) in net asset value | 0.16 | 0.06 | ||||||
| Net asset value, end of period | $ | 26.70 | $ | 26.54 | ||||
| TOTAL RETURN(d) | 6.03 | % | 5.63 | % | ||||
| RATIOS/SUPPLEMENTAL DATA: | ||||||||
| Net assets, end of period (000s) | $ | 402,482 | $ | 117,018 | ||||
| Ratios to Average Net Assets (including interest expense) | ||||||||
| Ratio of expenses to average net assets excluding fee waivers and reimbursements/recoupment of previously waived fees(e) | 2.58 | % | 2.71 | %(f) | ||||
| Ratio of expenses to average net assets including fee waivers and reimbursements/recoupment of previously waived fees(e) | 2.59 | % | 2.66 | %(f) | ||||
| Ratio of net investment income to average net assets(e)(g) | 0.94 | % | 0.57 | %(f) | ||||
| Ratios to Average Net Assets (excluding interest expense) | ||||||||
| Ratio of expenses to average net assets excluding fee waivers and reimbursements/recoupment of previously waived fees(e) | 2.41 | % | 2.46 | %(f) | ||||
| Ratio of expenses to average net assets including fee waivers and reimbursements/recoupment of previously waived fees(e) | 2.41 | % | 2.41 | %(f) | ||||
| Ratio of net investment income to average net assets excluding fee waivers and reimbursements(e)(g) | 1.14 | % | 0.77 | %(f) | ||||
| Portfolio turnover rate | 15 | % | 11 | %(h) | ||||
| (a) | The Fund’s Class M shares commenced operations on November 17, 2016. |
| (b) | Calculated using the average shares method. |
| (c) | Total distributions during a calendar year generally will be made from the Fund’s net investment income, net realized gains on investments and net unrealized gains on investments, if any. The portion of distributions paid not attributable to net investment income or net realized gains on investments, if any, is distributed from the Fund’s assets and is treated by shareholders as a nontaxable distribution (“Return of Capital”) for tax purposes. Return of capital is a tax concept, not an economic concept. The tax character of the Fund’s distributions, in isolation, does not reveal much information about whether the distributions are supported by the Fund’s returns. Reported distributions from net investment income and realized gains on investments are not an indication as to whether or not the Fund’s distributions are supported by the Fund’s returns. A Fund can have distributions from net investment income and realized capital gains in years in which it incurs an economic loss due to unrealized losses not being recognized for tax purposes. A common method in which to determine if the Fund’s distributions are supported by economic returns is to examine the Fund’s Net Asset Value (“NAV”) over the course of a year. If the Fund’s NAV has increased, the Fund will have economically earned more than it has distributed, regardless of whether such distributions are reported as being from net investment income, net realized gains on investments or return of capital. If a Fund’s NAV decreases, the Fund will have distributed more than it has economically earned or it will have incurred an economic loss. |
| (d) | Total returns are for the period indicated and have not been annualized and do not reflect the impact of sales charge. Total returns would have been lower had certain expenses not been waived during the period. Returns shown do not reflect the deduction of taxes that a shareholder would pay on Fund distributions or the redemption of Fund shares. |
See Notes to Financial Statements.
| 32 | 1.888.926.2688 | www.griffincapital.com |
| Griffin Institutional Access Real Estate Fund – Class M | Financial Highlights |
For a Share Outstanding Throughout the Periods Presented
| (e) | The ratios of expenses to average net assets and net investment income to average net assets do not reflect the expenses of the underlying private real estate funds in which the Fund invests which typically range from 0.80% to 1.00% on an annual basis. However, the Fund invests in each underlying private real estate investment fund based upon the net asset value of each such fund which reflects the costs of investing in the applicable fund, including the management fee of the underlying fund and other operating expenses. The net asset value of each underlying private real estate investment fund is incorporated into the ratios described above. |
| (f) | Annualized. |
| (g) | Recognition of net investment income is affected by the timing and declaration of dividends by the underlying investment companies in which the Fund invests. |
| (h) | Portfolio turnover rate for periods less than one full year has not been annualized and is calculated at the Fund level. |
See Notes to Financial Statements.
| Annual Report | September 30, 2018 | 33 |
| Griffin Institutional Access Real Estate Fund – Class L | Financial Highlights |
For a Share Outstanding Throughout the Periods Presented
| For the Year Ended September 30, 2018 | For the Period Ended September 30, 2017(a) | |||||||
| Net asset value, beginning of period | $ | 26.64 | $ | 26.63 | ||||
| INCOME FROM INVESTMENT OPERATIONS: | ||||||||
| Net investment income(b) | 0.32 | 0.12 | ||||||
| Net realized and unrealized gain | 1.32 | 0.59 | ||||||
| Total from investment operations | 1.64 | 0.71 | ||||||
| DISTRIBUTIONS: | ||||||||
| From net realized gain on investments | (0.20 | ) | (0.15 | ) | ||||
| Return of capital | (1.21 | ) | (0.55 | ) | ||||
| Total distributions(c) | (1.41 | ) | (0.70 | ) | ||||
| Net increase/(decrease) in net asset value | 0.23 | 0.01 | ||||||
| Net asset value, end of period | $ | 26.87 | $ | 26.64 | ||||
| TOTAL RETURN(d) | 6.30 | % | 2.70 | % | ||||
| RATIOS/SUPPLEMENTAL DATA: | ||||||||
| Net assets, end of period (000s) | $ | 45,853 | $ | 13,833 | ||||
| Ratios to Average Net Assets (including interest expense) | ||||||||
| Ratio of expenses to average net assets excluding fee waivers and reimbursements/recoupment of previously waived fees(e) | 2.34 | % | 2.44 | %(f) | ||||
| Ratio of expenses to average net assets including fee waivers and reimbursements/recoupment of previously waived fees(e) | 2.35 | % | 2.39 | %(f) | ||||
| Ratio of net investment income to average net assets(e)(g) | 1.19 | % | 1.05 | %(f) | ||||
| Ratios to Average Net Assets (excluding interest expense) | ||||||||
| Ratio of expenses to average net assets excluding fee waivers and reimbursements/recoupment of previously waived fees(e) | 2.16 | % | 2.21 | %(f) | ||||
| Ratio of expenses to average net assets including fee waivers and reimbursements/recoupment of previously waived fees(e) | 2.16 | % | 2.16 | %(f) | ||||
| Ratio of net investment income to average net assets excluding fee waivers and reimbursements(e)(g) | 1.39 | % | 1.23 | %(f) | ||||
| Portfolio turnover rate | 15 | % | 11 | %(h) | ||||
| (a) | The Fund’s Class L shares commenced operations on April 25, 2017. |
| (b) | Calculated using the average shares method. |
| (c) | Total distributions during a calendar year generally will be made from the Fund’s net investment income, net realized gains on investments and net unrealized gains on investments, if any. The portion of distributions paid not attributable to net investment income or net realized gains on investments, if any, is distributed from the Fund’s assets and is treated by shareholders as a nontaxable distribution (“Return of Capital”) for tax purposes. Return of capital is a tax concept, not an economic concept. The tax character of the Fund’s distributions, in isolation, does not reveal much information about whether the distributions are supported by the Fund’s returns. Reported distributions from net investment income and realized gains on investments are not an indication as to whether or not the Fund’s distributions are supported by the Fund’s returns. A Fund can have distributions from net investment income and realized capital gains in years in which it incurs an economic loss due to unrealized losses not being recognized for tax purposes. A common method in which to determine if the Fund’s distributions are supported by economic returns is to examine the Fund’s Net Asset Value (“NAV”) over the course of a year. If the Fund’s NAV has increased, the Fund will have economically earned more than it has distributed, regardless of whether such distributions are reported as being from net investment income, net realized gains on investments or return of capital. If a Fund’s NAV decreases, the Fund will have distributed more than it has economically earned or it will have incurred an economic loss. |
| (d) | Total returns are for the period indicated and have not been annualized and do not reflect the impact of sales charge. Total returns would have been lower had certain expenses not been waived during the period. Returns shown do not reflect the deduction of taxes that a shareholder would pay on Fund distributions or the redemption of Fund shares. |
See Notes to Financial Statements.
| 34 | 1.888.926.2688 | www.griffincapital.com |
| Griffin Institutional Access Real Estate Fund – Class L | Financial Highlights |
For a Share Outstanding Throughout the Periods Presented
| (e) | The ratios of expenses to average net assets and net investment income to average net assets do not reflect the expenses of the underlying private real estate funds in which the Fund invests which typically range from 0.80% to 1.00% on an annual basis. However, the Fund invests in each underlying private real estate investment fund based upon the net asset value of each such fund which reflects the costs of investing in the applicable fund, including the management fee of the underlying fund and other operating expenses. The net asset value of each underlying private real estate investment fund is incorporated into the ratios described above. |
| (f) | Annualized. |
| (g) | Recognition of net investment income is affected by the timing and declaration of dividends by the underlying investment companies in which the Fund invests. |
| (h) | Portfolio turnover rate for periods less than one full year has not been annualized and is calculated at the Fund level. |
See Notes to Financial Statements.
| Annual Report | September 30, 2018 | 35 |
| Griffin Institutional Access Real Estate Fund | Notes to Financial Statements |
September 30, 2018
1. ORGANIZATION
Griffin Institutional Access Real Estate Fund (the “Fund”) is registered under the Investment Company Act of 1940, as amended (the “1940 Act”), as a non-diversified, closed-end management investment company. The Fund engages in a continuous offering of shares and operates as an interval fund that offers quarterly repurchases of shares at net asset value. The Fund’s investment adviser is Griffin Capital Advisor, LLC (the “Adviser”). The investment objective of the Fund is to generate a return comprised of both current income and capital appreciation with moderate volatility and low correlation to the broader markets. The Fund pursues its investment objective by strategically investing across private institutional real estate investment funds as well as a diversified set of public real estate securities.
The Fund was organized as a statutory trust on November 5, 2013, under the laws of the State of Delaware. The Fund commenced operations on June 30, 2014, and is authorized to issue an unlimited number of shares with no par value.
The Fund currently offers Class A, Class C, Class I, Class M and Class L shares. Class A shares commenced operations on June 30, 2014, Class C and Class I shares commenced operations on August 10, 2015, Class M shares commenced operations on November 17, 2016 and Class L shares commenced operations on April 25, 2017. The sales load payable by each investor depends on the amount invested by such investor in the Fund. Class A shares are offered subject to a maximum sales charge of 5.75% of the offering price. Class C, Class I and Class M shares are offered at net asset value. Class L shares are offered subject to a maximum sales charge of 4.25% of the offering price. Class C shares may be subject to a 1.00% contingent deferred sales charge on shares redeemed during the first 365 days after their purchase. Each class represents an interest in the same assets of the Fund and classes are identical except for differences in their sales charge structures and ongoing service and distribution charges. All classes of shares have equal voting privileges except that each class has exclusive voting rights with respect to its service and/or distribution plans. The Fund's income, expenses (other than class specific distribution fees) and realized and unrealized gains and losses are allocated proportionately each day based upon the relative net assets of each class.
2. SIGNIFICANT ACCOUNTING POLICIES
The following is a summary of significant accounting policies followed by the Fund in preparation of its financial statements in conformity with accounting principles generally accepted in the United States of America (“U.S. GAAP”). The Fund is considered an investment company following accounting and reporting guidance in Accounting Standards Codification (“ASC”) Topic 946 - Financial Services - Investment Companies. The preparation of financial statements requires management to make estimates and assumptions that affect the reported amounts of assets and liabilities and disclosure of contingent assets and liabilities at the date of the financial statements and the reported amounts of income and expenses for the period. Actual results could differ from those estimates.
Security Valuation – Securities listed on an exchange are valued at the last reported sale price at the close of the regular trading session of the primary exchange or market on which they are traded, on the business day the value is being determined, or in the case of securities listed on NASDAQ at the NASDAQ Official Closing Price (“NOCP”). In the absence of a sale, such securities shall be valued at the last bid price for securities held long and the last ask price for securities held short, or if a closing bid or ask price, as applicable, is not available, at either the exchange or system-defined closing price on the exchange or system in which such securities are principally traded. Short-term investments that mature in 60 days or less are valued at amortized cost, provided such valuations represent fair value.
When price quotations for certain securities are not readily available, or if the available quotations are not believed to be reflective of market value by the Adviser, those securities will be valued at “fair value” as determined in good faith by the Fair Value Pricing Committee using procedures adopted by and under the supervision of the Fund’s Board of Trustees (the “Trustees”). There can be no assurance that the Fund could purchase or sell a portfolio security at the price used to calculate the Fund’s Net Asset Value (“NAV”).
Fair valuation procedures may be used to value a substantial portion of the assets of the Fund and may be applied when, for example, (1) a portfolio security is not traded in a public market or the principal market in which the security trades is closed, (2) trading in a portfolio security is suspended and not resumed prior to the normal market close, (3) a portfolio security is not traded in significant volume for a substantial period, or (4) the Adviser determines that the quotation or price for a portfolio security provided by a broker-dealer or independent pricing service is inaccurate.
| 36 | 1.888.926.2688 | www.griffincapital.com |
| Griffin Institutional Access Real Estate Fund | Notes to Financial Statements |
September 30, 2018
Valuation of Private REITs – The Fund’s private real estate allocation generally includes open-end private investment funds that elect to be treated as real estate investment trusts (“REIT”). Further, the Fund’s private real estate allocation consists of private funds investing in real estate assets (“Private Equity REITs”) and private funds investing in debt instruments secured or otherwise supported by real estate assets (“Private Debt REITs” and together with the Private Equity REITs, the “Private REITs”). The Private REITs measure their investment assets at fair value and report a NAV per share on a calendar quarter basis. For non-calendar quarter-end days, the fair value of each Private Equity REIT is estimated by adjusting the most recent NAV for each Private Equity REIT by the change in a proprietary index that the Trustees have deemed to be representative of the entire Private Equity REIT market. With regards to each Private Debt REIT, the Adviser will accrue income on a daily basis and will update the NAV, generally on a quarterly basis. In accordance with Accounting Standards Codification (“ASC”) 820, the Fund has elected to apply the practical expedient and to value its investments in Private REITs at their respective NAVs each quarter. In the event that a price is not provided by a Private REIT following the end of the quarter, the Fund’s fair valuation procedures will be followed. As of September 30, 2018, all of the Fund’s investments in Private REITs were valued at their respective sponsored issued NAVs.
Valuation of Fund of Funds – The Fund may invest a portion of its assets in open-end investment companies and exchange-traded funds (the “Underlying Funds”). The Underlying Funds value securities in their portfolios for which market quotations are readily available at their market values (generally the last reported sale price) and all other securities and assets at their fair value to the methods established by the board of directors of the Underlying Funds. Open-ended investment companies, such as mutual funds, are valued at their respective net asset values as reported by such investment companies.
Fair Value Measurements – A three-tier hierarchy has been established to classify fair value measurements for disclosure purposes. Inputs refer broadly to the assumptions that market participants would use in pricing the asset or liability, including assumptions about risk. Inputs may be observable or unobservable. Observable inputs are inputs that reflect the assumptions market participants would use in pricing the asset or liability that are developed based on market data obtained from sources independent of the reporting entity. Unobservable inputs are inputs that reflect the reporting entity’s own assumptions about the assumptions market participants would use in pricing the asset or liability that are developed based on the best information available. In accordance with the authoritative guidance on fair value measurements and disclosure under U.S. GAAP, the Fund discloses fair value of its investments in a hierarchy that prioritizes the inputs to valuation techniques used to measure the fair value:
| Level 1 – | Unadjusted quoted prices in active markets for identical, unrestricted assets or liabilities that the Fund has the ability to access at the measurement date; |
| Level 2 – | Quoted prices which are not active, quoted prices for similar assets or liabilities in active markets or inputs other than quoted prices that are observable (either directly or indirectly) for substantially the full term of the asset or liability at the measurement date; and |
| Level 3 – | Significant unobservable prices or inputs (including the Fund’s own assumptions in determining the fair value of investments) where there is little or no market activity for the asset or liability at the measurement date. |
The availability of observable inputs can vary from security to security and is affected by a wide variety of factors, including, for example, the type of security, whether the security is new and not yet established in the marketplace, the liquidity of markets and other characteristics particular to the security. To the extent that valuation is based on models or inputs that are less observable or unobservable in the market, the determination of fair value requires more judgment. Accordingly, the degree of judgment exercised in determining fair value is greatest for instruments categorized in Level 3.
An investment level within the fair value hierarchy is based on the lowest level input, individually or in the aggregate, that is significant to fair value measurement. The valuation techniques used by the Fund to measure fair value during the year ended September 30, 2018 maximized the use of observable inputs and minimized the use of unobservable inputs.
The inputs or methodologies used for valuing securities are not necessarily an indication of the risk or liquidity associated with investing in those securities. The following is a summary of the fair valuations according to the inputs used in valuing the Fund’s investments as of September 30, 2018:
| Investments in Securities at Value | Level 1 - Quoted Prices | Level 2 - Other Significant Observable Inputs | Level 3 - Significant Unobservable Inputs | Total | ||||||||||||
| Real Estate Investment Trusts | ||||||||||||||||
| Private Investment Funds (Measured at net asset value)(a) | $ | – | $ | – | $ | – | $ | 1,984,645,864 | ||||||||
| Publicly Traded Securities | 529,984,098 | – | – | 529,984,098 | ||||||||||||
| Total | $ | 529,984,098 | $ | – | $ | – | $ | 2,514,629,962 | ||||||||
| (a) | In accordance with Subtopic 820-10, certain investments that are measured at fair value using the net asset value per share (or its equivalent) practical expedient have not been classified in the fair value hierarchy. The fair value amounts presented in this table are intended to permit reconciliation of the fair value hierarchy to the amounts presented in the Statement of Assets and Liabilities. |
| Annual Report | September 30, 2018 | 37 |
| Griffin Institutional Access Real Estate Fund | Notes to Financial Statements |
September 30, 2018
There were no transfers out of or into level 3 during the year ended September 30, 2018. It is the Fund’s policy to recognize transfers between levels at the end of the reporting period.
For the year ended September 30, 2018, the Fund did not use unobservable inputs (Level 3) when determining fair value.
Investment Transactions – Investment security transactions are accounted for on trade date. Gains and losses on securities sold are determined on a specific identification basis.
Investment Income – Interest income is accrued and recorded on a daily basis including amortization of premiums, accretion of discounts and income earned from money market funds. Interest is not accrued on securities that are in default. Dividend income is recorded on the ex-dividend date.
Exchange-Traded Funds (“ETFs”) – The Fund may invest in ETFs, which are funds whose shares are traded on a national exchange. ETFs may be based on underlying equity or fixed income securities, as well as commodities or currencies. ETFs do not sell individual shares directly to investors and only issue their shares in large blocks known as “creation units.” The investor purchasing a creation unit then sells the individual shares on a secondary market. Although similar diversification benefits may be achieved through an investment in another investment company, ETFs generally offer greater liquidity and lower expenses. Because an ETF incurs its own fees and expenses, shareholders of the Fund investing in an ETF will indirectly bear those costs. The Fund will also incur brokerage commissions and related charges when purchasing or selling shares of an ETF. Unlike typical investment company shares, which are valued once daily, shares in an ETF may be purchased or sold on a securities exchange throughout the trading day at market prices that are generally close to the NAV of the ETF.
Concentration of Credit Risk – The Fund places its cash with one banking institution, which is insured by Federal Deposit Insurance Corporation (“FDIC”). The FDIC limit is $250,000. At various times throughout the year, the amount on deposit may exceed the FDIC limit and subject the Fund to a credit risk. The Fund does not believe that such deposits are subject to any unusual risk associated with investment activities.
Industry Concentration – If a Fund has significant investments in the securities of issuers within a particular industry, any development affecting that industry will have a greater impact on the value of the net assets of the Fund than would be the case if the Fund did not have significant investments in that industry. In addition, this may increase the risk of loss in the Fund and increase the volatility of the Fund’s net asset value per share. Occasionally, market conditions, regulatory changes or other developments may negatively impact this industry, and therefore the value of the Fund’s portfolio will be adversely affected. As of September 30, 2018, the Fund had 95.75% of the value of its net assets invested within the Real Estate industry.
Distributions to Shareholders – Distributions from net investment income, if any, will be declared and paid quarterly. Distributions of net realized capital gains, if any, will be declared and paid annually. Income and capital gains distributions are determined in accordance with income tax regulations, which may differ from U.S. GAAP. Distributions to shareholders are recorded on the ex-dividend date.
Indemnification – The Fund indemnifies its Officers and Trustees for certain liabilities that may arise from the performance of their duties to the Fund. Additionally, in the normal course of business, the Fund enters into contracts that contain a variety of representations and warranties and which provide general indemnities. The Fund’s maximum exposure under these arrangements is unknown, as this would involve future claims that may be made against the Fund that have not yet occurred. However, based on industry experience, the Fund expects the risk of loss due to these warranties and indemnities to be remote.
Federal Income Taxes – The Fund intends to continue to comply with the requirements of Subchapter M of the Internal Revenue Code applicable to regulated investment companies and will distribute all of its taxable income, if any, to shareholders. Accordingly, no provision for federal income taxes is required in the financial statements.
The Fund recognizes the tax benefits of uncertain tax positions only when the position is “more likely than not” to be sustained assuming examination by tax authorities. Management has reviewed the tax positions and has concluded that no liability for unrecognized tax benefits should be recorded related to uncertain tax positions taken in the Fund’s tax returns for open tax years or expected to be taken in the Fund’s 2018 returns.
| 38 | 1.888.926.2688 | www.griffincapital.com |
| Griffin Institutional Access Real Estate Fund | Notes to Financial Statements |
September 30, 2018
3. ADVISORY FEES, ADMINISTRATION FEES AND OTHER AGREEMENTS
Investment Advisory
Pursuant to the Investment Advisory Agreement with the Fund (“Advisory Agreement”), the Adviser is entitled to an investment advisory fee, computed daily and payable monthly at an annual rate of 1.50% of the average daily net assets of the Fund.
The Adviser and the Fund have entered into an expense limitation and reimbursement agreement (the “Expense Limitation Agreement”) under which the Adviser has agreed contractually to waive its fees and to pay or absorb the ordinary annual operating expenses of the Fund (including organizational and offering expenses, but excluding taxes, interest, brokerage commissions, acquired fund fees and expenses and extraordinary expenses) so that the total annual operating expenses of the Fund do not exceed 1.91% per annum of Class A average daily net assets, 2.66% per annum of Class C average daily net assets, 1.66% per annum of Class I average daily net assets, 2.41% per annum of Class M average daily net assets and 2.16% per annum of Class L average daily net assets (the “Expense Limitations”). The Expense Limitation Agreement will be in effect until at least February 1, 2019 and can be extended at the discretion of the Adviser and the Trustees. In consideration of the Adviser’s agreement to limit the Fund’s expenses, the Fund has agreed to repay the Adviser in the amount of any fees waived and Fund expenses paid or absorbed, subject to the limitations that: (1) the reimbursement for fees and expenses will be made only if payable not more than three years from the date in which they were incurred; and (2) the reimbursement may not be made if it would cause the Expense Limitations to be exceeded.
During the year ended September 30, 2018, the fees waived/reimbursed and recoupment of previously waived fees under the Expense Limitation Agreement were as follows:
| Fees (Waived)/ Reimbursed By Advisor | Recoupment of Previously Waived Fees By Advisor | |||||||
| Griffin Institutional Access Real Estate Fund | $ | (305,759 | ) | $ | 371,216 | |||
As of September 30, 2018, the balance of recoupable expenses for the Fund was as follows:
| Fund | Expires September 30, 2019 | Expires September 30, 2020 | Expires September 30, 2021 | |||||||||
| Griffin Institutional Access Real Estate Fund | $ | 1,040,196 | $ | 986,733 | $ | 287,015 | (a) | |||||
| (a) | Current year waiver amounts differ from the recoupable balance due to class specific reimbursements that were recouped during the year. |
Sub-advisory services are provided to the Fund pursuant to agreements between the Adviser and both Aon Hewitt Investment Consulting, Inc. and CenterSquare Investment Management LLC. (the “Sub-Advisers”). Under the terms of the sub-advisory agreements, the Adviser compensates the Sub-Advisers based on a portion of the Fund’s average daily net assets which they have been allocated to manage.
Fund Administration and Accounting Fees and Expenses
ALPS Fund Services, Inc. serves as the Fund’s administrator and accounting agent (the “Administrator”) and receives customary fees from the Fund for such services. The Administrator is also reimbursed by the Fund for certain out of pocket expenses.
Transfer Agent
DST Systems, Inc. serves as transfer, dividend paying and shareholder servicing agent for the Fund (the “Transfer Agent”).
Compliance Services
Ryan Del Giudice of Griffin Capital serves as the Chief Compliance Officer to the Fund. Separately, Cipperman Compliance Services, LLC provides various compliance services to the Fund pursuant to a consulting agreement between Cipperman Compliance Services LLC and the Fund.
Distributor
The Fund has entered into a Distribution Agreement with ALPS Distributors, Inc. (the “Distributor”) to provide distribution services to the Fund. The Distributor serves as principal underwriter of shares of the Fund. Under the Distribution Agreement the Class C and Class M shares will pay to the Distributor a Distribution Fee that will accrue at an annual rate equal to 0.75% of the Fund’s average daily net assets attributable to Class C and Class M shares, payable on a quarterly basis. Class L shares will pay to the Distributor a Distribution Fee that will accrue at an annual rate equal to 0.25% of the Fund’s average daily net assets attributable to Class L, payable on a quarterly basis. For the year ended September 30, 2018, Class C, Class M and Class L shares incurred distribution fees of $3,393,426, $1,807,676 and $74,298, respectively. Class A and Class I shares are not currently subject to a Distribution Fee. Under the Shareholder Services Plan, the Class A, Class C and Class L shares may pay up to 0.25% per year of their average daily net assets for such services. Class I and Class M shares are not currently subject to a shareholder services fee. For the year ended September 30, 2018, Class A, Class C and Class L shares incurred shareholder servicing fees of $1,669,429, $1,131,142 and $74,298, respectively.
| Annual Report | September 30, 2018 | 39 |
| Griffin Institutional Access Real Estate Fund | Notes to Financial Statements |
September 30, 2018
The Distributor has entered into a wholesale marketing agreement with Griffin Capital Securities, LLC, a registered broker-dealer affiliate of the Adviser. Pursuant to the terms of the wholesale marketing agreement, Griffin Capital Securities will seek to market and otherwise promote the Fund through various wholesale distribution channels, including regional and independent retail broker-dealers and registered investment advisers.
Officer and Trustee Compensation
Each Trustee who is not affiliated with the Trust or Adviser receives an annual retainer of $50,000, paid quarterly, as well as reimbursement for any reasonable expenses incurred attending the meetings and $500 per non-interested Trustee for each special telephonic meeting (exclusive of one special telephonic meeting per year and any telephonic meeting to review the agenda of any upcoming meeting of the Board). The chairperson of the Audit Committee receives an additional annual retainer of $10,000. None of the Fund’s executive officers receive compensation from the Fund.
Certain Trustees and officers of the Fund are also officers of the Adviser and are not paid by the Fund for serving in such capacities.
4. PURCHASES AND SALES OF INVESTMENT SECURITIES
The cost of purchases and proceeds from the sale of securities, other than short-term securities, for the year ended September 30, 2018 were as follows:
| Purchases of Securities | Proceeds from Sales of Securities | |||||||
| Griffin Institutional Access Real Estate Fund | $ | 876,676,453 | $ | 331,530,935 | ||||
5. TAX BASIS INFORMATION
Distributions are determined in accordance with federal income tax regulations, which differ from U.S. GAAP, and, therefore, may differ significantly in amount or character from net investment income and realized gains for financial reporting purposes. Financial reporting records are adjusted for permanent book/tax differences to reflect tax character but are not adjusted for temporary differences. The amounts and characteristics of tax basis distributions and composition of distributable earnings/(accumulated losses) are finalized at fiscal year-end.
For the year ended September 30, 2018, the following reclassifications, which had no impact on results of operations or net assets, were recorded to reflect tax character.
| Paid-in Capital | Total Distributable Earnings | |||||||
| Griffin Institutional Access Real Estate Fund | $ | 604,871 | $ | (604,871 | ) | |||
Included in the amounts reclassified was a net operating loss offset to paid in capital of $574,183.
The tax character of distributions paid for the years ended September 30, 2018 and September 30, 2017 were as follows:
| Year | Ordinary Income | Long-Term Capital Gain | Return of Capital | ||||||||||
| 2018 | $ | – | $ | 16,921,360 | $ | 102,127,207 | |||||||
| 2017 | 1,146,088 | 16,717,107 | 65,756,667 | ||||||||||
As of September 30, 2018 the components of accumulated earnings/(deficit) on a tax basis were as follows:
| Other cumulative effect of timing differences | Net unrealized appreciation on investments | Total | ||||||||||
| Griffin Institutional Access Real Estate Fund | $ | (22,842,109 | ) | $ | 260,218,502 | $ | 237,376,393 | |||||
| 40 | 1.888.926.2688 | www.griffincapital.com |
| Griffin Institutional Access Real Estate Fund | Notes to Financial Statements |
September 30, 2018
As of September 30, 2018, net unrealized appreciation of investments based on the federal tax cost was as follows:
| Gross Appreciation (excess of value over tax cost) | Gross Depreciation (excess of tax cost over value) | Net Unrealized Appreciation | Cost of Investments for Income Tax Purposes | |||||||||||||
| Griffin Institutional Access Real Estate Fund | $ | 274,396,006 | $ | (14,177,504 | ) | $ | 260,218,502 | $ | 2,254,411,460 | |||||||
The difference between book basis and tax basis net unrealized appreciation is primarily attributable to the investments in partnerships, wash sales and certain other investments.
The Fund elects to defer to the year ending September 30, 2019, capital losses recognized during the period 11/1/2017 to 9/30/2018 in the amount of $1,098,825.
The Fund elects to defer to the year ending September 30, 2019, late year ordinary losses in the amount of $21,743,284.
6. LINE OF CREDIT
The Fund has entered into secured bank lines of credit through BNP Paribas Prime Brokerage International, Ltd. (“BNP”) and Credit Suisse First Boston Ltd. (“Credit Suisse”) (collectively the “Banks”) for the purpose of investment purchases subject to the limitations of the 1940 Act for borrowings.
Borrowings under the BNP arrangement bear interest at the 3 month LIBOR plus 95 basis points at the time of borrowing. During the year ended September 30, 2018, the Fund incurred $2,021,537 of interest expense related to the BNP borrowings. Average borrowings and the average interest rate for the days the BNP line of credit was outstanding during the year ended September 30, 2018 were $70,892,576 and 2.98%, respectively. The largest outstanding borrowing during the year ended September 30, 2018 relating to BNP was $135,644,585. As of September 30, 2018, the Fund had no outstanding borrowings relating to BNP.
For the period of October 1, 2017 to December 17, 2017, borrowings under the Credit Suisse arrangement bore interest at the 3 month LIBOR plus 250 basis points at the time of borrowing. For the period of December 18, 2017 to September 30, 2018, the borrowings bore interest at the 3 month LIBOR plus 235 basis points at the time of borrowing. During the year ended September 30, 2018, the Fund incurred $850,467 of interest expense related to the Credit Suisse borrowings. For the period of October 1, 2017 to December 17, 2017, the unused amount under the Credit Suisse arrangement incurred a fee equal to 90 basis points. For the period of December 18, 2017 to September 30, 2018, the unused amount under the Credit Suisse arrangement incurred a fee equal to 77.5 basis points. During the year ended September 30, 2018, the Fund incurred total unused fees of $1,470,268 which is included in interest expense. Average borrowings and the average interest rate for the days the Credit Suisse line of credit was outstanding during the year ended September 30, 2018 were $65,357,798 and 4.34%, respectively. The largest outstanding borrowing during the year ended September 30, 2018 relating to Credit Suisse was $100,000,000. As of September 30, 2018, the Fund had no outstanding borrowings and $200,000,000 unused outstanding relating to Credit Suisse.
As collateral for the lines of credit, the Fund grants the Banks a first position security interest in and lien on securities of any kind or description held by the Fund in the collateral accounts. As of September 30, 2018, the Fund had $2,359,900,723 of the private and public securities pledged as collateral for its lines of credit.
7. REPURCHASE OFFERS
The Fund is an interval fund and, as such, has adopted a fundamental policy to make quarterly repurchase offers, at net asset value, of no less than 5% of the Fund’s shares outstanding. There is no guarantee that shareholders will be able to sell all of the shares they desire to sell in a quarterly repurchase offer, although each shareholder will have the right to require the Fund to purchase at least 5% of such shareholder’s shares in each quarterly repurchase. Liquidity will be provided to shareholders only through the Fund’s quarterly repurchases. Shareholders will be notified in writing of each quarterly repurchase offer and the date the repurchase offer ends (the “Repurchase Request Deadline”). Shares will be repurchased at the NAV per share determined as of the close of regular trading on the NYSE no later than the 14th day after the Repurchase Request Deadline, or the next business day if the 14th day is not a business day (each a “Repurchase Pricing Date”).
| Annual Report | September 30, 2018 | 41 |
| Griffin Institutional Access Real Estate Fund | Notes to Financial Statements |
September 30, 2018
During the year ended September 30, 2018, the Fund completed four quarterly repurchase offers. In these offers, the Fund offered to repurchase up to 5% of the number of its outstanding shares as of the Repurchase Pricing Dates. No repurchase offer was oversubscribed. The result of those repurchase offers were as follows:
| Repurchase Offer #1 | Repurchase Offer #2 | Repurchase Offer #3 | Repurchase Offer #4 | |
| Commencement Date | September 28, 2017 | December 27, 2017 | March 30, 2018 | June 29, 2018 |
| Repurchase Request Deadline | November 6, 2017 | February 5, 2018 | May 2, 2018 | August 3, 2018 |
| Repurchase Pricing Date | November 6, 2017 | February 5, 2018 | May 2, 2018 | August 3, 2018 |
| Amount Repurchased | $80,026,748 | $74,989,061 | $72,636,012 | $64,165,781 |
| Shares Repurchased | 2,982,437 | 2,837,124 | 2,727,034 | 2,373,387 |
8. SEC REGULATIONS
On October 4, 2018, the SEC amended Regulation S-X to require certain financial statement disclosure requirements to conform them to US Generally Accepted Accounting Principles for investment companies. Effective November 4, 2018, the Fund adopted disclosure requirement changes for Regulation S-X and these changes are reflected throughout this report. The Fund’s adoption of those amendments, effective with the financial statements prepared as of September 30, 2018, had no effect on the Fund’s net assets or results of operations.
9. RECENT ACCOUNTING PRONOUNCEMENT
In August 2018, the FASB issued ASU 2018-13, which changes the fair value measurement disclosure requirements of FASB ASC Topic 820, Fair Value Measurement. The update to Topic 820 includes new, eliminated, and modified disclosure requirements. ASU 2018-13 is effective for fiscal years beginning after December 15, 2019, including interim periods. Early adoption is permitted for any eliminated or modified disclosures. Management is currently evaluating the impact of the ASU to the Fund’s financial statements.
10. SUBSEQUENT EVENTS
Subsequent events after the date of the Statement of Assets and Liabilities have been evaluated through the date the financial statements were issued.
The Fund completed a quarterly repurchase offer on November 6, 2018 which resulted in 2,742,643 shares being repurchased for $73,811,767.
Management has determined that there were no other subsequent events to report through the issuance of these financial statements.
| 42 | 1.888.926.2688 | www.griffincapital.com |
| Griffin Institutional Access Real Estate Fund | Report of Independent Registered Public Accounting Firm |
To the Board of Trustees and Shareholders of
Griffin Institutional Access Real Estate Fund
Opinion on the Financial Statements
We have audited the accompanying statement of assets and liabilities of Griffin Institutional Access Real Estate Fund (the “Fund”), including the portfolio of investments, as of September 30, 2018, and the related statement of operations and cash flows for the year then ended, the statements of changes in net assets for each of the years in the two-year period then ended and the financial highlights for the years or periods presented, and the related notes (collectively referred to as the “financial statements”). In our opinion, the financial statements present fairly, in all material respects, the financial position of the Fund as of September 30, 2018, and the results of its operations and cash flows for the year then ended, the changes in its net assets for each of the years in the two-year period then ended and its financial highlights for the years or periods presented, in conformity with accounting principles generally accepted in the United States of America.
Basis for Opinion
These financial statements are the responsibility of the Fund's management. Our responsibility is to express an opinion on the Fund’s financial statements based on our audits. We are a public accounting firm registered with the Public Company Accounting Oversight Board (United States) (“PCAOB”) and are required to be independent with respect to the Fund in accordance with the U.S. federal securities law and the applicable rules and regulations of the Securities and Exchange Commission and the PCAOB.
We conducted our audits in accordance with the standards of the PCAOB. Those standards require that we plan and perform the audits to obtain reasonable assurance about whether the financial statements are free of material misstatement, whether due to error or fraud. The Fund is not required to have, nor were we engaged to perform, an audit of its internal control over financial reporting. As part of our audits we are required to obtain an understanding of internal control over financial reporting but not for the purpose of expressing an opinion on the effectiveness of the Fund’s internal control over financial reporting. Accordingly, we express no such opinion.
Our audits included performing procedures to assess the risk of material misstatement of the financial statements, whether due to error or fraud, and performing procedures that respond to those risks. Such procedures include examining, on a test basis, evidence regarding the amounts and disclosures in the financial statements. Our procedures included confirmation of securities owned as of September 30, 2018 by correspondence with the custodian, brokers, and other appropriate parties or by other appropriate procedures when necessary. Our audits also included evaluating the accounting principles used and significant estimates made by management, as well as evaluating the overall presentation of the financial statements. We believe that our audit provides a reasonable basis for our opinion.

We have served as the auditor of the Griffin Institutional Access Real Estate Fund since 2014.
Philadelphia, Pennsylvania
November 29, 2018
| Annual Report | September 30, 2018 | 43 |
| Griffin Institutional Access Real Estate Fund | Additional Information |
September 30, 2018 (Unaudited)
1. PROXY VOTING POLICIES AND VOTING RECORD
A description of the policies and procedures that the Fund uses to vote proxies relating to portfolio securities is available without charge upon request by calling toll-free 888-926-2688, or on the Securities and Exchange Commission’s (“SEC”) website at http://www.sec.gov. Information regarding how the Fund voted proxies relating to portfolio securities during the most recent 12-month period ended June 30th is available without charge upon request by calling toll-free 888-926-2688, or on the SEC’s website at http://www.sec.gov.
2. QUARTERLY PORTFOLIO HOLDINGS
The Fund files a complete listing of portfolio holdings for the Fund with the SEC as of the first and third quarters of each fiscal year on Form N-Q. The filings are available upon request by calling 888-926-2688. Furthermore, you may obtain a copy of the filing on the SEC’s website at http://www.sec.gov. The Fund’s Form N-Q may also be reviewed and copied at the SEC’s Public Reference Room in Washington, D.C., and information on the operation of the Public Reference Room may be obtained by calling 1-800-SEC-0330.
3. TAX INFORMATION (UNAUDITED)
Pursuant to Section 852(b)(3) of the Internal Revenue Code, the Fund designates $16,921,360 as a long-term capital gain distribution for the year ended September 30, 2018.
| 44 | 1.888.926.2688 | www.griffincapital.com |
| Griffin Institutional Access Real Estate Fund | Trustees’ Consideration and Approval of Renewal of Advisory Agreements |
September 30, 2018 (Unaudited)
Trustees Consideration and Approval of Continuation of Advisory Agreement with Griffin Capital Advisor, LLC
Griffin Capital Advisor, LLC (the “Adviser”) supervises the investments of the Fund pursuant to an Investment Advisory Agreement. At a meeting of the Fund’s Board of Trustees on May 22, 2018 the Trustees approved the continuation of the Investment Advisory Agreement for a one-year term. In considering whether to approve the Investment Advisory Agreement, the Trustees reviewed and considered the information they deemed reasonably necessary, including the following material factors: (i) the nature, extent, and quality of the services provided by the Adviser; (ii) the investment performance of the Fund; (iii) the costs of the services provided by the Adviser; (iv) the profits to be realized by the Adviser and its affiliates from the relationship with the Fund; (v) the extent to which economies of scale would be realized as the Fund grows and whether advisory fee levels reflect those economies of scale for the benefit of the Fund’s investors.
At the meeting, the Trustees reviewed various informational materials, including the Investment Advisory Agreement for the Fund and a memorandum from the Adviser to the Trustees containing information about the advisory firm and its business. The memorandum provided information about the Adviser’s finances, personnel, services to the Fund, investment advice, fees, and compliance program. It also contained information on Fund expenses, including comparative expense ratio information for other investment companies with strategies similar to the Fund. The Trustees also reviewed a memorandum from the Fund’s legal counsel that summarized the fiduciary duties and responsibilities of the Board of Trustees in reviewing and approving the Investment Advisory Agreement, including the types of information and factors that should be considered in order to make an informed decision.
The Independent Trustees were assisted by counsel throughout the Management Agreement review process. The Board relied upon the advice of counsel and their own business judgment in determining the material factors to be considered in evaluating the Management Agreement and the weight to be given to each factor considered. The conclusions reached by the Trustees were based on a comprehensive evaluation of all of the information provided and were not the result of any one factor. Moreover, each Trustee may have afforded different weight to the various factors in reaching his conclusions with respect to the approval of the Management Agreement.
The nature, extent, and quality of the services provided by the Adviser. The Trustees evaluated the Adviser’s staffing, personnel, and methods of operating; the education and experience of the Adviser’s personnel; the Adviser’s compliance programs, policies, and procedures; the financial condition of the Adviser; and the level of commitment to the Fund and the Adviser by the principals of the Adviser. The Trustees considered the responsibilities of the Adviser under the Management Agreement and reviewed the services provided to the Fund including, without limitation, the Adviser’s procedures for formulating investment recommendations and assuring compliance with the Fund’s investment objectives and limitations, coordination of services for the Fund among the Fund’s service providers, expertise and experience in the field, and efforts to promote the Fund, grow the Fund’s assets, and assist in the distribution of Fund shares. The Trustees noted that the Adviser seeks to achieve the Fund’s investment objective of generation of a balanced return comprised of current income and capital appreciation with moderate volatility and low correlation to the broader markets, through pursuing strategic investing across private institutional real estate investment funds as well as a diversified set of public real estate securities. The Trustees also noted that the Adviser continues its process of allocating between public and private real estate securities and allows the Fund to invest across a diversified set of investment managers and strategies as well as to provide investment exposure across property types and geographies. The Board commended the Adviser’s robust investment process, which has benefited the Fund through negotiation of fee reductions and other benefits for the Fund. The Trustees reviewed the balance sheet of the Adviser and discussed the financial stability and profitability of the firm. The Trustees noted that the Fund’s principal officers are personnel of the Adviser, and its affiliates serve the Fund without additional compensation. The Board noted that the depth of experience of the personnel of the Adviser continues to grow, as shown by the Adviser’s engagement of a new CCO. The Board lauded the recognition given to the Adviser by other financial advisers in the real estate industry for their knowledge of private fund investments. After reviewing the foregoing information and other information in the Adviser’s Memorandum (e.g., the Adviser’s Form ADV and descriptions of the Adviser’s business and compliance program), the Board concluded that the nature, extent, and quality of the services provided by the Adviser to the Fund were satisfactory.
The Investment Performance of the Fund. The Trustees noted the Fund’s strong positive performance since its inception. The Board acknowledged that the Fund outperformed the Barclays U.S. Aggregate Bond Index, and underperformed the S&P 500 in each of the since inception through March 31, 2018 period. The Board took note of the underperformance to the S&P 500 related general bull market that has occurred since that time. The Board also did note that the Fund had provided better risk-adjusted returns than the S&P 500 since inception. After reviewing the Fund’s performance, both with respect to the relevant indices and the peer group of the Fund, and other factors, the Board concluded that it was satisfied with the performance of the Fund.
The costs of the services to be provided by the Adviser. The Trustees evaluated the current and projected asset levels of the Fund; and the overall expenses of the Fund, including the nature and frequency of advisory fee payments.
The Trustees then compared the fees and expenses of the Fund (including the management fee) to other peer funds comparable in terms of the type of fund, the nature of its investment strategy, and its style of investment management, among other factors. The Trustees determined that the base management fee was higher than other funds, but noted that other funds had externalized certain services that the Adviser provided (such as research) as part of its management fees, and agreed that it was important to consider the entire expense ratio in the comparison. In that regard, they noted that the net expense ratio was below the average of the peer group. The Trustees noted that some peer funds had variable components to their management fee, which might make the management fee higher than the Fund’s in certain circumstances. The Board considered that other peer funds also utilized less laborious strategies.
| Annual Report | September 30, 2018 | 45 |
| Griffin Institutional Access Real Estate Fund | Trustees’ Consideration and Approval of Renewal of Advisory Agreements |
September 30, 2018 (Unaudited)
The Trustees noted that the Adviser had agreed to an Expense Limitation Agreement that limits the Fund’s annual operating expenses that was still in effect and that fund expenses have continued to exceed the limitation amount and, thus the Adviser has continued to waive some of its expenses. Following further consideration and discussion of the foregoing, the Board concluded that the fee paid to the Adviser by the Fund was fair and reasonable in relation to the nature and quality of the services provided by the Adviser and that they reflected charges that were within a range of what could have been negotiated at arm’s length.
The profits to be realized by the Adviser and its affiliates from the relationship with the Fund. The Trustees reviewed the Adviser’s profitability analysis in connection with its management of the Fund, and noted that the Adviser earned what the Board considered to be a reasonable profit from its relationship with the Fund. The Board concluded that the Adviser’s profitability was not excessive.
The extent to which economies of scale would be realized as the Fund grows and whether advisory fee levels reflect those economies of scale for the benefit of the Fund’s investors. The Trustees considered that the Fund’s fee arrangements with the Adviser involved both the management fee and an Expense Limitation Agreement. The Trustees noted that, while the management fee remains the same at all asset levels, the Fund’s shareholders continue to benefit from the Fund’s expense limitation arrangement until the Fund’s assets grew to a level where the Fund’s expenses fell below the cap set by the arrangement and the Adviser begins receiving its full fee. The Trustees also noted that the Fund’s shareholders would benefit from economies of scale under the Fund’s agreements with service providers other than the Adviser. Further, the size of the Fund has allowed the Adviser to lead additional negotiations to reduce the Fund’s fees when making investments, which, while time intensive for the Adviser, reflected significant benefits to the Fund. Following further discussion of the Fund’s current and projected asset levels, expectations for growth, and fee levels, the Board determined that the Fund’s fee arrangements were fair and reasonable in relation to the nature and quality of the services provided by the Adviser and that the Expense Limitation Agreement has provided savings for the benefit of the Fund’s investors.
Based upon all of the foregoing considerations, the Board of Trustees, including a majority of the Independent Trustees, approved the continuation of the Investment Advisory Agreement for the Fund.
Trustees Consideration and Approval of Continuation of Sub-Advisory Agreement with Aon Hewitt Investment Consulting, Inc.
Aon Hewitt Investment Consulting, Inc. (“Aon”) provides advisory services to the Fund by recommending private investment securities in which to invest to the Adviser pursuant to an Investment Sub-Advisory Agreement. At a meeting of the Fund’s Board of Trustees on Aon, the Trustees approved the continuation of the Investment Sub-Advisory Agreement for a one-year term. In considering whether to approve the Investment Sub- Advisory Agreement, the Trustees reviewed and considered the information they deemed reasonably necessary, including the following material factors: (i) the nature, extent, and quality of the services provided by Aon; (ii) the investment performance of the Fund and Aon; (iii) the costs of the services provided by Aon; (iv) the profits to be realized by Aon and its affiliates from the relationship with the Fund; (v) the extent to which economies of scale would be realized as the Fund grows and whether the advisory fee levels reflect these economies of scale for benefit of the Fund’s investors.
The nature, extent, and quality of the services provided by Aon. The Trustees evaluated Aon’s staffing, personnel, and methods of operating; the education and experience of Aon’s personnel; Aon’s compliance programs, policies, and procedures; the financial condition of Aon; and the level of commitment to the Fund and Aon by the principals of Aon. The Trustees reviewed the balance sheet of Aon (specifically its parent company) and discussed the financial stability and profitability of the firm. The Trustees considered the responsibilities of Aon under the Investment Sub-Advisory Agreement and reviewed the services provided to the Fund including, without limitation, Aon’s procedures for formulating investment recommendations and assuring compliance with the Fund’s investment objectives and limitations, and efforts to promote the Fund, grow the Fund’s assets, and assist in the distribution of Fund shares. The Trustees noted that Aon supports the Adviser in seeking to achieve the Fund’s investment objective to generate a balanced return comprised of current income and capital appreciation with moderate volatility and low correlation to the broader markets by pursuing strategically investing across private institutional real estate investment funds. The Board also noted that Aon provides data and information utilized by the Adviser in investing across a diversified set of investment managers and strategies as well as to provide investment exposure across property types and geographies. The Trustees observed the fact that Aon had added significant experience and talent to its team through a recent acquisition. After reviewing the foregoing information and further information in the memorandum from Aon (e.g., Aon’s Form ADV and descriptions of Aon’s business and compliance program), the Board concluded that the nature, extent, and quality of the services provided by Aon were satisfactory.
| 46 | 1.888.926.2688 | www.griffincapital.com |
| Griffin Institutional Access Real Estate Fund | Trustees’ Consideration and Approval of Renewal of Advisory Agreements |
September 30, 2018 (Unaudited)
The investment performance of the Fund and Aon. The Trustees discussed the performance of the private investments portion of the Fund. The Trustees noted the Fund’s continued strong performance in the period since inception and recalled their deliberations relating to the Adviser. The Board agreed that they should consider the performance of the Fund as a whole in reviewing this factor and noted that Adviser continued to be satisfied with Aon’s performance and the data provided. After reviewing these considerations, the Board concluded that the investment performance of Aon was satisfactory.
The costs of the services to be provided by Aon. The Trustees evaluated the overall expenses of the Fund, including the nature and frequency of advisory and sub-advisory fee payments. Trustees noted that the Adviser paid the fee to Aon out of its management fee, agreeing that, accordingly, the Fund’s overall management fee and expenses was the appropriate vehicle to compare to other funds. The Board recalled their deliberations relating to the Adviser’s cost of services. Following further consideration and discussion of the foregoing, the Board concluded that the fees to be paid to Aon by the Fund were fair and reasonable in relation to the nature and quality of the services provided by Aon and that they reflected charges that were within a range of what could have been negotiated at arm’s length.
The profits to be realized by Aon and its affiliates from the relationship with the Fund. The Trustees reviewed Aon’s profitability analysis in connection with its management of the Fund, and noted that Aon earned what the Board considered to be a reasonable profit from its relationship with the Fund. The Board concluded that Aon’s profitability was not excessive.
The extent to which economies of scale would be realized as the Fund grows and whether the advisory fee levels reflect these economies of scale for benefit of the Fund’s investors. The Trustees considered that the Fund’s fee arrangements with Aon and noted that the sub-advisory fee contained break points, which caused the Adviser to pay lower fees to Aon based on higher asset levels. Following further discussion of the Fund’s current and projected asset levels, expectations for growth, and levels of fees, the Board determined that the Fund’s fee arrangements were fair and reasonable in relation to the nature and quality of the services provided by Aon.
Based upon all of the foregoing considerations, the Board of Trustees, including a majority of the Independent Trustees, approved the continuation of the Investment Sub-Advisory Agreement with Aon.
| Annual Report | September 30, 2018 | 47 |
| Griffin Institutional Access Real Estate Fund | Trustees and Officers |
September 30, 2018 (Unaudited)
The business and affairs of the Fund are managed under the direction of the Trustees. Information concerning the Trustees and officers of the Fund is set forth below. Generally, each Trustee and officer serves an indefinite term or until certain circumstances such as his resignation, death, or otherwise as specified in the Fund’s organizational documents. Any Trustee may be removed at a meeting of shareholders by a vote meeting the requirements of the Fund’s organizational documents. The Statement of Additional Information of the Fund includes additional information about the Trustees and officers and is available, without charge, upon request by calling the Fund toll-free at 888-926-2688.
| INDEPENDENT TRUSTEES | ||||
| Name, Address and Age | Position/Term of Office* | Principal Occupation During Past Five Years | Number of Portfolios in Fund Complex** Overseen by Trustee | Other Directorships held by Trustee During Last Five Years |
| Nathan Headrick Age: 44 | Trustee Since 2014 | General Counsel, Triloma Capital (private equity firm), 2013-present; Founder and Partner, DDW Holdings LLC (due diligence software provider), 2013-present; President, Bluerock Capital Markets (public and private equity fund broker-dealer), 2013; General Counsel and Chief Compliance Officer, CNL Securities (public and private equity fund broker-dealer), 2008-2013; and General Counsel, Corporate Capital Trust (Public non-traded BDC), 2012-2013. | 2 | Class of 1938 Foundation (nonprofit), 1996-present; Orange County Regional History Center (nonprofit), 2005-2013;Junior Achievement of Florida (nonprofit), 2007-2011; Florida Children’s Hospital (nonprofit), 2007-2011; and United Cerebral Palsy of Central Florida (nonprofit), 2004-2011. |
| Robb Chapin Age: 56 | Trustee Since 2014 | Chief Executive Officer, ROC Senior Housing Fund Manager, LLC (real estate fund management), 2013-present; Managing Partner, Servant Investments, LLC (real estate fund management), 2005-2013; and Managing Partner, Servant Capital Group, LLC (real estate fund management), 2012-2013. | 2 | ROC Seniors Housing & Medical Properties Fund, LP (real estate fund), 2013-present. |
| Ira Cohen Age: 59 | Trustee Since 2014 | Executive Vice President, Recognos Financial (financial data services firm), 2015-present; Chief Executive Officer, Ira Cohen Consulting, LLC (mutual fund operations consulting firm), 2005-present. | 2 | Valued Advisers Trust (14 portfolios), 2010-present; and Angel Oak Funds Trust (2 portfolios), 2014-present. |
| 48 | 1.888.926.2688 | www.griffincapital.com |
| Griffin Institutional Access Real Estate Fund | Trustees and Officers |
September 30, 2018 (Unaudited)
| INTERESTED TRUSTEES AND OFFICERS | ||||
| Name, Address and Age | Position/Term of Office* | Principal Occupation During Past Five Years | Number of Portfolios in Fund Complex** Overseen by Trustee | Other Directorships held by Trustee During Last Five Years |
| Kevin Shields Age: 60 | President and Trustee Since 2014 | Chairman and Chief Executive Officer of Griffin Capital Company, LLC 1995-present; Director, Griffin Capital Essential Asset REIT, Inc., 2008-present; Director, Griffin Capital Essential Asset REIT II, Inc. 2014-present; Director., Griffin Capital BDC Corp., 2014-2017. | 2 | President, Griffin Institutional Access Credit Fund, 2017-Present; Chairman, Griffin Capital Company, LLC 1995-present; Chief Executive Officer, Griffin Capital Credit Advisor, LLC; Chairman and Chief Executive Officer, Griffin Capital Securities, LLC; President and Chief Executive Officer, Griffin Capital Essential Asset REIT, Inc. and Griffin Capital Essential Asset REIT II, Inc.; President and Director, Griffin Capital BDC Corp., 2014-2017. |
| Joseph Miller Age: 55 | Treasurer Since 2014 | Chief Financial Officer and Chief Operating Officer, Griffin Capital Company, LLC; Chief Financial Officer, Griffin Capital BDC Corp., 2014-2017. | N/A | Treasurer, Griffin Institutional Access Credit Fund, 2017-Present |
| Randy Anderson Age: 50 | Portfolio Manager, Secretary and Trustee Since 2014 | Chief Economist, Griffin Capital Company, LLC; Chief Investment Officer, Griffin Capital Advisor, LLC; President, Griffin Capital Asset Management Company, LLC; Howard Phillips Eminent Scholar Chair and Professor of Real Estate, University of Central Florida; President, Bluerock Real Estate LLC; President, CNL Real Estate Advisors; Chief Economist, Marcus and Millichap Company; Executive Vice President, Griffin Capital BDC Corp., 2014-2017. | 2 | Executive Vice President and Secretary, Griffin Institutional Access Credit Fund, 2017-Present |
| Ryan Del Giudice Age: 28 | Chief Compliance Officer Since 2018 | Chief Compliance Officer, Griffin Capital Advisor, LLC, 2018-present; Chief Compliance Officer, Griffin Capital Credit Advisor, LLC, 2018-present; Griffin Capital Company, LLC, 2017-present; Vice President, Cipperman Compliance Services, LLC, 2015-2017; Manager, Cipperman Compliance Services, LLC, 2013-2015; Regulatory Administration Associate, BNY Mellon Asset Servicing, 2012-2013. | N/A | Chief Compliance Officer, Griffin Institutional Access Credit Fund, 2018-Present |
| Matthew Shafroth Age: 36 | Assistant Treasurer Since 2018 | Fund Controller, ALPS Fund Services, Inc., 2018-present. Assistant Fund Controller, ALPS Fund Services, Inc., 2013-2018. | N/A | Assistant Treasurer, Griffin Institutional Access Credit Fund, 2018-Present |
| Howard S. Hirsch Age: 52 | Vice President and Assistant Secretary Since 2015 | Vice President and General Counsel – Securities, Griffin Capital Company, LLC, 2014-present; Vice President and Secretary, Griffin Capital Essential Asset REIT II, Inc., 2014-present; Vice President and Secretary, Griffin Capital Essential Asset REIT, Inc., 2015-present; Vice President and Secretary, Griffin Capital BDC Corp., 2014-2017; Vice President, Griffin Capital BDC Advisor, LLC, 2014-2017; Shareholder, Baker Donelson, Caldwell & Berkowitz, PC, 2009-2014. | N/A | Vice President and Assistant Secretary, Griffin Institutional Access Credit Fund, 2017-Present |
| Christopher Moore Age: 33 | Assistant Secretary Since 2016 | Vice President and Senior Counsel, ALPS Fund Services, Inc., 2016-present; Associate, Thompson Hine LLP, 2013-2016; Corporate Counsel, DSW, Inc., 2012-2013. | N/A | Assistant Secretary, Griffin Institutional Access Credit Fund, 2017-Present |
| * | The term of office for each Trustee and officer listed above will continue indefinitely. |
| ** | The term “Fund Complex” refers to the Griffin Institutional Access Real Estate Fund and the Griffin Institutional Access Credit Fund. |
| Annual Report | September 30, 2018 | 49 |

Item 2. Code of Ethics.
| (a) | As of the end of the period covered by this report, the registrant has adopted a code of ethics that applies to the registrant's principal executive officer, principal financial officer, principal accounting officer or controller, or persons performing similar functions, regardless of whether these individuals are employed by the registrant or a third party. |
| (b) | Not applicable. |
| (c) | During the period covered by this report, there were no amendments to the provisions of the code of ethics adopted in Item 2(a) of this report. |
| (d) | During the period covered by this report, the registrant had not granted any express or implicit waivers from the provisions of the code of ethics adopted in Item 2(a) of this report. |
| (e) | Not applicable. |
| (f) | The registrant’s Code of Ethics is attached hereto as exhibit 13(A)(1) hereto. |
Item 3. Audit Committee Financial Expert.
The Board of Trustees of the registrant has determined that the registrant has at least one Audit Committee Financial Expert serving on its audit committee. The Board of Trustees of the registrant has designated Mr. Ira Cohen as the registrant’s Audit Committee Financial Expert. Mr. Cohen is “independent” as defined in paragraph (a)(2) of Item 3 to Form N-CSR.
Item 4. Principal Accountant Fees and Services.
| (a) | Audit Fees: For the registrant’s last two fiscal years ended September 30, 2017 and September 30, 2018, the aggregate fees billed for professional services rendered by the principal accountant for the audit of the registrant’s annual financial statements or services that are normally provided by the accountant in connection with statutory and regulatory filings or engagements were $17,500 and $20,500, respectively. |
| (b) | Audit-Related Fees: For the registrant’s last two fiscal years ended September 30, 2017 and September 30, 2018, the aggregate fees billed for assurance and related services by the principal accountant that are reasonably related to the performance of the audit of the registrant’s financial statements and not otherwise reported under paragraph (a) of Item 4 of this report were $0 and $0, respectively. |
| (c) | Tax Fees: For the registrant’s last two fiscal years ended September 30, 2017 and September 30, 2018, the aggregate fees billed for professional services rendered by the principal accountant for tax compliance, tax advice and tax planning, which were comprised of the preparation of excise filings and income tax returns for the registrant were $3,000 and $3,000, respectively. |
| (d) | All Other Fees: For the registrant’s last two fiscal years ended September 30, 2017 and September 30, 2018, the aggregate fees billed for products and services other than the services reported in paragraphs (a) through (c) of Item 4 of this report, were provided by the principal accountant, $0 and $0, respectively. |
| (e) | (1) | The audit committee’s pre-approval policies and procedures require that all services to be performed by the registrant’s principal accountant must be pre-approved by the registrant’s audit committee. |
| (2) | No services described in paragraphs (b) through (d) of Item 4 of this report were approved by the registrant’s audit committee pursuant to paragraph (c)(7)(i)(C) of Rule 2-01 of Regulation S-X. |
| (f) | Not applicable to the registrant. |
| (g) | For the registrant’s last two fiscal year ended September 30, 2017 and September 30, 2018, the aggregate non-audit fees for services rendered to the registrant, the registrant’s investment adviser (not including any sub-adviser whose role is primarily portfolio management and is subcontracted with or overseen by another investment adviser) and any entity controlling, controlled by, or under common control with the adviser that provides ongoing services to the registrant were $3,000 and $3,000, respectively. |
| (h) | The registrant's audit committee has considered whether the provision of non-audit services to the registrant's investment adviser (not including any sub-adviser whose role is primarily portfolio management and is subcontracted with or overseen by another investment adviser), and any entity controlling, controlled by, or under common control with the investment adviser that provides ongoing services to the registrant, that were not pre-approved pursuant to paragraph (c)(7)(ii) of Rule 2-01 of Regulation S-X, is compatible with maintaining the principal accountant's independence. |
Item 5. Audit Committee of Listed Registrants.
Not applicable to the registrant.
Item 6. Investments.
| (a) | The schedule of investments is included as part of the Reports to Stockholders filed under Item 1 of this Form N-CSR. |
| (b) | Not applicable to the registrant. |
Item 7. Disclosure of Proxy Voting Policies and Procedures for Closed-End Management Investment Companies.
Policy
Griffin Capital Advisor, LLC, (the “Adviser”), as a matter of policy and as a fiduciary to the Fund, has the responsibility for voting proxies for securities consistent with the best interests of the Fund. The Adviser maintains written policies and procedures as to the handling, voting and reporting of proxy voting and makes appropriate disclosures about the Adviser’s proxy policies and practices and the availability of the Adviser’s proxy voting record. The Adviser does not vote proxies regarding securities held by Private REITs but rather, may vote on issues regarding the Private REITs. In general, the Adviser does not receive proxies to be voted due to the nature of its investments on behalf of the Fund; this policy is intended to comply with Rule 206(4)-6 in the infrequent instance that the Adviser receives a proxy, or other action requiring a vote, from a Private REIT. The Adviser has delegated proxy voting authority for the public equities to the Public Sub-Adviser of the Fund.
Background & Description
In general, proxy voting is an important right of shareholders and reasonable care and diligence must be undertaken to ensure that such rights are properly and timely exercised.
Investment advisers registered with the SEC, and which exercise voting authority with respect to client securities, are required by Rule 206(4)-6 of the Advisers Act to (a) adopt and implement written policies and procedures that are reasonably designed to ensure that client securities are voted in the best interests of clients, which must include how an adviser addresses material conflicts that may arise between an adviser’s interests and those of its clients; (b) disclose to clients how they may obtain information from the adviser with respect to the voting of proxies for their securities; (c) describe to clients a summary of its proxy voting policies and procedures and, upon request, furnish a copy to its clients; and (d) maintain certain records relating to the adviser’s proxy voting activities when the adviser does have proxy voting authority.
The Adviser is responsible for voting on issues regarding the Private REITs. The voting rights of the Fund, as holders of interests in Private REITs, are generally contract rights set out in the organizational documents (e.g., the limited partnership agreement, limited liability company agreement, memorandum and articles of association of the Private REITs). Private REITs, if privately placed, generally are not subject to the regulatory scheme applicable to public companies. Because most, if not all, of the Private REITs are privately placed, they generally do not issue proxies. Instead, they may solicit consents from their limited partners, members or shareholders. The Public Sub-Adviser exercises voting authority for the Fund’s allocation to publicly traded securities. The term “Proxies” will refer to any such consents or other action requiring a vote as well as any per se proxies.
Responsibility
The Chief Compliance Officer (“CCO”) has responsibility for implementation and monitoring of the Adviser’s proxy voting policy, practices, disclosures and record keeping, including outlining voting guidelines in its procedures.
Procedures
The Adviser has adopted procedures to implement the firm’s proxy voting policy and to monitor and ensure its policy is observed and amended or updated, as appropriate, which include the following:
Voting Procedures
| • | In the event Adviser employees, officers, or directors receive proxy materials on behalf of the Fund, the employees, officers and directors will forward such materials to the appropriate members of the Adviser’s Investment Committee to vote the Proxy. |
| • | The Adviser’s Investment Committee will analyze the proxy materials and determine how the Adviser should vote the Proxy in accordance with applicable voting guidelines (see below). The Adviser’s Investment Committee may consider information provided by the Private REIT’s personnel regarding the nature of the proxy. Additionally, the Adviser’s Investment Committee and CCO will identify if any material conflicts exist for the Adviser. A member of the Investment Committee will then provide a Proxy Voting Form, maintained separately, stating that the Adviser is not subject to conflicts of interest regarding the Private REIT or the subject of the Proxy. |
| • | The CCO or designee, is responsible for coordinating this process in a timely and appropriate manner and delivering the Proxy to the Private REIT prior to the deadline. |
Proxy Voting Guidelines
| • | In the absence of specific voting guidelines from the Fund, the Adviser will vote Proxies in the best interests of the Fund. |
| • | Because in the context of Private REITs each solicited vote raises unique questions, each Proxy with respect to a Private REIT will be analyzed by the Investment Committee, on a case-by-case basis. |
| • | The Adviser may determine not to vote a Proxy if doing so would not be in the Fund’s best interest, such as when the Adviser determines that the cost of voting the Proxy exceeds the expected benefit to the Fund. |
Proxy Voting Guidelines: Public Sub-Adviser
| • | The Public Sub-Adviser exercises voting authority for the Fund’s allocation to publicly traded securities in a manner consistent with the Public Sub-Adviser’s proxy voting policies and procedures, and any written instructions from the Adviser or the Fund. |
| • | The Public Sub-Adviser has retained a proxy voting vendor to provide proxy voting research, guidance and to vote proxies. In most cases the Public Sub-Adviser will vote in strict accordance with the vendor’s recommendation but reserves the right to change that vote when the Public Sub-Adviser disagrees with a recommendation and feels it is in the best interest of the Fund or when otherwise advised by the Fund in writing. |
| • | The Public Sub-Adviser must notify the Adviser of votes contrary to its general guidelines, votes on non-routine matters and instances where the Public Sub-Adviser refrains from voting during its quarterly reporting to the Adviser. The Adviser will request the Public Sub-Adviser to provide periodic reporting related to its proxy voting practices, and any votes which are voted contrary to its respective guidelines. |
| • | The Public Sub-Adviser may refrain from voting Fund proxies: |
| • | the voting materials are not received in sufficient time to allow proper analysis or an informed vote by the voting deadline; |
| • | it determines the cost of voting will likely exceed the expected potential benefit to the Fund; or |
| • | the securities are of a de minimis amount |
Material Conflicts of Interest in Connection with Proxy Voting
| • | Material conflicts of interest may arise in situations that include, but are not limited to, when a Private REIT or an affiliate of such Private REIT has a relationship with the Fund or an affiliate of the Adviser and such Private REIT is soliciting proxies and failure to vote in a certain way may affect the Adviser’s relationship with such company and materially impact the Adviser’s business; or when a personal relationship between an Adviser officer and management of a company or other proponents of proxy proposals could impact the voting decision. |
| • | From time to time, the Adviser will review a proxy which presents a potential material conflict. As a fiduciary to the Fund, the Adviser takes these potential conflicts very seriously. While the Adviser’s primary goal in addressing any such potential conflict is to ensure that proxy votes are cast in the Fund’s best interest and are not affected by the Adviser’s potential conflict, there are a number of courses that the Adviser may take. The final decision about which course to follow shall be made by the Investment Committee. Casting a vote in the best interest of the Fund would eliminate the Adviser’s discretion on the particular issue and hence avoid the conflict. |
| • | The Adviser will maintain a record of the analysis of any potential conflict of interest and its resolution. |
Disclosure
The Adviser will provide conspicuously displayed information in the Fund’s Registration Statement summarizing this proxy voting policy and procedures, including a statement that the Investors may request information regarding how the Adviser voted the Fund’s Proxies, and may request a copy of these policies and procedures.
Requests for Information
| • | All requests for information regarding proxy votes, or policies and procedures, received by any Adviser employee, officer, or director should be forwarded to the CCO. |
| • | In response to any request from an Investor, the CCO will prepare a written response with the information requested. |
Recordkeeping
The CCO shall retain the following proxy records in accordance with the Adviser’s Recordkeeping Policy:
| • | These policies and procedures and any amendments; |
| • | Each Proxy statement that the Adviser receives; |
| • | A record of each vote that the Adviser casts; |
| • | Any document the Adviser created that was material to deciding how to vote Proxies, or that memorializes that decision; |
| • | A copy of each written request for information on how the Adviser voted such Proxies, and a copy of any written response. |
Item 8. Portfolio Managers of Closed-End Management Investment Companies.
Randy I. Anderson Ph.D., CRE — Dr. Anderson serves as Chief Investment Officer of the Adviser, a position he has held since its inception in 2014, and as Chairman of the Board and the Fund’s Portfolio Manager, positions he has held since the Fund’s formation. Additionally, Dr. Anderson serves as the Chief Economist of Griffin Capital, a position he has held since joining Griffin Capital in 2014. In addition, Dr. Anderson serves as President of Griffin Capital Asset Management Company, LLC and has held such position since September 2015.
Dr. Anderson is also the Chief Investment Officer and a Principal of Griffin Capital Credit Advisor, LLC, a position he has held since its formation in 2017. Dr. Anderson also serves as Chairman of the Board of Trustees of Griffin Institutional Access Credit Fund, a position he has held since its inception. From 2012-2013, Dr. Anderson held several senior executive positions at Bluerock Real Estate LLC, including founding partner of the Bluerock Total Income+ Real Estate Fund, where he was the Portfolio Manager. Dr. Anderson served as the Howard Phillips Eminent Scholar Chair and Professor of Real Estate at the University of Central Florida from 2008 through 2013, where he was responsible for growing the real estate program, including the establishment of the Professional MS in Real Estate. While at the University of Central Florida, Dr. Anderson was a member of the University Foundation Investment Sub-Committee which provides investment advice for the endowment, was the academic member of the Florida Association of Realtors Education Foundation Advisory Board, and was an ex-officio board member of the Central Florida Commercial Association of Realtors. In 2007, Dr. Anderson was President, Chief Executive Officer, and founding partner of Franklin Square Capital Partners, where he helped establish, strategically organize, and capitalize the firm. From 2005 through 2007, Dr. Anderson also served as Chief Economist for CNL Financial Group as well as Divisional President for CNL Real Estate Advisors. Prior to CNL, Dr. Anderson was the Chief Economist and Director of Research for the Marcus and Millichap Company from 2002 through 2005 and Vice President of Research at Prudential Real Estate Advisors from 2001 through 2002.
Dr. Anderson is a former co-editor of the Journal of Real Estate Portfolio Management and the Journal of Real Estate Literature. Dr. Anderson received the Kinnard Young Scholar Award from the American Real Estate Society, an award which recognizes outstanding real estate scholarship for young academics, served as the Executive Director for the American Real Estate Society, was named a Homer Hoyt Fellow and a NAIOP Distinguished Fellow, and has been invited to guest lecture at leading global universities. Dr. Anderson received his B.A. in Finance from North Central College in 1991 as a Presidential Scholar and holds a Ph.D. in Finance as a Presidential Fellow from the University of Alabama, where he graduated with highest distinction in 1996.
Dr. Anderson receives a fixed salary, retirement plan benefits, and distributions, if any, through his ownership share in the Adviser. Dr. Anderson is also entitled to receive a discretionary bonus, based upon, among other things, the performance of the Fund and Adviser.
Spencer Propper - Mr. Propper serves as the Fund’s Associate Portfolio Manager and as Vice President and a Principal of the Adviser. Mr. Propper also is the Vice President and a Principal of Griffin Capital Credit Advisor, LLC. Additionally, Mr. Propper serves as Managing Director of Griffin Capital. Mr. Propper joined Griffin Capital in 2014. Previously, Mr. Propper was a Director at Lakemont Group, a boutique real estate investment banking and consulting firm. Within this role Mr. Propper provided portfolio management services to the Bluerock Total Income+ Real Estate Fund. Additionally, at the Lakemont Group, Mr. Propper was responsible for overseeing projects for a variety of clients including pension funds, private equity firms and publicly traded real estate companies and specialized in structured finance, market analysis and strategic due diligence. Mr. Propper holds a Master of Business Administration and Bachelor of Science in Finance and Real Estate from the University of Central Florida.
Mr. Propper receives a fixed salary, retirement plan benefits, and distributions, if any, through his ownership share in the Adviser. Mr. Propper is also entitled to receive a discretionary bonus, based upon, among other things, the performance of the Fund and Adviser.
As of September 30, 2018, Dr. Anderson and Mr. Propper were responsible for the management of the following types of accounts in addition to the Fund:
Other Accounts By Type | Total Number of Accounts by Account Type | Total Assets By Account Type | Number of Accounts by Type Subject to a Performance Fee | Total Assets By Account Type Subject to a Performance Fee |
| Registered Investment Companies | 1 | $154,912,571 | 0 | $0.00 |
| Other Pooled Investment Vehicles | 0 | $0 | 0 | $0 |
| Other Accounts | 0 | $0.00 | 0 | $0.00 |
Because the Portfolio Manager and the Associate Portfolio Manager may manage assets for other registered investment companies (“Client Accounts”) or may be affiliated with such Client Accounts, there may be an incentive to favor one Client Account over another, resulting in conflicts of interest. For example, affiliates of the Adviser may, directly or indirectly, receive fees from Client Accounts that are higher than the fee the Adviser receives from the Fund. In those instances, a portfolio manager may have an incentive to favor the Client Accounts over the Fund. Notwithstanding the difference in principal investment strategies between the Fund and the Client Accounts, the Adviser has adopted trade allocation and other policies and procedures that it believes are reasonably designed to address these and other conflicts of interest.
As of September 30, 2018, Dr. Anderson and Mr. Propper did not have direct beneficial ownership in Fund shares. Dr. Anderson and Mr. Propper hold minority profit interests in Griffin Capital, LLC. Griffin Capital, LLC is the indirect parent company of Griffin Capital Vertical Partners, L.P., which owns shares in the registrant totaling more than $1,000,000.
Item 9. Purchases of Equity Securities by Closed-End Management Investment Company and Affiliates Purchasers.
None.
Item 10. Submission of Matters to a Vote of Security Holders.
No changes have occurred.
Item 11. Controls and Procedures.
| (a) | Based on an evaluation of the registrant’s disclosure controls and procedures (as defined in Rule 30a-3(c) under the 1940 Act), the registrant’s principal executive officer and principal financial officer have concluded that the registrant’s disclosure controls and procedures are effective as of a date within 90 days of the filing date of this report. |
| (b) | There were no significant changes in the registrant’s internal control over financial reporting that occurred during the registrant’s last fiscal half-year that have materially affected, or are reasonably likely to materially affect, the registrant’s internal control over financial reporting. |
Item 12. Disclosure of Securities Lending Activities for Closed-End Management Investment Companies.
None.
Item 13. Exhibits.
| (a)(1) | Registrant’s Code of Ethics for Senior Financial Officers, which is the subject of the disclosure required by Item 2 of Form N-CSR, is attached hereto as exhibit EX 99.13(A)(1). |
| (a)(2) | Certifications required by Item 13(a)(2) of Form N-CSR are filed herewith as Exhibit 99.CERT. |
| (a)(3) | None. |
| (a)(4) | Not applicable. |
| (b) | Certifications required by Item 13(b) of Form N-CSR are filed herewith as Exhibit 99.906CERT. |
SIGNATURES
Pursuant to the requirements of the Securities Exchange Act of 1934 and the Investment Company Act of 1940, the registrant has duly caused this report to be signed on its behalf by the undersigned, thereunto duly authorized.
GRIFFIN INSTITUTIONAL ACCESS REAL ESTATE FUND
| By: | /s/ Kevin Shields | |
| Kevin Shields | ||
| President (Principal Executive Officer) | ||
| Date: | December 7, 2018 |
Pursuant to the requirements of the Securities Exchange Act of 1934 and the Investment Company Act of 1940, this report has been signed below by the following persons on behalf of the registrant and in the capacities and on the dates indicated.
| By: | /s/ Kevin Shields | |
| Kevin Shields | ||
| President (Principal Executive Officer) | ||
| Date: | December 7, 2018 | |
| By: | /s/ Joseph Miller | |
| Joseph Miller | ||
| Treasurer (Principal Financial Officer) | ||
| Date: | December 7, 2018 |