Diversified Real Asset Income Fund (DRA) Inactive
Filed: 8 Aug 16, 12:00am
UNITED STATES
SECURITIES AND EXCHANGE COMMISSION
Washington, D.C. 20549
FORM N-CSR
CERTIFIED SHAREHOLDER REPORT OF REGISTERED
MANAGEMENT INVESTMENT COMPANIES
Investment Company Act file number | 811-22936 |
Diversified Real Asset Income Fund
(Exact name of registrant as specified in charter)
Nuveen Investments
333 West Wacker Drive
Chicago, IL 60606
(Address of principal executive offices) (Zip code)
Kevin J. McCarthy
Nuveen Investments
333 West Wacker Drive
Chicago, IL 60606
(Name and address of agent for service)
Registrant’s telephone number, including area code: (312) 917-7700
Date of fiscal year end: May 31
Date of reporting period: May 31, 2016
Form N-CSR is to be used by management investment companies to file reports with the Commission not later than 10 days after the transmission to stockholders of any report that is required to be transmitted to stockholders under Rule 30e-1 under the Investment Company Act of 1940 (17 CFR 270.30e-1). The Commission may use the information provided on Form N-CSR in its regulatory, disclosure review, inspection, and policymaking roles.
A registrant is required to disclose the information specified by Form N-CSR, and the Commission will make this information public. A registrant is not required to respond to the collection of information contained in Form N-CSR unless the Form displays a currently valid Office of Management and Budget (“OMB”) control number. Please direct comments concerning the accuracy of the information collection burden estimate and any suggestions for reducing the burden to Secretary, Securities and Exchange Commission, 450 Fifth Street, NW, Washington, DC 20549-0609. The OMB has reviewed this collection of information under the clearance requirements of 44 U.S.C. ss. 3507.
ITEM 1. REPORTS TO STOCKHOLDERS.
 | ||
| Closed-End Funds |
| Nuveen | ||
| Closed-End Funds |
| Annual Report May 31, 2016
| |||||
| DRA | ||||||
| Diversified Real Asset Income Fund | ||||||
| ||||||||||||
| ||||||||||||
Life is Complex | ||||||||||||
Nuveen makes things e-simple.
It only takes a minute to sign up for e-Reports. Once enrolled, you’ll receive an e-mail as soon as your Nuveen Fund information is ready. No more waiting for delivery by regular mail. Just click on the link within the e-mail to see the report and save it on your computer if you wish. | ||||||||||||
| Free e-Reports right to your e-mail! | ||
www.investordelivery.com If you receive your Nuveen Fund distributions and statements from your financial advisor or brokerage account. | ||
www.nuveen.com/accountaccess If you receive your Nuveen Fund distributions and statements directly from Nuveen. | ||
| ||||||
of Contents
| 4 | ||||
| 9 | ||||
| 10 | ||||
| 12 | ||||
| 14 | ||||
| 16 | ||||
| 17 | ||||
| 18 | ||||
| 27 | ||||
| 28 | ||||
| 29 | ||||
| 30 | ||||
| 32 | ||||
| 34 | ||||
| 46 | ||||
| 47 | ||||
| 49 | ||||
| 50 | ||||
| NUVEEN | 3 |
Comments
Diversified Real Asset Income Fund (DRA) (the Fund) is a closed-end fund managed by Nuveen Fund Advisors, LLC (NFAL) and sub-advised by Nuveen Asset Management, LLC (NAM). The Fund is sub-advised by NAM using its real asset income strategy, and its portfolio managers are John G. Wenker, Jay L. Rosenberg, Jeffrey T. Schmitz, CFA, Brenda A. Langenfeld, CFA, and Tryg T. Sarsland. David A. Yale was also a part of DRA’s management team until February 29, 2016, when he retired from NAM.
Here the portfolio management team reviews economic and market conditions, key investment strategies and the Fund’s performance for the twelve-month reporting period ended May 31, 2016.
What factors affected the U.S. economy and financial markets during the twelve-month reporting period ended May 31, 2016?
Over the twelve-month period, U.S. economic data continued to point to subdued growth, rising employment and tame inflation. Economic activity has continued to hover around a 2% annualized growth rate since the end of the Great Recession in 2009, as measured by real gross domestic product (GDP), which is the value of the goods and services produced by the nation’s economy less the value of the goods and services used up in production, adjusted for price changes. For the first quarter of 2016, real GDP increased at an annual rate of 0.8%, as reported by the “second” estimate of the Bureau of Economic Analysis, down from 1.4% in the fourth quarter of 2015.
The labor and housing markets were among the bright spots in the economy during the reporting period, as both showed steady improvement. As reported by the Bureau of Labor Statistics, the unemployment rate fell to 4.7% in May 2016 from 5.5% in May 2015, and job gains averaged slightly above 200,000 per month for the past twelve months. The S&P/Case-Shiller U.S. National Home Price Index, which covers all nine U.S. census divisions, recorded a 5.0% annual gain in April 2016 (most recent data available at the time this report was prepared). The 10-City and 20-City Composites reported year-over-year increases of 4.7% and 5.4%, respectively.
Consumers, whose purchases comprise the largest component of the U.S. economy, benefited from lower gasoline prices and an improving jobs market but didn’t necessarily spend more. Pessimism about the economy’s future and lackluster wage growth likely contributed to consumers’ somewhat muted spending. Lower energy prices and tepid wage growth also weighed on inflation during this reporting period. The Consumer Price Index CPI rose 1.0% over the twelve-month period ended May 2016 on a seasonally adjusted basis, as reported by the U.S. Bureau of Labor Statistics. The core CPI (which excludes food and energy) increased 2.2% during the same period, slightly above the Fed’s unofficial longer term inflation objective of 2.0%.
Business investment was also rather restrained. Corporate earnings growth slowed during 2015, reflecting an array of factors ranging from weakening demand amid sluggish U.S. and global growth to the impact of falling commodity prices and a strong U.S. dollar. Energy, materials and industrials companies were hit particularly hard by the downturn in
Certain statements in this report are forward-looking statements. Discussions of specific investments are for illustration only and are not intended as recommendations of individual investments. The forward-looking statements and other views expressed herein are those of the portfolio managers as of the date of this report. Actual future results or occurrences may differ significantly from those anticipated in any forward-looking statements and the views expressed herein are subject to change at any time, due to numerous market and other factors. The Fund disclaims any obligation to update publicly or revise any forward-looking statements or views expressed herein.
Ratings shown are the highest rating given by one of the following national rating agencies: Standard & Poor’s (S&P), Moody’s Investors Service (Moody’s), Inc. or Fitch, Inc. (Fitch). Credit ratings are subject to change. AAA, AA, A and BBB are investment grade ratings; BB, B, CCC, CC, C and D are below investment grade ratings. Certain bonds backed by U.S. Government or agency securities are regarded as having an implied rating equal to the rating of such securities. Holdings designated N/R are not rated by these national rating agencies.
Refer to the Glossary of Terms Used in this Report for further definition of the terms used within this section.
| 4 | NUVEEN |
natural resource prices, as well as the expectation of rising interest rates, which would make their debts more costly to service. With demand waning, companies, especially in the health care and technology sectors, looked to consolidations with rivals as a way to boost revenues. Merger and acquisition deals, both in the U.S. and globally, reached record levels in the calendar year 2015.
With the current expansion on solid footing, the U.S. Federal Reserve (Fed) prepared to raise one of its main interest rates, which had been held near zero since December 2008 to help stimulate the economy. After delaying the rate change for most of 2015 because of a weak global economic growth outlook, the Fed announced in December 2015 that it would raise the fed funds target rate by 0.25%. The news was widely expected and therefore had a relatively muted impact on the financial markets.
Although the Fed continued to emphasize future rate increases would be gradual, investors worried about the pace. This, along with uncertainties about the global macroeconomic backdrop, another downdraft in oil prices and a spike in stock market volatility triggered significant losses across assets that carry more risk and fueled demand for “safe haven” assets such as Treasury bonds and gold from January through mid-February. However, fear began to subside in March, propelling assets that carry more risk higher. The Fed held the rate steady at both the January and March policy meetings, as well as lowered its expectations to two rate increases in 2016 from four. Also boosting investor confidence were reassuring statements from the European Central Bank (ECB), some positive economic data in the U.S. and abroad, a retreat in the U.S. dollar and an oil price rally. At its April meeting, the Fed indicated its readiness to raise its benchmark rate at the next policy meeting in June. However, a very disappointing jobs growth report in May and the significant uncertainty surrounding the U.K.’s referendum on whether Britain should leave the European Union (EU), colloquially known as “Brexit,” dampened the Fed’s outlook. These concerns led the Fed to again hold rates steady at its June meeting (after the close of this reporting period). Subsequent to the close of this reporting period, on June 23, 2016, the U.K. voted in favor of leaving the EU. The event triggered considerable market volatility, with a steep drop in the U.K. sterling, turbulence in global equity markets and a rotation into safe-haven assets such as gold, the U.S. dollar and U.S. Treasuries.
During the reporting period, three of the five “real asset” categories represented in DRA’s Custom Blended Index produced positive absolute returns. Both real estate segments were strong performers with the real estate investment trust (REIT) preferred benchmark for the Fund gaining 8.23%, as measured by the Wells Fargo Hybrid & Preferred Securities REIT Index, while the public commercial REIT sector advanced 4.29%, according to the FTSE EPRA/NAREIT Developed Index. Both real estate sectors substantially outperformed the broad global market MSCI World Index, which returned -3.96% over the same time frame. These segments were supported by positive commercial real estate fundamentals as well as interest rates that remained well contained as the U.S. Fed remained on hold after its December hike and the ECB embarked on additional monetary easing. The other preferred benchmark for the Fund, the Barclays Global Capital Securities Index, gained 1.81%. Meanwhile, global infrastructure equities fell -3.93%, as measured by the S&P Global Infrastructure Index. Much of the downfall occurred during the first half of the reporting period in the utility and energy sectors, which are both large components of the S&P Global Infrastructure Index. The dramatic decline in oil prices put pressure on pipeline and master limited partnership (MLP) companies in the energy sector, while increasing interest rates hampered the utility names. High yield bonds also took a step backward as spreads widened during the “risk-off” environment experienced in the first half of the reporting period, caused by the sustained downward movement in oil prices. The overall high yield market, as measured by the Barclays U.S. Corporate High Yield Bond Index, produced a -0.81 % return during the reporting period.
What key strategies were used to manage the Fund during this twelve-month reporting period ended May 31, 2016?
The Fund’s investment objective is a high level of current income and long-term capital appreciation. Since the Fund’s commencement of operations in 2014, the portfolio management team has been repositioning its assets to align DRA’s
| NUVEEN | 5 |
Portfolio Managers’ Comments (continued)
portfolio with NAM’s real asset income strategy. With this strategy, at least 80% of the Fund’s managed assets will be invested in a global portfolio of securities that provide investment exposure to real assets, focusing on infrastructure and REIT securities. The portfolio management team actively manages the Fund’s allocations among the infrastructure and real estate categories, with the flexibility to invest across the capital structure in any type of equity and debt security offered by a particular company, including common shares, preferred shares, corporate debt instruments and mortgage-backed securities. All of the Fund’s debt investments may be rated lower than investment grade (Ba1/BB+ or lower by S&P, Moody’s or Fitch), but no more than 10% of the Fund’s managed assets may be invested in securities rated CCC+/Caa1 or lower at any time. The Fund may also invest up to 75% of its managed assets in non-U.S. issuers. Our goal is to have the Fund’s portfolio fairly equally balanced between U.S. and non-U.S. exposure, although this allocation may change based on market conditions. We may also opportunistically write (sell) call options primarily on securities issued by real asset related companies, seeking to enhance the Fund’s risk-adjusted total returns over time.
In addition, we typically use leverage as part of the Fund’s management strategy, which we are currently doing through the use of bank borrowings. The Fund utilizes credit facilities that charge either one-month LIBOR plus a spread, or three-month LIBOR plus a spread. The borrowed proceeds are used to invest in more securities that the Fund would typically hold. Leverage is discussed in more detail in the Fund Leverage section of this report.
NAM’s real asset income strategy invests primarily in five security types: global infrastructure common stock, REIT common stock, global infrastructure preferred stock and hybrids, REIT preferred stock, and debt securities. The Fund’s primary benchmark is the Morgan Stanley Capital International (MSCI) World Index. The Fund’s comparative benchmark is a Custom Blended Index, which is an index NAM created to represent a model asset allocation for an income-oriented product providing investment exposure to real assets. Effective December 31, 2015, we changed the Custom Blended Index constituents to the following: 28% S&P Global Infrastructure Index, 21% FTSE EPRA/NAREIT Developed Index, 18% Wells Fargo Hybrid & Preferred Securities REIT Index, 15% Barclays Global Capital Securities Index and 18% Barclays U.S. Corporate High Yield Bond Index. The changes were made with the aim to more accurately reflect the investment team’s experience and expectations for the long-run strategy positioning and offer a more appropriate performance benchmark. Our real asset income strategy attempts to add value versus the benchmark in two ways: by re-allocating among the five main security types when we see pockets of value at differing times and, more importantly, through individual security selection.
Our security selection process starts with a screening process for securities across the real assets markets that provide higher yields. From the group of securities providing significant yields, we focus on owning those securities with the highest total return potential. Our process places a premium on finding securities with revenues that come from tangible assets with long-term concessions, contracts or leases, which are therefore capable of producing steady, predictable and recurring cash flows. We employ a bottom-up, fundamental approach to security selection and portfolio construction. We look for stable companies that demonstrate consistent and growing cash flow, strong balance sheets and histories of being good stewards of shareholder capital.
During the reporting period, we made further progress in repositioning the Fund with approximately 90% of the portfolio’s total assets realigned with the real asset income strategy as of May 31, 2016. As part of this repositioning, we have been selling holdings that we believe have lower yield and lower capital appreciation potential and buying assets that have more potential to achieve the Fund’s objectives, while also more equally balancing the Fund’s U.S. and non-U.S. exposure. This includes looking for ways to opportunistically monetize the Fund’s whole loan positions, but only when we are confident that we are achieving fair value for these assets.
In an effort to protect against potential increases in interest rates, we also sold (shorted) five-year U.S. Treasury futures contracts for part of the reporting period to hedge some of the duration, or interest rate sensitivity, of the bonds in the portfolio. However, rates for Treasury securities with maturities of five years and longer moved generally lower during the reporting period. Therefore, the hedge decreased in value on a mark-to-market basis, which was offset by higher prices of the underlying bonds resulting in a negligible impact on performance over the reporting period.
| 6 | NUVEEN |
How did the Fund perform during this twelve-month reporting period ended May 31, 2016?
The table in the Performance Overview and Holding Summaries section of this report provides total return performance for the Fund for the one-year and since inception periods ended May 31, 2016. For the twelve-month period reporting period ended May 31, 2016, the Fund’s total return at net asset value (NAV) outperformed both the MSCI World Index and its Custom Blended Index.
Our management team is still in the process of transitioning the Fund’s portfolio to our global real asset income strategy, making comparisons to its global, equity-oriented benchmarks somewhat less meaningful. That being said, the Fund exhibited strong performance during a generally difficult market environment for most asset classes, particularly international equities.
Much of the Fund’s outperformance during the reporting period was due to security selection within the equity universes of both global infrastructure and global real estate, with infrastructure equities responsible for the majority of the better-than-benchmark return. The story for the period revolved around declining oil prices and the effect they had on both equity and debt prices. Global oil markets continued to grapple with oversupply amidst the glut created as a result of the U.S. shale energy boom, which has led to very high domestic production. The inventory of crude oil in the U.S. is approximately 100 million barrels higher than it has averaged over the past five years, and while the total number of rigs is down more than 60% from the peak, production remains elevated due to efficiency gains. Our underweight position and security selection in pipeline equities was the most significant positive factor for the Fund as energy infrastructure sold off dramatically amid the softening global economic data and continued pressure on oil prices. We have positioned the Fund with an underweight in energy equities for nearly a year and a half, while also staying focused on higher-quality companies. Pipeline companies in the infrastructure index were down nearly 30% on a weighted basis during the reporting period, while our portfolio’s holdings fell less than 9%.
Relative to the Fund’s benchmark, the REIT common equity portion of the portfolio was also beneficial to returns as security selection within the group contributed positively. Generally speaking, real estate equities rallied for much of the reporting period. Within the portfolio, given our primary objective to provide a high level of income, domestic health care companies represented a sizeable allocation because of their superior yields relative to some of the higher growth sectors within real estate. Our holdings within the portfolio performed well during the reporting period; therefore, given our overweight in the area relative to benchmark, this positioning was the leading factor in the Fund’s REIT equity outperformance. The Fund also benefited from an overweight position in the net lease sector. This area of the REIT market turned in strong results as concerns around global growth led to a more sanguine outlook for interest rates, which benefited the sector’s longer duration leases in relative terms.
High yield debt was the Fund’s leading detractor during the reporting period relative to the benchmark. Throughout the reporting period, the performance of the high yield portfolio was hampered by heightened concerns for the energy sector and independent power producers. The significant drop in oil prices through mid-February 2016 was taken as a signal by the market that a global economic recession was imminent. Given the Fund’s mandate to invest in real asset companies, it will hold more infrastructure names than the broader high yield benchmark. As a result, approximately 4% of the portfolio was allocated to pipelines, which were adversely affected by the declining prices of oil and natural gas. While the debt of these companies held up much better than their equity prices, these holdings were still the leading area of underperformance within our high yield debt portfolio relative to the benchmark.
The credit performance of the Fund’s whole loan portfolio was relatively stable during the reporting period due to the continued strong performance of the commercial real estate sector. As of May 31, 2016, approximately 11% of the Fund’s net asset value remained in whole loans, which we are continuing to monetize. During the reporting period, twenty-eight loans were sold or paid off and two participating loans were settled. We used the proceeds from the whole loan sales and payoffs to provide liquidity for the tender offer noted below, and to partially pay down leverage and reallocate to the generally higher yielding real asset income strategy.
| NUVEEN | 7 |
Portfolio Managers’ Comments (continued)
In the real asset income portion of the portfolio, we reduced the Fund’s U.S. exposure slightly, keeping it roughly in line with what we expect over the long term. The change in geography was mostly due to our continued reduction to U.S. REIT equities. While real estate fundamentals remain supportive and many REITs are trading at discounts, we believe that growth within the sector is beginning to slow modestly, especially in some of the larger coastal markets such as New York City and San Francisco. In most major property sectors, building prices are also well past 2007 peak prices, which may indicate that REITs are a little later in their cycle. We reallocated the capital to the global infrastructure equity and preferred sectors, where we believe we can find commensurate income characteristics with similar-to-better total return potential. Our outlook for global growth is somewhat sanguine which, combined with very easy global monetary policy, should keep interest rates well contained. In turn, we believe this should benefit the higher-yielding and longer asset duration companies the Fund holds within infrastructure.
In the Fund’s high yield debt portfolio, our largest absolute exposure remained in pipeline companies, although we slightly reduced exposure to that group during the period. Real estate debt was the recipient of the bulk of the proceeds. As noted, the slowdown in cash flow growth and property price appreciation likely reduces potential total returns for REIT equities. However, given high occupancies, continued economic growth and supportive jobs numbers, we believe real estate companies will continue to have the ability to service their debt, making their bonds attractive on a relative basis. That being said, we continued to invest our high yield portfolio across the spectrum of real estate and infrastructure segments. We also looked for opportunities to rotate out of the more economically-sensitive areas of energy midstream and independent power producers and into more stable sectors such as health care real estate, data centers and waste.
Also, the Fund conducted a third and final tender offer to purchase up to 10% of its outstanding shares for cash at a price per share equal to 99% of NAV on the expiration date of December 1, 2015. The tender offer was oversubscribed, which meant that the Fund purchased 10% of its respective outstanding common shares on a pro-rata basis based on the number of shares tendered. Refer to the Share Information section of this report for more details.
| 8 | NUVEEN |
Leverage
IMPACT OF THE FUND’S LEVERAGE STRATEGY ON PERFORMANCE
One important factor impacting the return of the Fund relative to its benchmarks was the Fund’s utilization of leverage through the use of bank borrowings. The Fund uses leverage because our research has shown that, over time, leveraging provides opportunities for additional income and total return for shareholders. However, the use of leverage also can expose shareholders to additional volatility. For example, as the prices of securities held by the Fund decline, the negative impact of these valuation changes on NAV and shareholder total return is magnified by the use of leverage. Conversely, leverage may enhance returns during periods when the prices of securities held by the Fund generally are rising. During the reporting period, the income generated from the spread between the cost of borrowing and the yield from invested assets was positive. The Fund’s use of leverage had a positive impact on the performance of the Fund over the reporting period.
As of May 31, 2016, the Fund’s percentages of leverage are as shown in the accompanying table.
| DRA | ||||
Effective Leverage* | 28.87 | % | ||
Regulatory Leverage* | 28.87 | % | ||
| * | Effective leverage is the Fund’s effective economic leverage, and includes both regulatory leverage and the leverage effects of certain derivative and other investments in a Fund’s portfolio that increase the Fund’s investment exposure. During this reporting period, the Fund was not invested in any derivatives or other investments that resulted in economic leverage. Regulatory leverage consists of borrowings of the Fund. Both of these are part of the Fund’s capital structure. Regulatory leverage is subject to asset coverage limits set forth in the Investment Company Act of 1940. |
THE FUND’S REGULATORY LEVERAGE
Bank Borrowings
As noted above the Fund employs leverage through the use of bank borrowings. The Fund’s bank borrowing activities are as shown in the accompanying table.
| Current Reporting Period | Subsequent to the Close of the Reporting Period | |||||||||||||||||||||||||||||||
| Regulatory Leverage | June 1, 2015 | Draws | Paydowns | May 31, 2016 | Draws | Paydowns | July 27, 2016 | |||||||||||||||||||||||||
Bank Borrowings | $ | 170,300,000 | $ | — | $ | (34,000,000 | ) | $ | 136,300,000 | $ | — | $ | — | $ | 136,300,000 | |||||||||||||||||
Refer to Notes to Financial Statements, Note 8 – Borrowing Arrangements for further details.
THE FUND’S EFFECTIVE LEVERAGE
Total Return Swaps
Subsequent to the close of the reporting period, the Fund invested in total return swaps which modestly increased the overall effective leverage of the Fund. Under the terms of the swaps, the Fund receives the total return on an underlying basket of exchange-traded-funds (ETFs) in exchange for periodic interest payments.
| NUVEEN | 9 |
Information
DISTRIBUTION INFORMATION
The following information regarding the Fund’s distributions is current as of May 31, 2016, and may differ from previously issued distribution notifications.
The Fund has a cash flow-based distribution program. Under this program, the Fund seeks to maintain an attractive and stable regular distribution based on the Fund’s net cash flow received from its portfolio investments. Fund distributions are not intended to include expected portfolio appreciation; however, the Fund invests in securities that make payments which ultimately may be fully or partially treated as gains or return of capital for tax purposes. This tax treatment will generally “flow through” to the Fund’s distributions, but the specific tax treatment is often not known with certainty until after the end of the Fund’s tax year. As a result, regular distributions throughout the year are likely to be re-characterized for tax purposes as either long-term gains (both realized and unrealized), or as a non-taxable return of capital.
The figures in the table below provide the sources (for tax purposes) of the Fund’s distributions as of May 31, 2016. These sources include amounts attributable to realized gains and/or returns of capital. The information shown below is for the distributions paid on common shares for all prior months in the current fiscal year. These amounts should not be used for tax reporting purposes, and the distribution sources may differ for financial reporting than for tax reporting. The final determination of the tax characteristics of all distributions paid in 2016 will be made in early 2017 and reported to you on Form 1099-DIV. More details about the tax characteristics of the Fund’s distributions are available on www.nuveen.com/CEFdistributions.
Data as of May 31, 2016
Current Month | Fiscal YTD | |||||||||||||||||||||||||||
Estimated Percentage of Distributions | Estimated Per Share Amounts | |||||||||||||||||||||||||||
| Net Investment Income | Realized Gains | Return of Capital | Total Distributions | Net Investment Income | Realized Gains | Return of Capital | ||||||||||||||||||||||
100% | 0.0% | 0.0% | $ | 1.6450 | $ | 1.6450 | $ | 0.0000 | $ | 0.0000 | ||||||||||||||||||
The following table provides information regarding fund distributions and total return performance over various time periods. This information is intended to help you better understand whether fund returns for the specified time periods were sufficient to meet fund distributions.
Data as of May 31, 2016
| Annualized | Cumulative | |||||||||||||||||||||||
| Inception Date | Latest Monthly Per Share Distribution | Current Distribution on NAV | 1-Year Return on NAV | Since Inception Return on NAV | Calendar YTD Distributions on NAV | Calendar YTD Return on NAV | ||||||||||||||||||
9/8/2014 | $ | 0.1180 | 7.54 | % | 2.26 | % | 4.54 | % | 8.08 | % | 8.44 | % | ||||||||||||
| 10 | NUVEEN |
SHARE REPURCHASES
The Fund’s Board of Trustees has authorized the Fund to participate in Nuveen’s closed-end fund complex-wide share repurchase program. Under the share repurchase program, the Fund may repurchase annually up to 10% of its outstanding shares in open-market transactions at the Adviser’s discretion. The Fund is prohibited, however, from repurchasing its shares during periods when the Fund also has an outstanding tender offer (as described below).
As of May 31, 2016, and since the inception of the Fund’s repurchase program, the Fund has cumulatively repurchased and retired its outstanding shares as shown in the accompanying table.
| DRA | ||||
Shares cumulatively repurchased and retired | 622,500 | |||
Approximate number of shares authorized for repurchase | 2,025,000 | |||
During the current reporting period, the Fund repurchased and retired its shares at a weighted average price per share and a weighted average discount per share as shown in the accompanying table.
| DRA | ||||
Shares repurchased and retired | 496,500 | |||
Weighted average price per share repurchased and retired | $15.41 | |||
Weighted average discount per share repurchased and retired | 14.63 | % | ||
TENDER OFFER
The Fund’s Board of Trustees has authorized the Fund to conduct a series of up to three tender offers pursuant to which the Fund would offer to purchase up to 10% of the Fund’s outstanding shares for cash on a pro rata basis at a price per share equal to 99% of the NAV per common share, as determined as of the close of regular trading on the NYSE on the expiration date of the tender offer.
During the period September 8, 2014 (commencement of operations) through May 31, 2015, the Fund conducted two tender offers. On October 22, 2015, Nuveen announced the Fund’s third tender offer, which commenced on November 2, 2015 and expired on December 1, 2015. The tender offer was oversubscribed (55% of the outstanding shares were tendered), and therefore the Fund purchased 10% of its outstanding shares from participating shareholders on a pro-rata basis based on the number of shares properly tendered.
Refer to Notes to Financial Statements, Note 4 – Fund Shares, Tender Offers for further details.
OTHER SHARE INFORMATION
As of May 31, 2016, and during the current reporting period, the Fund’s share price was trading at a premium/(discount) to its NAV as shown in the accompanying table.
| DRA | ||||
NAV | $ | 18.77 | ||
Share price | $ | 16.19 | ||
Premium/(Discount) to NAV | (13.75 | )% | ||
12-month average premium/(discount) to NAV | (12.72 | )% | ||
| NUVEEN | 11 |
Considerations
Diversified Real Asset Income Fund (DRA)
Investing in closed-end funds involves risk; principal loss is possible. There is no guarantee the Fund’s investment objectives will be achieved. Closed-end fund shares may frequently trade at a discount or premium to their net asset value. Concentration in specific sectors may involve greater risk and volatility than more diversified investments: real estate investments may suffer due to economic downturns and changes in real estate values, rents, property taxes, interest rates and tax laws; infrastructure-related securities may face adverse economic, regulatory, political, and legal changes. Prices of equity securities may decline significantly over short or extended periods of time. Debt or fixed income securities such as those held by the Fund, are subject to market risk, credit risk, interest rate risk, derivatives risk, liquidity risk, and income risk. As interest rates rise, bond prices fall. Leverage increases return volatility and magnifies the Fund’s potential return and its risks; there is no guarantee a fund’s leverage strategy will be successful. For these and other risks such as whole loan risk and foreign investment risk, see the Fund’s web page at www.nuveen.com/DRA.
| 12 | NUVEEN |
THIS PAGE INTENTIONALLY LEFT BLANK
| NUVEEN | 13 |
DRA
Diversified Real Asset Income Fund
Performance Overview and Holding Summaries as of May 31, 2016
Refer to the Glossary of Terms Used in this Report for further definitions of terms used in this section.
Average Annual Total Returns as of May 31, 2016
| Average Annual | ||||||||
| 1-Year | Since Inception | |||||||
| DRA at NAV | 2.26% | 4.54% | ||||||
| DRA at Share Price | 0.09% | 2.34% | ||||||
| MSCI World Index | (3.96)% | (0.37)% | ||||||
| Custom Blended Index (New Comparative Benchmark) | 1.57% | 1.62% | ||||||
| Custom Blended Index (Old Comparative Benchmark) | 3.21% | 3.25% | ||||||
As previously noted in the Portfolio Managers’ Comments section of this report, the Fund is in the process of transitioning its portfolio to a global real asset income strategy. Therefore, comparisons to the Fund’s global, equity-oriented benchmarks are less meaningful until the Fund’s transitioning is complete. The Fund’s goal over time will be to opportunistically reduce its whole loan exposure while also more equally balancing its U.S. and non-U.S. exposure. Effective December 31, 2015, the Custom Blended Index constituents were changed. The changes were made with the aim to more accurately reflect the investment team’s experience and expectations for the long-run strategy positioning and offer a more appropriate performance benchmark. The Fund maintains the MSCI World Index as its primary benchmark.
Since inception returns are from September 8, 2014. Past performance is not predictive of future results. Current performance may be higher or lower than the data shown. Returns do not reflect the deduction of taxes that shareholders may have to pay on Fund distributions or upon the sale of Fund shares. Returns at NAV are net of Fund expenses, and assume reinvestment of distributions. Comparative index return information is provided for the Fund’s shares at NAV only. Indexes are not available for direct investment.
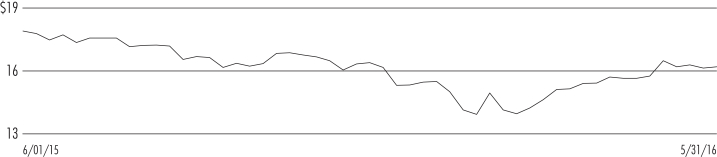
Share Price Performance — Weekly Closing Price
| 14 | NUVEEN |
This data relates to the securities held in the Fund’s portfolio of investments as of the end of the reporting period. It should not be construed as a measure of performance for the Fund itself. Holdings are subject to change.
Ratings shown are the highest rating given by one of the following national rating agencies: Standard & Poor’s Group, Moody’s Investors Service, Inc. or Fitch, Inc. Credit ratings are subject to change. AAA, AA, A and BBB are investment grade ratings; BB, B, CCC, CC, C and D are below investment grade ratings. Certain bonds backed by U.S. Government or agency securities are regarded as having an implied rating equal to the rating of such securities. Holdings designated N/R are not rated by these national rating agencies.
Fund Allocation
(% of net assets)
| Whole Loans | 10.7% | |||
| Corporate Notes | 2.4% | |||
| Other Fixed-Income Type Securities1 | 65.2% | |||
| Equity Type Securities2 | 57.1% | |||
Repurchase Agreements | 4.6% | |||
| Other Assets Less Liabilities | 0.6% | |||
| Net Assets Plus Borrowings | 140.6% | |||
| Borrowings | (40.6)% | |||
| Net Assets | 100% |
Portfolio Asset Allocation
(% of total investments, at value)
| Whole Loans | 7.6% | |||
| Corporate Notes | 1.7% | |||
| Other Fixed-Income Type Securities1 | 46.5% | |||
| Equity Type Securities2 | 40.9% | |||
Repurchase Agreements | 3.3% | |||
| Total | 100% |
Whole Loans and Industries
(% of total investments, at value)
| Real Estate Investment Trust | 35.2% | |||
Electric Utilities | 15.6% | |||
| Multi-Utilities | 8.1% | |||
| Whole Loans | 7.6% | |||
Oil, Gas & Consumable Fuels | 6.5% | |||
| Transportation Infrastructure | 4.1% | |||
Repurchase Agreements | 3.3% | |||
| Other | 19.6% | |||
| Total | 100% |
Whole Loan
State Concentration
(% of total whole loans, at value)
Washington | 21.2% | |||
Texas | 17.9% | |||
National | 16.2% | |||
Florida | 12.6% | |||
Oklahoma | 11.2% | |||
Arizona | 6.2% | |||
Other | 14.7% | |||
| Total | 100% |
Credit Quality
(% of total other fixed-income type securities, at value)1
| A | 1.8% | |||
| BBB | 29.0% | |||
| BB | 24.3% | |||
| B | 10.9% | |||
| CCC | 2.2% | |||
| N/R (not rated) | 31.8% | |||
| Total | 100% |
Country Allocation
(% of total investments, at value)
| United States | 65.1% | |||
Canada | 6.1% | |||
| United Kingdom | 5.4% | |||
Australia | 5.4% | |||
Singapore | 3.1% | |||
Hong Kong | 2.7% | |||
Italy | 2.4% | |||
| Other | 9.8% | |||
| Total | 100% |
| 1 | Includes convertible preferred, $25 par (or similar) retail preferred, convertible bonds, corporate bonds and $1,000 par (or similar) institutional preferred. |
| 2 | Includes common stocks, common stock rights and investment companies. |
| NUVEEN | 15 |
Meeting Report
The annual meeting of shareholders was held in the offices of Nuveen Investments on December 16, 2015 for DRA; at this meeting the shareholders were asked to elect Board Members.
| DRA | ||||
| Common Shares | ||||
Approval of the Board Members was reached as follows: | ||||
Roger A. Gibson | ||||
For | 16,064,312 | |||
Withhold | 683,311 | |||
Total | 16,747,623 | |||
Leonard W. Kedrowski | ||||
For | 16,033,784 | |||
Withhold | 713,839 | |||
Total | 16,747,623 | |||
Richard K. Riederer | ||||
For | 16,063,976 | |||
Withhold | 683,647 | |||
Total | 16,747,623 | |||
James M. Wade | ||||
For | 16,032,685 | |||
Withhold | 714,938 | |||
Total | 16,747,623 | |||
| 16 | NUVEEN |
Independent Registered Public Accounting Firm
To the Board of Trustees and Shareholders of
Diversified Real Asset Income Fund:
In our opinion, the accompanying statement of assets and liabilities, including the portfolio of investments, and the related statements of operations, of changes in net assets, and of cash flows and the financial highlights present fairly, in all material respects, the financial position of Diversified Real Asset Income Fund (hereinafter referred to as the “Fund”) at May 31, 2016, the results of its operations and its cash flows for the year then ended, and the changes in its net assets and the financial highlights for the year then ended and for the period September 8, 2014 (commencement of operations) through May 31, 2015, in conformity with accounting principles generally accepted in the United States of America. These financial statements and financial highlights (hereafter referred to as “financial statements”) are the responsibility of the Fund’s management. Our responsibility is to express an opinion on these financial statements based on our audits. We conducted our audits of these financial statements in accordance with the standards of the Public Company Accounting Oversight Board (United States). Those standards require that we plan and perform the audit to obtain reasonable assurance about whether the financial statements are free of material misstatement. An audit includes examining, on a test basis, evidence supporting the amounts and disclosures in the financial statements, assessing the accounting principles used and significant estimates made by management, and evaluating the overall financial statement presentation. We believe that our audits, which included confirmation of securities at May 31, 2016 by correspondence with the custodian, provides a reasonable basis for our opinion.
PricewaterhouseCoopers LLP
Chicago, IL
July 27, 2016
| NUVEEN | 17 |
DRA
Diversified Real Asset Income Fund | ||
| May 31, 2016 |
| Principal Amount (000) | Description (1) | Interest Rate (7) | Maturity (7) | Value | ||||||||||||||||||
LONG-TERM INVESTMENTS – 135.4% (96.7% of Total Investments) |
| |||||||||||||||||||||
WHOLE LOANS – 10.7% (7.6% of Total Investments) (2), (3), (4) |
| |||||||||||||||||||||
| Commercial Loans – 7.2% (5.1% of Total Investments) | ||||||||||||||||||||||
| $ | 2,222 | 150 North Pantano I, AZ | 4.900% | 8/01/19 | $ | 2,222,233 | ||||||||||||||||
| 1,350 | Carl’s Jr., Idaho Springs, CO | 4.125% | 5/01/23 | 1,276,242 | ||||||||||||||||||
| 6,896 | Clear Lake Central I, Webster, TX, (5) | 4.925% | 9/01/16 | 2,640,025 | ||||||||||||||||||
| 3,750 | Magnolia Retail Land, Magnolia, TX, (5) | 6.900% | 10/01/16 | 3,750,000 | ||||||||||||||||||
| 14,000 | NCH Commercial Pool II, Rocky Point, Mexico, (5), (6) | 11.925% | 8/01/14 | 5,749,800 | ||||||||||||||||||
| 1,859 | Palace Court, Santa Fe, NM, (5) | 4.875% | 8/01/16 | 1,055,863 | ||||||||||||||||||
| 1,222 | Perkins Restaurant, Maple Grove, MN | 6.375% | 1/01/18 | 1,221,511 | ||||||||||||||||||
| 4,523 | RealtiCorp Fund III, Crystal River, FL, (5) | 5.925% | 7/01/16 | 4,522,755 | ||||||||||||||||||
| 2,106 | RL Stowe Portfolio, Belmont, NC and Chattanooga, TN | 3.925% | 1/01/20 | 1,716,112 | ||||||||||||||||||
| 37,928 | Total Commercial Loans | 24,154,541 | ||||||||||||||||||||
| Multifamily Loans – 3.5% (2.5% of Total Investments) | ||||||||||||||||||||||
| 4,915 | NCH Multifamily Pool, Oklahoma City, OK, (5), (6) | 11.925% | 8/01/14 | 38,134 | ||||||||||||||||||
| 4,400 | NCH Multifamily Pool II, Rocky Point Mexico, (5), (6) | 11.925% | 8/01/14 | 4,001,360 | ||||||||||||||||||
| 12,774 | Sapphire Skies I, Cle Elum, WA, (5), (8) | 0.925% | 3/01/20 | 7,600,006 | ||||||||||||||||||
| 22,089 | Total Multifamily Loans | 11,639,500 | ||||||||||||||||||||
| $ | 60,017 | Total Whole Loans (cost 58,380,362) | 35,794,041 | |||||||||||||||||||
| Principal Amount (000) | Description (1) | Coupon | Maturity | Value | ||||||||||||||||||
CORPORATE NOTES – 2.4% (1.7% of Total Investments) (2), (3), (4) |
| |||||||||||||||||||||
| Diversified Financial Services – 2.4% (1.7% of Total Investments) | ||||||||||||||||||||||
| $ | 8,000 | Stratus III, Stratus Properties Inc., (5) | 7.250% | 12/31/16 | $ | 8,000,000 | ||||||||||||||||
| $ | 8,000 | Total Corporate Notes (cost $8,000,000) | 8,000,000 | |||||||||||||||||||
| Shares | Description (1) | Value | ||||||||||||||||||||
COMMON STOCKS – 56.0% (40.0% of Total Investments) |
| |||||||||||||||||||||
| Air Freight & Logistics – 1.8% (1.3% of Total Investments) | ||||||||||||||||||||||
| 193,890 | BPost SA | $ | 5,110,685 | |||||||||||||||||||
| 27,043 | Oesterreichische Post AG | 968,728 | ||||||||||||||||||||
Total Air Freight & Logistics | 6,079,413 | |||||||||||||||||||||
| Commercial Services & Supplies – 0.1% (0.1% of Total Investments) | ||||||||||||||||||||||
| 15,920 | Covanta Holding Corporation | 265,386 | ||||||||||||||||||||
| Diversified Telecommunication Services – 1.2% (0.9% of Total Investments) | ||||||||||||||||||||||
| 2,181,653 | HKBN Limited | 2,667,143 | ||||||||||||||||||||
| 533,514 | Singapore Telecommunications Limited | 1,499,309 | ||||||||||||||||||||
Total Diversified Telecommunication Services | 4,166,452 | |||||||||||||||||||||
| Electric Utilities – 8.7% (6.2% of Total Investments) | ||||||||||||||||||||||
| 109,388 | Alupar Investimento SA | 374,152 | ||||||||||||||||||||
| 1,773,725 | AusNet Services | 2,019,087 | ||||||||||||||||||||
| 873 | Avangrid Inc. | 36,683 | ||||||||||||||||||||
| 24,770 | Brookfield Infrastructure Partners LP | 1,059,165 | ||||||||||||||||||||
| 677,100 | Contact Energy Limited | 2,469,299 | ||||||||||||||||||||
| 18,279 | Duke Energy Corporation | 1,429,966 | ||||||||||||||||||||
| 567,863 | EDP - Energias de Portugal, S.A. | 1,892,340 | ||||||||||||||||||||
| 44,325 | Endesa S.A, (9) | 911,401 | ||||||||||||||||||||
| 3,081 | Hafslund ASA, Class B Shares | 23,939 | ||||||||||||||||||||
| 1,996,873 | HK Electric Investments Limited, 144A | 1,752,556 | ||||||||||||||||||||
| 18 | NUVEEN |
| Shares | Description (1) | Value | ||||||||||||||||||||
| Electric Utilities (continued) | ||||||||||||||||||||||
| 1,491,550 | Infratil Limited | $ | 3,405,992 | |||||||||||||||||||
| 60,820 | Scottish and Southern Energy PLC | 1,349,518 | ||||||||||||||||||||
| 123,884 | Southern Company | 6,124,825 | ||||||||||||||||||||
| 3,031,580 | Spark Infrastructure Group | 5,039,472 | ||||||||||||||||||||
| 220,385 | Transmissora Alianca de Energia Eletrica SA | 1,166,694 | ||||||||||||||||||||
Total Electric Utilities | 29,055,089 | |||||||||||||||||||||
| Gas Utilities – 2.7% (1.9% of Total Investments) | ||||||||||||||||||||||
| 10,550 | AmeriGas Partners, LP | 484,034 | ||||||||||||||||||||
| 26,697 | Enagas | 800,237 | ||||||||||||||||||||
| 1,359,845 | Snam Rete Gas S.p.A | 7,784,549 | ||||||||||||||||||||
Total Gas Utilities | 9,068,820 | |||||||||||||||||||||
| Health Care Providers & Services – 0.4% (0.3% of Total Investments) | ||||||||||||||||||||||
| 109,737 | Sienna Senior Living Inc., Subscription | 1,452,728 | ||||||||||||||||||||
| Independent Power & Renewable Electricity Producers – 1.3% (0.9% of Total Investments) | ||||||||||||||||||||||
| 14,978 | Brookfield Renewable Energy Partners LP | 432,415 | ||||||||||||||||||||
| 31,621 | NextEra Energy Partners LP | 902,147 | ||||||||||||||||||||
| 839,598 | Renewables Infrastructure Group Limited | 1,190,495 | ||||||||||||||||||||
| 168,453 | Saeta Yield S.A, (9) | 1,676,367 | ||||||||||||||||||||
| 26,829 | TransAlta Renewables Inc. | 263,104 | ||||||||||||||||||||
Total Independent Power & Renewable Electricity Producers | 4,464,528 | |||||||||||||||||||||
| Media – 0.2% (0.1% of Total Investments) | ||||||||||||||||||||||
| 31,326 | SES SA | 701,629 | ||||||||||||||||||||
| Multi-Utilities – 8.2% (5.8% of Total Investments) | ||||||||||||||||||||||
| 71,209 | CenterPoint Energy, Inc. | 1,604,339 | ||||||||||||||||||||
| 770,152 | Centrica PLC | 2,273,286 | ||||||||||||||||||||
| 1,915,134 | Duet Group | 3,252,784 | ||||||||||||||||||||
| 227,724 | Engie | 3,508,007 | ||||||||||||||||||||
| 13,091,020 | Keppel Infrastructure Trust | 4,848,174 | ||||||||||||||||||||
| 98,321 | National Grid PLC | 7,257,073 | ||||||||||||||||||||
| 790,271 | Redes Energeticas Nacionais SA | 2,331,891 | ||||||||||||||||||||
| 1,023,267 | Vector Limited | 2,340,118 | ||||||||||||||||||||
Total Multi-Utilities | 27,415,672 | |||||||||||||||||||||
| Oil, Gas & Consumable Fuels – 3.7% (2.7% of Total Investments) | ||||||||||||||||||||||
| 13,954 | AltaGas Limited, (WI/DD) | 322,527 | ||||||||||||||||||||
| 79,551 | Enbridge Energy Partners LP | 1,729,439 | ||||||||||||||||||||
| 60,489 | Enbridge Income Fund Holdings Inc. | 1,430,868 | ||||||||||||||||||||
| 232,123 | Enterprise Products Partnership LP | 6,443,734 | ||||||||||||||||||||
| 47,770 | Spectra Energy Corporation | 1,521,952 | ||||||||||||||||||||
| 143,636 | Veresen Inc. | 1,123,808 | ||||||||||||||||||||
Total Oil, Gas & Consumable Fuels | 12,572,328 | |||||||||||||||||||||
| Real Estate Investment Trust – 21.4% (15.3% of Total Investments) | ||||||||||||||||||||||
| 443,564 | AEW UK REIT PLC | 630,390 | ||||||||||||||||||||
| 15,332 | Agree Realty Corporation | 652,683 | ||||||||||||||||||||
| 218,261 | Armada Hoffler Properties Inc. | 2,640,958 | ||||||||||||||||||||
| 572,895 | Ascendas Real Estate Investment Trust | 952,676 | ||||||||||||||||||||
| 77,103 | Blackstone Mortgage Trust Inc., Class A | 2,173,534 | ||||||||||||||||||||
| 3,086 | Camden Property Trust | 262,958 | ||||||||||||||||||||
| 68,491 | CapitaMall Trust | 100,963 | ||||||||||||||||||||
| 3,334 | Care Capital Properties, Inc. | 86,651 | ||||||||||||||||||||
| 59,374 | CareTrust REIT Inc. | 795,018 | ||||||||||||||||||||
| 76,066 | Choice Properties Real Estate Investment Trust | 795,841 | ||||||||||||||||||||
| 165,118 | City Office REIT, Inc. | 1,943,439 | ||||||||||||||||||||
| 2,643 | Cofinimmo, SANV | 322,010 | ||||||||||||||||||||
| 58,594 | Colony Financial Inc. | 1,073,442 | ||||||||||||||||||||
| 95,639 | Community Healthcare Trust Inc. | 1,784,624 | ||||||||||||||||||||
| 156,580 | Crombie Real Estate Investment Trust | 1,750,458 | ||||||||||||||||||||
| 4,811 | DiamondRock Hospitality Company | 43,010 | ||||||||||||||||||||
| NUVEEN | 19 |
| DRA | Diversified Real Asset Income Fund | |||
| Portfolio of Investments (continued) | May 31, 2016 |
| Shares | Description (1) | Value | ||||||||||||||||||||
| Real Estate Investment Trust (continued) | ||||||||||||||||||||||
| 6,151 | Digital Realty Trust Inc. | $ | 587,113 | |||||||||||||||||||
| 71,156 | Easterly Government Properties, Inc. | 1,332,040 | ||||||||||||||||||||
| 5,395 | Entertainment Properties Trust | 384,556 | ||||||||||||||||||||
| 32,964 | Eurocommercial Properties NV | 1,550,721 | ||||||||||||||||||||
| 474,398 | Fortune REIT | 526,855 | ||||||||||||||||||||
| 1,787 | Four Corners Property Trust, Inc. | 34,739 | ||||||||||||||||||||
| 2,055,667 | Frasers Centrepoint Trust | 3,015,356 | ||||||||||||||||||||
| 77,367 | Gaming and Leisure Properties Inc. | 2,546,148 | ||||||||||||||||||||
| 28,424 | Health Care Property Investors Inc. | 934,297 | ||||||||||||||||||||
| 9,323 | ICADE | 673,327 | ||||||||||||||||||||
| 167,263 | Immobiliare Grande Distribuzione SIIQ SpA | 150,745 | ||||||||||||||||||||
| 70,451 | Independence Realty Trust | 549,518 | ||||||||||||||||||||
| 142,978 | InnVest Real Estate Investment Trust | 723,967 | ||||||||||||||||||||
| 38,309 | Investors Real Estate Trust | 238,282 | ||||||||||||||||||||
| 1,071,711 | Keppel DC REIT | 840,497 | ||||||||||||||||||||
| 279,212 | Killam Apartment Real Estate I, (WI/DD) | 2,533,742 | ||||||||||||||||||||
| 18,936 | Lexington Corporate Properties Trust | 178,945 | ||||||||||||||||||||
| 97,966 | Liberty Property Trust | 3,656,091 | ||||||||||||||||||||
| 70,309 | LondonMetric Property PLC | 167,514 | ||||||||||||||||||||
| 36,946 | LTC Properties Inc. | 1,722,423 | ||||||||||||||||||||
| 2,643,850 | Mapletree Greater China Commercial Trust | 1,881,470 | ||||||||||||||||||||
| 417,690 | Mapletree Logistics Trust | 295,728 | ||||||||||||||||||||
| 67,382 | MGM Growth Properties LLC, (9) | 1,549,786 | ||||||||||||||||||||
| 4,821 | Monmouth Real Estate Investment Corporation | 57,322 | ||||||||||||||||||||
| 15,228 | New Senior Investment Group Inc. | 157,914 | ||||||||||||||||||||
| 151,700 | Crombie Real Estate Investment Receipt, (9) | 1,694,746 | ||||||||||||||||||||
| 237,733 | NorthWest Healthcare Properties REIT | 1,734,933 | ||||||||||||||||||||
| 35,003 | Omega Healthcare Investors Inc. | 1,117,296 | ||||||||||||||||||||
| 105,508 | OneREIT | 276,774 | ||||||||||||||||||||
| 643,582 | Parkway Life Real Estate Investment Trust | 1,149,671 | ||||||||||||||||||||
| 19,045 | Pebblebrook Hotel Trust | 488,504 | ||||||||||||||||||||
| 225,345 | Physicians Realty Trust | 4,279,302 | ||||||||||||||||||||
| 615,754 | Plaza Retail REIT | 2,291,440 | ||||||||||||||||||||
| 644,300 | Prologis Property Mexico SA de CV | 973,253 | ||||||||||||||||||||
| 191,477 | Pure Industrial Real Estate Trust | 746,138 | ||||||||||||||||||||
| 19,956 | Sabra Health Care Real Estate Investment Trust Inc. | 417,879 | ||||||||||||||||||||
| 60,803 | Smart Real Estate Investment Trust | 1,599,652 | ||||||||||||||||||||
| 159,200 | Spirit Realty Capital Inc. | 1,822,840 | ||||||||||||||||||||
| 39,849 | STAG Industrial Inc. | 850,776 | ||||||||||||||||||||
| 82,903 | Starwood Property Trust Inc. | 1,709,460 | ||||||||||||||||||||
| 945,954 | TF Administradora Industrial S de RL de CV | 1,578,063 | ||||||||||||||||||||
| 245,382 | Tritax Big Box REIT PLC | 488,673 | ||||||||||||||||||||
| 18,419 | Universal Health Realty Income Trust | 985,416 | ||||||||||||||||||||
| 25,700 | Urstadt Biddle Properties Inc. | 543,812 | ||||||||||||||||||||
| 149,407 | VEREIT, Inc. | 1,432,813 | ||||||||||||||||||||
| 1,487 | Welltower Inc. | 102,469 | ||||||||||||||||||||
| 49,675 | Wereldhave NV | 2,529,473 | ||||||||||||||||||||
| 69,190 | WPT Industrial Real Estate Investment Trust | 729,954 | ||||||||||||||||||||
Total Real Estate Investment Trust | 71,841,088 | |||||||||||||||||||||
| Road & Rail – 0.5% (0.4% of Total Investments) | ||||||||||||||||||||||
| 381,015 | MTR Corporation | 1,804,376 | ||||||||||||||||||||
| Transportation Infrastructure – 5.5% (3.9% of Total Investments) | ||||||||||||||||||||||
| 257,196 | Cosco Pacific Limited | 261,143 | ||||||||||||||||||||
| 6,502,771 | Hopewell Highway Infrastructure Limited | 3,230,151 | ||||||||||||||||||||
| 5,158,024 | Hutchison Port Holdings Trust | 2,217,950 | ||||||||||||||||||||
| 193,099 | Jiangsu Expressway Company Limited | 265,392 | ||||||||||||||||||||
| 27,921 | Macquarie Infrastructure Corporation | 1,999,423 | ||||||||||||||||||||
| 676,587 | Sydney Airport | 3,462,144 | ||||||||||||||||||||
| 755,074 | Transurban Group | 6,576,045 | ||||||||||||||||||||
| 388,357 | Zhejiang Expressway Company Limited | 363,831 | ||||||||||||||||||||
Total Transportation Infrastructure | 18,376,079 | |||||||||||||||||||||
| Water Utilities – 0.3% (0.2% of Total Investments) | ||||||||||||||||||||||
| 671,766 | Inversiones Aguas Metropolitanas SA | 992,020 | ||||||||||||||||||||
Total Common Stocks (cost $178,947,947) | 188,255,608 | |||||||||||||||||||||
| 20 | NUVEEN |
| Shares | Description (1) | Coupon | Ratings (11) | Value | ||||||||||||||||||
CONVERTIBLE PREFERRED SECURITIES – 6.4% (4.6% of Total Investments) |
| |||||||||||||||||||||
| Electric Utilities – 2.4% (1.8% of Total Investments) | ||||||||||||||||||||||
| 58,787 | Exelon Corporation | 6.500% | BB+ | $ | 2,775,922 | |||||||||||||||||
| 83,598 | NextEra Energy Inc. | 6.371% | BBB | 5,052,663 | ||||||||||||||||||
| 7,366 | NextEra Energy Inc. | 5.799% | BBB | 452,714 | ||||||||||||||||||
Total Electric Utilities | 8,281,299 | |||||||||||||||||||||
| Gas Utilities – 0.5% (0.3% of Total Investments) | ||||||||||||||||||||||
| 27,189 | Spire, Inc., (10) | 6.750% | N/R | 1,566,630 | ||||||||||||||||||
| Multi-Utilities – 0.2% (0.1% of Total Investments) | ||||||||||||||||||||||
| 8,317 | Black Hills Corp, Convertible Preferred | 7.750% | N/R | 565,722 | ||||||||||||||||||
| Oil, Gas & Consumable Fuels – 0.2% (0.1% of Total Investments) | ||||||||||||||||||||||
| 17,217 | Anadarko Petroleum Corporation | 7.500% | N/R | 671,463 | ||||||||||||||||||
| Real Estate Investment Trust – 3.1% (2.3% of Total Investments) | ||||||||||||||||||||||
| 65,693 | Alexandria Real Estate Equities Inc., (10) | 7.000% | Baa3 | 2,152,471 | ||||||||||||||||||
| 45,883 | American Homes 4 Rent | 5.000% | N/R | 1,220,947 | ||||||||||||||||||
| 44,237 | American Tower Corporation | 5.500% | N/R | 4,671,870 | ||||||||||||||||||
| 15,639 | Equity Commonwealth | 6.500% | Ba1 | 407,709 | ||||||||||||||||||
| 1,147 | FelCor Lodging Trust Inc., Series A. | 1.950% | CCC | 28,893 | ||||||||||||||||||
| 6,205 | Lexington Corporate Properties Trust, Series B | 6.500% | N/R | 310,250 | ||||||||||||||||||
| 27,446 | Ramco-Gershenson Properties Trust | 7.250% | N/R | 1,794,419 | ||||||||||||||||||
Total Real Estate Investment Trust | 10,586,559 | |||||||||||||||||||||
Total Convertible Preferred Securities (cost $20,046,269) | 21,671,673 | |||||||||||||||||||||
| Shares | Description (1) | Coupon | Ratings (11) | Value | ||||||||||||||||||
$25 PAR (OR SIMILAR) RETAIL PREFERRED – 31.5% (22.5% of Total Investments) |
| |||||||||||||||||||||
| Electric Utilities – 6.6% (4.7% of Total Investments) | ||||||||||||||||||||||
| 11,814 | APT Pipelines Limited, (10) | 6.840% | N/R | $ | 876,143 | |||||||||||||||||
| 111,794 | Entergy Arkansas Inc., (10) | 6.450% | Baa3 | 2,829,786 | ||||||||||||||||||
| 64,379 | Entergy New Orleans, Inc. | 5.500% | A– | 1,687,374 | ||||||||||||||||||
| 37,111 | Entergy Texas Inc. | 5.625% | A– | 999,028 | ||||||||||||||||||
| 78,424 | Integrys Energy Group Inc., (10) | 6.000% | Baa1 | 2,058,630 | ||||||||||||||||||
| 66,732 | NextEra Energy Inc. | 5.000% | BBB | 1,698,329 | ||||||||||||||||||
| 63,074 | NextEra Energy Inc., (WI/DD) | 5.250% | Baa2 | 1,576,850 | ||||||||||||||||||
| 68,738 | Pacific Gas & Electric Corporation | 6.000% | BBB+ | 2,163,872 | ||||||||||||||||||
| 163,255 | PPL Capital Funding, Inc. | 5.900% | BBB | 4,357,276 | ||||||||||||||||||
| 75,040 | SCE Trust I | 5.625% | Baa1 | 1,963,046 | ||||||||||||||||||
| 64,585 | SCE Trust V | 5.450% | Baa1 | 1,845,839 | ||||||||||||||||||
Total Electric Utilities | 22,056,173 | |||||||||||||||||||||
| Independent Power & Renewable Electricity Producers – 0.2% (0.1% of Total Investments) | ||||||||||||||||||||||
| 35,503 | Brookfield Renewable Partners, Preferred Equity | 5.750% | BB+ | 680,090 | ||||||||||||||||||
| Multi-Utilities – 1.4% (1.0% of Total Investments) | ||||||||||||||||||||||
| 45,190 | Dominion Resources Inc. | 6.375% | Baa3 | 2,266,279 | ||||||||||||||||||
| 6,736 | DTE Energy Company | 5.250% | Baa1 | 171,499 | ||||||||||||||||||
| 87,209 | DTE Energy Company, (10) | 5.375% | Baa1 | 2,188,405 | ||||||||||||||||||
Total Multi-Utilities | 4,626,183 | |||||||||||||||||||||
| Oil, Gas & Consumable Fuels – 0.7% (0.5% of Total Investments) | ||||||||||||||||||||||
| 7,841 | Kinder Morgan Inc., Delaware | 9.750% | N/R | 358,491 | ||||||||||||||||||
| 27,207 | Nustar Logistics Limited Partnership | 7.625% | Ba2 | 699,220 | ||||||||||||||||||
| 70,252 | Pembina Pipeline Corporation | 5.750% | BB+ | 1,348,414 | ||||||||||||||||||
Total Oil, Gas, & Consumable Fuels | 2,406,125 | |||||||||||||||||||||
| Real Estate Investment Trust – 22.3% (16.0% of Total Investments) | ||||||||||||||||||||||
| 5,585 | American Homes 4 Rent | 5.500% | N/R | 147,835 | ||||||||||||||||||
| 37,395 | American Homes 4 Rent | 5.000% | N/R | 1,005,926 | ||||||||||||||||||
| NUVEEN | 21 |
| DRA | Diversified Real Asset Income Fund | |||
| Portfolio of Investments (continued) | May 31, 2016 |
| Shares | Description (1) | Coupon | Ratings (11) | Value | ||||||||||||||||||
| Real Estate Investment Trust (continued) | ||||||||||||||||||||||
| 118,661 | American Homes 4 Rent | 6.500% | N/R | $ | 3,032,975 | |||||||||||||||||
| 20,397 | Apartment Investment & Management Company | 6.875% | BB | 566,017 | ||||||||||||||||||
| 27,746 | Apollo Commercial Real Estate Finance | 8.625% | N/R | 712,517 | ||||||||||||||||||
| 50,287 | Arbor Realty Trust Incorporated | 7.375% | N/R | 1,260,192 | ||||||||||||||||||
| 38,141 | CBL & Associates Properties Inc. | 7.375% | BB | 941,701 | ||||||||||||||||||
| 141,933 | CBL & Associates Properties Inc. | 6.625% | BB | 3,439,037 | ||||||||||||||||||
| 183,565 | Cedar Shopping Centers Inc., Series A | 7.250% | N/R | 4,829,595 | ||||||||||||||||||
| 51,391 | Chesapeake Lodging Trust | 7.750% | N/R | 1,344,902 | ||||||||||||||||||
| 89,981 | Colony Financial Inc. | 7.125% | N/R | 2,124,451 | ||||||||||||||||||
| 31,117 | Colony Financial Inc. | 8.500% | N/R | 809,042 | ||||||||||||||||||
| 27,720 | Colony Financial Inc. | 7.500% | N/R | 686,902 | ||||||||||||||||||
| 35,581 | Coresite Realty Corporation | 7.250% | N/R | 946,455 | ||||||||||||||||||
| 51,216 | Corporate Office Properties Trust | 7.375% | BB | 1,327,007 | ||||||||||||||||||
| 133,569 | Digital Realty Trust Inc. | 6.350% | Baa3 | 3,538,243 | ||||||||||||||||||
| 62,222 | Dupont Fabros Technology | 6.625% | Ba2 | 1,601,594 | ||||||||||||||||||
| 56,817 | EPR Properties Inc. | 9.000% | BB | 1,969,845 | ||||||||||||||||||
| 20,575 | EPR Properties Inc. | 6.625% | Baa3 | 544,620 | ||||||||||||||||||
| 22,267 | EPR Properties Inc. | 5.750% | BB | 618,800 | ||||||||||||||||||
| 740 | Equity Lifestyle Properties Inc. | 6.750% | N/R | 19,277 | ||||||||||||||||||
| 83,444 | General Growth Properties | 6.375% | N/R | 2,252,988 | ||||||||||||||||||
| 89,228 | Gramercy Property Trust | 7.125% | N/R | 2,377,926 | ||||||||||||||||||
| 80,071 | Hersha Hospitality Trust | 6.875% | N/R | 2,094,657 | ||||||||||||||||||
| 88,840 | Hersha Hospitality Trust | 6.500% | N/R | 2,204,120 | ||||||||||||||||||
| 78,372 | Investors Real Estate Trust | 7.950% | N/R | 2,072,156 | ||||||||||||||||||
| 5,052 | LaSalle Hotel Properties | 6.375% | N/R | 128,220 | ||||||||||||||||||
| 82,560 | LaSalle Hotel Properties | 6.300% | N/R | 2,079,686 | ||||||||||||||||||
| 3,055 | Monmouth Real Estate Investment Corp | 7.875% | N/R | 79,827 | ||||||||||||||||||
| 685 | Northstar Realty Finance Corporation | 8.875% | N/R | 16,926 | ||||||||||||||||||
| 26,061 | Northstar Realty Finance Corporation | 8.750% | N/R | 639,276 | ||||||||||||||||||
| 144,100 | Pebblebrook Hotel Trust | 6.500% | N/R | 3,717,780 | ||||||||||||||||||
| 22,084 | Post Properties, Inc., Series A | 8.500% | Baa3 | 1,460,415 | ||||||||||||||||||
| 23,041 | Rait Financial Trust | 7.125% | N/R | 555,519 | ||||||||||||||||||
| 39,071 | Saul Centers, Inc. | 6.875% | N/R | 1,028,349 | ||||||||||||||||||
| 4,233 | STAG Industrial Inc. | 9.000% | BB+ | 110,481 | ||||||||||||||||||
| 62,200 | STAG Industrial Inc. | 6.875% | BB+ | 1,648,300 | ||||||||||||||||||
| 14,210 | Summit Hotel Properties Inc. | 9.250% | N/R | 365,055 | ||||||||||||||||||
| 82,307 | Summit Hotel Properties Inc. | 7.875% | N/R | 2,130,105 | ||||||||||||||||||
| 123,744 | Summit Hotel Properties Inc. | 7.125% | N/R | 3,144,335 | ||||||||||||||||||
| 919 | Sun Communities Inc. | 7.125% | N/R | 24,041 | ||||||||||||||||||
| 105,364 | Sunstone Hotel Investors Inc. | 6.450% | N/R | 2,736,303 | ||||||||||||||||||
| 86,598 | Taubman Centers Incorporated., Series J | 6.500% | N/R | 2,254,146 | ||||||||||||||||||
| 52,608 | Taubman Centers Incorporated, Series K | 6.250% | N/R | 1,359,917 | ||||||||||||||||||
| 13,319 | Terreno Realty Corporation | 7.750% | �� | BB | 349,624 | |||||||||||||||||
| 54,781 | UMH Properties Inc. | 8.000% | N/R | 1,440,740 | ||||||||||||||||||
| 58,201 | Urstadt Biddle Properties | 7.125% | N/R | 1,521,956 | ||||||||||||||||||
| 113,565 | Urstadt Biddle Properties | 6.750% | N/R | 3,038,999 | ||||||||||||||||||
| 6,339 | VEREIT, Inc. | 6.700% | N/R | 166,018 | ||||||||||||||||||
| 40,338 | WP GLIMCHER, Inc. | 7.500% | Ba1 | 1,037,090 | ||||||||||||||||||
| 61,190 | WP GLIMCHER, Inc. | 6.875% | Ba1 | 1,556,674 | ||||||||||||||||||
Total Real Estate Investment Trust | 75,058,562 | |||||||||||||||||||||
| Trading Companies & Distributors – 0.3% (0.2% of Total Investments) | ||||||||||||||||||||||
| 36,000 | GATX Corporation | 5.625% | BBB | 888,840 | ||||||||||||||||||
Total $25 Par (or similar) Retail Preferred (cost $102,801,469) |
| 105,715,973 | ||||||||||||||||||||
| Principal Amount (000) | Description (1) | Coupon | Maturity | Ratings (11) | Value | |||||||||||||||||
CONVERTIBLE BONDS – 0.8% (0.6% of Total Investments) |
| |||||||||||||||||||||
| Multi-Utilities – 0.5% (0.4% of Total Investments) | ||||||||||||||||||||||
| $ | 1,670 | Dominion Resources Inc. | 5.750% | 10/01/54 | BBB– | $ | 1,636,600 | |||||||||||||||
| 22 | NUVEEN |
| Principal Amount (000) | Description (1) | Coupon | Maturity | Ratings (11) | Value | |||||||||||||||||
| Oil, Gas & Consumable Fuels – 0.3% (0.2% of Total Investments) | ||||||||||||||||||||||
| $ | 1,705 | DCP Midstream LLC, 144A | 5.850% | 5/21/43 | BB– | $ | 1,159,400 | |||||||||||||||
| $ | 3,375 | Total Convertible Bonds (cost $3,312,587) | 2,796,000 | |||||||||||||||||||
| Principal Amount (000) (12) | Description (1) | Coupon | Maturity | Ratings (11) | Value | |||||||||||||||||
CORPORATE BONDS – 19.4% (13.8% of Total Investments) |
| |||||||||||||||||||||
| Commercial Services & Supplies – 2.0% (1.4% of Total Investments) | ||||||||||||||||||||||
| $ | 1,610 | ADS Waste Holdings Inc. | 8.250% | 10/01/20 | CCC+ | $ | 1,658,300 | |||||||||||||||
| 1,370 | Casella Waste Systems Inc. | 7.750% | 2/15/19 | B | 1,399,113 | |||||||||||||||||
| 2,140 | Covanta Holding Corporation | 5.875% | 3/01/24 | Ba3 | 2,129,300 | |||||||||||||||||
| 1,485 | GFL Environmental Corporation, 144A | 9.875% | 2/01/21 | B | 1,581,525 | |||||||||||||||||
Total Commercial Services & Supplies | 6,768,238 | |||||||||||||||||||||
| Construction & Engineering – 0.2% (0.2% of Total Investments) | ||||||||||||||||||||||
| 6,500 | NOK | VV Holding AS, 144A | 6.370% | 7/10/19 | N/R | 753,682 | ||||||||||||||||
| Consumer Finance – 0.2% (0.1% of Total Investments) | ||||||||||||||||||||||
| 705 | Covenant Surgical Partners Inc., 144A | 8.750% | 8/01/19 | B– | 671,512 | |||||||||||||||||
| Diversified Telecommunication Services – 1.6% (1.1% of Total Investments) | ||||||||||||||||||||||
| 1,452 | CyrusOne LP Finance | 6.375% | 11/15/22 | B+ | 1,539,120 | |||||||||||||||||
| 1,930 | Qualitytech LP/QTS Finance Corp. | 5.875% | 8/01/22 | BB– | 1,968,600 | |||||||||||||||||
| 1,890 | SBA Communications Corporation | 4.875% | 7/15/22 | B | 1,894,725 | |||||||||||||||||
Total Diversified Telecommunication Services | 5,402,445 | |||||||||||||||||||||
| Electric Utilities – 0.2% (0.1% of Total Investments) | ||||||||||||||||||||||
| 775 | Intergen NV, 144A | 7.000% | 6/30/23 | B+ | 548,312 | |||||||||||||||||
| Energy Equipment & Services – 0.7% (0.5% of Total Investments) | ||||||||||||||||||||||
| 1,020 | Compressco Partners LP / Compressco Finance Corporation | 7.250% | 8/15/22 | B– | 826,200 | |||||||||||||||||
| 1,390 | EUR | Origin Energy Finance Limited, Reg S | 7.875% | 6/16/71 | BB | 1,542,359 | ||||||||||||||||
Total Energy Equipment & Services | 2,368,559 | |||||||||||||||||||||
| Gas Utilities – 1.2% (0.9% of Total Investments) | ||||||||||||||||||||||
| 895 | AmeriGas Finance LLC | 7.000% | 5/20/22 | Ba2 | 943,106 | |||||||||||||||||
| 1,465 | Ferrellgas LP | 6.750% | 1/15/22 | B+ | 1,377,100 | |||||||||||||||||
| 765 | LBC Tank Terminals Holdings Netherlands BV, 144A | 6.875% | 5/15/23 | B | 738,225 | |||||||||||||||||
| 975 | Suburban Propane Partners LP | 5.750% | 3/01/25 | BB– | 957,938 | |||||||||||||||||
Total Gas Utilities | 4,016,369 | |||||||||||||||||||||
| Health Care Equipment & Supplies – 0.3% (0.2% of Total Investments) | ||||||||||||||||||||||
| 895 | Tenet Healthcare Corporation | 8.125% | 4/01/22 | B– | 900,594 | |||||||||||||||||
| Health Care Providers & Services – 2.3% (1.7% of Total Investments) | ||||||||||||||||||||||
| 1,195 | Acadia Healthcare | 5.625% | 2/15/23 | B | 1,214,419 | |||||||||||||||||
| 1,035 | Community Health Systems, Inc. | 6.875% | 2/01/22 | B+ | 889,469 | |||||||||||||||||
| 1,235 | HCA Inc. | 5.375% | 2/01/25 | BB | 1,253,525 | |||||||||||||||||
| 1,010 | IASIS Healthcare Capital Corporation | 8.375% | 5/15/19 | CCC+ | 969,600 | |||||||||||||||||
| 1,295 | Kindred Healthcare Inc. | 6.375% | 4/15/22 | B2 | 1,165,500 | |||||||||||||||||
| 1,200 | Lifepoint Health Inc. | 5.875% | 12/01/23 | Ba2 | 1,239,000 | |||||||||||||||||
| 1,225 | Select Medical Corporation | 6.375% | 6/01/21 | B– | 1,179,062 | |||||||||||||||||
Total Health Care Providers & Services | 7,910,575 | |||||||||||||||||||||
| Independent Power & Renewable Electricity Producers – 0.3% (0.2% of Total Investments) | ||||||||||||||||||||||
| 1,355 | GenOn Energy Inc. | 9.500% | 10/15/18 | CCC+ | 1,067,062 | |||||||||||||||||
| NUVEEN | 23 |
| DRA | Diversified Real Asset Income Fund | |||
| Portfolio of Investments (continued) | May 31, 2016 |
| Principal Amount (000) (12) | Description (1) | Coupon | Maturity | Ratings (11) | Value | |||||||||||||||||
| Internet Software & Services – 0.4% (0.3% of Total Investments) | ||||||||||||||||||||||
| $ | 1,445 | Equinix Inc. | 5.750% | 1/01/25 | BB | $ | 1,502,800 | |||||||||||||||
| IT Services – 0.5% (0.3% of Total Investments) | ||||||||||||||||||||||
| 1,510 | Zayo Group LLC / Zayo Capital Inc. | 6.000% | 4/01/23 | B– | 1,551,525 | |||||||||||||||||
| Marine – 0.2% (0.1% of Total Investments) | ||||||||||||||||||||||
| 955 | Navios South American Logistics Inc., Finance US Inc., 144A | 7.250% | 5/01/22 | B– | 604,037 | |||||||||||||||||
| Media – 0.4% (0.3% of Total Investments) | ||||||||||||||||||||||
| 1,170 | Lamar Media Corporation, 144A | 5.750% | 2/01/26 | Ba1 | 1,231,425 | |||||||||||||||||
| Multi-Utilities – 1.1% (0.8% of Total Investments) | ||||||||||||||||||||||
| 1,505 | GBP | Centrica PLC, Reg S | 5.250% | 4/10/75 | BBB | 2,057,294 | ||||||||||||||||
| 1,200 | GBP | RWE AG, Reg S | 7.000% | 3/29/49 | BB+ | 1,664,960 | ||||||||||||||||
Total Multi-Utilities | 3,722,254 | |||||||||||||||||||||
| Oil, Gas & Consumable Fuels – 3.2% (2.3% of Total Investments) | ||||||||||||||||||||||
| 100 | Calumet Specialty Products | 6.500% | 4/15/21 | CCC+ | 67,000 | |||||||||||||||||
| 1,415 | Calumet Specialty Products | 7.625% | 1/15/22 | CCC+ | 937,437 | |||||||||||||||||
| 510 | Crestwood Midstream Partners LP | 6.125% | 3/01/22 | BB– | 481,797 | |||||||||||||||||
| 1,090 | Energy Transfer Equity LP | 5.500% | 6/01/27 | BB+ | 945,575 | |||||||||||||||||
| 835 | Gibson Energy, 144A | 6.750% | 7/15/21 | BB | 828,738 | |||||||||||||||||
| 670 | Global Partners LP/GLP Finance | 6.250% | 7/15/22 | B+ | 547,725 | |||||||||||||||||
| 95 | Global Partners LP/GLP Finance | 7.000% | 6/15/23 | B+ | 77,662 | |||||||||||||||||
| 1,015 | Martin Mid-Stream Partners LP Finance | 7.250% | 2/15/21 | B– | 941,412 | |||||||||||||||||
| 1,205 | NGL Energy Partners LP/Fin Co | 5.125% | 7/15/19 | BB– | 1,084,500 | |||||||||||||||||
| 705 | NGL Energy Partners LP/Fin Co | 6.875% | 10/15/21 | BB– | 606,300 | |||||||||||||||||
| 920 | Northern Tier Energy LLC | 7.125% | 11/15/20 | BB– | 908,500 | |||||||||||||||||
| 470 | PBF Holding Company LLC | 8.250% | 2/15/20 | BBB– | 488,800 | |||||||||||||||||
| 1,505 | Rose Rock Midstream LP / Rose Rock Finance Corporation | 5.625% | 7/15/22 | B | 1,298,062 | |||||||||||||||||
| 925 | Sabine Pass Liquefaction LLC | 6.250% | 3/15/22 | BB+ | 945,813 | |||||||||||||||||
| 765 | Summit Midstream Holdings LLC Finance | 5.500% | 8/15/22 | B | 627,300 | |||||||||||||||||
Total Oil, Gas, & Consumable Fuels | 10,786,621 | |||||||||||||||||||||
| Real Estate Investment Trust – 2.3% (1.7% of Total Investments) | ||||||||||||||||||||||
| 1,285 | Corporate Office Properties LP | 5.000% | 7/01/25 | BBB– | 1,320,679 | |||||||||||||||||
| 1,725 | DuPont Fabros Technology LP | 5.625% | 6/15/23 | Ba1 | 1,772,438 | |||||||||||||||||
| 270 | EPR Properties Inc. | 4.500% | 4/01/25 | Baa2 | 264,331 | |||||||||||||||||
| 1,010 | Geo Group Inc. | 6.000% | 4/15/26 | Ba3 | 1,020,100 | |||||||||||||||||
| 1,615 | Omega Healthcare Investors Inc. | 4.500% | 4/01/27 | BBB– | 1,543,559 | |||||||||||||||||
| 1,400 | PLA Administradora Industrial, S. de R.L. de C.V., 144A | 5.250% | 11/10/22 | Baa3 | 1,400,140 | |||||||||||||||||
| 445 | Vereit Operating Partner, (WI/DD) | 4.875% | 6/01/26 | BB+ | 454,456 | |||||||||||||||||
Total Real Estate Investment Trust | 7,775,703 | |||||||||||||||||||||
| Real Estate Management & Development – 0.9% (0.6% of Total Investments) | ||||||||||||||||||||||
| 1,165 | Hunt Companies Inc., 144A | 9.625% | 3/01/21 | N/R | 1,141,700 | |||||||||||||||||
| 1,800 | Kennedy-Wilson Holdings Incorporated | 5.875% | 4/01/24 | BB– | 1,759,500 | |||||||||||||||||
Total Real Estate Management & Development | 2,901,200 | |||||||||||||||||||||
| Road & Rail – 0.3% (0.2% of Total Investments) | ||||||||||||||||||||||
| 1,075 | Watco Companies LLC Finance, 144A | 6.375% | 4/01/23 | B | 1,076,344 | |||||||||||||||||
| Software – 0.4% (0.3% of Total Investments) | ||||||||||||||||||||||
| 1,265 | SixSigma Networks Mexico SA de CV, 144A | 8.250% | 11/07/21 | B+ | 1,227,050 | |||||||||||||||||
| Transportation Infrastructure – 0.3% (0.2% of Total Investments) | ||||||||||||||||||||||
| 1,020 | Aeropuerto Internacional de Tocumen SA | 5.750% | 10/09/23 | BBB | 1,049,886 | |||||||||||||||||
| 24 | NUVEEN |
| Principal Amount (000) (12) | Description (1) | Coupon | Maturity | Ratings (11) | Value | |||||||||||||||||
| Wireless Telecommunication Services – 0.4% (0.3% of Total Investments) | ||||||||||||||||||||||
| $ | 1,546 | Inmarsat Finance PLC, 144A | 4.875% | 5/15/22 | BB+ | $ | 1,364,345 | |||||||||||||||
Total Corporate Bonds (cost $67,671,359) | 65,200,538 | |||||||||||||||||||||
| Shares | Description (1) | Value | ||||||||||||||||||||
COMMON STOCK RIGHTS – 0.0% (0.0% of Total Investments) |
| |||||||||||||||||||||
| Utilities – 0.0% (0.0% of Total Investments) | ||||||||||||||||||||||
| 14,031 | Alupar Investimento SA | $ | 1,009 | |||||||||||||||||||
Total Common Stock Rights (cost $—) | 1,009 | |||||||||||||||||||||
| Principal Amount (000) (12) | Description (1) | Coupon | Maturity | Ratings (11) | Value | |||||||||||||||||
1,000 PAR (OR SIMILAR) INSTITUTIONAL PREFERRED – 7.1% (5.0% of Total Investments) |
| |||||||||||||||||||||
| Diversified Financial Services – 0.4% (0.3% of Total Investments) | ||||||||||||||||||||||
| $ | 1,200 | National Rural Utilities Cooperative Finance Corporation | 5.250% | 4/20/46 | A3 | $ | 1,214,250 | |||||||||||||||
| Electric Utilities – 4.0% (2.8% of Total Investments) | ||||||||||||||||||||||
| 2,360 | AES Gener SA, 144A | 8.375% | 12/18/73 | BB | 2,478,000 | |||||||||||||||||
| 1,080 | ComEd Financing III | 6.350% | 3/15/33 | Baa2 | 1,143,242 | |||||||||||||||||
| 1,995 | Enel SpA, 144A | 8.750% | 9/24/73 | BBB– | 2,299,238 | |||||||||||||||||
| 1,800 | EUR | Energias de Portugal, SA, Reg S | 5.375% | 9/16/75 | Ba2 | 1,978,237 | ||||||||||||||||
| 995 | FPL Group Capital Inc. | 6.350% | 10/01/66 | BBB | 756,200 | |||||||||||||||||
| 3,065 | GBP | NGG Finance PLC, Reg S | 5.625% | 6/18/73 | BBB | 4,651,279 | ||||||||||||||||
Total Electric Utilities | 13,306,196 | |||||||||||||||||||||
| Energy Equipment & Services – 1.4% (1.0% of Total Investments) | ||||||||||||||||||||||
| 5,290 | Transcanada Trust | 5.625% | 5/20/75 | BBB | 4,744,495 | |||||||||||||||||
| Oil, Gas & Consumable Fuels – 0.9% (0.6% of Total Investments) | ||||||||||||||||||||||
| 2,795 | Enterprise Products Operating LP | 7.034% | 1/15/68 | Baa2 | 2,891,414 | |||||||||||||||||
| Water Utilities – 0.4% (0.3% of Total Investments) | ||||||||||||||||||||||
| 888 | GBP | Pennon Group PLC, Reg S | 6.750% | N/A (13) | N/R | 1,344,301 | ||||||||||||||||
Total $1,000 Par (or similar) Institutional Preferred (cost $23,954,931) |
| 23,500,656 | ||||||||||||||||||||
| Shares | Description (1), (14) | Value | ||||||||||||||||||||
INVESTMENT COMPANIES – 1.1% (0.9% of Total Investments) |
| |||||||||||||||||||||
| Diversified Other – 0.8% (0.6% of Total Investments) | ||||||||||||||||||||||
| 2,216 | 3I Infrastructure Fund | $ | 5,479 | |||||||||||||||||||
| 1,504,839 | John Laing Infrastructure Fund | 2,676,467 | ||||||||||||||||||||
Total Diversified Other | 2,681,946 | |||||||||||||||||||||
| Real Estate Management & Development – 0.3% (0.3% of Total Investments) | ||||||||||||||||||||||
| 764,974 | Starwood European Real Estate Finance Limited | 1,179,966 | ||||||||||||||||||||
Total Investment Companies (cost $3,888,040) | 3,861,912 | |||||||||||||||||||||
Total Long-Term Investments (cost $467,002,964) | 454,797,410 | |||||||||||||||||||||
| NUVEEN | 25 |
| DRA | Diversified Real Asset Income Fund | |||
| Portfolio of Investments (continued) | May 31, 2016 |
| Principal Amount (000) | Description (1) | Coupon | Maturity | Value | ||||||||||||||||||
SHORT-TERM INVESTMENTS – 4.6% (3.3% of Total Investments) |
| |||||||||||||||||||||
| REPURCHASE AGREEMENTS – 4.6% (3.3% of Total Investments) | ||||||||||||||||||||||
| $ | 15,337 | Repurchase Agreement with Fixed Income Clearing Corporation, dated 5/31/16, repurchase price $15,336,847, collateralized by $14,095,000 U.S. Treasury Bonds, 3.125%, due 2/15/43, value $15,645,450 | 0.030% | 6/01/16 | $ | 15,336,834 | ||||||||||||||||
Total Short-Term Investments (cost $15,336,834) | 15,336,834 | |||||||||||||||||||||
Total Investments (cost $482,339,798) – 140.0% | 470,134,244 | |||||||||||||||||||||
Borrowings – (40.6)% (15), (16) | (136,300,000 | ) | ||||||||||||||||||||
Other Assets Less Liabilities – 0.6% | 2,011,914 | |||||||||||||||||||||
Net Assets – 100% | $ | 335,846,158 | ||||||||||||||||||||
For Fund portfolio compliance purposes, the Fund’s industry classifications refer to any one or more of the industry sub-classifications used by one or more widely recognized market indexes or ratings group indexes, and/or as defined by Fund management. This definition may not apply for purposes of this report which may combine industry sub-classifications into sectors for reporting ease.
| (1) | All percentages shown in the Portfolio of Investments are based on net assets unless otherwise noted. |
| (2) | Interest rates on whole loans and corporate notes are the net coupon rates in effect (after reducing the coupon rate by any mortgage servicing fees paid to mortgage servicers) as of the end of the reporting period. |
| (3) | Securities purchased as part of a private placement, which have not been registered with U.S. Securities and Exchange Commission under the Securities Act of 1933 and which are considered to be illiquid. |
| (4) | Investments valued at fair value using methods determined in good faith by, or at the discretion of, the Board. For fair value measurement disclosure purposes, investments are classified as Level 3 unless otherwise noted. See Notes to Financial Statements, Note 2 – Investment Valuation and Fair Value Measurements for more information. |
| (5) | Interest only – Represents securities that entitle holders to receive only interest payments on the mortgage. Principal balance on the loan is due at maturity. The interest rate disclosed represents the net coupon rate in effect as of the end of the reporting period. |
| (6) | Loan is currently in default with regards to scheduled interest and/or principal payments. |
| (7) | Represents the interest rate, coupon and maturity in effect as of the end of the reporting period. |
| (8) | The interest rate will increase to 2.000% on March 1, 2017. |
| (9) | Non-income producing; issuer has not declared a dividend within the past twelve months. |
| (10) | For fair value measurement disclosure purposes, investment classified as Level 2. See Notes to Financial Statements, Note 2 – Investment Valuation and Fair Value Measurements for more information. |
| (11) | Ratings (not covered by the report of independent registered public accounting firm): Using the highest of Standard & Poor’s Group (“Standard & Poor’s”), Moody’s Investors Service, Inc. (“Moody’s”) or Fitch, Inc. (“Fitch”) rating. Ratings below BBB by Standard & Poor’s, Baa by Moody’s or BBB by Fitch are considered to be below investment grade. Holdings designated N/R are not rated by any of these national rating agencies. |
| (12) | Principal Amount (000) denominated in U.S. Dollars, unless otherwise noted. |
| (13) | Perpetual security. Maturity date is not applicable. |
| (14) | A copy of the most recent financial statements for these investment companies can be obtained directly from the Securities and Exchange Commission on its website at http://www.sec.gov. |
| (15) | The Fund segregates 100% of its eligible investments (excluding any investments separately pledged as collateral for specific investments in derivatives) in the Portfolio of Investments as collateral for Borrowings. |
| (16) | Borrowings as a percentage of Total Investments is 29.0%. |
| 144A | Investment is exempt from registration under Rule 144A of the Securities Act of 1933, as amended. These investments may only be resold in transactions exempt from registration, which are normally those transactions with qualified institutional buyers. |
| EUR | Euro |
| GBP | Pound Sterling |
| NOK | Norwegian Krone |
| Reg S | Regulation S allows U.S. companies to sell securities to persons or entities located outside of the United States without registering those securities with the Securities and Exchange Commission. Specifically, Regulation S provides a safe harbor from the registration requirements of the Securities Act for the offers and sales of securities by both foreign and domestic issuers that are made outside the United States. |
| REIT | Real Estate Investment Trust |
| (WI/DD) | Investment, or portion of investment, purchased on a when-issued or delayed delivery basis. |
See accompanying notes to financial statements.
| 26 | NUVEEN |
Assets and Liabilities | May 31, 2016 | |||||
Assets | ||||
Long-term investments, at value (cost $467,002,964) | $ | 454,797,410 | ||
Short-term investments, at value (cost approximates value) | 15,336,834 | |||
Cash denominated in foreign currencies (cost $109,600) | 107,947 | |||
Receivable for: | ||||
Dividends | 1,084,076 | |||
Interest | 3,651,152 | |||
Investments sold | 4,926,042 | |||
Reclaims | 133,688 | |||
Other assets | 5,008 | |||
Total assets | 480,042,157 | |||
Liabilities | ||||
Borrowings | 136,300,000 | |||
Payable for: | ||||
Dividends | 2,063,633 | |||
Investments purchased | 5,018,905 | |||
Accrued expenses: | ||||
Management fees | 206,333 | |||
Interest on borrowings | 333,937 | |||
Other | 273,191 | |||
Total liabilities | 144,195,999 | |||
Net assets | $ | 335,846,158 | ||
Shares outstanding | 17,894,895 | |||
Net asset value (“NAV”) per share outstanding | $ | 18.77 | ||
Net assets consist of: | ||||
Shares, $.01 par value per share | $ | 178,949 | ||
Paid-in surplus | 435,640,861 | |||
Undistributed (Over-distribution of) net investment income | 746,064 | |||
Accumulated net realized gain (loss) | (88,510,374 | ) | ||
Net unrealized appreciation (depreciation) | (12,209,342 | ) | ||
Net assets | $ | 335,846,158 | ||
Authorized shares | Unlimited |
See accompanying notes to financial statements.
| NUVEEN | 27 |
Operations | Year Ended May 31, 2016 | |||||
Investment Income | ||||
Dividends (net of tax withheld of $591,783) | $ | 19,421,147 | ||
Interest | 16,143,920 | |||
Total investment income | 35,565,067 | |||
Expenses | ||||
Management fees | 4,794,532 | |||
Interest expense on borrowings | 1,810,502 | |||
Custodian fees | 219,906 | |||
Trustees fees | 221,662 | |||
Professional fees | 443,410 | |||
Shareholder reporting expenses | 107,883 | |||
Shareholder servicing agent fees | 24,729 | |||
Stock exchange listing fees | 10,412 | |||
Tender offer expense | 130,961 | |||
Other | 116,739 | |||
Total expenses before expense reimbursement | 7,880,736 | |||
Expense reimbursement | (2,112,550 | ) | ||
Net expenses | 5,768,186 | |||
Net investment income (loss) | 29,796,881 | |||
Realized and Unrealized Gain (Loss) | ||||
Net realized gain (loss) from: | ||||
Investments and foreign currency | (42,360,044 | ) | ||
Futures contracts | (143,895 | ) | ||
Change in net unrealized appreciation (depreciation) of: | ||||
Investments and foreign currency | 14,953,637 | |||
Futures contracts | 41,626 | |||
Net realized and unrealized gain (loss) | (27,508,676 | ) | ||
Net increase (decrease) in net assets from operations | $ | 2,288,205 |
See accompanying notes to financial statements.
| 28 | NUVEEN |
Changes in Net Assets | ||||||
| Year Ended 5/31/16 | For the Period 9/08/14 (commencement of operations) through 5/31/15 | |||||||
Operations | ||||||||
Net investment income | $ | 29,796,881 | $ | 26,489,652 | ||||
Net realized gain (loss) from: | ||||||||
Investments and foreign currency | (42,360,044 | ) | (15,201,632 | ) | ||||
Futures contracts | (143,895 | ) | (19,441 | ) | ||||
Change in net unrealized appreciation (depreciation) of: | ||||||||
Investments and foreign currency | 14,953,637 | 13,131,032 | ||||||
Futures contracts | 41,626 | (41,626 | ) | |||||
Net increase (decrease) in net assets from operations | 2,288,205 | 24,357,985 | ||||||
Distributions to Shareholders | ||||||||
From net investment income | (31,602,898 | ) | (23,836,500 | ) | ||||
Decrease in net assets from distributions to shareholders | (31,602,898 | ) | (23,836,500 | ) | ||||
Capital Share Transactions | ||||||||
Shares issued in the mergers | — | 506,888,241 | ||||||
Cost of shares repurchased and retired | (7,660,004 | ) | (2,181,619 | ) | ||||
Cost of shares repurchased and retired through tender offer | (36,737,199 | ) | (95,670,093 | ) | ||||
Net increase (decrease) in net assets from capital share transactions | (44,397,203 | ) | 409,036,529 | |||||
Net increase (decrease) in net assets | (73,711,896 | ) | 409,558,014 | |||||
Net assets at the beginning of period | 409,558,054 | 40 | ||||||
Net assets at the end of period | $ | 335,846,158 | $ | 409,558,054 | ||||
Undistributed (Over-distribution of) net investment income at the end of period | $ | 746,064 | $ | 3,170,534 | ||||
See accompanying notes to financial statements.
| NUVEEN | 29 |
Cash Flows | Year Ended May 31, 2016 | |||||
Cash Flows from Operating Activities: | ||||
Net Increase (Decrease) in Net Assets from Operations | $ | 2,288,205 | ||
Adjustments to reconcile the net increase (decrease) in net assets from operations to net cash provided by (used in) operating activities: | ||||
Purchases of investments | (409,211,722 | ) | ||
Proceeds from sales and maturities of investments | 494,627,356 | |||
Proceeds from (Purchases of) short-term investments, net | 3,116,977 | |||
Proceeds from (Payments for) cash denominated in foreign currencies, net | (24,675 | ) | ||
Proceeds from (Payments for) closed foreign currency spot contracts | (66,237 | ) | ||
Taxes paid on undistributed capital gains | (56,067 | ) | ||
Amortization (Accretion) of premiums and discounts, net | (576,237 | ) | ||
Capital gain and return of capital distributions from investments | (2,298,344 | ) | ||
(Increase) Decrease in: | ||||
Receivable for dividends | (457,720 | ) | ||
Receivable for interest | (219,919 | ) | ||
Receivable for investments sold | (3,674,816 | ) | ||
Receivable for reclaims | (40,308 | ) | ||
Other assets | 115,447 | |||
Increase (Decrease) in: | ||||
Payable for investments purchased | (456,056 | ) | ||
Payable for variation margin on futures contracts | (14,828 | ) | ||
Accrued management fees | 99,304 | |||
Accrued interest on borrowings | 73,077 | |||
Accrued other expenses | (108,013 | ) | ||
Net realized (gain) loss from: | ||||
Investments and foreign currency | 42,360,044 | |||
Paydowns | (11,449 | ) | ||
Change in net unrealized (appreciation) depreciation of investments and foreign currency | (14,953,637 | ) | ||
Net cash provided by (used in) operating activities | 110,510,382 | |||
Cash Flows from Financing Activities | ||||
Repayments of borrowings | (34,000,000 | ) | ||
Cash distributions paid to shareholders | (32,203,179 | ) | ||
Cost of shares repurchased and retired | (7,660,004 | ) | ||
Cost of shares repurchased and retired through tender offer | (36,737,199 | ) | ||
Net cash provided by (used in) financing activities | (110,600,382 | ) | ||
Net Increase (Decrease) in Cash | (90,000 | ) | ||
Cash at the beginning of period | 90,000 | |||
Cash at the end of period | $ | — | ||
| Supplemental Disclosure of Cash Flow Information | ||||
Cash paid for interest on borrowings (excluding borrowing costs) | $ | 1,542,435 | ||
See accompanying notes to financial statements.
| 30 | NUVEEN |
THIS PAGE INTENTIONALLY LEFT BLANK
| NUVEEN | 31 |
Highlights
Selected data for a share outstanding throughout each period:
| Investment Operations | Less Distributions | Discounts from Shares | ||||||||||||||||||||||||||||||||||||||||||||||
| Beginning NAV | Net Investment Income(a) | Net Realized/ Unrealized Gain (Loss) | Total | From Net Investment Income | From Accumu lated Net Realized Gains | Return of Capital | Total | Repur chased and Retired | Repur and Retired through | Ending NAV | Ending Share Price | |||||||||||||||||||||||||||||||||||||
Year Ended 5/31: |
| |||||||||||||||||||||||||||||||||||||||||||||||
2016 | $ | 20.06 | $ | 1.55 | $ | (1.28 | ) | $ | 0.27 | $ | (1.65 | ) | $ | — | $ | — | $ | (1.65 | ) | $ | 0.07 | $ | 0.02 | $ | 18.77 | $ | 16.19 | |||||||||||||||||||||
2015(f) | 20.00 | 1.14 | (0.14 | ) | 1.00 | (1.03 | ) | — | — | (1.03 | ) | 0.01 | 0.08 | 20.06 | 17.91 | |||||||||||||||||||||||||||||||||
| Borrowings at End of Period | ||||||||
| Aggregate Amount Outstanding (000) | Asset Coverage Per $1,000 | |||||||
Year Ended 5/31: |
| |||||||
2016 | $ | 136,300 | $ | 3,464 | ||||
2015(f) | 170,300 | 3,405 | ||||||
| 32 | NUVEEN |
| Ratios/Supplemental Data | ||||||||||||||||||||||||||||||
| Total Returns | Ratios to Average Net Assets Before Reimbursement(c) | Ratios to Average Net Assets After Reimbursement(c)(d) | ||||||||||||||||||||||||||||
| Based on NAV(b) | Based on Market Value(b) | Ending Net Assets (000) | Expenses | Net Investment Income | Expenses | Net Investment Income | Portfolio Turnover Rate(e) | |||||||||||||||||||||||
| 2.26 | % | 0.09 | % | $ | 335,846 | 2.22 | % | 7.80 | % | 1.63 | % | 8.40 | % | 87 | % | |||||||||||||||
| 5.60 | 3.99 | 409,558 | 2.10 | * | 7.10 | * | 1.40 | * | 7.80 | * | 104 | |||||||||||||||||||
| (a) | Per share Net Investment Income is calculated using the average daily shares method. |
| (b) | Total Return Based on NAV is the combination of changes in NAV, reinvested dividend income at NAV and reinvested capital gains distributions at NAV, if any. The last dividend declared in the period, which is typically paid on the first business day of the following month, is assumed to be reinvested at the ending NAV. The actual reinvest price for the last dividend declared in the period may often be based on the Fund’s market price (and not its NAV), and therefore may be different from the price used in the calculation. Total returns are not annualized. |
Total Return Based on Share Price is the combination of changes in the market price per share and the effect of reinvested dividend income and reinvested capital gains distributions, if any, at the average price paid per share at the time of reinvestment. The last dividend declared in the period, which is typically paid on the first business day of the following month, is assumed to be reinvested at the ending market price. The actual reinvestment for the last dividend declared in the period may take place over several days, and in some instances may not be based on the market price, so the actual reinvestment price may be different from the price used in the calculation. Total returns are not annualized.
| (c) • | Net Investment Income ratios reflect income earned and expenses incurred on assets attributable to reverse repurchase agreements and/or borrowings (as described in Note 8 – Borrowing Arrangements), where applicable. The Fund ceased utilizing reverse repurchase agreements during the period September 8, 2014 (commencement of operations) through May 31, 2015. |
| • | Each ratio includes the effect of all interest expense paid and other costs related to borrowings and/or reverse repurchase agreements, where applicable, as follows: |
| Ratios of Interest Expense to Average Net Assets | ||||
Year Ended 5/31: |
| |||
2016 | 0.51 | % | ||
2015(f) | 0.38 | * | ||
| (d) | After expense reimbursement from the Adviser, where applicable. |
| (e) | Portfolio Turnover Rate is calculated based on the lesser of long-term purchases or sales (as disclosed in Note 5 – Investment Transactions) divided by the average long-term market value during the period. |
| (f) | For the period from September 8, 2014 (commencement of operations) through May 31, 2015. |
| * | Annualized. |
See accompanying notes to financial statements.
| NUVEEN | 33 |
Financial Statements
1. General Information and Significant Accounting Policies
General Information
Fund Information
Diversified Real Asset Income Fund (the “Fund”) is registered under the Investment Company Act of 1940, as amended, as a diversified closed-end management investment company. The Fund’s shares are listed on the New York Stock Exchange (“NYSE”) and trade under the ticker symbol “DRA.” The Fund was organized as a Massachusetts business trust on January 21, 2014.
The end of the reporting period for the Fund is May 31, 2016, and the period covered by these Notes to Financial Statements is the fiscal year ended May 31, 2016 (the “current fiscal period”).
Investment Adviser
The Fund’s investment adviser is Nuveen Fund Advisors, LLC (the “Adviser”), a wholly-owned subsidiary of Nuveen Investments, Inc. (“Nuveen”). Nuveen is an operating division of TIAA Global Asset Management. The Adviser is responsible for the Fund’s overall investment strategy and asset allocation decisions, including the Fund’s use of leverage. The Adviser has entered into a sub-advisory agreement with Nuveen Asset Management, LLC (the “Sub-Adviser”), a subsidiary of the Adviser, under which the Sub-Adviser manages the Fund’s investment portfolio.
Investment Objectives and Principal Investment Strategies
The Fund’s investment objective is a high level of current income and long-term capital appreciation. Under normal conditions:
| • | The Fund will invest at least 80% of its managed assets in securities or other instruments that provide investment exposure to real assets. Real assets are any tangible assets, as distinguished from financial assets, and generally include real estate, infrastructure and natural resources. Real asset related investments are: (i) whole loans, loan participation and other mortgage-related interests; (ii) securities of companies that are in the energy, telecommunications, utilities or materials sectors; (iii) securities of companies in the real estate or transportation industry groups; (iv) securities of companies that, if not in one of these sectors or industry groups (a) derive at least 50% of their revenues or profits from the ownership, management, operation, development, construction, financing or sale of real assets or (b) have at least 50% of the fair market value of their assets invested in real assets or (v) pooled investment vehicles that primarily invest in the foregoing companies or that are otherwise designed primarily to provide investment exposure to real assets. |
| • | All of the Fund’s debt securities may be rated lower than investment grade quality (BB+/Ba1 or lower), and no more than 10% of the Fund’s managed assets may be invested in debt securities rated CCC+/Caa1 or lower (except that this limitation shall not apply to whole loans, mortgage participations and other mortgage-related instruments). |
| • | The Fund may invest up to 75% of its managed assets in securities of non-U.S. issuers through the direct investment in securities of non-U.S. companies and through depositary receipts. Non-U.S. issuers are those (i) whose securities are traded principally on a stock exchange or over-the-counter (“OTC”) in a non-U.S. country, (ii) that are organized under the laws of and have a principal office(s) in a non-U.S. country or (iii) that have at least 50% of their revenues, profits or assets in non-U.S. countries. |
| • | The Fund may invest up to 50% of its managed assets in securities of issuers located in emerging markets. |
| • | The Fund may invest up to 10% of its total assets in securities of other open- or closed-end investment companies (including exchange-traded-funds (“ETFs”)) that invest primarily in securities of the types in which the Fund may invest directly. |
The Fund may employ an option writing strategy, focused on securities issued by real asset related companies, that seeks to produce option premiums for the purpose of enhancing the Fund’s risk-adjusted total returns over time. The Fund may also enter into derivative instruments to manage market or business risk, enhance return, hedge certain risks of its investments in fixed-income securities or as a substitute for a position in the underlying asset. Such instruments include financial futures contracts, swap contracts (including credit default swaps and interest rate swaps), options on financial futures, options on swap contracts, or other derivative instruments.
The Fund may utilize leverage through the usage of (a) reverse repurchase agreements; (b) borrowings, including loans from certain financial institutions, and/or the issuance of debt securities, including fixed and floating rate notes or liquidity supported variable rate demand obligations; and (b) the issuance of preferred shares of beneficial interest or other senior securities. The Fund also may utilize derivatives and other portfolio techniques that have the economic effect of leverage by creating additional investment exposure.
| 34 | NUVEEN |
Significant Accounting Policies
The Fund is an investment company and follows accounting and reporting guidance under Financial Accounting Standards Board (FASB) Accounting Standards Codification (ASC) Topic 946 “Financial Services – Investment Companies.” The following is a summary of significant accounting policies followed by the Fund in the preparation of its financial statements in accordance with accounting principles generally accepted in the United States of America (“U.S. GAAP”).
Investment Transactions
Investment transactions are recorded on a trade date basis. Realized gains and losses from investment transactions are determined on the specific identification method, which is the same basis used for federal income tax purposes. Investments purchased on a when-issued/delayed delivery basis may have extended settlement periods. Any investments so purchased are subject to market fluctuation during this period. The Fund has earmarked securities in its portfolio with a current value at least equal to the amount of the when-issued/delayed delivery purchase commitments.
As of the end of the reporting period, the Fund’s outstanding when-issued/delayed delivery purchase commitments were as follows:
Outstanding when-issued/delayed delivery purchase commitments | $3,476,412 |
Participation Interests in Whole Loans
Periodically, the Fund invests in whole loans which obligate the borrower to pay, in addition to regular interest and principal amounts, additional amounts representing a participation in certain above-threshold cash flows generated by the collateral underlying the loan and/or gains realized in the liquidation of such collateral. The Fund’s right to receive these additional payments is referred to as a “participation interest.” The Fund’s policy is to not recognize a participation interest as an asset, or recognize payment amounts (income or liquidation) received on participation interests as income or capital gain, as the case may be, until such time as the participation interests are realizable. Those income or liquidation items will be realizable if the rights associated with the participation interest are reasonably certain to result in a receipt of payment. If those items are not realizable, an income payment or a liquidating payment with respect to a participation interest will be recognized only upon receipt of that payment from the borrower.
Investment Income
Dividend income is recorded on the ex-dividend date or, for foreign securities, when information is available. Interest income, which reflects the amortization of premiums and includes accretion of discounts for financial reporting purposes, is recorded on an accrual basis. Interest income collected for loans that are no longer held by the Fund is recorded when information is available. Interest income also reflects paydown gains and losses, if any.
During the normal course of business, the Fund may negotiate with the borrower in a loan agreement one or more of the following items: (i) entrance fees, (ii) exit fees, (iii) modification fees and (iv) prepayment penalties. Such fees, if any, are recorded when information is available and recognized as a component of “Fees income” on the Statement of Operations.
Professional Fees
Professional fees presented on the Statement of Operations consist of legal fees incurred in the normal course of operations, audit fees, tax consulting fees and, in some cases, workout expenditures. Workout expenditures are incurred in an attempt to protect or enhance an investment or to pursue other claims or legal actions on behalf of Fund shareholders. If a refund is received for workout expenditures paid in a prior reporting period, such amounts will be recognized as “Legal fee refund” on the Statement of Operations.
Dividends and Distributions to Shareholders
Distributions to shareholders are recorded on the ex-dividend date. The amount and timing of distributions are determined in accordance with federal income tax regulations, which may differ from U.S. GAAP.
The Fund makes monthly cash distributions to shareholders of a stated dollar amount per share. Subject to approval and oversight by the Fund’s Board of Trustees (the “Board”), the Fund seeks to establish a distribution rate that roughly corresponds to the cash flows from its investment strategies through regular distributions (a “Cash Flow-Based Distribution Program”). The Fund seeks to establish a relatively stable common share distribution rate that roughly corresponds to the Fund’s net cash flows after expense from its investments over an extended period of time. Actual net cash flows the Fund receives may differ from the Fund’s distribution rate over shorter time periods over a specific timeframe. The portion of distributions paid attributed to net unrealized gains, if any, is distributed from the Fund’s assets and is treated by shareholders as a non-taxable distribution (“Return of Capital”) for tax purposes. In the event that total distributions during a calendar year exceed the Fund’s total return on net asset value (“NAV”), the difference will reduce NAV per share. If the Fund’s total return on NAV exceeds total distributions during a calendar year, the excess will be reflected as an increase in NAV per share. The final determination of the source and character of all distributions for the fiscal year are made after the end of the fiscal year and is reflected in the financial statements contained in the annual report as of May 31 each year.
| NUVEEN | 35 |
Notes to Financial Statements (continued)
The tax character of Fund distributions for a fiscal year is dependent upon the amount and tax character of distributions received from securities held in the Fund’s portfolio. Distributions received from certain securities in which the Fund invests, most notably Real Estate Investment Trust (“REIT”) securities, may be characterized for tax purposes as ordinary income, long-term capital gain and/or a return of capital. The issuer of a security reports the tax character of its distributions only once per year, generally during the first two months of the calendar year. The distribution is included in the Fund’s ordinary income until such time the Fund is notified by the issuer of the actual tax character. For the fiscal year just ended, dividend income, net realized gain (loss) and unrealized appreciation (depreciation) recognized on the Statement of Operations reflect the amounts of ordinary income, capital gain, and/or return of capital as reported by the issuers of such securities.
Indemnifications
Under the Fund’s organizational documents, its officers and trustees are indemnified against certain liabilities arising out of the performance of their duties to the Fund. In addition, in the normal course of business, the Fund enters into contracts that provide general indemnifications to other parties. The Fund’s maximum exposure under these arrangements is unknown as this would involve future claims that may be made against the Fund that have not yet occurred. However, the Fund has not had prior claims or losses pursuant to these contracts and expects the risk of loss to be remote.
Netting Agreements
In the ordinary course of business, the Fund may enter into transactions subject to enforceable master repurchase agreements, International Swaps and Derivative Association, Inc. (“ISDA”) master agreements or other similar arrangements (“netting agreements”). Generally, the right to offset in netting agreements allows the Fund to offset certain securities and derivatives with a specific counterparty as well as any collateral received or delivered to that counterparty based on the terms of the agreements. Generally, the Fund manages its cash collateral and securities collateral on a counterparty basis.
The Fund’s investments subject to netting agreements as of the end of the reporting period, if any, are further described in Note 3 – Portfolio Securities and Investments in Derivatives.
Use of Estimates
The preparation of financial statements in conformity with U.S. GAAP requires management to make estimates and assumptions that affect the reported amounts of assets and liabilities at the date of the financial statements and the reported amounts of increases and decreases in net assets from operations during the reporting period. Actual results may differ from those estimates.
2. Investment Valuation and Fair Value Measurements
The fair valuation input levels as described below are for fair value measurement purposes.
Fair value is defined as the price that would be received upon selling an investment or transferring a liability in an orderly transaction to an independent buyer in the principal or most advantageous market for the investment. A three-tier hierarchy is used to maximize the use of observable market data and minimize the use of unobservable inputs and to establish classification of fair value measurements for disclosure purposes. Observable inputs reflect the assumptions market participants would use in pricing the asset or liability. Observable inputs are based on market data obtained from sources independent of the reporting entity. Unobservable inputs reflect the reporting entity’s own assumptions about the assumptions market participants would use in pricing the asset or liability. Unobservable inputs are based on the best information available in the circumstances. The following is a summary of the three-tiered hierarchy of valuation input levels.
| Level 1 – | Inputs are unadjusted and prices are determined using quoted prices in active markets for identical securities. | |
| Level 2 – | Prices are determined using other significant observable inputs (including quoted prices for similar securities, interest rates, prepayment speeds, credit risk, etc.). | |
| Level 3 – | Prices are determined using significant unobservable inputs (including management’s assumptions in determining the fair value of investments). |
Prices of fixed-income securities are provided by an independent pricing service (“pricing service”) approved by the Board. The pricing service establishes a security’s fair value using methods that may include consideration of the following: yields or prices of investments of comparable quality, type of issue, coupon, maturity and rating, market quotes or indications of value from security dealers, evaluations of anticipated cash flows or collateral, general market conditions and other information and analysis, including the obligor’s credit characteristics considered relevant. These securities are generally classified as Level 2. In pricing certain securities, particularly less liquid and lower quality securities, the pricing service may consider information about a security, its issuer or market activity, provided by the Adviser. These securities are generally classified as Level 2 or Level 3 depending on the priority of the significant inputs.
Common stocks and other equity-type securities are valued at the last sales price on the securities exchange on which such securities are primarily traded and are generally classified as Level 1. Securities primarily traded on the NASDAQ National Market (“NASDAQ”) are valued at the NASDAQ Official Closing Price and are generally classified as Level 1. However, securities traded on a securities exchange or NASDAQ for which there were no transactions on a given day or securities not listed on a securities exchange or NASDAQ are valued at the quoted bid price and are generally classified as Level 2.
| 36 | NUVEEN |
Investments in investment companies are valued at their respective NAVs on valuation date and are generally classified as Level 1.
Repurchase agreements are valued at contract amount plus accrued interest, which approximates market value. These securities are generally classified as Level 2.
Futures contracts are valued using the closing settlement price or, in the absence of such a price, the last traded price and are generally classified as Level 1.
Investments initially valued in currencies other than the U.S. dollar are converted to the U.S. dollar using exchange rates obtained from pricing services. As a result, the NAV of the Fund’s shares may be affected by changes in the value of currencies in relation to the U.S. dollar. The value of securities traded in markets outside the United States or denominated in currencies other than the U.S. dollar may be affected significantly on a day that the NYSE is closed and an investor is not able to purchase, redeem or exchange shares. If significant market events occur between the time of determination of the closing price of a foreign security on an exchange and the time that the Fund’s NAV is determined, or if under the Fund’s procedures, the closing price of a foreign security is not deemed to be reliable, the security would be valued at fair value as determined in accordance with procedures established in good faith by the Board. These securities are generally classified as Level 2 or Level 3 depending on the priority of the significant inputs.
Commercial and multifamily whole loans are generally fair valued using a discounted cash flow methodology designed to incorporate, among other things, the present value of the projected stream of cash flows for such investments (the “discounted cash flow” methodology). For commercial and multifamily whole loans, the discounted cash flow methodology takes into account a number of relevant factors, including changes in prevailing interest rates, yield spreads, the borrower’s creditworthiness (i.e. the debt service coverage ratio), lien position, delinquency status, and the projected rate of prepayments. For first lien loans, if the resulting price from the discounted cash flow methodology is lower than the current average loss recovery on commercial mortgage-backed securities (the “price floor”), the loan will be fair valued at the price floor (the “price floor” methodology). In addition, for all loans, if the resulting price from the discounted cash flow methodology is above the loan’s par value plus any prepayment penalty (the “price ceiling”), the loan will be fair valued at the price ceiling (the “anticipated recovery rate” methodology). Newly purchased loans are initially fair valued at their purchase price and subsequently fair valued using the discounted cash flow methodology. Loans with a pending short payoff will be fair valued at the anticipated recovery rate. If the Fund’s Valuation Committee, as described below, concludes that the fundamentals of a loan or its underlying collateral do not support the use of the discounted cash flow, price ceiling or price floor methodologies, a fair value determination may be made that incorporates other relevant factors (e.g., third-party appraisal of loan collateral). Valuations of commercial and multifamily whole loans are determined no less frequently than weekly. Although the Adviser believes the pricing methodologies to be reasonable and appropriate, the actual values that may be realized upon a current sale of commercial and multifamily whole loans can only be determined in negotiations between the Fund and third parties, and may vary significantly from fair value prices used by the Fund.
The significant unobservable inputs used in the determination of fair value using the discounted cash flow methodology for commercial and multifamily whole loans include yield and liquidity spreads and debt service coverage ratios, ceilings, floors and appraisals. Significant increases (decreases) in yield and liquidity spreads would result in lower (higher) fair values. A significant decrease (increase) in the debt service coverage ratio of a loan’s borrower could result in lower (higher) fair values.
Single family whole loans are generally fair valued using the discounted cash flow methodology. For single family whole loans, the pricing methodology takes into account a number of relevant factors, including changes in prevailing interest rates, yield spreads, delinquency status, loan to value ratios, lien position, and prepayment speeds. If the resulting price from the discounted cash flow methodology is above 103% of the loan’s par value (the “price ceiling”), the loan will be fair valued at the price ceiling (the “price ceiling” methodology). Valuations of single family whole loans are determined no less frequently than weekly. Although the Adviser believes the pricing methodologies to be reasonable and appropriate, the actual values that may be realized upon a current sale of single family whole loans can only be determined in negotiations between the Fund and third parties, and may vary significantly from fair value prices used by the Fund.
The significant unobservable input used in the determination of fair value using the discounted cash flow methodology for single family whole loans is the yield spread. Significant increases (decreases) in yield spreads would result in lower (higher) fair values.
Corporate notes are fair valued using the discounted cash flow methodology. For corporate notes, the discounted cash flow methodology takes into account changes in prevailing interest rates, yield and liquidity spreads. If the resulting price from the discounted cash flow methodology is above the note’s par value plus any prepayment penalty (the “price ceiling”), the note will be fair valued at the price ceiling (the “price ceiling” methodology). Currently all corporate notes are fair valued at the price ceiling. Valuations of corporate notes are determined no less frequently than weekly. Although the Adviser believes the pricing methodologies to be reasonable and appropriate, the actual values that may be realized upon a current sale of corporate notes can only be determined in negotiations between the Fund and third parties, and may vary significantly from fair value prices used by the Fund.
The significant unobservable input used in the determination of fair value using the discounted cash flow methodology for corporate notes are yield and liquidity spreads. Significant increases (decreases) in yield and liquidity spreads would result in lower (higher) fair values.
| NUVEEN | 37 |
Notes to Financial Statements (continued)
Real estate owned properties are valued, whenever possible, using a third-party appraisal or broker’s opinion of value. If a third-party appraisal or broker’s opinion is not available, a property is valued at the current average loss recovery on commercial mortgage-backed securities (the “average recovery rate” methodology). There were no real estate owned properties held by the Fund as of the end of the reporting period.
Certain securities may not be able to be priced by the pre-established pricing methods as described above. Such securities may be valued by the Board and/or its appointee at fair value. These securities generally include, but are not limited to, restricted securities (securities which may not be publicly sold without registration under the Securities Act of 1933, as amended) for which a pricing service is unable to provide a market price; securities whose trading has been formally suspended; debt securities that have gone into default and for which there is no current market quotation; a security whose market price is not available from a pre-established pricing source; a security with respect to which an event has occurred that is likely to materially affect the value of the security after the market has closed but before the calculation of the Fund’s NAV (as may be the case in non-U.S. markets on which the security is primarily traded) or make it difficult or impossible to obtain a reliable market quotation; and a security whose price, as provided by the pricing service, is not deemed to reflect the security’s fair value. As a general principle, the fair value of a security would appear to be the amount that the owner might reasonably expect to receive for it in a current sale. A variety of factors may be considered in determining the fair value of such securities, which may include consideration of the following: yields or prices of investments of comparable quality, type of issue, coupon, maturity and rating, market quotes or indications of value from security dealers, evaluations of anticipated cash flows or collateral, general market conditions and other information and analysis, including the obligor’s credit characteristics considered relevant. These securities are generally classified as Level 2 or Level 3 depending on the priority of the significant inputs. Regardless of the method employed to value a particular security, all valuations are subject to review by the Board and/or its appointee.
The inputs or methodologies used for valuing securities are not an indication of the risks associated with investing in those securities. The following is a summary of the Fund’s fair value measurements as of the end of the reporting period:
| Level 1 | Level 2 | Level 3 | Total | |||||||||||||
Long-Term Investments:* | ||||||||||||||||
Whole Loans | $ | — | $ | — | $ | 35,794,041 | ** | $ | 35,794,041 | |||||||
Corporate Notes | — | — | 8,000,000 | ** | 8,000,000 | |||||||||||
Common Stocks | 188,255,608 | — | — | 188,255,608 | ||||||||||||
Convertible Preferred Securities | 17,952,572 | 3,719,101 | ** | — | 21,671,673 | |||||||||||
$25 Par (or similar) Retail Preferred | 97,763,009 | 7,952,964 | ** | — | 105,715,973 | |||||||||||
Convertible Bonds | — | 2,796,000 | — | 2,796,000 | ||||||||||||
Corporate Bonds | — | 65,200,538 | — | 65,200,538 | ||||||||||||
Common Stock Rights | 1,009 | — | — | 1,009 | ||||||||||||
$1,000 Par (or similar) Institutional Preferred | — | 23,500,656 | — | 23,500,656 | ||||||||||||
Investment Companies | 3,861,912 | — | — | 3,861,912 | ||||||||||||
Short-Term Investments: | ||||||||||||||||
Repurchase Agreements | — | 15,336,834 | — | 15,336,834 | ||||||||||||
Total | $ | 307,834,110 | $ | 118,506,093 | $ | 43,794,041 | $ | 470,134,244 | ||||||||
| * | Refer to the Fund’s portfolio of investments for whole loan categories and industry classifications. |
| ** | Refer to the Fund’s Portfolio of Investments for securities classified as Level 2 and/or Level 3, where applicable. |
The following is a reconciliation of the Fund’s Level 3 investments held at the beginning and end of the measurement period:
| Level 3 | ||||||||||||
| Whole Loans | Corporate Notes | Total | ||||||||||
Balance at the beginning of period | $ | 119,325,282 | $ | 14,580,000 | $ | 133,905,282 | ||||||
Gains (losses): | ||||||||||||
Net realized gains (losses) | (18,961,585 | ) | — | (18,961,585 | ) | |||||||
Change in net unrealized appreciation (depreciation) | 7,750,923 | (80,000 | ) | 7,670,923 | ||||||||
Purchases at cost | 55,614 | — | 55,614 | |||||||||
Sales at proceeds | (72,962,550 | ) | (6,500,000 | ) | (79,462,550 | ) | ||||||
Net discounts (premiums) | 586,357 | — | 586,357 | |||||||||
Transfers into | — | — | — | |||||||||
Transfers (out of) | — | — | — | |||||||||
Balance at the end of period | $ | 35,794,041 | $ | 8,000,000 | $ | 43,794,041 | ||||||
Change in net unrealized appreciation (depreciation) during the period of Level 3 securities held as of the end of the reporting period | $ | (7,564,540 | ) | $ | (80,000 | ) | $ | (7,644,540 | ) | |||
| 38 | NUVEEN |
The valuation techniques and significant unobservable inputs used in recurring Level 3 fair value measurements of assets as of the end of the reporting period, were as follows:
| Market Value | Techniques | Unobservable Inputs | Range | |||||||||
Commercial & Multifamily Whole Loans | $ | 1,754,246 | Discounted Cash Flow | Yield Spread | 2.915% - 3.015 | % | ||||||
| Discounted Cash Flow | Liquidity Spread | 0.50 | % | |||||||||
| Discounted Cash Flow | Debt Service Coverage Ratio | 0.00 - 1.00 | ||||||||||
| 9,751,160 | Appraisals | N/A | N/A | |||||||||
| 11,516,273 | Expected Value | N/A | N/A | |||||||||
Commercial & Multifamily Whole Loans and Corporate Notes | 19,716,499 | Price Ceiling | Cap | 100.00 | ||||||||
Commercial Whole Loans | 1,055,863 | Price Floor | (1-Loss Severity) | 56.8 | % | |||||||
Total | $ | 43,794,041 | ||||||||||
The table below presents the transfers in and out of the three valuation levels for the Fund as of the end of the reporting period when compared to the valuation levels as of the end of the previous fiscal year. Changes in valuation inputs or methodologies may result in transfers into or out of an assigned level within the fair value hierarchy. Transfers in or out of levels are generally due to the availability of publicly available information and to the significance or extent the Adviser determines that the valuation inputs or methodologies may impact the valuation of those securities.
| Level 1 | Level 2 | Level 3 | ||||||||||||||||||||||
| Transfers In | (Transfers Out) | Transfers In | (Transfers Out) | Transfers In | (Transfers Out) | |||||||||||||||||||
Common Stock | $ | 58,295,411 | $ | — | $ | — | $ | (58,295,411 | ) | $ | — | $ | — | |||||||||||
$25 Par (or similar) Retail Preferred | — | (2,934,773 | ) | 2,934,773 | — | — | — | |||||||||||||||||
The Board is responsible for the valuation process and has appointed the oversight of the daily valuation process to the Adviser’s Valuation Committee. The Valuation Committee, pursuant to the valuation policies and procedures adopted by the Board, is responsible for making fair value determinations, evaluating the effectiveness of the Fund’s pricing policies and reporting to the Board. The Valuation Committee is aided in its efforts by the Adviser’s dedicated Securities Valuation Team, which is responsible for administering the daily valuation process and applying fair value methodologies as approved by the Valuation Committee. When determining the reliability of independent pricing services for investments owned by the Fund, the Valuation Committee, among other things, conducts due diligence reviews of the pricing services and monitors the quality of security prices received through various testing reports conducted by the Securities Valuation Team.
The Valuation Committee will consider pricing methodologies it deems relevant and appropriate when making a fair value determination, based on the facts and circumstances specific to the portfolio instrument. Fair value determinations generally will be derived as follows, using public or private market information:
| (i) | If available, fair value determinations shall be derived by extrapolating from recent transactions or quoted prices for identical or comparable securities. |
| (ii) | If such information is not available, an analytical valuation methodology may be used based on other available information including, but not limited to: analyst appraisals, research reports, corporate action information, issuer financial statements and shelf registration statements. Such analytical valuation methodologies may include, but are not limited to: multiple of earnings, discount from market value of a similar freely-traded security, discounted cash flow analysis, book value or a multiple thereof, risk premium/yield analysis, yield to maturity and/or fundamental investment analysis. |
The purchase price of a portfolio instrument will be used to fair value the instrument only if no other valuation methodology is available or deemed appropriate, and it is determined that the purchase price fairly reflects the instrument’s current value.
For each portfolio security that has been fair valued pursuant to the policies adopted by the Board, the fair value price is compared against the last available and next available market quotations. The Valuation Committee reviews the results of such testing and fair valuation occurrences are reported to the Board.
| NUVEEN | 39 |
Notes to Financial Statements (continued)
3. Portfolio Securities and Investments in Derivatives
Portfolio Securities
Foreign Currency Transactions
To the extent that the Fund may invest in securities and/or contracts that are denominated in a currency other than U.S. dollars, the Fund will be subject to currency risk, which is the risk that an increase in the U.S. dollar relative to the foreign currency will reduce returns or portfolio value. Generally, when the U.S. dollar rises in value against a foreign currency, the Fund’s investments denominated in that currency will lose value because its currency is worth fewer U.S. dollars; the opposite effect occurs if the U.S. dollar falls in relative value. Investments and other assets and liabilities denominated in foreign currencies are converted into U.S. dollars on a spot (i.e. cash) basis at the spot rate prevailing in the foreign currency exchange market at the time of valuation. Purchases and sales of investments and income denominated in foreign currencies are translated into U.S. dollars on the respective dates of such transactions.
As of the end of the reporting period, the Fund’s investments in non-U.S. securities were as follows:
| Value | % of Total Investments | |||||||
Country: | ||||||||
Canada | $ | 28,653,939 | 6.1 | % | ||||
United Kingdom | 25,456,113 | 5.4 | ||||||
Australia | 25,237,332 | 5.4 | ||||||
Singapore | 14,583,845 | 3.1 | ||||||
Hong Kong | 12,460,174 | 2.7 | ||||||
Italy | 11,145,933 | 2.4 | ||||||
Other | 46,447,536 | 9.8 | ||||||
Total non-U.S. Securities | 163,984,872 | 34.9 | % | |||||
The books and records of the Fund are maintained in U.S. dollars. Foreign currencies, assets and liabilities are translated into U.S. dollars at 4:00 p.m. Eastern Time. Investment transactions, income and expenses are translated on the respective dates of such transactions. Net realized foreign currency gains and losses resulting from changes in exchange rates include foreign currency gains and losses between trade date and settlement date of the transactions, foreign currency transactions and the difference between the amounts of interest and dividends recorded on the books of the Fund and the amounts actually received.
The realized gains and losses resulting from changes in foreign currency exchange rates and changes in foreign exchange rates associated with (i) foreign currency, (ii) investments, (iii) investments in derivatives and (iv) other assets and liabilities are recognized as a component of “Net realized gain (loss) from investments and foreign currency” on the Statement of Operations, when applicable.
The unrealized gains and losses resulting from changes in foreign currency exchange rates and changes in foreign exchange rates associated with (i) investments and (ii) other assets and liabilities are recognized as a component of “Change in net unrealized appreciation (depreciation) of investments and foreign currency” on the Statement of Operations, when applicable. The unrealized gains and losses resulting from changes in foreign exchange rates associated with investments in derivatives are recognized as a component of the respective derivative’s related “Change in net unrealized appreciation (depreciation)” on the Statement of Operations, when applicable.
Whole Loans
Whole loans and participating mortgages may bear a greater risk of loss arising from a default on the part of the borrower of the underlying loans than do traditional mortgage-backed securities. This is because whole loans and participating mortgages, unlike most mortgage-backed securities, generally are not backed by any government guarantee or private credit enhancement. Such risk may be greater during a period of declining or stagnant real estate values.
The Funds may invest in single family, multi-family and commercial loans. A participating loan is a whole loan that contains provisions for the lender to participate in the income stream provided by the property, including net cash flow and capital proceeds. An outstanding participating loan agreement may provide excess cash flows and certain appreciation rights after the mortgage obligation has been fully paid and before the sale of the property to a third party.
On occasion real estate property may be acquired through foreclosure or deed in lieu of foreclosure on whole loans or similar obligations. The Fund may incur costs and delays or loss in the collection of principal and/or interest to which it is entitled in the event of such foreclosure. Also there is no assurance that the subsequent sale of the foreclosed property will produce an amount equal to the sum of the unpaid principal balance of the loan as of the date the borrower went into default, the accrued unpaid interest, and all of the foreclosure expenses. In such case, the Fund may suffer a loss.
| 40 | NUVEEN |
The Fund may also receive rental or other income as a result of holding real estate. This income would generally fail to meet the test for “qualifying income” set forth in Section 851 of the Internal Revenue Code and could result in adverse tax consequences to the Fund. In addition; the Fund may incur expenses associated with maintaining or improving any real estate owned. When such events occur, real estate income is recognized on a net basis on the Statement of Operations and capital improvements are recorded as an addition to the cost basis of the property, which will increase any loss at sale.
As of the end of the reporting period, the Fund did not own any real estate property.
The delinquency loan profile as to the timely payment of principal and interest of the whole loans in which the Fund was invested as of the end of the reporting period is as follows:
| Current | 30 Days | 60 Days | 90 Days | 120+ Days | Total | |||||||||||||||||||||||||||||||||||||||||||
| Whole Loan Category | Value | %* | Value | %* | Value | %* | Value | %* | Value | %* | Value | % | ||||||||||||||||||||||||||||||||||||
Multi-family loans | $ | 7,600,006 | 65.3 | % | $ | — | — | % | $ | — | — | % | $ | — | — | % | $ | 4,039,494 | 34.7 | % | $ | 11,639,500 | 100 | % | ||||||||||||||||||||||||
Commercial loans | 18,404,741 | 76.2 | — | — | — | — | — | — | 5,749,800 | 23.8 | 24,154,541 | 100 | ||||||||||||||||||||||||||||||||||||
| * | As a of percentage of the total value of the whole loan category as of the end of the reporting period. |
Repurchase Agreements
In connection with transactions in repurchase agreements, it is the Fund’s policy that its custodian take possession of the underlying collateral securities, the fair value of which exceeds the principal amount of the repurchase transaction, including accrued interest, at all times. If the counterparty defaults, and the fair value of the collateral declines, realization of the collateral may be delayed or limited.
The following table presents the repurchase agreements for the Fund that are subject to netting agreements as of the end of the reporting period, and the collateral delivered related to those repurchase agreements.
| Counterparty | Short-Term Investments, at Value | Collateral Pledged (From) Counterparty* | Net Exposure | |||||||||
Fixed Income Clearing Corporation | $ | 15,336,834 | $ | (15,336,834 | ) | $ | — | |||||
| * | As of the end of the reporting period, the value of the collateral pledged from the counterparty exceeded the value of the repurchase agreements. Refer to the Fund’s Portfolio of Investments for details on the repurchase agreements. |
Zero Coupon Securities
A zero coupon security does not pay a regular interest coupon to its holders during the life of the security. Income to the holder of the security comes from accretion of the difference between the original purchase price of the security at issuance and the par value of the security at maturity and is effectively paid at maturity. The market prices of zero coupon securities generally are more volatile than the market prices of securities that pay interest periodically.
Investments in Derivatives
The Fund is authorized to invest in certain derivative instruments, such as futures, options and swap contracts. The Fund limits its investments in futures, options on futures and swap contracts to the extent necessary for the Adviser to claim the exclusion from registration by the Commodity Futures Trading Commission as a commodity pool operator with respect to the Fund. The Fund records derivative instruments at fair value, with changes in fair value recognized on the Statement of Operations, when applicable. Even though the Fund’s investments in derivatives may represent economic hedges, they are not considered to be hedge transactions for financial reporting purposes.
Futures Contracts
Upon execution of a futures contract, the Fund is obligated to deposit cash or eligible securities, also known as “initial margin,” into an account at its clearing broker equal to a specified percentage of the contract amount. Cash held by the broker to cover initial margin requirements on open futures contracts, if any, is recognized as “Cash collateral at brokers” on the Statement of Assets and Liabilities. Investments in futures contracts obligate the Fund and the clearing broker to settle monies on a daily basis representing changes in the prior days “mark-to-market” of the open contracts. If the Fund has unrealized appreciation the clearing broker would credit the Fund’s account with an amount equal to appreciation and conversely if the Fund has unrealized depreciation the clearing broker would debit the Fund’s account with an amount equal to depreciation. These daily cash settlements are also known as “variation margin.” Variation margin is recognized as a receivable and/or payable for “Variation margin on futures contracts” on the Statement of Assets and Liabilities.
During the period the futures contract is open, changes in the value of the contract are recognized as an unrealized gain or loss by “marking-to-market” on a daily basis to reflect the changes in market value of the contract, which is recognized as a component of “Change in net unrealized appreciation (depreciation) of futures contracts” on the Statement of Operations. When the contract is closed or expired, the Fund records a realized gain or loss equal
| NUVEEN | 41 |
Notes to Financial Statements (continued)
to the difference between the value of the contract on the closing date and value of the contract when originally entered into, which is recognized as a component of “Net realized gain (loss) from futures contracts” on the Statement of Operations.
Risks of investments in futures contracts include the possible adverse movement in the price of the securities or indices underlying the contracts, the possibility that there may not be a liquid secondary market for the contracts and/or that a change in the value of the contract may not correlate with a change in the value of the underlying securities or indices.
During the current fiscal period, the Fund shorted U.S. Treasury futures contracts for a portion of the reporting period to hedge against potential increases in interest rates.
The average notional amount of futures contracts outstanding during the current fiscal period was as follows:
Average notional amount of futures contracts outstanding* | $ | 6,511,108 |
| * | The average notional amount is calculated based on the absolute aggregate notional amount of contracts outstanding at the beginning of the fiscal period and at the end of each fiscal quarter within the current fiscal period. |
The following table presents the amount of net realized gain (loss) and change in net unrealized appreciation (depreciation) recognized on futures contracts on the Statement of Operations during the current fiscal period, and the primary underlying risk exposure.
| Underlying Risk Exposure | Derivative Instrument | Net Realized Gain (Loss) from Futures Contracts | Change in Net Unrealized Appreciation (Depreciation) of Futures Contracts | |||||||
| Interest rate | Futures contracts | $ | (143,895 | ) | $ | 41,626 | ||||
Market and Counterparty Credit Risk
In the normal course of business the Fund may invest in financial instruments and enter into financial transactions where risk of potential loss exists due to changes in the market (market risk) or failure of the other party to the transaction to perform (counterparty credit risk). The potential loss could exceed the value of the financial assets recorded on the financial statements. Financial assets, which potentially expose the Fund to counterparty credit risk, consist principally of cash due from counterparties on forward, option and swap transactions, when applicable. The extent of the Fund’s exposure to counterparty credit risk in respect to these financial assets approximates its carrying value as recorded on the Statement of Assets and Liabilities.
The Fund helps manage counterparty credit risk by entering into agreements only with counterparties the Adviser believes have the financial resources to honor their obligations and by having the Adviser monitor the financial stability of the counterparties. Additionally, counterparties may be required to pledge collateral daily (based on the daily valuation of the financial asset) on behalf of the Fund with a value approximately equal to the amount of any unrealized gain above a pre-determined threshold. Reciprocally, when the Fund has an unrealized loss, the Fund has instructed the custodian to pledge assets of the Fund as collateral with a value approximately equal to the amount of the unrealized loss above a pre-determined threshold. Collateral pledges are monitored and subsequently adjusted if and when the valuations fluctuate, either up or down, by at least the pre-determined threshold amount.
4. Fund Shares
Share Repurchase Program
The Board has authorized the Fund to participate in Nuveen’s closed-end fund complex-wide share repurchase program. Under the share repurchase program, the Fund may repurchase up to 10% of its outstanding shares as of the authorization date (approximately 2,535,000 shares) in open-market transactions at the Adviser’s discretion.
Tender Offers
The Board has authorized the Fund to conduct a series of up to three tender offers pursuant to which the Fund would offer to purchase up to 10% of its then outstanding shares for cash on a pro rata basis at a price per share equal to 99% of the NAV per share as determined as of the close of regular trading on the NYSE on the expiration date of the tender offer.
On September 23, 2014, Nuveen announced the Fund’s first tender offer, which commenced on October 3, 2014 and expired on November 7, 2014. The tender offer was oversubscribed (66% of outstanding shares were tendered), and therefore the Fund purchased 10% of its outstanding shares from participating shareholders on a pro-rata basis based on the number of shares properly tendered.
On March 24, 2015, Nuveen announced the Fund’s second tender offer, which commenced on April 6, 2015 and expired on May 8, 2015. The tender offer was oversubscribed (59% of outstanding shares were tendered), and therefore the Fund purchased 10% of its outstanding shares from participating shareholders on a pro-rata basis based on the number of shares properly tendered.
On October 22, 2015, Nuveen announced the Fund’s third and final tender offer, which commenced on November 2, 2015 and expired on December 1, 2015. The tender offer was oversubscribed (55% of outstanding shares were tendered), and therefore the Fund purchased 10% of its outstanding shares from participating shareholders on a pro-rata basis based on the number of shares properly tendered.
| 42 | NUVEEN |
The final results of each tender offer are as shown in the accompanying table.
| November 7, 2014 Expiration | May 8, 2015 Expiration | December 1, 2015 Expiration | ||||||||||
Number of shares outstanding before tender offer | 25,344,382 | 22,683,944 | 20,241,550 | |||||||||
Number of shares authorized for tender offer | 2,534,438 | 2,268,394 | 2,024,155 | |||||||||
Purchase price (99% of share NAV on expiration date) | $19.8695 | $19.9754 | $18.1494 | |||||||||
Number of shares outstanding after tender offer | 22,809,944 | 20,415,550 | 18,217,395 | |||||||||
Share Transactions
Transactions in shares (excluding shares owned by the Adviser) during the current and prior fiscal periods were as follows:
| Year Ended 5/31/16 | Period 9/08/14 (commencement of operations) through 5/31/15 | |||||||
Shares:* | ||||||||
Issued in mergers | — | 25,344,380 | ||||||
Repurchased and retired (open market purchases) | (496,500 | ) | (126,000 | ) | ||||
Repurchased and retired through tender offer November 7, 2014 expiration | — | (2,534,438 | ) | |||||
Repurchased and retired through tender offer May 8, 2015 expiration | — | (2,268,394 | ) | |||||
Repurchased and retired through tender offer December 1, 2015 expiration | (2,024,155 | ) | — | |||||
Total | (2,520,655 | ) | 20,415,548 | |||||
Open market purchases: | ||||||||
Weighted average price per share | $ | 15.41 | $ | 17.29 | ||||
Weighted average discount per share | 14.63 | % | 12.99 | % | ||||
| * | As of May 31, 2015 and May 31, 2016, the Adviser and Sub-Adviser each owned one share of the Fund. |
Tender Offers: | ||||||||||||
Expiration | November 7, 2014 | May 8, 2015 | December 1, 2015 | |||||||||
Purchase price per share | $19.8695 | $19.9754 | $18.1494 | |||||||||
Discount per share | 1.00 | % | 1.00 | % | 1.00 | % |
5. Investment Transactions
Long-term purchases and sales (including maturities but excluding derivative transactions) during the current fiscal period aggregated $409,211,722 and $494,627,356, respectively.
6. Income Tax Information
The Fund intends to distribute substantially all of its investment company taxable income to shareholders and to otherwise comply with the requirements of Subchapter M of the Internal Revenue Code applicable to regulated investment companies. In any year when the Fund realizes net capital gains, the Fund may choose to distribute all or a portion of its net capital gains to shareholders, or alternatively, to retain all or a portion of its net capital gains and pay federal corporate income taxes on such retained gains.
For all open tax years and all major taxing jurisdictions, management of the Fund has concluded that there are no significant uncertain tax positions that would require recognition in the financial statements. Open tax years are those that are open for examination by taxing authorities (i.e., generally the last four tax year ends and the interim tax period since then). Furthermore, management of the Fund is also not aware of any tax positions for which it is reasonably possible that the total amounts of unrecognized tax benefits will significantly change in the next twelve months.
The following information is presented on an income tax basis. Differences between amounts for financial statement and federal income tax purposes are primarily due to timing differences in recognizing certain gains and losses on investment transactions. To the extent that differences arise that are permanent in nature, such amounts are reclassified within the capital accounts as detailed below. Temporary differences do not require reclassification. Temporary and permanent differences do not impact the NAV of the Fund.
| NUVEEN | 43 |
Notes to Financial Statements (continued)
As of May 31, 2016, the cost and unrealized appreciation (depreciation) of investments, as determined on a federal income tax basis, were as follows:
Cost of investments | $ | 490,831,324 | ||
Gross unrealized: | ||||
Appreciation | $ | 21,159,019 | ||
Depreciation | (41,856,099 | ) | ||
Net unrealized appreciation (depreciation) of investments | $ | (20,697,080 | ) |
Permanent differences, primarily due to federal taxes paid, bond premium amortization adjustments, complex securities character adjustments, foreign currency transactions, investments in partnerships, investments in passive foreign investment companies, paydowns and nondeductible offering costs, resulted in reclassifications among the Fund’s components of net assets as of May 31, 2016, the Fund’s tax year end, as follows:
Paid-in surplus | $(188,498) | |||
Undistributed (Over-distribution of) net investment income | (618,453 | ) | ||
Accumulated net realized gain (loss) | 806,951 | |||
| The tax components of undistributed net ordinary income and net long-term capital gains as of May 31, 2016, the Fund’s tax year end, were as follows: | ||||
Undistributed net ordinary income1 | $ | 3,250,647 | ||
Undistributed net long-term capital gains | — | |||
1 Net ordinary income consists of net taxable income derived from dividends, interests, and net short-term capital gains, if any. Undistributed net ordinary income (on a tax basis) has not been reduced for the dividend declared on May 11, 2016 and paid on June 1, 2016. |
| |||
| The tax character of distributions paid during the Fund’s tax years ended May 31, 2016 and May 31, 2015, was designated for purposes of the dividends paid deduction as follows: | ||||
| 2016 | ||||
Distributions from net ordinary income2 | $ | 32,196,361 | ||
Distributions from net long-term capital gains | — | |||
| For the period September 8, 2014 (commencement of operations) through May 31, 2015 | ||||
Distributions from net ordinary income2 | $ | 21,131,440 | ||
Distributions from net long-term capital gains | — | |||
2 Net ordinary income consists of net taxable income derived from dividends, interest and current year earnings and profits attributable to short-term realized gains. |
| |||
As of May 31, 2016, the Fund’s tax year end, the Fund had unused capital loss carryforwards available for federal income tax purposes to be applied against future capital gains, if any. If not applied, the carryforwards will expire as shown in the following table.
Capital losses to be carried forward – not subject to expiration | $80,413,610 |
A portion of the Fund’s capital loss carryforwards are subject to an annual limitation under the Internal Revenue Code and related regulations.
7. Management Fees and Other Transactions with Affiliates
Management Fees
The Fund’s management fee compensates the Adviser for overall investment advisory and administrative services and general office facilities. The Sub-Adviser is compensated for its services to the Fund from the management fees paid to the Adviser.
The Fund’s management fee consists of two components – a fund-level fee, based only on the amount of assets within the Fund, and a complex-level fee, based on the aggregate amount of all eligible fund assets managed by the Adviser. This pricing structure enables Fund shareholders to benefit from growth in the assets within the Fund as well as from growth in the amount of complex-wide assets managed by the Adviser.
The annual Fund-level fee, payable monthly, is calculated according to the following schedule:
| Average Daily Managed Assets* | Fund-Level Fee | |||
For the first $125 million | 0.8000 | % | ||
For the next $125 million | 0.7875 | |||
For the next $250 million | 0.7750 | |||
For the next $500 million | 0.7625 | |||
For managed assets over $1 billion | 0.7500 | |||
| 44 | NUVEEN |
The annual complex-level fee, payable monthly, is calculated by multiplying the current complex-wide fee rate, determined according to the following schedule by the Fund’s daily managed assets:
| Complex-Level Managed Asset Breakpoint Level* | Effective Rate at Breakpoint Level | |||
$55 billion | 0.2000 | % | ||
$56 billion | 0.1996 | |||
$57 billion | 0.1989 | |||
$60 billion | 0.1961 | |||
$63 billion | 0.1931 | |||
$66 billion | 0.1900 | |||
$71 billion | 0.1851 | |||
$76 billion | 0.1806 | |||
$80 billion | 0.1773 | |||
$91 billion | 0.1691 | |||
$125 billion | 0.1599 | |||
$200 billion | 0.1505 | |||
$250 billion | 0.1469 | |||
$300 billion | 0.1445 | |||
| * | For the complex-level fees, managed assets include closed-end fund assets managed by the Adviser that are attributable to certain types of leverage. For these purposes, leverage includes the funds’ use of preferred stock and borrowings and certain investments in the residual interest certificates (also called inverse floating rate securities) in tender option bond (TOB) trusts, including the portion of assets held by a TOB trust that has been effectively financed by the trust’s issuance of floating rate securities, subject to an agreement by the Adviser as to certain funds to limit the amount of such assets for determining managed assets in certain circumstances. The complex-level fee is calculated based upon the aggregate daily managed assets of all Nuveen funds that constitute “eligible assets.” Eligible assets do not include assets attributable to investments in other Nuveen funds or assets in excess of a determined amount (originally $2 billion) added to the Nuveen fund complex in connection with the Adviser’s assumption of the management of the former First American Funds effective January 1, 2011. As of May 31, 2016, the complex-level fee for the Fund was 0.1621%. |
The Adviser has agreed to waive fees and/or reimburse expenses of the Fund through September 8, 2016, so that total annual Fund operating expenses, after fee waivers and/or expense reimbursements and excluding any costs of leverage and expenses related to the Fund’s tender offers, do not exceed 1.02% of the Fund’s average net assets.
Other Transactions with Affiliates
The Fund pays no compensation directly to those of its trustees who are affiliated with the Adviser or to its officers, all of whom receive remuneration for their services to the Fund from the Adviser or its affiliates.
8. Borrowing Arrangements
The Fund has entered into borrowings arrangements as a means of leverage.
During the current fiscal period, the Fund was entered into a 364-day $122,000,000 (maximum commitment amount) term loan (“Term Loan”) and a $38,000,000 (maximum commitment amount) revolving line of credit (“Line of Credit”), each with Sumitomo Mitsui Banking Corporation (“Sumitomo”) (collectively, the “Borrowings”). As of the end of the reporting period, the outstanding balance on these Borrowings was $136,300,000.
On December 18, 2015, the Fund renewed its Borrowings with Sumitomo through December 18, 2016. In addition, the Fund decreased the maximum commitment amount on the Term Loan from $132,500,000 to $122,000,000. All other terms of the Borrowings remained unchanged.
Interest is charged on the Term Loan and the Line of Credit at a rate per annum equal to the three-month LIBOR plus 0.65% and the one-month LIBOR or three-month LIBOR plus 0.65%, respectively. In addition to interest, the Fund also accrues a 0.125% per annum commitment fee on the undrawn portion of the Borrowings. During the current fiscal period, the average daily balance outstanding and average annual interest rate on these Borrowings were $151,015,366 and 1.06%, respectively.
In order to maintain these Borrowings, the Fund must meet certain collateral, asset coverage and other requirements. Borrowings outstanding are fully secured by securities held in the Fund’s portfolio of investments.
Borrowings outstanding are recognized as “Borrowings” on the Statement of Assets and Liabilities. Interest expense and other fees incurred on the drawn amount and undrawn balance are recognized as a component of “Interest expense on borrowings” on the Statement of Operations.
9. Subsequent Events
Total Return Swaps
Subsequent to the close of the reporting period, the Fund invested in total return swaps which modestly increased the overall effective leverage of the Fund. Under the terms of the swaps, the Fund receives the total return on an underlying basket of ETFs in exchange for periodic interest payments.
| NUVEEN | 45 |
Fund Information (Unaudited)
| Board of Trustees* | ||||||
| Roger A. Gibson | Leonard W. Kedrowski** | Richard K. Riederer | James M. Wade |
| * | The Fund’s Board of Trustees is comprised entirely of independent trustees. |
| ** | Chairman of the Board of Trustees |
Fund Manager Nuveen Fund Advisors, LLC 333 West Wacker Drive Chicago, IL 60606 | Custodians State Street Bank Boston, MA 02111
U.S. Bank National Association 1555 North RiverCenter Drive Suite 302 Milwaukee, WI 53202 | Legal Counsel Ropes & Gray LLP Chicago, IL 60606 | Independent Registered PricewaterhouseCoopers LLP One North Wacker Drive Chicago, IL 60606 | Transfer Agent and State Street Bank Nuveen Funds P.O. Box 43071 Providence, (800) 257-8787 | ||||
Quarterly Form N-Q Portfolio of Investments Information
The Fund is required to file its complete schedule of portfolio holdings with the Securities and Exchange Commission (SEC) for the first and third quarters of each fiscal year on Form N-Q. You may obtain this information directly from the SEC. Visit the SEC on-line at http://www.sec.gov or in person at the SEC’s Public Reference Room in Washington, D.C. Call the SEC toll-free at (800) SEC-0330 for room hours and operation.
Nuveen Funds’ Proxy Voting Information
You may obtain (i) information regarding how each fund voted proxies relating to portfolio securities held during the most recent twelve-month period ended June 30, without charge, upon request, by calling Nuveen toll-free at (800) 257-8787 or on Nuveen’s website at www.nuveen.com and (ii) a description of the policies and procedures that each fund used to determine how to vote proxies relating to portfolio securities without charge, upon request, by calling Nuveen toll free at (800) 257-8787. You may also obtain this information directly from the SEC. Visit the SEC on-line at http://www.sec.gov.
CEO Certification Disclosure
The Fund’s Chief Executive Officer (CEO) has submitted to the New York Stock Exchange (NYSE) the annual CEO certification as required by Section 303A.12(a) of the NYSE Listed Company Manual. The Fund has filed with the SEC the certification of its CEO and Chief Financial Officer required by Section 302 of the Sarbanes-Oxley Act.
Share Repurchases
The Fund intends to repurchase, through its open-market share repurchase program, shares of its own common shares of beneficial interest at such times and in such amounts as is deemed advisable. During the period covered by this report, the Fund repurchased shares of its common shares of beneficial interest (excluding common shares that may have been purchased through a tender offer), as shown in the accompanying table. Any future repurchases will be reported to shareholders in the next annual or semi-annual report.
| DRA | ||||
Shares repurchased | 496,500 | |||
Distribution Information
The Fund hereby designates its percentage of dividends paid from net ordinary income as dividends qualifying for the 70% dividends received deduction (“DRD”) for corporations and its percentage as qualified dividend income (“QDI”) for individuals under Section 1(h) (11) of the Internal Revenue Code as shown in the accompanying table. The actual qualified dividend income distributions will be reported to shareholders on Form 1099-DIV which will be sent to shareholders shortly after calendar year end.
| DRA | ||||
% DRD | 3.63% | |||
% QDI | 15.38% | |||
The Fund hereby designates its percentages of dividends paid from net ordinary income as dividends qualifying as Interest-Related Dividends as defined in Internal Revenue Code Section 871(k) for the taxable year ended May 31, 2016:
| DRA | ||||
% of Interest-Related Dividends | 38.16% | |||
FINRA BrokerCheck
The Financial Industry Regulatory Authority (FINRA) provides information regarding the disciplinary history of FINRA member firms and associated investment professionals. This information as well as an investor brochure describing FINRA BrokerCheck is available to the public by calling the FINRA BrokerCheck Hotline number at (800) 289-9999 or by visiting www.FlNRA.org.
| 46 | NUVEEN |
Used in this Report (Unaudited)
| n | Average Annual Total Return: This is a commonly used method to express an investment’s performance over a particular, usually multi-year time period. It expresses the return that would have been necessary each year to equal the investment’s actual cumulative performance (including change in NAV or market price and reinvested dividends and capital gains distributions, if any) over the time period being considered. |
| n | Custom Blended Index (Old Comparative Benchmark): A five index blend comprised of weightings approximating the Fund’s proposed portfolio. The Fund’s proposed portfolio may differ significantly from the blended portfolio and actual returns may be substantially lower. Benchmark returns do not include the effects of any sales charges or management fees. |
| Weighting Percentage | Index | Definition | ||
| 33% | S&P Global Infrastructure Index | An unmanaged index comprised of 75 of the largest publicly listed infrastructure companies that meet specific investability requirements. | ||
| 20% | BofA/Merrill Lynch REIT Preferred Index | An unmanaged index of investment grade REIT preferred shares with a deal size in excess of $100 million, weighted by capitalization and considered representative of investment grade preferred real estate stock performance. | ||
| 20% | Barclays U.S. Corporate High Yield Bond Index | An index that covers the U.S. dollar-denominated, non-investment grade, fixed-rate, taxable corporate bond market. | ||
| 15% | MSCI U.S. RElT Index | A free float-adjusted market capitalization weighted index that is comprised of equity REITs that are included in the MSCI U.S. Investable Market 2500 Index, with the exception of specialty equity RElTs that do not generate a majority of their revenue and income from real estate rental and leasing operations. This index represents approximately 85% of the U.S. REIT universe. | ||
| 12% | BofA/Merrill Lynch Fixed Rate Preferred Securities Index | Tracks the performance of fixed-rate U.S. dollar denominated preferred securities issued in the U.S. domestic market. Qualifying securities must be rated investment-grade (based on an average of Moody’s, S&P and Fitch) and must have an investment grade rated country of risk (based on an average of Moody’s, S&P and Fitch foreign currency long-term sovereign debt ratings). |
| n | Custom Blended Index (New Comparative Benchmark effective December 31, 2015): A five index blend comprised of weightings approximating the Fund’s proposed portfolio. The Fund’s proposed portfolio may differ significantly from the blended portfolio and actual returns may be substantially lower. Benchmark returns do not include the effects of any sales charges or management fees. |
| Weighting Percentage | Index | Definition | ||
| 28% | S&P Global Infrastructure Index | An unmanaged index comprised of 75 of the largest publicly listed infrastructure companies that meet specific investability requirements. | ||
| 21% | Financial Times Stock Exchange - European Public Real Estate Association/National Association of Real Estate Investments Trust (FTSE EPRA/NAREIT) Developed Index | An index designed to track the performance of listed real estate companies and REITs worldwide. | ||
| 18% | Wells Fargo Hybrid & Preferred Securities REIT Index | An Index designed to track the performance of preferred securities issued in the U.S. market by real estate investment trusts (REITs). The index is composed exclusively of preferred shares and depositary shares. | ||
| 15% | Barclays Global Capital Securities Index | An index that tracks fixed-rate, investment grade capital securities denominated in USD, EUR and GBP. | ||
| 18% | Barclays U.S. Corporate High Yield Bond Index | An index that covers the U.S. dollar-denominated, non-investment grade, fixed-rate, taxable corporate bond market. |
| NUVEEN | 47 |
Glossary of Terms Used in this Report (Unaudited) (continued)
| n | Effective Leverage: Effective leverage is a fund’s effective economic leverage, and includes both regulatory leverage (see below) and the leverage effects of certain derivative investments in the fund’s portfolio. |
| n | Gross Domestic Product (GDP): The total market value of all final goods and services produced in a country/region in a given year, equal to total consumer, investment and government spending, plus the value of exports, minus the value of imports. |
| n | Leverage: Leverage is created whenever a fund has investment exposure (both reward and/or risk) equivalent to more than 100% of the investment capital. |
| n | Morgan Stanley Capital International (MSCI) World Index: A free-float adjusted market capitalization-weighted index that is designed to measure equity market performance of developed markets. Index returns assume reinvestment of distributions, but do not include the effects of any applicable sales charges or management fees. |
| n | Net Asset Value (NAV) Per Share: A fund’s Net Assets is equal to its total assets (securities, cash, accrued earnings and receivables) less its total liabilities. NAV per share is equal to the fund’s Net Assets divided by its number of shares outstanding. |
| n | Regulatory Leverage: Regulatory leverage consists of preferred shares issued by or borrowings of a fund. Both of these are part of a fund’s capital structure. Regulatory leverage is subject to asset coverage limits set in the Investment Company Act of 1940. |
| 48 | NUVEEN |
Easily and Conveniently
Nuveen makes reinvesting easy. A phone call is all it takes to set up your reinvestment account.
Nuveen Closed-End Funds Automatic Reinvestment Plan
Your Nuveen Closed-End Fund allows you to conveniently reinvest distributions in additional Fund shares.
By choosing to reinvest, you’ll be able to invest money regularly and automatically, and watch your investment grow through the power of compounding. Just like distributions in cash, there may be times when income or capital gains taxes may be payable on distributions that are reinvested.
It is important to note that an automatic reinvestment plan does not ensure a profit, nor does it protect you against loss in a declining market.
Easy and convenient
To make recordkeeping easy and convenient, each quarter you’ll receive a statement showing your total distributions, the date of investment, the shares acquired and the price per share, and the total number of shares you own.
How shares are purchased
The shares you acquire by reinvesting will either be purchased on the open market or newly issued by the Fund. If the shares are trading at or above net asset value at the time of valuation, the Fund will issue new shares at the greater of the net asset value or 95% of the then-current market price. If the shares are trading at less than net asset value, shares for your account will be purchased on the open market. If the Plan Agent begins purchasing Fund shares on the open market while shares are trading below net asset value, but the Fund’s shares subsequently trade at or above their net asset value before the Plan Agent is able to complete its purchases, the Plan Agent may cease open-market purchases and may invest the uninvested portion of the distribution in newly-issued Fund shares at a price equal to the greater of the shares’ net asset value or 95% of the shares’ market value on the last business day immediately prior to the purchase date. Distributions received to purchase shares in the open market will normally be invested shortly after the distribution payment date. No interest will be paid on distributions awaiting reinvestment. Because the market price of the shares may increase before purchases are completed, the average purchase price per share may exceed the market price at the time of valuation, resulting in the acquisition of fewer shares than if the distribution had been paid in shares issued by the Fund. A pro rata portion of any applicable brokerage commissions on open market purchases will be paid by Plan participants. These commissions usually will be lower than those charged on individual transactions.
Flexible
You may change your distribution option or withdraw from the Plan at any time, should your needs or situation change.
You can reinvest whether your shares are registered in your name, or in the name of a brokerage firm, bank, or other nominee. Ask your investment advisor if his or her firm will participate on your behalf. Participants whose shares are registered in the name of one firm may not be able to transfer the shares to another firm and continue to participate in the Plan.
The Fund reserves the right to amend or terminate the Plan at anytime. Although the Fund reserves the right to amend the Plan to include a service charge payable by the participants, there is no direct service charge to participants in the Plan at this time.
Call today to start reinvesting distributions
For more information on the Nuveen Automatic Reinvestment Plan or to enroll in or withdraw from the Plan, speak with your financial advisor or call us at (800) 257-8787.
| NUVEEN | 49 |
Members & Officers
The management of the Fund, including general supervision of the duties performed for the Fund by the Adviser, is the responsibility of the Board of Trustees of the Fund. The number of trustees is currently set at four. None of the trustees who are not “interested” persons of the Fund (referred to herein as “independent trustees”) has ever been a director or employee of, or consultant to, Nuveen or its affiliates. The names and business addresses of the trustees and officers of the Fund, their principal occupations and other affiliations during the past five years, the number of portfolios each trustee oversees and other directorships trustees hold are set forth below.
Name, Year of Birth & Address | Position(s) Held with the Fund | Year First Elected or Appointed and Term(1) | Principal Occupation(s) Including other Directorships During Past 5 Years | Number of Portfolios in Nuveen Fund Complex Overseen by Board Member | ||||
| Independent Board Members: | ||||||||
n LEONARD W. KEDROWSKI | Owner and President, Executive and Management Consulting, Inc., a management consulting firm; Member, investment advisory committee, Sisters of the Good Shepherd; Certified Public Accountant; former Vice President, Chief Financial Officer, Treasurer, Secretary, and Director, Andersen Windows, a large privately-held manufacturer of wood windows; former Director, Protection Mutual Insurance Company, an international property and casualty insurer; Independent Board Member, First American Fund Complex since 1993. | |||||||
1941 901 Marquette Avenue Minneapolis, MN 55402 | Chairman and Board Member | 2014 (since inception) Term: annual | 1 | |||||
| ||||||||
| ||||||||
| ||||||||
| ||||||||
n ROGER A. GIBSON | Director, Charterhouse Group, Inc., a private equity firm, since October 2005; Advisor/Consultant, Future Freight™, a logistics/supply chain company; non-profit board member; prior to retirement in 2005, served in several executive positions for United Airlines, including Vice President and Chief Operating Officer – Cargo; Independent Board Member, First American Fund Complex since 1997. | |||||||
1946 901 Marquette Avenue Minneapolis, MN 55402 | Board Member | 2014 (since inception) Term: annual | 1 | |||||
| ||||||||
| ||||||||
n RICHARD K. RIEDERER | Owner and Chief Executive Officer, RKR Consultants, Inc., a consulting company providing advice on business strategy, mergers and acquisitions; Certified Financial Analyst; non-profit board member; former Chief Executive Officer and President, Weirton Steel Corporation; former Vice President and Treasurer, Harnischfeger Industries, a capital machinery manufacturer; former Treasurer and Director of Planning, Allis Chalmers Corporation, an equipment manufacturing company; former Chairman, American Iron & Steel Institute, a North American steel industry trade association; Independent Board Member, First American Fund Complex since 2001 and Firstar Funds 1988-2001. | |||||||
1944 901 Marquette Avenue Minneapolis, MN 55402 | Board Member | 2014 (since inception) Term: annual | 1 | |||||
| ||||||||
| ||||||||
| ||||||||
| ||||||||
| ||||||||
n JAMES M. WADE | Owner and President, Jim Wade Homes, a homebuilding company; formerly, Vice President and Chief Financial Officer, Johnson Controls, Inc.; Independent Board Member, First American Fund Complex since 2001 and Firstar Funds 1988-2001. | |||||||
1943 901 Marquette Avenue Minneapolis, MN 55402 | Board Member | 2014 (since inception) Term: annual | 1 | |||||
| 50 | NUVEEN |
Name, Year of Birth | Position(s) Held with the Fund | Year First Elected or Appointed(2) | Principal Occupation(s) During Past 5 Years | |||
| Officers of the Funds: | ||||||
n GIFFORD R. ZIMMERMAN | Managing Director (since 2002), and Assistant Secretary of Nuveen Securities, LLC; Managing Director (since 2004) and Assistant Secretary (since 1994) of Nuveen Investments, Inc.; Managing Director (since 2002), Assistant Secretary (since 1997) and Co-General Counsel (since 2011) of Nuveen Fund Advisors, LLC; Managing Director, Assistant Secretary and Associate General Counsel of Nuveen Asset Management, LLC (since 2011); Managing Director and Assistant Secretary of Nuveen Investments Advisers, LLC (since 2002) and Symphony Asset Management LLC (since 2003); Vice President and Assistant Secretary of NWQ Investment Management Company, LLC (since 2002), Santa Barbara Asset Management, LLC (since 2006), and of Winslow Capital Management, LLC, (since 2010); Vice President and Assistant Secretary (since 2013), formerly, Chief Administrative Officer and Chief Compliance Officer (2006-2013) of Nuveen Commodities Asset Management, LLC; Chartered Financial Analyst. | |||||
1956 333 W. Wacker Drive Chicago, IL 60606 | Chief Administrative Officer | 2014 (since inception) | ||||
n WILLIAM ADAMS IV | Co-Chief Executive Officer and Co-President (since March 2016), formerly, Senior Executive Vice President, Global Structured Products (2010-2016), prior thereto, Executive Vice President, U.S. Structured Products, (1999-2010) of Nuveen Investments, Inc.; Co-President of Nuveen Fund Advisors, LLC (since 2011); Co-Chief Executive Officer (since 2016), formerly, Senior Executive Vice President of Nuveen Securities, LLC; President (since 2011), of Nuveen Commodities Asset Management, LLC; Board Member of the Chicago Symphony Orchestra and of Gilda’s Club Chicago. | |||||
1955 333 W. Wacker Drive Chicago, IL 60606 | Vice President | 2014 (since inception) | ||||
n CEDRIC H. ANTOSIEWICZ | Managing Director of Nuveen Securities, LLC. (since 2004); Managing Director of Nuveen Fund Advisors, LLC (since 2014). | |||||
1962 333 W. Wacker Drive Chicago, IL 60606 | Vice President | 2014 (since inception) | ||||
n MARGO L. COOK | Co-Chief Executive Officer and Co-President (since March 2016), formerly, Senior Executive Vice President of Nuveen Investments, Inc; Co-Chief Executive Officer (since 2015), previously, Executive Vice President (2013-2015) of Nuveen Securities, LLC; Senior Executive Vice President (since 2015) of Nuveen Fund Advisors, LLC (Executive Vice President 2011-2015); formerly, Managing Director of Nuveen Commodities Asset Management, LLC (2011-2016); Chartered Financial Analyst. | |||||
1964 333 W. Wacker Drive Chicago, IL 60606 | Vice President | 2014 (since inception) | ||||
n LORNA C. FERGUSON | Managing Director (since 2004) of Nuveen Investments Holdings, Inc. | |||||
1945 333 W. Wacker Drive Chicago, IL 60606 | Vice President | 2014 (since inception) | ||||
n STEPHEN D. FOY | Managing Director (since 2014), formerly, Senior Vice President (2013-2014) and Vice President (2005-2013) of Nuveen Fund Advisors, LLC; Chief Financial Officer of Nuveen Commodities Asset Management, LLC (since 2010); Managing Director (since 2016) of Nuveen Securities, LLC; Certified Public Accountant. | |||||
1954 333 W. Wacker Drive Chicago, IL 60606 | Vice President and Controller | 2014 (since inception) | ||||
n SHERRI A. HLAVACEK | Executive Vice President (since 2015, formerly, Managing Director) and Controller of Nuveen Fund Advisors, LLC; Managing Director and Controller of Nuveen Commodities Asset Management, LLC; Executive Vice President (since 2015, formerly, Managing Director), Treasurer and Controller of Nuveen Asset Management, LLC; Executive Vice President, Principal Financial Officer (since 2015, formerly, Managing Director), Treasurer and Corporate Controller of Nuveen Investments, Inc.; Executive Vice President (since 2015, formerly, Managing Director), Treasurer and Corporate Controller of Nuveen Investments Advisers, LLC and Nuveen Investments Holdings, Inc.; Executive Vice President, (formerly,Managing Director), Chief Financial Officer and Corporate Controller of Nuveen Securities, LLC; Vice President, Controller and Treasurer of NWQ Investment Management Company, LLC; Vice President and Controller of Santa Barbara Asset Management, LLC, Tradewinds Global Investors, LLC, Symphony Asset Management LLC and Winslow Capital Management, LLC; Certified Public Accountant. | |||||
1962 333 W. Wacker Drive Chicago, IL 60606 | Vice President and Treasurer | 2015 | ||||
| NUVEEN | 51 |
Board Members & Officers (continued)
Name, Year of Birth | Position(s) Held with the Fund | Year First Elected or Appointed(2) | Principal Occupation(s) During Past 5 Years | |||
| Officers of the Funds (continued): | ||||||
n WALTER M. KELLY | Senior Vice President (since 2008) of Nuveen Investments Holdings, Inc. | |||||
1970 333 W. Wacker Drive Chicago, IL 60606 | Chief Compliance Officer and Vice President | 2014 (since inception) | ||||
n DAVID J. LAMB | Senior Vice President of Nuveen Holdings, Inc. (since 2006), Vice President prior to 2006. | |||||
1963 333 W. Wacker Drive Chicago, IL 6o6o6 | Vice President | 2015 | ||||
n TINA M. LAZAR | Senior Vice President of Nuveen Investments Holdings, Inc. and Nuveen Securities, LLC. | |||||
1961 333 W. Wacker Drive Chicago, IL 60606 | Vice President | 2014 (since inception) | ||||
n KEVIN J. MCCARTHY | Executive Vice President, Secretary and General Counsel (since March 2016), formerly, Managing Director and Assistant Secretary of Nuveen Investments, Inc.; Executive Vice President (since March 2016), formerly, Managing Director, and Assistant Secretary (since 2008) of Nuveen Securities, LLC; Executive Vice President and Secretary (since March 2016), formerly, Managing Director (2008-2016) and Assistant Secretary (2007-2016), and Co-General Counsel (since 2011) of Nuveen Fund Advisors, LLC; Executive Vice President and Secretary (since March 2016), formerly, Managing Director, Assistant Secretary (2011-2016), and Associate General Counsel (since 2011) of Nuveen Asset Management, LLC; Executive Vice President and Secretary of Nuveen Investments Advisers, LLC; Vice President (since 2007) and Secretary (since March 2016) of NWQ Investment Management Company, LLC, Symphony Asset Management LLC, Santa Barbara Asset Management, LLC, Winslow Capital Management, LLC (since 2010) and Tradewinds Global Investors, LLC (since 2016); Vice President (since 2010) and Secretary (since 2016), formerly, Assistant Secretary of Nuveen Commodities Asset Management, LLC. | |||||
1966 333 W. Wacker Drive Chicago, IL 6o6o6 | Vice President and Secretary | 2014 (since inception) | ||||
n KATHLEEN L. PRUDHOMME | Managing Director, Assistant Secretary and Co-General Counsel (since 2011) of Nuveen Fund Advisors, LLC; Managing Director, Assistant Secretary and Associate General Counsel (since 2011) of Nuveen Asset Management, LLC; Managing Director and Assistant Secretary (since 2011) of Nuveen Securities, LLC; formerly, Deputy General Counsel, FAF Advisors, Inc. (2004-201o). | |||||
1953 901 Marquette Avenue Minneapolis, MN 55402 | Vice President and Assistant Secretary | 2014 (since inception) | ||||
n JOEL T. SLAGER | Fund Tax Director for Nuveen Funds (since 2013); previously, Vice President of Morgan Stanley Investment Management, Inc., Assistant Treasurer of the Morgan Stanley Funds (from 2010 to 2013). | |||||
1978 333 W. Wacker Drive Chicago, IL 60606 | Vice President and Assistant Secretary | 2014 (since inception) | ||||
n JOHN G. WENKER | Managing Director, Head of Real Assets, Nuveen Asset Management, LLC since January 2011; prior thereto, Managing Director, U.S. Bancorp Asset Management, Inc. | |||||
1951 901 Marquette Avenue Minneapolis, MN 55402 | Vice President | 2014 (since inception) | ||||
n SHARON E. WALTON | Assistant Vice President, Research Analyst, Nuveen Asset Management, LLC since January 2011; prior thereto, Real Estate Portfolio Manager, U.S. Bancorp Asset Management, Inc. | |||||
1974 901 Marquette Avenue Minneapolis, MN 55402 | Vice President | 2016 | ||||
| (1) | Each member of the Board of Trustees is elected to serve until the next annual shareholders’ meeting subsequent to its election or thereafter in each case when its respective successors are duly elected or appointed. The year first elected or appointed represents the year in which the board member was first elected or appointed to any fund in the Nuveen Complex. |
| (2) | Officers serve one year terms ending in June of each year. |
| 52 | NUVEEN |
Notes
| NUVEEN | 53 |
Notes
| 54 | NUVEEN |
Notes
| NUVEEN | 55 |
| ||||||||||||||
| ||||||||||||||
| Nuveen: | ||||||||||||||
| Serving Investors for Generations | ||||||||||||||
| ||||||||||||||
| Since 1898, financial advisors and their clients have relied on Nuveen to provide dependable investment solutions through continued adherence to proven, long-term investing principles. Today, we offer a range of high quality equity and fixed-income solutions designed to be integral components of a well-diversified core portfolio. | ||||||||||||||
| ||||||||||||||
Focused on meeting investor needs.
Nuveen helps secure the long-term goals of individual investors and the advisors who serve them. As an operating division of TIAA Global Asset Management, Nuveen provides access to investment expertise from leading asset managers and solutions across traditional and alternative asset classes. Built on more than a century of industry leadership, Nuveen’s teams of experts align with clients’ specific financial needs and goals, demonstrating commitment to advisors and investors through market perspectives and wealth management and portfolio advisory services. Nuveen manages more than $239 billion in assets as of June 30, 2016. | ||||||||||||||
| ||||||||||||||
Find out how we can help you.
To learn more about how the products and services of Nuveen may be able to help you meet your financial goals, talk to your financial advisor, or call us at (800) 257-8787. Please read the information provided carefully before you invest. Investors should consider the investment objective and policies, risk considerations, charges and expenses of any investment carefully. Where applicable, be sure to obtain a prospectus, which contains this and other relevant information. To obtain a prospectus, please contact your securities representative or Nuveen, 333 W. Wacker Dr., Chicago, IL 60606. Please read the prospectus carefully before you invest or send money.
Learn more about Nuveen Funds at: www.nuveen.com/cef | ||||||||||||||
| ||||||||||||||
Distributed by Nuveen Securities, LLC | 333 West Wacker Drive | Chicago, IL 60606 | www.nuveen.com/cef
EAN-D-0515D 17353-INV-Y-07/17
ITEM 2. CODE OF ETHICS.
As of the end of the period covered by this report, the registrant has adopted a code of ethics that applies to the registrant’s principal executive officer, principal financial officer, principal accounting officer or controller, or persons performing similar functions. There were no amendments to or waivers from the Code during the period covered by this report. The registrant has posted the code of ethics on its website at www.nuveen.com/CEF/Shareholder/FundGovernance.aspx. (To view the code, click on Code of Conduct.)
ITEM 3. AUDIT COMMITTEE FINANCIAL EXPERT.
The registrant’s Board of Directors or Trustees (“Board”) determined that the registrant has at least one “audit committee financial expert” (as defined in Item 3 of Form N-CSR) serving on its Audit Committee. The registrant’s audit committee financial experts are Carole E. Stone and Jack B. Evans, who are “independent” for purposes of Item 3 of Form N-CSR.
Ms. Stone served for five years as Director of the New York State Division of the Budget. As part of her role as Director, Ms. Stone was actively involved in overseeing the development of the State’s operating, local assistance and capital budgets, its financial plan and related documents; overseeing the development of the State’s bond-related disclosure documents and certifying that they fairly presented the State’s financial position; reviewing audits of various State and local agencies and programs; and coordinating the State’s system of internal audit and control. Prior to serving as Director, Ms. Stone worked as a budget analyst/examiner with increasing levels of responsibility over a 30 year period, including approximately five years as Deputy Budget Director. Ms. Stone has also served as Chair of the New York State Racing Association Oversight Board, as Chair of the Public Authorities Control Board, as a Commissioner on the New York State Commission on Public Authority Reform and as a member of the Boards of Directors of several New York State public authorities. These positions have involved overseeing operations and finances of certain entities and assessing the adequacy of project/entity financing and financial reporting. Currently, Ms. Stone is on the Board of Directors of CBOE Holdings, Inc., of the Chicago Board Options Exchange, and of C2 Options Exchange. Ms. Stone’s position on the boards of these entities and as a member of both CBOE Holdings’ Audit Committee and its Finance Committee has involved, among other things, the oversight of audits, audit plans and preparation of financial statements.
Mr. Evans was formerly President and Chief Operating Officer of SCI Financial Group, Inc., a full service registered broker-dealer and registered investment adviser (“SCI”). As part of his role as President and Chief Operating Officer, Mr. Evans actively supervised the Chief Financial Officer (the “CFO”) and actively supervised the CFO’s preparation of financial statements and other filings with various regulatory authorities. In such capacity, Mr. Evans was actively involved in the preparation of SCI’s financial statements and the resolution of issues raised in connection therewith. Mr. Evans has also served on the audit committee of various reporting companies. At such companies, Mr. Evans was involved in the oversight of audits, audit plans, and the preparation of financial statements. Mr. Evans also formerly chaired the audit committee of the Federal Reserve Bank of Chicago.
ITEM 4. PRINCIPAL ACCOUNTANT FEES AND SERVICES.
Diversified Real Asset Income Fund
The following tables show the amount of fees that PricewaterhouseCoopers LLP, the Funds’ auditor, billed to the Funds’ during the Funds’ last two full fiscal years. The Audit Committee approved in advance all audit services and non-audit services that PricewaterhouseCoopers LLP provided to the Funds, except for those non-audit services that were subject to the pre-approval exception under Rule 2-01 of Regulation S-X (the “pre-approval exception”). The preapproval exception for services provided directly to the Funds waives the pre-approval requirement for services other than audit, review or attest services if: (A) the aggregate amount of all such services provided constitutes no more than 5% of the total amount of revenues paid by the Funds during the fiscal year in which the services are provided; (B) the Funds did not recognize the services as non-audit services at the time of the engagement; and (C) the services are promptly brought to the Audit Committee’s attention, and the Committee (or its delegate) approves the services before the audit is completed.
The Audit Committee has delegated certain pre-approval responsibilities to its Chairman (or, in his absence, any other member of the Audit Committee).
SERVICES THAT THE FUND’S AUDITOR BILLED TO THE FUND
Fiscal Year Ended | Audit Fees Billed to Fund 1 | Audit-Related Fees Billed to Fund 2 | Tax Fees Billed to Fund 3 | All Other Fees Billed to Fund 4 | ||||||||||||
May 31, 2016 | $ | 64,250 | $ | 15,670 | $ | 7,525 | $ | 0 | ||||||||
|
|
|
|
|
|
|
| |||||||||
Percentage approved pursuant to pre-approval exception | 0 | % | 0 | % | 0 | % | 0 | % | ||||||||
|
|
|
|
|
|
|
| |||||||||
May 31, 2015 | $ | 103,100 | $ | 0 | $ | 22,800 | $ | 0 | ||||||||
|
|
|
|
|
|
|
| |||||||||
Percentage approved pursuant to pre-approval exception | 0 | % | 0 | % | 0 | % | 0 | % | ||||||||
|
|
|
|
|
|
|
| |||||||||
1 “Audit Fees” are the aggregate fees billed for professional services for the audit of the Fund’s annual financial statements and services provided in connection with statutory and regulatory filings or engagements.
2 “Audit Related Fees” are the aggregate fees billed for assurance and related services reasonably related to the performance of the audit or review of financial statements that are not reported under “Audit Fees”. These fees include offerings related to the Fund’s common shares and leverage.
3 “Tax Fees” are the aggregate fees billed for professional services for tax advice, tax compliance, and tax planning. These fees include: all global withholding tax services; excise and state tax reviews; capital gain, tax equalization and taxable basis calculation performed by the principal accountant.
4 “All Other Fees” are the aggregate fees billed for products and services other than “Audit Fees”, “Audit-Related Fees” and “Tax Fees”. These fees represent all engagements pertaining to the Fund’s use of leverage.
SERVICES THAT THE FUND’S AUDITOR BILLED TO THE
ADVISER AND AFFILIATED FUND SERVICE PROVIDERS
The following tables show the amount of fees billed by PricewaterhouseCoopers LLP to Nuveen Fund Advisors, LLC (formerly Nuveen Fund Advisors, Inc.) (the “Adviser”), and any entity controlling, controlled by or under common control with the Adviser that provides ongoing services to the Fund (“Affiliated Fund Service Provider”), for engagements directly related to the Fund’s operations and financial reporting, during the Fund’s last two full fiscal years.
The tables also show the percentage of fees subject to the pre-approval exception. The pre-approval exception for services provided to the Adviser and any Affiliated Fund Service Provider (other than audit, review or attest services) waives the pre-approval requirement if: (A) the aggregate amount of all such services provided constitutes no more than 5% of the total amount of revenues paid to PricewaterhouseCoopers LLP by the Fund, the Adviser and Affiliated Fund Service Providers during the fiscal year in which the services are provided that would have to be pre-approved by the Audit Committee; (B) the Fund did not recognize the services as non-audit services at the time of the engagement; and (C) the services are promptly brought to the Audit Committee’s attention, and the Committee (or its delegate) approves the services before the Fund’s audit is completed.
Fiscal Year Ended | Audit-Related Fees Billed to Adviser and Affiliated Fund Service Providers | Tax Fees Billed to Adviser and Affiliated Fund Service Providers | All Other Fees Billed to Adviser and Affiliated Fund Service Providers | |||||||||
May 31, 2016 | $ | 0 | $ | 0 | $ | 0 | ||||||
|
|
|
|
|
| |||||||
Percentage approved pursuant to pre-approval exception | 0 | % | 0 | % | 0 | % | ||||||
|
|
|
|
|
| |||||||
May 31, 2015 | $ | 0 | $ | 0 | $ | 0 | ||||||
|
|
|
|
|
| |||||||
Percentage approved pursuant to pre-approval exception | 0 | % | 0 | % | 0 | % | ||||||
|
|
|
|
|
| |||||||
NON-AUDIT SERVICES
The following table shows the amount of fees that PricewaterhouseCoopers LLP billed during the Fund’s last two full fiscal years for non-audit services. The Audit Committee is required to pre-approve non-audit services that PricewaterhouseCoopers LLP provide to the Adviser and any Affiliated Fund Services Provider, if the engagement related directly to the Fund’s operations and financial reporting (except for those subject to the pre-approval exception described above). The Audit Committee requested and received information from PricewaterhouseCoopers LLP about any non-audit services that PricewaterhouseCoopers LLP rendered during the Fund’s last fiscal year to the Adviser and any Affiliated Fund Service Provider. The Committee considered this information in evaluating PricewaterhouseCoopers LLP independence.
Fiscal Year Ended | Total Non-Audit Fees Billed to Fund | Total Non-Audit Fees billed to Adviser and Affiliated Fund Service Providers (engagements related directly to the operations and financial reporting of the Fund) | Total Non-Audit Fees billed to Adviser and Affiliated Fund Service Providers (all other engagements) | Total | ||||||||||||
May 31, 2016 | $ | 7,525 | $ | 0 | $ | 0 | $ | 7,525 | ||||||||
May 31, 2015 | $ | 22,800 | $ | 0 | $ | 0 | $ | 22,800 | ||||||||
“Non-Audit Fees billed to Fund” for both fiscal year ends represent “Tax Fees” and “All Other Fees” billed to Fund in their respective amounts from the previous table.
Less than 50 percent of the hours expended on the principal accountant’s engagement to audit the registrant’s financial statements for the most recent fiscal year were attributed to work performed by persons other than the principal accountant’s full-time, permanent employees.
Audit Committee Pre-Approval Policies and Procedures. Generally, the Audit Committee must approve (i) all non-audit services to be performed for the Fund by the Fund’s independent accountants and (ii) all audit and non-audit services to be performed by the Fund’s independent accountants for the Affiliated Fund Service Providers with respect to operations and financial reporting of the Fund. Regarding tax and research projects conducted by the independent accountants for the Fund and Affiliated Fund Service Providers (with respect to operations and financial reports of the Fund) such engagements will be (i) pre-approved by the Audit Committee if they are expected to be for amounts greater than $10,000; (ii) reported to the Audit Committee chairman for his verbal approval prior to engagement if they are expected to be for amounts under $10,000 but greater than $5,000; and (iii) reported to the Audit Committee at the next Audit Committee meeting if they are expected to be for an amount under $5,000.
ITEM 5. AUDIT COMMITTEE OF LISTED REGISTRANTS.
The registrant’s Board has a separately designated Audit Committee established in accordance with Section 3(a)(58)(A) of the Securities Exchange Act of 1934, as amended (15 U.S.C. 78c(a)(58)(A)). The members of the audit committee are Jack B. Evans, David J. Kundert, John K. Nelson, Carole E. Stone and Terence J. Toth.
ITEM 6. SCHEDULE OF INVESTMENTS.
(a) See Portfolio of Investments in Item 1.
(b) Not applicable.
ITEM 7. DISCLOSURE OF PROXY VOTING POLICIES AND PROCEDURES FOR CLOSED-END MANAGEMENT INVESTMENT COMPANIES.
Nuveen Fund Advisors, LLC is the registrant’s investment adviser (also referred to as the “Adviser”). The Adviser is responsible for the on-going monitoring of the Fund’s investment portfolio, managing the Fund’s business affairs and providing certain clerical, bookkeeping and administrative services. The Adviser has engaged Nuveen Asset Management, LLC (“Sub-Adviser”) as Sub-Adviser to provide discretionary investment advisory services. As part of these services, the Adviser has delegated to the Sub-Adviser the full responsibility for proxy voting on securities held in the registrant’s portfolio and related duties in accordance with the Sub-Adviser’s policies and procedures. The Adviser periodically monitors the Sub-Adviser’s voting to ensure that it is carrying out its duties. The Sub-Adviser’s proxy voting policies and procedures are attached to this filing as an exhibit and incorporated herein by reference.
ITEM 8. PORTFOLIO MANAGERS OF CLOSED-END MANAGEMENT INVESTMENT COMPANIES.
Nuveen Fund Advisors, LLC is the registrant’s investment adviser (also referred to as the “Adviser”). The Adviser is responsible for the selection and on-going monitoring of the Fund’s investment portfolio, managing the Fund’s business affairs and providing certain clerical, bookkeeping and administrative services. The Adviser has engaged Nuveen Asset Management, LLC (“Nuveen Asset Management” or “Sub-Adviser”) as Sub-Adviser to provide discretionary investment advisory services. The following section provides information on the portfolio manager at the Sub-Adviser:
| Item 8(a)(1). | PORTFOLIO MANAGER BIOGRAPHIES |
Brenda A. Langenfeld, Jay L. Rosenberg, Tryg T. Sarsland, Jeffrey T. Schmitz and John G. Wenker, are primarily responsible for the day-to-day management of the portion of the registrant’s portfolio managed by Nuveen Asset Management.
Brenda A. Langenfeld, CFA, is a Vice President at Nuveen Asset Management and a portfolio manager for the fund. She started working in the financial services industry with FAF Advisors, Inc. (“FAF”) in 2004. Previously, Ms. Langenfeld was a member of the High Grade Credit Sector Team, responsible for trading corporate bonds, and prior to that, she was a member of the Securitized Debt Sector Team, trading mortgage-backed securities, asset-backed securities and commercial mortgage-backed securities.
Jay L. Rosenberg is a Managing Director at Nuveen Asset Management and a portfolio manager for the fund. entered the financial services industry in 1995 and joined FAF Advisors, Inc. in 2005 and was named Lead Portfolio Manager of the Real Estate Securities strategy in 2006. He joined Nuveen Asset Management as Managing Director and Lead Portfolio Manager of the Real Estate Securities and Global Infrastructure strategies on January 1, 2011 in connection with the firm’s acquisition of a portion of FAF’s asset management business. In September 2011, he was named Lead Portfolio Manager of the Real Asset Income strategy and in May 2014, he was named Head of Investments for Real Assets.
Tryg T. Sarsland is a Senior Vice President at Nuveen Asset Management and a portfolio manager for the fund. He entered the financial services industry in 2000 and joined Nuveen Asset Management as Vice President and Portfolio Manager Associate in 2011. In December 2012, he was named Co-Portfolio Manager of the Global Infrastructure strategy. In March 2014, he was named Senior Vice President and in April 2016, he was named Co-Portfolio Manager of the Real Asset Income strategy.
Jeffrey T. Schmitz, CFA, is a Vice President at Nuveen Asset Management and a portfolio manager for the fund. He entered the financial services industry in 1987 and joined FAF in 2006 as Senior Credit Analyst. He joined Nuveen Asset Management on January 1, 2011 as Vice President and Co-Portfolio Manager of the High Yield Bond strategy in connection with the firm’s acquisition of a portion of FAF’s asset management business. In September 2011, he was named Co-Portfolio Manager of the Real Asset Income strategy.
John G. Wenker, is a Managing Director, Head of Real Assets, and a portfolio manager for the Fund. Mr. Wenker serves in a strategic role as head of real assets, which includes the firm’s equity and debt real estate products and its global infrastructure strategy. He is the lead manager of the firm’s Real Estate Debt product and co-lead manager of the Real Estate Securities strategy, which invests primarily in equity REITs. Mr. Wenker started working in the financial services industry in 1983 as a mortgage banker at Norwest Mortgage and then as a public finance investment banker focused on housing and government projects for Miller & Schroeder Financial. He also worked for the Minneapolis Community Development Agency managing several of its finance departments including the commercial real estate and housing revenue bond programs. Mr. Wenker joined USBAM (formerly known as FAF Advisors, Inc.) in 1992 as a portfolio manager for four real estate debt closed-end funds. He joined Nuveen Asset Management in January 2011.
| Item 8(a)(2). | OTHER ACCOUNTS MANAGED BY PORTFOLIO MANAGERS |
In addition to the Fund, as of May 31, 2016, the portfolio managers are also primarily responsible for the day-to-day portfolio management of the following accounts:
Portfolio Manager | Type of Account | Number of Accounts | Assets* | |||||||
| B. Langenfeld | Registered Investment Companies | 5 | $ | 5.66 billion | ||||||
| Pooled Investment Accounts | 4 | $ | 179 million | |||||||
| Other Accounts | 292 | $ | 477 million | |||||||
| J. Rosenberg | Registered Investment Companies | 4 | $ | 6.854 billion | ||||||
| Pooled Investment Accounts | 11 | $ | 1.375 billion | |||||||
| Other Accounts | 9 | $ | 1.023 billion | |||||||
| T. Sarsland | Registered Investment Companies | 3 | $ | 2.283 billion | ||||||
| Pooled Investment Accounts | 11 | $ | 1.375 billion | |||||||
| Other Accounts | 9 | $ | 1.023 billion | |||||||
| J. Schmitz | Registered Investment Companies | 8 | $ | 2.996 billion | ||||||
| Pooled Investment Accounts | 4 | $ | 149.1 million | |||||||
| Other Accounts | 3 | $ | 553.1 million | |||||||
| J. Wenker | Registered Investment Companies | 0 | $ | 0 | ||||||
| Pooled Investment Accounts | 0 | 0 | ||||||||
| Other Accounts | 0 | 0 | ||||||||
* Assets are as of May 31, 2016. None of the assets in these accounts are subject to an advisory fee based on performance.
POTENTIAL MATERIAL CONFLICTS OF INTEREST
Actual or apparent conflicts of interest may arise when a portfolio manager has day-to-day management responsibilities with respect to more than one account. More specifically, portfolio managers who manage multiple accounts are presented a number of potential conflicts, including, among others, those discussed below.
The management of multiple accounts may result in a portfolio manager devoting unequal time and attention to the management of each account. Nuveen Asset Management seeks to manage such competing interests for the time and attention of portfolio managers by having portfolio managers focus on a particular investment discipline. Most accounts managed by a portfolio manager in a particular investment strategy are managed using the same investment models.
If a portfolio manager identifies a limited investment opportunity which may be suitable for more than one account, an account may not be able to take full advantage of that opportunity due to an allocation of filled purchase or sale orders across all eligible accounts. To deal with these situations, Nuveen Asset Management has adopted procedures for allocating limited opportunities across multiple accounts.
With respect to many of its clients’ accounts, Nuveen Asset Management determines which broker to use to execute transaction orders, consistent with its duty to seek best execution of the transaction. However, with respect to certain other accounts, Nuveen Asset Management may be limited by the client with respect to the selection of brokers or may be instructed to direct trades through a particular broker. In these cases, Nuveen Asset Management may place separate, non-simultaneous, transactions for a Fund and other accounts which may temporarily affect the market price of the security or the execution of the transaction, or both, to the detriment of the Fund or the other accounts.
Some clients are subject to different regulations. As a consequence of this difference in regulatory requirements, some clients may not be permitted to engage in all the investment techniques or transactions or to engage in these transactions to the same extent as the other accounts managed by the portfolio manager. Finally, the appearance of a conflict of interest may arise where Nuveen Asset Management has an incentive, such as a performance-based management fee, which relates to the management of some accounts, with respect to which a portfolio manager has day-to-day management responsibilities.
Nuveen Asset Management has adopted certain compliance procedures which are designed to address these types of conflicts common among investment managers. However, there is no guarantee that such procedures will detect each and every situation in which a conflict arises.
| Item 8(a)(3). | FUND MANAGER COMPENSATION |
Portfolio manager compensation consists primarily of base pay, an annual cash bonus and long term incentive payments.
Base pay. Base pay is determined based upon an analysis of the portfolio manager’s general performance, experience, and market levels of base pay for such position.
Annual cash bonus. The Fund’s portfolio managers are eligible for an annual cash bonus based on investment performance, qualitative evaluation and financial performance of Nuveen Asset Management.
A portion of each portfolio manager’s annual cash bonus is based on the Fund’s investment performance, generally measured over the past one- and three or five-year periods unless the portfolio manager’s tenure is shorter. Investment performance for the Fund generally is determined by evaluating the Fund’s performance relative to its benchmark(s) and/or Lipper industry peer group.
A portion of the cash bonus is based on a qualitative evaluation made by each portfolio manager’s supervisor taking into consideration a number of factors, including the portfolio manager’s team collaboration, expense management, support of personnel responsible for asset growth, and his or her compliance with Nuveen Asset Management‘s policies and procedures.
The final factor influencing a portfolio manager’s cash bonus is the financial performance of Nuveen Asset Management based on its operating earnings.
Long-term incentive compensation. Certain key employees of Nuveen Investments and its affiliates, including certain portfolio managers, participate in a Long-Term Performance Plan designed to provide compensation opportunities that links a portion of each participant’s compensation to Nuveen Investments’ financial and operational performance. In addition, certain key employees of Nuveen Asset Management, including certain portfolio managers, have received profits interests in Nuveen Asset Management which entitle their holders to participate in the firm’s growth over time.
There are generally no differences between the methods used to determine compensation with respect to the Fund and the Other Accounts shown in the table above.
| Item 8(a)(4). | OWNERSHIP OF DRA SECURITIES AS OF MAY 31, 2016 |
Name of Portfolio Manager | None | $1 - $10,000 | $10,001- $50,000 | $50,001- $100,000 | $100,001-$500,000 | $500,001- $1,000,000 | Over $1,000,000 | |||||||
B. Langenfeld | X | |||||||||||||
J. Rosenberg | X | |||||||||||||
T. Sarsland | X | |||||||||||||
J. Schmitz | X | |||||||||||||
J. Wenker | X |
ITEM 9. PURCHASES OF EQUITY SECURITIES BY CLOSED-END MANAGEMENT INVESTMENT COMPANY AND AFFILIATED PURCHASERS.
| Period* | (a) | (b) | (c) | (d)* | ||||||||||||
| TOTAL NUMBER OF SHARES (OR UNITS) PURCHASED | AVERAGE PRICE PAID PER SHARE (OR UNIT) | TOTAL NUMBER OF SHARES (OR UNITS) PURCHASED AS PART OF PUBLICLY ANNOUNCED PLANS OR PROGRAMS | MAXIMUM NUMBER (OR APPROXIMATE DOLLAR VALUE) OF SHARES (OR UNITS) THAT MAY YET BE PURCHASED UNDER THE PLANS OR PROGRAMS | |||||||||||||
JUNE 1-30, 2015 | 174,000 | $ | 17.64 | 174,000 | 2,235,000 | |||||||||||
JULY 1-31, 2015 | 0 | 0 | 2,235,000 | |||||||||||||
AUGUST 1-31, 2015 | 0 | 0 | 2,235,000 | |||||||||||||
SEPTEMBER 1-30, 2015 | 0 | 0 | 2,025,000 | |||||||||||||
OCTOBER 1-31, 2015 | 0 | 0 | 2,025,000 | |||||||||||||
NOVEMBER 1-30, 2015 | 0 | 0 | 2,025,000 | |||||||||||||
DECEMBER 1-31, 2015 | 0 | 0 | 2,025,000 | |||||||||||||
JANUARY 1-31, 2016 | 146,794 | $ | 14.13 | 146,794 | 1,878,206 | |||||||||||
FEBRUARY 1-29, 2016 | 154,006 | $ | 14.09 | 154,006 | 1,724,200 | |||||||||||
MARCH 1-31, 2016 | 10,000 | $ | 15.58 | 10,000 | 1,714,200 | |||||||||||
APRIL 1-30, 2016 | 11,700 | $ | 15.58 | 11,700 | 1,702,500 | |||||||||||
MAY 1-31, 2016 | 0 | 0 | 1,702,500 | |||||||||||||
TOTAL | 496,500 | |||||||||||||||
* The registrant’s repurchase program, for the repurchase of 2,535,000 shares was authorized on September 23, 2014. The program was reauthorized for a maximum repurchase amount of 2,025,000 shares on September 30, 2015. Any repurchases made by the registrant pursuant to the program were made through open-market transactions.
ITEM 10. SUBMISSION OF MATTERS TO A VOTE OF SECURITY HOLDERS.
There have been no material changes to the procedures by which shareholders may recommend nominees to the registrant’s Board implemented after the registrant last provided disclosure in response to this Item.
ITEM 11. CONTROLS AND PROCEDURES.
| (a) | The registrant’s principal executive and principal financial officers, or persons performing similar functions, have concluded that the registrant’s disclosure controls and procedures (as defined in Rule 30a-3(c) under the Investment Company Act of 1940, as amended (the “1940 Act”) (17 CFR 270.30a-3(c))) are effective, as of a date within 90 days of the filing date of this report that includes the disclosure required by this paragraph, based on their evaluation of the controls and procedures required by Rule 30a-3(b) under the 1940 Act (17 CFR 270.30a-3(b)) and Rules 13a-15(b) or 15d-15 (b) under the Securities Exchange Act of 1934, as amended (the “Exchange Act”) (17 CFR 240.13a-15(b) or 240.15d-15 (b)). |
| (b) | There were no changes in the registrant’s internal control over financial reporting (as defined in Rule 30a-3(d) under the 1940 Act (17 CFR 270.30a-3(d)) that occurred during the second fiscal quarter of the period covered by this report that has materially affected, or is reasonably likely to materially affect, the registrant’s internal control over financial reporting. |
ITEM 12. EXHIBITS.
File the exhibits listed below as part of this Form.
(a)(1) Any code of ethics, or amendment thereto, that is the subject of the disclosure required by Item 2, to the extent that the registrant intends to satisfy the Item 2 requirements through filing of an exhibit: Not applicable because the code is posted on registrant’s website at www.nuveen.com/CEF/Shareholder/FundGovernance.aspx and there were no amendments during the period covered by this report. (To view the code, click on Code of Conduct.)
(a)(2) A separate certification for each principal executive officer and principal financial officer of the registrant as required by Rule 30a-2(a) under the 1940 Act (17 CFR 270.30a-2(a)) in the exact form set forth below: Ex-99.CERT Attached hereto.
(a)(3) Any written solicitation to purchase securities under Rule 23c-1 under the 1940 Act (17 CFR 270.23c-1) sent or given during the period covered by the report by or on behalf of the registrant to 10 or more persons. Not applicable.
(b) If the report is filed under Section 13(a) or 15(d) of the Exchange Act, provide the certifications required by Rule 30a-2(b) under the 1940 Act (17 CFR 270.30a-2(b)); Rule 13a-14(b) or Rule 15d-14(b) under the Exchange Act (17 CFR 240.13a-14(b) or 240.15d-14(b)), and Section 1350 of Chapter 63 of Title 18 of the United States Code (18 U.S.C. 1350) as an exhibit. A certification furnished pursuant to this paragraph will not be deemed “filed” for purposes of Section 18 of the Exchange Act (15 U.S.C. 78r), or otherwise subject to the liability of that section. Such certification will not be deemed to be incorporated by reference into any filing under the Securities Act of 1933 or the Exchange Act, except to the extent that the registrant specifically incorporates it by reference. Ex-99.906 CERT attached hereto.
SIGNATURES
Pursuant to the requirements of the Securities Exchange Act of 1934 and the Investment Company Act of 1940, the registrant has duly caused this report to be signed on its behalf by the undersigned, thereunto duly authorized.
(Registrant) Diversified Real Asset Income Fund
| By (Signature and Title) | /s/ Kevin J. McCarthy | |||
| Kevin J. McCarthy | ||||
| Vice President and Secretary | ||||
| Date: August 8, 2016 | ||||
Pursuant to the requirements of the Securities Exchange Act of 1934 and the Investment Company Act of 1940, this report has been signed below by the following persons on behalf of the registrant and in the capacities and on the dates indicated.
| By (Signature and Title) | /s/ Gifford R. Zimmerman | |||
| Gifford R. Zimmerman | ||||
| Chief Administrative Officer | ||||
| (principal executive officer) | ||||
| Date: August 8, 2016 | ||||
| By (Signature and Title) | /s/ Stephen D. Foy | |||
| Stephen D. Foy | ||||
| Vice President and Controller | ||||
| (principal financial officer) | ||||
| Date: August 8, 2016 | ||||