| | OMB APPROVAL |
| | OMB Number: | 3235-0570 |
| | Expires: | January 31, 2017 |
| UNITED STATES | Estimated average burden hours per response. . . . . . . . . . . . . . . . .20.6 |
| SECURITIES AND EXCHANGE COMMISSION | |
| Washington, D.C. 20549 | |
| | | | |
FORM N-CSR
CERTIFIED SHAREHOLDER REPORT OF REGISTERED
MANAGEMENT INVESTMENT COMPANIES
Investment Company Act file number | 811-22955 |
|
Tekla Healthcare Opportunities Fund |
(Exact name of registrant as specified in charter) |
|
100 Federal Street, 19th Floor, Boston, MA | | 02110 |
(Address of principal executive offices) | | (Zip code) |
|
100 Federal Street, 19th Floor, Boston, MA 02110 |
(Name and address of agent for service) |
|
Registrant’s telephone number, including area code: | 617-772-8500 | |
|
Date of fiscal year end: | September 30 | |
|
Date of reporting period: | October 1, 2015 to September 30, 2016 | |
| | | | | | | | | |
ITEM 1. REPORTS TO STOCKHOLDERS.
TEKLA HEALTHCARE
OPPORTUNITIES FUND

TEKLA HEALTHCARE
OPPORTUNITIES FUND
Distribution policy: The Fund has implemented a managed distribution policy (the Policy) that provides for monthly distributions at a rate set by the Board of Trustees. Under the current Policy, the Fund intends to make monthly distributions at a rate of $0.1125 per share to shareholders of record. The Policy would result in a return of capital to shareholders, if the amount of the distribution exceeds the Fund's net investment income and realized capital gains. A return of capital may occur, for example, when some or all of the money that you invested in the Fund is paid back to you. A return of capital distribution does not necessarily reflect the Fund's investment performance and should not be confused with "yield" or "income."
The amounts and sources of distributions reported in the Fund's notices pursuant to Section 19(a) of the Investment Company Act of 1940 are only estimates and are not being provided for tax reporting purposes. The actual amounts and sources of the amounts for tax reporting purposes will depend upon the Fund's investment experience during its fiscal year and may be subject to changes based on tax regulations. The Fund will send you a Form 1099-DIV for the calendar year that tells you how to report distributions for federal income tax purposes.
You should not draw any conclusions about the Fund's investment performance from the amount of distributions pursuant to the Policy or from the terms of the Policy. The Policy has been established by the Trustees and may be changed or terminated by them without shareholder approval. The Trustees regularly review the Policy and the frequency and rate of distributions considering the purpose and effect of the Policy, the financial market environment, and the Fund's income, capital gains and capital available to pay distributions. The suspension or termination of the Policy could have the effect of creating a trading discount or widening an existing trading discount. At this time there are no reasonably foreseeable circumstances that might cause the Trustees to terminate the Policy.
Consider these risks before investing: As with any investment company that invests in equity securities, the Fund is subject to market risk—the possibility that the prices of equity securities will decline over short or extended periods of time. As a result, the value of an investment in the Fund's shares will fluctuate with the market generally and market sectors in particular. You could lose money over short or long periods of time. Political and economic news can influence market-wide trends and can cause disruptions in the U.S. or world financial markets. Other factors may be ignored by the market as a whole but may cause movements in the price of one company's stock or the stock of companies in one or more industries. All of these factors may have a greater impact on initial public offerings and emerging company shares. Different types of equity securities tend to shift into and out of favor with investors, depending on market and economic conditions. The performance of funds that invest in equity securities of Healthcare Companies may at times be better or worse than the performance of funds that focus on other types of securities or that have a broader investment style.
TEKLA HEALTHCARE
OPPORTUNITIES FUND
Dear Shareholders,
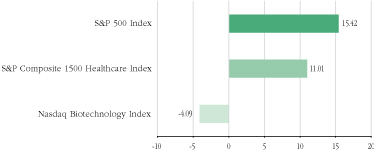
As you know, Tekla Healthcare Opportunities Fund ("THQ" or "the Fund") invests in healthcare/biotechnology. As you may also know, after an extended period of growth, volatility in this sector has been elevated and performance weak as of late. Part of the increased volatility is inherent in our sector while another part probably results from the election season discussion we have been having in the U.S. about the value healthcare brings to our citizens and to what extent the prices of drugs should reflect that value rather than merely production cost. Healthcare fundamentals have been solid in recent years (as reflected generally by the S&P Composite 1500 Healthcare Index®*) and particularly in the biotech sector (as reflected by the NASDAQ Biotechnology Index®*). Strength in healthcare relative to the S&P 500 Index®* over the last five years is illustrated in the following chart.
5 Year Performance
Ending September 30, 2106

It seems pretty clear that questions about pricing have attenuated the upward climb in the healthcare sector since a mid-2015 high. In the last 12 months, this has resulted in a more moderate return for the healthcare sector in general and for biotechnology in particular. We see much of this result as a disconnect between sector potential and performance. It is our view that, as we head into 2017, we may well experience heightened volatility as Mr. Trump's intentions and priorities become clear, but over the longer term, we are confident that we will return to a period where fundamentals drive performance. We see this as a positive for the healthcare/biotechnology sector.
1
Respectfully yours,
Daniel R. Omstead, Ph.D.
President and Portfolio Manager
2
Thoughts on the State of the Healthcare/
Biotechnology Industry
The healthcare/biotechnology sector has been much in the news of late. Moreover, this sector has been drawn into the political discussion surrounding the 2016 national election season. At times, this has caused some volatility and probably some downward movement within the healthcare/biotechnology sector. It is not the first time the sector has been drawn into national debate (recall the discussions surrounding the creation and implementation of the Affordable Care Act ("Obamacare")) nor will it likely be the last.
The current discussion undoubtedly results from a number of both macro and micro factors. On the macro level, healthcare represents nearly 20% of the US economy. Moreover, the sector is growing relatively rapidly and projections suggest that this growth could overwhelm other parts of the economy. Such concern results in much debate, but in the end we believe sector growth reflects its contribution to societal welfare and is good for the Fund and its shareholders.
On the micro level, healthcare is also a significant portion of the "economy". Obamacare has increased the number of people who are covered by health insurance and imposed a number of mandated criteria. Healthcare products and services are difficult and expensive to develop and therefore expensive to purchase. For many years, most Americans paid health insurance premiums (or had them largely paid for by their employers) and received services at relatively modest out-of-pocket costs (i.e., at a low "co-pay") to the individual. Recent trends have, in our view, produced a change in this profile. For a variety of reasons, probably related to the increasing cost/price of healthcare products, we have seen what we expect will be a migration to higher deductible healthcare insurance plans. The consequence has been that, in some cases, the cost to the consumer for certain basic medical products or services has increased, sometimes dramatically. Focusing for the moment on healthcare products rather than services, in some cases, such increases can be the result of over-reaching drug company pricing strategies while in other cases the increases might be the result of fairly priced drugs where the individual or employers have elected to use high deductible plans. Such plans decrease insurance premiums but increase out of pocket costs to the individual at or near the point of care.
This topic has become a controversial issue generating a great deal of public and political attention. Politicians at the national level have spoken aggressively about the need to limit price increases for some drugs. Our
3
view is that a significant portion of this discussion is political rather than substantive as we believe that most drug companies do and will price their drugs based on the value they provide to patients. It is also our view that many or most drugs produce a significant benefit to patients. We would expect that as time goes on, drugs will be more and more targeted to specific patients with specific conditions and that, in the extreme, companies will get paid more when a drug successfully treats a patient's malady and less (or nothing) when the drug is ineffective. We don't see the likelihood of drug price controls or the introduction of a single payer solution as some have suggested or pushed for. In our view, these solutions won't work well. Having said this, the fact of the matter is that we are currently in an environment where a tweet from a national political candidate or other politician can have an impact on the price of a given company's stock and in some cases on the price of a group of stocks. It is our expectation that after Mr. Trump's priorities have been articulated, sector volatility will decrease and the market will be able to focus on the fundamentals of the healthcare/biotechnology sector. We believe these fundamentals are sound.
We continue to be impressed by the potential of the healthcare sector to improve the quality and durability of patients' lives. As we have previously noted, there have been approximately 250 new public companies formed in the healthcare/biotechnology sector over the last several years. These companies are seeking to develop treatments for a myriad of diseases in nearly every area of clinical research. It is difficult to generalize, but we see promising opportunities in treatments aimed at a wide variety of cancers, as well as in the areas of rare diseases, ophthalmology, various blood disorders, the central nervous system, dermatology and antibiotics, among a wide variety of indications.
In addition, we see many developments in the next year or so which are poised to have an effect on healthcare. For example, we note that there are several drugs in late stage development intended for use in Alzheimer's disease. Many people experience a loss of cognitive function, but there are few effective treatments. Results from several late stage clinical trials sponsored by prominent pharmaceutical and biotech companies involving the use of antibody based therapies are expected to be reported in the coming years. If successful, these drugs would be widely used and would help a large number of patients in need.
We are also impressed by progress in the general area of immuno-oncology. This is a field in which drugs or other treatments are used to boost a patient's own immune system, typically to treat hematologic or solid tumors. Initial generations of so-called checkpoint inhibitors which
4
take the "brakes" off a patient's own self limited response to cancer have been remarkably effective in treating lung and other cancers. An additional generation of drugs and treatments stimulate or enhance other aspects of a patient's intrinsic immune response to cancer. Clinical trial results for these so-called immuno-oncology agents have been particularly impressive and have the potential to dramatically improve the lives of certain cancer patients. We would expect FDA approval of one or more new groups in this class soon.
The development of drugs to treat rare diseases is a further example of recent progress. These are diseases which affect a small number of patients. There are upwards of a thousand such diseases which result from a single gene defect. In recent years, we have seen the development of more and more drugs to treat such diseases. We were particularly impressed in the last year to note the FDA's benevolence in approving a drug which appears to have activity in a very rare disease called Duchenne's Muscular Dystrophy. This disease causes debilitating effects and ultimately death, predominantly in young males.
The emergence of generic biological drugs is also notable. Both traditional generic and branded pharmaceutical companies are moving ahead diligently to create and gain approval of drugs that are biosimilar to the now extensive group of biological drugs that have reached the marketplace. This trend should allow the price of some drugs to decrease through competition to the benefit of payers and patients but should also allow the original sponsors to continue to benefit (if at a lower economic reward) after the expiration of governing patents.
Beyond the developments described above, we would also note trends we have observed in the product reimbursement area as being significant. Over the last several years we have seen more competition even for branded products. As an example, multiple antibody products (so-called PCSK9 inhibitors) capable of treating recalcitrant hypercholesterolemia have reached the marketplace. While each of these products is patent protected, due to their similar therapeutic effects, payers have been able to negotiate attractive pricing for these products. We see this trend, along with the development of generic biosimilars, as evidence of enhanced competition in the drug industry.
5
TEKLA HEALTHCARE
OPPORTUNITIES FUND
Fund Essentials
Objective of the Fund
The Fund's investment objective is to seek current income and long-term capital appreciation by investing primarily in securities of healthcare companies. In addition, the Fund seeks to provide regular distribution of income and realized capital gains.
Description of the Fund
Tekla Healthcare Opportunities Fund ("THQ") is a non-diversified closed-end fund traded on the New York Stock Exchange under the ticker THQ. THQ employs a versatile investment strategy with broad access to opportunities within 11 sub-sectors of healthcare and has the ability to invest across a company's full capital structure.
Investment Philosophy
Tekla Capital Management LLC, the Investment Adviser to the Fund, believes that:
• Aging demographics and adoption of new medical products and services can provide long-term tailwinds for healthcare companies
• Late stage biotechnology product pipeline could lead to significant increases in biotechnology sales
• Investment opportunity spans 11 sub-sectors including biotechnology, healthcare technology, managed care and healthcare REITs
• Robust M&A activity in healthcare may create additional investment opportunities
Fund Overview and Characteristics as of 9/30/16
Market Price1 | | $17.48 | |
NAV2 | | $19.14 | |
Premium/(Discount) | | -8.67% | |
Average 30 Day Volume | | 130,973 | |
Net Assets | | $837,073,481 | |
Managed Assets | | $1,062,073,481 | |
Leverage Outstanding | | $225,000,000 | |
Total Leverage Ratio3 | | 21.18% | |
Ticker | | THQ | |
NAV Ticker | | XTHQX | |
Commencement of
Operations Date | |
7/31/14 | |
Fiscal Year
Distributions
Per Share | | $1.65 | |
1 The closing price at which the Fund's shares were traded on the exchange.
2 Per-share dollar value of the Fund, calculated by dividing the total value of all the securities in its portfolio, plus any other assets and less liabilities, by the number of Fund shares outstanding.
3 As a percentage of managed assets.
Holdings of the Fund (Data is based on net assets)
Asset Allocation as of 9/30/16

Sub-Sector Allocation as of 9/30/16

This data is subject to change on a daily basis.
6
TEKLA HEALTHCARE
OPPORTUNITIES FUND
Largest Holdings by Issuer
(Excludes Short-Term Investments)
As of September 30, 2016
| Issuer – Sector | | % of Net
Assets | |
| Gilead Sciences, Inc. – Biotechnology | | | 8.0 | % | |
| Merck & Co., Inc. – Pharmaceuticals | | | 6.5 | % | |
| UnitedHealth Group, Inc. – Health Care Providers & Services | | | 5.8 | % | |
| Abbott Laboratories – Health Care Equipment & Supplies | | | 5.7 | % | |
| Celgene Corporation – Biotechnology | | | 5.1 | % | |
| Biogen Inc. – Biotechnology | | | 5.0 | % | |
| Johnson & Johnson – Pharmaceuticals | | | 4.8 | % | |
| Medtronic plc – Health Care Equipment & Supplies | | | 4.7 | % | |
| Eli Lilly & Company – Pharmaceuticals | | | 4.6 | % | |
| Allergan plc – Pharmaceuticals | | | 4.5 | % | |
| Amgen Inc. – Biotechnology | | | 4.2 | % | |
| Alexion Pharmaceuticals, Inc. – Biotechnology | | | 3.3 | % | |
| CVS Caremark Corporation – Health Care Providers & Services | | | 3.0 | % | |
| Vertex Pharmaceuticals Incorporated – Biotechnology | | | 2.8 | % | |
| ARIAD Pharmaceuticals, Inc. – Biotechnology | | | 2.7 | % | |
| Cigna Corporation – Health Care Providers & Services | | | 2.6 | % | |
| Pfizer, Inc. – Pharmaceuticals | | | 2.6 | % | |
| Humana, Inc. – Healthcare Providers & Services | | | 2.4 | % | |
| Zimmer Biomet Holdings, Inc. – Healthcare Equipment & Supplies | | | 2.3 | % | |
| HCA Holdings, Inc. – Health Care Equipment & Supplies | | | 1.9 | % | |
Fund Performance
THQ is a closed-end fund which invests predominantly in healthcare companies. Subject to regular consideration, the Trustees of THQ have instituted a policy of making monthly distributions to shareholders.
The Fund invests in equity and debt of healthcare companies. The Fund seeks to benefit from the earnings growth of the healthcare industry while capturing income. Income is derived from multiple sources including equity dividends, fixed income coupons, real estate investment trust distributions, convertible securities coupons and selective equity covered call writing premiums. In order to accomplish its objectives, THQ often holds a majority of its assets in equities. Allocation of assets to various healthcare sectors can vary significantly as can the percentage of the portfolio which is overwritten.
7
The Fund may invest up to 15 percent of managed assets, measured at the time of investment, in the debt of healthcare companies. It may also invest up to 25 percent of managed assets in healthcare REITs. The Fund may also hold up to 30 percent of managed assets in convertible securities and may invest a portion of its assets in restricted securities. In order to generate additional "current" income THQ often sells (or writes) calls against a material portion of its equity assets. The portion of equity assets overwritten can vary, but usually represents less than 20 percent of managed assets. At times, the overwritten portion of assets is materially less than 20 percent of managed assets. The use of covered calls is intended to produce "current" income, but may limit upside in bullish markets. The Fund may also use leverage to enhance yield. The Fund may incur leverage up to 20 percent of managed assets at the time of borrowing. "Managed assets" means the total assets of the Fund (including any assets attributable to borrowings for investment purposes) minus the sum of the Fund's accrued liabilities (other than liabilities representing borrowings for investment purposes).
The Fund considers investments in companies of all sizes and in all healthcare subsectors, including but not limited to, biotechnology, pharmaceuticals, healthcare equipment, healthcare supplies, life science tools and services, healthcare distributors, managed healthcare, healthcare technology, and healthcare facilities. The Fund emphasizes innovation, investing both in public and pre-public venture companies. The Fund considers its pre-public and other restricted investments to be a differentiating characteristic. Among the various healthcare subsectors, THQ has considered the biotechnology subsector, including both pre-public and public companies, to be a key contributor to the healthcare sector. The Fund holds biotech assets, including both public and pre-public, often representing 25-35% of net assets.
There is no commonly published index which matches the investment strategy of THQ. With respect to the Fund's equity investments, THQ often holds 20-40% of its managed assets, measured at the time of investment, in biotechnology. By contrast, the S&P Composite 1500 Healthcare Index® ("S15HLTH") consists of more than 160 companies representing most or all of the healthcare subsectors in which THQ typically invests; biotechnology often represents 15-20% of this index. By contrast, the NASDAQ Biotechnology Index® ("NBI"), which contains approximately 180 constituents, is much more narrowly constructed. The vast majority of this index is comprised of biotechnology, pharmaceutical and life science tools companies. In recent years, biotechnology has often represented 72-82% of the NBI. Neither the S15HLTH nor NBI indices contain any material amount of pre-public company assets.
8
The S&P 500 Health Care Corporate Bond Index®* ("SP5HCBIT") measures the performance of U.S. corporate debt issued by constituents in the healthcare sector of the S&P 500 Index® ("SPX"). This index is generally reflective of the debt assets in which THQ invests though the Fund invests in the SPX debt components as well as those of smaller capitalization companies.
The FTSE NAREIT Health Care Property Sector Index®* ("FNHEA") is comprised of U.S. publicly traded REITs in the healthcare sector. This index is generally reflective of the REITs in which THQ invests.
We present both NAV and stock returns for the Fund in comparison to several commonly published indices. We note that THQ is a dynamically configured multi-asset class healthcare growth and income fund. There is no readily available index comprised of similar characteristics to THQ and to which THQ can directly be compared. Therefore, we provide returns for a number of indices representing the major components of THQ's assets. Having said this, we note that there are no readily available indices representing the covered call strategy employed by THQ or the restricted security components of THQ. The following data for available funds over the six-month, one-year and since inception periods are provided for comparison.
Fund Performance for the Period Ended September 30, 2016
| Period | | THQ
NAV | | THQ
MKT | | NBI | | S15HLTH | | SPX | | SP5HCBIT | | FNHEA | |
| 6 month | | | 12.33 | | | | 14.32 | | | | 11.23 | | | | 7.56 | | | | 6.40 | | | | 3.77 | | | | 14.93 | | |
| 1 year | | | 12.44 | | | | 18.25 | | | | -4.09 | | | | 11.01 | | | | 15.42 | | | | 8.77 | | | | 22.40 | | |
inception | | | 8.48 | | | | 1.64 | | | | 6.39 | | | | 9.51 | | | | 6.76 | | | | 5.08 | | | | 10.33 | | |
Inception date July 29,2014

All performance over one-year has been annualized.
Performance data quoted represents past performance, which is no guarantee of future results, and current performance may be lower or higher than the figures shown. The NAV total return takes into account the Fund's total annual expenses and does not reflect transaction charges. If transaction charges were reflected, NAV total return would be reduced. All distributions are assumed to be reinvested either in accordance with the dividend reinvestment plan (DRIP) for market price returns or NAV for NAV returns. Until the DRIP price is available from the Plan Agent, the market price returns reflect the reinvestment at the closing market price on the last business day of the month. Once the DRIP is available around mid-month, the market price returns are updated to reflect reinvestment at the DRIP price.
9
Portfolio Highlights as of September 30, 2016
Among other investments, Tekla Healthcare Opportunities' performance benefitted in the past year from the following:
Immunomedics, Inc. (IMMU) showed significant stock strength over the past year based on generally positive efficacy data for their agent IMMU-132 for a severe subtype of breast cancer known as triple-negative, increasing the value of our convertible debt position.
In Ariad Pharmaceuticals, Inc. (ARIA) we saw improved commercial execution under new management, as well as underappreciated activity of pipeline agent Brigatinib in ALK+ non-small cell lung cancer which helped our convertible debt holding.
Positioning in Bristol-Myers Squibb Company (BMY) had a positive relative impact in 2016. BMY was a significant outperformer for the majority of 2016, however a negative clinical catalyst in August resulted in a below average full year performance.
Among other examples, Tekla Healthcare Opportunities' performance was negatively impacted by the following investments:
AbbVie Inc. (ABBV) experienced a year of relative outperformance in 2016 following a year of significant underperformance in 2015. Our positioning in this name had a negative relative impact on a 1 year basis.
Allergan PLC (AGN) is a large and well diversified pharmaceutical company with products in various therapeutic areas including central nervous system, eye care, aesthetics, dermatology, and gastroenterology. In November 2015, Pfizer announced a merger deal with AGN which we believe would have benefited AGN. However, the merger was ultimately abandoned by Pfizer. AGN's stock price subsequent to Pfizer's abandonment has been poor.
*The trademarks NASDAQ Biotechnology Index®, S&P Composite 1500 Healthcare Index®, S&P 500 Index®, S&P 500 Health Care Corporate Bond Index® and FTSE NAREIT Health Care Property Sector Index® referenced in this report are the property of their respective owners. These trademarks are not owned by or associated with the Fund or its service providers, including Tekla Capital Management LLC.
10
TEKLA HEALTHCARE
OPPORTUNITIES FUND
SCHEDULE OF INVESTMENTS
SEPTEMBER 30, 2016
SHARES | | CONVERTIBLE PREFERRED
STOCKS (Restricted) (a) (b) - 0.6% of Net Assets | | VALUE | |
| | | Biotechnology - 0.5% | |
| | 1,464,497 | | | BioClin Therapeutics, Inc. Series A | | $ | 951,923 | | |
| | 2,133,333 | | | GenomeDx Biosciences, Inc. Series C | | | 3,199,999 | | |
| | | | 4,151,922 | | |
| | | Health Care Equipment & Supplies - 0.1% | |
| | 407,078 | | | IlluminOss Medical, Inc. Series AA | | | 407,078 | | |
| | 383,470 | | | IlluminOss Medical, Inc. Series Junior Preferred | | | 383,470 | | |
| | | | 790,548 | | |
| | | | | TOTAL CONVERTIBLE
PREFERRED STOCKS
(Cost $4,567,718) | | | 4,942,470 | | |
| | | PREFERRED STOCK - 1.6% of Net Assets | |
| | | Real Estate Investment Trust - 1.6% | |
| | 200,000 | | | Welltower, Inc. | | | 13,310,000 | | |
| | | | | TOTAL PREFERRED STOCK
(Cost $11,919,596) | | | 13,310,000 | | |
| | | | | MANDATORY CONVERTIBLE
PREFERRED STOCKS - 1.7% of Net Assets | | | |
| | | Pharmaceuticals - 1.7% | |
| | 5,000 | | | Allergan plc, 5.50% due 03/01/18 | | | 4,108,150 | | |
| | 13,000 | | | Teva Pharmaceutical Industries Ltd.,
7.00% due 12/15/18 | | | 10,573,020 | | |
| | | | | TOTAL MANDATORY CONVERTIBLE
PREFERRED STOCKS
(Cost $18,000,000) | | | 14,681,170 | | |
The accompanying notes are an integral part of these financial statements.
11
TEKLA HEALTHCARE
OPPORTUNITIES FUND
SCHEDULE OF INVESTMENTS
SEPTEMBER 30, 2016
(continued)
PRINCIPAL
AMOUNT | | CONVERTIBLE AND NON-CONVERTIBLE
NOTES - 18.2% of Net Assets
Convertible Notes - 4.9% | | VALUE | |
| | | Biotechnology - 3.2% | |
$ | 14,330,000 | | | ARIAD Pharmaceuticals, Inc.,
3.63% due 6/15/19 (c) | | $ | 22,981,738 | | |
| | 4,000,000 | | | Immunomedics, Inc., 4.75% due 2/15/20 | | | 3,377,500 | | |
| | | | 26,359,238 | | |
| | | Pharmaceuticals - 1.7% | |
| | 13,000,000 | | | Aegerion Pharmaceuticals, Inc.,
2.00% due 8/15/19 (c) | | | 8,571,875 | | |
| | 7,000,000 | | | Egalet Corporation, 5.50% due 4/1/20 (c) | | | 5,963,125 | | |
| | | | 14,535,000 | | |
| | | | | TOTAL CONVERTIBLE NOTES | | | 40,894,238 | | |
| | | Non-Convertible Notes - 13.3% | |
| | | Biotechnology - 1.3% | |
| | 10,000,000 | | | Amgen Inc. 3.63% due 5/15/22 | | | 10,736,860 | | |
| | | | 10,736,860 | | |
| | | Health Care Equipment & Supplies - 1.4% | |
| | 5,000,000 | | | Medtronic, Inc., 3.50% due 3/15/25 | | | 5,384,330 | | |
| | 6,000,000 | | | Zimmer Biomet Holdings, Inc.,
4.25% due 8/15/35 | | | 6,088,812 | | |
| | | | 11,473,142 | | |
| | | Health Care Providers & Services - 8.9% | |
| | 12,693,000 | | | Acadia Healthcare Company. Inc.,
5.13% due 7/01/22 | | | 12,566,070 | | |
| | 10,500,000 | | | Anthem Inc., 3.50% due 8/15/24 | | | 11,054,873 | | |
| | 8,665,000 | | | Cigna Corporation, 5.88% due 3/15/41 | | | 10,891,784 | | |
| | 8,250,000 | | | Express Scripts Holding Company,
6.13% due 11/15/41 | | | 10,217,988 | | |
| | 9,700,000 | | | HCA Holdings, Inc., 6.25% due 2/15/21 | | | 10,524,500 | | |
| | 7,500,000 | | | HealthSouth Corporation,
5.75% due 11/01/24 | | | 7,767,150 | | |
| | 10,500,000 | | | UnitedHealth Group Inc.,
4.38% due 3/15/42 | | | 11,706,251 | | |
| | | | 74,728,616 | | |
The accompanying notes are an integral part of these financial statements.
12
TEKLA HEALTHCARE
OPPORTUNITIES FUND
SCHEDULE OF INVESTMENTS
SEPTEMBER 30, 2016
(continued)
| PRINCIPAL AMOUNT | |
Pharmaceuticals - 1.7% | | VALUE | |
$ | 4,750,000 | | | AstraZeneca PLC, 6.45% due 9/15/37 (f) | | $ | 6,623,699 | | |
| | 780,000 | | | Mallinckrodt International Finance SA,
4.75% due 4/15/23 | | | 702,000 | | |
| | 5,020,000 | | | Wyeth LLC, 5.95% due 4/01/37 | | | 6,713,100 | | |
| | | | 14,038,799 | | |
| | | TOTAL NON-CONVERTIBLE NOTES | | | 110,977,417 | | |
| | | TOTAL CONVERTIBLE AND
NON-CONVERTIBLE NOTES
(Cost $144,301,815) | | | 151,871,655 | | |
SHARES | | COMMON STOCKS AND
WARRANTS - 103.6% of Net Assets | | | |
| | | Biotechnology - 35.8% | |
| | 156 | | | AbbVie Inc. | | | 9,839 | | |
| | 224,090 | | | Alexion Pharmaceuticals, Inc. (b) (d) | | | 27,459,989 | | |
| | 72,601 | | | Alkermes plc (b) | | | 3,414,425 | | |
| | 146,000 | | | Amgen Inc. | | | 24,354,260 | | |
| | 33,451 | | | Ardelyx, Inc. (b) | | | 432,856 | | |
| | 133,931 | | | Biogen Inc. (b) | | | 41,924,421 | | |
| | 137,500 | | | BioMarin Pharmaceutical Inc. (b) | | | 12,721,500 | | |
| | 404,864 | | | Celgene Corporation (b) | | | 42,320,434 | | |
| | 159,000 | | | Cepheid, Inc. (b) | | | 8,377,710 | | |
| | 305,100 | | | Eleven Biotherapeutics, Inc. warrants
(Restricted, expiration 11/24/17) (a) (b) | | | 15,255 | | |
| | 845,719 | | | Gilead Sciences, Inc. (d) | | | 66,913,287 | | |
| | 112,223 | | | Incyte Corporation (b) | | | 10,581,507 | | |
| | 125,100 | | | Juno Therapeutics, Inc. (b) | | | 3,754,251 | | |
| | 300,000 | | | Karyopharm Therapeutics, Inc. (b) | | | 2,919,000 | | |
| | 320,405 | | | Natera, Inc. (b) | | | 3,559,699 | | |
| | 1,409,626 | | | Pieris Pharmaceuticals, Inc. (b) | | | 2,579,615 | | |
| | 40,496 | | | Pieris Pharmaceuticals, Inc., Series A
warrants (Restricted, expiration 6/8/21) (a) (b) | | | 12,959 | | |
| | 20,248 | | | Pieris Pharmaceuticals, Inc., Series B
warrants (Restricted, expiration 6/8/21) (a) (b) | | | 9,314 | | |
| | 165,000 | | | Puma Biotechnology, Inc. (b) | | | 11,063,250 | | |
| | 93,700 | | | Sarepta Therapeutics, Inc. (b) (d) | | | 5,754,117 | | |
The accompanying notes are an integral part of these financial statements.
13
TEKLA HEALTHCARE
OPPORTUNITIES FUND
SCHEDULE OF INVESTMENTS
SEPTEMBER 30, 2016
(continued)
SHARES | | Biotechnology - continued | | VALUE | |
| | 68,700 | | | United Therapeutics Corporation (b) (d) | | $ | 8,112,096 | | |
| | 265,543 | | | Vertex Pharmaceuticals Incorporated (b) (d) | | | 23,158,005 | | |
| | | | 299,447,789 | | |
| | | Health Care Equipment & Supplies - 13.3% | |
| | 1,138,300 | | | Abbott Laboratories (d) | | | 48,138,707 | | |
| | 32,278 | | | Becton Dickinson and Co. | | | 5,801,325 | | |
| | 773,500 | | | Endologix, Inc. (b) | | | 9,900,800 | | |
| | 397,030 | | | Medtronic plc | | | 34,303,392 | | |
| | 102,300 | | | Zimmer Biomet Holdings, Inc. | | | 13,301,046 | | |
| | | | 111,445,270 | | |
| | | Health Care Providers & Services - 19.1% | |
| | 134,007 | | | AmerisourceBergen Corporation | | | 10,825,085 | | |
| | 112,200 | | | Centene Corporation (b) | | | 7,512,912 | | |
| | 60,950 | | | Charles River Laboratories International, Inc. (b) | | | 5,079,573 | | |
| | 86,400 | | | Cigna Corporation | | | 11,259,648 | | |
| | 209,572 | | | Community Health Systems, Inc. (b) | | | 2,418,461 | | |
| | 278,479 | | | CVS Caremark Corporation (d) | | | 24,781,846 | | |
| | 161,100 | | | DaVita, Inc. (b) (d) | | | 10,643,877 | | |
| | 65,784 | | | HCA Holdings, Inc. (b) | | | 4,975,244 | | |
| | 112,000 | | | Humana, Inc. | | | 19,811,680 | | |
| | 190,000 | | | Molina Healthcare, Inc. (b) | | | 11,080,800 | | |
| | 52,393 | | | Quorum Health Corporation (b) | | | 328,504 | | |
| | 164,500 | | | Tenet Healthcare Corporation (b) | | | 3,727,570 | | |
| | 264,121 | | | UnitedHealth Group, Inc. | | | 36,976,940 | | |
| | 86,604 | | | Universal Health Services, Inc. | | | 10,671,345 | | |
| | | | 160,093,485 | | |
| | | Health Care Technology - 0.3% | |
| | 173,600 | | | Allscripts Healthcare Solutions, Inc. (b) | | | 2,286,312 | | |
| | | Life Sciences Tools & Services - 1.9% | |
| | 249,600 | | | Agilent Technologies, Inc. | | | 11,753,664 | | |
| | 25,750 | | | Thermo Fisher Scientific Inc. | | | 4,095,795 | | |
| | | | 15,849,459 | | |
| | | Pharmaceuticals - 23.5% | |
| | 145,970 | | | Allergan plc (b) (d) | | | 33,618,351 | | |
| | 87,163 | | | Diplomat Pharmacy, Inc. (b) | | | 2,441,436 | | |
| | 478,005 | | | Eli Lilly & Company (d) | | | 38,364,681 | | |
| | 337,312 | | | Johnson & Johnson | | | 39,846,666 | | |
| | 870,500 | | | Merck & Co., Inc. | | | 54,327,905 | | |
The accompanying notes are an integral part of these financial statements.
14
TEKLA HEALTHCARE
OPPORTUNITIES FUND
SCHEDULE OF INVESTMENTS
SEPTEMBER 30, 2016
(continued)
SHARES | | Pharmaceuticals - continued | | VALUE | |
| | 70,900 | | | Mylan NV (b) (d) | | $ | 2,702,708 | | |
| | 646,037 | | | Pfizer, Inc. | | | 21,881,273 | | |
| | 72,300 | | | Teva Pharmaceutical Industries Ltd. (d) (e) | | | 3,326,523 | | |
| | | | 196,509,543 | | |
| | | Real Estate Investment Trusts - 9.7% | |
| | 203,105 | | | Care Capital Properties, Inc. | | | 5,788,493 | | |
| | 106,212 | | | LTC Properties, Inc. | | | 5,521,962 | | |
| | 709,455 | | | Medical Properties Trust, Inc. | | | 10,478,650 | | |
| | 413,116 | | | Omega Healthcare Investors, Inc. | | | 14,644,962 | | |
| | 530,672 | | | Physicians Realty Trust | | | 11,430,675 | | |
| | 456,190 | | | Sabra Health Care REIT, Inc. | | | 11,486,864 | | |
| | 479,604 | | | Senior Housing Properties Trust | | | 10,891,807 | | |
| | 15,000 | | | Ventas Realty, LP / Ventas Capital
Corporation | | | 399,900 | | |
| | 152,491 | | | Ventas, Inc. | | | 10,770,439 | | |
| | | | 81,413,752 | | |
| | | | | Real Estate Management &
Development - 0.0% | | | |
| | 5,323 | | | The RMR Group Inc, Class A | | | 201,955 | | |
| | | | 201,955 | | |
| | | | | TOTAL COMMON STOCKS
AND WARRANTS
(Cost $890,259,629) | | | 867,247,565 | | |
PRINCIPAL
AMOUNT | | SHORT-TERM INVESTMENT - 2.1% of
Net Assets | | | |
$ | 18,034,000 | | | Repurchase Agreement, Fixed Income Clearing
Corp., repurchase value $18,034,000,
0.03%, dated 09/30/16, due 10/03/16
(collateralized by U.S. Treasury
Note 3.50%, due 5/15/20, market value
$18,395,213) | | | 18,034,000 | | |
| | | | | TOTAL SHORT-TERM INVESTMENTS
(Cost $18,034,000) | | | 18,034,000 | | |
| | | | | TOTAL INVESTMENTS - 127.8%
(Cost $1,087,082,758) | | | 1,070,086,860 | | |
The accompanying notes are an integral part of these financial statements.
15
TEKLA HEALTHCARE
OPPORTUNITIES FUND
SCHEDULE OF INVESTMENTS
SEPTEMBER 30, 2016
(continued)
NUMBER OF
CONTRACTS
(100 SHARES
EACH) | | CALL OPTION CONTRACTS
WRITTEN - (0.1)%
of Net Assets | | VALUE | |
| | 2,539 | | | Abbott Laboratories Oct16 43 Call | | $ | (139,645 | ) | |
| | 822 | | | Alexion Pharmaceuticals, Inc. Oct16 133 Call | | | (50,964 | ) | |
| | 263 | | | Allergan plc Oct16 260 Call | | | (3,945 | ) | |
| | 1,182 | | | CVS Caremark Corporation Oct16 91 Call | | | (68,556 | ) | |
| | 1,611 | | | DaVita, Inc. Oct16 67.5 Call | | | (88,605 | ) | |
| | 1,327 | | | Eli Lilly & Company Oct16 82 Call | | | (92,890 | ) | |
| | 1,300 | | | Gilead Sciences, Inc. Oct16 86 Call | | | (19,500 | ) | |
| | 709 | | | Mylan NV Oct16 43.5 Call | | | (4,609 | ) | |
| | 937 | | | Sarepta Therapeutics, Inc. Oct16 60 Call | | | (356,060 | ) | |
| | 686 | | | Teva Pharmaceutical Industries Ltd.
Oct16 53.5 Call | | | (4,802 | ) | |
| | 189 | | | United Therapeutics Corporation
Oct16 130 Call | | | (6,615 | ) | |
| | 227 | | | Vertex Pharmaceuticals Incorporated
Oct16 96.5 Call | | | (17,025 | ) | |
| | | | | TOTAL CALL OPTION CONTRACTS
WRITTEN
(Premiums received $1,441,696) | | | (853,216 | ) | |
| | | | | TOTAL INVESTMENTS LESS CALL
OPTION CONTRACTS
WRITTEN - 127.7%
(Cost $1,085,641,062) | | | 1,069,233,644 | | |
| | | | | OTHER LIABILITIES IN EXCESS
OF OTHER ASSETS - (27.7)% | | | (232,160,163 | ) | |
| | | | | NET ASSETS - 100% | | $ | 837,073,481 | | |
(a) Security fair valued. See Investment Valuation and Fair Value Measurements.
(b) Non-income producing security.
(c) Security exempt from registration under Rule 144A of the Securities Act of 1933, as amended. These securities may be resold in transactions exempt from registration, normally to qualified institutional buyers.
(d) A portion of security is pledged as collateral for call options written.
(e) American Depository Receipt
(f) Foreign security.
The accompanying notes are an integral part of these financial statements.
16
TEKLA HEALTHCARE
OPPORTUNITIES FUND
STATEMENT OF ASSETS AND LIABILITIES
SEPTEMBER 30, 2016
ASSETS: | |
Investments, at value (cost $1,087,082,758) | | $ | 1,070,086,860 | | |
Cash | | | 533 | | |
Dividends and interest receivable | | | 2,337,203 | | |
Receivable for investments sold | | | 158,480 | | |
Prepaid expenses | | | 137,159 | | |
Total assets | | | 1,072,720,235 | | |
LIABILITIES: | |
Payable for investments purchased | | | 7,721,280 | | |
Accrued advisory fee | | | 905,123 | | |
Accrued investor support service fees | | | 45,256 | | |
Accrued shareholder reporting fees | | | 47,257 | | |
Accrued trustee fees | | | 565 | | |
Loan Payable | | | 225,000,000 | | |
Options written, at value (premium received $1,441,696) | | | 853,216 | | |
Income distribution payable | | | 219,228 | | |
Interest payable | | | 731,398 | | |
Accrued other | | | 123,431 | | |
Total liabilities | | | 235,646,754 | | |
Commitments and Contingencies (see Note 1) | | | | | |
NET ASSETS | | $ | 837,073,481 | | |
SOURCES OF NET ASSETS: | |
Shares of beneficial interest, par value $.01 per share,
unlimited number of shares authorized, amount paid
in on 43,725,090 shares issued and outstanding | | $ | 833,597,610 | | |
Accumulated net investment loss | | | (219,228 | ) | |
Accumulated net realized gain on investments and
options | | | 20,102,517 | | |
Net unrealized loss on investments and options | | | (16,407,418 | ) | |
Total net assets (equivalent to $19.14 per
share based on 43,725,090 shares outstanding) | | $ | 837,073,481 | | |
The accompanying notes are an integral part of these financial statements.
17
TEKLA HEALTHCARE
OPPORTUNITIES FUND
STATEMENT OF OPERATIONS
YEAR ENDED SEPTEMBER 30, 2016
INVESTMENT INCOME: | |
Dividend income (net of foreign tax of $140,970) | | $ | 15,600,688 | | |
Interest and other income | | | 7,577,333 | | |
Total investment income | | | 23,178,021 | | |
EXPENSES: | |
Advisory fees | | | 10,368,888 | | |
Interest expense | | | 3,092,735 | | |
Investor support service fees | | | 645,315 | | |
Administration fees | | | 166,693 | | |
Auditing fees | | | 38,730 | | |
Shareholder reporting | | | 160,393 | | |
Trustees' fees and expenses | | | 139,110 | | |
Custodian fees | | | 139,039 | | |
Legal fees | | | 125,313 | | |
Transfer agent fees | | | 26,349 | | |
Other (see Note 2) | | | 407,949 | | |
Total expenses | | | 15,310,514 | | |
Net investment gain | | | 7,867,507 | | |
REALIZED AND UNREALIZED GAIN (LOSS): | |
Net realized gain (loss) on: | |
Investments | | | 24,642,204 | | |
Closed or expired option contracts written | | | 6,767,438 | | |
Net realized gain | | | 31,409,642 | | |
Change in unrealized appreciation (depreciation) | |
Investments | | | 50,432,066 | | |
Option contracts written | | | (1,127,168 | ) | |
Change in unrealized appreciation (depreciation) | | | 49,304,898 | | |
Net realized and unrealized gain (loss) | | | 80,714,540 | | |
Net increase in net assets resulting
from operations | | $ | 88,582,047 | | |
The accompanying notes are an integral part of these financial statements.
18
TEKLA HEALTHCARE
OPPORTUNITIES FUND
STATEMENTS OF CHANGES IN NET ASSETS
| | | Year ended
September 30,
2016 | | Year ended
September 30,
2015 | |
NET INCREASE (DECREASE) IN
NET ASSETS RESULTING FROM
OPERATIONS: | |
Net investment gain | | $ | 7,867,507 | | | $ | 4,665,864 | | |
Net realized gain | | | 31,409,642 | | | | 101,554,427 | | |
Change in net unrealized
appreciation (depreciation) | | | 49,304,898 | | | | (71,464,348 | ) | |
Net increase in net assets
resulting from operations | | | 88,582,047 | | | | 34,755,943 | | |
DISTRIBUTIONS TO SHAREHOLDERS
FROM: | |
Net investment income | | | (72,504,372 | ) | | | (59,235,598 | ) | |
Total distributions | | | (72,504,372 | ) | | | (59,235,598 | ) | |
CAPITAL SHARE TRANSACTIONS: | |
Fund shares repurchased (153,131 and
0 shares, respectively) (see Note 1) | | | (2,709,105 | ) | | | — | | |
Total capital share transactions | | | (2,709,105 | ) | | | — | | |
Net increase (decrease) in
net assets | | | 13,368,570 | | | | (24,479,655 | ) | |
NET ASSETS: | |
Beginning of year | | | 823,704,911 | | | | 848,184,566 | | |
End of year | | $ | 837,073,481 | | | $ | 823,704,911 | | |
Accumulated net investment loss
included in net assets at end of year | | ($ | 219,228 | ) (a) | | ($ | 319,519 | ) (a) | |
(a) Reflects reclassifications to the Fund's capital accounts to reflect income and gains available for distribution under income tax regulations.
The accompanying notes are an integral part of these financial statements.
19
TEKLA HEALTHCARE
OPPORTUNITIES FUND
STATEMENT OF CASH FLOWS
YEAR ENDED SEPTEMBER 30, 2016
CASH FLOWS FROM OPERATING ACTIVITIES: | |
Purchases of portfolio securities | | ($ | 475,413,339 | ) | |
Purchases to close option contracts written | | | (69,206 | ) | |
Net maturities of short-term investments | | | (6,851,000 | ) | |
Sales of portfolio securities | | | 541,672,830 | | |
Proceeds from option contracts written | | | 8,252,345 | | |
Interest income received | | | 7,678,346 | | |
Dividend income received | | | 15,765,047 | | |
Other operating receipts (expenses paid) | | | (16,040,348 | ) | |
Net cash provided from operating activities | | | 74,994,675 | | |
CASH FLOWS FROM FINANCING ACTIVITIES: | |
Cash distributions paid | | | (72,285,144 | ) | |
Fund shares repurchased | | | (2,709,105 | ) | |
Net cash used for financing activities | | | (74,994,249 | ) | |
NET INCREASE IN CASH | | | 426 | | |
CASH AT BEGINNING OF YEAR | | | 107 | | |
CASH AT END OF YEAR | | $ | 533 | | |
RECONCILIATION OF NET INCREASE IN NET ASSETS
RESULTING FROM OPERATIONS TO NET CASH
PROVIDED FROM OPERATING ACTIVITIES: | |
Net increase in net assets resulting from operations | | $ | 88,582,047 | | |
Purchases of portfolio securities | | | (475,413,339 | ) | |
Purchases to close option contracts written | | | (69,206 | ) | |
Net maturities of short-term investments | | | (6,851,000 | ) | |
Sales of portfolio securities | | | 541,672,830 | | |
Proceeds from option contracts written | | | 8,252,345 | | |
Accretion of discount | | | (280,794 | ) | |
Net realized gain on investments and options | | | (31,409,642 | ) | |
Increase in net unrealized appreciation
(depreciation) on investments and options | | | (49,304,898 | ) | |
Decrease in dividends and interest receivable | | | 546,166 | | |
Decrease in accrued expenses | | | (588,206 | ) | |
Decrease in prepaid expenses and interest payable | | | (141,628 | ) | |
Net cash provided from operating activities | | $ | 74,994,675 | | |
The accompanying notes are an integral part of these financial statements.
20
TEKLA HEALTHCARE
OPPORTUNITIES FUND
FINANCIAL HIGHLIGHTS
| | | Year ended
September 30,
2016 | | Year ended
September 30,
2015 | | Period
July 31,
2014 to
September 30,
2014 (1) | |
OPERATING PERFORMANCE FOR A SHARE
OUTSTANDING THROUGHOUT EACH PERIOD | |
Net asset value per share, beginning of period | | $ | 18.77 | | | $ | 19.33 | | | $ | 19.10 | (2) | |
Net investment income (loss) (3) | | | 0.18 | | | | 0.11 | | | | (0.01 | ) | |
Net realized and unrealized gain | | | 1.78 | | | | 0.68 | | | | 0.39 | | |
Total increase (decrease) from investment operations | | | 1.96 | | | | 0.79 | | | | 0.38 | | |
Distributions to shareholders from: | |
Income distributions to shareholders | | | (1.65 | ) | | | (1.35 | ) | | | (0.11 | ) | |
Total distributions | | | (1.65 | ) | | | (1.35 | ) | | | (0.11 | ) | |
Capital charges with respect to issuance of shares | | | — | | | | — | | | | (0.04 | ) | |
Increase resulting from shares repurchased (3) | | | 0.06 | | | | — | | | | — | | |
Net asset value per share, end of period | | $ | 19.14 | | | $ | 18.77 | | | $ | 19.33 | | |
Per share market value, end of period | | $ | 17.48 | | | $ | 16.30 | | | $ | 18.85 | | |
Total investment return at market value | | | 18.25 | % | | | (7.37 | %) | | | (5.42 | %)* | |
Total investment return at net asset value | | | 12.44 | % | | | 4.02 | % | | | 2.02 | %* | |
RATIOS | |
Expenses to average net assets | | | 1.88 | % | | | 1.60 | % | | | 1.28 | %** | |
Expenses, excluding interest expense, to average net assets | | | 1.50 | % | | | 1.44 | % | | | 1.28 | %** | |
Net investment income (loss) to average net assets | | | 0.96 | % | | | 0.50 | % | | | (0.41 | %)** | |
SUPPLEMENTAL DATA | |
Net assets at end of period (in millions) | | $ | 837 | | | $ | 824 | | | $ | 848 | | |
Portfolio turnover rate | | | 48.24 | % | | | 92.61 | % | | | 19.61 | %* | |
* Not Annualized.
** Annualized.
(1) Commenced operations on July 31, 2014.
(2) Net asset value beginning of period reflects a deduction of $0.90 per share sales charge from the initial offering price of $20.00 per share.
(3) Computed using average shares outstanding.
The accompanying notes are an integral part of these financial statements.
21
TEKLA HEALTHCARE
OPPORTUNITIES FUND
NOTES TO FINANCIAL STATEMENTS
SEPTEMBER 30, 2016
(1) Organization and Significant Accounting Policies
Tekla Healthcare Opportunities Fund (the Fund) is a Massachusetts business trust formed on April 2, 2014 and registered under the Investment Company Act of 1940 as a non-diversified closed-end management investment company. The Fund commenced operations on July 31, 2014. The Fund's investment objective is to seek current income and long-term capital appreciation through investments in U.S. and non-U.S. companies in the healthcare industry (including equity securities, debt securities and pooled investment vehicles). The Fund invests primarily in securities of public and private companies believed by the Fund's Investment Adviser, Tekla Capital Management LLC (the Adviser), to have significant potential for above-average growth. The Fund may invest in private companies and other restricted securities, including private investments in public equity and venture capital investments, if these securities would currently comprise 10% or less of Managed Assets.
The preparation of these financial statements requires the use of certain estimates by management in determining the Fund's assets, liabilities, revenues and expenses. Actual results could differ from these estimates and such differences could be material. The following is a summary of significant accounting policies followed by the Fund, which are in conformity with accounting principles generally accepted in the United States of America ("GAAP"). The Fund is an investment company and follows accounting and reporting guidance in the Financial Accounting Standards Board Accounting Standards Codification 946. Events or transactions occurring after September 30, 2016, through the date that the financial statements were issued, have been evaluated in the preparation of these financial statements.
Derivatives Strategy Changes
Earlier this year, the Board approved an expanded use of derivatives by the Fund. Prior to this approval, the Fund's investment strategy provided that the Fund would not invest more than 30% of its Managed Assets as measured at the time of investment, in derivatives, including options, futures, options on futures, forwards, swaps, options on swaps and other derivatives, for hedging purposes. The Board approved the Fund's use of these derivatives for non-hedging purposes as well. Accordingly, the Fund may now also invest in derivatives for hedging and non-hedging purposes, subject to a limit of 10% of its Managed Assets in derivatives other than its option writing strategy.
A revised description of the Fund's investment strategy with respect to derivatives is as follows: The Fund will not invest more than 30% of its Managed Assets (the total assets of the Fund (including any assets attributable to borrowings for investment purposes) minus the sum of the Fund's accrued liabilities (other than liabilities representing borrowings for investment purposes)) as measured at the time of investment in derivatives, including options, futures, options on futures, forwards, swaps, options on swaps and other derivatives. The Fund employs a strategy of writing (selling) covered call options on a portion of the common stocks in its portfolio, writing (selling) put options on a portion of the common stocks in its portfolio and, to a lesser extent, writing (selling) covered call and writing (selling) put options on indices of securities and sectors of securities generally within the healthcare industry. This option strategy is intended to generate current income from option premiums as a means to enhance distributions payable to the Fund's Shareholders. Over time, as the Fund's portfolio becomes more seasoned, its ability to benefit from capital appreciation may become more limited, and the Fund will lose money to the extent that it writes covered call options and the
22
TEKLA HEALTHCARE
OPPORTUNITIES FUND
NOTES TO FINANCIAL STATEMENTS
SEPTEMBER 30, 2016
(continued)
securities on which it writes the option appreciates above the exercise price of the option by an amount that exceeds the exercise price of the option. Therefore, over time, the Adviser may choose to decrease its use of the option writing strategy to the extent that it may negatively impact the Fund's ability to benefit from capital appreciation. Other than the Fund's option strategy, the Fund may invest up to 10% of its Managed Assets in derivatives. Derivative instruments can be illiquid, may disproportionately increase losses, and may have a potentially large adverse impact on Fund performance.
Although both OTC and exchange-traded derivatives markets may experience the lack of liquidity, OTC non-standardized derivative transactions are generally less liquid than exchange-traded instruments. The illiquidity of the derivatives markets may be due to various factors, including congestion, disorderly markets, limitations on deliverable supplies, the participation of speculators, government regulation and intervention, and technical and operational or system failures. In addition, daily limits on price fluctuations and speculative position limits on exchanges on which the Fund may conduct its transactions in derivative instruments may prevent prompt liquidation of positions, subjecting the Fund to the potential of greater losses. Losses from investments in derivative instruments can result from a lack of correlation between changes in the value of derivative instruments and the portfolio assets (if any) being hedged, the potential illiquidity of the markets for derivative instruments, the failure of the counterparty to perform its contractual obligations, or the risks arising from margin requirements and related leverage factors associated with such transactions. Losses may also arise if the Fund receives cash collateral under the transactions and some or all of that collateral is invested in the market. To the extent that cash collateral is so invested, such collateral will be subject to market depreciation or appreciation, and the Fund may be responsible for any loss that might result from its investment of the counterparty's cash collateral. The use of these management techniques also involves the risk of loss if the Adviser is incorrect in its expectation of the timing or level of fluctuations in securities prices, interest rates or currency prices. Investments in derivative instruments may be harder to value, subject to greater volatility and more likely subject to changes in tax treatment than other investments. For these reasons, the Adviser's use of derivative instruments may not be successful. Trading in derivative instruments can result in large amounts of leverage. Thus, the leverage offered by trading in derivative instruments will magnify the gains and losses experienced by the Fund and could cause the Fund's net asset value to be subject to wider fluctuations than would be the case if the Fund did not use the leverage feature in derivative instruments.
Investment Valuation
Shares of publicly traded companies listed on national securities exchanges or trading in the over-the-counter market are typically valued at the last sale price, as of the close of trading, generally 4 p.m., Eastern time. The Board of Trustees of the Fund (the "Trustees") has established and approved fair valuation policies and procedures with respect to securities for which quoted prices may not be available or which do not reflect fair value. Convertible bonds, corporate and government bonds are valued using a third-party pricing service. Convertible bonds are valued using this pricing service only on days when there is no sale reported. Puts and calls generally are valued at the close of regular trading on the securities or commodities exchange on which they are primarily traded. Options on securities generally are valued at their last sale price in the case of exchange traded options or, in the case of OTC-traded options, the average of the last sale price as obtained from two or more dealers unless there is only
23
TEKLA HEALTHCARE
OPPORTUNITIES FUND
NOTES TO FINANCIAL STATEMENTS
SEPTEMBER 30, 2016
(continued)
one dealer, in which case that dealer's price is used. Gain or loss is recognized when the option contract expires, is exercised, or is closed. Forward foreign currency contracts are valued on the basis of the value of the underlying currencies at the prevailing currency exchange rate. Restricted securities of companies that are publicly traded are typically valued based on the closing market quote on the valuation date adjusted for the impact of the restriction as determined in good faith by the Adviser also using fair valuation policies and procedures approved by the Trustees described below. Non-exchange traded warrants of publicly traded companies are generally valued using the Black-Scholes model, which incorporates both observable and unobservable inputs. Short-term investments with a maturity of 60 days or less are generally valued at amortized cost, which approximates fair value.
Convertible preferred shares, warrants or convertible note interests in private companies, milestone interests, and other restricted securities, as well as shares of publicly traded companies for which market quotations are not readily available, such as stocks for which trading has been halted or for which there are no current day sales, or which do not reflect fair value, are typically valued in good faith, based upon the recommendations made by the Adviser pursuant to fair valuation policies and procedures approved by the Trustees.
The Adviser has a Valuation Sub-Committee comprised of senior management which reports to the Valuation Committee of the Board at least quarterly. Each fair value determination is based on a consideration of relevant factors, including both observable and unobservable inputs. Observable and unobservable inputs the Adviser considers may include (i) the existence of any contractual restrictions on the disposition of securities; (ii) information obtained from the company, which may include an analysis of the company's financial statements, the company's products or intended markets or the company's technologies; (iii) the price of the same or similar security negotiated at arm's length in an issuer's completed subsequent round of financing; (iv) the price and extent of public trading in similar securities of the issuer or of comparable companies; or (v) a probability and time value adjusted analysis of contractual terms. Where available and appropriate, multiple valuation methodologies are applied to confirm fair value. Significant unobservable inputs identified by the Adviser are often used in the fair value determination. A significant change in any of these inputs may result in a significant change in the fair value measurement. Due to the uncertainty inherent in the valuation process, such estimates of fair value may differ significantly from the values that would have been used had a ready market for the investments existed, and differences could be material. Additionally, changes in the market environment and other events that may occur over the life of the investments may cause the gains or losses ultimately realized on these investments to be different from the valuations used at the date of these financial statements.
Options on Securities
An option contract is a contract in which the writer (seller) of the option grants the buyer of the option, upon payment of a premium, the right to purchase from (call option) or sell to (put option) the writer a designated instrument at a specified price within a specified period of time. Certain options, including options on indices, will require cash settlement by the Fund if the option is exercised. The Fund enters into option contracts in order to hedge against potential adverse price movements in the value of portfolio assets, as a temporary substitute for selling selected investments, to lock in the purchase price of a security or currency which it expects to purchase in the near future, as a temporary substitute for
24
TEKLA HEALTHCARE
OPPORTUNITIES FUND
NOTES TO FINANCIAL STATEMENTS
SEPTEMBER 30, 2016
(continued)
purchasing selected investments, or to enhance potential gain or to gain or hedge exposure to financial market risk.
The Fund's obligation under an exchange traded written option or investment in an exchange-traded purchased option is valued at the last sale price or in the absence of a sale, the mean between the closing bid and asked prices.
If the Fund writes a covered call option, the Fund foregoes, in exchange for the premium, the opportunity to profit during the option period from an increase in the market value of the underlying security above the exercise price. If the Fund writes a put option it accepts the risk of a decline in the market value of the underlying security below the exercise price. Over-the-counter options have the risk of the potential inability of counterparties to meet the terms of their contracts. The Fund's maximum exposure to purchased options is limited to the premium initially paid. In addition, certain risks may arise upon entering into option contracts including the risk that an illiquid secondary market will limit the Fund's ability to close out an option contract prior to the expiration date and that a change in the value of the option contract may not correlate exactly with changes in the value of the securities or currencies hedged.
All options on securities and securities indices written by the Fund are required to be covered. When the Fund writes a call option, this means that during the life of the option the Fund may own or have the contractual right to acquire the securities subject to the option or may maintain with the Fund's custodian in a segregated account appropriate liquid securities in an amount at least equal to the market value of the securities underlying the option. When the Fund writes a put option, this means that the Fund will maintain with the Fund's custodian in a segregated account appropriate liquid securities in an amount at least equal to the exercise price of the option.
Transactions in call options written for the year ended September 30, 2016 were as follows:
| | | Contracts | | Premiums | |
Options outstanding, September 30, 2015 | | | 9,815 | | | $ | 2,210,005 | | |
Options written | | | 56,500 | | | | 8,252,345 | | |
Options terminated in closing purchase transactions | | | (2,751 | ) | | | (226,665 | ) | |
Options exercised | | | (13,750 | ) | | | (2,184,010 | ) | |
Options expired | | | (38,022 | ) | | | (6,609,979 | ) | |
Options outstanding, September 30, 2016 | | | 11,792 | | | $ | 1,441,696 | | |
Average Number of Contracts | | | 5,056 | | | | | | |
Derivatives not accounted
for as hedging instruments
under ASC 815 | | Statement of Assets and
Liabilities Location | | Statement of Operations Location | |
Equity Contracts
| |
| | Liabilities, options
written, at value
| | |
$853,216
| | | Net realized gain on
closed or expired option
contracts written | | |
$6,767,438 | | |
| | | | | | | | | | | | | Change in unrealized
appreciation (depreciation)
on option contracts
written | | | ($1,127,168) | | |
25
TEKLA HEALTHCARE
OPPORTUNITIES FUND
NOTES TO FINANCIAL STATEMENTS
SEPTEMBER 30, 2016
(continued)
Investment Transactions and Income
Investment transactions are recorded on a trade date basis. Gains and losses from sales of investments are recorded using the "identified cost" method. Interest income is recorded on the accrual basis, adjusted for amortization of premiums and accretion of discounts. Dividend income is recorded on the ex-dividend date, less any foreign taxes withheld. Upon notification from issuers, some of the dividend income received may be redesignated as a reduction of cost of the related investment if it represents a return of capital.
The aggregate cost of purchases and proceeds from sales of investment securities (other than short-term investments) for the year ended September 30, 2016 totaled $476,032,438 and $534,750,308, respectively.
Repurchase Agreements
In managing short-term investments the Fund may from time to time enter into transactions in repurchase agreements. In a repurchase agreement, the Fund's custodian takes possession of the underlying collateral securities from the counterparty, the market value of which is at least equal to the principal, including accrued interest, of the repurchase transaction at all times. In the event of default or bankruptcy by the other party to the agreement, realization and/or retention of the collateral by the Fund may be delayed. The Fund may enter into repurchase transactions with any broker, dealer, registered clearing agency or bank. Repurchase agreement transactions are not counted for purposes of the limitations imposed on the Fund's investment in debt securities.
Distribution Policy
Pursuant to a Securities and Exchange Commission exemptive order the Fund may make periodic distributions that include capital gains as frequently as 12 times in any one taxable year in respect of its common shares, and the Fund has implemented a managed distribution policy (the Policy) providing for monthly distributions at a rate set by the Board of Trustees. Under the current Policy, the Fund intends to make monthly distributions at a rate of $0.1125 per share to shareholders of record. If taxable income and net long-term realized gains exceed the amount required to be distributed under the Policy, the Fund will at a minimum make distributions necessary to comply with the requirements of the Internal Revenue Code. The Policy has been established by the Trustees and may be changed by them without shareholder approval. The Trustees regularly review the Policy and the frequency and distribution rate considering the purpose and effect of the Policy, the financial market environment, and the Fund's income, capital gains and capital available to pay distributions.
Share Repurchase Program
In March 2016, the Trustees approved the renewal of the share repurchase program to allow the Fund to purchase up to 12% of its outstanding common shares in the open market for a one-year period beginning July 11, 2016. Prior to this renewal, in March 2015, the Trustees approved the renewal of the share repurchase program to allow the Fund to repurchase up to 12% of its outstanding shares for a one year period beginning July 11, 2015. The share repurchase program is intended to enhance shareholder value and potentially reduce the discount between the market price of the Fund's shares and the Fund's net asset value.
26
TEKLA HEALTHCARE
OPPORTUNITIES FUND
NOTES TO FINANCIAL STATEMENTS
SEPTEMBER 30, 2016
(continued)
During the year ended September 30, 2016 the Fund repurchased 153,131 shares at a total cost of $2,709,105. The weighted average discount per share between the cost of repurchase and the net asset value applicable to such shares at the date of repurchase was 8.76%.
During the period July 11, 2015 to September 30, 2015, the Fund did not repurchase any shares through the repurchase program.
Federal Taxes
It is the Fund's policy to comply with the requirements of the Internal Revenue Code applicable to regulated investment companies and to distribute to its shareholders substantially all of its taxable income and its net realized capital gains, if any. Therefore, no Federal income or excise tax provision is required.
As of September 30, 2016, the Fund had no uncertain tax positions that would require financial statement recognition or disclosure. The Fund's federal tax returns are subject to examination by the Internal Revenue Service for a period of three years.
Distributions
The Fund records all distributions to shareholders on the ex-dividend date. Such distributions are determined in conformity with income tax regulations, which may differ from GAAP. These differences include temporary and permanent differences from losses on wash sale transactions, installment sale adjustments and ordinary loss netting to reduce short term capital gains. Reclassifications are made to the Fund's capital accounts to reflect income and gains available for distribution under income tax regulations. At September 30, 2016, the Fund reclassified $64,737,156 from accumulated net realized gain on investment and $64,737,156 to accumulated net investment loss, to adjust for current period book/tax differences.
The tax basis components of distributable earnings and the tax cost as of September 30, 2016 were as follows:
Cost of Investments for tax purposes | | $ | 1,085,480,445 | | |
Gross tax unrealized appreciation | | $ | 73,355,421 | | |
Gross tax unrealized depreciation | | ($ | 89,602,222 | ) | |
Net tax unrealized depreciation on investments | | ($ | 16,246,801 | ) | |
Undistributed long-term capital gains | | $ | 19,941,900 | | |
The Fund has designated the distributions for its taxable years ended September 30, 2016 and 2015 as follows:
| | | 2016 | | 2015 | |
Ordinary income (includes short-term capital gain) | | $ | 60,171,751 | | | $ | 59,235,598 | | |
Long-term capital gain | | $ | 12,332,621 | | | $ | — | | |
Statement of Cash Flows
The cash amount shown in the Statement of Cash Flows is the amount included in the Fund's Statement of Assets and Liabilities and represents cash on hand at September 30, 2016.
27
TEKLA HEALTHCARE
OPPORTUNITIES FUND
NOTES TO FINANCIAL STATEMENTS
SEPTEMBER 30, 2016
(continued)
Commitments and Contingencies
Under the Fund's organizational documents, its officers and Trustees may be indemnified against certain liabilities and expenses arising out of the performance of their duties to the Fund. Additionally, in the normal course of business, the Fund enters into agreements with service providers that may contain indemnification clauses. The Fund's maximum exposure under these agreements is unknown as this would involve future claims that may be made against the Fund that have not yet occurred. However, based on experience, the Fund expects the risk of loss to be remote.
Loan Payable
The Fund maintains a $225,000,000 line of credit with the Bank of Nova Scotia (the "Line of Credit") which expires on January 6, 2017. As of September 30, 2016, the Fund had drawn down $225,000,000 from the Line of Credit, which was the maximum borrowing outstanding during the period. The Fund is charged interest at the rate of 0.70% above the relevant LIBOR rate adjusted by the Statutory Reserve Rate for borrowing (per annum). The Fund is also charged a commitment fee on the daily unused balance of the line of credit at the rate of 0.25% (per annum). Per the Line of Credit agreement, the Fund paid an upfront fee of 0.10% on the total line of credit balance, which is being amortized through January 4, 2017. The Fund pledges its investment securities as the collateral for the line of credit per the terms of the agreement. The weighted average interest rate and the weighted average outstanding loan payable for the period from October 1, 2015 to September 30, 2016 were 1.3579% and $225,000,000, respectively. The stated carrying amount of the line of credit approximates its fair value based upon the short term nature of the borrowings and the interest rates being based upon the market terms. The borrowings under the line of credit would be considered as Level 2 in the fair value hierarchy (See Note 3) at September 30, 2016.
Investor Support Services
The Fund has retained Destra Capital Investment LLC to provide investor support services in connection with the ongoing operation of the Fund. The Fund will pay Destra a fee in an annual amount equal to, (i) 0.10% of the average aggregate daily value of the Fund's Managed Assets from July 31, 2015 to December 31, 2015 and (ii) 0.05% of the average aggregate daily value of the Fund's Managed Assets from January 1, 2016 through the remaining term of the investor support services agreement.
(2) Investment Advisory and Other Affiliated Fees
The Fund has entered into an Investment Advisory Agreement (the Advisory Agreement) with the Adviser. Pursuant to the terms of the Advisory Agreement, the Fund pays the Adviser a monthly fee at the rate when annualized of 1.00% of the average daily value of the Fund's Managed Assets. Managed Assets means the total assets of the Fund minus the Fund's liabilities other than the loan payable.
The Fund has entered into a Services Agreement (the Agreement) with the Adviser. Pursuant to the terms of the Agreement, the Fund reimburses the Adviser for certain services related to a portion of the payment of salary and provision of benefits to the Fund's Chief Compliance
28
TEKLA HEALTHCARE
OPPORTUNITIES FUND
NOTES TO FINANCIAL STATEMENTS
SEPTEMBER 30, 2016
(continued)
Officer. During the year ended September 30, 2016, these payments amounted to $73,132 and are included in the Other category of expenses in the Statement of Operations, together with insurance and other expenses incurred to unaffiliated entities. Expenses incurred pursuant to the Agreement as well as certain expenses paid for by the Adviser are allocated to the Fund in an equitable fashion as approved by the Trustees of the Fund.
The Fund pays compensation to Independent Trustees in the form of a retainer, attendance fees, and additional compensation to Board and Committee chairpersons. The Fund does not pay compensation directly to Trustees or officers of the Fund who are also officers of the Adviser.
(3) Fair Value Measurements
The Fund uses a three-tier hierarchy to prioritize the assumptions, referred to as inputs, used in valuation techniques to measure fair value. The three-tier hierarchy of inputs is summarized in the three broad levels. Level 1 includes quoted prices in active markets for identical investments. Level 2 includes prices determined using other significant observable inputs (including quoted prices for similar investments, interest rates, credit risk, etc.). The independent pricing vendor may value bank loans and debt securities at an evaluated bid price by employing methodologies designed to identify the market value for such securities and such securities are considered Level 2 in the fair value hierarchy. Level 3 includes prices determined using significant unobservable inputs (including the Fund's own assumptions in determining the fair value of investments). These inputs or methodology used for valuing securities are not necessarily an indication of the risk associated with investing in those securities.
The following is a summary of the inputs used as of September 30, 2016 to value the Fund's net assets. For the year ended September 30, 2016, there were no transfers between Levels 1 and 2. The Fund accounts for transfers between levels at the beginning of the period.
Assets at Value | | Level 1 | | Level 2 | | Level 3 | | Total | |
Convertible Preferred Stocks | |
Biotechnology | | | | | | | | | | $ | 4,151,922 | | | $ | 4,151,922 | | |
Health Care Equipment & Supplies | | | | | | | | | | | 790,548 | | | | 790,548 | | |
Preferred Stock | |
Real Estate Investment Trust | | $ | 13,310,000 | | | | | | | | — | | | | 13,310,000 | | |
Mandatory Convertible Preferred Stocks | |
Pharmaceuticals | | | 14,681,170 | | | | | | | | — | | | | 14,681,170 | | |
Convertible Notes | |
Biotechnology | | | — | | | $ | 26,359,238 | | | | — | | | | 26,359,238 | | |
Pharmaceuticals | | | — | | | | 14,535,000 | | | | — | | | | 14,535,000 | | |
Non-Convertible Notes | |
Biotechnology | | | — | | | | 10,736,860 | | | | — | | | | 10,736,860 | | |
Health Care Equipment & Supplies | | | — | | | | 11,473,142 | | | | — | | | | 11,473,142 | | |
Health Care Providers & Services | | | — | | | | 74,728,616 | | | | — | | | | 74,728,616 | | |
Pharmaceuticals | | | — | | | | 14,038,799 | | | | — | | | | 14,038,799 | | |
29
TEKLA HEALTHCARE
OPPORTUNITIES FUND
NOTES TO FINANCIAL STATEMENTS
SEPTEMBER 30, 2016
(continued)
Assets at Value | | Level 1 | | Level 2 | | Level 3 | | Total | |
Common Stocks and Warrants | |
Biotechnology | | $ | 299,410,261 | | | | — | | | $ | 37,528 | | | $ | 299,447,789 | | |
Health Care Equipment & Supplies | | | 111,445,270 | | | | — | | | | — | | | | 111,445,270 | | |
Health Care Providers & Services | | | 160,093,485 | | | | — | | | | — | | | | 160,093,485 | | |
Health Care Technology | | | 2,286,312 | | | | — | | | | — | | | | 2,286,312 | | |
Life Sciences Tools & Services | | | 15,849,459 | | | | — | | | | — | | | | 15,849,459 | | |
Pharmaceuticals | | | 196,509,543 | | | | — | | | | — | | | | 196,509,543 | | |
Real Estate Investment Trusts | | | 81,413,752 | | | | — | | | | — | | | | 81,413,752 | | |
Real Estate Management & Development | | | 201,955 | | | | — | | | | — | | | | 201,955 | | |
Short-term Investment | | | — | | | $ | 18,034,000 | | | | — | | | | 18,034,000 | | |
Total | | $ | 895,201,207 | | | $ | 169,905,655 | | | $ | 4,979,998 | | | $ | 1,070,086,860 | | |
Other Financial Instruments | |
Liabilities | |
Call Options Contracts Written | | ($ | 853,216 | ) | | $ | — | | | $ | — | | | ($ | 853,216 | ) | |
Total | | ($ | 853,216 | ) | | $ | — | | | $ | — | | | ($ | 853,216 | ) | |
The following is a reconciliation of Level 3 assets for which significant unobservable inputs were used to determine fair value.
Level 3 Assets | | Balance as of
September 30,
2015 | | Net realized
gain (loss)
and change in
unrealized
appreciation
(depreciation) | | Cost of
purchases
and
conversions | | Proceeds
from sales
and
conversions | | Net
transfers
in (out
of)
Level 3 | | Balance as
of
September 30,
2016 | |
Convertible Preferred
Stocks | |
Biotechnology | | | | | | ($ | 2,944 | ) | | $ | 4,154,866 | | | | | | | | | | | $ | 4,151,922 | | |
Health Care
Equipment &
Supplies | | | | | | | 377,696 | | | | 412,852 | | | | | | | | | | | | 790,548 | | |
Common Stocks and
Warrants | |
Biotechnology | | | | | | | 29,902 | | | | 7,626 | | | | | | | | | | | | 37,528 | | |
Total | | $ | — | | | $ | 404,654 | | | $ | 4,575,344 | | | $ | — | | | $ | — | | | $ | 4,979,998 | | |
Net change in unrealized appreciation (depreciation) from
investments still held as of September 30, 2016 | | $ | 404,654 | | |
30
TEKLA HEALTHCARE
OPPORTUNITIES FUND
NOTES TO FINANCIAL STATEMENTS
SEPTEMBER 30, 2016
(continued)
The following is a quantitative disclosure about significant unobservable inputs used in the determination of the fair value of Level 3 assets.
| | | Fair Value at
9/30/2016 | | Valuation Technique | | Unobservable Input | | Range
(Weighted Average) | |
Private Companies and
Other Restricted
Securities | | |
$37,528
| | |
Income approach,
Black-Scholes | |
Discount for lack of
marketability | |
20%-50% (32.19%)
| |
| | | 3,990,547
| | | Adjusted capital asset
pricing model | | Discount rate
Price to sales multiple | | 16.11%-30.87% (21.30%)
2.14-3.53 (2.63) | |
| | | | 951,923
| | | Market approach,
recent transaction | |
(a) | |
N/A | |
| | | | $4,979,998 | | | | | | | | |
(a) The valuation technique used as a basis to approximate fair value of these investments is based upon subsequent financing rounds. There is no quantitative information to provide as these methods of measure are investment specific.
(4) Private Companies and Other Restricted Securities
The Fund may invest in private companies and other restricted securities if these securities would currently comprise 10% or less of Managed Assets. The value of these securities represented less than 1% of the Fund's Managed Assets at September 30, 2016.
The following table details the acquisition date, cost, carrying value per unit, and value of the Fund's private companies and other restricted securities at September 30, 2016. The Fund on its own does not have the right to demand that such securities be registered.
Security (#) | | Acquisition
Date | | Cost | | Carrying Value
per Unit | | Value | |
BioClin Therapeutics, Inc. | |
Series A Cvt. Pfd | | 1/19/16 | | $ | 952,547 | | | $ | 0.65 | | | $ | 951,923 | | |
Eleven Biotherapeutics, Inc. | |
Warrants (expiration 11/24/17) | | 11/25/14 | | | 2,780 | | | | 0.05 | | | | 15,255 | | |
GenomeDx Biosciences, Inc. | |
Series C Cvt. Pfd | | 2/22/16 | | | 3,202,319 | | | | 1.50 | | | | 3,199,999 | | |
IlluminOss Medical, Inc. | |
Series AA Cvt. Pfd | | 1/21/16 | | | 282,638 | | | | 1.00 | | | | 407,078 | | |
Series Junior Preferred Cvt. Pfd | | 1/21/16 | | | 130,214 | | | | 1.00 | | | | 383,470 | | |
Pieris Pharmaceuticals, Inc. | |
Series A Warrants (expiration 6/8/21) | | 6/7/16 | | | 5,084 | | | | 0.32 | | | | 12,959 | | |
Series B Warrants (expiration 6/8/21) | | 6/7/16 | | | 2,542 | | | | 0.46 | | | | 9,314 | | |
| | | | | $ | 4,578,124 | | | | | $ | 4,979,998 | | |
(#) See Schedule of Investments and corresponding footnotes for more information on each issuer.
31
REPORT OF INDEPENDENT REGISTERED PUBLIC ACCOUNTING FIRM
To the Board of Trustees and Shareholders of Tekla Healthcare Opportunities Fund:
We have audited the accompanying statement of assets and liabilities of Tekla Healthcare Opportunities Fund (the "Fund"), including the schedule of investments, as of September 30, 2016, the related statements of operations and cash flows for the year then ended, the statements of changes in net assets for the two years in the period then ended and the financial highlights for the two years in the period then ended and for the period July 31, 2014 (commencement of operations) to September 30, 2014. These financial statements and financial highlights are the responsibility of the Fund's management. Our responsibility is to express an opinion on these financial statements and financial highlights based on our audits.
We conducted our audits in accordance with the standards of the Public Company Accounting Oversight Board (United States). Those standards require that we plan and perform the audit to obtain reasonable assurance about whether the financial statements and financial highlights are free of material misstatement. The Fund is not required to have, nor were we engaged to perform, an audit of its internal control over financial reporting. Our audits included consideration of internal control over financial reporting as a basis for designing audit procedures that are appropriate in the circumstances, but not for the purpose of expressing an opinion on the effectiveness of the Fund's internal control over financial reporting. Accordingly, we express no such opinion. An audit also includes examining, on a test basis, evidence supporting the amounts and disclosures in the financial statements, assessing the accounting principles used and significant estimates made by management, as well as evaluating the overall financial statement presentation. Our procedures included confirmation of securities owned as of September 30, 2016, by correspondence with the custodian and brokers; where replies were not received from brokers, we performed other auditing procedures. We believe that our audits provide a reasonable basis for our opinion.
In our opinion, the financial statements and financial highlights referred to above present fairly, in all material respects, the financial position of Tekla Healthcare Opportunities Fund as of September 30, 2016, the results of its operations and its cash flows for the year then ended, the changes in its net assets for the two years in the period then ended and the financial highlights for the two years in the period then ended and for the period July 31, 2014 (commencement of operations) to September 30, 2014, in conformity with accounting principles generally accepted in the United States of America.
DELOITTE & TOUCHE LLP
Boston, Massachusetts
November 18, 2016
32
TEKLA HEALTHCARE
OPPORTUNITIES FUND
TRUSTEES
Name, Address1
and Date of Birth | | Position(s) Held with
Fund, Term of Office2 and
Length of Time Served | | Principal Occupation(s)
During Past 5 Years and
Other Directorship Held | | Number of
Portfolios in Fund
Complex Overseen
by Trustee | |
Independent Trustees: | | | | | | | |
Michael W. Bonney
8/1958 | | Trustee (since 2014) | | Partner, Third Rock Ventures (2016); Chief Executive Officer and Director, Cubist Pharmaceuticals, Inc. (2012 -2015); President, Chief Executive Officer and Director, Cubist Pharmaceuticals, Inc. (2003-2012); Director, Celgene Corporation (since 2015); Director, Global Blood Therapeutics (since 2016); Director, Revolution Medicine (since 2016); Director, Alnylam Pharmaceuticals, Inc. (since 2014); Director, NPS Pharmaceuticals, Inc. (2012-2015); Chairman of the Board of Trustees, Bates College (since 2010); Board member of the Pharmaceutical Research and Manufacturers of America (PhRMA) (2009-2014). | | | 4 | | |
Rakesh K. Jain, Ph.D.
12/1950 | | Trustee (since 2014) | | Director, Steele Lab of Tumor Biology at Massachusetts General Hospital (since 1991); A.W. Cook Professor of Tumor Biology (Radiation Oncology) at Harvard Medical School (since 1991); Ad hoc Consultant/Scientific Advisory Board Member for pharmaceutical/biotech companies (various times since 2002); Ad hoc Consultant, Gershon Lehman Group (since 2004); Director, Co-Founder, XTuit Pharmaceuticals, Inc. (since 2012). | | | 4 | | |
Oleg M. Pohotsky, M.B.A, J.D.
3/1947 | | Trustee (since 2014)
Chairman (since 2014) | | Consultant and Managing Partner, Right Bank Partners (since 2002) (Corporate governance and strategy advisory); Adviser, Board Advisers, Kaufman & Co. LLC (since 2008) (Investment bank); Director, Avangard Investment Holdings (since 2011) (Agriculture); Director, The New America High Income Fund, Inc. (since 2013). | | | 4 | | |
33
TEKLA HEALTHCARE
OPPORTUNITIES FUND
TRUSTEES
(continued)
Name, Address1
and Date of Birth | | Position(s) Held with
Fund, Term of Office2 and
Length of Time Served | | Principal Occupation(s)
During Past 5 Years and
Other Directorship Held | | Number of
Portfolios in Fund
Complex Overseen
by Trustee | |
William S. Reardon, CPA
6/1946 | | Trustee (since 2014) | | Independent Consultant (since 2002); Director, Idera Pharmaceuticals, Inc. (since 2002); Director, Synta Pharmaceuticals, Inc. (2004-2016). | | | 4 | | |
Uwe E. Reinhardt, Ph.D.
9/1937 | | Trustee (since 2014) | | Professor of Economics, Princeton University (since 1968); Director, Boston Scientific Corporation (2002-2015); Director, Amerigroup, Inc. (2002-2012). | | | 4 | | |
Lucinda H. Stebbins, CPA
11/1945 | | Trustee (since 2014) | | Independent Consultant, Deutsche Bank (2004-2015); Director, Bald Peak Land Company, Inc. (2008-2014); Director, Solstice Home Care, Inc. (since 2014). | | | 4 | | |
Interested Trustee: | | | | | | | |
Daniel R. Omstead, Ph.D.3
7/1953 | | President (since 2015);
Trustee (since 2014) | | President of the Fund, Tekla Healthcare Investors (HQH) (since 2001), Tekla Life Sciences Investors (HQL) (since 2001) and Tekla Healthcare World Healthcare Fund (THW) (since 2015); President, Chief Executive Officer and Managing Member of Tekla Capital Management LLC (since 2002); Director: Celladon Corporation (2012-2014); Concentric Medical, Inc. (2008-2012); Dynex Corporation (since 2011); EBI Life Sciences, Inc. (since 2015); Euthymics Biosciences, Inc. (since 2015); GenomeDx Biosciences Inc. (since 2016); IlluminOss Medical, Inc. (since 2011); Insightra Medical, Inc. (since 2015); Magellan Diagnostics, Inc. (2006-2016); Neurovance, Inc. (since 2015); Palyon Medical Corporation (2009-2015); Tibion Corporation (2011-2013) and Veniti, Inc. (since 2015). | | | 4 | | |
1 The Address for each Trustee is: Tekla Healthcare Opportunities Fund, 100 Federal Street, 19th Floor, Boston, Massachusetts, 02110, 617-772-8500.
2 Each Trustee currently is serving a three year term.
3 Trustee considered to be an "interested person" within the meaning of the Investment Company Act of 1940, as amended (the "1940 Act"), through position or affiliation with the Adviser.
34
TEKLA HEALTHCARE
OPPORTUNITIES FUND
OFFICERS
Name, Address1
and Date of Birth | | Position(s) Held with
Fund, Term of Office2 and
Length of Time Served | | Principal Occupation(s) During Past 5 Years | |
Daniel R. Omstead, Ph.D.
7/1953 | | President (since 2014);
Trustee (since 2014) | | President of the Fund, HQH (since 2001), HQL (since 2001) and THW (since 2015); President, Chief Executive Officer and Managing Member of Tekla Capital Management LLC (since 2002); Director: Celladon Corporation (2012-2014); Concentric Medical, Inc. (2008-2012); Dynex Corporation (since 2011); EBI Life Sciences, Inc. (since 2015); Euthymics Biosciences, Inc. (since 2015); GenomeDx Biosciences Inc. (since 2016); IlluminOss Medical, Inc. (since 2011); Insightra Medical, Inc. (since 2015); Magellan Diagnostics, Inc. (2006-2016); Neurovance, Inc. (since 2015); Palyon Medical Corporation (2009-2015); Tibion Corporation (2011-2013) and Veniti, Inc. (since 2015). | |
Laura Woodward, CPA
11/1968 | | Chief Compliance Officer, Secretary and Treasurer (since 2014) | | Chief Compliance Officer, Secretary and Treasurer, the Fund, HQH (since 2009), HQL (since 2009) and THW (since 2015); Chief Compliance Officer and Vice President of Fund Administration, Tekla Capital Management LLC (since 2009); Senior Manager, PricewaterhouseCoopers LLP (1990-2009). | |
1 The Address for each officer is: Tekla Healthcare Opportunities Fund; 100 Federal Street, 19th Floor, Boston, Massachusetts, 02110, 617-772-8500.
2 Each officer serves in such capacity for an indefinite period of time at the pleasure of the Trustees.
The Fund's Statement of Additional Information includes additional information about the Fund's Trustees and is available without charge, upon request by calling (617) 772-8500 or writing to Tekla Capital Management LLC at 100 Federal Street, 19th Floor, Boston, MA 02110.
35
TEKLA HEALTHCARE
OPPORTUNITIES FUND
ANNUAL MEETING REPORT
An Annual Meeting of Shareholders was held on June 14, 2016. Shareholders voted to elect Trustees of the Fund to hold office for a term of three years or until their respective successors shall have been duly elected and qualified. The following votes were cast with respect to each of the nominees:
| | | For | | Withheld | |
Rakesh K. Jain. Ph. D. | | | 36,882,353 | | | | 1,574,956 | | |
Daniel R. Omstead, Ph.D. | | | 36,960,991 | | | | 1,496,318 | | |
Lucinda H. Stebbins, CPA | | | 36,969,958 | | | | 1,487,351 | | |
Rakesh K. Jain, Ph.D., Daniel R. Omstead, Ph.D. and Lucinda H. Stebbins, CPA were elected to serve until the 2019 Annual Meeting.
Trustees serving until the 2017 Annual Meeting are Michael W. Bonney, and Uwe E. Reinhardt, Ph.D.
Trustees serving until the 2018 Annual Meeting are Oleg Pohotsky, MBA, J.D. and William S. Reardon, CPA.
Shareholders ratified the appointment of Deloitte & Touche LLP as the independent registered public accountants of the Fund for the fiscal year ending September 30, 2016 by the following votes:
| | | For | | Against | | Abstain | |
| | | | | | 37,966,284 | | | | 168,787 | | | | 322,238 | | |
FOR MORE INFORMATION
A description of the Fund's proxy voting policies and procedures and information regarding how the Fund voted proxies related to portfolio securities during the most recent 12-month period ended June 30 are available (i) without charge, upon request by calling 1-800-451-2597; (ii) by writing to Tekla Capital Management LLC at 100 Federal Street, 19th Floor, Boston, MA 02110; (iii) on the Fund's website at www.teklacap.com; and (iv) on the SEC's website at http://www.sec.gov.
The Fund's complete Schedule of Investments for the first and third quarters of its fiscal year will be filed quarterly with the SEC on Form N-Q. This Schedule of Investments will also be available on the Fund's website at www.teklacap.com, or the SEC's website at http://www.sec.gov. The Fund's Form N-Q may be reviewed and copied at the SEC's Public Reference Room in Washington, DC or by calling 1-800-SEC-0330.
You can find information regarding the Fund at the Fund's website, www.teklacap.com. The Fund regularly posts information to its website, including information regarding daily share pricing and distributions and press releases, and maintains links to the Fund's SEC filings. The Fund currently publishes and distributes quarterly fact cards, including performance, portfolio holdings and sector information for each fiscal quarter, approximately 15 days after the end of each quarter. These fact cards will be available on the Fund's website and by request from the Fund's marketing and investor support services agent, Destra Capital Investments, at (877) 855-3434.
36
TEKLA HEALTHCARE
OPPORTUNITIES FUND
FEDERAL TAX INFORMATION (unaudited)
Certain information for the Fund is required to be provided to shareholders based on the Fund's income and distributions for the taxable year ended December 31, 2016. In February 2017, shareholders will receive Form 1099-DIV, which will include their share of qualified dividends and capital gains and return of capital distributed during the calendar year 2016. Shareholders are advised to check with their tax advisors for information on the treatment of these amounts on their individual tax returns.
For corporate shareholders, 15.61% of ordinary income dividends paid by the Fund qualified for the dividends received deduction during the period July 31, 2016 to September 30, 2016.
Under Section 854(b)(2) of the Code, the Fund designated $9,571,341 as qualified dividends for the year ended September 30, 2016.
DISTRIBUTION POLICY
The Fund has a fixed distribution policy as described in the Notes to Financial Statements. For more information contact your financial adviser.
SHARE REPURCHASE PROGRAM
In March 2016, the Trustees reauthorized the share repurchase program to allow the Fund to repurchase up to 12% of its outstanding shares for a one year period beginning July 11, 2016.
PORTFOLIO MANAGEMENT
Daniel R. Omstead, Ph.D., Jason C. Akus, M.D./M.B.A., Timothy Gasperoni, M.B.A, Ph.D., Christian M. Richard, M.B.A, M.S., William R. Hite, CFA, Christopher Abbott, Robert Benson, CFA, CAIA, Amanda Birdsey-Benson, Ph.D., Alan Kwan, M.B.A, Ph.D., and Joshua A.W. Mosberg, Ph.D. are members of a team that analyzes investments on behalf of the Fund. Dr. Omstead exercises ultimate decision making authority with respect to investments.
DIVIDEND REINVESTMENT AND
STOCK PURCHASE PLAN
Reinvestment of Distributions. Under the Dividend Reinvestment and Stock Purchase Plan, dividends and/or distributions to a Shareholder will automatically be reinvested in additional shares of the Fund. Each registered Shareholder may elect to have dividends and distributions distributed in cash (i.e., "opt-out") rather than participate in the Dividend Reinvestment and Stock Purchase Plan. For any registered Shareholder that does not so elect, dividends and/or distributions on such Shareholder's shares will be reinvested by Computershare Trust Company, N.A. (the "Plan Agent"), as agent for Shareholders in additional shares, as set forth below. Participation in the Dividend Reinvestment and Stock Purchase Plan is completely voluntary, and may be terminated or resumed at any time without penalty by internet, telephone or notice if received and processed by the Plan Agent prior to the dividend record date; otherwise such termination or resumption will be effective with respect to any subsequently declared dividend or other distribution. Participants who hold their shares through a broker or other nominee
37
TEKLA HEALTHCARE
OPPORTUNITIES FUND
DIVIDEND REINVESTMENT AND
STOCK PURCHASE PLAN (continued)
and who wish to elect to receive any dividends and distributions in cash must contact their broker or nominee.
The Plan Agent's fees for the handling of the reinvestment of dividends and distributions will be paid by the Fund. Each participant will pay a per share fee (currently $0.05 per share) incurred in connection with open market purchases. If a participant elects to have the Plan Agent sell all or a part of his or her shares and remit the proceeds to the participant, the Plan Agent is authorized to deduct a $15 sales fee per trade and a per share fee of $0.12 from such proceeds. All per share fees include any applicable brokerage commissions the Plan Agent is required to pay. The automatic reinvestment of Dividends will not relieve Participants of any federal, state or local income tax that may be payable (or required to be withheld) on such dividend.
The Plan Agent will acquire shares for participants' accounts by purchasing either newly issued shares from the Fund or outstanding shares in the open market, depending upon the circumstances. If on the payment date of a dividend or distribution the NAV per share is equal to or less than the closing market price (plus estimated per share fees in connection with the purchase of shares), the Plan Agent will invest the dividend or distribution in newly issued shares. The number of newly issued shares to be credited to each participant's account will be determined by dividing the amount of the participant's cash dividend or distribution by the greater of the NAV per share on the payment date or 95% of the closing market price per share on the payment date. If on the payment date the NAV per share is greater than the closing market price per share (plus per share fees), the Plan Agent will invest the dividend or distribution in shares acquired in open-market purchases. The per share price for open-market purchases will be the weighted average price of the shares on the payment date.
Stock Purchase Plan. All registered shareholders can voluntarily purchase additional shares in the Fund at any time through the Plan Agent. The minimum investment under this option is $50. Participants can make an investment online or by sending a check to the Plan Agent. Each investment will entail a transaction fee of $5.00 plus $0.05 per share purchased. Shareholders can also authorize the Plan Agent to make automatic withdrawals from a bank account.
Each automatic transaction will entail a fee of $2.50 plus $0.05 per share purchased. There is a $25 charge for each returned check or rejected electronic funds transfer.
Amendment or Termination of Plan. The Fund reserves the right to amend or terminate the Plan upon notice in writing to each participant at least 30 days prior to any record date for the payment of any dividend or distribution by the Fund.
Plan Agent. You can contact the Plan Agent at www.computershare.com/investor, at P.O. Box 30170, College Station, TX 77842-3170 or at 1-800-426-5523.
38
TEKLA HEALTHCARE
OPPORTUNITIES FUND
New York Stock Exchange Symbol: THQ
NAV Symbol: XTHQX
100 Federal Street, 19th Floor
Boston, Massachusetts 02110
(617) 772-8500
www.teklacap.com
Officers
Daniel R. Omstead, Ph.D., President
Laura Woodward, CPA, Chief Compliance Officer,
Secretary and Treasurer
Trustees
Michael W. Bonney
Rakesh K. Jain, Ph.D.
Daniel R. Omstead, Ph.D.
Oleg M. Pohotsky, M.B.A., J.D.
William S. Reardon, CPA
Uwe E. Reinhardt, Ph.D.
Lucinda H. Stebbins, CPA
Investment Adviser
Tekla Capital Management LLC
Administrator & Custodian
State Street Bank and Trust Company
Transfer Agent
Computershare, Inc.
Legal Counsel
Dechert LLP
Shareholders with questions regarding share transfers may call
1-800-426-5523
Daily net asset value may be obtained from
our website (www.teklacap.com) or by calling
(617) 772-8500
Item 2. CODE OF ETHICS.
(a) As of the end of the period covered by this report, the Registrant has adopted a code of ethics that applies to the Registrant’s principal executive officer, principal financial officer, principal accounting officer or controller, or persons performing similar functions, regardless of whether these individuals are employed by the Registrant or a third party.
(b) No disclosures are required by this Item.
(c) During the period covered by this report, the Registrant did not make any substantive amendment to the code of ethics.
(d) During the period covered by this report, the Registrant did not grant any waiver, including any implicit waiver, from any provision of the code of ethics.
(e) Not applicable.
(f) A copy of the Registrant’s code is filed as Exhibit 1 to this Form N-CSR. Copies of the Code will also be made available, free of charge, upon request, by writing or calling Tekla Capital Management LLC at 100 Federal Street, 19th Floor, Boston, MA 02110, (617) 772-8500.
ITEM 3. AUDIT COMMITTEE FINANCIAL EXPERT.
The Registrant’s Board of Trustees has determined that the Registrant has at least one audit committee financial expert serving on its audit committee. The audit committee financial expert is Oleg M. Pohotsky. He is “independent” for the purposes of Item 3.
ITEM 4. PRINCIPAL ACCOUNTANT FEES AND SERVICES.
(a) Audit Fees. The aggregate fees billed in each of the last two fiscal years for professional services rendered by the principal accountant for the audit of the Registrant’s annual financial statements or services that are normally provided by the accountant in connection with statutory and regulatory filings or engagements for those fiscal years were $36,000 for the fiscal year ended September 30, 2016 and $0 for the fiscal year ended September 30, 2015.
(b) Audit Related Fees. The Registrant was not billed any fees in each of the last two fiscal years ended September 30 for assurance and related services by the principal accountant that are reasonably related to the performance of the audit of the Registrant’s financial statements and not otherwise included above.
(c) Tax Fees. The aggregate fees billed in each of the last two fiscal years for professional services rendered by the principal accountant for tax compliance, tax advice, and tax planning were $4,650 for the fiscal year ended September 30, 2016 and $4,650 for the fiscal year ended September 30, 2015. The nature of the services comprising the fees disclosed under this category was tax compliance.
(d) All Other Fees. The aggregate fees billed in each of the last two fiscal years ended September 30 for products and services provided by the principal accountant, other than the services reported in paragraphs (a) through (c) of this Item were $0 for the fiscal year ended September 30, 2016 and $0 for the fiscal year ended September 30, 2015. The nature of the services comprising the fees disclosed under this category was services related to the initial public offering of the Registrant.
(e) (1) Pre-approval Policies and Procedures.
Pursuant to the Registrant’s Audit Committee Charter (“Charter”), the Audit Committee is responsible for approving in advance the firm to be employed as the Registrant’s independent auditor. In addition, the Charter provides
that the Audit Committee is responsible for approving any and all proposals by the Registrant, its investment adviser or their affiliated persons or any entity controlling, controlled by, or under common control with the adviser that provides services to the Registrant to employ the independent auditor to render permissible non-audit services related directly to the operations and financial reporting of the Registrant. In determining whether to pre-approve non-audit services, the Audit Committee considers whether such services are consistent with the independent auditor’s independence. The Charter further permits the Audit Committee to delegate to one or more of its members authority to pre-approve permissible non-audit services to the registrant, provided that any pre-approval determination of a delegate is for services with an estimated budget of less than $15,000.
(2) None of the services described in each of paragraphs (b) through (d) of this Item were approved by the Audit Committee pursuant to paragraph (c)(7)(i)(C) of Rule 2-01 of Regulation S-X. All services described in paragraphs (b) through (d) of the NCSR were approved in advance by the Audit Committee of each Fund.
(f) Not applicable.
(g) None.
(h) Not applicable.
ITEM 5. AUDIT COMMITTEE OF LISTED REGISTRANTS.
The Registrant has a separately-designated standing Audit Committee established in accordance with Section 3(a)(58)(A) of the Exchange Act (15 U.S.C. 78c(a)(58)(A)). The members of the Audit Committee are Oleg M. Pohotsky, Uwe E. Reinhardt, Lucinda H. Stebbins and William S. Reardon.
ITEM 6. INVESTMENTS.
The Registrant’s Schedule of Investments is included as part of the Report to Shareholders filed under Item 1 of this form.
ITEM 7. DISCLOSURE OF PROXY VOTING POLICIES AND PROCEDURES FOR CLOSED-END MANAGEMENT INVESTMENT COMPANIES.
The Registrant has adopted the following proxy voting policies and procedures.
PROXY VOTING POLICIES AND PROCEDURES
Policy
The following are the policies and procedures adopted and implemented by Tekla Capital Management LLC (“TCM”) for voting proxies with respect to portfolio securities held by Tekla Healthcare Investors,Tekla Life Sciences Investors, Tekla Healthcare Opportunities Fund and Tekla World Healthcare Fund (each a “Fund” and collectively the “Funds”). The policies and procedures are reasonably designed to ensure that proxies are voted in the best interest of the Funds and the Funds’ shareholders, in accordance with TCM’s fiduciary duties and Rule 206(4)-6 under the Investment Advisers Act of 1940 (the “Investment Advisers Act”). TCM considers the “best interests” of the Funds and their shareholders to mean their best long-term economic interests.
TCM shall vote proxies for the exclusive benefit, and in the best economic interest, of the Funds and their shareholders. Such exercise of voting rights shall be subject to the same standard of care as is generally applicable to TCM’s performance of its duties, as set forth in the advisory agreements with the Funds. The policies and procedures contained herein are designed to be guidelines, however each vote is ultimately cast on a case-by-case basis, taking into consideration the relevant facts and circumstances at the time of the vote. Any material conflicts that may arise will be resolved in the best interests of the Funds and their shareholders.
A proxy committee has been designated and is responsible for administering and overseeing the proxy voting process. The committee consists of the President of TCM, TCM’s Chief Compliance Officer (“CCO”), and the analyst responsible for oversight of the company that is the subject of the proxy. The committee considers proxy questions and determines the vote on behalf of the Funds.
Procedures
Logistics
TCM’s CCO shall be responsible for maintaining the proxy log, monitoring corporate actions and confirming the timely voting of proxies. The proxy log shall contain the following information, in accordance with Form N-PX:
· the name of the issuer;
· the exchange ticker symbol, if available;
· the CUSIP number, if available;
· the shareholder meeting date;
· a brief identification of the matter voted on;
· whether the matter was proposed by the issuer or a security holder;
· whether TCM cast its vote on the matter;
· how TCM cast its vote on the matter (for, against, abstain; for or withhold regarding the election of directors); and
· whether TCM cast its vote for or against management;
TCM’s CCO shall also record whether any conflicts of interest have been identified and, if so, what action was taken to resolve the conflict with respect to each vote cast and each abstention.
Substantive Voting Decisions
TCM’s substantive voting decisions turn on the particular facts and circumstances of each proxy vote. The following is a list of common proxy vote issues and TCM’s standard considerations when determining how to vote such proxies.
Routine Matters/Corporate Administrative Items. After an initial review, TCM generally votes with management on routine matters related to the operation of the issuer that are not expected to have a significant economic impact on the issuer and/or its shareholders.
Potential for Major Economic Impact. TCM may review and analyze on a case-by-case basis, non-routine proposals that are more likely to affect the structure and operation of the issuer and to have a greater impact on the value of the investment.
Corporate Governance. TCM may review and consider corporate governance issues related to proxy matters and generally supports proposals that foster good corporate governance practices.
Special Interest Issues. TCM may consider: (i) the long-term benefit to shareholders of promoting corporate accountability and responsibility on social issues; (ii) management’s responsibility with respect to special interest issues; (iii) any economic costs and restrictions on management; and (iv) the responsibility of TCM to vote proxies for the greatest long-term shareholder value.
Limitations on Director Tenure and Retirement. TCM may consider: (i) a reasonable retirement age for directors, e.g. 70 or 72; (ii) the introduction of new perspectives on the board; and (iii) the arbitrary nature of such limitations and the possibility of detracting from the board’s stability and continuity.
Directors’ Minimum Stock Ownership. TCM may consider: (i) the benefits of additional vested interest; (ii) the ability of a director to serve a company well regardless of the extent of his or her share ownership; and (iii) the impact of limiting the number of persons qualified to be directors.
D&O Indemnification and Liability Protection. TCM may consider: (i) indemnifying directors for acts conducted in the normal course of business; (ii) limiting liability for monetary damages for violating the duty of care; (iii) expanding coverage beyond legal expenses to acts that represent more serious violations of fiduciary obligation than carelessness (e.g. negligence); and (iv) providing expanded coverage in cases when a director’s legal defense was unsuccessful if the director was found to have acted in good faith and in a manner that he or she reasonably believed was in the best interests of the issuer.
Director Nominations in Contested Elections. TCM may consider: (i) long-term financial performance of the issuer relative to its industry; (ii) management’s track record; (iii) background to proxy contest; (iv) qualifications of both slates of nominees; (v) evaluations of what each side is offering shareholders as well as the likelihood that the proposed objectives and goals can be met; and (vi) stock ownership positions.
Cumulative Voting. TCM may consider: (i) the ability of significant stockholders to elect a director of their choosing; (ii) the ability of minority shareholders to concentrate their support in favor of a director or directors of their choosing; and (iii) the potential to limit the ability of directors to work for all shareholders.
Classified Boards. TCM may consider: (i) providing continuity; (ii) promoting long-term planning; and (iii) guarding against unwanted takeovers.
Poison Pills. TCM may consider: (i) TCM’s position on supporting proposals to require a shareholder vote on other shareholder rights plans; (ii) ratifying or redeeming a poison pill in the interest of protecting the value of the issuer; and (iii) other alternatives to prevent a takeover at a price demonstrably below the true value of the issuer.
Fair Price Provisions. TCM may consider: (i) the vote required to approve the proposed acquisition; (ii) the vote required to repeal the fair price provision; (iii) the mechanism for determining fair price; and (iv) whether these provisions are bundled with other anti-takeover measures (e.g., supermajority voting requirements) that may entrench management and discourage attractive tender offers.
Equal Access. TCM may consider: (i) the opportunity for significant shareholders of the issuer to evaluate and propose voting recommendations on proxy proposals and director nominees, and to nominate candidates to the board; and (ii) the added complexity and burden.
Charitable Contributions. TCM may consider: (i) the potential benefits to shareholders; (ii) the potential to detract the issuer’s resources from more direct uses of increasing shareholder value; and (iii) the responsibility of shareholders to make individual contributions.
Stock Authorizations: TCM may consider: (i) the need for the increase; (ii) the percentage increase with respect to the existing authorization; (iii) voting rights of the stock; and (iv) overall capitalization structures.
Preferred Stock. TCM may consider: (i) whether the new class of preferred stock has unspecified voting, conversion, dividend distribution, and other rights; (ii) whether the issuer expressly states that the stock will not be used as a takeover defense or carry superior voting rights; (iii) whether the issuer specifies the voting, dividend, conversion, and other rights of such stock and the terms of the preferred stock appear reasonable; and (iv) whether the stated purpose is to raise capital or make acquisitions in the normal course of business.
Director Compensation. TCM may consider: (i) whether director shares are at the same market risk as those of the shareholders; and (ii) how option programs for outside directors compare with the standards of internal programs.
Golden and Tin Parachutes. TCM may consider: (i) whether they will be submitted for shareholder approval; and (ii) the employees covered by the plan and the quality of management.
Compensation. TCM may consider: (i) Whether the company has an independent compensation committee; (ii) whether the compensation committee engaged independent consultants; (iii) whether the compensation committee has lapsed or waived equity vesting restrictions; and (iv) whether the company has adopted or extended a Golden Parachute without shareholder approval. TCM will generally support annual advisory votes on executive compensation.
Limitations
TCM may abstain from voting a proxy if it concludes that the effect on shareholders’ economic interests or the value of the portfolio holding is indeterminable or insignificant. TCM may abstain from voting a proxy if it concludes that the cost of voting is disproportionate to the economic impact the vote would have on the portfolio holdings. With respect to certain privately held companies, TCM may not have the opportunity to vote or may have a limitation on its ability to vote. For example, in certain cases a company may be permitted by its charter or other governing documents to take action without a shareholder meeting and with written consent of fewer than all shareholders.
Conflicts of Interest
The Proxy Committee identifies any potential conflicts of interest. Each potential conflict must be addressed in a manner which will be in the best interest of the Funds and their shareholders. If any potential conflict is identified the Proxy Committee consults with the Funds’ counsel. Where conflicts of interest arise between clients and TCM, TCM may convene an ad-hoc committee to debate the conflict and to give a ruling on a preferred course of action. If the ad-hoc committee determines that TCM has a conflict of interest in any instance, TCM’s CCO shall disclose the conflict to the Board and seek voting instructions.
TCM may cause the proxies to be voted in accordance with the recommendations of an independent third party service provider that TCM may use to assist in voting proxies.
Disclosure
The following disclosure shall be provided in connection with these policies and procedures:
· TCM shall provide a description or a copy of these policies and procedures to the Boards of Trustees of the Funds annually and upon request.
· TCM shall make available to the Funds its proxy voting records, for inclusion on the Funds’ Form N-PX.
· TCM shall include its proxy voting policies and procedures in its annual filing on Form N-CSR.
· TCM shall cause the Funds’ shareholder reports to include a statement that a copy of these policies and procedures is available upon request (i) by calling a toll-free number; (ii) on the Funds’ website, (if the Funds choose); and (iii) on the SEC’s website.
· TCM shall cause the Funds’ annual and semi-annual reports to include a statement that information is available regarding how the Funds voted proxies during the most recent twelve-month period (i) without charge, upon request, either by calling a toll-free number or on or through the Funds’ website, or both; and (ii) on the SEC’s website.
Recordkeeping
TCM shall maintain records of proxies voted in accordance with Section 204-2 of the Advisers Act, including proxy statements, a record of each vote cast, and a copy of any document created by the Adviser that was material to making a decision of how to vote the proxy, or that memorializes the basis for the Adviser’s decision on how to vote the proxy. TCM shall also maintain a copy of its policies and procedures and each written request from a client for proxy voting records and the Adviser’s written response to any client request, either written or oral, for such records. Proxy statements that are filed on EDGAR shall be considered maintained by TCM. All such records shall be maintained for a period of five years in an easily accessible place, the first two years in the offices of TCM.
ITEM 8. PORTFOLIO MANAGERS OF CLOSED-END MANAGEMENT INVESTMENT COMPANIES.
(a)(1) As of December 1, 2016, Daniel R. Omstead, Ph.D., Jason C. Akus, M.D./M.B.A., Christian M. Richard, M.S, M.B.A, Timothy Gasperoni, Ph.D, M.B.A., Amanda Birdsey-Benson, Ph.D., Alan Kwan, Ph.D, M.B.A, William R. Hite, CFA®, Joshua A.W. Mosberg, Ph.D., Christopher Abbott and Robert Benson, CFA®, CAIA are members of a team that analyzes investments on behalf of the Registrant. Dr. Omstead exercises ultimate decision making authority with respect to investments. Dr. Omstead also performs other duties including management of the investment adviser and makes investments on behalf of Tekla Healthcare Investors (“HQH”), Tekla Life Science Investors (“HQL”), and Tekla World Healthcare Fund (“THW”). The date each team member joined the portfolio management team and each team member’s business experience for at least the last five years is included below.
Daniel R. Omstead, Ph.D. is President and Chief Executive Officer of the investment adviser and has been employed by the investment adviser of the Registrant since 2000. He is also President of the Registrant, HQH, HQL and THW.
Jason C. Akus, M.D./M.B.A. is Senior Vice President, Research of the investment adviser and is responsible for investment research and due diligence in the biotechnology, medical device, and diagnostic areas. Dr. Akus joined the investment adviser of the Registrant in 2001.
Christian M. Richard, M.S., M.B.A is Senior Vice President, Research of TCM. He was previously a Partner/Head of Research for Merlin Biomed Private Equity, Merlin. He joined TCM in 2015.
Timothy Gasperoni, Ph.D., M.B.A. is Senior Vice President, Research of TCM. He was previously a Senior Analyst and Founding Member of Sabby Capital and was a Partner and Senior Analyst at Crosswind Investments, LLC. He joined TCM in 2015.
Amanda Birdsey-Benson, Ph.D. is Senior Analyst of TCM. She was previously an analyst for R.A. Capital Management. She joined TCM in 2014.
Alan Kwan, Ph.D., M.B.A.is Senior Analyst of TCM. He was previously a Principal Investigator at GlaxoSmithKline, plc. He joined TCM in 2014.
William R. Hite, CFA® is Senior Analyst of TCM. He was previously an Associate Analyst at Columbia Management, an Associate Analyst at Lazard Capital Markets and worked at Leerink Partners. He joined TCM in 2015.
Joshua A.W. Mosberg, Ph.D., is Senior Analyst, Research. Previously, he was a Consultant at Clarion Healthcare, a boutique strategy consulting firm focused on the biopharmaceutical industry. Dr. Mosberg received his Ph.D. in Chemical Biology from Harvard University. He joined TCM in 2015.
Christopher Abbott , is Senior Analyst. Previously, Mr. Abbott spent 8 years at Leerink Partners where he was a Vice President on the Equity Research team covering the Healthcare IT and Healthcare Supply Chain group. He joined TCM in 2016.
Robert Benson, CFA®, CAIA, is Senior Analyst, Research. Previously, Mr. Benson spent 12 years at State Street Global Advisors (SSgA) where he performed quantitative research for asset allocation, equities, and alternatives teams. He joined TCM in 2016.
(a)(2) The following table lists the number and types of other accounts and assets under management in those accounts advised by the Registrant’s portfolio management team as of the end of the Registrant’s fiscal year.
| | REGISTERED | | | | | | | | | | | |
| | INVESTMENT | | | | | | | | | | | |
PORTFOLIO | | COMPANY | | ASSETS | | POOLED | | ASSETS | | OTHER | | ASSETS | |
MANAGER | | ACCOUNTS | | MANAGED | | ACCOUNTS | | MANAGED | | ACCOUNTS | | MANAGED | |
Daniel R. Omstead | | 3 | | $ | 2,061 million | | 0 | | 0 | | 0 | | 0 | |
Jason C. Akus | | 3 | | $ | 2,061 million | | 0 | | 0 | | 0 | | 0 | |
Christian Richard | | 3 | | $ | 2,061 million | | 0 | | 0 | | 0 | | 0 | |
Timothy Gasperoni | | 3 | | $ | 2,061 million | | 0 | | 0 | | 0 | | 0 | |
Amanda Birdsey-Benson | | 3 | | $ | 2,061 million | | 0 | | 0 | | 0 | | 0 | |
Alan Kwan | | 3 | | $ | 2,061 million | | 0 | | 0 | | 0 | | 0 | |
William R. Hite | | 3 | | $ | 2,061 million | | 0 | | 0 | | 0 | | 0 | |
Joshua A.W. Mosberg | | 3 | | $ | 2,061 million | | 0 | | 0 | | 0 | | 0 | |
Christopher Abbott | | 3 | | $ | 2,061 million | | 0 | | 0 | | 0 | | 0 | |
Robert Benson | | 3 | | $ | 2,061 million | | 0 | | 0 | | 0 | | 0 | |
None of the funds or other accounts is subject to a performance-based advisory fee.
Each member of the portfolio management team may perform investment management services for other accounts similar to those provided to the Registrant and the investment action for each account may differ. The portfolio management team may discover an investment opportunity that may be suitable for more than one account. However, the investment opportunity may be limited so that all accounts may not be able to fully participate or an investment opportunity or investment allocation may be allocated to just one account or may be allocated between accounts at different levels based on an investment decision made by the investment team. The investment team may subsequently make investment decisions that result in investment levels that make the accounts more differentiated or, conversely, more closely or completely aligned. Such investment decisions may occur within a day or two. In addition, the investment adviser may receive different compensation from each account. In that case, the portfolio management team may have an incentive to direct investments to an account that could result in higher fees for the investment adviser. The registrant has adopted procedures designed to allocate investments fairly across multiple accounts.
Additionally, a portfolio manager may be perceived to have a conflict of interest if he has other executive management responsibilities. In addition to managing the Registrant, HQH, HQL and THW, Dr. Omstead is the President of the investment adviser of the Registrant. Dr. Omstead periodically discusses the amount of time he allocates to each of his responsibilities with the Registrant’s Board of Trustees.
The portfolio management team’s management of personal accounts may also present certain conflicts of interest. The Registrant has adopted a code of ethics designed to address these potential conflicts.
(a)(3) As of September 30, 2016, portfolio manager compensation is comprised of a base salary and discretionary compensation as described below.
Base Salary Compensation. The team members receive a base salary compensation linked to individual experience and responsibilities. The amount of base salary is reviewed annually.
Discretionary Compensation. Discretionary Compensation is in the form of a cash bonus, paid annually, which may be up to 60% of the team member’s base salary. Several factors affect discretionary compensation, which can vary by team member and circumstances. The discretionary compensation component is determined based on factors including investment performance of accounts managed by the team predominantly relative to the S&P 500 Index and a blended consideration of appropriate healthcare indices and related performance metrics during the Fund’s fiscal year, performance of specific investments proposed by the individual, financial performance of the investment adviser and a qualitative assessment of the individual overall contribution to the investment team and to the investment adviser. Discretionary compensation is evaluated annually after the completion of the Registrant’s fiscal year.
(a)(4) As of September 30, 2016, the dollar range of Registrant’s shares beneficially owned by the portfolio managers are as follows as of the end of the Registrant’s fiscal year:
PORTFOLIO MANAGER | | DOLLAR RANGE OF SHARES BENEFICIALLY OWNED | |
| | | |
Daniel R. Omstead | | $10,001-$50,000 | |
Jason C. Akus | | none | |
Christian Richard | | none | |
Timothy Gasperoni | | none | |
Amanda Birdsey-Benson | | none | |
Alan Kwan | | none | |
William R. Hite | | none | |
Joshua A.W. Mosberg | | none | |
Christopher Abbott | | none | |
Robert Benson | | none | |
(b) N/A.
ITEM 9. PURCHASES OF EQUITY SECURITIES BY CLOSED-END MANAGEMENT INVESTMENT COMPANY AND AFFILIATED PURCHASERS.
Period | | (a) Total No.
of Shares
Purchased (1) | | (b) Average
Price Paid per
Share | | (c) Total No.
of Shares
Purchased as
Part of
Publicly
Announced Plans
or Programs | | (d) Maximum No.
of Shares that
May Yet Be
Purchased Under
the Plans or
Programs | |
Month #1 (Oct. 1, 2015 - Oct. 31, 2015) | | | | | | | | | |
Month #2 (Nov. 1, 2015 – Nov. 30, 2015) | | | | | | | | | |
Month #3 (Dec. 1, 2015 – Dec. 31, 2015) | | | | | | | | | |
Month #4 (Jan. 1, 2016 – Jan. 31, 2016) | | | | | | | | | |
Month #5 (Feb. 1, 2016 – Feb. 28, 2016) | | | | | | | | | |
Month #6 (Mar. 1, 2016 – Mar. 31, 2016) | | | | | | | | | |
Month #7 (Apri. 1, 2016 – Apri. 30, 2016) | | | | | | | | | |
Month #8 (May 1, 2016 – May 31, 2016) | | | | | | | | | |
Month #9 (June 1, 2016 – June 30, 2016) | | | | | | | | | |
Month #10 (Jul. 1, 2016 – Jul. 31, 2016) | | | | | | | | | |
Month #11 (Aug. 1, 2016 – Aug. 31, 2016) | | | | | | | | 5,265,386 | |
Month #12 (Sep. 1, 2016 – Sep. 30, 2016) | | 153,131 | | 17.67 | | 153,131 | | 5,112,255 | |
Total | | 153,131 | | 17.67 | | 153,131 | | | |
(1) In March 2016, the share repurchase program was renewed to allow the Registrant to repurchase up to 12% of its outstanding shares for a one year period ending July 10, 2017. Prior to this renewal, in March 2015, the share repurchase program was renewed to allow the Registrant to repurchase up to 12% of its outstanding shares for a one year period ending July 10, 2016.
ITEM 10. SUBMISSION OF MATTERS TO A VOTE OF SECURITY HOLDERS.
There have been no material changes, to the procedures by which the shareholders may recommend nominees to the Registrant’s Board of Trustees, where those changes were implemented after the Registrant last provided disclosure in response to
the requirements of Item 407(c)(2)(iv) of Regulation S-K (17 CFR229.407)(as required by Item 22(b)(15) of Schedule 14A (17 CFR240.14a-101)), or this Item.
ITEM 11. CONTROLS AND PROCEDURES.
(a) In the opinion of the principal executive officer and principal financial officer, based on their evaluation which took place within 90 days of this filing, the Registrant’s disclosure controls and procedures are adequately designed and are operating effectively to ensure (i) that material information relating to the Registrant, including its consolidated subsidiaries, is made known to them by others within those entities, particularly during the period in which this report is being prepared; and (ii) that information required to be disclosed by the registrant on Form N-CSR is recorded, processed, summarized and reported within the time period specified in the Securities and Exchange Commission’s rules and forms.
(b) There were no changes in the Registrant’s internal control over financial reporting that occurred during the Registrant’s most recent fiscal half-year that have materially affected or that are reasonably likely to materially affect the Registrant’s internal control over financial reporting.
ITEM 12. EXHIBITS.
(a)(1) The Code of Ethics that is the subject of the disclosure required by Item 2 is attached hereto (Exhibit 1).
(a)(2) Separate certifications of the Principal Executive and Financial Officers as required by Rule 30a-2(a) under the 1940 Act and Section 302 of the Sarbanes-Oxley Act of 2002 are attached hereto (Exhibit 2 and 3).
(a)(3) Notice to Fund’s shareholders in accordance with Investment Company Act Section 19(a) and Rule 19a-1(Exhibit 4).
(b) Certifications pursuant to Section 906 of the Sarbanes-Oxley Act of 2002 are attached hereto (Exhibit 5).
SIGNATURES
Pursuant to the requirements of the Securities Exchange Act of 1934 and the Investment Company Act of 1940, the registrant has duly caused this report to be signed on its behalf by the undersigned, thereunto duly authorized.
(Registrant) | TEKLA HEALTHCARE OPPORTUNITIES FUND |
|
By (Signature and Title)* | /s/ Daniel R. Omstead |
| Daniel R. Omstead, President |
|
Date: | 12/1/16 | |
| | | | |
Pursuant to the requirements of the Securities Exchange Act of 1934 and the Investment Company Act of 1940, this report has been signed below by the following persons on behalf of the registrant and in the capacities and on the dates indicated.
By (Signature and Title)* | /s/ Laura Woodward |
| Laura Woodward, Treasurer |
|
Date: | 12/1/16 | |
| | | |
* Print the name and title of each signing officer under his or her signature.