| | OMB APPROVAL |
| | OMB Number: | 3235-0570 |
| | Expires: | August 31, 2020 |
| UNITED STATES | Estimated average burden hours per response. . . . . . . . . . . . . . .20.6 |
| SECURITIES AND EXCHANGE COMMISSION | |
| Washington, D.C. 20549 | |
FORM N-CSR
CERTIFIED SHAREHOLDER REPORT OF REGISTERED
MANAGEMENT INVESTMENT COMPANIES
Investment Company Act file number | 811-22955 |
|
Tekla Healthcare Opportunities Fund |
(Exact name of registrant as specified in charter) |
|
100 Federal Street, 19th Floor, Boston, MA | | 02110 |
(Address of principal executive offices) | | (Zip code) |
|
Laura Woodward, Chief Compliance Officer and Vice President of Fund Administration
100 Federal Street, 19th Floor, Boston, MA 02110 |
(Name and address of agent for service) |
|
Registrant’s telephone number, including area code: | 617-772-8500 | |
|
Date of fiscal year end: | September 30 | |
|
Date of reporting period: | October 1, 2018 to September 30, 2019 | |
| | | | | | | | | |
ITEM 1. REPORTS TO STOCKHOLDERS.
TEKLA HEALTHCARE
OPPORTUNITIES FUND

Beginning on January 1, 2021, as permitted by regulations adopted by the Securities and Exchange Commission, paper copies of the Fund's annual and semi-annual shareholder reports will no longer be sent by mail, unless you specifically request paper copies of the reports. Instead, the reports will be made available on the Fund's website, teklacap.com., and you will be notified by mail each time a report is posted and provided with a website link to access the report.
Beginning on January 1, 2019, you may elect to receive all future reports in paper free of charge. If you invest through a financial intermediary, you can contact your financial intermediary to request that you continue to receive paper copies of your shareholder reports. If you invest directly with the Fund, you can call Computershare at 1-800-426-5523 to inform the Fund that you wish to continue receiving paper copies of your shareholder reports. Your election to receive reports in paper will apply to all funds held in your account if you invest through your financial intermediary or all funds held with the fund complex if you invest directly with the Fund.
TEKLA HEALTHCARE
OPPORTUNITIES FUND
Distribution policy: The Fund has implemented a managed distribution policy (the Policy) that provides for monthly distributions at a rate set by the Board of Trustees. Under the current Policy, the Fund intends to make monthly distributions at a rate of $0.1125 per share to shareholders of record. The Policy would result in a return of capital to shareholders, if the amount of the distribution exceeds the Fund's net investment income and realized capital gains. A return of capital may occur, for example, when some or all of the money that you invested in the Fund is paid back to you. A return of capital distribution does not necessarily reflect the Fund's investment performance and should not be confused with "yield" or "income."
The amounts and sources of distributions reported in the Fund's notices pursuant to Section 19(a) of the Investment Company Act of 1940 are only estimates and are not being provided for tax reporting purposes. The actual amounts and sources of the amounts for tax reporting purposes will depend upon the Fund's investment experience during its fiscal year and may be subject to changes based on tax regulations. The Fund will send you a Form 1099-DIV for the calendar year that tells you how to report distributions for federal income tax purposes.
You should not draw any conclusions about the Fund's investment performance from the amount of distributions pursuant to the Policy or from the terms of the Policy. The Policy has been established by the Trustees and may be changed or terminated by them without shareholder approval. The Trustees regularly review the Policy and the frequency and rate of distributions considering the purpose and effect of the Policy, the financial market environment, and the Fund's income, capital gains and capital available to pay distributions. The suspension or termination of the Policy could have the effect of creating a trading discount or widening an existing trading discount. At this time there are no reasonably foreseeable circumstances that might cause the Trustees to terminate the Policy.
Consider these risks before investing: As with any investment company that invests in equity securities, the Fund is subject to market risk—the possibility that the prices of equity securities will decline over short or extended periods of time. As a result, the value of an investment in the Fund's shares will fluctuate with the market generally and market sectors in particular. You could lose money over short or long periods of time. Political and economic news can influence market-wide trends and can cause disruptions in the U.S. or world financial markets. Other factors may be ignored by the market as a whole but may cause movements in the price of one company's stock or the stock of companies in one or more industries. All of these factors may have a greater impact on initial public offerings and emerging company shares. Different types of equity securities tend to shift into and out of favor with investors, depending on market and economic conditions. The performance of funds that invest in equity securities of healthcare companies may at times be better or worse than the performance of funds that focus on other types of securities or that have a broader investment style.
TEKLA HEALTHCARE
OPPORTUNITIES FUND
Dear Shareholders,
Investing in healthcare companies continues to be an interesting and dynamic endeavor. As investors, our primary emphasis at Tekla has been to identify novel technologies and drugs being developed and/or commercialized by smart management teams and then invest in the associated companies at the right time and price. Over the last twenty years, we have seen and reported to you on remarkable progress in improving the quality and durability of patients' lives. Throughout this time there has been widespread agreement about the novelty and impact of these new drugs, products and related services, but there also has been legitimate concern about the associated dollar cost, particularly in the U.S., to both individuals and society. The result has been the promulgation of numerous proposals to dramatically change or even replace the current healthcare insurance/delivery system, at least in the United States. A popular U.S. theme reprised with vigor of late is to replace the current U.S. healthcare delivery system, which is largely employer based. The most common proposal is a centrally managed, single payer system which would presumably define benefits and premiums for recipients, as well as reimbursement/payments for providers, manufacturers and distributors. Given the current national conversation about this and the potential impact of such change in the U.S., the largest global pharma/biotech market, we have developed a view of the likely outcome and its impact on our investing approach.
We conclude that there may well be some near-term volatility in our sector rising from the recent proposals, particularly in the next year as the U.S. presidential election is resolved. However, beyond this period, we don't foresee dramatic change in how healthcare works in the U.S. While Americans see issues with healthcare cost, coverage and quality in general, a significant majority of U.S. adults rate both their own healthcare coverage (69%) and the care they personally receive (80%) as Good or Excellent (Source: Gallup). In addition, the rate at which healthcare spending is growing has declined in recent years (Source: American Medical Association). Furthermore, as we have previously noted, healthcare comprises almost 20% of the U.S. economy and a complete replacement would be tumultuous. The combination of these factors does not suggest to us any fundamental change in the near term. Rather than sweeping change, we expect that there will continue to be modest changes to address the specific issues. As a result, we do not conclude the need for a major change in our investing approach. We will incorporate market, sentiment and cost related factors, but our
1
fundamental approach to investing will continue to emphasize differentiated products and talented management.
Having said this, given the breadth of the healthcare sector, there will always be macro and micro factors that make us more or less confident in the short-term prospects of the healthcare sector or one of its subsectors. In recent months, for example, the sector has seen increased volatility relative to other times and has underperformed the broad S&P 500® Index* ("SPX"). This makes us a bit more cautious than usual. But as UBS Financial Services ("UBS") has recently noted, the healthcare sector, which often trades at a premium to the broad market, is now trading at a wider discount to the broad market than it has in quite some time. UBS also notes the long-term consistent quality of healthcare earnings history and points out that, unlike the broad SPX market, forward earnings estimates for the healthcare sector have not been negative in any of the last 20 years. They further conclude that we are entering into a "risk aversion" period in the current market cycle, based on the Purchasing Managers' Index® declining to less than 50. UBS' analysis indicates that healthcare has historically outperformed the broad market in such periods. As you might expect, these factors make us more positive toward the healthcare sector in the near and intermediate term.
With regard to micro factors, there are, as usual, both bearish and bullish factors. As an example, litigation involving opioid producing companies has been a negative of late, hurting individual company stocks and generally depressing sentiment and valuations in the specialty pharma and drug distributor subsectors. The hope is that a "global" settlement will lift valuations.
Novel approaches to product and service delivery hold both encouraging and cautionary possibilities. Retail giant Amazon, for example, continues to push deeper into healthcare. The Company remains a potential disruptor to traditional healthcare channel companies with a growing portfolio of medical supplies. The acquisition of PillPack gave Amazon mail order pharmacy capabilities which may well compete with traditional players. In addition, Amazon continues to advance its joint venture with Berkshire Hathaway and JP Morgan which aims to reduce healthcare costs for employees. While these developments are seen by many as threatening the status quo, we continue to see opportunity in the form of new entities that seek to change how various aspects of medical and related sector (e.g., consumer) products are delivered to consumers. Our view as always is that the market is evolving and that traditional players that can evolve with it will prosper and that those that don't won't. We endeavor to invest in the former and divest the latter.
2
In addition, the development and commercialization of biosimilar drug products continues to move forward, providing an opportunity to reduce the cost to payers and patients of biological products that have lost proprietary status. A new group of companies has been built for the purpose of competing with traditional pharma and biotech entities. Interestingly, a number of traditional pharma players have developed their own subsidiaries aimed at competing in the biosimilar market. We think these developments will drive both quality and cost effectiveness.
Clinical trial successes and failures continue to both excite and disappoint the market. Among recent successes, we have seen cardiovascular benefit demonstrated by two new products. Amarin Corporation plc's Vascepa has demonstrated a mortality benefit and The Medicine Co.'s gene therapy product has demonstrated a differentiated way to reduce cholesterol. Furthermore, and surprisingly to many, after an apparent failure earlier this year that hit the biotech sector hard, it may well be that an anti-amyloid antibody developed by Biogen, Inc. can have a beneficial impact on Alzheimer's disease. Balancing these positive developments there have been, as always a few results that have disappointed us in recent months. These include Gilead Sciences, Inc.'s recent NASH trial, Novavax, Inc.'s RSV trial and Allergan plc's recent trial in major depressive disorder.
Probably the most encouraging development in recent quarters has been an apparent increase in the rate of successful merger and acquisition activity. After some initial uncertainty, it now looks like the megamerger of Bristol-Myers Squibb and Co. and Celgene Corp. will be completed. We are also encouraged by the expected acquisition of Allergan by AbbVie, Inc. and the merger of Mylan N.V. with Pfizer, Inc.'s generic drug unit.
As always, we thank you for your consideration of the Tekla Funds. Please call our distribution partner Destra Capital Advisors LLC or us if you have any questions.
Be well,
Daniel R. Omstead
President and Portfolio Manager
3
TEKLA HEALTHCARE
OPPORTUNITIES FUND
Fund Essentials
Objective of the Fund
The Fund's investment objective is to seek current income and long-term capital appreciation.
Description of the Fund
Tekla Healthcare Opportunities Fund ("THQ") is a non-diversified closed-end healthcare fund traded on the New York Stock Exchange under the ticker THQ. THQ employs a versatile growth and income investment strategy investing across all healthcare sub-sectors and across a company's full capital structure.
Investment Philosophy
Tekla Capital Management LLC, the Investment Adviser to the Fund, believes that:
• Aging demographics and adoption of new medical products and services may provide long-term tailwinds for healthcare companies
• Late stage biotechnology product pipeline could lead to significant increases in biotechnology sales
• Investment opportunity spans 11 sub-sectors including biotechnology, healthcare technology, managed care and healthcare REITs
• Robust M&A activity in healthcare may create additional investment opportunities
Fund Overview and Characteristics as of 9/30/19
Market Price1 | | $ | 17.46 | | |
NAV2 | | $ | 18.80 | | |
Premium/(Discount) | | | -7.13 | % | |
Average 30 Day Volume | | | 95,990 | | |
Net Assets | | $ | 779,686,117 | | |
Managed Assets | | $ | 1,004,686,117 | | |
Leverage Outstanding | | $ | 225,000,000 | | |
Total Leverage Ratio3 | | | 22.40 | % | |
Ticker | | | THQ | | |
NAV Ticker | | | XTHQX | | |
Commencement of
Operations Date | | |
7/31/14 | | |
Fiscal Year to Date
Distributions
per Share | | $ | 1.35 | | |
1 The closing price at which the Fund's shares were traded on the exchange.
2 Per-share dollar value of the Fund, calculated by dividing the total value of all the securities in its portfolio, plus any other assets and less liabilities, by the number of Fund shares outstanding.
3 As a percentage of managed assets
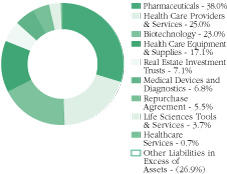
Holdings of the Fund (Data is based on net assets)
Asset Allocation as of 9/30/19
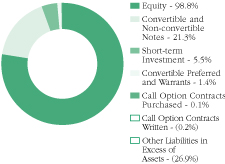
Sector Diversification as of 9/30/19
This data is subject to change on a daily basis.
4
TEKLA HEALTHCARE
OPPORTUNITIES FUND
Largest Holdings by Issuer
(Excludes Short-Term Investments)
As of September 30, 2019
| Issuer – Sector | | % of Net
Assets | |
| Merck & Co., Inc. – Pharmaceuticals | | | 8.8 | % | |
| Johnson & Johnson – Pharmaceuticals | | | 8.3 | % | |
| Pfizer, Inc. – Pharmaceuticals | | | 7.0 | % | |
| UnitedHealth Group, Inc. – Health Care Providers & Services | | | 6.9 | % | |
| Amgen, Inc. – Biotechnology | | | 4.7 | % | |
| Anthem, Inc. – Health Care Providers & Services | | | 4.3 | % | |
| AbbVie, Inc. – Biotechnology | | | 4.2 | % | |
| Bristol-Myers Squibb Co. – Pharmaceuticals | | | 4.2 | % | |
| CVS Health Corp. – Health Care Providers & Services | | | 4.1 | % | |
| Gilead Sciences, Inc. – Biotechnology | | | 3.9 | % | |
| Medtronic plc – Health Care Equipment & Supplies | | | 3.2 | % | |
| Abbott Laboratories – Health Care Equipment & Supplies | | | 2.7 | % | |
| Celgene Corp. – Biotechnology | | | 2.6 | % | |
| Stryker Corp. – Health Care Equipment & Supplies | | | 2.3 | % | |
| Intuitive Surgical, Inc. – Medical Devices and Diagnostics | | | 2.3 | % | |
| Thermo Fisher Scientific, Inc. – Life Sciences Tools & Services | | | 2.1 | % | |
| Allergan plc – Pharmaceuticals | | | 2.0 | % | |
| Zoetis, Inc. – Pharmaceuticals | | | 1.8 | % | |
| Becton, Dickinson and Co. – Health Care Equipment & Supplies | | | 1.7 | % | |
| Zimmer Biomet Holdings, Inc. – Health Care Equipment & Supplies | | | 1.7 | % | |
Portfolio Highlights as of September 30, 2019
Among other investments, Tekla Healthcare Opportunities Fund's performance benefitted in the past year by the following:
Galapagos NV (GLPG) is a Belgian/Dutch large-cap company with a predominantly inflammatory focus that is on the cusp of transitioning to a commercial stage company on the basis of their Gilead-partnered asset, filgotinib. We expect regulatory filing for rheumatoid arthritis by the end of the year, with approval and launch coming in mid-'20. Although likely preclusive of a near term acquisition, we view the close collaboration with Gilead as a long-term asset for the Company that should accelerate their earlier stage clinical compounds.
DENTSPLY Sirona, Inc. (XRAY) is a global distributor and manufacturer of dental products that is in the midst of a successful turnaround.
5
In late 2018 the stock lost over half its value when the Company was forced to lower financial outlook guidance due to pricing pressures and problems with its distributor relationships. As a result, Dentsply enacted a corporate restructuring process and streamlined its sales and manufacturing divisions. These initiatives have begun to bear fruit as the stock has posted solid earnings the last two quarters and we believe remains poised for significant upside.
The Medicines Co. (MDCO) has a lead asset, the RNA-modulator Inclisiran, in multiple dyslipidemia phase III studies for which the company will report results in the coming months. Assuming success, this agent will represent a new modality in the treatment of dyslipidemia with an annual vaccine-like dosing regimen that should prove attractive to the medical community. The stock has appreciated significantly since the beginning of the year, helping the Fund's performance.
Among other examples, Tekla Healthcare Opportunities Fund's performance was negatively impacted by the following investments:
Teva Pharmaceutical Industries Ltd. (TEVA) is one of the largest manufacturers of generic pharmaceuticals. The U.S. generic drug industry has faced significant headwinds over the past several years due to increased competition, fewer blockbuster drugs rolling off patent, consolidation among large buying consortiums, and uncertainty around opioid drug litigation. Overall, this has led to persistent generic price deflation and a challenging operating environment. Following a management change in late 2017, turnaround efforts have included the rationalization of unprofitable products and significant cost cutting efforts. Overall, TEVA's restructuring efforts and stabilization of generic deflation helps position the company to deleverage its balance sheet and return to growth, but opioid litigation uncertainty continues to weigh on TEVA. We have decreased our ownership of this stock over the past year, but Fund performance was negatively affected in the reporting period.
Diplomat Pharmacy, Inc. (DPLO) is the largest independent provider of specialty pharmacy services in the U.S., positioning it well to capitalize on the rapidly growing specialty drug market. The Company acquired two small middle market Pharmacy Benefit Managers ("PBM") to diversify its business, but integration did not proceed as hoped and DPLO saw significant PBM customer losses which has weighed on the Company's growth and share price. The Company's specialty pharmacy and infusion businesses remain attractive assets, and management is currently exploring strategic alternatives. There is a reasonable likelihood that the Company is ultimately acquired by a strategic buyer.
6
Exelixis, Inc. (EXEL) is a mid-cap biotech company focused on the development of small molecule TKIs for oncology. Its lead product, Cabometyx, is approved in kidney cancer, where it appears likely to remain the mainstay of treatment in the second-line setting. However, prospects for use in front-line patients may be limited given emerging competition from other immuno-oncology combinations. Cabometyx is also approved for second-line liver cancer, but we see limited uptake in this tumor type.
Fund Performance
THQ is a closed-end fund which invests predominantly in healthcare companies. Subject to regular consideration, the Trustees of THQ have instituted a policy of making monthly distributions to shareholders.
The Fund invests in equity and debt of healthcare companies. The Fund seeks to benefit from the earnings growth of the healthcare industry while capturing income. Income is derived from multiple sources including equity dividends, fixed income coupons, real estate investment trust distributions, convertible securities coupons and selective equity covered call writing premiums. In order to accomplish its objectives, THQ often holds a majority of its assets in equities. Allocation of assets to various healthcare sectors can vary significantly as can the percentage of the portfolio which is overwritten.
The Fund may invest up to 20 percent of managed assets, measured at the time of investment, in the debt of healthcare companies. It may also invest up to 25 percent of managed assets in healthcare REITs. The Fund may also hold up to 30 percent of managed assets in convertible securities and may invest a portion of its assets in restricted securities. In order to generate additional "current" income, THQ often sells (or writes) calls against a material portion of its equity assets. The portion of equity assets overwritten can vary, but usually represents less than 20 percent of managed assets. At times, the overwritten portion of assets is materially less than 20 percent of managed assets. The use of covered calls is intended to produce "current" income, but may limit upside in bullish markets. The Fund may also use leverage to enhance yield. The Fund may incur leverage up to 20 percent of managed assets at the time of borrowing. "Managed Assets" means the total assets of the Fund (including any assets attributable to borrowings for investment purposes) minus the sum of the Fund's accrued liabilities (other than liabilities representing borrowings for investment purposes).
The Fund considers investments in companies of all sizes and in all healthcare subsectors, including but not limited to, biotechnology,
7
pharmaceuticals, healthcare equipment, healthcare supplies, life science tools and services, healthcare distributors, managed healthcare, healthcare technology, and healthcare facilities. The Fund emphasizes innovation, investing both in public and pre-public venture companies. The Fund considers its pre-public and other restricted investments to be a differentiating characteristic. Among the various healthcare subsectors, THQ has considered the biotechnology subsector, including both pre-public and public companies, to be a key contributor to the healthcare sector. The Fund holds biotech assets, including both public and pre-public, often representing 15-30% of net assets.
There is no commonly published index which matches the investment strategy of THQ. With respect to the Fund's equity investments, THQ often holds 15-30% of its assets in biotechnology. This compares with the S&P Composite 1500® Health Care Index* ("S15HLTH") that consists of more than 170 companies representing most or all of the healthcare subsectors in which THQ typically invests; biotechnology often represents 15-20% of this index. By contrast, the NASDAQ Biotechnology Index®* ("NBI"), which contains approximately 220 constituents, is much more narrowly constructed. The vast majority of this index is comprised of biotechnology, pharmaceutical and life science tools companies. In recent years, biotechnology has often represented 72-82% of the NBI. Neither the S15HLTH nor NBI indices contain any material amount of pre-public company assets.
The S&P 500® Health Care Corporate Bond Index* ("SP5HCBIT") measures the performance of U.S. corporate debt issued by constituents in the healthcare sector of the SPX. This index is generally reflective of the debt assets in which THQ invests though the Fund invests in the SPX debt components as well as those of smaller capitalization companies.
The FTSE NAREIT Health Care Property Sector Index®* ("FNHEA") is comprised of U.S. publicly traded REITs in the healthcare sector. This index is generally reflective of the REITs in which THQ invests.
Given the circumstances, we present both NAV and stock returns for the Fund in comparison to several commonly published indices. We note that THQ is a dynamically configured multi-asset class healthcare growth and income fund. There is no readily available index comprised of similar characteristics to THQ and to which THQ can directly be compared. Therefore, we provide returns for a number of indices representing the major components of THQ's assets. Having said this, we note that there are no readily available indices representing the covered call strategy employed by THQ or the restricted security components of THQ. We
8
also note that unlike any of the various indicies we describe, the Fund makes a regular cash distribution to shareholders.
Fund Performance as of September 30, 2019
Period | | THQ NAV | | THQ MKT | | NBI | | S15HLTH | | SPX | | SP5HCBIT | | FNHEA | |
| 6 month | | | -0.11 | | | | 3.03 | | | | -10.68 | | | | -0.99 | | | | 6.08 | | | | 7.52 | | | | 14.16 | | |
| 1 year | | | -3.81 | | | | 0.63 | | | | -17.99 | | | | -4.33 | | | | 4.25 | | | | 12.53 | | | | 32.99 | | |
| 5 year | | | 7.70 | | | | 6.65 | | | | 2.27 | | | | 9.43 | | | | 10.83 | | | | 4.93 | | | | 10.08 | | |
inception | | | 7.85 | | | | 5.28 | | | | 3.60 | | | | 9.78 | | | | 10.55 | | | | 4.65 | | | | 8.79 | | |
Inception date July 29, 2014
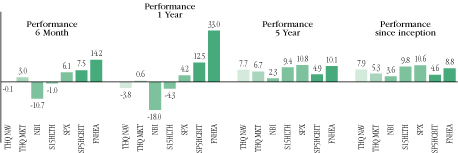
All performance over one-year has been annualized.
Performance data quoted represents past performance, which is no guarantee of future results, and current performance may be lower or higher than the figures shown. The NAV total return takes into account the Fund's total annual expenses and does not reflect transaction charges. If transaction charges were reflected, NAV total return would be reduced. All distributions are assumed to be reinvested either in accordance with the dividend reinvestment plan (DRIP) for market price returns or NAV for NAV returns. Until the DRIP price is available from the Plan Agent, the market price returns reflect the reinvestment at the closing market price on the last business day of the month. Once the DRIP is available around mid-month, the market price returns are updated to reflect reinvestment at the DRIP price.
**The trademarks NASDAQ Biotechnology Index®, S&P Composite 1500® Health Care Index, S&P 500® Index, S&P 500® Health Care Corporate Bond Index and FTSE NAREIT Health Care Property Sector Index® referenced in this report are the property of their respective owners. These trademarks are not owned by or associated with the Fund or its service providers, including Tekla Capital Management LLC.
9
TEKLA HEALTHCARE
OPPORTUNITIES FUND
SCHEDULE OF INVESTMENTS
SEPTEMBER 30, 2019
SHARES | | CONVERTIBLE PREFERRED AND WARRANTS
(Restricted) (a) (b) - 1.4% of Net Assets | | VALUE | |
| | | Biotechnology - 1.3% | |
| | 911,124 | | | Decipher Biosciences, Inc. Series II, 8.00% | | $ | 1,272,840 | | |
| | 905,797 | | | Decipher Biosciences, Inc. Series III, 8.00% | | | 1,967,391 | | |
| | 1,106,444 | | | Galera Therapeutics, Inc. Series C, 6.00% | | | 2,449,999 | | |
| | 264,833 | | | Oculis SA, Series B2 (c) | | | 2,209,308 | | |
| | 2,538,462 | | | Rainier Therapeutics, Inc. Series A, 6.00% | | | 1,302,739 | | |
| | 1,470,588 | | | Rainier Therapeutics, Inc. Series B, 6.00% | | | 1,100,000 | | |
| | | | 10,302,277 | | |
| | | | | Health Care Equipment & Supplies - 0.1% | | | |
| | 407,078 | | | IlluminOss Medical, Inc. Series AA, 8.00% | | | 339,300 | | |
| | 383,470 | | | IlluminOss Medical, Inc. Junior Preferred,
8.00% | | | 38 | | |
| | 21,885 | | | IlluminOss Medical, Inc. Warrants
(expiration 01/11/27, exercise price $1.00) | | | 0 | | |
| | 21,885 | | | IlluminOss Medical, Inc. Warrants
(expiration 02/06/27, exercise price $1.00) | | | 0 | | |
| | 32,792 | | | IlluminOss Medical, Inc. Warrants
(expiration 03/31/27, exercise price $1.00) | | | 0 | | |
| | 27,356 | | | IlluminOss Medical, Inc. Warrants
(expiration 09/06/27, exercise price $1.00) | | | 0 | | |
| | 10,942 | | | IlluminOss Medical, Inc. Warrants
(expiration 11/20/27, exercise price $1.00) | | | 0 | | |
| | 21,388 | | | IlluminOss Medical, Inc. Warrants
(expiration 01/29/29, exercise price $1.00) | | | 0 | | |
| | 5,968 | | | IlluminOss Medical, Inc. Warrants
(expiration 04/29/29, exercise price $1.00) | | | 0 | | |
| | 9,423 | | | IlluminOss Medical, Inc. Warrants
(expiration 05/13/29, exercise price $1.00) | | | 0 | | |
| | 13,003 | | | IlluminOss Medical, Inc. Warrants
(expiration 07/02/29, exercise price $1.00) | | | 0 | | |
| | 4,250 | | | IlluminOss Medical, Inc. Warrants
(expiration 08/29/29, exercise price $1.00) | | | 0 | | |
| | 24,668 | | | IlluminOss Medical, Inc. Warrants
(expiration 09/27/29, exercise price $1.00) | | | 0 | | |
| | | | 339,338 | | |
| | | | | TOTAL CONVERTIBLE PREFERRED AND
WARRANTS
(Cost $13,022,152) | | | 10,641,615 | | |
The accompanying notes are an integral part of these financial statements.
10
TEKLA HEALTHCARE
OPPORTUNITIES FUND
SCHEDULE OF INVESTMENTS
SEPTEMBER 30, 2019
(continued)
PRINCIPAL
AMOUNT | | CONVERTIBLE AND NON-CONVERTIBLE
NOTES - 21.3% of Net Assets | | VALUE | |
| | | | | Convertible Notes (Restricted) (a) - 0.3% | | | |
| | | Biotechnology - 0.2% | |
$ | 1,315,551 | | | Rainier Therapeutics, Inc. Promissory Notes,
8.00% due 03/31/20 | | $ | 1,315,551 | | |
| | | | | Health Care Equipment & Supplies - 0.1% | | | |
| | 774,246 | | | IlluminOss Medical, Inc. Promissory Notes,
8.00% due 12/31/21 | | | 774,246 | | |
| | | | | Total Convertible Notes | | | 2,089,797 | | |
| | | Non-Convertible Notes - 21.0% | |
| | | | | Biotechnology - 4.2% | | | |
| | 5,303,000 | | | AbbVie, Inc., 4.25% due 11/14/28 | | | 5,753,953 | | |
| | 3,245,000 | | | AbbVie, Inc., 3.20% due 05/14/26 | | | 3,304,262 | | |
| | 2,200,000 | | | Amgen, Inc., 3.20% due 11/02/27 | | | 2,300,038 | | |
| | 10,000,000 | | | Amgen, Inc., 3.63% due 05/15/22 | | | 10,345,272 | | |
| | 840,000 | | | Biogen, Inc., 3.63% due 09/15/22 | | | 873,367 | | |
| | 10,000,000 | | | Gilead Sciences, Inc., 2.95% due 03/01/27 | | | 10,311,119 | | |
| | | | 32,888,011 | | |
| | | | | Health Care Equipment & Supplies - 2.2% | | | |
| | 2,100,000 | | | Abbott Laboratories, 3.40% due 11/30/23 | | | 2,202,394 | | |
| | 2,413,000 | | | Becton, Dickinson and Co., 3.70%
due 06/06/27 | | | 2,561,591 | | |
| | 2,225,000 | | | Medtronic, Inc., 3.50% due 03/15/25 | | | 2,388,299 | | |
| | 3,500,000 | | | Stryker Corp., 3.65% due 03/07/28 | | | 3,791,894 | | |
| | 6,000,000 | | | Zimmer Biomet Holdings, Inc., 4.25%
due 08/15/35 | | | 6,069,293 | | |
| | | | 17,013,471 | | |
| | | Health Care Providers & Services - 9.0% | |
| | 6,393,000 | | | Acadia Healthcare Co., Inc., 5.13%
due 07/01/22 | | | 6,440,947 | | |
| | 2,975,000 | | | Anthem, Inc., 4.10% due 03/01/28 | | | 3,213,189 | | |
| | 10,500,000 | | | Anthem, Inc., 3.50% due 08/15/24 | | | 11,004,599 | | |
| | 2,325,000 | | | Anthem, Inc., 4.65% due 08/15/44 | | | 2,592,612 | | |
| | 1,504,000 | | | Cigna Corp, 4.38% due 10/15/28 | | | 1,643,385 | | |
| | 3,600,000 | | | CVS Health Corp., 4.30% due 03/25/28 | | | 3,892,807 | | |
| | 3,700,000 | | | CVS Health Corp., 5.05% due 03/25/48 | | | 4,199,236 | | |
| | 2,100,000 | | | CVS Health Corp., 3.70% due 03/09/23 | | | 2,185,970 | | |
| | 2,100,000 | | | CVS Health Corp., 4.78% due 03/25/38 | | | 2,299,885 | | |
| | 3,125,000 | | | Encompass Health Corp., 5.75% due 11/01/24 | | | 3,157,656 | | |
The accompanying notes are an integral part of these financial statements.
11
TEKLA HEALTHCARE
OPPORTUNITIES FUND
SCHEDULE OF INVESTMENTS
SEPTEMBER 30, 2019
(continued)
| PRINCIPAL AMOUNT | | Health Care Providers & Services - continued | | VALUE | |
$ | 8,250,000 | | | Express Scripts Holding Co., 6.13%
due 11/15/41 | | $ | 10,464,430 | | |
| | 2,100,000 | | | Express Scripts Holding Co., 3.50%
due 06/15/24 | | | 2,192,969 | | |
| | 4,850,000 | | | HCA Healthcare, Inc., 6.25% due 02/15/21 | | | 5,078,435 | | |
| | 2,750,000 | | | Tenet Healthcare Corp., 4.63% due 07/15/24 | | | 2,826,257 | | |
| | 1,460,000 | | | UnitedHealth Group, Inc., 3.85% due 06/15/28 | | | 1,598,334 | | |
| | 2,100,000 | | | UnitedHealth Group, Inc., 2.88% due 12/15/21 | | | 2,140,177 | | |
| | 4,970,000 | | | UnitedHealth Group, Inc., 3.88% due 12/15/28 | | | 5,471,921 | | |
| | | | 70,402,809 | | |
| | | Healthcare Services - 0.3% | |
| | 2,100,000 | | | Laboratory Corporation of America
Holdings, 3.60% due 02/01/25 | | | 2,201,889 | | |
| | | Life Sciences Tools & Services - 0.3% | |
| | 2,100,000 | | | Thermo Fisher Scientific, Inc., 3.20%
due 08/15/27 | | | 2,195,302 | | |
| | | Pharmaceuticals - 5.0% | |
| | 4,750,000 | | | AstraZeneca plc, 6.45% due 09/15/37 (c) | | | 6,702,911 | | |
| | 7,500,000 | | | Bristol-Myers Squibb Co., 3.20% due 06/15/2 (d) | | | 7,868,363 | | |
| | 2,100,000 | | | Bristol-Myers Squibb Co., 3.40% due 07/26/29 (d) | | | 2,243,055 | | |
| | 2,200,000 | | | Johnson & Johnson, 2.90% due 01/15/28 | | | 2,313,848 | | |
| | 4,200,000 | | | Merck & Co., Inc., 2.80% due 05/18/23 | | | 4,324,231 | | |
| | 2,100,000 | | | Merck & Co., Inc., 2.75% due 02/10/25 | | | 2,174,671 | | |
| | 4,000,000 | | | Merck & Co., Inc., 3.40% due 03/07/29 | | | 4,339,036 | | |
| | 8,100,000 | | | Pfizer, Inc., 3.45% due 03/15/29 | | | 8,770,038 | | |
| | | | 38,736,153 | | |
| | Total Non-Convertible Notes | | | 163,437,635 | | |
| | | TOTAL CONVERTIBLE AND
NON-CONVERTIBLE NOTES
(Cost $ 159,687,152) | | | 165,527,432 | | |
SHARES | | COMMON STOCKS AND WARRANTS - 98.8%
of Net Assets | | | |
| | | Biotechnology - 17.3% | | | |
| | 315,686 | | | AbbVie, Inc. (e) | | | 23,903,744 | | |
| | 50,716 | | | Alexion Pharmaceuticals, Inc. (b) | | | 4,967,125 | | |
| | 125,117 | | | Amgen, Inc. (e) | | | 24,211,391 | | |
| | 58,535 | | | Atreca, Inc. (b) | | | 716,468 | | |
| | 125,178 | | | Atreca, Inc.(Restricted) (a) (b) | | | 1,378,961 | | |
The accompanying notes are an integral part of these financial statements.
12
TEKLA HEALTHCARE
OPPORTUNITIES FUND
SCHEDULE OF INVESTMENTS
SEPTEMBER 30, 2019
(continued)
SHARES | | Biotechnology - continued | | VALUE | |
| | 35,596 | | | Biogen, Inc. (b) | | $ | 8,287,461 | | |
| | 204,109 | | | Celgene Corp. (b) | | | 20,268,024 | | |
| | 47,991 | | | Esperion Therapeutics, Inc. (b) | | | 1,759,350 | | |
| | 116,040 | | | Exelixis, Inc. (b) | | | 2,052,167 | | |
| | 317,890 | | | Gilead Sciences, Inc. (e) | | | 20,147,868 | | |
| | 54,000 | | | Incyte, Corp. (b) (e) | | | 4,008,420 | | |
| | 11,459 | | | Ligand Pharmaceuticals, Inc. (b) (e) | | | 1,140,629 | | |
| | 40,093 | | | Nektar Therapeutics (b) | | | 730,294 | | |
| | 336 | | | Neurocrine Biosciences, Inc. (b) | | | 30,277 | | |
| | 226,241 | | | Pieris Pharmaceuticals, Inc. (b) | | | 771,482 | | |
| | 40,496 | | | Pieris Pharmaceuticals, Inc., Series A
Warrants (expiration 06/08/21,
exercise price $3.00) (a) (b) | | | 72,488 | | |
| | 20,248 | | | Pieris Pharmaceuticals, Inc., Series B
Warrants (expiration 06/08/21,
exercise price $2.00) (a) (b) | | | 46,773 | | |
| | 12,196 | | | Puma Biotechnology, Inc. (b) | | | 131,290 | | |
| | 23,521 | | | Regeneron Pharmaceuticals, Inc. (b) (e) | | | 6,524,725 | | |
| | 41,951 | | | REGENXBIO, Inc. (b) (e) | | | 1,493,456 | | |
| | 68,859 | | | Vertex Pharmaceuticals, Inc. (b) (e) | | | 11,666,092 | | |
| | 27,479 | | | Xencor, Inc. (b) | | | 926,867 | | |
| | | | 135,235,352 | | |
| | | Health Care Equipment & Supplies - 14.8% | |
| | 222,429 | | | Abbott Laboratories | | | 18,610,634 | | |
| | 16,384 | | | ABIOMED, Inc. (b) (e) | | | 2,914,550 | | |
| | 107,126 | | | Baxter International, Inc. (e) | | | 9,370,311 | | |
| | 42,835 | | | Becton, Dickinson and Co. (e) | | | 10,835,542 | | |
| | 87,621 | | | DENTSPLY Sirona, Inc. (e) | | | 4,671,076 | | |
| | 40,800 | | | Edwards Lifesciences Corp. (b) (e) | | | 8,972,328 | | |
| | 17,402 | | | Hologic, Inc. (b) | | | 878,627 | | |
| | 25,306 | | | IDEXX Laboratories, Inc. (b) (e) | | | 6,881,461 | | |
| | 34,888 | | | Inogen, Inc. (b) | | | 1,671,484 | | |
| | 14,585 | | | Masimo Corp. (b) (e) | | | 2,170,102 | | |
| | 205,126 | | | Medtronic plc (e) | | | 22,280,786 | | |
| | 4,660 | | | STERIS plc | | | 673,323 | | |
| | 65,638 | | | Stryker Corp. (e) | | | 14,197,499 | | |
| | 6,379 | | | Teleflex Inc. | | | 2,167,265 | | |
| | 82,221 | | | Wright Medical Group N.V. (b) | | | 1,696,219 | | |
| | 53,363 | | | Zimmer Biomet Holdings, Inc. | | | 7,325,139 | | |
| | | | 115,316,346 | | |
The accompanying notes are an integral part of these financial statements.
13
TEKLA HEALTHCARE
OPPORTUNITIES FUND
SCHEDULE OF INVESTMENTS
SEPTEMBER 30, 2019
(continued)
SHARES | | Health Care Providers & Services - 16.0% | | VALUE | |
| | 49,650 | | | Acadia Healthcare Co., Inc. (b) | | $ | 1,543,122 | | |
| | 70,598 | | | Anthem, Inc. (e) | | | 16,950,580 | | |
| | 42,387 | | | Cardinal Health, Inc. (c) (e) | | | 2,000,243 | | |
| | 21,540 | | | Charles River Laboratories International, Inc. (b) (e) | | | 2,851,250 | | |
| | 82,890 | | | Cigna Corp. (b) (e) | | | 12,581,873 | | |
| | 109,035 | | | Community Health Systems, Inc. (b) | | | 392,526 | | |
| | 306,016 | | | CVS Health Corp. (e) | | | 19,300,429 | | |
| | 127,901 | | | Diplomat Pharmacy, Inc. (b) | | | 626,715 | | |
| | 50,780 | | | HCA Healthcare, Inc. (e) | | | 6,114,928 | | |
| | 31,810 | | | HealthEquity, Inc. (b) (e) | | | 1,817,782 | | |
| | 51,105 | | | Humana, Inc. (e) | | | 13,066,015 | | |
| | 141,136 | | | Tenet Healthcare Corp. (b) | | | 3,121,928 | | |
| | 205,388 | | | UnitedHealth Group, Inc. (e) | | | 44,634,920 | | |
| | | | 125,002,311 | | |
| | | Healthcare Services - 0.4% | |
| | 17,903 | | | Laboratory Corporation of America Holdings (b) | | | 3,007,704 | | |
| | | Life Sciences Tools & Services - 3.4% | |
| | 34,025 | | | Agilent Technologies, Inc. | | | 2,607,336 | | |
| | 23,856 | | | Illumina, Inc. (b) (e) | | | 7,257,472 | | |
| | 12,456 | | | PerkinElmer, Inc. | | | 1,060,878 | | |
| | 19,700 | | | PRA Health Sciences, Inc. (b) | | | 1,954,831 | | |
| | 48,561 | | | Thermo Fisher Scientific, Inc. (e) | | | 14,144,362 | | |
| | | | 27,024,879 | | |
| | | Medical Devices and Diagnostics - 6.8% | |
| | 19,377 | | | Align Technology, Inc. (b) (e) | | | 3,505,687 | | |
| | 323,903 | | | Boston Scientific Corp. (b) (e) | | | 13,179,613 | | |
| | 86,056 | | | Danaher Corp. | | | 12,429,068 | | |
| | 32,983 | | | Intuitive Surgical, Inc. (b) (e) | | | 17,808,511 | | |
| | 19,824 | | | Quest Diagnostics, Inc. | | | 2,121,763 | | |
| | 27,547 | | | ResMed, Inc. | | | 3,721,875 | | |
| | | | 52,766,517 | | |
| | | Pharmaceuticals - 33.0% | |
| | 91,959 | | | Allergan plc (c) | | | 15,475,780 | | |
| | 109,765 | | | AmerisourceBergen Corp. (e) | | | 9,036,952 | | |
| | 427,584 | | | Bristol-Myers Squibb Co. (e) | | | 21,682,785 | | |
| | 114,082 | | | Eli Lilly & Co. (e) | | | 12,757,790 | | |
| | 25,696 | | | IQVIA Holdings, Inc. (b) | | | 3,838,468 | | |
| | 480,865 | | | Johnson & Johnson (e) | | | 62,214,314 | | |
| | 65,556 | | | McKesson Corp. (e) | | | 8,958,883 | | |
| | 14,381 | | | Medicines Co. (The) (b) | | | 719,050 | | |
| | 687,999 | | | Merck & Co., Inc. (e) | | | 57,915,756 | | |
The accompanying notes are an integral part of these financial statements.
14
TEKLA HEALTHCARE
OPPORTUNITIES FUND
SCHEDULE OF INVESTMENTS
SEPTEMBER 30, 2019
(continued)
SHARES | | Pharmaceuticals - continued | | VALUE | |
| | 112,651 | | | Mylan N.V. (b) | | $ | 2,228,237 | | |
| | 1,278,548 | | | Pfizer, Inc. (e) | | | 45,938,230 | | |
| | 352,804 | | | Teva Pharmaceutical Industries Ltd. (b) (f) | | | 2,427,292 | | |
| | 109,700 | | | Zoetis, Inc. (e) | | | 13,667,523 | | |
| | 656,921 | | | Zyla Life Sciences (a) (b) (g) | | | 712,759 | | |
| | | | 257,573,819 | | |
| | | Real Estate Investment Trusts - 7.1% | |
| | 126,122 | | | LTC Properties, Inc. | | | 6,459,969 | | |
| | 119,109 | | | Medical Properties Trust, Inc. | | | 2,329,772 | | |
| | 105,543 | | | New Senior Investment Group Inc. | | | 705,027 | | |
| | 223,295 | | | Omega Healthcare Investors, Inc. | | | 9,331,498 | | |
| | 248,608 | | | Physicians Realty Trust | | | 4,412,792 | | |
| | 395,119 | | | Sabra Health Care REIT, Inc. | | | 9,071,932 | | |
| | 293,879 | | | Senior Housing Properties Trust | | | 2,719,850 | | |
| | 118,869 | | | Ventas, Inc. | | | 8,681,003 | | |
| | 127,462 | | | Welltower, Inc. | | | 11,554,430 | | |
| | | | 55,266,273 | | |
| | | | | TOTAL COMMON STOCKS AND WARRANTS
(Cost $ 785,461,663) | | | 771,193,201 | | |
PRINCIPAL
AMOUNT | | SHORT-TERM INVESTMENT - 5.5% of Net Assets | | | |
$ | 42,691,000 | | | Repurchase Agreement, Fixed Income Clearing
Corp., repurchase value $42,691,000, 0.25%,
dated 09/30/19, due 10/01/19 (collateralized
by U.S. Treasury Notes 1.88%, due 09/30/22,
market value $43,549,427) | | | 42,691,000 | | |
| | | | | TOTAL SHORT-TERM INVESTMENT
(Cost $42,691,000) | | | 42,691,000 | | |
The accompanying notes are an integral part of these financial statements.
15
TEKLA HEALTHCARE
OPPORTUNITIES FUND
SCHEDULE OF INVESTMENTS
SEPTEMBER 30, 2019
(continued)
NUMBER OF
CONTRACTS
(100 SHARES
EACH)/
NOTIONAL
AMOUNT ($) | | CALL OPTION CONTRACTS PURCHASED - 0.1%
of Net Assets | |
VALUE
| |
65/2,340,000 | | Biogen, Inc. Jun20 360 Call | | $ | 16,413 | | |
2,500/12,500,000 | | Bristol-Myers Squibb Co. Jan20 50 Call | | | 697,500 | | |
| | TOTAL CALL OPTION CONTRACTS PURCHASED
(Premium paid $1,445,488) | | | 713,913 | | |
| | | OPTION CONTRACTS WRITTEN - (0.2)%
of Net Assets | | | |
| | Call Option Contracts Written - (0.2)%
of Net Assets | | | |
600/(4,440,000) | | AbbVie, Inc. Oct19 74 Call | | | (139,200 | ) | |
78/(1,560,000) | | ABIOMED, Inc. Oct19 200 Call | | | (5,460 | ) | |
59/(1,121,000) | | Align Technology, Inc. Oct19 190 Call | | | (15,930 | ) | |
103/(875,500) | | AmerisourceBergen Corp. Oct19 85 Call | | | (11,845 | ) | |
118/(2,419,000) | | Amgen, Inc. Oct19 205 Call | | | (5,074 | ) | |
66/(1,716,000) | | Anthem, Inc. Oct19 260 Call | | | (4,224 | ) | |
52/(1,404,000) | | Anthem, Inc. Oct19 270 Call | | | (884 | ) | |
101/(883,750) | | Baxter International, Inc. Oct19 87.5 Call | | | (15,150 | ) | |
40/(1,040,000) | | Becton, Dickinson and Co. Oct19 260 Call | | | (6,000 | ) | |
386/(1,698,400) | | Boston Scientific Corp. Oct19 44 Call | | | (3,088 | ) | |
2,500/(15,000,000) | | Bristol-Myers Squibb Co. Jan20 60 Call | | | (60,000 | ) | |
212/(1,017,600) | | Cardinal Health, Inc. Oct19 48 Call | | | (20,140 | ) | |
51/(714,000) | | Charles River Laboratories International,
Inc. Oct19 140 Call | | | (3,443 | ) | |
477/(7,870,500) | | Cigna Corp. Oct19 165 Call | | | (19,557 | ) | |
83/(1,411,000) | | Cigna Corp. Oct19 170 Call | | | (1,411 | ) | |
262/(1,689,900) | | CVS Health Corp. Oct19 64.5 Call | | | (19,126 | ) | |
290/(1,885,000) | | CVS Health Corp. Oct19 65 Call | | | (14,500 | ) | |
163/(896,500) | | DENTSPLY Sirona, Inc. Oct19 55 Call | | | (8,150 | ) | |
38/(855,000) | | Edwards Lifesciences Corp. Oct19 225 Call | | | (9,690 | ) | |
108/(1,242,000) | | Eli Lilly & Co. Oct19 115 Call | | | (10,800 | ) | |
624/(4,118,400) | | Gilead Sciences, Inc. Oct19 66 Call | | | (24,960 | ) | |
48/(585,600) | | HCA Healthcare, Inc. Oct19 122 Call | | | (9,120 | ) | |
69/(414,000) | | Healthequity, Inc. Oct19 60 Call | | | (9,315 | ) | |
89/(2,558,750) | | Humana, Inc. Oct19 287.5 Call | | | (3,560 | ) | |
The accompanying notes are an integral part of these financial statements.
16
TEKLA HEALTHCARE
OPPORTUNITIES FUND
SCHEDULE OF INVESTMENTS
SEPTEMBER 30, 2019
(continued)
NUMBER OF
CONTRACTS
(100 SHARES
EACH)/
NOTIONAL
AMOUNT ($) | | Call Option Contracts Written - continued | | VALUE | |
24/(672,000) | | IDEXX Laboratories, Inc. Oct19 280 Call | | $ | (7,440 | ) | |
238/(7,437,500) | | Illumina, Inc. Oct19 312.5 Call | | | (130,424 | ) | |
66/(577,500) | | Incyte, Corp. Oct19 87.5 Call | | | (1,155 | ) | |
60/(3,270,000) | | Intuitive Surgical, Inc. Oct19 545 Call | | | (79,800 | ) | |
548/(7,233,600) | | Johnson & Johnson Oct19 132 Call | | | (67,952 | ) | |
700/(9,660,000) | | Johnson & Johnson Oct19 135 Call | | | (30,100 | ) | |
31/(325,500) | | Ligand Pharmaceuticals, Inc.
Oct19 105 Call | | | (6,200 | ) | |
55/(880,000) | | Masimo Corp. Oct19 160 Call | | | (3,025 | ) | |
108/(1,620,000) | | McKesson Corp. Oct19 150 Call | | | (5,076 | ) | |
915/(8,006,250) | | Merck & Co., Inc. Oct19 87.5 Call | | | (29,280 | ) | |
2,450/(9,065,000) | | Pfizer, Inc. Oct19 37 Call | | | (58,800 | ) | |
22/(682,000) | | Regeneron Pharmaceuticals, Inc.
Oct19 310 Call | | | (1,716 | ) | |
355/(1,420,000) | | REGENXBIO, Inc. Oct19 40 Call | | | (47,925 | ) | |
340/(10,200,000) | | Thermo Fisher Scientific, Inc.
Oct19 300 Call | | | (91,800 | ) | |
193/(4,390,750) | | UnitedHealth Group, Inc. Oct19 227.5 Call | | | (43,425 | ) | |
57/(1,368,000) | | UnitedHealth Group, Inc. Oct19 240 Call | | | (2,508 | ) | |
64/(1,136,000) | | Vertex Pharmaceuticals, Inc.
Oct19 177.5 Call | | | (10,112 | ) | |
103/(1,297,800) | | Zoetis, Inc. Oct19 126 Call | | | (14,935 | ) | |
| | Total Call Option Contracts Written
(Premiums received $2,080,589) | | | (1,052,300 | ) | |
The accompanying notes are an integral part of these financial statements.
17
TEKLA HEALTHCARE
OPPORTUNITIES FUND
SCHEDULE OF INVESTMENTS
SEPTEMBER 30, 2019
(continued)
NUMBER OF
CONTRACTS
(100 SHARES
EACH)/
NOTIONAL
AMOUNT ($) | | Put Option Contracts Written - 0.0%
of Net Assets | | VALUE | |
2,500/(10,000,000) | | Bristol-Myers Squibb Co. Jan20 40 Put | | $ | (60,000 | ) | |
470/(4,700,000) | | Medtronic plc Oct19 100 Put | | | (6,580 | ) | |
117/(2,340,000) | | Stryker Corp. Oct19 200 Put | | | (6,143 | ) | |
| | Total Put Option Contracts Written
(Premiums received $704,326) | | | (72,723 | ) | |
| | TOTAL OPTION CONTRACTS WRITTEN
(Premiums received $2,784,915) | | | (1,125,023 | ) | |
| | | TOTAL INVESTMENTS - 126.9%
(Cost $999,522,540) | | | 989,642,138 | | |
| | | OTHER LIABILITIES IN EXCESS
OF ASSETS - (26.9)% | | | (209,956,021 | ) | |
| | | NET ASSETS - 100% | | $ | 779,686,117 | | |
(a) Security fair valued using significant unobservable inputs. See Investment Valuation and Fair Value Measurements.
(b) Non-income producing security.
(c) Foreign security.
(d) Security exempt from registration under Rule 144A of the Securities Act of 1933, as amended. These securities may be resold in transactions exempt from registration, normally to qualified institutional buyers.
(e) A portion of security is pledged as collateral for call options written.
(f) American Depository Receipt
(g) Affiliated issuers in which the Fund holds 5% or more of the voting securities (total market value of $712,759).
The accompanying notes are an integral part of these financial statements.
18
TEKLA HEALTHCARE OPPORTUNITIES FUND
STATEMENT OF ASSETS AND LIABILITIES
SEPTEMBER 30, 2019
ASSETS: | |
Investments in unaffiliated issuers, at value
(cost $995,321,894) | | $ | 990,054,401 | | |
Investments in affiliated issuers, at value
(cost $6,985,561) | | | 712,759 | | |
Total investments | | | 990,767,160 | | |
Cash and restricted cash | | | 17,040,486 | | |
Dividends and interest receivable | | | 2,212,991 | | |
Prepaid expenses | | | 76,624 | | |
Total assets | | | 1,010,097,261 | | |
LIABILITIES: | |
Payable for investments purchased | | | 1,989,998 | | |
Accrued advisory fee | | | 857,184 | | |
Accrued investor support service fees | | | 42,859 | | |
Accrued shareholder reporting fees | | | 38,612 | | |
Accrued trustee fees | | | 1,409 | | |
Loan payable | | | 225,000,000 | | |
Options written, at value (premium received $2,784,915) | | | 1,125,023 | | |
Income distribution payable | | | 103,873 | | |
Interest payable | | | 1,125,881 | | |
Accrued other | | | 126,305 | | |
Total liabilities | | | 230,411,144 | | |
Commitments and Contingencies (see Notes 1 and 5) | | | |
NET ASSETS | | $ | 779,686,117 | | |
SOURCES OF NET ASSETS: | |
Shares of beneficial interest, par value $.01 per share,
unlimited number of shares authorized, amount
paid in on 41,462,660 shares issued and outstanding | | $ | 794,031,680 | | |
Total distributable earnings (loss) | | | (14,345,563 | ) | |
Total net assets (equivalent to $18.80 per share
based on 41,462,660 shares outstanding) | | $ | 779,686,117 | | |
The accompanying notes are an integral part of these financial statements.
19
TEKLA HEALTHCARE OPPORTUNITIES FUND
STATEMENT OF OPERATIONS
YEAR ENDED SEPTEMBER 30, 2019
INVESTMENT INCOME: | |
Dividend income | | $ | 16,725,426 | | |
Interest and other income | | | 5,696,805 | | |
Total investment income | | | 22,422,231 | | |
EXPENSES: | |
Advisory fees | | | 10,276,793 | | |
Interest expense | | | 7,340,262 | | |
Investor support service fees | | | 513,840 | | |
Administration fees | | | 194,602 | | |
Custodian fees | | | 165,464 | | |
Auditing fees | | | 69,484 | | |
Shareholder reporting | | | 141,342 | | |
Trustees' fees and expenses | | | 126,269 | | |
Legal fees | | | 110,968 | | |
Transfer agent fees | | | 28,061 | | �� |
Other (see Note 2) | | | 369,113 | | |
Total expenses | | | 19,336,198 | | |
Net investment income | | | 3,086,033 | | |
REALIZED AND UNREALIZED GAIN (LOSS): | |
Net realized gain (loss) on: | |
Investments in affiliated issuers | | | 6,985,561 | | |
Investments in unaffiliated issuers | | | 32,912,243 | | |
Closed or expired option contracts written | | | 5,304,158 | | |
Foreign currency transactions | | | 7,669 | | |
Net realized gain | | | 45,209,631 | | |
Change in unrealized appreciation (depreciation) on: | |
Investments in affiliated issuers | | | 12,760 | | |
Investments in unaffiliated issuers | | | (91,084,809 | ) | |
Option contracts purchased | | | (731,575 | ) | |
Option contracts written | | | 1,650,226 | | |
Change in unrealized appreciation (depreciation) | | | (90,153,398 | ) | |
Net realized and unrealized gain (loss) | | | (44,943,767 | ) | |
Net decrease in net assets resulting from
operations | | ($ | 41,857,734 | ) | |
The accompanying notes are an integral part of these financial statements.
20
TEKLA HEALTHCARE OPPORTUNITIES FUND
STATEMENTS OF CHANGES IN NET ASSETS
| | | Year ended
September 30,
2019 | | Year ended
September 30,
2018 | |
NET INCREASE (DECREASE) IN NET
ASSETS RESULTING FROM OPERATIONS: | |
Net investment income | | $ | 3,086,033 | | | $ | 5,716,320 | | |
Net realized gain | | | 45,209,631 | | | | 51,428,217 | | |
Change in net unrealized appreciation
(depreciation) | | | (90,153,398 | ) | | | 38,720,068 | | |
Net increase (decrease) in net
assets resulting from operations | | | (41,857,734 | ) | | | 95,864,605 | | |
DISTRIBUTIONS TO SHAREHOLDERS
FROM (See Note 1): | |
Distributions | | | (56,059,707 | ) | | | (57,856,225 | ) | |
Total distributions | | | (56,059,707 | ) | | | (57,856,225 | ) | |
CAPITAL SHARE TRANSACTIONS: | |
Fund shares repurchased (610,415
and 1,443,016 shares, respectively)
(see Note 1) | | | (10,638,148 | ) | | | (25,422,774 | ) | |
Total capital share transactions | | | (10,638,148 | ) | | | (25,422,774 | ) | |
Net increase (decrease) in
net assets | | | (108,555,589 | ) | | | 12,585,606 | | |
NET ASSETS: | |
Beginning of year | | | 888,241,706 | | | | 875,656,100 | | |
End of year | | $ | 779,686,117 | | | $ | 888,241,706 | | |
The accompanying notes are an integral part of these financial statements.
21
TEKLA HEALTHCARE OPPORTUNITIES FUND
STATEMENT OF CASH FLOWS
YEAR ENDED SEPTEMBER 30, 2019
CASH FLOWS FROM OPERATING ACTIVITIES: | |
Purchases of portfolio securities | | ($ | 567,976,948 | ) | |
Purchases to close option contracts written | | | (2,038,581 | ) | |
Net maturities of short-term investments | | | (22,289,000 | ) | |
Sales of portfolio securities | | | 635,959,650 | | |
Proceeds from option contracts written | | | 10,497,860 | | |
Interest income received | | | 5,755,084 | | |
Dividend income received | | | 16,751,585 | | |
Other operating receipts (expenses paid) | | | (18,386,721 | ) | |
Net cash provided from operating activities | | | 58,272,929 | | |
CASH FLOWS FROM FINANCING ACTIVITIES: | |
Cash distributions paid | | | (56,132,696 | ) | |
Fund shares repurchased | | | (10,638,148 | ) | |
Net cash used for financing activities | | | (66,770,544 | ) | |
NET DECREASE IN CASH AND RESTRICTED CASH | | | (8,497,915 | ) | |
CASH AND RESTRICTED CASH AT BEGINNING OF YEAR | | | 25,538,401 | | |
CASH AND RESTRICTED CASH AT END OF YEAR | | $ | 17,040,486 | * | |
RECONCILIATION OF NET INCREASE IN NET ASSETS
RESULTING FROM OPERATIONS TO NET CASH
PROVIDED FROM OPERATING ACTIVITIES: | |
Net decrease in net assets resulting from operations | | ($ | 41,857,734 | ) | |
Purchases of portfolio securities | | | (567,976,948 | ) | |
Purchases to close option contracts written | | | (2,038,581 | ) | |
Net maturities of short-term investments | | | (22,289,000 | ) | |
Sales of portfolio securities | | | 635,959,650 | | |
Proceeds from option contracts written | | | 10,497,860 | | |
Accretion of discount | | | 295,090 | | |
Net realized (gain) loss on investments, options and
foreign currencies | | | (45,209,631 | ) | |
Decrease in net unrealized (appreciation)
depreciation on investments and options | | | 90,153,398 | | |
Increase in dividends and interest receivable | | | (210,652 | ) | |
Decrease in accrued expenses | | | (158,410 | ) | |
Increase in prepaid expenses and interest payable | | | 1,107,887 | | |
Net cash provided from operating activities | | $ | 58,272,929 | | |
Cash paid for interest | | $ | 6,214,381 | | |
* Includes $486 of cash and $17,040,000 of restricted cash.
The accompanying notes are an integral part of these financial statements.
22
TEKLA HEALTHCARE OPPORTUNITIES FUND
| | | For the years ended September 30, | |
| | | 2019 | | 2018 | | 2017 | | 2016 | | 2015 | |
OPERATING PERFORMANCE FOR A
SHARE OUTSTANDING THROUGHOUT
EACH YEAR | |
Net asset value per share, beginning of year | | $ | 21.11 | | | $ | 20.12 | | | $ | 19.14 | | | $ | 18.77 | | | $ | 19.33 | | |
Net investment income (1) | | | 0.07 | | | | 0.13 | | | | 0.16 | | | | 0.18 | | | | 0.11 | | |
Net realized and unrealized gain (loss) | | | (1.06 | ) | | | 2.15 | | | | 2.16 | | | | 1.78 | | | | 0.68 | | |
Total increase (decrease) from investment
operations | | | (0.99 | ) | | | 2.28 | | | | 2.32 | | | | 1.96 | | | | 0.79 | | |
Distributions to shareholders from: | |
Income | | | (0.15 | ) | | | (0.58 | ) | | | (1.03 | ) | | | (1.37 | )(2) | | | (1.35 | ) | |
Net realized capital gains | | | (1.20 | ) | | | (0.77 | ) | | | (0.32 | ) | | | (0.28 | )(2) | | | — | | |
Total distributions | | | (1.35 | ) | | | (1.35 | ) | | | (1.35 | ) | | | (1.65 | ) | | | (1.35 | ) | |
Increase resulting from shares repurchased (1) | | | 0.03 | | | | 0.06 | | | | 0.01 | | | | 0.06 | | | | — | | |
Net asset value per share, end of year | | $ | 18.80 | | | $ | 21.11 | | | $ | 20.12 | | | $ | 19.14 | | | $ | 18.77 | | |
Per share market value, end of year | | $ | 17.46 | | | $ | 18.74 | | | $ | 18.57 | | | $ | 17.48 | | | $ | 16.30 | | |
Total investment return at market value | | | 0.63 | % | | | 9.00 | % | | | 14.85 | % | | | 18.25 | % | | | (7.37 | %) | |
Total investment return at net asset value | | | (3.81 | %) | | | 13.32 | % | | | 13.64 | % | | | 12.44 | % | | | 4.02 | % | |
RATIOS | |
Expenses to average net assets | | | 2.42 | % | | | 2.21 | % | | | 2.03 | % | | | 1.88 | % | | | 1.60 | % | |
Expenses, excluding interest expense, to
average net assets | | | 1.50 | % | | | 1.49 | % | | | 1.51 | % | | | 1.50 | % | | | 1.44 | % | |
Net investment income to average net assets | | | 0.39 | % | | | 0.69 | % | | | 0.86 | % | | | 0.96 | % | | | 0.50 | % | |
SUPPLEMENTAL DATA | |
Net assets at end of year (in millions) | | $ | 780 | | | $ | 888 | | | $ | 876 | | | $ | 837 | | | $ | 824 | | |
Portfolio turnover rate | | | 55.92 | % | | | 39.59 | % | | | 36.22 | % | | | 48.24 | % | | | 92.61 | % | |
(1) Computed using average shares outstanding.
(2) Amount previously presented incorrectly as solely distributions from income has been revised to reflect the proper classification.
The accompanying notes are an integral part of these financial statements.
23
TEKLA HEALTHCARE OPPORTUNITIES FUND
NOTES TO FINANCIAL STATEMENTS
SEPTEMBER 30, 2019
(1) Organization and Significant Accounting Policies
Tekla Healthcare Opportunities Fund (the Fund) is a Massachusetts business trust formed on April 2, 2014 and registered under the Investment Company Act of 1940 as a non-diversified closed-end management investment company. The Fund commenced operations on July 31, 2014. The Fund's investment objective is to seek current income and long-term capital appreciation through investments in U.S. and non-U.S. companies in the healthcare industry (including equity securities, debt securities and pooled investment vehicles). The Fund invests primarily in securities of public and private companies believed by the Fund's Investment Adviser, Tekla Capital Management LLC (the Adviser), to have significant potential for above-average growth. The Fund may invest in private companies and other restricted securities, including private investments in public equity and venture capital investments, if these securities would currently comprise 10% or less of Managed Assets.
The preparation of these financial statements requires the use of certain estimates by management in determining the Fund's assets, liabilities, revenues and expenses. Actual results could differ from these estimates and such differences could be material. The following is a summary of significant accounting policies followed by the Fund, which are in conformity with accounting principles generally accepted in the United States of America (GAAP). The Fund is an investment company and follows accounting and reporting guidance in the Financial Accounting Standards Board Accounting Standards Codification 946. Events or transactions occurring after September 30, 2019, through the date that the financial statements were issued, have been evaluated in the preparation of these financial statements.
Clarification in Foreign Security Investment Definition
Effective January 31, 2019, the Fund will not invest more than 20% of its Managed Assets as measured at the time of investment in non-U.S. securities, which may include securities denominated in the U.S. dollars or in non-U.S. currencies or multinational currency units. The Fund may invest in non-U.S. securities of so-called emerging market issuers. For purposes of the Fund, the Adviser determines, in its discretion, whether a company is a non-U.S. company using an independent analysis of one or more classifications assigned by third parties. These classifications are generally based on a number of criteria, including a company's country of domicile, the primary stock exchange on which a company's securities trade, the location from which the majority of a company's revenue is derived, and a company's reporting currency. Non-U.S. securities markets generally are not as developed or efficient as those in the United States. Securities of some non-U.S. issuers are less liquid and more volatile than securities of comparable U.S. issuers. Similarly, volume and liquidity in most non-U.S. securities markets are less than in the United States and, at times, price volatility can be greater than in the United States.
Change in Debt Investment Strategy
The Board approved on March 21, 2019, an increase in the Fund's limit on debt security investments from 15% of Managed Assets to 20% of Managed Assets. This change was effective on March 29, 2019.
Investment Valuation
Shares of publicly traded companies listed on national securities exchanges or trading in the over-the-counter market are typically valued at the last sale price, as of the close of trading, generally 4 p.m., Eastern time. The Board of Trustees of the Fund (the Trustees) has established
24
TEKLA HEALTHCARE OPPORTUNITIES FUND
NOTES TO FINANCIAL STATEMENTS
SEPTEMBER 30, 2019
(continued)
and approved fair valuation policies and procedures with respect to securities for which quoted prices may not be available or which do not reflect fair value. Convertible, corporate and government bonds are valued using a third-party pricing service. Convertible bonds are valued using this pricing service only on days when there is no sale reported. Puts and calls generally are valued at the close of regular trading on the securities or commodities exchange on which they are primarily traded. Options on securities generally are valued at their last bid price in the case of exchange traded options or, in the case of OTC-traded options, the average of the last bid price as obtained from two or more dealers unless there is only one dealer, in which case that dealer's price is used. Forward foreign currency contracts are valued on the basis of the value of the underlying currencies at the prevailing currency exchange rate. Restricted securities of companies that are publicly traded are typically valued based on the closing market quote on the valuation date adjusted for the impact of the restriction as determined in good faith by the Adviser also using fair valuation policies and procedures approved by the Trustees described below. Non-exchange traded warrants of publicly traded companies are generally valued using the Black-Scholes model, which incorporates both observable and unobservable inputs. Short-term investments with a maturity of 60 days or less are generally valued at amortized cost, which approximates fair value.
Convertible preferred shares, warrants or convertible note interests in private companies and other restricted securities, as well as shares of publicly traded companies for which market quotations are not readily available, such as stocks for which trading has been halted or for which there are no current day sales, or which do not reflect fair value, are typically valued in good faith, based upon the recommendations made by the Adviser pursuant to fair valuation policies and procedures approved by the Trustees.
The Adviser has a Valuation Sub-Committee comprised of senior management which reports to the Valuation Committee of the Board at least quarterly. Each fair value determination is based on a consideration of relevant factors, including both observable and unobservable inputs. Observable and unobservable inputs the Adviser considers may include (i) the existence of any contractual restrictions on the disposition of securities; (ii) information obtained from the company, which may include an analysis of the company's financial statements, products, intended markets or technologies; (iii) the price of the same or similar security negotiated at arm's length in an issuer's completed subsequent round of financing; (iv) the price and extent of public trading in similar securities of the issuer or of comparable companies; or (v) a probability and time value adjusted analysis of contractual terms. Where available and appropriate, multiple valuation methodologies are applied to confirm fair value. Significant unobservable inputs identified by the Adviser are often used in the fair value determination. A significant change in any of these inputs may result in a significant change in the fair value measurement. Due to the uncertainty inherent in the valuation process, such estimates of fair value may differ significantly from the values that would have been used had a ready market for the investments existed, and differences could be material. Additionally, changes in the market environment and other events that may occur over the life of the investments may cause the gains or losses ultimately realized on these investments to be different from the valuations used at the date of these financial statements.
Options on Securities
An option contract is a contract in which the writer (seller) of the option grants the buyer of the option, upon payment of a premium, the right to purchase from (call option) or sell to
25
TEKLA HEALTHCARE OPPORTUNITIES FUND
NOTES TO FINANCIAL STATEMENTS
SEPTEMBER 30, 2019
(continued)
(put option) the writer a designated instrument at a specified price within a specified period of time. Certain options, including options on indices, will require cash settlement by the Fund if the option is exercised. The Fund enters into option contracts in order to hedge against potential adverse price movements in the value of portfolio assets, as a temporary substitute for selling selected investments, to lock in the purchase price of a security or currency which it expects to purchase in the near future, as a temporary substitute for purchasing selected investments, or to enhance potential gain or to gain or hedge exposure to financial market risk.
The Fund's obligation under an exchange traded written option or investment in an exchange traded purchased option is valued at the last sale price or in the absence of a sale, the mean between the closing bid and asked prices. Gain or loss is recognized when the option contract expires, is exercised or is closed.
If the Fund writes a covered call option, the Fund foregoes, in exchange for the premium, the opportunity to profit during the option period from an increase in the market value of the underlying security above the exercise price. If the Fund writes a put option it accepts the risk of a decline in the market value of the underlying security below the exercise price. Over-the-counter options have the risk of the potential inability of counterparties to meet the terms of their contracts. The Fund's maximum exposure to purchased options is limited to the premium initially paid. In addition, certain risks may arise upon entering into option contracts including the risk that an illiquid secondary market will limit the Fund's ability to close out an option contract prior to the expiration date and that a change in the value of the option contract may not correlate exactly with changes in the value of the securities or currencies hedged.
All options on securities and securities indices written by the Fund are required to be covered. When the Fund writes a call option, this means that during the life of the option the Fund may own or have the contractual right to acquire the securities subject to the option or may maintain with the Fund's custodian in a segregated account appropriate liquid securities in an amount at least equal to the market value of the securities underlying the option. The prices provided by a pricing service take into account broker dealer market price quotations for institutional size trading in similar groups of securities, yields or securities with similar characteristics, security quantity, maturity, coupon and other security characteristics as well as any developments related to the specific securities. The pricing service may use a matrix approach, regarding securities with similar characteristics to determine the valuation for a security. When the Fund writes a put option, this means that the Fund will maintain with the Fund's custodian in a segregated account appropriate liquid securities in an amount at least equal to the exercise price of the option.
The average number of outstanding call options written and options purchased for the year ended September 30, 2019 were 10,626 and 1,935, respectively.
Derivatives not accounted
for as hedging instruments
under ASC 815 | | Statement of Assets and
Liabilities Location | | Statement of Operations Location | |
Equity Contracts
| | | | | | Assets, investments
in unaffiliated
issuers, at value
| | |
$713,913
| | | Change in unrealized
appreciation (depreciation)
on option contracts
purchased | | |
($731,575) | | |
26
TEKLA HEALTHCARE OPPORTUNITIES FUND
NOTES TO FINANCIAL STATEMENTS
SEPTEMBER 30, 2019
(continued)
Derivatives not accounted
for as hedging instruments
under ASC 815 | | Statement of Assets and
Liabilities Location | | Statement of Operations Location | |
Equity Contracts
| | | | | | Liabilities, options
written, at value
| | $ | 1,125,022
| | | Net realized gain (loss) on
closed or expired option
contracts written | | | $5,304,158 | | |
| | | | | | | | | | | | | | | Change in unrealized
appreciation (depreciation)
on option contracts written | | | $1,650,226 | | |
Investment Transactions and Income
Investment transactions are recorded on a trade date basis. Gains and losses from sales of investments are recorded using the "identified cost" method. Interest income is recorded on the accrual basis, adjusted for amortization of premiums and accretion of discounts. Dividend income is recorded on the ex-dividend date, less any foreign taxes withheld. Upon notification from issuers, some of the dividend income received may be redesignated as a reduction of cost of the related investment if it represents a return of capital.
The aggregate cost of purchases and proceeds from sales of investment securities (other than short-term investments) for the year ended September 30, 2019 totaled $551,133,844 and $605,279,878, respectively.
Repurchase Agreements
In managing short-term investments the Fund may from time to time enter into transactions in repurchase agreements. In a repurchase agreement, the Fund's custodian takes possession of the underlying collateral securities from the counterparty, the market value of which is at least equal to the principal, including accrued interest, of the repurchase transaction at all times. In the event of default or bankruptcy by the other party to the agreement, realization and/or retention of the collateral by the Fund may be delayed. The Fund may enter into repurchase transactions with any broker, dealer, registered clearing agency or bank. Repurchase agreement transactions are not counted for purposes of the limitations imposed on the Fund's investment in debt securities.
Distribution Policy
Pursuant to a Securities and Exchange Commission exemptive order the Fund may make periodic distributions that include capital gains as frequently as 12 times in any one taxable year in respect of its common shares, and the Fund has implemented a managed distribution policy (the Policy) providing for monthly distributions at a rate set by the Board of Trustees. Under the current Policy, the Fund intends to make monthly distributions at a rate of $0.1125 per share to shareholders of record. If taxable income and net long-term realized gains exceed the amount required to be distributed under the Policy, the Fund will at a minimum make distributions necessary to comply with the requirements of the Internal Revenue Code. The Policy has been established by the Trustees and may be changed by them without shareholder approval. The Trustees regularly review the Policy and the frequency and distribution rate considering the purpose and effect of the Policy, the financial market environment, and the Fund's income, capital gains and capital available to pay distributions.
27
TEKLA HEALTHCARE OPPORTUNITIES FUND
NOTES TO FINANCIAL STATEMENTS
SEPTEMBER 30, 2019
(continued)
Share Repurchase Program
In March 2019, the Trustees approved the renewal of the share repurchase program to allow the Fund to purchase up to 12% of its outstanding common shares in the open market for a one-year period ending July 14, 2020. Prior to this renewal, in March 2018, the Trustees approved the renewal of the share repurchase program to allow the Fund to repurchase up to 12% of its outstanding shares for a one year period ending July 14, 2019. The share repurchase program is intended to enhance shareholder value and potentially reduce the discount between the market price and the Fund's shares and the Fund's net asset value.
During the year ended September 30, 2019, the Fund repurchased 610,415 shares at a total cost of $10,638,148. The weighted average discount per share between the cost of repurchase and the net asset value applicable to such shares at the date of repurchase was 10.17%.
During the year ended September 30, 2018, the Fund repurchased 1,443,016 shares at a total cost of $25,422,774. The weighted average discount per share between the cost of repurchase and net asset value applicable to such shares at the date of repurchase was 9.68%.
Federal Taxes
It is the Fund's policy to comply with the requirements of the Internal Revenue Code applicable to regulated investment companies and to distribute to its shareholders substantially all of its taxable income and its net realized capital gains, if any. Therefore, no Federal income or excise tax provision is required.
As of September 30, 2019, the Fund had no uncertain tax positions that would require financial statement recognition or disclosure. The Fund's federal tax returns are subject to examination by the Internal Revenue Service for a period of three years.
Distributions
The Fund records all distributions to shareholders on the ex-dividend date. Such distributions are determined in conformity with income tax regulations, which may differ from GAAP. These differences include temporary and permanent differences from losses on wash sale transactions, distributions from real estate investment trusts and premium amortization accruals. Reclassifications are made to the Fund's capital accounts to reflect income and gains available for distribution under income tax regulations. At September 30, 2019, the Fund reclassified $53,050,942 from accumulated net realized gain on investment and $53,050,942 to undistributed net investment income for current book/tax differences.
The tax basis components of distributable earnings and the tax cost as of September 30, 2019 were as follows:
Cost of investments for tax purposes | | $ | 1,007,165,199 | | |
Gross tax unrealized appreciation | | $ | 80,434,055 | | |
Gross tax unrealized depreciation | | ($ | 97,957,115 | ) | |
Net tax unrealized depreciation on investments | | ( | $17,523,060 | ) | |
Undistributed long-term capital gains | | | — | | |
Undistributed ordinary income | | $ | 3,281,371 | | |
28
TEKLA HEALTHCARE OPPORTUNITIES FUND
NOTES TO FINANCIAL STATEMENTS
SEPTEMBER 30, 2019
(continued)
The Fund has designated the distributions for its taxable years ended September 30, 2019 and 2018 as follows:
Distributions paid from: | | 2019 | | 2018 | |
Ordinary income (includes short-term capital gain) | | $ | 6,371,333 | | | $ | 24,800,136 | | |
Long-term capital gain | | $ | 49,688,374 | | | $ | 33,056,089 | | |
Statement of Cash Flows
The cash and restricted cash amount shown in the Statement of Cash Flows is the amount included in the Fund's Statement of Assets and Liabilities and represents cash and restricted cash on hand at September 30, 2019.
Commitments and Contingencies
Under the Fund's organizational documents, its officers and Trustees may be indemnified against certain liabilities and expenses arising out of the performance of their duties to the Fund. Additionally, in the normal course of business, the Fund enters into agreements with service providers that may contain indemnification clauses. The Fund's maximum exposure under these agreements is unknown as this would involve future claims that may be made against the Fund that have not yet occurred. However, based on experience, the Fund expects the risk of loss to be remote.
Loan Payable
The Fund maintains a $225,000,000 line of credit with the Bank of Nova Scotia (the "Line of Credit") which expires on January 31, 2020. As of September 30, 2019, the Fund had drawn down $225,000,000 from the Line of Credit, which was the maximum borrowing outstanding during the period. The Fund is charged interest at the rate of 0.70% above the relevant LIBOR rate adjusted by the Statutory Reserve Rate for borrowing (per annum). The Fund is also charged a commitment fee on the daily unused balance of the line of credit at the rate of 0.10% (per annum). Per the Line of Credit agreement, the Fund paid an upfront fee of 0.05% on the total line of credit balance, which is being amortized through January 30, 2020. The Fund pledges its investment securities as the collateral for the line of credit per the terms of the agreement. The weighted average interest rate and the average outstanding loan payable for the period from October 1, 2018 to September 30, 2019 were 3.2098% and $225,000,000 respectively. The stated carrying amount of the line of credit approximates its fair value based upon the short term nature of the borrowings and the interest rates being based upon the market terms. The borrowings under the line of credit would be considered as Level 2 in the fair value hierarchy (See Note 4) at September 30, 2019.
Investor Support Services
The Fund has retained Destra Capital Advisors LLC (Destra) to provide investor support services in connection with the ongoing operation of the Fund. The Fund pays Destra a fee in an annual amount equal to 0.05% of the average aggregate daily value of the Fund's Managed Assets pursuant to the investor support services agreement.
(2) Investment Advisory and Other Affiliated Fees
The Fund has entered into an Investment Advisory Agreement (the Advisory Agreement) with the Adviser. Pursuant to the terms of the Advisory Agreement, the Fund pays the Adviser a monthly fee at the rate when annualized of 1.00% of the average daily value of the Fund's
29
TEKLA HEALTHCARE OPPORTUNITIES FUND
NOTES TO FINANCIAL STATEMENTS
SEPTEMBER 30, 2019
(continued)
Managed Assets. Managed Assets means the total assets of the Fund minus the Fund's liabilities other than the loan payable.
The Fund has entered into a Services Agreement (the Agreement) with the Adviser. Pursuant to the terms of the Agreement, the Fund reimburses the Adviser for certain services related to a portion of the payment of salary and provision of benefits to the Fund's Chief Compliance Officer. During the year ended September 30, 2019 these payments amounted to $93,801 and are included in the Other category of expenses in the Statement of Operations, together with insurance and other expenses incurred to unaffiliated entities. Expenses incurred pursuant to the Agreement as well as certain expenses paid for by the Adviser are allocated to the Fund in an equitable fashion as approved by the Trustees or officers of the Fund who are also officers of the Adviser.
The Fund pays compensation to Independent Trustees in the form of a retainer, attendance fees and additional compensation to Board and Committee chairpersons. The Fund does not pay compensation directly to Trustees or officers of the Fund who are also officers of the Adviser.
(3) Other Transactions with Affiliates
An affiliate company is a company in which the Fund holds 5% or more of the voting securities. Transactions involving such companies during the year ended September 30, 2019 were as follows:
Affiliated Companies | | Beginning
Value as of
September 30,
2018 | | Purchases at
Cost | | Proceeds
from Sales | | Net Realized
Gain/(Loss)
on sale of
Affiliated
Companies | | Change in
Unrealized
Appreciation/
Depreciation | | Ending Value
as of
September 30,
2019 | |
Zyla Life Sciences | | $ | 700,000 | * | | $ | — | | | $ | — | | | $ | — | | | $ | 12,759 | | | $ | 712,759 | | |
| | | $ | 700,000 | | | $ | — | | | $ | — | | | $ | — | | | $ | 12,759 | | | $ | 712,759 | | |
* Not an affiliate at September 30, 2018.
| | | Shares/
Principal
Amount as of
September 30,
2019 | | Dividend/
Interest
Income from
Affiliated
Companies | | Capital Gain
Distributions
from Affiliated
Companies | |
Zyla Life Sciences | | | 656,921 | | | $ | — | | | $ | — | | |
| | | 656,921 | | | $ | — | | | $ | — | | |
(4) Fair Value Measurements
The Fund uses a three-tier hierarchy to prioritize the assumptions, referred to as inputs, used in valuation techniques to measure fair value. The three-tier hierarchy of inputs is summarized in the three broad levels. Level 1 includes quoted prices in active markets for identical investments. Level 2 includes prices determined using other significant observable inputs (including quoted prices for similar investments, interest rates, credit risk, etc.). The independent pricing vendor may value bank loans and debt securities at an evaluated bid price by employing methodologies that utilize actual market transactions, broker-supplied valuations, and/or other methodologies designed to identify the market value for such securities and such securities are considered Level 2 in the fair value hierarchy. Level 3 includes prices determined using
30
TEKLA HEALTHCARE OPPORTUNITIES FUND
NOTES TO FINANCIAL STATEMENTS
SEPTEMBER 30, 2019
(continued)
significant unobservable inputs (including the Fund's own assumptions in determining the fair value of investments). These inputs or methodology used for valuing securities are not necessarily an indication of the risk associated with investing in those securities.
For the year ended September 30, 2019, the total amount of transfers between Level 3 and Level 2 was $2,449,998. The two investments were transferred due to an initial public offering lock-up period and a corporate action. There were no other transfers between levels.
The following is a summary of the levels used as of September 30, 2019 to value the Fund's net assets.
Assets at Value | | Level 1 | | Level 2 | | Level 3 | | Total | |
Convertible Preferred and Warrants | |
Biotechnology | | | — | | | | — | | | $ | 10,302,277 | | | $ | 10,302,277 | | |
Health Care Equipment & Supplies | | | — | | | | — | | | | 339,338 | | | | 339,338 | | |
Convertible Notes | |
Biotechnology | | | — | | | | — | | | | 1,315,551 | | | | 1,315,551 | | |
Health Care Equipment & Supplies | | | — | | | | — | | | | 774,246 | | | | 774,246 | | |
Non-Convertible Notes | |
Biotechnology | | | — | | | $ | 32,888,011 | | | | — | | | | 32,888,011 | | |
Health Care Equipment & Supplies | | | — | | | | 17,013,471 | | | | — | | | | 17,013,471 | | |
Health Care Providers & Services | | | — | | | | 70,402,809 | | | | — | | | | 70,402,809 | | |
Healthcare Services | | | — | | | | 2,201,889 | | | | — | | | | 2,201,889 | | |
Life Sciences Tools & Services | | | — | | | | 2,195,302 | | | | — | | | | 2,195,302 | | |
Pharmaceuticals | | | — | | | | 38,736,153 | | | | — | | | | 38,736,153 | | |
Common Stocks and Warrants | |
Biotechnology | | $ | 133,737,130 | | | | 1,378,961 | | | | 119,261 | | | | 135,235,352 | | |
Health Care Equipment & Supplies | | | 115,316,346 | | | | — | | | | — | | | | 115,316,346 | | |
Health Care Providers & Services | | | 125,002,311 | | | | — | | | | — | | | | 125,002,311 | | |
Healthcare Services | | | 3,007,704 | | | | — | | | | — | | | | 3,007,704 | | |
Life Sciences Tools & Services | | | 27,024,879 | | | | — | | | | — | | | | 27,024,879 | | |
Medical Devices and Diagnostics | | | 52,766,517 | | | | — | | | | — | | | | 52,766,517 | | |
Pharmaceuticals | | | 256,861,060 | | | | 712,759 | | | | — | | | | 257,573,819 | | |
Real Estate Investment Trusts | | | 55,266,273 | | | | — | | | | — | | | | 55,266,273 | | |
Short-term Investment | | | — | | | | 42,691,000 | | | | — | | | | 42,691,000 | | |
Total | | $ | 768,982,220 | | | $ | 208,220,355 | | | $ | 12,850,673 | | | $ | 990,053,248 | | |
Other Financial Instruments | |
Assets | |
Call Option Contracts Purchased | | $ | 713,913 | | | $ | — | | | $ | — | | | $ | 713,913 | | |
Liabilities | |
Call Option Contracts Written | | | (1,125,023 | ) | | | — | | | | — | | | | (1,125,023 | ) | |
Total | | ($ | 411,110 | ) | | $ | — | | | $ | — | | | ($ | 411,110 | ) | |
31
TEKLA HEALTHCARE OPPORTUNITIES FUND
NOTES TO FINANCIAL STATEMENTS
SEPTEMBER 30, 2019
(continued)
The following is a reconciliation of Level 3 assets for which significant unobservable inputs were used to determine fair value.
Investments in
Securities | | Balance as of
September 30,
2018 | | Net realized
gain (loss) and
change in
unrealized
appreciation
(depreciation) | | Cost of
purchases
and
conversions | | Proceeds
from
sales and
conversions | | Net
transfers
into
(out of)
Level 3 | | Balance
as of
September 30,
2019 | |
Convertible Preferred and Warrants
Biotechnology | | $ | 8,675,519 | | | $ | (108,539 | ) | | $ | 7,705,852 | | | $ | (4,220,557 | ) | | $ | (1,749,998 | ) | | $ | 10,302,277 | | |
Health Care Equipment &
Supplies | | | 790,548 | | | | (451,210 | ) | | | 0 | | | | 0 | | | | 0 | | | | 339,338 | | |
Convertible Notes | |
Biotechnology | | | 0 | | | | 0 | | | | 1,315,551 | | | | 0 | | | | 0 | | | | 1,315,551 | | |
Health Care Equipment &
Supplies | | | 459,441 | | | | 0 | | | | 314,805 | | | | 0 | | | | 0 | | | | 774,246 | | |
Pharmaceuticals | | | 700,000 | | | | 0 | | | | 0 | | | | 0 | | | | (700,000 | ) | | | 0 | | |
Common stocks and warrants
Biotechnology | | | 162,591 | | | | (43,330 | ) | | | 0 | | | | 0 | | | | 0 | | | | 119,261 | | |
Total | | $ | 10,788,099 | | | ($ | 603,079 | ) | | $ | 9,336,208 | | | ($ | 4,220,557 | ) | | ($ | 2,449,998 | ) | | $ | 12,850,673 | | |
Net change in unrealized appreciation (depreciation) from
investments still held as of September 30, 2019 | | ($ | 2,795,616 | ) | |
The following is a quantitative disclosure about significant unobservable inputs used in the determination of the fair value of Level 3 assets.
| | | Fair Value at
September 30,
2019 | | Valuation Technique | | Unobservable Input | | Range
(Weighted Average) | |
Private Companies
and Other | | $ | 119,261 | | | Income approach, | | Discount for lack of | | 20.00% (20.00%) | |
Restricted Securities | | | | Black-Scholes | | marketability | | | |
| | | | 7,281,873 | | | Probability weighted
expected return model | | Discount rate
Price to sales multiple | | 23.32
3.68x-4.11x (3.96x)%-48.10% (21.75%) | |
| | | | 2,209,308 | | | Market approach,
recent transaction | | (a)
| | N/A
| |
| | | | 3,240,231 | | | Market comparable
| | Discount for lack of
marketability
Earnings ratio | | 15.00
6.25x (6.25x)% (15.00%) | |
| | | $ | 12,850,673 | | | | | | | | |
(a) The valuation technique used as a basis to approximate fair value of these investments is based upon subsequent financing rounds. There is no quantitative information to provide as these methods of measure are investment specific.
32
TEKLA HEALTHCARE OPPORTUNITIES FUND
NOTES TO FINANCIAL STATEMENTS
SEPTEMBER 30, 2019
(continued)
(5) Private Companies and Other Restricted Securities
The Fund may invest in private companies and other restricted securities if these securities would currently comprise 10% or less of Managed Assets. The value of these securities represented 2% of the Fund's Managed Assets at September 30, 2019.
At September 30, 2019, the Fund had commitments of $598,569 relating to additional investments in two private companies.
The following table details the acquisition date, cost, carrying value per unit, and value of the Fund's private companies and other restricted securities at September 30, 2019. The Fund on its own does not have the right to demand that such securities be registered.
| Security (#) | | Acquisition
Date | | Cost | | Carrying Value
per Unit | | Value | |
Atreca, Inc. Common | | 09/05/18 | | $ | 1,751,068 | | | $ | 11.02 | | | $ | 1,378,961 | | |
Decipher Biosciences, Inc. | |
Series II Cvt. Pfd | | 03/29/19 | | | 4,220,600 | | | | 1.40 | | | | 1,272,840 | | |
Series III Cvt. Pfd | | 03/29/19 | | | 954,795 | | | | 2.17 | | | | 1,967,391 | | |
Galera Therapeutics, Inc. Series C Cvt. Pfd | | 08/30/18 | | | 2,450,062 | | | | 2.21 | | | | 2,449,999 | | |
IlluminOss Medical, Inc. | |
Series AA Cvt. Pfd | | 01/21/16 | | | 284,688 | | | | 0.83 | | | | 339,300 | | |
Junior Preferred | | 01/21/16 | | | 132,722 | | | | 0.00 | † | | | 38 | | |
Cvt. Promissory Note | | 03/28/17 | | | 131,484 | | | | 100.00 | | | | 131,169 | | |
Cvt. Promissory Note | | 11/21/17 | | | 43,864 | | | | 100.00 | | | | 43,770 | | |
Cvt. Promissory Note | | 01/11/18 | | | 87,571 | | | | 100.00 | | | | 87,539 | | |
Cvt. Promissory Note | | 02/06/18 | | | 87,539 | | | | 100.00 | | | | 87,539 | | |
Cvt. Promissory Note | | 09/05/18 | | | 109,424 | | | | 100.00 | | | | 109,424 | | |
Cvt. Promissory Note | | 01/28/19 | | | 85,552 | | | | 100.00 | | | | 85,552 | | |
Cvt. Promissory Note | | 04/10/19 | | | 23,872 | | | | 100.00 | | | | 23,872 | | |
Cvt. Promissory Note | | 05/10/19 | | | 37,693 | | | | 100.00 | | | | 37,693 | | |
Cvt. Promissory Note | | 07/01/19 | | | 52,013 | | | | 100.00 | | | | 52,013 | | |
Cvt. Promissory Note | | 08/29/19 | | | 17,000 | | | | 100.00 | | | | 17,000 | | |
Cvt. Promissory Note | | 09/27/19 | | | 98,675 | | | | 100.00 | | | | 98,675 | | |
Warrants (expiration 01/11/27) | | 01/11/18 | | | 13 | | | | 0.00 | | | | 0 | | |
Warrants (expiration 02/06/27) | | 02/06/18 | | | 0 | | | | 0.00 | | | | 0 | | |
Warrants (expiration 03/31/27) | | 03/28/17 | | | 152 | | | | 0.00 | | | | 0 | | |
Warrants (expiration 09/06/27) | | 09/05/18 | | | 0 | | | | 0.00 | | | | 0 | | |
Warrants (expiration 11/20/27) | | 11/21/17 | | | 40 | | | | 0.00 | | | | 0 | | |
Warrants (expiration 01/29/29) | | 01/28/19 | | | 0 | | | | 0.00 | | | | 0 | | |
Warrants (expiration 04/29/29) | | 04/10/19 | | | 0 | | | | 0.00 | | | | 0 | | |
Warrants (expiration 05/13/29) | | 05/10/19 | | | 0 | | | | 0.00 | | | | 0 | | |
Warrants (expiration 07/02/29) | | 07/01/19 | | | 0 | | | | 0.00 | | | | 0 | | |
Warrants (expiration 08/29/29) | | 08/29/19 | | | 0 | | | | 0.00 | | | | 0 | | |
Warrants (expiration 09/27/29) | | 09/27/19 | | | 0 | | | | 0.00 | | | | 0 | | |
Oculis SA, Series B2 Cvt. Pfd | | 01/16/19 | | | 2,227,793 | | | | 8.34 | | | | 2,209,308 | | |
33
TEKLA HEALTHCARE OPPORTUNITIES FUND
NOTES TO FINANCIAL STATEMENTS
SEPTEMBER 30, 2019
(continued)
| Security (#) | | Acquisition
Date | | Cost | | Carrying Value
per Unit | | Value | |
Rainier Therapeutics, Inc. | |
Series A Cvt. Pfd | | 01/19/16, 10/24/16 | | $ | 1,651,214 | | | $ | 0.51 | | | $ | 1,302,739 | | |
Series B Cvt. Pfd | | 03/03/17 | | | 1,100,073 | | | | 0.75 | | | | 1,100,000 | | |
Cvt. Promissory Note | | 01/30/19 | | | 417,280 | | | | 100.00 | | | | 417,280 | | |
Cvt. Promissory Note | | 03/28/19 | | | 417,280 | | | | 100.00 | | | | 417,280 | | |
Cvt. Promissory Note | | 07/16/19 | | | 480,992 | | | | 100.00 | | | | 480,991 | | |
| | | | | $ | 16,863,459 | | | | | $ | 14,110,373 | | |
(#) See Schedule of Investments and corresponding footnotes for more information on each issuer.
† Carrying value per unit is greater than $0.00 but less than $0.01
34
REPORT OF INDEPENDENT REGISTERED PUBLIC ACCOUNTING FIRM
To the Board of Trustees and Shareholders of Tekla Healthcare Opportunities Fund:
We have audited the accompanying statement of assets and liabilities of Tekla Healthcare Opportunities Fund (the "Fund"), including the schedule of investments, as of September 30, 2019, the related statements of operations and cash flows for the year then ended, the statements of changes in net assets for each of the two years in the period then ended and the financial highlights for each of the five years in the period then ended, and the related notes. In our opinion, the financial statements and financial highlights present fairly, in all material respects, the financial position of the Fund as of September 30, 2019, and the results of its operations and its cash flows for the year then ended, the changes in its net assets for each of the two years in the period then ended and the financial highlights for each of the five years in the period then ended, in conformity with accounting principles generally accepted in the United States of America.
These financial statements and financial highlights are the responsibility of the Fund's management. Our responsibility is to express an opinion on the Fund's financial statements and financial highlights based on our audits. We are a public accounting firm registered with the Public Company Accounting Oversight Board (United States) (PCAOB) and are required to be independent with respect to the Fund in accordance with the U.S. federal securities laws and the applicable rules and regulations of the Securities and Exchange Commission and the PCAOB.
We conducted our audits in accordance with the standards of the PCAOB. Those standards require that we plan and perform the audit to obtain reasonable assurance about whether the financial statements and financial highlights are free of material misstatement, whether due to error or fraud. The Fund is not required to have, nor were we engaged to perform, an audit of its internal control over financial reporting. As part of our audits we are required to obtain an understanding of internal control over financial reporting but not for the purpose of expressing an opinion on the effectiveness of the Fund's internal control over financial reporting. Accordingly, we express no such opinion.
Our audits included performing procedures to assess the risks of material misstatement of the financial statements and financial highlights, whether due to error or fraud, and performing procedures that respond to those risks. Such procedures included examining, on a test basis, evidence regarding the amounts and disclosures in the financial statements and financial highlights. Our audits also included evaluating the accounting principles used and significant estimates made by management, as well as evaluating the overall presentation of the financial statements and financial highlights. Our procedures included confirmation of securities owned as of September 30, 2019 by correspondence with the custodian and brokers; when replies were not received from brokers, we performed other auditing procedures. We believe that our audits provide a reasonable basis for our opinion.
DELOITTE & TOUCHE LLP
Boston, Massachusetts
November 22, 2019
We have served as the auditor of one or more Tekla Capital Management LLC investment companies since 2004.
35
TEKLA HEALTHCARE OPPORTUNITIES FUND
Name, Address1, Date of Birth,
Length of Time Served, Principal Occupation(s)
During Past 5 Years and Other Directorship Held | | Position(s) Held with Fund,
Term of Office2 | | Number of Portfolios
in Fund Complex
Overseen by Trustee | |
| Rakesh K. Jain, Ph.D., Born: 12/1950 | | Trustee since 2014 | | 4 | |
Director, Steele Lab of Tumor Biology at Massachusetts General Hospital (since 1991); A.W. Cook Professor of Tumor Biology (Radiation Oncology) at Harvard Medical School (since 1991); Ad hoc Consultant/Scientific Advisory Board Member for pharmaceutical/biotech companies (various times since 2002); Ad hoc Consultant, Gershon Lehman Group (since 2004); Director, Co-Founder, XTuit Pharmaceuticals, Inc. (2012-2018). | |
| Thomas M. Kent, CPA, Born: 6/1953 | | Trustee since 2017 | | 4 | |
Director, Principal Global Investors Trust Co. (since 2014); Trustee, Thayer Academy (2009-2018); Director, New England Canada Business Council (since 2017). | |
Oleg M. Pohotsky, M.B.A., J.D., Born: 3/1947
| | Trustee since 2014
Chairman since 2014 | | 4 | |
Consultant and Managing Partner, Right Bank Partners (since 2002); Adviser, Board Advisers, Kaufman & Co. LLC (since 2008); Director, AvangardCo Investments Holdings (since 2011); Director, The New America High Income Fund, Inc. (since 2013). | |
| William S. Reardon, M.B.A., Born: 6/1946 | | Trustee since 2014 | | 4 | |
Independent Consultant (since 2002); Director, Idera Pharmaceuticals, Inc (2002-2019); Director, Synta Pharmaceuticals, Inc. (2004-2016). | |
| Lucinda H. Stebbins, M.B.A., CPA, Born: 11/1945 | | Trustee since 2014 | | 4 | |
Independent Consultant, Deutsche Bank (2004-2015); Director, Bald Peak Land Company (2008-2014); Director, Solstice Home Care, Inc. (since 2014). | |
INTERESTED TRUSTEES
Daniel R. Omstead, Ph.D., Born: 7/1953
| | President since 2014
Trustee since 2014 | | 4 | |
President of the Fund (since 2014),of Tekla Healthcare Investors (HQH) (since 2001), of Tekla Life Sciences Investors (HQL) (since 2001) of Tekla Healthcare World Healthcare Fund (THW) (since 2015); President, Chief Executive Officer and Managing Member of Tekla Capital Management LLC (since 2002); Director: Palyon Medical Corporation (2009-2015); Celladon Corporation (2012-2014); IlluminOss Medical, Inc. (since 2011); Magellan Diagnostics, Inc.(2006-2016); Dynex Corporation (2011-2017); Insightra Medical, Inc. (2015-2016); Neurovance, Inc. (2015-2017); EBI Life Sciences, Inc. (2015-2017); Euthymics Biosciences, Inc. (2015-2017); Veniti, Inc. (2015-2017); Joslin Diabetes Center (since 2016); Decipher Biosciences, Inc. (2016-2018). | |
1 The Address for each Trustee is: Tekla Healthcare Opportunities Fund, 100 Federal Street, 19th Floor, Boston, Massachusetts, 02110, 617-772-8500.
2 Each Trustee currently is serving a three year term.
3 Trustee considered to be an "interested person" within the meaning of the Investment Company Act of 1940, as amended (the "1940 Act"), through position or affiliation with the Adviser.
36
TEKLA HEALTHCARE OPPORTUNITIES FUND
Name, Address1, Date of Birth,
Position(s) Held with Fund, Term of Office2
and Length of Time Served | | Principal
Occupation(s)
During Past 5 Years | |
| Daniel R. Omstead, Ph.D., Born: 7/1953 | | President since 2014 | |
President of the Fund, of HQH (since 2001), of HQL (since 2001) of THW (since 2015); President, Chief Executive Officer and Managing Member of Tekla Capital Management LLC (since 2002). | |
| Laura Woodward, CPA, Born: 11/1968 | | Chief Compliance Officer,
Secretary and Treasurer
since 2014 | |
Chief Compliance Officer, Secretary and Treasurer, of the Fund, of HQH (since 2009), of HQL (since 2009) of THW (Since 2015); Chief Compliance Officer and Vice President of Fund Administration, Tekla Capital Management LLC (since 2009); Senior Manager, PricewaterhouseCoopers LLP (1990-2009). | |
1 The Address for each officer is: Tekla Healthcare Opportunities Fund; 100 Federal Street, 19th Floor, Boston, Massachusetts, 02110, 617-772-8500.
2 Each officer serves in such capacity for an indefinite period of time at the pleasure of the Trustees.
The Fund's Statement of Additional Information includes additional information about the fund Directors and is available without charge, upon request by calling (617) 772-8500 or writing to Tekla Capital Management LLC at 100 Federal Street, 19th Floor, Boston, MA 02110.
37
TEKLA HEALTHCARE
OPPORTUNITIES FUND
ANNUAL MEETING REPORT: An Annual Meeting of Shareholders was held on June 13, 2019. Shareholders voted to elect Trustees of the Fund to hold office for a term of three years or until their respective successors shall have been duly elected and qualified. The following votes were cast with respect to each of the nominees:
| | | For | | Withheld | |
Rakesh K. Jain, Ph.D. | | | 36,503,149 | | | | 1,074,205 | | |
Daniel R. Omstead, Ph.D. | | | 36,545,927 | | | | 1,031,427 | | |
Lucinda H. Stebbins, M.B.A, CPA | | | 36,514,644 | | | | 1,062,710 | | |
Rakesh K. Jain, Ph.D., Daniel R. Omstead, Ph.D. and Lucinda H. Stebbins, M.B.A, CPA were elected to serve until the 2022 Annual Meeting.
Trustee serving until the 2020 Annual Meeting is Thomas M. Kent, CPA.*
Trustees serving until the 2021 Annual Meeting are Oleg M. Pohotsky, M.B.A., J.D. and William S. Reardon, M.B.A.
Shareholders ratified the appointment of Deloitte & Touche LLP as the independent registered public accountants of the Fund for the fiscal year ending September 30, 2019 by the following votes:
| For | | Against | | Abstain | |
| | 37,108,201 | | | | 215,499 | | | | 253,654 | | |
* Elizabeth G. Nabel, M.D. resigned as a Trustee effective June 13, 2019.
FOR MORE INFORMATION: A description of the Fund's proxy voting policies and procedures and information on how the Fund voted proxies relating to portfolio securities during the most recent 12-month period ended June 30 is available is available (i) without charge, upon request by calling 1-800-451-2597; (ii) by writing to Tekla Capital Management LLC at 100 Federal Street, 19th Floor, Boston, MA 02110; (iii) on the Fund's website at www.teklacap.com; and (iv) on the SEC's website at www.sec.gov.
The Fund's complete Schedule of Investments for the first and third quarters of its fiscal year will be filed quarterly with the SEC on Form N-PORT. This Schedule of Investments will also be available on the Fund's website at www.teklacap.com, or the SEC's website at www.sec.gov.
You can find information regarding the Fund at the Fund's website, www.teklacap.com. The Fund regularly posts information to its website, including information regarding daily share pricing and distributions and press releases, and maintains links to the Fund's SEC filings. The Fund currently publishes and distributes quarterly fact cards, which include performance, portfolio holdings and sector information for each fiscal quarter. These fact cards will be available on the Fund's website and by request from the Fund's marketing and investor support services agent, Destra Capital Advisors LLC, at 1-877 855-3434.
FEDERAL TAX INFORMATION (unaudited): Certain information for the Fund is required to be provided to shareholders based on the Fund's income and distributions for the taxable year ended December 31, 2019. In February 2020, shareholders will receive Form 1099-DIV, which will include their share of qualified dividends and capital gains and return of capital distributed during the calendar year 2019. Shareholders are advised to check with their tax advisors for information on the treatment of these amounts on their individual tax returns.
For corporate shareholders, 100.00% of ordinary income dividends paid by the Fund qualified for the dividends received deduction during the period July 31, 2019 to September 30, 2019.
38
TEKLA HEALTHCARE
OPPORTUNITIES FUND
Under Section 854(b)(2) of the Code, the Fund designated $12,866,193 as qualified dividends for the year ended September 30, 2019.
DISTRIBUTION POLICY: The Fund has a managed distribution policy as described in the Notes to Financial Statements. For more information contact your financial adviser.
SHARE REPURCHASE PROGRAM: In March 2019, the Trustees reauthorized the share repurchase program to allow the Fund to repurchase up to 12% of its outstanding shares for a one year period ending July 14, 2020.
PORTFOLIO MANAGEMENT: Daniel R. Omstead, Ph.D., Jason C. Akus, M.D./M.B.A., Timothy Gasperoni, M.B.A., Ph.D., Christian M. Richard, M.B.A., M.S., Henry Skinner, Ph.D., Ashton L. Wilson, Christopher Abbott, Robert Benson, CFA, CAIA, Richard Goss, Alan Kwan, M.B.A., M.S., Ph.D., Jack Liu, M.B.A., Ph.D., and Loretta Tse, Ph.D. are members of a team that analyzes investments on behalf of the Fund. Dr. Omstead exercises ultimate decision making authority with respect to investments.
DIVIDEND REINVESTMENT AND
STOCK PURCHASE PLAN
Reinvestment of Distributions. Under the Dividend Reinvestment and Stock Purchase Plan, dividends and/or distributions to a Shareholder will automatically be reinvested in additional Shares of the Fund. Each registered Shareholder may elect to have dividends and distributions distributed in cash (i.e., "opt-out") rather than participate in the Dividend Reinvestment and Stock Purchase Plan. For any registered Shareholder that does not so elect, dividends and/or distributions on such Shareholder's Shares will be reinvested by Computershare Trust Company, N.A. (the "Plan Agent"), as agent for Shareholders in additional Shares, as set forth below. Participation in the Dividend Reinvestment and Stock Purchase Plan is completely voluntary, and may be terminated or resumed at any time without penalty by internet, telephone or notice if received and processed by the Plan Agent prior to the dividend record date; otherwise such termination or resumption will be effective with respect to any subsequently declared dividend or other distribution. Participants who hold their Shares through a broker or other nominee and who wish to elect to receive any dividends and distributions in cash must contact their broker or nominee.
The Plan Agent's fees for the handling of the reinvestment of dividends and distributions will be paid by the Fund. Each participant will pay a per Share fee (currently $0.05 per Share) incurred in connection with open market purchases. If a participant elects to have the Plan Agent sell all or a part of his or her Shares and remit the proceeds to the participant, the Plan Agent is authorized to deduct a $15 sales fee per trade and a per Share fee of $0.12 from such proceeds. All per Share fees include any applicable brokerage commissions the Plan Agent is required to pay. The automatic reinvestment of Dividends will not relieve Participants of any federal, state or local income tax that may be payable (or required to be withheld) on such dividend.
The Plan Agent will acquire shares for participants' accounts by purchasing either newly issued shares from the Fund or outstanding shares in the open market, depending upon the circumstances. If on the payment date of a dividend or distribution the NAV per share is equal to or less than the closing market price (plus estimated per share fees in connection with the purchase of shares), the Plan Agent will invest the dividend or distribution in newly issued shares. The number of newly issued shares to be credited to each participant's account will be determined by dividing the amount of the participant's cash dividend or distribution by the greater of the NAV per share on the payment date or 95% of the closing market price per share on the payment date. If on the payment date the NAV per share is greater than the
39
TEKLA HEALTHCARE
OPPORTUNITIES FUND
DIVIDEND REINVESTMENT AND
STOCK PURCHASE PLAN
(continued)
closing market price per share (plus per share fees), the Plan Agent will invest the dividend or distribution in shares acquired in open-market purchases. The per share price for open-market purchases will be the weighted average price of the shares on the payment date.
Stock Purchase Plan. All registered shareholders can voluntarily purchase additional shares in the Fund at any time through the Plan Agent. The minimum investment under this option is $50. Participants can make an investment online or by sending a check to the Plan Agent. Each investment will entail a transaction fee of $5.00 plus $0.05 per share purchased. Shareholders can also authorize the Plan Agent to make automatic withdrawals from a bank account.
Each automatic transaction will entail a fee of $2.50 plus $0.05 per share purchased. There is a $25 charge for each returned check or rejected electronic funds transfer.
Amendment or Termination of Plan. The Fund reserves the right to amend or terminate the Plan upon notice in writing to each participant at least 30 days prior to any record date for the payment of any dividend or distribution by the Fund.
Plan Agent. You can contact the Plan Agent at www.computershare.com/investor, at P.O. Box 30170, College Station, TX 77842-3170 or at 1-800-426-5523.
40
TEKLA HEALTHCARE
OPPORTUNITIES FUND
New York Stock Exchange Symbol: THQ
NAV Symbol: XTHQX
100 Federal Street, 19th Floor
Boston, Massachusetts 02110
(617) 772-8500
www.teklacap.com
Officers
Daniel R. Omstead, Ph.D., President
Laura Woodward, CPA, Chief Compliance Officer,
Secretary and Treasurer
Trustees
Rakesh K. Jain, Ph.D.
Thomas M. Kent, CPA
Daniel R. Omstead, Ph.D.
Oleg M. Pohotsky, M.B.A, J.D.
William S. Reardon, M.B.A
Lucinda H. Stebbins, M.B.A, CPA
Investment Adviser
Tekla Capital Management LLC
Administrator & Custodian
State Street Bank and Trust Company
Transfer Agent
Computershare, Inc.
Legal Counsel
Dechert LLP
Shareholders with questions regarding share transfers may call
1-800-426-5523
Daily net asset value may be obtained from
our website (www.teklacap.com) or by calling
617-772-8500
Item 2. CODE OF ETHICS.
(a) As of the end of the period covered by this report, the Registrant has adopted a code of ethics that applies to the Registrant’s principal executive officer, principal financial officer, principal accounting officer or controller, or persons performing similar functions, regardless of whether these individuals are employed by the Registrant or a third party.
(b) No disclosures are required by this Item.
(c) During the period covered by this report, the Registrant did not make any substantive amendment to the code of ethics.
(d) During the period covered by this report, the Registrant did not grant any waiver, including any implicit waiver, from any provision of the code of ethics.
(e) Not applicable.
(f) A copy of the Registrant’s code is filed as Exhibit 1 to this Form N-CSR. Copies of the Code will also be made available, free of charge, upon request, by writing or calling Tekla Capital Management LLC at 100 Federal Street, 19th Floor, Boston, MA 02110, (617) 772-8500.
ITEM 3. AUDIT COMMITTEE FINANCIAL EXPERT.
The Registrant’s Board of Trustees has determined that the Registrant has at least one audit committee financial expert serving on its audit committee. The audit committee financial expert is William S. Reardon. He is “independent” for the purposes of Item 3.
ITEM 4. PRINCIPAL ACCOUNTANT FEES AND SERVICES.
(a) Audit Fees. The aggregate fees billed for each of the last two fiscal years for professional services rendered by the principal accountant for the audit of the Registrant’s annual financial statements or services that are normally provided by the accountant in connection with statutory and regulatory filings or engagements for those fiscal years were $63,654 for the fiscal year ended September 30, 2019 and $61,800 for the fiscal year ended September 30, 2018.
(b) Audit Related Fees. The Registrant was not billed any fees in each of the last two fiscal years ended September 30 for assurance and related services by the principal accountant that are reasonably related to the performance of the audit of the Registrant’s financial statements and not otherwise included above.
(c) Tax Fees. The aggregate fees billed in each of the last two fiscal years for professional services rendered by the principal accountant for tax compliance, tax advice, and tax planning were $5,830 for the fiscal year ended September 30, 2019 and $2,750 for the fiscal year ended September 30, 2018. The nature of the services comprising the fees disclosed under this category was tax compliance.
(d) All Other Fees. The Registrant was not billed any fees in each of the last two fiscal years ended September 30 for products and services provided by the principal accountant, other than the services reported in paragraphs (a) through (c) of this Item.
(e) (1) Pre-approval Policies and Procedures.
Pursuant to the Registrant’s Audit Committee Charter (“Charter”), the Audit Committee is responsible for approving in advance the firm to be employed as the Registrant’s independent auditor. In addition, the Charter provides
that the Audit Committee is responsible for approving any and all proposals by the Registrant, its investment adviser or their affiliated persons or any entity controlling, controlled by, or under common control with the adviser that provides services to the Registrant to employ the independent auditor to render permissible non-audit services related directly to the operations and financial reporting of the Registrant. In determining whether to pre-approve non-audit services, the Audit Committee considers whether such services are consistent with the independent auditor’s independence. The Charter further permits the Audit Committee to delegate to one or more of its members authority to pre-approve permissible non-audit services to the registrant, provided that any pre-approval determination of a delegate is for services with an estimated budget of less than $15,000.
(2) None of the services described in each of paragraphs (b) through (d) of this Item were approved by the Audit Committee pursuant to paragraph (c)(7)(i)(C) of Rule 2-01 of Regulation S-X. All services described in paragraphs (b) through (d) of the NCSR were approved in advance by the Audit Committee of each Fund.
(f) Not applicable.
(g) None.
(h) Not applicable.
ITEM 5. AUDIT COMMITTEE OF LISTED REGISTRANTS.
The Registrant has a separately-designated standing Audit Committee established in accordance with Section 3(a)(58)(A) of the Exchange Act (15 U.S.C. 78c(a)(58)(A)). The members of the Audit Committee are Lucinda H. Stebbins, Thomas M. Kent and William S. Reardon.
ITEM 6. INVESTMENTS.
The Registrant’s Schedule of Investments is included as part of the Report to Shareholders filed under Item 1 of this form.
ITEM 7. DISCLOSURE OF PROXY VOTING POLICIES AND PROCEDURES FOR CLOSED-END MANAGEMENT INVESTMENT COMPANIES.
The Registrant has adopted the following proxy voting policies and procedures.
PROXY VOTING POLICIES AND PROCEDURES
Policy
The following are the policies and procedures adopted and implemented by Tekla Capital Management LLC (“TCM”) for voting proxies with respect to portfolio securities held by Tekla Healthcare Investors,Tekla Life Sciences Investors, Tekla Healthcare Opportunities Fund and Tekla World Healthcare Fund (each a “Fund” and collectively the “Funds”). The policies and procedures are reasonably designed to ensure that proxies are voted in the best interest of the Funds and the Funds’ shareholders, in accordance with TCM’s fiduciary duties and Rule 206(4)-6 under the Investment Advisers Act of 1940 (the “Investment Advisers Act”). TCM considers the “best interests” of the Funds and their shareholders to mean their best long-term economic interests.
TCM shall vote proxies for the exclusive benefit, and in the best economic interest, of the Funds and their shareholders. Such exercise of voting rights shall be subject to the same standard of care as is generally applicable to TCM’s performance of its duties, as set forth in the advisory agreements with the Funds. The policies and procedures contained herein are designed to be guidelines, however each vote is ultimately cast on a case-by-case basis, taking into consideration the relevant facts and circumstances at the time of the vote. Any material conflicts that may arise will be resolved in the best interests of the Funds and their shareholders.
A proxy committee has been designated and is responsible for administering and overseeing the proxy voting process. The committee consists of the President of TCM, TCM’s Chief Compliance Officer (“CCO”), and the analyst responsible for oversight of the company that is the subject of the proxy. The committee considers proxy questions and determines the vote on behalf of the Funds.
Procedures
Logistics
TCM’s CCO shall be responsible for maintaining the proxy log, monitoring corporate actions and confirming the timely voting of proxies. The proxy log shall contain the following information, in accordance with Form N-PX:
· the name of the issuer;
· the exchange ticker symbol, if available;
· the CUSIP number, if available;
· the shareholder meeting date;
· a brief identification of the matter voted on;
· whether the matter was proposed by the issuer or a security holder;
· whether TCM cast its vote on the matter;
· how TCM cast its vote on the matter (for, against, abstain; for or withhold regarding the election of directors); and
· whether TCM cast its vote for or against management;
TCM’s CCO shall also record whether any conflicts of interest have been identified and, if so, what action was taken to resolve the conflict with respect to each vote cast and each abstention.
Substantive Voting Decisions
TCM’s substantive voting decisions turn on the particular facts and circumstances of each proxy vote. The following is a list of common proxy vote issues and TCM’s standard considerations when determining how to vote such proxies.
Routine Matters/Corporate Administrative Items. After an initial review, TCM generally votes with management on routine matters related to the operation of the issuer that are not expected to have a significant economic impact on the issuer and/or its shareholders.
Potential for Major Economic Impact. TCM may review and analyze on a case-by-case basis, non-routine proposals that are more likely to affect the structure and operation of the issuer and to have a greater impact on the value of the investment.
Corporate Governance. TCM may review and consider corporate governance issues related to proxy matters and generally supports proposals that foster good corporate governance practices.
Special Interest Issues. TCM may consider: (i) the long-term benefit to shareholders of promoting corporate accountability and responsibility on social issues; (ii) management’s responsibility with respect to special interest issues; (iii) any economic costs and restrictions on management; and (iv) the responsibility of TCM to vote proxies for the greatest long-term shareholder value.
Limitations on Director Tenure and Retirement. TCM may consider: (i) a reasonable retirement age for directors, e.g. 70 or 72; (ii) the introduction of new perspectives on the board; and (iii) the arbitrary nature of such limitations and the possibility of detracting from the board’s stability and continuity.
Directors’ Minimum Stock Ownership. TCM may consider: (i) the benefits of additional vested interest; (ii) the ability of a director to serve a company well regardless of the extent of his or her share ownership; and (iii) the impact of limiting the number of persons qualified to be directors.
D&O Indemnification and Liability Protection. TCM may consider: (i) indemnifying directors for acts conducted in the normal course of business; (ii) limiting liability for monetary damages for violating the duty of care; (iii) expanding coverage beyond legal expenses to acts that represent more serious violations of fiduciary obligation than carelessness (e.g. negligence); and (iv) providing expanded coverage in cases when a director’s legal defense was unsuccessful if the director was found to have acted in good faith and in a manner that he or she reasonably believed was in the best interests of the issuer.
Director Nominations in Contested Elections. TCM may consider: (i) long-term financial performance of the issuer relative to its industry; (ii) management’s track record; (iii) background to proxy contest; (iv) qualifications of both slates of nominees; (v) evaluations of what each side is offering shareholders as well as the likelihood that the proposed objectives and goals can be met; and (vi) stock ownership positions.
Cumulative Voting. TCM may consider: (i) the ability of significant stockholders to elect a director of their choosing; (ii) the ability of minority shareholders to concentrate their support in favor of a director or directors of their choosing; and (iii) the potential to limit the ability of directors to work for all shareholders.
Classified Boards. TCM may consider: (i) providing continuity; (ii) promoting long-term planning; and (iii) guarding against unwanted takeovers.
Poison Pills. TCM may consider: (i) TCM’s position on supporting proposals to require a shareholder vote on other shareholder rights plans; (ii) ratifying or redeeming a poison pill in the interest of protecting the value of the issuer; and (iii) other alternatives to prevent a takeover at a price demonstrably below the true value of the issuer.
Fair Price Provisions. TCM may consider: (i) the vote required to approve the proposed acquisition; (ii) the vote required to repeal the fair price provision; (iii) the mechanism for determining fair price; and (iv) whether these provisions are bundled with other anti-takeover measures (e.g., supermajority voting requirements) that may entrench management and discourage attractive tender offers.
Equal Access. TCM may consider: (i) the opportunity for significant shareholders of the issuer to evaluate and propose voting recommendations on proxy proposals and director nominees, and to nominate candidates to the board; and (ii) the added complexity and burden.
Charitable Contributions. TCM may consider: (i) the potential benefits to shareholders; (ii) the potential to detract the issuer’s resources from more direct uses of increasing shareholder value; and (iii) the responsibility of shareholders to make individual contributions.
Stock Authorizations: TCM may consider: (i) the need for the increase; (ii) the percentage increase with respect to the existing authorization; (iii) voting rights of the stock; and (iv) overall capitalization structures.
Preferred Stock. TCM may consider: (i) whether the new class of preferred stock has unspecified voting, conversion, dividend distribution, and other rights; (ii) whether the issuer expressly states that the stock will not be used as a takeover defense or carry superior voting rights; (iii) whether the issuer specifies the voting, dividend, conversion, and other rights of such stock and the terms of the preferred stock appear reasonable; and (iv) whether the stated purpose is to raise capital or make acquisitions in the normal course of business.
Director Compensation. TCM may consider: (i) whether director shares are at the same market risk as those of the shareholders; and (ii) how option programs for outside directors compare with the standards of internal programs.
Golden and Tin Parachutes. TCM may consider: (i) whether they will be submitted for shareholder approval; and (ii) the employees covered by the plan and the quality of management.
Compensation. TCM may consider: (i) Whether the company has an independent compensation committee; (ii) whether the compensation committee engaged independent consultants; (iii) whether the compensation committee has lapsed or waived equity vesting restrictions; and (iv) whether the company has adopted or extended a Golden Parachute without shareholder approval. TCM will generally support annual advisory votes on executive compensation.
Limitations
TCM may abstain from voting a proxy if it concludes that the effect on shareholders’ economic interests or the value of the portfolio holding is indeterminable or insignificant. TCM may abstain from voting a proxy if it concludes that the cost of voting is disproportionate to the economic impact the vote would have on the portfolio holdings. With respect to certain privately held companies, TCM may not have the opportunity to vote or may have a limitation on its ability to vote. For example, in certain cases a company may be permitted by its charter or other governing documents to take action without a shareholder meeting and with written consent of fewer than all shareholders.
Conflicts of Interest
The Proxy Committee identifies any potential conflicts of interest. Each potential conflict must be addressed in a manner which will be in the best interest of the Funds and their shareholders. If any potential conflict is identified the Proxy Committee consults with the Funds’ counsel. Where conflicts of interest arise between clients and TCM, TCM may convene an ad-hoc committee to debate the conflict and to give a ruling on a preferred course of action. If the ad-hoc committee determines that TCM has a conflict of interest in any instance, TCM’s CCO shall disclose the conflict to the Board and seek voting instructions.
TCM may cause the proxies to be voted in accordance with the recommendations of an independent third party service provider that TCM may use to assist in voting proxies.
Disclosure
The following disclosure shall be provided in connection with these policies and procedures:
· TCM shall provide a description or a copy of these policies and procedures to the Boards of Trustees of the Funds annually and upon request.
· TCM shall make available to the Funds its proxy voting records, for inclusion on the Funds’ Form N-PX.
· TCM shall include its proxy voting policies and procedures in its annual filing on Form N-CSR.
· TCM shall cause the Funds’ shareholder reports to include a statement that a copy of these policies and procedures is available upon request (i) by calling a toll-free number; (ii) on the Funds’ website, (if the Funds choose); and (iii) on the SEC’s website.
· TCM shall cause the Funds’ annual and semi-annual reports to include a statement that information is available regarding how the Funds voted proxies during the most recent twelve-month period (i) without charge, upon request, either by calling a toll-free number or on or through the Funds’ website, or both; and (ii) on the SEC’s website.
Recordkeeping
TCM shall maintain records of proxies voted in accordance with Section 204-2 of the Advisers Act, including proxy statements, a record of each vote cast, and a copy of any document created by the Adviser that was material to making a decision of how to vote the proxy, or that memorializes the basis for the Adviser’s decision on how to vote the proxy. TCM shall also maintain a copy of its policies and procedures and each written request from a client for proxy voting records and the Adviser’s written response to any client request, either written or oral, for such records. Proxy statements that are filed on EDGAR shall be considered maintained by TCM. All such records shall be maintained for a period of five years in an easily accessible place, the first two years in the offices of TCM.
ITEM 8. PORTFOLIO MANAGERS OF CLOSED-END MANAGEMENT INVESTMENT COMPANIES.
(a)(1) As of December 5, 2019, Daniel R. Omstead, Ph.D., Jason C. Akus, M.D./M.B.A., Timothy Gasperoni, M.B.A., Ph.D, Christian M. Richard, M.B.A, M.S, Henry Skinner, Ph.D., Ashton L. Wilson, Christopher Abbott, Robert Benson, CFA, CAIA, Richard Goss, Alan Kwan, M.B.A., M.S., Ph.D, Jack Liu, M.B.A., Ph.D., and Loretta Tse, Ph.D. are members of a team that analyzes investments on behalf of the Registrant. Dr. Omstead exercises ultimate decision making authority with respect to investments. Dr. Omstead also performs other duties including management of the investment adviser and makes investments on behalf of Tekla Healthcare Investors (“HQH”), Tekla Life Science Investors (“HQL”), and Tekla World Healthcare Fund (“THW”). The date each team member joined the portfolio management team and each team member’s business experience for at least the last five years is included below.
Daniel R. Omstead, Ph.D. is President and Chief Executive Officer of the investment adviser and has been employed by the investment adviser of the Registrant since 2000. He is also President of the Registrant, HQH, HQL and THW.
Jason C. Akus, M.D./M.B.A. is Senior Vice President, Research of the investment adviser and is responsible for investment research and due diligence in the biotechnology, medical device, and diagnostic areas. Dr. Akus joined the investment adviser of the Registrant in 2001.
Timothy Gasperoni, M.B.A., Ph.D. is Senior Vice President, Research of the investment adviser. He was previously a Senior Analyst and Founding Member of Sabby Capital. He joined TCM in 2015.
Christian M. Richard, M.B.A., M.S. is Senior Vice President, Research of the investment adviser. He was previously a Partner/Head of Research for Merlin Biomed Private Equity/ Merlin Nexus. He joined TCM in 2015.
Henry Skinner, Ph.D. is Senior Vice President, Venture of the investment adviser. He was previously Vice President and Deputy Head and Managing Director of the Novartis Venture Fund. He joined TCM in October 2017.
Ashton L.Wilson is Senior Vice President of the investment adviser. He was previously an Vice President in equity derivative trading at Goldman Sachs & Co. and was an equity derivative trader at Bank of America Merrill Lynch. He joined TCM in 2018.
Christopher Abbott is Vice President, Research of the investment adviser. Previously, Mr. Abbott was at Leerink Partners where he was a Vice President on the Equity Research Team. He joined TCM in 2016.
Alan Kwan, M.B.A., M.S., Ph.D. is Vice President, Research of the investment adviser. He was previously a Principal Investigator at GlaxoSmithKline, plc. He joined TCM in 2014.
Robert Benson, CFA, CAIA is Senior Analyst, Research of the investment adviser. Previously, Mr. Benson was at State Street Global Advisors (SSgA) where he performed quantitative research for asset allocation, equities, and alternatives teams. He joined TCM in 2016.
Richard Goss is Senior Analyst of the investment adviser. Previously, Mr. Goss was at Leerink Partners where he was a Vice President on the Large Pharma and Biotech Equity Research Teams and a Healthcare Analyst at Datamonitor. He joined TCM in 2018.
Jack Liu, M.B.A., Ph.D. is Senior Analyst of the investment adviser. He was previously a Research Analyst at Weatherbie Capital. He joined TCM in 2019.
Loretta Tse, Ph.D. is Senior Analyst of the investment adviser. She previously ran a biotech consulting business and worked at various venture funds and start-up companies and was Managing Director at Fred Hutchinson Cancer Research Center. She joined TCM in 2015.
(a)(2) The following table lists the number and types of other accounts and assets under management in those accounts advised by the Registrant’s portfolio management team as of the end of the Registrant’s fiscal year.
| | REGISTERED | | | | | | | | | | | |
| | INVESTMENT | | | | | | | | | | | |
PORTFOLIO | | COMPANY | | ASSETS | | POOLED | | ASSETS | | OTHER | | ASSETS | |
MANAGER | | ACCOUNTS | | MANAGED | | ACCOUNTS | | MANAGED | | ACCOUNTS | | MANAGED | |
Daniel R. Omstead | | 3 | | $ | | 1,782 million | | 0 | | 0 | | 0 | | 0 | |
Jason C. Akus | | 3 | | $ | | 1,782 million | | 0 | | 0 | | 0 | | 0 | |
Timothy Gasperoni | | 3 | | $ | | 1,782 million | | 0 | | 0 | | 0 | | 0 | |
Christian M. Richard | | 3 | | $ | | 1,782 million | | 0 | | 0 | | 0 | | 0 | |
Henry Skinner | | 3 | | $ | | 1,782 million | | 0 | | 0 | | 0 | | 0 | |
Ashton L.Wilson | | 3 | | $ | | 1,782 million | | 0 | | 0 | | 0 | | 0 | |
Christopher Abbott | | 3 | | $ | | 1,782 million | | 0 | | 0 | | 0 | | 0 | |
Alan Kwan | | 3 | | $ | | 1,782 million | | 0 | | 0 | | 0 | | 0 | |
Robert Benson | | 3 | | $ | | 1,782 million | | 0 | | 0 | | 0 | | 0 | |
Richard Goss | | 3 | | $ | | 1,782 million | | 0 | | 0 | | 0 | | 0 | |
Jack Liu | | 3 | | $ | | 1,782 million | | 0 | | 0 | | 0 | | 0 | |
Loretta Tse | | 3 | | $ | | 1,782 million | | 0 | | 0 | | 0 | | 0 | |
None of the funds or other accounts is subject to a performance-based advisory fee.
Each member of the portfolio management team may perform investment management services for other accounts similar to those provided to the Registrant and the investment action for each account may differ. The portfolio management team may discover an investment opportunity that may be suitable for more than one account. However, the investment opportunity may be limited so that all accounts may not be able to fully participate or an investment opportunity or investment allocation may be allocated to just one account or may be allocated between accounts at different levels based on an investment decision made by the investment team. The investment team may subsequently make investment decisions that result in investment levels that make the accounts more differentiated or, conversely, more closely or completely aligned. Such investment decisions may occur within a day or two. In addition, the investment adviser may receive different compensation from each account. In that case, the portfolio management team may have an incentive to direct investments to an account that could result in higher fees for the investment adviser. The registrant has adopted procedures designed to allocate investments fairly across multiple accounts.
Additionally, a portfolio manager may be perceived to have a conflict of interest if he has other executive management responsibilities. In addition to managing the Registrant, HQH, HQL and THW, Dr. Omstead is the President of the investment adviser of the Registrant. Dr. Omstead periodically discusses the amount of time he allocates to each of his responsibilities with the Registrant’s Board of Trustees.
The portfolio management team’s management of personal accounts may also present certain conflicts of interest. The Registrant has adopted a code of ethics designed to address these potential conflicts.
(a)(3) As of September 30, 2019, portfolio manager compensation is comprised of a base salary and discretionary compensation as described below.
Base Salary Compensation. The team members receive a base salary compensation linked to individual experience and responsibilities. The amount of base salary is reviewed annually.
Discretionary Compensation. Discretionary Compensation is in the form of a cash bonus, paid annually, which may be up to 50% of the team member’s base salary. Several factors affect discretionary compensation, which can vary by team member and circumstances. The discretionary compensation component is determined based on factors including investment performance of accounts managed by the team predominantly relative to the S&P 500 Index and a blended consideration of appropriate healthcare indices and related performance metrics during the Fund’s fiscal year, performance of specific investments proposed by the individual, financial performance of the investment adviser and a qualitative assessment of the individual overall contribution to the investment team and to the investment adviser. Discretionary compensation is evaluated annually after the completion of the Registrant’s fiscal year.
(a)(4) As of September 30, 2019, the dollar range of Registrant’s shares beneficially owned by the portfolio managers are as follows as of the end of the Registrant’s fiscal year:
PORTFOLIO MANAGER | | DOLLAR RANGE OF SHARES BENEFICIALLY OWNED | |
| | | |
Daniel R. Omstead | | $500,001-$1,000,000 | |
Jason C. Akus | | none | |
Timothy Gasperoni | | none | |
Christian M. Richard | | none | |
Henry Skinner | | none | |
Ashton L.Wilson | | none | |
Christopher Abbott | | none | |
Alan Kwan | | none | |
Robert Benson | | none | |
Richard Goss | | none | |
Jack Liu | | none | |
Loretta Tse | | none | |
(b) N/A.
ITEM 9. PURCHASES OF EQUITY SECURITIES BY CLOSED-END MANAGEMENT INVESTMENT COMPANY AND AFFILIATED PURCHASERS.
Period | | (a) Total No.
of Shares
Purchased (1) | | (b) Average
Price Paid per
Share | | (c) Total No.
of Shares
Purchased as
Part of
Publicly
Announced Plans
or Programs | | (d) Maximum No.
of Shares that
May Yet Be
Purchased Under
the Plans or
Programs | |
Month #1 (Oct. 1, 2018 - Oct. 31, 2018) | | 447,210 | (2) | $ | 17.86 | | 424,308 | | 4,196,790 | |
Month #2 (Nov. 1, 2018 – Nov. 30, 2018) | | 42,145 | | $ | 18.01 | | 42,145 | | 4,154,645 | |
Month #3 (Dec. 1, 2018– Dec. 31, 2018) | | 143,962 | | $ | 15.91 | | 143,962 | | 4,010,683 | |
Month #4 (Jan. 1, 2019 – Jan. 31, 2019) | | — | | — | | — | | 4,010,683 | |
Month #5 (Feb. 1, 2019– Feb. 28, 2019) | | — | | — | | — | | 4,010,683 | |
Month #6 (Mar. 1, 2019– Mar. 31, 2019) | | — | | — | | — | | 4,010,683 | |
Month #7 (Apr. 1, 2019 – Apr. 30, 2019) | | — | | — | | — | | 4,010,683 | |
Month #8 (May 1, 2019 – May 31, 2019) | | — | | — | | — | | 4,010,683 | |
Month #9 (Jun. 1, 2019 – Jun. 30, 2019) | | — | | — | | — | | 4,010,683 | |
Month #10 (Jul. 1, 2019 – Jul. 31, 2019) | | — | | — | | — | | 4,975,519 | |
Month #11 (Aug. 1, 2019 – Aug. 31, 2019) | | — | | — | | — | | 4,975,519 | |
Month #12 (Sep. 1, 2019 – Sep. 30, 2019) | | — | | — | | — | | 4,975,519 | |
Total | | 633,317 | | $ | 17.41 | | 610,415 | | | |
(1) On March 19, 2015, the share repurchase program was announced, which has been subsequently reviewed and approved by the Board of Trustees. On March 22, 2018, the Trustees approved the renewal of the repurchase program, allowing the Registrant to repurchase up to 12% of its outstanding shares in the open market for a one year period ending July 14, 2019. On March 21, 2019, the Trustees approved the renewal of the share repurchase program allowing the Registrant to repurchase up to 12% of its outstanding shares in the open market for a one year period ending July 14, 2020.
(2) 22,902 shares were purchased in Month #1 by Daniel R. Omstead in the open market. Dr. Omstead is a director of the Registrant and a controlling person of the Registrant’s investment adviser. Accordingly, Dr. Omstead may be deemed an “affiliated purchaser” of the Registrant’s shares as such term is defined by Rule 10b-18(a)(3) under the Exchange Act of 1934.
ITEM 10. SUBMISSION OF MATTERS TO A VOTE OF SECURITY HOLDERS.
There have been no material changes, to the procedures by which the shareholders may recommend nominees to the Registrant’s Board of Trustees, where those changes were implemented after the Registrant last provided disclosure in response to
the requirements of Item 407(c)(2)(iv) of Regulation S-K (17 CFR229.407)(as required by Item 22(b)(15) of Schedule 14A (17 CFR240.14a-101)), or this Item.
ITEM 11. CONTROLS AND PROCEDURES.
(a) In the opinion of the principal executive officer and principal financial officer, based on their evaluation which took place within 90 days of this filing, the Registrant’s disclosure controls and procedures are adequately designed and are operating effectively to ensure (i) that material information relating to the Registrant, including its consolidated subsidiaries, is made known to them by others within those entities, particularly during the period in which this report is being prepared; and (ii) that information required to be disclosed by the registrant on Form N-CSR is recorded, processed, summarized and reported within the time period specified in the Securities and Exchange Commission’s rules and forms.
(b) There were no changes in the Registrant’s internal control over financial reporting that occurred during the Registrant’s most recent fiscal half-year that have materially affected or that are reasonably likely to materially affect the Registrant’s internal control over financial reporting.
ITEM 12. EXHIBITS.
(a)(1) The Code of Ethics that is the subject of the disclosure required by Item 2 is attached hereto (Exhibit 1).
(a)(2) Separate certifications of the Principal Executive and Financial Officers as required by Rule 30a-2(a) under the 1940 Act and Section 302 of the Sarbanes-Oxley Act of 2002 are attached hereto (Exhibit 2 and 3).
(a)(3) Notice to Fund’s shareholders in accordance with Investment Company Act Section 19(a) and Rule 19a-1(Exhibit 4).
(b) Certifications pursuant to Section 906 of the Sarbanes-Oxley Act of 2002 are attached hereto (Exhibit 5).
SIGNATURES
Pursuant to the requirements of the Securities Exchange Act of 1934 and the Investment Company Act of 1940, the registrant has duly caused this report to be signed on its behalf by the undersigned, thereunto duly authorized.
(Registrant) | TEKLA HEALTHCARE OPPORTUNITIES FUND |
| |
By (Signature and Title)* | /s/ Daniel R. Omstead |
| Daniel R. Omstead, President |
|
Date: | 12/5/19 | |
| | | | |
Pursuant to the requirements of the Securities Exchange Act of 1934 and the Investment Company Act of 1940, this report has been signed below by the following persons on behalf of the registrant and in the capacities and on the dates indicated.
By (Signature and Title)* | /s/ Laura Woodward |
| Laura Woodward, Treasurer |
|
Date: | 12/5/19 | |
| | | |
* Print the name and title of each signing officer under his or her signature.