Deep Dive into Outsourced Water & Digital Enablement Transformation September 2021

© 2021 EVOQUA WATER TECHNOLOGIES | 2 This presentation contains forward-looking statements within the meaning of the Private Securities Litigation Reform Act of 1995. All of these forward-looking statements are based on our current expectations, assumptions, estimates and projections. While we believe these expectations, assumptions, estimates and projections are reasonable, such forward-looking statements are only predictions and involve known and unknown risks and uncertainties, many of which are beyond our control. These and other important factors may cause our actual results, performance or achievements to differ materially from any future results, performance or achievements expressed or implied by these forward-looking statements, or could affect our share price. Some of the factors that could cause actual results to differ materially from those expressed or implied by the forward-looking statements include, among other things, general global economic and business conditions, including the impacts of the COVID-19 pandemic and disruptions in global supply chains; our ability to compete successfully in our markets; our ability to execute projects on budget and on schedule; the potential for us to incur liabilities to customers as a result of warranty claims or failure to meet performance guarantees; our ability to meet our customers’ safety standards or the potential for adverse publicity affecting our reputation as a result of incidents such as workplace accidents, mechanical failures, spills, uncontrolled discharges, damage to customer or third-party property or the transmission of contaminants or diseases; our ability to continue to develop or acquire new products, services and solutions and adapt our business to meet the demands of our customers, comply with changes to government regulations and achieve market acceptance with acceptable margins; our ability to implement our growth strategy, including acquisitions and our ability to identify suitable acquisition targets; our ability to operate or integrate any acquired businesses, assets or product lines profitably or otherwise successfully implement our growth strategy; our ability to achieve the expected benefits of our restructuring actions; material and other cost inflation and our ability to mitigate the impact of inflation by increasing selling prices and/or improving our productivity efficiencies; our ability to accurately predict the timing of contract awards; delays in enactment or repeals of environmental laws and regulations; the potential for us to become subject to claims relating to handling, storage, release or disposal of hazardous materials; our ability to retain our senior management and other key personnel and to attract key talent in increasingly competitive labor markets; our increasing dependence on the continuous and reliable operation of our information technology systems; risks associated with product defects and unanticipated or improper use of our products; litigation, regulatory or enforcement actions and reputational risk as a result of the nature of our business or our participation in large-scale projects; seasonality of sales and weather conditions; risks related to government customers, including potential challenges to our government contracts or our eligibility to serve government customers; the potential for our contracts with federal, state and local governments to be terminated or adversely modified prior to completion; risks related to foreign, federal, state and local environmental, health and safety laws and regulations and the costs associated therewith; risks associated with international sales and operations, including our operations in the People's Republic of China; our ability to adequately protect our intellectual property from third-party infringement; risks related to our substantial indebtedness; our need for a significant amount of cash, which depends on many factors beyond our control; and other risks and uncertainties, including those listed under Part I, Item IA. “Risk Factors” in our Annual Report on Form 10-K for the fiscal year ended September 30, 2020, as filed with the SEC on November 20, 2020, and in other filings we may make from time to time with the SEC. All statements other than statements of historical fact included in the presentation are forward-looking statements, including, but not limited to, potential benefits of our outsourced water offerings, expected IRR on outsourced water projects, expected contract renewal rates, growth opportunities, planned product launches and statements about our digital business strategy. Any forward-looking statements made in this presentation speak only as of September 28, 2021. We undertake no obligation to update or revise, or to publicly announce any update or revision to, any of the forward-looking statements made herein, whether as a result of new information, future events or otherwise. These forward-looking statements should not be relied upon as representing the Company’s views as of any date subsequent to the date of this presentation. Immaterial rounding differences may be present in the data included in this presentation. Use of Non-GAAP Financial Measures - This presentation contains financial measures that are not calculated and presented in accordance with generally accepted accounting principles in the United States (“GAAP”). These non-GAAP adjusted financial measures are provided as additional information for investors. We believe these non-GAAP adjusted financial measures, which include Integrated Solutions and Services segment backlog, are helpful to management and investors in highlighting trends in our operating results and provide greater clarity and comparability period over period to management and our investors regarding the operational impact of long-term strategic decisions as to capital structure, the tax jurisdictions in which we operate and capital investments. The presentation of this additional information is not meant to be considered in isolation or as a substitute for GAAP measures. For definitions of the non-GAAP financial measures used in this presentation and reconciliations to the most directly comparable respective GAAP measures, see the Appendix to this presentation. Forward-looking statement safe harbor and non-GAAP financial information
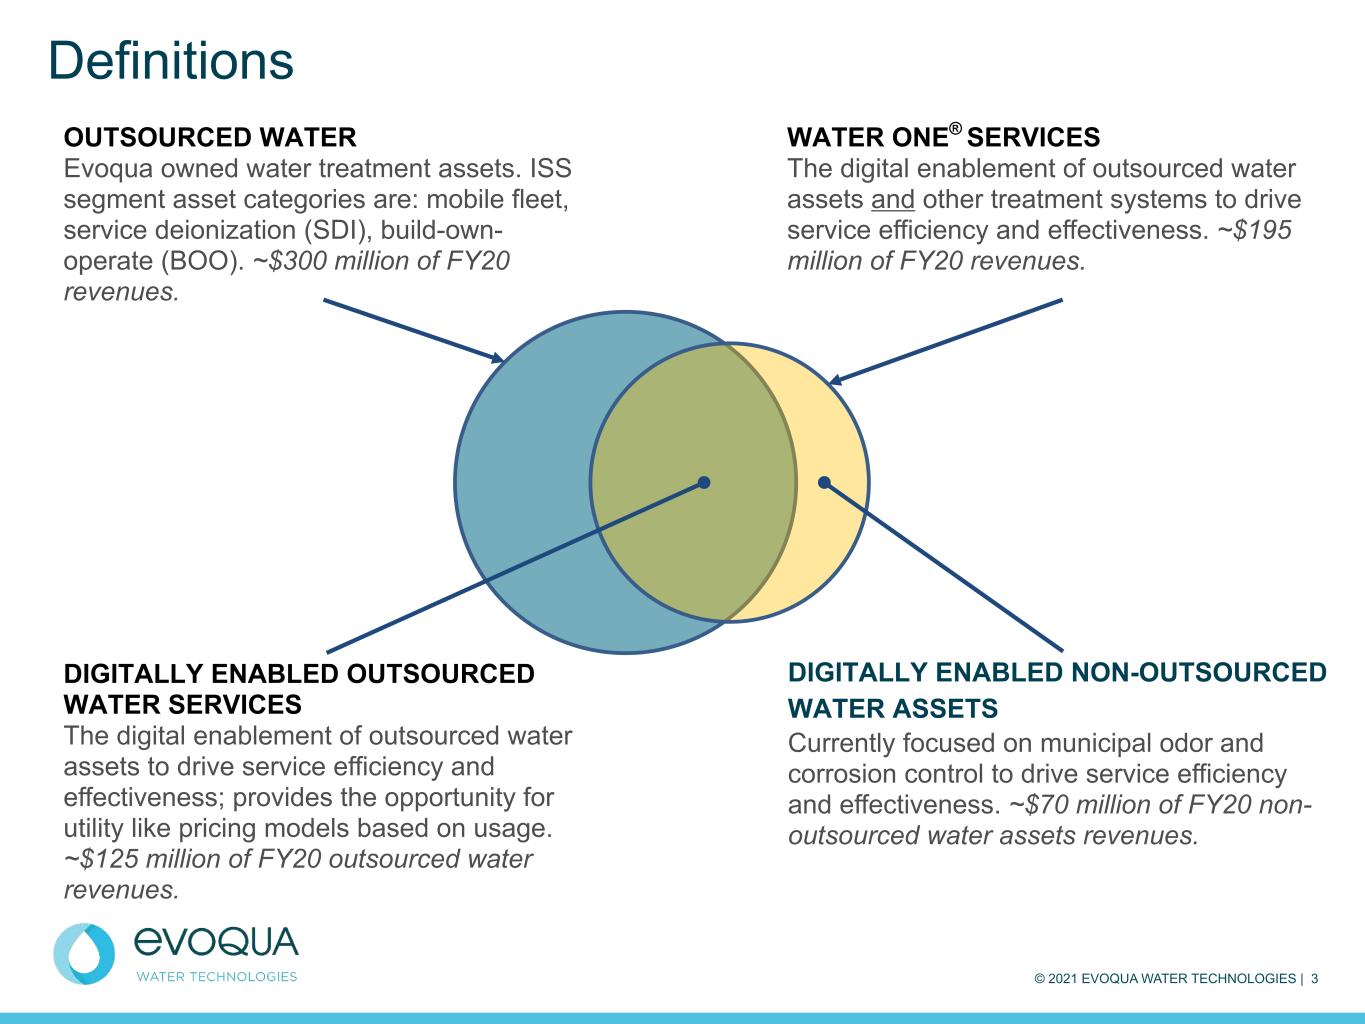
© 2021 EVOQUA WATER TECHNOLOGIES | 3 Definitions OUTSOURCED WATER Evoqua owned water treatment assets. ISS segment asset categories are: mobile fleet, service deionization (SDI), build-own- operate (BOO). ~$300 million of FY20 revenues. DIGITALLY ENABLED NON-OUTSOURCED WATER ASSETS Currently focused on municipal odor and corrosion control to drive service efficiency and effectiveness. ~$70 million of FY20 non- outsourced water assets revenues. DIGITALLY ENABLED OUTSOURCED WATER SERVICES The digital enablement of outsourced water assets to drive service efficiency and effectiveness; provides the opportunity for utility like pricing models based on usage. ~$125 million of FY20 outsourced water revenues. WATER ONE® SERVICES The digital enablement of outsourced water assets and other treatment systems to drive service efficiency and effectiveness. ~$195 million of FY20 revenues.
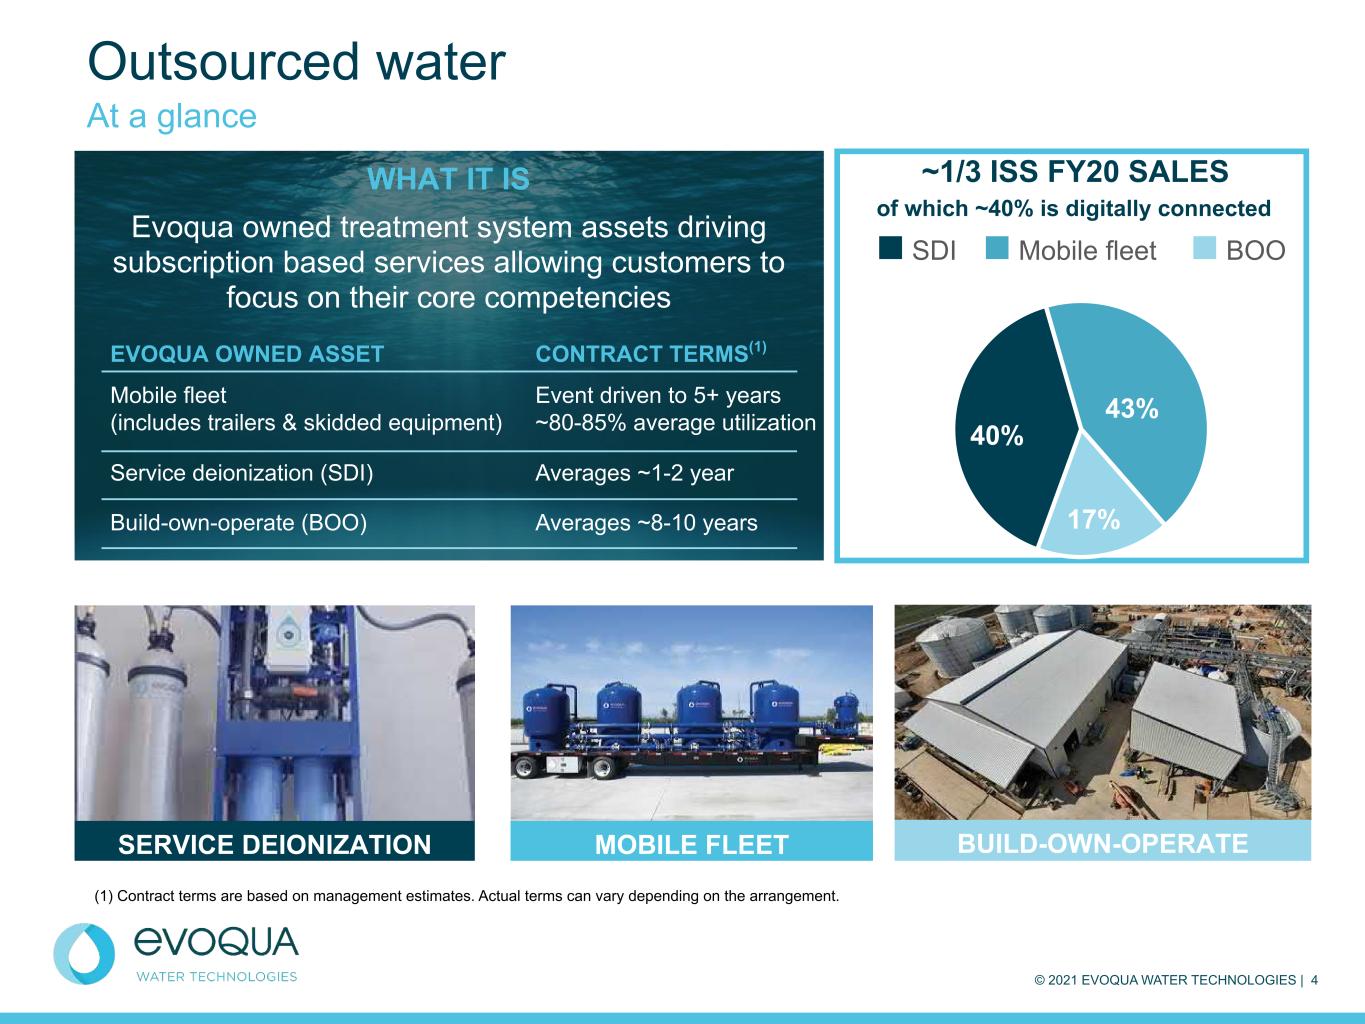
© 2021 EVOQUA WATER TECHNOLOGIES | 4 Outsourced water At a glance WHAT IT IS Evoqua owned treatment system assets driving subscription based services allowing customers to focus on their core competencies 40% 43% 17% SDI Mobile fleet BOO ~1/3 ISS FY20 SALES EVOQUA OWNED ASSET CONTRACT TERMS(1) Mobile fleet (includes trailers & skidded equipment) Event driven to 5+ years ~80-85% average utilization Service deionization (SDI) Averages ~1-2 year Build-own-operate (BOO) Averages ~8-10 years of which ~40% is digitally connected MOBILE FLEETSERVICE DEIONIZATION BUILD-OWN-OPERATE (1) Contract terms are based on management estimates. Actual terms can vary depending on the arrangement.

© 2021 EVOQUA WATER TECHNOLOGIES | 5 Outsourced water - serving multiple end markets Examples of vertical markets served FOOD & BEVERAGE AQUATICS MICROELECTRONICS HEALTHCARE & PHARMA MUNICIPAL DRINKING WATER POWER MUNICIPAL WASTE WATER CHEMICAL PROCESSING LIGHT & GENERAL INDUSTRY END MARKETS WE SERVE REFINING MARINE Outsourced water serves majority of end markets today. Expansion continues across all end markets.
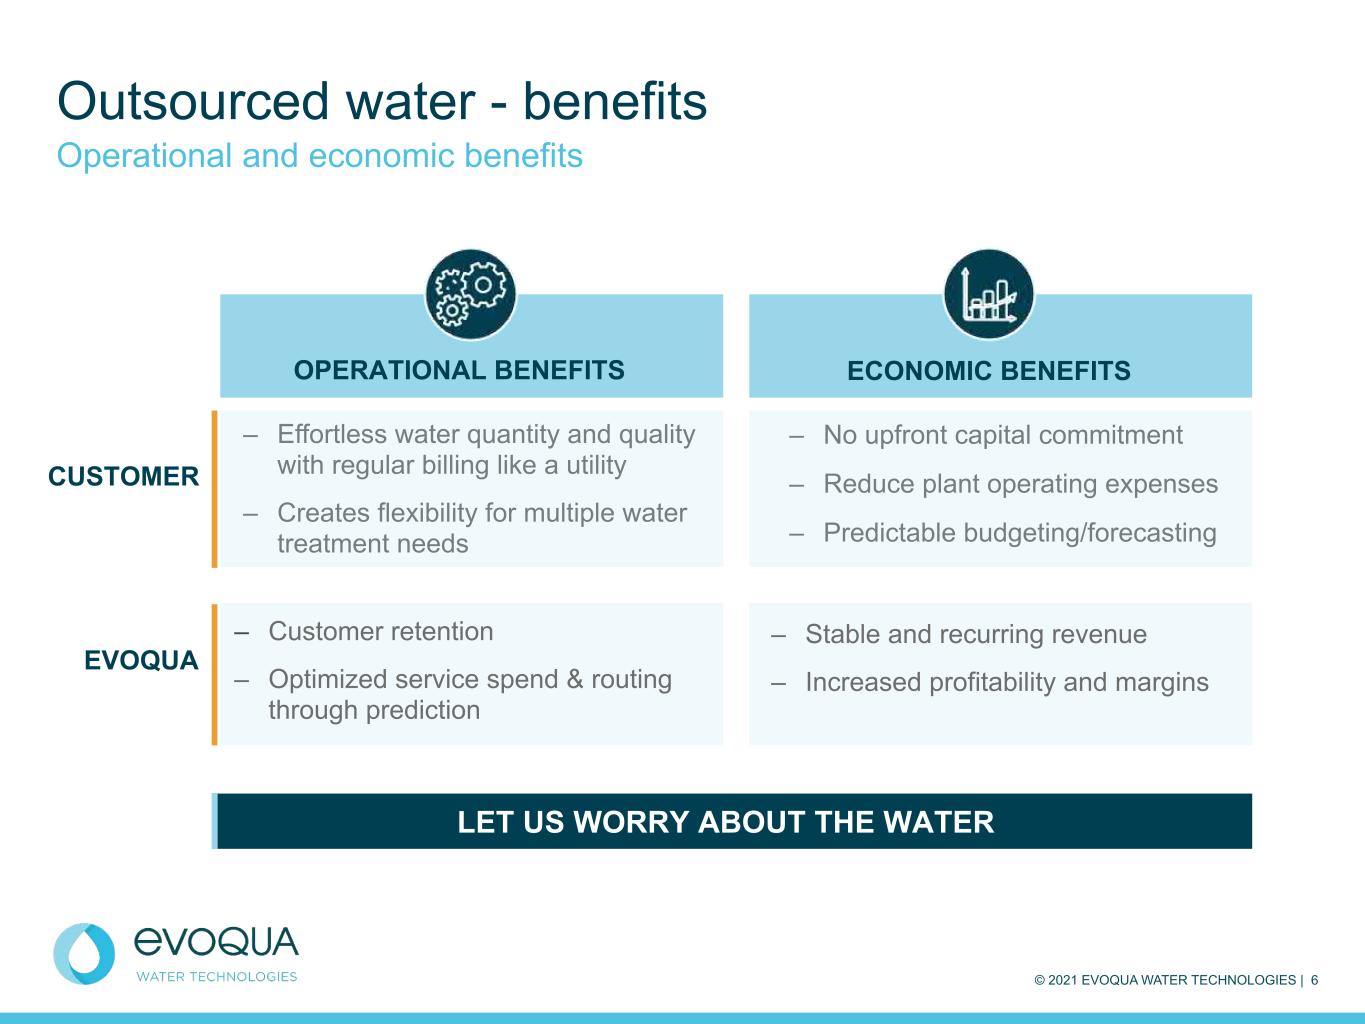
© 2021 EVOQUA WATER TECHNOLOGIES | 6 Outsourced water - benefits Operational and economic benefits LET US WORRY ABOUT THE WATER OPERATIONAL BENEFITS – Effortless water quantity and quality with regular billing like a utility – Creates flexibility for multiple water treatment needs ECONOMIC BENEFITS – No upfront capital commitment – Reduce plant operating expenses – Predictable budgeting/forecasting CUSTOMER EVOQUA – Customer retention – Optimized service spend & routing through prediction – Stable and recurring revenue – Increased profitability and margins
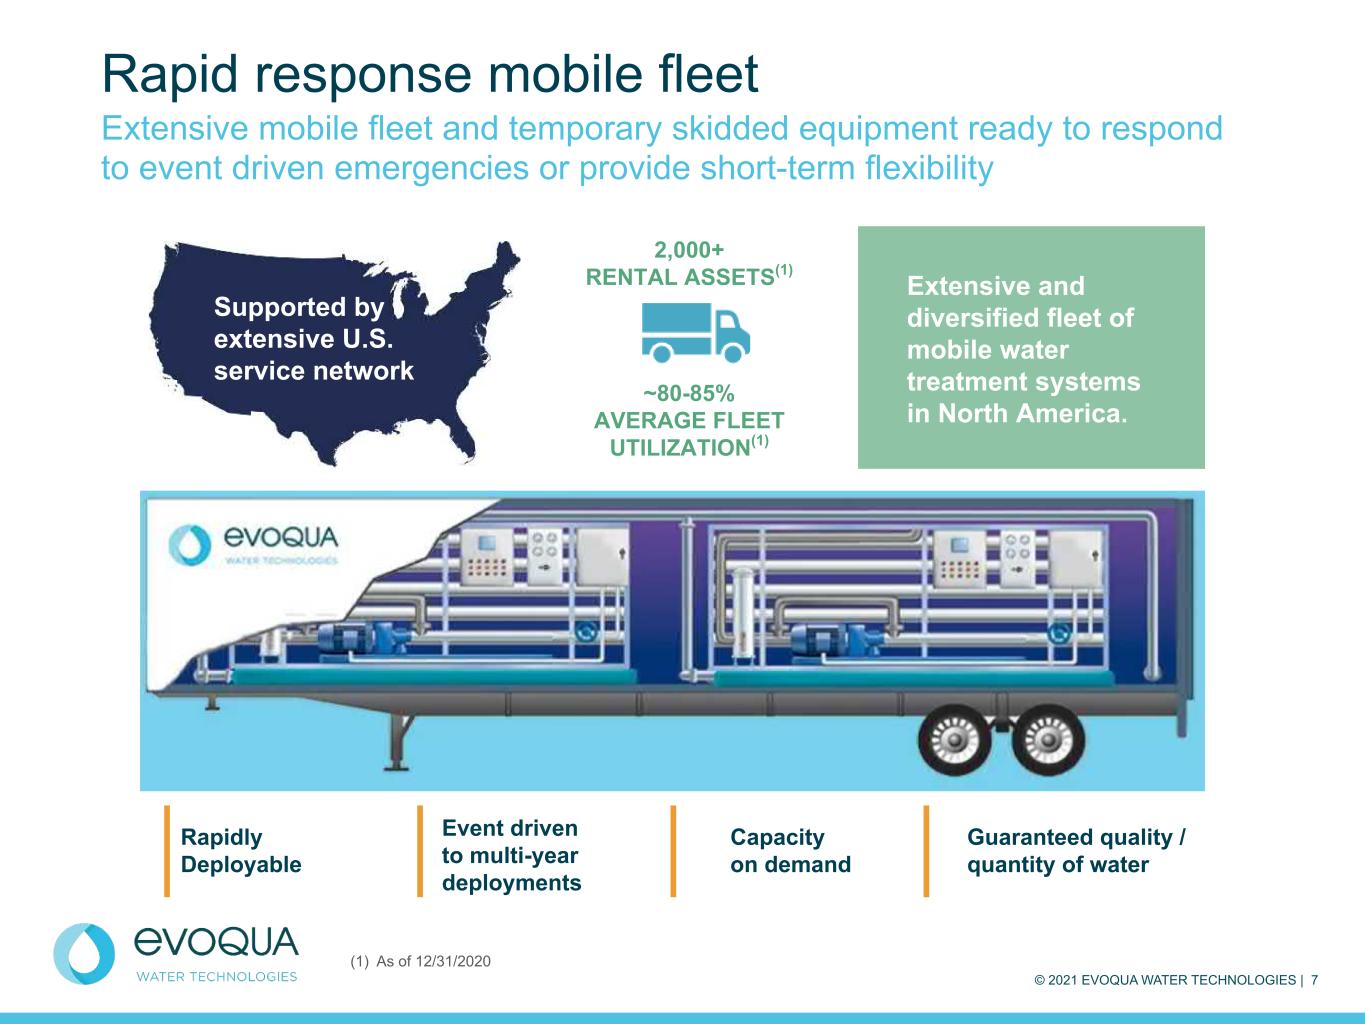
© 2021 EVOQUA WATER TECHNOLOGIES | 7 Rapid response mobile fleet Extensive mobile fleet and temporary skidded equipment ready to respond to event driven emergencies or provide short-term flexibility Supported by extensive U.S. service network Rapidly Deployable Event driven to multi-year deployments Capacity on demand Guaranteed quality / quantity of water Extensive and diversified fleet of mobile water treatment systems in North America. (1) As of 12/31/2020 2,000+ RENTAL ASSETS(1) ~80-85% AVERAGE FLEET UTILIZATION(1)

© 2021 EVOQUA WATER TECHNOLOGIES | 8 Mobile fleet at a glance Skid-mounted reverse osmosis unit to remove minerals and dissolved solids Mobile scrubber systems for odor control/vapor treatment Mobile units using granular activated carbon to remove PFAS Mobile ultrafiltration trailer DAF unit to for industrial wastewater treatment Thermal oxidizers to treat pipeline venting, storage tank venting and other vapor-related processes Mobile Deionization is a plug and play trailerized/ portable treatment solution
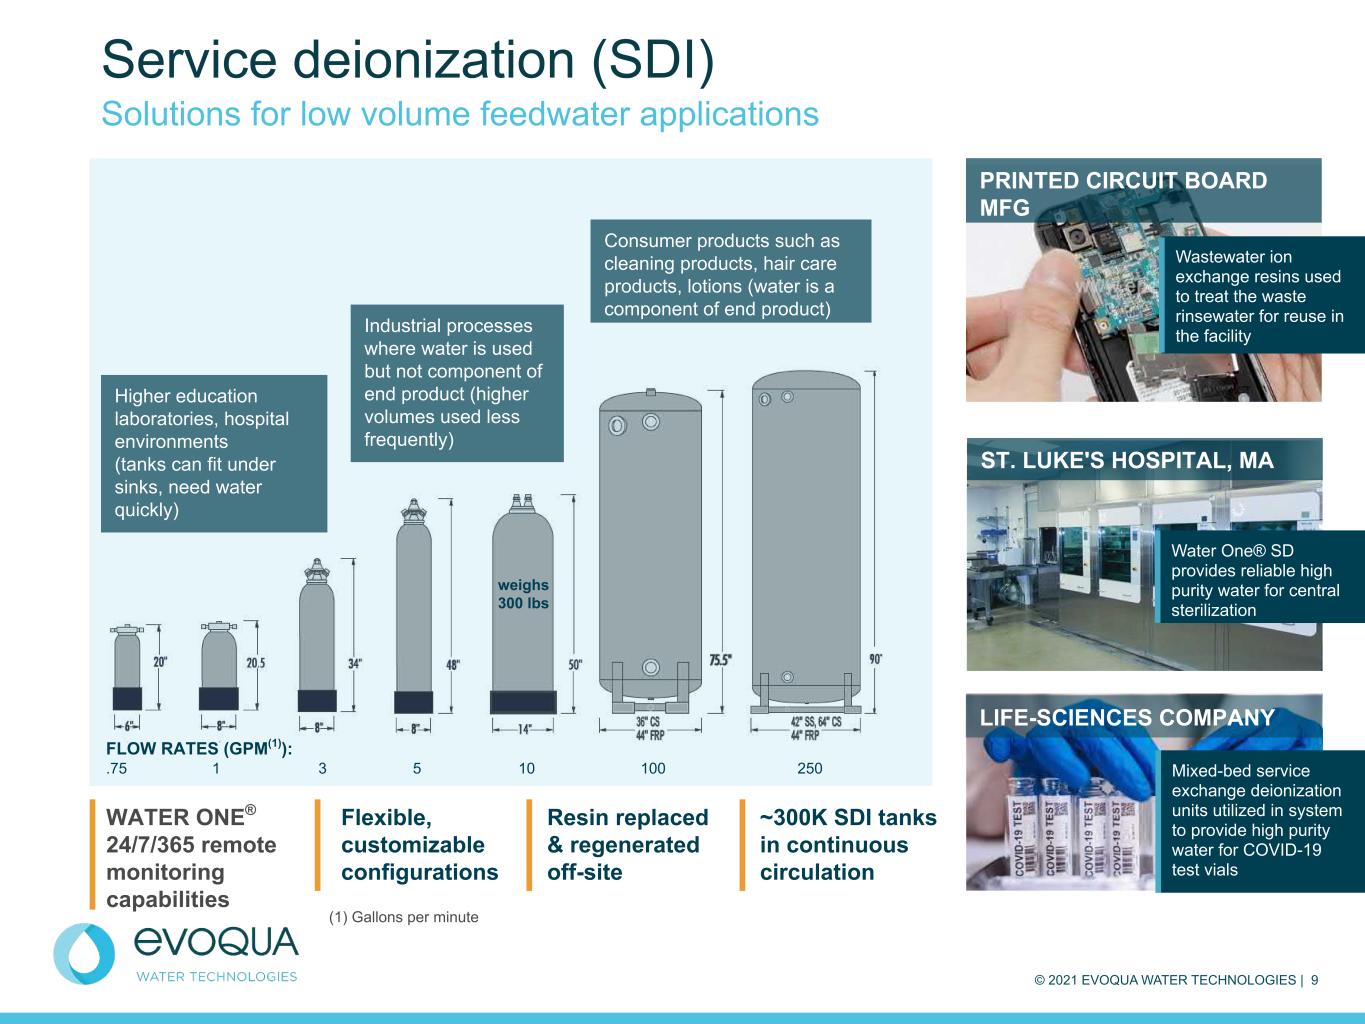
© 2021 EVOQUA WATER TECHNOLOGIES | 9 Service deionization (SDI) Solutions for low volume feedwater applications Flexible, customizable configurations (1) Gallons per minute FLOW RATES (GPM(1)): .75 1 3 5 10 100 250 Higher education laboratories, hospital environments (tanks can fit under sinks, need water quickly) Industrial processes where water is used but not component of end product (higher volumes used less frequently) Consumer products such as cleaning products, hair care products, lotions (water is a component of end product) Wastewater ion exchange resins used to treat the waste rinsewater for reuse in the facility PRINTED CIRCUIT BOARD MFG ST. LUKE'S HOSPITAL, MA Water One® SD provides reliable high purity water for central sterilization LIFE-SCIENCES COMPANY Mixed-bed service exchange deionization units utilized in system to provide high purity water for COVID-19 test vials Resin replaced & regenerated off-site ~300K SDI tanks in continuous circulation WATER ONE® 24/7/365 remote monitoring capabilities weighs 300 lbs
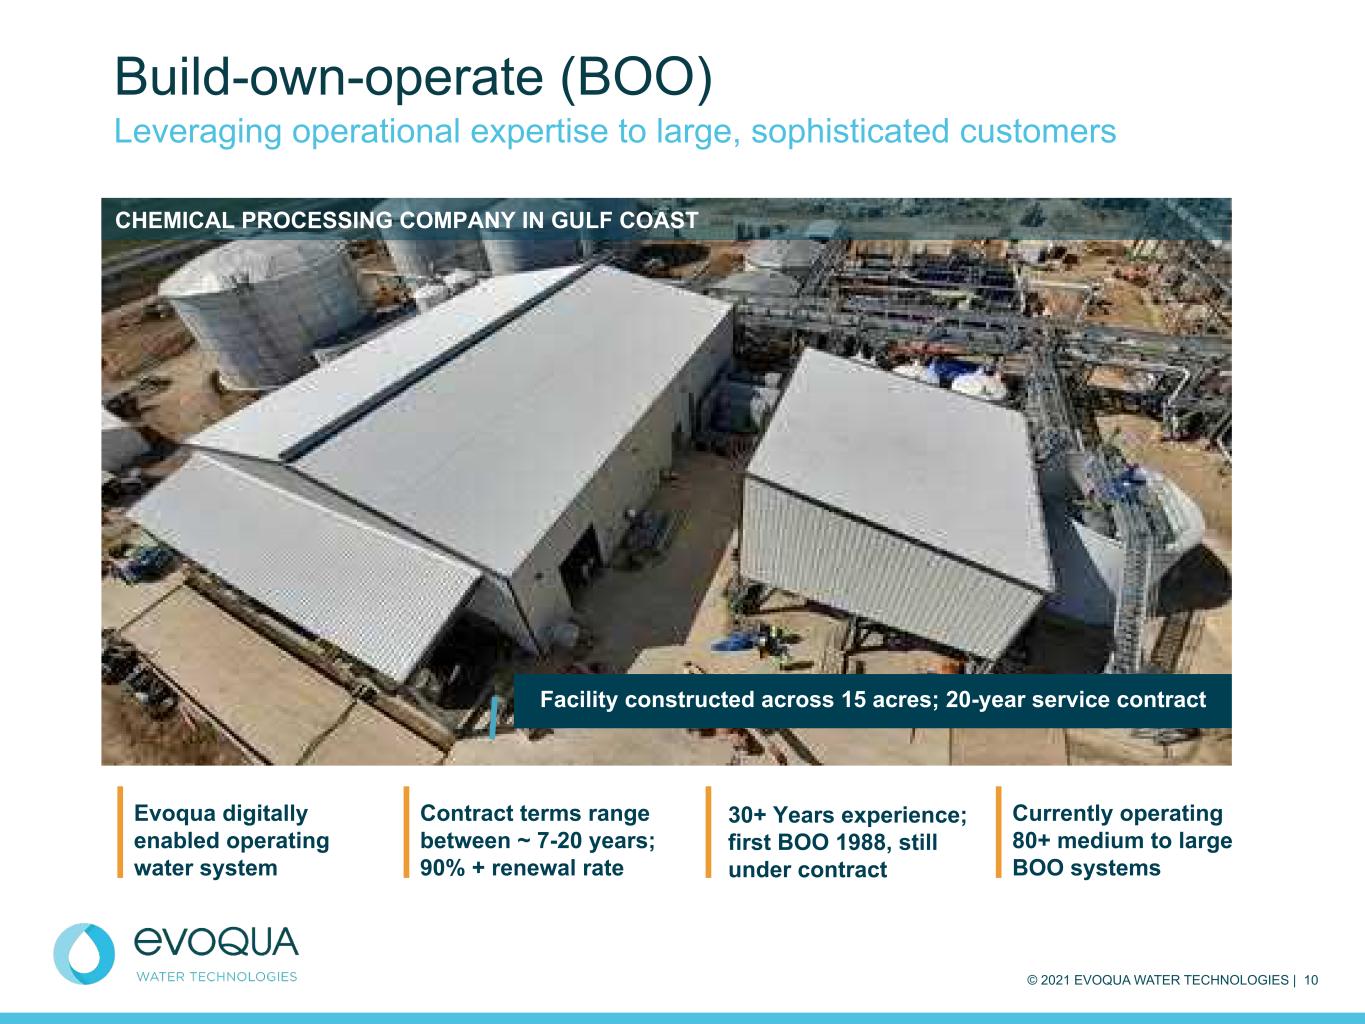
© 2021 EVOQUA WATER TECHNOLOGIES | 10 Build-own-operate (BOO) Leveraging operational expertise to large, sophisticated customers CHEMICAL PROCESSING COMPANY IN GULF COAST Facility constructed across 15 acres; 20-year service contract 30+ Years experience; first BOO 1988, still under contract Evoqua digitally enabled operating water system Currently operating 80+ medium to large BOO systems Contract terms range between ~ 7-20 years; 90% + renewal rate
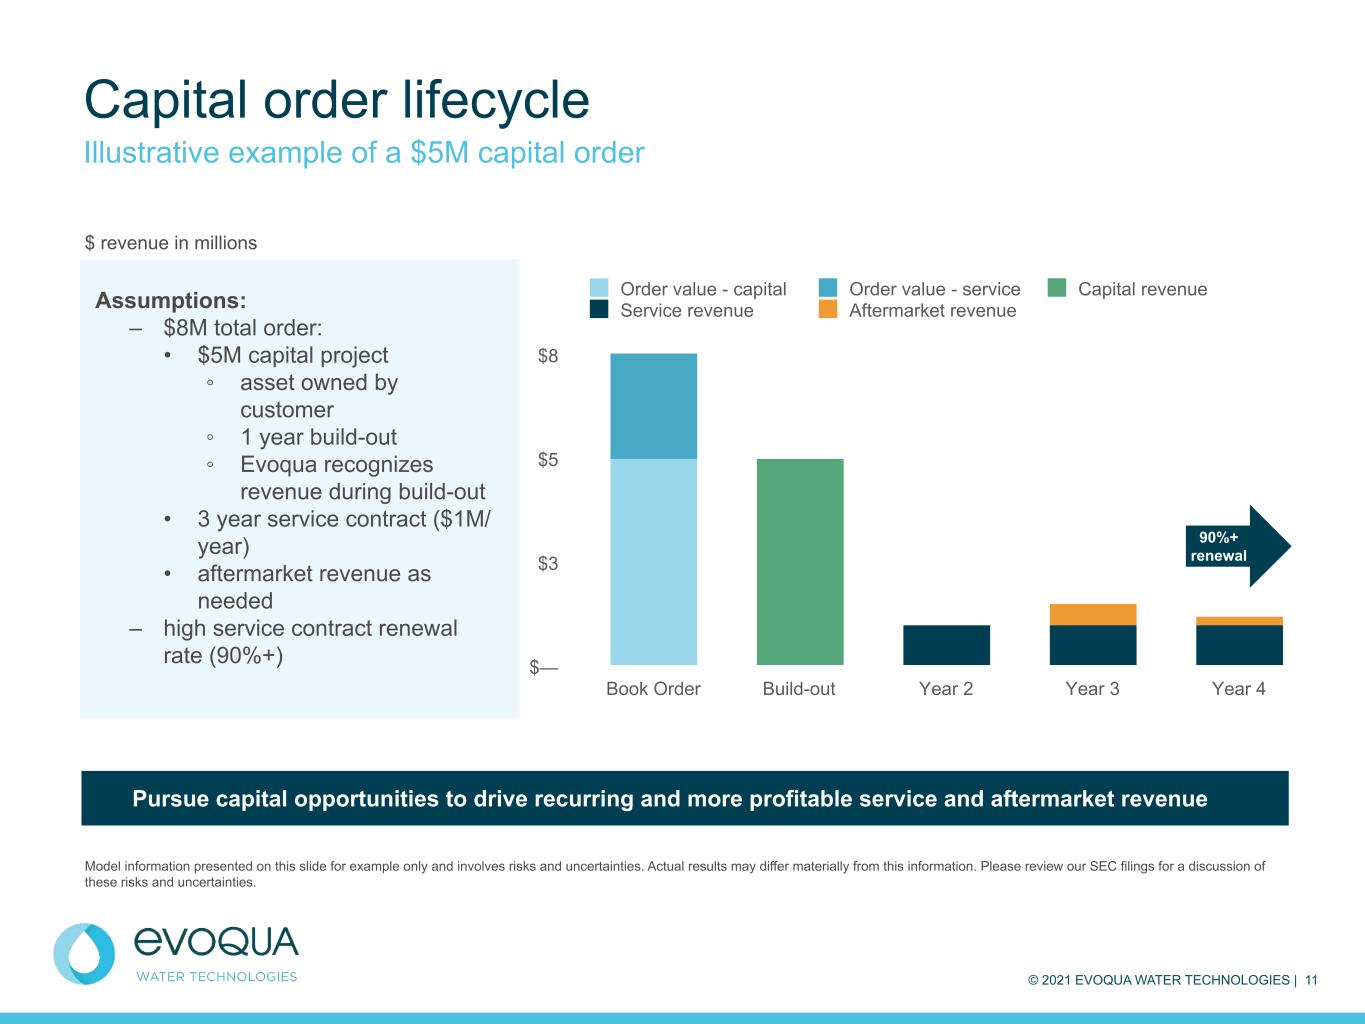
© 2021 EVOQUA WATER TECHNOLOGIES | 11 Order value - capital Order value - service Capital revenue Service revenue Aftermarket revenue Book Order Build-out Year 2 Year 3 Year 4 $— $3 $5 $8 Capital order lifecycle Illustrative example of a $5M capital order Model information presented on this slide for example only and involves risks and uncertainties. Actual results may differ materially from this information. Please review our SEC filings for a discussion of these risks and uncertainties. $ revenue in millions Assumptions: – $8M total order: • $5M capital project ◦ asset owned by customer ◦ 1 year build-out ◦ Evoqua recognizes revenue during build-out • 3 year service contract ($1M/ year) • aftermarket revenue as needed – high service contract renewal rate (90%+) 90%+ renewal Pursue capital opportunities to drive recurring and more profitable service and aftermarket revenue
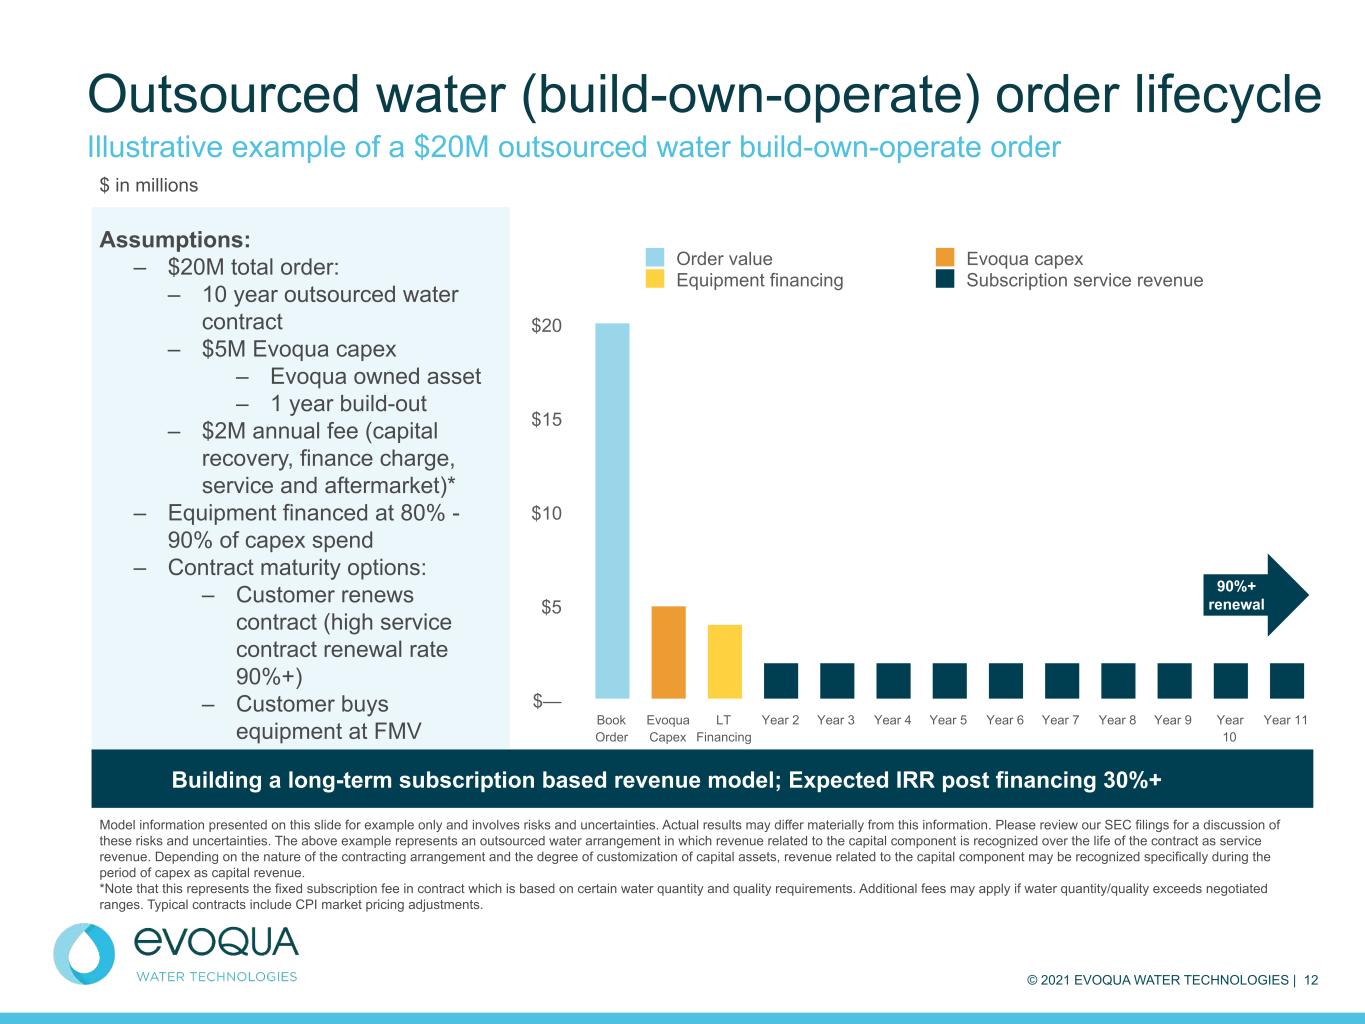
© 2021 EVOQUA WATER TECHNOLOGIES | 12 Order value Evoqua capex Equipment financing Subscription service revenue Book Order Evoqua Capex LT Financing Year 2 Year 3 Year 4 Year 5 Year 6 Year 7 Year 8 Year 9 Year 10 Year 11 $— $5 $10 $15 $20 Outsourced water (build-own-operate) order lifecycle Illustrative example of a $20M outsourced water build-own-operate order Model information presented on this slide for example only and involves risks and uncertainties. Actual results may differ materially from this information. Please review our SEC filings for a discussion of these risks and uncertainties. The above example represents an outsourced water arrangement in which revenue related to the capital component is recognized over the life of the contract as service revenue. Depending on the nature of the contracting arrangement and the degree of customization of capital assets, revenue related to the capital component may be recognized specifically during the period of capex as capital revenue. *Note that this represents the fixed subscription fee in contract which is based on certain water quantity and quality requirements. Additional fees may apply if water quantity/quality exceeds negotiated ranges. Typical contracts include CPI market pricing adjustments. $ in millions Assumptions: – $20M total order: – 10 year outsourced water contract – $5M Evoqua capex – Evoqua owned asset – 1 year build-out – $2M annual fee (capital recovery, finance charge, service and aftermarket)* – Equipment financed at 80% - 90% of capex spend – Contract maturity options: – Customer renews contract (high service contract renewal rate 90%+) – Customer buys equipment at FMV 90%+ renewal Building a long-term subscription based revenue model; Expected IRR post financing 30%+
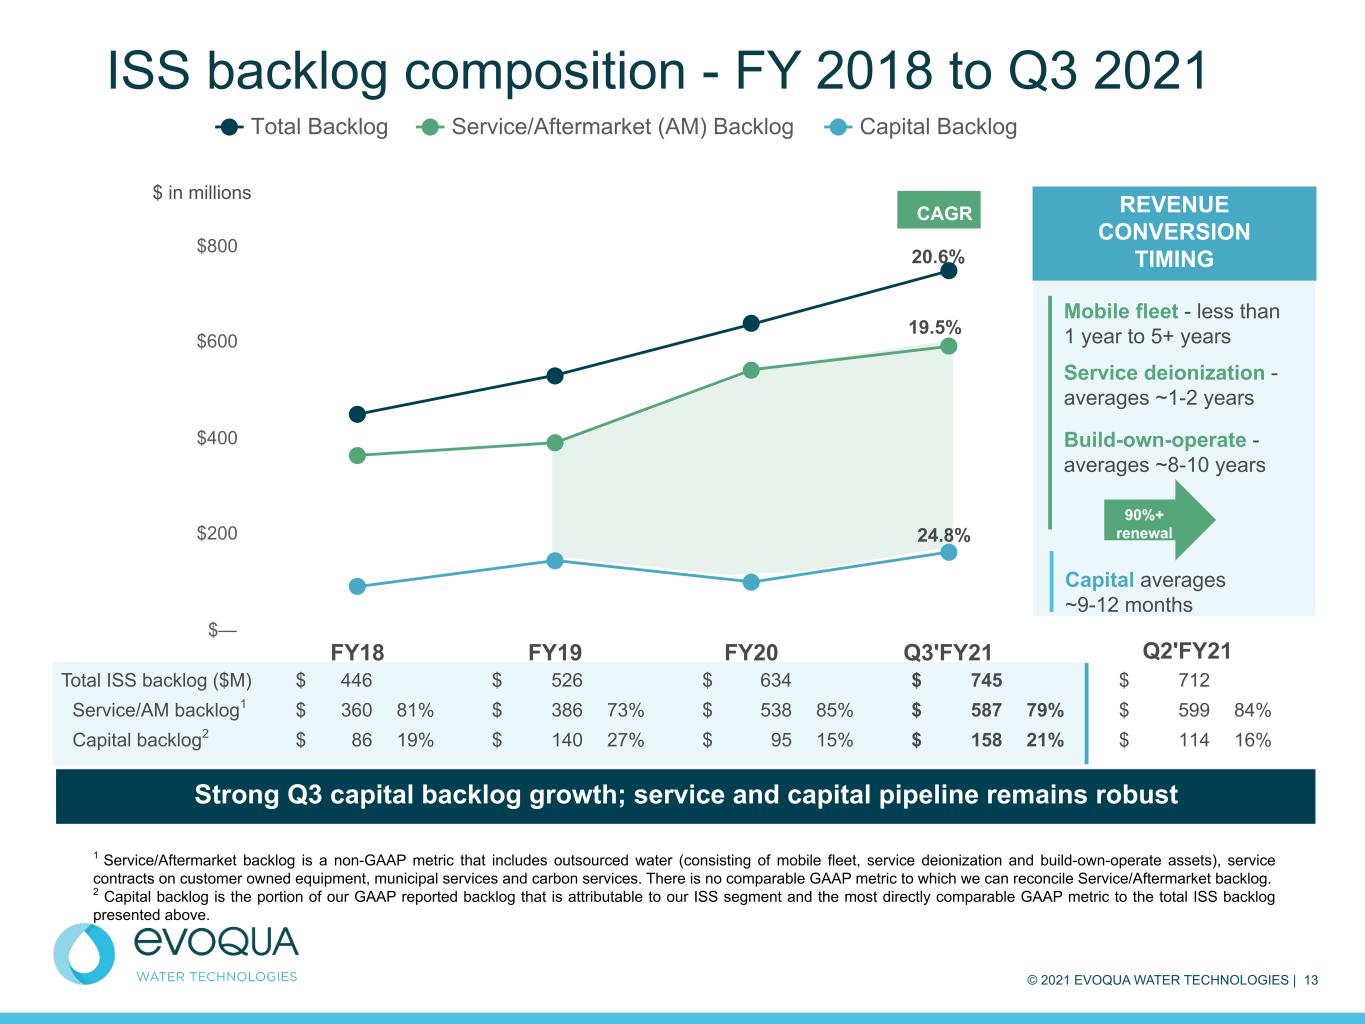
© 2021 EVOQUA WATER TECHNOLOGIES | 13 Total ISS backlog ($M) $ 446 $ 526 $ 634 $ 745 $ 712 Service/AM backlog1 $ 360 81% $ 386 73% $ 538 85% $ 587 79% $ 599 84% Capital backlog2 $ 86 19% $ 140 27% $ 95 15% $ 158 21% $ 114 16% ISS backlog composition - FY 2018 to Q3 2021 Strong Q3 capital backlog growth; service and capital pipeline remains robust $ in millions 24.8% 1 Service/Aftermarket backlog is a non-GAAP metric that includes outsourced water (consisting of mobile fleet, service deionization and build-own-operate assets), service contracts on customer owned equipment, municipal services and carbon services. There is no comparable GAAP metric to which we can reconcile Service/Aftermarket backlog. 2 Capital backlog is the portion of our GAAP reported backlog that is attributable to our ISS segment and the most directly comparable GAAP metric to the total ISS backlog presented above. Capital averages ~9-12 months Mobile fleet - less than 1 year to 5+ years Service deionization - averages ~1-2 years Build-own-operate - averages ~8-10 years 90%+ renewal 20.6% 19.5% REVENUE CONVERSION TIMING CAGR Total Backlog Service/Aftermarket (AM) Backlog Capital Backlog FY18 FY19 FY20 Q3'FY21 $— $200 $400 $600 $800 $1,000 Q2'FY21
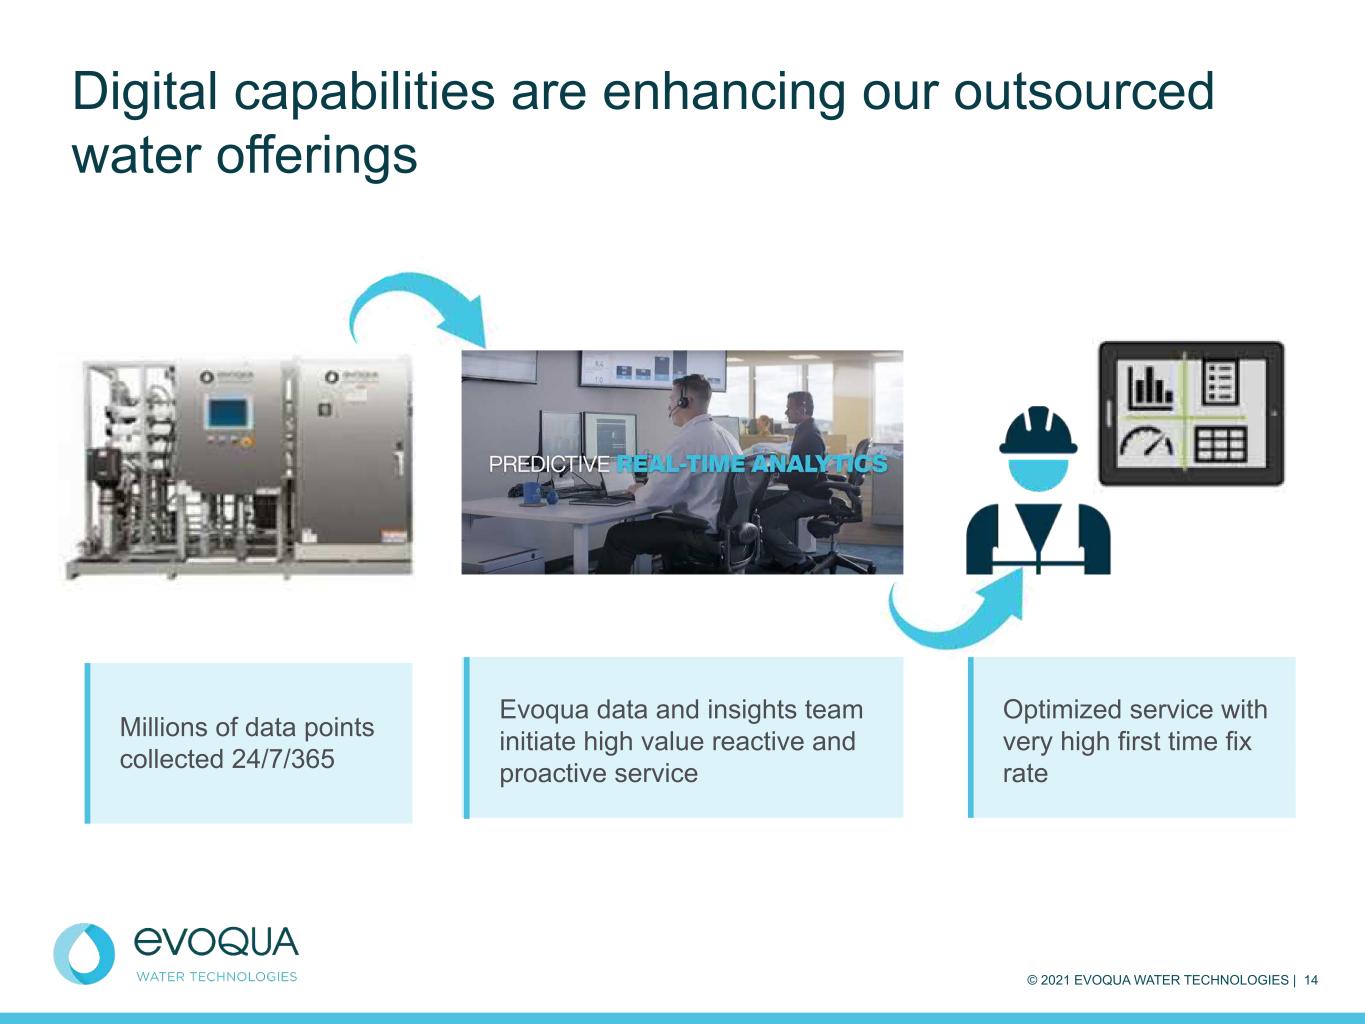
© 2021 EVOQUA WATER TECHNOLOGIES | 14 Digital capabilities are enhancing our outsourced water offerings Millions of data points collected 24/7/365 Optimized service with very high first time fix rate Evoqua data and insights team initiate high value reactive and proactive service

© 2021 EVOQUA WATER TECHNOLOGIES | 15 CURRENT STATE Outsourced Water vs Digitally Enabled (FY20) Outsourced water growth enabled by digital FUTURE STATE Outsourced Water Growth Enabled by Digital Transitions customers to pricing models based on usage Evoqua’s digital outsourced water offering combines key technologies (such as service deionization, build-own- operate) with outcome-based water guarantees Using 24/7/365 remote monitoring, Evoqua provides proactive, predictive services to maintain customer water needs
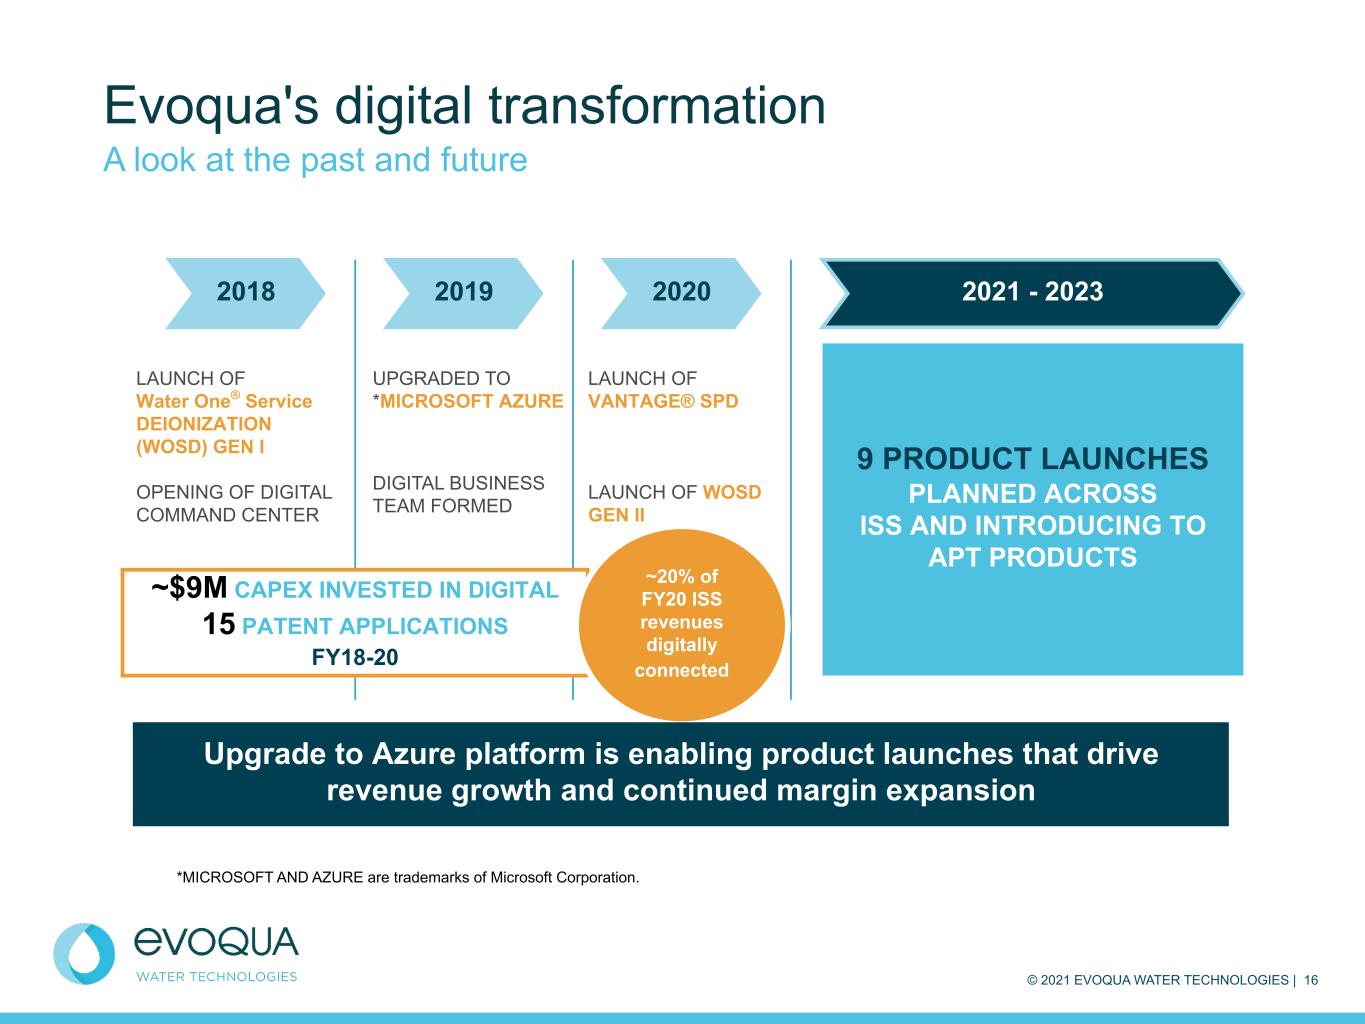
© 2021 EVOQUA WATER TECHNOLOGIES | 16 2018 2019 2020 2021 - 2023 Evoqua's digital transformation A look at the past and future LAUNCH OF Water One® Service DEIONIZATION (WOSD) GEN I OPENING OF DIGITAL COMMAND CENTER UPGRADED TO *MICROSOFT AZURE DIGITAL BUSINESS TEAM FORMED LAUNCH OF VANTAGE® SPD LAUNCH OF WOSD GEN II 9 PRODUCT LAUNCHES PLANNED ACROSS ISS AND INTRODUCING TO APT PRODUCTS ~$9M CAPEX INVESTED IN DIGITAL 15 PATENT APPLICATIONS FY18-20 ~20% of FY20 ISS revenues digitally connected Upgrade to Azure platform is enabling product launches that drive revenue growth and continued margin expansion *MICROSOFT AND AZURE are trademarks of Microsoft Corporation.

© 2021 EVOQUA WATER TECHNOLOGIES | 17 Evoqua's digital command center Measuring customer data real time • Customer driven service level agreements in place • High response speed and triage accuracy • Skill sets are specialized and focused • Fast adoption and application of new data driven insights PROVIDING SURVEILLANCE DIGITAL DASHBOARD EXAMPLE
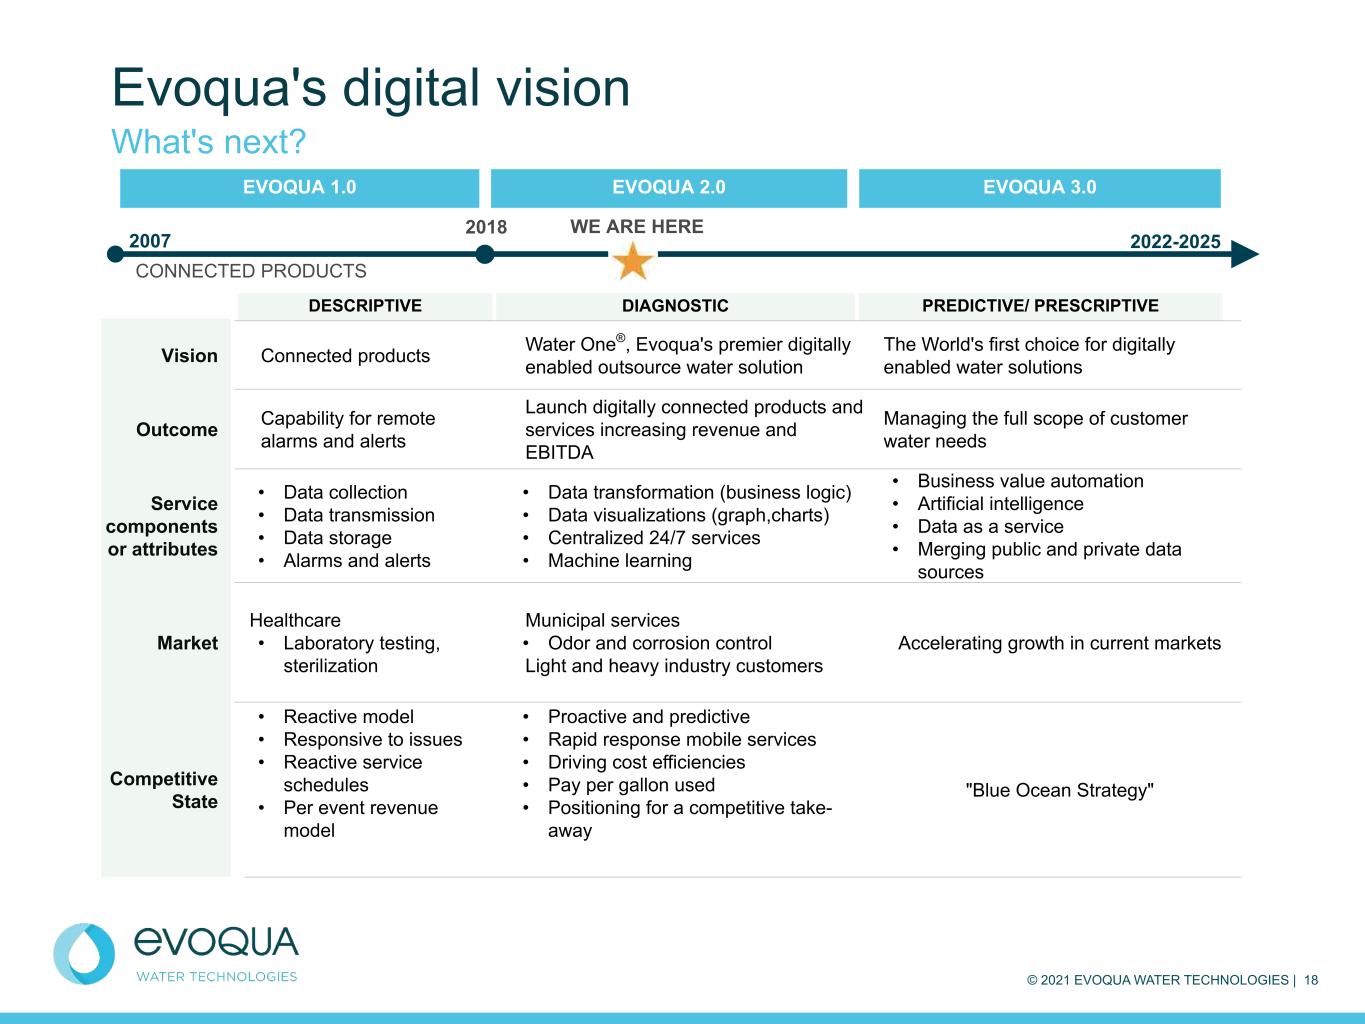
© 2021 EVOQUA WATER TECHNOLOGIES | 18 Evoqua's digital vision What's next? EVOQUA 1.0 EVOQUA 2.0 EVOQUA 3.0 CONNECTED PRODUCTS WE ARE HERE 2007 2022-2025 2018 Vision Connected products Water One®, Evoqua's premier digitally enabled outsource water solution The World's first choice for digitally enabled water solutions Outcome Capability for remote alarms and alerts Launch digitally connected products and services increasing revenue and EBITDA Managing the full scope of customer water needs Service components or attributes • Data collection • Data transmission • Data storage • Alarms and alerts • Data transformation (business logic) • Data visualizations (graph,charts) • Centralized 24/7 services • Machine learning • Business value automation • Artificial intelligence • Data as a service • Merging public and private data sources Market Healthcare • Laboratory testing, sterilization Municipal services • Odor and corrosion control Light and heavy industry customers Accelerating growth in current markets Competitive State • Reactive model • Responsive to issues • Reactive service schedules • Per event revenue model • Proactive and predictive • Rapid response mobile services • Driving cost efficiencies • Pay per gallon used • Positioning for a competitive take- away "Blue Ocean Strategy" DESCRIPTIVE DIAGNOSTIC PREDICTIVE/ PRESCRIPTIVE
© 2021 EVOQUA WATER TECHNOLOGIES | 19 Thank You
©2021 EVOQUA WATER TECHNOLOGIES | 20 Appendix
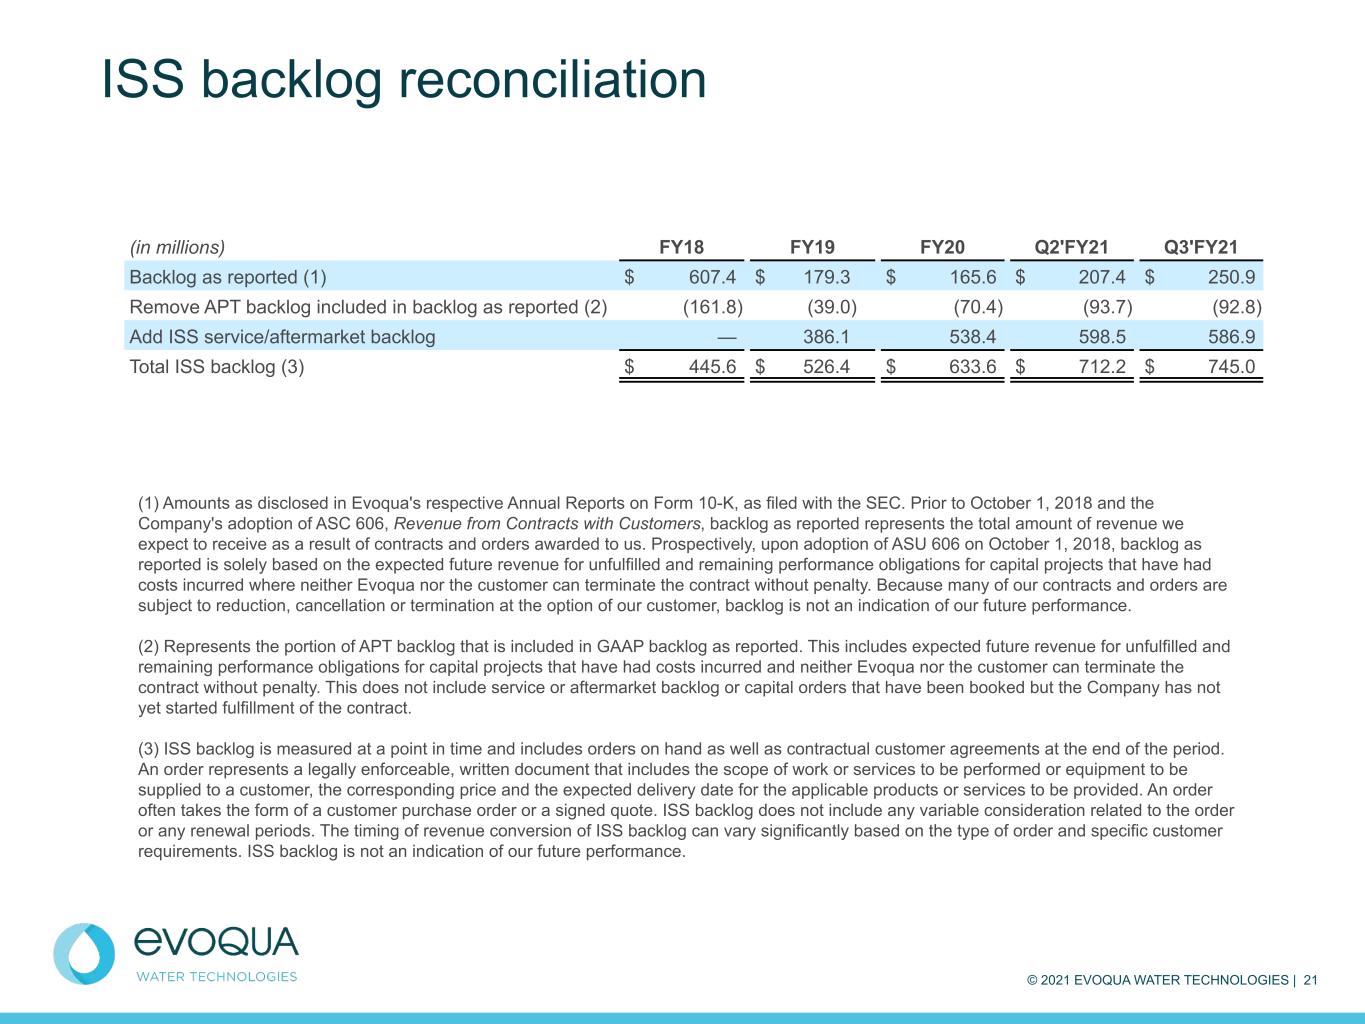
© 2021 EVOQUA WATER TECHNOLOGIES | 21 ISS backlog reconciliation (in millions) FY18 FY19 FY20 Q2'FY21 Q3'FY21 Backlog as reported (1) $ 607.4 $ 179.3 $ 165.6 $ 207.4 $ 250.9 Remove APT backlog included in backlog as reported (2) (161.8) (39.0) (70.4) (93.7) (92.8) Add ISS service/aftermarket backlog — 386.1 538.4 598.5 586.9 Total ISS backlog (3) $ 445.6 $ 526.4 $ 633.6 $ 712.2 $ 745.0 (1) Amounts as disclosed in Evoqua's respective Annual Reports on Form 10-K, as filed with the SEC. Prior to October 1, 2018 and the Company's adoption of ASC 606, Revenue from Contracts with Customers, backlog as reported represents the total amount of revenue we expect to receive as a result of contracts and orders awarded to us. Prospectively, upon adoption of ASU 606 on October 1, 2018, backlog as reported is solely based on the expected future revenue for unfulfilled and remaining performance obligations for capital projects that have had costs incurred where neither Evoqua nor the customer can terminate the contract without penalty. Because many of our contracts and orders are subject to reduction, cancellation or termination at the option of our customer, backlog is not an indication of our future performance. (2) Represents the portion of APT backlog that is included in GAAP backlog as reported. This includes expected future revenue for unfulfilled and remaining performance obligations for capital projects that have had costs incurred and neither Evoqua nor the customer can terminate the contract without penalty. This does not include service or aftermarket backlog or capital orders that have been booked but the Company has not yet started fulfillment of the contract. (3) ISS backlog is measured at a point in time and includes orders on hand as well as contractual customer agreements at the end of the period. An order represents a legally enforceable, written document that includes the scope of work or services to be performed or equipment to be supplied to a customer, the corresponding price and the expected delivery date for the applicable products or services to be provided. An order often takes the form of a customer purchase order or a signed quote. ISS backlog does not include any variable consideration related to the order or any renewal periods. The timing of revenue conversion of ISS backlog can vary significantly based on the type of order and specific customer requirements. ISS backlog is not an indication of our future performance.


