TrimTabs ETF Trust
TrimTabs All Cap U.S. Free-Cash-Flow ETF
TrimTabs All Cap International Free-Cash-Flow ETF
Annual Report
July 31, 2020
Beginning on January 1, 2021, as permitted by regulations adopted by the U.S. Securities and Exchange Commission, paper copies of the Funds’ shareholder reports will no longer be sent by mail, unless you specifically request paper copies of the Funds’ reports from your financial intermediary, such as a broker-dealer or bank. Instead, the reports will be made available on a website, and you will be notified by mail each time a report is posted and provided with a website link to access the report.
If you already elected to receive shareholder reports electronically, you will not be affected by this change and you need not take any action. Please contact your financial intermediary to elect to receive shareholder reports and other Fund communications electronically.
You may elect to receive all future reports in paper free of charge. Please contact your financial intermediary to inform them that you wish to continue receiving paper copies of shareholder reports and for details about whether your election to receive reports in paper will apply to all funds held with your financial intermediary.
TrimTabs ETF Trust
TABLE OF CONTENTS
| Shareholder Letter for TrimTabs All Cap U.S. Free-Cash-Flow ETF | 1 |
| Performance Summary for TrimTabs All Cap U.S. Free-Cash-Flow ETF | 4 |
| Managers’ Discussion of Fund Performance for | |
| TrimTabs All Cap U.S. Free-Cash-Flow ETF | 5 |
| Shareholder Letter for TrimTabs All Cap International Free-Cash-Flow ETF | 6 |
| Performance Summary for TrimTabs All Cap International Free-Cash-Flow ETF | 9 |
| Managers’ Discussion of Fund Performance for | |
| TrimTabs All Cap International Free-Cash-Flow ETF | 10 |
| Shareholder Expense Examples | 11 |
| Portfolio Holdings Allocation | 13 |
| Schedules of Investments | 14 |
| Statements of Assets and Liabilities | 22 |
| Statements of Operations | 23 |
| Statements of Changes in Net Assets | 24 |
| Financial Highlights | 26 |
| Notes to Financial Statements | 28 |
| Report of Independent Registered Public Accounting Firm | 39 |
| Additional Information | 40 |
TrimTabs All Cap U.S. Free-Cash-Flow ETF
SHAREHOLDER LETTER
July 31, 2020 (Unaudited)
Dear Shareholder,
We are pleased to provide you with the Annual Report of the TrimTabs All Cap U.S. Free-Cash-Flow ETF (“Fund”). This report refers to the twelve-month period starting July 31, 2019 through July 31, 2020.
For the twelve-month period, the Fund returned 6.42% measured in market price and 6.97% measured in net asset value (“NAV”). By comparison, the broad-based benchmark for the Fund, the Russell 3000 Total Return Index (“Russell Index”), returned 10.93% for the period starting July 31, 2019 through July 31, 2020.
Looking specifically at 2020, for the six-month period ending July 31, 2020, the Fund returned 1.31% at market price and 1.41% at NAV. By comparison, the Russell Index returned 2.01%.
From inception, starting September 27, 2016, the Fund returned an annualized rate of 13.45% at market and 13.53% at NAV. The Russell Index during this period returned an annualized rate of 13.11%.
At the start of the reporting period, the US and global stock markets were dealing with a challenging environment driven by a major trade dispute between the US and, primarily, China but also intermittently with Mexico, Canada, and Europe. In October of 2019, both China and the US came to the table to discuss a US – China “Phase 1” trade agreement as tariffs were set to rise on December 15th. This provided some relief to global markets.
The US stock market rallied into the end of 2019 and into early 2020 on the announcement of a deal. At the same time, the US finalized agreements with Mexico and Canada. During the turbulent negotiation period, we noticed that large capitalization companies had more flexibility to adapt and manage their supply chains and thus were outperforming small- and mid-capitalization companies with less flexibility.
By February of 2020, the market was reaching new highs on the back of a narrow group of the largest capitalization companies producing strong organic growth. While we were not surprised to see a pullback in the US stock market, we underestimated the rapid spread and economic severity of the COVID-19 pandemic. The sell-off in US and global stock markets was rapid and relentless as economies were shut down to flatten the virus case curve.
The performance data quoted represents past performance. Past performance does not guarantee future results. The investment return and principal value of an investment will fluctuate so that an investor’s shares, when sold or redeemed, may be worth more or less than their original cost and current performance may be lower or higher than the performance quoted. Performance current to the most recent month-end can be obtained by calling (toll free 800-617-0004).
TrimTabs All Cap U.S. Free-Cash-Flow ETF
SHAREHOLDER LETTER
July 31, 2020 (Unaudited) (Continued)
On March 9, 2020 10-year US treasury yields reached a historical and unprecedented low of 0.54%. Credit markets were stressed, especially in the energy sector. Financial crises have usually started with a credit crisis; as companies struggle to fund on-going operations. The credit crisis was exacerbated by the shutdown across many sectors. Exploding unemployment claims followed.
By late March, the US Federal Reserve and US Government announced unprecedented amounts of fiscal and monetary stimulus to support the US economy during the shutdown. While the US stock market bottomed in late March, the US economy became even more bifurcated as technology, consumer staples, and healthcare companies benefitted from the crisis while other industries such as airlines, restaurants, entertainment, hotels, banks, and energy companies struggled.
The COVID-19 Pandemic accelerated trends in digital consumption that were firmly in place before the pandemic and underscored a bifurcated economy. These behaviors, which include on-line shopping, on-line payments, streaming content, video conferencing, work-from-home, at-home workouts, and video gaming, appear to be sticky and longer lasting. These trends have disrupted companies with traditional business models that do not have the flexibility to adapt, innovate, and serve in this environment.
While the virus remains ubiquitous with rolling outbreaks around the world, the US economy is slowly opening back up and improving. Globally, there have been great strides made towards a commercial vaccination. We have seen unprecedented cooperation between the FDA, public companies, and private foundations to improve treatments, find therapies, and create a vaccine. The market continues to pivot towards the next step of the recovery.
Our Fund uses a “quantamental” process, which combines our proprietary quantitative models, focused on Free Cash Flow, with seasoned and disciplined active, fundamental management to find high quality companies. We believe this strategy identifies organically growing companies that are likely to generate superior investment returns over the long-term. Our research shows that seeking companies with strong free cash flow, good balance sheets and a reduced number of outstanding common shares have improved the odds of outperforming our benchmark over a longer time frame.
Our team looks forward to helping serve your investment goals and we appreciate your trust.
Janet Flanders Johnston, CFA
Co-Chief Investment Officer
Portfolio Manager
Bob Shea
CEO
Co-Chief Investment Officer
TrimTabs All Cap U.S. Free-Cash-Flow ETF
SHAREHOLDER LETTER
July 31, 2020 (Unaudited) (Continued)
Must be preceded or accompanied by a current Fund prospectus.
Opinions expressed are subject to change at any time, are not guaranteed and should not be considered investment advice.
Past performance is no guarantee of future results.
Fund holdings and sector allocations are subject to change and are not recommendations to buy or sell any security. Current and future portfolio holdings are subject to risk. Please refer to the Schedule of Investments contained in this report for a full listing of fund holdings.
Investing involves risk, including the possible loss of principal. Shares of any ETF are bought and sold at market price (not NAV), may trade at a discount or premium to NAV and are not individually redeemed from the Fund. Owners of the shares may acquire those shares from the Fund and tender those shares for redemption to the Fund in Creation Unit aggregations only, consisting of 25,000 shares. Brokerage commissions will reduce returns. Investments in the Fund include risks associated with small and mid-cap securities which involve limited liquidity and greater volatility than large-cap securities.
The Russell 3000® Index measures the performance of the 3,000 largest publicly traded U.S. companies, based on market capitalization. The Index measures the performance of approximately 98% of the total market capitalization of the publicly traded U.S. equity market. The Index return reflects the reinvestment of income dividends and capital gain distributions, if any, but does not reflect fees, brokerage commissions, or other expenses of investing. It is not possible to invest directly in the Index.
Free Cash Flow (FCF) represents the cash that a company is able to generate after accounting for capital expenditures.
The TrimTabs All Cap U.S. Free-Cash-Flow ETF is distributed by Quasar Distributors, LLC.
TrimTabs All Cap U.S. Free-Cash-Flow ETF
PERFORMANCE SUMMARY
July 31, 2020 (Unaudited)
Growth of a $10,000 Investment
| | One | Three | Since |
| Average Annual Total Returns (as of July 31, 2020) | Year | Year | Inception(a) |
| TrimTabs All Cap U.S. | | | |
| Free-Cash-Flow ETF – NAV | 6.97% | 10.87% | 13.53% |
| TrimTabs All Cap U.S. | | | |
| Free-Cash-Flow ETF – Market | 6.42% | 10.68% | 13.45% |
Russell 3000® Total Return Index | 10.93% | 11.39% | 13.11% |
This chart assumes an initial gross investment of $10,000 made on September 27, 2016 (commencement of the Fund’s operations). Returns shown include the reinvestment of all dividends. Returns shown do not reflect the deductions of taxes that a shareholder would pay on Fund distributions or the redemption of Fund shares. Past performance is not predictive of future performance. Investment return and principal value will fluctuate so that your shares, when redeemed, may be worth more or less than original cost. Index returns do not reflect the effects of fees or expenses. It is not possible to invest directly in an index.The total operating expense ratio as stated in the fee table to the Fund’s prospectus dated November 29, 2019, as supplemented May 29, 2020, is 0.59%. For performance information current to the most recent month-end, please call 1-800-617-0004.
(a) Commencement of operations on September 27, 2016.
TrimTabs All Cap U.S. Free-Cash-Flow ETF
MANAGERS’ DISCUSSION OF FUND PERFORMANCE
July 31, 2020 (Unaudited)
For the twelve-month period from July 31, 2019 through July 31, 2020, the Fund returned 6.42% measured in market price and 6.97% measured in net asset value (“NAV”). By comparison, the broad-based benchmark for the Fund, the Russell 3000 Index (“Russell Index”), returned 10.93% over the same period.
An important characteristic for the period under review is that there was a bias toward larger capitalization issues. This can be illustrated by measuring the performance of the S&P 500 Index in its normal capitalization-weighted basis and on an equal-weighted basis. For both the twelve-month period and the first half of 2020, the equal-weighted version of the index underperformed the capitalization-weighted version by 11.39% and 8.83%, respectively.
It has often been the case that during market stress, smaller stocks underperform larger ones as investors seek what they believe is the relative safety of larger stocks. Because the cap-weighted version is heavily biased toward larger capitalization stocks, this environment presented headwinds for non-cap-weighted portfolios. The relevance to the Fund is that the Funds holdings are initiated at an equal weight basis, whereas our benchmark is cap-weighted.
As of July 31, 2020, five companies accounted for over 20% of the S&P 500 Index. Because we have an equal weight portfolio construction methodology for the Fund, a market environment that is driven by a handful of names will be a headwind for our Fund’s relative performance. This was the case for the twelve-month period, from July 31, 2019 to July 31, 2020.
A bifurcated US economy has emerged during the COVID-19 pandemic. This pandemic has rapidly accelerated trends in digital consumption and cloud computing. These behaviors, which include on-line shopping, on-line payments, streaming content, video conferencing, work-from-home, at-home workouts, and video gaming, appear to be sticky and longer lasting. These trends have disrupted companies with traditional business models that do not have the flexibility to adapt, innovate, and serve in this environment. The fund has exposure across a wide range of sectors to the digital economy and therefore contributed to fund performance during the reporting period.
In response to the COVID-19 pandemic, we have followed the data and focused on companies with strong Free Cash Flow, robust balance sheets, and where we have a higher level of conviction on a fundamental basis. Most importantly, in this environment, where some sectors have rising levels of bankruptcies, we have paid close attention to credit quality and liquidity. Our main goal of this focus on credit quality is to minimize the risk of large negative surprises.
The views and opinions expressed in this discussion are those of TrimTabs Asset Management, LLC. The views and opinions expressed are subject to change at any time, are not guaranteed and should not be considered investment advice.
Past performance is no guarantee of future results.
Fund holdings and sector allocations are subject to change and are not recommendations to buy or sell any security. Current and future portfolio holdings are subject to risk.
TrimTabs All Cap International Free-Cash-Flow ETF
SHAREHOLDER LETTER
July 31, 2020 (Unaudited)
Dear Shareholder,
We are pleased to provide you with the Annual Report of the TrimTabs All Cap International Free-Cash-Flow ETF (“Fund”). This report refers to the twelve-month period starting July 31, 2019 through July 31, 2020.
For the twelve-month period, the Fund returned 2.97% measured in market price and 2.42% measured in net asset value (“NAV”). By comparison, the broad-based benchmark for the Fund, the S&P Developed Ex-US BMI Index (“S&P Index”), returned -0.29% for the period starting July 31, 2019 through July 31, 2020.
Looking specifically at 2020, for the six-month period ending July 31, 2020, the Fund was down 3.58% at market price and 3.32% at NAV. By comparison, the S&P Index was down 8.45%.
From inception, starting June 27, 2017, the Fund returned an annualized rate of 2.48% at market price and 2.49% at NAV. The S&P Index during this period returned an annualized rate of 1.63%.
At the start of the reporting period, international stock markets were dealing with a challenging environment driven by a major trade dispute between the US and, primarily, China but also intermittently with Mexico, Canada and Europe. International trade is a noticeably larger portion of economic activity outside the US than within. During the second half of 2019, other developed countries continued to be more impacted by these trade disputes than the US.
In October of 2019, both China and the US came to the table to discuss a US – China “Phase 1” trade agreement as tariffs were set to rise on December 15th. This provided some relief to global markets.
On December 31, 2019, China reported clusters of an unfamiliar illness in Wuhan, Hubei Province. By mid-January, COVID-19 had spread to Japan and other parts of Asia. The first cases were reported in Europe during mid-January. Other developed markets, non-US, saw cases peak in mid-February. These markets fell precipitously and bottomed on March 20, 2020 similarly to the US.
It was all hands on deck. An unprecedented amount of global central bank monetary support was used to reduce the impacts from economic shutdowns. Central Banks vowed to do whatever it takes. For the first time, Germany agreed to use fiscal stimulus to help their neighboring EU members and stimulate their own economy.
The performance data quoted represents past performance. Past performance does not guarantee future results. The investment return and principal value of an investment will fluctuate so that an investor’s shares, when sold or redeemed, may be worth more or less than their original cost and current performance may be lower or higher than the performance quoted. Performance current to the most recent month-end can be obtained by calling (toll free 800-617-0004).
TrimTabs All Cap International Free-Cash-Flow ETF
SHAREHOLDER LETTER
July 31, 2020 (Unaudited) (Continued)
The COVID-19 Pandemic accelerated trends in digital consumption that were firmly in place before the pandemic and underscored a bifurcated economy. These behaviors, which include on-line shopping, on-line payments, streaming content, video conferencing, work-from-home, at-home workouts, and video gaming, appear to be sticky and longer lasting. These trends have disrupted companies with traditional business models that do not have the flexibility to adapt, innovate, and serve in this environment.
While the virus remains ubiquitous with rolling outbreaks across the world, the global economy is slowly opening back up and improving. China has returned to work at 100% capacity. Globally, there have been great strides made towards a commercial vaccination. We have seen unprecedented cooperation between regulatory agencies, public companies, and private foundations to improve treatments, find therapies, and create a vaccine. The market continues to pivot towards the next step of the recovery.
Our Fund uses a “quantamental” process, which combines our proprietary quantitative models, focused on Free Cash Flow, with seasoned and disciplined active, fundamental management to find high quality companies. We believe this strategy identifies organically growing companies that are likely to generate superior investment returns over the long-term. Our research shows that seeking companies with strong free cash flow, good balance sheets and a reduced number of outstanding common shares have improved the odds of outperforming our benchmark over a longer time frame.
Our team looks forward to helping serve your investment goals and we appreciate your trust.
Janet Flanders Johnston, CFA
Co-Chief Investment Officer
Portfolio Manager
Bob Shea
CEO
Chief Investment Officer
Must be preceded or accompanied by a current Fund prospectus.
Opinions expressed are subject to change at any time, are not guaranteed and should not be considered investment advice.
Past performance is no guarantee of future results.
Fund holdings and sector allocations are subject to change and are not recommendations to buy or sell any security. Current and future portfolio holdings are subject to risk. Please refer to the Schedule of Investments contained in this report for a full listing of fund holdings.
TrimTabs All Cap International Free-Cash-Flow ETF
SHAREHOLDER LETTER
July 31, 2020 (Unaudited) (Continued)
Investing involves risk, including the possible loss of principal. Shares of any ETF are bought and sold at market price (not NAV), may trade at a discount or premium to NAV and are not individually redeemed from the Fund. Brokerage commissions will reduce returns. Investments in the Fund include risks associated with small-and mid-cap securities which involve limited liquidity and greater volatility than large-cap securities. Returns on investments in foreign securities could be more volatile than investments in securities of domestic issuers.
The S&P Developed Ex-U.S. BMI Index is a market capitalization weighted index that defines and measures the investable universe of publicly traded companies domiciled in developed countries outside the U.S. The S&P Index is float adjusted, meaning that only those shares publicly available to investors are included in the S&P Index calculation. It is not possible to invest directly in the Index. Free Cash Flow (FCF) represents the cash that a company is able to generate after accounting for capital expenditures.
The TrimTabs All Cap International Free-Cash-Flow ETF is distributed by Quasar Distributors, LLC.
TrimTabs All Cap International Free-Cash-Flow ETF
PERFORMANCE SUMMARY
July 31, 2020 (Unaudited)
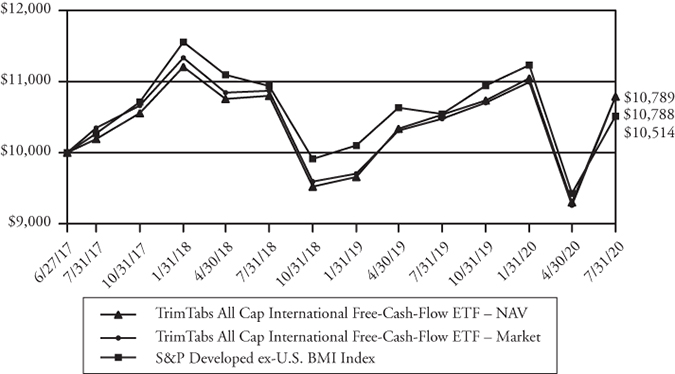
Growth of a $10,000 Investment
| | One | Three | Since |
| Average Annual Total Returns (as of July 31, 2020) | Year | Year | Inception(a) |
| TrimTabs All Cap International | | | |
| Free-Cash-Flow ETF – NAV | 2.42% | 1.91% | 2.49% |
| TrimTabs All Cap International | | | |
| Free-Cash-Flow ETF – Market | 2.97% | 1.40% | 2.48% |
| S&P Developed ex-U.S. BMI Index | -0.29%
| 0.79% | 1.63% |
This chart assumes an initial gross investment of $10,000 made on June 27, 2017 (commencement of the Fund’s operations). Returns shown include the reinvestment of all dividends. Returns shown do not reflect the deductions of taxes that a shareholder would pay on Fund distributions or the redemption of Fund shares. Past performance is not predictive of future performance. Investment return and principal value will fluctuate so that your shares, when redeemed, may be worth more or less than original cost. Index returns do not reflect the effects of fees or expenses. It is not possible to invest directly in an index.The total operating expense ratio as stated in the fee table to the Fund’s prospectus dated November 29, 2019, as supplemented May 29, 2020, is 0.61%. For performance information current to the most recent month-end, please call 1-800-617-0004.
(a) Commencement of operations on June 27, 2017.
TrimTabs All Cap International Free-Cash-Flow ETF
MANAGERS’ DISCUSSION OF FUND PERFORMANCE
July 31, 2020 (Unaudited)
For the twelve-month period from July 31, 2019 through July 31, 2020, the Fund returned 2.97% measured in market price and 2.42% measured in net asset value (“NAV”). By comparison, the broad-based benchmark for the Fund, the S&P Developed ex-US BMI Index (“S&P Index”), returned -0.29%.
During the second half of 2019, the global investment and economic environment was sensitive to the development of a major trade dispute between the US and, primarily, China but also intermittently with Mexico, Canada and Europe. International trade is a noticeably larger portion of economic activity outside the US than within.
As the trade conflict progressed, we strived to respond in the Fund in meaningful ways. As always, we emphasized companies with strong Free Cash Flow and robust balance sheets. On a fundamental basis, we looked at companies with other high-quality characteristics such as significant market share, competitive advantages, global brand awareness, and disruptive and/or state of the art technology. When possible, we added highly ranked companies with higher revenue exposure to the US where growth was stronger than the rest of the world.
In response to the COVID-19 pandemic, we have followed the data and focused on companies with strong Free Cash Flow, strong balance sheets, and where we have a higher level of conviction on a fundamental basis. Most importantly, in this environment, where some sectors have rising levels of bankruptcies, we have paid close attention to credit quality and liquidity. Our main goal of this focus on credit quality is to minimize the risk of large negative surprises.
Globally, we have observed the emergence of a bifurcated economy during the COVID-19 pandemic. This pandemic has rapidly accelerated trends in digital consumption and cloud computing. These behaviors, which include on-line shopping, on-line payments, streaming content, video conferencing, work-from-home, at-home workouts, and video gaming, appear to be sticky and longer lasting. These trends have disrupted companies with traditional business models that do not have the flexibility to adapt, innovate, and serve in this environment. The Fund’s portfolio has global exposure to companies with state of the art technology.
The views and opinions expressed in this discussion are those of TrimTabs Asset Management, LLC. The views and opinions expressed are subject to change at any time, are not guaranteed and should not be considered investment advice.
Past performance is no guarantee of future results.
Fund holdings and sector allocations are subject to change and are not recommendations to buy or sell any security. Current and future portfolio holdings are subject to risk.
TrimTabs ETF Trust
SHAREHOLDER EXPENSE EXAMPLES
For the Six-Months Ended July 31, 2020 (Unaudited)
As a shareholder of the Fund you incur two types of costs: (1) transaction costs for purchasing and selling shares; and (2) ongoing costs, including management fees and other Fund expenses. The following examples are intended to help you understand your ongoing costs (in dollars and cents) of investing in the Funds and to compare these costs with the ongoing costs of investing in other funds.
Each example is based on an investment of $1,000 invested at the beginning of the period and held for the entire six-month period as indicated below.
Actual Expenses
The first line in the table below provides information about actual account values and actual expenses. You may use the information provided in this line, together with the amount you invested, to estimate the expenses that you paid over the period. Simply divide your account value by $1,000 (for example, an $8,600 ending account value divided by $1,000 = 8.6), then multiply the result by the number in the first line under the heading entitled “Expenses Paid During Period” to estimate the expenses you paid on your account during the period.
Hypothetical Example for Comparison Purposes
The second line in the table below provides information about hypothetical account values and hypothetical expenses based on the Fund’s actual expense ratio and an assumed rate of return of 5% per year before expenses, which is not the Fund’s actual return. The hypothetical account values and expenses may not be used to estimate the actual ending account balance or expenses you paid for the period. You may use this information to compare the ongoing costs of investing in a Fund and other funds. To do so, compare this 5% hypothetical example with the 5% hypothetical examples that appear in the shareholder reports of the other funds. Please note that the expenses shown in the table are meant to highlight your ongoing costs only and do not reflect any transactional cost, such as brokerage commissions paid on purchases and sales of Fund shares. Therefore, the second line in the table below is useful in comparing ongoing Fund costs only and will not help you determine the relative total costs of owning different funds. In addition, if these transactional costs were included, your costs would have been higher.
TrimTabs ETF Trust
SHAREHOLDER EXPENSE EXAMPLES
For the Six-Months Ended July 31, 2020 (Unaudited) (Continued)
| | | | Expenses |
| | Beginning | Ending | Paid During |
| | Account | Account | Period |
| | Value | Value | 2/1/20 – |
| | 2/1/20 | 7/31/20 | 7/31/20(a) |
| TrimTabs All Cap U.S. | | | |
| Free-Cash-Flow ETF | | | |
| Actual | $1,000.00 | $1,016.10 | $2.96 |
| Hypothetical (5% return | | | |
| before expenses) | $1,000.00 | $1,021.93 | $2.97 |
| | | | |
| | | | Expenses |
| | Beginning | Ending | Paid During |
| | Account | Account | Period |
| | Value | Value | 2/1/20 – |
| | 2/1/20 | 7/31/20 | 7/31/20(a) |
| TrimTabs All Cap International | | | |
| Free-Cash-Flow ETF | | | |
| Actual | $1,000.00 | $ 976.70 | $2.90 |
| Hypothetical (5% return | | | |
| before expenses) | $1,000.00 | $1,021.93 | $2.97 |
(a) | Actual Expenses Paid are equal to the Fund’s annualized expense ratio of 0.59%, multiplied by the average account value over the period, multiplied by 182/366 to reflect the period. |
TrimTabs ETF Trust
PORTFOLIO HOLDINGS ALLOCATION (as a % of net assets)
July 31, 2020 (Unaudited)
TrimTabs All Cap U.S. Free-Cash-Flow ETF
| Communication Services | | | 6.6 | % |
| Consumer Discretionary | | | 14.7 | % |
| Consumer Staples | | | 9.9 | % |
| Energy | | | 2.0 | % |
| Financials | | | 14.1 | % |
| Health Care | | | 14.3 | % |
| Industrials | | | 9.4 | % |
| Information Technology | | | 27.0 | %(a) |
| Materials | | | 1.3 | % |
| Short-Term Investments | | | 0.7 | % |
| Liabilities in Excess of Other Assets | | | 0.0 | %(b) |
| Total Net Assets | | | 100.0 | % |
TrimTabs All Cap International Free-Cash-Flow ETF
| Australia | | | 5.9 | % |
| Canada | | | 5.2 | % |
| China | | | 3.3 | % |
| Denmark | | | 2.8 | % |
| Finland | | | 1.3 | % |
| France | | | 8.2 | % |
| Germany | | | 5.6 | % |
| Hong Kong | | | 1.6 | % |
| Ireland | | | 1.5 | % |
| Israel | | | 3.7 | % |
| Japan | | | 21.7 | % |
| Netherlands | | | 1.8 | % |
| Norway | | | 3.2 | % |
| Republic of Korea | | | 5.0 | % |
| Spain | | | 1.7 | % |
| Switzerland | | | 14.6 | % |
| United Kingdom | | | 10.8 | % |
| Other Countries | | | 1.5 | % |
| Short-Term Investments | | | 0.4 | % |
| Other Assets in Excess of Liabilities | | | 0.2 | % |
| Total Net Assets | | | 100.0 | % |
(a) | Amount represents investments in a particular sector. No industry within this sector represented more than 25% of the Fund’s total assets at the time of investment. |
(b) | Less than 0.05%. |
TrimTabs All Cap U.S. Free-Cash-Flow ETF
SCHEDULE OF INVESTMENTS
July 31, 2020
| | | Shares | | | Value | |
| COMMON STOCKS – 99.3% | | | | | | |
| | | | | | | |
| Communication Services – 6.6% | | | | | | |
| Activision Blizzard, Inc. | | | 8,740 | | | $ | 722,186 | |
| Alphabet, Inc. – Class A (a) | | | 1,425 | | | | 2,120,329 | |
| Facebook, Inc. – Class A (a) | | | 8,175 | | | | 2,073,752 | |
| The Walt Disney Co. | | | 10,205 | | | | 1,193,373 | |
| Zillow Group, Inc. – Class C (a) | | | 16,080 | | | | 1,099,711 | |
| | | | | | | | 7,209,351 | |
| Consumer Discretionary – 14.7% | | | | | | | | |
| Alibaba Group Holding Ltd. – ADR (a) | | | 5,628 | | | | 1,412,741 | |
| Amazon.com, Inc. (a) | | | 962 | | | | 3,044,422 | |
| Etsy, Inc. (a) | | | 10,402 | | | | 1,231,389 | |
| iRobot Corp. (a) | | | 9,175 | | | | 666,931 | |
| Lululemon Athletica, Inc. (a) | | | 3,289 | | | | 1,070,865 | |
| Marriott International, Inc. | | | 12,863 | | | | 1,078,241 | |
| NIKE, Inc. – Class B | | | 13,193 | | | | 1,287,769 | |
| Peloton Interactive, Inc. – Class A (a) | | | 14,346 | | | | 978,684 | |
| Starbucks Corp. | | | 13,882 | | | | 1,062,389 | |
| The Home Depot, Inc. | | | 5,259 | | | | 1,396,212 | |
| Thor Industries, Inc. | | | 9,309 | | | | 1,061,133 | |
| Yum China Holdings, Inc. | | | 33,627 | | | | 1,723,047 | |
| | | | | | | | 16,013,823 | |
| Consumer Staples – 9.9% | | | | | | | | |
| Brown-Forman Corp. – Class B | | | 16,302 | | | | 1,130,381 | |
| Colgate-Palmolive Co. | | | 13,485 | | | | 1,041,042 | |
| Costco Wholesale Corp. | | | 4,125 | | | | 1,342,811 | |
| Monster Beverage Corp. (a) | | | 15,840 | | | | 1,243,123 | |
| The Boston Beer Co., Inc. – Class A (a) | | | 2,049 | | | | 1,660,591 | |
| The Clorox Co. | | | 4,550 | | | | 1,076,120 | |
| The Estee Lauder Companies, Inc. | | | 5,266 | | | | 1,040,246 | |
| The Hershey Co. | | | 6,426 | | | | 934,405 | |
| Walmart, Inc. | | | 10,384 | | | | 1,343,690 | |
| | | | | | | | 10,812,409 | |
| Energy – 2.0% | | | | | | | | |
| Exxon Mobil Corp. | | | 52,363 | | | | 2,203,435 | |
The accompanying notes are an integral part of these financial statements.
TrimTabs All Cap U.S. Free-Cash-Flow ETF
SCHEDULE OF INVESTMENTS
July 31, 2020 (Continued)
| | | Shares | | | Value | |
| COMMON STOCKS – 99.3% (Continued) | | | | | | |
| | | | | | | |
| Financials – 14.1% | | | | | | |
| Aon PLC | | | 5,574 | | | $ | 1,143,896 | |
| Bank of America Corp. | | | 47,903 | | | | 1,191,827 | |
| Berkshire Hathaway, Inc. – Class B (a) | | | 7,826 | | | | 1,532,174 | |
| JPMorgan Chase & Co. | | | 27,075 | | | | 2,616,528 | |
| MarketAxess Holdings, Inc. | | | 2,862 | | | | 1,478,796 | |
| Moody’s Corp. | | | 4,035 | | | | 1,135,046 | |
| Morgan Stanley | | | 33,824 | | | | 1,653,317 | |
| Morningstar, Inc. | | | 4,520 | | | | 759,541 | |
| MSCI, Inc. | | | 3,393 | | | | 1,275,700 | |
| S&P Global, Inc. | | | 3,708 | | | | 1,298,727 | |
| The Progressive Corp. | | | 13,795 | | | | 1,246,240 | |
| | | | | | | | 15,331,792 | |
| Health Care – 14.3% | | | | | | | | |
| Abbott Laboratories | | | 11,691 | | | | 1,176,582 | |
| AbbVie, Inc. | | | 13,592 | | | | 1,290,017 | |
| Edwards Lifesciences Corp. (a) | | | 13,003 | | | | 1,019,565 | |
| Gilead Sciences, Inc. | | | 16,869 | | | | 1,172,902 | |
| Humana, Inc. | | | 3,270 | | | | 1,283,311 | |
| Illumina, Inc. (a) | | | 2,999 | | | | 1,146,098 | |
| Intuitive Surgical, Inc. (a) | | | 1,847 | | | | 1,266,008 | |
| Medtronic PLC | | | 6,527 | | | | 629,725 | |
| Regeneron Pharmaceuticals, Inc. (a) | | | 1,635 | | | | 1,033,434 | |
| UnitedHealth Group, Inc. | | | 6,780 | | | | 2,052,848 | |
| Vertex Pharmaceuticals, Inc. (a) | | | 3,396 | | | | 923,712 | |
| Zimmer Biomet Holdings, Inc. | | | 7,857 | | | | 1,059,595 | |
| Zoetis, Inc. | | | 9,829 | | | | 1,490,863 | |
| | | | | | | | 15,544,660 | |
| Industrials – 9.4% | | | | | | | | |
| CoStar Group, Inc. (a) | | | 1,696 | | | | 1,441,193 | |
| Lockheed Martin Corp. | | | 2,670 | | | | 1,011,850 | |
| Norfolk Southern Corp. | | | 5,679 | | | | 1,091,561 | |
| Old Dominion Freight Line, Inc. | | | 8,832 | | | | 1,614,666 | |
| Proto Labs, Inc. (a) | | | 10,831 | | | | 1,301,020 | |
| Rockwell Automation, Inc. | | | 5,408 | | | | 1,179,701 | |
| Trane Technologies PLC | | | 10,520 | | | | 1,176,872 | |
The accompanying notes are an integral part of these financial statements.
TrimTabs All Cap U.S. Free-Cash-Flow ETF
SCHEDULE OF INVESTMENTS
July 31, 2020 (Continued)
| | | Shares | | | Value | |
| COMMON STOCKS – 99.3% (Continued) | | | | | | |
| | | | | | | |
| Industrials – 9.4% (Continued) | | | | | | |
| Trex Co., Inc. (a) | | | 10,020 | | | $ | 1,396,087 | |
| | | | | | | | 10,212,950 | |
| Information Technology – 27.0% (d) | | | | | | | | |
| Accenture PLC – Class A | | | 6,140 | | | | 1,380,149 | |
| ANSYS, Inc. (a) | | | 4,602 | | | | 1,429,381 | |
| Apple, Inc. | | | 5,138 | | | | 2,183,856 | |
| Cadence Design Systems, Inc. (a) | | | 10,594 | | | | 1,157,394 | |
| FLIR Systems, Inc. | | | 25,860 | | | | 1,077,328 | |
| Fortinet, Inc. (a) | | | 8,066 | | | | 1,115,528 | |
| HP, Inc. | | | 59,644 | | | | 1,048,542 | |
| Intel Corp. | | | 23,980 | | | | 1,144,565 | |
| Jack Henry & Associates, Inc. | | | 6,608 | | | | 1,178,206 | |
| Keysight Technologies, Inc. (a) | | | 10,415 | | | | 1,040,354 | |
| Leidos Holdings, Inc. | | | 10,398 | | | | 989,474 | |
| Mastercard, Inc. – Class A | | | 3,743 | | | | 1,154,828 | |
| Maxim Integrated Products, Inc. | | | 16,498 | | | | 1,123,349 | |
| Microsoft Corp. | | | 13,366 | | | | 2,740,164 | |
| Nice Ltd. – ADR (a) | | | 8,505 | | | | 1,745,566 | |
| NVIDIA Corp. | | | 4,152 | | | | 1,762,898 | |
| Qualys, Inc. (a) | | | 8,983 | | | | 1,109,221 | |
| ServiceNow, Inc. (a) | | | 1,661 | | | | 729,511 | |
| Teradyne, Inc. | | | 10,147 | | | | 902,677 | |
| Texas Instruments, Inc. | | | 8,978 | | | | 1,145,144 | |
| VeriSign, Inc. (a) | | | 5,341 | | | | 1,130,583 | |
| Visa, Inc. – Class A | | | 5,480 | | | | 1,043,392 | |
| Zoom Video Communications, Inc. – Class A (a) | | | 3,942 | | | | 1,000,913 | |
| | | | | | | | 29,333,023 | |
| Materials – 1.3% | | | | | | | | |
| Louisiana-Pacific Corp. | | | 43,430 | | | | 1,375,428 | |
| TOTAL COMMON STOCKS | | | | | | | | |
| (Cost $86,090,589) | | | | | | | 108,036,871 | |
The accompanying notes are an integral part of these financial statements.
TrimTabs All Cap U.S. Free-Cash-Flow ETF
SCHEDULE OF INVESTMENTS
July 31, 2020 (Continued)
| | | Shares | | | Value | |
| SHORT-TERM INVESTMENTS – 0.7% | | | | | | |
| | | | | | | |
| Money Market Funds – 0.7% | | | | | | |
| Fidelity Institutional Money Market Funds – | | | | | | |
| Government Portfolio, Institutional Class, 0.050% (b) | | | 758,524 | | | $ | 758,524 | |
| TOTAL SHORT-TERM INVESTMENTS | | | | | | | | |
| (Cost $758,524) | | | | | | | 758,524 | |
| | | | | | | | | |
| Total Investments (Cost $86,849,113) – 100.0% | | | | | | | 108,795,395 | |
| Liabilities in Excess of Other Assets – 0.0% (c) | | | | | | | (4,263 | ) |
| TOTAL NET ASSETS – 100.0% | | | | | | $ | 108,791,132 | |
Percentages are stated as a percent of net assets.
ADR – American Depositary Receipt
| (a) | Non-income producing security. |
| (b) | Rate disclosed is the seven day yield as of July 31, 2020. |
| (c) | Less than 0.05%. |
| (d) | Amount represents investments in a particular sector. No industry within this sector represented more than 25% of the Fund’s total assets at the time of investment. |
For Fund compliance purposes, the Fund’s sector classifications refers to any one or more of the sector classifications used by one or more widely recognized market indexes or ratings group indexes, and/or they may be defined by Fund management. This definition does not apply for all purposes of this report, which may combine classifications for reporting ease.
The accompanying notes are an integral part of these financial statements.
TrimTabs All Cap International Free-Cash-Flow ETF
SCHEDULE OF INVESTMENTS
July 31, 2020
| | | Shares | | | Value | |
| COMMON STOCKS – 94.8% | | | | | | |
| | | | | | | |
| Communication Services – 6.7% | | | | | | |
| Capcom Co. Ltd. | | | 4,296 | | | $ | 167,611 | |
| Kakaku.com, Inc. | | | 5,361 | | | | 128,790 | |
| Nintendo Co. Ltd. | | | 300 | | | | 131,614 | |
| Rightmove PLC | | | 19,207 | | | | 139,086 | |
| Tencent Holdings Ltd. | | | 2,620 | | | | 180,519 | |
| | | | | | | | 747,620 | |
| Consumer Discretionary – 10.5% | | | | | | | | |
| adidas AG (a) | | | 510 | | | | 140,517 | |
| Alibaba Group Holding Ltd. – ADR (a) | | | 652 | | | | 163,665 | |
| Lululemon Athletica, Inc. (a) | | | 873 | | | | 284,240 | |
| Oriental Land Co. Ltd. | | | 986 | | | | 118,016 | |
| Puma SE (a) | | | 1,772 | | | | 137,430 | |
| Toyota Motor Corp. | | | 2,008 | | | | 117,933 | |
| Yum China Holdings, Inc. | | | 3,943 | | | | 202,039 | |
| | | | | | | | 1,163,840 | |
| Consumer Staples – 11.7% | | | | | | | | |
| Alimentation Couche-Tard, Inc. – Class B | | | 3,966 | | | | 137,831 | |
| Diageo PLC | | | 5,571 | | | | 204,262 | |
| Ebro Foods SA | | | 8,330 | | | | 186,435 | |
| Kao Corp. | | | 1,500 | | | | 108,204 | |
| L’Oreal SA | | | 459 | | | | 153,012 | |
| Nestle SA | | | 1,190 | | | | 140,658 | |
| Reckitt Benckiser Group PLC | | | 1,340 | | | | 135,168 | |
| Shiseido Co. Ltd. | | | 1,960 | | | | 108,318 | |
| Strauss Group Ltd. | | | 4,487 | | | | 127,180 | |
| | | | | | | | 1,301,068 | |
| Energy – 2.1% | | | | | | | | |
| Neste Oyj | | | 3,111 | | | | 142,480 | |
| TOTAL SE | | | 2,415 | | | | 89,041 | |
| | | | | | | | 231,521 | |
| Financials – 8.9% | | | | | | | | |
| BNP Paribas SA (a) | | | 4,564 | | | | 183,408 | |
| DNB ASA (a) | | | 12,644 | | | | 192,469 | |
| Partners Group Holding AG | | | 119 | | | | 114,661 | |
The accompanying notes are an integral part of these financial statements.
TrimTabs All Cap International Free-Cash-Flow ETF
SCHEDULE OF INVESTMENTS
July 31, 2020 (Continued)
| | | Shares | | | Value | |
| COMMON STOCKS – 94.8% (Continued) | | | | | | |
| | | | | | | |
| Financials – 8.9% (Continued) | | | | | | |
| Tokio Marine Holdings, Inc. | | | 2,437 | | | $ | 102,126 | |
| UBS Group AG | | | 16,410 | | | | 191,669 | |
| Zurich Insurance Group AG | | | 559 | | | | 205,495 | |
| | | | | | | | 989,828 | |
| Health Care – 10.3% | | | | | | | | |
| Cochlear Ltd. | | | 841 | | | | 114,294 | |
| CSL Ltd. | | | 897 | | | | 173,097 | |
| ICON PLC (a) | | | 868 | | | | 160,979 | |
| Novartis AG | | | 2,652 | | | | 218,847 | |
| Novo Nordisk A/S – Class B | | | 2,059 | | | | 135,786 | |
| Roche Holding AG | | | 670 | | | | 231,575 | |
| Shionogi & Co. Ltd. | | | 1,800 | | | | 106,430 | |
| | | | | | | | 1,141,008 | |
| Industrials – 15.6% | | | | | | | | |
| Ashtead Group PLC | | | 4,386 | | | | 139,801 | |
| Canadian Pacific Railway Ltd. | | | 577 | | | | 158,779 | |
| Daikin Industries Ltd. | | | 1,000 | | | | 174,295 | |
| FANUC Corp. | | | 600 | | | | 100,354 | |
| GEA Group AG | | | 4,065 | | | | 146,668 | |
| Howden Joinery Group PLC | | | 17,214 | | | | 110,480 | |
| Intertek Group PLC | | | 1,808 | | | | 127,280 | |
| Legrand SA | | | 1,583 | | | | 122,101 | |
| Recruit Holdings Co. Ltd. | | | 3,775 | | | | 116,543 | |
| Siemens AG | | | 1,566 | | | | 199,815 | |
| TOMRA Systems ASA (a) | | | 4,006 | | | | 164,301 | |
| Vestas Wind Systems A/S | | | 1,377 | | | | 176,827 | |
| | | | | | | | 1,737,244 | |
| Information Technology – 19.7% | | | | | | | | |
| ASML Holding NV | | | 567 | | | | 200,170 | |
| Atlassian Corp PLC – Class A (a) | | | 1,054 | | | | 186,189 | |
| Dassault Systemes SE | | | 986 | | | | 178,981 | |
| Halma PLC | | | 5,397 | | | | 153,869 | |
| Logitech International SA | | | 2,906 | | | | 210,606 | |
| Nice Ltd. – ADR (a) | | | 1,378 | | | | 282,821 | |
The accompanying notes are an integral part of these financial statements.
TrimTabs All Cap International Free-Cash-Flow ETF
SCHEDULE OF INVESTMENTS
July 31, 2020 (Continued)
| | | Shares | | | Value | |
| COMMON STOCKS – 94.8% (Continued) | | | | | | |
| | | | | | | |
| Information Technology – 19.7% (Continued) | | | | | | |
| Nomura Research Institute Ltd. | | | 6,712 | | | $ | 176,019 | |
| Omron Corp. | | | 3,221 | | | | 229,126 | |
| Samsung Electronics Co. Ltd. – GDR (b) | | | 173 | | | | 208,638 | |
| SCSK Corp. | | | 2,238 | | | | 112,899 | |
| Tokyo Electron Ltd. | | | 565 | | | | 153,720 | |
| Yaskawa Electric Corp. | | | 3,004 | | | | 98,899 | |
| | | | | | | | 2,191,937 | |
| Materials – 6.4% | | | | | | | | |
| Air Liquide SA | | | 1,095 | | | | 180,064 | |
| Fortescue Metals Group Ltd. | | | 17,738 | | | | 220,635 | |
| Givaudan SA | | | 39 | | | | 160,384 | |
| Sika AG | | | 676 | | | | 148,202 | |
| | | | | | | | 709,285 | |
| Real Estate – 2.9% | | | | | | | | |
| Goodman Group (c) | | | 12,656 | | | | 153,082 | |
| Japan Logistics Fund, Inc. (c) | | | 55 | | | | 164,706 | |
| | | | | | | | 317,788 | |
| TOTAL COMMON STOCKS | | | | | | | | |
| (Cost $8,578,937) | | | | | | | 10,531,139 | |
| | | | | | | | | |
| EXCHANGE TRADED FUNDS – 4.6% | | | | | | | | |
| iShares MSCI Europe Financials ETF | | | 11,336 | | | | 163,465 | |
| iShares MSCI South Korea ETF | | | 5,834 | | | | 351,557 | |
| TOTAL EXCHANGE TRADED FUNDS | | | | | | | | |
| (Cost $563,428) | | | | | | | 515,022 | |
The accompanying notes are an integral part of these financial statements.
TrimTabs All Cap International Free-Cash-Flow ETF
SCHEDULE OF INVESTMENTS
July 31, 2020 (Continued)
| | | Shares | | | Value | |
| SHORT-TERM INVESTMENTS – 0.4% | | | | | | |
| | | | | | | |
| Money Market Funds – 0.4% | | | | | | |
| Fidelity Institutional Money Market Funds – | | | | | | |
| Government Portfolio, Institutional Class, 0.050% (d) | | | 44,803 | | | $ | 44,803 | |
| TOTAL SHORT-TERM INVESTMENTS | | | | | | | | |
| (Cost $44,803) | | | | | | | 44,803 | |
| | | | | | | | | |
| Total Investments (Cost $9,187,169) – 99.8% | | | | | | | 11,090,964 | |
| Other Assets in Excess of Liabilities – 0.2% | | | | | | | 25,239 | |
| TOTAL NET ASSETS – 100.0% | | | | | | $ | 11,116,203 | |
Percentages are stated as a percent of net assets.
ADR – American Depositary Receipt
GDR – Global Depositary Receipt
PLC – Public Limited Company
| (a) | Non-income producing security. |
| (b) | Security exempt from registration under Regulation S of the Securities Act of 1933. Such securities are treated as liquid according to the Fund’s liquidity guidelines. At July 31, 2020, the value of this security amounted to $208,638 or 1.9% of net assets. |
| (c) | Real Estate Investment Trust. |
| (d) | Rate disclosed is the seven day yield as of July 31, 2020. |
For Fund compliance purposes, the Fund’s sector classifications refers to any one or more of the sector classifications used by one or more widely recognized market indexes or ratings group indexes, and/or they may be defined by Fund management. This definition does not apply for all purposes of this report, which may combine classifications for reporting ease.
The accompanying notes are an integral part of these financial statements.
TrimTabs ETF Trust
STATEMENTS OF ASSETS & LIABILITIES
July 31, 2020
| | | | | | TrimTabs | |
| | | TrimTabs | | | All Cap | |
| | | All Cap U.S. | | | International | |
| | | Free-Cash-Flow | | | Free-Cash-Flow | |
| | | ETF | | | ETF | |
| ASSETS | | | | | | |
| Investments in Securities, at Value* | | $ | 108,795,395 | | | $ | 11,090,964 | |
| Receivable for Investment Securities Sold | | | 981,805 | | | | — | |
| Interest and Dividends Receivable | | | 66,123 | | | | 30,765 | |
| Total Assets | | | 109,843,323 | | | | 11,121,729 | |
| | | | | | | | | |
| LIABILITIES | | | | | | | | |
| Management Fees Payable | | | 54,106 | | | | 5,526 | |
| Payable for Fund Shares Redeemed | | | 998,085 | | | | — | |
| Total Liabilities | | | 1,052,191 | | | | 5,526 | |
| NET ASSETS | | $ | 108,791,132 | | | $ | 11,116,203 | |
| | | | | | | | | |
| NET ASSETS CONSIST OF: | | | | | | | | |
| Paid-in Capital | | $ | 101,858,167 | | | $ | 11,121,784 | |
| Total Distributable Earnings | | | | | | | | |
| (Accumulated Deficit) | | | 6,932,965 | | | | (5,581 | ) |
| Net Assets | | $ | 108,791,132 | | | $ | 11,116,203 | |
| * Identified Cost: | | | | | | | | |
| Investments in Securities | | $ | 86,849,113 | | | $ | 9,187,169 | |
| | | | | | | | | |
| Net Asset Value (unlimited shares authorized): | | | | | | | | |
| Net Assets | | $ | 108,791,132 | | | $ | 11,116,203 | |
| Shares Outstanding (No Par Value) | | | 2,725,000 | | | | 425,000 | |
| Net Asset Value, Offering and | | | | | | | | |
| Redemption Price per Share | | $ | 39.92 | | | $ | 26.16 | |
The accompanying notes are an integral part of these financial statements.
TrimTabs ETF Trust
STATEMENTS OF OPERATIONS
Year Ended July 31, 2020
| | | | | | TrimTabs | |
| | | TrimTabs | | | All Cap | |
| | | All Cap U.S. | | | International | |
| | | Free-Cash-Flow | | | Free-Cash-Flow | |
| | | ETF | | | ETF | |
| INVESTMENT INCOME | | | | | | |
| Income: | | | | | | |
| Dividends (net of foreign withholding tax | | | | | | |
| of $0 and $27,284, respectively) | | $ | 1,444,646 | | | $ | 181,483 | |
| Interest | | | 20,235 | | | | 2,104 | |
| Total Investment Income | | | 1,464,881 | | | | 183,587 | |
| | | | | | | | | |
| Expenses: | | | | | | | | |
| Management Fees | | | 680,513 | | | | 68,189 | |
| Total Expenses | | | 680,513 | | | | 68,189 | |
| Net Investment Income | | | 784,368 | | | | 115,398 | |
| | | | | | | | | |
| REALIZED & UNREALIZED | | | | | | | | |
| GAIN (LOSS) ON INVESTMENTS | | | | | | | | |
| Net Realized Gain (Loss) on: | | | | | | | | |
| Investment Securities | | | (4,729,815 | ) | | | (1,098,415 | ) |
| Foreign Currencies | | | — | | | | (12,987 | ) |
| Total | | | (4,729,815 | ) | | | (1,111,402 | ) |
| Net Change in Unrealized Appreciation of: | | | | | | | | |
| Investments Securities | | | 9,605,380 | | | | 1,034,212 | |
| Foreign Currency Translations | | | — | | | | 1,892 | |
| Total | | | 9,605,380 | | | | 1,036,104 | |
| Net Realized and Unrealized Gain (Loss) | | | | | | | | |
| on Investments and Foreign Currencies | | | 4,875,565 | | | | (75,298 | ) |
| NET INCREASE IN NET ASSETS | | | | | | | | |
| RESULTING FROM OPERATIONS | | $ | 5,659,933 | | | $ | 40,100 | |
The accompanying notes are an integral part of these financial statements.
TrimTabs All Cap U.S. Free-Cash-Flow ETF
STATEMENTS OF CHANGES IN NET ASSETS
| | | Year Ended | | | Year Ended | |
| | | July 31, 2020 | | | July 31, 2019 | |
| OPERATIONS | | | | | | |
| Net Investment Income | | $ | 784,368 | | | $ | 1,037,781 | |
| Net Realized Loss on Investments | | | (4,729,815 | ) | | | (296,359 | ) |
| Net Change in Unrealized | | | | | | | | |
| Appreciation of Investments | | | 9,605,380 | | | | 1,466,422 | |
| Net Increase in Net Assets | | | | | | | | |
| Resulting from Operations | | | 5,659,933 | | | | 2,207,844 | |
| | | | | | | | | |
| DISTRIBUTIONS TO SHAREHOLDERS | | | | | | | | |
| Dividends and Distributions | | | (915,650 | ) | | | (684,621 | ) |
| Total Distributions to Shareholders | | | (915,650 | ) | | | (684,621 | ) |
| | | | | | | | | |
| CAPITAL SHARE TRANSACTIONS | | | | | | | | |
| Proceeds from Shares Sold | | | 8,485,742 | | | | 55,574,345 | |
| Payments for Shares Redeemed | | | (28,495,215 | ) | | | (32,254,807 | ) |
| Net Increase (Decrease) in Net Assets Derived | | | | | | | | |
from Capital Share Transactions(a) | | | (20,009,473 | ) | | | 23,319,538 | |
| Net Increase (Decrease) in Net Assets | | | (15,265,190 | ) | | | 24,842,761 | |
| | | | | | | | | |
| NET ASSETS | | | | | | | | |
| Beginning of Year | | | 124,056,322 | | | | 99,213,561 | |
| End of Year | | $ | 108,791,132 | | | $ | 124,056,322 | |
| | | | | | | | | |
| (a) Summary of capital share transactions is as follows: | | | | | | | | |
| | | Shares | | | Shares | |
| Subscriptions | | | 250,000 | | | | 1,500,000 | |
| Redemptions | | | (825,000 | ) | | | (925,000 | ) |
| Net Increase (Decrease) | | | (575,000 | ) | | | 575,000 | |
The accompanying notes are an integral part of these financial statements.
TrimTabs All Cap International Free-Cash-Flow ETF
STATEMENTS OF CHANGES IN NET ASSETS
| | | Year Ended | | | Year Ended | |
| | | July 31, 2020 | | | July 31, 2019 | |
| OPERATIONS | | | | | | |
| Net Investment Income | | $ | 115,398 | | | $ | 165,219 | |
| Net Realized Loss on Investments | | | | | | | | |
| and Foreign Currencies | | | (1,111,402 | ) | | | (653,938 | ) |
| Net Change in Unrealized Appreciation of | | | | | | | | |
| Investments and Foreign Currencies | | | 1,036,104 | | | | 299,056 | |
| Net Increase (Decrease) in Net Assets | | | | | | | | |
| Resulting from Operations | | | 40,100 | | | | (189,663 | ) |
| | | | | | | | | |
| DISTRIBUTIONS TO SHAREHOLDERS | | | | | | | | |
| Dividends and Distributions | | | (244,461 | ) | | | (92,157 | ) |
| Total Distributions to Shareholders | | | (244,461 | ) | | | (92,157 | ) |
| | | | | | | | | |
| CAPITAL SHARE TRANSACTIONS | | | | | | | | |
| Proceeds from Shares Sold | | | — | | | | 2,544,445 | |
| Payments for Shares Redeemed | | | (1,040,455 | ) | | | — | |
| Net Increase (Decrease) in Net Assets | | | | | | | | |
Derived from Capital Share Transactions(a) | | | (1,040,455 | ) | | | 2,544,445 | |
| Net Increase (Decrease) in Net Assets | | | (1,244,816 | ) | | | 2,262,625 | |
| | | | | | | | | |
| NET ASSETS | | | | | | | | |
| Beginning of Year | | | 12,361,019 | | | | 10,098,394 | |
| End of Year | | $ | 11,116,203 | | | $ | 12,361,019 | |
| | | | | | | | | |
| (a) Summary of capital share transactions is as follows: | | | | | | | | |
| | | Shares | | | Shares | |
| Subscriptions | | | — | | | | 100,000 | |
| Redemptions | | | (50,000 | ) | | | — | |
| Net Increase (Decrease) | | | (50,000 | ) | | | 100,000 | |
The accompanying notes are an integral part of these financial statements.
TrimTabs All Cap U.S. Free-Cash-Flow ETF
FINANCIAL HIGHLIGHTS
For a capital share outstanding throughout the year/period
| | | Year Ended | | | Year Ended | | | Year Ended | | | Period Ended | |
| | | July 31, | | | July 31, | | | July 31, | | | July 31, | |
| | | 2020 | | | 2019 | | | 2018 | | | 2017(a) | |
| Net Asset Value, | | | | | | | | | | | | |
| Beginning of Year/Period | | $ | 37.59 | | | $ | 36.41 | | | $ | 29.81 | | | $ | 25.00 | |
| | | | | | | | | | | | | | | | | |
| Income from Investment | | | | | | | | | | | | | | | | |
| Operations: | | | | | | | | | | | | | | | | |
Net Investment Income(b) | | | 0.25 | | | | 0.30 | | | | 0.21 | | | | 0.16 | |
| Net Realized and Unrealized | | | | | | | | | | | | | | | | |
| Gain on Investments | | | 2.36 | | | | 1.07 | | | | 6.53 | | | | 4.70 | |
| Total from | | | | | | | | | | | | | | | | |
| Investment Operations | | | 2.61 | | | | 1.37 | | | | 6.74 | | | | 4.86 | |
| | | | | | | | | | | | | | | | | |
| Less Distributions: | | | | | | | | | | | | | | | | |
| From Net Investment Income | | | (0.28 | ) | | | (0.19 | ) | | | (0.14 | ) | | | (0.05 | ) |
| Total Distributions | | | (0.28 | ) | | | (0.19 | ) | | | (0.14 | ) | | | (0.05 | ) |
| Net Asset Value, | | | | | | | | | | | | | | | | |
| End of Year/Period | | $ | 39.92 | | | $ | 37.59 | | | $ | 36.41 | | | $ | 29.81 | |
| Total Return | | | 6.97 | % | | | 3.89 | % | | | 22.62 | % | | | 19.47 | %(c) |
| | | | | | | | | | | | | | | | | |
| Supplemental Data: | | | | | | | | | | | | | | | | |
| Net Assets at | | | | | | | | | | | | | | | | |
| End of Year/Period (000’s) | | $ | 108,791 | | | $ | 124,056 | | | $ | 99,214 | | | $ | 27,574 | |
| | | | | | | | | | | | | | | | | |
| Ratios to Average Net Assets: | | | | | | | | | | | | | | | | |
| Expenses to Average Net Assets | | | 0.59 | % | | | 0.59 | % | | | 0.59 | % | | | 0.59 | %(d) |
| Net Investment Income | | | | | | | | | | | | | | | | |
| to Average Net Assets | | | 0.68 | % | | | 0.84 | % | | | 0.60 | % | | | 0.68 | %(d) |
Portfolio Turnover Rate(e) | | | 83 | % | | | 49 | % | | | 42 | % | | | 63 | %(c) |
| (a) | Commencement of operations on September 27, 2016. |
| (b) | Calculated based on average shares outstanding during the period. |
| (c) | Not annualized. |
| (d) | Annualized. |
| (e) | Excludes impact of in-kind transactions. |
The accompanying notes are an integral part of these financial statements.
TrimTabs All Cap International Free-Cash-Flow ETF
FINANCIAL HIGHLIGHTS
For a capital share outstanding throughout the year/period
| | | Year Ended | | | Year Ended | | | Year Ended | | | Period Ended | |
| | | July 31, | | | July 31, | | | July 31, | | | July 31, | |
| | | 2020 | | | 2019 | | | 2018 | | | 2017(a) | |
| Net Asset Value, | | | | | | | | | | | | |
| Beginning of Year/Period | | $ | 26.02 | | | $ | 26.93 | | | $ | 25.48 | | | $ | 25.00 | |
| | | | | | | | | | | | | | | | | |
| Income from Investment | | | | | | | | | | | | | | | | |
| Operations: | | | | | | | | | | | | | | | | |
Net Investment Income(b) | | | 0.25 | | | | 0.37 | | | | 0.34 | | | | 0.01 | |
| Net Realized and Unrealized | | | | | | | | | | | | | | | | |
| Gain (Loss) on Investments | | | 0.40 | | | | (1.08 | ) | | | 1.18 | | | | 0.47 | |
| Total from | | | | | | | | | | | | | | | | |
| Investment Operations | | | 0.65 | | | | (0.71 | ) | | | 1.52 | | | | 0.48 | |
| | | | | | | | | | | | | | | | | |
| Less Distributions: | | | | | | | | | | | | | | | | |
| From Net Investment Income | | | (0.51 | ) | | | (0.20 | ) | | | (0.07 | ) | | | — | |
| Total Distributions | | | (0.51 | ) | | | (0.20 | ) | | | (0.07 | ) | | | — | |
| Net Asset Value, | | | | | | | | | | | | | | | | |
| End of Year/Period | | $ | 26.16 | | | $ | 26.02 | | | $ | 26.93 | | | $ | 25.48 | |
| Total Return | | | 2.42 | % | | | -2.47 | % | | | 5.97 | % | | | 1.92 | %(c) |
| | | | | | | | | | | | | | | | | |
| Supplemental Data: | | | | | | | | | | | | | | | | |
| Net Assets at | | | | | | | | | | | | | | | | |
| End of Year/Period (000’s) | | $ | 11,116 | | | $ | 12,361 | | | $ | 10,098 | | | $ | 3,822 | |
| | | | | | | | | | | | | | | | | |
| Ratios to Average Net Assets: | | | | | | | | | | | | | | | | |
| Expenses to Average Net Assets | | | 0.59 | % | | | 0.59 | % | | | 0.59 | % | | | 0.59 | %(d) |
| Net Investment Income | | | | | | | | | | | | | | | | |
| to Average Net Assets | | | 1.00 | % | | | 1.48 | % | | | 1.28 | % | | | 0.35 | %(d) |
Portfolio Turnover Rate(e) | | | 45 | % | | | 43 | % | | | 83 | % | | | 0 | %(c) |
| (a) | Commencement of operations on June 27, 2017. |
| (b) | Calculated based on average shares outstanding during the period. |
| (c) | Not annualized. |
| (d) | Annualized. |
| (e) | Excludes impact of in-kind transactions. |
The accompanying notes are an integral part of these financial statements.
TrimTabs ETF Trust
NOTES TO FINANCIAL STATEMENTS
July 31, 2020
1. ORGANIZATION
The TrimTabs All Cap U.S. Free-Cash-Flow ETF (formerly known as the TrimTabs Float Shrink ETF) and TrimTabs All Cap International Free-Cash-Flow ETF (each, a “Fund” and collectively, the “Funds”) are each a series of the TrimTabs ETF Trust (the “Trust”). The Trust was organized as a Delaware statutory trust on April 2, 2014. Each Fund is classified as a diversified, open-end management investment company registered under the Investment Company Act of 1940, as amended (the “1940 Act”). TrimTabs All Cap U.S. Free-Cash-Flow ETF commenced operations on September 27, 2016 and that is the date the initial creation units were established. The Fund seeks to generate long-term returns in excess of the total return of the Russell 3000® Index (the “Russell Index”), with less volatility than the Russell Index. TrimTabs All Cap International Free-Cash-Flow ETF commenced operations on June 27, 2017 and that is the date the initial creation units were established. The Fund seeks to generate long-term returns in excess of the total return of the S&P Developed ex-U.S. BMI Index, with similar volatility to the S&P Developed ex-U.S. BMI Index.
Shares of the Funds are listed and traded on the Cboe BZX Exchange, Inc. (“Cboe” or the “Exchange”). Market prices for the shares may be different from their net asset value (“NAV”). Each Fund issues and redeems shares on a continuous basis at NAV only in large blocks of shares, called “Creation Units,” which generally consist of 25,000 shares. Creation Units are issued and redeemed principally in-kind for securities included in a specified universe. Once created, shares generally trade in the secondary market at market prices that change throughout the day in amounts less than a Creation Unit. Except when aggregated in Creation Units, shares are not redeemable securities of a Fund. Shares of a Fund may only be purchased directly from or redeemed directly to a Fund by certain financial institutions (“Authorized Participants”). An Authorized Participant is either (i) a broker-dealer or other participant in the clearing process through the Continuous Net Settlement System of the National Securities Clearing Corporation or (ii) a DTC participant and, in each case, must have executed a Participant Agreement with Quasar Distributors, LLC (the “Distributor”). Most retail investors do not qualify as Authorized Participants or have the resources to buy and sell whole Creation Units. Therefore, most retail investors may purchase shares in the secondary market with the assistance of a broker and are subject to customary brokerage commissions or fees.
Each Fund currently offers one class of shares, which have no front end sales loads, no deferred sales charges, and no redemption fees. A purchase (i.e., creation) transaction fee is imposed for the transfer and other transaction costs associated with the purchase of Creation Units. TrimTabs All Cap U.S. Free-Cash-Flow ETF charges $500 for the standard fixed creation fee and TrimTabs All Cap International Free-Cash-Flow ETF charges $1,500 for the standard fixed creation fee, payable to the Custodian. In addition, a variable fee may be charged on all cash transactions or substitutes for Creation Units of up to a maximum of 2% as a percentage of the total value of the Creation Units subject to the transaction. Variable fees received by each Fund are
TrimTabs ETF Trust
NOTES TO FINANCIAL STATEMENTS
July 31, 2020 (Continued)
displayed in the Capital Share Transactions section of the Statement of Changes in Net Assets. There were no variable fees charged in either Fund during the fiscal year. Each Fund may issue an unlimited number of shares of beneficial interest, with no par value. Shares of each Fund have equal rights and privileges with respect to such Fund.
2. SIGNIFICANT ACCOUNTING POLICIES
Each Fund is a registered investment company and accordingly follows the investment company accounting and reporting guidance of the Financial Accounting Standards Board (“FASB”) Accounting Standard Codification (“ASC”) Topic 946 Financial Services – Investment Companies.
The following is a summary of significant accounting policies followed by each Fund in the preparation of their financial statements. These policies are in conformity with accounting principles generally accepted in the United States of America (“GAAP”).
Security Transactions and Investment Income: Investment securities transactions are accounted for on the trade date. Gains and losses realized on sales of securities are computed on the basis of specific identification. Dividend income is recorded on the ex-dividend date. Withholding taxes on foreign dividends have been provided for in accordance with the Funds’ understanding of the applicable tax rules and regulations. Interest income is recorded on an accrual basis. Discounts and premiums on securities purchased are accreted and amortized over the lives of the respective securities.
Dividend Distributions: Distributions to shareholders are recorded on the ex-dividend date and are determined in accordance with federal income tax regulations, which may differ from GAAP. Each Fund distributes all or substantially all of its net investment income to shareholders in the form of dividends.
Federal Income Taxes: The Funds comply with the requirements of subchapter M of the Internal Revenue Code of 1986, as amended, necessary to qualify as regulated investment companies and distribute substantially all net taxable investment income and net realized gains to shareholders in a manner which results in no tax cost to the Funds. Therefore, no federal income tax provision is required. As of and during the year ended July 31, 2020, the Funds did not have any tax positions that did not meet the “more-likely-than-not” threshold of being sustained by the applicable tax authority. As of and during the year ended July 31, 2020, the Funds did not have liabilities for any unrecognized tax benefits on uncertain tax positions as income tax expense in the Statements of Operations. During the year ended July 31, 2020, the Funds did not incur any interest or penalties. The Funds are subject to examination by U.S. taxing authorities for the tax periods since each Fund’s commencement of operations.
Currency Translation: Assets and liabilities, including investment securities, denominated in currencies other than U.S. dollars are translated into U.S. dollars at the exchange rates supplied by one or more pricing vendors on the valuation date. Purchases and sales of investment securities and income and expenses are translated into U.S. dollars at the exchange rates on the dates of such transactions. The effects of changes in exchange rates
TrimTabs ETF Trust
NOTES TO FINANCIAL STATEMENTS
July 31, 2020 (Continued)
on investment securities are included with the net realized gain or loss and net unrealized appreciation or depreciation on investments in the Funds’ Statement of Operations. The realized gain or loss and unrealized appreciation or depreciation resulting from all other transactions denominated in currencies other than U.S. dollars are disclosed separately.
Use of Estimates: The preparation of financial statements in conformity with GAAP requires management to make estimates and assumptions that affect the reported amounts of assets and liabilities and disclosure of contingent assets and liabilities at the date of the financial statements, and the reported amounts of increases and decreases in net assets from operations during the reporting period. Actual results could differ from those estimates.
Share Valuation: The NAV per share of each Fund is calculated by dividing the sum of the value of the securities held by the Fund, plus cash and other assets, minus all liabilities (including estimated accrued expenses) by the total number of shares outstanding for the Fund, rounded to the nearest cent. The offering and redemption price per share for each Fund is equal to the Fund’s net asset value per share.
Guarantees and Indemnifications: The Funds indemnify their officers and trustees for certain liabilities that may arise from the performance of their duties to the Funds. Additionally, in the normal course of business, the Trust enters into contracts with its vendors and others that provide for general indemnifications. The Trust and Funds’ maximum exposure under these arrangements is unknown, as this would involve future claims that may be made against the Funds. However, based on industry experience, the Funds expect that risk of loss to be remote.
Reclassification of Capital Accounts: U.S. GAAP requires that certain components of net assets relating to permanent differences be reclassified between financial and tax reporting. These reclassifications have no effect on net assets or NAV per share. For the fiscal year ended July 31, 2020, the following table shows the reclassifications made:
| | Distributable Earnings | | | Paid-In | |
| | (Accumulated Deficit) | | | Capital | |
| TrimTabs All Cap U.S. Free-Cash-Flow ETF | | $ | (4,033,795 | ) | | | $ | 4,033,795 | |
| TrimTabs All Cap International Free-Cash-Flow ETF | | $ | 7,487 | | | | $ | (7,487 | ) |
During the fiscal year ended July 31, 2020, the Funds realized the following net capital gains resulting from in-kind redemptions in which shareholders exchanged Fund shares for securities held by the Funds rather than for cash. Because such gains are not taxable to the Funds, and are not distributed to shareholders, they have been reclassified from distributable earnings to paid-in capital.
| | Gains/(Losses) from | |
| | In-Kind Redemptions | |
| TrimTabs All Cap U.S. Free-Cash-Flow ETF | | $ | 4,123,412 | | |
| TrimTabs All Cap International Free-Cash-Flow ETF | | $ | (3,505 | ) | |
TrimTabs ETF Trust
NOTES TO FINANCIAL STATEMENTS
July 31, 2020 (Continued)
Subsequent Events: The Trust has evaluated the need for disclosures and/or adjustments resulting from subsequent events through the date the financial statements were issued. Based on this evaluation, no adjustments or disclosures were required to the financial statements other than the events listed below.
The global outbreak of COVID-19 (commonly referred to as “coronavirus”) has disrupted economic markets and the prolonged economic impact is uncertain. The ultimate economic fallout from the pandemic, and the long-term impact on economies, markets, industries and individual issuers, are not known. The operational and financial performance of the issuers of securities in which the Funds invest depends on future developments, including the duration and spread of the outbreak, and such uncertainty may in turn adversely affect the value and liquidity of the Funds’ investments, impair the Funds’ ability to satisfy redemption requests, and negatively impact the Funds’ performance.
3. SECURITIES VALUATION
Investment Valuation: Each Fund calculates its net asset value (“NAV”) each day the New York Stock Exchange (the “NYSE”) is open for trading as of the close of regular trading on the NYSE, normally 4:00 p.m. Eastern time (the “NAV Calculation Time”).
Equity securities are valued primarily on the basis of market quotations reported on stock exchanges and other securities markets around the world. If an equity security is listed on a national securities exchange, the security is valued at the closing price or, if the closing price is not readily available, the mean of the closing bid and asked prices.
Market quotations and indicative bids are obtained from outside pricing services approved and monitored pursuant to a policy approved by the Funds’ Board of Trustees (the “Board”). If a market quotation is not readily available or is deemed not to reflect market value, the Funds will determine the price of the security held by the Funds based on a determination of the security’s fair value pursuant to policies and procedures approved by the Board. In addition, the Funds may use fair valuation to price securities that trade on a foreign exchange when a significant event has occurred after the foreign exchange closes but before the time at which the Funds’ NAV’s are calculated. Such valuations would typically be categorized as Level 2 or Level 3 in the fair value hierarchy described below.
Foreign exchanges typically close before the time at which Fund share prices are calculated and may be closed altogether on some days when shares of the Funds are traded. Significant events affecting a foreign security may include, but are not limited to: corporate actions, earnings announcements, litigation or other events impacting a single issuer; governmental action that affects securities in one sector or country; natural disasters or armed conflicts affecting a country or region; or significant domestic or foreign market fluctuations.
TrimTabs ETF Trust
NOTES TO FINANCIAL STATEMENTS
July 31, 2020 (Continued)
Fair valuations and valuations of investments that are not actively trading involve judgment and may differ materially from valuations that would have been used had greater market activity occurred.
Fair Valuation Measurement:
The FASB established a framework for measuring fair value in accordance with GAAP. Under FASB ASC Topic 820, Fair Value Measurement, various inputs are used in determining the value of each Fund’s investments. The inputs or methodology used for valuing securities are not necessarily an indication of the risk associated with investing in those securities. The three Levels of inputs of the fair value hierarchy are defined as follows:
| Level 1 — | Unadjusted quoted prices in active markets for identical assets or liabilities. |
| | |
| Level 2 — | Observable inputs other than quoted prices included in Level 1 that are observable for the asset or liability, either directly or indirectly. These inputs may include quoted prices for the identical instrument on an inactive market, prices for similar securities, interest rates, prepayment speeds, credit risk, yield curves, default rates and similar data. |
| | |
| Level 3 — | Unobservable inputs for the asset or liability, to the extent relevant observable inputs are not available; representing the Fund’s own assumptions about the assumptions a market participant would use in valuing the asset or liability and would be based on the best information available. |
A financial instrument’s level within the fair value hierarchy is based on the lowest level of any input that is significant to the fair value measurement.
The availability of observable inputs can vary from security to security and is affected by a wide variety of factors, including, for example, the type of security, whether the security is new and not yet established in the marketplace, the liquidity of markets, and other characteristics particular to the security. To the extent that valuation is based on models or inputs that are less observable or unobservable in the market, the determination of fair value requires more judgment. Accordingly, the degree of judgment exercised in determining fair value is greatest for instruments categorized in Level 3.
The following is a summary of the inputs used to value the Fund’s investments as of July 31, 2020:
TrimTabs All Cap U.S. Free-Cash-Flow ETF
Description^ | | Level 1 | | | Level 2 | | | Level 3 | | | Total | |
| Common Stocks | | $ | 108,036,871 | | | $ | — | | | $ | — | | | $ | 108,036,871 | |
| Short-Term Investments | | | 758,524 | | | | — | | | | — | | | | 758,524 | |
| Total Investments | | | | | | | | | | | | | | | | |
| in Securities | | $ | 108,795,395 | | | $ | — | | | $ | — | | | $ | 108,795,395 | |
TrimTabs ETF Trust
NOTES TO FINANCIAL STATEMENTS
July 31, 2020 (Continued)
TrimTabs All Cap International Free-Cash-Flow ETF
Description^ | | Level 1 | | | Level 2 | | | Level 3 | | | Total | |
| Common Stocks | | $ | 10,531,139 | | | $ | — | | | $ | — | | | $ | 10,531,139 | |
| Exchange Traded Funds | | | 515,022 | | | | — | | | | — | | | | 515,022 | |
| Short-Term Investments | | | 44,803 | | | | — | | | | — | | | | 44,803 | |
| Total Investments | | | | | | | | | | | | | | | | |
| in Securities | | $ | 11,090,964 | | | $ | — | | | $ | — | | | $ | 11,090,964 | |
^ See Schedule of Investments for sector breakouts.
The Funds did not invest in any Level 3 securities during the period.
4. OTHER RELATED PARTY TRANSACTIONS
TrimTabs Asset Management, LLC. (“the Adviser”) serves as the investment adviser to the Funds. Pursuant to an Investment Advisory Agreement (“Investment Advisory Agreement”) between the Trust, on behalf of the Funds, and the Adviser, the Adviser provides investment advice to the Funds and oversees the day-to-day operations of the Funds, subject to the direction and control of the Board and the officers of the Trust. The Adviser administers the Funds’ business affairs, provides office facilities and equipment and certain clerical, bookkeeping and administrative services. The Adviser bears the costs of all advisory and non-advisory services required to operate the Funds, including payment of Trustee compensation, in exchange for a single unitary management fee. For services provided to the Funds, each Fund pays the Adviser 0.59% at an annual rate based on each Fund’s average daily net assets. Certain officers and a Trustee of the Trust are affiliated with the Adviser and are not paid any fees by the Funds for serving in such capacities.
Quasar Distributors, LLC acts as the Fund’s principal underwriter in a continuous public offering of the Funds’ shares. The Trust has adopted a distribution and service plan (“Rule 12b-1 Plan”) pursuant to Rule 12b-1 under the 1940 Act. Under the Rule 12b-1 Plan, each Fund is authorized to pay distribution fees in connection with the sale and distribution of its shares and pay service fees in connection with the provision of ongoing services to shareholders. To date, the Rule 12b-1 Plan has not been implemented for the Funds and there is no current intention to implement the Rule 12b-1 Plan.
5. SERVICE AND CUSTODY AGREEMENTS
The Funds have entered into Service Agreements with U.S. Bancorp Fund Services, LLC (“Fund Services” or “Administrator”), doing business as U.S. Bank Global Fund Services and a Custody Agreement with U.S. Bank, N.A. (“USB”), an affiliate of Fund Services. Under these agreements, Fund Services and USB provide certain transfer agency, administrative, accounting and custody services and are paid by the Adviser under the unitary fee arrangement noted above.
TrimTabs ETF Trust
NOTES TO FINANCIAL STATEMENTS
July 31, 2020 (Continued)
6. INVESTMENT TRANSACTIONS
For the fiscal year ended July 31, 2020, the aggregate purchases and sales of securities by each Fund, excluding short-term securities and in-kind transactions, were as follows:
| | | Purchases | | | Sales | |
| TrimTabs All Cap U.S. Free-Cash-Flow ETF | | $ | 94,677,927 | | | $ | 93,789,983 | |
| TrimTabs All Cap International Free-Cash-Flow ETF | | $ | 5,110,194 | | | $ | 5,330,561 | |
For the fiscal year ended July 31, 2020, in-kind transactions associated with creations and redemptions were as follows:
| | | Purchases | | | Sales | |
| TrimTabs All Cap U.S. Free-Cash-Flow ETF | | $ | 8,146,109 | | | $ | 27,812,662 | |
| TrimTabs All Cap International Free-Cash-Flow ETF | | $ | — | | | $ | 985,913 | |
For the fiscal year ended July 31, 2020, there were no long-term purchases or sales of U.S. Government Securities for the Funds.
7. INCOME TAX INFORMATION
The components of tax basis cost of investments and net unrealized appreciation for federal income tax purposes as of July 31, 2020 were as follows:
| | | | | | | TrimTabs | | |
| | | TrimTabs | | | | All Cap | | |
| | | All Cap U.S. | | | | International | | |
| | Free-Cash-Flow ETF | | Free-Cash-Flow ETF | |
| Tax cost of investments | | $ | 86,870,447 | | | | $ | 9,256,689 | | |
| Gross tax unrealized appreciation | | | 24,175,759 | | | | | 2,224,079 | | |
| Gross tax unrealized depreciation | | | (2,250,811 | ) | | | | (388,768 | ) | |
| Net tax unrealized appreciation | | | 21,924,948 | | | | | 1,835,311 | | |
| Undistributed ordinary income | | | 436,993 | | | | | 85,613 | | |
| Undistributed long-term capital gains | | | — | | | | | — | | |
| Total accumulated gain | | | 436,993 | | | | | 85,613 | | |
| Other accumulated loss | | | (15,428,976 | ) | | | | (1,926,505 | ) | |
| Distributable earnings (deficit) | | $ | 6,932,965 | | | | $ | (5,581 | ) | |
The difference between book and tax-basis cost is attributable to the realization for tax purposes of unrealized gains on investments in passive foreign investment companies and wash sales. Under tax law, certain capital and foreign currency losses realized after October 31 and within the taxable year are deemed to arise on the first business day of each Fund’s next taxable year.
At July 31, 2020, the Funds had the following capital loss carryforwards:
| | | Short-Term | | | Long-Term | | | Expires | |
| TrimTabs All Cap U.S. Free-Cash-Flow ETF | | $ | 15,428,976 | | | $ | — | | | Indefinite | |
| TrimTabs All Cap International | | | | | | | | | | | |
| Free-Cash-Flow ETF | | $ | 1,153,650 | | | $ | 772,855 | | | Indefinite | |
TrimTabs ETF Trust
NOTES TO FINANCIAL STATEMENTS
July 31, 2020 (Continued)
The tax character of distributions paid by the Funds during the fiscal year ended July 31, 2020 and July 31, 2019 was as follows:
| | | Ordinary Income | |
| | | July 31, 2020 | | | July 31, 2019 | |
| TrimTabs All Cap U.S. Free-Cash-Flow ETF | | $ | 915,650 | | | $ | 684,621 | |
| TrimTabs All Cap International Free-Cash-Flow ETF | | $ | 244,461 | | | $ | 92,157 | |
8. CERTAIN RISKS
Asia-Pacific Risk. Investments in securities of issuers in Asia-Pacific countries involve risks that are specific to the Asia-Pacific region, including certain legal, regulatory, political and economic risks. Certain Asia-Pacific countries have experienced expropriation and/or nationalization of assets, confiscatory taxation, political instability, armed conflict and social instability as a result of religious, ethnic, socio-economic and/or political unrest. Some economies in this region are dependent on a range of commodities, and are strongly affected by international commodity prices and particularly vulnerable to price changes for these products. The market for securities in this region may also be directly influenced by the flow of international capital, and by the economic and market conditions of neighboring countries. Many Asia-Pacific economies have experienced rapid growth and industrialization, and there is no assurance that this growth rate will be maintained. Some Asia-Pacific economies are highly dependent on trade and economic conditions in other countries can impact these economies.
| | Japan Risk. The Japanese economy may be subject to considerable degrees of economic, political and social instability. Since 2000, Japan’s economic growth rate has remained relatively low. In addition, Japan is subject to the risk of natural disasters, such as earthquakes and tsunamis. |
Depositary Receipts Risk. The risks of investments in depositary receipts are substantially similar to Foreign Investment Risks. In addition, depositary receipts may not track the price of the underlying foreign securities, and their value may change materially at times when the U.S. markets are not open for trading.
Equity Investing Risk. An investment in the Fund involves risks similar to those of investing in any fund holding equity securities, such as market fluctuations, changes in interest rates and perceived trends in stock prices. The values of equity securities could decline generally or could underperform other investments. In addition, securities may decline in value due to factors affecting a specific issuer, market or securities markets generally.
ETF Risk. As an ETF, the Fund is subject to the following risks:
| | Authorized Participants Concentration Risk. The Fund may have a limited number of financial institutions that may act as Authorized Participants (“APs”). To the extent that those APs exit the business or are unable to process creation and/or redemption orders, shares may trade at a discount to net asset value (or “NAV”) and possibly face delisting. |
| | |
| | Flash Crash Risk. Sharp price declines in securities owned by the Fund may trigger trading halts, which may result in the Fund’s shares trading in the market at an |
TrimTabs ETF Trust
NOTES TO FINANCIAL STATEMENTS
July 31, 2020 (Continued)
| | increasingly large discount to NAV during part (or all) of a trading day. Shareholders could suffer significant losses to the extent that they sell shares at these temporarily low market prices. |
| | |
| | International Closed Market Trading Risk. Because certain investments of the Funds trade in markets that are closed when the Fund and Exchange are open, there are likely to be deviations between the current prices of such investments and the prices at which such investments are marked for purposes of the Fund’s Intraday Indicative Value (“IIV”). As a result, shares may appear to trade at a significant discount or premium to NAV. |
| | |
| | Large Shareholder Risk. Certain shareholders, including the Adviser or an affiliate of the Adviser, may own a substantial amount of the Fund’s shares. Redemptions by large shareholders could have a significant negative impact on the Fund. In addition, transactions by large shareholders may account for a large percentage of the trading volume on the Exchange and may, therefore, have a material upward or downward effect on the market price of the shares. |
| | |
| | Premium-Discount Risk. Shares may trade above or below their NAV. Accordingly, investors may pay more than NAV when purchasing shares or receive less than NAV when selling shares. The market prices of shares will generally fluctuate in accordance with changes in NAV, changes in the relative supply of, and demand for, shares, and changes in the liquidity, or the perceived liquidity, of the Fund’s holdings. |
| | |
| | Secondary Market Trading Risk. Investors buying or selling shares in the secondary market may pay brokerage commissions or other charges, which may be a significant proportional cost for investors seeking to buy or sell relatively small amounts of shares. Although the shares are listed on the Exchange, there can be no assurance that an active or liquid trading market for them will develop or be maintained. In addition, trading in shares on the Exchange may be halted. |
Europe Risk. Decreasing imports or exports, changes in governmental or European Union (the “EU”) regulations on trade, changes in the exchange rate of the euro, the default or threat of default by an EU member country on its sovereign debt, and/or an economic recession in an EU member country may have a significant adverse effect on the securities of EU issuers. The European financial markets have recently experienced volatility and adversity due to concerns about withdrawal of member countries from the EU and economic downturns and rising government debt levels in several European countries. These events have adversely affected the exchange rate of the euro and may continue to significantly affect every country in Europe.
Foreign Investment Risk. Returns on investments in foreign securities could be more volatile than, or trail the returns on, investments in U.S. securities. Exposures to foreign securities entail special risks, including due to: differences in information available about foreign issuers; differences in investor protection standards in other jurisdictions; capital controls risks, including the risk of a foreign jurisdiction imposing restrictions on the
TrimTabs ETF Trust
NOTES TO FINANCIAL STATEMENTS
July 31, 2020 (Continued)
ability to repatriate or transfer currency or other assets; political, diplomatic and economic risks; regulatory risks; and foreign market and trading risks, including the costs of trading and risks of settlement in foreign jurisdictions. In addition, the Fund’s investments in securities denominated in other currencies could decline due to changes in local currency relative to the value of the U.S. dollar, which may affect the Fund’s returns.
Geographic Region Risk. A natural or other disaster could occur in a geographic region in which the Fund invests, which could affect the economy or particular business operations of companies in the specific geographic region, causing an adverse impact on the Fund’s investments.
Investment Risk. An investment in the Fund is not a deposit of a bank and is not insured or guaranteed by the Federal Deposit Insurance Corporation or any other government agency. When you sell your shares, they could be worth less than what you paid for them.
Large Capitalization Company Risk. The Fund’s investments in large capitalization companies may underperform other segments of the market because they may be less responsive to competitive challenges and opportunities and unable to attain high growth rates during periods of economic expansion.
Management Risk. The Fund is actively managed using proprietary investment strategies and processes that are based on quantitative stock selection rules and algorithms ( the “quantitative investment process”). There can be no guarantee that the Fund will achieve its investment objective or that the quantitative investment process will produce intended results.. The Fund may be adversely affected by imperfections, errors or limitations in the construction or implementation of the quantitative investment process and/or the Adviser’s ability to monitor and timely adjust the metrics or update the data or features underlying the quantitative investment process. Any of these factors could result in the Fund underperforming comparable investment vehicles.
Market Events Risk. Turbulence in the financial markets and reduced liquidity in the equity markets may negatively affect issuers, which could have an adverse effect on the Fund. In addition, there is a risk that policy changes by the U.S. Government and/or Federal Reserve, such as increasing interest rates, could cause increased volatility in financial markets and higher levels of Fund redemptions, which could have a negative impact on the Fund.
Sector Risk. To the extent that the Fund invests more heavily in particular sectors of the economy, its performance will be especially sensitive to developments that significantly affect those sectors. As of July 31, 2020 27.05% of TTAC’s net assets were focused in the Information Technology Sector.
Small and Medium Capitalization Company Risk. Investing in securities of small and medium capitalization companies involves greater risk than customarily is associated with investing in larger, more established companies. These companies’ securities may be more volatile and less liquid than those of more established companies. Often, small and
TrimTabs ETF Trust
NOTES TO FINANCIAL STATEMENTS
July 31, 2020 (Continued)
medium capitalization companies and the industries in which they focus are still evolving and, as a result, they may be more sensitive to changing market conditions. Small and medium capitalization companies may be particularly affected by interest rate increases, as they may find it more difficult to borrow money to continue or expand operations, or may have difficulty in repaying any loans which are floating rate.
TrimTabs ETF Trust
REPORT OF INDEPENDENT REGISTERED PUBLIC ACCOUNTING FIRM
To the Board of Trustees of TrimTabs ETF Trustand the Shareholders of TrimTabs All Cap U.S. Free-Cash-Flow ETF
and TrimTabs All Cap International Free-Cash-Flow ETF
Opinion on the Financial Statements
We have audited the accompanying statements of assets and liabilities of TrimTabs All Cap U.S. Free-Cash-Flow ETF and TrimTabs All Cap International Free-Cash-Flow ETF, each a series of shares of beneficial interest in TrimTabs ETF Trust (the “Funds”), including the schedules of investments, as of July 31, 2020, and the related statements of operations for the year then ended, the statements of changes in net assets for each of the years in the two-year period then ended, the financial highlights as noted in the table below, and the related notes (collectively referred to as the “financial statements”). In our opinion, the financial statements present fairly, in all material respects, the financial position of the Funds as of July 31, 2020, and the results of their operations for the year then ended, the changes in their net assets for each of the years in the two-year period then ended and their financial highlights as noted in the table below, in conformity with accounting principles generally accepted in the United States of America.
| Fund | Financial Highlights Presented |
| TrimTabs All Cap U.S. | For the period from September 27, 2016 (commencement of operations) |
| Free-Cash-Flow ETF | to July 31, 2017 and for each of the years in the three-year period ended |
| | July 31, 2020 |
| TrimTabs All Cap International | For the period from June 27, 2017 (commencement of operations) to July 31, |
| Free-Cash-Flow ETF | 2017 and for each of the years in the three-year period ended July 31, 2020 |
Basis for Opinion
These financial statements are the responsibility of the Funds’ management. Our responsibility is to express an opinion on the Funds’ financial statements based on our audits. We are a public accounting firm registered with the Public Company Accounting Oversight Board (United States) (“PCAOB”) and are required to be independent with respect to the Funds in accordance with the U.S. federal securities law and the applicable rules and regulations of the Securities and Exchange Commission and the PCAOB.
We conducted our audits in accordance with the standards of the PCAOB. Those standards require that we plan and perform the audits to obtain reasonable assurance about whether the financial statements are free of material misstatement, whether due to error or fraud. The Funds are not required to have, nor were we engaged to perform, an audit of their internal control over financial reporting. As part of our audits we are required to obtain an understanding of internal control over financial reporting but not for the purpose of expressing an opinion on the effectiveness of the Funds’ internal control over financial reporting. Accordingly, we express no such opinion.
Our audits included performing procedures to assess the risk of material misstatement of the financial statements, whether due to error or fraud, and performing procedures that respond to those risks. Such procedures included examining, on a test basis, evidence regarding the amounts and disclosures in the financial statements. Our procedures included confirmation of securities owned as of July 31, 2020 by correspondence with the custodian and brokers. Our audits also included evaluating the accounting principles used and significant estimates made by management, as well as evaluating the overall presentation of the financial statements. We believe that our audits provide a reasonable basis for our opinion.
BBD, LLP
We have served as the auditor of one or more of the Funds in the TrimTabs ETF Trust since 2016.
Philadelphia, Pennsylvania
September 25, 2020
TrimTabs ETF Trust
ADDITIONAL INFORMATION
July 31, 2020 (Unaudited)
1. FREQUENCY DISTRIBUTION OF PREMIUMS AND DISCOUNTS
Information regarding how often shares of each Fund traded on the Exchange at a price above (i.e., at a premium) or below (i.e., at a discount) the NAV of the Fund is available on the Funds’ website at www.trimtabsfunds.com.
2. FEDERAL TAX INFORMATION
QUALIFIED DIVIDEND INCOME/DIVIDENDS RECEIVED DEDUCTION
For the fiscal year ended July 31, 2020, certain dividends paid by the Funds may be subject to a maximum tax rate of 23.8%, as provided for by the Jobs and Growth Tax Relief Reconciliation Act of 2003. The percentage of dividends declared from ordinary income designated as qualified dividend income was as follows:
| TrimTabs All Cap U.S. Free-Cash-Flow ETF | 100.00% |
| TrimTabs All Cap International Free-Cash-Flow ETF | 97.99% |
For corporate shareholders, the percent of ordinary income distributions qualifying for the corporate dividends received deduction for the fiscal year ended July 31, 2020, was as follows:
| TrimTabs All Cap U.S. Free-Cash-Flow ETF | 100.00% |
| TrimTabs All Cap International Free-Cash-Flow ETF | 0.39% |
SHORT-TERM CAPITAL GAIN
The Percentage of taxable ordinary income distributions that are designated as short-term capital gain distributions under Internal Revenue Section 871(k)(2)(C) for each Fund were as follows (unaudited).
| TrimTabs All Cap U.S. Free-Cash-Flow ETF | 0.00% |
| TrimTabs All Cap International Free-Cash-Flow ETF | 0.00% |
3. DISCLOSURE OF PORTFOLIO HOLDINGS
The Funds file their complete schedule of portfolio holdings for their first and third fiscal quarters with the Securities and Exchange Commission (“SEC”) on Part F of Form N-PORT (or any successor form). The Funds’ Part F of Form N-PORT (or any successor form) is available without charge, upon request, by calling toll free at 1-800-617-0004. Furthermore, you may obtain the Part F of Form N-PORT (or any successor form) on the SEC’s website at www.sec.gov. Each Fund’s portfolio holdings are posted daily on their website at www.trimtabsfunds.com.
4. PROXY VOTING POLICIES AND PROCEDURES
A description of the policies and procedures the Funds use to determine how to vote proxies related to portfolio securities is provided in the Statement of Additional Information (“SAI”). The SAI is available without charge upon request by calling toll free at 1-800-617-0004, by accessing the SEC’s website at www.sec.gov or by accessing the Funds’ website at www.trimtabsfunds.com. Information on how the Funds voted
TrimTabs ETF Trust
ADDITIONAL INFORMATION
July 31, 2020 (Unaudited) (Continued)
proxies related to portfolio securities during the period ended June 30 is available without charge, upon request, by calling 1-800-617-0004 or by accessing the website of the SEC.
5. INVESTMENT ADVISORY AGREEMENT APPROVAL
At a meeting held on March 12, 2020, the Board of Trustees (the “Board”) of TrimTabs ETF Trust (the “Trust”), including the Trustees of the Trust who were not “interested persons,” as that term is defined in the Investment Company Act of 1940 (the “Independent Trustees”), reviewed and unanimously approved the renewal of the investment advisory agreement (the “Advisory Agreement”) between TrimTabs Asset Management, LLC (“TTAM”) and the Trust, on behalf of each of TrimTabs All Cap U.S. Free-Cash-Flow ETF (“TTAC”) and TrimTabs All Cap International Free-Cash-Flow ETF (“TTAI” and, together with TTAC, the “Funds” and, each, a “Fund”).
In evaluating the Advisory Agreement, the Board, including the Independent Trustees, reviewed the materials furnished by TTAM. The Board considered the following factors, among others, in connection with its renewal of the Advisory Agreement: (1) the nature, extent, and quality of the services provided by TTAM; (2) the investment performance of each Fund; (3) a comparison of fees and expenses of each Fund to a group of comparable peer funds (the “Peer Group”); (4) profitability of the Funds to TTAM; (5) the extent to which economies of scale might be realized as each Fund grows; and (6) any ancillary benefits derived by TTAM from its relationship with the Funds. The Board also considered the materials that they had received at past meetings, including at routine quarterly meetings, relating to the nature, extent and quality of TTAM’s services, including information concerning each Fund’s advisory fee, total expense ratio and performance.
In addition, prior to approving the Advisory Agreement, the Independent Trustees met in executive session with counsel to the Independent Trustees without representatives of TTAM. The Independent Trustees reviewed with counsel to the Independent Trustees the legal standards applicable to their consideration of the Advisory Agreement for each Fund. The Independent Trustees relied upon the advice of counsel and their own business judgment in determining the material factors to be considered in evaluating the Advisory Agreement and the weight to be given to each such factor.
Nature, Extent and Quality of Services
With respect to the nature, extent and quality of the services provided, the Board considered the portfolio management and other personnel of TTAM who perform services for the Funds, the compliance function of TTAM, and the financial condition of TTAM. Further, the Board evaluated the integrity of TTAM’s personnel, the experience of the portfolio manager for each Fund, and the management of each Fund’s investments in accordance with its stated investment objective and policies. The Board also considered the demonstrated ability of the portfolio manager to continue to manage each Fund’s investments in accordance with the Fund’s stated investment objective.
TrimTabs ETF Trust
ADDITIONAL INFORMATION
July 31, 2020 (Unaudited) (Continued)
Based on their review and other considerations, the Board concluded, in the exercise of its reasonable business judgment, that the nature, extent and quality of the services supported renewal of the Advisory Agreement.
Performance
With respect to the performance of each Fund, the Board considered each Fund’s performance since inception, including, for TTAI, two-year, and, for TTAC, three-year periods. In this regard, among other things, the Board considered each Fund’s total return compared to the total return of its benchmark index and Peer Group. The Board observed that TTAC had outperformed its Peer Group median and average total returns for each of the three-year and since inception periods, and its benchmark for the since-inception period. The Board also observed that TTAI had underperformed its benchmark and Peer Group median and average total returns for each period since inception but did not have the lowest total returns of its Peer Group for any period since inception. Based on their review and other considerations, the Board concluded, in the exercise of its reasonable business judgment, that each Fund’s investment performance supported renewal of the Advisory Agreement.
Comparative Fees and Expenses
The Board considered the fee structure of the Advisory Agreement with respect to each Fund. The Board also reviewed information compiled by TTAM comparing each Fund’s advisory fee and expense ratio to the advisory fees and expense ratios of each Fund’s respective Peer Group. The Board noted that TTAC’s advisory fee was higher than the median and average advisory fee of its Peer Group, but that its expense ratio was lower than the median and average expense ratios of its Peer Group. The Board also noted that TTAI’s advisory fee and expense ratio were both higher than the median and average, but below the maximum, advisory fees and expense ratios of its Peer Group. Based on their review and other considerations, the Board concluded, in the exercise of its reasonable business judgment, that each Fund’s fees and expenses supported renewal of the Advisory Agreement.
Costs and Profitability
The Board also reviewed the overall profitability to TTAM of the Funds. In this regard, the Board noted that, under the unitary fee structure, TTAM, and not the Funds, is responsible for covering all of the Funds’ expenses, except for the fee payment under the Advisory Agreement, payments under each Fund’s Rule 12b-1 plan, brokerage expenses, acquired fund fees and expenses, taxes, interest (including borrowing costs and dividend expenses on securities sold short), litigation expenses and other extraordinary expenses (including litigation to which the Trust or a Fund may be a party and indemnification of the Trustees and officers with respect thereto), in exchange for payment of the advisory fee. Based on their review and other considerations, the Board concluded, in the
TrimTabs ETF Trust
ADDITIONAL INFORMATION
July 31, 2020 (Unaudited) (Continued)
exercise of its reasonable business judgment, that the profitability analysis supported renewal of the Advisory Agreement.
Economies of Scale
The Board further considered whether economies of scale would be realized by a Fund as its assets continue to increase, including the extent to which this is reflected in the level of fees charged. The Board noted that the advisory fee schedule for each Fund does not currently include breakpoints. Based on their review, the current asset levels of the Funds, and other considerations, the Board concluded, in the exercise of its reasonable business judgment, that the possibility of realizing future economies of scale was not a material factor in connection with the renewal of the Advisory Agreement at that time.
Ancillary Benefits
The Board then considered the extent to which TTAM might derive ancillary (or fall-out) benefits as a result of its relationship with the Funds. For example, the Board noted that TTAM may engage in soft dollar transactions in the future, although it does not currently plan to do so. The Board also noted that TTAM may obtain a reputational benefit from the continued success of TTAC. Based on their review and other considerations, the Board concluded, in the exercise of its reasonable business judgment, that ancillary benefits were not a material factor in connection with the renewal of the Advisory Agreement.
Conclusion
Based on their review of the facts and circumstances related to the Advisory Agreement, the Trustees concluded that each Fund and its shareholders could benefit from TTAM’s continued management. Thus, the Board determined that the renewal of the Advisory Agreement with respect to each Fund was appropriate and in the best interest of each Fund and its shareholders. In their deliberations, the Board did not identify any particular information that was all-important or controlling, and each Trustee may have attributed different weights to different factors. Based on their review, including consideration of each of the factors referenced above, the Trustees determined, in the exercise of their reasonable business judgment, that the advisory arrangement for each Fund, as outlined in the Advisory Agreement, was fair and reasonable in light of the services performed, expenses incurred and such other matters as the Board considered relevant.
After full consideration of the above factors as well as other factors, the Board, including the Independent Trustees, unanimously approved the continuance of the Advisory Agreement on behalf of each Fund.
TrimTabs ETF Trust
ADDITIONAL INFORMATION
July 31, 2020 (Unaudited) (Continued)
6. TRUSTEES AND OFFICERS
Additional information about each Trustee of the Trust is set forth below. The address of each Trustee of the Trust is c/o TrimTabs Asset Management, LLC 1345 Avenue of the Americas, 2nd Floor, New York, NY, 10105. The Funds’ Statement of Additional Information includes additional information about the Trustees and is available without charge, upon request, by calling toll-free at 1-800-617-0004.
| | | Term of | | Number of | |
| | | Office | | Portfolios | Other |
| | | and | Principal | in Fund | Directorships |
| | Position(s) | Length | Occupation(s) | Complex | Held by Trustee |
| Name, Year | Held with | of Time | During Past | Overseen | During Past |
of Birth | the Trust | Served | Five Years | by Trustee | Five Years |
| Independent Trustees | | | | | |
| Stephen J. Posner | Trustee | Since | Financial Adviser, | 2 | Director, TrimTabs |
| YOB: 1944 | | 2014 | Wunderlich | | Investment Research |
| | | | Securities, Inc. | | (2016-2017).** |
| | | | (2005-2014). | | |
| | | | | | |
| David A. Kelly | Trustee | Since | Founder and | 2 | Member, Audit |
| YOB: 1938 | | 2015 | President, Three | | Committee, |
| | | | Lakes Advisors, Inc. | | Greenwich Historical |
| | | | (1996-present). | | Society (2011-2013). |
| | | | | | |
| Interested Trustee* | | | | | |
| Charles Biderman | Trustee; | Trustee | Consultant, | 2 | None. |
| YOB: 1946 | formerly | since | Informa TrimTabs | | |
| | President | 2014; | (2017-2017); | | |
| | | President | Founder, TrimTabs | | |
| | | from 2014 | Asset Management, | | |
| | | to 2017 | LLC (1990-present); | | |
| | | | Founder and Chief | | |
| | | | Executive Officer, | | |
| | | | TrimTabs Investment | | |
| | | | Research (1990- | | |
| | | | 2017); President, | | |
| | | | TrimTabs Index | | |
| | | | Services, LLC | | |
| | | | (2014-2016). | | |
| * | Mr. Biderman is an “interested person,” as defined by the Investment Company Act of 1940, as amended, because of his employment with and ownership interest in TrimTabs. |
| ** | TrimTabs Investment Research does not control and is not controlled by or under common control with the Adviser. |
TrimTabs ETF Trust
ADDITIONAL INFORMATION
July 31, 2020 (Unaudited) (Continued)
| | | Term of | |
| | Position(s) | Office and | |
| Name, Year | Held with | Length of | |
of Birth | the Trust | Time Served | Principal Occupation(s) During Past Five Years |
| Officers | | | |
| Janet Johnston | President | President | Co-Chief Investment Officer, TrimTabs Asset |
| YOB: 1963 | and | and | Management, LLC (2019-present); Portfolio Manager, |
| | Principal | Principal | TrimTabs Asset Management, LLC (2017-Present); |
| | Executive | Executive | Sole Proprietor of a timber and hunting business |
| | Officer; | Officer | (2015-present); ETF Adviser, Madrona Partners |
| | formerly | since 2019; | (2012-2015). |
| | Vice | Vice President | |
| | President | 2018-2019 | |
| | | | |
| Derin Cohen | Chief | Chief | Chief Operating and Compliance Officer, TrimTabs |
| YOB: 1991 | Compliance | Compliance | Asset Management, LLC (2019-present); Vice President, |
| | Officer and | Officer, | Marketing and Operations, TrimTabs Asset Management |
| | Anti-Money | Anti-Money | (2017-2019), Lead Generation Associate, SinglePlatform |
| | Laundering | Laundering | (2017-2017), Internal Control Associate, Maxim Group |
| | Officer; | Officer | LLC, (2013-2017). |
| | formerly | since 2019; | |
| | Vice | Vice President | |
| | President | from | |
| | | 2018-2019 | |
| | | | |
| Vince (Qijun) Chen | Vice | Since 2019 | Quantitative Analyst, TrimTabs Asset Management, LLC |
| YOB: 1994 | President, | | (2017-present). |
| | Treasurer, | | |
| | and | | |
| | Principal | | |
| | Financial | | |
| | Officer | | |
Investment Adviser
TrimTabs Asset Management, LLC
1345 Avenue of the Americas, 2nd Floor
New York, NY 10105
Distributor
Quasar Distributors, LLC
111 East Kilbourn Avenue, Suite 2200
Milwaukee, WI 53202
Administrator, Fund Accountant & Transfer Agent
U.S. Bancorp Fund Services, LLC
615 East Michigan Street
Milwaukee, WI 53202
Custodian
U.S. Bank, N.A.
1555 North RiverCenter Drive, Suite 302
Milwaukee, WI 53212
Independent Registered Public Accounting Firm
BBD, LLP
1835 Market Street, 3rd Floor
Philadelphia, PA 19103
Legal Counsel
Stradley Ronon Stevens & Young, LLP
2005 Market Street, Suite 2600
Philadelphia, PA 19103-7018
Item 2. Code of Ethics.
The registrant has adopted a code of ethics that applies to the registrant’s principal executive officer and principal financial officer. The registrant has not made any substantive amendments to its code of ethics during the period covered by this report. The registrant has not granted any waivers from any provisions of the code of ethics during the period covered by this report.
A copy of the registrant’s Code of Ethics is filed herewith.
Item 3. Audit Committee Financial Expert.
The registrant’s board of TrimTabs ETF has determined that it does not have an audit committee financial expert serving on its audit committee. At this time, the registrant believes that the experience provided by each member of the audit committee together offers the registrant adequate oversight for the registrant’s level of financial complexity.
Item 4. Principal Accountant Fees and Services.
The registrant has engaged its principal accountant to perform audit services, audit-related services, tax services and other services during the past two fiscal years. “Audit services” refer to performing an audit of the registrant's annual financial statements or services that are normally provided by the accountant in connection with statutory and regulatory filings or engagements for those fiscal years. “Audit-related services” refer to the assurance and related services by the principal accountant that are reasonably related to the performance of the audit. “Tax services” refer to professional services rendered by the principal accountant for tax compliance, tax advice, and tax planning. “Other services” provided by the principal accountant were BBD, LLP. The following table details the aggregate fees billed or expected to be billed for each of the last two fiscal years for audit fees, audit-related fees, tax fees and other fees by the principal accountant.
TrimTabs All Cap U.S. Free-Cash-Flow ETF
| | FYE 07/31/2020 | FYE 07/31/19 |
Audit Fees | $12,500 | $12,500 |
Audit-Related Fees | | |
Tax Fees | $3,000 | $3,000 |
All Other Fees | | |
TrimTabs All Cap International Free-Cash-Flow ETF
| | FYE 07/31/2020 | FYE 07/31/19 |
Audit Fees | $14,500 | $14,500 |
Audit-Related Fees | | |
Tax Fees | $3,000 | $3,000 |
All Other Fees | | |
The audit committee has adopted pre-approval policies and procedures that require the audit committee to pre‑approve all audit and non‑audit services of the registrant, including services provided to any entity affiliated with the registrant.
The percentage of fees billed by BBD, LLP applicable to non-audit services pursuant to waiver of pre-approval requirement were as follows:
TrimTabs All Cap U.S. Free-Cash-Flow ETF
| | FYE 07/31/2020 | FYE 07/31/2019 |
Audit-Related Fees | 0% | 0% |
Tax Fees | 0% | 0% |
All Other Fees | 0% | 0% |
TrimTabs All Cap International Free-Cash-Flow ETF
| | FYE 07/31/2020 | FYE 07/31/2019 |
Audit-Related Fees | 0% | 0% |
Tax Fees | 0% | 0% |
All Other Fees | 0% | 0% |
All of the principal accountant’s hours spent on auditing the registrant’s financial statements were attributed to work performed by full‑time permanent employees of the principal accountant.
The following table indicates the non-audit fees billed or expected to be billed by the registrant’s accountant for services to the registrant and to the registrant’s investment adviser (and any other controlling entity, etc.—not sub-adviser) for the last two years. The audit committee of the board of trustees/directors has considered whether the provision of non-audit services that were rendered to the registrant's investment adviser is compatible with maintaining the principal accountant's independence and has concluded that the provision of such non-audit services by the accountant has not compromised the accountant’s independence.
TrimTabs All Cap U.S. Free-Cash-Flow ETF
Non-Audit Related Fees | FYE 07/31/2020 | FYE 07/31/2019 |
Registrant | - | - |
Registrant’s Investment Adviser | - | - |
TrimTabs All Cap International Free-Cash-Flow ETF
Non-Audit Related Fees | FYE 07/31/2020 | FYE 07/31/2019 |
Registrant | - | - |
Registrant’s Investment Adviser | - | - |
Item 5. Audit Committee of Listed Registrants.
The registrant is an issuer as defined in Rule 10A-3 under the Securities Exchange Act of 1934, (the “Act”) and has a separately-designated standing audit committee established in accordance with Section 3(a)(58)(A) of the Act. The independent members of the committee are as follows: David Kelly and Stephen Posner.
Item 6. Investments.
Schedule of Investments is included as part of the report to shareholders filed under Item 1 of this Form.
Item 7. Disclosure of Proxy Voting Policies and Procedures for Closed-End Management Investment Companies.
Not applicable to open-end investment companies.
Item 8. Portfolio Managers of Closed-End Management Investment Companies.
Not applicable to open-end investment companies.
Item 9. Purchases of Equity Securities by Closed‑End Management Investment Company and Affiliated Purchasers.
Not applicable to open-end investment companies.
Item 10. Submission of Matters to a Vote of Security Holders.
There have been no material changes to the procedures by which shareholders may recommend nominees to the registrant’s board of TrimTabs ETF Trust.
Item 11. Controls and Procedures.
(a) | The Registrant’s President/Principal Executive Officer and Treasurer/Principal Financial Officer have reviewed the Registrant's disclosure controls and procedures (as defined in Rule 30a-3(c) under the Investment Company Act of 1940 (the “Act”)) as of a date within 90 days of the filing of this report, as required by Rule 30a-3(b) under the Act and Rules 13a-15(b) or 15d‑15(b) under the Securities Exchange Act of 1934. Based on their review, such officers have concluded that the disclosure controls and procedures are effective in ensuring that information required to be disclosed in this report is appropriately recorded, processed, summarized and reported and made known to them by others within the Registrant and by the Registrant’s service provider. |
(b) | There were no changes in the Registrant's internal control over financial reporting (as defined in Rule 30a-3(d) under the Act) that occurred during the period covered by this report that have materially affected, or are reasonably likely to materially affect, the Registrant's internal control over financial reporting. |
Item 12. Disclosure of Securities Lending Activities for Closed-End Management Investment Companies
Not applicable to open-end investment companies.
Item 13. Exhibits.
(3) Any written solicitation to purchase securities under Rule 23c‑1 under the Act sent or given during the period covered by the report by or on behalf of the registrant to 10 or more persons. Not applicable to open-end investment companies.
(4) Change in the registrant’s independent public accountant. There was no change in the registrant’s independent public accountant for the period covered by this report.
SIGNATURES
Pursuant to the requirements of the Securities Exchange Act of 1934 and the Investment Company Act of 1940, the registrant has duly caused this report to be signed on its behalf by the undersigned, thereunto duly authorized.
(Registrant) Trim Tabs ETF Trust
By (Signature and Title)* /s/Janet F. Johnston
Janet F. Johnston, President (Principal Executive Officer)
Date September 29, 2020
Pursuant to the requirements of the Securities Exchange Act of 1934 and the Investment Company Act of 1940, this report has been signed below by the following persons on behalf of the registrant and in the capacities and on the dates indicated.
By (Signature and Title)* /s/Janet F. Johnston
Janet F. Johnston , President (Principal Executive Officer)
Date September 29, 2020
By (Signature and Title)* /s/Vince (Qijun) Chen
Vince (Qijun) Chen, Treasurer (Principal Financial Officer)
Date September 29, 2020
* Print the name and title of each signing officer under his or her signature.