TrimTabs ETF Trust
FCF US Quality ETF (TTAC)
FCF International Quality ETF (TTAI)
Donoghue Forlines Tactical High Yield ETF (DFHY)
Donoghue Forlines Risk Managed Innovation ETF (DFNV)
Donoghue Forlines Yield Enhanced Real Asset ETF (DFRA)
Annual Report
July 31, 2022
TrimTabs ETF Trust
TABLE OF CONTENTS
Management’s Discussion of Fund Performance for FCF US Quality ETF | | | 1 |
| | | | |
Performance Summary for FCF US Quality ETF | | | 3 |
| | | | |
Management’s Discussion of Fund Performance for | | | |
FCF International Quality ETF | | | 4 |
| | | | |
Performance Summary for FCF International Quality ETF | | | 6 |
| | | | |
Management’s Discussion of Fund Performance for | | | |
Donoghue Forlines Tactical High Yield ETF | | | 7 |
| | | | |
Performance Summary for Donoghue Forlines Tactical High Yield ETF | | | 9 |
| | | | |
Management’s Discussion of Fund Performance for | | | |
Donoghue Forlines Risk Managed Innovation ETF | | | 10 |
| | | | |
Performance Summary for Donoghue Forlines Risk Managed Innovation ETF | | | 12 |
| | | | |
Management’s Discussion of Fund Performance for | | | |
Donoghue Forlines Yield Enhanced Real Asset ETF | | | 13 |
| | | | |
Performance Summary for Donoghue Forlines Yield Enhanced Real Asset ETF | | | 15 |
| | | | |
Shareholder Expense Examples | | | 16 |
| | | | |
Portfolio Holdings Allocation | | | 18 |
| | | | |
Schedules of Investments | | | 20 |
| | | | |
Statements of Assets and Liabilities | | | 42 |
| | | | |
Statements of Operations | | | 44 |
| | | | |
Statements of Changes in Net Assets | | | 46 |
| | | | |
Financial Highlights | | | 51 |
| | | | |
Notes to Financial Statements | | | 56 |
| | | | |
Report of Independent Registered Public Accounting Firm | | | 77 |
| | | | |
Additional Information | | | 79 |
FCF US Quality ETF
MANAGEMENT’S DISCUSSION OF FUND PERFORMANCE
July 31, 2022 (Unaudited)
The FCF US Quality ETF (TTAC) returned -2.92% (NAV) and -2.89% (Market) for the 12 months ended July 31, 2022. Our benchmark, the Russell 3000 Total Return Index (R3000), returned -7.35% over the same period.
For the 12-month period, on an absolute basis, the leading contributors of TTAC were Energy and Large Blend stocks, adding 1.57% and 0.71% respectively. On a benchmark relative basis, the best active contributors were Communication Services and Large Blend stocks, adding 2.08% and 1.73% active returns over R3000; The main active detractors were Utilities and Large Value stocks, losing 0.54% and 0.78% respectively.
TTAC owns a portfolio of high-quality stocks selected by our proprietary free cash flow algorithm: as of July 31, 2022, the weighted average return on assets for TTAC was 13.56%, compared to 10.65% for R3000; and a cash flow return of 6.53% compared to 1.16%. Historically, high-quality stocks underperformed in the recovery stage but remained resilient throughout the economic cycle. We believe holding a Large and Mid-cap high-quality portfolio selected by the proprietary free cash flow metrics informed by our research as a core position may benefit investors in the long term.
Must be preceded or accompanied by a current Fund prospectus.
The views and opinions expressed in this discussion are those of FCF Advisors LLC. The views and opinions expressed are subject to change at any time, are not guaranteed, and should not be considered investment advice.
Past performance is no guarantee of future results.
Fund holdings and sector allocations are subject to change and are not recommendations to buy or sell any security. Current and future portfolio holdings are subject to risk. Please refer to the Schedule of Investments contained in this report for a full listing of fund holdings.
Investing involves risk, including the possible loss of principal. Individual shares of any ETF are bought and sold at market price (not NAV), may trade at a discount or premium to NAV, and are not individually redeemed from the Fund. Brokerage commissions will reduce returns. Investments in the Fund include risks associated with small and mid-cap securities which may have less liquidity and greater volatility than large-cap securities.
The performance data quoted represents past performance. Past performance does not guarantee future results. The investment return and principal value of an investment will fluctuate so that an investor’s shares, when sold or redeemed, may be worth more or less than their original cost and current performance may be lower or higher than the performance quoted. Performance current to the most recent month-end can be obtained by calling (toll free 800-617-0004).
The Russell 3000® Index measures the performance of the 3,000 largest publicly traded U.S. companies, based on market capitalization. The Index measures the performance of approximately 98% of the total market capitalization of the publicly traded U.S. equity market. The Index return reflects the reinvestment of income dividends and capital gain distributions, if any, but does not reflect fees, brokerage commissions, or other expenses of investing. It is not possible to invest directly in the Index.
Free Cash Flow represents the cash that a company is able to generate after accounting for capital expenditures.
FCF US Quality ETF
MANAGEMENT’S DISCUSSION OF FUND PERFORMANCE
July 31, 2022 (Unaudited) (Continued)
The FCF US Quality ETF is distributed by Quasar Distributors, LLC.
The return on equity is a measure of the profitability of a business in relation to the equity.
A company’s debt-to-capital ratio or D/C ratio is the ratio of its total debt to its total capital, its debt and equity combined.
FCF US Quality ETF
PERFORMANCE SUMMARY
July 31, 2022 (Unaudited)
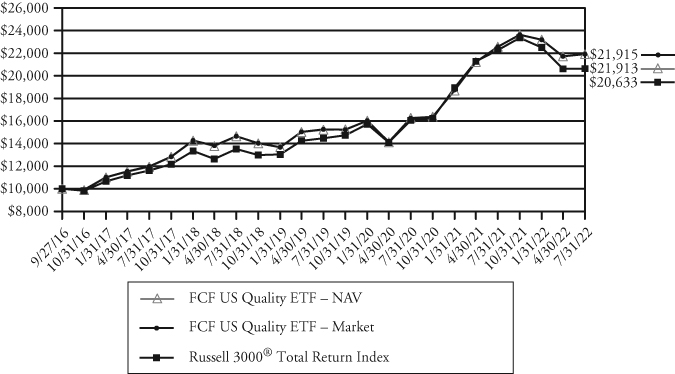
Growth of a $10,000 Investment
| | One | Five | Since |
| Average Annual Total Returns (as of July 31, 2022) | Year | Year | Inception(a) |
FCF US Quality ETF – NAV | -2.92% | 12.90% | 14.37% |
FCF US Quality ETF – Market | -2.89% | 12.84% | 14.38% |
Russell 3000® Total Return Index | -7.35% | 12.18% | 13.20% |
This chart assumes an initial gross investment of $10,000 made on September 27, 2016 (commencement of the Fund’s operations). Returns shown include the reinvestment of all dividends. Returns shown do not reflect the deductions of taxes that a shareholder would pay on Fund distributions or the redemption of Fund shares. Past performance is not predictive of future performance. Investment return and principal value will fluctuate so that your shares, when redeemed, may be worth more or less than original cost. Index returns do not reflect the effects of fees or expenses. It is not possible to invest directly in an index. The total operating expense ratio as stated in the fee table to the Fund’s prospectus dated November 29, 2021 is 0.59%. For performance information current to the most recent month-end, please call 1-800-617-0004.
(a) | Commencement of operations on September 27, 2016. |
FCF International Quality ETF
MANAGEMENT’S DISCUSSION OF FUND PERFORMANCE
July 31, 2022 (Unaudited)
The FCF International Quality ETF (TTAI) returned -17.93% (NAV) and -17.75% (Market) for the 12 months ended July 31, 2022. Our benchmark, the MSCI All Country World Index ex-USA, returned -15.26% over the same period.
For the 12-month period ended July 31, 2022, on an absolute basis, the leading detractors of TTAI were Industrials and Large Blend stocks with -4.09% and -4.48% returns respectively. On a benchmark relative basis, the main active contributors were Information Technology and Large Growth stocks, adding 1.04% and 0.92% respectively; geographically, we outperformed in Emerging Asia, Canada and Latin America, adding 0.98%, 0.74% and 0.57% respectively active returns over the benchmark.
TTAI owns a portfolio of high-quality stocks selected by our proprietary free cash flow algorithm: as of July 31, 2022, the weighted average cash flow return for TTAI was 14.97% compared to the benchmark’s 7.08%. Historically, high-quality stocks underperformed in the recovery stage but remained resilient throughout the economic cycle. We believe holding a Large and Mid-cap high-quality portfolio selected by the proprietary free cash flow metrics informed by our research as a core position may benefit investors in the long term.
Must be preceded or accompanied by a current Fund prospectus.
The views and opinions expressed in this discussion are those of FCF Advisors LLC. The views and opinions expressed are subject to change at any time, are not guaranteed, and should not be considered investment advice.
Past performance is no guarantee of future results.
Fund holdings and sector allocations are subject to change and are not recommendations to buy or sell any security. Current and future portfolio holdings are subject to risk. Please refer to the Schedule of Investments contained in this report for a full listing of fund holdings.
Investing involves risk, including the possible loss of principal. Individual shares of any ETF are bought and sold at market price (not NAV), may trade at a discount or premium to NAV, and are not individually redeemed from the Fund. Brokerage commissions will reduce returns. Investments in the Fund include risks associated with small-and mid-cap securities which may have less liquidity and greater volatility than large-cap securities. Returns on investments in foreign securities could be more volatile than investments in securities of domestic issuers.
The performance data quoted represents past performance. Past performance does not guarantee future results. The investment return and principal value of an investment will fluctuate so that an investor’s shares, when sold or redeemed, may be worth more or less than their original cost and current performance may be lower or higher than the performance quoted. Performance current to the most recent month-end can be obtained by calling (toll free 800-617-0004).
The MSCI All Country World Index ex-USA (“MSCI Index”) is a market capitalization weighted index maintained by Morgan Stanley Capital International (MSCI). It is designed to provide a broad measure of stock performance throughout the world, with the exception of U.S.-based companies. The MSCI Index includes both developed and emerging markets. It is not possible to invest directly in the MSCI Index.
FCF International Quality ETF
MANAGEMENT’S DISCUSSION OF FUND PERFORMANCE
July 31, 2022 (Unaudited) (Continued)
Free Cash Flow represents the cash that a company is able to generate after accounting for capital expenditures.
The FCF International Quality ETF is distributed by Quasar Distributors, LLC.
The return on equity is a measure of the profitability of a business in relation to the equity.
A company’s debt-to-capital ratio or D/C ratio is the ratio of its total debt to its total capital, its debt and equity combined.
FCF International Quality ETF
PERFORMANCE SUMMARY
July 31, 2022 (Unaudited)
Growth of a $10,000 Investment
| | One | Five | Since |
| Average Annual Total Returns (as of July 31, 2022) | Year | Year | Inception(a) |
FCF International Quality ETF – NAV | -17.93% | 3.99% | 4.30% |
FCF International Quality ETF – Market | -17.75% | 3.71% | 4.34% |
S&P Developed Ex-U.S. BMI Index* | -15.54% | 2.82% | 3.31% |
MSCI All Country World Index ex-USA (Net)* | -15.26% | 2.45% | 3.05% |
| * | Effective March 28, 2022, the Fund’s broad-based securities market index was changed from the S&P Developed Ex-U.S. BMI Index to the MSCI All Country World Index ex-USA to more closely align the Fund’s principal investment strategy, which includes exposure to emerging markets countries. |
This chart assumes an initial gross investment of $10,000 made on June 27, 2017 (commencement of the Fund’s operations). Returns shown include the reinvestment of all dividends. Returns shown do not reflect the deductions of taxes that a shareholder would pay on Fund distributions or the redemption of Fund shares. Past performance is not predictive of future performance. Investment return and principal value will fluctuate so that your shares, when redeemed, may be worth more or less than original cost. Index returns do not reflect the effects of fees or expenses. It is not possible to invest directly in an index. The total operating expense ratio as stated in the fee table to the Fund’s prospectus dated November 29, 2021 is 0.60%. For performance information current to the most recent month-end, please call 1-800-617-0004.
(a) | Commencement of operations on June 27, 2017. |
Donoghue Forlines Tactical High Yield ETF
MANAGEMENT’S DISCUSSION OF FUND PERFORMANCE
July 31, 2022 (Unaudited)
The Donoghue Forlines Tactical High Yield ETF (DFHY or the “Fund”) was down -9.96% (NAV) and -10.01% (Market) for the 1 year ended July 31, 2022. Our benchmark, the Bloomberg U.S. Aggregate Bond Index was down -9.12% for the same time period.
DFHY slightly underperformed the broader market index, the Bloomberg U.S. Aggregate Bond Index, for the 1 year ended July 31, 2022. During this time period, bond markets were challenged by sharply higher interest rates and volatility. DFHY is a fund of funds that tactically allocates exposure to high yield bond ETFs or intermediate term treasury bond ETFs on a daily buy-sell signal. DFHY aims to capture the majority of the upside and more importantly avoid the majority of the downside of the high yield asset class during a full credit market cycle. The strategy utilizes proprietary defensive “Tactical” indicators to attempt to mitigate downside volatility and preserve capital by shifting primarily towards intermediate term treasury exposure during market declines. The underlying funds are passively managed and track indexes, therefore DFHY seeks to derive its alpha from being invested in the high yield bond market or intermediate term treasury market at the more opportune time. The Fund could also seek to derive alpha from the broader fixed income benchmark, the Bloomberg U.S. Aggregate Bond Index, by holding high yield bonds (which the benchmark Index does not) and holding less duration than the broader market index, the Bloomberg U.S. Aggregate Bond Index. On an absolute basis, both our high yield bond ETFs and intermediate term treasury ETFs produced negative returns during the period.
The Fund’s underlying index experienced 7 risk mitigation signals for the 1 year ended July 31, 2022. The Fund began the time period allocated to a 100% mix of high yield bond ETFs. The first sell signal occurred on August 5, 2021, which saw the Fund allocate to an 80% mix of intermediate term Treasury ETFs and a 20% mix of high yield bond ETFs. A subsequent buy signal triggered on August 26, 2021, which saw the Fund allocate back to a 100% mix of high yield bond ETFs. The Fund performed in line with its benchmark over that time period. Another sell signal occurred on October 1, 2021, which saw the Fund allocate to an 80% mix of intermediate term Treasury ETFs and a 20% mix of high yield bond ETFs. A subsequent buy signal triggered on November 5, 2021, which saw the Fund allocate back to a 100% mix of high yield bond ETFs. The Fund underperformed its benchmark over that time period. Another sell signal occurred on November 18, 2021, which saw the Fund allocate to an 80% mix of intermediate term Treasury ETFs and a 20% mix of high yield bond ETFs. A subsequent buy signal triggered on December 13, 2021, which saw the Fund allocate back to a 100% mix of high yield bond ETFs. The Fund underperformed its benchmark over that time period. Another sell signal occurred on January 10, 2022, which saw the Fund allocate to an 80% mix of intermediate term Treasury ETFs and a 20% mix of high yield bond ETFs. A subsequent buy signal triggered on April 5, 2022, which saw the Fund allocate back to a 100% mix of high yield bond ETFs. The Fund underperformed its benchmark over that time period. A risk mitigation signal triggered on April 8, 2022, which saw the Fund allocate back an 80% mix of intermediate term Treasury ETFs and a 20% mix of high yield bond ETFs. A subsequent buy signal triggered on May 31, 2022, which saw the Fund allocate back to a 100% mix of high yield bond ETFs. The Fund
Donoghue Forlines Tactical High Yield ETF
MANAGEMENT’S DISCUSSION OF FUND PERFORMANCE
July 31, 2022 (Unaudited) (Continued)
underperformed its benchmark over that time period. A risk mitigation signal triggered on June 10, 2022, which saw the Fund allocate back an 80% mix of intermediate term Treasury ETFs and a 20% mix of high yield bond ETFs. A subsequent buy signal triggered on July 21, 2022, which saw the Fund allocate back to a 100% mix of high yield bond ETFs. While the signals did not provide positive attribution against being fully invested in high yield bond ETFs for the duration of the time period, the portfolio benefited from less exposure to duration than the benchmark index.
Must be preceded or accompanied by a current Fund prospectus.
The views and opinions expressed in this discussion are those of FCF Advisors LLC and Donoghue Forlines LLC. The views and opinions expressed are subject to change at any time, are not guaranteed and should not be considered investment advice.
Past performance is no guarantee of future results.
Fund holdings and sector allocations are subject to change and are not recommendations to buy or sell any security. Current and future portfolio holdings are subject to risk. Please refer to the Schedule of Investments contained in this report for a full listing of fund holdings.
The performance data quoted represents past performance. Past performance does not guarantee future results. The investment return and principal value of an investment will fluctuate so that an investor’s shares, when sold or redeemed, may be worth more or less than their original cost and current performance may be lower or higher than the performance quoted. Performance current to the most recent month-end can be obtained by calling (toll free 800-617-0004).
Investing involves risk, including the possible loss of principal. Individual shares of any ETF are bought and sold at market price (not NAV), may trade at a discount or premium to NAV and are not individually redeemed from the Fund. Brokerage commissions will reduce returns. Because the Fund invests in ETFs, an investor will indirectly bear the principal risks of the underlying funds, including illiquidity, and an investment in the Fund will entail more costs and expenses than a direct investment in the Underlying ETFs. Passive funds that seek to track an index may hold the component securities of the underlying index regardless of the current or projected performance of a specific security or the relevant market as a whole, which could cause the fund returns to be lower than if the fund employed an active strategy. The performance of the Fund may diverge from that of its Index. Active and frequent trading of portfolio securities may result in increased transaction costs to the Fund and may also result in higher taxes if Shares are held in a taxable account. Investments in debt securities typically decrease in value when interest rates rise. This risk is usually greater for longer-term debt securities. Investments in high yield securities and unrated securities of similar credit quality are considered to be speculative and are generally subject to a greater risk of loss of principal and interest than investment grade securities. Investment in a fund that utilizes a tactical overlay that seeks to minimize risk may not be appropriate for every investor seeking a particular risk profile.
The Donoghue Forlines Tactical High Yield ETF is distributed by Quasar Distributors, LLC
FCF Tactical High Yield Index tracks the performance of a rules-based tactical strategy that employs technical signals to determine a bullish or defensive posture: when bullish, the Index is fully invested into selected High Yield Bond exchange-traded funds (“ETFs”); when defensive, the Index directs 80% of its position into selected intermediate-term U.S. Treasury ETFs.
The Bloomberg U.S. Aggregate Bond Index, or the Agg, is a broad base, market capitalization-weighted bond market index representing intermediate term investment grade bonds traded in the United States.
Alpha is a term used in investing to describe an investment strategy’s ability to beat the market, or its “edge.”
Bond duration is a way of measuring how much bond prices are likely to change if and when interest rates move. In more technical terms, bond duration is measurement of interest rate risk.
Donoghue Forlines Tactical High Yield ETF
PERFORMANCE SUMMARY
July 31, 2022 (Unaudited)
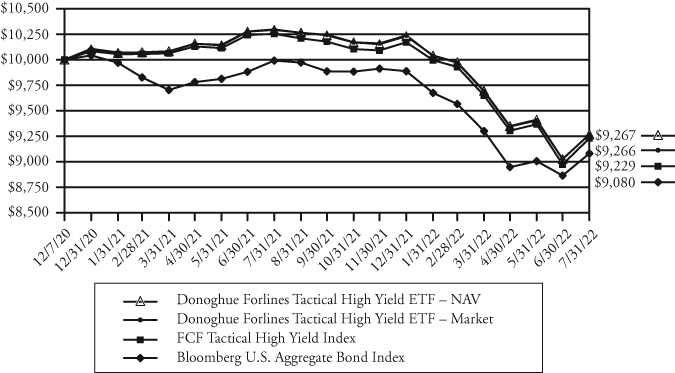
Growth of a $10,000 Investment
| | One | Since |
| Average Annual Total Returns (as of July 31, 2022) | Year | Inception(a) |
Donoghue Forlines Tactical High Yield ETF – NAV | -9.96% | -4.52% |
Donoghue Forlines Tactical High Yield ETF – Market | -10.01% | -4.52% |
FCF Tactical High Yield Index | -9.99% | -4.76% |
Bloomberg U.S. Aggregate Bond Index | -9.12% | -5.69% |
This chart assumes an initial gross investment of $10,000 made on December 7, 2020 (commencement of the Fund’s operations). Returns shown include the reinvestment of all dividends. Returns shown do not reflect the deductions of taxes that a shareholder would pay on Fund distributions or the redemption of Fund shares. Past performance is not predictive of future performance. Investment return and principal value will fluctuate so that your shares, when redeemed, may be worth more or less than original cost. Index returns do not reflect the effects of fees or expenses. It is not possible to invest directly in an index. The total operating expense ratio as stated in the fee table to the Fund’s prospectus dated November 29, 2021 is 0.88%. For performance information current to the most recent month-end, please call 1-800-617-0004.
(a) | Commencement of operations on December 7, 2020. |
Donoghue Forlines Risk Managed Innovation ETF
MANAGEMENT’S DISCUSSION OF FUND PERFORMANCE
July 31, 2022 (Unaudited)
The Donoghue Forlines Risk Managed Innovation ETF (DFNV) was down -15.16% (NAV) and -15.10% (Market) for the 1 year ended July 31, 2022. Our benchmark, the Russell 1000 Total Return Index (R1000), was down -6.87% for the same time period.
On an absolute basis, the leading contributors of DFNV were Healthcare stocks with a -9.38% return, and Information Technology stocks with -13.99% return; the largest detractors were Consumer Discretionary stocks with a -35.16% return, and Communication Services stocks with a -26.35% return. On a benchmark relative basis, the best active contributors were Communications stocks, adding 1.16% active return over R1000. The main active detractors were Information Technology stocks, losing -3.60%, and Energy stocks, losing -1.74%.
DFNV owns a portfolio of high-quality innovative stocks selected by our proprietary free cash flow algorithm: as of July 31, 2022, the weighted average return on equity for DFNV was 44.99%, compared to 39.68% of R1000 and debt-to-capital of 44.76% compared to 41.81. DFNV remained fully invested during the period ended July 31st, 2022, as the fund’s underlying index did not employ the downside risk mitigation model. Rising interest rates and persistent inflation weighed on growth stocks during the time period. We believe holding a portfolio of high-quality innovative stocks selected by the proprietary free cash flow metrics informed by our research as a core position may benefit investors in the long term.
Must be preceded or accompanied by a current Fund prospectus.
The views and opinions expressed in this discussion are those of FCF Advisors LLC and Donoghue Forlines LLC. The views and opinions expressed are subject to change at any time, are not guaranteed and should not be considered investment advice.
Past performance is no guarantee of future results.
Fund holdings and sector allocations are subject to change and are not recommendations to buy or sell any security. Current and future portfolio holdings are subject to risk. Please refer to the Schedule of Investments contained in this report for a full listing of fund holdings.
The performance data quoted represents past performance. Past performance does not guarantee future results. The investment return and principal value of an investment will fluctuate so that an investor’s shares, when sold or redeemed, may be worth more or less than their original cost and current performance may be lower or higher than the performance quoted. Performance current to the most recent month-end can be obtained by calling (toll free 800-617-0004).
Investing involves risk, including the possible loss of principal. Individual shares of any ETF are bought and sold at market price (not NAV), may trade at a discount or premium to NAV and are not individually redeemed from the Fund. Brokerage commissions will reduce returns. Investments in the Fund include risks associated with small-and mid-cap securities which may have less liquidity and greater volatility than large-cap securities. Because the Fund may invest in ETFs, an investor will indirectly bear the principal risks of the underlying funds, including illiquidity, and an investment in
Donoghue Forlines Risk Managed Innovation ETF
MANAGEMENT’S DISCUSSION OF FUND PERFORMANCE
July 31, 2022 (Unaudited) (Continued)
the Fund will entail more costs and expenses than a direct investment in the Underlying ETFs. Passive funds that seek to track an index may hold the component securities of the underlying index regardless of the current or projected performance of a specific security or the relevant market as a whole, which could cause the fund returns to be lower than if the fund employed an active strategy. The performance of the Fund may diverge from that of its Index. Active and frequent trading of portfolio securities may result in increased transaction costs to the Fund and may also result in higher taxes if Shares are held in a taxable account. Investment in a fund that utilizes a downside protection model that seeks to minimize risk only during certain prolonged bear market environments may not be appropriate for ever investor seeking a particular risk profile.
Free Cash Flow represents the cash that a company is able to generate after accounting for capital expenditures.
The Donoghue Forlines Risk Managed Innovation ETF is distributed by Quasar Distributors, LLC.
FCF Risk Managed Quality Innovation Index tracks the performance of a rules-based strategy that aims to provide risk-managed exposure to U.S. publicly traded companies with strong free cash flow and strong research and development (“R&D”) investment.
The Russell 1000 Index is a stock market index that tracks the highest-ranking 1,000 stocks in the Russell 3000 Index, which represent about 90% of the total market capitalization of that index.
Return on equity (ROE) is a measure of financial performance calculated by dividing net income by shareholders’ equity.
The weighted average return is the sum total of the product (or multiplication) of weights that are associated with different investment options and their respective returns.
A company’s debt-to-capital ratio or D/C ratio is the ratio of its total debt to its total capital, its debt and equity combined.
Donoghue Forlines Risk Managed Innovation ETF
PERFORMANCE SUMMARY
July 31, 2022 (Unaudited)
Growth of a $10,000 Investment
| | One | Since |
| Average Annual Total Returns (as of July 31, 2022) | Year | Inception(a) |
Donoghue Forlines Risk Managed Innovation ETF – NAV | -15.16% | 0.32% |
Donoghue Forlines Risk Managed Innovation ETF – Market | -15.10% | 0.34% |
FCF Risk Managed Quality Innovation Index | -14.93% | 0.70% |
Russell 1000® Total Return Index | -6.87% | 6.84% |
This chart assumes an initial gross investment of $10,000 made on December 7, 2020 (commencement of the Fund’s operations). Returns shown include the reinvestment of all dividends. Returns shown do not reflect the deductions of taxes that a shareholder would pay on Fund distributions or the redemption of Fund shares. Past performance is not predictive of future performance. Investment return and principal value will fluctuate so that your shares, when redeemed, may be worth more or less than original cost. Index returns do not reflect the effects of fees or expenses. It is not possible to invest directly in an index. The total operating expense ratio as stated in the fee table to the Fund’s prospectus dated November 29, 2021 is 0.69%. For performance information current to the most recent month-end, please call 1-800-617-0004.
(a) | Commencement of operations on December 7, 2020. |
Donoghue Forlines Yield Enhanced Real Asset ETF
MANAGEMENT’S DISCUSSION OF FUND PERFORMANCE
July 31, 2022 (Unaudited)
The Donoghue Forlines Yield Enhanced Real Asset ETF (DFRA) began trading on December 14, 2021. Since inception on December 13, 2021 through the period ending July 31, 2022, the Fund was up 6.88% (NAV) and 6.79% (Market). Our benchmark, the S&P Real Assets Equity Index, was down -0.42% over the same period.
DFRA outperformed its benchmark since inception to the period ended July 31st, 2022. Real asset equities, as represented by the S&P Real Asset Equity Index, outperformed the broader market, as represented by the S&P 500 Index , during this time period. The largest contributors to performance were Energy stocks and Consumer Staples stocks, respectively up 46.27% and 41.58% during the time period. The largest detractors were Real Estate stocks and Information Technology stocks, respectively down -15.05% and -9.84%.
DFRA owns a portfolio of high-quality real asset stocks* selected by our proprietary free cash flow algorithm: as of July 31st, 2022 the weighted average return on equity for DFRA was 24.91% and debt-to-capital of 46.64%. The price-to-sales ratio was 3.90 and the price-to-earnings ratio 13.26. Historically, real asset stocks have outperformed in periods of high inflation. We believe holding a portfolio of high-quality real asset stocks selected by the proprietary free cash flow metrics informed by our research as a core position may provide diversification and benefit investors in the long term.
| * | “Real asset” stocks are currently defined as common stock, real estate investment trusts (“REITs”), master limited partnerships (“MLPs”), and American Depositary Receipts (“ADRs”) included in the “Real Assets Industry Group,” as defined by FCF Indexes LLC, the index provider for the FCF Yield Enhanced Real Asset Index. |
The views and opinions expressed in this discussion are those of FCF Advisors LLC and Donoghue Forlines LLC. The views and opinions expressed are subject to change at any time, are not guaranteed and should not be considered investment advice.
Fund holdings and sector allocations are subject to change and are not recommendations to buy or sell any security. Current and future portfolio holdings are subject to risk. Please refer to the Schedule of Investments contained in this report for a full listing of fund holdings.
The performance data quoted represents past performance. Past performance does not guarantee future results. The investment return and principal value of an investment will fluctuate so that an investor’s shares, when sold or redeemed, may be worth more or less than their original cost and current performance may be lower or higher than the performance quoted. Performance current to the most recent month-end can be obtained by calling (toll free 800-617-0004).
Investing involves risk, including the possible loss of principal. Individual shares of any ETF are bought and sold at market price (not NAV), may trade at a discount or premium to NAV and are not individually redeemed from the Fund. Brokerage commissions will reduce returns.
Passive funds that seek to track an index may hold the component securities of the underlying index regardless of the current or projected performance of a specific security or the relevant market as a whole, which could cause the fund returns to be lower than if the fund employed an active strategy. The performance of the Fund may diverge from that of its Index known as tracking error. The Fund is new with limited performance history to evaluate.
Donoghue Forlines Yield Enhanced Real Asset ETF
MANAGEMENT’S DISCUSSION OF FUND PERFORMANCE
July 31, 2022 (Unaudited) (Continued)
The Fund may be subject to certain risks associated with direct investments in REITs such as the quality of credit, changes in their underlying properties and by defaults by borrowers or tenants. MLPs can be affected by macroeconomic factors, expectations of interest rates, investor sentiment or changes in a particular issuer’s financial condition. The Fund is more susceptible to adverse developments affecting one or more of these sectors.
Free Cash Flow represents the cash that a company is able to generate after accounting for capital expenditures.
The Donoghue Forlines Yield Enhanced Real Asset ETF is distributed by Quasar Distributors, LLC.
Return on equity (ROE) is a measure of financial performance calculated by dividing net income by shareholders’ equity. A company’s earnings are its after-tax net income. This is the company’s bottom line or its profits.
Market Price: The current price at which shares are bought and sold. Market returns are based upon last trade price.
NAV: The dollar value of a single share, based on the value of the underlying assets of the fund minus its liabilities, divided by the number of shares outstanding. Calculated at the end of each business day.
The S&P Real Assets Equity Index is a static weighted return of investable and liquid equity indexed components that measures the performance of real return strategies that invest in listed global property, infrastructure, natural resources, and timber and forestry companies.
The FCF Yield Enhanced Real Asset Index is designed to track the investment result of a rules-based strategy that aims to provide exposure to global “real assets” equities.
The Standard and Poor’s 500, or simply the S&P 500, is a stock market index tracking the stock performance of 500 large companies listed on exchanges in the United States.
Price–sales ratio, P/S ratio, or PSR, is a valuation metric for stocks. It is calculated by dividing the company’s market capitalization by the revenue in the most recent year; or, equivalently, divide the per-share stock price by the per-share revenue.
The price-earnings ratio, also known as P/E ratio, P/E, or PER, is the ratio of a company’s share price to the company’s earnings per share. The ratio is used for valuing companies and to find out whether they are overvalued or undervalued.
Donoghue Forlines Yield Enhanced Real Asset ETF
PERFORMANCE SUMMARY
July 31, 2022 (Unaudited)
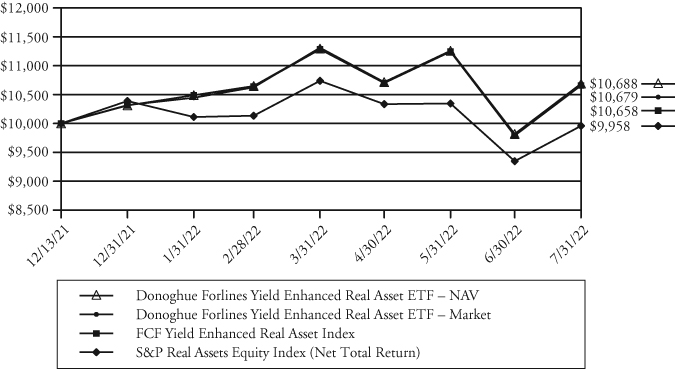
Growth of a $10,000 Investment
| | Since |
| Cumulative Returns (as of July 31, 2022) | Inception(a) |
Donoghue Forlines Yield Enhanced Real Asset ETF – NAV | 6.88% |
Donoghue Forlines Yield Enhanced Real Asset ETF – Market | 6.79% |
FCF Yield Enhanced Real Asset Index | 6.58% |
S&P Real Assets Equity Index (Net Total Return) | -0.42% |
This chart assumes an initial gross investment of $10,000 made on December 13, 2021 (commencement of the Fund’s operations). Returns shown include the reinvestment of all dividends. Returns shown do not reflect the deductions of taxes that a shareholder would pay on Fund distributions or the redemption of Fund shares. Past performance is not predictive of future performance. Investment return and principal value will fluctuate so that your shares, when redeemed, may be worth more or less than original cost. Index returns do not reflect the effects of fees or expenses. It is not possible to invest directly in an index. The total operating expense ratio as stated in the fee table to the Fund’s prospectus dated November 29, 2021 is 0.69%. For performance information current to the most recent month-end, please call 1-800-617-0004.
(a) | Commencement of operations on December 13, 2021. |
TrimTabs ETF Trust
SHAREHOLDER EXPENSE EXAMPLES
For the Six-Months Ended July 31, 2022 (Unaudited)
As a shareholder of a Fund you incur two types of costs: (1) transaction costs for purchasing and selling shares; and (2) ongoing costs, including management fees and other Fund expenses. The following examples are intended to help you understand your ongoing costs (in dollars and cents) of investing in the Funds and to compare these costs with the ongoing costs of investing in other funds.
Each example is based on an investment of $1,000 invested at the beginning of the period and held for the entire six-month period as indicated below.
Actual Expenses
The first line in the table below provides information about actual account values and actual expenses. You may use the information provided in this line, together with the amount you invested, to estimate the expenses that you paid over the period. Simply divide your account value by $1,000 (for example, an $8,600 ending account value divided by $1,000 = 8.6), then multiply the result by the number in the first line under the heading entitled “Expenses Paid During Period” to estimate the expenses you paid on your account during the period.
Hypothetical Example for Comparison Purposes
The second line in the table below provides information about hypothetical account values and hypothetical expenses based on the respective Fund’s actual expense ratio and an assumed rate of return of 5% per year before expenses, which is not the Fund’s actual return. The hypothetical account values and expenses may not be used to estimate the actual ending account balance or expenses you paid for the period. You may use this information to compare the ongoing costs of investing in a Fund and other funds. To do so, compare this 5% hypothetical example with the 5% hypothetical examples that appear in the shareholder reports of the other funds. Please note that the expenses shown in the table are meant to highlight your ongoing costs only and do not reflect any transactional cost, such as brokerage commissions paid on purchases and sales of Fund shares. Therefore, the second line in the table below is useful in comparing ongoing Fund costs only and will not help you determine the relative total costs of owning different funds. In addition, if these transactional costs were included, your costs would have been higher.
| | Beginning | Ending | Expenses Paid |
| | Account | Account | During Period |
| | Value | Value | 2/1/22 – |
| | 2/1/22 | 7/31/22 | 7/31/22(a) |
| FCF US Quality ETF | | | |
Actual | $1,000.00 | $ 945.00 | $2.85 |
Hypothetical (5% return before expenses) | $1,000.00 | $1,021.87 | $2.96 |
TrimTabs ETF Trust
SHAREHOLDER EXPENSE EXAMPLES
For the Six-Months Ended July 31, 2022 (Unaudited) (Continued)
| | Beginning | Ending | Expenses Paid |
| | Account | Account | During Period |
| | Value | Value | 2/1/22 – |
| | 2/1/22 | 7/31/22 | 7/31/22(a) |
| FCF International Quality ETF | | | |
Actual | $1,000.00 | $ 864.30 | $2.73 |
Hypothetical (5% return before expenses) | $1,000.00 | $1,021.87 | $2.96 |
| | | | |
| | Beginning | Ending | Expenses Paid |
| | Account | Account | During Period |
| | Value | Value | 2/1/22 |
| | 2/1/22 | 7/31/22 | 7/31/22(b) |
| Donoghue Forlines | | | |
| Tactical High Yield ETF | | | |
Actual | $1,000.00 | $ 923.00 | $3.29 |
Hypothetical (5% return before expenses) | $1,000.00 | $1,021.37 | $3.46 |
| | | | |
| | Beginning | Ending | Expenses Paid |
| | Account | Account | During Period |
| | Value | Value | 2/1/22 |
| | 2/1/22 | 7/31/22 | 7/31/22(b) |
| Donoghue Forlines Risk | | | |
| Managed Innovation ETF | | | |
Actual | $1,000.00 | $ 908.10 | $3.26 |
Hypothetical (5% return before expenses) | $1,000.00 | $1,021.37 | $3.46 |
| | | | |
| | Beginning | Ending | Expenses Paid |
| | Account | Account | During Period |
| | Value | Value | 2/1/22 |
| | 2/1/22 | 7/31/22 | 7/31/22(b) |
| Donoghue Forlines Yield | | | |
| Enhanced Real Asset ETF | | | |
Actual | $1,000.00 | $1,018.90 | $3.45 |
Hypothetical (5% return before expenses) | $1,000.00 | $1,021.37 | $3.46 |
(a) | Actual Expenses Paid are equal to the Fund’s annualized expense ratio of 0.59%, multiplied by the average account value over the period, multiplied by 181/365 to reflect the period. |
(b) | Actual Expenses Paid are equal to the Fund’s annualized expense ratio of 0.69%, multiplied by the average account value over the period, multiplied by 181/365 to reflect the period. |
TrimTabs ETF Trust
PORTFOLIO HOLDINGS ALLOCATION (as a % of net assets)
July 31, 2022 (Unaudited)
| FCF US Quality ETF | | | |
Communications | | | 4.3 | % |
Consumer Discretionary | | | 8.6 | % |
Consumer Staples | | | 8.1 | % |
Energy | | | 7.1 | % |
Financials | | | 9.4 | % |
Health Care | | | 16.0 | % |
Industrials | | | 5.6 | % |
Materials | | | 3.4 | % |
Technology | | | 33.6 | %(a) |
REITs | | | 2.8 | % |
Money Market Fund | | | 0.8 | % |
Investment Purchased with the Cash Proceeds from Securities Lending | | | 10.6 | %(b) |
Liabilities in Excess of Other Assets | | | (10.3 | )% |
Total Net Assets | | | 100.0 | % |
| | | | | |
| FCF International Quality ETF | | | | |
Australia | | | 9.7 | % |
Austria | | | 0.5 | % |
Belgium | | | 0.7 | % |
Brazil | | | 2.6 | % |
Canada | | | 10.2 | % |
China | | | 8.6 | % |
Denmark | | | 5.2 | % |
Finland | | | 1.5 | % |
France | | | 3.6 | % |
Germany | | | 3.5 | % |
Hong Kong | | | 1.2 | % |
India | | | 0.4 | % |
Ireland | | | 2.3 | % |
Israel | | | 0.8 | % |
Italy | | | 1.3 | % |
Japan | | | 7.4 | % |
Mexico | | | 0.7 | % |
Netherlands | | | 2.9 | % |
Norway | | | 3.4 | % |
Portugal | | | 0.7 | % |
Republic of Korea | | | 0.3 | % |
Singapore | | | 0.7 | % |
South Africa | | | 2.8 | % |
Spain | | | 0.5 | % |
Sweden | | | 3.4 | % |
Switzerland | | | 7.7 | % |
Taiwan | | | 2.7 | % |
United Kingdom | | | 12.9 | % |
Money Market Fund | | | 1.0 | % |
Investment Purchased with the Cash Proceeds from Securities Lending | | | 6.0 | %(b) |
Liabilities in Excess of Other Assets | | | (5.2 | )% |
Total Net Assets | | | 100.0 | % |
TrimTabs ETF Trust
PORTFOLIO HOLDINGS ALLOCATION (as a % of net assets)
July 31, 2022 (Unaudited) (Continued)
| Donoghue Forlines Tactical High Yield ETF | | | |
Exchange-Traded Funds | | | 99.7 | % |
Money Market Fund | | | 0.3 | % |
Investment Purchased with the Cash Proceeds from Securities Lending | | | 29.4 | %(b) |
Liabilities in Excess of Other Assets | | | (29.4 | )% |
Total Net Assets | | | 100.0 | % |
| | | | | |
| Donoghue Forlines Risk Managed Innovation ETF | | | | |
Communications | | | 9.9 | % |
Consumer Discretionary | | | 1.6 | % |
Consumer Staples | | | 2.7 | % |
Energy | | | 1.4 | % |
Health Care | | | 25.6 | %(c) |
Industrials | | | 3.5 | % |
Technology | | | 55.0 | %(c) |
Money Market Fund | | | 0.3 | % |
Investment Purchased with the Cash Proceeds from Securities Lending | | | 14.6 | %(b) |
Liabilities in Excess of Other Assets | | | (14.6 | )% |
Total Net Assets | | | 100.0 | % |
| | | | | |
| Donoghue Forlines Yield Enhanced Real Asset ETF | | | | |
Consumer Staples | | | 1.3 | % |
Energy | | | 29.3 | %(d) |
Industrials | | | 19.9 | % |
Materials | | | 13.2 | % |
Technology | | | 1.4 | % |
Preferred Stock | | | 2.3 | % |
Master Limited Partnerships | | | 11.5 | % |
REITs | | | 20.7 | % |
Money Market Fund | | | 0.3 | % |
Investment Purchased with the Cash Proceeds from Securities Lending | | | 24.0 | %(b) |
Liabilities in Excess of Other Assets | | | (23.9 | )% |
Total Net Assets | | | 100.0 | % |
(a) | Amount represents investments in a particular sector. No industry within this sector represented more than 25% of the Fund’s total assets at the time of investment. |
(b) | Represents cash received as collateral in return for securities lent as part of the securities lending program. The cash is invested in the Mount Vernon Liquid Assets Portfolio, LLC as noted in the applicable schedules of investments listed in this report. |
(c) | The amount represents investments in a particular sector. Within the sector, the Fund will concentrate its investments (i.e. invest more than 25% of its total assets) in a particular industry or group of industries to approximately the same extent the FCF Risk Managed Quality Innovation Index is concentrated. |
(d) | The amount represents investments in a particular sector. Within the sector, the Fund will concentrate its investments (i.e. invest more than 25% of its total assets) in a particular industry or group of industries to approximately the same extent the FCF Yield Enhanced Real Asset Index is concentrated. |
FCF US Quality ETF
SCHEDULE OF INVESTMENTS
July 31, 2022
| | | Shares | | | Value | |
| | | | | | | |
| COMMON STOCKS – 96.1% | | | | | | |
| | | | | | | |
| Communications – 4.3% | | | | | | |
Alphabet, Inc. – Class A (a) | | | 28,640 | | | $ | 3,331,405 | |
Booking Holdings, Inc. (a) | | | 452 | | | | 874,932 | |
Expedia Group, Inc. (a) | | | 3,529 | | | | 374,250 | |
Interpublic Group of Cos., Inc. | | | 42,496 | | | | 1,269,356 | |
Meta Platforms, Inc. – Class A (a) | | | 7,410 | | | | 1,178,931 | |
Sirius XM Holdings, Inc. (d) | | | 86,641 | | | | 578,762 | |
VeriSign, Inc. (a) | | | 200 | | | | 37,832 | |
| | | | | | | | 7,645,468 | |
| | | | | | | | | |
| Consumer Discretionary – 8.6% | | | | | | | | |
AutoNation, Inc. (a)(d) | | | 14,243 | | | | 1,691,214 | |
AutoZone, Inc. (a) | | | 813 | | | | 1,737,698 | |
Chipotle Mexican Grill, Inc. (a)(d) | | | 523 | | | | 818,087 | |
Dick’s Sporting Goods, Inc. (d) | | | 60 | | | | 5,616 | |
Etsy, Inc. (a)(d) | | | 5,756 | | | | 597,012 | |
Genuine Parts Co. | | | 5,670 | | | | 866,773 | |
Group 1 Automotive, Inc. | | | 5,670 | | | | 1,003,136 | |
Home Depot, Inc. | | | 3,479 | | | | 1,046,970 | |
Lowe’s Cos., Inc. | | | 4,625 | | | | 885,826 | |
Masco Corp. (d) | | | 23,206 | | | | 1,285,148 | |
O’Reilly Automotive, Inc. (a) | | | 2,465 | | | | 1,734,349 | |
Starbucks Corp. | | | 17,716 | | | | 1,501,963 | |
Ulta Beauty, Inc. (a) | | | 3,156 | | | | 1,227,400 | |
Williams-Sonoma, Inc. (d) | | | 6,173 | | | | 891,505 | |
Winmark Corp. | | | 112 | | | | 24,881 | |
| | | | | | | | 15,317,578 | |
| | | | | | | | | |
| Consumer Staples – 8.1% | | | | | | | | |
Altria Group, Inc. | | | 23,584 | | | | 1,034,394 | |
BellRing Brands, Inc. (a) | | | 33,247 | | | | 802,583 | |
Clorox Co. | | | 5,631 | | | | 798,701 | |
Coca-Cola Co. | | | 39,748 | | | | 2,550,629 | |
Colgate-Palmolive Co. | | | 15,397 | | | | 1,212,360 | |
Costco Wholesale Corp. | | | 3,731 | | | | 2,019,590 | |
Estee Lauder Cos., Inc. – Class A | | | 3,225 | | | | 880,748 | |
Hershey Co. (d) | | | 4,814 | | | | 1,097,399 | |
Kroger Co. | | | 14,746 | | | | 684,804 | |
The accompanying notes are an integral part of these financial statements.
FCF US Quality ETF
SCHEDULE OF INVESTMENTS
July 31, 2022 (Continued)
| | | Shares | | | Value | |
| | | | | | | |
| COMMON STOCKS – 96.1% (Continued) | | | | | | |
| | | | | | | |
| Consumer Staples – 8.1% (Continued) | | | | | | |
Philip Morris International, Inc. | | | 16,941 | | | $ | 1,645,818 | |
Procter & Gamble Co. | | | 11,777 | | | | 1,635,943 | |
Target Corp. | | | 17 | | | | 2,778 | |
| | | | | | | | 14,365,747 | |
| | | | | | | | | |
| Energy – 7.1% | | | | | | | | |
APA Corp. | | | 18,414 | | | | 684,448 | |
Chord Energy Corp. (d) | | | 34 | | | | 4,360 | |
ConocoPhillips | | | 11,534 | | | | 1,123,758 | |
Devon Energy Corp. | | | 10,570 | | | | 664,325 | |
Enphase Energy, Inc. (a) | | | 3,397 | | | | 965,360 | |
Exxon Mobil Corp. | | | 27,129 | | | | 2,629,614 | |
Magnolia Oil & Gas Corp. – Class A (d) | | | 64,931 | | | | 1,566,785 | |
Occidental Petroleum Corp. | | | 11,859 | | | | 779,729 | |
Ovintiv, Inc. | | | 30,303 | | | | 1,548,180 | |
PDC Energy, Inc. (d) | | | 10,186 | | | | 669,118 | |
Targa Resources Corp. | | | 14,366 | | | | 992,834 | |
Texas Pacific Land Corp. | | | 474 | | | | 869,245 | |
| | | | | | | | 12,497,756 | |
| | | | | | | | | |
| Financials – 9.4% | | | | | | | | |
Allstate Corp. | | | 370 | | | | 43,279 | |
American Express Co. | | | 7,021 | | | | 1,081,375 | |
American Financial Group, Inc. | | | 10,031 | | | | 1,340,944 | |
Bank of America Corp. | | | 151 | | | | 5,105 | |
Berkshire Hathaway, Inc. – Class B (a) | | | 6,634 | | | | 1,994,180 | |
Goldman Sachs Group, Inc. | | | 3,307 | | | | 1,102,521 | |
JPMorgan Chase & Co. | | | 22,701 | | | | 2,618,787 | |
LPL Financial Holdings, Inc. (d) | | | 7,766 | | | | 1,630,239 | |
Morgan Stanley | | | 10,584 | | | | 892,231 | |
SEI Investments Co. | | | 16,602 | | | | 919,087 | |
Synchrony Financial | | | 30,737 | | | | 1,029,075 | |
T Rowe Price Group, Inc. (d) | | | 7,396 | | | | 913,184 | |
U.S. Bancorp | | | 21,946 | | | | 1,035,851 | |
Visa, Inc. – Class A (d) | | | 5,922 | | | | 1,256,116 | |
Wells Fargo & Co. | | | 928 | | | | 40,711 | |
Willis Towers Watson PLC | | | 3,210 | | | | 664,277 | |
| | | | | | | | 16,566,962 | |
The accompanying notes are an integral part of these financial statements.
FCF US Quality ETF
SCHEDULE OF INVESTMENTS
July 31, 2022 (Continued)
| | | Shares | | | Value | |
| | | | | | | |
| COMMON STOCKS – 96.1% (Continued) | | | | | | |
| | | | | | | |
| Health Care – 16.0% | | | | | | |
Abbott Laboratories | | | 12,736 | | | $ | 1,386,186 | |
AbbVie, Inc. | | | 16,760 | | | | 2,405,228 | |
Alector, Inc. (a) | | | 40,000 | | | | 408,800 | |
Amgen, Inc. | | | 9,216 | | | | 2,280,683 | |
Bristol-Myers Squibb Co. | | | 26,314 | | | | 1,941,447 | |
Chemed Corp. (d) | | | 1,799 | | | | 865,481 | |
Eli Lilly & Co. | | | 6,640 | | | | 2,189,142 | |
Gilead Sciences, Inc. | | | 14,841 | | | | 886,750 | |
Hologic, Inc. (a) | | | 12,325 | | | | 879,758 | |
Johnson & Johnson | | | 16,176 | | | | 2,823,035 | |
McKesson Corp. | | | 5,171 | | | | 1,766,310 | |
Medpace Holdings, Inc. (a) | | | 5,347 | | | | 906,477 | |
Mettler-Toledo International, Inc. (a) | | | 844 | | | | 1,139,172 | |
Molina Healthcare, Inc. (a) | | | 5,173 | | | | 1,695,296 | |
Pfizer, Inc. | | | 51,282 | | | | 2,590,254 | |
Regeneron Pharmaceuticals, Inc. (a) | | | 1,207 | | | | 702,100 | |
UnitedHealth Group, Inc. | | | 5,031 | | | | 2,728,512 | |
Waters Corp. (a) | | | 2,088 | | | | 760,095 | |
| | | | | | | | 28,354,726 | |
| | | | | | | | | |
| Industrials – 5.6% | | | | | | | | |
3M Co. (d) | | | 45 | | | | 6,446 | |
Allegion PLC (d) | | | 48 | | | | 5,074 | |
Emerson Electric Co. | | | 59 | | | | 5,314 | |
General Dynamics Corp. | | | 3,150 | | | | 714,011 | |
Insperity, Inc. | | | 6,846 | | | | 751,280 | |
Keysight Technologies, Inc. (a) | | | 6,127 | | | | 996,250 | |
Lennox International, Inc. (d) | | | 280 | | | | 67,068 | |
Lockheed Martin Corp. | | | 3,475 | | | | 1,437,990 | |
Louisiana-Pacific Corp. (d) | | | 20,132 | | | | 1,280,999 | |
Oshkosh Corp. | | | 11,603 | | | | 999,018 | |
Otis Worldwide Corp. | | | 17,667 | | | | 1,381,029 | |
Rollins, Inc. (d) | | | 15,821 | | | | 610,216 | |
Union Pacific Corp. | | | 29 | | | | 6,592 | |
United Parcel Service, Inc. – Class B | | | 8,680 | | | | 1,691,645 | |
| | | | | | | | 9,952,932 | |
The accompanying notes are an integral part of these financial statements.
FCF US Quality ETF
SCHEDULE OF INVESTMENTS
July 31, 2022 (Continued)
| | | Shares | | | Value | |
| | | | | | | |
| COMMON STOCKS – 96.1% (Continued) | | | | | | |
| | | | | | | |
| Materials – 3.4% | | | | | | |
CF Industries Holdings, Inc. | | | 11,963 | | | $ | 1,142,347 | |
Dow, Inc. | | | 11,110 | | | | 591,163 | |
Eagle Materials, Inc. | | | 8,211 | | | | 1,038,281 | |
LyondellBasell Industries NV – Class A | | | 11,161 | | | | 994,668 | |
Sherwin-Williams Co. | | | 6,042 | | | | 1,461,802 | |
Trex Co., Inc. (a) | | | 11,401 | | | | 735,593 | |
Vale SA – ADR (d) | | | 1,316 | | | | 17,713 | |
| | | | | | | | 5,981,567 | |
| | | | | | | | | |
| Technology – 33.6% (c) | | | | | | | | |
Accenture PLC – Class A | | | 7,176 | | | | 2,197,722 | |
Adobe, Inc. (a) | | | 4,495 | | | | 1,843,489 | |
Apple, Inc. | | | 65,092 | | | | 10,578,101 | |
ASML Holding NV – NY Reg Shares | | | 1,894 | | | | 1,087,989 | |
Atlassian Corp. PLC – Class A (a) | | | 5,684 | | | | 1,189,775 | |
Autodesk, Inc. (a) | | | 4,010 | | | | 867,443 | |
Box, Inc. – Class A (a) | | | 24,063 | | | | 684,352 | |
Broadcom, Inc. | | | 4,389 | | | | 2,350,222 | |
Cadence Design Systems, Inc. (a) | | | 7,552 | | | | 1,405,276 | |
Cisco Systems, Inc. | | | 45,095 | | | | 2,045,960 | |
CommVault Systems, Inc. (a) | | | 13,261 | | | | 743,809 | |
Crowdstrike Holdings, Inc. – Class A (a) | | | 3,292 | | | | 604,411 | |
Dropbox, Inc. – Class A (a) | | | 37,661 | | | | 856,411 | |
FactSet Research Systems, Inc. | | | 2,443 | | | | 1,049,708 | |
Fair Isaac Corp. (a) | | | 2,627 | | | | 1,213,753 | |
Fortinet, Inc. (a) | | | 28,901 | | | | 1,723,945 | |
Gartner, Inc. (a) | | | 4,472 | | | | 1,187,226 | |
HP, Inc. | | | 39,471 | | | | 1,317,937 | |
International Business Machines Corp. | | | 9,289 | | | | 1,214,908 | |
Jack Henry & Associates, Inc. | | | 7,077 | | | | 1,470,388 | |
Manhattan Associates, Inc. (a)(d) | | | 7,362 | | | | 1,035,612 | |
MarketAxess Holdings, Inc. | | | 1,460 | | | | 395,339 | |
Mastercard, Inc. – Class A | | | 4,966 | | | | 1,756,921 | |
Microchip Technology, Inc. (d) | | | 8,287 | | | | 570,643 | |
Microsoft Corp. | | | 22,023 | | | | 6,182,737 | |
Moody’s Corp. | | | 3,563 | | | | 1,105,421 | |
Motorola Solutions, Inc. | | | 2,952 | | | | 704,318 | |
The accompanying notes are an integral part of these financial statements.
FCF US Quality ETF
SCHEDULE OF INVESTMENTS
July 31, 2022 (Continued)
| | | Shares | | | Value | |
| | | | | | | |
| COMMON STOCKS – 96.1% (Continued) | | | | | | |
| | | | | | | |
| Technology – 33.6% (c) (Continued) | | | | | | |
MSCI, Inc. | | | 1,782 | | | $ | 857,748 | |
NetApp, Inc. | | | 55 | | | | 3,923 | |
NVIDIA Corp. | | | 8,476 | | | | 1,539,496 | |
Palo Alto Networks, Inc. (a) | | | 3,105 | | | | 1,549,705 | |
Paychex, Inc. | | | 8,035 | | | | 1,030,730 | |
Pure Storage, Inc. – Class A (a) | | | 31,448 | | | | 891,551 | |
QUALCOMM, Inc. | | | 585 | | | | 84,860 | |
ServiceNow, Inc. (a) | | | 3,162 | | | | 1,412,339 | |
Synopsys, Inc. (a) | | | 2,945 | | | | 1,082,287 | |
Veeva Systems, Inc. – Class A (a) | | | 3,977 | | | | 889,178 | |
VMware, Inc. – Class A | | | 5,954 | | | | 691,855 | |
Western Union Co. | | | 24,142 | | | | 410,897 | |
Workday, Inc. – Class A (a) | | | 5,666 | | | | 878,797 | |
Zebra Technologies Corp. (a) | | | 2,011 | | | | 719,315 | |
| | | | | | | | 59,426,497 | |
TOTAL COMMON STOCKS | | | | | | | | |
(Cost $152,918,281) | | | | | | | 170,109,233 | |
| | | | | | | | | |
| | | | | | | | | |
| REITs – 2.8% | | | | | | | | |
| | | | | | | | | |
| Real Estate – 2.8% | | | | | | | | |
American Tower Corp. | | | 8,174 | | | | 2,213,764 | |
Gaming and Leisure Properties, Inc. | | | 13,150 | | | | 683,668 | |
Iron Mountain, Inc. (d) | | | 26,632 | | | | 1,291,386 | |
Simon Property Group, Inc. | | | 7,389 | | | | 802,741 | |
TOTAL REITs | | | | | | | | |
(Cost $4,548,022) | | | | | | | 4,991,559 | |
| | | | | | | | | |
| | | | | | | | | |
| MONEY MARKET FUND – 0.8% | | | | | | | | |
Fidelity Institutional Money Market Fund – | | | | | | | | |
Government Portfolio, Institutional Class, 1.49% (b) | | | 1,361,957 | | | | 1,361,957 | |
TOTAL MONEY MARKET FUND | | | | | | | | |
(Cost $1,361,957) | | | | | | | 1,361,957 | |
The accompanying notes are an integral part of these financial statements.
FCF US Quality ETF
SCHEDULE OF INVESTMENTS
July 31, 2022 (Continued)
| | | Shares | | | Value | |
| | | | | | | |
| INVESTMENT PURCHASED WITH THE CASH | | | | | | |
| PROCEEDS FROM SECURITIES LENDING – 10.6% | | | | | | |
| | | | | | | |
| Investment Company – 10.6% | | | | | | |
Mount Vernon Liquid Asset Portfolio, LLC, 2.02% (b) | | | 18,745,040 | | | $ | 18,745,040 | |
TOTAL INVESTMENT PURCHASED WITH THE | | | | | | | | |
CASH PROCEEDS FROM SECURITIES LENDING | | | | | | | | |
(Cost $18,745,040) | | | | | | | 18,745,040 | |
| | | | | | | | | |
| Total Investments (Cost $177,573,300) – 110.3% | | | | | | | 195,207,789 | |
| Liabilities in Excess of Other Assets – (10.3)% | | | | | | | (18,270,147 | ) |
| TOTAL NET ASSETS – 100.0% | | | | | | $ | 176,937,642 | |
Percentages are stated as a percent of net assets.
ADR – American Depositary Receipt
PLC – Public Limited Company
REIT – Real Estate Investment Trust
| (a) | Non-income producing security. |
| (b) | Rate disclosed is the seven day annualized yield as of July 31, 2022. |
| (c) | Amount represents investments in a particular sector. No industry within this sector represented more than 25% of the Fund’s total assets at the time of investment. |
| (d) | All or a portion of this security was out on loan at July 31, 2022. Total loaned securities had a market value of $18,626,055 as of July 31, 2022. |
For Fund compliance purposes, the Fund’s sector classifications refers to any one or more of the sector classifications used by one or more widely recognized market indexes or ratings group indexes, and/or they may be defined by Fund management. This definition does not apply for all purposes of this report, which may combine classifications for reporting ease.
The accompanying notes are an integral part of these financial statements.
FCF International Quality ETF
SCHEDULE OF INVESTMENTS
July 31, 2022
| | | Shares | | | Value | |
| | | | | | | |
| COMMON STOCKS – 96.2% | | | | | | |
| | | | | | | |
| Communications – 7.1% | | | | | | |
America Movil SAB de CV – ADR | | | 20,139 | | | $ | 381,231 | |
Kakaku.com, Inc. | | | 22,206 | | | | 431,464 | |
KDDI Corp. | | | 11,944 | | | | 384,429 | |
MTN Group Ltd. | | | 33,434 | | | | 279,804 | |
MultiChoice Group | | | 48,823 | | | | 349,634 | |
NetEase, Inc. – ADR (e) | | | 8,405 | | | | 781,497 | |
Telenor ASA | | | 32,392 | | | | 392,119 | |
Telstra Corp. Ltd. | | | 110,738 | | | | 300,979 | |
Ubisoft Entertainment SA – ADR (a) | | | 30,092 | | | | 254,578 | |
WPP PLC – ADR | | | 4,963 | | | | 267,804 | |
| | | | | | | | 3,823,539 | |
| | | | | | | | | |
| Consumer Discretionary – 11.3% | | | | | | | | |
adidas AG | | | 1,820 | | | | 312,129 | |
Bunzl PLC | | | 11,437 | | | | 427,730 | |
BYD Co. Ltd. – Class H | | | 13,986 | | | | 508,848 | |
Domino’s Pizza Enterprises Ltd. | | | 4,102 | | | | 207,618 | |
Geberit AG | | | 614 | | | | 321,820 | |
Hennes & Mauritz AB – Class B | | | 31,823 | | | | 404,967 | |
Howden Joinery Group PLC | | | 38,541 | | | | 317,471 | |
JD Sports Fashion PLC | | | 251,153 | | | | 396,235 | |
La Francaise des Jeux SAEM (b) | | | 7,209 | | | | 256,772 | |
Lululemon Athletica, Inc. (a) | | | 812 | | | | 252,134 | |
LVMH Moet Hennessy Louis Vuitton SE | | | 1,171 | | | | 807,850 | |
Mercedes-Benz Group AG | | | 5,332 | | | | 311,823 | |
Next PLC | | | 4,603 | | | | 381,514 | |
Pandora A/S | | | 3,454 | | | | 254,939 | |
Persimmon PLC – ADR | | | 60 | | | | 2,768 | |
Pinduoduo, Inc. – ADR (a) | | | 5,737 | | | | 281,170 | |
Topsports International Holdings Ltd. (b) | | | 177,970 | | | | 148,272 | |
Yadea Group Holdings Ltd. (b) | | | 107,766 | | | | 232,009 | |
ZOZO, Inc. | | | 12,697 | | | | 272,602 | |
| | | | | | | | 6,098,671 | |
| | | | | | | | | |
| Consumer Staples – 10.6% | | | | | | | | |
Chongqing Brewery Co. Ltd. – Class A | | | 16,166 | | | | 294,900 | |
Coles Group Ltd. | | | 42,221 | | | | 553,121 | |
Diageo PLC | | | 9,601 | | | | 453,889 | |
The accompanying notes are an integral part of these financial statements.
FCF International Quality ETF
SCHEDULE OF INVESTMENTS
July 31, 2022 (Continued)
| | | Shares | | | Value | |
| | | | | | | |
| COMMON STOCKS – 96.2% (Continued) | | | | | | |
| | | | | | | |
| Consumer Staples – 10.6% (Continued) | | | | | | |
Dollarama, Inc. | | | 9,454 | | | $ | 572,976 | |
Haleon PLC – ADR (a) | | | 14,014 | | | | 98,518 | |
Imperial Brands PLC | | | 14,052 | | | | 307,856 | |
Jeronimo Martins SGPS SA | | | 16,128 | | | | 372,858 | |
Kesko Oyj – Class B | | | 15,069 | | | | 371,477 | |
Kweichow Moutai Co. Ltd. – Class A | | | 1,482 | | | | 417,605 | |
Loblaw Cos Ltd. | | | 4,199 | | | | 382,240 | |
L’Oreal SA | | | 1,726 | | | | 649,347 | |
Reckitt Benckiser Group PLC | | | 3,878 | | | | 313,867 | |
Sun Art Retail Group Ltd. | | | 439,218 | | | | 129,249 | |
Unilever PLC | | | 16,947 | | | | 826,248 | |
| | | | | | | | 5,744,151 | |
| | | | | | | | | |
| Energy – 4.8% | | | | | | | | |
Aker BP ASA | | | 13,304 | | | | 459,605 | |
Equinor ASA – ADR (e) | | | 18,082 | | | | 694,530 | |
Imperial Oil Ltd. | | | 7,145 | | | | 342,422 | |
OMV AG | | | 6,769 | | | | 286,553 | |
Orron Energy AB | | | 13,988 | | | | 17,206 | |
Petroleo Brasileiro SA – ADR | | | 47,421 | | | | 677,172 | |
Woodside Energy Group Ltd. – ADR (e) | | | 1,369 | | | | 31,090 | |
Woodside Energy Group Ltd. | | | 3,853 | | | | 86,093 | |
| | | | | | | | 2,594,671 | |
| | | | | | | | | |
| Financials – 13.5% | | | | | | | | |
Admiral Group PLC | | | 8,521 | | | | 199,029 | |
Bank of Montreal | | | 3,092 | | | | 308,246 | |
China Merchants Bank Co. Ltd. – Class H | | | 53,020 | | | | 286,379 | |
Commonwealth Bank of Australia | | | 9,545 | | | | 672,044 | |
Deutsche Boerse AG | | | 2,513 | | | | 437,912 | |
FinecoBank Banca Fineco SpA | | | 23,237 | | | | 287,129 | |
Gjensidige Forsikring ASA | | | 14,168 | | | | 295,231 | |
Hargreaves Lansdown PLC | | | 21,307 | | | | 220,089 | |
Hong Kong Exchanges & Clearing Ltd. | | | 11,740 | | | | 536,906 | |
Industrial & Commercial Bank of China Ltd. – Class H | | | 440,106 | | | | 232,671 | |
Japan Exchange Group, Inc. | | | 12,606 | | | | 199,323 | |
Nihon M&A Center Holdings, Inc. | | | 9,956 | | | | 131,776 | |
The accompanying notes are an integral part of these financial statements.
FCF International Quality ETF
SCHEDULE OF INVESTMENTS
July 31, 2022 (Continued)
| | | Shares | | | Value | |
| | | | | | | |
| COMMON STOCKS – 96.2% (Continued) | | | | | | |
| | | | | | | |
| Financials – 13.5% (Continued) | | | | | | |
Partners Group Holding AG | | | 532 | | | $ | 577,356 | |
Ping An Insurance Group Co. of China Ltd. – Class H | | | 47,154 | | | | 277,521 | |
Royal Bank of Canada (e) | | | 10,690 | | | | 1,042,382 | |
Singapore Exchange Ltd. | | | 50,916 | | | | 364,897 | |
Toronto-Dominion Bank | | | 10,179 | | | | 661,192 | |
Zurich Insurance Group AG | | | 1,325 | | | | 577,552 | |
| | | | | | | | 7,307,635 | |
| | | | | | | | | |
| Health Care – 9.5% | | | | | | | | |
Amplifon SpA | | | 11,740 | | | | 386,482 | |
Astellas Pharma, Inc. | | | 21,824 | | | | 341,639 | |
Coloplast A/S – Class B | | | 1,653 | | | | 192,770 | |
Getinge AB – Class B | | | 10,009 | | | | 224,858 | |
GSK PLC – ADR | | | 11,211 | | | | 472,776 | |
Medibank Pvt Ltd. | | | 132,964 | | | | 316,796 | |
Novo Nordisk A/S – Class B | | | 13,301 | | | | 1,559,538 | |
Roche Holding AG | | | 3,000 | | | | 994,064 | |
Sonic Healthcare Ltd. | | | 16,882 | | | | 404,230 | |
Straumann Holding AG | | | 2,019 | | | | 271,081 | |
| | | | | | | | 5,164,234 | |
| | | | | | | | | |
| Industrials – 12.0% | | | | | | | | |
AP Moller – Maersk A/S – Class A | | | 301 | | | | 802,132 | |
Atlas Copco AB – Class A | | | 62,370 | | | | 724,342 | |
COSCO SHIPPING Holdings Co. Ltd. – Class H | | | 267,367 | | | | 399,864 | |
Deutsche Post AG | | | 8,560 | | | | 340,325 | |
Epiroc AB – Class A | | | 7,997 | | | | 140,625 | |
Evergreen Marine Corp. Taiwan Ltd. | | | 79,000 | | | | 251,979 | |
GEA Group AG | | | 13,223 | | | | 491,523 | |
Intertek Group PLC | | | 6,036 | | | | 321,665 | |
Iveco Group NV (a) | | | 7,158 | | | | 43,591 | |
Kone Oyj – Class B | | | 8,992 | | | | 408,965 | |
Kuehne + Nagel International AG | | | 1,678 | | | | 449,888 | |
Recruit Holdings Co. Ltd. | | | 12,876 | | | | 478,251 | |
Rentokil Initial PLC | | | 44,272 | | | | 291,786 | |
Samsung Heavy Industries Co. Ltd. (a) | | | 44,225 | | | | 191,321 | |
Schindler Holding AG | | | 1,321 | | | | 256,747 | |
The accompanying notes are an integral part of these financial statements.
FCF International Quality ETF
SCHEDULE OF INVESTMENTS
July 31, 2022 (Continued)
| | | Shares | | | Value | |
| | | | | | | |
| COMMON STOCKS – 96.2% (Continued) | | | | | | |
| | | | | | | |
| Industrials – 12.0% (Continued) | | | | | | |
SGS SA | | | 164 | | | $ | 398,865 | |
Wan Hai Lines Ltd. | | | 62,100 | | | | 221,927 | |
Yang Ming Marine Transport Corp. | | | 94,800 | | | | 283,694 | |
| | | | | | | | 6,497,490 | |
| | | | | | | | | |
| Materials – 9.2% | | | | | | | | |
Anglo American PLC – ADR | | | 22,096 | | | | 398,391 | |
BHP Group Ltd. – ADR (e) | | | 3,601 | | | | 198,199 | |
BHP Group Ltd. | | | 21,324 | | | | 576,296 | |
Evraz PLC (c) | | | 49,526 | | | | 151,676 | |
Exxaro Resources Ltd. | | | 20,477 | | | | 248,742 | |
Fortescue Metals Group Ltd. – ADR | | | 4,340 | | | | 111,929 | |
Fortescue Metals Group Ltd. | | | 22,025 | | | | 282,232 | |
James Hardie Industries PLC | | | 14,784 | | | | 363,601 | |
Kumba Iron Ore Ltd. | | | 12,920 | | | | 382,897 | |
MMG Ltd. (a) | | | 681,580 | | | | 201,438 | |
Rio Tinto Ltd. | | | 3,596 | | | | 245,800 | |
Shaanxi Coal Industry Co. Ltd. – Class A | | | 162,900 | | | | 462,064 | |
Sibanye Stillwater Ltd. | | | 101,838 | | | | 248,284 | |
Vale SA – ADR (e) | | | 31,546 | | | | 424,609 | |
West Fraser Timber Co. Ltd. | | | 7,476 | | | | 699,932 | |
| | | | | | | | 4,996,090 | |
| | | | | | | | | |
| Real Estate – 0.6% | | | | | | | | |
Daito Trust Construction Co. Ltd. | | | 3,627 | | | | 342,437 | |
| | | | | | | | | |
| Technology – 16.5% | | | | | | | | |
Accenture PLC – Class A (e) | | | 1,491 | | | | 456,634 | |
ASML Holding NV | | | 1,850 | | | | 1,050,141 | |
Atlassian Corp. PLC – Class A (a) | | | 2,905 | | | | 608,075 | |
AUO Corp. | | | 572,000 | | | | 255,042 | |
Capcom Co. Ltd. | | | 10,030 | | | | 277,545 | |
CGI, Inc. (a) | | | 6,216 | | | | 532,987 | |
Check Point Software Technologies Ltd. (a) | | | 3,620 | | | | 451,052 | |
Constellation Software, Inc. | | | 425 | | | | 722,973 | |
Experian PLC | | | 12,090 | | | | 421,527 | |
Infosys Ltd. – ADR (e) | | | 11,323 | | | | 220,685 | |
The accompanying notes are an integral part of these financial statements.
FCF International Quality ETF
SCHEDULE OF INVESTMENTS
July 31, 2022 (Continued)
| | | Shares | | | Value | |
| | | | | | | |
| COMMON STOCKS – 96.2% (Continued) | | | | | | |
| | | | | | | |
| Technology – 16.5% (Continued) | | | | | | |
Lenovo Group Ltd. | | | 360,844 | | | $ | 348,897 | |
Nomura Research Institute Ltd. | | | 10,951 | | | | 327,257 | |
Pegatron Corp. | | | 112,592 | | | | 233,901 | |
Realtek Semiconductor Corp. | | | 19,627 | | | | 224,189 | |
RELX PLC | | | 27,855 | | | | 822,946 | |
Telefonaktiebolaget LM Ericsson – ADR (e) | | | 13,601 | | | | 102,551 | |
Telefonaktiebolaget LM Ericsson – Class B | | | 28,323 | | | | 214,244 | |
Temenos AG | | | 3,810 | | | | 300,205 | |
Trend Micro, Inc. | | | 14,471 | | | | 836,681 | |
Wolters Kluwer NV | | | 4,862 | | | | 526,734 | |
| | | | | | | | 8,934,266 | |
| | | | | | | | | |
| Utilities – 1.1% | | | | | | | | |
Elia Group SA/NV | | | 2,457 | | | | 372,406 | |
Red Electrica Corp. SA | | | 12,519 | | | | 246,048 | |
| | | | | | | | 618,454 | |
TOTAL COMMON STOCKS | | | | | | | | |
(Cost $61,066,030) | | | | | | | 52,121,638 | |
| | | | | | | | | |
| | | | | | | | | |
| PREFERRED STOCK – 0.6% | | | | | | | | |
| | | | | | | | | |
| Utilities – 0.6% | | | | | | | | |
Cia Energetica de Minas Gerais – ADR | | | 155,592 | | | | 345,414 | |
TOTAL PREFERRED STOCK | | | | | | | | |
(Cost $301,525) | | | | | | | 345,414 | |
| | | | | | | | | |
| | | | | | | | | |
| REITs – 1.4% | | | | | | | | |
| | | | | | | | | |
| Real Estate – 1.4% | | | | | | | | |
Goodman Group | | | 32,277 | | | | 466,825 | |
Segro PLC | | | 21,800 | | | | 290,702 | |
TOTAL REITs | | | | | | | | |
(Cost $800,185) | | | | | | | 757,527 | |
The accompanying notes are an integral part of these financial statements.
FCF International Quality ETF
SCHEDULE OF INVESTMENTS
July 31, 2022 (Continued)
| | | Shares | | | Value | |
| | | | | | | |
| MONEY MARKET FUND – 1.0% | | | | | | |
Fidelity Institutional Money Market Fund – | | | | | | |
Government Portfolio, Institutional Class, 1.49% (d) | | | 541,439 | | | $ | 541,439 | |
TOTAL MONEY MARKET FUND | | | | | | | | |
(Cost $541,439) | | | | | | | 541,439 | |
| | | | | | | | | |
| | | | | | | | | |
| INVESTMENT PURCHASED WITH THE CASH | | | | | | | | |
| PROCEEDS FROM SECURITIES LENDING – 6.0% | | | | | | | | |
| | | | | | | | | |
| Investment Company – 6.0% | | | | | | | | |
Mount Vernon Liquid Asset Portfolio, LLC, 2.02% (d) | | | 3,228,249 | | | | 3,228,249 | |
TOTAL INVESTMENT PURCHASED WITH THE | | | | | | | | |
CASH PROCEEDS FROM SECURITIES LENDING | | | | | | | | |
(Cost $3,228,249) | | | | | | | 3,228,249 | |
| | | | | | | | | |
| Total Investments (Cost $65,937,428) – 105.2% | | | | | | | 56,994,267 | |
| Liabilities in Excess of Other Assets – (5.2)% | | | | | | | (2,837,054 | ) |
| TOTAL NET ASSETS – 100.0% | | | | | | $ | 54,157,213 | |
Percentages are stated as a percent of net assets.
ADR – American Depositary Receipt
PLC – Public Limited Company
REIT – Real Estate Investment Trust
| (a) | Non-income producing security. |
| (b) | Security exempt from registration under Rule 144(a) and Regulation S of the Securities Act of 1933. Such securities are treated as liquid securities according to the Fund’s liquidity guidelines. At July 31, 2022, the value of these securities amounted to $637,053 or 1.18% of net assets. |
| (c) | Security fair valued using valuation guidelines established by the Board of Trustees. The value of this security at July 31, 2022 was $151,676. |
| (d) | Rate disclosed is the seven day annualized yield as of July 31, 2022. |
| (e) | All or a portion of this security was out on loan at July 31, 2022. Total loaned securities had a market value of $3,162,859 as of July 31, 2022. |
For Fund compliance purposes, the Fund’s sector classifications refers to any one or more of the sector classifications used by one or more widely recognized market indexes or ratings group indexes, and/or they may be defined by Fund management. This definition does not apply for all purposes of this report, which may combine classifications for reporting ease.
The accompanying notes are an integral part of these financial statements.
Donoghue Forlines Tactical High Yield ETF
SCHEDULE OF INVESTMENTS
July 31, 2022
| | | Shares | | | Value | |
| EXCHANGE-TRADED FUNDS – 99.7% | | | | | | |
iShares 0-5 Year High Yield Corporate Bond ETF (b) | | | 114,660 | | | $ | 4,846,678 | |
iShares Broad USD High Yield Corporate Bond ETF (b) | | | 223,569 | | | | 8,211,689 | |
iShares Fallen Angels USD Bond ETF | | | 163,812 | | | | 4,213,245 | |
iShares iBoxx High Yield Corporate Bond ETF (b) | | | 106,463 | | | | 8,324,342 | |
JPMorgan High Yield Research Enhanced ETF | | | 69,237 | | | | 3,207,058 | |
SPDR Bloomberg High Yield Bond ETF (b) | | | 52,060 | | | | 5,017,543 | |
SPDR Bloomberg Short-Term High Yield Bond ETF (b) | | | 139,664 | | | | 3,516,739 | |
VanEck Fallen Angel High Yield Bond ETF | | | 128,416 | | | | 3,640,593 | |
Xtrackers USD High Yield Corporate Bond ETF | | | 180,624 | | | | 6,462,727 | |
TOTAL EXCHANGE-TRADED FUNDS | | | | | | | | |
(Cost $46,589,591) | | | | | | | 47,440,614 | |
| | | | | | | | | |
| MONEY MARKET FUND – 0.3% | | | | | | | | |
Fidelity Institutional Money Market Fund – | | | | | | | | |
Government Portfolio, Institutional Class, 1.49% (a) | | | 162,381 | | | | 162,381 | |
TOTAL MONEY MARKET FUND | | | | | | | | |
(Cost $162,381) | | | | | | | 162,381 | |
| | | | | | | | | |
| INVESTMENT PURCHASED WITH THE CASH | | | | | | | | |
| PROCEEDS FROM SECURITIES LENDING – 29.4% | | | | | | | | |
| | | | | | | | | |
| Investment Company – 29.4% | | | | | | | | |
Mount Vernon Liquid Asset Portfolio, LLC, 2.02% (a) | | | 13,991,235 | | | | 13,991,235 | |
TOTAL INVESTMENT PURCHASED WITH THE | | | | | | | | |
CASH PROCEEDS FROM SECURITIES LENDING | | | | | | | | |
(Cost $13,991,235) | | | | | | | 13,991,235 | |
| | | | | | | | | |
| Total Investments (Cost $60,743,207) – 129.4% | | | | | | | 61,594,230 | |
| Liabilities in Excess of Other Assets – (29.4%) | | | | | | | (14,007,200 | ) |
| TOTAL NET ASSETS – 100.0% | | | | | | $ | 47,587,030 | |
Percentages are stated as a percent of net assets.
ETF – Exchange-Traded Fund
| (a) | Rate disclosed is the seven day annualized yield as of July 31, 2022. |
| (b) | All or a portion of this security was out on loan at July 31, 2022. Total loaned securities had a market value of $13,704,208 as of July 31, 2022. |
The accompanying notes are an integral part of these financial statements.
Donoghue Forlines Risk Managed Innovation ETF
SCHEDULE OF INVESTMENTS
July 31, 2022
| | | Shares | | | Value | |
| | | | | | | |
| COMMON STOCKS – 99.7% | | | | | | |
| | | | | | | |
| Communications – 9.9% | | | | | | |
Alphabet, Inc. – Class A (a) | | | 17,586 | | | $ | 2,045,604 | |
Electronic Arts, Inc. | | | 7,341 | | | | 963,359 | |
Expedia Group, Inc. (a) | | | 5,958 | | | | 631,846 | |
GoDaddy, Inc. – Class A (a) | | | 10,131 | | | | 751,518 | |
Match Group, Inc. (a) | | | 8,555 | | | | 627,167 | |
Meta Platforms, Inc. – Class A (a) | | | 9,085 | | | | 1,445,423 | |
Pinterest, Inc. – Class A (a) | | | 29,765 | | | | 579,822 | |
Playtika Holding Corp. (a) | | | 33,973 | | | | 416,849 | |
Sirius XM Holdings, Inc. (d) | | | 151,241 | | | | 1,010,290 | |
Trade Desk, Inc. – Class A (a)(d) | | | 14,953 | | | | 672,885 | |
| | | | | | | | 9,144,763 | |
| | | | | | | | | |
| Consumer Discretionary – 1.6% | | | | | | | | |
eBay, Inc. (d) | | | 15,654 | | | | 761,254 | |
Etsy, Inc. (a)(d) | | | 7,182 | | | | 744,917 | |
| | | | | | | | 1,506,171 | |
| | | | | | | | | |
| Consumer Staples – 2.7% | | | | | | | | |
Clorox Co. (d) | | | 5,131 | | | | 727,781 | |
Colgate-Palmolive Co. | | | 12,382 | | | | 974,959 | |
Philip Morris International, Inc. | | | 8,590 | | | | 834,518 | |
| | | | | | | | 2,537,258 | |
| | | | | | | | | |
| Energy – 1.4% | | | | | | | | |
Enphase Energy, Inc. (a) | | | 4,647 | | | | 1,320,584 | |
| | | | | | | | | |
| Health Care – 25.6% (c) | | | | | | | | |
Abbott Laboratories | | | 3,372 | | | | 367,009 | |
AbbVie, Inc. | | | 12,409 | | | | 1,780,816 | |
ABIOMED, Inc. (a) | | | 2,547 | | | | 746,296 | |
Agilent Technologies, Inc. | | | 6,215 | | | | 833,432 | |
Amgen, Inc. | | | 6,018 | | | | 1,489,274 | |
Bio-Techne Corp. | | | 1,857 | | | | 715,465 | |
Bristol-Myers Squibb Co. | | | 21,648 | | | | 1,597,189 | |
Edwards Lifesciences Corp. (a)(d) | | | 7,909 | | | | 795,171 | |
Eli Lilly & Co. | | | 5,212 | | | | 1,718,344 | |
Exelixis, Inc. (a)(d) | | | 21,400 | | | | 447,688 | |
Gilead Sciences, Inc. | | | 19,521 | | | | 1,166,380 | |
The accompanying notes are an integral part of these financial statements.
Donoghue Forlines Risk Managed Innovation ETF
SCHEDULE OF INVESTMENTS
July 31, 2022 (Continued)
| | | Shares | | | Value | |
| COMMON STOCKS – 99.7% (Continued) | | | | | | |
| | | | | | | |
| Health Care – 25.6% (c) (Continued) | | | | | | |
Hologic, Inc. (a) | | | 10,398 | | | $ | 742,209 | |
Horizon Therapeutics PLC (a) | | | 8,656 | | | | 718,188 | |
Jazz Pharmaceuticals PLC (a) | | | 4,248 | | | | 662,943 | |
Johnson & Johnson | | | 9,951 | | | | 1,736,649 | |
Merck & Co., Inc. | | | 15,312 | | | | 1,367,974 | |
Mettler-Toledo International, Inc. (a) | | | 665 | | | | 897,570 | |
Moderna, Inc. (a)(d) | | | 4,440 | | | | 728,560 | |
Organon & Co. | | | 18,740 | | | | 594,433 | |
Pfizer, Inc. (d) | | | 35,091 | | | | 1,772,446 | |
Regeneron Pharmaceuticals, Inc. (a) | | | 1,279 | | | | 743,982 | |
Royalty Pharma PLC – Class A | | | 16,123 | | | | 701,189 | |
Tandem Diabetes Care, Inc. (a) | | | 5,661 | | | | 374,815 | |
Vertex Pharmaceuticals, Inc. (a) | | | 3,803 | | | | 1,066,399 | |
| | | | | | | | 23,764,421 | |
| | | | | | | | | |
| Industrials – 3.5% | | | | | | | | |
Keysight Technologies, Inc. (a) | | | 5,867 | | | | 953,974 | |
Lennox International, Inc. (d) | | | 1,999 | | | | 478,821 | |
Lockheed Martin Corp. | | | 2,635 | | | | 1,090,389 | |
Trimble, Inc. (a) | | | 10,761 | | | | 747,136 | |
| | | | | | | | 3,270,320 | |
| | | | | | | | | |
| Technology – 55.0% (c) | | | | | | | | |
Accenture PLC – Class A | | | 2,295 | | | | 702,867 | |
Adobe, Inc. (a)(d) | | | 3,736 | | | | 1,532,208 | |
Akamai Technologies, Inc. (a) | | | 5,283 | | | | 508,330 | |
ANSYS, Inc. (a) | | | 2,265 | | | | 631,912 | |
Apple, Inc. | | | 19,769 | | | | 3,212,660 | |
Arista Networks, Inc. (a)(d) | | | 8,615 | | | | 1,004,767 | |
Atlassian Corp. PLC – Class A (a) | | | 4,174 | | | | 873,702 | |
Autodesk, Inc. (a) | | | 5,001 | | | | 1,081,816 | |
Bentley Systems, Inc. – Class B | | | 18,246 | | | | 722,542 | |
Broadcom, Inc. | | | 3,008 | | | | 1,610,724 | |
Cadence Design Systems, Inc. (a) | | | 6,744 | | | | 1,254,924 | |
Cisco Systems, Inc. | | | 33,971 | | | | 1,541,264 | |
Coupa Software, Inc. (a) | | | 5,011 | | | | 327,820 | |
Crowdstrike Holdings, Inc. – Class A (a) | | | 5,801 | | | | 1,065,064 | |
Datadog, Inc. – Class A (a)(d) | | | 8,649 | | | | 882,285 | |
The accompanying notes are an integral part of these financial statements.
Donoghue Forlines Risk Managed Innovation ETF
SCHEDULE OF INVESTMENTS
July 31, 2022 (Continued)
| | | Shares | | | Value | |
| COMMON STOCKS – 99.7% (Continued) | | | | | | |
| | | | | | | |
| Technology – 55.0% (c) (Continued) | | | | | | |
DocuSign, Inc. (a)(d) | | | 8,501 | | | $ | 543,894 | |
Dropbox, Inc. – Class A (a)(d) | | | 27,728 | | | | 630,535 | |
Dynatrace, Inc. (a) | | | 16,772 | | | | 631,130 | |
F5 Networks, Inc. (a) | | | 3,890 | | | | 651,030 | |
FactSet Research Systems, Inc. | | | 1,909 | | | | 820,259 | |
Fair Isaac Corp. (a) | | | 1,169 | | | | 540,113 | |
Fortinet, Inc. (a) | | | 17,900 | | | | 1,067,735 | |
GlobalFoundries, Inc. (a)(d) | | | 12,875 | | | | 662,805 | |
HubSpot, Inc. (a) | | | 2,073 | | | | 638,484 | |
International Business Machines Corp. (d) | | | 10,387 | | | | 1,358,516 | |
Intuit, Inc. | | | 3,166 | | | | 1,444,234 | |
Jack Henry & Associates, Inc. | | | 3,926 | | | | 815,705 | |
Juniper Networks, Inc. | | | 20,410 | | | | 572,092 | |
Lattice Semiconductor Corp. (a) | | | 11,206 | | | | 689,169 | |
Lumentum Holdings, Inc. (a)(d) | | | 6,301 | | | | 569,989 | |
Manhattan Associates, Inc. (a)(d) | | | 5,010 | | | | 704,757 | |
Microchip Technology, Inc. (d) | | | 13,800 | | | | 950,268 | |
Motorola Solutions, Inc. | | | 4,622 | | | | 1,102,763 | |
MSCI, Inc. | | | 1,876 | | | | 902,994 | |
NetApp, Inc. | | | 10,446 | | | | 745,113 | |
NortonLifeLock, Inc. | | | 29,412 | | | | 721,476 | |
NXP Semiconductors NV | | | 5,426 | | | | 997,733 | |
ON Semiconductor Corp. (a)(d) | | | 13,975 | | | | 933,251 | |
Oracle Corp. | | | 20,722 | | | | 1,613,001 | |
Palantir Technologies, Inc. – Class A (a) | | | 80,026 | | | | 828,269 | |
Palo Alto Networks, Inc. (a) | | | 2,145 | | | | 1,070,570 | |
PayPal Holdings, Inc. (a) | | | 12,561 | | | | 1,086,903 | |
Pure Storage, Inc. – Class A (a)(d) | | | 24,863 | | | | 704,866 | |
RingCentral, Inc. – Class A (a) | | | 5,670 | | | | 280,608 | |
ServiceNow, Inc. (a) | | | 2,711 | | | | 1,210,895 | |
Synaptics, Inc. (a) | | | 3,382 | | | | 490,221 | |
Synopsys, Inc. (a)(d) | | | 3,384 | | | | 1,243,620 | |
Tenable Holdings, Inc. (a) | | | 7,374 | | | | 285,005 | |
Teradyne, Inc. | | | 4,992 | | | | 503,643 | |
Ubiquiti, Inc. (d) | | | 2,508 | | | | 756,488 | |
Veeva Systems, Inc. – Class A (a) | | | 4,778 | | | | 1,068,265 | |
VMware, Inc. – Class A | | | 9,819 | | | | 1,140,968 | |
The accompanying notes are an integral part of these financial statements.
Donoghue Forlines Risk Managed Innovation ETF
SCHEDULE OF INVESTMENTS
July 31, 2022 (Continued)
| | | Shares | | | Value | |
| COMMON STOCKS – 99.7% (Continued) | | | | | | |
| | | | | | | |
| Technology – 55.0% (c) (Continued) | | | | | | |
Workday, Inc. – Class A (a) | | | 5,601 | | | $ | 868,715 | |
Zebra Technologies Corp. (a) | | | 2,133 | | | | 762,953 | |
Zoom Video Communications, Inc. – Class A (a) | | | 7,461 | | | | 774,899 | |
Zscaler, Inc. (a) | | | 5,003 | | | | 775,765 | |
| | | | | | | | 51,112,584 | |
TOTAL COMMON STOCKS | | | | | | | | |
(Cost $96,813,709) | | | | | | | 92,656,101 | |
| | | | | | | | | |
| MONEY MARKET FUND – 0.3% | | | | | | | | |
Fidelity Institutional Money Market Fund – | | | | | | | | |
Government Portfolio, Institutional Class, 1.49% (b) | | | 283,957 | | | | 283,957 | |
TOTAL MONEY MARKET FUND | | | | | | | | |
(Cost $283,957) | | | | | | | 283,957 | |
| | | | | | | | | |
| INVESTMENT PURCHASED WITH THE CASH | | | | | | | | |
| PROCEEDS FROM SECURITIES LENDING – 14.6% | | | | | | | | |
| | | | | | | | | |
| Investment Company – 14.6% | | | | | | | | |
Mount Vernon Liquid Asset Portfolio, LLC, 2.02% (b) | | | 13,550,477 | | | | 13,550,477 | |
TOTAL INVESTMENT PURCHASED WITH THE | | | | | | | | |
CASH PROCEEDS FROM SECURITIES LENDING | | | | | | | | |
(Cost $13,550,477) | | | | | | | 13,550,477 | |
| | | | | | | | | |
| Total Investments (Cost $110,648,143) – 114.6% | | | | | | | 106,490,535 | |
| Liabilities in Excess of Other Assets – (14.6)% | | | | | | | (13,537,583 | ) |
| TOTAL NET ASSETS – 100.0% | | | | | | $ | 92,952,952 | |
Percentages are stated as a percent of net assets.
PLC – Public Limited Company
| (a) | Non-income producing security. |
| (b) | Rate disclosed is the seven day annualized yield as of July 31, 2022. |
| (c) | The amount represents investments in a particular sector. Within the sector, the Fund will concentrate its investments (i.e. invest more than 25% of its total assets) in a particular industry or group of industries to approximately the same extent of the Underlying Index is concentrated. |
| (d) | All or a portion of this security was out on loan at July 31, 2022. Total loaned securities had a market value of $13,381,801 as of July 31, 2022. |
For Fund compliance purposes, the Fund’s sector classifications refers to any one or more of the sector classifications used by one or more widely recognized market indexes or ratings group indexes, and/or they may be defined by Fund management. This definition does not apply for all purposes of this report, which may combine classifications for reporting ease.
The accompanying notes are an integral part of these financial statements.
Donoghue Forlines Yield Enhanced Real Asset ETF
SCHEDULE OF INVESTMENTS
July 31, 2022
| | | Shares | | | Value | |
| COMMON STOCKS – 65.1% | | | | | | |
| | | | | | | |
| Consumer Staples – 1.3% | | | | | | |
Archer-Daniels-Midland Co. | | | 5,557 | | | $ | 459,953 | |
| | | | | | | | | |
| Energy – 29.3% (c) | | | | | | | | |
Antero Midstream Corp. (b) | | | 30,355 | | | | 305,371 | |
BP PLC – ADR | | | 21,255 | | | | 624,472 | |
Chesapeake Energy Corp. (b) | | | 3,732 | | | | 351,442 | |
Chevron Corp. | | | 5,248 | | | | 859,517 | |
ConocoPhillips | | | 5,920 | | | | 576,786 | |
Coterra Energy, Inc. | | | 11,647 | | | | 356,282 | |
Devon Energy Corp. | | | 7,908 | | | | 497,018 | |
Ecopetrol SA – ADR | | | 26,516 | | | | 284,782 | |
Eni SpA – ADR | | | 17,229 | | | | 413,841 | |
EOG Resources, Inc. | | | 3,881 | | | | 431,645 | |
Equinor ASA – ADR (b) | | | 18,229 | | | | 700,176 | |
Equitrans Midstream Corp. | | | 39,012 | | | | 306,244 | |
Exxon Mobil Corp. (b) | | | 10,338 | | | | 1,002,062 | |
Kinder Morgan, Inc. | | | 27,923 | | | | 502,335 | |
ONEOK, Inc. (b) | | | 7,621 | | | | 455,279 | |
Petroleo Brasileiro SA – ADR | | | 41,911 | | | | 598,489 | |
Shell PLC – ADR | | | 13,093 | | | | 698,904 | |
TotalEnergies SE – ADR (b) | | | 12,557 | | | | 641,160 | |
Williams Cos., Inc. | | | 15,174 | | | | 517,282 | |
Woodside Energy Group Ltd. – ADR | | | 4,289 | | | | 97,403 | |
| | | | | | | | 10,220,490 | |
| | | | | | | | | |
| Industrials – 19.9% | | | | | | | | |
3M Co. (b) | | | 4,252 | | | | 609,056 | |
Allison Transmission Holdings, Inc. | | | 6,933 | | | | 290,285 | |
AO Smith Corp. | | | 5,295 | | | | 335,015 | |
Emerson Electric Co. | | | 5,720 | | | | 515,200 | |
Honeywell International, Inc. (b) | | | 3,086 | | | | 593,932 | |
Hubbell, Inc. | | | 1,644 | | | | 360,069 | |
Lennox International, Inc. (b) | | | 1,612 | | | | 386,122 | |
Lincoln Electric Holdings, Inc. | | | 2,210 | | | | 312,582 | |
Norfolk Southern Corp. | | | 1,941 | | | | 487,521 | |
Oshkosh Corp. (b) | | | 3,428 | | | | 295,151 | |
Parker-Hannifin Corp. | | | 1,693 | | | | 489,429 | |
The accompanying notes are an integral part of these financial statements.
Donoghue Forlines Yield Enhanced Real Asset ETF
SCHEDULE OF INVESTMENTS
July 31, 2022 (Continued)
| | | Shares | | | Value | |
| | | | | | | |
| COMMON STOCKS – 65.1% (Continued) | | | | | | |
| | | | | | | |
| Industrials – 19.9% (Continued) | | | | | | |
Rockwell Automation, Inc. (b) | | | 1,828 | | | $ | 466,652 | |
Siemens AG – ADR | | | 9,788 | | | | 545,583 | |
Union Pacific Corp. | | | 2,909 | | | | 661,216 | |
Waste Management, Inc. | | | 3,520 | | | | 579,251 | |
| | | | | | | | 6,927,064 | |
| | | | | | | | | |
| Materials – 13.2% | | | | | | | | |
BHP Group Ltd. – ADR (b) | | | 11,879 | | | | 653,820 | |
Dow, Inc. | | | 8,538 | | | | 454,307 | |
Eastman Chemical Co. (b) | | | 3,394 | | | | 325,587 | |
Linde PLC (b) | | | 2,016 | | | | 608,832 | |
LyondellBasell Industries NV – Class A | | | 4,778 | | | | 425,815 | |
Newmont Corp. | | | 8,183 | | | | 370,526 | |
Rio Tinto PLC – ADR (b) | | | 9,089 | | | | 554,702 | |
Sibanye Stillwater Ltd. – ADR | | | 29,207 | | | | 290,318 | |
Southern Copper Corp. | | | 9,383 | | | | 467,273 | |
Vale SA – ADR (b) | | | 34,554 | | | | 465,097 | |
| | | | | | | | 4,616,277 | |
| | | | | | | | | |
| Technology – 1.4% | | | | | | | | |
Corning, Inc. | | | 12,752 | | | | 468,764 | |
TOTAL COMMON STOCKS | | | | | | | | |
(Cost $23,691,422) | | | | | | | 22,692,548 | |
| | | | | | | | | |
| | | | | | | | | |
| PREFERRED STOCKS – 2.3% | | | | | | | | |
| | | | | | | | | |
| Energy – 1.7% | | | | | | | | |
Petroleo Brasileiro SA – ADR | | | 44,324 | | | | 581,974 | |
| | | | | | | | | |
| Materials – 0.6% | | | | | | | | |
Gerdau SA – ADR | | | 44,892 | | | | 211,890 | |
TOTAL PREFERRED STOCKS | | | | | | | | |
(Cost $784,498) | | | | | | | 793,864 | |
The accompanying notes are an integral part of these financial statements.
Donoghue Forlines Yield Enhanced Real Asset ETF
SCHEDULE OF INVESTMENTS
July 31, 2022 (Continued)
| | | Shares | | | Value | |
| | | | | | | |
| MASTER LIMITED PARTNERSHIPS – 11.5% | | | | | | |
| | | | | | | |
| Energy – 11.5% | | | | | | |
Crestwood Equity Partners, LP | | | 10,078 | | | $ | 272,207 | |
DCP Midstream LP | | | 9,169 | | | | 310,829 | |
Energy Transfer, LP | | | 44,783 | | | | 506,496 | |
EnLink Midstream, LLC | | | 29,756 | | | | 291,609 | |
Enterprise Products Partners, LP | | | 21,718 | | | | 580,522 | |
Magellan Midstream Partners, LP | | | 7,627 | | | | 392,790 | |
MPLX, LP | | | 16,501 | | | | 536,448 | |
Plains All American Pipeline, LP | | | 30,977 | | | | 341,986 | |
Shell Midstream Partners, LP | | | 22,319 | | | | 358,220 | |
Western Midstream Partners, LP | | | 14,904 | | | | 399,278 | |
TOTAL MASTER LIMITED PARTNERSHIPS | | | | | | | | |
(Cost $3,582,507) | | | | | | | 3,990,385 | |
| | | | | | | | | |
| | | | | | | | | |
| REITs – 20.7% | | | | | | | | |
| | | | | | | | | |
| Financials – 2.1% | | | | | | | | |
Annaly Capital Management, Inc. (b) | | | 60,578 | | | | 416,777 | |
New Residential Investment Corp. | | | 29,617 | | | | 323,121 | |
| | | | | | | | 739,898 | |
| | | | | | | | | |
| Real Estate – 18.6% | | | | | | | | |
American Tower Corp. | | | 2,649 | | | | 717,429 | |
AvalonBay Communities, Inc. | | | 2,042 | | | | 436,865 | |
Crown Castle International Corp. | | | 3,172 | | | | 573,054 | |
EastGroup Properties, Inc. | | | 1,756 | | | | 299,468 | |
Equity LifeStyle Properties, Inc. | | | 5,158 | | | | 379,216 | |
Equity Residential | | | 5,542 | | | | 434,437 | |
Extra Space Storage, Inc. | | | 2,470 | | | | 468,114 | |
First Industrial Realty Trust, Inc. | | | 5,444 | | | | 282,816 | |
Gaming and Leisure Properties, Inc. | | | 8,325 | | | | 432,817 | |
Iron Mountain, Inc. (b) | | | 7,869 | | | | 381,568 | |
Lamar Advertising Co. – Class A | | | 3,807 | | | | 384,735 | |
Medical Properties Trust, Inc. | | | 17,637 | | | | 304,062 | |
Omega Healthcare Investors, Inc. (b) | | | 10,538 | | | | 326,678 | |
Public Storage | | | 1,702 | | | | 555,550 | |
Simon Property Group, Inc. | | | 4,737 | | | | 514,628 | |
| | | | | | | | 6,491,437 | |
TOTAL REITs | | | | | | | | |
(Cost $7,802,523) | | | | | | | 7,231,335 | |
The accompanying notes are an integral part of these financial statements.
Donoghue Forlines Yield Enhanced Real Asset ETF
SCHEDULE OF INVESTMENTS
July 31, 2022 (Continued)
| | | Shares | | | Value | |
| MONEY MARKET FUND – 0.3% | | | | | | |
Fidelity Institutional Money Market Fund – | | | | | | |
Government Portfolio, Institutional Class, 1.49% (a) | | | 90,796 | | | $ | 90,796 | |
TOTAL MONEY MARKET FUND | | | | | | | | |
(Cost $90,796) | | | | | | | 90,796 | |
| | | | | | | | | |
| INVESTMENT PURCHASED WITH THE CASH | | | | | | | | |
| PROCEEDS FROM SECURITIES LENDING – 24.0% | | | | | | | | |
| | | | | | | | | |
| Investment Company – 24.0% | | | | | | | | |
Mount Vernon Liquid Asset Portfolio, LLC, 2.02% (a) | | | 8,374,921 | | | | 8,374,921 | |
TOTAL INVESTMENT PURCHASED WITH THE | | | | | | | | |
CASH PROCEEDS FROM SECURITIES LENDING | | | | | | | | |
(Cost $8,374,921) | | | | | | | 8,374,921 | |
| | | | | | | | | |
| Total Investments (Cost $44,326,667) – 123.9% | | | | | | | 43,173,849 | |
| Liabilities in Excess of Other Assets – (23.9)% | | | | | | | (8,316,595 | ) |
| TOTAL NET ASSETS – 100.0% | | | | | | $ | 34,857,254 | |
Percentages are stated as a percent of net assets.
ADR – American Depositary Receipt
PLC – Public Limited Company
REIT – Real Estate Investment Trust
| (a) | Rate disclosed is the seven day annualized yield as of July 31, 2022. |
| (b) | All or a portion of this security was out on loan at July 31, 2022. Total loaned securities had a market value of $8,349,450 as of July 31, 2022. |
| (c) | The amount represents investments in a particular sector. Within the sector, the Fund will concentrate its investments (i.e. invest more than 25% of its total assets) in a particular industry or group of industries to approximately the same extent of the Underlying Index is concentrated. |
For Fund compliance purposes, the Fund’s sector classifications refers to any one or more of the sector classifications used by one or more widely recognized market indexes or ratings group indexes, and/or they may be defined by Fund management. This definition does not apply for all purposes of this report, which may combine classifications for reporting ease.
The accompanying notes are an integral part of these financial statements.
TrimTabs ETF Trust
(This Page Intentionally Left Blank.)
TrimTabs ETF Trust
STATEMENTS OF ASSETS & LIABILITIES
July 31, 2022
| | | | | | FCF | |
| | | FCF US | | | International | |
| | | Quality ETF | | | Quality ETF | |
| ASSETS | | | | | | |
Investments in Securities, at Value* (Including securities on | | | | | | |
loan valued at $18,626,055 and $3,162,859, respectively) | | $ | 195,207,789 | | | $ | 56,994,267 | |
Foreign Currency, at Value* | | | — | | | | 175,938 | |
Receivable for Investment Securities Sold | | | 11,677,627 | | | | — | |
Interest and Dividends Receivable | | | 158,444 | | | | 239,028 | |
Securities Lending Income Receivable | | | 4,137 | | | | 2,195 | |
| Total Assets | | | 207,047,997 | | | | 57,411,428 | |
| | | | | | | | | |
| LIABILITIES | | | | | | | | |
Payable for Securities Loaned | | | 18,745,040 | | | | 3,228,249 | |
Payable for Investment Securities Purchased | | | 11,280,875 | | | | — | |
Management Fees Payable | | | 84,440 | | | | 25,966 | |
| Total Liabilities | | | 30,110,355 | | | | 3,254,215 | |
| NET ASSETS | | $ | 176,937,642 | | | $ | 54,157,213 | |
| | | | | | | | | |
| NET ASSETS CONSIST OF: | | | | | | | | |
Paid-in Capital | | $ | 159,691,568 | | | $ | 62,600,593 | |
Total Distributable Earnings (Deficit) | | | 17,246,074 | | | | (8,443,380 | ) |
| Net Assets | | $ | 176,937,642 | | | $ | 54,157,213 | |
| | | | | | | | | |
* Identified Cost: | | | | | | | | |
| Investments in Securities | | $ | 177,573,300 | | | $ | 65,937,428 | |
| Foreign Currency | | $
| — | | | $
| 178,929 | |
| | | | | | | | | |
| Net Asset Value (unlimited shares authorized): | | | | | | | | |
Net Assets | | $ | 176,937,642 | | | $ | 54,157,213 | |
Shares Outstanding (No Par Value) | | | 3,625,000 | | | | 1,850,000 | |
Net Asset Value, Offering and Redemption Price per Share | | $ | 48.81 | | | $ | 29.27 | |
The accompanying notes are an integral part of these financial statements.
TrimTabs ETF Trust
STATEMENTS OF ASSETS & LIABILITIES
July 31, 2022 (Continued)
| | | Donoghue | | | Donoghue | | | Donoghue | |
| | | Forlines | | | Forlines | | | Forlines | |
| | | Tactical High | | | Risk Managed | | | Yield Enhanced | |
| | | Yield ETF | | | Innovation ETF | | | Real Asset ETF | |
| ASSETS | | | | | | | | | |
Investments in Securities, at Value* (Including | | | | | | | | | |
securities on loan valued at $13,704,208, | | | | | | | | | |
$13,381,801, and $8,349,450, respectively) | | $ | 61,594,230 | | | $ | 106,490,535 | | | $ | 43,173,849 | |
Interest and Dividends Receivable | | | 111 | | | | 58,780 | | | | 89,341 | |
Securities Lending Income Receivable | | | 5,736 | | | | 5,556 | | | | 1,204 | |
| Total Assets | | | 61,600,077 | | | | 106,554,871 | | | | 43,264,394 | |
| | | | | | | | | | | | | |
| LIABILITIES | | | | | | | | | | | | |
Payable for Securities Loaned | | | 13,991,235 | | | | 13,550,477 | | | | 8,374,921 | |
Management Fees Payable | | | 21,812 | | | | 51,442 | | | | 32,219 | |
| Total Liabilities | | | 14,013,047 | | | | 13,601,919 | | | | 8,407,140 | |
| NET ASSETS | | $ | 47,587,030 | | | $ | 92,952,952 | | | $ | 34,857,254 | |
| | | | | | | | | | | | | |
| NET ASSETS CONSIST OF: | | | | | | | | | | | | |
Paid-in Capital | | $ | 52,755,177 | | | $ | 100,603,658 | | | $ | 34,014,348 | |
Total Distributable Earnings (Deficit) | | | (5,168,147 | ) | | | (7,650,706 | ) | | | 842,906 | |
| Net Assets | | $ | 47,587,030 | | | $ | 92,952,952 | | | $ | 34,857,254 | |
* Identified Cost: | | | | | | | | | | | | |
| Investments in Securities | | $ | 60,743,207 | | | $ | 110,648,143 | | | $ | 44,326,667 | |
| | | | | | | | | | | | | |
| Net Asset Value (unlimited shares authorized): | | | | | | | | | | | | |
Net Assets | | $ | 47,587,030 | | | $ | 92,952,952 | | | $ | 34,857,254 | |
Shares Outstanding (No Par Value) | | | 2,150,000 | | | | 3,875,000 | | | | 1,325,000 | |
Net Asset Value, Offering and | | | | | | | | | | | | |
Redemption Price per Share | | $ | 22.13 | | | $ | 23.99 | | | $ | 26.31 | |
The accompanying notes are an integral part of these financial statements.
TrimTabs ETF Trust
STATEMENTS OF OPERATIONS
Year Ended July 31, 2022
| | | | | | FCF | |
| | | FCF US | | | International | |
| | | Quality ETF | | | Quality ETF | |
| INVESTMENT INCOME | | | | | | |
Income: | | | | | | |
| Dividends (net of foreign withholding tax | | | | | | |
| and issuance fees of $1,912 and $244,766, respectively) | | $ | 3,347,675 | | | $ | 2,099,780 | |
| Non-Cash Dividends | | | — | | | | 541,446 | |
| Interest | | | 4,086 | | | | 889 | |
| Securities Lending Income | | | 29,086 | | | | 9,899 | |
| Total Investment Income | | | 3,380,847 | | | | 2,652,014 | |
| | | | | | | | | |
Expenses: | | | | | | | | |
| Management Fees | | | 1,147,390 | | | | 399,992 | |
| Total Expenses | | | 1,147,390 | | | | 399,992 | |
| Net Investment Income | | | 2,233,457 | | | | 2,252,022 | |
| | | | | | | | | |
| REALIZED & UNREALIZED | | | | | | | | |
| GAIN (LOSS) ON INVESTMENTS | | | | | | | | |
Net Realized Gain (Loss) on: | | | | | | | | |
| Investment Securities | | | (374,619 | ) | | | (1,906,992 | ) |
| Redemptions In-Kind | | | 13,911,304 | | | | 272,003 | |
| Foreign Currencies | | | — | | | | (103,802 | ) |
Total | | | 13,536,685 | | | | (1,738,791 | ) |
Net Change in Unrealized Appreciation (Depreciation) of: | | | | | | | | |
| Investment Securities | | | (20,902,235 | ) | | | (14,487,858 | ) |
| Foreign Currencies | | | — | | | | (9,522 | ) |
Total | | | (20,902,235 | ) | | | (14,497,380 | ) |
Net Realized and Unrealized Loss on | | | | | | | | |
Investments and Foreign Currencies | | | (7,365,550 | ) | | | (16,236,171 | ) |
| NET DECREASE IN NET ASSETS | | | | | | | | |
| RESULTING FROM OPERATIONS | | $ | (5,132,093 | ) | | $ | (13,984,149 | ) |
The accompanying notes are an integral part of these financial statements.
TrimTabs ETF Trust
STATEMENTS OF OPERATIONS
Year/Period Ended July 31, 2022 (Continued)
| | | Donoghue | | | Donoghue | | | Donoghue | |
| | | Forlines | | | Forlines | | | Forlines Yield | |
| | | Tactical High | | | Risk Managed | | | Enhanced Real | |
| | | Yield ETF | | | Innovation ETF | | | Asset ETF(a) | |
| INVESTMENT INCOME | | | | | | | | | |
Income: | | | | | | | | | |
| Dividends (net of foreign withholding tax | | | | | | | | | |
| and issuance fees of $0, $2,155, | | | | | | | | | |
| and $36,079, respectively) | | $ | 1,914,056 | | | $ | 987,280 | | | $ | 1,606,088 | |
| Non-Cash Dividends | | | — | | | | — | | | | 239,682 | |
| Interest | | | 207 | | | | 664 | | | | 625 | |
| Securities Lending Income | | | 124,553 | | | | 33,132 | | | | 8,779 | |
| Total Investment Income | | | 2,038,816 | | | | 1,021,076 | | | | 1,855,174 | |
| | | | | | | | | | | | | |
Expenses: | | | | | | | | | | | | |
| Management Fees | | | 438,052 | | | | 618,608 | | | | 285,963 | |
| Total Expenses | | | 438,052 | | | | 618,608 | | | | 285,963 | |
| Net Investment Income | | | 1,600,764 | | | | 402,468 | | | | 1,569,211 | |
| | | | | | | | | | | | | |
| REALIZED & UNREALIZED | | | | | | | | | | | | |
| GAIN (LOSS) ON INVESTMENTS | | | | | | | | | | | | |
Net Realized Gain (Loss) on: | | | | | | | | | | | | |
| Investment Securities | | | (6,701,351 | ) | | | (2,001,837 | ) | | | 1,465,884 | |
| Redemptions In-Kind | | | (522,551 | ) | | | 1,958,349 | | | | (900,104 | ) |
| Foreign Currencies | | | — | | | | — | | | | — | |
Total | | | (7,223,902 | ) | | | (43,488 | ) | | | 565,780 | |
Net Change in Unrealized | | | | | | | | | | | | |
Appreciation (Depreciation) of: | | | | | | | | | | | | |
| Investment Securities | | | 37,334 | | | | (15,726,612 | ) | | | (1,152,818 | ) |
| Foreign Currencies | | | — | | | | — | | | | — | |
Total | | | 37,334 | | | | (15,726,612 | ) | | | (1,152,818 | ) |
Net Realized and Unrealized Loss | | | | | | | | | | | | |
on Investments and Foreign Currencies | | | (7,186,568 | ) | | | (15,770,100 | ) | | | (587,038 | ) |
| NET INCREASE (DECREASE) IN NET ASSETS | | | | | | | | | | | | |
| RESULTING FROM OPERATIONS | | $ | (5,585,804 | ) | | $ | (15,367,632 | ) | | $ | 982,173 | |
(a) | Fund commenced operations on December 13, 2021. |
The accompanying notes are an integral part of these financial statements.
FCF US Quality ETF
STATEMENTS OF CHANGES IN NET ASSETS
| | | Year Ended | | | Year Ended | |
| | | July 31, 2022 | | | July 31, 2021 | |
| OPERATIONS | | | | | | |
| Net Investment Income | | $ | 2,233,457 | | | $ | 1,104,334 | |
| Net Realized Gain on Investments | | | 13,536,685 | | | | 40,737,117 | |
| Change in Unrealized | | | | | | | | |
| Appreciation (Depreciation) of Investments | | | (20,902,235 | ) | | | 16,590,442 | |
| Net Increase (Decrease) in Net Assets | | | | | | | | |
| Resulting from Operations | | | (5,132,093 | ) | | | 58,431,893 | |
| | | | | | | | | |
| DISTRIBUTIONS TO SHAREHOLDERS | | | | | | | | |
| Dividends and Distributions | | | (19,681,904 | ) | | | (757,531 | ) |
| Total Distributions to Shareholders | | | (19,681,904 | ) | | | (757,531 | ) |
| | | | | | | | | |
| CAPITAL SHARE TRANSACTIONS | | | | | | | | |
| Proceeds from Shares Sold | | | 59,418,927 | | | | 75,829,263 | |
| Payments for Shares Redeemed | | | (61,616,675 | ) | | | (38,345,370 | ) |
| Net Increase (Decrease) in Net Assets Derived | | | | | | | | |
from Capital Share Transactions(a) | | | (2,197,748 | ) | | | 37,483,893 | |
| Net Increase (Decrease) in Net Assets | | | (27,011,745 | ) | | | 95,158,255 | |
| | | | | | | | | |
| NET ASSETS | | | | | | | | |
| Beginning of Year | | | 203,949,387 | | | | 108,791,132 | |
| End of Year | | $ | 176,937,642 | | | $ | 203,949,387 | |
(a) | Summary of capital share transactions is as follows: |
| | | Shares | | | Shares | |
| Subscriptions | | | 1,125,000 | | | | 1,800,000 | |
| Redemptions | | | (1,200,000 | ) | | | (825,000 | ) |
| Net Increase (Decrease) | | | (75,000 | ) | | | 975,000 | |
The accompanying notes are an integral part of these financial statements.
FCF International Quality ETF
STATEMENTS OF CHANGES IN NET ASSETS
| | | Year Ended | | | Year Ended | |
| | | July 31, 2022 | | | July 31, 2021 | |
| OPERATIONS | | | | | | |
| Net Investment Income | | $ | 2,252,022 | | | $ | 343,425 | |
| Net Realized Gain (Loss) on Investments | | | | | | | | |
| and Foreign Currencies | | | (1,738,791 | ) | | | 2,863,740 | |
| Change in Unrealized Appreciation (Depreciation) | | | | | | | | |
| of Investments and Foreign Currencies | | | (14,497,380 | ) | | | 3,640,258 | |
| Net Increase (Decrease) in Net Assets | | | | | | | | |
| Resulting from Operations | | | (13,984,149 | ) | | | 6,847,423 | |
| | | | | | | | | |
| DISTRIBUTIONS TO SHAREHOLDERS | | | | | | | | |
| Dividends and Distributions | | | (1,705,435 | ) | | | (86,243 | ) |
| Total Distributions to Shareholders | | | (1,705,435 | ) | | | (86,243 | ) |
| | | | | | | | | |
| CAPITAL SHARE TRANSACTIONS | | | | | | | | |
| Proceeds from Shares Sold | | | 32,564,450 | | | | 41,236,142 | |
| Payments for Shares Redeemed | | | (21,831,178 | ) | | | — | |
| Net Increase in Net Assets Derived from | | | | | | | | |
Capital Share Transactions(a) | | | 10,733,272 | | | | 41,236,142 | |
| Net Increase (Decrease) in Net Assets | | | (4,956,312 | ) | | | 47,997,322 | |
| | | | | | | | | |
| NET ASSETS | | | | | | | | |
| Beginning of Year | | | 59,113,525 | | | | 11,116,203 | |
| End of Year | | $ | 54,157,213 | | | $ | 59,113,525 | |
(a) | Summary of capital share transactions is as follows: |
| | | Shares | | | Shares | |
| Subscriptions | | | 925,000 | | | | 1,200,000 | |
| Redemptions | | | (700,000 | ) | | | — | |
| Net Increase | | | 225,000 | | | | 1,200,000 | |
The accompanying notes are an integral part of these financial statements.
Donoghue Forlines Tactical High Yield ETF
STATEMENTS OF CHANGES IN NET ASSETS
| | | Year Ended | | | Period Ended | |
| | | July 31, 2022 | | | July 31, 2021(a) | |
| OPERATIONS | | | | | | |
| Net Investment Income | | $ | 1,600,764 | | | $ | 1,841,662 | |
| Net Realized Loss on Investments | | | (7,223,902 | ) | | | (227,604 | ) |
| Change in Unrealized | | | | | | | | |
| Appreciation (Depreciation) of Investments | | | 37,334 | | | | 813,689 | |
| Net Increase (Decrease) in Net Assets | | | | | | | | |
| Resulting from Operations | | | (5,585,804 | ) | | | 2,427,747 | |
| | | | | | | | | |
| DISTRIBUTIONS TO SHAREHOLDERS | | | | | | | | |
| Dividends and Distributions | | | (1,832,922 | ) | | | (1,599,003 | ) |
| Total Distributions to Shareholders | | | (1,832,922 | ) | | | (1,599,003 | ) |
| | | | | | | | | |
| CAPITAL SHARE TRANSACTIONS | | | | | | | | |
| Proceeds from Shares Sold | | | 23,731,897 | | | | 95,676,528 | |
| Payments for Shares Redeemed | | | (57,678,098 | ) | | | (7,553,315 | ) |
| Net Increase (Decrease) in Net Assets Derived | | | | | | | | |
from Capital Share Transactions(b) | | | (33,946,201 | ) | | | 88,123,213 | |
| Net Increase (Decrease) in Net Assets | | | (41,364,927 | ) | | | 88,951,957 | |
| | | | | | | | | |
| NET ASSETS | | | | | | | | |
| Beginning of Period | | | 88,951,957 | | | | — | |
| End of Period | | $ | 47,587,030 | | | $ | 88,951,957 | |
(a) | Fund commenced operations on December 7, 2020. |
(b) | Summary of capital share transactions is as follows: |
| | | Shares | | | Shares | |
| Subscriptions | | | 1,050,000 | | | | 3,825,000 | |
| Redemptions | | | (2,425,000 | ) | | | (300,000 | ) |
| Net Increase (Decrease) | | | (1,375,000 | ) | | | 3,525,000 | |
The accompanying notes are an integral part of these financial statements.
Donoghue Forlines Risk Managed Innovation ETF
STATEMENTS OF CHANGES IN NET ASSETS
| | | Year Ended | | | Period Ended | |
| | | July 31, 2022 | | | July 31, 2021(a) | |
| OPERATIONS | | | | | | |
| Net Investment Income | | $ | 402,468 | | | $ | 61,671 | |
| Net Realized Gain (Loss) on Investments | | | (43,488 | ) | | | 3,487,656 | |
| Change in Unrealized | | | | | | | | |
| Appreciation (Depreciation) of Investments | | | (15,726,612 | ) | | | 11,569,004 | |
| Net Increase (Decrease) in Net Assets | | | | | | | | |
| Resulting from Operations | | | (15,367,632 | ) | | | 15,118,331 | |
| | | | | | | | | |
| DISTRIBUTIONS TO SHAREHOLDERS | | | | | | | | |
| Dividends and Distributions | | | (4,065,017 | ) | | | (18,013 | ) |
| Total Distributions to Shareholders | | | (4,065,017 | ) | | | (18,013 | ) |
| | | | | | | | | |
| CAPITAL SHARE TRANSACTIONS | | | | | | | | |
| Proceeds from Shares Sold | | | 41,013,310 | | | | 85,427,155 | |
| Payments for Shares Redeemed | | | (15,989,915 | ) | | | (13,165,267 | ) |
| Net Increase in Net Assets Derived | | | | | | | | |
from Capital Share Transactions(b) | | | 25,023,395 | | | | 72,261,888 | |
| Net Increase in Net Assets | | | 5,590,746 | | | | 87,362,206 | |
| | | | | | | | | |
| NET ASSETS | | | | | | | | |
| Beginning of Period | | | 87,362,206 | | | | — | |
| End of Period | | $ | 92,952,952 | | | $ | 87,362,206 | |
(a) | Fund commenced operations on December 7, 2020. |
(b) | Summary of capital share transactions is as follows: |
| | | Shares | | | Shares | |
| Subscriptions | | | 1,500,000 | | | | 3,425,000 | |
| Redemptions | | | (575,000 | ) | | | (475,000 | ) |
| Net Increase | | | 925,000 | | | | 2,950,000 | |
The accompanying notes are an integral part of these financial statements.
Donoghue Forlines Yield Enhanced Real Asset ETF
STATEMENT OF CHANGES IN NET ASSETS
| | | Period Ended | |
| | | July 31, 2022(a) | |
| OPERATIONS | | | |
| Net Investment Income | | $ | 1,569,211 | |
| Net Realized Gain on Investments | | | 565,780 | |
| Change in Unrealized Depreciation of Investments | | | (1,152,818 | ) |
| Net Increase in Net Assets Resulting from Operations | | | 982,173 | |
| | | | | |
| DISTRIBUTIONS TO SHAREHOLDERS | | | | |
| Dividends and Distributions | | | (1,150,709 | ) |
| Total Distributions to Shareholders | | | (1,150,709 | ) |
| | | | | |
| CAPITAL SHARE TRANSACTIONS | | | | |
| Proceeds from Shares Sold | | | 77,786,935 | |
| Payments for Shares Redeemed | | | (42,761,145 | ) |
Net Increase in Net Assets Derived from Capital Share Transactions(b) | | | 35,025,790 | |
| Net Increase in Net Assets | | | 34,857,254 | |
| | | | | |
| NET ASSETS | | | | |
| Beginning of Period | | | — | |
| End of Period | | $ | 34,857,254 | |
(a) | Fund commenced operations on December 13, 2021. |
(b) | Summary of capital share transactions is as follows: |
| | | Shares | |
| Subscriptions | | | 3,050,000 | |
| Redemptions | | | (1,725,000 | ) |
| Net Increase | | | 1,325,000 | |
The accompanying notes are an integral part of these financial statements.
FCF US Quality ETF
FINANCIAL HIGHLIGHTS
For a capital share outstanding throughout each year
| | | Year | | | Year | | | Year | | | Year | | | Year | |
| | | Ended | | | Ended | | | Ended | | | Ended | | | Ended | |
| | | July 31, | | | July 31, | | | July 31, | | | July 31, | | | July 31, | |
| | | 2022 | | | 2021 | | | 2020 | | | 2019 | | | 2018 | |
Net Asset Value, Beginning of Year | | $ | 55.12 | | | $ | 39.92 | | | $ | 37.59 | | | $ | 36.41 | | | $ | 29.81 | |
| | | | | | | | | | | | | | | | | | | | | |
| Income from Investment Operations: | | | | | | | | | | | | | | | | | | | | |
Net Investment Income(a) | | | 0.60 | | | | 0.28 | | | | 0.25 | | | | 0.30 | | | | 0.21 | |
Net Realized and Unrealized | | | | | | | | | | | | | | | | | | | | |
Gain (Loss) on Investments | | | (1.59 | ) | | | 15.11 | | | | 2.36 | | | | 1.07 | | | | 6.53 | |
| Total from Investment Operations | | | (0.99 | ) | | | 15.39 | | | | 2.61 | | | | 1.37 | | | | 6.74 | |
| | | | | | | | | | | | | | | | | | | | | |
| Less Distributions: | | | | | | | | | | | | | | | | | | | | |
From Net Investment Income | | | (0.47 | ) | | | (0.19 | ) | | | (0.28 | ) | | | (0.19 | ) | | | (0.14 | ) |
From Net Realized Gain on Investments | | | (4.85 | ) | | | — | | | | — | | | | — | | | | — | |
| Total Distributions | | | (5.32 | ) | | | (0.19 | ) | | | (0.28 | ) | | | (0.19 | ) | | | (0.14 | ) |
Net Asset Value, End of Year | | $ | 48.81 | | | $ | 55.12 | | | $ | 39.92 | | | $ | 37.59 | | | $ | 36.41 | |
Total Return | | | -2.92 | %(c) | | | 38.64 | % | | | 6.97 | % | | | 3.89 | % | | | 22.62 | % |
| | | | | | | | | | | | | | | | | | | | | |
| Supplemental Data: | | | | | | | | | | | | | | | | | | | | |
Net Assets at End of Year (000’s) | | $ | 176,938 | | | $ | 203,949 | | | $ | 108,791 | | | $ | 124,056 | | | $ | 99,214 | |
| | | | | | | | | | | | | | | | | | | | | |
| Ratios to Average Net Assets: | | | | | | | | | | | | | | | | | | | | |
Expenses to Average Net Assets | | | 0.59 | % | | | 0.59 | % | | | 0.59 | % | | | 0.59 | % | | | 0.59 | % |
Net Investment Income to Average Net Assets | | | 1.15 | % | | | 0.61 | % | | | 0.68 | % | | | 0.84 | % | | | 0.60 | % |
Portfolio Turnover Rate(b) | | | 51 | % | | | 98 | % | | | 83 | % | | | 49 | % | | | 42 | % |
(a) | Calculated based on average shares outstanding during the year. |
(b) | Excludes impact of in-kind transactions. |
(c) | During the fiscal year ended July 31, 2022, the Advisor reimbursed the Fund for certain losses. Had the Fund not been reimbursed for these losses the total return would have remained at -2.92%. |
The accompanying notes are an integral part of these financial statements.
FCF International Quality ETF
FINANCIAL HIGHLIGHTS
For a capital share outstanding throughout each year
| | | Year | | | Year | | | Year | | | Year | | | Year | |
| | | Ended | | | Ended | | | Ended | | | Ended | | | Ended | |
| | | July 31, | | | July 31, | | | July 31, | | | July 31, | | | July 31, | |
| | | 2022 | | | 2021 | | | 2020 | | | 2019 | | | 2018 | |
Net Asset Value, Beginning of Year | | $ | 36.38 | | | $ | 26.16 | | | $ | 26.02 | | | $ | 26.93 | | | $ | 25.48 | |
| | | | | | | | | | | | | | | | | | | | | |
| Income from Investment Operations: | | | | | | | | | | | | | | | | | | | | |
Net Investment Income(a) | | | 1.12 | | | | 0.44 | | | | 0.25 | | | | 0.37 | | | | 0.34 | |
Net Realized and Unrealized | | | | | | | | | | | | | | | | | | | | |
Gain (Loss) on Investments | | | (7.50 | ) | | | 9.98 | | | | 0.40 | | | | (1.08 | ) | | | 1.18 | |
| Total from Investment Operations | | | (6.38 | ) | | | 10.42 | | | | 0.65 | | | | (0.71 | ) | | | 1.52 | |
| | | | | | | | | | | | | | | | | | | | | |
| Less Distributions: | | | | | | | | | | | | | | | | | | | | |
From Net Investment Income | | | (0.31 | ) | | | (0.20 | ) | | | (0.51 | ) | | | (0.20 | ) | | | (0.07 | ) |
From Net Realized Gain on Investments | | | (0.42 | ) | | | — | | | | — | | | | — | | | | — | |
| Total Distributions | | | (0.73 | ) | | | (0.20 | ) | | | (0.51 | ) | | | (0.20 | ) | | | (0.07 | ) |
Net Asset Value, End of Year | | $ | 29.27 | | | $ | 36.38 | | | $ | 26.16 | | | $ | 26.02 | | | $ | 26.93 | |
Total Return | | | -17.93 | % | | | 39.96 | % | | | 2.42 | % | | | -2.47 | % | | | 5.97 | % |
| | | | | | | | | | | | | | | | | | | | | |
| Supplemental Data: | | | | | | | | | | | | | | | | | | | | |
Net Assets at End of Year (000’s) | | $ | 54,157 | | | $ | 59,114 | | | $ | 11,116 | | | $ | 12,361 | | | $ | 10,098 | |
| | | | | | | | | | | | | | | | | | | | | |
| Ratios to Average Net Assets: | | | | | | | | | | | | | | | | | | | | |
Expenses to Average Net Assets | | | 0.59 | % | | | 0.59 | % | | | 0.59 | % | | | 0.59 | % | | | 0.59 | % |
Net Investment Income to Average Net Assets | | | 3.32 | % | | | 1.32 | % | | | 1.00 | % | | | 1.48 | % | | | 1.28 | % |
Portfolio Turnover Rate(b) | | | 42 | % | | | 87 | % | | | 45 | % | | | 43 | % | | | 83 | % |
(a) | Calculated based on average shares outstanding during the year. |
(b) | Excludes impact of in-kind transactions. |
The accompanying notes are an integral part of these financial statements.
Donoghue Forlines Tactical High Yield ETF
FINANCIAL HIGHLIGHTS
For a capital share outstanding throughout each period
| | | Year Ended | | | Period Ended | |
| | | July 31, 2022 | | | July 31, 2021(a) | |
Net Asset Value, Beginning of Year/Period | | $ | 25.23 | | | $ | 25.00 | |
| | | | | | | | | |
| Income from Investment Operations: | | | | | | | | |
Net Investment Income(b) | | | 0.61 | | | | 0.57 | |
Net Realized and Unrealized Gain (Loss) on Investments | | | (3.08 | ) | | | 0.15 | |
| Total from Investment Operations | | | (2.47 | ) | | | 0.72 | |
| | | | | | | | | |
| Less Distributions: | | | | | | | | |
From Net Investment Income | | | (0.63 | ) | | | (0.49 | ) |
| Total Distributions | | | (0.63 | ) | | | (0.49 | ) |
Net Asset Value, End of Year/Period | | $ | 22.13 | | | $ | 25.23 | |
Total Return | | | -9.96 | % | | | 2.92 | %(c) |
| | | | | | | | | |
| Supplemental Data: | | | | | | | | |
Net Assets at End of Year/Period (000’s) | | $ | 47,587 | | | $ | 88,952 | |
| | | | | | | | | |
Ratios to Average Net Assets(f): | | | | | | | | |
Expenses to Average Net Assets | | | 0.69 | % | | | 0.69 | %(d) |
Net Investment Income to Average Net Assets | | | 2.52 | % | | | 3.54 | %(d) |
Portfolio Turnover Rate(e) | | | 1029 | % | | | 327 | %(c) |
(a) | Commencement of operations on December 7, 2020. |
(b) | Calculated based on average shares outstanding during the period. |
(c) | Not annualized. |
(d) | Annualized. |
(e) | Excludes impact of in-kind transactions. |
(f) | Income and expense ratios presented do not reflect the income and expenses of underlying funds. |
The accompanying notes are an integral part of these financial statements.
Donoghue Forlines Risk Managed Innovation ETF
FINANCIAL HIGHLIGHTS
For a capital share outstanding throughout each period
| | | Year Ended | | | Period Ended | |
| | | July 31, 2022 | | | July 31, 2021(a) | |
Net Asset Value, Beginning of Year/Period | | $ | 29.61 | | | $ | 25.00 | |
| | | | | | | | | |
| Income from Investment Operations: | | | | | | | | |
Net Investment Income(b) | | | 0.12 | | | | 0.02 | |
Net Realized and Unrealized Gain (Loss) on Investments | | | (4.34 | ) | | | 4.60 | |
| Total from Investment Operations | | | (4.22 | ) | | | 4.62 | |
| | | | | | | | | |
| Less Distributions: | | | | | | | | |
From Net Investment Income | | | (0.05 | ) | | | (0.01 | ) |
From Net Realized Gain on Investments | | | (1.35 | ) | | | — | |
| Total Distributions | | | (1.40 | ) | | | (0.01 | ) |
Net Asset Value, End of Year/Period | | $ | 23.99 | | | $ | 29.61 | |
Total Return | | | -15.16 | % | | | 18.48 | %(c) |
| | | | | | | | | |
| Supplemental Data: | | | | | | | | |
Net Assets at End of Year/Period (000’s) | | $ | 92,953 | | | $ | 87,362 | |
| | | | | | | | | |
| Ratios to Average Net Assets: | | | | | | | | |
Expenses to Average Net Assets | | | 0.69 | % | | | 0.69 | %(d) |
Net Investment Income to Average Net Assets | | | 0.45 | % | | | 0.11 | %(d) |
Portfolio Turnover Rate(e) | | | 82 | % | | | 40 | %(c) |
(a) | Commencement of operations on December 7, 2020. |
(b) | Calculated based on average shares outstanding during the period. |
(c) | Not annualized. |
(d) | Annualized. |
(e) | Excludes impact of in-kind transactions. |
The accompanying notes are an integral part of these financial statements.
Donoghue Forlines Yield Enhanced Real Asset ETF
FINANCIAL HIGHLIGHTS
For a capital share outstanding throughout the period
| | Period Ended |
| | July 31, 2022(a) |
Net Asset Value, Beginning of Period | | $ | 25.00 | |
| | | | | |
| Income from Investment Operations: | | | | |
Net Investment Income(b) | | | 0.63 | |
Net Realized and Unrealized Gain on Investments | | | 1.11 | (f) |
| Total from Investment Operations | | | 1.74 | |
| | | | | |
| Less Distributions: | | | | |
From Net Investment Income | | | (0.43 | ) |
| Total Distributions | | | (0.43 | ) |
Net Asset Value, End of Period | | $ | 26.31 | |
Total Return | | | 6.88 | %(c) |
| | | | | |
| Supplemental Data: | | | | |
Net Assets at End of Period (000’s) | | $ | 34,857 | |
| | | | | |
| Ratios to Average Net Assets: | | | | |
Expenses to Average Net Assets | | | 0.69 | %(d) |
Net Investment Income to Average Net Assets | | | 3.79 | %(d) |
Portfolio Turnover Rate(e) | | | 48 | %(c) |
(a) | Commencement of operations on December 13, 2021. |
(b) | Calculated based on average shares outstanding during the period. |
(c) | Not annualized. |
(d) | Annualized. |
(e) | Excludes impact of in-kind transactions. |
(f) | As required by the SEC standard per share data calculation methodology, this represents a balancing figure derived from the other amounts in the financial highlights tables that captures all other changes affecting net asset value per share. This per share gain amount does not correlate to the aggregate of the net realized and unrealized loss in the Statement of Operations for the period ended July 31, 2022, primarily due to the timing of sales and repurchases of the Fund’s shares in relation to fluctuating market values of the Fund’s portfolio. |
The accompanying notes are an integral part of these financial statements.
TrimTabs ETF Trust
NOTES TO FINANCIAL STATEMENTS
July 31, 2022
1. ORGANIZATION
The FCF US Quality ETF (formerly known as the TrimTabs U.S. Free Cash Flow Quality ETF) (“TTAC”), FCF International Quality ETF (formerly known as the TrimTabs International Free Cash Flow Quality ETF) (“TTAI”), Donoghue Forlines Tactical High Yield ETF (formerly known as the TrimTabs Donoghue Forlines Tactical High Yield ETF) (“DFHY”), Donoghue Forlines Risk Managed Innovation ETF (formerly known as the TrimTabs Donoghue Forlines Risk Managed Innovation ETF) (“DFNV”) and Donoghue Forlines Yield Enhanced Real Asset ETF (“DFRA”) (each, a “Fund” and collectively, the “Funds”) are each a series of the TrimTabs ETF Trust (the “Trust”). The Trust was organized as a Delaware statutory trust on April 2, 2014. Each Fund is classified as a diversified, open-end management investment company registered under the Investment Company Act of 1940, as amended (the “1940 Act”).
FCF US Quality ETF commenced operations on September 27, 2016 and that is the date the initial creation units were established. The Fund seeks to generate long-term returns in excess of the total return of the Russell 3000® Index (the “Russell Index”), with less volatility than the Russell Index. FCF International Quality ETF commenced operations on June 27, 2017 and that is the date the initial creation units were established. Effective March 28, 2022, the Fund seeks to generate long-term total returns (prior to March 28, 2022, the Fund had seeked to generate long-term returns in excess of the total return of the S&P Developed ex-U.S. BMI Index, with similar volatility to the S&P Developed ex-U.S. BMI Index). Donoghue Forlines Tactical High Yield ETF commenced operations on December 7, 2020 and that is the date the initial creation units were established. The Fund seeks to provide investment results that closely correspond, before fees and expenses, to the performance of the FCF Tactical High Yield Index. DFHY is a “fund of funds”, meaning it will generally invest its assets in other registered investment companies. Donoghue Forlines Risk Managed Innovation ETF commenced operations on December 7, 2020 and that is the date the initial creation units were established. The Fund seeks to provide investment results that closely correspond, before fees and expenses, to the performance of the FCF Risk Managed Quality Innovation Index. Donoghue Forlines Yield Enhanced Real Asset ETF commenced operations on December 13, 2021 and that is the date the initial creation units were established. The Fund seeks to provide investment results that closely correspond, before fees and expenses, to the performance of the FCF Yield Enhanced Real Asset Index.
Shares of the Funds are listed and traded on the Cboe BZX Exchange, Inc. (“Cboe” or the “Exchange”). Market prices for the shares may be different from their net asset value (“NAV”). Each Fund issues and redeems shares on a continuous basis at NAV only in large blocks of shares, called “Creation Units,” which generally consist of 25,000 shares. Creation Units are issued and redeemed principally in-kind for securities included in a specified universe. Once created, shares generally trade in the secondary market at market prices that change throughout the day in amounts less than a Creation Unit.
TrimTabs ETF Trust
NOTES TO FINANCIAL STATEMENTS
July 31, 2022 (Continued)
Except when aggregated in Creation Units, shares are not redeemable securities of a Fund. Shares of a Fund may only be purchased directly from or redeemed directly to a Fund by certain financial institutions (“Authorized Participants”). An Authorized Participant is either (i) a broker-dealer or other participant in the clearing process through the Continuous Net Settlement System of the National Securities Clearing Corporation or (ii) a DTC participant and, in each case, must have executed a Participant Agreement with Quasar Distributors, LLC (the “Distributor”). Most retail investors do not qualify as Authorized Participants or have the resources to buy and sell whole Creation Units. Therefore, most retail investors may purchase shares in the secondary market with the assistance of a broker and are subject to customary brokerage commissions or fees.
Each Fund currently offers one class of shares, which have no front-end sales loads, no deferred sales charges, and no redemption fees. A purchase (i.e., creation) transaction fee is imposed for the transfer and other transaction costs associated with the purchase of Creation Units. FCF US Quality ETF charges $500 for the standard fixed creation fee, FCF International Quality ETF charges $2,000 for the standard fixed creation fee, and Donoghue Forlines Tactical High Yield ETF, Donoghue Forlines Risk Managed Innovation ETF and Donoghue Forlines Yield Enhanced Real Asset ETF each charge $300 for the standard fixed creation fee, payable to the Custodian. In addition, a variable fee may be charged on all cash transactions or substitutes for Creation Units of up to a maximum of 2% as a percentage of the total value of the Creation Units subject to the transaction. Variable fees received by each Fund are displayed in the Capital Share Transactions section of the Statement of Changes in Net Assets. There were no variable fees charged in any Fund during the fiscal period. Each Fund may issue an unlimited number of shares of beneficial interest, with no par value. Shares of each Fund have equal rights and privileges with respect to such Fund.
2. SIGNIFICANT ACCOUNTING POLICIES
Each Fund is a registered investment company and accordingly follows the investment company accounting and reporting guidance of the Financial Accounting Standards Board (“FASB”) Accounting Standard Codification (“ASC”) Topic 946 Financial Services – Investment Companies.
The following is a summary of significant accounting policies followed by each Fund in the preparation of their financial statements. These policies are in conformity with accounting principles generally accepted in the United States of America (“GAAP”).
Security Transactions and Investment Income: Investment securities transactions are accounted for on the trade date. Gains and losses realized on sales of securities are computed on the basis of specific identification. Dividend income is recorded on the ex-dividend date. Withholding taxes on foreign dividends have been provided for in
TrimTabs ETF Trust
NOTES TO FINANCIAL STATEMENTS
July 31, 2022 (Continued)
accordance with the Funds’ understanding of the applicable tax rules and regulations. Interest income is recorded on an accrual basis. Discounts and premiums on securities purchased are accreted and amortized over the lives of the respective securities.
Dividend Distributions: Distributions to shareholders are recorded on the ex-dividend date and are determined in accordance with federal income tax regulations, which may differ from GAAP. Each Fund distributes all or substantially all of its net investment income to shareholders in the form of dividends.
Federal Income Taxes: The Funds comply with the requirements of subchapter M of the Internal Revenue Code of 1986, as amended, necessary to qualify as regulated investment companies and distribute substantially all net taxable investment income and net realized gains to shareholders in a manner which results in no tax cost to the Funds. Therefore, no federal income tax provision is required. As of and during the year ended July 31, 2022, the Funds did not have any tax positions that did not meet the “more-likely-than-not” threshold of being sustained by the applicable tax authority. As of and during the year ended July 31, 2022, the Funds did not have liabilities for any unrecognized tax benefits on uncertain tax positions as income tax expense in the Statements of Operations. During the year ended July 31, 2022, the Funds did not incur any interest or penalties. The Funds are subject to examination by U.S. taxing authorities for the prior three fiscal years.
Currency Translation: Assets and liabilities, including investment securities, denominated in currencies other than U.S. dollars are translated into U.S. dollars at the exchange rates supplied by one or more pricing vendors on the valuation date. Purchases and sales of investment securities and income and expenses are translated into U.S. dollars at the exchange rates on the dates of such transactions. The effects of changes in exchange rates on investment securities are included with the net realized gain or loss and net unrealized appreciation or depreciation on investments in the Funds’ Statements of Operations. The realized gain or loss and unrealized appreciation or depreciation resulting from all other transactions denominated in currencies other than U.S. dollars are disclosed separately.
Use of Estimates: The preparation of financial statements in conformity with GAAP requires management to make estimates and assumptions that affect the reported amounts of assets and liabilities and disclosure of contingent assets and liabilities at the date of the financial statements, and the reported amounts of increases and decreases in net assets from operations during the reporting period. Actual results could differ from those estimates.
Share Valuation: The NAV per share of each Fund is calculated by dividing the sum of the value of the securities held by the Fund, plus cash and other assets, minus all liabilities (including estimated accrued expenses) by the total number of shares outstanding for the Fund, rounded to the nearest cent. The offering and redemption price per share for each Fund is equal to the Fund’s net asset value per share.
TrimTabs ETF Trust
NOTES TO FINANCIAL STATEMENTS
July 31, 2022 (Continued)
Guarantees and Indemnifications: The Funds indemnify their officers and trustees for certain liabilities that may arise from the performance of their duties to the Funds. Additionally, in the normal course of business, the Trust enters into contracts with its vendors and others that provide for general indemnifications. The Trust and Funds’ maximum exposure under these arrangements is unknown, as this would involve future claims that may be made against the Funds. However, based on industry experience, the Funds expect that risk of loss to be remote.
Reclassification of Capital Accounts: U.S. GAAP requires that certain components of net assets relating to permanent differences be reclassified between financial and tax reporting. These reclassifications have no effect on net assets or NAV per share. For the fiscal year ended July 31, 2022, the following table shows the reclassifications made:
| | | Distributable Earnings | | | Paid-In | |
| | | (Accumulated Deficit) | | | Capital | |
FCF US Quality ETF | | $ | (13,033,782 | ) | | $ | 13,033,782 | |
FCF International Quality ETF | | $ | 490,605 | | | $ | (490,605 | ) |
Donoghue Forlines Tactical High Yield ETF | | $ | 1,486,167 | | | $ | (1,486,167 | ) |
Donoghue Forlines Risk Managed Innovation ETF | | $ | (1,919,909 | ) | | $ | 1,919,909 | |
Donoghue Forlines Yield Enhanced Real Asset ETF | | $ | 1,011,442 | | | $ | (1,011,442 | ) |
During the fiscal year ended July 31, 2022, the Funds realized the following net capital gains or losses resulting from in-kind redemptions in which shareholders exchanged Fund shares for securities held by the Funds rather than for cash. Because such gains or losses are not taxable or deductible to the Funds, and are not distributed to shareholders, they have been reclassified from distributable earnings to paid-in capital.
| | | Gains (Losses) from | |
| | | In-Kind Redemptions | |
FCF US Quality ETF | | $ | 13,911,304 | |
FCF International Quality ETF | | $ | 272,003 | |
Donoghue Forlines Tactical High Yield ETF | | $ | (522,551 | ) |
Donoghue Forlines Risk Managed Innovation ETF | | $ | 1,958,349 | |
Donoghue Forlines Yield Enhanced Real Asset ETF | | $ | (900,104 | ) |
Underlying Investment in Other Investment Companies: The Donoghue Forlines Tactical High Yield ETF participates in the securities lending program and receives cash collateral in return for securities lent. The collateral is invested in the Mount Vernon Liquid Assets Portfolio, LLC of which the investment objective is to seek to maximize current income to the extent consistent with the preservation of capital and liquidity and to maintain a stable net asset value of $1.00 per unit by investing in dollar-denominated securities with remaining maturities of 397 calendar days or less. As of July 31, 2022, the percentage of the Donoghue Forlines Tactical High Yield ETF’s total net assets invested in the Mount Vernon Liquid Assets Portfolio, LLC was 29.4%.
TrimTabs ETF Trust
NOTES TO FINANCIAL STATEMENTS
July 31, 2022 (Continued)
Subsequent Events: The Trust has evaluated the need for disclosures and/or adjustments resulting from subsequent events through the date the financial statements were issued. Based on this evaluation, no adjustments or disclosures were required to the financial statements.
3. SECURITIES VALUATION
Investment Valuation: Each Fund calculates its net asset value (“NAV”) each day the New York Stock Exchange (the “NYSE”) is open for trading as of the close of regular trading on the NYSE, normally 4:00 p.m. Eastern time (the “NAV Calculation Time”).
Equity securities are valued primarily on the basis of market quotations reported on stock exchanges and other securities markets around the world. If an equity security is listed on a national securities exchange, the security is valued at the closing price or, if the closing price is not readily available, the mean of the closing bid and asked prices.
Investments in other open-end investment companies, including money market funds, are valued at the investment company’s net asset value per share, with the exception of exchange-traded open-end investment companies, which are priced as equity securities described above.
Market quotations and indicative bids are obtained from outside pricing services approved and monitored pursuant to a policy approved by the Funds’ Board of Trustees (the “Board”). If a market quotation is not readily available or is deemed not to reflect market value, the Funds will determine the price of the security held by the Funds based on a determination of the security’s fair value pursuant to policies and procedures approved by the Board. In addition, the Funds may use fair valuation to price securities that trade on a foreign exchange when a significant event has occurred after the foreign exchange closes but before the time at which the Funds’ NAV’s are calculated. Such valuations would typically be categorized as Level 2 or Level 3 in the fair value hierarchy described below.
Foreign exchanges typically close before the time at which Fund share prices are calculated and may be closed altogether on some days when shares of the Funds are traded. Significant events affecting a foreign security may include, but are not limited to: corporate actions, earnings announcements, litigation or other events impacting a single issuer; governmental action that affects securities in one sector or country; natural disasters or armed conflicts affecting a country or region; or significant domestic or foreign market fluctuations.
Fair valuations and valuations of investments that are not actively trading involve judgment and may differ materially from valuations that would have been used had greater market activity occurred.
TrimTabs ETF Trust
NOTES TO FINANCIAL STATEMENTS
July 31, 2022 (Continued)
Fair Valuation Measurement:
The FASB established a framework for measuring fair value in accordance with GAAP. Under FASB ASC Topic 820, Fair Value Measurement, various inputs are used in determining the value of each Fund’s investments. The inputs or methodology used for valuing securities are not necessarily an indication of the risk associated with investing in those securities. The three Levels of inputs of the fair value hierarchy are defined as follows:
| Level 1 — | Unadjusted quoted prices in active markets for identical assets or liabilities. |
| | |
| Level 2 — | Observable inputs other than quoted prices included in Level 1 that are observable for the asset or liability, either directly or indirectly. These inputs may include quoted prices for the identical instrument on an inactive market, prices for similar securities, interest rates, prepayment speeds, credit risk, yield curves, default rates and similar data. |
| | |
| Level 3 — | Unobservable inputs for the asset or liability, to the extent relevant observable inputs are not available; representing the Fund’s own assumptions about the assumptions a market participant would use in valuing the asset or liability and would be based on the best information available. |
A financial instrument’s level within the fair value hierarchy is based on the lowest level of any input that is significant to the fair value measurement.
The availability of observable inputs can vary from security to security and is affected by a wide variety of factors, including, for example, the type of security, whether the security is new and not yet established in the marketplace, the liquidity of markets, and other characteristics particular to the security. To the extent that valuation is based on models or inputs that are less observable or unobservable in the market, the determination of fair value requires more judgment. Accordingly, the degree of judgment exercised in determining fair value is greatest for instruments categorized in Level 3.
The following is a summary of the inputs used to value the Fund’s investments as of July 31, 2022:
FCF US Quality ETF
Description^ | | Non-Categorized | | | Level 1 | | | Level 2 | | | Level 3 | | | Total | |
| Common Stocks | | $ | — | | | $ | 170,109,233 | | | $ | — | | | $ | — | | | $ | 170,109,233 | |
| REITs | | | — | | | | 4,991,559 | | | | — | | | | — | | | | 4,991,559 | |
| Money Market Fund | | | — | | | | 1,361,957 | | | | — | | | | — | | | | 1,361,957 | |
| Investment Purchased | | | | | | | | | | | | | | | | | | | | |
| with the Cash | | | | | | | | | | | | | | | | | | | | |
| Proceeds from | | | | | | | | | | | | | | | | | | | | |
| Securities Lending* | | | 18,745,040 | | | | — | | | | — | | | | — | | | | 18,745,040 | |
| Total Investments | | $ | 18,745,040 | | | $ | 176,462,749 | | | $ | — | | | $ | — | | | $ | 195,207,789 | |
TrimTabs ETF Trust
NOTES TO FINANCIAL STATEMENTS
July 31, 2022 (Continued)
| FCF International Quality ETF | |
| | | | | | | | | | | | | | | | |
Description^ | | Non-Categorized | | | Level 1 | | | Level 2 | | | Level 3 | | | Total | |
| Common Stocks | | $ | — | | | $ | 51,969,962 | | | $ | — | | | $ | 151,676 | | | $ | 52,121,638 | |
| Preferred Stock | | | — | | | | 345,414 | | | | — | | | | — | | | | 345,414 | |
| REITs | | | — | | | | 757,527 | | | | — | | | | — | | | | 757,527 | |
| Money Market Fund | | | — | | | | 541,439 | | | | — | | | | — | | | | 541,439 | |
| Investment Purchased | | | | | | | | | | | | | | | | | | | | |
| with the Cash | | | | | | | | | | | | | | | | | | | | |
| Proceeds from | | | | | | | | | | | | | | | | | | | | |
| Securities Lending* | | | 3,228,249 | | | | — | | | | — | | | | — | | | | 3,228,249 | |
| Total Investments | | $ | 3,228,249 | | | $ | 53,614,342 | | | $ | — | | | $ | 151,676 | | | $ | 56,994,267 | |
| | | | | | | | | | | | | | | | | | | | | |
| Donoghue Forlines Tactical High Yield ETF | |
| | | | | | | | | | | | | | | | |
Description^ | | Non-Categorized | | | Level 1 | | | Level 2 | | | Level 3 | | | Total | |
| Exchange-Traded | | | | | | | | | | | | | | | | | | | | |
| Funds | | $ | — | | | $ | 47,440,614 | | | $ | — | | | $ | — | | | $ | 47,440,614 | |
| Money Market Fund | | | — | | | | 162,381 | | | | — | | | | — | | | | 162,381 | |
| Investment Purchased | | | | | | | | | | | | | | | | | | | | |
| with the Cash | | | | | | | | | | | | | | | | | | | | |
| Proceeds from | | | | | | | | | | | | | | | | | | | | |
| Securities Lending* | | | 13,991,235 | | | | — | | | | — | | | | — | | | | 13,991,235 | |
| Total Investments | | $ | 13,991,235 | | | $ | 47,602,995 | | | $ | — | | | $ | — | | | $ | 61,594,230 | |
| | | | | | | | | | | | | | | | | | | | | |
| Donoghue Forlines Risk Managed Innovation ETF | |
| | | | | | | | | | | | | | | | |
Description^ | | Non-Categorized | | | Level 1 | | | Level 2 | | | Level 3 | | | Total | |
| Common Stocks | | $ | — | | | $ | 92,656,101 | | | $ | — | | | $ | — | | | $ | 92,656,101 | |
| Money Market Fund | | | — | | | | 283,957 | | | | — | | | | — | | | | 283,957 | |
| Investment Purchased | | | | | | | | | | | | | | | | | | | | |
| with the Cash | | | | | | | | | | | | | | | | | | | | |
| Proceeds from | | | | | | | | | | | | | | | | | | | | |
| Securities Lending* | | | 13,550,477 | | | | — | | | | — | | | | — | | | | 13,550,477 | |
| Total Investments | | $ | 13,550,477 | | | $ | 92,940,058 | | | $ | — | | | $ | — | | | $ | 106,490,535 | |
TrimTabs ETF Trust
NOTES TO FINANCIAL STATEMENTS
July 31, 2022 (Continued)
| Donoghue Forlines Yield Enhanced Real Asset ETF | | | | | | | | | | | | | | | |
| | | | | | | | | | | | | | | | |
Description^ | | Non-Categorized | | | Level 1 | | | Level 2 | | | Level 3 | | | Total | |
| Common Stocks | | $ | — | | | $ | 22,692,548 | | | $ | — | | | $ | — | | | $ | 22,692,548 | |
| Preferred Stocks | | | — | | | | 793,864 | | | | — | | | | — | | | | 793,864 | |
| Master Limited | | | | | | | | | | | | | | | | | | | | |
| Partnerships | | | — | | | | 3,990,385 | | | | — | | | | — | | | | 3,990,385 | |
| REITs | | | — | | | | 7,231,335 | | | | — | | | | — | | | | 7,231,335 | |
| Money Market Fund | | | — | | | | 90,796 | | | | — | | | | — | | | | 90,796 | |
| Investment Purchased | | | | | | | | | | | | | | | | | | | | |
| with the Cash | | | | | | | | | | | | | | | | | | | | |
| Proceeds from | | | | | | | | | | | | | | | | | | | | |
| Securities Lending* | | | 8,374,921 | | | | — | | | | — | | | | — | | | | 8,374,921 | |
| Total Investments | | $ | 8,374,921 | | | $ | 34,798,928 | | | $ | — | | | $ | — | | | $ | 43,173,849 | |
| ^ | See Schedule of Investments for sector breakouts. |
| * | Certain investments that are measured at fair value using the NAV per share (or its equivalent) as a practical expedient have not been characterized in the fair value hierarchy. The fair value amounts presented in the table are intended to permit reconciliation of the fair value hierarchy to the amount presented in the Statements of Assets and Liabilities. See Note 8 for additional information regarding securities lending. |
FCF International Quality ETF
Level 3 Reconciliation Disclosure
| | | Equities | |
| Balance as of July 31, 2021 | | $ | — | |
| Transfers in | | | 151,676 | |
| Balance as of July 31, 2022 | | $ | 151,676 | |
| | | | | |
| Change in unrealized appreciation (depreciation) during | | | | |
| the period for Level 3 investments held at July 31, 2022 | | $ | — | |
The Level 3 investments as of July 31, 2022 represented 0.28% of net assets and did not warrant a disclosure of significant unobservable valuation inputs.
4. OTHER RELATED PARTY TRANSACTIONS
FCF Advisors LLC (formerly TrimTabs Asset Management, LLC) (“the Adviser”) serves as the investment adviser to the Funds. Pursuant to an Investment Advisory Agreement (“Investment Advisory Agreement”) between the Trust, on behalf of the Funds, and the Adviser, the Adviser provides investment advice to the Funds and oversees the day-to-day operations of the Funds, subject to the direction and control of the Board and the officers of the Trust. The Adviser administers the Funds’ business affairs, provides office facilities and equipment and certain clerical, bookkeeping and administrative services. The Adviser bears the costs of all advisory and non-advisory services required to operate the Funds, including payment of Trustee compensation, in exchange for a single unitary management
TrimTabs ETF Trust
NOTES TO FINANCIAL STATEMENTS
July 31, 2022 (Continued)
fee. For services provided to the Funds, TTAC and TTAI each pay the Adviser 0.59% and DFHY, DFNV and DFRA each pay the Adviser 0.69% at an annual rate based on each Fund’s average daily net assets. Certain officers and a Trustee of the Trust are affiliated with the Adviser and are not paid any fees by the Funds for serving in such capacities.
The Adviser has overall responsibility for overseeing the investment of the Funds’ assets, managing the Funds’ business affairs and providing certain clerical, bookkeeping and other administrative services for the Trust. Donoghue Forlines LLC (“Donoghue” or “the Sub-Adviser”) acts as the Sub-Adviser to DFHY, DFNV, and DFRA. The Sub-Adviser has responsibility to make day-to-day investment decisions for DFHY, DFNV, and DFRA and selects broker-dealers for executing portfolio transactions, subject to the Sub-Adviser’s best execution obligations and the Trust’s and the Sub-Adviser’s brokerage policies. For the services it provides to DFHY, DFNV, and DFRA, the Sub-Adviser is compensated by the Adviser from the management fees paid by DFHY, DFNV, and DFRA to the Adviser.
5. SERVICE AND CUSTODY AGREEMENTS
The Funds have entered into Service Agreements with U.S. Bancorp Fund Services, LLC (“Fund Services” or “Administrator”), doing business as U.S. Bank Global Fund Services and a Custody Agreement with U.S. Bank, N.A. (“USB”), an affiliate of Fund Services. Under these agreements, Fund Services and USB provide certain transfer agency, administrative, accounting and custody services and are paid by the Adviser under the unitary fee arrangement noted above.
Quasar Distributors, LLC (“Quasar”) acts as the Funds’ principal underwriter in a continuous public offering of the Funds’ shares. Quasar is a wholly-owned broker-dealer subsidiary of Foreside Financial Group, LLC (“Foreside”).
The Trust has adopted a distribution and service plan (“Rule 12b-1 Plan”) pursuant to Rule 12b-1 under the 1940 Act. Under the Rule 12b-1 Plan, each Fund is authorized to pay distribution fees in connection with the sale and distribution of its shares and pay service fees in connection with the provision of ongoing services to shareholders. To date, the Rule 12b-1 Plan has not been implemented for the Funds and there is no current intention to implement the Rule 12b-1 Plan.
6. INVESTMENT TRANSACTIONS
For the year or period ended July 31, 2022, the aggregate purchases and sales of securities by each Fund, excluding short-term securities and in-kind transactions, were as follows:
| | | Purchases | | | Sales | |
| FCF US Quality ETF | | $ | 97,236,650 | | | $ | 115,474,387 | |
| FCF International Quality ETF | | $ | 28,467,589 | | | $ | 29,751,127 | |
| Donoghue Forlines Tactical High Yield ETF | | $ | 655,109,210 | | | $ | 655,403,569 | |
| Donoghue Forlines Risk Managed Innovation ETF | | $ | 73,578,294 | | | $ | 77,296,007 | |
| Donoghue Forlines Yield Enhanced Real Asset ETF | | $ | 31,771,038 | | | $ | 30,774,301 | |
TrimTabs ETF Trust
NOTES TO FINANCIAL STATEMENTS
July 31, 2022 (Continued)
For the year or period ended July 31, 2022, in-kind transactions associated with creations and redemptions were as follows:
| | | Purchases | | | Sales | |
| FCF US Quality ETF | | $ | 58,239,700 | | | $ | 59,712,255 | |
| FCF International Quality ETF | | $ | 31,408,556 | | | $ | 19,524,924 | |
| Donoghue Forlines Tactical High Yield ETF | | $ | 23,678,118 | | | $ | 57,568,044 | |
| Donoghue Forlines Risk Managed Innovation ETF | | $ | 40,965,454 | | | $ | 15,950,911 | |
| Donoghue Forlines Yield Enhanced Real Asset ETF | | $ | 77,172,811 | | | $ | 42,363,178 | |
For the year or period ended July 31, 2022, there were no long-term purchases or sales of U.S. Government Securities for the Funds.
7. INCOME TAX INFORMATION
The components of tax basis cost of investments and net unrealized appreciation for federal income tax purposes as of July 31, 2022 were as follows:
| | | FCF US | | | FCF International | |
| | | Quality ETF | | | Quality ETF | |
Tax cost of investments | | $ | 179,581,284 | | | $ | 66,519,771 | |
Gross tax unrealized appreciation | | | 25,597,930 | | | | 1,868,391 | |
Gross tax unrealized depreciation | | | (9,971,425 | ) | | | (11,393,895 | ) |
Net tax unrealized appreciation (depreciation) | | | 15,626,505 | | | | (9,525,504 | ) |
Undistributed ordinary income | | | 204,093 | | | | 1,708,083 | |
Undistributed long-term capital gains | | | 1,415,476 | | | | — | |
Total accumulated gain | | | 1,619,569 | | | | 1,708,083 | |
Other accumulated gain (loss) | | | — | | | | (625,959 | ) |
Distributable earnings | | $ | 17,246,074 | | | $ | (8,443,380 | ) |
| | | Donoghue | | | Donoghue | | | Donoghue | |
| | | Forlines | | | Forlines | | | Forlines | |
| | | Tactical High | | | Risk Managed | | | Yield Enhanced | |
| | | Yield ETF | | | Innovation ETF | | | Real Asset ETF | |
Tax cost of investments | | $ | 61,750,227 | | | $ | 110,908,475 | | | $ | 44,280,339 | |
Gross tax unrealized appreciation | | | 982,457 | | | | 7,106,316 | | | | 1,932,211 | |
Gross tax unrealized depreciation | | | (1,138,454 | ) | | | (11,524,256 | ) | | | (3,038,701 | ) |
Net tax unrealized (depreciation) | | | (155,997 | ) | | | (4,417,940 | ) | | | (1,106,490 | ) |
Undistributed ordinary income | | | 10,501 | | | | 358,209 | | | | 1,922,637 | |
Undistributed long-term capital gains | | | — | | | | — | | | | 26,759 | |
Total accumulated gain | | | 10,501 | | | | 358,209 | | | | 1,949,396 | |
Other accumulated gain (loss) | | | (5,022,651 | ) | | | (3,590,975 | ) | | | — | |
Distributable earnings | | $ | (5,168,147 | ) | | $ | (7,650,706 | ) | | $ | 842,906 | |
TrimTabs ETF Trust
NOTES TO FINANCIAL STATEMENTS
July 31, 2022 (Continued)
The difference between book and tax-basis cost is attributable to the realization for tax purposes of unrealized gains on investments in passive foreign investment companies and wash sales. Under tax law, certain capital and foreign currency losses realized after October 31 and within the taxable year are deemed to arise on the first business day of each Fund’s next taxable year.
At July 31, 2022, the Funds had the following capital loss carryforwards:
| | | Short-Term | | | Long-Term | | Expires |
| FCF US Quality ETF | | $ | — | | | $ | — | | Indefinite |
| FCF International Quality ETF | | $ | 616,829 | | | $ | — | | Indefinite |
| Donoghue Forlines Tactical High Yield ETF | | $ | 5,006,897 | | | $ | 15,754 | | Indefinite |
| Donoghue Forlines Risk Managed Innovation ETF | | $ | — | | | $ | — | | Indefinite |
| Donoghue Forlines Yield Enhanced Real Asset ETF | | $ | — | | | $ | — | | Indefinite |
The tax character of distributions paid by the Funds during the fiscal period ended July 31, 2022 and the fiscal period ended July 31, 2021 was as follows:
| | | Ordinary Income | | | Capital Gains | |
| | | July 31, 2022 | | | July 31, 2021 | | | July 31, 2022 | | | July 31, 2021 | |
| FCF US Quality ETF | | $ | 5,304,037 | | | $ | 757,531 | | | $ | 14,377,867 | | | $ | — | |
| FCF International Quality ETF | | $ | 778,251 | | | $ | 86,243 | | | $ | 927,184 | | | $ | — | |
| Donoghue Forlines Tactical | | | | | | | | | | | | | | | | |
| High Yield ETF | | $ | 1,832,922 | | | $ | 1,599,003 | | | $ | — | | | $ | — | |
| Donoghue Forlines Risk | | | | | | | | | | | | | | | | |
| Managed Innovation ETF | | $ | 3,938,297 | | | $ | 18,013 | | | $ | 126,720 | | | $ | — | |
| Donoghue Forlines Yield | | | | | | | | | | | | | | | | |
| Enhanced Real Asset ETF | | $ | 1,150,709 | | | | n/a | | | $ | — | | | | n/a | |
At July 31, 2022, the Donoghue Forlines Risk Managed Innovation Fund deferred, on a tax basis, post-October losses of $3,590,975.
8. SECURITIES LENDING
Following terms of a securities lending agreement with USB, each Fund may lend securities from its portfolio to brokers, dealers and financial institutions in order to increase the return on its portfolio, primarily through the receipt of borrowing fees and earnings on invested collateral. Any such loan must be continuously secured by collateral in cash or cash equivalents maintained on a current basis in an amount at least equal to 105% of the value of the loaned securities that are foreign securities or 102% of the value of any U.S. loaned securities. Loans shall be marked to market daily. If the market value of the collateral at the close of trading on a business day is less than the margin percentage of the market value of the loaned securities at the close of trading that day, reasonable efforts will be made to seek an additional amount of collateral the following business day. During the time securities are on loan, the borrower will pay the Funds any accrued income on those securities, and the Funds may invest the cash collateral and earn
TrimTabs ETF Trust
NOTES TO FINANCIAL STATEMENTS
July 31, 2022 (Continued)
income or receive an agreed-upon fee from a borrower that has delivered cash-equivalent collateral. In determining whether or not to lend a security to a particular broker, dealer or financial institution, the Adviser considers all relevant facts and circumstances, including the size, creditworthiness and reputation of the broker, relevant facts dealer or financial institution. Securities lending involves the risk of a default or insolvency of the borrower. In either of these cases, a Fund could experience delays in recovering securities or collateral or could lose all or part of the value of the loaned securities. A Fund also could lose money in the event of a decline in the value of the collateral provided for loaned securities. Additionally, the loaned portfolio securities may not be available to the Fund on a timely basis and the Fund may therefore lose the opportunity to sell the securities at a desirable price. Any decline in the value of a security that occurs while the security is out on loan would continue to be borne by the Funds.
Each Fund receives cash as collateral in return for securities lent, if any, as part of the securities lending program. The collateral is invested in the Mount Vernon Liquid Assets Portfolio, LLC of which the investment objective is to seek to maximize current income to the extent consistent with the preservation of capital and liquidity and maintain a stable NAV of $1.00 per unit. As of July 31, 2022, the Funds held the following amounts in the Mount Vernon Liquid Assets Portfolio, LLC:
| | | Amount Held at | |
| | | July 31, 2022 | |
FCF US Quality ETF | | $ | 18,745,040 | |
FCF International Quality ETF | | $ | 3,228,249 | |
Donoghue Forlines Tactical High Yield ETF | | $ | 13,991,235 | |
Donoghue Forlines Risk Managed Innovation ETF | | $ | 13,550,477 | |
Donoghue Forlines Yield Enhanced Real Asset ETF | | $ | 8,374,921 | |
The remaining contractual maturity of all securities lending transactions is overnight and continuous. The Funds are not subject to a master netting agreement with respect to securities lending; therefore no additional disclosures are required. The income earned by the Funds on investments of cash collateral received from borrowers for the securities loaned to them are reflected in the Funds’ Statements of Operations. Securities lending income, as disclosed in the Funds’ Statements of Operations, represents the income earned from the investment of cash collateral, net of fee rebates paid to the borrower and net of fees paid to the Custodian as lending agent.
9. CERTAIN RISKS
Active and Frequent Trading Risk. Active and frequent trading of portfolio securities may result in increased transaction costs to the Fund, including brokerage commissions, dealer mark-ups and other transaction costs on the sale of the securities and on reinvestment in other securities, and may also result in higher taxes if Shares are held in a taxable account.
TrimTabs ETF Trust
NOTES TO FINANCIAL STATEMENTS
July 31, 2022 (Continued)
Asia-Pacific Risk. Investments in securities of issuers in Asia-Pacific countries involve risks that are specific to the Asia-Pacific region, including certain legal, regulatory, political and economic risks. Certain Asia-Pacific countries have experienced expropriation and/or nationalization of assets, confiscatory taxation, political instability, armed conflict and social instability as a result of religious, ethnic, socio-economic and/or political unrest. Some economies in this region are dependent on a range of commodities, and are strongly affected by international commodity prices and particularly vulnerable to price changes for these products. The market for securities in this region may also be directly influenced by the flow of international capital, and by the economic and market conditions of neighboring countries. Many Asia-Pacific economies have experienced rapid growth and industrialization, and there is no assurance that this growth rate will be maintained. Some Asia-Pacific economies are highly dependent on trade and economic conditions in other countries can impact these economies.
Concentration Risk. A fund concentrated in an industry or group of industries is likely to present more risks than a fund that is broadly diversified over several industries or groups of industries. Compared to the broad market, an individual industry or group of related industries may be more strongly affected by changes in the economic climate, broad market shifts, moves in a particular dominant stock or regulatory changes.
Depositary Receipts Risk. The risks of investments in depositary receipts are substantially similar to a direct investment in a foreign security. Returns on investments in foreign securities could be more volatile than, or trail the returns on, investments in U.S. securities. Exposures to foreign securities entail special risks, including due to: differences in information available about foreign issuers; differences in investor protection standards in other jurisdictions; capital controls risks, including the risk of a foreign jurisdiction imposing restrictions on the ability to repatriate or transfer currency or other assets; political, diplomatic and economic risks; regulatory risks; and foreign market and trading risks, including the costs of trading and risks of settlement in foreign jurisdictions. In addition, depositary receipts may not track the price of the underlying foreign securities, and their value may change materially at times when the U.S. markets are not open for trading.
Derivatives Risk. A derivative instrument derives its value from an underlying security, currency, commodity, interest rate, index or other asset (collectively, “underlying asset”). The Fund’s investments in derivatives may pose risks in addition to and greater than those associated with investing directly in the underlying assets, including counterparty, leverage and liquidity risks. Derivatives may also be harder to value, less tax efficient and subject to changing government regulation that could impact the Fund’s ability to use certain derivatives or their cost. Derivatives strategies may not always be successful.
| | Futures Contracts Risk. Exchange-traded futures contracts are a type of derivative, which call for the future delivery of an asset, or cash settlement, at a certain stated price on a specified future date. Futures contracts involve the risk of imperfect |
TrimTabs ETF Trust
NOTES TO FINANCIAL STATEMENTS
July 31, 2022 (Continued)
| | correlation between movements in the price of the instruments and the price of the underlying assets. In addition, there is the risk that the Fund may not be able to enter into a closing transaction because of an illiquid market. Exchanges can limit the number of positions that can be held or controlled by the Fund or the Sub-Adviser, thus limiting the ability to implement the Fund’s strategies. Futures markets are highly volatile, and the use of futures may increase the volatility of the Fund’s NAV. |
Downside Protection Model Risk. Neither the Adviser nor the Sub-Adviser can offer assurances that the downside protection model employed by DFNV’s Underlying Index methodology will achieve its intended results, or that downside protection will be provided during periods of time when the Equity Portfolio is declining or during any period of time deemed to be a bear market. For example, the Underlying Index methodology would not have triggered a signal to employ the downside protection model during the market volatility experienced in March 2020. While significant dips occurred in the market at that time, the bear market environment was short lived, and markets began recovering relatively quickly. As discussed above, signals are typically only triggered during prolonged bear markets, meaning that the signal is triggered based on the duration of the decline not the amount of the decline. Accordingly, while the signal would not have triggered in March 2020, it would have triggered during the financial crisis of 2007-2008, during which a prolonged bear market occurred. Investment in a fund that utilizes a downside protection model that seeks to minimize risk only during certain prolonged bear market environments may not be appropriate for every investor seeking a particular risk profile.
Emerging Markets Risk. Investments in emerging markets are generally subject to greater market volatility, political, social and economic instability, uncertain trading markets and more governmental limitations than investments in more developed markets. Companies in emerging markets may be subject to less stringent regulatory, accounting, auditing, and financial reporting and recordkeeping standards than companies in more developed countries, which could impede the Adviser’s ability to evaluate such companies or impact TTAI’s performance. Securities laws and the enforcement of systems of taxation in many emerging market countries may change quickly and unpredictably, and the ability to bring and enforce actions may be limited or otherwise impaired. In addition, investments in emerging markets may experience lower trading volume, greater price fluctuations, delayed settlement, unexpected market closures and lack of timely information, and may be subject to additional transaction costs.
Equity Investing Risk. An investment in TTAC, TTAI, DFNV or DFRA involves risks similar to those of investing in any fund holding equity securities, such as market fluctuations, changes in interest rates and perceived trends in stock prices. The values of equity securities could decline generally or could underperform other investments. In addition, securities may decline in value due to factors affecting a specific issuer, market or securities markets generally.
TrimTabs ETF Trust
NOTES TO FINANCIAL STATEMENTS
July 31, 2022 (Continued)
ESG Evaluation Risk. The ESG factors utilized in rating TTAC’s or TTAI’s portfolio and individual securities may vary across eligible investments and issuers, and not every ESG factor may be identified or evaluated by the Adviser. TTAC’s and TTAI’s portfolio will not be solely based on ESG considerations and, therefore, the issuers in which a Fund invests may not be considered ESG focused issuers. In addition, because individual securities are only excluded from TTAC’s and TTAI’s portfolio based on their ESG rating if the Portfolio ESG Score fails to satisfy the ESG Criteria, the Fund will likely invest in securities that, individually, would not satisfy the ESG Criteria. The evaluation of ESG ratings may affect TTAC’s and TTAI’s exposure to certain issuers or industries and may not work as intended. The Funds may underperform other funds that do not assess an issuer’s ESG rating or that use a different methodology or different factors to determine a security’s or an entire portfolio’s ESG rating. Information used by the Adviser to evaluate the ESG rating of TTAC’s or TTAI’s portfolio or any individual security may not be readily available, complete or accurate, and may vary across providers and issuers, as ESG is not a uniformly defined characteristic. There is no guarantee that screening TTAC’s or TTAI’s portfolio or individual securities based on their ESG ratings will increase the Fund’s performance.
ETF Risk. As an ETF, the Fund is subject to the following risks:
| | Authorized Participants Concentration Risk. The Fund may have a limited number of financial institutions that may act as Authorized Participants (“APs”). To the extent that those APs exit the business or are unable to process creation and/or redemption orders, shares may trade at a discount to net asset value (or “NAV”) and possibly face delisting. |
| | |
| | Flash Crash Risk. Sharp price declines in securities owned by the Fund may trigger trading halts, which may result in the Fund’s shares trading in the market at an increasingly large discount to NAV during part (or all) of a trading day. Shareholders could suffer significant losses to the extent that they sell shares at these temporarily low market prices. |
| | |
| | International Closed Market Trading Risk. Because certain of the Fund’s investments trade in markets that are closed when the Fund and Exchange are open, there are likely to be deviations between the current prices of such investments and the prices at which such investments are valued by the Fund. As a result, shares may appear to trade at a significant discount or premium to NAV. |
| | |
| | Large Shareholder Risk. Certain shareholders, including the Adviser, the Sub-Adviser or their respective affiliates, or groups of related shareholders, such as those investing in one or more model portfolios, may own a substantial amount of the Fund’s shares. The disposition of Fund shares by large shareholders resulting in redemptions through or by APs could have a significant negative impact on the Fund. In addition, transactions by large shareholders may account for a large percentage of the trading volume on the Exchange and may, therefore, have a material upward or downward effect on the market price of the Shares. |
TrimTabs ETF Trust
NOTES TO FINANCIAL STATEMENTS
July 31, 2022 (Continued)
| | Premium-Discount Risk. Shares may trade above or below their NAV. Accordingly, investors may pay more than NAV when purchasing Shares or receive less than NAV when selling Shares. The market prices of Shares will generally fluctuate in accordance with changes in NAV, changes in the relative supply of, and demand for Shares, and changes in the liquidity, or the perceived liquidity, of the Fund’s holdings. |
| | |
| | Secondary Market Trading Risk. Investors buying or selling Shares in the secondary market may pay brokerage commissions or other charges, which may be a significant proportional cost for investors seeking to buy or sell relatively small amounts of Shares. Although the Shares are listed on the Exchange, there can be no assurance that an active or liquid trading market for them will develop or be maintained. In addition, trading in Shares on the Exchange may be halted. |
Europe Risk. Decreasing imports or exports, changes in governmental or European Union (the “EU”) regulations on trade, changes in the exchange rate of the euro, the default or threat of default by an EU member country on its sovereign debt, and/or an economic recession in an EU member country may have a significant adverse effect on the securities of EU issuers. The European financial markets have recently experienced volatility and adversity due to concerns about withdrawal of member countries from the EU and economic downturns and rising government debt levels in several European countries. These events have adversely affected the exchange rate of the euro and may continue to significantly affect every country in Europe.
| | • | United Kingdom Risk. Following a referendum in June 2016, the United Kingdom (the “UK”) formally exited from the European Union (the “EU”) on January 31, 2020 (known as “Brexit”). Brexit’s impact could be significant and may result in increased volatility and illiquidity, potentially lower economic growth on markets in the UK, Europe, and globally, and changes in legal and regulatory regimes to which certain Fund assets are or become subject, any of which may adversely affect the value of TTAI’s investments. Brexit could lead to legal and tax uncertainty and potentially divergent national laws and regulations, as the UK determines which EU laws to replace or replicate. The extent of the impact of Brexit remains unclear, and the uncertainty may have a significant negative effect on the value of the TTAI’s investments. |
Foreign Investment Risk. Returns on investments in foreign securities could be more volatile than, or trail the returns on, investments in U.S. securities. Exposures to foreign securities entail special risks, including due to: differences in information available about foreign issuers; differences in investor protection standards in other jurisdictions; capital controls risks, including the risk of a foreign jurisdiction imposing restrictions on the ability to repatriate or transfer currency or other assets; political, diplomatic and economic risks; regulatory risks; and foreign market and trading risks, including the costs of trading and risks of settlement in foreign jurisdictions. In addition, the Fund’s
TrimTabs ETF Trust
NOTES TO FINANCIAL STATEMENTS
July 31, 2022 (Continued)
investments in securities denominated in other currencies could decline due to changes in local currency relative to the value of the U.S. dollar, which may affect the Fund’s returns.
Geographic Region Risk. To the extent that the Fund invests a significant portion of its assets in a specific geographic region or a particular country, the Fund will generally have more exposure to that region or country’s economic risks. In the event of economic or political turmoil or a deterioration of diplomatic relations in a region or country where a significant portion of the Fund’s assets are invested, the Fund may experience substantial illiquidity or reduction in the value of the Fund’s investments. Adverse conditions in a certain region or country can also adversely affect securities of issuers in other countries whose economies appear to be unrelated.
High Yield (Junk Bond) Securities Risk. High yield securities and unrated securities of similar credit quality are considered to be speculative with respect to the issuer’s continuing ability to make principal and interest payments and are generally subject to greater levels of credit quality risk than investment grade securities. High yield securities are usually issued by companies, including smaller and medium capitalization companies, without long track records of sales and earnings, or with questionable credit strength. These companies may be particularly affected by interest rate increases, as they may find it more difficult to borrow money to continue or expand operations, or may have difficulty in repaying floating rate loans. These fixed-income securities are considered below “investment-grade.” The retail secondary market for these “junk bonds” may be less liquid than that of higher-rated fixed income securities, and adverse conditions could make it difficult at times to sell these securities or could result in lower prices than higher-rated fixed income securities. These risks can reduce the value of the shares of an Underlying ETF and the income it earns.
Index-Based Strategy Risk. With respect to each of DFHY, DFNV, and DFRA, the Fund is managed as an index-based fund that seeks to track the performance of its Underlying Index. This differs from an actively managed fund, which typically seeks to outperform a benchmark index. As a result, the Fund may hold the component securities of the Underlying Index regardless of the current or projected performance of a specific security or the relevant market as a whole. Maintaining investments in securities regardless of market conditions or the performance of individual securities could cause the Fund’s returns to be lower than if the Fund employed an active strategy. The Fund will seek to track the Underlying Index in all market conditions, including during adverse market conditions when other funds may seek to take temporary defensive measures (such as investing significantly in cash or cash equivalents). Accordingly, unless the Underlying Index allocates significant portions of its assets to cash and/or cash equivalents during times of adverse market or economic conditions, the Fund may be subject to a higher level of market risk during such times than other funds. Additionally, the Fund generally rebalances and reconstitutes its portfolio, and
TrimTabs ETF Trust
NOTES TO FINANCIAL STATEMENTS
July 31, 2022 (Continued)
implements downside protection allocations, in accordance with the Underlying Index and, therefore, any changes to the Underlying Index’s rebalance, reconstitution or downside protection trigger schedule will typically result in corresponding changes to the Fund’s rebalance, reconstitution or downside protection trigger schedule.
Index Calculation Risk. Each of DFHY’s, DFNV’s and DFRA’s Underlying Index relies on various sources of information to assess the criteria of issuers included in the Underlying Index and to determine whether a “buy” or “sell” trigger should be issued, including information that may be based on assumptions and estimates. DFHY, DFNV, DFRA, the Index Provider, the Adviser, the Sub-Adviser, the Underlying Index calculation agent and any of their affiliates cannot offer assurances that an Underlying Index’s calculation methodology or sources of information will provide an accurate assessment of included issuers or the appropriate trigger at any particular time.
Index Correlation Risk. While the Sub-Adviser seeks to track the performance of the Underlying Index closely (i.e., to achieve a high degree of correlation with the Underlying Index), the Fund’s returns may not match or achieve a high degree of correlation with the returns of the Underlying Index due to operating expenses, transaction costs, cash flows, regulatory requirements and/or operational inefficiencies.
Investment Risk. An investment in the Fund is not a deposit of a bank and is not insured or guaranteed by the Federal Deposit Insurance Corporation or any other government agency. When you sell your shares, they could be worth less than what you paid for them.
Large Capitalization Company Risk. Investments in large capitalization companies may underperform other segments of the market because they may be less responsive to competitive challenges and opportunities and unable to attain high growth rates during periods of economic expansion.
Liquidity Risk. Liquidity risk exists when a particular investment is difficult to purchase or sell. If an Underlying ETF invests in illiquid securities or its portfolio securities otherwise become illiquid, it may reduce the returns of the Underlying ETF because the Underlying ETF may be unable to sell the illiquid securities at an advantageous time or price. In the event that an Underlying ETF voluntarily or involuntarily liquidates its portfolio assets during periods of infrequent trading of its securities, the Underlying ETF may not receive full value for those assets, which will reduce the value of the Underlying ETF’s shares, and in turn, the value of the Fund’s investment in such shares.
Management Risk. Each of TTAC and TTAI is actively managed using proprietary systematic stock selection models (the “Systematic Models”), which are based on the Adviser’s research and analysis. There can be no guarantee that the Fund will achieve its investment objective or that the Systematic Models will produce intended results. The Fund may be adversely affected by imperfections, errors or limitations in the
TrimTabs ETF Trust
NOTES TO FINANCIAL STATEMENTS
July 31, 2022 (Continued)
construction or implementation of the Systematic Models and/or the Adviser’s ability to monitor and timely adjust the metrics or update the data or features underlying the Systematic Models. Any of these factors could result in the Fund underperforming comparable investment vehicles.
Market Events Risk. The value of securities in the Fund’s portfolio may decline due to daily fluctuations in the securities markets that are generally beyond the Fund’s control, including the quality of the Fund’s investments, economic conditions, adverse investor sentiment, lower demand for a company’s goods or services, and general market conditions. In a declining market, the prices for all securities (including those in the Fund’s portfolio) may decline, regardless of their long-term prospects. Security values tend to move in cycles, with periods when securities markets generally rise and periods when they generally decline. In addition, local, regional or global events such as war, acts of terrorism, the spread of infectious illness or other public health issue, recessions, or other events could have a significant impact on the Fund, its investments and the trading of its Shares. For example, an outbreak of an infectious respiratory illness, COVID-19, has resulted in travel restrictions, disruption of healthcare systems, prolonged quarantines, supply chain disruptions, lower consumer demand, layoffs, ratings downgrades, defaults and has heightened pre-existing political, social and economic concerns. Certain markets have experienced temporary closures, extreme volatility, severe losses, reduced liquidity and increased trading costs. These events will have an impact on the Fund and its investments and could impact the Fund’s ability to purchase or sell securities or cause increased premiums or discounts to the Fund’s net asset value (“NAV”). The ongoing effects of COVID-19, and the length of its impact on the Fund or its investments, are unpredictable.
MLP Risk. An MLP is a publicly traded partnership primarily engaged in the transportation, storage, processing, refining, marketing, exploration, production, and mining of minerals and natural resources. MLP common units, like other equity securities, can be affected by macroeconomic and other factors affecting the stock market in general, expectations of interest rates, investor sentiment towards an issuer or certain market sector, changes in a particular issuer’s financial condition, or unfavorable or unanticipated poor performance of a particular issuer (in the case of MLPs, generally measured in terms of distributable cash flow). Prices of common units of individual MLPs, like the prices of other equity securities, also can be affected by fundamentals unique to the partnership or company, including earnings power and coverage ratios.
MLP Tax Risk. MLPs taxed as partnerships, subject to the application of certain partnership audit rules, generally do not pay U.S. federal income tax at the partnership level. Rather, each partner is allocated a share of the MLP’s income, gains, losses, deductions and expenses. A change in current tax law, or a change in the underlying business mix of a given MLP, could result in an MLP being treated as a corporation for U.S. federal income tax purposes, which would result in such MLP being required to
TrimTabs ETF Trust
NOTES TO FINANCIAL STATEMENTS
July 31, 2022 (Continued)
pay U.S. federal income tax on its taxable income. The classification of an MLP as a corporation for U.S. federal income tax purposes would have the effect of reducing the amount of cash available for distribution by the MLP. Thus, if any of the MLPs owned by DFRA were treated as corporations for U.S. federal income tax purposes, it could result in a reduction in the value of your investment in DFRA and lower income.
Real Assets Industry Group Risk. The risks of investing in the Real Assets Industry Group include the risks of focusing investments in the real estate, infrastructure, commodities and natural resources related sectors, and adverse developments in these sectors may significantly affect the value of the Shares. Accordingly, DFRA is more susceptible to adverse developments affecting one or more of these sectors than a fund that invests more broadly, and the Fund may perform poorly during a downturn affecting issuers in those sectors. Companies involved in activities related to the Real Assets Industry Group can be adversely affected by, among other things, government regulation or deregulation, global political and economic developments, energy and commodity prices, the overall supply and demand for oil and gas, changes in tax zoning laws, environmental issues, and low inflation.
REITs Risk. A REIT is a company that pools investor funds to invest primarily in income producing real estate or real estate related loans or interests. DFRA may be subject to certain risks associated with direct investments in REITs. REITs may be affected by changes in their underlying properties and by defaults by borrowers or tenants. Mortgage REITs may be affected by the quality of the credit extended. Furthermore, REITs are dependent on specialized management skills. Some REITs may have limited diversification and may be subject to risks inherent in financing a limited number of properties. REITs depend generally on their ability to generate cash flow to make distributions to shareholders or unitholders and may be subject to defaults by borrowers and to self-liquidations.
Sampling Risk. The use of a representative sampling approach may result in the Fund holding a smaller number of securities than are in the Underlying Index. As a result, an adverse development to an issuer of securities that the Fund holds could result in a greater decline in NAV than would be the case if the Fund held all of the securities in the Underlying Index. To the extent the assets in the Fund are smaller, these risks will be greater. In addition, by sampling the securities in the Underlying Index, the Fund faces the chance that the securities selected for the Fund, in the aggregate, will not provide investment performance matching that of the Underlying Index, thereby increasing tracking error.
Sector Focus Risk. To the extent that the Fund’s investments are focused on a particular industry or group of industries or sector, the Fund is subject to loss due to adverse occurrences that may affect that industry or group of industries or sector. Focusing on a particular sector, industry or group of industries could increase the Fund’s volatility over the short term.
TrimTabs ETF Trust
NOTES TO FINANCIAL STATEMENTS
July 31, 2022 (Continued)
Small and Medium Capitalization Company Risk. Investing in the securities of small and medium capitalization companies involves greater risks and the possibility of greater price volatility than customarily is associated with investing in larger, more established companies. Such companies often have narrower markets for their goods and/or services and more limited managerial and financial resources than larger, more established companies, and often have limited product lines, services, markets, financial resources or are dependent on a small management group. In addition, because such securities are not well-known to the investing public, do not have significant institutional ownership and are followed by relatively few security analysts, there will normally be less publicly available information concerning these securities compared to what is available for the securities of larger companies. As a result, the performance of small and medium capitalization companies may be more volatile and they may face greater risk of business failure, which could increase the volatility of the Fund’s portfolio.
Tactical Overlay Risk. Neither the Adviser nor the Sub-Adviser can offer assurances that the tactical overlay process employed by DFHY’s Underlying Index methodology will achieve its intended results. Investment in a fund that utilizes a tactical overlay that seeks to minimize risk may not be appropriate for every investor seeking a particular risk profile.
Underlying ETFs Risk. In seeking to track its Underlying Index, each of DFHY and DFNV may invest a portion of its assets in Underlying ETFs. In those situations, the Fund’s investment performance is directly related to the performance of the Underlying ETFs. The Fund’s net asset value (or “NAV”) will change with changes in the value of the Underlying ETFs based on their market valuations. An investment in the Fund will entail more costs and expenses than a direct investment in the Underlying ETFs. As the Underlying ETFs, or the Fund’s allocations among the Underlying ETFs, change from time to time, or to the extent that the total annual fund operating expenses of any Underlying ETF changes, the weighted average operating expenses borne by the Fund may increase or decrease.
U.S. Treasury Securities Risk. U.S. Treasury securities may differ from other securities in their interest rates, maturities, times of issuance and other characteristics and may provide relatively lower returns than those of other securities. Similar to other issuers, changes to the financial condition or credit rating of a government may cause the value of U.S. Treasury securities or Underlying ETFs providing exposure to such securities to decline.
TrimTabs ETF Trust
REPORT OF INDEPENDENT REGISTERED PUBLIC ACCOUNTING FIRM
To the Board of Trustees of TrimTabs ETF Trust and the Shareholders of FCF US Quality ETF, FCF International Quality ETF, Donoghue Forlines Tactical High Yield ETF, Donoghue Forlines Risk Managed Innovation ETF, and Donoghue Forlines Yield Enhanced Real Asset ETF
Opinion on the Financial Statements
We have audited the accompanying statements of assets and liabilities of FCF US Quality ETF (formerly known as the TrimTabs U.S. Free Cash Flow Quality ETF), FCF International Quality ETF (formerly known as the TrimTabs International Free Cash Flow Quality ETF), Donoghue Forlines Tactical High Yield ETF (formerly known as the TrimTabs Donoghue Forlines Tactical High Yield ETF), Donoghue Forlines Risk Managed Innovation ETF (formerly known as the TrimTabs Donoghue Forlines Risk Managed Innovation ETF), and Donoghue Forlines Yield Enhanced Real Asset ETF, each a series of shares of beneficial interest in TrimTabs ETF Trust (the “Funds”), including the schedules of investments, as of July 31, 2022, and the related statements of operations and changes in net assets and the financial highlights as noted in the table below, and the related notes (collectively referred to as the “financial statements”). In our opinion, the financial statements present fairly, in all material respects, the financial position of the Funds as of July 31, 2022, and the results of their operations, the changes in their net assets and their financial highlights for each of the periods noted in the table below, in conformity with accounting principles generally accepted in the United States of America.
Fund | Financial Statements Presented |
FCF US Quality ETF | The statement of operations for the year ended July 31, 2022, the statements of changes in net assets for each of the years in |
| | the two-year period then ended and the financial highlights for each of the years in the five-year period then ended. |
FCF International | The statement of operations for the year ended July 31, 2022, |
Quality ETF | the statements of changes in net assets for each of the years in the two-year period then ended and the financial highlights |
| | for each of the years in the five-year period then ended. |
Donoghue Forlines | The statement of operations for the year ended July 31, 2022 |
Tactical High Yield ETF | and the statements of changes in net assets and financial highlights for the year ended July 31, 2022 and for the |
| | period December 7, 2020 (commencement of operations) to July 31, 2021. |
Donoghue Forlines | The statement of operations for the year ended July 31, 2022 |
Risk Managed | and the statements of changes in net assets and financial |
Innovation ETF | highlights for the year ended July 31, 2022 and for the period December 7, 2020 (commencement of operations) to July 31, 2021. |
TrimTabs ETF Trust
REPORT OF INDEPENDENT REGISTERED PUBLIC ACCOUNTING FIRM
(Continued)
Donoghue Forlines | The statements of operations and changes in net assets and |
Yield Enhanced | the financial highlights for the period from December 13, |
Real Asset ETF | 2021 (commencement of operations) through July 31, 2022. |
Basis for Opinion
These financial statements are the responsibility of the Funds’ management. Our responsibility is to express an opinion on the Funds’ financial statements based on our audits. We are a public accounting firm registered with the Public Company Accounting Oversight Board (United States) (“PCAOB”) and are required to be independent with respect to the Funds in accordance with the U.S. federal securities law and the applicable rules and regulations of the Securities and Exchange Commission and the PCAOB.
We conducted our audits in accordance with the standards of the PCAOB. Those standards require that we plan and perform the audits to obtain reasonable assurance about whether the financial statements are free of material misstatement, whether due to error or fraud. The Funds are not required to have, nor were we engaged to perform, an audit of their internal control over financial reporting. As part of our audits we are required to obtain an understanding of internal control over financial reporting but not for the purpose of expressing an opinion on the effectiveness of the Funds’ internal control over financial reporting. Accordingly, we express no such opinion.
Our audits included performing procedures to assess the risk of material misstatement of the financial statements, whether due to error or fraud, and performing procedures that respond to those risks. Such procedures included examining, on a test basis, evidence regarding the amounts and disclosures in the financial statements. Our procedures included confirmation of securities owned as of July 31, 2022 by correspondence with the custodian and broker. Our audits also included evaluating the accounting principles used and significant estimates made by management, as well as evaluating the overall presentation of the financial statements. We believe that our audits provide a reasonable basis for our opinion.
BBD, LLP
We have served as the auditor of one or more of the Funds in the TrimTabs ETF Trust since 2016.
Philadelphia, Pennsylvania
September 29, 2022
TrimTabs ETF Trust
ADDITIONAL INFORMATION
July 31, 2022 (Unaudited)
1. FREQUENCY DISTRIBUTION OF PREMIUMS AND DISCOUNTS
Information regarding how often shares of each Fund traded on the Exchange at a price above (i.e., at a premium) or below (i.e., at a discount) the NAV of the Fund is available on the Funds’ website at www.fcf-funds.com.
2. FEDERAL TAX INFORMATION
QUALIFIED DIVIDEND INCOME/DIVIDENDS RECEIVED DEDUCTION
For the fiscal period ended July 31, 2022, certain dividends paid by the Funds may be subject to a maximum tax rate of 23.8%, as provided by the Tax Cuts and Jobs Act of 2017.
The percentage of dividends declared from ordinary income designated as qualified dividend income was as follows:
| FCF US Quality ETF | | | 71.28 | % |
| FCF International Quality ETF | | | 100.00 | % |
| Donoghue Forlines Tactical High Yield ETF | | | 0.00 | % |
| Donoghue Forlines Risk Managed Innovations ETF | | | 29.12 | % |
| Donoghue Forlines Yield Enhanced Real Asset ETF | | | 51.03 | % |
For corporate shareholders, the percent of ordinary income distributions qualifying for the corporate dividends received deduction for the fiscal period ended July 31, 2022, was as follows:
| FCF US Quality ETF | | | 71.19 | % |
| FCF International Quality ETF | | | 0.46 | % |
| Donoghue Forlines Tactical High Yield ETF | | | 0.00 | % |
| Donoghue Forlines Risk Managed Innovation ETF | | | 17.94 | % |
| Donoghue Forlines Yield Enhanced Real Asset ETF | | | 19.03 | % |
SHORT-TERM CAPITAL GAIN
The Percentage of taxable ordinary income distributions that are designated as short-term capital gain distributions under Internal Revenue Section 871(k)(2)(C) for each Fund were as follows (unaudited):
| FCF US Quality ETF | | | 67.08 | % |
| FCF International Quality ETF | | | 0.00 | % |
| Donoghue Forlines Tactical High Yield ETF | | | 0.00 | % |
| Donoghue Forlines Risk Managed Innovation ETF | | | 99.15 | % |
| Donoghue Forlines Yield Enhanced Real Asset ETF | | | 0.00 | % |
3. DISCLOSURE OF PORTFOLIO HOLDINGS
The Funds file their complete schedule of portfolio holdings for their first and third fiscal quarters with the Securities and Exchange Commission (“SEC”) on Part F of Form N-PORT. The Funds’ Part F of Form N-PORT is available without charge, upon
TrimTabs ETF Trust
ADDITIONAL INFORMATION
July 31, 2022 (Unaudited) (Continued)
request, by calling toll free at 1-800-617-0004. Furthermore, you may obtain the Part F of Form N-PORT on the SEC’s website at www.sec.gov. Each Fund’s portfolio holdings are posted daily on their website at www.fcf-funds.com.
4. PROXY VOTING POLICIES AND PROCEDURES
A description of the policies and procedures the Funds use to determine how to vote proxies related to portfolio securities is provided in the Statement of Additional Information (“SAI”). The SAI is available without charge upon request by calling toll free at 1-800-617-0004, by accessing the SEC’s website at www.sec.gov or by accessing the Funds’ website at www.fcf-funds.com. Information on how the Funds voted proxies related to portfolio securities during the period ended June 30 is available without charge, upon request, by calling 1-800-617-0004 or by accessing the website of the SEC.
5. INVESTMENT ADVISORY AND SUB-ADVISORY AGREEMENT APPROVAL
At a meeting held on March 15, 2022, the Board of Trustees (the “Board”) of TrimTabs ETF Trust (the “Trust”), including the Trustees of the Trust who were not “interested persons,” as that term is defined in the Investment Company Act of 1940 (the “Independent Trustees”), reviewed and unanimously approved the renewal of: (i) the investment advisory agreement (the “Advisory Agreement”) between FCF Advisors LLC (“FCF”) and the Trust, on behalf of each of FCF US Quality ETF (“TTAC”), FCF International Quality ETF (“TTAI”), Donoghue Forlines Tactical High Yield ETF (“DFHY”) and Donoghue Forlines Risk Managed Innovation ETF (“DFNV” and, together with TTAC, TTAI and DFHY, the “Funds” and, each, a “Fund”); and (ii) the sub-advisory agreement (the “Sub-Advisory Agreement”) between FCF and Donoghue Forlines LLC (“Donoghue”) with respect to DFHY and DFNV.
In evaluating the Advisory Agreement and Sub-Advisory Agreement, the Board, including the Independent Trustees, reviewed the materials furnished by FCF and Donoghue. The Board considered the following factors, among others, in connection with its renewal of the Advisory Agreement and Sub-Advisory Agreement, as it pertained to each Fund: (1) the nature, extent, and quality of the services provided by FCF and Donoghue; (2) the investment performance of each Fund; (3) a comparison of fees and expenses of each Fund to its respective peer group (each, a “Peer Group”); (4) the profitability to FCF and Donoghue; (5) the extent to which economies of scale might be realized as each Fund grows; and (6) any ancillary benefits derived by FCF and Donoghue from their relationships with the Funds. The Board also considered the materials that they had received at past meetings, including at routine quarterly meetings, relating to the nature, extent and quality of FCF’s and Donoghue’s services, including information concerning each Fund’s advisory fee, sub-advisory fee, total expense ratio and performance.
In addition, prior to approving the Advisory Agreement and Sub-Advisory Agreement, the Independent Trustees met in executive session with counsel to the Independent
TrimTabs ETF Trust
ADDITIONAL INFORMATION
July 31, 2022 (Unaudited) (Continued)
Trustees without representatives of FCF or Donoghue. The Independent Trustees reviewed with counsel to the Independent Trustees the legal standards applicable to their consideration of the Advisory Agreement and Sub-Advisory Agreement for each Fund. The Independent Trustees relied upon the advice of counsel and their own business judgment in determining the material factors to be considered in evaluating the Advisory Agreement and Sub-Advisory Agreement and the weight to be given to each such factor.
Nature, Extent and Quality of Services
With respect to the nature, extent and quality of the services provided, the Board considered the portfolio management and other personnel of both FCF (who perform services for TTAC and TTAI) and Donoghue (who perform services for DFNV and DFHY), the compliance functions of FCF and Donoghue, and the financial condition of FCF and Donoghue. Further, the Board evaluated the integrity of FCF’s and Donoghue’s personnel, the stock selection models on which FCF relies in managing each of TTAC and TTAI, and the management of each Fund’s investments in accordance with its stated investment objective and policies. The Board also considered that DFNV and DFHY utilize index-based strategies pursuant to which FCF’s affiliate serves as index provider. The Board further considered the demonstrated ability of the portfolio management teams for each Fund to continue to manage each Fund’s investments in accordance with each Fund’s stated investment objective.
Based on their review and other considerations, the Board concluded, in the exercise of its reasonable business judgment, that the nature, extent and quality of the services supported renewal of the Advisory Agreement and Sub-Advisory Agreement.
Performance
With respect to the performance of each Fund, the Board considered each Fund’s since inception, one-year, three-year and five-year performance, as applicable. In this regard, among other things, the Board considered each Fund’s total return compared to the total return of its benchmark index and Peer Group. The Board observed that TTAC had outperformed its Peer Group median and average total returns as well as its benchmark for the one-year, five-year and since inception periods, and also the average total returns of its Peer Group for the three-year period, and only underperformed its benchmark and Peer Group median total returns for the three-year period. The Board observed that TTAI had outperformed its Peer Group median and average total returns as well as its benchmark for the one-year and three-year periods, and its benchmark for the since inception period, and only underperformed its Peer Group median and average total returns for the since inception periods.
With respect to DFHY, the Board observed that the Fund had outperformed its benchmark for the one-year and since inception periods, but underperformed its Peer
TrimTabs ETF Trust
ADDITIONAL INFORMATION
July 31, 2022 (Unaudited) (Continued)
Group median and average total returns for the same time periods. The Board observed that DFNV had outperformed its Peer Group median and average total returns for the one-year and since inception periods, but underperformed its benchmark for the same time periods.
Based on their review and other considerations, the Board concluded, in the exercise of its reasonable business judgment, that each Fund’s investment performance supported renewal of the Advisory Agreement and Sub-Advisory Agreement.
Comparative Fees and Expenses
The Board considered the fee structure of the Advisory Agreement with respect to each Fund and the Sub-Advisory Agreement with respect to DFHY and DFNV. The Board also reviewed information compiled by the Funds’ administrator comparing each Fund’s advisory fee and expense ratio to the advisory fees and expense ratios of each Fund’s respective Peer Group. The Board noted that TTAC’s advisory fee and expense ratio were higher than the median and average advisory fee and expense ratio of its Peer Group, but that its expense ratio was below the maximum expense ratio in its Peer Group. The Board also noted that TTAI’s, DFHY’s and DFNV’s advisory fees and expense ratios were both higher than the median and average, but below the maximum, advisory fees and expense ratios of their corresponding Peer Groups.
Based on their review and other considerations, the Board concluded, in the exercise of its reasonable business judgment, that each Fund’s fees and expenses supported renewal of the Advisory Agreement and Sub-Advisory Agreement.
Costs and Profitability
The Board also reviewed the compensation and benefits received by FCF and Donoghue from their relationships with the Funds. In this regard, the Board took into consideration that the advisory fee for each Fund was structured as a “unified fee,” pursuant to which FCF would pay all of the Funds’ expenses, except for the fee payment under the Advisory Agreement, payments under each Fund’s Rule 12b-1 plan (if any), brokerage expenses, acquired fund fees and expenses, taxes, interest (including borrowing costs and dividend expenses on securities sold short), litigation expenses and other extraordinary expenses (including litigation to which the Trust or a Fund may be a party and indemnification of the Trustees and officers with respect thereto), and considered the benefits that accrue to each Fund as a result of this fee structure. The Board noted that FCF is therefore contractually responsible for compensating the Trust’s other service providers and paying each Fund’s other expenses out of its own fees and resources. The Board also considered the extent to which Donoghue would bear a portion of these expenses for each of DFHY and DFNV pursuant to the Sub-Advisory Agreement. The Board noted that, under the Sub-Advisory Agreement, Donoghue would likely supplement a portion of the costs of operating DFHY and DFNV for some period of time and considered the benefits that would accrue to those Funds.
TrimTabs ETF Trust
ADDITIONAL INFORMATION
July 31, 2022 (Unaudited) (Continued)
Based on their review and other considerations, the Board concluded, in the exercise of its reasonable business judgment, that the profitability analysis supported renewal of the Advisory Agreement and Sub-Advisory Agreement.
Economies of Scale
The Board considered the information provided by FCF and Donoghue as to the extent to which economies of scale would be realized as a Fund grows and whether anticipated fee levels reflect economies of scale for the benefit of shareholders. The Board noted that, because the advisory fee schedule for each Fund does not currently include breakpoints, any reduction in fixed costs associated with the management of a Fund would be enjoyed by FCF and/or Donoghue; however, the Board also noted that the unified fee structure provides a level of certainty in expenses for each Fund. Based on their review, the current asset levels of the Funds, and other considerations, the Board concluded, in the exercise of its reasonable business judgment, that the possibility of realizing future economies of scale was not a material factor in connection with the renewal of the Advisory Agreement and Sub-Advisory Agreement at this time.
Ancillary Benefits
The Board then considered the extent to which FCF and Donoghue might derive ancillary (or fall-out) benefits as a result of their relationships with the Funds. For example, the Board noted that FCF and Donoghue may engage in soft dollar transactions in the future, although neither currently plans to do so. The Board also noted that FCF and Donoghue may obtain a reputational benefit from the success of any Fund. Based on their review and other considerations, the Board concluded, in the exercise of its reasonable business judgment, that ancillary benefits were not a material factor in connection with the renewal of the Advisory Agreement and Sub-Advisory Agreement.
Conclusion
Based on their review of the facts and circumstances related to the Advisory Agreement and Sub-Advisory Agreement, the Trustees concluded that each Fund and its shareholders could benefit from FCF’s and, with respect to DFHY and DFNV, Donoghue’s continued management. Thus, the Board determined that the renewal of the Advisory Agreement with respect to each Fund and the Sub-Advisory Agreement with respect to DFHY and DFNV was appropriate and in the best interest of each Fund and its shareholders. In their deliberations, the Board did not identify any particular information that was all-important or controlling, and each Trustee may have attributed different weights to different factors. Based on their review, including consideration of each of the factors referenced above, the Trustees determined, in the exercise of their reasonable business judgment, that the advisory and sub-advisory arrangements for each Fund, as outlined in the Advisory Agreement and Sub-Advisory Agreement, were fair
TrimTabs ETF Trust
ADDITIONAL INFORMATION
July 31, 2022 (Unaudited) (Continued)
and reasonable in light of the services performed, expenses incurred and such other matters as the Board considered relevant.
After full consideration of the above factors as well as other factors, the Board, including the Independent Trustees, unanimously approved the continuance of the Advisory Agreement on behalf of each Fund and the Sub-Advisory Agreement with respect to DFHY and DFNV.
6. TRUSTEES AND OFFICERS
Additional information about each Trustee of the Trust is set forth below. The address of each Trustee of the Trust is c/o FCF Advisors LLC 1345 Avenue of the Americas, 2nd Floor, New York, NY, 10105. The Funds’ Statement of Additional Information includes additional information about the Trustees and is available without charge, upon request, by calling toll-free at 1-800-617-0004.
| | | Term of | | Number of | |
| | | Office | | Portfolios | Other |
| | | and | Principal | in Fund | Directorships |
| | Position(s) | Length | Occupation | Complex | Held by Trustee |
| Name, Year | Held with | of Time | During Past | Overseen | During Past |
of Birth | the Trust | Served | Five Years | by Trustee | Five Years |
| | | | | | |
| Independent Trustees | | | | | |
| | | | | | |
| Stephen J. Posner | Trustee | Since | Retired Since | 5 | Director, TrimTabs |
| YOB: 1944 | | 2014 | 2014 | | Investment Research |
| | | |
| | (2016-2017)** |
| | | | | | |
| David A. Kelly | Trustee | Since | Founder and | 5 | None |
| YOB: 1938 | | 2015 | President, Three | | |
| | | | Lakes Advisors, Inc. | | |
| | | | (1996-present) | | |
| | | | | | |
| Interested Trustee* | | | | | |
| | | | | | |
| Jacob Pluchenik | Trustee | Since | Managing Member, | 5 | None |
| YOB: 1976 | | June | GF Investments | | |
| | | 2021 | (2005-present); | | |
| | | | Member, FCF | | |
| | | | Advisors LLC | | |
| | | | (2016-present) | | |
| * | Mr. Pluchenik is an “interested person,” as defined by the Investment Company Act of 1940, as amended, because of his ownership interest in the Adviser. |
| ** | TrimTabs Investment Research does not control and is not controlled by or under common control with the Adviser. |
TrimTabs ETF Trust
ADDITIONAL INFORMATION
July 31, 2022 (Unaudited) (Continued)
| | | Term of | |
| | Position(s) | Office and | |
| Name, Year | Held with | Length of | |
of Birth | the Trust | Time Served | Principal Occupation During Past Five Years |
| | | | |
| Officers | | | |
| | | | |
Bob Shea | President | Since | CEO and Chief Investment Officer, FCF Advisors LLC |
YOB: 1962 | and | January | (2020-Present) and Portfolio Manager (2021-Present); |
| | Principal | 2021 | President and Co-Chief Investment Officer, |
| | Executive | | W.E. Donoghue & Co., LLC (2017-2019); |
| | Officer | | Co-Founder, CEO and Strategic Advisor, |
| | | | JA Forlines Global (2009-2017) |
| | | | |
Derin Cohen | Chief | Chief | Chief Operating & Compliance Officer, FCF Advisors |
YOB: 1991 | Compliance | Compliance | LLC (2019-present) and Vice President, Marketing and |
| | Officer and | Officer, | Operations (2017-2019); Lead Generation Associate, |
| | Anti-Money | Anti-Money | SinglePlatform (2017-2017); Internal Control Associate, |
| | Laundering | Laundering | Maxim Group LLC (2013-2017) |
| | Officer | Officer | |
| | Formerly: | since 2019; | |
| | Vice | Vice President | |
| | President | (2018-2019) | |
| | | | |
Vince (Qijun) Chen | Vice | Since 2019 | Quantitative Analyst, FCF Advisors LLC (2017-Present) |
YOB: 1994 | President, | | and Portfolio Manager (2021-Present); Application |
| | Treasurer, | | Developer, NYC Human Resources Administration |
| | and | | (2017-2017) |
| | Principal | | |
| | Financial | | |
| | Officer | | |
Investment Adviser
FCF Advisors LLC
1345 Avenue of the Americas, 2nd Floor
New York, NY 10105
Investment Sub-Adviser
Donoghue Forlines LLC
One International Place, Suite 2920
Boston, MA 02110
Distributor
Quasar Distributors, LLC
111 East Kilbourn Avenue, Suite 2200
Milwaukee, WI 53202
Administrator, Fund Accountant & Transfer Agent
U.S. Bank Global Fund Services
615 East Michigan Street
Milwaukee, WI 53202
Custodian
U.S. Bank N.A.
1555 North RiverCenter Drive, Suite 302
Milwaukee, WI 53212
Independent Registered Public Accounting Firm
BBD, LLP
1835 Market Street, 3rd Floor
Philadelphia, PA 19103
Legal Counsel
Stradley Ronon Stevens & Young, LLP
2005 Market Street, Suite 2600
Philadelphia, PA 19103-7018
(b) Not Applicable.
Item 2. Code of Ethics.
The registrant has adopted a code of ethics that applies to the registrant’s principal executive officer and principal financial officer. The registrant has not made any substantive amendments to its code of ethics during the period covered by this report. The registrant has not granted any waivers from any provisions of the code of ethics during the period covered by this report.
A copy of the registrant’s Code of Ethics is filed herewith.
Item 3. Audit Committee Financial Expert.
The registrant’s board of TrimTabs ETF has determined that it does not have an audit committee financial expert serving on its audit committee. At this time, the registrant believes that the experience provided by each member of the audit committee together offers the registrant adequate oversight for the registrant’s level of financial complexity.
Item 4. Principal Accountant Fees and Services.
The registrant has engaged its principal accountant to perform audit services, audit-related services, tax services and other services during the past two fiscal years. “Audit services” refer to performing an audit of the registrant's annual financial statements or services that are normally provided by the accountant in connection with statutory and regulatory filings or engagements for those fiscal years. “Audit-related services” refer to the assurance and related services by the principal accountant that are reasonably related to the performance of the audit. “Tax services” refer to professional services rendered by the principal accountant for tax compliance, tax advice, and tax planning. “Other services” were provided by the principal accountant BBD, LLP. The following table details the aggregate fees billed or expected to be billed for each of the last two fiscal years for audit fees, audit-related fees, tax fees and other fees by the principal accountant.
FCF US Quality ETF
| | | FYE 07/31/2022 | FYE 07/31/2021 | |
| | Audit Fees | $12,500 | $12,500 | |
| | Audit-Related Fees | N/A | N/A | |
| | Tax Fees | $3,000 | $3,000 | |
| | All Other Fees | N/A | N/A | |
FCF International Quality ETF
| | | FYE 07/31/2022 | FYE 07/31/2021 | |
| | Audit Fees | $14,500 | $14,500 | |
| | Audit-Related Fees | N/A | N/A | |
| | Tax Fees | $3,000 | $3,000 | |
| | All Other Fees | N/A | N/A | |
Donoghue Forlines Tactical High Yield ETF
| | | FYE 07/31/2022 | FYE 07/31/2021 | |
| | Audit Fees | $12,500 | $12,500 | |
| | Audit-Related Fees | N/A | N/A | |
| | Tax Fees | $3,000 | $3,000 | |
| | All Other Fees | N/A | N/A | |
Donoghue Forlines Risk Managed Innovation ETF
| | | FYE 07/31/2022 | FYE 07/31/2021 | |
| | Audit Fees | $12,500 | $12,500 | |
| | Audit-Related Fees | N/A | N/A | |
| | Tax Fees All Other Fees | $3,000 N/A | $3,000 N/A | |
Donoghue Forlines Yield Enhanced Real Asset ETF
| | | FYE 07/31/2022 | FYE 07/31/2021 | |
| | Audit Fees | $12,500 | N/A | |
| | Audit-Related Fees | N/A | N/A | |
| | Tax Fees All Other Fees | $3,000 N/A | N/A N/A | |
The audit committee has adopted pre-approval policies and procedures that require the audit committee to pre‑approve all audit and non‑audit services of the registrant, including services provided to any entity affiliated with the registrant.
The percentage of fees billed by BBD, LLP applicable to non-audit services pursuant to waiver of pre-approval requirement were as follows:
FCF US Quality ETF
| | | FYE 07/31/2022 | FYE 07/31/2021 | |
| | Audit-Related Fees | 0% | 0% | |
| | Tax Fees | 0% | 0% | |
| | All Other Fees | 0% | 0% | |
FCF International Quality ETF
| | | FYE 07/31/2022 | FYE 07/31/2021 | |
| | Audit-Related Fees | 0% | 0% | |
| | Tax Fees | 0% | 0% | |
| | All Other Fees | 0% | 0% | |
Donoghue Forlines Tactical High Yield ETF
| | | FYE 07/31/2022 | FYE 07/31/2021 | |
| | Audit-Related Fees | 0% | 0% | |
| | Tax Fees | 0% | 0% | |
| | All Other Fees | 0% | 0% | |
Donoghue Forlines Risk Managed Innovation ETF
| | | FYE 07/31/2022 | FYE 07/31/2021 | |
| | Audit-Related Fees | 0% | 0% | |
| | Tax Fees | 0% | 0% | |
| | All Other Fees | 0% | 0% | |
Donoghue Forlines Yield Enhanced Real Asset ETF
| | | FYE 07/31/2022 | FYE 07/31/2021 | |
| | Audit-Related Fees | 0% | N/A | |
| | Tax Fees | 0% | N/A | |
| | All Other Fees | 0% | N/A | |
All of the principal accountant’s hours spent on auditing the registrant’s financial statements were attributed to work performed by full‑time permanent employees of the principal accountant.
The following table indicates the non-audit fees billed or expected to be billed by the registrant’s accountant for services to the registrant and to the registrant’s investment adviser (and any other controlling entity, etc.—not sub-adviser) for the last two years. The audit committee of the board of trustees/directors has considered whether the provision of non-audit services that were rendered to the registrant's investment adviser is compatible with maintaining the principal accountant's independence and has concluded that the provision of such non-audit services by the accountant has not compromised the accountant’s independence.
FCF US Quality ETF
| | Non-Audit Related Fees | FYE 07/31/2022 | FYE 07/31/2021 | |
| | Registrant | - | - | |
| | Registrant’s Investment Adviser | - | - | |
FCF International Quality ETF
| | Non-Audit Related Fees | FYE 07/31/2022 | FYE 07/31/2021 | |
| | Registrant | - | - | |
| | Registrant’s Investment Adviser | - | - | |
Donoghue Forlines Tactical High Yield ETF
| | Non-Audit Related Fees | FYE 07/31/2022 | FYE 07/31/2021 | |
| | Registrant | - | - | |
| | Registrant’s Investment Adviser | - | - | |
Donoghue Forlines Risk Managed Innovation ETF
| | Non-Audit Related Fees | FYE 07/31/2022 | FYE 07/31/2021 | |
| | Registrant | - | - | |
| | Registrant’s Investment Adviser | - | - | |
Donoghue Forlines Yield Enhanced Real Asset ETF
| | Non-Audit Related Fees | FYE 07/31/2022 | FYE 07/31/2021 | |
| | Registrant | - | N/A | |
| | Registrant’s Investment Adviser | - | N/A | |
The registrant has not been identified by the U.S. Securities and Exchange Commission as having filed an annual report issued by a registered public accounting firm branch or office that is located in a foreign jurisdiction where the Public Company Accounting Oversight Board is unable to inspect or completely investigate because of a position taken by an authority in that jurisdiction.
The registrant is not a foreign issuer.
Item 5. Audit Committee of Listed Registrants.
(a) | The registrant is an issuer as defined in Rule 10A-3 under the Securities Exchange Act of 1934, (the “Act”) and has a separately-designated standing audit committee established in accordance with Section 3(a)(58)(A) of the Act. The independent members of the committee are as follows: David Kelly and Stephen Posner. |
Item 6. Investments.
(a) | Schedule of Investments is included as part of the report to shareholders filed under Item 1 of this Form. |
Item 7. Disclosure of Proxy Voting Policies and Procedures for Closed-End Management Investment Companies.
Not applicable to open-end investment companies.
Item 8. Portfolio Managers of Closed-End Management Investment Companies.
Not applicable to open-end investment companies.
Item 9. Purchases of Equity Securities by Closed‑End Management Investment Company and Affiliated Purchasers.
Not applicable to open-end investment companies.
Item 10. Submission of Matters to a Vote of Security Holders.
There have been no material changes to the procedures by which shareholders may recommend nominees to the registrant’s board of TrimTabs ETF Trust.
Item 11. Controls and Procedures.
| (a) | The Registrant’s President/Principal Executive Officer and Treasurer/Principal Financial Officer have reviewed the Registrant's disclosure controls and procedures (as defined in Rule 30a-3(c) under the Investment Company Act of 1940 (the “Act”)) as of a date within 90 days of the filing of this report, as required by Rule 30a-3(b) under the Act and Rules 13a-15(b) or 15d‑15(b) under the Securities Exchange Act of 1934. Based on their review, such officers have concluded that the disclosure controls and procedures are effective in ensuring that information required to be disclosed in this report is appropriately recorded, processed, summarized and reported and made known to them by others within the Registrant and by the Registrant’s service provider. |
| (b) | There were no changes in the Registrant's internal control over financial reporting (as defined in Rule 30a-3(d) under the Act) that occurred during the period covered by this report that have materially affected, or are reasonably likely to materially affect, the Registrant's internal control over financial reporting. |
Item 12. Disclosure of Securities Lending Activities for Closed-End Management Investment Companies
Not applicable to open-end investment companies.
Item 13. Exhibits.
(3) Any written solicitation to purchase securities under Rule 23c‑1 under the Act sent or given during the period covered by the report by or on behalf of the registrant to 10 or more persons. Not applicable to open-end investment companies.
(4) Change in the registrant’s independent public accountant. There was no change in the registrant’s independent public accountant for the period covered by this report.
SIGNATURES
Pursuant to the requirements of the Securities Exchange Act of 1934 and the Investment Company Act of 1940, the registrant has duly caused this report to be signed on its behalf by the undersigned, thereunto duly authorized.
(Registrant) TrimTabs ETF Trust
By (Signature and Title)* /s/ Robert J. Shea Jr.
Robert J. Shea Jr., President (Principal Executive Officer)
Date 10/7/2022
Pursuant to the requirements of the Securities Exchange Act of 1934 and the Investment Company Act of 1940, this report has been signed below by the following persons on behalf of the registrant and in the capacities and on the dates indicated.
By (Signature and Title)* /s/ Robert J. Shea Jr.
Robert J. Shea Jr., President (Principal Executive Officer)
Date 10/7/2022
By (Signature and Title)* /s/ Vince (Qijun) Chen
Vince (Qijun) Chen, Treasurer (Principal Financial Officer)
Date 10/7/2022
* Print the name and title of each signing officer under his or her signature.