UNITED STATES
SECURITIES AND EXCHANGE COMMISSION
Washington, D.C. 20549
FORMN-CSR
CERTIFIED SHAREHOLDER REPORT OF REGISTERED MANAGEMENT
INVESTMENT COMPANIES
Investment Company Act file number:811-23002
LATTICE STRATEGIES TRUST
(Exact name of registrant as specified in charter)
690 Lee Road, Wayne, Pennsylvania 19087
(Address of Principal Executive Offices) (Zip Code)
Thomas R. Phillips, Esquire
Hartford Funds Management Company, LLC
690 Lee Road
Wayne, Pennsylvania 19087
(Name and Address of Agent for Service)
Copy to:
John V. O’Hanlon, Esq.
Dechert LLP
One International Place, 40th Floor
100 Oliver Street
Boston, MA 02110-2605
Registrant’s telephone number, including area code: (610)386-4068
Date of fiscal year end: September 30
Date of reporting period: September 30, 2019
FormN-CSR is to be used by management investment companies to file reports with the Commission not later than 10 days after the transmission to stockholders of any report that is required to be transmitted to stockholders under Rule30e-1 under the Investment Company Act of 1940 (17 CFR270.30e-1). The Commission may use the information provided on FormN-CSR in its regulatory, disclosure review, inspection, and policymaking roles.
A registrant is required to disclose the information specified by FormN-CSR, and the Commission will make this information public. A registrant is not required to respond to the collection of information contained in FormN-CSR unless the Form displays a currently valid Office of Management and Budget (“OMB”) control number. Please direct comments concerning the accuracy of the information collection burden estimate and any suggestions for reducing the burden to Secretary, Securities and Exchange Commission, 450 Fifth Street, NW, Washington, DC 20549-0609. The OMB has reviewed this collection of information under the clearance requirements of 44 U.S.C. § 3507.
Item 1. Reports to Stockholders.
Hartford Multifactor ETFs
Annual Report
September 30, 2019
Hartford Multifactor Developed Markets (ex-US) ETF
Hartford Multifactor Emerging Markets ETF
Hartford Multifactor Global Small Cap ETF1
Hartford Multifactor Low Volatility International Equity ETF2
Hartford Multifactor Low Volatility US Equity ETF
Hartford Multifactor REIT ETF
Hartford Multifactor US Equity ETF
1 Effective November 6, 2019, Hartford Multifactor Global Small Cap ETF’s name changed to Hartford Multifactor Small Cap ETF
2 Effective November 6, 2019, Hartford Multifactor Low Volatility International Equity ETF’s name changed to Hartford Multifactor Diversified International ETF
Beginning on January 1, 2021, as permitted by regulations adopted by the Securities and Exchange Commission, paper copies of the Funds’ shareholder reports like this one will no longer be sent by mail, unless you specifically request paper copies of the reports from the Funds or from your financial intermediary, such as a broker-dealer or bank. Instead, the reports will be made available on the Funds’ website (www.hartfordfunds.com). You will be notified by mail each time a report is posted and provided with a website link to access the report. You may at any time elect to receive paper copies of all shareholder reports free of charge by contacting your financial intermediary. Your election to receive reports in paper will apply to all Hartford Funds held in your account.
HARTFORDFUNDS
OUR BENCHMARK IS THE INVESTORS.®

A MESSAGE FROM THE PRESIDENT
Dear Fellow Shareholders:
Thank you for investing in Hartford Multifactor ETFs. The following is the Funds’ Annual Report covering the period from October 1, 2018 through September 30, 2019.
Market Review
During the 12 months ended September 30, 2019, U.S. stocks, as measured by the S&P 500 Index (the “Index”),1 gained 4.25%.
Political uncertainty remained a core driver of increased market volatility throughout the period. Escalating trade tensions between the U.S. and China, continued debate over how the UK will handle its departure from the European Union, and the September announcement of an impeachment inquiry against President Trump all weighed on markets.
Against this backdrop, however, July 1, 2019 marked a significant milestone: The U.S. entered the longest period of economic expansion on record, according to The National Bureau of Economic Research. Strong consumer spending in the U.S. has continued to buoy the domestic economy, helped by an unemployment rate that stayed at or below 4% throughout the 12-month period ended September 30, 2019.
However, signs of a slowing global economy prompted central banks around the world to shift to more accommodating monetary policy. The U.S. Federal Reserve cut interest rates in July and September 2019, to 1.75-2%, while the European Central Bank, which already had established negative interest rates, further cut its rate to -0.5% as of September 18, 2019.
Politics, both at home and abroad, are likely to continue to play a key role in market movements this year. For this reason, we encourage you to maintain a strong relationship with your financial advisor, who can help guide you through shifting markets confidently. He or she can help you proactively build a portfolio that takes market uncertainty into account, along with your unique investment goals and risk tolerances. Your advisor can help you find a fit within our family of funds as you work toward those goals.
Thank you again for investing in Hartford Multifactor ETFs. For the most up-to-date information on our funds, please take advantage of all the resources available at hartfordfunds.com.

James Davey
President
Hartford Funds
| 1 | S&P 500 Index is a market capitalization-weighted price index composed of 500 widely held common stocks. |
Hartford Multifactor ETFs
Table of Contents
| * | Effective November 6, 2019, the Fund’s name changed to the Hartford Multifactor Small Cap ETF. |
| ** | Effective November 6, 2019, the Fund’s name changed to the Hartford Multifactor Diversified International ETF. |
The views expressed in each Fund’s Manager Discussion contained in the Fund Overview section are views of that Fund’ssub-adviser and portfolio management team through the end of the period and are subject to change based on market and other conditions. Each Fund’s Manager Discussion is for informational purposes only and does not represent an offer, recommendation or solicitation to buy, hold or sell any security. The specific securities identified and described, if any, do not represent all of the securities purchased or sold and you should not assume that investments in the securities identified and discussed will be profitable.
|
| Hartford Multifactor Developed Markets (ex-US) ETF |
Fund Overview
September 30, 2019 (Unaudited)
| | |
Inception 2/25/2015 (sub-advised by Mellon Investments Corporation) | | Investment objective – The Fund seeks to provide investment results that, before fees and expenses, correspond to the total return performance of an index that tracks the performance of companies located in major developed markets of Europe, Canada and the Pacific Region. |
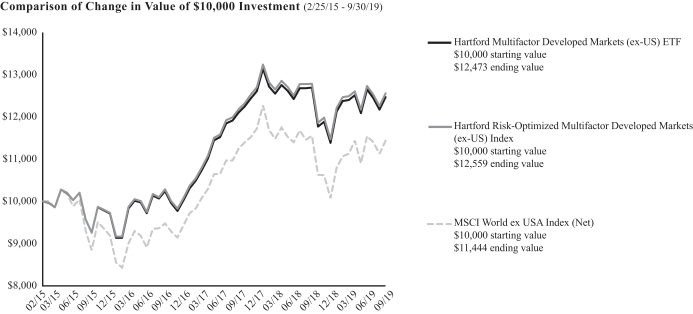
The chart above represents the hypothetical growth of a $10,000 investment in the Fund. The difference in returns between the Fund and the Index was primarily the result of the Fund’s operating expenses, including transaction costs, that are not reflected in the Index’s results.
Average Annual Total Returns
for the Periods Ending 9/30/19
| | | | | | | | |
| | | 1 Year | | | Since
Inception1 | |
Multifactor Developed Markets (ex-US) ETF (NAV Return) | | | -1.78% | | | | 4.92% | |
Multifactor Developed Markets (ex-US) ETF (Market Price Return) | | | -1.42% | | | | 4.99% | |
Hartford Risk-Optimized Multifactor Developed Markets(ex-US) Index | | | -1.80% | | | | 5.08% | |
MSCI World ex USA Index (Net) | | | -0.95% | | | | 2.98% | |
Information regarding how often shares of the Fund traded on NYSE Arca at a price above (i.e., at a premium) or below (i.e., at a discount) the NAV of the Fund can be found at hartfordfunds.com.
PERFORMANCE DATA QUOTED REPRESENTS PAST PERFORMANCE AND DOES NOT GUARANTEE FUTURE RESULTS. The investment return and principal value of the investment will fluctuate so that investors’ shares, when redeemed or sold, may be worth more or less than their original cost. The table does not reflect the deductions of taxes that a shareholder would pay on Fund distributions or the redemption or sale of Fund shares. Current performance may be lower or higher than the performance data quoted. To obtain performance data current to the most recent month-end, please visit our website hartfordfunds.com.
Total returns are calculated using the daily 4:00 pm net asset value (NAV). Market price returns reflect the midpoint of the bid/ask spread as of the close of trading on the exchange where Fund shares are listed. Market price returns do not represent the returns you would receive if you traded shares at other times.
The Fund’s Shares are bought and sold at market price (not NAV) and are not individually redeemed from the Fund. Owners of the Shares may acquire those Shares from the Fund and tender those shares for redemption to the Fund in Creation Unit aggregations only, typically consisting of 50,000 Shares.
The index is unmanaged, and its results include reinvested dividends and/or distributions, but do not reflect the effect of sales charges, commissions, expenses or taxes.
You cannot invest directly in an index.
See “Benchmark Glossary” for a detailed list of benchmarks and descriptions used in this report.
The total annual fund operating expense ratio as shown in the Fund’s most recent prospectus was 0.29%. Actual expenses may be higher or lower. Please see the accompanying Financial Highlights for expense ratios for the period ended September 30, 2019.
|
| Hartford Multifactor Developed Markets (ex-US) ETF |
Fund Overview – (continued)
September 30, 2019 (Unaudited)
Hartford Multifactor Developed Markets (ex-US) ETF (“the Fund”) seeks to provide investment results that, before fees and expenses, correspond to the total return performance of Hartford Risk-Optimized Multifactor Developed Markets (ex-US) Index (LRODMX) (“the Index”), which tracks the performance of companies located in major developed markets of Europe, Canada, and the Pacific Region.
The Fund seeks to generate returns by investing in index constituents that are selected and weighted through a rules-based methodology that seeks to:
| 1) | Deliberately Allocate Risks by providing exposure to the growth potential of international companies while explicitly seeking to reduce volatility and drawdown risk. |
| 2) | Improve Diversification by diversifying exposure across developed market economies and potentially reducing individual country, currency, and individual company risks. |
| 3) | Enhance Return Potential by selecting companies with a favorable combination of low valuation (50%), high momentum (30%), and high quality (20%) investment factors. |
| 4) | Maintain Consistency by reapplying the index methodology twice a year in March and September to maintain intended investment exposures. |
The Fund returned -1.78% at net asset value (“NAV”) for the fiscal year ending September 30, 2019 compared to Hartford Risk-Optimized Multifactor Developed Market (ex-US) Index, which returned-1.80% for the same period. Futures contracts are used to equitize dividend receivables and cash during Fund rebalancing. The use of derivatives did not have a material impact on performance during the period.
Important Risks
Investing involves risk, including the possible loss of principal. Security prices fluctuate in value depending on general market and economic conditions and the prospects of individual companies.•Foreign investments may be more volatile and less liquid than U.S. investments and are subject to the risk of currency fluctuations and adverse political and economic developments.•Investments focused in a sector, industry or group of industries may increase volatility and risk.•The Fund is not actively managed but rather attempts to track the performance of an index. The Fund’s returns may diverge from that of the index.
Composition by Sector(1)
as of September 30, 2019
| | | | |
| Sector | | Percentage of
Net Assets | |
Equity Securities | | | | |
Communication Services | | | 6.8 | % |
Consumer Discretionary | | | 10.1 | |
Consumer Staples | | | 9.5 | |
Energy | | | 4.8 | |
Financials | | | 21.4 | |
Health Care | | | 11.4 | |
Industrials | | | 12.7 | |
Information Technology | | | 5.7 | |
Materials | | | 5.2 | |
Real Estate | | | 6.0 | |
Utilities | | | 5.8 | |
| | | | |
Total | | | 99.4 | % |
| | | | |
Short-Term Investments | | | 0.0 | * |
Other Assets & Liabilities | | | 0.6 | |
| | | | |
Total | | | 100.0 | % |
| | | | |
| * | Percentage rounds to zero. |
| (1) | A sector may be comprised of several industries. For Fund compliance purposes, the Fund may not use the same classification system. These sector classifications are used for financial reporting purposes. |
|
| Hartford Multifactor Emerging Markets ETF |
Fund Overview
September 30, 2019 (Unaudited)
| | |
Inception 2/25/2015 (sub-advised by Mellon Investments Corporation) | | Investment objective – The Fund seeks to provide investment results that, before fees and expenses, correspond to the total return performance of an index based upon the emerging markets of the world. |
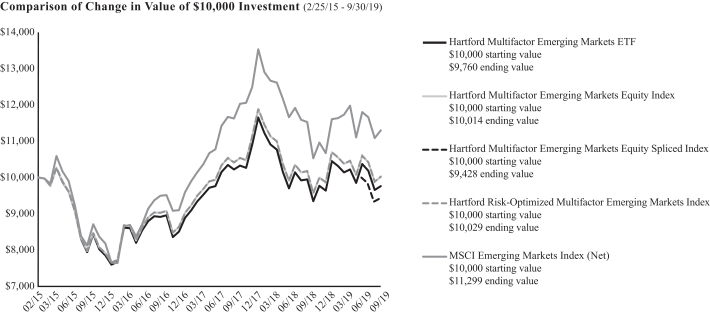
The chart above represents the hypothetical growth of a $10,000 investment in the Fund. The difference in returns between the Fund and the Index was primarily the result of the Fund’s operating expenses, including transaction costs, that are not reflected in the Index’s results.
Average Annual Total Returns
for the Periods Ending 9/30/19
| | | | | | | | |
| | | 1 Year | | | Since
Inception | |
Multifactor Emerging Markets ETF (NAV Return) | | | -1.90% | | | | -0.53% | 1 |
Multifactor Emerging Markets ETF (Market Price Return) | | | -1.83% | | | | -0.62% | 1 |
Hartford Multifactor Emerging Markets Equity Index | | | — | | | | -5.72% | 2 |
Hartford Multifactor Emerging Markets Equity Spliced Index3 | | | -1.61% | | | | 0.03% | 1 |
Hartford Risk-Optimized Multifactor Emerging Markets Index | | | -1.46% | | | | 0.06% | 1 |
MSCI Emerging Markets Index (Net) | | | -2.02% | | | | 2.69% | 1 |
| 3 | The performance of Hartford Multifactor Emerging Markets Equity Spliced Index reflects the performance of Hartford Risk-Optimized Multifactor Emerging Markets Index through 09/11/2019, and the performance of the Hartford Multifactor Emerging Markets Equity Index for the period from 09/11/2019 though 09/30/2019 |
Information regarding how often shares of the Fund traded on NYSE Arca at a price above (i.e., at a premium) or below (i.e., at a discount) the NAV of the Fund can be found at hartfordfunds.com.
PERFORMANCE DATA QUOTED REPRESENTS PAST PERFORMANCE AND DOES NOT GUARANTEE FUTURE RESULTS. The investment return and principal value of the investment will fluctuate so that investors’ shares, when redeemed or sold, may be worth more or less than their original cost. The table does not reflect the deductions of taxes that a shareholder would pay on Fund distributions or the redemption or sale of Fund shares. Current performance may be lower or higher than the performance data quoted. To obtain performance data current to the most recent month-end, please visit our website hartfordfunds.com.
Total returns are calculated using the daily 4:00 pm net asset value (NAV). Market price returns reflect the midpoint of the bid/ask spread as of the close of trading on the exchange where Fund shares are listed. Market price returns do not represent the returns you would receive if you traded shares at other times.
The Fund’s Shares are bought and sold at market price (not NAV) and are not individually redeemed from the Fund. Owners of the Shares may acquire those Shares from the Fund and tender those shares for redemption to the Fund in Creation Unit aggregations only, typically consisting of 100,000 Shares.
The index is unmanaged, and its results include reinvested dividends and/or distributions, but do not reflect the effect of sales charges, commissions, expenses or taxes.
Effective September 11, 2019, the Fund changed its proprietary custom benchmark index to Hartford Multifactor Emerging Markets Equity Index from Hartford Risk-Optimized Multifactor Emerging Markets Index because Lattice, the Fund’s investment adviser, believes that the new index better reflects the Fund’s revised investment strategy. Performance information prior to September 11, 2019 reflects the Fund’s performance when it tracked its prior index.
You cannot invest directly in an index.
See “Benchmark Glossary” for a detailed list of benchmarks and descriptions used in this report.
The total annual fund operating expense ratio as shown in the Fund’s most recent prospectus as supplemented was 0.44%. Actual expenses may be higher or lower. Please see the accompanying Financial Highlights for expense ratios for the period ended September 30, 2019.
|
| Hartford Multifactor Emerging Markets ETF |
Fund Overview – (continued)
September 30, 2019 (Unaudited)
Hartford Multifactor Emerging Markets ETF (“the Fund”) seeks to provide investment results that, before fees and expenses, correspond to the total return performance of Hartford Multifactor Emerging Markets Equity Index (LROEMX) (“the Index”), which tracks the performance of companies located in the emerging markets of the world.
The Fund seeks to generate returns and reduce volatility by investing in index constituents that are selected and weighted through a rules-based methodology that seeks to:
| 1) | Deliberately Allocate Risks by expanding the investment opportunity and seeking to harness emerging markets’ growth potential and allocating risk across countries while explicitly seeking to reduce volatility and drawdown risk. |
| 2) | Improve Diversification by improving exposure to countries earlier in their growth cycle (beyond the largest emerging countries) as well as to companies tied more closely to local emerging economies. |
| 3) | Enhance Return Potential by selecting companies with a favorable combination of low valuation (50%), high momentum (30%), and high quality (20%) investment factors. |
| 4) | Maintain Consistency by reapplying the index methodology twice a year in March and September to maintain intended investment exposures. |
The Fund returned -1.90% at net asset value (“NAV”) for the fiscal year ending September 30, 2019 as compared to Hartford Multifactor Emerging Markets Equity Spliced Index which returned-1.61% for the same period. The difference in returns between the Fund and the Index was primarily the result of the Fund’s transaction costs and operating expenses that are not reflected in the Index’s results.Futures contracts are used to equitize dividend receivables and cash during Fund rebalancing. The use of derivatives did not have a material impact on performance during the period.
Important Risks
Investing involves risk, including the possible loss of principal. Security prices fluctuate in value depending on general market and economic conditions and the prospects of individual companies.• Foreign investments may be more volatile and less liquid than U.S. investments and are subject to the risk of currency fluctuations and adverse political and economic developments. These risks may be greater for investments in emerging markets.• Investments focused in a sector, industry or group of industries may increase volatility and risk.• The Fund is not actively managed but rather attempts to track the performance of an index. The Fund’s returns may diverge from that of the index.
Composition by Sector(1)
as of September 30, 2019
| | | | |
| Sector | | Percentage of
Net Assets | |
Equity Securities | | | | |
Communication Services | | | 12.8 | % |
Consumer Discretionary | | | 11.9 | |
Consumer Staples | | | 6.5 | |
Energy | | | 5.4 | |
Financials | | | 25.1 | |
Health Care | | | 4.0 | |
Industrials | | | 6.9 | |
Information Technology | | | 13.2 | |
Materials | | | 7.9 | |
Real Estate | | | 1.2 | |
Utilities | | | 4.6 | |
| | | | |
Total | | | 99.5 | % |
| | | | |
Short-Term Investments | | | 0.1 | |
Other Assets & Liabilities | | | 0.4 | |
| | | | |
Total | | | 100.0 | % |
| | | | |
| (1) | A sector may be comprised of several industries. For Fund compliance purposes, the Fund may not use the same classification system. These sector classifications are used for financial reporting purposes. |
|
| Hartford Multifactor Global Small Cap ETF* |
Fund Overview
September 30, 2019 (Unaudited)
| | |
Inception 3/23/2015 (sub-advised by Mellon Investments Corporation) | | Investment objective – The Fund seeks to provide investment results that, before fees and expenses, correspond to the total return performance of an index that tracks the performance of small capitalization exchange traded equity securities. |
| * | Effective November 6, 2019, the Fund changed its strategy and proprietary custom benchmark. The information in this report is as of the fiscal year ended September 30, 2019 and reflects the Fund’s prior strategy and benchmark. |
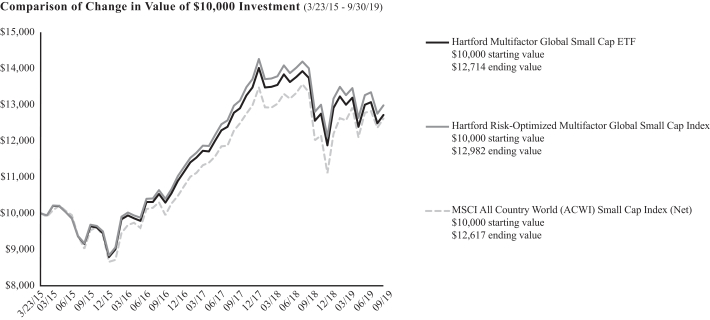
The chart above represents the hypothetical growth of a $10,000 investment in the Fund. The difference in returns between the Fund and the Index was primarily the result of the Fund’s operating expenses, including transaction costs, that are not reflected in the Index’s results.
Average Annual Total Returns
for the Periods Ending 9/30/19
| | | | | | | | |
| | | 1 Year | | | Since
Inception1 | |
Multifactor Global Small Cap ETF (NAV Return) | | | -7.46% | | | | 5.45% | |
Multifactor Global Small Cap ETF (Market Price Return) | | | -7.33% | | | | 5.39% | |
Hartford Risk-Optimized Multifactor Global Small Cap Index | | | -7.27% | | | | 5.94% | |
MSCI ACWI Small Cap Index (Net) | | | -5.45% | | | | 5.27% | |
Information regarding how often shares of the Fund traded on NYSE Arca at a price above (i.e., at a premium) or below (i.e., at a discount) the NAV of the Fund can be found at hartfordfunds.com.
PERFORMANCE DATA QUOTED REPRESENTS PAST PERFORMANCE AND DOES NOT GUARANTEE FUTURE RESULTS. The investment return and principal value of the investment will fluctuate so that investors’ shares, when redeemed or sold, may be worth more or less than their original cost. The table does not reflect the deductions of taxes that a shareholder would pay on Fund distributions or the redemption or sale of Fund shares. Current performance may be lower or higher than the performance data quoted. To obtain performance data current to the most recent month-end, please visit our website hartfordfunds.com.
Total returns are calculated using the daily 4:00 pm net asset value (NAV). Market price returns reflect the midpoint of the bid/ask spread as of the close of trading on the exchange where Fund shares are listed. Market price returns do not represent the returns you would receive if you traded shares at other times.
The Fund’s Shares are bought and sold at market price (not NAV) and are not individually redeemed from the Fund. Owners of the Shares may acquire those Shares from the Fund and tender those shares for redemption to the Fund in Creation Unit aggregations only, typically consisting of 100,000 Shares.
The index is unmanaged, and its results include reinvested dividends and/or distributions, but do not reflect the effect of sales charges, commissions, expenses or taxes.
You cannot invest directly in an index.
See “Benchmark Glossary” for a detailed list of benchmarks and descriptions used in this report.
The total annual fund operating expense ratio as shown in the Fund’s most recent prospectus was 0.39%. Actual expenses may be higher or lower. Please see the accompanying Financial Highlights for expense ratios for the period ended September 30, 2019.
|
| Hartford Multifactor Global Small Cap ETF |
Fund Overview – (continued)
September 30, 2019 (Unaudited)
Hartford Multifactor Global Small Cap ETF (“the Fund”) seeks to provide investment results that, before fees and expenses, correspond to the total return performance of Hartford Risk-Optimized Multifactor Global Small Cap Index (LROGSX) (“the Index”), which tracks the performance of small cap exchange-traded equity securities.
Effective November 6, 2019, Hartford Multifactor Global Small Cap ETF will begin tracking a new underlying index, Hartford Multifactor Small Cap Index (Bloomberg Ticker: LROSCX). This new index, which commenced operations on June 28, 2019, will seek to provide U.S. small cap core equity exposure and will continue to seek a target volatility reduction target of up to 15% over a complete market cycle. In connection with this index change, the Fund’s name will change to the Hartford Multifactor Small Cap ETF. The Fund seeks to generate returns by investing in index constituents that are selected and weighted through a rules-based methodology that seeks to:
| 1) | Deliberately Allocate Risks by addressing risks common to small cap investing such as volatility, drawdown, and valuation risk and taking advantage of lower correlation and valuation opportunities around the world. |
| 2) | Improve Diversification by expanding the opportunity set to include small companies from the U.S., developed and emerging markets. |
| 3) | Enhance Return Potential by selecting companies with a favorable combination of low valuation (50%), high momentum (30%), and high quality (20%) investment factors. |
| 4) | Maintain Consistency by reapplying the index methodology twice a year in March and September to maintain intended investment exposures. |
The Fund returned -7.46% at net asset value (“NAV”) for the fiscal year ending September 30, 2019 as compared to Hartford Risk-Optimized Multifactor Global Small Cap Index which returned-7.27% for the same period. The difference in returns between the Fund and the Index was primarily the result of the Fund’s transaction costs and operating expenses that are not reflected in the Index’s results. Futures contracts are used to equitize dividend receivables and cash during Fund rebalancing. The use of derivatives did not have a material impact on performance during the period.
Important Risks
Investing involves risk, including the possible loss of principal. Security prices fluctuate in value depending on general market and economic conditions and the prospects of individual companies.• Foreign investments may be more volatile and less liquid than U.S. investments and are subject to the risk of currency fluctuations and adverse political and economic developments. These risks may be greater for investments in emerging markets.• Small cap securities can have greater risk and volatility than large-cap securities. • Investments focused in a sector, industry or group of industries may increase volatility and risk.• The Fund is not actively managed but rather attempts to track the performance of an index. The Fund’s returns may diverge from that of the index.
Composition by Sector(1)
as of September 30, 2019
| | | | |
| Sector | | Percentage of
Net Assets | |
Equity Securities | | | | |
Communication Services | | | 6.2 | % |
Consumer Discretionary | | | 15.3 | |
Consumer Staples | | | 5.9 | |
Energy | | | 6.1 | |
Financials | | | 10.8 | |
Health Care | | | 10.8 | |
Industrials | | | 15.5 | |
Information Technology | | | 13.5 | |
Materials | | | 5.8 | |
Real Estate | | | 7.9 | |
Utilities | | | 1.2 | |
| | | | |
Total | | | 99.0 | % |
| | | | |
Short-Term Investments | | | 0.1 | |
Other Assets & Liabilities | | | 0.9 | |
| | | | |
Total | | | 100.0 | % |
| | | | |
| (1) | A sector may be comprised of several industries. For Fund compliance purposes, the Fund may not use the same classification system. These sector classifications are used for financial reporting purposes. |
|
| Hartford Multifactor Low Volatility International Equity ETF* |
Fund Overview
September 30, 2019 (Unaudited)
| | |
Inception 5/10/2017 (sub-advised by Mellon Investments Corporation) | | Investment objective – The Fund seeks to provide investment results that, before fees and expenses, correspond to the total return performance of an index that tracks the performance of companies located in both developed and emerging markets. |
| * | Effective November 6, 2019, the Fund changed its strategy and proprietary custom benchmark. The information in this report is as of the fiscal year ended September 30, 2019 and reflects the Fund’s prior strategy and benchmark. |
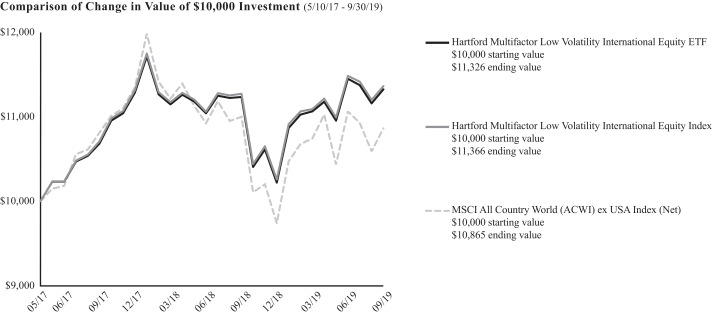
The chart above represents the hypothetical growth of a $10,000 investment in the Fund. The difference in returns between the Fund and the Index was primarily the result of the Fund’s operating expenses, including transaction costs, that are not reflected in the Index’s results.
Average Annual Total Returns
for the Periods Ending 9/30/19
| | | | | | | | |
| | | 1 Year | | | Since
Inception1 | |
Multifactor Low Volatility International Equity ETF (NAV Return) | | | 0.81% | | | | 5.34% | |
Multifactor Low Volatility International Equity ETF (Market Price Return) | | | 0.55% | | | | 5.32% | |
Hartford Multifactor Low Volatility International Equity Index | | | 0.83% | | | | 5.50% | |
MSCI ACWI ex USA Index (Net) | | | -1.23% | | | | 3.53% | |
Information regarding how often shares of the Fund traded on Cboe BZX at a price above (i.e., at a premium) or below (i.e., at a discount) the NAV of the Fund can be found at hartfordfunds.com.
PERFORMANCE DATA QUOTED REPRESENTS PAST PERFORMANCE AND DOES NOT GUARANTEE FUTURE RESULTS. The investment return and principal value of the investment will fluctuate so that investors’ shares, when redeemed or sold, may be worth more or less than their original cost. The table does not reflect the deductions of taxes that a shareholder would pay on Fund distributions or the redemption or sale of Fund shares. Current performance may be lower or higher than the performance data quoted. To obtain performance data current to the most recent month-end, please visit our website hartfordfunds.com.
Total returns are calculated using the daily 4:00 pm net asset value (NAV). Market price returns reflect the midpoint of the bid/ask spread as of the close of trading on the exchange where Fund shares are listed. Market price returns do not represent the returns you would receive if you traded shares at other times.
The Fund’s Shares are bought and sold at market price (not NAV) and are not individually redeemed from the Fund. Owners of the Shares may acquire those Shares from the Fund
and tender those shares for redemption to the Fund in Creation Unit aggregations only, typically consisting of 100,000 Shares.
The index is unmanaged, and its results include reinvested dividends and/or distributions, but do not reflect the effect of sales charges, commissions, expenses or taxes.
You cannot invest directly in an index.
See “Benchmark Glossary” for a detailed list of benchmarks and descriptions used in this report.
The total annual fund operating expense ratio as shown in the Fund’s most recent prospectus was 0.29%. Actual expenses may be higher or lower. Please see the accompanying Financial Highlights for expense ratios for the period ended September 30, 2019.
|
| Hartford Multifactor Low Volatility International Equity ETF |
Fund Overview – (continued)
September 30, 2019 (Unaudited)
Hartford Multifactor Low Volatility International Equity ETF (“the Fund”) seeks to provide investment results that, before fees and expenses, correspond to the total return performance of Hartford Multifactor Low Volatility International Equity Index (LLVINX) (“the Index”), which tracks the performance of companies located in both developed (ex U.S.) and emerging markets.
Effective November 6, 2019, Hartford Multifactor Low Volatility International ETF will begin tracking a new underlying index, Hartford Multifactor Diversified International Index (Bloomberg Ticker: LRODEX). This new index, which commenced operations on June 28, 2019, will seek to provide exposure to developed market (ex-U.S.) and emerging market companies and will seek to achieve a volatility reduction target of up to 15% over a complete market cycle. In connection with this index change, the Fund’s name will change to Hartford Multifactor Diversified International ETF.
The Fund seeks to generate returns by investing in index constituents that are selected and weighted through a rules-based methodology that seeks to:
| 1) | Deliberately Allocate Risks by selecting low volatility companies while balancing sector risk and reducing volatility and drawdown risk. |
| 2) | Improve Diversification by diversifying exposure across developed (excluding the U.S.) and emerging economies while balancing risk across sectors. |
| 3) | Enhance Return Potential by selecting companies exhibiting the low volatility factor while maintaining positive exposure to other potentially return-enhancing factors such as value, momentum, and quality. |
| 4) | Maintain Consistency by reapplying the index methodology twice a year in March and September to maintain intended investment exposures. |
The Fund returned 0.81% at net asset value (“NAV”) for the fiscal year ending September 30, 2019 as compared to Hartford Multifactor Low Volatility International Equity Index which returned 0.83% for the same period. The difference in returns between the Fund and the Index was primarily the result of the Fund’s transaction costs and operating expenses that are not reflected in the Index’s results. Futures contracts are used to equitize dividend receivables and cash during Fund rebalancing. The use of derivatives did not have a material impact on performance during the period.
Important Risks
Investing involves risk, including the possible loss of principal. Security prices fluctuate in value depending on general market and economic conditions and the prospects of individual companies.•The Fund may experience more than a minimum level of volatility as there is no guarantee that the underlying index’s strategy of seeking to lower volatility will be successful.•Foreign investments may be more volatile and less liquid than U.S. investments and are subject to the risk of currency fluctuations and adverse political and economic developments. These risks may be greater for investments in emerging markets.•Investments focused in a sector, industry or group of industries may increase volatility and risk.•The Fund is not actively managed but rather attempts to track the performance of an index. The Fund’s returns may diverge from that of the index.
Composition by Sector(1)
as of September 30, 2019
| | | | |
| Sector | | Percentage of
Net Assets | |
Equity Securities | | | | |
Communication Services | | | 11.6 | % |
Consumer Discretionary | | | 13.4 | |
Consumer Staples | | | 8.0 | |
Energy | | | 5.5 | |
Financials | | | 6.9 | |
Health Care | | | 10.1 | |
Industrials | | | 16.6 | |
Information Technology | | | 11.2 | |
Materials | | | 6.6 | |
Real Estate | | | 6.5 | |
Utilities | | | 3.2 | |
| | | | |
Total | | | 99.6 | % |
| | | | |
Other Assets & Liabilities | | | 0.4 | |
| | | | |
Total | | | 100.0 | % |
| | | | |
| (1) | A sector may be comprised of several industries. For Fund compliance purposes, the Fund may not use the same classification system. These sector classifications are used for financial reporting purposes. |
|
| Hartford Multifactor Low Volatility US Equity ETF |
Fund Overview
September 30, 2019 (Unaudited)
| | |
Inception 5/10/2017 (sub-advised by Mellon Investments Corporation) | | Investment objective – The Fund seeks to provide investment results that, before fees and expenses, correspond to the total return performance of an index that tracks the performance of exchange traded U.S. equity securities. |
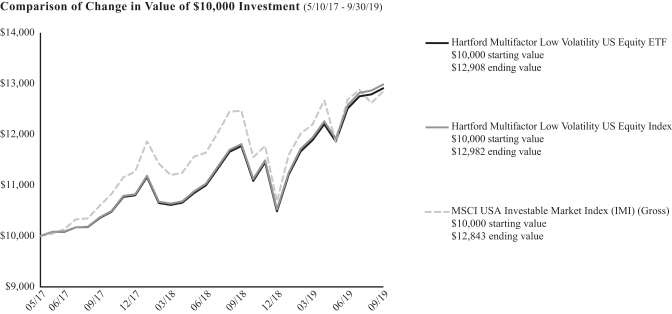
The chart above represents the hypothetical growth of a $10,000 investment in the Fund. The difference in returns between the Fund and the Index was primarily the result of the Fund’s operating expenses, including transaction costs, that are not reflected in the Index’s results.
Average Annual Total Returns
for the Periods Ending 9/30/19
| | | | | | | | |
| | | 1 Year | | | Since
Inception1 | |
Multifactor Low Volatility US Equity ETF (NAV Return) | | | 9.62% | | | | 11.26% | |
Multifactor Low Volatility US Equity ETF (Market Price Return) | | | 9.31% | | | | 11.32% | |
Hartford Multifactor Low Volatility US Equity Index | | | 9.89% | | | | 11.53% | |
MSCI USA IMI (Gross) | | | 3.01% | | | | 11.03% | |
Information regarding how often shares of the Fund traded on Cboe BZX at a price above (i.e., at a premium) or below (i.e., at a discount) the NAV of the Fund can be found at hartfordfunds.com.
PERFORMANCE DATA QUOTED REPRESENTS PAST PERFORMANCE AND DOES NOT GUARANTEE FUTURE RESULTS. The investment return and principal value of the investment will fluctuate so that investors’ shares, when redeemed or sold, may be worth more or less than their original cost. The table does not reflect the deductions of taxes that a shareholder would pay on Fund distributions or the redemption or sale of Fund shares. Current performance may be lower or higher than the performance data quoted. To obtain performance data current to the most recent month-end, please visit our website hartfordfunds.com.
Total returns are calculated using the daily 4:00 pm net asset value (NAV). Market price returns reflect the midpoint of the bid/ask spread as of the close of trading on the exchange where Fund shares are listed. Market price returns do not represent the returns you would receive if you traded shares at other times.
The Fund’s Shares are bought and sold at market price (not NAV) and are not individually redeemed from the Fund. Owners of the Shares may acquire those Shares from the Fund and tender those shares for redemption to the Fund in Creation Unit aggregations only, typically consisting of 50,000 Shares.
The index is unmanaged, and its results include reinvested dividends and/or distributions, but do not reflect the effect of sales charges, commissions, expenses or taxes.
You cannot invest directly in an index.
See “Benchmark Glossary” for a detailed list of benchmarks and descriptions used in this report.
The total annual fund operating expense ratio as shown in the Fund’s most recent prospectus was 0.21%. Actual expenses may be higher or lower. Expenses shown include acquired fund fees and expenses incurred by investing in the securities of other investment companies. Please see the accompanying Financial Highlights for expense ratios for the period ended September 30, 2019.
|
| Hartford Multifactor Low Volatility US Equity ETF |
Fund Overview – (continued)
September 30, 2019 (Unaudited)
Hartford Multifactor Low Volatility US Equity ETF (“the Fund”) seeks to provide investment results that, before fees and expenses, correspond to the total return performance of Hartford Multifactor Low Volatility US Equity Index (LLVUSX) (“the Index”), which tracks the performance of exchange-traded large-cap U.S. equity securities.
The Fund seeks to generate returns by investing in index constituents that are selected and weighted through a rules-based methodology that seeks to:
| 1) | Deliberately Allocate Risks by selecting low volatility companies while balancing sector risk and reducing volatility and drawdown risk. |
| 2) | Improve Diversification by diversifying exposure across U.S.large-, mid-, and small-cap companies while balancing risk across sectors. |
| 3) | Enhance Return Potential by selecting companies exhibiting the low volatility factor while maintaining positive exposure to other potentially return-enhancing factors such as value, momentum, and quality. |
| 4) | Maintain Consistency by reapplying the index methodology twice a year in March and September to maintain intended investment exposures. |
The Fund returned 9.62% at net asset value (“NAV”) for the fiscal year ending September 30, 2019 as compared to Hartford Multifactor Low Volatility US Equity Index which returned 9.89% for the same period. The difference in returns between the Fund and the Index was primarily the result of the Fund’s transaction costs and operating expenses that are not reflected in the Index’s results. Futures contracts are used to equitize dividend receivables and cash during Fund rebalancing. The use of derivatives did not have a material impact on performance during the period.
Important Risks
Investing involves risk, including the possible loss of principal. Security prices fluctuate in value depending on general market and economic conditions and the prospects of individual companies.• The Fund may experience more than a minimum level of volatility as there is no guarantee that the underlying index’s strategy of seeking to lower volatility will be successful.• Investments focused in a sector, industry or group of industries may increase volatility and risk.• The Fund is not actively managed but rather attempts to track the performance of an index. The Fund’s returns may diverge from that of the index.
Composition by Sector(1)
as of September 30, 2019
| | | | |
| Sector | | Percentage of
Net Assets | |
Equity Securities | | | | |
Communication Services | | | 8.3 | % |
Consumer Discretionary | | | 15.9 | |
Consumer Staples | | | 9.0 | |
Energy | | | 5.3 | |
Financials | | | 7.7 | |
Health Care | | | 8.8 | |
Industrials | | | 15.5 | |
Information Technology | | | 11.3 | |
Materials | | | 9.0 | |
Real Estate | | | 6.0 | |
Utilities | | | 3.0 | |
| | | | |
Total | | | 99.8 | % |
| | | | |
Other Assets & Liabilities | | | 0.2 | |
| | | | |
Total | | | 100.0 | % |
| | | | |
| (1) | A sector may be comprised of several industries. For Fund compliance purposes, the Fund may not use the same classification system. These sector classifications are used for financial reporting purposes. |
|
| Hartford Multifactor REIT ETF |
Fund Overview
September 30, 2019 (Unaudited)
| | |
Inception 10/03/2016 (sub-advised by Mellon Investments Corporation) | | Investment objective – The Fund seeks to provide investment results that, before fees and expenses, correspond to the total return performance of an index that tracks the performance of publicly traded real estate investment trusts. |
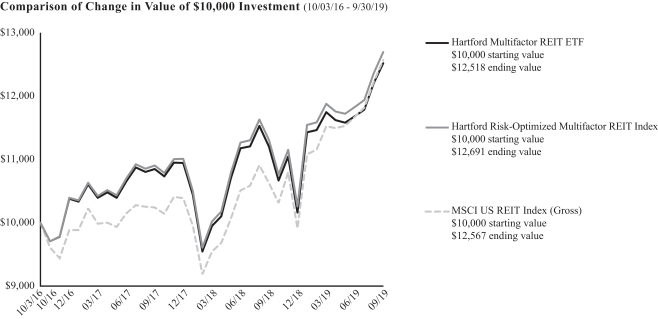
The chart above represents the hypothetical growth of a $10,000 investment in the Fund. The difference in returns between the Fund and the Index was primarily the result of the Fund’s operating expenses, including transaction costs, that are not reflected in the Index’s results.
Average Annual Total Returns
for the Periods Ending 9/30/19
| | | | | | | | |
| | | 1 Year | | | Since
Inception1 | |
Multifactor REIT ETF (NAV Return) | | | 11.75% | | | | 7.80% | |
Multifactor REIT ETF (Market Price Return) | | | 11.68% | | | | 7.77% | |
Hartford Risk-Optimized Multifactor REIT Index | | | 12.25% | | | | 8.29% | |
MSCI US REIT Index (Gross) | | | 18.31% | | | | 7.94% | |
Information regarding how often shares of the Fund traded on NYSE Arca at a price above (i.e., at a premium) or below (i.e., at a discount) the NAV of the Fund can be found at hartfordfunds.com.
PERFORMANCE DATA QUOTED REPRESENTS PAST PERFORMANCE AND DOES NOT GUARANTEE FUTURE RESULTS. The investment return and principal value of the investment will fluctuate so that investors’ shares, when redeemed or sold, may be worth more or less than their original cost. The table does not reflect the deductions of taxes that a shareholder would pay on Fund distributions or the redemption or sale of Fund shares. Current performance may be lower or higher than the performance data quoted. To obtain performance data current to the most recent month-end, please visit our website hartfordfunds.com.
Total returns are calculated using the daily 4:00 pm net asset value (NAV). Market price returns reflect the midpoint of the bid/ask spread as of the close of trading on the exchange where Fund shares are listed. Market price returns do not represent the returns you would receive if you traded shares at other times.
The Fund’s Shares are bought and sold at market price (not NAV) and are not individually redeemed from the Fund. Owners of the Shares may acquire those Shares from the Fund and tender those shares for redemption to the Fund in Creation Unit aggregations only, typically consisting of 100,000 Shares.
The index is unmanaged, and its results include reinvested dividends and/or distributions, but do not reflect the effect of sales charges, commissions, expenses or taxes.
You cannot invest directly in an index.
See “Benchmark Glossary” for a detailed list of benchmarks and descriptions used in this report.
The total annual fund operating expense ratio as shown in the Fund’s most recent prospectus was 0.45%. Actual expenses may be higher or lower. Please see the accompanying Financial Highlights for expense ratios for the period ended September 30, 2019.
|
| Hartford Multifactor REIT ETF |
Fund Overview – (continued)
September 30, 2019 (Unaudited)
Hartford Multifactor REIT ETF (“the Fund”) seeks to provide investment results that, before fees and expenses, correspond to the total return performance of Hartford Risk-Optimized Multifactor REIT Index (LROREX) (“the Index”), which is designed to capture the income and growth potential of investing in the U.S. REIT universe.
The Fund seeks to generate returns by investing in index constituents that are selected and weighted through a rules-based methodology that seeks to:
| 1) | Deliberately Allocate Risks by balancing risk across property types and selecting U.S. REITs with income and growth potential. |
| 2) | Improve Diversification by reducing concentration at the property type and individual company levels. |
| 3) | Enhance Return Potential by selecting companies with a favorable combination of high quality (50%), high momentum (30%), and low valuation (20%) investment factors. |
| 4) | Maintain Consistency by reapplying the index methodology twice a year in March and September to maintain intended investment exposures. |
The Fund returned 11.75% at net asset value (“NAV”) for the fiscal year ending September 30, 2019 as compared to Hartford Risk-Optimized Multifactor US REIT Index which returned 12.25% for the same period. The difference in returns between the Fund and the Index was primarily the result of the Fund’s transaction costs and operating expenses that are not reflected in the Index’s results. Futures contracts are used to equitize dividend receivables and cash during Fund rebalancing. The use of derivatives did not have a material impact on performance during the period.
Important Risks
Investing involves risk, including the possible loss of principal. Security prices fluctuate in value depending on general market and economic conditions and the prospects of individual companies.• A concentration in real estate securities, such as REITs, may subject a fund to risks associated with the direct ownership of real estate as well as the risks related to the way real estate companies are organized and operated. Real estate is sensitive to changes in interest rates and general and local economic conditions and developments.• The Fund may invest in a smaller number of issuers, so it may be more exposed to risks and volatility than a more broadly diversified fund.• The Fund is not actively managed but rather attempts to track the performance of an index. The Fund’s returns may diverge from that of the index.
Composition by Sector(1)
as of September 30, 2019
| | | | |
| Sector | | Percentage of
Net Assets | |
Equity Securities | | | | |
Real Estate | | | 99.4 | % |
Short-Term Investments | | | 0.1 | |
Other Assets & Liabilities | | | 0.5 | |
| | | | |
Total | | | 100.0 | % |
| | | | |
| (1) | A sector may be comprised of several industries. For Fund compliance purposes, the Fund may not use the same classification system. These sector classifications are used for financial reporting purposes. |
|
| Hartford Multifactor US Equity ETF |
Fund Overview
September 30, 2019 (Unaudited)
| | |
Inception 2/25/2015 (sub-advised by Mellon Investments Corporation) | | Investment objective – The Fund seeks to provide investment results that, before fees and expenses, correspond to the total return performance of an index that tracks the performance of exchange traded U.S. equity securities. |
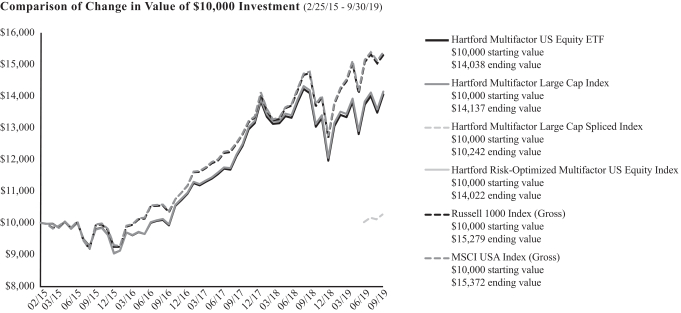
The chart above represents the hypothetical growth of a $10,000 investment in the Fund. The difference in returns between the Fund and the Index was primarily the result of the Fund’s operating expenses, including transaction costs, that are not reflected in the Index’s results.
Average Annual Total Returns
for the Periods Ending 09/30/2019
| | | | | | | | |
| | | 1 Year | | | Since
Inception | |
Multifactor US Equity ETF (NAV Return) | | | -0.31% | | | | 7.66% | 1 |
Multifactor US Equity ETF (Market Price Return) | | | -0.31% | | | | 7.66% | 1 |
Hartford Multifactor Large Cap Index | | | — | | | | 2.42% | 2 |
Hartford Multifactor Large Cap Spliced Index3 | | | -0.26% | | | | 7.82% | 1 |
Hartford Risk-Optimized Multifactor US Equity Index | | | -1.07% | | | | 7.63% | 1 |
Russell 1000 Index (Gross) | | | 3.87% | | | | 9.67% | 1 |
MSCI USA Index (Gross) | | | 4.14% | | | | 9.81% | 1 |
| 3 | The performance of the Hartford Multifactor Large Cap Spliced Index reflects the performance of the Hartford Risk-Optimized Multifactor US Equity Index through 09/11/2019, and the performance of the Hartford Multifactor Large Cap Index for the period from 09/11/2019 through 09/30/2019. |
Information regarding how often shares of the Fund traded on NYSE Arca at a price above (i.e., at a premium) or below (i.e., at a discount) the NAV of the Fund can be found at hartfordfunds.com.
PERFORMANCE DATA QUOTED REPRESENTS PAST PERFORMANCE AND DOES NOT GUARANTEE FUTURE RESULTS. The investment return and principal value of the investment will fluctuate so that investors’ shares, when redeemed or sold, may be worth more or less than their original cost. The table does not reflect the deductions of taxes that a shareholder would pay on Fund distributions or the redemption or sale of Fund shares. Current performance may be lower or higher than the performance data quoted. To obtain performance data current to the most recent month-end, please visit our website hartfordfunds.com.
Total returns are calculated using the daily 4:00 pm net asset value (NAV). Market price returns reflect the midpoint of the bid/ask spread as of the close of trading on the exchange where Fund shares are listed. Market price returns do not represent the returns you would receive if you traded shares at other times.
The Fund’s Shares are bought and sold at market price (not NAV) and are not individually redeemed from the Fund. Owners of the Shares may acquire those Shares from the Fund and tender those shares for redemption to the Fund in Creation Unit aggregations only, typically consisting of 50,000 Shares.
The index is unmanaged, and its results include reinvested dividends and/or distributions, but do not reflect the effect of sales charges, commissions, expenses or taxes.
Effective September 11, 2019, the Fund changed its proprietary custom benchmark index from Hartford Risk-Optimized Multifactor US Equity Index to Hartford Multifactor Large Cap Index and its underlying reference index because Lattice, the Fund’s investment adviser, believes that the new index better reflects the Fund’s revised investment strategy. Performance information prior to September 11, 2019 reflects the Fund’s performance when it tracked its prior index.
You cannot invest directly in an index.
See “Benchmark Glossary” for a detailed list of benchmarks and descriptions used in this report.
The total annual fund operating expense ratio as shown in the Fund’s most recent prospectus was 0.19%. Actual expenses may be higher or lower. Please see the accompanying Financial Highlights for expense ratios for the period ended September 30, 2019.
|
| Hartford Multifactor US Equity ETF |
Fund Overview – (continued)
September 30, 2019 (Unaudited)
Hartford Multifactor US Equity ETF (“the Fund”) seeks to provide investment results that, before fees and expenses, correspond to the total return performance of Hartford Multifactor Large Cap Index (LROUSLX) (“the Index”), which tracks the performance of large-cap exchange-traded U.S. equity securities.
The Fund seeks to generate returns by investing in index constituents that are selected and weighted through a rules-based methodology that seeks to:
| 1) | Deliberately Allocate Risks by allocating capital deeper in the U.S. large cap universe toward companies with more favorable risk/reward potential while explicitly seeking to reduce volatility and drawdown risk. |
| 2) | Improve Diversification by providing diversified exposure across the U.S. large cap universe, beyond mega-caps. |
| 3) | Enhance Return Potential by selecting companies with a favorable combination of low valuation (50%), high momentum (30%), and high quality (20%) investment factors. |
| 4) | Maintain Consistency by reapplying the index methodology twice a year in March and September to maintain intended investment exposures. |
The Fund returned -0.31% at net asset value (“NAV”) for the fiscal year ending September 30, 2019 as compared to Hartford Multifactor Large Cap Spliced Index which returned-0.26% for the same period. The difference in returns between the Fund and the Index was primarily the result of the Fund’s transaction costs and operating expenses that are not reflected in the Index’s results. Futures contracts are used to equitize dividend receivables and cash during Fund rebalancing. The use of derivatives did not have a material impact on performance during the period.
Important Risks
Investing involves risk, including the possible loss of principal. Security prices fluctuate in value depending on general market and economic conditions and the prospects of individual companies.•Investments focused in a sector, industry or group of industries may increase volatility and risk.•The Fund is not actively managed but rather attempts to track the performance of an index. The Fund’s returns may diverge from that of the index.
Composition by Sector(1)
as of September 30, 2019
| | | | |
| Sector | | Percentage of
Net Assets | |
Equity Securities | | | | |
Communication Services | | | 7.4 | % |
Consumer Discretionary | | | 8.3 | |
Consumer Staples | | | 8.6 | |
Energy | | | 2.4 | |
Financials | | | 15.6 | |
Health Care | | | 15.1 | |
Industrials | | | 7.6 | |
Information Technology | | | 19.9 | |
Materials | | | 3.1 | |
Real Estate | | | 5.6 | |
Utilities | | | 5.2 | |
| | | | |
Total | | | 98.8 | % |
| | | | |
Short-Term Investments | | | 0.1 | |
Other Assets & Liabilities | | | 1.1 | |
| | | | |
Total | | | 100.0 | % |
| | | | |
| (1) | A sector may be comprised of several industries. For Fund compliance purposes, the Fund may not use the same classification system. These sector classifications are used for financial reporting purposes. |
|
| Hartford Multifactor ETFs |
Benchmark Glossary (Unaudited)
Below are descriptions of each Index referenced in this report.
Hartford Multifactor Emerging Markets Equity Index seeks to enhance return potential available from investment in emerging market companies while reducing volatility by up to fifteen-percent over a complete market cycle.
Hartford Multifactor Large Cap Index seeks to enhance return potential available from investment in the initial capitalization-weighted universe while reducing volatility by up to fifteen-percent over a complete market cycle.
Hartford Multifactor Low Volatility International Equity Indexseeks to address risks and opportunities within developed (excluding the U.S.) and emerging market stocks by selecting equity securities exhibiting low volatility and constructing the portfolio in a way that is designed to improve overall exposure to value, momentum, quality and size factors.
Hartford Multifactor Low Volatility US Equity Indexseeks to address risks and opportunities within U.S. equities across the capitalization spectrum by selecting equity securities exhibiting low volatility and constructing the portfolio in a way that is designed to improve overall exposure to value, momentum and quality factors.
Hartford Risk-Optimized Multifactor Developed Markets(ex-US) Indexseeks to address risks and opportunities within developed market stocks located outside the United States by selecting equity securities exhibiting a favorable combination of factors, including value, momentum, and quality.
Hartford Risk-Optimized Multifactor Emerging Markets Index seeks to balance risks within and across the equity markets of emerging economies while emphasizing constituents exhibiting a favorable combination of factor characteristics.
Hartford Risk-Optimized Multifactor Global Small Cap Index seeks to address risks and opportunities within global small cap stocks by selecting equity securities of companies domiciled within the global small cap equity universe and exhibiting a favorable combination of factors, including value, momentum, and quality.
Hartford Risk-Optimized Multifactor REIT Indexseeks to address risks and opportunities withinU.S.-focused equity Real Estate Investment Trusts (REITs) by selecting securities with a favorable combination of factors, including quality, momentum, and value.
Hartford Risk-Optimized Multifactor US Equity Index seeks to improve returns through a market cycle relative to traditionalcap-weighted U.S. large cap market indices and active U.S. large cap market strategies.
These indices are unmanaged, and their results include reinvested dividends and/or distributions, but do not reflect the effect of sales charges, commissions, expenses or taxes.
MSCI ACWI ex USA Index (Net)(reflects reinvested dividends net of withholding taxes but reflects no deduction for fees, expenses or other taxes) is designed to capture large and mid cap representation across developed markets (excluding the United States) and emerging market countries.
MSCI ACWI Small Cap Index (Net)(reflects reinvested dividends net of withholding taxes but reflects no deduction for fees, expenses or other
taxes) is designed to capture small cap representation across developed markets and emerging markets countries.
MSCI Emerging Markets Index (Net)(reflects reinvested dividends net of withholding taxes but reflects no deduction for fees, expenses or other taxes) is designed to capture large and mid cap representation across emerging market countries.
MSCI USA Index (Gross) (reflects no deduction for fees, expenses or taxes) is a free float-adjusted market capitalization index that is designed to measure the performance of the large and mid cap segments of the U.S. market.
MSCI US REIT Index (Gross) (reflects no deduction for fees, expenses or taxes) is a free float-adjusted market capitalization weighted index that is comprised of equity REITs.
MSCI USA IMI (Gross) (reflects no deduction for fees, expenses or taxes) is designed to measure the performance of the large, mid and small cap segments of the U.S. market.
MSCI World ex USA Index (Net)(reflects reinvested dividends net of withholding taxes but reflects no deduction for fees, expenses or other taxes) is a free float-adjusted market capitalization index that is designed to capture large and mid cap representation across developed markets countries – excluding the United States.
Neither MSCI nor any other party involved in or related to compiling, computing or creating the MSCI data makes any express or implied warranties or representations with respect to such data (or the results to be obtained by the use thereof), and all such parties hereby expressly disclaim all warranties of originality, accuracy, completeness, merchantability or fitness for a particular purpose with respect to any of such data. Without limiting any of the foregoing, in no event shall MSCI, any of its affiliates or any third party involved in or related to compiling, computing or creating the data have any liability for any direct, indirect, special, punitive, consequential or any other damages (including lost profits) even if notified of the possibility of such damages. No further distribution or dissemination of the MSCI data is permitted without MSCI’s express written consent.
Russell 1000 Index (Gross) (reflects no deduction for fees, expenses or taxes) is designed to measure the performance of the 1,000 largest companies in the Russell 3000 Index. The Russell 3000 Index is designed to measure the performance of the 3,000 largest U.S. companies based on total market capitalizations.
|
| Hartford Multifactor ETFs |
Expense Examples (Unaudited)
Your Fund’s Expenses
As a shareholder of a Fund, you incur two types of costs: (1) transaction costs, including brokerage commissions paid on purchases and sales of Fund shares and (2) ongoing costs, including investment management fees and certain other fund expenses. This example is intended to help you understand your ongoing costs (in dollars) of investing in a Fund and to compare these costs with the ongoing costs of investing in other exchange-traded funds. The example is based on an investment of $1,000 invested at the beginning of the period and held for the entire period of April 1, 2019 through September 30, 2019. To the extent a Fund was subject to acquired fund fees and expenses during the period, acquired fund fees and expenses are not included in the annualized expense ratio below.
Actual Expenses
The first set of columns of the table below provides information about actual account values and actual expenses. You may use this information, together with the amount you invested, to estimate the expenses that you paid over the period. Simply divide your account value by $1,000 (for example, an $8,600 account value divided by $1,000 = 8.6), then multiply the result by the number in the line under the heading entitled “Expenses Paid During the Period” to estimate the expenses you paid on your account during this period.
Hypothetical Example for Comparison Purposes
The second set of columns of the table below provides information about hypothetical account values and hypothetical expenses based on a Fund’s actual expense ratio and an assumed rate of return of 5% per year before expenses, which is not the Fund’s actual return. The hypothetical account values and expenses may not be used to estimate the actual ending account balance or expenses you paid for the period. You may use this information to compare the ongoing costs of investing in a Fund and other funds. To do so, compare this 5% hypothetical example with the 5% hypothetical examples that appear in the shareholder reports of the other funds.
Please note that the expenses shown in the table are meant to highlight your ongoing costs only and do not reflect any transactional costs, such as brokerage commissions paid on purchases and sales of shares of the Funds. Therefore, the second set of columns of the table is useful in comparing ongoing costs only, and will not help you determine the relative total costs of owning different exchange-traded funds. In addition, if these transactional costs were included, your costs would be higher. Expense ratios may vary period to period because of various factors, such as an increase in expenses not covered by the management fee (including extraordinary expenses and interest expense). Expenses are equal to a Fund’s annualized expense ratio multiplied by average account value over the period, multiplied by 183/365 (to reflect the one-half year period).
| | | | | | | | | | | | | | | | | | | | | | | | | | | | |
| | | Actual Return | | | Hypothetical (5% return before expenses) | |
| | | Beginning
Account Value
April 1, 2019 | | | Ending
Account Value
September 30, 2019 | | | Expenses paid
during the period
April 1, 2019
through
September 30, 2019 | | | Beginning
Account Value
April 1, 2019 | | | Ending
Account Value
September 30, 2019 | | | Expenses paid
during the period
April 1, 2019
through
September 30, 2019 | | | Annualized
expense
ratio | |
Hartford Multifactor Developed Markets (ex-US) ETF | |
| | | | | | | |
| | $ | 1,000.00 | | | $ | 1,005.40 | | | $ | 1.46 | | | $ | 1,000.00 | | | $ | 1,023.62 | | | $ | 1.47 | | | | 0.29 | % |
|
Hartford Multifactor Emerging Markets ETF | |
| | | | | | | |
| | $ | 1,000.00 | | | $ | 962.20 | | | $ | 2.41 | | | $ | 1,000.00 | | | $ | 1,022.61 | | | $ | 2.48 | | | | 0.49 | % |
|
Hartford Multifactor Global Small Cap ETF | |
| | | | | | | |
| | $ | 1,000.00 | | | $ | 978.30 | | | $ | 1.93 | | | $ | 1,000.00 | | | $ | 1,023.11 | | | $ | 1.98 | | | | 0.39 | % |
|
Hartford Multifactor Low Volatility International Equity ETF | |
| | | | | | | |
| | $ | 1,000.00 | | | $ | 1,023.60 | | | $ | 1.47 | | | $ | 1,000.00 | | | $ | 1,023.62 | | | $ | 1.47 | | | | 0.29 | % |
|
Hartford Multifactor Low Volatility US Equity ETF | |
| | | | | | | |
| | $ | 1,000.00 | | | $ | 1,086.10 | | | $ | 0.99 | | | $ | 1,000.00 | | | $ | 1,024.12 | | | $ | 0.96 | | | | 0.19 | % |
|
Hartford Multifactor REIT ETF | |
| | | | | | | |
| | $ | 1,000.00 | | | $ | 1,065.80 | | | $ | 2.33 | | | $ | 1,000.00 | | | $ | 1,022.81 | | | $ | 2.28 | | | | 0.45 | % |
|
Hartford Multifactor US Equity ETF | |
| | | | | | | |
| | $ | 1,000.00 | | | $ | 1,053.40 | | | $ | 0.98 | | | $ | 1,000.00 | | | $ | 1,024.12 | | | $ | 0.96 | | | | 0.19 | % |
|
| Hartford Multifactor Developed Markets (ex-US) ETF |
Schedule of Investments
September 30, 2019
| | | | | | | | | | |
| Shares or Principal Amount | | Market Value† | |
| COMMON STOCKS - 99.4% | | | |
| | | | | | Australia - 8.4% | |
| | | 741,274 | | | AGL Energy Ltd. | | $ | 9,579,083 | |
| | | 460,274 | | | Amcor plc | | | 4,423,652 | |
| | | 183,420 | | | Ansell Ltd. | | | 3,390,825 | |
| | | 450,631 | | | Aurizon Holdings Ltd. | | | 1,793,175 | |
| | | 337,938 | | | AusNet Services | | | 413,679 | |
| | | 284,248 | | | Australia & New Zealand Banking Group Ltd. | | | 5,467,598 | |
| | | 856,822 | | | Bendigo & Adelaide Bank Ltd. | | | 6,639,881 | |
| | | 368,525 | | | BHP Group Ltd. | | | 9,126,816 | |
| | | 812,518 | | | Caltex Australia Ltd. | | | 14,423,429 | |
| | | 416,250 | | | CIMIC Group Ltd. | | | 8,829,265 | |
| | | 870,412 | | | Coca-Cola Amatil Ltd. | | | 6,252,074 | |
| | | 42,532 | | | Cochlear Ltd. | | | 5,970,928 | |
| | | 170,453 | | | Coles Group Ltd. | | | 1,770,415 | |
| | | 109,917 | | | Commonwealth Bank of Australia | | | 5,992,211 | |
| | | 38,030 | | | CSL Ltd. | | | 5,993,991 | |
| | | 741,927 | | | Dexus REIT | | | 5,969,683 | |
| | | 1,250,406 | | | GPT Group REIT | | | 5,194,950 | |
| | | 355,422 | | | Insurance Australia Group Ltd. | | | 1,893,743 | |
| | | 32,422 | | | Macquarie Group Ltd. | | | 2,866,328 | |
| | | 2,563,671 | | | Mirvac Group REIT | | | 5,290,946 | |
| | | 158,029 | | | National Australia Bank Ltd. | | | 3,165,504 | |
| | | 934,738 | | | Orora Ltd. | | | 1,821,954 | |
| | | 1,865,428 | | | Qantas Airways Ltd. | | | 7,913,685 | |
| | | 58,192 | | | Ramsay Health Care Ltd. | | | 2,545,991 | |
| | | 2,991,005 | | | Scentre Group REIT | | | 7,927,921 | |
| | | 333,722 | | | Sonic Healthcare Ltd. | | | 6,313,459 | |
| | | 759,883 | | | South32 Ltd. | | | 1,342,758 | |
| | | 700,648 | | | Stockland REIT | | | 2,150,111 | |
| | | 102,343 | | | Suncorp Group Ltd.* | | | 942,198 | |
| | | 3,006,448 | | | Telstra Corp. Ltd. | | | 7,117,221 | |
| | | 2,637,417 | | | Vicinity Centres REIT | | | 4,571,530 | |
| | | 4,853,237 | | | Viva Energy Group Ltd.(1) | | | 6,382,866 | |
| | | 42,471 | | | Washington H Soul Pattinson & Co., Ltd. | | | 602,395 | |
| | | 653,565 | | | Wesfarmers Ltd. | | | 17,543,712 | |
| | | 144,732 | | | Westpac Banking Corp. | | | 2,893,293 | |
| | | 524,886 | | | Whitehaven Coal Ltd. | | | 1,100,969 | |
| | | 420,815 | | | Woolworths Group Ltd. | | | 10,580,757 | |
| | | | | | | | | | |
| | | | | | | | | 196,198,996 | |
| | | | | | | | | | |
| | | | | | Austria - 0.3% | |
| | | 68,228 | | | BAWAG Group AG*(1) | | | 2,686,683 | |
| | | 15,366 | | | Lenzing AG | | | 1,480,040 | |
| | | 14,073 | | | Oesterreichische Post AG | | | 494,025 | |
| | | 17,671 | | | OMV AG | | | 948,605 | |
| | | 138,802 | | | UNIQA Insurance Group AG | | | 1,253,702 | |
| | | | | | | | | | |
| | | | | | | | | 6,863,055 | |
| | | | | | | | | | |
| | | | | | Belgium - 2.0% | |
| | | 13,140 | | | Ackermans & van Haaren N.V. | | | 1,996,936 | |
| | | 161,778 | | | Ageas | | | 8,973,724 | |
| | | 186,646 | | | Colruyt S.A. | | | 10,231,047 | |
| | | 20,732 | | | Elia System Operator S.A. | | | 1,695,152 | |
| | | 407,469 | | | Proximus SADP | | | 12,105,067 | |
| | | 11,640 | | | Sofina S.A. | | | 2,588,745 | |
| | | 89,063 | | | Telenet Group Holding N.V. | | | 4,204,277 | |
| | | 52,332 | | | UCB S.A. | | | 3,799,686 | |
| | | | | | | | | | |
| | | | | | | | | 45,594,634 | |
| | | | | | | | | | |
| | | | | | Canada - 11.4% | |
| | | 131,291 | | | Air Canada* | | | 4,284,807 | |
| | | 260,544 | | | Alimentation Couche-Tard, Inc. Class B | | | 7,989,491 | |
| | | 63,090 | | | Atco Ltd. Class I | | | 2,310,123 | |
| | | 207,166 | | | Bank of Montreal | | | 15,268,322 | |
| | | 109,867 | | | Bank of Nova Scotia | | | 6,244,329 | |
| | | 197,808 | | | BCE, Inc. | | | 9,573,668 | |
| | | | | | | | | | |
| Shares or Principal Amount | | Market Value† | |
| COMMON STOCKS - 99.4% - (continued) | | | |
| | | | | | Canada - 11.4% - (continued) | |
| | | 161,378 | | | Canadian Apartment Properties REIT | | $ | 6,639,169 | |
| | | 16,713 | | | Canadian Imperial Bank of Commerce | | | 1,379,832 | |
| | | 43,413 | | | Canadian Tire Corp. Ltd. Class A | | | 4,874,782 | |
| | | 53,260 | | | Canadian Utilities Ltd. Class A | | | 1,570,848 | |
| | | 212,848 | | | Capital Power Corp. | | | 4,932,158 | |
| | | 170,038 | | | CGI, Inc.* | | | 13,454,064 | |
| | | 3,284 | | | Constellation Software, Inc. | | | 3,281,892 | |
| | | 67,842 | | | Emera, Inc. | | | 2,980,129 | |
| | | 379,983 | | | Empire Co., Ltd. Class A | | | 10,294,555 | |
| | | 3,576 | | | Fairfax Financial Holdings Ltd. | | | 1,577,329 | |
| | | 34,489 | | | Fortis, Inc. | | | 1,459,010 | |
| | | 123,702 | | | George Weston Ltd. | | | 10,413,765 | |
| | | 509,642 | | | Great-West Lifeco, Inc. | | | 12,244,495 | |
| | | 148,525 | | | Husky Energy, Inc. | | | 1,045,508 | |
| | | 555,516 | | | Hydro One Ltd.(1) | | | 10,275,368 | |
| | | 126,384 | | | iA Financial Corp., Inc. | | | 5,755,054 | |
| | | 91,494 | | | Imperial Oil Ltd. | | | 2,384,096 | |
| | | 53,471 | | | Intact Financial Corp. | | | 5,385,063 | |
| | | 153,907 | | | Loblaw Cos., Ltd. | | | 8,771,769 | |
| | | 19,045 | | | Magna International, Inc. | | | 1,015,829 | |
| | | 350,741 | | | Manulife Financial Corp. | | | 6,437,316 | |
| | | 145,618 | | | Metro, Inc. | | | 6,415,331 | |
| | | 28,178 | | | National Bank of Canada | | | 1,402,941 | |
| | | 15,745 | | | Onex Corp. | | | 976,689 | |
| | | 28,804 | | | Open Text Corp. | | | 1,175,656 | |
| | | 211,087 | | | Parkland Fuel Corp. | | | 6,774,235 | |
| | | 308,671 | | | Power Corp. of Canada | | | 7,115,286 | |
| | | 501,042 | | | Power Financial Corp. | | | 11,625,385 | |
| | | 10,323 | | | Quebecor, Inc. Class B | | | 234,529 | |
| | | 209,830 | | | RioCan Real Estate Investment Trust REIT | | | 4,180,752 | |
| | | 170,833 | | | Rogers Communications, Inc. Class B | | | 8,326,173 | |
| | | 169,500 | | | Royal Bank of Canada | | | 13,758,433 | |
| | | 97,910 | | | Saputo, Inc. | | | 3,011,250 | |
| | | 123,886 | | | Shaw Communications, Inc. Class B | | | 2,435,614 | |
| | | 304,263 | | | Sun Life Financial, Inc. | | | 13,613,701 | |
| | | 121,837 | | | Suncor Energy, Inc. | | | 3,845,595 | |
| | | 30,553 | | | TC Energy Corp. | | | 1,583,033 | |
| | | 223,433 | | | TELUS Corp. | | | 7,956,847 | |
| | | 31,755 | | | Thomson Reuters Corp. | | | 2,123,774 | |
| | | 38,605 | | | Toromont Industries Ltd. | | | 1,866,103 | |
| | | 91,511 | | | Toronto-Dominion Bank | | | 5,339,294 | |
| | | | | | | | | | |
| | | | | | | | | 265,603,392 | |
| | | | | | | | | | |
| | | | | | China - 0.2% | |
| | | 597,500 | | | Kerry Logistics Network Ltd. | | | 955,768 | |
| | | 6,526,000 | | | Yangzijiang Shipbuilding Holdings Ltd. | | | 4,530,306 | |
| | | | | | | | | | |
| | | | | | | | | 5,486,074 | |
| | | | | | | | | | |
| | | | | | Denmark - 1.9% | |
| | | 84 | | | Carlsberg A/S Class B | | | 12,419 | |
| | | 36,867 | | | Coloplast A/S Class B | | | 4,441,126 | |
| | | 14,115 | | | GN Store Nord A/S | | | 573,170 | |
| | | 211,251 | | | H. Lundbeck A/S | | | 7,008,232 | |
| | | 133,171 | | | ISS A/S | | | 3,295,951 | |
| | | 269,358 | | | Novo Nordisk A/S Class B | | | 13,850,292 | |
| | | 56,851 | | | Orsted A/S(1) | | | 5,284,527 | |
| | | 15,836 | | | Pandora A/S | | | 635,655 | |
| | | 13,629 | | | Rockwool International A/S Class B | | | 2,726,377 | |
| | | 80,632 | | | Topdanmark A/S | | | 3,892,348 | |
| | | 97,162 | | | Tryg A/S | | | 2,784,954 | |
| | | | | | | | | | |
| | | | | | | | | 44,505,051 | |
| | | | | | | | | | |
| | | | | | Finland - 0.6% | |
| | | 38,224 | | | Elisa Oyj | | | 1,971,076 | |
| | | 24,803 | | | Kesko Oyj Class B | | | 1,567,252 | |
| | | 32,855 | | | Kone Oyj Class B | | | 1,871,159 | |
The accompanying notes are an integral part of these financial statements.
|
| Hartford Multifactor Developed Markets (ex-US) ETF |
Schedule of Investments – (continued)
September 30, 2019
| | | | | | | | | | |
| Shares or Principal Amount | | Market Value† | |
| COMMON STOCKS - 99.4% - (continued) | | | |
| | | | | | Finland - 0.6% - (continued) | |
| | | 36,015 | | | Neste Oyj | | $ | 1,192,434 | |
| | | 49,948 | | | Orion Oyj Class B | | | 1,863,392 | |
| | | 98,005 | | | Sampo Oyj Class A | | | 3,897,707 | |
| | | 75,107 | | | Tieto Oyj | | | 1,924,218 | |
| | | 36,526 | | | Valmet Oyj | | | 709,206 | |
| | | | | | | | | | |
| | | | | | | | | 14,996,444 | |
| | | | | | | | | | |
| | | | | | France - 6.0% | |
| | | 33,814 | | | Air Liquide S.A. | | | 4,814,441 | |
| | | 128,834 | | | Alstom S.A. | | | 5,341,496 | |
| | | 6,877 | | | Arkema S.A. | | | 641,169 | |
| | | 99,442 | | | AXA S.A. | | | 2,540,085 | |
| | | 43,009 | | | BioMerieux | | | 3,558,830 | |
| | | 449,006 | | | Bouygues S.A. | | | 17,989,356 | |
| | | 56,453 | | | Cie de Saint-Gobain | | | 2,215,622 | |
| | | 95,278 | | | Cie Generale des Etablissements Michelin SCA | | | 10,636,499 | |
| | | 276,140 | | | CNP Assurances | | | 5,337,577 | |
| | | 18,529 | | | Covivio REIT | | | 1,961,450 | |
| | | 4,877 | | | Eiffage S.A. | | | 505,744 | |
| | | 24,952 | | | Eurazeo SE | | | 1,856,582 | |
| | | 38,150 | | | Ipsen S.A. | | | 3,622,587 | |
| | | 21,228 | | | Klepierre S.A. REIT | | | 721,128 | |
| | | 137,266 | | | Korian S.A. | | | 5,644,699 | |
| | | 7,034 | | | L’Oreal S.A. | | | 1,970,029 | |
| | | 42,414 | | | Nexity S.A. | | | 2,019,752 | |
| | | 416,107 | | | Orange S.A. | | | 6,530,145 | |
| | | 95,030 | | | Peugeot S.A. | | | 2,370,407 | |
| | | 55,415 | | | Rubis SCA | | | 3,220,036 | |
| | | 115,252 | | | Sanofi | | | 10,687,595 | |
| | | 13,878 | | | Sartorius Stedim Biotech | | | 1,942,666 | |
| | | 3,468 | | | Schneider Electric SE | | | 304,355 | |
| | | 270,974 | | | SCOR SE | | | 11,193,305 | |
| | | 35,596 | | | Sodexo S.A. | | | 3,997,096 | |
| | | 640,408 | | | Suez | | | 10,071,141 | |
| | | 35,808 | | | Thales S.A. | | | 4,118,496 | |
| | | 238,892 | | | TOTAL S.A. | | | 12,471,171 | |
| | | 56,397 | | | Veolia Environnement S.A. | | | 1,430,118 | |
| | | | | | | | | | |
| | | | | | | | | 139,713,577 | |
| | | | | | | | | | |
| | | | | | Germany - 6.0% | |
| | | 98,877 | | | 1&1 Drillisch AG | | | 3,082,957 | |
| | | 43,753 | | | Allianz SE | | | 10,200,541 | |
| | | 286,685 | | | Alstria Office AG REIT | | | 4,919,442 | |
| | | 1,156,050 | | | Aroundtown S.A. | | | 9,457,483 | |
| | | 14,071 | | | BASF SE | | | 983,614 | |
| | | 13,918 | | | Bayerische Motoren Werke AG | | | 980,050 | |
| | | 15,987 | | | Carl Zeiss Meditec AG | | | 1,823,076 | |
| | | 125,605 | | | Covestro AG(1) | | | 6,216,829 | |
| | | 656,431 | | | Deutsche Telekom AG | | | 11,016,577 | |
| | | 60,274 | | | DWS Group GmbH & Co. KGaA(1) | | | 1,782,074 | |
| | | 133,146 | | | Evonik Industries AG | | | 3,287,778 | |
| | | 56,589 | | | Hannover Rueck SE | | | 9,568,634 | |
| | | 34,212 | | | HeidelbergCement AG | | | 2,473,598 | |
| | | 23,279 | | | Hochtief AG | | | 2,654,618 | |
| | | 67,350 | | | Knorr-Bremse AG | | | 6,332,169 | |
| | | 22,922 | | | LEG Immobilien AG | | | 2,623,904 | |
| | | 150,435 | | | Merck KGaA | | | 16,949,836 | |
| | | 647,021 | | | Metro AG | | | 10,213,934 | |
| | | 48,926 | | | Muenchener Rueckversicherungs-Gesellschaft AG in Muenchen | | | 12,662,707 | |
| | | 15,341 | | | Rheinmetall AG | | | 1,940,908 | |
| | | 311,983 | | | Siemens Healthineers AG(1) | | | 12,276,769 | |
| | | 83,428 | | | Talanx AG* | | | 3,605,385 | |
| | | 1,059,290 | | | Telefonica Deutschland Holding AG | | | 2,954,075 | |
| | | 61,511 | | | Vonovia SE | | | 3,121,610 | |
| | | | | | | | | | |
| | | | | | | | | 141,128,568 | |
| | | | | | | | | | |
| | | | | | | | | | |
| Shares or Principal Amount | | Market Value† | |
| COMMON STOCKS - 99.4% - (continued) | | | |
| | | | | | Hong Kong - 4.1% | |
| | | 2,745,688 | | | Champion REIT | | $ | 1,775,728 | |
| | | 1,021,320 | | | Chow Tai Fook Jewellery Group Ltd. | | | 842,914 | |
| | | 378,000 | | | CK Hutchison Holdings Ltd. | | | 3,336,684 | |
| | | 629,980 | | | CLP Holdings Ltd. | | | 6,617,707 | |
| | | 357,433 | | | Dairy Farm International Holdings Ltd. | | | 2,251,828 | |
| | | 217,810 | | | Hang Seng Bank Ltd. | | | 4,695,498 | |
| | | 913,000 | | | Henderson Land Development Co., Ltd. | | | 4,250,899 | |
| | | 3,389,609 | | | HK Electric Investments & HK Electric Investments Ltd. | | | 3,229,887 | |
| | | 38,800 | | | Hong Kong & China Gas Co., Ltd. | | | 75,626 | |
| | | 1,111,184 | | | Hongkong Land Holdings Ltd. | | | 6,244,854 | |
| | | 702,000 | | | Hysan Development Co., Ltd. | | | 2,829,706 | |
| | | 81,526 | | | Jardine Matheson Holdings Ltd. | | | 4,361,641 | |
| | | 25,485 | | | Jardine Strategic Holdings Ltd. | | | 761,492 | |
| | | 799,188 | | | Link REIT | | | 8,813,149 | |
| | | 3,597,000 | | | New World Development Co., Ltd. | | | 4,670,952 | |
| | | 941,000 | | | NWS Holdings Ltd. | | | 1,457,221 | |
| | | 7,128,575 | | | PCCW Ltd. | | | 4,001,037 | |
| | | 167,000 | | | Power Assets Holdings Ltd. | | | 1,121,585 | |
| | | 1,980,000 | | | Sino Land Co., Ltd. | | | 2,975,279 | |
| | | 1,805,000 | | | SITC International Holdings Co., Ltd. | | | 1,860,398 | |
| | | 173,000 | | | Sun Hung Kai Properties Ltd. | | | 2,489,272 | |
| | | 728,000 | | | Swire Pacific Ltd. Class A | | | 6,774,447 | |
| | | 620,600 | | | Swire Properties Ltd. | | | 1,947,440 | |
| | | 300,235 | | | VTech Holdings Ltd. | | | 2,617,683 | |
| | | 7,486,792 | | | WH Group Ltd.(1) | | | 6,704,248 | |
| | | 644,000 | | | Wharf Real Estate Investment Co., Ltd. | | | 3,515,983 | |
| | | 1,733,111 | | | Yue Yuen Industrial Holdings Ltd. | | | 4,742,102 | |
| | | | | | | | | | |
| | | | | | | | | 94,965,260 | |
| | | | | | | | | | |
| | | | | | Ireland - 0.7% | |
| | | 23,094 | | | CRH plc | | | 795,344 | |
| | | 210,627 | | | Glanbia plc | | | 2,617,731 | |
| | | 69,654 | | | ICON plc* | | | 10,262,820 | |
| | | 17,634 | | | Kerry Group plc Class A | | | 2,062,798 | |
| | | | | | | | | | |
| | | | | | | | | 15,738,693 | |
| | | | | | | | | | |
| | | | | | Israel - 1.8% | |
| | | 127,003 | | | Bank Hapoalim BM* | | | 1,001,175 | |
| | | 1,174,699 | | | Bank LeumiLe-Israel BM | | | 8,361,256 | |
| | | 861,291 | | | Israel Chemicals Ltd. | | | 4,276,967 | |
| | | 2,839,566 | | | Israel Discount Bank Ltd. Class A | | | 12,491,215 | |
| | | 384,642 | | | Mizrahi Tefahot Bank Ltd. | | | 9,561,272 | |
| | | 60,028 | | | Strauss Group Ltd. | | | 1,880,732 | |
| | | 46,958 | | | Taro Pharmaceutical Industries Ltd. | | | 3,542,981 | |
| | | | | | | | | | |
| | | | | | | | | 41,115,598 | |
| | | | | | | | | | |
| | | | | | Italy - 2.9% | |
| | | 1,751,502 | | | A2A S.p.A. | | | 3,215,576 | |
| | | 27,839 | | | ACEA S.p.A. | | | 556,013 | |
| | | 313,758 | | | Assicurazioni Generali S.p.A. | | | 6,081,808 | |
| | | 17,631 | | | DiaSorin S.p.A. | | | 2,050,914 | |
| | | 749,996 | | | Enel S.p.A. | | | 5,601,690 | |
| | | 784,256 | | | Eni S.p.A. | | | 11,999,011 | |
| | | 1,165,239 | | | Italgas S.p.A. | | | 7,522,974 | |
| | | 389,638 | | | Pirelli & C. S.p.A.(1) | | | 2,305,724 | |
| | | 691,017 | | | Poste Italiane S.p.A.(1) | | | 7,857,405 | |
| | | 129,188 | | | Recordati S.p.A. | | | 5,543,492 | |
| | | 1,158,663 | | | Unipol Gruppo S.p.A. | | | 6,171,869 | |
| | | 2,999,986 | | | UnipolSai Assicurazioni S.p.A. | | | 7,980,226 | |
| | | | | | | | | | |
| | | | | | | | | 66,886,702 | |
| | | | | | | | | | |
| | | | | | Japan - 21.4% | |
| | | 55,105 | | | ABC-Mart, Inc. | | | 3,502,858 | |
| | | 64,859 | | | Aeon Co., Ltd. | | | 1,188,556 | |
The accompanying notes are an integral part of these financial statements.
|
| Hartford Multifactor Developed Markets (ex-US) ETF |
Schedule of Investments – (continued)
September 30, 2019
| | | | | | | | | | |
| Shares or Principal Amount | | Market Value† | |
| COMMON STOCKS - 99.4% - (continued) | | | |
| | | | | | Japan - 21.4% - (continued) | |
| | | 143,182 | | | Alfresa Holdings Corp. | | $ | 3,196,837 | |
| | | 185,641 | | | ANA Holdings, Inc. | | | 6,242,141 | |
| | | 174,688 | | | Aozora Bank Ltd. | | | 4,367,402 | |
| | | 59,394 | | | Asahi Kasei Corp. | | | 584,735 | |
| | | 492,365 | | | Astellas Pharma, Inc. | | | 7,009,054 | |
| | | 159,200 | | | Azbil Corp. | | | 4,255,645 | |
| | | 148,259 | | | Bandai Namco Holdings, Inc. | | | 9,232,321 | |
| | | 193,397 | | | Bic Camera, Inc. | | | 2,034,628 | |
| | | 330,993 | | | Bridgestone Corp. | | | 12,814,015 | |
| | | 310,600 | | | Brother Industries Ltd. | | | 5,621,407 | |
| | | 133,897 | | | Canon Marketing Japan, Inc. | | | 2,842,098 | |
| | | 330,203 | | | Canon, Inc. | | | 8,806,941 | |
| | | 147,237 | | | Dai-ichi Life Holdings, Inc. | | | 2,219,284 | |
| | | 39,500 | | | Daiichikosho Co., Ltd. | | | 1,823,780 | |
| | | 1,222,517 | | | Daiwa Securities Group, Inc. | | | 5,445,475 | |
| | | 270,320 | | | FUJIFILM Holdings Corp. | | | 11,855,811 | |
| | | 95,448 | | | Fujitsu Ltd. | | | 7,643,788 | |
| | | 317,700 | | | Hakuhodo DY Holdings, Inc. | | | 4,588,755 | |
| | | 392,400 | | | Haseko Corp. | | | 4,567,561 | |
| | | 133,100 | | | Heiwa Corp. | | | 2,740,204 | |
| | | 14,393 | | | Hikari Tsushin, Inc. | | | 3,113,656 | |
| | | 84,200 | | | Hitachi High-Technologies Corp. | | | 4,861,513 | |
| | | 181,673 | | | Hitachi Ltd. | | | 6,762,623 | |
| | | 298,000 | | | Hitachi Metals Ltd. | | | 3,215,064 | |
| | | 63,734 | | | Hitachi Transport System Ltd. | | | 1,863,515 | |
| | | 269,900 | | | Honda Motor Co., Ltd. | | | 6,988,805 | |
| | | 74,821 | | | Hoya Corp. | | | 6,105,449 | |
| | | 307,000 | | | Iida Group Holdings Co., Ltd. | | | 4,993,810 | |
| | | 451,071 | | | ITOCHU Corp. | | | 9,311,491 | |
| | | 391,293 | | | Japan Airlines Co., Ltd. | | | 11,629,268 | |
| | | 428,681 | | | Japan Post Holdings Co., Ltd. | | | 3,946,681 | |
| | | 1,202,938 | | | JXTG Holdings, Inc. | | | 5,480,700 | |
| | | 565,448 | | | K’s Holdings Corp. | | | 6,152,828 | |
| | | 164,400 | | | Kajima Corp. | | | 2,155,492 | |
| | | 81,149 | | | Kaken Pharmaceutical Co., Ltd. | | | 3,761,800 | |
| | | 31,976 | | | Kaneka Corp. | | | 995,598 | |
| | | 33,600 | | | Kansai Electric Power Co., Inc. | | | 375,717 | |
| | | 259,351 | | | KDDI Corp. | | | 6,779,242 | |
| | | 1,934,888 | | | Konica Minolta, Inc. | | | 13,463,204 | |
| | | 261,400 | | | Kyushu Railway Co. | | | 8,332,389 | |
| | | 114,422 | | | Lawson, Inc. | | | 5,854,764 | |
| | | 86,300 | | | Marubeni Corp. | | | 573,097 | |
| | | 591,400 | | | Mazda Motor Corp. | | | 5,250,505 | |
| | | 1,167,600 | | | Mebuki Financial Group, Inc. | | | 2,873,760 | |
| | | 256,750 | | | Medipal Holdings Corp. | | | 5,715,850 | |
| | | 11,216 | | | MEIJI Holdings Co., Ltd. | | | 817,785 | |
| | | 169,400 | | | Mitsubishi Chemical Holdings Corp. | | | 1,207,078 | |
| | | 129,500 | | | Mitsubishi Corp. | | | 3,176,539 | |
| | | 135,600 | | | Mitsubishi Electric Corp. | | | 1,797,335 | |
| | | 211,700 | | | Mitsubishi Heavy Industries Ltd. | | | 8,289,747 | |
| | | 33,427 | | | Mitsubishi Tanabe Pharma Corp. | | | 366,514 | |
| | | 51,100 | | | Mitsui & Co., Ltd. | | | 835,945 | |
| | | 145,017 | | | NEC Corp. | | | 6,118,691 | |
| | | 38,769 | | | NH Foods Ltd. | | | 1,558,652 | |
| | | 179,575 | | | Nihon Kohden Corp. | | | 5,275,509 | |
| | | 235,000 | | | Nikon Corp. | | | 2,931,113 | |
| | | 98,081 | | | Nippo Corp. | | | 1,814,147 | |
| | | 249,668 | | | Nippon Kayaku Co., Ltd. | | | 2,980,076 | |
| | | 198,653 | | | Nippon Telegraph & Telephone Corp. | | | 9,477,260 | |
| | | 338,070 | | | Nissan Motor Co., Ltd. | | | 2,108,656 | |
| | | 163,360 | | | NTT Data Corp. | | | 2,107,091 | |
| | | 287,724 | | | NTT DOCOMO, Inc. | | | 7,329,208 | |
| | | 278,000 | | | Obayashi Corp. | | | 2,767,782 | |
| | | 338,100 | | | ORIX Corp. | | | 5,039,825 | |
| | | 296,151 | | | Osaka Gas Co., Ltd. | | | 5,664,068 | |
| | | | | | | | | | |
| Shares or Principal Amount | | Market Value† | |
| COMMON STOCKS - 99.4% - (continued) | | | |
| | | | | | Japan - 21.4% - (continued) | |
| | | 48,204 | | | Otsuka Holdings Co., Ltd. | | $ | 1,801,935 | |
| | | 561,200 | | | Panasonic Corp. | | | 4,546,720 | |
| | | 30,866 | | | Resona Holdings, Inc. | | | 132,232 | |
| | | 196,469 | | | Ricoh Co., Ltd. | | | 1,768,812 | |
| | | 74,828 | | | Rohto Pharmaceutical Co., Ltd. | | | 2,041,110 | |
| | | 182,600 | | | Sankyo Co., Ltd. | | | 6,276,743 | |
| | | 114,268 | | | Sawai Pharmaceutical Co., Ltd. | | | 5,899,750 | |
| | | 56,200 | | | Secom Co., Ltd. | | | 5,126,251 | |
| | | 552,500 | | | Seiko Epson Corp. | | | 7,770,530 | |
| | | 126,065 | | | Sekisui Chemical Co., Ltd. | | | 1,951,485 | |
| | | 512,748 | | | Sekisui House Ltd. | | | 10,081,790 | |
| | | 141,689 | | | Seven & I Holdings Co., Ltd. | | | 5,417,154 | |
| | | 210,500 | | | SG Holdings Co., Ltd. | | | 5,151,723 | |
| | | 46,940 | | | Shimamura Co., Ltd. | | | 3,717,848 | |
| | | 20,700 | | | Shionogi & Co., Ltd. | | | 1,149,010 | |
| | | 115,100 | | | Ship Healthcare Holdings, Inc. | | | 4,893,680 | |
| | | 532,458 | | | Skylark Holdings Co., Ltd. | | | 9,685,981 | |
| | | 201,700 | | | Softbank Corp. | | | 2,732,258 | |
| | | 755,000 | | | Sojitz Corp. | | | 2,340,273 | |
| | | 49,700 | | | Sompo Holdings, Inc. | | | 2,077,214 | |
| | | 363,700 | | | Sony Financial Holdings, Inc. | | | 7,881,429 | |
| | | 363,093 | | | Subaru Corp. | | | 10,213,303 | |
| | | 21,317 | | | Sugi Holdings Co., Ltd. | | | 1,153,869 | |
| | | 156,201 | | | Sumitomo Dainippon Pharma Co., Ltd. | | | 2,565,411 | |
| | | 488,600 | | | Sumitomo Electric Industries Ltd. | | | 6,198,201 | |
| | | 328,029 | | | Sumitomo Forestry Co., Ltd. | | | 4,358,544 | |
| | | 42,800 | | | Sumitomo Heavy Industries Ltd. | | | 1,267,268 | |
| | | 24,300 | | | Sumitomo Mitsui Trust Holdings, Inc. | | | 875,992 | |
| | | 88,200 | | | Sumitomo Rubber Industries Ltd. | | | 1,046,240 | |
| | | 19,007 | | | Suntory Beverage & Food Ltd. | | | 812,513 | |
| | | 177,382 | | | Suzuken Co., Ltd. | | | 9,519,460 | |
| | | 22,200 | | | Suzuki Motor Corp. | | | 942,229 | |
| | | 39,100 | | | Taisei Corp. | | | 1,514,074 | |
| | | 19,300 | | | Taisho Pharmaceutical Holdings Co., Ltd. | | | 1,401,851 | |
| | | 234,900 | | | Taiyo Nippon Sanso Corp. | | | 4,744,730 | |
| | | 143,900 | | | Teijin Ltd. | | | 2,764,158 | |
| | | 3,200 | | | Terumo Corp. | | | 103,040 | |
| | | 7,111 | | | Toho Gas Co., Ltd. | | | 271,741 | |
| | | 200,000 | | | Tokio Marine Holdings, Inc. | | | 10,694,425 | |
| | | 250,300 | | | Tokyo Electric Power Co. Holdings, Inc.* | | | 1,225,156 | |
| | | 275,696 | | | Tokyo Gas Co., Ltd. | | | 6,950,116 | |
| | | 43,519 | | | Toyo Suisan Kaisha Ltd. | | | 1,743,579 | |
| | | 244,100 | | | Toyota Boshoku Corp. | | | 3,412,770 | |
| | | 38,400 | | | Toyota Motor Corp. | | | 2,563,908 | |
| | | 51,100 | | | TS Tech Co., Ltd. | | | 1,550,849 | |
| | | 109,747 | | | Tsumura & Co. | | | 2,934,710 | |
| | | 111,289 | | | TV Asahi Holdings Corp. | | | 1,745,407 | |
| | | 52,349 | | | West Japan Railway Co. | | | 4,422,843 | |
| | | 443,357 | | | Yamada Denki Co., Ltd. | | | 2,145,507 | |
| | | 72,880 | | | Yamazaki Baking Co., Ltd. | | | 1,300,140 | |
| | | 71,753 | | | Zensho Holdings Co., Ltd. | | | 1,546,930 | |
| | | | | | | | | | |
| | | | | | | | | 499,236,030 | |
| | | | | | | | | | |
| | | | | | Luxembourg - 0.2% | |
| | | 165,268 | | | Grand City Properties S.A. | | | 3,718,815 | |
| | | 773,451 | | | L’Occitane International S.A. | | | 1,539,128 | |
| | | | | | | | | | |
| | | | | | | | | 5,257,943 | |
| | | | | | | | | | |
| | | | | | Netherlands - 3.5% | |
| | | 415,471 | | | Aegon N.V. | | | 1,728,897 | |
| | | 313,464 | | | ASR Nederland N.V. | | | 11,574,680 | |
| | | 105,061 | | | GrandVision N.V.(1) | | | 3,147,490 | |
| | | 538,414 | | | Koninklijke Ahold Delhaize N.V. | | | 13,474,100 | |
| | | 68,873 | | | Koninklijke DSM N.V. | | | 8,289,421 | |
| | | 319,958 | | | NN Group N.V. | | | 11,350,543 | |
| | | 253,808 | | | Randstad N.V. | | | 12,476,468 | |
The accompanying notes are an integral part of these financial statements.
|
| Hartford Multifactor Developed Markets (ex-US) ETF |
Schedule of Investments – (continued)
September 30, 2019
| | | | | | | | | | |
| Shares or Principal Amount | | Market Value† | |
| COMMON STOCKS - 99.4% - (continued) | | | |
| | | | | | Netherlands - 3.5% - (continued) | |
| | | 513,001 | | | Royal Dutch Shell plc Class A | | $ | 15,070,955 | |
| | | 64,116 | | | Wolters Kluwer N.V. | | | 4,681,852 | |
| | | | | | | | | | |
| | | | | | | | | 81,794,406 | |
| | | | | | | | | | |
| | | | | | New Zealand - 0.5% | |
| | | 350,184 | | | Contact Energy Ltd. | | | 1,875,238 | |
| | | 64,538 | | | EBOS Group Ltd. | | | 1,011,714 | |
| | | 520,046 | | | Fisher & Paykel Healthcare Corp. Ltd. | | | 5,641,441 | |
| | | 35,165 | | | Mainfreight Ltd. | | | 879,803 | |
| | | 146,792 | | | Meridian Energy Ltd. | | | 478,639 | |
| | | 924,323 | | | Spark New Zealand Ltd.* | | | 2,549,745 | |
| | | | | | | | | | |
| | | | | | | | | 12,436,580 | |
| | | | | | | | | | |
| | | | | | Norway - 1.4% | |
| | | 272,769 | | | Austevoll Seafood ASA | | | 2,589,308 | |
| | | 503,972 | | | Equinor ASA | | | 9,598,595 | |
| | | 257,216 | | | Leroy Seafood Group ASA | | | 1,564,367 | |
| | | 174,878 | | | Marine Harvest ASA* | | | 4,039,962 | |
| | | 681,511 | | | Orkla ASA | | | 6,207,590 | |
| | | 16,573 | | | Salmar ASA | | | 727,786 | |
| | | 113,046 | | | SpareBank 1SR-Bank ASA | | | 1,233,609 | |
| | | 353,444 | | | Telenor ASA | | | 7,101,206 | |
| | | | | | | | | | |
| | | | | | | | | 33,062,423 | |
| | | | | | | | | | |
| | | | | | Portugal - 0.5% | |
| | | 652,498 | | | Galp Energia SGPS S.A. | | | 9,834,458 | |
| | | 454,040 | | | NOS SGPS S.A. | | | 2,479,922 | |
| | | | | | | | | | |
| | | | | | | | | 12,314,380 | |
| | | | | | | | | | |
| | | | | | Russia - 1.2% | |
| | | 2,706,430 | | | Evraz plc | | | 15,595,080 | |
| | | 247,665 | | | Polymetal International plc | | | 3,479,251 | |
| | | 401,298 | | | VEON Ltd. | | | 963,115 | |
| | | 212,385 | | | X5 Retail Group N.V. GDR | | | 7,429,227 | |
| | | | | | | | | | |
| | | | | | | | | 27,466,673 | |
| | | | | | | | | | |
| | | | | | Singapore - 2.0% | |
| | | 4,675,098 | | | ComfortDelGro Corp. Ltd. | | | 8,113,555 | |
| | | 306,604 | | | DBS Group Holdings Ltd. | | | 5,542,772 | |
| | | 158,700 | | | Jardine Cycle & Carriage Ltd. | | | 3,442,765 | |
| | | 1,131,800 | | | Mapletree Commercial Trust REIT | | | 1,874,193 | |
| | | 3,050,700 | | | NetLink NBN Trust UNIT | | | 1,963,355 | |
| | | 965,982 | | | Oversea-Chinese Banking Corp. Ltd. | | | 7,585,917 | |
| | | 777,711 | | | SATS Ltd. | | | 2,721,904 | |
| | | 924,488 | | | Singapore Airlines Ltd. | | | 6,110,218 | |
| | | 798,700 | | | Singapore Technologies Engineering Ltd. | | | 2,217,809 | |
| | | 963,600 | | | Singapore Telecommunications Ltd. | | | 2,160,894 | |
| | | 518,700 | | | Venture Corp. Ltd. | | | 5,742,496 | |
| | | | | | | | | | |
| | | | | | | | | 47,475,878 | |
| | | | | | | | | | |
| | | | | | Spain - 2.4% | |
| | | 80,158 | | | Acciona S.A. | | | 8,485,398 | |
| | | 150,075 | | | ACS Actividades de Construccion y Servicios S.A. | | | 5,998,007 | |
| | | 76,733 | | | Ebro Foods S.A. | | | 1,534,220 | |
| | | 162,170 | | | Enagas S.A. | | | 3,758,719 | |
| | | 402,409 | | | Endesa S.A. | | | 10,590,369 | |
| | | 642,844 | | | Gestamp Automocion S.A.(1) | | | 2,999,546 | |
| | | 120,766 | | | Iberdrola S.A. | | | 1,255,501 | |
| | | 33,050 | | | Inmobiliaria Colonial Socimi S.A. | | | 398,864 | |
| | | 1,061,649 | | | Mapfre S.A. | | | 2,859,959 | |
| | | 306,054 | | | Merlin Properties Socimi S.A. REIT | | | 4,274,185 | |
| | | 1,565,819 | | | Prosegur Cash S.A.(1) | | | 2,249,899 | |
| | | 98,486 | | | Red Electrica Corp. S.A. | | | 2,000,829 | |
| | | 168,147 | | | Repsol S.A. | | | 2,628,721 | |
| | | 568,532 | | | Telefonica S.A. | | | 4,339,314 | |
| | | 36,436 | | | Viscofan S.A. | | | 1,708,069 | |
| | | | | | | | | | |
| | | | | | | | | 55,081,600 | |
| | | | | | | | | | |
| | | | | | | | | | |
| Shares or Principal Amount | | Market Value† | |
| COMMON STOCKS - 99.4% - (continued) | | | |
| | | | | | Sweden - 2.5% | |
| | | 49,706 | | | Atrium Ljungberg AB Class B | | $ | 1,099,562 | |
| | | 276,586 | | | Axfood AB | | | 5,882,145 | |
| | | 165,961 | | | BillerudKorsnas AB | | | 1,797,658 | |
| | | 242,889 | | | Castellum AB | | | 5,207,508 | |
| | | 55,697 | | | Electrolux AB Class B | | | 1,322,160 | |
| | | 69,658 | | | Essity AB Class B | | | 2,035,439 | |
| | | 153,443 | | | Fastighets AB Balder Class B* | | | 5,818,010 | |
| | | 176,730 | | | Hennes & Mauritz AB Class B | | | 3,430,293 | |
| | | 155,512 | | | ICA Gruppen AB | | | 7,193,427 | |
| | | 86,883 | | | Loomis AB Class B | | | 3,057,472 | |
| | | 464,970 | | | Securitas AB Class B | | | 7,131,449 | |
| | | 93,627 | | | Skandinaviska Enskilda Banken AB Class A | | | 861,599 | |
| | | 70,340 | | | Skanska AB Class B | | | 1,426,524 | |
| | | 132,460 | | | Svenska Handelsbanken AB Class A | | | 1,241,861 | |
| | | 610,938 | | | Swedbank AB Class A | | | 8,804,780 | |
| | | 441,278 | | | Telia Co., AB | | | 1,977,911 | |
| | | 18,375 | | | Volvo AB Class B | | | 258,371 | |
| | | 47,274 | | | Wihlborgs Fastigheter AB | | | 769,297 | |
| | | | | | | | | | |
| | | | | | | | | 59,315,466 | |
| | | | | | | | | | |
| | | | | | Switzerland - 6.2% | |
| | | 145,995 | | | Adecco Group AG | | | 8,084,886 | |
| | | 95,862 | | | Baloise Holding AG | | | 17,189,115 | |
| | | 3,935 | | | Banque Cantonale Vaudoise | | | 3,014,932 | |
| | | 10,872 | | | Bucher Industries AG | | | 3,399,578 | |
| | | 22 | | | Chocoladefabriken Lindt & Spruengli AG | | | 1,822,394 | |
| | | 24,180 | | | Coca-Cola HBC AG* | | | 791,706 | |
| | | 899 | | | Givaudan S.A. | | | 2,509,969 | |
| | | 57,763 | | | Helvetia Holding AG | | | 7,976,699 | |
| | | 55,943 | | | Julius Baer Group Ltd.* | | | 2,480,870 | |
| | | 59,604 | | | Kuehne + Nagel International AG | | | 8,786,830 | |
| | | 59,232 | | | Nestle S.A. | | | 6,431,972 | |
| | | 84,636 | | | Novartis AG | | | 7,345,334 | |
| | | 37,909 | | | PSP Swiss Property AG | | | 4,816,798 | |
| | | 49,882 | | | Roche Holding AG | | | 14,529,636 | |
| | | 1,249 | | | SGS S.A. | | | 3,098,858 | |
| | | 19,576 | | | Sika AG | | | 2,866,265 | |
| | | 17,041 | | | Sonova Holding AG | | | 3,964,812 | |
| | | 35,697 | | | Swiss Life Holding AG | | | 17,079,716 | |
| | | 82,192 | | | Swiss Re AG | | | 8,580,642 | |
| | | 3,745 | | | Swisscom AG | | | 1,848,933 | |
| | | 46,887 | | | Zurich Insurance Group AG | | | 17,962,026 | |
| | | | | | | | | | |
| | | | | | | | | 144,581,971 | |
| | | | | | | | | | |
| | | | | | United Kingdom - 11.2% | |
| | | 198,591 | | | 3i Group plc | | | 2,854,701 | |
| | | 202,768 | | | Anglo American plc | | | 4,675,585 | |
| | | 53,545 | | | Ashtead Group plc | | | 1,493,866 | |
| | | 97,837 | | | AstraZeneca plc | | | 8,754,188 | |
| | | 83,350 | | | Auto Trader Group plc(1) | | | 523,832 | |
| | | 2,298,238 | | | Avast plc(1) | | | 10,988,617 | |
| | | 402,554 | | | Barratt Developments plc | | | 3,214,515 | |
| | | 192,512 | | | Bellway plc | | | 7,937,798 | |
| | | 25,026 | | | Berkeley Group Holdings plc | | | 1,288,784 | |
| | | 1,836,887 | | | BP plc | | | 11,675,623 | |
| | | 393,012 | | | Britvic plc | | | 4,763,174 | |
| | | 3,908,502 | | | BT Group plc | | | 8,601,208 | |
| | | 40,175 | | | Burberry Group plc | | | 1,076,296 | |
| | | 5,824,475 | | | Centrica plc | | | 5,292,687 | |
| | | 83,176 | | | Close Brothers Group plc | | | 1,444,193 | |
| | | 36,643 | | | Coca-Cola European Partners plc | | | 2,045,347 | |
| | | 374,995 | | | Compass Group plc | | | 9,671,882 | |
| | | 68,463 | | | Diageo plc | | | 2,811,950 | |
| | | 2,848,124 | | | Direct Line Insurance Group plc | | | 10,536,245 | |
| | | 240,456 | | | Electrocomponents plc | | | 1,907,668 | |
| | | 99,000 | | | Ferguson plc* | | | 7,251,541 | |
The accompanying notes are an integral part of these financial statements.
|
| Hartford Multifactor Developed Markets (ex-US) ETF |
Schedule of Investments – (continued)
September 30, 2019
| | | | | | | | | | |
| Shares or Principal Amount | | Market Value† | |
| COMMON STOCKS - 99.4% - (continued) | | | |
| | | | | | United Kingdom - 11.2% - (continued) | |
| | | 105,415 | | | Fiat Chrysler Automobiles N.V. | | $ | 1,365,124 | |
| | | 390,664 | | | GlaxoSmithKline plc | | | 8,398,767 | |
| | | 32,670 | | | Hiscox Ltd. | | | 668,303 | |
| | | 724,352 | | | Howden Joinery Group plc | | | 5,002,235 | |
| | | 563,443 | | | HSBC Holdings plc | | | 4,336,789 | |
| | | 2,017,769 | | | Kingfisher plc | | | 5,142,073 | |
| | | 4,677,682 | | | Legal & General Group plc | | | 14,318,535 | |
| | | 371,481 | | | Marks & Spencer Group plc | | | 844,368 | |
| | | 206,909 | | | Mondi plc | | | 3,972,493 | |
| | | 477,206 | | | National Grid plc | | | 5,186,108 | |
| | | 822,318 | | | Pearson plc | | | 7,478,465 | |
| | | 132,076 | | | Pennon Group plc | | | 1,346,002 | |
| | | 55,053 | | | Persimmon plc | | | 1,472,167 | |
| | | 566,801 | | | Redrow plc | | | 4,316,536 | |
| | | 380,904 | | | RELX plc | | | 9,070,920 | |
| | | 760,042 | | | Rentokil Initial plc | | | 4,381,412 | |
| | | 330,944 | | | Rio Tinto plc | | | 17,165,234 | |
| | | 2,806,036 | | | Royal Mail plc | | | 7,320,325 | |
| | | 605,593 | | | RSA Insurance Group plc | | | 3,986,585 | |
| | | 382,924 | | | Sage Group plc | | | 3,262,558 | |
| | | 683,528 | | | Smith & Nephew plc | | | 16,500,877 | |
| | | 147,411 | | | Spectris plc | | | 4,439,636 | |
| | | 46,687 | | | SSP Group plc | | | 356,701 | |
| | | 584,286 | | | Tate & Lyle plc | | | 5,299,313 | |
| | | 694,086 | | | Taylor Wimpey plc | | | 1,381,345 | |
| | | 29,247 | | | Travis Perkins plc | | | 465,290 | |
| | | 1,252,862 | | | Tritax Big Box plc REIT | | | 2,309,676 | |
| | | 164,041 | | | Unilever plc | | | 9,885,020 | |
| | | 162,707 | | | WH Smith plc | | | 3,984,010 | |
| | | | | | | | | | |
| | | | | | | | | 262,466,567 | |
| | | | | | | | | | |
| | | | | | United States - 0.1% | |
| | | 21,741 | | | Waste Connections, Inc. | | | 1,998,563 | |
| | | | | | | | | | |
| | | |
| | | | | | Total Common Stocks
(cost $2,268,506,051) | | $ | 2,321,284,524 | |
| | | | | | | | | | |
| | | | | | | | | | |
| Shares or Principal Amount | | Market Value† | |
| SHORT-TERM INVESTMENTS - 0.0% | | | |
| | | | | | U.S. Treasury Bill - 0.0% | |
| $ | | | 420,000 | | | 1.92%, 12/12/2019(2)(3) | | $ | 418,508 | |
| | | | | | | | | | |
| | | |
| | | | | | Total Short-Term Investments
(cost $418,391) | | $ | 418,508 | |
| | | | | | | | | | |
| | | | | | | | | | | | | | |
| | | | |
| | | | | | Total Investments
(cost $2,268,924,442) | | | 99.4 | % | | $ | 2,321,703,032 | |
| | | | | | Other Assets and Liabilities | | | 0.6 | % | | | 13,985,122 | |
| | | | | | | | | | | | | | |
| | | | | | Total Net Assets | | | 100.0 | % | | $ | 2,335,688,154 | |
| | | | | | | | | | | | | | |
| Note: | Percentage of investments as shown is the ratio of the total market value to total net assets. |
| | The Fund may refer to any one or more of the industry classifications used by one or more widely recognized market indices, ratings group and/or as defined by Fund management. Industry classifications may not be identical across all security types. |
| | For Fund compliance purposes, the Fund may not use the same classification system. These classifications are used for financial reporting purposes. |
| | See “Glossary” for abbreviation descriptions. |
| (1) | Security was purchased pursuant to Rule 144A under the Securities Act of 1933 and may be sold in transactions that are exempt from registration (typically only to qualified institutional buyers) or in a public offering registered under the Securities Act of 1933. At September 30, 2019, the aggregate value of these securities was $81,681,877, representing 3.5% of net assets. |
| (2) | The rate shown represents current yield to maturity. |
| (3) | This security has been pledged as collateral in connection with futures contracts. |
| | | | | | | | | | | | | | | | |
| Futures Contracts Outstanding at September 30, 2019 | |
Description | | Number of
Contracts | | | Expiration
Date | | | Current
Notional
Amount | | | Value and
Unrealized
Appreciation/
(Depreciation) | |
| Long position contracts: | |
MSCI EAFE Index Future | | | 78 | | | | 12/20/2019 | | | $ | 7,403,760 | | | $ | (43,047 | ) |
| | | | | | | | | | | | | | | | |
Total futures contracts | | | $ | (43,047 | ) |
| | | | | | | | | | | | | | | | |
| † | See Significant Accounting Policies of accompanying Notes to Financial Statements regarding valuation of investments. |
The accompanying notes are an integral part of these financial statements.
|
| Hartford Multifactor Developed Markets (ex-US) ETF |
Schedule of Investments – (continued)
September 30, 2019
Fair Valuation Summary
The following is a summary of the fair valuations according to the inputs used as of September 30, 2019 in valuing the Fund’s investments.
| | | | | | | | | | | | | | | | |
Description | | Total | | | Level 1 | | | Level 2 | | | Level 3(1) | |
Assets | | | | | | | | | | | | | | | | |
Common Stocks | | | | | | | | | | | | | | | | |
Australia | | $ | 196,198,996 | | | $ | 196,198,996 | | | $ | — | | | $ | — | |
Austria | | | 6,863,055 | | | | 6,863,055 | | | | — | | | | — | |
Belgium | | | 45,594,634 | | | | 45,594,634 | | | | — | | | | — | |
Canada | | | 265,603,392 | | | | 265,603,392 | | | | — | | | | — | |
China | | | 5,486,074 | | | | 5,486,074 | | | | — | | | | — | |
Denmark | | | 44,505,051 | | | | 44,505,051 | | | | — | | | | — | |
Finland | | | 14,996,444 | | | | 14,996,444 | | | | — | | | | — | |
France | | | 139,713,577 | | | | 139,713,577 | | | | — | | | | — | |
Germany | | | 141,128,568 | | | | 141,128,568 | | | | — | | | | — | |
Hong Kong | | | 94,965,260 | | | | 94,965,260 | | | | — | | | | — | |
Ireland | | | 15,738,693 | | | | 15,738,693 | | | | — | | | | — | |
Israel | | | 41,115,598 | | | | 41,115,598 | | | | — | | | | — | |
Italy | | | 66,886,702 | | | | 66,886,702 | | | | — | | | | — | |
Japan | | | 499,236,030 | | | | 499,236,030 | | | | — | | | | — | |
Luxembourg | | | 5,257,943 | | | | 5,257,943 | | | | — | | | | — | |
Netherlands | | | 81,794,406 | | | | 81,794,406 | | | | — | | | | — | |
New Zealand | | | 12,436,580 | | | | 12,436,580 | | | | — | | | | — | |
Norway | | | 33,062,423 | | | | 33,062,423 | | | | — | | | | — | |
Portugal | | | 12,314,380 | | | | 12,314,380 | | | | — | | | | — | |
Russia | | | 27,466,673 | | | | 27,466,673 | | | | — | | | | — | |
Singapore | | | 47,475,878 | | | | 47,475,878 | | | | — | | | | — | |
Spain | | | 55,081,600 | | | | 55,081,600 | | | | — | | | | — | |
Sweden | | | 59,315,466 | | | | 59,315,466 | | | | — | | | | — | |
Switzerland | | | 144,581,971 | | | | 144,581,971 | | | | — | | | | — | |
United Kingdom | | | 262,466,567 | | | | 262,466,567 | | | | — | | | | — | |
United States | | | 1,998,563 | | | | 1,998,563 | | | | — | | | | — | |
Short-Term Investments | | | 418,508 | | | | — | | | | 418,508 | | | | — | |
| | | | | | | | | | | | | | | | |
Total | | $ | 2,321,703,032 | | | $ | 2,321,284,524 | | | $ | 418,508 | | | $ | — | |
| | | | | | | | | | | | | | | | |
Liabilities | | | | | | | | | | | | | | | | |
Futures Contracts(2) | | $ | (43,047 | ) | | $ | (43,047 | ) | | $ | — | | | $ | — | |
| | | | | | | | | | | | | | | | |
Total | | $ | (43,047 | ) | | $ | (43,047 | ) | | $ | — | | | $ | — | |
| | | | | | | | | | | | | | | | |
| (1) | For the year ended September 30, 2019, there were no transfers in and out of Level 3. |
| (2) | Derivative instruments (excluding purchased and written options, if applicable) are valued at the unrealized appreciation/(depreciation) on the investments. |
The accompanying notes are an integral part of these financial statements.
|
| Hartford Multifactor Emerging Markets ETF |
Schedule of Investments
September 30, 2019
| | | | | | | | | | |
| Shares or Principal Amount | | Market Value† | |
| COMMON STOCKS - 95.8% | | | |
| | | | | | Brazil - 4.6% | |
| | | 6,100 | | | Alpargatas S.A.* | | $ | 37,929 | |
| | | 22,700 | | | Ambev S.A. | | | 104,906 | |
| | | 12,208 | | | Banco do Brasil S.A. | | | 133,323 | |
| | | 9,159 | | | BB Seguridade Participacoes S.A. | | | 77,025 | |
| | | 41,000 | | | Bradespar S.A. | | | 310,645 | |
| | | 70,500 | | | Cia de Transmissao de Energia Eletrica Paulista* | | | 418,051 | |
| | | 8,100 | | | Cia Energetica de Minas Gerais | | | 27,866 | |
| | | 40,500 | | | Cia Siderurgica Nacional S.A. | | | 128,635 | |
| | | 16,500 | | | Engie Brasil Energia S.A. | | | 175,838 | |
| | | 27,700 | | | Hypera S.A. | | | 222,975 | |
| | | 12,179 | | | Lojas Renner S.A. | | | 147,567 | |
| | | 97,000 | | | Petrobras Distribuidora S.A. | | | 641,093 | |
| | | 61,700 | | | TIM Participacoes S.A. | | | 176,417 | |
| | | 30,000 | | | Transmissora Alianca de Energia Eletrica S.A. | | | 207,423 | |
| | | 29,324 | | | Vale S.A. | | | 336,155 | |
| | | | | | | | | | |
| | | | | | | | | 3,145,848 | |
| | | | | | | | | | |
| | | | | | Chile - 3.1% | |
| | | 457,298 | | | AES Gener S.A. | | | 99,535 | |
| | | 333,009 | | | Aguas Andinas S.A. Class A | | | 182,372 | |
| | | 3,646 | | | Banco de Credito e Inversiones S.A. | | | 229,924 | |
| | | 1,452,993 | | | Banco Santander Chile | | | 102,499 | |
| | | 218,654 | | | Cencosud S.A. | | | 360,317 | |
| | | 28,146 | | | Cia Cervecerias Unidas S.A. | | | 314,818 | |
| | | 149,691 | | | Colbun S.A. | | | 27,033 | |
| | | 7,439 | | | Empresas COPEC S.A. | | | 70,232 | |
| | | 3,201,173 | | | Enel Americas S.A. | | | 586,863 | |
| | | 70,882 | | | Enel Chile S.A. | | | 6,135 | |
| | | 20,217 | | | SACI Falabella | | | 113,133 | |
| | | 12,668 | | | Vina Concha y Toro S.A. | | | 25,207 | |
| | | | | | | | | | |
| | | | | | | | | 2,118,068 | |
| | | | | | | | | | |
| | | | | | China - 20.2% | |
| | | 166,000 | | | Agricultural Bank of China Ltd. Class H | | | 65,008 | |
| | | 114,000 | | | Anhui Conch Cement Co., Ltd. Class H | | | 676,927 | |
| | | 24,000 | | | ANTA Sports Products Ltd. | | | 198,536 | |
| | | 1,412 | | | Baidu, Inc. ADR* | | | 145,097 | |
| | | 1,587,000 | | | Bank of China Ltd. Class H | | | 623,512 | |
| | | 319,000 | | | Bank of Communications Co., Ltd. Class H | | | 208,342 | |
| | | 640,000 | | | China CITIC Bank Corp. Ltd. Class H | | | 341,251 | |
| | | 390,000 | | | China Construction Bank Corp. Class H | | | 297,497 | |
| | | 746,000 | | | China Everbright Bank Co., Ltd. Class H | | | 317,836 | |
| | | 293,500 | | | China Galaxy Securities Co., Ltd. Class H | | | 156,121 | |
| | | 304,000 | | | China Lesso Group Holdings Ltd. | | | 287,736 | |
| | | 82,000 | | | China Life Insurance Co., Ltd. Class H | | | 189,953 | |
| | | 7,000 | | | China Mengniu Dairy Co., Ltd.* | | | 26,207 | |
| | | 114,000 | | | China Merchants Bank Co., Ltd. Class H | | | 542,414 | |
| | | 455,500 | | | China Minsheng Banking Corp. Ltd. Class H | | | 309,694 | |
| | | 264,000 | | | China Petroleum & Chemical Corp. Class H | | | 156,930 | |
| | | 222,500 | | | China Railway Construction Corp. Ltd. Class H | | | 243,236 | |
| | | 292,000 | | | China Railway Group Ltd. Class H | | | 177,299 | |
| | | 1,486,000 | | | China Telecom Corp. Ltd. Class H | | | 676,713 | |
| | | 416,000 | | | CNOOC Ltd. | | | 634,661 | |
| | | 638,000 | | | Dongfeng Motor Group Co., Ltd. Class H | | | 606,309 | |
| | | 91,600 | | | Fuyao Glass Industry Group Co., Ltd. Class H(1) | | | 254,139 | |
| | | 110,000 | | | Geely Automobile Holdings Ltd. | | | 186,621 | |
| | | 1,070,500 | | | Great Wall Motor Co., Ltd. Class H | | | 716,908 | |
| | | 464,000 | | | Guangzhou Automobile Group Co., Ltd. Class H | | | 443,912 | |
| | | 92,000 | | | Guangzhou Baiyunshan Pharmaceutical Holdings Co., Ltd. Class H | | | 303,365 | |
| | | 75,600 | | | Guangzhou R&F Properties Co., Ltd. Class H | | | 114,373 | |
| | | 192,000 | | | Industrial & Commercial Bank of China Ltd. Class H | | | 128,581 | |
| | | 1,100 | | | JD.com, Inc. ADR* | | | 31,031 | |
| | | 294,000 | | | Jiangsu Expressway Co., Ltd. Class H | | | 373,529 | |
| | | 728,000 | | | Lenovo Group Ltd. | | | 485,680 | |
| | | | | | | | | | |
| Shares or Principal Amount | | Market Value† | |
| COMMON STOCKS - 95.8% - (continued) | | | |
| | | | | | China - 20.2% - (continued) | |
| | | 42,000 | | | Li Ning Co., Ltd. | | $ | 120,545 | |
| | | 1,146,000 | | | People’s Insurance Co., Group of China Ltd. Class H | | | 459,020 | |
| | | 430,000 | | | PICC Property & Casualty Co., Ltd. Class H | | | 501,888 | |
| | | 57,500 | | | Ping An Insurance Group Co. of China Ltd. Class H | | | 660,494 | |
| | | 72,000 | | | Shandong Weigao Group Medical Polymer Co., Ltd. Class H | | | 74,118 | |
| | | 183,000 | | | Shanghai Pharmaceuticals Holding Co., Ltd. Class H | | | 331,479 | |
| | | 194,400 | | | Sinopharm Group Co., Ltd. Class H | | | 608,786 | |
| | | 93,000 | | | Times China Holdings, Ltd. | | | 144,730 | |
| | | 178,000 | | | TravelSky Technology Ltd. Class H | | | 369,651 | |
| | | 20,000 | | | Tsingtao Brewery Co., Ltd. Class H | | | 120,673 | |
| | | 84,000 | | | Uni-President China Holdings Ltd. | | | 90,650 | |
| | | 2,300 | | | YY, Inc. ADR* | | | 129,329 | |
| | | 79,800 | | | Zhuzhou CRRC Times Electric Co., Ltd. Class H | | | 330,320 | |
| | | 28,000 | | | Zijin Mining Group Co., Ltd. Class H | | | 9,679 | |
| | | 104,600 | | | Zoomlion Heavy Industry Science and Technology Co., Ltd. | | | 70,851 | |
| | | | | | | | | | |
| | | | | | | | | 13,941,631 | |
| | | | | | | | | | |
| | | | | | Colombia - 0.3% | |
| | | 291,123 | | | Grupo Energia Bogota S.A. ESP* | | | 182,870 | |
| | | 8,697 | | | Interconexion Electrica S.A. ESP | | | 45,604 | |
| | | | | | | | | | |
| | | | | | | | | 228,474 | |
| | | | | | | | | | |
| | | | | | Hong Kong - 2.6% | |
| | | 72,500 | | | China Mobile Ltd. | | | 599,743 | |
| | | 40,000 | | | China Overseas Land & Investment Ltd. | | | 125,775 | |
| | | 102,000 | | | China Resources Cement Holdings Ltd. | | | 102,268 | |
| | | 24,000 | | | China Resources Gas Group Ltd. | | | 118,631 | |
| | | 30,100 | | | China Resources Land Ltd. | | | 126,130 | |
| | | 24,000 | | | Guangdong Investment Ltd. | | | 46,963 | |
| | | 248,000 | | | Hopson Development Holdings Ltd. | | | 248,019 | |
| | | 29,000 | | | Kingboard Holdings Ltd. | | | 76,760 | |
| | | 158,000 | | | Kunlun Energy Co., Ltd. | | | 136,044 | |
| | | 78,000 | | | Shenzhen International Holdings Ltd. | | | 149,843 | |
| | | 61,500 | | | Sino Biopharmaceutical Ltd. | | | 78,136 | |
| | | 17,000 | | | Sun Art Retail Group Ltd. | | | 17,261 | |
| | | | | | | | | | |
| | | | | | | | | 1,825,573 | |
| | | | | | | | | | |
| | | | | | India - 3.7% | |
| | | 3,334 | | | Axis Bank Ltd. GDR | | | 162,366 | |
| | | 9,921 | | | Dr. Reddy’s Laboratories Ltd. ADR | | | 375,907 | |
| | | 2,982 | | | HDFC Bank Ltd. ADR | | | 170,123 | |
| | | 19,437 | | | ICICI Bank Ltd. ADR | | | 236,743 | |
| | | 58,724 | | | Infosys Ltd. ADR | | | 667,692 | |
| | | 9,212 | | | Larsen & Toubro Ltd. GDR | | | 191,609 | |
| | | 873 | | | Reliance Industries Ltd. GDR(1) | | | 32,563 | |
| | | 7,146 | | | State Bank of India GDR* | | | 274,406 | |
| | | 6,028 | | | Vedanta Ltd. ADR | | | 52,323 | |
| | | 46,210 | | | Wipro Ltd. ADR | | | 168,666 | |
| | | 3,489 | | | WNS Holdings Ltd. ADR* | | | 204,979 | |
| | | | | | | | | | |
| | | | | | | | | 2,537,377 | |
| | | | | | | | | | |
| | | | | | Indonesia - 4.8% | |
| | | 1,034,200 | | | Astra International Tbk PT | | | 480,854 | |
| | | 974,400 | | | Bank Mandiri Persero Tbk PT | | | 478,791 | |
| | | 1,123,500 | | | Bank Negara Indonesia Persero Tbk PT | | | 581,735 | |
| | | 1,065,500 | | | Bank Rakyat Indonesia Persero Tbk PT | | | 309,254 | |
| | | 52,400 | | | Indo Tambangraya Megah Tbk PT | | | 45,774 | |
| | | 345,800 | | | Indofood Sukses Makmur Tbk PT | | | 187,577 | |
| | | 491,600 | | | Kalbe Farma Tbk PT | | | 58,008 | |
| | | 2,168,500 | | | Telekomunikasi Indonesia Persero Tbk PT | | | 658,417 | |
| | | 39,800 | | | Unilever Indonesia Tbk PT | | | 130,377 | |
| | | 240,700 | | | United Tractors Tbk PT | | | 348,884 | |
| | | | | | | | | | |
| | | | | | | | | 3,279,671 | |
| | | | | | | | | | |
The accompanying notes are an integral part of these financial statements.
|
| Hartford Multifactor Emerging Markets ETF |
Schedule of Investments – (continued)
September 30, 2019
| | | | | | | | | | |
| Shares or Principal Amount | | Market Value† | |
| COMMON STOCKS - 95.8% - (continued) | | | |
| | | | | | Malaysia - 4.4% | |
| | | 472,300 | | | AirAsia Group Bhd | | $ | 198,531 | |
| | | 424,100 | | | BerMaz Auto Bhd | | | 230,941 | |
| | | 211,400 | | | CIMB Group Holdings Bhd | | | 253,963 | |
| | | 333,200 | | | DiGi.Com Bhd | | | 378,003 | |
| | | 29,088 | | | Hong Leong Bank Bhd | | | 113,656 | |
| | | 2,600 | | | Kuala Lumpur Kepong Bhd | | | 14,332 | |
| | | 253,900 | | | Malayan Banking Bhd | | | 516,047 | |
| | | 18,100 | | | Maxis Bhd | | | 24,208 | |
| | | 206,300 | | | Petronas Chemicals Group Bhd | | | 371,507 | |
| | | 75,200 | | | Petronas Gas Bhd | | | 294,191 | |
| | | 38,400 | | | Public Bank Bhd | | | 184,159 | |
| | | 152,300 | | | RHB Bank Bhd | | | 205,152 | |
| | | 67,400 | | | Tenaga Nasional Bhd | | | 219,569 | |
| | | | | | | | | | |
| | | | | | | | | 3,004,259 | |
| | | | | | | | | | |
| | | | | | Mexico - 3.6% | |
| | | 725,125 | | | America Movil S.A.B. de C.V. Class L | | | 538,408 | |
| | | 95,056 | | | Coca-Cola Femsa S.A.B. de C.V. | | | 577,924 | |
| | | 33,198 | | | Fomento Economico Mexicano S.A.B. de C.V. | | | 304,068 | |
| | | 14,462 | | | Grupo Financiero Banorte S.A.B. de C.V. Class O | | | 77,906 | |
| | | 128,600 | | | Megacable Holdings S.A.B. de C.V. UNIT | | | 517,748 | |
| | | 156,059 | | | Wal-Mart de Mexico S.A.B. de C.V. | | | 462,312 | |
| | | | | | | | | | |
| | | | | | | | | 2,478,366 | |
| | | | | | | | | | |
| | | | | | Philippines - 3.5% | |
| | | 158,200 | | | Alliance Global Group, Inc. | | | 33,270 | |
| | | 7,015 | | | Ayala Corp. | | | 119,714 | |
| | | 24,270 | | | Ayala Land, Inc. | | | 23,156 | |
| | | 193,890 | | | BDO Unibank, Inc. | | | 534,946 | |
| | | 357,700 | | | First Gen Corp. | | | 169,775 | |
| | | 7,285 | | | Globe Telecom, Inc. | | | 257,217 | |
| | | 29,140 | | | Manila Electric Co. | | | 208,022 | |
| | | 240,300 | | | Metro Pacific Investments Corp. | | | 23,089 | |
| | | 149,170 | | | Metropolitan Bank & Trust Co. | | | 196,860 | |
| | | 13,840 | | | PLDT, Inc. | | | 302,274 | |
| | | 13,260 | | | Puregold Price Club, Inc. | | | 9,990 | |
| | | 81,960 | | | San Miguel Corp. | | | 271,197 | |
| | | 10,360 | | | San Miguel Food and Beverage, Inc. | | | 18,389 | |
| | | 11,805 | | | SM Investments Corp. | | | 221,159 | |
| | | 284,000 | | | Vista Land & Lifescapes, Inc. | | | 42,301 | |
| | | | | | | | | | |
| | | | | | | | | 2,431,359 | |
| | | | | | | | | | |
| | | | | | Poland - 2.7% | |
| | | 11,171 | | | Asseco Poland S.A. | | | 142,244 | |
| | | 18,881 | | | Bank Polska Kasa Opieki S.A. | | | 482,250 | |
| | | 20,981 | | | Eurocash S.A. | | | 109,899 | |
| | | 9,075 | | | KGHM Polska Miedz S.A.* | | | 181,086 | |
| | | 18,539 | | | Polski Koncern Naftowy ORLEN S.A. | | | 456,406 | |
| | | 12,754 | | | Powszechna Kasa Oszczednosci Bank Polski S.A. | | | 125,086 | |
| | | 39,740 | | | Powszechny Zaklad Ubezpieczen S.A. | | | 370,523 | |
| | | | | | | | | | |
| | | | | | | | | 1,867,494 | |
| | | | | | | | | | |
| | | | | | Russia - 2.9% | |
| | | 52,538 | | | Gazprom PJSC ADR | | | 362,722 | |
| | | 7,081 | | | LUKOIL PJSC ADR | | | 585,882 | |
| | | 462 | | | Magnit PJSC GDR | | | 6,036 | |
| | | 6,431 | | | MMC Norilsk Nickel PJSC ADR | | | 164,634 | |
| | | 14,423 | | | Mobile TeleSystems PJSC ADR | | | 116,826 | |
| | | 9,741 | | | Novolipetsk Steel PJSC GDR | | | 211,575 | |
| | | 4,364 | | | Rosneft Oil Co. PJSC GDR | | | 27,999 | |
| | | 11,684 | | | Sberbank of Russia PJSC ADR | | | 165,621 | |
| | | 17,422 | | | Severstal PJSC GDR | | | 250,006 | |
| | | 12,629 | | | Surgutneftegas PJSC ADR | | | 67,755 | |
| | | 1,191 | | | Tatneft PJSC ADR | | | 75,628 | |
| | | | | | | | | | |
| | | | | | | | | 2,034,684 | |
| | | | | | | | | | |
| | | | | | | | | | |
| Shares or Principal Amount | | Market Value† | |
| COMMON STOCKS - 95.8% - (continued) | | | |
| | | | | | South Africa - 3.7% | |
| | | 18,070 | | | Absa Group Ltd. | | $ | 182,184 | |
| | | 9,527 | | | Barloworld Ltd. | | | 72,634 | |
| | | 1,075 | | | Bid Corp. Ltd. | | | 22,833 | |
| | | 13,461 | | | Bidvest Group Ltd. | | | 169,398 | |
| | | 20,127 | | | FirstRand Ltd. | | | 82,552 | |
| | | 2,180 | | | Foschini Group Ltd. | | | 23,502 | |
| | | 6,662 | | | Kumba Iron Ore Ltd. | | | 164,532 | |
| | | 67,657 | | | MTN Group Ltd. | | | 429,703 | |
| | | 16,136 | | | Nedbank Group Ltd. | | | 241,383 | |
| | | 18,548 | | | Sappi Ltd. | | | 45,934 | |
| | | 5,043 | | | SPAR Group Ltd. | | | 63,529 | |
| | | 17,960 | | | Standard Bank Group Ltd. | | | 206,920 | |
| | | 119,617 | | | Telkom S.A. SOC Ltd. | | | 556,885 | |
| | | 22,518 | | | Truworths International Ltd. | | | 78,711 | |
| | | 10,917 | | | Vodacom Group Ltd. | | | 86,141 | |
| | | 32,908 | | | Woolworths Holdings Ltd. | | | 119,543 | |
| | | | | | | | | | |
| | | | | | | | | 2,546,384 | |
| | | | | | | | | | |
| | | | | | South Korea - 13.4% | |
| | | 5,300 | | | Asia Paper Manufacturing Co., Ltd. | | | 131,597 | |
| | | 2,790 | | | Binggrae Co., Ltd. | | | 135,984 | |
| | | 12,947 | | | Cheil Worldwide, Inc. | | | 268,433 | |
| | | 5,265 | | | Chongkundang Holdings Corp. | | | 398,787 | |
| | | 239 | | | CJ CheilJedang Corp. | | | 46,855 | |
| | | 78 | | | CJ Corp. | | | 5,347 | |
| | | 16,223 | | | Daeduck Electronics Co. | | | 147,155 | |
| | | 1,752 | | | Daelim Industrial Co., Ltd. | | | 152,329 | |
| | | 9,047 | | | Daesang Corp. | | | 168,286 | |
| | | 1,663 | | | DB Insurance Co., Ltd. | | | 71,739 | |
| | | 17,800 | | | Deutsch Motors, Inc.* | | | 116,072 | |
| | | 2,440 | | | DongKook Pharmaceutical Co., Ltd. | | | 127,900 | |
| | | 800 | | | ENF Technology Co., Ltd. | | | 12,674 | |
| | | 901 | | | F&F Co., Ltd. | | | 72,990 | |
| | | 1,277 | | | Fila Korea Ltd. | | | 61,814 | |
| | | 513 | | | GOLFZON Co., Ltd. | | | 28,606 | |
| | | 1,631 | | | GS Home Shopping, Inc. | | | 211,485 | |
| | | 3,139 | | | GS Retail Co., Ltd. | | | 108,250 | |
| | | 4,952 | | | Handsome Co., Ltd. | | | 120,887 | |
| | | 1,616 | | | Hankook Tire & Technology Co., Ltd. | | | 43,570 | |
| | | 808 | | | Huchems Fine Chemical Corp. | | | 14,456 | |
| | | 1,920 | | | Hyundai Home Shopping Network Corp. | | | 146,871 | |
| | | 1,214 | | | Hyundai Mobis Co., Ltd. | | | 255,761 | |
| | | 1,603 | | | Hyundai Motor Co. | | | 179,578 | |
| | | 7,284 | | | iMarketKorea, Inc. | | | 63,331 | |
| | | 1,447 | | | Industrial Bank of Korea | | | 15,968 | |
| | | 1,312 | | | Innocean Worldwide, Inc. | | | 73,050 | |
| | | 5,846 | | | INTOPS Co., Ltd. | | | 61,825 | |
| | | 7,632 | | | IS Dongseo Co., Ltd. | | | 191,733 | |
| | | 2,000 | | | Jeju Air Co., Ltd. | | | 40,881 | |
| | | 10,590 | | | Kia Motors Corp. | | | 403,715 | |
| | | 814 | | | KT&G Corp. | | | 71,795 | |
| | | 11,981 | | | LF Corp. | | | 202,329 | |
| | | 463 | | | LG Chem Ltd. | | | 115,929 | |
| | | 4,042 | | | LG Electronics, Inc. | | | 227,756 | |
| | | 48,484 | | | LG Uplus Corp. | | | 553,281 | |
| | | 368 | | | Lotte Chemical Corp. | | | 72,606 | |
| | | 1,700 | | | Mcnex Co., Ltd. | | | 33,683 | |
| | | 1,820 | | | Meritz Fire & Marine Insurance Co., Ltd. | | | 29,062 | |
| | | 5,883 | | | NHN Corp.* | | | 306,409 | |
| | | 4,411 | | | NICE Information Service Co., Ltd. | | | 48,493 | |
| | | 860 | | | POSCO | | | 163,207 | |
| | | 24,100 | | | Power Logics Co., Ltd.* | | | 210,546 | |
| | | 2,336 | | | S&T Motiv Co., Ltd. | | | 106,044 | |
| | | 1,391 | | | S-1 Corp. | | | 114,080 | |
| | | 18,845 | | | Samsung Electronics Co., Ltd. | | | 772,769 | |
The accompanying notes are an integral part of these financial statements.
|
| Hartford Multifactor Emerging Markets ETF |
Schedule of Investments – (continued)
September 30, 2019
| | | | | | | | | | |
| Shares or Principal Amount | | Market Value† | |
| COMMON STOCKS - 95.8% - (continued) | | | |
| | | | | | South Korea - 13.4% - (continued) | |
| | | 300 | | | Samsung Fire & Marine Insurance Co., Ltd. | | $ | 55,930 | |
| | | 8,063 | | | SFA Engineering Corp. | | | 284,462 | |
| | | 3,139 | | | Shinhan Financial Group Co., Ltd. | | | 109,694 | |
| | | 203 | | | SK Holdings Co., Ltd. | | | 34,621 | |
| | | 9,456 | | | SK Hynix, Inc. | | | 649,821 | |
| | | 1,991 | | | SK Telecom Co., Ltd. | | | 401,978 | |
| | | 6,476 | | | Spigen Korea Co., Ltd. | | | 305,893 | |
| | | 25,388 | | | WiSoL Co., Ltd. | | | 303,514 | |
| | | 1,036 | | | Woongjin Coway Co., Ltd. | | | 73,273 | |
| | | 2,813 | | | Youngone Corp. | | | 83,956 | |
| | | | | | | | | | |
| | | | | | | | | 9,209,060 | |
| | | | | | | | | | |
| | | | | | Taiwan - 12.9% | |
| | | 6,000 | | | Acter Group Corp. Ltd. | | | 30,653 | |
| | | 14,000 | | | Asustek Computer, Inc. | | | 93,184 | |
| | | 255,159 | | | Chang Hwa Commercial Bank Ltd. | | | 178,059 | |
| | | 25,000 | | | Chang Wah Electromaterials, Inc. | | | 128,527 | |
| | | 66,431 | | | Chicony Electronics Co., Ltd. | | | 195,710 | |
| | | 136,590 | | | China Life Insurance Co., Ltd.* | | | 108,305 | |
| | | 216,000 | | | China Motor Corp.(4) | | | 171,619 | |
| | | 78,000 | | | Chunghwa Telecom Co., Ltd. | | | 279,070 | |
| | | 250,000 | | | Compal Electronics, Inc. | | | 144,241 | |
| | | 135,000 | | | Coretronic Corp. | | | 162,307 | |
| | | 429,628 | | | CTBC Financial Holding Co., Ltd. | | | 285,269 | |
| | | 247,360 | | | E.Sun Financial Holding Co., Ltd. | | | 209,293 | |
| | | 247,000 | | | Far Eastern International Bank | | | 95,537 | |
| | | 31,000 | | | Far EasTone Telecommunications Co., Ltd. | | | 72,443 | |
| | | 69,000 | | | Formosa Chemicals & Fibre Corp. | | | 192,825 | |
| | | 16,000 | | | Formosa Plastics Corp. | | | 48,736 | |
| | | 14,301 | | | Foxconn Technology Co., Ltd. | | | 29,824 | |
| | | 65,000 | | | Fubon Financial Holding Co., Ltd. | | | 93,338 | |
| | | 14,000 | | | Getac Technology Corp. | | | 21,096 | |
| | | 61,000 | | | Gigabyte Technology Co., Ltd. | | | 97,621 | |
| | | 116,000 | | | Great Wall Enterprise Co., Ltd. | | | 140,960 | |
| | | 231,224 | | | Hon Hai Precision Industry Co., Ltd. | | | 545,556 | |
| | | 120,000 | | | Inventec Corp. | | | 82,773 | |
| | | 17,000 | | | King Yuan Electronics Co., Ltd. | | | 19,096 | |
| | | 118,245 | | | Lite-On Technology Corp. | | | 187,899 | |
| | | 26,000 | | | MediaTek, Inc. | | | 309,239 | |
| | | 324,273 | | | Mega Financial Holding Co., Ltd. | | | 300,500 | |
| | | 97,000 | | | Nan Ya Plastics Corp. | | | 217,921 | |
| | | 30,000 | | | Nichidenbo Corp. | | | 47,479 | |
| | | 22,000 | | | Novatek Microelectronics Corp. | | | 126,223 | |
| | | 15,000 | | | Pegatron Corp. | | | 26,108 | |
| | | 8,000 | | | Phison Electronics Corp. | | | 71,299 | |
| | | 329,000 | | | Pou Chen Corp. | | | 421,530 | |
| | | 41,000 | | | Powertech Technology, Inc. | | | 115,238 | |
| | | 4,000 | | | President Chain Store Corp. | | | 37,390 | |
| | | 28,000 | | | Qisda Corp. | | | 19,088 | |
| | | 100,000 | | | Radiant Opto-Electronics Corp. | | | 381,956 | |
| | | 103,803 | | | Shanghai Commercial & Savings Bank Ltd. | | | 174,318 | |
| | | 326,910 | | | Shin Kong Financial Holding Co., Ltd. | | | 98,944 | |
| | | 50,000 | | | Sigurd Microelectronics Corp. | | | 53,345 | |
| | | 19,000 | | | Simplo Technology Co., Ltd. | | | 159,229 | |
| | | 4,000 | | | Sinbon Electronics Co., Ltd. | | | 15,536 | |
| | | 149,832 | | | SinoPac Financial Holdings Co., Ltd. | | | 58,437 | |
| | | 70,000 | | | Systex Corp. | | | 164,709 | |
| | | 280,000 | | | Taichung Commercial Bank Co., Ltd. | | | 106,948 | |
| | | 837,000 | | | Taiwan Business Bank | | | 343,978 | |
| | | 133,000 | | | Taiwan PCB Techvest Co., Ltd. | | | 153,901 | |
| | | 32,000 | | | Taiwan Semiconductor Manufacturing Co., Ltd. | | | 280,552 | |
| | | 65,000 | | | Tripod Technology Corp. | | | 233,606 | |
| | | 230,800 | | | Uni-President Enterprises Corp. | | | 556,458 | |
| | | 39,000 | | | United Integrated Services Co., Ltd. | | | 206,788 | |
| | | 100,000 | | | United Microelectronics Corp. | | | 43,192 | |
| | | | | | | | | | |
| Shares or Principal Amount | | Market Value† | |
| COMMON STOCKS - 95.8% - (continued) | | | |
| | | | | | Taiwan - 12.9% - (continued) | |
| | | 94,000 | | | Walsin Lihwa Corp. | | $ | 43,933 | |
| | | 98,686 | | | Wistron Corp. | | | 79,682 | |
| | | 10,000 | | | Wistron NeWeb Corp. | | | 26,302 | |
| | | 103,000 | | | Zhen Ding Technology Holding Ltd. | | | 368,515 | |
| | | | | | | | | | |
| | | | | | | | | 8,856,285 | |
| | | | | | | | | | |
| | | | | | Thailand - 6.1% | |
| | | 63,614 | | | Advanced Info Service PCL NVDR | | | 457,580 | |
| | | 34,600 | | | Bangkok Bank PCL NVDR | | | 196,276 | |
| | | 191,500 | | | Bangkok Dusit Medical Services PCL NVDR | | | 151,522 | |
| | | 26,800 | | | CP ALL PCL NVDR | | | 71,195 | |
| | | 56,400 | | | Delta Electronics Thailand PCL NVDR | | | 91,280 | |
| | | 2,300 | | | Electricity Generating PCL NVDR | | | 26,997 | |
| | | 134,900 | | | Hana Microelectronics PCL NVDR | | | 124,601 | |
| | | 94,100 | | | Kasikornbank PCL NVDR | | | 481,499 | |
| | | 474,600 | | | Krung Thai Bank PCL NVDR | | | 266,899 | |
| | | 47,800 | | | PTT Exploration & Production PCL NVDR | | | 189,106 | |
| | | 278,000 | | | PTT Global Chemical PCL NVDR | | | 488,556 | |
| | | 281,700 | | | PTT PCL NVDR | | | 425,981 | |
| | | 28,100 | | | Siam Cement PCL NVDR | | | 374,850 | |
| | | 95,000 | | | Siam Commercial Bank PCL NVDR | | | 366,520 | |
| | | 203,100 | | | Thanachart Capital PCL NVDR | | | 378,509 | |
| | | 26,300 | | | Tisco Financial Group PCL NVDR | | | 88,140 | |
| | | | | | | | | | |
| | | | | | | | | 4,179,511 | |
| | | | | | | | | | |
| | | | | | Turkey - 3.3% | |
| | | 72,383 | | | Akbank T.A.S.* | | | 104,091 | |
| | | 13,379 | | | Arcelik A.S.* | | | 45,114 | |
| | | 25,185 | | | BIM Birlesik Magazalar A.S. | | | 219,089 | |
| | | 13,089 | | | Celebi Hava Servisi A.S. | | | 230,069 | |
| | | 636,878 | | | Dogan Sirketler Grubu Holding A.S. | | | 172,571 | |
| | | 2,725 | | | EGE Endustri VE Ticaret A.S. | | | 227,787 | |
| | | 133,099 | | | Enka Insaat ve Sanayi A.S. | | | 133,182 | |
| | | 47,951 | | | Eregli Demir ve Celik Fabrikalari T.A.S. | | | 58,171 | |
| | | 17,567 | | | Ford Otomotiv Sanayi A.S. | | | 184,801 | |
| | | 163,398 | | | Iskenderun Demir ve Celik A.S. | | | 177,968 | |
| | | 102,364 | | | Soda Sanayii A.S. | | | 107,141 | |
| | | 6,026 | | | TAV Havalimanlari Holding A.S. | | | 25,186 | |
| | | 37,760 | | | Tekfen Holding A.S. | | | 127,996 | |
| | | 34,023 | | | Tofas Turk Otomobil Fabrikasi A.S. | | | 122,197 | |
| | | 28,860 | | | Turkiye Garanti Bankasi A.S.* | | | 52,185 | |
| | | 50,921 | | | Vestel Beyaz Esya Sanayi ve Ticaret A.S. | | | 136,715 | |
| | | 319,400 | | | Yapi ve Kredi Bankasi A.S.* | | | 136,324 | |
| | | | | | | | | | |
| | | | | | | | | 2,260,587 | |
| | | | | | | | | | |
| | | |
| | | | | | Total Common Stocks
(cost $65,944,202) | | $ | 65,944,631 | |
| | | | | | | | | | |
| |
| PREFERRED STOCKS - 3.7% | | | |
| | | | | | Brazil - 2.9% | |
| | | 28,503 | | | Banco Bradesco S.A.* | | | 232,108 | |
| | | 4,300 | | | Cia Paranaense de Energia* | | | 51,213 | |
| | | 37,000 | | | Gerdau S.A.* | | | 116,896 | |
| | | 59,116 | | | Itau Unibanco Holding S.A.* | | | 497,151 | |
| | | 44,785 | | | Itausa - Investimentos Itau S.A.* | | | 141,707 | |
| | | 45,192 | | | Petroleo Brasileiro S.A.* | | | 298,900 | |
| | | 50,902 | | | Telefonica Brasil S.A. | | | 671,378 | |
| | | | | | | | | | |
| | | | | | | | | 2,009,353 | |
| | | | | | | | | | |
| | | | | | Chile - 0.2% | |
| | | 24,000 | | | Embotelladora Andina S.A. Class B | | | 80,417 | |
| | | 2,070 | | | Sociedad Quimica y Minera de Chile S.A. Class B* | | | 57,051 | |
| | | | | | | | | | |
| | | | | | | | | 137,468 | |
| | | | | | | | | | |
| | | | | | Colombia - 0.6% | |
| | | 9,162 | | | Banco Davivienda S.A., 3.17% | | | 111,942 | |
The accompanying notes are an integral part of these financial statements.
|
| Hartford Multifactor Emerging Markets ETF |
Schedule of Investments – (continued)
September 30, 2019
| | | | | | | | | | |
| Shares or Principal Amount | | Market Value† | |
| |
| PREFERRED STOCKS - 3.7% - (continued) | | | |
| | | | | | Colombia - 0.6% - (continued) | |
| | | 25,910 | | | Bancolombia S.A., 3.18% | | $ | 320,295 | |
| | | | | | | | | | |
| | | | | | | | | 432,237 | |
| | | | | | | | | | |
| | | |
| | | | | | Total Preferred Stocks
(cost $2,011,200) | | $ | 2,579,058 | |
| | | | | | | | | | |
| | | |
| | | | | | Total Long-Term Investments
(cost $67,955,402) | | $ | 68,523,689 | |
| | | | | | | | | | |
| |
| SHORT-TERM INVESTMENTS - 0.1% | | | |
| | | | | | U.S. Treasury Bill - 0.1% | |
| $ | | | 50,000 | | | 1.92%, 12/12/2019(2)(3) | | $ | 49,822 | |
| | | | | | | | | | |
| | | |
| | | | | | Total Short-Term Investments
(cost $49,809) | | $ | 49,822 | |
| | | | | | | | | | |
| | | | | | | | | | | | | | |
| | | | |
| | | | | | Total Investments
(cost $68,005,211) | | | 99.6 | % | | $ | 68,573,511 | |
| | | | | | Other Assets and Liabilities | | | 0.4 | % | | | 249,786 | |
| | | | | | | | | | | | | | |
| | | | | | Total Net Assets | | | 100.0 | % | | $ | 68,823,297 | |
| | | | | | | | | | | | | | |
| Note: | Percentage of investments as shown is the ratio of the total market value to total net assets. |
| | The Fund may refer to any one or more of the industry classifications used by one or more widely recognized market indices, ratings group and/or as defined by Fund management. Industry classifications may not be identical across all security types. |
| | For Fund compliance purposes, the Fund may not use the same classification system. These classifications are used for financial reporting purposes. |
| | See “Glossary” for abbreviation descriptions. |
| (1) | Security was purchased pursuant to Rule 144A under the Securities Act of 1933 and may be sold in transactions that are exempt from registration (typically only to qualified institutional buyers) or in a public offering registered under the Securities Act of 1933. At September 30, 2019, the aggregate value of these securities was $286,702, representing 0.4% of net assets. |
| (2) | The rate shown represents current yield to maturity. |
| (3) | This security has been pledged as collateral in connection with futures contracts. |
| (4) | This security is valued in good faith at fair value as determined under policies and procedures established by and under the supervision of the Board of Trustees. At September 30, 2019, the aggregate fair value of this security was $171,619, which represented 0.2% of total net assets. This amount excludes securities that are principally traded in certain foreign markets and whose prices are adjusted pursuant to a third party pricing service methodology approved by the Board of Trustees. |
| | | | | | | | | | | | | | | | | | |
| Futures Contracts Outstanding at September 30, 2019 | |
Description | | Number of
Contracts | | | Expiration
Date | | | Current
Notional
Amount | | | Value and
Unrealized
Appreciation/
(Depreciation) | |
| Long position contracts: | |
MSCI Emerging Market Index Future | | | 7 | | | | 12/20/2019 | | | $ | 350,665 | | | $ | (7,768 | ) |
| | | | | | | | | | | | | | | | | | |
Total futures contracts | | | $ | (7,768 | ) |
| | | | | | | | | | | | | | | | | | |
| † | See Significant Accounting Policies of accompanying Notes to Financial Statements regarding valuation of investments. |
The accompanying notes are an integral part of these financial statements.
|
| Hartford Multifactor Emerging Markets ETF |
Schedule of Investments – (continued)
September 30, 2019
Fair Valuation Summary
The following is a summary of the fair valuations according to the inputs used as of September 30, 2019 in valuing the Fund’s investments.
| | | | | | | | | | | | | | | | |
Description | | Total | | | Level 1 | | | Level 2 | | | Level 3(1) | |
Assets | | | | | | | | | | | | | | | | |
Common Stocks | | | | | | | | | | | | | | | | |
Brazil | | $ | 3,145,848 | | | $ | 3,145,848 | | | $ | — | | | $ | — | |
Chile | | | 2,118,068 | | | | 2,118,068 | | | | — | | | | — | |
China | | | 13,941,631 | | | | 13,770,012 | | | | — | | | | 171,619 | |
Colombia | | | 228,474 | | | | 228,474 | | | | — | | | | — | |
Hong Kong | | | 1,825,573 | | | | 1,825,573 | | | | — | | | | — | |
India | | | 2,537,377 | | | | 2,537,377 | | | | — | | | | — | |
Indonesia | | | 3,279,671 | | | | 3,279,671 | | | | — | | | | — | |
Malaysia | | | 3,004,259 | | | | 3,004,259 | | | | — | | | | — | |
Mexico | | | 2,478,366 | | | | 2,478,366 | | | | — | | | | — | |
Philippines | | | 2,431,359 | | | | 2,431,359 | | | | — | | | | — | |
Poland | | | 1,867,494 | | | | 1,867,494 | | | | — | | | | — | |
Russia | | | 2,034,684 | | | | 2,034,684 | | | | — | | | | — | |
South Africa | | | 2,546,384 | | | | 2,546,384 | | | | — | | | | — | |
South Korea | | | 9,209,060 | | | | 9,209,060 | | | | — | | | | — | |
Taiwan | | | 8,856,285 | | | | 8,856,285 | | | | — | | | | — | |
Thailand | | | 4,179,511 | | | | 4,179,511 | | | | — | | | | — | |
Turkey | | | 2,260,587 | | | | 2,260,587 | | | | — | | | | — | |
Preferred Stocks | | | 2,579,058 | | | | 2,579,058 | | | | — | | | | — | |
Short-Term Investments | | | 49,822 | | | | — | | | | 49,822 | | | | — | |
| | | | | | | | | | | | | | | | |
Total | | $ | 68,573,511 | | | $ | 68,352,070 | | | $ | 49,822 | | | $ | 171,619 | |
| | | | | | | | | | | | | | | | |
Liabilities | | | | | | | | | | | | | | | | |
Futures Contracts(2) | | $ | (7,768 | ) | | $ | (7,768 | ) | | $ | — | | | $ | — | |
| | | | | | | | | | | | | | | | |
Total | | $ | (7,768 | ) | | $ | (7,768 | ) | | $ | — | | | $ | — | |
| | | | | | | | | | | | | | | | |
| (1) | For the year ended September 30, 2019, there were no transfers in and out of Level 3. |
| (2) | Derivative instruments (excluding purchased and written options, if applicable) are valued at the unrealized appreciation/(depreciation) on the investments. |
Level 3 investments at the beginning and/or end of the period in relation to net assets were not significant and accordingly, a reconciliation of Level 3 assets for the year ended September 30, 2019 is not presented.
The accompanying notes are an integral part of these financial statements.
|
| Hartford Multifactor Global Small Cap ETF |
Schedule of Investments
September 30, 2019
| | | | | | | | | | |
| Shares or Principal Amount | | Market Value† | |
| COMMON STOCKS - 98.7% | | | |
| | | | | | Australia - 5.8% | |
| | | 30,796 | | | Abacus Property Group | | $ | 81,420 | |
| | | 55,219 | | | Australian Pharmaceutical Industries Ltd. | | | 50,277 | |
| | | 2,892 | | | BWP Trust REIT | | | 7,705 | |
| | | 63,714 | | | Cromwell Property Group REIT | | | 54,574 | |
| | | 17,799 | | | CSR Ltd. | | | 51,259 | |
| | | 10,713 | | | Elders Ltd. | | | 45,665 | |
| | | 27,115 | | | Genworth Mortgage Insurance Australia Ltd. | | | 62,178 | |
| | | 21,884 | | | Growthpoint Properties Australia Ltd. REIT | | | 63,762 | |
| | | 29,998 | | | Inghams Group Ltd. | | | 63,731 | |
| | | 2,616 | | | JBHi-Fi Ltd. | | | 59,988 | |
| | | 8,143 | | | Mineral Resources Ltd. | | | 73,484 | |
| | | 2,930 | | | Northern Star Resources Ltd. | | | 21,817 | |
| | | 16,143 | | | OceanaGold Corp. | | | 42,186 | |
| | | 15,553 | | | Regis Resources Ltd. | | | 51,400 | |
| | | 18,501 | | | Sandfire Resources NL | | | 81,856 | |
| | | 4,421 | | | Shopping Centres Australasia Property Group REIT | | | 7,782 | |
| | | 39,386 | | | St. Barbara Ltd. | | | 77,035 | |
| | | 50,243 | | | Viva Energy REIT | | | 96,576 | |
| | | | | | | | | | |
| | | | | | | | | 992,695 | |
| | | | | | | | | | |
| | | | | | Belgium - 0.2% | |
| | | 6,125 | | | AGFA-Gevaert N.V.* | | | 25,134 | |
| | | 286 | | | Tessenderlo Group S.A.* | | | 9,042 | |
| | | | | | | | | | |
| | | | | | | | | 34,176 | |
| | | | | | | | | | |
| | | | | | Bermuda - 0.4% | |
| | | 960 | | | Argo Group International Holdings Ltd. | | | 67,430 | |
| | | | | | | | | | |
| | | | | | Brazil - 1.5% | |
| | | 8,868 | | | Cia de Transmissao de Energia Eletrica Paulista* | | | 52,585 | |
| | | 684 | | | Cia Hering | | | 5,701 | |
| | | 10,753 | | | Construtora Tenda S.A. | | | 63,608 | |
| | | 10,154 | | | EDP - Energias do Brasil S.A. | | | 47,779 | |
| | | 1,357 | | | Ez Tec Empreendimentos e Participacoes S.A. | | | 11,795 | |
| | | 3,378 | | | Grendene S.A. | | | 7,080 | |
| | | 9,791 | | | MRV Engenharia e Participacoes S.A. | | | 41,464 | |
| | | 4,257 | | | Tupy S.A. | | | 18,345 | |
| | | 1,848 | | | Unipar Carbocloro S.A. | | | 14,095 | |
| | | | | | | | | | |
| | | | | | | | | 262,452 | |
| | | | | | | | | | |
| | | | | | Canada - 4.6% | |
| | | 1,486 | | | Aecon Group, Inc. | | | 20,472 | |
| | | 2,975 | | | Aritzia, Inc.* | | | 37,727 | |
| | | 340 | | | Canadian Solar, Inc.* | | | 6,419 | |
| | | 2,214 | | | Canfor Corp.* | | | 25,969 | |
| | | 3,132 | | | Canfor Pulp Products, Inc. | | | 22,970 | |
| | | 3,864 | | | Cascades, Inc. | | | 33,795 | |
| | | 1,931 | | | Celestica, Inc.* | | | 13,855 | |
| | | 3,903 | | | Centerra Gold, Inc.* | | | 33,193 | |
| | | 1,931 | | | Empire Co., Ltd. Class A | | | 52,315 | |
| | | 2,556 | | | InterRent Real Estate Investment Trust REIT | | | 31,583 | |
| | | 5,593 | | | Intertape Polymer Group, Inc. | | | 72,870 | |
| | | 24,219 | | | Just Energy Group, Inc. | | | 57,438 | |
| | | 3,256 | | | Killam Apartment Real Estate Investment Trust REIT | | | 49,258 | |
| | | 1,313 | | | Mercer International, Inc. | | | 16,465 | |
| | | 262 | | | NFI Group, Inc. | | | 5,565 | |
| | | 338 | | | Norbord, Inc. | | | 8,108 | |
| | | 3,471 | | | North West Co., Inc. | | | 74,191 | |
| | | 1,362 | | | Parkland Fuel Corp. | | | 43,709 | |
| | | 2,343 | | | Spin Master Corp.*(1) | | | 71,635 | |
| | | 6,314 | | | Summit Industrial Income REIT | | | 62,615 | |
| | | 2,767 | | | Transcontinental, Inc. Class A | | | 32,351 | |
| | | 673 | | | Uni-Select, Inc. | | | 5,612 | |
| | | 10,373 | | | Western Forest Products, Inc. | | | 9,402 | |
| | | | | | | | | | |
| | | | | | | | | 787,517 | |
| | | | | | | | | | |
| | | | | | | | | | |
| Shares or Principal Amount | | Market Value† | |
| COMMON STOCKS - 98.7% - (continued) | | | |
| | | | | | China - 6.8% | |
| | | 42,522 | | | BAIC Motor Corp. Ltd. Class H(1) | | $ | 26,253 | |
| | | 12,000 | | | China Communications Construction Co., Ltd. Class H | | | 9,383 | |
| | | 20,531 | | | China Lesso Group Holdings Ltd. | | | 19,433 | |
| | | 77,025 | | | China Oriental Group Co., Ltd. | | | 26,627 | |
| | | 103,000 | | | China Railway Signal & Communication Corp. Ltd. Class H(1) | | | 63,723 | |
| | | 15,000 | | | China Reinsurance Group Corp. Class H | | | 2,430 | |
| | | 75,000 | | | China SCE Group Holdings Ltd. | | | 34,537 | |
| | | 25,122 | | | CSC Financial Co., Ltd. Class H(1) | | | 18,394 | |
| | | 33,000 | | | Dongyue Group Ltd. | | | 15,449 | |
| | | 75,242 | | | Great Wall Motor Co., Ltd. Class H | | | 50,389 | |
| | | 22,366 | | | Guangzhou R&F Properties Co., Ltd. Class H | | | 33,837 | |
| | | 58,000 | | | Jiangsu Expressway Co., Ltd. Class H | | | 73,689 | |
| | | 35,600 | | | JNBY Design Ltd. | | | 51,133 | |
| | | 1,870 | | | Livzon Pharmaceutical Group, Inc. Class H | | | 4,795 | |
| | | 86,000 | | | Maanshan Iron & Steel Co., Ltd. Class H | | | 32,362 | |
| | | 136,646 | | | Metallurgical Corp. of China Ltd. Class H | | | 30,678 | |
| | | 85,000 | | | People’s Insurance Co., Group of China Ltd. Class H | | | 34,046 | |
| | | 79,614 | | | Red Star Macalline Group Corp. Ltd. Class H(1) | | | 66,519 | |
| | | 77,082 | | | Shenzhen Expressway Co., Ltd. Class H | | | 100,490 | |
| | | 103,215 | | | Sinotrans Ltd. Class H | | | 32,389 | |
| | | 84,219 | | | Tianneng Power International Ltd. | | | 59,302 | |
| | | 20,303 | | | Times China Holdings, Ltd. | | | 31,596 | |
| | | 68,000 | | | Tong Ren Tang Technologies Co., Ltd. Class H | | | 61,847 | |
| | | 29,402 | | | TravelSky Technology Ltd. Class H | | | 61,059 | |
| | | 57,706 | | | Weichai Power Co., Ltd. Class H | | | 83,179 | |
| | | 62,814 | | | Xtep International Holdings Ltd. | | | 33,973 | |
| | | 40,000 | | | Yadea Group Holdings Ltd.(1) | | | 8,674 | |
| | | 3,637 | | | Yangtze Optical Fibre and Cable Joint Stock Ltd. Co., Class H(1) | | | 5,864 | |
| | | 13,600 | | | YiChang HEC ChangJiang Pharmaceutical Co., Ltd. Class H(1) | | | 66,357 | |
| | | 10,000 | | | Zhejiang Expressway Co., Ltd. Class H | | | 8,649 | |
| | | 3,300 | | | Zhuzhou CRRC Times Electric Co., Ltd. Class H | | | 13,660 | |
| | | | | | | | | | |
| | | | | | | | | 1,160,716 | |
| | | | | | | | | | |
| | | | | | Denmark - 0.4% | |
| | | 751 | | | Sydbank A/S | | | 13,247 | |
| | | 1,251 | | | Topdanmark A/S | | | 60,389 | |
| | | | | | | | | | |
| | | | | | | | | 73,636 | |
| | | | | | | | | | |
| | | | | | Finland - 0.0% | |
| | | 1,034 | | | Finnair Oyj | | | 7,231 | |
| | | | | | | | | | |
| | | | | | France - 1.7% | |
| | | 1,099 | | | Criteo S.A. ADR* | | | 20,540 | |
| | | 50 | | | Fnac Darty S.A.* | | | 3,162 | |
| | | 933 | | | Gaztransport Et Technigaz S.A. | | | 92,409 | |
| | | 3,441 | | | Lagardere SCA | | | 76,153 | |
| | | 3,269 | | | Quadient SAS | | | 67,713 | |
| | | 533 | | | Societe BIC S.A. | | | 35,794 | |
| | | | | | | | | | |
| | | | | | | | | 295,771 | |
| | | | | | | | | | |
| | | | | | Georgia - 0.2% | |
| | | 1,858 | | | Bank of Georgia Group plc | | | 30,589 | |
| | | | | | | | | | |
| | | | | | Germany - 1.0% | |
| | | 8,617 | | | Borussia Dortmund GmbH & Co., KGaA | | | 86,709 | |
| | | 2,136 | | | TAG Immobilien AG* | | | 48,762 | |
| | | 1,611 | | | TLG Immobilien AG | | | 43,820 | |
| | | | | | | | | | |
| | | | | | | | | 179,291 | |
| | | | | | | | | | |
| | | | | | Hong Kong - 3.0% | |
| | | 444,000 | | | Bosideng International Holdings Ltd. | | | 189,168 | |
| | | 93,000 | | | Champion REIT | | | 60,146 | |
| | | 37,000 | | | HKBN Ltd. | | | 68,153 | |
| | | 9,000 | | | Pacific Textiles Holdings Ltd. | | | 6,050 | |
| | | 64,000 | | | Sa Sa International Holdings Ltd. | | | 14,205 | |
The accompanying notes are an integral part of these financial statements.
|
| Hartford Multifactor Global Small Cap ETF |
Schedule of Investments – (continued)
September 30, 2019
| | | | | | | | | | |
| Shares or Principal Amount | | Market Value† | |
| COMMON STOCKS - 98.7% - (continued) | | | |
| | | | | | Hong Kong - 3.0% - (continued) | |
| | | 31,000 | | | Shanghai Industrial Holdings Ltd. | | $ | 57,734 | |
| | | 30,000 | | | Shanghai Industrial Urban Development Group Ltd. | | | 3,789 | |
| | | 21,120 | | | Shenzhen Investment Ltd. | | | 7,786 | |
| | | 41,000 | | | SmarTone Telecommunications Holdings Ltd. | | | 35,616 | |
| | | 38,515 | | | Yuexiu Real Estate Investment Trust | | | 24,663 | |
| | | 60,000 | | | Yuexiu Transport Infrastructure Ltd. | | | 51,815 | |
| | | | | | | | | | |
| | | | | | | | | 519,125 | |
| | | | | | | | | | |
| | | | | | Ireland - 0.1% | |
| | | 9,902 | | | Green REIT plc | | | 20,576 | |
| | | | | | | | | | |
| | | | | | Israel - 1.6% | |
| | | 958 | | | Airport City Ltd.* | | | 18,604 | |
| | | 26,602 | | | Bezeq The Israeli Telecommunication Corp. Ltd.* | | | 17,618 | |
| | | 80 | | | Israel Corp. Ltd.* | | | 17,987 | |
| | | 14 | | | Mehadrin Ltd.* | | | 548 | |
| | | 328 | | | Mizrahi Tefahot Bank Ltd. | | | 8,153 | |
| | | 165,228 | | | Oil Refineries Ltd.* | | | 87,135 | |
| | | 454 | | | Paz Oil Co., Ltd. | | | 66,354 | |
| | | 2,175 | | | Phoenix Holdings Ltd. | | | 13,798 | |
| | | 1,818 | | | Tower Semiconductor Ltd.* | | | 35,824 | |
| | | | | | | | | | |
| | | | | | | | | 266,021 | |
| | | | | | | | | | |
| | | | | | Italy - 1.0% | |
| | | 17,276 | | | Enav S.p.A.(1) | | | 97,562 | |
| | | 44,818 | | | Saras S.p.A | | | 76,711 | |
| | | | | | | | | | |
| | | | | | | | | 174,273 | |
| | | | | | | | | | |
| | | | | | Japan - 16.1% | |
| | | 315 | | | Adastria Co., Ltd. | | | 7,080 | |
| | | 2,181 | | | Amano Corp. | | | 66,394 | |
| | | 1,532 | | | AOKI Holdings, Inc. | | | 14,728 | |
| | | 3,005 | | | Arcs Co., Ltd. | | | 62,811 | |
| | | 1,000 | | | Asahi Holdings, Inc. | | | 20,597 | |
| | | 5,500 | | | Avex, Inc. | | | 64,427 | |
| | | 700 | | | BML, Inc. | | | 18,822 | |
| | | 10,900 | | | Citizen Watch Co., Ltd. | | | 53,252 | |
| | | 257 | | | cocokara fine, Inc. | | | 13,840 | |
| | | 900 | | | Daicel Corp. | | | 7,603 | |
| | | 600 | | | Daiho Corp. | | | 15,833 | |
| | | 900 | | | Daiwabo Holdings Co., Ltd. | | | 37,307 | |
| | | 3,900 | | | DCM Holdings Co., Ltd. | | | 38,251 | |
| | | 3,249 | | | Doutor Nichires Holdings Co., Ltd. | | | 64,394 | |
| | | 2,800 | | | DTS Corp. | | | 58,241 | |
| | | 1,558 | | | Dydo Group Holdings, Inc. | | | 63,502 | |
| | | 700 | | | Fujitsu General Ltd. | | | 11,652 | |
| | | 5,021 | | | Geo Holdings Corp. | | | 59,606 | |
| | | 9,100 | | | Hazama Ando Corp. | | | 67,697 | |
| | | 1,467 | | | Heiwado Co., Ltd. | | | 27,528 | |
| | | 1,947 | | | Inaba Denki Sangyo Co., Ltd. | | | 85,032 | |
| | | 10,400 | | | Itochu Enex Co., Ltd. | | | 79,004 | |
| | | 2,300 | | | Iwatani Corp. | | | 77,678 | |
| | | 3,500 | | | Kaga Electronics Co., Ltd. | | | 62,600 | |
| | | 2,221 | | | Kanematsu Corp. | | | 24,948 | |
| | | 12,100 | | | Kansai Mirai Financial Group, Inc. | | | 76,020 | |
| | | 900 | | | Keihin Corp. | | | 13,199 | |
| | | 500 | | | Kinden Corp. | | | 7,416 | |
| | | 1,568 | | | Kokuyo Co., Ltd. | | | 21,879 | |
| | | 9,100 | | | Konica Minolta, Inc. | | | 63,319 | |
| | | 4,281 | | | KYORIN Holdings, Inc. | | | 70,865 | |
| | | 1,469 | | | Kyowa Exeo Corp. | | | 35,612 | |
| | | 437 | | | Kyudenko Corp. | | | 14,557 | |
| | | 2,178 | | | Maeda Road Construction Co., Ltd. | | | 47,359 | |
| | | 6,000 | | | Marvelous, Inc. | | | 46,246 | |
| | | 2,168 | | | Maxell Holdings Ltd. | | | 30,953 | |
| | | 6,182 | | | MCJ Co., Ltd. | | | 38,897 | |
| | | 599 | | | Megmilk Snow Brand Co., Ltd. | | | 14,416 | |
| | | | | | | | | | |
| Shares or Principal Amount | | Market Value† | |
| COMMON STOCKS - 98.7% - (continued) | | | |
| | | | | | Japan - 16.1% - (continued) | |
| | | 4,760 | | | Ministop Co., Ltd. | | $ | 61,265 | |
| | | 2,623 | | | Mirait Holdings Corp. | | | 39,536 | |
| | | 2,900 | | | Mixi, Inc. | | | 60,992 | |
| | | 782 | | | Mochida Pharmaceutical Co., Ltd. | | | 29,884 | |
| | | 3,569 | | | NEC Networks & System Integration Corp. | | | 96,791 | |
| | | 773 | | | Nihon Unisys Ltd. | | | 24,891 | |
| | | 661 | | | Nojima Corp. | | | 11,082 | |
| | | 6,200 | | | Oki Electric Industry Co., Ltd. | | | 84,388 | |
| | | 969 | | | PAL GROUP Holdings Co., Ltd. | | | 29,946 | |
| | | 1,161 | | | Paramount Bed Holdings Co., Ltd. | | | 42,164 | |
| | | 3,778 | | | Plenus Co., Ltd. | | | 63,273 | |
| | | 3,300 | | | Raito Kogyo Co., Ltd. | | | 43,298 | |
| | | 3,100 | | | Sanki Engineering Co., Ltd. | | | 36,715 | |
| | | 1,400 | | | Senko Group Holdings Co., Ltd. | | | 10,894 | |
| | | 4,400 | | | SKY Perfect JSAT Holdings, Inc. | | | 17,791 | |
| | | 2,039 | | | St Marc Holdings Co., Ltd. | | | 44,883 | |
| | | 5,700 | | | Sumitomo Mitsui Construction Co., Ltd. | | | 29,904 | |
| | | 600 | | | Sushiro Global Holdings Ltd. | | | 40,361 | |
| | | 1,919 | | | T-Gaia Corp. | | | 38,691 | |
| | | 274 | | | Taikisha Ltd. | | | 8,252 | |
| | | 3,208 | | | Takuma Co., Ltd. | | | 36,362 | |
| | | 613 | | | Toho Holdings Co., Ltd. | | | 14,186 | |
| | | 6,200 | | | TOKAI Holdings Corp. | | | 57,999 | |
| | | 300 | | | Tokyo Seimitsu Co., Ltd. | | | 8,813 | |
| | | 4,800 | | | Tokyu Construction Co., Ltd. | | | 36,686 | |
| | | 1,900 | | | Toshiba TEC Corp. | | | 56,081 | |
| | | 300 | | | Towa Pharmaceutical Co., Ltd. | | | 6,951 | |
| | | 396 | | | Unipres Corp. | | | 6,203 | |
| | | 6,300 | | | United Super Markets Holdings, Inc. | | | 56,078 | |
| | | 1,328 | | | Valor Holdings Co., Ltd. | | | 22,364 | |
| | | 7,400 | | | Yamazen Corp. | | | 64,363 | |
| | | | | | | | | | |
| | | | | | | | | 2,764,652 | |
| | | | | | | | | | |
| | | | | | Liechtenstein - 0.2% | |
| | | 216 | | | VP Bank AG | | | 33,922 | |
| | | | | | | | | | |
| | | | | | Luxembourg - 0.3% | |
| | | 941 | | | Altisource Portfolio Solutions S.A.* | | | 19,027 | |
| | | 1,034 | | | Grand City Properties S.A. | | | 23,267 | |
| | | | | | | | | | |
| | | | | | | | | 42,294 | |
| | | | | | | | | | |
| | | | | | Netherlands - 0.4% | |
| | | 794 | | | Flow Traders(1) | | | 20,792 | |
| | | 5,822 | | | PostNL N.V. | | | 12,935 | |
| | | 570 | | | Signify N.V.(1) | | | 15,678 | |
| | | 628 | | | Sligro Food Group N.V. | | | 17,767 | |
| | | | | | | | | | |
| | | | | | | | | 67,172 | |
| | | | | | | | | | |
| | | | | | New Zealand - 0.9% | |
| | | 51,457 | | | Air New Zealand Ltd. | | | 90,345 | |
| | | 17,546 | | | Z Energy Ltd. | | | 61,613 | |
| | | | | | | | | | |
| | | | | | | | | 151,958 | |
| | | | | | | | | | |
| | | | | | Norway - 0.8% | |
| | | 251 | | | Entra ASA(1) | | | 3,939 | |
| | | 3,001 | | | SpareBank 1 SMN | | | 32,534 | |
| | | 8,423 | | | Veidekke ASA | | | 94,650 | |
| | | | | | | | | | |
| | | | | | | | | 131,123 | |
| | | | | | | | | | |
| | | | | | Poland - 0.5% | |
| | | 64,069 | | | EPP N.V. | | | 78,594 | |
| | | | | | | | | | |
| | | | | | Singapore - 0.8% | |
| | | 15,600 | | | ComfortDelGro Corp. Ltd. | | | 27,074 | |
| | | 7,917 | | | Frasers Centrepoint Trust REIT | | | 15,686 | |
| | | 2,342 | | | Kulicke & Soffa Industries, Inc. | | | 54,990 | |
| | | 3,200 | | | Mapletree North Asia Commercial Trust REIT | | | 3,054 | |
| | | 9,500 | | | StarHub Ltd. | | | 8,931 | |
The accompanying notes are an integral part of these financial statements.
|
| Hartford Multifactor Global Small Cap ETF |
Schedule of Investments – (continued)
September 30, 2019
| | | | | | | | | | |
| Shares or Principal Amount | | Market Value† | |
| COMMON STOCKS - 98.7% - (continued) | | | |
| | | | | | Singapore - 0.8% - (continued) | |
| | | 35,100 | | | Yanlord Land Group Ltd. | | $ | 29,696 | |
| | | | | | | | | | |
| | | | | | | | | 139,431 | |
| | | | | | | | | | |
| | | | | | South Africa - 0.8% | |
| | | 12,629 | | | Reunert Ltd. | | | 57,471 | |
| | | 17,605 | | | Telkom S.A. SOC Ltd. | | | 81,961 | |
| | | | | | | | | | |
| | | | | | | | | 139,432 | |
| | | | | | | | | | |
| | | | | | South Korea - 4.8% | |
| | | 1,386 | | | Binggrae Co., Ltd. | | | 67,553 | |
| | | 3,653 | | | Cheil Worldwide, Inc. | | | 75,738 | |
| | | 586 | | | CJ Corp. | | | 40,172 | |
| | | 189 | | | Com2uSCorp | | | 14,742 | |
| | | 727 | | | Daesang Corp. | | | 13,523 | |
| | | 3,917 | | | DGB Financial Group, Inc. | | | 24,396 | |
| | | 525 | | | GS Home Shopping, Inc. | | | 68,075 | |
| | | 610 | | | GS Retail Co., Ltd. | | | 21,036 | |
| | | 191 | | | Hanwha Corp. | | | 4,032 | |
| | | 1,439 | | | Harim Holdings Co., Ltd. | | | 11,333 | |
| | | 1,552 | | | Huchems Fine Chemical Corp. | | | 27,766 | |
| | | 500 | | | Hyundai Home Shopping Network Corp. | | | 38,248 | |
| | | 2,702 | | | Hyundai Marine & Fire Insurance Co., Ltd. | | | 59,635 | |
| | | 533 | | | IS Dongseo Co., Ltd. | | | 13,390 | |
| | | 4,202 | | | JB Financial Group Co., Ltd. | | | 19,743 | |
| | | 1,828 | | | Jeju Air Co., Ltd. | | | 37,365 | |
| | | 72 | | | Korea Petrochemical Ind Co., Ltd. | | | 7,675 | |
| | | 7,445 | | | Korean Reinsurance Co. | | | 49,855 | |
| | | 3,727 | | | LF Corp. | | | 62,940 | |
| | | 4,396 | | | Meritz Fire & Marine Insurance Co., Ltd. | | | 70,195 | |
| | | 90 | | | NongShim Co., Ltd. | | | 18,773 | |
| | | 406 | | | S&T Motiv Co., Ltd. | | | 18,431 | |
| | | 372 | | | S-1 Corp. | | | 30,509 | |
| | | 208 | | | Samsung Card Co., Ltd. | | | 6,112 | |
| | | 221 | | | Soulbrain Co., Ltd. | | | 13,488 | |
| | | | | | | | | | |
| | | | | | | | | 814,725 | |
| | | | | | | | | | |
| | | | | | Spain - 0.2% | |
| | | 762 | | | Bolsas y Mercados Espanoles SHMSF S.A. | | | 19,256 | |
| | | 529 | | | Cia de Distribucion Integral Logista Holdings S.A. | | | 10,312 | |
| | | 799 | | | Lar Espana Real Estate Socimi S.A. REIT | | | 6,716 | |
| | | | | | | | | | |
| | | | | | | | | 36,284 | |
| | | | | | | | | | |
| | | | | | Sweden - 2.1% | |
| | | 9,744 | | | Bilia AB Class A | | | 77,449 | |
| | | 6,033 | | | Clas Ohlson AB Class B | | | 57,955 | |
| | | 3,040 | | | Hemfosa Fastigheter AB | | | 30,826 | |
| | | 1,097 | | | JM AB | | | 28,072 | |
| | | 7,266 | | | Nobina AB(1) | | | 45,486 | |
| | | 7,482 | | | Peab AB | | | 66,547 | |
| | | 36,677 | | | SAS AB* | | | 46,778 | |
| | | | | | | | | | |
| | | | | | | | | 353,113 | |
| | | | | | | | | | |
| | | | | | Switzerland - 1.1% | |
| | | 148 | | | Autoneum Holding AG | | | 16,282 | |
| | | 127 | | | BKW AG | | | 9,438 | |
| | | 3 | | | dormakaba Holding AG* | | | 1,936 | |
| | | 509 | | | Galenica AG*(1) | | | 29,249 | |
| | | 609 | | | Implenia AG | | | 22,891 | |
| | | 24 | | | Schweiter Technologies AG | | | 22,889 | |
| | | 831 | | | Sunrise Communications Group AG*(1) | | | 64,712 | |
| | | 274 | | | Valiant Holding AG | | | 27,258 | |
| | | | | | | | | | |
| | | | | | | | | 194,655 | |
| | | | | | | | | | |
| | | | | | Taiwan - 4.3% | |
| | | 15,000 | | | Coretronic Corp. | | | 18,034 | |
| | | 55,909 | | | Eva Airways Corp. | | | 24,598 | |
| | | 1,208 | | | FLEXium Interconnect, Inc. | | | 3,676 | |
| | | | | | | | | | |
| Shares or Principal Amount | | Market Value† | |
| COMMON STOCKS - 98.7% - (continued) | | | |
| | | | | | Taiwan - 4.3% - (continued) | |
| | | 17,000 | | | Fusheng Precision Co., Ltd. | | $ | 98,084 | |
| | | 37,563 | | | Gigabyte Technology Co., Ltd. | | | 60,114 | |
| | | 11,650 | | | Great Wall Enterprise Co., Ltd. | | | 14,157 | |
| | | 106,000 | | | HannStar Display Corp. | | | 21,866 | |
| | | 10,000 | | | Micro-Star International Co., Ltd. | | | 29,106 | |
| | | 14,469 | | | Powertech Technology, Inc. | | | 40,668 | |
| | | 14,637 | | | Primax Electronics Ltd. | | | 27,883 | |
| | | 21,000 | | | Radiant Opto-Electronics Corp. | | | 80,211 | |
| | | 30,000 | | | Ruentex Industries Ltd.* | | | 64,691 | |
| | | 8,871 | | | Tripod Technology Corp. | | | 31,882 | |
| | | 16,000 | | | United Integrated Services Co., Ltd. | | | 84,836 | |
| | | 10,562 | | | Wistron NeWeb Corp. | | | 27,780 | |
| | | 10,083 | | | WT Microelectronics Co., Ltd. | | | 12,594 | |
| | | 25,000 | | | Zhen Ding Technology Holding Ltd. | | | 89,445 | |
| | | | | | | | | | |
| | | | | | | | | 729,625 | |
| | | | | | | | | | |
| | | | | | Thailand - 0.3% | |
| | | 1,136 | | | Fabrinet* | | | 59,413 | |
| | | | | | | | | | |
| | | | | | United Kingdom - 4.1% | |
| | | 1,327 | | | Aggreko plc | | | 13,586 | |
| | | 4,894 | | | Avast plc(1) | | | 23,400 | |
| | | 22,880 | | | Charter Court Financial Services Group plc(1) | | | 85,290 | |
| | | 4,706 | | | Countryside Properties plc(1) | | | 19,485 | |
| | | 2,229 | | | Daily Mail & General Trust plc | | | 23,403 | |
| | | 2,597 | | | Dart Group plc | | | 29,283 | |
| | | 861 | | | Euromoney Institutional Investor plc | | | 15,703 | |
| | | 3,206 | | | Go-Ahead Group plc | | | 79,568 | |
| | | 1,501 | | | Greggs plc | | | 38,658 | |
| | | 25,005 | | | Halfords Group plc | | | 52,445 | |
| | | 6,036 | | | Hudson Ltd. Class A* | | | 74,062 | |
| | | 2,840 | | | John Laing Group plc(1) | | | 12,844 | |
| | | 1,124 | | | Just Group plc* | | | 733 | |
| | | 927 | | | National Express Group plc | | | 4,946 | |
| | | 15,382 | | | OneSavings Bank plc | | | 70,021 | |
| | | 4,021 | | | Safestore Holdings plc REIT | | | 33,125 | |
| | | 292 | | | Spectris plc | | | 8,794 | |
| | | 9,579 | | | Stagecoach Group plc | | | 15,782 | |
| | | 85 | | | Tate & Lyle plc | | | 771 | |
| | | 7,275 | | | UNITE Group plc | | | 97,897 | |
| | | | | | | | | | |
| | | | | | | | | 699,796 | |
| | | | | | | | | | |
| | | | | | United States - 32.7% | |
| | | 1,256 | | | 1-800-Flowers.com, Inc. Class A* | | | 18,583 | |
| | | 1,597 | | | Aaron’s, Inc. | | | 102,623 | |
| | | 1,815 | | | Abercrombie & Fitch Co., Class A | | | 28,314 | |
| | | 265 | | | Acushnet Holdings Corp. | | | 6,996 | |
| | | 64 | | | Addus HomeCare Corp.* | | | 5,074 | |
| | | 453 | | | AMC Networks, Inc. Class A* | | | 22,269 | |
| | | 719 | | | Amedisys, Inc.* | | | 94,196 | |
| | | 595 | | | American National Insurance Co. | | | 73,619 | |
| | | 3,388 | | | Amkor Technology, Inc.* | | | 30,831 | |
| | | 1,886 | | | AMN Healthcare Services, Inc.* | | | 108,558 | |
| | | 962 | | | ANGI Homeservices, Inc. Class A* | | | 6,816 | |
| | | 171 | | | AngioDynamics, Inc.* | | | 3,150 | |
| | | 1,087 | | | Anika Therapeutics, Inc.* | | | 59,665 | |
| | | 3,617 | | | Apollo Medical Holdings, Inc.* | | | 63,732 | |
| | | 767 | | | Arch Coal, Inc. Class A | | | 56,911 | |
| | | 1,198 | | | Argan, Inc. | | | 47,069 | |
| | | 50 | | | Atrion Corp. | | | 38,959 | |
| | | 4,540 | | | Avaya Holdings Corp.* | | | 46,444 | |
| | | 1,262 | | | Big Lots, Inc. | | | 30,919 | |
| | | 429 | | | BioTelemetry, Inc.* | | | 17,473 | |
| | | 198 | | | Blackstone Mortgage Trust, Inc. Class A REIT | | | 7,098 | |
| | | 122 | | | Boston Beer Co., Inc. Class A* | | | 44,418 | |
| | | 467 | | | BP Prudhoe Bay Royalty Trust | | | 4,292 | |
| | | 537 | | | Brady Corp. Class A | | | 28,488 | |
The accompanying notes are an integral part of these financial statements.
|
| Hartford Multifactor Global Small Cap ETF |
Schedule of Investments – (continued)
September 30, 2019
| | | | | | | | | | |
| Shares or Principal Amount | | Market Value† | |
| COMMON STOCKS - 98.7% - (continued) | | | |
| | | | | | United States - 32.7% - (continued) | |
| | | 1,086 | | | Brinker International, Inc. | | $ | 46,340 | |
| | | 2,597 | | | Buckle, Inc. | | | 53,498 | |
| | | 26 | | | CACI International, Inc. Class A* | | | 6,013 | |
| | | 890 | | | Cactus, Inc. Class A* | | | 25,757 | |
| | | 372 | | | Cal-Maine Foods, Inc. | | | 14,863 | |
| | | 494 | | | Cambrex Corp.* | | | 29,393 | |
| | | 2,110 | | | Casa Systems, Inc.* | | | 16,574 | |
| | | 124 | | | Casey’s General Stores, Inc. | | | 19,984 | |
| | | 20 | | | Chemed Corp. | | | 8,351 | |
| | | 42 | | | Chesapeake Utilities Corp. | | | 4,003 | |
| | | 1,054 | | | Chico’s FAS, Inc. | | | 4,248 | |
| | | 536 | | | Chimera Investment Corp. REIT | | | 10,484 | |
| | | 68 | | | Coca-Cola Bottling Co., Consolidated | | | 20,663 | |
| | | 365 | | | CONMED Corp. | | | 35,095 | |
| | | 1,223 | | | CONSOL Energy, Inc.* | | | 19,116 | |
| | | 1,363 | | | Corvel Corp.* | | | 103,179 | |
| | | 886 | | | CSG Systems International, Inc. | | | 45,788 | |
| | | 1,667 | | | CVR Energy, Inc. | | | 73,398 | |
| | | 794 | | | Designer Brands, Inc. | | | 13,593 | |
| | | 1,046 | | | Dick’s Sporting Goods, Inc. | | | 42,687 | |
| | | 413 | | | Diodes, Inc.* | | | 16,582 | |
| | | 166 | | | DISH Network Corp. Class A* | | | 5,656 | |
| | | 516 | | | Dolby Laboratories, Inc. Class A | | | 33,354 | |
| | | 192 | | | Douglas Dynamics, Inc. | | | 8,557 | |
| | | 705 | | | EchoStar Corp. Class A* | | | 27,932 | |
| | | 1,348 | | | Emergent BioSolutions, Inc.* | | | 70,473 | |
| | | 1,270 | | | Employers Holdings, Inc. | | | 55,347 | |
| | | 3,296 | | | Ennis, Inc. | | | 66,612 | |
| | | 1,501 | | | Ensign Group, Inc. | | | 71,192 | |
| | | 857 | | | ePlus, Inc.* | | | 65,209 | |
| | | 263 | | | FB Financial Corp. | | | 9,876 | |
| | | 857 | | | FBL Financial Group, Inc. Class A | | | 51,000 | |
| | | 2,009 | | | First Interstate BancSystem, Inc. Class A | | | 80,842 | |
| | | 6,567 | | | Five Point Holdings LLC Class A* | | | 49,253 | |
| | | 516 | | | Genesco, Inc.* | | | 20,650 | |
| | | 15,593 | | | Genworth Financial, Inc. Class A* | | | 68,609 | |
| | | 680 | | | Getty Realty Corp. REIT | | | 21,801 | |
| | | 1,810 | | | Globus Medical, Inc. Class A* | | | 92,527 | |
| | | 65 | | | Graham Holdings Co. Class B | | | 43,124 | |
| | | 453 | | | Granite Point Mortgage Trust, Inc. REIT | | | 8,489 | |
| | | 402 | | | Greenbrier Cos., Inc. | | | 12,108 | |
| | | 554 | | | Greif, Inc. Class A | | | 20,991 | |
| | | 628 | | | Guess?, Inc. | | | 11,637 | |
| | | 2,921 | | | H&R Block, Inc. | | | 68,994 | |
| | | 951 | | | Horace Mann Educators Corp. | | | 44,060 | |
| | | 57 | | | Hub Group, Inc. Class A* | | | 2,651 | |
| | | 56 | | | ICF International, Inc. | | | 4,730 | |
| | | 393 | | | Ichor Holdings Ltd.* | | | 9,503 | |
| | | 479 | | | Industrial Logistics Properties Trust REIT | | | 10,179 | |
| | | 1,256 | | | Ingles Markets, Inc. Class A | | | 48,808 | |
| | | 3,832 | | | Inovalon Holdings, Inc. Class A* | | | 62,807 | |
| | | 1,592 | | | Insight Enterprises, Inc.* | | | 88,659 | |
| | | 32 | | | Insperity, Inc. | | | 3,156 | |
| | | 509 | | | Kaman Corp. | | | 30,265 | |
| | | 215 | | | Kelly Services, Inc. Class A | | | 5,207 | |
| | | 2,736 | | | Laureate Education, Inc. Class A* | | | 45,349 | |
| | | 810 | | | LHC Group, Inc.* | | | 91,984 | |
| | | 603 | | | Louisiana-Pacific Corp. | | | 14,822 | |
| | | 1,015 | | | Magellan Health, Inc.* | | | 63,032 | |
| | | 6,931 | | | Magnolia Oil & Gas Corp. Class A* | | | 76,934 | |
| | | 610 | | | ManTech International Corp. Class A | | | 43,560 | |
| | | 1,093 | | | Marcus & Millichap, Inc. REIT* | | | 38,791 | |
| | | 1,604 | | | Match Group, Inc. | | | 114,590 | |
| | | 201 | | | MAXIMUS, Inc. | | | 15,529 | |
| | | 195 | | | McGrath Rent Corp. | | | 13,570 | |
| | | | | | | | | | |
| Shares or Principal Amount | | Market Value† | |
| COMMON STOCKS - 98.7% - (continued) | | | |
| | | | | | United States - 32.7% - (continued) | |
| | | 1,449 | | | MEDNAX, Inc.* | | $ | 32,776 | |
| | | 474 | | | Mercury General Corp. | | | 26,487 | |
| | | 50 | | | Meredith Corp. | | | 1,833 | |
| | | 5,147 | | | Meridian Bioscience, Inc. | | | 48,845 | |
| | | 1,846 | | | MFA Financial, Inc. REIT | | | 13,587 | |
| | | 44 | | | MicroStrategy, Inc. Class A* | | | 6,528 | |
| | | 623 | | | MSG Networks, Inc. Class A* | | | 10,105 | |
| | | 695 | | | Murphy USA, Inc.* | | | 59,284 | |
| | | 1,137 | | | National HealthCare Corp. | | | 93,063 | |
| | | 827 | | | National Presto Industries, Inc. | | | 73,677 | |
| | | 281 | | | National Western Life Group, Inc. Class A | | | 75,412 | |
| | | 1,722 | | | NextGen Healthcare, Inc.* | | | 26,984 | |
| | | 218 | | | NorthWestern Corp. | | | 16,361 | |
| | | 233 | | | NuVasive, Inc.* | | | 14,768 | |
| | | 760 | | | Oritani Financial Corp. | | | 13,448 | |
| | | 2,512 | | | Par Pacific Holdings, Inc.* | | | 57,424 | |
| | | 1,928 | | | Patterson Cos., Inc. | | | 34,357 | |
| | | 981 | | | PC Connection, Inc. | | | 38,161 | |
| | | 1,298 | | | PennyMac Financial Services, Inc.* | | | 39,433 | |
| | | 653 | | | PennyMac Mortgage Investment Trust REIT | | | 14,516 | |
| | | 1,721 | | | Phibro Animal Health Corp. Class A | | | 36,709 | |
| | | 7,346 | | | Photronics, Inc.* | | | 79,925 | |
| | | 204 | | | Portland General Electric Co. | | | 11,499 | |
| | | 2,278 | | | Premier, Inc. Class A* | | | 65,880 | |
| | | 1,979 | | | ProPetro Holding Corp.* | | | 17,989 | |
| | | 3,258 | | | Renewable Energy Group, Inc.* | | | 48,886 | |
| | | 997 | | | REX American Resources Corp.* | | | 76,101 | |
| | | 221 | | | Safety Insurance Group, Inc. | | | 22,394 | |
| | | 3,875 | | | Sally Beauty Holdings, Inc.* | | | 57,699 | |
| | | 44 | | | Sanderson Farms, Inc. | | | 6,659 | |
| | | 1,863 | | | Schneider National, Inc. Class B | | | 40,464 | |
| | | 92 | | | Scholastic Corp. | | | 3,474 | |
| | | 659 | | | Select Medical Holdings Corp.* | | | 10,920 | |
| | | 1,342 | | | Selective Insurance Group, Inc. | | | 100,905 | |
| | | 541 | | | Sleep Number Corp.* | | | 22,354 | |
| | | 3,451 | | | SMART Global Holdings, Inc.* | | | 87,932 | |
| | | 464 | | | Spirit Airlines, Inc.* | | | 16,843 | |
| | | 3,047 | | | Steelcase, Inc. Class A | | | 56,065 | |
| | | 730 | | | Stepan Co. | | | 70,854 | |
| | | 92 | | | Sturm Ruger & Co., Inc. | | | 3,842 | |
| | | 1,084 | | | Sunstone Hotel Investors, Inc. REIT | | | 14,894 | |
| | | 2,646 | | | Sykes Enterprises, Inc.* | | | 81,073 | |
| | | 1,392 | | | Telephone & Data Systems, Inc. | | | 35,914 | |
| | | 2,794 | | | TPG RE Finance Trust, Inc. REIT | | | 55,433 | |
| | | 397 | | | Trinseo S.A. | | | 17,051 | |
| | | 9,155 | | | TrustCo Bank Corp. | | | 74,613 | |
| | | 203 | | | TTM Technologies, Inc.* | | | 2,476 | |
| | | 304 | | | U.S. Physical Therapy, Inc. | | | 39,687 | |
| | | 36 | | | UniFirst Corp. | | | 7,024 | |
| | | 4,174 | | | Unisys Corp.* | | | 31,013 | |
| | | 995 | | | United Fire Group, Inc. | | | 46,745 | |
| | | 1,879 | | | United States Cellular Corp.* | | | 70,613 | |
| | | 65 | | | Unitil Corp. | | | 4,124 | |
| | | 765 | | | Universal Corp. | | | 41,930 | |
| | | 82 | | | USANA Health Sciences, Inc.* | | | 5,608 | |
| | | 3,440 | | | Virtu Financial, Inc. Class A | | | 56,278 | |
| | | 280 | | | Vishay Intertechnology, Inc. | | | 4,740 | |
| | | 3,038 | | | Warrior Met Coal, Inc. | | | 59,302 | |
| | | 1,874 | | | Weis Markets, Inc. | | | 71,474 | |
| | | 82 | | | Williams-Sonoma, Inc. | | | 5,574 | |
| | | | | | | | | | |
| | | | | | | | | 5,608,534 | |
| | | | | | | | | | |
| | | |
| | | | | | Total Common Stocks
(cost $17,102,536) | | $ | 16,916,222 | |
| | | | | | | | | | |
The accompanying notes are an integral part of these financial statements.
|
| Hartford Multifactor Global Small Cap ETF |
Schedule of Investments – (continued)
September 30, 2019
| | | | | | | | | | |
| Shares or Principal Amount | | Market Value† | |
| PREFERRED STOCKS - 0.3% | | | |
| | | | | | Germany - 0.3% | |
| | | 5,482 | | | Schaeffler AG, 4.39% | | $ | 42,098 | |
| | | | | | | | | | |
| | | |
| | | | | | Total Preferred Stocks
(cost $78,402) | | $ | 42,098 | |
| | | | | | | | | | |
| | | |
| | | | | | Total Long-Term Investments
(cost $17,180,938) | | $ | 16,958,320 | |
| | | | | | | | | | |
| |
| SHORT-TERM INVESTMENTS - 0.1% | | | |
| | | | | | U.S. Treasury Bill - 0.1% | |
| $ | | | 20,000 | | | 1.92%, 12/12/2019(2)(3) | | $ | 19,929 | |
| | | | | | | | | | |
| | | |
| | | | | | Total Short-Term Investments
(cost $19,923) | | $ | 19,929 | |
| | | | | | | | | | |
| | | | | | | | | | | | | | |
| | | | |
| | | | | | Total Investments
(cost $17,200,861) | | | 99.1 | % | | $ | 16,978,249 | |
| | | | | | Other Assets and Liabilities | | | 0.9 | % | | | 154,679 | |
| | | | | | | | | | | | | | |
| | | | | | Total Net Assets | | | 100.0 | % | | $ | 17,132,928 | |
| | | | | | | | | | | | | | |
| Note: | Percentage of investments as shown is the ratio of the total market value to total net assets. |
| | The Fund may refer to any one or more of the industry classifications used by one or more widely recognized market indices, ratings group and/or as defined by Fund management. Industry classifications may not be identical across all security types. |
| | For Fund compliance purposes, the Fund may not use the same classification system. These classifications are used for financial reporting purposes. |
| | See “Glossary” for abbreviation descriptions. |
| (1) | Security was purchased pursuant to Rule 144A under the Securities Act of 1933 and may be sold in transactions that are exempt from registration (typically only to qualified institutional buyers) or in a public offering registered under the Securities Act of 1933. At September 30, 2019, the aggregate value of these securities was $745,856, representing 4.4% of net assets. |
| (2) | The rate shown represents current yield to maturity. |
| (3) | This security has been pledged as collateral in connection with futures contracts. |
| | | | | | | | | | | | | | | | |
| Futures Contracts Outstanding at September 30, 2019 | |
Description | | Number of
Contracts | | | Expiration
Date | | | Current
Notional
Amount | | | Value and
Unrealized
Appreciation/
(Depreciation) | |
| Long position contracts: | |
E-Mini Russell 2000 | | | 1 | | | | 12/20/2019 | | | $ | 76,250 | | | $ | (3,132 | ) |
MSCI EAFE Index Future | | | 1 | | | | 12/20/2019 | | | | 94,920 | | | | (552 | ) |
| | | | | | | | | | | | | | | | |
Total | | | $ | (3,684 | ) |
| | | | | | | | | | | | | | | | |
Total futures contracts | | | $ | (3,684 | ) |
| | | | | | | | | | | | | | | | |
| † | See Significant Accounting Policies of accompanying Notes to Financial Statements regarding valuation of investments. |
The accompanying notes are an integral part of these financial statements.
|
| Hartford Multifactor Global Small Cap ETF |
Schedule of Investments – (continued)
September 30, 2019
Fair Valuation Summary
The following is a summary of the fair valuations according to the inputs used as of September 30, 2019 in valuing the Fund’s investments.
| | | | | | | | | | | | | | | | |
Description | | Total | | | Level 1 | | | Level 2 | | | Level 3(1) | |
Assets | |
Common Stocks | |
Australia | | $ | 992,695 | | | $ | 992,695 | | | $ | — | | | $ | — | |
Belgium | | | 34,176 | | | | 34,176 | | | | — | | | | — | |
Bermuda | | | 67,430 | | | | 67,430 | | | | — | | | | — | |
Brazil | | | 262,452 | | | | 262,452 | | | | — | | | | — | |
Canada | | | 787,517 | | | | 787,517 | | | | — | | | | — | |
China | | | 1,160,716 | | | | 1,160,716 | | | | — | | | | — | |
Denmark | | | 73,636 | | | | 73,636 | | | | — | | | | — | |
Finland | | | 7,231 | | | | 7,231 | | | | — | | | | — | |
France | | | 295,771 | | | | 295,771 | | | | — | | | | — | |
Georgia | | | 30,589 | | | | 30,589 | | | | — | | | | — | |
Germany | | | 179,291 | | | | 179,291 | | | | — | | | | — | |
Hong Kong | | | 519,125 | | | | 519,125 | | | | — | | | | — | |
Ireland | | | 20,576 | | | | 20,576 | | | | — | | | | — | |
Israel | | | 266,021 | | | | 266,021 | | | | — | | | | — | |
Italy | | | 174,273 | | | | 174,273 | | | | — | | | | — | |
Japan | | | 2,764,652 | | | | 2,764,652 | | | | — | | | | — | |
Liechtenstein | | | 33,922 | | | | 33,922 | | | | — | | | | — | |
Luxembourg | | | 42,294 | | | | 42,294 | | | | — | | | | — | |
Netherlands | | | 67,172 | | | | 67,172 | | | | — | | | | — | |
New Zealand | | | 151,958 | | | | 151,958 | | | | — | | | | — | |
Norway | | | 131,123 | | | | 131,123 | | | | — | | | | — | |
Poland | | | 78,594 | | | | 78,594 | | | | — | | | | — | |
Singapore | | | 139,431 | | | | 139,431 | | | | — | | | | — | |
South Africa | | | 139,432 | | | | 139,432 | | | | — | | | | — | |
South Korea | | | 814,725 | | | | 814,725 | | | | — | | | | — | |
Spain | | | 36,284 | | | | 36,284 | | | | — | | | | — | |
Sweden | | | 353,113 | | | | 353,113 | | | | — | | | | — | |
Switzerland | | | 194,655 | | | | 194,655 | | | | — | | | | — | |
Taiwan | | | 729,625 | | | | 729,625 | | | | — | | | | — | |
Thailand | | | 59,413 | | | | 59,413 | | | | — | | | | — | |
United Kingdom | | | 699,796 | | | | 699,796 | | | | — | | | | — | |
United States | | | 5,608,534 | | | | 5,608,534 | | | | — | | | | — | |
Preferred Stocks | | | 42,098 | | | | 42,098 | | | | — | | | | — | |
Short-Term Investments | | | 19,929 | | | | — | | | | 19,929 | | | | — | |
| | | | | | | | | | | | | | | | |
Total | | $ | 16,978,249 | | | $ | 16,958,320 | | | $ | 19,929 | | | $ | — | |
| | | | | | | | | | | | | | | | |
Liabilities | |
Futures Contracts(2) | | $ | (3,684 | ) | | $ | (3,684 | ) | | $ | — | | | $ | — | |
| | | | | | | | | | | | | | | | |
Total | | $ | (3,684 | ) | | $ | (3,684 | ) | | $ | — | | | $ | — | |
| | | | | | | | | | | | | | | | |
| (1) | For the year ended September 30, 2019, there were no transfers in and out of Level 3. |
| (2) | Derivative instruments (excluding purchased and written options, if applicable) are valued at the unrealized appreciation/(depreciation) on the investments. |
The accompanying notes are an integral part of these financial statements.
|
| Hartford Multifactor Low Volatility International Equity ETF |
Schedule of Investments
September 30, 2019
| | | | | | | | |
| Shares or Principal Amount | | Market Value† | |
| COMMON STOCKS - 99.5% | |
| | | | Australia - 6.7% | |
| | 1,248 | | | AGL Energy Ltd. | | $ | 16,127 | |
| | 2,281 | | | Amcor plc | | | 21,923 | |
| | 8,447 | | | Aurizon Holdings Ltd. | | | 33,613 | |
| | 869 | | | Australia & New Zealand Banking Group Ltd. | | | 16,715 | |
| | 1,234 | | | Caltex Australia Ltd. | | | 21,905 | |
| | 72 | | | Cochlear Ltd. | | | 10,108 | |
| | 51 | | | Commonwealth Bank of Australia | | | 2,780 | |
| | 2,169 | | | Computershare Ltd. | | | 23,626 | |
| | 183 | | | CSL Ltd. | | | 28,843 | |
| | 1,349 | | | GPT Group REIT | | | 5,605 | |
| | 708 | | | National Australia Bank Ltd. | | | 14,182 | |
| | 598 | | | Ramsay Health Care Ltd. | | | 26,163 | |
| | 1,640 | | | Sonic Healthcare Ltd. | | | 31,026 | |
| | 920 | | | Stockland REIT | | | 2,823 | |
| | 1,462 | | | Tabcorp Holdings Ltd. | | | 4,782 | |
| | 2,956 | | | Transurban Group | | | 29,287 | |
| | 1,224 | | | Wesfarmers Ltd. | | | 32,856 | |
| | 260 | | | Westpac Banking Corp. | | | 5,198 | |
| | 1,351 | | | Woolworths Group Ltd. | | | 33,969 | |
| | | | | | | | |
| | | | | | | 361,531 | |
| | | | | | | | |
| | | | Belgium - 0.1% | |
| | 33 | | | Cofinimmo S.A. REIT | | | 4,648 | |
| | | | | | | | |
| | | | Brazil - 0.4% | |
| | 5,009 | | | Ambev S.A. | | | 23,149 | |
| | | | | | | | |
| | | | Canada - 10.3% | |
| | 410 | | | Alimentation Couche-Tard, Inc. Class B | | | 12,573 | |
| | 359 | | | Bank of Montreal | | | 26,459 | |
| | 333 | | | Bank of Nova Scotia | | | 18,926 | |
| | 601 | | | BCE, Inc. | | | 29,088 | |
| | 1,410 | | | CAE, Inc. | | | 35,846 | |
| | 600 | | | Canadian Apartment Properties REIT | | | 24,684 | |
| | 200 | | | Canadian Imperial Bank of Commerce | | | 16,512 | |
| | 303 | | | Canadian National Railway Co. | | | 27,224 | |
| | 181 | | | Canadian Tire Corp. Ltd. Class A | | | 20,324 | |
| | 364 | | | CCL Industries, Inc. Class B | | | 14,692 | |
| | 65 | | | CGI, Inc.* | | | 5,143 | |
| | 634 | | | Enbridge, Inc. | | | 22,267 | |
| | 1,500 | | | First Capital Realty, Inc. | | | 25,004 | |
| | 6 | | | George Weston Ltd. | | | 505 | |
| | 210 | | | Imperial Oil Ltd. | | | 5,472 | |
| | 536 | | | Inter Pipeline Ltd. | | | 9,412 | |
| | 48 | | | Loblaw Cos., Ltd. | | | 2,736 | |
| | 9 | | | Onex Corp. | | | 558 | |
| | 637 | | | Pembina Pipeline Corp. | | | 23,628 | |
| | 135 | | | Quebecor, Inc. Class B | | | 3,067 | |
| | 1,359 | | | RioCan Real Estate Investment Trust REIT | | | 27,077 | |
| | 16 | | | Ritchie Bros Auctioneers, Inc. | | | 638 | |
| | 495 | | | Rogers Communications, Inc. Class B | | | 24,126 | |
| | 265 | | | Royal Bank of Canada | | | 21,510 | |
| | 1,352 | | | Shaw Communications, Inc. Class B | | | 26,580 | |
| | 843 | | | Suncor Energy, Inc. | | | 26,608 | |
| | 416 | | | TC Energy Corp. | | | 21,554 | |
| | 876 | | | TELUS Corp. | | | 31,196 | |
| | 152 | | | Thomson Reuters Corp. | | | 10,166 | |
| | 416 | | | Toronto-Dominion Bank | | | 24,272 | |
| | 300 | | | WSP Global, Inc. | | | 17,545 | |
| | | | | | | | |
| | | | | | | 555,392 | |
| | | | | | | | |
| | | | China - 2.3% | |
| | 27,000 | | | China Construction Bank Corp. Class H | | | 20,596 | |
| | 1,500 | | | China Merchants Bank Co., Ltd. Class H | | | 7,137 | |
| | 46,000 | | | China Telecom Corp. Ltd. Class H | | | 20,948 | |
| | 6,000 | | | Fuyao Glass Industry Group Co., Ltd. Class H(1) | | | 16,647 | |
| | 20,000 | | | Guangzhou Automobile Group Co., Ltd. Class H | | | 19,134 | |
| | | | | | | | |
| Shares or Principal Amount | | Market Value† | |
| COMMON STOCKS - 99.5% - (continued) | |
| | | | China - 2.3% - (continued) | |
| | 4,000 | | | Jiangsu Expressway Co., Ltd. Class H | | $ | 5,082 | |
| | 2,300 | | | Shenzhou International Group Holdings Ltd. | | | 30,043 | |
| | 30,000 | | | Zall Smart Commerce Group Ltd.* | | | 3,597 | |
| | | | | | | | |
| | | | | | | 123,184 | |
| | | | | | | | |
| | | | Denmark - 2.1% | |
| | 201 | | | Carlsberg A/S Class B | | | 29,716 | |
| | 243 | | | Coloplast A/S Class B | | | 29,272 | |
| | 310 | | | DSV A/S | | | 29,504 | |
| | 488 | | | Novo Nordisk A/S Class B | | | 25,093 | |
| | | | | | | | |
| | | | | | | 113,585 | |
| | | | | | | | |
| | | | Finland - 0.1% | |
| | 137 | | | Kone Oyj Class B | | | 7,802 | |
| | | | | | | | |
| | | | France - 4.0% | |
| | 232 | | | Air Liquide S.A. | | | 33,032 | |
| | 193 | | | EssilorLuxottica S.A. | | | 27,826 | |
| | 46 | | | Hermes International | | | 31,795 | |
| | 74 | | | L’Oreal S.A. | | | 20,725 | |
| | 1,926 | | | Orange S.A. | | | 30,226 | |
| | 267 | | | Sanofi | | | 24,760 | |
| | 144 | | | Sodexo S.A. | | | 16,170 | |
| | 63 | | | Thales S.A. | | | 7,246 | |
| | 447 | | | TOTAL S.A. | | | 23,335 | |
| | 5 | | | Vinci S.A. | | | 539 | |
| | | | | | | | |
| | | | | | | 215,654 | |
| | | | | | | | |
| | | | Germany - 3.4% | |
| | 114 | | | adidas AG | | | 35,501 | |
| | 118 | | | Allianz SE | | | 27,510 | |
| | 178 | | | BASF SE | | | 12,443 | |
| | 1,356 | | | Deutsche Telekom AG | | | 22,757 | |
| | 236 | | | Merck KGaA | | | 26,591 | |
| | 248 | | | SAP SE | | | 29,168 | |
| | 240 | | | Siemens AG | | | 25,707 | |
| | | | | | | | |
| | | | | | | 179,677 | |
| | | | | | | | |
| | | | Hong Kong - 5.5% | |
| | 2,000 | | | China Mobile Ltd. | | | 16,545 | |
| | 17,000 | | | CITIC Ltd. | | | 21,468 | |
| | 1,500 | | | CK Hutchison Holdings Ltd. | | | 13,241 | |
| | 2,000 | | | CK Infrastructure Holdings Ltd. | | | 13,458 | |
| | 2,500 | | | CLP Holdings Ltd. | | | 26,262 | |
| | 1,100 | | | Dairy Farm International Holdings Ltd. | | | 6,930 | |
| | 8,000 | | | Guangdong Investment Ltd. | | | 15,654 | |
| | 800 | | | Hang Seng Bank Ltd. | | | 17,246 | |
| | 11,000 | | | HKBN Ltd. | | | 20,262 | |
| | 11,616 | | | Hong Kong & China Gas Co., Ltd. | | | 22,641 | |
| | 300 | | | Jardine Strategic Holdings Ltd. | | | 8,964 | |
| | 3,000 | | | Link REIT | | | 33,083 | |
| | 3,594 | | | MTR Corp. Ltd. | | | 20,172 | |
| | 13,000 | | | PCCW Ltd. | | | 7,296 | |
| | 1,000 | | | Power Assets Holdings Ltd. | | | 6,716 | |
| | 2,000 | | | Swire Pacific Ltd. Class A | | | 18,611 | |
| | 1,700 | | | VTech Holdings Ltd. | | | 14,822 | |
| | 10,000 | | | Zhongyu Gas Holdings Ltd. | | | 9,746 | |
| | | | | | | | |
| | | | | | | 293,117 | |
| | | | | | | | |
| | | | India - 2.4% | |
| | 236 | | | HDFC Bank Ltd. ADR | | | 13,464 | |
| | 2,515 | | | Infosys Ltd. ADR | | | 28,596 | |
| | 1,396 | | | Larsen & Toubro Ltd. GDR | | | 29,037 | |
| | 774 | | | Mahindra & Mahindra Ltd. GDR | | | 5,998 | |
| | 5,582 | | | Wipro Ltd. ADR | | | 20,374 | |
| | 529 | | | WNS Holdings Ltd. ADR* | | | 31,079 | |
| | | | | | | | |
| | | | | | | 128,548 | |
| | | | | | | | |
The accompanying notes are an integral part of these financial statements.
|
| Hartford Multifactor Low Volatility International Equity ETF |
Schedule of Investments – (continued)
September 30, 2019
| | | | | | | | |
| Shares or Principal Amount | | Market Value† | |
| COMMON STOCKS - 99.5% - (continued) | |
| | | | Indonesia - 2.9% | |
| | 52,200 | | | Astra International Tbk PT | | $ | 24,271 | |
| | 12,500 | | | Bank Central Asia Tbk PT | | | 26,726 | |
| | 65,185 | | | Chandra Asri Petrochemical Tbk PT | | | 37,655 | |
| | 1,614,100 | | | Hanson International Tbk PT* | | | 10,461 | |
| | 13,900 | | | Indofood CBP Sukses Makmur Tbk PT | | | 11,775 | |
| | 77,000 | | | Telekomunikasi Indonesia Persero Tbk PT | | | 23,379 | |
| | 7,200 | | | Unilever Indonesia Tbk PT | | | 23,586 | |
| | | | | | | | |
| | | | | | | 157,853 | |
| | | | | | | | |
| | | | Ireland - 1.1% | |
| | 634 | | | CRH plc | | | 21,834 | |
| | 1,189 | | | Experian plc | | | 38,081 | |
| | | | | | | | |
| | | | | | | 59,915 | |
| | | | | | | | |
| | | | Israel - 2.5% | |
| | 315 | | | Alony Hetz Properties & Investments Ltd. | | | 4,608 | |
| | 171 | | | Azrieli Group Ltd. | | | 13,431 | |
| | 200 | | | Check Point Software Technologies Ltd.* | | | 21,900 | |
| | 247 | | | Nice Ltd.* | | | 36,313 | |
| | 118 | | | Paz Oil Co., Ltd. | | | 17,246 | |
| | 964 | | | Radware Ltd.* | | | 23,387 | |
| | 216 | | | Taro Pharmaceutical Industries Ltd. | | | 16,297 | |
| | | | | | | | |
| | | | | | | 133,182 | |
| | | | | | | | |
| | | | Italy - 1.4% | |
| | 1,620 | | | Eni S.p.A. | | | 24,786 | |
| | 644 | | | Recordati S.p.A. | | | 27,634 | |
| | 4,840 | | | Snam S.p.A. | | | 24,452 | |
| | | | | | | | |
| | | | | | | 76,872 | |
| | | | | | | | |
| | | | Japan - 16.1% | |
| | 700 | | | ANA Holdings, Inc. | | | 23,537 | |
| | 1,700 | | | Astellas Pharma, Inc. | | | 24,200 | |
| | 500 | | | Bridgestone Corp. | | | 19,357 | |
| | 1,100 | | | Canon, Inc. | | | 29,338 | |
| | 300 | | | Chugai Pharmaceutical Co., Ltd. | | | 23,317 | |
| | 1,800 | | | DeNA Co., Ltd. | | | 31,761 | |
| | 400 | | | Denso Corp. | | | 17,577 | |
| | 300 | | | East Japan Railway Co. | | | 28,619 | |
| | 600 | | | FUJIFILM Holdings Corp. | | | 26,315 | |
| | 100 | | | Hankyu Hanshin Holdings, Inc. | | | 3,854 | |
| | 1,700 | | | ITOCHU Corp. | | | 35,093 | |
| | 500 | | | Japan Airlines Co., Ltd. | | | 14,860 | |
| | 5 | | | Japan Logistics Fund, Inc. REIT | | | 12,371 | |
| | 2,300 | | | Japan Post Holdings Co., Ltd. | | | 21,175 | |
| | 1 | | | Japan Real Estate Investment Corp. REIT | | | 6,708 | |
| | 1 | | | Japan Retail Fund Investment Corp. REIT | | | 2,115 | |
| | 500 | | | Kaken Pharmaceutical Co., Ltd. | | | 23,178 | |
| | 300 | | | KDDI Corp. | | | 7,842 | |
| | 500 | | | Kintetsu Group Holdings Co., Ltd. | | | 26,047 | |
| | 300 | | | Kuraray Co., Ltd. | | | 3,684 | |
| | 500 | | | McDonald’s Holdings Co. Japan Ltd. | | | 24,196 | |
| | 500 | | | Mitsubishi Corp. | | | 12,265 | |
| | 1,600 | | | Mitsubishi Electric Corp. | | | 21,208 | |
| | 600 | | | Mitsubishi Heavy Industries Ltd. | | | 23,495 | |
| | 500 | | | Mitsubishi Tanabe Pharma Corp. | | | 5,482 | |
| | 600 | | | Mitsui & Co., Ltd. | | | 9,815 | |
| | 9,700 | | | Mizuho Financial Group, Inc. | | | 14,863 | |
| | 300 | | | Nagoya Railroad Co., Ltd. | | | 8,966 | |
| | 700 | | | NEC Corp. | | | 29,535 | |
| | 1,800 | | | Nippon Kayaku Co., Ltd. | | | 21,485 | |
| | 3,500 | | | Nissan Motor Co., Ltd. | | | 21,831 | |
| | 1,000 | | | NTT DOCOMO, Inc. | | | 25,473 | |
| | 200 | | | Oriental Land Co., Ltd. | | | 30,423 | |
| | 400 | | | Otsuka Holdings Co., Ltd. | | | 14,953 | |
| | 300 | | | Secom Co., Ltd. | | | 27,364 | |
| | 1,900 | | | Seiko Epson Corp. | | | 26,722 | |
| | | | | | | | |
| Shares or Principal Amount | | Market Value† | |
| COMMON STOCKS - 99.5% - (continued) | |
| | | | Japan - 16.1% - (continued) | |
| | 1,900 | | | Sekisui House Ltd. | | $ | 37,358 | |
| | 200 | | | Seven & i Holdings Co., Ltd. | | | 7,647 | |
| | 1,700 | | | Skylark Holdings Co., Ltd. | | | 30,925 | |
| | 1,300 | | | Sumitomo Rubber Industries Ltd. | | | 15,421 | |
| | 200 | | | Tokio Marine Holdings, Inc. | | | 10,695 | |
| | 500 | | | Toyota Motor Corp. | | | 33,384 | |
| | 5,600 | | | Yamada Denki Co., Ltd. | | | 27,100 | |
| | | | | | | | |
| | | | | | | 861,554 | |
| | | | | | | | |
| | | | Malaysia - 2.2% | |
| | 23,500 | | | DiGi.Com Bhd | | | 26,660 | |
| | 7,400 | | | HAP Seng Consolidated Bhd | | | 17,426 | |
| | 15,300 | | | IHH Healthcare Bhd | | | 20,756 | |
| | 2,300 | | | Kuala Lumpur Kepong Bhd | | | 12,678 | |
| | 5,000 | | | Maxis Bhd | | | 6,688 | |
| | 11,500 | | | Petronas Chemicals Group Bhd | | | 20,709 | |
| | 3,200 | | | Tenaga Nasional Bhd | | | 10,425 | |
| | | | | | | | |
| | | | | | | 115,342 | |
| | | | | | | | |
| | | | Mexico - 0.2% | |
| | 1,404 | | | Fomento Economico Mexicano S.A.B. de C.V. | | | 12,860 | |
| | | | | | | | |
| | | | Netherlands - 1.2% | |
| | 78 | | | Koninklijke DSM N.V. | | | 9,388 | |
| | 137 | | | Koninklijke Philips N.V. | | | 6,348 | |
| | 616 | | | QIAGEN N.V.* | | | 20,174 | |
| | 895 | | | Royal Dutch Shell plc Class A | | | 26,293 | |
| | | | | | | | |
| | | | | | | 62,203 | |
| | | | | | | | |
| | | | Norway - 1.7% | |
| | 1,785 | | | Atea ASA* | | | 22,985 | |
| | 1,265 | | | Equinor ASA | | | 24,093 | |
| | 832 | | | Marine Harvest ASA* | | | 19,221 | |
| | 1,189 | | | Telenor ASA | | | 23,889 | |
| | | | | | | | |
| | | | | | | 90,188 | |
| | | | | | | | |
| | | | Philippines - 0.7% | |
| | 9,400 | | | Ayala Land, Inc. | | | 8,968 | |
| | 1,530 | | | Manila Electric Co. | | | 10,922 | |
| | 640 | | | SM Investments Corp. | | | 11,990 | |
| | 10,800 | | | SM Prime Holdings, Inc. | | | 7,752 | |
| | | | | | | | |
| | | | | | | 39,632 | |
| | | | | | | | |
| | | | Portugal - 0.1% | |
| | 192 | | | Galp Energia SGPS S.A. | | | 2,894 | |
| | | | | | | | |
| | | | Russia - 0.1% | |
| | 284 | | | MMC Norilsk Nickel PJSC ADR | | | 7,270 | |
| | | | | | | | |
| | | | Singapore - 0.8% | |
| | 200 | | | Ascendas Real Estate Investment Trust REIT | | | 451 | |
| | 2,700 | | | Mapletree Logistics Trust REIT | | | 3,163 | |
| | 3,900 | | | SATS Ltd. | | | 13,650 | |
| | 5,400 | | | Singapore Telecommunications Ltd. | | | 12,144 | |
| | 1,300 | | | Suntec Real Estate Investment Trust REIT | | | 1,786 | |
| | 2,300 | | | UOL Group Ltd. | | | 12,474 | |
| | | | | | | | |
| | | | | | | 43,668 | |
| | | | | | | | |
| | | | South Africa - 0.5% | |
| | 19,110 | | | Fortress REIT Ltd. Class A, REIT | | | 25,963 | |
| | | | | | | | |
| | | | South Korea - 5.2% | |
| | 42 | | | Chong Kun Dang Pharmaceutical Corp. | | | 2,928 | |
| | 68 | | | GS Home Shopping, Inc. | | | 8,817 | |
| | 308 | | | Hyundai Department Store Co., Ltd. | | | 20,110 | |
| | 274 | | | Hyundai Home Shopping Network Corp. | | | 20,960 | |
| | 206 | | | Hyundai Motor Co. | | | 23,077 | |
| | 916 | | | Kangwon Land, Inc. | | | 22,629 | |
| | 65 | | | KB Financial Group, Inc. | | | 2,320 | |
| | 594 | | | Kia Motors Corp. | | | 22,645 | |
The accompanying notes are an integral part of these financial statements.
|
| Hartford Multifactor Low Volatility International Equity ETF |
Schedule of Investments – (continued)
September 30, 2019
| | | | | | | | |
| Shares or Principal Amount | | Market Value† | |
| COMMON STOCKS - 99.5% - (continued) | |
| | | | South Korea - 5.2% - (continued) | |
| | 1,990 | | | KT Corp. | | $ | 22,507 | |
| | 200 | | | LG Corp. | | | 11,704 | |
| | 88 | | | NongShim Co., Ltd. | | | 18,356 | |
| | 15 | | | Ottogi Corp. | | | 7,311 | |
| | 281 | | | S-1 Corp. | | | 23,046 | |
| | 647 | | | Samsung Electronics Co., Ltd. | | | 26,531 | |
| | 196 | | | Shinhan Financial Group Co., Ltd. | | | 6,849 | |
| | 74 | | | SK Holdings Co., Ltd. | | | 12,621 | |
| | 121 | | | SK Telecom Co., Ltd. | | | 24,430 | |
| | | | | | | | |
| | | | | | | 276,841 | |
| | | | | | | | |
| | | | Spain - 0.9% | |
| | 307 | | | Amadeus IT Group S.A. | | | 21,996 | |
| | 3,644 | | | Telefonica S.A. | | | 27,813 | |
| | | | | | | | |
| | | | | | | 49,809 | |
| | | | | | | | |
| | | | Sweden - 1.3% | |
| | 1,216 | | | Assa Abloy AB Class B | | | 27,097 | |
| | 793 | | | Swedbank AB Class A | | | 11,429 | |
| | 6,599 | | | Telia Co., AB | | | 29,578 | |
| | | | | | | | |
| | | | | | | 68,104 | |
| | | | | | | | |
| | | | Switzerland - 2.8% | |
| | 58 | | | Alcon, Inc.* | | | 3,385 | |
| | 12 | | | Givaudan S.A. | | | 33,503 | |
| | 296 | | | Nestle S.A. | | | 32,143 | |
| | 291 | | | Novartis AG | | | 25,255 | |
| | 81 | | | Roche Holding AG | | | 23,594 | |
| | 259 | | | Swiss Re AG | | | 27,039 | |
| | 15 | | | Swisscom AG | | | 7,406 | |
| | | | | | | | |
| | | | | | | 152,325 | |
| | | | | | | | |
| | | | Taiwan - 5.2% | |
| | 2,000 | | | Cheng Shin Rubber Industry Co., Ltd. | | | 2,952 | |
| | 10,000 | | | Chong Hong Construction Co., Ltd. | | | 25,625 | |
| | 8,000 | | | Chunghwa Telecom Co., Ltd. | | | 28,623 | |
| | 41,000 | | | Compal Electronics, Inc. | | | 23,655 | |
| | 26,000 | | | Everlight Electronics Co., Ltd. | | | 23,340 | |
| | 2,000 | | | Far EasTone Telecommunications Co., Ltd. | | | 4,674 | |
| | 1,000 | | | Formosa Chemicals & Fibre Corp. | | | 2,795 | |
| | 2,000 | | | Formosa Plastics Corp. | | | 6,092 | |
| | 2,000 | | | Foxconn Technology Co., Ltd. | | | 4,171 | |
| | 6,000 | | | Highwealth Construction Corp. | | | 9,650 | |
| | 2,800 | | | Hon Hai Precision Industry Co., Ltd. | | | 6,606 | |
| | 3,000 | | | Hung Sheng Construction Ltd.* | | | 1,924 | |
| | 3,000 | | | Nan Ya Plastics Corp. | | | 6,740 | |
| | 7,000 | | | Pou Chen Corp. | | | 8,969 | |
| | 2,000 | | | Powertech Technology, Inc. | | | 5,621 | |
| | 8,000 | | | Sinbon Electronics Co., Ltd. | | | 31,072 | |
| | 1,000 | | | Supreme Electronics Co., Ltd. | | | 935 | |
| | 2,000 | | | Taiwan Mobile Co., Ltd. | | | 7,220 | |
| | 3,000 | | | Taiwan Semiconductor Manufacturing Co., Ltd. | | | 26,302 | |
| | 12,000 | | | Uni-President Enterprises Corp. | | | 28,932 | |
| | 20,000 | | | WT Microelectronics Co., Ltd. | | | 24,980 | |
| | | | | | | | |
| | | | | | | 280,878 | |
| | | | | | | | |
| | | | Thailand - 2.9% | |
| | 1,000 | | | Advanced Info Service PCL NVDR | | | 7,193 | |
| | 13,800 | | | Airports of Thailand PCL NVDR | | | 33,727 | |
| | 261,700 | | | Bangkok Land PCL NVDR | | | 12,578 | |
| | 1,400 | | | Bumrungrad Hospital PCL NVDR | | | 5,859 | |
| | 10,500 | | | Central Pattana PCL NVDR | | | 23,345 | |
| | 10,600 | | | CP ALL PCL NVDR | | | 28,159 | |
| | 900 | | | Electricity Generating PCL NVDR | | | 10,564 | |
| | 2,900 | | | Ratch Group PCL NVDR | | | 6,780 | |
| | 1,404 | | | Siam Cement PCL NVDR | | | 18,729 | |
| | 10,700 | | | Supalai plc NVDR | | | 6,297 | |
| | | | | | | | |
| | | | | | | 153,231 | |
| | | | | | | | |
| | | | | | | | |
| Shares or Principal Amount | | Market Value† | |
| COMMON STOCKS - 99.5% - (continued) | |
| | | | Turkey - 1.6% | |
| | 2,504 | | | BIM Birlesik Magazalar A.S. | | $ | 21,783 | |
| | 27,264 | | | Enka Insaat ve Sanayi A.S. | | | 27,281 | |
| | 2,060 | | | KOC Holding A.S. | | | 6,899 | |
| | 17,221 | | | Soda Sanayii A.S. | | | 18,025 | |
| | 501 | | | Tupras Turkiye Petrol Rafinerileri A.S. | | | 12,732 | |
| | | | | | | | |
| | | | | | | 86,720 | |
| | | | | | | | |
| | | | United Kingdom - 10.7% | |
| | 343 | | | AstraZeneca plc | | | 30,691 | |
| | 1,958 | | | BAE Systems plc | | | 13,753 | |
| | 4,296 | | | BP plc | | | 27,306 | |
| | 1,111 | | | Compass Group plc | | | 28,655 | |
| | 465 | | | Croda International plc | | | 27,849 | |
| | 780 | | | Diageo plc | | | 32,037 | |
| | 362 | | | Ferguson plc* | | | 26,516 | |
| | 1,152 | | | GlaxoSmithKline plc | | | 24,766 | |
| | 1,359 | | | Halma plc | | | 33,008 | |
| | 2,031 | | | HSBC Holdings plc | | | 15,633 | |
| | 2,598 | | | Informa plc | | | 27,277 | |
| | 348 | | | InterContinental Hotels Group plc | | | 21,764 | |
| | 292 | | | Intertek Group plc | | | 19,712 | |
| | 156 | | | Linde plc | | | 30,220 | |
| | 2,132 | | | Pearson plc | | | 19,389 | |
| | 1,091 | | | RELX plc | | | 25,981 | |
| | 6,238 | | | Rentokil Initial plc | | | 35,960 | |
| | 3,799 | | | Rightmove plc | | | 25,776 | |
| | 747 | | | Sage Group plc | | | 6,365 | |
| | 1,415 | | | Smith & Nephew plc | | | 34,159 | |
| | 174 | | | Smiths Group plc | | | 3,366 | |
| | 493 | | | Unilever N.V. | | | 29,641 | |
| | 399 | | | Unilever plc | | | 24,044 | |
| | 6,145 | | | Vodafone Group plc | | | 12,267 | |
| | | | | | | | |
| | | | | | | 576,135 | |
| | | | | | | | |
| | | | United States - 0.1% | |
| | 88 | | | Carnival plc | | | 3,654 | |
| | | | | | | | |
| | |
| | | | Total Common Stocks
(cost $5,018,677) | | $ | 5,343,380 | |
| | | | | | | | |
|
| PREFERRED STOCKS - 0.1% | |
| | | | Germany - 0.1% | |
| | 67 | | | Fuchs Petrolub SE, 2.01% | | | 2,517 | |
| | | | | | | | |
| | |
| | | | Total Preferred Stocks
(cost $3,006) | | $ | 2,517 | |
| | | | | | | | |
| | |
| | | | Total Long-Term Investments
(cost $5,021,683) | | $ | 5,345,897 | |
| | | | | | | | |
| | | | | | | | | | | | |
| | | |
| | | | Total Investments
(cost $5,021,683) | | | 99.6 | % | | $ | 5,345,897 | |
| | | | Other Assets and Liabilities | | | 0.4 | % | | | 22,468 | |
| | | | | | | | | | | | |
| | | | Total Net Assets | | | 100.0 | % | | $ | 5,368,365 | |
| | | | | | | | | | | | |
| Note: | Percentage of investments as shown is the ratio of the total market value to total net assets. |
| | The Fund may refer to any one or more of the industry classifications used by one or more widely recognized market indices, ratings group and/or as defined by Fund management. Industry classifications may not be identical across all security types. |
| | For Fund compliance purposes, the Fund may not use the same classification system. These classifications are used for financial reporting purposes. |
| | See “Glossary” for abbreviation descriptions. |
The accompanying notes are an integral part of these financial statements.
|
| Hartford Multifactor Low Volatility International Equity ETF |
Schedule of Investments – (continued)
September 30, 2019
| (1) | Security was purchased pursuant to Rule 144A under the Securities Act of 1933 and may be sold in transactions that are exempt from registration (typically only to qualified institutional buyers) or in a public offering registered under the Securities Act of 1933. At September 30, 2019, the aggregate value of this security was $16,647, representing 0.3% of net assets. |
| † | See Significant Accounting Policies of accompanying Notes to Financial Statements regarding valuation of investments. |
Fair Valuation Summary
The following is a summary of the fair valuations according to the inputs used as of September 30, 2019 in valuing the Fund’s investments.
| | | | | | | | | | | | | | | | |
Description | | Total | | | Level 1 | | | Level 2 | | | Level 3(1) | |
Assets | |
Common Stocks | |
Australia | | $ | 361,531 | | | $ | 361,531 | | | $ | — | | | $ | — | |
Belgium | | | 4,648 | | | | 4,648 | | | | — | | | | — | |
Brazil | | | 23,149 | | | | 23,149 | | | | — | | | | — | |
Canada | | | 555,392 | | | | 555,392 | | | | — | | | | — | |
China | | | 123,184 | | | | 123,184 | | | | — | | | | — | |
Denmark | | | 113,585 | | | | 113,585 | | | | — | | | | — | |
Finland | | | 7,802 | | | | 7,802 | | | | — | | | | — | |
France | | | 215,654 | | | | 215,654 | | | | — | | | | — | |
Germany | �� | | 179,677 | | | | 179,677 | | | | — | | | | — | |
Hong Kong | | | 293,117 | | | | 293,117 | | | | — | | | | — | |
India | | | 128,548 | | | | 128,548 | | | | — | | | | — | |
Indonesia | | | 157,853 | | | | 157,853 | | | | — | | | | — | |
Ireland | | | 59,915 | | | | 59,915 | | | | — | | | | — | |
Israel | | | 133,182 | | | | 133,182 | | | | — | | | | — | |
Italy | | | 76,872 | | | | 76,872 | | | | — | | | | — | |
Japan | | | 861,554 | | | | 861,554 | | | | — | | | | — | |
Malaysia | | | 115,342 | | | | 115,342 | | | | — | | | | — | |
Mexico | | | 12,860 | | | | 12,860 | | | | — | | | | — | |
Netherlands | | | 62,203 | | | | 62,203 | | | | — | | | | — | |
Norway | | | 90,188 | | | | 90,188 | | | | — | | | | — | |
Philippines | | | 39,632 | | | | 39,632 | | | | — | | | | — | |
Portugal | | | 2,894 | | | | 2,894 | | | | — | | | | — | |
Russia | | | 7,270 | | | | 7,270 | | | | — | | | | — | |
Singapore | | | 43,668 | | | | 43,668 | | | | — | | | | — | |
South Africa | | | 25,963 | | | | 25,963 | | | | — | | | | — | |
South Korea | | | 276,841 | | | | 276,841 | | | | — | | | | — | |
Spain | | | 49,809 | | | | 49,809 | | | | — | | | | — | |
Sweden | | | 68,104 | | | | 68,104 | | | | — | | | | — | |
Switzerland | | | 152,325 | | | | 152,325 | | | | — | | | | — | |
Taiwan | | | 280,878 | | | | 280,878 | | | | — | | | | — | |
Thailand | | | 153,231 | | | | 153,231 | | | | — | | | | — | |
Turkey | | | 86,720 | | | | 86,720 | | | | — | | | | — | |
United Kingdom | | | 576,135 | | | | 576,135 | | | | — | | | | — | |
United States | | | 3,654 | | | | 3,654 | | | | — | | | | — | |
Preferred Stocks | | | 2,517 | | | | 2,517 | | | | — | | | | — | |
| | | | | | | | | | | | | | | | |
Total | | $ | 5,345,897 | | | $ | 5,345,897 | | | $ | — | | | $ | — | |
| | | | | | | | | | | | | | | | |
| (1) | For the year ended September 30, 2019, there were no transfers in and out of Level 3. |
The accompanying notes are an integral part of these financial statements.
|
| Hartford Multifactor Low Volatility US Equity ETF |
Schedule of Investments
September 30, 2019
| | | | | | | | |
| Shares or Principal Amount | | Market Value† | |
| COMMON STOCKS - 99.8% | |
| | | | Automobiles & Components - 0.5% | |
| | 1,030 | | | General Motors Co. | | $ | 38,604 | |
| | | | | | | | |
| | | | Banks - 1.0% | |
| | 374 | | | Capitol Federal Financial, Inc. | | | 5,154 | |
| | 34 | | | Commerce Bancshares, Inc. | | | 2,062 | |
| | 128 | | | JP Morgan Chase & Co. | | | 15,064 | |
| | 834 | | | TFS Financial Corp. | | | 15,029 | |
| | 656 | | | US Bancorp | | | 36,303 | |
| | | | | | | | |
| | | | | | | 73,612 | |
| | | | | | | | |
| | | | Capital Goods - 9.6% | |
| | 218 | | | 3M Co. | | | 35,839 | |
| | 11 | | | Alamo Group, Inc. | | | 1,295 | |
| | 22 | | | Allegion plc | | | 2,280 | |
| | 293 | | | Cummins, Inc. | | | 47,662 | |
| | 123 | | | Eaton Corp. plc | | | 10,227 | |
| | 189 | | | EMCOR Group, Inc. | | | 16,277 | |
| | 39 | | | ESCO Technologies, Inc. | | | 3,103 | |
| | 150 | | | General Dynamics Corp. | | | 27,410 | |
| | 486 | | | HD Supply Holdings, Inc.* | | | 19,039 | |
| | 601 | | | Honeywell International, Inc. | | | 101,689 | |
| | 32 | | | Huntington Ingalls Industries, Inc. | | | 6,777 | |
| | 54 | | | IDEX Corp. | | | 8,850 | |
| | 130 | | | Ingersoll-Rand plc | | | 16,017 | |
| | 51 | | | Johnson Controls International plc | | | 2,238 | |
| | 582 | | | Kaman Corp. | | | 34,606 | |
| | 38 | | | Lennox International, Inc. | | | 9,233 | |
| | 217 | | | Lincoln Electric Holdings, Inc. | | | 18,827 | |
| | 172 | | | Lockheed Martin Corp. | | | 67,090 | |
| | 301 | | | MSC Industrial Direct Co., Inc. Class A | | | 21,832 | |
| | 126 | | | Northrop Grumman Corp. | | | 47,224 | |
| | 847 | | | PACCAR, Inc. | | | 59,299 | |
| | 129 | | | Quanta Services, Inc. | | | 4,876 | |
| | 342 | | | Raytheon Co. | | | 67,097 | |
| | 12 | | | Roper Technologies, Inc. | | | 4,279 | |
| | 496 | | | Toro Co. | | | 36,357 | |
| | 471 | | | United Technologies Corp. | | | 64,301 | |
| | 45 | | | Watsco, Inc. | | | 7,613 | |
| | | | | | | | |
| | | | | | | 741,337 | |
| | | | | | | | |
| | | | Commercial & Professional Services - 3.9% | |
| | 466 | | | Brady Corp. Class A | | | 24,721 | |
| | 1,612 | | | CBIZ, Inc.* | | | 37,882 | |
| | 58 | | | Cintas Corp. | | | 15,550 | |
| | 466 | | | Exponent, Inc. | | | 32,574 | |
| | 274 | | | ICF International, Inc. | | | 23,145 | |
| | 141 | | | IHS Markit Ltd.* | | | 9,430 | |
| | 624 | | | Republic Services, Inc. | | | 54,007 | |
| | 53 | | | UniFirst Corp. | | | 10,341 | |
| | 140 | | | Verisk Analytics, Inc. | | | 22,140 | |
| | 628 | | | Waste Management, Inc. | | | 72,220 | |
| | | | | | | | |
| | | | | | | 302,010 | |
| | | | | | | | |
| | | | Consumer Durables & Apparel - 0.4% | |
| | 368 | | | VF Corp. | | | 32,748 | |
| | | | | | | | |
| | | | Consumer Services - 9.7% | |
| | 274 | | | Bright Horizons Family Solutions, Inc.* | | | 41,785 | |
| | 519 | | | Carnival Corp. | | | 22,686 | |
| | 537 | | | Cheesecake Factory, Inc. | | | 22,382 | |
| | 318 | | | Choice Hotels International, Inc. | | | 28,289 | |
| | 222 | | | Cracker Barrel Old Country Store, Inc. | | | 36,108 | |
| | 471 | | | Darden Restaurants, Inc. | | | 55,682 | |
| | 450 | | | Dunkin’ Brands Group, Inc. | | | 35,712 | |
| | 949 | | | Extended Stay America, Inc. | | | 13,894 | |
| | 51 | | | Graham Holdings Co. Class B | | | 33,836 | |
| | 1,397 | | | H&R Block, Inc. | | | 32,997 | |
| | 229 | | | Hilton Worldwide Holdings, Inc. | | | 21,322 | |
| | | | | | | | |
| Shares or Principal Amount | | Market Value† | |
| COMMON STOCKS - 99.8% - (continued) | |
| | | | Consumer Services - 9.7% - (continued) | |
| | 509 | | | Hyatt Hotels Corp. Class A | | $ | 37,498 | |
| | 804 | | | International Speedway Corp. Class A | | | 36,188 | |
| | 88 | | | Jack in the Box, Inc. | | | 8,019 | |
| | 520 | | | McDonald’s Corp. | | | 111,649 | |
| | 711 | | | Service Corp. International | | | 33,993 | |
| | 772 | | | Starbucks Corp. | | | 68,260 | |
| | 1,697 | | | Wendy’s Co. | | | 33,906 | |
| | 642 | | | Yum! Brands, Inc. | | | 72,822 | |
| | | | | | | | |
| | | | | | | 747,028 | |
| | | | | | | | |
| | | | Diversified Financials - 3.7% | |
| | 2,968 | | | AGNC Investment Corp. REIT | | | 47,755 | |
| | 65 | | | American Express Co. | | | 7,688 | |
| | 3,736 | | | Annaly Capital Management, Inc. REIT | | | 32,877 | |
| | 1,481 | | | Apollo Commercial Real Estate Finance, Inc. REIT | | | 28,391 | |
| | 171 | | | ARMOUR Residential, Inc. REIT | | | 2,864 | |
| | 308 | | | Berkshire Hathaway, Inc. Class B* | | | 64,070 | |
| | 878 | | | Blackstone Mortgage Trust, Inc. Class A REIT | | | 31,476 | |
| | 483 | | | Chimera Investment Corp. REIT | | | 9,448 | |
| | 88 | | | Invesco Mortgage Capital, Inc. REIT | | | 1,347 | |
| | 2,449 | | | MFA Financial, Inc. REIT | | | 18,025 | |
| | 23 | | | Nasdaq, Inc. | | | 2,285 | |
| | 857 | | | Redwood Trust, Inc. REIT | | | 14,064 | |
| | 442 | | | Starwood Property Trust, Inc. REIT | | | 10,705 | |
| | 1,133 | | | Two Harbors Investment Corp. REIT | | | 14,876 | |
| | | | | | | | |
| | | | | | | 285,871 | |
| | | | | | | | |
| | | | Energy - 5.3% | |
| | 973 | | | Chevron Corp. | | | 115,398 | |
| | 171 | | | ConocoPhillips | | | 9,744 | |
| | 1,646 | | | Exxon Mobil Corp. | | | 116,224 | |
| | 2,546 | | | Kinder Morgan, Inc. | | | 52,473 | |
| | 647 | | | Occidental Petroleum Corp. | | | 28,772 | |
| | 313 | | | ONEOK, Inc. | | | 23,065 | |
| | 586 | | | Phillips 66 | | | 60,006 | |
| | | | | | | | |
| | | | | | | 405,682 | |
| | | | | | | | |
| | | | Food & Staples Retailing - 1.8% | |
| | 102 | | | Costco Wholesale Corp. | | | 29,387 | |
| | 433 | | | Sysco Corp. | | | 34,380 | |
| | 313 | | | US Foods Holding Corp.* | | | 12,865 | |
| | 547 | | | Walmart, Inc. | | | 64,918 | |
| | | | | | | | |
| | | | | | | 141,550 | |
| | | | | | | | |
| | | | Food, Beverage & Tobacco - 4.7% | |
| | 1,247 | | | Archer-Daniels-Midland Co. | | | 51,214 | |
| | 27 | | | Brown-Forman Corp. Class B | | | 1,695 | |
| | 1,350 | | | Coca-Cola Co. | | | 73,494 | |
| | 736 | | | Flowers Foods, Inc. | | | 17,024 | |
| | 318 | | | Hershey Co. | | | 49,287 | |
| | 398 | | | Hormel Foods Corp. | | | 17,404 | |
| | 610 | | | Kellogg Co. | | | 39,253 | |
| | 18 | | | Lancaster Colony Corp. | | | 2,496 | |
| | 30 | | | McCormick & Co., Inc. | | | 4,689 | |
| | 422 | | | Mondelez International, Inc. Class A | | | 23,345 | |
| | 518 | | | PepsiCo., Inc. | | | 71,018 | |
| | 326 | | | Tootsie Roll Industries, Inc. | | | 12,108 | |
| | | | | | | | |
| | | | | | | 363,027 | |
| | | | | | | | |
| | | | Health Care Equipment & Services - 4.6% | |
| | 275 | | | Abbott Laboratories | | | 23,009 | |
| | 598 | | | Baxter International, Inc. | | | 52,307 | |
| | 23 | | | Chemed Corp. | | | 9,604 | |
| | 315 | | | Danaher Corp. | | | 45,496 | |
| | 28 | | | Laboratory Corp. of America Holdings* | | | 4,704 | |
| | 1,018 | | | Medtronic plc | | | 110,575 | |
| | 144 | | | National HealthCare Corp. | | | 11,786 | |
The accompanying notes are an integral part of these financial statements.
|
| Hartford Multifactor Low Volatility US Equity ETF |
Schedule of Investments – (continued)
September 30, 2019
| | | | | | | | |
| Shares or Principal Amount | | Market Value† | |
| COMMON STOCKS - 99.8% - (continued) | |
| | | | Health Care Equipment & Services - 4.6% - (continued) | |
| | 389 | | | Quest Diagnostics, Inc. | | $ | 41,635 | |
| | 225 | | | STERIS plc | | | 32,510 | |
| | 62 | | | Stryker Corp. | | | 13,411 | |
| | 42 | | | UnitedHealth Group, Inc. | | | 9,127 | |
| | | | | | | | |
| | | | | | | 354,164 | |
| | | | | | | | |
| | | | Household & Personal Products - 2.5% | |
| | 309 | | | Church & Dwight Co., Inc. | | | 23,249 | |
| | 207 | | | Clorox Co. | | | 31,437 | |
| | 360 | | | Colgate-Palmolive Co. | | | 26,464 | |
| | 97 | | | Herbalife Nutrition Ltd.* | | | 3,673 | |
| | 104 | | | Kimberly-Clark Corp. | | | 14,773 | |
| | 622 | | | Procter & Gamble Co. | | | 77,364 | |
| | 74 | | | WD-40 Co. | | | 13,582 | |
| | | | | | | | |
| | | | | | | 190,542 | |
| | | | | | | | |
| | | | Insurance - 3.0% | |
| | 543 | | | Aflac, Inc. | | | 28,410 | |
| | 26 | | | Alleghany Corp.* | | | 20,742 | |
| | 129 | | | American Financial Group, Inc. | | | 13,913 | |
| | 142 | | | American National Insurance Co. | | | 17,570 | |
| | 23 | | | Argo Group International Holdings Ltd. | | | 1,616 | |
| | 188 | | | Arthur J Gallagher & Co. | | | 16,839 | |
| | 581 | | | Axis Capital Holdings Ltd. | | | 38,764 | |
| | 205 | | | Brown & Brown, Inc. | | | 7,392 | |
| | 83 | | | Chubb Ltd. | | | 13,399 | |
| | 48 | | | Everest Re Group Ltd. | | | 12,772 | |
| | 141 | | | Globe Life, Inc. | | | 13,502 | |
| | 367 | | | Loews Corp. | | | 18,893 | |
| | 8 | | | White Mountains Insurance Group Ltd. | | | 8,640 | |
| | 259 | | | WR Berkley Corp. | | | 18,708 | |
| | | | | | | | |
| | | | | | | 231,160 | |
| | | | | | | | |
| | | | Materials - 9.0% | |
| | 335 | | | Air Products & Chemicals, Inc. | | | 74,323 | |
| | 313 | | | AptarGroup, Inc. | | | 37,075 | |
| | 292 | | | Ashland Global Holdings, Inc. | | | 22,499 | |
| | 372 | | | Ball Corp. | | | 27,085 | |
| | 115 | | | Eastman Chemical Co. | | | 8,490 | |
| | 367 | | | Ecolab, Inc. | | | 72,681 | |
| | 168 | | | International Flavors & Fragrances, Inc. | | | 20,612 | |
| | 402 | | | Linde plc | | | 77,875 | |
| | 265 | | | LyondellBasell Industries N.V. Class A | | | 23,710 | |
| | 77 | | | NewMarket Corp. | | | 36,351 | |
| | 673 | | | Nucor Corp. | | | 34,262 | |
| | 396 | | | PPG Industries, Inc. | | | 46,930 | |
| | 143 | | | Reliance Steel & Aluminum Co. | | | 14,251 | |
| | 668 | | | RPM International, Inc. | | | 45,965 | |
| | 397 | | | Sensient Technologies Corp. | | | 27,254 | |
| | 54 | | | Sherwin-Williams Co. | | | 29,693 | |
| | 1,237 | | | Silgan Holdings, Inc. | | | 37,153 | |
| | 645 | | | Sonoco Products Co. | | | 37,546 | |
| | 247 | | | WR Grace & Co. | | | 16,490 | |
| | | | | | | | |
| | | | | | | 690,245 | |
| | | | | | | | |
| | | | Media & Entertainment - 4.0% | |
| | 7 | | | Alphabet, Inc. Class A* | | | 8,548 | |
| | 94 | | | AMC Networks, Inc. Class A* | | | 4,621 | |
| | 28 | | | Cable One, Inc. | | | 35,132 | |
| | 609 | | | CBS Corp. Class B | | | 24,585 | |
| | 485 | | | Cinemark Holdings, Inc. | | | 18,740 | |
| | 1,434 | | | Comcast Corp. Class A | | | 64,645 | |
| | 1,121 | | | Interpublic Group of Cos., Inc. | | | 24,169 | |
| | 57 | | | Liberty Media Corp-Liberty SiriusXM* | | | 2,392 | |
| | 684 | | | Omnicom Group, Inc. | | | 53,557 | |
| | 571 | | | Walt Disney Co. | | | 74,413 | |
| | | | | | | | |
| | | | | | | 310,802 | |
| | | | | | | | |
| | | | | | | | |
| Shares or Principal Amount | | Market Value† | |
| COMMON STOCKS - 99.8% - (continued) | |
| | | | Pharmaceuticals, Biotechnology & Life Sciences - 4.2% | |
| | 43 | | | Amgen, Inc. | | $ | 8,321 | |
| | 249 | | | Eli Lilly & Co. | | | 27,846 | |
| | 868 | | | Johnson & Johnson | | | 112,302 | |
| | 1,018 | | | Merck & Co., Inc. | | | 85,695 | |
| | 1,837 | | | Pfizer, Inc. | | | 66,003 | |
| | 220 | | | Zoetis, Inc. | | | 27,410 | |
| | | | | | | | |
| | | | | | | 327,577 | |
| | | | | | | | |
| | | | Real Estate - 6.0% | |
| | 431 | | | American Campus Communities, Inc. REIT | | | 20,723 | |
| | 132 | | | American Tower Corp. REIT | | | 29,189 | |
| | 296 | | | Apartment Investment & Management Co. Class A, REIT | | | 15,433 | |
| | 836 | | | Apple Hospitality, Inc. REIT | | | 13,861 | |
| | 58 | | | AvalonBay Communities, Inc. REIT | | | 12,489 | |
| | 77 | | | Camden Property Trust REIT | | | 8,548 | |
| | 230 | | | Crown Castle International Corp. REIT | | | 31,972 | |
| | 220 | | | Douglas Emmett, Inc. REIT | | | 9,423 | |
| | 12 | | | EastGroup Properties, Inc. REIT | | | 1,500 | |
| | 141 | | | EPR Properties REIT | | | 10,837 | |
| | 1,052 | | | Equity Commonwealth REIT | | | 36,031 | |
| | 235 | | | Equity LifeStyle Properties, Inc. REIT | | | 31,396 | |
| | 29 | | | Essex Property Trust, Inc. REIT | | | 9,473 | |
| | 415 | | | Gaming and Leisure Properties, Inc. REIT | | | 15,870 | |
| | 84 | | | Life Storage, Inc. REIT | | | 8,854 | |
| | 373 | | | LTC Properties, Inc. REIT | | | 19,105 | |
| | 113 | | | Mid-America Apartment Communities, Inc. REIT | | | 14,691 | |
| | 316 | | | National Health Investors, Inc. REIT | | | 26,035 | |
| | 137 | | | PS Business Parks, Inc. REIT | | | 24,927 | |
| | 71 | | | Public Storage REIT | | | 17,414 | |
| | 531 | | | Rayonier, Inc. REIT | | | 14,974 | |
| | 1,203 | | | Retail Opportunity Investments Corp. REIT | | | 21,931 | |
| | 224 | | | Sun Communities, Inc. REIT | | | 33,253 | |
| | 265 | | | UDR, Inc. REIT | | | 12,847 | |
| | 207 | | | WP Carey, Inc. REIT | | | 18,527 | |
| | | | | | | | |
| | | | | | | 459,303 | |
| | | | | | | | |
| | | | Retailing - 5.3% | |
| | 42 | | | AutoZone, Inc.* | | | 45,554 | |
| | 38 | | | Dollar General Corp. | | | 6,040 | |
| | 831 | | | eBay, Inc. | | | 32,392 | |
| | 174 | | | Expedia Group, Inc. | | | 23,387 | |
| | 613 | | | Genuine Parts Co. | | | 61,049 | |
| | 418 | | | Home Depot, Inc. | | | 96,984 | |
| | 162 | | | Murphy USA, Inc.* | | | 13,819 | |
| | 4 | | | O’Reilly Automotive, Inc.* | | | 1,594 | |
| | 162 | | | Pool Corp. | | | 32,676 | |
| | 124 | | | Ross Stores, Inc. | | | 13,621 | |
| | 80 | | | Target Corp. | | | 8,553 | |
| | 1,264 | | | TJX Cos., Inc. | | | 70,455 | |
| | | | | | | | |
| | | | | | | 406,124 | |
| | | | | | | | |
| | | | Semiconductors & Semiconductor Equipment - 0.3% | |
| | 391 | | | Intel Corp. | | | 20,148 | |
| | | | | | | | |
| | | | Software & Services - 9.8% | |
| | 572 | | | Accenture plc Class A | | | 110,024 | |
| | 872 | | | Amdocs Ltd. | | | 57,648 | |
| | 263 | | | Automatic Data Processing, Inc. | | | 42,453 | |
| | 73 | | | Broadridge Financial Solutions, Inc. | | | 9,083 | |
| | 465 | | | Citrix Systems, Inc. | | | 44,882 | |
| | 14 | | | Cognizant Technology Solutions Corp. Class A | | | 844 | |
| | 56 | | | ExlService Holdings, Inc.* | | | 3,750 | |
| | 348 | | | Fidelity National Information Services, Inc. | | | 46,201 | |
| | 125 | | | Fiserv, Inc.* | | | 12,949 | |
| | 537 | | | Genpact Ltd. | | | 20,809 | |
| | 608 | | | International Business Machines Corp. | | | 88,415 | |
| | 295 | | | Jack Henry & Associates, Inc. | | | 43,061 | |
The accompanying notes are an integral part of these financial statements.
|
| Hartford Multifactor Low Volatility US Equity ETF |
Schedule of Investments – (continued)
September 30, 2019
| | | | | | | | |
| Shares or Principal Amount | | Market Value† | |
| COMMON STOCKS - 99.8% - (continued) | |
| | | | Software & Services - 9.8% - (continued) | |
| | 57 | | | Mastercard, Inc. Class A | | $ | 15,480 | |
| | 478 | | | MAXIMUS, Inc. | | | 36,930 | |
| | 303 | | | Microsoft Corp. | | | 42,126 | |
| | 499 | | | Oracle Corp. | | | 27,460 | |
| | 695 | | | Paychex, Inc. | | | 57,525 | |
| | 231 | | | Visa, Inc. Class A | | | 39,734 | |
| | 2,567 | | | Western Union Co. | | | 59,477 | |
| | | | | | | | |
| | | | | | | 758,851 | |
| | | | | | | | |
| | | | Technology Hardware & Equipment - 1.2% | |
| | 472 | | | Amphenol Corp. Class A | | | 45,548 | |
| | 381 | | | Cisco Systems, Inc. | | | 18,825 | |
| | 67 | | | Dolby Laboratories, Inc. Class A | | | 4,331 | |
| | 296 | | | Juniper Networks, Inc. | | | 7,326 | |
| | 194 | | | TE Connectivity Ltd. | | | 18,077 | |
| | | | | | | | |
| | | | | | | 94,107 | |
| | | | | | | | |
| | | | Telecommunication Services - 4.3% | |
| | 3,212 | | | AT&T, Inc. | | | 121,542 | |
| | 631 | | | Cogent Communications Holdings, Inc. | | | 34,768 | |
| | 779 | | | T-Mobile US, Inc.* | | | 61,362 | |
| | 1,853 | | | Verizon Communications, Inc. | | | 111,847 | |
| | | | | | | | |
| | | | | | | 329,519 | |
| | | | | | | | |
| | | | Transportation - 2.0% | |
| | 93 | | | AMERCO | | | 36,274 | |
| | 257 | | | CH Robinson Worldwide, Inc. | | | 21,788 | |
| | 81 | | | Expeditors International of Washington, Inc. | | | 6,018 | |
| | 80 | | | J.B. Hunt Transport Services, Inc. | | | 8,852 | |
| | 218 | | | Landstar System, Inc. | | | 24,542 | |
| | 217 | | | Union Pacific Corp. | | | 35,150 | |
| | 226 | | | United Airlines Holdings, Inc.* | | | 19,981 | |
| | 16 | | | United Parcel Service, Inc. Class B | | | 1,917 | |
| | | | | | | | |
| | | | | | | 154,522 | |
| | | | | | | | |
| | | | Utilities - 3.0% | |
| | 294 | | | Alliant Energy Corp. | | | 15,855 | |
| | 65 | | | American Electric Power Co., Inc. | | | 6,090 | |
| | 26 | | | Atmos Energy Corp. | | | 2,961 | |
| | 163 | | | CenterPoint Energy, Inc. | | | 4,919 | |
| | 240 | | | CMS Energy Corp. | | | 15,348 | |
| | 217 | | | Consolidated Edison, Inc. | | | 20,500 | |
| | 127 | | | DTE Energy Co. | | | 16,886 | |
| | 195 | | | Duke Energy Corp. | | | 18,693 | |
| | 96 | | | Entergy Corp. | | | 11,267 | |
| | 486 | | | Hawaiian Electric Industries, Inc. | | | 22,166 | |
| | 54 | | | IDACORP, Inc. | | | 6,084 | |
| | 456 | | | MDU Resources Group, Inc. | | | 12,855 | |
| | 114 | | | Portland General Electric Co. | | | 6,426 | |
| | 125 | | | Public Service Enterprise Group, Inc. | | | 7,760 | |
| | 414 | | | Southern Co. | | | 25,573 | |
| | 180 | | | Spire, Inc. | | | 15,703 | |
| | 74 | | | WEC Energy Group, Inc. | | | 7,037 | |
| | 276 | | | Xcel Energy, Inc. | | | 17,910 | |
| | | | | | | | |
| | | | | | | 234,033 | |
| | | | | | | | |
| | |
| | | | Total Common Stocks
(cost $6,668,913) | | $ | 7,692,566 | |
| | | | | | | | |
| | | | | | | | | | | | |
| | | |
| | | | Total Investments
(cost $6,668,913) | | | 99.8 | % | | $ | 7,692,566 | |
| | | | Other Assets and Liabilities | | | 0.2 | % | | | 15,253 | |
| | | | | | | | | | | | |
| | | | Total Net Assets | | | 100.0 | % | | $ | 7,707,819 | |
| | | | | | | | | | | | |
| Note: | Percentage of investments as shown is the ratio of the total market value to total net assets. |
| | Equity industry classifications used in this report are the Global Industry Classification Standard, which was developed by and is the exclusive property and service mark of MSCI, Inc. and Standard & Poor’s. |
| | For Fund compliance purposes, the Fund may not use the same classification system. These classifications are used for financial reporting purposes. |
| | See “Glossary” for abbreviation descriptions. |
| † | See Significant Accounting Policies of accompanying Notes to Financial Statements regarding valuation of investments. |
The accompanying notes are an integral part of these financial statements.
|
| Hartford Multifactor Low Volatility US Equity ETF |
Schedule of Investments – (continued)
September 30, 2019
Fair Valuation Summary
The following is a summary of the fair valuations according to the inputs used as of September 30, 2019 in valuing the Fund’s investments.
| | | | | | | | | | | | | | | | |
Description | | Total | | | Level 1 | | | Level 2 | | | Level 3(1) | |
Assets | | | | | | | | | | | | | | | | |
Common Stocks | | | | | | | | | | | | | | | | |
Automobiles & Components | | $ | 38,604 | | | $ | 38,604 | | | $ | — | | | $ | — | |
Banks | | | 73,612 | | | | 73,612 | | | | — | | | | — | |
Capital Goods | | | 741,337 | | | | 741,337 | | | | — | | | | — | |
Commercial & Professional Services | | | 302,010 | | | | 302,010 | | | | — | | | | — | |
Consumer Durables & Apparel | | | 32,748 | | | | 32,748 | | | | — | | | | — | |
Consumer Services | | | 747,028 | | | | 747,028 | | | | — | | | | — | |
Diversified Financials | | | 285,871 | | | | 285,871 | | | | — | | | | — | |
Energy | | | 405,682 | | | | 405,682 | | | | — | | | | — | |
Food & Staples Retailing | | | 141,550 | | | | 141,550 | | | | — | | | | — | |
Food, Beverage & Tobacco | | | 363,027 | | | | 363,027 | | | | — | | | | — | |
Health Care Equipment & Services | | | 354,164 | | | | 354,164 | | | | — | | | | — | |
Household & Personal Products | | | 190,542 | | | | 190,542 | | | | — | | | | — | |
Insurance | | | 231,160 | | | | 231,160 | | | | — | | | | — | |
Materials | | | 690,245 | | | | 690,245 | | | | — | | | | — | |
Media & Entertainment | | | 310,802 | | | | 310,802 | | | | — | | | | — | |
Pharmaceuticals, Biotechnology & Life Sciences | | | 327,577 | | | | 327,577 | | | | — | | | | — | |
Real Estate | | | 459,303 | | | | 459,303 | | | | — | | | | — | |
Retailing | | | 406,124 | | | | 406,124 | | | | — | | | | — | |
Semiconductors & Semiconductor Equipment | | | 20,148 | | | | 20,148 | | | | — | | | | — | |
Software & Services | | | 758,851 | | | | 758,851 | | | | — | | | | — | |
Technology Hardware & Equipment | | | 94,107 | | | | 94,107 | | | | — | | | | — | |
Telecommunication Services | | | 329,519 | | | | 329,519 | | | | — | | | | — | |
Transportation | | | 154,522 | | | | 154,522 | | | | — | | | | — | |
Utilities | | | 234,033 | | | | 234,033 | | | | — | | | | — | |
| | | | | | | | | | | | | | | | |
Total | | $ | 7,692,566 | | | $ | 7,692,566 | | | $ | — | | | $ | — | |
| | | | | | | | | | | | | | | | |
| (1) | For the year ended September 30, 2019, there were no transfers in and out of Level 3. |
The accompanying notes are an integral part of these financial statements.
|
| Hartford Multifactor REIT ETF |
Schedule of Investments
September 30, 2019
| | | | | | | | | | |
| Shares or Principal Amount | | Market Value† | |
| COMMON STOCKS - 99.4% | |
| | | | Diversified REITs - 9.7% | |
| | | 7,448 | | | American Assets Trust, Inc. REIT | | $ | 348,120 | |
| | | 20,209 | | | Armada Hoffler Properties, Inc. REIT | | | 365,581 | |
| | | 24,772 | | | Empire State Realty Trust, Inc. Class A, REIT | | | 353,496 | |
| | | 13,987 | | | Gladstone Commercial Corp. REIT | | | 328,694 | |
| | | 33,465 | | | Lexington Realty Trust REIT | | | 343,016 | |
| | | 50 | | | PS Business Parks, Inc. REIT | | | 9,098 | |
| | | | | | | | | | |
| | | | | | | | | 1,748,005 | |
| | | | | | | | | | |
| | | | Health Care REITs - 9.7% | |
| | | 13,835 | | | CareTrust, Inc. REIT | | | 325,192 | |
| | | 7,076 | | | LTC Properties, Inc. REIT | | | 362,433 | |
| | | 18,542 | | | Medical Properties Trust, Inc. REIT | | | 362,682 | |
| | | 4,162 | | | National Health Investors, Inc. REIT | | | 342,907 | |
| | | 8,517 | | | Omega Healthcare Investors, Inc. REIT | | | 355,925 | |
| | | | | | | | | | |
| | | | | | | | | 1,749,139 | |
| | | | | | | | | | |
| | | | Hotel & Resort REITs - 8.5% | |
| | | 21,476 | | | Host Hotels & Resorts, Inc. REIT | | | 371,320 | |
| | | 2,633 | | | MGM Growth Properties LLC Class A, REIT | | | 79,122 | |
| | | 4,317 | | | Ryman Hospitality Properties, Inc. REIT | | | 353,174 | |
| | | 31,031 | | | Summit Hotel Properties, Inc. REIT | | | 359,959 | |
| | | 17,160 | | | Xenia Hotels & Resorts, Inc. REIT | | | 362,419 | |
| | | | | | | | | | |
| | | | | | | | | 1,525,994 | |
| | | | | | | | | | |
| | | | Industrial REITs - 7.0% | |
| | | 5,817 | | | Americold Realty Trust REIT | | | 215,636 | |
| | | 2,799 | | | EastGroup Properties, Inc. REIT | | | 349,931 | |
| | | 8,713 | | | First Industrial Realty Trust, Inc. REIT | | | 344,687 | |
| | | 16,324 | | | Industrial Logistics Properties Trust REIT | | | 346,885 | |
| | | | | | | | | | |
| | | | | | | | | 1,257,139 | |
| | | | | | | | | | |
| | | | Office REITs - 7.6% | |
| | | 21,168 | | | City Office, Inc. REIT | | | 304,607 | |
| | | 11,664 | | | Corporate Office Properties Trust REIT | | | 347,354 | |
| | | 7,904 | | | Highwoods Properties, Inc. REIT | | | 355,206 | |
| | | 17,590 | | | Piedmont Office Realty Trust, Inc. Class A, REIT | | | 367,279 | |
| | | | | | | | | | |
| | | | | | | | | 1,374,446 | |
| | | | | | | | | | |
| | | | Residential REITs - 12.6% | |
| | | 3,607 | | | Apartment Investment & Management Co. Class A, REIT | | | 188,069 | |
| | | 3,116 | | | Camden Property Trust REIT | | | 345,907 | |
| | | 2,554 | | | Equity LifeStyle Properties, Inc. REIT | | | 341,215 | |
| | | 1,089 | | | Essex Property Trust, Inc. REIT | | | 355,722 | |
| | | 2,715 | | | Mid-America Apartment Communities, Inc. REIT | | | 352,977 | |
| | | 2,309 | | | Sun Communities, Inc. REIT | | | 342,771 | |
| | | 7,140 | | | UDR, Inc. REIT | | | 346,147 | |
| | | | | | | | | | |
| | | | | | | | | 2,272,808 | |
| | | | | | | | | | |
| | | | Retail REITs - 25.2% | |
| | | 4,695 | | | Agree Realty Corp. REIT | | | 343,439 | |
| | | 18,812 | | | Brixmor Property Group, Inc. REIT | | | 381,696 | |
| | | 416,173 | | | CBL & Associates Properties, Inc. REIT | | | 536,863 | |
| | | 2,590 | | | Federal Realty Investment Trust REIT | | | 352,603 | |
| | | 11,068 | | | Getty Realty Corp. REIT | | | 354,840 | |
| | | 27,795 | | | RPT Realty REIT | | | 376,622 | |
| | | 6,504 | | | Saul Centers, Inc. REIT | | | 354,533 | |
| | | 2,270 | | | Simon Property Group, Inc. REIT | | | 353,326 | |
| | | 34,864 | | | Spirit MTA REIT | | | 294,252 | |
| | | 24,098 | | | Tanger Factory Outlet Centers, Inc. REIT | | | 373,037 | |
| | | 120 | | | Taubman Centers, Inc. REIT | | | 4,900 | |
| | | 107,960 | | | Washington Prime Group, Inc. REIT | | | 446,954 | |
| | | 12,696 | | | Weingarten Realty Investors REIT | | | 369,834 | |
| | | | | | | | | | |
| | | | | | | | | 4,542,899 | |
| | | | | | | | | | |
| | | | | | | | | | |
| Shares or Principal Amount | | Market Value† | |
| COMMON STOCKS - 99.4% - (continued) | |
| | | | | | Specialized REITs - 19.1% | | | |
| | | 2,909 | | | Coresite Realty Corp. REIT | | $ | 354,462 | |
| | | 9,784 | | | CubeSmart REIT | | | 341,462 | |
| | | 2,798 | | | Digital Realty Trust, Inc. REIT | | | 363,208 | |
| | | 4,316 | | | EPR Properties REIT | | | 331,728 | |
| | | 243 | | | Equinix, Inc. REIT | | | 140,162 | |
| | | 1,730 | | | Extra Space Storage, Inc. REIT | | | 202,099 | |
| | | 8,619 | | | Gaming and Leisure Properties, Inc. REIT | | | 329,590 | |
| | | 10,572 | | | Iron Mountain, Inc. REIT | | | 342,427 | |
| | | 1,340 | | | Public Storage REIT | | | 328,662 | |
| | | 6,877 | | | QTS Realty Trust, Inc. Class A, REIT | | | 353,546 | |
| | | 15,380 | | | VICI Properties, Inc. REIT | | | 348,357 | |
| | | | | | | | | | |
| | | | | | | | | 3,435,703 | |
| | | | | | | | | | |
| | | |
| | | | | | Total Common Stocks
(cost $17,037,056) | | $ | 17,906,133 | |
| | | | | | | | | | |
| |
| SHORT-TERM INVESTMENTS - 0.1% | | | |
| | | | | | U.S. Treasury Bill - 0.1% | |
| $ | | | 10,000 | | | 1.92%, 12/12/2019(1)(2) | | | 9,964 | |
| | | | | | | | | | |
| | | |
| | | | | | Total Short-Term Investments
(cost $9,962) | | $ | 9,964 | |
| | | | | | | | | | |
| | | | | | | | | | | | | | |
| | | | |
| | | | | | Total Investments
(cost $17,047,018) | | | 99.5 | % | | $ | 17,916,097 | |
| | | | | | Other Assets and Liabilities | | | 0.5 | % | | | 84,002 | |
| | | | | | | | | | | | | | |
| | | | | | Total Net Assets | | | 100.0 | % | | $ | 18,000,099 | |
| | | | | | | | | | | | | | |
| Note: | Percentage of investments as shown is the ratio of the total market value to total net assets. |
| | Equity industry classifications used in this report are the Global Industry Classification Standard, which was developed by and is the exclusive property and service mark of MSCI, Inc. and Standard & Poor’s. |
| | For Fund compliance purposes, the Fund may not use the same classification system. These classifications are used for financial reporting purposes. |
| | See “Glossary” for abbreviation descriptions. |
| (1) | The rate shown represents current yield to maturity. |
| (2) | This security has been pledged as collateral in connection with futures contracts. |
The accompanying notes are an integral part of these financial statements.
|
| Hartford Multifactor REIT ETF |
Schedule of Investments – (continued)
September 30, 2019
| | | | | | | | | | | | | | | | |
| Futures Contracts Outstanding at September 30, 2019 | |
Description | | Number of
Contracts | | | Expiration
Date | | | Current
Notional
Amount | | | Value and
Unrealized
Appreciation/
(Depreciation) | |
| Long position contracts: | |
S&P Real Estate Sector(E-Mini) Future | | | 2 | | | | 12/20/2019 | | | $ | 95,250 | | | $ | 809 | |
| | | | | | | | | | | | | | | | |
Total futures contracts | | | $ | 809 | |
| | | | | | | | | | | | | | | | |
| † | See Significant Accounting Policies of accompanying Notes to Financial Statements regarding valuation of investments. |
Fair Valuation Summary
The following is a summary of the fair valuations according to the inputs used as of September 30, 2019 in valuing the Fund’s investments.
| | | | | | | | | | | | | | | | |
Description | | Total | | | Level 1 | | | Level 2 | | | Level 3(1) | |
Assets | | | | | | | | | | | | | | | | |
Common Stocks | | | | | | | | | | | | | | | | |
Diversified REITs | | $ | 1,748,005 | | | $ | 1,748,005 | | | $ | — | | | $ | — | |
Health Care REITs | | | 1,749,139 | | | | 1,749,139 | | | | — | | | | — | |
Hotel & Resort REITs | | | 1,525,994 | | | | 1,525,994 | | | | — | | | | — | |
Industrial REITs | | | 1,257,139 | | | | 1,257,139 | | | | — | | | | — | |
Office REITs | | | 1,374,446 | | | | 1,374,446 | | | | — | | | | — | |
Residential REITs | | | 2,272,808 | | | | 2,272,808 | | | | — | | | | — | |
Retail REITs | | | 4,542,899 | | | | 4,542,899 | | | | — | | | | — | |
Specialized REITs | | | 3,435,703 | | | | 3,435,703 | | | | — | | | | — | |
Short-Term Investments | | | 9,964 | | | | — | | | | 9,964 | | | | — | |
Futures Contracts(2) | | | 809 | | | | 809 | | | | — | | | | — | |
| | | | | | | | | | | | | | | | |
Total | | $ | 17,916,906 | | | $ | 17,906,942 | | | $ | 9,964 | | | $ | — | |
| | | | | | | | | | | | | | | | |
| (1) | For the year ended September 30, 2019, there were no transfers in and out of Level 3. |
| (2) | Derivative instruments (excluding purchased and written options, if applicable) are valued at the unrealized appreciation/(depreciation) on the investments. |
The accompanying notes are an integral part of these financial statements.
|
| Hartford Multifactor US Equity ETF |
Schedule of Investments
September 30, 2019
| | | | | | | | | | |
| Shares or Principal Amount | | Market Value† | |
| COMMON STOCKS - 98.8% | |
| | | | Automobiles & Components - 0.2% | |
| | | 8,994 | | | General Motors Co. | | $ | 337,095 | |
| | | 8,456 | | | Gentex Corp. | | | 232,836 | |
| | | | | | | | | | |
| | | | | | | | | 569,931 | |
| | | | | | | | | | |
| | | | Banks - 1.9% | |
| | | 22,577 | | | Bank of America Corp. | | | 658,571 | |
| | | 1,523 | | | Bank of Hawaii Corp. | | | 130,871 | |
| | | 12,447 | | | Citigroup, Inc. | | | 859,839 | |
| | | 19,379 | | | JP Morgan Chase & Co. | | | 2,280,715 | |
| | | 1,021 | | | PNC Financial Services Group, Inc. | | | 143,103 | |
| | | 7,416 | | | Popular, Inc. | | | 401,057 | |
| | | 29,704 | | | Wells Fargo & Co. | | | 1,498,270 | |
| | | | | | | | | | |
| | | | | | | | | 5,972,426 | |
| | | | | | | | | | |
| | | | Capital Goods - 5.1% | |
| | | 14,052 | | | AGCO Corp. | | | 1,063,736 | |
| | | 4,396 | | | Allegion plc | | | 455,645 | |
| | | 544 | | | Crane Co. | | | 43,863 | |
| | | 12,430 | | | Cummins, Inc. | | | 2,021,988 | |
| | | 5,504 | | | Eaton Corp. plc | | | 457,657 | |
| | | 8,531 | | | EMCOR Group, Inc. | | | 734,690 | |
| | | 6,799 | | | Emerson Electric Co. | | | 454,581 | |
| | | 2,040 | | | Generac Holdings, Inc.* | | | 159,814 | |
| | | 14,748 | | | Graco, Inc. | | | 678,998 | |
| | | 11,580 | | | Honeywell International, Inc. | | | 1,959,336 | |
| | | 2,523 | | | Huntington Ingalls Industries, Inc. | | | 534,346 | |
| | | 3,028 | | | Illinois Tool Works, Inc. | | | 473,852 | |
| | | 7,046 | | | Ingersoll-Rand plc | | | 868,138 | |
| | | 4,599 | | | Lennox International, Inc. | | | 1,117,419 | |
| | | 1,454 | | | Lincoln Electric Holdings, Inc. | | | 126,149 | |
| | | 495 | | | Lockheed Martin Corp. | | | 193,080 | |
| | | 6,821 | | | Masco Corp. | | | 284,299 | |
| | | 853 | | | Northrop Grumman Corp. | | | 319,696 | |
| | | 17,780 | | | PACCAR, Inc. | | | 1,244,778 | |
| | | 1,495 | | | Raytheon Co. | | | 293,304 | |
| | | 3,508 | | | Snap-on, Inc. | | | 549,142 | |
| | | 5,896 | | | Toro Co. | | | 432,177 | |
| | | 2,291 | | | Wabco Holdings, Inc.* | | | 306,421 | |
| | | 4,734 | | | Watsco, Inc. | | | 800,898 | |
| | | | | | | | | | |
| | | | | | | | | 15,574,007 | |
| | | | | | | | | | |
| | | | Commercial & Professional Services - 1.3% | |
| | | 489 | | | Cintas Corp. | | | 131,101 | |
| | | 20,424 | | | KAR Auction Services, Inc. | | | 501,409 | |
| | | 4,947 | | | ManpowerGroup, Inc. | | | 416,736 | |
| | | 15,415 | | | Republic Services, Inc. | | | 1,334,168 | |
| | | 487 | | | Verisk Analytics, Inc. | | | 77,014 | |
| | | 13,561 | | | Waste Management, Inc. | | | 1,559,515 | |
| | | | | | | | | | |
| | | | | | | | | 4,019,943 | |
| | | | | | | | | | |
| | | | Consumer Durables & Apparel - 1.5% | |
| | | 1,419 | | | Carter’s, Inc. | | | 129,427 | |
| | | 1,179 | | | D.R. Horton, Inc. | | | 62,145 | |
| | | 8,478 | | | Deckers Outdoor Corp.* | | | 1,249,318 | |
| | | 5,895 | | | Garmin Ltd. | | | 499,248 | |
| | | 277 | | | NVR, Inc.* | | | 1,029,706 | |
| | | 25,255 | | | PulteGroup, Inc. | | | 923,070 | |
| | | 4,244 | | | Ralph Lauren Corp. | | | 405,175 | |
| | | 10,669 | | | Toll Brothers, Inc. | | | 437,962 | |
| | | | | | | | | | |
| | | | | | | | | 4,736,051 | |
| | | | | | | | | | |
| | | | Consumer Services - 2.3% | |
| | | 3,751 | | | Cracker Barrel Old Country Store, Inc. | | | 610,100 | |
| | | 5,231 | | | Darden Restaurants, Inc. | | | 618,409 | |
| | | 84,543 | | | H&R Block, Inc. | | | 1,996,905 | |
| | | 11,204 | | | McDonald’s Corp. | | | 2,405,611 | |
| | | 1,666 | | | Starbucks Corp. | | | 147,308 | |
| | | | | | | | | | |
| Shares or Principal Amount | | Market Value† | |
| COMMON STOCKS - 98.8% - (continued) | |
| | | | Consumer Services - 2.3% - (continued) | |
| | | 14,963 | | | Wendy’s Co. | | $ | 298,961 | |
| | | 10,289 | | | Yum! Brands, Inc. | | | 1,167,081 | |
| | | | | | | | | | |
| | | | | | | | | 7,244,375 | |
| | | | | | | | | | |
| | | | Diversified Financials - 3.1% | |
| | | 36,307 | | | AGNC Investment Corp. REIT | | | 584,180 | |
| | | 5,521 | | | American Express Co. | | | 653,024 | |
| | | 9,817 | | | Berkshire Hathaway, Inc. Class B* | | | 2,042,132 | |
| | | 38,728 | | | Blackstone Mortgage Trust, Inc. Class A REIT | | | 1,388,399 | |
| | | 1,064 | | | Capital One Financial Corp. | | | 96,803 | |
| | | 41,203 | | | Chimera Investment Corp. REIT | | | 805,931 | |
| | | 20,454 | | | Federated Investors, Inc. Class B | | | 662,914 | |
| | | 21,727 | | | Franklin Resources, Inc. | | | 627,041 | |
| | | 3,473 | | | Intercontinental Exchange, Inc. | | | 320,454 | |
| | | 89,298 | | | MFA Financial, Inc. REIT | | | 657,233 | |
| | | 20,484 | | | Santander Consumer USA Holdings, Inc. | | | 522,547 | |
| | | 38,163 | | | Starwood Property Trust, Inc. REIT | | | 924,308 | |
| | | 4,172 | | | Synchrony Financial | | | 142,223 | |
| | | | | | | | | | |
| | | | | | | | | 9,427,189 | |
| | | | | | | | | | |
| | | | Energy - 2.4% | |
| | | 40,722 | | | Cabot Oil & Gas Corp. | | | 715,485 | |
| | | 23,247 | | | Chevron Corp. | | | 2,757,094 | |
| | | 19,907 | | | ConocoPhillips | | | 1,134,301 | |
| | | 32,016 | | | Exxon Mobil Corp. | | | 2,260,650 | |
| | | 2,198 | | | Occidental Petroleum Corp. | | | 97,745 | |
| | | 4,139 | | | Phillips 66 | | | 423,834 | |
| | | | | | | | | | |
| | | | | | | | | 7,389,109 | |
| | | | | | | | | | |
| | | | Food & Staples Retailing - 3.0% | |
| | | 4,539 | | | Casey’s General Stores, Inc. | | | 731,505 | |
| | | 5,604 | | | Costco Wholesale Corp. | | | 1,614,569 | |
| | | 8,545 | | | Kroger Co. | | | 220,290 | |
| | | 6,376 | | | Performance Food Group Co.* | | | 293,360 | |
| | | 21,821 | | | Sysco Corp. | | | 1,732,587 | |
| | | 32,891 | | | US Foods Holding Corp.* | | | 1,351,820 | |
| | | 13,568 | | | Walgreens Boots Alliance, Inc. | | | 750,446 | |
| | | 22,249 | | | Walmart, Inc. | | | 2,640,511 | |
| | | | | | | | | | |
| | | | | | | | | 9,335,088 | |
| | | | | | | | | | |
| | | | Food, Beverage & Tobacco - 3.6% | |
| | | 1,231 | | | Altria Group, Inc. | | | 50,348 | |
| | | 14,352 | | | Archer-Daniels-Midland Co. | | | 589,437 | |
| | | 32,865 | | | Coca-Cola Co. | | | 1,789,171 | |
| | | 45,612 | | | Flowers Foods, Inc. | | | 1,055,005 | |
| | | 11,306 | | | Hershey Co. | | | 1,752,317 | |
| | | 6,659 | | | Hormel Foods Corp. | | | 291,198 | |
| | | 4,843 | | | Ingredion, Inc. | | | 395,867 | |
| | | 1,382 | | | JM Smucker Co. | | | 152,048 | |
| | | 1,277 | | | McCormick & Co., Inc. | | | 199,595 | |
| | | 22,552 | | | PepsiCo., Inc. | | | 3,091,879 | |
| | | 11,264 | | | Philip Morris International, Inc. | | | 855,275 | |
| | | 9,080 | | | Tyson Foods, Inc. Class A | | | 782,151 | |
| | | | | | | | | | |
| | | | | | | | | 11,004,291 | |
| | | | | | | | | | |
| | | | Health Care Equipment & Services - 8.7% | |
| | | 27,400 | | | Abbott Laboratories | | | 2,292,558 | |
| | | 338 | | | Anthem, Inc. | | | 81,154 | |
| | | 7,658 | | | Baxter International, Inc. | | | 669,845 | |
| | | 27,826 | | | Boston Scientific Corp.* | | | 1,132,240 | |
| | | 21,280 | | | Centene Corp.* | | | 920,573 | |
| | | 21,334 | | | Cerner Corp. | | | 1,454,339 | |
| | | 2,269 | | | Chemed Corp. | | | 947,466 | |
| | | 1,153 | | | Cooper Cos., Inc. | | | 342,441 | |
| | | 7,124 | | | Danaher Corp. | | | 1,028,919 | |
| | | 7,132 | | | Globus Medical, Inc. Class A* | | | 364,588 | |
| | | 1,132 | | | HCA Healthcare, Inc. | | | 136,316 | |
The accompanying notes are an integral part of these financial statements.
|
| Hartford Multifactor US Equity ETF |
Schedule of Investments – (continued)
September 30, 2019
| | | | | | | | | | |
| Shares or Principal Amount | | Market Value† | |
| COMMON STOCKS - 98.8% - (continued) | |
| | | | Health Care Equipment & Services - 8.7% - (continued) | |
| | | 37,059 | | | Henry Schein, Inc.* | | $ | 2,353,247 | |
| | | 1,081 | | | Hill-Rom Holdings, Inc. | | | 113,754 | |
| | | 3,270 | | | Hologic, Inc.* | | | 165,102 | |
| | | 735 | | | ICU Medical, Inc.* | | | 117,306 | |
| | | 142 | | | IDEXX Laboratories, Inc.* | | | 38,614 | |
| | | 13,829 | | | Laboratory Corp. of America Holdings* | | | 2,323,272 | |
| | | 19,829 | | | Medtronic plc | | | 2,153,826 | |
| | | 4,168 | | | Molina Healthcare, Inc.* | | | 457,313 | |
| | | 17,045 | | | Quest Diagnostics, Inc. | | | 1,824,326 | |
| | | 7,248 | | | ResMed, Inc. | | | 979,277 | |
| | | 8,739 | | | STERIS plc | | | 1,262,698 | |
| | | 4,787 | | | Stryker Corp. | | | 1,035,428 | |
| | | 11,248 | | | UnitedHealth Group, Inc. | | | 2,444,415 | |
| | | 8,244 | | | Varian Medical Systems, Inc.* | | | 981,778 | |
| | | 4,127 | | | WellCare Health Plans, Inc.* | | | 1,069,595 | |
| | | | | | | | | | |
| | | | | | | | | 26,690,390 | |
| | | | | | | | | | |
| | | | | | Household & Personal Products - 2.0% | |
| | | 6,197 | | | Church & Dwight Co., Inc. | | | 466,262 | |
| | | 1,427 | | | Clorox Co. | | | 216,718 | |
| | | 7,862 | | | Colgate-Palmolive Co. | | | 577,936 | |
| | | 5,856 | | | Estee Lauder Cos., Inc. Class A | | | 1,165,051 | |
| | | 9,802 | | | Kimberly-Clark Corp. | | | 1,392,374 | |
| | | 17,886 | | | Procter & Gamble Co. | | | 2,224,661 | |
| | | | | | | | | | |
| | | | | | | | | 6,043,002 | |
| | | | | | | | | | |
| | | | | | Insurance - 10.6% | |
| | | 43,443 | | | Aflac, Inc. | | | 2,272,938 | |
| | | 536 | | | Alleghany Corp.* | | | 427,599 | |
| | | 12,847 | | | Allstate Corp. | | | 1,396,212 | |
| | | 17,711 | | | American Financial Group, Inc. | | | 1,910,131 | |
| | | 4,118 | | | American International Group, Inc. | | | 229,373 | |
| | | 14,939 | | | Arch Capital Group Ltd.* | | | 627,139 | |
| | | 12,054 | | | Arthur J Gallagher & Co. | | | 1,079,677 | |
| | | 14,892 | | | Axis Capital Holdings Ltd. | | | 993,594 | |
| | | 6,013 | | | Chubb Ltd. | | | 970,739 | |
| | | 10,847 | | | Cincinnati Financial Corp. | | | 1,265,520 | |
| | | 43,692 | | | CNA Financial Corp. | | | 2,151,831 | |
| | | 4,305 | | | Everest Re Group Ltd. | | | 1,145,517 | |
| | | 5,518 | | | Fidelity National Financial, Inc. | | | 245,054 | |
| | | 5,686 | | | First American Financial Corp. | | | 335,531 | |
| | | 1,063 | | | Globe Life, Inc. | | | 101,793 | |
| | | 6,839 | | | Hanover Insurance Group, Inc. | | | 926,958 | |
| | | 17,074 | | | Loews Corp. | | | 878,970 | |
| | | 216 | | | Markel Corp.* | | | 255,290 | |
| | | 338 | | | Marsh & McLennan Cos., Inc. | | | 33,817 | |
| | | 45,562 | | | MetLife, Inc. | | | 2,148,704 | |
| | | 93,344 | | | Old Republic International Corp. | | | 2,200,118 | |
| | | 19,474 | | | Principal Financial Group, Inc. | | | 1,112,744 | |
| | | 13,217 | | | Progressive Corp. | | | 1,021,013 | |
| | | 12,891 | | | Prudential Financial, Inc. | | | 1,159,545 | |
| | | 9,914 | | | Reinsurance Group of America, Inc. | | | 1,585,050 | |
| | | 6,604 | | | RenaissanceRe Holdings Ltd. | | | 1,277,544 | |
| | | 7,116 | | | Selective Insurance Group, Inc. | | | 535,052 | |
| | | 11,288 | | | Travelers Cos., Inc. | | | 1,678,413 | |
| | | 748 | | | White Mountains Insurance Group Ltd. | | | 807,840 | |
| | | 1,707 | | | Willis Towers Watson plc | | | 329,400 | |
| | | 19,829 | | | WR Berkley Corp. | | | 1,432,249 | |
| | | | | | | | | | |
| | | | | | | | | 32,535,355 | |
| | | | | | | | | | |
| | | | | | Materials - 3.1% | |
| | | 4,009 | | | Air Products & Chemicals, Inc. | | | 889,437 | |
| | | 6,452 | | | AptarGroup, Inc. | | | 764,239 | |
| | | 1,234 | | | Celanese Corp. | | | 150,906 | |
| | | 3,442 | | | Ecolab, Inc. | | | 681,654 | |
| | | 5,868 | | | International Paper Co. | | | 245,400 | |
| | | | | | | | | | |
| Shares or Principal Amount | | Market Value† | |
| COMMON STOCKS - 98.8% - (continued) | |
| | | | | | Materials - 3.1% - (continued) | |
| | | 3,461 | | | Linde plc | | $ | 670,465 | |
| | | 7,144 | | | LyondellBasell Industries N.V. Class A | | | 639,174 | |
| | | 2,128 | | | NewMarket Corp. | | | 1,004,607 | |
| | | 6,812 | | | Packaging Corp. of America | | | 722,753 | |
| | | 6,911 | | | PPG Industries, Inc. | | | 819,023 | |
| | | 11,809 | | | Reliance Steel & Aluminum Co. | | | 1,176,885 | |
| | | 30,054 | | | Sonoco Products Co. | | | 1,749,443 | |
| | | | | | | | | | |
| | | | | | | | | 9,513,986 | |
| | | | | | | | | | |
| | | | | | Media & Entertainment - 4.0% | |
| | | 1,295 | | | Alphabet, Inc. Class A* | | | 1,581,376 | |
| | | 749 | | | Cable One, Inc. | | | 939,770 | |
| | | 13,606 | | | CBS Corp. Class B | | | 549,274 | |
| | | 2,245 | | | Cinemark Holdings, Inc. | | | 86,747 | |
| | | 36,074 | | | Comcast Corp. Class A | | | 1,626,216 | |
| | | 3,892 | | | DISH Network Corp. Class A* | | | 132,600 | |
| | | 7,075 | | | Facebook, Inc. Class A* | | | 1,259,916 | |
| | | 46,184 | | | Interpublic Group of Cos., Inc. | | | 995,727 | |
| | | 6,075 | | | Live Nation Entertainment, Inc.* | | | 403,016 | |
| | | 17,638 | | | Match Group, Inc. | | | 1,260,059 | |
| | | 23,990 | | | Omnicom Group, Inc. | | | 1,878,417 | |
| | | 13,214 | | | Walt Disney Co. | | | 1,722,049 | |
| | | | | | | | | | |
| | | | | | | | | 12,435,167 | |
| | | | | | | | | | |
| | | | | | Pharmaceuticals, Biotechnology & Life Sciences - 6.4% | |
| | | 8,420 | | | AbbVie, Inc. | | | 637,562 | |
| | | 1,098 | | | Agilent Technologies, Inc. | | | 84,140 | |
| | | 6,266 | | | Amgen, Inc. | | | 1,212,534 | |
| | | 1,776 | | | Bio-Rad Laboratories, Inc. Class A* | | | 590,946 | |
| | | 18,708 | | | Bristol-Myers Squibb Co. | | | 948,683 | |
| | | 1,709 | | | Charles River Laboratories International, Inc.* | | | 226,220 | |
| | | 10,383 | | | Eli Lilly & Co. | | | 1,161,131 | |
| | | 16,627 | | | Gilead Sciences, Inc. | | | 1,053,819 | |
| | | 235 | | | IQVIA Holdings, Inc.* | | | 35,104 | |
| | | 6,462 | | | Jazz Pharmaceuticals plc* | | | 828,041 | |
| | | 26,206 | | | Johnson & Johnson | | | 3,390,532 | |
| | | 41,470 | | | Merck & Co., Inc. | | | 3,490,945 | |
| | | 928 | | | Mettler-Toledo International, Inc.* | | | 653,683 | |
| | | 101,854 | | | Pfizer, Inc. | | | 3,659,614 | |
| | | 1,572 | | | Waters Corp.* | | | 350,918 | |
| | | 10,446 | | | Zoetis, Inc. | | | 1,301,467 | |
| | | | | | | | | | |
| | | | | | | | | 19,625,339 | |
| | | | | | | | | | |
| | | | | | Real Estate - 5.6% | |
| | | 1,467 | | | Alexandria Real Estate Equities, Inc. REIT | | | 225,977 | |
| | | 538 | | | American Tower Corp. REIT | | | 118,968 | |
| | | 21,458 | | | Apartment Investment & Management Co. Class A, REIT | | | 1,118,820 | |
| | | 44,651 | | | Apple Hospitality, Inc. REIT | | | 740,314 | |
| | | 413 | | | AvalonBay Communities, Inc. REIT | | | 88,931 | |
| | | 6,942 | | | Brixmor Property Group, Inc. REIT | | | 140,853 | |
| | | 1,564 | | | Camden Property Trust REIT | | | 173,620 | |
| | | 3,710 | | | CBRE Group, Inc. Class A* | | | 196,667 | |
| | | 2,982 | | | Crown Castle International Corp. REIT | | | 414,528 | |
| | | 2,885 | | | CubeSmart REIT | | | 100,687 | |
| | | 2,629 | | | Douglas Emmett, Inc. REIT | | | 112,600 | |
| | | 8,885 | | | EPR Properties REIT | | | 682,901 | |
| | | 67,264 | | | Equity Commonwealth REIT | | | 2,303,792 | |
| | | 3,484 | | | Equity LifeStyle Properties, Inc. REIT | | | 465,462 | |
| | | 932 | | | Essex Property Trust, Inc. REIT | | | 304,438 | |
| | | 1,056 | | | Extra Space Storage, Inc. REIT | | | 123,362 | |
| | | 19,729 | | | Gaming and Leisure Properties, Inc. REIT | | | 754,437 | |
| | | 22,930 | | | HCP, Inc. REIT | | | 816,996 | |
| | | 22,861 | | | Host Hotels & Resorts, Inc. REIT | | | 395,267 | |
| | | 5,510 | | | Iron Mountain, Inc. REIT | | | 178,469 | |
| | | 14,505 | | | Kimco Realty Corp. REIT | | | 302,864 | |
The accompanying notes are an integral part of these financial statements.
|
| Hartford Multifactor US Equity ETF |
Schedule of Investments – (continued)
September 30, 2019
| | | | | | | | | | |
| Shares or Principal Amount | | Market Value† | |
| COMMON STOCKS - 98.8% - (continued) | |
| | | | | | Real Estate - 5.6% - (continued) | |
| | | 8,750 | | | Lamar Advertising Co., Class A, REIT | | $ | 716,888 | |
| | | 2,380 | | | Liberty Property Trust REIT | | | 122,165 | |
| | | 62,229 | | | Medical Properties Trust, Inc. REIT | | | 1,217,199 | |
| | | 2,292 | | | Mid-America Apartment Communities, Inc. REIT | | | 297,983 | |
| | | 6,474 | | | National Health Investors, Inc. REIT | | | 533,393 | |
| | | 4,836 | | | National Retail Properties, Inc. REIT | | | 272,750 | |
| | | 3,243 | | | PS Business Parks, Inc. REIT | | | 590,064 | |
| | | 3,271 | | | Public Storage REIT | | | 802,278 | |
| | | 881 | | | Realty Income Corp. | | | 67,555 | |
| | | 15,454 | | | Service Properties Trust REIT | | | 398,559 | |
| | | 2,313 | | | STORE Capital Corp. REIT | | | 86,529 | |
| | | 3,504 | | | Sun Communities, Inc. REIT | | | 520,169 | |
| | | 1,354 | | | Ventas, Inc. REIT | | | 98,883 | |
| | | 54,994 | | | VEREIT, Inc. REIT | | | 537,841 | |
| | | 12,872 | | | Weingarten Realty Investors REIT | | | 374,961 | |
| | | 1,168 | | | Welltower, Inc. REIT | | | 105,879 | |
| | | 7,890 | | | WP Carey, Inc. REIT | | | 706,155 | |
| | | | | | | | | | |
| | | | | | | | | 17,209,204 | |
| | | | | | | | | | |
| | | | | | Retailing - 4.3% | |
| | | 8,737 | | | Aaron’s, Inc. | | | 561,440 | |
| | | 963 | | | AutoZone, Inc.* | | | 1,044,489 | |
| | | 7,820 | | | Best Buy Co., Inc. | | | 539,502 | |
| | | 79 | | | Booking Holdings, Inc.* | | | 155,046 | |
| | | 1,687 | | | Burlington Stores, Inc.* | | | 337,096 | |
| | | 4,385 | | | Dollar General Corp. | | | 696,952 | |
| | | 8,158 | | | eBay, Inc. | | | 317,999 | |
| | | 13,034 | | | Gap, Inc. | | | 226,270 | |
| | | 11,865 | | | Genuine Parts Co. | | | 1,181,635 | |
| | | 8,823 | | | Home Depot, Inc. | | | 2,047,112 | |
| | | 31,894 | | | Macy’s, Inc. | | | 495,633 | |
| | | 18,983 | | | Nordstrom, Inc. | | | 639,158 | |
| | | 1,114 | | | O’Reilly Automotive, Inc.* | | | 443,940 | |
| | | 344 | | | Pool Corp. | | | 69,385 | |
| | | 2,908 | | | Ross Stores, Inc. | | | 319,444 | |
| | | 16,495 | | | Target Corp. | | | 1,763,480 | |
| | | 20,601 | | | TJX Cos., Inc. | | | 1,148,300 | |
| | | 18,861 | | | Williams-Sonoma, Inc. | | | 1,282,171 | |
| | | | | | | | | | |
| | | | | | | | | 13,269,052 | |
| | | | | | | | | | |
| | | | | | Semiconductors & Semiconductor Equipment - 2.6% | |
| | | 6,729 | | | Broadcom, Inc. | | | 1,857,675 | |
| | | 62,770 | | | Intel Corp. | | | 3,234,538 | |
| | | 5,772 | | | Mellanox Technologies Ltd.* | | | 632,554 | |
| | | 17,512 | | | Texas Instruments, Inc. | | | 2,263,251 | |
| | | | | | | | | | |
| | | | | | | | | 7,988,018 | |
| | | | | | | | | | |
| | | | | | Software & Services - 11.3% | |
| | | 13,144 | | | Accenture plc Class A | | | 2,528,248 | |
| | | 3,226 | | | ACI Worldwide, Inc.* | | | 101,054 | |
| | | 4,291 | | | Adobe, Inc.* | | | 1,185,389 | |
| | | 955 | | | Akamai Technologies, Inc.* | | | 87,268 | |
| | | 34,763 | | | Amdocs Ltd. | | | 2,298,182 | |
| | | 1,825 | | | Black Knight, Inc.* | | | 111,434 | |
| | | 10,693 | | | Booz Allen Hamilton Holding Corp. | | | 759,417 | |
| | | 8,307 | | | Broadridge Financial Solutions, Inc. | | | 1,033,640 | |
| | | 3,983 | | | CACI International, Inc. Class A* | | | 921,109 | |
| | | 1,487 | | | Cadence Design Systems, Inc.* | | | 98,261 | |
| | | 9,313 | | | Citrix Systems, Inc. | | | 898,891 | |
| | | 576 | | | Cognizant Technology Solutions Corp. Class A | | | 34,713 | |
| | | 2,684 | | | Fidelity National Information Services, Inc. | | | 356,328 | |
| | | 495 | | | Fiserv, Inc.* | | | 51,277 | |
| | | 12,055 | | | Genpact Ltd. | | | 467,131 | |
| | | 16,007 | | | International Business Machines Corp. | | | 2,327,738 | |
| | | 2,302 | | | Intuit, Inc. | | | 612,194 | |
| | | 15,490 | | | j2 Global, Inc. | | | 1,406,802 | |
| | | | | | | | | | |
| Shares or Principal Amount | | Market Value† | |
| COMMON STOCKS - 98.8% - (continued) | |
| | | | | | Software & Services - 11.3% - (continued) | |
| | | 919 | | | Leidos Holdings, Inc. | | $ | 78,924 | |
| | | 7,158 | | | Mastercard, Inc. Class A | | | 1,943,898 | |
| | | 22,880 | | | MAXIMUS, Inc. | | | 1,767,709 | |
| | | 17,905 | | | Microsoft Corp. | | | 2,489,332 | |
| | | 39,204 | | | Oracle Corp. | | | 2,157,396 | |
| | | 11,476 | | | Paychex, Inc. | | | 949,868 | |
| | | 8,895 | | | PayPal Holdings, Inc.* | | | 921,433 | |
| | | 2,693 | | | Sabre Corp. | | | 60,310 | |
| | | 3,499 | | | salesforce.com, Inc.* | | | 519,391 | |
| | | 2,565 | | | Synopsys, Inc.* | | | 352,046 | |
| | | 2,265 | | | Verint Systems, Inc.* | | | 96,897 | |
| | | 2,688 | | | VeriSign, Inc.* | | | 507,037 | |
| | | 10,221 | | | Visa, Inc. Class A | | | 1,758,114 | |
| | | 21,510 | | | VMware, Inc. Class A | | | 3,227,791 | |
| | | 119,763 | | | Western Union Co. | | | 2,774,909 | |
| | | | | | | | | | |
| | | | | | | | | 34,884,131 | |
| | | | | | | | | | |
| | | | | | Technology Hardware & Equipment - 6.0% | |
| | | 8,072 | | | Amphenol Corp. Class A | | | 778,948 | |
| | | 7,187 | | | Apple, Inc. | | | 1,609,672 | |
| | | 14,172 | | | Arrow Electronics, Inc.* | | | 1,056,948 | |
| | | 4,850 | | | Avnet, Inc. | | | 215,752 | |
| | | 10,211 | | | CDW Corp. | | | 1,258,404 | |
| | | 57,757 | | | Cisco Systems, Inc. | | | 2,853,773 | |
| | | 24,784 | | | Corning, Inc. | | | 706,840 | |
| | | 12,715 | | | Dolby Laboratories, Inc. Class A | | | 821,898 | |
| | | 6,088 | | | F5 Networks, Inc.* | | | 854,877 | |
| | | 36,811 | | | Hewlett Packard Enterprise Co. | | | 558,423 | |
| | | 103,307 | | | HP, Inc. | | | 1,954,569 | |
| | | 3,342 | | | Jabil, Inc. | | | 119,543 | |
| | | 93,965 | | | Juniper Networks, Inc. | | | 2,325,634 | |
| | | 4,976 | | | Motorola Solutions, Inc. | | | 847,960 | |
| | | 6,089 | | | Seagate Technology plc | | | 327,527 | |
| | | 11,624 | | | TE Connectivity Ltd. | | | 1,083,124 | |
| | | 10,354 | | | Tech Data Corp.* | | | 1,079,301 | |
| | | 2,191 | | | Viavi Solutions, Inc.* | | | 30,685 | |
| | | | | | | | | | |
| | | | | | | | | 18,483,878 | |
| | | | | | | | | | |
| | | | | | Telecommunication Services - 3.4% | |
| | | 84,208 | | | AT&T, Inc. | | | 3,186,431 | |
| | | 40,255 | | | Sprint Corp.* | | | 248,373 | |
| | | 29,670 | | | T-Mobile US, Inc.* | | | 2,337,106 | |
| | | 37,420 | | | Telephone & Data Systems, Inc. | | | 965,436 | |
| | | 60,029 | | | Verizon Communications, Inc. | | | 3,623,350 | |
| | | | | | | | | | |
| | | | | | | | | 10,360,696 | |
| | | | | | | | | | |
| | | | | | Transportation - 1.2% | |
| | | 16,923 | | | CH Robinson Worldwide, Inc. | | | 1,434,732 | |
| | | 8,867 | | | Delta Air Lines, Inc. | | | 510,739 | |
| | | 2,099 | | | Expeditors International of Washington, Inc. | | | 155,935 | |
| | | 2,242 | | | Landstar System, Inc. | | | 252,404 | |
| | | 4,175 | | | Union Pacific Corp. | | | 676,266 | |
| | | 6,277 | | | United Airlines Holdings, Inc.* | | | 554,950 | |
| | | | | | | | | | |
| | | | | | | | | 3,585,026 | |
| | | | | | | | | | |
| | | | | | Utilities - 5.2% | |
| | | 9,458 | | | AES Corp. | | | 154,544 | |
| | | 3,911 | | | ALLETE, Inc. | | | 341,860 | |
| | | 7,698 | | | Alliant Energy Corp. | | | 415,153 | |
| | | 8,698 | | | Ameren Corp. | | | 696,275 | |
| | | 6,859 | | | American Electric Power Co., Inc. | | | 642,620 | |
| | | 2,652 | | | Atmos Energy Corp. | | | 302,036 | |
| | | 2,411 | | | Avangrid, Inc. | | | 125,975 | |
| | | 4,565 | | | Black Hills Corp. | | | 350,272 | |
| | | 9,721 | | | CenterPoint Energy, Inc. | | | 293,380 | |
| | | 9,158 | | | CMS Energy Corp. | | | 585,654 | |
| | | 8,430 | | | Consolidated Edison, Inc. | | | 796,382 | |
The accompanying notes are an integral part of these financial statements.
|
| Hartford Multifactor US Equity ETF |
Schedule of Investments – (continued)
September 30, 2019
| | | | | | | | | | |
| Shares or Principal Amount | | Market Value† | |
| COMMON STOCKS - 98.8% - (continued) | |
| | | | | | Utilities - 5.2% - (continued) | |
| | | 5,609 | | | DTE Energy Co. | | $ | 745,773 | |
| | | 3,913 | | | Duke Energy Corp. | | | 375,100 | |
| | | 6,497 | | | Entergy Corp. | | | 762,488 | |
| | | 6,022 | | | Evergy, Inc. | | | 400,824 | |
| | | 2,124 | | | Eversource Energy | | | 181,538 | |
| | | 15,492 | | | Exelon Corp. | | | 748,418 | |
| | | 18,343 | | | FirstEnergy Corp. | | | 884,683 | |
| | | 20,618 | | | Hawaiian Electric Industries, Inc. | | | 940,387 | |
| | | 2,764 | | | MDU Resources Group, Inc. | | | 77,917 | |
| | | 1,122 | | | NextEra Energy, Inc. | | | 261,415 | |
| | | 7,280 | | | NorthWestern Corp. | | | 546,364 | |
| | | 10,455 | | | OGE Energy Corp. | | | 474,448 | |
| | | 8,525 | | | Pinnacle West Capital Corp. | | | 827,522 | |
| | | 16,384 | | | Portland General Electric Co. | | | 923,566 | |
| | | 9,130 | | | PPL Corp. | | | 287,504 | |
| | | 7,857 | | | Public Service Enterprise Group, Inc. | | | 487,763 | |
| | | 10,691 | | | Southern Co. | | | 660,383 | |
| | | 3,878 | | | Southwest Gas Holdings, Inc. | | | 353,053 | |
| | | 3,274 | | | Spire, Inc. | | | 285,624 | |
| | | 4,388 | | | UGI Corp. | | | 220,585 | |
| | | 3,841 | | | WEC Energy Group, Inc. | | | 365,279 | |
| | | 9,004 | | | Xcel Energy, Inc. | | | 584,270 | |
| | | | | | | | | | |
| | | | | | | | | 16,099,055 | |
| | | | | | | | | | |
| | | |
| | | | | | Total Common Stocks
(cost $290,906,240) | | $ | 303,994,709 | |
| | | | | | | | | | |
| | | | | | | | | | |
| Shares or Principal Amount | | Market Value† | |
| SHORT-TERM INVESTMENTS - 0.1% | |
| | | | | | U.S. Treasury Bill - 0.1% | |
| $ | | | 185,000 | | | 1.90%, 12/12/2019(1)(2) | | $ | 184,343 | |
| | | | | | | | | | |
| | | |
| | | | | | Total Short-Term Investments
(cost $184,299) | | $ | 184,343 | |
| | | | | | | | | | |
| | | | | | | | | | | | | | |
| | | | |
| | | | | | Total Investments
(cost $291,090,539) | | | 98.9 | % | | $ | 304,179,052 | |
| | | | | | Other Assets and Liabilities | | | 1.1 | % | | | 3,312,217 | |
| | | | | | | | | | | | | | |
| | | | | | Total Net Assets | | | 100.0 | % | | $ | 307,491,269 | |
| | | | | | | | | | | | | | |
| Note: | Percentage of investments as shown is the ratio of the total market value to total net assets. |
| | Equity industry classifications used in this report are the Global Industry Classification Standard, which was developed by and is the exclusive property and service mark of MSCI, Inc. and Standard & Poor’s. |
| | For Fund compliance purposes, the Fund may not use the same classification system. These classifications are used for financial reporting purposes. |
| | See “Glossary” for abbreviation descriptions. |
| (1) | The rate shown represents current yield to maturity. |
| (2) | This security has been pledged as collateral in connection with futures contracts. |
| | | | | | | | | | | | | | | | |
| Futures Contracts Outstanding at September 30, 2019 | |
Description | | Number of
Contracts | | | Expiration
Date | | | Current
Notional
Amount | | | Value and
Unrealized
Appreciation/
(Depreciation) | |
| Long position contracts: | |
S&P 500(E-Mini) Future | | | 23 | | | | 12/20/2019 | | | $ | 3,425,275 | | | $ | (25,340 | ) |
| | | | | | | | | | | | | | | | |
Total futures contracts | | | $ | (25,340 | ) |
| | | | | | | | | | | | | | | | |
The accompanying notes are an integral part of these financial statements.
|
| Hartford Multifactor US Equity ETF |
Schedule of Investments – (continued)
September 30, 2019
Fair Valuation Summary
The following is a summary of the fair valuations according to the inputs used as of September 30, 2019 in valuing the Fund’s investments.
| | | | | | | | | | | | | | | | |
Description | | Total | | | Level 1 | | | Level 2 | | | Level 3(1) | |
Assets | | | | | | | | | | | | | | | | |
Common Stocks | | | | | | | | | | | | | | | | |
Automobiles & Components | | $ | 569,931 | | | $ | 569,931 | | | $ | — | | | $ | — | |
Banks | | | 5,972,426 | | | | 5,972,426 | | | | — | | | | — | |
Capital Goods | | | 15,574,007 | | | | 15,574,007 | | | | — | | | | — | |
Commercial & Professional Services | | | 4,019,943 | | | | 4,019,943 | | | | — | | | | — | |
Consumer Durables & Apparel | | | 4,736,051 | | | | 4,736,051 | | | | — | | | | — | |
Consumer Services | | | 7,244,375 | | | | 7,244,375 | | | | — | | | | — | |
Diversified Financials | | | 9,427,189 | | | | 9,427,189 | | | | — | | | | — | |
Energy | | | 7,389,109 | | | | 7,389,109 | | | | — | | | | — | |
Food & Staples Retailing | | | 9,335,088 | | | | 9,335,088 | | | | — | | | | — | |
Food, Beverage & Tobacco | | | 11,004,291 | | | | 11,004,291 | | | | — | | | | — | |
Health Care Equipment & Services | | | 26,690,390 | | | | 26,690,390 | | | | — | | | | — | |
Household & Personal Products | | | 6,043,002 | | | | 6,043,002 | | | | — | | | | — | |
Insurance | | | 32,535,355 | | | | 32,535,355 | | | | — | | | | — | |
Materials | | | 9,513,986 | | | | 9,513,986 | | | | — | | | | — | |
Media & Entertainment | | | 12,435,167 | | | | 12,435,167 | | | | — | | | | — | |
Pharmaceuticals, Biotechnology & Life Sciences | | | 19,625,339 | | | | 19,625,339 | | | | — | | | | — | |
Real Estate | | | 17,209,204 | | | | 17,209,204 | | | | — | | | | — | |
Retailing | | | 13,269,052 | | | | 13,269,052 | | | | — | | | | — | |
Semiconductors & Semiconductor Equipment | | | 7,988,018 | | | | 7,988,018 | | | | — | | | | — | |
Software & Services | | | 34,884,131 | | | | 34,884,131 | | | | — | | | | — | |
Technology Hardware & Equipment | | | 18,483,878 | | | | 18,483,878 | | | | — | | | | — | |
Telecommunication Services | | | 10,360,696 | | | | 10,360,696 | | | | — | | | | — | |
Transportation | | | 3,585,026 | | | | 3,585,026 | | | | — | | | | — | |
Utilities | | | 16,099,055 | | | | 16,099,055 | | | | — | | | | — | |
Short-Term Investments | | | 184,343 | | | | — | | | | 184,343 | | | | — | |
| | | | | | | | | | | | | | | | |
Total | | $ | 304,179,052 | | | $ | 303,994,709 | | | $ | 184,343 | | | $ | — | |
| | | | | | | | | | | | | | | | |
Liabilities | | | | | | | | | | | | | | | | |
Futures Contracts(2) | | $ | (25,340 | ) | | $ | (25,340 | ) | | $ | — | | | $ | — | |
| | | | | | | | | | | | | | | | |
Total | | $ | (25,340 | ) | | $ | (25,340 | ) | | $ | — | | | $ | — | |
| | | | | | | | | | | | | | | | |
| (1) | For the year ended September 30, 2019, there were no transfers in and out of Level 3. |
| (2) | Derivative instruments (excluding purchased and written options, if applicable) are valued at the unrealized appreciation/(depreciation) on the investments. |
The accompanying notes are an integral part of these financial statements.
|
| Hartford Multifactor ETFs |
Glossary (abbreviations used in the preceding Schedules of Investments)
| | |
| Index Abbreviations: |
MSCI | | Morgan Stanley Capital International |
S&P | | Standard & Poors |
|
| Other Abbreviations: |
ADR | | American Depositary Receipt |
GDR | | Global Depositary Receipt |
NVDR | | Non-Voting Depositary Receipt |
PJSC | | Private Joint Stock Company |
PT | | Perseroan Terbatas |
REIT | | Real Estate Investment Trust |
|
| Hartford Multifactor ETFs |
Statements of Assets and Liabilities
September 30, 2019
| | | | | | | | | | | | | | | | |
| | | Hartford
Multifactor
Developed
Markets
(ex-US) ETF | | | Hartford
Multifactor
Emerging
Markets ETF | | | Hartford
Multifactor
Global Small
Cap ETF | | | Hartford
Multifactor
Low Volatility
International
Equity ETF | |
Assets: | | | | | | | | | | | | | | | | |
Investments in securities, at market value | | $ | 2,321,703,032 | | | $ | 68,573,511 | | | $ | 16,978,249 | | | $ | 5,345,897 | |
Cash | | | 992,733 | | | | 119,810 | | | | 101,565 | | | | 413 | |
Foreign currency | | | 4,500,400 | | | | 25,388 | | | | 36,070 | | | | 10,270 | |
Receivables: | | | | | | | | | | | | | | | | |
Investment securities sold | | | 6,035,908 | | | | — | | | | 2,849,405 | | | | — | |
Dividends and interest | | | 9,087,137 | | | | 123,913 | | | | 62,797 | | | | 16,186 | |
Securities lending income | | | 3,169 | | | | 6 | | | | 11 | | | | — | |
Variation margin on futures contracts | | | 25,760 | | | | 1,715 | | | | 399 | | | | — | |
Tax reclaims | | | 1,306,304 | | | | 5,316 | | | | 3,251 | | | | 2,353 | |
| | | | | | | | | | | | | | | | |
Total assets | | | 2,343,654,443 | | | | 68,849,659 | | | | 20,031,747 | | | | 5,375,119 | |
| | | | | | | | | | | | | | | | |
Liabilities: | | | | | | | | | | | | | | | | |
Payables: | | | | | | | | | | | | | | | | |
Investment securities purchased | | | 5,590,230 | | | | — | | | | 38,270 | | | | 5,475 | |
Fund shares redeemed | | | 1,823,094 | | | | — | | | | 2,854,123 | | | | — | |
Investment management fees | | | 552,965 | | | | 26,362 | | | | 6,426 | | | | 1,279 | |
| | | | | | | | | | | | | | | | |
Total liabilities | | | 7,966,289 | | | | 26,362 | | | | 2,898,819 | | | | 6,754 | |
| | | | | | | | | | | | | | | | |
Net assets | | $ | 2,335,688,154 | | | $ | 68,823,297 | | | $ | 17,132,928 | | | $ | 5,368,365 | |
| | | | | | | | | | | | | | | | |
Summary of Net Assets: | | | | | | | | | | | | | | | | |
Paid-in-capital | | $ | 2,400,229,144 | | | $ | 79,570,037 | | | $ | 19,061,415 | | | $ | 5,136,723 | |
Distributable earnings | | | (64,540,990 | ) | | | (10,746,740 | ) | | | (1,928,487 | ) | | | 231,642 | |
| | | | | | | | | | | | | | | | |
Net assets | | $ | 2,335,688,154 | | | $ | 68,823,297 | | | $ | 17,132,928 | | | $ | 5,368,365 | |
| | | | | | | | | | | | | | | | |
Net asset value per share | | $ | 27.76 | | | $ | 22.20 | | | $ | 28.55 | | | $ | 26.84 | |
| | | | | | | | | | | | | | | | |
Shares issued and outstanding | | | 84,150,000 | | | | 3,100,000 | | | | 600,000 | | | | 200,000 | |
| | | | | | | | | | | | | | | | |
Cost of investments | | $ | 2,268,924,442 | | | $ | 68,005,211 | | | $ | 17,200,861 | | | $ | 5,021,683 | |
Cost of foreign currency | | $ | 4,520,165 | | | $ | 25,389 | | | $ | 36,295 | | | $ | 10,305 | |
The accompanying notes are an integral part of these financial statements.
|
| Hartford Multifactor ETFs |
Statements of Assets and Liabilities – (continued)
September 30, 2019
| | | | | | | | | | | | |
| | | Hartford
Multifactor Low
Volatility US
Equity ETF | | | Hartford
Multifactor
REIT ETF | | | Hartford
Multifactor
US Equity ETF | |
Assets: | | | | | | | | | | | | |
Investments in securities, at market value | | $ | 7,692,566 | | | $ | 17,916,097 | | | $ | 304,179,052 | |
Cash | | | 3,554 | | | | 18,499 | | | | 2,858,983 | |
Receivables: | | | | | | | | | | | | |
Dividends and interest | | | 12,915 | | | | 88,547 | | | | 483,153 | |
Variation margin on futures contracts | | | — | | | | 199 | | | | 16,920 | |
| | | | | | | | | | | | |
Total assets | | | 7,709,035 | | | | 18,023,342 | | | | 307,538,108 | |
| | | | | | | | | | | | |
Liabilities: | | | | | | | | | | | | |
Payables: | | | | | | | | | | | | |
Investment securities purchased | | | — | | | | 16,636 | | | | — | |
Investment management fees | | | 1,216 | | | | 6,607 | | | | 46,839 | |
| | | | | | | | | | | | |
Total liabilities | | | 1,216 | | | | 23,243 | | | | 46,839 | |
| | | | | | | | | | | | |
Net assets | | $ | 7,707,819 | | | $ | 18,000,099 | | | $ | 307,491,269 | |
| | | | | | | | | | | | |
Summary of Net Assets: | | | | | | | | | | | | |
Paid-in-capital | | $ | 6,916,381 | | | $ | 18,127,780 | | | $ | 307,769,384 | |
Distributable earnings | | | 791,438 | | | | (127,681 | ) | | | (278,115 | ) |
| | | | | | | | | | | | |
Net assets | | $ | 7,707,819 | | | $ | 18,000,099 | | | $ | 307,491,269 | |
| | | | | | | | | | | | |
Net asset value per share | | $ | 30.83 | | | $ | 16.36 | | | $ | 32.20 | |
| | | | | | | | | | | | |
Shares issued and outstanding | | | 250,000 | | | | 1,100,000 | | | | 9,550,000 | |
| | | | | | | | | | | | |
Cost of investments | | $ | 6,668,913 | | | $ | 17,047,018 | | | $ | 291,090,539 | |
The accompanying notes are an integral part of these financial statements.
|
| Hartford Multifactor ETFs |
Statements of Operations
For the Year Ended September 30, 2019
| | | | | | | | | | | | | | | | |
| | | Hartford
Multifactor
Developed
Markets
(ex-US) ETF | | | Hartford
Multifactor
Emerging
Markets ETF | | | Hartford
Multifactor
Global Small
Cap ETF | | | Hartford
Multifactor
Low Volatility
International
Equity ETF | |
Investment Income: | | | | | | | | | | | | | | | | |
Dividends | | $ | 74,835,782 | | | $ | 2,965,064 | | | $ | 737,772 | | | $ | 172,009 | |
Interest | | | 9,395 | | | | 841 | | | | 652 | | | | — | |
Securities lending | | | 771,697 | | | | 6,450 | | | | 17,318 | | | | 980 | |
Less: Foreign tax withheld | | | (7,148,104 | ) | | | (384,760 | ) | | | (66,186 | ) | | | (19,189 | ) |
| | | | | | | | | | | | | | | | |
Total investment income, net | | | 68,468,770 | | | | 2,587,595 | | | | 689,556 | | | | 153,800 | |
| | | | | | | | | | | | | | | | |
Expenses: | | | | | | | | | | | | | | | | |
Investment management fees | | | 5,150,796 | | | | 373,633 | | | | 84,416 | | | | 15,212 | |
| | | | | | | | | | | | | | | | |
Total expenses, net | | | 5,150,796 | | | | 373,633 | | | | 84,416 | | | | 15,212 | |
| | | | | | | | | | | | | | | | |
Net Investment Income (Loss) | | | 63,317,974 | | | | 2,213,962 | | | | 605,140 | | | | 138,588 | |
| | | | | | | | | | | | | | | | |
Net Realized Gain (Loss) on Investments, Other Financial Instruments and Foreign Currency Transactions: | | | | | | | | | | | | | | | | |
Net realized gain (loss) on investments | | | (62,941,170 | )(1) | | | (4,364,513 | )(1) | | | 546,346 | (1) | | | (28,311 | ) |
Net realized gain (loss) on futures contracts | | | 480,602 | | | | (28,947 | ) | | | (3,383 | ) | | | — | |
Net realized gain (loss) on other foreign currency transactions | | | 7,673 | | | | (36,117 | ) | | | (5,160 | ) | | | (197 | ) |
| | | | | | | | | | | | | | | | |
Net Realized Gain (Loss) on Investments, Other Financial Instruments and Foreign Currency Transactions | | | (62,452,895 | ) | | | (4,429,577 | ) | | | 537,803 | | | | (28,508 | ) |
| | | | | | | | | | | | | | | | |
Net Changes in Unrealized Appreciation (Depreciation) of Investments, Other Financial Instruments and Foreign Currency Transactions: | | | | | | | | | | | | | | | | |
Net unrealized appreciation (depreciation) of investments | | | 38,849,047 | | | | (920,519 | ) | | | (2,715,397 | ) | | | (73,953 | ) |
Net unrealized appreciation (depreciation) of futures contracts | | | (48,179 | ) | | | (9,144 | ) | | | (2,830 | ) | | | — | |
Net unrealized appreciation (depreciation) of translation of other assets and liabilities in foreign currencies | | | (50,271 | ) | | | (6,235 | ) | | | (676 | ) | | | (39 | ) |
| | | | | | | | | | | | | | | | |
Net Changes in Unrealized Appreciation (Depreciation) of Investments, Other Financial Instruments and Foreign Currency Transactions | | | 38,750,597 | | | | (935,898 | ) | | | (2,718,903 | ) | | | (73,992 | ) |
| | | | | | | | | | | | | | | | |
Net Gain (Loss) on Investments, Other Financial Instruments and Foreign Currency Transactions | | | (23,702,298 | ) | | | (5,365,475 | ) | | | (2,181,100 | ) | | | (102,500 | ) |
| | | | | | | | | | | | | | | | |
Net Increase (Decrease) in Net Assets Resulting from Operations | | $ | 39,615,676 | | | $ | (3,151,513 | ) | | $ | (1,575,960 | ) | | $ | 36,088 | |
| | | | | | | | | | | | | | | | |
| (1) | Includes realized gains/(losses) as a result ofin-kind redemptions (See Note 10 in Notes to Financial Statements). |
The accompanying notes are an integral part of these financial statements.
|
| Hartford Multifactor ETFs |
Statements of Operations – (continued)
For the Year Ended September 30, 2019
| | | | | | | | | | | | |
| | | Hartford
Multifactor
Low Volatility
US Equity ETF | | | Hartford
Multifactor
REIT ETF | | | Hartford
Multifactor
US Equity ETF | |
Investment Income: | | | | | | | | | | | | |
Dividends | | $ | 160,750 | | | $ | 902,883 | | | $ | 6,032,293 | |
Interest | | | — | | | | 241 | | | | 1,276 | |
Securities lending | | | 524 | | | | 4,329 | | | | 16,581 | |
Less: Foreign tax withheld | | | — | | | | — | | | | (903 | ) |
| | | | | | | | | | | | |
Total investment income, net | | | 161,274 | | | | 907,453 | | | | 6,049,247 | |
| | | | | | | | | | | | |
Expenses: | | | | | | | | | | | | |
Investment management fees | | | 12,817 | | | | 110,655 | | | | 452,420 | |
| | | | | | | | | | | | |
Total expenses, net | | | 12,817 | | | | 110,655 | | | | 452,420 | |
| | | | | | | | | | | | |
Net Investment Income (Loss) | | | 148,457 | | | | 796,798 | | | | 5,596,827 | |
| | | | | | | | | | | | |
Net Realized Gain (Loss) on Investments and Other Financial Instruments | | | | | | | | | | | | |
Net realized gain (loss) on investments | | | 369,522 | (1) | | | 1,146,098 | (1) | | | (702,658 | )(1) |
Net realized gain (loss) on futures contracts | | | — | | | | 18,383 | | | | 129,198 | |
| | | | | | | | | | | | |
Net Realized Gain (Loss) on Investments and Other Financial Instruments | | | 369,522 | | | | 1,164,481 | | | | (573,460 | ) |
| | | | | | | | | | | | |
Net Changes in Unrealized Appreciation (Depreciation) of Investments and Other Financial Instruments: | | | | | | | | | | | | |
Net unrealized appreciation (depreciation) of investments | | | 283,389 | | | | 414,280 | | | | 858,041 | |
Net unrealized appreciation (depreciation) of futures contracts | | | — | | | | 1,218 | | | | (26,065 | ) |
| | | | | | | | | | | | |
Net Changes in Unrealized Appreciation (Depreciation) of Investments and Other Financial Instruments | | | 283,389 | | | | 415,498 | | | | 831,976 | |
| | | | | | | | | | | | |
Net Gain (Loss) on Investments and Other Financial Instruments | | | 652,911 | | | | 1,579,979 | | | | 258,516 | |
| | | | | | | | | | | | |
Net Increase (Decrease) in Net Assets Resulting from Operations | | $ | 801,368 | | | $ | 2,376,777 | | | $ | 5,855,343 | |
| | | | | | | | | | | | |
| (1) | Includes realized gains/(losses) as a result ofin-kind redemptions (See Note 10 in Notes to Financial Statements). |
The accompanying notes are an integral part of these financial statements.
|
| Hartford Multifactor ETFs |
Statements of Changes in Net Assets
| | | | | | | | | | | | | | | | | | | | | | | | |
| | | Hartford Multifactor
Developed Markets(ex-US) ETF | | | Hartford Multifactor
Emerging Markets ETF | | | Hartford Multifactor
Global Small Cap ETF | |
| | | For the
Year Ended
September 30,
2019 | | | For the
Year Ended
September 30,
2018 | | | For the
Year Ended
September 30,
2019 | | | For the
Year Ended
September 30,
2018 | | | For the
Year Ended
September 30,
2019 | | | For the
Year Ended
September 30,
2018 | |
Operations: | | | | | | | | | | | | | | | | | | | | | | | | |
Net investment income (loss) | | $ | 63,317,974 | | | $ | 12,080,162 | | | $ | 2,213,962 | | | $ | 1,483,870 | | | $ | 605,140 | | | $ | 476,213 | |
Net realized gain (loss) on investments, other financial instruments and foreign currency transactions | | | (62,452,895 | ) | | | (5,987,452 | ) | | | (4,429,577 | ) | | | (859,431 | ) | | | 537,803 | | | | 858,346 | |
Net changes in unrealized appreciation (depreciation) of investments, other financial instruments and foreign currency transactions | | | 38,750,597 | | | | 2,113,375 | | | | (935,898 | ) | | | (3,878,089 | ) | | | (2,718,903 | ) | | | 82,255 | |
| | | | | | | | | | | | | | | | | | | | | | | | |
Net Increase (Decrease) in Net Assets Resulting from Operations | | | 39,615,676 | | | | 8,206,085 | | | | (3,151,513 | ) | | | (3,253,650 | ) | | | (1,575,960 | ) | | | 1,416,814 | |
| | | | | | | | | | | | | | | | | | | | | | | | |
Distributions to Shareholders | | | (48,161,644 | ) | | | (8,013,824 | ) | | | (2,004,488 | ) | | | (1,141,715 | ) | | | (601,511 | ) | | | (470,072 | ) |
| | | | | | | | | | | | | | | | | | | | | | | | |
Fund Share Transactions: | | | | | | | | | | | | | | | | | | | | | | | | |
Sold | | | 1,846,730,495 | | | | 738,684,038 | | | | 33,068,894 | | | | 25,448,866 | | | | 5,860,452 | | | | 6,275,566 | |
Redeemed | | | (313,561,980 | ) | | | (59,138,041 | ) | | | (24,270,963 | ) | | | (2,229,949 | ) | | | (8,794,812 | ) | | | (3,128,922 | ) |
Other Capital | | | — | | | | 321 | | | | 101,198 | | | | 17,212 | | | | 1,652 | | | | 1,646 | |
| | | | | | | | | | | | | | | | | | | | | | | | |
Net increase from capital share transactions | | | 1,533,168,515 | | | | 679,546,318 | | | | 8,899,129 | | | | 23,236,129 | | | | (2,932,708 | ) | | | 3,148,290 | |
| | | | | | | | | | | | | | | | | | | | | | | | |
Net Increase (Decrease) in Net Assets | | | 1,524,622,547 | | | | 679,738,579 | | | | 3,743,128 | | | | 18,840,764 | | | | (5,110,179 | ) | | | 4,095,032 | |
| | | | | | | | | | | | | | | | | | | | | | | | |
Net Assets: | | | | | | | | | | | | | | | | | | | | | | | | |
Beginning of period | | | 811,065,607 | | | | 131,327,028 | | | | 65,080,169 | | | | 46,239,405 | | | | 22,243,107 | | | | 18,148,075 | |
| | | | | | | | | | | | | | | | | | | | | | | | |
End of period | | $ | 2,335,688,154 | | | $ | 811,065,607 | | | $ | 68,823,297 | | | $ | 65,080,169 | | | $ | 17,132,928 | | | $ | 22,243,107 | |
| | | | | | | | | | | | | | | | | | | | | | | | |
The accompanying notes are an integral part of these financial statements.
|
| Hartford Multifactor ETFs |
Statements of Changes in Net Assets – (continued)
| | | | | | | | | | | | | | | | |
| | | Hartford Multifactor
Low Volatility
International Equity ETF | | | Hartford Multifactor
Low Volatility
US Equity ETF | |
| | | For the
Year Ended
September 30,
2019 | | | For the
Year Ended
September 30,
2018 | | | For the
Year Ended
September 30,
2019 | | | For the
Year Ended
September 30,
2018 | |
Operations: | | | | | | | | | | | | | | | | |
Net investment income (loss) | | $ | 138,588 | | | $ | 130,277 | | | $ | 148,457 | | | $ | 95,116 | |
Net realized gain (loss) on investments, other financial instruments and foreign currency transactions | | | (28,508 | ) | | | (42,526 | ) | | | 369,522 | | | | (50,947 | ) |
Net changes in unrealized appreciation (depreciation) of investments, other financial instruments and foreign currency transactions | | | (73,992 | ) | | | 184,054 | | | | 283,389 | | | | 604,114 | |
| | | | | | | | | | | | | | | | |
Net Increase (Decrease) in Net Assets Resulting from Operations | | | 36,088 | | | | 271,805 | | | | 801,368 | | | | 648,283 | |
| | | | | | | | | | | | | | | | |
Distributions to Shareholders | | | (137,798 | ) | | | (118,511 | ) | | | (140,380 | ) | | | (96,129 | ) |
| | | | | | | | | | | | | | | | |
Fund Share Transactions: | | | | | | | | | | | | | | | | |
Sold | | | — | | | | — | | | | 4,275,263 | | | | 1,329,697 | |
Redeemed | | | — | | | | — | | | | (2,971,711 | ) | | | — | |
Other Capital | | | — | | | | — | | | | — | | | | — | |
| | | | | | | | | | | | | | | | |
Net increase (decrease) from capital share transactions | | | — | | | | — | | | | 1,303,552 | | | | 1,329,697 | |
| | | | | | | | | | | | | | | | |
Net Increase (Decrease) in Net Assets | | | (101,710 | ) | | | 153,294 | | | | 1,964,540 | | | | 1,881,851 | |
| | | | | | | | | | | | | | | | |
Net Assets: | | | | | | | | | | | | | | | | |
Beginning of period | | | 5,470,075 | | | | 5,316,781 | | | | 5,743,279 | | | | 3,861,428 | |
| | | | | | | | | | | | | | | | |
End of period | | $ | 5,368,365 | | | $ | 5,470,075 | | | $ | 7,707,819 | | | $ | 5,743,279 | |
| | | | | | | | | | | | | | | | |
The accompanying notes are an integral part of these financial statements.
|
| Hartford Multifactor ETFs |
Statements of Changes in Net Assets – (continued)
| | | | | | | | | | | | | | | | |
| | | Hartford Multifactor REIT ETF | | | Hartford Multifactor US Equity
ETF | |
| | | For the
Year Ended
September 30,
2019 | | | For the
Year Ended
September 30,
2018 | | | For the
Year Ended
September 30,
2019 | | | For the
Year Ended
September 30,
2018 | |
Operations: | |
Net investment income (loss) | | $ | 796,798 | | | $ | 649,569 | | | $ | 5,596,827 | | | $ | 1,515,229 | |
Net realized gain (loss) on investments and other financial instruments | | | 1,164,481 | | | | 828,354 | | | | (573,460 | ) | | | 1,330,846 | |
Net changes in unrealized appreciation (depreciation) of investments and other financial instruments | | | 415,498 | | | | 257,144 | | | | 831,976 | | | | 8,292,564 | |
| | | | | | | | | | | | | | | | |
Net Increase (Decrease) in Net Assets Resulting from Operations | | | 2,376,777 | | | | 1,735,067 | | | | 5,855,343 | | | | 11,138,639 | |
| | | | | | | | | | | | | | | | |
Distributions to Shareholders: | |
From distributable earnings | | | (833,172 | ) | | �� | (677,992 | ) | | | (5,407,729 | ) | | | (1,496,009 | ) |
From tax return of capital | | | (402,584 | ) | | | (41,564 | ) | | | — | | | | — | |
| | | | | | | | | | | | | | | | |
Total distributions | | | (1,235,756 | ) | | | (719,556 | ) | | | (5,407,729 | ) | | | (1,496,009 | ) |
| | | | | | | | | | | | | | | | |
Fund Share Transactions: | |
Sold | | | 7,709,666 | | | | 26,773,879 | | | | 182,696,968 | | | | 142,311,556 | |
Redeemed | | | (18,538,614 | ) | | | (9,438,842 | ) | | | (48,956,914 | ) | | | (13,174,555 | ) |
| | | | | | | | | | | | | | | | |
Net increase (decrease) from capital share transactions | | | (10,828,948 | ) | | | 17,335,037 | | | | 133,740,054 | | | | 129,137,001 | |
| | | | | | | | | | | | | | | | |
Net Increase (Decrease) in Net Assets | | | (9,687,927 | ) | | | 18,350,548 | | | | 134,187,668 | | | | 138,779,631 | |
| | | | | | | | | | | | | | | | |
Net Assets: | |
Beginning of period | | | 27,688,026 | | | | 9,337,478 | | | | 173,303,601 | | | | 34,523,970 | |
| | | | | | | | | | | | | | | | |
End of period | | $ | 18,000,099 | | | $ | 27,688,026 | | | $ | 307,491,269 | | | $ | 173,303,601 | |
| | | | | | | | | | | | | | | | |
The accompanying notes are an integral part of these financial statements.
|
| Hartford Multifactor ETFs |
Financial Highlights
| | | | | | | | | | | | | | | | | | | | | | | | | | | | | | | | | | | | | | | | | | | | | | | | | | | | | | | | | | | | | | | | |
| | | — SelectedPer-Share Data(1) — | | | — Ratios and Supplemental Data — | |
| | | Net Asset
Value at
Beginning
of Period | | | Net
Investment
Income
(Loss) | | | Net
Realized
and
Unrealized
Gain (Loss)
on
Investments | | | Total from
Investment
Operations | | | Other
Capital | | | Dividends
from Net
Investment
Income | | | Distributions
from
Capital
Gains | | | Returns
of
Capital | | | Total
Dividends
and
Distributions | | | Net
Asset
Value
at
End of
Period | | | Total
Return(2) | | | Net
Assets at
End of
Period
(000s) | | | Ratio of
Expenses
to
Average
Net
Assets
Before
Adjust-
ments(3) | | | Ratio of
Expenses
to
Average
Net
Assets
After
Adjust-
ments | | | Ratio of
Net
Investment
Income
(Loss) to
Average
Net Assets | | | Portfolio
Turnover(4) | |
|
| Hartford Multifactor Developed Markets(ex-US) ETF | |
|
For the Year Ended September 30, 2019 | |
| | $ | 28.97 | | | $ | 0.98 | | | $ | (1.51 | ) | | $ | (0.53 | ) | | $ | — | | | $ | (0.68 | ) | | $ | — | | | $ | — | | | $ | (0.68 | ) | | $ | 27.76 | | | | (1.78 | )% | | $ | 2,335,688 | | | | 0.29 | % | | | 0.29 | % | | | 3.56 | % | | | 63 | % |
|
For the Year Ended September 30, 2018 | |
| | $ | 28.24 | | | $ | 0.91 | | | $ | 0.45 | (5) | | $ | 1.36 | | | $ | — | (6) | | $ | (0.63 | ) | | $ | — | | | $ | — | | | $ | (0.63 | ) | | $ | 28.97 | | | | 4.85 | % | | $ | 811,066 | | | | 0.31 | % | | | 0.31 | % | | | 3.17 | % | | | 47 | % |
|
For the Year Ended September 30, 2017 | |
| | $ | 24.60 | | | $ | 0.82 | | | $ | 3.55 | | | $ | 4.37 | | | $ | — | | | $ | (0.73 | ) | | $ | — | | | $ | — | | | $ | (0.73 | ) | | $ | 28.24 | | | | 18.18 | % | | $ | 131,327 | | | | 0.42 | % | | | 0.40 | % | | | 3.13 | % | | | 46 | % |
|
For the Year Ended September 30, 2016 | |
| | $ | 22.84 | | | $ | 0.70 | | | $ | 1.70 | | | $ | 2.40 | | | $ | — | | | $ | (0.64 | ) | | $ | — | | | $ | — | | | $ | (0.64 | ) | | $ | 24.60 | | | | 10.62 | % | | $ | 34,440 | | | | 0.58 | % | | | 0.50 | % | | | 2.97 | % | | | 54 | % |
|
For the Period Ended September 30, 2015(7) | |
| | $ | 25.00 | | | $ | 0.55 | | | $ | (2.35 | ) | | $ | (1.80 | ) | | $ | — | | | $ | (0.36 | ) | | $ | — | | | $ | — | | | $ | (0.36 | ) | | $ | 22.84 | | | | (7.36 | )%(11) | | $ | 27,406 | | | | 0.50 | %(8) | | | 0.50 | %(8) | | | 3.75 | %(8) | | | 42 | % |
|
| Hartford Multifactor Emerging Markets ETF | |
|
For the Year Ended September 30, 2019 | |
| | $ | 23.24 | | | $ | 0.66 | | | $ | (1.12 | ) | | $ | (0.46 | ) | | $ | 0.03 | | | $ | (0.61 | ) | | $ | — | | | $ | — | | | $ | (0.61 | ) | | $ | 22.20 | | | | (1.90 | )% | | $ | 68,823 | | | | 0.49 | % | | | 0.49 | % | | | 2.89 | % | | | 78 | % |
|
For the Year Ended September 30, 2018 | |
| | $ | 24.34 | | | $ | 0.60 | | | $ | (1.24 | ) | | $ | (0.64 | ) | | $ | 0.01 | | | $ | (0.47 | ) | | $ | — | | | $ | — | | | $ | (0.47 | ) | | $ | 23.24 | | | | (2.64 | )% | | $ | 65,080 | | | | 0.52 | % | | | 0.52 | % | | | 2.42 | % | | | 25 | % |
|
For the Year Ended September 30, 2017 | |
| | $ | 21.62 | | | $ | 0.49 | | | $ | 2.63 | | | $ | 3.12 | | | $ | — | | | $ | (0.40 | ) | | $ | — | | | $ | — | | | $ | (0.40 | ) | | $ | 24.34 | | | | 14.63 | % | | $ | 46,239 | | | | 0.62 | % | | | 0.60 | % | | | 2.17 | % | | | 30 | % |
|
For the Year Ended September 30, 2016 | |
| | $ | 19.68 | | | $ | 0.45 | | | $ | 1.91 | | | $ | 2.36 | | | $ | — | | | $ | (0.42 | ) | | $ | — | | | $ | — | | | $ | (0.42 | ) | | $ | 21.62 | | | | 12.20 | % | | $ | 23,786 | | | | 0.76 | % | | | 0.65 | % | | | 2.22 | % | | | 49 | % |
|
For the Period Ended September 30, 2015(7) | |
| | $ | 25.00 | | | $ | 0.44 | | | $ | (5.55 | ) | | $ | (5.11 | ) | | $ | — | | | $ | (0.21 | ) | | $ | — | | | $ | — | | | $ | (0.21 | ) | | $ | 19.68 | | | | (20.59 | )%(11) | | $ | 19,685 | | | | 0.65 | %(8) | | | 0.65 | %(8) | | | 3.23 | %(8) | | | 17 | % |
|
| Hartford Multifactor Global Small Cap ETF | |
|
For the Year Ended September 30, 2019 | |
| | $ | 31.78 | | | $ | 0.81 | | | $ | (3.23 | ) | | $ | (2.42 | ) | | $ | — | (6) | | $ | (0.81 | ) | | $ | — | | | $ | — | | | $ | (0.81 | ) | | $ | 28.55 | | | | (7.46 | )% | | $ | 17,133 | | | | 0.39 | % | | | 0.39 | % | | | 2.80 | % | | | 50 | % |
|
For the Year Ended September 30, 2018 | |
| | $ | 30.25 | | | $ | 0.72 | | | $ | 1.54 | | | $ | 2.26 | | | $ | — | (6) | | $ | (0.73 | ) | | $ | — | | | $ | — | | | $ | (0.73 | ) | | $ | 31.78 | | | | 7.52 | % | | $ | 22,243 | | | | 0.44 | % | | | 0.44 | % | | | 2.26 | % | | | 41 | % |
|
For the Year Ended September 30, 2017 | |
| | $ | 25.46 | | | $ | 0.57 | | | $ | 4.79 | | | $ | 5.36 | | | $ | — | | | $ | (0.57 | ) | | $ | — | | | $ | — | | | $ | (0.57 | ) | | $ | 30.25 | | | | 21.37 | % | | $ | 18,148 | | | | 0.60 | % | | | 0.56 | % | | | 2.08 | % | | | 48 | % |
|
For the Year Ended September 30, 2016 | |
| | $ | 22.69 | | | $ | 0.60 | | | $ | 2.76 | | | $ | 3.36 | | | $ | — | | | $ | (0.59 | ) | | $ | — | | | $ | — | | | $ | (0.59 | ) | | $ | 25.46 | | | | 15.05 | % | | $ | 10,185 | | | | 0.83 | % | | | 0.60 | % | | | 2.54 | % | | | 62 | % |
|
For the Period Ended September 30, 2015(9) | |
| | $ | 25.00 | | | $ | 0.44 | | | $ | (2.54 | ) | | $ | (2.10 | ) | | $ | — | | | $ | (0.21 | ) | | $ | — | | | $ | — | | | $ | (0.21 | ) | | $ | 22.69 | | | | (8.50 | )%(11) | | $ | 6,807 | | | | 0.60 | %(8) | | | 0.60 | %(8) | | | 3.44 | %(8) | | | 44 | % |
|
| Hartford Multifactor Low Volatility International Equity ETF | |
|
For the Year Ended September 30, 2019 | |
| | $ | 27.35 | | | $ | 0.69 | | | $ | (0.51 | ) | | $ | 0.18 | | | $ | — | | | $ | (0.69 | ) | | $ | — | | | $ | — | | | $ | (0.69 | ) | | $ | 26.84 | | | | 0.81 | % | | $ | 5,368 | | | | 0.29 | % | | | 0.29 | % | | | 2.64 | % | | | 38 | % |
|
For the Year Ended September 30, 2018 | |
| | $ | 26.58 | | | $ | 0.65 | | | $ | 0.71 | | | $ | 1.36 | | | $ | — | | | $ | (0.59 | ) | | $ | — | | | $ | — | | | $ | (0.59 | ) | | $ | 27.35 | | | | 5.16 | % | | $ | 5,470 | | | | 0.33 | % | | | 0.33 | % | | | 2.37 | % | | | 35 | % |
|
For the Period Ended September 30, 2017(10) | |
| | $ | 25.02 | | | $ | 0.30 | | | $ | 1.40 | | | $ | 1.70 | | | $ | — | | | $ | (0.14 | ) | | $ | — | | | $ | — | | | $ | (0.14 | ) | | $ | 26.58 | | | | 6.84 | %(11) | | $ | 5,317 | | | | 0.39 | %(8) | | | 0.39 | %(8) | | | 3.01 | %(8) | | | 48 | % |
The accompanying notes are an integral part of these financial statements.
|
| Hartford Multifactor ETFs |
Financial Highlights – (continued)
| | | | | | | | | | | | | | | | | | | | | | | | | | | | | | | | | | | | | | | | | | | | | | | | | | | | | | | | | | | | | | | | |
| | | — SelectedPer-Share Data(1) — | | | — Ratios and Supplemental Data — | |
| | | Net Asset
Value at
Beginning
of Period | | | Net
Investment
Income
(Loss) | | | Net
Realized
and
Unrealized
Gain (Loss)
on
Investments | | | Total from
Investment
Operations | | | Other
Capital | | | Dividends
from Net
Investment
Income | | | Distributions
from
Capital
Gains | | | Returns
of
Capital | | | Total
Dividends
and
Distributions | | | Net
Asset
Value
at
End of
Period | | | Total
Return(2) | | | Net
Assets at
End of
Period
(000s) | | | Ratio of
Expenses
to
Average
Net
Assets
Before
Adjust-
ments(3) | | | Ratio of
Expenses
to
Average
Net
Assets
After
Adjust-
ments | | | Ratio of
Net
Investment
Income
(Loss) to
Average
Net Assets | | | Portfolio
Turnover(4) | |
|
| Hartford Multifactor Low Volatility US Equity ETF | |
|
For the Year Ended September 30, 2019 | |
| | $ | 28.72 | | | $ | 0.63 | | | $ | 2.07 | | | $ | 2.70 | | | $ | — | | | $ | (0.59 | ) | | $ | — | | | $ | — | | | $ | (0.59 | ) | | $ | 30.83 | | | | 9.62 | % | | $ | 7,708 | | | | 0.19 | % | | | 0.19 | % | | | 2.20 | % | | | 53 | % |
|
For the Year Ended September 30, 2018 | |
| | $ | 25.74 | | | $ | 0.54 | | | $ | 2.96 | | | $ | 3.50 | | | $ | — | | | $ | (0.52 | ) | | $ | — | | | $ | — | | | $ | (0.52 | ) | | $ | 28.72 | | | | 13.73 | % | | $ | 5,743 | | | | 0.22 | % | | | 0.22 | % | | | 2.00 | % | | | 26 | % |
|
For the Period Ended September 30, 2017(10) | |
| | $ | 25.03 | | | $ | 0.20 | | | $ | 0.68 | | | $ | 0.88 | | | $ | — | | | $ | (0.17 | ) | | $ | — | | | $ | — | | | $ | (0.17 | ) | | $ | 25.74 | | | | 3.53 | %(11) | | $ | 3,861 | | | | 0.29 | %(8) | | | 0.29 | %(8) | | | 2.05 | %(8) | | | 16 | % |
|
| Hartford Multifactor REIT ETF | |
|
For the Year Ended September 30, 2019 | |
| | $ | 15.38 | | | $ | 0.50 | | | $ | 1.23 | | | $ | 1.73 | | | $ | — | | | $ | (0.51 | ) | | $ | — | | | $ | (0.24 | ) | | $ | (0.75 | ) | | $ | 16.36 | | | | 11.75 | % | | $ | 18,000 | | | | 0.45 | % | | | 0.45 | % | | | 3.24 | % | | | 50 | % |
|
For the Year Ended September 30, 2018 | |
| | $ | 15.56 | | | $ | 0.59 | | | $ | (0.12 | )(5) | | $ | 0.47 | | | $ | — | | | $ | (0.61 | ) | | $ | — | | | $ | (0.04 | ) | | $ | (0.65 | ) | | $ | 15.38 | | | | 3.27 | % | | $ | 27,688 | | | | 0.45 | % | | | 0.45 | % | | | 3.89 | % | | | 35 | % |
|
For the Period Ended September 30, 2017(12) | |
| | $ | 14.79 | | | $ | 0.50 | | | $ | 0.74 | | | $ | 1.24 | | | $ | — | | | $ | (0.45 | ) | | $ | (0.02 | ) | | $ | — | | | $ | (0.47 | ) | | $ | 15.56 | | | | 8.47 | %(11) | | $ | 9,337 | | | | 0.50 | %(8) | | | 0.45 | %(8) | | | 3.29 | %(8) | | | 43 | % |
|
| Hartford Multifactor US Equity ETF | |
|
For the Year Ended September 30, 2019 | |
| | $ | 33.01 | | | $ | 0.73 | | | $ | (0.89 | )(5) | | $ | (0.16 | ) | | $ | — | | | $ | (0.65 | ) | | $ | — | | | $ | — | | | $ | (0.65 | ) | | $ | 32.20 | | | | (0.31 | )% | | $ | 307,491 | | | | 0.19 | % | | | 0.19 | % | | | 2.35 | % | | | 81 | % |
|
For the Year Ended September 30, 2018 | |
| | $ | 28.77 | | | $ | 0.57 | | | $ | 4.15 | | | $ | 4.72 | | | $ | — | | | $ | (0.48 | ) | | $ | — | | | $ | — | | | $ | (0.48 | ) | | $ | 33.01 | | | | 16.47 | % | | $ | 173,304 | | | | 0.21 | % | | | 0.21 | % | | | 1.80 | % | | | 36 | % |
|
For the Year Ended September 30, 2017 | |
| | $ | 24.44 | | | $ | 0.51 | | | $ | 4.30 | | | $ | 4.81 | | | $ | — | | | $ | (0.48 | ) | | $ | — | | | $ | — | | | $ | (0.48 | ) | | $ | 28.77 | | | | 19.84 | % | | $ | 34,524 | | | | 0.34 | % | | | 0.31 | % | | | 1.92 | % | | | 36 | % |
|
For the Year Ended September 30, 2016 | |
| | $ | 22.90 | | | $ | 0.52 | | | $ | 1.53 | | | $ | 2.05 | | | $ | — | | | $ | (0.51 | ) | | $ | — | | | $ | — | | | $ | (0.51 | ) | | $ | 24.44 | | | | 9.01 | % | | $ | 28,111 | | | | 0.44 | % | | | 0.35 | % | | | 2.22 | % | | | 51 | % |
|
For the Period Ended September 30, 2015(7) | |
| | $ | 25.00 | | | $ | 0.26 | | | $ | (2.11 | ) | | $ | (1.85 | ) | | $ | — | | | $ | (0.25 | ) | | $ | — | | | $ | — | | | $ | (0.25 | ) | | $ | 22.90 | | | | (7.46 | )%(11) | | $ | 22,900 | | | | 0.35 | %(8) | | | 0.35 | %(8) | | | 1.82 | %(8) | | | 38 | % |
| (1) | Information presented relates to a share outstanding throughout the indicated period. Net investment income (loss) per share amounts are calculated based on average shares outstanding unless otherwise noted. |
| (2) | Total return is calculated assuming a hypothetical purchase of beneficial shares on the opening of the first day at the net asset value and a sale on the closing of the last day at the net asset value of each period reported. Dividends and distributions, if any, are assumed for purposes of this calculation, to be reinvested at market price at the end of the distribution day. |
| (3) | Adjustments include waivers and reimbursements, if applicable. |
| (4) | Portfolio turnover rate excludes securities received or delivered fromin-kind processing of creations or redemptions. |
| (5) | Per share amount was not in accord with the net realized and unrealized gain (loss) for the period because of the timing of transactions in shares of the Fund and the amount and timing ofper-share net realized and unrealized gain (loss) on such shares. |
| (6) | Per share amount is less than $0.005. |
| (7) | Commenced operations on February 25, 2015. |
| (9) | Commenced operations on March 23, 2015. |
| (10) | Commenced operations on May 10, 2017. |
| (12) | Commenced operations on October 3, 2016. |
The accompanying notes are an integral part of these financial statements.
|
| Hartford Multifactor ETFs |
Notes to Financial Statements
September 30, 2019
Lattice Strategies Trust (the “Trust”) is anopen-end registered management investment company comprised of seven series as of September 30, 2019. Financial statements for the series of the Trust listed below (each, a “Fund” and collectively, the “Funds”) are included in this report.
Lattice Strategies Trust:
Hartford Multifactor Developed Markets(ex-US) ETF (the “Multifactor Developed Markets(ex-US) ETF”)
Hartford Multifactor Emerging Markets ETF (the “Multifactor Emerging Markets ETF”)
Hartford Multifactor Global Small Cap ETF (the “Multifactor Global Small Cap ETF”)
Hartford Multifactor Low Volatility International Equity ETF (the “Multifactor Low Volatility International Equity ETF”)
Hartford Multifactor Low Volatility US Equity ETF (the “Multifactor Low Volatility US Equity ETF”)
Hartford Multifactor REIT ETF (the “Multifactor REIT ETF”)
Hartford Multifactor US Equity ETF (the “Multifactor US Equity ETF”)
Each Fund is an exchange-traded fund (‘‘ETF’’). ETFs are funds that trade on an exchange like other publicly traded securities. Each Fund is designed to track an index. Shares of Multifactor Developed Markets(ex-US) ETF, Multifactor Emerging Markets ETF, Multifactor Global Small Cap ETF, Multifactor REIT ETF and Multifactor US Equity ETF are listed and traded on NYSE Arca, Inc. (“NYSE Arca”). Shares of Multifactor Low Volatility International Equity ETF and Multifactor Low Volatility US Equity ETF are listed and traded on Cboe BZX Exchange, Inc. (“Cboe BZX”). Each share of a Fund represents a partial ownership in the Fund’s assets and liabilities, including securities held by the Fund. Shares of a Fund may be purchased or redeemed directly from the Fund only in Creation Units at net asset value (“NAV”) by certain large institutional investors (‘‘Authorized Participants’’) who have entered into agreements with ALPS Distributors, Inc. (‘‘ALPS’’ or the ‘‘Distributor’’), the Funds’ Distributor.
The assets of each Fund are separate, and a shareholder’s interest is limited to the Fund in which shares are held. The Trust was organized as a Delaware statutory trust on April 15, 2014 and is registered with the Securities and Exchange Commission (the “SEC”) under the Investment Company Act of 1940, as amended (the “1940 Act”). The shares of the Funds are registered under the Securities Act of 1933, as amended (the ‘‘Securities Act’’). Each Fund, except Multifactor REIT ETF, is a diversifiedopen-end management investment company. Multifactor REIT ETF is anon-diversifiedopen-end management investment company. Each Fund applies specialized accounting and reporting standards under Financial Accounting Standards Board (“FASB”) Accounting Standards Codification Topic 946 ��Financial Services – Investment Companies.”
Multifactor Low Volatility International Equity ETF and Multifactor Low Volatility US Equity ETF commenced operations on May 10, 2017. Multifactor REIT ETF commenced operations on October 3, 2016. Multifactor Global Small Cap ETF commenced operations on March 23, 2015. Each of the other Funds commenced operations on February 25, 2015.
| 2. | Significant Accounting Policies: |
The following is a summary of significant accounting policies of each Fund used in the preparation of its financial statements, which are in accordance with United States Generally Accepted Accounting Principles (“U.S. GAAP”). The preparation of financial statements in accordance with U.S. GAAP may require management to make estimates and assumptions that affect the reported amounts of assets and liabilities and disclosure of contingent assets and liabilities at the date of the financial statements and the reported amounts of increases and decreases in net assets from operations during the reporting period. Actual results could differ from those estimates.
| | a) | Determination of Net Asset Value – The NAV is determined as of the close of regular trading on the New York Stock Exchange (the “Exchange”) (normally 4:00 p.m. Eastern Time) (the “NYSE Close”) on each day that the Exchange is open (“Valuation Date”). If the Exchange is closed due to weather or other extraordinary circumstances on a day it would typically be open for business, each Fund may treat such day as a typical business day and accept creation and redemption orders and calculate each Fund’s NAV in accordance with applicable law. The net asset value for the shares is determined by dividing the value of the Fund’s net assets attributable to the shares by the number of shares outstanding. Information that becomes known to a Fund after the NAV has been calculated on a particular day will not generally be used to retroactively adjust the NAV determined earlier that day. |
| | b) | Investment Valuation and Fair Value Measurements – For purposes of calculating the NAV, portfolio securities and other assets held in a Fund’s portfolio for which market prices are readily available are valued at market value. Market value is generally determined on the basis of official close price or last reported trade price. If no trades were reported, market value is based on prices obtained from a quotation reporting system, established market makers (including evaluated prices), or independent pricing services. Pricing vendors may use matrix pricing or valuation models that utilize certain inputs and assumptions to derive values, including transaction data, credit quality information, general market conditions, news, and other factors and assumptions. |
If market prices are not readily available or are deemed unreliable, a Fund will use the fair value of the security or other instrument as determined in good faith under policies and procedures established by and under the supervision of the Board of Trustees of the Trust (“Valuation Procedures”). Market prices are considered not readily available where there is an absence of current or reliable market-based data (e.g., trade information or broker quotes), including where events occur after the close of the relevant market, but prior to the NYSE
|
| Hartford Multifactor ETFs |
Notes to Financial Statements – (continued)
September 30, 2019
Close, that materially affect the values of a Fund’s portfolio holdings or assets. In addition, market prices are considered not readily available when, due to extraordinary circumstances, the exchanges or markets on which the securities or other instruments trade, do not open for trading for the entire day and no other market prices are available. Fair value pricing is subjective in nature and the use of fair value pricing by a Fund may cause the NAV of its shares to differ significantly from the NAV that would have been calculated using market prices at the close of the exchange on which a portfolio holding is primarily traded. There can be no assurance that a Fund could obtain the fair value assigned to an investment if the Fund were to sell the investment at approximately the time at which the Fund determines its NAV.
Securities and other instruments that are primarily traded on foreign markets may trade on days that are not business days of the Funds. The value of the foreign securities or other instruments in which a Fund invests may change on days when a shareholder will not be able to purchase, sell or redeem shares of the Fund.
Fixed income investments (other than short-term obligations) held by a Fund are normally valued at prices supplied by independent pricing services in accordance with the Valuation Procedures. Short-term investments maturing in 60 days or less are generally valued at amortized cost if their original term to maturity was 60 days or less, or by amortizing their value on the 61st day prior to maturity, if the original term exceeded 60 days.
Exchange-traded derivatives, such as options, futures and options on futures, are valued at the last sale price determined by the exchange where such instruments principally trade as of the close of such exchange (“Exchange Close”). If a last sale price is not available, the value will be the mean of the most recently quoted bid and ask prices as of the Exchange Close. If a mean of the bid and ask prices cannot be calculated for the day, the value will be the most recently quoted bid price as of the Exchange Close.Over-the-counter derivatives are normally valued based on prices supplied by independent pricing services in accordance with the Valuation Procedures.
Investments valued in currencies other than U.S. dollars are converted to U.S. dollars using the prevailing spot currency exchange rates obtained from independent pricing services for calculation of the NAV. As a result, the NAV of a Fund’s shares may be affected by changes in the value of currencies in relation to the U.S. dollar. The value of securities or other instruments traded in markets outside the United States or denominated in currencies other than the U.S. dollar may be affected significantly on a day that the Exchange is closed and the market value may change on days when an investor is not able to purchase, redeem or sell shares of a Fund.
Foreign currency contracts represent agreements to exchange currencies on specific future dates at predetermined rates. Foreign currency contracts are valued using foreign currency exchange rates and forward rates as provided by an independent pricing service on the Valuation Date.
Investments inopen-end mutual funds, if any, are valued at the respective NAV of eachopen-end mutual fund on the Valuation Date. Shares of investment companies listed and traded on an exchange are valued in the same manner as any exchange-listed equity security. Suchopen-end mutual funds and listed investment companies may use fair value pricing as disclosed in their prospectuses.
Financial instruments for which prices are not available from an independent pricing service may be valued using market quotations obtained from one or more dealers that make markets in the respective financial instrument in accordance with the Valuation Procedures.
U.S. GAAP defines fair value as the price that a Fund would receive to sell an asset or pay to transfer a liability in an orderly transaction between market participants. The U.S. GAAP fair value measurement standards require disclosure of a fair value hierarchy for each major category of assets and liabilities. Various inputs are used in determining the fair value of each Fund’s investments. These inputs are summarized into three broad hierarchy levels. This hierarchy is based on whether the valuation inputs are observable or unobservable. These levels are:
| | • | | Level 1 – Quoted prices in active markets for identical investments. Level 1 may include exchange-traded instruments, such as domestic equities, some foreign equities, options, futures, mutual funds, exchange-traded funds, rights and warrants. |
| | • | | Level 2 – Observable inputs other than Level 1 prices, such as quoted prices for similar investments; quoted prices in markets that are not active; or other inputs that are observable or can be corroborated by observable market data. Level 2 may include debt investments that are traded less frequently than exchange-traded instruments and which are valued using independent pricing services; senior floating rate interests, which are valued using an aggregate of dealer bids; short-term investments, which are valued at amortized cost; and swaps, which are valued based upon the terms of each swap contract. |
| | • | | Level 3 – Significant unobservable inputs that are supported by limited or no market activity. Level 3 may include financial instruments whose values are determined using indicative market quotes or require significant management judgment or estimation. These unobservable valuation inputs may include estimates for current yields, maturity/duration, prepayment speed, and indicative market quotes for comparable investments along with other assumptions relating to credit quality, collateral value, complexity of the investment structure, general market conditions and liquidity. This category may include investments where trading has been halted or there are certain restrictions on trading. While these investments are priced using unobservable inputs, the valuation of these investments reflects the best available data and management believes the prices are a reasonable representation of exit price. |
|
| Hartford Multifactor ETFs |
Notes to Financial Statements – (continued)
September 30, 2019
The Board of Trustees (the “Board”) has delegated theday-to-day responsibility for implementing the valuation procedures to the Valuation Committee. The Valuation Committee will consider all relevant factors in determining an investment’s fair value, and may seek the advice of such Fund’ssub-adviser, as applicable, knowledgeable brokers, and legal counsel in making such determination. The Valuation Committee reports to the Audit Committee of the Board.
Valuation levels are not necessarily indicative of the risk associated with investing in such investments. Individual investments within any of the above mentioned asset classes may be assigned a different hierarchical level than those presented above, as individual circumstances dictate.
For additional information, refer to the Fair Valuation Summary and the Level 3 roll-forward reconciliation, if applicable, which follows each Fund’s Schedule of Investments.
| | c) | Investment Transactions and Investment Income – Investment transactions are recorded as of the trade date (the date the order to buy or sell is executed) for financial reporting purposes. Investments purchased or sold on a when-issued or delayed-delivery basis may be settled a month or more after the trade date. Realized gains and losses are determined on the basis of identified cost. |
Dividend income from domestic securities is accrued on theex-dividend date. The Multifactor REIT ETF dividend income and capital gain loss amounts include estimates based on prior year REIT allocations. In general, dividend income from foreign securities is recorded on theex-date; however, dividend notifications in certain foreign jurisdictions may not be available in a timely manner and as a result, a Fund will record the dividend as soon as the relevant details (i.e., rate per share, payment date, shareholders of record, etc.) are publicly available.Non-cash dividends received in the form of stock are recorded as dividend income at market value. Interest income, including amortization of premium, accretion of discounts, inflation adjustments and additional principal receivedin-kind in lieu of cash, is accrued on a daily basis. Please refer to Note 8 for Securities Lending Information.
| | d) | Taxes – A Fund may be subject to taxes imposed on realized gains on securities of certain foreign countries in which such Fund invests. A Fund may also be subject to taxes withheld on foreign dividends from securities in which the Fund invests. The amount of any foreign taxes withheld and foreign tax expense is included on the accompanying Statements of Operations as a reduction to net investment income or net realized gain on investments in these securities, if applicable. |
| | e) | Foreign Currency Transactions – Assets and liabilities denominated in currencies other than U.S. dollars are translated into U.S. dollars at the exchange rates in effect on the Valuation Date. Purchases and sales of investments, income and expenses are translated into U.S. dollars at the exchange rates on the dates of such transactions. |
A Fund does not isolate that portion of portfolio investment valuation resulting from fluctuations in the foreign currency exchange rates from the fluctuations arising from changes in the market prices of investments held. Exchange rate fluctuations are included with the net realized and unrealized gain or loss on investments in the accompanying financial statements.
Net realized foreign exchange gains or losses arise from sales of foreign currencies and the difference between asset and liability amounts initially stated in foreign currencies and the U.S. dollar value of the amounts actually received or paid. Net unrealized foreign exchange gains or losses arise from changes in the value of other assets and liabilities at the end of the reporting period, resulting from changes in the exchange rates.
| | f) | Dividend Distributions to Shareholders – Dividends are declared pursuant to a policy adopted by the Board. Dividends and/or distributions to shareholders are recorded onex-date. The policy of Multifactor Developed Markets(ex-US) ETF, Multifactor Emerging Markets ETF, Multifactor Global Small Cap ETF and Multifactor Low Volatility International Equity ETF is to pay dividends from net investment income and realized gains, if any, semi-annually. The policy of Multifactor Low Volatility US Equity ETF, Multifactor REIT ETF and Multifactor US Equity ETF is to pay dividends from net investment income, if any, quarterly. Amounts may vary significantly from period to period and realized gains, if any, are paid at least once a year. Dividends may be declared and paid more frequently or at any other times to comply with the distribution requirements of the Internal Revenue Code. |
Income dividends and capital gains distributions are determined in accordance with federal income tax regulations, which may differ from U.S. GAAP with respect to character and timing (see Federal Income Taxes: Distributions and Components of Distributable Earnings and Reclassification of Capital Accounts notes).
| 3. | Securities and Other Investments: |
Restricted Securities – Each Fund may invest in securities that are subject to legal or contractual restrictions on resale. These securities generally may be resold in transactions exempt from registration or to the public if the securities are registered. Disposal of these securities may involve time-consuming negotiations and expense, and prompt sale at an acceptable price may be difficult. Information regarding restricted securities, if applicable, is included at the end of each Fund’s Schedule of Investments.
|
| Hartford Multifactor ETFs |
Notes to Financial Statements – (continued)
September 30, 2019
| 4. | Financial Derivative Instruments: |
| | a) | Foreign Currency Contracts – A Fund may enter into foreign currency contracts that obligate the Fund to purchase or sell currencies at specified future dates. Foreign currency contracts may be used in connection with settling purchases or sales of securities to hedge the currency exposure associated with some or all of a Fund’s investments and/or as part of an investment strategy. Foreign currency contracts are marked to market daily and the change in value is recorded by a Fund as an unrealized gain or loss. A Fund will record a realized gain or loss when the foreign currency contract is settled. |
Foreign currency contracts involve elements of market risk in excess of the amounts reflected in the Statements of Assets and Liabilities. In addition, risks may arise upon entering into these contracts from the potential inability of the counterparties to meet the terms of the contracts and from unanticipated movements in the value of the foreign currencies relative to the U.S. dollar. Upon entering into a foreign currency contract, a Fund may be required to post margin equal to its outstanding exposure thereunder.
During the year ended September 30, 2019, the Funds had not used Foreign Currency Contracts. There were no open contracts at September 30, 2019.
| | b) | Futures Contracts – A Fund may enter into futures contracts. A futures contract is an agreement between two parties to buy or sell an asset at a set price on a future date. A Fund may use futures contracts to manage risk or obtain exposure to the investment markets, commodities, or movements in interest rates and currency values. The primary risks associated with the use of futures contracts are the imperfect correlation between the change in market value of the investments held by a Fund and the prices of futures contracts and the possibility of an illiquid market. Upon entering into a futures contract, a Fund is required to deposit with a futures commission merchant (“FCM”) an amount of cash or U.S. Government or Agency Obligations in accordance with the initial margin requirements of the broker or exchange. Futures contracts are marked to market daily and an appropriate amount equal to the change in value (“variation margin”) is paid or received by a Fund. Gains or losses are recognized but not considered realized until the contracts expire or are closed. Futures contracts involve, to varying degrees, risk of loss in excess of the variation margin disclosed on the Statements of Assets and Liabilities. |
During the year ended September 30, 2019, Multifactor Developed Markets(ex-US) ETF, Multifactor Emerging Markets ETF, Multifactor Global Small Cap ETF, Multifactor REIT ETF and Multifactor US Equity ETF had used Futures Contracts.
| | c) | Additional Derivative Instrument Information: |
Multifactor Developed Markets(ex-US) ETF
The Effect of Derivative Instruments on the Statement of Assets and Liabilities as of September 30, 2019:
| | | | | | | | | | | | | | | | | | | | | | | | | | | | |
| | | Risk Exposure Category | |
| | | Interest Rate
Contracts | | | Foreign
Exchange
Contracts | | | Credit
Contracts | | | Equity
Contracts | | | Commodity
Contracts | | | Other
Contracts | | | Total | |
Liabilities: | |
Unrealized depreciation on futures contracts(1) | | $ | — | | | $ | — | | | $ | — | | | $ | 43,047 | | | $ | — | | | $ | — | | | $ | 43,047 | |
| | | | | | | | | | | | | | | | | | | | | | | | | | | | |
Total | | $ | — | | | $ | — | | | $ | — | | | $ | 43,047 | | | $ | — | | | $ | — | | | $ | 43,047 | |
| | | | | | | | | | | | | | | | | | | | | | | | | | | | |
| | (1) | Amount represents the cumulative depreciation on futures contracts as disclosed within the Schedule of Investments under the open “Futures Contracts” section. Only current day’s variation margin, if any, is reported within the Statement of Assets and Liabilities. |
The Effect of Derivative Instruments on the Statement of Operations for the year ended September 30, 2019:
| | | | | | | | | | | | | | | | | | | | | | | | | | | | |
| | | Risk Exposure Category | |
| | | Interest Rate
Contracts | | | Foreign
Exchange
Contracts | | | Credit
Contracts | | | Equity
Contracts | | | Commodity
Contracts | | | Other
Contracts | | | Total | |
Realized Gain (Loss) on Derivatives Recognized as a Result of Operations: | | | | | | | | | | | | | | | | | | | | | | | | | | | | |
Net realized gain (loss) on futures contracts | | $ | — | | | $ | — | | | $ | — | | | $ | 480,602 | | | $ | — | | | $ | — | | | $ | 480,602 | |
| | | | | | | | | | | | | | | | | | | | | | | | | | | | |
Total | | $ | — | | | $ | — | | | $ | — | | | $ | 480,602 | | | $ | — | | | $ | — | | | $ | 480,602 | |
| | | | | | | | | | | | | | | | | | | | | | | | | | | | |
Net Change in Unrealized Appreciation (Depreciation) on Derivatives Recognized as a Result of Operations: | | | | | | | | | | | | | | | | | | | | | | | | | | | | |
Net change in unrealized appreciation (depreciation) of futures contracts | | $ | — | | | $ | — | | | $ | — | | | $ | (48,179 | ) | | $ | — | | | $ | — | | | $ | (48,179 | ) |
| | | | | | | | | | | | | | | | | | | | | | | | | | | | |
Total | | $ | — | | | $ | — | | | $ | — | | | $ | (48,179 | ) | | $ | — | | | $ | — | | | $ | (48,179 | ) |
| | | | | | | | | | | | | | | | | | | | | | | | | | | | |
For the year ended September 30, 2019, the average amount or number per contract outstanding for each derivative type was as follows:
| | | | | | | | | | | | | | | | | | |
Derivative Description | | Average Notional
Par, Contracts
or Face Amount |
Futures Contracts Long at Number of Contracts | | 72 |
|
| Hartford Multifactor ETFs |
Notes to Financial Statements – (continued)
September 30, 2019
Multifactor Emerging Markets ETF
The Effect of Derivative Instruments on the Statement of Assets and Liabilities as of September 30, 2019:
| | | | | | | | | | | | | | | | | | | | | | | | | | | | |
| | | Risk Exposure Category | |
| | | Interest Rate
Contracts | | | Foreign
Exchange
Contracts | | | Credit
Contracts | | | Equity
Contracts | | | Commodity
Contracts | | | Other
Contracts | | | Total | |
Liabilities: | |
Unrealized depreciation on futures contracts(1) | | $ | — | | | $ | — | | | $ | — | | | $ | 7,768 | | | $ | — | | | $ | — | | | $ | 7,768 | |
| | | | | | | | | | | | | | | | | | | | | | | | | | | | |
Total | | $ | — | | | $ | — | | | $ | — | | | $ | 7,768 | | | $ | — | | | $ | — | | | $ | 7,768 | |
| | | | | | | | | | | | | | | | | | | | | | | | | | | | |
| | (1) | Amount represents the cumulative depreciation on futures contracts as disclosed within the Schedule of Investments under the open “Futures Contracts” section. Only current day’s variation margin, if any, is reported within the Statement of Assets and Liabilities. |
The Effect of Derivative Instruments on the Statement of Operations for the year ended September 30, 2019:
| | | | | | | | | | | | | | | | | | | | | | | | | | | | |
| | | Risk Exposure Category | |
| | | Interest Rate
Contracts | | | Foreign
Exchange
Contracts | | | Credit
Contracts | | | Equity
Contracts | | | Commodity
Contracts | | | Other
Contracts | | | Total | |
Realized Gain (Loss) on Derivatives Recognized as a Result of Operations: | | | | | | | | | | | | | | | | | | | | | | | | | | | | |
Net realized gain (loss) on futures contracts | | $ | — | | | $ | — | | | $ | — | | | $ | (28,947 | ) | | $ | — | | | $ | — | | | $ | (28,947 | ) |
| | | | | | | | | | | | | | | | | | | | | | | | | | | | |
Total | | $ | — | | | $ | — | | | $ | — | | | $ | (28,947 | ) | | $ | — | | | $ | — | | | $ | (28,947 | ) |
| | | | | | | | | | | | | | | | | | | | | | | | | | | | |
Net Change in Unrealized Appreciation (Depreciation) on Derivatives Recognized as a Result of Operations: | | | | | | | | | | | | | | | | | | | | | | | | | | | | |
Net change in unrealized appreciation (depreciation) of futures contracts | | $ | — | | | $ | — | | | $ | — | | | $ | (9,144 | ) | | $ | — | | | $ | — | | | $ | (9,144 | ) |
| | | | | | | | | | | | | | | | | | | | | | | | | | | | |
Total | | $ | — | | | $ | — | | | $ | — | | | $ | (9,144 | ) | | $ | — | | | $ | — | | | $ | (9,144 | ) |
| | | | | | | | | | | | | | | | | | | | | | | | | | | | |
For the year ended September 30, 2019, the average amount or number per contract outstanding for each derivative type was as follows:
| | |
Derivative Description | | Average Notional
Par, Contracts
or Face Amount |
Futures Contracts Long at Number of Contracts | | 8 |
Multifactor Global Small Cap ETF
The Effect of Derivative Instruments on the Statement of Assets and Liabilities as of September 30, 2019:
| | | | | | | | | | | | | | | | | | | | | | | | | | | | |
| | | Risk Exposure Category | |
| | | Interest Rate
Contracts | | | Foreign
Exchange
Contracts | | | Credit
Contracts | | | Equity
Contracts | | | Commodity
Contracts | | | Other
Contracts | | | Total | |
Liabilities: | |
Unrealized depreciation on futures contracts(1) | | $ | — | | | $ | — | | | $ | — | | | $ | 3,684 | | | $ | — | | | $ | — | | | $ | 3,684 | |
| | | | | | | | | | | | | | | | | | | | | | | | | | | | |
Total | | $ | — | | | $ | — | | | $ | — | | | $ | 3,684 | | | $ | — | | | $ | — | | | $ | 3,684 | |
| | | | | | | | | | | | | | | | | | | | | | | | | | | | |
| | (1) | Amount represents the cumulative depreciation on futures contracts as disclosed within the Schedule of Investments under the open “Futures Contracts” section. Only current day’s variation margin, if any, is reported within the Statement of Assets and Liabilities. |
The Effect of Derivative Instruments on the Statement of Operations for the year ended September 30, 2019:
| | | | | | | | | | | | | | | | | | | | | | | | | | | | |
| | | Risk Exposure Category | |
| | | Interest Rate
Contracts | | | Foreign
Exchange
Contracts | | | Credit
Contracts | | | Equity
Contracts | | | Commodity
Contracts | | | Other
Contracts | | | Total | |
Realized Gain (Loss) on Derivatives Recognized as a Result of Operations: | | | | | | | | | | | | | | | | | | | | | | | | | | | | |
Net realized gain (loss) on futures contracts | | $ | — | | | $ | — | | | $ | — | | | $ | (3,383 | ) | | $ | — | | | $ | — | | | $ | (3,383 | ) |
| | | | | | | | | | | | | | | | | | | | | | | | | | | | |
Total | | $ | — | | | $ | — | | | $ | — | | | $ | (3,383 | ) | | $ | — | | | $ | — | | | $ | (3,383 | ) |
| | | | | | | | | | | | | | | | | | | | | | | | | | | | |
Net Change in Unrealized Appreciation (Depreciation) on Derivatives Recognized as a Result of Operations: | | | | | | | | | | | | | | | | | | | | | | | | | | | | |
Net change in unrealized appreciation (depreciation) of futures contracts | | $ | — | | | $ | — | | | $ | — | | | $ | (2,830 | ) | | $ | — | | | $ | — | | | $ | (2,830 | ) |
| | | | | | | | | | | | | | | | | | | | | | | | | | | | |
Total | | $ | — | | | $ | — | | | $ | — | | | $ | (2,830 | ) | | $ | — | | | $ | — | | | $ | (2,830 | ) |
| | | | | | | | | | | | | | | | | | | | | | | | | | | | |
|
| Hartford Multifactor ETFs |
Notes to Financial Statements – (continued)
September 30, 2019
Multifactor Global Small Cap ETF – (continued)
For the year ended September 30, 2019, the average amount or number per contract outstanding for each derivative type was as follows:
| | | | | | | | | | | | | | |
Derivative Description | | Average Notional
Par, Contracts
or Face Amount |
Futures Contracts Long at Number of Contracts | | 2 |
Multifactor REIT ETF
The Effect of Derivative Instruments on the Statement of Assets and Liabilities as of September 30, 2019:
| | | | | | | | | | | | | | | | | | | | | | | | | | | | |
| | | Risk Exposure Category | |
| | | Interest Rate
Contracts | | | Foreign
Exchange
Contracts | | | Credit
Contracts | | | Equity
Contracts | | | Commodity
Contracts | | | Other
Contracts | | | Total | |
Assets: | |
Unrealized appreciation on futures contracts(1) | | $ | — | | | $ | — | | | $ | — | | | $ | 809 | | | $ | — | | | $ | — | | | $ | 809 | |
| | | | | | | | | | | | | | | | | | | | | | | | | | | | |
Total | | $ | — | | | $ | — | | | $ | — | | | $ | 809 | | | $ | — | | | $ | — | | | $ | 809 | |
| | | | | | | | | | | | | | | | | | | | | | | | | | | | |
| | (1) | Amount represents the cumulative appreciation on futures contracts as disclosed within the Schedule of Investments under the open “Futures Contracts” section. Only current day’s variation margin, if any, is reported within the Statement of Assets and Liabilities. |
The Effect of Derivative Instruments on the Statement of Operations for the year ended September 30, 2019:
| | | | | | | | | | | | | | | | | | | | | | | | | | | | |
| | | Risk Exposure Category | |
| | | Interest Rate
Contracts | | | Foreign
Exchange
Contracts | | | Credit
Contracts | | | Equity
Contracts | | | Commodity
Contracts | | | Other
Contracts | | | Total | |
Realized Gain (Loss) on Derivatives Recognized as a Result of Operations: | | | | | | | | | | | | | | | | | | | | | | | | | | | | |
Net realized gain (loss) on futures contracts | | $ | — | | | $ | — | | | $ | — | | | $ | 18,383 | | | $ | — | | | $ | — | | | $ | 18,383 | |
| | | | | | | | | | | | | | | | | | | | | | | | | | | | |
Total | | $ | — | | | $ | — | | | $ | — | | | $ | 18,383 | | | $ | — | | | $ | — | | | $ | 18,383 | |
| | | | | | | | | | | | | | | | | | | | | | | | | | | | |
Net Change in Unrealized Appreciation (Depreciation) on Derivatives Recognized as a Result of Operations: | | | | | | | | | | | | | | | | | | | | | | | | | | | | |
Net change in unrealized appreciation (depreciation) of futures contracts | | $ | — | | | $ | — | | | $ | — | | | $ | 1,218 | | | $ | — | | | $ | — | | | $ | 1,218 | |
| | | | | | | | | | | | | | | | | | | | | | | | | | | | |
Total | | $ | — | | | $ | — | | | $ | — | | | $ | 1,218 | | | $ | — | | | $ | — | | | $ | 1,218 | |
| | | | | | | | | | | | | | | | | | | | | | | | | | | | |
For the year ended September 30, 2019, the average amount or number per contract outstanding for each derivative type was as follows:
| | | | | | | | | | | | | | | | | | |
Derivative Description | | Average Notional
Par, Contracts
or Face Amount |
Futures Contracts Long at Number of Contracts | | 3 |
Multifactor US Equity ETF
The Effect of Derivative Instruments on the Statement of Assets and Liabilities as of September 30, 2019:
| | | | | | | | | | | | | | | | | | | | | | | | | | | | |
| | | Risk Exposure Category | |
| | | Interest Rate
Contracts | | | Foreign
Exchange
Contracts | | | Credit
Contracts | | | Equity
Contracts | | | Commodity
Contracts | | | Other
Contracts | | | Total | |
Liabilities: | |
Unrealized depreciation on futures contracts(1) | | $ | — | | | $ | — | | | $ | — | | | $ | 25,340 | | | $ | — | | | $ | — | | | $ | 25,340 | |
| | | | | | | | | | | | | | | | | | | | | | | | | | | | |
Total | | $ | — | | | $ | — | | | $ | — | | | $ | 25,340 | | | $ | — | | | $ | — | | | $ | 25,340 | |
| | | | | | | | | | | | | | | | | | | | | | | | | | | | |
| | (1) | Amount represents the cumulative depreciation on futures contracts as disclosed within the Schedule of Investments under the open “Futures Contracts” section. Only current day’s variation margin, if any, is reported within the Statement of Assets and Liabilities. |
|
| Hartford Multifactor ETFs |
Notes to Financial Statements – (continued)
September 30, 2019
Multifactor US Equity ETF – (continued)
The Effect of Derivative Instruments on the Statement of Operations for the year ended September 30, 2019:
| | | | | | | | | | | | | | | | | | | | | | | | | | | | |
| | | Risk Exposure Category | |
| | | Interest Rate
Contracts | | | Foreign
Exchange
Contracts | | | Credit
Contracts | | | Equity
Contracts | | | Commodity
Contracts | | | Other
Contracts | | | Total | |
Realized Gain (Loss) on Derivatives Recognized as a Result of Operations: | | | | | | | | | | | | | | | | | | | | | | | | | | | | |
Net realized gain (loss) on futures contracts | | $ | — | | | $ | — | | | $ | — | | | $ | 129,198 | | | $ | — | | | $ | — | | | $ | 129,198 | |
| | | | | | | | | | | | | | | | | | | | | | | | | | | | |
Total | | $ | — | | | $ | — | | | $ | — | | | $ | 129,198 | | | $ | — | | | $ | — | | | $ | 129,198 | |
| | | | | | | | | | | | | | | | | | | | | | | | | | | | |
Net Change in Unrealized Appreciation (Depreciation) on Derivatives Recognized as a Result of Operations: | | | | | | | | | | | | | | | | | | | | | | | | | | | | |
Net change in unrealized appreciation (depreciation) of futures contracts | | $ | — | | | $ | — | | | $ | — | | | $ | (26,065 | ) | | $ | — | | | $ | — | | | $ | (26,065 | ) |
| | | | | | | | | | | | | | | | | | | | | | | | | | | | |
Total | | $ | — | | | $ | — | | | $ | — | | | $ | (26,065 | ) | | $ | — | | | $ | — | | | $ | (26,065 | ) |
| | | | | | | | | | | | | | | | | | | | | | | | | | | | |
For the year ended September 30, 2019, the average amount or number per contract outstanding for each derivative type was as follows:
| | | | | | | | | | | | | | | | | | |
Derivative Description | | Average Notional
Par, Contracts
or Face Amount |
Futures Contracts Long at Number of Contracts | | 6 |
| | d) | Balance Sheet Offsetting Information – Set forth below are tables which disclose both gross information and net information about instruments and transactions eligible for offset in the financial statements, and instruments and transactions that are subject to a master netting arrangement, as well as amounts related to margin, reflected as financial collateral (including cash collateral), held at clearing brokers, counterparties and a Fund’s custodian. The master netting arrangements allow the clearing brokers to net any collateral held in or on behalf of a Fund, or liabilities or payment obligations of the clearing brokers to a Fund, against any liabilities or payment obligations of a Fund to the clearing brokers. A Fund is required to deposit financial collateral (including cash collateral) at the Fund’s custodian on behalf of clearing brokers and counterparties to continually meet the original and maintenance requirements established by the clearing brokers and counterparties. Such requirements are specific to the respective clearing broker or counterparty. Certain master netting arrangements may not be enforceable in a bankruptcy. |
The following tables present a Fund’s derivative assets and liabilities, presented on a gross basis as no amounts are netted within the Statements of Assets and Liabilities, by counterparty net of amounts available for offset under a master netting agreement or similar agreement (“MNA”) and net of the related collateral received/pledged by a Fund as of September 30, 2019:
Multifactor Developed Markets(ex-US) ETF
| | | | | | | | |
Derivative Financial Instruments: | | Assets | | | Liabilities | |
Futures contracts | | $ | — | | | $ | (43,047 | ) |
| | | | | | | | |
Total gross amount of derivative assets and liabilities in the Statement of Assets and Liabilities | | | — | | | | (43,047 | ) |
| | | | | | | | |
Derivatives not subject to a MNA | | | — | | | | 43,047 | |
| | | | | | | | |
Total gross amount of assets and liabilities subject to MNA or similar agreements | | | — | | | | — | |
| | | | | | | | |
Multifactor Emerging Markets ETF
| | | | | | | | |
Derivative Financial Instruments: | | Assets | | | Liabilities | |
Futures contracts | | $ | — | | | $ | (7,768 | ) |
| | | | | | | | |
Total gross amount of derivative assets and liabilities in the Statement of Assets and Liabilities | | | — | | | | (7,768 | ) |
| | | | | | | | |
Derivatives not subject to a MNA | | | — | | | | 7,768 | |
| | | | | | | | |
Total gross amount of assets and liabilities subject to MNA or similar agreements | | | — | | | | — | |
| | | | | | | | |
Multifactor Global Small Cap ETF
| | | | | | | | |
Derivative Financial Instruments: | | Assets | | | Liabilities | |
Futures contracts | | $ | — | | | $ | (3,684 | ) |
| | | | | | | | |
Total gross amount of derivative assets and liabilities in the Statement of Assets and Liabilities | | | — | | | | (3,684 | ) |
| | | | | | | | |
Derivatives not subject to a MNA | | | — | | | | 3,684 | |
| | | | | | | | |
Total gross amount of assets and liabilities subject to MNA or similar agreements | | | — | | | | — | |
| | | | | | | | |
|
| Hartford Multifactor ETFs |
Notes to Financial Statements – (continued)
September 30, 2019
Multifactor REIT ETF
| | | | | | | | |
Derivative Financial Instruments: | | Assets | | | Liabilities | |
Futures contracts | | $ | 809 | | | $ | — | |
| | | | | | | | |
Total gross amount of derivative assets and liabilities in the Statement of Assets and Liabilities | | | 809 | | | | — | |
| | | | | | | | |
Derivatives not subject to a MNA | | | (809 | ) | | | — | |
| | | | | | | | |
Total gross amount of assets and liabilities subject to MNA or similar agreements | | | — | | | | — | |
| | | | | | | | |
Multifactor US Equity ETF
| | | | | | | | |
Derivative Financial Instruments: | | Assets | | | Liabilities | |
Futures contracts | | $ | — | | | $ | (25,340 | ) |
| | | | | | | | |
Total gross amount of derivative assets and liabilities in the Statement of Assets and Liabilities | | | — | | | | (25,340 | ) |
| | | | | | | | |
Derivatives not subject to a MNA | | | — | | | | 25,340 | |
| | | | | | | | |
Total gross amount of assets and liabilities subject to MNA or similar agreements | | | — | | | | — | |
| | | | | | | | |
A Fund’s investments expose it to various types of risks associated with financial instruments and the markets. A Fund may be exposed to the risks described below. Each Fund’s prospectus provides details of its principal risks.
The market values of equity securities, such as common stocks and preferred stocks, or equity related derivative investments, such as futures and options, may decline due to general market conditions that are not specifically related to a particular company, such as real or perceived adverse economic conditions, changes in the general outlook for corporate earnings, changes in interest or currency rates or adverse investor sentiment generally. The market value of equity securities may also decline due to factors that affect a particular industry or industries, such as labor shortages or increased production costs and competitive conditions within an industry. Equity securities and equity related investments generally have greater market price volatility than fixed income securities. The extent of each Fund’s exposure to market risk is the market value of the investments held as shown in the Fund’s Schedule of Investments.
Investing in the securities ofnon-U.S. issuers, whether directly or indirectly, involves certain considerations and risks not typically associated with securities of U.S. issuers. Such risks include, but are not limited to: generally less liquid and less efficient securities markets; generally greater price volatility; exchange rate fluctuations; imposition of restrictions on the expatriation of funds or other protectionist measures; less publicly available information about issuers; the imposition of withholding or other taxes; higher transaction and custody costs; settlement delays and risk of loss attendant in settlement procedures; difficulties in enforcing contractual obligations; less regulation of securities markets; different accounting, disclosure and reporting requirements; more substantial governmental involvement in the economy; higher inflation rates; and greater social, economic and political uncertainties. These risks are heightened for investments in issuers from countries with less developed markets.
Securities lending involves the risk that a Fund may lose money because the borrower of the loaned securities fails to return the securities in a timely manner or at all. A Fund could also lose money in the event of a decline in the value of the collateral provided for the loaned securities or a decline in the value of any investments made with cash collateral. These events could also trigger adverse tax consequences for a Fund that lends its holdings.
| | a) | Each Fund intends to continue to qualify as a Regulated Investment Company (“RIC”) under Subchapter M of the Internal Revenue Code (“IRC”) by distributing substantially all of its taxable net investment income and net realized capital gains to its shareholders each year. Each Fund has distributed substantially all of its income and capital gains in prior years, if applicable, and intends to distribute substantially all of its income and capital gains during the calendar year ending December 31, 2019. Accordingly, no provision for federal income or excise taxes has been made in the accompanying financial statements. Distributions from short-term capital gains are treated as ordinary income distributions for federal income tax purposes. |
| | b) | Net Investment Income (Loss), Net Realized Gains (Losses) and Distributions – Net investment income (loss) and net realized gains (losses) may differ for financial statement and tax purposes primarily because of losses deferred due to wash sale adjustments, adjustments due to foreign currency gains and losses, adjustments related to Passive Foreign Investment Companies (“PFICs”), Real Estate Investment Trusts (“REITs”), RICs, certain derivatives and partnerships. The character of distributions made during the year from net investment income or net realized gains may differ from their ultimate characterization for federal income tax purposes. Also, due to the timing of dividend distributions, the fiscal year in which amounts are distributed may differ from the year that the income or realized gains (losses) were recorded by each Fund. |
|
| Hartford Multifactor ETFs |
Notes to Financial Statements – (continued)
September 30, 2019
| | c) | Distributions and Components of Distributable Earnings– The tax character of distributions paid by each Fund for the years ended September 30, 2019 and September 30, 2018 are as follows (as adjusted for dividends payable, if applicable): |
| | | | | | | | | | | | | | | | |
| | | For the Year Ended
September 30, 2019 | | | For the Year Ended
September 30, 2018 | |
Fund | | Ordinary
Income | | | Tax Return of
Capital | | | Ordinary
Income | | | Tax Return of
Capital | |
Multifactor Developed Markets(ex-US) ETF | | $ | 48,161,644 | | | $ | — | | | $ | 8,013,824 | | | $ | — | |
Multifactor Emerging Markets ETF | | | 2,004,488 | | | | — | | | | 1,141,715 | | | | — | |
Multifactor Global Small Cap ETF | | | 601,511 | | | | — | | | | 470,072 | | | | — | |
Multifactor Low Volatility International Equity ETF | | | 137,798 | | | | — | | | | 118,511 | | | | — | |
Multifactor Low Volatility US Equity ETF | | | 140,380 | | | | — | | | | 96,129 | | | | — | |
Multifactor REIT ETF | | | 833,172 | | | | 402,584 | | | | 677,992 | | | | 41,564 | |
Multifactor US Equity ETF | | | 5,407,729 | | | | — | | | | 1,496,009 | | | | — | |
As of September 30, 2019, the components of distributable earnings (deficit) for each Fund on a tax basis are as follows:
| | | | | | | | | | | | | | | | |
Fund | | Undistributed
Ordinary
Income | | | Accumulated
Capital and
Other Losses | | | Unrealized
Appreciation
(Depreciation) on
Investments | | | Total
Accumulated
Earnings
(Deficit) | |
Multifactor Developed Markets(ex-US) ETF | | $ | 24,483,653 | | | $ | (129,891,346 | ) | | $ | 40,866,703 | | | $ | (64,540,990 | ) |
Multifactor Emerging Markets ETF | | | 1,245,568 | | | | (11,878,067 | ) | | | (114,241 | ) | | | (10,746,740 | ) |
Multifactor Global Small Cap ETF | | | 278,445 | | | | (1,901,678 | ) | | | (305,254 | ) | | | (1,928,487 | ) |
Multifactor Low Volatility International Equity ETF | | | 64,636 | | | | (123,557 | ) | | | 290,563 | | | | 231,642 | |
Multifactor Low Volatility US Equity ETF | | | 8,532 | | | | (220,957 | ) | | | 1,003,863 | | | | 791,438 | |
Multifactor REIT ETF | | | — | | | | (738,950 | ) | | | 611,269 | | | | (127,681 | ) |
Multifactor US Equity ETF | | | 479,089 | | | | (13,486,456 | ) | | | 12,729,252 | | | | (278,115 | ) |
| | d) | Reclassification of Capital Accounts– The Funds may record reclassifications in their capital accounts. These reclassifications have no impact on the total net assets of the Funds. The reclassifications are a result of permanent differences between U.S. GAAP and tax accounting for such items as treatment of the tax gains/losses on in-kind redemptions. Adjustments are made to reflect the impact these items have on current and future distributions to shareholders. Therefore, the source of the Funds’ distributions may be shown in the accompanying Statements of Changes in Net Assets as from distributable earnings or from capital depending on the type of book and tax differences that exist. For the year ended September 30, 2019, the Funds recorded reclassifications to increase (decrease) the accounts listed below: |
| | | | | | | | |
Fund | | Paid-in-Capital | | | Distributable
earnings (Loss) | |
Multifactor Developed Markets(ex-US) ETF | | $ | 53,206,275 | | | $ | (53,206,275 | ) |
Multifactor Emerging Markets ETF | | | 2,200,571 | | | | (2,200,571 | ) |
Multifactor Global Small Cap ETF | | | 1,524,189 | | | | (1,524,189 | ) |
Multifactor Low Volatility International Equity ETF | | | — | | | | — | |
Multifactor Low Volatility US Equity ETF | | | 499,849 | | | | (499,849 | ) |
Multifactor REIT ETF | | | 1,134,791 | | | | (1,134,791 | ) |
Multifactor US Equity ETF | | | 9,259,565 | | | | (9,259,565 | ) |
| | e) | Tax Basis of Investments – The aggregate cost of investments for federal income tax purposes at September 30, 2019 is different from book purposes primarily due to wash sale loss deferrals and passive foreign investment company (PFIC) mark-to-market adjustments. The net unrealized appreciation/(depreciation) on investments for tax purposes, which consists of gross unrealized appreciation and depreciation, was also different from book purposes primarily due to wash sale loss deferrals and mark-to-market adjustments on futures and PFICs. Both the cost and unrealized appreciation and depreciation for federal income tax purposes are disclosed below: |
| | | | | | | | | | | | | | | | |
Fund | | Tax Cost | | | Gross Unrealized
Appreciation | | | Gross Unrealized
Depreciation | | | Net Unrealized
Appreciation
(Depreciation) | |
Multifactor Developed Markets(ex-US) ETF | | $ | 2,280,785,162 | | | $ | 127,855,669 | | | $ | (86,937,326 | ) | | $ | 40,918,343 | |
Multifactor Emerging Markets ETF | | | 68,683,457 | | | | 3,092,193 | | | | (3,202,139 | ) | | | (109,946 | ) |
Multifactor Global Small Cap ETF | | | 17,282,722 | | | | 1,754,346 | | | | (2,059,408 | ) | | | (305,062 | ) |
Multifactor Low Volatility International Equity ETF | | | 5,055,260 | | | | 528,629 | | | | (237,992 | ) | | | 290,637 | |
Multifactor Low Volatility US Equity ETF | | | 6,688,703 | | | | 1,073,056 | | | | (69,193 | ) | | | 1,003,863 | |
Multifactor REIT ETF | | | 17,304,828 | | | | 1,437,515 | | | | (826,247 | ) | | | 611,268 | |
Multifactor US Equity ETF | | | 291,449,800 | | | | 16,368,193 | | | | (3,638,941 | ) | | | 12,729,252 | |
|
| Hartford Multifactor ETFs |
Notes to Financial Statements – (continued)
September 30, 2019
| | f) | Capital Loss Carryforward– Under the Regulated Investment Company Modernization Act of 2010, funds are permitted to carry forward capital losses for an unlimited period. |
At September 30, 2019 (tax year end), each Fund’s capital loss carryforwards for U.S. federal income tax purposes were as follows:
| | | | | | | | |
| | | Short-Term
Capital Loss
Carryforward with
No Expiration | | | Long-Term
Capital Loss
Carryforward with
No Expiration | |
Fund |
Multifactor Developed Markets(ex-US) ETF | | $ | 107,334,369 | | | $ | 22,556,977 | |
Multifactor Emerging Markets ETF | | | 6,704,506 | | | | 5,173,561 | |
Multifactor Global Small Cap ETF | | | 1,200,254 | | | | 701,424 | |
Multifactor Low Volatility International Equity ETF | | | 123,557 | | | | — | |
Multifactor Low Volatility US Equity ETF | | | 148,022 | | | | 72,935 | |
Multifactor REIT ETF | | | 598,680 | | | | 140,270 | |
Multifactor US Equity ETF | | | 9,907,946 | | | | 3,578,510 | |
| | g) | Accounting for Uncertainty in Income Taxes – Pursuant to provisions set forth by U.S. GAAP, Hartford Funds Management Company, LLC (“HFMC”) reviews each Fund’s tax positions for all open tax years. As of September 30, 2019, HFMC had reviewed the open tax years and concluded that there was no reason to record a liability for net unrecognized tax obligations relating to uncertain income tax positions. Each Fund files U.S. tax returns. Although the statute of limitations for examining a Fund’s U.S. tax returns remains open for 3 years, no examination is currently in progress. HFMC is not aware of any tax positions for which it is reasonably possible that the total amounts of unrecognized tax obligations will significantly change in the next twelve months. The Funds recognize interest and penalties, if any, related to unrecognized tax benefits as income tax expense on the Statements of Operations. During the year ended September 30, 2019, the Funds did not incur any interest or penalties. |
| | a) | Investment Advisory Agreement– Lattice Strategies LLC (the “Adviser” or “Lattice”) serves as each Fund’s investment adviser pursuant to an Investment Advisory Agreement with the Trust. Lattice is a wholly owned subsidiary of Hartford Funds Management Company, LLC (“HFMC”), which is an indirect subsidiary of The Hartford Financial Services Group, Inc. (“The Hartford”). Lattice has overall investment supervisory responsibility for each Fund. In addition, Lattice provides administrative personnel, services, equipment, facilities and office space for proper operation of each Fund. Lattice has contracted with Mellon Investments Corporation (“Mellon”) under asub-advisory agreement pursuant to which Mellon performs the daily investment of the assets of each Fund in accordance with each Fund’s investment objective and policies. Each Fund pays a fee to Lattice, a portion of which may be used to compensate Mellon. |
The schedule below reflects the rates of compensation paid to Lattice for investment advisory services rendered as of September 30, 2019; the rates are accrued daily and paid monthly based on each Fund’s average daily net assets, at the following annual rates:
| | |
Fund | | Management Fee Rates |
Multifactor Developed Markets(ex-US) ETF | | 0.29% |
Multifactor Emerging Markets ETF | | 0.44% |
Multifactor Global Small Cap ETF | | 0.39% |
Multifactor Low Volatility International Equity ETF | | 0.29% |
Multifactor Low Volatility US Equity ETF | | 0.19% |
Multifactor REIT ETF | | 0.45% |
Multifactor US Equity ETF | | 0.19% |
Prior to September 11, 2019, Multifactor Emerging Markets ETF paid the rate of 0.49% to Lattice for investment advisory services rendered. The rate was accrued daily and paid monthly based on the Fund’s average daily net assets.
Under the Investment Advisory Agreement, the Adviser agrees to pay all expenses of the Trust, except (i) brokerage expenses and other expenses (such as stamp taxes) connected with the execution of portfolio transactions or in connection with creation and redemption transactions; (ii) legal fees or expenses in connection with any arbitration, litigation or pending or threatened arbitration or litigation, including any settlements in connection therewith; (iii) extraordinary expenses; (iv) distribution fees and expenses paid by the Trust under any distribution plan adopted pursuant to Rule12b-1 under the 1940 Act; and (v) the advisory fee payable to the Adviser under the Investment Advisory Agreement. The Adviser also does not pay any acquired fund fees and expenses. The payment or assumption by the Adviser of any expense of the Trust that the Adviser is not required by the Investment Advisory Agreement to pay or assume shall not obligate the Adviser to pay or assume the same or any similar expense of the Trust on any subsequent occasion.
| | b) | Distribution Plans – Each Fund has adopted a Rule12b-1 Distribution and Service Plan in accordance with Rule12b-1 under the 1940 Act pursuant to which payments of up to 0.25% of each Fund’s average daily net assets may be made for the sale and distribution of its Shares. The Board has determined that the Funds may not make payments under the Rule12b-1 Distribution and Service Plan until authorized to do |
|
| Hartford Multifactor ETFs |
Notes to Financial Statements – (continued)
September 30, 2019
| | so by affirmative action of the Board. No Rule12b-1 fees are currently paid by the Funds and there are no plans to impose these fees. However, in the event Rule12b-1 fees are charged in the future, they will be paid out of the respective Fund’s assets. |
For the year ended September 30, 2019, the Funds did not pay any Rule12b-1 fees.
| | c) | Other Related Party Transactions – Certain officers of the Trust are trustees and/or officers of HFMC and/or The Hartford or its subsidiaries. For the year ended September 30, 2019, the Trust’s Chief Compliance Officer’s (“CCO”) compensation was paid by HFMC. As part of the Trust’s Chief Compliance Officer Services Agreement, HFMC also pays any CCO compensation on behalf of the Funds. |
Each Fund may lend Fund securities to certain creditworthy borrowers in U.S. andnon-U.S. markets in an amount not to exceed one third (33 1/3 %) of the value of its total assets. The borrowers provide collateral that is marked to market daily, in an amount at least equal to the current market value of the securities loaned. A Fund may terminate a loan at any time and recall the securities loaned. A Fund receives the value of any interest or cash ornon-cash distributions paid on the loaned securities. A Fund cannot vote proxies for securities on loan, but may recall loans to vote proxies if a material issue affecting the Fund’s economic interest in the investment is to be voted upon. Interest earned on securities out on loan is not eligible for qualified interest income for federal tax purposes. Should the borrower of the securities fail financially, a Fund may experience delays in recovering the securities or exercising its rights in the collateral. Loans are made only to borrowers that are deemed by the securities lending agent to be of good financial standing. In a loan transaction, a Fund will also bear the risk of any decline in value of securities acquired with cash collateral received by the Fund. Each Fund will seek to minimize this risk by limiting the investment of cash collateral to high quality instruments of short maturity. This strategy is not used to leverage a Fund.
With respect to loans that are collateralized by cash, the borrower will be entitled to receive a fee based on the amount of cash collateral. A Fund is compensated by the difference between the amount earned on the reinvestment of cash collateral and the fee paid to the borrower. In the case of collateral other than cash, a Fund is compensated by a fee paid by the borrower equal to a percentage of the market value of the loaned securities. Any cash collateral may be reinvested in certain short-term instruments either directly on behalf of the lending Fund or through one or more joint accounts or money market funds, which may include those managed by the Adviser. Anynon-cash collateral received cannot be sold,re-invested or pledged by the Fund, except in the event of borrower default.
A Fund may pay a portion of the interest or fees earned from securities lending to a borrower as described above, and to one or more securities lending agents approved by the Board who administer the lending program for the Funds in accordance with guidelines approved by the Board. In such capacity, the lending agent causes the delivery of loaned securities from a Fund to borrowers, arranges for the return of loaned securities to the Fund at the termination of a loan, requests deposit of collateral, monitors the daily value of the loaned securities and collateral, requests that borrowers add to the collateral when required by the loan agreements, and provides recordkeeping and accounting services necessary for the operation of the program. State Street Bank and Trust Company (“State Street”) has been approved by the Board to serve as securities lending agent for the Funds and the Trust has entered into an agreement with State Street for such services. Among other matters, the Trust has agreed to indemnify State Street for certain liabilities. Any securities lending income earned by a Fund appears on the Statements of Operations net of any fees paid to State Street for serving as the securities lending agent.
Effective September 9, 2019, the agreement with State Street has been terminated.
Securities lending involves exposure to certain risks, including operational risk (i.e., the risk of losses resulting from problems in the settlement and accounting process – especially in certain international markets such as Taiwan), ‘‘gap’’ risk (i.e., the risk of a mismatch between the return on cash collateral reinvestments and the fees a Fund has agreed to pay a borrower), risk of loss of collateral, credit, legal, counterparty and market risk. Although State Street has agreed to provide a Fund with indemnification in the event of a borrower default, a Fund is still exposed to the risk of losses in the event a borrower does not return a Fund’s securities as agreed. For example, delays in recovery of securities loaned may cause a Fund to lose the opportunity to sell the securities at a desirable price.
At September 30, 2019, the Funds had no securities on loan or held any cash ornon-cash collateral.
| 9. | Custodian and Transfer Agent: |
State Street serves as Custodian for the Funds pursuant to a custodian agreement (“Custodian Agreement”) dated December 31, 2014, as amended November 21, 2017. As Custodian, State Street holds each Fund’s assets, calculates the net asset value of the Shares and calculates net income and realized capital gains or losses. State Street serves as Transfer Agent of each Fund pursuant to a transfer agency agreement (“Transfer Agency Agreement”) dated February 13, 2018. As Transfer Agent, State Street maintains the records of each Authorized Participant’s ownership of each Fund and processes the purchases and redemptions of Creation Units.
For the services provided under the Custodian Agreement and Transfer Agency Agreement, Lattice, and not the Funds, compensates State Street pursuant to the Funds’ unitary management fee structure.
|
| Hartford Multifactor ETFs |
Notes to Financial Statements – (continued)
September 30, 2019
| 10. | Investment Transactions: |
For the year ended September 30, 2019, the cost of purchases and proceeds from sales of investment securities (excluding short-term investments) were as follows:
| | | | | | | | |
Fund | | Total Cost of
Purchases | | | Total Sales
Proceeds | |
Multifactor Developed Markets(ex-US) ETF | | $ | 1,171,823,217 | | | $ | 1,107,050,082 | |
Multifactor Emerging Markets ETF | | | 63,156,108 | | | | 59,459,787 | |
Multifactor Global Small Cap ETF | | | 13,329,207 | | | | 10,730,627 | |
Multifactor Low Volatility International Equity ETF | | | 2,001,803 | | | | 1,997,044 | |
Multifactor Low Volatility US Equity ETF | | | 3,592,713 | | | | 4,252,413 | |
Multifactor REIT ETF | | | 12,158,394 | | | | 12,024,567 | |
Multifactor US Equity ETF | | | 193,019,910 | | | | 193,195,713 | |
For the year ended September 30, 2019,in-kind transactions, which are not included in the table above, associated with purchase or redemption of Creation Units were as follows:
| | | | | | | | | | | | |
Fund | | Cost of Purchases | | | Sales Proceeds | | | Realized
Gain/(Loss) | |
Multifactor Developed Markets(ex-US) ETF | | $ | 1,784,074,274 | | | $ | 311,823,424 | | | $ | 54,851,642 | |
Multifactor Emerging Markets ETF | | | 19,927,344 | | | | 14,642,979 | | | | 2,242,445 | |
Multifactor Global Small Cap ETF | | | 2,571,747 | | | | 8,150,504 | | | | 1,600,615 | |
Multifactor Low Volatility US Equity ETF | | | 4,277,898 | | | | 2,236,601 | | | | 502,412 | |
Multifactor REIT ETF | | | 7,707,448 | | | | 18,499,077 | | | | 1,722,458 | |
Multifactor US Equity ETF | | | 178,158,469 | | | | 43,689,149 | | | | 9,373,101 | |
Each Fund will issue and redeem Shares at NAV only with certain Authorized Participants in large increments known as ‘‘Creation Units.” Purchases of Creation Units are made by tendering a basket of designated securities to a Fund and redemption proceeds are paid with a basket of securities from the Fund with a balancing cash component to equate the market value of the basket securities delivered or redeemed to the NAV per Creation Unit on the transaction date. Cash may be substituted in an amount equivalent to the value of certain securities generally when they are not available in sufficient quantity for delivery. Each Fund’s Shares are available in smaller increments to individual investors in the secondary market at market prices and may be subject to commissions. Authorized Participants may be required to pay a transaction fee when purchasing and redeeming Creation Units of the Fund. The transaction fee is used to defray the costs associated with the issuance and redemption of Creation Units
Purchase or redemption of Creation Units is only available to an Authorized Participant. An Authorized Participant is either (1) a ‘‘Participating Party,’’ (i.e., a broker-dealer or other participant in the clearing process of the Continuous Net Settlement System of the NSCC) (‘‘Clearing Process’’), or (2) a participant of DTC (‘‘DTC Participant’’), and, in each case, must have executed an agreement (‘‘Participation Agreement’’) with the Distributor with respect to creations and redemptions of Creation Units.
If a Creation Unit is purchased or redeemed for cash or outside of the Clearing Process, a higher transaction fee may be charged. The following table discloses Creation Unit breakdown for each Fund:
| | | | | | | | | | | | | | | | |
Fund | | Standard
Creation
Unit Shares | | | Standard
In-Kind
Creation Fee | | | Value at
September 30,
2019 | | | Standard
In-Kind
Redemption
Fee | |
Multifactor Developed Markets(ex-US) ETF | | | 50,000 | | | $ | 3,000 | | | $ | 1,388,000 | | | $ | 3,000 | |
Multifactor Emerging Markets ETF | | | 100,000 | | | $ | 2,000 | | | | 2,220,000 | | | $ | 2,000 | |
Multifactor Global Small Cap ETF | | | 100,000 | | | $ | 2,000 | | | | 2,855,000 | | | $ | 2,000 | |
Multifactor Low Volatility International Equity ETF | | | 100,000 | | | $ | 2,200 | | | | 2,684,000 | | | $ | 2,200 | |
Multifactor Low Volatility US Equity ETF | | | 50,000 | | | $ | 650 | | | | 1,541,500 | | | $ | 650 | |
Multifactor REIT ETF | | | 100,000 | | | $ | 250 | | | | 1,636,000 | | | $ | 250 | |
Multifactor US Equity ETF | | | 50,000 | | | $ | 800 | | | | 1,610,000 | | | $ | 800 | |
Shares of Multifactor Developed Markets(ex-US) ETF, Multifactor Emerging Markets ETF, Multifactor Global Small Cap ETF, Multifactor REIT ETF and Multifactor US Equity ETF are listed on the NYSE Arca and shares of Multifactor Low Volatility International Equity ETF and Multifactor Low Volatility US Equity ETF are listed on the Cboe BZX. Shares of each Fund are publicly traded. Retail investors may purchase or sell shares in the secondary market (not from the Fund) through a broker or dealer. Investors purchasing or selling shares in the secondary market may pay a commission, market premium or discount or other transaction charge, to a broker or dealer, as well as some or all of the spread between the bid and the offered price for each purchase or sale transaction. Unless imposed by a broker or dealer, there is no minimum dollar amount upon purchase and no minimum number of shares that must be purchased in the secondary market. Because transactions in the secondary market occur at market prices, an investor may pay more than NAV upon purchase of shares and may receive less than a Fund’s NAV upon sale of shares.
|
| Hartford Multifactor ETFs |
Notes to Financial Statements – (continued)
September 30, 2019
Because each Fund is structured as an ETF, individual Shares may only be purchased and sold on a listing exchange through a broker-dealer. The price of Shares is based on market price, and because ETF shares trade at market prices rather than at NAV, Shares may trade at a price greater than NAV (a premium) or less than NAV (a discount). Multifactor Developed Markets(ex-US) ETF, Multifactor Low Volatility US Equity ETF and Multifactor US Equity ETF will only issue or redeem Creation Units of 50,000 shares to Authorized Participants who have entered into agreements with the Distributor. Multifactor Emerging Markets ETF, Multifactor Low Volatility International Equity ETF, Multifactor Global Small Cap ETF and Multifactor REIT ETF will only issue or redeem Creation Units of 100,000 shares to Authorized Participants who have entered into agreements with the Distributor. The Funds generally will issue or redeem Creation Units in return for a designated basket of securities (and an amount of cash) that the Fund specifies each day. The Funds do not impose any restrictions on the frequency of purchases and redemptions; however, the Funds reserve the right to reject or limit purchases at any time.
The following information is for the year ended September 30, 2019, and the year ended September 30, 2018:
| | | | | | | | | | | | | | | | |
| | | For the Year Ended
September 30, 2019 | | | For the Year Ended
September 30, 2018 | |
| | | Shares | | | Amount | | | Shares | | | Amount | |
| Multifactor Developed Markets(ex-US) ETF | | | | | | | | | | | | |
Shares Sold | | | 67,400,000 | | | $ | 1,846,730,495 | | | | 25,400,000 | | | $ | 738,684,038 | |
Shares Redeemed | | | (11,250,000 | ) | | | (313,561,980 | ) | | | (2,050,000 | ) | | | (59,138,041 | ) |
Other Capital | | | — | | | | — | | | | — | | | | 321 | |
| | | | | | | | | | | | | | | | |
Net Increase (Decrease) | | | 56,150,000 | | | | 1,533,168,515 | | | | 23,350,000 | | | | 679,546,318 | |
| | | | | | | | | | | | | | | | |
| | | | |
| Multifactor Emerging Markets ETF | | | | | | | | | | | | |
Shares Sold | | | 1,400,000 | | | $ | 33,068,894 | | | | 1,000,000 | | | $ | 25,448,866 | |
Shares Redeemed | | | (1,100,000 | ) | | | (24,270,963 | ) | | | (100,000 | ) | | | (2,229,949 | ) |
Other Capital | | | — | | | | 101,198 | | | | — | | | | 17,212 | |
| | | | | | | | | | | | | | | | |
Net Increase (Decrease) | | | 300,000 | | | | 8,899,129 | | | | 900,000 | | | | 23,236,129 | |
| | | | | | | | | | | | | | | | |
| | | | |
| Multifactor Global Small Cap ETF | | | | | | | | | | | | |
Shares Sold | | | 200,000 | | | $ | 5,860,452 | | | | 200,000 | | | $ | 6,275,566 | |
Shares Redeemed | | | (300,000 | ) | | | (8,794,812 | ) | | | (100,000 | ) | | | (3,128,922 | ) |
Other Capital | | | — | | | | 1,652 | | | | — | | | | 1,646 | |
| | | | | | | | | | | | | | | | |
Net Increase (Decrease) | | | (100,000 | ) | | | (2,932,708 | ) | | | 100,000 | | | | 3,148,290 | |
| | | | | | | | | | | | | | | | |
| Multifactor Low Volatility International Equity ETF | | | | | | | | | | | | |
Shares Sold | | | — | | | $ | — | | | | — | | | $ | — | |
Shares Redeemed | | | — | | | | — | | | | — | | | | — | |
Other Capital | | | — | | | | — | | | | — | | | | — | |
| | | | | | | | | | | | | | | | |
Net Increase (Decrease) | | | — | | | | — | | | | — | | | | — | |
| | | | | | | | | | | | | | | | |
| | | | |
| Multifactor Low Volatility US Equity ETF | | | | | | | | | | | | |
Shares Sold | | | 150,000 | | | $ | 4,275,263 | | | | 50,000 | | | $ | 1,329,697 | |
Shares Redeemed | | | (100,000 | ) | | | (2,971,711 | ) | | | — | | | | — | |
| | | | | | | | | | | | | | | | |
Net Increase (Decrease) | | | 50,000 | | | | 1,303,552 | | | | 50,000 | | | | 1,329,697 | |
| | | | | | | | | | | | | | | | |
| | | | |
| Multifactor REIT ETF | | | | | | | | | | | | |
Shares Sold | | | 500,000 | | | $ | 7,709,666 | | | | 1,800,000 | | | $ | 26,773,879 | |
Shares Redeemed | | | (1,200,000 | ) | | | (18,538,614 | ) | | | (600,000 | ) | | | (9,438,842 | ) |
| | | | | | | | | | | | | | | | |
Net Increase (Decrease) | | | (700,000 | ) | | | (10,828,948 | ) | | | 1,200,000 | | | | 17,335,037 | |
| | | | | | | | | | | | | | | | |
| | | | |
| Multifactor US Equity ETF | | | | | | | | | | | | |
Shares Sold | | | 5,900,000 | | | $ | 182,696,968 | | | | 4,450,000 | | | $ | 142,311,556 | |
Shares Redeemed | | | (1,600,000 | ) | | | (48,956,914 | ) | | | (400,000 | ) | | | (13,174,555 | ) |
| | | | | | | | | | | | | | | | |
Net Increase (Decrease) | | | 4,300,000 | | | | 133,740,054 | | | | 4,050,000 | | | | 129,137,001 | |
| | | | | | | | | | | | | | | | |
As of September 30, 2019, affiliates of The Hartford had ownership of shares in certain Funds as follows:
| | | | |
Fund | | Percentage
of Fund | |
Multifactor Low Volatility International Equity ETF | | | 40 | % |
Multifactor Low Volatility US Equity ETF | | | 56 | % |
Multifactor REIT ETF | | | 41 | % |
|
| Hartford Multifactor ETFs |
Notes to Financial Statements – (continued)
September 30, 2019
As of September 30, 2019, affiliated funds of funds in the aggregate owned a portion of the Funds identified below. Therefore, these Funds may experience relatively large purchases or redemptions of their shares as a result of purchase and sale activity from these affiliated funds of funds. Affiliated funds of funds owned shares in the Fund listed below as follows:
| | | | |
Fund | | Percentage
of Fund | |
Multifactor Developed Markets(ex-US) ETF | | | 3 | % |
Multifactor Emerging Markets ETF | | | 5 | % |
Multifactor US Equity ETF | | | 31 | % |
Under the Trust’s organizational documents, the Trust shall indemnify its officers and trustees to the full extent required or permitted under the applicable laws of the State of Delaware and federal securities laws. In addition, the Trust, on behalf of the Funds, may enter into contracts that contain a variety of indemnifications. The Trust’s maximum exposure under these arrangements is unknown. However, as of the date of these financial statements, the Trust has not had prior claims or losses pursuant to these contracts and expects the risk of loss to be remote.
| 14. | Recent Accounting Pronouncement: |
The FASB recently issued ASU2017-08 (the “ASU” or “Update”) to amend the amortization period to the earliest call date for purchased callable debt securities held at a premium. The ASU is effective for public entities for fiscal years beginning after December 15, 2018, and will become effective for private entities one year later. Management is currently evaluating the implication, if any, of additional disclosure and its impact on the Funds’ financial statements.
In August 2018, the FASB issued Accounting Standards Update2018-13, Fair Value Measurement (Topic 820): Disclosure Framework – Changes to the Disclosure Requirements for Fair Value Measurement (“ASU2018-13”). The update introduces new fair value disclosure requirements, eliminates some prior fair value disclosure requirements, and modifies certain existing fair value disclosure requirements.
ASU2018-13 is effective for fiscal years beginning after December 15, 2019 and for interim periods within those fiscal years, however, an entity is permitted to early adopt either the entire standard or only the provisions that eliminate or modify requirements. Management has elected to early adopt the provisions of ASU2018-13 that eliminate disclosure requirements effective with the current reporting period. The impact of each Fund’s early adoption of these provisions was limited to changes in the Fund’s financial statement disclosures regarding fair value, primarily those disclosures related to transfers between Level 1 and Level 2 of the fair value hierarchy and the timing of transfers between levels of the fair value hierarchy. Management is currently evaluating the potential impact of adopting the additional provisions of ASU2018-13.
In connection with the preparation of the financial statements of the Funds as of and for the period ended September 30, 2019, events and transactions subsequent to September 30, 2019, through the date the financial statements were issued have been evaluated by the Funds’ management for possible adjustment and/or disclosure.
Effective November 6, 2019, Hartford Multifactor Global Small Cap ETF changed its name (now known as Hartford Multifactor Small Cap ETF), principal investment strategy and benchmark. Also effective November 6, 2019, the management fee rate for Multifactor Global Small Cap ETF was reduced from 0.39% to 0.34%. The information in this report is as of September 30, 2019 and therefore, does not reflect any of these changes. For more information, please see the Fund’s most recent prospectus.
Effective November 6, 2019, Hartford Multifactor Low Volatility International Equity ETF changed its name (now known as Hartford Multifactor Diversified International ETF), principal investment strategy and benchmark. The information in this report is as of September 30, 2019 and therefore, does not reflect any of these changes. For more information, please see the Fund’s most recent prospectus.
Effective on or about October 1, 2019, Citibank, N.A. has been approved by the Board to serve as securities lending agent for the Funds and the Trust has entered into an agreement with Citibank, N.A. for such services.
|
| Report of Independent Registered Public Accounting Firm |
To the Shareholders and the Board of Trustees of
Lattice Strategies Trust
Opinion on the Financial Statements
We have audited the accompanying statements of assets and liabilities of Lattice Strategies Trust (the “Trust”) (comprising Hartford Multifactor Developed Markets(ex-US) ETF, Hartford Multifactor Emerging Markets ETF, Hartford Multifactor Global Small Cap ETF, Hartford Multifactor Low Volatility International Equity ETF, Hartford Multifactor Low Volatility US Equity ETF, Hartford Multifactor REIT ETF and Hartford Multifactor US Equity ETF) (collectively referred to as the “Funds”), including the schedules of investments, as of September 30, 2019, and the related statements of operations, changes in net assets, and the financial highlights for each of the periods indicated in the table below and the related notes (collectively referred to as the “financial statements”). In our opinion, the financial statements present fairly, in all material respects, the financial position of each of the Funds comprising Lattice Strategies Trust at September 30, 2019, the results of their operations, changes in net assets and financial highlights for each of the periods indicated in the table below, in conformity with U.S. generally accepted accounting principles.
| | | | | | |
Funds comprising
Lattice Strategies Trust | | Statement of operations | | Statements of changes in
net assets | | Financial highlights |
Hartford Multifactor Developed Markets(ex-US) ETF Hartford Multifactor Emerging Markets ETF Hartford Multifactor Global Small Cap ETF Hartford Multifactor US Equity ETF | | For the year ended September 30, 2019 | | For each of the two years in the period ended September 30, 2019 | | For each of the four years in the period ended September 30, 2019 |
| Hartford Multifactor REIT ETF | | For the year ended September 30, 2019 | | For each of the two years in the period ended September 30, 2019 | | For each of the two years in the period ended September 30, 2019 and the period from October 3, 2016 (commencement of operations) through September 30, 2017 |
Hartford Multifactor Low Volatility International Equity ETF Hartford Multifactor Low Volatility US Equity ETF | | For the year ended September 30, 2019 | | For each of the two years in the period ended September 30, 2019 | | For each of the two years in the period ended September 30, 2019 and the period from May 10, 2017 (commencement of operations) through September 30, 2017 |
The financial highlights of the Hartford Multifactor Developed Markets(ex-US) ETF, Hartford Multifactor Emerging Markets ETF, Hartford Multifactor Global Small Cap ETF and Hartford Multifactor US Equity ETF, for the period presented through September 30, 2015, were audited by other auditors whose report dated November 24, 2015, expressed an unqualified opinion on those financial highlights.
Basis for Opinion
These financial statements are the responsibility of the Trust’s management. Our responsibility is to express an opinion on each of the Funds’ financial statements based on our audits. We are a public accounting firm registered with the Public Company Accounting Oversight Board (United States) (“PCAOB”) and are required to be independent with respect to the Trust in accordance with the U.S. federal securities laws and the applicable rules and regulations of the Securities and Exchange Commission and the PCAOB.
We conducted our audits in accordance with the standards of the PCAOB. Those standards require that we plan and perform the audits to obtain reasonable assurance about whether the financial statements are free of material misstatement, whether due to error or fraud. The Trust is not required to have, nor were we engaged to perform, an audit of the Trust’s internal control over financial reporting. As part of our audits we are required to obtain an understanding of internal control over financial reporting but not for the purpose of expressing an opinion on the effectiveness of the Trust’s internal control over financial reporting. Accordingly, we express no such opinion.
Our audits included performing procedures to assess the risks of material misstatement of the financial statements, whether due to error or fraud, and performing procedures that respond to those risks. Such procedures included examining, on a test basis, evidence regarding the amounts and disclosures in the financial statements. Our procedures included confirmation of securities owned as of September 30, 2019, by correspondence with the custodian and others or by other appropriate auditing procedures where replies from others were not received. Our audits also included evaluating the accounting principles used and significant estimates made by management, as well as evaluating the overall presentation of the financial statements. We believe that our audits provide a reasonable basis for our opinion.

We have served as the auditor of one or more Hartford investment companies since 2002.
Philadelphia, Pennsylvania
November 26, 2019
|
| Hartford Multifactor ETFs |
Trustees and Officers of the Trust
Lattice Strategies Trust (the “Trust”) is governed by a Board of Trustees (the “Trustees”). The following tables present certain information regarding the Trustees and officers of the Trust as of September 30, 2019. For more information regarding the Trustees and officers, please refer to the Statement of Additional Information, which is available, without charge, upon request by calling1-800-456-7526.
| | | | | | | | | | |
NAME, YEAR OF BIRTH
AND ADDRESS(1) | | POSITION
HELD WITH
THE TRUST | | TERM OF
OFFICE(2) AND
LENGTH OF
TIME SERVED | | PRINCIPAL OCCUPATION(S)
DURING PAST 5 YEARS | | NUMBER OF
PORTFOLIOS
IN FUND
COMPLEX(3)
OVERSEEN
BY TRUSTEE | | OTHER DIRECTORSHIPS
FOR PUBLIC COMPANIES
AND OTHER REGISTERED
INVESTMENT COMPANIES
HELD BY TRUSTEE |
| NON-INTERESTED TRUSTEES |
| | | | | |
HILARY E. ACKERMANN (1956) | | Trustee | | Since 2017 | | Ms. Ackermann served as Chief Risk Officer at Goldman Sachs Bank USA from October 2008 to November 2011. Ms. Ackermann has served as a Director of Vistra Energy Corporation, formerly known as Dynegy, Inc. (an independent power company) since October 2012 and as a Director of Credit Suisse Holdings (USA), Inc. since January 2017. | | 81 | | Ms. Ackermann serves as a Director of Vistra Energy Corporation (October 2012 to present) and as a Director of Credit Suisse Holdings (USA), Inc. from January 2017 to present. |
| | | | | |
ROBIN C. BEERY (1967) | | Trustee | | Since 2014 | | Ms. Beery has served as a consultant to ArrowMark Partners (an alternative asset manager) since March of 2015 and since November 2018 has been employed by ArrowMark Partners as a Senior Advisor. Previously, she was Executive Vice President, Head of Distribution, for Janus Capital Group, and Chief Executive Officer and President of the Janus Mutual Funds (a global asset manager) from September 2009 to August 2014. | | 81 | | Ms. Beery serves as a Director of UMB Financial Corporation (January 2015 to present). |
| | | | | |
LYNN S. BIRDSONG(4) (1946) | | Trustee and Chairman of the Board | | Trustee since 2017; Chairman of the Board since August 2019 | | Mr. Birdsong currently serves as a Director of Aberdeen Global and Aberdeen Global II (investment funds) (since September 2014), Aberdeen Islamic SICAV and Aberdeen Liquidity Fund (investment funds) (since 2016), and Aberdeen Alpha Fund (since December 2017). Mr. Birdsong served as an Independent Director of Nomura Partners Funds, Inc. (formerly, The Japan Fund) (April 2003 to February 2015) and as a Director of the Sovereign High Yield Investment Company (April 2010 to June 2014). From 2003 to March 2005, Mr. Birdsong was an Independent Director of the Atlantic Whitehall Funds. From 1979 to 2002, Mr. Birdsong was a Managing Director of Zurich Scudder Investments, an investment management firm. During his employment with Scudder, Mr. Birdsong was an Interested Director of The Japan Fund. From January 1981 through December 2013, Mr. Birdsong was a partner in Birdsong Company, an advertising specialty firm. | | 81 | | None |
| | | | | |
CHRISTINE R. DETRICK (1958) | | Trustee | | Since 2017 | | Ms. Detrick has served as a Director of Reinsurance Group of America since January 2014. Previously, she was a director of Forest City Realty Trust (a real estate company) from November 2014 to March 2018, a Director of Forethought Financial Group, Inc. (a financial services company) from January 2012 to January 2014 and a Senior Partner/Advisor at Bain & Company (a management consulting firm) from September 2002 to December 2012. | | 81 | | Ms. Detrick serves as a Director of Reinsurance Group of America (January 2014 to present). |
| | | | | |
DUANE E. HILL (1945) | | Trustee | | Since 2017 | | Mr. Hill is a Partner of TSG Ventures L.P., a private equity investment company. Mr. Hill is a former partner of TSG Capital Group, a private equity investment firm that served as sponsor and lead investor in leveraged buyouts of middle market companies. | | 81 | | None |
|
| Hartford Multifactor ETFs |
Trustees and Officers of the Trust – (continued)
| | | | | | | | | | |
NAME, YEAR OF BIRTH
AND ADDRESS(1) | | POSITION
HELD WITH
THE TRUST | | TERM OF
OFFICE(2) AND
LENGTH OF
TIME SERVED | | PRINCIPAL OCCUPATION(S)
DURING PAST 5 YEARS | | NUMBER OF
PORTFOLIOS
IN FUND
COMPLEX(3)
OVERSEEN
BY TRUSTEE | | OTHER DIRECTORSHIPS
FOR PUBLIC COMPANIES
AND OTHER REGISTERED
INVESTMENT COMPANIES
HELD BY TRUSTEE |
| | | | | |
PHILLIP O. PETERSON(5) (1944) | | Trustee | | Since 2017 | | Mr. Peterson is a mutual fund industry consultant. He was a partner of KPMG LLP (an accounting firm) until July 1999. From February 2007 to February 2018, Mr. Peterson served as a member of the Board of Trustees of the William Blair Funds. From February 2012 to February 2014, Mr. Peterson served as a Trustee of Symetra Variable Mutual Funds. From January 2004 to April 2005, Mr. Peterson served as Independent President of the Strong Mutual Funds. | | 81 | | None |
| | | | | |
LEMMA W. SENBET (1946) | | Trustee | | Since 2017 | | Dr. Senbet currently serves as the William E. Mayer Chair Professor of Finance, and previously was the Founding Director, Center for Financial Policy, in the Robert H. Smith School of Business at the University of Maryland. He was chair of the Finance Department Robert H. Smith School of Business at the University of Maryland from 1998 to 2006. In June 2013, he began a sabbatical from the University to serve as Executive Director of the African Economic Research Consortium which focuses on economic policy research and training, which he completed in 2018. Previously, he was a chaired professor of finance at the University of Wisconsin-Madison. Also, he was a Director of the Fortis Funds from March 2000 to July 2002. Dr. Senbet served as Director of the American Finance Association and President of the Western Finance Association. In 2006, Dr. Senbet was inducted Fellow of Financial Management Association International for his career-long distinguished scholarship and professional service. | | 81 | | None |
| | | | | |
DAVID SUNG (1953) | | Trustee | | Since 2014 | | Mr. Sung has served as a Director of Nippon Wealth Bank since April 2015 and CITIC-Prudential Fund Management Company, Inc. since January 2016. Mr. Sung is an Independent Director of seven investment funds, including twoclosed-end registered investment companies, sponsored by Ironwood Capital Management. Previously, he was a Partner at Ernst & Young LLP from October 1995 to July 2014. | | 81 | | Mr. Sung serves as a Trustee of Ironwood Institutional Multi-Strategy Fund, LLC and Ironwood Multi-Strategy Fund, LLC (October 2015 to present) (2 portfolios). |
|
| OFFICERS AND INTERESTED TRUSTEES |
| | | | | |
JAMES E. DAVEY(6) (1964) | | Trustee, President and Chief Executive Officer | | Trustee since 2017; President and Chief Executive Officer since 2017 | | Mr. Davey serves as Executive Vice President of The Hartford Financial Services Group, Inc. Additionally, Mr. Davey serves as Chairman of the Board, Manager, and Senior Managing Director of Hartford Funds Distributors, LLC (“HFD”). He also currently serves as Director, Chairman of the Board, President and Senior Managing Director of Hartford Administrative Services Company (“HASCO”). Mr. Davey also serves as President, Manager, Chairman of the Board, and Senior Managing Director for Hartford Funds Management Company, LLC (“HFMC”), and Director, Chairman, President, and Senior Managing Director for Hartford Funds Management Group, Inc. (“HFMG”). Mr. Davey also serves as Manager, Chairman of the Board, and President of Lattice Strategies LLC (since July 2016). Mr. Davey has served in various positions within The Hartford and its subsidiaries in connection with the operation of the Hartford Funds. Mr. Davey joined The Hartford in 2002. | | 81 | | None |
|
| Hartford Multifactor ETFs |
Trustees and Officers of the Trust – (continued)
| | | | | | | | | | |
NAME, YEAR OF BIRTH
AND ADDRESS(1) | | POSITION
HELD WITH
THE TRUST | | TERM OF
OFFICE(2) AND
LENGTH OF
TIME SERVED | | PRINCIPAL OCCUPATION(S)
DURING PAST 5 YEARS | | NUMBER OF
PORTFOLIOS
IN FUND
COMPLEX(3)
OVERSEEN
BY TRUSTEE | | OTHER DIRECTORSHIPS
FOR PUBLIC COMPANIES
AND OTHER REGISTERED
INVESTMENT COMPANIES
HELD BY TRUSTEE |
| | | | | |
ANDREW S. DECKER (1963) | | AML Compliance Officer | | Since 2016 | | Mr. Decker serves as Chief Compliance Officer and AML Compliance Officer of HASCO (since April 2015) and Vice President of HASCO (since April 2018). Mr. Decker serves as AML Officer of HFD (since May 2015). Mr. Decker also serves as Vice President of HFMG (since April 2018). Prior to joining The Hartford, Mr. Decker served as Vice President and AML Officer at Janney Montgomery Scott (a broker dealer) from April 2011 to January 2015. Mr. Decker served as AML Compliance and Sanctions Enforcement Officer at SEI Investments from December 2007 to April 2011. | | N/A | | N/A |
| | | | | |
AMY N. FURLONG (1979) | | Vice President and Treasurer | | Since 2018 | | Ms. Furlong serves as Vice President and Assistant Treasurer of HFMC (since September 2019). Ms. Furlong has served in various positions within The Hartford and its subsidiaries in connection with the operation of the Hartford Funds. Ms. Furlong joined The Hartford in 2004. Prior to joining The Hartford, Ms. Furlong worked at KPMG LLP in audit services. | | N/A | | N/A |
| | | | | |
WALTER F. GARGER (1965) | | Vice President and Chief Legal Officer | | Since 2016 | | Mr. Garger serves as Secretary, Managing Director and General Counsel of HFD, HASCO, HFMC and HFMG (since 2013). Mr. Garger also serves as Secretary and General Counsel of Lattice Strategies LLC (since July 2016). Mr. Garger has served in various positions within The Hartford and its subsidiaries in connection with the operation of the Hartford Funds. Mr. Garger joined The Hartford in 1995. | | N/A | | N/A |
| | | | | |
ALBERT Y. LEE (1979) | | Vice President and Assistant Treasurer | | Since 2016 | | Mr. Lee serves as Head of Systemic Strategies and ETF Operations and Senior Vice President of HFMG (since July 2016). Mr. Lee also serves as Senior Vice President of Lattice Strategies LLC (since June 2017). Previously, Mr. Lee served as Managing Director and Chief Operating Officer, Lattice Strategies LLC (2009-2016); Chief Operating Officer at Avicenna Capital Management (2007-2009); and Chief Financial Officer at Steeple Capital LP (2005-2007). | | N/A | | N/A |
| | | | | |
THEODORE J. LUCAS (1966) | | Vice President | | Since 2017 | | Mr. Lucas serves as Executive Vice President of HFMG (since July 2016) and as Executive Vice President of Lattice Strategies LLC (since June 2017). Previously, Mr. Lucas served as Managing Partner of Lattice Strategies LLC (2003 to 2016). | | N/A | | N/A |
| | | | | |
JOSEPH G. MELCHER (1973) | | Chief Compliance Officer and Vice President | | Since 2017 | | Mr. Melcher serves as Executive Vice President of HFD (since December 2013) and has served as President (from April 2018 to June 2019) and Chief Executive Officer (from April 2018 to June 2019) of HFD. He also serves as Executive Vice President of HFMG and HASCO (since December 2013). Mr. Melcher also serves as Executive Vice President (since December 2013) and Chief Compliance Officer (since December 2012) of HFMC. Mr. Melcher also serves as Executive Vice President and Chief Compliance Officer of Lattice Strategies, LLC (since July 2016). Mr. Melcher has served in various positions within The Hartford and its subsidiaries in connection with the operation of the Hartford Funds since joining The Hartford in 2012. Prior to joining The Hartford, Mr. Melcher worked at Touchstone Investments, a member of the Western & Southern Financial Group, where he held the position of Vice President and Chief Compliance Officer from 2010 through 2012 and Assistant Vice President, Compliance from 2005 to 2010. | | N/A | | N/A |
|
| Hartford Multifactor ETFs |
Trustees and Officers of the Trust – (continued)
| | | | | | | | | | |
NAME, YEAR OF BIRTH
AND ADDRESS(1) | | POSITION
HELD WITH
THE TRUST | | TERM OF
OFFICE(2) AND
LENGTH OF
TIME SERVED | | PRINCIPAL OCCUPATION(S)
DURING PAST 5 YEARS | | NUMBER OF
PORTFOLIOS
IN FUND
COMPLEX(3)
OVERSEEN
BY TRUSTEE | | OTHER DIRECTORSHIPS
FOR PUBLIC COMPANIES
AND OTHER REGISTERED
INVESTMENT COMPANIES
HELD BY TRUSTEE |
| | | | | |
VERNON J. MEYER (1964) | | Vice President | | Since 2016 | | Mr. Meyer serves as Managing Director and Chief Investment Officer of HFMC and Managing Director of HFMG (since 2013). Mr. Meyer has served in various positions within The Hartford and its subsidiaries in connection with the operation of the Hartford Funds. Mr. Meyer joined The Hartford in 2004. | | N/A | | N/A |
| | | | | |
ALICE A. PELLEGRINO (1960) | | Vice President and Assistant Secretary | | Since 2016 | | Ms. Pellegrino serves as Vice President of HFMG (since December 2013). Ms. Pellegrino also serves as Vice President and Assistant Secretary of Lattice Strategies LLC (since June 2017). Ms. Pellegrino is a Senior Counsel and has served in various positions within The Hartford and its subsidiaries in connection with the operation of the Hartford Funds. Ms. Pellegrino joined The Hartford in 2007. | | N/A | | N/A |
| | | | | |
THOMAS R. PHILLIPS (1960) | | Vice President and Secretary | | Since 2017 | | Mr. Phillips currently serves as Vice President (since February 207) and Assistant Secretary (since June 2017) for HFMG. Mr. Phillips is Deputy General Counsel for HFMG. Prior to joining HFMG in 2017, Mr. Phillips was a Director and Chief Legal Officer of Saturna Capital Corporation from 2014–2016. Prior to that, Mr. Phillips was a Partner and Deputy General Counsel of Lord, Abbett & Co. LLC. | | N/A | | N/A |
| (1) | The address for each officer and Trustee is c/o Hartford Funds 690 Lee Road, Wayne, PA 19087. |
| (2) | Each Trustee holds an indefinite term until the earlier of (i) the election and qualification of his or her successor or (ii) when the Trustee turns 75 years of age. Each officer shall serve until his or her successor is elected and qualifies. |
| (3) | The portfolios of the “Fund Complex” are series of The Hartford Mutual Funds, Inc., The Hartford Mutual Funds II, Inc., Hartford Series Fund, Inc., Hartford HLS Series Fund II, Inc., Hartford Funds Master Fund, Lattice Strategies Trust, Hartford Funds Exchange-Traded Trust, Hartford Funds NextShares Trust, and Hartford Schroders Opportunistic Income Fund. |
| (4) | Effective August 7, 2019, Mr. Birdsong has been appointed as Chairman of the Board. |
| (5) | Effective December 5, 2019, Mr. Peterson will retire from the Board of Trustees. |
| (6) | “Interested person,” as defined in the 1940 Act, of the Trust because of the person’s affiliation with, or equity ownership of HFMC or affiliated companies. |
|
| Hartford Multifactor ETFs |
HOW TO OBTAIN A COPY OF EACH FUND’S PROXY VOTING POLICIES AND VOTING RECORDS (UNAUDITED)
A description of the policies and procedures that each Fund uses to determine how to vote proxies relating to portfolio securities and information about how each Fund voted proxies relating to portfolio securities during the most recent twelve-month period ended June 30, are available (1) without charge, upon request, by calling 800-456-7526 and (2) on the SEC’s website at http://www.sec.gov.
QUARTERLY PORTFOLIO HOLDINGS INFORMATION (UNAUDITED)
Each Fund will file its complete schedule of portfolio holdings with the SEC for the first and third quarters of each fiscal year as an exhibit to its reports onForm N-PORT. Each Fund’s Form N-PORT reports once filed will be available (1) without charge, upon request, by calling 800-456-7526 and (2) on the SEC’s website at http://www.sec.gov.
|
| Hartford Multifactor ETFs |
Approval of Investment Advisory and InvestmentSub-Advisory Agreements (Unaudited)
Lattice Strategies Trust
Hartford Multifactor Developed Markets(ex-US) ETF
Hartford Multifactor Emerging Markets ETF
Hartford Multifactor Global Small Cap ETF
Hartford Multifactor Low Volatility International Equity ETF
Hartford Multifactor Low Volatility US Equity ETF
Hartford Multifactor REIT ETF
Hartford Multifactor US Equity ETF
Section 15(c) of the Investment Company Act of 1940, as amended (the “1940 Act”), requires that each investment company’s board of trustees, including a majority of those trustees who are not “interested persons” of the investment company, as defined in the 1940 Act (the “Independent Trustees”), annually review and consider the continuation of the investment company’s investment advisory andsub-advisory agreements. At its meeting held onAugust 6-7, 2019, the Board of Trustees (the “Board”) of Lattice Strategies Trust (the “Trust”), including each of the Independent Trustees, unanimously voted to approve (i) the continuation of an investment advisory agreement (the “Investment Advisory Agreement”) by and between the Trust, on behalf of each of its funds listed above (each a “Fund” and collectively, the “Funds”) and Lattice Strategies LLC (“Lattice Strategies”), a wholly owned subsidiary of Hartford Funds Management Company, LLC; and (ii) a separate investmentsub-advisory agreement (the“Sub-Advisory Agreement” and collectively with the Investment Advisory Agreement, the “Agreements”) between Lattice Strategies and the Funds’sub-adviser, Mellon Investments Corporation (the“Sub-adviser,” and together with Lattice Strategies, the “Advisers”).
In the months preceding theAugust 6-7, 2019 meeting, the Board requested and reviewed written responses from the Advisers to questions posed to the Advisers on behalf of the Independent Trustees and supporting materials relating to those questions and responses. In addition, the Board considered such additional information as it deemed reasonably necessary to evaluate the Agreements, as applicable, with respect to each Fund, which included information furnished to the Board at its meetings throughout the year, as well as information specifically prepared in connection with the approval of the Agreements that was presented at the Board’s meetings held on June 18, 2019 and August6-7, 2019. Information provided to the Board at its meetings throughout the year included, among other things, reports on Fund performance, including tracking difference, legal, compliance and risk management matters, sales and marketing activity, and the other services provided to each Fund by the Advisers and their affiliates. The Board also considered the materials andin-person presentations by Fund officers and representatives of Lattice Strategies received at the Board’s meetings on June 18, 2019 andAugust 6-7, 2019 concerning the Agreements.
The Independent Trustees, advised by independent legal counsel throughout the evaluation process, engaged service providers to assist them with evaluating the Agreements with respect to each Fund, as applicable. Broadridge Financial Solutions, Inc. (“Broadridge”), an independent provider of investment company data, was retained to provide the Board with reports on how each Fund’s contractual advisory fees and overall expense ratio compared to those of comparable investment companies with similar investment objectives. The Independent Trustees also engaged an independent financial services consultant (the “Consultant”) to assist them in evaluating the Funds’ respective advisory fees, overall expense ratios and investment performance. In addition, the Consultant reviewed the profitability methodologies used by Lattice Strategies in connection with the continuation of the Investment Advisory Agreement.
In determining whether to continue the Agreements for a Fund, the members of the Board reviewed and evaluated information and factors they believed to be relevant and appropriate through the exercise of their reasonable business judgment. While individual members of the Board may have weighed certain factors differently, the Board’s determination to continue the Agreements was based on a comprehensive consideration of all information provided to the Board throughout the year and specifically with respect to the continuation of the Agreements. The Board was also furnished with an analysis of its fiduciary obligations in connection with its evaluation of the Agreements and, throughout the evaluation process, the Board was assisted by counsel for the Funds. The Independent Trustees were also separately assisted by independent legal counsel. A more detailed summary of the important, but not necessarily all, factors the Board considered with respect to its approval of the Agreements is provided below.
Nature, Extent and Quality of Services Provided by the Advisers
The Board requested and considered information concerning the nature, extent and quality of the services provided to each Fund by the Advisers. The Board considered, among other things, the terms of the Agreements and the range of services provided by the Advisers. The Board considered the Advisers’ professional personnel who provide services to the Funds, including each Adviser’s ability and experience in attracting and retaining qualified personnel to service the Funds. The Board considered each Adviser’s reputation and overall financial strength, as well as its willingness to consider and implement organizational and operational changes designed to enhance services to the Funds. In addition, the Board considered the quality of each Adviser’s communications with the Board and responsiveness to Board inquiries and requests made from time to time with respect to the Funds.
The Board also requested and evaluated information concerning each Adviser’s regulatory and compliance environment. In this regard, the Board requested and reviewed information about each Adviser’s compliance policies and procedures, compliance history, and a report from the Funds’ Chief Compliance Officer about each Adviser’s compliance with applicable laws and regulations, including responses to regulatory developments and any compliance issues raised by regulators. The Board also noted the Advisers’ support of the Funds’ compliance control structure, as applicable, and, in particular, the resources devoted by the Advisers in support of the Funds’ obligations pursuant toRule 38a-1 under the 1940 Act and the Funds’ liquidity risk management program, as well as the efforts of the Advisers to combat cybersecurity risks and invest in business continuity planning.
|
| Hartford Multifactor ETFs |
Approval of Investment Advisory and InvestmentSub-Advisory Agreements (Unaudited) – (continued)
With respect to Lattice Strategies, the Board noted that, under the Investment Advisory Agreement, Lattice Strategies is responsible for the management of the Funds, including oversight of fund operations and service providers, and the provision of administrative and investment advisory services in connection with selecting, monitoring and supervising theSub-adviser. In this regard, the Board evaluated information about the nature and extent of responsibilities retained and risks assumed by Lattice Strategies that were not delegated to or assumed by theSub-adviser. The Board considered that Lattice Strategies is responsible for the creation, maintenance and ongoing monitoring of each Fund’s custom proprietary benchmark index. The Board considered Lattice Strategies’ ongoing monitoring of people, process and performance and oversight of the Funds’ portfolio managers. The Board considered Lattice Strategies’ periodic due diligence reviews of theSub-adviser and ongoing oversight of theSub-adviser’s investment approach and results, process for monitoring best execution of portfolio trades and other trading operations by theSub-adviser, and approach to risk management with respect to the Funds and the service providers to the Funds. The Board considered Lattice Strategies’ oversight of the Funds’ securities lending program and noted the income earned by the Funds in connection with their participation in the program. The Board also considered Lattice Strategies’day-to-day oversight of each Fund’s compliance with its investment objective and policies as well as with applicable laws and regulations.
The Board considered that Lattice Strategies or its affiliates are responsible for providing the Funds’ officers. The Board also considered the entrepreneurial and other risks assumed by Lattice Strategies in connection with sponsoring and providing ongoing services to each Fund.
With respect to theSub-adviser, which is responsible for the daily investment of the Funds’ assets, subject to oversight by Lattice Strategies, the Board considered, among other things, the quality of each Fund’s portfolio managers, theSub-adviser’s other investment personnel, its investment process, its investment research capabilities and resources, its performance record, its trade execution capabilities and its experience. The Board considered the experience of each Fund’s portfolio managers, the number of accounts managed by the portfolio managers, and theSub-adviser’s method for compensating the portfolio managers.
Based on these considerations, the Board concluded that it was satisfied with the nature, extent and quality of the services provided to each Fund by Lattice Strategies and theSub-adviser.
Performance of each Fund and the Advisers
The Board considered the investment performance of each Fund. In this regard, the Board reviewed the performance of each Fund over different time periods presented in the materials and evaluated Lattice Strategies’ analysis of the Fund’s performance for these time periods. The Board considered information and materials provided to the Board by the Advisers concerning Fund performance, including information comparing each Fund’s investment performance to the performance of its custom proprietary benchmark index. For details regarding each Fund’s performance, see theFund-by-Fund synopsis below.
The Board considered the detailed investment analytics reports provided by each Adviser throughout the year, including in connection with the approval of the Agreements. These reports include, among other things, information on each Fund’s gross returns and net returns, each Fund’s tracking difference as it relates to tracking the performance of its custom proprietary benchmark index, various statistics concerning the Fund’s portfolio, and a narrative summary of various factors affecting Fund performance. In reviewing the tracking difference reports, the Board considered Lattice Strategies’ assessment of each Fund’s tracking difference, including information comparing each Fund’s tracking difference to a general tracking difference range established for the Fund over various periods, Lattice Strategies’ views regarding the appropriateness of the general tracking difference ranges and explanations of the factors contributing to any tracking difference. For details regarding each Fund’s tracking difference, see theFund-by-Fund synopsis below. The Board considered the Advisers’ work with the Investment Committee, which assists the Board in evaluating the performance of each Fund at periodic meetings throughout the year and specifically with respect to the approval of the Agreements. The Board also considered the analysis provided by the Consultant relating to each Fund’s performance track record.
While the Board primarily evaluated each Fund’s performance by reviewing the Fund’s tracking difference relative to its custom proprietary benchmark index, the Board also considered Lattice Strategies’ assessment of the quality of each Fund’s custom proprietary benchmark index and whether each such index was continuing to function as intended. The Board reviewed the performance of each Fund and its custom proprietary benchmark index relative to an unaffiliated broad-based securities market index and found such comparisons to be useful in evaluating the quality of the Fund’s custom proprietary benchmark index. The Board also considered that Lattice Strategies believes that each Fund’s custom proprietary benchmark index was continuing to function as intended.
In light of all the considerations noted above, the Board concluded that it had continued confidence in Lattice Strategies’ and theSub-adviser’s overall capabilities to manage the Funds.
Costs of the Services and Profitability of the Advisers
The Board reviewed information regarding Lattice Strategies’ cost to provide investment management and related services to each Fund and Lattice Strategies’ estimated profitability, both overall and for each Fund, on apre-tax basis without regard to distribution expenses. The Board also requested and received information relating to the operations and profitability of theSub-adviser. The Board considered representations from Lattice Strategies and theSub-adviser that theSub-adviser’s fees were negotiated at arm’s length and that thesub-advisory fees are paid by Lattice Strategies and not the Funds. Accordingly, the Board concluded that the profitability of theSub-adviser is a less relevant factor with respect to the Board’s consideration of theSub-Advisory Agreement.
|
| Hartford Multifactor ETFs |
Approval of Investment Advisory and InvestmentSub-Advisory Agreements (Unaudited) – (continued)
The Board considered the Consultant’s review of the methodologies and estimates used by Lattice Strategies in calculating profitability in connection with the continuation of the Investment Advisory Agreement, including a description of the methodology used to allocate certain expenses. The Board noted the Consultant’s view that Lattice Strategies’ process for calculating and reporting Fund profitability is reasonable and consistent with the process previously reviewed by the Consultant. In this regard, the Board noted that the Consultant had previously performed a full review of this process and reported that such process is sound and consistent with common industry practice.
Based on these considerations, the Board concluded that the profits anticipated to be realized by the Advisers from their relationships with the Funds would not be excessive.
Comparison of Fees and Services Provided by the Advisers
The Board considered the comparative information that had been provided at meetings on June 18, 2019 and August6-7, 2019 with respect to the services rendered to and the management fees to be paid by each Fund to Lattice Strategies and the total expense ratio of the Fund. The Board considered that Lattice Strategies would pay all expenses of the Trust, except for (i) brokerage expenses and other expenses (such as stamp taxes) connected with the execution of portfolio transactions or in connection with creation and redemption transactions; (ii) legal fees or expenses in connection with any arbitration, litigation or pending or threatened arbitration or litigation, including any settlements in connection therewith; (iii) extraordinary expenses; (iv) any distribution fees and expenses paid by the Trust under any distribution plan adopted pursuant to Rule12b-1 under the 1940 Act; and (v) the advisory fee payable to Lattice Strategies. The Board also considered comparative information with respect to thesub-advisory fees to be paid by Lattice Strategies to theSub-adviser with respect to each Fund. In this regard, the Board requested and reviewed information from Lattice Strategies and theSub-adviser relating to the management andsub-advisory fees, including thesub-advisory fee schedule, and total operating expenses for each Fund. The Board also reviewed information from Broadridge comparing each Fund’s contractual management fees and overall expense ratio relative to an appropriate group of funds selected by Broadridge (“Peer Group”). For details regarding each Fund’s expenses, see theFund-by-Fund synopsis below.
The Board considered the methodology used by Broadridge to select the applicable Peer Groups. While the Board recognized that comparisons between a Fund and its Peer Group may be imprecise given the different service levels and characteristics of the investment companies and the different business models and cost structures of the Advisers, the comparative information provided by Broadridge assisted the Board in evaluating the reasonableness of each Fund’s fees and total operating expenses. In addition, the Board considered the analysis and recommendations of the Consultant relating to each Fund’s fees and total operating expenses.
The Board received information regarding fees charged by Lattice Strategies to other clients that are mutual funds with investment strategies similar to those of Hartford Multifactor Developed Markets(ex-US) ETF and Hartford Multifactor US Equity ETF. The Board reviewed information about structural, operational and other differences between the Hartford Multifactor Developed Markets(ex-US) ETF and Hartford Multifactor US Equity ETF and the other mutual fund clients, including differences in the services provided by Lattice Strategies to each type of product and differences in the marketplace in which each type of product must compete.
Based on these considerations, the Board concluded that each Fund’s fees and total operating expenses, in conjunction with the information about quality of services, profitability, economies of scale, and other matters discussed, were reasonable in light of the services provided.
Economies of Scale
The Board considered information regarding the extent to which economies of scale may be realized as a Fund grows and whether fee levels reflect these economies of scale for the benefit of shareholders of the Fund. The Board also considered that any economies of scale in respect of the management of a Fund would benefit Lattice Strategies due to the unitary fee structure of the Fund. The Board considered that each Fund could share in the benefits from economies of scale as assets in the Fund grow. The Board noted that the Funds do not have management fee breakpoints. However, the Board considered that Lattice Strategies shares potential economies of scale with shareholders in a variety of ways, including through initially setting competitive fee rates and pricing each Fund to scale at inception, as well as additional investments in Lattice Strategies’ business and the provision of improved or additional infrastructure and services to the Funds and their shareholders. The Board also noted that, for each of the Hartford Multifactor Global Small Cap ETF, Hartford Multifactor Emerging Markets ETF and Hartford Multifactor REIT ETF, the Fund’s current low asset levels means that the Fund has achieved limited, if any, economies of scale.
The Board also considered how any benefits from economies of scale would be realized by the various parties. Based on these considerations, the Board concluded that it was satisfied with the extent to which economies of scale would be shared for the benefit of each Fund’s shareholders. The Board noted, however, that it would review future growth in each Fund’s assets and the appropriateness of any potential future management fee breakpoints as part of its future annual review of the Agreements.
Other Benefits
The Board considered other benefits to the Advisers and their affiliates from their relationships with the Funds.
|
| Hartford Multifactor ETFs |
Approval of Investment Advisory and InvestmentSub-Advisory Agreements (Unaudited) – (continued)
Fund-by-Fund factors
Solely for purposes of theFund-by-Fund discussion below, the Board noted that Fund performance is referred to as “in line with” a Fund’s custom proprietary benchmark index where the Fund’s tracking difference relative to its custom proprietary benchmark index was within a range previously established by the Board.
Hartford Multifactor Developed Markets(ex-US) ETF
| • | | The Board noted that the Fund exceeded its tracking difference threshold for the1-year period but was in line with its custom proprietary benchmark index for the3-year period. The Board noted that the Fund seeks to provide investment results that, before fees and expenses, correspond to the total return performance of its custom proprietary benchmark index. The Board considered the causes of the tracking difference for the Fund, noting that the Fund outperformed its custom proprietary index on a gross of fees basis. |
| • | | The Board noted that the Fund’s contractual management fee, actual management fee and total expenses were in the 1st quintile of its expense group. |
Hartford Multifactor Emerging Markets ETF
| • | | The Board noted that the Fund’s performance was in line with its custom proprietary benchmark index for the1- and3-year periods, noting that the Fund seeks to provide investment results that, before fees and expenses, correspond to the total return performance of its custom proprietary benchmark index. The Board also noted that the Fund will replace its custom proprietary benchmark index with a new custom proprietary benchmark index and considered that certain changes will be made to the Fund’s principal investment strategy. |
| • | | The Board noted that the Fund’s contractual management fee was in the 2nd quintile of its expense group, while its actual management fee was in the 4th quintile and its total expenses were in the 3rd quintile. In considering the Fund’s expenses, the Board noted the shareholder savings expected to result from a permanent fee reduction, which will be implemented on September 11, 2019. |
Hartford Multifactor Global Small Cap ETF
| • | | The Board noted that the Fund’s performance was in line with its custom proprietary benchmark index for the1- and3-year periods, noting that the Fund seeks to provide investment results that, before fees and expenses, correspond to the total return performance of its custom proprietary benchmark index. The Board also noted that the Fund will replace its custom proprietary benchmark index with a new custom proprietary benchmark index and considered that certain changes will be made to the Fund’s principal investment strategy. |
| • | | The Board noted that the Fund’s contractual management fee and total expenses were in the 2nd quintile of its expense group, while its actual management fee was in the 3rd quintile. In considering the Fund’s expenses, the Board noted the shareholder savings expected to result from a permanent fee reduction, which will be implemented on November 6, 2019. The Board considered that the Fund’s expense group would change as a result of the upcoming changes to the Fund’s principal investment strategy and noted that the Fund’s revised contractual management fee and its expected total expenses and actual management fee are expected to be in the 2nd quintile of its new expense group. |
Hartford Multifactor Low Volatility International Equity ETF
| • | | The Board noted that the Fund exceeded its tracking difference threshold for the1-year period but was in line with its custom proprietary benchmark index since the Fund’s inception. The Board noted that the Fund seeks to provide investment results that, before fees and expenses, correspond to the total return performance of its custom proprietary benchmark index. The Board considered the causes of the tracking difference for the Fund, noting that the Fund outperformed its custom proprietary index on a gross of fees basis. The Board also noted that the Fund will replace its custom proprietary benchmark index with a new custom proprietary benchmark index and considered that certain changes will be made to the Fund’s principal investment strategy. |
| • | | The Board noted that the Fund’s contractual management fee and total expenses were in the 1st quintile of its expense group, while its actual management fee was in the 2nd quintile. |
Hartford Multifactor Low Volatility US Equity ETF
| • | | The Board noted that the Fund’s performance was in line with its custom proprietary benchmark index for the1-year period, noting that the Fund seeks to provide investment results that, before fees and expenses, correspond to the total return performance of its custom proprietary benchmark index. |
| • | | The Board noted that the Fund’s contractual management fee, actual management fee and total expenses were in the 2nd quintile of its expense group. |
|
| Hartford Multifactor ETFs |
Approval of Investment Advisory and InvestmentSub-Advisory Agreements (Unaudited) – (continued)
Hartford Multifactor REIT ETF
| • | | The Board noted that the Fund’s performance was in line with its custom proprietary benchmark index for the1-year period, noting that the Fund seeks to provide investment results that, before fees and expenses, correspond to the total return performance of its custom proprietary benchmark index. |
| • | | The Board noted that the Fund’s contractual management fee and total expenses were ranked 2nd out of four in its expense group, while its actual management fee was ranked 3rd out of four in its expense group. |
Hartford Multifactor US Equity ETF
| • | | The Board noted that the Fund’s performance was in line with its custom proprietary benchmark index for the1- and3-year periods, noting that the Fund seeks to provide investment results that, before fees and expenses, correspond to the total return performance of its custom proprietary benchmark index. The Board also noted that the Fund will replace its custom proprietary benchmark index with a new custom proprietary benchmark index and considered that certain changes will be made to the Fund’s principal investment strategy. |
| • | | The Board noted that the Fund’s contractual management fee, actual management fee and total expenses were in the 1st quintile of its expense group. |
* * * *
Based upon its review of these various factors, among others, the Board concluded that it is in the best interests of each Fund for the Board to continue the Agreements for an additional year. In reaching this decision, the Board did not assign relative weights to the factors discussed above or deem any one or group of them to be controlling in and of themselves. In connection with their deliberations, the Independent Trustees met separately in executive session on several occasions, with independent legal counsel and the Consultant, to review the relevant materials and consider their responsibilities under relevant laws and regulations.
THIS PRIVACY POLICY IS NOT PART OF THIS REPORT
CUSTOMER PRIVACY NOTICE
The Hartford Financial Services Group, Inc. and Affiliates*
(herein called “we, our, and us”)
This Privacy Policy applies to our United States Operations
We value your trust. We are committed to the responsible:
a) management;
b) use; and
c) protection;
ofPersonal Information.
This notice describes how we collect, disclose, and protectPersonal Information.
We collectPersonal Information to:
a) service yourTransactionswith us; and
b) support our business functions.
We may obtainPersonal Information from:
a)You;
b) yourTransactionswith us; and
c) third parties such as a consumer-reporting agency.
Based on the type of product or serviceYou apply for or get from us,Personal Information such as:
a) your name;
b) your address;
c) your income;
d) your payment; or
e) your credit history;
may be gathered from sources such as applications,Transactions, and consumer reports.
To serveYou and service our business, we may share certainPersonal Information. We will sharePersonal Information, only as allowed by law, with affiliates such as:
a) our insurance companies;
b) our employee agents;
c) our brokerage firms; and
d) our administrators.
As allowed by law, we may sharePersonal Financial Information with our affiliates to:
a) market our products; or
b) market our services;
toYou without providingYou with an option to prevent these disclosures.
We may also sharePersonal Information, only as allowed by law, with unaffiliated third parties including:
a) independent agents;
b) brokerage firms;
c) insurance companies;
d) administrators; and
e) service providers;
who help us serveYou and service our business.
When allowed by law, we may share certainPersonal Financial Information with other unaffiliated third parties who assist us by performing services or functions such as:
a) taking surveys;
b) marketing our products or services; or
c) offering financial products or services under a joint agreement between us and one or more financial institutions.
We, and third parties we partner with, may track some of the pagesYou visit through the use of:
a) cookies;
b) pixel tagging; or
c) other technologies;
and currently do not process or comply with any web browser’s “do not track” signal or other similar mechanism that indicates a request to disable online tracking of individual users who visit our websites or use our services.
For more information, our Online Privacy Policy, which governs information we collect on our website and our affiliate websites, is available at https://www.thehartford.com/online-privacy-policy.
We will not sell or share yourPersonal Financial Information with anyone for purposes unrelated to our business functions without offeringYou the opportunity to:
a)“opt-out;” or
b)“opt-in;”
as required by law.
We only disclosePersonal Health Information with:
a) your authorization; or
b) as otherwise allowed or required by law.
Our employees have access toPersonal Information in the course of doing their jobs, such as:
a) underwriting policies;
b) paying claims;
c) developing new products; or
d) advising customers of our products and services.
We use manual and electronic security procedures to maintain:
a) the confidentiality; and
b) the integrity of;
Personal Information that we have. We use these procedures to guard against unauthorized access.
Some techniques we use to protectPersonal Information include:
a) secured files;
b) user authentication;
c) encryption;
d) firewall technology; and
e) the use of detection software.
We are responsible for and must:
a) identify information to be protected;
b) provide an adequate level of protection for that data; and
c) grant access to protected data only to those people who must use it in the performance of theirjob-related duties.
Employees who violate our privacy policies and procedures may be subject to discipline, which may include termination of their employment with us.
We will continue to follow our Privacy Policy regardingPersonal Information even when a business relationship no longer exists between us.
As used in this Privacy Notice:
Application means your request for our product or service.
Personal Financial Information means financial information such as:
a) credit history;
b) income;
c) financial benefits; or
d) policy or claim information.
Personal Financial Informationmay include Social Security Numbers, Driver’s license numbers, or other government-issued identification numbers, or credit, debit card, or bank account numbers.
Personal Health Information means health information such as:
a) your medical records; or
b) information about your illness, disability or injury.
Personal Information means information that identifiesYou personally and is not otherwise available to the public. It includes:
a)Personal Financial Information; and
b)Personal Health Information.
Transaction means your business dealings with us, such as:
a) yourApplication;
b) your request for us to pay a claim; and
c) your request for us to take an action on your account.
You means an individual who has given usPersonal Information in conjunction with:
a) asking about;
b) applying for; or
c) obtaining;
a financial product or service from us if the product or service is used mainly for personal, family, or household purposes.
If you have any questions or comments about this privacy notice, please feel free to contact us at The Hartford – Law Department, Privacy Law, One Hartford Plaza, Hartford, CT 06155, or at CorporatePrivacyOffice@thehartford.com.
This Customer Privacy Notice is being provided on behalf of The Hartford Financial Services Group, Inc. and its affiliates (including the following as of March 2019), to the extent required by the Gramm-Leach-Bliley Act and implementing regulations.
1stAGChoice, Inc.; Access CoverageCorp, Inc.; Access CoverageCorp Technologies, Inc.; Business Management Group, Inc.; Cervus Claim Solutions, LLC; First State Insurance Company; FTC Resolution Company LLC; Hart Re Group L.L.C.; Hartford Accident and Indemnity Company; Hartford Administrative Services Company; Hartford Casualty General Agency, Inc.; Hartford Casualty Insurance Company; Hartford Fire General Agency, Inc.; Hartford Fire Insurance Company; Hartford Funds Distributors, LLC; Hartford Funds Management Company, LLC; Hartford Funds Management Group, Inc.; Hartford Group Benefits Holding Company; Hartford Holdings, Inc.; Hartford Insurance Company of Illinois; Hartford Insurance Company of the Midwest; Hartford Insurance Company of the Southeast; Hartford Insurance, Ltd.; Hartford Integrated Technologies, Inc.; Hartford Investment Management Company; Hartford Life and Accident Insurance Company; Hartford Life, Ltd.; Hartford Lloyd’s Corporation; Hartford Lloyd’s Insurance Company; Hartford Management, Ltd.; Hartford of Texas General Agency, Inc.; Hartford Residual Market, L.C.C.; Hartford Specialty Insurance Services of Texas, LLC; Hartford STAG Ventures LLC; Hartford Strategic Investments, LLC; Hartford Underwriters General Agency, Inc.; Hartford Underwriters Insurance Company; Heritage Holdings, Inc.; Heritage Reinsurance Company, Ltd.; HIMCO Distribution Services Company; HLA LLC; HL Investment Advisors, LLC; Horizon Management Group, LLC; HRA Brokerage Services, Inc.; Lattice Strategies LLC; Maxum Casualty Insurance Company; Maxum Indemnity Company; Maxum Specialty Services Corporation; MPC Resolution Company LLC; New England Insurance Company; New England Reinsurance Corporation; New Ocean Insurance Co., Ltd.; Nutmeg Insurance Agency, Inc.; Nutmeg Insurance Company; Pacific Insurance Company, Limited; Property and Casualty Insurance Company of Hartford; Renato Acquisition Co.; Sentinel Insurance Company, Ltd; Trumbull Flood Management, L.L.C.; Trumbull Insurance Company; Twin City Fire Insurance Company;Y-Risk, LLC.
Revised March 2019
This report is submitted for the general information of the shareholders of the Funds referenced in this report. It is not authorized for distribution to persons who are not shareholders of one or more Funds referenced in this report unless preceded or accompanied by a current prospectus for the relevant Funds. Nothing herein contained is to be considered an offer of sale or a solicitation of an offer to buy shares of any Fund listed in this report. Such offering is only made by prospectus, which includes details as to the offering price and other material information.
The information cannot be used or relied upon for the purpose of avoiding IRS penalties. These materials are not intended to provide tax, accounting or legal advice. As with all matters of a tax or legal nature, you should consult your own tax or legal counsel for advice.
Investors should carefully consider a fund’s investment objectives, risks, charges and expenses. This and other important information is contained in the fund’s prospectus and summary prospectus, which can be obtained by visiting hartfordfunds.com. Please read it carefully before investing.
Exchange-traded products are distributed by ALPS Distributors, Inc. (ALPS). Advisory services are provided by Lattice Strategies, LLC (Lattice) and Mellon Investments Corporation. Hartford Funds refers to Hartford Funds Distributors, LLC, Member FINRA, Hartford Funds Management Company, LLC, and Lattice, which are not affiliated with ALPS.
ETFAR-MLT19 11/19 213583 LAT001595_11/2020 Printed in U.S.A.

Item 2. Code of Ethics.
| | (a) | The registrant, as of the end of the period covered by this report, has adopted a code of ethics that applies to the registrant’s principal executive officer, principal financial officer, principal accounting officer or controller, or persons performing similar functions, regardless of whether these individuals are employed by the registrant or a third party. |
| | (c) | There have been no amendments to the Registrant’s Code of Ethics during the reporting period for this FormN-CSR. |
| | (d) | The registrant has not granted any waivers, including an implicit waiver, from a provision of the code of ethics that applies to the registrant’s principal executive officer, principal financial officer, principal accounting officer or controller, or persons performing similar functions, regardless of whether these individuals are employed by the registrant or a third party, that relates to one or more of the items set forth in paragraph (b) of this item’s instructions. |
| | (f) | A copy of the code of ethics is filed herewith. |
Item 3. Audit Committee Financial Expert.
The Board of Trustees of the Registrant (the “Board”) has designated David Sung as an Audit Committee Financial Expert. Mr. Sung is considered by the Board to be an independent trustee.
Item 4. Principal Accountant Fees and Services.
| | (a) | Audit Fees: The aggregate fees billed in each of the last two fiscal years for professional services rendered by the principal accountant for the audit of the registrant’s annual financial statements or services that are normally provided by the accountant in connection with statutory and regulatory filings or engagements for those fiscal years were: |
$112,000 for the fiscal year ended September 30, 2018; $112,000 for the fiscal year ended September 30, 2019.
| | (b) | Audit Related Fees: The aggregate fees billed in each of the last two fiscal years for assurance and related services by the principal accountant that are reasonably |
| | related to the performance of the audit of the registrant’s financial statements and are not reported under paragraph (a) of this Item were: |
$0 for the fiscal year ended September 30, 2018; $0 for the fiscal year ended September 30, 2019. Audit-related services principally in connection with Rule17Ad-13 under the Securities Exchange Act of 1934.
| | (c) | Tax Fees: The aggregate fees billed in each of the last two fiscal years for professional services rendered by the principal accountant for tax compliance, tax advice, and tax planning were: |
$69,713 for the fiscal year ended September 30, 2018; $85,817 for the fiscal year ended September 30, 2019.Tax-related services are principally in connection with, but not limited to, general tax services, excise tax and Passive Foreign Investment Company (PFIC) analysis.
| | (d) | All Other Fees:The aggregate fees billed in each of the last two fiscal years for products and services provided by the principal accountant, other than the services reported in paragraphs (a) through (c) of this Item were: |
$0 for the fiscal year ended September 30, 2018; $0 for the fiscal year ended September 30, 2019.
| | (e) | Pre-Approval Policies and Procedures |
(1) ThePre-Approval Policies and Procedures (the “Policy”) adopted by the Audit Committee of the Registrant (also, the “Fund”) sets forth the procedures pursuant to which services performed by the independent registered public accounting firm for the Registrant may bepre-approved. The following are some main provisions from the Policy.
| | 1. | The Audit Committee mustpre-approve all audit services andnon-audit services that the independent registered public accounting firm provides to the Fund. |
| | 2. | The Audit Committee mustpre-approve any engagement of the independent registered public accounting firm to providenon-audit services to any Service Affiliate (which is defined to include any entity controlling, controlled by, or under common control with the investment adviser that provides ongoing services to the Fund) during the period of the independent registered public accounting firm’s engagement to provide audit services to the Fund, if thenon-audit services to the Service Affiliate directly impact the Fund’s operations and financial reporting. |
| | 3. | The Audit Committee shallpre-approve certainnon-audit services to the Fund and its Service Affiliates pursuant to procedures set forth in the Policy. |
| | 4. | The Audit Committee, from time to time, may designate one or more of its members who are Independent Trustees (each a “Designated Member”) to consider, on the Audit Committee’s behalf, anynon-audit services, whether to the Fund or to any Service Affiliate, that have not beenpre-approved by the Audit Committee. The Designated Member also shall review, on the |
| | Audit Committee’s behalf, any proposed material change in the nature or extent of anynon-audit services previously approved. In considering any requestednon-audit services or proposed material change in such services, the Designated Member shall not authorize services which would exceed $50,000 in fees for such services. |
| | 5. | The independent registered public accounting firm may not provide specified prohibitednon-audit services set forth in the Policy to the Fund, the Fund’s investment adviser, the Service Affiliates or any other member of the investment company complex. |
(2) There were nopre-approval requirements waived for the services provided to the Registrant described in paragraphs (b)-(d) of Item 4 by the Audit Committee pursuant to paragraph (c)(7)(i)(C) of Rule2-01 of RegulationS-X (the “De Minimis Rule”). There were no fees billed for services provided to the Adviser described in paragraphs (b)-(d) of Item 4 that were required to bepre-approved by the Audit Committee as described in paragraph (e)(1) of Item 4.
| | (f) | None of the hours expended on the principal accountant’s engagement to audit the registrant’s financial statements for the year ended September 30, 2019, were attributed to work performed by persons other than the principal accountant’s full-time, permanent employees. |
| | (g) | For the fiscal year ended September 30, 2019, the aggregatenon-audit fees billed by the Registrant’s accountant for services rendered to the Registrant, and rendered to the Registrant’s Adviser (not including anysub-adviser whose role is primarily portfolio management and is subcontracted with or overseen by another investment adviser), and any entity controlling, controlled by, or under common control with the Adviser that provided ongoing services to the Registrant for each of the last two fiscal years of the Registrant were: |
Non-Audit fees: $69,713 for the fiscal year ended September 30, 2018; $85,817 for the fiscal year ended September 30, 2019.
| | (h) | The registrant’s audit committee of the board of trustees has considered whether the provision ofnon-audit services that were rendered to the Registrant’s investment adviser (not including anysub-adviser whose role is primarily portfolio management and is subcontracted with or overseen by another investment adviser), and any entity controlling, controlled by, or under common control with the investment adviser that provides ongoing services to the registrant that were notpre-approved pursuant to paragraph (c)(7)(ii) of Rule2-01 of RegulationS-X is compatible with maintaining the principal accountant’s independence. |
Item 5. Audit Committee of Listed Registrants.
| | (a) | The Registrant has an audit committee that was established by the Board of Trustees of the Registrant in accordance with Section 3(a)(58)(A) of the Securities Exchange Act of 1934, as amended. The members of the Registrant’s Audit Committee are Hilary E. Ackermann, Lynn S. Birdsong and David Sung. |
Item 6. Investments.
| | (a) | The Schedule of Investments in securities of unaffiliated issuers as of the close of the reporting period is included as part of the annual report to shareholders filed under Item 1 of this Form. |
Item 7. Disclosure of Proxy Voting Policies and Procedures forClosed-End Management Investment Companies.
Not applicable.
Item 8. Portfolio Managers ofClosed-End Management Investment Companies.
Not applicable.
Item 9. Purchases of Equity Securities byClosed-End Management Investment Company and Affiliated Purchasers.
Not applicable.
Item 10. Submission of Matters to a Vote of Security Holders.
There have been no material changes to the procedures by which shareholders may recommend nominees to the registrant’s board of trustees during the period covered by this report.
Item 11. Controls and Procedures.
| | (a) | The registrant’s principal executive and principal financial officers, or persons performing similar functions, have concluded that the registrant’s disclosure controls and procedures (as defined in Rule30a-3(c) under the Investment Company Act of 1940, as amended (the “1940 Act”) (17 CFR270.30a-3(c))) are generally effective to provide reasonable assurance, as of a date within 90 days of the filing date of the report that includes the disclosure required by this paragraph, based on their evaluation of these controls and procedures required by Rule30a-3(b) under the 1940 Act (17 CFR270.30a-3(b)) and Rules13a-15(b) or15d-15(b) under the Securities Exchange Act of 1934, as amended (17 CFR240.13a-15(b) or240.15d-15(b)). |
| | (b) | There were no changes in the registrant’s internal control over financial reporting (as defined in Rule30a-3(d) under the 1940 Act (17 CFR270.30a-3(d)) that occurred during the period covered by this report that have materially affected, or are reasonably likely to materially affect, the registrant’s internal control over financial reporting. |
Item 12. Disclosure of Securities Lending Activities forClosed-End Management Investment Companies
Not applicable.
Item 13. Exhibits.
| | |
| (a)(1) | | Code of Ethics referred to in Item 2 is attached. |
| (a)(2) | | Separate certifications for each principal executive officer and principal financial officer of the registrant as required by Rule30a-2(a) under the 1940 Act (17 CFR270.30a-2(a)) and Section 302 of the Sarbanes-Oxley Act of 2002 are attached hereto. |
| (a)(3) | | Not applicable. |
| (a)(4) | | Change in Registrant’s Independent Public Accountant |
| (b) | | Certifications pursuant to Rule30a-2(b) under the 1940 Act and Section 906 of the Sarbanes-Oxley Act of 2002 are attached hereto. |
SIGNATURES
Pursuant to the requirements of the Securities Exchange Act of 1934 and the Investment Company Act of 1940, the registrant has duly caused this report to be signed on its behalf by the undersigned, thereunto duly authorized.
| | | | |
| | LATTICE STRATEGIES TRUST |
| | |
| Date: December 6, 2019 | | By: | | /s/ James E. Davey |
| | | | James E. Davey |
| | | | President and |
| | | | Chief Executive Officer |
Pursuant to the requirements of the Securities Exchange Act of 1934 and the Investment Company Act of 1940, this report has been signed below by the following persons on behalf of the registrant and in the capacities and on the dates indicated.
| | | | |
| Date: December 6, 2019 | | By: | | /s/ James E. Davey |
| | | | James E. Davey |
| | | | President and |
| | | | Chief Executive Officer |
| | |
| Date: December 6, 2019 | | By: | | /s/ Amy N. Furlong |
| | | | Amy N. Furlong |
| | | | Treasurer (Principal Financial Officer and |
| | | | Principal Accounting Officer) |