UNITED STATES
SECURITIES AND EXCHANGE COMMISSION
Washington, D.C. 20549
FORM N-CSR
CERTIFIED SHAREHOLDER REPORT OF REGISTERED MANAGEMENT INVESTMENT
COMPANIES
Investment Company Act file number: 811-23002
LATTICE STRATEGIES TRUST
(Exact name of registrant as specified in charter)
690 Lee Road, Wayne, Pennsylvania 19087
(Address of Principal Executive Offices) (Zip Code)
Thomas R. Phillips, Esquire
Hartford Funds Management Company, LLC
690 Lee Road
Wayne, Pennsylvania 19087
(Name and Address of Agent for Service)
Copy to:
John V. O’Hanlon, Esq/
Dechert LLP
One International Place, 40th Floor
100 Oliver Street
Boston, MA 02110-2605
Registrant’s telephone number, including area code: (610) 386-4068
Date of fiscal year end: September 30
Date of reporting period: September 30, 2021
Form N-CSR is to be used by management investment companies to file reports with the Commission not later than 10 days after the transmission to stockholders of any report that is required to be transmitted to stockholders under Rule 30e-1 under the Investment Company Act of 1940 (17 CFR 270.30e-1). The Commission may use the information provided on Form N-CSR in its regulatory, disclosure review, inspection, and policymaking roles.
A registrant is required to disclose the information specified by Form N-CSR, and the Commission will make this information public. A registrant is not required to respond to the collection of information contained in Form N-CSR unless the Form displays a currently valid Office of Management and Budget (“OMB”) control number. Please direct comments concerning the accuracy of the information collection burden estimate and any suggestions for reducing the burden to Secretary, Securities and Exchange Commission, 100 F Street, NE, Washington, DC 20549. The OMB has reviewed this collection of information under the clearance requirements of 44 U.S.C. § 3507.
Item 1. Reports to Stockholders.

Hartford Multifactor ETFs
Annual Report
September 30, 2021
| ■ Hartford Longevity Economy ETF |
| ■ Hartford Multifactor Developed Markets (ex-US) ETF |
| ■ Hartford Multifactor Diversified International ETF |
| ■ Hartford Multifactor Emerging Markets ETF |
| ■ Hartford Multifactor Small Cap ETF |
| ■ Hartford Multifactor US Equity ETF |
A MESSAGE FROM THE PRESIDENT
Dear Shareholders:
Thank you for investing in Hartford Multifactor Exchange-Traded Funds. The following is the Funds’ Annual Report covering the period from October 1, 2020 through September 30, 2021.
Market Review
During the 12 months ended September 30, 2021, U.S. stocks, as measured by the S&P 500 Index,1 gained 30%, a number that underscores a truly remarkable equity-market rebound, particularly when compared with the broad sell-off endured by stocks in March 2020 at the start of the COVID-19 pandemic.
That said, the market’s extraordinary performance occurred against a backdrop of uncertain and sometimes contradictory economic signals: inflation fears; global supply-chain bottlenecks; tight labor markets; political gridlock; a stubbornly persistent pandemic and a U.S. Federal Reserve (Fed) regularly signaling its intention to cut back on the monetary stimulus that helped fuel the recovery.
A year ago, markets had already recovered from their March 2020 lows, yet the economy faced its share of headwinds, not least a fiercely divisive US presidential election and a resurgence of COVID-19 infections. Once the election was settled in November 2020, the emergence of safe and effective COVID-19 vaccines provided a significant lift to equity markets, as did a major $900 billion economic relief package passed by Congress in late December 2020.
As federal, state, and local health officials geared up for one of the largest mass-vaccination programs in history, the markets proved resilient as the S&P 500 Index continued the long streak of positive returns that began in April 2020.
In March 2021, the U.S. Congress fast-tracked approval of the Biden administration’s $1.9 trillion economic stimulus package. In August 2021, a $1.2 trillion proposal for an infrastructure spending package received U.S. Senate approval and, eventually, the approval of the U.S. House of Representatives in early November 2021. But, the outcome for the administration’s $1.75 trillion “Build Back Better” proposal, focused on social-safety-net improvements and climate-change mitigation, remained uncertain.
On the monetary front, the Fed continued to maintain its ongoing policy of near-zero interest rates in support of the recovery for the bulk of the period covered by this report. But in September 2021, Fed Chairman Jerome Powell rattled markets when he announced preparations for reducing the $120 billion in new money the Fed has been pouring into markets each month since the start of the pandemic.
An uptick in the inflation rate that began last spring added to the uncertain sentiment, with the Consumer Price Index rising 5.3% for the twelve-month period ended August 2021. After seven straight months of gains buoyed by record profits and predictions of future growth, the S&P 500 Index in September 2021 suffered a 4.8% decline, its worst monthly drop since the start of the pandemic.
With so many unsettled political and economic-policy questions looming, market volatility may continue. Nowadays, it’s more important than ever to maintain a strong relationship with your financial professional.
Thank you again for investing in Hartford Multifactor Exchange-Traded Funds. For the most up-to-date information on our funds, please take advantage of all the resources available at hartfordfunds.com.
James Davey
President
Hartford Funds
| | 1 S&P 500 Index is a market capitalization-weighted price index composed of 500 widely held common stocks. The index is unmanaged and not available for direct investment. Past performance is not indicative of future results. |
Hartford Multifactor ETFs
Table of Contents
The views expressed in each Fund’s Manager Discussion contained in the Fund Overview section are views of that Fund’s sub-adviser and portfolio management team through the end of the period and are subject to change based on market and other conditions. Each Fund’s Manager Discussion is for informational purposes only and does not represent an offer, recommendation or solicitation to buy, hold or sell any security. The specific securities identified and described, if any, do not represent all of the securities purchased or sold and you should not assume that investments in the securities identified and discussed will be profitable.
Hartford Longevity Economy ETF
Fund Overview
September 30, 2021 (Unaudited)
Inception 03/16/2021
Sub-advised by Mellon Investments Corporation | Investment objective – The Fund seeks to provide investment results that, before fees and expenses, correspond to the total return performance of the Hartford Longevity Economy Index (LHLGEX) (the “Index”), which is designed to generate attractive risk-adjusted returns by investing in companies that comprise industries that reflect certain themes that are expected to benefit from the growth of the aging population and the substantial buying power it represents. |
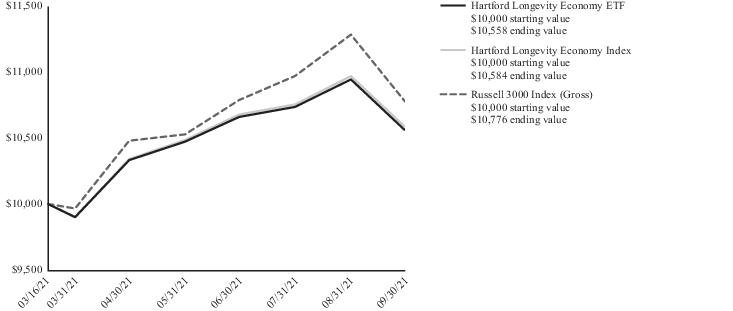
Comparison of Change in Value of $10,000 Investment (03/16/2021 - 09/30/2021)
The chart above represents the hypothetical growth of a $10,000 investment in the Fund. The difference in returns between the Fund and the Index was primarily the result of the Fund’s operating expenses, including transaction costs, that are not reflected in the Index’s results.
| Cumulative Total Returns |
| for the Period Ending 09/30/2021 |
| | Since
Inception1 |
| Hartford Longevity Economy ETF (NAV Return) | 5.58% |
| Hartford Longevity Economy ETF (Market Price Return) | 5.66% |
| Hartford Longevity Economy Index | 5.84% |
| Russell 3000 Index (Gross) | 7.76% |
Information regarding how often shares of the Fund traded on NYSE Arca, Inc. (“NYSE Arca”) at a price above (i.e., at a premium) or below (i.e., at a discount) the NAV of the Fund can be found at hartfordfunds.com.
PERFORMANCE DATA QUOTED REPRESENTS PAST PERFORMANCE AND DOES NOT GUARANTEE FUTURE RESULTS. The investment return and principal value of the investment will fluctuate so that investors’ shares, when redeemed or sold, may be worth more or less than their original cost. The chart and table do not reflect the deductions of taxes that a shareholder would pay on Fund distributions or the redemption or sale of Fund shares. Current performance may be lower or higher than the performance data quoted. To obtain performance data current to the most recent month-end, please visit our website hartfordfunds.com.
Total returns for the report period presented in the table may differ from the return in the Financial Highlights. The total return presented in the Financial Highlights section of the reports is calculated in the same manner, but also takes into account certain adjustments that are necessary under generally accepted accounting principles.
ETF shares are bought and sold at market price, not net asset value (NAV). Total returns are calculated using the daily 4:00 p.m. Eastern Time NAV. Market price returns reflect the midpoint of the bid/ask spread as of the close of trading on the exchange
where Fund shares are listed. Market price returns do not represent the returns an investor would receive if they traded shares at other times. Brokerage commissions apply and will reduce returns.
The index is unmanaged, and its results include reinvested dividends and/or distributions, but do not reflect the effect of sales charges, commissions, expenses or taxes.
You cannot invest directly in an index.
See “Benchmark Glossary” for benchmark descriptions.
The total annual fund operating expense ratio as shown in the Fund’s most recent prospectus was 0.44%. Actual expenses may be higher or lower. Please see the accompanying Financial Highlights for expense ratios for the period ended 09/30/2021.
Hartford Longevity Economy ETF
Fund Overview – (continued)
September 30, 2021 (Unaudited)
Manager Discussion
Hartford Longevity Economy ETF (“the Fund”) seeks to provide investment results that, before fees and expenses, correspond to the total return performance of the Hartford Longevity Economy Index (LHLGEX), which is designed to generate attractive risk-adjusted returns by investing in companies that comprise industries that reflect certain themes that are expected to benefit from the growth of the aging population and the substantial buying power it represents.
The Fund seeks to generate returns by investing in index constituents that are selected and weighted through a rules-based methodology that seeks to:
1) Provide Top-Down Thematic Exposure by identifying a Longevity Economy opportunity set. Starting with the full investable US equity universe, we seek to identify sub-industries that we believe may benefit from the Longevity themes and the growth of an aging population.
2) Provide Prudent Portfolio Construction and Risk Allocation through conviction-based industry and position size risk controls to help build significant top-down Longevity exposure to higher conviction sub-industries.
3) Enhance Return Potential by selecting companies in the Longevity opportunity set with a favorable combination of low valuation (50%), high momentum (30%), and high quality (20%) investment factors.
4) Maintain Consistency by reapplying the index methodology twice a year in March and September to maintain intended investment exposures.
For the period from March 16, 2021 (commencement of operations) through September 30, 2021, the Fund returned 5.58% at net asset value (“NAV”) as compared to the Hartford Longevity Economy Index which returned 5.84% for the same period. The difference in returns between the Fund and the Index was primarily the result of the Fund’s transaction costs and other operating expenses that are not reflected in the Index’s results.
The Fund invests in companies that comprise industries that reflect certain themes that are expected to benefit from the growth of the aging population and the substantial buying power it represents. Additionally, the Index uses multifactor stock selection and a comprehensive risk framework to help achieve targeted characteristics, relative sector and size constraints, and positive exposures to value, momentum, and quality risk factors. The Fund lagged its reference index, the Russell 3000 Index, for the period from March 16, 2021 (commencement of operations) through September 30, 2021 due to poor stock selection, as Index underweights in technology hardware and services companies, including Microsoft, NVIDIA, Apple, and Alphabet, were top detractors from relative performance for the period. From a risk factor standpoint, the Fund’s positive exposure to the value factor, along with its smaller market capitalization companies compared to the reference index, detracted from relative results for the period.
The Fund did not use derivatives during the period.
U.S. equity markets generated positive results over the trailing twelve-month period ended September 30, 2021, with the Russell 3000 Index returning 31.88%. The rally in equities off market lows in March 2020 was sustained through the fourth quarter of 2020, and strong returns continued during the first half of 2021 on the back of robust earnings, accommodative monetary policy, and optimism around vaccination rates supporting the broad reopening of the economy. Positive forecasts of economic growth and accelerating earnings from strong demand for goods and services provided support for stock prices. Equity results moderated in the third quarter of 2021 as reopening momentum slowed on concerns over inflation, monetary policy normalization, and supply chain disruptions. After posting a return of 32.01% through the first three quarters of the twelve-month period ended September 30, 2021, the Russell 3000 Index returned -0.10% in the final quarter of the period.
Important Risks
The Fund is new and has a limited operating history. Investing involves risk, including the possible loss of principal. Security prices fluctuate in value depending on general market and economic conditions and the prospects of individual companies. • The Fund is not actively managed but rather attempts to track the performance of an index. The Fund’s returns may diverge from that of the index. • The Fund's focus on securities of issuers that are expected to benefit from providing goods and services that are needed by or attractive to the world's aging populations may affect the Fund's exposure to certain industries or types of investments. Certain investments in companies focused on longevity and aging solutions may be affected by government regulations or other factors. • Investments focused in a sector, industry or group of industries may increase volatility and risk.
| Composition by Sector(1) |
| as of 09/30/2021 |
| Sector | Percentage
of Net Assets |
| Equity Securities | |
| Communication Services | 13.6% |
| Consumer Discretionary | 15.4 |
| Consumer Staples | 3.9 |
| Financials | 11.9 |
| Health Care | 21.8 |
| Industrials | 2.6 |
| Information Technology | 28.5 |
| Real Estate | 1.2 |
| Utilities | 1.0 |
| Total | 99.9% |
| Short-Term Investments | 0.9 |
| Other Assets & Liabilities | (0.8) |
| Total | 100.0% |
| (1) | A sector may be comprised of several industries. For Fund compliance purposes, the Fund may not use the same classification system. These sector classifications are used for financial reporting purposes. |
Hartford Multifactor Developed Markets (ex-US) ETF
Fund Overview
September 30, 2021 (Unaudited)
Inception 02/25/2015
Sub-advised by Mellon Investments Corporation | Investment objective – The Fund seeks to provide investment results that, before fees and expenses, correspond to the total return performance of an index that tracks the performance of companies located in major developed markets of Europe, Canada and the Pacific Region. |
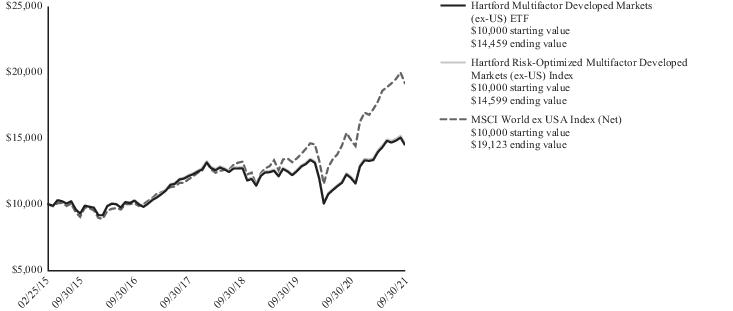
Comparison of Change in Value of $10,000 Investment (02/25/2015 - 09/30/2021)
The chart above represents the hypothetical growth of a $10,000 investment in the Fund. The difference in returns between the Fund and the Index was primarily the result of the Fund’s operating expenses, including transaction costs, that are not reflected in the Index’s results.
| Average Annual Total Returns |
| for the Periods Ending 09/30/2021 |
| | 1 Year | 5 Years | Since
Inception1 |
| Multifactor Developed Markets (ex-US) ETF (NAV Return) | 20.81% | 7.13% | 5.75% |
| Multifactor Developed Markets (ex-US) ETF (Market Price Return) | 20.24% | 6.90% | 5.67% |
| Hartford Risk-Optimized Multifactor Developed Markets (ex-US) Index | 20.96% | 7.25% | 5.91% |
| MSCI World ex USA Index (Net) | 26.50% | 8.88% | 5.80% |
Information regarding how often shares of the Fund traded on NYSE Arca, Inc. (“NYSE Arca”) at a price above (i.e., at a premium) or below (i.e., at a discount) the NAV of the Fund can be found at hartfordfunds.com.
PERFORMANCE DATA QUOTED REPRESENTS PAST PERFORMANCE AND DOES NOT GUARANTEE FUTURE RESULTS. The investment return and principal value of the investment will fluctuate so that investors’ shares, when redeemed or sold, may be worth more or less than their original cost. The chart and table do not reflect the deductions of taxes that a shareholder would pay on Fund distributions or the redemption or sale of Fund shares. Current performance may be lower or higher than the performance data quoted. To obtain performance data current to the most recent month-end, please visit our website hartfordfunds.com.
Total returns for the report period presented in the table may differ from the return in the Financial Highlights. The total return presented in the Financial Highlights section of the reports is calculated in the same manner, but also takes into account certain adjustments that are necessary under generally accepted accounting principles.
ETF shares are bought and sold at market price, not net asset value (NAV). Total returns are calculated using the daily 4:00 p.m. Eastern Time NAV. Market price returns reflect the midpoint of the bid/ask spread as of the close of trading on the exchange
where Fund shares are listed. Market price returns do not represent the returns an investor would receive if they traded shares at other times. Brokerage commissions apply and will reduce returns.
The index is unmanaged, and its results include reinvested dividends and/or distributions, but do not reflect the effect of sales charges, commissions, expenses or taxes.
You cannot invest directly in an index.
See “Benchmark Glossary” for benchmark descriptions.
The total annual fund operating expense ratio as shown in the Fund’s most recent prospectus was 0.29%. Actual expenses may be higher or lower. Please see the accompanying Financial Highlights for expense ratios for the year ended 09/30/2021.
Hartford Multifactor Developed Markets (ex-US) ETF
Fund Overview – (continued)
September 30, 2021 (Unaudited)
Manager Discussion
Hartford Multifactor Developed Markets (ex-US) ETF (“the Fund”) seeks to provide investment results that, before fees and expenses, correspond to the total return performance of Hartford Risk-Optimized Multifactor Developed Markets (ex-US) Index (LRODMX), which tracks the performance of companies located in major developed markets of Europe, Canada, and the Pacific Region.
The Fund seeks to generate returns by investing in index constituents that are selected and weighted through a rules-based methodology that seeks to:
1) Deliberately Allocate Risks by providing exposure to the growth potential of international companies while explicitly seeking to reduce volatility and drawdown risk.
2) Improve Diversification by diversifying exposure across developed market economies and potentially reducing individual country, currency, and individual company risks.
3) Enhance Return Potential by selecting companies with a favorable combination of low valuation (50%), high momentum (30%), and high quality (20%) investment factors.
4) Maintain Consistency by reapplying the index methodology twice a year in March and September to maintain intended investment exposures.
The Fund returned 20.81% at net asset value (“NAV”) for the fiscal year ended September 30, 2021 compared to the Hartford Risk- Optimized Multifactor Developed Markets (ex-US) Index, which returned 20.96% for the same period. The difference in returns between the Fund and the Index was primarily the result of the Fund’s transaction costs and other operating expenses that are not reflected in the Index’s results.
The Fund seeks exposures to return-enhancing factors along with less volatility and reduced concentration at the country, sector, and market cap levels vs. cap-weighted indices and invests in companies that we believe exhibit a favorable combination of low valuation, high momentum, and high quality. The Fund lagged its reference index, the MSCI World ex USA Index, for the twelve-month period as the Fund’s lower-volatility exposure detracted from relative performance amid a period of strong equity returns. The Fund’s smaller market capitalization companies versus the MSCI World ex USA Index also detracted from performance as larger-cap international stocks outperformed over the period.
The Fund made limited use of derivatives during the year; therefore, derivatives had no material impact on performance.
International developed equity markets generated positive results over the trailing twelve-month period ended September 30, 2021, with the MSCI World ex USA Index returning 26.50%. The rally in equities off market lows in March 2020 was sustained through the fourth quarter of 2020, and strong returns continued during the first half of 2021 on the back of robust earnings, accommodative monetary policy, and optimism around vaccination rates supporting the broad reopening of the economy. Positive forecasts of economic growth and accelerating earnings from strong demand for goods and services provided support for stock prices. Equity results moderated in the third quarter of 2021
as reopening momentum slowed on concerns over inflation, monetary policy normalization, and supply chain disruptions. After posting a return of 27.34% through the first three quarters of the twelve-month period ended September 30, 2021, the MSCI World ex USA Index returned -0.66% in the final quarter of the period.
Important Risks
Investing involves risk, including the possible loss of principal. Security prices fluctuate in value depending on general market and economic conditions and the prospects of individual companies. • The Fund is not actively managed but rather attempts to track the performance of an index. The Fund’s returns may diverge from that of the index. • Foreign investments may be more volatile and less liquid than U.S. investments and are subject to the risk of currency fluctuations and adverse regulatory, political and economic developments. These risks may be greater in particular geographic regions or countries. • Investments focused in a country, region, sector, industry or group of industries may increase volatility and risk. • Mid-cap securities can have greater risks and volatility than large-cap securities.
| Composition by Sector(1) |
| as of 09/30/2021 |
| Sector | Percentage
of Net Assets |
| Equity Securities | |
| Communication Services | 7.1% |
| Consumer Discretionary | 10.1 |
| Consumer Staples | 11.6 |
| Energy | 2.1 |
| Financials | 15.6 |
| Health Care | 12.8 |
| Industrials | 15.1 |
| Information Technology | 8.2 |
| Materials | 6.2 |
| Real Estate | 4.9 |
| Utilities | 5.2 |
| Total | 98.9% |
| Short-Term Investments | 1.8 |
| Other Assets & Liabilities | (0.7) |
| Total | 100.0% |
| (1) | A sector may be comprised of several industries. For Fund compliance purposes, the Fund may not use the same classification system. These sector classifications are used for financial reporting purposes. |
Hartford Multifactor Diversified International ETF
Fund Overview
September 30, 2021 (Unaudited)
Inception 05/10/2017
Sub-advised by Mellon Investments Corporation | Investment objective – The Fund seeks to provide investment results that, before fees and expenses, correspond to the total return performance of an index that tracks the performance of companies located in both developed and emerging markets. |
Comparison of Change in Value of $10,000 Investment (05/10/2017 - 09/30/2021)
The chart above represents the hypothetical growth of a $10,000 investment in the Fund. The difference in returns between the Fund and the Index was primarily the result of the Fund’s operating expenses, including transaction costs, that are not reflected in the Index’s results.
| Average Annual Total Returns |
| for the Periods Ending 09/30/2021 |
| | 1 Year | Since
Inception1 |
| Multifactor Diversified International ETF (NAV Return) | 25.06% | 5.94% |
| Multifactor Diversified International ETF (Market Price Return) | 24.41% | 5.88% |
| Hartford Multifactor Diversified International Index | 25.78% | 5.64% 2 |
| MSCI All Country World (ACWI) ex USA Index (Net) | 23.92% | 7.73% |
| 1 | Inception: 05/10/2017 |
| 2 | The Hartford Multifactor Diversified International Index commenced operations on 06/28/2019. Reflects annualized returns starting on 06/28/2019. |
Performance information prior to 11/06/2019 reflects the Fund’s performance when it tracked its prior index.
Information regarding how often shares of the Fund traded on Cboe BZX Exchange, Inc. (“Cboe BZX”) at a price above (i.e., at a premium) or below (i.e., at a discount) the NAV of the Fund can be found at hartfordfunds.com.
PERFORMANCE DATA QUOTED REPRESENTS PAST PERFORMANCE AND DOES NOT GUARANTEE FUTURE RESULTS. The investment return and principal value of the investment will fluctuate so that investors’ shares, when redeemed or sold, may be worth more or less than their original cost. The chart and table do not reflect the deductions of taxes that a shareholder would pay on Fund distributions or the redemption or sale of Fund shares. Current performance may be lower or higher than the performance data quoted. To obtain performance data current to the most recent month-end, please visit our website hartfordfunds.com.
Total returns for the report period presented in the table may differ from the return in the Financial Highlights. The total return presented in the Financial Highlights section of the reports is calculated in the same manner, but also takes into account certain adjustments that are necessary under generally accepted accounting principles.
ETF shares are bought and sold at market price, not net asset value (NAV). Total returns are calculated using the daily 4:00 p.m. Eastern Time NAV. Market price returns reflect the midpoint of the bid/ask spread as of the close of trading on the exchange where Fund shares are listed. Market price returns do not represent the returns an investor would receive if they traded shares at other times. Brokerage commissions apply and will reduce returns.
The index is unmanaged, and its results include reinvested dividends and/or distributions, but do not reflect the effect of sales charges, commissions, expenses or taxes.
You cannot invest directly in an index.
See “Benchmark Glossary” for benchmark descriptions.
The total annual fund operating expense ratio as shown in the Fund’s most recent prospectus was 0.29%. Actual expenses may be higher or lower. Please see the accompanying Financial Highlights for expense ratios for the year ended 09/30/2021.
Hartford Multifactor Diversified International ETF
Fund Overview – (continued)
September 30, 2021 (Unaudited)
Manager Discussion
Hartford Multifactor Diversified International ETF (“the Fund”) seeks to provide investment results that, before fees and expenses, correspond to the total return performance of Hartford Multifactor Diversified International Index (LRODEX), which tracks the performance of companies located in both developed (ex US) and emerging markets.
The Fund seeks to generate returns by investing in index constituents that are selected and weighted through a rules-based methodology that seeks to:
1) Deliberately Allocate Risks by providing exposure to the growth potential of international companies while explicitly seeking to reduce volatility and drawdown risk.
2) Improve Diversification by diversifying exposure across developed (excluding the US) and emerging economies while balancing risk across sectors.
3) Enhance Return Potential by selecting companies with a favorable combination of low valuation (50%), high momentum (30%), and high quality (20%) investment factors.
4) Maintain Consistency by reapplying the index methodology twice a year in March and September to maintain intended investment exposures.
The Fund returned 25.06% at net asset value (“NAV”) for the fiscal year ended September 30, 2021 as compared to the Hartford Multifactor Diversified International Index, which returned 25.78% for the same period. The difference in returns between the Fund and the Index was primarily the result of the Fund’s transaction costs and other operating expenses that are not reflected in the Index’s results.
The Fund seeks exposures to return-enhancing factors along with less volatility and reduced concentration at the country, sector, and market cap levels versus cap-weighted indices and invests in companies that we believe exhibit a favorable combination of low valuation, high momentum, and high quality. The Fund outperformed its reference index, the MSCI All Country World (ACWI) ex USA Index, for the twelve-month period, as developed international and emerging-market value stocks meaningfully outperformed developed international and emerging-market growth stocks. The Fund’s positive active exposure to the value factor was a significant positive contributor to relative performance.
The Fund made limited use of derivatives during the year; therefore, derivatives had no material impact on performance.
International equity markets generated positive results over the trailing twelve-month period ended September 30, 2021, with the MSCI All Country World (ACWI) ex USA Index returning 23.92%. The rally in equities off market lows in March 2020 was sustained through the fourth quarter of 2020, and strong returns continued during the first half of 2021 on the back of robust earnings, accommodative monetary policy, and optimism around vaccination rates supporting the broad reopening of the economy. Positive forecasts of economic growth and accelerating earnings from strong demand for goods and services provided support for stock prices. Equity results moderated in the third quarter of 2021 as reopening momentum slowed on concerns over inflation, monetary policy normalization, and supply
chain disruptions. After posting a return of 27.73% through the first three quarters of the twelve-month period ended September 30, 2021, the MSCI All Country World (ACWI) ex USA Index returned -2.99% in the final quarter of the period.
Important Risks
Investing involves risk, including the possible loss of principal. Security prices fluctuate in value depending on general market and economic conditions and the prospects of individual companies. • The Fund is not actively managed but rather attempts to track the performance of an index. The Fund’s returns may diverge from that of the index. • Foreign investments may be more volatile and less liquid than U.S. investments and are subject to the risk of currency fluctuations and adverse regulatory, political and economic developments. These risks may be greater for investments in emerging markets. • Investments focused in a particular country, region, sector or industry are subject to greater volatility and risk.
| Composition by Sector(1) |
| as of 09/30/2021 |
| Sector | Percentage
of Net Assets |
| Equity Securities | |
| Communication Services | 8.5% |
| Consumer Discretionary | 11.3 |
| Consumer Staples | 10.2 |
| Energy | 5.6 |
| Financials | 16.5 |
| Health Care | 10.8 |
| Industrials | 11.5 |
| Information Technology | 12.0 |
| Materials | 6.4 |
| Real Estate | 3.7 |
| Utilities | 2.8 |
| Total | 99.3% |
| Short-Term Investments | 1.8 |
| Other Assets & Liabilities | (1.1) |
| Total | 100.0% |
| (1) | A sector may be comprised of several industries. For Fund compliance purposes, the Fund may not use the same classification system. These sector classifications are used for financial reporting purposes. |
Hartford Multifactor Emerging Markets ETF
Fund Overview
September 30, 2021 (Unaudited)
Inception 02/25/2015
Sub-advised by Mellon Investments Corporation | Investment objective – The Fund seeks to provide investment results that, before fees and expenses, correspond to the total return performance of an index based upon the emerging markets of the world. |
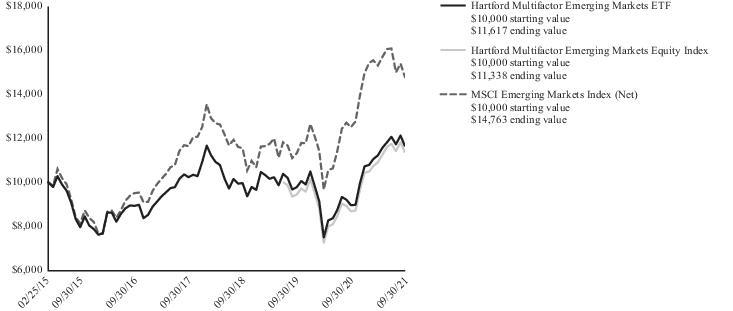
Comparison of Change in Value of $10,000 Investment (02/25/2015 - 09/30/2021)
The chart above represents the hypothetical growth of a $10,000 investment in the Fund. The difference in returns between the Fund and the Index was primarily the result of the Fund’s operating expenses, including transaction costs, that are not reflected in the Index’s results.
| Average Annual Total Returns |
| for the Periods Ending 09/30/2021 |
| | 1 Year | 5 Years | Since
Inception1 |
| Multifactor Emerging Markets ETF (NAV Return) | 29.86% | 5.44% | 2.30% |
| Multifactor Emerging Markets ETF (Market Price Return) | 27.96% | 4.93% | 2.17% |
| Hartford Multifactor Emerging Markets Equity Index | 30.75% | — | 5.72% 2 |
| MSCI Emerging Markets Index (Net) | 18.20% | 9.23% | 6.09% |
| 1 | Inception: 02/25/2015 |
| 2 | The Hartford Multifactor Emerging Markets Equity Index commenced operations on 06/28/2019. Reflects annualized returns starting on 06/28/2019. |
Performance information prior to 09/11/2019 reflects the Fund’s performance when it tracked its prior index.
Information regarding how often shares of the Fund traded on NYSE Arca, Inc. (“NYSE Arca”) at a price above (i.e., at a premium) or below (i.e., at a discount) the NAV of the Fund can be found at hartfordfunds.com.
PERFORMANCE DATA QUOTED REPRESENTS PAST PERFORMANCE AND DOES NOT GUARANTEE FUTURE RESULTS. The investment return and principal value of the investment will fluctuate so that investors’ shares, when redeemed or sold, may be worth more or less than their original cost. The chart and table do not reflect the deductions of taxes that a shareholder would pay on Fund distributions or the redemption or sale of Fund shares. Current performance may be lower or higher than the performance data quoted. To obtain performance data current to the most recent month-end, please visit our website hartfordfunds.com.
Total returns for the report period presented in the table may differ from the return in the Financial Highlights. The total return presented in the Financial Highlights section of the reports is calculated in the same manner, but also takes into account certain adjustments that are necessary under generally accepted accounting principles.
ETF shares are bought and sold at market price, not net asset value (NAV). Total returns are calculated using the daily 4:00 p.m. Eastern Time NAV. Market price returns reflect the midpoint of the bid/ask spread as of the close of trading on the exchange where Fund shares are listed. Market price returns do not represent the returns an investor would receive if they traded shares at other times. Brokerage commissions apply and will reduce returns.
The index is unmanaged, and its results include reinvested dividends and/or distributions, but do not reflect the effect of sales charges, commissions, expenses or taxes.
You cannot invest directly in an index.
See “Benchmark Glossary” for benchmark descriptions.
The total annual fund operating expense ratio as shown in the Fund’s most recent prospectus was 0.44%. Actual expenses may be higher or lower. Please see the accompanying Financial Highlights for expense ratios for the year ended 09/30/2021.
Hartford Multifactor Emerging Markets ETF
Fund Overview – (continued)
September 30, 2021 (Unaudited)
Manager Discussion
Hartford Multifactor Emerging Markets ETF (“the Fund”) seeks to provide investment results that, before fees and expenses, correspond to the total return performance of the Hartford Multifactor Emerging Markets Equity Index (LROEMX), which tracks the performance of companies located in the emerging markets of the world.
The Fund seeks to generate returns and reduce volatility by investing in index constituents that are selected and weighted through a rules-based methodology that seeks to:
1) Deliberately Allocate Risks by expanding the investment opportunity and seeking to harness emerging markets’ growth potential and allocating risk across countries while explicitly seeking to reduce volatility and drawdown risk.
2) Improve Diversification by improving exposure to countries earlier in their growth cycle (beyond the largest emerging countries) as well as to companies tied more closely to local emerging economies.
3) Enhance Return Potential by selecting companies with a favorable combination of low valuation (50%), high momentum (30%), and high quality (20%) investment factors.
4) Maintain Consistency by reapplying the index methodology twice a year in March and September to maintain intended investment exposures.
The Fund returned 29.86% at net asset value (“NAV”) for the fiscal year ended September 30, 2021 as compared to the Hartford Multifactor Emerging Markets Equity Index, which returned 30.75% for the same period. The difference in returns between the Fund and the Index was primarily the result of the Fund’s transaction costs and other operating expenses that are not reflected in the Index’s results.
The Fund seeks exposures to return-enhancing factors along with less volatility and reduced concentration at the country, sector, and market cap levels vs. cap-weighted indices and invests in companies that we believe exhibit a favorable combination of low valuation, high momentum, and high quality. The Fund outperformed its reference index, the MSCI Emerging Markets Index, for the twelve-month period, as emerging-markets value stocks meaningfully outperformed emerging-markets growth stocks as well as emerging-markets stocks overall. The Fund’s positive exposure to the value factor was a significant positive contributor to relative performance. The smaller overall market capitalization of the companies in the Fund's portfolio relative to the companies that comprise the MSCI Emerging Markets Index also contributed to performance, as large-cap emerging markets stocks lagged over the period. In addition, the Fund’s underweight to China versus the MSCI Emerging Markets Index also contributed positively to results.
The Fund made limited use of derivatives during the year; therefore, derivatives had no material impact on performance.
Emerging-markets equities generated positive results over the trailing twelve-month period ending September 30, 2021, with the MSCI Emerging Markets Index returning 18.20%. The rally in equities off market lows reached in March 2020 was sustained through the fourth quarter of 2020 and strong returns continued during the first half of 2021 on the back of robust earnings, accommodative monetary policy,
and optimism around COVID-19 vaccination rates supporting the broad reopening of the economy. Positive forecasts of economic growth and accelerating earnings from strong demand for goods and services provided support for stock prices. Equity results moderated in the third quarter of 2021 as reopening momentum slowed on concerns over inflation, monetary policy normalization, and supply chain disruptions. After posting a return of 28.61% through the first three quarters of the twelve-month period ended September 30, 2021, the MSCI Emerging Markets Index returned -8.09% in the final quarter of the period.
Important Risks
Investing involves risk, including the possible loss of principal. Security prices fluctuate in value depending on general market and economic conditions and the prospects of individual companies. • The Fund is not actively managed but rather attempts to track the performance of an index. The Fund’s returns may diverge from that of the index. • Foreign investments may be more volatile and less liquid than U.S. investments and are subject to the risk of currency fluctuations and adverse regulatory, political and economic developments. These risks may be greater for investments in emerging markets and in particular geographic regions or countries. • Investments focused in a country, region, sector, industry or group of industries may increase volatility and risk.
| Composition by Sector(1) |
| as of 09/30/2021 |
| Sector | Percentage
of Net Assets |
| Equity Securities | |
| Communication Services | 12.1% |
| Consumer Discretionary | 16.1 |
| Consumer Staples | 6.0 |
| Energy | 6.4 |
| Financials | 19.4 |
| Health Care | 4.2 |
| Industrials | 2.8 |
| Information Technology | 21.8 |
| Materials | 5.2 |
| Real Estate | 2.3 |
| Utilities | 3.1 |
| Total | 99.4% |
| Short-Term Investments | 0.2 |
| Other Assets & Liabilities | 0.4 |
| Total | 100.0% |
| (1) | A sector may be comprised of several industries. For Fund compliance purposes, the Fund may not use the same classification system. These sector classifications are used for financial reporting purposes. |
Hartford Multifactor Small Cap ETF
Fund Overview
September 30, 2021 (Unaudited)
Inception 03/23/2015
Sub-advised by Mellon Investments Corporation | Investment objective – The Fund seeks to provide investment results that, before fees and expenses, correspond to the total return performance of an index that tracks the performance of small capitalization exchange traded equity securities. |
Comparison of Change in Value of $10,000 Investment (03/23/2015 - 09/30/2021)
The chart above represents the hypothetical growth of a $10,000 investment in the Fund. The difference in returns between the Fund and the Index was primarily the result of the Fund’s operating expenses, including transaction costs, that are not reflected in the Index’s results.
| Average Annual Total Returns |
| for the Periods Ending 09/30/2021 |
| | 1 Year | 5 Years | Since
Inception1 |
| Multifactor Small Cap ETF (NAV Return) | 50.39% | 11.04% | 9.21% |
| Multifactor Small Cap ETF (Market Price Return) | 50.53% | 10.90% | 9.19% |
| Hartford Multifactor Small Cap Index | 50.96% | — | 17.01% 2 |
| Russell 2000 Index (Gross) | 47.68% | 13.45% | 10.37% |
| 1 | Inception: 03/23/2015 |
| 2 | The Hartford Multifactor Small Cap Index commenced operations on 06/28/2019. Reflects annualized returns starting on 06/28/2019. |
Performance information prior to 11/06/2019 reflects the Fund’s performance when it tracked its prior index.
Information regarding how often shares of the Fund traded on NYSE Arca, Inc. (“NYSE Arca”) at a price above (i.e., at a premium) or below (i.e., at a discount) the NAV of the Fund can be foundat hartfordfunds.com.
PERFORMANCE DATA QUOTED REPRESENTS PAST PERFORMANCE AND DOES NOT GUARANTEE FUTURE RESULTS. The investment return and principal value of the investment will fluctuate so that investors’ shares, when redeemed or sold, may be worth more or less than their original cost. The chart and table do not reflect the deductions of taxes that a shareholder would pay on Fund distributions or the redemption or sale of Fund shares. Current performance may be lower or higher than the performance data quoted. To obtain performance data current to the most recent month-end, please visit our website hartfordfunds.com.
Total returns for the report period presented in the table may differ from the return in the Financial Highlights. The total return presented in the Financial Highlights section of the reports is calculated in the same manner, but also takes into account certain adjustments that are necessary under generally accepted accounting principles.
ETF shares are bought and sold at market price, not net asset value (NAV). Total returns are calculated using the daily 4:00 p.m. Eastern Time NAV. Market price returns reflect the midpoint of the bid/ask spread as of the close of trading on the exchange
where Fund shares are listed. Market price returns do not represent the returns an investor would receive if they traded shares at other times. Brokerage commissions apply and will reduce returns.
The index is unmanaged, and its results include reinvested dividends and/or distributions, but do not reflect the effect of sales charges, commissions, expenses or taxes.
You cannot invest directly in an index.
See “Benchmark Glossary” for benchmark descriptions.
The total annual fund operating expense ratio as shown in the Fund’s most recent prospectus was 0.34%. Actual expenses may be higher or lower. Please see the accompanying Financial Highlights for expense ratios for the year ended 09/30/2021.
Hartford Multifactor Small Cap ETF
Fund Overview – (continued)
September 30, 2021 (Unaudited)
Manager Discussion
Hartford Multifactor Small Cap ETF (“the Fund”) seeks to provide investment results that, before fees and expenses, correspond to the total return performance of Hartford Multifactor Small Cap Index (LROSCX), which tracks the performance of small cap exchange-traded equity securities.
The Fund seeks to generate returns by investing in index constituents that are selected and weighted through a rules-based methodology that seeks to:
1) Deliberately Allocate Risks by providing exposure to the growth potential of small companies while explicitly seeking to reduce volatility and drawdown risk.
2) Improve Diversification by diversifying exposure across sectors and potentially reducing individual company risks.
3) Enhance Return Potential by selecting companies with a favorable combination of low valuation (50%), high momentum (30%), and high quality (20%) investment factors.
4) Maintain Consistency by reapplying the index methodology twice a year in March and September to maintain intended investment exposures.
The Fund returned 50.39% at net asset value (“NAV”) for the fiscal year ended September 30, 2021 as compared to the Hartford Multifactor Small Cap Index which returned 50.96% for the same period. The difference in returns between the Fund and the Index was primarily the result of the Fund’s transaction costs and other operating expenses that are not reflected in the Index’s results.
The Fund seeks exposures to return-enhancing factors along with less volatility and reduced concentration at the sector level vs. cap-weighted indices and invests in companies that we believe exhibit a favorable combination of low valuation, high momentum, and high quality. The Fund outperformed its reference index, the Russell 2000 Index, for the twelve-month period, as small-cap value stocks meaningfully outperformed and the Fund’s positive exposure to the value factor was a significant contributor to performance relative to the Russell 2000 Index.
The Fund made limited use of derivatives during the year; therefore, derivatives had no material impact on performance.
U.S. small-cap markets generated positive results over the trailing twelve-month period ended September 30, 2021, with the Russell 2000 Index returning 47.68%. The rally in equities off market lows in March 2020 was sustained through the fourth quarter of 2020, and strong returns continued during the first half of 2021 on the back of robust earnings, accommodative monetary policy, and optimism around vaccination rates supporting the broad reopening of the economy. Positive forecasts of economic growth and accelerating earnings from strong demand for goods and services provided support for stock prices. Equity results moderated in the third quarter of 2021 as reopening momentum slowed on concerns over inflation, monetary policy normalization, and supply chain disruptions. After posting a return of 54.41% through the first three quarters of the twelve-month period ended September 30, 2021, the Russell 2000 Index returned -4.36% in the final quarter of the period.
Important Risks
Investing involves risk, including the possible loss of principal. Security prices fluctuate in value depending on general market and economic conditions and the prospects of individual companies. • The Fund is not actively managed but rather attempts to track the performance of an index. The Fund’s returns may diverge from that of the index. • Small cap securities can have greater risk and volatility than large-cap securities. • Investments focused in a particular sector or industry are subject to greater market volatility risk.
| Composition by Sector(1) |
| as of 09/30/2021 |
| Sector | Percentage
of Net Assets |
| Equity Securities | |
| Communication Services | 5.7% |
| Consumer Discretionary | 13.4 |
| Consumer Staples | 5.8 |
| Energy | 2.8 |
| Financials | 18.3 |
| Health Care | 19.0 |
| Industrials | 13.8 |
| Information Technology | 10.5 |
| Materials | 3.6 |
| Real Estate | 5.9 |
| Utilities | 0.7 |
| Total | 99.5% |
| Short-Term Investments | 0.1 |
| Other Assets & Liabilities | 0.4 |
| Total | 100.0% |
| (1) | A sector may be comprised of several industries. For Fund compliance purposes, the Fund may not use the same classification system. These sector classifications are used for financial reporting purposes. |
Hartford Multifactor US Equity ETF
Fund Overview
September 30, 2021 (Unaudited)
Inception 02/25/2015
Sub-advised by Mellon Investments Corporation | Investment objective – The Fund seeks to provide investment results that, before fees and expenses, correspond to the total return performance of an index that tracks the performance of exchange traded U.S. equity securities. |
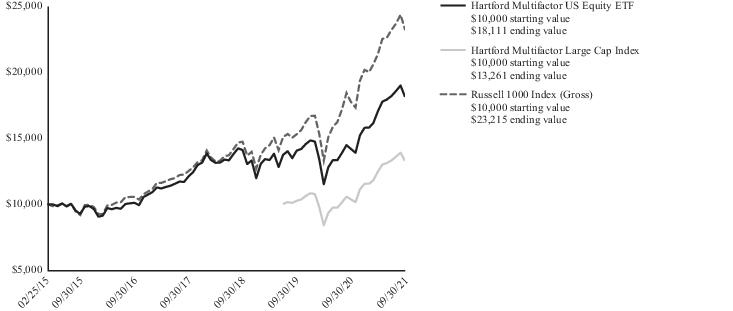
Comparison of Change in Value of $10,000 Investment (02/25/2015 - 09/30/2021)
The chart above represents the hypothetical growth of a $10,000 investment in the Fund. The difference in returns between the Fund and the Index was primarily the result of the Fund’s operating expenses, including transaction costs, that are not reflected in the Index’s results.
| Average Annual Total Returns |
| for the Periods Ending 09/30/2021 |
| | 1 Year | 5 Years | Since
Inception1 |
| Multifactor US Equity ETF (NAV Return) | 27.83% | 12.42% | 9.42% |
| Multifactor US Equity ETF (Market Price Return) | 27.92% | 12.40% | 9.42% |
| Hartford Multifactor Large Cap Index | 28.12% | — | 13.32% 2 |
| Russell 1000 Index (Gross) | 30.96% | 17.11% | 13.62% |
| 1 | Inception: 02/25/2015 |
| 2 | The Hartford Multifactor Large Cap Index commenced operations on 06/28/2019. Reflects annualized returns starting on 06/28/2019. |
Performance information prior to 09/11/2019 reflects the Fund’s performance when it tracked its prior index.
Information regarding how often shares of the Fund traded on NYSE Arca, Inc. (“NYSE Arca”) at a price above (i.e., at a premium) or below (i.e., at a discount) the NAV of the Fund can be found at hartfordfunds.com.
PERFORMANCE DATA QUOTED REPRESENTS PAST PERFORMANCE AND DOES NOT GUARANTEE FUTURE RESULTS. The investment return and principal value of the investment will fluctuate so that investors’ shares, when redeemed or sold, may be worth more or less than their original cost. The chart and table do not reflect the deductions of taxes that a shareholder would pay on Fund distributions or the redemption or sale of Fund shares. Current performance may be lower or higher than the performance data quoted. To obtain performance data current to the most recent month-end, please visit our website hartfordfunds.com.
Total returns for the report period presented in the table may differ from the return in the Financial Highlights. The total return presented in the Financial Highlights section of the reports is calculated in the same manner, but also takes into account certain adjustments that are necessary under generally accepted accounting principles.
ETF shares are bought and sold at market price, not net asset value (NAV). Total returns are calculated using the daily 4:00 p.m. Eastern Time NAV. Market price returns reflect the midpoint of the bid/ask spread as of the close of trading on the exchange
where Fund shares are listed. Market price returns do not represent the returns an investor would receive if they traded shares at other times. Brokerage commissions apply and will reduce returns.
The index is unmanaged, and its results include reinvested dividends and/or distributions, but do not reflect the effect of sales charges, commissions, expenses or taxes.
You cannot invest directly in an index.
See “Benchmark Glossary” for benchmark descriptions.
The total annual fund operating expense ratio as shown in the Fund’s most recent prospectus was 0.19%. Actual expenses may be higher or lower. Please see the accompanying Financial Highlights for expense ratios for the year ended 09/30/2021.
Hartford Multifactor US Equity ETF
Fund Overview – (continued)
September 30, 2021 (Unaudited)
Manager Discussion
Hartford Multifactor US Equity ETF (“the Fund”) seeks to provide investment results that, before fees and expenses, correspond to the total return performance of Hartford Multifactor Large Cap Index (LROLCX), which tracks the performance of large-cap exchange-traded U.S. equity securities.
The Fund seeks to generate returns by investing in index constituents that are selected and weighted through a rules-based methodology that seeks to:
1) Deliberately Allocate Risks by allocating capital deeper in the US Large Cap Universe toward companies with more favorable risk/reward potential while explicitly seeking to reduce volatility and drawdown risk.
2) Improve Diversification by providing diversified exposure across the US Large Cap Universe, beyond mega-caps.
3) Enhance Return Potential by selecting companies with a favorable combination of low valuation (50%), high momentum (30%), and high quality (20%) investment factors.
4) Maintain Consistency by reapplying the index methodology twice a year in March and September to maintain intended investment exposures.
The Fund returned 27.83% at net asset value (“NAV”) for the fiscal year ended September 30, 2021 as compared to the Hartford Multifactor Large Cap Index which returned 28.12% for the same period. The difference in returns between the Fund and the Index was primarily the result of the Fund’s transaction costs and other operating expenses that are not reflected in the Index’s results.
The Fund seeks exposures to return-enhancing factors along with less volatility and reduced concentration at the sector and market cap levels versus cap-weighted indices and invests in companies that we believe exhibit a favorable combination of low valuation, high momentum, and high quality. The Fund underperformed its reference index, the Russell 1000 Index, for the twelve-month period, as the Fund’s lower volatility exposure relative to the Russell 1000 Index detracted from relative performance during this period of strong returns generated by equities.
The Fund made limited use of derivatives during the year; therefore, derivatives had no material impact on performance.
U.S. large-cap equity markets generated positive results over the trailing twelve-month period ended September 30, 2021, with the Russell 1000 Index returning 30.96%. The rally in equities off market
lows in March 2020 was sustained through the fourth quarter of 2020, and strong returns continued during the first half of 2021 on the back of robust earnings, accommodative monetary policy, and optimism around vaccination rates supporting the broad reopening of the economy. Positive forecasts of economic growth and accelerating earnings from strong demand for goods and services provided support for stock prices. Equity results moderated in the third quarter of 2021 as reopening momentum slowed on concerns over inflation, monetary policy normalization, and supply chain disruptions. After posting a return of 30.69% through the first three quarters of the twelve-month period ended September 30, 2021, the Russell 1000 Index returned 0.21% in the final quarter of the period.
Important Risks
Investing involves risk, including the possible loss of principal. Security prices fluctuate in value depending on general market and economic conditions and the prospects of individual companies. • The Fund is not actively managed but rather attempts to track the performance of an index. The Fund’s returns may diverge from that of the index. • Investments focused in a sector, industry or group of industries may increase volatility and risk.
| Composition by Sector(1) |
| as of 09/30/2021 |
| Sector | Percentage
of Net Assets |
| Equity Securities | |
| Communication Services | 9.0% |
| Consumer Discretionary | 10.3 |
| Consumer Staples | 7.6 |
| Energy | 0.6 |
| Financials | 10.0 |
| Health Care | 15.4 |
| Industrials | 10.6 |
| Information Technology | 25.6 |
| Materials | 2.1 |
| Real Estate | 4.1 |
| Utilities | 4.3 |
| Total | 99.6% |
| Short-Term Investments | 0.3 |
| Other Assets & Liabilities | 0.1 |
| Total | 100.0% |
| (1) | A sector may be comprised of several industries. For Fund compliance purposes, the Fund may not use the same classification system. These sector classifications are used for financial reporting purposes. |
Hartford Multifactor ETFs
Benchmark Glossary (Unaudited)
| Hartford Longevity Economy Index seeks to generate attractive risk-adjusted returns by investing in companies that comprise industries that reflect certain themes that are expected to benefit from the growth of the aging population and the substantial buying power it represents. |
| Hartford Multifactor Diversified International Index seeks to enhance return potential available from investment in developed market (excluding the US) and emerging market companies while reducing volatility by up to fifteen-percent over a complete market cycle. |
| Hartford Multifactor Emerging Markets Equity Index seeks to enhance return potential available from investment in emerging market companies while reducing volatility by up to fifteen-percent over a complete market cycle. |
| Hartford Multifactor Large Cap Index seeks to enhance return potential available from investment in the initial capitalized-weighted universe while reducing volatility by up to fifteen-percent over a complete market cycle. |
| Hartford Multifactor Small Cap Index seeks to enhance return potential available from investment in the initial capitalization-weighted universe while reducing volatility by up to fifteen-percent over a complete market cycle. |
| Hartford Risk-Optimized Multifactor Developed Markets (ex-US) Index seeks to address risks and opportunities within developed market stocks located outside the United States by selecting equity securities exhibiting a favorable combination of factors, including value, momentum, and quality. |
| MSCI ACWI (All Country World) ex USA Index (Net) (reflects reinvested dividends net of withholding taxes but reflects no deduction for fees, expenses or other taxes) is designed to capture large and mid cap representation across developed markets (excluding the United States) and emerging market countries. |
| MSCI Emerging Markets Index (Net) reflects reinvested dividends net of withholding taxes but (reflects no deduction for fees, expenses or other taxes) is designed to capture large and mid cap representation across emerging market countries. |
| MSCI World ex USA Index (Net) (reflects no deduction for fees, expenses or other taxes) is a free float-adjusted market capitalization index that is designed to capture large and mid cap representation across developed markets countries—excluding the United States. |
| Neither MSCI nor any other party involved in or related to compiling, computing or creating the MSCI data makes any express or implied warranties or representations with respect to such data (or the results to be obtained by the use thereof), and all such parties hereby expressly disclaim all warranties of originality, accuracy, completeness, merchantability or fitness for a particular purpose with respect to any of such data. Without limiting any of the foregoing, in no event shall MSCI, any of its affiliates or any third party involved in or related to compiling, computing or creating the data have any liability for any direct, indirect, special, punitive, consequential or any other damages (including lost profits) even if notified of the possibility of such damages. No further distribution or dissemination of the MSCI data is permitted without MSCI’s express written consent. |
| Russell 1000 Index (Gross) (reflects no deduction for fees, expenses or taxes) is designed to measure the performance of the 1,000 largest companies in the Russell 3000 Index. The Russell 3000 Index is designed to measure the performance of the 3,000 largest U.S. companies based on total market capitalizations. |
| Russell 2000 Index (Gross) (reflects no deduction for fees, expenses or taxes) is an index comprised of 2,000 of the smallest U.S.-domiciled company common stocks based on a combination of their market capitalization and current index membership. |
| Russell 3000 Index (Gross) is designed to measure the performance of the 3,000 largest U.S. companies based on total market capitalization. |
Hartford Multifactor ETFs
Expense Examples (Unaudited)
Your Fund's Expenses
As a shareholder of a Fund, you incur two types of costs: (1) transaction costs, including brokerage commissions paid on purchases and sales of Fund shares and (2) ongoing costs, including investment management fees and certain other fund expenses. This example is intended to help you understand your ongoing costs (in dollars) of investing in a Fund and to compare these costs with the ongoing costs of investing in other exchange-traded funds. The example is based on an investment of $1,000 invested at the beginning of the period and held for the entire period of April 1, 2021 through September 30, 2021. To the extent a Fund was subject to acquired fund fees and expenses during the period, acquired fund fees and expenses are not included in the annualized expense ratio below.
Actual Expenses
The first set of columns of the table below provides information about actual account values and actual expenses. You may use this information, together with the amount you invested, to estimate the expenses that you paid over the period. Simply divide your account value by $1,000 (for example, an $8,600 account value divided by $1,000 = 8.6), then multiply the result by the number in the line under the heading entitled “Expenses Paid During the Period” to estimate the expenses you paid on your account during this period.
Hypothetical Example for Comparison Purposes
The second set of columns of the table below provides information about hypothetical account values and hypothetical expenses based on a Fund’s actual expense ratio and an assumed rate of return of 5% per year before expenses, which is not the Fund’s actual return. The hypothetical account values and expenses may not be used to estimate the actual ending account balance or expenses you paid for the period. You may use this information to compare the ongoing costs of investing in a Fund and other funds. To do so, compare this 5% hypothetical example with the 5% hypothetical examples that appear in the shareholder reports of the other funds.
Please note that the expenses shown in the table are meant to highlight your ongoing costs only and do not reflect any transactional costs, such as brokerage commissions paid on purchases and sales of shares of the Funds. Therefore, the second set of columns of the table is useful in comparing ongoing costs only, and will not help you determine the relative total costs of owning different exchange-traded funds. In addition, if these transactional costs were included, your costs would be higher. Expense ratios may vary period to period because of various factors, such as an increase in expenses not covered by the management fee (extraordinary expenses and interest expense). Expenses are equal to a Fund's annualized expense ratio multiplied by average account value over the period, multiplied by 183/365 (to reflect the one-half year period).
| | Actual Return | | Hypothetical (5% return before expenses) |
| | Beginning
Account Value
April 1, 2021 | | Ending
Account Value
September 30, 2021 | | Expenses paid
during the period
April 1, 2021
through
September 30, 2021 | | Beginning
Account Value
April 1, 2021 | | Ending
Account Value
September 30, 2021 | | Expenses paid
during the period
April 1, 2021
through
September 30, 2021 | | Annualized
expense
ratio |
| Hartford Longevity Economy ETF | $ 1,000.00 | | $ 1,066.50 | | $ 2.28 | | $ 1,000.00 | | $ 1,022.86 | | $ 2.23 | | 0.44% |
| Hartford Multifactor Developed Markets (ex-US) ETF | $ 1,000.00 | | $ 1,037.90 | | $ 1.48 | | $ 1,000.00 | | $ 1,023.61 | | $ 1.47 | | 0.29% |
| Hartford Multifactor Diversified International ETF | $ 1,000.00 | | $ 1,048.10 | | $ 1.49 | | $ 1,000.00 | | $ 1,023.61 | | $ 1.47 | | 0.29% |
| Hartford Multifactor Emerging Markets ETF | $ 1,000.00 | | $ 1,036.60 | | $ 2.25 | | $ 1,000.00 | | $ 1,022.86 | | $ 2.23 | | 0.44% |
| Hartford Multifactor Small Cap ETF | $ 1,000.00 | | $ 1,015.40 | | $ 1.72 | | $ 1,000.00 | | $ 1,023.36 | | $ 1.72 | | 0.34% |
| Hartford Multifactor US Equity ETF | $ 1,000.00 | | $ 1,064.20 | | $ 0.98 | | $ 1,000.00 | | $ 1,024.12 | | $ 0.96 | | 0.19% |
Hartford Longevity Economy ETF
Schedule of Investments
September 30, 2021
| Shares or Principal Amount | | Market Value† |
| COMMON STOCKS - 99.9% |
| | Automobiles & Components - 1.1% |
| 6,215 | Ford Motor Co.* | $ 88,004 |
| 2,917 | General Motors Co.* | 153,755 |
| 561 | Gentex Corp. | 18,502 |
| 119 | Thor Industries, Inc. | 14,609 |
| 185 | Winnebago Industries, Inc. | 13,403 |
| | | | 288,273 |
| | Banks - 4.5% |
| 2,780 | Bank of America Corp. | 118,011 |
| 223 | CIT Group, Inc. | 11,585 |
| 2,642 | Citigroup, Inc. | 185,415 |
| 1,371 | Citizens Financial Group, Inc. | 64,410 |
| 179 | Eagle Bancorp, Inc. | 10,292 |
| 2,481 | Fifth Third Bancorp | 105,294 |
| 131 | First Horizon National Corp. | 2,134 |
| 350 | First Interstate BancSystem, Inc. Class A | 14,091 |
| 1,087 | JP Morgan Chase & Co. | 177,931 |
| 1,610 | KeyCorp. | 34,808 |
| 84 | M&T Bank Corp. | 12,545 |
| 361 | OceanFirst Financial Corp. | 7,729 |
| 385 | PNC Financial Services Group, Inc. | 75,321 |
| 436 | Popular, Inc. | 33,864 |
| 367 | Preferred Bank | 24,472 |
| 738 | Regions Financial Corp. | 15,727 |
| 1,266 | Towne Bank | 39,385 |
| 632 | Trustmark Corp. | 20,363 |
| 1,373 | U.S. Bancorp | 81,611 |
| 932 | Umpqua Holdings Corp. | 18,873 |
| 1,327 | Wells Fargo & Co. | 61,586 |
| | | | 1,115,447 |
| | Capital Goods - 1.9% |
| 467 | General Dynamics Corp. | 91,546 |
| 527 | Huntington Ingalls Industries, Inc. | 101,743 |
| 224 | L3Harris Technologies, Inc. | 49,334 |
| 345 | Lockheed Martin Corp. | 119,059 |
| 335 | Northrop Grumman Corp. | 120,650 |
| | | | 482,332 |
| | Consumer Durables & Apparel - 2.6% |
| 511 | Carter's, Inc. | 49,690 |
| 570 | D.R. Horton, Inc. | 47,863 |
| 732 | Garmin Ltd. | 113,797 |
| 1,010 | Kontoor Brands, Inc. | 50,450 |
| 24 | La-Z-Boy, Inc. | 774 |
| 543 | Leggett & Platt, Inc. | 24,348 |
| 8 | Mohawk Industries, Inc.* | 1,419 |
| 1,345 | Newell Brands, Inc. | 29,778 |
| 6 | NVR, Inc.* | 28,764 |
| 176 | Polaris, Inc. | 21,060 |
| 635 | PulteGroup, Inc. | 29,159 |
| 1,749 | Sturm Ruger & Co., Inc. | 129,041 |
| 583 | Whirlpool Corp. | 118,850 |
| | | | 644,993 |
| | Consumer Services - 2.7% |
| 24 | Booking Holdings, Inc.* | 56,973 |
| 124 | Boyd Gaming Corp.* | 7,844 |
| 715 | Choice Hotels International, Inc. | 90,355 |
| 39 | Churchill Downs, Inc. | 9,363 |
| 6 | Domino's Pizza, Inc. | 2,862 |
| 956 | Everi Holdings, Inc.* | 23,116 |
| 146 | Graham Holdings Co. Class B | 86,017 |
| 1,993 | H&R Block, Inc. | 49,825 |
| 128 | Hilton Worldwide Holdings, Inc.* | 16,910 |
| 286 | McDonald's Corp. | 68,958 |
| Shares or Principal Amount | | Market Value† |
| COMMON STOCKS - 99.9% - (continued) |
| | Consumer Services - 2.7% - (continued) |
| 186 | Monarch Casino & Resort, Inc.* | $ 12,460 |
| 733 | Red Rock Resorts, Inc. Class A* | 37,544 |
| 152 | Starbucks Corp. | 16,767 |
| 531 | Travel + Leisure Co. | 28,955 |
| 104 | Vail Resorts, Inc.* | 34,741 |
| 429 | Wyndham Hotels & Resorts, Inc. | 33,115 |
| 744 | Yum! Brands, Inc. | 90,999 |
| | | | 666,804 |
| | Diversified Financials - 3.8% |
| 1,489 | Ally Financial, Inc. | 76,013 |
| 82 | American Express Co. | 13,737 |
| 2,633 | Bank of New York Mellon Corp. | 136,495 |
| 142 | Berkshire Hathaway, Inc. Class B* | 38,758 |
| 9 | BlackRock, Inc. | 7,548 |
| 554 | Capital One Financial Corp. | 89,731 |
| 268 | Charles Schwab Corp. | 19,521 |
| 118 | Discover Financial Services | 14,496 |
| 197 | Goldman Sachs Group, Inc. | 74,472 |
| 230 | Houlihan Lokey, Inc. | 21,183 |
| 35 | Intercontinental Exchange, Inc. | 4,019 |
| 170 | Janus Henderson Group plc | 7,026 |
| 697 | Jefferies Financial Group, Inc. | 25,880 |
| 68 | Moody's Corp. | 24,147 |
| 484 | Morgan Stanley | 47,098 |
| 236 | Nasdaq, Inc. | 45,553 |
| 493 | Northern Trust Corp. | 53,150 |
| 1,326 | Raymond James Financial, Inc. | 122,363 |
| 10 | S&P Global, Inc. | 4,249 |
| 125 | State Street Corp. | 10,590 |
| 970 | Synchrony Financial | 47,414 |
| 175 | T Rowe Price Group, Inc. | 34,423 |
| 401 | Voya Financial, Inc. | 24,617 |
| | | | 942,483 |
| | Food & Staples Retailing - 0.9% |
| 43 | Costco Wholesale Corp. | 19,322 |
| 2,090 | Kroger Co. | 84,499 |
| 809 | Walgreens Boots Alliance, Inc. | 38,063 |
| 324 | Walmart, Inc. | 45,159 |
| 650 | Weis Markets, Inc. | 34,158 |
| | | | 221,201 |
| | Food, Beverage & Tobacco - 1.1% |
| 1,756 | Flowers Foods, Inc. | 41,494 |
| 111 | General Mills, Inc. | 6,640 |
| 391 | Hershey Co. | 66,177 |
| 390 | Kellogg Co. | 24,929 |
| 1,625 | Tyson Foods, Inc. Class A | 128,277 |
| | | | 267,517 |
| | Health Care Equipment & Services - 13.1% |
| 505 | Abbott Laboratories | 59,656 |
| 625 | Anthem, Inc. | 233,000 |
| 2,159 | Baxter International, Inc. | 173,648 |
| 325 | Becton Dickinson and Co. | 79,892 |
| 594 | Boston Scientific Corp.* | 25,774 |
| 3,235 | Cardinal Health, Inc. | 160,003 |
| 766 | Centene Corp.* | 47,730 |
| 2,421 | Cerner Corp. | 170,729 |
| 1,479 | Change Healthcare, Inc.* | 30,970 |
| 646 | Cigna Corp. | 129,303 |
| 68 | CONMED Corp. | 8,896 |
| 193 | Cooper Cos., Inc. | 79,769 |
| 2,422 | CVS Health Corp. | 205,531 |
| 105 | Danaher Corp. | 31,966 |
The accompanying notes are an integral part of these financial statements.
Hartford Longevity Economy ETF
Schedule of Investments – (continued)
September 30, 2021
| Shares or Principal Amount | | Market Value† |
| COMMON STOCKS - 99.9% - (continued) |
| | Health Care Equipment & Services - 13.1% - (continued) |
| 668 | Edwards Lifesciences Corp.* | $ 75,624 |
| 532 | Encompass Health Corp. | 39,921 |
| 738 | Globus Medical, Inc. Class A* | 56,546 |
| 335 | HCA Healthcare, Inc. | 81,311 |
| 740 | Hill-Rom Holdings, Inc. | 111,000 |
| 275 | Hologic, Inc.* | 20,298 |
| 571 | Humana, Inc. | 222,205 |
| 82 | IDEXX Laboratories, Inc.* | 50,996 |
| 461 | Laboratory Corp. of America Holdings* | 129,744 |
| 395 | Magellan Health, Inc.* | 37,347 |
| 801 | Medtronic plc | 100,405 |
| 307 | Molina Healthcare, Inc.* | 83,292 |
| 176 | National HealthCare Corp. | 12,317 |
| 197 | NuVasive, Inc.* | 11,790 |
| 2,267 | Premier, Inc. Class A | 87,869 |
| 1,178 | Quest Diagnostics, Inc. | 171,175 |
| 124 | ResMed, Inc. | 32,680 |
| 349 | STERIS plc | 71,294 |
| 400 | Stryker Corp. | 105,488 |
| 527 | UnitedHealth Group, Inc. | 205,920 |
| 174 | Universal Health Services, Inc. Class B | 24,076 |
| 85 | West Pharmaceutical Services, Inc. | 36,086 |
| 473 | Zimmer Biomet Holdings, Inc. | 69,228 |
| | | | 3,273,479 |
| | Household & Personal Products - 1.9% |
| 293 | Church & Dwight Co., Inc. | 24,193 |
| 140 | Clorox Co. | 23,185 |
| 1,321 | Colgate-Palmolive Co. | 99,841 |
| 144 | Estee Lauder Cos., Inc. Class A | 43,190 |
| 674 | Kimberly-Clark Corp. | 89,265 |
| 315 | Nu Skin Enterprises, Inc. Class A | 12,748 |
| 450 | Procter & Gamble Co. | 62,910 |
| 764 | Reynolds Consumer Products, Inc. | 20,888 |
| 910 | Spectrum Brands Holdings, Inc. | 87,060 |
| 126 | USANA Health Sciences, Inc.* | 11,617 |
| | | | 474,897 |
| | Insurance - 3.6% |
| 2,051 | Aflac, Inc. | 106,919 |
| 814 | Allstate Corp. | 103,630 |
| 421 | American Financial Group, Inc. | 52,974 |
| 185 | American National Group, Inc. | 34,971 |
| 279 | Arch Capital Group Ltd.* | 10,652 |
| 439 | Athene Holding Ltd. Class A* | 30,234 |
| 445 | Cincinnati Financial Corp. | 50,828 |
| 794 | Employers Holdings, Inc. | 31,355 |
| 140 | Fidelity National Financial, Inc. | 6,348 |
| 59 | First American Financial Corp. | 3,956 |
| 108 | Hanover Insurance Group, Inc. | 13,999 |
| 4 | Markel Corp.* | 4,780 |
| 1,462 | Mercury General Corp. | 81,390 |
| 205 | MetLife, Inc. | 12,655 |
| 4,695 | Old Republic International Corp. | 108,595 |
| 859 | Principal Financial Group, Inc. | 55,320 |
| 1,360 | Prudential Financial, Inc. | 143,072 |
| 63 | Safety Insurance Group, Inc. | 4,993 |
| 203 | Travelers Cos., Inc. | 30,858 |
| 308 | Unum Group | 7,718 |
| | | | 895,247 |
| | Media & Entertainment - 12.3% |
| 585 | Activision Blizzard, Inc. | 45,273 |
| 89 | Alphabet, Inc. Class A* | 237,943 |
| Shares or Principal Amount | | Market Value† |
| COMMON STOCKS - 99.9% - (continued) |
| | Media & Entertainment - 12.3% - (continued) |
| 727 | Altice USA, Inc.* | $ 15,063 |
| 1,565 | Bumble, Inc.* | 78,219 |
| 3,986 | Cargurus, Inc.* | 125,200 |
| 132 | Charter Communications, Inc. Class A* | 96,038 |
| 3,046 | Comcast Corp. Class A | 170,363 |
| 269 | DISH Network Corp. Class A* | 11,691 |
| 470 | Electronic Arts, Inc. | 66,857 |
| 683 | Facebook, Inc. Class A* | 231,803 |
| 1,635 | Fox Corp. | 65,580 |
| 1,760 | IAC/InterActiveCorp * | 229,310 |
| 22 | John Wiley & Sons, Inc. Class A | 1,149 |
| 48 | Liberty Broadband Corp. Class C* | 8,290 |
| 811 | Liberty Media Corp-Liberty Formula One* | 41,694 |
| 3,089 | Lions Gate Entertainment Corp.* | 43,833 |
| 170 | Madison Square Garden Sports Corp.* | 31,611 |
| 1,403 | Match Group, Inc.* | 220,257 |
| 216 | Netflix, Inc.* | 131,833 |
| 1,160 | News Corp. Class A | 27,295 |
| 137 | Nexstar Media Group, Inc. | 20,819 |
| 2,222 | Pinterest, Inc. Class A* | 113,211 |
| 9,923 | QuinStreet, Inc.* | 174,248 |
| 6,849 | Sirius XM Holdings, Inc.(1) | 41,779 |
| 1,255 | Snap, Inc. Class A* | 92,707 |
| 4,004 | TEGNA, Inc. | 78,959 |
| 281 | TripAdvisor, Inc.* | 9,512 |
| 2,147 | Twitter, Inc.* | 129,657 |
| 647 | Walt Disney Co.* | 109,453 |
| 2,678 | World Wrestling Entertainment, Inc. | 150,664 |
| 5,623 | Yelp, Inc.* | 209,401 |
| 581 | Zillow Group, Inc.* | 51,209 |
| 353 | ZoomInfo Technologies, Inc.* | 21,600 |
| | | | 3,082,521 |
| | Pharmaceuticals, Biotechnology & Life Sciences - 8.7% |
| 1,811 | AbbVie, Inc. | 195,353 |
| 675 | Agilent Technologies, Inc. | 106,333 |
| 1,044 | Amgen, Inc. | 222,007 |
| 10 | Bio-Rad Laboratories, Inc. Class A* | 7,460 |
| 2,467 | Bristol-Myers Squibb Co. | 145,972 |
| 346 | Bruker Corp. | 27,023 |
| 75 | Charles River Laboratories International, Inc.* | 30,950 |
| 240 | Eli Lilly & Co. | 55,452 |
| 2,610 | Gilead Sciences, Inc. | 182,308 |
| 151 | Incyte Corp.* | 10,386 |
| 239 | IQVIA Holdings, Inc.* | 57,250 |
| 386 | Jazz Pharmaceuticals plc* | 50,261 |
| 1,249 | Johnson & Johnson | 201,713 |
| 2,728 | Merck & Co., Inc. | 204,900 |
| 53 | Mettler-Toledo International, Inc.* | 73,000 |
| 74 | PerkinElmer, Inc. | 12,823 |
| 3,835 | Pfizer, Inc. | 164,943 |
| 1,225 | Prestige Consumer Healthcare, Inc.* | 68,735 |
| 152 | Regeneron Pharmaceuticals, Inc.* | 91,987 |
| 63 | Thermo Fisher Scientific, Inc. | 35,994 |
| 338 | Vertex Pharmaceuticals, Inc.* | 61,310 |
| 216 | Waters Corp.* | 77,177 |
| 534 | Zoetis, Inc. | 103,671 |
| | | | 2,187,008 |
| | Real Estate - 1.2% |
| 2,713 | Apple Hospitality, Inc. REIT | 42,676 |
| 192 | Extra Space Storage, Inc. REIT | 32,254 |
| 596 | Healthpeak Properties, Inc. REIT | 19,954 |
| 160 | Public Storage REIT | 47,536 |
The accompanying notes are an integral part of these financial statements.
Hartford Longevity Economy ETF
Schedule of Investments – (continued)
September 30, 2021
| Shares or Principal Amount | | Market Value† |
| COMMON STOCKS - 99.9% - (continued) |
| | Real Estate - 1.2% - (continued) |
| 738 | Ventas, Inc. REIT | $ 40,745 |
| 2,515 | VICI Properties, Inc. REIT | 71,451 |
| 728 | Welltower, Inc. REIT | 59,987 |
| | | | 314,603 |
| | Retailing - 9.0% |
| 1,171 | Aaron's Co., Inc. | 32,249 |
| 75 | Amazon.com, Inc.* | 246,378 |
| 399 | BATH + BODY WORKS, Inc. | 25,149 |
| 1,152 | Best Buy Co., Inc. | 121,778 |
| 998 | Big Lots, Inc. | 43,273 |
| 4 | Chewy, Inc. Class A* | 272 |
| 411 | Dick's Sporting Goods, Inc. | 49,225 |
| 432 | Dollar General Corp. | 91,644 |
| 611 | Dollar Tree, Inc.* | 58,485 |
| 3,537 | eBay, Inc. | 246,423 |
| 199 | Etsy, Inc.* | 41,384 |
| 2,201 | Groupon, Inc.* | 50,205 |
| 614 | Home Depot, Inc. | 201,552 |
| 917 | Lowe's Cos., Inc. | 186,023 |
| 234 | Overstock.com, Inc.* | 18,233 |
| 17,349 | Qurate Retail, Inc. Series A | 176,786 |
| 702 | Rent-A-Center, Inc. | 39,459 |
| 1,563 | Revolve Group, Inc.* | 96,547 |
| 1,100 | Shutterstock, Inc. | 124,652 |
| 767 | Target Corp. | 175,467 |
| 585 | Tractor Supply Co. | 118,527 |
| 376 | Wayfair, Inc. Class A* | 96,072 |
| | | | 2,239,783 |
| | Semiconductors & Semiconductor Equipment - 4.9% |
| 198 | Advanced Micro Devices, Inc.* | 20,374 |
| 712 | Analog Devices, Inc. | 119,246 |
| 231 | Broadcom, Inc. | 112,019 |
| 248 | Diodes, Inc.* | 22,466 |
| 4,961 | Intel Corp. | 264,322 |
| 67 | Microchip Technology, Inc. | 10,284 |
| 1,019 | Micron Technology, Inc.* | 72,329 |
| 215 | NVIDIA Corp. | 44,539 |
| 260 | NXP Semiconductors N.V. | 50,926 |
| 558 | ON Semiconductor Corp.* | 25,540 |
| 318 | Qorvo, Inc.* | 53,166 |
| 856 | QUALCOMM, Inc. | 110,407 |
| 451 | Skyworks Solutions, Inc. | 74,316 |
| 187 | Synaptics, Inc.* | 33,610 |
| 1,025 | Texas Instruments, Inc. | 197,015 |
| 89 | Xilinx, Inc. | 13,438 |
| | | | 1,223,997 |
| | Software & Services - 15.3% |
| 1,192 | ACI Worldwide, Inc.* | 36,630 |
| 212 | Adobe, Inc.* | 122,053 |
| 99 | Akamai Technologies, Inc.* | 10,354 |
| 53 | Aspen Technology, Inc.* | 6,508 |
| 170 | Autodesk, Inc.* | 48,479 |
| 382 | Automatic Data Processing, Inc. | 76,369 |
| 211 | Bentley Systems, Inc. Class B | 12,795 |
| 194 | Blackbaud, Inc.* | 13,648 |
| 651 | Broadridge Financial Solutions, Inc. | 108,483 |
| 66 | Cadence Design Systems, Inc.* | 9,995 |
| 2,465 | CDK Global, Inc. | 104,886 |
| 36 | Citrix Systems, Inc. | 3,865 |
| 696 | CommVault Systems, Inc.* | 52,416 |
| 188 | Concentrix Corp.* | 33,276 |
| 3,230 | CSG Systems International, Inc. | 155,686 |
| Shares or Principal Amount | | Market Value† |
| COMMON STOCKS - 99.9% - (continued) |
| | Software & Services - 15.3% - (continued) |
| 2,087 | Dolby Laboratories, Inc. Class A | $ 183,656 |
| 1,292 | Dropbox, Inc. Class A* | 37,752 |
| 606 | Evertec, Inc. | 27,706 |
| 569 | ExlService Holdings, Inc.* | 70,055 |
| 200 | Fair Isaac Corp.* | 79,586 |
| 429 | Fortinet, Inc.* | 125,285 |
| 550 | InterDigital, Inc. | 37,301 |
| 252 | Intuit, Inc. | 135,957 |
| 1,343 | j2 Global, Inc.* | 183,481 |
| 118 | Jack Henry & Associates, Inc. | 19,359 |
| 1,497 | MAXIMUS, Inc. | 124,550 |
| 1,481 | McAfee Corp. | 32,745 |
| 769 | Microsoft Corp. | 216,797 |
| 1,684 | NCR Corp.* | 65,272 |
| 5,228 | Nortonlifelock, Inc. | 132,268 |
| 2,512 | Oracle Corp. | 218,871 |
| 127 | Palo Alto Networks, Inc.* | 60,833 |
| 1,192 | Paychex, Inc. | 134,040 |
| 4,060 | Progress Software Corp. | 199,711 |
| 246 | salesforce.com, Inc.* | 66,720 |
| 2,267 | SS&C Technologies Holdings, Inc. | 157,330 |
| 122 | Synopsys, Inc.* | 36,528 |
| 75 | TTEC Holdings, Inc. | 7,015 |
| 1,875 | Verint Systems, Inc.* | 83,981 |
| 430 | VeriSign, Inc.* | 88,154 |
| 178 | Visa, Inc. Class A | 39,650 |
| 1,438 | VMware, Inc. Class A*(1) | 213,831 |
| 5,876 | Western Union Co. | 118,813 |
| 7,163 | Xperi Holding Corp. | 134,951 |
| | | | 3,827,641 |
| | Technology Hardware & Equipment - 8.3% |
| 1,301 | Apple, Inc. | 184,092 |
| 186 | Arrow Electronics, Inc.* | 20,886 |
| 613 | Avnet, Inc. | 22,663 |
| 428 | Benchmark Electronics, Inc. | 11,432 |
| 444 | CDW Corp. | 80,817 |
| 2,255 | Dell Technologies, Inc.* | 234,610 |
| 13,822 | Hewlett Packard Enterprise Co. | 196,963 |
| 7,676 | HP, Inc. | 210,015 |
| 527 | Insight Enterprises, Inc.* | 47,472 |
| 1,365 | Jabil, Inc. | 79,675 |
| 1,471 | Methode Electronics, Inc. | 61,856 |
| 2,294 | NetApp, Inc. | 205,909 |
| 121 | Plexus Corp.* | 10,819 |
| 1,944 | Sanmina Corp.* | 74,922 |
| 2,242 | Seagate Technology Holdings plc | 185,010 |
| 2,795 | Super Micro Computer, Inc.* | 102,213 |
| 723 | SYNNEX Corp. | 75,264 |
| 164 | TE Connectivity Ltd. | 22,504 |
| 1,829 | TTM Technologies, Inc.* | 22,991 |
| 900 | Western Digital Corp.* | 50,796 |
| 8,707 | Xerox Holdings Corp. | 175,620 |
| | | | 2,076,529 |
| | Telecommunication Services - 1.3% |
| 2,089 | AT&T, Inc. | 56,424 |
| 3,688 | Telephone & Data Systems, Inc. | 71,916 |
| 388 | T-Mobile U.S., Inc.* | 49,571 |
| 2,925 | Verizon Communications, Inc. | 157,979 |
| | | | 335,890 |
| | Transportation - 0.7% |
| 376 | Landstar System, Inc. | 59,340 |
| 59 | Old Dominion Freight Line, Inc. | 16,873 |
The accompanying notes are an integral part of these financial statements.
Hartford Longevity Economy ETF
Schedule of Investments – (continued)
September 30, 2021
| Shares or Principal Amount | | Market Value† |
| COMMON STOCKS - 99.9% - (continued) |
| | Transportation - 0.7% - (continued) |
| 2,261 | Schneider National, Inc. Class B | $ 51,415 |
| 913 | Werner Enterprises, Inc. | 40,419 |
| | | | 168,047 |
| | Utilities - 1.0% |
| 167 | Alliant Energy Corp. | 9,349 |
| 171 | American Electric Power Co., Inc. | 13,882 |
| 46 | Edison International | 2,552 |
| 231 | Entergy Corp. | 22,941 |
| 144 | Evergy, Inc. | 8,957 |
| 963 | Exelon Corp. | 46,551 |
| 1,642 | FirstEnergy Corp. | 58,488 |
| 426 | MDU Resources Group, Inc. | 12,639 |
| 413 | Otter Tail Corp. | 23,116 |
| 29 | PPL Corp. | 808 |
| 280 | Southern Co. | 17,351 |
| 655 | UGI Corp. | 27,916 |
| | | | 244,550 |
| | Total Common Stocks
(cost $25,253,706) | | $ 24,973,242 |
| SHORT-TERM INVESTMENTS - 0.9% |
| | Securities Lending Collateral - 0.9% |
| 15,205 | Fidelity Investments Money Market Funds, Government Portfolio, Institutional Class, 0.01%(2) | $ 15,205 |
| 201,580 | Goldman Sachs Financial Square Funds, Government Fund, Institutional Class, 0.03%(2) | 201,580 |
| 11,009 | Invesco Government & Agency Portfolio, Institutional Class, 0.03%(2) | 11,009 |
| | Total Short-Term Investments
(cost $227,794) | $ 227,794 |
| | Total Investments
(cost $25,481,500) | 100.8% | $ 25,201,036 |
| | Other Assets and Liabilities | (0.8)% | (200,093) |
| | Total Net Assets | 100.0% | $ 25,000,943 |
| Note: | Percentage of investments as shown is the ratio of the total market value to total net assets. |
| | Equity industry classifications used in this report are the Global Industry Classification Standard, which was developed by and is the exclusive property and service mark of MSCI, Inc. and Standard & Poor’s. |
| | For Fund compliance purposes, the Fund may not use the same classification system. These classifications are used for financial reporting purposes. |
| | See “Glossary” for abbreviation descriptions. |
| * | Non-income producing. |
| (1) | Represents entire or partial securities on loan. See Note 8 in the accompanying Notes to Financial Statements for securities lending information. |
| (2) | Current yield as of period end. |
| † | See Significant Accounting Policies of accompanying Notes to Financial Statements regarding valuation of investments. |
The accompanying notes are an integral part of these financial statements.
Hartford Longevity Economy ETF
Schedule of Investments – (continued)
September 30, 2021
Fair Value Summary
The following is a summary of the fair valuations according to the inputs used as of September 30, 2021 in valuing the Fund’s investments.
| Description | | Total | | Level 1 | | Level 2 | | Level 3(1) |
| Assets | | | | | | | | |
| Common Stocks | | | | | | | | |
| Automobiles & Components | | $ 288,273 | | $ 288,273 | | $ — | | $ — |
| Banks | | 1,115,447 | | 1,115,447 | | — | | — |
| Capital Goods | | 482,332 | | 482,332 | | — | | — |
| Consumer Durables & Apparel | | 644,993 | | 644,993 | | — | | — |
| Consumer Services | | 666,804 | | 666,804 | | — | | — |
| Diversified Financials | | 942,483 | | 942,483 | | — | | — |
| Food & Staples Retailing | | 221,201 | | 221,201 | | — | | — |
| Food, Beverage & Tobacco | | 267,517 | | 267,517 | | — | | — |
| Health Care Equipment & Services | | 3,273,479 | | 3,273,479 | | — | | — |
| Household & Personal Products | | 474,897 | | 474,897 | | — | | — |
| Insurance | | 895,247 | | 895,247 | | — | | — |
| Media & Entertainment | | 3,082,521 | | 3,082,521 | | — | | — |
| Pharmaceuticals, Biotechnology & Life Sciences | | 2,187,008 | | 2,187,008 | | — | | — |
| Real Estate | | 314,603 | | 314,603 | | — | | — |
| Retailing | | 2,239,783 | | 2,239,783 | | — | | — |
| Semiconductors & Semiconductor Equipment | | 1,223,997 | | 1,223,997 | | — | | — |
| Software & Services | | 3,827,641 | | 3,827,641 | | — | | — |
| Technology Hardware & Equipment | | 2,076,529 | | 2,076,529 | | — | | — |
| Telecommunication Services | | 335,890 | | 335,890 | | — | | — |
| Transportation | | 168,047 | | 168,047 | | — | | — |
| Utilities | | 244,550 | | 244,550 | | — | | — |
| Short-Term Investments | | 227,794 | | 227,794 | | — | | — |
| Total | | $ 25,201,036 | | $ 25,201,036 | | $ — | | $ — |
| (1) | For the period ended September 30, 2021, there were no transfers in and out of Level 3. |
The accompanying notes are an integral part of these financial statements.
Hartford Multifactor Developed Markets (ex-US) ETF
Schedule of Investments
September 30, 2021
| Shares or Principal Amount | | Market Value† |
| COMMON STOCKS - 98.9% |
| | Australia - 8.9% |
| 199,627 | Ansell Ltd. | $ 4,931,661 |
| 9,981 | ASX Ltd. | 583,992 |
| 1,487,798 | Aurizon Holdings Ltd. | 4,073,156 |
| 1,484,279 | AusNet Services | 2,701,867 |
| 398,231 | Australia & New Zealand Banking Group Ltd. | 8,097,693 |
| 564,195 | Bendigo & Adelaide Bank Ltd. | 3,851,313 |
| 265,544 | BHP Group Ltd. | 7,214,191 |
| 543,020 | BlueScope Steel Ltd. | 8,041,138 |
| 269,890 | Brambles Ltd. | 2,099,667 |
| 768,089 | Coles Group Ltd. | 9,426,549 |
| 9,667 | Commonwealth Bank of Australia | 728,532 |
| 546,456 | Computershare Ltd. | 7,192,028 |
| 29,951 | CSL Ltd. | 6,347,742 |
| 1,226,709 | Dexus REIT | 9,570,026 |
| 404,521 | Evolution Mining Ltd. | 1,019,798 |
| 852,534 | Fortescue Metals Group Ltd. | 9,212,789 |
| 115,202 | GPT Group REIT | 421,906 |
| 1,313,269 | Harvey Norman Holdings Ltd. | 4,771,660 |
| 261,558 | JB Hi-Fi Ltd. | 8,600,389 |
| 926,573 | Medibank Pvt Ltd. | 2,402,824 |
| 1,417,454 | Metcash Ltd. | 4,023,920 |
| 287,654 | Mineral Resources Ltd. | 9,310,933 |
| 2,809,331 | Mirvac Group REIT | 6,067,670 |
| 5,487 | National Australia Bank Ltd. | 110,305 |
| 90,245 | Premier Investments Ltd. | 1,979,123 |
| 18,439 | Pro Medicus Ltd. | 727,373 |
| 318,495 | Reece Ltd. | 4,401,142 |
| 352,629 | Sonic Healthcare Ltd. | 10,356,982 |
| 86,529 | Suncorp Group Ltd. | 785,053 |
| 3,224,920 | Telstra Corp. Ltd. | 9,155,020 |
| 100,055 | Washington H Soul Pattinson & Co., Ltd.(1) | 2,820,161 |
| 308,308 | Wesfarmers Ltd. | 12,415,879 |
| 30,291 | Westpac Banking Corp. | 568,899 |
| 350,389 | Woolworths Group Ltd. | 9,959,626 |
| | | | 173,971,007 |
| | Austria - 0.3% |
| 62,442 | Andritz AG | 3,421,519 |
| 34,690 | Oesterreichische Post AG | 1,471,465 |
| 28,662 | Vienna Insurance Group AG Wiener Versicherung Gruppe | 827,124 |
| | | | 5,720,108 |
| | Belgium - 1.5% |
| 8,857 | Ackermans & van Haaren N.V. | 1,528,432 |
| 161,286 | Ageas S.A. | 8,004,018 |
| 6,740 | Cofinimmo S.A. REIT | 1,023,283 |
| 67,341 | Etablissements Franz Colruyt N.V.(1) | 3,433,973 |
| 22,947 | Groupe Bruxelles Lambert S.A. | 2,528,598 |
| 374,427 | Proximus S.A. | 7,437,769 |
| 6,012 | Sofina S.A. | 2,391,283 |
| 21,362 | UCB S.A. | 2,396,525 |
| 4,067 | VGP N.V. | 936,091 |
| | | | 29,679,972 |
| | Canada - 10.7% |
| 213,847 | Alimentation Couche-Tard, Inc. Class B | 8,180,152 |
| 42,439 | Atco Ltd. Class I | 1,361,090 |
| 325,951 | B2Gold Corp. | 1,114,077 |
| 83,436 | Bank of Montreal | 8,328,123 |
| 61,230 | Bank of Nova Scotia | 3,768,000 |
| 171,853 | BCE, Inc. | 8,607,233 |
| 138,275 | Canadian Apartment Properties REIT | 6,451,778 |
| 14,239 | Canadian Imperial Bank of Commerce(1) | 1,584,796 |
| Shares or Principal Amount | | Market Value† |
| COMMON STOCKS - 98.9% - (continued) |
| | Canada - 10.7% - (continued) |
| 32,906 | Canadian Tire Corp. Ltd. Class A | $ 4,603,749 |
| 52,583 | Capital Power Corp. | 1,772,759 |
| 69,989 | CGI, Inc.* | 5,943,969 |
| 1,239 | Constellation Software, Inc. | 2,029,403 |
| 78,505 | Emera, Inc. | 3,554,522 |
| 200,891 | Empire Co., Ltd. Class A | 6,121,003 |
| 62,476 | Enbridge, Inc. | 2,488,486 |
| 19,736 | Fairfax Financial Holdings Ltd. | 7,965,595 |
| 100,157 | Finning International, Inc. | 2,470,621 |
| 65,525 | Fortis, Inc. | 2,906,303 |
| 57,864 | George Weston Ltd. | 6,240,186 |
| 329,420 | Great-West Lifeco, Inc. | 10,021,586 |
| 181,436 | Hydro One Ltd.(2) | 4,287,953 |
| 94,602 | iA Financial Corp., Inc. | 5,366,144 |
| 25,794 | IGM Financial, Inc. | 921,323 |
| 509,079 | Kinross Gold Corp. | 2,728,536 |
| 61,968 | Linamar Corp. | 3,217,141 |
| 189,572 | Loblaw Cos., Ltd. | 13,006,748 |
| 17,247 | Magna International, Inc. | 1,297,694 |
| 185,012 | Manulife Financial Corp. | 3,560,479 |
| 179,402 | Metro, Inc. | 8,764,408 |
| 27,404 | Onex Corp. | 1,936,894 |
| 45,112 | Open Text Corp. | 2,201,384 |
| 91,860 | Parkland Corp.(1) | 2,580,651 |
| 314,836 | Power Corp. of Canada | 10,375,659 |
| 155,796 | Quebecor, Inc. Class B | 3,764,389 |
| 106,042 | Rogers Communications, Inc. Class B | 4,951,166 |
| 87,984 | Royal Bank of Canada | 8,752,910 |
| 71,639 | Saputo, Inc. | 1,821,441 |
| 99,011 | Shaw Communications, Inc. Class B | 2,877,677 |
| 83,848 | Stantec, Inc. | 3,938,080 |
| 68,316 | Sun Life Financial, Inc. | 3,515,967 |
| 40,595 | TC Energy Corp. | 1,953,405 |
| 189,655 | TELUS Corp. | 4,167,814 |
| 50,535 | Toromont Industries Ltd. | 4,217,599 |
| 101,663 | Toronto-Dominion Bank | 6,728,849 |
| 150,071 | Tourmaline Oil Corp. | 5,241,853 |
| | | | 207,689,595 |
| | China - 0.5% |
| 9,885,100 | Yangzijiang Shipbuilding Holdings Ltd. | 10,048,201 |
| | Denmark - 2.0% |
| 2,358 | AP Moller - Maersk A/S Class B | 6,389,213 |
| 5,327 | Carlsberg A/S Class B | 871,353 |
| 44,569 | Coloplast A/S Class B | 6,991,584 |
| 151,786 | H. Lundbeck A/S | 4,126,972 |
| 148,303 | Novo Nordisk A/S Class B | 14,363,162 |
| 8,010 | SimCorp A/S | 948,551 |
| 24,880 | Topdanmark A/S | 1,287,411 |
| 169,724 | Tryg A/S | 3,859,468 |
| | | | 38,837,714 |
| | Finland - 1.0% |
| 15,600 | Elisa Oyj | 969,791 |
| 75,105 | Fortum Oyj | 2,288,359 |
| 214,790 | Kesko Oyj Class B | 7,428,097 |
| 50,959 | Kone Oyj Class B | 3,589,602 |
| 57,451 | Metsa Board Oyj | 538,988 |
| 15,256 | Nokian Renkaat Oyj | 548,286 |
| 108,915 | Orion Oyj Class B | 4,323,276 |
| | | | 19,686,399 |
| | France - 6.4% |
| 2,469 | Air Liquide S.A. | 396,539 |
The accompanying notes are an integral part of these financial statements.
Hartford Multifactor Developed Markets (ex-US) ETF
Schedule of Investments – (continued)
September 30, 2021
| Shares or Principal Amount | | Market Value† |
| COMMON STOCKS - 98.9% - (continued) |
| | France - 6.4% - (continued) |
| 19,579 | Arkema S.A. | $ 2,598,129 |
| 60,209 | Atos SE | 3,220,311 |
| 113,806 | AXA S.A. | 3,176,702 |
| 49,687 | BioMerieux | 5,675,553 |
| 52,514 | BNP Paribas S.A.(1) | 3,374,139 |
| 339,619 | Bollore S.A. | 1,969,975 |
| 326,128 | Bouygues S.A. | 13,568,981 |
| 3,073 | Capgemini SE | 641,596 |
| 550,200 | Carrefour S.A. | 9,912,336 |
| 36,484 | Cie de Saint-Gobain | 2,462,570 |
| 53,167 | Cie Generale des Etablissements Michelin SCA | 8,182,856 |
| 58,021 | Danone S.A. | 3,970,725 |
| 22,670 | Dassault Aviation S.A. | 2,559,029 |
| 43,598 | Eiffage S.A. | 4,430,286 |
| 465,717 | Electricite de France S.A. | 5,877,798 |
| 23,255 | Eurazeo SE | 2,189,800 |
| 20 | Hermes International | 27,734 |
| 50,806 | Ipsen S.A. | 4,861,266 |
| 4,988 | L'Oreal S.A. | 2,062,894 |
| 1,054,298 | Orange S.A.(1) | 11,427,009 |
| 36,617 | Publicis Groupe S.A. | 2,472,395 |
| 116,517 | Rubis SCA | 4,036,267 |
| 140,448 | Sanofi | 13,523,115 |
| 5,246 | Sartorius Stedim Biotech | 2,940,824 |
| 13,412 | SEB S.A. | 1,894,794 |
| 223,272 | Suez | 5,093,712 |
| 2,897 | Trigano S.A. | 545,926 |
| 31,483 | Verallia S.A.(2) | 1,087,319 |
| 77,720 | Vivendi S.A.(1) | 982,253 |
| | | | 125,162,833 |
| | Germany - 4.8% |
| 20,519 | Allianz SE | 4,633,392 |
| 393,144 | Aroundtown S.A. | 2,720,136 |
| 42,825 | Aurubis AG | 3,244,942 |
| 14,987 | Bayerische Motoren Werke AG | 1,437,474 |
| 41,535 | Brenntag AG | 3,878,878 |
| 37,200 | Covestro AG(2) | 2,558,322 |
| 12,339 | Dermapharm Holding SE | 1,192,644 |
| 98,953 | Deutsche Post AG | 6,247,852 |
| 186,081 | Deutsche Telekom AG | 3,751,597 |
| 88,469 | Deutsche Wohnen SE(1) | 5,425,948 |
| 86,849 | E.ON SE | 1,063,708 |
| 116,370 | Fresenius Medical Care AG & Co. KGaA | 8,208,006 |
| 103,273 | Fresenius SE & Co. KGaA | 4,971,251 |
| 51,317 | Fuchs Petrolub SE | 2,403,932 |
| 15,996 | Gerresheimer AG | 1,572,070 |
| 57,289 | Lanxess AG | 3,889,424 |
| 31,979 | LEG Immobilien AG | 4,528,984 |
| 64,376 | Merck KGaA | 14,000,297 |
| 50,570 | Software AG | 2,363,079 |
| 153,252 | TAG Immobilien AG | 4,497,121 |
| 1,272,582 | Telefonica Deutschland Holding AG | 3,625,203 |
| 102,028 | Uniper SE | 4,262,745 |
| 5,616 | Volkswagen AG | 1,260,338 |
| 26,455 | Vonovia SE | 1,591,255 |
| | | | 93,328,598 |
| | Hong Kong - 4.3% |
| 2,320,000 | BOC Hong Kong Holdings Ltd. | 7,003,526 |
| 3,113,520 | Chow Tai Fook Jewellery Group Ltd. | 5,959,349 |
| 984,500 | CK Asset Holdings Ltd. | 5,703,654 |
| 652,500 | CK Hutchison Holdings Ltd. | 4,354,387 |
| 422,480 | CLP Holdings Ltd. | 4,070,318 |
| Shares or Principal Amount | | Market Value† |
| COMMON STOCKS - 98.9% - (continued) |
| | Hong Kong - 4.3% - (continued) |
| 364,010 | Hang Seng Bank Ltd. | $ 6,247,132 |
| 1,430,000 | Henderson Land Development Co., Ltd. | 5,483,291 |
| 1,407,609 | HK Electric Investments & HK Electric Investments Ltd. | 1,397,727 |
| 2,262,000 | HKT Trust & HKT Ltd. | 3,097,496 |
| 55,000 | Hysan Development Co., Ltd. | 179,102 |
| 9,626 | Jardine Matheson Holdings Ltd. | 510,563 |
| 1,222,500 | Kerry Logistics Network Ltd.(1) | 2,616,283 |
| 784,000 | Kerry Properties Ltd. | 2,069,611 |
| 452,750 | New World Development Co., Ltd. | 1,852,375 |
| 714,000 | NWS Holdings Ltd. | 661,294 |
| 4,201,770 | PCCW Ltd. | 2,159,003 |
| 95,000 | Power Assets Holdings Ltd. | 558,920 |
| 744,000 | Sino Land Co., Ltd. | 1,001,602 |
| 1,604,000 | SITC International Holdings Co., Ltd. | 5,759,000 |
| 596,500 | Sun Hung Kai Properties Ltd. | 7,463,290 |
| 827,800 | Swire Properties Ltd. | 2,075,707 |
| 7,056,792 | WH Group Ltd.(2) | 5,031,080 |
| 2,346,000 | Xinyi Glass Holdings Ltd. | 7,021,742 |
| 965,111 | Yue Yuen Industrial Holdings Ltd.* | 1,951,385 |
| | | | 84,227,837 |
| | Ireland - 0.3% |
| 19,129 | Glanbia plc | 315,694 |
| 9,106 | Kerry Group plc Class A | 1,224,194 |
| 70,811 | Smurfit Kappa Group plc | 3,724,174 |
| | | | 5,264,062 |
| | Israel - 1.1% |
| 189,461 | Bank Leumi Le-Israel BM | 1,614,396 |
| 1,821,212 | Bezeq The Israeli Telecommunication Corp. Ltd.* | 2,150,240 |
| 58,343 | Check Point Software Technologies Ltd.* | 6,595,093 |
| 66,079 | First International Bank of Israel Ltd. | 2,421,009 |
| 644,633 | ICL Group Ltd. | 4,735,614 |
| 22,873 | Strauss Group Ltd. | 669,355 |
| 82,801 | Tower Semiconductor Ltd.* | 2,497,004 |
| | | | 20,682,711 |
| | Italy - 2.4% |
| 2,846,223 | A2A S.p.A. | 5,856,718 |
| 4,160 | ACEA S.p.A. | 88,904 |
| 282,238 | Assicurazioni Generali S.p.A. | 6,015,364 |
| 42,804 | De' Longhi S.p.A. | 1,541,807 |
| 8,822 | DiaSorin S.p.A. | 1,854,169 |
| 174,899 | Enel S.p.A. | 1,348,152 |
| 204,071 | Freni Brembo S.p.A. | 2,580,303 |
| 907,326 | Hera S.p.A. | 3,718,265 |
| 23,741 | Interpump Group S.p.A. | 1,540,819 |
| 724,134 | Iren S.p.A. | 2,151,799 |
| 486,289 | Italgas S.p.A. | 3,122,259 |
| 150,233 | Prysmian S.p.A. | 5,279,092 |
| 246,400 | Snam S.p.A. | 1,369,571 |
| 552,964 | Telecom Italia S.p.A. | 217,507 |
| 430,421 | Terna S.p.A. | 3,060,860 |
| 1,297,095 | Unipol Gruppo S.p.A. | 7,597,518 |
| | | | 47,343,107 |
| | Japan - 20.6% |
| 38,205 | ABC-Mart, Inc. | 2,167,490 |
| 194,200 | Air Water, Inc. | 3,120,776 |
| 125,600 | Aisin Corp. | 4,581,600 |
| 37,400 | Ajinomoto Co., Inc. | 1,108,173 |
| 366,282 | Alfresa Holdings Corp. | 5,502,027 |
| 900 | Amada Co., Ltd. | 9,389 |
| 60,488 | Aozora Bank Ltd. | 1,484,890 |
The accompanying notes are an integral part of these financial statements.
Hartford Multifactor Developed Markets (ex-US) ETF
Schedule of Investments – (continued)
September 30, 2021
| Shares or Principal Amount | | Market Value† |
| COMMON STOCKS - 98.9% - (continued) |
| | Japan - 20.6% - (continued) |
| 417,765 | Astellas Pharma, Inc. | $ 6,898,786 |
| 125,900 | Azbil Corp. | 5,427,551 |
| 145,093 | Bridgestone Corp. | 6,899,964 |
| 340,600 | Brother Industries Ltd. | 7,530,900 |
| 78,497 | Canon Marketing Japan, Inc. | 1,832,007 |
| 393,303 | Canon, Inc. | 9,660,290 |
| 57,500 | Chubu Electric Power Co., Inc. | 681,033 |
| 30,600 | COMSYS Holdings Corp. | 808,778 |
| 60,700 | Dai-ichi Life Holdings, Inc. | 1,345,383 |
| 81,300 | Daio Paper Corp. | 1,527,996 |
| 12,800 | Daito Trust Construction Co., Ltd. | 1,495,962 |
| 101,400 | Daiwa House Industry Co., Ltd. | 3,398,025 |
| 375,717 | Daiwa Securities Group, Inc. | 2,201,939 |
| 31,700 | Ebara Corp. | 1,576,832 |
| 52,900 | Ezaki Glico Co., Ltd. | 2,012,642 |
| 147,420 | FUJIFILM Holdings Corp. | 12,735,661 |
| 76,348 | Fujitsu Ltd. | 13,897,628 |
| 386,500 | Haseko Corp. | 5,199,521 |
| 115,173 | Hitachi Ltd. | 6,854,123 |
| 21,700 | Hitachi Transport System Ltd. | 967,578 |
| 237,800 | Honda Motor Co., Ltd. | 7,363,648 |
| 6,721 | Hoya Corp. | 1,052,651 |
| 64,800 | Idemitsu Kosan Co., Ltd. | 1,710,964 |
| 199,100 | Iida Group Holdings Co., Ltd. | 5,141,000 |
| 71,471 | ITOCHU Corp. | 2,099,130 |
| 133,300 | Iwatani Corp. | 7,849,258 |
| 5,600 | Izumi Co., Ltd. | 187,210 |
| 237,500 | Japan Post Bank Co., Ltd. | 2,043,469 |
| 210,081 | Japan Post Holdings Co., Ltd. | 1,778,557 |
| 52,000 | Japan Post Insurance Co., Ltd. | 949,353 |
| 120,700 | Japan Tobacco, Inc. | 2,369,106 |
| 1,519,000 | JXTG Holdings, Inc. | 6,206,696 |
| 412,200 | Kajima Corp. | 5,327,290 |
| 56,800 | Kaneka Corp. | 2,390,105 |
| 186,151 | KDDI Corp. | 6,158,040 |
| 134,000 | Kewpie Corp. | 3,260,677 |
| 120,000 | Kinden Corp. | 2,030,562 |
| 445,548 | K's Holdings Corp. | 4,628,189 |
| 74,300 | Kyowa Exeo Corp. | 1,830,614 |
| 64,122 | Lawson, Inc. | 3,149,349 |
| 502,500 | Marubeni Corp. | 4,202,850 |
| 34,800 | Matsumotokiyoshi Holdings Co., Ltd. | 1,575,084 |
| 213,750 | Medipal Holdings Corp. | 4,040,320 |
| 71,416 | MEIJI Holdings Co., Ltd. | 4,614,917 |
| 48,900 | Mitsubishi Corp. | 1,549,724 |
| 169,600 | Mitsubishi Electric Corp. | 2,366,724 |
| 8,000 | Mitsubishi Heavy Industries Ltd. | 216,823 |
| 1,042,000 | Mitsubishi UFJ Financial Group, Inc. | 6,144,134 |
| 166,476 | Mitsubishi UFJ Lease & Finance Co., Ltd. | 877,328 |
| 40,900 | Mitsui & Co., Ltd. | 903,227 |
| 186,400 | Mitsui Chemicals, Inc. | 6,289,904 |
| 311,000 | Mizuho Financial Group, Inc. | 4,416,576 |
| 54,500 | Morinaga Milk Industry Co., Ltd. | 3,419,225 |
| 119,117 | NEC Corp. | 6,480,306 |
| 124,800 | NEC Networks & System Integration Corp. | 2,362,336 |
| 103,475 | Nihon Kohden Corp. | 3,524,132 |
| 9,100 | Nihon Unisys Ltd. | 237,746 |
| 3,500 | Nintendo Co., Ltd. | 1,703,652 |
| 63,481 | Nippo Corp. | 2,284,349 |
| 45,900 | Nippon Express Co., Ltd. | 3,175,873 |
| 152,806 | Nippon Telegraph & Telephone Corp. | 4,225,019 |
| 79,700 | Nippon Yusen KK | 6,035,985 |
| 29,700 | Nomura Research Institute Ltd. | 1,102,021 |
| Shares or Principal Amount | | Market Value† |
| COMMON STOCKS - 98.9% - (continued) |
| | Japan - 20.6% - (continued) |
| 105,800 | NTT Data Corp. | $ 2,052,942 |
| 144,900 | Obayashi Corp. | 1,206,472 |
| 22,500 | OBIC Business Consultants Co., Ltd. | 1,149,451 |
| 62,100 | Open House Co., Ltd. | 3,684,535 |
| 13,500 | Oracle Corp. Japan | 1,188,169 |
| 113,100 | ORIX Corp. | 2,138,839 |
| 346,451 | Osaka Gas Co., Ltd. | 6,362,340 |
| 12,400 | Otsuka Corp. | 637,921 |
| 110,200 | Otsuka Holdings Co., Ltd. | 4,728,007 |
| 1,200 | PALTAC Corp. | 54,313 |
| 1,000 | Pan Pacific International Holdings Corp. | 20,775 |
| 230,600 | Panasonic Corp. | 2,872,812 |
| 161,666 | Resona Holdings, Inc. | 650,286 |
| 211,600 | Ricoh Co., Ltd. | 2,177,162 |
| 45,300 | Rinnai Corp. | 4,977,620 |
| 186,100 | Sanwa Holdings Corp. | 2,428,515 |
| 7,200 | Secom Co., Ltd. | 522,891 |
| 367,300 | Seiko Epson Corp. | 7,436,529 |
| 119,000 | Seino Holdings Co., Ltd. | 1,449,438 |
| 149,065 | Sekisui Chemical Co., Ltd. | 2,574,486 |
| 358,448 | Sekisui House Ltd. | 7,554,474 |
| 173,389 | Seven & i Holdings Co., Ltd. | 7,902,156 |
| 98,940 | Shimamura Co., Ltd. | 9,302,089 |
| 369,828 | Shimizu Corp. | 2,794,219 |
| 112,700 | Ship Healthcare Holdings, Inc. | 2,913,079 |
| 104,500 | Softbank Corp. | 1,418,465 |
| 195,293 | Subaru Corp. | 3,638,060 |
| 64,017 | Sugi Holdings Co., Ltd. | 4,676,124 |
| 250,700 | Sumitomo Dainippon Pharma Co., Ltd. | 4,489,344 |
| 116,400 | Sumitomo Electric Industries Ltd. | 1,560,694 |
| 90,829 | Sumitomo Forestry Co., Ltd. | 1,745,350 |
| 50,300 | Sumitomo Heavy Industries Ltd. | 1,325,855 |
| 111,200 | Sumitomo Mitsui Financial Group, Inc. | 3,930,744 |
| 459,900 | Sumitomo Rubber Industries Ltd. | 5,869,573 |
| 36,800 | Sundrug Co., Ltd. | 1,124,696 |
| 27,607 | Suntory Beverage & Food Ltd. | 1,148,075 |
| 61,382 | Suzuken Co., Ltd. | 1,804,463 |
| 46,500 | Taisei Corp. | 1,500,336 |
| 32,500 | Taisho Pharmaceutical Holdings Co., Ltd. | 1,902,084 |
| 14,911 | Toho Gas Co., Ltd. | 651,500 |
| 124,600 | Tohoku Electric Power Co., Inc. | 917,958 |
| 255,696 | Tokyo Gas Co., Ltd. | 4,764,436 |
| 90,200 | Toppan, Inc. | 1,538,432 |
| 7,700 | Toshiba Corp. | 325,391 |
| 112,800 | Tosoh Corp. | 2,056,332 |
| 33,219 | Toyo Suisan Kaisha Ltd. | 1,475,242 |
| 241,100 | Toyota Boshoku Corp. | 4,302,309 |
| 1,602,157 | Yamada Denki Co., Ltd. | 6,748,947 |
| 135,546 | Yamaha Motor Co., Ltd. | 3,790,307 |
| 86,080 | Yamazaki Baking Co., Ltd. | 1,501,337 |
| 248,700 | Yokohama Rubber Co., Ltd. | 4,491,423 |
| 89,153 | Zensho Holdings Co., Ltd. | 2,218,138 |
| | | | 399,896,202 |
| | Luxembourg - 0.5% |
| 48,643 | Eurofins Scientific SE | 6,248,583 |
| 132,379 | Grand City Properties S.A. | 3,304,681 |
| | | | 9,553,264 |
| | Netherlands - 3.8% |
| 104,260 | ASR Nederland N.V. | 4,775,286 |
| 446,379 | Koninklijke Ahold Delhaize N.V. | 14,865,505 |
| 20,505 | Koninklijke DSM N.V. | 4,105,278 |
| 2,359,216 | Koninklijke KPN N.V. | 7,423,389 |
The accompanying notes are an integral part of these financial statements.
Hartford Multifactor Developed Markets (ex-US) ETF
Schedule of Investments – (continued)
September 30, 2021
| Shares or Principal Amount | | Market Value† |
| COMMON STOCKS - 98.9% - (continued) |
| | Netherlands - 3.8% - (continued) |
| 23,989 | Koninklijke Philips N.V. | $ 1,065,931 |
| 107,843 | Koninklijke Vopak N.V. | 4,249,478 |
| 234,486 | NN Group N.V.(1) | 12,302,464 |
| 112,157 | Randstad N.V.(1) | 7,552,091 |
| 154,213 | Signify N.V.(2) | 7,711,990 |
| 77,720 | Universal Music Group N.V.*(1) | 2,082,051 |
| 64,084 | Wolters Kluwer N.V. | 6,801,660 |
| | | | 72,935,123 |
| | New Zealand - 0.8% |
| 633,643 | Contact Energy Ltd. | 3,693,654 |
| 322,825 | Fisher & Paykel Healthcare Corp. Ltd. Class C | 7,126,429 |
| 219,055 | Mercury NZ Ltd. | 982,248 |
| 924,483 | Spark New Zealand Ltd. | 3,051,848 |
| | | | 14,854,179 |
| | Norway - 1.5% |
| 82,979 | Austevoll Seafood ASA | 985,757 |
| 34,174 | Entra ASA(2) | 734,041 |
| 54,120 | Kongsberg Gruppen ASA | 1,511,522 |
| 531,801 | Norsk Hydro ASA | 3,991,592 |
| 732,967 | Orkla ASA | 6,735,815 |
| 29,918 | Salmar ASA | 1,993,334 |
| 476,710 | Telenor ASA | 8,044,148 |
| 89,102 | Yara International ASA | 4,433,027 |
| | | | 28,429,236 |
| | Portugal - 0.3% |
| 73,037 | Galp Energia SGPS S.A. | 829,533 |
| 246,244 | Jeronimo Martins SGPS S.A. | 4,911,467 |
| | | | 5,741,000 |
| | Singapore - 1.8% |
| 4,712,798 | ComfortDelGro Corp. Ltd. | 5,241,842 |
| 273,209 | DBS Group Holdings Ltd. | 6,101,722 |
| 863,500 | Olam International Ltd. | 1,119,446 |
| 932,252 | Oversea-Chinese Banking Corp. Ltd. | 7,896,949 |
| 257,500 | Singapore Exchange Ltd. | 1,892,936 |
| 1,650,500 | Singapore Technologies Engineering Ltd. | 4,632,001 |
| 163,200 | United Overseas Bank Ltd. | 3,107,484 |
| 428,700 | Venture Corp. Ltd. | 5,674,528 |
| | | | 35,666,908 |
| | Spain - 1.7% |
| 26,197 | Acciona S.A. | 4,347,697 |
| 16,310 | Fluidra S.A. | 651,190 |
| 284,256 | Grifols S.A. | 6,944,563 |
| 23,892 | Grupo Catalana Occidente S.A. | 872,223 |
| 256,273 | Iberdrola S.A. | 2,579,214 |
| 1,753,647 | Mapfre S.A. | 3,831,054 |
| 61,668 | Naturgy Energy Group S.A. | 1,554,475 |
| 272,133 | Red Electrica Corp. S.A. | 5,459,376 |
| 847,622 | Telefonica S.A. | 3,975,577 |
| 33,369 | Viscofan S.A. | 2,186,958 |
| | | | 32,402,327 |
| | Sweden - 4.3% |
| 659 | Assa Abloy AB Class B | 19,261 |
| 160,237 | Axfood AB | 3,840,831 |
| 102,487 | Boliden AB | 3,307,072 |
| 43,221 | Bure Equity AB | 1,794,339 |
| 441,016 | Electrolux AB Class B(1) | 10,197,980 |
| 50,190 | Essity AB Class B | 1,560,451 |
| 242,917 | Getinge AB Class B | 9,712,737 |
| 114,335 | ICA Gruppen AB | 5,255,054 |
| 128,613 | Industrivarden AB Class C | 3,998,690 |
| Shares or Principal Amount | | Market Value† |
| COMMON STOCKS - 98.9% - (continued) |
| | Sweden - 4.3% - (continued) |
| 621,990 | Investor AB Class B | $ 13,447,164 |
| 46,842 | L E Lundbergforetagen AB Class B | 2,583,965 |
| 157,741 | Lundin Energy AB | 5,892,377 |
| 60,622 | Samhallsbyggnadsbolaget i Norden AB | 335,936 |
| 344,177 | Securitas AB Class B | 5,470,371 |
| 212,195 | Skanska AB Class B | 5,353,051 |
| 109,188 | Swedish Match AB | 956,770 |
| 874,260 | Telefonaktiebolaget LM Ericsson Class B(1) | 9,903,260 |
| 18,210 | Volvo AB Class B | 410,178 |
| | | | 84,039,487 |
| | Switzerland - 7.1% |
| 119,629 | Adecco Group AG | 6,029,861 |
| 10,797 | Allreal Holding AG | 2,141,228 |
| 4,862 | ALSO Holding AG | 1,407,236 |
| 2,856 | Bachem Holding AG | 2,189,034 |
| 25,902 | Baloise Holding AG | 3,951,176 |
| 22,544 | Banque Cantonale Vaudoise | 1,718,260 |
| 21,285 | BKW AG | 2,304,535 |
| 6,523 | Bucher Industries AG | 3,118,677 |
| 31,475 | DKSH Holding AG | 2,471,505 |
| 794 | Emmi AG | 819,662 |
| 48,356 | Galenica AG(2) | 3,416,048 |
| 4,484 | Geberit AG | 3,311,868 |
| 41,640 | Kuehne + Nagel International AG | 14,257,186 |
| 108,267 | Logitech International S.A. | 9,663,194 |
| 39,539 | Nestle S.A. | 4,776,808 |
| 68,465 | Novartis AG | 5,638,812 |
| 28,638 | PSP Swiss Property AG | 3,456,760 |
| 37,811 | Roche Holding AG | 13,860,183 |
| 7,575 | Schindler Holding AG | 1,960,235 |
| 14,625 | SFS Group AG | 1,994,211 |
| 1,301 | SGS S.A. | 3,801,818 |
| 1,793 | Siegfried Holding AG | 1,603,004 |
| 9,623 | Sonova Holding AG | 3,664,136 |
| 16,059 | Swiss Life Holding AG | 8,151,296 |
| 45,589 | Swiss Prime Site AG | 4,466,779 |
| 22,968 | Swisscom AG | 13,231,498 |
| 8,112 | Tecan Group AG | 4,621,888 |
| 377,150 | UBS Group AG | 6,064,480 |
| 12,160 | Zurich Insurance Group AG | 5,000,349 |
| | | | 139,091,727 |
| | United Kingdom - 12.3% |
| 28,491 | 3i Group plc | 492,299 |
| 151,864 | Admiral Group plc | 6,364,124 |
| 24,500 | Anglo American plc | 866,332 |
| 154,653 | AstraZeneca plc ADR | 9,288,459 |
| 649,684 | Aviva plc | 3,468,091 |
| 1,243,598 | B&M European Value Retail S.A. | 9,903,215 |
| 1,549,543 | BAE Systems plc | 11,808,875 |
| 12,957 | Berkeley Group Holdings plc | 762,067 |
| 1,904,194 | BT Group plc* | 4,102,898 |
| 96,787 | Close Brothers Group plc | 2,018,878 |
| 56,972 | Computacenter plc | 2,087,919 |
| 675,411 | ConvaTec Group plc(2) | 1,967,092 |
| 6,894 | Dechra Pharmaceuticals plc | 450,833 |
| 1,442,681 | Direct Line Insurance Group plc | 5,633,413 |
| 121,639 | DS Smith plc | 677,206 |
| 200,183 | Electrocomponents plc | 2,909,703 |
| 828,227 | Evraz plc | 6,637,904 |
| 52,856 | Ferguson plc | 7,365,590 |
| 118,682 | Frasers Group plc* | 1,093,770 |
| 582 | Genus plc | 42,925 |
| 318,126 | GlaxoSmithKline plc | 12,155,594 |
The accompanying notes are an integral part of these financial statements.
Hartford Multifactor Developed Markets (ex-US) ETF
Schedule of Investments – (continued)
September 30, 2021
| Shares or Principal Amount | | Market Value† |
| COMMON STOCKS - 98.9% - (continued) |
| | United Kingdom - 12.3% - (continued) |
| 114,848 | Halma plc | $ 4,400,989 |
| 182,440 | Hikma Pharmaceuticals plc | 6,026,830 |
| 565,141 | Howden Joinery Group plc | 6,826,068 |
| 1,804,008 | HSBC Holdings plc | 9,487,712 |
| 313,191 | IG Group Holdings plc | 3,397,333 |
| 139,728 | IMI plc | 3,127,478 |
| 363,941 | Imperial Brands plc | 7,647,871 |
| 22,918 | Intertek Group plc | 1,537,967 |
| 591,503 | J Sainsbury plc | 2,276,217 |
| 2,085,055 | Kingfisher plc | 9,460,309 |
| 4,621,810 | Lloyds Banking Group plc | 2,902,158 |
| 308,705 | Mondi plc | 7,615,157 |
| 275,109 | National Grid plc | 3,281,365 |
| 391,579 | Pearson plc | 3,758,202 |
| 18,943 | Pennon Group plc | 289,389 |
| 172,491 | Phoenix Group Holdings plc | 1,501,526 |
| 123,412 | RELX plc | 3,572,664 |
| 151,321 | Rio Tinto plc | 10,025,197 |
| 1,491,645 | Royal Mail plc | 8,471,427 |
| 524,223 | Sage Group plc | 5,015,710 |
| 66,254 | Schroders plc | 3,211,543 |
| 422,322 | Segro plc REIT | 6,804,784 |
| 56,148 | Smith & Nephew plc | 974,351 |
| 98,241 | Softcat plc | 2,683,706 |
| 103,292 | Spectris plc | 5,391,289 |
| 17,124 | Spirax-Sarco Engineering plc | 3,456,446 |
| 84,369 | SSE plc | 1,787,153 |
| 359,267 | Standard Chartered plc | 2,112,062 |
| 606,727 | Tate & Lyle plc | 5,659,481 |
| 314,739 | Tesco plc | 1,074,951 |
| 1,469,045 | Tritax Big Box plc REIT | 4,211,154 |
| 31,096 | Unilever plc | 1,679,229 |
| 222,807 | Vodafone Group plc | 340,378 |
| 2,223,672 | WM Morrison Supermarkets plc | 8,829,961 |
| | | | 238,935,244 |
| | Total Common Stocks
(cost $1,723,413,608) | | $ 1,923,186,841 |
| SHORT-TERM INVESTMENTS - 1.8% |
| | Securities Lending Collateral - 1.8% |
| 2,373,154 | Fidelity Investments Money Market Funds, Government Portfolio, Institutional Class, 0.01%(3) | $ 2,373,154 |
| Shares or Principal Amount | | Market Value† |
| SHORT-TERM INVESTMENTS - 1.8% - (continued) |
| | Securities Lending Collateral - 1.8% - (continued) |
| 31,462,657 | Goldman Sachs Financial Square Funds, Government Fund, Institutional Class, 0.03%(3) | $ 31,462,657 |
| 1,718,350 | Invesco Government & Agency Portfolio, Institutional Class, 0.03%(3) | 1,718,350 |
| | Total Short-Term Investments
(cost $35,554,161) | $ 35,554,161 |
| | Total Investments
(cost $1,758,967,769) | 100.7% | $ 1,958,741,002 |
| | Other Assets and Liabilities | (0.7)% | (12,816,198) |
| | Total Net Assets | 100.0% | $ 1,945,924,804 |
| Note: | Percentage of investments as shown is the ratio of the total market value to total net assets. |
| | The Fund may refer to any one or more of the industry classifications used by one or more widely recognized market indices, ratings group and/or as defined by Fund management. Industry classifications may not be identical across all security types. |
| | For Fund compliance purposes, the Fund may not use the same classification system. These classifications are used for financial reporting purposes. |
| | See “Glossary” for abbreviation descriptions. |
| * | Non-income producing. |
| (1) | Represents entire or partial securities on loan. See Note 8 in the accompanying Notes to Financial Statements for securities lending information. |
| (2) | Security was purchased pursuant to Rule 144A under the Securities Act of 1933 and may be sold in transactions that are exempt from registration (typically only to qualified institutional buyers) or in a public offering registered under the Securities Act of 1933. At September 30, 2021, the aggregate value of these securities was $26,793,845, representing 1.4% of net assets. |
| (3) | Current yield as of period end. |
| Futures Contracts Outstanding at September 30, 2021 |
| Description | | Number of
Contracts | | Expiration
Date | | Current
Notional
Amount | | Value and
Unrealized
Appreciation/
(Depreciation) |
| Long position contracts: |
| MSCI EAFE Index Future | | 126 | | 12/17/2021 | | $ 14,282,100 | | $ (498,176) |
| Total futures contracts | | $ (498,176) |
† See Significant Accounting Policies of accompanying Notes to Financial Statements regarding valuation of investments.
The accompanying notes are an integral part of these financial statements.
Hartford Multifactor Developed Markets (ex-US) ETF
Schedule of Investments – (continued)
September 30, 2021
Fair Value Summary
The following is a summary of the fair valuations according to the inputs used as of September 30, 2021 in valuing the Fund’s investments.
| Description | | Total | | Level 1 | | Level 2 | | Level 3(1) |
| Assets | | | | | | | | |
| Common Stocks | | | | | | | | |
| Australia | | $ 173,971,007 | | $ 173,971,007 | | $ — | | $ — |
| Austria | | 5,720,108 | | 5,720,108 | | — | | — |
| Belgium | | 29,679,972 | | 29,679,972 | | — | | — |
| Canada | | 207,689,595 | | 207,689,595 | | — | | — |
| China | | 10,048,201 | | 10,048,201 | | — | | — |
| Denmark | | 38,837,714 | | 38,837,714 | | — | | — |
| Finland | | 19,686,399 | | 19,686,399 | | — | | — |
| France | | 125,162,833 | | 125,162,833 | | — | | — |
| Germany | | 93,328,598 | | 93,328,598 | | — | | — |
| Hong Kong | | 84,227,837 | | 84,227,837 | | — | | — |
| Ireland | | 5,264,062 | | 5,264,062 | | — | | — |
| Israel | | 20,682,711 | | 20,682,711 | | — | | — |
| Italy | | 47,343,107 | | 47,343,107 | | — | | — |
| Japan | | 399,896,202 | | 399,896,202 | | — | | — |
| Luxembourg | | 9,553,264 | | 9,553,264 | | — | | — |
| Netherlands | | 72,935,123 | | 72,935,123 | | — | | — |
| New Zealand | | 14,854,179 | | 14,854,179 | | — | | — |
| Norway | | 28,429,236 | | 28,429,236 | | — | | — |
| Portugal | | 5,741,000 | | 5,741,000 | | — | | — |
| Singapore | | 35,666,908 | | 35,666,908 | | — | | — |
| Spain | | 32,402,327 | | 32,402,327 | | — | | — |
| Sweden | | 84,039,487 | | 84,039,487 | | — | | — |
| Switzerland | | 139,091,727 | | 139,091,727 | | — | | — |
| United Kingdom | | 238,935,244 | | 238,935,244 | | — | | — |
| Short-Term Investments | | 35,554,161 | | 35,554,161 | | — | | — |
| Total | | $ 1,958,741,002 | | $ 1,958,741,002 | | $ — | | $ — |
| Liabilities | | | | | | | | |
| Futures Contracts(2) | | $ (498,176) | | $ (498,176) | | $ — | | $ — |
| Total | | $ (498,176) | | $ (498,176) | | $ — | | $ — |
| (1) | For the year ended September 30, 2021, there were no transfers in and out of Level 3. |
| (2) | Derivative instruments (excluding purchased and written options, if applicable) are valued at the unrealized appreciation/(depreciation) on the investments. |
The accompanying notes are an integral part of these financial statements.
Hartford Multifactor Diversified International ETF
Schedule of Investments
September 30, 2021
| Shares or Principal Amount | | Market Value† |
| COMMON STOCKS - 99.3% |
| | Australia - 7.6% |
| 96 | AGL Energy Ltd. | $ 401 |
| 916 | Ansell Ltd. | 22,629 |
| 1,390 | Australia & New Zealand Banking Group Ltd. | 28,264 |
| 857 | BHP Group Ltd. | 23,283 |
| 1,278 | BlueScope Steel Ltd. | 18,925 |
| 1,748 | Coles Group Ltd. | 21,453 |
| 25 | CSL Ltd. | 5,298 |
| 3,198 | Dexus REIT | 24,949 |
| 3,049 | Fortescue Metals Group Ltd. | 32,949 |
| 1,444 | JB Hi-Fi Ltd. | 47,481 |
| 9,140 | Metcash Ltd. | 25,947 |
| 981 | Mineral Resources Ltd. | 31,754 |
| 7,701 | Mirvac Group REIT | 16,633 |
| 1,314 | Sonic Healthcare Ltd. | 38,593 |
| 8,363 | Telstra Corp. Ltd. | 23,741 |
| 916 | Wesfarmers Ltd. | 36,888 |
| 1,266 | Woolworths Group Ltd. | 35,985 |
| | | | 435,173 |
| | Austria - 0.3% |
| 269 | Andritz AG | 14,740 |
| 124 | Oesterreichische Post AG | 5,260 |
| | | | 20,000 |
| | Belgium - 1.2% |
| 34 | Ackermans & van Haaren N.V. | 5,867 |
| 653 | Ageas S.A. | 32,406 |
| 390 | Etablissements Franz Colruyt N.V. | 19,888 |
| 468 | Proximus S.A. | 9,296 |
| | | | 67,457 |
| | Brazil - 1.5% |
| 2,900 | JBS S.A. | 19,729 |
| 2,000 | Petrobras Distribuidora S.A. | 8,622 |
| 1,300 | Telefonica Brasil S.A. | 10,228 |
| 2,900 | Transmissora Alianca de Energia Eletrica S.A. UNIT | 19,075 |
| 2,200 | Vale S.A. ADR | 30,690 |
| | | | 88,344 |
| | Canada - 5.0% |
| 195 | Alimentation Couche-Tard, Inc. Class B | 7,459 |
| 393 | Bank of Montreal | 39,227 |
| 100 | Bank of Nova Scotia | 6,154 |
| 3 | Canadian Imperial Bank of Commerce(1) | 334 |
| 76 | Canadian Tire Corp. Ltd. Class A | 10,633 |
| 1,131 | Empire Co., Ltd. Class A | 34,461 |
| 23 | Fairfax Financial Holdings Ltd. | 9,283 |
| 109 | George Weston Ltd. | 11,755 |
| 630 | Great-West Lifeco, Inc. | 19,166 |
| 78 | iA Financial Corp., Inc. | 4,424 |
| 478 | Loblaw Cos., Ltd. | 32,796 |
| 20 | Magna International, Inc. | 1,505 |
| 524 | Manulife Financial Corp. | 10,084 |
| 28 | Metro, Inc. | 1,368 |
| 1,065 | Power Corp. of Canada | 35,098 |
| 11 | Rogers Communications, Inc. Class B | 514 |
| 357 | Royal Bank of Canada | 35,515 |
| 422 | Toronto-Dominion Bank | 27,931 |
| | | | 287,707 |
| | Chile - 0.2% |
| 1,054 | CAP S.A. | 11,186 |
| | China - 8.3% |
| 53,000 | Agricultural Bank of China Ltd. Class H | 18,246 |
| 500 | Anhui Conch Cement Co., Ltd. Class H | 2,698 |
| Shares or Principal Amount | | Market Value† |
| COMMON STOCKS - 99.3% - (continued) |
| | China - 8.3% - (continued) |
| 128,000 | Bank of China Ltd. Class H | $ 45,382 |
| 47,000 | Bank of Communications Co., Ltd. Class H | 27,893 |
| 37,000 | China Construction Bank Corp. Class H | 26,521 |
| 1,000 | China Longyuan Power Group Corp. Ltd. Class H | 2,472 |
| 94,000 | China Petroleum & Chemical Corp. Class H | 46,610 |
| 35,000 | China Railway Group Ltd. Class H | 17,445 |
| 21,500 | China Shenhua Energy Co., Ltd. Class H | 50,321 |
| 400 | China Vanke Co., Ltd. Class H | 1,094 |
| 32,000 | CITIC Ltd. | 34,118 |
| 2,400 | Haier Smart Home Co., Ltd. Class H | 8,463 |
| 13,000 | Industrial & Commercial Bank of China Ltd. Class H | 7,231 |
| 48,000 | Lenovo Group Ltd. | 51,609 |
| 142,000 | PetroChina Co., Ltd. Class H | 67,309 |
| 20,000 | PICC Property & Casualty Co., Ltd. Class H | 19,397 |
| 500 | Ping An Insurance Group Co. of China Ltd. Class H | 3,420 |
| 40,900 | Yangzijiang Shipbuilding Holdings Ltd. | 41,575 |
| | | | 471,804 |
| | Denmark - 1.4% |
| 8 | AP Moller - Maersk A/S Class B | 21,677 |
| 16 | Coloplast A/S Class B | 2,510 |
| 568 | Novo Nordisk A/S Class B | 55,011 |
| | | | 79,198 |
| | Finland - 0.3% |
| 425 | Fortum Oyj | 12,949 |
| 9 | Kesko Oyj Class B | 312 |
| 82 | Kone Oyj Class B | 5,776 |
| | | | 19,037 |
| | France - 3.7% |
| 49 | Air Liquide S.A. | 7,870 |
| 316 | AXA S.A. | 8,821 |
| 143 | BNP Paribas S.A. | 9,188 |
| 1,470 | Carrefour S.A. | 26,483 |
| 188 | Cie de Saint-Gobain | 12,689 |
| 134 | Cie Generale des Etablissements Michelin SCA | 20,624 |
| 88 | Danone S.A. | 6,022 |
| 1 | Hermes International | 1,387 |
| 12 | L'Oreal S.A. | 4,963 |
| 10 | LVMH Moet Hennessy Louis Vuitton SE | 7,187 |
| 3,205 | Orange S.A.(1) | 34,737 |
| 531 | Sanofi | 51,128 |
| 100 | Schneider Electric SE | 16,677 |
| 114 | Vivendi S.A.(1) | 1,441 |
| | | | 209,217 |
| | Germany - 2.7% |
| 121 | Allianz SE | 27,323 |
| 40 | Bayerische Motoren Werke AG | 3,837 |
| 463 | Deutsche Post AG | 29,234 |
| 769 | Deutsche Telekom AG | 15,504 |
| 68 | Fresenius Medical Care AG & Co. KGaA | 4,796 |
| 193 | Fresenius SE & Co. KGaA | 9,290 |
| 32 | LEG Immobilien AG | 4,532 |
| 244 | Merck KGaA | 53,064 |
| 28 | Volkswagen AG | 6,284 |
| | | | 153,864 |
| | Hong Kong - 3.1% |
| 6,000 | BOC Hong Kong Holdings Ltd. | 18,113 |
| 4,000 | China Overseas Land & Investment Ltd. | 9,115 |
| 7,400 | Chow Tai Fook Jewellery Group Ltd. | 14,164 |
| 5,000 | CK Asset Holdings Ltd. | 28,967 |
| 2,500 | CK Hutchison Holdings Ltd. | 16,683 |
| 2,000 | CLP Holdings Ltd. | 19,269 |
The accompanying notes are an integral part of these financial statements.
Hartford Multifactor Diversified International ETF
Schedule of Investments – (continued)
September 30, 2021
| Shares or Principal Amount | | Market Value† |
| COMMON STOCKS - 99.3% - (continued) |
| | Hong Kong - 3.1% - (continued) |
| 3,000 | Henderson Land Development Co., Ltd. | $ 11,503 |
| 2,000 | SITC International Holdings Co., Ltd. | 7,181 |
| 2,000 | Sun Hung Kai Properties Ltd. | 25,024 |
| 500 | Techtronic Industries Co., Ltd. | 9,962 |
| 6,500 | WH Group Ltd.(2) | 4,634 |
| 2,000 | Wharf Holdings Ltd. | 6,641 |
| 2,000 | Xinyi Glass Holdings Ltd. | 5,986 |
| | | | 177,242 |
| | India - 0.8% |
| 127 | Dr. Reddy's Laboratories Ltd. ADR | 8,273 |
| 684 | Infosys Ltd. ADR | 15,219 |
| 1,300 | Vedanta Ltd. ADR | 19,864 |
| | | | 43,356 |
| | Indonesia - 1.0% |
| 18,700 | Astra International Tbk PT | 7,186 |
| 2,500 | Gudang Garam Tbk PT | 5,686 |
| 58,100 | Telekomunikasi Indonesia Persero Tbk PT | 14,979 |
| 16,500 | United Tractors Tbk PT | 29,974 |
| | | | 57,825 |
| | Israel - 2.7% |
| 7,207 | Bezeq The Israeli Telecommunication Corp. Ltd.* | 8,509 |
| 34 | Check Point Software Technologies Ltd.* | 3,843 |
| 89 | Danel Adir Yeoshua Ltd. | 17,380 |
| 479 | Delek Automotive Systems Ltd. | 6,088 |
| 213 | Electra Consumer Products Ltd. | 10,392 |
| 57 | Fox Wizel Ltd. | 7,189 |
| 862 | Harel Insurance Investments & Financial Services Ltd. | 8,919 |
| 6,211 | Mivne Real Estate KD Ltd. | 21,851 |
| 2,462 | Phoenix Holdings Ltd. | 28,137 |
| 236 | Rami Levy Chain Stores Hashikma Marketing Ltd. | 16,957 |
| 2,618 | Shufersal Ltd. | 21,261 |
| 111 | Strauss Group Ltd. | 3,248 |
| | | | 153,774 |
| | Italy - 0.8% |
| 6,683 | A2A S.p.A. | 13,751 |
| 453 | Assicurazioni Generali S.p.A. | 9,655 |
| 1,470 | Enel S.p.A. | 11,331 |
| 257 | Prysmian S.p.A. | 9,031 |
| | | | 43,768 |
| | Japan - 15.9% |
| 300 | Aisin Corp. | 10,943 |
| 300 | Alfresa Holdings Corp. | 4,506 |
| 1,700 | Astellas Pharma, Inc. | 28,073 |
| 400 | Bridgestone Corp. | 19,022 |
| 700 | Brother Industries Ltd. | 15,477 |
| 1,100 | Canon, Inc. | 27,018 |
| 400 | Daiwa House Industry Co., Ltd. | 13,404 |
| 500 | FUJIFILM Holdings Corp. | 43,195 |
| 300 | Fujitsu Ltd. | 54,609 |
| 400 | Haseko Corp. | 5,381 |
| 800 | Hitachi Ltd. | 47,609 |
| 1,300 | Honda Motor Co., Ltd. | 40,255 |
| 300 | Iida Group Holdings Co., Ltd. | 7,746 |
| 600 | ITOCHU Corp. | 17,622 |
| 600 | Iwatani Corp. | 35,331 |
| 500 | JXTG Holdings, Inc. | 2,043 |
| 200 | Kajima Corp. | 2,585 |
| 1,000 | KDDI Corp. | 33,081 |
| 500 | Konica Minolta, Inc. | 2,707 |
| 2,200 | Marubeni Corp. | 18,401 |
| Shares or Principal Amount | | Market Value† |
| COMMON STOCKS - 99.3% - (continued) |
| | Japan - 15.9% - (continued) |
| 100 | MEIJI Holdings Co., Ltd. | $ 6,462 |
| 500 | Mitsubishi Corp. | 15,846 |
| 1,000 | Mitsubishi Electric Corp. | 13,955 |
| 5,400 | Mitsubishi UFJ Financial Group, Inc. | 31,841 |
| 600 | Mitsui & Co., Ltd. | 13,250 |
| 200 | Mitsui Chemicals, Inc. | 6,749 |
| 1,500 | Mizuho Financial Group, Inc. | 21,302 |
| 200 | NEC Corp. | 10,881 |
| 300 | Nihon Kohden Corp. | 10,217 |
| 800 | Nippon Telegraph & Telephone Corp. | 22,120 |
| 300 | Nippon Yusen KK | 22,720 |
| 1,000 | Osaka Gas Co., Ltd. | 18,364 |
| 300 | Otsuka Holdings Co., Ltd. | 12,871 |
| 2,000 | Panasonic Corp. | 24,916 |
| 1,100 | Sanwa Holdings Corp. | 14,354 |
| 400 | Seiko Epson Corp. | 8,099 |
| 300 | Sekisui Chemical Co., Ltd. | 5,181 |
| 600 | Sekisui House Ltd. | 12,645 |
| 800 | Seven & i Holdings Co., Ltd. | 36,460 |
| 200 | Shimamura Co., Ltd. | 18,804 |
| 1,200 | Softbank Corp. | 16,289 |
| 600 | Subaru Corp. | 11,177 |
| 600 | Sumitomo Mitsui Financial Group, Inc. | 21,209 |
| 3,200 | Sumitomo Rubber Industries Ltd. | 40,841 |
| 100 | Taisei Corp. | 3,227 |
| 700 | Tokyo Gas Co., Ltd. | 13,043 |
| 500 | Toyota Motor Corp. | 8,963 |
| 3,600 | Yamada Denki Co., Ltd. | 15,165 |
| 400 | Yamaha Motor Co., Ltd. | 11,185 |
| 700 | Yokohama Rubber Co., Ltd. | 12,642 |
| | | | 909,786 |
| | Luxembourg - 0.1% |
| 26 | Eurofins Scientific SE | 3,340 |
| | Malaysia - 2.1% |
| 13,000 | DiGi.Com Bhd | 13,818 |
| 14,100 | Hartalega Holdings Bhd | 20,713 |
| 17,000 | Kossan Rubber Industries | 9,380 |
| 11,045 | Malayan Banking Bhd | 21,238 |
| 1,900 | Petronas Gas Bhd | 7,634 |
| 7,653 | RHB Bank Bhd | 9,981 |
| 6,400 | Tenaga Nasional Bhd | 14,798 |
| 35,400 | Top Glove Corp. Bhd | 24,352 |
| | | | 121,914 |
| | Mexico - 1.1% |
| 1,400 | America Movil S.A.B. de C.V. Class L, ADR | 24,738 |
| 600 | Coca-Cola Femsa SAB de CV | 33,762 |
| 1,600 | Grupo Bimbo S.A.B. de C.V. Series A | 4,518 |
| | | | 63,018 |
| | Netherlands - 1.4% |
| 1,718 | Koninklijke Ahold Delhaize N.V. | 57,214 |
| 432 | NN Group N.V. | 22,665 |
| 114 | Universal Music Group N.V.* | 3,054 |
| | | | 82,933 |
| | New Zealand - 1.2% |
| 1,039 | Fisher & Paykel Healthcare Corp. Ltd. Class C | 22,936 |
| 5,126 | Goodman Property Trust REIT | 8,558 |
| 10,520 | Spark New Zealand Ltd. | 34,728 |
| | | | 66,222 |
| | Norway - 2.5% |
| 141 | Atea ASA* | 2,442 |
The accompanying notes are an integral part of these financial statements.
Hartford Multifactor Diversified International ETF
Schedule of Investments – (continued)
September 30, 2021
| Shares or Principal Amount | | Market Value† |
| COMMON STOCKS - 99.3% - (continued) |
| | Norway - 2.5% - (continued) |
| 78 | Entra ASA(2) | $ 1,675 |
| 4,351 | Europris ASA(2) | 28,910 |
| 232 | Kongsberg Gruppen ASA | 6,480 |
| 2,665 | Norsk Hydro ASA | 20,003 |
| 1,428 | Orkla ASA | 13,123 |
| 2,193 | Telenor ASA | 37,005 |
| 928 | Veidekke ASA | 11,396 |
| 452 | Yara International ASA | 22,488 |
| | | | 143,522 |
| | Philippines - 1.8% |
| 455 | Globe Telecom, Inc. | 26,617 |
| 2,600 | Manila Electric Co. | 15,189 |
| 22,640 | Metropolitan Bank & Trust Co. | 19,395 |
| 1,260 | PLDT, Inc. | 41,498 |
| | | | 102,699 |
| | Poland - 1.7% |
| 2,324 | Polski Koncern Naftowy ORLEN S.A. | 47,998 |
| 20,086 | Polskie Gornictwo Naftowe i Gazownictwo S.A. | 32,694 |
| 1,668 | Powszechny Zaklad Ubezpieczen S.A. | 15,331 |
| | | | 96,023 |
| | Russia - 0.1% |
| 349 | Gazprom PJSC ADR | 3,485 |
| | Singapore - 0.9% |
| 1,106 | DBS Group Holdings Ltd. | 24,701 |
| 2,142 | Oversea-Chinese Banking Corp. Ltd. | 18,145 |
| 500 | Venture Corp. Ltd. | 6,618 |
| | | | 49,464 |
| | South Africa - 0.1% |
| 207 | Kumba Iron Ore Ltd. | 6,824 |
| | South Korea - 3.1% |
| 24 | Coway Co., Ltd. | 1,504 |
| 28 | Hankook Tire & Technology Co., Ltd. | 1,023 |
| 149 | Kia Motors Corp. | 10,219 |
| 397 | Korea Electric Power Corp. | 7,896 |
| 208 | KT&G Corp. | 14,265 |
| 201 | LG Electronics, Inc. | 21,645 |
| 1,983 | LG Uplus Corp. | 25,122 |
| 19 | POSCO | 5,296 |
| 685 | Samsung Electronics Co., Ltd. | 42,870 |
| 7 | Samsung Fire & Marine Insurance Co., Ltd. | 1,389 |
| 84 | SK Hynix, Inc. | 7,307 |
| 146 | SK Telecom Co., Ltd. | 39,953 |
| | | | 178,489 |
| | Spain - 0.4% |
| 288 | Banco Bilbao Vizcaya Argentaria S.A. | 1,908 |
| 1,038 | Iberdrola S.A. | 10,447 |
| 2,587 | Telefonica S.A. | 12,134 |
| | | | 24,489 |
| | Sweden - 4.3% |
| 66 | Assa Abloy AB Class B | 1,929 |
| 722 | Axfood AB | 17,306 |
| 271 | Boliden AB | 8,745 |
| 1,505 | Electrolux AB Class B(1) | 34,801 |
| 637 | Getinge AB Class B | 25,470 |
| 59 | ICA Gruppen AB | 2,712 |
| 578 | Industrivarden AB Class C | 17,971 |
| 2,558 | Investor AB Class B | 55,303 |
| 247 | L E Lundbergforetagen AB Class B | 13,625 |
| 113 | Securitas AB Class B | 1,796 |
| Shares or Principal Amount | | Market Value† |
| COMMON STOCKS - 99.3% - (continued) |
| | Sweden - 4.3% - (continued) |
| 731 | Skanska AB Class B | $ 18,441 |
| 3,219 | Telefonaktiebolaget LM Ericsson Class B(1) | 36,463 |
| 420 | Volvo AB Class B | 9,460 |
| | | | 244,022 |
| | Switzerland - 3.0% |
| 1 | Geberit AG | 739 |
| 118 | Kuehne + Nagel International AG | 40,402 |
| 202 | Logitech International S.A. | 18,029 |
| 153 | Nestle S.A. | 18,484 |
| 141 | Novartis AG | 11,613 |
| 147 | Roche Holding AG | 53,885 |
| 19 | Swiss Life Holding AG | 9,644 |
| 1,030 | UBS Group AG | 16,562 |
| | | | 169,358 |
| | Taiwan - 6.8% |
| 35,000 | Acer, Inc. | 31,092 |
| 1,000 | ASE Technology Holding, Co., Ltd. | 3,912 |
| 3,000 | Asustek Computer, Inc. | 35,050 |
| 16,000 | AU Optronics Corp. | 10,136 |
| 12,000 | Cathay Financial Holding Co., Ltd. | 24,939 |
| 41,000 | Compal Electronics, Inc. | 34,730 |
| 9,000 | Fubon Financial Holding Co., Ltd. | 24,777 |
| 120 | Great Wall Enterprise Co., Ltd. | 236 |
| 9,800 | Hon Hai Precision Industry Co., Ltd. | 36,934 |
| 44,000 | Innolux Corp. | 26,848 |
| 13,000 | Lite-On Technology Corp. | 29,163 |
| 2,000 | Micro-Star International Co., Ltd. | 9,296 |
| 12,000 | Pegatron Corp. | 28,858 |
| 16,000 | Pou Chen Corp. | 19,382 |
| 1,000 | Powertech Technology, Inc. | 3,751 |
| 9,000 | Quanta Computer, Inc. | 25,035 |
| 2,000 | Sino-American Silicon Products, Inc. | 13,029 |
| 5,000 | Synnex Technology International Corp. | 9,368 |
| 3,000 | United Microelectronics Corp. | 6,892 |
| 600 | Wan Hai Lines Ltd. | 4,383 |
| 8,000 | Wistron Corp. | 7,897 |
| 5,000 | Yuanta Financial Holding Co., Ltd. | 4,433 |
| | | | 390,141 |
| | Thailand - 2.3% |
| 3,200 | Advanced Info Service PCL NVDR | 18,537 |
| 5,300 | PTT PCL NVDR | 6,109 |
| 1,200 | Siam Cement PCL NVDR | 14,257 |
| 32,400 | Sri Trang Agro-Industry PCL NVDR | 32,079 |
| 43,000 | Sri Trang Gloves Thailand PCL(1) | 39,715 |
| 8,200 | Supalai PCL | 4,847 |
| 20,600 | Thai Union Group PCL | 13,212 |
| | | | 128,756 |
| | Turkey - 0.8% |
| 1,346 | BIM Birlesik Magazalar A.S. | 9,681 |
| 13,100 | Eregli Demir ve Celik Fabrikalari T.A.S. | 24,551 |
| 120 | Ford Otomotiv Sanayi AS | 2,257 |
| 4,938 | Turkcell Iletisim Hizmetleri AS | 8,521 |
| | | | 45,010 |
| | United Kingdom - 9.1% |
| 345 | Anglo American plc | 12,199 |
| 117 | Ashtead Group plc | 8,907 |
| 388 | AstraZeneca plc ADR | 23,303 |
| 852 | Aviva plc | 4,548 |
| 3,604 | B&M European Value Retail S.A. | 28,700 |
| 5,815 | BAE Systems plc | 44,315 |
| 5,002 | BT Group plc* | 10,778 |
The accompanying notes are an integral part of these financial statements.
Hartford Multifactor Diversified International ETF
Schedule of Investments – (continued)
September 30, 2021
| Shares or Principal Amount | | Market Value† |
| COMMON STOCKS - 99.3% - (continued) |
| | United Kingdom - 9.1% - (continued) |
| 178 | Ferguson plc | $ 24,805 |
| 1,238 | GlaxoSmithKline plc | 47,304 |
| 614 | Hikma Pharmaceuticals plc | 20,283 |
| 475 | Howden Joinery Group plc | 5,737 |
| 6,400 | HSBC Holdings plc | 33,666 |
| 1,275 | Imperial Brands plc | 26,793 |
| 6,401 | Kingfisher plc | 29,043 |
| 715 | Mondi plc | 17,638 |
| 492 | National Grid plc | 5,868 |
| 176 | RELX plc | 5,095 |
| 616 | Rio Tinto plc | 40,811 |
| 8,427 | Royal Mail plc | 47,859 |
| 1,649 | Segro plc REIT | 26,570 |
| 322 | Spectris plc | 16,807 |
| 332 | SSE plc | 7,033 |
| 1,317 | Tate & Lyle plc | 12,285 |
| 2,702 | Tritax Big Box plc REIT | 7,746 |
| 86 | Unilever plc | 4,644 |
| 1,357 | WM Morrison Supermarkets plc | 5,388 |
| | | | 518,125 |
| | Total Common Stocks
(cost $5,250,891) | | $ 5,666,572 |
| SHORT-TERM INVESTMENTS - 1.8% |
| | Securities Lending Collateral - 1.8% |
| 7,056 | Fidelity Investments Money Market Funds, Government Portfolio, Institutional Class, 0.01%(3) | $ 7,056 |
| 93,547 | Goldman Sachs Financial Square Funds, Government Fund, Institutional Class, 0.03%(3) | 93,547 |
| 5,109 | Invesco Government & Agency Portfolio, Institutional Class, 0.03%(3) | 5,109 |
| | Total Short-Term Investments
(cost $105,712) | $ 105,712 |
| | Total Investments
(cost $5,356,603) | 101.1% | $ 5,772,284 |
| | Other Assets and Liabilities | (1.1)% | (65,547) |
| | Total Net Assets | 100.0% | $ 5,706,737 |
| Note: | Percentage of investments as shown is the ratio of the total market value to total net assets. |
| | The Fund may refer to any one or more of the industry classifications used by one or more widely recognized market indices, ratings group and/or as defined by Fund management. Industry classifications may not be identical across all security types. |
| | For Fund compliance purposes, the Fund may not use the same classification system. These classifications are used for financial reporting purposes. |
| | See “Glossary” for abbreviation descriptions. |
| * | Non-income producing. |
| (1) | Represents entire or partial securities on loan. See Note 8 in the accompanying Notes to Financial Statements for securities lending information. |
| (2) | Security was purchased pursuant to Rule 144A under the Securities Act of 1933 and may be sold in transactions that are exempt from registration (typically only to qualified institutional buyers) or in a public offering registered under the Securities Act of 1933. At September 30, 2021, the aggregate value of these securities was $35,219, representing 0.6% of net assets. |
| (3) | Current yield as of period end. |
| † | See Significant Accounting Policies of accompanying Notes to Financial Statements regarding valuation of investments. |
The accompanying notes are an integral part of these financial statements.
Hartford Multifactor Diversified International ETF
Schedule of Investments – (continued)
September 30, 2021
Fair Value Summary
The following is a summary of the fair valuations according to the inputs used as of September 30, 2021 in valuing the Fund’s investments.
| Description | | Total | | Level 1 | | Level 2 | | Level 3(1) |
| Assets | | | | | | | | |
| Common Stocks | | | | | | | | |
| Australia | | $ 435,173 | | $ 435,173 | | $ — | | $ — |
| Austria | | 20,000 | | 20,000 | | — | | — |
| Belgium | | 67,457 | | 67,457 | | — | | — |
| Brazil | | 88,344 | | 88,344 | | — | | — |
| Canada | | 287,707 | | 287,707 | | — | | — |
| Chile | | 11,186 | | 11,186 | | — | | — |
| China | | 471,804 | | 471,804 | | — | | — |
| Denmark | | 79,198 | | 79,198 | | — | | — |
| Finland | | 19,037 | | 19,037 | | — | | — |
| France | | 209,217 | | 209,217 | | — | | — |
| Germany | | 153,864 | | 153,864 | | — | | — |
| Hong Kong | | 177,242 | | 177,242 | | — | | — |
| India | | 43,356 | | 43,356 | | — | | — |
| Indonesia | | 57,825 | | 57,825 | | — | | — |
| Israel | | 153,774 | | 153,774 | | — | | — |
| Italy | | 43,768 | | 43,768 | | — | | — |
| Japan | | 909,786 | | 909,786 | | — | | — |
| Luxembourg | | 3,340 | | 3,340 | | — | | — |
| Malaysia | | 121,914 | | 121,914 | | — | | — |
| Mexico | | 63,018 | | 63,018 | | — | | — |
| Netherlands | | 82,933 | | 82,933 | | — | | — |
| New Zealand | | 66,222 | | 66,222 | | — | | — |
| Norway | | 143,522 | | 143,522 | | — | | — |
| Philippines | | 102,699 | | 102,699 | | — | | — |
| Poland | | 96,023 | | 96,023 | | — | | — |
| Russia | | 3,485 | | 3,485 | | — | | — |
| Singapore | | 49,464 | | 49,464 | | — | | — |
| South Africa | | 6,824 | | 6,824 | | — | | — |
| South Korea | | 178,489 | | 178,489 | | — | | — |
| Spain | | 24,489 | | 24,489 | | — | | — |
| Sweden | | 244,022 | | 244,022 | | — | | — |
| Switzerland | | 169,358 | | 169,358 | | — | | — |
| Taiwan | | 390,141 | | 390,141 | | — | | — |
| Thailand | | 128,756 | | 128,756 | | — | | — |
| Turkey | | 45,010 | | 45,010 | | — | | — |
| United Kingdom | | 518,125 | | 518,125 | | — | | — |
| Short-Term Investments | | 105,712 | | 105,712 | | — | | — |
| Total | | $ 5,772,284 | | $ 5,772,284 | | $ — | | $ — |
| (1) | For the year ended September 30, 2021, there were no transfers in and out of Level 3. |
The accompanying notes are an integral part of these financial statements.
Hartford Multifactor Emerging Markets ETF
Schedule of Investments
September 30, 2021
| Shares or Principal Amount | | Market Value† |
| COMMON STOCKS - 97.9% |
| | Brazil - 2.6% |
| 10,846 | BB Seguridade Participacoes S.A. | $ 39,710 |
| 11,039 | Equatorial Energia S.A. | 51,357 |
| 2,900 | JBS S.A. | 19,729 |
| 11,100 | Lojas Renner S.A. | 70,117 |
| 14,500 | Magazine Luiza S.A. | 38,160 |
| 20,600 | Petrobras Distribuidora S.A. | 88,806 |
| 8,100 | Raia Drogasil S.A. | 34,741 |
| 29,445 | Telefonica Brasil S.A. | 231,663 |
| 14,300 | TOTVS S.A. | 94,740 |
| 26,000 | Transmissora Alianca de Energia Eletrica S.A. UNIT | 171,014 |
| 19,000 | Vale S.A. ADR | 265,050 |
| | | | 1,105,087 |
| | Cayman Islands - 0.1% |
| 2,500 | Wuxi Biologics Cayman, Inc.* | 40,625 |
| | Chile - 2.4% |
| 2,696,284 | Banco de Chile | 248,316 |
| 1,698 | Banco de Credito e Inversiones S.A. | 61,882 |
| 4,022,957 | Banco Santander Chile | 201,247 |
| 6,325 | Cia Cervecerias Unidas S.A. | 56,225 |
| 208,194 | Colbun S.A. | 33,682 |
| 14,672 | Empresas CMPC S.A. | 27,603 |
| 22,132 | Empresas COPEC S.A. | 183,389 |
| 220,475 | Enel Americas S.A. | 26,043 |
| 31,844 | Falabella S.A. | 111,348 |
| 1,000 | Sociedad Quimica y Minera de Chile S.A. | 53,720 |
| | | | 1,003,455 |
| | China - 26.0% |
| 7,500 | AAC Technologies Holdings, Inc. | 35,792 |
| 982,000 | Agricultural Bank of China Ltd. Class H | 338,070 |
| 20,700 | Alibaba Group Holding Ltd.* | 378,121 |
| 42,500 | Anhui Conch Cement Co., Ltd. Class H | 229,297 |
| 11,000 | ANTA Sports Products Ltd. | 207,434 |
| 3 | Baidu, Inc. ADR* | 461 |
| 1,108,000 | Bank of China Ltd. Class H | 392,835 |
| 592,000 | Bank of Communications Co., Ltd. Class H | 351,338 |
| 35 | BeiGene Ltd.* | 12,705 |
| 2,500 | BYD Co., Ltd. Class H | 78,038 |
| 37,000 | China Conch Venture Holdings Ltd. | 171,344 |
| 575,000 | China Construction Bank Corp. Class H | 412,157 |
| 394,000 | China Everbright Bank Co., Ltd. Class H | 139,184 |
| 40,000 | China Life Insurance Co., Ltd. Class H | 65,668 |
| 18,000 | China Longyuan Power Group Corp. Ltd. Class H | 44,488 |
| 24,000 | China Mengniu Dairy Co., Ltd. | 154,612 |
| 38,000 | China Merchants Bank Co., Ltd. Class H | 302,891 |
| 509,500 | China Minsheng Banking Corp. Ltd. Class H(1) | 204,856 |
| 21,400 | China Pacific Insurance Group Co., Ltd. Class H | 63,639 |
| 574,000 | China Petroleum & Chemical Corp. Class H | 284,617 |
| 339,000 | China Railway Group Ltd. Class H | 168,963 |
| 126,000 | China Shenhua Energy Co., Ltd. Class H | 294,903 |
| 1,320,000 | China Tower Corp. Ltd. Class H | 172,956 |
| 46,000 | China Vanke Co., Ltd. Class H | 125,863 |
| 106,000 | Chinasoft International Ltd. | 187,364 |
| 185,000 | CITIC Ltd. | 197,247 |
| 3,000 | CITIC Securities Co., Ltd. Class H | 7,646 |
| 53,071 | Country Garden Holdings Co., Ltd. | 54,880 |
| 10,000 | Country Garden Services Holdings Co., Ltd. | 79,002 |
| 116,000 | CSPC Pharmaceutical Group Ltd. | 139,176 |
| 13,200 | ENN Energy Holdings Ltd. | 217,721 |
| 25,600 | Fuyao Glass Industry Group Co., Ltd. Class H | 136,967 |
| 3,600 | GF Securities Co., Ltd. | 6,280 |
| 8,500 | Great Wall Motor Co., Ltd. Class H | 31,337 |
| Shares or Principal Amount | | Market Value† |
| COMMON STOCKS - 97.9% - (continued) |
| | China - 26.0% - (continued) |
| 31,400 | Guotai Junan Securities Co., Ltd. Class H* | $ 45,257 |
| 82,600 | Haier Smart Home Co., Ltd. Class H | 291,262 |
| 14,600 | Huatai Securities Co., Ltd. | 22,543 |
| 528,000 | Industrial & Commercial Bank of China Ltd. Class H | 293,686 |
| 5,106 | JD.com, Inc. ADR* | 368,857 |
| 12,000 | Jiangxi Copper Co., Ltd. Class H | 21,673 |
| 16,000 | Kingdee International Software Group Co., Ltd.* | 53,541 |
| 338,000 | Lenovo Group Ltd. | 363,415 |
| 20,500 | Li Ning Co., Ltd. | 237,400 |
| 20,000 | Longfor Properties Co., Ltd. | 92,233 |
| 7,700 | Meituan Class B* | 243,919 |
| 965 | NetEase, Inc. ADR | 82,411 |
| 690,000 | PetroChina Co., Ltd. Class H | 327,067 |
| 158,000 | PICC Property & Casualty Co., Ltd. Class H | 153,237 |
| 49,000 | Ping An Insurance Group Co. of China Ltd. Class H | 335,179 |
| 298,000 | Postal Savings Bank of China Co., Ltd. Class H | 205,949 |
| 64,000 | Shandong Weigao Group Medical Polymer Co., Ltd. Class H | 114,441 |
| 15,500 | Shanghai Fosun Pharmaceutical Group Co., Ltd. | 79,743 |
| 15,900 | Shenzhou International Group Holdings Ltd. | 338,643 |
| 4,900 | Sunny Optical Technology Group Co., Ltd. | 128,910 |
| 4,900 | Tencent Holdings Ltd. | 290,425 |
| 1,006 | Trip.com Group Ltd. ADR* | 30,935 |
| 1,019 | Vipshop Holdings Ltd. ADR* | 11,352 |
| 5,000 | WuXi AppTec Co., Ltd. Class H | 116,961 |
| 59,000 | Xiaomi Corp. Class B* | 161,812 |
| 65,494 | Xinyi Solar Holdings Ltd. | 134,275 |
| 22,000 | Yanzhou Coal Mining Co., Ltd. Class H | 41,656 |
| 5,775 | Yum China Holdings, Inc. | 335,585 |
| 20,000 | Zhongsheng Group Holdings Ltd. | 161,086 |
| 16,000 | Zijin Mining Group Co., Ltd. Class H | 19,772 |
| 8,400 | ZTE Corp. | 27,624 |
| 2,615 | ZTO Express Cayman, Inc. ADR | 80,176 |
| | | | 10,898,877 |
| | Cyprus - 0.3% |
| 7,011 | Polymetal International plc | 118,922 |
| | Hong Kong - 1.9% |
| 34,000 | China Gas Holdings Ltd. | 100,454 |
| 66,000 | China Overseas Land & Investment Ltd. | 150,404 |
| 32,000 | China Resources Gas Group Ltd. | 168,126 |
| 20,000 | China Resources Land Ltd. | 84,397 |
| 12,000 | Geely Automobile Holdings Ltd. | 34,452 |
| 126,000 | Sino Biopharmaceutical Ltd. | 104,560 |
| 49,000 | Wharf Holdings Ltd. | 162,711 |
| | | | 805,104 |
| | India - 4.8% |
| 1,715 | Axis Bank Ltd. GDR* | 87,636 |
| 5,515 | Dr. Reddy's Laboratories Ltd. ADR | 359,247 |
| 13,865 | ICICI Bank Ltd. ADR | 261,633 |
| 17,916 | Infosys Ltd. ADR | 398,631 |
| 4,426 | Reliance Industries Ltd. GDR | 301,411 |
| 1,955 | State Bank of India GDR | 120,233 |
| 4,900 | Vedanta Ltd. ADR | 74,872 |
| 45,239 | Wipro Ltd. ADR | 399,460 |
| | | | 2,003,123 |
| | Indonesia - 3.7% |
| 614,700 | Astra International Tbk PT | 236,217 |
| 121,400 | Bank Central Asia Tbk PT | 296,873 |
| 52,100 | Bank Mandiri Persero Tbk PT | 22,387 |
| 761,700 | Bank Rakyat Indonesia Persero Tbk PT | 204,894 |
| 34,400 | Indofood CBP Sukses Makmur Tbk PT | 20,069 |
The accompanying notes are an integral part of these financial statements.
Hartford Multifactor Emerging Markets ETF
Schedule of Investments – (continued)
September 30, 2021
| Shares or Principal Amount | | Market Value† |
| COMMON STOCKS - 97.9% - (continued) |
| | Indonesia - 3.7% - (continued) |
| 22,100 | Indofood Sukses Makmur Tbk PT | $ 9,805 |
| 1,525,700 | Kalbe Farma Tbk PT | 152,437 |
| 544,400 | Merdeka Copper Gold Tbk PT* | 95,852 |
| 1,342,200 | Sarana Menara Nusantara Tbk PT | 124,256 |
| 787,800 | Telekomunikasi Indonesia Persero Tbk PT | 203,108 |
| 188,700 | Unilever Indonesia Tbk PT | 52,078 |
| 83,200 | United Tractors Tbk PT | 151,141 |
| | | | 1,569,117 |
| | Malaysia - 3.6% |
| 84,100 | CIMB Group Holdings Bhd | 96,022 |
| 258,900 | DiGi.Com Bhd | 275,195 |
| 73,400 | Hartalega Holdings Bhd | 107,825 |
| 16,100 | Inari Amertron Bhd | 14,191 |
| 109,724 | Malayan Banking Bhd | 210,982 |
| 2,800 | Malaysian Pacific Industries Bhd | 30,364 |
| 10,100 | Maxis Bhd | 11,315 |
| 10,300 | MISC Bhd | 17,001 |
| 3,400 | Nestle Malaysia Bhd | 108,095 |
| 61,300 | Petronas Chemicals Group Bhd | 127,388 |
| 5,600 | Petronas Dagangan Bhd | 25,576 |
| 23,100 | Petronas Gas Bhd | 92,808 |
| 36,600 | Public Bank Bhd | 35,582 |
| 91,900 | Tenaga Nasional Bhd | 212,491 |
| 51,800 | TIME dotCom Bhd | 56,298 |
| 101,100 | Top Glove Corp. Bhd | 69,549 |
| | | | 1,490,682 |
| | Mexico - 4.1% |
| 21,900 | America Movil S.A.B. de C.V. Class L, ADR | 386,973 |
| 18,500 | Arca Continental S.A.B. de C.V. | 113,173 |
| 2,900 | Coca-Cola Femsa SAB de CV | 163,183 |
| 3,000 | Fomento Economico Mexicano S.A.B. de C.V. ADR | 260,160 |
| 10,621 | Gruma S.A.B. de C.V. Class B | 121,975 |
| 59,400 | Grupo Bimbo S.A.B. de C.V. Series A | 167,723 |
| 25,100 | Grupo Financiero Inbursa S.A.B. de C.V. Class O* | 23,751 |
| 20,600 | Grupo Mexico S.A.B. de C.V. Series B | 82,302 |
| 800 | Grupo Televisa S.A.B. | 8,784 |
| 42,700 | Kimberly-Clark de Mexico S.A.B. de C.V. Class A | 70,458 |
| 5,100 | Orbia Advance Corp. S.A.B. de C.V. | 13,154 |
| 94,682 | Wal-Mart de Mexico S.A.B. de C.V. | 322,374 |
| | | | 1,734,010 |
| | Philippines - 2.7% |
| 7,695 | Ayala Corp. | 123,247 |
| 94,600 | Ayala Land, Inc. | 62,127 |
| 18,790 | Bank of the Philippine Islands | 30,003 |
| 17,110 | BDO Unibank, Inc. | 37,098 |
| 3,120 | Globe Telecom, Inc. | 182,515 |
| 8,010 | International Container Terminal Services, Inc. | 30,620 |
| 17,380 | Manila Electric Co. | 101,534 |
| 41,800 | Metropolitan Bank & Trust Co. | 35,810 |
| 7,025 | PLDT, Inc. | 231,366 |
| 9,435 | SM Investments Corp. | 183,114 |
| 209,800 | SM Prime Holdings, Inc. | 134,698 |
| | | | 1,152,132 |
| | Poland - 2.7% |
| 11,295 | Cyfrowy Polsat S.A. | 101,196 |
| 245 | Dino Polska S.A.*(2) | 20,495 |
| 2,885 | KGHM Polska Miedz S.A. | 114,528 |
| 36 | LPP S.A. | 134,164 |
| 9,109 | Orange Polska S.A.* | 18,419 |
| 8,563 | Polski Koncern Naftowy ORLEN S.A. | 176,855 |
| Shares or Principal Amount | | Market Value† |
| COMMON STOCKS - 97.9% - (continued) |
| | Poland - 2.7% - (continued) |
| 87,422 | Polskie Gornictwo Naftowe i Gazownictwo S.A. | $ 142,297 |
| 14,398 | Powszechna Kasa Oszczednosci Bank Polski S.A.* | 153,144 |
| 31,608 | Powszechny Zaklad Ubezpieczen S.A.* | 290,511 |
| | | | 1,151,609 |
| | Russia - 2.0% |
| 36,969 | Gazprom PJSC ADR | 369,172 |
| 440 | LUKOIL PJSC ADR | 42,161 |
| 3,816 | MMC Norilsk Nickel PJSC ADR | 114,213 |
| 15,583 | Sberbank of Russia PJSC ADR | 293,272 |
| 132 | Yandex N.V. Class A* | 10,519 |
| | | | 829,337 |
| | South Africa - 2.5% |
| 26,310 | FirstRand Ltd. | 112,812 |
| 1,399 | Foschini Group Ltd.* | 12,697 |
| 1,750 | Kumba Iron Ore Ltd. | 57,688 |
| 5,986 | Mr. Price Group Ltd. | 80,060 |
| 4,732 | MTN Group Ltd.* | 44,461 |
| 16,442 | MultiChoice Group Ltd. | 124,771 |
| 1,115 | Naspers Ltd. Class N | 184,729 |
| 3,088 | Sanlam Ltd. | 13,120 |
| 4,791 | Shoprite Holdings Ltd. | 56,922 |
| 22,732 | Vodacom Group Ltd. | 217,635 |
| 36,739 | Woolworths Holdings Ltd. | 144,221 |
| | | | 1,049,116 |
| | South Korea - 15.0% |
| 3,739 | BNK Financial Group, Inc. | 27,916 |
| 3,935 | Coway Co., Ltd. | 246,602 |
| 813 | DB HiTek Co., Ltd. | 37,491 |
| 374 | DB Insurance Co., Ltd. | 20,090 |
| 2,659 | Fila Holdings Corp. | 95,782 |
| 3,245 | GS Holdings Corp. | 122,647 |
| 1,797 | Hana Financial Group, Inc. | 70,423 |
| 4,173 | Hankook Tire & Technology Co., Ltd. | 152,434 |
| 11,802 | Hanon Systems | 155,998 |
| 303 | Hansol Chemical Co., Ltd. | 88,674 |
| 1,884 | Hotel Shilla Co., Ltd. | 137,799 |
| 59 | Hyosung TNC Corp. | 32,141 |
| 671 | Hyundai Mobis Co., Ltd. | 143,381 |
| 587 | Hyundai Motor Co. | 99,155 |
| 561 | Iljin Materials Co., Ltd. | 49,277 |
| 3,472 | Industrial Bank of Korea | 30,791 |
| 702 | Kakao Corp. | 69,963 |
| 4,248 | Kangwon Land, Inc.* | 102,792 |
| 1,428 | KB Financial Group, Inc. | 66,696 |
| 3,071 | Kia Motors Corp. | 210,612 |
| 7,072 | Korea Electric Power Corp. | 140,664 |
| 166 | Korea Zinc Co., Ltd. | 70,522 |
| 3,626 | KT&G Corp. | 248,675 |
| 50 | LG Chem Ltd. | 32,770 |
| 10,859 | LG Display Co., Ltd.* | 173,799 |
| 2,310 | LG Electronics, Inc. | 248,754 |
| 69 | LG Household & Health Care Ltd. | 77,916 |
| 447 | LG Innotek Co., Ltd. | 78,716 |
| 18,380 | LG Uplus Corp. | 232,855 |
| 536 | Mando Corp.* | 25,849 |
| 764 | NAVER Corp. | 250,365 |
| 315 | NCSoft Corp. | 160,427 |
| 183 | Orion Corp. | 18,161 |
| 1,470 | Pearl Abyss Corp.* | 99,821 |
| 305 | POSCO | 85,008 |
| 830 | Samsung C&T Corp. | 86,575 |
The accompanying notes are an integral part of these financial statements.
Hartford Multifactor Emerging Markets ETF
Schedule of Investments – (continued)
September 30, 2021
| Shares or Principal Amount | | Market Value† |
| COMMON STOCKS - 97.9% - (continued) |
| | South Korea - 15.0% - (continued) |
| 1,511 | Samsung Electro-Mechanics Co., Ltd. | $ 226,522 |
| 6,582 | Samsung Electronics Co., Ltd. | 411,931 |
| 685 | Samsung Fire & Marine Insurance Co., Ltd. | 135,959 |
| 262 | Samsung SDI Co., Ltd. | 158,882 |
| 2,052 | Samsung SDS Co., Ltd. | 278,164 |
| 2,161 | Samsung Securities Co., Ltd. | 87,426 |
| 2,705 | Shinhan Financial Group Co., Ltd. | 92,299 |
| 482 | Shinsegae, Inc. | 107,269 |
| 4,683 | SK Hynix, Inc. | 407,389 |
| 1,173 | SK Telecom Co., Ltd.* | 320,990 |
| 1,738 | Woori Financial Group, Inc. | 17,101 |
| 774 | Yuhan Corp. | 40,204 |
| | | | 6,275,677 |
| | Taiwan - 17.4% |
| 9,000 | Accton Technology Corp. | 84,959 |
| 189,000 | Acer, Inc. | 167,899 |
| 14,000 | Advantech Co., Ltd. | 183,414 |
| 31,000 | ASE Technology Holding, Co., Ltd. | 121,283 |
| 24,000 | Asustek Computer, Inc. | 280,397 |
| 18,000 | Catcher Technology Co., Ltd. | 108,218 |
| 68,000 | Cathay Financial Holding Co., Ltd. | 141,318 |
| 73,000 | Cheng Shin Rubber Industry Co., Ltd. | 93,017 |
| 138,000 | China Development Financial Holding Corp. | 70,336 |
| 6,000 | China Steel Corp. | 7,817 |
| 62,000 | Chunghwa Telecom Co., Ltd. | 245,904 |
| 344,000 | Compal Electronics, Inc. | 291,395 |
| 81,000 | CTBC Financial Holding Co., Ltd. | 66,578 |
| 19,000 | Delta Electronics, Inc. | 171,856 |
| 16,000 | E Ink Holdings, Inc. | 42,383 |
| 3,000 | Eclat Textile Co., Ltd. | 65,361 |
| 5,000 | Elite Material Co., Ltd. | 39,034 |
| 72,000 | Far EasTone Telecommunications Co., Ltd. | 158,935 |
| 11,000 | Feng TAY Enterprise Co., Ltd. | 84,887 |
| 92,000 | First Financial Holding Co., Ltd. | 74,464 |
| 38,000 | Foxconn Technology Co., Ltd. | 95,885 |
| 37,000 | Fubon Financial Holding Co., Ltd. | 101,861 |
| 420 | Great Wall Enterprise Co., Ltd. | 828 |
| 59,224 | Hon Hai Precision Industry Co., Ltd. | 223,202 |
| 62,000 | Innolux Corp. | 37,831 |
| 255,000 | Inventec Corp. | 236,141 |
| 1,000 | Largan Precision Co., Ltd. | 78,606 |
| 123,245 | Lite-On Technology Corp. | 276,478 |
| 19 | Lotes Co., Ltd. | 378 |
| 8,000 | MediaTek, Inc. | 259,866 |
| 104,000 | Mega Financial Holding Co., Ltd. | 119,639 |
| 30,000 | Micro-Star International Co., Ltd. | 139,445 |
| 1,000 | momo.com, Inc. | 58,147 |
| 7,000 | Nan Ya Plastics Corp. | 22,989 |
| 13,000 | Novatek Microelectronics Corp. | 191,310 |
| 1,000 | Parade Technologies Ltd. | 59,403 |
| 81,000 | Pegatron Corp. | 194,792 |
| 2,000 | Phison Electronics Corp. | 27,063 |
| 92,000 | Pou Chen Corp. | 111,448 |
| 32,000 | Powertech Technology, Inc. | 120,027 |
| 3,000 | President Chain Store Corp. | 30,150 |
| 102,000 | Quanta Computer, Inc. | 283,735 |
| 6,000 | Realtek Semiconductor Corp. | 106,710 |
| 10,000 | Simplo Technology Co., Ltd. | 103,552 |
| 2,000 | Sino-American Silicon Products, Inc. | 13,029 |
| Shares or Principal Amount | | Market Value† |
| COMMON STOCKS - 97.9% - (continued) |
| | Taiwan - 17.4% - (continued) |
| 10,000 | SinoPac Financial Holdings Co., Ltd. | $ 4,989 |
| 140,000 | Synnex Technology International Corp. | 262,307 |
| 24,044 | Taishin Financial Holding Co., Ltd. | 15,620 |
| 39,000 | Taiwan Cement Corp. | 71,391 |
| 105,060 | Taiwan Cooperative Financial Holding Co., Ltd. | 83,338 |
| 59,000 | Taiwan Mobile Co., Ltd. | 209,440 |
| 3,000 | Taiwan Semiconductor Manufacturing Co., Ltd. ADR | 334,950 |
| 29,000 | Teco Electric and Machinery Co., Ltd. | 32,528 |
| 16,000 | Uni-President Enterprises Corp. | 39,224 |
| 69,000 | United Microelectronics Corp. | 158,504 |
| 13,000 | Vanguard International Semiconductor Corp. | 70,691 |
| 7,600 | Wan Hai Lines Ltd. | 55,512 |
| 141,686 | Wistron Corp. | 139,853 |
| 2,000 | Wiwynn Corp. | 62,454 |
| 138,000 | WPG Holdings Ltd. | 240,233 |
| 80,000 | Yuanta Financial Holding Co., Ltd. | 70,925 |
| 13,000 | Zhen Ding Technology Holding Ltd. | 46,148 |
| | | | 7,290,077 |
| | Thailand - 3.9% |
| 58,947 | Advanced Info Service PCL NVDR | 341,469 |
| 43,300 | Bangkok Chain Hospital PCL NVDR | 27,386 |
| 344,800 | Bangkok Dusit Medical Services PCL NVDR | 232,346 |
| 5,300 | Bumrungrad Hospital PCL | 22,165 |
| 33,800 | Central Retail Corp. PCL | 33,465 |
| 46,600 | Com7 PCL NVDR | 92,622 |
| 68,900 | CP ALL PCL NVDR | 129,308 |
| 11,000 | Hana Microelectronics PCL NVDR | 25,684 |
| 379,200 | Home Product Center PCL NVDR | 152,420 |
| 20,900 | Intouch Holdings PCL NVDR | 49,725 |
| 4,600 | KCE Electronics PCL NVDR | 10,706 |
| 110,100 | Land & Houses PCL | 25,870 |
| 13,200 | PTT Exploration & Production PCL NVDR | 45,840 |
| 93,900 | PTT PCL NVDR | 108,234 |
| 18,300 | Siam Cement PCL NVDR | 217,426 |
| 112,500 | Sri Trang Gloves Thailand PCL(1) | 103,905 |
| 7,300 | Thai Union Group PCL | 4,682 |
| | | | 1,623,253 |
| | Turkey - 2.2% |
| 71,252 | Akbank T.A.S. | 42,747 |
| 28,102 | BIM Birlesik Magazalar A.S. | 202,124 |
| 119,988 | Eregli Demir ve Celik Fabrikalari T.A.S. | 224,870 |
| 5,282 | Ford Otomotiv Sanayi AS | 99,347 |
| 13,856 | Petkim Petrokimya Holding A.S.* | 10,184 |
| 7,846 | Tofas Turk Otomobil Fabrikasi AS | 45,923 |
| 124,696 | Turkcell Iletisim Hizmetleri AS | 215,166 |
| 43,191 | Turkiye Garanti Bankasi A.S. | 44,921 |
| 23,926 | Turkiye Sise ve Cam Fabrikalari A.S. | 22,056 |
| | | | 907,338 |
| | Total Common Stocks
(cost $39,085,985) | | $ 41,047,541 |
| PREFERRED STOCKS - 1.5% |
| | Brazil - 1.2% |
| 37,957 | Banco Bradesco S.A. | $ 145,102 |
| 5,647 | Bradespar S.A. (Preference Shares) | 54,174 |
| 35,371 | Itau S.A. | 72,314 |
The accompanying notes are an integral part of these financial statements.
Hartford Multifactor Emerging Markets ETF
Schedule of Investments – (continued)
September 30, 2021
| Shares or Principal Amount | | Market Value† |
| PREFERRED STOCKS - 1.5% - (continued) |
| | Brazil - 1.2% - (continued) |
| 37,461 | Itau Unibanco Holding S.A. | $ 198,893 |
| 8,200 | Petroleo Brasileiro S.A. | 40,978 |
| | | | 511,461 |
| | Colombia - 0.3% |
| 11,929 | Bancolombia S.A. | 103,270 |
| | Total Preferred Stocks
(cost $551,821) | | $ 614,731 |
| | Total Long-Term Investments
(cost $39,637,806) | | $ 41,662,272 |
| SHORT-TERM INVESTMENTS - 0.2% |
| | Securities Lending Collateral - 0.2% |
| 6,851 | Fidelity Investments Money Market Funds, Government Portfolio, Institutional Class, 0.01%(3) | $ 6,851 |
| 90,821 | Goldman Sachs Financial Square Funds, Government Fund, Institutional Class, 0.03%(3) | 90,821 |
| 4,960 | Invesco Government & Agency Portfolio, Institutional Class, 0.03%(3) | 4,960 |
| | Total Short-Term Investments
(cost $102,632) | $ 102,632 |
| | Total Investments
(cost $39,740,438) | 99.6% | $ 41,764,904 |
| | Other Assets and Liabilities | 0.4% | 147,924 |
| | Total Net Assets | 100.0% | $ 41,912,828 |
| Note: | Percentage of investments as shown is the ratio of the total market value to total net assets. |
| | The Fund may refer to any one or more of the industry classifications used by one or more widely recognized market indices, ratings group and/or as defined by Fund management. Industry classifications may not be identical across all security types. |
| | For Fund compliance purposes, the Fund may not use the same classification system. These classifications are used for financial reporting purposes. |
| | See “Glossary” for abbreviation descriptions. |
| * | Non-income producing. |
| (1) | Represents entire or partial securities on loan. See Note 8 in the accompanying Notes to Financial Statements for securities lending information. |
| (2) | Security was purchased pursuant to Rule 144A under the Securities Act of 1933 and may be sold in transactions that are exempt from registration (typically only to qualified institutional buyers) or in a public offering registered under the Securities Act of 1933. At September 30, 2021, the aggregate value of this security was $20,495, representing 0.0% of net assets. |
| (3) | Current yield as of period end. |
| Futures Contracts Outstanding at September 30, 2021 |
| Description | | Number of
Contracts | | Expiration
Date | | Current
Notional
Amount | | Value and
Unrealized
Appreciation/
(Depreciation) |
| Long position contracts: |
| MSCI Emerging Markets Index Future | | 4 | | 12/17/2021 | | $ 249,120 | | $ (10,888) |
| Total futures contracts | | $ (10,888) |
† See Significant Accounting Policies of accompanying Notes to Financial Statements regarding valuation of investments.
The accompanying notes are an integral part of these financial statements.
Hartford Multifactor Emerging Markets ETF
Schedule of Investments – (continued)
September 30, 2021
Fair Value Summary
The following is a summary of the fair valuations according to the inputs used as of September 30, 2021 in valuing the Fund’s investments.
| Description | | Total | | Level 1 | | Level 2 | | Level 3(1) |
| Assets | | | | | | | | |
| Common Stocks | | | | | | | | |
| Brazil | | $ 1,105,087 | | $ 1,105,087 | | $ — | | $ — |
| Cayman Islands | | 40,625 | | 40,625 | | — | | — |
| Chile | | 1,003,455 | | 1,003,455 | | — | | — |
| China | | 10,898,877 | | 10,898,877 | | — | | — |
| Cyprus | | 118,922 | | 118,922 | | — | | — |
| Hong Kong | | 805,104 | | 805,104 | | — | | — |
| India | | 2,003,123 | | 2,003,123 | | — | | — |
| Indonesia | | 1,569,117 | | 1,569,117 | | — | | — |
| Malaysia | | 1,490,682 | | 1,490,682 | | — | | — |
| Mexico | | 1,734,010 | | 1,734,010 | | — | | — |
| Philippines | | 1,152,132 | | 1,152,132 | | — | | — |
| Poland | | 1,151,609 | | 1,151,609 | | — | | — |
| Russia | | 829,337 | | 829,337 | | — | | — |
| South Africa | | 1,049,116 | | 1,049,116 | | — | | — |
| South Korea | | 6,275,677 | | 6,275,677 | | — | | — |
| Taiwan | | 7,290,077 | | 7,290,077 | | — | | — |
| Thailand | | 1,623,253 | | 1,623,253 | | — | | — |
| Turkey | | 907,338 | | 907,338 | | — | | — |
| Preferred Stocks | | 614,731 | | 614,731 | | — | | — |
| Short-Term Investments | | 102,632 | | 102,632 | | — | | — |
| Total | | $ 41,764,904 | | $ 41,764,904 | | $ — | | $ — |
| Liabilities | | | | | | | | |
| Futures Contracts(2) | | $ (10,888) | | $ (10,888) | | $ — | | $ — |
| Total | | $ (10,888) | | $ (10,888) | | $ — | | $ — |
| (1) | For the year ended September 30, 2021, there were no transfers in and out of Level 3. |
| (2) | Derivative instruments (excluding purchased and written options, if applicable) are valued at the unrealized appreciation/(depreciation) on the investments. |
The accompanying notes are an integral part of these financial statements.
Hartford Multifactor Small Cap ETF
Schedule of Investments
September 30, 2021
| Shares or Principal Amount | | Market Value† |
| COMMON STOCKS - 99.5% |
| | Automobiles & Components - 0.2% |
| 1,252 | Standard Motor Products, Inc. | $ 54,725 |
| | Banks - 10.2% |
| 961 | Ameris Bancorp | 49,857 |
| 1,542 | Associated Banc-Corp. | 33,030 |
| 253 | BancorpSouth Bank | 7,534 |
| 936 | Bankwell Financial Group, Inc. | 27,546 |
| 778 | Banner Corp. | 42,953 |
| 3,661 | BCB Bancorp, Inc. | 54,036 |
| 949 | Cadence Bancorp | 20,840 |
| 711 | Cathay General Bancorp | 29,428 |
| 874 | Central Pacific Financial Corp. | 22,444 |
| 678 | Central Valley Community Bancorp | 14,577 |
| 261 | City Holding Co. | 20,335 |
| 2,325 | Civista Bancshares, Inc. | 54,010 |
| 287 | Community Trust Bancorp, Inc. | 12,083 |
| 1,879 | CVB Financial Corp. | 38,275 |
| 280 | Eagle Bancorp, Inc. | 16,100 |
| 102 | Farmers National Banc Corp. | 1,602 |
| 2,534 | Financial Institutions, Inc. | 77,667 |
| 8,844 | First BanCorp | 124,391 |
| 3,178 | First Busey Corp. | 78,274 |
| 878 | First Financial Corp. | 36,920 |
| 1,325 | First Hawaiian, Inc. | 38,889 |
| 5,340 | First Interstate BancSystem, Inc. Class A | 214,988 |
| 297 | First Merchants Corp. | 12,426 |
| 1,582 | FNB Corp. | 18,383 |
| 3,852 | Fulton Financial Corp. | 58,859 |
| 94 | Great Southern Bancorp, Inc. | 5,152 |
| 3,977 | Hanmi Financial Corp. | 79,779 |
| 648 | Heartland Financial USA, Inc. | 31,156 |
| 853 | Heritage Financial Corp. | 21,752 |
| 2,000 | Hilltop Holdings, Inc. | 65,340 |
| 678 | HomeStreet, Inc. | 27,900 |
| 6,991 | Hope Bancorp, Inc. | 100,950 |
| 1,399 | Independent Bank Corp. | 34,261 |
| 539 | Meridian Bancorp, Inc. | 11,190 |
| 296 | Midland States Bancorp, Inc. | 7,320 |
| 194 | National Bank Holdings Corp. | 7,853 |
| 492 | NBT Bancorp, Inc. | 17,771 |
| 2,780 | Northwest Bancshares, Inc. | 36,918 |
| 1,423 | OceanFirst Financial Corp. | 30,466 |
| 1,890 | Old National Bancorp | 32,036 |
| 218 | Park National Corp. | 26,585 |
| 793 | PCB Bancorp | 15,789 |
| 193 | Peoples Bancorp, Inc. | 6,101 |
| 843 | Preferred Bank | 56,211 |
| 3,944 | Primis Financial Corp. | 57,030 |
| 192 | QCR Holdings, Inc. | 9,876 |
| 758 | Renasant Corp. | 27,326 |
| 1,387 | Republic Bancorp, Inc. | 70,252 |
| 161 | ServisFirst Bancshares, Inc. | 12,526 |
| 2,902 | Shore Bancshares, Inc. | 51,452 |
| 3,265 | Simmons First National Corp. Class A | 96,513 |
| 3,066 | Towne Bank | 95,383 |
| 581 | TriCo Bancshares | 25,215 |
| 1,180 | TrustCo Bank Corp. NY | 37,725 |
| 2,342 | Trustmark Corp. | 75,459 |
| 3,706 | Umpqua Holdings Corp. | 75,046 |
| 467 | Univest Financial Corp. | 12,791 |
| 609 | Walker & Dunlop, Inc. | 69,122 |
| Shares or Principal Amount | | Market Value† |
| COMMON STOCKS - 99.5% - (continued) |
| | Banks - 10.2% - (continued) |
| 295 | Washington Federal, Inc. | $ 10,121 |
| 166 | Washington Trust Bancorp, Inc. | 8,795 |
| 2,279 | Waterstone Financial, Inc. | 46,697 |
| 411 | WesBanco, Inc. | 14,007 |
| | | | 2,515,313 |
| | Capital Goods - 6.8% |
| 247 | Alamo Group, Inc. | 34,464 |
| 6,459 | Alpha Pro Tech Ltd.*(1) | 43,469 |
| 850 | Applied Industrial Technologies, Inc. | 76,611 |
| 2,246 | Atkore International Group, Inc* | 195,222 |
| 2,259 | BlueLinx Holdings, Inc.* | 110,420 |
| 3,370 | Boise Cascade Co. | 181,913 |
| 932 | Comfort Systems USA, Inc. | 66,470 |
| 278 | Encore Wire Corp. | 26,363 |
| 1,265 | Federal Signal Corp. | 48,854 |
| 943 | Global Industrial Co. Common St | 35,730 |
| 2,543 | GMS, Inc.* | 111,383 |
| 6,016 | GrafTech International Ltd. | 62,085 |
| 2,057 | Great Lakes Dredge & Dock Corp.* | 31,040 |
| 278 | Greenbrier Cos., Inc. | 11,951 |
| 1,165 | IES Holdings, Inc.* | 53,229 |
| 248 | Kadant, Inc. | 50,617 |
| 471 | McGrath Rent Corp. | 33,888 |
| 1,798 | Miller Industries, Inc. | 61,204 |
| 1,266 | Mueller Industries, Inc. | 52,033 |
| 2,340 | MYR Group, Inc.* | 232,830 |
| 569 | National Presto Industries, Inc. | 46,704 |
| 689 | Primoris Services Corp. | 16,874 |
| 1,396 | Sterling Construction Co., Inc.* | 31,647 |
| 693 | Veritiv Corp.* | 62,065 |
| | | | 1,677,066 |
| | Commercial & Professional Services - 4.8% |
| 229 | Barrett Business Services, Inc. | 17,464 |
| 2,012 | Brady Corp. Class A | 102,008 |
| 4,290 | Deluxe Corp. | 153,968 |
| 4,554 | Ennis, Inc. | 85,843 |
| 1,549 | Healthcare Services Group, Inc. | 38,710 |
| 1,837 | Herman Miller, Inc. | 69,181 |
| 5,051 | HNI Corp. | 185,473 |
| 1,821 | Kelly Services, Inc. Class A | 34,380 |
| 2,361 | Kforce, Inc. | 140,810 |
| 4,100 | Kimball International, Inc. Class B | 45,920 |
| 896 | ManTech International Corp. Class A | 68,024 |
| 4,606 | Resources Connection, Inc. | 72,683 |
| 8,767 | Steelcase, Inc. Class A | 111,166 |
| 345 | UniFirst Corp. | 73,354 |
| | | | 1,198,984 |
| | Consumer Durables & Apparel - 4.0% |
| 1,106 | Acushnet Holdings Corp. | 51,650 |
| 5,110 | Ethan Allen Interiors, Inc. | 121,107 |
| 483 | Green Brick Partners, Inc.* | 9,911 |
| 836 | Johnson Outdoors, Inc. Class A | 88,449 |
| 2,419 | Kontoor Brands, Inc. | 120,829 |
| 1,290 | Lakeland Industries, Inc.* | 27,090 |
| 394 | MDC Holdings, Inc. | 18,408 |
| 1,905 | Nautilus, Inc.* | 17,736 |
| 10,286 | Smith & Wesson Brands, Inc. | 213,537 |
| 2,522 | Sturm Ruger & Co., Inc. | 186,073 |
| 1,261 | Superior Group of Cos., Inc. | 29,369 |
The accompanying notes are an integral part of these financial statements.
Hartford Multifactor Small Cap ETF
Schedule of Investments – (continued)
September 30, 2021
| Shares or Principal Amount | | Market Value† |
| COMMON STOCKS - 99.5% - (continued) |
| | Consumer Durables & Apparel - 4.0% - (continued) |
| 1,078 | Tupperware Brands Corp.* | $ 22,767 |
| 1,228 | Vera Bradley, Inc.* | 11,556 |
| 2,094 | Vista Outdoor, Inc.* | 84,409 |
| | | | 1,002,891 |
| | Consumer Services - 1.0% |
| 2,052 | American Public Education, Inc.* | 52,552 |
| 6,351 | Perdoceo Education Corp.* | 67,066 |
| 3,617 | Stride, Inc.* | 129,995 |
| | | | 249,613 |
| | Diversified Financials - 2.5% |
| 240 | A-Mark Precious Metals, Inc. | 14,405 |
| 1,298 | B. Riley Financial, Inc. | 76,634 |
| 6,657 | Cherry Hill Mortgage Investment Corp. REIT | 59,114 |
| 3,776 | Cowen, Inc. | 129,555 |
| 651 | Moelis & Co. Class A | 40,277 |
| 2,606 | Oppenheimer Holdings, Inc. Class A | 118,026 |
| 104 | Regional Management Corp. | 6,051 |
| 3,054 | Victory Capital Holdings, Inc. | 106,920 |
| 2,939 | Virtu Financial, Inc. Class A | 71,800 |
| | | | 622,782 |
| | Energy - 2.8% |
| 1,218 | Bonanza Creek Energy, Inc. | 58,342 |
| 914 | Centrus Energy Corp.* | 35,335 |
| 6,338 | CONSOL Energy, Inc.* | 164,915 |
| 53 | Dorian LPG Ltd. | 658 |
| 1,265 | Equitrans Midstream Corp. | 12,827 |
| 6,693 | Magnolia Oil & Gas Corp. Class A | 119,069 |
| 601 | Oasis Petroleum, Inc. | 59,751 |
| 1,726 | Renewable Energy Group, Inc.* | 86,645 |
| 5,399 | TechnipFMC plc* | 40,655 |
| 9,588 | W&T Offshore, Inc.* | 35,667 |
| 2,398 | World Fuel Services Corp. | 80,621 |
| | | | 694,485 |
| | Food & Staples Retailing - 3.2% |
| 800 | Andersons, Inc. | 24,664 |
| 3,271 | Ingles Markets, Inc. Class A | 215,984 |
| 4,295 | SpartanNash Co. | 94,060 |
| 6,223 | Sprouts Farmers Market, Inc.* | 144,187 |
| 3,142 | United Natural Foods, Inc.* | 152,136 |
| 3,120 | Weis Markets, Inc. | 163,956 |
| | | | 794,987 |
| | Food, Beverage & Tobacco - 1.7% |
| 330 | Coca-Cola Consolidated, Inc. | 130,079 |
| 1,325 | John B Sanfilippo & Son, Inc. | 108,279 |
| 1 | Mehadrin Ltd.* | 30 |
| 827 | Universal Corp. | 39,969 |
| 10,902 | Vector Group Ltd. | 139,001 |
| | | | 417,358 |
| | Health Care Equipment & Services - 10.9% |
| 402 | Addus HomeCare Corp.* | 32,060 |
| 8,195 | Allscripts Healthcare Solutions, Inc.* | 109,567 |
| 1,520 | Apollo Medical Holdings, Inc.* | 138,396 |
| 14 | Atrion Corp. | 9,765 |
| 114 | BioLife Solutions, Inc.* | 4,824 |
| 10,840 | Castlight Health, Inc.* | 17,019 |
| 7,124 | Co-Diagnostics, Inc.* | 69,317 |
| 9,646 | Community Health Systems, Inc.* | 112,858 |
| 3,053 | Computer Programs & Systems, Inc. | 108,259 |
| 402 | Corvel Corp.* | 74,860 |
| Shares or Principal Amount | | Market Value† |
| COMMON STOCKS - 99.5% - (continued) |
| | Health Care Equipment & Services - 10.9% - (continued) |
| 9,378 | Cross Country Healthcare, Inc.* | $ 199,189 |
| 1,580 | Fulgent Genetics, Inc.* | 142,121 |
| 1,257 | Hanger, Inc.* | 27,604 |
| 571 | ICU Medical, Inc.* | 133,260 |
| 6,313 | InfuSystem Holdings, Inc.* | 82,258 |
| 2,677 | Inovalon Holdings, Inc. Class A* | 107,856 |
| 619 | Integer Holdings Corp.* | 55,301 |
| 1,280 | Joint Corp.* | 125,466 |
| 2,604 | LeMaitre Vascular, Inc. | 138,246 |
| 394 | Magellan Health, Inc.* | 37,253 |
| 11,365 | Meridian Bioscience, Inc.* | 218,663 |
| 829 | Merit Medical Systems, Inc.* | 59,522 |
| 881 | ModivCare, Inc.* | 160,007 |
| 1,701 | National HealthCare Corp. | 119,036 |
| 2,248 | NextGen Healthcare, Inc.* | 31,697 |
| 1,410 | Orthofix Medical, Inc.* | 53,749 |
| 6,788 | Owens & Minor, Inc. | 212,397 |
| 3,527 | Patterson Cos., Inc. | 106,304 |
| 1,318 | Sharps Compliance Corp.* | 10,900 |
| | | | 2,697,754 |
| | Household & Personal Products - 0.9% |
| 1,178 | Central Garden & Pet Co. Class A* | 50,654 |
| 2,050 | Nu Skin Enterprises, Inc. Class A | 82,963 |
| 1,090 | USANA Health Sciences, Inc.* | 100,498 |
| | | | 234,115 |
| | Insurance - 5.6% |
| 612 | American Equity Investment Life Holding Co. | 18,097 |
| 1,327 | American National Group, Inc. | 250,843 |
| 467 | Assured Guaranty Ltd. | 21,860 |
| 7,308 | CNO Financial Group, Inc. | 172,030 |
| 3,222 | Donegal Group, Inc. | 46,687 |
| 3,541 | Employers Holdings, Inc. | 139,834 |
| 986 | HCI Group, Inc. | 109,219 |
| 1,984 | Horace Mann Educators Corp. | 78,943 |
| 3,225 | Mercury General Corp. | 179,536 |
| 1,252 | Safety Insurance Group, Inc. | 99,221 |
| 1,965 | Stewart Information Services Corp. | 124,306 |
| 13,646 | Tiptree, Inc. | 136,733 |
| | | | 1,377,309 |
| | Materials - 3.6% |
| 3,723 | Commercial Metals Co. | 113,403 |
| 2,387 | Greif, Inc. Class A | 154,200 |
| 300 | Hawkins, Inc. | 10,464 |
| 1,602 | Kronos Worldwide, Inc. | 19,881 |
| 1,595 | Myers Industries, Inc. | 31,214 |
| 832 | Olympic Steel, Inc. | 20,268 |
| 3,579 | Schnitzer Steel Industries, Inc. Class A | 156,796 |
| 2,574 | Schweitzer-Mauduit International, Inc. | 89,215 |
| 2,129 | Silgan Holdings, Inc. | 81,668 |
| 347 | Stepan Co. | 39,190 |
| 311 | SunCoke Energy, Inc. | 1,953 |
| 2,476 | Tredegar Corp. | 30,158 |
| 957 | Trinseo S.A. | 51,659 |
| 219 | Tronox Holdings plc | 5,398 |
| 1,449 | Worthington Industries, Inc. | 76,362 |
| | | | 881,829 |
| | Media & Entertainment - 3.4% |
| 3,281 | AMC Networks, Inc. Class A* | 152,862 |
| 19,283 | Entravision Communications Corp. | 136,909 |
| 775 | Gray Television, Inc. | 17,686 |
| 3,428 | John Wiley & Sons, Inc. Class A | 178,976 |
The accompanying notes are an integral part of these financial statements.
Hartford Multifactor Small Cap ETF
Schedule of Investments – (continued)
September 30, 2021
| Shares or Principal Amount | | Market Value† |
| COMMON STOCKS - 99.5% - (continued) |
| | Media & Entertainment - 3.4% - (continued) |
| 2,552 | Lee Enterprises, Inc.* | $ 57,777 |
| 3,330 | Meredith Corp.* | 185,481 |
| 5,820 | TEGNA, Inc. | 114,770 |
| | | | 844,461 |
| | Pharmaceuticals, Biotechnology & Life Sciences - 8.1% |
| 3,799 | Amphastar Pharmaceuticals, Inc.* | 72,219 |
| 8,733 | BioDelivery Sciences International, Inc.* | 31,526 |
| 38,255 | Catalyst Pharmaceuticals, Inc.* | 202,751 |
| 3,441 | Collegium Pharmaceutical, Inc.* | 67,925 |
| 9,735 | Corcept Therapeutics, Inc.* | 191,585 |
| 699 | Eagle Pharmaceuticals, Inc.* | 38,990 |
| 310 | Emergent BioSolutions, Inc.* | 15,522 |
| 3,337 | Harrow Health, Inc.* | 30,333 |
| 4,883 | Harvard Bioscience, Inc.* | 34,083 |
| 487 | Innoviva, Inc.* | 8,138 |
| 3,004 | Inotiv, Inc.* | 87,837 |
| 10,740 | Ironwood Pharmaceuticals, Inc.* | 140,264 |
| 4,100 | MiMedx Group, Inc.* | 24,846 |
| 7,153 | Organogenesis Holdings, Inc.* | 101,859 |
| 33,488 | Ovid therapeutics, Inc.* | 112,520 |
| 438 | Pacira BioSciences, Inc.* | 24,528 |
| 7,331 | Phibro Animal Health Corp. Class A | 157,910 |
| 1,961 | Prestige Consumer Healthcare, Inc.* | 110,032 |
| 1,027 | Sage Therapeutics, Inc.* | 45,506 |
| 13,094 | SIGA Technologies, Inc.* | 96,765 |
| 6,076 | Supernus Pharmaceuticals, Inc.* | 162,047 |
| 14,577 | Vanda Pharmaceuticals, Inc.* | 249,850 |
| | | | 2,007,036 |
| | Real Estate - 5.9% |
| 17,812 | Apartment Investment and Management Co. | 122,012 |
| 10,726 | Bluerock Residential Growth REIT, Inc. REIT | 136,649 |
| 7,314 | Brandywine Realty Trust | 98,154 |
| 228 | Centerspace REIT | 21,546 |
| 6,805 | City Office, Inc. REIT | 121,537 |
| 5,064 | Columbia Property Trust, Inc. REIT | 96,317 |
| 2,316 | CTO Realty Growth, Inc. | 124,508 |
| 5,007 | Farmland Partners, Inc. REIT | 60,034 |
| 911 | Forestar Group, Inc.* | 16,972 |
| 19,604 | Geo Group, Inc. REIT | 146,442 |
| 705 | Getty Realty Corp. REIT | 20,664 |
| 2,879 | Independence Realty Trust, Inc. REIT | 58,588 |
| 1,117 | Industrial Logistics Properties Trust | 28,383 |
| 1,599 | iStar, Inc. REIT | 40,103 |
| 499 | Kennedy-Wilson Holdings, Inc. | 10,439 |
| 726 | Marcus & Millichap, Inc. REIT* | 29,490 |
| 166 | NexPoint Residential Trust, Inc. REIT | 10,272 |
| 3,718 | Piedmont Office Realty Trust, Inc. Class A, REIT | 64,805 |
| 481 | PotlatchDeltic Corp. REIT | 24,810 |
| 375 | Preferred Apartment Communities, Inc. Class A, REIT | 4,586 |
| 2,274 | RMR Group, Inc. Class A | 76,065 |
| 3,548 | RPT Realty REIT | 45,273 |
| 4,078 | UMH Properties, Inc. | 93,386 |
| | | | 1,451,035 |
| | Retailing - 8.2% |
| 3,012 | 1-800-Flowers.com, Inc. Class A* | 91,896 |
| 2,393 | Abercrombie & Fitch Co. Class A* | 90,048 |
| 462 | Asbury Automotive Group, Inc.* | 90,894 |
| 7,617 | Big 5 Sporting Goods Corp. | 175,496 |
| 4,197 | Big Lots, Inc. | 181,982 |
| 5,024 | Buckle, Inc. | 198,900 |
| Shares or Principal Amount | | Market Value† |
| COMMON STOCKS - 99.5% - (continued) |
| | Retailing - 8.2% - (continued) |
| 506 | Citi Trends, Inc.* | $ 36,918 |
| 6,780 | Haverty Furniture Cos., Inc. | 228,554 |
| 2,844 | Hibbett Sports, Inc. | 201,184 |
| 1,513 | MarineMax, Inc.* | 73,411 |
| 622 | Murphy USA, Inc. | 104,036 |
| 3,909 | Rent-A-Center, Inc. | 219,725 |
| 8,928 | Sally Beauty Holdings, Inc.* | 150,437 |
| 166 | Shutterstock, Inc. | 18,811 |
| 153 | Sleep Number Corp.* | 14,302 |
| 4,789 | Sportsman's Warehouse Holdings, Inc.* | 84,286 |
| 2,085 | Zumiez, Inc.* | 82,900 |
| | | | 2,043,780 |
| | Semiconductors & Semiconductor Equipment - 2.3% |
| 6,716 | Amkor Technology, Inc. | 167,564 |
| 480 | Axcelis Technologies, Inc.* | 22,574 |
| 749 | Diodes, Inc.* | 67,852 |
| 2,051 | Kulicke & Soffa Industries, Inc. | 119,532 |
| 7,038 | Magnachip Semiconductor Corp.* | 124,995 |
| 4,466 | Photronics, Inc.* | 60,872 |
| | | | 563,389 |
| | Software & Services - 1.7% |
| 3,018 | CSG Systems International, Inc. | 145,468 |
| 397 | Evertec, Inc. | 18,151 |
| 473 | ExlService Holdings, Inc.* | 58,236 |
| 11,720 | Information Services Group, Inc. | 84,150 |
| 814 | TTEC Holdings, Inc. | 76,133 |
| 1,603 | Xperi Holding Corp. | 30,200 |
| | | | 412,338 |
| | Technology Hardware & Equipment - 6.5% |
| 3,933 | Aviat Networks, Inc.* | 129,239 |
| 1,088 | Avnet, Inc. | 40,223 |
| 8,971 | Daktronics, Inc.* | 48,713 |
| 1,261 | ePlus, Inc.* | 129,391 |
| 384 | Fabrinet * | 39,364 |
| 2,531 | Insight Enterprises, Inc.* | 227,993 |
| 412 | Kimball Electronics, Inc.* | 10,617 |
| 2,640 | Methode Electronics, Inc. | 111,012 |
| 2,242 | NETGEAR, Inc.* | 71,542 |
| 794 | OSI Systems, Inc.* | 75,271 |
| 342 | PC Connection, Inc. | 15,058 |
| 1,239 | Plexus Corp.* | 110,779 |
| 3,440 | Sanmina Corp.* | 132,578 |
| 3,197 | Super Micro Computer, Inc.* | 116,914 |
| 3,398 | Turtle Beach Corp.* | 94,532 |
| 6,423 | Vishay Intertechnology, Inc. | 129,038 |
| 431 | Vishay Precision Group, Inc.* | 14,986 |
| 5,659 | Xerox Holdings Corp. | 114,142 |
| | | | 1,611,392 |
| | Telecommunication Services - 2.3% |
| 5,668 | IDT Corp. Class B* | 237,772 |
| 9,856 | Telephone & Data Systems, Inc. | 192,192 |
| 4,711 | United States Cellular Corp.* | 150,234 |
| | | | 580,198 |
| | Transportation - 2.2% |
| 903 | ArcBest Corp. | 73,838 |
| 1,534 | Hub Group, Inc. Class A* | 105,463 |
| 2,216 | Marten Transport Ltd. | 34,769 |
| 10 | Matson, Inc. | 807 |
| 7,777 | Radiant Logistics, Inc.* | 49,695 |
The accompanying notes are an integral part of these financial statements.
Hartford Multifactor Small Cap ETF
Schedule of Investments – (continued)
September 30, 2021
| Shares or Principal Amount | | Market Value† |
| COMMON STOCKS - 99.5% - (continued) |
| | Transportation - 2.2% - (continued) |
| 962 | Ryder System, Inc. | $ 79,567 |
| 3,092 | Schneider National, Inc. Class B | 70,312 |
| 2,840 | Werner Enterprises, Inc. | 125,727 |
| | | | 540,178 |
| | Utilities - 0.7% |
| 602 | Avista Corp. | 23,550 |
| 127 | Chesapeake Utilities Corp. | 15,246 |
| 191 | MGE Energy, Inc. | 14,039 |
| 244 | Northwest Natural Holding Co. | 11,222 |
| 710 | Otter Tail Corp. | 39,739 |
| 430 | Southwest Gas Holdings, Inc. | 28,758 |
| 1,096 | Unitil Corp. | 46,887 |
| | | | 179,441 |
| | Total Common Stocks
(cost $24,561,587) | | $ 24,652,459 |
| SHORT-TERM INVESTMENTS - 0.1% |
| | Securities Lending Collateral - 0.1% |
| 1,332 | Fidelity Investments Money Market Funds, Government Portfolio, Institutional Class, 0.01%(2) | $ 1,332 |
| 17,654 | Goldman Sachs Financial Square Funds, Government Fund, Institutional Class, 0.03%(2) | 17,654 |
| 964 | Invesco Government & Agency Portfolio, Institutional Class, 0.03%(2) | 964 |
| | Total Short-Term Investments
(cost $19,950) | $ 19,950 |
| | Total Investments
(cost $24,581,537) | 99.6% | $ 24,672,409 |
| | Other Assets and Liabilities | 0.4% | 99,344 |
| | Total Net Assets | 100.0% | $ 24,771,753 |
| Note: | Percentage of investments as shown is the ratio of the total market value to total net assets. |
| | The Fund may refer to any one or more of the industry classifications used by one or more widely recognized market indices, ratings group and/or as defined by Fund management. Industry classifications may not be identical across all security types. |
| | For Fund compliance purposes, the Fund may not use the same classification system. These classifications are used for financial reporting purposes. |
| | See “Glossary” for abbreviation descriptions. |
| * | Non-income producing. |
| (1) | Represents entire or partial securities on loan. See Note 8 in the accompanying Notes to Financial Statements for securities lending information. |
| (2) | Current yield as of period end. |
| Futures Contracts Outstanding at September 30, 2021 |
| Description | | Number of
Contracts | | Expiration
Date | | Current
Notional
Amount | | Value and
Unrealized
Appreciation/
(Depreciation) |
| Long position contracts: |
| E-Mini Russell 2000 | | 1 | | 12/17/2021 | | $ 110,040 | | $ (1,092) |
| Total futures contracts | | $ (1,092) |
† See Significant Accounting Policies of accompanying Notes to Financial Statements regarding valuation of investments.
The accompanying notes are an integral part of these financial statements.
Hartford Multifactor Small Cap ETF
Schedule of Investments – (continued)
September 30, 2021
Fair Value Summary
The following is a summary of the fair valuations according to the inputs used as of September 30, 2021 in valuing the Fund’s investments.
| Description | | Total | | Level 1 | | Level 2 | | Level 3(1) |
| Assets | | | | | | | | |
| Common Stocks | | | | | | | | |
| Automobiles & Components | | $ 54,725 | | $ 54,725 | | $ — | | $ — |
| Banks | | 2,515,313 | | 2,515,313 | | — | | — |
| Capital Goods | | 1,677,066 | | 1,677,066 | | — | | — |
| Commercial & Professional Services | | 1,198,984 | | 1,198,984 | | — | | — |
| Consumer Durables & Apparel | | 1,002,891 | | 1,002,891 | | — | | — |
| Consumer Services | | 249,613 | | 249,613 | | — | | — |
| Diversified Financials | | 622,782 | | 622,782 | | — | | — |
| Energy | | 694,485 | | 694,485 | | — | | — |
| Food & Staples Retailing | | 794,987 | | 794,987 | | — | | — |
| Food, Beverage & Tobacco | | 417,358 | | 417,358 | | — | | — |
| Health Care Equipment & Services | | 2,697,754 | | 2,697,754 | | — | | — |
| Household & Personal Products | | 234,115 | | 234,115 | | — | | — |
| Insurance | | 1,377,309 | | 1,377,309 | | — | | — |
| Materials | | 881,829 | | 881,829 | | — | | — |
| Media & Entertainment | | 844,461 | | 844,461 | | — | | — |
| Pharmaceuticals, Biotechnology & Life Sciences | | 2,007,036 | | 2,007,036 | | — | | — |
| Real Estate | | 1,451,035 | | 1,451,035 | | — | | — |
| Retailing | | 2,043,780 | | 2,043,780 | | — | | — |
| Semiconductors & Semiconductor Equipment | | 563,389 | | 563,389 | | — | | — |
| Software & Services | | 412,338 | | 412,338 | | — | | — |
| Technology Hardware & Equipment | | 1,611,392 | | 1,611,392 | | — | | — |
| Telecommunication Services | | 580,198 | | 580,198 | | — | | — |
| Transportation | | 540,178 | | 540,178 | | — | | — |
| Utilities | | 179,441 | | 179,441 | | — | | — |
| Short-Term Investments | | 19,950 | | 19,950 | | — | | — |
| Total | | $ 24,672,409 | | $ 24,672,409 | | $ — | | $ — |
| Liabilities | | | | | | | | |
| Futures Contracts(2) | | $ (1,092) | | $ (1,092) | | $ — | | $ — |
| Total | | $ (1,092) | | $ (1,092) | | $ — | | $ — |
| (1) | For the year ended September 30, 2021, there were no transfers in and out of Level 3. |
| (2) | Derivative instruments (excluding purchased and written options, if applicable) are valued at the unrealized appreciation/(depreciation) on the investments. |
The accompanying notes are an integral part of these financial statements.
Hartford Multifactor US Equity ETF
Schedule of Investments
September 30, 2021
| Shares or Principal Amount | | Market Value† |
| COMMON STOCKS - 99.6% |
| | Automobiles & Components - 0.2% |
| 46,211 | Ford Motor Co.* | $ 654,348 |
| 4,852 | Gentex Corp. | 160,019 |
| | | | 814,367 |
| | Banks - 3.7% |
| 62,665 | Bank of America Corp. | 2,660,129 |
| 1,647 | Citigroup, Inc. | 115,587 |
| 302 | First Citizens BancShares, Inc. Class A | 254,637 |
| 21,001 | JP Morgan Chase & Co. | 3,437,654 |
| 3,186 | M&T Bank Corp. | 475,797 |
| 66,581 | People's United Financial, Inc. | 1,163,170 |
| 6,354 | PNC Financial Services Group, Inc. | 1,243,097 |
| 1,739 | Popular, Inc. | 135,068 |
| 12,361 | South State Corp. | 922,996 |
| 6,986 | U.S. Bancorp | 415,248 |
| 12,978 | UMB Financial Corp. | 1,255,102 |
| 2,637 | United Bankshares, Inc. | 95,934 |
| 12,659 | Valley National Bancorp | 168,491 |
| 20,927 | Wells Fargo & Co. | 971,222 |
| 17,396 | Zions Bancorp NA | 1,076,639 |
| | | | 14,390,771 |
| | Capital Goods - 5.9% |
| 6,625 | 3M Co. | 1,162,157 |
| 19,280 | A.O. Smith Corp. | 1,177,430 |
| 1,407 | Acuity Brands, Inc. | 243,932 |
| 3,609 | Allegion plc | 477,038 |
| 2,965 | BWX Technologies, Inc. | 159,695 |
| 2,290 | Carlisle Cos., Inc. | 455,229 |
| 10,139 | Carrier Global Corp. | 524,795 |
| 2,392 | Cummins, Inc. | 537,148 |
| 17,009 | Fastenal Co. | 877,834 |
| 958 | Generac Holdings, Inc.* | 391,506 |
| 4,547 | General Dynamics Corp. | 891,348 |
| 4,337 | Graco, Inc. | 303,460 |
| 7,130 | Huntington Ingalls Industries, Inc. | 1,376,518 |
| 646 | Illinois Tool Works, Inc. | 133,483 |
| 11,548 | Johnson Controls International plc | 786,188 |
| 4,901 | L3Harris Technologies, Inc. | 1,079,396 |
| 2,534 | Lennox International, Inc. | 745,427 |
| 5,311 | Lockheed Martin Corp. | 1,832,826 |
| 3,448 | Masco Corp. | 191,536 |
| 11,940 | MSC Industrial Direct Co., Inc. Class A | 957,469 |
| 6,863 | Northrop Grumman Corp. | 2,471,709 |
| 3,175 | Otis Worldwide Corp. | 261,239 |
| 2,666 | Quanta Services, Inc. | 303,444 |
| 4,151 | Snap-on, Inc. | 867,351 |
| 8,107 | Toro Co. | 789,703 |
| 2,410 | Trane Technologies plc | 416,087 |
| 8,749 | UFP Industries, Inc. | 594,757 |
| 778 | Valmont Industries, Inc. | 182,923 |
| 6,486 | Watsco, Inc. | 1,716,325 |
| 2,652 | WW Grainger, Inc. | 1,042,395 |
| | | | 22,950,348 |
| | Commercial & Professional Services - 2.2% |
| 9,359 | Booz Allen Hamilton Holding Corp. | 742,637 |
| 1,715 | Equifax, Inc. | 434,615 |
| 11,043 | FTI Consulting, Inc.* | 1,487,492 |
| 8,616 | Jacobs Engineering Group, Inc. | 1,141,878 |
| 6,109 | ManpowerGroup, Inc. | 661,483 |
| 11,100 | Republic Services, Inc. | 1,332,666 |
| Shares or Principal Amount | | Market Value† |
| COMMON STOCKS - 99.6% - (continued) |
| | Commercial & Professional Services - 2.2% - (continued) |
| 5,273 | Robert Half International, Inc. | $ 529,040 |
| 4,109 | Waste Connections, Inc. | 517,446 |
| 11,613 | Waste Management, Inc. | 1,734,518 |
| | | | 8,581,775 |
| | Consumer Durables & Apparel - 1.5% |
| 5,955 | Carter's, Inc. | 579,064 |
| 8,665 | Garmin Ltd. | 1,347,061 |
| 16,339 | Newell Brands, Inc. | 361,746 |
| 18,569 | NIKE, Inc. Class B | 2,696,776 |
| 4,027 | Whirlpool Corp. | 820,944 |
| | | | 5,805,591 |
| | Consumer Services - 1.4% |
| 4,934 | Domino's Pizza, Inc. | 2,353,320 |
| 54,818 | H&R Block, Inc. | 1,370,450 |
| 3,381 | McDonald's Corp. | 815,193 |
| 1,341 | Service Corp. International/US | 80,809 |
| 694 | Starbucks Corp. | 76,555 |
| 5,799 | Yum! Brands, Inc. | 709,276 |
| | | | 5,405,603 |
| | Diversified Financials - 2.7% |
| 21,676 | Bank of New York Mellon Corp. | 1,123,684 |
| 12,643 | Berkshire Hathaway, Inc. Class B* | 3,450,780 |
| 5,343 | Cboe Global Markets, Inc. | 661,784 |
| 10,478 | Charles Schwab Corp. | 763,217 |
| 13,360 | Franklin Resources, Inc. | 397,059 |
| 13,296 | Houlihan Lokey, Inc. | 1,224,562 |
| 19,060 | Invesco Ltd. | 459,537 |
| 3,963 | Janus Henderson Group plc | 163,791 |
| 9,624 | Jefferies Financial Group, Inc. | 357,339 |
| 552 | Nasdaq, Inc. | 106,547 |
| 11,071 | Raymond James Financial, Inc. | 1,021,632 |
| 31,301 | SLM Corp. | 550,898 |
| | | | 10,280,830 |
| | Energy - 0.6% |
| 36,063 | Cabot Oil & Gas Corp. | 784,731 |
| 2 | DTE Midstream LLC* | 92 |
| 25,101 | Exxon Mobil Corp. | 1,476,441 |
| | | | 2,261,264 |
| | Food & Staples Retailing - 2.1% |
| 9,960 | BJ's Wholesale Club Holdings, Inc.* | 547,003 |
| 1,487 | Casey's General Stores, Inc. | 280,225 |
| 2,039 | Costco Wholesale Corp. | 916,225 |
| 71,225 | Kroger Co. | 2,879,627 |
| 24,040 | Walmart, Inc. | 3,350,695 |
| | | | 7,973,775 |
| | Food, Beverage & Tobacco - 4.2% |
| 9,915 | Altria Group, Inc. | 451,331 |
| 15,902 | Archer-Daniels-Midland Co. | 954,279 |
| 16,273 | Bunge Ltd. | 1,323,320 |
| 5,815 | Campbell Soup Co. | 243,125 |
| 32,084 | Coca-Cola Co. | 1,683,447 |
| 2,960 | Conagra Brands, Inc. | 100,255 |
| 69,018 | Flowers Foods, Inc. | 1,630,895 |
| 18,881 | General Mills, Inc. | 1,129,461 |
| 6,747 | Hershey Co. | 1,141,930 |
| 5,284 | Hormel Foods Corp. | 216,644 |
| 13,052 | JM Smucker Co. | 1,566,632 |
| 22,691 | Kellogg Co. | 1,450,409 |
The accompanying notes are an integral part of these financial statements.
Hartford Multifactor US Equity ETF
Schedule of Investments – (continued)
September 30, 2021
| Shares or Principal Amount | | Market Value† |
| COMMON STOCKS - 99.6% - (continued) |
| | Food, Beverage & Tobacco - 4.2% - (continued) |
| 18,195 | PepsiCo., Inc. | $ 2,736,710 |
| 9,996 | Philip Morris International, Inc. | 947,521 |
| 7,906 | Tyson Foods, Inc. Class A | 624,100 |
| | | | 16,200,059 |
| | Health Care Equipment & Services - 7.6% |
| 25,357 | Abbott Laboratories | 2,995,422 |
| 1,230 | AmerisourceBergen Corp. | 146,923 |
| 15,343 | AMN Healthcare Services, Inc.* | 1,760,609 |
| 4,895 | Anthem, Inc. | 1,824,856 |
| 16,889 | Baxter International, Inc. | 1,358,382 |
| 2,160 | Becton Dickinson and Co. | 530,971 |
| 33,111 | Cardinal Health, Inc. | 1,637,670 |
| 4,767 | Centene Corp.* | 297,032 |
| 15,819 | Cerner Corp. | 1,115,556 |
| 2,979 | Cigna Corp. | 596,277 |
| 1,626 | Cooper Cos., Inc. | 672,042 |
| 33,487 | CVS Health Corp. | 2,841,707 |
| 2,140 | Danaher Corp. | 651,502 |
| 1,545 | Globus Medical, Inc. Class A* | 118,378 |
| 2,515 | Henry Schein, Inc.* | 191,542 |
| 8,056 | Hill-Rom Holdings, Inc. | 1,208,400 |
| 3,685 | Humana, Inc. | 1,434,018 |
| 1,376 | IDEXX Laboratories, Inc.* | 855,734 |
| 1,408 | Laboratory Corp. of America Holdings* | 396,268 |
| 976 | Molina Healthcare, Inc.* | 264,799 |
| 38,625 | Premier, Inc. Class A | 1,497,105 |
| 10,500 | Quest Diagnostics, Inc. | 1,525,755 |
| 371 | Quidel Corp.* | 52,367 |
| 3,973 | ResMed, Inc. | 1,047,084 |
| 597 | STERIS plc | 121,955 |
| 8,937 | UnitedHealth Group, Inc. | 3,492,043 |
| 2,088 | West Pharmaceutical Services, Inc. | 886,440 |
| | | | 29,520,837 |
| | Household & Personal Products - 1.3% |
| 5,163 | Clorox Co. | 855,044 |
| 7,744 | Colgate-Palmolive Co. | 585,292 |
| 5,842 | Kimberly-Clark Corp. | 773,714 |
| 20,436 | Procter & Gamble Co. | 2,856,953 |
| | | | 5,071,003 |
| | Insurance - 3.6% |
| 13,240 | Aflac, Inc. | 690,200 |
| 16,127 | Allstate Corp. | 2,053,128 |
| 2,339 | American Financial Group, Inc. | 294,316 |
| 830 | Arthur J Gallagher & Co. | 123,380 |
| 739 | Assurant, Inc. | 116,577 |
| 1,374 | Chubb Ltd. | 238,362 |
| 14,438 | Cincinnati Financial Corp. | 1,649,108 |
| 3,002 | Everest Re Group Ltd. | 752,842 |
| 4,187 | Fidelity National Financial, Inc. | 189,839 |
| 7,467 | Hanover Insurance Group, Inc. | 967,873 |
| 7,408 | Kemper Corp. | 494,780 |
| 240 | Markel Corp.* | 286,831 |
| 80,932 | Old Republic International Corp. | 1,871,957 |
| 7,531 | Principal Financial Group, Inc. | 484,996 |
| 10,657 | Progressive Corp. | 963,286 |
| 10,308 | Prudential Financial, Inc. | 1,084,402 |
| 10,889 | Selective Insurance Group, Inc. | 822,446 |
| 4,263 | Travelers Cos., Inc. | 648,019 |
| | | | 13,732,342 |
| | Materials - 2.1% |
| 6,380 | Amcor plc | 73,944 |
| Shares or Principal Amount | | Market Value† |
| COMMON STOCKS - 99.6% - (continued) |
| | Materials - 2.1% - (continued) |
| 2,699 | AptarGroup, Inc. | $ 322,126 |
| 6,905 | Avery Dennison Corp. | 1,430,785 |
| 15,063 | International Paper Co. | 842,323 |
| 3,390 | Louisiana-Pacific Corp. | 208,044 |
| 16,152 | Newmont Corp. | 877,054 |
| 10,212 | Nucor Corp. | 1,005,780 |
| 1,114 | Packaging Corp. of America | 153,108 |
| 1,250 | PPG Industries, Inc. | 178,762 |
| 8,833 | Reliance Steel & Aluminum Co. | 1,257,996 |
| 2,008 | RPM International, Inc. | 155,921 |
| 5,454 | Sealed Air Corp. | 298,825 |
| 1,324 | Sherwin-Williams Co. | 370,363 |
| 9,642 | Sonoco Products Co. | 574,470 |
| 4,741 | Steel Dynamics, Inc. | 277,254 |
| | | | 8,026,755 |
| | Media & Entertainment - 6.1% |
| 15,809 | Activision Blizzard, Inc. | 1,223,458 |
| 1,352 | Alphabet, Inc. Class A* | 3,614,599 |
| 1,067 | Charter Communications, Inc. Class A* | 776,307 |
| 57,665 | Comcast Corp. Class A | 3,225,203 |
| 1,379 | Electronic Arts, Inc. | 196,163 |
| 9,566 | Facebook, Inc. Class A* | 3,246,605 |
| 56,087 | Fox Corp. | 2,249,650 |
| 11,154 | IAC/InterActiveCorp * | 1,453,255 |
| 19,327 | Interpublic Group of Cos., Inc. | 708,721 |
| 1,878 | Netflix, Inc.* | 1,146,218 |
| 65,803 | News Corp. Class A | 1,548,345 |
| 34,757 | Omnicom Group, Inc. | 2,518,492 |
| 3,004 | Take-Two Interactive Software, Inc.* | 462,826 |
| 6,865 | Walt Disney Co.* | 1,161,352 |
| | | | 23,531,194 |
| | Pharmaceuticals, Biotechnology & Life Sciences - 7.8% |
| 24,106 | AbbVie, Inc. | 2,600,314 |
| 3,128 | Agilent Technologies, Inc. | 492,754 |
| 8,498 | Amgen, Inc. | 1,807,100 |
| 1,004 | Biogen, Inc.* | 284,122 |
| 311 | Bio-Rad Laboratories, Inc. Class A* | 231,990 |
| 1,647 | Bio-Techne Corp. | 798,087 |
| 15,600 | Bristol-Myers Squibb Co. | 923,052 |
| 17,651 | Eli Lilly & Co. | 4,078,264 |
| 23,787 | Gilead Sciences, Inc. | 1,661,522 |
| 11,600 | Jazz Pharmaceuticals plc* | 1,510,436 |
| 24,383 | Johnson & Johnson | 3,937,854 |
| 25,463 | Merck & Co., Inc. | 1,912,526 |
| 288 | Mettler-Toledo International, Inc.* | 396,680 |
| 1,353 | PerkinElmer, Inc. | 234,461 |
| 67,285 | Pfizer, Inc. | 2,893,928 |
| 1,516 | Regeneron Pharmaceuticals, Inc.* | 917,453 |
| 5,018 | Thermo Fisher Scientific, Inc. | 2,866,934 |
| 5,592 | United Therapeutics Corp.* | 1,032,171 |
| 3,550 | Waters Corp.* | 1,268,415 |
| 1,585 | Zoetis, Inc. | 307,712 |
| | | | 30,155,775 |
| | Real Estate - 4.1% |
| 2,454 | Alexandria Real Estate Equities, Inc. REIT | 468,886 |
| 18,190 | American Homes 4 Rent Class A, REIT | 693,403 |
| 1,406 | American Tower Corp. REIT | 373,166 |
| 6,174 | Americold Realty Trust REIT | 179,355 |
| 2,232 | AvalonBay Communities, Inc. | 494,700 |
| 1,232 | Camden Property Trust REIT | 181,683 |
| 4,811 | Crown Castle International Corp. REIT | 833,843 |
| 27,435 | CubeSmart REIT | 1,329,226 |
The accompanying notes are an integral part of these financial statements.
Hartford Multifactor US Equity ETF
Schedule of Investments – (continued)
September 30, 2021
| Shares or Principal Amount | | Market Value† |
| COMMON STOCKS - 99.6% - (continued) |
| | Real Estate - 4.1% - (continued) |
| 4,403 | Digital Realty Trust, Inc. REIT | $ 636,013 |
| 8,292 | Duke Realty Corp. REIT | 396,938 |
| 402 | Equinix, Inc. REIT | 317,632 |
| 10,496 | Equity Residential REIT | 849,336 |
| 398 | Essex Property Trust, Inc. REIT | 127,257 |
| 12,083 | Extra Space Storage, Inc. REIT | 2,029,823 |
| 23,988 | Iron Mountain, Inc. REIT | 1,042,279 |
| 11,793 | Kilroy Realty Corp. REIT | 780,815 |
| 11,211 | Life Storage, Inc. REIT | 1,286,350 |
| 3,317 | Mid-America Apartment Communities, Inc. REIT | 619,450 |
| 11,738 | National Storage Affiliates Trust | 619,649 |
| 8,305 | Public Storage REIT | 2,467,415 |
| | | | 15,727,219 |
| | Retailing - 7.2% |
| 6,526 | Advance Auto Parts, Inc. | 1,363,216 |
| 677 | Amazon.com, Inc.* | 2,223,972 |
| 3,706 | AutoNation, Inc.* | 451,243 |
| 1,137 | AutoZone, Inc.* | 1,930,615 |
| 10,635 | Best Buy Co., Inc. | 1,124,226 |
| 4,581 | Dick's Sporting Goods, Inc. | 548,666 |
| 10,673 | Dollar General Corp. | 2,264,170 |
| 7,150 | Dollar Tree, Inc.* | 684,398 |
| 28,159 | eBay, Inc. | 1,961,837 |
| 10,343 | Foot Locker, Inc. | 472,261 |
| 13,251 | Genuine Parts Co. | 1,606,419 |
| 10,357 | Home Depot, Inc. | 3,399,789 |
| 2,261 | Lowe's Cos., Inc. | 458,666 |
| 2,870 | O'Reilly Automotive, Inc.* | 1,753,742 |
| 4,388 | Pool Corp. | 1,906,191 |
| 13,943 | Target Corp. | 3,189,740 |
| 10,988 | Tractor Supply Co. | 2,226,279 |
| 623 | Williams-Sonoma, Inc. | 110,477 |
| | | | 27,675,907 |
| | Semiconductors & Semiconductor Equipment - 3.4% |
| 758 | Analog Devices, Inc. | 126,950 |
| 6,557 | Applied Materials, Inc. | 844,083 |
| 4,257 | Broadcom, Inc. | 2,064,347 |
| 1,983 | Entegris, Inc. | 249,660 |
| 70,282 | Intel Corp. | 3,744,625 |
| 1,990 | KLA Corp. | 665,675 |
| 535 | Lam Research Corp. | 304,495 |
| 7,510 | NVIDIA Corp. | 1,555,772 |
| 917 | Qorvo, Inc.* | 153,313 |
| 3,393 | QUALCOMM, Inc. | 437,629 |
| 1,125 | Skyworks Solutions, Inc. | 185,377 |
| 832 | Synaptics, Inc.* | 149,535 |
| 2,057 | Teradyne, Inc. | 224,563 |
| 10,677 | Texas Instruments, Inc. | 2,052,226 |
| 1,789 | Xilinx, Inc. | 270,121 |
| | | | 13,028,371 |
| | Software & Services - 14.3% |
| 12,079 | Accenture plc Class A | 3,864,314 |
| 5,101 | Adobe, Inc.* | 2,936,748 |
| 11,841 | Akamai Technologies, Inc.* | 1,238,450 |
| 2,090 | Aspen Technology, Inc.* | 256,652 |
| 7,490 | Automatic Data Processing, Inc. | 1,497,401 |
| 11,468 | Broadridge Financial Solutions, Inc. | 1,911,027 |
| 961 | Cadence Design Systems, Inc.* | 145,534 |
| 14,477 | Citrix Systems, Inc. | 1,554,395 |
| 13,279 | Cloudflare, Inc.* | 1,495,879 |
| 2,661 | Cognizant Technology Solutions Corp. Class A | 197,473 |
| Shares or Principal Amount | | Market Value† |
| COMMON STOCKS - 99.6% - (continued) |
| | Software & Services - 14.3% - (continued) |
| 18,130 | Dolby Laboratories, Inc. Class A | $ 1,595,440 |
| 22,478 | Dropbox, Inc. Class A* | 656,807 |
| 1,622 | EPAM Systems, Inc.* | 925,318 |
| 3,226 | Fortinet, Inc.* | 942,121 |
| 2,675 | Gartner, Inc.* | 812,879 |
| 16,540 | International Business Machines Corp. | 2,297,902 |
| 2,939 | Intuit, Inc. | 1,585,620 |
| 16,571 | j2 Global, Inc.* | 2,263,930 |
| 9,749 | Jack Henry & Associates, Inc. | 1,599,421 |
| 4,744 | Mastercard, Inc. Class A | 1,649,394 |
| 31,739 | MAXIMUS, Inc. | 2,640,685 |
| 13,842 | Microsoft Corp. | 3,902,337 |
| 62,927 | Nortonlifelock, Inc. | 1,592,053 |
| 39,067 | Oracle Corp. | 3,403,908 |
| 17,302 | Paychex, Inc. | 1,945,610 |
| 9,010 | PayPal Holdings, Inc.* | 2,344,492 |
| 5,144 | salesforce.com, Inc.* | 1,395,156 |
| 624 | Synopsys, Inc.* | 186,832 |
| 13,526 | Teradata Corp.* | 775,716 |
| 811 | Tyler Technologies, Inc.* | 371,965 |
| 5,274 | VeriSign, Inc.* | 1,081,223 |
| 10,846 | Visa, Inc. Class A | 2,415,946 |
| 9,369 | VMware, Inc. Class A*(1) | 1,393,170 |
| 101,726 | Western Union Co. | 2,056,900 |
| 1,692 | Zoom Video Communications, Inc. Class A* | 442,458 |
| | | | 55,375,156 |
| | Technology Hardware & Equipment - 7.9% |
| 4,011 | Amphenol Corp. Class A | 293,725 |
| 21,402 | Apple, Inc. | 3,028,383 |
| 4,922 | Arrow Electronics, Inc.* | 552,691 |
| 8,768 | CDW Corp. | 1,595,951 |
| 75,078 | Cisco Systems, Inc. | 4,086,496 |
| 28,474 | Corning, Inc. | 1,039,016 |
| 22,609 | Dell Technologies, Inc.* | 2,352,240 |
| 78,562 | Hewlett Packard Enterprise Co. | 1,119,508 |
| 121,386 | HP, Inc. | 3,321,121 |
| 16,403 | Jabil, Inc. | 957,443 |
| 36,457 | Juniper Networks, Inc. | 1,003,297 |
| 7,852 | Keysight Technologies, Inc.* | 1,290,005 |
| 10,500 | Motorola Solutions, Inc. | 2,439,360 |
| 22,401 | NetApp, Inc. | 2,010,714 |
| 37,528 | Seagate Technology Holdings plc | 3,096,811 |
| 13,576 | SYNNEX Corp. | 1,413,262 |
| 1,630 | Zebra Technologies Corp. Class A* | 840,135 |
| | | | 30,440,158 |
| | Telecommunication Services - 2.9% |
| 124,563 | AT&T, Inc. | 3,364,447 |
| 64,078 | Lumen Technologies, Inc. | 793,926 |
| 12,303 | T-Mobile U.S., Inc.* | 1,571,831 |
| 102,172 | Verizon Communications, Inc. | 5,518,310 |
| | | | 11,248,514 |
| | Transportation - 2.5% |
| 2,430 | AMERCO | 1,569,853 |
| 17,269 | CH Robinson Worldwide, Inc. | 1,502,403 |
| 16,807 | Expeditors International of Washington, Inc. | 2,002,218 |
| 2,198 | FedEx Corp. | 481,999 |
| 2,719 | J.B. Hunt Transport Services, Inc. | 454,671 |
| 3,338 | Knight-Swift Transportation Holdings, Inc. | 170,739 |
The accompanying notes are an integral part of these financial statements.
Hartford Multifactor US Equity ETF
Schedule of Investments – (continued)
September 30, 2021
| Shares or Principal Amount | | Market Value† |
| COMMON STOCKS - 99.6% - (continued) |
| | Transportation - 2.5% - (continued) |
| 8,542 | Landstar System, Inc. | $ 1,348,099 |
| 12,279 | United Parcel Service, Inc. Class B | 2,236,006 |
| | | | 9,765,988 |
| | Utilities - 4.3% |
| 15,352 | Alliant Energy Corp. | 859,405 |
| 11,868 | Ameren Corp. | 961,308 |
| 10,817 | American Electric Power Co., Inc. | 878,124 |
| 4,631 | Atmos Energy Corp. | 408,454 |
| 13,246 | CMS Energy Corp. | 791,184 |
| 16,358 | Consolidated Edison, Inc. | 1,187,427 |
| 10,482 | Dominion Energy, Inc. | 765,396 |
| 1,250 | DTE Energy Co. | 139,638 |
| 6,497 | Duke Energy Corp. | 634,042 |
| 1,371 | Entergy Corp. | 136,154 |
| 5,831 | Evergy, Inc. | 362,688 |
| 10,311 | Exelon Corp. | 498,434 |
| 37,376 | FirstEnergy Corp. | 1,331,333 |
| 39,539 | Hawaiian Electric Industries, Inc. | 1,614,377 |
| 5,243 | IDACORP, Inc. | 542,021 |
| 4,353 | MDU Resources Group, Inc. | 129,154 |
| 30,709 | National Fuel Gas Co. | 1,612,837 |
| 2,218 | OGE Energy Corp. | 73,105 |
| 13,627 | Portland General Electric Co. | 640,333 |
| 2,077 | Public Service Enterprise Group, Inc. | 126,489 |
| 9,518 | Southern Co. | 589,830 |
| 16,835 | UGI Corp. | 717,508 |
| 8,382 | WEC Energy Group, Inc. | 739,292 |
| 11,424 | Xcel Energy, Inc. | 714,000 |
| | | | 16,452,533 |
| | Total Common Stocks
(cost $351,987,130) | | $ 384,416,135 |
| Shares or Principal Amount | | Market Value† |
| SHORT-TERM INVESTMENTS - 0.3% |
| | Securities Lending Collateral - 0.3% |
| 71,206 | Fidelity Investments Money Market Funds, Government Portfolio, Institutional Class, 0.01%(2) | $ 71,206 |
| 944,025 | Goldman Sachs Financial Square Funds, Government Fund, Institutional Class, 0.03%(2) | 944,025 |
| 51,558 | Invesco Government & Agency Portfolio, Institutional Class, 0.03%(2) | 51,558 |
| | Total Short-Term Investments
(cost $1,066,789) | $ 1,066,789 |
| | Total Investments
(cost $353,053,919) | 99.9% | $ 385,482,924 |
| | Other Assets and Liabilities | 0.1% | 477,266 |
| | Total Net Assets | 100.0% | $ 385,960,190 |
| Note: | Percentage of investments as shown is the ratio of the total market value to total net assets. |
| | Equity industry classifications used in this report are the Global Industry Classification Standard, which was developed by and is the exclusive property and service mark of MSCI, Inc. and Standard & Poor’s. |
| | For Fund compliance purposes, the Fund may not use the same classification system. These classifications are used for financial reporting purposes. |
| | See “Glossary” for abbreviation descriptions. |
| * | Non-income producing. |
| (1) | Represents entire or partial securities on loan. See Note 8 in the accompanying Notes to Financial Statements for securities lending information. |
| (2) | Current yield as of period end. |
| Futures Contracts Outstanding at September 30, 2021 |
| Description | | Number of
Contracts | | Expiration
Date | | Current
Notional
Amount | | Value and
Unrealized
Appreciation/
(Depreciation) |
| Long position contracts: |
| S&P 500 (E-Mini) Future | | 7 | | 12/17/2021 | | $ 1,504,213 | | $ (52,157) |
| Total futures contracts | | $ (52,157) |
† See Significant Accounting Policies of accompanying Notes to Financial Statements regarding valuation of investments.
The accompanying notes are an integral part of these financial statements.
Hartford Multifactor US Equity ETF
Schedule of Investments – (continued)
September 30, 2021
Fair Value Summary
The following is a summary of the fair valuations according to the inputs used as of September 30, 2021 in valuing the Fund’s investments.
| Description | | Total | | Level 1 | | Level 2 | | Level 3(1) |
| Assets | | | | | | | | |
| Common Stocks | | | | | | | | |
| Automobiles & Components | | $ 814,367 | | $ 814,367 | | $ — | | $ — |
| Banks | | 14,390,771 | | 14,390,771 | | — | | — |
| Capital Goods | | 22,950,348 | | 22,950,348 | | — | | — |
| Commercial & Professional Services | | 8,581,775 | | 8,581,775 | | — | | — |
| Consumer Durables & Apparel | | 5,805,591 | | 5,805,591 | | — | | — |
| Consumer Services | | 5,405,603 | | 5,405,603 | | — | | — |
| Diversified Financials | | 10,280,830 | | 10,280,830 | | — | | — |
| Energy | | 2,261,264 | | 2,261,264 | | — | | — |
| Food & Staples Retailing | | 7,973,775 | | 7,973,775 | | — | | — |
| Food, Beverage & Tobacco | | 16,200,059 | | 16,200,059 | | — | | — |
| Health Care Equipment & Services | | 29,520,837 | | 29,520,837 | | — | | — |
| Household & Personal Products | | 5,071,003 | | 5,071,003 | | — | | — |
| Insurance | | 13,732,342 | | 13,732,342 | | — | | — |
| Materials | | 8,026,755 | | 8,026,755 | | — | | — |
| Media & Entertainment | | 23,531,194 | | 23,531,194 | | — | | — |
| Pharmaceuticals, Biotechnology & Life Sciences | | 30,155,775 | | 30,155,775 | | — | | — |
| Real Estate | | 15,727,219 | | 15,727,219 | | — | | — |
| Retailing | | 27,675,907 | | 27,675,907 | | — | | — |
| Semiconductors & Semiconductor Equipment | | 13,028,371 | | 13,028,371 | | — | | — |
| Software & Services | | 55,375,156 | | 55,375,156 | | — | | — |
| Technology Hardware & Equipment | | 30,440,158 | | 30,440,158 | | — | | — |
| Telecommunication Services | | 11,248,514 | | 11,248,514 | | — | | — |
| Transportation | | 9,765,988 | | 9,765,988 | | — | | — |
| Utilities | | 16,452,533 | | 16,452,533 | | — | | — |
| Short-Term Investments | | 1,066,789 | | 1,066,789 | | — | | — |
| Total | | $ 385,482,924 | | $ 385,482,924 | | $ — | | $ — |
| Liabilities | | | | | | | | |
| Futures Contracts(2) | | $ (52,157) | | $ (52,157) | | $ — | | $ — |
| Total | | $ (52,157) | | $ (52,157) | | $ — | | $ — |
| (1) | For the year ended September 30, 2021, there were no transfers in and out of Level 3. |
| (2) | Derivative instruments (excluding purchased and written options, if applicable) are valued at the unrealized appreciation/(depreciation) on the investments. |
The accompanying notes are an integral part of these financial statements.
Hartford Multifactor ETFs
GLOSSARY: (abbreviations used in preceding Schedule of Investments)
| Counterparty Abbreviations: |
| BNP | BNP Paribas Securities Services |
| CITI | Citigroup Global Markets, Inc. |
| HSBC | HSBC Bank USA |
| MSC | Morgan Stanley |
| UBS | UBS AG |
| WEST | Westpac International |
| Index Abbreviations: |
| ASX | Australian Securities Exchange |
| CBOE | Chicago Board Options Exchange |
| EAFE | Europe, Australasia and Far East |
| S&P | Standard & Poor's |
| Other Abbreviations: |
| ADR | American Depositary Receipt |
| Bhd | Berhad |
| GDR | Global Depositary Receipt |
| MSCI | Morgan Stanley Capital International |
| NVDR | Non-Voting Depositary Receipt |
| PJSC | Private Joint Stock Company |
| PT | Perseroan Terbatas |
| REIT | Real Estate Investment Trust |
| Tbk | Terbuka |
Hartford Multifactor ETFs
Statements of Assets and Liabilities
September 30, 2021
| | Hartford
Longevity
Economy
ETF | | Hartford
Multifactor
Developed
Markets (ex-US)
ETF | | Hartford
Multifactor
Diversified
International
ETF | | Hartford
Multifactor
Emerging
Markets ETF | | Hartford
Multifactor Small
Cap ETF | | Hartford
Multifactor US
Equity ETF |
| Assets: | | | | | | | | | | | |
| Investments in securities, at market value(1) | $ 25,201,036 | | $ 1,958,741,002 | | $ 5,772,284 | | $ 41,764,904 | | $ 24,672,409 | | $ 385,482,924 |
| Cash | 4,550 | | 830,716 | | 2,808 | | 50,224 | | 65,887 | | 1,002,388 |
| Cash collateral due from broker on futures contracts | — | | 579,000 | | — | | 29,000 | | 41,000 | | 94,000 |
| Cash collateral held for securities on loan | 11,989 | | 1,871,271 | | 5,564 | | 5,402 | | 1,050 | | 56,147 |
| Foreign currency | — | | 7,872,280 | | 10,002 | | 40,088 | | 2 | | — |
| Receivables: | | | | | | | | | | | |
| Investment securities sold | — | | 1,096,169 | | — | | — | | — | | — |
| Dividends and interest | 31,988 | | 7,683,924 | | 33,932 | | 137,601 | | 17,531 | | 527,028 |
| Securities lending income | 510 | | 349,363 | | 351 | | 324 | | 201 | | 2,634 |
| Variation margin on futures contracts | — | | 179,756 | | — | | 1,961 | | — | | — |
| Tax reclaims | — | | 4,627,128 | | 6,396 | | 6,905 | | 2,754 | | — |
| Total assets | 25,250,073 | | 1,983,830,609 | | 5,831,337 | | 42,036,409 | | 24,800,834 | | 387,165,121 |
| Liabilities: | | | | | | | | | | | |
| Obligation to return securities lending collateral | 239,783 | | 37,425,432 | | 111,276 | | 108,034 | | 21,000 | | 1,122,936 |
| Payables: | | | | | | | | | | | |
| Investment securities purchased | — | | — | | 11,924 | | — | | — | | — |
| Investment management fees | 9,347 | | 480,373 | | 1,400 | | 15,547 | | 7,052 | | 63,810 |
| Variation margin on futures contracts | — | | — | | — | | — | | 1,029 | | 18,185 |
| Total liabilities | 249,130 | | 37,905,805 | | 124,600 | | 123,581 | | 29,081 | | 1,204,931 |
| Net assets | $ 25,000,943 | | $ 1,945,924,804 | | $ 5,706,737 | | $ 41,912,828 | | $ 24,771,753 | | $ 385,960,190 |
| Summary of Net Assets: | | | | | | | | | | | |
| Paid-in-capital | $ 25,737,526 | | $ 2,006,347,451 | | $ 5,628,835 | | $ 52,684,319 | | $ 27,945,271 | | $ 385,566,630 |
| Distributable earnings (loss) | (736,583) | | (60,422,647) | | 77,902 | | (10,771,491) | | (3,173,518) | | 393,560 |
| Net assets | 25,000,943 | | 1,945,924,804 | | 5,706,737 | | 41,912,828 | | 24,771,753 | | 385,960,190 |
| Net asset value per share | 26.32 | | 30.26 | | 28.53 | | 24.65 | | 38.11 | | 39.89 |
| Shares issued and outstanding | 950,000 | | 64,300,000 | | 200,000 | | 1,700,000 | | 650,000 | | 9,675,000 |
| Cost of investments | $ 25,481,500 | | $ 1,758,967,769 | | $ 5,356,603 | | $ 39,740,438 | | $ 24,581,537 | | $ 353,053,919 |
| Cost of foreign currency | $ — | | $ 7,976,056 | | $ 10,034 | | $ 40,292 | | $ 2 | | $ — |
| (1) Includes Investment in securities on loan, at market value | $ 232,140 | | $ 43,472,480 | | $ 105,154 | | $ 240,384 | | $ 20,190 | | $ 1,085,361 |
The accompanying notes are an integral part of these financial statements.
Hartford Multifactor ETFs
Statements of Operations
For the Year Ended September 30, 2021
| | Hartford
Longevity
Economy
ETF(1) | | Hartford
Multifactor
Developed
Markets (ex-US)
ETF | | Hartford
Multifactor
Diversified
International
ETF | | Hartford
Multifactor
Emerging
Markets ETF | | Hartford
Multifactor Small
Cap ETF | | Hartford
Multifactor US
Equity ETF |
| Investment Income: | | | | | | | | | | | |
| Dividends | $ 136,347 | | $ 78,934,856 | | $ 268,267 | | $ 1,648,399 | | $ 253,657 | | $ 5,676,612 |
| Interest | 15 | | 484 | | 3 | | 60 | | 96 | | 839 |
| Securities lending | 770 | | 755,803 | | 1,625 | | 2,057 | | 2,999 | | 11,847 |
| Less: Foreign tax withheld | (45) | | (6,311,495) | | (27,517) | | (215,419) | | (179) | | (80) |
| Total investment income, net | 137,087 | | 73,379,648 | | 242,378 | | 1,435,097 | | 256,573 | | 5,689,218 |
| Expenses: | | | | | | | | | | | |
| Investment management fees | 35,977 | | 5,813,533 | | 16,032 | | 189,362 | | 47,966 | | 638,095 |
| Total expenses | 35,977 | | 5,813,533 | | 16,032 | | 189,362 | | 47,966 | | 638,095 |
| Net Investment Income (Loss) | 101,110 | | 67,566,115 | | 226,346 | | 1,245,735 | | 208,607 | | 5,051,123 |
| Net Realized Gain (Loss) on Investments, Other Financial Instruments and Foreign Currency Transactions on: | | | | | | | | | | | |
| Investments | 215,074 (2) | | 131,076,388 (2) | | 512,217 | | 7,830,035 (2) | | 2,146,243 (2) | | 45,824,241 (2) |
| Futures contracts | — | | 2,978,740 | | — | | 35,234 | | 40,309 | | 327,068 |
| Other foreign currency transactions | — | | 128,802 | | (1,838) | | (6,599) | | — | | — |
| Net Realized Gain (Loss) on Investments, Other Financial Instruments and Foreign Currency Transactions | 215,074 | | 134,183,930 | | 510,379 | | 7,858,670 | | 2,186,552 | | 46,151,309 |
| Net Changes in Unrealized Appreciation (Depreciation) of Investments, Other Financial Instruments and Foreign Currency Transactions of: | | | | | | | | | | | |
| Investments | (280,464) | | 179,175,870 | | 440,824 | | 2,524,192 | | 706,981 | | 21,993,228 |
| Futures contracts | — | | (152,408) | | — | | (5,620) | | 292 | | (48,412) |
| Translation of other assets and liabilities in foreign currencies | — | | (228,325) | | (247) | | (360) | | (38) | | — |
| Net Changes in Unrealized Appreciation (Depreciation) of Investments, Other Financial Instruments and Foreign Currency Transactions | (280,464) | | 178,795,137 | | 440,577 | | 2,518,212 | | 707,235 | | 21,944,816 |
| Net Gain (Loss) on Investments, Other Financial Instruments and Foreign Currency Transactions | (65,390) | | 312,979,067 | | 950,956 | | 10,376,882 | | 2,893,787 | | 68,096,125 |
| Net Increase (Decrease) in Net Assets Resulting from Operations | $ 35,720 | | $ 380,545,182 | | $ 1,177,302 | | $ 11,622,617 | | $ 3,102,394 | | $ 73,147,248 |
| (1) | Commenced operations on March 16, 2021. |
| (2) | Includes realized gains/(losses) as a result of in-kind redemptions (See Note 12 in Notes to Financial Statements). |
The accompanying notes are an integral part of these financial statements.
Hartford Multifactor ETFs
Statements of Changes in Net Assets
For the Year Ended September 30, 2021
| | Hartford
Longevity
Economy ETF(1) | | Hartford Multifactor
Developed Markets (ex-US) ETF |
| | For the
Period Ended
September 30,
2021 | | For the
Year Ended
September 30,
2021 | | For the
Year Ended
September 30,
2020 |
| Operations: | | | | | |
| Net investment income (loss) | $ 101,110 | | $ 67,566,115 | | $ 60,351,769 |
| Net realized gain (loss) on investments, other financial instruments and foreign currency transactions | 215,074 | | 134,183,930 | | (197,721,076) |
| Net changes in unrealized appreciation (depreciation) of investments, other financial instruments and foreign currency transactions | (280,464) | | 178,795,137 | | (32,293,474) |
| Net Increase (Decrease) in Net Assets Resulting from Operations | 35,720 | | 380,545,182 | | (169,662,781) |
| Distributions to Shareholders | (73,437) | | (66,581,005) | | (66,697,468) |
| Fund Share Transactions: | | | | | |
| Sold | 29,116,378 | | 39,421,674 | | 475,004,269 |
| Redeemed | (4,077,718) | | (408,608,631) | | (573,184,590) |
| Net increase (decrease) from capital share transactions | 25,038,660 | | (369,186,957) | | (98,180,321) |
| Net Increase (Decrease) in Net Assets | 25,000,943 | | (55,222,780) | | (334,540,570) |
| Net Assets: | | | | | |
| Beginning of period | — | | 2,001,147,584 | | 2,335,688,154 |
| End of period | $ 25,000,943 | | $ 1,945,924,804 | | $ 2,001,147,584 |
| (1) | Commenced operations on March 16, 2021. |
The accompanying notes are an integral part of these financial statements.
Hartford Multifactor ETFs
Statements of Changes in Net Assets – (continued)
For the Year Ended September 30, 2021
| | Hartford Multifactor
Diversified International ETF | | Hartford Multifactor
Emerging Markets ETF |
| | For the
Year Ended
September 30,
2021 | | For the
Year Ended
September 30,
2020 | | For the
Year Ended
September 30,
2021 | | For the
Year Ended
September 30,
2020 |
| Operations: | | | | | | | |
| Net investment income (loss) | $ 226,346 | | $ 151,165 | | $ 1,245,735 | | $ 1,536,632 |
| Net realized gain (loss) on investments, other financial instruments and foreign currency transactions | 510,379 | | (281,036) | | 7,858,670 | | (8,583,548) |
| Net changes in unrealized appreciation (depreciation) of investments, other financial instruments and foreign currency transactions | 440,577 | | (349,146) | | 2,518,212 | | (1,062,247) |
| Net Increase (Decrease) in Net Assets Resulting from Operations | 1,177,302 | | (479,017) | | 11,622,617 | | (8,109,163) |
| Distributions to Shareholders | (198,992) | | (163,843) | | (1,364,480) | | (2,328,245) |
| Fund Share Transactions: | | | | | | | |
| Sold | — | | 2,754,532 | | — | | 3,623,318 |
| Redeemed | — | | (2,751,610) | | (11,443,163) | | (18,945,241) |
| Other Capital | — | | — | | 11,522 | | 22,366 |
| Net increase (decrease) from capital share transactions | — | | 2,922 | | (11,431,641) | | (15,299,557) |
| Net Increase (Decrease) in Net Assets | 978,310 | | (639,938) | | (1,173,504) | | (25,736,965) |
| Net Assets: | | | | | | | |
| Beginning of period | 4,728,427 | | 5,368,365 | | 43,086,332 | | 68,823,297 |
| End of period | $ 5,706,737 | | $ 4,728,427 | | $ 41,912,828 | | $ 43,086,332 |
The accompanying notes are an integral part of these financial statements.
Hartford Multifactor ETFs
Statements of Changes in Net Assets – (continued)
For the Year Ended September 30, 2021
| | Hartford Multifactor
Small Cap ETF | | Hartford Multifactor
US Equity ETF |
| | For the
Year Ended
September 30,
2021 | | For the
Year Ended
September 30,
2020 | | For the
Year Ended
September 30,
2021 | | For the
Year Ended
September 30,
2020 |
| Operations: | | | | | | | |
| Net investment income (loss) | $ 208,607 | | $ 199,353 | | $ 5,051,123 | | $ 6,630,038 |
| Net realized gain (loss) on investments, other financial instruments and foreign currency transactions | 2,186,552 | | (861,728) | | 46,151,309 | | (11,372,316) |
| Net changes in unrealized appreciation (depreciation) of investments, other financial instruments and foreign currency transactions | 707,235 | | (390,314) | | 21,944,816 | | (2,631,141) |
| Net Increase (Decrease) in Net Assets Resulting from Operations | 3,102,394 | | (1,052,689) | | 73,147,248 | | (7,373,419) |
| Distributions to Shareholders | (202,752) | | (463,148) | | (5,642,254) | | (6,397,955) |
| Fund Share Transactions: | | | | | | | |
| Sold | 21,056,818 | | 3,000,116 | | 245,723,876 | | 70,914,373 |
| Redeemed | (6,907,604) | | (10,895,246) | | (172,629,516) | | (119,273,432) |
| Other Capital | — | | 936 | | — | | — |
| Net increase (decrease) from capital share transactions | 14,149,214 | | (7,894,194) | | 73,094,360 | | (48,359,059) |
| Net Increase (Decrease) in Net Assets | 17,048,856 | | (9,410,031) | | 140,599,354 | | (62,130,433) |
| Net Assets: | | | | | | | |
| Beginning of period | 7,722,897 | | 17,132,928 | | 245,360,836 | | 307,491,269 |
| End of period | $ 24,771,753 | | $ 7,722,897 | | $ 385,960,190 | | $ 245,360,836 |
The accompanying notes are an integral part of these financial statements.
Hartford Multifactor ETFs
| | —Selected Per-Share Data(1)— | | —Ratios and Supplemental Data — |
| | Net Asset
Value at
Beginning
of Period | | Net
Investment
Income
(Loss) | | Net
Realized
and
Unrealized
Gain (Loss)
on
Investments | | Total
from
Investment
Operations | | Other
Capital | | Dividends
from Net
Investment
Income | | Total
Dividends
and
Distributions | | Net
Asset
Value at
End of
Period | | Total
Return(2) | | Net
Assets at
End of
Period
(000s) | | Ratio of
Expenses
to
Average
Net
Assets
Before
Adjust-
ments(3) | | Ratio of
Expenses
to
Average
Net
Assets
After
Adjust-
ments | | Ratio of
Net
Investment
Income
(Loss) to
Average
Net Assets | | Portfolio
Turnover(4) |
| Hartford Longevity Economy ETF(5) |
| For the Period Ended September 30, 2021 |
| | $ 25.00 | | $ 0.18 | | $ 1.22 | | $ 1.40 | | $ — | | $ (0.08) | | $ (0.08) | | $ 26.32 | | 5.58% (6) | | $ 25,001 | | 0.44% (7) | | 0.44% (7) | | 1.23% (7) | | 70% (8) |
| Hartford Multifactor Developed Markets (ex-US) ETF |
| For the Year Ended September 30, 2021 |
| | $ 25.89 | | $ 0.99 | | $ 4.37 | | $ 5.36 | | $ — | | $ (0.99) | | $ (0.99) | | $ 30.26 | | 20.81% | | $ 1,945,925 | | 0.29% | | 0.29% | | 3.37% | | 44% |
| For the Year Ended September 30, 2020 |
| | $ 27.76 | | $ 0.68 | | $ (1.79) | | $ (1.11) | | $ — | | $ (0.76) | | $ (0.76) | | $ 25.89 | | (4.04)% | | $ 2,001,148 | | 0.29% | | 0.29% | | 2.60% | | 57% |
| For the Year Ended September 30, 2019 |
| | $ 28.97 | | $ 0.98 | | $ (1.51) | | $ (0.53) | | $ — | | $ (0.68) | | $ (0.68) | | $ 27.76 | | (1.78)% | | $ 2,335,688 | | 0.29% | | 0.29% | | 3.56% | | 63% |
| For the Year Ended September 30, 2018 |
| | $ 28.24 | | $ 0.91 | | $ 0.45(9) | | $ 1.36 | | $ 0.00 (10) | | $ (0.63) | | $ (0.63) | | $ 28.97 | | 4.85% | | $ 811,066 | | 0.31% | | 0.31% | | 3.17% | | 47% |
| For the Year Ended September 30, 2017 |
| | $ 24.60 | | $ 0.82 | | $ 3.55 | | $ 4.37 | | $ — | | $ (0.73) | | $ (0.73) | | $ 28.24 | | 18.18% | | $ 131,327 | | 0.42% | | 0.40% | | 3.13% | | 46% |
| Hartford Multifactor Diversified International ETF |
| For the Year Ended September 30, 2021 |
| | $ 23.64 | | $ 1.13 | | $ 4.75 | | $ 5.88 | | $ — | | $ (0.99) | | $ (0.99) | | $ 28.53 | | 25.06% | | $ 5,707 | | 0.29% | | 0.29% | | 4.09% | | 89% |
| For the Year Ended September 30, 2020 |
| | $ 26.84 | | $ 0.75 | | $ (3.13) | | $ (2.38) | | $ — | | $ (0.82) | | $ (0.82) | | $ 23.64 | | (9.03)% | | $ 4,728 | | 0.29% | | 0.29% | | 3.06% | | 156% |
| For the Year Ended September 30, 2019 |
| | $ 27.35 | | $ 0.69 | | $ (0.51) | | $ 0.18 | | $ — | | $ (0.69) | | $ (0.69) | | $ 26.84 | | 0.81% | | $ 5,368 | | 0.29% | | 0.29% | | 2.64% | | 38% |
| For the Year Ended September 30, 2018 |
| | $ 26.58 | | $ 0.65 | | $ 0.71 | | $ 1.36 | | $ — | | $ (0.59) | | $ (0.59) | | $ 27.35 | | 5.16% | | $ 5,470 | | 0.33% | | 0.33% | | 2.37% | | 35% |
| For the Period Ended September 30, 2017(11) |
| | $ 25.02 | | $ 0.30 | | $ 1.40 | | $ 1.70 | | $ — | | $ (0.14) | | $ (0.14) | | $ 26.58 | | 6.84% (6) | | $ 5,317 | | 0.39% (7) | | 0.39% (7) | | 3.01% (7) | | 48% |
| Hartford Multifactor Emerging Markets ETF |
| For the Year Ended September 30, 2021 |
| | $ 19.58 | | $ 0.69 | | $ 5.10 | | $ 5.79 | | $ 0.01 | | $ (0.73) | | $ (0.73) | | $ 24.65 | | 29.81% | | $ 41,913 | | 0.44% | | 0.44% | | 2.89% | | 96% |
| For the Year Ended September 30, 2020 |
| | $ 22.20 | | $ 0.58 | | $ (2.37) | | $ (1.79) | | $ 0.01 | | $ (0.84) | | $ (0.84) | | $ 19.58 | | (8.34)% | | $ 43,086 | | 0.44% | | 0.44% | | 2.80% | | 77% |
| For the Year Ended September 30, 2019 |
| | $ 23.24 | | $ 0.66 | | $ (1.12) | | $ (0.46) | | $ 0.03 | | $ (0.61) | | $ (0.61) | | $ 22.20 | | (1.90)% | | $ 68,823 | | 0.49% | | 0.49% | | 2.89% | | 78% |
| For the Year Ended September 30, 2018 |
| | $ 24.34 | | $ 0.60 | | $ (1.24) | | $ (0.64) | | $ 0.01 | | $ (0.47) | | $ (0.47) | | $ 23.24 | | (2.64)% | | $ 65,080 | | 0.52% | | 0.52% | | 2.42% | | 25% |
| For the Year Ended September 30, 2017 |
| | $ 21.62 | | $ 0.49 | | $ 2.63 | | $ 3.12 | | $ — | | $ (0.40) | | $ (0.40) | | $ 24.34 | | 14.63% | | $ 46,239 | | 0.62% | | 0.60% | | 2.17% | | 30% |
| Hartford Multifactor Small Cap ETF |
| For the Year Ended September 30, 2021 |
| | $ 25.74 | | $ 0.54 | | $ 12.37 | | $ 12.91 | | $ — | | $ (0.54) | | $ (0.54) | | $ 38.11 | | 50.39% | | $ 24,772 | | 0.34% | | 0.34% | | 1.48% | | 73% |
| For the Year Ended September 30, 2020 |
| | $ 28.55 | | $ 0.41 | | $ (2.34) | | $ (1.93) | | $ 0.00 (10) | | $ (0.88) | | $ (0.88) | | $ 25.74 | | (7.05)% | | $ 7,723 | | 0.35% | | 0.35% | | 1.52% | | 158% |
The accompanying notes are an integral part of these financial statements.
Hartford Multifactor ETFs
Financial Highlights – (continued)
| | —Selected Per-Share Data(1)— | | —Ratios and Supplemental Data — |
| | Net Asset
Value at
Beginning
of Period | | Net
Investment
Income
(Loss) | | Net
Realized
and
Unrealized
Gain (Loss)
on
Investments | | Total
from
Investment
Operations | | Other
Capital | | Dividends
from Net
Investment
Income | | Total
Dividends
and
Distributions | | Net
Asset
Value at
End of
Period | | Total
Return(2) | | Net
Assets at
End of
Period
(000s) | | Ratio of
Expenses
to
Average
Net
Assets
Before
Adjust-
ments(3) | | Ratio of
Expenses
to
Average
Net
Assets
After
Adjust-
ments | | Ratio of
Net
Investment
Income
(Loss) to
Average
Net Assets | | Portfolio
Turnover(4) |
| Hartford Multifactor Small Cap ETF – (continued) |
| For the Year Ended September 30, 2019 |
| | $ 31.78 | | $ 0.81 | | $ (3.23) | | $ (2.42) | | $ 0.00 (10) | | $ (0.81) | | $ (0.81) | | $ 28.55 | | (7.46)% | | $ 17,133 | | 0.39% | | 0.39% | | 2.80% | | 50% |
| For the Year Ended September 30, 2018 |
| | $ 30.25 | | $ 0.72 | | $ 1.54 | | $ 2.26 | | $ 0.00 (10) | | $ (0.73) | | $ (0.73) | | $ 31.78 | | 7.52% | | $ 22,243 | | 0.44% | | 0.44% | | 2.26% | | 41% |
| For the Year Ended September 30, 2017 |
| | $ 25.46 | | $ 0.57 | | $ 4.79 | | $ 5.36 | | $ — | | $ (0.57) | | $ (0.57) | | $ 30.25 | | 21.37% | | $ 18,148 | | 0.60% | | 0.56% | | 2.08% | | 48% |
| Hartford Multifactor US Equity ETF |
| For the Year Ended September 30, 2021 |
| | $ 31.76 | | $ 0.57 | | $ 8.22 | | $ 8.79 | | $ — | | $ (0.66) | | $ (0.66) | | $ 39.89 | | 27.83% | | $ 385,960 | | 0.19% | | 0.19% | | 1.50% | | 76% |
| For the Year Ended September 30, 2020 |
| | $ 32.20 | | $ 0.70 | | $ (0.45) | | $ 0.25 | | $ — | | $ (0.69) | | $ (0.69) | | $ 31.76 | | 0.92% | | $ 245,361 | | 0.19% | | 0.19% | | 2.25% | | 71% |
| For the Year Ended September 30, 2019 |
| | $ 33.01 | | $ 0.73 | | $ (0.89)(9) | | $ (0.16) | | $ — | | $ (0.65) | | $ (0.65) | | $ 32.20 | | (0.31)% | | $ 307,491 | | 0.19% | | 0.19% | | 2.35% | | 81% |
| For the Year Ended September 30, 2018 |
| | $ 28.77 | | $ 0.57 | | $ 4.15 | | $ 4.72 | | $ — | | $ (0.48) | | $ (0.48) | | $ 33.01 | | 16.47% | | $ 173,304 | | 0.21% | | 0.21% | | 1.80% | | 36% |
| For the Year Ended September 30, 2017 |
| | $ 24.44 | | $ 0.51 | | $ 4.30 | | $ 4.81 | | $ — | | $ (0.48) | | $ (0.48) | | $ 28.77 | | 19.84% | | $ 34,524 | | 0.34% | | 0.31% | | 1.92% | | 36% |
| FINANCIAL HIGHLIGHTS FOOTNOTES |
| (1) | Information presented relates to a share outstanding throughout the indicated period. Net investment income (loss) per share amounts are calculated based on average shares outstanding unless otherwise noted. |
| (2) | Total return is calculated assuming a hypothetical purchase of beneficial shares on the opening of the first day at the net asset value and a sale on the closing of the last day at the net asset value of each period reported. Dividends and distributions, if any, are assumed for purposes of this calculation, to be reinvested at net asset value at the end of the distribution day. |
| (3) | Adjustments include waivers and reimbursements, if applicable. Ratios do not include fees paid indirectly (see Expenses in the accompanying Notes to Financial Statements). |
| (4) | Portfolio turnover rate excludes securities received or delivered from in-kind processing of creations or redemptions. |
| (5) | Commenced operations on March 16, 2021. |
| (6) | Not annualized. |
| (7) | Annualized. |
| (8) | Reflects the Fund's portfolio turnover for the period March 16, 2021 through September 30, 2021. |
| (9) | Per share amount was not in accord with the net realized and unrealized gain (loss) for the period because of the timing of transactions in shares of the Fund and the amount and timing of per-share net realized and unrealized gain (loss) on such shares. |
| (10) | Per share amount is less than $0.005. |
| (11) | Commenced operations on May 10, 2017. |
The accompanying notes are an integral part of these financial statements.
Hartford Multifactor ETFs
Notes to Financial Statements
September 30, 2021
| 1. | Organization: |
| | Lattice Strategies Trust (the "Trust") is an open-end registered management investment company comprised of six series as of September 30, 2021. Financial statements for the series of the Trust listed below (each, a “Fund” and collectively, the “Funds”) are included in this report. |
| | |
| Lattice Strategies Trust: |
| Hartford Longevity Economy ETF (the "Longevity Economy ETF") |
| Hartford Multifactor Developed Markets (ex-US) ETF (the "Multifactor Developed Markets (ex-US) ETF") |
| Hartford Multifactor Diversified International ETF (the "Multifactor Diversified International ETF") |
| Hartford Multifactor Emerging Markets ETF (the "Multifactor Emerging Markets ETF") |
| Hartford Multifactor Small Cap ETF (the "Multifactor Small Cap ETF") |
| Hartford Multifactor US Equity ETF (the "Multifactor US Equity ETF") |
Longevity Economy ETF commenced operations on March 16, 2021. Multifactor Diversified International ETF commenced operations on May 10, 2017. Multifactor Small Cap ETF commenced operations on March 23, 2015. Each of the other Funds commenced operations on February 25, 2015.
Each Fund is an exchange-traded fund (‘‘ETF’’) that trades on an exchange like other publicly traded securities. Each Fund is designed to track an index. Shares of Longevity Economy ETF, Multifactor Developed Markets (ex-US) ETF, Multifactor Emerging Markets ETF, Multifactor Small Cap ETF and Multifactor US Equity ETF are listed and traded on NYSE Arca, Inc. ("NYSE Arca"). Shares of Multifactor Diversified International ETF are listed and traded on Cboe BZX Exchange, Inc. (“Cboe BZX”). Each share of a Fund represents a partial ownership in the Fund's assets and liabilities, including securities held by the Fund. Shares of a Fund may be purchased or redeemed directly from the Fund in Creation Units at net asset value ("NAV") only by certain large institutional investors (‘‘Authorized Participants’’) who have entered into agreements with ALPS Distributors, Inc. (‘‘ALPS’’ or the ‘‘Distributor’’), the Funds’ Distributor.
The assets of each Fund are separate, and a shareholder's interest is limited to the Fund in which shares are held. The Trust was organized as a Delaware statutory trust on April 15, 2014 and is registered with the Securities and Exchange Commission (the “SEC”) under the Investment Company Act of 1940, as amended (the “1940 Act”). The shares of the Funds are registered under the Securities Act of 1933, as amended (the ‘‘Securities Act’’). Each Fund is a diversified open-end management investment company. Each Fund applies specialized accounting and reporting standards under Financial Accounting Standards Board ("FASB") Accounting Standards Codification Topic 946 "Financial Services – Investment Companies."
| 2. | Significant Accounting Policies: |
| | The following is a summary of significant accounting policies of each Fund used in the preparation of its financial statements, which are in accordance with United States Generally Accepted Accounting Principles (“U.S. GAAP”). The preparation of financial statements in accordance with U.S. GAAP may require management to make estimates and assumptions that affect the reported amounts of assets and liabilities and disclosure of contingent assets and liabilities at the date of the financial statements and the reported amounts of increases and decreases in net assets from operations during the reporting period. Actual results could differ from those estimates. |
| a) | Determination of Net Asset Value – The net asset value ("NAV") of each Fund's shares is determined as of the close of regular trading on the New York Stock Exchange (the “Exchange”) (normally 4:00 p.m. Eastern Time) (the “NYSE Close”) on each day that is open (“Valuation Date”). If the Exchange is closed due to weather or other extraordinary circumstances on a day it would typically be open for business, each Fund may treat such day as a typical business day and accept creation and redemption orders and calculate each Fund’s NAV in accordance with applicable law. The NAV for the shares of each Fund is determined by dividing the value of the Fund’s net assets attributable to the shares by the number of shares outstanding. Information that becomes known to the Funds after the NAV has been calculated on a particular day will not generally be used to retroactively adjust the NAV determined earlier that day. |
| b) | Investment Valuation and Fair Value Measurements – For purposes of calculating the NAV per share of each Fund, portfolio securities and other assets held in a Fund’s portfolio for which market prices are readily available are valued at market value. Market value is generally determined on the basis of official close price or last reported trade price. If no trades were reported, market value is based on prices obtained from a quotation reporting system, established market makers (including evaluated prices), or independent pricing services. Pricing vendors may use matrix pricing or valuation models that utilize certain inputs and assumptions to derive values, including transaction data, credit quality information, general market conditions, news, and other factors and assumptions. |
| | If market prices are not readily available or are deemed unreliable, a Fund will use the fair value of the security or other instrument as determined in good faith under policies and procedures established by and under the supervision of the Board of Trustees (the "Board") of the Trust (“Valuation Procedures”). Market prices are considered not readily available where there is an absence of current or reliable market-based data (e.g., trade information or broker quotes), including where events occur after the close of the relevant market, but prior |
Hartford Multifactor ETFs
Notes to Financial Statements – (continued)
September 30, 2021
| | to the NYSE Close, that materially affect the values of a Fund’s portfolio holdings or assets. In addition, market prices are considered not readily available when, due to extraordinary circumstances, the exchanges or markets on which the securities or other instruments trade do not open for trading for the entire day and no other market prices are available. Fair value pricing is subjective in nature and the use of fair value pricing by a Fund may cause the NAV of its shares to differ significantly from the NAV that would have been calculated using market prices at the close of the exchange on which a portfolio holding is primarily traded. There can be no assurance that a Fund could obtain the fair value assigned to an investment if the Fund were to sell the investment at approximately the time at which the Fund determines its NAV. |
| | Securities and other instruments that are primarily traded on foreign markets may trade on days that are not business days of the Funds. The value of the foreign securities or other instruments in which a Fund invests may change on days when a shareholder will not be able to purchase, sell or redeem shares of the Fund. |
| | Fixed income investments (other than short-term obligations) and non-exchange traded derivatives held by a Fund are normally valued at prices supplied by independent pricing services in accordance with the Valuation Procedures. Short-term investments maturing in 60 days or less are generally valued at amortized cost which approximates fair value. |
| | Exchange-traded derivatives, such as options, futures and options on futures, are valued at the last sale price determined by the exchange where such instruments principally trade as of the close of such exchange. If a last sale price is not available, the value will be the mean of the most recently quoted bid and ask prices as of the close of the relevant exchange. If a mean of the bid and ask prices cannot be calculated for the day, the value will be the most recently quoted bid price as of the close of the relevant exchange. Over-the-counter derivatives and other instruments that do not trade on an exchange are normally valued based on prices supplied by independent pricing services in accordance with the Valuation Procedures. |
| | Investments valued in currencies other than U.S. dollars are converted to U.S. dollars using the prevailing spot currency exchange rates obtained from independent pricing services for calculation of the NAV. As a result, the NAV of a Fund’s shares may be affected by changes in the value of currencies in relation to the U.S. dollar. The value of securities or other instruments traded in markets outside the United States or denominated in currencies other than the U.S. dollar may be affected significantly on a day that the Exchange is closed and the market value may change on days when an investor is not able to purchase, redeem or sell shares of a Fund. |
| | Foreign currency contracts represent agreements to exchange currencies on specific future dates at predetermined rates. Foreign currency contracts are valued using foreign currency exchange rates and forward rates as provided by an independent pricing service on the Valuation Date. |
| | Investments in open-end mutual funds, if any, are valued at the respective NAV of each open-end mutual fund on the Valuation Date. Shares of investment companies listed and traded on an exchange are valued in the same manner as any exchange-listed equity security. Such open-end mutual funds and listed investment companies may use fair value pricing as disclosed in their prospectuses. |
| | Financial instruments for which prices are not available from an independent pricing service may be valued using market quotations obtained from one or more dealers that make markets in the respective financial instrument in accordance with the Valuation Procedures. |
| | U.S. GAAP defines fair value as the price that a Fund would receive to sell an asset or pay to transfer a liability in an orderly transaction between market participants. The U.S. GAAP fair value measurement standards require disclosure of a fair value hierarchy for each major category of assets and liabilities. Various inputs are used in determining the fair value of each Fund’s investments. These inputs are summarized into three broad hierarchy levels. This hierarchy is based on whether the valuation inputs are observable or unobservable. These levels are: |
| • | Level 1 – Quoted prices in active markets for identical investments. Level 1 may include exchange-traded instruments, such as domestic equities, some foreign equities, options, futures, mutual funds, exchange-traded funds, rights and warrants. |
| • | Level 2 – Observable inputs other than Level 1 prices, such as quoted prices for similar investments; quoted prices in markets that are not active; or other inputs that are observable or can be corroborated by observable market data. Level 2 may include debt investments that are traded less frequently than exchange traded instruments and which are valued using independent pricing services; senior floating rate interests, which are valued using an aggregate of dealer bids; short-term investments, which are valued at amortized cost; and swaps, which are valued based upon the terms of each swap contract. |
| • | Level 3 – Significant unobservable inputs that are supported by limited or no market activity. Level 3 may include financial instruments whose values are determined using indicative market quotes or require significant management judgment or estimation. These unobservable valuation inputs may include estimates for current yields, maturity/duration, prepayment speed, and indicative market quotes for comparable investments along with other assumptions relating to credit quality, collateral value, complexity of the investment structure, general market conditions and liquidity. This category may include investments where trading has been halted or there are certain restrictions on trading. While these investments are priced using unobservable inputs, the valuation of these investments reflects the best available data and management believes the prices are a reasonable representation of exit price. |
Hartford Multifactor ETFs
Notes to Financial Statements – (continued)
September 30, 2021
The Board has delegated the day-to-day responsibility for implementing the Valuation Procedures to the Valuation Committee. The Valuation Committee will consider all relevant factors in determining an investment’s fair value, and may seek the advice of such Fund’s sub-adviser, knowledgeable brokers, and legal counsel in making such determination. The Valuation Committee reports to the Audit Committee of the Board.
Valuation levels are not necessarily indicative of the risk associated with investing in such investments. Individual investments within any of the above mentioned asset classes may be assigned a different hierarchical level than those presented above, as individual circumstances dictate.
For additional information, refer to the Fair Value Summary and the Level 3 roll-forward reconciliation, if applicable, which follows each Fund’s Schedule of Investments.
| c) | Investment Transactions and Investment Income – Investment transactions are recorded as of the trade date (the date the order to buy or sell is executed) for financial reporting purposes. Investments purchased or sold on a when-issued or delayed-delivery basis may be settled a month or more after the trade date. Realized gains and losses are determined on the basis of identified cost. |
| | Dividend income from domestic securities is accrued on the ex-dividend date. In general, dividend income from foreign securities is recorded on the ex-date; however, dividend notifications in certain foreign jurisdictions may not be available in a timely manner and as a result, a Fund will record the dividend as soon as the relevant details (i.e., rate per share, payment date, shareholders of record, etc.) are publicly available. |
| | Please refer to Note 8 for Securities Lending information. |
| d) | Taxes – A Fund may be subject to taxes imposed on realized gains on securities of certain foreign countries in which such Fund invests. A Fund may also be subject to taxes withheld on foreign dividends and interest from securities in which a Fund invests. The amount of any foreign taxes withheld and foreign tax expense is included on the accompanying Statements of Operations as a reduction to net investment income or net realized or unrealized gain on investments in these securities, if applicable. |
| e) | Foreign Currency Transactions – Assets and liabilities denominated in currencies other than U.S. dollars are translated into U.S. dollars at the exchange rates in effect on the Valuation Date. Purchases and sales of investments, income and expenses are translated into U.S. dollars at the exchange rates on the dates of such transactions. |
| | A Fund does not isolate that portion of portfolio investment valuation resulting from fluctuations in the foreign currency exchange rates from the fluctuations arising from changes in the market prices of investments held. Exchange rate fluctuations are included with the net realized and unrealized gain or loss on investments in the accompanying financial statements. |
| | Net realized foreign exchange gains or losses arise from sales of foreign currencies and the difference between asset and liability amounts initially stated in foreign currencies and the U.S. dollar value of the amounts actually received or paid. Net unrealized foreign exchange gains or losses arise from changes in the value of other assets and liabilities at the end of the reporting period, resulting from changes in the exchange rates. |
| f) | Dividend Distributions to Shareholders – Dividends are declared pursuant to a policy adopted by the Board. Dividends and/or distributions to shareholders are recorded on ex-date. The policy of Multifactor Developed Markets (ex-US) ETF, Multifactor Diversified International ETF and Multifactor Emerging Markets ETF is to pay dividends from net investment income and realized gains, if any, semi-annually. The policy of Longevity Economy ETF, Multifactor US Equity ETF and Multifactor Small Cap ETF is to pay dividends from net investment income and realized gains, if any, quarterly. The policy of Multifactor Small Cap ETF until June 1, 2020 was to pay dividends from net investment income, if any, semi-annually. Amounts may vary significantly from period to period and realized gains, if any, are paid at least once a year. Dividends may be declared and paid more frequently or at any other times to comply with the distribution requirements of the Internal Revenue Code. |
| | Income dividends and capital gains distributions are determined in accordance with federal income tax regulations, which may differ from U.S. GAAP with respect to character and timing. (See Federal Income Taxes: Distributions and Components of Distributable Earnings and classification of Capital Accounts notes). |
| 3. | Securities and Other Investments: |
| | Restricted Securities – Each Fund may invest in securities that are subject to legal or contractual restrictions on resale. These securities generally may be resold in transactions exempt from registration or to the public if the securities are registered. Disposal of these securities may involve time-consuming negotiations and expense, and prompt sale at an acceptable price may be difficult. Information regarding restricted securities, if applicable, is included at the end of each Fund’s Schedule of Investments. |
Hartford Multifactor ETFs
Notes to Financial Statements – (continued)
September 30, 2021
| 4. | Financial Derivative Instruments: |
| | The following disclosures contain information on how and why a Fund may use derivative instruments, the credit-risk-related contingent features in certain derivative instruments, and how derivative instruments affect a Fund’s financial position and results of operations. The location and fair value amounts of these instruments on the Statements of Assets and Liabilities and the realized gains and losses and changes in unrealized gains and losses on the Statements of Operations, each categorized by type of derivative contract, are included in the following Additional Derivative Instrument Information footnote. The derivative instruments outstanding as of period-end are disclosed in the notes to the Schedules of Investments, if applicable. The amounts of realized gains and losses and changes in unrealized gains and losses on derivative instruments during the period are disclosed in the Statements of Operations. |
| a) | Futures Contracts – A Fund may enter into futures contracts. A futures contract is an agreement between two parties to buy or sell an asset at a set price on a future date. A Fund may use futures contracts to manage risk or obtain exposure to the investment markets, commodities, or movements in interest rates and currency values. The primary risks associated with the use of futures contracts are the imperfect correlation between the change in market value of the investments held by a Fund and the prices of futures contracts and the possibility of an illiquid market. Upon entering into a futures contract, a Fund is required to deposit with a futures commission merchant (“FCM”) an amount of cash or U.S. Government or Agency Obligations in accordance with the initial margin requirements of the broker or exchange. Futures contracts are marked to market daily and an appropriate amount equal to the change in value (“variation margin”) is paid or received by a Fund. Gains or losses are recognized but not considered realized until the contracts expire or are closed. Futures contracts involve, to varying degrees, risk of loss in excess of the variation margin disclosed on the Statements of Assets and Liabilities. |
| | During the year ended September 30, 2021, each of Multifactor Developed Markets (ex-US) ETF, Multifactor Emerging Markets ETF, Multifactor Small Cap ETF and Multifactor US Equity ETF had used Futures Contracts. |
| b) | Additional Derivative Instrument Information: |
| | Multifactor Developed Markets (ex-US) ETF |
| | |
| The Effect of Derivative Instruments on the Statement of Assets and Liabilities as of September 30, 2021: |
| | Risk Exposure Category |
| | Interest Rate
Contracts | | Foreign
Currency
Contracts | | Credit
Contracts | | Equity
Contracts | | Commodity
Contracts | | Total |
| Liabilities: | | | | | | | | | | | |
| Unrealized depreciation on futures contracts(1) | $ — | | $ — | | $ — | | $ 498,176 | | $ — | | $ 498,176 |
| Total | $ — | | $ — | | $ — | | $ 498,176 | | $ — | | $ 498,176 |
| (1) | Amount represents the cumulative depreciation on futures contracts as disclosed within the Schedule of Investments under the open “Futures Contracts” section. Only current day’s variation margin, if any, is reported within the Statement of Assets and Liabilities. |
| The Effect of Derivative Instruments on the Statement of Operations for the year ended September 30, 2021: |
| | Risk Exposure Category |
| | Interest Rate
Contracts | | Foreign
Currency
Contracts | | Credit
Contracts | | Equity
Contracts | | Commodity
Contracts | | Total |
| Realized Gain (Loss) on Derivatives Recognized as a Result of Operations: | | | | | | | | | | | |
| Net realized gain (loss) on futures contracts | $ — | | $ — | | $ — | | $ 2,978,740 | | $ — | | $ 2,978,740 |
| Total | $ — | | $ — | | $ — | | $ 2,978,740 | | $ — | | $ 2,978,740 |
| Net Change in Unrealized Appreciation (Depreciation) on Derivatives Recognized as a Result of Operations: | | | | | | | | | | | |
| Net change in unrealized appreciation (depreciation) of futures contracts | $ — | | $ — | | $ — | | $ (152,408) | | $ — | | $ (152,408) |
| Total | $ — | | $ — | | $ — | | $ (152,408) | | $ — | | $ (152,408) |
For the year ended September 30, 2021, the average monthly amount or number per contract outstanding for each derivative type was as follows:
| Derivative Description | | Average Notional
Par, Contracts
or Face Amount |
| Futures Contracts Number of Long Contracts | | 92 |
Hartford Multifactor ETFs
Notes to Financial Statements – (continued)
September 30, 2021
Multifactor Emerging Markets ETF
| The Effect of Derivative Instruments on the Statement of Assets and Liabilities as of September 30, 2021: |
| | Risk Exposure Category |
| | Interest Rate
Contracts | | Foreign
Currency
Contracts | | Credit
Contracts | | Equity
Contracts | | Commodity
Contracts | | Total |
| Liabilities: | | | | | | | | | | | |
| Unrealized depreciation on futures contracts(1) | $ — | | $ — | | $ — | | $ 10,888 | | $ — | | $ 10,888 |
| Total | $ — | | $ — | | $ — | | $ 10,888 | | $ — | | $ 10,888 |
| (1) | Amount represents the cumulative depreciation on futures contracts as disclosed within the Schedule of Investments under the open “Futures Contracts” section. Only current day’s variation margin, if any, is reported within the Statement of Assets and Liabilities. |
| The Effect of Derivative Instruments on the Statement of Operations for the year ended September 30, 2021: |
| | Risk Exposure Category |
| | Interest Rate
Contracts | | Foreign
Currency
Contracts | | Credit
Contracts | | Equity
Contracts | | Commodity
Contracts | | Total |
| Realized Gain (Loss) on Derivatives Recognized as a Result of Operations: | | | | | | | | | | | |
| Net realized gain (loss) on futures contracts | $ — | | $ — | | $ — | | $ 35,234 | | $ — | | $ 35,234 |
| Total | $ — | | $ — | | $ — | | $ 35,234 | | $ — | | $ 35,234 |
| Net Change in Unrealized Appreciation (Depreciation) on Derivatives Recognized as a Result of Operations: | | | | | | | | | | | |
| Net change in unrealized appreciation (depreciation) of futures contracts | $ — | | $ — | | $ — | | $ (5,620) | | $ — | | $ (5,620) |
| Total | $ — | | $ — | | $ — | | $ (5,620) | | $ — | | $ (5,620) |
For the year ended September 30, 2021, the average monthly amount or number per contract outstanding for each derivative type was as follows:
| Derivative Description | | Average Notional
Par, Contracts
or Face Amount |
| Futures Contracts Number of Long Contracts | | 3 |
Multifactor Small Cap ETF
| The Effect of Derivative Instruments on the Statement of Assets and Liabilities as of September 30, 2021: |
| | Risk Exposure Category |
| | Interest Rate
Contracts | | Foreign
Currency
Contracts | | Credit
Contracts | | Equity
Contracts | | Commodity
Contracts | | Total |
| Liabilities: | | | | | | | | | | | |
| Unrealized depreciation on futures contracts(1) | $ — | | $ — | | $ — | | $ 1,092 | | $ — | | $ 1,092 |
| Total | $ — | | $ — | | $ — | | $ 1,092 | | $ — | | $ 1,092 |
| (1) | Amount represents the cumulative depreciation on futures contracts as disclosed within the Schedule of Investments under the open “Futures Contracts” section. Only current day’s variation margin, if any, is reported within the Statement of Assets and Liabilities. |
Hartford Multifactor ETFs
Notes to Financial Statements – (continued)
September 30, 2021
Multifactor Small Cap ETF – (continued)
| The Effect of Derivative Instruments on the Statement of Operations for the year ended September 30, 2021: |
| | Risk Exposure Category |
| | Interest Rate
Contracts | | Foreign
Currency
Contracts | | Credit
Contracts | | Equity
Contracts | | Commodity
Contracts | | Total |
| Realized Gain (Loss) on Derivatives Recognized as a Result of Operations: | | | | | | | | | | | |
| Net realized gain (loss) on futures contracts | $ — | | $ — | | $ — | | $ 40,309 | | $ — | | $ 40,309 |
| Total | $ — | | $ — | | $ — | | $ 40,309 | | $ — | | $ 40,309 |
| Net Change in Unrealized Appreciation (Depreciation) on Derivatives Recognized as a Result of Operations: | | | | | | | | | | | |
| Net change in unrealized appreciation (depreciation) of futures contracts | $ — | | $ — | | $ — | | $ 292 | | $ — | | $ 292 |
| Total | $ — | | $ — | | $ — | | $ 292 | | $ — | | $ 292 |
For the year ended September 30, 2021, the average monthly amount or number per contract outstanding for each derivative type was as follows:
| Derivative Description | | Average Notional
Par, Contracts
or Face Amount |
| Futures Contracts Number of Long Contracts | | 1 |
Multifactor US Equity ETF
| The Effect of Derivative Instruments on the Statement of Assets and Liabilities as of September 30, 2021: |
| | Risk Exposure Category |
| | Interest Rate
Contracts | | Foreign
Currency
Contracts | | Credit
Contracts | | Equity
Contracts | | Commodity
Contracts | | Total |
| Liabilities: | | | | | | | | | | | |
| Unrealized depreciation on futures contracts(1) | $ — | | $ — | | $ — | | $ 52,157 | | $ — | | $ 52,157 |
| Total | $ — | | $ — | | $ — | | $ 52,157 | | $ — | | $ 52,157 |
| (1) | Amount represents the cumulative depreciation on futures contracts as disclosed within the Schedule of Investments under the open “Futures Contracts” section. Only current day’s variation margin, if any, is reported within the Statement of Assets and Liabilities. |
| The Effect of Derivative Instruments on the Statement of Operations for the year ended September 30, 2021: |
| | Risk Exposure Category |
| | Interest Rate
Contracts | | Foreign
Currency
Contracts | | Credit
Contracts | | Equity
Contracts | | Commodity
Contracts | | Total |
| Realized Gain (Loss) on Derivatives Recognized as a Result of Operations: | | | | | | | | | | | |
| Net realized gain (loss) on futures contracts | $ — | | $ — | | $ — | | $ 327,068 | | $ — | | $ 327,068 |
| Total | $ — | | $ — | | $ — | | $ 327,068 | | $ — | | $ 327,068 |
| Net Change in Unrealized Appreciation (Depreciation) on Derivatives Recognized as a Result of Operations: | | | | | | | | | | | |
| Net change in unrealized appreciation (depreciation) of futures contracts | $ — | | $ — | | $ — | | $ (48,412) | | $ — | | $ (48,412) |
| Total | $ — | | $ — | | $ — | | $ (48,412) | | $ — | | $ (48,412) |
For the year ended September 30, 2021, the average monthly amount or number per contract outstanding for each derivative type was as follows:
| Derivative Description | | Average Notional
Par, Contracts
or Face Amount |
| Futures Contracts Number of Long Contracts | | 6 |
| c) | Balance Sheet Offsetting Information – Set forth below are tables which disclose both gross information and net information about instruments and transactions eligible for offset in the financial statements, and instruments and transactions that are subject to a master |
Hartford Multifactor ETFs
Notes to Financial Statements – (continued)
September 30, 2021
| | netting arrangement, as well as amounts related to margin, reflected as financial collateral (including cash collateral), held at clearing brokers, counterparties and a Fund's custodian. The master netting arrangements allow the clearing brokers to net any collateral held in or on behalf of a Fund, or liabilities or payment obligations of the clearing brokers to a Fund, against any liabilities or payment obligations of a Fund to the clearing brokers. A Fund is required to deposit financial collateral (including cash collateral) at the Fund's custodian on behalf of clearing brokers and counterparties to continually meet the original and maintenance requirements established by the clearing brokers and counterparties. Such requirements are specific to the respective clearing broker or counterparty. Certain master netting arrangements may not be enforceable in a bankruptcy. |
| | The following tables present a Fund's derivative assets and liabilities, presented on a gross basis as no amounts are netted within the Statements of Assets and Liabilities, by counterparty net of amounts available for offset under a master netting agreement or similar agreement ("MNA") and net of the related collateral received/pledged by a Fund as of September 30, 2021: |
| | |
| Multifactor Developed Markets (ex-US) ETF | | | | |
| Derivative Financial Instruments: | | Assets | | Liabilities |
| Futures contracts | | $ — | | $ (498,176) |
| Total gross amount of derivative assets and liabilities in the Statement of Assets and Liabilities | | — | | (498,176) |
| Derivatives not subject to a MNA | | — | | 498,176 |
| Total gross amount of assets and liabilities subject to MNA or similar agreements | | $ — | | $ — |
| Multifactor Emerging Markets ETF | | | | |
| Derivative Financial Instruments: | | Assets | | Liabilities |
| Futures contracts | | $ — | | $ (10,888) |
| Total gross amount of derivative assets and liabilities in the Statement of Assets and Liabilities | | — | | (10,888) |
| Derivatives not subject to a MNA | | — | | 10,888 |
| Total gross amount of assets and liabilities subject to MNA or similar agreements | | $ — | | $ — |
| Multifactor Small Cap ETF | | | | |
| Derivative Financial Instruments: | | Assets | | Liabilities |
| Futures contracts | | $ — | | $ (1,092) |
| Total gross amount of derivative assets and liabilities in the Statement of Assets and Liabilities | | — | | (1,092) |
| Derivatives not subject to a MNA | | — | | 1,092 |
| Total gross amount of assets and liabilities subject to MNA or similar agreements | | $ — | | $ — |
| Multifactor US Equity ETF | | | | |
| Derivative Financial Instruments: | | Assets | | Liabilities |
| Futures contracts | | $ — | | $ (52,157) |
| Total gross amount of derivative assets and liabilities in the Statement of Assets and Liabilities | | — | | (52,157) |
| Derivatives not subject to a MNA | | — | | 52,157 |
| Total gross amount of assets and liabilities subject to MNA or similar agreements | | $ — | | $ — |
| 5. | Principal Risks: |
| | A Fund’s investments expose it to various types of risks associated with financial instruments and the markets. A Fund may be exposed to the risks described below. Each Fund's prospectus provides details of that Fund's principal risks. |
| | The market values of equity securities, such as common stocks and preferred stocks, or equity related derivative investments, such as futures and options, may decline due to general market conditions that are not specifically related to a particular company, such as real or perceived adverse economic conditions, changes in the general outlook for corporate earnings, changes in interest or currency rates or adverse investor sentiment generally. The market value of equity securities may also decline due to factors that affect a particular industry or industries, such as labor shortages or increased production costs and competitive conditions within an industry. Equity securities and equity related investments generally have greater market price volatility than fixed income securities. The extent of each Fund’s exposure to market risk is the market value of the investments held as shown in the Fund’s Schedule of Investments. |
Hartford Multifactor ETFs
Notes to Financial Statements – (continued)
September 30, 2021
| | A widespread health crisis, such as a global pandemic, could cause substantial market volatility, exchange trading suspensions or restrictions and closures of securities exchanges and businesses, impact the ability to complete redemptions, and adversely impact Fund performance. The current ongoing outbreak of COVID-19, a respiratory disease caused by a novel coronavirus, has negatively affected the worldwide economy, the financial health of individual companies and the market in significant and unforeseen ways. The future impact of the ongoing COVID-19 pandemic remains unclear. The effects to public health, business and market conditions resulting from COVID-19 pandemic may have a significant negative impact on the performance of a Fund’s investments, including exacerbating other pre-existing political, social and economic risks. |
| | Investing in the securities of non-U.S. issuers, whether directly or indirectly, involves certain considerations and risks not typically associated with securities of U.S. issuers. Such risks include, but are not limited to: generally less liquid and less efficient securities markets; generally greater price volatility; exchange rate fluctuations; imposition of restrictions on the expatriation of funds or other protectionist measures; less publicly available information about issuers; the imposition of withholding or other taxes; higher transaction and custody costs; settlement delays and risk of loss attendant in settlement procedures; difficulties in enforcing contractual obligations; less regulation of securities markets; different accounting, disclosure and reporting requirements; more substantial governmental involvement in the economy; higher inflation rates; and greater social, economic and political uncertainties. Non-U.S. issuers may also be affected by political, social, economic or diplomatic developments in a foreign country or region or the U.S. (including the imposition of sanctions, tariffs, or other governmental restrictions). These risks are heightened for investments in issuers from countries with less developed markets. |
| | A Fund’s focus on securities of issuers that reflect a specific theme or focus on a specific sector or industry may affect the Fund’s exposure to certain industries or types of investments. The Fund’s relative investment performance may also be affected depending on whether such themes, sectors, industries or investments are in or out of favor with the market. Certain investments may be dependent on U.S. and foreign government policies, including tax incentives and subsidies and developments affecting companies focused on longevity and aging solutions generally. In addition, under certain market conditions, a Fund may underperform funds that invest in a broader array of investments |
| | Securities lending involves the risk that a Fund may lose money because the borrower of the loaned securities fails to return the securities in a timely manner or at all. A Fund could also lose money in the event of a decline in the value of the collateral provided for the loaned securities or a decline in the value of any investments made with cash collateral. These events could also trigger adverse tax consequences for a Fund that lends its holdings. |
| a) | Each Fund intends to continue to qualify as a Regulated Investment Company ("RIC") under Subchapter M of the Internal Revenue Code (“IRC”) by distributing substantially all of its taxable net investment income and net realized capital gains to its shareholders each year. Each Fund has distributed substantially all of its income and capital gains in prior years, if applicable, and intends to distribute substantially all of its income and capital gains during the calendar year ending December 31, 2021. Accordingly, no provision for federal income or excise taxes has been made in the accompanying financial statements. Distributions from short-term capital gains are treated as ordinary income distributions for federal income tax purposes. |
| b) | Net Investment Income (Loss), Net Realized Gains (Losses) and Distributions – Net investment income (loss) and net realized gains (losses) may differ for financial statement and tax purposes primarily because of losses deferred due to wash sale adjustments, foreign currency gains and losses, adjustments related to Passive Foreign Investment Companies ("PFICs"), Real Estate Investment Trusts ("REITs"), RICs, certain derivatives and partnerships. The character of distributions made during the year from net investment income or net realized gains may differ from their ultimate characterization for federal income tax purposes. Also, due to the timing of dividend distributions, the fiscal year in which amounts are distributed may differ from the year that the income or realized gains (losses) were recorded by each Fund. |
| c) | Distributions and Components of Distributable Earnings – The tax character of distributions paid by each Fund for the year ended September 30, 2021 and September 30, 2020 are as follows (as adjusted for dividends payable, if applicable): |
| | |
| | | For the Year Ended
September 30, 2021 | | For the Year Ended
September 30, 2020 |
| Fund | | Ordinary
Income | | Ordinary
Income |
| Longevity Economy ETF(1) | | $ 73,437 | | $ — |
| Multifactor Developed Markets (ex-US) ETF | | 66,581,005 | | 66,697,468 |
| Multifactor Diversified International ETF | | 198,992 | | 163,843 |
| Multifactor Emerging Markets ETF | | 1,364,480 | | 2,328,245 |
| Multifactor Small Cap ETF | | 202,752 | | 463,148 |
| Multifactor US Equity ETF | | 5,642,254 | | 6,397,955 |
| (1) | For the period March 16, 2021 (commencement of operations) through September 30, 2021. |
Hartford Multifactor ETFs
Notes to Financial Statements – (continued)
September 30, 2021
As of September 30, 2021, the components of total accumulated earnings (deficit) for each Fund on a tax basis are as follows:
| Fund | | Undistributed
Ordinary
Income | | Accumulated
Capital and
Other Losses | | Unrealized
Appreciation
(Depreciation)
on Investments | | Total
Accumulated
Earnings
(Deficit) |
| Longevity Economy ETF | | $ 27,673 | | $ (411,394) | | $ (352,862) | | $ (736,583) |
| Multifactor Developed Markets (ex-US) ETF | | 36,268,369 | | (283,952,554) | | 187,261,538 | | (60,422,647) |
| Multifactor Diversified International ETF | | 165,245 | | (477,047) | | 389,704 | | 77,902 |
| Multifactor Emerging Markets ETF | | 803,804 | | (13,380,541) | | 1,805,246 | | (10,771,491) |
| Multifactor Small Cap ETF | | 13,118 | | (3,274,560) | | 87,924 | | (3,173,518) |
| Multifactor US Equity ETF | | 55,600 | | (31,023,209) | | 31,361,169 | | 393,560 |
| d) | Reclassification of Capital Accounts – The Funds may record reclassifications in their capital accounts. These reclassifications have no impact on the total net assets of the Funds. The reclassifications are a result of permanent differences between U.S. GAAP and tax accounting for such items as redemption in-kind transactions. Adjustments are made to reflect the impact these items have on current and future distributions to shareholders. Therefore, the source of the Funds’ distributions may be shown in the accompanying Statements of Changes in Net Assets as from distributable earnings or from capital depending on the type of book and tax differences that exist. For the year or period ended September 30, 2021, the Funds recorded reclassifications to increase (decrease) the accounts listed below: |
| | |
| Fund | | Paid-in-Capital | | Distributable
Earnings (Loss) |
| Longevity Economy ETF(1) | | $ 698,866 | | $ (698,866) |
| Multifactor Developed Markets (ex-US) ETF | | 64,651,461 | | (64,651,461) |
| Multifactor Emerging Markets ETF | | 1,142,127 | | (1,142,127) |
| Multifactor Small Cap ETF | | 1,720,670 | | (1,720,670) |
| Multifactor US Equity ETF | | 46,681,028 | | (46,681,028) |
| (1) | For the period March 16, 2021 (commencement of operations) through September 30, 2021. |
| e) | Capital Loss Carryforward – Under the Regulated Investment Company Modernization Act of 2010, funds are permitted to carry forward capital losses for an unlimited period of time. |
| | At September 30, 2021 (tax year end), each Fund's capital loss carryforwards for U.S. federal income tax purposes were as follows: |
| | |
| Fund | | Short-Term
Capital Loss
Carryforward with
No Expiration | | Long-Term
Capital Loss
Carryforward with
No Expiration |
| Longevity Economy ETF | | $ 411,394 | | $ — |
| Multifactor Developed Markets (ex-US) ETF | | 202,716,410 | | 81,236,144 |
| Multifactor Diversified International ETF | | 419,538 | | 57,509 |
| Multifactor Emerging Markets ETF | | 7,037,836 | | 6,342,705 |
| Multifactor Small Cap ETF | | 2,226,711 (1) | | 1,047,849 (1) |
| Multifactor US Equity ETF | | 23,354,516 | | 7,668,693 |
| (1) | Future utilization of losses are subject to limitation under the current tax laws. |
During the year ended September 30, 2021, Multifactor Developed Markets (ex-US) ETF utilized $60,638,784, Multifactor Diversified International ETF utilized $455,109, Multifactor Emerging Markets Equity ETF utilized $5,988,122, Multifactor Small Cap ETF utilized $465,827 and Multifactor US Equity ETF utilized $355,001 of prior year capital loss carryforwards, respectively.
| f) | Tax Basis of Investments – The aggregate cost of investments for federal income tax purposes at September 30, 2021 is different from book purposes primary due to wash sale loss deferrals, passive foreign investment company (PFIC) mark-to-market adjustments and non-taxable distributions from underlying investments. The net unrealized appreciation/(depreciation) on investments for tax purposes, which consists of gross unrealized appreciation and depreciation was also different from book purposes primarily due to wash sales loss deferrals, REIT adjustments and mark-to-market adjustments on PFICs and futures. Both the cost and unrealized appreciation and depreciation for federal |
Hartford Multifactor ETFs
Notes to Financial Statements – (continued)
September 30, 2021
| | income tax purposes are disclosed below: |
| | |
| Fund | | Tax Cost | | Gross Unrealized
Appreciation | | Gross Unrealized
(Depreciation) | | Net Unrealized
Appreciation
(Depreciation) |
| Longevity Economy ETF | | $ 25,553,898 | | $ 603,939 | | $ (956,801) | | $ (352,862) |
| Multifactor Developed Markets (ex-US) ETF | | 1,771,390,446 | | 250,612,516 | | (63,261,960) | | 187,350,556 |
| Multifactor Diversified International ETF | | 5,382,470 | | 581,819 | | (192,005) | | 389,814 |
| Multifactor Emerging Markets ETF | | 39,958,281 | | 4,154,246 | | (2,347,623) | | 1,806,623 |
| Multifactor Small Cap ETF | | 24,584,549 | | 1,506,606 | | (1,418,746) | | 87,860 |
| Multifactor US Equity ETF | | 354,121,756 | | 37,850,627 | | (6,489,459) | | 31,361,168 |
| g) | Accounting for Uncertainty in Income Taxes – Pursuant to provisions set forth by U.S. GAAP, Hartford Funds Management Company, LLC ("HFMC") reviews each Fund’s tax positions for all open tax years. As of September 30, 2021, HFMC had reviewed the open tax years and concluded that there was no reason to record a liability for net unrecognized tax obligations relating to uncertain income tax positions. Each Fund files U.S. tax returns. Although the statute of limitations for examining a Fund’s U.S. tax returns remains open for three years, no examination is currently in progress. The Funds recognize interest and penalties, if any, related to unrecognized tax benefits as income tax expense on the Statements of Operations. During the year or period ended September 30, 2021, the Funds did not incur any interest or penalties. HFMC is not aware of any tax positions for which it is reasonably possible that the total amounts of unrecognized tax obligations will significantly change in the next twelve months. |
| a) | Investment Advisory Agreement – Lattice Strategies LLC (the “Adviser” or “Lattice”) serves as each Fund’s investment adviser pursuant to an Investment Advisory Agreement with the Trust. Lattice is a wholly owned subsidiary of HFMC, which is an indirect subsidiary of The Hartford Financial Services Group, Inc. (“The Hartford”). Lattice has overall investment supervisory responsibility for each Fund. In addition, Lattice provides administrative personnel, services, equipment, facilities and office space for proper operation of each Fund. Lattice has contracted with Mellon Investments Corporation (“Mellon”) under a sub-advisory agreement pursuant to which Mellon performs the daily investment of the assets of each Fund in accordance with each Fund’s investment objective and policies. Each Fund pays a fee to Lattice, a portion of which may be used to compensate Mellon. |
| | Under the Investment Advisory Agreement, the Adviser agrees to pay all expenses of the Trust, except for (i) interest and taxes; (ii) brokerage expenses and other expenses (such as stamp taxes) connected with the execution of portfolio transactions or in connection with creation and redemption transactions; (iii) legal fees or expenses in connection with any arbitration, litigation or pending or threatened arbitration or litigation, including any settlements in connection therewith; (iv) extraordinary expenses; (v) distribution fees and expenses paid by the Trust under any distribution plan adopted pursuant to Rule 12b-1 under the 1940 Act; (vi) acquired fund fees and expenses; and (vii) the advisory fee payable to the Adviser under the Investment Advisory Agreement. The payment or assumption by the Adviser of any expense of the Trust that the Adviser is not required by the Investment Advisory Agreement to pay or assume shall not obligate the Adviser to pay or assume the same or any similar expense of the Trust on any subsequent occasion. |
| | The schedule below reflects the rates of compensation paid to Lattice for investment advisory services rendered as of September 30, 2021; the rates are accrued daily and paid monthly based on each Fund’s average daily net assets, at the following annual rates: |
| | |
| Fund | | Management Fee Rates |
| Longevity Economy ETF | | 0.44% |
| Multifactor Developed Markets (ex-US) ETF | | 0.29% |
| Multifactor Diversified International ETF | | 0.29% |
| Multifactor Emerging Markets ETF | | 0.44% |
| Multifactor Small Cap ETF | | 0.34% |
| Multifactor US Equity ETF | | 0.19% |
| b) | Distribution Plans - Each Fund has adopted a Rule 12b-1 Distribution and Service Plan in accordance with Rule 12b-1 under the 1940 Act pursuant to which payments of up to 0.25% of each Fund’s average daily net assets may be made for the sale and distribution of its shares. The Board has determined that the Funds may not make payments under the Rule 12b-1 Distribution and Service Plan until authorized to do so by affirmative action of the Board. No Rule 12b-1 fees are currently paid by the Funds and there are no plans to impose these fees. |
For the year or period ended September 30, 2021, the Funds did not pay any Rule 12b-1 fees.
| c) | Other Related Party Transactions – Certain officers of the Trust are trustees and/or officers of HFMC and/or The Hartford or its subsidiaries. For the year or period ended September 30, 2021, a portion of the Trust's Chief Compliance Officer’s ("CCO") compensation was paid by HFMC. As part of the Funds' Investment Management Agreement, HFMC also pays any CCO compensation on behalf of the Funds. |
Hartford Multifactor ETFs
Notes to Financial Statements – (continued)
September 30, 2021
| 8. | Securities Lending: |
| | The Trust has entered into a securities lending agency agreement (“lending agreement”) with Citibank, N.A. (“Citibank”). A Fund may lend portfolio securities to certain borrowers in U.S. and non-U.S. markets in an amount not to exceed one-third (33 1/3%) of the value of its total assets. If a Fund security is on loan, under the lending agreement, the borrower is required to deposit cash or liquid securities as collateral at least equal to 100% of the market value of the loaned securities; and cash collateral is invested for the benefit of the Fund by the Fund’s lending agent pursuant to collateral investment guidelines. The collateral is marked to market daily, in an amount at least equal to the current market value of the securities loaned. |
| | A Fund is subject to certain risks while its securities are on loan, including the following: (i) the risk that the borrower defaults on the loan and the collateral is inadequate to cover the Fund’s loss; (ii) the risk that the earnings on the collateral invested are not sufficient to pay fees incurred in connection with the loan; (iii) the Fund could lose money in the event of a decline in the value of the collateral provided for loaned securities or a decline in the value of any investments made with cash collateral; (iv) the risk that the borrower may use the loaned securities to cover a short sale, which may in turn place downward pressure on the market prices of the loaned securities; (v) the risk that return of loaned securities could be delayed and interfere with portfolio management decisions; and (vi) the risk that any efforts to restrict or recall the securities for purposes of voting may not be effective. These events could also trigger adverse tax consequences for the Fund. |
| | The Funds retain loan fees and the interest on cash collateral investments but are required to pay the borrower a rebate for the use of cash collateral. In cases where the lent security is of high value to borrowers, there may be a negative rebate (i.e., a net payment from the borrower to the Funds). Upon termination of a loan, the Funds are required to return to the borrower an amount equal to the cash collateral, plus any rebate owed to the borrowers. |
| | The net income earned on the securities lending (after payment of rebates and Citibank’s fee) is included on the Statements of Operations as Investment Income from securities lending. The Funds also receive payments from the borrower during the period of the loan, equivalent to dividends and interest earned on the securities loaned, which are recorded as Investment Income from dividends or interest, respectively, on the Statements of Operations. |
| | The following table presents the market value of each Funds' securities on loan, net of amounts available for offset under the master netting arrangements and any related collateral received by the Fund as of September 30, 2021. |
| | |
| Fund | | Investment Securities on Loan, at market value,
Presented on the Statement of Assets and Liabilities(1) | | Collateral Posted by Borrower(2) | | Net Amount(3) |
| Longevity Economy ETF | | $ 232,140 | | $ (232,140) | | $ — |
| Multifactor Developed Markets (ex-US) ETF | | 43,472,480 | | (43,472,480) | | — |
| Multifactor Diversified International ETF | | 105,154 | | (105,154) | | — |
| Multifactor Emerging Markets ETF | | 240,384 | | (240,384) | | — |
| Multifactor Small Cap ETF | | 20,190 | | (20,190) | | — |
| Multifactor US Equity ETF | | 1,085,361 | | (1,085,361) | | — |
| (1) | It is each Fund’s policy to obtain additional collateral from, or return excess collateral to, the borrower by the end of the next business day following the valuation date of the securities loaned. Therefore, the value of the collateral held may be temporarily less than that required under the lending contract. |
| (2) | Collateral received in excess of the market value of securities on loan is not presented in this table. |
| (3) | Net amount represents the net amount receivable due from the counterparty in the event of default. |
The total cash and non-cash collateral received by each Fund in connection with securities lending transactions is presented below:
| Fund | | Cash
Collateral | | Non-Cash
Collateral |
| Longevity Economy ETF | | $ 239,783 | | $ — |
| Multifactor Developed Markets (ex-US) ETF | | 37,425,432 | | 8,732,366 |
| Multifactor Diversified International ETF | | 111,276 | | 2,293 |
| Multifactor Emerging Markets ETF | | 108,034 | | 144,390 |
| Multifactor Small Cap ETF | | 21,000 | | — |
| Multifactor US Equity ETF | | 1,122,936 | | — |
| 9. | Secured Borrowings: |
| | The following tables reflect a breakdown of transactions accounted for as secured borrowings, the gross obligation by the type of collateral pledged, and the remaining contractual maturity of those transactions as of September 30, 2021. |
Hartford Multifactor ETFs
Notes to Financial Statements – (continued)
September 30, 2021
| | Certain Transfers Accounted For As Secured Borrowings |
| | Remaining Contractual Maturity of the Agreements |
| | |
| | Overnight and
Continuous | | < 30 days | | Between
30 & 90 days | | > 90 days | | Total |
| Longevity Economy ETF | | | | | | | | | |
| Securities Lending Transactions(1) | | | | | | | | | |
| Common Stocks | $ 239,783 | | $ — | | $ — | | $ — | | $ 239,783 |
| Total Borrowings | $ 239,783 | | $ — | | $ — | | $ — | | $ 239,783 |
| Gross amount of recognized liabilities for securities lending transactions | | $ 239,783 |
| Multifactor Developed Markets (ex-US) ETF | | | | | | | | | |
| Securities Lending Transactions(1) | | | | | | | | | |
| Common Stocks | $ 37,425,432 | | $ — | | $ — | | $ — | | $ 37,425,432 |
| Total Borrowings | $ 37,425,432 | | $ — | | $ — | | $ — | | $ 37,425,432 |
| Gross amount of recognized liabilities for securities lending transactions | | $ 37,425,432 |
| Multifactor Diversified International ETF | | | | | | | | | |
| Securities Lending Transactions(1) | | | | | | | | | |
| Common Stocks | $ 111,276 | | $ — | | $ — | | $ — | | $ 111,276 |
| Total Borrowings | $ 111,276 | | $ — | | $ — | | $ — | | $ 111,276 |
| Gross amount of recognized liabilities for securities lending transactions | | $ 111,276 |
| Multifactor Emerging Markets ETF | | | | | | | | | |
| Securities Lending Transactions(1) | | | | | | | | | |
| Common Stocks | $ 108,034 | | $ — | | $ — | | $ — | | $ 108,034 |
| Total Borrowings | $ 108,034 | | $ — | | $ — | | $ — | | $ 108,034 |
| Gross amount of recognized liabilities for securities lending transactions | | $ 108,034 |
| Multifactor Small Cap ETF | | | | | | | | | |
| Securities Lending Transactions(1) | | | | | | | | | |
| Common Stocks | $ 21,000 | | $ — | | $ — | | $ — | | $ 21,000 |
| Total Borrowings | $ 21,000 | | $ — | | $ — | | $ — | | $ 21,000 |
| Gross amount of recognized liabilities for securities lending transactions | | $ 21,000 |
| Multifactor US Equity ETF | | | | | | | | | |
| Securities Lending Transactions(1) | | | | | | | | | |
| Common Stocks | $ 1,122,936 | | $ — | | $ — | | $ — | | $ 1,122,936 |
| Total Borrowings | $ 1,122,936 | | $ — | | $ — | | $ — | | $ 1,122,936 |
| Gross amount of recognized liabilities for securities lending transactions | | $ 1,122,936 |
| (1) | Amount represents the payable for cash collateral received on securities on loan. This will generally be in the “Overnight and Continuous” column as the securities are typically callable on demand. |
| 10. | Custodian and Transfer Agent: |
| | State Street Bank and Trust Company ("State Street") serves as Custodian for the Funds pursuant to a custodian agreement ("Custodian Agreement") dated December 31, 2014, as amended from time to time. As Custodian, State Street holds each Fund’s assets, calculates the net asset value of the shares and calculates net income and realized capital gains or losses. State Street serves as Transfer Agent of each Fund pursuant to a transfer agency and service agreement ("Transfer Agency and Service Agreement") dated February 13, 2018, as amended from time to time. As Transfer Agent, State Street maintains the records of each Authorized Participant’s ownership of each Fund and processes the purchases and redemptions of Creation Units. |
| | For the services provided under the Custodian Agreement and Transfer Agency and Service Agreement, Lattice, and not the Funds, compensates State Street pursuant to the Funds' unitary management fee structure. |
Hartford Multifactor ETFs
Notes to Financial Statements – (continued)
September 30, 2021
| 11. | Affiliate Holdings: |
| | As of September 30, 2021, affiliates of The Hartford had ownership of shares in each Fund as follows: |
| | |
| Fund | | Percentage
of Fund |
| Longevity Economy ETF | | 99% |
| Multifactor Diversified International ETF | | 40% |
| Multifactor Small Cap ETF | | 58% |
As of September 30, 2021, affiliated funds of funds and the 529 plan for which HFMC serves as the program manager (the “529 plan”) in the aggregate owned a portion of the Funds identified below. Therefore, these Funds may experience relatively large purchases or redemptions of their shares as a result of purchase and sale activity from these affiliated funds of funds and the 529 plan. Affiliated funds of funds and the 529 plan owned shares in the Funds listed below as follows:
| Fund | | Percentage
of Fund |
| Multifactor Developed Markets (ex-US) ETF | | 5% |
| Multifactor Emerging Markets ETF | | 12% |
| Multifactor US Equity ETF | | 26% |
| 12. | Investment Transactions: |
| | For the year or period ended September 30, 2021, the cost of purchases and proceeds from sales of investment securities (excluding short-term investments) were as follows: |
| | |
| Fund | | Cost of Purchases
Excluding U.S.
Government
Obligations | | Sales Proceeds
Excluding U.S.
Government
Obligations | | Total Cost of
Purchases | | Total Sales
Proceeds |
| Longevity Economy ETF | | $ 13,247,050 | | $ 10,965,236 | | $ 13,247,050 | | $ 10,965,236 |
| Multifactor Developed Markets (ex-US) ETF | | 867,083,886 | | 875,483,435 | | 867,083,886 | | 875,483,435 |
| Multifactor Diversified International ETF | | 4,851,749 | | 4,843,674 | | 4,851,749 | | 4,843,674 |
| Multifactor Emerging Markets ETF | | 40,372,336 | | 45,423,315 | | 40,372,336 | | 45,423,315 |
| Multifactor Small Cap ETF | | 10,318,705 | | 10,254,668 | | 10,318,705 | | 10,254,668 |
| Multifactor US Equity ETF | | 249,394,065 | | 249,840,182 | | 249,394,065 | | 249,840,182 |
For the year or period ended September 30, 2021, in-kind transactions, which are not included in the table above, associated with purchase or redemption of Creation Units were as follows:
| Fund | | Cost of Purchases | | Sales Proceeds | | Realized
Gain/(Loss) |
| Longevity Economy ETF | | $ 26,824,462 | | $ 4,075,056 | | $ 698,883 |
| Multifactor Developed Markets (ex-US) ETF | | 37,055,113 | | 397,305,956 | | 66,692,405 |
| Multifactor Emerging Markets ETF | | — | | 6,483,905 | | 1,205,138 |
| Multifactor Small Cap ETF | | 21,052,551 | | 6,905,576 | | 1,717,294 |
| Multifactor US Equity ETF | | 243,692,502 | | 170,678,013 | | 46,849,737 |
| 13. | Share Transactions: |
| | Each Fund will issue and redeem shares at NAV only with certain Authorized Participants in large increments known as ‘‘Creation Units.” Purchases of Creation Units are made by tendering a basket of designated securities and/or cash to a Fund and redemption proceeds are paid with a basket of securities and/or cash from the Fund with a balancing cash component to equate the market value of the basket securities delivered or redeemed to the NAV per Creation Unit on the transaction date. Cash may be substituted in an amount equivalent to the value of securities included in the relevant baskets for any reason at the Trust’s sole discretion. Each Fund’s shares are available in smaller increments to individual investors in the secondary market at market prices and may be subject to commissions. Authorized Participants may be required to pay a transaction fee when purchasing and redeeming Creation Units of the Fund. The transaction fee is used to defray the costs associated with the issuance and redemption of Creation Units, and is recorded as Other Capital on the Statements of Changes in Net Assets. |
| | Purchase or redemption of Creation Units is only available to an Authorized Participant. An Authorized Participant is either (1) a ‘‘Participating Party,’’ (i.e., a broker-dealer or other participant in the clearing process of the Continuous Net Settlement System of the NSCC) (‘‘Clearing Process’’), or (2) a participant of DTC (‘‘DTC Participant’’), and, in each case, must have executed an agreement (‘‘Participation Agreement’’) with the Distributor with respect to creations and redemptions of Creation Units. |
Hartford Multifactor ETFs
Notes to Financial Statements – (continued)
September 30, 2021
| | Shares of Longevity Economy ETF, Multifactor Developed Markets (ex-US) ETF, Multifactor Emerging Markets ETF, Multifactor Small Cap ETFand Multifactor US Equity ETF are listed on the NYSE Arca and shares of Multifactor Diversified International ETF are listed on the Cboe BZX. Shares of each Fund are publicly traded. Retail investors may purchase or sell shares in the secondary market (not from the Fund) through a broker or dealer. Investors purchasing or selling shares in the secondary market may pay a commission, market premium or discount or other transaction charge, to a broker or dealer, as well as some or all of the spread between the bid and the offered price for each purchase or sale transaction. Unless imposed by a broker or dealer, there is no minimum dollar amount upon purchase and no minimum number of shares that must be purchased in the secondary market. Because transactions in the secondary market occur at market prices, an investor may pay more than NAV upon purchase of shares and may receive less than a Fund’s NAV upon sale of shares. |
| | Because each Fund is structured as an ETF, individual shares may only be purchased and sold on a listing exchange through a broker-dealer. The price of shares is based on market price, and because ETF shares trade at market prices rather than at NAV, shares may trade at a price greater than NAV (a premium) or less than NAV (a discount). The Funds generally will issue or redeem Creation Units in return for a designated basket of securities and/or cash that the Fund specifies each business day. The Funds do not impose any restrictions on the frequency of purchases and redemptions; however, the Funds reserve the right to reject or limit purchases at any time. |
| | The following information is for the years or periods ended September 30, 2021 and September 30, 2020: |
| | |
| | For the Year or Period Ended
September 30, 2021 | | For the Year Ended
September 30, 2020 |
| | Shares | | Amount | | Shares | | Amount |
| Longevity Economy ETF(1) | | | | | | | |
| Shares Sold | 1,100,001 | | $ 29,116,378 | | | | |
| Shares Redeemed | (150,001) | | (4,077,718) | | | | |
| Total Net Increase (Decrease) | 950,000 | | 25,038,660 | | | | |
| Multifactor Developed Markets (ex-US) ETF | | | | | | | |
| Shares Sold | 1,400,000 | | $ 39,421,674 | | 16,650,000 | | $ 475,004,269 |
| Shares Redeemed | (14,400,000) | | (408,608,631) | | (23,500,000) | | (573,184,590) |
| Total Net Increase (Decrease) | (13,000,000) | | (369,186,957) | | (6,850,000) | | (98,180,321) |
| Multifactor Diversified International ETF | | | | | | | |
| Shares Sold | — | | $ — | | 100,000 | | $ 2,754,532 |
| Shares Redeemed | — | | — | | (100,000) | | (2,751,610) |
| Total Net Increase (Decrease) | — | | — | | — | | 2,922 |
| Multifactor Emerging Markets ETF | | | | | | | |
| Shares Sold | — | | $ — | | 200,000 | | $ 3,623,318 |
| Shares Redeemed | (500,000) | | (11,443,163) | | (1,100,000) | | (18,945,241) |
| Other Capital | — | | 11,522 | | — | | 22,366 |
| Total Net Increase (Decrease) | (500,000) | | (11,431,641) | | (900,000) | | (15,299,557) |
| Multifactor Small Cap ETF | | | | | | | |
| Shares Sold | 550,000 | | $ 21,056,818 | | 100,000 | | $ 3,000,116 |
| Shares Redeemed | (200,000) | | (6,907,604) | | (400,000) | | (10,895,246) |
| Other Capital | — | | — | | — | | 936 |
| Total Net Increase (Decrease) | 350,000 | | 14,149,214 | | (300,000) | | (7,894,194) |
| Multifactor US Equity ETF | | | | | | | |
| Shares Sold | 6,450,000 | | $ 245,723,876 | | 2,250,000 | | $ 70,914,373 |
| Shares Redeemed | (4,500,000) | | (172,629,516) | | (4,075,000) | | (119,273,432) |
| Total Net Increase (Decrease) | 1,950,000 | | 73,094,360 | | (1,825,000) | | (48,359,059) |
| (1) | Commenced operations on March 16, 2021. |
| 14. | Indemnifications: |
| | Under the Trust’s organizational documents, the Trust shall indemnify its officers and trustees to the full extent required or permitted under the applicable laws of the State of Delaware and federal securities laws. In addition, the Trust, on behalf of the Funds, may enter into contracts that contain a variety of indemnifications. The Trust’s maximum exposure under these arrangements is unknown. However, as of the date of these financial statements, the Trust has not had prior claims or losses pursuant to these contracts and expects the risk of loss to be remote. |
Hartford Multifactor ETFs
Notes to Financial Statements – (continued)
September 30, 2021
| 15. | Recent Accounting Pronouncement: |
| | In March 2020, FASB issued Accounting Standards Update (“ASU”) No. 2020-04, Reference Rate Reform (Topic 848); Facilitation of the Effects of Reference Rate Reform on Financial Reporting, which provides optional guidance for a limited period of time to ease the potential burden in accounting for (or recognizing the effects of) reference rate reform. The guidance is applicable to contracts referencing LIBOR or another reference rate that is expected to be discontinued due to reference rate reform. The ASU is effective as of March 12, 2020 and generally can be applied through December 31, 2022. Management is evaluating the underlying securities referencing LIBOR or another reference rate that is expected to be discontinued over the period of time the ASU is effective. |
| 16. | Change in Independent Registered Public Accounting Firm: |
| | On November 6, 2019, the Trust, on behalf of each of Developed Markets (ex – US) ETF, Diversified International ETF, Emerging Markets ETF, Small Cap ETF and US Equity ETF, dismissed Ernst & Young LLP (“EY”) as the Funds’ independent registered public accounting firm effective upon the issuance of EY’s report on the Funds’ financial statements as of and for the fiscal year ended September 30, 2019. EY’s report on the Funds’ financial statements for the fiscal periods ended September 30, 2018 and September 30, 2019 contained no adverse opinion or disclaimer of opinion nor was EY’s report qualified or modified as to uncertainty, audit scope or accounting principles. During the Funds’ fiscal periods ended on September 30, 2018 and September 30, 2019 and through November 26, 2019 (the “Covered Period”), (i) there were no disagreements with EY on any matter of accounting principles or practices, financial statement disclosure or auditing scope or procedure, which disagreements, if not resolved to the satisfaction of EY, would have caused it to make reference to the subject matter of the disagreements in connection with its reports on the Funds’ financial statements for the Covered Period, and (ii) there were no “reportable events” of the kind described in Item 304(a)(1)(v) of Regulation S-K under the Securities Exchange Act of 1934, as amended. |
| | On November 6, 2019, the Audit Committee of the Trust’s Board of Trustees participated in and approved the decision to engage PricewaterhouseCoopers LLP (“PwC”) as the independent registered public accounting firm for each of Developed Markets (ex – US) ETF, Diversified International ETF, Emerging Markets ETF, Small Cap ETF and US Equity ETF for the fiscal year ended September 30, 2020. The selection of PwC does not reflect any disagreements with or dissatisfaction by the Trust or the Board with the performance of the Funds’ prior independent registered public accounting firm, EY. During the Covered Period, neither the Funds, nor anyone on their behalf, consulted with PwC on items which: (i) concerned the application of accounting principles to a specified transaction, either completed or proposed, or the type of audit opinion that might be rendered on the Funds’ financial statements; or (ii) concerned the subject of a disagreement (as defined in paragraph (a)(1)(iv) of Item 304 of Regulation S-K) or reportable events (as described in paragraph (a)(1)(v) of Item 304 of Regulation S-K). |
| 17. | Subsequent Events: |
| | Management has evaluated all subsequent transactions and events through the date on which these financial statements were issued and has determined that no additional items require disclosure in these financial statements. |
Report of Independent Registered Public Accounting Firm
To the Board of Trustees of Lattice Strategies Trust and Shareholders of Hartford Longevity Economy ETF, Hartford Multifactor Developed Markets (ex-US) ETF, Hartford Multifactor Diversified International ETF, Hartford Multifactor Emerging Markets ETF, Hartford Multifactor Small Cap ETF, and Hartford Multifactor US Equity ETF
Opinions on the Financial Statements
We have audited the accompanying statements of assets and liabilities, including the schedules of investments, of each of the funds indicated in the table below (constituting Lattice Strategies Trust, hereafter collectively referred to as the "Funds") as of September 30, 2021, the related statements of operations and of changes in net assets for each of the periods indicated in the table below, including the related notes, and the financial highlights for each of the periods indicated in the table below (collectively referred to as the “financial statements”). In our opinion, the financial statements present fairly, in all material respects, the financial position of each of the Funds as of September 30, 2021, the results of each of their operations, the changes in each of their net assets, and each of the financial highlights for each of the periods indicated in the table below, in conformity with accounting principles generally accepted in the United States of America.
| Fund | Statement of
operations | Statement of changes in net assets | Financial highlights |
Hartford Multifactor Developed Markets (ex-US) ETF
Hartford Multifactor Diversified International Equity ETF
Hartford Multifactor Emerging Markets ETF
Hartford Multifactor Small Cap ETF
Hartford Multifactor US Equity ETF | For the year ended September 30, 2021 | For the years ended September 30, 2021
and 2020 | For the years ended September 30, 2021
and 2020 |
| Hartford Longevity Economy ETF | For the period March 16, 2021
(commencement of operations)
to September 30, 2021 | For the period March 16, 2021
(commencement of operations)
to September 30, 2021 | For the period March 16, 2021
(commencement of operations)
to September 30, 2021 |
The financial statements of the Funds as of and for the year ended September 30, 2019 and the financial highlights for each of the periods ended on or prior to September 30, 2019 (not presented herein, other than the financial highlights) were audited by other auditors whose report dated November 26, 2019 expressed an unqualified opinion on those financial statements and financial highlights.
Basis for Opinions
These financial statements are the responsibility of the Funds’ management. Our responsibility is to express an opinion on the Funds’ financial statements based on our audits. We are a public accounting firm registered with the Public Company Accounting Oversight Board (United States) (“PCAOB”) and are required to be independent with respect to the Funds in accordance with the U.S. federal securities laws and the applicable rules and regulations of the Securities and Exchange Commission and the PCAOB.
We conducted our audits of these financial statements in accordance with the standards of the PCAOB. Those standards require that we plan and perform the audit to obtain reasonable assurance about whether the financial statements are free of material misstatement, whether due to error or fraud.
Our audits included performing procedures to assess the risks of material misstatement of the financial statements, whether due to error or fraud, and performing procedures that respond to those risks. Such procedures included examining, on a test basis, evidence regarding the amounts and disclosures in the financial statements. Our audits also included evaluating the accounting principles used and significant estimates made by management, as well as evaluating the overall presentation of the financial statements. Our procedures included confirmation of securities owned as of September 30, 2021 by correspondence with the custodian, transfer agent and brokers; when replies were not received from brokers, we performed other auditing procedures. We believe that our audits provide a reasonable basis for our opinions.
/s/ PricewaterhouseCoopers LLP
Philadelphia, Pennsylvania
November 23, 2021
We have served as the auditor of one or more Hartford investment companies since 2020.
Hartford Multifactor ETFs
Operation of the Liquidity Risk Management Program (Unaudited)
This section describes the operation and effectiveness of the Liquidity Risk Management Program (“LRM Program”) established in accordance with Rule 22e-4 under the Investment Company Act of 1940, as amended (the “Liquidity Rule”). The LRM Program seeks to assess and manage each Fund’s liquidity risk. The Liquidity Rule generally defines liquidity risk as the risk that a Fund could not meet its obligation to redeem shares without significant dilution of the non-redeeming investors’ interests in the Fund. The Board of Trustees (“Board”) of Lattice Strategies Trust has appointed Hartford Funds Management Company, LLC (“HFMC”) to serve as the administrator of the LRM Program with respect to each of the Funds, subject to the oversight of the Board. In order to efficiently and effectively administer the LRM Program, HFMC established a Liquidity Risk Oversight Committee.
The LRM Program is comprised of various components designed to support the assessment and/or management of liquidity risk, including: (1) the assessment and periodic review (no less frequently than annually) of certain factors that influence each Fund’s liquidity risk; (2) the classification and periodic review (no less frequently than monthly) of each Fund’s investments into one of four liquidity categories that reflect an estimate of their liquidity under current market conditions; (3) a 15% limit on the acquisition of “illiquid investments” (as defined under the Liquidity Rule); (4) the determination of a minimum percentage of each Fund’s assets that generally will be invested in highly liquid investments (“HLIM”); (5) the periodic review (no less frequently than annually) of the HLIM and the adoption and implementation of policies and procedures for responding to a shortfall of a Fund’s highly liquid investments below its HLIM; and (6) periodic reporting to the Board.
At a meeting of the Board held May 11-13, 2021, HFMC provided an annual written report to the Board covering the period from April 1, 2020 through March 31, 2021. The annual report addressed important aspects of the LRM Program, including, but not limited to:
| • | the operation of the LRM Program (and related policies and procedures utilized in connection with management of the Funds’ liquidity risk); |
| • | an assessment of the adequacy and effectiveness of the LRM Program’s (and related policies and procedures’) implementation; |
| • | the operation, and assessment of the adequacy and effectiveness, of each Fund’s HLIM; |
| • | whether the third-party liquidity vendor’s (“LRM Program Vendor”) processes for determining preliminary liquidity classifications, including the particular methodologies or factors used and metrics analyzed by the LRM Program Vendor, are sufficient under the Liquidity Rule and appropriate in light of each Fund’s specific circumstances; and |
| • | any material changes to the LRM Program. |
In addition, HFMC provides a quarterly report on the LRM Program at each quarterly meeting of the Board’s Compliance and Risk Oversight Committee. The quarterly report included information regarding the Funds’ liquidity as measured by established parameters, a summary of developments within the capital markets that may impact liquidity, and other factors that may impact liquidity. Among other things, HFMC reports any changes to a Fund’s HLIM.
From April 1, 2020 through March 31, 2021, HFMC did not reduce the HLIM for any Fund. As part of its ongoing review and assessment, HFMC increased (by 1%) the HLIM for Hartford Multifactor Developed Markets (ex-US) ETF based on the HFMC’s methodology of assessing the potential maximum one-day redemption amount to exceed a certain threshold.
Based on its review and assessment, HFMC has concluded that the LRM Program is operating effectively to assess and manage the liquidity risk of each Fund and that the LRM Program has been and continues to be adequately and effectively implemented with respect to each Fund. Because liquidity in the capital markets in which the Funds invest is beyond the control of the Funds, there can be no assurance that the LRM Program will ensure liquidity under all circumstances and does not protect against the risk of loss.
Hartford Multifactor ETFs
Trustees and Officers of the Trust (Unaudited)
Lattice Strategies Trust (the “Trust”) is governed by a Board of Trustees (the “Trustees”). The following tables present certain information regarding the Trustees and officers of the Trust as of September 30, 2021. For more information regarding the Trustees and officers, please refer to the Statement of Additional Information, which is available, without charge, upon request by calling 1-800-456-7526.
NAME, YEAR OF BIRTH
AND ADDRESS(1) | | POSITION
HELD WITH
THE TRUST | | TERM OF
OFFICE(2) AND
LENGTH OF
TIME SERVED | | PRINCIPAL OCCUPATION(S)
DURING PAST 5 YEARS | | NUMBER OF
PORTFOLIOS
IN FUND
COMPLEX(3)
OVERSEEN
BY TRUSTEE | | OTHER DIRECTORSHIPS
FOR PUBLIC COMPANIES
AND OTHER REGISTERED
INVESTMENT COMPANIES
BY TRUSTEE |
| NON-INTERESTED TRUSTEES |
HILARY E. ACKERMANN
(1956) | | Trustee | | Since 2017 | | Ms. Ackermann served as Chief Risk Officer at Goldman Sachs Bank USA from October 2008 to November 2011. | | 76 | | Ms. Ackermann served as a Director of Dynegy, Inc. from October 2012 until its acquisition in by Vistra Energy Corporation in 2018, and since that time she has served as a Director of Vistra. Ms. Ackermann serves as a Director of Credit Suisse Holdings (USA), Inc. from January 2017 to present. |
ROBIN C. BEERY
(1967) | | Trustee | | Since 2016 | | Ms. Beery has served as a consultant to ArrowMark Partners (an alternative asset manager) since March of 2015 and since November 2018 has been employed by ArrowMark Partners as a Senior Advisor. Previously, she was Executive Vice President, Head of Distribution, for Janus Capital Group, and Chief Executive Officer and President of the Janus Mutual Funds (a global asset manager) from September 2009 to August 2014. | | 76 | | Ms. Beery serves as an independent Director of UMB Financial Corporation (January 2015 to present), has chaired the Compensation Committee since April 2017, and serves on the Audit Committee and the Risk Committee. |
LYNN S. BIRDSONG†
(1946) | | Trustee | | Trustee since 2017; Chair of the Board 2019-2021 | | From January 1981 through December 2013, Mr. Birdsong was a partner in Birdsong Company, an advertising specialty firm. From 1979 to 2002, Mr. Birdsong was a Managing Director of Zurich Scudder Investments, an investment management firm. | | 76 | | None |
DERRICK D. CEPHAS
(1952) | | Trustee | | Since 2020 | | Mr. Cephas currently serves as Of Counsel to Squire Patton Boggs LLP, an international law firm with 45 offices in 20 countries. Until his retirement in October 2020, Mr. Cephas was a Partner of Weil, Gotshal & Manges LLP, an international law firm headquartered in New York, where he served as the Head of the Financial Institutions Practice (April 2011 to October 2020). | | 76 | | Mr. Cephas currently serves a Director of Signature Bank, a New York-based commercial bank, and is a member of the Credit Committee, Examining Committee and Risk Committee. Mr. Cephas currently serves as a Director of Claros Mortgage Trust, Inc., a real estate investment trust. |
CHRISTINE R. DETRICK(4)
(1958) | | Trustee and Chair of the Board | | Since 2017; Chair of the Board since 2021 | | Ms. Detrick served as a Senior Partner/Advisor at Bain & Company (a management consulting firm) from September 2002 to December 2012. | | 76 | | Ms. Detrick serves as a Director and Chair of the Nominating and Governance Committee of Reinsurance Group of America (from January 2014 to present). She also serves as a Director of Charles River Associates (May 2020 to present) and serves as a Director of Capital One Financial Corporation (since November 2021). |
Hartford Multifactor ETFs
Trustees and Officers of the Trust (Unaudited) – (continued)
NAME, YEAR OF BIRTH
AND ADDRESS(1) | | POSITION
HELD WITH
THE TRUST | | TERM OF
OFFICE(2) AND
LENGTH OF
TIME SERVED | | PRINCIPAL OCCUPATION(S)
DURING PAST 5 YEARS | | NUMBER OF
PORTFOLIOS
IN FUND
COMPLEX(3)
OVERSEEN
BY TRUSTEE | | OTHER DIRECTORSHIPS
FOR PUBLIC COMPANIES
AND OTHER REGISTERED
INVESTMENT COMPANIES
BY TRUSTEE |
ANDREW A. JOHNSON
(1962) | | Trustee | | Since 2020 | | Mr. Johnson currently serves as a Diversity and Inclusion Advisor at Neuberger Berman, a private, global investment management firm. Prior to his current role, Mr. Johnson served as Chief Investment Officer and Head of Global Investment Grade Fixed Income at Neuberger Berman (January 2009 to December 2018). | | 76 | | Mr. Johnson currently serves as a Director of AGNC Investment Corp., a real estate investment trust. |
PAUL L. ROSENBERG
(1953) | | Trustee | | Since 2020 | | Mr. Rosenberg is a Partner of The Bridgespan Group, a global nonprofit consulting firm that is a social impact advisor to nonprofits, non-governmental organizations, philanthropists and institutional investors (October 2007 to present). | | 76 | | None |
LEMMA W. SENBET†
(1946) | | Trustee | | Since 2017 | | Dr. Senbet currently serves as the William E. Mayer Chair Professor of Finance in the Robert H. Smith School of Business at the University of Maryland, where he was chair of the Finance Department from 1998 to 2006. In June 2013, he began a sabbatical from the University to serve as Executive Director of the African Economic Research Consortium which focuses on economic policy research and training, which he completed in 2018. | | 76 | | None |
DAVID SUNG
(1953) | | Trustee | | Since 2016 | | Mr. Sung was a Partner at Ernst & Young LLP from October 1995 to July 2014. | | 76 | | Mr. Sung serves as a Trustee of Ironwood Institutional Multi-Strategy Fund, LLC and Ironwood Multi-Strategy Fund, LLC (October 2015 to present). |
| OFFICERS AND INTERESTED TRUSTEE |
JAMES E. DAVEY(5)
(1964) | | Trustee, President and Chief Executive Officer | | Trustee since 2017; President and Chief Executive Officer since 2017 | | Mr. Davey serves as Executive Vice President of The Hartford Financial Services Group, Inc. Mr. Davey has served in various positions within The Hartford and its subsidiaries and joined The Hartford in 2002. Additionally, Mr. Davey serves as Director, Chairman, President, and Senior Managing Director for Hartford Funds Management Group, Inc. ("HFMG"). Mr. Davey also serves as President, Manager, Chairman of the Board, and Senior Managing Director for Hartford Funds Management Company, LLC (“HFMC”); Manager, Chairman of the Board, and President of Lattice Strategies LLC (“Lattice”); Chairman of the Board, Manager, and Senior Managing Director of Hartford Funds Distributors, LLC (“HFD”); and Chairman of the Board, President and Senior Managing Director of Hartford Administrative Services Company (“HASCO”), each of which is an affiliate of HFMG. | | 76 | | None |
ANDREW S. DECKER
(1963) | | AML Compliance Officer | | Since 2016 | | Mr. Decker serves as Chief Compliance Officer and AML Compliance Officer of HASCO (since April 2015) and Vice President of HASCO (since April 2018). Mr. Decker serves as AML Officer of HFD (since May 2015). Mr. Decker also serves as Vice President of HFMG (since April 2018). Prior to joining The Hartford, Mr. Decker served as Vice President and AML Officer at Janney Montgomery Scott (a broker dealer) from April 2011 to January 2015. | | N/A | | N/A |
AMY N. FURLONG
(1979) | | Vice President | | Since 2018 | | Ms. Furlong serves as Vice President and Assistant Treasurer of HFMC (since September 2019). From 2018 through March 15, 2021, Ms. Furlong served as the Treasurer of the Trust. Ms. Furlong has served in various positions within The Hartford and its subsidiaries in connection with the operation of the Hartford Funds. Ms. Furlong joined The Hartford in 2004. | | N/A | | N/A |
Hartford Multifactor ETFs
Trustees and Officers of the Trust (Unaudited) – (continued)
NAME, YEAR OF BIRTH
AND ADDRESS(1) | | POSITION
HELD WITH
THE TRUST | | TERM OF
OFFICE(2) AND
LENGTH OF
TIME SERVED | | PRINCIPAL OCCUPATION(S)
DURING PAST 5 YEARS | | NUMBER OF
PORTFOLIOS
IN FUND
COMPLEX(3)
OVERSEEN
BY TRUSTEE | | OTHER DIRECTORSHIPS
FOR PUBLIC COMPANIES
AND OTHER REGISTERED
INVESTMENT COMPANIES
BY TRUSTEE |
WALTER F. GARGER
(1965) | | Vice President and Chief Legal Officer | | Since 2016 | | Mr. Garger serves as Secretary, Managing Director and General Counsel of HFMG, HFMC, HFD, and HASCO (since 2013). Mr. Garger also serves as Secretary and General Counsel of Lattice (since July 2016). Mr. Garger has served in various positions within The Hartford and its subsidiaries in connection with the operation of the Hartford Funds. Mr. Garger joined The Hartford in 1995. | | N/A | | N/A |
THEODORE J. LUCAS
(1966) | | Vice President | | Since 2017 | | Mr. Lucas serves as Executive Vice President of HFMG (since July 2016) and as Executive Vice President of Lattice (since June 2017). Previously, Mr. Lucas served as Managing Partner of Lattice (2003 to 2016). | | N/A | | N/A |
JOSEPH G. MELCHER
(1973) | | Vice President and Chief Compliance Officer | | Since 2016 | | Mr. Melcher serves as Executive Vice President of HFMG and HASCO (since December 2013). Mr. Melcher also serves as Executive Vice President (since December 2013) and Chief Compliance Officer (since December 2012) of HFMC, serves as Executive Vice President and Chief Compliance Officer of Lattice (since July 2016), serves as Executive Vice President of HFD (since December 2013), and has served as President and Chief Executive Officer of HFD (from April 2018 to June 2019). | | N/A | | N/A |
VERNON J. MEYER
(1964) | | Vice President | | Since 2016 | | Mr. Meyer serves as Managing Director and Chief Investment Officer of HFMC and Managing Director of HFMG (since 2013). Mr. Meyer also serves as Senior Vice President-Investments of Lattice (since March 2019). Mr. Meyer has served in various positions within The Hartford and its subsidiaries in connection with the operation of the Hartford Funds. Mr. Meyer joined The Hartford in 2004. | | N/A | | N/A |
DAVID A. NAAB
(1985) | | Vice President and Treasurer | | Since March 15, 2021 | | Mr. Naab serves as Vice President and Treasurer of the Trust. Prior to joining HFMC in 2021, Mr. Naab served in various positions as an associate, senior associate, manager, senior manager, and director within the investment management, financial services, and asset & wealth management practice groups of PricewaterhouseCoopers, LLP from 2007 to 2020. | | N/A | | N/A |
ALICE A. PELLEGRINO
(1960) | | Vice President and Assistant Secretary | | Since 2016 | | Ms. Pellegrino serves as Vice President of HFMG (since December 2013). Ms. Pellegrino also serves as Vice President and Assistant Secretary of Lattice (since June 2017). Ms. Pellegrino is a Senior Counsel and has served in various positions within The Hartford and its subsidiaries in connection with the operation of the Hartford Funds. Ms. Pellegrino joined The Hartford in 2007. | | N/A | | N/A |
THOMAS R. PHILLIPS
(1960) | | Vice President and Secretary | | Since 2017 | | Mr. Phillips is Deputy General Counsel for HFMG and currently serves as Vice President (since February 2017) and Assistant Secretary (since June 2017) for HFMG. Prior to joining HFMG in 2017, Mr. Phillips was a Director and Chief Legal Officer of Saturna Capital Corporation from 2014–2016. Prior to that, Mr. Phillips was a Partner and Deputy General Counsel of Lord, Abbett & Co. LLC. | | N/A | | N/A |
| † | Effective as of December 31, 2021, Messrs. Birdsong and Senbet will retire as Trustees. As a result, Mr. Birdsong retired as Chair of the Board effective November 4, 2021. |
| (1) | The address for each officer and Trustee is c/o Hartford Funds 690 Lee Road, Wayne, Pennsylvania 19087. |
| (2) | Each Trustee holds an indefinite term until the Trustee's retirement, which must be no later than December 31 of the year in which the Trustee turns 75 years of age, or the Trustee's resignation, removal, or death prior to the Trustee's retirement. Each officer shall serve until his or her successor is elected and qualifies. |
| (3) | The portfolios of the “Fund Complex” are operational series of The Hartford Mutual Funds, Inc., The Hartford Mutual Funds II, Inc., Hartford Series Fund, Inc., Hartford HLS Series Fund II, Inc., Lattice Strategies Trust, and Hartford Funds Exchange-Traded Trust. |
| (4) | Effective November 4, 2021, Ms. Detrick was elected as Chair of the Board of Trustees. |
| (5) | “Interested person,” as defined in the 1940 Act, of the Trust because of the person’s affiliation with, or equity ownership of HFMC or affiliated companies. |
Hartford Multifactor ETFs
HOW TO OBTAIN A COPY OF EACH FUND’S PROXY VOTING POLICIES AND VOTING RECORDS (UNAUDITED)
A description of the policies and procedures that each Fund uses to determine how to vote proxies relating to portfolio securities and information about how each Fund voted proxies relating to portfolio securities during the most recent twelve-month period ended June 30, are available (1) without charge, upon request, by calling 888-843-7824 and (2) on the SEC’s website at http://www.sec.gov.
QUARTERLY PORTFOLIO HOLDINGS INFORMATION (UNAUDITED)
Each Fund files its complete schedule of portfolio holdings with the SEC for the first and third quarters of each fiscal year as an exhibit to its reports on Form N-PORT. Each Fund’s portfolio holdings filed as an exhibit to Form N-PORT for the most recent first and third quarter of the Fund’s fiscal year are available (1) without charge, upon request, by calling 888-843-7824, (2) on the Funds’ website, hartfordfunds.com, and (3) on the SEC’s website at http://www.sec.gov.
Hartford Multifactor ETFs
Approval of Investment Management and Investment Sub-Advisory Agreements (Unaudited)
Lattice Strategies Trust
Hartford Multifactor Developed Markets (ex-US) ETF
Hartford Multifactor Diversified International ETF
Hartford Multifactor Emerging Markets ETF
Hartford Multifactor Small Cap ETF
Hartford Multifactor US Equity ETF
Section 15(c) of the Investment Company Act of 1940, as amended (the “1940 Act”), requires that each registered investment company’s board of trustees, including a majority of those trustees who are not “interested persons” of the investment company, as defined in the 1940 Act (the “Independent Trustees”), annually review and consider the continuation of the investment company’s investment advisory and sub-advisory agreements. At its meeting held on August 3-4, 2021, the Board of Trustees (the “Board”) of Lattice Strategies Trust (the “Trust”), including each of the Independent Trustees, unanimously voted to approve (i) the continuation of an investment advisory agreement (the “Investment Advisory Agreement”) by and between the Trust, on behalf of each of its series listed above (each a “Fund” and collectively, the “Funds”), and Lattice Strategies LLC (“Lattice Strategies”), a wholly owned subsidiary of Hartford Funds Management Company, LLC; and (ii) a separate investment sub-advisory agreement (the “Sub-advisory Agreement” and together with the Investment Advisory Agreement, the “Agreements”) between Lattice Strategies and the Funds’ sub-adviser, Mellon Investments Corporation (the “Sub-adviser,” and together with Lattice Strategies, the “Advisers”).
In the months preceding the August 3-4, 2021 meeting, the Board requested and reviewed written responses from the Advisers to questions posed to the Advisers on behalf of the Independent Trustees and supporting materials relating to those questions and responses. In addition, the Board considered such additional information as it deemed reasonably necessary to evaluate the Agreements, as applicable, with respect to each Fund, which included information furnished to the Board and its committees at their meetings throughout the year and in between regularly scheduled meetings on particular matters as the need arose, as well as information specifically prepared in connection with the approval of the continuation of the Agreements that was presented at the Board’s meetings held on June 15-16, 2021 and August 3-4, 2021. Information provided to the Board and its committees at their meetings throughout the year included, among other things, reports on Fund performance, including tracking difference, legal, compliance and risk management matters, sales and marketing activity, secondary market trading premium and discount information, and the other services provided to each Fund by the Advisers and their affiliates. The members of the Board also considered the materials and presentations by Fund officers and representatives of Lattice Strategies received at the Board’s meetings on June 15-16, 2021 and August 3-4, 2021 concerning the Agreements and at the special meeting of the Board’s Investment Committee on May 18, 2021 concerning Fund performance and other investment-related matters.
The Independent Trustees, advised by independent legal counsel throughout the evaluation process, engaged service providers to assist them with evaluating the Agreements with respect to each Fund, as applicable. Broadridge Financial Solutions, Inc. (“Broadridge”), an independent provider of investment company data, was retained to provide the Board with reports on how each Fund’s contractual advisory fees and overall expense ratio compared to those of comparable investment companies with similar investment objectives. The Independent Trustees also engaged an independent financial services consultant (the “Consultant”) to assist them in evaluating the Funds’ respective advisory fees, overall expense ratios and investment performance. In addition, the Consultant reviewed the profitability methodologies used by Lattice Strategies in connection with the continuation of the Investment Advisory Agreement.
In determining whether to approve the continuation of the Agreements for a Fund, the members of the Board reviewed and evaluated information and factors they believed to be relevant and appropriate through the exercise of their reasonable business judgment. While individual members of the Board may have weighed certain factors differently, the Board’s determination to approve the continuation of the Agreements was based on a comprehensive consideration of all information provided to the Board throughout the year and specifically with respect to the continuation of the Agreements. The Board was also furnished with an analysis of its fiduciary obligations in connection with its evaluation of the Agreements. Throughout the evaluation process, the Board was assisted by counsel for the Funds. The Independent Trustees were also separately assisted by independent legal counsel throughout the evaluation process. In connection with their deliberations, the Independent Trustees met separately with independent legal counsel and the Consultant on June 11, 2021 and in executive session on several occasions to consider their responsibilities under relevant laws and regulations and to discuss the materials presented and other matters deemed relevant to their consideration of the approval of the continuation of the Agreements. As a result of the discussions that occurred during the June 11, 2021 and June 15-16, 2021 meetings, the Independent Directors presented Lattice Strategies with requests for additional information on certain topics. Lattice Strategies and its affiliates responded to these requests with written additional information in advance of the August 3-4, 2021 meeting. A more detailed summary of the important, but not necessarily all, factors the Board considered with respect to its approval of the continuation of the Agreements is provided below.
Nature, Extent and Quality of Services Provided by the Advisers
Hartford Multifactor ETFs
Approval of Investment Management and Investment Sub-Advisory Agreements (Unaudited) – (continued)
The Board requested and considered information concerning the nature, extent and quality of the services provided to each Fund by the Advisers. The Board considered, among other things, the terms of the Agreements and the range of services provided by the Advisers. The Board considered the Advisers’ professional personnel who provide services to the Funds, including each Adviser’s ability and experience in attracting and retaining qualified personnel to service the Funds. The Board considered each Adviser’s reputation and overall financial strength, as well as its willingness to consider and implement organizational and operational changes designed to enhance services to the funds managed by Lattice Strategies and its affiliates (the “Hartford funds”). In addition, the Board considered the quality of each Adviser’s communications with the Board and responsiveness to Board inquiries and requests made from time to time with respect to the Funds and other Hartford funds. In this regard, the Board took into account Lattice Strategies’ and its affiliates’ communications with the Board in light of the coronavirus (“COVID-19”) pandemic.
The Board also requested and evaluated information concerning each Adviser’s regulatory and compliance environment. In this regard, the Board requested and reviewed information about each Adviser’s compliance policies and procedures and compliance history and a report from the Funds’ Chief Compliance Officer about each Adviser’s compliance with applicable laws and regulations, including responses to regulatory developments and any compliance or other issues raised by regulators. The Board also noted the Advisers’ support of the Funds’ compliance control structure, as applicable, and, in particular, the resources devoted by the Advisers in support of the Funds’ obligations pursuant to Rule 38a-1 under the 1940 Act and the Funds’ liquidity risk management program, as well as the efforts of the Advisers to combat cybersecurity risks. The Board also considered investments by Lattice Strategies and its affiliates in business continuity planning designed to benefit the Funds, and the implementation of their business continuity plans due to the COVID-19 pandemic. The Board also noted Lattice Strategies’ and its affiliates’ commitment to maintaining high quality systems and expending substantial resources to prepare for and respond to ongoing changes to the market, regulatory and control environments in which the Funds and their service providers operate, including changes associated with the COVID-19 pandemic.
With respect to Lattice Strategies, the Board noted that, under the Investment Advisory Agreement, Lattice Strategies is responsible for the management of the Funds, including oversight of fund operations and service providers, and the provision of administrative and investment advisory services in connection with selecting, monitoring and supervising the Sub-adviser. In this regard, the Board evaluated information about the nature and extent of responsibilities retained and risks assumed by Lattice Strategies that were not delegated to or assumed by the Sub-adviser, including the entrepreneurial and other risks assumed by Lattice Strategies in connection with sponsoring and providing ongoing services to each Fund. The Board considered that Lattice Strategies is responsible for the creation, maintenance and ongoing monitoring of each Fund’s custom proprietary benchmark index. The Board considered Lattice Strategies’ and its affiliates’ ongoing monitoring of people, process and performance, including their quarterly reviews of each of the Hartford funds, semi-annual meetings with the leaders of each Fund’s portfolio management team, and oversight of the Hartford funds’ portfolio managers. The Board noted that Lattice Strategies and its affiliates have demonstrated a record of initiating changes to the portfolio management and/or investment strategies of the Hartford funds when warranted. The Board considered Lattice Strategies’ periodic due diligence reviews of the Sub-adviser and ongoing oversight of the Sub-adviser’s investment approach and results, process for monitoring best execution of portfolio trades and other trading operations by the Sub-adviser, and approach to risk management with respect to the Funds and the service providers to the Funds. The Board considered Lattice Strategies’ oversight of the securities lending program for the Funds that engage in securities lending and noted the income earned by the Funds that participate in such program. The Board also considered Lattice Strategies’ day-to-day oversight of each Fund’s compliance with its investment objective and policies as well as with applicable laws and regulations, noting that regulatory and other developments had over time led to an increase in the scope of Lattice Strategies’ oversight in this regard.
In addition, the Board considered Lattice Strategies’ and its affiliates’ ongoing commitment to review and rationalize the Hartford funds product line-up. The Board also considered the expenses that Lattice Strategies and its affiliates had incurred, as well as the risks Lattice Strategies and its affiliates had assumed, in connection with the launch of new funds and changes to existing Hartford funds in recent years. The Board considered that Lattice Strategies or its affiliates are responsible for providing the Funds’ officers.
With respect to the Sub-adviser, which is responsible for the daily investment of the assets of each Fund, subject to oversight by Lattice Strategies, among the other services set forth in the Sub-advisory Agreement, the Board considered, among other things, the Sub-adviser’s investment personnel, investment process, investment research capabilities and resources, performance record, process used for monitoring factors that drive tracking difference, trade execution capabilities and experience. The Board considered the experience of each Fund’s portfolio managers, the number of accounts managed by the portfolio managers, and the Sub-adviser’s method for compensating the portfolio managers. The Board also considered the Sub-adviser’s succession planning practices to ensure continuity of portfolio management services provided to the Funds.
Based on these considerations, the Board concluded that it was satisfied with the nature, extent and quality of the services provided to each Fund by Lattice Strategies and the Sub-adviser.
Performance of each Fund and the Advisers
Hartford Multifactor ETFs
Approval of Investment Management and Investment Sub-Advisory Agreements (Unaudited) – (continued)
The Board considered the investment performance of each Fund. In this regard, the Board reviewed the performance of each Fund over different time periods presented in the materials and evaluated Lattice Strategies’ analysis of the Fund’s performance for these time periods. The Board considered information and materials provided to the Board by the Advisers concerning Fund performance, including information comparing each Fund’s investment performance to the performance of its custom proprietary benchmark index. For details regarding each Fund’s performance, see the Fund-by-Fund synopsis below.
The Board considered the detailed investment analytics reports provided by Lattice Strategies throughout the year, including in connection with the approval of the continuation of the Agreements. These reports include, among other things, information on each Fund’s gross returns and net returns, each Fund’s gross and net tracking difference as it relates to tracking the performance of its custom proprietary benchmark index, various statistics concerning the Fund’s portfolio, a narrative summary of various factors affecting Fund performance, and commentary on the effect of current and recent market conditions. In reviewing the tracking difference reports, the Board considered Lattice Strategies’ assessment of each Fund’s tracking difference, including information comparing each Fund’s tracking difference to both a general tracking difference range established for the Fund and the tracking difference for an appropriate group of peer funds over various periods, Lattice Strategies’ views regarding the appropriateness of the general tracking difference ranges and explanations of the factors contributing to any tracking difference. The Board noted the factors driving tracking difference for each Fund that are outside the control of the Advisers. For details regarding each Fund’s tracking difference, see the Fund-by-Fund synopsis below. The Board considered the Advisers’ work with the Investment Committee, which assists the Board in evaluating the performance of each Fund at periodic meetings throughout the year and specifically with respect to the approval of the continuation of the Agreements. The Board considered that the Investment Committee, in its evaluation of investment performance at meetings throughout the year, focused particular attention on information indicating less favorable performance of certain Hartford funds for specific time periods and discussed with the Advisers the reasons for such performance. The Board also considered the analysis provided by the Consultant relating to each Fund’s performance track record and tracking difference.
While the Board primarily evaluated each Fund’s performance by reviewing the Fund’s tracking difference relative to its custom proprietary benchmark index, the Board also considered Lattice Strategies’ assessment of the quality of each Fund’s custom proprietary benchmark index and whether each such index was continuing to function as intended. The Board reviewed the performance of certain Funds and their custom proprietary benchmark indexes relative to unaffiliated broad-based securities market indexes and found such comparisons to be useful in evaluating the performance of such Funds and their custom proprietary benchmark indexes. The Board considered that Lattice Strategies believes that each Fund’s custom proprietary benchmark index was continuing to function as intended.
In light of all the considerations noted above, the Board concluded that it had continued confidence in Lattice Strategies’ and the Sub-adviser’s overall capabilities to manage the Funds.
Costs of the Services and Profitability of the Advisers
The Board reviewed information regarding Lattice Strategies’ cost to provide investment management and related services to each Fund and Lattice Strategies’ profitability, both overall and for each Fund, on a pre-tax basis without regard to distribution expenses. The Board also requested and received information relating to the operations and profitability of the Sub-adviser. The Board considered representations from Lattice Strategies and the Sub-adviser that the Sub-adviser’s fees were negotiated at arm’s length and that the sub-advisory fees are paid by Lattice Strategies and not the Funds. Accordingly, the Board concluded that the profitability of the Sub-adviser is a less relevant factor with respect to the Board’s consideration of the Sub-advisory Agreement.
The Board considered the Consultant’s review of the methodologies and estimates used by Lattice Strategies in calculating profitability in connection with the continuation of the Investment Advisory Agreement, including a description of the methodology used to allocate certain expenses. The Board noted the Consultant’s view that Lattice Strategies’ process for calculating and reporting Fund profitability is reasonable and consistent with the process previously reviewed by the Consultant. The Board noted that the Consultant had previously performed a full review of this process and reported that such process is reasonable, sound and consistent with common industry practice.
Based on these considerations, the Board concluded that the profits realized by the Advisers from their relationships with the Funds were not excessive.
Comparison of Fees and Services Provided by the Advisers
Hartford Multifactor ETFs
Approval of Investment Management and Investment Sub-Advisory Agreements (Unaudited) – (continued)
The Board considered the comparative information that had been provided at meetings on June 15-16, 2021 and August 3-4, 2021 with respect to the services rendered to and the management fees to be paid by each Fund to Lattice Strategies and the total expense ratio of the Fund. The Board considered that Lattice Strategies would pay all expenses of the Trust, except for (i) brokerage expenses and other expenses (such as stamp taxes) connected with the execution of portfolio transactions or in connection with creation and redemption transactions; (ii) legal fees or expenses in connection with any arbitration, litigation or pending or threatened arbitration or litigation, including any settlements in connection therewith; (iii) extraordinary expenses; (iv) any distribution fees and expenses paid by the Trust under any distribution plan adopted pursuant to Rule 12b-1 under the 1940 Act; and (v) the advisory fee payable to Lattice Strategies. The Board also considered comparative information with respect to the sub-advisory fees to be paid by Lattice Strategies to the Sub-adviser with respect to each Fund. In this regard, the Board requested and reviewed information from Lattice Strategies and the Sub-adviser relating to the management and sub-advisory fees, including the sub-advisory fee schedule, and total operating expenses for each Fund. The Board also reviewed information from Broadridge comparing each Fund’s contractual management fees, actual management fees and total expense ratios relative to an appropriate group of funds selected by Broadridge (“Peer Group”). The Board considered such information from Broadridge in consultation with the Consultant. For details regarding each Fund’s expenses, see the Fund-by-Fund synopsis below.
The Board considered the methodology used by Broadridge to select the applicable Peer Groups. While the Board recognized that comparisons between a Fund and its Peer Group may be imprecise given, among other differences, the different service levels and characteristics of the investment companies and the different business models and cost structures of the Advisers, the comparative information provided by Broadridge assisted the Board in evaluating the reasonableness of each Fund’s fees and total operating expenses. In addition, the Board considered the analysis and views of the Consultant relating to each Fund’s fees and total operating expenses and the Peer Groups.
Based on these considerations, the Board concluded that each Fund’s fees and total operating expenses, in conjunction with the information about quality of services, profitability, economies of scale, and other matters considered, were reasonable in light of the services provided.
Economies of Scale
The Board considered information regarding the extent to which economies of scale may be realized as a Fund grows and whether fee levels reflect these economies of scale for the benefit of shareholders of the Fund. The Board also considered that any economies of scale in respect of the management of a Fund would benefit Lattice Strategies due to the unitary fee structure of the Fund, but that the unitary fee protects shareholders from a rise in operating costs and/or a decline in Fund assets and is a transparent means of informing the Fund’s shareholders of the fees associated with the Fund. The Board considered that each Fund could share in the benefits from economies of scale as assets in the Fund grow. The Board noted that each Fund’s management fee does not contain breakpoints. However, the Board considered that Lattice Strategies shares anticipated or potential economies of scale with shareholders in a variety of ways, including through initially setting competitive fee rates and pricing each Fund to scale at inception, as well as additional investments in Lattice Strategies’ business and the provision of improved or additional infrastructure and services to the Funds and their shareholders. The Board also noted that, for each of the Hartford Multifactor Small Cap ETF and Hartford Multifactor Emerging Markets ETF, the Fund’s current low asset levels means that the Fund has achieved limited, if any, economies of scale.
The Board also considered how any benefits from economies of scale would be realized by the various parties. Based on these considerations, the Board concluded that it was satisfied with the extent to which economies of scale would be shared for the benefit of each Fund’s shareholders. The Board noted, however, that it would review any future growth in each Fund’s assets and the appropriateness of any potential future management fee breakpoints as part of its future annual review of the Agreements.
Other Benefits
The Board considered other benefits to the Advisers and their affiliates from their relationships with the Funds.
Fund-by-Fund Factors
Solely for purposes of the Fund-by-Fund discussion below, the Board noted that Fund performance is referred to as “in line with” a Fund’s custom proprietary benchmark index where the Fund’s net tracking difference relative to its custom proprietary benchmark index was within a range previously established by the Board as of March 31, 2021.
Hartford Multifactor ETFs
Approval of Investment Management and Investment Sub-Advisory Agreements (Unaudited) – (continued)
Hartford Multifactor Developed Markets (ex-US) ETF
| • | The Board considered that the Fund’s performance was in line with its custom proprietary benchmark index for the 1-, 3-, and 5-year periods, noting that the Fund seeks to provide investment results that, before fees and expenses, correspond to the total return performance of its custom proprietary Benchmark index. The Board noted recent and upcoming changes to the Fund’s portfolio management team. |
| • | The Board noted that the Fund's contractual management fee was in the 1st quintile of its Peer Group, while its actual management fee and total expenses were in the 2nd quintile of its Peer Group. |
Hartford Multifactor Diversified International ETF
| • | The Board considered that the Fund’s performance exceeded its tracking difference threshold for the 1-year period and was in line with its custom proprietary benchmark index for the 3-year period, noting that the Fund seeks to provide investment results that, before fees and expenses, correspond to the total return performance of its custom proprietary benchmark index. The Board noted recent and upcoming changes to the Fund’s portfolio management team. |
| • | The Board noted that the Fund’s contractual management fee, actual management fee, and total expenses were in the 2nd quintile of its Peer Group. |
Hartford Multifactor Emerging Markets ETF
| • | The Board noted that the Fund’s performance exceeded its tracking difference threshold for the 1-year period and was in line with its custom proprietary benchmark index for the 3- and 5-year periods, noting that the Fund seeks to provide investment results that, before fees and expenses, correspond to the total return performance of its custom proprietary benchmark index. The Board noted recent and upcoming changes to the Fund’s portfolio management team. |
| • | The Board noted that the Fund’s contractual management fee and actual management fee were in the 2nd quintile of its Peer Group, while its total expenses were in the 1st quintile of its Peer Group. |
Hartford Multifactor Small Cap ETF
| • | The Board considered that the Fund’s performance exceeded its tracking difference threshold for the 1-year period and was in line with its custom proprietary benchmark index for the 3- and 5-year periods, noting that the Fund seeks to provide investment results that, before fees and expenses, correspond to the total return performance of its custom proprietary benchmark index. The Board noted recent and upcoming changes to the Fund’s portfolio management team. |
| • | The Board noted that the Fund’s contractual management fee and total expenses were in the 2nd quintile of its Peer Group, while its actual management fee was in the 3rd quintile of its Peer Group. |
Hartford Multifactor US Equity ETF
| • | The Board considered that the Fund’s performance exceeded its tracking difference threshold for the 1-year period and was in line with its custom proprietary benchmark index for the 3- and 5-year periods, noting that the Fund seeks to provide investment results that, before fees and expenses, correspond to the total return performance of its custom proprietary benchmark index. The Board noted recent and upcoming changes to the Fund’s portfolio management team. |
| • | The Board noted that the Fund’s contractual management fee was in the 1st quintile of its Peer Group, while its actual management fee and total expenses were in the 2nd quintile of its Peer Group. |
* * * *
Based upon its review of these various factors, among others, the Board concluded that it is in the best interests of each Fund and its shareholders for the Board to approve the continuation of the Agreements for an additional year. In reaching this decision, the Board did not assign relative weights to the factors discussed above or deem any one or group of them to be controlling in and of themselves.
THIS PRIVACY POLICY IS NOT PART OF THIS REPORT
CUSTOMER PRIVACY NOTICE
The Hartford Financial Services Group, Inc. and Affiliates*
(herein called “we, our, and us”)
This Privacy Policy applies to our United States Operations
We value your trust. We are committed to the responsible:
| a) | management; |
| b) | use; and |
| c) | protection; |
of Personal Information.
This notice describes how we collect, disclose, and protect Personal Information.
We collect Personal Information to:
| a) | service your Transactions with us; and |
| b) | support our business functions. |
We may obtain Personal Information from:
| a) | You; |
| b) | your Transactions with us; and |
| c) | third parties such as a consumer-reporting agency. |
Based on the type of product or service You apply for or get from us, Personal Information such as:
| a) | your name; |
| b) | your address; |
| c) | your income; |
| d) | your payment; or |
| e) | your credit history; |
may be gathered from sources such as applications, Transactions, and consumer reports.
To serve You and service our business, we may share certain Personal Information. We will share Personal Information, only as allowed by law, with affiliates such as:
| a) | our insurance companies; |
| b) | our employee agents; |
| c) | our brokerage firms; and |
| d) | our administrators. |
As allowed by law, we may share Personal Financial Information with our affiliates to:
| a) | market our products; or |
| b) | market our services; |
to You without providing You with an option to prevent these disclosures.
We may also share Personal Information, only as allowed by law, with unaffiliated third parties including:
| a) | independent agents; |
| b) | brokerage firms; |
| c) | insurance companies; |
| d) | administrators; and |
| e) | service providers; |
who help us serve You and service our business.
When allowed by law, we may share certain Personal Financial Information with other unaffiliated third parties who assist us by performing services or functions such as:
| a) | taking surveys; |
| b) | marketing our products or services; or |
| c) | offering financial products or services under a joint agreement |
between us and one or more financial institutions.
We, and third parties we partner with, may track some of the pages You visit through the use of:
| a) | cookies; |
| b) | pixel tagging; or |
| c) | other technologies; |
and currently do not process or comply with any web browser’s “do not track” signal or other similar mechanism that indicates a request to disable online tracking of individual users who visit our websites or use our services.
For more information, our Online Privacy Policy, which governs information we collect on our website and our affiliate websites, is available at https://www.thehartford.com/online-privacy-policy.
We will not sell or share your Personal Financial Information with anyone for purposes unrelated to our business functions without offering You the opportunity to:
| a) | “opt-out;” or |
| b) | “opt-in;” |
as required by law.
We only disclose Personal Health Information with:
| a) | your authorization; or |
| b) | as otherwise allowed or required by law. |
Our employees have access to Personal Information in the course of doing their jobs, such as:
| a) | underwriting policies; |
| b) | paying claims; |
| c) | developing new products; or |
| d) | advising customers of our products and services. |
We use manual and electronic security procedures to maintain:
| a) | the confidentiality; and |
Personal Information that we have. We use these procedures to guard against unauthorized access.
Some techniques we use to protect Personal Information include:
| d) | firewall technology; and |
| e) | the use of detection software. |
We are responsible for and must:
| a) | identify information to be protected; |
| b) | provide an adequate level of protection for that data; and |
| c) | grant access to protected data only to those people who must use |
it in the performance of their job-related duties.
Employees who violate our privacy policies and procedures may be subject to discipline, which may include termination of their employment with us.
We will continue to follow our Privacy Policy regarding Personal Information even when a business relationship no longer exists between us.
As used in this Privacy Notice:
Application means your request for our product or service.
Personal Financial Information means financial information such as:
| d) | policy or claim information. |
Personal Financial Information may include Social Security Numbers, Driver’s license numbers, or other government-issued identification numbers, or credit, debit card, or bank account numbers.
Personal Health Information means health information such as:
| a) | your medical records; or |
| b) | information about your illness, disability or injury. |
Personal Information means information that identifies You personally and is not otherwise available to the public. It includes:
| a) | Personal Financial Information; and |
| b) | Personal Health Information. |
Transaction means your business dealings with us, such as:
| b) | your request for us to pay a claim; and |
| c) | your request for us to take an action on your account. |
You means an individual who has given us Personal Information in conjunction with:
a financial product or service from us if the product or service is used mainly for personal, family, or household purposes.
If you have any questions or comments about this privacy notice, please feel free to contact us at The Hartford – Consumer Rights and Privacy Compliance Unit, One Hartford Plaza, Mail Drop: T 04.180, Hartford, CT 06155, or at ConsumerPrivacyInquiriesMailbox@thehartford.com.
This Customer Privacy Notice is being provided on behalf of The Hartford Financial Services Group, Inc. and its affiliates (including the following as of February 2021), to the extent required by the Gramm-Leach-Bliley Act and implementing regulations:
1stAGChoice, Inc.; Access CoverageCorp, Inc.; Access CoverageCorp Technologies, Inc.; Assurances Continentales Continentale Verzekeringen N.V; Bracht, Deckers & Mackelbert N.V.; Business Management Group, Inc.; Canal Re S.A.; Cervus Claim Solutions, LLC; First State Insurance Company; FTC Resolution Company LLC; Hart Re Group L.L.C.; Hartford Accident and Indemnity Company; Hartford Administrative Services Company; Hartford Casualty General Agency, Inc.; Hartford Casualty Insurance Company; Hartford Fire General Agency, Inc.; Hartford Fire Insurance Company; Hartford Funds Distributors, LLC; Hartford Funds Management Company, LLC; Hartford Funds Management Group, Inc.; Hartford Holdings, Inc.; Hartford Insurance Company of Illinois; Hartford Insurance Company of the Midwest; Hartford Insurance Company of the Southeast; Hartford Insurance, Ltd.; Hartford Integrated Technologies, Inc.; Hartford Investment Management Company; Hartford Life and Accident Insurance Company; Hartford Lloyd’s Corporation; Hartford Lloyd’s Insurance Company; Hartford Management, Ltd.; Hartford Productivity Services LLC; Hartford of Texas General Agency, Inc.; Hartford Residual Market, L.C.C.; Hartford Specialty Insurance Services of Texas, LLC; Hartford STAG Ventures LLC; Hartford Strategic Investments, LLC; Hartford Underwriters General Agency, Inc.; Hartford Underwriters Insurance Company; Heritage Holdings, Inc.; Heritage Reinsurance Company, Ltd.; HLA LLC; HL Investment Advisors, LLC; Horizon Management Group, LLC; HRA Brokerage Services, Inc.; Lattice Strategies LLC; Maxum Casualty Insurance Company; Maxum Indemnity Company; Maxum Specialty Services Corporation; Millennium Underwriting Limited; MPC Resolution Company LLC; Navigators (Asia) Limited; Navigators Corporate Underwriters Limited; Navigators Holdings (Europe) N.V.; Navigators Holdings (UK) Limited; Navigators Insurance Company; Navigators International Insurance Company Ltd.; Navigators Management Company, Inc.; Navigators Management (UK) Limited; Navigators N.V.; Navigators Specialty Insurance Company; Navigators Underwriting Agency Limited; Navigators Underwriting Limited; New BDM NV; New England Insurance Company; New England Reinsurance Corporation; New Ocean Insurance Co., Ltd.; NIC Investments (Chile) SpA; Nutmeg Insurance Agency, Inc.; Nutmeg Insurance Company; Pacific Insurance Company, Limited; Property and Casualty Insurance Company of Hartford; Sentinel Insurance Company, Ltd; The Navigators Group, Inc.; Trumbull Flood Management, L.L.C.; Trumbull Insurance Company; Twin City Fire Insurance Company; Y-Risk, LLC.
Revised February 2021
[This page is intentionally left blank]
[This page is intentionally left blank]
This report is submitted for the general information of the shareholders of the Funds referenced in this report. It is not authorized for distribution to persons who are not shareholders of one or more Funds referenced in this report unless preceded or accompanied by a current prospectus for the relevant Funds. Nothing herein contained is to be considered an offer of sale or a solicitation of an offer to buy shares of any Fund listed in this report.
The information cannot be used or relied upon for the purpose of avoiding IRS penalties. These materials are not intended to provide tax, accounting or legal advice. As with all matters of a tax or legal nature, you should consult your own tax or legal counsel for advice.
Investors should carefully consider a fund’s investment objectives, risks, charges and expenses. This and other important information is contained in the fund’s prospectus and summary prospectus, which can be obtained by visiting hartfordfunds.com. Please read it carefully before investing.
Exchange-traded products are distributed by ALPS Distributors, Inc. (ALPS). Advisory services are provided by Lattice Strategies, LLC (Lattice) and Mellon Investments Corporation. Hartford Funds refers to Hartford Funds Distributors, LLC, Member FINRA, Hartford Funds Management Company, LLC, and Lattice, which are not affiliated with ALPS.
ETFAR-MLT21 11/21 225371 LAT002157 Printed in the U.S.A.
Item 2. Code of Ethics.
The registrant, as of the end of the period covered by this report, has adopted a code of ethics that applies to the registrant’s principal executive officer, principal financial officer, principal accounting officer or controller, or persons performing similar functions, regardless of whether these individuals are employed by the registrant or a third party. There have been no amendments, during the period covered by this report, to a provision of the code of ethics that applies to the registrant’s principal executive officer, principal financial officer, principal accounting officer or controller, or persons performing similar functions, regardless of whether these individuals are employed by the registrant or a third party, and that relates to any element of the code of ethics description. The registrant has not granted any waivers, including an implicit waiver, from a provision of the code of ethics that applies to the registrant’s principal executive officer, principal financial officer, principal accounting officer or controller, or persons performing similar functions, regardless of whether these individuals are employed by the registrant or a third party, that relates to one or more of the items set forth in paragraph (b) of this item’s instructions. A copy of the code of ethics is filed herewith.
Item 3. Audit Committee Financial Expert.
The Board of Trustees of the registrant (the “Board”) has designated David Sung as an Audit Committee Financial Expert. Mr. Sung is considered by the Board to be an independent trustee.
Item 4. Principal Accountant Fees and Services.
| | (a) | Audit Fees: The aggregate fees billed for each of the last two fiscal years for professional services rendered by the principal accountant for the audit of the registrant’s annual financial statements or services that are normally provided by the accountant in connection with statutory and regulatory filings or engagements for those fiscal years were: |
$99,840 for the fiscal year ended September 30, 2021; $80,000 for the fiscal year ended September 30, 2020.
| | (b) | Audit Related Fees: The aggregate fees billed in each of the last two fiscal years for assurance and related services by the principal accountant that are reasonably related to the performance of the audit of the registrant’s financial statements and are not reported under paragraph (a) of this Item were: |
$0 for the fiscal year ended September 30, 2021; $0 for the fiscal year ended September 30, 2020.
| | (c) | Tax Fees: The aggregate fees billed in each of the last two fiscal years for professional services rendered by the principal accountant for tax compliance, tax advice, and tax planning were: |
$94,960 for the fiscal year ended September 30, 2021; $88,562 for the fiscal year ended September 30, 2020. Tax-related services are principally in connection with, but not limited to, general tax compliance services, and excise tax review.
| | (d) | All Other Fees: The aggregate fees billed in each of the last two fiscal years for products and services provided by the principal accountant, other than the services reported in paragraphs (a) through (c) of this Item were: |
$464 for the fiscal year ended September 30, 2021; $0 for the fiscal year ended September 30, 2020.
| | (e) | Pre-Approval Policies and Procedures |
(1) The Pre-Approval Policies and Procedures (the “Policy”) adopted by the Audit Committee of the Registrant (also, the “Fund”) sets forth the procedures pursuant to which services performed by the independent registered public accounting firm for the Registrant may be pre-approved. The following summarizes the pre-approval requirements under the Policy.
| | a. | The Audit Committee must pre-approve all audit services and non-audit services that the independent registered public accounting firm provides to the Fund. |
| | b. | The Audit Committee must pre-approve any engagement of the independent registered public accounting firm to provide non-audit services to any Service Affiliate (which is defined to include any entity controlling, controlled by, or under common control with the investment adviser that provides ongoing services to the Fund) during the period of the independent registered public accounting firm’s engagement to provide audit services to the Fund, if the non-audit services to the Service Affiliate directly impact the Fund’s operations and financial reporting. |
| | c. | The Audit Committee, from time to time, may designate one or more of its members who are Independent Trustees (each a “Designated Member”) to consider, on the Audit Committee’s behalf, any non-audit services, whether to the Fund or to any Service Affiliate, that have not been pre-approved by the Audit Committee. The Designated Member also shall review, on the Audit Committee’s behalf, any proposed material change in the nature or extent of any non-audit services previously approved. In considering any requested non-audit services or proposed material change in such services, the Designated Member shall not authorize services which would exceed $50,000 in fees for such services. |
| | d. | The independent registered public accounting firm may not provide specified prohibited non-audit services set forth in the Policy to the Fund, the Fund’s investment adviser, the Service Affiliates or any other member of the investment company complex. |
(2) One hundred percent of the services described in items 4(b) through 4(d) were approved in accordance with the Audit Committee’s Pre-Approval Policy. As a result, none of such services was approved pursuant to paragraph (c) (7) (i) (c) of Rule 2-01 of Regulation S-X.
| | (f) | None of the hours expended on the principal accountant’s engagement to audit the registrant’s financial statements for the year ended September 30, 2021, were attributed to work performed by persons other than the principal accountant’s full-time, permanent employees. |
| | (g) | The aggregate non-audit fees billed by the registrant’s accountant for services rendered to the registrant, and rendered to the registrant’s investment adviser (not including any sub-adviser whose role is primarily portfolio management and is subcontracted with or overseen by another investment adviser), and any entity controlling, controlled by, or under common control with the adviser that provides ongoing services to the registrant for each of the last two fiscal years of the registrant were: |
Non-Audit fees: $95,424 for the fiscal year ended September 30, 2021; $88,562 for the fiscal year ended September 30, 2020.
| | (h) | The registrant’s audit committee of the board of trustees has considered whether the provision of non-audit services that were rendered to the Registrant’s investment adviser (not including any sub-adviser whose role is primarily portfolio management and is subcontracted with or overseen by another investment adviser), and any entity controlling, controlled by, or under common control with the investment adviser that provides ongoing services to the registrant that were not pre-approved pursuant to paragraph (c)(7)(ii) of Rule 2-01 of Regulation S-X is compatible with maintaining the principal accountant’s independence. |
Item 5. Audit Committee of Listed Registrants.
| | (a) | The Registrant has an audit committee that was established by the Board of Trustees of the Registrant in accordance with Section 3(a)(58)(A) of the Securities Exchange Act of 1934, as amended. The members of the Registrant’s Audit Committee are Hilary E. Ackermann, Lynn S. Birdsong, Derrick D. Cephas, Paul L. Rosenberg and David Sung. |
Item 6. Investments.
| | (a) | The Schedule of Investments in securities of unaffiliated issuers as of the close of the reporting period is included as part of the annual report filed under Item 1 of this form. |
Item 7. Disclosure of Proxy Voting Policies and Procedures for Closed-End Management Investment Companies.
Not applicable.
Item 8. Portfolio Managers of Closed-End Management Investment Companies.
Not applicable.
Item 9. Purchases of Equity Securities by Closed-End Management Investment Company and Affiliated Purchasers.
Not applicable.
Item 10. Submission of Matters to a Vote of Security Holders.
There have been no material changes to the procedures by which the shareholders may recommend nominees to the registrant’s board of trustees, where those changes were implemented after the registrant last provided disclosure in response to the requirements of Item 407(c)(2)(iv) of Regulation S-K (17 CFR 229.407) (as required by Item 22(b)(15) of Schedule 14A (17 CFR 240.14a-101)), or this Item
Item 11. Controls and Procedures.
| | (a) | The registrant’s principal executive and principal financial officers, or persons performing similar functions, have concluded that the registrant’s disclosure controls and procedures (as defined in Rule 30a-3(c) under the Investment Company Act of 1940, as amended (the “1940 Act”) (17 CFR 270.30a-3(c))) are generally effective to provide reasonable assurance, as of a date within 90 days of the filing date of the report that includes the disclosure required by this paragraph, based on their evaluation of these controls and procedures required by Rule 30a-3(b) under the 1940 Act (17 CFR 270.30a-3(b)) and Rules 13a-15(b) or 15d-15(b) under the Securities Exchange Act of 1934, as amended (17 CFR 240.13a-15(b) or 240.15d-15(b)). |
| | (b) | There were no changes in the registrant’s internal control over financial reporting (as defined in Rule 30a-3(d) under the 1940 Act (17 CFR 270.30a-3(d)) that occurred during the period covered by this report that have materially affected, or are reasonably likely to materially affect, the registrant’s internal control over financial reporting. |
Item 12. Disclosure of Securities Lending Activities for Closed-End Management Investment Companies
Not applicable.
Item 13. Exhibits.
SIGNATURES
Pursuant to the requirements of the Securities Exchange Act of 1934 and the Investment Company Act of 1940, the registrant has duly caused this report to be signed on its behalf by the undersigned, thereunto duly authorized.
| | | | | | |
| | | | LATTICE STRATEGIES TRUST |
| | | |
Date: December 2, 2021 | | | | By: | | /s/ James E. Davey |
| | | | | | James E. Davey |
| | | | | | President and |
| | | | | | Chief Executive Officer |
Pursuant to the requirements of the Securities Exchange Act of 1934 and the Investment Company Act of 1940, this report has been signed below by the following persons on behalf of the registrant and in the capacities and on the dates indicated.
| | | | | | |
| Date: December 2, 2021 | | | | By: | | /s/ James E. Davey |
| | | | | | James E. Davey |
| | | | | | President and |
| | | | | | Chief Executive Officer |
| | | |
| Date: December 2, 2021 | | | | By: | | /s/ David A. Naab |
| | | | | | David A. Naab |
| | | | | | Treasurer |
| | | | | | (Principal Financial Officer and Principal Accounting Officer) |