UNITED STATES
SECURITIES AND EXCHANGE COMMISSION
Washington, D.C. 20549
FORM N-CSR/A
CERTIFIED SHAREHOLDER REPORT OF REGISTERED
MANAGEMENT INVESTMENT COMPANIES
Investment Company Act File Number 811-22959
1290 FUNDS
(Exact name of registrant as specified in charter)
1290 Avenue of the Americas
New York, New York 10104
(Address of principal executive offices)
WILLIAM T. MACGREGOR ESQ.
Executive Vice President, General Counsel and Secretary
Equitable Investment Management Group, LLC
1290 Avenue of the Americas
New York, New York 10104
(Name and Address of Agent for Service)
Copies to:
MARK C. AMOROSI, ESQ.
K&L Gates LLP
1601 K Street N.W.
Washington, D.C. 20006
Registrant’s telephone number, including area code: (212) 554-1234
Date of fiscal year end: October 31
Date of reporting period: October 31, 2020
| Item 1. | Reports to Stockholders. |
The following is a copy of the report transmitted to shareholders pursuant to Rule 30e-1 under the Investment Company Act of 1940 (17 CFR 270.30e-1).

Annual Report
October 31, 2020
Beginning on January 1, 2021, as permitted by regulations adopted by the Securities and Exchange Commission, paper copies of the Funds’ annual and semi-annual shareholder reports will no longer be sent by mail, unless you specifically request paper copies of the shareholder reports from the Funds or from your financial intermediary, such as a broker-dealer or bank. Instead, the shareholder reports will be made available on the Funds’ website (www.1290Funds.com/literature.php), and you will be notified by mail each time a shareholder report is posted and provided with a website link to access the shareholder report.
If you already elected to receive shareholder reports electronically, you will not be affected by this change and you need not take any action. You may elect to receive the Funds’ shareholder reports and other communications electronically by contacting your financial intermediary or, if you invest directly with the Funds, by calling 1-888-310-0416 or by sending an e-mail request to 1290Funds@dfinsolutions.com.
You may elect to receive all future shareholder reports in paper free of charge. If you invest through a financial intermediary, you can contact your financial intermediary to request that you continue to receive paper copies of your shareholder reports. If you invest directly with the Funds, you can call 1-888-310-0416 or send an e-mail request to 1290Funds@dfinsolutions.com to let the Funds know that you wish to continue receiving paper copies of your shareholder reports. Your election to receive reports in paper will apply to all 1290 Funds held in your account if you invest through your financial intermediary or all 1290 Funds held with the fund complex if you invest directly with the Funds.
1290 Funds
Annual Report
October 31, 2020
Table of Contents
Market Overview for the year ended October 31, 2020
The economy and financial markets were driven by the impact of the emerging COVID-19 pandemic for much of the reporting period. The markets have seen unprecedented volatility, with unemployment soaring from a 60-year low to a 90-year high over the course of two months (U.S. Bureau of Labor Statistics). Extraordinary monetary and fiscal response then gave rise to a market rebound and the shortest recession on record during the Spring. Against this backdrop, a bull market in selected sectors and regions was driven by monetary and fiscal stimulus, the evolving Chinese and U.S. economic recoveries, and heightened virus vaccine hopes.
Economic growth was driven by attempts to control the expansion of the pandemic, along with global central bank actions to support economies and the proper functioning of the financial markets. Looking at the U.S. economy, fourth quarter 2019 annualized gross domestic product (GDP) annualized growth was 2.4%. Lockdowns and social distancing then started to take a toll on the economy, as the Commerce Department reported that first-quarter 2020 annualized GDP growth was down 5.0%. Second-quarter annualized GDP growth then contracted 31.4%, marking the steepest quarterly decline on record. The economy then rebounded, as the initial estimate for third-quarter GDP growth was 33.1% (U.S. Bureau of Economic Analysis).
The U.S. bond markets produced positive gains as the Federal Reserve Board (Fed) took a number of aggressive actions in March 2020. First, the Fed lowered the federal funds rate from a range between 1.50% and 1.75% to a range between 1.00% and 1.25%, then lowered again to a range between 0.00% and 0.25%. On March 23, the Fed announced that it would make unlimited purchases of Treasury and mortgage-backed securities, and introduced a new credit facility to buy investment-grade credit rated down to BBB- in the primary and secondary markets. During the second quarter, the Fed expanded its credit facilities to include the purchase of individual corporate bonds, which supported spread tightening. In August 2020, Fed Chair Jerome Powell said the central bank had changed how it viewed the tradeoff between lower unemployment and higher inflation. Its new approach to setting U.S. monetary policy will entail letting inflation and employment run higher, which could mean interest rates remain “low for longer.” Finally, at its meeting in September, projections from individual members of the Federal Open Market Committee indicated that rates could stay anchored near zero through 2023.
U.S. equity markets proved resilient, if uneven, beginning the period strongly amid improved economic data and optimism that a new ‘Phase One’ deal between the U.S. and China could be a step towards the resolution of their protracted trade war. From February 2020, however, growing concerns about the spread of a deadly coronavirus caused a sharp shift in investor sentiment. In a bid to contain the virus, governments around the world enacted extraordinary measures to lock-down their citizens, halting economic activity across many sectors. With fears about the impact of the virus mounting, equity markets suffered steep losses and volatility spiked to record highs. Beginning in late March, equity markets started to recover, underpinned by strong monetary and fiscal policy support worldwide. Gradual reopening of economies and optimism about a vaccine provided further support. Stock markets nevertheless reversed course in September with investors focusing on rising cases, particularly in Europe, which appeared to imperil the nascent economic recovery. U.S. equities slipped in October as the economic recovery slowed and a surge in coronavirus cases dented investor sentiment. As of this writing, the results of the U.S. presidential election are providing some clarity for markets and positive initial data from vaccine trials have helped to instill some confidence despite the increase in coronavirus cases.
Source: Equitable Investment Management Group, LLC. As of 10/31/20. This information is provided for general information only and is not intended to provide specific advice or recommendations for any individual investor.
PAST PERFORMANCE IS NO GUARANTEE OP FUTURE RESULTS. No investment is risk-free. Bond investments are subject to interest rate risk so that when interest rates rise, the prices of bonds can decrease and the investor can lose principal value. High yield bonds are subject to a high degree of credit and market risk. International securities carry additional risks including currency exchange fluctuation and different government regulations, economic conditions or accounting standards. Smaller company stocks involve a greater risk than is customarily associated with more established companies. Index performance is referenced for illustrative purposes only. You cannot invest directly in an index.
Fund holdings and sector allocations are subject to change. Please see the Portfolio of Investments for a complete list of fund holdings.
1
NOTES ON PERFORMANCE (Unaudited)
Total Returns
Performance of the 1290 Funds as shown on the following pages compares each Fund’s performance to that of a broad-based securities index and, with respect to certain Funds, customized composite benchmarks. Each Fund’s rates of return are net of investment advisory fees and expenses of the Fund. Each Fund has a separate investment objective it seeks to achieve by following a separate investment policy. There is no guarantee that these objectives will be attained. The objectives and policies of each Fund will affect its return and its risk. Keep in mind that past performance is not an indication of future results.
Benchmarks
60% S&P 500® Index/40% Bloomberg Barclays U.S. Aggregate Bond Index is a hypothetical combination of unmanaged indexes. The composite index combines the total return of the S&P 500® Index at a weighting of 60% and the Bloomberg Barclays U.S. Aggregate Bond Index at a weighting of 40%.
Bloomberg Barclays U.S. Aggregate Bond Index covers the U.S. dollar denominated investment-grade, fixed-rate, taxable bond market of securities. The index includes bonds from the Treasury, government-related and corporate securities, agency fixed rate and hybrid adjustable mortgage pass through securities, asset-backed securities and commercial mortgage-backed securities.
ICE BofA U.S. 3-Month Treasury Bill Index measures the returns of negotiable debt obligations issued by the U.S. government and backed by its full faith and credit, having a maturity of three months.
ICE BofA U.S. High Yield Index tracks the performance of U.S. dollar denominated below investment grade corporate debt publicly issued in the U.S. domestic market. Qualifying securities must have at least 18 months to final maturity at the time of issuance, at least one year remaining term to final maturity as of the rebalancing date, a fixed coupon schedule and a minimum amount outstanding of $100 million. It is capitalization-weighted.
Morgan Stanley Capital International (MSCI) World (Net) Index (“MSCI World (Net) Index”) is a free float-adjusted market capitalization weighted index that is designed to measure the equity market performance of developed markets. The index consists of 23 developed market country indexes.
Russell 2500™ Value Index measures the performance of those Russell 2500TM Index companies with lower price-to-book ratios and lower forecasted growth values. It is market-capitalization weighted.
Standard & Poor’s 500® Composite Stock Price Index (“S&P 500® Index”) is a weighted index of common stocks of 500 leading companies in leading industries of the U.S. economy, capturing 75% coverage of U.S. equities. The index is capitalization weighted, thereby giving greater weight to companies with the largest market capitalizations.
The Standard & Poor’s Target Date Index Series (each, an “S&P Target Date Index”) comprises eleven multi-asset class indices, each corresponding to a particular target retirement date. The asset allocation for each index in the series is determined once a year through survey of large fund management companies that offer target date products. Each index is fully investable, with varying levels of exposure to equities, fixed income and commodities.
Glossary
Bloomberg Barclays U.S. Corporate High Yield — 2% Issuer Cap Index is a sub-index of the Bloomberg Barclays U.S. Corporate High Yield Index which measures the USD-denominated, high yield, fixed-rate corporate bond market. This sub-index caps exposure caps any issuer exposure to a fixed percentage of 2%.
CBOE Volatility Index (known as the VIX), is measure of constant, 30-day expected volatility of the U.S. stock market, derived from prices of the S&P 500 Index call and put options.
Credit ratings: Investment grade is a rating that signifies a municipal or corporate bond presents a relatively low risk of default. Bond rating firms like Standard & Poor’s and Moody’s use different designations, consisting of the upper- and lower-case letters “A” and “B,” to identify a bond’s credit quality rating. “AAA” and “AA” (high credit quality) and “A” and “BBB” (medium credit quality) are considered investment grade. Credit ratings for bonds below these designations (“BB,” “BBB-,” “B,” “CCC,” etc.) are considered low credit quality, and are commonly referred to as “junk bonds.”
Corporate bonds are a type of debt security that is issued by a firm and sold to investors. Corporate bonds are typically seen as somewhat riskier than U.S. government bonds, so they usually have higher interest rates to compensate for this additional risk.
Derivative is a financial instrument with a price that is dependent upon or derived from one or more underlying assets.
Diversified spread is the sale of multiple, diversified futures contracts and the purchase of other multiple, diversified offsetting futures contracts. A spread tracks the difference between a long and short position.
Drawdown is a peak-to-trough decline during a specific period for an investment, trading account, or fund. A drawdown is usually quoted as the percentage
2
NOTES ON PERFORMANCE (Unaudited)
between the peak and the subsequent trough. If a trading account has $10,000 in it, and the funds drop to $9,000 before moving back above $10,000, then the trading account witnessed a 10% drawdown.
Duration is a measure of the sensitivity of the price of a bond or other debt instrument to a change in interest rates.
Factor returns are he return attributable to a particular common factor.
Federal funds rate is the target interest rate set by the Federal Open Market Committee (FOMC) at which commercial banks borrow and lend their excess reserves to each other overnight.
Futures are derivative financial contracts that obligate the parties to transact an asset at a predetermined future date and price. drawdown
Inflation is the decline of purchasing power of a given currency over time.
JPMorgan Emerging Markets Bond Index Global (“EMBI Global”) measures the performance of fix-rate for external-currency denominated debt instruments including brady bonds, loans, Eurobonds in emerging markets. Countries covered are Argentina, Brazil, Bulgaria, Mexico, Morocco, Nigeria, the Philippines, Poland, Russia, and South Africa. It covers more of the eligible instruments than the EMBI+ by relaxing somewhat the strict EMBI+ limits on secondary market trading liquidity.
Monetary policy accommodation is when a central bank sets low interest rates so that credit is easily attainable. This makes borrowing easy for business, which stimulates investment and expansion of operations.
Mortgage backed security (MBS) is a type of asset-backed security that is secured by a mortgage or collection of mortgages.
Quantitative easing is the introduction of new money into the money supply by a central bank.
Shiller Barclays Cyclically Adjusted Price-to-Earnings (CAPE) Total Return Index aims to identify undervalued sectors in the large-cap equity market based on a modified CAPE® ratio, which is designed to assess longer term equity valuations by using an inflation adjusted earnings horizon.
Smart beta defines a set of investment strategies that emphasize the use of alternative index construction rules to traditional market capitalization-based indices.
Spread Sectors are nongovernmental fixed income investments with higher yields at greater risk than governmental investments.
Swap is a derivative contract through which two parties exchange financial instruments.
Treasury securities, or Treasuries, are debt obligations of the U.S. government. When you buy a U.S. Treasury security, you are lending money to the federal government for a specified period of time.
Yield refers to the earnings generated and realized on an investment over a particular period of time.
Yield spread is the difference between yields on differing debt instruments of varying maturities, credit ratings, issuer, or risk level, calculated by deducting the yield of one instrument from the other.
Spread tightening is when that difference contracts.
3
1290 DIVERSIFIED BOND FUND (Unaudited)
INVESTMENT ADVISER
| Ø | | Equitable Investment Management Group, LLC |
INVESTMENT SUB-ADVISER
| Ø | | Brandywine Global Investment Management, LLC (Brandywine Global) |
PERFORMANCE RESULTS
| | | | | | | | | | | | | | |
| |
| Annualized Total Returns as of 10/31/20 | |
| | | | | |
| | | | | 1
Year | | | 5
Years | | | Since
Incept. | |
Fund – Class A Shares* | | without Sales Charge | | | 8.32 | % | | | 5.39 | % | | | 4.75 | % |
| | | with Sales Charge (a) | | | 3.32 | | | | 4.43 | | | | 3.85 | |
Fund – Class I Shares* | | | | | 8.34 | | | | 5.65 | | | | 5.00 | |
Fund – Class R Shares* | | | | | 7.77 | | | | 5.09 | | | | 4.46 | |
Bloomberg Barclays U.S. Aggregate Bond Index | | | | | 6.19 | | | | 4.08 | | | | 4.01 | |
| |
* Date of inception 7/6/15. (a) A 4.50% front-end sales charge was deducted. Returns for periods greater than one year are annualized. | |
The performance quoted is past performance and is not a guarantee of future results. Mutual funds are subject to certain market risks. Investment returns and principal value of an investment will fluctuate so that an investor’s shares, when redeemed, may be worth more or less than their original cost. Current performance may be higher or lower than the performance data shown. For the most current month-end performance data please call 1-888-310-0416 or visit www.1290Funds.com.
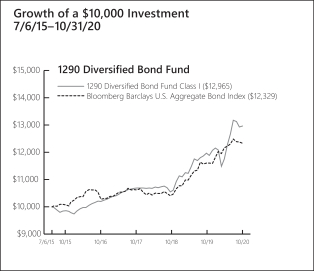
The graph illustrates comparative performance for $10,000 invested in the Class I Shares of the 1290 Diversified Bond Fund and the Bloomberg Barclays U.S. Aggregate Bond Index from 7/6/15 to 10/31/20. The performance of the Bloomberg Barclays U.S. Aggregate Bond Index reflects an initial investment at the end of the month closest to the Fund’s inception. The performance of the Fund assumes reinvestment of all dividends and capital gain distributions, if any, and does not include a sales charge. The performance of the Bloomberg Barclays U.S. Aggregate Bond Index does not reflect the deduction of expenses or a sales charge associated with a mutual fund and has been adjusted to reflect reinvestment of all dividends, capital gain distributions, and interest of the securities included in the benchmark.
As of March 1, 2020, the gross expense ratios for Class A, I and R shares were 1.55%, 1.34% and 1.88%, respectively. The net expense ratios for Class A, I and R shares were 0.75%, 0.50% and 1.00%, respectively. The net expense ratios reflect the Adviser’s decision to contractually limit expenses through April 30, 2021. Fund Performance may also reflect the waiver of the Fund’s fees and reimbursement of expenses for certain periods since the inception date. Without these waivers and reimbursements, performance would have been lower.
In addition, performance shown in this section does not reflect the deduction of taxes that a shareholder would pay on Fund distributions or redemption of Fund shares.
PERFORMANCE SUMMARY
The Fund’s Class I shares returned 8.34% for the year ended October 31, 2020. The Fund’s benchmark, the Bloomberg Barclays U.S. Aggregate Bond Index, returned 6.19% over the same year.
Overview — Brandywine Global Investment Management, LLC (Brandywine Global)
Market Overview
The fixed-income markets generated mixed results over the twelve-months ended October 31, 2020 (Source: Brandywine Global). Most spread sectors (non-Treasuries) underperformed equal-duration Treasuries given periods of heightened risk aversion. This was driven by the ongoing pandemic, sharply falling global growth, aggressive monetary policy accommodation, ongoing trade conflicts, and a number of geopolitical issues.
Both short- and long-term U.S. Treasury yields moved sharply lower during the reporting period. Two-year Treasury yields began the reporting period at 1.52% and rose as high as 1.68% on November 7 and 8, 2019. Their low for the period of 0.11% occurred several times during the third quarter of 2020 and ended at 0.14% on October 31, 2020. Ten-year Treasury yields began the reporting period at 1.69% and moved as high as 1.94% on November 8, 2019. Their low of 0.52% occurred on August 4, 2020 and ended the reporting period at 0.88%.
All told, the Bloomberg Barclays U.S. Aggregate Bond Index, returned 6.19% for the twelve months ended October 31, 2020. For comparison purposes, riskier fixed-income securities, including high-yield bond and emerging market debt, produced weaker results. Over the fiscal year, the Bloomberg Barclays U.S. Corporate High Yield — 2% Issuer Cap Index and the JPMorgan Emerging Markets Bond Index Global (“EMBI Global”) returned 3.42% and 1.97%, respectively.
4
1290 DIVERSIFIED BOND FUND (Unaudited)
Fund Highlights
The subadvisor believed the flexibility of the investment guidelines allowed them to nimbly position the Fund to take advantage of tactical opportunities and reallocate when risk on/risk off sentiment presented itself.
Portfolio Positioning:
| • | | U.S. Government/Investment Grade — At period end, we were negative U.S. Treasury duration as we are down on the space. Our bond model is presenting Treasuries as being extremely overvalued relative to their history. During times like these, our inclination has been to buy high quality corporate bonds that have strong balance sheets and resilient business models. |
| • | | International Sovereigns (Developed Markets) — We ended the period with tactical allocations in core Europe. At period end, we had sold out of our Italian sovereign exposure, but continued to have a short duration position in French OATs (government bonds) through futures. |
| • | | International Sovereigns (Emerging Markets) — At period end, we maintained exposure to select Emerging Markets that we believe exhibit attractive levels of high real yield and strong valuation tailwinds. |
| • | | Structured Credit — At period end, we maintained our position in structured credit. In the wake of the collapse of treasury yields, we had sold down our U.S. Treasury position and repatriated our profits into structured credit. |
| • | | Currency — We continue to believe the U.S. dollar is overvalued, and in the intermediate term, we expect the significant amount of quantitative easing (QE) to put downward pressure on the U.S. dollar. We focused non-dollar exposure in select emerging market and European currencies. |
What helped performance during the year?
| • | | The largest contributor to the Fund’s performance by far was its U.S. investment-grade corporate bond holdings. We regarded the significant widening of corporate spreads during the first quarter of 2020 and subsequent policy initiative as the kind of classic opportunity that we seek. We rotated heavily into this sector during the second quarter of 2020. More corporate spread tightening during the third quarter of 2020 further enhanced the Fund’s results. |
| • | | The Fund’s Italian BTP (government securities indexed to the Italian inflation rate) exposure was another notable positive performer. We initiated a position during the period through both the actual bonds and futures as its spreads greatly widened off the initial COVID-19 market sell-off. Italy had been devasted by the health crisis. Yet, the government’s aggressive efforts to combat the novel coronavirus had helped put the country in a position to open its economy. This, along with the fiscal and monetary aid from the European Central Bank (ECB) helped Italy’s economy and allowed Italian spreads to eventually compress. We closed out of the position in October 2020. |
| • | | Lastly, some emerging market bond holdings contributed to the Fund’s performance, with our local currency Mexican government bond exposure adding much value. Mexico’s central bank continued its interest rate cutting program during the period, bringing borrowing costs to their lowest since 2016. As a result, economic activity began to recover in Mexico during the summer, although uncertainty and downside risks are still present due to the lingering pandemic. |
What hurt performance during the year?
| • | | Much of the performance detraction came from our currency exposures, including the Brazilian real, Russian ruble, and Australian dollar. The risk-off selling of investors during the start of the COVID-19 pandemic affected many currencies, including the Brazilian real. However, instead of participating in the later emerging market asset rebound, the currency tumbled as economic headwinds remained for the country and the pandemic pushed Brazil’s public sector debt to a record 86% of gross domestic product in July 2020. For the ruble, the position was adversely impacted by rising COVID-19 cases, inflation, and geopolitical risks within Russia. Lastly, a short position in the Australian dollar as a risk-off hedge was a drag on performance. The Australian dollar appreciated significantly, as improving Purchasing Manager Index data in China helped lift the currencies of its trading partners. |
| • | | Another negative performer was the Fund’s agency mortgage backed security (MBS) allocations. During the March decline mortgage real estate investment trusts and traditional money managers, suffering margin calls and large redemptions during the downturn, were forced to liquidate MBS positions, largely driving the precipitous drop in prices from which the sector has yet to fully rebound. |
| | | | |
| | |
Fund Characteristics As of October 31, 2020 | | | |
Weighted Average Life (Years) | | | 9.39 | |
Weighted Average Coupon (%) | | | 4.39 | |
Weighted Average Effective Duration (Years)* | | | 3.20 | |
Weighted Average Rating** | | | A- | |
| |
* Effective duration is a measure of the price sensitivity of the Fund to interest rate movements, taking into account specific features of the securities in which it invests. ** Weighted Average Rating has been provided by the Investment Sub-Adviser. A credit rating is an assessment provided by a nationally recognized statistical rating organization (NRSRO) of the creditworthiness of an issuer with respect to debt obligations, including specific securities, money market instruments or other debts. Ratings are measured on a scale that generally ranges from AAA (highest) to D (lowest); ratings are subject to change without notice. | |
5
1290 DIVERSIFIED BOND FUND (Unaudited)
| | | | |
| | |
Sector Weightings
as of October 31, 2020 | | % of
Net Assets | |
Foreign Government Securities | | | 21.6 | % |
U.S. Treasury Obligations | | | 17.5 | |
Industrials | | | 8.6 | |
Financials | | | 8.4 | |
Energy | | | 7.4 | |
Information Technology | | | 6.9 | |
Materials | | | 6.0 | |
Commercial Mortgage-Backed Securities | | | 4.1 | |
Consumer Discretionary | | | 3.4 | |
Consumer Staples | | | 3.2 | |
Collateralized Mortgage Obligations | | | 2.9 | |
Investment Companies | | | 2.1 | |
Utilities | | | 1.8 | |
Communication Services | | | 1.8 | |
Asset-Backed Securities | | | 1.2 | |
Health Care | | | 0.6 | |
Cash and Other | | | 2.5 | |
| | | | | |
| | | | 100.0 | % |
| | | | | |
Holdings are subject to change without notice. | | | | |
UNDERSTANDING YOUR EXPENSES:
As a shareholder of the Fund, you incur two types of costs:
(1) transaction costs, including applicable sales charges and redemption fees; and (2) ongoing costs, including investment advisory fees, distribution and/or service (12b-1) fees (in the case of Class A and Class R shares of the Fund), and other Fund expenses. These examples are intended to help you understand your ongoing costs (in dollars) of investing in the Fund and to compare these costs with the ongoing costs of investing in other mutual funds.
The examples are based on an investment of $1,000 invested at the beginning of the six-month period ended October 31, 2020 and held for the entire six-month period.
Actual Expenses
The first line of the following table provides information about actual account values and actual expenses. You may use the information in this line, together with the amount you invested, to estimate the expenses that you paid over the period. Simply divide your account value by $1,000 (for example, an $8,600 account value divided by $1,000 = 8.6), then multiply the result by the number in the first line under the heading entitled “Expenses Paid During Period” to estimate the expenses you paid on your account during this period.
Hypothetical Example for Comparison Purposes
The second line of the following table provides information about hypothetical account values and hypothetical expenses based on the Fund’s actual expense ratio and an assumed rate of return of 5% per year before expenses, which is not the Fund’s actual return. The hypothetical account values and expenses may not be used to estimate the actual ending account balance or expenses you paid for the period. You may use this information to compare the ongoing costs of investing in the Fund and other funds. To do so, compare this 5% hypothetical example with the 5% hypothetical examples that appear in the shareholder reports of the other funds.
Please note that the expenses shown in the table are meant to highlight your ongoing costs only and do not reflect any transactional costs, such as sales charges (loads), redemption fees, or exchange fees. Therefore, the second line of the table is useful in comparing ongoing costs only, and will not help you determine the relative total costs of owning different funds. In addition, if these transactional costs were included, your costs would have been higher.
EXAMPLE
| | | | | | | | | | | | |
| | | | |
| | | Beginning
Account
Value
5/1/20 | | | Ending
Account
Value
10/31/20 | | | Expenses
Paid
During
Period*
5/1/20 -
10/31/20 | |
Class A | | | | | | | | | | | | |
Actual | | | $1,000.00 | | | | $1,103.30 | | | | $3.97 | |
Hypothetical (5% average annual return before expenses) | | | 1,000.00 | | | | 1,021.37 | | | | 3.81 | |
Class I | | | | | | | | | | | | |
Actual | | | 1,000.00 | | | | 1,103.00 | | | | 2.64 | |
Hypothetical (5% average annual return before expenses) | | | 1,000.00 | | | | 1,022.62 | | | | 2.54 | |
Class R | | | | | | | | | | | | |
Actual | | | 1,000.00 | | | | 1,099.30 | | | | 5.28 | |
Hypothetical (5% average annual return before expenses) | | | 1,000.00 | | | | 1,020.11 | | | | 5.08 | |
| |
* Expenses are equal to the Portfolio’s A, I and R shares annualized expense ratio of 0.75%, 0.50% and 1.00%, respectively, multiplied by the average account value over the period, and multiplied by 184/366 (to reflect the one-half year period). | |
6
1290 FUNDS
1290 DIVERSIFIED BOND FUND
PORTFOLIO OF INVESTMENTS
October 31, 2020
| | | | | | | | |
| | | |
| | | Principal Amount | | | Value
(Note 1) | |
LONG-TERM DEBT SECURITIES: | | | | | | | | |
Asset-Backed Securities (1.2%) | | | | | |
Aames Mortgage Investment Trust, | |
Series 2006-1 A4
0.709%, 4/25/36 (l) | | $ | 849,593 | | | $ | 837,319 | |
Park Place Securities, Inc. Asset-Backed Pass-Through Certificates, | | | | | |
Series 2005-WHQ2 M2
0.839%, 5/25/35 (l) | | | 366,869 | | | | 364,700 | |
Popular ABS Mortgage Pass-Through Trust, | |
Series 2005-5 MV1
0.589%, 11/25/35 (l) | | | 548,273 | | | | 537,903 | |
Towd Point Mortgage Trust, | |
Series 2018-3 A2
3.875%, 5/25/58 (l)§ | | | 345,000 | | | | 367,195 | |
| | | | | | | | |
Total Asset-Backed Securities | | | | | | | 2,107,117 | |
| | | | | | | | |
Collateralized Mortgage Obligations (2.9%) | |
Angel Oak Mortgage Trust, | |
Series 2019-5 A2
2.716%, 10/25/49 (l)§ | | | 2,335,280 | | | | 2,361,811 | |
Connecticut Avenue Securities Trust, | |
Series 2018-R07 1M2
2.549%, 4/25/31 (l)§ | | | 481,761 | | | | 479,089 | |
FNMA, | | | | | | | | |
Series 2018-C06 1M2
2.149%, 3/25/31 (l) | | | 487,558 | | | | 472,875 | |
Residential Mortgage Loan Trust, | |
Series 2019-3 A1
2.633%, 9/25/59 (l)§ | | | 1,154,028 | | | | 1,175,769 | |
TDA CAM FTA, | |
Series 9 B
0.000%, 4/28/50 (l)(m) | | EUR | 800,000 | | | | 702,173 | |
| | | | | | | | |
Total Collateralized Mortgage Obligations | | | | | | | 5,191,717 | |
| | | | | | | | |
Commercial Mortgage-Backed Securities (4.1%) | |
Credit Suisse Mortgage Capital Certificates, | |
Series 2019-ICE4 A
1.128%, 5/15/36 (l)§ | | $ | 730,000 | | | | 729,092 | |
FREMF Mortgage Trust, | |
Series 2015-K48 B
3.639%, 8/25/48 (l)§ | | | 2,710,000 | | | | 2,924,987 | |
Series 2017-K61 C
3.684%, 12/25/49 (l)§ | | | 1,305,000 | | | | 1,360,383 | |
JPMBB Commercial Mortgage Securities Trust, | |
Series 2015-C32 C
4.654%, 11/15/48 (l) | | | 2,765,280 | | | | 2,308,435 | |
| | | | | | | | |
Total Commercial Mortgage-Backed Securities | | | | | | | 7,322,897 | |
| | | | | | | | |
Corporate Bonds (48.1%) | | | | | | | | |
Communication Services (1.8%) | | | | | |
Entertainment (0.7%) | | | | | | | | |
Walt Disney Co. (The)
4.625%, 3/23/40 | | | 275,000 | | | | 347,083 | |
4.700%, 3/23/50 | | | 710,000 | | | | 926,309 | |
| | | | | | | | |
| | | | | | | 1,273,392 | |
| | | | | | | | |
Interactive Media & Services (1.1%) | | | | | |
Baidu, Inc. | | | | | | | | |
2.375%, 10/9/30 | | | 390,000 | | | | 395,487 | |
Tencent Holdings Ltd. | | | | | | | | |
3.240%, 6/3/50§ | | | 1,450,000 | | | | 1,456,163 | |
| | | | | | | | |
| | | | | | | 1,851,650 | |
| | | | | | | | |
Total Communication Services | | | | | | | 3,125,042 | |
| | | | | | | | |
Consumer Discretionary (3.4%) | | | | | |
Automobiles (0.9%) | | | | | | | | |
General Motors Co. | | | | | | | | |
6.800%, 10/1/27 | | | 470,000 | | | | 580,022 | |
6.250%, 10/2/43 | | | 835,000 | | | | 1,025,435 | |
| | | | | | | | |
| | | | | | | 1,605,457 | |
| | | | | | | | |
Hotels, Restaurants & Leisure (2.5%) | | | | | |
Marriott International, Inc. | |
Series GG
3.500%, 10/15/32 | | | 3,375,000 | | | | 3,333,262 | |
McDonald’s Corp. | | | | | | | | |
3.600%, 7/1/30 | | | 80,000 | | | | 92,080 | |
3.625%, 9/1/49 | | | 105,000 | | | | 117,275 | |
4.200%, 4/1/50 | | | 320,000 | | | | 388,418 | |
Scientific Games International, Inc. | | | | | | | | |
5.000%, 10/15/25§ | | | 535,000 | | | | 535,669 | |
| | | | | | | | |
| | | | | | | 4,466,704 | |
| | | | | | | | |
Total Consumer Discretionary | | | | | | | 6,072,161 | |
| | | | | | | | |
Consumer Staples (3.2%) | | | | | | | | |
Beverages (1.0%) | | | | | | | | |
Anheuser-Busch InBev Worldwide, Inc. | | | | | | | | |
4.500%, 6/1/50 | | | 1,480,000 | | | | 1,753,502 | |
| | | | | | | | |
Food & Staples Retailing (1.9%) | | | | | |
Walgreens Boots Alliance, Inc. | | | | | | | | |
4.650%, 6/1/46 | | | 1,530,000 | | | | 1,656,151 | |
4.100%, 4/15/50 | | | 1,700,000 | | | | 1,704,313 | |
| | | | | | | | |
| | | | | | | 3,360,464 | |
| | | | | | | | |
Food Products (0.3%) | | | | | | | | |
BRF SA | | | | | | | | |
4.875%, 1/24/30§ | | | 510,000 | | | | 510,775 | |
| | | | | | | | |
Total Consumer Staples | | | | | | | 5,624,741 | |
| | | | | | | | |
Energy (7.4%) | | | | | | | | |
Oil, Gas & Consumable Fuels (7.4%) | | | | | |
Apache Corp. | | | | | | | | |
4.250%, 1/15/44 | | | 2,055,000 | | | | 1,741,613 | |
Cheniere Energy, Inc. | | | | | | | | |
4.625%, 10/15/28§ | | | 195,000 | | | | 202,129 | |
Concho Resources, Inc. | | | | | | | | |
4.875%, 10/1/47 | | | 1,235,000 | | | | 1,518,329 | |
Devon Energy Corp. | | | | | | | | |
5.600%, 7/15/41 | | | 190,000 | | | | 195,643 | |
5.000%, 6/15/45 | | | 90,000 | | | | 86,874 | |
Exxon Mobil Corp. | | | | | | | | |
4.114%, 3/1/46 | | | 1,250,000 | | | | 1,424,866 | |
See Notes to Financial Statements.
7
1290 FUNDS
1290 DIVERSIFIED BOND FUND
PORTFOLIO OF INVESTMENTS (Continued)
October 31, 2020
| | | | | | | | |
| | | |
| | | Principal Amount | | | Value
(Note 1) | |
Occidental Petroleum Corp. | | | | | | | | |
4.200%, 3/15/48 | | $ | 2,415,000 | | | $ | 1,569,750 | |
Petrobras Global Finance BV | | | | | | | | |
6.900%, 3/19/49 | | | 2,280,000 | | | | 2,580,139 | |
Petroleos Mexicanos | | | | | | | | |
6.500%, 6/2/41 | | | 665,000 | | | | 513,712 | |
7.690%, 1/23/50 | | | 3,065,000 | | | | 2,543,797 | |
Total Capital International SA
3.127%, 5/29/50 | | | 780,000 | | | | 770,564 | |
| | | | | | | | |
| | | | | | | 13,147,416 | |
| | | | | | | | |
Total Energy | | | | | | | 13,147,416 | |
| | | | | | | | |
Financials (8.4%) | | | | | | | | |
Banks (6.2%) | | | | | | | | |
Banco Mercantil del Norte SA | | | | | | | | |
(US Treasury Yield Curve Rate T Note Constant Maturity
5 Year + 4.97%),
6.750%, 9/27/24 (k)(m)(y) | | | 1,695,000 | | | | 1,688,644 | |
Bank of America Corp. | | | | | | | | |
(ICE LIBOR USD 3 Month + 3.15%), 4.083%, 3/20/51 (k) | | | 1,860,000 | | | | 2,271,069 | |
Bank of Nova Scotia (The) | | | | | | | | |
(SOFR + 0.55%), 0.650%, 9/15/23 (k) | | | 3,575,000 | | | | 3,574,486 | |
Itau Unibanco Holding SA | | | | | | | | |
(US Treasury Yield Curve Rate T Note Constant Maturity
5 Year + 3.98%),
6.125%, 12/12/22 (k)(m)(y) | | | 1,660,000 | | | | 1,583,432 | |
Wells Fargo & Co. | | | | | | | | |
(ICE LIBOR USD 3 Month + 3.77%), 4.478%, 4/4/31 (k) | | | 1,020,000 | | | | 1,225,879 | |
(ICE LIBOR USD 3 Month + 4.24%), 5.013%, 4/4/51 (k) | | | 515,000 | | | | 692,468 | |
| | | | | | | | |
| | | | | | | 11,035,978 | |
| | | | | | | | |
Capital Markets (1.8%) | | | | | | | | |
Ares Capital Corp. | | | | | | | | |
4.250%, 3/1/25 | | | 280,000 | | | | 292,706 | |
FS KKR Capital Corp. | | | | | | | | |
4.750%, 5/15/22 | | | 287,000 | | | | 293,684 | |
4.625%, 7/15/24 | | | 150,000 | | | | 151,627 | |
Intercontinental Exchange, Inc. | | | | | | | | |
3.000%, 6/15/50 | | | 910,000 | | | | 941,789 | |
Owl Rock Capital Corp. | | | | | | | | |
5.250%, 4/15/24 | | | 1,110,000 | | | | 1,164,746 | |
4.000%, 3/30/25 | | | 335,000 | | | | 336,569 | |
| | | | | | | | |
| | | | | | | 3,181,121 | |
| | | | | | | | |
Insurance (0.4%) | | | | | | | | |
Markel Corp. | | | | | | | | |
3.350%, 9/17/29 | | | 165,000 | | | | 181,007 | |
Teachers Insurance & Annuity Association of America | | | | | | | | |
3.300%, 5/15/50§ | | | 475,000 | | | | 481,748 | |
| | | | | | | | |
| | | | | | | 662,755 | |
| | | | | | | | |
Total Financials | | | | | | | 14,879,854 | |
| | | | | | | | |
Health Care (0.6%) | | | | | | | | |
Biotechnology (0.6%) | | | | | | | | |
Amgen, Inc. | | | | | | | | |
3.150%, 2/21/40 | | | 815,000 | | | | 857,387 | |
3.375%, 2/21/50 | | | 235,000 | | | | 249,919 | |
| | | | | | | | |
| | | | | | | 1,107,306 | |
| | | | | | | | |
Total Health Care | | | | | | | 1,107,306 | |
| | | | | | | | |
Industrials (8.6%) | | | | | | | | |
Aerospace & Defense (3.5%) | | | | | | | | |
Boeing Co. (The) | | | | | | | | |
3.750%, 2/1/50 | | | 3,665,000 | | | | 3,246,191 | |
5.805%, 5/1/50 | | | 845,000 | | | | 994,051 | |
3.950%, 8/1/59 | | | 365,000 | | | | 331,111 | |
Embraer Netherlands Finance BV | | | | | | | | |
6.950%, 1/17/28§ | | | 1,645,000 | | | | 1,644,105 | |
| | | | | | | | |
| | | | | | | 6,215,458 | |
| | | | | | | | |
Airlines (2.3%) | | | | | | | | |
Delta Air Lines, Inc. | | | | | | | | |
7.000%, 5/1/25§ | | | 693,000 | | | | 756,236 | |
4.750%, 10/20/28§ | | | 1,665,000 | | | | 1,698,300 | |
Southwest Airlines Co. | | | | | | | | |
5.125%, 6/15/27 | | | 1,505,000 | | | | 1,673,545 | |
| | | | | | | | |
| | | | | | | 4,128,081 | |
| | | | | | | | |
Construction & Engineering (0.8%) | | | | | |
Valmont Industries, Inc. | | | | | | | | |
5.000%, 10/1/44 | | | 1,300,000 | | | | 1,424,044 | |
| | | | | | | | |
Industrial Conglomerates (2.0%) | | | | | |
3M Co. | | | | | | | | |
3.700%, 4/15/50 | | | 285,000 | | | | 338,443 | |
General Electric Co. | | | | | | | | |
4.350%, 5/1/50 | | | 2,940,000 | | | | 3,123,232 | |
| | | | | | | | |
| | | | | | | 3,461,675 | |
| | | | | | | | |
Total Industrials | | | | | | | 15,229,258 | |
| | | | | | | | |
Information Technology (6.9%) | | | | | |
IT Services (1.2%) | | | | | | | | |
International Business Machines Corp. | | | | | | | | |
4.250%, 5/15/49 | | | 1,805,000 | | | | 2,224,576 | |
| | | | | | | | |
Semiconductors & Semiconductor Equipment (1.4%) | |
Intel Corp. | | | | | | | | |
4.750%, 3/25/50 | | | 625,000 | | | | 853,620 | |
4.950%, 3/25/60 | | | 150,000 | | | | 217,006 | |
NVIDIA Corp. | | | | | | | | |
3.500%, 4/1/40 | | | 195,000 | | | | 225,657 | |
3.500%, 4/1/50 | | | 485,000 | | | | 560,630 | |
NXP BV | | | | | | | | |
3.400%, 5/1/30§ | | | 515,000 | | | | 566,227 | |
| | | | | | | | |
| | | | | | | 2,423,140 | |
| | | | | | | | |
Software (2.7%) | | | | | | | | |
Oracle Corp. | | | | | | | | |
3.600%, 4/1/50 | | | 1,010,000 | | | | 1,101,306 | |
3.850%, 4/1/60 | | | 1,690,000 | | | | 1,928,147 | |
VMware, Inc. | | | | | | | | |
4.700%, 5/15/30 | | | 1,465,000 | | | | 1,722,763 | |
| | | | | | | | |
| | | | | | | 4,752,216 | |
| | | | | | | | |
See Notes to Financial Statements.
8
1290 FUNDS
1290 DIVERSIFIED BOND FUND
PORTFOLIO OF INVESTMENTS (Continued)
October 31, 2020
| | | | | | | | |
| | | |
| | | Principal Amount | | | Value
(Note 1) | |
Technology Hardware, Storage & Peripherals (1.6%) | |
Dell International LLC | | | | | | | | |
7.125%, 6/15/24§ | | $ | 485,000 | | | $ | 500,956 | |
6.020%, 6/15/26§ | | | 1,955,000 | | | | 2,318,122 | |
Hewlett Packard Enterprise Co. | | | | | | | | |
6.200%, 10/15/35 (e) | | | 75,000 | | | | 92,813 | |
| | | | | | | | |
| | | | | | | 2,911,891 | |
| | | | | | | | |
Total Information Technology | | | | | | | 12,311,823 | |
| | | | | | | | |
Materials (6.0%) | | | | | | | | |
Chemicals (0.3%) | | | | | | | | |
LYB International Finance III LLC | | | | | | | | |
4.200%, 5/1/50 | | | 510,000 | | | | 554,098 | |
| | | | | | | | |
Construction Materials (0.8%) | | | | | |
Cemex SAB de CV | | | | | | | | |
7.375%, 6/5/27§ | | | 1,290,000 | | | | 1,422,225 | |
| | | | | | | | |
Metals & Mining (4.9%) | | | | | | | | |
Anglo American Capital plc | | | | | | | | |
5.625%, 4/1/30§ | | | 1,365,000 | | | | 1,678,422 | |
First Quantum Minerals Ltd. | | | | | | | | |
6.500%, 3/1/24§ | | | 590,000 | | | | 585,575 | |
Freeport-McMoRan, Inc. | | | | | | | | |
5.450%, 3/15/43 | | | 3,165,000 | | | | 3,592,275 | |
Steel Dynamics, Inc. | | | | | | | | |
3.450%, 4/15/30 | | | 1,145,000 | | | | 1,261,576 | |
3.250%, 10/15/50 | | | 1,638,000 | | | | 1,587,530 | |
| | | | | | | | |
| | | | | | | 8,705,378 | |
| | | | | | | | |
Total Materials | | | | | | | 10,681,701 | |
| | | | | | | | |
Utilities (1.8%) | | | | | | | | |
Independent Power and Renewable Electricity Producers (0.9%) | |
AES Corp. (The) | | | | | | | | |
3.950%, 7/15/30§ | | | 1,450,000 | | | | 1,603,943 | |
| | | | | | | | |
Multi-Utilities (0.9%) | | | | | | | | |
Consolidated Edison Co. of New York, Inc. | |
Series 20A 3.350%, 4/1/30 | | | 1,145,000 | | | | 1,305,113 | |
Series 20B 3.950%, 4/1/50 | | | 210,000 | | | | 249,101 | |
| | | | | | | | |
| | | | | | | 1,554,214 | |
| | | | | | | | |
Total Utilities | | | | | | | 3,158,157 | |
| | | | | | | | |
Total Corporate Bonds | | | | | | | 85,337,459 | |
| | | | | | | | |
Foreign Government Securities (21.6%) | |
Commonwealth of Australia | |
5.750%, 7/15/22 (m) | | AUD | 6,695,000 | | | | 5,156,978 | |
Mex Bonos Desarr Fix Rt | | | | | | | | |
8.000%, 11/7/47 | | MXN | 199,000,000 | | | | 10,170,353 | |
Series M 6.500%, 6/9/22 | | | 71,400,000 | | | | 3,469,185 | |
Republic of Indonesia | | | | | | | | |
7.500%, 6/15/35 | | IDR | 46,700,000,000 | | | | 3,290,953 | |
7.500%, 4/15/40 | | | 53,300,000,000 | | | | 3,726,445 | |
Republic of South Africa | | | | | | | | |
8.750%, 2/28/48 | | ZAR | 271,330,000 | | | | 12,644,974 | |
| | | | | | | | |
Total Foreign Government Securities | | | | | | | 38,458,888 | |
| | | | | | | | |
U.S. Treasury Obligations (17.5%) | |
U.S. Treasury Notes | | | | | | | | |
(US Treasury 3 Month Bill Money Market Yield + 0.11%), 0.214%, 4/30/22 (k) | | $ | 17,540,000 | | | | 17,556,898 | |
(US Treasury 3 Month Bill Money Market Yield + 0.06%), 0.155%, 7/31/22 (k) | | | 13,475,000 | | | | 13,474,683 | |
| | | | | | | | |
Total U.S. Treasury Obligations | | | | | | | 31,031,581 | |
| | | | | | | | |
Total Long-Term Debt Securities (95.4%)
(Cost $165,464,106) | | | | | | | 169,449,659 | |
| | | | | | | | |
| | | |
| | | Number of
Shares | | | Value
(Note 1) | |
| | |
SHORT-TERM INVESTMENT: | | | | | | | | |
Investment Company (2.1%) | | | | | | | | |
JPMorgan Prime Money Market Fund, IM Shares | | | 3,677,346 | | | | 3,679,553 | |
| | | | | | | | |
Total Short-Term Investment (2.1%)
(Cost $3,679,892) | | | | | | | 3,679,553 | |
| | | | | | | | |
Total Investments in Securities (97.5%)
(Cost $169,143,998) | | | | | | | 173,129,212 | |
Other Assets Less Liabilities (2.5%) | | | | | | | 4,373,615 | |
| | | | | | | | |
Net Assets (100%) | | | | | | $ | 177,502,827 | |
| | | | | | | | |
| § | Securities exempt from registration under Rule 144A of the Securities Act of 1933. These securities may only be resold to qualified institutional buyers. At October 31, 2020, the market value of these securities amounted to $25,358,921 or 14.3% of net assets. Securities denoted with “§” but without “b” have been determined to be liquid under the guidelines established by the Board of Trustees. To the extent any securities might provide a right to demand registration, such rights have not been relied upon when determining liquidity. |
| (e) | Step Bond - Coupon rate increases or decreases in increments to maturity. Rate disclosed is as of October 31, 2020. Maturity date disclosed is the ultimate maturity date. |
| (k) | Variable or floating rate security, linked to the referenced benchmark. The interest rate shown was the current rate as of October 31, 2020. |
| (l) | Variable or floating rate security, the interest rate of which adjusts periodically based on changes in current interest rates and prepayments on the underlying pool of assets. The interest rate shown was the current rate as of October 31, 2020. |
| (m) | Regulation S is an exemption for securities offerings that are made outside of the United States and do not involve direct selling efforts in the United States. Resale restrictions may apply for purposes of the Securities Act of 1933. At October 31, 2020, the market value of these securities amounted to $9,131,227 or 5.1% of net assets. |
| (y) | Securities are perpetual and, thus, do not have a predetermined maturity date. The coupon rate for these securities are fixed for a period of time and may be structured to adjust thereafter. The date shown, if applicable, reflects the next call date. The coupon rate shown is the rate in effect as of October 31, 2020. |
See Notes to Financial Statements.
9
1290 FUNDS
1290 DIVERSIFIED BOND FUND
PORTFOLIO OF INVESTMENTS (Continued)
October 31, 2020
Glossary:
| | EUR | — European Currency Unit |
| | FNMA | — Federal National Mortgage Association |
| | ICE | — Intercontinental Exchange |
| | LIBOR | — London Interbank Offered Rate |
| | SOFR | — Secured Overnight Financing Rate |
| | USD | — United States Dollar |
| | | | |
| | |
Country Diversification As a Percentage of Total Net Assets | | | |
Australia | | | 2.9 | % |
Belgium | | | 1.0 | |
Brazil | | | 3.6 | |
Canada | | | 2.0 | |
China | | | 1.0 | |
France | | | 0.4 | |
Indonesia | | | 3.9 | |
Mexico | | | 11.2 | |
Netherlands | | | 0.3 | |
South Africa | | | 8.1 | |
Spain | | | 0.4 | |
United States | | | 62.4 | |
Zambia | | | 0.3 | |
Cash and Other | | | 2.5 | |
| | | | | |
| | | | 100.0 | % |
| | | | | |
Futures contracts outstanding as of October 31, 2020 (Note 1):
| | | | | | | | | | | | | | | | | | | | |
Description | | Number of
Contracts | | | Expiration
Date | | | Trading
Currency | | | Notional
Amount ($) | | | Value and
Unrealized
Appreciation
(Depreciation) ($) | |
Short Contracts | | | | | | | | | | | | | | | | | | | | |
Euro-OAT | | | (99 | ) | | | 12/2020 | | | | EUR | | | | (19,613,743 | ) | | | (266,585 | ) |
U.S. Treasury 10 Year Note | | | (141 | ) | | | 12/2020 | | | | USD | | | | (19,488,844 | ) | | | 138,547 | |
U.S. Treasury Ultra Bond | | | (102 | ) | | | 12/2020 | | | | USD | | | | (21,930,000 | ) | | | 532,638 | |
| | | | | | | | | | | | | | | | | | | | |
| | | | | | | | | | | | | | | | | | | 404,600 | |
| | | | | | | | | | | | | | | | | | | | |
See Notes to Financial Statements.
10
1290 FUNDS
1290 DIVERSIFIED BOND FUND
PORTFOLIO OF INVESTMENTS (Continued)
October 31, 2020
Forward Foreign Currency Contracts outstanding as of October 31, 2020 (Note 1):
| | | | | | | | | | | | | | | | | | | | |
Currency Purchased | | | Currency Sold | | | Counterparty | | Settlement
Date | | | Unrealized
Appreciation
(Depreciation) ($) | |
NZD | | | 11,010,000 | | | USD | | | 7,261,205 | | | HSBC Bank plc | | | 11/4/2020 | | | | 18,607 | |
USD | | | 13,644,774 | | | NZD | | | 20,520,000 | | | JPMorgan Chase Bank | | | 11/4/2020 | | | | 76,950 | |
MXN | | | 170,600,000 | | | USD | | | 7,761,531 | | | JPMorgan Chase Bank | | | 11/5/2020 | | | | 279,274 | |
USD | | | 2,757,534 | | | PEN | | | 9,800,000 | | | HSBC Bank plc** | | | 11/6/2020 | | | | 47,014 | |
ZAR | | | 55,400,000 | | | USD | | | 3,302,278 | | | JPMorgan Chase Bank | | | 11/13/2020 | | | | 98,070 | |
USD | | | 5,282,088 | | | RUB | | | 411,000,000 | | | Citibank NA** | | | 11/17/2020 | | | | 115,913 | |
USD | | | 17,865,901 | | | HUF | | | 5,530,000,000 | | | HSBC Bank plc | | | 11/18/2020 | | | | 312,387 | |
USD | | | 8,332,866 | | | AUD | | | 11,780,000 | | | HSBC Bank plc | | | 11/25/2020 | | | | 51,736 | |
USD | | | 7,430,088 | | | AUD | | | 10,360,000 | | | JPMorgan Chase Bank | | | 11/25/2020 | | | | 147,193 | |
KRW | | | 3,060,000,000 | | | USD | | | 2,582,714 | | | HSBC Bank plc** | | | 12/11/2020 | | | | 113,923 | |
USD | | | 13,051,506 | | | CHF | | | 11,840,000 | | | Goldman Sachs Bank USA | | | 12/11/2020 | | | | 123,753 | |
USD | | | 3,345,834 | | | CHF | | | 3,050,000 | | | HSBC Bank plc | | | 12/11/2020 | | | | 15,627 | |
USD | | | 8,433,475 | | | EUR | | | 7,190,000 | | | Citibank NA | | | 1/12/2021 | | | | 44,662 | |
USD | | | 5,084,664 | | | EUR | | | 4,300,000 | | | HSBC Bank plc | | | 1/12/2021 | | | | 67,711 | |
MXN | | | 6,500,000 | | | USD | | | 301,568 | | | Citibank NA | | | 2/3/2021 | | | | 1,696 | |
| | | | | | | | | | | | | | | | | | | | |
Total unrealized appreciation | | | | | | | 1,514,516 | |
| | | | | | | | | | | | | | | | | | | | |
NZD | | | 9,830,000 | | | USD | | | 6,567,472 | | | JPMorgan Chase Bank | | | 11/4/2020 | | | | (67,876 | ) |
USD | | | 210,493 | | | NZD | | | 320,000 | | | Morgan Stanley | | | 11/4/2020 | | | | (1,091 | ) |
USD | | | 6,868,885 | | | MXN | | | 156,800,000 | | | Citibank NA | | | 11/5/2020 | | | | (521,492 | ) |
USD | | | 608,862 | | | MXN | | | 13,800,000 | | | National Australia Bank Ltd. | | | 11/5/2020 | | | | (41,567 | ) |
PEN | | | 9,800,000 | | | USD | | | 2,788,265 | | | HSBC Bank plc** | | | 11/6/2020 | | | | (77,745 | ) |
USD | | | 8,996,089 | | | ZAR | | | 151,600,000 | | | Citibank NA | | | 11/13/2020 | | | | (308,833 | ) |
USD | | | 3,435,512 | | | ZAR | | | 60,700,000 | | | HSBC Bank plc | | | 11/13/2020 | | | | (290,140 | ) |
USD | | | 2,956,324 | | | ZAR | | | 50,800,000 | | | JPMorgan Chase Bank | | | 11/13/2020 | | | | (161,684 | ) |
USD | | | 198,835 | | | ZAR | | | 3,400,000 | | | Morgan Stanley | | | 11/13/2020 | | | | (9,851 | ) |
RUB | | | 1,110,000,000 | | | USD | | | 14,583,477 | | | Citibank NA** | | | 11/17/2020 | | | | (631,034 | ) |
HUF | | | 4,180,000,000 | | | USD | | | 13,708,763 | | | HSBC Bank plc | | | 11/18/2020 | | | | (440,465 | ) |
HUF | | | 1,350,000,000 | | | USD | | | 4,370,161 | | | Morgan Stanley | | | 11/18/2020 | | | | (84,945 | ) |
CZK | | | 191,000,000 | | | USD | | | 8,342,068 | | | HSBC Bank plc | | | 11/19/2020 | | | | (177,930 | ) |
GBP | | | 200,000 | | | USD | | | 267,703 | | | Citibank NA | | | 11/20/2020 | | | | (8,575 | ) |
GBP | | | 7,150,000 | | | USD | | | 9,422,823 | | | HSBC Bank plc | | | 11/20/2020 | | | | (159,010 | ) |
USD | | | 4,587,623 | | | GBP | | | 3,560,000 | | | Citibank NA | | | 11/20/2020 | | | | (24,849 | ) |
USD | | | 2,965,753 | | | GBP | | | 2,320,000 | | | HSBC Bank plc | | | 11/20/2020 | | | | (40,127 | ) |
AUD | | | 10,360,000 | | | USD | | | 7,615,636 | | | HSBC Bank plc | | | 11/25/2020 | | | | (332,740 | ) |
AUD | | | 11,780,000 | | | USD | | | 8,474,827 | | | JPMorgan Chase Bank | | | 11/25/2020 | | | | (193,696 | ) |
CLP | | | 7,810,000,000 | | | USD | | | 10,199,151 | | | HSBC Bank plc** | | | 12/4/2020 | | | | (101,407 | ) |
USD | | | 6,075,564 | | | CLP | | | 4,815,000,000 | | | HSBC Bank plc** | | | 12/4/2020 | | | | (149,870 | ) |
GBP | | | 4,810,000 | | | USD | | | 6,398,238 | | | Citibank NA | | | 12/8/2020 | | | | (165,368 | ) |
GBP | | | 120,000 | | | USD | | | 159,120 | | | JPMorgan Chase Bank | | | 12/8/2020 | | | | (3,622 | ) |
USD | | | 2,617,432 | | | KRW | | | 3,060,000,000 | | | HSBC Bank plc** | | | 12/11/2020 | | | | (79,206 | ) |
EUR | | | 6,500,000 | | | USD | | | 7,640,685 | | | Citibank NA | | | 1/12/2021 | | | | (56,918 | ) |
BRL | | | 36,900,000 | | | USD | | | 6,593,878 | | | HSBC Bank plc** | | | 1/14/2021 | | | | (179,575 | ) |
COP | | | 65,800,000,000 | | | USD | | | 16,973,856 | | | JPMorgan Chase Bank** | | | 1/22/2021 | | | | (36,343 | ) |
USD | | | 5,301,305 | | | JPY | | | 555,000,000 | | | JPMorgan Chase Bank | | | 1/26/2021 | | | | (6,577 | ) |
USD | | | 8,876,704 | | | ZAR | | | 147,000,000 | | | HSBC Bank plc | | | 1/29/2021 | | | | (63,668 | ) |
| | | | | | | | | | | | | | | | | | | | |
Total unrealized depreciation | | | | | | | (4,416,204 | ) |
| | | | | | | | | | | | | | | | | | | | |
Net unrealized depreciation | | | | | | | (2,901,688 | ) |
| | | | | | | | | | | | | | | | | | | | |
| ** | Non-deliverable forward. |
See Notes to Financial Statements.
11
1290 FUNDS
1290 DIVERSIFIED BOND FUND
PORTFOLIO OF INVESTMENTS (Continued)
October 31, 2020
Centrally Cleared Credit default swap contracts outstanding — sell protection as of October 31, 2020 (Note 1):
| | | | | | | | | | | | | | | | | | | | | | | | | | | | | | | | |
Reference
Obligation/Index | | Financing
Rate (Paid) /
Received
by the
Fund (%) | | | Frequency of
Payments
Made/
Received | | | Maturity
Date | | | Implied
Credit
Spread (%) | | | Notional
Amount | | | Upfront
(Payments)
Receipts ($) | | | Unrealized
Appreciation
(Depreciation) ($) | | | Value ($) | |
Goodyear Tire & Rubber Co. (The) | | | 5.00 | | | | Quarterly | | | | 6/20/2022 | | | | 1.30 | | | USD | 1,010,000 | | | | 62,960 | | | | 3,780 | | | | 66,740 | |
United States Steel Corp. | | | 5.00 | | | | Quarterly | | | | 6/20/2021 | | | | 4.95 | | | USD | 520,000 | | | | 13,094 | | | | (10,049 | ) | | | 3,045 | |
| | | | | | | | | | | | | | | | | | | | | | | | | | | | | | | | |
| | | | | | | | | | | | | | | | | | | | | | | 76,054 | | | | (6,269 | ) | | | 69,785 | |
| | | | | | | | | | | | | | | | | | | | | | | | | | | | | | | | |
Centrally Cleared Credit default swap contracts outstanding — buy protection as of October 31, 2020 (Note 1):
| | | | | | | | | | | | | | | | | | | | | | | | | | | | | | | | |
Reference
Obligation/Index | | Financing
Rate (Paid) /
Received
by the
Fund (%) | | | Frequency of
Payments
Made/
Received | | | Maturity
Date | | | Implied
Credit
Spread (%) | | | Notional
Amount | | | Upfront
(Payments)
Receipts ($) | | | Unrealized
Appreciation
(Depreciation) ($) | | | Value ($) | |
CDX North American High Yield Index Series 35-V1 | | | 5.00 | | | | Quarterly | | | | 12/20/2025 | | | | 4.23 | | | USD | 8,435,000 | | | | (324,633 | ) | | | (11,917 | ) | | | (336,550 | ) |
| | | | | | | | | | | | | | | | | | | | | | | | | | | | | | | | |
Total Centrally Cleared Credit default swap contracts outstanding | | | | (248,579 | ) | | | (18,186 | ) | | | (266,765 | ) |
| | | | | | | | | | | | | | | | | | | | | | | | | | | | | | | | |
The following is a summary of the inputs used to value the Fund’s assets and liabilities carried at fair value as of October 31, 2020:
The inputs or methodology used for valuing securities are not necessarily an indication of the risk associated with investing in those securities.
Various inputs are used in determining the value of the Fund’s investments. These inputs are summarized in the three broad levels listed below:
| | | | | | | | | | | | | | | | |
| | | | | |
| Investment Type | | Level 1
Quoted Prices in
Active Markets for
Identical
Securities | | | Level 2
Significant Other
Observable Inputs
(including quoted prices
for similar securities,
interest rates,
prepayment speeds,
credit risk, etc.) | | | Level 3
Significant Unobservable
Inputs (including the
Fund’s own
assumptions in
determining the fair
value of investments) | | | Total | |
Assets: | |
Asset-Backed Securities | | $ | — | | | $ | 2,107,117 | | | $ | — | | | $ | 2,107,117 | |
Centrally Cleared Credit Default Swaps | | | — | | | | 3,780 | | | | — | | | | 3,780 | |
Collateralized Mortgage Obligations | | | — | | | | 5,191,717 | | | | — | | | | 5,191,717 | |
Commercial Mortgage-Backed Securities | | | — | | | | 7,322,897 | | | | — | | | | 7,322,897 | |
Corporate Bonds | | | | | | | | | | | | | | | | |
Communication Services | | | — | | | | 3,125,042 | | | | — | | | | 3,125,042 | |
Consumer Discretionary | | | — | | | | 6,072,161 | | | | — | | | | 6,072,161 | |
Consumer Staples | | | — | | | | 5,624,741 | | | | — | | | | 5,624,741 | |
Energy | | | — | | | | 13,147,416 | | | | — | | | | 13,147,416 | |
Financials | | | — | | | | 14,879,854 | | | | — | | | | 14,879,854 | |
Health Care | | | — | | | | 1,107,306 | | | | — | | | | 1,107,306 | |
Industrials | | | — | | | | 15,229,258 | | | | — | | | | 15,229,258 | |
Information Technology | | | — | | | | 12,311,823 | | | | — | | | | 12,311,823 | |
Materials | | | — | | | | 10,681,701 | | | | — | | | | 10,681,701 | |
Utilities | | | — | | | | 3,158,157 | | | | — | | | | 3,158,157 | |
See Notes to Financial Statements.
12
1290 FUNDS
1290 DIVERSIFIED BOND FUND
PORTFOLIO OF INVESTMENTS (Continued)
October 31, 2020
| | | | | | | | | | | | | | | | |
| | | | | |
| Investment Type | | Level 1
Quoted Prices in
Active Markets for
Identical
Securities | | | Level 2
Significant Other
Observable Inputs
(including quoted prices
for similar securities,
interest rates,
prepayment speeds,
credit risk, etc.) | | | Level 3
Significant Unobservable
Inputs (including the
Fund’s own
assumptions in
determining the fair
value of investments) | | | Total | |
Foreign Government Securities | | $ | — | | | $ | 38,458,888 | | | $ | — | | | $ | 38,458,888 | |
Forward Currency Contracts | | | — | | | | 1,514,516 | | | | — | | | | 1,514,516 | |
Futures | | | 671,185 | | | | — | | | | — | | | | 671,185 | |
Short-Term Investment | | | | | | | | | | | | | | | | |
Investment Company | | | 3,679,553 | | | | — | | | | — | | | | 3,679,553 | |
U.S. Treasury Obligations | | | — | | | | 31,031,581 | | | | — | | | | 31,031,581 | |
| | | | | | | | | | | | | | | | |
Total Assets | | $ | 4,350,738 | | | $ | 170,967,955 | | | $ | — | | | $ | 175,318,693 | |
| | | | | | | | | | | | | | | | |
| | | | |
Liabilities: | | | | | | | | | | | | | | | | |
Centrally Cleared Credit Default Swaps | | $ | — | | | $ | (21,966 | ) | | $ | — | | | $ | (21,966 | ) |
Forward Currency Contracts | | | — | | | | (4,416,204 | ) | | | — | | | | (4,416,204 | ) |
Futures | | | (266,585 | ) | | | — | | | | — | | | | (266,585 | ) |
| | | | | | | | | | | | | | | | |
Total Liabilities | | $ | (266,585 | ) | | $ | (4,438,170 | ) | | $ | — | | | $ | (4,704,755 | ) |
| | | | | | | | | | | | | | | | |
Total | | $ | 4,084,153 | | | $ | 166,529,785 | | | $ | — | | | $ | 170,613,938 | |
| | | | | | | | | | | | | | | | |
Fair Values of Derivative Instruments as of October 31, 2020:
| | | | | | |
| | | Statement of Assets and Liabilities | |
Derivatives Contracts^ | | Asset Derivatives | | Fair Value | |
Interest rate contracts | | Receivables, Net assets - Unrealized appreciation | | $ | 671,185 | * |
Foreign exchange contracts | | Receivables | | | 1,514,516 | |
Credit contracts | | Receivables | | | 3,780 | |
| | | | | | |
Total | | | | $ | 2,189,481 | |
| | | | | | |
| | |
| | | Liability Derivatives | | | |
Interest rate contracts | | Payables, Net assets - Unrealized depreciation | | $ | (266,585 | )* |
Foreign exchange contracts | | Payables | | | (4,416,204 | ) |
Credit contracts | | Payables | | | (21,966 | ) |
| | | | | | |
Total | | | | $ | (4,704,755 | ) |
| | | | | | |
| * | Includes cumulative appreciation/depreciation of futures contracts as reported in the Portfolio of Investments. Only variation margin is reported within the Statement of Assets & Liabilities. |
The Effect of Derivative Instruments on the Statement of Operations for the year ended October 31, 2020:
| | | | | | | | | | | | | | | | |
| Amount of Realized Gain or (Loss) on Derivatives Recognized in Income | |
Derivatives Contracts^ | | Futures | | | Forward
Foreign
Currency
Contracts | | | Swaps | | | Total | |
Interest rate contracts | | $ | 1,500,672 | | | $ | — | | | $ | 122,133 | | | $ | 1,622,805 | |
Foreign exchange contracts | | | — | | | | (1,001,536 | ) | | | — | | | | (1,001,536 | ) |
Credit contracts | | | — | | | | — | | | | (1,805,608 | ) | | | (1,805,608 | ) |
| | | | | | | | | | | | | | | | |
Total | | $ | 1,500,672 | | | $ | (1,001,536 | ) | | $ | (1,683,475 | ) | | $ | (1,184,339 | ) |
| | | | | | | | | | | | | | | | |
See Notes to Financial Statements.
13
1290 FUNDS
1290 DIVERSIFIED BOND FUND
PORTFOLIO OF INVESTMENTS (Continued)
October 31, 2020
| | | | | | | | | | | | | | | | |
| Amount of Unrealized Appreciation or (Depreciation) on Derivatives Recognized in Income | |
Derivatives Contracts^ | | Futures | | | Forward
Foreign
Currency
Contracts | | | Swaps | | | Total | |
Interest rate contracts | | $ | 374,592 | | | $ | — | | | $ | — | | | $ | 374,592 | |
Foreign exchange contracts | | | — | | | | (3,068,660 | ) | | | — | | | | (3,068,660 | ) |
Credit contracts | | | — | | | | — | | | | (43,038 | ) | | | (43,038 | ) |
| | | | | | | | | | | | | | | | |
Total | | $ | 374,592 | | | $ | (3,068,660 | ) | | $ | (43,038 | ) | | $ | (2,737,106 | ) |
| | | | | | | | | | | | | | | | |
^ This Fund held forward foreign currency contracts, futures and swaps contracts as a substitute for investing in conventional securities, hedging and in an attempt to enhance returns.
The Fund held swap contracts with an average notional balance of approximately $11,976,000, forward foreign currency contracts with an average settlement value of approximately $172,877,000 and futures contracts with an average notional balance of approximately $42,313,000 during the year ended October 31, 2020.
The following table presents the Fund’s gross derivative assets and liabilities by counterparty net of amounts available for offset under netting arrangements and any related collateral received or pledged by the Fund as of October 31, 2020:
| | | | | | | | | | | | | | | | |
Counterparty | | Gross Amount of
Derivative Assets
Presented in the
Statement of Assets
and Liabilities (a) | | | Derivatives
Available
for Offset | | | Collateral
Received | | | Net Amount Due
from Counterparty | |
Citibank NA | | $ | 162,271 | | | $ | (162,271 | ) | | $ | — | | | $ | — | |
Goldman Sachs Bank USA | | | 123,753 | | | | — | | | | — | | | | 123,753 | |
HSBC Bank plc | | | 627,005 | | | | (627,005 | ) | | | — | | | | — | |
JPMorgan Chase Bank | | | 601,487 | | | | (469,798 | ) | | | (70,000 | ) | | | 61,689 | |
| | | | | | | | | | | | | | | | |
Total | | $ | 1,514,516 | | | $ | (1,259,074 | ) | | $ | (70,000 | ) | | $ | 185,442 | |
| | | | | | | | | | | | | | | | |
| | | | |
Counterparty | | Gross Amount of
Derivative Liabilities
Presented in the
Statement of Assets
and Liabilities (a) | | | Derivatives
Available
for Offset | | | Collateral
Pledged | | | Net Amount Due
to Counterparty | |
Citibank NA | | $ | 1,717,069 | | | $ | (162,271 | ) | | $ | (490,000 | ) | | $ | 1,064,798 | |
HSBC Bank plc | | | 2,091,883 | | | | (627,005 | ) | | | (430,000 | ) | | | 1,034,878 | |
JPMorgan Chase Bank | | | 469,798 | | | | (469,798 | ) | | | — | | | | — | |
Morgan Stanley | | | 95,887 | | | | — | | | | — | | | | 95,887 | |
National Australia Bank Ltd. | | | 41,567 | | | | — | | | | — | | | | 41,567 | |
| | | | | | | | | | | | | | | | |
Total | | $ | 4,416,204 | | | $ | (1,259,074 | ) | | $ | (920,000 | ) | | $ | 2,237,130 | |
| | | | | | | | | | | | | | | | |
| (a) | For financial reporting purposes the Fund does not offset derivative assets and derivative liabilities subject to master netting arrangements in the Statement of Assets and Liabilities. |
Investment security transactions for the year ended October 31, 2020 were as follows:
| | | | |
Cost of Purchases: | | | | |
Long-term investments other than U.S. government debt securities | | $ | 199,525,489 | |
Long-term U.S. government debt securities | | | 108,440,259 | |
| | | | |
| | $ | 307,965,748 | |
| | | | |
Net Proceeds of Sales and Redemptions: | | | | |
Long-term investments other than U.S. government debt securities | | $ | 143,502,986 | |
Long-term U.S. government debt securities | | | 82,931,218 | |
| | | | |
| | $ | 226,434,204 | |
| | | | |
See Notes to Financial Statements.
14
1290 FUNDS
1290 DIVERSIFIED BOND FUND
PORTFOLIO OF INVESTMENTS (Continued)
October 31, 2020
As of October 31, 2020, the gross unrealized appreciation (depreciation) of investments based on the aggregate cost of investments in securities and derivative instruments, if applicable, for Federal income tax purposes was as follows:
| | | | |
Aggregate gross unrealized appreciation | | $ | 9,106,087 | |
Aggregate gross unrealized depreciation | | | (5,675,112 | ) |
| | | | |
Net unrealized appreciation | | $ | 3,430,975 | |
| | | | |
Federal income tax cost of investments in securities and derivative instruments, if applicable | | $ | 166,934,384 | |
| | | | |
See Notes to Financial Statements.
15
1290 FUNDS
1290 DIVERSIFIED BOND FUND
STATEMENT OF ASSETS AND LIABILITIES
October 31, 2020
| | | | |
ASSETS | | | | |
Investments in Securities, at value
(Cost $169,143,998) | | $ | 173,129,212 | |
Cash | | | 1,363,174 | |
Foreign cash (Cost $913) | | | 907 | |
Cash held as collateral for forward foreign currency contracts | | | 920,000 | |
Due from broker for futures variation margin | | | 2,027,510 | |
Receivable for Fund shares sold | | | 1,785,226 | |
Dividends, interest and other receivables | | | 1,755,138 | |
Unrealized appreciation on forward foreign currency contracts | | | 1,514,516 | |
Variation Margin on Centrally Cleared Swaps | | | 1,501,887 | |
Prepaid registration and filing fees | | | 30,043 | |
Other assets | | | 3,961 | |
| | | | |
Total assets | | | 184,031,574 | |
| | | | |
LIABILITIES | | | | |
Unrealized depreciation on forward foreign currency contracts | | | 4,416,204 | |
Payable for securities purchased | | | 1,769,011 | |
Payable for Fund shares redeemed | | | 120,875 | |
Payable for return of cash collateral on forward foreign currency contracts | | | 70,000 | |
Administrative fees payable | | | 15,290 | |
Transfer agent fees payable | | | 6,762 | |
Trustees’ fees payable | | | 3,549 | |
Distribution fees payable – Class A | | | 1,650 | |
Distribution fees payable – Class R | | | 125 | |
Accrued expenses | | | 125,281 | |
| | | | |
Total liabilities | | | 6,528,747 | |
| | | | |
NET ASSETS | | $ | 177,502,827 | |
| | | | |
Net assets were comprised of: | | | | |
Paid in capital | | $ | 171,182,627 | |
Total distributable earnings (loss) | | | 6,320,200 | |
| | | | |
Net assets | | $ | 177,502,827 | |
| | | | |
Class A | | | | |
Net asset value and redemption price per share, $7,795,721 / 730,095 shares outstanding (unlimited amount authorized: $0.001 par value) | | $ | 10.68 | |
Maximum sales charge (4.50% of offering price) | | | 0.50 | |
| | | | |
Maximum offering price per share | | $ | 11.18 | |
| | | | |
Class I | | | | |
Net asset value, offering and redemption price per share, $169,408,721 / 15,824,941 shares outstanding (unlimited amount authorized: $0.001 par value) | | $ | 10.71 | |
| | | | |
Class R | | | | |
Net asset value, offering and redemption price per share, $298,385 / 28,058 shares outstanding (unlimited amount authorized: $0.001 par value) | | $ | 10.63 | |
| | | | |
STATEMENT OF OPERATIONS
For the Year Ended October 31, 2020
| | | | |
INVESTMENT INCOME | | | | |
Interest (net of $75,954 foreign withholding tax) | | $ | 5,341,518 | |
Dividends | | | 31,398 | |
| | | | |
Total income | | | 5,372,916 | |
| | | | |
EXPENSES | |
Investment advisory fees | | | 724,551 | |
Administrative fees | | | 181,139 | |
Professional fees | | | 143,440 | |
Transfer agent fees | | | 118,100 | |
Printing and mailing expenses | | | 81,495 | |
Registration and filing fees | | | 49,429 | |
Custodian fees | | | 45,900 | |
Distribution fees – Class A | | | 15,464 | |
Trustees’ fees | | | 10,234 | |
Distribution fees – Class R | | | 948 | |
Miscellaneous | | | 58,783 | |
| | | | |
Gross expenses | | | 1,429,483 | |
Less: Waiver from investment adviser | | | (809,448 | ) |
| | | | |
Net expenses | | | 620,035 | |
| | | | |
NET INVESTMENT INCOME (LOSS) | | | 4,752,881 | |
| | | | |
REALIZED AND UNREALIZED GAIN (LOSS) | |
Realized gain (loss) on: | | | | |
Investments in securities | | | 3,729,634 | |
Futures contracts | | | 1,500,672 | |
Forward foreign currency contracts | | | (1,001,536 | ) |
Foreign currency transactions | | | (834,304 | ) |
Swaps | | | (1,683,475 | ) |
| | | | |
Net realized gain (loss) | | | 1,710,991 | |
| | | | |
Change in unrealized appreciation (depreciation) on: | |
Investments in securities | | | 4,107,958 | |
Futures contracts | | | 374,592 | |
Forward foreign currency contracts | | | (3,068,660 | ) |
Foreign currency translations | | | 9,144 | |
Swaps | | | (43,038 | ) |
| | | | |
Net change in unrealized appreciation (depreciation) | | | 1,379,996 | |
| | | | |
NET REALIZED AND UNREALIZED GAIN (LOSS) | | | 3,090,987 | |
| | | | |
NET INCREASE (DECREASE) IN NET ASSETS RESULTING FROM OPERATIONS | | $ | 7,843,868 | |
| | | | |
See Notes to Financial Statements.
16
1290 FUNDS
1290 DIVERSIFIED BOND FUND
STATEMENT OF CHANGES IN NET ASSETS
| | | | | | | | |
| | | Year Ended October 31, | |
| | | 2020 | | | 2019 | |
INCREASE (DECREASE) IN NET ASSETS FROM OPERATIONS: | | | | | | | | |
Net investment income (loss) | | $ | 4,752,881 | | | $ | 2,144,112 | |
Net realized gain (loss) | | | 1,710,991 | | | | 2,739,734 | |
Net change in unrealized appreciation (depreciation) | | | 1,379,996 | | | | 1,170,648 | |
| | | | | | | | |
NET INCREASE (DECREASE) IN NET ASSETS RESULTING FROM OPERATIONS | | | 7,843,868 | | | | 6,054,494 | |
| | | | | | | | |
Distributions to shareholders: | | | | | | | | |
Class A | | | (285,275 | ) | | | (81,362 | ) |
Class I | | | (4,265,925 | ) | | | (2,130,998 | ) |
Class R | | | (6,818 | ) | | | (4,205 | ) |
| | | | | | | | |
Total distributions to shareholders | | | (4,558,018 | ) | | | (2,216,565 | ) |
| | | | | | | | |
CAPITAL SHARES TRANSACTIONS: | | | | | | | | |
Class A | | | | | | | | |
Capital shares sold [632,166 and 432,884 shares, respectively] | | | 6,539,329 | | | | 4,348,727 | |
Capital shares issued in reinvestment of dividends [28,380 and 7,599 shares, respectively] | | | 280,472 | | | | 77,418 | |
Capital shares repurchased [(302,477) and (88,427) shares, respectively] | | | (3,076,148 | ) | | | (910,471 | ) |
| | | | | | | | |
Total Class A transactions | | | 3,743,653 | | | | 3,515,674 | |
| | | | | | | | |
Class I | | | | | | | | |
Capital shares sold [10,858,869 and 5,191,046 shares, respectively] | | | 113,708,337 | | | | 52,777,026 | |
Capital shares issued in reinvestment of dividends [286,239 and 87,879 shares, respectively] | | | 2,834,997 | | | | 899,213 | |
Capital shares repurchased [(3,157,638) and (650,622) shares, respectively] | | | (31,454,948 | ) | | | (6,704,718 | ) |
| | | | | | | | |
Total Class I transactions | | | 85,088,386 | | | | 46,971,521 | |
| | | | | | | | |
Class R | | | | | | | | |
Capital shares sold [15,969 and 3,873 shares, respectively] | | | 161,483 | | | | 39,837 | |
Capital shares issued in reinvestment of dividends [209 and 48 shares, respectively] | | | 2,059 | | | | 490 | |
Capital shares repurchased [(2,149) and (17) shares, respectively] | | | (20,526 | ) | | | (166 | ) |
| | | | | | | | |
Total Class R transactions | | | 143,016 | | | | 40,161 | |
| | | | | | | | |
NET INCREASE (DECREASE) IN NET ASSETS RESULTING FROM CAPITAL SHARE TRANSACTIONS | | | 88,975,055 | | | | 50,527,356 | |
| | | | | | | | |
TOTAL INCREASE (DECREASE) IN NET ASSETS | | | 92,260,905 | | | | 54,365,285 | |
NET ASSETS: | |
Beginning of year | | | 85,241,922 | | | | 30,876,637 | |
| | | | | | | | |
End of year | | $ | 177,502,827 | | | $ | 85,241,922 | |
| | | | | | | | |
See Notes to Financial Statements.
17
1290 FUNDS
1290 DIVERSIFIED BOND FUND
FINANCIAL HIGHLIGHTS
| | | | | | | | | | | | | | | | | | | | |
| | | Year Ended October 31, | |
| Class A | | 2020 | | | 2019 | | | 2018 | | | 2017 | | | 2016 | |
Net asset value, beginning of year | | $ | 10.34 | | | $ | 9.52 | | | $ | 10.12 | | | $ | 9.89 | | | $ | 9.82 | |
| | | | | | | | | | | | | | | | | | | | |
Income (loss) from investment operations: | | | | | | | | | | | | | | | | | | | | |
Net investment income (loss) (e) | | | 0.39 | * | | | 0.41 | ** | | | 0.26 | | | | 0.19 | | | | 0.16 | |
Net realized and unrealized gain (loss) | | | 0.43 | | | | 0.80 | | | | (0.40 | ) | | | 0.23 | | | | 0.17 | |
| | | | | | | | | | | | | | | | | | | | |
Total from investment operations | | | 0.82 | | | | 1.21 | | | | (0.14 | ) | | | 0.42 | | | | 0.33 | |
| | | | | | | | | | | | | | | | | | | | |
Less distributions: | |
Dividends from net investment income | | | (0.15 | ) | | | (0.39 | ) | | | (0.43 | ) | | | (0.19 | ) | | | (0.10 | ) |
Distributions from net realized gains | | | (0.33 | ) | | | — | | | | — | | | | — | | | | — | |
Return of capital | | | — | | | | — | | | | (0.03 | ) | | | — | | | | (0.16 | ) |
| | | | | | | | | | | | | | | | | | | | |
Total dividends and distributions | | | (0.48 | ) | | | (0.39 | ) | | | (0.46 | ) | | | (0.19 | ) | | | (0.26 | ) |
| | | | | | | | | | | | | | | | | | | | |
Net asset value, end of year | | $ | 10.68 | | | $ | 10.34 | | | $ | 9.52 | | | $ | 10.12 | | | $ | 9.89 | |
| | | | | | | | | | | | | | | | | | | | |
Total return | | | 8.32 | % | | | 12.97 | % | | | (1.44 | )% | | | 4.25 | % | | | 3.39 | % |
| | | | | | | | | | | | | | | | | | | | |
Ratios/Supplemental Data: | |
Net assets, end of year (000’s) | | $ | 7,796 | | | $ | 3,848 | | | $ | 190 | | | $ | 111 | | | $ | 109 | |
Ratio of expenses to average net assets: | | | | | | | | | | | | | | | | | | | | |
After waivers and reimbursements (f) | | | 0.75 | % | | | 0.75 | % | | | 1.05 | % | | | 1.30 | % | | | 1.40 | % |
Before waivers and reimbursements (f) | | | 1.42 | % | | | 1.55 | % | | | 1.85 | % | | | 1.76 | % | | | 1.84 | % |
Ratio of net investment income (loss) to average net assets: | | | | | | | | | | | | | | | | | | | | |
After waivers and reimbursements (f) | | | 3.76 | %* | | | 4.00 | %** | | | 2.63 | % | | | 1.93 | % | | | 1.68 | % |
Before waivers and reimbursements (f) | | | 3.09 | %* | | | 3.19 | %** | | | 1.83 | % | | | 1.48 | % | | | 1.24 | % |
Portfolio turnover rate^ | | | 200 | % | | | 194 | % | | | 139 | %*** | | | 117 | % | | | 152 | % |
| |
| | | Year Ended October 31, | |
| Class I | | 2020 | | | 2019 | | | 2018 | | | 2017 | | | 2016 | |
Net asset value, beginning of year | | $ | 10.37 | | | $ | 9.53 | | | $ | 10.13 | | | $ | 9.89 | | | $ | 9.82 | |
| | | | | | | | | | | | | | | | | | | | |
Income (loss) from investment operations: | | | | | | | | | | | | | | | | | | | | |
Net investment income (loss) (e) | | | 0.41 | * | | | 0.42 | ** | | | 0.27 | | | | 0.22 | | | | 0.19 | |
Net realized and unrealized gain (loss) | | | 0.41 | | | | 0.84 | | | | (0.38 | ) | | | 0.23 | | | | 0.16 | |
| | | | | | | | | | | | | | | | | | | | |
Total from investment operations | | | 0.82 | | | | 1.26 | | | | (0.11 | ) | | | 0.45 | | | | 0.35 | |
| | | | | | | | | | | | | | | | | | | | |
Less distributions: | |
Dividends from net investment income | | | (0.15 | ) | | | (0.42 | ) | | | (0.46 | ) | | | (0.21 | ) | | | (0.11 | ) |
Distributions from net realized gains | | | (0.33 | ) | | | — | | | | — | | | | — | | | | — | |
Return of capital | | | — | | | | — | | | | (0.03 | ) | | | — | | | | (0.17 | ) |
| | | | | | | | | | | | | | | | | | | | |
Total dividends and distributions | | | (0.48 | ) | | | (0.42 | ) | | | (0.49 | ) | | | (0.21 | ) | | | (0.28 | ) |
| | | | | | | | | | | | | | | | | | | | |
Net asset value, end of year | | $ | 10.71 | | | $ | 10.37 | | | $ | 9.53 | | | $ | 10.13 | | | $ | 9.89 | |
| | | | | | | | | | | | | | | | | | | | |
Total return | | | 8.34 | % | | | 13.43 | % | | | (1.19 | )% | | | 4.58 | % | | | 3.63 | % |
| | | | | | | | | | | | | | | | | | | | |
Ratios/Supplemental Data: | |
Net assets, end of year (000’s) | | $ | 169,409 | | | $ | 81,249 | | | $ | 30,590 | | | $ | 71,053 | | | $ | 69,321 | |
Ratio of expenses to average net assets: | | | | | | | | | | | | | | | | | | | | |
After waivers and reimbursements (f) | | | 0.50 | % | | | 0.50 | % | | | 0.91 | % | | | 1.05 | % | | | 1.15 | % |
Before waivers and reimbursements (f) | | | 1.17 | % | | | 1.34 | % | | | 1.54 | % | | | 1.51 | % | | | 1.58 | % |
Ratio of net investment income (loss) to average net assets: | | | | | | | | | | | | | | | | | | | | |
After waivers and reimbursements (f) | | | 3.95 | %* | | | 4.12 | %** | | | 2.70 | % | | | 2.18 | % | | | 1.92 | % |
Before waivers and reimbursements (f) | | | 3.28 | %* | | | 3.28 | %** | | | 2.06 | % | | | 1.73 | % | | | 1.49 | % |
Portfolio turnover rate^ | | | 200 | % | | | 194 | % | | | 139 | %*** | | | 117 | % | | | 152 | % |
See Notes to Financial Statements.
18
1290 FUNDS
1290 DIVERSIFIED BOND FUND
FINANCIAL HIGHLIGHTS (Continued)
| | | | | | | | | | | | | | | | | | | | |
| | | Year Ended October 31, | |
| Class R | | 2020 | | | 2019 | | | 2018 | | | 2017 | | | 2016 | |
Net asset value, beginning of year | | $ | 10.34 | | | $ | 9.51 | | | $ | 10.11 | | | $ | 9.88 | | | $ | 9.82 | |
| | | | | | | | | | | | | | | | | | | | |
Income (loss) from investment operations: | | | | | | | | | | | | | | | | | | | | |
Net investment income (loss) (e) | | | 0.35 | * | | | 0.35 | ** | | | 0.23 | | | | 0.17 | | | | 0.14 | |
Net realized and unrealized gain (loss) | | | 0.41 | | | | 0.85 | | | | (0.39 | ) | | | 0.23 | | | | 0.15 | |
| | | | | | | | | | | | | | | | | | | | |
Total from investment operations | | | 0.76 | | | | 1.20 | | | | (0.16 | ) | | | 0.40 | | | | 0.29 | |
| | | | | | | | | | | | | | | | | | | | |
Less distributions: | |
Dividends from net investment income | | | (0.14 | ) | | | (0.37 | ) | | | (0.41 | ) | | | (0.17 | ) | | | (0.09 | ) |
Distributions from net realized gains | | | (0.33 | ) | | | — | | | | — | | | | — | | | | — | |
Return of capital | | | — | | | | — | | | | (0.03 | ) | | | — | | | | (0.14 | ) |
| | | | | | | | | | | | | | | | | | | | |
Total dividends and distributions | | | (0.47 | ) | | | (0.37 | ) | | | (0.44 | ) | | | (0.17 | ) | | | (0.23 | ) |
| | | | | | | | | | | | | | | | | | | | |
Net asset value, end of year | | $ | 10.63 | | | $ | 10.34 | | | $ | 9.51 | | | $ | 10.11 | | | $ | 9.88 | |
| | | | | | | | | | | | | | | | | | | | |
Total return | | | 7.77 | % | | | 12.84 | % | | | (1.69 | )% | | | 4.04 | % | | | 3.05 | % |
| | | | | | | | | | | | | | | | | | | | |
Ratios/Supplemental Data: | |
Net assets, end of year (000’s) | | $ | 298 | | | $ | 145 | | | $ | 96 | | | $ | 101 | | | $ | 99 | |
Ratio of expenses to average net assets: | | | | | | | | | | | | | | | | | | | | |
After waivers and reimbursements (f) | | | 1.00 | % | | | 1.00 | % | | | 1.32 | % | | | 1.55 | % | | | 1.65 | % |
Before waivers and reimbursements (f) | | | 1.67 | % | | | 1.88 | % | | | 2.09 | % | | | 2.01 | % | | | 2.08 | % |
Ratio of net investment income (loss) to average net assets: | | | | | | | | | | | | | | | | | | | | |
After waivers and reimbursements (f) | | | 3.43 | %* | | | 3.51 | %** | | | 2.34 | % | | | 1.68 | % | | | 1.42 | % |
Before waivers and reimbursements (f) | | | 2.75 | %* | | | 2.63 | %** | | | 1.57 | % | | | 1.23 | % | | | 0.99 | % |
Portfolio turnover rate^ | | | 200 | % | | | 194 | % | | | 139 | %*** | | | 117 | % | | | 152 | % |
| * | Includes accretion, interest and inflation adjustments on Argentine TIPS Bonds. Without this income, the per share income for each class would have been $0.08 lower and the ratios for each class would have been 0.73% lower. |
| ** | Includes accretion, interest and inflation adjustments on Argentine TIPS Bonds. Without this income, the per share income for each class would have been $0.07 lower and the ratios for each class would have been 0.65% lower. |
| *** | The portfolio turnover rate calculation includes purchases and sales made as a result of the replacement of the sub-adviser. Excluding such transactions, the portfolio turnover rate would have been 64%. |
| ^ | Portfolio turnover rate excludes derivatives, if any. |
| (e) | Net investment income (loss) per share is based on average shares outstanding. |
| (f) | Expenses do not include the expenses of the underlying funds (“indirect expenses”), if applicable. |
See Notes to Financial Statements.
19
1290 DOUBLELINE DYNAMIC ALLOCATION FUND (Unaudited)
INVESTMENT ADVISER
| Ø | | Equitable Investment Management Group, LLC |
INVESTMENT SUB-ADVISER
PERFORMANCE RESULTS
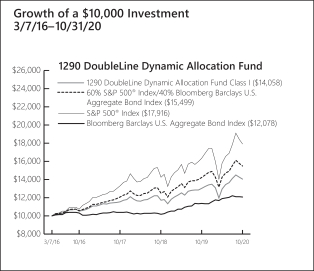
| | | | | | | | | | | | |
| |
| Annualized Total Returns as of 10/31/20 | |
| | | | |
| | | | | | 1
Year | | | Since
Incept. | |
Fund – Class A Shares* | | | without Sales Charge | | | | 7.64 | % | | | 7.34 | % |
| | | | with Sales Charge (a | ) | | | 1.75 | | | | 6.05 | |
Fund – Class I Shares* | | | | | | | 7.89 | | | | 7.60 | |
Fund – Class R Shares* | | | | | | | 7.30 | | | | 7.08 | |
60% S&P 500® Index/ 40% Bloomberg Barclays U.S. Aggregate Bond Index | | | | | | | 8.96 | | | | 9.88 | |
S&P 500® Index | | | | | | | 9.71 | | | | 13.35 | |
Bloomberg Barclays U.S. Aggregate Bond Index | | | | | | | 6.19 | | | | 4.14 | |
| |
* Date of inception 3/7/16. (a) A 5.50% front-end sales charge was deducted. Returns for periods greater than one year are annualized. | |
The performance quoted is past performance and is not a guarantee of future results. Mutual funds are subject to certain market risks. Investment returns and principal value of an investment will fluctuate so that an investor’s shares, when redeemed, may be worth more or less than their original cost. Current performance may be higher or lower than the performance data shown. For the most current month-end performance data please call 1-888-310-0416 or visit www.1290Funds.com.
The graph illustrates comparative performance for $10,000 invested in the Class I Shares of the 1290 DoubleLine Dynamic Allocation Fund and the 60% S&P 500® Index/40% Bloomberg Barclays U.S. Aggregate Bond Index, the S&P 500® Index and the Bloomberg Barclays U.S. Aggregate Bond Index from 3/7/16 to 10/31/20. The performance of each of the 60% S&P 500® Index/40% Bloomberg Barclays U.S. Aggregate Bond Index, the S&P 500® Index and the Bloomberg Barclays U.S. Aggregate Bond Index reflects an initial investment at the end of the month closest to the Fund’s inception. The performance of the Fund assumes reinvestment of all dividends and capital gain distributions, if any, and does not include a sales charge. The performance of the 60% S&P 500® Index/40% Bloomberg Barclays U.S. Aggregate Bond Index, the S&P 500® Index and the Bloomberg Barclays U.S. Aggregate Bond Index does not reflect the deduction of expenses or a sales charge associated with a mutual fund and has been adjusted to reflect reinvestment of all dividends, capital gain distributions, and interest of the securities included in the benchmark.
As of March 1, 2020, the gross expense ratios for Class A, I and R shares were 1.72%, 1.47% and 1.97%, respectively. The net expense ratios for Class A, I and R shares were 1.20%, 0.95% and 1.45%, respectively. The net expense ratios reflect the Adviser’s decision to contractually limit expenses through April 30, 2021. Fund Performance may also reflect the waiver of the Fund’s fees and reimbursement of expenses for certain periods since the inception date. Without these waivers and reimbursements, performance would have been lower.
In addition, performance shown in this section does not reflect the deduction of taxes that a shareholder would pay on Fund distributions or redemption of Fund shares.
PERFORMANCE SUMMARY
The Fund’s Class I shares returned 7.89% for the year ended October 31, 2020. The Fund’s benchmarks, the 60% S&P 500® Index/40% Bloomberg Barclays U.S. Aggregate Bond Index, the S&P 500® Index and the Bloomberg Barclays U.S. Aggregate Bond Index returned 8.96%, 9.71% and 6.19%, respectively over the same year.
Overview — DoubleLine Capital LP
For the year ended October 31, 2020 a hypothetical Rip Van Winkle investor, who only observed the year-over-year market returns, would see a healthy 9.71% return from the S&P 500® Index and 6.19% return from the Bloomberg Barclays U.S. Aggregate Bond Index. During the period the return streams were anything but tranquil, with the S&P 500® Index experiencing a peak to trough drawdown of 33.79% during the first quarter of 2020 as the COVID-19 pandemic ravaged the global economy and financial markets. The VIX index, a measure of U.S. equity market volatility, peaked at an astronomical 82.69 in March, showing the widespread fear brought on by the virus. Due to swift and unprecedented fiscal and monetary
20
1290 DOUBLELINE DYNAMIC ALLOCATION FUND (Unaudited)
policy backstops, the U.S. fixed income and equity markets staged a rapid recovery, with equities reaching new all-time highs in September while the 10-Year U.S. Treasury reached an all-time low yield of 0.51% in August.
Fund Highlights
The Fund’s allocation to the Shiller Barclays CAPE® U.S. Sector Index (“CAPE® Index”) underperformed the S&P 500® Index in the year ended October 31, 2020. The CAPE® Index was allocated to 8 sectors during the period: consumer staples, consumer discretionary, communication services, financials, industrial, materials and technology and real estate. The three sectors which contributed the most to the CAPE® Index’s return were technology, industrials and communications. The three sectors which detracted the most from the CAPE® Index’s return were materials, financials and real estate.
The Fund’s active equity investments outperformed the S&P 500® Index in year ended October 31, 2020. An emphasis on risk management, opportunistic buying and value helped performance relative to the S&P 500® Index.
The return of the Fund’s fixed income investments was positive in the year ended October 31, 2020 but underperformed the Bloomberg Barclays U.S. Aggregate Bond Index’s return. The two best returning sectors in the period were agency mortgage backed securities and U.S. Treasuries. The two sectors which detracted the most from performance during the period were bank loans and non-agency mortgage backed securities.
| | | | |
| | |
Fund Characteristics As of October 31, 2020 | | | |
Weighted Average Life (Years) | | | 6.28 | |
Weighted Average Coupon (%) | | | 2.99 | |
Weighted Average Effective Duration (Years)* | | | 4.65 | |
Weighted Average Rating** | | | A3 | |
| |
* Effective duration is a measure of the price sensitivity of the Fund to interest rate movements, taking into account specific features of the securities in which it invests. ** Weighted Average Rating has been provided by the Investment Sub-Adviser. A credit rating is an assessment provided by a nationally recognized statistical rating organization (NRSRO) of the creditworthiness of an issuer with respect to debt obligations, including specific securities, money market instruments or other debts. Ratings are measured on a scale that generally ranges from AAA (highest) to D (lowest); ratings are subject to change without notice. | |
| | | | |
| | |
Sector Weightings
as of October 31, 2020 | | % of
Net Assets | |
U.S. Treasury Obligations | | | 26.5 | % |
Collateralized Mortgage Obligations | | | 13.1 | |
Information Technology | | | 9.1 | |
Investment Companies | | | 7.1 | |
Financials | | | 6.0 | |
Health Care | | | 5.6 | |
Communication Services | | | 5.0 | |
Consumer Discretionary | | | 4.9 | |
Industrials | | | 4.2 | |
Mortgage-Backed Securities | | | 3.2 | |
Consumer Staples | | | 3.2 | |
Asset-Backed Securities | | | 2.7 | |
Energy | | | 2.3 | |
Materials | | | 1.1 | |
Real Estate | | | 1.1 | |
Utilities | | | 1.0 | |
Cash and Other | | | 3.9 | |
| | | | | |
| | | | 100.0 | % |
| | | | | |
Holdings are subject to change without notice. | | | | |
UNDERSTANDING YOUR EXPENSES:
As a shareholder of the Fund, you incur two types of costs:
(1) transaction costs, including applicable sales charges and redemption fees; and (2) ongoing costs, including investment advisory fees, distribution and/or service (12b-1) fees (in the case of Class A and Class R shares of the Fund), and other Fund expenses. These examples are intended to help you understand your ongoing costs (in dollars) of investing in the Fund and to compare these costs with the ongoing costs of investing in other mutual funds.
The examples are based on an investment of $1,000 invested at the beginning of the six-month period ended October 31, 2020 and held for the entire six-month period.
Actual Expenses
The first line of the following table provides information about actual account values and actual expenses. You may use the information in this line, together with the amount you invested, to estimate the expenses that you paid over the period. Simply divide your account value by $1,000 (for example, an $8,600 account value divided by $1,000 = 8.6), then multiply the result by the number in the first line under the heading entitled ‘‘Expenses Paid During Period’’ to estimate the expenses you paid on your account during this period.
21
1290 DOUBLELINE DYNAMIC ALLOCATION FUND (Unaudited)
Hypothetical Example for Comparison Purposes
The second line of the following table provides information about hypothetical account values and hypothetical expenses based on the Fund’s actual expense ratio and an assumed rate of return of 5% per year before expenses, which is not the Fund’s actual return. The hypothetical account values and expenses may not be used to estimate the actual ending account balance or expenses you paid for the period. You may use this information to compare the ongoing costs of investing in the Fund and other funds. To do so, compare this 5% hypothetical example with the 5% hypothetical examples that appear in the shareholder reports of the other funds.
Please note that the expenses shown in the table are meant to highlight your ongoing costs only and do not reflect any transactional costs, such as sales charges (loads), redemption fees, or exchange fees. Therefore, the second line of the table is useful in comparing ongoing costs only, and will not help you determine the relative total costs of owning different funds. In addition, if these transactional costs were included, your costs would have been higher.
EXAMPLE
| | | | | | | | | | | | |
| | | | |
| | | Beginning
Account
Value
5/1/20 | | | Ending
Account
Value
10/31/20 | | | Expenses
Paid
During
Period*
5/1/20 -
10/31/20 | |
Class A | | | | | | | | | | | | |
Actual | | | $1,000.00 | | | | $1,083.10 | | | | $6.04 | |
Hypothetical (5% average annual return before expenses) | | | 1,000.00 | | | | 1,019.33 | | | | 5.86 | |
Class I | | | | | | | | | | | | |
Actual | | | 1,000.00 | | | | 1,084.00 | | | | 4.74 | |
Hypothetical (5% average annual return before expenses) | | | 1,000.00 | | | | 1,020.59 | | | | 4.59 | |
Class R | | | | | | | | | | | | |
Actual | | | 1,000.00 | | | | 1,082.20 | | | | 7.35 | |
Hypothetical (5% average annual return before expenses) | | | 1,000.00 | | | | 1,018.08 | | | | 7.12 | |
| |
* Expenses are equal to the Portfolio’s A, I and R shares annualized expense ratio of 1.15%, 0.90% and 1.40%, respectively, multiplied by the average account value over the period, and multiplied by 184/366 (to reflect the one-half year period). | |
22
1290 FUNDS
1290 DOUBLELINE DYNAMIC ALLOCATION FUND
PORTFOLIO OF INVESTMENTS
October 31, 2020
| | | | | | | | |
| | | |
| | | Principal
Amount | | | Value
(Note 1) | |
LONG-TERM DEBT SECURITIES: | | | | | | | | |
Asset-Backed Securities (2.7%) | | | | | | | | |
CSMC Trust, | | | | | | | | |
Series 2019-JR1 A1
4.095%, 9/27/66 (l)§ | | $ | 452,848 | | | $ | 455,641 | |
GSAA Home Equity Trust, | | | | | | | | |
Series 2007-9 A2A
6.500%, 8/25/47 | | | 372,296 | | | | 268,026 | |
Long Beach Mortgage Loan Trust, | | | | | | | | |
Series 2006-7 1A
0.304%, 8/25/36 (l) | | | 505,162 | | | | 325,463 | |
Pretium Mortgage Credit Partners I LLC, | | | | | |
Series 2020-NPL3 A1
3.105%, 6/27/60 (e)§ | | | 750,000 | | | | 749,975 | |
| | | | | | | | |
Total Asset-Backed Securities | | | | | | | 1,799,105 | |
| | | | | | | | |
Collateralized Mortgage Obligations (13.1%) | |
Alternative Loan Trust, | | | | | | | | |
Series 2005-11CB 2A6
5.500%, 6/25/25 | | | 418,242 | | | | 417,166 | |
Banc of America Alternative Loan Trust, | | | | | |
Series 2006-5 CB14
6.000%, 6/25/46 (l) | | | 209,787 | | | | 202,142 | |
BRAVO Residential Funding Trust, | | | | | | | | |
Series 2020-RPL1 M1
3.250%, 5/26/59 (l)§ | | | 500,000 | | | | 519,755 | |
CHL Mortgage Pass-Through Trust, | | | | | | | | |
Series 2006-20 1A33
6.000%, 2/25/37 | | | 539,915 | | | | 415,664 | |
Series 2006-OA5 2A1
0.349%, 4/25/46 (l) | | | 700,562 | | | | 584,837 | |
FHLMC, | | | | | | | | |
Series 3998 AZ
4.000%, 2/15/42 | | | 1,413,530 | | | | 1,561,994 | |
Series 4894 ZE
3.500%, 7/15/49 | | | 1,466,782 | | | | 1,575,329 | |
FNMA, | | | | | | | | |
Series 2013-5 EZ
2.000%, 8/25/42 | | | 627,730 | | | | 643,781 | |
Series 2017-4 CH
3.000%, 6/25/42 | | | 49,576 | | | | 50,003 | |
Series 2018-21
(Zero Coupon), 4/25/48 PO | | | 263,851 | | | | 243,776 | |
GCAT LLC, | | | | | | | | |
Series 2020-1 A1
2.981%, 1/26/60 (e)§ | | | 223,716 | | | | 220,149 | |
HarborView Mortgage Loan Trust, | | | | | | | | |
Series 2005-8 1A2A
0.807%, 9/19/35 (l) | | | 461,590 | | | | 388,623 | |
New Residential Mortgage Loan Trust, | | | | | | | | |
Series 2016-1A A1
3.750%, 3/25/56 (l)§ | | | 312,834 | | | | 334,952 | |
PRPM LLC, | | | | | | | | |
Series 2020-3 A1
2.857%, 9/25/25 (e)§ | | | 487,981 | | | | 488,074 | |
RALI Trust, | | | | | | | | |
Series 2006-QS4 A10
6.000%, 4/25/36 | | | 469,542 | | | | 452,061 | |
Wells Fargo Mortgage Backed Securities Trust, | |
Series 2007-7 A1
6.000%, 6/25/37 | | | 236,581 | | | | 235,391 | |
Series 2007-AR6 A2
3.024%, 10/25/37 (l) | | | 296,800 | | | | 279,939 | |
| | | | | | | | |
Total Collateralized Mortgage Obligations | | | | | | | 8,613,636 | |
| | | | | | | | |
Corporate Bonds (15.8%) | | | | | | | | |
Communication Services (1.8%) | | | | | | | | |
Diversified Telecommunication Services (0.6%) | |
AT&T, Inc. | | | | | | | | |
3.500%, 9/15/53§ | | | 18,000 | | | | 17,171 | |
3.550%, 9/15/55§ | | | 80,000 | | | | 75,865 | |
CCO Holdings LLC | | | | | | | | |
5.750%, 2/15/26§ | | | 30,000 | | | | 31,025 | |
5.000%, 2/1/28§ | | | 30,000 | | | | 31,425 | |
CenturyLink, Inc. | | | | | | | | |
5.125%, 12/15/26§ | | | 30,000 | | | | 30,675 | |
4.000%, 2/15/27§ | | | 25,000 | | | | 25,500 | |
Cincinnati Bell, Inc.
7.000%, 7/15/24§ | | | 20,000 | | | | 20,675 | |
Frontier Communications Corp.
5.875%, 10/15/27§ | | | 10,000 | | | | 10,175 | |
Intelsat Jackson Holdings SA
8.500%, 10/15/24 (h)§ | | | 30,000 | | | | 18,525 | |
Telesat Canada
6.500%, 10/15/27§ | | | 10,000 | | | | 9,975 | |
Verizon Communications, Inc. | | | | | | | | |
(ICE LIBOR USD 3 Month + 1.10%), 1.380%, 5/15/25 (k) | | | 70,000 | | | | 71,574 | |
Zayo Group Holdings, Inc. | | | | | | | | |
4.000%, 3/1/27§ | | | 30,000 | | | | 29,371 | |
6.125%, 3/1/28§ | | | 15,000 | | | | 15,150 | |
| | | | | | | | |
| | | | | | | 387,106 | |
| | | | | | | | |
Entertainment (0.1%) | | | | | | | | |
Lions Gate Capital Holdings LLC
6.375%, 2/1/24§ | | | 45,000 | | | | 43,268 | |
Live Nation Entertainment, Inc.
6.500%, 5/15/27§ | | | 30,000 | | | | 32,250 | |
| | | | | | | | |
| | | | | | | 75,518 | |
| | | | | | | | |
Media (0.9%) | | | | | | | | |
Cengage Learning, Inc.
9.500%, 6/15/24§ | | | 25,000 | | | | 20,188 | |
Charter Communications Operating LLC
4.908%, 7/23/25 | | | 110,000 | | | | 126,204 | |
Comcast Corp. | | | | | | | | |
3.400%, 4/1/30 | | | 60,000 | | | | 68,518 | |
1.500%, 2/15/31 | | | 130,000 | | | | 126,963 | |
Diamond Sports Group LLC
5.375%, 8/15/26§ | | | 15,000 | | | | 8,738 | |
DISH DBS Corp.
5.875%, 11/15/24 | | | 25,000 | | | | 25,109 | |
GCI LLC
4.750%, 10/15/28§ | | | 30,000 | | | | 30,966 | |
Gray Television, Inc.
7.000%, 5/15/27§ | | | 45,000 | | | | 48,544 | |
iHeartCommunications, Inc.
8.375%, 5/1/27 | | | 5,000 | | | | 4,876 | |
Interpublic Group of Cos., Inc. (The)
4.650%, 10/1/28 | | | 50,000 | | | | 58,767 | |
See Notes to Financial Statements.
23
1290 FUNDS
1290 DOUBLELINE DYNAMIC ALLOCATION FUND
PORTFOLIO OF INVESTMENTS (Continued)
October 31, 2020
| | | | | | | | |
| | | |
| | | Principal
Amount | | | Value
(Note 1) | |
Nexstar Broadcasting, Inc.
5.625%, 7/15/27§ | | $ | 20,000 | | | $ | 20,850 | |
Radiate Holdco LLC
4.500%, 9/15/26§ | | | 20,000 | | | | 20,044 | |
Scripps Escrow, Inc.
5.875%, 7/15/27§ | | | 25,000 | | | | 24,250 | |
Sirius XM Radio, Inc.
4.125%, 7/1/30§ | | | 35,000 | | | | 35,893 | |
| | | | | | | | |
| | | | | | | 619,910 | |
| | | | | | | | |
Wireless Telecommunication Services (0.2%) | |
Gogo Intermediate Holdings LLC
9.875%, 5/1/24§ | | | 15,000 | | | | 15,750 | |
Sprint Corp.
7.125%, 6/15/24 | | | 45,000 | | | | 51,759 | |
T-Mobile USA, Inc. | | | | | | | | |
3.750%, 4/15/27§ | | | 15,000 | | | | 16,705 | |
2.050%, 2/15/28§ | | | 45,000 | | | | 45,675 | |
| | | | | | | | |
| | | | | | | 129,889 | |
| | | | | | | | |
Total Communication Services | | | | | | | 1,212,423 | |
| | | | | | | | |
Consumer Discretionary (1.8%) | | | | | |
Auto Components (0.1%) | |
Clarios Global LP
6.250%, 5/15/26§ | | | 15,000 | | | | 15,577 | |
Icahn Enterprises LP
5.250%, 5/15/27 | | | 25,000 | | | | 25,839 | |
| | | | | | | | |
| | | | | | | 41,416 | |
| | | | | | | | |
Automobiles (0.0%) | |
Ford Motor Co.
9.000%, 4/22/25 | | | 20,000 | | | | 23,518 | |
| | | | | | | | |
Distributors (0.1%) | |
Performance Food Group, Inc.
5.500%, 10/15/27§ | | | 35,000 | | | | 35,875 | |
| | | | | | | | |
Hotels, Restaurants & Leisure (0.9%) | |
1011778 BC ULC
5.000%, 10/15/25§ | | | 11,000 | | | | 11,279 | |
Boyd Gaming Corp.
4.750%, 12/1/27 | | | 45,000 | | | | 43,664 | |
Caesars Entertainment, Inc.
6.250%, 7/1/25§ | | | 35,000 | | | | 35,962 | |
Caesars Resort Collection LLC
5.250%, 10/15/25§ | | | 35,000 | | | | 33,239 | |
Carnival Corp.
11.500%, 4/1/23§ | | | 10,000 | | | | 11,000 | |
Cedar Fair LP
5.250%, 7/15/29 | | | 25,000 | | | | 22,578 | |
Golden Nugget, Inc.
6.750%, 10/15/24§ | | | 45,000 | | | | 38,014 | |
Hilton Domestic Operating Co., Inc. | | | | | | | | |
5.375%, 5/1/25§ | | | 5,000 | | | | 5,184 | |
5.750%, 5/1/28§ | | | 5,000 | | | | 5,232 | |
IRB Holding Corp.
6.750%, 2/15/26§ | | | 35,000 | | | | 35,350 | |
McDonald’s Corp.
3.600%, 7/1/30 | | | 55,000 | | | | 63,305 | |
MGM Resorts International
6.750%, 5/1/25 | | | 45,000 | | | | 47,336 | |
Scientific Games International, Inc.
7.250%, 11/15/29§ | | | 20,000 | | | | 19,806 | |
Six Flags Theme Parks, Inc.
7.000%, 7/1/25§ | | | 55,000 | | | | 58,163 | |
Twin River Worldwide Holdings, Inc.
6.750%, 6/1/27§ | | | 40,000 | | | | 40,420 | |
Viking Cruises Ltd. | | | | | | | | |
13.000%, 5/15/25§ | | | 10,000 | | | | 11,275 | |
5.875%, 9/15/27§ | | | 55,000 | | | | 42,554 | |
Wyndham Hotels & Resorts, Inc. | | | | | | | | |
4.375%, 8/15/28§ | | | 20,000 | | | | 19,878 | |
Yum! Brands, Inc.
3.625%, 3/15/31 | | | 40,000 | | | | 39,175 | |
| | | | | | | | |
| | | | | | | 583,414 | |
| | | | | | | | |
Household Durables (0.1%) | |
Mattamy Group Corp.
4.625%, 3/1/30§ | | | 35,000 | | | | 35,788 | |
Tempur Sealy International, Inc.
5.500%, 6/15/26 | | | 30,000 | | | | 31,124 | |
| | | | | | | | |
| | | | | | | 66,912 | |
| | | | | | | | |
Internet & Direct Marketing Retail (0.1%) | |
Expedia Group, Inc.
3.250%, 2/15/30 | | | 70,000 | | | | 67,766 | |
| | | | | | | | |
Multiline Retail (0.2%) | |
Dollar Tree, Inc.
4.000%, 5/15/25 | | | 110,000 | | | | 123,873 | |
| | | | | | | | |
Specialty Retail (0.2%) | |
Asbury Automotive Group, Inc. | | | | | | | | |
4.500%, 3/1/28§ | | | 5,000 | | | | 5,081 | |
4.750%, 3/1/30§ | | | 6,000 | | | | 6,195 | |
Group 1 Automotive, Inc.
4.000%, 8/15/28§ | | | 5,000 | | | | 5,006 | |
Home Depot, Inc. (The)
3.900%, 6/15/47 | | | 55,000 | | | | 66,706 | |
PetSmart, Inc. | | | | | | | | |
7.125%, 3/15/23§ | | | 20,000 | | | | 20,000 | |
5.875%, 6/1/25§ | | | 12,000 | | | | 12,267 | |
Staples, Inc.
7.500%, 4/15/26§ | | | 35,000 | | | | 32,594 | |
| | | | | | | | |
| | | | | | | 147,849 | |
| | | | | | | | |
Textiles, Apparel & Luxury Goods (0.1%) | |
William Carter Co. (The)
5.500%, 5/15/25§ | | | 75,000 | | | | 78,844 | |
| | | | | | | | |
Total Consumer Discretionary | | | | | | | 1,169,467 | |
| | | | | | | | |
Consumer Staples (1.0%) | | | | | |
Beverages (0.3%) | |
Anheuser-Busch Cos. LLC
4.900%, 2/1/46 | | | 50,000 | | | | 61,140 | |
Constellation Brands, Inc.
3.150%, 8/1/29 | | | 105,000 | | | | 116,114 | |
| | | | | | | | |
| | | | | | | 177,254 | |
| | | | | | | | |
Food & Staples Retailing (0.1%) | |
Albertsons Cos., Inc.
4.625%, 1/15/27§ | | | 30,000 | | | | 30,853 | |
3.500%, 3/15/29§ | | | 20,000 | | | | 19,363 | |
US Foods, Inc.
6.250%, 4/15/25§ | | | 5,000 | | | | 5,213 | |
| | | | | | | | |
| | | | | | | 55,429 | |
| | | | | | | | |
See Notes to Financial Statements.
24
1290 FUNDS
1290 DOUBLELINE DYNAMIC ALLOCATION FUND
PORTFOLIO OF INVESTMENTS (Continued)
October 31, 2020
| | | | | | | | |
| | | |
| | | Principal
Amount | | | Value
(Note 1) | |
Food Products (0.4%) | |
B&G Foods, Inc. | | | | | | | | |
5.250%, 4/1/25 | | $ | 20,000 | | | $ | 20,600 | |
5.250%, 9/15/27 | | | 15,000 | | | | 15,515 | |
JBS USA LUX SA | | | | | | | | |
5.750%, 6/15/25§ | | | 5,000 | | | | 5,125 | |
6.750%, 2/15/28§ | | | 43,000 | | | | 47,119 | |
Kraft Heinz Foods Co. | | | | | | | | |
5.000%, 7/15/35 | | | 15,000 | | | | 17,162 | |
5.200%, 7/15/45 | | | 35,000 | | | | 38,545 | |
Post Holdings, Inc.
4.625%, 4/15/30§ | | | 30,000 | | | | 30,825 | |
Smithfield Foods, Inc.
4.250%, 2/1/27§ | | | 115,000 | | | | 125,453 | |
| | | | | | | | |
| | | | | | | 300,344 | |
| | | | | | | | |
Household Products (0.1%) | |
Energizer Holdings, Inc.
4.750%, 6/15/28§ | | | 35,000 | | | | 36,101 | |
Kronos Acquisition Holdings, Inc.
9.000%, 8/15/23§ | | | 30,000 | | | | 30,412 | |
| | | | | | | | |
| | | | | | | 66,513 | |
| | | | | | | | |
Tobacco (0.1%) | |
Altria Group, Inc.
4.450%, 5/6/50 | | | 60,000 | | | | 66,599 | |
| | | | | | | | |
Total Consumer Staples | | | | | | | 666,139 | |
| | | | | | | | |
Energy (1.8%) | | | | | |
Energy Equipment & Services (0.2%) | |
Schlumberger Investment SA
2.650%, 6/26/30 | | | 30,000 | | | | 29,979 | |
Tervita Corp.
7.625%, 12/1/21§ | | | 30,000 | | | | 28,762 | |
Transocean Poseidon Ltd.
6.875%, 2/1/27§ | | | 35,000 | | | | 26,250 | |
Transocean, Inc.
11.500%, 1/30/27§ | | | 11,000 | | | | 3,637 | |
USA Compression Partners LP
6.875%, 9/1/27 | | | 50,000 | | | | 50,261 | |
| | | | | | | | |
| | | | | | | 138,889 | |
| | | | | | | | |
Oil, Gas & Consumable Fuels (1.6%) | |
Antero Midstream Partners LP
5.750%, 3/1/27§ | | | 16,000 | | | | 14,480 | |
Apache Corp. | | | | | | | | |
4.625%, 11/15/25 | | | 10,000 | | | | 9,450 | |
4.375%, 10/15/28 | | | 20,000 | | | | 18,382 | |
Cenovus Energy, Inc.
5.375%, 7/15/25 | | | 20,000 | | | | 21,050 | |
Cheniere Energy Partners LP | | | | | | | | |
5.250%, 10/1/25 | | | 15,000 | | | | 15,258 | |
5.625%, 10/1/26 | | | 25,000 | | | | 25,625 | |
Energy Transfer Operating LP | | | | | | | | |
4.750%, 1/15/26 | | | 45,000 | | | | 48,315 | |
4.200%, 4/15/27 | | | 5,000 | | | | 5,189 | |
EOG Resources, Inc.
4.375%, 4/15/30 | | | 50,000 | | | | 58,637 | |
EQM Midstream Partners LP
6.500%, 7/1/27§ | | | 35,000 | | | | 36,750 | |
EQT Corp.
7.875%, 2/1/25 (e) | | | 20,000 | | | | 22,250 | |
Exxon Mobil Corp. | | | | | | | | |
2.610%, 10/15/30 | | | 25,000 | | | | 26,283 | |
4.227%, 3/19/40 | | | 10,000 | | | | 11,899 | |
Gulfport Energy Corp.
6.375%, 5/15/25 | | | 30,000 | | | | 16,500 | |
Hess Midstream Operations LP
5.125%, 6/15/28§ | | | 35,000 | | | | 34,912 | |
Hilcorp Energy I LP
6.250%, 11/1/28§ | | | 30,000 | | | | 27,450 | |
Indigo Natural Resources LLC
6.875%, 2/15/26§ | | | 15,000 | | | | 14,925 | |
Kinder Morgan Energy Partners LP
6.950%, 1/15/38 | | | 45,000 | | | | 57,815 | |
Marathon Petroleum Corp.
5.125%, 12/15/26 | | | 55,000 | | | | 62,904 | |
MEG Energy Corp.
7.125%, 2/1/27§ | | | 50,000 | | | | 44,986 | |
NuStar Logistics LP
6.375%, 10/1/30 | | | 25,000 | | | | 25,125 | |
Occidental Petroleum Corp. | | | | | | | | |
8.000%, 7/15/25 | | | 15,000 | | | | 14,625 | |
3.500%, 8/15/29 | | | 20,000 | | | | 14,429 | |
6.625%, 9/1/30 | | | 20,000 | | | | 17,486 | |
Parkland Corp.
5.875%, 7/15/27§ | | | 55,000 | | | | 56,619 | |
Parsley Energy LLC
5.625%, 10/15/27§ | | | 35,000 | | | | 37,144 | |
Peabody Energy Corp.
6.000%, 3/31/22§ | | | 20,000 | | | | 9,000 | |
QEP Resources, Inc.
5.625%, 3/1/26 | | | 35,000 | | | | 22,225 | |
Rattler Midstream LP
5.625%, 7/15/25§ | | | 15,000 | | | | 15,516 | |
Sabine Pass Liquefaction LLC
5.000%, 3/15/27 | | | 55,000 | | | | 61,574 | |
Sunoco LP
6.000%, 4/15/27 | | | 15,000 | | | | 15,468 | |
Targa Resources Partners LP
5.500%, 3/1/30§ | | | 30,000 | | | | 30,156 | |
Total Capital International SA
3.386%, 6/29/60 | | | 55,000 | | | | 56,472 | |
Viper Energy Partners LP
5.375%, 11/1/27§ | | | 25,000 | | | | 25,500 | |
Western Midstream Operating LP
4.100%, 2/1/25 (e) | | | 20,000 | | | | 18,806 | |
WPX Energy, Inc. | | | | | | | | |
5.875%, 6/15/28 | | | 20,000 | | | | 20,500 | |
4.500%, 1/15/30 | | | 20,000 | | | | 19,200 | |
| | | | | | | | |
| | | | | | | 1,032,905 | |
| | | | | | | | |
Total Energy | | | | | | | 1,171,794 | |
| | | | | | | | |
Financials (3.1%) | | | | | |
Banks (1.0%) | |
Bank of America Corp. | | | | | | | | |
(ICE LIBOR USD 3 Month + 1.21%), 3.974%, 2/7/30 (k) | | | 55,000 | | | | 63,399 | |
Bank of Montreal | | | | | | | | |
(USD Swap Semi 5 Year + 1.43%), 3.803%, 12/15/32 (k) | | | 60,000 | | | | 66,330 | |
Bank of Nova Scotia (The) | | | | | | | | |
1.625%, 5/1/23 | | | 80,000 | | | | 82,224 | |
3.400%, 2/11/24 | | | 35,000 | | | | 37,940 | |
See Notes to Financial Statements.
25
1290 FUNDS
1290 DOUBLELINE DYNAMIC ALLOCATION FUND
PORTFOLIO OF INVESTMENTS (Continued)
October 31, 2020
| | | | | | | | |
| | | |
| | | Principal
Amount | | | Value
(Note 1) | |
Citigroup, Inc. | | | | | | | | |
(ICE LIBOR USD 3 Month + 1.10%), 1.380%, 5/17/24 (k) | | $ | 120,000 | | | $ | 121,336 | |
Commonwealth Bank of Australia
3.900%, 7/12/47§ | | | 50,000 | | | | 60,026 | |
Mitsubishi UFJ Financial Group, Inc. | | | | | | | | |
(ICE LIBOR USD 3 Month + 0.74%), 0.981%, 3/2/23 (k) | | | 120,000 | | | | 120,476 | |
Santander Holdings USA, Inc.
3.400%, 1/18/23 | | | 115,000 | | | | 120,699 | |
| | | | | | | | |
| | | | | | | 672,430 | |
| | | | | | | | |
Capital Markets (0.4%) | |
Goldman Sachs Group, Inc. (The)
3.625%, 2/20/24 | | | 110,000 | | | | 119,671 | |
Morgan Stanley | | | | | | | | |
(ICE LIBOR USD 3 Month + 0.85%), 3.737%, 4/24/24 (k) | | | 110,000 | | | | 118,165 | |
| | | | | | | | |
| | | | | | | 237,836 | |
| | | | | | | | |
Consumer Finance (1.0%) | |
American Express Co.
3.400%, 2/22/24 | | | 115,000 | | | | 125,108 | |
Capital One Financial Corp. | | | | | | | | |
(ICE LIBOR USD 3 Month + 0.72%), 0.934%, 1/30/23 (k) | | | 130,000 | | | | 130,046 | |
Discover Financial Services
4.100%, 2/9/27 | | | 85,000 | | | | 95,048 | |
General Motors Financial Co., Inc. | | | | | | | | |
(ICE LIBOR USD 3 Month + 0.99%), 1.224%, 1/5/23 (k) | | | 105,000 | | | | 103,954 | |
John Deere Capital Corp.
2.600%, 3/7/24 | | | 60,000 | | | | 64,141 | |
Navient Corp.
5.000%, 3/15/27 | | | 15,000 | | | | 13,974 | |
OneMain Finance Corp. | | | | | | | | |
6.625%, 1/15/28 | | | 30,000 | | | | 32,775 | |
5.375%, 11/15/29 | | | 15,000 | | | | 15,394 | |
Synchrony Financial
3.950%, 12/1/27 | | | 60,000 | | | | 65,416 | |
| | | | | | | | |
| | | | | | | 645,856 | |
| | | | | | | | |
Diversified Financial Services (0.1%) | |
MPH Acquisition Holdings LLC
5.750%, 11/1/28§ | | | 45,000 | | | | 44,213 | |
Verscend Escrow Corp.
9.750%, 8/15/26§ | | | 32,000 | | | | 34,406 | |
| | | | | | | | |
| | | | | | | 78,619 | |
| | | | | | | | |
Insurance (0.5%) | |
Alliant Holdings Intermediate LLC
6.750%, 10/15/27§ | | | 20,000 | | | | 21,000 | |
Athene Global Funding
3.000%, 7/1/22§ | | | 70,000 | | | | 72,205 | |
Berkshire Hathaway Finance Corp.
2.850%, 10/15/50 | | | 40,000 | | | | 40,752 | |
GTCR AP Finance, Inc.
8.000%, 5/15/27§ | | | 30,000 | | | | 31,950 | |
NFP Corp.
6.875%, 8/15/28§ | | | 20,000 | | | | 19,454 | |
Prudential Financial, Inc.
3.905%, 12/7/47 | | | 55,000 | | | | 62,151 | |
Willis North America, Inc.
4.500%, 9/15/28 | | | 55,000 | | | | 65,582 | |
| | | | | | | | |
| | | | | | | 313,094 | |
| | | | | | | | |
Thrifts & Mortgage Finance (0.1%) | |
Nationstar Mortgage Holdings, Inc.
5.500%, 8/15/28§ | | | 25,000 | | | | 24,937 | |
PennyMac Financial Services, Inc.
5.375%, 10/15/25§ | | | 35,000 | | | | 35,788 | |
| | | | | | | | |
| | | | | | | 60,725 | |
| | | | | | | | |
Total Financials | | | | | | | 2,008,560 | |
| | | | | | | | |
Health Care (1.6%) | | | | | |
Biotechnology (0.2%) | |
AbbVie, Inc.
4.700%, 5/14/45 | | | 100,000 | | | | 121,562 | |
| | | | | | | | |
Health Care Equipment & Supplies (0.0%) | |
Ortho-Clinical Diagnostics, Inc.
7.250%, 2/1/28§ | | | 45,000 | | | | 47,002 | |
| | | | | | | | |
Health Care Providers & Services (1.0%) | |
Anthem, Inc.
2.375%, 1/15/25 | | | 60,000 | | | | 63,681 | |
Centene Corp.
3.000%, 10/15/30 | | | 20,000 | | | | 20,769 | |
Cigna Corp. | | | | | | | | |
(ICE LIBOR USD 3 Month + 0.89%), 1.127%, 7/15/23 (k) | | | 95,000 | | | | 95,982 | |
4.900%, 12/15/48 | | | 95,000 | | | | 122,374 | |
CVS Health Corp.
5.050%, 3/25/48 | | | 75,000 | | | | 95,091 | |
HCA, Inc.
4.125%, 6/15/29 | | | 55,000 | | | | 62,336 | |
Legacy LifePoint Health LLC | | | | | | | | |
6.750%, 4/15/25§ | | | 10,000 | | | | 10,575 | |
4.375%, 2/15/27§ | | | 25,000 | | | | 24,743 | |
Radiology Partners, Inc.
9.250%, 2/1/28§ | | | 25,000 | | | | 26,650 | |
Select Medical Corp.
6.250%, 8/15/26§ | | | 55,000 | | | | 57,837 | |
Tenet Healthcare Corp.
6.125%, 10/1/28§ | | | 40,000 | | | | 38,800 | |
West Street Merger Sub, Inc.
6.375%, 9/1/25§ | | | 45,000 | | | | 45,675 | |
| | | | | | | | |
| | | | | | | 664,513 | |
| | | | | | | | |
Pharmaceuticals (0.4%) | |
Bausch Health Cos., Inc.
6.250%, 2/15/29§ | | | 60,000 | | | | 61,649 | |
Eli Lilly and Co.
3.950%, 3/15/49 | | | 100,000 | | | | 123,639 | |
Royalty Pharma plc
3.300%, 9/2/40§ | | | 65,000 | | | | 63,610 | |
| | | | | | | | |
| | | | | | | 248,898 | |
| | | | | | | | |
Total Health Care | | | | | | | 1,081,975 | |
| | | | | | | | |
Industrials (1.9%) | | | | | |
Aerospace & Defense (0.4%) | |
Bombardier, Inc.
6.000%, 10/15/22§ | | | 30,000 | | | | 26,700 | |
Lockheed Martin Corp.
4.700%, 5/15/46 | | | 95,000 | | | | 127,098 | |
See Notes to Financial Statements.
26
1290 FUNDS
1290 DOUBLELINE DYNAMIC ALLOCATION FUND
PORTFOLIO OF INVESTMENTS (Continued)
October 31, 2020
| | | | | | | | |
| | | |
| | | Principal
Amount | | | Value
(Note 1) | |
TransDigm, Inc.
8.000%, 12/15/25§ | | $ | 5,000 | | | $ | 5,414 | |
6.250%, 3/15/26§ | | | 55,000 | | | | 57,200 | |
6.375%, 6/15/26 | | | 15,000 | | | | 14,958 | |
5.500%, 11/15/27 | | | 30,000 | | | | 29,288 | |
Triumph Group, Inc.
7.750%, 8/15/25 | | | 15,000 | | | | 9,750 | |
| | | | | | | | |
| | | | | | | 270,408 | |
| | | | | | | | |
Airlines (0.1%) | |
Delta Air Lines, Inc.
4.750%, 10/20/28§ | | | 10,000 | | | | 10,200 | |
Mileage Plus Holdings LLC
6.500%, 6/20/27§ | | | 30,000 | | | | 31,200 | |
| | | | | | | | |
| | | | | | | 41,400 | |
| | | | | | | | |
Building Products (0.2%) | |
Builders FirstSource, Inc.
6.750%, 6/1/27§ | | | 30,000 | | | | 32,100 | |
Griffon Corp.
5.750%, 3/1/28 | | | 50,000 | | | | 52,250 | |
Owens Corning
4.400%, 1/30/48 | | | 60,000 | | | | 66,562 | |
| | | | | | | | |
| | | | | | | 150,912 | |
| | | | | | | | |
Commercial Services & Supplies (0.4%) | |
Allied Universal Holdco LLC | | | | | | | | |
6.625%, 7/15/26§ | | | 20,000 | | | | 20,901 | |
9.750%, 7/15/27§ | | | 40,000 | | | | 42,600 | |
Garda World Security Corp.
8.750%, 5/15/25§ | | | 30,000 | | | | 29,925 | |
GFL Environmental, Inc. | | | | | | | | |
3.750%, 8/1/25§ | | | 30,000 | | | | 30,187 | |
5.125%, 12/15/26§ | | | 35,000 | | | | 36,673 | |
8.500%, 5/1/27§ | | | 12,000 | | | | 13,080 | |
KAR Auction Services, Inc.
5.125%, 6/1/25§ | | | 35,000 | | | | 35,394 | |
Prime Security Services Borrower LLC
3.375%, 8/31/27§ | | | 35,000 | | | | 33,688 | |
| | | | | | | | |
| | | | | | | 242,448 | |
| | | | | | | | |
Construction & Engineering (0.0%) | |
Pike Corp.
5.500%, 9/1/28§ | | | 25,000 | | | | 25,568 | |
| | | | | | | | |
Industrial Conglomerates (0.2%) | |
Roper Technologies, Inc.
1.750%, 2/15/31 | | | 140,000 | | | | 137,730 | |
| | | | | | | | |
Professional Services (0.1%) | |
Dun & Bradstreet Corp. (The)
6.875%, 8/15/26§ | | | 18,000 | | | | 19,260 | |
Jaguar Holding Co. II
5.000%, 6/15/28§ | | | 15,000 | | | | 15,597 | |
| | | | | | | | |
| | | | | | | 34,857 | |
| | | | | | | | |
Road & Rail (0.3%) | |
Burlington Northern Santa Fe LLC
3.050%, 2/15/51 | | | 25,000 | | | | 26,828 | |
CSX Corp.
3.800%, 11/1/46 | | | 55,000 | | | | 62,742 | |
Kenan Advantage Group, Inc. (The)
7.875%, 7/31/23§ | | | 5,000 | | | | 5,000 | |
Penske Truck Leasing Co. LP
4.200%, 4/1/27§ | | | 55,000 | | | | 61,515 | |
Uber Technologies, Inc.
7.500%, 9/15/27§ | | | 25,000 | | | | 26,069 | |
| | | | | | | | |
| | | | | | | 182,154 | |
| | | | | | | | |
Trading Companies & Distributors (0.2%) | |
Air Lease Corp.
3.250%, 3/1/25 | | | 65,000 | | | | 66,289 | |
Beacon Roofing Supply, Inc.
4.875%, 11/1/25§ | | | 45,000 | | | | 44,145 | |
United Rentals North America, Inc.
5.250%, 1/15/30 | | | 25,000 | | | | 27,094 | |
| | | | | | | | |
| | | | | | | 137,528 | |
| | | | | | | | |
Total Industrials | | | | | | | 1,223,005 | |
| | | | | | | | |
Information Technology (0.7%) | | | | | |
Communications Equipment (0.0%) | |
Avaya, Inc.
6.125%, 9/15/28§ | | | 20,000 | | | | 20,550 | |
| | | | | | | | |
IT Services (0.1%) | |
GTT Communications, Inc.
7.875%, 12/31/24§ | | | 15,000 | | | | 7,500 | |
Tempo Acquisition LLC
6.750%, 6/1/25§ | | | 50,000 | | | | 50,612 | |
| | | | | | | | |
| | | | | | | 58,112 | |
| | | | | | | | |
Semiconductors & Semiconductor Equipment (0.2%) | |
NXP BV
3.875%, 6/18/26§ | | | 115,000 | | | | 129,576 | |
| | | | | | | | |
Software (0.1%) | |
BY Crown Parent LLC
4.250%, 1/31/26§ | | | 15,000 | | | | 15,262 | |
CDK Global, Inc.
5.250%, 5/15/29§ | | | 10,000 | | | | 10,704 | |
Oracle Corp.
3.600%, 4/1/50 | | | 55,000 | | | | 59,972 | |
| | | | | | | | |
| | | | | | | 85,938 | |
| | | | | | | | |
Technology Hardware, Storage & Peripherals (0.3%) | |
Apple, Inc.
4.650%, 2/23/46 | | | 75,000 | | | | 101,851 | |
2.950%, 9/11/49 | | | 25,000 | | | | 26,794 | |
NetApp, Inc.
1.875%, 6/22/25 | | | 65,000 | | | | 67,135 | |
| | | | | | | | |
| | | | | | | 195,780 | |
| | | | | | | | |
Total Information Technology | | | | | | | 489,956 | |
| | | | | | | | |
Materials (0.6%) | | | | | |
Chemicals (0.1%) | |
Gates Global LLC
6.250%, 1/15/26§ | | | 15,000 | | | | 15,488 | |
Ingevity Corp.
3.875%, 11/1/28§ | | | 30,000 | | | | 30,456 | |
Nutrien Ltd.
4.200%, 4/1/29 | | | 50,000 | | | | 59,162 | |
| | | | | | | | |
| | | | | | | 105,106 | |
| | | | | | | | |
Containers & Packaging (0.3%) | |
Flex Acquisition Co., Inc.
6.875%, 1/15/25§ | | | 40,000 | | | | 39,400 | |
See Notes to Financial Statements.
27
1290 FUNDS
1290 DOUBLELINE DYNAMIC ALLOCATION FUND
PORTFOLIO OF INVESTMENTS (Continued)
October 31, 2020
| | | | | | | | |
| | | |
| | | Principal
Amount | | | Value
(Note 1) | |
Packaging Corp. of America
3.000%, 12/15/29 | | $ | 60,000 | | | $ | 65,964 | |
Silgan Holdings, Inc.
4.125%, 2/1/28 | | | 30,000 | | | | 31,023 | |
WRKCo, Inc.
3.750%, 3/15/25 | | | 55,000 | | | | 61,122 | |
| | | | | | | | |
| | | | | | | 197,509 | |
| | | | | | | | |
Metals & Mining (0.2%) | |
Arconic Corp.
6.125%, 2/15/28§ | | | 35,000 | | | | 36,811 | |
Novelis Corp.
4.750%, 1/30/30§ | | | 45,000 | | | | 45,551 | |
SunCoke Energy Partners LP
7.500%, 6/15/25§ | | | 30,000 | | | | 26,850 | |
| | | | | | | | |
| | | | | | | 109,212 | |
| | | | | | | | |
Total Materials | | | | | | | 411,827 | |
| | | | | | | | |
Real Estate (0.5%) | | | | | |
Equity Real Estate Investment Trusts (REITs) (0.5%) | |
Alexandria Real Estate Equities, Inc. (REIT)
4.000%, 1/15/24 | | | 110,000 | | | | 121,125 | |
American Tower Corp. (REIT)
3.950%, 3/15/29 | | | 55,000 | | | | 63,108 | |
Crown Castle International Corp. (REIT) | | | | | |
3.650%, 9/1/27 | | | 55,000 | | | | 61,243 | |
3.300%, 7/1/30 | | | 30,000 | | | | 32,617 | |
ESH Hospitality, Inc. (REIT)
5.250%, 5/1/25§ | | | 20,000 | | | | 20,000 | |
Iron Mountain, Inc. (REIT)
4.500%, 2/15/31§ | | | 15,000 | | | | 14,832 | |
VICI Properties LP (REIT) | | | | | | | | |
3.750%, 2/15/27§ | | | 5,000 | | | | 5,012 | |
4.125%, 8/15/30§ | | | 15,000 | | | | 15,188 | |
| | | | | | | | |
| | | | | | | 333,125 | |
| | | | | | | | |
Real Estate Management & Development (0.0%) | |
Realogy Group LLC
7.625%, 6/15/25§ | | | 10,000 | | | | 10,563 | |
| | | | | | | | |
Total Real Estate | | | | | | | 343,688 | |
| | | | | | | | |
Utilities (1.0%) | | | | | |
Electric Utilities (0.6%) | |
Eversource Energy | | | | | | | | |
Series R
1.650%, 8/15/30 | | | 65,000 | | | | 63,566 | |
Georgia Power Co. | | | | | | | | |
Series A
2.200%, 9/15/24 | | | 60,000 | | | | 63,302 | |
Monongahela Power Co. 5.400%, 12/15/43§ | | | 70,000 | | | | 95,230 | |
NextEra Energy Capital Holdings, Inc. 2.250%, 6/1/30 | | | 60,000 | | | | 62,189 | |
PG&E Corp.
5.000%, 7/1/28 | | | 45,000 | | | | 45,005 | |
Pinnacle West Capital Corp. 1.300%, 6/15/25 | | | 70,000 | | | | 70,850 | |
| | | | | | | | |
| | | | | | | 400,142 | |
| | | | | | | | |
Gas Utilities (0.2%) | |
Brooklyn Union Gas Co. (The) 4.487%, 3/4/49§ | | | 50,000 | | | | 63,287 | |
East Ohio Gas Co. (The) 3.000%, 6/15/50§ | | | 65,000 | | | | 65,831 | |
| | | | | | | | |
| | | | | | | 129,118 | |
| | | | | | | | |
Independent Power and Renewable Electricity Producers (0.1%) | |
Calpine Corp. | | | | | | | | |
5.125%, 3/15/28§ | | | 25,000 | | | | 25,700 | |
4.625%, 2/1/29§ | | | 15,000 | | | | 15,146 | |
| | | | | | | | |
| | | | | | | 40,846 | |
| | | | | | | | |
Water Utilities (0.1%) | |
Essential Utilities, Inc. 2.704%, 4/15/30 | | | 65,000 | | | | 68,761 | |
| | | | | | | | |
Total Utilities | | | | | | | 638,867 | |
| | | | | | | | |
Total Corporate Bonds | | | | | | | 10,417,701 | |
| | | | | | | | |
Mortgage-Backed Securities (3.2%) | | | | | | | | |
FHLMC
2.000%, 10/1/50 | | | 498,352 | | | | 507,405 | |
FHLMC UMBS
2.000%, 9/1/40 | | | 1,586,083 | | | | 1,638,688 | |
| | | | | | | | |
Total Mortgage-Backed Securities | | | | | | | 2,146,093 | |
| | | | | | | | |
U.S. Treasury Obligations (10.3%) | |
U.S. Treasury Bonds | | | | | | | | |
4.750%, 2/15/37 | | | 220,000 | | | | 338,094 | |
1.125%, 8/15/40 | | | 400,000 | | | | 380,512 | |
2.750%, 11/15/47 | | | 240,000 | | | | 302,062 | |
1.375%, 8/15/50 | | | 360,000 | | | | 337,945 | |
U.S. Treasury Notes | | | | | | | | |
1.750%, 11/30/21 | | | 440,000 | | | | 447,592 | |
0.125%, 10/15/23 | | | 70,000 | | | | 69,857 | |
2.125%, 9/30/24 | | | 350,000 | | | | 375,127 | |
2.250%, 10/31/24 | | | 350,000 | | | | 377,286 | |
2.750%, 2/28/25 | | | 210,000 | | | | 231,945 | |
3.000%, 9/30/25 | | | 340,000 | | | | 383,350 | |
0.250%, 10/31/25 | | | 690,000 | | | | 685,546 | |
2.250%, 3/31/26 | | | 290,000 | | | | 318,094 | |
1.625%, 10/31/26 | | | 340,000 | | | | 362,213 | |
0.500%, 6/30/27 | | | 410,000 | | | | 407,375 | |
0.500%, 10/31/27 | | | 1,020,000 | | | | 1,010,772 | |
2.250%, 11/15/27 | | | 350,000 | | | | 389,038 | |
0.625%, 8/15/30 | | | 380,000 | | | | 371,682 | |
| | | | | | | | |
Total U.S. Treasury Obligations | | | | | | | 6,788,490 | |
| | | | | | | | |
Total Long-Term Debt Securities (45.1%)
(Cost $29,307,472) | | | | | | | 29,765,025 | |
| | | | | | | | |
| | | |
| | | Number of
Shares | | | Value
(Note 1) | |
COMMON STOCKS: | | | | | | | | |
Communication Services (3.2%) | | | | | | | | |
Interactive Media & Services (2.4%) | |
Alphabet, Inc., Class A* | | | 526 | | | | 850,074 | |
Facebook, Inc., Class A* | | | 2,820 | | | | 741,970 | |
| | | | | | | | |
| | | | | | | 1,592,044 | |
| | | | | | | | |
Media (0.8%) | |
Comcast Corp., Class A | | | 12,557 | | | | 530,408 | |
| | | | | | | | |
Total Communication Services | | | | | | | 2,122,452 | |
| | | | | | | | |
See Notes to Financial Statements.
28
1290 FUNDS
1290 DOUBLELINE DYNAMIC ALLOCATION FUND
PORTFOLIO OF INVESTMENTS (Continued)
October 31, 2020
| | | | | | | | |
| | | |
| | | Number of
Shares | | | Value
(Note 1) | |
Consumer Discretionary (3.1%) | | | | | | | | |
Internet & Direct Marketing Retail (1.8%) | | | | | |
Amazon.com, Inc.* | | | 386 | | | $ | 1,171,954 | |
| | | | | | | | |
Multiline Retail (0.5%) | |
Dollar General Corp. | | | 1,593 | | | | 332,475 | |
| | | | | | | | |
Specialty Retail (0.8%) | |
Ross Stores, Inc. | | | 3,356 | | | | 285,830 | |
Ulta Beauty, Inc.* | | | 1,232 | | | | 254,741 | |
| | | | | | | | |
| | | | | | | 540,571 | |
| | | | | | | | |
Total Consumer Discretionary | | | | | | | 2,045,000 | |
| | | | | | | | |
Consumer Staples (2.2%) | | | | | | | | |
Beverages (0.6%) | |
Constellation Brands, Inc., Class A | | | 2,429 | | | | 401,344 | |
| | | | | | | | |
Food & Staples Retailing (0.2%) | |
Sysco Corp. | | | 2,160 | | | | 119,470 | |
| | | | | | | | |
Household Products (0.9%) | |
Procter & Gamble Co. (The) | | | 4,405 | | | | 603,925 | |
| | | | | | | | |
Tobacco (0.5%) | |
Philip Morris International, Inc. | | | 4,541 | | | | 322,502 | |
| | | | | | | | |
Total Consumer Staples | | | | | | | 1,447,241 | |
| | | | | | | | |
Energy (0.5%) | | | | | | | | |
Oil, Gas & Consumable Fuels (0.5%) | |
Exxon Mobil Corp. | | | 6,706 | | | | 218,750 | |
Pioneer Natural Resources Co. | | | 1,538 | | | | 122,363 | |
| | | | | | | | |
| | | | | | | 341,113 | |
| | | | | | | | |
Total Energy | | | | | | | 341,113 | |
| | | | | | | | |
Financials (2.9%) | | | | | | | | |
Banks (1.4%) | |
Citigroup, Inc. | | | 8,205 | | | | 339,851 | |
First Republic Bank | | | 2,042 | | | | 257,578 | |
Truist Financial Corp. | | | 7,444 | | | | 313,541 | |
| | | | | | | | |
| | | | | | | 910,970 | |
| | | | | | | | |
Capital Markets (0.8%) | |
Charles Schwab Corp. (The) | | | 6,825 | | | | 280,576 | |
Intercontinental Exchange, Inc. | | | 2,773 | | | | 261,771 | |
| | | | | | | | |
| | | | | | | 542,347 | |
| | | | | | | | |
Insurance (0.7%) | |
Aflac, Inc. | | | 6,461 | | | | 219,351 | |
Willis Towers Watson plc | | | 1,175 | | | | 214,414 | |
| | | | | | | | |
| | | | | | | 433,765 | |
| | | | | | | | |
Total Financials | | | | | | | 1,887,082 | |
| | | | | | | | |
Health Care (4.0%) | |
Biotechnology (0.3%) | |
BioMarin Pharmaceutical, Inc.* | | | 1,632 | | | | 121,470 | |
Vertex Pharmaceuticals, Inc.* | | | 428 | | | | 89,178 | |
| | | | | | | | |
| | | | | | | 210,648 | |
| | | | | | | | |
Health Care Equipment & Supplies (1.0%) | |
Alcon, Inc.* | | | 4,193 | | | | 238,330 | |
Boston Scientific Corp.* | | | 12,105 | | | | 414,838 | |
| | | | | | | | |
| | | | | | | 653,168 | |
| | | | | | | | |
Health Care Providers & Services (1.3%) | |
Anthem, Inc. | | | 1,332 | | | | 363,370 | |
UnitedHealth Group, Inc. | | | 1,623 | | | | 495,242 | |
| | | | | | | | |
| | | | | | | 858,612 | |
| | | | | | | | |
Pharmaceuticals (1.4%) | |
AstraZeneca plc (ADR) | | | 6,678 | | | | 334,969 | |
Roche Holding AG (ADR) | | | 9,553 | | | | 382,024 | |
Zoetis, Inc. | | | 1,220 | | | | 193,431 | |
| | | | | | | | |
| | | | | | | 910,424 | |
| | | | | | | | |
Total Health Care | | | | | | | 2,632,852 | |
| | | | | | | | |
Industrials (2.3%) | |
Aerospace & Defense (0.4%) | |
Boeing Co. (The) | | | 2,018 | | | | 291,379 | |
| | | | | | | | |
Electrical Equipment (0.4%) | |
AMETEK, Inc. | | | 2,861 | | | | 280,950 | |
| | | | | | | | |
Industrial Conglomerates (0.6%) | |
Honeywell International, Inc. | | | 2,217 | | | | 365,694 | |
| | | | | | | | |
Machinery (0.9%) | |
Fortive Corp. | | | 4,809 | | | | 296,235 | |
Parker-Hannifin Corp. | | | 1,370 | | | | 285,453 | |
| | | | | | | | |
| | | | | | | 581,688 | |
| | | | | | | | |
Total Industrials | | | | | | | 1,519,711 | |
| | | | | | | | |
Information Technology (8.4%) | |
Communications Equipment (0.5%) | |
Motorola Solutions, Inc. | | | 2,088 | | | | 330,029 | |
| | | | | | | | |
Electronic Equipment, Instruments & Components (0.6%) | |
Corning, Inc. | | | 11,579 | | | | 370,181 | |
| | | | | | | | |
IT Services (1.4%) | |
PayPal Holdings, Inc.* | | | 2,574 | | | | 479,099 | |
Visa, Inc., Class A | | | 2,595 | | | | 471,537 | |
| | | | | | | | |
| | | | | | | 950,636 | |
| | | | | | | | |
Semiconductors & Semiconductor Equipment (1.4%) | |
Analog Devices, Inc. | | | 2,901 | | | | 343,855 | |
KLA Corp. | | | 1,133 | | | | 223,405 | |
Lam Research Corp. | | | 975 | | | | 333,528 | |
| | | | | | | | |
| | | | | | | 900,788 | |
| | | | | | | | |
Software (3.2%) | |
Adobe, Inc.* | | | 933 | | | | 417,144 | |
Microsoft Corp. | | | 6,821 | | | | 1,381,048 | |
Splunk, Inc.* | | | 1,736 | | | | 343,798 | |
| | | | | | | | |
| | | | | | | 2,141,990 | |
| | | | | | | | |
Technology Hardware, Storage & Peripherals (1.3%) | |
Apple, Inc. | | | 8,094 | | | | 881,113 | |
| | | | | | | | |
Total Information Technology | | | | | | | 5,574,737 | |
| | | | | | | | |
Materials (0.5%) | |
Chemicals (0.5%) | |
DuPont de Nemours, Inc. | | | 5,773 | | | | 328,368 | |
| | | | | | | | |
Total Materials | | | | | | | 328,368 | |
| | | | | | | | |
See Notes to Financial Statements.
29
1290 FUNDS
1290 DOUBLELINE DYNAMIC ALLOCATION FUND
PORTFOLIO OF INVESTMENTS (Continued)
October 31, 2020
| | | | | | | | |
| | | |
| | | Number of
Shares | | | Value
(Note 1) | |
Real Estate (0.6%) | |
Equity Real Estate Investment Trusts (REITs) (0.6%) | |
American Tower Corp. (REIT) | | | 1,582 | | | $ | 363,306 | |
| | | | | | | | |
Total Real Estate | | | | | | | 363,306 | |
| | | | | | | | |
Total Common Stocks (27.7%)
(Cost $14,948,695) | | | | | | | 18,261,862 | |
| | | | | | | | |
INVESTMENT COMPANIES: | |
Fixed Income (6.8%) | |
DoubleLine Floating Rate Fund, Class I‡ | | | 203,022 | | | | 1,873,892 | |
DoubleLine Global Bond Fund, Class I‡ | | | 246,165 | | | | 2,619,197 | |
| | | | | | | | |
Total Investment Companies (6.8%)
(Cost $4,436,700) | | | | | | | 4,493,089 | |
| | | | | | | | |
SHORT-TERM INVESTMENTS: | | | | | |
Investment Company (0.3%) | | | | | |
JPMorgan Prime Money Market Fund, IM Shares | | | 204,825 | | | | 204,948 | |
| | | | | | | | |
| | | |
| | | Principal
Amount | | | Value
(Note 1) | |
U.S. Treasury Obligations (16.2%) | | | | | |
U.S. Treasury Bills | | | | | | | | |
0.08%, 11/27/20 (p)(t) | | $ | 690,000 | | | | 689,958 | |
0.09%, 2/2/21 (p) | | | 1,000,000 | | | | 999,758 | |
0.10%, 2/25/21 (p) | | | 3,500,000 | | | | 3,498,827 | |
0.11%, 6/17/21 (p) | | | 3,000,000 | | | | 2,997,983 | |
0.12%, 9/9/21 (p) | | | 2,500,000 | | | | 2,497,286 | |
| | | | | | | | |
Total U.S. Treasury Obligations | | | | | | | 10,683,812 | |
| | | | | | | | |
Total Short-Term Investments (16.5%)
(Cost $10,886,572) | | | | | | | 10,888,760 | |
| | | | | | | | |
Total Investments in Securities (96.1%)
(Cost $59,579,439) | | | | | | | 63,408,736 | |
Other Assets Less Liabilities (3.9%) | | | | | | | 2,593,287 | |
| | | | | | | | |
Net Assets (100%) | | | | | | $ | 66,002,023 | |
| | | | | | | | |
| ‡ | All, or a portion, of the security is an affiliated company as defined under the Investment Company Act of 1940. |
| § | Securities exempt from registration under Rule 144A of the Securities Act of 1933. These securities may only be resold to qualified institutional buyers. At October 31, 2020, the market value of these securities amounted to $6,880,818 or 10.4% of net assets. Securities denoted with “§” but without “b” have been determined to be liquid under the guidelines established by the Board of Trustees. To the extent any securities might provide a right to demand registration, such rights have not been relied upon when determining liquidity. |
| (e) | Step Bond - Coupon rate increases or decreases in increments to maturity. Rate disclosed is as of October 31, 2020. Maturity date disclosed is the ultimate maturity date. |
| (h) | Defaulted security. A security is classified as defaulted if the issuer files for bankruptcy or fails to make a scheduled interest or principal payment within the grace period set forth in the security’s governing documents. |
| (k) | Variable or floating rate security, linked to the referenced benchmark. The interest rate shown was the current rate as of October 31, 2020. |
| (l) | Variable or floating rate security, the interest rate of which adjusts periodically based on changes in current interest rates and prepayments on the underlying pool of assets. The interest rate shown was the current rate as of October 31, 2020. |
| (t) | All, or a portion of security held by broker as collateral for OTC Swap contracts, with a total collateral value of $659,972. |
Glossary:
| | ADR | — American Depositary Receipt |
| | CAPE | — Cyclically Adjusted Price Earnings |
| | FHLMC | — Federal Home Loan Mortgage Corp. |
| | FNMA | — Federal National Mortgage Association |
| | ICE | — Intercontinental Exchange |
| | LIBOR | — London Interbank Offered Rate |
| | UMBS | — Uniform Mortgage-Backed Securities |
| | USD | — United States Dollar |
See Notes to Financial Statements.
30
1290 FUNDS
1290 DOUBLELINE DYNAMIC ALLOCATION FUND
PORTFOLIO OF INVESTMENTS (Continued)
October 31, 2020
Investments in companies which were affiliates for the year ended October 31, 2020, were as follows:
| | | | | | | | | | | | | | | | | | | | | | | | | | | | | | | | | | | | |
Security Description | | Shares at
October 31,
2020 | | | Market
Value
October 31,
2019 ($) | | | Purchases
at Cost
($) | | | Proceeds
from
Sales ($) | | | Net
Realized
Gain
(Loss)
($) | | | Change
in Unrealized
Appreciation/
(Depreciation)
($) | | | Market Value
October 31,
2020 ($) | | | Dividend/
Interest
Income
($) | | | Capital Gain
Distributions
($) | |
INVESTMENT COMPANIES: | | | | | | | | | | | | | | | | | | | | | | | | | | | | | | | | | | | | |
Fixed Income | | | | | | | | | | | | | | | | | | | | | | | | | | | | | | | | | | | | |
DoubleLine Floating Rate Fund, Class I | | | 203,022 | | | | 1,682,018 | | | | 900,000 | | | | (600,000 | ) | | | (110,658 | ) | | | 2,532 | | | | 1,873,892 | | | | 73,851 | | | | — | |
DoubleLine Global Bond Fund, Class I | | | 246,165 | | | | 2,383,588 | | | | 1,000,000 | | | | (800,000 | ) | | | (20,388 | ) | | | 55,997 | | | | 2,619,197 | | | | 8,090 | | | | 123 | |
| | | | | | | | | | | | | | | | | | | | | | | | | | | | | | | | | |
Total | | | | | | | 4,065,606 | | | | 1,900,000 | | | | (1,400,000 | ) | | | (131,046 | ) | | | 58,529 | | | | 4,493,089 | | | | 81,941 | | | | 123 | |
| | | | | | | | | | | | | | | | | | | | | | | | | | | | | | | | | |
OTC Total return swap contracts outstanding as of October 31, 2020 (Note 1):
| | | | | | | | | | | | | | | | | | | | |
Reference Entity | | Payments Made
by Fund | | Payments Received
by Fund | | Frequency of
Payments
Made/Received | | Counterparty | | Maturity
Date | | | Notional
Amount | | | Value and
Unrealized
Appreciation
(Depreciation)
($) | |
Shiller Barclays CAPE US Sector II ER USD Index | | 0.40% and decrease in total return of index | | Increase in total return of index | | At maturity | | Barclays Bank plc | | | 11/10/2020 | | | | USD 10,900,000 | | | | (554,161 | ) |
| | | | | | | | | | | | | | | | | | | | |
| | | | | | | | | | | | | | | | | | | (554,161 | ) |
| | | | | | | | | | | | | | | | | | | | |
The following is a summary of the inputs used to value the Fund’s assets and liabilities carried at fair value as of October 31, 2020:
The inputs or methodology used for valuing securities are not necessarily an indication of the risk associated with investing in those securities.
Various inputs are used in determining the value of the Fund’s investments. These inputs are summarized in the three broad levels listed below:
| | | | | | | | | | | | | | | | |
| | | | | |
| Investment Type | | Level 1
Quoted Prices in
Active Markets for
Identical
Securities | | | Level 2
Significant Other
Observable Inputs
(including quoted prices
for similar securities,
interest rates,
prepayment speeds,
credit risk, etc.) | | | Level 3
Significant Unobservable
Inputs (including the
Fund’s own assumptions in
determining the fair
value of investments) | | | Total | |
Assets: | |
Asset-Backed Securities | | $ | — | | | $ | 1,799,105 | | | $ | — | | | $ | 1,799,105 | |
Collateralized Mortgage Obligations | | | — | | | | 8,613,636 | | | | — | | | | 8,613,636 | |
Common Stocks | | | | | | | | |
Communication Services | | | 2,122,452 | | | | — | | | | — | | | | 2,122,452 | |
Consumer Discretionary | | | 2,045,000 | | | | — | | | | — | | | | 2,045,000 | |
Consumer Staples | | | 1,447,241 | | | | — | | | | — | | | | 1,447,241 | |
Energy | | | 341,113 | | | | — | | | | — | | | | 341,113 | |
Financials | | | 1,887,082 | | | | — | | | | — | | | | 1,887,082 | |
Health Care | | | 2,632,852 | | | | — | | | | — | | | | 2,632,852 | |
Industrials | | | 1,519,711 | | | | — | | | | — | | | | 1,519,711 | |
Information Technology | | | 5,574,737 | | | | — | | | | — | | | | 5,574,737 | |
Materials | | | 328,368 | | | | — | | | | — | | | | 328,368 | |
Real Estate | | | 363,306 | | | | — | | | | — | | | | 363,306 | |
See Notes to Financial Statements.
31
1290 FUNDS
1290 DOUBLELINE DYNAMIC ALLOCATION FUND
PORTFOLIO OF INVESTMENTS (Continued)
October 31, 2020
| | | | | | | | | | | | | | | | |
| | | | | |
| Investment Type | | Level 1
Quoted Prices in
Active Markets for
Identical
Securities | | | Level 2
Significant Other
Observable Inputs
(including quoted prices
for similar securities,
interest rates,
prepayment speeds,
credit risk, etc.) | | | Level 3
Significant Unobservable
Inputs (including the
Fund’s own assumptions in
determining the fair
value of investments) | | | Total | |
Corporate Bonds | | | | | | | | | | | | | | | | |
Communication Services | | $ | — | | | $ | 1,212,423 | | | $ | — | | | $ | 1,212,423 | |
Consumer Discretionary | | | — | | | | 1,169,467 | | | | — | | | | 1,169,467 | |
Consumer Staples | | | — | | | | 666,139 | | | | — | | | | 666,139 | |
Energy | | | — | | | | 1,171,794 | | | | — | | | | 1,171,794 | |
Financials | | | — | | | | 2,008,560 | | | | — | | | | 2,008,560 | |
Health Care | | | — | | | | 1,081,975 | | | | — | | | | 1,081,975 | |
Industrials | | | — | | | | 1,223,005 | | | | — | | | | 1,223,005 | |
Information Technology | | | — | | | | 489,956 | | | | — | | | | 489,956 | |
Materials | | | — | | | | 411,827 | | | | — | | | | 411,827 | |
Real Estate | | | — | | | | 343,688 | | | | — | | | | 343,688 | |
Utilities | | | — | | | | 638,867 | | | | — | | | | 638,867 | |
Investment Companies | | | 4,493,089 | | | | — | | | | — | | | | 4,493,089 | |
Mortgage-Backed Securities | | | — | | | | 2,146,093 | | | | — | | | | 2,146,093 | |
Short-Term Investments | | | | | | | | |
Investment Company | | | 204,948 | | | | — | | | | — | | | | 204,948 | |
U.S. Treasury Obligations | | | — | | | | 10,683,812 | | | | — | | | | 10,683,812 | |
U.S. Treasury Obligations | | | — | | | | 6,788,490 | | | | — | | | | 6,788,490 | |
| | | | | | | | | | | | | | | | |
Total Assets | | $ | 22,959,899 | | | $ | 40,448,837 | | | $ | — | | | $ | 63,408,736 | |
| | | | | | | | | | | | | | | | |
| | | | |
Liabilities: | | | | | | | | | | | | | | | | |
Total Return Swaps | | $ | — | | | $ | (554,161 | ) | | $ | — | | | $ | (554,161 | ) |
| | | | | | | | | | | | | | | | |
Total Liabilities | | $ | — | | | $ | (554,161 | ) | | $ | — | | | $ | (554,161 | ) |
| | | | | | | | | | | | | | | | |
Total | | $ | 22,959,899 | | | $ | 39,894,676 | | | $ | — | | | $ | 62,854,575 | |
| | | | | | | | | | | | | | | | |
Fair Values of Derivative Instruments as of October 31, 2020:
| | | | | | |
| | | Statement of Assets and Liabilities | |
Derivatives Contracts^ | | Liability Derivatives | | Fair Value | |
Equity contracts | | Payables, Net assets – Unrealized depreciation | | $ | (554,161 | ) |
| | | | | | |
Total | | | | $ | (554,161 | ) |
| | | | | | |
The Effect of Derivative Instruments on the Statement of Operations for the year ended October 31, 2020:
| | | | | | | | |
| Amount of Realized Gain or (Loss) on Derivatives Recognized in Income | |
Derivatives Contracts^ | | Swaps | | | Total | |
Equity contracts | | $ | 2,505,145 | | | $ | 2,505,145 | |
| | | | | | | | |
Total | | $ | 2,505,145 | | | $ | 2,505,145 | |
| | | | | | | | |
| | | | | | | | |
| Amount of Unrealized Appreciation or (Depreciation) on Derivatives Recognized in Income | |
Derivatives Contracts^ | | Swaps | | | Total | |
Equity contracts | | $ | (1,070,556 | ) | | $ | (1,070,556 | ) |
| | | | | | | | |
Total | | $ | (1,070,556 | ) | | $ | (1,070,556 | ) |
| | | | | | | | |
^ The Fund held swaps contracts as a substitute for investing in conventional securities.
The Fund held swap contracts with an average notional value of approximately $10,846,000 during the year ended October 31, 2020.
See Notes to Financial Statements.
32
1290 FUNDS
1290 DOUBLELINE DYNAMIC ALLOCATION FUND
PORTFOLIO OF INVESTMENTS (Continued)
October 31, 2020
The following table presents the Fund’s gross derivative assets and liabilities by counterparty net of amounts available for offset under netting arrangements and any related collateral received or pledged by the Fund as of October 31, 2020:
| | | | | | | | | | | | | | | | |
Counterparty | | Gross Amount of
Derivative Liabilities
Presented in the
Statement of Assets
and Liabilities (a) | | | Derivatives
Available
for Offset | | | Collateral
Pledged* | | | Net Amount
Due to
Counterparty | |
Barclays Bank plc | | $ | 554,161 | | | $ | — | | | $ | (554,161 | ) | | $ | — | |
| | | | | | | | | | | | | | | | |
Total | | $ | 554,161 | | | $ | — | | | $ | (554,161 | ) | | $ | — | |
| | | | | | | | | | | | | | | | |
| (a) | For financial reporting purposes the Fund does not offset derivative assets and derivative liabilities subject to master netting arrangements in the Statement of Assets and Liabilities. |
| * | The table above does not include the additional collateral pledged to the counterparty. Total additional collateral pledged is $105,811. |
Investment security transactions for the year ended October 31, 2020 were as follows:
| | | | |
Cost of Purchases: | | | | |
Long-term investments other than U.S. government debt securities | | $ | 35,727,937 | |
Long-term U.S. government debt securities | | | 30,136,531 | |
| | | | |
| | $ | 65,864,468 | |
| | | | |
Net Proceeds of Sales and Redemptions: | | | | |
Long-term investments other than U.S. government debt securities | | $ | 33,572,640 | |
Long-term U.S. government debt securities | | | 30,551,874 | |
| | | | |
| | $ | 64,124,514 | |
| | | | |
As of October 31, 2020, the gross unrealized appreciation (depreciation) of investments based on the aggregate cost of investments in securities and derivative instruments, if applicable, for Federal income tax purposes was as follows:
| | | | |
Aggregate gross unrealized appreciation | | $ | 4,028,006 | |
Aggregate gross unrealized depreciation | | | (1,448,125 | ) |
| | | | |
Net unrealized appreciation | | $ | 2,579,881 | |
| | | | |
Federal income tax cost of investments in securities and derivative instruments, if applicable | | $ | 60,274,694 | |
| | | | |
See Notes to Financial Statements.
33
1290 FUNDS
1290 DOUBLELINE DYNAMIC ALLOCATION FUND
STATEMENT OF ASSETS AND LIABILITIES
October 31, 2020
| | | | |
ASSETS | |
Investments in Securities, at value: | | | | |
Affiliated Issuers (Cost $4,436,700) | | $ | 4,493,089 | |
Unaffiliated Issuers (Cost $55,142,739) | | | 58,915,647 | |
Cash | | | 3,066,946 | |
Receivable for securities sold | | | 1,701,825 | |
Dividends, interest and other receivables | | | 176,694 | |
Receivable for Fund shares sold | | | 16,089 | |
Prepaid registration and filing fees | | | 13,323 | |
Other assets | | | 662 | |
| | | | |
Total assets | | | 68,384,275 | |
| | | | |
LIABILITIES | |
Payable for securities purchased | | | 1,706,752 | |
Market value on OTC swap contracts | | | 554,161 | |
Investment advisory fees payable | | | 19,721 | |
Administrative fees payable | | | 8,576 | |
Transfer agent fees payable | | | 6,408 | |
Trustees’ fees payable | | | 1,318 | |
Distribution fees payable – Class A | | | 769 | |
Distribution fees payable – Class R | | | 78 | |
Accrued expenses | | | 84,469 | |
| | | | |
Total liabilities | | | 2,382,252 | |
| | | | |
NET ASSETS | | $ | 66,002,023 | |
| | | | |
Net assets were comprised of: | | | | |
Paid in capital | | $ | 58,143,346 | |
Total distributable earnings (loss) | | | 7,858,677 | |
| | | | |
Net assets | | $ | 66,002,023 | |
| | | | |
Class A | | | | |
Net asset value and redemption price per share, $3,519,514 / 306,880 shares outstanding (unlimited amount authorized: $0.001 par value) | | $ | 11.47 | |
Maximum sales charge (5.50% of offering price) | | | 0.67 | |
| | | | |
Maximum offering price per share | | $ | 12.14 | |
| | | | |
Class I | | | | |
Net asset value, offering and redemption price per share, $62,303,461 / 5,420,408 shares outstanding (unlimited amount authorized: $0.001 par value) | | $ | 11.49 | |
| | | | |
Class R | | | | |
Net asset value, offering and redemption price per share, $179,048 / 15,645 shares outstanding (unlimited amount authorized: $0.001 par value) | | $ | 11.44 | |
| | | | |
STATEMENT OF OPERATIONS
For the Year Ended October 31, 2020
| | | | |
INVESTMENT INCOME | |
Interest | | $ | 1,064,779 | |
Dividends ($81,941 of dividend income received from affiliates) | | | 348,972 | |
| | | | |
Total income | | | 1,413,751 | |
| | | | |
EXPENSES | |
Investment advisory fees | | | 471,663 | |
Professional fees | | | 99,539 | |
Administrative fees | | | 94,333 | |
Printing and mailing expenses | | | 51,675 | |
Transfer agent fees | | | 42,540 | |
Registration and filing fees | | | 39,713 | |
Custodian fees | | | 24,100 | |
Distribution fees – Class A | | | 8,142 | |
Trustees’ fees | | | 5,315 | |
Distribution fees – Class R | | | 855 | |
Miscellaneous | | | 28,033 | |
| | | | |
Gross expenses | | | 865,908 | |
Less: Waiver from investment adviser | | | (288,029 | ) |
| | | | |
Net expenses | | | 577,879 | |
| | | | |
NET INVESTMENT INCOME (LOSS) | | | 835,872 | |
| | | | |
REALIZED AND UNREALIZED GAIN (LOSS) | |
Realized gain (loss) on: | | | | |
Investments in securities ($(131,046) realized gain (loss) from affiliates) | | | 1,482,178 | |
Net distributions of realized gain received from underlying funds ($123 received from affiliates) | | | 123 | |
Swaps | | | 2,505,145 | |
| | | | |
Net realized gain (loss) | | | 3,987,446 | |
| | | | |
Change in unrealized appreciation (depreciation) on: | | | | |
Investments in securities ($58,529 of change in unrealized appreciation (depreciation) from affiliates) | | | 981,678 | |
Swaps | | | (1,070,556 | ) |
| | | | |
Net change in unrealized appreciation (depreciation) | | | (88,878 | ) |
| | | | |
NET REALIZED AND UNREALIZED GAIN (LOSS) | | | 3,898,568 | |
| | | | |
NET INCREASE (DECREASE) IN NET ASSETS RESULTING FROM OPERATIONS | | $ | 4,734,440 | |
| | | | |
See Notes to Financial Statements.
34
1290 FUNDS
1290 DOUBLELINE DYNAMIC ALLOCATION FUND
STATEMENT OF CHANGES IN NET ASSETS
| | | | | | | | |
| | | Year Ended October 31, | |
| | 2020 | | | 2019 | |
INCREASE (DECREASE) IN NET ASSETS FROM OPERATIONS: | |
Net investment income (loss) | | $ | 835,872 | | | $ | 1,147,151 | |
Net realized gain (loss) | | | 3,987,446 | | | | 2,234,610 | |
Net change in unrealized appreciation (depreciation) | | | (88,878 | ) | | | 2,741,136 | |
| | | | | | | | |
NET INCREASE (DECREASE) IN NET ASSETS RESULTING FROM OPERATIONS | | | 4,734,440 | | | | 6,122,897 | |
| | | | | | | | |
Distributions to shareholders: | | | | | | | | |
Class A | | | (113,973 | ) | | | (83,828 | ) |
Class I | | | (3,268,817 | ) | | | (2,637,668 | ) |
Class R | | | (8,405 | ) | | | (6,450 | ) |
| | | | | | | | |
Total distributions to shareholders | | | (3,391,195 | ) | | | (2,727,946 | ) |
| | | | | | | | |
CAPITAL SHARES TRANSACTIONS: | | | | | | | | |
Class A | | | | | | | | |
Capital shares sold [315,066 and 55,587 shares, respectively] | | | 3,448,824 | | | | 596,061 | |
Capital shares issued in reinvestment of dividends [9,946 and 7,863 shares, respectively] | | | 108,112 | | | | 79,177 | |
Capital shares repurchased [(203,489) and (108,047) shares, respectively] | | | (2,244,959 | ) | | | (1,145,133 | ) |
| | | | | | | | |
Total Class A transactions | | | 1,311,977 | | | | (469,895 | ) |
| | | | | | | | |
Class I | | | | | | | | |
Capital shares sold [164,950 and 54,826 shares, respectively] | | | 1,862,167 | | | | 587,053 | |
Capital shares issued in reinvestment of dividends [19,730 and 18,482 shares, respectively] | | | 214,461 | | | | 186,113 | |
Capital shares repurchased [(95,972) and (113,792) shares, respectively] | | | (983,589 | ) | | | (1,175,255 | ) |
| | | | | | | | |
Total Class I transactions | | | 1,093,039 | | | | (402,089 | ) |
| | | | | | | | |
Class R | | | | | | | | |
Capital shares sold [382 and 145 shares, respectively] | | | 4,171 | | | | 1,462 | |
Capital shares issued in reinvestment of dividends [258 and 205 shares, respectively] | | | 2,814 | | | | 2,068 | |
Capital shares repurchased [(21) and (17) shares, respectively] | | | (233 | ) | | | (181 | ) |
| | | | | | | | |
Total Class R transactions | | | 6,752 | | | | 3,349 | |
| | | | | | | | |
NET INCREASE (DECREASE) IN NET ASSETS RESULTING FROM CAPITAL SHARE TRANSACTIONS | | | 2,411,768 | | | | (868,635 | ) |
| | | | | | | | |
TOTAL INCREASE (DECREASE) IN NET ASSETS | | | 3,755,013 | | | | 2,526,316 | |
NET ASSETS: | |
Beginning of year | | | 62,247,010 | | | | 59,720,694 | |
| | | | | | | | |
End of year | | $ | 66,002,023 | | | $ | 62,247,010 | |
| | | | | | | | |
See Notes to Financial Statements.
35
1290 FUNDS
1290 DOUBLELINE DYNAMIC ALLOCATION FUND
FINANCIAL HIGHLIGHTS
| | | | | | | | | | | | | | | | | | | | |
| | | Year Ended October 31, | | | March 7, 2016* to
October 31, 2016 | |
| Class A | | 2020 | | | 2019 | | | 2018 | | | 2017 | |
Net asset value, beginning of period | | $ | 11.23 | | | $ | 10.61 | | | $ | 11.25 | | | $ | 10.53 | | | $ | 10.00 | |
| | | | | | | | | | | | | | | | | | | | |
Income (loss) from investment operations: | | | | | | | | | | | | | | | | | | | | |
Net investment income (loss) (e)(x) | | | 0.12 | | | | 0.18 | | | | 0.15 | | | | 0.11 | | | | 0.06 | |
Net realized and unrealized gain (loss) | | | 0.70 | | | | 0.91 | | | | (0.01 | ) | | | 0.87 | | | | 0.47 | |
| | | | | | | | | | | | | | | | | | | | |
Total from investment operations | | | 0.82 | | | | 1.09 | | | | 0.14 | | | | 0.98 | | | | 0.53 | |
| | | | | | | | | | | | | | | | | | | | |
Less distributions: | |
Dividends from net investment income | | | (0.18 | ) | | | (0.17 | ) | | | (0.13 | ) | | | (0.09 | ) | | | — | |
Distributions from net realized gains | | | (0.40 | ) | | | (0.30 | ) | | | (0.65 | ) | | | (0.17 | ) | | | — | |
| | | | | | | | | | | | | | | | | | | | |
Total dividends and distributions | | | (0.58 | ) | | | (0.47 | ) | | | (0.78 | ) | | | (0.26 | ) | | | — | |
| | | | | | | | | | | | | | | | | | | | |
Net asset value, end of period | | $ | 11.47 | | | $ | 11.23 | | | $ | 10.61 | | | $ | 11.25 | | | $ | 10.53 | |
| | | | | | | | | | | | | | | | | | | | |
Total return (b) | | | 7.64 | % | | | 10.73 | % | | | 1.19 | % | | | 9.46 | % | | | 5.30 | % |
| | | | | | | | | | | | | | | | | | | | |
Ratios/Supplemental Data: | |
Net assets, end of period (000’s) | | $ | 3,520 | | | $ | 2,081 | | | $ | 2,440 | | | $ | 1,271 | | | $ | 356 | |
Ratio of expenses to average net assets: | | | | | | | | | | | | | | | | | | | | |
After waivers (a)(f) | | | 1.16 | %(j) | | | 1.15 | %(j) | | | 1.20 | %(k) | | | 1.21 | % | | | 1.22 | % |
Before waivers (a)(f) | | | 1.61 | % | | | 1.67 | % | | | 1.66 | % | | | 1.75 | % | | | 1.85 | % |
Ratio of net investment income (loss) to average net assets: | | | | | | | | | | | | | | | | | | | | |
After waivers (a)(f)(x) | | | 1.05 | % | | | 1.70 | % | | | 1.39 | % | | | 1.02 | % | | | 0.89 | %(l) |
Before waivers (a)(f)(x) | | | 0.60 | % | | | 1.19 | % | | | 0.93 | % | | | 0.48 | % | | | 0.26 | %(l) |
Portfolio turnover rate^ | | | 131 | % | | | 63 | % | | | 79 | % | | | 86 | % | | | 56 | %(z) |
| | |
| | | Year Ended October 31, | | | March 7, 2016* to
October 31, 2016 | |
| Class I | | 2020 | | | 2019 | | | 2018 | | | 2017 | |
Net asset value, beginning of period | | $ | 11.25 | | | $ | 10.63 | | | $ | 11.27 | | | $ | 10.55 | | | $ | 10.00 | |
| | | | | | | | | | | | | | | | | | | | |
Income (loss) from investment operations: | | | | | | | | | | | | | | | | | | | | |
Net investment income (loss) (e)(x) | | | 0.15 | | | | 0.21 | | | | 0.18 | | | | 0.14 | | | | 0.08 | |
Net realized and unrealized gain (loss) | | | 0.70 | | | | 0.91 | | | | (0.01 | ) | | | 0.86 | | | | 0.47 | |
| | | | | | | | | | | | | | | | | | | | |
Total from investment operations | | | 0.85 | | | | 1.12 | | | | 0.17 | | | | 1.00 | | | | 0.55 | |
| | | | | | | | | | | | | | | | | | | | |
Less distributions: | |
Dividends from net investment income | | | (0.21 | ) | | | (0.20 | ) | | | (0.16 | ) | | | (0.11 | ) | | | — | |
Distributions from net realized gains | | | (0.40 | ) | | | (0.30 | ) | | | (0.65 | ) | | | (0.17 | ) | | | — | |
| | | | | | | | | | | | | | | | | | | | |
Total dividends and distributions | | | (0.61 | ) | | | (0.50 | ) | | | (0.81 | ) | | | (0.28 | ) | | | — | |
| | | | | | | | | | | | | | | | | | | | |
Net asset value, end of period | | $ | 11.49 | | | $ | 11.25 | | | $ | 10.63 | | | $ | 11.27 | | | $ | 10.55 | |
| | | | | | | | | | | | | | | | | | | | |
Total return (b) | | | 7.89 | % | | | 11.00 | % | | | 1.44 | % | | | 9.68 | % | | | 5.50 | % |
| | | | | | | | | | | | | | | | | | | | |
Ratios/Supplemental Data: | |
Net assets, end of period (000’s) | | $ | 62,303 | | | $ | 59,997 | | | $ | 57,126 | | | $ | 59,101 | | | $ | 53,478 | |
Ratio of expenses to average net assets: | | | | | | | | | | | | | | | | | | | | |
After waivers (a)(f) | | | 0.91 | %(j) | | | 0.90 | %(j) | | | 0.95 | %(k) | | | 0.96 | % | | | 0.97 | % |
Before waivers (a)(f) | | | 1.36 | % | | | 1.42 | % | | | 1.41 | % | | | 1.50 | % | | | 1.55 | % |
Ratio of net investment income (loss) to average net assets: | | | | | | | | | | | | | | | | | | | | |
After waivers (a)(f)(x) | | | 1.35 | % | | | 1.95 | % | | | 1.62 | % | | | 1.27 | % | | | 1.12 | %(l) |
Before waivers (a)(f)(x) | | | 0.89 | % | | | 1.43 | % | | | 1.16 | % | | | 0.72 | % | | | 0.55 | %(l) |
Portfolio turnover rate^ | | | 131 | % | | | 63 | % | | | 79 | % | | | 86 | % | | | 56 | %(z) |
See Notes to Financial Statements.
36
1290 FUNDS
1290 DOUBLELINE DYNAMIC ALLOCATION FUND
FINANCIAL HIGHLIGHTS (Continued)
| | | | | | | | | | | | | | | | | | | | |
| | | Year Ended October 31, | | | March 7, 2016* to
October 31, 2016 | |
| Class R | | 2020 | | | 2019 | | | 2018 | | | 2017 | |
Net asset value, beginning of period | | $ | 11.21 | | | $ | 10.59 | | | $ | 11.23 | | | $ | 10.52 | | | $ | 10.00 | |
| | | | | | | | | | | | | | | | | | | | |
Income (loss) from investment operations: | | | | | | | | | | | | | | | | | | | | |
Net investment income (loss) (e)(x) | | | 0.09 | | | | 0.15 | | | | 0.12 | | | | 0.08 | | | | 0.04 | |
Net realized and unrealized gain (loss) | | | 0.70 | | | | 0.91 | | | | (0.01 | ) | | | 0.87 | | | | 0.48 | |
| | | | | | | | | | | | | | | | | | | | |
Total from investment operations | | | 0.79 | | | | 1.06 | | | | 0.11 | | | | 0.95 | | | | 0.52 | |
| | | | | | | | | | | | | | | | | | | | |
Less distributions: | |
Dividends from net investment income | | | (0.16 | ) | | | (0.14 | ) | | | (0.10 | ) | | | (0.07 | ) | | | — | |
Distributions from net realized gains | | | (0.40 | ) | | | (0.30 | ) | | | (0.65 | ) | | | (0.17 | ) | | | — | |
| | | | | | | | | | | | | | | | | | | | |
Total dividends and distributions | | | (0.56 | ) | | | (0.44 | ) | | | (0.75 | ) | | | (0.24 | ) | | | — | |
| | | | | | | | | | | | | | | | | | | | |
Net asset value, end of period | | $ | 11.44 | | | $ | 11.21 | | | $ | 10.59 | | | $ | 11.23 | | | $ | 10.52 | |
| | | | | | | | | | | | | | | | | | | | |
Total return (b) | | | 7.30 | % | | | 10.46 | % | | | 0.93 | % | | | 9.15 | % | | | 5.20 | % |
| | | | | | | | | | | | | | | | | | | | |
Ratios/Supplemental Data: | |
Net assets, end of period (000’s) | | $ | 179 | | | $ | 168 | | | $ | 156 | | | $ | 112 | | | $ | 105 | |
Ratio of expenses to average net assets: | | | | | | | | | | | | | | | | | | | | |
After waivers (a)(f) | | | 1.41 | %(j) | | | 1.40 | %(j) | | | 1.45 | %(k) | | | 1.46 | % | | | 1.47 | % |
Before waivers (a)(f) | | | 1.86 | % | | | 1.92 | % | | | 1.91 | % | | | 2.01 | % | | | 2.05 | % |
Ratio of net investment income (loss) to average net assets: | | | | | | | | | | | | | | | | | | | | |
After waivers (a)(f)(x) | | | 0.84 | % | | | 1.44 | % | | | 1.13 | % | | | 0.77 | % | | | 0.62 | %(l) |
Before waivers (a)(f)(x) | | | 0.39 | % | | | 0.93 | % | | | 0.67 | % | | | 0.22 | % | | | 0.05 | %(l) |
Portfolio turnover rate^ | | | 131 | % | | | 63 | % | | | 79 | % | | | 86 | % | | | 56 | %(z) |
| * | Commencement of Operations. |
| ^ | Portfolio turnover rate excludes derivatives, if any. |
| (a) | Ratios for periods less than one year are annualized. Certain non-recurring expenses incurred by the Fund are not annualized for periods less than one year. |
| (b) | Total returns for periods less than one year are not annualized. |
| (e) | Net investment income (loss) per share is based on average shares outstanding. |
| (f) | Expenses do not include the expenses of the underlying funds (“indirect expenses”), if applicable. |
| (j) | Including direct and indirect expenses, the net expense ratio after waivers and reimbursements would be 1.20% for Class A, 0.95% for Class I and 1.45% for Class R. |
| (k) | Including direct and indirect expenses, the net expense ratio after waivers and reimbursements would be 1.25% for Class A, 1.00% for Class I and 1.50% for Class R. |
| (l) | The annualized ratio of net investment income to average net assets may not be indicative of operating results for a full year. |
| (x) | Recognition of net investment income is affected by the timing of dividend declarations by the underlying funds in which the Fund invests. |
| (z) | Portfolio turnover rate for periods less than one year is not annualized. |
See Notes to Financial Statements.
37
1290 GAMCO SMALL/MID CAP VALUE FUND (Unaudited)
INVESTMENT ADVISER
| Ø | | Equitable Investment Management Group, LLC |
INVESTMENT SUB-ADVISER
| Ø | | GAMCO Asset Management, Inc. |
PERFORMANCE RESULTS
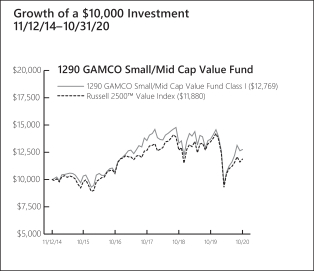
| | | | | | | | | | | | | | |
| |
| Annualized Total Returns as of 10/31/20 | |
| | | | | |
| | | | | 1
Year | | | 5
Years | | | Since
Incept. | |
Fund – Class A Shares* | | without Sales Charge | | | (7.04 | )% | | | 4.04 | % | | | 3.92 | % |
| | | with Sales Charge (a) | | | (12.18 | ) | | | 2.87 | | | | 2.95 | |
Fund – Class I Shares* | | | | | (6.88 | ) | | | 4.30 | | | | 4.18 | |
Fund – Class R Shares* | | | | | (7.31 | ) | | | 3.78 | | | | 3.66 | |
Fund – Class T Shares*† | | without Sales Charge | | | (6.88 | ) | | | 4.30 | | | | 4.18 | |
| | | with Sales Charge (b) | | | (9.20 | ) | | | 3.78 | | | | 3.73 | |
Russell 2500TM Value Index | | | | | (11.92 | ) | | | 3.91 | | | | 2.93 | |
| |
* Date of inception 11/12/14. † Class T Shares currently are not offered for sale. (a) A 5.50% front-end sales charge was deducted. (b) A 2.50% front-end sales charge was deducted. Returns for periods greater than one year are annualized. | |
The performance quoted is past performance and is not a guarantee of future results. Mutual funds are subject to certain market risks. Investment returns and principal value of an investment will fluctuate so that an investor’s shares, when redeemed, may be worth more or less than their original cost. Current performance may be higher or lower than the performance data shown. For the most current month-end performance data please call 1-888-310-0416 or visit www.1290Funds.com.
The graph illustrates comparative performance for $10,000 invested in the Class I Shares of the 1290 GAMCO Small/Mid Cap Value Fund and the Russell 2500TM Value Index from 11/12/14 to 10/31/20. The performance of the Russell 2500TM Value Index reflects an initial investment at the end of the month closest to the Fund’s inception. The performance of the Fund assumes reinvestment of all dividends and capital gain distributions, if any, and does not include a sales charge. The performance of the Russell 2500TM Value Index does not reflect the deduction of expenses or a sales charge associated with a mutual fund and has been adjusted to reflect reinvestment of all dividends, capital gain distributions, and interest of the securities included in the benchmark.
As of March 1, 2020, the gross expense ratios for Class A, I, R and T shares were 1.66%, 1.41%, 1.91% and 1.66%, respectively. The net expense ratios for Class A, I, R and T shares were 1.25%, 1.00%, 1.50% and 1.25%, respectively. The net expense ratios reflect the Adviser’s decision to contractually limit expenses through April 30, 2021. Fund Performance may also reflect the waiver of the Fund’s fees and reimbursement of expenses for certain periods since the inception date. Without these waivers and reimbursements, performance would have been lower.
In addition, performance shown in this section does not reflect the deduction of taxes that a shareholder would pay on Fund distributions or redemption of Fund shares.
PERFORMANCE SUMMARY
The Fund’s Class I shares returned (6.88)% for the year ended October 31, 2020. The Fund’s benchmark, the Russell 2500TM Value Index, returned (11.92)% over the same year.
Overview — GAMCO Asset Management, Inc.
The Sub-Adviser believes there are several reasons for an optimistic stock market outlook including upcoming fiscal stimulus, positive small business sentiment, a booming housing market, capital inflows into equity funds and continued low rates. Over the next twelve months, we believe we will likely see a cyclical renewal which will disproportionately benefit smaller capitalization and value companies, including several of the Fund’s holdings in areas that have been uniquely impacted by COVID-19, like live entertainment companies.
We believe long evolving changes in market structure, exacerbated by the economic shifts brought on by COVID-19, have created a wealth of opportunities among smaller companies, especially among those characterized as Value. Small- and mid-capitalization companies continue to significantly lag behind their larger cap counterparts for the trailing 1-, 3-, 5- and 10-year periods. Additionally, value-focused companies have continued to trail within the broader smaller cap category for the trailing 1-, 3-, 5- and 10-year periods ended October 31, 2020 (source: GAMCO, FTSE Russell). In many cases, we believe these stocks remain at bargain valuations that could provide significant upside as clarity on the shape of recovery increases. We believe the sharp market decline in March underscored the importance of investing in companies with sustainable
38
1290 GAMCO SMALL/MID CAP VALUE FUND (Unaudited)
cash generation and adaptable managements favored by our fundamental value focused approach. In our opinion, at least three elements could trigger a more durable rotation in investor preferences:
| • | | Sustained COVID-19 re-opening and economic recovery. This appears to us to be more a matter of when than if and may favor cyclical firms and those most directly impacted by COVID-19 (including live entertainment, travel and leisure companies). |
| • | | Renewed merger and acquisition (M&A) activity as the economic and electoral landscape becomes clearer. Scale remains as important as ever, funding costs are still low, and a number of entities stressed by the COVID-19 crisis will be looking for alternatives. Small- and mid-cap companies dominate this menu. |
| • | | A shift from the Goldilocks macroeconomic backdrop of low interest rates, low inflation and steady but modest economic growth of most of the last ten years. With interest rates pinned to nearly zero and demographic, political and productivity trends pointing to decelerating long-term growth, government stimulus-fed inflation seems to us to be the variable most likely to change. A steeper yield curve could benefit financials, while above-expectation inflation favors those with pricing power. |
Fund Highlights
We buy businesses we believe are selling at a discount to their Private Market Value (the price an informed industrialist would pay for the entire company), with a catalyst in place that could potentially surface values. Industry consolidation, financial engineering (e.g. spin-offs), changes in management and changes in regulation are just a few catalysts in which the Fund is rich. Our philosophy and process focus on fundamental company research and individual stock selection.
Our holdings have tended to be domestically focused with strong franchises and often pricing power. We have never been top-down allocators, trying to chase every trend. Rather, we rely on fundamental bottom-up research informed by our view of the shifting political and economic tides.
The Fund outperformed the Russell 2500 Value Index during this period. As you know, the Fund looks quite different from the index and occasionally we have seen periods where returns differ significantly. The Fund’s lower exposure to financials, real estate and energy services companies drove outperformance during the period.
What helped performance during the year?
| • | | Virtual health care company Teladoc LLC more than doubled during the period on increased virtual visits. Teladoc makes most of its revenue from monthly subscription fees, so a recent drop in virtual visits has not been important financially. |
| • | | Lennar Corp., one of the largest domestic homebuilders, was up during the period on strength in the housing market spurred by a rebound in-home purchases driven by the pandemic, low inventory in new and existing homes and record low interest rates. |
| • | | The Fund’s strategic underweighting in financial companies, which we believe can be viewed as commodities to an extent because of these companies’ strong reliance on interest rates, was one of the largest contributors to the Fund’s relative performance during the period, after real estate. With rates pinned to nearly zero and demographic, political and productivity trends pointing to decelerating long-term growth, government stimulus-fed inflation seems to us to be the variable most likely to change. A steeper yield curve would benefit financials while above-expectation inflation favors those with pricing power. |
| • | | A systemic underweight to energy due to the general avoidance of purely commodity driven businesses contributed to the Fund’s relative performance during the period. |
What hurt performance during the year?
| • | | Despite strong second and third quarter performance, overweighting in industrial companies was a detractor to performance for the period. GAMCO’s fundamental investment process is driven by our search to identify the best investment opportunities at any given time, and our 40+ years of compound, accumulated knowledge of industrial companies has led to our high conviction in the industrial sector. Cyclicals typically lead the way during a recovery and we believe are likely to disproportionately benefit once a vaccine has been approved. |
| • | | The Fund’s relative performance was dampened by its overweighting to communication services companies, which were particularly hard hit at the end of the first quarter due to advertising exposure, including Clear Channel Outdoors, The E.W. Scripps Company, Sinclair Broadcast Group, Inc. and Meredith Corp. and live entertainment exposure including Madison Square Garden Entertainment Corp., Madison Square Garden Sports Corp. and Liberty Braves Group. Political spending leading up to the presidential election helped provide momentum for companies with advertising exposure during the third quarter and the two run-off races in the Georgia senate election continue that momentum. We also see company specific and broad catalysts in place for the live entertainment companies. For example, we believe |
39
1290 GAMCO SMALL/MID CAP VALUE FUND (Unaudited)
| | Liberty Braves is the ultimate franchise business with strong barriers to entry, namely a short list of pure play sports assets. The repeal of The Professional and Amateur Sports Protection Act of 1992 (PASPA), which banned sports betting, is likely to drive ratings and increase franchise values. Franchise value has not been impaired by COVID-19 disruptions and we are seeing pent-up demand for sports from consumers. In the meantime, we believe we have identified several catalysts that will help to surface value over the long-term: a spin off to eliminate the tracking stock discount, a real estate spin off as a real estate investment trust (REIT), a sale to a private buyer and the league-wide integration of sports betting. |
| • | | Shares of Macquarie Infrastructure Corp. (MIC) have been impacted by COVID-related travel and restrictions on Atlantic Aviation and MIC Hawaii. However, general aviation flight activity has continued to increase and its bulk liquid storage and handling business, IMTT, saw sustained high levels of storage utilization. A potential near-term catalyst for MIC could be the sale of one of its operating businesses. |
| | | | |
| | |
Sector Weightings
as of October 31, 2020 | | % of
Net Assets | |
Industrials | | | 37.9 | % |
Consumer Staples | | | 12.4 | |
Materials | | | 11.6 | |
Communication Services | | | 10.4 | |
Consumer Discretionary | | | 9.4 | |
Health Care | | | 6.2 | |
Utilities | | | 2.6 | |
Financials | | | 2.5 | |
Information Technology | | | 2.3 | |
Investment Company | | | 1.9 | |
Real Estate | | | 1.4 | |
Energy | | | 0.8 | |
Cash and Other | | | 0.6 | |
| | | | | |
| | | | 100.0 | % |
| | | | | |
Holdings are subject to change without notice. | | | | |
UNDERSTANDING YOUR EXPENSES:
As a shareholder of the Fund, you incur two types of costs:
(1) transaction costs, including applicable sales charges and redemption fees; and (2) ongoing costs, including investment advisory fees, distribution and/or service (12b-1) fees (in the case of Class A, Class R and Class T shares of the Fund), and other Fund expenses. These examples are intended to help you understand your ongoing costs (in dollars) of investing in the Fund and to compare these costs with the ongoing costs of investing in other mutual funds.
The examples are based on an investment of $1,000 invested at the beginning of the six-month period ended October 31, 2020 and held for the entire six-month period.
Actual Expenses
The first line of the following table provides information about actual account values and actual expenses. You may use the information in this line, together with the amount you invested, to estimate the expenses that you paid over the period. Simply divide your account value by $1,000 (for example, an $8,600 account value divided by $1,000 = 8.6), then multiply the result by the number in the first line under the heading entitled ‘‘Expenses Paid During Period’’ to estimate the expenses you paid on your account during this period.
Hypothetical Example for Comparison Purposes
The second line of the following table provides information about hypothetical account values and hypothetical expenses based on the Fund’s actual expense ratio and an assumed rate of return of 5% per year before expenses, which is not the Fund’s actual return. The hypothetical account values and expenses may not be used to estimate the actual ending account balance or expenses you paid for the period. You may use this information to compare the ongoing costs of investing in the Fund and other funds. To do so, compare this 5% hypothetical example with the 5% hypothetical examples that appear in the shareholder reports of the other funds.
Please note that the expenses shown in the table are meant to highlight your ongoing costs only and do not reflect any transactional costs, such as sales charges (loads), redemption fees, or exchange fees. Therefore, the second line of the table is useful in comparing ongoing costs only, and will not help you determine the relative total costs of owning different funds. In addition, if these transactional costs were included, your costs would have been higher.
40
1290 GAMCO SMALL/MID CAP VALUE FUND (Unaudited)
EXAMPLE
| | | | | | | | | | | | |
| | | | |
| | | Beginning
Account
Value
5/1/20 | | | Ending
Account
Value
10/31/20 | | | Expenses
Paid
During
Period*
5/1/20 -
10/31/20 | |
Class A | |
Actual | | | $1,000.00 | | | | $1,192.30 | | | | $6.87 | |
Hypothetical (5% average annual return before expenses) | | | 1,000.00 | | | | 1,018.87 | | | | 6.33 | |
Class I | |
Actual | | | 1,000.00 | | | | 1,194.40 | | | | 5.50 | |
Hypothetical (5% average annual return before expenses) | | | 1,000.00 | | | | 1,020.12 | | | | 5.06 | |
Class R | |
Actual | | | 1,000.00 | | | | 1,190.10 | | | | 8.24 | |
Hypothetical (5% average annual return before expenses) | | | 1,000.00 | | | | 1,017.61 | | | | 7.59 | |
Class T** | |
Actual | | | 1,000.00 | | | | 1,193.10 | | | | 5.50 | |
Hypothetical (5% average annual return before expenses) | | | 1,000.00 | | | | 1,020.12 | | | | 5.07 | |
| |
* Expenses are equal to the Portfolio’s A, I, R and T shares annualized expense ratio of 1.25%, 1.00%, 1.50% and 1.00%, respectively, multiplied by the average account value over the period, and multiplied by 184/366 (to reflect the one-half year period). ** Class T shares currently are not offered for sale. | |
41
1290 FUNDS
1290 GAMCO SMALL/MID CAP VALUE FUND
PORTFOLIO OF INVESTMENTS
October 31, 2020
| | | | | | | | |
| | | |
| | | Number of
Shares | | | Value
(Note 1) | |
COMMON STOCKS: | | | | | | | | |
Communication Services (10.4%) | |
Diversified Telecommunication Services (0.0%) | |
Intelsat SA* | | | 1,000 | | | $ | 550 | |
| | | | | | | | |
Entertainment (1.1%) | |
Liberty Media Corp.-Liberty Braves, Class A* | | | 7,000 | | | | 144,900 | |
Liberty Media Corp.-Liberty Braves, Class C* | | | 19,000 | | | | 388,930 | |
Madison Square Garden Entertainment Corp.* | | | 2,200 | | | | 143,000 | |
Madison Square Garden Sports Corp., Class A* | | | 2,000 | | | | 283,280 | |
| | | | | | | | |
| | | | | | | 960,110 | |
| | | | | | | | |
Media (8.3%) | |
AMC Networks, Inc., Class A* | | | 25,000 | | | | 531,250 | |
Clear Channel Outdoor Holdings, Inc.* | | | 470,063 | | | | 420,236 | |
Corus Entertainment, Inc., Class B | | | 180,000 | | | | 475,569 | |
DISH Network Corp., Class A* | | | 5,000 | | | | 127,450 | |
EW Scripps Co. (The), Class A | | | 45,000 | | | | 408,600 | |
Grupo Televisa SAB (ADR)* | | | 90,000 | | | | 572,400 | |
JCDecaux SA* | | | 29,000 | | | | 449,067 | |
Loral Space & Communications, Inc. | | | 14,000 | | | | 243,740 | |
Meredith Corp. | | | 64,000 | | | | 704,000 | |
MSG Networks, Inc., Class A* | | | 48,000 | | | | 429,120 | |
Sinclair Broadcast Group, Inc., Class A | | | 42,000 | | | | 780,360 | |
Sirius XM Holdings, Inc. | | | 34,560 | | | | 198,029 | |
TEGNA, Inc. | | | 30,000 | | | | 360,900 | |
ViacomCBS, Inc. | | | 27,000 | | | | 771,390 | |
ViacomCBS, Inc., Class A | | | 24,000 | | | | 716,640 | |
WideOpenWest, Inc.* | | | 36,000 | | | | 179,640 | |
| | | | | | | | |
| | | | | | | 7,368,391 | |
| | | | | | | | |
Wireless Telecommunication Services (1.0%) | |
Gogo, Inc.* | | | 22,000 | | | | 176,880 | |
Millicom International Cellular SA | | | 3,000 | | | | 89,520 | |
United States Cellular Corp.* | | | 20,000 | | | | 582,400 | |
| | | | | | | | |
| | | | | | | 848,800 | |
| | | | | | | | |
Total Communication Services | | | | | | | 9,177,851 | |
| | | | | | | | |
Consumer Discretionary (9.4%) | | | | | | | | |
Auto Components (0.8%) | | | | | | | | |
Dana, Inc. | | | 46,000 | | | | 643,540 | |
Lear Corp. | | | 600 | | | | 72,486 | |
| | | | | | | | |
| | | | | | | 716,026 | |
| | | | | | | | |
Diversified Consumer Services (0.7%) | |
H&R Block, Inc. | | | 14,000 | | | | 241,640 | |
Terminix Global Holdings, Inc.* | | | 8,000 | | | | 376,720 | |
| | | | | | | | |
| | | | | | | 618,360 | |
| | | | | | | | |
Hotels, Restaurants & Leisure (2.1%) | |
Caesars Entertainment, Inc.* | | | 4,000 | | | | 179,280 | |
Churchill Downs, Inc. | | | 3,200 | | | | 477,280 | |
Dover Motorsports, Inc. | | | 15,000 | | | | 22,800 | |
Golden Entertainment, Inc.* | | | 45,000 | | | | 578,700 | |
Nathan’s Famous, Inc. | | | 8,000 | | | | 406,080 | |
Wynn Resorts Ltd. | | | 3,000 | | | | 217,290 | |
| | | | | | | | |
| | | | | | | 1,881,430 | |
| | | | | | | | |
Household Durables (1.6%) | |
Bassett Furniture Industries, Inc. | | | 35,000 | | | | 516,600 | |
Hunter Douglas NV* | | | 4,000 | | | | 232,047 | |
Lennar Corp., Class B | | | 11,000 | | | | 625,790 | |
| | | | | | | | |
| | | | | | | 1,374,437 | |
| | | | | | | | |
Internet & Direct Marketing Retail (0.6%) | |
Lands’ End, Inc.* | | | 12,000 | | | | 192,600 | |
Stamps.com, Inc.* | | | 1,500 | | | | 334,860 | |
| | | | | | | | |
| | | | | | | 527,460 | |
| | | | | | | | |
Leisure Products (3.4%) | |
Brunswick Corp. | | | 34,000 | | | | 2,166,140 | |
Mattel, Inc.* | | | 60,000 | | | | 826,200 | |
| | | | | | | | |
| | | | | | | 2,992,340 | |
| | | | | | | | |
Specialty Retail (0.2%) | |
Carvana Co.* | | | 1,000 | | | | 185,350 | |
| | | | | | | | |
Total Consumer Discretionary | | | | | | | 8,295,403 | |
| | | | | | | | |
Consumer Staples (12.4%) | | | | | | | | |
Beverages (3.6%) | | | | | | | | |
Davide Campari-Milano NV | | | 15,000 | | | | 156,463 | |
National Beverage Corp.* | | | 12,500 | | | | 978,625 | |
Remy Cointreau SA | | | 12,000 | | | | 2,028,396 | |
| | | | | | | | |
| | | | | | | 3,163,484 | |
| | | | | | | | |
Food & Staples Retailing (0.8%) | |
Casey’s General Stores, Inc. | | | 2,200 | | | | 370,854 | |
Ingles Markets, Inc., Class A | | | 9,500 | | | | 340,670 | |
| | | | | | | | |
| | | | | | | 711,524 | |
| | | | | | | | |
Food Products (5.5%) | |
Bunge Ltd. | | | 28,000 | | | | 1,588,440 | |
Farmer Bros Co.* | | | 45,273 | | | | 157,097 | |
Hain Celestial Group, Inc. (The)* | | | 24,000 | | | | 738,000 | |
J M Smucker Co. (The) | | | 12,000 | | | | 1,346,400 | |
Maple Leaf Foods, Inc. | | | 42,000 | | | | 764,783 | |
McCormick & Co., Inc. | | | 1,800 | | | | 321,750 | |
| | | | | | | | |
| | | | | | | 4,916,470 | |
| | | | | | | | |
Household Products (1.6%) | |
Energizer Holdings, Inc. | | | 36,000 | | | | 1,416,600 | |
| | | | | | | | |
Personal Products (0.9%) | |
Edgewell Personal Care Co.* | | | 30,000 | | | | 786,600 | |
| | | | | | | | |
Total Consumer Staples | | | | | | | 10,994,678 | |
| | | | | | | | |
Energy (0.8%) | | | | | | | | |
Energy Equipment & Services (0.8%) | |
Dril-Quip, Inc.* | | | 15,000 | | | | 388,500 | |
RPC, Inc.* | | | 145,000 | | | | 345,100 | |
| | | | | | | | |
Total Energy | | | | | | | 733,600 | |
| | | | | | | | |
Financials (2.5%) | | | | | | | | |
Banks (1.8%) | | | | | | | | |
Atlantic Capital Bancshares, Inc.* | | | 14,000 | | | | 194,320 | |
Cadence Bancorp | | | 9,000 | | | | 100,980 | |
Flushing Financial Corp. | | | 30,000 | | | | 383,700 | |
Synovus Financial Corp. | | | 35,000 | | | | 910,000 | |
| | | | | | | | |
| | | | | | | 1,589,000 | |
| | | | | | | | |
See Notes to Financial Statements.
42
1290 FUNDS
1290 GAMCO SMALL/MID CAP VALUE FUND
PORTFOLIO OF INVESTMENTS (Continued)
October 31, 2020
| | | | | | | | |
| | | |
| | | Number of
Shares | | | Value
(Note 1) | |
Capital Markets (0.7%) | |
Federated Hermes, Inc., Class B | | | 20,000 | | | $ | 478,000 | |
Waddell & Reed Financial, Inc., Class A | | | 12,000 | | | | 184,200 | |
| | | | | | | | |
| | | | | | | 662,200 | |
| | | | | | | | |
Total Financials | | | | | | | 2,251,200 | |
| | | | | | | | |
Health Care (6.2%) | | | | | | | | |
Biotechnology (0.1%) | | | | | | | | |
Clovis Oncology, Inc.* | | | 14,000 | | | | 69,020 | |
| | | | | | | | |
Health Care Equipment & Supplies (0.5%) | |
Cutera, Inc.* | | | 25,000 | | | | 473,250 | |
| | | | | | | | |
Health Care Providers & Services (1.5%) | |
Option Care Health, Inc.* | | | 22,527 | | | | 300,285 | |
Patterson Cos., Inc. | | | 42,000 | | | | 1,044,750 | |
| | | | | | | | |
| | | | | | | 1,345,035 | |
| | | | | | | | |
Health Care Technology (3.6%) | |
Evolent Health, Inc., Class A* | | | 55,000 | | | | 546,700 | |
Teladoc Health, Inc.* | | | 13,500 | | | | 2,652,210 | |
| | | | | | | | |
| | | | | | | 3,198,910 | |
| | | | | | | | |
Life Sciences Tools & Services (0.2%) | |
Bio-Rad Laboratories, Inc., Class A* | | | 300 | | | | 175,926 | |
| | | | | | | | |
Pharmaceuticals (0.3%) | |
Intersect ENT, Inc.* | | | 16,000 | | | | 248,000 | |
| | | | | | | | |
Total Health Care | | | | | | | 5,510,141 | |
| | | | | | | | |
Industrials (37.9%) | | | | | | | | |
Aerospace & Defense (4.5%) | | | | | | | | |
AAR Corp. | | | 21,000 | | | | 408,660 | |
Aerojet Rocketdyne Holdings, Inc.* | | | 26,200 | | | | 849,404 | |
Kaman Corp. | | | 18,500 | | | | 733,710 | |
Moog, Inc., Class A | | | 13,000 | | | | 811,070 | |
Moog, Inc., Class B | | | 1,800 | | | | 88,632 | |
Textron, Inc. | | | 30,000 | | | | 1,074,000 | |
| | | | | | | | |
| | | | | | | 3,965,476 | |
| | | | | | | | |
Building Products (3.1%) | |
Armstrong Flooring, Inc.* | | | 90,000 | | | | 266,400 | |
Griffon Corp. | | | 116,000 | | | | 2,487,040 | |
| | | | | | | | |
| | | | | | | 2,753,440 | |
| | | | | | | | |
Commercial Services & Supplies (2.2%) | |
IAA, Inc.* | | | 8,000 | | | | 452,720 | |
KAR Auction Services, Inc. | | | 8,688 | | | | 126,497 | |
Matthews International Corp., Class A | | | 60,000 | | | | 1,309,800 | |
Team, Inc.* | | | 15,000 | | | | 80,400 | |
| | | | | | | | |
| | | | | | | 1,969,417 | |
| | | | | | | | |
Construction & Engineering (0.8%) | |
Arcosa, Inc. | | | 16,000 | | | | 738,720 | |
| | | | | | | | |
Electrical Equipment (1.1%) | |
AZZ, Inc. | | | 30,000 | | | | 1,007,700 | |
| | | | | | | | |
Machinery (21.3%) | |
Astec Industries, Inc. | | | 60,000 | | | | 3,048,000 | |
CIRCOR International, Inc.* | | | 59,000 | | | | 1,646,100 | |
CNH Industrial NV* | | | 39,000 | | | | 303,030 | |
Donaldson Co., Inc. | | | 1,000 | | | | 47,500 | |
Eastern Co. (The) | | | 17,000 | | | | 347,990 | |
EnPro Industries, Inc. | | | 44,000 | | | | 2,596,880 | |
Flowserve Corp. | | | 48,000 | | | | 1,397,760 | |
Graco, Inc. | | | 4,500 | | | | 278,550 | |
Hyster-Yale Materials Handling, Inc. | | | 11,000 | | | | 466,400 | |
Ingersoll Rand, Inc.* | | | 24,000 | | | | 838,560 | |
ITT, Inc. | | | 3,500 | | | | 211,785 | |
Kennametal, Inc. | | | 26,000 | | | | 806,000 | |
Mueller Industries, Inc. | | | 40,000 | | | | 1,157,200 | |
Mueller Water Products, Inc., Class A | | | 34,000 | | | | 352,240 | |
Navistar International Corp.* | | | 22,470 | | | | 968,682 | |
Park-Ohio Holdings Corp. | | | 21,000 | | | | 414,540 | |
Shyft Group, Inc. (The) | | | 5,000 | | | | 96,550 | |
Toro Co. (The) | | | 6,500 | | | | 533,650 | |
Trinity Industries, Inc. | | | 95,000 | | | | 1,789,800 | |
Twin Disc, Inc.* | | | 86,000 | | | | 435,160 | |
Watts Water Technologies, Inc., Class A | | | 10,000 | | | | 1,107,700 | |
Welbilt, Inc.* | | | 12,500 | | | | 76,000 | |
| | | | | | | | |
| | | | | | | 18,920,077 | |
| | | | | | | | |
Trading Companies & Distributors (3.9%) | |
Ashtead Group plc | | | 3,000 | | | | 108,863 | |
GATX Corp. | | | 12,000 | | | | 819,360 | |
Herc Holdings, Inc.* | | | 57,000 | | | | 2,528,520 | |
| | | | | | | | |
| | | | | | | 3,456,743 | |
| | | | | | | | |
Transportation Infrastructure (1.0%) | |
Macquarie Infrastructure Corp. | | | 33,000 | | | | 851,400 | |
| | | | | | | | |
Total Industrials | | | | | | | 33,662,973 | |
| | | | | | | | |
Information Technology (2.3%) | | | | | | | | |
Communications Equipment (0.1%) | |
Communications Systems, Inc. | | | 20,000 | | | | 79,400 | |
EchoStar Corp., Class A* | | | 1,600 | | | | 37,056 | |
| | | | | | | | |
| | | | | | | 116,456 | |
| | | | | | | | |
Electronic Equipment, Instruments & Components (0.5%) | |
Landis+Gyr Group AG* | | | 7,500 | | | | 418,471 | |
| | | | | | | | |
IT Services (0.2%) | |
MoneyGram International, Inc.* | | | 27,000 | | | | 139,050 | |
| | | | | | | | |
Software (0.6%) | |
A10 Networks, Inc.* | | | 25,000 | | | | 168,500 | |
Cloudflare, Inc., Class A* | | | 500 | | | | 25,985 | |
FireEye, Inc.* | | | 16,000 | | | | 221,440 | |
Zuora, Inc., Class A* | | | 9,000 | | | | 86,580 | |
| | | | | | | | |
| | | | | | | 502,505 | |
| | | | | | | | |
Technology Hardware, Storage & Peripherals (0.9%) | |
Diebold Nixdorf, Inc.* | | | 135,000 | | | | 841,050 | |
| | | | | | | | |
Total Information Technology | | | | | | | 2,017,532 | |
| | | | | | | | |
Materials (11.6%) | | | | | | | | |
Chemicals (9.1%) | | | | | | | | |
Axalta Coating Systems Ltd.* | | | 11,000 | | | | 276,210 | |
Chr Hansen Holding A/S | | | 1,200 | | | | 120,893 | |
Core Molding Technologies, Inc.* | | | 110,260 | | | | 847,900 | |
Element Solutions, Inc.* | | | 126,000 | | | | 1,476,720 | |
See Notes to Financial Statements.
43
1290 FUNDS
1290 GAMCO SMALL/MID CAP VALUE FUND
PORTFOLIO OF INVESTMENTS (Continued)
October 31, 2020
| | | | | | | | |
| | | |
| | | Number of
Shares | | | Value
(Note 1) | |
Ferro Corp.* | | | 95,000 | | | $ | 1,221,700 | |
GCP Applied Technologies, Inc.* | | | 95,000 | | | | 2,071,950 | |
HB Fuller Co. | | | 8,500 | | | | 384,625 | |
Scotts Miracle-Gro Co. (The) | | | 6,200 | | | | 930,310 | |
Tredegar Corp. | | | 15,000 | | | | 218,700 | |
Valvoline, Inc. | | | 26,000 | | | | 511,420 | |
| | | | | | | | |
| | | | | | | 8,060,428 | |
| | | | | | | | |
Containers & Packaging (1.9%) | |
Greif, Inc., Class A | | | 29,000 | | | | 1,177,110 | |
Myers Industries, Inc. | | | 36,000 | | | | 516,240 | |
| | | | | | | | |
| | | | | | | 1,693,350 | |
| | | | | | | | |
Metals & Mining (0.6%) | |
Ampco-Pittsburgh Corp.* | | | 40,392 | | | | 175,705 | |
Freeport-McMoRan, Inc. | | | 20,000 | | | | 346,800 | |
TimkenSteel Corp.* | | | 5,000 | | | | 19,350 | |
| | | | | | | | |
| | | | | | | 541,855 | |
| | | | | | | | |
Total Materials | | | | | | | 10,295,633 | |
| | | | | | | | |
Real Estate (1.4%) | | | | | | | | |
Equity Real Estate Investment Trusts (REITs) (0.5%) | |
Ryman Hospitality Properties, Inc. (REIT) | | | 5,000 | | | | 199,250 | |
Seritage Growth Properties (REIT), Class A* | | | 22,000 | | | | 280,060 | |
| | | | | | | | |
| | | | | | | 479,310 | |
| | | | | | | | |
Real Estate Management & Development (0.9%) | |
St Joe Co. (The)* | | | 28,000 | | | | 757,120 | |
| | | | | | | | |
Total Real Estate | | | | | | | 1,236,430 | |
| | | | | | | | |
Utilities (2.6%) | | | | | | | | |
Gas Utilities (1.2%) | | | | | | | | |
National Fuel Gas Co. | | | 26,500 | | | | 1,058,940 | |
| | | | | | | | |
Independent Power and Renewable Electricity Producers (1.4%) | |
AES Corp. (The) | | | 64,000 | | | | 1,248,000 | |
| | | | | | | | |
Total Utilities | | | | | | | 2,306,940 | |
| | | | | | | | |
Total Common Stocks (97.5%)
(Cost $92,134,824) | | | | | | | 86,482,381 | |
| | | | | | | | |
| | | |
| | | Number of
Warrants | | | Value
(Note 1) | |
WARRANTS: | | | | | | | | |
Energy (0.0%) | | | | | | | | |
Energy Equipment & Services (0.0%) | |
Weatherford International plc, expiring 12/13/23* | | | 1,117 | | | | 134 | |
| | | | | | | | |
Total Energy | | | | | | | 134 | |
| | | | | | | | |
Health Care (0.0%) | | | | | | | | |
Health Care Providers & Services (0.0%) | |
Option Care Health, Inc., expiring 6/30/25* | | | 22 | | | | 8 | |
| | | | | | | | |
Total Health Care | | | | | | | 8 | |
| | | | | | | | |
Materials (0.0%) | | | | | | | | |
Metals & Mining (0.0%) | |
Ampco-Pittsburgh Corp., expiring 8/1/25* | | | 30,000 | | | | 16,203 | |
| | | | | | | | |
Total Materials | | | | | | | 16,203 | |
| | | | | | | | |
Total Warrants (0.0%)
(Cost $—) | | | | | | | 16,345 | |
| | | | | | | | |
| | | |
| | | Number of
Shares | | | Value
(Note 1) | |
SHORT-TERM INVESTMENT: | | | | | | | | |
Investment Company (1.9%) | | | | | | | | |
JPMorgan Prime Money Market Fund, IM Shares | | | 1,692,450 | | | | 1,693,466 | |
| | | | | | | | |
Total Short-Term Investment (1.9%)
(Cost $1,693,665) | | | | | | | 1,693,466 | |
| | | | | | | | |
Total Investments in Securities (99.4%)
(Cost $93,828,489) | | | | | | | 88,192,192 | |
Other Assets Less Liabilities (0.6%) | | | | 545,541 | |
| | | | | | | | |
Net Assets (100%) | | | | | | $ | 88,737,733 | |
| | | | | | | | |
Glossary:
| | ADR | — American Depositary Receipt |
See Notes to Financial Statements.
44
1290 FUNDS
1290 GAMCO SMALL/MID CAP VALUE FUND
PORTFOLIO OF INVESTMENTS (Continued)
October 31, 2020
The following is a summary of the inputs used to value the Fund’s assets and liabilities carried at fair value as of October 31, 2020:
The inputs or methodology used for valuing securities are not necessarily an indication of the risk associated with investing in those securities.
Various inputs are used in determining the value of the Fund’s investments. These inputs are summarized in the three broad levels listed below:
| | | | | | | | | | | | | | | | |
| | | | | |
| Investment Type | | Level 1
Quoted Prices in
Active Markets for
Identical
Securities | | | Level 2
Significant Other
Observable Inputs
(including quoted prices
for similar securities,
interest rates,
prepayment speeds,
credit risk, etc.)(a) | | | Level 3
Significant Unobservable
Inputs (including the
Fund’s own assumptions in
determining the fair
value of investments) | | | Total | |
Assets: | | | | | | | | | | | | | | | | |
Common Stocks | | | | | | | | | | | | | | | | |
Communication Services | | $ | 8,728,784 | | | $ | 449,067 | | | $ | — | | | $ | 9,177,851 | |
Consumer Discretionary | | | 8,063,356 | | | | 232,047 | | | | — | | | | 8,295,403 | |
Consumer Staples | | | 8,809,819 | | | | 2,184,859 | | | | — | | | | 10,994,678 | |
Energy | | | 733,600 | | | | — | | | | — | | | | 733,600 | |
Financials | | | 2,067,000 | | | | 184,200 | | | | — | | | | 2,251,200 | |
Health Care | | | 5,510,141 | | | | — | | | | — | | | | 5,510,141 | |
Industrials | | | 33,554,110 | | | | 108,863 | | | | — | | | | 33,662,973 | |
Information Technology | | | 1,460,011 | | | | 557,521 | | | | — | | | | 2,017,532 | |
Materials | | | 10,174,740 | | | | 120,893 | | | | — | | | | 10,295,633 | |
Real Estate | | | 1,236,430 | | | | — | | | | — | | | | 1,236,430 | |
Utilities | | | 2,306,940 | | | | — | | | | — | | | | 2,306,940 | |
Short-Term Investment | | | | | | | | | | | | | | | | |
Investment Company | | | 1,693,466 | | | | — | | | | — | | | | 1,693,466 | |
Warrants | | | | | | | | | | | | | | | | |
Energy | | | — | | | | 134 | | | | — | | | | 134 | |
Health Care | | | — | | | | 8 | | | | — | | | | 8 | |
Materials | | | 16,203 | | | | — | | | | — | | | | 16,203 | |
| | | | | | | | | | | | | | | | |
Total Assets | | $ | 84,354,600 | | | $ | 3,837,592 | | | $ | — | | | $ | 88,192,192 | |
| | | | | | | | | | | | | | | | |
Total Liabilities | | $ | — | | | $ | — | | | $ | — | | | $ | — | |
| | | | | | | | | | | | | | | | |
Total | | $ | 84,354,600 | | | $ | 3,837,592 | | | $ | — | | | $ | 88,192,192 | |
| | | | | | | | | | | | | | | | |
(a) Securities with a market value of $8 transferred from Level 3 to Level 2 at the end of the period due to active trading.
The Fund held no derivatives contracts during the year ended October 31, 2020.
Investment security transactions for the year ended October 31, 2020 were as follows:
| | | | |
Cost of Purchases: | | | | |
Long-term investments other than U.S. government debt securities | | $ | 16,320,988 | |
Net Proceeds of Sales and Redemptions: | | | | |
Long-term investments other than U.S. government debt securities | | $ | 17,758,082 | |
As of October 31, 2020, the gross unrealized appreciation (depreciation) of investments based on the aggregate cost of investments in securities and derivative instruments, if applicable, for Federal income tax purposes was as follows:
| | | | |
Aggregate gross unrealized appreciation | | $ | 10,267,828 | |
Aggregate gross unrealized depreciation | | | (18,543,321 | ) |
| | | | |
Net unrealized depreciation | | $ | (8,275,493 | ) |
| | | | |
Federal income tax cost of investments in securities and derivative instruments, if applicable | | $ | 96,467,685 | |
| | | | |
For the year ended October 31, 2020, the Fund incurred approximately $8,192 as brokerage commissions with G. Research, an affiliated broker/dealer.
See Notes to Financial Statements.
45
1290 FUNDS
1290 GAMCO SMALL/MID CAP VALUE FUND
STATEMENT OF ASSETS AND LIABILITIES
October 31, 2020
| | | | |
ASSETS | |
Investments in Securities, at value (Cost $93,828,489) | | $ | 88,192,192 | |
Cash | | | 331,000 | |
Foreign cash (Cost $7,351) | | | 7,624 | |
Receivable for Fund shares sold | | | 290,630 | |
Receivable for securities sold | | | 100,323 | |
Prepaid registration and filing fees | | | 25,906 | |
Dividends, interest and other receivables | | | 20,836 | |
Other assets | | | 717 | |
| | | | |
Total assets | | | 88,969,228 | |
| | | | |
LIABILITIES | |
Payable for Fund shares redeemed | | | 73,732 | |
Investment advisory fees payable | | | 46,435 | |
Transfer agent fees payable | | | 15,962 | |
Administrative fees payable | | | 11,762 | |
Trustees’ fees payable | | | 1,118 | |
Distribution fees payable – Class A | | | 753 | |
Distribution fees payable – Class R | | | 303 | |
Accrued expenses | | | 81,430 | |
| | | | |
Total liabilities | | | 231,495 | |
| | | | |
NET ASSETS | | $ | 88,737,733 | |
| | | | |
Net assets were comprised of: | | | | |
Paid in capital | | $ | 100,634,673 | |
Total distributable earnings (loss) | | | (11,896,940 | ) |
| | | | |
Net assets | | $ | 88,737,733 | |
| | | | |
Class A | | | | |
Net asset value and redemption price per share, $3,399,719 / 298,009 shares outstanding (unlimited amount authorized: $0.001 par value) | | $ | 11.41 | |
Maximum sales charge (5.50% of offering price) | | | 0.66 | |
| | | | |
Maximum offering price per share | | $ | 12.07 | |
| | | | |
Class I | | | | |
Net asset value, offering and redemption price per share, $84,536,653 / 7,394,663 shares outstanding (unlimited amount authorized: $0.001 par value) | | $ | 11.43 | |
| | | | |
Class R | | | | |
Net asset value, offering and redemption price per share, $684,972 / 60,435 shares outstanding (unlimited amount authorized: $0.001 par value) | | $ | 11.33 | |
| | | | |
Class T** | | | | |
Net asset value and redemption price per share, $116,389 / 10,179 shares outstanding (unlimited amount authorized: $0.001 par value) | | $ | 11.43 | |
Maximum sales charge (2.50% of offering price) | | | 0.29 | |
| | | | |
Maximum offering price per share | | $ | 11.72 | |
| | | | |
| ** | Class T shares currently are not offered for sale. |
STATEMENT OF OPERATIONS
For the Year Ended October 31, 2020
| | | | |
INVESTMENT INCOME | |
Dividends (net of $14,327 foreign withholding tax) | | $ | 1,458,217 | |
Interest | | | 2,232 | |
| | | | |
Total income | | | 1,460,449 | |
| | | | |
EXPENSES | |
Investment advisory fees | | | 670,000 | |
Administrative fees | | | 134,001 | |
Transfer agent fees | | | 119,850 | |
Professional fees | | | 106,638 | |
Printing and mailing expenses | | | 60,987 | |
Registration and filing fees | | | 40,256 | |
Custodian fees | | | 15,950 | |
Distribution fees – Class A | | | 8,950 | |
Trustees’ fees | | | 7,572 | |
Distribution fees – Class R | | | 3,817 | |
Distribution fees – Class T** | | | 287 | |
Miscellaneous | | | 28,468 | |
| | | | |
Gross expenses | | | 1,196,776 | |
Less: Waiver from investment adviser | | | (294,675 | ) |
Waiver from distributor | | | (287 | ) |
| | | | |
Net expenses | | | 901,814 | |
| | | | |
NET INVESTMENT INCOME (LOSS) | | | 558,635 | |
| | | | |
REALIZED AND UNREALIZED GAIN (LOSS) | |
Realized gain (loss) on: | | | | |
Investments in securities | | | (5,640,967 | ) |
Foreign currency transactions | | | 5,970 | |
| | | | |
Net realized gain (loss) | | | (5,634,997 | ) |
| | | | |
Change in unrealized appreciation (depreciation) on: | |
Investments in securities | | | (2,560,485 | ) |
Foreign currency translations | | | 378 | |
| | | | |
Net change in unrealized appreciation (depreciation) | | | (2,560,107 | ) |
| | | | |
NET REALIZED AND UNREALIZED GAIN (LOSS) | | | (8,195,104 | ) |
| | | | |
NET INCREASE (DECREASE) IN NET ASSETS RESULTING FROM OPERATIONS | | $ | (7,636,469 | ) |
| | | | |
| ** | Class T shares currently are not offered for sale. |
See Notes to Financial Statements.
46
1290 FUNDS
1290 GAMCO SMALL/MID CAP VALUE FUND
STATEMENT OF CHANGES IN NET ASSETS
| | | | | | | | |
| | | Year Ended October 31, | |
| | 2020 | | | 2019 | |
INCREASE (DECREASE) IN NET ASSETS FROM OPERATIONS: | |
Net investment income (loss) | | $ | 558,635 | | | $ | 609,998 | |
Net realized gain (loss) | | | (5,634,997 | ) | | | 340,659 | |
Net change in unrealized appreciation (depreciation) | | | (2,560,107 | ) | | | 1,060,409 | |
| | | | | | | | |
NET INCREASE (DECREASE) IN NET ASSETS RESULTING FROM OPERATIONS | | | (7,636,469 | ) | | | 2,011,066 | |
| | | | | | | | |
Distributions to shareholders: | | | | | | | | |
Class A | | | (60,182 | ) | | | (42,434 | ) |
Class I | | | (1,732,560 | ) | | | (1,255,738 | ) |
Class R | | | (12,206 | ) | | | (7,956 | ) |
Class T** | | | (2,304 | ) | | | (1,787 | ) |
| | | | | | | | |
Total distributions to shareholders | | | (1,807,252 | ) | | | (1,307,915 | ) |
| | | | | | | | |
CAPITAL SHARES TRANSACTIONS: | | | | | | | | |
Class A | | | | | | | | |
Capital shares sold [70,938 and 70,453 shares, respectively] | | | 814,267 | | | | 886,229 | |
Capital shares issued in reinvestment of dividends[4,524 and 3,493 shares, respectively] | | | 58,133 | | | | 40,904 | |
Capital shares repurchased [(90,086) and (53,218) shares, respectively] | | | (1,052,654 | ) | | | (654,905 | ) |
| | | | | | | | |
Total Class A transactions | | | (180,254 | ) | | | 272,228 | |
| | | | | | | | |
Class I | | | | | | | | |
Capital shares sold [1,728,565 and 1,868,998 shares, respectively] | | | 19,427,004 | | | | 23,316,263 | |
Capital shares issued in reinvestment of dividends[78,814 and 59,543 shares, respectively] | | | 1,012,764 | | | | 697,247 | |
Capital shares repurchased [(2,068,613) and (1,297,404) shares, respectively] | | | (22,454,789 | ) | | | (15,901,713 | ) |
| | | | | | | | |
Total Class I transactions | | | (2,015,021 | ) | | | 8,111,797 | |
| | | | | | | | |
Class R | | | | | | | | |
Capital shares sold [13,459 and 21,731 shares, respectively] | | | 146,764 | | | | 268,538 | |
Capital shares issued in reinvestment of dividends[820 and 575 shares, respectively] | | | 10,489 | | | | 6,698 | |
Capital shares repurchased [(27,510) and (13,939) shares, respectively] | | | (316,593 | ) | | | (167,220 | ) |
| | | | | | | | |
Total Class R transactions | | | (159,340 | ) | | | 108,016 | |
| | | | | | | | |
NET INCREASE (DECREASE) IN NET ASSETS RESULTING FROM CAPITAL SHARE TRANSACTIONS | | | (2,354,615 | ) | | | 8,492,041 | |
| | | | | | | | |
TOTAL INCREASE (DECREASE) IN NET ASSETS | | | (11,798,336 | ) | | | 9,195,192 | |
NET ASSETS: | |
Beginning of year | | | 100,536,069 | | | | 91,340,877 | |
| | | | | | | | |
End of year | | $ | 88,737,733 | | | $ | 100,536,069 | |
| | | | | | | | |
| ** | Class T shares currently are not offered for sale. |
See Notes to Financial Statements.
47
1290 FUNDS
1290 GAMCO SMALL/MID CAP VALUE FUND
FINANCIAL HIGHLIGHTS
| | | | | | | | | | | | | | | | | | | | |
| | | Year Ended October 31, | |
| Class A | | 2020 | | | 2019 | | | 2018 | | | 2017 | | | 2016 | |
Net asset value, beginning of year | | $ | 12.46 | | | $ | 12.33 | | | $ | 12.83 | | | $ | 10.28 | | | $ | 10.25 | |
| | | | | | | | | | | | | | | | | | | | |
Income (loss) from investment operations: | | | | | | | | | | | | | | | | | | | | |
Net investment income (loss) (e) | | | 0.04 | # | | | 0.05 | | | | 0.03 | | | | 0.06 | ### | | | 0.05 | |
Net realized and unrealized gain (loss) | | | (0.90 | ) | | | 0.22 | | | | (0.25 | ) | | | 2.67 | | | | 0.25 | |
| | | | | | | | | | | | | | | | | | | | |
Total from investment operations | | | (0.86 | ) | | | 0.27 | | | | (0.22 | ) | | | 2.73 | | | | 0.30 | |
| | | | | | | | | | | | | | | | | | | | |
Less distributions: | | | | | | | | | | | | | | | | | | | | |
Dividends from net investment income | | | (0.04 | ) | | | (0.02 | ) | | | (0.03 | ) | | | (0.02 | ) | | | — | ## |
Distributions from net realized gains | | | (0.15 | ) | | | (0.12 | ) | | | (0.25 | ) | | | (0.16 | ) | | | (0.27 | ) |
| | | | | | | | | | | | | | | | | | | | |
Total dividends and distributions | | | (0.19 | ) | | | (0.14 | ) | | | (0.28 | ) | | | (0.18 | ) | | | (0.27 | ) |
| | | | | | | | | | | | | | | | | | | | |
Net asset value, end of year | | $ | 11.41 | | | $ | 12.46 | | | $ | 12.33 | | | $ | 12.83 | | | $ | 10.28 | |
| | | | | | | | | | | | | | | | | | | | |
Total return | | | (7.04 | )% | | | 2.29 | % | | | (1.84 | )% | | | 26.72 | % | | | 3.08 | % |
| | | | | | | | | | | | | | | | | | | | |
Ratios/Supplemental Data: | | | | | | | | | | | | | | | | | | | | |
Net assets, end of year (000’s) | | $ | 3,400 | | | $ | 3,896 | | | $ | 3,599 | | | $ | 2,063 | | | $ | 591 | |
Ratio of expenses to average net assets: | | | | | | | | | | | | | | | | | | | | |
After waivers and reimbursements (f) | | | 1.25 | %(j) | | | 1.24 | %(j) | | | 1.24 | %(j) | | | 1.27 | % | | | 1.35 | % |
Before waivers and reimbursements (f) | | | 1.58 | % | | | 1.66 | % | | | 1.79 | % | | | 2.72 | % | | | 4.38 | % |
Ratio of net investment income (loss) to average net assets: | | | | | | | | | | | | | | | | | | | | |
After waivers and reimbursements (f) | | | 0.40 | %(g) | | | 0.39 | % | | | 0.26 | % | | | 0.48 | %(aa) | | | 0.49 | % |
Before waivers and reimbursements (f) | | | 0.07 | %(g) | | | (0.03 | )% | | | (0.28 | )% | | | (0.97 | )%(aa) | | | (2.53 | )% |
Portfolio turnover rate ^ | | | 19 | % | | | 37 | % | | | 49 | % | | | 88 | % | | | 76 | % |
| |
| | | Year Ended October 31, | |
| Class I | | 2020 | | | 2019 | | | 2018 | | | 2017 | | | 2016 | |
Net asset value, beginning of year | | $ | 12.49 | | | $ | 12.36 | | | $ | 12.86 | | | $ | 10.30 | | | $ | 10.27 | |
| | | | | | | | | | | | | | | | | | | | |
Income (loss) from investment operations: | | | | | | | | | | | | | | | | | | | | |
Net investment income (loss) (e) | | | 0.07 | # | | | 0.08 | | | | 0.07 | | | | 0.08 | ### | | | 0.05 | |
Net realized and unrealized gain (loss) | | | (0.91 | ) | | | 0.23 | | | | (0.26 | ) | | | 2.68 | | | | 0.28 | |
| | | | | | | | | | | | | | | | | | | | |
Total from investment operations | | | (0.84 | ) | | | 0.31 | | | | (0.19 | ) | | | 2.76 | | | | 0.33 | |
| | | | | | | | | | | | | | | | | | | | |
Less distributions: | | | | | | | | | | | | | | | | | | | | |
Dividends from net investment income | | | (0.07 | ) | | | (0.06 | ) | | | (0.06 | ) | | | (0.04 | ) | | | (0.03 | ) |
Distributions from net realized gains | | | (0.15 | ) | | | (0.12 | ) | | | (0.25 | ) | | | (0.16 | ) | | | (0.27 | ) |
| | | | | | | | | | | | | | | | | | | | |
Total dividends and distributions | | | (0.22 | ) | | | (0.18 | ) | | | (0.31 | ) | | | (0.20 | ) | | | (0.30 | ) |
| | | | | | | | | | | | | | | | | | | | |
Net asset value, end of year | | $ | 11.43 | | | $ | 12.49 | | | $ | 12.36 | | | $ | 12.86 | | | $ | 10.30 | |
| | | | | | | | | | | | | | | | | | | | |
Total return | | | (6.88 | )% | | | 2.57 | % | | | (1.60 | )% | | | 27.09 | % | | | 3.34 | % |
| | | | | | | | | | | | | | | | | | | | |
Ratios/Supplemental Data: | | | | | | | | | | | | | | | | | | | | |
Net assets, end of year (000’s) | | $ | 84,537 | | | $ | 95,601 | | | $ | 86,815 | | | $ | 21,317 | | | $ | 6,041 | |
Ratio of expenses to average net assets: | | | | | | | | | | | | | | | | | | | | |
After waivers and reimbursements (f) | | | 1.00 | %(j) | | | 0.99 | %(j) | | | 0.99 | %(j) | | | 1.02 | % | | | 1.10 | % |
Before waivers and reimbursements (f) | | | 1.33 | % | | | 1.41 | % | | | 1.51 | % | | | 2.47 | % | | | 4.09 | % |
Ratio of net investment income (loss) to average net assets: | | | | | | | | | | | | | | | | | | | | |
After waivers and reimbursements (f) | | | 0.64 | %(g) | | | 0.64 | % | | | 0.54 | % | | | 0.69 | %(aa) | | | 0.49 | % |
Before waivers and reimbursements (f) | | | 0.31 | %(g) | | | 0.22 | % | | | 0.03 | % | | | (0.76 | )%(aa) | | | (2.51 | )% |
Portfolio turnover rate ^ | | | 19 | % | | | 37 | % | | | 49 | % | | | 88 | % | | | 76 | % |
See Notes to Financial Statements.
48
1290 FUNDS
1290 GAMCO SMALL/MID CAP VALUE FUND
FINANCIAL HIGHLIGHTS (Continued)
| | | | | | | | | | | | | | | | | | | | |
| |
| | | Year Ended October 31, | |
| Class R | | 2020 | | | 2019 | | | 2018 | | | 2017 | | | 2016 | |
Net asset value, beginning of year | | $ | 12.38 | | | $ | 12.26 | | | $ | 12.76 | | | $ | 10.23 | | | $ | 10.23 | |
| | | | | | | | | | | | | | | | | | | | |
Income (loss) from investment operations: | | | | | | | | | | | | | | | | | | | | |
Net investment income (loss) (e) | | | 0.02 | # | | | 0.02 | | | | — | ## | | | 0.03 | ### | | | 0.04 | |
Net realized and unrealized gain (loss) | | | (0.91 | ) | | | 0.22 | | | | (0.25 | ) | | | 2.66 | | | | 0.23 | |
| | | | | | | | | | | | | | | | | | | | |
Total from investment operations | | | (0.89 | ) | | | 0.24 | | | | (0.25 | ) | | | 2.69 | | | | 0.27 | |
| | | | | | | | | | | | | | | | | | | | |
Less distributions: | | | | | | | | | | | | | | | | | | | | |
Dividends from net investment income | | | (0.01 | ) | | | — | | | | — | | | | — | | | | — | |
Distributions from net realized gains | | | (0.15 | ) | | | (0.12 | ) | | | (0.25 | ) | | | (0.16 | ) | | | (0.27 | ) |
| | | | | | | | | | | | | | | | | | | | |
Total dividends and distributions | | | (0.16 | ) | | | (0.12 | ) | | | (0.25 | ) | | | (0.16 | ) | | | (0.27 | ) |
| | | | | | | | | | | | | | | | | | | | |
Net asset value, end of year | | $ | 11.33 | | | $ | 12.38 | | | $ | 12.26 | | | $ | 12.76 | | | $ | 10.23 | |
| | | | | | | | | | | | | | | | | | | | |
Total return | | | (7.31 | )% | | | 2.02 | % | | | (2.07 | )% | | | 26.49 | % | | | 2.77 | % |
| | | | | | | | | | | | | | | | | | | | |
Ratios/Supplemental Data: | | | | | | | | | | | | | | | | | | | | |
Net assets, end of year (000’s) | | $ | 685 | | | $ | 912 | | | $ | 801 | | | $ | 332 | | | $ | 168 | |
Ratio of expenses to average net assets: | | | | | | | | | | | | | | | | | | | | |
After waivers and reimbursements (f) | | | 1.50 | %(j) | | | 1.49 | %(j) | | | 1.49 | %(j) | | | 1.53 | % | | | 1.60 | % |
Before waivers and reimbursements (f) | | | 1.83 | % | | | 1.91 | % | | | 2.05 | % | | | 3.00 | % | | | 4.65 | % |
Ratio of net investment income (loss) to average net assets: | | | | | | | | | | | | | | | | | | | | |
After waivers and reimbursements (f) | | | 0.15 | %(g) | | | 0.14 | % | | | 0.02 | % | | | 0.27 | %(aa) | | | 0.42 | % |
Before waivers and reimbursements (f) | | | (0.19 | )%(g) | | | (0.28 | )% | | | (0.54 | )% | | | (1.21 | )%(aa) | | | (2.64 | )% |
Portfolio turnover rate ^ | | | 19 | % | | | 37 | % | | | 49 | % | | | 88 | % | | | 76 | % |
| |
| | | Year Ended October 31, | |
| Class T** | | 2020 | | | 2019 | | | 2018 | | | 2017 | | | 2016 | |
Net asset value, beginning of year | | $ | 12.49 | | | $ | 12.36 | | | $ | 12.86 | | | $ | 10.30 | | | $ | 10.27 | |
| | | | | | | | | | | | | | | | | | | | |
Income (loss) from investment operations: | | | | | | | | | | | | | | | | | | | | |
Net investment income (loss) (e) | | | 0.07 | # | | | 0.08 | | | | 0.07 | | | | 0.11 | ### | | | 0.08 | |
Net realized and unrealized gain (loss) | | | (0.91 | ) | | | 0.23 | | | | (0.26 | ) | | | 2.65 | | | | 0.25 | |
| | | | | | | | | | | | | | | | | | | | |
Total from investment operations | | | (0.84 | ) | | | 0.31 | | | | (0.19 | ) | | | 2.76 | | | | 0.33 | |
| | | | | | | | | | | | | | | | | | | | |
Less distributions: | | | | | | | | | | | | | | | | | | | | |
Dividends from net investment income | | | (0.07 | ) | | | (0.06 | ) | | | (0.06 | ) | | | (0.04 | ) | | | (0.03 | ) |
Distributions from net realized gains | | | (0.15 | ) | | | (0.12 | ) | | | (0.25 | ) | | | (0.16 | ) | | | (0.27 | ) |
| | | | | | | | | | | | | | | | | | | | |
Total dividends and distributions | | | (0.22 | ) | | | (0.18 | ) | | | (0.31 | ) | | | (0.20 | ) | | | (0.30 | ) |
| | | | | | | | | | | | | | | | | | | | |
Net asset value, end of year | | $ | 11.43 | | | $ | 12.49 | | | $ | 12.36 | | | $ | 12.86 | | | $ | 10.30 | |
| | | | | | | | | | | | | | | | | | | | |
Total return | | | (6.88 | )% | | | 2.57 | % | | | (1.60 | )% | | | 27.09 | % | | | 3.34 | % |
| | | | | | | | | | | | | | | | | | | | |
Ratios/Supplemental Data: | | | | | | | | | | | | | | | | | | | | |
Net assets, end of year (000’s) | | $ | 116 | | | $ | 127 | | | $ | 126 | | | $ | 131 | | | $ | 105 | |
Ratio of expenses to average net assets: | | | | | | | | | | | | | | | | | | | | |
After waivers and reimbursements (f) | | | 1.00 | %(j) | | | 0.99 | %(j) | | | 0.99 | %(j) | | | 1.03 | % | | | 1.10 | % |
Before waivers and reimbursements (f) | | | 1.58 | % | | | 1.66 | % | | | 1.80 | % | | | 3.02 | % | | | 5.11 | % |
Ratio of net investment income (loss) to average net assets: | | | | | | | | | | | | | | | | | | | | |
After waivers and reimbursements (f) | | | 0.64 | %(g) | | | 0.64 | % | | | 0.50 | % | | | 0.89 | %(aa) | | | 0.77 | % |
Before waivers and reimbursements (f) | | | 0.06 | %(g) | | | (0.02 | )% | | | (0.31 | )% | | | (1.10 | )%(aa) | | | (3.23 | )% |
Portfolio turnover rate ^ | | | 19 | % | | | 37 | % | | | 49 | % | | | 88 | % | | | 76 | % |
See Notes to Financial Statements.
49
1290 FUNDS
1290 GAMCO SMALL/MID CAP VALUE FUND
FINANCIAL HIGHLIGHTS (Continued)
| ** | Class T shares currently are not offered for sale. Class T shares were formerly known as Class C shares. |
| # | Includes income resulting from a special dividend. Without this dividend, the per share income amounts would be $0.04, $0.06, $0.01 and $0.06 for Class A, Class I, Class R and Class T, respectively. |
| ## | Per share amount is less than $0.005. |
| ### | Includes income resulting from a special dividend. Without this dividend, the per share income amounts would be $0.02, $0.04, $(0.01) and $0.07 for Class A, Class I, Class R and Class T, respectively. |
| ^ | Portfolio turnover rate excludes derivatives, if any. |
| (e) | Net investment income (loss) per share is based on average shares outstanding. |
| (f) | Expenses do not include the expenses of the underlying funds (“indirect expenses”), if applicable. |
| (g) | Includes income resulting from a special dividend. Without this dividend, the ratios for each class would have been 0.09% lower. |
| (j) | Including direct and indirect expenses, the net expense ratio after waivers and reimbursements would be 1.25% for Class A, 1.00% for Class I, 1.50% for Class R and 1.00% for Class T. |
| (aa) | Includes income resulting from a special dividend. Without this dividend, the ratios for each class would have been 0.34% lower. |
See Notes to Financial Statements.
50
1290 HIGH YIELD BOND FUND (Unaudited)
INVESTMENT ADVISER
| Ø | | Equitable Investment Management Group, LLC |
INVESTMENT SUB-ADVISER
| Ø | | AXA Investment Managers, Inc. |
PERFORMANCE RESULTS
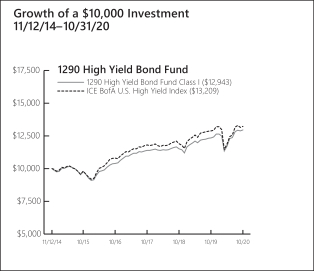
| | | | | | | | | | | | | | |
| |
| Annualized Total Returns as of 10/31/20 | |
| | | | | |
| | | | | 1
Year | | | 5
Years | | | Since
Incept. | |
Fund – Class A Shares* | | without Sales Charge | | | 4.72 | % | | | 5.55 | % | | | 4.16 | % |
| | | with Sales Charge (a) | | | (0.02 | ) | | | 4.58 | | | | 3.36 | |
Fund – Class I Shares* | | | | | 4.98 | | | | 5.80 | | | | 4.42 | |
Fund – Class R Shares* | | | | | 4.46 | | | | 5.27 | | | | 3.89 | |
Fund – Class T Shares*† | | without Sales Charge | | | 4.98 | | | | 5.81 | | | | 4.42 | |
| | | with Sales Charge (b) | | | 2.38 | | | | 5.28 | | | | 3.97 | |
ICE BofA US High Yield
Index | | | | | 2.54 | | | | 6.14 | | | | 4.77 | |
| |
* Date of inception 11/12/14. † Class T Shares currently are not offered for sale. (a) A 4.50% front-end sales charge was deducted. (b) A 2.50% front-end sales charge was deducted. Returns for periods greater than one year are annualized. | |
The performance quoted is past performance and is not a guarantee of future results. Mutual funds are subject to certain market risks. Investment returns and principal value of an investment will fluctuate so that an investor’s shares, when redeemed, may be worth more or less than their original cost. Current performance may be higher or lower than the performance data shown. For the most current month-end performance data please call 1-888-310-0416 or visit www.1290Funds.com.
The graph illustrates comparative performance for $10,000 invested in the Class I Shares of the 1290 High Yield Bond Fund and the ICE BofA U.S. High Yield Index from 11/12/14 to 10/31/20. The performance of the ICE BofA U.S. High Yield Index reflects an initial investment at the end of the month closest to the Fund’s inception. The performance of the Fund assumes reinvestment of all dividends and capital gain distributions, if any, and does not include a sales charge. The performance of the ICE BofA U.S. High Yield Index does not reflect the deduction of expenses or a sales charge associated with a mutual fund and has been adjusted to reflect reinvestment of all dividends, capital gain distributions, and interest of the securities included in the benchmark.
As of March 1, 2020, the gross expense ratios for Class A, I, R and T shares were 1.79%, 1.53%, 2.03% and 1.78%, respectively. The net expense ratios for Class A, I, R and T shares were 1.00%, 0.75%, 1.25% and 1.00%, respectively. The net expense ratios reflect the Adviser’s decision to contractually limit expenses through April 30, 2021. Fund Performance may also reflect the waiver of the Fund’s fees and reimbursement of expenses for certain periods since the inception date. Without these waivers and reimbursements, performance would have been lower.
In addition, performance shown in this section does not reflect the deduction of taxes that a shareholder would pay on Fund distributions or redemption of Fund shares.
PERFORMANCE SUMMARY
The Fund’s Class I shares returned 4.98% for the year ended October 31, 2020. The Fund’s benchmark, the ICE BofA U.S. High Yield Index, returned 2.54% over the same year.
Overview — AXA Investment Managers, Inc.
The U.S. high-yield market posted a positive return for the year ended October 31, 2020, as the ICE BofA U.S. High Yield Index generated a total return of +2.54% for the period. Returns were driven by the onset of the COVID-19 healthcare crisis, along with subsequent fiscal and monetary actions and progress toward the development of a vaccine, as well as uncertainty surrounding the U.S. presidential election. Flows in the high-yield market supported prices for the period, with $41.22 billion of inflows. Nonetheless, more bonds were chasing investors as the high-yield new-issue market priced $444.2 billion of new issues during the twelve months ended October 31, 2020, significantly higher than the $236.2 billion priced during the prior twelve-month period. In a sign the economy had slowed dramatically, the period saw $82.9 billion of high-yield default volume, higher than the $30.7 billion of high yield default volume in the prior twelve-month period. The par-weighted high-yield default rate ended the period at 6.34%, up from 2.54% in October 2019.
Fund Highlights
During the year ended October 31, 2020 the 1290 High Yield Bond Fund’s relative performance benefited from positive security selection, particularly within the highest yielding segment of the market. The Fund’s macro risk positioning had a positive impact on relative performance. Fund performance benefited from participating in multiple new issues during the period which performed well post pricing.
51
1290 HIGH YIELD BOND FUND (Unaudited)
What helped performance during the year?
| • | | Positive security selection in the energy and telecommunications sectors helped performance during the period. |
| • | | The Fund’s underweight with in the energy sector and its overweight within the technology sector both positively impacted relative performance. |
| • | | The top contributors to return during the period were debt positions in Sprint Corp., Rackspace Hosting, Inc. and Polaris Intermediate Corp. (MultiPlan). |
| | • | | Sprint was the fourth largest wireless telecommunication service provider in the US until it merged with T-Mobile US in early 2020. T-Mobile U.S. and Sprint combined are now the second largest wireless company in the U.S. The Sprint 8 3/4s of 2032 were a top contributor in the twelve months ending October 31st given the successful merger of Sprint and T-Mobile U.S., with the combined company’s credit profile far better than stand-alone Sprint’s in terms of improved credit rating trends, lower leverage, higher free cash flow generation, larger scale and greater equity support. |
| | • | | Rackspace is a provider of managed IT solutions including managed dedicated server/private cloud hosting, public cloud, managed public cloud services, and managed IT applications. Rackspace was a top performer due to its IPO in August of 2020. The company used the majority of proceeds from the offering to reduce debt. |
| | • | | MultiPlan is an independent preferred provider organization that helps insurers control costs through rental of its provider network, analytics-based solutions, and fraud, waste and abuse prevention services. MultiPlan was a top performer during the period due to its July 2020 announcement that it would be acquired by Churchill Capital, a SPAC/blank check company, and list on the New York Stock Exchange. The acquisition closed in early October 2020. |
What hurt performance during the year?
| • | | Negative security selection within the health care sector hurt performance. |
| • | | The Fund’s underweight within the automotive sector detracted from the Fund’s relative performance. |
| • | | The bottom contributors to return during the period were debt positions in Diamond Sports Group LLC, Surgery Center Holdings, Inc. (Surgery Partners) and Bombardier, Inc. |
| | • | | Diamond Sports Group is a regional sports network company that televises professional baseball, basketball and hockey games in select markets. The Diamond Sports Group 6.625% bonds due 2027 were a bottom contributor in the year ended October 31st as the COVID-19 pandemic led to a full stoppage of professional sports for several months, driving an increase in leverage. |
| | • | | Surgery Partners owns and operates ambulatory surgery centers and surgical hospitals. Surgery Partners bonds underperformed during the period due to the COVID-19 crisis, which caused most states to halt elective surgeries during April and most of May. |
| | • | | Bombardier is one of the largest suppliers of business jets and rail components in the world. The company has been struggling over the last several years as soft demand in their business jet segment, high capital expenditures to manufacture a new aircraft (formerly known as the C-Series) and recent weakness in their transportation business caused excessive free cash flow burn. These headwinds were significantly exacerbated in the months following March 2020 with the onset of the COVID-19 pandemic and subsequent economic shut down. The combination of these factors resulted in the bond being a bottom contributor in the period. |
| | | | |
| | |
Fund Characteristics As of October 31, 2020 | | | |
Weighted Average Life (Years) | | | 5.66 | |
Weighted Average Coupon (%) | | | 6.55 | |
Weighted Average Effective Duration (Years)* | | | 3.16 | |
Weighted Average Rating** | | | B2 | |
| |
* Effective duration is a measure of the price sensitivity of the Fund to interest rate movements, taking into account specific features of the securities in which it invests. ** Weighted Average Rating has been provided by the Investment Sub-Adviser. A credit rating is an assessment provided by a nationally recognized statistical rating organization (NRSRO) of the creditworthiness of an issuer with respect to debt obligations, including specific securities, money market instruments or other debts. Ratings are measured on a scale that generally ranges from AAA (highest) to D (lowest); ratings are subject to change without notice. | |
52
1290 HIGH YIELD BOND FUND (Unaudited)
| | | | |
| | |
Sector Weightings
as of October 31, 2020 | | % of
Net Assets | |
Industrials | | | 15.7 | % |
Communication Services | | | 12.4 | |
Information Technology | | | 12.2 | |
Materials | | | 10.6 | |
Consumer Discretionary | | | 10.0 | |
Energy | | | 8.4 | |
Consumer Staples | | | 7.4 | |
Health Care | | | 7.0 | |
Financials | | | 6.8 | |
Real Estate | | | 3.8 | |
Investment Companies | | | 1.8 | |
Cash and Other | | | 3.9 | |
| | | | | |
| | | | 100.0 | % |
| | | | | |
Holdings are subject to change without notice. | | | | |
UNDERSTANDING YOUR EXPENSES:
As a shareholder of the Fund, you incur two types of costs:
(1) transaction costs, including applicable sales charges and redemption fees; and (2) ongoing costs, including investment advisory fees, distribution and/or service (12b-1) fees (in the case of Class A, Class R and Class T shares of the Fund), and other Fund expenses. These examples are intended to help you understand your ongoing costs (in dollars) of investing in the Fund and to compare these costs with the ongoing costs of investing in other mutual funds.
The examples are based on an investment of $1,000 invested at the beginning of the six-month period ended October 31, 2020 and held for the entire six-month period.
Actual Expenses
The first line of the following table provides information about actual account values and actual expenses. You may use the information in this line, together with the amount you invested, to estimate the expenses that you paid over the period. Simply divide your account value by $1,000 (for example, an $8,600 account value divided by $1,000 = 8.6), then multiply the result by the number in the first line under the heading entitled ‘‘Expenses Paid During Period’’ to estimate the expenses you paid on your account during this period.
Hypothetical Example for Comparison Purposes
The second line of the following table provides information about hypothetical account values and hypothetical expenses based on the Fund’s actual expense ratio and an assumed rate of return of 5% per year before expenses, which is not the Fund’s actual return. The hypothetical account values and expenses may not be used to estimate the actual ending account balance or expenses you paid for the period. You may use this information to compare the ongoing costs of investing in the Fund and other funds. To do so, compare this 5% hypothetical example with the 5% hypothetical examples that appear in the shareholder reports of the other funds.
Please note that the expenses shown in the table are meant to highlight your ongoing costs only and do not reflect any transactional costs, such as sales charges (loads), redemption fees, or exchange fees. Therefore, the second line of the table is useful in comparing ongoing costs only, and will not help you determine the relative total costs of owning different funds. In addition, if these transactional costs were included, your costs would have been higher.
EXAMPLE
| | | | | | | | | | | | |
| | | | |
| | | Beginning
Account
Value
5/1/20 | | | Ending
Account
Value
10/31/20 | | | Expenses
Paid
During
Period*
5/1/20 -
10/31/20 | |
Class A | |
Actual | | | $1,000.00 | | | | $1,101.50 | | | | $5.28 | |
Hypothetical (5% average annual return before expenses) | | | 1,000.00 | | | | 1,020.11 | | | | 5.08 | |
Class I | |
Actual | | | 1,000.00 | | | | 1,102.80 | | | | 3.96 | |
Hypothetical (5% average annual return before expenses) | | | 1,000.00 | | | | 1,021.37 | | | | 3.81 | |
Class R | |
Actual | | | 1,000.00 | | | | 1,098.90 | | | | 6.59 | |
Hypothetical (5% average annual return before expenses) | | | 1,000.00 | | | | 1,018.85 | | | | 6.34 | |
Class T** | |
Actual | | | 1,000.00 | | | | 1,102.80 | | | | 3.96 | |
Hypothetical (5% average annual return before expenses) | | | 1,000.00 | | | | 1,021.37 | | | | 3.81 | |
| |
* Expenses are equal to the Portfolio’s A, I, R and T shares annualized expense ratio of 1.00%, 0.75%, 1.25% and 0.75%, respectively, multiplied by the average account value over the period, and multiplied by 184/366 (to reflect the one-half year period). ** Class T shares currently are not offered for sale. | |
53
1290 FUNDS
1290 HIGH YIELD BOND FUND
PORTFOLIO OF INVESTMENTS
October 31, 2020
| | | | | | | | |
| | | |
| | | Principal
Amount | | | Value
(Note 1) | |
LONG-TERM DEBT SECURITIES: | |
Corporate Bonds (94.3%) | |
Communication Services (12.4%) | | | | | |
Diversified Telecommunication Services (5.7%) | |
Altice France SA
5.125%, 1/15/29§ | | $ | 200,000 | | | $ | 199,310 | |
CCO Holdings LLC | | | | | | | | |
5.375%, 5/1/25§ | | | 165,000 | | | | 169,521 | |
5.750%, 2/15/26§ | | | 162,000 | | | | 167,534 | |
5.875%, 5/1/27§ | | | 80,000 | | | | 83,250 | |
4.750%, 3/1/30§ | | | 110,000 | | | | 115,429 | |
4.500%, 5/1/32§ | | | 159,000 | | | | 164,366 | |
CenturyLink, Inc. | | | | | | | | |
5.125%, 12/15/26§ | | | 230,000 | | | | 235,175 | |
4.000%, 2/15/27§ | | | 132,000 | | | | 134,640 | |
Series G
6.875%, 1/15/28 | | | 128,000 | | | | 141,600 | |
Series W
6.750%, 12/1/23 | | | 70,000 | | | | 76,569 | |
Cincinnati Bell, Inc.
7.000%, 7/15/24§ | | | 285,000 | | | | 294,619 | |
Sprint Capital Corp.
8.750%, 3/15/32 | | | 156,000 | | | | 233,415 | |
Windstream Escrow LLC
7.750%, 8/15/28§ | | | 79,000 | | | | 76,038 | |
Zayo Group Holdings, Inc. | | | | | | | | |
4.000%, 3/1/27§ | | | 245,000 | | | | 239,867 | |
6.125%, 3/1/28§ | | | 209,000 | | | | 211,090 | |
| | | | | | | | |
| | | | | | | 2,542,423 | |
| | | | | | | | |
Entertainment (0.7%) | |
Lions Gate Capital Holdings LLC
6.375%, 2/1/24§ | | | 38,000 | | | | 36,537 | |
Live Nation Entertainment, Inc. | | | | | | | | |
4.875%, 11/1/24§ | | | 164,000 | | | | 157,596 | |
6.500%, 5/15/27§ | | | 86,000 | | | | 92,450 | |
4.750%, 10/15/27§ | | | 51,000 | | | | 46,984 | |
| | | | | | | | |
| | | | | | | 333,567 | |
| | | | | | | | |
Interactive Media & Services (0.9%) | |
Rackspace Technology Global, Inc.
8.625%, 11/15/24§ | | | 385,000 | | | | 402,325 | |
| | | | | | | | |
Media (4.1%) | |
Diamond Sports Group LLC
6.625%, 8/15/27§ | | | 274,000 | | | | 113,710 | |
DISH DBS Corp.
5.875%, 7/15/22 | | | 112,000 | | | | 115,360 | |
Gray Television, Inc.
4.750%, 10/15/30§ | | | 162,000 | | | | 158,861 | |
McGraw-Hill Global Education Holdings LLC
7.875%, 5/15/24§ | | | 110,000 | | | | 82,225 | |
Meredith Corp.
6.875%, 2/1/26 | | | 210,000 | | | | 173,644 | |
National CineMedia LLC
5.875%, 4/15/28§ | | | 51,000 | | | | 35,764 | |
Nexstar Broadcasting, Inc.
5.625%, 7/15/27§ | | | 146,000 | | | | 152,205 | |
Sinclair Television Group, Inc. | | | | | | | | |
5.625%, 8/1/24§ | | | 96,000 | | | | 95,685 | |
5.500%, 3/1/30§ | | | 166,000 | | | | 155,874 | |
Sirius XM Radio, Inc.
4.625%, 7/15/24§ | | | 130,000 | | | | 134,056 | |
TEGNA, Inc. | | | | | | | | |
5.500%, 9/15/24§ | | | 33,000 | | | | 33,557 | |
4.750%, 3/15/26§ | | | 98,000 | | | | 101,185 | |
5.000%, 9/15/29 | | | 94,000 | | | | 95,175 | |
Ziggo Bond Co. BV
6.000%, 1/15/27§ | | | 200,000 | | | | 207,250 | |
Ziggo BV
5.500%, 1/15/27§ | | | 180,000 | | | | 186,750 | |
| | | | | | | | |
| | | | | | | 1,841,301 | |
| | | | | | | | |
Wireless Telecommunication Services (1.0%) | |
Sprint Corp. | | | | | | | | |
7.875%, 9/15/23 | | | 128,000 | | | | 145,920 | |
7.625%, 3/1/26 | | | 114,000 | | | | 138,510 | |
T-Mobile USA, Inc. | | | | | | | | |
6.000%, 3/1/23 | | | 101,000 | | | | 100,747 | |
6.000%, 4/15/24 | | | 64,000 | | | | 65,133 | |
| | | | | | | | |
| | | | | | | 450,310 | |
| | | | | | | | |
Total Communication Services | | | | | | | 5,569,926 | |
| | | | | | | | |
Consumer Discretionary (10.0%) | | | | | |
Auto Components (0.6%) | |
Icahn Enterprises LP | | | | | | | | |
4.750%, 9/15/24 | | | 176,000 | | | | 179,080 | |
5.250%, 5/15/27 | | | 96,000 | | | | 99,221 | |
| | | | | | | | |
| | | | | | | 278,301 | |
| | | | | | | | |
Automobiles (0.9%) | |
Ford Motor Co. | | | | | | | | |
9.000%, 4/22/25 | | | 221,000 | | | | 259,881 | |
9.625%, 4/22/30 | | | 105,000 | | | | 140,700 | |
| | | | | | | | |
| | | | | | | 400,581 | |
| | | | | | | | |
Distributors (0.8%) | |
Core & Main LP
6.125%, 8/15/25§ | | | 56,000 | | | | 57,366 | |
Performance Food Group, Inc. | | | | | | | | |
5.500%, 6/1/24§ | | | 76,000 | | | | 76,095 | |
6.875%, 5/1/25§ | | | 73,000 | | | | 77,517 | |
5.500%, 10/15/27§ | | | 50,000 | | | | 51,250 | |
Univar Solutions USA, Inc.
5.125%, 12/1/27§ | | | 108,000 | | | | 111,748 | |
| | | | | | | | |
| | | | | | | 373,976 | |
| | | | | | | | |
Diversified Consumer Services (0.4%) | |
GEMS MENASA Cayman Ltd.
7.125%, 7/31/26§ | | | 200,000 | | | | 198,062 | |
| | | | | | | | |
Hotels, Restaurants & Leisure (3.2%) | |
1011778 BC ULC | | | | | | | | |
4.250%, 5/15/24§ | | | 36,000 | | | | 36,630 | |
5.750%, 4/15/25§ | | | 126,000 | | | | 134,059 | |
5.000%, 10/15/25§ | | | 90,000 | | | | 92,286 | |
Caesars Entertainment, Inc.
6.250%, 7/1/25§ | | | 131,000 | | | | 134,603 | |
Churchill Downs, Inc.
5.500%, 4/1/27§ | | | 118,000 | | | | 121,835 | |
Dave & Buster’s, Inc.
7.625%, 11/1/25§ | | | 46,000 | | | | 45,137 | |
See Notes to Financial Statements.
54
1290 FUNDS
1290 HIGH YIELD BOND FUND
PORTFOLIO OF INVESTMENTS (Continued)
October 31, 2020
| | | | | | | | |
| | | |
| | | Principal
Amount | | | Value
(Note 1) | |
Golden Entertainment, Inc.
7.625%, 4/15/26§ | | $ | 134,000 | | | $ | 134,670 | |
Hilton Domestic Operating Co., Inc. | | | | | | | | |
5.125%, 5/1/26 | | | 40,000 | | | | 40,700 | |
5.750%, 5/1/28§ | | | 96,000 | | | | 100,448 | |
LTF Merger Sub, Inc.
8.500%, 6/15/23§ | | | 332,000 | | | | 301,290 | |
Powdr Corp.
6.000%, 8/1/25§ | | | 45,000 | | | | 45,373 | |
Station Casinos LLC
4.500%, 2/15/28§ | | | 94,000 | | | | 88,261 | |
Vail Resorts, Inc.
6.250%, 5/15/25§ | | | 58,000 | | | | 61,190 | |
Wyndham Hotels & Resorts, Inc.
4.375%, 8/15/28§ | | | 105,000 | | | | 104,362 | |
| | | | | | | | |
| | | | | | | 1,440,844 | |
| | | | | | | | |
Household Durables (0.3%) | |
CD&R Smokey Buyer, Inc.
6.750%, 7/15/25§ | | | 30,000 | | | | 31,950 | |
Picasso Finance Sub, Inc.
6.125%, 6/15/25§ | | | 42,000 | | | | 44,205 | |
Williams Scotsman International, Inc.
4.625%, 8/15/28§ | | | 48,000 | | | | 48,240 | |
| | | | | | | | |
| | | | | | | 124,395 | |
| | | | | | | | |
Internet & Direct Marketing Retail (1.3%) | |
Getty Images, Inc.
9.750%, 3/1/27§ | | | 278,000 | | | | 279,737 | |
Photo Holdings Merger Sub, Inc.
8.500%, 10/1/26§ | | | 322,000 | | | | 299,460 | |
| | | | | | | | |
| | | | | | | 579,197 | |
| | | | | | | | |
Specialty Retail (1.6%) | |
Asbury Automotive Group, Inc.
4.750%, 3/1/30§ | | | 63,000 | | | | 65,048 | |
eG Global Finance plc
8.500%, 10/30/25§ | | | 200,000 | | | | 203,250 | |
Ken Garff Automotive LLC
4.875%, 9/15/28§ | | | 96,000 | | | | 94,939 | |
Specialty Building Products Holdings LLC
6.375%, 9/30/26§ | | | 204,000 | | | | 208,590 | |
SRS Distribution, Inc.
8.250%, 7/1/26§ | | | 73,000 | | | | 77,015 | |
White Cap Buyer LLC
6.875%, 10/15/28§ | | | 52,000 | | | | 53,300 | |
| | | | | | | | |
| | | | | | | 702,142 | |
| | | | | | | | |
Textiles, Apparel & Luxury Goods (0.9%) | |
G-III Apparel Group Ltd.
7.875%, 8/15/25§ | | | 212,000 | | | | 214,650 | |
Wolverine World Wide, Inc.
6.375%, 5/15/25§ | | | 160,000 | | | | 170,634 | |
| | | | | | | | |
| | | | | | | 385,284 | |
| | | | | | | | |
Total Consumer Discretionary | | | | | | | 4,482,782 | |
| | | | | | | | |
Consumer Staples (7.4%) | | | | | |
Food & Staples Retailing (0.5%) | |
United Natural Foods, Inc.
6.750%, 10/15/28§ | | | 87,000 | | | | 87,707 | |
US Foods, Inc.
6.250%, 4/15/25§ | | | 148,000 | | | | 154,290 | |
| | | | | | | | |
| | | | | | | 241,997 | |
| | | | | | | | |
Food Products (3.3%) | |
B&G Foods, Inc. | | | | | | | | |
5.250%, 4/1/25 | | | 101,000 | | | | 104,030 | |
5.250%, 9/15/27 | | | 74,000 | | | | 76,543 | |
Clearwater Seafoods, Inc.
6.875%, 5/1/25§ | | | 149,000 | | | | 154,738 | |
Kraft Heinz Foods Co. | | | | | | | | |
6.875%, 1/26/39 | | | 116,000 | | | | 154,796 | |
4.375%, 6/1/46 | | | 265,000 | | | | 268,546 | |
Lamb Weston Holdings, Inc. | | | | | | | | |
4.625%, 11/1/24§ | | | 22,000 | | | | 22,715 | |
4.875%, 11/1/26§ | | | 77,000 | | | | 79,936 | |
Pilgrim’s Pride Corp.
5.875%, 9/30/27§ | | | 96,000 | | | | 101,172 | |
Post Holdings, Inc. | | | | | | | | |
5.750%, 3/1/27§ | | | 236,000 | | | | 247,260 | |
4.625%, 4/15/30§ | | | 100,000 | | | | 102,750 | |
Sigma Holdco BV
7.875%, 5/15/26§ | | | 200,000 | | | | 196,500 | |
| | | | | | | | |
| | | | | | | 1,508,986 | |
| | | | | | | | |
Household Products (2.6%) | |
Central Garden & Pet Co. | | | | | | | | |
6.125%, 11/15/23 | | | 121,000 | | | | 123,021 | |
4.125%, 10/15/30 | | | 84,000 | | | | 85,050 | |
Energizer Holdings, Inc. | | | | | | | | |
7.750%, 1/15/27§ | | | 149,000 | | | | 161,516 | |
4.750%, 6/15/28§ | | | 223,000 | | | | 230,013 | |
Kronos Acquisition Holdings, Inc.
9.000%, 8/15/23§ | | | 311,000 | | | | 315,276 | |
Spectrum Brands, Inc. | | | | | | | | |
5.750%, 7/15/25 | | | 220,000 | | | | 225,775 | |
5.500%, 7/15/30§ | | | 21,000 | | | | 22,470 | |
| | | | | | | | |
| | | | | | | 1,163,121 | |
| | | | | | | | |
Personal Products (1.0%) | |
Edgewell Personal Care Co.
5.500%, 6/1/28§ | | | 148,000 | | | | 155,215 | |
Prestige Brands, Inc. | | | | | | | | |
6.375%, 3/1/24§ | | | 221,000 | | | | 225,420 | |
5.125%, 1/15/28§ | | | 50,000 | | | | 51,875 | |
| | | | | | | | |
| | | | | | | 432,510 | |
| | | | | | | | |
Total Consumer Staples | | | | | | | 3,346,614 | |
| | | | | | | | |
Energy (8.4%) | | | | | |
Energy Equipment & Services (0.3%) | |
Precision Drilling Corp. | | | | | | | | |
7.750%, 12/15/23 | | | 93,000 | | | | 69,634 | |
7.125%, 1/15/26§ | | | 105,000 | | | | 67,200 | |
| | | | | | | | |
| | | | | | | 136,834 | |
| | | | | | | | |
Oil, Gas & Consumable Fuels (8.1%) | |
American Midstream Partners LP
9.500%, 12/15/21(e)§ | | | 315,000 | | | | 305,550 | |
Ascent Resources Utica Holdings LLC
7.000%, 11/1/26§ | | | 176,000 | | | | 156,200 | |
See Notes to Financial Statements.
55
1290 FUNDS
1290 HIGH YIELD BOND FUND
PORTFOLIO OF INVESTMENTS (Continued)
October 31, 2020
| | | | | | | | |
| | | |
| | | Principal
Amount | | | Value
(Note 1) | |
Blue Racer Midstream LLC | | | | | | | | |
6.125%, 11/15/22§ | �� | $ | 246,000 | | | $ | 239,542 | |
6.625%, 7/15/26§ | | | 150,000 | | | | 134,438 | |
Calumet Specialty Products Partners LP
11.000%, 4/15/25§ | | | 119,000 | | | | 115,008 | |
Crestwood Midstream Partners LP | | | | | | | | |
6.250%, 4/1/23(e) | | | 222,000 | | | | 214,907 | |
5.625%, 5/1/27§ | | | 54,000 | | | | 47,186 | |
CrownRock LP
5.625%, 10/15/25§ | | | 268,000 | | | | 262,305 | |
Delek Logistics Partners LP
6.750%, 5/15/25 | | | 195,000 | | | | 174,037 | |
Endeavor Energy Resources LP
6.625%, 7/15/25§ | | | 28,000 | | | | 29,050 | |
Genesis Energy LP | | | | | | | | |
5.625%, 6/15/24 | | | 82,000 | | | | 70,537 | |
7.750%, 2/1/28 | | | 212,000 | | | | 175,960 | |
Hilcorp Energy I LP
6.250%, 11/1/28§ | | | 136,000 | | | | 124,440 | |
Holly Energy Partners LP
5.000%, 2/1/28§ | | | 201,000 | | | | 190,447 | |
Indigo Natural Resources LLC
6.875%, 2/15/26§ | | | 82,000 | | | | 81,590 | |
NuStar Logistics LP
5.750%, 10/1/25 | | | 85,000 | | | | 85,581 | |
Occidental Petroleum Corp. | | | | | | | | |
2.700%, 2/15/23 | | | 51,000 | | | | 45,645 | |
2.900%, 8/15/24 | | | 96,000 | | | | 79,920 | |
6.625%, 9/1/30 | | | 100,000 | | | | 87,430 | |
6.450%, 9/15/36 | | | 132,000 | | | | 106,920 | |
PBF Logistics LP
6.875%, 5/15/23 | | | 220,000 | | | | 172,700 | |
Southern Star Central Corp.
5.125%, 7/15/22§ | | | 181,000 | | | | 181,377 | |
Southwestern Energy Co.
7.750%, 10/1/27 | | | 97,000 | | | | 100,274 | |
Summit Midstream Holdings LLC
5.500%, 8/15/22 | | | 202,000 | | | | 162,610 | |
Targa Resources Partners LP | | | | | | | | |
5.875%, 4/15/26 | | | 92,000 | | | | 93,725 | |
4.875%, 2/1/31§ | | | 105,000 | | | | 102,769 | |
WPX Energy, Inc.
4.500%, 1/15/30 | | | 124,000 | | | | 119,040 | |
| | | | | | | | |
| | | | | | | 3,659,188 | |
| | | | | | | | |
Total Energy | | | | | | | 3,796,022 | |
| | | | | | | | |
Financials (6.8%) | | | | | |
Capital Markets (0.2%) | |
MSCI, Inc.
4.750%, 8/1/26§ | | | 94,000 | | | | 97,290 | |
| | | | | | | | |
Consumer Finance (1.4%) | |
AerCap Ireland Capital DAC
6.500%, 7/15/25 | | | 150,000 | | | | 164,865 | |
Avolon Holdings Funding Ltd.
5.250%, 5/15/24§ | | | 67,000 | | | | 68,142 | |
Curo Group Holdings Corp.
8.250%, 9/1/25§ | | | 144,000 | | | | 118,080 | |
Enova International, Inc.
8.500%, 9/1/24§ | | | 154,000 | | | | 142,354 | |
OneMain Finance Corp.
8.875%, 6/1/25 | | | 77,000 | | | | 84,700 | |
Park Aerospace Holdings Ltd.
5.500%, 2/15/24§ | | | 62,000 | | | | 63,998 | |
| | | | | | | | |
| | | | | | | 642,139 | |
| | | | | | | | |
Diversified Financial Services (2.1%) | |
Cardtronics, Inc.
5.500%, 5/1/25§ | | | 130,000 | | | | 130,812 | |
Refinitiv US Holdings, Inc. | | | | | | | | |
6.250%, 5/15/26§ | | | 238,000 | | | | 254,215 | |
8.250%, 11/15/26§ | | | 110,000 | | | | 119,185 | |
Shift4 Payments LLC
4.625%, 11/1/26§ | | | 87,000 | | | | 87,653 | |
Verscend Escrow Corp.
9.750%, 8/15/26§ | | | 330,000 | | | | 354,816 | |
| | | | | | | | |
| | | | | | | 946,681 | |
| | | | | | | | |
Insurance (2.0%) | |
Acrisure LLC | | | | | | | | |
8.125%, 2/15/24§ | | | 300,000 | | | | 313,410 | |
7.000%, 11/15/25§ | | | 52,000 | | | | 51,844 | |
Alliant Holdings Intermediate LLC
6.750%, 10/15/27§ | | | 102,000 | | | | 107,100 | |
HUB International Ltd.
7.000%, 5/1/26§ | | | 297,000 | | | | 304,425 | |
NFP Corp.
6.875%, 8/15/28§ | | | 119,000 | | | | 115,751 | |
| | | | | | | | |
| | | | | | | 892,530 | |
| | | | | | | | |
Thrifts & Mortgage Finance (1.1%) | |
Freedom Mortgage Corp. | | | | | | | | |
8.250%, 4/15/25§ | | | 396,000 | | | | 399,703 | |
7.625%, 5/1/26§ | | | 74,000 | | | | 73,769 | |
| | | | | | | | |
| | | | | | | 473,472 | |
| | | | | | | | |
Total Financials | | | | | | | 3,052,112 | |
| | | | | | | | |
Health Care (7.0%) | | | | | |
Health Care Equipment & Supplies (0.5%) | |
Hill-Rom Holdings, Inc.
5.000%, 2/15/25§ | | | 118,000 | | | | 120,950 | |
Varex Imaging Corp.
7.875%, 10/15/27§ | | | 107,000 | | | | 109,541 | |
| | | | | | | | |
| | | | | | | 230,491 | |
| | | | | | | | |
Health Care Providers & Services (2.6%) | |
Acadia Healthcare Co., Inc.
5.000%, 4/15/29§ | | | 99,000 | | | | 102,000 | |
AdaptHealth LLC
6.125%, 8/1/28§ | | | 178,000 | | | | 185,120 | |
Centene Corp. | | | | | | | | |
5.375%, 6/1/26§ | | | 237,000 | | | | 249,374 | |
5.375%, 8/15/26§ | | | 118,000 | | | | 124,785 | |
HCA, Inc.
7.690%, 6/15/25 | | | 91,000 | | | | 108,062 | |
Tenet Healthcare Corp.
4.875%, 1/1/26§ | | | 194,000 | | | | 196,434 | |
Vizient, Inc.
6.250%, 5/15/27§ | | | 33,000 | | | | 34,815 | |
West Street Merger Sub, Inc.
6.375%, 9/1/25§ | | | 172,000 | | | | 174,580 | |
| | | | | | | | |
| | | | | | | 1,175,170 | |
| | | | | | | | |
See Notes to Financial Statements.
56
1290 FUNDS
1290 HIGH YIELD BOND FUND
PORTFOLIO OF INVESTMENTS (Continued)
October 31, 2020
| | | | | | | | |
| | | |
| | | Principal
Amount | | | Value
(Note 1) | |
Life Sciences Tools & Services (0.2%) | |
Avantor, Inc.
6.000%, 10/1/24§ | | $ | 75,000 | | | $ | 78,368 | |
| | | | | | | | |
Pharmaceuticals (3.7%) | |
Bausch Health Americas, Inc.
9.250%, 4/1/26§ | | | 217,000 | | | | 239,243 | |
Bausch Health Cos., Inc. | | | | | | | | |
7.000%, 3/15/24§ | | | 340,000 | | | | 351,050 | |
5.500%, 11/1/25§ | | | 126,000 | | | | 129,062 | |
6.250%, 2/15/29§ | | | 146,000 | | | | 150,012 | |
Catalent Pharma Solutions, Inc. | | | | | | | | |
4.875%, 1/15/26§ | | | 115,000 | | | | 117,300 | |
5.000%, 7/15/27§ | | | 79,000 | | | | 82,752 | |
Cheplapharm Arzneimittel GmbH
5.500%, 1/15/28§ | | | 200,000 | | | | 202,542 | |
Herbalife Nutrition Ltd.
7.875%, 9/1/25§ | | | 253,000 | | | | 267,623 | |
P&L Development LLC
7.750%, 11/15/25§ | | | 116,000 | | | | 118,175 | |
| | | | | | | | |
| | | | | | | 1,657,759 | |
| | | | | | | | |
Total Health Care | | | | | | | 3,141,788 | |
| | | | | | | | |
Industrials (15.7%) | | | | | |
Aerospace & Defense (1.0%) | |
Howmet Aerospace, Inc.
6.875%, 5/1/25 | | | 107,000 | | | | 118,770 | |
Rolls-Royce plc
5.750%, 10/15/27§ | | | 200,000 | | | | 202,000 | |
Spirit AeroSystems, Inc.
7.500%, 4/15/25§ | | | 152,000 | | | | 152,950 | |
| | | | | | | | |
| | | | | | | 473,720 | |
| | | | | | | | |
Air Freight & Logistics (0.3%) | |
XPO Logistics, Inc.
6.250%, 5/1/25§ | | | 149,000 | | | | 158,360 | |
| | | | | | | | |
Building Products (1.0%) | |
Forterra Finance LLC
6.500%, 7/15/25§ | | | 59,000 | | | | 62,466 | |
JELD-WEN, Inc.
6.250%, 5/15/25§ | | | 111,000 | | | | 119,325 | |
Standard Industries, Inc.
4.375%, 7/15/30§ | | | 124,000 | | | | 127,255 | |
Summit Materials LLC
5.250%, 1/15/29§ | | | 137,000 | | | | 140,768 | |
| | | | | | | | |
| | | | | | | 449,814 | |
| | | | | | | | |
Commercial Services & Supplies (6.0%) | |
ACCO Brands Corp.
5.250%, 12/15/24§ | | | 138,000 | | | | 141,105 | |
ADT Security Corp. (The) | | | | | | | | |
4.125%, 6/15/23 | | | 110,000 | | | | 114,153 | |
4.875%, 7/15/32§ | | | 72,000 | | | | 74,138 | |
Allied Universal Holdco LLC | | | | | | | | |
6.625%, 7/15/26§ | | | 230,000 | | | | 240,358 | |
9.750%, 7/15/27§ | | | 278,000 | | | | 296,070 | |
Aramark Services, Inc. | | | | | | | | |
5.000%, 4/1/25§ | | | 116,000 | | | | 117,748 | |
6.375%, 5/1/25§ | | | 92,000 | | | | 96,267 | |
Brink’s Co. (The)
5.500%, 7/15/25§ | | | 49,000 | | | | 50,960 | |
Cimpress plc
7.000%, 6/15/26§ | | | 150,000 | | | | 148,500 | |
Covanta Holding Corp.
5.000%, 9/1/30 | | | 55,000 | | | | 55,550 | |
Garda World Security Corp.
9.500%, 11/1/27§ | | | 195,000 | | | | 209,137 | |
GFL Environmental, Inc. | | | | | | | | |
3.750%, 8/1/25§ | | | 80,000 | | | | 80,500 | |
7.000%, 6/1/26§ | | | 70,000 | | | | 72,975 | |
5.125%, 12/15/26§ | | | 140,000 | | | | 146,692 | |
KAR Auction Services, Inc.
5.125%, 6/1/25§ | | | 116,000 | | | | 117,305 | |
Matthews International Corp.
5.250%, 12/1/25§ | | | 321,000 | | | | 304,950 | |
Nielsen Co. Luxembourg SARL (The)
5.500%, 10/1/21§ | | | 14,000 | | | | 14,028 | |
Nielsen Finance LLC | | | | | | | | |
5.000%, 4/15/22§ | | | 33,000 | | | | 32,918 | |
5.625%, 10/1/28§ | | | 84,000 | | | | 86,520 | |
5.875%, 10/1/30§ | | | 269,000 | | | | 282,786 | |
| | | | | | | | |
| | | | | | | 2,682,660 | |
| | | | | | | | |
Construction & Engineering (1.6%) | |
MasTec, Inc.
4.500%, 8/15/28§ | | | 121,000 | | | | 124,025 | |
New Enterprise Stone & Lime Co., Inc.
6.250%, 3/15/26§ | | | 241,000 | | | | 249,134 | |
Pike Corp.
5.500%, 9/1/28§ | | | 66,000 | | | | 67,499 | |
PowerTeam Services LLC
9.033%, 12/4/25§ | | | 164,000 | | | | 173,840 | |
Weekley Homes LLC
4.875%, 9/15/28§ | | | 111,000 | | | | 112,284 | |
| | | | | | | | |
| | | | | | | 726,782 | |
| | | | | | | | |
Machinery (0.9%) | |
Clark Equipment Co.
5.875%, 6/1/25§ | | | 35,000 | | | | 36,400 | |
Hillenbrand, Inc.
5.750%, 6/15/25 | | | 19,000 | | | | 20,187 | |
Mueller Water Products, Inc.
5.500%, 6/15/26§ | | | 52,000 | | | | 53,820 | |
Welbilt, Inc.
9.500%, 2/15/24 | | | 272,000 | | | | 276,080 | |
| | | | | | | | |
| | | | | | | 386,487 | |
| | | | | | | | |
Professional Services (1.1%) | |
Dun & Bradstreet Corp. (The) | | | | | | | | |
6.875%, 8/15/26§ | | | 93,000 | | | | 99,510 | |
10.250%, 2/15/27§ | | | 347,000 | | | | 388,536 | |
| | | | | | | | |
| | | | | | | 488,046 | |
| | | | | | | | |
Road & Rail (2.4%) | |
Capitol Investment Merger Sub 2 LLC
10.000%, 8/1/24§ | | | 115,000 | | | | 121,900 | |
DAE Funding LLC | | | | | | | | |
5.250%, 11/15/21§ | | | 100,000 | | | | 100,875 | |
5.000%, 8/1/24§ | | | 67,000 | | | | 67,168 | |
Kenan Advantage Group, Inc. (The)
7.875%, 7/31/23§ | | | 382,000 | | | | 382,000 | |
Watco Cos. LLC
6.500%, 6/15/27§ | | | 376,000 | | | | 392,920 | |
| | | | | | | | |
| | | | | | | 1,064,863 | |
| | | | | | | | |
See Notes to Financial Statements.
57
1290 FUNDS
1290 HIGH YIELD BOND FUND
PORTFOLIO OF INVESTMENTS (Continued)
October 31, 2020
| | | | | | | | |
| | | |
| | | Principal
Amount | | | Value
(Note 1) | |
Trading Companies & Distributors (1.4%) | |
Aviation Capital Group LLC
5.500%, 12/15/24§ | | $ | 157,000 | | | $ | 163,483 | |
Beacon Roofing Supply, Inc.
4.875%, 11/1/25§ | | | 84,000 | | | | 82,404 | |
Brightstar Escrow Corp.
9.750%, 10/15/25§ | | | 128,000 | | | | 127,360 | |
WESCO Distribution, Inc.
7.250%, 6/15/28§ | | | 237,000 | | | | 258,922 | |
| | | | | | | | |
| | | | | | | 632,169 | |
| | | | | | | | |
Total Industrials | | | | | | | 7,062,901 | |
| | | | | | | | |
Information Technology (12.2%) | | | | | |
Communications Equipment (1.5%) | |
CommScope, Inc. | | | | | | | | |
5.500%, 3/1/24§ | | | 190,000 | | | | 193,800 | |
6.000%, 3/1/26§ | | | 214,000 | | | | 221,757 | |
8.250%, 3/1/27§ | | | 237,000 | | | | 244,999 | |
| | | | | | | | |
| | | | | | | 660,556 | |
| | | | | | | | |
Electronic Equipment, Instruments & Components (0.6%) | |
Itron, Inc.
5.000%, 1/15/26§ | | | 270,000 | | | | 275,400 | |
| | | | | | | | |
IT Services (2.1%) | |
Alliance Data Systems Corp. | | | | | | | | |
4.750%, 12/15/24§ | | | 339,000 | | | | 314,846 | |
7.000%, 1/15/26§ | | | 162,000 | | | | 162,251 | |
Black Knight InfoServ LLC
3.625%, 9/1/28§ | | | 90,000 | | | | 91,125 | |
Cablevision Lightpath LLC
5.625%, 9/15/28§ | | | 200,000 | | | | 202,000 | |
Presidio Holdings, Inc. | | | | | | | | |
4.875%, 2/1/27§ | | | 45,000 | | | | 46,125 | |
8.250%, 2/1/28§ | | | 36,000 | | | | 38,115 | |
Science Applications International Corp.
4.875%, 4/1/28§ | | | 40,000 | | | | 41,903 | |
Unisys Corp.
6.875%, 11/1/27§ | | | 69,000 | | | | 71,329 | |
| | | | | | | | |
| | | | | | | 967,694 | |
| | | | | | | | |
Software (6.2%) | |
ACI Worldwide, Inc.
5.750%, 8/15/26§ | | | 145,000 | | | | 152,341 | |
Ascend Learning LLC | | | | | | | | |
6.875%, 8/1/25§ | | | 190,000 | | | | 194,750 | |
6.875%, 8/1/25§ | | | 114,000 | | | | 117,633 | |
Boxer Parent Co., Inc.
7.125%, 10/2/25§ | | | 129,000 | | | | 138,030 | |
BY Crown Parent LLC
4.250%, 1/31/26§ | | | 83,000 | | | | 84,452 | |
Camelot Finance SA
4.500%, 11/1/26§ | | | 456,000 | | | | 477,090 | |
CDK Global, Inc.
5.875%, 6/15/26 | | | 66,000 | | | | 68,640 | |
Change Healthcare Holdings LLC
5.750%, 3/1/25§ | | | 459,000 | | | | 457,302 | |
Granite Merger Sub 2, Inc.
11.000%, 7/15/27§ | | | 191,000 | | | | 208,190 | |
Logan Merger Sub, Inc.
5.500%, 9/1/27§ | | | 96,000 | | | | 97,080 | |
NortonLifeLock, Inc.
5.000%, 4/15/25§ | | | 112,000 | | | | 114,068 | |
Solera LLC
10.500%, 3/1/24§ | | | 430,000 | | | | 445,050 | |
SS&C Technologies, Inc.
5.500%, 9/30/27§ | | | 241,000 | | | | 256,062 | |
| | | | | | | | |
| | | | | | | 2,810,688 | |
| | | | | | | | |
Technology Hardware, Storage & Peripherals (1.8%) | |
Dell International LLC | | | | | | | | |
5.875%, 6/15/21§ | | | 211,000 | | | | 211,508 | |
7.125%, 6/15/24§ | | | 171,000 | | | | 176,626 | |
Everi Payments, Inc.
7.500%, 12/15/25§ | | | 92,000 | | | | 93,150 | |
NCR Corp. | | | | | | | | |
8.125%, 4/15/25§ | | | 51,000 | | | | 56,100 | |
5.000%, 10/1/28§ | | | 265,000 | | | | 262,350 | |
| | | | | | | | |
| | | | | | | 799,734 | |
| | | | | | | | |
Total Information Technology | | | | | | | 5,514,072 | |
| | | | | | | | |
Materials (10.6%) | | | | | |
Chemicals (3.3%) | |
Avient Corp.
5.750%, 5/15/25§ | | | 73,000 | | | | 77,015 | |
Axalta Coating Systems LLC
4.875%, 8/15/24§ | | | 150,000 | | | | 153,000 | |
Blue Cube Spinco LLC
10.000%, 10/15/25 | | | 172,000 | | | | 181,613 | |
Illuminate Buyer LLC
9.000%, 7/1/28§ | | | 117,000 | | | | 125,629 | |
INEOS Group Holdings SA
5.625%, 8/1/24§ | | | 200,000 | | | | 202,262 | |
Minerals Technologies, Inc.
5.000%, 7/1/28§ | | | 83,000 | | | | 85,075 | |
Nouryon Holding BV
8.000%, 10/1/26§ | | | 150,000 | | | | 157,875 | |
NOVA Chemicals Corp.
4.875%, 6/1/24§ | | | 104,000 | | | | 102,877 | |
Nufarm Australia Ltd.
5.750%, 4/30/26§ | | | 123,000 | | | | 123,615 | |
Olin Corp.
9.500%, 6/1/25§ | | | 117,000 | | | | 138,620 | |
PQ Corp.
5.750%, 12/15/25§ | | | 136,000 | | | | 140,335 | |
| | | | | | | | |
| | | | | | | 1,487,916 | |
| | | | | | | | |
Containers & Packaging (6.3%) | |
ARD Finance SA
6.500%, 6/30/27 PIK§ | | | 200,000 | | | | 202,750 | |
Ardagh Packaging Finance plc
6.000%, 2/15/25§ | | | 200,000 | | | | 207,000 | |
Berry Global, Inc.
5.125%, 7/15/23 | | | 75,000 | | | | 75,731 | |
Flex Acquisition Co., Inc.
7.875%, 7/15/26§ | | | 261,000 | | | | 263,388 | |
Graham Packaging Co., Inc.
7.125%, 8/15/28§ | | | 81,000 | | | | 84,847 | |
Intelligent Packaging Limited Finco, Inc.
6.000%, 9/15/28§ | | | 105,000 | | | | 106,838 | |
See Notes to Financial Statements.
58
1290 FUNDS
1290 HIGH YIELD BOND FUND
PORTFOLIO OF INVESTMENTS (Continued)
October 31, 2020
| | | | | | | | |
| | | |
| | | Principal
Amount | | | Value
(Note 1) | |
LABL Escrow Issuer LLC | | | | | | | | |
6.750%, 7/15/26§ | | $ | 225,000 | | | $ | 236,250 | |
10.500%, 7/15/27§ | | | 162,000 | | | | 173,340 | |
Mauser Packaging Solutions Holding Co. | | | | | | | | |
5.500%, 4/15/24§ | | | 286,000 | | | | 285,737 | |
7.250%, 4/15/25§ | | | 470,000 | | | | 453,409 | |
OI European Group BV
4.000%, 3/15/23§ | | | 150,000 | | | | 151,500 | |
Owens-Brockway Glass Container, Inc. | | | | | | | | |
5.875%, 8/15/23§ | | | 130,000 | | | | 136,532 | |
6.625%, 5/13/27§ | | | 144,000 | | | | 154,440 | |
Sealed Air Corp.
4.875%, 12/1/22§ | | | 102,000 | | | | 106,463 | |
Trivium Packaging Finance BV
5.500%, 8/15/26(e)§ | | | 200,000 | | | | 209,750 | |
| | | | | | | | |
| | | | | | | 2,847,975 | |
| | | | | | | | |
Metals & Mining (1.0%) | |
Hudbay Minerals, Inc.
6.125%, 4/1/29§ | | | 65,000 | | | | 66,625 | |
Kaiser Aluminum Corp.
6.500%, 5/1/25§ | | | 172,000 | | | | 182,750 | |
Novelis Corp.
4.750%, 1/30/30§ | | | 190,000 | | | | 192,326 | |
| | | | | | | | |
| | | | | | | 441,701 | |
| | | | | | | | |
Total Materials | | | | | | | 4,777,592 | |
| | | | | | | | |
Real Estate (3.8%) | | | | | |
Equity Real Estate Investment Trusts (REITs) (1.7%) | |
Iron Mountain, Inc. (REIT)
5.000%, 7/15/28§ | | | 120,000 | | | | 122,275 | |
MGM Growth Properties Operating Partnership LP (REIT)
4.625%, 6/15/25§ | | | 153,000 | | | | 155,324 | |
Park Intermediate Holdings LLC (REIT) | | | | | | | | |
7.500%, 6/1/25§ | | | 79,000 | | | | 82,752 | |
5.875%, 10/1/28§ | | | 153,000 | | | | 150,514 | |
SBA Communications Corp. (REIT)
4.875%, 9/1/24 | | | 88,000 | | | | 89,699 | |
XHR LP (REIT)
6.375%, 8/15/25§ | | | 166,000 | | | | 164,340 | |
| | | | | | | | |
| | | | | | | 764,904 | |
| | | | | | | | |
Real Estate Management & Development (2.1%) | |
Cushman & Wakefield US Borrower LLC
6.750%, 5/15/28§ | | | 115,000 | | | | 122,259 | |
Greystar Real Estate Partners LLC
5.750%, 12/1/25§ | | | 227,000 | | | | 229,838 | |
Howard Hughes Corp. (The) | | | | | | | | |
5.375%, 3/15/25§ | | | 166,000 | | | | 166,000 | |
5.375%, 8/1/28§ | | | 89,000 | | | | 89,890 | |
Realogy Group LLC | | | | | | | | |
7.625%, 6/15/25§ | | | 102,000 | | | | 107,738 | |
9.375%, 4/1/27§ | | | 226,000 | | | | 239,277 | |
| | | | | | | | |
| | | | | | | 955,002 | |
| | | | | | | | |
Total Real Estate | | | | | | | 1,719,906 | |
| | | | | | | | |
Total Corporate Bonds | | | | | | | 42,463,715 | |
| | | | | | | | |
Total Long-Term Debt Securities (94.3%)
(Cost $41,959,307) | | | | | | | 42,463,715 | |
| | | | | | | | |
| | | |
| | | Number of
Shares | | | Value
(Note 1) | |
SHORT-TERM INVESTMENT: | | | | | | | | |
Investment Company (1.8%) | | | | | | | | |
JPMorgan Prime Money Market Fund, IM Shares | | | 831,292 | | | | 831,791 | |
| | | | | | | | |
Total Short-Term Investment (1.8%)
(Cost $831,818) | | | | | | | 831,791 | |
| | | | | | | | |
Total Investments in Securities (96.1%)
(Cost $42,791,125) | | | | | | | 43,295,506 | |
Other Assets Less Liabilities (3.9%) | | | | | | | 1,744,700 | |
| | | | | | | | |
Net Assets (100%) | | | | | | $ | 45,040,206 | |
| | | | | | | | |
| § | Securities exempt from registration under Rule 144A of the Securities Act of 1933. These securities may only be resold to qualified institutional buyers. At October 31, 2020, the market value of these securities amounted to $36,303,329 or 80.6% of net assets. Securities denoted with “§” but without “b” have been determined to be liquid under the guidelines established by the Board of Trustees. To the extent any securities might provide a right to demand registration, such rights have not been relied upon when determining liquidity. |
| (e) | Step Bond - Coupon rate increases or decreases in increments to maturity. Rate disclosed is as of October 31, 2020. Maturity date disclosed is the ultimate maturity date. |
Glossary:
| | PIK | — Payment-in Kind Security |
See Notes to Financial Statements.
59
1290 FUNDS
1290 HIGH YIELD BOND FUND
PORTFOLIO OF INVESTMENTS (Continued)
October 31, 2020
The following is a summary of the inputs used to value the Fund’s assets and liabilities carried at fair value as of October 31, 2020:
The inputs or methodology used for valuing securities are not necessarily an indication of the risk associated with investing in those securities.
Various inputs are used in determining the value of the Fund’s investments. These inputs are summarized in the three broad levels listed below:
| | | | | | | | | | | | | | | | |
| | | | | |
| Investment Type | | Level 1
Quoted Prices in
Active Markets for
Identical
Securities | | | Level 2
Significant Other
Observable Inputs
(including quoted prices
for similar securities,
interest rates,
prepayment speeds,
credit risk, etc.) | | | Level 3
Significant Unobservable
Inputs (including the
Fund’s own
assumptions in
determining the fair
value of investments) | | | Total | |
Assets: | | | | | | | | | | | | | | | | |
Corporate Bonds | | | | | | | | | | | | | | | | |
Communication Services | | $ | — | | | $ | 5,569,926 | | | $ | — | | | $ | 5,569,926 | |
Consumer Discretionary | | | — | | | | 4,482,782 | | | | — | | | | 4,482,782 | |
Consumer Staples | | | — | | | | 3,346,614 | | | | — | | | | 3,346,614 | |
Energy | | | — | | | | 3,796,022 | | | | — | | | | 3,796,022 | |
Financials | | | — | | | | 3,052,112 | | | | — | | | | 3,052,112 | |
Health Care | | | — | | | | 3,141,788 | | | | — | | | | 3,141,788 | |
Industrials | | | — | | | | 7,062,901 | | | | — | | | | 7,062,901 | |
Information Technology | | | — | | | | 5,514,072 | | | | — | | | | 5,514,072 | |
Materials | | | — | | | | 4,777,592 | | | | — | | | | 4,777,592 | |
Real Estate | | | — | | | | 1,719,906 | | | | — | | | | 1,719,906 | |
Short-Term Investment | | | | | | | | | | | | | | | | |
Investment Company | | | 831,791 | | | | — | | | | — | | | | 831,791 | |
| | | | | | | | | | | | | | | | |
Total Assets | | $ | 831,791 | | | $ | 42,463,715 | | | $ | — | | | $ | 43,295,506 | |
| | | | | | | | | | | | | | | | |
Total Liabilities | | $ | — | | | $ | — | | | $ | — | | | $ | — | |
| | | | | | | | | | | | | | | | |
Total | | $ | 831,791 | | | $ | 42,463,715 | | | $ | — | | | $ | 43,295,506 | |
| | | | | | | | | | | | | | | | |
The Fund held no derivatives contracts during the year ended October 31, 2020.
Investment security transactions for the year ended October 31, 2020 were as follows:
| | | | |
Cost of Purchases: | | | | |
Long-term investments other than U.S. government debt securities | | $ | 29,285,167 | |
Net Proceeds of Sales and Redemptions: | | | | |
Long-term investments other than U.S. government debt securities | | $ | 21,940,562 | |
As of October 31, 2020, the gross unrealized appreciation (depreciation) of investments based on the aggregate cost of investments in securities and derivative instruments, if applicable, for Federal income tax purposes was as follows:
| | | | |
Aggregate gross unrealized appreciation | | $ | 1,167,153 | |
Aggregate gross unrealized depreciation | | | (761,615 | ) |
| | | | |
Net unrealized appreciation | | $ | 405,538 | |
| | | | |
Federal income tax cost of investments in securities and derivative instruments, if applicable | | $ | 42,889,968 | |
| | | | |
See Notes to Financial Statements.
60
1290 FUNDS
1290 HIGH YIELD BOND FUND
STATEMENT OF ASSETS AND LIABILITIES
October 31, 2020
| | | | |
ASSETS | | | | |
Investments in Securities, at value
(Cost $42,791,125) | | $ | 43,295,506 | |
Cash | | | 975,962 | |
Dividends, interest and other receivables | | | 682,575 | |
Receivable for Fund shares sold | | | 610,113 | |
Prepaid registration and filing fees | | | 23,919 | |
Other assets | | | 406 | |
| | | | |
Total assets | | | 45,588,481 | |
| | | | |
LIABILITIES | | | | |
Payable for securities purchased | | | 287,630 | |
Dividends and distributions payable | | | 120,879 | |
Payable for Fund shares redeemed | | | 50,095 | |
Transfer agent fees payable | | | 7,847 | |
Administrative fees payable | | | 1,265 | |
Distribution fees payable – Class A | | | 451 | |
Trustees’ fees payable | | | 339 | |
Distribution fees payable – Class R | | | 270 | |
Accrued expenses | | | 79,499 | |
| | | | |
Total liabilities | | | 548,275 | |
| | | | |
NET ASSETS | | $ | 45,040,206 | |
| | | | |
Net assets were comprised of: | | | | |
Paid in capital | | $ | 48,145,851 | |
Total distributable earnings (loss) | | | (3,105,645 | ) |
| | | | |
Net assets | | $ | 45,040,206 | |
| | | | |
Class A | | | | |
Net asset value and redemption price per share, $2,115,170 / 234,846 shares outstanding (unlimited amount authorized: $0.001 par value) | | $ | 9.01 | |
Maximum sales charge (4.50% of offering price) | | | 0.42 | |
| | | | |
Maximum offering price per share | | $ | 9.43 | |
| | | | |
Class I | | | | |
Net asset value, offering and redemption price per share, $42,158,794 / 4,677,382 shares outstanding (unlimited amount authorized: $0.001 par value) | | $ | 9.01 | |
| | | | |
Class R | | | | |
Net asset value, offering and redemption price per share, $638,351 / 70,906 shares outstanding (unlimited amount authorized: $0.001 par value) | | $ | 9.00 | |
| | | | |
Class T** | | | | |
Net asset value and redemption price per share, $127,891 / 14,192 shares outstanding (unlimited amount authorized: $0.001 par value) | | $ | 9.01 | |
Maximum sales charge (2.50% of offering price) | | | 0.23 | |
| | | | |
Maximum offering price per share | | $ | 9.24 | |
| | | | |
| ** | Class T shares currently are not offered for sale. |
STATEMENT OF OPERATIONS
For the Year Ended October 31, 2020
| | | | |
INVESTMENT INCOME | |
Interest | | $ | 2,325,423 | |
Dividends | | | 7,541 | |
| | | | |
Total income | | | 2,332,964 | |
| | | | |
EXPENSES | |
Investment advisory fees | | | 234,622 | |
Professional fees | | | 89,769 | |
Administrative fees | | | 58,656 | |
Transfer agent fees | | | 54,450 | |
Printing and mailing expenses | | | 42,063 | |
Registration and filing fees | | | 37,187 | |
Custodian fees | | | 13,850 | |
Distribution fees – Class A | | | 4,738 | |
Trustees’ fees | | | 3,305 | |
Distribution fees – Class R | | | 2,092 | |
Distribution fees – Class T** | | | 316 | |
Miscellaneous | | | 23,383 | |
| | | | |
Gross expenses | | | 564,431 | |
Less: Waiver from investment adviser | | | (264,144 | ) |
Waiver from distributor | | | (316 | ) |
| | | | |
Net expenses | | | 299,971 | |
| | | | |
NET INVESTMENT INCOME (LOSS) | | | 2,032,993 | |
| | | | |
REALIZED AND UNREALIZED GAIN (LOSS) | |
Net realized gain (loss) on investments in securities | | | (779,061 | ) |
Net change in unrealized appreciation (depreciation) on investments in securities | | | 638,517 | |
| | | | |
NET REALIZED AND UNREALIZED GAIN (LOSS) | | | (140,544 | ) |
| | | | |
NET INCREASE (DECREASE) IN NET ASSETS RESULTING FROM OPERATIONS | | $ | 1,892,449 | |
| | | | |
| ** | Class T shares currently are not offered for sale. |
See Notes to Financial Statements.
61
1290 FUNDS
1290 HIGH YIELD BOND FUND
STATEMENT OF CHANGES IN NET ASSETS
| | | | | | | | |
| | | Year Ended October 31, | |
| | 2020 | | | 2019 | |
INCREASE (DECREASE) IN NET ASSETS FROM OPERATIONS: | |
Net investment income (loss) | | $ | 2,032,993 | | | $ | 1,904,693 | |
Net realized gain (loss) | | | (779,061 | ) | | | (25,701 | ) |
Net change in unrealized appreciation (depreciation) | | | 638,517 | | | | 503,655 | |
| | | | | | | | |
NET INCREASE (DECREASE) IN NET ASSETS RESULTING FROM OPERATIONS | | | 1,892,449 | | | | 2,382,647 | |
| | | | | | | | |
Distributions to shareholders: | | | | | | | | |
Class A | | | (97,300 | ) | | | (108,202 | ) |
Class I | | | (1,991,604 | ) | | | (1,764,776 | ) |
Class R | | | (20,555 | ) | | | (15,017 | ) |
Class T** | | | (6,828 | ) | | | (6,981 | ) |
| | | | | | | | |
Total distributions to shareholders | | | (2,116,287 | ) | | | (1,894,976 | ) |
| | | | | | | | |
Tax return of capital: | | | | | | | | |
Class A | | | — | | | | (2,254 | ) |
Class I | | | — | | | | (34,332 | ) |
Class R | | | — | | | | (323 | ) |
Class T** | | | — | | | | (136 | ) |
| | | | | | | | |
Total tax return of capital | | | — | | | | (37,045 | ) |
| | | | | | | | |
CAPITAL SHARES TRANSACTIONS: | | | | | | | | |
Class A | | | | | | | | |
Capital shares sold [89,343 and 31,260 shares, respectively] | | | 763,955 | | | | 285,024 | |
Capital shares issued in reinvestment of dividends [9,833 and 11,087 shares, respectively] | | | 87,170 | | | | 99,880 | |
Capital shares repurchased [(43,500) and (143,061) shares, respectively] | | | (366,344 | ) | | | (1,297,523 | ) |
| | | | | | | | |
Total Class A transactions | | | 484,781 | | | | (912,619 | ) |
| | | | | | | | |
Class I | | | | | | | | |
Capital shares sold [1,051,502 and 569,065 shares, respectively] | | | 9,441,895 | | | | 5,164,420 | |
Capital shares issued in reinvestment of dividends [62,699 and 33,563 shares, respectively] | | | 556,687 | | | | 303,346 | |
Capital shares repurchased [(349,797) and (90,055) shares, respectively] | | | (3,056,860 | ) | | | (809,784 | ) |
| | | | | | | | |
Total Class I transactions | | | 6,941,722 | | | | 4,657,982 | |
| | | | | | | | |
Class R | | | | | | | | |
Capital shares sold [36,206 and 2,702 shares, respectively] | | | 319,125 | | | | 24,313 | |
Capital shares issued in reinvestment of dividends [1,252 and 609 shares, respectively] | | | 11,136 | | | | 5,496 | |
Capital shares repurchased [(480) and (1,517) shares, respectively] | | | (4,274 | ) | | | (13,763 | ) |
| | | | | | | | |
Total Class R transactions | | | 325,987 | | | | 16,046 | |
| | | | | | | | |
NET INCREASE (DECREASE) IN NET ASSETS RESULTING FROM CAPITAL SHARE TRANSACTIONS | | | 7,752,490 | | | | 3,761,409 | |
| | | | | | | | |
TOTAL INCREASE (DECREASE) IN NET ASSETS | | | 7,528,652 | | | | 4,212,035 | |
NET ASSETS: | |
Beginning of year | | | 37,511,554 | | | | 33,299,519 | |
| | | | | | | | |
End of year | | $ | 45,040,206 | | | $ | 37,511,554 | |
| | | | | | | | |
| | ** | Class T shares currently are not offered for sale. |
See Notes to Financial Statements.
62
1290 FUNDS
1290 HIGH YIELD BOND FUND
FINANCIAL HIGHLIGHTS
| | | | | | | | | | | | | | | | | | | | |
Class A | | Year Ended October 31, | |
| | 2020 | | | 2019 | | | 2018 | | | 2017 | | | 2016 | |
Net asset value, beginning of year | | $ | 9.06 | | | $ | 8.93 | | | $ | 9.33 | | | $ | 9.01 | | | $ | 9.15 | |
| | | | | | | | | | | | | | | | | | | | |
Income (loss) from investment operations: | | | | | | | | | | | | | | | | | | | | |
Net investment income (loss) (e) | | | 0.44 | | | | 0.47 | | | | 0.48 | | | | 0.49 | | | | 0.61 | |
Net realized and unrealized gain (loss) | | | (0.03 | ) | | | 0.14 | | | | (0.40 | ) | | | 0.32 | | | | (0.09 | ) |
| | | | | | | | | | | | | | | | | | | | |
Total from investment operations | | | 0.41 | | | | 0.61 | | | | 0.08 | | | | 0.81 | | | | 0.52 | |
| | | | | | | | | | | | | | | | | | | | |
Less distributions: | |
Dividends from net investment income | | | (0.46 | ) | | | (0.47 | ) | | | (0.48 | ) | | | (0.48 | ) | | | (0.65 | ) |
Return of capital | | | — | | | | (0.01 | ) | | | — | | | | (0.01 | ) | | | (0.01 | ) |
| | | | | | | | | | | | | | | | | | | | |
Total dividends and distributions | | | (0.46 | ) | | | (0.48 | ) | | | (0.48 | ) | | | (0.49 | ) | | | (0.66 | ) |
| | | | | | | | | | | | | | | | | | | | |
Net asset value, end of year | | $ | 9.01 | | | $ | 9.06 | | | $ | 8.93 | | | $ | 9.33 | | | $ | 9.01 | |
| | | | | | | | | | | | | | | | | | | | |
Total return | | | 4.72 | % | | | 6.97 | % | | | 0.86 | % | | | 9.20 | % | | | 6.17 | % |
| | | | | | | | | | | | | | | | | | | | |
Ratios/Supplemental Data: | | | | | | | | | | | | | | | | | | | | |
Net assets, end of year (000’s) | | $ | 2,115 | | | $ | 1,623 | | | $ | 2,500 | | | $ | 709 | | | $ | 355 | |
Ratio of expenses to average net assets: | | | | | | | | | | | | | | | | | | | | |
After waivers and reimbursements (f) | | | 1.00 | % | | | 1.00 | % | | | 1.04 | % | | | 1.06 | % | | | 1.06 | % |
Before waivers and reimbursements (f) | | | 1.68 | % | | | 1.79 | % | | | 1.77 | % | | | 1.84 | % | | | 1.81 | % |
Ratio of net investment income (loss) to average net assets: | | | | | | | | | | | | | | | | | | | | |
After waivers and reimbursements (f) | | | 4.97 | % | | | 5.27 | % | | | 5.20 | % | | | 5.26 | % | | | 7.06 | % |
Before waivers and reimbursements (f) | | | 4.29 | % | | | 4.48 | % | | | 4.47 | % | | | 4.48 | % | | | 6.31 | % |
Portfolio turnover rate^ | | | 59 | % | | | 54 | % | | | 45 | % | | | 54 | % | | | 79 | % |
| |
| | | Year Ended October 31, | |
| Class I | | 2020 | | | 2019 | | | 2018 | | | 2017 | | | 2016 | |
Net asset value, beginning of year | | $ | 9.06 | | | $ | 8.94 | | | $ | 9.34 | | | $ | 9.01 | | | $ | 9.15 | |
| | | | | | | | | | | | | | | | | | | | |
Income (loss) from investment operations: | | | | | | | | | | | | | | | | | | | | |
Net investment income (loss) (e) | | | 0.47 | | | | 0.50 | | | | 0.50 | | | | 0.52 | | | | 0.58 | |
Net realized and unrealized gain (loss) | | | (0.04 | ) | | | 0.12 | | | | (0.40 | ) | | | 0.33 | | | | (0.04 | ) |
| | | | | | | | | | | | | | | | | | | | |
Total from investment operations | | | 0.43 | | | | 0.62 | | | | 0.10 | | | | 0.85 | | | | 0.54 | |
| | | | | | | | | | | | | | | | | | | | |
Less distributions: | |
Dividends from net investment income | | | (0.48 | ) | | | (0.49 | ) | | | (0.50 | ) | | | (0.51 | ) | | | (0.67 | ) |
Return of capital | | | — | | | | (0.01 | ) | | | — | | | | (0.01 | ) | | | (0.01 | ) |
| | | | | | | | | | | | | | | | | | | | |
Total dividends and distributions | | | (0.48 | ) | | | (0.50 | ) | | | (0.50 | ) | | | (0.52 | ) | | | (0.68 | ) |
| | | | | | | | | | | | | | | | | | | | |
Net asset value, end of year | | $ | 9.01 | | | $ | 9.06 | | | $ | 8.94 | | | $ | 9.34 | | | $ | 9.01 | |
| | | | | | | | | | | | | | | | | | | | |
Total return | | | 4.98 | % | | | 7.12 | % | | | 1.09 | % | | | 9.58 | % | | | 6.44 | % |
| | | | | | | | | | | | | | | | | | | | |
Ratios/Supplemental Data: | |
Net assets, end of year (000’s) | | $ | 42,159 | | | $ | 35,453 | | | $ | 30,386 | | | $ | 30,185 | | | $ | 27,710 | |
Ratio of expenses to average net assets: | | | | | | | | | | | | | | | | | | | | |
After waivers and reimbursements (f) | | | 0.75 | % | | | 0.75 | % | | | 0.80 | % | | | 0.82 | % | | | 0.84 | % |
Before waivers and reimbursements (f) | | | 1.43 | % | | | 1.53 | % | | | 1.52 | % | | | 1.58 | % | | | 1.53 | % |
Ratio of net investment income (loss) to average net assets: | | | | | | | | | | | | | | | | | | | | |
After waivers and reimbursements (f) | | | 5.22 | % | | | 5.50 | % | | | 5.47 | % | | | 5.55 | % | | | 6.62 | % |
Before waivers and reimbursements (f) | | | 4.54 | % | | | 4.71 | % | | | 4.74 | % | | | 4.79 | % | | | 5.94 | % |
Portfolio turnover rate^ | | | 59 | % | | | 54 | % | | | 45 | % | | | 54 | % | | | 79 | % |
See Notes to Financial Statements.
63
1290 FUNDS
1290 HIGH YIELD BOND FUND
FINANCIAL HIGHLIGHTS (Continued)
| | | | | | | | | | | | | | | | | | | | |
| | | Year Ended October 31, | |
| Class R | | 2020 | | | 2019 | | | 2018 | | | 2017 | | | 2016 | |
Net asset value, beginning of year | | $ | 9.05 | | | $ | 8.93 | | | $ | 9.33 | | | $ | 9.01 | | | $ | 9.15 | |
| | | | | | | | | | | | | | | | | | | | |
Income (loss) from investment operations: | | | | | | | | | | | | | | | | | | | | |
Net investment income (loss) (e) | | | 0.42 | | | | 0.45 | | | | 0.45 | | | | 0.47 | | | | 0.59 | |
Net realized and unrealized gain (loss) | | | (0.03 | ) | | | 0.13 | | | | (0.39 | ) | | | 0.32 | | | | (0.10 | ) |
| | | | | | | | | | | | | | | | | | | | |
Total from investment operations | | | 0.39 | | | | 0.58 | | | | 0.06 | | | | 0.79 | | | | 0.49 | |
| | | | | | | | | | | | | | | | | | | | |
Less distributions: | |
Dividends from net investment income | | | (0.44 | ) | | | (0.45 | ) | | | (0.46 | ) | | | (0.46 | ) | | | (0.62 | ) |
Return of capital | | | — | | | | (0.01 | ) | | | — | | | | (0.01 | ) | | | (0.01 | ) |
| | | | | | | | | | | | | | | | | | | | |
Total dividends and distributions | | | (0.44 | ) | | | (0.46 | ) | | | (0.46 | ) | | | (0.47 | ) | | | (0.63 | ) |
| | | | | | | | | | | | | | | | | | | | |
Net asset value, end of year | | $ | 9.00 | | | $ | 9.05 | | | $ | 8.93 | | | $ | 9.33 | | | $ | 9.01 | |
| | | | | | | | | | | | | | | | | | | | |
Total return | | | 4.46 | % | | | 6.59 | % | | | 0.63 | % | | | 8.95 | % | | | 5.91 | % |
| | | | | | | | | | | | | | | | | | | | |
Ratios/Supplemental Data: | | | | | | | | | | | | | | | | | | | | |
Net assets, end of year (000’s) | | $ | 638 | | | $ | 307 | | | $ | 287 | | | $ | 218 | | | $ | 195 | |
Ratio of expenses to average net assets: | | | | | | | | | | | | | | | | | | | | |
After waivers and reimbursements (f) | | | 1.25 | % | | | 1.25 | % | | | 1.30 | % | | | 1.32 | % | | | 1.31 | % |
Before waivers and reimbursements (f) | | | 1.92 | % | | | 2.03 | % | | | 2.02 | % | | | 2.08 | % | | | 2.06 | % |
Ratio of net investment income (loss) to average net assets: | | | | | | | | | | | | | | | | | | | | |
After waivers and reimbursements (f) | | | 4.69 | % | | | 5.00 | % | | | 4.96 | % | | | 5.05 | % | | | 6.83 | % |
Before waivers and reimbursements (f) | | | 4.01 | % | | | 4.22 | % | | | 4.23 | % | | | 4.28 | % | | | 6.08 | % |
Portfolio turnover rate^ | | | 59 | % | | | 54 | % | | | 45 | % | | | 54 | % | | | 79 | % |
| |
| | | Year Ended October 31, | |
| Class T** | | 2020 | | | 2019 | | | 2018 | | | 2017 | | | 2016 | |
Net asset value, beginning of year | | $ | 9.06 | | | $ | 8.93 | | | $ | 9.33 | | | $ | 9.01 | | | $ | 9.15 | |
| | | | | | | | | | | | | | | | | | | | |
Income (loss) from investment operations: | | | | | | | | | | | | | | | | | | | | |
Net investment income (loss) (e) | | | 0.47 | | | | 0.50 | | | | 0.50 | | | | 0.52 | | | | 0.63 | |
Net realized and unrealized gain (loss) | | | (0.04 | ) | | | 0.13 | | | | (0.40 | ) | | | 0.32 | | | | (0.09 | ) |
| | | | | | | | | | | | | | | | | | | | |
Total from investment operations | | | 0.43 | | | | 0.63 | | | | 0.10 | | | | 0.84 | | | | 0.54 | |
| | | | | | | | | | | | | | | | | | | | |
Less distributions: | |
Dividends from net investment income | | | (0.48 | ) | | | (0.49 | ) | | | (0.50 | ) | | | (0.51 | ) | | | (0.67 | ) |
Return of capital | | | — | | | | (0.01 | ) | | | — | | | | (0.01 | ) | | | (0.01 | ) |
| | | | | | | | | | | | | | | | | | | | |
Total dividends and distributions | | | (0.48 | ) | | | (0.50 | ) | | | (0.50 | ) | | | (0.52 | ) | | | (0.68 | ) |
| | | | | | | | | | | | | | | | | | | | |
Net asset value, end of year | | $ | 9.01 | | | $ | 9.06 | | | $ | 8.93 | | | $ | 9.33 | | | $ | 9.01 | |
| | | | | | | | | | | | | | | | | | | | |
Total return | | | 4.98 | % | | | 7.24 | % | | | 1.09 | % | | | 9.46 | % | | | 6.44 | % |
| | | | | | | | | | | | | | | | | | | | |
Ratios/Supplemental Data: | |
Net assets, end of year (000’s) | | $ | 128 | | | $ | 129 | | | $ | 127 | | | $ | 132 | | | $ | 128 | |
Ratio of expenses to average net assets: | | | | | | | | | | | | | | | | | | | | |
After waivers and reimbursements (f) | | | 0.75 | % | | | 0.75 | % | | | 0.80 | % | | | 0.82 | % | | | 0.81 | % |
Before waivers and reimbursements (f) | | | 1.68 | % | | | 1.78 | % | | | 1.77 | % | | | 2.08 | % | | | 2.56 | % |
Ratio of net investment income (loss) to average net assets: | | | | | | | | | | | | | | | | | | | | |
After waivers and reimbursements (f) | | | 5.23 | % | | | 5.50 | % | | | 5.46 | % | | | 5.56 | % | | | 7.30 | % |
Before waivers and reimbursements (f) | | | 4.30 | % | | | 4.47 | % | | | 4.49 | % | | | 4.30 | % | | | 5.55 | % |
Portfolio turnover rate^ | | | 59 | % | | | 54 | % | | | 45 | % | | | 54 | % | | | 79 | % |
| ** | Class T shares currently are not offered for sale. Class T shares were formerly known as Class C shares. |
| ^ | Portfolio turnover rate excludes derivatives, if any. |
| (e) | Net investment income (loss) per share is based on average shares outstanding. |
| (f) | Expenses do not include the expenses of the underlying funds (“indirect expenses”), if applicable. |
See Notes to Financial Statements.
64
1290 MULTI-ALTERNATIVE STRATEGIES FUND (Unaudited)
INVESTMENT ADVISER
| Ø | | Equitable Investment Management Group, LLC |
PERFORMANCE RESULTS
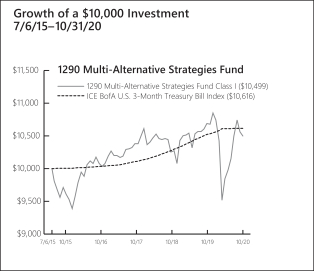
| | | | | | | | | | | | | | |
| |
| Annualized Total Returns as of 10/31/20 | |
| | | | | |
| | | | | 1
Year | | | 5
Years | | | Since
Incept. | |
Fund – Class A Shares* | | without Sales Charge | | | (2.01 | )% | | | 1.33 | % | | | 0.67 | % |
| | | with Sales Charge (a) | | | (7.40 | ) | | | 0.19 | | | | (0.39 | ) |
Fund – Class I Shares* | | | | | (1.76 | ) | | | 1.57 | | | | 0.92 | |
Fund – Class R Shares* | | | | | (2.27 | ) | | | 1.07 | | | | 0.41 | |
ICE BofA US 3-Month Treasury Bill Index | | | | | 0.92 | | | | 1.20 | | | | 1.13 | |
| |
* Date of inception 7/6/15. (a) A 5.50% front-end sales charge was deducted. Returns for periods greater than one year are annualized. | |
The performance quoted is past performance and is not a guarantee of future results. Mutual funds are subject to certain market risks. Investment returns and principal value of an investment will fluctuate so that an investor’s shares, when redeemed, may be worth more or less than their original cost. Current performance may be higher or lower than the performance data shown. For the most current month-end performance data please call 1-888-310-0416 or visit www.1290Funds.com.
The graph illustrates comparative performance for $10,000 invested in the Class I Shares of the 1290 Multi-Alternative Strategies Fund and the ICE BofA U.S. 3-Month Treasury Bill Index from 7/6/15 to 10/31/20. The performance of the ICE BofA U.S. 3-Month Treasury Bill Index reflects an initial investment at the end of the month closest to the Fund’s inception. The performance of the Fund assumes reinvestment of all dividends and capital gain distributions, if any, and does not include a sales charge. The performance of the ICE BofA U.S. 3-Month Treasury Bill Index does not reflect the deduction of expenses or a sales charge associated with a mutual fund and has been adjusted to reflect reinvestment of all dividends, capital gain distributions, and interest of the securities included in the benchmark.
As of March 1, 2020, the gross expense ratios including acquired fund fees for Class A, I and R shares were 2.52%, 2.26% and 2.76%, respectively. The net expense ratios for Class A, I and R shares were 1.69%, 1.44%, and 1.94%, respectively. The net expense ratios reflect the Adviser’s decision to contractually limit expenses through April 30, 2021. Fund Performance may also reflect the waiver of the Fund’s fees and reimbursement of expenses for certain periods since the inception date. Without these waivers and reimbursements, performance would have been lower.
In addition, performance shown in this section does not reflect the deduction of taxes that a shareholder would pay on Fund distributions or redemption of Fund shares.
PERFORMANCE SUMMARY
The Fund’s Class I shares returned (1.76)% for the year ended October 31, 2020. The Fund’s benchmark, the ICE BofA US 3-Month Treasury Bill Index, returned 0.92% over the same year.
What helped performance during the year*?
| • | | The convertible securities ETF was the top contributor to performance with the asset class up over 33% for the period, outperforming equities, which were up only 9.7% as measured by the S&P 500® Index. |
| • | | Precious metals had strong performance for the year ended October 31, 2020, with silver and gold up about 29% and 21%, respectively. |
| • | | Real return added to performance as inflation-protected securities were up 6.5%. |
What hurt performance during the year*?
| • | | Global real estate was the top detractor from performance with U.S. real estate investment trusts (REITs) down over 20% for the period as the pandemic continued to put pressure on retail and office properties. |
| • | | Multi-strategies detracted from performance, mainly driven by the poor performance of the JPMorgan Diversified Alternatives ETF. |
| • | | Commodities hurt relative performance, driven by a decline in energy prices. |
| * | The Fund does not hold a position in any single security directly but has exposure through ETFs. |
65
1290 MULTI-ALTERNATIVE STRATEGIES FUND (Unaudited)
| | | | |
| |
Table by Asset Class (as a percentage of Total
Investments in Securities) As of October 31, 2020 | |
Alternatives | | | 36.8 | % |
Fixed Income | | | 22.7 | |
Commodity | | | 16.2 | |
Equity | | | 14.8 | |
Specialty | | | 9.5 | |
| | | | |
| |
Top 10 Holdings (as a percentage of Total Investments in
Securities) As of October 31, 2020 | |
Invesco DB G10 Currency Harvest Fund | | | 9.5 | % |
IQ Merger Arbitrage ETF | | | 9.3 | |
ProShares Hedge Replication ETF | | | 9.2 | |
WisdomTree Managed Futures Strategy Fund | | | 9.2 | |
SPDR Bloomberg Barclays Convertible Securities ETF | | | 8.9 | |
Invesco DB Gold Fund | | | 6.3 | |
Vanguard Short-Term Inflation-Protected Securities ETF | | | 4.7 | |
ProShares Long Online/Short Stores ETF | | | 4.7 | |
iShares U.S. Fixed Income Balanced Risk Factor ETF | | | 4.7 | |
ProShares RAFI Long/Short | | | 4.5 | |
Holdings are subject to change without notice. | | | | |
UNDERSTANDING YOUR EXPENSES:
As a shareholder of the Fund, you incur two types of costs:
(1) transaction costs, including applicable sales charges and redemption fees; and (2) ongoing costs, including investment advisory fees, distribution and/or service (12b-1) fees (in the case of Class A and Class R shares of the Fund), and other Fund expenses. These examples are intended to help you understand your ongoing costs (in dollars) of investing in the Fund and to compare these costs with the ongoing costs of investing in other mutual funds.
The examples are based on an investment of $1,000 invested at the beginning of the six-month period ended October 31, 2020 and held for the entire six-month period.
Actual Expenses
The first line of the following table provides information about actual account values and actual expenses. You may use the information in this line, together with the amount you invested, to estimate the expenses that you paid over the period. Simply divide your account value by $1,000 (for example, an $8,600 account value divided by $1,000 = 8.6), then multiply the result by the number in the first line under the heading entitled ‘‘Expenses Paid During Period’’ to estimate the expenses you paid on your account during this period.
Hypothetical Example for Comparison Purposes
The second line of the following table provides information about hypothetical account values and hypothetical expenses based on the Fund’s actual expense ratio and an assumed rate of return of 5% per year before expenses, which is not the Fund’s actual return. The hypothetical account values and expenses may not be used to estimate the actual ending account balance or expenses you paid for the period. You may use this information to compare the ongoing costs of investing in the Fund and other funds. To do so, compare this 5% hypothetical example with the 5% hypothetical examples that appear in the shareholder reports of the other funds.
Please note that the expenses shown in the table are meant to highlight your ongoing costs only and do not reflect any transactional costs, such as sales charges (loads), redemption fees, or exchange fees. Therefore, the second line of the table is useful in comparing ongoing costs only, and will not help you determine the relative total costs of owning different funds. In addition, if these transactional costs were included, your costs would have been higher.
EXAMPLE
| | | | | | | | | | | | |
| | | | |
| | | Beginning
Account
Value
5/1/20 | | | Ending
Account
Value
10/31/20 | | | Expenses
Paid
During
Period*
5/1/20 -
10/31/20 | |
Class A | | | | | | | | | | | | |
Actual | | | $1,000.00 | | | | $1,064.40 | | | | $5.56 | |
Hypothetical (5% average annual return before expenses) | | | 1,000.00 | | | | 1,019.75 | | | | 5.44 | |
Class I | | | | | | | | | | | | |
Actual | | | 1,000.00 | | | | 1,066.50 | | | | 4.27 | |
Hypothetical (5% average annual return before expenses) | | | 1,000.00 | | | | 1,021.00 | | | | 4.18 | |
Class R | | | | | | | | | | | | |
Actual | | | 1,000.00 | | | | 1,063.60 | | | | 6.85 | |
Hypothetical (5% average annual return before expenses) | | | 1,000.00 | | | | 1,018.50 | | | | 6.70 | |
| |
* Expenses are equal to the Portfolio’s A, I and R shares annualized expense ratio of 1.07%, 0.82% and 1.32%, respectively, multiplied by the average account value over the period, and multiplied by 184/366 (to reflect the one-half year period). | |
66
1290 FUNDS
1290 MULTI-ALTERNATIVE STRATEGIES FUND
PORTFOLIO OF INVESTMENTS
October 31, 2020
| | | | | | | | |
| | | |
| | | Number of
Shares | | | Value
(Note 1) | |
| | | | | | | | |
EXCHANGE TRADED FUNDS (ETF): | | | | | | | | |
Alternatives (36.8%) | | | | | | | | |
IQ Merger Arbitrage ETF* | | | 39,140 | | | $ | 1,338,979 | |
ProShares Hedge Replication ETF | | | 28,950 | | | | 1,331,700 | |
ProShares Long Online/Short Stores ETF | | | 7,950 | | | | 676,068 | |
ProShares RAFI Long/Short‡ | | | 21,760 | | | | 653,631 | |
WisdomTree Managed Futures Strategy Fund | | | 38,050 | | | | 1,324,521 | |
| | | | | | | | |
Total Alternatives | | | | | | | 5,324,899 | |
| | | | | | | | |
Commodity (16.2%) | | | | | | | | |
Invesco DB Base Metals Fund | | | 12,540 | | | | 195,499 | |
Invesco DB Commodity Index Tracking Fund | | | 50,950 | | | | 644,517 | |
Invesco DB Gold Fund | | | 16,480 | | | | 904,936 | |
Invesco DB Precious Metals Fund | | | 2,860 | | | | 146,832 | |
Invesco DB Silver Fund | | | 800 | | | | 26,901 | |
iShares Commodities Select Strategy ETF | | | 17,470 | | | | 422,425 | |
| | | | | | | | |
Total Commodity | | | | | | | 2,341,110 | |
| | | | | | | | |
Equity (14.8%) | | | | | | | | |
iShares Core US REIT ETF | | | 15,050 | | | | 641,431 | |
iShares MSCI Global Agriculture Producers ETF | | | 7,470 | | | | 213,392 | |
SPDR MSCI USA StrategicFactors ETF | | | 6,930 | | | | 636,936 | |
Vanguard Global ex-U.S. Real Estate ETF | | | 13,660 | | | | 641,747 | |
| | | | | | | | |
Total Equity | | | | | | | 2,133,506 | |
| | | | | | | | |
| | | | | | | | |
Fixed Income (22.7%) | | | | | | | | |
iShares TIPS Bond ETF | | | 5,130 | | | | 642,430 | |
iShares U.S. Fixed Income Balanced Risk Factor ETF | | | 6,660 | | | | 674,958 | |
SPDR Bloomberg Barclays Convertible Securities ETF | | | 18,670 | | | | 1,286,549 | |
Vanguard Short-Term Inflation-Protected Securities ETF | | | 13,420 | | | | 679,589 | |
| | | | | | | | |
Total Fixed Income | | | | | | | 3,283,526 | |
| | | | | | | | |
Specialty (9.5%) | | | | | | | | |
Invesco DB G10 Currency Harvest Fund‡ | | | 59,770 | | | | 1,380,986 | |
| | | | | | | | |
Total Investments in Securities (100.0%)
(Cost $14,134,100) | | | | | | | 14,464,027 | |
Other Assets Less Liabilities (0.0%) | | | | | | | 4,006 | |
| | | | | | | | |
Net Assets (100%) | | | | | | $ | 14,468,033 | |
| | | | | | | | |
| ‡ | All, or a portion, of the security is an affiliated company as defined under the Investment Company Act of 1940. |
Glossary:
| | TIPS | — Treasury Inflation Protected Security |
Investments in companies which were affiliates for the year ended October 31, 2020, were as follows:
| | | | | | | | | | | | | | | | | | | | | | | | | | | | | | | | | | | | |
Security Description | | Shares at
October 31,
2020 | | | Market Value
October 31,
2019 ($) | | | Purchases
at Cost ($) | | | Proceeds
from
Sales ($) | | | Net
Realized
Gain
(Loss) ($) | | | Change
in Unrealized
Appreciation/
(Depreciation)
($) | | | Market
Value
October 31,
2020 ($) | | | Dividend/
Interest
Income
($) | | | Capital Gain
Distributions
($) | |
EXCHANGE TRADED FUNDS (ETF): | | | | | | | | | | | | | | | | | | | | | | | | | | | | | | | | | | | | |
Alternatives | | | | | | | | | | | | | | | | | | | | | | | | | | | | | | | | | | | | |
ProShares RAFI Long/Short | | | 21,760 | | | | 798,675 | | | | — | | | | (36,921 | ) | | | (11,631 | ) | | | (96,492 | ) | | | 653,631 | | | | 12,682 | | | | — | |
Specialty | | | | | | | | | | | | | | | | | | | | | | | | | | | | | | | | | | | | |
Invesco DB G10 Currency Harvest Fund | | | 59,770 | | | | 1,714,829 | | | | — | | | | (257,039 | ) | | | (1,755 | ) | | | (75,049 | ) | | | 1,380,986 | | | | 24,422 | | | | — | |
| | | | | | | | | | | | | | | | | | | | | | | | | | | | | | | | | | | | |
Total | | | | | | | 2,513,504 | | | | — | | | | (293,960 | ) | | | (13,386 | ) | | | (171,541 | ) | | | 2,034,617 | | | | 37,104 | | | | — | |
| | | | | | | | | | | | | | | | | | | | | | | | | | | | | | | | | | | | |
See Notes to Financial Statements.
67
1290 FUNDS
1290 MULTI-ALTERNATIVE STRATEGIES FUND
PORTFOLIO OF INVESTMENTS (Continued)
October 31, 2020
The following is a summary of the inputs used to value the Fund’s assets and liabilities carried at fair value as of October 31, 2020:
The inputs or methodology used for valuing securities are not necessarily an indication of the risk associated with investing in those securities.
Various inputs are used in determining the value of the Fund’s investments. These inputs are summarized in the three broad levels listed below:
| | | | | | | | | | | | | | | | |
| | | | | |
| Investment Type | | Level 1
Quoted Prices in
Active Markets for
Identical
Securities | | | Level 2
Significant Other
Observable Inputs
(including quoted prices
for similar securities,
interest rates,
prepayment speeds,
credit risk, etc.) | | | Level 3
Significant Unobservable
Inputs (including the
Fund’s own
assumptions in
determining the fair
value of investments) | | | Total | |
Assets: | | | | | | | | | | | | | | | | |
Exchange Traded Funds | | | | | | | | | | | | | | | | |
Exchange Traded Funds | | $ | 14,464,027 | | | $ | — | | | $ | — | | | $ | 14,464,027 | |
| | | | | | | | | | | | | | | | |
Total Assets | | $ | 14,464,027 | | | $ | — | | | $ | — | | | $ | 14,464,027 | |
| | | | | | | | | | | | | | | | |
Total Liabilities | | $ | — | | | $ | — | | | $ | — | | | $ | — | |
| | | | | | | | | | | | | | | | |
Total | | $ | 14,464,027 | | | $ | — | | | $ | — | | | $ | 14,464,027 | |
| | | | | | | | | | | | | | | | |
The Fund held no derivatives contracts during the year ended October 31, 2020.
Investment security transactions for the year ended October 31, 2020 were as follows:
| | | | |
Cost of Purchases: | | | | |
Long-term investments other than U.S. government debt securities | | $ | 2,397,618 | |
Net Proceeds of Sales and Redemptions: | | | | |
Long-term investments other than U.S. government debt securities | | $ | 5,717,155 | |
As of October 31, 2020, the gross unrealized appreciation (depreciation) of investments based on the aggregate cost of investments in securities and derivative instruments, if applicable, for Federal income tax purposes was as follows:
| | | | |
Aggregate gross unrealized appreciation | | $ | 1,042,205 | |
Aggregate gross unrealized depreciation | | | (1,043,820 | ) |
| | | | |
Net unrealized depreciation | | $ | (1,615 | ) |
| | | | |
Federal income tax cost of investments in securities and derivative instruments, if applicable | | $ | 14,465,642 | |
| | | | |
See Notes to Financial Statements.
68
1290 FUNDS
1290 MULTI-ALTERNATIVE STRATEGIES FUND
STATEMENT OF ASSETS AND LIABILITIES
October 31, 2020
| | | | |
ASSETS | |
Investments in Securities, at value: | | | | |
Affiliated Issuers (Cost $2,265,798) | | $ | 2,034,617 | |
Unaffiliated Issuers (Cost $11,868,302) | | | 12,429,410 | |
Cash | | | 44,167 | |
Prepaid registration and filing fees | | | 14,363 | |
Receivable from investment adviser | | | 2,172 | |
Receivable for Fund shares sold | | | 3 | |
Other assets | | | 162 | |
| | | | |
Total assets | | | 14,524,894 | |
| | | | |
LIABILITIES | | | | |
Transfer agent fees payable | | | 6,524 | |
Payable for Fund shares redeemed | | | 5,721 | |
Trustees’ fees payable | | | 193 | |
Distribution fees payable – Class A | | | 120 | |
Distribution fees payable – Class R | | | 58 | |
Accrued expenses | | | 44,245 | |
| | | | |
Total liabilities | | | 56,861 | |
| | | | |
NET ASSETS | | $ | 14,468,033 | |
| | | | |
Net assets were comprised of: | | | | |
Paid in capital | | $ | 14,662,997 | |
Total distributable earnings (loss) | | | (194,964 | ) |
| | | | |
Net assets | | $ | 14,468,033 | |
| | | | |
Class A | | | | |
Net asset value and redemption price per share, $555,578 / 55,991 shares outstanding (unlimited amount authorized: $0.001 par value) | | $ | 9.92 | |
Maximum sales charge (5.50% of offering price) | | | 0.58 | |
| | | | |
Maximum offering price per share | | $ | 10.50 | |
| | | | |
Class I | | | | |
Net asset value, offering and redemption price per share, $13,776,003 / 1,385,874 shares outstanding (unlimited amount authorized: $0.001 par value) | | $ | 9.94 | |
| | | | |
Class R | | | | |
Net asset value, offering and redemption price per share, $136,452 / 13,822 shares outstanding (unlimited amount authorized: $0.001 par value) | | $ | 9.87 | |
| | | | |
STATEMENT OF OPERATIONS
For the Year Ended October 31, 2020
| | | | |
INVESTMENT INCOME | |
Dividends ($37,104 of dividend income received from affiliates) | | $ | 353,977 | |
Interest | | | 647 | |
| | | | |
Total income | | | 354,624 | |
| | | | |
EXPENSES | | | | |
Investment advisory fees | | | 81,793 | |
Professional fees | | | 48,349 | |
Transfer agent fees | | | 37,550 | |
Registration and filing fees | | | 33,459 | |
Printing and mailing expenses | | | 30,607 | |
Administrative fees | | | 30,000 | |
Custodian fees | | | 5,150 | |
Tax expense | | | 2,116 | |
Distribution fees – Class A | | | 1,474 | |
Trustees’ fees | | | 1,388 | |
Distribution fees – Class R | | | 591 | |
Miscellaneous | | | 9,728 | |
| | | | |
Gross expenses | | | 282,205 | |
Less: Waiver from investment adviser | | | (111,793 | ) |
Reimbursement from investment adviser | | | (35,510 | ) |
| | | | |
Net expenses | | | 134,902 | |
| | | | |
NET INVESTMENT INCOME (LOSS) | | | 219,722 | |
| | | | |
REALIZED AND UNREALIZED GAIN (LOSS) | | | | |
Net realized gain (loss) on investments in securities ($(13,386) realized gain (loss) from affiliates) | | | (373,771 | ) |
Net change in unrealized appreciation (depreciation) on investments in securities ($(171,541) of change in unrealized appreciation (depreciation) from affiliates) | | | (296,652 | ) |
| | | | |
NET REALIZED AND UNREALIZED GAIN (LOSS) | | | (670,423 | ) |
| | | | |
NET INCREASE (DECREASE) IN NET ASSETS RESULTING FROM OPERATIONS | | $ | (450,701 | ) |
| | | | |
See Notes to Financial Statements.
69
1290 FUNDS
1290 MULTI-ALTERNATIVE STRATEGIES FUND
STATEMENT OF CHANGES IN NET ASSETS
| | | | | | | | |
| | | Year Ended October 31, | |
| | | 2020 | | | 2019 | |
INCREASE (DECREASE) IN NET ASSETS FROM OPERATIONS: | | | | | | | | |
Net investment income (loss) | | $ | 219,722 | | | $ | 244,037 | |
Net realized gain (loss) | | | (373,771 | ) | | | (50,597 | ) |
Net change in unrealized appreciation (depreciation) | | | (296,652 | ) | | | 583,673 | |
| | | | | | | | |
NET INCREASE (DECREASE) IN NET ASSETS RESULTING FROM OPERATIONS | | | (450,701 | ) | | | 777,113 | |
| | | | | | | | |
Distributions to shareholders: | | | | | | | | |
Class A | | | (11,965 | ) | | | (7,113 | ) |
Class I | | | (380,272 | ) | | | (217,148 | ) |
Class R | | | (1,934 | ) | | | (740 | ) |
| | | | | | | | |
Total distributions to shareholders | | | (394,171 | ) | | | (225,001 | ) |
| | | | | | | | |
CAPITAL SHARES TRANSACTIONS: | | | | | | | | |
Class A | | | | | | | | |
Capital shares sold [2,595 and 5,825 shares, respectively] | | | 26,323 | | | | 59,103 | |
Capital shares issued in reinvestment of dividends[983 and 623 shares, respectively] | | | 9,992 | | | | 6,163 | |
Capital shares repurchased [(8,344) and (28,247) shares, respectively] | | | (79,600 | ) | | | (286,221 | ) |
| | | | | | | | |
Total Class A transactions | | | (43,285 | ) | | | (220,955 | ) |
| | | | | | | | |
Class I | | | | | | | | |
Capital shares sold [43,009 and 178,038 shares, respectively] | | | 429,302 | | | | 1,799,614 | |
Capital shares issued in reinvestment of dividends[15,947 and 9,966 shares, respectively] | | | 162,026 | | | | 98,568 | |
Capital shares repurchased [(392,851) and (276,662) shares, respectively] | | | (3,786,507 | ) | | | (2,793,490 | ) |
| | | | | | | | |
Total Class I transactions | | | (3,195,179 | ) | | | (895,308 | ) |
| | | | | | | | |
Class R | | | | | | | | |
Capital shares sold [2,570 and 703 shares, respectively] | | | 25,161 | | | | 7,121 | |
Capital shares issued in reinvestment of dividends[21 and 4 shares, respectively] | | | 215 | | | | 40 | |
Capital shares repurchased [(17) and (22) shares, respectively] | | | (169 | ) | | | (223 | ) |
| | | | | | | | |
Total Class R transactions | | | 25,207 | | | | 6,938 | |
| | | | | | | | |
NET INCREASE (DECREASE) IN NET ASSETS RESULTING FROM CAPITAL SHARE TRANSACTIONS | | | (3,213,257 | ) | | | (1,109,325 | ) |
| | | | | | | | |
TOTAL INCREASE (DECREASE) IN NET ASSETS | | | (4,058,129 | ) | | | (557,213 | ) |
NET ASSETS: | | | | | | | | |
Beginning of year | | | 18,526,162 | | | | 19,083,375 | |
| | | | | | | | |
End of year | | $ | 14,468,033 | | | $ | 18,526,162 | |
| | | | | | | | |
See Notes to Financial Statements.
70
1290 FUNDS
1290 MULTI-ALTERNATIVE STRATEGIES FUND
FINANCIAL HIGHLIGHTS
| | | | | | | | | | | | | | | | | | | | |
| | | Year Ended October 31, | |
| Class A | | 2020 | | | 2019 | | | 2018 | | | 2017 | | | 2016 | |
Net asset value, beginning of year | | $ | 10.32 | | | $ | 10.02 | | | $ | 10.21 | | | $ | 9.97 | | | $ | 9.70 | |
| | | | | | | | | | | | | | | | | | | | |
Income (loss) from investment operations: | | | | | | | | | | | | | | | | | | | | |
Net investment income (loss) (e)(x) | | | 0.10 | | | | 0.11 | | | | 0.04 | | | | 0.02 | | | | 0.01 | |
Net realized and unrealized gain (loss) | | | (0.30 | ) | | | 0.28 | | | | (0.19 | ) | | | 0.26 | | | | 0.33 | |
| | | | | | | | | | | | | | | | | | | | |
Total from investment operations | | | (0.20 | ) | | | 0.39 | | | | (0.15 | ) | | | 0.28 | | | | 0.34 | |
| | | | | | | | | | | | | | | | | | | | |
Less distributions: | | | | | | | | | | | | | | | | | | | | |
Dividends from net investment income | | | (0.20 | ) | | | (0.04 | ) | | | — | | | | (0.01 | ) | | | (0.05 | ) |
Distributions from net realized gains | | | — | | | | (0.05 | ) | | | (0.04 | ) | | | (0.03 | ) | | | — | |
Return of capital | | | — | | | | — | | | | — | | | | — | | | | (0.02 | ) |
| | | | | | | | | | | | | | | | | | | | |
Total dividends and distributions | | | (0.20 | ) | | | (0.09 | ) | | | (0.04 | ) | | | (0.04 | ) | | | (0.07 | ) |
| | | | | | | | | | | | | | | | | | | | |
Net asset value, end of year | | $ | 9.92 | | | $ | 10.32 | | | $ | 10.02 | | | $ | 10.21 | | | $ | 9.97 | |
| | | | | | | | | | | | | | | | | | | | |
Total return | | | (2.01 | )% | | | 3.98 | % | | | (1.49 | )% | | | 2.78 | % | | | 3.53 | % |
| | | | | | | | | | | | | | | | | | | | |
Ratios/Supplemental Data: | | | | | | | | | | | | | | | | | | | | |
Net assets, end of year (000’s) | | $ | 556 | | | $ | 627 | | | $ | 827 | | | $ | 659 | | | $ | 410 | |
Ratio of expenses to average net assets: | | | | | | | | | | | | | | | | | | | | |
After waivers and reimbursements (f) | | | 1.06 | %***(j) | | | 1.07 | %**(k) | | | 1.03 | %(m) | | | 1.00 | %(m) | | | 0.98 | %(m) |
Before waivers and reimbursements (f) | | | 1.97 | % | | | 1.89 | % | | | 1.79 | % | | | 2.08 | % | | | 2.62 | % |
Ratio of net investment income (loss) to average net assets: | | | | | | | | | | | | | | | | | | | | |
After waivers and reimbursements (f)(x) | | | 1.03 | % | | | 1.12 | % | | | 0.39 | % | | | 0.20 | % | | | 0.10 | % |
Before waivers and reimbursements (f)(x) | | | 0.12 | % | | | 0.30 | % | | | (0.37 | )% | | | (0.88 | )% | | | (1.55 | )% |
Portfolio turnover rate^ | | | 15 | % | | | 8 | % | | | 5 | % | | | 13 | % | | | 2 | % |
| |
| | | Year Ended October 31, | |
| Class I | | 2020 | | | 2019 | | | 2018 | | | 2017 | | | 2016 | |
Net asset value, beginning of year | | $ | 10.34 | | | $ | 10.04 | | | $ | 10.23 | | | $ | 9.99 | | | $ | 9.71 | |
| | | | | | | | | | | | | | | | | | | | |
Income (loss) from investment operations: | | | | | | | | | | | | | | | | | | | | |
Net investment income (loss) (e)(x) | | | 0.13 | | | | 0.13 | | | | 0.07 | | | | 0.05 | | | | 0.05 | |
Net realized and unrealized gain (loss) | | | (0.31 | ) | | | 0.29 | | | | (0.20 | ) | | | 0.25 | | | | 0.31 | |
| | | | | | | | | | | | | | | | | | | | |
Total from investment operations | | | (0.18 | ) | | | 0.42 | | | | (0.13 | ) | | | 0.30 | | | | 0.36 | |
| | | | | | | | | | | | | | | | | | | | |
Less distributions: | | | | | | | | | | | | | | | | | | | | |
Dividends from net investment income | | | (0.22 | ) | | | (0.07 | ) | | | (0.02 | ) | | | (0.03 | ) | | | (0.05 | ) |
Distributions from net realized gains | | | — | | | | (0.05 | ) | | | (0.04 | ) | | | (0.03 | ) | | | — | |
Return of capital | | | — | | | | — | | | | — | | | | — | | | | (0.03 | ) |
| | | | | | | | | | | | | | | | | | | | |
Total dividends and distributions | | | (0.22 | ) | | | (0.12 | ) | | | (0.06 | ) | | | (0.06 | ) | | | (0.08 | ) |
| | | | | | | | | | | | | | | | | | | | |
Net asset value, end of year | | $ | 9.94 | | | $ | 10.34 | | | $ | 10.04 | | | $ | 10.23 | | | $ | 9.99 | |
| | | | | | | | | | | | | | | | | | | | |
Total return | | | (1.76 | )% | | | 4.25 | % | | | (1.25 | )% | | | 3.04 | % | | | 3.76 | % |
| | | | | | | | | | | | | | | | | | | | |
Ratios/Supplemental Data: | | | | | | | | | | | | | | | | | | | | |
Net assets, end of year (000’s) | | $ | 13,776 | | | $ | 17,783 | | | $ | 18,151 | | | $ | 16,358 | | | $ | 12,233 | |
Ratio of expenses to average net assets: | | | | | | | | | | | | | | | | | | | | |
After waivers and reimbursements (f) | | | 0.81 | %***(j) | | | 0.82 | %**(k) | | | 0.78 | %(m) | | | 0.75 | %(m) | | | 0.73 | %(m) |
Before waivers and reimbursements (f) | | | 1.71 | % | | | 1.63 | % | | | 1.54 | % | | | 1.82 | % | | | 2.24 | % |
Ratio of net investment income (loss) to average net assets: | | | | | | | | | | | | | | | | | | | | |
After waivers and reimbursements (f)(x) | | | 1.36 | % | | | 1.32 | % | | | 0.66 | % | | | 0.45 | % | | | 0.50 | % |
Before waivers and reimbursements (f)(x) | | | 0.46 | % | | | 0.50 | % | | | (0.11 | )% | | | (0.62 | )% | | | (1.02 | )% |
Portfolio turnover rate^ | | | 15 | % | | | 8 | % | | | 5 | % | | | 13 | % | | | 2 | % |
See Notes to Financial Statements.
71
1290 FUNDS
1290 MULTI-ALTERNATIVE STRATEGIES FUND
FINANCIAL HIGHLIGHTS (Continued)
| | | | | | | | | | | | | | | | | | | | |
| | | Year Ended October 31, | |
| Class R | | 2020 | | | 2019 | | | 2018 | | | 2017 | | | 2016 | |
Net asset value, beginning of year | | $ | 10.27 | | | $ | 9.97 | | | $ | 10.19 | | | $ | 9.95 | | | $ | 9.69 | |
| | | | | | | | | | | | | | | | | | | | |
Income (loss) from investment operations: | | | | | | | | | | | | | | | | | | | | |
Net investment income (loss) (e)(x) | | | 0.06 | | | | 0.08 | | | | 0.03 | | | | — | # | | | — | # |
Net realized and unrealized gain (loss) | | | (0.29 | ) | | | 0.29 | | | | (0.21 | ) | | | 0.27 | | | | 0.32 | |
| | | | | | | | | | | | | | | | | | | | |
Total from investment operations | | | (0.23 | ) | | | 0.37 | | | | (0.18 | ) | | | 0.27 | | | | 0.32 | |
| | | | | | | | | | | | | | | | | | | | |
Less distributions: | | | | | | | | | | | | | | | | | | | | |
Dividends from net investment income | | | (0.17 | ) | | | (0.02 | ) | | | — | | | | — | | | | (0.04 | ) |
Distributions from net realized gains | | | — | | | | (0.05 | ) | | | (0.04 | ) | | | (0.03 | ) | | | — | |
Return of capital | | | — | | | | — | | | | — | | | | — | | | | (0.02 | ) |
| | | | | | | | | | | | | | | | | | | | |
Total dividends and distributions | | | (0.17 | ) | | | (0.07 | ) | | | (0.04 | ) | | | (0.03 | ) | | | (0.06 | ) |
| | | | | | | | | | | | | | | | | | | | |
Net asset value, end of year | | $ | 9.87 | | | $ | 10.27 | | | $ | 9.97 | | | $ | 10.19 | | | $ | 9.95 | |
| | | | | | | | | | | | | | | | | | | | |
Total return | | | (2.27 | )% | | | 3.74 | % | | | (1.79 | )% | | | 2.53 | % | | | 3.30 | % |
| | | | | | | | | | | | | | | | | | | | |
Ratios/Supplemental Data: | | | | | | | | | | | | | | | | | | | | |
Net assets, end of year (000’s) | | $ | 136 | | | $ | 116 | | | $ | 105 | | | $ | 105 | | | $ | 101 | |
Ratio of expenses to average net assets: | | | | | | | | | | | | | | | | | | | | |
After waivers and reimbursements (f) | | | 1.31 | %***(j) | | | 1.32 | %**(k) | | | 1.26 | %(m) | | | 1.25 | %(m) | | | 1.22 | %(m) |
Before waivers and reimbursements (f) | | | 2.23 | % | | | 2.13 | % | | | 2.02 | % | | | 2.32 | % | | | 2.73 | % |
Ratio of net investment income (loss) to average net assets: | | | | | | | | | | | | | | | | | | | | |
After waivers and reimbursements (f)(x) | | | 0.65 | % | | | 0.78 | % | | | 0.27 | % | | | (0.02 | )% | | | 0.02 | % |
Before waivers and reimbursements (f)(x) | | | (0.26 | )% | | | (0.04 | )% | | | (0.49 | )% | | | (1.08 | )% | | | (1.50 | )% |
Portfolio turnover rate^ | | | 15 | % | | | 8 | % | | | 5 | % | | | 13 | % | | | 2 | % |
| ** | Includes tax expense of 0.04%. |
| *** | Includes tax expense of 0.01%. |
| # | Per share amount is less than $0.005. |
| ^ | Portfolio turnover rate excludes derivatives, if any. |
| (e) | Net investment income (loss) per share is based on average shares outstanding. |
| (f) | Expenses do not include the expenses of the underlying funds (“indirect expenses”), if applicable. |
| (j) | Including direct and indirect expenses, the net expense ratio after waivers and reimbursements would be 1.66% for Class A, 1.41% for Class I and 1.91% for Class R. |
| (k) | Including direct and indirect expenses, the net expense ratio after waivers and reimbursements would be 1.69% for Class A, 1.44% for Class I and 1.94% for Class R. |
| (m) | Including direct and indirect expenses, the net expense ratio after waivers and reimbursements would be 1.65% for Class A, 1.40% for Class I and 1.90% for Class R. |
| (x) | Recognition of net investment income is affected by the timing of dividend declarations by the underlying funds in which the Fund invests. |
See Notes to Financial Statements.
72
1290 RETIREMENT 2020 FUND (Unaudited)
INVESTMENT ADVISER
| Ø | | Equitable Investment Management Group, LLC |
PERFORMANCE RESULTS
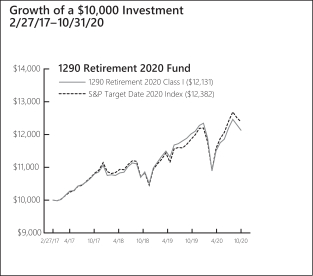
| | | | | | | | |
| |
| Annualized Total Returns as of 10/31/20 | |
| | | |
| | | 1
Year | | | Since
Incept. | |
Fund – Class I Shares* | | | 1.03 | % | | | 5.40 | % |
S&P Target Date 2020 Index | | | 4.53 | | | | 5.99 | |
| |
* Date of inception 2/27/17. Returns for periods greater than one year are annualized. | |
The performance quoted is past performance and is not a guarantee of future results. Mutual funds are subject to certain market risks. Investment returns and principal value of an investment will fluctuate so that an investor’s shares, when redeemed, may be worth more or less than their original cost. Current performance may be higher or lower than the performance data shown. For the most current month-end performance data please call 1-888-310-0416 or visit www.1290Funds.com.
The graph illustrates comparative performance for $10,000 invested in the Class I Shares of the 1290 Retirement 2020 Fund and the S&P Target Date 2020 Index from 2/27/17 to 10/31/20. The performance of the S&P Target Date 2020 Index reflects an initial investment at the end of the month closest to the Fund’s inception. The performance of the Fund assumes reinvestment of all dividends and capital gain distributions, if any, and does not include a sales charge. The performance of the S&P Target Date 2020 Index does not reflect the deduction of expenses or a sales charge associated with a mutual fund and has been adjusted to reflect reinvestment of all dividends, capital gain distributions, and interest of the securities included in the benchmark.
As of March 1, 2020, the gross expense ratio including acquired fund fees for Class I shares was 2.21%. The net expense ratio for Class I shares was 0.65%. The net expense ratio reflects the Adviser’s decision to contractually limit expenses through April 30, 2021. Fund Performance may also reflect the waiver of the Fund���s fees and reimbursement of expenses for certain periods since the inception date. Without these waivers and reimbursements, performance would have been lower.
In addition, performance shown in this section does not reflect the deduction of taxes that a shareholder would pay on Fund distributions or redemption of Fund shares.
PERFORMANCE SUMMARY
The Fund’s Class I shares returned 1.03% for the year ended October 31, 2020. The Fund’s benchmark, the S&P Target Date 2020 Index, returned 4.53% over the same year.
Overview
Each 1290 Retirement Fund’s (as defined in the Notes to the Financial Statements) performance will reflect the performance of the underlying asset classes and depends upon their percentage weighting within the Fund. Here’s why: The 1290 Retirement Funds are managed to target a specific year of planned retirement. The asset mix will become more conservative each year, until about 10 years after the target retirement year, when it will become relatively stable. The 1290 Retirement Funds balance the need for appreciation with the need for income as retirement approaches and focus on supporting an income stream over a long-term retirement withdrawal horizon. To achieve its asset class exposure, each 1290 Retirement Fund invests in exchange-traded funds (ETFs) representing various equity and bond asset classes. Because of this, each of the 1290 Retirement Fund’s performance will be a function of the asset class performance and the percentage weighting of each asset class in the 1290 Retirement Fund. Current target and actual allocations, as well as performance, are available in a separate quarterly Fund Fact Sheet.
What helped performance during the year?
| • | | The Fund had no dedicated position in real estate, which contributed to performance. The sector was down about 25% for the twelve-month period. |
| • | | The Fund’s fixed income ETFs outperformed relative to their respective benchmarks. Having active weight exposure to Treasury Inflation-Protected Securities (TIPS) contributed to performance, as TIPS was the best performing asset category within fixed income. |
What hurt performance during the year?
| • | | Security selection within equities was the top detractor from performance, as having a low volatility tilt was not beneficial across regions and market cap. |
73
1290 RETIREMENT 2020 FUND (Unaudited)
| | | | |
| |
Table by Asset Class (as a percentage of Total Investments
in Securities)
As of October 31, 2020 | |
Fixed Income | | | 50.2 | % |
Equity | | | 49.3 | |
Investment Company | | | 0.5 | |
| | | | |
| |
Top 10 Holdings (as a percentage of Total Investments in
Securities)
As of October 31, 2020 | |
iShares Core U.S. Aggregate Bond ETF | | | 29.9 | % |
iShares Core S&P Total US Stock Market ETF | | | 17.1 | |
iShares TIPS Bond ETF | | | 7.5 | |
iShares Core MSCI EAFE ETF | | | 5.9 | |
Invesco S&P 500 Low Volatility ETF | | | 5.7 | |
iShares MSCI USA Min Vol Factor ETF | | | 5.5 | |
Vanguard Short-Term Bond ETF | | | 4.9 | |
Vanguard Total International Bond ETF | | | 4.0 | |
SPDR Bloomberg Barclays High Yield Bond ETF | | | 3.9 | |
Invesco S&P International Developed Low Volatility ETF | | | 3.0 | |
Holdings are subject to change without notice. | | | | |
UNDERSTANDING YOUR EXPENSES:
As a shareholder of the Fund, you incur two types of costs:
(1) transaction costs, including applicable sales charges and redemption fees; and (2) ongoing costs, including investment advisory fees, distribution and/or service (12b-1) fees and other Fund expenses. These examples are intended to help you understand your ongoing costs (in dollars) of investing in the Fund and to compare these costs with the ongoing costs of investing in other mutual funds.
The examples are based on an investment of $1,000 invested at the beginning of the six-month period ended October 31, 2020 and held for the entire six-month period.
Actual Expenses
The first line of the following table provides information about actual account values and actual expenses. You may use the information in this line, together with the amount you invested, to estimate the expenses that you paid over the period. Simply divide your account value by $1,000 (for example, an $8,600 account value divided by $1,000 = 8.6), then multiply the result by the number in the first line under the heading entitled “Expenses Paid During Period” to estimate the expenses you paid on your account during this period.
Hypothetical Example for Comparison Purposes
The second line of the following table provides information about hypothetical account values and hypothetical expenses based on the Fund’s actual expense ratio and an assumed rate of return of 5% per year before expenses, which is not the Fund’s actual return. The hypothetical account values and expenses may not be used to estimate the actual ending account balance or expenses you paid for the period. You may use this information to compare the ongoing costs of investing in the Fund and other funds. To do so, compare this 5% hypothetical example with the 5% hypothetical examples that appear in the shareholder reports of the other funds.
Please note that the expenses shown in the table are meant to highlight your ongoing costs only and do not reflect any transactional costs, such as sales charges (loads), redemption fees, or exchange fees. Therefore, the second line of the table is useful in comparing ongoing costs only, and will not help you determine the relative total costs of owning different funds. In addition, if these transactional costs were included, your costs would have been higher.
EXAMPLE
| | | | | | | | | | | | |
| | | | |
| | | Beginning
Account
Value
5/1/20 | | | Ending
Account
Value
10/31/20 | | | Expenses
Paid
During
Period*
5/1/20 -
10/31/20 | |
Class I | |
Actual | | | $1,000.00 | | | | $1,055.10 | | | | $2.75 | |
Hypothetical (5% average annual return before expenses) | | | 1,000.00 | | | | 1,022.46 | | | | 2.71 | |
| |
* Expenses are equal to the Portfolio’s I shares annualized expense ratio of 0.53%, multiplied by the average account value over the period, and multiplied by 184/366 (to reflect the one-half year period). | |
74
1290 FUNDS
1290 RETIREMENT 2020 FUND
PORTFOLIO OF INVESTMENTS
October 31, 2020
| | | | | | | | |
| | | |
| | | Number of
Shares | | | Value
(Note 1) | |
EXCHANGE TRADED FUNDS (ETF): | | | | | | | | |
Equity (49.1%) | | | | | | | | |
Invesco S&P 500 Low Volatility ETF | | | 13,260 | | | $ | 689,918 | |
Invesco S&P Emerging Markets Low Volatility ETF | | | 3,540 | | | | 70,269 | |
Invesco S&P International Developed Low Volatility ETF | | | 13,180 | | | | 361,396 | |
Invesco S&P MidCap Low Volatility ETF | | | 8,570 | | | | 356,598 | |
Invesco S&P SmallCap Low Volatility ETF | | | 5,780 | | | | 195,884 | |
iShares Core MSCI EAFE ETF | | | 12,310 | | | | 715,950 | |
iShares Core MSCI Emerging Markets ETF | | | 3,510 | | | | 187,680 | |
iShares Core S&P Total US Stock Market ETF | | | 28,030 | | | | 2,075,620 | |
iShares MSCI EAFE Min Vol Factor ETF | | | 5,470 | | | | 358,230 | |
iShares MSCI Emerging Markets Min Vol Factor ETF | | | 2,190 | | | | 120,362 | |
iShares MSCI USA Min Vol Factor ETF | | | 10,900 | | | | 672,094 | |
SPDR SSGA US Small Cap Low Volatility Index ETF | | | 2,200 | | | | 169,026 | |
| | | | | | | | |
Total Equity | | | | | | | 5,973,027 | |
| | | | | | | | |
Fixed Income (50.0%) | | | | | | | | |
iShares Core U.S. Aggregate Bond ETF | | | 30,910 | | | | 3,622,652 | |
iShares TIPS Bond ETF | | | 7,300 | | | | 914,179 | |
SPDR Bloomberg Barclays High Yield Bond ETF | | | 4,556 | | | | 475,191 | |
Vanguard Short-Term Bond ETF | | | 7,220 | | | | 598,033 | |
Vanguard Total International Bond ETF | | | 8,210 | | | | 478,971 | |
| | | | | | | | |
Total Fixed Income | | | | | | | 6,089,026 | |
| | | | | | | | |
Total Exchange Traded Funds (99.1%)
(Cost $11,710,437) | | | | | | | 12,062,053 | |
| | | | | | | | |
SHORT-TERM INVESTMENT: | | | | | | | | |
Investment Company (0.5%) | | | | | | | | |
JPMorgan Prime Money Market Fund, IM Shares | | | 62,891 | | | | 62,929 | |
| | | | | | | | |
Total Short-Term Investment (0.5%)
(Cost $62,931) | | | | | | | 62,929 | |
| | | | | | | | |
Total Investments in Securities (99.6%)
(Cost $11,773,368) | | | | | | | 12,124,982 | |
Other Assets Less Liabilities (0.4%) | | | | | | | 42,653 | |
| | | | | | | | |
Net Assets (100%) | | | | | | $ | 12,167,635 | |
| | | | | | | | |
The following is a summary of the inputs used to value the Fund’s assets and liabilities carried at fair value as of October 31, 2020:
The inputs or methodology used for valuing securities are not necessarily an indication of the risk associated with investing in those securities.
Various inputs are used in determining the value of the Fund’s investments. These inputs are summarized in the three broad levels listed below:
| | | | | | | | | | | | | | | | |
| | | | | |
| Investment Type | | Level 1
Quoted Prices in
Active Markets for
Identical
Securities | | | Level 2
Significant Other
Observable Inputs
(including quoted prices
for similar securities,
interest rates,
prepayment speeds,
credit risk, etc.) | | | Level 3
Significant Unobservable
Inputs (including the
Fund’s own assumptions in
determining the fair
value of investments) | | | Total | |
Assets: | |
Exchange Traded Funds | | | | | | | | | | | | | | | | |
Exchange Traded Funds | | $ | 12,062,053 | | | $ | — | | | $ | — | | | $ | 12,062,053 | |
Short-Term Investment | | | | | | | | | | | | | | | | |
Investment Company | | | 62,929 | | | | — | | | | — | | | | 62,929 | |
| | | | | | | | | | | | | | | | |
Total Assets | | $ | 12,124,982 | | | $ | — | | | $ | — | | | $ | 12,124,982 | |
| | | | | | | | | | | | | | | | |
Total Liabilities | | $ | — | | | $ | — | | | $ | — | | | $ | — | |
| | | | | | | | | | | | | | | | |
Total | | $ | 12,124,982 | | | $ | ��� | | | $ | — | | | $ | 12,124,982 | |
| | | | | | | | | | | | | | | | |
See Notes to Financial Statements.
75
1290 FUNDS
1290 RETIREMENT 2020 FUND
PORTFOLIO OF INVESTMENTS (Continued)
October 31, 2020
The Fund held no derivatives contracts during the year ended October 31, 2020.
Investment security transactions for the year ended October 31, 2020 were as follows:
| | | | |
Cost of Purchases: | | | | |
Long-term investments other than U.S. government debt securities | | $ | 4,923,028 | |
Net Proceeds of Sales and Redemptions: | | | | |
Long-term investments other than U.S. government debt securities | | $ | 3,516,498 | |
As of October 31, 2020, the gross unrealized appreciation (depreciation) of investments based on the aggregate cost of investments in securities and derivative instruments, if applicable, for Federal income tax purposes was as follows:
| | | | |
Aggregate gross unrealized appreciation | | $ | 510,255 | |
Aggregate gross unrealized depreciation | | | (220,169 | ) |
| | | | |
Net unrealized appreciation | | $ | 290,086 | |
| | | | |
Federal income tax cost of investments in securities and derivative instruments, if applicable | | $ | 11,834,896 | |
| | | | |
See Notes to Financial Statements.
76
1290 FUNDS
1290 RETIREMENT 2020 FUND
STATEMENT OF ASSETS AND LIABILITIES
October 31, 2020
| | | | |
|
ASSETS | |
Investments in Securities, at value (Cost $11,773,368) | | $ | 12,124,982 | |
Cash | | | 75,000 | |
Receivable from investment adviser | | | 7,310 | |
Prepaid registration and filing fees | | | 5,236 | |
Receivable for Fund shares sold | | | 541 | |
Dividends, interest and other receivables | | | 10 | |
Other assets | | | 115 | |
| | | | |
Total assets | | | 12,213,194 | |
| | | | |
LIABILITIES | | | | |
Transfer agent fees payable | | | 2,092 | |
Trustees’ fees payable | | | 157 | |
Accrued expenses | | | 43,310 | |
| | | | |
Total liabilities | | | 45,559 | |
| | | | |
NET ASSETS | | $ | 12,167,635 | |
| | | | |
Net assets were comprised of: | | | | |
Paid in capital | | $ | 11,456,930 | |
Total distributable earnings (loss) | | | 710,705 | |
| | | | |
Net assets | | $ | 12,167,635 | |
| | | | |
Class I | | | | |
Net asset value, offering and redemption price per share, $12,167,635 / 1,076,326 shares outstanding (unlimited amount authorized: $0.001 par value) | | $ | 11.30 | |
| | | | |
STATEMENT OF OPERATIONS
For the Year Ended October 31, 2020
| | | | |
INVESTMENT INCOME | |
Dividends | | $ | 275,757 | |
Interest | | | 291 | |
| | | | |
Total income | | | 276,048 | |
| | | | |
EXPENSES | | | | |
Investment advisory fees | | | 55,535 | |
Professional fees | | | 45,073 | |
Printing and mailing expenses | | | 36,161 | |
Administrative fees | | | 30,023 | |
Registration and filing fees | | | 20,567 | |
Transfer agent fees | | | 11,475 | |
Custodian fees | | | 5,750 | |
Trustees’ fees | | | 953 | |
Tax expense | | | 195 | |
Miscellaneous | | | 8,488 | |
| | | | |
Gross expenses | | | 214,220 | |
Less: Waiver from investment adviser | | | (85,558 | ) |
Reimbursement from investment adviser | | | (69,289 | ) |
| | | | |
Net expenses | | | 59,373 | |
| | | | |
NET INVESTMENT INCOME (LOSS) | | | 216,675 | |
| | | | |
REALIZED AND UNREALIZED GAIN (LOSS) | | | | |
Net realized gain (loss) on investments in securities | | | 227,081 | |
Net change in unrealized appreciation (depreciation) on investments in securities | | | (352,860 | ) |
| | | | |
NET REALIZED AND UNREALIZED GAIN (LOSS) | | | (125,779 | ) |
| | | | |
NET INCREASE (DECREASE) IN NET ASSETS RESULTING FROM OPERATIONS | | $ | 90,896 | |
| | | | |
STATEMENT OF CHANGES IN NET ASSETS
| | | | | | | | |
| | | Year Ended October 31, | |
| | | 2020 | | | 2019 | |
INCREASE (DECREASE) IN NET ASSETS FROM OPERATIONS: | |
Net investment income (loss) | | $ | 216,675 | | | $ | 200,268 | |
Net realized gain (loss) | | | 227,081 | | | | 144,361 | |
Net change in unrealized appreciation (depreciation) | | | (352,860 | ) | | | 762,470 | |
| | | | | | | | |
NET INCREASE (DECREASE) IN NET ASSETS RESULTING FROM OPERATIONS | | | 90,896 | | | | 1,107,099 | |
| | | | | | | | |
Distributions to shareholders: | | | | | | | | |
Class I | | | (377,438 | ) | | | (142,418 | ) |
| | | | | | | | |
CAPITAL SHARES TRANSACTIONS: | | | | | | | | |
Class I | | | | | | | | |
Capital shares sold [473,233 and 364,955 shares, respectively] | | | 5,300,940 | | | | 3,974,381 | |
Capital shares issued in reinvestment of dividends [24,677 and 9,100 shares, respectively] | | | 279,838 | | | | 93,918 | |
Capital shares repurchased [(354,598) and (170,980) shares, respectively] | | | (3,917,201 | ) | | | (1,901,097 | ) |
| | | | | | | | |
NET INCREASE (DECREASE) IN NET ASSETS RESULTING FROM CAPITAL SHARE TRANSACTIONS | | | 1,663,577 | | | | 2,167,202 | |
| | | | | | | | |
TOTAL INCREASE (DECREASE) IN NET ASSETS | | | 1,377,035 | | | | 3,131,883 | |
NET ASSETS: | | | | | | | | |
Beginning of year | | | 10,790,600 | | | | 7,658,717 | |
| | | | | | | | |
End of year | | $ | 12,167,635 | | | $ | 10,790,600 | |
| | | | | | | | |
See Notes to Financial Statements.
77
1290 FUNDS
1290 RETIREMENT 2020 FUND
FINANCIAL HIGHLIGHTS
| | | | | | | | | | | | | | | | |
| | | Year Ended October 31, | | | February 27, 2017* to
October 31, 2017 | |
| Class I | | 2020 | | | 2019 | | | 2018 | |
Net asset value, beginning of period | | $ | 11.57 | | | $ | 10.49 | | | $ | 10.66 | | | $ | 10.00 | |
| | | | | | | | | | | | | | | | |
Income (loss) from investment operations: | | | | | | | | | | | | | | | | |
Net investment income (loss) (e)(x) | | | 0.22 | | | | 0.23 | | | | 0.20 | | | | 0.12 | |
Net realized and unrealized gain (loss) | | | (0.10 | ) | | | 1.05 | | | | (0.17 | ) | | | 0.54 | |
| | | | | | | | | | | | | | | | |
Total from investment operations | | | 0.12 | | | | 1.28 | | | | 0.03 | | | | 0.66 | |
| | | | | | | | | | | | | | | | |
Less distributions: | | | | | | | | | | | | | | | | |
Dividends from net investment income | | | (0.24 | ) | | | (0.15 | ) | | | (0.18 | ) | | | — | |
Distributions from net realized gains | | | (0.15 | ) | | | (0.05 | ) | | | (0.02 | ) | | | — | |
| | | | | | | | | | | | | | | | |
Total dividends and distributions | | | (0.39 | ) | | | (0.20 | ) | | | (0.20 | ) | | | — | |
| | | | | | | | | | | | | | | | |
Net asset value, end of period | | $ | 11.30 | | | $ | 11.57 | | | $ | 10.49 | | | $ | 10.66 | |
| | | | | | | | | | | | | | | | |
Total return (b) | | | 1.03 | % | | | 12.37 | % | | | 0.24 | % | | | 6.60 | % |
| | | | | | | | | | | | | | | | |
Ratios/Supplemental Data: | | | | | | | | | | | | | | | | |
Net assets, end of period (000’s) | | $ | 12,168 | | | $ | 10,791 | | | $ | 7,659 | | | $ | 2,665 | |
Ratio of expenses to average net assets: | | | | | | | | | | | | | | | | |
After waivers and reimbursements (a)(f) | | | 0.53 | %**(j) | | | 0.54 | %(j) | | | 0.53 | %(j) | | | 0.53 | %(j) |
Before waivers and reimbursements (a)(f) | | | 1.93 | % | | | 2.09 | % | | | 3.93 | % | | | 5.32 | % |
Ratio of net investment income (loss) to average net assets: | | | | | | | | | | | | | | | | |
After waivers and reimbursements (a)(f)(x) | | | 1.95 | % | | | 2.10 | % | | | 1.88 | % | | | 1.66 | %(l) |
Before waivers and reimbursements (a)(f)(x) | | | 0.56 | % | | | 0.55 | % | | | (1.52 | )% | | | (3.13 | )%(l) |
Portfolio turnover rate^ | | | 32 | % | | | 18 | % | | | 8 | % | | | 2 | %(z) |
| * | Commencement of Operations. |
| ** | Includes tax expense of less than 0.005%. |
| ^ | Portfolio turnover rate excludes derivatives, if any. |
| (a) | Ratios for periods less than one year are annualized. Certain non-recurring expenses incurred by the Fund are not annualized for periods less than one year. |
| (b) | Total returns for periods less than one year are not annualized. |
| (e) | Net investment income (loss) per share is based on average shares outstanding. |
| (f) | Expenses do not include the expenses of the underlying funds (“indirect expenses”), if applicable. |
| (j) | Including direct and indirect expenses, the net expense ratio after waivers and reimbursements would be 0.65%. |
| (l) | The annualized ratio of net investment income to average net assets may not be indicative of operating results for a full year. |
| (x) | Recognition of net investment income is affected by the timing of dividend declarations by the underlying funds in which the Fund invests. |
| (z) | Portfolio turnover rate for periods less than one year is not annualized. |
See Notes to Financial Statements.
78
1290 RETIREMENT 2025 FUND (Unaudited)
INVESTMENT ADVISER
| Ø | | Equitable Investment Management Group, LLC |
PERFORMANCE RESULTS
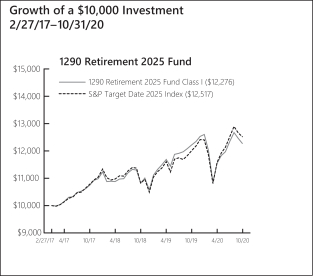
| | | | | | | | |
| |
| Annualized Total Returns as of 10/31/20 | |
| | | |
| | | 1
Year | | | Since
Incept. | |
Fund – Class I Shares* | | | 0.47 | % | | | 5.74 | % |
S&P Target Date 2025 Index | | | 4.26 | | | | 6.30 | |
| |
* Date of inception 2/27/17. Returns for periods greater than one year are annualized. | |
|
The performance quoted is past performance and is not a guarantee of future results. Mutual funds are subject to certain market risks. Investment returns and principal value of an investment will fluctuate so that an investor’s shares, when redeemed, may be worth more or less than their original cost. Current performance may be higher or lower than the performance data shown. For the most current month-end performance data please call 1-888-310-0416 or visit www.1290Funds.com.
The graph illustrates comparative performance for $10,000 invested in the Class I Shares of the 1290 Retirement 2025 Fund and the S&P Target Date 2025 Index from 2/27/17 to 10/31/20. The performance of the S&P Target Date 2025 Index reflects an initial investment at the end of the month closest to the Fund’s inception. The performance of the Fund assumes reinvestment of all dividends and capital gain distributions, if any, and does not include a sales charge. The performance of the S&P Target Date 2025 Index does not reflect the deduction of expenses or a sales charge associated with a mutual fund and has been adjusted to reflect reinvestment of all dividends, capital gain distributions, and interest of the securities included in the benchmark.
As of March 1, 2020, the gross expense ratio including acquired fund fees for Class I shares was 1.71%. The net expense ratio for Class I shares was 0.65%. The net expense ratio reflects the Adviser’s decision to contractually limit expenses through April 30, 2021. Fund Performance may also reflect the waiver of the Fund’s fees and reimbursement of expenses for certain periods since the inception date. Without these waivers and reimbursements, performance would have been lower.
In addition, performance shown in this section does not reflect the deduction of taxes that a shareholder would pay on Fund distributions or redemption of Fund shares.
PERFORMANCE SUMMARY
The Fund’s Class I shares returned 0.47% for the year ended October 31, 2020. The Fund’s benchmark, the S&P Target Date 2025 Index, returned 4.26% over the same year.
Overview
Each 1290 Retirement Fund’s (as defined in the Notes to the Financial Statements) performance will reflect the performance of the underlying asset classes and depends upon their percentage weighting within the Fund. Here’s why: The 1290 Retirement Funds are managed to target a specific year of planned retirement. The asset mix will become more conservative each year, until about 10 years after the target retirement year, when it will become relatively stable. The 1290 Retirement Funds balance the need for appreciation with the need for income as retirement approaches and focus on supporting an income stream over a long-term retirement withdrawal horizon. To achieve its asset class exposure, each 1290 Retirement Fund invests in exchange-traded funds (ETFs) representing various equity and bond asset classes. Because of this, each of the 1290 Retirement Fund’s performance will be a function of the asset class performance and the percentage weighting of each asset class in the 1290 Retirement Fund. Current target and actual allocations, as well as performance, are available in a separate quarterly Fund Fact Sheet.
What helped performance during the year?
| • | | The Fund had no dedicated position in real estate which contributed to performance. The sector was down about 25% for the twelve-month period. |
| • | | The Fund’s fixed income ETFs outperformed relative to their respective benchmark. Having active weight exposure to Treasury Inflation Protected Securities (TIPS) contributed to performance, as TIPS was the best performing asset category within fixed income. |
What hurt performance during the year?
| • | | Security selection within equities was the top detractor from performance, as having a low volatility tilt was not beneficial across regions and market cap. |
79
1290 RETIREMENT 2025 FUND (Unaudited)
| | | | |
| |
Table by Asset Class (as a percentage of Total
Investments in Securities) As of October 31, 2020 | |
Equity | | | 59.3 | % |
Fixed Income | | | 40.0 | |
Investment Company | | | 0.7 | |
| | | | |
| |
Top 10 Holdings (as a percentage of Total Investments in
Securities) As of October 31, 2020 | |
iShares Core U.S. Aggregate Bond ETF | | | 27.9 | % |
iShares Core S&P Total US Stock Market ETF | | | 20.5 | |
iShares Core MSCI EAFE ETF | | | 7.3 | |
Invesco S&P 500 Low Volatility ETF | | | 6.7 | |
iShares MSCI USA Min Vol Factor ETF | | | 6.6 | |
iShares TIPS Bond ETF | | | 6.0 | |
Invesco S&P MidCap Low Volatility ETF | | | 3.8 | |
Invesco S&P International Developed Low Volatility ETF | | | 3.8 | |
iShares MSCI EAFE Min Vol Factor ETF | | | 3.7 | |
Vanguard Short-Term Bond ETF | | | 2.3 | |
Holdings are subject to change without notice. | | | | |
UNDERSTANDING YOUR EXPENSES:
As a shareholder of the Fund, you incur two types of costs:
(1) transaction costs, including applicable sales charges and redemption fees; and (2) ongoing costs, including investment advisory fees, distribution and/or service (12b-1) fees and other Fund expenses. These examples are intended to help you understand your ongoing costs (in dollars) of investing in the Fund and to compare these costs with the ongoing costs of investing in other mutual funds.
The examples are based on an investment of $1,000 invested at the beginning of the six-month period ended October 31, 2020 and held for the entire six-month period.
Actual Expenses
The first line of the following table provides information about actual account values and actual expenses. You may use the information in this line, together with the amount you invested, to estimate the expenses that you paid over the period. Simply divide your account value by $1,000 (for example, an $8,600 account value divided by $1,000 = 8.6), then multiply the result by the number in the first line under the heading entitled ‘‘Expenses Paid During Period’’ to estimate the expenses you paid on your account during this period.
Hypothetical Example for Comparison Purposes
The second line of the following table provides information about hypothetical account values and hypothetical expenses based on the Fund’s actual expense ratio and an assumed rate of return of 5% per year before expenses, which is not the Fund’s actual return. The hypothetical account values and expenses may not be used to estimate the actual ending account balance or expenses you paid for the period. You may use this information to compare the ongoing costs of investing in the Fund and other funds. To do so, compare this 5% hypothetical example with the 5% hypothetical examples that appear in the shareholder reports of the other funds.
Please note that the expenses shown in the table are meant to highlight your ongoing costs only and do not reflect any transactional costs, such as sales charges (loads), redemption fees, or exchange fees. Therefore, the second line of the table is useful in comparing ongoing costs only, and will not help you determine the relative total costs of owning different funds. In addition, if these transactional costs were included, your costs would have been higher.
EXAMPLE
| | | | | | | | | | | | |
| | | | |
| | | Beginning
Account
Value
5/1/20 | | | Ending
Account
Value
10/31/20 | | | Expenses
Paid
During
Period*
5/1/20 -
10/31/20 | |
Class I | |
Actual | | $ | 1,000.00 | | | $ | 1,063.30 | | | $ | 2.78 | |
Hypothetical (5% average annual return before expenses) | | | 1,000.00 | | | | 1,022.44 | | | | 2.72 | |
| |
* Expenses are equal to the Portfolio’s I shares annualized expense ratio of 0.54%, multiplied by the average account value over the period, and multiplied by 184/366 (to reflect the one-half year period). | |
80
1290 FUNDS
1290 RETIREMENT 2025 FUND
PORTFOLIO OF INVESTMENTS
October 31, 2020
| | | | | | | | |
| | | |
| | | Number of
Shares | | | Value
(Note 1) | |
EXCHANGE TRADED FUNDS (ETF): | |
Equity (59.1%) | |
Invesco S&P 500 Low Volatility ETF | | | 26,240 | | | $ | 1,365,267 | |
Invesco S&P Emerging Markets Low Volatility ETF | | | 8,180 | | | | 162,373 | |
Invesco S&P International Developed Low Volatility ETF | | | 28,020 | | | | 768,308 | |
Invesco S&P MidCap Low Volatility ETF | | | 18,510 | | | | 770,201 | |
Invesco S&P SmallCap Low Volatility ETF | | | 10,640 | | | | 360,590 | |
iShares Core MSCI EAFE ETF | | | 25,560 | | | | 1,486,570 | |
iShares Core MSCI Emerging Markets ETF | | | 6,710 | | | | 358,784 | |
iShares Core S&P Total US Stock Market ETF | | | 56,480 | | | | 4,182,344 | |
iShares MSCI EAFE Min Vol Factor ETF | | | 11,480 | | | | 751,825 | |
iShares MSCI Emerging Markets Min Vol Factor ETF | | | 3,390 | | | | 186,314 | |
iShares MSCI USA Min Vol Factor ETF | | | 21,770 | | | | 1,342,338 | |
SPDR SSGA US Small Cap Low Volatility Index ETF | | | 4,790 | | | | 368,016 | |
| | | | | | | | |
Total Equity | | | | | | | 12,102,930 | |
| | | | | | | | |
Fixed Income (39.9%) | | | | | | | | |
iShares Core U.S. Aggregate Bond ETF | | | 48,640 | | | | 5,700,608 | |
iShares TIPS Bond ETF | | | 9,760 | | | | 1,222,245 | |
SPDR Bloomberg Barclays High Yield Bond ETF | | | 3,446 | | | | 359,418 | |
Vanguard Short-Term Bond ETF | | | 5,760 | | | | 477,101 | |
Vanguard Total International Bond ETF | | | 6,810 | | | | 397,295 | |
| | | | | | | | |
Total Fixed Income | | | | | | | 8,156,667 | |
| | | | | | | | |
Total Exchange Traded Funds (99.0%)
(Cost $19,748,522) | | | | | | | 20,259,597 | |
| | | | | | | | |
SHORT-TERM INVESTMENT: | | | | | | | | |
Investment Company (0.7%) | | | | | | | | |
JPMorgan Prime Money Market Fund, IM Shares | | | 149,214 | | | | 149,303 | |
| | | | | | | | |
Total Short-Term Investment (0.7%)
(Cost $149,314) | | | | | | | 149,303 | |
| | | | | | | | |
Total Investments in Securities (99.7%)
(Cost $19,897,836) | | | | | | | 20,408,900 | |
Other Assets Less Liabilities (0.3%) | | | | | | | 46,720 | |
| | | | | | | | |
Net Assets (100%) | | | | | | $ | 20,455,620 | |
| | | | | | | | |
The following is a summary of the inputs used to value the Fund’s assets and liabilities carried at fair value as of October 31, 2020:
The inputs or methodology used for valuing securities are not necessarily an indication of the risk associated with investing in those securities.
Various inputs are used in determining the value of the Fund’s investments. These inputs are summarized in the three broad levels listed below:
| | | | | | | | | | | | | | | | |
| | | | | |
| Investment Type | | Level 1
Quoted Prices in
Active Markets for
Identical
Securities | | | Level 2
Significant Other
Observable Inputs
(including quoted prices
for similar securities,
interest rates,
prepayment speeds,
credit risk, etc.) | | | Level 3
Significant Unobservable
Inputs (including the
Fund’s own assumptions in
determining the fair
value of investments) | | | Total | |
Assets: | |
Exchange Traded Funds | | | | | | | | | | | | | | | | |
Exchange Traded Funds | | $ | 20,259,597 | | | $ | — | | | $ | — | | | $ | 20,259,597 | |
Short-Term Investment | | | | | | | | | | | | | | | | |
Investment Company | | | 149,303 | | | | — | | | | — | | | | 149,303 | |
| | | | | | | | | | | | | | | | |
Total Assets | | $ | 20,408,900 | | | $ | — | | | $ | — | | | $ | 20,408,900 | |
| | | | | | | | | | | | | | | | |
Total Liabilities | | $ | — | | | $ | — | | | $ | — | | | $ | — | |
| | | | | | | | | | | | | | | | |
Total | | $ | 20,408,900 | | | $ | — | | | $ | — | | | $ | 20,408,900 | |
| | | | | | | | | | | | | | | | |
See Notes to Financial Statements.
81
1290 FUNDS
1290 RETIREMENT 2025 FUND
PORTFOLIO OF INVESTMENTS (Continued)
October 31, 2020
The Fund held no derivatives contracts during the year ended October 31, 2020.
Investment security transactions for the year ended October 31, 2020 were as follows:
| | | | |
Cost of Purchases: | | | | |
Long-term investments other than U.S. government debt securities | | $ | 7,963,520 | |
Net Proceeds of Sales and Redemptions: | | | | |
Long-term investments other than U.S. government debt securities | | $ | 6,537,394 | |
As of October 31, 2020, the gross unrealized appreciation (depreciation) of investments based on the aggregate cost of investments in securities and derivative instruments, if applicable, for Federal income tax purposes was as follows:
| | | | |
Aggregate gross unrealized appreciation | | $ | 855,776 | |
Aggregate gross unrealized depreciation | | | (466,057 | ) |
| | | | |
Net unrealized appreciation | | $ | 389,719 | |
| | | | |
Federal income tax cost of investments in securities and derivative instruments, if applicable | | $ | 20,019,181 | |
| | | | |
See Notes to Financial Statements.
82
1290 FUNDS
1290 RETIREMENT 2025 FUND
STATEMENT OF ASSETS AND LIABILITIES
October 31, 2020
| | | | |
ASSETS | |
Investments in Securities, at value (Cost $19,897,836) | | $ | 20,408,900 | |
Cash | | | 74,999 | |
Receivable for Fund shares sold | | | 10,372 | |
Prepaid registration and filing fees | | | 5,796 | |
Receivable from investment adviser | | | 4,938 | |
Dividends, interest and other receivables | | | 19 | |
Other assets | | | 200 | |
| | | | |
Total assets | | | 20,505,224 | |
| | | | |
LIABILITIES | | | | |
Transfer agent fees payable | | | 2,036 | |
Payable for Fund shares redeemed | | | 391 | |
Trustees’ fees payable | | | 212 | |
Accrued expenses | | | 46,965 | |
| | | | |
Total liabilities | | | 49,604 | |
| | | | |
NET ASSETS | | $ | 20,455,620 | |
| | | | |
Net assets were comprised of: | | | | |
Paid in capital | | $ | 19,422,228 | |
Total distributable earnings (loss) | | | 1,033,392 | |
| | | | |
Net assets | | $ | 20,455,620 | |
| | | | |
Class I | | | | |
Net asset value, offering and redemption price per share, $20,455,620 / 1,791,895 shares outstanding (unlimited amount authorized: $0.001 par value) | | $ | 11.42 | |
| | | | |
STATEMENT OF OPERATIONS
For the Year Ended October 31, 2020
| | | | |
INVESTMENT INCOME | |
Dividends | | $ | 467,228 | |
Interest | | | 390 | |
| | | | |
Total income | | | 467,618 | |
| | | | |
EXPENSES | | | | |
Investment advisory fees | | | 96,613 | |
Professional fees | | | 50,082 | |
Printing and mailing expenses | | | 45,717 | |
Administrative fees | | | 29,996 | |
Registration and filing fees | | | 21,382 | |
Transfer agent fees | | | 10,990 | |
Custodian fees | | | 6,700 | |
Trustees’ fees | | | 1,627 | |
Tax expense | | | 373 | |
Miscellaneous | | | 12,388 | |
| | | | |
Gross expenses | | | 275,868 | |
Less: Waiver from investment adviser | | | (126,609 | ) |
Reimbursement from investment adviser | | | (45,488 | ) |
| | | | |
Net expenses | | | 103,771 | |
| | | | |
NET INVESTMENT INCOME (LOSS) | | | 363,847 | |
| | | | |
REALIZED AND UNREALIZED GAIN (LOSS) | | | | |
Net realized gain (loss) on investments in securities | | | 309,167 | |
Net change in unrealized appreciation (depreciation) on investments in securities | | | (691,760 | ) |
| | | | |
NET REALIZED AND UNREALIZED GAIN (LOSS) | | | (382,593 | ) |
| | | | |
NET INCREASE (DECREASE) IN NET ASSETS RESULTING FROM OPERATIONS | | $ | (18,746 | ) |
| | | | |
STATEMENT OF CHANGES IN NET ASSETS
| | | | | | | | |
| | | Year Ended October 31, | |
| | 2020 | | | 2019 | |
INCREASE (DECREASE) IN NET ASSETS FROM OPERATIONS: | |
Net investment income (loss) | | $ | 363,847 | | | $ | 314,181 | |
Net realized gain (loss) | | | 309,167 | | | | 326,657 | |
Net change in unrealized appreciation (depreciation) | | | (691,760 | ) | | | 1,336,178 | |
| | | | | | | | |
NET INCREASE (DECREASE) IN NET ASSETS RESULTING FROM OPERATIONS | | | (18,746 | ) | | | 1,977,016 | |
| | | | | | | | |
Distributions to shareholders: | | | | | | | | |
Class I | | | (724,697 | ) | | | (176,541 | ) |
| | | | | | | | |
CAPITAL SHARES TRANSACTIONS: | | | | | | | | |
Class I | | | | | | | | |
Capital shares sold [743,738 and 1,042,196 shares, respectively] | | | 8,393,396 | | | | 11,528,327 | |
Capital shares issued in reinvestment of dividends [62,744 and 12,850 shares, respectively] | | | 724,697 | | | | 134,540 | |
Capital shares repurchased [(640,274) and (397,479) shares, respectively] | | | (7,121,415 | ) | | | (4,546,482 | ) |
| | | | | | | | |
NET INCREASE (DECREASE) IN NET ASSETS RESULTING FROM CAPITAL SHARE TRANSACTIONS | | | 1,996,678 | | | | 7,116,385 | |
| | | | | | | | |
TOTAL INCREASE (DECREASE) IN NET ASSETS | | | 1,253,235 | | | | 8,916,860 | |
NET ASSETS: | | | | | | | | |
Beginning of year | | | 19,202,385 | | | | 10,285,525 | |
| | | | | | | | |
End of year | | $ | 20,455,620 | | | $ | 19,202,385 | |
| | | | | | | | |
See Notes to Financial Statements.
83
1290 FUNDS
1290 RETIREMENT 2025 FUND
FINANCIAL HIGHLIGHTS
| | | | | | | | | | | | | | | | |
| Class I | | Year Ended October 31, | | | February 27, 2017* to
October 31, 2017 | |
| | 2020 | | | 2019 | | | 2018 | |
Net asset value, beginning of period | | $ | 11.81 | | | $ | 10.62 | | | $ | 10.75 | | | $ | 10.00 | |
| | | | | | | | | | | | | | | | |
Income (loss) from investment operations: | | | | | | | | | | | | | | | | |
Net investment income (loss) (e)(x) | | | 0.21 | | | | 0.22 | | | | 0.21 | | | | 0.11 | |
Net realized and unrealized gain (loss) | | | (0.15 | ) | | | 1.14 | | | | (0.14 | ) | | | 0.64 | |
| | | | | | | | | | | | | | | | |
Total from investment operations | | | 0.06 | | | | 1.36 | | | | 0.07 | | | | 0.75 | |
| | | | | | | | | | | | | | | | |
Less distributions: | | | | | | | | | | | | | | | | |
Dividends from net investment income | | | (0.23 | ) | | | (0.14 | ) | | | (0.18 | ) | | | — | |
Distributions from net realized gains | | | (0.22 | ) | | | (0.03 | ) | | | (0.02 | ) | | | — | |
| | | | | | | | | | | | | | | | |
Total dividends and distributions | | | (0.45 | ) | | | (0.17 | ) | | | (0.20 | ) | | | — | |
| | | | | | | | | | | | | | | | |
Net asset value, end of period | | $ | 11.42 | | | $ | 11.81 | | | $ | 10.62 | | | $ | 10.75 | |
| | | | | | | | | | | | | | | | |
Total return (b) | | | 0.47 | % | | | 12.99 | % | | | 0.60 | % | | | 7.50 | % |
| | | | | | | | | | | | | | | | |
Ratios/Supplemental Data: | | | | | | | | | | | | | | | | |
Net assets, end of period (000’s) | | $ | 20,456 | | | $ | 19,202 | | | $ | 10,286 | | | $ | 2,688 | |
Ratio of expenses to average net assets: | | | | | | | | | | | | | | | | |
After waivers and reimbursements (a)(f) | | | 0.54 | %**(j) | | | 0.54 | %(j) | | | 0.54 | %(j) | | | 0.53 | %(j) |
Before waivers and reimbursements (a)(f) | | | 1.43 | % | | | 1.58 | % | | | 3.23 | % | | | 5.30 | % |
Ratio of net investment income (loss) to average net assets: | | | | | | | | | | | | | | | | |
After waivers and reimbursements (a)(f)(x) | | | 1.88 | % | | | 1.99 | % | | | 1.91 | % | | | 1.62 | %(l) |
Before waivers and reimbursements (a)(f)(x) | | | 0.99 | % | | | 0.95 | % | | | (0.79 | )% | | | (3.15 | )%(l) |
Portfolio turnover rate^ | | | 34 | % | | | 23 | % | | | 4 | % | | | 2 | %(z) |
| * | Commencement of Operations. |
| ** | Includes tax expense of less than 0.005%. |
| ^ | Portfolio turnover rate excludes derivatives, if any. |
| (a) | Ratios for periods less than one year are annualized. Certain non-recurring expenses incurred by the Fund are not annualized for periods less than one year. |
| (b) | Total returns for periods less than one year are not annualized. |
| (e) | Net investment income (loss) per share is based on average shares outstanding. |
| (f) | Expenses do not include the expenses of the underlying funds (“indirect expenses”), if applicable. |
| (j) | Including direct and indirect expenses, the net expense ratio after waivers and reimbursements would be 0.65%. |
| (l) | The annualized ratio of net investment income to average net assets may not be indicative of operating results for a full year. |
| (x) | Recognition of net investment income is affected by the timing of dividend declarations by the underlying funds in which the Fund invests. |
| (z) | Portfolio turnover rate for periods less than one year is not annualized. |
See Notes to Financial Statements.
84
1290 RETIREMENT 2030 FUND (Unaudited)
INVESTMENT ADVISER
| Ø | | Equitable Investment Management Group, LLC |
PERFORMANCE RESULTS
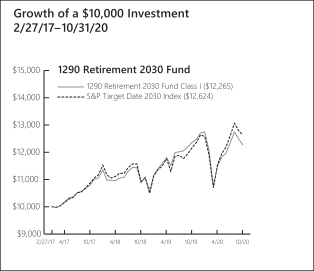
| | | | | | | | |
| |
| Annualized Total Returns as of 10/31/20 | |
| | | |
| | | 1
Year | | | Since
Incept. | |
Fund – Class I Shares* | | | (0.68 | )% | | | 5.72 | % |
S&P Target Date 2030 Index | | | 3.91 | | | | 6.55 | |
| |
* Date of inception 2/27/17. Returns for periods greater than one year are annualized. | |
The performance quoted is past performance and is not a guarantee of future results. Mutual funds are subject to certain market risks. Investment returns and principal value of an investment will fluctuate so that an investor’s shares, when redeemed, may be worth more or less than their original cost. Current performance may be higher or lower than the performance data shown. For the most current month-end performance data please call 1-888-310-0416 or visit www.1290Funds.com.
The graph illustrates comparative performance for $10,000 invested in the Class I Shares of the 1290 Retirement 2030 Fund and the S&P Target Date 2030 Index from 2/27/17 to 10/31/20. The performance of the S&P Target Date 2030 Index reflects an initial investment at the end of the month closest to the Fund’s inception. The performance of the Fund assumes reinvestment of all dividends and capital gain distributions, if any, and does not include a sales charge. The performance of the S&P Target Date 2030 Index does not reflect the deduction of expenses or a sales charge associated with a mutual fund and has been adjusted to reflect reinvestment of all dividends, capital gain distributions, and interest of the securities included in the benchmark.
As of March 1, 2020, the gross expense ratio including acquired fund fees for Class I shares was 3.26%. The net expense ratio for Class I shares was 0.65%. The net expense ratio reflects the Adviser’s decision to contractually limit expenses through April 30, 2021. Fund Performance may also reflect the waiver of the Fund’s fees and reimbursement of expenses for certain periods since the inception date. Without these waivers and reimbursements, performance would have been lower.
In addition, performance shown in this section does not reflect the deduction of taxes that a shareholder would pay on Fund distributions or redemption of Fund shares.
PERFORMANCE SUMMARY
The Fund’s Class I shares returned (0.68)% for the year ended October 31, 2020. The Fund’s benchmark, the S&P Target Date 2030 Index, returned 3.91% over the same year.
Overview
Each 1290 Retirement Fund’s (as defined in the Notes to the Financial Statements) performance will reflect the performance of the underlying asset classes and depends upon their percentage weighting within the Fund. Here’s why: The 1290 Retirement Funds are managed to target a specific year of planned retirement. The asset mix will become more conservative each year, until about 10 years after the target retirement year, when it will become relatively stable. The 1290 Retirement Funds balance the need for appreciation with the need for income as retirement approaches and focus on supporting an income stream over a long-term retirement withdrawal horizon. To achieve its asset class exposure, each 1290 Retirement Fund invests in exchange-traded funds (ETFs) representing various equity and bond asset classes. Because of this, each of the 1290 Retirement Fund’s performance will be a function of the asset class performance and the percentage weighting of each asset class in the 1290 Retirement Fund. Current target and actual allocations, as well as performance, are available in a separate quarterly Fund Fact Sheet.
What helped performance during the year?
| • | | The Fund had no dedicated position in real estate which contributed to performance. The sector was down about 25% for the twelve-month period. |
| • | | The Fund’s fixed income ETFs outperformed relative to their respective benchmark. Having active weight exposure to Treasury Inflation Protected Securities (TIPS) contributed to performance, as TIPS was the best performing asset category within fixed income. |
What hurt performance during the year?
| • | | Security selection within equities was the top detractor from performance, as having a low volatility tilt was not beneficial across regions and market cap. |
| • | | Within fixed income, having no exposure to high yield detracted from performance as it was up 7.79%. |
85
1290 RETIREMENT 2030 FUND (Unaudited)
| | | | |
| |
Table by Asset Class (as a percentage of Total
Investments in Securities) | |
| | |
| As of October 31, 2020 | | | |
Equity | | | 69.2 | % |
Fixed Income | | | 30.8 | |
| | | | |
| | |
Top 10 Holdings (as a percentage of Total
Investments in Securities) | | | |
| | |
| As of October 31, 2020 | | | |
iShares Core U.S. Aggregate Bond ETF | | | 26.2 | % |
iShares Core S&P Total US Stock Market ETF | | | 23.4 | |
iShares Core MSCI EAFE ETF | | | 8.9 | |
iShares MSCI USA Min Vol Factor ETF | | | 7.7 | |
Invesco S&P 500 Low Volatility ETF | | | 7.4 | |
iShares TIPS Bond ETF | | | 4.6 | |
Invesco S&P MidCap Low Volatility ETF | | | 4.5 | |
Invesco S&P International Developed Low Volatility ETF | | | 4.5 | |
iShares MSCI EAFE Min Vol Factor ETF | | | 4.3 | |
SPDR SSGA US Small Cap Low Volatility Index ETF | | | 2.2 | |
Holdings are subject to change without notice. | | | | |
UNDERSTANDING YOUR EXPENSES:
As a shareholder of the Fund, you incur two types of costs:
(1) transaction costs, including applicable sales charges and redemption fees; and (2) ongoing costs, including investment advisory fees, distribution and/or service (12b-1) fees and other Fund expenses. These examples are intended to help you understand your ongoing costs (in dollars) of investing in the Fund and to compare these costs with the ongoing costs of investing in other mutual funds.
The examples are based on an investment of $1,000 invested at the beginning of the six-month period ended October 31, 2020 and held for the entire six-month period.
Actual Expenses
The first line of the following table provides information about actual account values and actual expenses. You may use the information in this line, together with the amount you invested, to estimate the expenses that you paid over the period. Simply divide your account value by $1,000 (for example, an $8,600 account value divided by $1,000 = 8.6), then multiply the result by the number in the first line under the heading entitled ‘‘Expenses Paid During Period’’ to estimate the expenses you paid on your account during this period.
Hypothetical Example for Comparison Purposes
The second line of the following table provides information about hypothetical account values and hypothetical expenses based on the Fund’s actual expense ratio and an assumed rate of return of 5% per year before expenses, which is not the Fund’s actual return. The hypothetical account values and expenses may not be used to estimate the actual ending account balance or expenses you paid for the period. You may use this information to compare the ongoing costs of investing in the Fund and other funds. To do so, compare this 5% hypothetical example with the 5% hypothetical examples that appear in the shareholder reports of the other funds.
Please note that the expenses shown in the table are meant to highlight your ongoing costs only and do not reflect any transactional costs, such as sales charges (loads), redemption fees, or exchange fees. Therefore, the second line of the table is useful in comparing ongoing costs only, and will not help you determine the relative total costs of owning different funds. In addition, if these transactional costs were included, your costs would have been higher.
EXAMPLE
| | | | | | | | | | | | |
| | | | |
| | | Beginning
Account
Value
5/1/20 | | | Ending
Account
Value
10/31/20 | | | Expenses
Paid
During
Period*
5/1/20 -
10/31/20 | |
Class I | |
Actual | | | $1,000.00 | | | | $1,066.40 | | | | $2.78 | |
Hypothetical (5% average annual return before expenses) | | | 1,000.00 | | | | 1,022.45 | | | | 2.72 | |
| |
* Expenses are equal to the Portfolio’s I shares annualized expense ratio of 0.53%, multiplied by the average account value over the period, and multiplied by 184/366 (to reflect the one-half year period). | |
86
1290 FUNDS
1290 RETIREMENT 2030 FUND
PORTFOLIO OF INVESTMENTS
October 31, 2020
| | | | | | | | |
| | | |
| | | Number of
Shares | | | Value
(Note 1) | |
EXCHANGE TRADED FUNDS (ETF): | |
Equity (69.2%) | | | | | | | | |
Invesco S&P 500 Low Volatility ETF | | | 8,130 | | | $ | 423,004 | |
Invesco S&P Emerging Markets Low Volatility ETF | | | 3,110 | | | | 61,733 | |
Invesco S&P International Developed Low Volatility ETF | | | 9,330 | | | | 255,828 | |
Invesco S&P MidCap Low Volatility ETF | | | 6,170 | | | | 256,734 | |
Invesco S&P SmallCap Low Volatility ETF | | | 3,570 | | | | 120,987 | |
iShares Core MSCI EAFE ETF | | | 8,650 | | | | 503,084 | |
iShares Core MSCI Emerging Markets ETF | | | 2,130 | | | | 113,891 | |
iShares Core S&P Total US Stock Market ETF | | | 17,960 | | | | 1,329,938 | |
iShares MSCI EAFE Min Vol Factor ETF | | | 3,740 | | | | 244,933 | |
iShares MSCI Emerging Markets Min Vol Factor ETF | | | 1,030 | | | | 56,609 | |
iShares MSCI USA Min Vol Factor ETF | | | 7,090 | | | | 437,169 | |
SPDR SSGA US Small Cap Low Volatility Index ETF | | | 1,660 | | | | 127,538 | |
| | | | | | | | |
Total Equity | | | | | | | 3,931,448 | |
| | | | | | | | |
Fixed Income (30.8%) | | | | | | | | |
iShares Core U.S. Aggregate Bond ETF | | | 12,690 | | | | 1,487,268 | |
iShares TIPS Bond ETF | | | 2,090 | | | | 261,731 | |
| | | | | | | | |
Total Fixed Income | | | | | | | 1,748,999 | |
| | | | | | | | |
Total Investments in Securities (100.0%)
(Cost $5,586,909) | | | | | | | 5,680,447 | |
Other Assets Less Liabilities (0.0%) | | | | | | | 1,571 | |
| | | | | | | | |
Net Assets (100%) | | | | | | $ | 5,682,018 | |
| | | | | | | | |
The following is a summary of the inputs used to value the Fund’s assets and liabilities carried at fair value as of October 31, 2020:
The inputs or methodology used for valuing securities are not necessarily an indication of the risk associated with investing in those securities.
Various inputs are used in determining the value of the Fund’s investments. These inputs are summarized in the three broad levels listed below:
| | | | | | | | | | | | | | | | |
| | | | | |
| Investment Type | | Level 1
Quoted Prices in
Active Markets for
Identical
Securities | | | Level 2
Significant Other
Observable Inputs
(including quoted prices
for similar securities,
interest rates,
prepayment speeds,
credit risk, etc.) | | | Level 3
Significant Unobservable
Inputs (including the
Fund’s own
assumptions in
determining the fair
value of investments) | | | Total | |
Assets: | |
Exchange Traded Funds | | | | | | | | | | | | | | | | |
Exchange Traded Funds | | $ | 5,680,447 | | | $ | — | | | $ | — | | | $ | 5,680,447 | |
| | | | | | | | | | | | | | | | |
Total Assets | | $ | 5,680,447 | | | $ | — | | | $ | — | | | $ | 5,680,447 | |
| | | | | | | | | | | | | | | | |
Total Liabilities | | $ | — | | | $ | — | | | $ | — | | | $ | — | |
| | | | | | | | | | | | | | | | |
Total | | $ | 5,680,447 | | | $ | — | | | $ | — | | | $ | 5,680,447 | |
| | | | | | | | | | | | | | | | |
The Fund held no derivatives contracts during the year ended October 31, 2020.
Investment security transactions for the year ended October 31, 2020 were as follows:
| | | | |
Cost of Purchases: | | | | |
Long-term investments other than U.S. government debt securities | | $ | 2,344,586 | |
Net Proceeds of Sales and Redemptions: | | | | |
Long-term investments other than U.S. government debt securities | | $ | 3,094,605 | |
See Notes to Financial Statements.
87
1290 FUNDS
1290 RETIREMENT 2030 FUND
PORTFOLIO OF INVESTMENTS (Continued)
October 31, 2020
As of October 31, 2020, the gross unrealized appreciation (depreciation) of investments based on the aggregate cost of investments in securities and derivative instruments, if applicable, for Federal income tax purposes was as follows:
| | | | |
Aggregate gross unrealized appreciation | | $ | 238,296 | |
Aggregate gross unrealized depreciation | | | (171,499 | ) |
| | | | |
Net unrealized appreciation | | $ | 66,797 | |
| | | | |
Federal income tax cost of investments in securities and derivative instruments, if applicable | | $ | 5,613,650 | |
| | | | |
See Notes to Financial Statements.
88
1290 FUNDS
1290 RETIREMENT 2030 FUND
STATEMENT OF ASSETS AND LIABILITIES
October 31, 2020
| | | | |
|
ASSETS | |
Investments in Securities, at value (Cost $5,586,909) | | $ | 5,680,447 | |
Cash | | | 30,752 | |
Receivable from investment adviser | | | 8,691 | |
Prepaid registration and filing fees | | | 4,912 | |
Receivable for Fund shares sold | | | 719 | |
Dividends, interest and other receivables | | | 1 | |
Other assets | | | 59 | |
| | | | |
Total assets | | | 5,725,581 | |
| | | | |
LIABILITIES | | | | |
Accrued professional fees | | | 32,508 | |
Transfer agent fees payable | | | 2,121 | |
Trustees’ fees payable | | | 60 | |
Accrued expenses | | | 8,874 | |
| | | | |
Total liabilities | | | 43,563 | |
| | | | |
NET ASSETS | | $ | 5,682,018 | |
| | | | |
Net assets were comprised of: | | | | |
Paid in capital | | $ | 5,248,308 | |
Total distributable earnings (loss) | | | 433,710 | |
| | | | |
Net assets | | $ | 5,682,018 | |
| | | | |
Class I | | | | |
Net asset value, offering and redemption price per share, $5,682,018 / 491,001 shares outstanding (unlimited amount authorized: $0.001 par value) | | $ | 11.57 | |
| | | | |
STATEMENT OF OPERATIONS
For the Year Ended October 31, 2020
| | | | |
|
INVESTMENT INCOME | |
Dividends | | $ | 152,247 | |
Interest | | | 354 | |
| | | | |
Total income | | | 152,601 | |
| | | | |
EXPENSES | | | | |
Professional fees | | | 41,919 | |
Investment advisory fees | | | 30,726 | |
Printing and mailing expenses | | | 30,093 | |
Administrative fees | | | 29,998 | |
Registration and filing fees | | | 20,040 | |
Transfer agent fees | | | 11,565 | |
Custodian fees | | | 5,100 | |
Trustees’ fees | | | 505 | |
Tax expense | | | 243 | |
Miscellaneous | | | 6,897 | |
| | | | |
Gross expenses | | | 177,086 | |
Less: Waiver from investment adviser | | | (60,724 | ) |
Reimbursement from investment adviser | | | (83,266 | ) |
| | | | |
Net expenses | | | 33,096 | |
| | | | |
NET INVESTMENT INCOME (LOSS) | | | 119,505 | |
| | | | |
REALIZED AND UNREALIZED GAIN (LOSS) | | | | |
Net realized gain (loss) on investments in securities | | | 265,571 | |
Net change in unrealized appreciation (depreciation) on investments in securities | | | (519,309 | ) |
| | | | |
NET REALIZED AND UNREALIZED GAIN (LOSS) | | | (253,738 | ) |
| | | | |
NET INCREASE (DECREASE) IN NET ASSETS RESULTING FROM OPERATIONS | | $ | (134,233 | ) |
| | | | |
STATEMENT OF CHANGES IN NET ASSETS
| | | | | | | | |
| | | Year Ended October 31, | |
| | | 2020 | | | 2019 | |
INCREASE (DECREASE) IN NET ASSETS FROM OPERATIONS: | | | | | | | | |
Net investment income (loss) | | $ | 119,505 | | | $ | 104,968 | |
Net realized gain (loss) | | | 265,571 | | | | 19,025 | |
Net change in unrealized appreciation (depreciation) | | | (519,309 | ) | | | 544,946 | |
| | | | | | | | |
NET INCREASE (DECREASE) IN NET ASSETS RESULTING FROM OPERATIONS | | | (134,233 | ) | | | 668,939 | |
| | | | | | | | |
Distributions to shareholders: | | | | | | | | |
Class I | | | (136,178 | ) | | | (88,204 | ) |
| | | | | | | | |
CAPITAL SHARES TRANSACTIONS: | | | | | | | | |
Class I | | | | | | | | |
Capital shares sold [192,899 and 189,006 shares, respectively] | | | 2,225,805 | | | | 2,128,791 | |
Capital shares issued in reinvestment of dividends [6,335 and 3,168 shares, respectively] | | | 75,078 | | | | 33,204 | |
Capital shares repurchased [(273,913) and (26,204) shares, respectively] | | | (3,072,689 | ) | | | (291,050 | ) |
| | | | | | | | |
NET INCREASE (DECREASE) IN NET ASSETS RESULTING FROM CAPITAL SHARE TRANSACTIONS | | | (771,806 | ) | | | 1,870,945 | |
| | | | | | | | |
TOTAL INCREASE (DECREASE) IN NET ASSETS | | | (1,042,217 | ) | | | 2,451,680 | |
NET ASSETS: | | | | | | | | |
Beginning of year | | | 6,724,235 | | | | 4,272,555 | |
| | | | | | | | |
End of year | | $ | 5,682,018 | | | $ | 6,724,235 | |
| | | | | | | | |
See Notes to Financial Statements.
89
1290 FUNDS
1290 RETIREMENT 2030 FUND
FINANCIAL HIGHLIGHTS
| | | | | | | | | | | | | | | | |
| | | Year Ended October 31, | | | February 27, 2017* to
October 31, 2017 | |
| Class I | | 2020 | | | 2019 | | | 2018 | |
Net asset value, beginning of period | | $ | 11.89 | | | $ | 10.69 | | | $ | 10.80 | | | $ | 10.00 | |
| | | | | | | | | | | | | | | | |
Income (loss) from investment operations: | | | | | | | | | | | | | | | | |
Net investment income (loss) (e)(x) | | | 0.22 | | | | 0.22 | | | | 0.20 | | | | 0.11 | |
Net realized and unrealized gain (loss) | | | (0.30 | ) | | | 1.20 | | | | (0.12 | ) | | | 0.69 | |
| | | | | | | | | | | | | | | | |
Total from investment operations | | | (0.08 | ) | | | 1.42 | | | | 0.08 | | | | 0.80 | |
| | | | | | | | | | | | | | | | |
Less distributions: | | | | | | | | | | | | | | | | |
Dividends from net investment income | | | (0.21 | ) | | | (0.18 | ) | | | (0.18 | ) | | | — | |
Distributions from net realized gains | | | (0.03 | ) | | | (0.04 | ) | | | (0.01 | ) | | | — | |
| | | | | | | | | | | | | | | | |
Total dividends and distributions | | | (0.24 | ) | | | (0.22 | ) | | | (0.19 | ) | | | — | |
| | | | | | | | | | | | | | | | |
Net asset value, end of period | | $ | 11.57 | | | $ | 11.89 | | | $ | 10.69 | | | $ | 10.80 | |
| | | | | | | | | | | | | | | | |
Total return (b) | | | (0.68 | )% | | | 13.56 | % | | | 0.70 | % | | | 8.00 | % |
| | | | | | | | | | | | | | | | |
Ratios/Supplemental Data: | | | | | | | | | | | | | | | | |
Net assets, end of period (000’s) | | $ | 5,682 | | | $ | 6,724 | | | $ | 4,273 | | | $ | 2,701 | |
Ratio of expenses to average net assets: | | | | | | | | | | | | | | | | |
After waivers and reimbursements (a)(f) | | | 0.54 | %**(j) | | | 0.54 | %(j) | | | 0.54 | %(j) | | | 0.53 | %(j) |
Before waivers and reimbursements (a)(f) | | | 2.88 | % | | | 3.14 | % | | | 4.74 | % | | | 5.27 | % |
Ratio of net investment income (loss) to average net assets: | | | | | | | | | | | | | | | | |
After waivers and reimbursements (a)(f)(x) | | | 1.95 | % | | | 1.98 | % | | | 1.78 | % | | | 1.59 | %(l) |
Before waivers and reimbursements (a)(f)(x) | | | (0.40 | )% | | | (0.62 | )% | | | (2.41 | )% | | | (3.15 | )%(l) |
Portfolio turnover rate^ | | | 38 | % | | | 5 | % | | | 3 | % | | | 1 | %(z) |
| * | Commencement of Operations. |
| ** | Includes tax expense of less than 0.005%. |
| ^ | Portfolio turnover rate excludes derivatives, if any. |
| (a) | Ratios for periods less than one year are annualized. Certain non-recurring expenses incurred by the Fund are not annualized for periods less than one year. |
| (b) | Total returns for periods less than one year are not annualized. |
| (e) | Net investment income (loss) per share is based on average shares outstanding. |
| (f) | Expenses do not include the expenses of the underlying funds (“indirect expenses”), if applicable. |
| (j) | Including direct and indirect expenses, the net expense ratio after waivers and reimbursements would be 0.65%. |
| (l) | The annualized ratio of net investment income to average net assets may not be indicative of operating results for a full year. |
| (x) | Recognition of net investment income is affected by the timing of dividend declarations by the underlying funds in which the Fund invests. |
| (z) | Portfolio turnover rate for periods less than one year is not annualized. |
See Notes to Financial Statements.
90
1290 RETIREMENT 2035 FUND (Unaudited)
INVESTMENT ADVISER
| Ø | | Equitable Investment Management Group, LLC |
PERFORMANCE RESULTS
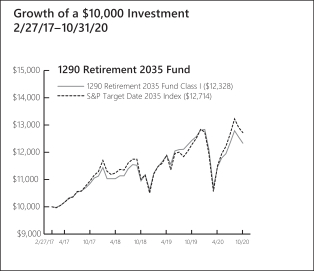
| | | | | | | | |
Annualized Total Returns as of 10/31/20 | |
| | | |
| | | 1
Year | | | Since
Incept. | |
Fund – Class I Shares* | | | (0.87 | )% | | | 5.86 | % |
S&P Target Date 2035 Index | | | 3.54 | | | | 6.75 | |
| |
* Date of inception 2/27/17. Returns for periods greater than one year are annualized. | |
The performance quoted is past performance and is not a guarantee of future results. Mutual funds are subject to certain market risks. Investment returns and principal value of an investment will fluctuate so that an investor’s shares, when redeemed, may be worth more or less than their original cost. Current performance may be higher or lower than the performance data shown. For the most current month-end performance data please call 1-888-310-0416 or visit www.1290Funds.com.
The graph illustrates comparative performance for $10,000 invested in the Class I Shares of the 1290 Retirement 2035 Fund and the S&P Target Date 2035 Index from 2/27/17 to 10/31/20. The performance of the S&P Target Date 2035 Index reflects an initial investment at the end of the month closest to the Fund’s inception. The performance of the Fund assumes reinvestment of all dividends and capital gain distributions, if any, and does not include a sales charge. The performance of the S&P Target Date 2035 Index does not reflect the deduction of expenses or a sales charge associated with a mutual fund and has been adjusted to reflect reinvestment of all dividends, capital gain distributions, and interest of the securities included in the benchmark.
As of March 1, 2020, the gross expense ratio including acquired fund fees for Class I shares was 2.62%. The net expense ratio for Class I shares was 0.65%. The net expense ratio reflects the Adviser’s decision to contractually limit expenses through April 30, 2021. Fund Performance may also reflect the waiver of the Fund’s fees and reimbursement of expenses for certain periods since the inception date. Without these waivers and reimbursements, performance would have been lower.
In addition, performance shown in this section does not reflect the deduction of taxes that a shareholder would pay on Fund distributions or redemption of Fund shares
PERFORMANCE SUMMARY
The Fund’s Class I shares returned (0.87)% for the year ended October 31, 2020. The Fund’s benchmark, the S&P Target Date 2035 Index, returned 3.54% over the same year.
Overview
Each 1290 Retirement Fund’s (as defined in the Notes to the Financial Statements) performance will reflect the performance of the underlying asset classes and depends upon their percentage weighting within the Fund. Here’s why: The 1290 Retirement Funds are managed to target a specific year of planned retirement. The asset mix will become more conservative each year, until about 10 years after the target retirement year, when it will become relatively stable. The 1290 Retirement Funds balance the need for appreciation with the need for income as retirement approaches and focus on supporting an income stream over a long-term retirement withdrawal horizon. To achieve its asset class exposure, each 1290 Retirement Fund invests in exchange-traded funds (ETFs) representing various equity and bond asset classes. Because of this, each of the 1290 Retirement Fund’s performance will be a function of the asset class performance and the percentage weighting of each asset class in the 1290 Retirement Fund. Current target and actual allocations, as well as performance, are available in a separate quarterly Fund Fact Sheet.
What helped performance during the year?
| • | | The Fund had no dedicated position in real estate which contributed to performance. The sector was down about 25% for the twelve-month period. |
| • | | The Fund’s fixed income ETFs outperformed relative to their respective benchmark. Having active weight exposure to Treasury Inflation Protected Securities (TIPS) contributed to performance, as TIPS was the best performing asset category within fixed income. |
What hurt performance during the year?
| • | | Security selection within equities was the top detractor from performance, as having a low volatility tilt was not beneficial across regions and market cap. |
| • | | Within fixed income, having no exposure to high yield detracted from performance as it was up 7.79%. |
91
1290 RETIREMENT 2035 FUND (Unaudited)
| | | | |
| |
Table by Asset Class (as a percentage of Total
Investments in Securities) As of October 31, 2020 | |
Equity | | | 74.2 | % |
Fixed Income | | | 25.4 | |
Investment Company | | | 0.4 | |
| | | | |
| |
Top 10 Holdings (as a percentage of Total Investments in
Securities) As of October 31, 2020 | |
iShares Core S&P Total US Stock Market ETF | | | 25.1 | % |
iShares Core U.S. Aggregate Bond ETF | | | 21.7 | |
iShares Core MSCI EAFE ETF | | | 9.2 | |
Invesco S&P 500 Low Volatility ETF | | | 8.5 | |
iShares MSCI USA Min Vol Factor ETF | | | 8.4 | |
Invesco S&P MidCap Low Volatility ETF | | | 4.8 | |
iShares MSCI EAFE Min Vol Factor ETF | | | 4.8 | |
Invesco S&P International Developed Low Volatility ETF | | | 4.7 | |
iShares TIPS Bond ETF | | | 3.7 | |
Invesco S&P SmallCap Low Volatility ETF | | | 2.3 | |
Holdings are subject to change without notice. | | | | |
UNDERSTANDING YOUR EXPENSES:
As a shareholder of the Fund, you incur two types of costs:
(1) transaction costs, including applicable sales charges and redemption fees; and (2) ongoing costs, including investment advisory fees, distribution and/or service (12b-1) fees and other Fund expenses. These examples are intended to help you understand your ongoing costs (in dollars) of investing in the Fund and to compare these costs with the ongoing costs of investing in other mutual funds.
The examples are based on an investment of $1,000 invested at the beginning of the six-month period ended October 31, 2020 and held for the entire six-month period.
Actual Expenses
The first line of the following table provides information about actual account values and actual expenses. You may use the information in this line, together with the amount you invested, to estimate the expenses that you paid over the period. Simply divide your account value by $1,000 (for example, an $8,600 account value divided by $1,000 = 8.6), then multiply the result by the number in the first line under the heading entitled ‘‘Expenses Paid During Period’’ to estimate the expenses you paid on your account during this period.
Hypothetical Example for Comparison Purposes
The second line of the following table provides information about hypothetical account values and hypothetical expenses based on the Fund’s actual expense ratio and an assumed rate of return of 5% per year before expenses, which is not the Fund’s actual return. The hypothetical account values and expenses may not be used to estimate the actual ending account balance or expenses you paid for the period. You may use this information to compare the ongoing costs of investing in the Fund and other funds. To do so, compare this 5% hypothetical example with the 5% hypothetical examples that appear in the shareholder reports of the other funds.
Please note that the expenses shown in the table are meant to highlight your ongoing costs only and do not reflect any transactional costs, such as sales charges (loads), redemption fees, or exchange fees. Therefore, the second line of the table is useful in comparing ongoing costs only, and will not help you determine the relative total costs of owning different funds. In addition, if these transactional costs were included, your costs would have been higher.
EXAMPLE
| | | | | | | | | | | | |
| | | | |
| | | Beginning
Account
Value
5/1/20 | | | Ending
Account
Value
10/31/20 | | | Expenses
Paid
During
Period*
5/1/20 -
10/31/20 | |
Class I | | | | | | | | | | | | |
Actual | | $ | 1,000.00 | | | $ | 1,074.90 | | | $ | 2.78 | |
Hypothetical (5% average annual return before expenses) | | | 1,000.00 | | | | 1,022.46 | | | | 2.71 | |
| |
* Expenses are equal to the Portfolio’s I shares annualized expense ratio of 0.53%, multiplied by the average account value over the period, and multiplied by 184/366 (to reflect the one-half year period). | |
92
1290 FUNDS
1290 RETIREMENT 2035 FUND
PORTFOLIO OF INVESTMENTS
October 31, 2020
| | | | | | | | |
| | | |
| | | Number of
Shares | | | Value
(Note 1) | |
EXCHANGE TRADED FUNDS (ETF): | | | | | |
Equity (74.0%) | | | | | | | | |
Invesco S&P 500 Low Volatility ETF | | | 15,480 | | | $ | 805,425 | |
Invesco S&P Emerging Markets Low Volatility ETF | | | 4,340 | | | | 86,149 | |
Invesco S&P International Developed Low Volatility ETF | | | 16,160 | | | | 443,107 | |
Invesco S&P MidCap Low Volatility ETF | | | 10,930 | | | | 454,797 | |
Invesco S&P SmallCap Low Volatility ETF | | | 6,560 | | | | 222,318 | |
iShares Core MSCI EAFE ETF | | | 15,000 | | | | 872,400 | |
iShares Core MSCI Emerging Markets ETF | | | 4,070 | | | | 217,623 | |
iShares Core S&P Total US Stock Market ETF | | | 32,140 | | | | 2,379,967 | |
iShares MSCI EAFE Min Vol Factor ETF | | | 6,900 | | | | 451,881 | |
iShares MSCI Emerging Markets Min Vol Factor ETF | | | 1,810 | | | | 99,478 | |
iShares MSCI USA Min Vol Factor ETF | | | 13,000 | | | | 801,580 | |
SPDR SSGA US Small Cap Low Volatility Index ETF | | | 2,690 | | | | 206,673 | |
| | | | | | | | |
Total Equity | | | | | | | 7,041,398 | |
| | | | | | | | |
Fixed Income (25.3%) | | | | | | | | |
iShares Core U.S. Aggregate Bond ETF | | | 17,540 | | | | 2,055,688 | |
iShares TIPS Bond ETF | | | 2,840 | | | | 355,653 | |
| | | | | | | | |
Total Fixed Income | | | | | | | 2,411,341 | |
| | | | | | | | |
Total Exchange Traded Funds (99.3%)
(Cost $9,133,943) | | | | | | | 9,452,739 | |
| | | | | | | | |
| | |
SHORT-TERM INVESTMENT: | | | | | | | | |
Investment Company (0.4%) | | | | | | | | |
JPMorgan Prime Money Market Fund, IM Shares | | | 37,828 | | | | 37,850 | |
| | | | | | | | |
Total Short-Term Investment (0.4%)
(Cost $37,853) | | | | | | | 37,850 | |
| | | | | | | | |
Total Investments in Securities (99.7%)
(Cost $9,171,796) | | | | | | | 9,490,589 | |
Other Assets Less Liabilities (0.3%) | | | | | | | 30,748 | |
| | | | | | | | |
Net Assets (100%) | | | | | | $ | 9,521,337 | |
| | | | | | | | |
The following is a summary of the inputs used to value the Fund’s assets and liabilities carried at fair value as of October 31, 2020:
The inputs or methodology used for valuing securities are not necessarily an indication of the risk associated with investing in those securities.
Various inputs are used in determining the value of the Fund’s investments. These inputs are summarized in the three broad levels listed below:
| | | | | | | | | | | | | | | | |
| | | | | |
| Investment Type | | Level 1
Quoted Prices in
Active Markets for
Identical
Securities | | | Level 2
Significant Other
Observable Inputs
(including quoted prices
for similar securities,
interest rates,
prepayment speeds,
credit risk, etc.) | | | Level 3
Significant Unobservable
Inputs (including the
Fund’s own
assumptions in
determining the fair
value of investments) | | | Total | |
Assets: | | | | | |
Exchange Traded Funds | | | | | | | | | | | | | | | | |
Exchange Traded Funds | | $ | 9,452,739 | | | $ | — | | | $ | — | | | $ | 9,452,739 | |
Short-Term Investment | | | | | | | | | | | | | | | | |
Investment Company | | | 37,850 | | | | — | | | | — | | | | 37,850 | |
| | | | | | | | | | | | | | | | |
Total Assets | | $ | 9,490,589 | | | $ | — | | | $ | — | | | $ | 9,490,589 | |
| | | | | | | | | | | | | | | | |
Total Liabilities | | $ | — | | | $ | — | | | $ | — | | | $ | — | |
| | | | | | | | | | | | | | | | |
Total | | $ | 9,490,589 | | | $ | — | | | $ | — | | | $ | 9,490,589 | |
| | | | | | | | | | | | | | | | |
The Fund held no derivatives contracts during the year ended October 31, 2020.
Investment security transactions for the year ended October 31, 2020 were as follows:
| | | | |
Cost of Purchases: | | | | |
Long-term investments other than U.S. government debt securities | | $ | 4,974,748 | |
Net Proceeds of Sales and Redemptions: | | | | |
Long-term investments other than U.S. government debt securities | | $ | 3,708,807 | |
See Notes to Financial Statements.
93
1290 FUNDS
1290 RETIREMENT 2035 FUND
PORTFOLIO OF INVESTMENTS (Continued)
October 31, 2020
As of October 31, 2020, the gross unrealized appreciation (depreciation) of investments based on the aggregate cost of investments in securities and derivative instruments, if applicable, for Federal income tax purposes was as follows:
| | | | |
Aggregate gross unrealized appreciation | | $ | 495,047 | |
Aggregate gross unrealized depreciation | | | (232,173 | ) |
| | | | |
Net unrealized appreciation | | $ | 262,874 | |
| | | | |
Federal income tax cost of investments in securities and derivative instruments, if applicable | | $ | 9,227,715 | |
| | | | |
See Notes to Financial Statements.
94
1290 FUNDS
1290 RETIREMENT 2035 FUND
STATEMENT OF ASSETS AND LIABILITIES
October 31, 2020
| | | | |
ASSETS | |
Investments in Securities, at value
(Cost $9,171,796) | | $ | 9,490,589 | |
Cash | | | 75,000 | |
Receivable from investment adviser | | | 7,850 | |
Prepaid registration and filing fees | | | 5,098 | |
Receivable for Fund shares sold | | | 57 | |
Dividends, interest and other receivables | | | 4 | |
Other assets | | | 109 | |
| | | | |
Total assets | | | 9,578,707 | |
| | | | |
LIABILITIES | |
Payable for Fund shares redeemed | | | 12,737 | |
Transfer agent fees payable | | | 2,147 | |
Trustees’ fees payable | | | 139 | |
Accrued expenses | | | 42,347 | |
| | | | |
Total liabilities | | | 57,370 | |
| | | | |
NET ASSETS | | $ | 9,521,337 | |
| | | | |
Net assets were comprised of: | | | | |
Paid in capital | | $ | 8,824,897 | |
Total distributable earnings (loss) | | | 696,440 | |
| | | | |
Net assets | | $ | 9,521,337 | |
| | | | |
Class I | | | | |
Net asset value, offering and redemption price per share, $9,521,337 / 819,668 shares outstanding (unlimited amount authorized: $0.001 par value) | | $ | 11.62 | |
| | | | |
STATEMENT OF OPERATIONS
For the Year Ended October 31, 2020
| | | | |
INVESTMENT INCOME | |
Dividends | | $ | 225,917 | |
Interest | | | 397 | |
| | | | |
Total income | | | 226,314 | |
| | | | |
EXPENSES | | | | |
Investment advisory fees | | | 46,187 | |
Professional fees | | | 43,800 | |
Printing and mailing expenses | | | 34,295 | |
Administrative fees | | | 29,999 | |
Registration and filing fees | | | 20,318 | |
Transfer agent fees | | | 11,730 | |
Custodian fees | | | 5,550 | |
Trustees’ fees | | | 772 | |
Tax expense | | | 321 | |
Miscellaneous | | | 7,383 | |
| | | | |
Gross expenses | | | 200,355 | |
Less: Waiver from investment adviser | | | (76,186 | ) |
Reimbursement from investment adviser | | | (74,699 | ) |
| | | | |
Net expenses | | | 49,470 | |
| | | | |
NET INVESTMENT INCOME (LOSS) | | | 176,844 | |
| | | | |
REALIZED AND UNREALIZED GAIN (LOSS) | | | | |
Net realized gain (loss) on investments in securities | | | 260,773 | |
Net change in unrealized appreciation (depreciation) on investments in securities | | | (390,885 | ) |
| | | | |
NET REALIZED AND UNREALIZED GAIN (LOSS) | | | (130,112 | ) |
| | | | |
NET INCREASE (DECREASE) IN NET ASSETS RESULTING FROM OPERATIONS | | $ | 46,732 | |
| | | | |
See Notes to Financial Statements.
95
1290 FUNDS
1290 RETIREMENT 2035 FUND
STATEMENT OF CHANGES IN NET ASSETS
| | | | | | | | |
| | | Year Ended October 31, | |
| | 2020 | | | 2019 | |
INCREASE (DECREASE) IN NET ASSETS FROM OPERATIONS: | |
Net investment income (loss) | | $ | 176,844 | | | $ | 144,226 | |
Net realized gain (loss) | | | 260,773 | | | | 63,099 | |
Net change in unrealized appreciation (depreciation) | | | (390,885 | ) | | | 696,566 | |
| | | | | | | | |
NET INCREASE (DECREASE) IN NET ASSETS RESULTING FROM OPERATIONS | | | 46,732 | | | | 903,891 | |
| | | | | | | | |
Distributions to shareholders: | | | | | | | | |
Class I | | | (225,614 | ) | | | (107,092 | ) |
| | | | | | | | |
CAPITAL SHARES TRANSACTIONS: | | | | | | | | |
Class I | | | | | | | | |
Capital shares sold [500,034 and 166,637 shares, respectively] | | | 5,533,567 | | | | 1,919,697 | |
Capital shares issued in reinvestment of dividends [12,315 and 6,075 shares, respectively] | | | 147,039 | | | | 64,342 | |
Capital shares repurchased [(388,587) and (98,499) shares, respectively] | | | (4,349,860 | ) | | | (1,103,345 | ) |
| | | | | | | | |
NET INCREASE (DECREASE) IN NET ASSETS RESULTING FROM CAPITAL SHARE TRANSACTIONS | | | 1,330,746 | | | | 880,694 | |
| | | | | | | | |
TOTAL INCREASE (DECREASE) IN NET ASSETS | | | 1,151,864 | | | | 1,677,493 | |
NET ASSETS: | | | | | | | | |
Beginning of year | | | 8,369,473 | | | | 6,691,980 | |
| | | | | | | | |
End of year | | $ | 9,521,337 | | | $ | 8,369,473 | |
| | | | | | | | |
See Notes to Financial Statements.
96
1290 FUNDS
1290 RETIREMENT 2035 FUND
FINANCIAL HIGHLIGHTS
| | | | | | | | | | | | | | | | |
| | | Year Ended October 31, | | | February 27, 2017* to
October 31, 2017 | |
| Class I | | 2020 | | | 2019 | | | 2018 | |
Net asset value, beginning of period | | $ | 12.03 | | | $ | 10.76 | | | $ | 10.85 | | | $ | 10.00 | |
| | | | | | | | | | | | | | | | |
Income (loss) from investment operations: | | | | | | | | | | | | | | | | |
Net investment income (loss) (e)(x) | | | 0.22 | | | | 0.22 | | | | 0.19 | | | | 0.11 | |
Net realized and unrealized gain (loss) | | | (0.32 | ) | | | 1.23 | | | | (0.09 | ) | | | 0.74 | |
| | | | | | | | | | | | | | | | |
Total from investment operations | | | (0.10 | ) | | | 1.45 | | | | 0.10 | | | | 0.85 | |
| | | | | | | | | | | | | | | | |
Less distributions: | | | | | | | | | | | | | | | | |
Dividends from net investment income | | | (0.22 | ) | | | (0.16 | ) | | | (0.18 | ) | | | — | |
Distributions from net realized gains | | | (0.09 | ) | | | (0.02 | ) | | | (0.01 | ) | | | — | |
| | | | | | | | | | | | | | | | |
Total dividends and distributions | | | (0.31 | ) | | | (0.18 | ) | | | (0.19 | ) | | | — | |
| | | | | | | | | | | | | | | | |
Net asset value, end of period | | $ | 11.62 | | | $ | 12.03 | | | $ | 10.76 | | | $ | 10.85 | |
| | | | | | | | | | | | | | | | |
Total return (b) | | | (0.87 | )% | | | 13.61 | % | | | 0.88 | % | | | 8.50 | % |
| | | | | | | | | | | | | | | | |
Ratios/Supplemental Data: | | | | | | | | | | | | | | | | |
Net assets, end of period (000’s) | | $ | 9,521 | | | $ | 8,369 | | | $ | 6,692 | | | $ | 2,712 | |
Ratio of expenses to average net assets: | | | | | | | | | | | | | | | | |
After waivers and reimbursements (a)(f) | | | 0.54 | %**(j) | | | 0.54 | %(j) | | | 0.53 | %(j) | | | 0.53 | %(j) |
Before waivers and reimbursements (a)(f) | | | 2.17 | % | | | 2.50 | % | | | 3.95 | % | | | 5.28 | % |
Ratio of net investment income (loss) to average net assets: | | | | | | | | | | | | | | | | |
After waivers and reimbursements (a)(f)(x) | | | 1.92 | % | | | 1.98 | % | | | 1.73 | % | | | 1.58 | %(l) |
Before waivers and reimbursements (a)(f)(x) | | | 0.28 | % | | | 0.01 | % | | | (1.68 | )% | | | (3.17 | )%(l) |
Portfolio turnover rate^ | | | 40 | % | | | 13 | % | | | 2 | % | | | 1 | %(z) |
| * | Commencement of Operations. |
| ** | Includes tax expense of less than 0.005%. |
| ^ | Portfolio turnover rate excludes derivatives, if any. |
| (a) | Ratios for periods less than one year are annualized. Certain non-recurring expenses incurred by the Fund are not annualized for periods less than one year. |
| (b) | Total returns for periods less than one year are not annualized. |
| (e) | Net investment income (loss) per share is based on average shares outstanding. |
| (f) | Expenses do not include the expenses of the underlying funds (“indirect expenses”), if applicable. |
| (j) | Including direct and indirect expenses, the net expense ratio after waivers and reimbursements would be 0.65%. |
| (l) | The annualized ratio of net investment income to average net assets may not be indicative of operating results for a full year. |
| (x) | Recognition of net investment income is affected by the timing of dividend declarations by the underlying funds in which the Fund invests. |
| (z) | Portfolio turnover rate for periods less than one year is not annualized. |
See Notes to Financial Statements.
97
1290 RETIREMENT 2040 FUND (Unaudited)
INVESTMENT ADVISER
| Ø | | Equitable Investment Management Group, LLC |
PERFORMANCE RESULTS
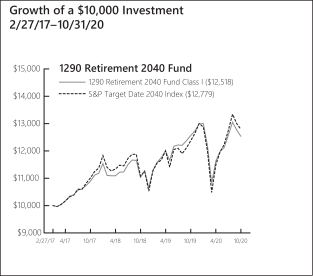
| | | | | | | | |
| |
| Annualized Total Returns as of 10/31/20 | |
| | | |
| | | 1
Year | | | Since
Incept. | |
Fund – Class I Shares* | | | (0.24 | )% | | | 6.30 | % |
S&P Target Date 2040 Index | | | 3.30 | | | | 6.90 | |
| |
* Date of inception 2/27/17. Returns for periods greater than one year are annualized. | |
The performance quoted is past performance and is not a guarantee of future results. Mutual funds are subject to certain market risks. Investment returns and principal value of an investment will fluctuate so that an investor’s shares, when redeemed, may be worth more or less than their original cost. Current performance may be higher or lower than the performance data shown. For the most current month-end performance data please call 1-888-310-0416 or visit www.1290Funds.com.
The graph illustrates comparative performance for $10,000 invested in the Class I Shares of the 1290 Retirement 2040 Fund and the S&P Target Date 2040 Index from 2/27/17 to 10/31/20. The performance of the S&P Target Date 2040 Index reflects an initial investment at the end of the month closest to the Fund’s inception. The performance of the Fund assumes reinvestment of all dividends and capital gain distributions, if any, and does not include a sales charge. The performance of the S&P Target Date 2040 Index does not reflect the deduction of expenses or a sales charge associated with a mutual fund and has been adjusted to reflect reinvestment of all dividends, capital gain distributions, and interest of the securities included in the benchmark.
As of March 1, 2020, the gross expense ratio including acquired fund fees for Class I shares was 4.69%. The net expense ratio for Class I shares was 0.65%. The net expense ratio reflects the Adviser’s decision to ontractually limit expenses through April 30, 2021. Fund Performance may also reflect the waiver of the Fund’s fees and reimbursement of expenses for certain periods since the inception date. Without these waivers and reimbursements, performance would have been lower.
In addition, performance shown in this section does not reflect the deduction of taxes that a shareholder would pay on Fund distributions or redemption of Fund shares.
PERFORMANCE SUMMARY
The Fund’s Class I shares returned (0.24)% for the year ended October 31, 2020. The Fund’s benchmark, the S&P Target Date 2040 Index, returned 3.30% over the same year.
Overview
Each 1290 Retirement Fund’s (as defined in the Notes to the Financial Statements) performance will reflect the performance of the underlying asset classes and depends upon their percentage weighting within the Fund. Here’s why: The 1290 Retirement Funds are managed to target a specific year of planned retirement. The asset mix will become more conservative each year, until about 10 years after the target retirement year, when it will become relatively stable. The 1290 Retirement Funds balance the need for appreciation with the need for income as retirement approaches and focus on supporting an income stream over a long-term retirement withdrawal horizon. To achieve its asset class exposure, each 1290 Retirement Fund invests in exchange-traded funds (ETFs) representing various equity and bond asset classes. Because of this, each of the 1290 Retirement Fund’s performance will be a function of the asset class performance and the percentage weighting of each asset class in the 1290 Retirement Fund. Current target and actual allocations, as well as performance, are available in a separate quarterly Fund Fact Sheet.
What helped performance during the year?
| • | | The Fund had no dedicated position in real estate which contributed to performance. The sector was down about 25% for the twelve-month period. |
| • | | The Fund’s fixed income ETFs outperformed relative to their respective benchmark. Having active weight exposure to Treasury Inflation Protected Securities (TIPS) contributed to performance, as TIPS was the best performing asset category within fixed income. |
What hurt performance during the year?
| • | | Security selection within equities was the top detractor from performance, as having a low volatility tilt was not beneficial across regions and market cap. |
| • | | Within fixed income, having no exposure to high yield detracted from performance as it was up 7.79%. |
| | | | |
| |
Table by Asset Class (as a percentage of Total
Investments in Securities) As of October 31, 2020 | |
Equity | | | 79.8 | % |
Fixed Income | | | 20.2 | |
98
1290 RETIREMENT 2040 FUND (Unaudited)
| | | | |
| |
Top 10 Holdings (as a percentage of Total Investments in
Securities) As of October 31, 2020 | |
iShares Core S&P Total US Stock Market ETF | | | 27.4 | % |
iShares Core U.S. Aggregate Bond ETF | | | 17.2 | |
iShares Core MSCI EAFE ETF | | | 9.8 | |
Invesco S&P 500 Low Volatility ETF | | | 9.3 | |
iShares MSCI USA Min Vol Factor ETF | | | 9.0 | |
iShares MSCI EAFE Min Vol Factor ETF | | | 5.0 | |
Invesco S&P MidCap Low Volatility ETF | | | 4.9 | |
Invesco S&P International Developed Low Volatility ETF | | | 4.8 | |
iShares TIPS Bond ETF | | | 3.0 | |
iShares Core MSCI Emerging Markets ETF | | | 2.7 | |
Holdings are subject to change without notice. | | | | |
UNDERSTANDING YOUR EXPENSES:
As a shareholder of the Fund, you incur two types of costs:
(1) transaction costs, including applicable sales charges and redemption fees; and (2) ongoing costs, including investment advisory fees, distribution and/or service (12b-1) fees and other Fund expenses. These examples are intended to help you understand your ongoing costs (in dollars) of investing in the Fund and to compare these costs with the ongoing costs of investing in other mutual funds.
The examples are based on an investment of $1,000 invested at the beginning of the six-month period ended October 31, 2020 and held for the entire six-month period.
Actual Expenses
The first line of the following table provides information about actual account values and actual expenses. You may use the information in this line, together with the amount you invested, to estimate the expenses that you paid over the period. Simply divide your account value by $1,000 (for example, an $8,600 account value divided by $1,000 = 8.6), then multiply the result by the number in the first line under the heading entitled ‘‘Expenses Paid During Period’’ to estimate the expenses you paid on your account during this period.
Hypothetical Example for Comparison Purposes
The second line of the following table provides information about hypothetical account values and hypothetical expenses based on the Fund’s actual expense ratio and an assumed rate of return of 5% per year before expenses, which is not the Fund’s actual return. The hypothetical account values and expenses may not be used to estimate the actual ending account balance or expenses you paid for the period. You may use this information to compare the ongoing costs of investing in the Fund and other funds. To do so, compare this 5% hypothetical example with the 5% hypothetical examples that appear in the shareholder reports of the other funds.
Please note that the expenses shown in the table are meant to highlight your ongoing costs only and do not reflect any transactional costs, such as sales charges (loads), redemption fees, or exchange fees. Therefore, the second line of the table is useful in comparing ongoing costs only, and will not help you determine the relative total costs of owning different funds. In addition, if these transactional costs were included, your costs would have been higher.
EXAMPLE
| | | | | | | | | | | | |
| | | | |
| | | Beginning
Account
Value
5/1/20 | | | Ending
Account
Value
10/31/20 | | | Expenses
Paid
During
Period*
5/1/20 -
10/31/20 | |
Class I | | | | | | | | | | | | |
Actual | | | $1,000.00 | | | | $1,076.60 | | | | $2.77 | |
Hypothetical (5% average annual return before expenses) | | | 1,000.00 | | | | 1,022.47 | | | | 2.70 | |
| |
* Expenses are equal to the Fund’s Class I shares annualized expense ratio of 0.53%, multiplied by the average account value over the period, and multiplied by 184/366 (to reflect the one-half year period). | |
99
1290 FUNDS
1290 RETIREMENT 2040 FUND
PORTFOLIO OF INVESTMENTS
October 31, 2020
| | | | | | | | |
| | | |
| | | Number of
Shares | | | Value
(Note 1) | |
EXCHANGE TRADED FUNDS (ETF): | | | | | | | | |
Equity (79.6%) | | | | | | | | |
Invesco S&P 500 Low Volatility ETF | | | 7,450 | | | $ | 387,623 | |
Invesco S&P Emerging Markets Low Volatility ETF | | | 2,450 | | | | 48,632 | |
Invesco S&P International Developed Low Volatility ETF | | | 7,340 | | | | 201,263 | |
Invesco S&P MidCap Low Volatility ETF | | | 4,900 | | | | 203,889 | |
Invesco S&P SmallCap Low Volatility ETF | | | 2,650 | | | | 89,809 | |
iShares Core MSCI EAFE ETF | | | 7,060 | | | | 410,610 | |
iShares Core MSCI Emerging Markets ETF | | | 2,100 | | | | 112,287 | |
iShares Core S&P Total US Stock Market ETF | | | 15,450 | | | | 1,144,073 | |
iShares MSCI EAFE Min Vol Factor ETF | | | 3,190 | | | | 208,913 | |
iShares MSCI Emerging Markets Min Vol Factor ETF | | | 890 | | | | 48,914 | |
iShares MSCI USA Min Vol Factor ETF | | | 6,070 | | | | 374,276 | |
SPDR SSGA US Small Cap Low Volatility Index ETF | | | 1,320 | | | | 101,416 | |
| | | | | | | | |
Total Equity | | | | | | | 3,331,705 | |
| | | | | | | | |
Fixed Income (20.1%) | | | | | | | | |
iShares Core U.S. Aggregate Bond ETF | | | 6,130 | | | | 718,436 | |
iShares TIPS Bond ETF | | | 990 | | | | 123,977 | |
| | | | | | | | |
Total Fixed Income | | | | | | | 842,413 | |
| | | | | | | | |
Total Investments in Securities (99.7%)
(Cost $3,947,778) | | | | | | | 4,174,118 | |
Other Assets Less Liabilities (0.3%) | | | | | | | 11,229 | |
| | | | | | | | |
Net Assets (100%) | | | | | | $ | 4,185,347 | |
| | | | | | | | |
The following is a summary of the inputs used to value the Fund’s assets and liabilities carried at fair value as of October 31, 2020:
The inputs or methodology used for valuing securities are not necessarily an indication of the risk associated with investing in those securities.
Various inputs are used in determining the value of the Fund’s investments. These inputs are summarized in the three broad levels listed below:
| | | | | | | | | | | | | | | | |
| | | | | |
| Investment Type | | Level 1
Quoted Prices in
Active Markets for
Identical
Securities | | | Level 2
Significant Other
Observable Inputs
(including quoted prices
for similar securities,
interest rates,
prepayment speeds,
credit risk, etc.) | | | Level 3
Significant Unobservable
Inputs (including the
Fund’s own
assumptions in
determining the fair
value of investments) | | | Total | |
Assets: | | | | | |
Exchange Traded Funds | | | | | | | | | | | | | | | | |
Exchange Traded Funds | | $ | 4,174,118 | | | $ | — | | | $ | — | | | $ | 4,174,118 | |
| | | | | | | | | | | | | | | | |
Total Assets | | $ | 4,174,118 | | | $ | — | | | $ | — | | | $ | 4,174,118 | |
| | | | | | | | | | | | | | | | |
Total Liabilities | | $ | — | | | $ | — | | | $ | — | | | $ | — | |
| | | | | | | | | | | | | | | | |
Total | | $ | 4,174,118 | | | $ | — | | | $ | — | | | $ | 4,174,118 | |
| | | | | | | | | | | | | | | | |
The Fund held no derivatives contracts during the year ended October 31, 2020.
Investment security transactions for the year ended October 31, 2020 were as follows:
| | | | |
Cost of Purchases: | | | | |
Long-term investments other than U.S. government debt securities | | $ | 1,171,098 | |
Net Proceeds of Sales and Redemptions: | | | | |
Long-term investments other than U.S. government debt securities | | $ | 812,941 | |
As of October 31, 2020, the gross unrealized appreciation (depreciation) of investments based on the aggregate cost of investments in securities and derivative instruments, if applicable, for Federal income tax purposes was as follows:
| | | | |
Aggregate gross unrealized appreciation | | $ | 331,836 | |
Aggregate gross unrealized depreciation | | | (115,588 | ) |
| | | | |
Net unrealized appreciation | | $ | 216,248 | |
| | | | |
Federal income tax cost of investments in securities and derivative instruments, if applicable | | $ | 3,957,870 | |
| | | | |
See Notes to Financial Statements.
100
1290 FUNDS
1290 RETIREMENT 2040 FUND
STATEMENT OF ASSETS AND LIABILITIES
October 31, 2020
| | | | |
ASSETS | | | | |
Investments in Securities, at value (Cost $3,947,778) | | $ | 4,174,118 | |
Cash | | | 38,198 | |
Receivable from investment adviser | | | 9,054 | |
Prepaid registration and filing fees | | | 4,768 | |
Receivable for Fund shares sold | | | 1,611 | |
Other assets | | | 46 | |
| | | | |
Total assets | | | 4,227,795 | |
| | | | |
LIABILITIES | | | | |
Accrued professional fees | | | 31,924 | |
Transfer agent fees payable | | | 2,151 | |
Trustees’ fees payable | | | 82 | |
Accrued expenses | | | 8,291 | |
| | | | |
Total liabilities | | | 42,448 | |
| | | | |
NET ASSETS | | $ | 4,185,347 | |
| | | | |
Net assets were comprised of: | | | | |
Paid in capital | | $ | 3,829,058 | |
Total distributable earnings (loss) | | | 356,289 | |
| | | | |
Net assets | | $ | 4,185,347 | |
| | | | |
Class I | | | | |
Net asset value, offering and redemption price per share, $4,185,347 / 354,828 shares outstanding (unlimited amount authorized: $0.001 par value) | | $ | 11.80 | |
| | | | |
STATEMENT OF OPERATIONS
For the Year Ended October 31, 2020
| | | | |
INVESTMENT INCOME | | | | |
Dividends | | $ | 103,738 | |
Interest | | | 252 | |
| | | | |
Total income | | | 103,990 | |
| | | | |
EXPENSES | | | | |
Professional fees | | | 40,749 | |
Administrative fees | | | 29,999 | |
Printing and mailing expenses | | | 28,146 | |
Investment advisory fees | | | 21,083 | |
Registration and filing fees | | | 19,801 | |
Transfer agent fees | | | 11,775 | |
Custodian fees | | | 4,751 | |
Trustees’ fees | | | 348 | |
Tax expense | | | 178 | |
Miscellaneous | | | 5,930 | |
| | | | |
Gross expenses | | | 162,760 | |
Less: Waiver from investment adviser | | | (51,082 | ) |
Reimbursement from investment adviser | | | (89,149 | ) |
| | | | |
Net expenses | | | 22,529 | |
| | | | |
NET INVESTMENT INCOME (LOSS) | | | 81,461 | |
| | | | |
REALIZED AND UNREALIZED GAIN (LOSS) | | | | |
Net realized gain (loss) on investments in securities | | | 77,816 | |
Net change in unrealized appreciation (depreciation) on investments in securities | | | (283,659 | ) |
| | | | |
NET REALIZED AND UNREALIZED GAIN (LOSS) | | | (205,843 | ) |
| | | | |
NET INCREASE (DECREASE) IN NET ASSETS RESULTING FROM OPERATIONS | | $ | (124,382 | ) |
| | | | |
STATEMENT OF CHANGES IN NET ASSETS
| | | | | | | | |
| | | Year Ended October 31, | |
| | 2020 | | | 2019 | |
INCREASE (DECREASE) IN NET ASSETS FROM OPERATIONS: | |
Net investment income (loss) | | $ | 81,461 | | | $ | 64,588 | |
Net realized gain (loss) | | | 77,816 | | | | 6,331 | |
Net change in unrealized appreciation (depreciation) | | | (283,659 | ) | | | 351,616 | |
| | | | | | | | |
NET INCREASE (DECREASE) IN NET ASSETS RESULTING FROM OPERATIONS | | | (124,382 | ) | | | 422,535 | |
| | | | | | | | |
Distributions to shareholders: | | | | | | | | |
Class I | | | (78,113 | ) | | | (68,399 | ) |
| | | | | | | | |
CAPITAL SHARES TRANSACTIONS: | | | | | | | | |
Class I | | | | | | | | |
Capital shares sold [84,591 and 71,724 shares, respectively] | | | 1,017,576 | | | | 832,237 | |
Capital shares issued in reinvestment of dividends [1,788 and 557 shares, respectively] | | | 21,588 | | | | 5,899 | |
Capital shares repurchased [(63,918) and (8,837) shares, respectively] | | | (656,757 | ) | | | (102,332 | ) |
| | | | | | | | |
NET INCREASE (DECREASE) IN NET ASSETS RESULTING FROM CAPITAL SHARE TRANSACTIONS | | | 382,407 | | | | 735,804 | |
| | | | | | | | |
TOTAL INCREASE (DECREASE) IN NET ASSETS | | | 179,912 | | | | 1,089,940 | |
NET ASSETS: | |
Beginning of year | | | 4,005,435 | | | | 2,915,495 | |
| | | | | | | | |
End of year | | $ | 4,185,347 | | | $ | 4,005,435 | |
| | | | | | | | |
See Notes to Financial Statements.
101
1290 FUNDS
1290 RETIREMENT 2040 FUND
FINANCIAL HIGHLIGHTS
| | | | | | | | | | | | | | | | |
| | | Year Ended October 31, | | | February 27, 2017* to
October 31, 2017 | |
| Class I | | 2020 | | | 2019 | | | 2018 | |
Net asset value, beginning of period | | $ | 12.05 | | | $ | 10.84 | | | $ | 10.89 | | | $ | 10.00 | |
| | | | | | | | | | | | | | | | |
Income (loss) from investment operations: | | | | | | | | | | | | | | | | |
Net investment income (loss) (e)(x) | | | 0.23 | | | | 0.22 | | | | 0.20 | | | | 0.11 | |
Net realized and unrealized gain (loss) | | | (0.26 | ) | | | 1.24 | | | | (0.06 | ) | | | 0.78 | |
| | | | | | | | | | | | | | | | |
Total from investment operations | | | (0.03 | ) | | | 1.46 | | | | 0.14 | | | | 0.89 | |
| | | | | | | | | | | | | | | | |
Less distributions: | |
Dividends from net investment income | | | (0.21 | ) | | | (0.20 | ) | | | (0.18 | ) | | | — | |
Distributions from net realized gains | | | (0.01 | ) | | | (0.05 | ) | | | (0.01 | ) | | | — | |
| | | | | | | | | | | | | | | | |
Total dividends and distributions | | | (0.22 | ) | | | (0.25 | ) | | | (0.19 | ) | | | — | |
| | | | | | | | | | | | | | | | |
Net asset value, end of period | | $ | 11.80 | | | $ | 12.05 | | | $ | 10.84 | | | $ | 10.89 | |
| | | | | | | | | | | | | | | | |
Total return (b) | | | (0.24 | )% | | | 13.79 | % | | | 1.26 | % | | | 8.90 | % |
| | | | | | | | | | | | | | | | |
Ratios/Supplemental Data: | |
Net assets, end of period (000’s) | | $ | 4,185 | | | $ | 4,005 | | | $ | 2,915 | | | $ | 2,722 | |
Ratio of expenses to average net assets: | | | | | | | | | | | | | | | | |
After waivers and reimbursements (a)(f) | | | 0.53 | %**(j) | | | 0.53 | %(j) | | | 0.53 | %(j) | | | 0.53 | %(j) |
Before waivers and reimbursements (a)(f) | | | 3.86 | % | | | 4.57 | % | | | 5.31 | % | | | 5.28 | % |
Ratio of net investment income (loss) to average net assets: | | | | | | | | | | | | | | | | |
After waivers and reimbursements (a)(f)(x) | | | 1.93 | % | | | 1.96 | % | | | 1.80 | % | | | 1.57 | %(l) |
Before waivers and reimbursements (a)(f)(x) | | | (1.39 | )% | | | (2.08 | )% | | | (2.99 | )% | | | (3.18 | )%(l) |
Portfolio turnover rate^ | | | 20 | % | | | 3 | % | | | 2 | % | | | 1 | %(z) |
| * | Commencement of Operations. |
| ** | Includes tax expense of less than 0.005%. |
| ^ | Portfolio turnover rate excludes derivatives, if any. |
| (a) | Ratios for periods less than one year are annualized. Certain non-recurring expenses incurred by the Fund are not annualized for periods less than one year. |
| (b) | Total returns for periods less than one year are not annualized. |
| (e) | Net investment income (loss) per share is based on average shares outstanding. |
| (f) | Expenses do not include the expenses of the underlying funds (“indirect expenses”), if applicable. |
| (j) | Including direct and indirect expenses, the net expense ratio after waivers and reimbursements would be 0.65%. |
| (l) | The annualized ratio of net investment income to average net assets may not be indicative of operating results for a full year. |
| (x) | Recognition of net investment income is affected by the timing of dividend declarations by the underlying funds in which the Fund invests. |
| (z) | Portfolio turnover rate for periods less than one year is not annualized. |
See Notes to Financial Statements.
102
1290 RETIREMENT 2045 FUND (Unaudited)
INVESTMENT ADVISER
| Ø | | Equitable Investment Management Group, LLC |
PERFORMANCE RESULTS
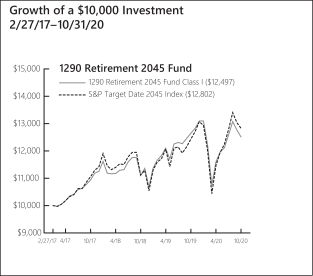
| | | | | | | | |
| | |
| Annualized Total Returns as of 10/31/20 | | | | |
| | | |
| | | 1
Year | | | Since
Incept. | |
Fund – Class I Shares* | | | (1.08 | )% | | | 6.26 | % |
S&P Target Date 2045 Index | | | 3.11 | | | | 6.96 | |
| |
* Date of inception 2/27/17. Returns for periods greater than one year are annualized. | |
The performance quoted is past performance and is not a guarantee of future results. Mutual funds are subject to certain market risks. Investment returns and principal value of an investment will fluctuate so that an investor’s shares, when redeemed, may be worth more or less than their original cost. Current performance may be higher or lower than the performance data shown. For the most current month-end performance data please call 1-888-310-0416 or visit www.1290Funds.com.
The graph illustrates comparative performance for $10,000 invested in the Class I Shares of the 1290 Retirement 2045 Fund and the S&P Target Date 2045 Index from 2/27/17 to 10/31/20. The performance of the S&P Target Date 2045 Index reflects an initial investment at the end of the month closest to the Fund’s inception. The performance of the Fund assumes reinvestment of all dividends and capital gain distributions, if any, and does not include a sales charge. The performance of the S&P Target Date 2045 Index does not reflect the deduction of expenses or a sales charge associated with a mutual fund and has been adjusted to reflect reinvestment of all dividends, capital gain distributions, and interest of the securities included in the benchmark.
As of March 1, 2020, the gross expense ratio including acquired fund fees for Class I shares was 3.64%. The net expense ratio for Class I shares was 0.65%. The net expense ratio reflects the Adviser’s decision to contractually limit expenses through April 30, 2021. Fund Performance may also reflect the waiver of the Fund’s fees and reimbursement of expenses for certain periods since the inception date. Without these waivers and reimbursements, performance would have been lower. In addition, performance shown in this section does not reflect the deduction of taxes that a shareholder would pay on Fund distributions or redemption of Fund shares.
PERFORMANCE SUMMARY
The Fund’s Class I shares returned (1.08)% for the year ended October 31, 2020. The Fund’s benchmark, the S&P Target Date 2045 Index, returned 3.11% over the same year.
Overview
Each 1290 Retirement Fund’s (as defined in the Notes to the Financial Statements) performance will reflect the performance of the underlying asset classes and depends upon their percentage weighting within the Fund. Here’s why: The 1290 Retirement Funds are managed to target a specific year of planned retirement. The asset mix will become more conservative each year, until about 10 years after the target retirement year, when it will become relatively stable. The 1290 Retirement Funds balance the need for appreciation with the need for income as retirement approaches and focus on supporting an income stream over a long-term retirement withdrawal horizon. To achieve its asset class exposure, each 1290 Retirement Fund invests in exchange-traded funds (ETFs) representing various equity and bond asset classes. Because of this, each of the 1290 Retirement Fund’s performance will be a function of the asset class performance and the percentage weighting of each asset class in the 1290 Retirement Fund. Current target and actual allocations, as well as performance, are available in a separate quarterly Fund Fact Sheet.
What helped performance during the year?
| • | | The Fund had no dedicated position in real estate which contributed to performance. The sector was down about 25% for the twelve-month period. |
| • | | The Fund’s fixed income ETFs outperformed relative to their respective benchmark. Having active weight exposure to Treasury Inflation Protected Securities (TIPS) contributed to performance, as TIPS was the best performing asset category within fixed income. |
What hurt performance during the year?
| • | | Security selection within equities was the top detractor from performance, as having a low volatility tilt was not beneficial across regions and market cap. |
| • | | Within fixed income, having no exposure to high yield detracted from performance as it was up 7.79%. |
103
1290 RETIREMENT 2045 FUND (Unaudited)
| | | | |
| |
Table by Asset Class (as a percentage of Total
Investments in Securities) | |
| |
| As of October 31, 2020 | |
Equity | | | 84.9 | % |
Fixed Income | | | 15.1 | |
| | | | |
| |
Top 10 Holdings (as a percentage of Total Investments in
Securities) | |
| | |
| As of October 31, 2020 | | | |
iShares Core S&P Total US Stock Market ETF | | | 29.2 | % |
iShares Core U.S. Aggregate Bond ETF | | | 12.8 | |
iShares Core MSCI EAFE ETF | | | 10.4 | |
iShares MSCI USA Min Vol Factor ETF | | | 9.8 | |
Invesco S&P 500 Low Volatility ETF | | | 9.7 | |
Invesco S&P International Developed Low Volatility ETF | | | 5.3 | |
Invesco S&P MidCap Low Volatility ETF | | | 5.3 | |
iShares MSCI EAFE Min Vol Factor ETF | | | 5.2 | |
Invesco S&P SmallCap Low Volatility ETF | | | 2.5 | |
SPDR SSGA US Small Cap Low Volatility Index ETF | | | 2.5 | |
| Holdings are subject to change without notice. | |
UNDERSTANDING YOUR EXPENSES:
As a shareholder of the Fund, you incur two types of costs:
(1) transaction costs, including applicable sales charges and redemption fees; and (2) ongoing costs, including investment advisory fees, distribution and/or service (12b-1) fees and other Fund expenses. These examples are intended to help you understand your ongoing costs (in dollars) of investing in the Fund and to compare these costs with the ongoing costs of investing in other mutual funds.
The examples are based on an investment of $1,000 invested at the beginning of the six-month period ended October 31, 2020 and held for the entire six-month period.
Actual Expenses
The first line of the following table provides information about actual account values and actual expenses. You may use the information in this line, together with the amount you invested, to estimate the expenses that you paid over the period. Simply divide your account value by $1,000 (for example, an $8,600 account value divided by $1,000 = 8.6), then multiply the result by the number in the first line under the heading entitled ‘‘Expenses Paid During Period’’ to estimate the expenses you paid on your account during this period.
Hypothetical Example for Comparison Purposes
The second line of the following table provides information about hypothetical account values and hypothetical expenses based on the Fund’s actual expense ratio and an assumed rate of return of 5% per year before expenses, which is not the Fund’s actual return. The hypothetical account values and expenses may not be used to estimate the actual ending account balance or expenses you paid for the period. You may use this information to compare the ongoing costs of investing in the Fund and other funds. To do so, compare this 5% hypothetical example with the 5% hypothetical examples that appear in the shareholder reports of the other funds.
Please note that the expenses shown in the table are meant to highlight your ongoing costs only and do not reflect any transactional costs, such as sales charges (loads), redemption fees, or exchange fees. Therefore, the second line of the table is useful in comparing ongoing costs only, and will not help you determine the relative total costs of owning different funds. In addition, if these transactional costs were included, your costs would have been higher.
EXAMPLE
| | | | | | | | | | | | |
| | | | |
| | | Beginning
Account
Value
5/1/20 | | | Ending
Account
Value
10/31/20 | | | Expenses
Paid
During
Period*
5/1/20 -
10/31/20 | |
Class I | | | | | | | | | | | | |
Actual | | | $1,000.00 | | | | $1,077.40 | | | | $2.76 | |
Hypothetical (5% average annual return before expenses) | | | 1,000.00 | | | | 1,022.48 | | | | 2.69 | |
| |
* Expenses are equal to the Portfolio’s I shares annualized expense ratio of 0.53%, multiplied by the average account value over the period, and multiplied by 184/366 (to reflect the one-half year period). | |
104
1290 FUNDS
1290 RETIREMENT 2045 FUND
PORTFOLIO OF INVESTMENTS
October 31, 2020
| | | | | | | | |
| | | |
| | | Number of
Shares | | | Value
(Note 1) | |
EXCHANGE TRADED FUNDS (ETF): | |
Equity (85.3%) | |
Invesco S&P 500 Low Volatility ETF | | | 12,460 | | | $ | 648,294 | |
Invesco S&P Emerging Markets Low Volatility ETF | | | 4,360 | | | | 86,546 | |
Invesco S&P International Developed Low Volatility ETF | | | 12,970 | | | | 355,637 | |
Invesco S&P MidCap Low Volatility ETF | | | 8,530 | | | | 354,933 | |
Invesco S&P SmallCap Low Volatility ETF | | | 4,920 | | | | 166,739 | |
iShares Core MSCI EAFE ETF | | | 11,890 | | | | 691,522 | |
iShares Core MSCI Emerging Markets ETF | | | 2,970 | | | | 158,806 | |
iShares Core S&P Total US Stock Market ETF | | | 26,230 | | | | 1,942,331 | |
iShares MSCI EAFE Min Vol Factor ETF | | | 5,310 | | | | 347,752 | |
iShares MSCI Emerging Markets Min Vol Factor ETF | | | 1,460 | | | | 80,242 | |
iShares MSCI USA Min Vol Factor ETF | | | 10,580 | | | | 652,363 | |
SPDR SSGA US Small Cap Low Volatility Index ETF | | | 2,130 | | | | 163,648 | |
| | | | | | | | |
Total Equity | | | | | | | 5,648,813 | |
| | | | | | | | |
Fixed Income (15.1%) | | | | | | | | |
iShares Core U.S. Aggregate Bond ETF | | | 7,280 | | | | 853,216 | |
iShares TIPS Bond ETF | | | 1,190 | | | | 149,024 | |
| | | | | | | | |
Total Fixed Income | | | | | | | 1,002,240 | |
| | | | | | | | |
Total Investments in Securities (100.4%)
(Cost $6,188,609) | | | | | | | 6,651,053 | |
Other Assets Less Liabilities (-0.4%) | | | | (25,754 | ) |
| | | | | |
Net Assets (100%) | | | | | | $ | 6,625,299 | |
| | | | | | | | |
The following is a summary of the inputs used to value the Fund’s assets and liabilities carried at fair value as of October 31, 2020:
The inputs or methodology used for valuing securities are not necessarily an indication of the risk associated with investing in those securities.
Various inputs are used in determining the value of the Fund’s investments. These inputs are summarized in the three broad levels listed below:
| | | | | | | | | | | | | | | | |
| | | | | |
| Investment Type | | Level 1
Quoted Prices in Active
Markets for Identical
Securities | | | Level 2
Significant Other
Observable Inputs
(including quoted prices for
similar securities, interest
rates, prepayment speeds,
credit risk, etc.) | | | Level 3
Significant Unobservable
Inputs (including the Fund’s
own assumptions in
determining the fair value
of investments) | | | Total | |
Assets: | | | | | |
Exchange Traded Funds | | | | | | | | | | | | | | | | |
Exchange Traded Funds | | $ | 6,651,053 | | | $ | — | | | $ | — | | | $ | 6,651,053 | |
| | | | | | | | | | | | | | | | |
Total Assets | | $ | 6,651,053 | | | $ | — | | | $ | — | | | $ | 6,651,053 | |
| | | | | | | | | | | | | | | | |
Total Liabilities | | $ | — | | | $ | — | | | $ | — | | | $ | — | |
| | | | | | | | | | | | | | | | |
Total | | $ | 6,651,053 | | | $ | — | | | $ | — | | | $ | 6,651,053 | |
| | | | | | | | | | | | | | | | |
The Fund held no derivatives contracts during the year ended October 31, 2020.
Investment security transactions for the year ended October 31, 2020 were as follows:
| | | | |
Cost of Purchases: | | | | |
Long-term investments other than U.S. government debt securities | | $ | 2,275,185 | |
Net Proceeds of Sales and Redemptions: | | | | |
Long-term investments other than U.S. government debt securities | | $ | 1,176,090 | |
As of October 31, 2020, the gross unrealized appreciation (depreciation) of investments based on the aggregate cost of investments in securities and derivative instruments, if applicable, for Federal income tax purposes was as follows:
| | | | |
Aggregate gross unrealized appreciation | | $ | 586,167 | |
Aggregate gross unrealized depreciation | | | (124,169 | ) |
| | | | |
Net unrealized appreciation | | $ | 461,998 | |
| | | | |
Federal income tax cost of investments in securities and derivative instruments, if applicable | | $ | 6,189,055 | |
| | | | |
See Notes to Financial Statements.
105
1290 FUNDS
1290 RETIREMENT 2045 FUND
STATEMENT OF ASSETS AND LIABILITIES
October 31, 2020
| | | | |
ASSETS | | | | |
Investments in Securities, at value (Cost $6,188,609) | | $ | 6,651,053 | |
Cash | | | 9,938 | |
Receivable from investment adviser | | | 8,374 | |
Prepaid registration and filing fees | | | 4,914 | |
Receivable for Fund shares sold | | | 451 | |
Dividends, interest and other receivables | | | 1 | |
Other assets | | | 79 | |
| | | | |
Total assets | | | 6,674,810 | |
| | | | |
LIABILITIES | | | | |
Payable for Fund shares redeemed | | | 6,132 | |
Transfer agent fees payable | | | 2,221 | |
Trustees’ fees payable | | | 133 | |
Accrued expenses | | | 41,025 | |
| | | | |
Total liabilities | | | 49,511 | |
| | | | |
NET ASSETS | | $ | 6,625,299 | |
| | | | |
Net assets were comprised of: | | | | |
Paid in capital | | $ | 5,902,274 | |
Total distributable earnings (loss) | | | 723,025 | |
| | | | |
Net assets | | $ | 6,625,299 | |
| | | | |
Class I | | | | |
Net asset value, offering and redemption price per share, $6,625,299 / 560,152 shares outstanding (unlimited amount authorized: $0.001 par value) | | $ | 11.83 | |
| | | | |
STATEMENT OF OPERATIONS
For the Year Ended October 31, 2020
| | | | |
INVESTMENT INCOME | | | | |
Dividends | | $ | 158,316 | |
Interest | | | 350 | |
| | | | |
Total income | | | 158,666 | |
| | | | |
EXPENSES | | | | |
Professional fees | | | 42,044 | |
Investment advisory fees | | | 32,328 | |
Printing and mailing expenses | | | 30,900 | |
Administrative fees | | | 29,998 | |
Registration and filing fees | | | 19,984 | |
Transfer agent fees | | | 12,460 | |
Custodian fees | | | 4,800 | |
Trustees’ fees | | | 539 | |
Tax expense | | | 282 | |
Miscellaneous | | | 6,626 | |
| | | | |
Gross expenses | | | 179,961 | |
Less: Waiver from investment adviser | | | (62,326 | ) |
Reimbursement from investment adviser | | | (83,225 | ) |
| | | | |
Net expenses | | | 34,410 | |
| | | | |
NET INVESTMENT INCOME (LOSS) | | | 124,256 | |
| | | | |
REALIZED AND UNREALIZED GAIN (LOSS) | | | | |
Net realized gain (loss) on investments in securities | | | 177,366 | |
Net change in unrealized appreciation (depreciation) on investments in securities | | | (187,202 | ) |
| | | | |
NET REALIZED AND UNREALIZED GAIN (LOSS) | | | (9,836 | ) |
| | | | |
NET INCREASE (DECREASE) IN NET ASSETS RESULTING FROM OPERATIONS | | $ | 114,420 | |
| | | | |
STATEMENT OF CHANGES IN NET ASSETS
| | | | | | | | |
| | | Year Ended October 31, | |
| | 2020 | | | 2019 | |
INCREASE (DECREASE) IN NET ASSETS FROM OPERATIONS: | |
Net investment income (loss) | | $ | 124,256 | | | $ | 90,582 | |
Net realized gain (loss) | | | 177,366 | | | | 422 | |
Net change in unrealized appreciation (depreciation) | | | (187,202 | ) | | | 506,810 | |
| | | | | | | | |
NET INCREASE (DECREASE) IN NET ASSETS RESULTING FROM OPERATIONS | | | 114,420 | | | | 597,814 | |
| | | | | | | | |
Distributions to shareholders: | | | | | | | | |
Class I | | | (106,681 | ) | | | (75,322 | ) |
| | | | | | | | |
CAPITAL SHARES TRANSACTIONS: | | | | | | | | |
Class I | | | | | | | | |
Capital shares sold [222,904 and 117,575 shares, respectively] | | | 2,464,519 | | | | 1,356,581 | |
Capital shares issued in reinvestment of dividends [4,128 and 2,113 shares, respectively] | | | 50,406 | | | | 22,572 | |
Capital shares repurchased [(129,465) and (8,569) shares, respectively] | | | (1,532,229 | ) | | | (100,710 | ) |
| | | | | | | | |
NET INCREASE (DECREASE) IN NET ASSETS RESULTING FROM CAPITAL SHARE TRANSACTIONS | | | 982,696 | | | | 1,278,443 | |
| | | | | | | | |
TOTAL INCREASE (DECREASE) IN NET ASSETS | | | 990,435 | | | | 1,800,935 | |
NET ASSETS: | |
Beginning of year | | | 5,634,864 | | | | 3,833,929 | |
| | | | | | | | |
End of year | | $ | 6,625,299 | | | $ | 5,634,864 | |
| | | | | | | | |
See Notes to Financial Statements.
106
1290 FUNDS
1290 RETIREMENT 2045 FUND
FINANCIAL HIGHLIGHTS
| | | | | | | | | | | | | | | | |
| | | Year Ended October 31, | | | February 27, 2017* to
October 31, 2017 | |
| Class I | | 2020 | | | 2019 | | | 2018 | |
| | | | |
Net asset value, beginning of period | | $ | 12.18 | | | $ | 10.91 | | | $ | 10.93 | | | $ | 10.00 | |
| | | | | | | | | | | | | | | | |
Income (loss) from investment operations: | | | | | | | | | | | | | | | | |
Net investment income (loss) (e)(x) | | | 0.23 | | | | 0.23 | | | | 0.20 | | | | 0.11 | |
Net realized and unrealized gain (loss) | | | (0.36 | ) | | | 1.25 | | | | (0.03 | ) | | | 0.82 | |
| | | | | | | | | | | | | | | | |
Total from investment operations | | | (0.13 | ) | | | 1.48 | | | | 0.17 | | | | 0.93 | |
| | | | | | | | | | | | | | | | |
Less distributions: | |
Dividends from net investment income | | | (0.22 | ) | | | (0.18 | ) | | | (0.18 | ) | | | — | |
Distributions from net realized gains | | | — | # | | | (0.03 | ) | | | (0.01 | ) | | | — | |
| | | | | | | | | | | | | | | | |
Total dividends and distributions | | | (0.22 | ) | | | (0.21 | ) | | | (0.19 | ) | | | — | |
| | | | | | | | | | | | | | | | |
Net asset value, end of period | | $ | 11.83 | | | $ | 12.18 | | | $ | 10.91 | | | $ | 10.93 | |
| | | | | | | | | | | | | | | | |
Total return (b) | | | (1.08 | )% | | | 13.85 | % | | | 1.53 | % | | | 9.30 | % |
| | | | | | | | | | | | | | | | |
Ratios/Supplemental Data: | |
Net assets, end of period (000’s) | | $ | 6,625 | | | $ | 5,635 | | | $ | 3,834 | | | $ | 2,741 | |
Ratio of expenses to average net assets: | | | | | | | | | | | | | | | | |
After waivers and reimbursements (a)(f) | | | 0.53 | %**(j) | | | 0.53 | %(j) | | | 0.53 | %(j) | | | 0.52 | %(j) |
Before waivers and reimbursements (a)(f) | | | 2.78 | % | | | 3.51 | % | | | 4.91 | % | | | 5.29 | % |
Ratio of net investment income (loss) to average net assets: | | | | | | | | | | | | | | | | |
After waivers and reimbursements (a)(f)(x) | | | 1.92 | % | | | 1.97 | % | | | 1.76 | % | | | 1.55 | %(l) |
Before waivers and reimbursements (a)(f)(x) | | | (0.33 | )% | | | (1.01 | )% | | | (2.62 | )% | | | (3.22 | )%(l) |
Portfolio turnover rate ^ | | | 18 | % | | | 1 | % | | | 2 | % | | | 1 | %(z) |
| * | Commencement of Operations. |
| ** | Includes tax expense of less than 0.005%. |
| # | Per share amount is less than $0.005. |
| ^ | Portfolio turnover rate excludes derivatives, if any. |
| (a) | Ratios for periods less than one year are annualized. Certain non-recurring expenses incurred by the Fund are not annualized for periods less than one year. |
| (b) | Total returns for periods less than one year are not annualized. |
| (e) | Net investment income (loss) per share is based on average shares outstanding. |
| (f) | Expenses do not include the expenses of the underlying funds (“indirect expenses”), if applicable. |
| (j) | Including direct and indirect expenses, the net expense ratio after waivers and reimbursements would be 0.65%. |
| (l) | The annualized ratio of net investment income to average net assets may not be indicative of operating results for a full year. |
| (x) | Recognition of net investment income is affected by the timing of dividend declarations by the underlying funds in which the Fund invests. |
| (z) | Portfolio turnover rate for periods less than one year is not annualized. |
See Notes to Financial Statements.
107
1290 RETIREMENT 2050 FUND (Unaudited)
INVESTMENT ADVISER
| Ø | | Equitable Investment Management Group, LLC |
PERFORMANCE RESULTS

| | | | | | | | |
| |
| Annualized Total Returns as of 10/31/20 | |
| | | |
| | | 1
Year | | | Since
Incept. | |
Fund – Class I Shares* | | | (2.05 | )% | | | 6.22 | % |
S&P Target Date 2050 Index | | | 3.05 | | | | 7.01 | |
| |
* Date of inception 2/27/17. Returns for periods greater than one year are annualized. | |
The performance quoted is past performance and is not a guarantee of future results. Mutual funds are subject to certain market risks. Investment returns and principal value of an investment will fluctuate so that an investor’s shares, when redeemed, may be worth more or less than their original cost. Current performance may be higher or lower than the performance data shown. For the most current month-end performance data please call 1-888-310-0416 or visit www.1290Funds.com.
The graph illustrates comparative performance for $10,000 invested in the Class I Shares of the 1290 Retirement 2050 Fund and the S&P Target Date 2050 Index from 2/27/17 to 10/31/20. The performance of the S&P Target Date 2050 Index reflects an initial investment at the end of the month closest to the Fund’s inception. The performance of the Fund assumes reinvestment of all dividends and capital gain distributions, if any, and does not include a sales charge. The performance of the S&P Target Date 2050 Index does not reflect the deduction of expenses or a sales charge associated with a mutual fund and has been adjusted to reflect reinvestment of all dividends, capital gain distributions, and interest of the securities included in the benchmark.
As of March 1, 2020, the gross expense ratio including acquired fund fees for Class I shares was 4.65%. The net expense ratio for Class I shares was 0.65%. The net expense ratio reflects the Adviser’s decision to contractually limit expenses through April 30, 2021. Fund Performance may also reflect the waiver of the Fund’s fees and reimbursement of expenses for certain periods since the inception date. Without these waivers and reimbursements, performance would have been lower.
In addition, performance shown in this section does not reflect the deduction of taxes that a shareholder would pay on Fund distributions or redemption of Fund shares.
PERFORMANCE SUMMARY
The Fund’s Class I shares returned (2.05)% for the year ended October 31, 2020. The Fund’s benchmark, the S&P Target Date 2050 Index, returned 3.05% over the same year.
Overview
Each 1290 Retirement Fund’s (as defined in the Notes to the Financial Statements) performance will reflect the performance of the underlying asset classes and depends upon their percentage weighting within the Fund. Here’s why: The 1290 Retirement Funds are managed to target a specific year of planned retirement. The asset mix will become more conservative each year, until about 10 years after the target retirement year, when it will become relatively stable. The 1290 Retirement Funds balance the need for appreciation with the need for income as retirement approaches and focus on supporting an income stream over a long-term retirement withdrawal horizon. To achieve its asset class exposure, each 1290 Retirement Fund invests in exchange-traded funds (ETFs) representing various equity and bond asset classes. Because of this, each of the 1290 Retirement Fund’s performance will be a function of the asset class performance and the percentage weighting of each asset class in the 1290 Retirement Fund. Current target and actual allocations, as well as performance, are available in a separate quarterly Fund Fact Sheet.
What helped performance during the year?
| • | | The Fund had no dedicated position in real estate which contributed to performance. The sector was down about 25% for the twelve-month period. |
| • | | The Fund’s fixed income ETFs outperformed relative to their respective benchmark. Having active weight exposure to Treasury Inflation Protected Securities (TIPS) contributed to performance, as TIPS was the best performing asset category within fixed income. |
What hurt performance during the year?
| • | | Security selection within equities was the top detractor from performance, as having a low volatility tilt was not beneficial across regions and market cap. |
| • | | Within fixed income, having no exposure to high yield detracted from performance as it was up 7.79%. |
108
1290 RETIREMENT 2050 FUND (Unaudited)
| | | | |
| |
Table by Asset Class (as a percentage of Total
Investments in Securities) As of October 31, 2020 | |
Equity | | | 89.8 | % |
Fixed Income | | | 10.2 | |
| | | | |
| |
Top 10 Holdings (as a percentage of Total Investments in
Securities) As of October 31, 2020 | |
iShares Core S&P Total US Stock Market ETF | | | 31.1 | % |
iShares Core MSCI EAFE ETF | | | 10.9 | |
iShares MSCI USA Min Vol Factor ETF | | | 10.6 | |
Invesco S&P 500 Low Volatility ETF | | | 10.5 | |
iShares Core U.S. Aggregate Bond ETF | | | 8.5 | |
Invesco S&P International Developed Low Volatility ETF | | | 5.7 | |
Invesco S&P MidCap Low Volatility ETF | | | 5.5 | |
iShares MSCI EAFE Min Vol Factor ETF | | | 5.4 | |
Invesco S&P SmallCap Low Volatility ETF | | | 3.0 | |
iShares Core MSCI Emerging Markets ETF | | | 2.7 | |
Holdings are subject to change without notice. | | | | |
UNDERSTANDING YOUR EXPENSES:
As a shareholder of the Fund, you incur two types of costs:
(1) transaction costs, including applicable sales charges and redemption fees; and (2) ongoing costs, including investment advisory fees, distribution and/or service (12b-1) fees and other Fund expenses. These examples are intended to help you understand your ongoing costs (in dollars) of investing in the Fund and to compare these costs with the ongoing costs of investing in other mutual funds.
The examples are based on an investment of $1,000 invested at the beginning of the six-month period ended October 31, 2020 and held for the entire six-month period.
Actual Expenses
The first line of the following table provides information about actual account values and actual expenses. You may use the information in this line, together with the amount you invested, to estimate the expenses that you paid over the period. Simply divide your account value by $1,000 (for example, an $8,600 account value divided by $1,000 = 8.6), then multiply the result by the number in the first line under the heading entitled ‘‘Expenses Paid During Period’’ to estimate the expenses you paid on your account during this period.
Hypothetical Example for Comparison Purposes
The second line of the following table provides information about hypothetical account values and hypothetical expenses based on the Fund’s actual expense ratio and an assumed rate of return of 5% per year before expenses, which is not the Fund’s actual return. The hypothetical account values and expenses may not be used to estimate the actual ending account balance or expenses you paid for the period. You may use this information to compare the ongoing costs of investing in the Fund and other funds. To do so, compare this 5% hypothetical example with the 5% hypothetical examples that appear in the shareholder reports of the other funds.
Please note that the expenses shown in the table are meant to highlight your ongoing costs only and do not reflect any transactional costs, such as sales charges (loads), redemption fees, or exchange fees. Therefore, the second line of the table is useful in comparing ongoing costs only, and will not help you determine the relative total costs of owning different funds. In addition, if these transactional costs were included, your costs would have been higher.
EXAMPLE
| | | | | | | | | | | | |
| | | | |
| | | Beginning
Account
Value
5/1/20 | | | Ending
Account
Value
10/31/20 | | | Expenses
Paid
During
Period*
5/1/20 -
10/31/20 | |
Class I | |
Actual | | | $1,000.00 | | | | $1,080.90 | | | | $2.75 | |
Hypothetical (5% average annual return before expenses) | | | 1,000.00 | | | | 1,022.50 | | | | 2.67 | |
| |
* Expenses are equal to the Portfolio’s I shares annualized expense ratio of 0.53%, multiplied by the average account value over the period, and multiplied by 184/366 (to reflect the one-half year period). | |
109
1290 FUNDS
1290 RETIREMENT 2050 FUND
PORTFOLIO OF INVESTMENTS
October 31, 2020
| | | | | | | | |
| | | |
| | | Number of
Shares | | | Value
(Note 1) | |
EXCHANGE TRADED FUNDS (ETF): | |
Equity (90.2%) | |
Invesco S&P 500 Low Volatility ETF | | | 9,630 | | | $ | 501,049 | |
Invesco S&P Emerging Markets Low Volatility ETF | | | 2,900 | | | | 57,565 | |
Invesco S&P International Developed Low Volatility ETF | | | 9,880 | | | | 270,910 | |
Invesco S&P MidCap Low Volatility ETF | | | 6,360 | | | | 264,639 | |
Invesco S&P SmallCap Low Volatility ETF | | | 4,190 | | | | 141,999 | |
iShares Core MSCI EAFE ETF | | | 8,970 | | | | 521,695 | |
iShares Core MSCI Emerging Markets ETF | | | 2,380 | | | | 127,259 | |
iShares Core S&P Total US Stock Market ETF | | | 20,060 | | | | 1,485,443 | |
iShares MSCI EAFE Min Vol Factor ETF | | | 3,960 | | | | 259,340 | |
iShares MSCI Emerging Markets Min Vol Factor ETF | | | 1,030 | | | | 56,609 | |
iShares MSCI USA Min Vol Factor ETF | | | 8,200 | | | | 505,612 | |
SPDR SSGA US Small Cap Low Volatility Index ETF | | | 1,360 | | | | 104,489 | |
| | | | | | | | |
Total Equity | | | | | | | 4,296,609 | |
| | | | | | | | |
Fixed Income (10.2%) | | | | | | | | |
iShares Core U.S. Aggregate Bond ETF | | | 3,470 | | | | 406,684 | |
iShares TIPS Bond ETF | | | 630 | | | | 78,895 | |
| | | | | | | | |
Total Fixed Income | | | | | | | 485,579 | |
| | | | | | | | |
Total Investments in Securities (100.4%)
(Cost $4,483,410) | | | | | | | 4,782,188 | |
Other Assets Less Liabilities (-0.4%) | | | | | | | (21,161 | ) |
| | | | | |
Net Assets (100%) | | | | | | $ | 4,761,027 | |
| | | | | | | | |
The following is a summary of the inputs used to value the Fund’s assets and liabilities carried at fair value as of October 31, 2020:
The inputs or methodology used for valuing securities are not necessarily an indication of the risk associated with investing in those securities.
Various inputs are used in determining the value of the Fund’s investments. These inputs are summarized in the three broad levels listed below:
| | | | | | | | | | | | | | | | |
| | | | | |
| Investment Type | | Level 1
Quoted Prices in
Active Markets for
Identical
Securities | | | Level 2
Significant Other
Observable Inputs
(including quoted prices
for similar securities,
interest rates,
prepayment speeds,
credit risk, etc.) | | | Level 3
Significant Unobservable
Inputs (including the
Fund’s own
assumptions in
determining the fair
value of investments) | | | Total | |
Assets: | | | | | |
Exchange Traded Funds | | | | | | | | | | | | | | | | |
Exchange Traded Funds | | $ | 4,782,188 | | | $ | — | | | $ | — | | | $ | 4,782,188 | |
| | | | | | | | | | | | | | | | |
Total Assets | | $ | 4,782,188 | | | $ | — | | | $ | — | | | $ | 4,782,188 | |
| | | | | | | | | | | | | | | | |
Total Liabilities | | $ | — | | | $ | — | | | $ | — | | | $ | — | |
| | | | | | | | | | | | | | | | |
Total | | $ | 4,782,188 | | | $ | — | | | $ | — | | | $ | 4,782,188 | |
| | | | | | | | | | | | | | | | |
The Fund held no derivatives contracts during the year ended October 31, 2020.
Investment security transactions for the year ended October 31, 2020 were as follows:
| | | | |
Cost of Purchases: | | | | |
Long-term investments other than U.S. government debt securities | | $ | 2,167,360 | |
Net Proceeds of Sales and Redemptions: | | | | |
Long-term investments other than U.S. government debt securities | | $ | 873,265 | |
As of October 31, 2020, the gross unrealized appreciation (depreciation) of investments based on the aggregate cost of investments in securities and derivative instruments, if applicable, for Federal income tax purposes was as follows:
| | | | |
Aggregate gross unrealized appreciation | | $ | 367,632 | |
Aggregate gross unrealized depreciation | | | (110,732 | ) |
| | | | |
Net unrealized appreciation | | $ | 256,900 | |
| | | | |
Federal income tax cost of investments in securities and derivative instruments, if applicable | | $ | 4,525,288 | |
| | | | |
See Notes to Financial Statements.
110
1290 FUNDS
1290 RETIREMENT 2050 FUND
STATEMENT OF ASSETS AND LIABILITIES
October 31, 2020
| | | | |
ASSETS | |
Investments in Securities, at value (Cost $4,483,410) | | $ | 4,782,188 | |
Cash | | | 6,927 | |
Receivable from investment adviser | | | 8,485 | |
Prepaid registration and filing fees | | | 4,767 | |
Receivable for Fund shares sold | | | 959 | |
Other assets | | | 46 | |
| | | | |
Total assets | | | 4,803,372 | |
| | | | |
LIABILITIES | |
Accrued professional fees | | | 31,988 | |
Transfer agent fees payable | | | 2,039 | |
Trustees’ fees payable | | | 102 | |
Accrued expenses | | | 8,216 | |
| | | | |
Total liabilities | | | 42,345 | |
| | | | |
NET ASSETS | | $ | 4,761,027 | |
| | | | |
Net assets were comprised of: | | | | |
Paid in capital | | $ | 4,400,641 | |
Total distributable earnings (loss) | | | 360,386 | |
| | | | |
Net assets | | $ | 4,761,027 | |
| | | | |
Class I | | | | |
Net asset value, offering and redemption price per share, $4,761,027 / 404,806 shares outstanding (unlimited amount authorized: $0.001 par value) | | $ | 11.76 | |
| | | | |
STATEMENT OF OPERATIONS
For the Year Ended October 31, 2020
| | | | |
INVESTMENT INCOME | | | | |
Dividends | | $ | 103,367 | |
Interest | | | 269 | |
| | | | |
Total income | | | 103,636 | |
| | | | |
EXPENSES | |
Professional fees | | | 40,773 | |
Administrative fees | | | 29,998 | |
Printing and mailing expenses | | | 27,727 | |
Investment advisory fees | | | 21,326 | |
Registration and filing fees | | | 19,780 | |
Transfer agent fees | | | 11,250 | |
Custodian fees | | | 4,900 | |
Trustees’ fees | | | 353 | |
Tax expense | | | 185 | |
Miscellaneous | | | 5,683 | |
| | | | |
Gross expenses | | | 161,975 | |
Less: Waiver from investment adviser | | | (51,324 | ) |
Reimbursement from investment adviser | | | (88,096 | ) |
| | | | |
Net expenses | | | 22,555 | |
| | | | |
NET INVESTMENT INCOME (LOSS) | | | 81,081 | |
| | | | |
REALIZED AND UNREALIZED GAIN (LOSS) | |
Net realized gain (loss) on investments in securities | | | 8,725 | |
Net change in unrealized appreciation (depreciation) on investments in securities | | | (260,439 | ) |
| | | | |
NET REALIZED AND UNREALIZED GAIN (LOSS) | | | (251,714 | ) |
| | | | |
NET INCREASE (DECREASE) IN NET ASSETS RESULTING FROM OPERATIONS | | $ | (170,633 | ) |
| | | | |
STATEMENT OF CHANGES IN NET ASSETS
| | | | | | | | |
| | | Year Ended October 31, | |
| | | 2020 | | | 2019 | |
INCREASE (DECREASE) IN NET ASSETS FROM OPERATIONS: | | | | | | | | |
Net investment income (loss) | | $ | 81,081 | | | $ | 65,387 | |
Net realized gain (loss) | | | 8,725 | | | | 6,188 | |
Net change in unrealized appreciation (depreciation) | | | (260,439 | ) | | | 370,029 | |
| | | | | | | | |
NET INCREASE (DECREASE) IN NET ASSETS RESULTING FROM OPERATIONS | | | (170,633 | ) | | | 441,604 | |
| | | | | | | | |
Distributions to shareholders: | | | | | | | | |
Class I | | | (76,047 | ) | | | (70,591 | ) |
| | | | | | | | |
CAPITAL SHARES TRANSACTIONS: | | | | | | | | |
Class I | | | | | | | | |
Capital shares sold [191,933 and 29,945 shares, respectively] | | | 2,194,147 | | | | 343,550 | |
Capital shares issued in reinvestment of dividends [1,323 and 756 shares, respectively] | | | 16,247 | | | | 8,091 | |
Capital shares repurchased [(94,603) and (4,097) shares, respectively] | | | (949,336 | ) | | | (44,001 | ) |
| | | | | | | | |
NET INCREASE (DECREASE) IN NET ASSETS RESULTING FROM CAPITAL SHARE TRANSACTIONS | | | 1,261,058 | | | | 307,640 | |
| | | | | | | | |
TOTAL INCREASE (DECREASE) IN NET ASSETS | | | 1,014,378 | | | | 678,653 | |
NET ASSETS: | | | | | | | | |
Beginning of year | | | 3,746,649 | | | | 3,067,996 | |
| | | | | | | | |
End of year | | $ | 4,761,027 | | | $ | 3,746,649 | |
| | | | | | | | |
See Notes to Financial Statements.
111
1290 FUNDS
1290 RETIREMENT 2050 FUND
FINANCIAL HIGHLIGHTS
| | | | | | | | | | | | | | | | |
| | | Year Ended October 31, | | | February 27, 2017* to
October 31, 2017 | |
| Class I | | 2020 | | | 2019 | | | 2018 | |
Net asset value, beginning of period | | $ | 12.24 | | | $ | 10.97 | | | $ | 10.98 | | | $ | 10.00 | |
| | | | | | | | | | | | | | | | |
Income (loss) from investment operations: | | | | | | | | | | | | | | | | |
Net investment income (loss) (e)(x) | | | 0.22 | | | | 0.22 | | | | 0.20 | | | | 0.11 | |
Net realized and unrealized gain (loss) | | | (0.46 | ) | | | 1.30 | | | | (0.02 | ) | | | 0.87 | |
| | | | | | | | | | | | | | | | |
Total from investment operations | | | (0.24 | ) | | | 1.52 | | | | 0.18 | | | | 0.98 | |
| | | | | | | | | | | | | | | | |
Less distributions: | |
Dividends from net investment income | | | (0.22 | ) | | | (0.20 | ) | | | (0.18 | ) | | | — | |
Distributions from net realized gains | | | (0.02 | ) | | | (0.05 | ) | | | (0.01 | ) | | | — | |
| | | | | | | | | | | | | | | | |
Total dividends and distributions | | | (0.24 | ) | | | (0.25 | ) | | | (0.19 | ) | | | — | |
| | | | | | | | | | | | | | | | |
Net asset value, end of period | | $ | 11.76 | | | $ | 12.24 | | | $ | 10.97 | | | $ | 10.98 | |
| | | | | | | | | | | | | | | | |
Total return (b) | | | (2.05 | )% | | | 14.18 | % | | | 1.63 | % | | | 9.80 | % |
| | | | | | | | | | | | | | | | |
Ratios/Supplemental Data: | |
Net assets, end of period (000’s) | | $ | 4,761 | | | $ | 3,747 | | | $ | 3,068 | | | $ | 2,744 | |
Ratio of expenses to average net assets: | | | | | | | | | | | | | | | | |
After waivers and reimbursements (a)(f) | | | 0.53 | %**(j) | | | 0.52 | %(j) | | | 0.52 | %(j) | | | 0.52 | %(j) |
Before waivers and reimbursements (a)(f) | | | 3.80 | % | | | 4.52 | % | | | 5.20 | % | | | 5.26 | % |
Ratio of net investment income (loss) to average net assets: | | | | | | | | | | | | | | | | |
After waivers and reimbursements (a)(f)(x) | | | 1.90 | % | | | 1.96 | % | | | 1.77 | % | | | 1.54 | %(l) |
Before waivers and reimbursements (a)(f)(x) | | | (1.37 | )% | | | (2.03 | )% | | | (2.90 | )% | | | (3.20 | )%(l) |
Portfolio turnover rate^ | | | 21 | % | | | 2 | % | | | 2 | % | | | 1 | %(z) |
| * | Commencement of Operations. |
| ** | Includes tax expense of less than 0.005%. |
| ^ | Portfolio turnover rate excludes derivatives, if any. |
| (a) | Ratios for periods less than one year are annualized. Certain non-recurring expenses incurred by the Fund are not annualized for periods less than one year. |
| (b) | Total returns for periods less than one year are not annualized. |
| (e) | Net investment income (loss) per share is based on average shares outstanding. |
| (f) | Expenses do not include the expenses of the underlying funds (“indirect expenses”), if applicable. |
| (j) | Including direct and indirect expenses, the net expense ratio after waivers and reimbursements would be 0.65% . |
| (l) | The annualized ratio of net investment income to average net assets may not be indicative of operating results for a full year. |
| (x) | Recognition of net investment income is affected by the timing of dividend declarations by the underlying funds in which the Fund invests. |
| (z) | Portfolio turnover rate for periods less than one year is not annualized. |
See Notes to Financial Statements.
112
1290 RETIREMENT 2055 FUND (Unaudited)
INVESTMENT ADVISER
| Ø | | Equitable Investment Management Group, LLC |
PERFORMANCE RESULTS
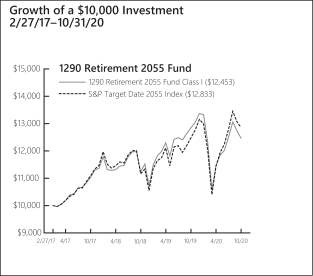
| | | | | | | | |
| |
| Annualized Total Returns as of 10/31/20 | |
| | | |
| | | 1
Year | | | Since
Incept. | |
Fund – Class I Shares* | | | (2.97 | )% | | | 6.15 | % |
S&P Target Date 2055 Index | | | 2.92 | | | | 7.03 | |
| |
* Date of inception 2/27/17. Returns for periods greater than one year are annualized. | |
The performance quoted is past performance and is not a guarantee of future results. Mutual funds are subject to certain market risks. Investment returns and principal value of an investment will fluctuate so that an investor’s shares, when redeemed, may be worth more or less than their original cost. Current performance may be higher or lower than the performance data shown. For the most current month-end performance data please call 1-888-310-0416 or visit www.1290Funds.com.
The graph illustrates comparative performance for $10,000 invested in the Class I Shares of the 1290 Retirement 2055 Fund and the S&P Target Date 2055 Index from 2/27/17 to 10/31/20. The performance of the S&P Target Date 2055 Index reflects an initial investment at the end of the month closest to the Fund’s inception. The performance of the Fund assumes reinvestment of all dividends and capital gain distributions, if any, and does not include a sales charge. The performance of the S&P Target Date 2055 Index does not reflect the deduction of expenses or a sales charge associated with a mutual fund and has been adjusted to reflect reinvestment of all dividends, capital gain distributions, and interest of the securities included in the benchmark.
As of March 1, 2020, the gross expense ratio including acquired fund fees for Class I shares was 4.87%. The net expense ratio for Class I shares was 0.65%. The net expense ratio reflects the Adviser’s decision to contractually limit expenses through April 30, 2021. Fund Performance may also reflect the waiver of the Fund’s fees and reimbursement of expenses for certain periods since the inception date. Without these waivers and reimbursements, performance would have been lower. In addition, performance shown in this section does not reflect the deduction of taxes that a shareholder would pay on Fund distributions or redemption of Fund shares.
PERFORMANCE SUMMARY
The Fund’s Class I shares returned (2.97)% for the year ended October 31, 2020. The Fund’s benchmark, the S&P Target Date 2055 Index, returned 2.92% over the same year.
Overview
Each 1290 Retirement Fund’s (as defined in the Notes to the Financial Statements) performance will reflect the performance of the underlying asset classes and depends upon their percentage weighting within the Fund. Here’s why: The 1290 Retirement Funds are managed to target a specific year of planned retirement. The asset mix will become more conservative each year, until about 10 years after the target retirement year, when it will become relatively stable. The 1290 Retirement Funds balance the need for appreciation with the need for income as retirement approaches and focus on supporting an income stream over a long-term retirement withdrawal horizon. To achieve its asset class exposure, each 1290 Retirement Fund invests in exchange-traded funds (ETFs) representing various equity and bond asset classes. Because of this, each Funds’ performance will be generated by its holdings in each asset class, and the asset class’s performance. You can find current target and actual allocations, as well as performance, in a separate quarterly Fund Fact Sheet.
What helped performance during the year?
| • | | The Fund had no dedicated position in real estate which contributed to performance. The sector was down about 25% for the twelve-month period. |
| • | | The Fund’s fixed income ETFs outperformed relative to their respective benchmark. Having active weight exposure to Treasury Inflation Protected Securities (TIPS) contributed to performance, as TIPS was the best performing asset category within fixed income. |
What hurt performance during the year?
| • | | Security selection within equities was the top detractor from performance, as having a low volatility tilt was not beneficial across regions and market cap. |
| • | | Within fixed income, having no exposure to high yield detracted from performance as it was up 7.79%. |
| | | | |
| |
Table by Asset Class (as a percentage of Total
Investments in Securities) | |
| | |
| As of October 31, 2020 | | | |
Equity | | | 95.0% | |
Fixed Income | | | 5.0 | |
113
1290 RETIREMENT 2055 FUND (Unaudited)
| | | | |
| |
Top 10 Holdings (as a percentage of Total Investments in
Securities) | |
| | |
| As of October 31, 2020 | | | |
iShares Core S&P Total US Stock Market ETF | | | 32.9% | |
iShares Core MSCI EAFE ETF | | | 11.6 | |
Invesco S&P 500 Low Volatility ETF | | | 11.1 | |
iShares MSCI USA Min Vol Factor ETF | | | 11.0 | |
iShares MSCI EAFE Min Vol Factor ETF | | | 5.8 | |
Invesco S&P MidCap Low Volatility ETF | | | 5.8 | |
Invesco S&P International Developed Low Volatility ETF | | | 5.8 | |
iShares Core U.S. Aggregate Bond ETF | | | 4.2 | |
Invesco S&P SmallCap Low Volatility ETF | | | 3.0 | |
iShares Core MSCI Emerging Markets ETF | | | 2.7 | |
Holdings are subject to change without notice.
UNDERSTANDING YOUR EXPENSES:
As a shareholder of the Fund, you incur two types of costs:
(1) transaction costs, including applicable sales charges and redemption fees; and (2) ongoing costs, including investment advisory fees, distribution and/or service (12b-1) fees and other Fund expenses. These examples are intended to help you understand your ongoing costs (in dollars) of investing in the Fund and to compare these costs with the ongoing costs of investing in other mutual funds.
The examples are based on an investment of $1,000 invested at the beginning of the six-month period ended October 31, 2020 and held for the entire six-month period.
Actual Expenses
The first line of the following table provides information about actual account values and actual expenses. You may use the information in this line, together with the amount you invested, to estimate the expenses that you paid over the period. Simply divide your account value by $1,000 (for example, an $8,600 account value divided by $1,000 = 8.6), then multiply the result by the number in the first line under the heading entitled ‘‘Expenses Paid During Period’’ to estimate the expenses you paid on your account during this period.
Hypothetical Example for Comparison Purposes
The second line of the following table provides information about hypothetical account values and hypothetical expenses based on the Fund’s actual expense ratio and an assumed rate of return of 5% per year before expenses, which is not the Fund’s actual return. The hypothetical account values and expenses may not be used to estimate the actual ending account balance or expenses you paid for the period. You may use this information to compare the ongoing costs of investing in the Fund and other funds. To do so, compare this 5% hypothetical example with the 5% hypothetical examples that appear in the shareholder reports of the other funds.
Please note that the expenses shown in the table are meant to highlight your ongoing costs only and do not reflect any transactional costs, such as sales charges (loads), redemption fees, or exchange fees. Therefore, the second line of the table is useful in comparing ongoing costs only, and will not help you determine the relative total costs of owning different funds. In addition, if these transactional costs were included, your costs would have been higher.
EXAMPLE
| | | | | | | | | | | | |
| | | | |
| | | Beginning
Account
Value
5/1/20 | | | Ending
Account
Value
10/31/20 | | | Expenses Paid During Period* 5/1/20- 10/31/20 | |
Class I | | | | | | | | | | | | |
Actual | | | $1,000.00 | | | | $1,086.10 | | | | $2.75 | % |
Hypothetical (5% average annual return before expenses) | | | 1,000.00 | | | | 1,022.50 | | | | 2.66 | % |
| |
* Expenses are equal to the Portfolio’s I shares annualized expense ratio of 0.52%, multiplied by the average account value over the period, and multiplied by 184/366 (to reflect the one-half year period). | |
114
1290 FUNDS
1290 RETIREMENT 2055 FUND
PORTFOLIO OF INVESTMENTS
October 31, 2020
| | | | | | | | |
| | | |
| | | Number of
Shares | | | Value
(Note 1) | |
EXCHANGE TRADED FUNDS (ETF): | | | | | | | | |
Equity (95.4%) | | | | | | | | |
Invesco S&P 500 Low Volatility ETF | | | 8,280 | | | $ | 430,808 | |
Invesco S&P Emerging Markets Low Volatility ETF | | | 2,130 | | | | 42,281 | |
Invesco S&P International Developed Low Volatility ETF | | | 8,220 | | | | 225,393 | |
Invesco S&P MidCap Low Volatility ETF | | | 5,430 | | | | 225,942 | |
Invesco S&P SmallCap Low Volatility ETF | | | 3,420 | | | | 115,904 | |
iShares Core MSCI EAFE ETF | | | 7,740 | | | | 450,158 | |
iShares Core MSCI Emerging Markets ETF | | | 1,990 | | | | 106,405 | |
iShares Core S&P Total US Stock Market ETF | | | 17,310 | | | | 1,281,806 | |
iShares MSCI EAFE Min Vol Factor ETF | | | 3,460 | | | | 226,595 | |
iShares MSCI Emerging Markets Min Vol Factor ETF | | | 1,230 | | | | 67,601 | |
iShares MSCI USA Min Vol Factor ETF | | | 6,940 | | | | 427,920 | |
SPDR SSGA US Small Cap Low Volatility Index ETF | | | 1,330 | | | | 102,184 | |
| | | | | | | | |
Total Equity | | | | | | | 3,702,997 | |
| | | | | | | | |
Fixed Income (5.0%) | | | | | | | | |
iShares Core U.S. Aggregate Bond ETF | | | 1,410 | | | | 165,252 | |
iShares TIPS Bond ETF | | | 230 | | | | 28,803 | |
| | | | | | | | |
Total Fixed Income | | | | | | | 194,055 | |
| | | | | | | | |
Total Investments in Securities (100.4%)
(Cost $3,491,041) | | | | | | | 3,897,052 | |
Other Assets Less Liabilities (-0.4%) | | | | | | | (14,144 | ) |
| | | | | | | | |
Net Assets (100%) | | | | | | $ | 3,882,908 | |
| | | | | | | | |
See Notes to Financial Statements.
115
1290 FUNDS
1290 RETIREMENT 2055 FUND
PORTFOLIO OF INVESTMENTS (Continued)
October 31, 2020
The following is a summary of the inputs used to value the Fund’s assets and liabilities carried at fair value as of October 31, 2020:
The inputs or methodology used for valuing securities are not necessarily an indication of the risk associated with investing in those securities.
Various inputs are used in determining the value of the Fund’s investments. These inputs are summarized in the three broad levels listed below:
| | | | | | | | | | | | | | | | |
| | | | | |
| Investment Type | | Level 1
Quoted Prices in
Active Markets for
Identical
Securities | | | Level 2
Significant Other
Observable Inputs
(including quoted prices
for similar securities,
interest rates,
prepayment speeds,
credit risk, etc.) | | | Level 3
Significant Unobservable
Inputs (including the
Fund’s own assumptions in
determining the fair
value of investments) | | | Total | |
Assets: | | | | | | | | | | | | | | | | |
Exchange Traded Funds | | | | | | | | | | | | | | | | |
Exchange Traded Funds | | $ | 3,897,052 | | | $ | — | | | $ | — | | | $ | 3,897,052 | |
| | | | | | | | | | | | | | | | |
Total Assets | | $ | 3,897,052 | | | $ | — | | | $ | — | | | $ | 3,897,052 | |
| | | | | | | | | | | | | | | | |
Total Liabilities | | $ | — | | | $ | — | | | $ | — | | | $ | — | |
| | | | | | | | | | | | | | | | |
Total | | $ | 3,897,052 | | | $ | — | | | $ | — | | | $ | 3,897,052 | |
| | | | | | | | | | | | | | | | |
The Fund held no derivatives contracts during the year ended October 31, 2020.
Investment security transactions for the year ended October 31, 2020 were as follows:
| | | | |
Cost of Purchases: | | | | |
Long-term investments other than U.S. government debt securities | | $ | 686,593 | |
Net Proceeds of Sales and Redemptions: | | | | |
Long-term investments other than U.S. government debt securities | | $ | 217,269 | |
As of October 31, 2020, the gross unrealized appreciation (depreciation) of investments based on the aggregate cost of investments in securities and derivative instruments, if applicable, for Federal income tax purposes was as follows:
| | | | |
Aggregate gross unrealized appreciation | | $ | 477,481 | |
Aggregate gross unrealized depreciation | | | (71,756 | ) |
| | | | |
Net unrealized appreciation | | $ | 405,725 | |
| | | | |
Federal income tax cost of investments in securities and derivative instruments, if applicable | | $ | 3,491,327 | |
| | | | |
See Notes to Financial Statements.
116
1290 FUNDS
1290 RETIREMENT 2055 FUND
STATEMENT OF ASSETS AND LIABILITIES
October 31, 2020
| | | | |
ASSETS | | | | |
Investments in Securities, at value (Cost $3,491,041) | | $ | 3,897,052 | |
Cash | | | 12,262 | |
Receivable from investment adviser | | | 8,893 | |
Prepaid registration and filing fees | | | 4,735 | |
Receivable for Fund shares sold | | | 2,047 | |
Other assets | | | 38 | |
| | | | |
Total assets | | | 3,925,027 | |
| | | | |
LIABILITIES | | | | |
Accrued professional fees | | | 31,847 | |
Transfer agent fees payable | | | 2,082 | |
Trustees’ fees payable | | | 86 | |
Accrued expenses | | | 8,104 | |
| | | | |
Total liabilities | | | 42,119 | |
| | | | |
NET ASSETS | | $ | 3,882,908 | |
| | | | |
Net assets were comprised of: | | | | |
Paid in capital | | $ | 3,388,711 | |
Total distributable earnings (loss) | | | 494,197 | |
| | | | |
Net assets | | $ | 3,882,908 | |
| | | | |
Class I | | | | |
Net asset value, offering and redemption price per share, $3,882,908 / 331,109 shares outstanding (unlimited amount authorized: $0.001 par value) | | $ | 11.73 | |
| | | | |
STATEMENT OF OPERATIONS
For the Year Ended October 31, 2020
| | | | |
INVESTMENT INCOME | | | | |
Dividends | | $ | 90,729 | |
Interest | | | 194 | |
| | | | |
Total income | | | 90,923 | |
| | | | |
EXPENSES | | | | |
Professional fees | | | 40,362 | |
Administrative fees | | | 29,998 | |
Printing and mailing expenses | | | 27,368 | |
Registration and filing fees | | | 19,752 | |
Investment advisory fees | | | 18,196 | |
Transfer agent fees | | | 11,425 | |
Custodian fees | | | 4,550 | |
Trustees’ fees | | | 308 | |
Tax expense | | | 182 | |
Miscellaneous | | | 5,576 | |
| | | | |
Gross expenses | | | 157,717 | |
Less: | | | | |
Waiver from investment adviser | | | (48,194 | ) |
Reimbursement from investment adviser | | | (90,331 | ) |
| | | | |
Net expenses | | | 19,192 | |
| | | | |
NET INVESTMENT INCOME (LOSS) | | | 71,731 | |
| | | | |
REALIZED AND UNREALIZED GAIN (LOSS) | | | | |
Net realized gain (loss) on investments in securities | | | 43,160 | |
Net change in unrealized appreciation (depreciation) on investments in securities | | | (160,255 | ) |
| | | | |
NET REALIZED AND UNREALIZED GAIN (LOSS) | | | (117,095 | ) |
| | | | |
NET INCREASE (DECREASE) IN NET ASSETS RESULTING FROM OPERATIONS | | $ | (45,364 | ) |
| | | | |
See Notes to Financial Statements.
117
1290 FUNDS
1290 RETIREMENT 2055 FUND
STATEMENT OF CHANGES IN NET ASSETS
| | | | | | | | |
| | | Year Ended
October 31, | |
| | | 2020 | | | 2019 | |
INCREASE (DECREASE) IN NET ASSETS FROM OPERATIONS: | | | | | | | | |
Net investment income (loss) | | $ | 71,731 | | | $ | 61,461 | |
Net realized gain (loss) | | | 43,160 | | | | 3,941 | |
Net change in unrealized appreciation (depreciation) | | | (160,255 | ) | | | 355,603 | |
| | | | | | | | |
NET INCREASE (DECREASE) IN NET ASSETS RESULTING FROM OPERATIONS | | | (45,364 | ) | | | 421,005 | |
| | | | | | | | |
Distributions to shareholders: | | | | | | | | |
Class I | | | (68,507 | ) | | | (69,041 | ) |
| | | | | | | | |
CAPITAL SHARES TRANSACTIONS: | | | | | | | | |
Class I | | | | | | | | |
Capital shares sold [68,876 and 23,882 shares, respectively] | | | 737,725 | | | | 280,169 | |
Capital shares issued in reinvestment of dividends[752 and 376 shares, respectively] | | | 9,307 | | | | 4,042 | |
Capital shares repurchased [(26,304) and (777) shares, respectively] | | | (295,539 | ) | | | (9,079 | ) |
| | | | | | | | |
NET INCREASE (DECREASE) IN NET ASSETS RESULTING FROM CAPITAL SHARE TRANSACTIONS | | | 451,493 | | | | 275,132 | |
| | | | | | | | |
TOTAL INCREASE (DECREASE) IN NET ASSETS | | | 337,622 | | | | 627,096 | |
NET ASSETS: | |
Beginning of year | | | 3,545,286 | | | | 2,918,190 | |
| | | | | | | | |
End of year | | $ | 3,882,908 | | | $ | 3,545,286 | |
| | | | | | | | |
See Notes to Financial Statements.
118
1290 FUNDS
1290 RETIREMENT 2055 FUND
FINANCIAL HIGHLIGHTS
| | | | | | | | | | | | | | | | |
Class I | | Year Ended October 31, | | | February 27, 2017* to
October 31, 2017 | |
| | 2020 | | | 2019 | | | 2018 | |
Net asset value, beginning of period | | $ | 12.32 | | | $ | 11.04 | | | $ | 11.02 | | | $ | 10.00 | |
| | | | | | | | | | | | | | | | |
Income (loss) from investment operations: | | | | | | | | | | | | | | | | |
Net investment income (loss) (e)(x) | | | 0.23 | | | | 0.22 | | | | 0.20 | | | | 0.11 | |
Net realized and unrealized gain (loss) | | | (0.58 | ) | | | 1.32 | | | | 0.01 | | | | 0.91 | |
| | | | | | | | | | | | | | | | |
Total from investment operations | | | (0.35 | ) | | | 1.54 | | | | 0.21 | | | | 1.02 | |
| | | | | | | | | | | | | | | | |
Less distributions: | |
Dividends from net investment income | | | (0.23 | ) | | | (0.21 | ) | | | (0.18 | ) | | | — | |
Distributions from net realized gains | | | (0.01 | ) | | | (0.05 | ) | | | (0.01 | ) | | | — | |
| | | | | | | | | | | | | | | | |
Total dividends and distributions | | | (0.24 | ) | | | (0.26 | ) | | | (0.19 | ) | | | — | |
| | | | | | | | | | | | | | | | |
Net asset value, end of period | | $ | 11.73 | | | $ | 12.32 | | | $ | 11.04 | | | $ | 11.02 | |
| | | | | | | | | | | | | | | | |
Total return (b) | | | (2.97 | )% | | | 14.29 | % | | | 1.90 | % | | | 10.20 | % |
| | | | | | | | | | | | | | | | |
Ratios/Supplemental Data: | |
Net assets, end of period (000’s) | | $ | 3,883 | | | $ | 3,545 | | | $ | 2,918 | | | $ | 2,755 | |
Ratio of expenses to average net assets: | | | | | | | | | | | | | | | | |
After waivers and reimbursements (a)(f) | | | 0.53 | %**(j) | | | 0.52 | %(j) | | | 0.52 | %(j) | | | 0.52 | %(j) |
Before waivers and reimbursements (a)(f) | | | 4.34 | % | | | 4.74 | % | | | 5.27 | % | | | 5.25 | % |
Ratio of net investment income (loss) to average net assets: | | | | | | | | | | | | | | | | |
After waivers and reimbursements (a)(f)(x) | | | 1.97 | % | | | 1.95 | % | | | 1.73 | % | | | 1.53 | %(l) |
Before waivers and reimbursements (a)(f)(x) | | | (1.84 | )% | | | (2.27 | )% | | | (3.02 | )% | | | (3.21 | )%(l) |
Portfolio turnover rate ^ | | | 6 | % | | | 2 | % | | | 2 | % | | | 1 | %(z) |
| * | Commencement of Operations. |
| ** | Includes tax expense of 0.01%. |
| ^ | Portfolio turnover rate excludes derivatives, if any. |
| (a) | Ratios for periods less than one year are annualized. Certain non-recurring expenses incurred by the Fund are not annualized for periods less than one year. |
| (b) | Total returns for periods less than one year are not annualized. |
| (e) | Net investment income (loss) per share is based on average shares outstanding. |
| (f) | Expenses do not include the expenses of the underlying funds (“indirect expenses”), if applicable. |
| (j) | Including direct and indirect expenses, the net expense ratio after waivers and reimbursements would be 0.66% in 2020 and 0.65% in 2019, 2018 and 2017. |
| (l) | The annualized ratio of net investment income to average net assets may not be indicative of operating results for a full year. |
| (x) | Recognition of net investment income is affected by the timing of dividend declarations by the underlying funds in which the Fund invests. |
| (z) | Portfolio turnover rate for periods less than one year is not annualized. |
See Notes to Financial Statements.
119
1290 RETIREMENT 2060 FUND (Unaudited)
INVESTMENT ADVISER
| Ø | | Equitable Investment Management Group, LLC |
PERFORMANCE RESULTS
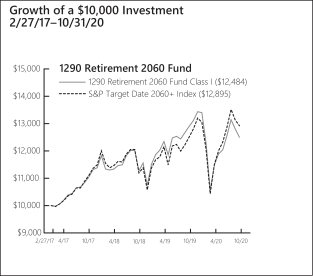
| | | | | | | | |
| | | |
Annualized Total Returns as of
10/31/20 | | | | | | |
| | | |
| | | 1
Year | | | Since
Incept. | |
Fund – Class I Shares* | | | (3.11 | )% | | | 6.22 | % |
S&P Target Date 2060+ Index | | | 3.11 | | | | 7.17 | |
| |
* Date of inception 2/27/17. Returns for periods greater than one year are annualized. | |
The performance quoted is past performance and is not a guarantee of future results. Mutual funds are subject to certain market risks. Investment returns and principal value of an investment will fluctuate so that an investor’s shares, when redeemed, may be worth more or less than their original cost. Current performance may be higher or lower than the performance data shown. For the most current month-end performance data please call 1-888-310-0416 or visit www.1290Funds.com.
The graph illustrates comparative performance for $10,000 invested in the Class I Shares of the 1290 Retirement 2060 Fund and the S&P Target Date 2060+ Index from 2/27/17 to 10/31/20. The performance of the S&P Target Date 2060+ Index reflects an initial investment at the end of the month closest to the Fund’s inception. The performance of the Fund assumes reinvestment of all dividends and capital gain distributions, if any, and does not include a sales charge. The performance of the S&P Target Date 2060+ Index does not reflect the deduction of expenses or a sales charge associated with a mutual fund and has been adjusted to reflect reinvestment of all dividends, capital gain distributions, and interest of the securities included in the benchmark.
As of March 1, 2020, the gross expense ratio including acquired fund fees for Class I shares was 4.96%. The net expense ratio for Class I shares was 0.65%. The net expense ratio reflects the Adviser’s decision to contractually limit expenses through April 30, 2021. Fund Performance may also reflect the waiver of the Fund’s fees and reimbursement of expenses for certain periods since the inception date. Without these waivers and reimbursements, performance would have been lower. In addition, performance shown in this section does not reflect the deduction of taxes that a shareholder would pay on Fund distributions or redemption of Fund shares.
PERFORMANCE SUMMARY
The Fund’s Class I shares returned (3.11)% for the year ended October 31, 2020. The Fund’s benchmark, the S&P Target Date 2060+ Index, returned 3.11% over the same year.
Overview
Each 1290 Retirement Fund’s (as defined in the Notes to the Financial Statements) performance will reflect the performance of the underlying asset classes and depends upon their percentage weighting within the Fund. Here’s why: The 1290 Retirement Funds are managed to target a specific year of planned retirement. The asset mix will become more conservative each year, until about 10 years after the target retirement year, when it will become relatively stable. The 1290 Retirement Funds balance the need for appreciation with the need for income as retirement approaches and focus on supporting an income stream over a long-term retirement withdrawal horizon. To achieve its asset class exposure, each 1290 Retirement Fund invests in exchange-traded funds (ETFs) representing various equity and bond asset classes. Because of this, each of the 1290 Retirement Fund’s performance will be a function of the asset class performance and the percentage weighting of each asset class in the 1290 Retirement Fund. Current target and actual allocations, as well as performance, are available in a separate quarterly Fund Fact Sheet.
What helped the 1290 Retirement Funds performance during the year?
| • | | The Fund had no dedicated position in real estate which contributed to performance. The sector was down about 25% for the twelve-month period. |
What hurt the 1290 Retirement Funds performance during the year?
| • | | Security selection within equities was the top detractor from performance, as having a low volatility tilt was not beneficial across regions and market cap. |
| • | | Within fixed income, having no exposure to high yield detracted from performance as it was up 7.79%. |
| | | | |
| |
Table by Asset Class (as a percentage of Total Investments
in Securities) | |
| | |
| As of October 31, 2020 | | | |
Equity | | | 100.0% | |
120
1290 RETIREMENT 2060 FUND (Unaudited)
| | | | |
| |
Top 10 Holdings (as a percentage of Total Investments in
Securities) | |
| | |
| As of October 31, 2020 | | | |
iShares Core S&P Total US Stock Market ETF | | | 34.5% | |
iShares Core MSCI EAFE ETF | | | 12.3 | |
iShares MSCI USA Min Vol Factor ETF | | | 11.6 | |
Invesco S&P 500 Low Volatility ETF | | | 11.6 | |
Invesco S&P International Developed Low Volatility ETF | | | 6.3 | |
iShares MSCI EAFE Min Vol Factor ETF | | | 6.2 | |
Invesco S&P MidCap Low Volatility ETF | | | 6.1 | |
SPDR SSGA US Small Cap Low Volatility Index ETF | | | 2.9 | |
iShares Core MSCI Emerging Markets ETF | | | 2.9 | |
Invesco S&P SmallCap Low Volatility ETF | | | 2.7 | |
Holdings are subject to change without notice.
UNDERSTANDING YOUR EXPENSES:
As a shareholder of the Fund, you incur two types of costs:
(1) transaction costs, including applicable sales charges and redemption fees; and (2) ongoing costs, including investment advisory fees, distribution and/or service (12b-1) fees and other Fund expenses. These examples are intended to help you understand your ongoing costs (in dollars) of investing in the Fund and to compare these costs with the ongoing costs of investing in other mutual funds.
The examples are based on an investment of $1,000 invested at the beginning of the six-month period ended October 31, 2020 and held for the entire six-month period.
Actual Expenses
The first line of the following table provides information about actual account values and actual expenses. You may use the information in this line, together with the amount you invested, to estimate the expenses that you paid over the period. Simply divide your account value by $1,000 (for example, an $8,600 account value divided by $1,000 = 8.6), then multiply the result by the number in the first line under the heading entitled ‘‘Expenses Paid During Period’’ to estimate the expenses you paid on your account during this period.
Hypothetical Example for Comparison Purposes
The second line of the following table provides information about hypothetical account values and hypothetical expenses based on the Fund’s actual expense ratio and an assumed rate of return of 5% per year before expenses, which is not the Fund’s actual return. The hypothetical account values and expenses may not be used to estimate the actual ending account balance or expenses you paid for the period. You may use this information to compare the ongoing costs of investing in the Fund and other funds. To do so, compare this 5% hypothetical example with the 5% hypothetical examples that appear in the shareholder reports of the other funds.
Please note that the expenses shown in the table are meant to highlight your ongoing costs only and do not reflect any transactional costs, such as sales charges (loads), redemption fees, or exchange fees. Therefore, the second line of the table is useful in comparing ongoing costs only, and will not help you determine the relative total costs of owning different funds. In addition, if these transactional costs were included, your costs would have been higher.
EXAMPLE
| | | | | | | | | | | | |
| | | | |
| | | Beginning
Account
Value
5/1/20 | | | Ending
Account
Value
10/31/20 | | | Expenses Paid During Period* 5/1/20 - 10/31/20 | |
Class I | |
Actual | | | $1,000.00 | | | | $1,087.80 | | | | $2.73 | |
Hypothetical (5% average annual return before expenses) | | | 1,000.00 | | | | 1,022.52 | | | | 2.65 | |
| |
* Expenses are equal to the Portfolio’s I shares annualized expense ratio of 0.52%, multiplied by the average account value over the period, and multiplied by 184/366 (to reflect the one-half year period). | |
121
1290 FUNDS
1290 RETIREMENT 2060 FUND
PORTFOLIO OF INVESTMENTS
October 31, 2020
| | | | | | | | |
| | | |
| | | Number of
Shares | | | Value
(Note 1) | |
| | | | | | | | |
EXCHANGE TRADED FUNDS (ETF): | |
Equity (100.0%) | |
Invesco S&P 500 Low Volatility ETF | | | 8,480 | | | $ | 441,214 | |
Invesco S&P Emerging Markets Low Volatility ETF | | | 2,760 | | | | 54,786 | |
Invesco S&P International Developed Low Volatility ETF | | | 8,790 | | | | 241,022 | |
Invesco S&P MidCap Low Volatility ETF | | | 5,640 | | | | 234,680 | |
Invesco S&P SmallCap Low Volatility ETF | | | 3,070 | | | | 104,042 | |
iShares Core MSCI EAFE ETF | | | 8,060 | | | | 468,770 | |
iShares Core MSCI Emerging Markets ETF | | | 2,070 | | | | 110,683 | |
iShares Core S&P Total US Stock Market ETF | | | 17,810 | | | | 1,318,830 | |
iShares MSCI EAFE Min Vol Factor ETF | | | 3,590 | | | | 235,109 | |
iShares MSCI Emerging Markets Min Vol Factor ETF | | | 980 | | | | 53,861 | |
iShares MSCI USA Min Vol Factor ETF | | | 7,200 | | | | 443,952 | |
SPDR SSGA US Small Cap Low Volatility Index ETF | | | 1,450 | | | | 111,404 | |
| | | | | | | | |
Total Investments in Securities (100.0%)
(Cost $3,442,629) | | | | | | | 3,818,353 | |
Other Assets Less Liabilities (0.0%) | | | | | | | (269 | ) |
| | | | | |
Net Assets (100%) | | | | | | $ | 3,818,084 | |
| | | | | | | | |
See Notes to Financial Statements.
122
1290 FUNDS
1290 RETIREMENT 2060 FUND
PORTFOLIO OF INVESTMENTS (Continued)
October 31, 2020
The following is a summary of the inputs used to value the Fund’s assets and liabilities carried at fair value as of October 31, 2020:
The inputs or methodology used for valuing securities are not necessarily an indication of the risk associated with investing in those securities.
Various inputs are used in determining the value of the Fund’s investments. These inputs are summarized in the three broad levels listed below:
| | | | | | | | | | | | | | | | |
| | | | | |
| Investment Type | | Level 1
Quoted Prices in
Active Markets for
Identical
Securities | | | Level 2
Significant Other
Observable Inputs
(including quoted prices
for similar securities,
interest rates,
prepayment speeds,
credit risk, etc.) | | | Level 3
Significant Unobservable
Inputs (including the
Fund’s own
assumptions in
determining the fair
value of investments) | | | Total | |
Assets: | | | | | |
Exchange Traded Funds | | | | | | | | | | | | | | | | |
Exchange Traded Funds | | $ | 3,818,353 | | | $ | — | | | $ | — | | | $ | 3,818,353 | |
| | | | | | | | | | | | | | | | |
Total Assets | | $ | 3,818,353 | | | $ | — | | | $ | — | | | $ | 3,818,353 | |
| | | | | | | | | | | | | | | | |
Total Liabilities | | $ | — | | | $ | — | | | $ | — | | | $ | — | |
| | | | | | | | | | | | | | | | |
Total | | $ | 3,818,353 | | | $ | — | | | $ | — | | | $ | 3,818,353 | |
| | | | | | | | | | | | | | | | |
The Fund held no derivatives contracts during the year ended October 31, 2020.
Investment security transactions for the year ended October 31, 2020 were as follows:
| | | | |
Cost of Purchases: | | | | |
Long-term investments other than U.S. government debt securities | | $ | 798,897 | |
Net Proceeds of Sales and Redemptions: | | | | |
Long-term investments other than U.S. government debt securities | | $ | 317,210 | |
As of October 31, 2020, the gross unrealized appreciation (depreciation) of investments based on the aggregate cost of investments in securities and derivative instruments, if applicable, for Federal income tax purposes was as follows:
| | | | |
Aggregate gross unrealized appreciation | | $ | 448,315 | |
Aggregate gross unrealized depreciation | | | (79,018 | ) |
| | | | |
Net unrealized appreciation | | $ | 369,297 | |
| | | | |
Federal income tax cost of investments in securities and derivative instruments, if applicable | | $ | 3,449,056 | |
| | | | |
See Notes to Financial Statements.
123
1290 FUNDS
1290 RETIREMENT 2060 FUND
STATEMENT OF ASSETS AND LIABILITIES
October 31, 2020
| | | | |
ASSETS | | | | |
Investments in Securities, at value (Cost $3,442,629) | | $ | 3,818,353 | |
Cash | | | 27,428 | |
Receivable from investment adviser | | | 9,120 | |
Prepaid registration and filing fees | | | 4,737 | |
Receivable for Fund shares sold | | | 623 | |
Other assets | | | 37 | |
| | | | |
Total assets | | | 3,860,298 | |
| | | | |
LIABILITIES | | | | |
Accrued professional fees | | | 31,877 | |
Transfer agent fees payable | | | 2,204 | |
Trustees’ fees payable | | | 88 | |
Accrued expenses | | | 8,045 | |
| | | | |
Total liabilities | | | 42,214 | |
| | | | |
NET ASSETS | | $ | 3,818,084 | |
| | | | |
Net assets were comprised of: | | | | |
Paid in capital | | $ | 3,347,679 | |
Total distributable earnings (loss) | | | 470,405 | |
| | | | |
Net assets | | $ | 3,818,084 | |
| | | | |
Class I | | | | |
Net asset value, offering and redemption price per share, $3,818,084 / 324,299 shares outstanding (unlimited amount authorized: $0.001 par value) | | $ | 11.77 | |
| | | | |
STATEMENT OF OPERATIONS
For the Year Ended October 31, 2020
| | | | |
INVESTMENT INCOME | | | | |
Dividends | | $ | 92,868 | |
Interest | | | 210 | |
| | | | |
Total income | | | 93,078 | |
| | | | |
EXPENSES | | | | |
Professional fees | | | 40,391 | |
Administrative fees | | | 29,999 | |
Printing and mailing expenses | | | 27,233 | |
Registration and filing fees | | | 19,748 | |
Investment advisory fees | | | 18,385 | |
Transfer agent fees | | | 12,110 | |
Custodian fees | | | 4,550 | |
Trustees’ fees | | | 312 | |
Tax expense | | | 230 | |
Miscellaneous | | | 5,574 | |
| | | | |
Gross expenses | | | 158,532 | |
Less: Waiver from investment adviser | | | (48,384 | ) |
Reimbursement from investment adviser | | | (90,821 | ) |
| | | | |
Net expenses | | | 19,327 | |
| | | | |
NET INVESTMENT INCOME (LOSS) | | | 73,751 | |
| | | | |
REALIZED AND UNREALIZED GAIN (LOSS) | | | | |
Net realized gain (loss) on investments in securities | | | 47,380 | |
Net change in unrealized appreciation (depreciation) on investments in securities | | | (197,894 | ) |
| | | | |
NET REALIZED AND UNREALIZED GAIN (LOSS) | | | (150,514 | ) |
| | | | |
NET INCREASE (DECREASE) IN NET ASSETS RESULTING FROM OPERATIONS | | $ | (76,763 | ) |
| | | | |
STATEMENT OF CHANGES IN NET ASSETS
| | | | | | | | |
| | | Year Ended October 31, | |
| | | 2020 | | | 2019 | |
INCREASE (DECREASE) IN NET ASSETS FROM OPERATIONS: | | | | | | | | |
Net investment income (loss) | | $ | 73,751 | | | $ | 59,624 | |
Net realized gain (loss) | | | 47,380 | | | | 5,740 | |
Net change in unrealized appreciation (depreciation) | | | (197,894 | ) | | | 352,798 | |
| | | | | | | | |
NET INCREASE (DECREASE) IN NET ASSETS RESULTING FROM OPERATIONS | | | (76,763 | ) | | | 418,162 | |
| | | | | | | | |
Distributions to shareholders: | | | | | | | | |
Class I | | | (69,322 | ) | | | (65,105 | ) |
| | | | | | | | |
CAPITAL SHARES TRANSACTIONS: | | | | | | | | |
Class I | | | | | | | | |
Capital shares sold [73,347 and 24,271 shares, respectively] | | | 838,258 | | | | 286,685 | |
Capital shares issued in reinvestment of dividends[795 and 242 shares, respectively] | | | 9,897 | | | | 2,604 | |
Capital shares repurchased [(31,794) and (1,648) shares, respectively] | | | (374,142 | ) | | | (19,043 | ) |
| | | | | | | | |
NET INCREASE (DECREASE) IN NET ASSETS RESULTING FROM CAPITAL SHARE TRANSACTIONS | | | 474,013 | | | | 270,246 | |
| | | | | | | | |
TOTAL INCREASE (DECREASE) IN NET ASSETS | | | 327,928 | | | | 623,303 | |
NET ASSETS: | | | | | | | | |
Beginning of year | | | 3,490,156 | | | | 2,866,853 | |
| | | | | | | | |
End of year | | $ | 3,818,084 | | | $ | 3,490,156 | |
| | | | | | | | |
See Notes to Financial Statements.
124
1290 FUNDS
1290 RETIREMENT 2060 FUND
FINANCIAL HIGHLIGHTS
| | | | | | | | | | | | | | | | |
| | | Year Ended October 31, | | | February 27, 2017* to
October 31, 2017 | |
| Class I | | 2020 | | | 2019 | | | 2018 | |
Net asset value, beginning of period | | $ | 12.38 | | | $ | 11.07 | | | $ | 11.03 | | | $ | 10.00 | |
| | | | | | | | | | | | | | | | |
Income (loss) from investment operations: | | | | | | | | | | | | | | | | |
Net investment income (loss) (e)(x) | | | 0.24 | | | | 0.22 | | | | 0.20 | | | | 0.11 | |
Net realized and unrealized gain (loss) | | | (0.61 | ) | | | 1.34 | | | | 0.03 | | | | 0.92 | |
| | | | | | | | | | | | | | | | |
Total from investment operations | | | (0.37 | ) | | | 1.56 | | | | 0.23 | | | | 1.03 | |
| | | | | | | | | | | | | | | | |
Less distributions: | |
Dividends from net investment income | | | (0.22 | ) | | | (0.21 | ) | | | (0.18 | ) | | | — | |
Distributions from net realized gains | | | (0.02 | ) | | | (0.04 | ) | | | (0.01 | ) | | | — | |
| | | | | | | | | | | | | | | | |
Total dividends and distributions | | | (0.24 | ) | | | (0.25 | ) | | | (0.19 | ) | | | — | |
| | | | | | | | | | | | | | | | |
Net asset value, end of period | | $ | 11.77 | | | $ | 12.38 | | | $ | 11.07 | | | $ | 11.03 | |
| | | | | | | | | | | | | | | | |
Total return (b) | | | (3.11 | )% | | | 14.43 | % | | | 2.09 | % | | | 10.30 | % |
| | | | | | | | | | | | | | | | |
Ratios/Supplemental Data: | |
Net assets, end of period (000’s) | | $ | 3,818 | | | $ | 3,490 | | | $ | 2,867 | | | $ | 2,758 | |
Ratio of expenses to average net assets: | | | | | | | | | | | | | | | | |
After waivers and reimbursements (a)(f) | | | 0.53 | %**(j) | | | 0.52 | %(j) | | | 0.52 | %(j) | | | 0.52 | %(j) |
Before waivers and reimbursements (a)(f) | | | 4.31 | % | | | 4.83 | % | | | 5.27 | % | | | 5.25 | % |
Ratio of net investment income (loss) to average net assets: | | | | | | | | | | | | | | | | |
After waivers and reimbursements (a)(f)(x) | | | 2.01 | % | | | 1.93 | % | | | 1.73 | % | | | 1.52 | %(l) |
Before waivers and reimbursements (a)(f)(x) | | | (1.78 | )% | | | (2.39 | )% | | | (3.02 | )% | | | (3.21 | )%(l) |
Portfolio turnover rate ^ | | | 9 | % | | | 2 | % | | | 2 | % | | | 1 | %(z) |
| * | Commencement of Operations. |
| ** | Includes tax expense of 0.01%. |
| ^ | Portfolio turnover rate excludes derivatives, if any. |
| (a) | Ratios for periods less than one year are annualized. Certain non-recurring expenses incurred by the Fund are not annualized for periods less than one year. |
| (b) | Total returns for periods less than one year are not annualized. |
| (e) | Net investment income (loss) per share is based on average shares outstanding. |
| (f) | Expenses do not include the expenses of the underlying funds (“indirect expenses”), if applicable. |
| (j) | Including direct and indirect expenses, the net expense ratio after waivers and reimbursements would be 0.66% in 2020 and 0.65% in 2019, 2018 and 2017. |
| (l) | The annualized ratio of net investment income to average net assets may not be indicative of operating results for a full year. |
| (x) | Recognition of net investment income is affected by the timing of dividend declarations by the underlying funds in which the Fund invests. |
| (z) | Portfolio turnover rate for periods less than one year is not annualized. |
See Notes to Financial Statements.
125
1290 SMARTBETA EQUITY FUND (Unaudited)
INVESTMENT ADVISER
| Ø | | Equitable Investment Management Group, LLC |
INVESTMENT SUB-ADVISER
| Ø | | AXA Rosenberg Investment Management LLC |
PERFORMANCE RESULTS
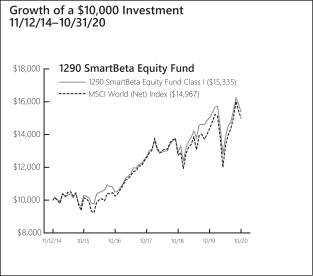
| | | | | | | | | | | | |
| | |
| Annualized Total Returns as of 10/31/20 | | | | |
| | | | |
| | | | | | 1
Year | | | 5
Years | |
Fund – Class A Shares* | | | without Sales Charge | | | | 2.07 | % | | | 8.03 | % |
| | | | with Sales Charge (a) | | | | (3.57 | ) | | | 6.81 | |
Fund – Class I Shares* | | | | | | | 2.30 | | | | 8.30 | |
Fund – Class R Shares* | | | | | | | 1.75 | | | | 7.76 | |
Fund – Class T Shares*† | | | without Sales Charge | | | | 2.30 | | | | 8.30 | |
| | | | with Sales Charge (b) | | | | (0.24 | ) | | | 7.76 | |
MSCI World (Net) Index | | | | | | | 4.36 | | | | 8.13 | |
| |
* Date of inception 11/12/14. † Class T Shares currently are not offered for sale. (a) A 5.50% front-end sales charge was deducted. (b) A 2.50% front-end sales charge was deducted. Returns for periods greater than one year are annualized. | |
The performance quoted is past performance and is not a guarantee of future results. Mutual funds are subject to certain market risks. Investment returns and principal value of an investment will fluctuate so that an investor’s shares, when redeemed, may be worth more or less than their original cost. Current performance may be higher or lower than the performance data shown. For the most current month-end performance data please call 1-888-310-0416 or visit www.1290Funds.com.
The graph illustrates comparative performance for $10,000 invested in the Class I Shares of the 1290 SmartBeta Equity Fund and the MSCI World (Net) Index from 11/12/14 to 10/31/20. The performance of the MSCI World (Net) Index reflects an initial investment at the end of the month closest to the Fund’s inception. The performance of the Fund assumes reinvestment of all dividends and capital gain distributions, if any, and does not include a sales charge. The performance of the MSCI World (Net) Index does not reflect the deduction of expenses or a sales charge associated with a mutual fund and has been adjusted to reflect reinvestment of all dividends, capital gain distributions, and interest of the securities included in the benchmark.
As of March 1, 2020, the gross expense ratios for Class A, I, R and T shares were 2.26%, 2.02%, 2.52% and 2.27%, respectively. The net expense ratios for Class A, I, R and T shares were 1.10%, 0.85%, 1.35% and 1.10%, respectively. The net expense ratios reflect the Adviser’s decision to contractually limit expenses through April 30, 2022. Fund Performance may also reflect the waiver of the Fund’s fees and reimbursement of expenses for certain periods since the inception date. Without these waivers and reimbursements, performance would have been lower.
In addition, performance shown in this section does not reflect the deduction of taxes that a shareholder would pay on Fund distributions or redemption of Fund shares.
PERFORMANCE SUMMARY
The Fund’s Class I shares returned 2.30% for the year ended October 31, 2020. The Fund’s benchmark, the MSCI World (Net) Index, returned 4.36% over the same year.
Overview — AXA Rosenberg Investment Management LLC
While equity markets experienced significant rotation over the period, sentiment was largely risk-on, with investors favoring cyclical sectors. Technology and consumer discretionary led markets upward. Health care also provided strong returns as a clear beneficiary of the pandemic. The energy sector lagged significantly, plagued by oil supply/demand imbalances. We note the performance of a narrow group of fast growth technology companies such as Facebook, Amazon, Apple, and Microsoft that dominated returns throughout the period — although they did give up a small portion of their prior gains late in the period on concerns over their elevated valuations.
Factor returns also experienced significant shifts during the year. In aggregate, low volatility delivered weak returns relative to the broader market, hurt by its defensiveness in phases of sharply rising markets. Quality kept better pace with these gains, while value continued to underperform as growth remained firmly in demand.
Fund Highlights
The 1290 SmartBeta Equity Fund rose in value during the year but lagged the rise in its benchmark index. For the period as a whole, the Fund performed in line with our expectations, providing protection during the market sell-off in the first quarter of 2020 and participating in all but the strongest phases of the prior and subsequent market rallies.
126
1290 SMARTBETA EQUITY FUND (Unaudited)
What helped performance during the year?
| • | | An emphasis on companies with less volatile returns helped to mitigate drawdowns during challenging periods for the market, especially in the first quarter of 2020 when the global coronavirus outbreak led to a wide-ranging sell-off. |
| • | | As oil prices slumped to multi-year lows, oil and gas companies faced significant headwinds and the Fund’s lower-than-benchmark allocation to the energy sector proved beneficial. |
What hurt performance during the year?
| • | | The Fund’s diversification away from the largest stocks in the index contributed to a below-benchmark weight in mega-cap technology stocks. This positioning weighed on the Fund’s performance as these firms led the market until their September sell-off. |
| • | | More broadly, the Fund’s lower-than-benchmark exposure to high growth and momentum stocks hurt returns in an environment in which these factors were strongly rewarded. |
| | | | |
| | |
Sector Weightings
as of October 31, 2020 | | % of
Net Assets | |
Information Technology | | | 17.0 | % |
Health Care | | | 14.7 | |
Financials | | | 14.3 | |
Industrials | | | 13.0 | |
Consumer Staples | | | 11.5 | |
Communication Services | | | 8.0 | |
Consumer Discretionary | | | 7.1 | |
Utilities | | | 5.3 | |
Materials | | | 3.0 | |
Real Estate | | | 2.9 | |
Investment Company | | | 1.1 | |
Energy | | | 0.8 | |
Cash and Other | | | 1.3 | |
| | | | | |
| | | | 100.0 | % |
| | | | | |
Holdings are subject to change without notice. | |
UNDERSTANDING YOUR EXPENSES:
As a shareholder of the Fund, you incur two types of costs:
(1) transaction costs, including applicable sales charges and redemption fees; and (2) ongoing costs, including investment advisory fees, distribution and/or service (12b-1) fees (in the case of Class A, Class R and Class T shares of the Fund), and other Fund expenses. These examples are intended to help you understand your ongoing costs (in dollars) of investing in the Fund and to compare these costs with the ongoing costs of investing in other mutual funds.
The examples are based on an investment of $1,000 invested at the beginning of the six-month period ended October 31, 2020 and held for the entire six-month period.
Actual Expenses
The first line of the following table provides information about actual account values and actual expenses. You may use the information in this line, together with the amount you invested, to estimate the expenses that you paid over the period. Simply divide your account value by $1,000 (for example, an $8,600 account value divided by $1,000 = 8.6), then multiply the result by the number in the first line under the heading entitled ‘‘Expenses Paid During Period’’ to estimate the expenses you paid on your account during this period.
Hypothetical Example for Comparison Purposes
The second line of the following table provides information about hypothetical account values and hypothetical expenses based on the Fund’s actual expense ratio and an assumed rate of return of 5% per year before expenses, which is not the Fund’s actual return. The hypothetical account values and expenses may not be used to estimate the actual ending account balance or expenses you paid for the period. You may use this information to compare the ongoing costs of investing in the Fund and other funds. To do so, compare this 5% hypothetical example with the 5% hypothetical examples that appear in the shareholder reports of the other funds.
Please note that the expenses shown in the table are meant to highlight your ongoing costs only and do not reflect any transactional costs, such as sales charges (loads), redemption fees, or exchange fees. Therefore, the second line of the table is useful in comparing ongoing costs only, and will not help you determine the relative total costs of owning different funds. In addition, if these transactional costs were included, your costs would have been higher.
127
1290 SMARTBETA EQUITY FUND (Unaudited)
EXAMPLE
| | | | | | | | | | | | |
| | | | |
| | | Beginning
Account
Value
5/1/20 | | | Ending
Account
Value
10/31/20 | | | Expenses
Paid
During
Period*
5/1/20 -
10/31/20 | |
Class A | |
Actual | | | $1,000.00 | | | | $1,107.10 | | | | $6.04 | |
Hypothetical (5% average annual return before expenses) | | | 1,000.00 | | | | 1,019.40 | | | | 5.79 | |
Class I | |
Actual | | | 1,000.00 | | | | 1,107.70 | | | | 4.71 | |
Hypothetical (5% average annual return before expenses) | | | 1,000.00 | | | | 1,020.67 | | | | 4.52 | |
Class R | |
Actual | | | 1,000.00 | | | | 1,105.50 | | | | 7.35 | |
Hypothetical (5% average annual return before expenses) | | | 1,000.00 | | | | 1,018.15 | | | | 7.05 | |
Class T** | |
Actual | | | 1,000.00 | | | | 1,107.70 | | | | 4.72 | |
Hypothetical (5% average annual return before expenses) | | | 1,000.00 | | | | 1,020.66 | | | | 4.52 | |
| |
* Expenses are equal to the Portfolio’s A, I, R and T shares annualized expense ratio of 1.14%, 0.89%, 1.39% and 0.89%, respectively, multiplied by the average account value over the period, and multiplied by 184/366 (to reflect the one-half year period). ** Class T shares currently are not offered for sale. | |
128
1290 FUNDS
1290 SMARTBETA EQUITY FUND
PORTFOLIO OF INVESTMENTS
October 31, 2020
| | | | | | | | |
| | | |
| | | Number of
Shares | | | Value
(Note 1) | |
COMMON STOCKS: | | | | | | | | |
Communication Services (8.0%) | | | | | | | | |
Diversified Telecommunication Services (3.0%) | |
AT&T, Inc. | | | 12,937 | | | $ | 349,558 | |
BCE, Inc. | | | 2,000 | | | | 80,372 | |
Deutsche Telekom AG (Registered) | | | 9,892 | | | | 150,637 | |
Elisa OYJ | | | 600 | | | | 29,526 | |
Nippon Telegraph & Telephone Corp. | | | 5,100 | | | | 107,686 | |
Orange SA | | | 3,042 | | | | 34,179 | |
Singapore Telecommunications Ltd. | | | 22,400 | | | | 33,339 | |
Spark New Zealand Ltd. | | | 15,563 | | | | 46,188 | |
Swisscom AG (Registered) | | | 201 | | | | 102,149 | |
Telenor ASA | | | 4,334 | | | | 66,896 | |
Telia Co. AB | | | 11,826 | | | | 45,358 | |
Verizon Communications, Inc. | | | 8,000 | | | | 455,920 | |
| | | | | | | | |
| | | | | | | 1,501,808 | |
| | | | | | | | |
Entertainment (1.0%) | | | | | | | | |
Activision Blizzard, Inc. | | | 2,500 | | | | 189,325 | |
Netflix, Inc.* | | | 200 | | | | 95,148 | |
Nintendo Co. Ltd. | | | 200 | | | | 109,212 | |
Take-Two Interactive Software, Inc.* | | | 300 | | | | 46,476 | |
Vivendi SA | | | 2,850 | | | | 82,393 | |
| | | | | | | | |
| | | | | | | 522,554 | |
| | | | | | | | |
Interactive Media & Services (2.8%) | | | | | | | | |
Alphabet, Inc., Class A* | | | 500 | | | | 808,055 | |
Facebook, Inc., Class A* | | | 2,300 | | | | 605,153 | |
| | | | | | | | |
| | | | | | | 1,413,208 | |
| | | | | | | | |
Media (0.7%) | | | | | | | | |
Charter Communications, Inc., Class A* | | | 100 | | | | 60,382 | |
Comcast Corp., Class A | | | 5,500 | | | | 232,320 | |
Omnicom Group, Inc. | | | 800 | | | | 37,760 | |
Quebecor, Inc., Class B | | | 2,000 | | | | 46,401 | |
| | | | | | | | |
| | | | | | | 376,863 | |
| | | | | | | | |
Wireless Telecommunication Services (0.5%) | |
KDDI Corp. | | | 5,000 | | | | 133,903 | |
Rogers Communications, Inc., Class B | | | 2,700 | | | | 109,678 | |
| | | | | | | | |
| | | | | | | 243,581 | |
| | | | | | | | |
Total Communication Services | | | | | | | 4,058,014 | |
| | | | | | | | |
Consumer Discretionary (7.1%) | | | | | | | | |
Automobiles (0.2%) | | | | | | | | |
Toyota Motor Corp. | | | 1,400 | | | | 91,690 | |
| | | | | | | | |
Distributors (0.1%) | | | | | | | | |
Genuine Parts Co. | | | 400 | | | | 36,172 | |
| | | | | | | | |
Hotels, Restaurants & Leisure (0.7%) | | | | | | | | |
Compass Group plc | | | 3,866 | | | | 52,882 | |
Domino’s Pizza, Inc. | | | 100 | | | | 37,832 | |
McDonald’s Corp. | | | 800 | | | | 170,400 | |
Restaurant Brands International, Inc. | | | 500 | | | | 25,981 | |
Yum! Brands, Inc. | | | 600 | | | | 55,998 | |
| | | | | | | | |
| | | | | | | 343,093 | |
| | | | | | | | |
Household Durables (0.7%) | | | | | | | | |
DR Horton, Inc. | | | 1,200 | | | | 80,172 | |
NVR, Inc.* | | | 10 | | | | 39,531 | |
Panasonic Corp. | | | 3,900 | | | | 36,076 | |
PulteGroup, Inc. | | | 1,000 | | | | 40,760 | |
Sekisui Chemical Co. Ltd. | | | 2,000 | | | | 31,237 | |
Sekisui House Ltd. | | | 3,000 | | | | 49,746 | |
Sony Corp. | | | 1,300 | | | | 108,351 | |
| | | | | | | | |
| | | | | | | 385,873 | |
| | | | | | | | |
Internet & Direct Marketing Retail (2.0%) | |
Amazon.com, Inc.* | | | 220 | | | | 667,953 | |
Booking Holdings, Inc.* | | | 100 | | | | 162,250 | |
eBay, Inc. | | | 3,456 | | | | 164,609 | |
| | | | | | | | |
| | | | | | | 994,812 | |
| | | | | | | | |
Multiline Retail (0.3%) | | | | | | | | |
Dollar General Corp. | | | 200 | | | | 41,742 | |
Wesfarmers Ltd. | | | 3,223 | | | | 104,516 | |
| | | | | | | | |
| | | | | | | 146,258 | |
| | | | | | | | |
Specialty Retail (2.5%) | | | | | | | | |
AutoZone, Inc.* | | | 100 | | | | 112,898 | |
Home Depot, Inc. (The) | | | 1,600 | | | | 426,736 | |
Industria de Diseno Textil SA | | | 2,000 | | | | 49,490 | |
Lowe’s Cos., Inc. | | | 1,900 | | | | 300,390 | |
O’Reilly Automotive, Inc.* | | | 200 | | | | 87,320 | |
Ross Stores, Inc. | | | 500 | | | | 42,585 | |
TJX Cos., Inc. (The) | | | 4,500 | | | | 228,600 | |
| | | | | | | | |
| | | | | | | 1,248,019 | |
| | | | | | | | |
Textiles, Apparel & Luxury Goods (0.6%) | |
Kering SA | | | 60 | | | | 36,300 | |
LVMH Moet Hennessy Louis Vuitton SE | | | 200 | | | | 93,896 | |
NIKE, Inc., Class B | | | 1,700 | | | | 204,136 | |
| | | | | | | | |
| | | | | | | 334,332 | |
| | | | | | | | |
Total Consumer Discretionary | | | | | | | 3,580,249 | |
| | | | | | | | |
Consumer Staples (11.5%) | | | | | | | | |
Beverages (2.7%) | | | | | | | | |
Brown-Forman Corp., Class B | | | 1,700 | | | | 118,507 | |
Carlsberg A/S, Class B | | | 200 | | | | 25,329 | |
Coca-Cola Co. (The) | | | 8,800 | | | | 422,928 | |
Diageo plc | | | 5,204 | | | | 168,336 | |
Monster Beverage Corp.* | | | 1,500 | | | | 114,855 | |
PepsiCo, Inc. | | | 3,291 | | | | 438,657 | |
Pernod Ricard SA | | | 200 | | | | 32,274 | |
Suntory Beverage & Food Ltd. | | | 900 | | | | 31,112 | |
| | | | | | | | |
| | | | | | | 1,351,998 | |
| | | | | | | | |
Food & Staples Retailing (2.2%) | | | | | | | | |
Alimentation Couche-Tard, Inc., Class B | | | 2,700 | | | | 83,150 | |
Coles Group Ltd. | | | 3,000 | | | | 37,527 | |
Costco Wholesale Corp. | | | 1,168 | | | | 417,700 | |
George Weston Ltd. | | | 500 | | | | 35,063 | |
Koninklijke Ahold Delhaize NV | | | 2,219 | | | | 60,977 | |
Loblaw Cos. Ltd. | | | 800 | | | | 39,823 | |
Metro, Inc. | | | 1,800 | | | | 83,968 | |
Seven & i Holdings Co. Ltd. | | | 2,400 | | | | 73,300 | |
Tesco plc | | | 11,965 | | | | 31,863 | |
Walmart, Inc. | | | 2,000 | | | | 277,500 | |
| | | | | | | | |
| | | | | | | 1,140,871 | |
| | | | | | | | |
See Notes to Financial Statements.
129
1290 FUNDS
1290 SMARTBETA EQUITY FUND
PORTFOLIO OF INVESTMENTS (Continued)
October 31, 2020
| | | | | | | | |
| | | |
| | | Number of
Shares | | | Value
(Note 1) | |
Food Products (2.1%) | | | | | | | | |
Barry Callebaut AG (Registered) | | | 17 | | | $ | 35,108 | |
General Mills, Inc. | | | 1,900 | | | | 112,328 | |
Hershey Co. (The) | | | 400 | | | | 54,984 | |
Hormel Foods Corp. | | | 600 | | | | 29,214 | |
Kellogg Co. | | | 1,500 | | | | 94,335 | |
McCormick & Co., Inc. (Non-Voting) | | | 600 | | | | 108,306 | |
Mondelez International, Inc., Class A | | | 5,703 | | | | 302,943 | |
Nestle SA (Registered) | | | 2,095 | | | | 235,381 | |
Nissin Foods Holdings Co. Ltd. | | | 500 | | | | 43,268 | |
Orkla ASA | | | 3,931 | | | | 37,114 | |
| | | | | | | | |
| | | | | | | 1,052,981 | |
| | | | | | | | |
Household Products (3.0%) | | | | | | | | |
Church & Dwight Co., Inc. | | | 1,500 | | | | 132,585 | |
Clorox Co. (The) | | | 700 | | | | 145,075 | |
Colgate-Palmolive Co. | | | 4,400 | | | | 347,116 | |
Essity AB, Class B | | | 1,257 | | | | 36,408 | |
Kimberly-Clark Corp. | | | 1,600 | | | | 212,144 | |
Lion Corp. | | | 1,800 | | | | 36,711 | |
Procter & Gamble Co. (The) | | | 3,800 | | | | 520,980 | |
Reckitt Benckiser Group plc | | | 396 | | | | 34,893 | |
Unicharm Corp. | | | 900 | | | | 41,786 | |
| | | | | | | | |
| | | | | | | 1,507,698 | |
| | | | | | | | |
Personal Products (1.5%) | | | | | | | | |
Estee Lauder Cos., Inc. (The), Class A | | | 800 | | | | 175,728 | |
Kao Corp. | | | 1,200 | | | | 85,317 | |
L’Oreal SA | | | 541 | | | | 175,208 | |
Unilever NV | | | 4,042 | | | | 228,308 | |
Unilever plc | | | 1,300 | | | | 74,126 | |
| | | | | | | | |
| | | | | | | 738,687 | |
| | | | | | | | |
Total Consumer Staples | | | | | | | 5,792,235 | |
| | | | | | | | |
Energy (0.8%) | | | | | | | | |
Oil, Gas & Consumable Fuels (0.8%) | | | | | | | | |
Enbridge, Inc. | | | 3,100 | | | | 85,417 | |
Neste OYJ | | | 1,200 | | | | 62,679 | |
TC Energy Corp. | | | 2,900 | | | | 114,146 | |
TOTAL SE | | | 3,916 | | | | 118,588 | |
| | | | | | | | |
Total Energy | | | | | | | 380,830 | |
| | | | | | | | |
Financials (14.3%) | | | | | | | | |
Banks (3.4%) | | | | | | | | |
Bank Hapoalim BM* | | | 4,000 | | | | 23,477 | |
Bank Leumi Le-Israel BM | | | 10,549 | | | | 50,020 | |
Bank of Montreal | | | 1,600 | | | | 95,270 | |
Bank of Nova Scotia (The) | | | 5,500 | | | | 228,496 | |
Canadian Imperial Bank of Commerce | | | 900 | | | | 67,134 | |
Commonwealth Bank of Australia | | | 1,286 | | | | 62,693 | |
DBS Group Holdings Ltd. | | | 3,700 | | | | 55,113 | |
Hang Seng Bank Ltd. | | | 1,400 | | | | 21,538 | |
JPMorgan Chase & Co. | | | 300 | | | | 29,412 | |
Mitsubishi UFJ Financial Group, Inc. | | | 7,900 | | | | 31,141 | |
Mizrahi Tefahot Bank Ltd. | | | 1,800 | | | | 35,205 | |
Mizuho Financial Group, Inc. | | | 3,460 | | | | 42,657 | |
National Bank of Canada | | | 1,300 | | | | 62,390 | |
Royal Bank of Canada | | | 5,100 | | | | 356,613 | |
Sumitomo Mitsui Financial Group, Inc. | | | 2,300 | | | | 63,700 | |
Sumitomo Mitsui Trust Holdings, Inc. | | | 1,300 | | | | 34,787 | |
Svenska Handelsbanken AB, Class A* | | | 4,000 | | | | 32,434 | |
Toronto-Dominion Bank (The) | | | 6,800 | | | | 300,010 | |
US Bancorp | | | 1,800 | | | | 70,110 | |
Westpac Banking Corp. | | | 3,771 | | | | 48,056 | |
| | | | | | | | |
| | | | | | | 1,710,256 | |
| | | | | | | | |
Capital Markets (4.1%) | | | | | | | | |
Ameriprise Financial, Inc. | | | 300 | | | | 48,249 | |
ASX Ltd. | | | 1,022 | | | | 57,411 | |
Bank of New York Mellon Corp. (The) | | | 4,100 | | | | 140,876 | |
BlackRock, Inc. | | | 500 | | | | 299,605 | |
Deutsche Boerse AG | | | 734 | | | | 108,041 | |
FactSet Research Systems, Inc. | | | 100 | | | | 30,650 | |
Hong Kong Exchanges & Clearing Ltd. | | | 1,500 | | | | 71,946 | |
Intercontinental Exchange, Inc. | | | 2,800 | | | | 264,320 | |
Japan Exchange Group, Inc. | | | 1,400 | | | | 34,354 | |
London Stock Exchange Group plc | | | 364 | | | | 39,051 | |
MarketAxess Holdings, Inc. | | | 100 | | | | 53,885 | |
Moody’s Corp. | | | 700 | | | | 184,030 | |
MSCI, Inc. | | | 400 | | | | 139,936 | |
Nasdaq, Inc. | | | 600 | | | | 72,594 | |
Northern Trust Corp. | | | 800 | | | | 62,616 | |
S&P Global, Inc. | | | 900 | | | | 290,457 | |
T. Rowe Price Group, Inc. | | | 900 | | | | 113,994 | |
TMX Group Ltd. | | | 500 | | | | 48,585 | |
| | | | | | | | |
| | | | | | | 2,060,600 | |
| | | | | | | | |
Consumer Finance (0.3%) | | | | | | | | |
American Express Co. | | | 1,600 | | | | 145,984 | |
| | | | | | | | |
Diversified Financial Services (0.8%) | | | | | | | | |
Berkshire Hathaway, Inc., Class B* | | | 1,900 | | | | 383,610 | |
ORIX Corp. | | | 2,600 | | | | 30,340 | |
| | | | | | | | |
| | | | | | | 413,950 | |
| | | | | | | | |
Insurance (5.7%) | | | | | | | | |
Aflac, Inc. | | | 2,900 | | | | 98,455 | |
Allianz SE (Registered) | | | 1,109 | | | | 195,211 | |
Allstate Corp. (The) | | | 1,500 | | | | 133,125 | |
American Financial Group, Inc. | | | 400 | | | | 29,976 | |
Aon plc, Class A | | | 1,200 | | | | 220,812 | |
Arthur J Gallagher & Co. | | | 900 | | | | 93,339 | |
Assicurazioni Generali SpA | | | 3,544 | | | | 47,544 | |
Brown & Brown, Inc. | | | 900 | | | | 39,159 | |
Chubb Ltd. | | | 1,900 | | | | 246,829 | |
Fidelity National Financial, Inc. | | | 1,200 | | | | 37,548 | |
Gjensidige Forsikring ASA | | | 1,820 | | | | 34,605 | |
Hannover Rueck SE | | | 376 | | | | 54,594 | |
Hartford Financial Services Group, Inc. (The) | | | 1,300 | | | | 50,076 | |
Intact Financial Corp. | | | 900 | | | | 92,966 | |
Japan Post Insurance Co. Ltd. | | | 2,600 | | | | 41,222 | |
Legal & General Group plc | | | 21,533 | | | | 51,768 | |
Manulife Financial Corp. | | | 7,000 | | | | 94,888 | |
Markel Corp.* | | | 40 | | | | 37,312 | |
Marsh & McLennan Cos., Inc. | | | 2,700 | | | | 279,342 | |
MetLife, Inc. | | | 2,400 | | | | 90,840 | |
MS&AD Insurance Group Holdings, Inc. | | | 1,200 | | | | 33,082 | |
Muenchener Rueckversicherungs-Gesellschaft AG in Muenchen (Registered) | | | 660 | | | | 154,458 | |
See Notes to Financial Statements.
130
1290 FUNDS
1290 SMARTBETA EQUITY FUND
PORTFOLIO OF INVESTMENTS (Continued)
October 31, 2020
| | | | | | | | |
| | | |
| | | Number of
Shares | | | Value
(Note 1) | |
Power Corp. of Canada | | | 3,400 | | | $ | 64,744 | |
Progressive Corp. (The) | | | 2,000 | | | | 183,800 | |
Sampo OYJ, Class A | | | 1,600 | | | | 60,401 | |
Sompo Holdings, Inc. | | | 900 | | | | 33,669 | |
Sun Life Financial, Inc. | | | 2,400 | | | | 95,492 | |
Tokio Marine Holdings, Inc. | | | 1,600 | | | | 71,688 | |
Travelers Cos., Inc. (The) | | | 1,000 | | | | 120,710 | |
Zurich Insurance Group AG | | | 280 | | | | 92,716 | |
| | | | | | | | |
| | | | | | | 2,880,371 | |
| | | | | | | | |
Total Financials | | | | | | | 7,211,161 | |
| | | | | | | | |
Health Care (14.7%) | | | | | | | | |
Biotechnology (1.2%) | | | | | | | | |
AbbVie, Inc. | | | 700 | | | | 59,570 | |
Amgen, Inc. | | | 1,006 | | | | 218,242 | |
CSL Ltd. | | | 384 | | | | 78,046 | |
Gilead Sciences, Inc. | | | 1,400 | | | | 81,410 | |
Regeneron Pharmaceuticals, Inc.* | | | 200 | | | | 108,712 | |
Vertex Pharmaceuticals, Inc.* | | | 400 | | | | 83,344 | |
| | | | | | | | |
| | | | | | | 629,324 | |
| | | | | | | | |
Health Care Equipment & Supplies (4.8%) | | | | | |
Abbott Laboratories | | | 3,000 | | | | 315,330 | |
Coloplast A/S, Class B | | | 400 | | | | 58,404 | |
Danaher Corp. | | | 1,900 | | | | 436,126 | |
Edwards Lifesciences Corp.* | | | 2,300 | | | | 164,887 | |
Hologic, Inc.* | | | 600 | | | | 41,292 | |
Hoya Corp. | | | 400 | | | | 45,289 | |
IDEXX Laboratories, Inc.* | | | 300 | | | | 127,446 | |
Intuitive Surgical, Inc.* | | | 200 | | | | 133,416 | |
Koninklijke Philips NV* | | | 1,392 | | | | 64,668 | |
Medtronic plc | | | 3,500 | | | | 351,995 | |
ResMed, Inc. | | | 600 | | | | 115,164 | |
Smith & Nephew plc | | | 1,574 | | | | 27,365 | |
STERIS plc | | | 500 | | | | 88,595 | |
Stryker Corp. | | | 1,500 | | | | 303,015 | |
Terumo Corp. | | | 900 | | | | 33,165 | |
West Pharmaceutical Services, Inc. | | | 400 | | | | 108,828 | |
| | | | | | | | |
| | | | | | | 2,414,985 | |
| | | | | | | | |
Health Care Providers & Services (1.7%) | |
AmerisourceBergen Corp. | | | 400 | | | | 38,428 | |
Anthem, Inc. | | | 500 | | | | 136,400 | |
Cigna Corp. | | | 700 | | | | 116,879 | |
HCA Healthcare, Inc. | | | 300 | | | | 37,182 | |
Humana, Inc. | | | 300 | | | | 119,784 | |
McKesson Corp. | | | 300 | | | | 44,247 | |
Sonic Healthcare Ltd. | | | 1,627 | | | | 39,928 | |
UnitedHealth Group, Inc. | | | 1,100 | | | | 335,654 | |
| | | | | | | | |
| | | | | | | 868,502 | |
| | | | | | | | |
Health Care Technology (0.2%) | | | | | | | | |
Cerner Corp. | | | 1,000 | | | | 70,090 | |
Veeva Systems, Inc., Class A* | | | 100 | | | | 27,005 | |
| | | | | | | | |
| | | | | | | 97,095 | |
| | | | | | | | |
Life Sciences Tools & Services (1.5%) | | | | | | | | |
Agilent Technologies, Inc. | | | 1,400 | | | | 142,926 | |
Mettler-Toledo International, Inc.* | | | 100 | | | | 99,791 | |
Thermo Fisher Scientific, Inc. | | | 900 | | | | 425,808 | |
Waters Corp.* | | | 300 | | | | 66,846 | |
| | | | | | | | |
| | | | | | | 735,371 | |
| | | | | | | | |
Pharmaceuticals (5.3%) | | | | | | | | |
Astellas Pharma, Inc. | | | 3,000 | | | | 41,288 | |
AstraZeneca plc | | | 884 | | | | 88,981 | |
Chugai Pharmaceutical Co. Ltd. | | | 1,200 | | | | 46,303 | |
Eli Lilly and Co. | | | 2,000 | | | | 260,920 | |
GlaxoSmithKline plc | | | 6,099 | | | | 101,757 | |
Johnson & Johnson | | | 3,700 | | | | 507,307 | |
Merck & Co., Inc. | | | 5,300 | | | | 398,613 | |
Merck KGaA | | | 497 | | | | 73,600 | |
Novartis AG (Registered) | | | 1,839 | | | | 143,527 | |
Novo Nordisk A/S, Class B | | | 1,886 | | | | 120,613 | |
Ono Pharmaceutical Co. Ltd. | | | 1,200 | | | | 34,116 | |
Otsuka Holdings Co. Ltd. | | | 1,200 | | | | 44,478 | |
Pfizer, Inc. | | | 5,100 | | | | 180,948 | |
Roche Holding AG | | | 667 | | | | 214,118 | |
Sanofi | | | 800 | | | | 72,319 | |
Shionogi & Co. Ltd. | | | 700 | | | | 33,047 | |
UCB SA | | | 309 | | | | 30,405 | |
Zoetis, Inc. | | | 1,800 | | | | 285,390 | |
| | | | | | | | |
| | | | | | | 2,677,730 | |
| | | | | | | | |
Total Health Care | | | | | | | 7,423,007 | |
| | | | | | | | |
Industrials (13.0%) | | | | | | | | |
Aerospace & Defense (1.1%) | | | | | | | | |
BAE Systems plc | | | 6,741 | | | | 34,678 | |
General Dynamics Corp. | | | 500 | | | | 65,665 | |
L3Harris Technologies, Inc. | | | 300 | | | | 48,333 | |
Lockheed Martin Corp. | | | 800 | | | | 280,104 | |
Northrop Grumman Corp. | | | 300 | | | | 86,946 | |
Teledyne Technologies, Inc.* | | | 100 | | | | 30,915 | |
| | | | | | | | |
| | | | | | | 546,641 | |
| | | | | | | | |
Air Freight & Logistics (0.9%) | | | | | | | | |
CH Robinson Worldwide, Inc. | | | 500 | | | | 44,215 | |
Deutsche Post AG (Registered) | | | 1,754 | | | | 77,736 | |
Expeditors International of Washington, Inc. | | | 1,300 | | | | 114,881 | |
SG Holdings Co. Ltd. | | | 1,600 | | | | 38,585 | |
United Parcel Service, Inc., Class B | | | 1,200 | | | | 188,532 | |
| | | | | | | | |
| | | | | | | 463,949 | |
| | | | | | | | |
Building Products (0.9%) | | | | | | | | |
Assa Abloy AB, Class B | | | 1,200 | | | | 25,769 | |
Daikin Industries Ltd. | | | 600 | | | | 112,332 | |
Geberit AG (Registered) | | | 140 | | | | 79,622 | |
Lennox International, Inc. | | | 100 | | | | 27,166 | |
Masco Corp. | | | 800 | | | | 42,880 | |
Trane Technologies plc | | | 1,100 | | | | 146,025 | |
| | | | | | | | |
| | | | | | | 433,794 | |
| | | | | | | | |
Commercial Services & Supplies (1.0%) | |
Cintas Corp. | | | 200 | | | | 62,910 | |
Copart, Inc.* | | | 300 | | | | 33,108 | |
Republic Services, Inc. | | | 400 | | | | 35,268 | |
Secom Co. Ltd. | | | 1,200 | | | | 101,386 | |
Waste Connections, Inc. | | | 800 | | | | 79,456 | |
Waste Management, Inc. | | | 1,800 | | | | 194,238 | |
| | | | | | | | |
| | | | | | | 506,366 | |
| | | | | | | | |
Construction & Engineering (0.4%) | | | | | | | | |
Bouygues SA | | | 1,098 | | | | 36,049 | |
Kajima Corp. | | | 2,000 | | | | 21,306 | |
See Notes to Financial Statements.
131
1290 FUNDS
1290 SMARTBETA EQUITY FUND
PORTFOLIO OF INVESTMENTS (Continued)
October 31, 2020
| | | | | | | | |
| | | |
| | | Number of
Shares | | | Value
(Note 1) | |
Obayashi Corp. | | | 5,300 | | | $ | 44,197 | |
Shimizu Corp. | | | 3,000 | | | | 20,760 | |
Taisei Corp. | | | 800 | | | | 24,846 | |
Vinci SA | | | 500 | | | | 39,566 | |
WSP Global, Inc. | | | 400 | | | | 25,301 | |
| | | | | | | | |
| | | | | | | 212,025 | |
| | | | | | | | |
Electrical Equipment (1.0%) | | | | | | | | |
AMETEK, Inc. | | | 500 | | | | 49,100 | |
Eaton Corp. plc | | | 800 | | | | 83,032 | |
Emerson Electric Co. | | | 1,800 | | | | 116,622 | |
Legrand SA | | | 300 | | | | 22,209 | |
Mitsubishi Electric Corp. | | | 4,500 | | | | 57,804 | |
Rockwell Automation, Inc. | | | 400 | | | | 94,848 | |
Schneider Electric SE | | | 637 | | | | 77,416 | |
| | | | | | | | |
| | | | | | | 501,031 | |
| | | | | | | | |
Industrial Conglomerates (1.2%) | | | | | | | | |
3M Co. | | | 1,400 | | | | 223,944 | |
Honeywell International, Inc. | | | 1,200 | | | | 197,940 | |
Roper Technologies, Inc. | | | 400 | | | | 148,536 | |
Siemens AG (Registered) | | | 498 | | | | 58,377 | |
| | | | | | | | |
| | | | | | | 628,797 | |
| | | | | | | | |
Machinery (2.2%) | | | | | | | | |
Alfa Laval AB* | | | 1,547 | | | | 31,402 | |
Atlas Copco AB, Class A | | | 2,428 | | | | 107,235 | |
Caterpillar, Inc. | | | 1,000 | | | | 157,050 | |
Cummins, Inc. | | | 500 | | | | 109,945 | |
Deere & Co. | | | 700 | | | | 158,137 | |
Dover Corp. | | | 400 | | | | 44,284 | |
IDEX Corp. | | | 200 | | | | 34,078 | |
Illinois Tool Works, Inc. | | | 900 | | | | 176,292 | |
Kone OYJ, Class B | | | 1,194 | | | | 95,064 | |
PACCAR, Inc. | | | 400 | | | | 34,152 | |
Parker-Hannifin Corp. | | | 200 | | | | 41,672 | |
Sandvik AB* | | | 2,000 | | | | 35,634 | |
Volvo AB, Class B* | | | 2,258 | | | | 43,964 | |
Xylem, Inc. | | | 500 | | | | 43,570 | |
| | | | | | | | |
| | | | | | | 1,112,479 | |
| | | | | | | | |
Marine (0.1%) | | | | | | | | |
Kuehne + Nagel International AG (Registered) | | | 180 | | | | 35,955 | |
| | | | | | | | |
Professional Services (1.6%) | | | | | | | | |
CoStar Group, Inc.* | | | 100 | | | | 82,361 | |
Experian plc | | | 2,134 | | | | 77,898 | |
IHS Markit Ltd. | | | 1,800 | | | | 145,566 | |
Recruit Holdings Co. Ltd. | | | 1,900 | | | | 72,573 | |
Teleperformance | | | 144 | | | | 43,326 | |
Thomson Reuters Corp. | | | 1,600 | | | | 124,392 | |
Verisk Analytics, Inc. | | | 800 | | | | 142,376 | |
Wolters Kluwer NV | | | 1,635 | | | | 132,529 | |
| | | | | | | | |
| | | | | | | 821,021 | |
| | | | | | | | |
Road & Rail (1.9%) | |
Canadian National Railway Co. | | | 3,200 | | | | 317,887 | |
Canadian Pacific Railway Ltd. | | | 500 | | | | 149,418 | |
CSX Corp. | | | 1,400 | | | | 110,516 | |
Hankyu Hanshin Holdings, Inc. | | | 1,000 | | | | 30,605 | |
Nagoya Railroad Co. Ltd. | | | 1,200 | | | | 31,983 | |
Norfolk Southern Corp. | | | 500 | | | | 104,560 | |
Old Dominion Freight Line, Inc. | | | 200 | | | | 38,074 | |
Union Pacific Corp. | | | 1,100 | | | | 194,909 | |
| | | | | | | | |
| | | | | | | 977,952 | |
| | | | | | | | |
Trading Companies & Distributors (0.6%) | |
Brenntag AG | | | 400 | | | | 25,570 | |
Fastenal Co. | | | 1,900 | | | | 82,137 | |
Ferguson plc | | | 473 | | | | 47,463 | |
Mitsui & Co. Ltd. | | | 1,900 | | | | 29,805 | |
Toyota Tsusho Corp. | | | 2,200 | | | | 61,602 | |
WW Grainger, Inc. | | | 200 | | | | 70,004 | |
| | | | | | | | |
| | | | | | | 316,581 | |
| | | | | | | | |
Transportation Infrastructure (0.1%) | |
Kamigumi Co. Ltd. | | | 1,400 | | | | 25,082 | |
| | | | | | | | |
Total Industrials | | | | | | | 6,581,673 | |
| | | | | | | | |
Information Technology (17.0%) | |
Communications Equipment (0.6%) | |
Cisco Systems, Inc. | | | 6,894 | | | | 247,495 | |
Motorola Solutions, Inc. | | | 400 | | | | 63,224 | |
| | | | | | | | |
| | | | | | | 310,719 | |
| | | | | | | | |
Electronic Equipment, Instruments & Components (0.8%) | |
Amphenol Corp., Class A | | | 600 | | | | 67,704 | |
CDW Corp. | | | 500 | | | | 61,300 | |
Corning, Inc. | | | 1,400 | | | | 44,758 | |
Hexagon AB, Class B | | | 646 | | | | 47,177 | |
Keyence Corp. | | | 200 | | | | 90,695 | |
Kyocera Corp. | | | 400 | | | | 22,035 | |
Trimble, Inc.* | | | 900 | | | | 43,317 | |
Zebra Technologies Corp., Class A* | | | 100 | | | | 28,364 | |
| | | | | | | | |
| | | | | | | 405,350 | |
| | | | | | | | |
IT Services (4.5%) | |
Accenture plc, Class A | | | 1,400 | | | | 303,674 | |
Automatic Data Processing, Inc. | | | 2,000 | | | | 315,920 | |
Booz Allen Hamilton Holding Corp. | | | 500 | | | | 39,250 | |
Broadridge Financial Solutions, Inc. | | | 500 | | | | 68,800 | |
CGI, Inc.* | | | 1,100 | | | | 68,256 | |
Cognizant Technology Solutions Corp., Class A | | | 1,400 | | | | 99,988 | |
EPAM Systems, Inc.* | | | 100 | | | | 30,895 | |
International Business Machines Corp. | | | 600 | | | | 66,996 | |
Jack Henry & Associates, Inc. | | | 300 | | | | 44,475 | |
Mastercard, Inc., Class A | | | 1,100 | | | | 317,504 | |
Nomura Research Institute Ltd. | | | 1,700 | | | | 50,028 | |
Paychex, Inc. | | | 1,100 | | | | 90,475 | |
PayPal Holdings, Inc.* | | | 1,207 | | | | 224,659 | |
VeriSign, Inc.* | | | 400 | | | | 76,280 | |
Visa, Inc., Class A | | | 2,700 | | | | 490,617 | |
| | | | | | | | |
| | | | | | | 2,287,817 | |
| | | | | | | | |
Semiconductors & Semiconductor Equipment (1.9%) | |
Applied Materials, Inc. | | | 2,500 | | | | 148,075 | |
ASML Holding NV | | | 390 | | | | 141,786 | |
Intel Corp. | | | 3,300 | | | | 146,124 | |
KLA Corp. | | | 300 | | | | 59,154 | |
Maxim Integrated Products, Inc. | | | 900 | | | | 62,685 | |
Texas Instruments, Inc. | | | 2,267 | | | | 327,786 | |
Xilinx, Inc. | | | 400 | | | | 47,476 | |
| | | | | | | | |
| | | | | | | 933,086 | |
| | | | | | | | |
See Notes to Financial Statements.
132
1290 FUNDS
1290 SMARTBETA EQUITY FUND
PORTFOLIO OF INVESTMENTS (Continued)
October 31, 2020
| | | | | | | | |
| | | |
| | | Number of
Shares | | | Value
(Note 1) | |
Software (6.1%) | |
Adobe, Inc.* | | | 900 | | | $ | 402,390 | |
Cadence Design Systems, Inc.* | | | 800 | | | | 87,496 | |
Check Point Software Technologies Ltd.* | | | 300 | | | | 34,068 | |
Citrix Systems, Inc. | | | 400 | | | | 45,308 | |
Constellation Software, Inc. | | | 100 | | | | 104,976 | |
Fair Isaac Corp.* | | | 100 | | | | 39,145 | |
Intuit, Inc. | | | 800 | | | | 251,744 | |
Microsoft Corp. | | | 6,810 | | | | 1,378,821 | |
Nice Ltd.* | | | 171 | | | | 38,982 | |
Open Text Corp. | | | 800 | | | | 29,393 | |
Oracle Corp. | | | 6,600 | | | | 370,326 | |
SAP SE | | | 1,340 | | | | 142,808 | |
Synopsys, Inc.* | | | 600 | | | | 128,316 | |
| | | | | | | | |
| | | | | | | 3,053,773 | |
| | | | | | | | |
Technology Hardware, Storage & Peripherals (3.1%) | |
Apple, Inc. | | | 12,504 | | | | 1,361,185 | |
Canon, Inc. | | | 2,800 | | | | 48,729 | |
FUJIFILM Holdings Corp. | | | 1,600 | | | | 81,562 | |
HP, Inc. | | | 2,000 | | | | 35,920 | |
Seagate Technology plc | | | 700 | | | | 33,474 | |
| | | | | | | | |
| | | | | | | 1,560,870 | |
| | | | | | | | |
Total Information Technology | | | | | | | 8,551,615 | |
| | | | | | | | |
Materials (3.0%) | |
Chemicals (2.3%) | |
Air Liquide SA | | | 287 | | | | 42,009 | |
Air Products and Chemicals, Inc. | | | 500 | | | | 138,120 | |
Chr Hansen Holding A/S | | | 200 | | | | 20,149 | |
Corteva, Inc. | | | 1,600 | | | | 52,768 | |
FMC Corp. | | | 400 | | | | 41,096 | |
Givaudan SA (Registered) | | | 41 | | | | 166,880 | |
Koninklijke DSM NV | | | 317 | | | | 50,760 | |
Linde plc | | | 1,000 | | | | 220,340 | |
Novozymes A/S, Class B | | | 400 | | | | 24,066 | |
PPG Industries, Inc. | | | 500 | | | | 64,860 | |
Sherwin-Williams Co. (The) | | | 300 | | | | 206,394 | |
Shin-Etsu Chemical Co. Ltd. | | | 300 | | | | 40,143 | |
Symrise AG | | | 634 | | | | 78,376 | |
Toray Industries, Inc. | | | 5,400 | | | | 24,496 | |
| | | | | | | | |
| | | | | | | 1,170,457 | |
| | | | | | | | |
Construction Materials (0.1%) | |
Vulcan Materials Co. | | | 300 | | | | 43,452 | |
| | | | | | | | |
Containers & Packaging (0.2%) | |
Ball Corp. | | | 800 | | | | 71,200 | |
| | | | | | | | |
Metals & Mining (0.4%) | |
BHP Group Ltd. | | | 2,538 | | | | 61,028 | |
BHP Group plc | | | 1,834 | | | | 35,594 | |
Franco-Nevada Corp. | | | 300 | | | | 40,890 | |
Newcrest Mining Ltd. | | | 2,719 | | | | 56,139 | |
Rio Tinto Ltd. | | | 411 | | | | 26,802 | |
| | | | | | | | |
| | | | | | | 220,453 | |
| | | | | | | | |
Total Materials | | | | | | | 1,505,562 | |
| | | | | | | | |
Real Estate (2.9%) | |
Equity Real Estate Investment Trusts (REITs) (2.5%) | |
Alexandria Real Estate Equities, Inc. (REIT) | | | 900 | | | | 136,368 | |
American Tower Corp. (REIT) | | | 900 | | | | 206,685 | |
Ascendas REIT (REIT) | | | 12,000 | | | | 25,349 | |
CapitaLand Mall Trust (REIT) | | | 36,928 | | | | 46,935 | |
Daiwa House REIT Investment Corp. (REIT) | | | 23 | | | | 53,263 | |
Dexus (REIT) | | | 8,671 | | | | 52,646 | |
Duke Realty Corp. (REIT) | | | 1,000 | | | | 37,990 | |
Equinix, Inc. (REIT) | | | 100 | | | | 73,124 | |
Equity LifeStyle Properties, Inc. (REIT) | | | 1,000 | | | | 59,190 | |
Equity Residential (REIT) | | | 1,400 | | | | 65,772 | |
Essex Property Trust, Inc. (REIT) | | | 100 | | | | 20,459 | |
GLP J-REIT (REIT) | | | 24 | | | | 36,855 | |
Goodman Group (REIT) | | | 7,429 | | | | 96,365 | |
Japan Real Estate Investment Corp. (REIT) | | | 17 | | | | 83,300 | |
Mid-America Apartment Communities, Inc. (REIT) | | | 300 | | | | 34,989 | |
Nippon Building Fund, Inc. (REIT) | | | 7 | | | | 35,351 | |
Nippon Prologis REIT, Inc. (REIT) | | | 12 | | | | 39,522 | |
Nomura Real Estate Master Fund, Inc. (REIT) | | | 28 | | | | 33,406 | |
Public Storage (REIT) | | | 400 | | | | 91,628 | |
Segro plc (REIT) | | | 3,499 | | | | 40,902 | |
| | | | | | | | |
| | | | | | | 1,270,099 | |
| | | | | | | | |
Real Estate Management & Development (0.4%) | |
CapitaLand Ltd. | | | 18,100 | | | | 34,121 | |
CK Asset Holdings Ltd. | | | 7,000 | | | | 32,433 | |
Daiwa House Industry Co. Ltd. | | | 1,000 | | | | 26,343 | |
Mitsubishi Estate Co. Ltd. | | | 4,400 | | | | 65,742 | |
Swiss Prime Site AG (Registered) | | | 583 | | | | 48,996 | |
| | | | | | | | |
| | | | | | | 207,635 | |
| | | | | | | | |
Total Real Estate | | | | | | | 1,477,734 | |
| | | | | | | | |
Utilities (5.3%) | |
Electric Utilities (2.1%) | |
Enel SpA | | | 9,207 | | | | 73,328 | |
Eversource Energy | | | 3,000 | | | | 261,810 | |
Fortis, Inc. | | | 900 | | | | 35,553 | |
Iberdrola SA | | | 21,511 | | | | 253,762 | |
Orsted A/S(m) | | | 780 | | | | 123,914 | |
Power Assets Holdings Ltd. | | | 6,500 | | | | 33,423 | |
PPL Corp. | | | 1,200 | | | | 33,000 | |
Red Electrica Corp. SA | | | 5,446 | | | | 95,958 | |
SSE plc | | | 2,023 | | | | 32,900 | |
Terna Rete Elettrica Nazionale SpA | | | 19,912 | | | | 134,662 | |
| | | | | | | | |
| | | | | | | 1,078,310 | |
| | | | | | | | |
Gas Utilities (0.8%) | |
APA Group | | | 5,011 | | | | 37,109 | |
Atmos Energy Corp. | | | 1,600 | | | | 146,672 | |
Hong Kong & China Gas Co. Ltd. | | | 26,000 | | | | 37,434 | |
Naturgy Energy Group SA | | | 2,062 | | | | 38,178 | |
Osaka Gas Co. Ltd. | | | 1,900 | | | | 35,855 | |
Snam SpA | | | 16,066 | | | | 78,447 | |
Tokyo Gas Co. Ltd. | | | 2,000 | | | | 45,160 | |
| | | | | | | | |
| | | | | | | 418,855 | |
| | | | | | | | |
See Notes to Financial Statements.
133
1290 FUNDS
1290 SMARTBETA EQUITY FUND
PORTFOLIO OF INVESTMENTS (Continued)
October 31, 2020
| | | | | | | | |
| | | |
| | | Number of
Shares | | | Value
(Note 1) | |
Independent Power and Renewable Electricity
Producers (0.1%) | |
Meridian Energy Ltd. | | | 15,598 | | | $ | 54,646 | |
| | | | | | | | |
Multi-Utilities (1.9%) | |
Algonquin Power & Utilities Corp. | | | 2,100 | | | | 31,840 | |
CMS Energy Corp. | | | 1,200 | | | | 75,996 | |
Consolidated Edison, Inc. | | | 2,600 | | | | 204,074 | |
E.ON SE | | | 6,562 | | | | 68,434 | |
National Grid plc | | | 11,977 | | | | 142,554 | |
NiSource, Inc. | | | 1,600 | | | | 36,752 | |
Public Service Enterprise Group, Inc. | | | 1,300 | | | | 75,595 | |
Sempra Energy | | | 1,800 | | | | 225,648 | |
WEC Energy Group, Inc. | | | 700 | | | | 70,385 | |
| | | | | | | | |
| | | | | | | 931,278 | |
| | | | | | | | |
Water Utilities (0.4%) | |
American Water Works Co., Inc. | | | 1,000 | | | | 150,510 | |
Severn Trent plc | | | 1,200 | | | | 37,789 | |
| | | | | | | | |
| | | | | | | 188,299 | |
| | | | | | | | |
Total Utilities | | | | | | | 2,671,388 | |
| | | | | | | | |
Total Common Stocks (97.6%)
(Cost $45,368,497) | | | | | | | 49,233,468 | |
| | | | | | | | |
SHORT-TERM INVESTMENT: | |
Investment Company (1.1%) | |
JPMorgan Prime Money Market Fund, IM Shares | | | 549,358 | | | | 549,687 | |
| | | | | | | | |
Total Short-Term Investment (1.1%)
(Cost $549,687) | | | | | | | 549,687 | |
| | | | | | | | |
Total Investments in
Securities (98.7%)
(Cost $45,918,184) | | | | | | | 49,783,155 | |
Other Assets Less Liabilities (1.3%) | | | | | | | 646,159 | |
| | | | | | | | |
Net Assets (100%) | | | | | | $ | 50,429,314 | |
| | | | | | | | |
| (m) | Regulation S is an exemption for securities offerings that are made outside of the United States and do not involve direct selling efforts in the United States. Resale restrictions may apply for purposes of the Securities Act of 1933. At October 31, 2020, the market value of these securities amounted to $123,914 or 0.2% of net assets. |
| | | | |
| | |
Country Diversification As a Percentage of Total Net Assets | | | |
Australia | | | 1.6 | % |
Belgium | | | 0.0 | # |
Canada | | | 6.2 | |
Denmark | | | 0.7 | |
Finland | | | 0.5 | |
France | | | 1.8 | |
Germany | | | 2.3 | |
Hong Kong | | | 0.4 | |
Israel | | | 0.4 | |
Italy | | | 0.7 | |
Japan | | | 6.3 | |
Netherlands | | | 0.9 | |
New Zealand | | | 0.2 | |
Norway | | | 0.3 | |
Singapore | | | 0.4 | |
Spain | | | 0.9 | |
Sweden | | | 0.8 | |
Switzerland | | | 2.3 | |
United Kingdom | | | 2.9 | |
United States | | | 69.1 | |
Cash and Other | | | 1.3 | |
| | | | | |
| | | | 100.0 | % |
| | | | | |
| # | Percent shown is less than 0.05%. |
The following is a summary of the inputs used to value the Fund’s assets and liabilities carried at fair value as of October 31, 2020:
The inputs or methodology used for valuing securities are not necessarily an indication of the risk associated with investing in those securities.
Various inputs are used in determining the value of the Fund’s investments. These inputs are summarized in the three broad levels listed below:
| | | | | | | | | | | | | | | | |
| | | | | |
| Investment Type | | Level 1 Quoted Prices in
Active Markets for
Identical
Securities | | | Level 2 Significant Other
Observable Inputs
(including quoted prices
for similar securities,
interest rates,
prepayment speeds,
credit risk, etc.) | | | Level 3 Significant Unobservable
Inputs (including the
Fund’s own
assumptions in
determining the fair
value of investments) | | | Total | |
Assets: | |
Common Stocks | | | | | | | | | | | | | | | | |
Communication Services | | $ | 3,116,548 | | | $ | 941,466 | | | $ | — | | | $ | 4,058,014 | |
Consumer Discretionary | | | 2,926,065 | | | | 654,184 | | | | — | | | | 3,580,249 | |
Consumer Staples | | | 4,267,889 | | | | 1,524,346 | | | | — | | | | 5,792,235 | |
Energy | | | 199,563 | | | | 181,267 | | | | — | | | | 380,830 | |
Financials | | | 5,498,239 | | | | 1,712,922 | | | | — | | | | 7,211,161 | |
See Notes to Financial Statements.
134
1290 FUNDS
1290 SMARTBETA EQUITY FUND
PORTFOLIO OF INVESTMENTS (Continued)
October 31, 2020
| | | | | | | | | | | | | | | | |
| | | | | |
| Investment Type | | Level 1 Quoted Prices in
Active Markets for
Identical
Securities | | | Level 2 Significant Other
Observable Inputs
(including quoted prices
for similar securities,
interest rates,
prepayment speeds,
credit risk, etc.) | | | Level 3 Significant Unobservable
Inputs (including the
Fund’s own
assumptions in
determining the fair
value of investments) | | | Total | |
Health Care | | $ | 6,031,590 | | | $ | 1,391,417 | | | $ | — | | | $ | 7,423,007 | |
Industrials | | | 4,781,345 | | | | 1,800,328 | | | | — | | | | 6,581,673 | |
Information Technology | | | 7,887,813 | | | | 663,802 | | | | — | | | | 8,551,615 | |
Materials | | | 879,120 | | | | 626,442 | | | | — | | | | 1,505,562 | |
Real Estate | | | 726,205 | | | | 751,529 | | | | — | | | | 1,477,734 | |
Utilities | | | 1,347,835 | | | | 1,323,553 | | | | — | | | | 2,671,388 | |
Short-Term Investment | | | | | | | | | | | | | | | | |
Investment Company | | | 549,687 | | | | — | | | | — | | | | 549,687 | |
| | | | | | | | | | | | | | | | |
Total Assets | | $ | 38,211,899 | | | $ | 11,571,256 | | | $ | — | | | $ | 49,783,155 | |
| | | | | | | | | | | | | | | | |
Total Liabilities | | $ | — | | | $ | — | | | $ | — | | | $ | — | |
| | | | | | | | | | | | | | | | |
Total | | $ | 38,211,899 | | | $ | 11,571,256 | | | $ | — | | | $ | 49,783,155 | |
| | | | | | | | | | | | | | | | |
The Fund held no derivatives contracts during the year ended October 31, 2020.
Investment security transactions for the year ended October 31, 2020 were as follows:
| | | | |
Cost of Purchases: | | | | |
Long-term investments other than U.S. government debt securities | | $ | 37,733,118 | |
Net Proceeds of Sales and Redemptions: | | | | |
Long-term investments other than U.S. government debt securities | | $ | 14,563,655 | |
As of October 31, 2020, the gross unrealized appreciation (depreciation) of investments based on the aggregate cost of investments in securities and derivative instruments, if applicable, for Federal income tax purposes was as follows:
| | | | |
Aggregate gross unrealized appreciation | | $ | 5,380,647 | |
Aggregate gross unrealized depreciation | | | (1,637,267 | ) |
| | | | |
Net unrealized appreciation | | $ | 3,743,380 | |
| | | | |
Federal income tax cost of investments in securities and derivative instruments, if applicable | | $ | 46,039,775 | |
| | | | |
See Notes to Financial Statements.
135
1290 FUNDS
1290 SMARTBETA EQUITY FUND
STATEMENT OF ASSETS AND LIABILITIES
October 31, 2020
| | | | |
ASSETS | | | | |
Investments in Securities, at value
(Cost $45,918,184) | | $ | 49,783,155 | |
Cash | | | 383,269 | |
Foreign cash (Cost $59,459) | | | 59,198 | |
Receivable for Fund shares sold | | | 767,196 | |
Dividends, interest and other receivables | | | 103,582 | |
Prepaid registration and filing fees | | | 24,451 | |
Other assets | | | 2,066 | |
| | | | |
Total assets | | | 51,122,917 | |
| | | | |
LIABILITIES | | | | |
Payable for securities purchased | | | 604,432 | |
Payable for Fund shares redeemed | | | 8,550 | |
Transfer agent fees payable | | | 7,804 | |
Administrative fees payable | | | 6,468 | |
Investment advisory fees payable | | | 920 | |
Trustees’ fees payable | | | 759 | |
Distribution fees payable – Class A | | | 722 | |
Distribution fees payable – Class R | | | 86 | |
Accrued expenses | | | 63,862 | |
| | | | |
Total liabilities | | | 693,603 | |
| | | | |
NET ASSETS | | $ | 50,429,314 | |
| | | | |
Net assets were comprised of: | | | | |
Paid in capital | | $ | 45,951,352 | |
Total distributable earnings (loss) | | | 4,477,962 | |
| | | | |
Net assets | | $ | 50,429,314 | |
| | | | |
Class A | | | | |
Net asset value and redemption price per share, $3,278,019 / 245,751 shares outstanding (unlimited amount authorized: $0.001 par value) | | $ | 13.34 | |
Maximum sales charge (5.50% of offering price) | | | 0.78 | |
| | | | |
Maximum offering price per share | | $ | 14.12 | |
| | | | |
Class I | | | | |
Net asset value, offering and redemption price per share, $46,777,477 / 3,497,940 shares outstanding (unlimited amount authorized: $0.001 par value) | | $ | 13.37 | |
| | | | |
Class R | | | | |
Net asset value, offering and redemption price per share, $235,697 / 17,715 shares outstanding (unlimited amount authorized: $0.001 par value) | | $ | 13.30 | |
| | | | |
Class T** | | | | |
Net asset value and redemption price per share, $138,121 / 10,332 shares outstanding (unlimited amount authorized: $0.001 par value) | | $ | 13.37 | |
Maximum sales charge (2.50% of offering price) | | | 0.34 | |
| | | | |
Maximum offering price per share | | $ | 13.71 | |
| | | | |
| ** | Class T shares currently are not offered for sale. |
STATEMENT OF OPERATIONS
For the Year Ended October 31, 2020
| | | | |
INVESTMENT INCOME | | | | |
Dividends (net of $41,788 foreign withholding tax) | | $ | 765,613 | |
Interest | | | 1,226 | |
| | | | |
Total income | | | 766,839 | |
| | | | |
EXPENSES | | | | |
Investment advisory fees | | | 248,236 | |
Professional fees | | | 72,228 | |
Transfer agent fees | | | 65,800 | |
Administrative fees | | | 53,194 | |
Printing and mailing expenses | | | 38,178 | |
Registration and filing fees | | | 33,096 | |
Custodian fees | | | 22,200 | |
Distribution fees – Class A | | | 7,038 | |
Trustees’ fees | | | 3,023 | |
Distribution fees – Class R | | | 763 | |
Distribution fees – Class T** | | | 339 | |
Miscellaneous | | | 24,011 | |
| | | | |
Gross expenses | | | 568,106 | |
Less: | | | | |
Waiver from investment adviser | | | (243,147 | ) |
Waiver from distributor | | | (339 | ) |
| | | | |
Net expenses | | | 324,620 | |
| | | | |
NET INVESTMENT INCOME (LOSS) | | | 442,219 | |
| | | | |
REALIZED AND UNREALIZED GAIN (LOSS) | | | | |
Realized gain (loss) on: | | | | |
Investments in securities | | | 251,257 | |
Foreign currency transactions | | | 2,834 | |
| | | | |
Net realized gain (loss) | | | 254,091 | |
| | | | |
Change in unrealized appreciation (depreciation) on: | | | | |
Investments in securities | | | (238,249 | ) |
Foreign currency translations | | | 1,425 | |
| | | | |
Net change in unrealized appreciation (depreciation) | | | (236,824 | ) |
| | | | |
NET REALIZED AND UNREALIZED GAIN (LOSS) | | | 17,267 | |
| | | | |
NET INCREASE (DECREASE) IN NET ASSETS RESULTING FROM OPERATIONS | | $ | 459,486 | |
| | | | |
| ** | Class T shares currently are not offered for sale. |
See Notes to Financial Statements.
136
1290 FUNDS
1290 SMARTBETA EQUITY FUND
STATEMENT OF CHANGES IN NET ASSETS
| | | | | | | | |
| | | Year Ended October 31, | |
| | 2020 | | | 2019 | |
INCREASE (DECREASE) IN NET ASSETS FROM OPERATIONS: | |
Net investment income (loss) | | $ | 442,219 | | | $ | 309,845 | |
Net realized gain (loss) | | | 254,091 | | | | 297,173 | |
Net change in unrealized appreciation (depreciation) | | | (236,824 | ) | | | 2,511,264 | |
| | | | | | | | |
NET INCREASE (DECREASE) IN NET ASSETS RESULTING FROM OPERATIONS | | | 459,486 | | | | 3,118,282 | |
| | | | | | | | |
Distributions to shareholders: | | | | | | | | |
Class A | | | (44,168 | ) | | | (49,479 | ) |
Class I | | | (572,775 | ) | | | (823,783 | ) |
Class R | | | (2,785 | ) | | | (6,108 | ) |
Class T** | | | (3,196 | ) | | | (6,200 | ) |
| | | | | | | | |
Total distributions to shareholders | | | (622,924 | ) | | | (885,570 | ) |
| | | | | | | | |
CAPITAL SHARES TRANSACTIONS: | | | | | | | | |
Class A | | | | | | | | |
Capital shares sold [145,209 and 94,431 shares, respectively] | | | 1,889,452 | | | | 1,199,186 | |
Capital shares issued in reinvestment of dividends [3,024 and 3,763 shares, respectively] | | | 40,643 | | | | 43,270 | |
Capital shares repurchased [(53,461) and (40,087) shares, respectively] | | | (718,635 | ) | | | (494,261 | ) |
| | | | | | | | |
Total Class A transactions | | | 1,211,460 | | | | 748,195 | |
| | | | | | | | |
Class I | | | | | | | | |
Capital shares sold [2,083,058 and 503,495 shares, respectively] | | | 27,872,805 | | | | 6,334,750 | |
Capital shares issued in reinvestment of dividends [20,252 and 21,002 shares, respectively] | | | 272,391 | | | | 241,529 | |
Capital shares repurchased [(397,169) and (81,503) shares, respectively] | | | (5,112,229 | ) | | | (1,019,728 | ) |
| | | | | | | | |
Total Class I transactions | | | 23,032,967 | | | | 5,556,551 | |
| | | | | | | | |
Class R | | | | | | | | |
Capital shares sold [6,415 and 127 shares, respectively] | | | 86,997 | | | | 1,616 | |
Capital shares issued in reinvestment of dividends [10 and 25 shares, respectively] | | | 132 | | | | 283 | |
Capital shares repurchased [(23) and (143) shares, respectively] | | | (302 | ) | | | (1,887 | ) |
| | | | | | | | |
Total Class R transactions | | | 86,827 | | | | 12 | |
| | | | | | | | |
NET INCREASE (DECREASE) IN NET ASSETS RESULTING FROM CAPITAL SHARE TRANSACTIONS | | | 24,331,254 | | | | 6,304,758 | |
| | | | | | | | |
TOTAL INCREASE (DECREASE) IN NET ASSETS | | | 24,167,816 | | | | 8,537,470 | |
NET ASSETS: | | | | | | | | |
Beginning of year | | | 26,261,498 | | | | 17,724,028 | |
| | | | | | | | |
End of year | | $ | 50,429,314 | | | $ | 26,261,498 | |
| | | | | | | | |
| | ** | Class T shares currently are not offered for sale. |
See Notes to Financial Statements.
137
1290 FUNDS
1290 SMARTBETA EQUITY FUND
FINANCIAL HIGHLIGHTS
| | | | | | | | | | | | | | | | | | | | |
Class A | | Year Ended October 31, | |
| | 2020 | | | 2019 | | | 2018 | | | 2017 | | | 2016 | |
Net asset value, beginning of year | | $ | 13.34 | | | $ | 12.09 | | | $ | 12.23 | | | $ | 10.25 | | | $ | 10.24 | |
| | | | | | | | | | | | | | | | | | | | |
Income (loss) from investment operations: | | | | | | | | | | | | | | | | | | | | |
Net investment income (loss) (e) | | | 0.14 | | | | 0.15 | | | | 0.15 | | | | 0.13 | | | | 0.12 | ## |
Net realized and unrealized gain (loss) | | | 0.14 | | | | 1.67 | | | | 0.06 | | | | 1.96 | | | | 0.04 | |
| | | | | | | | | | | | | | | | | | | | |
Total from investment operations | | | 0.28 | | | | 1.82 | | | | 0.21 | | | | 2.09 | | | | 0.16 | |
| | | | | | | | | | | | | | | | | | | | |
Less distributions: | | | | | | | | | | | | | | | | | | | | |
Dividends from net investment income | | | (0.13 | ) | | | (0.14 | ) | | | (0.15 | ) | | | (0.11 | ) | | | (0.15 | ) |
Distributions from net realized gains | | | (0.15 | ) | | | (0.43 | ) | | | (0.20 | ) | | | — | | | | — | |
| | | | | | | | | | | | | | | | | | | | |
Total dividends and distributions | | | (0.28 | ) | | | (0.57 | ) | | | (0.35 | ) | | | (0.11 | ) | | | (0.15 | ) |
| | | | | | | | | | | | | | | | | | | | |
Net asset value, end of year | | $ | 13.34 | | | $ | 13.34 | | | $ | 12.09 | | | $ | 12.23 | | | $ | 10.25 | |
| | | | | | | | | | | | | | | | | | | | |
Total return | | | 2.07 | % | | | 15.81 | % | | | 1.64 | % | | | 20.58 | % | | | 1.58 | % |
| | | | | | | | | | | | | | | | | | | | |
Ratios/Supplemental Data: | | | | | | | | | | | | | | | | | | | | |
Net assets, end of year (000’s) | | $ | 3,278 | | | $ | 2,014 | | | $ | 1,123 | | | $ | 685 | | | $ | 269 | |
Ratio of expenses to average net assets: | | | | | | | | | | | | | | | | | | | | |
After waivers and reimbursements (f) | | | 1.14 | % | | | 1.15 | % | | | 1.15 | % | | | 1.20 | % | | | 1.35 | % |
Before waivers and reimbursements (f) | | | 1.83 | % | | | 2.26 | % | | | 2.42 | % | | | 2.77 | % | | | 2.76 | % |
Ratio of net investment income (loss) to average net assets: | | | | | | | | | | | | | | | | | | | | |
After waivers and reimbursements (f) | | | 1.04 | % | | | 1.19 | % | | | 1.21 | % | | | 1.17 | % | | | 1.23 | %(aa) |
Before waivers and reimbursements (f) | | | 0.35 | % | | | 0.08 | % | | | (0.06 | )% | | | (0.41 | )% | | | (0.18 | )%(aa) |
Portfolio turnover rate ^ | | | 42 | % | | | 31 | % | | | 49 | % | | | 41 | % | | | 27 | % |
| | | | | | | | | | | | | | | | | | | | |
Class I | | Year Ended October 31, | |
| | 2020 | | | 2019 | | | 2018 | | | 2017 | | | 2016 | |
Net asset value, beginning of year | | $ | 13.37 | | | $ | 12.11 | | | $ | 12.25 | | | $ | 10.27 | | | $ | 10.26 | |
| | | | | | | | | | | | | | | | | | | | |
Income (loss) from investment operations: | | | | | | | | | | | | | | | | | | | | |
Net investment income (loss) (e) | | | 0.17 | | | | 0.19 | | | | 0.18 | | | | 0.17 | | | | 0.15 | ## |
Net realized and unrealized gain (loss). | | | 0.14 | | | | 1.67 | | | | 0.06 | | | | 1.95 | | | | 0.03 | |
| | | | | | | | | | | | | | | | | | | | |
Total from investment operations | | | 0.31 | | | | 1.86 | | | | 0.24 | | | | 2.12 | | | | 0.18 | |
| | | | | | | | | | | | | | | | | | | | |
Less distributions: | | | | | | | | | | | | | | | | | | | | |
Dividends from net investment income | | | (0.16 | ) | | | (0.17 | ) | | | (0.18 | ) | | | (0.14 | ) | | | (0.17 | ) |
Distributions from net realized gains | | | (0.15 | ) | | | (0.43 | ) | | | (0.20 | ) | | | — | | | | — | |
| | | | | | | | | | | | | | | | | | | | |
Total dividends and distributions | | | (0.31 | ) | | | (0.60 | ) | | | (0.38 | ) | | | (0.14 | ) | | | (0.17 | ) |
| | | | | | | | | | | | | | | | | | | | |
Net asset value, end of year | | $ | 13.37 | | | $ | 13.37 | | | $ | 12.11 | | | $ | 12.25 | | | $ | 10.27 | |
| | | | | | | | | | | | | | | | | | | | |
Total return | | | 2.30 | % | | | 16.16 | % | | | 1.86 | % | | | 20.85 | % | | | 1.84 | % |
| | | | | | | | | | | | | | | | | | | | |
Ratios/Supplemental Data: | | | | | | | | | | | | | | | | | | | | |
Net assets, end of year (000’s) | | $ | 46,777 | | | $ | 23,959 | | | $ | 16,340 | | | $ | 14,158 | | | $ | 10,838 | |
Ratio of expenses to average net assets: | | | | | | | | | | | | | | | | | | | | |
After waivers and reimbursements (f) | | | 0.89 | % | | | 0.90 | % | | | 0.90 | % | | | 0.96 | % | | | 1.10 | % |
Before waivers and reimbursements (f) | | | 1.58 | % | | | 2.02 | % | | | 2.16 | % | | | 2.49 | % | | | 2.51 | % |
Ratio of net investment income (loss) to average net assets: | | | | | | | | | | | | | | | | | | | | |
After waivers and reimbursements (f) | | | 1.27 | % | | | 1.49 | % | | | 1.47 | % | | | 1.48 | % | | | 1.44 | %(aa) |
Before waivers and reimbursements (f) | | | 0.58 | % | | | 0.37 | % | | | 0.21 | % | | | (0.05 | )% | | | 0.04 | %(aa) |
Portfolio turnover rate ^ | | | 42 | % | | | 31 | % | | | 49 | % | | | 41 | % | | | 27 | % |
See Notes to Financial Statements.
138
1290 FUNDS
1290 SMARTBETA EQUITY FUND
FINANCIAL HIGHLIGHTS (Continued)
| | | | | | | | | | | | | | | | | | | | |
Class R | | Year Ended October 31, | |
| | 2020 | | | 2019 | | | 2018 | | | 2017 | | | 2016 | |
Net asset value, beginning of year | | $ | 13.31 | | | $ | 12.06 | | | $ | 12.20 | | | $ | 10.23 | | | $ | 10.22 | |
| | | | | | | | | | | | | | | | | | | | |
Income (loss) from investment operations: | | | | | | | | | | | | | | | | | | | | |
Net investment income (loss) (e) | | | 0.10 | | | | 0.12 | | | | 0.12 | | | | 0.11 | | | | 0.10 | ## |
Net realized and unrealized gain (loss) | | | 0.14 | | | | 1.67 | | | | 0.06 | | | | 1.94 | | | | 0.03 | |
| | | | | | | | | | | | | | | | | | | | |
Total from investment operations | | | 0.24 | | | | 1.79 | | | | 0.18 | | | | 2.05 | | | | 0.13 | |
| | | | | | | | | | | | | | | | | | | | |
Less distributions: | | | | | | | | | | | | | | | | | | | | |
Dividends from net investment income | | | (0.10 | ) | | | (0.11 | ) | | | (0.12 | ) | | | (0.08 | ) | | | (0.12 | ) |
Distributions from net realized gains | | | (0.15 | ) | | | (0.43 | ) | | | (0.20 | ) | | | — | | | | — | |
| | | | | | | | | | | | | | | | | | | | |
Total dividends and distributions | | | (0.25 | ) | | | (0.54 | ) | | | (0.32 | ) | | | (0.08 | ) | | | (0.12 | ) |
| | | | | | | | | | | | | | | | | | | | |
Net asset value, end of year | | $ | 13.30 | | | $ | 13.31 | | | $ | 12.06 | | | $ | 12.20 | | | $ | 10.23 | |
| | | | | | | | | | | | | | | | | | | | |
Total return | | | 1.75 | % | | | 15.55 | % | | | 1.39 | % | | | 20.21 | % | | | 1.32 | % |
| | | | | | | | | | | | | | | | | | | | |
Ratios/Supplemental Data: | | | | | | | | | | | | | | | | | | | | |
Net assets, end of year (000’s) | | $ | 236 | | | $ | 151 | | | $ | 136 | | | $ | 137 | | | $ | 115 | |
Ratio of expenses to average net assets: | | | | | | | | | | | | | | | | | | | | |
After waivers and reimbursements (f) | | | 1.39 | % | | | 1.40 | % | | | 1.40 | % | | | 1.46 | % | | | 1.60 | % |
Before waivers and reimbursements (f) | | | 2.09 | % | | | 2.52 | % | | | 2.66 | % | | | 2.98 | % | | | 3.01 | % |
Ratio of net investment income (loss) to average net assets: | | | | | | | | | | | | | | | | | | | | |
After waivers and reimbursements (f) | | | 0.77 | % | | | 1.00 | % | | | 0.98 | % | | | 0.98 | % | | | 0.98 | %(aa) |
Before waivers and reimbursements (f) | | | 0.07 | % | | | (0.12 | )% | | | (0.29 | )% | | | (0.54 | )% | | | (0.43 | )%(aa) |
Portfolio turnover rate ^ | | | 42 | % | | | 31 | % | | | 49 | % | | | 41 | % | | | 27 | % |
| | | | | | | | | | | | | | | | | | | | |
Class T** | | Year Ended October 31, | |
| | 2020 | | | 2019 | | | 2018 | | | 2017 | | | 2016 | |
Net asset value, beginning of year | | $ | 13.37 | | | $ | 12.11 | | | $ | 12.25 | | | $ | 10.27 | | | $ | 10.26 | |
| | | | | | | | | | | | | | | | | | | | |
Income (loss) from investment operations: | | | | | | | | | | | | | | | | | | | | |
Net investment income (loss) (e) | | | 0.17 | | | | 0.19 | | | | 0.18 | | | | 0.17 | | | | 0.15 | ## |
Net realized and unrealized gain (loss) | | | 0.14 | | | | 1.67 | | | | 0.06 | | | | 1.95 | | | | 0.03 | |
| | | | | | | | | | | | | | | | | | | | |
Total from investment operations | | | 0.31 | | | | 1.86 | | | | 0.24 | | | | 2.12 | | | | 0.18 | |
| | | | | | | | | | | | | | | | | | | | |
Less distributions: | | | | | | | | | | | | | | | | | | | | |
Dividends from net investment income | | | (0.16 | ) | | | (0.17 | ) | | | (0.18 | ) | | | (0.14 | ) | | | (0.17 | ) |
Distributions from net realized gains | | | (0.15 | ) | | | (0.43 | ) | | | (0.20 | ) | | | — | | | | — | |
| | | | | | | | | | | | | | | | | | | | |
Total dividends and distributions | | | (0.31 | ) | | | (0.60 | ) | | | (0.38 | ) | | | (0.14 | ) | | | (0.17 | ) |
| | | | | | | | | | | | | | | | | | | | |
Net asset value, end of year | | $ | 13.37 | | | $ | 13.37 | | | $ | 12.11 | | | $ | 12.25 | | | $ | 10.27 | |
| | | | | | | | | | | | | | | | | | | | |
Total return | | | 2.30 | % | | | 16.16 | % | | | 1.86 | % | | | 20.85 | % | | | 1.84 | % |
| | | | | | | | | | | | | | | | | | | | |
Ratios/Supplemental Data: | | | | | | | | | | | | | | | | | | | | |
Net assets, end of year (000’s) | | $ | 138 | | | $ | 138 | | | $ | 125 | | | $ | 127 | | | $ | 106 | |
Ratio of expenses to average net assets: | | | | | | | | | | | | | | | | | | | | |
After waivers and reimbursements (f) | | | 0.90 | % | | | 0.90 | % | | | 0.90 | % | | | 0.96 | % | | | 1.10 | % |
Before waivers and reimbursements (f) | | | 1.84 | % | | | 2.27 | % | | | 2.41 | % | | | 2.96 | % | | | 3.51 | % |
Ratio of net investment income (loss) to average net assets: | | | | | | | | | | | | | | | | | | | | |
After waivers and reimbursements (f) | | | 1.28 | % | | | 1.50 | % | | | 1.47 | % | | | 1.48 | % | | | 1.48 | %(aa) |
Before waivers and reimbursements (f) | | | 0.33 | % | | | 0.13 | % | | | (0.04 | )% | | | (0.52 | )% | | | (0.93 | )%(aa) |
Portfolio turnover rate ^ | | | 42 | % | | | 31 | % | | | 49 | % | | | 41 | % | | | 27 | % |
| ** | Class T shares currently are not offered for sale. Class T shares were formerly known as Class C shares. |
| ## | Includes income resulting from a special dividend. Without this dividend, the per share income amounts would be $0.08, $0.11, $0.06 and $0.11 for Class A, Class I, Class R and Class T, respectively. |
| ^ | Portfolio turnover rate excludes derivatives, if any. |
| (e) | Net investment income (loss) per share is based on average shares outstanding. |
| (f) | Expenses do not include the expenses of the underlying funds (“indirect expenses”), if applicable. |
| (aa) | Includes income resulting from a special dividend. Without this dividend, the ratios for each class would have been 0.37% lower. |
See Notes to Financial Statements.
139
1290 FUNDS
NOTES TO FINANCIAL STATEMENTS
October 31, 2020
| Note 1 | Organization and Significant Accounting Policies |
1290 Funds (the “Trust”) was organized as a Delaware statutory trust on March 1, 2013 and is registered under the Investment Company Act of 1940, as amended (the “1940 Act”), as an open-end management investment company with fifteen diversified funds in operation (each, a “Fund” and collectively, the “Funds”). The investment adviser to each Fund is Equitable Investment Management Group, LLC (“EIM” or the “Adviser”) (formerly, AXA Equitable Funds Management Group, LLC), a wholly-owned subsidiary of Equitable Financial Life Insurance Company (“Equitable Financial”) (formerly, AXA Equitable Financial Life Insurance Company).
Each of the investment sub-advisers (each a “Sub-Adviser”) independently chooses and maintains a portfolio of securities for their respective Fund.
The 1290 Retirement 2020 Fund, 1290 Retirement 2025 Fund, 1290 Retirement 2030 Fund, 1290 Retirement 2035 Fund, 1290 Retirement 2040 Fund, 1290 Retirement 2045 Fund, 1290 Retirement 2050 Fund, 1290 Retirement 2055 Fund and the 1290 Retirement 2060 Fund (each, a “1290 Retirement Fund” and together, the “1290 Retirement Funds”) as well as 1290 Multi-Alternative Strategies Fund are types of mutual funds often described as “fund-of-funds.” These Funds pursue their investment objectives by investing exclusively in other unaffiliated investment companies or exchange-traded funds (“ETFs”). The underlying funds’ financial statements are included in each underlying fund’s annual report, which is filed with the SEC on Form N-CSR and are publicly available through the SEC’s EDGAR database (https://www.sec.gov/edgar/searchedgar/companysearch.html).
The Trust has authorized four classes of shares, Class A, Class I, Class R and Class T on behalf of each of the fifteen Funds. Class T shares are currently not offered for sale. Additionally, 1290 Retirement Funds currently only offer Class I shares for sale.
The Class A, Class R and Class T shares are subject to distribution fees imposed under distribution plans (“Distribution Plans”) adopted pursuant to Rule 12b-1 under the 1940 Act. Under the Trust’s multiple-class distribution system, all four classes of shares have identical voting, dividend, liquidation and other rights, other than the payment of distribution fees under the applicable Distribution Plan.
Additionally, Class A shares are sold at a maximum front-end sales charge of up to 4.50% for 1290 Diversified Bond Fund and 1290 High Yield Bond Fund, and up to 5.50% for 1290 DoubleLine Dynamic Allocation Fund, 1290 GAMCO Small/ Mid Cap Value Fund, 1290 Multi-Alternative Strategies Fund, 1290 SmartBeta Equity Fund and each 1290 Retirement Fund. Class A shares sold without a front-end sales charge are subject to a contingent deferred sales charge (“CDSC”) of 1% of the lesser of the original net asset value (“NAV”) of the redeemed shares at the time of purchase or the aggregate NAV of the redeemed shares at the time of redemption, if redeemed within 12 months of purchase. Class T shares are subject to a maximum front-end sales charge of up to 2.50%.
On September 10, 2019, EIM redeemed capital out of the 1290 Retirement 2025 Fund in the amount of $2,905,000 for Class I shares.
The investment objectives of each Fund are as follows:
1290 Diversified Bond Fund (sub-advised by Brandywine Global Investment Management, LLC) — Seeks to maximize total return consisting of income and capital appreciation.
1290 DoubleLine Dynamic Allocation Fund (sub-advised by DoubleLine Capital LP) — Seeks to achieve total return from long-term capital appreciation and income.
1290 GAMCO Small/Mid Cap Value Fund (sub-advised by GAMCO Asset Management Inc.) — Seeks to maximize capital appreciation.
140
1290 FUNDS
NOTES TO FINANCIAL STATEMENTS (Continued)
October 31, 2020
1290 High Yield Bond Fund (sub-advised by AXA Investment Managers, Inc.) — Seeks to maximize current income.
1290 Multi-Alternative Strategies Fund — Seeks long-term growth of capital.
1290 Retirement 2020 Fund — Seeks the highest total return over time consistent with its asset mix while managing portfolio volatility. Total return includes capital growth and income.
1290 Retirement 2025 Fund — Seeks the highest total return over time consistent with its asset mix while managing portfolio volatility. Total return includes capital growth and income.
1290 Retirement 2030 Fund — Seeks the highest total return over time consistent with its asset mix while managing portfolio volatility. Total return includes capital growth and income.
1290 Retirement 2035 Fund — Seeks the highest total return over time consistent with its asset mix while managing portfolio volatility. Total return includes capital growth and income.
1290 Retirement 2040 Fund — Seeks the highest total return over time consistent with its asset mix while managing portfolio volatility. Total return includes capital growth and income.
1290 Retirement 2045 Fund — Seeks the highest total return over time consistent with its asset mix while managing portfolio volatility. Total return includes capital growth and income.
1290 Retirement 2050 Fund — Seeks the highest total return over time consistent with its asset mix while managing portfolio volatility. Total return includes capital growth and income.
1290 Retirement 2055 Fund — Seeks the highest total return over time consistent with its asset mix while managing portfolio volatility. Total return includes capital growth and income.
1290 Retirement 2060 Fund — Seeks the highest total return over time consistent with its asset mix while managing portfolio volatility. Total return includes capital growth and income.
1290 SmartBeta Equity Fund (sub-advised by AXA Rosenberg Investment Management LLC) — Seeks to achieve long-term capital appreciation.
The following is a summary of the significant accounting policies of the Trust:
The preparation of financial statements in accordance with United States of America generally accepted accounting principles (“U.S. GAAP”) requires management to make estimates and assumptions that affect the reported amounts and disclosures. Actual results could differ from those estimates. The Funds are investment companies and, accordingly, follow the Investment Company accounting and reporting guidance of the Financial Accounting Standards Board Accounting Standards Codification Topic 946 — Investment Companies, which is part of U.S. GAAP.
In March 2017, the Financial Accounting Standards Board (“FASB”) issued Accounting Standards Update No. (“ASU”) 2017-08, “Receivables — Nonrefundable Fees and Other Costs (Subtopic 310-20): Premium Amortization on Purchased Callable Debt Securities.” ASU 2017-08 shortens the amortization period for certain callable debt securities, held at a premium, to be amortized to the earliest call date rather than the contractual maturity date. The Funds adopted and applied ASU 2017-08 on a modified retrospective basis through a cumulative-effect adjustment as of November 1, 2019.
As a result of the adoption of ASU 2017-08, as of November 1, 2019, for each Fund with in-scope securities, the amortized cost basis of investments was reduced and unrealized appreciation of investments was increased as listed below. There is no impact on net assets or overall results from operations.
| | | | |
Funds: | | Amounts | |
1290 Diversified Bond | | $ | 10,545 | |
1290 DoubleLine Dynamic Allocation | | | 3,579 | |
1290 High Yield Bond | | | 101,580 | |
141
1290 FUNDS
NOTES TO FINANCIAL STATEMENTS (Continued)
October 31, 2020
Valuation:
Equity securities (including securities issued by ETFs) listed on national securities exchanges are generally valued at the last sale price or official closing price on the date of valuation or, if there is no sale or official closing price, at the latest available bid price. Securities listed on the NASDAQ stock market will be valued using the NASDAQ Official Closing Price (“NOCP”). Generally, the NOCP will be the last sale price unless the reported trade for the security is outside the range of the bid/ask price. In such cases, the NOCP will be normalized to the nearer of the bid or ask price. Other unlisted stocks are generally valued at their last sale price or official closing price, or if there is no such price, at a bid price estimated by a broker.
Corporate and municipal bonds and notes are generally valued on the basis of prices provided by a pricing service. The pricing services may utilize many inputs that are observable in making evaluations which may include, but are not limited to, trading activity for similar securities, issuer details, yields, default rates, credit spreads, quoted prices and any developments related to the specific securities. However, when such prices are not available, such bonds and notes are generally valued at a bid price estimated by a broker.
Mortgage-backed and asset-backed securities are generally valued at evaluated prices obtained from a pricing service where available, or at a bid price obtained from one or more of the major dealers in such securities. The pricing service may utilize data such as issuer type, coupon, cash flows, collateral performance, mortgage prepayment projection tables and Adjustable Rate Mortgage evaluations that incorporate index data, periodic and life caps, the next coupon reset date and the convertibility of the bond in making evaluations. If a quoted price is unavailable, an equivalent yield or yield spread quotes may be obtained from a broker and converted to a price.
Options that are traded on an exchange are generally valued at their last sale price or official closing price on the date of valuation. Options not traded on an exchange or actively traded are valued according to fair value methods. The market value of a put or call option will usually reflect, among other factors, the market price of the underlying security.
U.S. Treasury securities and other obligations issued or guaranteed by the U.S. Government, its agencies or instrumentalities, are generally valued at prices obtained from a bond pricing service where available. The pricing service may utilize data received from active market makers and broker-dealers, yield curves and the spread over comparable U.S. Treasury issues in making evaluations.
Foreign securities, including foreign government securities, not traded directly in the U.S., or traded in American Depositary Receipts (“ADR”) or similar form, are generally valued at representative quoted prices from the primary exchange in the currency of the country of origin. Foreign currency is converted into U.S. dollar equivalent at current exchange rates.
Investments in shares of open-end investment companies (other than ETFs) held by a Fund are generally valued at the NAV of the shares of such funds as described in the underlying funds’ prospectuses.
Futures contracts are generally valued at their last settlement price or, if there is no sale, at the latest available bid price.
Forward foreign currency contracts are generally valued by interpolating between the forward and spot currency rates as quoted by a pricing service as of a designated hour on the valuation date. The pricing service may utilize data such as actual trading information and foreign currency rates gathered from leading market makers and foreign currency trading centers throughout the world in making evaluations. Forward foreign currency contracts may be settled with the counterparty in U.S. dollars without the delivery of foreign currency.
Swap agreements are two party contracts entered into primarily by institutional investors for periods ranging from a few weeks to more than one year. Swaps are marked-to-market daily based
142
1290 FUNDS
NOTES TO FINANCIAL STATEMENTS (Continued)
October 31, 2020
upon values from third party vendors, which may include a clearing counterparty, registered exchange, or quotations from market makers to the extent available. In the event that market quotes are not readily available and the swap cannot be valued pursuant to one of the valuation methods, the value of the swap will be determined in good faith by the Trust’s Valuation Committee (as discussed below).
If market quotations are not readily available for a security or other financial instrument, such security and instrument shall be referred to the Trust’s Valuation Committee (“Committee”), which will value the asset in good faith pursuant to procedures (“Pricing Procedures”) adopted by the Board of Trustees of the Trust (the “Board”).
The Board is responsible for ensuring that appropriate valuation methods are used to price securities for the Funds. The Board has delegated the responsibility of calculating the NAVs of each of the Funds and classes pursuant to these Pricing Procedures to the Trust’s administrator, EIM (in its capacity as administrator, the “Administrator”). The Administrator has entered into a sub- administration agreement with JPMorgan Chase Bank, N.A. (the “Sub-Administrator”), which assists in performing certain of the duties described herein. The Committee, established by the Board, determines the value of the Trust’s securities and assets for which market quotations are not readily available or for which valuation cannot otherwise be provided in accordance with procedures adopted by the Board. The Committee is comprised of senior employees from EIM.
Due to the inherent uncertainty of valuations of such securities, the fair value may differ significantly from the values that would have been used had a ready market for such securities existed.
Various inputs are used in determining the value of the Trust’s assets or liabilities carried at fair value. These inputs are summarized in three broad levels below:
| | • | | Level 1 - quoted prices in active markets for identical assets |
| | • | | Level 2 - other significant observable inputs (including quoted prices of similar securities, interest rates, prepayment speeds, credit risk, etc.) |
| | • | | Level 3 - significant unobservable inputs (including the Fund’s own assumptions in determining the fair value of investments) |
A summary of inputs used to value each Fund’s assets and liabilities carried at fair value as of October 31, 2020, is included in the Portfolio of Investments for each Fund. Changes in valuation techniques may result in transfers in or out of an investment’s assigned level.
Transfers into and transfers out of Level 3 are included in the Level 3 reconciliation following the Portfolio of Investments for each Fund, if any. Transfers between levels may be due to a decline, or an increase, in market activity (e.g., frequency of trades), which may result in a lack of, or increase in, available observable market inputs to determine price.
The inputs or methodology used to value securities are not necessarily an indication of the risk associated with investing in those securities. An investment’s level within the fair value hierarchy is based on the lowest level of any input, both individually and in the aggregate, that is significant to the fair value measurement.
The Committee has the ability to meet and review reports based on the valuation techniques used to value Level 3 securities. As part of a review, the Committee would consider obtaining updates from its pricing vendors and Sub-Advisers for fair valued securities. For example, with respect to model driven prices, the Committee may receive reports regarding a review and recalculation of pricing models and related discounts. For those securities which are valued based on broker quotes, the Committee may evaluate variances between existing broker quotes and any alternative broker quotes provided by a Sub-Adviser or other pricing source.
To substantiate unobservable inputs used in a fair valuation, the Secretary of the Committee may perform an independent verification as well as additional research for fair value notifications received from the pricing agents. Among other factors, particular areas of focus may include: description of security, historical pricing, intra-day price movement, last trade information, corporate
143
1290 FUNDS
NOTES TO FINANCIAL STATEMENTS (Continued)
October 31, 2020
actions, related securities, any available company news and announcements, any available trade data or other information. The Committee also notes the materiality of holdings and price changes on a Fund’s NAV.
The Committee reviews and considers changes in value for all fair valued securities that have occurred since the last review.
Pursuant to procedures approved by the Board, events or circumstances affecting the values of Fund securities that occur between the closing of their principal markets and the time the NAV is determined may be reflected in the Trust’s calculation of a NAV for each applicable Fund when the Adviser deems that the particular event or circumstance would materially affect such Fund’s NAV.
Security Transactions and Investment Income:
Securities transactions are recorded on the trade date net of brokerage fees, commissions, and transfer fees. Dividend income (net of withholding taxes) and distributions to shareholders are recorded on the ex-dividend date, except that certain dividends from foreign securities, if any, are recognized as soon as the Fund is informed of the ex-dividend date. Non-cash dividends, if any, are recorded at the fair market value of the asset received. Interest income (including amortization of premium and accretion of discount on long-term securities using the effective yield method) and interest expense are accrued daily. The Trust records paydown gains and losses realized on prepayments received on mortgage-backed securities as an adjustment to interest income.
The Funds record distributions received in excess of income from underlying investments as a reduction of cost of investments and/or realized gain. Such amounts are based on estimates if actual amounts are not available and actual amounts of income, realized gain and return of capital may differ from the estimated amounts. The Funds adjust the estimated amounts of components of distributions (and consequently its net investment income) as necessary once the issuers provide information about the actual composition of the distributions.
Realized gains and losses on the sale of investments are computed on the basis of the specific identified cost of the investments sold. Unrealized appreciation (depreciation) on investments and foreign currency denominated assets and liabilities, if any, is presented net of deferred taxes on unrealized appreciation in the Statements of Assets and Liabilities.
Allocation of Expenses and Income:
Expenses attributable to a single Fund or class are charged to that Fund or class. Expenses of the Trust not attributable to a single Fund or class are charged to each Fund or class in proportion to the average net assets of each Fund or other appropriate allocation methods.
All income earned and expenses incurred by each Fund are borne on a pro-rata basis by each outstanding class of shares, based on the proportionate interest in the Fund represented by the daily net assets of such class, except for distribution fees which are charged on a class-specific basis.
Foreign Currency Valuation:
The books and records of the Trust are kept in U.S. dollars. Foreign currency amounts are translated into U.S. dollars at current exchange rates at the following dates:
(i) Market value of investment securities, other assets and liabilities — at the valuation date.
(ii) Purchases and sales of investment securities, income and expenses — at the date of such transactions.
The Funds do not isolate that portion of the results of operations resulting from changes in foreign exchange rates on investments from the fluctuations arising from changes in market prices of securities held. Such fluctuations are included with the net realized and unrealized gain or loss on investments.
Reported realized foreign currency gains and losses arise from the disposition of foreign currency, currency gains or losses realized between the trade and settlement dates on securities
144
1290 FUNDS
NOTES TO FINANCIAL STATEMENTS (Continued)
October 31, 2020
transactions, and the difference between the amounts of dividends, interest and foreign withholding taxes recorded on each Fund’s books on the transaction date and the U.S. dollar equivalent of the amounts actually received or paid. These reported realized foreign currency gains and losses are included in Net realized gain (loss) on foreign currency transactions on the Statements of Operations. Unrealized foreign currency gains and losses arise from changes (due to changes in exchange rates) in the value of foreign currency and other assets and liabilities denominated in foreign currencies, which are held at year end and are included in Change in net unrealized appreciation/depreciation on foreign currency translations on the Statements of Operations.
Taxes:
Each Fund intends to comply with the requirements of the Internal Revenue Code of 1986, as amended, applicable to regulated investment companies (“RICs”) and to distribute substantially all of its net investment income and net realized capital gains to shareholders of each Fund. Therefore, no Federal, State and local income tax provisions are required.
The Funds are not aware of any tax positions for which it is reasonably possible that the total amounts of unrecognized tax benefits will significantly change in the next twelve months. However, the Funds’ conclusions may be subject to future review based on changes in, or the interpretation of, the accounting standards or tax laws and regulations. The Funds recognize interest and penalties, if any, related to uncertain tax positions as income tax expense in the Statements of Operations. During the year ended October 31, 2020, the Funds did not incur any interest or penalties. Each of the tax years in the four year period ended October 31, 2020 remains subject to examination by the Internal Revenue Service, state and local taxing authorities.
Dividends from net investment income, if any, are declared and distributed at least annually for all Funds (1290 Diversified Bond Fund and 1290 High Yield Bond Fund declare and distribute monthly). Dividends to shareholders of a Fund to which such gains are attributable from net realized short-term and long-term capital gains are declared and distributed at least annually. All distributions are calculated on a tax basis and, as such, the amounts may differ from financial statement investment income and realized gains. Short-term capital gains and foreign currency gains are treated as capital gains for U.S. GAAP purposes but are considered ordinary income for tax purposes. The tax character of distributions for the years ended October 31, 2020 and October 31, 2019 and the tax composition of undistributed ordinary income and undistributed long term gains at October 31, 2020 are presented in the following table. For the Funds, the cumulative timing differences related to the tax composition of undistributed ordinary income and long term gains are primarily due to foreign currency forwards mark-to-market (1290 Diversified Bond), capital loss carryover (1290 GAMCO Small/Mid Cap Value, 1290 High Yield Bond and 1290 Multi-Alternative Strategies), wash sale loss deferrals (1290 DoubleLine Dynamic Allocation, 1290 GAMCO Small/Mid Cap Value, 1290 Retirement 2020, 1290 Retirement 2025, 1290 Retirement 2035 and 1290 Retirement 2050), partnership basis adjustments (1290 Multi-Alternative Strategies) and deferral of losses on offsetting positions (1290 Diversified Bond).
| | | | | | | | | | | | | | | | | | | | | | | | |
| | | Year Ended October 31, 2020 | | | As of October 31, 2020 | | | Year Ended October 31, 2019 | |
Funds: | | Distributed
Ordinary
Income | | | Distributed
Long Term
Gains | | | Accumulated
Undistributed
Ordinary
Income | | | Accumulated
Undistributed
Long Term
Gains | | | Distributed
Ordinary
Income | | | Distributed
Long Term
Gains | |
1290 Diversified Bond | | $ | 3,422,102 | | | $ | 1,135,916 | | | $ | 2,641,710 | | | $ | 1,259,904 | | | $ | 2,216,565 | | | $ | — | |
1290 DoubleLine Dynamic Allocation | | | 2,459,180 | | | | 932,015 | | | | 3,317,519 | | | | 1,964,856 | | | | 1,100,643 | | | | 1,627,303 | |
1290 GAMCO Small/Mid Cap Value | | | 1,124,418 | | | | 682,834 | | | | 357,131 | | | | — | | | | 1,094,928 | | | | 212,987 | |
1290 High Yield Bond | | | 2,116,287 | | | | — | | | | — | | | | — | | | | 1,894,976 | | | | — | |
1290 Multi-Alternative Strategies | | | 394,171 | | | | — | | | | 51,956 | | | | — | | | | 203,361 | | | | 21,640 | |
1290 Retirement 2020 | | | 230,001 | | | | 147,437 | | | | 140,458 | | | | 280,161 | | | | 120,395 | | | | 22,023 | |
145
1290 FUNDS
NOTES TO FINANCIAL STATEMENTS (Continued)
October 31, 2020
| | | | | | | | | | | | | | | | | | | | | | | | |
| | | Year Ended October 31, 2020 | | | As of October 31, 2020 | | | Year Ended October 31, 2019 | |
Funds: | | Distributed
Ordinary
Income | | | Distributed
Long Term
Gains | | | Accumulated
Undistributed
Ordinary
Income | | | Accumulated
Undistributed
Long Term
Gains | | | Distributed
Ordinary
Income | | | Distributed
Long Term
Gains | |
1290 Retirement 2025 | | $ | 376,997 | | | $ | 347,700 | | | $ | 236,450 | | | $ | 407,223 | | | $ | 161,829 | | | $ | 14,712 | |
1290 Retirement 2030 | | | 117,233 | | | | 18,945 | | | | 75,802 | | | | 291,111 | | | | 84,195 | | | | 4,009 | |
1290 Retirement 2035 | | | 160,866 | | | | 64,748 | | | | 118,955 | | | | 314,610 | | | | 105,840 | | | | 1,252 | |
1290 Retirement 2040 | | | 73,000 | | | | 5,113 | | | | 52,828 | | | | 87,213 | | | | 65,663 | | | | 2,736 | |
1290 Retirement 2045 | | | 105,828 | | | | 853 | | | | 84,181 | | | | 176,846 | | | | 73,894 | | | | 1,428 | |
1290 Retirement 2050 | | | 71,246 | | | | 4,801 | | | | 53,465 | | | | 50,021 | | | | 67,767 | | | | 2,824 | |
1290 Retirement 2055 | | | 65,440 | | | | 3,067 | | | | 45,832 | | | | 42,640 | | | | 66,386 | | | | 2,655 | |
1290 Retirement 2060 | | | 64,568 | | | | 4,754 | | | | 47,825 | | | | 53,283 | | | | 62,501 | | | | 2,604 | |
1290 SmartBeta Equity | | | 324,944 | | | | 297,980 | | | | 382,281 | | | | 350,953 | | | | 248,559 | | | | 637,011 | |
Ordinary losses incurred after December 31st and within the taxable year are deemed to arise on the first business day of a Fund’s next taxable year. For the year ended October 31, 2020, the Fund elected to defer late year losses, in the amount listed below:
| | | | |
Fund: | | Deferred Late Year Losses | |
1290 Multi-Alternative Strategies | | $ | 37,322 | |
The following Fund elected to defer late year losses during the year ended October 31, 2019:
| | | | |
Fund: | | Deferred Late Year Losses | |
1290 Multi-Alternative Strategies | | $ | 1,381 | |
The following Fund had a Return of Capital during the year ended October 31, 2019:
| | | | |
Fund: | | Return of Capital | |
1290 High Yield Bond | | $ | 37,045 | |
Permanent book and tax differences relating to shareholder distributions resulted in reclassifications to undistributed (overdistributed) net investment income (loss), accumulated net realized gain (loss) and paid-in-capital at October 31, 2020 as follows:
| | | | | | | | | | | | |
Funds: | | Undistributed
Net Investment
Income (Loss) (a) | | | Accumulated
Net Realized
Gain (Loss) (a) | | | Paid In
Capital | |
1290 Diversified Bond | | $ | (1,364,126 | ) | | $ | 1,353,581 | | | $ | 10,545 | |
1290 DoubleLine Dynamic Allocation | | | 83,016 | | | | (86,595 | ) | | | 3,579 | |
1290 GAMCO Small/Mid Cap Value | | | (40,016 | ) | | | 40,016 | | | | — | |
1290 High Yield Bond | | | (7,541 | ) | | | (78,180 | ) | | | 85,721 | |
1290 Multi-Alternative Strategies | | | (3,986 | ) | | | 6,102 | | | | (2,116 | ) |
1290 Retirement 2020 | | | 195 | | | | — | | | | (195 | ) |
1290 Retirement 2025 | | | 373 | | | | — | | | | (373 | ) |
1290 Retirement 2030 | | | 243 | | | | — | | | | (243 | ) |
1290 Retirement 2035 | | | 321 | | | | — | | | | (321 | ) |
1290 Retirement 2040 | | | 178 | | | | — | | | | (178 | ) |
1290 Retirement 2045 | | | 282 | | | | — | | | | (282 | ) |
1290 Retirement 2050 | | | 185 | | | | — | | | | (185 | ) |
1290 Retirement 2055 | | | 182 | | | | — | | | | (182 | ) |
1290 Retirement 2060 | | | 230 | | | | — | | | | (230 | ) |
1290 SmartBeta Equity | | | 4,916 | | | | (4,916 | ) | | | — | |
| (a) | These components of net assets are included in Total Distributable Earnings (Loss) in the Statement of Assets and Liabilities. |
146
1290 FUNDS
NOTES TO FINANCIAL STATEMENTS (Continued)
October 31, 2020
The significant permanent book and tax differences related to the adjustments above are reclassification of foreign currency gains and losses (1290 Diversified Bond), distribution redesignation (1290 Diversified Bond) and netting of ordinary loss to reduce short term capital gains (1290 Diversified Bond).
Net capital losses recognized by the Funds may get carried forward indefinitely, and retain their character as short-term and/or long-term losses. A portion of 1290 High Yield Bond Fund’s capital loss carryforward is subject to an annual limitation under the Internal Revenue Code and related regulations. The following Funds utilized net capital loss carry forwards during the year and/or have capital losses incurred that will be carried forward:
| | | | | | | | | | | | | | | | |
| | | Utilized | | | Losses Carried Forward | |
Funds: | | Short Term | | | Long Term | | | Short Term | | | Long Term | |
1290 GAMCO Small/Mid Cap Value | | $ | — | | | $ | — | | | $ | 286,020 | | | | 3,692,862 | |
1290 High Yield Bond | | | — | | | | — | | | | 761,275 | | | | 2,527,448 | |
1290 Multi-Alternative Strategies | | | — | | | | 34,900 | | | | 145,235 | | | | 62,748 | |
Accounting for Derivative Instruments:
Following is a description of how and why the Funds use derivative instruments, the type of derivatives utilized by the Funds during the reporting period, as well as the primary underlying risk exposures related to each instrument type. Derivatives accounted for as hedging instruments must be disclosed separately from those that do not qualify for hedge accounting. Even though the Funds may use derivatives in an attempt to achieve an economic hedge, the Fund’s derivatives are not accounted for as hedging instruments because the Funds account for their derivatives at fair value and record any changes in fair value in current period earnings in the Statements of Operations. All open derivative positions at year end are reflected on each respective Fund’s Portfolio of Investments. The volume of derivative activity, based on month-end notional amounts during the period is also noted in each respective Fund’s Portfolio of Investments. Portfolio securities are reserved and/or pledged with the custodian as collateral for current or potential derivative holdings as necessary throughout the year.
Options:
Certain Funds may write (sell) covered options as a hedge to provide protection against adverse movements in the price of securities in the Fund or to enhance investment performance. Certain Funds purchase and sell exchange traded options on foreign currencies. When a Fund writes an option, an amount equal to the premium received by the Fund is recorded as a liability and is subsequently adjusted on a daily basis to the current market price of the option written. Premiums received from writing options that expire unexercised are recognized as gains on the expiration date. Premiums received from writing options that are exercised or are cancelled in closing purchase transactions are offset against the cost of any securities purchased or added to the proceeds or netted against the amount paid on the transaction to determine the realized gain or loss. In writing options, a Fund must assume that the option may be exercised at any time prior to the expiration of its obligation as a writer, and that in such circumstances the net proceeds of the sale (or cost of) purchase of the underlying securities and currencies pursuant to the call or put option may be substantially below or above the prevailing market price. A Fund also has the additional risk of not being able to enter into a closing purchase transaction if a liquid secondary market does not exist and bears the risk of unfavorable changes in the price of the financial instruments underlying the options.
Certain Funds may purchase put options on securities to increase the Fund’s total investment return or to protect its holdings against a substantial decline in market value. The purchase of put options on securities will enable a Fund to preserve, at least partially, unrealized gains in an appreciated security in its Fund without actually selling the security. In addition, the Funds will continue to receive interest or dividend income on the security. The Funds may also purchase call
147
1290 FUNDS
NOTES TO FINANCIAL STATEMENTS (Continued)
October 31, 2020
options on securities to protect against substantial increases in prices of securities that Funds intend to purchase pending their ability to invest in an orderly manner in those securities. The Funds may sell put or call options they have previously purchased, which could result in a net gain or loss depending on whether the amount received on the sale is more or less than the premium and other transaction costs paid on the put or call option which was bought.
Futures Contracts, Options on Futures Contracts and Foreign Currency Contracts:
The futures contracts used by the Funds are agreements to buy or sell a financial instrument for a set price in the future. Options on futures contracts used by the Funds are rights to buy, or sell a futures contract for a set price in the future. Certain Funds buy or sell futures contracts for the purpose of protecting their Fund securities against future changes in interest rates and indices which might adversely affect the value of the Funds’ securities or the price of securities that they intend to purchase at a later date. Initial margin deposits are made upon entering into futures contracts and can be in cash, certain money market instruments, treasury securities or other liquid, high grade debt securities. During the period the futures contracts are open, changes in the market price of the contracts are recognized as unrealized gains or losses by “marking-to-market” at the end of each trading day. Variation margin payments on futures contracts are received or made, depending upon whether unrealized gains or losses are incurred. When the contract is closed, the Fund records a realized gain or loss equal to the difference between the proceeds from or cost of the closing transactions and the Fund’s basis in the contract. The Funds enter into futures contracts only on exchanges or boards of trade. The exchange or board of trade acts as the counterparty to each futures transaction; therefore, a Fund’s credit risk is limited to failure of the exchange or board of trade.
During the year ended October 31, 2020, certain Funds held forward foreign currency contracts to either gain exposure to certain currencies, or enter into an economic hedge against changes in the values of securities held in the Fund, that do not qualify for hedge accounting under Accounting Standards Codification (“ASC”) 815. The Statement of Operations for each Fund reflects realized gains or losses, if any, in forward currency transactions and change in unrealized gains or losses in forward foreign currency transactions. Further information on the impact of these positions on the Funds’ financial statements can be found in the Statement of Operations and Portfolio of Investments for each Fund.
The Funds may be exposed to foreign currency risks associated with Fund investments. Certain Funds may purchase foreign currency on a spot (or cash) basis. In addition, certain Funds enter into contracts to purchase or sell foreign currencies at a future date (“forward contracts”). A forward foreign currency contract is a commitment to purchase or sell a foreign currency at a future date at a negotiated forward rate. Daily fluctuations in the value of such contracts are recognized as unrealized appreciation or depreciation by “marking-to-market”. The gain or loss arising from the difference between the original contracts and the closing of such contracts is included in realized gains or losses from foreign currency transactions in the Statements of Operations of the Funds. The Funds may engage in these forward contracts to protect against uncertainty in the level of future rates in connection with the purchase and sale of Fund securities (“transaction hedging”) and to protect the value of specific Fund positions (“position hedging”). The Funds also buy forward foreign currency contracts to gain exposure to currencies.
Swap Agreements:
Changes in Swap market value, if any, are reflected as a component of net changes in unrealized appreciation (depreciation) on the Statements of Operations. Daily changes in valuation of centrally cleared swaps, if any, are recorded as a receivable or payable for the change in value as appropriate (“variation margin”) on the Statements of Assets and Liabilities. There is potential for swaps to be illiquid. Over-the-counter (“OTC”) swap payments received or made at the beginning of the measurement period are reflected as such on the Statements of Assets and Liabilities and represent premiums paid or received upon entering into the swap agreement to compensate for differences between the stated terms of the swap agreement and prevailing market conditions
148
1290 FUNDS
NOTES TO FINANCIAL STATEMENTS (Continued)
October 31, 2020
(credit spreads, currency exchange rates, interest rates, and other relevant factors). These upfront premiums are recorded as realized gains or losses on the Statement of Operations upon termination or maturity of the swap. A liquidation payment received or made at the termination of the swap is recorded as realized gain or loss on the Statement of Operations. Net periodic payments received or paid by a Fund are included as part of realized gains or losses on the Statement of Operations.
Total return swap agreements involve commitments where cash flows are exchanged based on the price of an underlying reference and based on a fixed or variable rate. Total return swap agreements may involve commitments to pay interest in exchange for a market-linked return. One counterparty pays out the total return of a specific reference asset, which may include an underlying equity, index, or bond, and in return receives a fixed or variable rate. At the maturity date, a net cash flow is exchanged where the total return is equivalent to the return of the underlying reference less a financing rate, if any. As a receiver, the Fund would receive payments based on any positive total return and would owe payments in the event of a negative total return. As the payer, the Fund would owe payments on any net positive total return, and would receive payment in the event of a negative total return. In connection with total return swap agreements, securities or cash may be identified as collateral or margin in accordance with the terms of the respective swap agreements to provide assets of value and recourse in the event of default or bankruptcy/insolvency.
Currency swaps involve the exchange by one party with another party of a series of payments in specified currencies. Currency swaps usually involve the delivery of the entire principal value of one designated currency in exchange for the other designated currency. Therefore, the entire principal value of a currency swap is subject to the risk that the other party to the swap will default on its contractual delivery obligations. In addition, a Fund may enter into currency swaps that involve an agreement to pay interest streams in one currency based on a specified index in exchange for receiving interest streams denominated in another currency. Currency swaps may involve initial and final exchanges that correspond to the agreed upon notional amount.
Interest rate swaps involve the exchange between two parties of payments calculated by reference to specified interest rates (e.g., an exchange of floating rate payments for fixed rate payments). The purchase of an interest rate cap entitles the purchaser, to the extent that a specified index exceeds a predetermined interest rate, to receive payments of interest on a notional principal amount from the party selling such interest rate cap. The purchase of an interest rate floor entitles the purchaser, to the extent that a specified index falls below a predetermined interest rate, to receive payments of interest on a notional principal amount from the party selling such interest rate floor. Caps and floors may be less liquid than swaps. In addition, the value of interest rate transactions will fluctuate based on changes in interest rates.
Credit default swap agreements involve greater risks than if a Fund had invested in the reference obligation directly since, in addition to general market risks, credit default swaps are subject to illiquidity risk, counterparty risk and credit risk. A Fund will enter into credit default swap agreements only with counterparties that meet certain standards of creditworthiness. A buyer generally also will lose its investment and recover nothing should no credit event occur and the swap is held to its termination date. If a credit event were to occur, the value of any deliverable obligation received by the seller, coupled with the upfront or periodic payments previously received, may be less than the full notional value it pays to the buyer, resulting in a loss of value to the seller. A Fund’s obligations under a credit default swap agreement will be accrued daily (offset against any amounts owing to the Fund). In connection with credit default swaps in which a Fund is the buyer, the Fund will segregate or “earmark” cash or assets determined to be liquid, or enter into certain offsetting positions, with a value at least equal to the Fund’s exposure (any accrued but unpaid net amounts owed by the Fund to any counterparty), on a marked-to-market basis. In connection with credit default swaps in which a Fund is the seller, the Fund will segregate or “earmark” cash or assets determined to be liquid, or enter into offsetting positions, with a value at least equal to the full notional amount of the swap (minus any amounts owed to the Fund). Such segregation or “earmarking” is intended to ensure that the Fund has assets available to satisfy its obligations with respect to the transaction and limit any potential leveraging of the Fund. Such segregation or
149
1290 FUNDS
NOTES TO FINANCIAL STATEMENTS (Continued)
October 31, 2020
“earmarking” will not limit the Fund’s exposure to loss. To the extent that credit default swaps are entered into for hedging purposes or are covered as described above, the Adviser believes such obligations do not constitute “senior securities” under the 1940 Act and, accordingly, will not treat them as being subject to the Fund’s senior security and borrowing restrictions.
An option on a swap agreement, also called a “swaption,” is an option that gives the buyer the right, but not the obligation, to enter into a swap on a future date in exchange for paying a market-based “premium.” A receiver swaption gives the owner the right to receive the total return of a specified asset, reference rate, or index. A payer swaption gives the owner the right to pay the total return of a specified asset, reference rate, or index. A purchaser of a swaption risks losing only the amount of the premium they have paid should they decide to let the option expire, whereas the seller of a swaption is subject to the risk that they will become obligated if the option is exercised. Swaptions also include options that allow an existing swap to be terminated or extended by one of the counterparties.
Forward Settling Transactions:
Certain Funds make contracts to purchase or sell securities for a fixed price at a future date beyond customary settlement time (“forward settling transactions”). Funds may designate the segregation, either on their records or with the Trust’s custodian, of cash or other liquid securities in an amount sufficient to meet the purchase price, or may enter into offsetting contracts for the forward sale of other securities they own. These commitments are reported at market value in the financial statements. Forward settling transactions may be considered securities in themselves and involve a risk of loss if the value of the security to be purchased declines or if the value of the security to be sold increases prior to the settlement date, which is a risk in addition to the risk of decline in the value of the Funds’ other assets. Where such purchases or sales are made through dealers, a Fund relies on the dealer to consummate the sale. The dealer’s failure to do so may result in the loss to a Fund of an advantageous yield or price. Market risk exists on these commitments to the same extent as if the securities were owned on a settled basis and gains and losses are recorded and reported in the same manner. However, during the commitment period, these investments earn no interest or dividends.
Certain Funds may enter into to-be-announced purchase or sale commitments (“TBA transactions”), pursuant to which it agrees to purchase or sell, respectively, mortgage backed securities for a fixed unit price, with payment and delivery at a scheduled future date beyond the customary settlement period for such securities. With TBA transactions, the particular securities to be received or delivered by a Fund are not identified at the trade date; however, the securities must meet specified terms, including issuer, rate, and mortgage term, and be within industry accepted “good delivery” standards. Funds may enter into TBA transactions with the intention of taking possession of or relinquishing the underlying securities, may elect to extend the settlement by “rolling” the transaction, and/or may use TBA transactions to gain or reduce interim exposure to underlying securities. Until settlement, a Fund maintains liquid assets sufficient to settle its commitment to purchase a TBA or, in the case of a sale commitment, a Fund maintains an entitlement to the security to be sold.
Master netting arrangements and collateral:
International Swaps and Derivatives Association, Inc. Master Agreements (“ISDA Master Agreements”) govern bilateral OTC derivative transactions entered into by the Sub-Advisers on behalf of the Funds with select counterparties. ISDA Master Agreements maintain provisions for general obligations, representations, agreements, collateral posting and events of default or termination. Events of termination include conditions that may entitle counterparties to elect to terminate early and cause settlement of all outstanding transactions under the applicable ISDA Master Agreement. Any election to terminate early could be material to the financial statements. In limited circumstances, the ISDA Master Agreement may contain additional provisions that add counterparty protection beyond coverage of existing daily exposure if the counterparty has a decline
150
1290 FUNDS
NOTES TO FINANCIAL STATEMENTS (Continued)
October 31, 2020
in credit quality below a predefined level. These amounts, if any, may be segregated with a third-party custodian. The market value of OTC financial derivative instruments, collateral received or pledged, and net exposure by counterparty as of period end are disclosed in the Portfolio of Investments.
Master Securities Forward Transaction Agreements (“Master Forward Agreements”) govern certain forward settling transactions, such as TBA transactions, delayed-delivery or sale buybacks by and between the Sub-Advisers on behalf of the Funds and select counterparties. The Master Forward Agreements maintain provisions for, among other things, transaction initiation and confirmation, payment and transfer, events of default, termination, and maintenance of collateral. The market value of forward settling transactions, collateral pledged and/or received, and the net exposure by counterparty as of period end is disclosed in the Portfolio of Investments.
ISDA Master Agreements and Master Forward Agreements are intended to reduce the counterparty risk associated with relevant transactions by specifying credit protection mechanisms and providing standardization that is intended to improve legal certainty. Under most ISDA Master Agreements and Master Forward Agreements, collateral is routinely pledged if the total net exposure to certain transactions (net of existing collateral already in place) governed under the relevant master agreement with a counterparty in a given account exceeds a specified threshold, which typically ranges from zero to $250,000 (on a per counterparty basis) depending on the counterparty and the type of master agreement.
Collateral on OTC derivatives and centrally cleared derivatives may be in the form of cash or debt securities issued by the U.S. government or related agencies or foreign governments. Cash pledged as collateral by a Fund is reflected as cash held as collateral at the broker in the accompanying financial statements and generally is restricted from withdrawal by the Fund; securities pledged by a Fund are so noted in the accompanying Portfolio of Investments; both remain in the Fund’s assets. Securities received as collateral by counterparties are not included in the Fund’s assets because the Fund does not obtain effective control over those securities. The obligation to return cash collateral received from counterparties is included as a liability in the accompanying financial statements. Collateral posted or received by the Fund may be held in a segregated account at the respective counterparty or Fund’s custodian. For OTC derivatives, collateral posted or received by the Fund is held in a segregated account at the respective counterparty or Fund’s custodian.
Market and Credit Risk:
A Fund’s investments in financial instruments expose the Fund to various risks such as, but not limited to, interest rate, foreign currency, foreign securities, forward settling transactions and equity risks.
Interest rate risk is the risk that fixed income securities will decline in value because of changes in interest rates. When nominal interest rates decline, the value of certain fixed-income securities held by a Fund generally rises. Conversely, when nominal interest rates rise, the value of certain fixed income securities held by a Fund generally decreases. A nominal interest rate can be described as the sum of a real interest rate and an expected inflation rate. Interest rate changes can be sudden and unpredictable, and a Fund may lose money if these changes are not anticipated by Fund management. A Fund may not be able to hedge against changes in interest rates or may choose not to do so for cost or other reasons. In addition, any hedges may not work as intended. Fixed income securities with longer durations tend to be more sensitive to changes in interest rates, usually making them more volatile than securities with shorter durations. Duration is useful primarily as a measure of the sensitivity of a security’s market price to interest rate (i.e., yield) movements. As of October 31, 2020, interest rates are near historic lows in the United States, and below zero in other parts of the world, including certain European countries and Japan. A Fund is subject to greater risk of rising interest rates due to these market conditions. A significant or rapid rise in interest rates could result in losses to the Fund.
151
1290 FUNDS
NOTES TO FINANCIAL STATEMENTS (Continued)
October 31, 2020
Many debt securities, derivatives and other financial instruments utilize the London Interbank Offered Rate (“LIBOR”) as the reference or benchmark rate for variable interest rate calculations. In July 2017, the UK Financial Conduct Authority announced that after 2021 it will cease its active encouragement of UK banks to provide quotations needed to sustain LIBOR, suggesting that LIBOR may cease to be published after that time. Financial industry groups have begun planning for a transition to the use of a different benchmark, but there are obstacles to converting certain longer term securities and transactions to a new benchmark. The transition process might lead to increased volatility and illiquidity in markets that currently rely on the LIBOR to determine interest rates, a reduction in the values of some LIBOR-based investments, and reduced effectiveness of certain hedging strategies, which may adversely affect a Fund’s performance or net asset value. Since the usefulness of LIBOR as a benchmark could deteriorate during the transition period, these effects could occur prior to the end of 2021. In addition, the alternative reference or benchmark rate may be an ineffective substitute resulting in prolonged adverse market conditions for a Fund.
If a Fund invests directly in foreign currencies or in securities that trade in, and receive revenues in, foreign currencies, or in financial derivatives that provide exposure to foreign currencies, it will be subject to the risk that those currencies will decline in value relative to the base currency of the Fund, or, in the case of hedging positions, that the Fund’s base currency will decline in value relative to the currency being hedged. Currency rates in foreign countries may fluctuate significantly over short periods of time for a number of reasons, including changes in interest rates, intervention (or the failure to intervene) by U.S. or foreign governments, central banks or supranational entities such as the International Monetary Fund, or by the imposition of currency controls or other political developments in the United States or abroad. As a result, a Fund’s investments in foreign currency denominated securities may reduce the Fund’s returns. The Funds are subject to off-balance sheet risk to the extent of the value of the contracts for purchase of foreign currency and in an unlimited amount for sales of foreign currency.
Foreign (non-U.S.) securities in this report are classified by the country of risk of a holding. Investments in foreign securities, including depositary receipts, involve risks not associated with investment in U.S. securities. Foreign markets may be less liquid, more volatile and subject to less government supervision and regulation than U.S. markets. Differences between U.S. and foreign legal, political and economic systems, regulatory regimes and market practices also may impact security values, and it may take more time to clear and settle trades involving foreign securities. In addition, foreign operations or holding can involve risks relating to conditions in foreign countries.
Forward settling transactions and forward foreign currency contracts involve elements of both market and credit risk in excess of the amounts reflected in the Statements of Assets and Liabilities. They are executed directly with the counterparty and not through an exchange and can be terminated only by agreement of both parties to such contracts. With respect to such transactions there is no daily margin settlement. There is also the risk that the security will not be issued or that the other party to the transaction will not meet its obligations. If this occurs, the Fund may lose both the investment opportunity for its assets if set aside to pay for the security and any gain in the security. The use of forward settling transaction may result in market risk to the Funds that is greater than if the Funds had engaged solely in transactions that settle in the customary time.
Should interest rates or indices move unexpectedly, the Fund may not achieve the anticipated benefits of the futures contracts and may incur a loss. The use of futures contracts transactions involves the risk of imperfect correlation in movements in the price of futures contracts, interest rates and the underlying hedged assets. Use of long futures contracts subjects the Funds to risk of loss in excess of the amounts shown on the Statements of Assets and Liabilities, up to the notional value of the futures contracts. Use of short futures contracts subjects the Funds to unlimited risk of loss.
The market values of the Fund’s investments may decline due to general market conditions which are not specifically related to a particular company or issuer, such as real or perceived adverse economic conditions, changes in the general outlook for corporate earnings, changes in interest or
152
1290 FUNDS
NOTES TO FINANCIAL STATEMENTS (Continued)
October 31, 2020
currency rates or adverse investor sentiment generally. They may also decline due to factors which affect a particular industry or industries, such as labor shortages or increased production costs and competitive conditions within an industry. Equity securities and equity related investments generally have greater market price volatility than fixed income securities, although under certain market conditions fixed income securities may have comparable or greater price volatility. Credit ratings downgrades may also negatively affect securities held by a Fund. Even when markets perform well, there is no assurance that the investments held by a Fund will increase in value along with the broader market. In addition, market risk includes the risk that geopolitical events will disrupt the economy on a national or global level.
A Fund will be exposed to credit risk to parties with whom it trades and will also bear the risk of settlement default. The Fund is subject to the risk that the issuer or guarantor of a fixed income security, or the counterparty to a transaction, is unable or unwilling or is perceived as unable or unwilling to make timely interest or principal payments or otherwise honor its obligations, which may cause the Fund’s holding to lose value. The downgrade of a security’s credit rating may decrease its value. Lower credit quality also may lead to greater volatility in the price of a security and may negatively affect a security’s liquidity. The credit quality of a security can deteriorate suddenly and rapidly.
Certain Funds may invest in below investment grade high-yield securities (commonly known as “junk bonds”). These securities are considered to be high risk investments. Securities rated below investment grade are speculative in nature, involve greater risk of default by the issuing entity and may be subject to greater market fluctuations than higher rated fixed income securities because such securities are generally unsecured and subordinated to other creditors’ claims. The retail secondary market for these “junk bonds” may be less liquid than that of higher rated securities and adverse economic conditions could make it difficult to sell certain securities or could result in lower prices than those used in calculating the Fund’s NAV.
Because certain Funds invest in affiliated mutual funds, unaffiliated investment companies or ETFs, the Funds indirectly bear a portion of the fees and expenses incurred by the underlying funds and ETFs. As a result, the cost of investing in the Funds may be higher than the cost of investing in a Fund that exclusively invests directly in individual stocks and bonds. The Funds are also subject to certain risks related to the underlying funds’ and ETFs’ investments in securities and financial instruments (such as fixed income securities, including high yield, asset-backed and mortgage-related securities, equity securities, foreign and emerging markets securities, commodities and real estate securities) and the ability of the Fund to meet its investment objective will directly depend on the ability of the underlying fund or ETF to meet its investment objective. With respect to the Fund’s investments in ETFs, there is also the risk that an ETF’s performance may not match that of the relevant index. It is also possible that an active trading market for an ETF may not develop or be maintained, in which case the liquidity and value of the Fund’s investments in the ETF could be substantially and adversely affected. The extent to which the investment performance and risks associated with the Fund correlate to those of a particular underlying fund or ETF will depend upon the extent to which the Fund’s assets are allocated from time to time for investment in the underlying fund or ETF, which will vary.
Offsetting Assets and Liabilities:
The Funds may be subject to various netting arrangements with select counterparties (“Master Agreements”). Master Agreements govern the terms of certain transactions, and are intended to reduce the counterparty risk associated with relevant transactions by specifying credit protection mechanisms and providing standardization that is intended to improve legal certainty. As the Master Agreements are specific to unique operations of different asset types, they allow a Fund to close out and net its total exposure to counterparty in the event of a default with respect to all the transactions governed under a single Master Agreement with a counterparty. For financial reporting purposes the Statement of Assets and Liabilities generally show derivative assets and liabilities on a gross basis, which reflects the full risks and exposures prior to netting.
153
1290 FUNDS
NOTES TO FINANCIAL STATEMENTS (Continued)
October 31, 2020
The Trust, on behalf of each Fund, has entered into an investment advisory agreement (the “Advisory Agreement”) with the Adviser which provides that the Adviser is responsible for (i) providing a continuous investment program for the Funds; (ii) monitoring the implementation of the investment program for each Fund; (iii) assessing the investment objectives and policies, composition, investment style and investment process for each Fund; (iv) effecting transactions for each Fund and selecting brokers or dealers to execute such transactions; (v) developing and evaluating strategic initiatives with respect to the Funds; (vi) making recommendations to the Board regarding the investment programs of the Funds, including any changes to the investment objectives and policies of a Fund; (vii) coordinating and/or implementing strategic initiatives approved by the Board; and (viii) preparing and providing reports to the Board on the impact of such strategic initiatives. The Adviser is paid a fee for these services. The fee is accrued daily and paid monthly based on the Fund’s average daily net assets, at an annual rate of:
| | |
Funds: | | Investment Advisory Fees |
1290 Retirement 2020 | | 0.500% of average daily net assets |
1290 Retirement 2025 | | 0.500% of average daily net assets |
1290 Retirement 2030 | | 0.500% of average daily net assets |
1290 Retirement 2035 | | 0.500% of average daily net assets |
1290 Retirement 2040 | | 0.500% of average daily net assets |
1290 Retirement 2045 | | 0.500% of average daily net assets |
1290 Retirement 2050 | | 0.500% of average daily net assets |
1290 Retirement 2055 | | 0.500% of average daily net assets |
1290 Retirement 2060 | | 0.500% of average daily net assets |
| | | | | | | | | | | | | | | | | | | | |
| | | (as a percentage of average daily net assets) | |
Funds: | | First
$1 Billion | | | Next
$1 Billion | | | Next
$3 Billion | | | Next
$5 Billion | | | Thereafter | |
1290 DoubleLine Dynamic Allocation | | | 0.750 | % | | | 0.700 | % | | | 0.675 | % | | | 0.650 | % | | | 0.625 | % |
1290 GAMCO Small/Mid Cap Value | | | 0.750 | | | | 0.700 | | | | 0.675 | | | | 0.650 | | | | 0.625 | |
1290 SmartBeta Equity | | | 0.700 | | | | 0.650 | | | | 0.625 | | | | 0.600 | | | | 0.575 | |
| | | | | | | | | | | | | | | | |
| | | (as a percentage of average daily net assets) | |
Fund: | | First
$4 Billion | | | Next
$4 Billion | | | Next
$2 Billion | | | Thereafter | |
1290 Multi-Alternative Strategies | | | 0.500 | % | | | 0.490 | % | | | 0.480 | % | | | 0.470 | % |
| | | | | | | | | | | | |
| | | (as a percentage of average daily net assets) | |
Funds: | | First
$4 Billion | | | Next
$4 Billion | | | Thereafter | |
1290 Diversified Bond | | | 0.600 | % | | | 0.580 | % | | | 0.560 | % |
1290 High Yield Bond | | | 0.600 | | | | 0.580 | | | | 0.560 | |
On behalf of the Trust, the Adviser has entered into an investment sub-advisory agreement (“Sub-Advisory Agreements”) with each of the Sub-Advisers. Each of the Sub-Advisory Agreements obligates the Sub-Advisers for the respective Funds to: (i) continuously furnish investment programs for the Funds; (ii) place all orders for the purchase and sale of investments for the Funds with brokers or dealers selected by the Adviser or the respective Sub-Advisers; and (iii) perform certain limited related administrative functions in connection therewith. The Adviser pays the expenses of providing investment sub-advisory services to the Funds, including the fees of the Sub-Advisers of each Fund.
In addition to the advisory fee, each Fund pays the Administrator its proportionate share of an asset-based administration fee, which is equal to an annual rate of the greater of 0.15% of each Fund’s average daily net assets, or $30,000 per Fund (or $30,000 for each allocated portion (or
154
1290 FUNDS
NOTES TO FINANCIAL STATEMENTS (Continued)
October 31, 2020
sleeve) of a Fund, as applicable). The Administrator has contracted with the Sub-Administrator to provide, pursuant to a sub-administration agreement, the Funds with certain administrative services, including monitoring of Fund compliance and Fund accounting services.
The Trust, on behalf of the Funds, has entered into a distribution agreement (the “Distribution Agreement”) with ALPS Distributors, Inc. (“ALPS” or the “Distributor”), under which ALPS serves as Distributor for each Fund’s Class A, Class I, Class R and Class T shares. The Board has approved Distribution Plans pursuant to Rule 12b-1 under the 1940 Act for Class A, Class R and Class T shares for each Fund. Pursuant to the Distribution Plans, the Funds will pay the Distributor annual fees at the following rates:
| | | | |
Share Class: | | Distribution Fee and/or Service Fee
(as a % of average daily net
assets attributable to the class) | |
Class A | | | 0.25 | % |
Class R | | | 0.50 | |
Class T* | | | 0.25 | |
| * | The Distribution Fees for Class T shares are currently being waived. This waiver is voluntary and could be eliminated at any time at the discretion of the Distributor. The amounts waived for the year ended October 31, 2020 are included in Waiver from distributor on the Statement of Operations for each Fund and are not eligible for recoupment. |
The Trust, on behalf of the Funds, has entered into a transfer agency and service agreement (the “Transfer Agency Agreement”) with DST Asset Manager Solutions, Inc. (“DST”). Pursuant to the Transfer Agency Agreement, DST is responsible for, among other things, the issuance, transfer and redemption of shares, the opening and maintenance of shareholder accounts, the handling of certain communications between shareholders and the Trust, and the payment of dividends and distributions payable by the Funds. Under the Transfer Agency Agreement, DST receives a monthly fee comprised of a fixed base fee plus a fee computed on the basis of the number of shareholder accounts it maintains for the Trust during the month.
The Trust, on behalf of the Funds, has entered into a custody agreement (the “Custody Agreement”) with JPMorgan Chase Bank, N.A. (in this capacity, the “Custodian”). The custody agreement provides for an annual fee based on the amount of assets under custody plus transaction charges. The Custodian serves as custodian of the Trust’s Fund securities and other assets. Under the terms of the Custody Agreement between the Trust and the Custodian, the Custodian maintains and deposits in each Fund’s account, cash, securities and other assets of the Funds. The Custodian is also required, upon the order of the Trust, to deliver securities held by the Custodian, and to make payments for securities purchased by the Trust. The Custodian has also entered into sub-custodian agreements with a number of foreign banks and clearing agencies, pursuant to which Fund securities purchased outside the United States are maintained in the custody of these entities. At year end, certain of the Funds maintain significant cash balances with the Custodian or its affiliates. These balances are presented as cash on each Fund’s Statement of Assets and Liabilities.
The Adviser has contractually agreed to limit the expenses of certain Funds (exclusive of taxes, interest, brokerage commissions, dividend and interest expenses on securities sold short, capitalized expenses (other than offering costs), fees and expenses of other investment companies in which a Fund may invest (except as noted in the table below), 12b-1 fees and extraordinary expenses not incurred in the ordinary course of such Fund’s business) through April 30, 2022 (unless the Board consents to an earlier revision or termination of this arrangement) (“Expense Limitation Agreement”), pursuant to which the Adviser has agreed to make payments or waive or limit its fees so that the total annual operating expenses do not exceed the following annual rates:
| | | | |
Funds: | | Total Expense Limited
For All Share Classes to
(% of daily net assets) | |
1290 Diversified Bond | | | 0.50 | % |
1290 DoubleLine Dynamic Allocation* | | | 0.95 | |
155
1290 FUNDS
NOTES TO FINANCIAL STATEMENTS (Continued)
October 31, 2020
| | | | |
Funds: | | Total Expense Limited
For All Share Classes to
(% of daily net assets) | |
1290 GAMCO Small/Mid Cap Value* | | | 1.00 | % |
1290 High Yield Bond | | | 0.75 | |
1290 Multi-Alternative Strategies* | | | 1.40 | |
1290 Retirement 2020* | | | 0.65 | |
1290 Retirement 2025* | | | 0.65 | |
1290 Retirement 2030* | | | 0.65 | |
1290 Retirement 2035* | | | 0.65 | |
1290 Retirement 2040* | | | 0.65 | |
1290 Retirement 2045* | | | 0.65 | |
1290 Retirement 2050* | | | 0.65 | |
1290 Retirement 2055* | | | 0.65 | |
1290 Retirement 2060* | | | 0.65 | |
1290 SmartBeta Equity** | | | 0.85 | |
| * | Includes fees and expenses of other investment companies in which the Fund invests. |
| ** | Effective September 30, 2020. |
Prior to September 30, 2020 the expense limitation was as follows:
| | | | |
Fund: | | Total Expense Limited
For All Share Classes to
(% of daily net assets) | |
1290 SmartBeta Equity | | | 0.90 | % |
The Adviser first waives its advisory fees, then waives its administration fees, and then reimburses the Fund’s expenses out of its own resources. Each Fund may at a later date reimburse to the Adviser the advisory fees waived or other expenses assumed and paid for by the Adviser pursuant to the Expense Limitation Agreement within three years of payments or waivers being recorded, provided such Fund has reached a sufficient asset size to permit such reimbursement to be made without causing the total annual expense ratio of each Fund to exceed the percentage limits mentioned above for the respective period. Consequently, no reimbursement by a Fund will be made unless the Fund’s total annual expense ratio is less than the respective percentages stated above for the respective period. Any reimbursement, called recoupment fees on the Statement of Operations of the Fund, will be based on the earliest fees waived or assumed by the Adviser. During the year ended October 31, 2020, the Funds did not incur recoupment fees. At October 31, 2020, under the Expense Limitation Agreement, the amount that would be recoverable from each Fund is as follows:
| | | | | | | | | | | | | | | | |
| | | Amount Eligible Through | | | Total Eligible
For
Reimbursement | |
Funds: | | 2021 | | | 2022 | | | 2023 | |
1290 Diversified Bond | | $ | 350,461 | | | $ | 436,563 | | | $ | 809,448 | | | $ | 1,596,472 | |
1290 DoubleLine Dynamic Allocation | | | — | | | | 229,925 | | | | 262,989 | | | | 492,914 | |
1290 GAMCO Small/Mid Cap Value | | | 292,540 | | | | 407,167 | | | | 294,675 | | | | 994,382 | |
1290 High Yield Bond | | | — | | | | 227,837 | | | | 264,144 | | | | 491,981 | |
1290 Multi-Alternative Strategies | | | 141,540 | | | | 152,126 | | | | 147,303 | | | | 440,969 | |
1290 Retirement 2020 | | | 139,205 | | | | 148,122 | | | | 154,847 | | | | 442,174 | |
1290 Retirement 2025 | | | 140,647 | | | | 164,119 | | | | 172,097 | | | | 476,863 | |
1290 Retirement 2030 | | | 136,903 | | | | 137,980 | | | | 143,990 | | | | 418,873 | |
1290 Retirement 2035 | | | 139,321 | | | | 143,164 | | | | 150,885 | | | | 433,370 | |
1290 Retirement 2040 | | | 136,054 | | | | 133,015 | | | | 140,231 | | | | 409,300 | |
1290 Retirement 2045 | | | 138,025 | | | | 137,163 | | | | 145,551 | | | | 420,739 | |
1290 Retirement 2050 | | | 136,781 | | | | 133,264 | | | | 139,420 | | | | 409,465 | |
156
1290 FUNDS
NOTES TO FINANCIAL STATEMENTS (Continued)
October 31, 2020
| | | | | | | | | | | | | | | | |
| | | Amount Eligible Through | | | Total Eligible
For
Reimbursement | |
Funds: | | 2021 | | | 2022 | | | 2023 | |
1290 Retirement 2055 | | $ | 136,944 | | | $ | 132,927 | | | $ | 138,525 | | | $ | 408,396 | |
1290 Retirement 2060 | | | 136,329 | | | | 133,636 | | | | 139,205 | | | | 409,170 | |
1290 SmartBeta Equity | | | 208,207 | | | | 236,252 | | | | 243,147 | | | | 687,606 | |
During the year ended October 31, 2020, EIM voluntarily waived fees for certain Funds. These amounts are included in Voluntary waiver from investment adviser on the Statement of Operations for each Fund and are not eligible for recoupment.
Under the Trust’s organizational documents, its officers and trustees are indemnified against certain liabilities arising out of the performance of their duties to the Trust. In addition, in the normal course of business, the Trust enters into contracts with vendors and others that provide for general indemnifications. A Fund’s maximum exposure under these arrangements is unknown as this would involve future claims that may be made against the Fund. However, based on experience, the Trust and management expect the risk of loss to be remote.
The Distributor receives sales charges on the Funds’ Class A and Class T shares and the proceeds of contingent deferred sales charges paid by the investor in connection with certain redemptions of the Funds’ Class A shares. The Distributor has advised the Funds that for the year ended October 31, 2020, the proceeds retained from sales and redemptions are as follows:
| | | | | | | | | | | | |
| | | Class A | | | Class T | |
Funds: | | Front End
Sales
Charge | | | Contingent
Deferred
Sales Charge | | | Front End
Sales
Charge | |
1290 Diversified Bond | | $ | 110,672 | | | $ | — | | | $ | — | |
1290 DoubleLine Dynamic Allocation | | | 63,313 | | | | — | | | | — | |
1290 GAMCO Small/Mid Cap Value | | | 13,613 | | | | — | | | | — | |
1290 High Yield Bond | | | 21,935 | | | | — | | | | — | |
1290 Multi-Alternative Strategies | | | 1,285 | | | | — | | | | — | |
1290 SmartBeta Equity | | | 57,277 | | | | — | | | | — | |
Sales loads and contingent deferred sales charges imposed on purchases and redemptions of Fund shares are retained by the Trust’s Distributors and do not represent expenses or income of the Funds.
| Note 4 | Compensation of Officers |
Each officer of the Trust is an employee of Equitable Financial, the Adviser and/or Equitable Distributors, LLC, formerly AXA Distributors, LLC. No officer of the Trust, other than the Chief Compliance Officer, receives compensation paid by the Trust. During the year ended October 31, 2020, the three trusts in the fund complex reimbursed EIM for $248,900 of the Chief Compliance Officer’s compensation, including $753 reimbursed by the Trust.
| Note 5 | Percentage of Ownership by Affiliates |
At October 31, 2020, the Adviser and Equitable Financial held investments in each of the Funds as follows:
| | | | |
Funds: | | Percentage of
Ownership | |
1290 Diversified Bond | | | 18 | % |
1290 DoubleLine Dynamic Allocation | | | 87 | |
157
1290 FUNDS
NOTES TO FINANCIAL STATEMENTS (Concluded)
October 31, 2020
| | | | |
Funds: | | Percentage of
Ownership | |
1290 GAMCO Small/Mid Cap Value | | | 41 | % |
1290 High Yield Bond | | | 61 | |
1290 Multi-Alternative Strategies | | | 69 | |
1290 Retirement 2020 | | | 97 | |
1290 Retirement 2025 | | | 97 | |
1290 Retirement 2030 | | | 99 | |
1290 Retirement 2035 | | | 99 | |
1290 Retirement 2040 | | | 99 | |
1290 Retirement 2045 | | | 99 | |
1290 Retirement 2050 | | | 99 | |
1290 Retirement 2055 | | | 100 | |
1290 Retirement 2060 | | | 99 | |
1290 SmartBeta Equity | | | 27 | |
Note 6 - COVID - 19 Impact
The extent of the impact of the coronavirus (“COVID-19”) outbreak on the financial performance of the Trust’s investments will depend on future developments, including the duration and spread of the outbreak and related advisories and restrictions and the impact of COVID-19 on the financial markets and the overall economy, all of which are highly uncertain and cannot be predicted. If the financial markets and/or the overall economy are impacted for an extended period, the Trust’s investment results may be materially adversely affected.
Note 7 - Subsequent Events
The Adviser evaluated subsequent events from October 31, 2020, the date of these financial statements, through the date these financial statements were issued. There are no subsequent events that require recognition or disclosure in the financial statements.
158
Report of Independent Registered Public Accounting Firm
To the Board of Trustees of 1290 Funds and Shareholders of each of the fifteen funds listed in the table below
Opinions on the Financial Statements
We have audited the accompanying statements of assets and liabilities, including the portfolios of investments, of each of the funds listed in the table below (constituting 1290 Funds, hereafter collectively referred to as the “Funds”) as of October 31, 2020, the related statements of operations for the year ended October 31, 2020, the statements of changes in net assets for each of the two years in the period ended October 31, 2020, including the related notes, and the financial highlights for each of the periods indicated therein (collectively referred to as the “financial statements”). In our opinion, the financial statements present fairly, in all material respects, the financial position of each of the Funds as of October 31, 2020, the results of each of their operations for the year then ended, the changes in each of their net assets for each of the two years in the period ended October 31, 2020 and each of the financial highlights for each of the periods indicated therein in conformity with accounting principles generally accepted in the United States of America.
| | |
| 1290 Diversified Bond Fund | | 1290 Retirement 2035 Fund |
| 1290 DoubleLine Dynamic Allocation Fund | | 1290 Retirement 2040 Fund |
| 1290 GAMCO Small/Mid Cap Value Fund | | 1290 Retirement 2045 Fund |
| 1290 High Yield Bond Fund | | 1290 Retirement 2050 Fund |
| 1290 Multi-Alternative Strategies Fund | | 1290 Retirement 2055 Fund |
| 1290 Retirement 2020 Fund | | 1290 Retirement 2060 Fund |
| 1290 Retirement 2025 Fund | | 1290 SmartBeta Equity Fund |
| 1290 Retirement 2030 Fund | | |
Basis for Opinions
These financial statements are the responsibility of the Funds’ management. Our responsibility is to express an opinion on the Funds’ financial statements based on our audits. We are a public accounting firm registered with the Public Company Accounting Oversight Board (United States) (PCAOB) and are required to be independent with respect to the Funds in accordance with the U.S. federal securities laws and the applicable rules and regulations of the Securities and Exchange Commission and the PCAOB.
We conducted our audits of these financial statements in accordance with the standards of the PCAOB. Those standards require that we plan and perform the audit to obtain reasonable assurance about whether the financial statements are free of material misstatement, whether due to error or fraud.
Our audits included performing procedures to assess the risks of material misstatement of the financial statements, whether due to error or fraud, and performing procedures that respond to those risks. Such procedures included examining, on a test basis, evidence regarding the amounts and disclosures in the financial statements. Our audits also included evaluating the accounting principles used and significant estimates made by management, as well as evaluating the overall presentation of the financial statements. Our procedures included confirmation of securities owned as of October 31, 2020 by correspondence with the custodian, transfer agents and brokers; when replies were not received from brokers, we performed other auditing procedures. We believe that our audits provide a reasonable basis for our opinions.
/s/ PricewaterhouseCoopers LLP
New York, New York
December 16, 2020
We have served as the auditor of one or more investment companies in the EIM LLC — advised mutual fund complex since 1997.
159
1290 FUNDS
DISCLOSURE REGARDING ADVISORY CONTRACT APPROVALS
APPROVALS OF INVESTMENT ADVISORY AND INVESTMENT SUB-ADVISORY AGREEMENTS DURING THE SIX-MONTH PERIOD ENDED OCTOBER 31, 2020 (UNAUDITED)
At a meeting held on July 14-16, 2020,1 the Board of Trustees (the “Board”) of 1290 Funds (the “Trust”), including those Trustees who are not parties to any Agreement (as defined below) or “interested persons” (as that term is defined in the Investment Company Act of 1940, as amended (the “1940 Act”)) of such parties or the Trust (the “Independent Trustees”), considered and unanimously approved the renewal of the Investment Advisory Agreement (the “Advisory Agreement”) between the Trust and Equitable Investment Management Group, LLC (formerly known as AXA Equitable Funds Management Group, LLC) (“EIM” or the “Adviser”) and, as applicable, the renewal of the Investment Sub-Advisory Agreement (each, a “Sub-Advisory Agreement” and together with the Advisory Agreement, the “Agreements”) between the Adviser and each investment sub-adviser (each, a “Sub-Adviser” and together, the “Sub-Advisers”), as shown in the table below with respect to the series of the Trust (each, a “Fund” and together, the “Funds”) listed below, for an additional one-year term.
| | |
Funds | | Agreement(s) Renewed by the Trust’s Board with respect to the Funds |
1290 Multi-Alternative Strategies Fund 1290 Retirement 2020 Fund | | Advisory Agreement with EIM |
1290 Retirement 2025 Fund 1290 Retirement 2030 Fund 1290 Retirement 2035 Fund 1290 Retirement 2040 Fund 1290 Retirement 2045 Fund 1290 Retirement 2050 Fund 1290 Retirement 2055 Fund 1290 Retirement 2060 Fund (collectively, the “1290 Retirement Funds”) | | |
| |
1290 Diversified Bond Fund | | Advisory Agreement with EIM Sub-Advisory Agreement with Brandywine Global Investment Management LLC |
| |
1290 DoubleLine Dynamic Allocation Fund | | Advisory Agreement with EIM Sub-Advisory Agreement with DoubleLine Capital LP and DoubleLine Equity LP |
| |
1290 GAMCO Small/Mid Cap Value Fund | | Advisory Agreement with EIM Sub-Advisory Agreement with GAMCO Asset Management, Inc. |
| |
1290 High Yield Bond Fund | | Advisory Agreement with EIM Sub-Advisory Agreement with AXA Investment Managers, Inc. (“AXA IM”) |
| |
1290 SmartBeta Equity Fund | | Advisory Agreement with EIM Sub-Advisory Agreement with AXA Rosenberg Investment Management LLC (“AXA Rosenberg”) |
The Board noted that the Advisory Agreement and each Sub-Advisory Agreement had been updated to reflect a change in the Adviser’s name (as indicated above) and that no other changes to the Agreements had been proposed.
| 1 | The meeting was held by videoconference in reliance on an exemptive order issued by the Securities and Exchange Commission. Reliance on the exemptive order was necessary and appropriate due to circumstances related to the effects of COVID-19. All Trustees participating in the videoconference meeting were able to hear each other simultaneously during the meeting. Reliance on the exemptive order requires the Trustees, including a majority of the Independent Trustees, to ratify actions taken pursuant to the exemptive order by vote cast at the next in-person meeting. |
160
In reaching its decision to renew the Agreement(s) with respect to each Fund, the Board considered the overall fairness of the Agreement and whether the Agreement was in the best interests of the Fund and its shareholders. The Board further considered all factors it deemed relevant with respect to each Fund, including: (1) the nature, quality and extent of the overall services to be provided to the Fund by the Adviser, the relevant Sub-Adviser and, where applicable, their respective affiliates, including the investment performance of the Fund; (2) the level of the Fund’s advisory fee and, where applicable, sub-advisory fee, and the Fund’s expense ratios relative to those of peer funds; (3) the costs of the services to be provided by, and the profits to be realized by, the Adviser and its affiliates from their relationships with the Fund; (4) the anticipated effect of growth and size on the Fund’s performance and expenses, including any potential economies of scale and, if so, whether any such economies of scale are equitably shared with shareholders; and (5) “fall-out” benefits that may accrue to the Adviser, the relevant Sub-Adviser and their respective affiliates (that is, indirect benefits that they would not receive but for their relationships with the Fund). In considering each Agreement, the Board members did not identify any particular factor or information that was all-important or controlling, and each Trustee may have given different weights to different factors and, thus, each Trustee may have had a different basis for his or her decision.
In connection with its deliberations, the Board took into account information (both written and oral) provided to the Board, including its various committees, throughout the year, as well as information provided specifically in connection with the annual renewal process. The Trustees also recognized that the contractual arrangements for the Funds have been reviewed by the Trustees and discussed with the Adviser in prior years and that the Trustees’ conclusions may be based, in part, on their consideration of these same arrangements in prior years.
Information provided and discussed throughout the year included investment performance reports and related financial and general market outlook information for each Fund, as well as periodic reports on, among other matters, brokerage allocation and execution; pricing and valuation; legal and compliance matters; shareholder and other services and support provided to the Funds by the Adviser, the relevant Sub-Adviser and their respective affiliates; actual and potential conflicts of interest that could impact the business operations and relationships of the Adviser and the Trust or affect the Adviser’s recommendations about Sub-Advisers; sales and marketing activity; and risk management. In addition, the sub-groups of the Board’s Investment Committee, composed of Independent Trustees, met individually with, and engaged in extensive discussions along with management representatives and outside legal counsel with, Sub-Advisers during presentations made at regularly scheduled Investment Committee meetings during the year.
Information provided and discussed specifically in connection with the annual renewal process included a report prepared by Broadridge Financial Solutions Inc. (“Broadridge”), an independent provider of mutual fund industry data, as well as additional substantial material prepared by management. Broadridge provided its report directly to the Independent Trustees and included in its report comparative fee, expense, and investment performance information for each Fund. The materials provided by Broadridge in connection with the July 2020 annual renewal process reflected certain enhancements to the presentation and format of the materials provided by Broadridge in connection with the July 2019 annual renewal process. The enhancements were based on a review of the materials by the Independent Trustees, in consultation with their independent legal counsel, intended to ensure that the Independent Trustees continue to receive comparative fee, expense, and investment performance information in a format that enhances their review of the Funds’ investment advisory arrangements. The additional material prepared by management generally included Fund-by-Fund information showing each Fund’s average net assets; advisory fees and, where applicable, sub-advisory fees; expense ratios; expense limitation arrangements; investment performance (in addition to the performance information prepared by Broadridge); and profitability information, including information regarding the profitability of the Adviser’s operations on an overall Trust basis, as well as on a Fund-by-Fund basis. In addition, for each Fund, the Adviser and the relevant Sub-Adviser provided separate materials describing the Fund’s investment performance over various time periods and the services provided and the fees charged with respect to the Fund, and discussing whether the Fund had performed as expected over time and other matters.
The annual renewal process extends over at least two regular meetings of the Board in June and July, although the Independent Trustees believe that in fact the process extends year-round, to ensure that the Adviser and the Sub-Advisers have time to respond to any questions the Independent Trustees may have on their initial review of the materials and that the Independent Trustees have time to consider those responses. The Independent Trustees also held a conference call in advance of the meeting at which the Board approved the renewal of the Agreements to review the information provided and communicated follow-up questions for management to address at the renewal meeting. The Independent Trustees also met in executive sessions during
161
the meeting to discuss the Agreements and the information provided. When invited, management representatives attended portions of the executive sessions to review and discuss matters relating to the Agreements and to provide additional information requested by the Independent Trustees. At the meeting and during the portions of the executive sessions attended by management, the Independent Trustees and management engaged in extensive discussions and negotiations regarding the Agreements. As noted below, as a result of these extensive discussions and negotiations, the Adviser proposed to lower the contractual expense limitation arrangement for one of the Funds. The Independent Trustees were assisted by independent legal counsel prior to and during the meeting and during their deliberations regarding the Agreements and also received from legal counsel materials addressing, among other things, the legal standards applicable to their consideration of the proposed renewal of the Agreements. In addition, the Independent Trustees reviewed information and met during the year to discuss information relevant to their annual consideration of the Agreements.
The Board also noted that the Trust is an affiliated investment company of EQ Advisors Trust and EQ Premier VIP Trust (formerly known as AXA Premier VIP Trust), which are also managed by the Adviser, and that all of the Board members also currently serve on the Boards of Trustees of EQ Advisors Trust and EQ Premier VIP Trust. The Board also noted that each Sub-Adviser currently serves as investment sub-adviser for one or more series, or allocated portion(s) of series, of EQ Advisors Trust and EQ Premier VIP Trust (such Sub-Advisers together, the “EQ Sub-Advisers”). The Trustees took into account information relating to the Adviser and the EQ Sub-Advisers provided to the Trustees, in their capacities as Trustees of EQ Advisors Trust and EQ Premier VIP Trust, at prior meetings of the Boards of Trustees of EQ Advisors Trust and EQ Premier VIP Trust, and the Trustees noted their experience and familiarity with the Adviser, the EQ Sub-Advisers, and the series of EQ Advisors Trust and EQ Premier VIP Trust gained from their service on the Boards of Trustees of EQ Advisors Trust, EQ Premier VIP Trust, and the Trust.
Although the Board approved the renewal of the Agreements for all of the Funds at the same Board meeting, the Board considered each Fund separately. In approving the renewal of the relevant Agreement(s) with respect to each Fund, each Trustee, including the Independent Trustees, on the basis of their business judgment after review of the information provided, determined that the advisory fee and, where applicable, sub-advisory fee were fair and reasonable and that the renewal of the Agreement(s) was in the best interests of the applicable Fund and its shareholders. Although the Board gave attention to all information provided, the following discusses some of the primary factors it deemed relevant to its decision to renew the Agreements.
Nature, Quality and Extent of Services
The Board evaluated the nature, quality and extent of the overall services to be provided to each Fund and its shareholders by the Adviser, the relevant Sub-Adviser and, where applicable, their respective affiliates. In addition to the investment performance and expense information discussed below, the Board considered the Adviser’s and each relevant Sub-Adviser’s responsibilities with respect to each Fund and the Adviser’s and each relevant Sub-Adviser’s experience in serving as an investment adviser for the Fund(s) and for funds and accounts similar to the Fund(s) each advises, including, as applicable, series (or allocated portion(s) of series) of EQ Advisors Trust and EQ Premier VIP Trust.
With respect to the Adviser, the Board considered that the Adviser is responsible for, among other things, developing investment strategies for the Funds (and the portions thereof); researching, selecting and hiring Sub-Advisers, conducting ongoing “due diligence” on and monitoring Sub-Advisers, and, when necessary or advisable, terminating or replacing Sub-Advisers; allocating and rebalancing Fund assets among Sub-Advisers; overseeing the selection of investments for the Funds (or the portions thereof) that the Sub-Advisers sub-advise; making investment decisions for the Funds (or the portions thereof) that it manages directly; monitoring and evaluating the performance of the Funds (or the portions thereof); monitoring the investment operations and composition of the Funds (or the portions thereof) and, in connection therewith, monitoring compliance with the Funds’ investment objectives, policies and restrictions, as well as the Funds’ compliance with applicable law and the Trust’s compliance policies and procedures; monitoring brokerage selection, commission and other trading costs, quality of execution, and other brokerage matters; coordinating and managing the flow of information and communications relating to the Funds among the Sub-Advisers and other applicable parties; coordinating responses to regulatory agency inquiries relating to the operations of the Trust and coordinating litigation matters involving the Adviser and the Trust; and implementing Board directives as they relate to the Funds. The Board also considered information regarding the Adviser’s process for selecting and monitoring the Sub-Advisers and the other service providers to the Funds and its process for making investment decisions for the Funds (or the portions thereof) that it manages directly, as well as information regarding the qualifications and experience of, and
162
resources available to, the personnel who perform those functions with respect to the Funds. The Board further considered that the Adviser also provides the Trust with personnel, including Trust officers, in connection with carrying out its responsibilities and is responsible for coordinating the development of new initiatives and evaluating the impact of proposed products and services on the Trust and its assets. The Board also considered that the Adviser has assumed significant entrepreneurial risk in sponsoring the Funds and that the Adviser also bears and assumes significant ongoing risks, including investment, operational, enterprise, litigation, regulatory and compliance risks, with respect to the Funds. The Board considered that the Adviser’s responsibilities include daily monitoring of investment, operational, enterprise, litigation, regulatory and compliance risks as they relate to the Funds. The Board also considered information regarding, and met regularly with the Trust’s Director of Risk to discuss, the Adviser’s ongoing risk management activities and reporting.
With respect to the Sub-Advisers, the Board considered that each Sub-Adviser, subject to the oversight of the Adviser, is responsible for making investment decisions for the Fund (or the portion thereof) that it sub-advises; placing with brokers or dealers orders for the purchase and sale of investments for the Fund (or the portion thereof) that it sub-advises; and performing certain related administrative functions. The Board also reviewed information regarding each Sub-Adviser’s process for selecting investments for the Fund (or the portion thereof) that it sub-advises, as well as information regarding the qualifications and experience of the Sub-Adviser’s portfolio managers who provide services to the Fund that it sub-advises. The Board also considered information regarding each Sub-Adviser’s policies for executing portfolio transactions for the Fund (or the portion thereof) that it sub-advises and, where applicable, information regarding a Sub-Adviser’s policies for obtaining research from brokers and dealers.
In addition, the Board considered the allocation of Fund brokerage, including allocations to broker-dealers affiliated with the Adviser or a Sub-Adviser. The Board also considered the use of “soft” commission dollars to pay for research services, as applicable. In this regard, the Board also considered the Adviser’s and each Sub-Adviser’s trading experience and received information regarding how the Adviser and each Sub-Adviser seek to achieve “best execution” on behalf of a Fund (or portion thereof), including a report by an independent portfolio trading analytical firm.
The Board also considered the Trust’s Chief Compliance Officer’s evaluation of the Adviser’s and each Sub-Adviser’s compliance programs, policies and procedures, including those relating to cybersecurity, and any compliance matters involving the Adviser and any applicable Sub-Adviser that had been brought to the Board’s attention during the year. In addition, the Board considered whether there were any pending lawsuits, enforcement proceedings or regulatory investigations involving the Adviser and the Sub-Advisers and reviewed information regarding the Adviser’s and each Sub-Adviser’s financial condition and history of operations and potential conflicts of interest in managing the Funds. The Board also considered information as to the overall amount of assets sub-advised by each Sub-Adviser and noted the largest Sub-Adviser relationships. In addition to periodic reports throughout the year, the Independent Trustees received information about business relationships that the Adviser and/or its affiliates, including Equitable Financial Life Insurance Company (formerly known as AXA Equitable Life Insurance Company), have with Sub-Advisers and/or their affiliates in addition to the relationships involving the Funds. In this regard, the Board also received materials regarding the practices, policies and procedures adopted by the Adviser and the Trust to identify and mitigate actual and potential conflicts of interest, including conflicts that may arise in connection with those additional business relationships.
The Board also considered periodic reports provided to the Board regarding the services provided by the Adviser, the Sub-Advisers and, where applicable, their affiliates. The Board also considered actions taken by the Adviser and the Sub-Advisers in response to recent market conditions and considered the overall performance of the Adviser and the Sub-Advisers in this context. In this regard, among other things, the Board considered information about the impact of the COVID-19 pandemic on the Adviser’s and each Sub-Adviser’s operations and the Adviser’s and each Sub-Adviser’s ability to continue to provide the same scope and quality of services to its respective Fund(s) as before the pandemic. The Board noted that, at the Independent Trustees’ request, the Adviser had continued to provide the Board with regular updates on market volatility, the operation of the Trust and the Funds, developments related to the Adviser’s business, and the Adviser’s ongoing oversight of the Funds’ Sub-Advisers, including enhanced supervisory measures taken, in light of the widespread market and business disruptions resulting from the COVID-19 pandemic and responses to the pandemic. The Board also noted that, at the Independent Trustees’ request, the Adviser had continued to provide the Board with periodically updated EIM assets under management and Fund average net assets information, as well as updated investment performance information for all of the Funds.
163
The Board also considered strategic and other actions taken by the Adviser in response to recent events within the mutual fund industry, including actions taken in response to legal and regulatory developments affecting the mutual fund industry. The Board also requested and received throughout the past year information from the Adviser and various service providers on various topics impacting all mutual funds, including the COVID-19 pandemic; pricing and valuation of portfolio securities; liquidity risk management; cybersecurity; trustee independence; mutual fund board governance “best practices”; and the transition away from London Interbank Offered Rate (LIBOR). The Board noted that certain of these topics may present significant ongoing challenges for mutual funds and result in an increase in the responsibilities and costs of mutual fund service providers, including the Adviser.
The Board also considered the benefits to shareholders from participation in a Fund sponsored by the Adviser, including the Adviser’s experience operating a large fund complex that offers a wide range of portfolios, sub-advisers and investment styles. The Board likewise considered that shareholders have chosen to invest in mutual funds sponsored by the Adviser. In addition, the Board considered the nature, quality and extent of the administrative, shareholder servicing and distribution support services that the Adviser and its affiliates provide to the Funds and their shareholders. The Board also noted that, throughout the past year, the Adviser and its affiliates had continued or undertaken initiatives intended to enhance various aspects of the Trust’s and the Board’s operations and shareholders’ experience with the mutual funds sponsored by the Adviser. The Board also noted strategic and other actions and initiatives that the Adviser had identified, including actions and initiatives that are part of a broader effort to coordinate and enhance the collective efficiency of the governance and oversight of the fund complex and provide for potential cost savings to shareholders that may result from such efficiencies. In this regard, the Board also noted that the Adviser continually reviews the overall line-up of investment options and conducts in-depth analysis of its entire fund complex to provide recommendations to the Board to streamline and strengthen the fund complex’s line-up.
The Board also considered that, since the July 2019 annual renewal process, the Adviser and its affiliates had continued to update the Board on matters relating to the sale by AXA S.A. (“AXA”) of its remaining ownership interest in Equitable Holdings, Inc. (“Equitable Holdings”), the Adviser’s parent company, through a series of sales of Equitable Holding’s common stock (the “Sell-Down Plan”). In this regard, the Board had received from the Adviser presentations regarding its re-branding strategy utilizing the “Equitable” brand name. The Board also noted that it had received from the Adviser and its affiliates representations that their separation from AXA as contemplated by the Sell-Down Plan would not lead to a reduction in the quality or scope of portfolio management, administrative, regulatory compliance and other services provided by those firms to the Funds. The Board also noted that, as a result of the Sell-Down Plan, AXA IM and AXA Rosenberg were no longer affiliated with the Adviser.
For purposes of evaluating the nature, quality and extent of the overall services provided to each Fund, the Board also took into account discussions with the Adviser and the relevant Sub-Adviser about Fund investment performance that occur at Board and Investment Committee meetings throughout the year. In this regard, the Board noted that, as part of regularly scheduled Fund reviews and other detailed reports to the Board on Fund performance, the Board periodically considered information regarding each Fund’s performance over various time periods on both an absolute basis and relative to an appropriate broad-based securities market index (“benchmark”) and/or a custom blended index developed by the Adviser that comprises broad-based indexes (“blended benchmark”), and a peer group of other mutual funds deemed by Broadridge to be comparable to the Fund (“peer group”). The performance information generally included, among other information, annual total returns, average annual total returns, cumulative returns and/or rolling period total returns. The Board also considered certain information, reflected in Appendix A, provided to the Board regarding each Fund’s performance relative to a benchmark and/or a blended benchmark and a peer group for the one-, three- and five-year periods, as applicable, and since inception periods ended March 31, 2020. The Board noted that this information supplemented other performance information provided to the Board throughout the year and in connection with the annual renewal process. The Board also considered information, provided directly to the Board by Broadridge, regarding each Fund’s performance over various time periods relative to a benchmark and/or a blended benchmark and Broadridge’s “performance universe” consisting of a peer group of funds. The Board also took note of the relatively small size of each Fund and the likely impact that a Fund’s size has on its relative expenses and performance. The Board also noted that, at the Independent Trustees’ request, the Adviser had provided the Board with updated investment performance information for all of the Funds for periods ended April 30, 2020 and May 31, 2020, and would continue to provide updated performance, in light of the widespread market and business disruptions resulting from the COVID-19 pandemic and responses to the pandemic.
164
The Board received a description of, and factored into its evaluation of each Fund’s performance the limitations inherent in, Broadridge’s methodology for developing and constructing peer groups and determining, from year to year, which mutual funds should be included in which peer groups, among other things. The Board also noted that the number of mutual funds included in a peer group may be relatively small and may differ significantly from peer group to peer group and from year to year and that the constituent mutual funds included in a peer group also may differ from year to year, which, among other factors, can limit the relevance of the comparisons. While recognizing these inherent limitations, the Board believed the independent analysis conducted by Broadridge provided a useful measure of comparative performance.
In evaluating the Funds’ performance, the Board generally considered longer-term performance to be more important than short-term performance and also took into account factors including general market conditions (including the amount of volatility in the market over the past year); the “style” in which the Funds are managed, as applicable, and whether that style is in or out of favor in the market; issuer-specific information; and fund cash flows. In this regard, the Board also noted how changes in time periods for performance calculations (for example, whether a one-year period is from December to December or March to March) can significantly impact a Fund’s returns and peer ranking on a relative basis. The Board also considered that variations in performance among a Fund’s operating classes reflect variations in class expenses, which result in lower performance for higher expense classes.
Allocation Funds
With respect to the performance of the 1290 DoubleLine Dynamic Allocation Fund, the Board considered that the Fund allocates its assets between equity and fixed income investments and is advised by a single Sub-Adviser.
With respect to the performance of each of the 1290 Retirement Funds, the Board considered that each Fund operates as a fund-of-funds and invests in exchange traded securities of other investment companies or investment vehicles (“ETFs”) and recognized, therefore, that each Fund’s performance is based, in part, on the total returns of the ETFs in which it invests. The Board also considered that each of the 1290 Retirement Funds allocates its assets between equity and fixed income investments through its investments in ETFs.
The Board also factored into its evaluation of each Fund’s performance the limitations inherent in comparing the performance of asset allocation funds, such as the Funds, which may invest in equity and fixed income investments, to the performance of a peer group that includes funds that may allocate their assets between equity and fixed income investments in different percentages over time than the Funds and among other asset classes. The Board also factored into its evaluation of each 1290 Retirement Fund’s performance that, although the Fund’s benchmark may correspond to a particular target retirement date, it may have levels of exposure to equity and fixed income investments that vary from the Fund’s asset allocation over time.
Active Funds
With respect to the performance of the 1290 Diversified Bond, 1290 GAMCO Small/Mid Cap Value, 1290 High Yield Bond and 1290 SmartBeta Equity Funds, the Board considered that each Fund is actively managed and advised by a single Sub-Adviser. In evaluating the performance of the 1290 Diversified Bond Fund, the Board also noted that, in connection with a restructuring of the Fund on or about June 15, 2018, the Fund had replaced its two former sub-advisers with a new Sub-Adviser, and changed its investment objective, policies and strategy, performance benchmark, and fee and expense structure and, therefore, the Board focused on the Fund’s performance since that time. The Board also noted that, prior to January 1, 2018, the 1290 SmartBeta Equity Fund did not integrate Environmental, Social and Governance filters into its portfolio construction process.
With respect to the performance of the 1290 Multi-Alternative Strategies Fund, the Board considered that the Fund operates as a fund-of-funds and invests in ETFs and recognized, therefore, that the Fund’s performance is based, in part, on the total returns of the ETFs in which it invests.
All Funds
The Board and the Adviser discussed the performance of each Fund, including whether each Fund had performed as expected over time. The Board and the Adviser also discussed, where applicable, the reasons for a Fund’s underperformance for certain periods relative to its peer group and/or benchmark and/or blended benchmark, as applicable, and efforts to improve the Fund’s performance. Where applicable, the Board also considered steps that the Adviser and, where applicable, the relevant Sub-Adviser had taken to address a Fund’s performance, including any changes or additions to the Sub-Advisers or portfolio managers advising a Fund and
165
any changes to the investment strategies of a Fund. In this regard, the Board noted that performance is only one of the factors that it deems relevant to its consideration of a Fund’s Agreement(s) and that, after considering all relevant factors, it can reach a decision to renew an Agreement notwithstanding a Fund’s underperformance.
Based on its review and the explanations provided by the Adviser and, where applicable, the relevant Sub-Adviser regarding the performance of each Fund, the Board determined, with respect to each Fund, that (i) the Fund and its shareholders would benefit from the Adviser’s and, where applicable, the relevant Sub-Adviser’s continued management of the Fund, and (ii) the nature, quality and extent of the overall services provided by the Adviser, the relevant Sub-Adviser and, where applicable, their respective affiliates were appropriate for the Fund in light of its investment objective(s) and, thus, supported a decision to approve the renewal of the Agreement(s).
Expenses
The Board considered each Fund’s advisory fee and, where applicable, sub-advisory fee in light of the nature, quality and extent of the overall services provided by the Adviser and, where applicable, the relevant Sub-Adviser. The Board also reviewed comparative fee and expense information for each Fund provided directly to the Board by Broadridge. The information provided by Broadridge included an analysis of how each Fund’s contractual advisory fee, actual advisory fee, other expense components, and total expense ratio compared with those of peer groups of other mutual funds selected by Broadridge as constituting an appropriate expense comparison (an expense “group” and a broader expense “universe”) for the Fund (a Fund’s “Broadridge category”). For each Fund, Broadridge provided information on the Fund’s contractual advisory fee in comparison with the contractual advisory fee that would have been charged by other funds within a Broadridge category assuming the other funds were similar in size to the Fund, as well as information on the Fund’s actual advisory fee and total expense ratio in comparison with those of other funds within a Broadridge category. The advisory fee analysis includes within such fee any separate administrative fee paid by a fund, including the administrative fee a Fund paid to the Adviser in its capacity as administrator for the Fund. The contractual advisory fee analysis does not take into account any fee reimbursements or waivers, whereas the actual advisory fee analysis does take into account any advisory (including any administrative) fee reimbursements or waivers that benefit a fund. The total expense ratio represents a fund’s total net operating expenses and takes into account any expense reimbursements or fee waivers that benefit a fund. Broadridge provided, and the Board considered, total expense ratio comparisons including and excluding any 12b-1 or non 12b-1 service fees and, as applicable, including fees and expenses of any underlying funds in which a fund invests.
The Broadridge expense data was based upon historical information taken from each Fund’s audited annual report for the period ended October 31, 2019. Broadridge provided expense data for Class I shares of each Fund. The Board reviewed the expense data for Class I shares as a proxy for all of a Fund’s share classes. In this regard, the Board noted that the expenses for a Fund’s Class I shares are generally lower than the expenses for a Fund’s other share classes and that the expense comparisons may differ for different classes. Fund-specific contractual advisory fee and total expense ratio comparisons are provided below. The total expense ratio comparisons exclude any 12b-1 or non 12b-1 service fees. For the funds-of-funds and certain other Funds as noted below, the total expense ratio comparisons include fees and expenses of any underlying funds in which a fund invests. The Board also took note of the relatively small size of each Fund and the likely impact that a Fund’s size has on its relative expenses.
The Board received a description of, and factored into its evaluation of each Fund’s fees and expenses the limitations inherent in, Broadridge’s methodology for developing and constructing Broadridge categories and for determining, from year to year, which mutual funds should be included in which Broadridge categories, among other things. The Board recognized these inherent limitations and, taking into account commentary and supporting data presented by management, also recognized that comparisons between a Fund and other mutual funds in a Broadridge category may not be as relevant in certain circumstances, given that in some cases a Fund may exhibit notable differences (for example, in its objective(s), management techniques, and relative size) when compared to other mutual funds in a Broadridge category. The Board also noted that the number of mutual funds included in a Broadridge category may be relatively small and may differ significantly from category to category and from year to year and that the constituent mutual funds included in a Broadridge category (as well as their respective advisory/administrative fees and total expense ratios) also may differ from year to year, which can limit the relevance of the comparisons. The Board also noted that there is no standard definition of advisory and administrative services, meaning that different mutual funds may receive different services, rendering fee and expense comparisons more difficult. Nonetheless, the Board believed that the independent analysis conducted by Broadridge assisted the Board in evaluating the reasonableness of each Fund’s advisory fee and total expense ratio.
166
In addition, with respect to each sub-advised Fund, the Board further considered the relative levels of the sub-advisory fee paid to the relevant Sub-Adviser and the advisory fee retained by the Adviser in light of, among other factors, the nature and extent of responsibilities retained and risks assumed by the Adviser and not delegated to or assumed by the relevant Sub-Adviser, and the information prepared by management regarding the level of profits realized by the Adviser in connection with its operation of the Fund. The Board also considered the sub-advisory fee paid to each Sub-Adviser in light of fees charged by the Sub-Adviser to similar funds advised or sub-advised by the Sub-Adviser.
Allocation Funds
The Board considered that the contractual advisory fee for the 1290 DoubleLine Dynamic Allocation Fund and each of the 1290 Retirement Funds was above the median for the Fund’s respective Broadridge category. The Board also considered that the total expense ratio for the Class I shares of each of these Funds was above the median for the Fund’s respective Broadridge category. For each Fund, the total expense ratio included the fees and expenses of the underlying funds in which the Fund invests.
The Board also considered each 1290 Retirement Fund’s advisory fee rate relative to the advisory fee rates of other portfolios managed by the Adviser that, like the Funds, are structured as funds-of-funds, and noted that differences in the level of the fees reflected differences between a Fund and other funds-of-funds managed by the Adviser.
Active Funds
The Board considered that the contractual advisory fee for the 1290 Multi-Alternative Strategies Fund was at the median for the Fund’s Broadridge category. The Board also considered that the total expense ratio for the Class I shares of the Fund was at the median for the Fund’s Broadridge category. The total expense ratio included the fees and expenses of the underlying funds in which the Fund invests.
The Board considered that the contractual advisory fee for each of the 1290 Diversified Bond, 1290 GAMCO Small/Mid Cap Value, 1290 High Yield Bond and 1290 SmartBeta Equity Funds was above (but, in the case of the 1290 GAMCO Small/Mid Cap Value and 1290 SmartBeta Equity Funds, within five basis points of) the median for the Fund’s respective Broadridge category. The Board also considered that the total expense ratio for the Class I shares of each of the 1290 Diversified Bond and 1290 SmartBeta Equity Funds was at or below the median for the Fund’s respective Broadridge category, and the total expense ratio for the Class I shares of each of the 1290 GAMCO Small/Mid Cap Value and 1290 High Yield Bond Funds was above the median for the Fund’s respective Broadridge category. For the 1290 GAMCO Small/Mid Cap Value Fund, the total expense ratio included the fees and expenses of underlying funds in which the Fund may invest.
The Board also considered the 1290 Multi-Alternative Strategies Fund’s advisory fee rate relative to the advisory fee rates of other portfolios managed by the Adviser that, like the Fund, are structured as funds-of-funds, and noted that differences in the level of the fees reflected differences between the Fund and other funds-of-funds managed by the Adviser.
All Funds
The Board further considered that the advisory fee rate schedules for all Funds other than the 1290 Retirement Funds include breakpoints that reduce the fee rate as a Fund’s assets increase above certain levels. The Board noted that any such reduction in a Fund’s effective advisory fee would result in corresponding reductions in the Fund’s total expense ratios. In addition, the Board considered that the Adviser had contractually agreed to make payments or waive all or a portion of its advisory, administrative and other fees so that each Fund’s total expense ratios do not exceed certain levels as set forth in its prospectus. In this regard, the Board also noted that the expense limitation arrangements for each of the 1290 DoubleLine Dynamic Allocation, 1290 GAMCO Small/Mid Cap Value and 1290 Multi-Alternative Strategies Funds and each of the 1290 Retirement Funds include the fees and expenses of any underlying funds in which a Fund invests and, thus, such fees and expenses would not cause a Fund’s annual operating expenses to exceed its expense limitation. The Board noted that, as a result of these expense limitation arrangements, each Fund’s actual advisory fee was lower than its contractual advisory fee and was either at or below the median for the Fund’s respective Broadridge category.
The Board also considered that, after extensive discussions and negotiations with the Adviser, the Adviser had proposed to lower the contractual expense limitation arrangement for the 1290 SmartBeta Equity Fund effective September 30, 2020, and would present this proposal for the Board’s approval at its September 2020 meeting.
167
Based on its review, the Board determined, with respect to each Fund, that the Adviser’s advisory fee is fair and reasonable, and the Board determined, with respect to each sub-advised Fund, that the Sub-Adviser’s sub-advisory fee is fair and reasonable.
Profitability and Costs
The Board also considered the level of profits realized by the Adviser and its affiliates in connection with the operation of each Fund. In this respect, the Board reviewed profitability information setting forth the overall profitability of the Trust to the Adviser and its affiliates, as well as the Adviser’s and its affiliates’ profits in providing management and other services to each of the individual Funds during the 12-month period ended December 31, 2019, which was the most recent fiscal year for the Adviser. The Board also considered a year-over-year comparison of profitability information for the one-year periods ended December 31, 2019, 2018, and 2017. The Board noted that the Adviser was heavily subsidizing the Funds’ expenses and that the Funds were not profitable.
In reviewing the Adviser’s profitability analysis, attention was given to the methodology the Adviser followed in determining and allocating costs to each Fund. The Board recognized that cost allocation methodologies are inherently subjective and various cost allocation methodologies may each be reasonable while producing different results. In this regard, the Board noted that the cost allocation methodology was consistent with the redesigned cost allocation methodology followed in the profitability report presentations for the Funds made in the prior two years. The Board also noted that, in consultation with and through independent legal counsel, the Board’s Audit Committee had engaged an outside consultant to conduct an assessment of the redesigned cost allocation methodology prior to its being integrated into the Adviser’s profitability analysis in connection with the July 2018 annual renewal process. At that time, the Board took into account the consultant’s reported findings that, among other things, the redesigned cost allocation methodology includes expense categories that are reasonable and consistent to the services the Adviser provides to the Funds, the expense categories reviewed are consistent with industry practices and related cost allocation methods, and the allocation of those expenses and associated logic for the allocation to management and administration related revenue categories appear reasonable and consistent with observed industry practices and other established standards. The Board further noted that, in connection with the July 2019 annual renewal process, the Audit Committee had requested that the consultant review and update its prior report in light of certain adjustments that had been made to the redesigned cost allocation methodology and that, following such review, the consultant’s aforementioned reported findings remained unchanged. The Board also took into account management’s ongoing costs and expenditures in providing and improving services for the Funds, as well as the need to meet additional regulatory and compliance requirements resulting from changes in rules and other regulations and to adapt to other challenges impacting the mutual fund industry. In addition, the Board considered information prepared by management and from third party sources comparing the profitability of the Adviser on an overall basis to the profitability of other publicly held asset managers (including asset managers similar to the Adviser) over various time periods.
In addition, with respect to the sub-advised Funds, the Board also noted that the Board and the Adviser generally are aware of the fees charged by the Sub-Advisers to other clients (this information having been provided to the Board and the Adviser by the Sub-Advisers in conjunction with the proposed renewal of the Sub-Advisory Agreements) and that the Adviser believes that the fees agreed upon with the Sub-Advisers are reasonable in light of the nature, quality and extent of the investment sub-advisory services provided. The Adviser advised the Board that it does not regard Sub-Adviser profitability as meaningful to its evaluation of the Sub-Advisory Agreements. The Board acknowledged the Adviser’s view of Sub-Adviser profitability, noting the Board’s findings as to the reasonableness of the sub-advisory fees and that the fees paid to the Sub-Advisers are the product of negotiations with the Adviser and reflect levels of profitability acceptable to the Adviser and the Sub-Advisers based on the particular circumstances in each case for each of them. The Board further noted that each Sub-Adviser’s fee is paid by the Adviser and not the sub-advised Fund and that many responsibilities related to the advisory function are retained by the Adviser.
Based on its consideration of the factors above, the Board determined that the level of profits realized by the Adviser and its affiliates from providing services to each Fund was not excessive in view of the nature, quality and extent of the services provided.
Economies of Scale
The Board also considered whether economies of scale or efficiencies are realized by the Adviser as the Funds grow larger, the extent to which this is reflected in the level of advisory and administrative fees charged, and
168
whether there is potential for realization of any further economies of scale or efficiencies. While recognizing that any precise determination is inherently subject to assumptions and subjective assessments, the Board considered that any realized economies of scale or efficiencies may be shared with funds and their shareholders in a variety of ways, including: (i) breakpoints in the advisory fee or other fees so that a fund’s effective fee rate declines as the fund grows in size, (ii) subsidizing a fund’s expenses by making payments or waiving all or a portion of the advisory fee or other fees so that the fund’s total expense ratio does not exceed certain levels, (iii) setting the advisory fee or other fees so that a fund is priced to scale, which assumes that the fund has sufficient assets from inception to operate at a competitive fee rate without any fee waiver or expense reimbursement from the manager, and (iv) reinvestment in, and enhancements to, the services that the manager and its affiliates provide to a fund and its shareholders. The Board noted that the advisory fee rate schedules for all Funds other than the 1290 Retirement Funds include breakpoints that reduce the fee rate as Fund assets increase above certain levels. The Board also noted that the Adviser was subsidizing each Fund’s expenses by making payments or waiving all or a portion of its advisory, administrative and other fees so that the Fund’s total expense ratios do not exceed certain contractual levels as set forth in its prospectus. In this connection, the Board also considered that, after extensive discussions and negotiations with the Adviser, the Adviser had proposed to lower the contractual expense limitation arrangement for one of the Funds, as noted above, effective September 30, 2020, and would present this proposal for the Board’s approval at its September 2020 meeting. In addition, the Board considered that the Adviser shares any realized economies of scale with the Funds in other ways, which may include setting a Fund’s fees so that they are priced to scale. The Board considered that the effect of this pricing strategy is that the Adviser could lose money in the early stages of a Fund’s operation (and bear the risk that the Fund will never become profitable), while shareholders of the Fund receive the benefit of economies of scale that the Adviser expects the Fund will achieve as it grows. The Board further considered that the Adviser shares any realized economies of scale with the Funds through reinvestment in, and enhancements to, the services that the Adviser and its affiliates provide to the Funds and their shareholders, such as hiring additional personnel, providing additional resources in areas relating to management and administration of the Funds, and investing in technology (including cybersecurity improvements).
In addition, the Board noted that the sub-advisory fee schedules for certain Sub-Advisers aggregate the assets managed by the Sub-Adviser in a Fund and in one or more other mutual funds for which the Sub-Adviser serves as investment sub-adviser and the Adviser serves as investment adviser. The Board also noted that the sub-advisory fee schedules for certain Sub-Advisers include breakpoints that reduce the sub-advisory fee rate as applicable Fund assets under the Sub-Adviser’s management increase above certain levels. In this regard, the Board acknowledged that, at some levels, the breakpoints in a sub-advisory fee schedule may result in savings to the Adviser and not to shareholders. The Board also noted that the aggregation of assets may result in the affected Fund(s) reaching a breakpoint sooner than if the sub-advisory fee schedule did not aggregate assets, which also has the potential to benefit the Adviser.
Based on its consideration of the factors above and recognizing that the Funds have relatively low asset levels to date, the Board determined that there was a reasonable sharing of any realized economies of scale or efficiencies under the advisory, administrative and sub-advisory fee schedules at the present time.
Fall-Out and Other Benefits
The Board also considered the extent to which fall-out benefits may accrue to the Adviser and its affiliates. In this connection, the Board considered several possible fall-out benefits and other types of benefits, including the following. The Board noted that the Adviser also serves as the administrator for the Funds and receives compensation for acting in this capacity. The Board also noted that Equitable Distributors, LLC (formerly known as AXA Distributors, LLC), an affiliate of the Adviser, provides distribution support services for the Trust pursuant to an agreement with the Trust’s distributor, ALPS Distributors, Inc. Equitable Distributors, LLC may receive from the Funds compensation (which may include payments pursuant to Rule 12b-1 plans with respect to their Class A, Class T (when offered for sale), and Class R shares) for providing shareholder services and selling activities, which could lead to growth in the Trust’s assets and corresponding benefits from such growth, including economies of scale. The Board also recognized that other broker-dealers that are affiliated with the Adviser may sell, and earn sales commissions and/or other compensation with respect to, shares of the Funds. Further, the Board considered that Sanford C. Bernstein & Co., LLC, a registered broker-dealer, is an affiliate of the Adviser and may, from time to time, receive brokerage commissions from the Funds in connection with the purchase and sale of portfolio securities; provided, however, that those transactions, among other things, are consistent with seeking best execution. Based on its review, the Board determined that any “fall-out” benefits and other types of benefits that may accrue to the Adviser are fair and reasonable.
169
The Board also considered possible fall-out benefits and other types of benefits that may accrue to a Sub-Adviser, including the following. The Board considered that a Sub-Adviser, through its position as a Sub-Adviser to its respective Fund, may engage in soft dollar transactions. In addition, the Board considered that a Sub-Adviser may be affiliated with registered broker-dealers who may, from time to time, receive brokerage commissions from a Fund in connection with the purchase and sale of portfolio securities; provided, however, that those transactions, among other things, are consistent with seeking best execution. In cases where a Sub-Adviser’s affiliate executed a substantial portion of its respective Fund’s trades, the Board also considered the Sub-Adviser’s trading experience and discussed with the Adviser its monitoring of the Sub-Adviser’s brokerage selection, commission and other trading costs, and quality of execution. The Board also noted that certain Sub-Advisers serve or may serve as investment sub-advisers for other funds advised by the Adviser and receive sub-advisory fees with respect to those funds. The Board also recognized that a Sub-Adviser and its affiliates may sell, and earn sales commissions and/or other compensation with respect to, the Funds and other investment products issued by the Adviser or its affiliates. In addition, the Board noted that a Sub-Adviser may benefit from greater exposure in the marketplace with respect to the Sub-Adviser’s investment process and from expanding its level of assets under management, and a Sub-Adviser may derive benefits from its association with the Adviser. Based on its review, the Board determined that any “fall-out” benefits that may accrue to each Sub-Adviser are fair and reasonable.
170
Appendix A
The Board noted that the following information regarding each Fund’s performance relative to a benchmark and/or a blended benchmark and a peer group for the one-, three- and five-year periods, as applicable, and since inception periods ended March 31, 2020, supplemented other performance information (including performance based on rolling time periods) provided to the Board throughout the year and in connection with the annual renewal process. The performance results may differ from the performance results for more recent periods, including those shown elsewhere in this report.
1290 Funds Investment Performance
For periods ended March 31, 2020
| | | | | | | | | | | | | | | | | | | | | | | | | | | | | | | | | | | | |
| | | | | | 1 Year | | | 3 Year | | | 5 Year | | | Since Inception | |
| | | Inception
Date | | | Without
Sales
Charge | | | With
Sales
Charge | | | Without
Sales
Charge | | | With
Sales
Charge | | | Without
Sales
Charge | | | With
Sales
Charge | | | Without
Sales
Charge | | | With
Sales
Charge | |
1290 GAMCO Small/Mid Cap Value Fund - Class A | | | 11/12/2014 | | | | (32.19 | ) | | | (35.91 | ) | | | (9.27 | ) | | | (10.98 | ) | | | (2.15 | ) | | | (3.24 | ) | | | (1.17 | ) | | | (2.20 | ) |
1290 GAMCO Small/Mid Cap Value Fund - Class T | | | 11/12/2014 | | | | (31.95 | ) | | | (33.67 | ) | | | (9.04 | ) | | | (9.81 | ) | | | (1.90 | ) | | | (2.40 | ) | | | (0.92 | ) | | | (1.39 | ) |
1290 GAMCO Small/Mid Cap Value Fund - Class I | | | 11/12/2014 | | | | (31.95 | ) | | | n/a | | | | (9.03 | ) | | | n/a | | | | (1.90 | ) | | | n/a | | | | (0.91 | ) | | | n/a | |
1290 GAMCO Small/Mid Cap Value Fund - Class R | | | 11/12/2014 | | | | (32.29 | ) | | | n/a | | | | (9.48 | ) | | | n/a | | | | (2.37 | ) | | | n/a | | | | (1.41 | ) | | | n/a | |
Lipper Small-Cap Core Funds | | | | | | | (26.46 | ) | | | n/a | | | | (7.25 | ) | | | n/a | | | | (1.99 | ) | | | n/a | | | | (0.82 | ) | | | n/a | |
Russell 2500 Value Index | | | | | | | (28.60 | ) | | | n/a | | | | (8.40 | ) | | | n/a | | | | (2.14 | ) | | | n/a | | | | (1.33 | ) | | | n/a | |
| | | | | | | | | |
1290 Multi-Alternative Strategies Fund - Class A | | | 7/6/2015 | | | | (9.69 | ) | | | (14.64 | ) | | | (2.52 | ) | | | (4.33 | ) | | | | | | | | | | | (1.28 | ) | | | (2.44 | ) |
1290 Multi-Alternative Strategies Fund - Class I | | | 7/6/2015 | | | | (9.46 | ) | | | n/a | | | | (2.28 | ) | | | n/a | | | | | | | | | | | | (1.04 | ) | | | n/a | |
1290 Multi-Alternative Strategies Fund - Class R | | | 7/6/2015 | | | | (9.94 | ) | | | n/a | | | | (2.76 | ) | | | n/a | | | | | | | | | | | | (1.52 | ) | | | n/a | |
Lipper Alternative Multi-Strategy Funds | | | | | | | (6.81 | ) | | | n/a | | | | (1.68 | ) | | | n/a | | | | | | | | | | | | (0.94 | ) | | | n/a | |
ICE BofA US 3-Month Treasury Bill Index | | | | | | | 2.25 | | | | n/a | | | | 1.83 | | | | n/a | | | | | | | | | | | | 1.26 | | | | n/a | |
| | | | | | | | | |
1290 SmartBeta Equity Fund - Class A | | | 11/12/2014 | | | | (7.73 | ) | | | (12.83 | ) | | | 3.46 | | | | 1.54 | | | | 4.33 | | | | 3.16 | | | | 4.38 | | | | 3.30 | |
1290 SmartBeta Equity Fund - Class T | | | 11/12/2014 | | | | (7.50 | ) | | | (9.85 | ) | | | 3.70 | | | | 2.84 | | | | 4.58 | | | | 4.06 | | | | 4.64 | | | | 4.14 | |
1290 SmartBeta Equity Fund - Class I | | | 11/12/2014 | | | | (7.51 | ) | | | n/a | | | | 3.70 | | | | n/a | | | | 4.58 | | | | n/a | | | | 4.64 | | | | n/a | |
1290 SmartBeta Equity Fund - Class R | | | 11/12/2014 | | | | (7.95 | ) | | | n/a | | | | 3.18 | | | | n/a | | | | 4.06 | | | | n/a | | | | 4.12 | | | | n/a | |
Lipper Global Large-Cap Core Funds | | | | | | | (10.50 | ) | | | n/a | | | | 1.31 | | | | n/a | | | | 2.49 | | | | n/a | | | | 2.32 | | | | n/a | |
MSCI World (Net) Index | | | | | | | (10.39 | ) | | | n/a | | | | 1.92 | | | | n/a | | | | 3.25 | | | | n/a | | | | 3.42 | | | | n/a | |
| | | | | | | | | |
1290 High Yield Bond Fund - Class A | | | 11/12/2014 | | | | (5.46 | ) | | | (9.75 | ) | | | 0.94 | | | | (0.61 | ) | | | 2.25 | | | | 1.31 | | | | 2.08 | | | | 1.21 | |
1290 High Yield Bond Fund - Class T | | | 11/12/2014 | | | | (5.11 | ) | | | (7.46 | ) | | | 1.23 | | | | 0.37 | | | | 2.52 | | | | 2.01 | | | | 2.36 | | | | 1.87 | |
1290 High Yield Bond Fund - Class I | | | 11/12/2014 | | | | (5.11 | ) | | | n/a | | | | 1.20 | | | | n/a | | | | 2.52 | | | | n/a | | | | 2.36 | | | | n/a | |
1290 High Yield Bond Fund - Class R | | | 11/12/2014 | | | | (5.70 | ) | | | n/a | | | | 0.70 | | | | n/a | | | | 2.00 | | | | n/a | | | | 1.84 | | | | n/a | |
Lipper High Yield Funds | | | | | | | (7.48 | ) | | | n/a | | | | (0.01 | ) | | | n/a | | | | 1.76 | | | | n/a | | | | 1.77 | | | | n/a | |
ICE BofA US High Yield Index | | | | | | | (7.45 | ) | | | n/a | | | | 0.55 | | | | n/a | | | | 2.67 | | | | n/a | | | | 2.56 | | | | n/a | |
| | | | | | | | | |
1290 Diversified Bond Fund - Class A | | | 7/6/2015 | | | | 1.74 | | | | (2.84 | ) | | | 3.13 | | | | 1.56 | | | | | | | | | | | | 2.68 | | | | 1.69 | |
1290 Diversified Bond Fund - Class I | | | 7/6/2015 | | | | 2.04 | | | | n/a | | | | 3.42 | | | | n/a | | | | | | | | | | | | 2.97 | | | | n/a | |
1290 Diversified Bond Fund - Class R | | | 7/6/2015 | | | | 1.55 | | | | n/a | | | | 2.88 | | | | n/a | | | | | | | | | | | | 2.44 | | | | n/a | |
Lipper General Bond Funds | | | | | | | 1.87 | | | | n/a | | | | 2.67 | | | | n/a | | | | | | | | | | | | 2.77 | | | | n/a | |
Bloomberg Barclays U.S. Aggregate Bond Index | | | | | | | 8.93 | | | | n/a | | | | 4.82 | | | | n/a | | | | | | | | | | | | 3.85 | | | | n/a | |
171
| | | | | | | | | | | | | | | | | | | | | | | | | | | | | | | | | | | | |
| | | | | | 1 Year | | | 3 Year | | | 5 Year | | | Since Inception | |
| | | Inception
Date | | | Without
Sales
Charge | | | With
Sales
Charge | | | Without
Sales
Charge | | | With
Sales
Charge | | | Without
Sales
Charge | | | With
Sales
Charge | | | Without
Sales
Charge | | | With
Sales
Charge | |
| | | | | | | | | |
1290 DoubleLine Dynamic Allocation Fund - Class A | | | 3/7/2016 | | | | (2.75 | ) | | | (8.12 | ) | | | 2.29 | | | | 0.38 | | | | | | | | | | | | 4.30 | | | | 2.86 | |
1290 DoubleLine Dynamic Allocation Fund - Class I | | | 3/7/2016 | | | | (2.42 | ) | | | n/a | | | | 2.55 | | | | n/a | | | | | | | | | | | | 4.57 | | | | n/a | |
1290 DoubleLine Dynamic Allocation Fund - Class R | | | 3/7/2016 | | | | (2.99 | ) | | | n/a | | | | 2.01 | | | | n/a | | | | | | | | | | | | 4.03 | | | | n/a | |
Lipper Mixed-Asset Target Allocation Moderate Funds | | | | | | | (6.32 | ) | | | n/a | | | | 1.19 | | | | n/a | | | | | | | | | | | | 3.26 | | | | n/a | |
60% S&P 500 Index / 40% Bloomberg Barclays U.S. Aggregate Bond Index | | | | | | | (0.39 | ) | | | n/a | | | | 5.32 | | | | n/a | | | | | | | | | | | | 7.03 | | | | n/a | |
| | | | | | | | | |
1290 Retirement 2020 Fund - Class I | | | 2/27/2017 | | | | (3.86 | ) | | | n/a | | | | 2.80 | | | | n/a | | | | | | | | | | | | 2.79 | | | | n/a | |
Lipper Mixed-Asset Target 2020 Funds | | | | | | | (3.19 | ) | | | n/a | | | | 2.36 | | | | n/a | | | | | | | | | | | | 2.43 | | | | n/a | |
S&P Target Date 2020 Index | | | | | | | (2.99 | ) | | | n/a | | | | 2.82 | | | | n/a | | | | | | | | | | | | 2.82 | | | | n/a | |
| | | | | | | | | |
1290 Retirement 2025 Fund - Class I | | | 2/27/2017 | | | | (5.46 | ) | | | n/a | | | | 2.68 | | | | n/a | | | | | | | | | | | | 2.70 | | | | n/a | |
Lipper Mixed-Asset Target 2025 Funds | | | | | | | (4.24 | ) | | | n/a | | | | 2.44 | | | | n/a | | | | | | | | | | | | 2.56 | | | | n/a | |
S&P Target Date 2025 Index | | | | | | | (4.89 | ) | | | n/a | | | | 2.52 | | | | n/a | | | | | | | | | | | | 2.55 | | | | n/a | |
| | | | | | | | | |
1290 Retirement 2030 Fund - Class I | | | 2/27/2017 | | | | (7.09 | ) | | | n/a | | | | 2.37 | | | | n/a | | | | | | | | | | | | 2.40 | | | | n/a | |
Lipper Mixed-Asset Target 2030 Funds | | | | | | | (6.05 | ) | | | n/a | | | | 2.20 | | | | n/a | | | | | | | | | | | | 2.34 | | | | n/a | |
S&P Target Date 2030 Index | | | | | | | (6.88 | ) | | | n/a | | | | 2.13 | | | | n/a | | | | | | | | | | | | 2.19 | | | | n/a | |
| | | | | | | | | |
1290 Retirement 2035 Fund - Class I | | | 2/27/2017 | | | | (8.02 | ) | | | n/a | | | | 2.19 | | | | n/a | | | | | | | | | | | | 2.26 | | | | n/a | |
Lipper Mixed-Asset Target 2035 Funds | | | | | | | (7.98 | ) | | | n/a | | | | 1.93 | | | | n/a | | | | | | | | | | | | 2.14 | | | | n/a | |
S&P Target Date 2035 Index | | | | | | | (8.81 | ) | | | n/a | | | | 1.71 | | | | n/a | | | | | | | | | | | | 1.80 | | | | n/a | |
| | | | | | | | | |
1290 Retirement 2040 Fund - Class I | | | 2/27/2017 | | | | (7.97 | ) | | | n/a | | | | 2.49 | | | | n/a | | | | | | | | | | | | 2.55 | | | | n/a | |
Lipper Mixed-Asset Target 2040 Funds | | | | | | | (9.51 | ) | | | n/a | | | | 1.47 | | | | n/a | | | | | | | | | | | | 1.67 | | | | n/a | |
S&P Target Date 2040 Index | | | | | | | (10.10 | ) | | | n/a | | | | 1.44 | | | | n/a | | | | | | | | | | | | 1.54 | | | | n/a | |
| | | | | | | | | |
1290 Retirement 2045 Fund - Class I | | | 2/27/2017 | | | | (9.07 | ) | | | n/a | | | | 2.28 | | | | n/a | | | | | | | | | | | | 2.35 | | | | n/a | |
Lipper Mixed-Asset Target 2045 Funds | | | | | | | (10.61 | ) | | | n/a | | | | 1.28 | | | | n/a | | | | | | | | | | | | 1.53 | | | | n/a | |
S&P Target Date 2045 Index | | | | | | | (10.86 | ) | | | n/a | | | | 1.23 | | | | n/a | | | | | | | | | | | | 1.35 | | | | n/a | |
| | | | | | | | | |
1290 Retirement 2050 Fund - Class I | | | 2/27/2017 | | | | (10.36 | ) | | | n/a | | | | 2.00 | | | | n/a | | | | | | | | | | | | 2.11 | | | | n/a | |
Lipper Mixed-Asset Target 2050 Funds | | | | | | | (10.96 | ) | | | n/a | | | | 1.10 | | | | n/a | | | | | | | | | | | | 1.33 | | | | n/a | |
S&P Target Date 2050 Index | | | | | | | (11.23 | ) | | | n/a | | | | 1.18 | | | | n/a | | | | | | | | | | | | 1.31 | | | | n/a | |
| | | | | | | | | |
1290 Retirement 2055 Fund - Class I | | | 2/27/2017 | | | | (11.66 | ) | | | n/a | | | | 1.71 | | | | n/a | | | | | | | | | | | | 1.82 | | | | n/a | |
Lipper Mixed-Asset Target 2055 Funds | | | | | | | (11.15 | ) | | | n/a | | | | 1.15 | | | | n/a | | | | | | | | | | | | 1.42 | | | | n/a | |
S&P Target Date 2055 Index | | | | | | | (11.47 | ) | | | n/a | | | | 1.12 | | | | n/a | | | | | | | | | | | | 1.26 | | | | n/a | |
| | | | | | | | | |
1290 Retirement 2060 Fund - Class I | | | 2/27/2017 | | | | (12.13 | ) | | | n/a | | | | 1.64 | | | | n/a | | | | | | | | | | | | 1.76 | | | | n/a | |
Lipper Mixed-Asset Target 2060 Funds | | | | | | | (11.26 | ) | | | n/a | | | | 1.33 | | | | n/a | | | | | | | | | | | | 1.59 | | | | n/a | |
S&P Target Date 2060+ Index | | | | | | | (11.40 | ) | | | n/a | | | | 1.24 | | | | n/a | | | | | | | | | | | | 1.38 | | | | n/a | |
172
Federal Income Tax Information (Unaudited)
| | | | | | | | | | | | | | | | |
Funds: | | 70% Dividend
Received
Deduction | | | Foreign
Taxes | | | Foreign
Source Income | | | Long Term
Capital Gain | |
1290 Diversified Bond | | | 0.00 | % | | $ | — | | | $ | — | | | $ | 1,135,916 | |
1290 DoubleLine Dynamic Allocation | | | 15.21 | | | | — | | | | — | | | | 932,015 | |
1290 GAMCO Small/Mid Cap Value | | | 100.00 | | | | — | | | | — | | | | 682,834 | |
1290 High Yield Bond | | | 0.00 | | | | — | | | | — | | | | — | |
1290 Multi-Alternative Strategies | | | 19.34 | | | | 2,239 | | | | 16,925 | | | | — | |
1290 Retirement 2020 | | | 44.47 | | | | 3,976 | | | | 52,833 | | | | 147,437 | |
1290 Retirement 2025 | | | 59.55 | | | | 8,178 | | | | 94,432 | | | | 347,700 | |
1290 Retirement 2030 | | | 49.43 | | | | 3,200 | | | | 34,517 | | | | 18,945 | |
1290 Retirement 2035 | | | 58.32 | | | | 4,785 | | | | 51,950 | | | | 64,748 | |
1290 Retirement 2040 | | | 51.26 | | | | 2,341 | | | | 25,180 | | | | 5,113 | |
1290 Retirement 2045 | | | 63.12 | | | | 3,692 | | | | 39,509 | | | | 853 | |
1290 Retirement 2050 | | | 57.44 | | | | 2,490 | | | | 26,799 | | | | 4,801 | |
1290 Retirement 2055 | | | 58.09 | | | | 2,303 | | | | 25,072 | | | | 3,067 | |
1290 Retirement 2060 | | | 62.32 | | | | 2,473 | | | | 26,937 | | | | 4,754 | |
1290 SmartBeta Equity | | | 100.00 | | | | — | | | | — | | | | 297,980 | |
173
MANAGEMENT OF THE TRUST (UNAUDITED)
The Trust’s Board is responsible for the overall management of the Trust and the Funds, including general supervision and review of the Funds’ investment activities and their conformity with federal and state law as well as the stated policies of the Funds. The Board elects the officers of the Trust who are responsible for administering the Trust’s day-to-day operations. The Trustees of the Trust are identified in the table below along with information as to their principal business occupations held during the last five years and certain other information are shown below. The SAI includes additional information about the Trust’s Board and is available at the Funds’ website www.1290funds.com and available without charge upon request by calling 1-888-310-0416 or by sending an e-mail request to 1290funds@dfinsolutions.com.
The Trustees
| | | | | | | | | | |
Name, Address and
Year of Birth | | Position(s)
Held With
Fund | | Term of
Office** and
Length of
Time Served | | Principal Occupation(s) During Past 5 Years | | Number of
Funds in Fund
Complex
Overseen by Trustee† | | Other Directorships
Held by Trustee
During Past 5 Years |
| |
| Interested Trustees |
Steven M. Joenk* 1290 Avenue of the Americas, New York, New York (1958) | | Trustee,
and Chief Executive Officer | | From October 1, 2017 to present, Trustee and Chief Executive Officer, from June 2014 through February 2020, President and from June 9, 2014 through September 30, 2017, Trustee, Chairman, President and Chief Executive Officer | | From May 2011 to present, Chairman of the Board, Chief Executive Officer and President, EIM; from April 2017 to present, Senior Vice President and Chief Investment Officer, Equitable Financial, Inc.; from April 2017 to present, Managing Director and Chief Investment Officer and from September 1999 to April 2017, Managing Director, Equitable. | | 129 | | None |
| |
| Independent Trustees |
Mark A. Barnard c/o 1290 Funds 1290 Avenue of the Americas New York, NY 10104 (1949) | | Trustee | | From February 27, 2017 to present | | Retired. From 1995 to 1998, Manager of Private Investments, from 1998 to 2001, Director of Private Investments, and from 2001 to 2016, Managing Director – Private Investments, Howard Hughes Medical Institute; from 1985 to 1992, Assistant Director of Real Estate, and from 1992 to 1995, Associate Director of Real Estate, Massachusetts Institute of Technology. | | 129 | | None. |
174
| | | | | | | | | | |
Name, Address and
Year of Birth | | Position(s)
Held With
Fund | | Term of
Office** and
Length of
Time Served | | Principal Occupation(s) During Past 5 Years | | Number of
Funds in Fund
Complex
Overseen by Trustee† | | Other Directorships
Held by Trustee
During Past 5 Years |
Thomas W. Brock c/o 1290 Funds 1290 Avenue of the Americas New York, New York 10104
(1947) | | Trustee | | From January 1, 2016 to present | | Retired. From June 2016 to May 2017, Director, President and Chief Executive Officer and from January 2016 to June 2016 Director and interim President and Chief Executive Officer, Silver Bay Realty Trust Corp.; from 2006 to 2012, Chief Executive Officer and Co-Founder of Stone Harbor Investment Partners. | | 129 | | From December 2012 to January 2016, Lead Independent Director, Audit Committee Member and Compensation Committee Chair, Silver Bay Realty Trust Corp.; from 2016 to present, Chair and from 2005 to present, Director and Audit Committee Member, Liberty All-Star Funds (2); and from 2006 to 2012, Director, Stone Harbor Investment Funds (5). |
Michael B. Clement c/o 1290 Funds 1290 Avenue of the Americas New York, New York 10104
(1957) | | Trustee | | From
January 1, 2019 to present | | From 2011 to present, Professor of Accounting, most recently was appointed Department of Accounting Chair effective September 2018, and from 1997 to 2002, Assistant Professor, University of Texas; from 2002 to 2004, Vice President – Global Investment Research, Goldman Sachs; from 1988 to 1991, Vice President – Capital Planning and Analysis, and from 1982 to 1986, Manager – Audit Division, Citicorp; and from 1980 to 1982, Senior Assistant Accountant, Deloitte Haskins & Sells. | | 129 | | None. |
Donald E. Foley c/o 1290 Funds 1290 Avenue of the Americas New York, New York 10104
(1951) | | Trustee | | From June 9, 2014 to present | | Retired. From 2010 to 2011, Chairman of the Board and Chief Executive Officer, Wilmington Trust Corporation; from 1996 to 2010, Senior Vice President, Treasurer and Director of Tax, ITT Corporation; from 1989 to 1996, Assistant Treasurer, International Paper Company. | | 129 | | From 2011 to 2012 Director, and from 2012 to 2016, Advisory Committee Member, M&T Corporation; from 2007 to 2011, Director and member of the Audit Committee and Compensation Committee, Wilmington Trust Corporation; from 2008 to 2010, Advisory Board member, Northern Trust Company and Goldman Sachs Management Groups; from 2015 to present, Director, BioSig Technologies, Inc.; and from 2015 to present, Director, Wilmington Funds. |
175
| | | | | | | | | | |
Name, Address and
Year of Birth | | Position(s)
Held With
Fund | | Term of
Office** and
Length of
Time Served | | Principal Occupation(s) During Past 5 Years | | Number of
Funds in Fund
Complex
Overseen by Trustee† | | Other Directorships
Held by Trustee
During Past 5 Years |
Christopher P.A. Komisarjevsky c/o 1290 Funds 1290 Avenue of the Americas New York, New York 10104 (1945) | | Trustee | | From June 9, 2014 to present | | Retired. From 2006 to 2008, Senior Counselor for APCO Worldwide® (global communications consulting) and a member of its International Advisory Council; from 1998 to 2005, President and Chief Executive Officer, Burson-Marsteller Worldwide (public relations); from 1996 to 1998, President and Chief Executive Officer of Burson-Marsteller U.S.A. | | 129 | | None |
H. Thomas McMeekin c/o 1290 Funds 1290 Avenue of the Americas New York, New York 10104
(1953) | | Trustee | | From June 9, 2014 to present | | From 2015 to present, CEO of Blue Key Services, LLC., from 2000 to present, Managing Partner and Founder of Griffin Investments, LLC; from 2009 to 2012 Chief Investment Officer, AIG Life & Retirement and United Guaranty Corporation and Senior Managing Director of AIG Asset Management. | | 129 | | From 2015 to present, Director, Blue Key Services LLC; from 2012 to present, Director, Achaean Financial Group; from 2011 to 2012, Director, US Life Insurance Company in the City of New York. |
Gloria D. Reeg c/o 1290 Funds 1290 Avenue of the Americas New York, New York 10104 (1951) | | Trustee | | From February 27, 2017 to present | | Retired. From 2007 to 2016, Chief Investment Officer and Senior Vice President, New York-Presbyterian Hospital; from 2005 to 2007, Trustee and Treasurer, Casey Family Programs (foundation); from 2002 to 2004, Global Head of Fixed Income and Executive Director, Principal Global Investors (asset management firm); 1992 to 2000, Managing Director – Global Consulting, Russell Investment Group. | | 129 | | None. |
Gary S. Schpero c/o 1290 Funds 1290 Avenue of the Americas New York, New York 10104
(1953) | | Chairman of the Board | | From June 9, 2014 to present Independent Trustee, from October 1, 2017 to present, Chairman of the Board and from June 9, 2014 through September 2017, Lead Independent Trustee | | Retired. Prior to January 1, 2000, Partner of Simpson Thacher & Bartlett (law firm) and Managing Partner of the Investment Management and Investment Company Practice Group. | | 129 | | From May 2012 to present, Trustee, Blackstone/GSO Senior Floating Rate Term Fund and Blackstone/GSO Long – Short Credit Income Fund; from October 2012 to present, Trustee, Blackstone/GSO Strategic Credit Fund; from September 2017 to present, Trustee, Blackstone/GSO Floating Rate Enhanced Income Fund. |
176
| | | | | | | | | | |
Name, Address and
Year of Birth | | Position(s)
Held With
Fund | | Term of
Office** and
Length of
Time Served | | Principal Occupation(s) During Past 5 Years | | Number of
Funds in Fund
Complex
Overseen by Trustee† | | Other Directorships
Held by Trustee
During Past 5 Years |
Kathleen Stephansen c/o 1290 Funds 1290 Avenue of the Americas New York, New York 10104 (1954) | | Trustee | | From
January 1, 2019 to present | | From 2018 to present and in 2016, Senior Economic Advisor-Henderson Institute Center for Macroeconomics, Boston Consulting Group; From 2016 to 2018, Chief Economist, Huawei Technologies USA Inc.; from 2010 to 2016, held various positions at American International Group, including Chief Economist and Senior Managing Director and Senior Investment Strategies and Global Head of Sovereign Research – AIG Asset Management; from 2009 to 2010, Chief Economist and Managing Director, Aladdin Capital; from 2000 to 2009, Director and Head of Global Economics, Credit Suisse Securities (USA) LLC; and from 1984 to 2000, Co-Head of Economic Research and Chief International Economist, Donaldson, Lufkin & Jenrette Corporation. | | 129 | | None. |
Caroline L. Williams c/o 1290 Funds 1290 Avenue of the Americas New York, New York 10104 (1946) | | Trustee | | From June 9, 2014 to present | | Retired. From July 2010 to December 2012, Executive Vice President, from May 2005 to December 2007, Consultant and from May 2001 to May 2005, Chief Financial and Investment Officer, Nathan Cummings Foundation (non-profit organization); from 1988 to 1992, Managing Director, from 1982 to 1988, Senior Vice President, from 1978 to 1982, Vice President and from 1971 to 1976, Associate, Donaldson, Lufkin & Jenrette Securities Corporation (investment bank) from 1997 to 2009, Director, Hearst-Argyle Television. | | 129 | | None. |
| * | Affiliated with the Adviser. |
| ** | Each Trustee serves during the existence of the Trust until the next meeting of shareholders called for the purpose of electing Trustees and until the election and qualification of his or her successor or, if sooner, until he or she dies, declines to serve, resigns, retires, is removed, is incapacitated or is otherwise unable or unwilling to serve. Each Independent Trustee shall retire from the Board as of the last day of the calendar year in which he or she attains the age of 75 years. The Trust’s retirement policy is subject to periodic review by the Trust’s Governance Committee, which may recommend for Board approval any changes to the policy that it determines to be appropriate. |
| † | The registered investment companies in the fund complex include the EQ Premier VIP Trust, EQ Advisors Trust and 1290 Funds. Mr. Joenk serves as Trustee, President and Chief Executive Officer for each of the registered investment companies in the fund complex, except for the 1290 Funds for which he serves as Trustee and Chief Executive Officer. Mr. Schpero serves as Chairman of the Board for each such company. |
177
The Trust’s Officers
Each officer of the Trust is an employee of Equitable Investment Management Group, LLC (“EIM” or the “Manager”) (formerly, AXA Equitable Funds Management Group, LLC) and/or Equitable Distributors, LLC (formerly AXA Distributors, LLC). The Trust’s principal officers are:
| | | | | | |
| | | | |
Name, Address and
Year of Birth | | Position(s) Held
With Fund | | Term of Office and Length of Time Served* | | Principal Occupation(s) During Past 5 Years |
Steven M. Joenk 1290 Avenue of the Americas, New York, New York 10104
(1958) | | Trustee and Chief Executive Officer | | Trustee and Chief Executive Officer from June 2014 to present; President from June 2014 through February 2020 and Chairman of the Board from June 2014 through September 2017 | | From May 2011 to present, Chairman of the Board, Chief Executive Officer and President, EIM; from April 2017 to present, Senior Vice President and Chief Investment Officer, Equitable Financial, Inc.; from April 2017 to present, Managing Director and Chief Investment Officer and from September 1999 to April 2017, Managing Director, Equitable. |
Michal Levy 1290 Avenue of the Americas, New York, New York 10104 (1979) | | President | | President from February 2020 to Present, Vice President from June 2016 to February 2020 | | From December 2014 to present, member of the Board of Directors; from March 2017 to present, Senior Vice President and Chief Operating Officer of EIM; and from June 2014 to March 2017, Vice President of EIM; from April 2017 to present, Lead Director and from October 2013 to present, Senior Director of Equitable; from October 2011 to October 2013 and Assistant Vice President of Equitable. |
William MacGregor 1290 Avenue of the Americas, New York, New York 10104 (1975) | | Chief Legal Officer, Senior Vice President and Secretary | | Senior Vice President and Secretary from August
2018 to present; Chief Legal Officer from October 2018 to present | | From August 2018 to present, Managing Director and Associate General Counsel of Equitable; Executive Vice President and Secretary of EIM; from January 2017 to June 2018, Executive Director and Deputy General Counsel at UBS Business Solutions LLC; from July 2015 to June 2018, Executive Director and Deputy General Counsel at UBS Asset Management (Americas) Inc.; from June 2012 to July 2015, Senior Vice President, Secretary and Associate General Counsel of EIM; from May 2008 to July 2015, Lead Director and Associate Counsel of Equitable. |
Brian Walsh 1290 Avenue of the Americas, New York, New York 10104 (1968) | | Chief Financial Officer and Treasurer | | From June 2014 to present | | From May 2011 to present, Senior Vice President of EIM; from February 2011 to present, member of the Board of Directors of EIM; from February 2003 to present, Lead Director of Equitable. |
Kenneth Kozlowski 1290 Avenue of the Americas New York, New York 10104
(1961) | | Senior Vice President and Chief Investment Officer | | From June 2014 to present | | From June 2012 to present, Executive Vice President and Chief Investment Officer of EIM; from May 2011 to June 2012, Senior Vice President of EIM; from September 2011 to present, Managing Director of Equitable Financial and Equitable; from February 2001 to September 2011, Vice President of Equitable. |
Joseph J. Paolo 1290 Avenue of the Americas, New York, New York 10104 (1970) | | Chief Compliance Officer and Vice President | | From June 2014 to present | | From May 2011 to present, Senior Vice President and Chief Compliance Officer of EIM; from June 2007 to present, Lead Director of Equitable and Chief Compliance Officer of Equitable’s. |
Alwi Chan 1290 Avenue of the Americas, New York, New York 10104
(1974) | | Vice President and Deputy Chief Investment Officer | | From June 2014 to present | | From June 2012 to present, Senior Vice President and Deputy Chief Investment Officer of EIM; from May 2011 to June 2012, Vice President of EIM; from February 2007 to present, Lead Director of Equitable. |
James Kelly 1290 Avenue of the Americas, New York, New York 10104 (1968) | | Controller | | From June 2014 to present | | From May 2011 to present, Vice President of EIM; from September 2008 to present, Senior Director of Equitable; from March 2006 to September 2008, Assistant Vice President, Equitable. |
178
| | | | | | |
| | | | |
Name, Address and
Year of Birth | | Position(s) Held
With Fund | | Term of Office and Length of Time Served* | | Principal Occupation(s) During Past 5 Years |
Roselle Ibanga 1290 Avenue of the Americas, New York, New York 10104 (1978) | | Assistant Controller | | From June 2014 to present | | From February 2009 to present, Director of Equitable. |
Lisa Perrelli 1290 Avenue of the Americas, New York, New York 10104 (1974) | | Assistant Controller | | From June 2014 to present | | From November 2012 to present, Senior Director of Equitable; from September 2008 to November 2012, Assistant Vice President of Equitable. |
Kiesha T. Astwood-Smith, Esq. 1290 Avenue of the Americas, New York, New York 10104 (1973) | | Vice President and Assistant Secretary | | From September 2015 to present | | From December 2015 to present, Vice President, Assistant Secretary and Associate General Counsel of EIM; from September 2015 to present, Senior Director and Counsel of Equitable. From July 2006 to September 2015, Counsel of The Bank of New York Mellon; and from January 2010 to September 2015 Vice President and Assistant Secretary of the Dreyfus Family of Funds. |
Victoria Zozulya, Esq. 1290 Avenue of the Americas, New York, New York 10104 (1983) | | Vice President and Assistant Secretary | | From December 2018 to present. | | From September 2018 to present, Senior Director and Counsel of Equitable; from May 2011 to March 2014, Compliance Analyst, and from March 2014 to August 2018, Vice President and Assistant General Counsel, Neuberger Berman. |
Maureen E. Kane, Esq. 1290 Avenue of the Americas, New York, New York 10104 (1962) | | Vice President and Assistant Secretary | | From March 2019 to present. | | From February 2019 to present, Lead Director and Associate General Counsel of Equitable; from July 2014 to February 2019, Managing Director and Managing Counsel of The Bank of New York Mellon. |
Carla Byer 1290 Avenue of the Americas, New York, New York 10104 (1976) | | Vice President | | From June 2017 to present | | From April 2017 to present, Vice President of EIM. From April 2014 through August 2016, Senior Vice President, Zealot Networks. From September 2008 through April 2012, Vice President of EIM. |
Patricia Cox 1290 Avenue of the Americas, New York, New York 10104 (1958) | | Vice President and Anti-Money Laundering Compliance Officer | | From June 2014 to present | | From June 2014 to present, Vice President of EIM; from April 2014 to present, Senior Director of Equitable; Operations Consultant for Wells Real Estate Funds March 2009-September 2010; Director of Transfer Agent Operations for Wells Real Estate Funds October 2010 - March 2014; Senior VP of Operations for the Equitable Enterprise Group of Funds August 2004-August 2008. |
Miao Hu 1290 Avenue of the Americas, New York, New York 10104 (1978) | | Vice President | | From June 2016 to present | | From May 2006 to Present, Assistant Portfolio Manager and June 2016 to present, Vice President of EIM; from December 2014 to present, Director of Portfolio Analytics of Equitable; from November 2013 to December 2014, Lead Manager of Portfolio Analytics of Equitable. |
Xavier Poutas 1290 Avenue of the Americas, New York, New York 10104 (1977) | | Vice President | | From June 2016 to present | | From May 2011 to present, Assistant Portfolio Manager of EIM and from June, 2016 to present, Vice President of EIM; from November 2008 to August 2013, Director, from September 2013 to present, Senior Director of Equitable; and from November 2008 to August 2013, Director of Equitable. |
Helen Lai 1290 Avenue of the Americas, New York, New York 10104 (1973) | | Assistant Vice President | | From June 2016 to present | | From March 2013 to present, Pricing and Valuation-Compliance of EIM and Senior Manager, Equitable; and from May 2009 to December 2012, HSBC, Hedge Fund Investor Services. |
Jennifer Mastronardi 1290 Avenue of the Americas, New York, New York 10104 (1985) | | Assistant Vice President | | From June 2014 to present | | From February 2009 to present, Director of Equitable; from April 2015 to present, Vice President of EIM; from June 2007 to February 2009, Operations Associate in Managed Futures Department, Morgan Stanley. |
Helen Espaillat 1290 Avenue of the Americas, New York, New York 10104 (1963) | | Assistant Secretary | | From June 2014 to present | | From July 2004 to present, Lead Manager/Legal Assistant for Equitable and from March 2015 to present Assistant Vice President and Assistant Secretary of EIM. |
179
| | | | | | |
| | | | |
Name, Address and
Year of Birth | | Position(s) Held
With Fund | | Term of Office and Length of Time Served* | | Principal Occupation(s) During Past 5 Years |
Lorelei Fajardo 1290 Avenue of the Americas, New York, New York 10104 (1978) | | Assistant Secretary | | From June 2016 to present | | From July 2013 to present, Senior Manager/Legal Assistant of Equitable; from July 2008 to June 2013, Lead Associate/Legal Assistant of Equitable. |
Bradley Tobin 1290 Avenue of the Americas, New York, New York 10104 (1974) | | Vice President – Director of Risk | | From September 2019 to present | | From January 2019 to present, Director of Risk Management for Equitable; from February 2004 to December 2016 Investment Management at Prudential Annuities. |
Artemis Brannigan 1290 Avenue of the Americas, New York, New York 10104 (1974) | | Vice President | | From September 2019 to present | | From August 2019 to present, Senior Director of Equitable; From January 2016 to July 2019, Director of Prudential Financial; From October 2006 to December 2015, Vice President of BlackRock. |
Kevin McCarthy 1290 Avenue of the Americas, New York, New York 10104 (1983) | | Vice President | | From September 2019 to present | | From December 2018 to present, Assistant Portfolio Manager and a Director of Equitable. From August 2015 to November 2018, Lead Manager of Equitable; From October 2013 to August 2015, Senior Quantitative Analyst at Aviva Investors. |
Cheryl Cherian 1290 Avenue of the Americas, New York, New York 10104 (1979) | | Assistant Secretary | | From July 2019 to present | | From April 2019 to present, Lead Manager – Legal Assistant of Equitable; and from November 2016 to March 2018 worked at a mutual fund company. |
Monica Giron 1290 Avenue of the Americas, New York, New York 10104 (1976) | | Assistant Secretary | | From July 2019 to present | | From June 2019 to present, Lead Manager-Senior Legal Assistant of Equitable; and from August 2015 to May 2019, Senior Paralegal at Gemini Fund Services. |
| * | The officers in the table above (except Patricia Cox) hold similar positions with other registered investment companies in the fund complex. The registered investment companies in the fund complex include the Trust, EQ Premier VIP Trust and EQ Advisors Trust. |
| ** | Each officer is elected on an annual basis. |
180
PROXY VOTING POLICIES AND PROCEDURES (UNAUDITED)
A description of the policies and procedures that the Funds use to determine how to vote proxies relating to portfolio securities is available (i) without charge, upon request, by calling a toll-free number at 1-888-310-0416 and (ii) on the Securities and Exchange Commission’s website at http://www.sec.gov. Information regarding how the Funds voted proxies relating to portfolio securities during the most recent 12-month period ended June 30 is available without charge (i) on the Trust’s website at www.1290Funds.com and (ii) on the Securities and Exchange Commission’s website at http://www.sec.gov.
QUARTERLY PORTFOLIO HOLDINGS INFORMATION (UNAUDITED)
The Funds file their complete schedule of portfolio holdings with the Securities and Exchange Commission for the first and third quarters of each fiscal year as an exhibit to its reports on Form N-PORT. The Funds’ Form N-PORT filings are available on the Securities and Exchange Commission’s website at http://www.sec.gov.
181
| | |
| |
Visit the Funds’ Website: 1290Funds.com | |  |
| | |
| Must be accompanied or preceded by a Prospectus. 1290 Funds are distributed by ALPS Distributors, Inc. | | DFIN#93410 |
© 2020 Equitable Holdings, Inc. All rights reserved.
1290 Avenue of the Americas, New York, NY 10104.
Equitable Financial Life Insurance Company
1290 FUNDS
DISCLOSURE REGARDING ADVISORY CONTRACT APPROVAL
The following information supplements the Funds’ annual report for the period ended October 31, 2020:
APPROVAL OF INVESTMENT SUB-ADVISORY AGREEMENT DURING THE SIX-MONTH PERIOD ENDED OCTOBER 31, 2020 (UNAUDITED)
At a meeting held on June 16-18, 2020 (the “June 2020 Meeting”), the Board of Trustees (the “Board”) of 1290 Funds (the “Trust”), including those Trustees who are not parties to the Replacement Agreement (as defined below) or “interested persons” (as that term is defined in the Investment Company Act of 1940, as amended (the “1940 Act”)) of such parties or the Trust (the “Independent Trustees”), considered and unanimously approved a new Investment Sub-Advisory Agreement (the “Replacement Agreement”) between Equitable Investment Management Group, LLC (formerly known as AXA Equitable Funds Management Group, LLC) (the “Adviser”), which serves as the Trust’s investment adviser, and Brandywine Global Investment Management, LLC (“Brandywine Global” or the “Sub-Adviser”) with respect to 1290 Diversified Bond Fund (the “Fund”).
The Sub-Adviser is a subsidiary of Legg Mason, Inc. (“Legg Mason”). In February 2020, Franklin Resources, Inc., a global investment management organization operating as Franklin Templeton, announced that it had entered into an agreement with Legg Mason whereby Franklin Templeton would acquire Legg Mason in a transaction targeted to close in the third calendar quarter of 2020 (the “Acquisition”). Upon the closing of the Acquisition, Legg Mason would become a direct, wholly-owned subsidiary of Franklin Templeton, and each subsidiary of Legg Mason, including the Sub-Adviser, would become an indirect subsidiary of Franklin Templeton. At the time of the June 2020 Meeting, the Sub-Adviser was serving as investment sub-adviser for the Fund pursuant to an existing Investment Sub-Advisory Agreement between the Adviser and the Sub-Adviser dated November 13, 2019. The Board considered that the Acquisition would be deemed to result in a change of control of the Sub-Adviser under the 1940 Act, which in turn would result in the automatic termination of the existing Investment Sub-Advisory Agreement between the Adviser and the Sub-Adviser with respect to the Fund.
In anticipation of the change of control of the Sub-Adviser, at the June 2020 Meeting, the Board considered whether it would be in the best interests of the Fund and its shareholders to approve a new Investment Sub-Advisory Agreement between the Adviser and the Sub-Adviser (i.e., the Replacement Agreement) that would replace the existing Investment Sub-Advisory Agreement upon the closing of the Acquisition and, thereby, enable the Sub-Adviser to continue to provide uninterrupted investment sub-advisory services for the Fund. In this regard, the Board noted that it had most recently considered and approved the renewal of the Investment Sub-Advisory Agreement between the Adviser and the Sub-Adviser with respect to the Fund at a meeting held on July 16-18, 2019 (the “July 2019 Meeting”), in connection with the 2019 annual renewal of the Investment Sub-Advisory Agreement.
The Board also noted that the Trust is an affiliated investment company of EQ Premier VIP Trust and EQ Advisors Trust, which are also managed by the Adviser, and that all of the Board members also currently serve on the Boards of Trustees of EQ Premier VIP Trust and EQ Advisors Trust. The Board noted that the Sub-Adviser currently serves as investment sub-adviser for an allocated portion of the EQ/Core Plus Bond Portfolio, a series of EQ Premier VIP Trust, using the same core plus investment strategy and style and portfolio management team as the Sub-Adviser uses for the Fund, pursuant to an Investment Sub-Advisory
Agreement between the Adviser and the Sub-Adviser dated May 1, 2020, and that it had considered and approved that Investment Sub-Advisory Agreement at a meeting held on December 4-5, 2019 (the “December 2019 Meeting”). The Board also noted that Franklin Templeton affiliates currently serve as investment sub-advisers for series (or allocated portions thereof) of EQ Advisors Trust pursuant to Investment Sub-Advisory Agreements between the Adviser and the Franklin Templeton affiliates dated November 13, 2019, and that it had most recently considered and approved the renewal of the Investment Sub-Advisory Agreements between the Adviser and the Franklin Templeton affiliates at the July 2019 Meeting, in connection with the 2019 annual renewal of the Investment Sub-Advisory Agreements with respect to those series.
In reaching its decision to approve the Replacement Agreement, the Board considered the overall fairness of the Replacement Agreement and whether the Replacement Agreement was in the best interests of the Fund and its shareholders. The Board further considered all factors it deemed relevant with respect to the Fund and the Replacement Agreement, including: (1) the nature, quality and extent of the overall services to be provided to the Fund by the Sub-Adviser; (2) comparative performance information; (3) the level of the sub-advisory fee; (4) economies of scale that may be realized by the Fund; and (5) “fall out” benefits that may accrue to the Sub-Adviser and its affiliates (i.e. indirect benefits that the Sub-Adviser or its affiliates would not receive but for the relationship with the Fund). In considering the Replacement Agreement, the Board members did not identify any particular factor or information that was all-important or controlling, and each Trustee may have given different weights to different factors and, thus, each Trustee may have had a different basis for his or her decision.
In connection with its deliberations, the Board took into account information prepared by the Adviser, the Sub-Adviser, and Franklin Templeton, including memoranda and other materials addressing the factors set out above, which were provided to the Trustees prior to the meeting. The information provided to the Trustees described, among other things, the services provided by the Sub-Adviser, as well as the Sub-Adviser’s investment personnel, sub-advisory fee, performance information, and other matters. The Board also requested and evaluated information relating to the potential impact of the change of control on the Fund and its investment processes, and on the operations, personnel, organizational structure, and financial and other resources of the Sub-Adviser. In this regard, the Board also noted Franklin Templeton’s representation that the Acquisition is structured to preserve the autonomy of Legg Mason’s affiliates, thereby ensuring the continuity of Legg Mason’s investment philosophies, processes and global brands. The Board also took into account information, including information relating to the Sub-Adviser and the Franklin Templeton affiliates that serve as investment sub-advisers for other series (or allocated portions thereof) of EQ Advisors Trust, provided to the Trustees, including in their capacities as Trustees of EQ Premier VIP Trust and EQ Advisors Trust, at prior Board meetings, including the July 2019 and December 2019 Meetings.
During the June 2020 meeting, the Trustees met with senior representatives of the Adviser to discuss the Replacement Agreement and the information provided. The Independent Trustees also met in executive session during the meeting to discuss the Replacement Agreement and the information provided. The Independent Trustees were assisted by independent counsel prior to and during the meeting and during their deliberations regarding the Replacement Agreement and also received from legal counsel materials addressing, among other things, the legal standards applicable to their consideration of the Replacement Agreement.
In approving the Replacement Agreement, each Trustee, including the Independent Trustees, on the basis of their business judgment after review of the information provided, determined that the sub-advisory fee was fair and reasonable and that the approval of the Replacement Agreement was in the best interests of the Fund and its shareholders. Although the Board gave attention to all information provided, the following discusses some of the primary factors it deemed relevant to its decision to approve the Replacement Agreement.
Nature, Quality and Extent of Services
The Board evaluated the nature, quality and extent of the overall services to be provided to the Fund and its shareholders by the Sub-Adviser. In addition to the investment performance and expense information discussed below, the Board considered the Sub-Adviser’s responsibilities with respect to the Fund. The Board considered that the Sub-Adviser, subject to the oversight of the Adviser, is responsible for making investment decisions with respect to the Fund; placing with brokers or dealers orders for the purchase and sale of investments for the Fund; and performing certain related administrative functions. The Board also reviewed information regarding the Sub-Adviser’s process for selecting investments for the Fund, as well as information regarding the qualifications and experience of the Sub-Adviser’s portfolio managers who provide services to the Fund. The Board also considered information regarding the Sub-Adviser’s policies for executing portfolio transactions, including information regarding how the Sub-Adviser seeks to achieve “best execution” on behalf of the Fund. The Board also considered information about the impact of the coronavirus outbreak on the Sub-Adviser’s operations and its ability to continue to provide the same scope and quality of services to the Fund as before the outbreak. The Board also considered its general satisfaction with the nature and quality of the services being provided to the Fund by the Sub-Adviser.
In connection with the approval of the Replacement Agreement, the Board also considered the Sub-Adviser’s (together with Franklin Templeton’s) representations that (i) the resources available for servicing the Fund would not diminish after the change of control; (ii) the change of control is not expected to impact the day-to-day portfolio management of the Fund; (iii) the same portfolio managers who are primarily responsible for the securities selection, research and trading for the Fund immediately prior to the change of control would continue to manage the Fund after the change of control; (iv) the Sub-Adviser’s principal business activities would not be affected by the change of control; and (v) the Sub-Adviser’s management structure is not expected to change after the change of control. In this regard, the Board also noted that the terms of the Replacement Agreement between the Adviser and the Sub-Adviser are identical to the terms of the existing Investment Sub-Advisory Agreement between the Adviser and the Sub-Adviser, except as to the effective date.
The Board also factored into its review its familiarity with the Sub-Adviser’s compliance program, policies and procedures and, in this regard, also considered the Sub-Adviser’s representation that the change of control was not expected to have a material impact on its compliance program. The Board also considered the Sub-Adviser’s representation that there were no material pending lawsuits, enforcement proceedings or regulatory investigations that would impact the Sub-Adviser’s ability to provide services to the Fund, and reviewed information regarding the Sub-Adviser’s financial condition and history of operations and potential conflicts of interest in managing the Fund.
For purposes of evaluating the nature, quality and extent of the overall services to be provided to the Fund, the Board also received and reviewed performance data relating to the Sub-Adviser’s management of the Fund, as compared to the performance of an appropriate benchmark and peer group. The Board noted that, other than the EQ/Core Plus Bond Portfolio, the Sub-Adviser does not currently advise or sub-advise funds with investment objectives, policies and strategies similar to those of the Fund. The Trustees also noted that they had reviewed the Sub-Adviser’s performance through their oversight of its management of the Fund since its appointment to the Fund in June 2018. The Board generally considered longer-term performance to be more important than shorter-term performance. In this regard, the Board also considered the Sub-Adviser’s representations that the same portfolio managers would continue to be primarily responsible for the securities selection, research and trading for the Fund after the change of control, and the investment processes of the Fund were not expected to change as a result of the change of control. The Board also noted Franklin Templeton’s representation that it had put into place long-term retention arrangements for investment affiliate personnel. Notwithstanding the foregoing, the Board recognized that personnel changes may occur in the future in the ordinary course.
Based on its review, the Board determined that the nature, quality and extent of the overall services provided by the Sub-Adviser were appropriate for the Fund in light of its investment objective and, thus, supported a decision to approve the Replacement Agreement.
Expenses
The Board also considered the sub-advisory fee in light of the nature, quality and extent of the overall services provided by the Sub-Adviser. The Board considered the Adviser’s representation that the Fund’s fees and expenses were not expected to change as a result of the approval of the Replacement Agreement. The Board also considered that the sub-advisory fee that the Sub-Adviser would receive under the Replacement Agreement would be based on the same fee rate schedule in effect under the existing Investment Sub-Advisory Agreement. In addition, the Board considered the relative levels of the sub-advisory fee to be paid to the Sub-Adviser with respect to the Fund and the advisory fee to be retained by the Adviser in light of, among other factors, the nature and extent of responsibilities retained and risks assumed by the Adviser and not delegated to or assumed by the Sub-Adviser. The Board also noted that the sub-advisory fee rate schedule for the Fund is the same sub-advisory fee rate schedule that the Sub-Adviser charges to the EQ/Core Plus Bond Portfolio. The Board also noted that the advisory fee paid by the Fund to the Adviser would not change as a result of the approval of the Replacement Agreement.
The Board further noted that the Adviser, and not the Fund, would pay the Sub-Adviser and that the sub-advisory fee was negotiated between the Sub-Adviser and the Adviser. Moreover, the Board noted that the Adviser generally is aware of the fees charged by sub-advisers to other clients and that the Adviser believes that the fee agreed upon with the Sub-Adviser is reasonable in light of the nature, quality and extent of the investment sub-advisory services provided. Based on its review, the Board determined that the sub-advisory fee is fair and reasonable.
Profitability and Costs
The Board also considered the estimated impact of the sub-advisory fee on the profitability of the Adviser. In this regard, the Board noted again that the Fund’s fees and expenses were not expected to change as a result of the approval of the Replacement Agreement. The Adviser advised the Board that it does not regard
Sub-Adviser profitability as meaningful to its evaluation of the Replacement Agreement. The Board acknowledged the Adviser’s view of Sub-Adviser profitability, noting the Board’s findings as to the reasonableness of the sub-advisory fee and that the fee paid to the Sub-Adviser is the product of negotiations with the Adviser and reflects levels of profitability acceptable to the Adviser and the Sub-Adviser based on the particular circumstances in each case for each of them. The Board noted again that the Sub-Adviser’s fee would be paid by the Adviser and not the Fund and that many responsibilities related to the advisory function are retained by the Adviser.
Economies of Scale
The Board also considered whether economies of scale would be realized as the Fund grows larger and the extent to which this is reflected in the sub-advisory fee rate schedule. While recognizing that any precise determination is inherently subject to assumptions and subjective assessments, the Board noted that the sub-advisory fee rate schedule aggregates the assets managed by the Sub-Adviser in the Fund and the EQ/Core Plus Bond Portfolio. The Board also noted that the sub-advisory fee rate schedule includes breakpoints that would reduce the sub-advisory fee rate as aggregated assets under the Sub-Adviser’s management increase above certain levels. In this regard, the Board acknowledged that, at some levels, the breakpoints in a sub-advisory fee rate schedule may result in savings to the Adviser and not to shareholders. The Board also noted that the aggregation of assets may result in the Fund reaching a breakpoint sooner than if the sub-advisory fee rate schedule did not aggregate assets, which also has the potential to benefit the Adviser. The Board also noted that the sub-advisory fee rate schedule will not change under the Replacement Agreement. The Board considered these factors, and the relationship they bear to the fee structure charged to the Fund by the Adviser, and concluded that there would be a reasonable sharing of benefits from any economies of scale with the Fund.
Fall-Out and Other Benefits
The Board also considered possible fall-out benefits and other types of benefits that may accrue to the Sub-Adviser, including the following. The Board noted that the Sub-Adviser may benefit from greater exposure in the marketplace with respect to its investment process and from expanding its level of assets under management, and the Sub-Adviser may derive benefits from its association with the Adviser. The Board also noted that, as the principal business activities of the Sub-Adviser would not be affected by the change of control, such fall-out benefits were expected to remain after the change of control. Based on its review, the Board determined that any fall-out benefits and other types of benefits that may accrue to the Sub-Adviser are fair and reasonable.
Conclusion
At the June 2020 Meeting, the Board, including a majority of the Independent Trustees, considered and unanimously approved the Replacement Agreement, to take effect upon the closing of the Acquisition. The Board’s approval was based on its determination, made in the exercise of its business judgment, that it would be in the best interests of the Fund and its shareholders for the Sub-Adviser to continue to provide uninterrupted investment sub-advisory services for the Fund.
As of the end of the period covered by this report, the registrant has adopted a “code of ethics,” as defined in Item 2, that applies to the registrant’s principal executive officer, principal financial officer, principal accounting officer or controller, or persons performing similar functions. A copy of the registrant’s code of ethics is filed as an exhibit pursuant to Item 12(a)(1).
| Item 3. | Audit Committee Financial Expert. |
The registrant’s board of trustees has determined that Donald E. Foley and Caroline L. Williams serve on its audit committee as “audit committee financial experts” as defined in Item 3. Ms. Williams and Mr. Foley are considered to be “independent” for purposes of Item 3(a)(2).
| Item 4. | Principal Accountant Fees and Services. |
(a) Audit Fees for fiscal year 2020: $549,893 and for fiscal year 2019: $255,705.
(b) Audit-Related Fees fiscal year 2020: $0 and for fiscal year 2019: $0.
(c) Tax Fees for fiscal year 2020: $232,600 and for fiscal year 2019: $233,660.
Tax fees include amounts related to tax compliance, tax advice and tax planning.
(d) All Other Fees for fiscal year 2020: $0 and for fiscal year 2019: $0.
All other fees include amounts related to consultation on or review of the registrant’s various regulatory filings.
(e)(1) The registrant’s audit committee has adopted policies and procedures relating to pre-approval of services performed by the registrant’s principal accountant for the registrant. Audit, audit-related and tax services provided to the registrant on an annual basis require pre-approval by the entire audit committee. In the event that the audit fees exceed the pre-approved estimated amount, the audit committee’s delegate, consisting of the audit committee chair, independent board chair, the registrant’s chief executive officer and chief financial officer, acting by at least two of such individuals, has the authority to increase the amount by up to 10% of the pre-approved amount. Any additional amount requires pre-approval by the entire audit committee. The audit committee chair or the independent board chair also has the authority to approve de minimis non-audit services (i.e., services in which the fee does not exceed $10,000 per engagement) to be provided by the registrant’s principal accountant for the registrant, provided that each such service is brought to the attention of the audit committee prior to the completion of the audit of the registrant’s financial statements.
(e)(2) None of the services included in (b) – (d) above were approved by the audit committee pursuant to paragraph (c)(7)(i)(C) of Rule 2-01 of Regulation S-X.
(f) Not applicable.
(g) For fiscal year 2020: $0 and for fiscal year 2019: $523,000.
(h) The registrant’s audit committee has considered and determined that the provision of non-audit services that were rendered to the registrant’s investment adviser (not including any sub-advisers whose role is primarily portfolio management and is subcontracted with or overseen by another investment adviser), and any entity controlling, controlled by, or under common control with the investment adviser that provides ongoing services to the registrant that were not pre-approved pursuant to paragraph (c)(7)(ii) of Rule 2-01 of Regulation S-X is compatible with maintaining the principal accountant’s independence.
| Item 5. | Audit Committee of Listed Registrants. |
Not applicable.
| Item 6. | Schedule of Investments. |
The Schedule of Investments is included as part of the annual report to Shareholders filed under Item 1 of this Form N-CSR.
| Item 7. | Disclosure of Proxy Voting Policies and Procedures for Closed-End Management Investment Companies. |
Not applicable.
| Item 8. | Portfolio Managers of Closed-End Management Investment Companies |
Not applicable.
| Item 9. | Purchases of Equity Securities by Closed-End Management Investment Company and Affiliated Purchasers. |
Not applicable.
| Item 10. | Submission of Matters to a Vote of Security Holders. |
There have been no material changes to the procedures by which shareholders may recommend nominees to the registrant’s board of trustees.
| Item 11. | Controls and Procedures. |
| (a) | The registrant’s principal executive and principal financial officers, or persons performing similar functions, have concluded that the registrant’s disclosure controls and procedures (as defined in Rule 30a-3(c) under the Investment Company Act of 1940, as amended (the “1940 Act”)) are effective as of a date within 90 days of the filing of this report that includes the disclosure required by this paragraph, based on the evaluation of these controls and procedures required by Rule 30a-3(b) under the 1940 Act and Rule 15d-15(b) under the Securities Exchange Act of 1934, as amended. |
| (b) | The registrant’s certifying officers are not aware of any changes in the registrant’s internal control over financial reporting (as defined in Rule 30a-3(d) under the 1940 Act) that occurred during the registrant’s second fiscal quarter of the period covered by this report that has materially affected, or is reasonably likely to materially affect, the registrant’s internal control over financial reporting. |
| Item 12. | Disclosure of Securities Lending Activities for Close-End Management Investment Companies. |
Not Applicable.
SIGNATURES
Pursuant to the requirements of the Securities Exchange Act of 1934 and the Investment Company Act of 1940, the registrant has duly caused this report to be signed on its behalf by the undersigned, thereunto duly authorized.
1290 FUNDS
| | |
| By: | | /s/ Steven M. Joenk |
| Steven M. Joenk |
| Chief Executive Officer |
| January 5, 2021 |
Pursuant to the requirements of the Securities Exchange Act of 1934 and the Investment Company Act of 1940, this report has been signed below by the following persons on behalf of the registrant and in the capacities and on the dates indicated.
|
/s/ Steven M. Joenk |
| Steven M. Joenk |
| Chief Executive Officer |
| January 5, 2021 |
|
/s/ Brian E. Walsh |
| Brian E. Walsh |
| Chief Financial Officer |
| January 5, 2021 |