UNITED STATES
SECURITIES AND EXCHANGE COMMISSION
Washington, D.C. 20549
FORM N-CSR
CERTIFIED SHAREHOLDER REPORT OF REGISTERED
MANAGEMENT INVESTMENT COMPANIES
Investment Company Act File Number 811-22959
1290 FUNDS
(Exact name of registrant as specified in charter)
1290 Avenue of the Americas
New York, New York 10104
(Address of principal executive offices)
WILLIAM T. MACGREGOR ESQ.
Executive Vice President and Secretary
AXA Equitable Funds Management Group, LLC
1290 Avenue of the Americas
New York, New York 10104
(Name and Address of Agent for Service)
Copies to:
MARK C. AMOROSI, ESQ.
K&L Gates LLP
1601 K Street N.W.
Washington, D.C. 20006
Registrant’s telephone number, including area code: (212) 554-1234
Date of fiscal year end: October 31
Date of reporting period: October 31, 2018
| Item 1. | Reports to Stockholders. |
The following is a copy of the report transmitted to shareholders pursuant to Rule 30e-1 under the Investment Company Act of 1940 (17 CFR 270.30e-1).

Annual Report
October 31, 2018
1290 Funds
Annual Report
October 31, 2018
Table of Contents
Market Overview for the Twelve-Month Period Ended October 31, 2018
Economic Overview
In the twelve-month period ended October 31, 2018, against a generally positive economic backdrop, disruptions related to U.S. trade and foreign policy and a bumpy British exit from the European Union (Brexit) upended global markets, destabilizing business and consumer sentiment around the world.
Central Bank activity continued to be focused on normalizing balance sheets and unwinding stimulus strategies. The U.S. Federal Reserve raised rates four times and suggested it would continue to raise rates through the balance of 2018 and well into 2019. The Bank of England also raised rates. The Bank of Japan held rates and yields steady but widened the band around 10-year yields, potentially allowing them to move higher. In Europe, doubt over Italy’s formation of a new government gave way to concerns over budget deficit negotiations with the European Union. Meanwhile, Brexit negotiations reached an impasse late in the reporting period when the UK’s latest plan was unanimously rejected by Britain’s government, weighing on sentiment. Despite these uncertainties, Bloomberg Economics forecasts interest-rate increases around most of the developed world through next year.
In the emerging world, a stronger U.S. dollar and worsening global trade war kept pressure on financial assets everywhere and dimmed the outlook for China’s economy (despite a series of policies from the Chinese government aimed at boosting domestic demand). Financial instability in Turkey moderated over the quarter, as the country moved toward a more orthodox relationship between the government and the central bank. News in Argentina that the International Monetary Fund may increase the credit line extended to the economically suffering country at first seemed positive, but then varying accounts regarding the size of the increase left market participants skittish.
Even given rampant political uncertainty and worries over the aging U.S. economic expansion, a “risk on” sentiment was reflected in the performance of gold, which declined 5.1% in the past 12 months, as measured by the S&P GSCI Gold Index. Gold is typically a “flight-to-quality” asset that appreciates when investors are fearful of a stock market contraction and depreciates when sentiment is positive. Energy prices, conversely, returned to levels not seen since 2014, before correcting toward the end of the reporting period.
Bonds
Given central bank actions, it is not surprising that global fixed-income struggled. U.S. government bond yields moved higher and the curve flattened. The yield on the bellwether 10-year U.S. Treasury Note rose over the twelve months from 2.38% to 3.14%. As a consequence, U.S. bonds saw sharp price decreases in the intermediate- to long-term range. High-quality U.S. corporate bonds did not offer much relief from the negative trend, except at the short end of the yield curve.
The U.S. high-yield market posted a small but positive return in the twelve-month period ended October 31, 2018, as the ICE BofA Merrill Lynch U.S. High Yield Index generated a modest positive return for the period. Returns were driven by continued economic growth in the U.S., stable credit fundamentals and soft new issue volume which supported secondary trading levels — all partially offset by volatility in the stock market and rising interest rates.
Contractionary central bank actions, combined with higher U.S. rates and a weaker dollar, hurt global fixed-income markets as well, with world government bonds down slightly over the twelve-month period.
U.S. Equity
In the U.S., market distress over trade policy in the past year swamped tax and regulatory reform optimism, creating a volatile trading environment. Based on total return of 7.35% in the S&P 500® Index for the twelve-month period ended October 31, 2018, the twelve months might appear to be a period of seeming complacency. U.S. equity markets were boosted in part by corporate earnings growth, which continued to beat consensus estimates. Furthermore, U.S. consumer spending, consumer sentiment, employment and inflation data were all positive and supportive of economic growth. Nonetheless, the year was punctuated by two sharp sell-offs of approximately 10%. Both times, a sharp move in 30-year Treasury bond yields brought immediate consequences for the equity markets, once in January and February and again in September and October.
As trade-related turbulence led U.S. equities to pull back from highs earlier in the year, technology stocks remained among the highest-flying sectors. Strong returns also came from consumer discretionary stocks, which include many technology-related retailers; health care and consumer staples also outperformed. The weakest returns were reserved for sectors such as financials, industrials and materials.
Alternative sectors reflected the tensions between the relatively benign economic environment and the pressure brought by rising U.S. interest rates. The “risk-on” sentiment that dominated stock markets for much of the year was reflected in the performance of gold, which declined 5.1% in the past 12 months, as measured by the S&P GSCI Gold Index. Gold is typically a “flight-to-quality�� asset that appreciates when investors are fearful of a stock market contraction and depreciates when sentiment is positive. Base metals, also sensitive to softness in emerging markets, suffered even more. Other negative alternative sectors included real estate and agricultural producers.
Energy prices, conversely, returned to levels not seen since 2014, although stock gains were limited by the falling dollar. Other positive sectors included managed futures and commodity tracking securities.
2
International equity
The non-U.S. world’s stock markets struggled throughout the year, as Europe grappled with political crises in Italy, Germany and the U.K. Developed-world international stocks were down 6.85% in the past year, as measured by the MSCI EAFE Index. Hints the European Central Bank would begin curtailing stimulus measures and concerns about protectionism in the U.S. contributed to negative sentiment.
A dominant theme in the emerging markets was the impact of a falling U.S. dollar, rising U.S. interest rates and the trade war between the United States and China. The impact on Chinese equities was severe, as the MSCI China A NR lost 28.62% of its value in the past year. None of the emerging markets was immune, however, with the broad indexes down well into double-digits.
Source: AXA Equitable Funds Management Group, LLC doing business as 1290 Asset Managers®. As of 10/31/18.
This information is provided for general information only and is not intended to provide specific advice or recommendations for any individual investor.
PAST PERFORMANCE IS NO GUARANTEE OP FUTURE RESULTS. No investment is risk-free. Bond investments are subject to interest rate risk so that when interest rates rise, the prices of bonds can decrease and the investor can lose principal value. High yield bonds are subject to a high degree of credit and market risk. International securities carry additional risks including currency exchange fluctuation and different government regulations, economic conditions or accounting standards. Smaller company stocks involve a greater risk than is customarily associated with more established companies. Index performance is referenced for illustrative purposes only. You cannot invest directly in an index.
Fund holdings and sector allocations are subject to change. Please see the Portfolio of Investments for a complete list of fund holdings.
3
NOTES ON PERFORMANCE (Unaudited)
Total Returns
Performance of the 1290 Funds as shown on the following pages compares each Fund’s performance to that of a broad-based securities index and, with respect to certain Funds, customized composite benchmarks. Each Fund’s rates of return are net of investment advisory fees and expenses of the Fund. Each Fund has a separate investment objective it seeks to achieve by following a separate investment policy. There is no guarantee that these objectives will be attained. The objectives and policies of each Fund will affect its return and its risk. Keep in mind that past performance is not an indication of future results.
Benchmarks
60% S&P 500® Index/40% Bloomberg Barclays U.S. Aggregate Bond Index is a hypothetical combination of unmanaged indexes. The composite index combines the total return of the S&P 500® Index at a weighting of 60% and the Bloomberg Barclays U.S. Aggregate Bond Index at a weighting of 40%.
Bloomberg Barclays U.S. Aggregate Bond Index covers the U.S. dollar denominated investment-grade, fixed-rate, taxable bond market of securities. The index includes bonds from the Treasury, government-related and corporate securities, agency fixed rate and hybrid adjustable mortgage pass through securities, asset-backed securities and commercial mortgage-backed securities.
CBOE Volatility Index® (VIX® Index) is a key measure of market expectations of near-term volatility conveyed by S&P 500 stock index option prices.
ICE BofAML US 3-Month Treasury Bill Index measures the returns of negotiable debt obligations issued by the U.S. government and backed by its full faith and credit, having a maturity of three months.
ICE BofAML U.S. Convertibles Index consists of U.S. dollar denominated investment grade and non-investment grade convertible securities sold into the U.S. market and publicly traded in the United States. The index constituents are market value weighted based on the convertible securities prices and outstanding shares, and the underlying index is rebalanced daily.
ICE BofAML U.S. High Yield Index tracks the performance of U.S. dollar denominated below investment grade corporate debt publicly issued in the U.S. domestic market. Qualifying securities must have at least 18 months to final maturity at the time of issuance, at least one year remaining term to final maturity as of the rebalancing date, a fixed coupon schedule and a minimum amount outstanding of $100 million. It is capitalization-weighted.
ICE BofAML USD 3-Month Deposit Offered Rate Constant Maturity Index tracks the performance of a synthetic asset paying the London interbank offered rate (LIBOR) to a stated maturity. The index is based on the assumed purchase at par of a synthetic instrument having exactly its stated maturity and with a coupon equal to that day’s fixing rate. That issue is assumed to be sold the following business day (priced at a yield equal to the current day fixing rate) and rolled into a new instrument.
Morgan Stanley Capital International (MSCI) ACWI (Net) Index (“MSCI ACWI (Net) Index”) is a free float-adjusted market capitalization weighted index that is designed to measure the equity market performance of 23 developed markets and 24 emerging markets. The index covers approximately 85% of the global investment opportunities.
Morgan Stanley Capital International (MSCI) ACWI Minimum Volatility (Net) Index (“MSCI ACWI Minimum Volatility (Net) Index”) aims to reflect the performance characteristics of a minimum variance strategy applied to large and mid cap equities across 23 developed markets and 23 emerging markets countries. The index is calculated by optimizing the MSCI ACWI Index, its parent index, in USD for the lowest absolute risk (within a given set of constraints). Historically, the index has shown lower beta and volatility characteristics relative to the MSCI ACWI Index.
Morgan Stanley Capital International (MSCI) China A Index net return is an unmanaged index designed to measure large and mid-cap representation across China securities listed on the Shanghai and Shenzhen exchanges.
Morgan Stanley Capital International (MSCI) World (Net) Index (“MSCI World (Net) Index”) is a free float-adjusted market capitalization weighted index that is designed to measure the equity market performance of developed markets. The index consists of 23 developed market country indexes.
Russell 2500™ Value Index measures the performance of those Russell 2500TM Index companies with lower price-to-book ratios and lower forecasted growth values. It is market-capitalization weighted.
Standard & Poor’s 500® Composite Stock Price Index (“S&P 500® Index”) is a weighted index of common stocks of 500 leading companies in leading industries of the U.S. economy, capturing 75% coverage of U.S. equities. The index is capitalization weighted, thereby giving greater weight to companies with the largest market capitalizations.
The Standard & Poor’s GSCI Gold Index (“S&P GSCI Gold Index”) is an unmanaged index considered representative of the world gold market.
The Standard & Poor’s Target Date Index Series (each, an “S&P Target Date Index”) comprises eleven multi-asset class indices, each corresponding to a particular target retirement date. The asset allocation for each index in the series is determined once a year through survey of large fund management companies that offer target date products. Each index is fully investable, with varying levels of exposure to equities, fixed income and commodities.
Glossary
Derivative is a financial instrument with a price that is dependent upon or derived from one or more underlying assets.
Diversified spread is the sale of multiple, diversified futures contracts and the purchase of other multiple, diversified offsetting futures contracts. A spread tracks the difference between a long and short position.
4
NOTES ON PERFORMANCE (Unaudited)
Flight to quality is the action of investors moving their capital away from riskier investments to safer ones.
Long position is the buying of a security or financial instrument such as a stock, commodity or currency with the expectation the asset will rise in value.
Mortgage backed security (MBS) is a type of asset-backed security that is secured by a mortgage or collection of mortgages.
Quantitative easing is the introduction of new money into the money supply by a central bank.
Shiller Barclays Cyclically Adjusted Price-to-Earnings (CAPE) Total Return Index aims to identify undervalued sectors in the large-cap equity market based on a modified CAPE® ratio, which is designed to assess longer term equity valuations by using an inflation adjusted earnings horizon.
Smart beta defines a set of investment strategies that emphasize the use of alternative index construction rules to traditional market capitalization based indices.
Swap is a derivative contract through which two parties exchange financial instruments.
5
1290 CONVERTIBLE SECURITIES FUND (Unaudited)
INVESTMENT ADVISER
INVESTMENT SUB-ADVISER
| Ø | | Palisade Capital Management, L.L.C. |
PERFORMANCE RESULTS
| | | | | | | | | | | | |
| Annualized Total Returns as of 10/31/18 | |
| | | | | | 1
Year | | | Since
Incept. | |
Fund – Class A Shares* | | | without Sales Charge | | | | (0.46 | )% | | | 3.95 | % |
| | | | with Sales Charge (a) | | | | (4.90 | ) | | | 2.53 | |
Fund – Class I Shares* | | | | | | | (0.23 | ) | | | 4.21 | |
Fund – Class R Shares* | | | | | | | (0.78 | ) | | | 3.67 | |
ICE BofAML U.S. Convertibles Index | | | | | | | 3.67 | | | | 6.27 | |
* Date of inception 7/6/15. (a) A 4.50% front-end sales charge was deducted. Returns for periods greater than one year are annualized. | |
The performance quoted is past performance and is not a guarantee of future results. Mutual funds are subject to certain market risks. Investment returns and principal value of an investment will fluctuate so that an investor’s shares, when redeemed, may be worth more or less than their original cost. Current performance may be higher or lower than the performance data shown. For the most current month-end performance data please call 1-888-310-0416 or visit www.1290Funds.com.
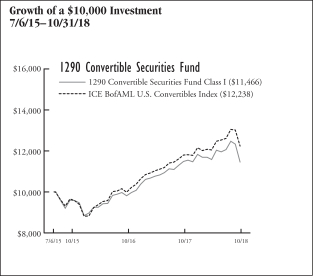
The graph illustrates comparative performance for $10,000 invested in the Class I Shares of the 1290 Convertible Securities Fund and the ICE BofAML U.S. Convertibles Index from 7/6/15 to 10/31/18. The performance of the ICE BofAML U.S. Convertibles Index reflects an initial investment at the end of the month closest to the Fund’s inception. The performance of the Fund assumes reinvestment of all dividends and capital gain distributions, if any, and does not include a sales charge. The performance of the ICE BofAML U.S. Convertibles Index does not reflect the deduction of expenses or a sales charge associated with a mutual fund and has been adjusted to reflect reinvestment of all dividends, capital gain distributions, and interest of the securities included in the benchmark.
Fund performance may reflect the waiver of the Fund’s fees and reimbursement of expenses for certain periods since the inception date. Without these waivers and reimbursements, performance would have been lower. Also, performance shown in this section does not reflect the deduction of taxes that a shareholder would pay on Fund distributions or redemption of Fund shares.
PERFORMANCE SUMMARY
The Fund’s Class I shares returned (0.23)% for the year ended October 31, 2018. The Fund’s benchmark, the ICE BofAML U.S. Convertibles Index, returned 3.67% over the same year.
Overview — Palisade Capital Management, L.L.C.
Over the twelve-month period ended October 31, 2018, early tax and regulatory reform optimism collided with headwinds from trade policy uncertainty, interest rate angst, and emerging market distress, creating a volatile trading environment. While our view of stronger economic growth for the period did play out, the uncertainty in the macro environment weighed on some of the investments in the Fund. The Fund’s overweight positioning in industrials, which was beneficial during the prior year, dragged on performance as the sector lagged expectations. Likewise, the Fund’s overweight in technology did not provide the boost we expected as the Fund’s holdings in semiconductor names, in particular, suffered from continued trade tensions, especially with China.
We continue to believe that economic fundamentals remain constructive, which may provide a good foundation for equity and credit markets in the coming months. This may provide opportunities for continued convertible price appreciation. We expect any resolution to current trade disputes to be a potentially positive catalyst and provide an additional tailwind for convertibles. We also believe that rising interest rates will not be a significant negative factor as we have seen historically, as equity-related gains may more than offset any potential interest rate drag. While our longer-term outlook remains positive, it is tempered by our view that volatile conditions could persist for a while. If our positive view does not play out as expected, we do believe that the defensive characteristics of convertibles could help cushion any downside. As such, we continue to believe that the convertibles market remains an attractive vehicle to help investors navigate near-term market volatility.
Fund Highlights
What helped performance during the year?
| • | | The Fund benefited from good security selection in the materials sector where Cleveland-Cliffs Inc. 1.50% generated double digit returns over the period. |
| • | | The Fund also benefited from an overweight to the health care sector, which was among the best performing sectors in the benchmark over the period. |
| • | | In financials, the Fund was well served by an underweight to the real estate investment trust (REITs) industry. |
6
1290 CONVERTIBLE SECURITIES FUND (Unaudited)
What hurt performance during the year?
| • | | Unfavorable security selection in health care weighed down results for the period. Notably, Incyte Corp. 1.25% and Dermira, Inc. 3.00% both experienced double digit declines. |
| • | | Unfavorable security selection in the energy sector further hindered results, where a position in Nabors Industries Ltd. 6.00% disappointed. |
| • | | Underperformance in the industrials sector was attributable to an overweight to the building and construction industry. |
| • | | The Fund was also hindered by underweights in the outperforming telecommunications and consumer staples sectors. |
| | | | |
Fund Characteristics As of October 31, 2018 | | | |
Weighted Average Life (Years) | | | N/A | |
Weighted Average Coupon (%) | | | N/A | |
Weighted Average Modified Duration (Years)* | | | N/A | |
Weighted Average Rating** | | | BB | |
* Modified duration is a measure of the price sensitivity of the Fund to interest rate movements, taking into account specific features of the securities in which it invests. ** Weighted Average Rating has been provided by the Investment Sub-Adviser. A credit rating is an assessment provided by a nationally recognized statistical rating organization (NRSRO) of the creditworthiness of an issuer with respect to debt obligations, including specific securities, money market instruments or other debts. Ratings are measured on a scale that generally ranges from AAA (highest) to D (lowest); ratings are subject to change without notice. | |
| | | | |
Sector Weightings as of October 31, 2018 | | % of Net Assets | |
Information Technology | | | 34.7 | % |
Health Care | | | 22.5 | |
Financials | | | 8.4 | |
Industrials | | | 7.9 | |
Consumer Discretionary | | | 6.8 | |
Communication Services | | | 5.6 | |
Energy | | | 5.5 | |
Real Estate | | | 2.3 | |
Materials | | | 2.2 | |
Utilities | | | 0.6 | |
Investment Company | | | 0.4 | |
Consumer Staples | | | 0.3 | |
Cash and Other | | | 2.8 | |
| | | | | |
| | | | 100.0 | % |
| | | | | |
Holdings are subject to change without notice. | |
UNDERSTANDING YOUR EXPENSES:
As a shareholder of the Fund, you incur two types of costs:
(1) transaction costs, including applicable sales charges and redemption fees; and (2) ongoing costs, including investment advisory fees, distribution and/or service (12b-1) fees (in the case of Class A and Class R shares of the Fund), and other Fund expenses. These examples are intended to help you understand your ongoing costs (in dollars) of investing in the Fund and to compare these costs with the ongoing costs of investing in other mutual funds.
The examples are based on an investment of $1,000 invested at the beginning of the six-month period ended October 31, 2018 and held for the entire six-month period.
Actual Expenses
The first line of the following table provides information about actual account values and actual expenses. You may use the information in this line, together with the amount you invested, to estimate the expenses that you paid over the period. Simply divide your account value by $1,000 (for example, an $8,600 account value divided by $1,000 = 8.6), then multiply the result by the number in the first line under the heading entitled “Expenses Paid During Period” to estimate the expenses you paid on your account during this period.
Hypothetical Example for Comparison Purposes
The second line of the following table provides information about hypothetical account values and hypothetical expenses based on the Fund’s actual expense ratio and an assumed rate of return of 5% per year before expenses, which is not the Fund’s actual return. The hypothetical account values and expenses may not be used to estimate the actual ending account balance or expenses you paid for the period. You may use this information to compare the ongoing costs of investing in the Fund and other funds. To do so, compare this 5% hypothetical example with the 5% hypothetical examples that appear in the shareholder reports of the other funds.
Please note that the expenses shown in the table are meant to highlight your ongoing costs only and do not reflect any transactional costs, such as sales charges (loads), redemption fees, or exchange fees. Therefore, the second line of the table is useful in comparing ongoing costs only, and will not help you determine the relative total costs of owning different funds. In addition, if these transactional costs were included, your costs would have been higher.
7
1290 CONVERTIBLE SECURITIES FUND (Unaudited)
EXAMPLE
| | | | | | | | | | | | |
| | | Beginning
Account
Value
5/1/18 | | | Ending
Account
Value
10/31/18 | | | Expenses Paid During Period*
5/1/18 -
10/31/18 | |
Class A | | | | | | | | | | | | |
Actual | | | $1,000.00 | | | | $988.10 | | | | $6.47 | |
Hypothetical (5% average annual return before expenses) | | | 1,000.00 | | | | 1,018.70 | | | | 6.57 | |
Class I | | | | | | | | | | | | |
Actual | | | 1,000.00 | | | | 989.20 | | | | 5.22 | |
Hypothetical (5% average annual return before expenses) | | | 1,000.00 | | | | 1,019.95 | | | | 5.30 | |
Class R | | | | | | | | | | | | |
Actual | | | 1,000.00 | | | | 986.10 | | | | 7.72 | |
Hypothetical (5% average annual return before expenses) | | | 1,000.00 | | | | 1,017.43 | | | | 7.84 | |
* Expenses are equal to the Fund’s Class A, I and R shares annualized expense ratios of 1.29%, 1.04% and 1.54%, respectively, multiplied by the average account value over the period, and multiplied by 184/365 (to reflect the one-half year period). | |
8
1290 FUNDS
1290 CONVERTIBLE SECURITIES FUND
PORTFOLIO OF INVESTMENTS
October 31, 2018
| | | | | | | | |
| | | Principal Amount | | | Value (Note 1) | |
| | | | | | | | |
LONG-TERM DEBT SECURITIES: | |
Convertible Bonds (81.9%) | |
Communication Services (5.6%) | |
Entertainment (1.0%) | | | | | | | | |
Live Nation Entertainment, Inc. | |
2.500%, 5/15/19 | | $ | 56,000 | | | $ | 84,682 | |
2.500%, 3/15/23§ | | | 30,000 | | | | 32,045 | |
Pandora Media, Inc.
1.750%, 12/1/23 | | | 110,000 | | | | 117,847 | |
| | | | | | | | |
| | | | | | | 234,574 | |
| | | | | | | | |
Interactive Media & Services (1.6%) | |
Momo, Inc.
1.250%, 7/1/25§ | | | 61,000 | | | | 53,375 | |
Twitter, Inc. | | | | | | | | |
0.250%, 9/15/19 | | | 65,000 | | | | 62,833 | |
0.250%, 6/15/24§ | | | 171,000 | | | | 160,335 | |
Weibo Corp.
1.250%, 11/15/22§ | | | 91,000 | | | | 80,957 | |
Zillow Group, Inc.
1.500%, 7/1/23 | | | 34,000 | | | | 30,906 | |
| | | | | | | | |
| | | | | | | 388,406 | |
| | | | | | | | |
Media (3.0%) | | | | | | | | |
DISH Network Corp.
3.375%, 8/15/26 | | | 520,000 | | | | 463,294 | |
Liberty Interactive LLC
1.750%, 9/30/46§ | | | 116,000 | | | | 129,512 | |
Liberty Media Corp.
1.375%, 10/15/23 | | | 90,000 | | | | 103,779 | |
| | | | | | | | |
| | | | | | | 696,585 | |
| | | | | | | | |
Total Communication Services | | | | | | | 1,319,565 | |
| | | | | | | | |
Consumer Discretionary (6.8%) | |
Automobiles (1.1%) | | | | | | | | |
Tesla, Inc.
2.375%, 3/15/22 | | | 209,000 | | | | 254,727 | |
| | | | | | | | |
Hotels, Restaurants & Leisure (1.1%) | |
Caesars Entertainment Corp.
5.000%, 10/1/24 | | | 177,000 | | | | 252,770 | |
| | | | | | | | |
Internet & Direct Marketing Retail (4.1%) | |
Booking Holdings, Inc.
0.350%, 6/15/20 | | | 297,000 | | | | 428,844 | |
Ctrip.com International Ltd.
1.250%, 9/15/22 | | | 45,000 | | | | 43,491 | |
Etsy, Inc. | | | | | | | | |
(Zero Coupon), 3/1/23 (b)§ | | | 67,000 | | | | 88,942 | |
IAC FinanceCo, Inc. | | | | | | | | |
0.875%, 10/1/22§ | | | 129,000 | | | | 180,242 | |
Liberty Expedia Holdings, Inc. | | | | | | | | |
1.000%, 6/30/47§ | | | 102,000 | | | | 101,429 | |
MercadoLibre, Inc. | | | | | | | | |
2.000%, 8/15/28§ | | | 122,000 | | | | 117,241 | |
| | | | | | | | |
| | | | | | | 960,189 | |
| | | | | | | | |
Specialty Retail (0.5%) | | | | | | | | |
RH | | | | | | | | |
(Zero Coupon), 7/15/20 | | | 61,000 | | | | 69,376 | |
| | | | | | | | |
(Zero Coupon), 6/15/23§ | | | 61,000 | | | | 53,685 | |
| | | | | | | | |
| | | | | | | 123,061 | |
| | | | | | | | |
Total Consumer Discretionary | | | | | | | 1,590,747 | |
| | | | | | | | |
Energy (4.6%) | | | | | | | | |
Energy Equipment & Services (2.4%) | |
Oil States International, Inc. | | | | | | | | |
1.500%, 2/15/23§ | | | 73,000 | | | | 66,418 | |
SEACOR Holdings, Inc. | | | | | | | | |
3.250%, 5/15/30 | | | 148,000 | | | | 138,195 | |
Transocean, Inc. | | | | | | | | |
0.500%, 1/30/23 | | | 121,000 | | | | 150,680 | |
Weatherford International Ltd. | | | | | | | | |
5.875%, 7/1/21 | | | 271,000 | | | | 208,001 | |
| | | | | | | | |
| | | | | | | 563,294 | |
| | | | | | | | |
Oil, Gas & Consumable Fuels (2.2%) | |
Cheniere Energy, Inc. | | | | | | | | |
4.250%, 3/15/45 | | | 120,000 | | | | 91,814 | |
Chesapeake Energy Corp. | | | | | | | | |
5.500%, 9/15/26 (e) | | | 139,000 | | | | 130,677 | |
Oasis Petroleum, Inc. | | | | | | | | |
2.625%, 9/15/23 | | | 121,000 | | | | 136,369 | |
PDC Energy, Inc. | | | | | | | | |
1.125%, 9/15/21 | | | 159,000 | | | | 149,460 | |
| | | | | | | | |
| | | | | | | 508,320 | |
| | | | | | | | |
Total Energy | | | | | | | 1,071,614 | |
| | | | | | | | |
Financials (2.1%) | | | | | | | | |
Consumer Finance (1.1%) | |
Encore Capital Group, Inc. | | | | | | | | |
3.000%, 7/1/20 | | | 90,000 | | | | 82,755 | |
3.250%, 3/15/22 | | | 30,000 | | | | 25,500 | |
EZCORP, Inc. | | | | | | | | |
2.875%, 7/1/24 | | | 30,000 | | | | 35,085 | |
2.375%, 5/1/25§ | | | 30,000 | | | | 26,250 | |
PRA Group, Inc. | | | | | | | | |
3.500%, 6/1/23 | | | 99,000 | | | | 93,571 | |
| | | | | | | | |
| | | | | | | 263,161 | |
| | | | | | | | |
Mortgage Real Estate Investment Trusts (REITs) (0.3%) | |
Western Asset Mortgage Capital Corp. (REIT) | | | | | | | | |
6.750%, 10/1/22 | | | 60,000 | | | | 59,023 | |
| | | | | | | | |
Thrifts & Mortgage Finance (0.7%) | | | | | | | | |
LendingTree, Inc. | | | | | | | | |
0.625%, 6/1/22 | | | 136,000 | | | | 159,760 | |
| | | | | | | | |
Total Financials | | | | | | | 481,944 | |
| | | | | | | | |
Health Care (20.1%) | | | | | | | | |
Biotechnology (8.8%) | | | | | | | | |
Acorda Therapeutics, Inc. | | | | | | | | |
1.750%, 6/15/21 | | | 65,000 | | | | 54,995 | |
Alder Biopharmaceuticals, Inc. | | | | | | | | |
2.500%, 2/1/25 | | | 115,000 | | | | 105,225 | |
BioMarin Pharmaceutical, Inc. | | | | | | | | |
1.500%, 10/15/20 | | | 211,000 | | | | 248,736 | |
Clovis Oncology, Inc. | | | | | | | | |
2.500%, 9/15/21 | | | 128,000 | | | | 97,120 | |
Exact Sciences Corp. | | | | | | | | |
1.000%, 1/15/25 | | | 332,000 | | | | 387,776 | |
See Notes to Financial Statements.
9
1290 FUNDS
1290 CONVERTIBLE SECURITIES FUND
PORTFOLIO OF INVESTMENTS (Continued)
October 31, 2018
| | | | | | | | |
| | | Principal Amount | | | Value (Note 1) | |
| | | | | | | | |
Flexion Therapeutics, Inc. | | | | | | | | |
3.375%, 5/1/24 | | $ | 144,000 | | | $ | 126,972 | |
Incyte Corp. | | | | | | | | |
1.250%, 11/15/20 | | | 75,000 | | | | 100,121 | |
Insmed, Inc. | | | | | | | | |
1.750%, 1/15/25 | | | 175,000 | | | | 131,672 | |
Ionis Pharmaceuticals, Inc. | | | | | | | | |
1.000%, 11/15/21 | | | 81,000 | | | | 84,516 | |
Ligand Pharmaceuticals, Inc. | | | | | | | | |
0.750%, 5/15/23§ | | | 221,000 | | | | 211,119 | |
Neurocrine Biosciences, Inc. | | | | | | | | |
2.250%, 5/15/24 | | | 65,000 | | | | 100,161 | |
Radius Health, Inc. | | | | | | | | |
3.000%, 9/1/24 | | | 90,000 | | | | 69,887 | |
Retrophin, Inc. | | | | | | | | |
2.500%, 9/15/25 | | | 58,000 | | | | 56,178 | |
Sarepta Therapeutics, Inc. | | | | | | | | |
1.500%, 11/15/24§ | | | 123,000 | | | | 242,213 | |
TESARO, Inc. | | | | | | | | |
3.000%, 10/1/21 | | | 40,000 | | | | 44,550 | |
| | | | | | | | |
| | | | | | | 2,061,241 | |
| | | | | | | | |
Health Care Equipment & Supplies (2.7%) | |
DexCom, Inc. | | | | | | | | |
0.750%, 5/15/22 | | | 60,000 | | | | 86,635 | |
Insulet Corp. | | | | | | | | |
1.375%, 11/15/24§ | | | 91,000 | | | | 102,715 | |
Nevro Corp. | | | | | | | | |
1.750%, 6/1/21 | | | 182,000 | | | | 172,639 | |
NuVasive, Inc. | | | | | | | | |
2.250%, 3/15/21 | | | 107,000 | | | | 119,377 | |
Wright Medical Group NV | | | | | | | | |
2.250%, 11/15/21 | | | 62,000 | | | | 84,893 | |
Wright Medical Group, Inc. | | | | | | | | |
2.000%, 2/15/20 | | | 58,000 | | | | 61,345 | |
| | | | | | | | |
| | | | | | | 627,604 | |
| | | | | | | | |
Health Care Providers & Services (1.9%) | |
Anthem, Inc. | | | | | | | | |
2.750%, 10/15/42 | | | 54,000 | | | | 204,913 | |
Molina Healthcare, Inc. | | | | | | | | |
1.125%, 1/15/20 | | | 74,000 | | | | 230,172 | |
| | | | | | | | |
| | | | | | | 435,085 | |
| | | | | | | | |
Health Care Technology (2.2%) | |
Allscripts Healthcare Solutions, Inc. | | | | | | | | |
1.250%, 7/1/20 | | | 105,000 | | | | 104,108 | |
Evolent Health, Inc. | | | | | | | | |
2.000%, 12/1/21 | | | 91,000 | | | | 105,878 | |
Teladoc Health, Inc. | | | | | | | | |
3.000%, 12/15/22 | | | 152,000 | | | | 263,276 | |
Vocera Communications, Inc. | | | | | | | | |
1.500%, 5/15/23§ | | | 36,000 | | | | 43,687 | |
| | | | | | | | |
| | | | | | | 516,949 | |
| | | | | | | | |
Life Sciences Tools & Services (0.7%) | |
Illumina, Inc. | | | | | | | | |
0.500%, 6/15/21 | | | 122,000 | | | | 164,353 | |
| | | | | | | | |
Pharmaceuticals (3.8%) | |
Assertio Therapeutics, Inc. | | | | | | | | |
2.500%, 9/1/21 | | | 85,000 | | | | 65,142 | |
| | | | | | | | |
Dermira, Inc. | | | | | | | | |
3.000%, 5/15/22 | | | 207,000 | | | | 175,986 | |
Horizon Pharma Investment Ltd. | | | | | | | | |
2.500%, 3/15/22 | | | 125,000 | | | | 121,712 | |
Jazz Investments I Ltd. | | | | | | | | |
1.875%, 8/15/21 | | | 120,000 | | | | 126,112 | |
1.500%, 8/15/24 | | | 59,000 | | | | 58,748 | |
Medicines Co. (The) | | | | | | | | |
2.500%, 1/15/22 | | | 131,000 | | | | 126,432 | |
Pacira Pharmaceuticals, Inc. | | | | | | | | |
2.375%, 4/1/22 | | | 131,000 | | | | 137,086 | |
Paratek Pharmaceuticals, Inc. | | | | | | | | |
4.750%, 5/1/24§ | | | 91,000 | | | | 78,069 | |
| | | | | | | | |
| | | | | | | 889,287 | |
| | | | | | | | |
Total Health Care | | | | | | | 4,694,519 | |
| | | | | | | | |
Industrials (6.4%) | | | | | | | | |
Air Freight & Logistics (1.3%) | | | | | | | | |
Atlas Air Worldwide Holdings, Inc. | | | | | | | | |
1.875%, 6/1/24 | | | 91,000 | | | | 96,744 | |
Echo Global Logistics, Inc. | | | | | | | | |
2.500%, 5/1/20 | | | 200,000 | | | | 197,404 | |
| | | | | | | | |
| | | | | | | 294,148 | |
| | | | | | | | |
Building Products (0.6%) | | | | | | | | |
Patrick Industries, Inc. | | | | | | | | |
1.000%, 2/1/23§ | | | 182,000 | | | | 153,449 | |
| | | | | | | | |
Commercial Services & Supplies (0.3%) | |
Team, Inc. | | | | | | | | |
5.000%, 8/1/23 | | | 57,000 | | | | 66,598 | |
| | | | | | | | |
Construction & Engineering (1.4%) | |
Dycom Industries, Inc. | | | | | | | | |
0.750%, 9/15/21 | | | 179,000 | | | | 180,310 | |
Tutor Perini Corp. | | | | | | | | |
2.875%, 6/15/21 | | | 143,000 | | | | 136,869 | |
| | | | | | | | |
| | | | | | | 317,179 | |
| | | | | | | | |
Machinery (1.8%) | |
Chart Industries, Inc. | | | | | | | | |
1.000%, 11/15/24§ | | | 155,000 | | | | 199,747 | |
Greenbrier Cos., Inc. (The) | | | | | | | | |
2.875%, 2/1/24 | | | 170,000 | | | | 178,647 | |
Meritor, Inc. | | | | | | | | |
3.250%, 10/15/37 | | | 60,000 | | | | 55,356 | |
| | | | | | | | |
| | | | | | | 433,750 | |
| | | | | | | | |
Transportation Infrastructure (1.0%) | |
Macquarie Infrastructure Corp. | | | | | | | | |
2.875%, 7/15/19 | | | 60,000 | | | | 59,511 | |
2.000%, 10/1/23 | | | 191,000 | | | | 169,998 | |
| | | | | | | | |
| | | | | | | 229,509 | |
| | | | | | | | |
Total Industrials | | | | | | | 1,494,633 | |
| | | | | | | | |
Information Technology (33.7%) | | | | | | | | |
Communications Equipment (3.3%) | | | | | | | | |
Finisar Corp. | | | | | | | | |
0.500%, 12/15/36 | | | 81,000 | | | | 72,028 | |
Infinera Corp. | | | | | | | | |
2.125%, 9/1/24 | | | 106,000 | | | | 93,545 | |
See Notes to Financial Statements.
10
1290 FUNDS
1290 CONVERTIBLE SECURITIES FUND
PORTFOLIO OF INVESTMENTS (Continued)
October 31, 2018
| | | | | | | | |
| | | Principal Amount | | | Value (Note 1) | |
| | | | | | | | |
Lumentum Holdings, Inc. | | | | | | | | |
0.250%, 3/15/24 | | $ | 253,000 | | | $ | 287,050 | |
Palo Alto Networks, Inc. | | | | | | | | |
(Zero Coupon), 7/1/19 | | | 145,000 | | | | 239,553 | |
0.750%, 7/1/23§ | | | 73,000 | | | | 70,917 | |
| | | | | | | | |
| | | | | | | 763,093 | |
| | | | | | | | |
Electronic Equipment, Instruments & Components (0.9%) | |
TTM Technologies, Inc. | | | | | | | | |
1.750%, 12/15/20 | | | 105,000 | | | | 137,888 | |
Vishay Intertechnology, Inc. | | | | | | | | |
2.250%, 11/15/40 | | | 50,000 | | | | 73,364 | |
| | | | | | | | |
| | | | | | | 211,252 | |
| | | | | | | | |
IT Services (2.6%) | | | | | | | | |
Akamai Technologies, Inc. | | | | | | | | |
0.125%, 5/1/25§ | | | 61,000 | | | | 59,513 | |
Cardtronics, Inc. | | | | | | | | |
1.000%, 12/1/20 | | | 41,000 | | | | 38,181 | |
GDS Holdings Ltd. | | | | | | | | |
2.000%, 6/1/25§ | | | 122,000 | | | | 89,007 | |
Okta, Inc. | | | | | | | | |
0.250%, 2/15/23§ | | | 90,000 | | | | 122,656 | |
Square, Inc. | | | | | | | | |
0.500%, 5/15/23§ | | | 122,000 | | | | 146,136 | |
Twilio, Inc. | | | | | | | | |
0.250%, 6/1/23§ | | | 82,000 | | | | 102,271 | |
Wix.com Ltd. | | | | | | | | |
(Zero Coupon), 7/1/23§ | | | 48,000 | | | | 47,448 | |
| | | | | | | | |
| | | | | | | 605,212 | |
| | | | | | | | |
Semiconductors & Semiconductor Equipment (14.1%) | |
Advanced Micro Devices, Inc. | | | | | | | | |
2.125%, 9/1/26 | | | 107,000 | | | | 254,902 | |
Cypress Semiconductor Corp. | | | | | | | | |
4.500%, 1/15/22 | | | 96,000 | | | | 113,352 | |
Inphi Corp. | | | | | | | | |
1.125%, 12/1/20 | | | 87,000 | | | | 90,915 | |
0.750%, 9/1/21 | | | 15,000 | | | | 13,912 | |
Intel Corp. | | | | | | | | |
3.250%, 8/1/39 | | | 211,000 | | | | 478,694 | |
Microchip Technology, Inc. | | | | | | | | |
1.625%, 2/15/25 | | | 259,000 | | | | 337,341 | |
1.625%, 2/15/27 | | | 485,000 | | | | 459,071 | |
Micron Technology, Inc. | | | | | | | | |
Series F | | | | | | | | |
2.125%, 2/15/33 | | | 47,000 | | | | 162,093 | |
Series G | | | | | | | | |
3.000%, 11/15/43 | | | 296,000 | | | | 385,687 | |
Novellus Systems, Inc. | | | | | | | | |
2.625%, 5/15/41 | | | 94,000 | | | | 402,856 | |
NXP Semiconductors NV | | | | | | | | |
1.000%, 12/1/19 | | | 45,000 | | | | 45,502 | |
ON Semiconductor Corp. | | | | | | | | |
1.000%, 12/1/20 | | | 120,000 | | | | 134,482 | |
Rambus, Inc. | | | | | | | | |
1.375%, 2/1/23§ | | | 91,000 | | | | 79,676 | |
SunPower Corp. | | | | | | | | |
4.000%, 1/15/23 | | | 30,000 | | | | 24,465 | |
Synaptics, Inc. | | | | | | | | |
0.500%, 6/15/22 | | | 107,000 | | | | 95,230 | |
| | | | | | | | |
Teradyne, Inc. | | | | | | | | |
1.250%, 12/15/23 | | | 121,000 | | | | 151,951 | |
Veeco Instruments, Inc. | | | | | | | | |
2.700%, 1/15/23 | | | 72,000 | | | | 60,197 | |
| | | | | | | | |
| | | | | | | 3,290,326 | |
| | | | | | | | |
Software (11.8%) | | | | | | | | |
Citrix Systems, Inc. | | | | | | | | |
0.500%, 4/15/19 | | | 150,000 | | | | 212,514 | |
Coupa Software, Inc. | | | | | | | | |
0.375%, 1/15/23§ | | | 47,000 | | | | 72,615 | |
DocuSign, Inc. | | | | | | | | |
0.500%, 9/15/23§ | | | 122,000 | | | | 114,375 | |
FireEye, Inc. | | | | | | | | |
0.875%, 6/1/24§ | | | 121,000 | | | | 127,126 | |
Series A | | | | | | | | |
1.000%, 6/1/35 | | | 148,000 | | | | 142,821 | |
Guidewire Software, Inc. | | | | | | | | |
1.250%, 3/15/25 | | | 137,000 | | | | 137,756 | |
HubSpot, Inc. | | | | | | | | |
0.250%, 6/1/22 | | | 61,000 | | | | 92,415 | |
Nutanix, Inc. | | | | | | | | |
(Zero Coupon), 1/15/23§ | | | 181,000 | | | | 199,385 | |
PROS Holdings, Inc. | | | | | | | | |
2.000%, 12/1/19 | | | 80,000 | | | | 87,944 | |
Q2 Holdings, Inc. | | | | | | | | |
0.750%, 2/15/23§ | | | 75,000 | | | | 82,097 | |
RealPage, Inc. | | | | | | | | |
1.500%, 11/15/22 | | | 93,000 | | | | 128,371 | |
Red Hat, Inc. | | | | | | | | |
0.250%, 10/1/19 | | | 118,000 | | | | 274,390 | |
RingCentral, Inc. | | | | | | | | |
(Zero Coupon), 3/15/23§ | | | 78,000 | | | | 88,124 | |
Rovi Corp. | | | | | | | | |
0.500%, 3/1/20 | | | 60,000 | | | | 56,936 | |
ServiceNow, Inc. | | | | | | | | |
(Zero Coupon), 6/1/22 | | | 119,000 | | | | 167,943 | |
Splunk, Inc. | | | | | | | | |
0.500%, 9/15/23§ | | | 243,000 | | | | 232,566 | |
1.125%, 9/15/25§ | | | 61,000 | | | | 57,741 | |
Synchronoss Technologies, Inc. | | | | | | | | |
0.750%, 8/15/19 | | | 95,000 | | | | 90,648 | |
Verint Systems, Inc. | | | | | | | | |
1.500%, 6/1/21 | | | 129,000 | | | | 127,998 | |
Workday, Inc. | | | | | | | | |
0.250%, 10/1/22 | | | 141,000 | | | | 156,613 | |
Zendesk, Inc. | | | | | | | | |
0.250%, 3/15/23§ | | | 90,000 | | | | 98,559 | |
| | | | | | | | |
| | | | | | | 2,748,937 | |
| | | | | | | | |
Technology Hardware, Storage & Peripherals (1.0%) | |
Pure Storage, Inc. | | | | | | | | |
0.125%, 4/15/23§ | | | 145,000 | | | | 147,896 | |
Western Digital Corp. | | | | | | | | |
1.500%, 2/1/24§ | | | 106,000 | | | | 89,348 | |
| | | | | | | | |
| | | | | | | 237,244 | |
| | | | | | | | |
Total Information Technology | | | | | | | 7,856,064 | |
| | | | | | | | |
Materials (1.7%) | | | | | | | | |
Construction Materials (1.0%) | | | | | | | | |
Cemex SAB de CV | | | | | | | | |
3.720%, 3/15/20 | | | 243,000 | | | | 238,719 | |
| | | | | | | | |
See Notes to Financial Statements.
11
1290 FUNDS
1290 CONVERTIBLE SECURITIES FUND
PORTFOLIO OF INVESTMENTS (Continued)
October 31, 2018
| | | | | | | | |
| | | Principal Amount | | | Value (Note 1) | |
| | | | | | | | |
Metals & Mining (0.7%) | | | | | | | | |
Allegheny Technologies, Inc. | | | | | | | | |
4.750%, 7/1/22 | | $ | 42,000 | | | $ | 81,269 | |
Cleveland-Cliffs, Inc. | | | | | | | | |
1.500%, 1/15/25 | | | 61,000 | | | | 87,076 | |
| | | | | | | | |
| | | | | | | 168,345 | |
| | | | | | | | |
Total Materials | | | | | | | 407,064 | |
| | | | | | | | |
Real Estate (0.9%) | | | | | | | | |
Equity Real Estate Investment Trusts (REITs) (0.5%) | |
Colony Capital, Inc. (REIT) | | | | | | | | |
5.000%, 4/15/23 | | | 65,000 | | | | 60,613 | |
IH Merger Sub LLC (REIT) | | | | | | | | |
3.500%, 1/15/22 | | | 54,000 | | | | 57,753 | |
| | | | | | | | |
| | | | | | | 118,366 | |
| | | | | | | | |
Real Estate Management & Development (0.4%) | |
Redfin Corp. | | | | | | | | |
1.750%, 7/15/23 | | | 97,000 | | | | 82,285 | |
| | | | | | | | |
Total Real Estate | | | | | | | 200,651 | |
| | | | | | | | |
Total Convertible Bonds | | | | | | | 19,116,801 | |
| | | | | | | | |
Total Long-Term Debt Securities (81.9%)
(Cost $18,964,625) | | | | | | | 19,116,801 | |
| | | | | | | | |
| | | Number of
Shares | | | Value
(Note 1) | |
CONVERTIBLE PREFERRED STOCKS: | |
Consumer Staples (0.3%) | | | | | | | | |
Food Products (0.3%) | | | | | | | | |
Bunge Ltd., | | | | | | | | |
4.875% | | | 592 | | | | 61,272 | |
| | | | | | | | |
Total Consumer Staples | | | | | | | 61,272 | |
| | | | | | | | |
Energy (0.9%) | | | | | | | | |
Energy Equipment & Services (0.5%) | | | | | | | | |
Nabors Industries Ltd., | | | | | | | | |
6.000% | | | 3,147 | | | | 119,586 | |
| | | | | | | | |
Oil, Gas & Consumable Fuels (0.4%) | | | | | | | | |
Hess Corp., | | | | | | | | |
8.000% | | | 1,390 | | | | 88,251 | |
| | | | | | | | |
Total Energy | | | | | | | 207,837 | |
| | | | | | | | |
Financials (6.3%) | | | | | | | | |
Banks (4.9%) | | | | | | | | |
Bank of America Corp., | | | | | | | | |
Series L | | | | | | | | |
7.250% | | | 292 | | | | 371,220 | |
Wells Fargo & Co., | | | | | | | | |
Series L | | | | | | | | |
7.500% | | | 610 | | | | 775,914 | |
| | | | | | | | |
| | | | | | | 1,147,134 | |
| | | | | | | | |
Capital Markets (0.9%) | | | | | | | | |
AMG Capital Trust II, | | | | | | | | |
5.150% | | | 545 | | | | 28,831 | |
Mandatory Exchangeable Trust, | | | | | | | | |
5.750%§ | | | 1,083 | | | | 174,720 | |
| | | | | | | | |
| | | | | | | 203,551 | |
| | | | | | | | |
| | | | | | | | |
Insurance (0.5%) | | | | | | | | |
Assurant, Inc., | | | | | | | | |
Series D | | | | | | | | |
6.500% | | | 1,218 | | | | 129,952 | |
| | | | | | | | |
Total Financials | | | | | | | 1,480,637 | |
| | | | | | | | |
Health Care (2.4%) | | | | | | | | |
Health Care Equipment & Supplies (2.4%) | |
Becton Dickinson and Co., | | | | | | | | |
Series A | | | | | | | | |
6.125% | | | 9,652 | | | | 566,283 | |
| | | | | | | | |
Total Health Care | | | | | | | 566,283 | |
| | | | | | | | |
Industrials (1.5%) | | | | | | | | |
Machinery (1.5%) | | | | | | | | |
Fortive Corp., | | | | | | | | |
Series A | | | | | | | | |
5.000% | | | 273 | | | | 268,143 | |
Rexnord Corp., | | | | | | | | |
Series A | | | | | | | | |
5.750% | | | 1,335 | | | | 76,322 | |
| | | | | | | | |
Total Industrials | | | | | | | 344,465 | |
| | | | | | | | |
Information Technology (1.0%) | | | | | | | | |
Electronic Equipment, Instruments & Components (1.0%) | |
Belden, Inc., | | | | | | | | |
6.750% | | | 1,833 | | | | 136,173 | |
MTS Systems Corp., | | | | | | | | |
8.750% | | | 812 | | | | 84,355 | |
| | | | | | | | |
Total Information Technology | | | | | | | 220,528 | |
| | | | | | | | |
Materials (0.5%) | | | | | | | | |
Chemicals (0.5%) | | | | | | | | |
International Flavors & Fragrances, Inc., | | | | | | | | |
6.000%* | | | 1,145 | | | | 65,929 | |
Rayonier Advanced Materials, Inc., | | | | | | | | |
Series A | | | | | | | | |
8.000% | | | 548 | | | | 50,553 | |
| | | | | | | | |
Total Materials | | | | | | | 116,482 | |
| | | | | | | | |
Real Estate (1.4%) | |
Equity Real Estate Investment Trusts (REITs) (1.4%) | |
Crown Castle International Corp. (REIT), | | | | | |
Series A | | | | | | | | |
6.875% | | | 186 | | | | 194,370 | |
Welltower, Inc. (REIT), | | | | | | | | |
Series I | | | | | | | | |
6.500% | | | 2,076 | | | | 127,882 | |
| | | | | | | | |
Total Real Estate | | | | | | | 322,252 | |
| | | | | | | | |
Utilities (0.6%) | | | | | | | | |
Electric Utilities (0.3%) | | | | | | | | |
NextEra Energy, Inc., | | | | | | | | |
6.123% | | | 1,095 | | | | 63,510 | |
| | | | | | | | |
Multi-Utilities (0.3%) | | | | | | | | |
Dominion Energy, Inc., | | | | | | | | |
Series A | | | | | | | | |
6.750% | | | 1,210 | | | | 58,020 | |
See Notes to Financial Statements.
12
1290 FUNDS
1290 CONVERTIBLE SECURITIES FUND
PORTFOLIO OF INVESTMENTS (Continued)
October 31, 2018
| | | | | | | | |
| | | Number of
Shares | | | Value
(Note 1) | |
| | | | | | | | |
Sempra Energy, | | | | | | | | |
Series A | | | | | | | | |
6.000% | | | 270 | | | $ | 26,773 | |
| | | | | | | | |
| | | | | | | 84,793 | |
| | | | | | | | |
Total Utilities | | | | | | | 148,303 | |
| | | | | | | | |
Total Convertible Preferred Stocks (14.9%)
(Cost $3,433,317) | | | | | | | 3,468,059 | |
| | | | | | | | |
SHORT-TERM INVESTMENT: | | | | | | | | |
Investment Company (0.4%) | | | | | | | | |
JPMorgan Prime Money Market Fund, IM Shares | | | 105,294 | | | | 105,315 | |
| | | | | | | | |
Total Short-Term Investment (0.4%)
(Cost $105,316) | | | | | | | 105,315 | |
| | | | | | | | |
Total Investments in Securities (97.2%)
(Cost $22,503,258) | | | | | | | 22,690,175 | |
Other Assets Less Liabilities (2.8%) | | | | | | | 651,154 | |
| | | | | | | | |
Net Assets (100%) | | | | | | $ | 23,341,329 | |
| | | | | | | | |
| § | Securities exempt from registration under Rule 144A of the Securities Act of 1933. These securities may only be resold to qualified institutional buyers. At October 31, 2018, the market value of these securities amounted to $4,323,606 or 18.5% of net assets. Securities denoted with “§” but without “b” have been determined to be liquid under the guidelines established by the Board of Trustees. To the extent any securities might provide a right to demand registration, such rights have not been relied upon when determining liquidity. |
| (b) | Rule 144A Illiquid Security. At October 31, 2018, the market value of these securities amounted to $88,942 or 0.4% of net assets. |
| (e) | Step Bond - Coupon rate increases or decreases in increments to maturity. Rate disclosed is as of October 31, 2018. Maturity date disclosed is the ultimate maturity date. |
The following is a summary of the inputs used to value the Fund’s assets and liabilities carried at fair value as of October 31, 2018:
The inputs or methodology used for valuing securities are not necessarily an indication of the risk associated with investing in those securities.
Various inputs are used in determining the value of the Fund’s investments. These inputs are summarized in the three broad levels listed below:
| | | | | | | | | | | | | | | | |
| | | | | |
| Investment Type | | Level 1
Quoted Prices in
Active Markets for
Identical
Securities | | | Level 2
Significant Other
Observable Inputs
(including quoted prices
for similar securities,
interest rates,
prepayment speeds,
credit risk, etc.) | | | Level 3
Significant Unobservable
Inputs (including the
Fund’s own assumptions in
determining the fair
value of investments) | | | Total | |
Assets: | |
Convertible Bonds | | | | | | | | | | | | | | | | |
Communication Services | | $ | — | | | $ | 1,319,565 | | | $ | — | | | $ | 1,319,565 | |
Consumer Discretionary | | | — | | | | 1,590,747 | | | | — | | | | 1,590,747 | |
Energy | | | — | | | | 1,071,614 | | | | — | | | | 1,071,614 | |
Financials | | | — | | | | 481,944 | | | | — | | | | 481,944 | |
Health Care | | | — | | | | 4,694,519 | | | | — | | | | 4,694,519 | |
Industrials | | | — | | | | 1,494,633 | | | | — | | | | 1,494,633 | |
Information Technology | | | — | | | | 7,856,064 | | | | — | | | | 7,856,064 | |
Materials | | | — | | | | 407,064 | | | | — | | | | 407,064 | |
Real Estate | | | — | | | | 200,651 | | | | — | | | | 200,651 | |
Convertible Preferred Stocks | | | | | | | | | | | | | | | | |
Consumer Staples | | | 61,272 | | | | — | | | | — | | | | 61,272 | |
Energy | | | 207,837 | | | | — | | | | — | | | | 207,837 | |
Financials | | | 1,147,134 | | | | 333,503 | | | | — | | | | 1,480,637 | |
Health Care | | | 566,283 | | | | — | | | | — | | | | 566,283 | |
Industrials | | | 344,465 | | | | — | | | | — | | | | 344,465 | |
Information Technology | | | 136,173 | | | | 84,355 | | | | — | | | | 220,528 | |
Materials | | | 116,482 | | | | — | | | | — | | | | 116,482 | |
Real Estate | | | 322,252 | | | | — | | | | — | | | | 322,252 | |
Utilities | | | 148,303 | | | | — | | | | — | | | | 148,303 | |
See Notes to Financial Statements.
13
1290 FUNDS
1290 CONVERTIBLE SECURITIES FUND
PORTFOLIO OF INVESTMENTS (Continued)
October 31, 2018
| | | | | | | | | | | | | | | | |
| | | | | |
| Investment Type | | Level 1
Quoted Prices in
Active Markets for
Identical
Securities | | | Level 2
Significant Other
Observable Inputs
(including quoted prices
for similar securities,
interest rates,
prepayment speeds,
credit risk, etc.) | | | Level 3
Significant Unobservable
Inputs (including the
Fund’s own assumptions in
determining the fair
value of investments) | | | Total | |
Short-Term Investment | | | | | | | | | | | | | | | | |
Investment Company | | $ | 105,315 | | | $ | — | | | $ | — | | | $ | 105,315 | |
| | | | | | | | | | | | | | | | |
Total Assets | | $ | 3,155,516 | | | $ | 19,534,659 | | | $ | — | | | $ | 22,690,175 | |
| | | | | | | | | | | | | | | | |
Total Liabilities | | $ | — | | | $ | — | | | $ | — | | | $ | — | |
| | | | | | | | | | | | | | | | |
Total | | $ | 3,155,516 | | | $ | 19,534,659 | | | $ | — | | | $ | 22,690,175 | |
| | | | | | | | | | | | | | | | |
The Fund held no derivatives contracts during the year ended October 31, 2018.
Investment security transactions for the year ended October 31, 2018 were as follows:
| | | | |
Cost of Purchases: | | | | |
Long-term investments other than U.S. government debt securities | | $ | 10,779,037 | |
Net Proceeds of Sales and Redemptions: | | | | |
Long-term investments other than U.S. government debt securities | | $ | 10,570,159 | |
As of October 31, 2018, the gross unrealized appreciation (depreciation) of investments based on the aggregate cost of investments in securities and derivative instruments, if applicable, for Federal income tax purposes was as follows:
| | | | |
Aggregate gross unrealized appreciation | | $ | 1,743,505 | |
Aggregate gross unrealized depreciation | | | (1,697,816 | ) |
| | | | |
Net unrealized appreciation | | $ | 45,689 | |
| | | | |
Federal income tax cost of investments in securities and derivative instruments, if applicable | | $ | 22,644,486 | |
| | | | |
See Notes to Financial Statements.
14
1290 FUNDS
1290 CONVERTIBLE SECURITIES FUND
STATEMENT OF ASSETS AND LIABILITIES
October 31, 2018
| | | | |
|
ASSETS | |
Investments in Securities, at value (Cost $22,503,258) | | $ | 22,690,175 | |
Cash | | | 642,918 | |
Dividends, interest and other receivables | | | 99,202 | |
Prepaid registration and filing fees | | | 16,209 | |
Receivable for securities sold | | | 3,082 | |
Receivable for Fund shares sold | | | 1,147 | |
Other assets | | | 292 | |
| | | | |
Total assets | | | 23,453,025 | |
| | | | |
LIABILITIES | | | | |
Dividends and distributions payable | | | 32,731 | |
Transfer agent fees payable | | | 5,029 | |
Administrative fees payable | | | 2,361 | |
Payable for Fund shares redeemed | | | 807 | |
Distribution fees payable – Class A | | | 111 | |
Distribution fees payable – Class R | | | 57 | |
Accrued expenses | | | 70,600 | |
| | | | |
Total liabilities | | | 111,696 | |
| | | | |
NET ASSETS | | $ | 23,341,329 | |
| | | | |
Net assets were comprised of: | | | | |
Paid in capital | | $ | 22,189,722 | |
Total distributable earnings (loss) | | | 1,151,607 | |
| | | | |
Net assets | | $ | 23,341,329 | |
| | | | |
Class A | | | | |
Net asset value and redemption price per share, $512,496 / 48,735 shares outstanding (unlimited amount authorized: $0.001 par value) | | $ | 10.52 | |
Maximum sales charge (4.50% of offering price) | | | 0.50 | |
| | | | |
Maximum offering price per share | | $ | 11.02 | |
| | | | |
Class I | | | | |
Net asset value and redemption price per share, $22,696,623 / 2,158,028 shares outstanding (unlimited amount authorized: $0.001 par value) | | $ | 10.52 | |
| | | | |
Class R | | | | |
Net asset value and redemption price per share, $132,210 / 12,576 shares outstanding (unlimited amount authorized: $0.001 par value) | | $ | 10.51 | |
| | | | |
STATEMENT OF OPERATIONS
For the Year Ended October 31, 2018
| | | | |
| |
INVESTMENT INCOME | | | | |
Interest | | $ | 338,309 | |
Dividends | | | 248,625 | |
| | | | |
Total income | | | 586,934 | |
| | | | |
EXPENSES | | | | |
Investment advisory fees | | | 168,174 | |
Professional fees | | | 80,125 | |
Administrative fees | | | 36,037 | |
Registration and filing fees | | | 33,823 | |
Transfer agent fees | | | 29,850 | |
Printing and mailing expenses | | | 23,768 | |
Custodian fees | | | 10,800 | |
Trustees’ fees | | | 2,521 | |
Distribution fees – Class A | | | 1,197 | |
Distribution fees – Class R | | | 679 | |
Miscellaneous | | | 21,118 | |
| | | | |
Gross expenses | | | 408,092 | |
Less: Waiver from investment adviser | | | (155,000 | ) |
| | | | |
Net expenses | | | 253,092 | |
| | | | |
NET INVESTMENT INCOME (LOSS) | | | 333,842 | |
| | | | |
REALIZED AND UNREALIZED GAIN (LOSS) | | | | |
Net realized gain (loss) on investments in securities | | | 1,094,133 | |
Net change in unrealized appreciation (depreciation) on investments in securities | | | (1,515,380 | ) |
| | | | |
NET REALIZED AND UNREALIZED GAIN (LOSS) | | | (421,247 | ) |
| | | | |
NET INCREASE (DECREASE) IN NET ASSETS RESULTING FROM OPERATIONS | | $ | (87,405 | ) |
| | | | |
See Notes to Financial Statements.
15
1290 FUNDS
1290 CONVERTIBLE SECURITIES FUND
STATEMENT OF CHANGES IN NET ASSETS
| | | | | | | | |
| | | Year Ended October 31, | |
| | 2018 | | | 2017 | |
INCREASE (DECREASE) IN NET ASSETS FROM OPERATIONS: | | | | | | | | |
Net investment income (loss) | | $ | 333,842 | | | $ | 389,728 | |
Net realized gain (loss) | | | 1,094,133 | | | | 835,244 | |
Net change in unrealized appreciation (depreciation) | | | (1,515,380 | ) | | | 2,187,146 | |
| | | | | | | | |
NET INCREASE (DECREASE) IN NET ASSETS RESULTING FROM OPERATIONS | | | (87,405 | ) | | | 3,412,118 | |
| | | | | | | | |
Distributions to shareholders: (a) | | | | | | | | |
Class A | | | (14,254 | ) | | | (9,313 | ) |
Class I | | | (777,213 | ) | | | (540,307 | ) |
Class R | | | (3,914 | ) | | | (2,099 | ) |
| | | | | | | | |
Total distributions to shareholders | | | (795,381 | ) | | | (551,719 | ) |
| | | | | | | | |
CAPITAL SHARES TRANSACTIONS: | | | | | | | | |
Class A | | | | | | | | |
Capital shares sold [ 10,198 and 2,344 shares, respectively ] | | | 114,133 | | | | 23,819 | |
Capital shares issued in reinvestment of dividends [ 1,010 and 691 shares, respectively ] | | | 10,820 | | | | 6,958 | |
Capital shares repurchased [ (2,118) and (2,543) shares, respectively ] | | | (23,402 | ) | | | (26,262 | ) |
| | | | | | | | |
Total Class A transactions | | | 101,551 | | | | 4,515 | |
| | | | | | | | |
Class I | | | | | | | | |
Capital shares sold [ 82,739 and 64,823 shares, respectively ] | | | 914,895 | | | | 666,975 | |
Capital shares issued in reinvestment of dividends [ 4,466 and 2,258 shares, respectively ] | | | 47,979 | | | | 22,933 | |
Capital shares repurchased [ (25,797) and (18,804) shares, respectively ] | | | (283,983 | ) | | | (192,919 | ) |
| | | | | | | | |
Total Class I transactions | | | 678,891 | | | | 496,989 | |
| | | | | | | | |
Class R | | | | | | | | |
Capital shares sold [ 2,514 and 0 shares, respectively ] | | | 27,506 | | | | — | |
Capital shares issued in reinvestment of dividends [ 69 and 0# shares, respectively ] | | | 733 | | | | 2 | |
Capital shares repurchased [ (17) and 0 shares, respectively ] | | | (185 | ) | | | — | |
| | | | | | | | |
Total Class R transactions | | | 28,054 | | | | 2 | |
| | | | | | | | |
NET INCREASE (DECREASE) IN NET ASSETS RESULTING FROM CAPITAL SHARE TRANSACTIONS | | | 808,496 | | | | 501,506 | |
| | | | | | | | |
TOTAL INCREASE (DECREASE) IN NET ASSETS | | | (74,290 | ) | | | 3,361,905 | |
NET ASSETS: | | | | | | | | |
Beginning of year | | | 23,415,619 | | | | 20,053,714 | |
| | | | | | | | |
End of year (b) | | $ | 23,341,329 | | | $ | 23,415,619 | |
| | | | | | | | |
# Number of shares is less than 0.5. | | | | | | | | |
(a) Prior year distributions to shareholders were made up of dividends from net investment income of $9,313, $540,307 and $2,099 for Classes A, I and R, respectively. These amounts were reclassified to conform with the current year presentation. | |
(b) Includes accumulated undistributed (overdistributed) net investment income of $99,779 as of October 31, 2017. The SEC eliminated the requirement to disclose undistributed net investment income in 2018. | |
See Notes to Financial Statements.
16
1290 FUNDS
1290 CONVERTIBLE SECURITIES FUND
FINANCIAL HIGHLIGHTS
| | | | | | | | | | | | | | | | |
Class A | | Year Ended October 31, | | | July 6, 2015* to
October 31, 2015 | |
| | 2018 | | | 2017 | | | 2016 | |
Net asset value, beginning of period | | $ | 10.91 | | | $ | 9.56 | | | $ | 9.56 | | | $ | 10.00 | |
| | | | | | | | | | | | | | | | |
Income (loss) from investment operations: | | | | | | | | | | | | | | | | |
Net investment income (loss) (e) | | | 0.13 | | | | 0.16 | | | | 0.14 | | | | 0.03 | |
Net realized and unrealized gain (loss) | | | (0.18 | ) | | | 1.43 | | | | 0.04 | | | | (0.44 | ) |
| | | | | | | | | | | | | | | | |
Total from investment operations | | | (0.05 | ) | | | 1.59 | | | | 0.18 | | | | (0.41 | ) |
| | | | | | | | | | | | | | | | |
Less distributions: | | | | | | | | | | | | | | | | |
Dividends from net investment income | | | (0.23 | ) | | | (0.24 | ) | | | (0.18 | ) | | | (0.03 | ) |
Distributions from net realized gains | | | (0.11 | ) | | | — | | | | — | | | | — | |
| | | | | | | | | | | | | | | | |
Total dividends and distributions | | | (0.34 | ) | | | (0.24 | ) | | | (0.18 | ) | | | (0.03 | ) |
| | | | | | | | | | | | | | | | |
Net asset value, end of period | | $ | 10.52 | | | $ | 10.91 | | | $ | 9.56 | | | $ | 9.56 | |
| | | | | | | | | | | | | | | | |
Total return (b) | | | (0.46 | )% | | | 16.82 | % | | | 1.97 | % | | | (4.08 | )% |
| | | | | | | | | | | | | | | | |
Ratios/Supplemental Data: | | | | | | | | | | | | | | | | |
Net assets, end of period (000’s) | | $ | 512 | | | $ | 433 | | | $ | 374 | | | $ | 206 | |
Ratio of expenses to average net assets: | | | | | | | | | | | | | | | | |
After waivers and reimbursements (a)(f) | | | 1.30 | % | | | 1.30 | % | | | 1.30 | % | | | 1.30 | % |
Before waivers and reimbursements (a)(f) | | | 1.94 | % | | | 2.07 | % | | | 2.26 | % | | | 2.09 | % |
Ratio of net investment income (loss) to average net assets: | | | | | | | | | | | | | | | | |
After waivers and reimbursements (a)(f) | | | 1.14 | % | | | 1.54 | % | | | 1.49 | % | | | 1.09 | %(l) |
Before waivers and reimbursements (a)(f) | | | 0.49 | % | | | 0.78 | % | | | 0.52 | % | | | 0.30 | %(l) |
Portfolio turnover rate (z)^ | | | 45 | % | | | 41 | % | | | 32 | % | | | 6 | % |
| | | | | | | | | | | | | | | | |
Class I | | Year Ended October 31, | | | July 6, 2015* to
October 31, 2015 | |
| | 2018 | | | 2017 | | | 2016 | |
Net asset value, beginning of period | | $ | 10.91 | | | $ | 9.56 | | | $ | 9.56 | | | $ | 10.00 | |
| | | | | | | | | | | | | | | | |
Income (loss) from investment operations: | | | | | | | | | | | | | | | | |
Net investment income (loss) (e) | | | 0.15 | | | | 0.18 | | | | 0.17 | | | | 0.04 | |
Net realized and unrealized gain (loss) | | | (0.17 | ) | | | 1.43 | | | | 0.04 | | | | (0.44 | ) |
| | | | | | | | | | | | | | | | |
Total from investment operations | | | (0.02 | ) | | | 1.61 | | | | 0.21 | | | | (0.40 | ) |
| | | | | | | | | | | | | | | | |
Less distributions: | | | | | | | | | | | | | | | | |
Dividends from net investment income | | | (0.26 | ) | | | (0.26 | ) | | | (0.21 | ) | | | (0.04 | ) |
Distributions from net realized gains | | | (0.11 | ) | | | — | | | | — | | | | — | |
| | | | | | | | | | | | | | | | |
Total dividends and distributions | | | (0.37 | ) | | | (0.26 | ) | | | (0.21 | ) | | | (0.04 | ) |
| | | | | | | | | | | | | | | | |
Net asset value, end of period | | $ | 10.52 | | | $ | 10.91 | | | $ | 9.56 | | | $ | 9.56 | |
| | | | | | | | | | | | | | | | |
Total return (b) | | | (0.23 | )% | | | 17.11 | % | | | 2.23 | % | | | (4.00 | )% |
| | | | | | | | | | | | | | | | |
Ratios/Supplemental Data: | | | | | | | | | | | | | | | | |
Net assets, end of period (000’s) | | $ | 22,697 | | | $ | 22,874 | | | $ | 19,584 | | | $ | 19,073 | |
Ratio of expenses to average net assets: | | | | | | | | | | | | | | | | |
After waivers and reimbursements (a)(f) | | | 1.05 | % | | | 1.05 | % | | | 1.05 | % | | | 1.05 | % |
Before waivers and reimbursements (a)(f) | | | 1.69 | % | | | 1.82 | % | | | 1.99 | % | | | 1.72 | % |
Ratio of net investment income (loss) to average net assets: | | | | | | | | | | | | | | | | |
After waivers and reimbursements (a)(f) | | | 1.40 | % | | | 1.80 | % | | | 1.78 | % | | | 1.37 | %(l) |
Before waivers and reimbursements (a)(f) | | | 0.75 | % | | | 1.03 | % | | | 0.84 | % | | | 0.70 | %(l) |
Portfolio turnover rate (z)^ | | | 45 | % | | | 41 | % | | | 32 | % | | | 6 | % |
See Notes to Financial Statements.
17
1290 FUNDS
1290 CONVERTIBLE SECURITIES FUND
FINANCIAL HIGHLIGHTS (Continued)
| | | | | | | | | | | | | | | | |
Class R | | Year Ended October 31, | | | July 6, 2015* to
October 31, 2015 | |
| | 2018 | | | 2017 | | | 2016 | |
Net asset value, beginning of period | | $ | 10.91 | | | $ | 9.56 | | | $ | 9.56 | | | $ | 10.00 | |
| | | | | | | | | | | | | | | | |
Income (loss) from investment operations: | | | | | | | | | | | | | | | | |
Net investment income (loss) (e) | | | 0.10 | | | | 0.13 | | | | 0.12 | | | | 0.03 | |
Net realized and unrealized gain (loss) | | | (0.18 | ) | | | 1.43 | | | | 0.04 | | | | (0.45 | ) |
| | | | | | | | | | | | | | | | |
Total from investment operations | | | (0.08 | ) | | | 1.56 | | | | 0.16 | | | | (0.42 | ) |
| | | | | | | | | | | | | | | | |
Less distributions: | | | | | | | | | | | | | | | | |
Dividends from net investment income | | | (0.21 | ) | | | (0.21 | ) | | | (0.16 | ) | | | (0.02 | ) |
Distributions from net realized gains | | | (0.11 | ) | | | — | | | | — | | | | — | |
| | | | | | | | | | | | | | | | |
Total dividends and distributions | | | (0.32 | ) | | | (0.21 | ) | | | (0.16 | ) | | | (0.02 | ) |
| | | | | | | | | | | | | | | | |
Net asset value, end of period | | $ | 10.51 | | | $ | 10.91 | | | $ | 9.56 | | | $ | 9.56 | |
| | | | | | | | | | | | | | | | |
Total return (b) | | | (0.78 | )% | | | 16.53 | % | | | 1.72 | % | | | (4.16 | )% |
| | | | | | | | | | | | | | | | |
Ratios/Supplemental Data: | | | | | | | | | | | | | | | | |
Net assets, end of period (000’s) | | $ | 132 | | | $ | 109 | | | $ | 96 | | | $ | 96 | |
Ratio of expenses to average net assets: | | | | | | | | | | | | | | | | |
After waivers and reimbursements (a)(f) | | | 1.55 | % | | | 1.55 | % | | | 1.55 | % | | | 1.55 | % |
Before waivers and reimbursements (a)(f) | | | 2.19 | % | | | 2.32 | % | | | 2.49 | % | | | 2.22 | % |
Ratio of net investment income (loss) to average net assets: | | | | | | | | | | | | | | | | |
After waivers and reimbursements (a)(f) | | | 0.90 | % | | | 1.30 | % | | | 1.28 | % | | | 0.87 | %(l) |
Before waivers and reimbursements (a)(f) | | | 0.25 | % | | | 0.53 | % | | | 0.34 | % | | | 0.20 | %(l) |
Portfolio turnover rate (z)^ | | | 45 | % | | | 41 | % | | | 32 | % | | | 6 | % |
| * | Commencement of Operations. |
| ^ | Portfolio turnover rate excludes derivatives, if any. |
| (a) | Ratios for periods less than one year are annualized. Certain non-recurring expenses incurred by the Fund are not annualized for periods less than one year. |
| (b) | Total returns for periods less than one year are not annualized. |
| (e) | Net investment income (loss) per share is based on average shares outstanding. |
| (f) | Expenses do not include the expenses of the underlying funds (“indirect expenses”), if applicable. |
| (l) | The annualized ratio of net investment income to average net assets may not be indicative of operating results for a full year. |
| (z) | Portfolio turnover rate for periods less than one year is not annualized. |
See Notes to Financial Statements.
18
1290 DIVERSIFIED BOND FUND (Unaudited)
INVESTMENT ADVISER
INVESTMENT SUB-ADVISERS
| Ø | | Brandywine Global Investment Management, LLC (Brandywine Global) (Effective June 15, 2018, Brandywine Global replaced Pacific Investment Management Company, LLC and TCW Investment Management Company LLC, as sub-advisers to the Fund) |
PERFORMANCE RESULTS
| | | | | | | | | | | | |
| Annualized Total Returns as of 10/31/18 | |
| | | | | | 1 Year | | | Since
Incept. | |
Fund – Class A Shares* | | | without Sales Charge | | | | (1.44 | )% | | | 1.36 | % |
| | | | with Sales Charge (a) | | | | (5.90 | ) | | | (0.03 | ) |
Fund – Class I Shares* | | | | | | | (1.19 | ) | | | 1.62 | |
Fund – Class R Shares* | | | | | | | (1.69 | ) | | | 1.10 | |
Bloomberg Barclays U.S. Aggregate Bond Index† | | | | | | | (2.05 | ) | | | 1.22 | |
ICE BofAML USD 3-Month Deposit Offered Rate Constant Maturity Index | | | | | | | 1.85 | | | | 1.07 | |
* Date of inception 7/6/15. † In 2018, the Fund’s benchmark index against which the Fund measures its performance, the ICE BofAML USD 3-Month Deposit Offered Rate Constant Maturity Index, was replaced with the Bloomberg Barclays U.S. Aggregate Bond Index. The Investment Adviser believes the Bloomberg Barclays U.S. Aggregate Bond Index serves as a better performance comparison for investors. (a) A 4.50% front-end sales charge was deducted. Returns for periods greater than one year are annualized. | |
The performance quoted is past performance and is not a guarantee of future results. Mutual funds are subject to certain market risks. Investment returns and principal value of an investment will fluctuate so that an investor’s shares, when redeemed, may be worth more or less than their original cost. Current performance may be higher or lower than the performance data shown. For the most current month-end performance data please call 1-888-310-0416 or visit www.1290Funds.com.
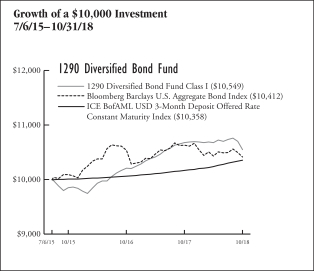
The graph illustrates comparative performance for $10,000 invested in the Class I Shares of the 1290 Diversified Bond Fund and the Bloomberg Barclays U.S. Aggregate Bond Index from 7/6/15 to 10/31/18. The performance of the Bloomberg Barclays U.S. Aggregate Bond Index reflects an initial investment at the end of the month closest to the Fund’s inception. The performance of the Fund assumes reinvestment of all dividends and capital gain distributions, if any, and does not include a sales charge. The performance of the Bloomberg Barclays U.S. Aggregate Bond Index does not reflect the deduction of expenses or a sales charge associated with a mutual fund and has been adjusted to reflect reinvestment of all dividends, capital gain distributions, and interest of the securities included in the benchmark.
Fund performance may reflect the waiver of the Fund’s fees and reimbursement of expenses for certain periods since the inception date. Without these waivers and reimbursements, performance would have been lower. Also, performance shown in this section does not reflect the deduction of taxes that a shareholder would pay on Fund distributions or redemption of Fund shares.
PERFORMANCE SUMMARY
The Fund’s Class I shares returned (1.19)% for the year ended October 31, 2018. The Fund’s benchmark, the Bloomberg Barclays U.S. Aggregate Bond Index and ICE BofAML USD 3-Month Deposit Offered Rate Constant Maturity Index returned (2.05)% and 1.85%, respectively, over the same year.
Overview — Brandywine Global Investment Management, LLC (Brandywine Global)
On June 15, 2018 the Fund changed its name from 1290 Unconstrained Bond Managers Fund, changed its subadviser to Brandywine Global, and changed its strategy.
Economic Outlook/Review:
| • | | A significant departure from traditional U.S. trade and foreign policy upended global markets in the second half of 2018, causing business and consumer sentiment to retreat around the world. |
| • | | The Federal Reserve (Fed) increased its policy rate in June, sending short-to-intermediate rates higher, while the long end of the Treasury curve remained anchored. |
| • | | Fed rhetoric was hawkish despite a flattening yield curve, strengthening U.S. dollar, and increasing global policy uncertainties — these factors collectively fostered a risk-off environment that profoundly affected global markets. |
Investment Outlook Strategy:
| • | | We believe synchronized global growth was temporarily derailed by trade tensions and should resume, albeit at a more modest pace. |
| • | | The Fed set expectations of a fourth rate hike in 2018 and emphasized that domestic conditions will influence its outlook and pace of tightening. |
| • | | Positive global economic indicators have been obfuscated but we believe they should resurface if protectionist sentiment subsides. |
Fund Highlights
What helped performance during the period June 15, 2018 to October 31, 2018?
| • | | United States Agency mortgage-backed securities (MBS), U.S. Non-Agency MBS, and U.S. corporates performed well and added to performance. |
19
1290 DIVERSIFIED BOND FUND (Unaudited)
| • | | A position in Brazilian bonds and currency added to the Fund — however, other Latin American countries including Mexico and Columbia all detracted from performance. Brazil’s rally came once their election was finished and the political uncertainty surrounding it was resolved. |
| • | | A short position in the Swiss Franc and a long position in the South African Rand were additive to performance. |
What hurt performance during the period June 15, 2018 to October 31, 2018?
| • | | Despite a rebound at period end, emerging countries struggled against risk-off sentiment and volatility. |
| • | | A strong U.S. dollar negatively impacted some currency positions such as the Euro, Pound and Yen. |
| • | | Derivatives can be used in the Fund for various investment purposes, including to hedge risk, to gain exposure or to short individual securities, to earn income and enhance return, and to manage duration. For the time period, bond futures and active currency forwards detracted from performance. |
| | | | |
Fund Characteristics
As of October 31, 2018 | | | |
Weighted Average Life (Years) | | | 9.14 | |
Weighted Average Coupon (%) | | | 3.49 | |
Weighted Average Modified Duration (Years)* | | | 5.99 | |
Weighted Average Rating** | | | A | |
* Modified duration is a measure of the price sensitivity of the Fund to interest rate movements, taking into account specific features of the securities in which it invests. ** Weighted Average Rating has been provided by the Investment Sub-Adviser. A credit rating is an assessment provided by a nationally recognized statistical rating organization (NRSRO) of the creditworthiness of an issuer with respect to debt obligations, including specific securities, money market instruments or other debts. Ratings are measured on a scale that generally ranges from AAA (highest) to D (lowest); ratings are subject to change without notice. | |
| | | | |
Sector Weightings
as of October 31, 2018 | | % of
Net Assets | |
U.S. Treasury Obligations | | | 28.0 | % |
Financials | | | 21.8 | |
Asset-Backed Securities | | | 16.4 | |
Foreign Government Securities | | | 13.6 | |
Collateralized Mortgage Obligations | | | 8.9 | |
Commercial Mortgage-Backed Securities | | | 5.5 | |
Real Estate | | | 1.4 | |
Utilities | | | 1.0 | |
Information Technology | | | 1.0 | |
Communication Services | | | 0.0 | |
Cash and Other | | | 2.4 | |
| | | | | |
| | | | 100.0 | % |
| | | | | |
Holdings are subject to change without notice. | | | | |
UNDERSTANDING YOUR EXPENSES:
As a shareholder of the Fund, you incur two types of costs:
(1) transaction costs, including applicable sales charges and redemption fees; and (2) ongoing costs, including investment advisory fees, distribution and/or service (12b-1) fees (in the case of Class A and Class R shares of the Fund), and other Fund expenses. These examples are intended to help you understand your ongoing costs (in dollars) of investing in the Fund and to compare these costs with the ongoing costs of investing in other mutual funds.
The examples are based on an investment of $1,000 invested at the beginning of the six-month period ended October 31, 2018 and held for the entire six-month period.
Actual Expenses
The first line of the following table provides information about actual account values and actual expenses. You may use the information in this line, together with the amount you invested, to estimate the expenses that you paid over the period. Simply divide your account value by $1,000 (for example, an $8,600 account value divided by $1,000 = 8.6), then multiply the result by the number in the first line under the heading entitled “Expenses Paid During Period” to estimate the expenses you paid on your account during this period.
Hypothetical Example for Comparison Purposes
The second line of the following table provides information about hypothetical account values and hypothetical expenses based on the Fund’s actual expense ratio and an assumed rate of return of 5% per year before expenses, which is not the Fund’s actual return. The hypothetical account values and expenses may not be used to estimate the actual ending account balance or expenses you paid for the period. You may use this information to compare the ongoing costs of investing in the Fund and other funds. To do so, compare this 5% hypothetical example with the 5% hypothetical examples that appear in the shareholder reports of the other funds.
Please note that the expenses shown in the table are meant to highlight your ongoing costs only and do not reflect any transactional costs, such as sales charges (loads), redemption fees, or exchange fees. Therefore, the second line of the table is useful in comparing ongoing costs only, and will not help you determine the relative total costs of owning different funds. In addition, if these transactional costs were included, your costs would have been higher.
20
1290 DIVERSIFIED BOND FUND (Unaudited)
EXAMPLE
| | | | | | | | | | | | |
| | | Beginning
Account
Value
5/1/18 | | | Ending
Account
Value
10/31/18 | | | Expenses
Paid
During
Period*
5/1/18 -
10/31/18 | |
Class A | | | | | | | | | | | | |
Actual | | $ | 1,000.00 | | | $ | 985.90 | | | $ | 4.32 | |
Hypothetical (5% average annual return before expenses) | | | 1,000.00 | | | | 1,020.86 | | | | 4.39 | |
Class I | | | | | | | | | | | | |
Actual | | | 1,000.00 | | | | 988.10 | | | | 3.57 | |
Hypothetical (5% average annual return before expenses) | | | 1,000.00 | | | | 1,021.61 | | | | 3.63 | |
Class R | | | | | | | | | | | | |
Actual | | | 1,000.00 | | | | 984.60 | | | | 5.66 | |
Hypothetical (5% average annual return before expenses) | | | 1,000.00 | | | | 1,019.50 | | | | 5.76 | |
* Expenses are equal to the Fund’s Class A, I and R shares annualized expense ratios of 0.86%, 0.71% and 1.13%, respectively, multiplied by the average account value over the period, and multiplied by 184/365 (to reflect the one-half year period). | |
21
1290 FUNDS
1290 DIVERSIFIED BOND FUND
PORTFOLIO OF INVESTMENTS
October 31, 2018
| | | | | | | | |
| | | Principal
Amount | | | Value
(Note 1) | |
| | | | | | | | |
LONG-TERM DEBT SECURITIES: | |
Asset-Backed Securities (16.4%) | |
Aames Mortgage Investment Trust, | |
Series 2006-1 A4
2.841%, 4/25/36 (l) | | $ | 1,400,000 | | | $ | 1,392,102 | |
Carrington Mortgage Loan Trust, | |
Series 2005-NC2 M4
3.301%, 5/25/35 (l) | | | 1,099,259 | | | | 1,101,055 | |
Park Place Securities, Inc. Asset-Backed Pass-Through Certificates, | |
Series 2005-WHQ2 M2
2.971%, 5/25/35 (l) | | | 842,629 | | | | 846,038 | |
Popular ABS Mortgage Pass-Through Trust, | |
Series 2005-5 MV1
2.721%, 11/25/35 (l) | | | 898,812 | | | | 901,856 | |
Towd Point Mortgage Trust, | |
Series 2017-6 A1
2.750%, 10/25/57 (l)§ | | | 860,567 | | | | 837,318 | |
| | | | | | | | |
Total Asset-Backed Securities | | | | | | | 5,078,369 | |
| | | | | | | | |
Collateralized Mortgage Obligations (8.9%) | |
FNMA | | | | | | | | |
Series 2016-C03 1M2
7.581%, 10/25/28 (l) | | | 581,000 | | | | 678,433 | |
Series 2016-C04 1M2
6.531%, 1/25/29 (l) | | | 1,000,000 | | | | 1,128,746 | |
TDA CAM FTA, | | | | | | | | |
Series 7 B
0.000%, 2/26/49 (l)(m) | | EUR | 1,100,000 | | | | 955,812 | |
| | | | | | | | |
Total Collateralized Mortgage Obligations | | | | | | | 2,762,991 | |
| | | | | | | | |
Commercial Mortgage-Backed Security (5.5%) | |
FHLMC Multifamily Structured Pass-Through Certificates, | |
Series K722 X1
1.309%, 3/25/23 IO (l) | | $ | 13,733,966 | | | | 623,786 | |
Series K727 A1
2.632%, 10/25/23 | | | 1,080,792 | | | | 1,060,305 | |
| | | | | | | | |
Total Commercial Mortgage-Backed Security | | | | | | | 1,684,091 | |
| | | | | | | | |
Corporate Bonds (25.2%) | | | | | | | | |
Financials (21.8%) | | | | | | | | |
Banks (6.8%) | | | | | | | | |
Bank of America Corp. | | | | | | | | |
Series L
2.250%, 4/21/20 | | | 450,000 | | | | 443,340 | |
Citigroup, Inc. | | | | | | | | |
(ICE LIBOR USD 3 Month + 1.25%), 3.646%, 7/1/26 (k) | | | 450,000 | | | | 451,268 | |
JPMorgan Chase & Co.
2.400%, 6/7/21 | | | 450,000 | | | | 438,404 | |
National Australia Bank Ltd. | | | | | | | | |
(ICE LIBOR USD 3 Month + 0.51%), 2.820%, 5/22/20 (k)§ | | | 300,000 | | | | 301,152 | |
| | | | | | | | |
UBS Group Funding Switzerland AG | |
(ICE LIBOR USD 3 Month + 1.22%), 3.530%, 5/23/23 (k)§ | | | 450,000 | | | | 454,204 | |
| | | | | | | | |
| | | | | | | 2,088,368 | |
| | | | | | | | |
Capital Markets (4.4%) | |
Goldman Sachs Group, Inc. (The) | |
(ICE LIBOR USD 3 Month + 0.75%), 3.060%, 2/23/23 (k) | | | 900,000 | | | | 898,898 | |
Morgan Stanley
2.650%, 1/27/20 | | | 450,000 | | | | 446,723 | |
| | | | | | | | |
| | | | | | | 1,345,621 | |
| | | | | | | | |
Consumer Finance (6.7%) | |
American Express Co.
2.650%, 12/2/22 | | | 450,000 | | | | 430,267 | |
Ford Motor Credit Co. LLC | | | | | | | | |
(ICE LIBOR USD 3 Month + 0.81%), 3.218%, 4/5/21 (k) | | | 900,000 | | | | 892,287 | |
General Motors Financial Co., Inc. | | | | | | | | |
(ICE LIBOR USD 3 Month + 0.93%), 3.366%, 4/13/20 (k) | | | 750,000 | | | | 753,210 | |
| | | | | | | | |
| | | | | | | 2,075,764 | |
| | | | | | | | |
Insurance (3.9%) | |
Metropolitan Life Global Funding I | |
(ICE LIBOR USD 3 Month + 0.23%), 2.638%, 1/8/21 (k)§ | | | 900,000 | | | | 900,098 | |
New York Life Global Funding | | | | | | | | |
(ICE LIBOR USD 3 Month + 0.16%), 2.556%, 10/1/20 (k)§ | | | 315,000 | | | | 315,858 | |
| | | | | | | | |
| | | | | | | 1,215,956 | |
| | | | | | | | |
Total Financials | | | | | | | 6,725,709 | |
| | | | | | | | |
Information Technology (1.0%) | | | | | |
Semiconductors & Semiconductor Equipment (1.0%) | |
Qorvo, Inc.
5.500%, 7/15/26§ | | | 300,000 | | | | 299,812 | |
| | | | | | | | |
Total Information Technology | | | | | | | 299,812 | |
| | | | | | | | |
Real Estate (1.4%) | | | | | |
Equity Real Estate Investment Trusts (REITs) (1.4%) | |
American Tower Corp. (REIT) | | | | | |
2.800%, 6/1/20 | | | 450,000 | | | | 445,199 | |
| | | | | | | | |
Total Real Estate | | | | | | | 445,199 | |
| | | | | | | | |
Utilities (1.0%) | | | | | |
Electric Utilities (1.0%) | |
DPL, Inc.
7.250%, 10/15/21 | | | 285,000 | | | | 302,641 | |
| | | | | | | | |
Total Utilities | | | | | | | 302,641 | |
| | | | | | | | |
Total Corporate Bonds | | | | | | | 7,773,361 | |
| | | | | | | | |
See Notes to Financial Statements.
22
1290 FUNDS
1290 DIVERSIFIED BOND FUND
PORTFOLIO OF INVESTMENTS (Continued)
October 31, 2018
| | | | | | | | |
| | | Principal
Amount | | | Value
(Note 1) | |
| | | | | | | | |
Foreign Government Securities (13.6%) | |
Federative Republic of Brazil | |
10.000%, 1/1/27 | | BRL | 2,510,000 | | | $ | 675,222 | |
Republic of Italy | | | | | | | | |
0.950%, 3/1/23 | | EUR | 1,460,000 | | | | 1,552,754 | |
Republic of South Africa | | | | | | | | |
8.750%, 2/28/48 | | ZAR | 25,205,000 | | | | 1,469,695 | |
United Mexican States | | | | | | | | |
8.000%, 11/7/47 | | MXN | 11,700,000 | | | | 507,581 | |
| | | | | | | | |
Total Foreign Government Securities | | | | | | | 4,205,252 | |
| | | | | | | | |
U.S. Treasury Obligations (28.0%) | |
U.S. Treasury Bonds | | | | | | | | |
2.750%, 8/15/47 | | $ | 1,640,000 | | | | 1,442,688 | |
U.S. Treasury Notes | | | | | | | | |
2.750%, 2/15/28 | | | 7,435,300 | | | | 7,194,756 | |
| | | | | | | | |
Total U.S. Treasury Obligations | | | | | | | 8,637,444 | |
| | | | | | | | |
Total Long-Term Debt Securities (97.6%)
(Cost $30,745,496) | | | | | | | 30,141,508 | |
| | | | | | | | |
| | | Number of
Rights | | | Value
(Note 1) | |
RIGHTS: | | | | | | | | |
Communication Services (0.0%) | | | | | |
Wireless Telecommunication Services (0.0%) | |
T-Mobile US, Inc., CVR (r)* | | | 32,000 | | | | — | |
T-Mobile USA, Inc., CVR (r)* | | | 22,000 | | | | — | |
| | | | | | | | |
Total Rights (0.0%)
(Cost $—) | | | | | | | — | |
| | | | | | | | |
Total Investments in Securities (97.6%)
(Cost $30,745,496) | | | | | | | 30,141,508 | |
Other Assets Less Liabilities (2.4%) | | | | | | | 735,129 | |
| | | | | |
Net Assets (100%) | | | | | | $ | 30,876,637 | |
| | | | | | | | |
| § | Securities exempt from registration under Rule 144A of the Securities Act of 1933. These securities may only be resold to qualified institutional buyers. At October 31, 2018, the market value of these securities amounted to $3,108,442 or 10.1% of net assets. Securities denoted with “§” but without “b” have been determined to be liquid under the guidelines established by the Board of Trustees. To the extent any securities might provide a right to demand registration, such rights have not been relied upon when determining liquidity. |
| (k) | Variable or floating rate security, linked to the referenced benchmark. The interest rate shown was the current rate as of October 31, 2018. |
| (l) | Variable or floating rate security, the interest rate of which adjusts periodically based on changes in current interest rates and prepayments on the underlying pool of assets. The interest rate shown was the current rate as of October 31, 2018. |
| (m) | Regulation S is an exemption for securities offerings that are made outside of the United States and do not involve direct selling efforts in the United States. Resale restrictions may apply for purposes of the Securities Act of 1933. At October 31, 2018, the market value of these securities amounted to $955,812 or 3.1% of net assets. |
| (r) | Value determined using significant unobservable inputs. |
Glossary:
| | CVR | — Contingent Value Rights |
| | EUR | — European Currency Unit |
| | FHLMC | — Federal Home Loan Mortgage Corp. |
| | FNMA | — Federal National Mortgage Association |
| | ICE | — Intercontinental Exchange |
| | LIBOR | — London Interbank Offered Rate |
| | USD | — United States Dollar |
Futures contracts outstanding as of October 31, 2018 (Note 1):
| | | | | | | | | | | | | | | | | | |
Description | | Number of
Contracts | | | Expiration
Date | | | Trading Currency | | Notional
Amount ($) | | | Value and
Unrealized
Appreciation
(Depreciation) ($) | |
Long Contracts | |
U.S. Treasury 10 Year Note | | | 105 | | | | 12/2018 | | | USD | | | 12,435,937 | | | | (159,364 | ) |
U.S. Treasury Long Bond | | | 9 | | | | 12/2018 | | | USD | | | 1,243,125 | | | | (12,113 | ) |
| | | | | | | | | | | | | | | | | | |
| | | | | | | | | | | | | | | | | (171,477 | ) |
| | | | | | | | | | | | | | | | | | |
Short Contracts | |
Euro-Bund | | | (19 | ) | | | 12/2018 | | | EUR | | | (3,448,851 | ) | | | 6,583 | |
Euro-Buxl | | | (8 | ) | | | 12/2018 | | | EUR | | | (1,602,926 | ) | | | (37,431 | ) |
| | | | | | | | | | | | | | | | | | |
| | | | | | | | | | | | | | | | | (30,848 | ) |
| | | | | | | | | | | | | | | | | | |
| | | | | | | | | | | | | | | | | (202,325 | ) |
| | | | | | | | | | | | | | | | | | |
See Notes to Financial Statements.
23
1290 FUNDS
1290 DIVERSIFIED BOND FUND
PORTFOLIO OF INVESTMENTS (Continued)
October 31, 2018
Forward foreign currency contracts outstanding as of October 31, 2018 (Note 1):
| | | | | | | | | | | | | | | | | | | | |
Currency Purchased | | | Currency Sold | | | Counterparty | | Settlement
Date | | | Unrealized
Appreciation
(Depreciation) ($) | |
USD | | | 131,703 | | | BRL | | | 490,000 | | | Citibank NA** | | | 11/8/2018 | | | | 145 | |
USD | | | 935,232 | | | EUR | | | 800,000 | | | Goldman Sachs Bank USA | | | 12/11/2018 | | | | 26,015 | |
USD | | | 1,830,824 | | | EUR | | | 1,600,000 | | | HSBC Bank plc | | | 12/11/2018 | | | | 12,389 | |
USD | | | 625,100 | | | EUR | | | 530,000 | | | Morgan Stanley | | | 12/11/2018 | | | | 22,744 | |
USD | | | 1,562,611 | | | EUR | | | 1,370,000 | | | National Australia Bank Ltd. | | | 12/11/2018 | | | | 5,576 | |
USD | | | 2,473,416 | | | CHF | | | 2,390,000 | | | Citibank NA | | | 12/13/2018 | | | | 90,532 | |
USD | | | 1,576,049 | | | GBP | | | 1,200,000 | | | HSBC Bank plc | | | 12/18/2018 | | | | 38,524 | |
USD | | | 1,492,649 | | | ZAR | | | 22,000,000 | | | HSBC Bank plc | | | 1/11/2019 | | | | 14,758 | |
USD | | | 928,668 | | | CAD | | | 1,220,000 | | | National Australia Bank Ltd. | | | 1/18/2019 | | | | 402 | |
USD | | | 300,658 | | | COP | | | 960,000,000 | | | HSBC Bank plc** | | | 1/30/2019 | | | | 3,499 | |
| | | | | | | | | | | | | | | | | | | | |
Total unrealized appreciation | | | | | | | 214,584 | |
| | | | | | | | |
USD | | | 513,920 | | | BRL | | | 2,110,000 | | | Citibank NA** | | | 11/8/2018 | | | | (52,586 | ) |
JPY | | | 104,000,000 | | | USD | | | 931,272 | | | Goldman Sachs Bank USA | | | 11/13/2018 | | | | (8,855 | ) |
EUR | | | 2,120,000 | | | USD | | | 2,477,453 | | | Citibank NA | | | 12/11/2018 | | | | (68,027 | ) |
EUR | | | 1,330,000 | | | USD | | | 1,573,117 | | | HSBC Bank plc | | | 12/11/2018 | | | | (61,543 | ) |
INR | | | 23,000,000 | | | USD | | | 311,400 | | | Barclays Bank plc** | | | 12/14/2018 | | | | (1,958 | ) |
GBP | | | 1,200,000 | | | USD | | | 1,578,396 | | | Citibank NA | | | 12/18/2018 | | | | (40,871 | ) |
GBP | | | 700,000 | | | USD | | | 927,195 | | | Morgan Stanley | | | 12/18/2018 | | | | (30,305 | ) |
SEK | | | 7,800,000 | | | USD | | | 885,493 | | | HSBC Bank plc | | | 1/14/2019 | | | | (26,723 | ) |
MXN | | | 15,800,000 | | | USD | | | 779,862 | | | Citibank NA | | | 1/15/2019 | | | | (11,737 | ) |
MXN | | | 35,000,000 | | | USD | | | 1,843,434 | | | HSBC Bank plc | | | 1/15/2019 | | | | (141,892 | ) |
MYR | | | 1,290,000 | | | USD | | | 310,866 | | | Barclays Bank plc** | | | 1/17/2019 | | | | (2,870 | ) |
COP | | | 960,000,000 | | | USD | | | 303,394 | | | HSBC Bank plc** | | | 1/30/2019 | | | | (6,236 | ) |
| | | | | | | | | | | | | | | | | | | | |
Total unrealized depreciation | | | | | | | (453,603 | ) |
| | | | | | | | |
Net unrealized depreciation | | | | | | | (239,019 | ) |
| | | | | | | | |
| ** | Non-deliverable forward. |
Centrally Cleared Credit default swap contracts outstanding — sell protection as of October 31, 2018 (Note 1):
| | | | | | | | | | | | | | | | | | | | | | | | | | | | | | | | |
Reference
Obligation/Index | | Financing
Rate (Paid)/
Received by
the Fund (%) | | | Frequency of
Payments
Made/Received | | | Maturity
Date | | | Implied
Credit
Spread (%) | | | Notional
Amount | | | Upfront
(Payments)
Receipts ($) | | | Unrealized
Appreciation
(Depreciation) ($) | | | Value ($) | |
CDX North America High Yield Index | | | 5.00 | | | | Quarterly | | | | 6/20/2023 | | | | 3.44 | | | | USD 5,700,000 | | | | 410,406 | | | | (31,184 | ) | | | 379,222 | |
| | | | | | | | | | | | | | | | | | | | | | | | | | | | | | | | |
| | | | | | | | | | | | | | | | | | | | | | | 410,406 | | | | (31,184 | ) | | | 379,222 | |
| | | | | | | | | | | | | | | | | | | | | | | | | | | | | | | | |
See Notes to Financial Statements.
24
1290 FUNDS
1290 DIVERSIFIED BOND FUND
PORTFOLIO OF INVESTMENTS (Continued)
October 31, 2018
The following is a summary of the inputs used to value the Fund’s assets and liabilities carried at fair value as of October 31, 2018:
The inputs or methodology used for valuing securities are not necessarily an indication of the risk associated with investing in those securities.
Various inputs are used in determining the value of the Fund’s investments. These inputs are summarized in the three broad levels listed below:
| | | | | | | | | | | | | | | | |
| | | | | |
| Investment Type | | Level 1
Quoted Prices in
Active Markets for
Identical
Securities | | | Level 2
Significant Other
Observable Inputs
(including quoted prices
for similar securities,
interest rates,
prepayment speeds,
credit risk, etc.) | | | Level 3
Significant Unobservable
Inputs (including the
Fund’s own
assumptions in
determining the fair
value of investments) | | | Total | |
Assets: | |
Asset-Backed Securities | | $ | — | | | $ | 5,078,369 | | | $ | — | | | $ | 5,078,369 | |
Collateralized Mortgage Obligations | | | — | | | | 2,762,991 | | | | — | | | | 2,762,991 | |
Commercial Mortgage-Backed Securities | | | — | | | | 1,684,091 | | | | — | | | | 1,684,091 | |
Corporate Bonds | | | | | | | | | | | | | | | | |
Financials | | | — | | | | 6,725,709 | | | | — | | | | 6,725,709 | |
Information Technology | | | — | | | | 299,812 | | | | — | | | | 299,812 | |
Real Estate | | | — | | | | 445,199 | | | | — | | | | 445,199 | |
Utilities | | | — | | | | 302,641 | | | | — | | | | 302,641 | |
Foreign Government Securities | | | — | | | | 4,205,252 | | | | — | | | | 4,205,252 | |
Forward Currency Contracts | | | — | | | | 214,584 | | | | — | | | | 214,584 | |
Futures | | | 6,583 | | | | — | | | | — | | | | 6,583 | |
U.S. Treasury Obligations | | | — | | | | 8,637,444 | | | | — | | | | 8,637,444 | |
Rights | | | | | | | | | | | | | | | | |
Communication Services | | | — | | | | — | | | | — | (a) | | | — | (a) |
| | | | | | | | | | | | | | | | |
Total Assets | | $ | 6,583 | | | $ | 30,356,092 | | | $ | — | | | $ | 30,362,675 | |
| | | | | | | | | | | | | | | | |
|
Liabilities: | |
Centrally Cleared Credit Default Swaps | | $ | — | | | $ | (31,184 | ) | | $ | — | | | $ | (31,184 | ) |
Forward Currency Contracts | | | — | | | | (453,603 | ) | | | — | | | | (453,603 | ) |
Futures | | | (208,908 | ) | | | — | | | | — | | | | (208,908 | ) |
| | | | | | | | | | | | | | | | |
Total Liabilities | | $ | (208,908 | ) | | $ | (484,787 | ) | | $ | — | | | $ | (693,695 | ) |
| | | | | | | | | | | | | | | | |
Total | | $ | (202,325 | ) | | $ | 29,871,305 | | | $ | — | | | $ | 29,668,980 | |
| | | | | | | | | | | | | | | | |
Fair Values of Derivative Instruments as of October 31, 2018:
| | | | | | |
| | | Statements of Assets and Liabilities | |
Derivatives Not Accounted for as
Hedging Instrument*^ | | Asset Derivatives | | Fair Value | |
Interest rate contracts | | Receivables, Net assets – Unrealized appreciation | | $ | 6,583 | |
Foreign exchange contracts | | Receivables | | | 214,584 | |
| | | | | | |
Total | | | | $ | 221,167 | |
| | | | | | |
| | |
| | | Liability Derivatives | | | |
Interest rate contracts | | Payables, Net assets – Unrealized depreciation | | $ | (208,908 | ) |
Foreign exchange contracts | | Payables | | | (453,603 | ) |
Credit contracts | | Payables | | | (31,184 | ) |
| | | | | | |
Total | | | | $ | (693,695 | ) |
| | | | | | |
See Notes to Financial Statements.
25
1290 FUNDS
1290 DIVERSIFIED BOND FUND
PORTFOLIO OF INVESTMENTS (Continued)
October 31, 2018
The Effect of Derivative Instruments on the Statement of Operations for the year ended October 31, 2018:
| | | | | | | | | | | | | | | | | | | | |
| Amount of Realized Gain or (Loss) on Derivatives Recognized in Income | |
Derivatives Not Accounted for as
Hedging Instruments^ | | Options | | | Futures | | | Forward
Foreign
Currency
Contracts | | | Swaps | | | Total | |
Interest rate contracts | | $ | (64,816 | ) | | $ | (54,018 | ) | | $ | — | | | $ | 266,793 | | | $ | 147,959 | |
Foreign exchange contracts | | | 10,033 | | | | — | | | | (12,590 | ) | | | — | | | | (2,557 | ) |
Credit contracts | | | — | | | | — | | | | — | | | | (6,813 | ) | | | (6,813 | ) |
| | | | | | | | | | | | | | | | | | | | |
Total | | $ | (54,783 | ) | | $ | (54,018 | ) | | $ | (12,590 | ) | | $ | 259,980 | | | $ | 138,589 | |
| | | | | | | | | | | | | | | | | | | | |
| | | | | | | | | | | | | | | | | | | | |
| Amount of Unrealized Appreciation or (Depreciation) on Derivatives Recognized in Income | |
Derivatives Not Accounted for as
Hedging Instruments^ | | Options | | | Futures | | | Forward
Foreign
Currency
Contracts | | | Swaps | | | Total | |
Interest rate contracts | | $ | (4,447 | ) | | $ | (200,067 | ) | | $ | — | | | $ | 53,030 | | | $ | (151,484 | ) |
Foreign exchange contracts | | | 387 | | | | — | | | | (258,025 | ) | | | — | | | | (257,638 | ) |
Credit contracts | | | — | | | | — | | | | — | | | | (30,960 | ) | | | (30,960 | ) |
| | | | | | | | | | | | | | | | | | | | |
Total | | $ | (4,060 | ) | | $ | (200,067 | ) | | $ | (258,025 | ) | | $ | 22,070 | | | $ | (440,082 | ) |
| | | | | | | | | | | | | | | | | | | | |
| * | Includes cumulative appreciation/depreciation of futures contracts and centrally cleared swaps as reported in the Portfolio of Investments. Only current day’s variation margin is reported within the Statement of Assets & Liabilities. |
^ The Fund held options, forward foreign currency contracts, futures, swaps and swaption contracts as a substitute for investing in conventional securities, hedging and in an attempt to enhance returns.
The Fund held forward foreign currency contracts with an average settlement value of approximately $11,894,000, options contracts with an average notional balance of approximately $129,000 for eight months, swaps with an average notional balance of approximately $25,200,000 for ten months and futures contracts with an average notional balance of approximately $14,830,000 for eleven months during the year ended October 31, 2018.
The following table presents the Fund’s gross derivative assets and liabilities by counterparty net of amounts available for offset under netting arrangements and any related collateral received or pledged by the Fund as of October 31, 2018:
| | | | | | | | | | | | | | | | |
Counterparty | | Gross Amount of
Derivative Assets
Presented in the
Statement of Assets
and Liabilities (a) | | | Derivatives
Available
for Offset | | | Collateral
Received | | | Net Amount Due
from Counterparty | |
Citibank NA. | | $ | 90,677 | | | $ | (90,677 | ) | | $ | — | | | $ | — | |
Goldman Sachs Bank USA | | | 26,015 | | | | (8,855 | ) | | | — | | | | 17,160 | |
HSBC Bank plc | | | 69,170 | | | | (69,170 | ) | | | — | | | | — | |
Morgan Stanley | | | 22,744 | | | | (22,744 | ) | | | — | | | | — | |
National Australia Bank Ltd. | | | 5,978 | | | | — | | | | — | | | | 5,978 | |
| | | | | | | | | | | | | | | | |
Total | | $ | 214,584 | | | $ | (191,446 | ) | | $ | — | | | $ | 23,138 | |
| | | | | | | | | | | | | | | | |
See Notes to Financial Statements.
26
1290 FUNDS
1290 DIVERSIFIED BOND FUND
PORTFOLIO OF INVESTMENTS (Continued)
October 31, 2018
| | | | | | | | | | | | | | | | |
Counterparty | | Gross Amount of
Derivative Liabilities
Presented in the
Statement of Assets
and Liabilities (a) | | | Derivatives
Available
for Offset | | | Collateral
Pledged | | | Net Amount
Due to
Counterparty | |
Barclays Bank plc | | $ | 4,828 | | | $ | — | | | $ | — | | | $ | 4,828 | |
Citibank NA. | | | 173,221 | | | | (90,677 | ) | | | (60,000 | ) | | | 22,544 | |
Goldman Sachs Bank USA | | | 8,855 | | | | (8,855 | ) | | | — | | | | — | |
HSBC Bank plc | | | 236,394 | | | | (69,170 | ) | | | — | | | | 167,224 | |
Morgan Stanley | | | 30,305 | | | | (22,744 | ) | | | — | | | | 7,561 | |
| | | | | | | | | | | | | | | | |
Total | | $ | 453,603 | | | $ | (191,446 | ) | | $ | (60,000 | ) | | $ | 202,157 | |
| | | | | | | | | | | | | | | | |
| (a) | For financial reporting purposes the Fund does not offset derivative assets and derivative liabilities subject to master netting arrangements in the Statement of Assets and Liabilities. |
The average amount of borrowings while outstanding for 112 days during the year ended October 31, 2018, was approximately $1,283,000 at a weighted average interest rate of 1.72%.
Investment security transactions for the year ended October 31, 2018 were as follows:
| | | | |
Cost of Purchases: | | | | |
Long-term investments other than U.S. government debt securities | | $ | 52,966,171 | |
Long-term U.S. government debt securities | | | 15,851,999 | |
| | | | |
| | $ | 68,818,170 | |
| | | | |
Net Proceeds of Sales and Redemptions: | | | | |
Long-term investments other than U.S. government debt securities | | $ | 15,102,066 | |
Long-term U.S. government debt securities | | | 16,919,423 | |
| | | | |
| | $ | 32,021,489 | |
| | | | |
As of October 31, 2018, the gross unrealized appreciation (depreciation) of investments based on the aggregate cost of investments in securities and derivative instruments, if applicable, for Federal income tax purposes was as follows:
| | | | |
Aggregate gross unrealized appreciation | | $ | 427,888 | |
Aggregate gross unrealized depreciation | | | (1,065,929 | ) |
| | | | |
Net unrealized depreciation | | $ | (638,041 | ) |
| | | | |
Federal income tax cost of investments in securities and derivative instruments, if applicable | | $ | 30,717,427 | |
| | | | |
See Notes to Financial Statements.
27
1290 FUNDS
1290 DIVERSIFIED BOND FUND
STATEMENT OF ASSETS AND LIABILITIES
October 31, 2018
| | | | |
ASSETS | | | | |
Investments in Securities, at value
(Cost $30,745,496) | | $ | 30,141,508 | |
Cash | | | 329,801 | |
Foreign cash (Cost $2) | | | 2 | |
Cash held as collateral for forward foreign currency contracts | | | 60,000 | |
Variation Margin on Centrally Cleared Swaps | | �� | 341,934 | |
Due from broker for futures variation margin | | | 230,423 | |
Unrealized appreciation on forward foreign currency contracts | | | 214,584 | |
Dividends, interest and other receivables | | | 186,645 | |
Prepaid registration and filing fees | | | 16,799 | |
Receivable from investment adviser | | | 7,899 | |
Other assets | | | 874 | |
| | | | |
Total assets | | | 31,530,469 | |
| | | | |
LIABILITIES | | | | |
Unrealized depreciation on forward foreign currency contracts | | | 453,603 | |
Dividends and distributions payable | | | 92,615 | |
Transfer agent fees payable | | | 4,439 | |
Payable for Fund shares redeemed | | | 2,251 | |
Trustees’ fees payable | | | 296 | |
Distribution fees payable – Class R | | | 41 | |
Distribution fees payable – Class A | | | 39 | |
Accrued expenses | | | 100,548 | |
| | | | |
Total liabilities | | | 653,832 | |
| | | | |
NET ASSETS | | $ | 30,876,637 | |
| | | | |
Net assets were comprised of: | | | | |
Paid in capital | | $ | 31,664,829 | |
Total distributable earnings (loss) | | | (788,192 | ) |
| | | | |
Net assets | | $ | 30,876,637 | |
| | | | |
Class A | | | | |
Net asset value and redemption price per share, $190,125 / 19,970 shares outstanding (unlimited amount authorized: $0.001 par value) | | $ | 9.52 | |
Maximum sales charge (4.50% of offering price) | | | 0.45 | |
| | | | |
Maximum offering price per share | | $ | 9.97 | |
| | | | |
Class I | | | | |
Net asset value and redemption price per share, $30,590,186 / 3,209,168 shares outstanding (unlimited amount authorized: $0.001 par value) | | $ | 9.53 | |
| | | | |
Class R | | | | |
Net asset value and redemption price per share, $96,326 / 10,125 shares outstanding (unlimited amount authorized: $0.001 par value) | | $ | 9.51 | |
| | | | |
STATEMENT OF OPERATIONS
For the Year Ended October 31, 2018
| | | | |
INVESTMENT INCOME | | | | |
Interest | | $ | 1,966,202 | |
Dividends | | | 20,661 | |
| | | | |
Total income | | | 1,986,863 | |
| | | | |
EXPENSES | | | | |
Investment advisory fees | | | 417,611 | |
Professional fees | | | 116,595 | |
Administrative fees | | | 82,711 | |
Printing and mailing expenses | | | 53,150 | |
Registration and filing fees | | | 37,547 | |
Custodian fees | | | 34,800 | |
Transfer agent fees | | | 26,730 | |
Interest expense | | | 6,650 | |
Trustees’ fees | | | 6,097 | |
Distribution fees – Class R | | | 494 | |
Distribution fees – Class A | | | 289 | |
Miscellaneous | | | 67,773 | |
| | | | |
Gross expenses | | | 850,447 | |
Less: Waiver from investment adviser | | | (350,461 | ) |
| | | | |
Net expenses | | | 499,986 | |
| | | | |
NET INVESTMENT INCOME (LOSS) | | | 1,486,877 | |
| | | | |
REALIZED AND UNREALIZED GAIN (LOSS) | | | | |
Realized gain (loss) on: | | | | |
Investments in securities | | | 836,243 | |
Net distributions of realized gain received from underlying funds | | | 3 | |
Futures contracts | | | (54,018 | ) |
Forward foreign currency contracts | | | (12,590 | ) |
Foreign currency transactions | | | (45,724 | ) |
Swaps | | | 259,980 | |
Options written | | | (46,450 | ) |
| | | | |
Net realized gain (loss) | | | 937,444 | |
| | | | |
Change in unrealized appreciation (depreciation) on: | |
Investments in securities | | | (2,232,117 | ) |
Futures contracts | | | (200,067 | ) |
Forward foreign currency contracts | | | (258,025 | ) |
Foreign currency translations | | | 269 | |
Swaps | | | 22,070 | |
Options written | | | (29,929 | ) |
| | | | |
Net change in unrealized appreciation (depreciation) | | | (2,697,799 | ) |
| | | | |
NET REALIZED AND UNREALIZED GAIN (LOSS) | | | (1,760,355 | ) |
| | | | |
NET INCREASE (DECREASE) IN NET ASSETS RESULTING FROM OPERATIONS | | $ | (273,478 | ) |
| | | | |
See Notes to Financial Statements.
28
1290 FUNDS
1290 DIVERSIFIED BOND FUND
STATEMENT OF CHANGES IN NET ASSETS
| | | | | | | | |
| | | Year Ended October 31, | |
| | 2018 | | | 2017 | |
INCREASE (DECREASE) IN NET ASSETS FROM OPERATIONS: | |
Net investment income (loss) | | $ | 1,486,877 | | | $ | 1,535,643 | |
Net realized gain (loss) | | | 937,444 | | | | 1,132,345 | |
Net change in unrealized appreciation (depreciation) | | | (2,697,799 | ) | | | 454,585 | |
| | | | | | | | |
NET INCREASE (DECREASE) IN NET ASSETS RESULTING FROM OPERATIONS | | | (273,478 | ) | | | 3,122,573 | |
| | | | | | | | |
Distributions to shareholders: (a) | | | | | | | | |
Class A | | | (5,071 | ) | | | (2,049 | ) |
Class I | | | (2,629,214 | ) | | | (1,461,459 | ) |
Class R | | | (4,106 | ) | | | (1,658 | ) |
| | | | | | | | |
Total distributions to shareholders | | | (2,638,391 | ) | | | (1,465,166 | ) |
| | | | | | | | |
Tax return of capital: | | | | | | | | |
Class A | | | (336 | ) | | | — | |
Class I | | | (174,340 | ) | | | — | |
Class R | | | (272 | ) | | | — | |
| | | | | | | | |
Total tax return of capital | | | (174,948 | ) | | | — | |
| | | | | | | | |
CAPITAL SHARES TRANSACTIONS: | | | | | | | | |
Class A | | | | | | | | |
Capital shares sold [ 9,592 and 0 shares, respectively ] | | | 93,228 | | | | — | |
Capital shares issued in reinvestment of dividends [ 83 and 18 shares, respectively ] | | | 803 | | | | 185 | |
Capital shares repurchased [ (709) and 0 shares, respectively ] | | | (7,010 | ) | | | — | |
| | | | | | | | |
Total Class A transactions | | | 87,021 | | | | 185 | |
| | | | | | | | |
Class I | | | | | | | | |
Capital shares sold [ 247,326 and 24,214 shares, respectively ] | | | 2,430,045 | | | | 241,700 | |
Capital shares issued in reinvestment of dividends [ 5,368 and 542 shares, respectively ] | | | 52,506 | | | | 5,431 | |
Capital shares repurchased [ (4,058,224) and (16,969) shares, respectively ] | | | (39,872,855 | ) | | | (167,959 | ) |
| | | | | | | | |
Total Class I transactions | | | (37,390,304 | ) | | | 79,172 | |
| | | | | | | | |
Class R | | | | | | | | |
Capital shares sold [ 113 and 0 shares, respectively ] | | | 1,100 | | | | — | |
Capital shares issued in reinvestment of dividends [ 2 and 0# shares, respectively ] | | | 16 | | | | 2 | |
| | | | | | | | |
Total Class R transactions | | | 1,116 | | | | 2 | |
| | | | | | | | |
NET INCREASE (DECREASE) IN NET ASSETS RESULTING FROM CAPITAL SHARE TRANSACTIONS | | | (37,302,167 | ) | | | 79,359 | |
| | | | | | | | |
TOTAL INCREASE (DECREASE) IN NET ASSETS | | | (40,388,984 | ) | | | 1,736,766 | |
NET ASSETS: | | | | | | | | |
Beginning of year | | | 71,265,621 | | | | 69,528,855 | |
| | | | | | | | |
End of year (b) | | $ | 30,876,637 | | | $ | 71,265,621 | |
| | | | | | | | |
# Number of shares is less than 0.5. | | | | | | | | |
(a) Prior year distributions to shareholders were made up of dividends from net investment income of $2,049, $1,461,459 and $1,658 for Classes A, I and R, respectively. These amounts were reclassified to conform with the current year presentation. | |
(b) Includes accumulated undistributed (overdistributed) net investment income of $1,108,187 as of October 31, 2017. The SEC eliminated the requirement to disclose undistributed net investment income in 2018. | |
See Notes to Financial Statements.
29
1290 FUNDS
1290 DIVERSIFIED BOND FUND
FINANCIAL HIGHLIGHTS
| | | | | | | | | | | | | | | | |
| | | Year Ended October 31, | | | July 6, 2015* to
October 31, 2015 | |
| Class A | | 2018 | | | 2017 | | | 2016 | |
Net asset value, beginning of period | | $ | 10.12 | | | $ | 9.89 | | | $ | 9.82 | | | $ | 10.00 | |
| | | | | | | | | | | | | | | | |
Income (loss) from investment operations: | | | | | | | | | | | | | | | | |
Net investment income (loss) (e) | | | 0.26 | | | | 0.19 | | | | 0.16 | | | | 0.01 | |
Net realized and unrealized gain (loss) | | | (0.40 | ) | | | 0.23 | | | | 0.17 | | | | (0.16 | ) |
| | | | | | | | | | | | | | | | |
Total from investment operations | | | (0.14 | ) | | | 0.42 | | | | 0.33 | | | | (0.15 | ) |
| | | | | | | | | | | | | | | | |
Less distributions: | | | | | | | | | | | | | | | | |
Dividends from net investment income | | | (0.43 | ) | | | (0.19 | ) | | | (0.10 | ) | | | (0.03 | ) |
Return of capital | | | (0.03 | ) | | | — | | | | (0.16 | ) | | | — | |
| | | | | | | | | | | | | | | | |
Total dividends and distributions | | | (0.46 | ) | | | (0.19 | ) | | | (0.26 | ) | | | (0.03 | ) |
| | | | | | | | | | | | | | | | |
Net asset value, end of period | | $ | 9.52 | | | $ | 10.12 | | | $ | 9.89 | | | $ | 9.82 | |
| | | | | | | | | | | | | | | | |
Total return (b) | | | (1.44 | )% | | | 4.25 | % | | | 3.39 | % | | | (1.54 | )% |
| | | | | | | | | | | | | | | | |
Ratios/Supplemental Data: | | | | | | | | | | | | | | | | |
Net assets, end of period (000’s) | | $ | 190 | | | $ | 111 | | | $ | 109 | | | $ | 98 | |
Ratio of expenses to average net assets: | | | | | | | | | | | | | | | | |
After waivers (a)(f) | | | 1.05 | % | | | 1.30 | % | | | 1.40 | % | | | 1.40 | % |
Before waivers (a)(f) | | | 1.85 | % | | | 1.76 | % | | | 1.84 | % | | | 1.62 | % |
Ratio of net investment income (loss) to average net assets: | | | | | | | | | | | | | | | | |
After waivers (a)(f) | | | 2.63 | % | | | 1.93 | % | | | 1.68 | % | | | 0.37 | %(l) |
Before waivers (a)(f) | | | 1.83 | % | | | 1.48 | % | | | 1.24 | % | | | 0.15 | %(l) |
Portfolio turnover rate (z)^ | | | 139 | %*** | | | 117 | % | | | 152 | % | | | 77 | % |
| | |
| | | Year Ended October 31, | | | July 6, 2015* to
October 31, 2015 | |
| Class I | | 2018 | | | 2017 | | | 2016 | |
Net asset value, beginning of period | | $ | 10.13 | | | $ | 9.89 | | | $ | 9.82 | | | $ | 10.00 | |
| | | | | | | | | | | | | | | | |
Income (loss) from investment operations: | | | | | | | | | | | | | | | | |
Net investment income (loss) (e) | | | 0.27 | | | | 0.22 | | | | 0.19 | | | | 0.02 | |
Net realized and unrealized gain (loss) | | | (0.38 | ) | | | 0.23 | | | | 0.16 | | | | (0.17 | ) |
| | | | | | | | | | | | | | | | |
Total from investment operations | | | (0.11 | ) | | | 0.45 | | | | 0.35 | | | | (0.15 | ) |
| | | | | | | | | | | | | | | | |
Less distributions: | | | | | | | | | | | | | | | | |
Dividends from net investment income | | | (0.46 | ) | | | (0.21 | ) | | | (0.11 | ) | | | (0.03 | ) |
Return of capital | | | (0.03 | ) | | | — | | | | (0.17 | ) | | | — | |
| | | | | | | | | | | | | | | | |
Total dividends and distributions | | | (0.49 | ) | | | (0.21 | ) | | | (0.28 | ) | | | (0.03 | ) |
| | | | | | | | | | | | | | | | |
Net asset value, end of period | | $ | 9.53 | | | $ | 10.13 | | | $ | 9.89 | | | $ | 9.82 | |
| | | | | | | | | | | | | | | | |
Total return (b) | | | (1.19 | )% | | | 4.58 | % | | | 3.63 | % | | | (1.49 | )% |
| | | | | | | | | | | | | | | | |
Ratios/Supplemental Data: | | | | | | | | | | | | | | | | |
Net assets, end of period (000’s) | | $ | 30,590 | | | $ | 71,053 | | | $ | 69,321 | | | $ | 68,572 | |
Ratio of expenses to average net assets: | | | | | | | | | | | | | | | | |
After waivers (a)(f) | | | 0.91 | % | | | 1.05 | % | | | 1.15 | % | | | 1.15 | % |
Before waivers (a)(f) | | | 1.54 | % | | | 1.51 | % | | | 1.58 | % | | | 1.36 | % |
Ratio of net investment income (loss) to average net assets: | | | | | | | | | | | | | | | | |
After waivers (a)(f) | | | 2.70 | % | | | 2.18 | % | | | 1.92 | % | | | 0.68 | %(l) |
Before waivers (a)(f) | | | 2.06 | % | | | 1.73 | % | | | 1.49 | % | | | 0.47 | %(l) |
Portfolio turnover rate (z)^ | | | 139 | %*** | | | 117 | % | | | 152 | % | | | 77 | % |
See Notes to Financial Statements.
30
1290 FUNDS
1290 DIVERSIFIED BOND FUND
FINANCIAL HIGHLIGHTS (Continued)
| | | | | | | | | | | | | | | | |
| | | Year Ended October 31, | | | July 6, 2015* to
October 31, 2015 | |
| Class R | | 2018 | | | 2017 | | | 2016 | |
Net asset value, beginning of period | | $ | 10.11 | | | $ | 9.88 | | | $ | 9.82 | | | $ | 10.00 | |
| | | | | | | | | | | | | | | | |
Income (loss) from investment operations: | | | | | | | | | | | | | | | | |
Net investment income (loss) (e) | | | 0.23 | | | | 0.17 | | | | 0.14 | | | | — | # |
Net realized and unrealized gain (loss) | | | (0.39 | ) | | | 0.23 | | | | 0.15 | | | | (0.16 | ) |
| | | | | | | | | | | | | | | | |
Total from investment operations | | | (0.16 | ) | | | 0.40 | | | | 0.29 | | | | (0.16 | ) |
| | | | | | | | | | | | | | | | |
Less distributions: | | | | | | | | | | | | | | | | |
Dividends from net investment income | | | (0.41 | ) | | | (0.17 | ) | | | (0.09 | ) | | | (0.02 | ) |
Return of capital | | | (0.03 | ) | | | — | | | | (0.14 | ) | | | — | |
| | | | | | | | | | | | | | | | |
Total dividends and distributions | | | (0.44 | ) | | | (0.17 | ) | | | (0.23 | ) | | | (0.02 | ) |
| | | | | | | | | | | | | | | | |
Net asset value, end of period | | $ | 9.51 | | | $ | 10.11 | | | $ | 9.88 | | | $ | 9.82 | |
| | | | | | | | | | | | | | | | |
Total return (b) | | | (1.69 | )% | | | 4.04 | % | | | 3.05 | % | | | (1.60 | )% |
| | | | | | | | | | | | | | | | |
Ratios/Supplemental Data: | | | | | | | | | | | | | | | | |
Net assets, end of period (000’s) | | $ | 96 | | | $ | 101 | | | $ | 99 | | | $ | 98 | |
Ratio of expenses to average net assets: | | | | | | | | | | | | | | | | |
After waivers (a)(f) | | | 1.32 | % | | | 1.55 | % | | | 1.65 | % | | | 1.65 | % |
Before waivers (a)(f) | | | 2.09 | % | | | 2.01 | % | | | 2.08 | % | | | 1.88 | % |
Ratio of net investment income (loss) to average net assets: | | | | | | | | | | | | | | | | |
After waivers (a)(f) | | | 2.34 | % | | | 1.68 | % | | | 1.42 | % | | | 0.12 | %(l) |
Before waivers (a)(f) | | | 1.57 | % | | | 1.23 | % | | | 0.99 | % | | | (0.11 | )%(l) |
Portfolio turnover rate (z)^ | | | 139 | %*** | | | 117 | % | | | 152 | % | | | 77 | % |
| * | Commencement of Operations. |
| *** | The portfolio turnover rate calculation includes purchases and sales made as a result of the replacement of the sub-adviser as discussed in Note 1. Excluding such transactions, the portfolio turnover rate would have been 64%. |
| # | Per share amount is less than $0.005. |
| ^ | Portfolio turnover rate excludes derivatives, if any. |
| (a) | Ratios for periods less than one year are annualized. Certain non-recurring expenses incurred by the Fund are not annualized for periods less than one year. |
| (b) | Total returns for periods less than one year are not annualized. |
| (e) | Net investment income (loss) per share is based on average shares outstanding. |
| (f) | Expenses do not include the expenses of the underlying funds (“indirect expenses”), if applicable. |
| (l) | The annualized ratio of net investment income to average net assets may not be indicative of operating results for a full year. |
| (z) | Portfolio turnover rate for periods less than one year is not annualized. |
See Notes to Financial Statements.
31
1290 DOUBLELINE DYNAMIC ALLOCATION FUND (Unaudited)
INVESTMENT ADVISER
INVESTMENT SUB-ADVISER
PERFORMANCE RESULTS
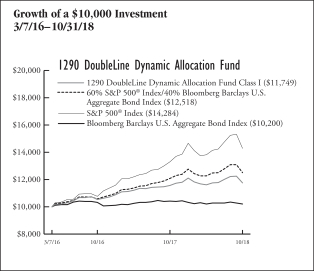
| | | | | | | | | | | | |
| Annualized Total Returns as of 10/31/18 | |
| | | | | | 1
Year | | | Since
Incept. | |
Fund – Class A Shares* | | | without Sales Charge | | | | 1.19 | % | | | 5.97 | % |
| | | | with Sales Charge (a | ) | | | (4.34 | ) | | | 3.74 | |
Fund – Class I Shares* | | | | | | | 1.44 | | | | 6.27 | |
Fund – Class R Shares* | | | | | | | 0.93 | | | | 5.72 | |
60% S&P 500® Index/
40% Bloomberg
Barclays U.S. Aggregate
Bond Index | | | | | | | 3.66 | | | | 8.84 | |
S&P 500® Index | | | | | | | 7.35 | | | | 14.39 | |
Bloomberg Barclays U.S. Aggregate Bond Index | | | | | | | (2.05 | ) | | | 0.75 | |
* Date of inception 3/7/16. | | | | | | | | | |
(a) A 5.50% front-end sales charge was deducted. Returns for periods greater than one year are annualized. | |
The performance quoted is past performance and is not a guarantee of future results. Mutual funds are subject to certain market risks. Investment returns and principal value of an investment will fluctuate so that an investor’s shares, when redeemed, may be worth more or less than their original cost. Current performance may be higher or lower than the performance data shown. For the most current month-end performance data please call 1-888-310-0416 or visit www.1290Funds.com.
The graph illustrates comparative performance for $10,000 invested in the Class I Shares of the 1290 DoubleLine Dynamic Allocation Fund and the 60% S&P 500® Index/40% Bloomberg Barclays U.S. Aggregate Bond Index, the S&P 500® Index and the Bloomberg Barclays U.S. Aggregate Bond Index from 3/7/16 to 10/31/18. The performance of each of the 60% S&P 500® Index/40% Bloomberg Barclays U.S. Aggregate Bond Index, the S&P 500® Index and the Bloomberg Barclays U.S. Aggregate Bond Index reflects an initial investment at the end of the month closest to the Fund’s inception. The performance of the Fund assumes reinvestment of all dividends and capital gain distributions, if any, and does not include a sales charge. The performance of the 60% S&P 500® Index/40% Bloomberg Barclays U.S. Aggregate Bond Index, the S&P 500® Index and the Bloomberg Barclays U.S. Aggregate Bond Index does not reflect the deduction of expenses or a sales charge associated with a mutual fund and has been adjusted to reflect reinvestment of all dividends, capital gain distributions, and interest of the securities included in the benchmark.
Fund performance may reflect the waiver of the Fund’s fees and reimbursement of expenses for certain periods since the inception date. Without these waivers and reimbursements, performance would have been lower. Also, performance shown in this section does not reflect the deduction of taxes that a shareholder would pay on Fund distributions or redemption of Fund shares.
PERFORMANCE SUMMARY
The Fund’s Class I shares returned 1.44% for the year ended October 31, 2018. The Fund’s benchmarks, the 60% S&P 500® Index/40% Bloomberg Barclays U.S. Aggregate Bond Index, the S&P 500® Index and the Bloomberg Barclays U.S. Aggregate Bond Index returned 3.66%, 7.35% and (2.05)%, respectively over the same year.
Overview — DoubleLine Capital LP
In retrospect, the twelve-month period ended October 31, 2018 was one of seeming complacency in the U.S. equity markets, punctuated by two sharp sell-offs of approximately 10% each. At the same time, the fixed income markets saw government bond yields move higher. The yield on the 10-year Treasury Note rose over the twelve months from 2.38% to 3.14%. The Federal Reserve raised rates four times (1.0% in total) and suggested they would continue to raise rates through the balance of 2018 and well into 2019. Commensurate with the Federal Reserve tightening, the short end of the yield curve marched steadily higher, leading to a significant flattening of the yield curve.
In the U.S. equity markets, the dominant characteristics for the first three months of the period were historically low volatility coupled with a steady series of all-time highs for the S&P 500® Index. November, December and January marked the thirteenth, fourteenth and fifteenth months in a row of positive returns for the S&P 500® Index. This brought equity valuations, as measured by the Shiller Barclays Cyclically Adjusted Price-to-Earnings (CAPE) Total Return Index (the CAPE Index) ratio, to levels seen only in the 1920’s and late 1990’s. At the same time, market volatility (as measured by the VIX Index) remained low through early January. The VIX Index fell to an all-time closing low of 9.14 in early November, 2017, re-testing those levels in the opening days of 2018 (closing at 9.15).
These historically unprecedented expectations were quickly dashed by the market action of early February 2018. Prompted by concerns of rising interest rates following the January payroll report, the S&P 500® Index fell by over 10% (intra-day levels) over the course of six trading days. The VIX Index spiked intraday to over 50, a level seen only during the Global Financial Crisis and briefly in August 2015.
By May, optimism about earnings and strong macroeconomic growth contributed to a renewed sense of calm in the U.S. equity
32
1290 DOUBLELINE DYNAMIC ALLOCATION FUND (Unaudited)
markets. The VIX Index of volatility settled back into the mid-teens and U.S. equities began again moving steadily higher. Fundamentally, U.S. corporations were enjoying a period of unusually strong revenue and earnings growth.
By August, the S&P 500® Index was setting new all-time highs, surpassing the January peak. Until early October, U.S. equities were able to shake off the risks from the building trade war and rising interest rates. This period was most notable for the divergence in returns between U.S. and non-U.S. equities, particularly the equity indices of nations with export-oriented economies. Even as the S&P 500® Index was reaching new highs, many non-U.S. markets were declining to their lowest levels of the year. This complacency came to a quick end in October. On September 17th, the Trump Administration announced the latest round of tariffs on Chinese imports. The 10% tariff on $200 billion in imports was backed up with the threat of future tariffs of 25%. Simultaneously, concerns over higher rates grew as the yield on 30-year U.S. Treasuries broke above a four-year high. Volatility, as measured by the VIX Index, spiked above 15 and by the second week of the month hit intra-day levels in excess of 28. Concurrently the S&P 500® Index declined from its September closing highs, narrowly missing “correction” territory.
Fund Highlights
The Fund’s allocation to U.S. equities was achieved using two sources of equity market return: First, exposure to the CAPE Index, which utilizes a systematic sector rotation strategy based upon the relative CAPE ratio; and second, an actively-managed U.S. large cap equity portfolio. Both of these portfolios are benchmarked to the S&P 500® Index. The Fund achieves exposure to the CAPE Index through the use of unfunded, triparty swap agreements. The Fund’s fixed income allocation is achieved with an actively-managed multi-sector fixed income portfolio benchmarked to the Bloomberg Barclays U.S. Aggregate Bond Index.
During the twelve-month period ended October 31, 2018, the CAPE Index was exposed to six of the eleven sectors of the S&P 500® Index: communication services, consumer discretionary, consumer staples, health care, industrials, and technology. Three of these sectors contributed positively to the returns of the CAPE Index and the Fund: consumer discretionary, health care, and technology. The Fund’s exposure to the CAPE Index outperformed the S&P 500® Index during the twelve-month period.
The active equity portion of the Fund underperformed the S&P 500® Index during the twelve-month period. Relative to the S&P 500® Index, the active equity portion of the Fund benefited from strong security selection in the communication services, consumer staples, and real estate sectors, as well as underweight allocations to the materials, real estate, and utilities sectors. It should be noted that due to changes in the Global Industry Classification Standard (GICS) in September 2018, some of the investments in the communication services sector were categorized in the technology and consumer discretionary sectors earlier in the twelve-month period. The Fund’s overweight allocation to financials and energy was a drag on relative returns. Security selection in energy, financials, and technology also hurt returns relative to the S&P 500® Index.
The total return of the fixed income allocation of the Fund, while slightly negative, was better than that of the Bloomberg Barclays U.S. Aggregate Bond Index. The fixed income allocations with the best returns were bank loans and high yield corporate bonds. Both allocations delivered positive returns over the twelve-month period. Global bonds and investment grade corporates delivered the weakest returns among the Fund’s allocations during the twelve-month period.
The Fund uses derivative instruments — unfunded, triparty swap agreements — to gain exposure to the CAPE Index. The Fund’s exposure to the CAPE Index, via these swap agreements, provided positive returns which outperformed the S&P 500® Index during the period.
Throughout the twelve months ended October 31, 2018, the Fund’s allocation to equities was below the 60% benchmark allocation. This conservative positioning contributed to the Fund’s underperformance relative to the benchmark allocation of 60% S&P 500® Index, 40% Bloomberg Barclays U.S. Aggregate Bond Index.
| | | | |
Fund Characteristics As of October 31, 2018 | | | |
Weighted Average Life (Years) | | | 6.18 | |
Weighted Average Coupon (%) | | | 3.47 | |
Weighted Average Modified Duration (Years)* | | | 4.68 | |
Weighted Average Rating** | | | A3 | |
* Modified duration is a measure of the price sensitivity of the Fund to interest rate movements, taking into account specific features of the securities in which it invests. ** Weighted Average Rating has been provided by the Investment Sub-Adviser. A credit rating is an assessment provided by a nationally recognized statistical rating organization (NRSRO) of the creditworthiness of an issuer with respect to debt obligations, including specific securities, money market instruments or other debts. Ratings are measured on a scale that generally ranges from AAA (highest) to D (lowest); ratings are subject to change without notice. | |
| | | | |
Sector Weightings
as of October 31, 2018 | | % of
Net Assets | |
U.S. Treasury Obligations | | | 34.9 | % |
Collateralized Mortgage Obligations | | | 13.5 | |
Investment Companies | | | 7.4 | |
Information Technology | | | 6.8 | |
Financials | | | 6.5 | |
Health Care | | | 5.8 | |
Consumer Discretionary | | | 3.7 | |
Energy | | | 3.3 | |
Industrials | | | 3.3 | |
Mortgage-Backed Securities | | | 3.0 | |
Communication Services | | | 2.7 | |
Consumer Staples | | | 1.8 | |
Asset-Backed Securities | | | 1.4 | |
Real Estate | | | 1.1 | |
Materials | | | 0.7 | |
Utilities | | | 0.5 | |
Cash and Other | | | 3.6 | |
| | | | | |
| | | | 100.0 | % |
| | | | | |
Holdings are subject to change without notice. | | | | |
33
1290 DOUBLELINE DYNAMIC ALLOCATION FUND (Unaudited)
UNDERSTANDING YOUR EXPENSES:
As a shareholder of the Fund, you incur two types of costs:
(1) transaction costs, including applicable sales charges and redemption fees; and (2) ongoing costs, including investment advisory fees, distribution and/or service (12b-1) fees (in the case of Class A and Class R shares of the Fund), and other Fund expenses. These examples are intended to help you understand your ongoing costs (in dollars) of investing in the Fund and to compare these costs with the ongoing costs of investing in other mutual funds.
The examples are based on an investment of $1,000 invested at the beginning of the six-month period ended October 31, 2018 and held for the entire six-month period.
Actual Expenses
The first line of the following table provides information about actual account values and actual expenses. You may use the information in this line, together with the amount you invested, to estimate the expenses that you paid over the period. Simply divide your account value by $1,000 (for example, an $8,600 account value divided by $1,000 = 8.6), then multiply the result by the number in the first line under the heading entitled “Expenses Paid During Period” to estimate the expenses you paid on your account during this period.
Hypothetical Example for Comparison Purposes
The second line of the following table provides information about hypothetical account values and hypothetical expenses based on the Fund’s actual expense ratio and an assumed rate of return of 5% per year before expenses, which is not the Fund’s actual return. The hypothetical account values and expenses may not be used to estimate the actual ending account balance or expenses you paid for the period. You may use this information to compare the ongoing costs of investing in the Fund and other funds. To do so, compare this 5% hypothetical example with the 5% hypothetical examples that appear in the shareholder reports of the other funds.
Please note that the expenses shown in the table are meant to highlight your ongoing costs only and do not reflect any transactional costs, such as sales charges (loads), redemption fees, or exchange fees. Therefore, the second line of the table is useful in comparing ongoing costs only, and will not help you determine the relative total costs of owning different funds. In addition, if these transactional costs were included, your costs would have been higher.
EXAMPLE
| | | | | | | | | | | | |
| | | Beginning
Account
Value
5/1/18 | | | Ending
Account
Value
10/31/18 | | | Expenses
Paid
During
Period*
5/1/18 -
10/31/18 | |
Class A | |
Actual | | | $1,000.00 | | | | $1,008.60 | | | | $6.05 | |
Hypothetical (5% average annual return before expenses) | | | 1,000.00 | | | | 1,019.19 | | | | 6.08 | |
Class I | |
Actual | | | 1,000.00 | | | | 1,010.40 | | | | 4.78 | |
Hypothetical (5% average annual return before expenses) | | | 1,000.00 | | | | 1,020.45 | | | | 4.81 | |
Class R | |
Actual | | | 1,000.00 | | | | 1,006.70 | | | | 7.30 | |
Hypothetical (5% average annual return before expenses) | | | 1,000.00 | | | | 1,017.93 | | | | 7.35 | |
* Expenses are equal to the Fund’s Class A, I and R shares annualized expense ratios of 1.19%, 0.94% and 1.44%, respectively, multiplied by the average account value over the period, and multiplied by 184/365 (to reflect the one-half year period). | |
34
1290 FUNDS
1290 DOUBLELINE DYNAMIC ALLOCATION FUND
PORTFOLIO OF INVESTMENTS
October 31, 2018
| | | | | | | | |
| | | Principal
Amount | | | Value
(Note 1) | |
LONG-TERM DEBT SECURITIES: | |
Asset-Backed Securities (1.4%) | |
CSMC Trust, | | | | | | | | |
Series 2018-RPL8 A1
4.125%, 7/25/58§ | | $ | 299,131 | | | $ | 298,006 | |
Pretium Mortgage Credit Partners I LLC, | |
Series 2018-NPL1 A1
3.375%, 1/27/33 (e)§ | | | 212,641 | | | | 211,394 | |
Series 2018-NPL3 A1
4.125%, 8/27/33 (e)§ | | | 320,374 | | | | 320,377 | |
| | | | | | | | |
Total Asset-Backed Securities | | | | | | | 829,777 | |
| | | | | | | | |
Collateralized Mortgage Obligations (13.5%) | |
Banc of America Alternative Loan Trust, | |
Series 2006-5 CB14
6.000%, 6/25/46 (l) | | | 294,353 | | | | 269,055 | |
CHL Mortgage Pass-Through Trust, | | | | | |
Series 2006-OA5 2A1
2.481%, 4/25/46 (l) | | | 868,572 | | | | 751,745 | |
FHLMC, | | | | | | | | |
Series 3998 AZ
4.000%, 2/15/42 | | | 1,305,026 | | | | 1,311,348 | |
Series 4768 CA
3.500%, 3/15/44 | | | 462,706 | | | | 459,716 | |
Series 4792 A
3.000%, 5/15/48 | | | 484,305 | | | | 459,272 | |
FNMA, | | | | | | | | |
Series 2013-41 SC
2.578%, 5/25/43 (l) | | | 1,199,297 | | | | 848,925 | |
Series 2013-5 EZ
2.000%, 8/25/42 | | | 815,749 | | | | 697,194 | |
Series 2017-13 ML
3.000%, 8/25/41 | | | 870,197 | | | | 847,343 | |
Series 2017-4 CH
3.000%, 6/25/42 | | | 191,337 | | | | 188,054 | |
Series 2018-21
(Zero Coupon), 4/25/48 PO | | | 479,306 | | | | 361,813 | |
JP Morgan Mortgage Trust, | | | | | | | | |
Series 2018-7FRB A2
2.966%, 4/25/46 (l)§ | | | 340,989 | | | | 341,548 | |
New Residential Mortgage Loan Trust, | |
Series 2016-1A A1
3.750%, 3/25/56 (l)§ | | | 508,418 | | | | 506,579 | |
RALI Trust, | | | | | | | | |
Series 2006-QS4 A10
6.000%, 4/25/36 | | | 664,531 | | | | 612,065 | |
Wells Fargo Mortgage Backed Securities Trust, | |
Series 2007-7 A1
6.000%, 6/25/37 | | | 423,683 | | | | 422,497 | |
| | | | | | | | |
Total Collateralized Mortgage Obligations | | | | | | | 8,077,154 | |
| | | | | | | | |
Corporate Bonds (13.0%) | |
Communication Services (1.3%) | | | | | |
Diversified Telecommunication Services (0.6%) | |
AT&T, Inc.
5.250%, 3/1/37 | | | 150,000 | | | | 142,903 | |
CCO Holdings LLC
5.750%, 2/15/26§ | | | 30,000 | | | | 29,700 | |
5.000%, 2/1/28§ | | | 35,000 | | | | 32,595 | |
Level 3 Financing, Inc.
5.375%, 1/15/24 | | | 65,000 | | | | 64,188 | |
Sprint Capital Corp.
6.875%, 11/15/28 | | | 15,000 | | | | 14,738 | |
Telesat Canada
8.875%, 11/15/24§ | | | 60,000 | | | | 63,825 | |
| | | | | | | | |
| | | | | | | 347,949 | |
| | | | | | | | |
Interactive Media & Services (0.1%) | |
Match Group, Inc.
5.000%, 12/15/27§ | | | 35,000 | | | | 33,337 | |
| | | | | | | | |
Media (0.6%) | |
Cengage Learning, Inc.
9.500%, 6/15/24§ | | | 35,000 | | | | 30,253 | |
Charter Communications Operating LLC
4.908%, 7/23/25 | | | 100,000 | | | | 99,990 | |
Comcast Corp.
3.700%, 4/15/24 | | | 90,000 | | | | 89,623 | |
CSC Holdings LLC
5.250%, 6/1/24 | | | 30,000 | | | | 28,881 | |
Interpublic Group of Cos., Inc. (The)
4.650%, 10/1/28 | | | 50,000 | | | | 49,110 | |
5.400%, 10/1/48 | | | 55,000 | | | | 51,779 | |
| | | | | | | | |
| | | | | | | 349,636 | |
| | | | | | | | |
Wireless Telecommunication Services (0.0%) | |
Sprint Corp.
7.125%, 6/15/24 | | | 30,000 | | | | 30,675 | |
| | | | | | | | |
Total Communication Services | | | | | | | 761,597 | |
| | | | | | | | |
Consumer Discretionary (1.2%) | | | | | |
Automobiles (0.2%) | |
Ford Motor Co.
7.450%, 7/16/31 | | | 90,000 | | | | 93,946 | |
General Motors Co. | | | | | | | | |
(ICE LIBOR USD 3 Month + 0.80%), 3.143%, 8/7/20 (k) | | | 20,000 | | | | 20,038 | |
| | | | | | | | |
| | | | | | | 113,984 | |
| | | | | | | | |
Hotels, Restaurants & Leisure (0.5%) | |
1011778 BC ULC
5.000%, 10/15/25§ | | | 65,000 | | | | 60,450 | |
Caesars Resort Collection LLC
5.250%, 10/15/25§ | | | 50,000 | | | | 46,530 | |
Eldorado Resorts, Inc.
6.000%, 4/1/25 | | | 45,000 | | | | 44,496 | |
6.000%, 9/15/26§ | | | 15,000 | | | | 14,728 | |
Hilton Domestic Operating Co., Inc.
5.125%, 5/1/26§ | | | 50,000 | | | | 48,875 | |
Royal Caribbean Cruises Ltd.
3.700%, 3/15/28 | | | 55,000 | | | | 50,412 | |
Viking Cruises Ltd.
5.875%, 9/15/27§ | | | 60,000 | | | | 56,925 | |
| | | | | | | | |
| | | | | | | 322,416 | |
| | | | | | | | |
Household Durables (0.1%) | |
Tempur Sealy International, Inc.
5.500%, 6/15/26 | | | 65,000 | | | | 59,313 | |
| | | | | | | | |
See Notes to Financial Statements.
35
1290 FUNDS
1290 DOUBLELINE DYNAMIC ALLOCATION FUND
PORTFOLIO OF INVESTMENTS (Continued)
October 31, 2018
| | | | | | | | |
| | | Principal
Amount | | | Value
(Note 1) | |
Leisure Products (0.1%) | |
Hasbro, Inc.
3.500%, 9/15/27 | | $ | 50,000 | | | $ | 45,868 | |
| | | | | | | | |
Multiline Retail (0.2%) | |
Dollar Tree, Inc.
4.000%, 5/15/25 | | | 150,000 | | | | 144,361 | |
| | | | | | | | |
Specialty Retail (0.1%) | |
PetSmart, Inc. | | | | | | | | |
7.125%, 3/15/23§ | | | 40,000 | | | | 28,000 | |
5.875%, 6/1/25§ | | | 30,000 | | | | 23,475 | |
| | | | | | | | |
| | | | | | | 51,475 | |
| | | | | | | | |
Total Consumer Discretionary | | | | | | | 737,417 | |
| | | | | | | | |
Consumer Staples (0.6%) | | | | | |
Beverages (0.1%) | |
Anheuser-Busch InBev Finance, Inc.
4.900%, 2/1/46 | | | 50,000 | | | | 47,130 | |
| | | | | | | | |
Food Products (0.3%) | |
JBS USA Lux SA
6.750%, 2/15/28§ | | | 50,000 | | | | 48,187 | |
Pilgrim’s Pride Corp.
5.750%, 3/15/25§ | | | 65,000 | | | | 60,613 | |
Smithfield Foods, Inc.
4.250%, 2/1/27§ | | | 105,000 | | | | 97,978 | |
| | | | | | | | |
| | | | | | | 206,778 | |
| | | | | | | | |
Tobacco (0.2%) | |
BAT Capital Corp.
(ICE LIBOR USD 3 Month + 0.88%), 3.194%, 8/15/22 (k)§ | | | 35,000 | | | | 35,226 | |
Reynolds American, Inc.
4.000%, 6/12/22 | | | 60,000 | | | | 60,091 | |
| | | | | | | | |
| | | | | | | 95,317 | |
| | | | | | | | |
Total Consumer Staples | | | | | | | 349,225 | |
| | | | | | | | |
Energy (1.7%) | | | | | |
Energy Equipment & Services (0.1%) | |
Nabors Industries, Inc.
5.750%, 2/1/25 | | | 35,000 | | | | 32,200 | |
Transocean, Inc.
7.250%, 11/1/25 (b)§ | | | 40,000 | | | | 38,800 | |
USA Compression Partners LP
6.875%, 4/1/26§ | | | 30,000 | | | | 30,413 | |
| | | | | | | | |
| | | | | | | 101,413 | |
| | | | | | | | |
Oil, Gas & Consumable Fuels (1.6%) | |
Apache Corp.
4.375%, 10/15/28 | | | 50,000 | | | | 48,070 | |
Canadian Natural Resources Ltd.
2.950%, 1/15/23 | | | 105,000 | | | | 100,955 | |
Cheniere Energy Partners LP
5.250%, 10/1/25 | | | 65,000 | | | | 63,596 | |
Energy Transfer Operating LP
4.750%, 1/15/26 | | | 95,000 | | | | 93,945 | |
4.200%, 4/15/27 | | | 5,000 | | | | 4,708 | |
EP Energy LLC
7.750%, 5/15/26§ | | | 30,000 | | | | 30,000 | |
EQM Midstream Partners LP
4.750%, 7/15/23 | | | 100,000 | | | | 100,970 | |
Extraction Oil & Gas, Inc.
5.625%, 2/1/26§ | | | 25,000 | | | | 21,125 | |
Gulfport Energy Corp.
6.375%, 5/15/25 | | | 60,000 | | | | 57,337 | |
Indigo Natural Resources LLC
6.875%, 2/15/26§ | | | 40,000 | | | | 37,800 | |
Kinder Morgan Energy Partners LP
6.950%, 1/15/38 | | | 130,000 | | | | 147,106 | |
Marathon Petroleum Corp.
5.125%, 12/15/26 (b)§ | | | 45,000 | | | | 46,172 | |
Peabody Energy Corp.
6.000%, 3/31/22§ | | | 30,000 | | | | 29,925 | |
QEP Resources, Inc.
5.625%, 3/1/26 | | | 35,000 | | | | 32,946 | |
Sabine Pass Liquefaction LLC
5.000%, 3/15/27 | | | 100,000 | | | | 101,084 | |
Sunoco LP
5.500%, 2/15/26§ | | | 30,000 | | | | 28,425 | |
| | | | | | | | |
| | | | | | | 944,164 | |
| | | | | | | | |
Total Energy | | | | | | | 1,045,577 | |
| | | | | | | | |
Financials (2.5%) | | | | | |
Banks (0.6%) | |
Bank of Montreal | | | | | | | | |
(USD Swap Semi 5 Year + 1.43%), 3.803%, 12/15/32 (k) | | | 40,000 | | | | 36,636 | |
Citigroup, Inc. | | | | | | | | |
(ICE LIBOR USD 3 Month + 1.10%), 3.412%, 5/17/24 (k) | | | 105,000 | | | | 105,492 | |
Mitsubishi UFJ Financial Group, Inc. | | | | | | | | |
(ICE LIBOR USD 3 Month + 0.74%), 3.061%, 3/2/23 (k) | | | 145,000 | | | | 144,940 | |
Santander Holdings USA, Inc.
3.400%, 1/18/23 | | | 100,000 | | | | 95,416 | |
| | | | | | | | |
| | | | | | | 382,484 | |
| | | | | | | | |
Capital Markets (0.2%) | |
Morgan Stanley | | | | | | | | |
(ICE LIBOR USD 3 Month + 0.85%), 3.737%, 4/24/24 (k) | | | 105,000 | | | | 103,728 | |
| | | | | | | | |
Consumer Finance (0.8%) | |
Ally Financial, Inc.
4.125%, 3/30/20 | | | 90,000 | | | | 90,000 | |
4.250%, 4/15/21 | | | 5,000 | | | | 4,987 | |
Capital One Financial Corp. | | | | | | | | |
(ICE LIBOR USD 3 Month + 0.72%), 3.240%, 1/30/23 (k) | | | 50,000 | | | | 49,617 | |
Discover Financial Services
4.100%, 2/9/27 | | | 105,000 | | | | 98,984 | |
General Motors Financial Co., Inc. | | | | | | | | |
(ICE LIBOR USD 3 Month + 0.99%), 3.398%, 1/5/23 (k) | | | 70,000 | | | | 68,999 | |
3.950%, 4/13/24 | | | 15,000 | | | | 14,406 | |
See Notes to Financial Statements.
36
1290 FUNDS
1290 DOUBLELINE DYNAMIC ALLOCATION FUND
PORTFOLIO OF INVESTMENTS (Continued)
October 31, 2018
| | | | | | | | |
| | | Principal
Amount | | | Value
(Note 1) | |
Synchrony Financial
3.950%, 12/1/27 | | $ | 135,000 | | | $ | 118,932 | |
| | | | | | | | |
| | | | | | | 445,925 | |
| | | | | | | | |
Diversified Financial Services (0.2%) | |
ASP AMC Merger Sub, Inc.
8.000%, 5/15/25§ | | | 35,000 | | | | 26,337 | |
Refinitiv US Holdings, Inc.
6.250%, 5/15/26§ | | | 25,000 | | | | 24,813 | |
Verscend Escrow Corp.
9.750%, 8/15/26§ | | | 75,000 | | | | 74,906 | |
| | | | | | | | |
| | | | | | | 126,056 | |
| | | | | | | | |
Insurance (0.7%) | |
Alliant Holdings Intermediate LLC
8.250%, 8/1/23§ | | | 60,000 | | | | 61,866 | |
Athene Global Funding
3.000%, 7/1/22§ | | | 100,000 | | | | 96,937 | |
Liberty Mutual Group, Inc.
6.500%, 5/1/42§ | | | 60,000 | | | | 70,183 | |
NFP Corp.
6.875%, 7/15/25§ | | | 65,000 | | | | 63,213 | |
Willis North America, Inc.
4.500%, 9/15/28 | | | 105,000 | | | | 103,459 | |
| | | | | | | | |
| | | | | | | 395,658 | |
| | | | | | | | |
Thrifts & Mortgage Finance (0.0%) | |
Nationstar Mortgage Holdings, Inc.
8.125%, 7/15/23§ | | | 25,000 | | | | 25,344 | |
| | | | | | | | |
Total Financials | | | | | | | 1,479,195 | |
| | | | | | | | |
Health Care (1.3%) | | | | | |
Biotechnology (0.1%) | |
AbbVie, Inc.
4.700%, 5/14/45 | | | 60,000 | | | | 54,143 | |
| | | | | | | | |
Health Care Equipment & Supplies (0.4%) | |
Avantor, Inc.
9.000%, 10/1/25§ | | | 85,000 | | | | 85,663 | |
Zimmer Biomet Holdings, Inc.
2.700%, 4/1/20 | | | 165,000 | | | | 163,215 | |
| | | | | | | | |
| | | | | | | 248,878 | |
| | | | | | | | |
Health Care Providers & Services (0.7%) | |
Centene Corp.
4.750%, 1/15/25 | | | 65,000 | | | | 64,200 | |
5.375%, 6/1/26§ | | | 5,000 | | | | 5,069 | |
CVS Health Corp.
5.050%, 3/25/48 | | | 50,000 | | | | 48,768 | |
Halfmoon Parent, Inc. | | | | | | | | |
(ICE LIBOR USD 3 Month + 0.89%), 3.326%, 7/15/23 (k)§ | | | 145,000 | | | | 145,046 | |
HCA, Inc.
5.250%, 4/15/25 | | | 15,000 | | | | 15,282 | |
5.375%, 9/1/26 | | | 80,000 | | | | 79,304 | |
WellCare Health Plans, Inc.
5.375%, 8/15/26§ | | | 40,000 | | | | 39,952 | |
| | | | | | | | |
| | | | | | | 397,621 | |
| | | | | | | | |
Pharmaceuticals (0.1%) | |
Teva Pharmaceutical Finance Netherlands III BV | |
2.800%, 7/21/23 | | | 100,000 | | | | 87,787 | |
| | | | | | | | |
Total Health Care | | | | | | | 788,429 | |
| | | | | | | | |
Industrials (1.7%) | | | | | |
Aerospace & Defense (0.2%) | |
Lockheed Martin Corp.
4.700%, 5/15/46 | | | 95,000 | | | | 96,531 | |
TransDigm, Inc.
6.375%, 6/15/26 | | | 30,000 | | | | 29,400 | |
| | | | | | | | |
| | | | | | | 125,931 | |
| | | | | | | | |
Airlines (0.2%) | |
Delta Air Lines, Inc.
3.625%, 3/15/22 | | | 105,000 | | | | 103,541 | |
| | | | | | �� | | |
Building Products (0.2%) | |
Builders FirstSource, Inc.
5.625%, 9/1/24§ | | | 60,000 | | | | 55,950 | |
Owens Corning
4.400%, 1/30/48 | | | 55,000 | | | | 43,183 | |
| | | | | | | | |
| | | | | | | 99,133 | |
| | | | | | | | |
Commercial Services & Supplies (0.3%) | |
Garda World Security Corp.
8.750%, 5/15/25§ | | | 60,000 | | | | 57,150 | |
Prime Security Services Borrower LLC | |
9.250%, 5/15/23§ | | | 48,000 | | | | 50,722 | |
Tervita Escrow Corp.
7.625%, 12/1/21§ | | | 60,000 | | | | 60,900 | |
| | | | | | | | |
| | | | | | | 168,772 | |
| | | | | | | | |
Industrial Conglomerates (0.1%) | |
Roper Technologies, Inc.
4.200%, 9/15/28 | | | 50,000 | | | | 49,032 | |
| | | | | | | | |
Machinery (0.1%) | |
BlueLine Rental Finance Corp.
9.250%, 3/15/24§ | | | 60,000 | | | | 62,625 | |
| | | | | | | | |
Road & Rail (0.4%) | |
Avolon Holdings Funding Ltd.
5.125%, 10/1/23§ | | | 80,000 | | | | 78,504 | |
CSX Corp.
3.800%, 11/1/46 | | | 55,000 | | | | 47,443 | |
Penske Truck Leasing Co. LP
4.200%, 4/1/27§ | | | 110,000 | | | | 106,846 | |
| | | | | | | | |
| | | | | | | 232,793 | |
| | | | | | | | |
Trading Companies & Distributors (0.2%) | |
Air Lease Corp.
3.250%, 3/1/25 | | | 65,000 | | | | 60,256 | |
Beacon Roofing Supply, Inc.
4.875%, 11/1/25§ | | | 55,000 | | | | 49,297 | |
United Rentals North America, Inc.
6.500%, 12/15/26 | | | 40,000 | | | | 40,400 | |
| | | | | | | | |
| | | | | | | 149,953 | |
| | | | | | | | |
Total Industrials | | | | | | | 991,780 | |
| | | | | | | | |
See Notes to Financial Statements.
37
1290 FUNDS
1290 DOUBLELINE DYNAMIC ALLOCATION FUND
PORTFOLIO OF INVESTMENTS (Continued)
October 31, 2018
| | | | | | | | |
| | | Principal
Amount | | | Value
(Note 1) | |
Information Technology (0.9%) | | | | | |
Communications Equipment (0.1%) | |
CommScope Technologies LLC
6.000%, 6/15/25§ | | $ | 50,000 | | | $ | 48,625 | |
| | | | | | | | |
Electronic Equipment, Instruments & Components (0.1%) | |
Arrow Electronics, Inc.
3.875%, 1/12/28 | | | 105,000 | | | | 95,461 | |
| | | | | | | | |
IT Services (0.1%) | |
GTT Communications, Inc.
7.875%, 12/31/24§ | | | 65,000 | | | | 61,184 | |
| | | | | | | | |
Semiconductors & Semiconductor Equipment (0.2%) | |
Microchip Technology, Inc.
4.333%, 6/1/23§ | | | 105,000 | | | | 102,604 | |
| | | | | | | | |
Software (0.4%) | |
CDK Global, Inc.
5.875%, 6/15/26 | | | 30,000 | | | | 30,225 | |
Genesys Telecommunications Laboratories, Inc.
10.000%, 11/30/24§ | | | 55,000 | | | | 59,641 | |
Informatica LLC
7.125%, 7/15/23§ | | | 60,000 | | | | 61,218 | |
Solera LLC
10.500%, 3/1/24§ | | | 15,000 | | | | 16,172 | |
Sophia LP
9.000%, 9/30/23§ | | | 55,000 | | | | 57,337 | |
| | | | | | | | |
| | | | | | | 224,593 | |
| | | | | | | | |
Total Information Technology | | | | | | | 532,467 | |
| | | | | | | | |
Materials (0.7%) | | | | | |
Chemicals (0.3%) | |
Hexion, Inc.
6.625%, 4/15/20 | | | 15,000 | | | | 13,275 | |
10.375%, 2/1/22§ | | | 45,000 | | | | 40,331 | |
Mosaic Co. (The)
4.050%, 11/15/27 | | | 100,000 | | | | 94,781 | |
| | | | | | | | |
| | | | | | | 148,387 | |
| | | | | | | | |
Containers & Packaging (0.3%) | |
Crown Americas LLC
4.750%, 2/1/26§ | | | 80,000 | | | | 75,504 | |
Flex Acquisition Co., Inc.
6.875%, 1/15/25§ | | | 60,000 | | | | 56,025 | |
WestRock Co.
3.750%, 3/15/25§ | | | 50,000 | | | | 48,200 | |
| | | | | | | | |
| | | | | | | 179,729 | |
| | | | | | | | |
Metals & Mining (0.1%) | |
SunCoke Energy Partners LP
7.500%, 6/15/25§ | | | 60,000 | | | | 61,050 | |
| | | | | | | | |
Total Materials | | | | | | | 389,166 | |
| | | | | | | | |
Real Estate (0.6%) | | | | | |
Equity Real Estate Investment Trusts (REITs) (0.6%) | |
Crown Castle International Corp. (REIT) | |
3.650%, 9/1/27 | | | 70,000 | | | | 64,801 | |
3.800%, 2/15/28 | | | 50,000 | | | | 46,635 | |
ESH Hospitality, Inc. (REIT)
5.250%, 5/1/25§ | | | 85,000 | | | | 80,435 | |
GLP Capital LP (REIT)
5.750%, 6/1/28 | | | 30,000 | | | | 30,394 | |
5.300%, 1/15/29 | | | 15,000 | | | | 14,719 | |
MPT Operating Partnership LP (REIT)
| |
5.250%, 8/1/26 | | | 65,000 | | | | 62,563 | |
Welltower, Inc. (REIT)
3.950%, 9/1/23 | | | 50,000 | | | | 49,706 | |
| | | | | | | | |
Total Real Estate | | | | | | | 349,253 | |
| | | | | | | | |
Utilities (0.5%) | | | | | |
Electric Utilities (0.5%) | |
Edison International
4.125%, 3/15/28 | | | 50,000 | | | | 48,811 | |
NextEra Energy Operating Partners LP
| | | | | |
4.500%, 9/15/27§ | | | 65,000 | | | | 59,719 | |
Southern Co. (The)
1.850%, 7/1/19 | | | 80,000 | | | | 79,317 | |
2.750%, 6/15/20 | | | 70,000 | | | | 69,022 | |
Vistra Operations Co. LLC
5.500%, 9/1/26§ | | | 60,000 | | | | 58,950 | |
| | | | | | | | |
Total Utilities | | | | | | | 315,819 | |
| | | | | | | | |
| | |
Total Corporate Bonds | | | | | | | 7,739,925 | |
| | | | | | | | |
Mortgage-Backed Securities (3.0%) | |
FHLMC
3.000%, 3/1/46 | | | 748,364 | | | | 709,569 | |
3.500%, 5/1/46 | | | 732,711 | | | | 711,558 | |
FNMA
3.500%, 7/1/42 | | | 339,296 | | | | 333,289 | |
| | | | | | | | |
Total Mortgage-Backed Securities | | | | | | | 1,754,416 | |
| | | | | | | | |
U.S. Treasury Obligations (8.3%) | |
U.S. Treasury Bonds
3.125%, 2/15/43 | | | 30,000 | | | | 28,622 | |
U.S. Treasury Notes | | | | | | | | |
1.375%, 2/15/20 | | | 340,000 | | | | 333,907 | |
2.125%, 8/31/20 | | | 320,000 | | | | 315,725 | |
2.000%, 9/30/20 | | | 300,000 | | | | 295,113 | |
1.750%, 10/31/20 | | | 320,000 | | | | 312,985 | |
1.625%, 11/30/20 | | | 300,000 | | | | 292,373 | |
2.000%, 5/31/21 | | | 300,000 | | | | 293,180 | |
1.125%, 6/30/21 | | | 360,000 | | | | 343,612 | |
2.750%, 8/15/21 | | | 360,000 | | | | 358,242 | |
2.750%, 9/15/21 | | | 360,000 | | | | 358,194 | |
2.625%, 2/28/23 | | | 310,000 | | | | 305,626 | |
2.500%, 3/31/23 | | | 370,000 | | | | 362,718 | |
2.750%, 4/30/23 | | | 360,000 | | | | 356,591 | |
1.875%, 8/31/24 | | | 290,000 | | | | 272,203 | |
2.125%, 9/30/24 | | | 120,000 | | | | 114,081 | |
2.250%, 10/31/24 | | | 220,000 | | | | 210,463 | |
3.000%, 9/30/25 | | | 240,000 | | | | 238,881 | |
2.250%, 11/15/27 | | | 190,000 | | | | 176,657 | |
| | | | | | | | |
Total U.S. Treasury Obligations | | | | | | | 4,969,173 | |
| | | | | | | | |
Total Long-Term Debt Securities (39.2%)
(Cost $24,297,042) | | | | | | | 23,370,445 | |
| | | | | | | | |
See Notes to Financial Statements.
38
1290 FUNDS
1290 DOUBLELINE DYNAMIC ALLOCATION FUND
PORTFOLIO OF INVESTMENTS (Continued)
October 31, 2018
| | | | | | | | |
| | | Number of
Shares | | | Value
(Note 1) | |
COMMON STOCKS: | |
Communication Services (1.4%) | |
Interactive Media & Services (1.4%) | |
Alphabet, Inc., Class A* | | | 458 | | | $ | 499,485 | |
Facebook, Inc., Class A* | | | 2,391 | | | | 362,930 | |
| | | | | | | | |
| | | | | | | 862,415 | |
| | | | | | | | |
Total Communication Services | | | | | | | 862,415 | |
| | | | | | | | |
Consumer Discretionary (2.5%) | |
Hotels, Restaurants & Leisure (0.4%) | |
Starbucks Corp. | | | 3,594 | | | | 209,422 | |
| | | | | | | | |
Internet & Direct Marketing Retail (1.7%) | |
Amazon.com, Inc.* | | | 368 | | | | 588,068 | |
Booking Holdings, Inc.* | | | 120 | | | | 224,950 | |
eBay, Inc.* | | | 7,483 | | | | 217,231 | |
| | | | | | | | |
| | | | | | | 1,030,249 | |
| | | | | | | | |
Multiline Retail (0.4%) | |
Dollar General Corp. | | | 2,107 | | | | 234,678 | |
| | | | | | | | |
Total Consumer Discretionary | | | | | | | 1,474,349 | |
| | | | | | | | |
Consumer Staples (1.2%) | |
Food & Staples Retailing (0.6%) | |
Sysco Corp. | | | 4,884 | | | | 348,376 | |
| | | | | | | | |
Tobacco (0.6%) | |
Philip Morris International, Inc. | | | 4,589 | | | | 404,153 | |
| | | | | | | | |
Total Consumer Staples | | | | | | | 752,529 | |
| | | | | | | | |
Energy (1.6%) | |
Energy Equipment & Services (0.5%) | |
Halliburton Co. | | | 4,357 | | | | 151,101 | |
Patterson-UTI Energy, Inc. | | | 8,907 | | | | 148,212 | |
| | | | | | | | |
| | | | | | | 299,313 | |
| | | | | | | | |
Oil, Gas & Consumable Fuels (1.1%) | |
Continental Resources, Inc.* | | | 4,336 | | | | 228,421 | |
Devon Energy Corp. | | | 6,660 | | | | 215,784 | |
Pioneer Natural Resources Co. | | | 1,359 | | | | 200,140 | |
| | | | | | | | |
| | | | | | | 644,345 | |
| | | | | | | | |
Total Energy | | | | | | | 943,658 | |
| | | | | | | | |
Financials (4.0%) | |
Banks (1.8%) | |
Citigroup, Inc. | | | 6,449 | | | | 422,152 | |
JPMorgan Chase & Co. | | | 4,006 | | | | 436,734 | |
Wells Fargo & Co. | | | 3,815 | | | | 203,072 | |
| | | | | | | | |
| | | | | | | 1,061,958 | |
| | | | | | | | |
Capital Markets (1.5%) | |
Charles Schwab Corp. (The) | | | 7,552 | | | | 349,204 | |
Goldman Sachs Group, Inc. (The) | | | 978 | | | | 220,412 | |
Intercontinental Exchange, Inc. | | | 4,028 | | | | 310,317 | |
| | | | | | | | |
| | | | | | | 879,933 | |
| | | | | | | | |
Insurance (0.7%) | |
Markel Corp.* | | | 212 | | | | 231,767 | |
Willis Towers Watson plc | | | 1,388 | | | | 198,706 | |
| | | | | | | | |
| | | | | | | 430,473 | |
| | | | | | | | |
Total Financials | | | | | | | 2,372,364 | |
| | | | | | | | |
Health Care (4.5%) | |
Biotechnology (0.6%) | |
Amgen, Inc. | | | 1,940 | | | | 374,012 | |
| | | | | | | | |
Health Care Equipment & Supplies (0.6%) | |
Abbott Laboratories | | | 5,021 | | | | 346,148 | |
| | | | | | | | |
Health Care Providers & Services (0.5%) | |
Cigna Corp. | | | 1,573 | | | | 336,323 | |
| | | | | | | | |
Pharmaceuticals (2.8%) | |
Allergan plc | | | 1,271 | | | | 200,831 | |
AstraZeneca plc (ADR) | | | 6,336 | | | | 245,710 | |
Bristol-Myers Squibb Co. | | | 4,318 | | | | 218,232 | |
Novartis AG (ADR) | | | 3,349 | | | | 292,903 | |
Roche Holding AG (ADR) | | | 4,887 | | | | 148,369 | |
Sanofi (ADR) | | | 5,748 | | | | 257,051 | |
Zoetis, Inc. | | | 3,258 | | | | 293,709 | |
| | | | | | | | |
| | | | | | | 1,656,805 | |
| | | | | | | | |
Total Health Care | | | | | | | 2,713,288 | |
| | | | | | | | |
Industrials (1.6%) | |
Aerospace & Defense (0.3%) | |
Northrop Grumman Corp. | | | 758 | | | | 198,558 | |
| | | | | | | | |
Air Freight & Logistics (0.5%) | |
FedEx Corp. | | | 1,247 | | | | 274,764 | |
| | | | | | | | |
Professional Services (0.4%) | |
Equifax, Inc. | | | 2,234 | | | | 226,617 | |
| | | | | | | | |
Trading Companies & Distributors (0.4%) | |
MSC Industrial Direct Co., Inc., Class A | | | 2,928 | | | | 237,344 | |
| | | | | | | | |
Total Industrials | | | | | | | 937,283 | |
| | | | | | | | |
Information Technology (5.9%) | |
Communications Equipment (0.3%) | |
Telefonaktiebolaget LM Ericsson (ADR) | | | 23,796 | | | | 206,073 | |
| | | | | | | | |
IT Services (2.7%) | |
Automatic Data Processing, Inc. | | | 1,553 | | | | 223,756 | |
Cognizant Technology Solutions Corp., Class A | | | 3,994 | | | | 275,706 | |
Fidelity National Information Services, Inc. | | | 1,799 | | | | 187,276 | |
PayPal Holdings, Inc.* | | | 4,874 | | | | 410,342 | |
Visa, Inc., Class A | | | 3,555 | | | | 490,057 | |
| | | | | | | | |
| | | | | | | 1,587,137 | |
| | | | | | | | |
Semiconductors & Semiconductor Equipment (0.6%) | |
Analog Devices, Inc. | | | 2,314 | | | | 193,705 | |
Lam Research Corp. | | | 1,182 | | | | 167,525 | |
| | | | | | | | |
| | | | | | | 361,230 | |
| | | | | | | | |
Software (1.2%) | |
Microsoft Corp. | | | 6,444 | | | | 688,284 | |
| | | | | | | | |
Technology Hardware, Storage & Peripherals (1.1%) | |
Apple, Inc. | | | 3,035 | | | | 664,240 | |
| | | | | | | | |
Total Information Technology | | | | | | | 3,506,964 | |
| | | | | | | | |
See Notes to Financial Statements.
39
1290 FUNDS
1290 DOUBLELINE DYNAMIC ALLOCATION FUND
PORTFOLIO OF INVESTMENTS (Continued)
October 31, 2018
| | | | | | | | |
| | | Number of
Shares | | | Value
(Note 1) | |
Real Estate (0.5%) | |
Equity Real Estate Investment Trusts (REITs) (0.5%) | |
American Tower Corp. (REIT) | | | 2,097 | | | $ | 326,733 | |
| | | | | | | | |
Total Real Estate | | | | | | | 326,733 | |
| | | | | | | | |
Total Common Stocks (23.2%)
(Cost $12,591,812) | | | | | | | 13,889,583 | |
| | | | | | | | |
INVESTMENT COMPANIES: | |
Fixed Income (7.4%) | |
DoubleLine Floating Rate Fund Class I‡ | | | 280,868 | | | | 2,769,359 | |
DoubleLine Global Bond Fund Class I‡ | | | 165,022 | | | | 1,633,717 | |
| | | | | | | | |
Total Investment Companies (7.4%)
(Cost $4,425,000) | | | | | | | 4,403,076 | |
| | | | | | | | |
| | | Principal
Amount | | | Value
(Note 1) | |
SHORT-TERM INVESTMENTS: | | | | | |
U.S. Treasury Obligations (26.6%) | | | | | |
U.S. Treasury Bills | | | | | | | | |
2.32%, 3/7/19 (p) | | $ | 2,190,000 | | | | 2,172,257 | |
2.54%, 7/18/19 (p) | | | 6,000,000 | | | | 5,891,985 | |
2.58%, 8/15/19 (p) | | | 8,000,000 | | | | 7,838,018 | |
| | | | | | | | |
Total U.S. Treasury Obligations | | | | | | | 15,902,260 | |
| | | | | |
Total Short-Term Investments (26.6%)
(Cost $15,913,360) | | | | | | | 15,902,260 | |
| | | | | | | | |
Total Investments in Securities (96.4%)
(Cost $57,227,214) | | | | | | | 57,565,364 | |
Other Assets Less Liabilities (3.6%) | | | | | | | 2,155,330 | |
| | | | | |
Net Assets (100%) | | | | | | $ | 59,720,694 | |
| | | | | | | | |
| ‡ | All, or a portion, of the security is an affiliated company as defined under the Investment Company Act of 1940. |
| § | Securities exempt from registration under Rule 144A of the Securities Act of 1933. These securities may only be resold to qualified institutional buyers. At October 31, 2018, the market value of these securities amounted to $4,779,579 or 8.0% of net assets. Securities denoted with “§” but without “b” have been determined to be liquid under the guidelines established by the Board of Trustees. To the extent any securities might provide a right to demand registration, such rights have not been relied upon when determining liquidity. |
| (b) | Rule 144A Illiquid Security. At October 31, 2018, the market value of these securities amounted to $84,972 or 0.1% of net assets. |
| (e) | Step Bond - Coupon rate increases or decreases in increments to maturity. Rate disclosed is as of October 31, 2018. Maturity date disclosed is the ultimate maturity date. |
| (k) | Variable or floating rate security, linked to the referenced benchmark. The interest rate shown was the current rate as of October 31, 2018. |
| (l) | Variable or floating rate security, the interest rate of which adjusts periodically based on changes in current interest rates and prepayments on the underlying pool of assets. The interest rate shown was the current rate as of October 31, 2018. |
Glossary:
| | ADR | — American Depositary Receipt |
| | CAPE | — Cyclically Adjusted Price Earnings |
| | FHLMC | — Federal Home Loan Mortgage Corp. |
| | FNMA | — Federal National Mortgage Association |
| | ICE | — Intercontinental Exchange |
| | LIBOR | — London Interbank Offered Rate |
| | USD | — United States Dollar |
Investments in companies which were affiliates for the year ended October 31, 2018, were as follows:
| | | | | | | | | | | | | | | | | | | | | | | | | | | | | | | | | | | | |
Security Description | | Shares at
October 31,
2018 | | | Market Value
October 31,
2017 ($) | | | Purchases
at Cost ($) | | | Proceeds
from
Sales ($) | | | Net
Realized
Gain
(Loss) ($) | | | Change
in Unrealized
Appreciation/
(Depreciation)
($) | | | Market Value
October 31,
2018 ($) | | | Dividend/
Interest
Income
($) | | | Capital Gain
Distributions
($) | |
DoubleLine Floating Rate Fund Class I | | | 280,868 | | | | 2,391,425 | | | | 400,000 | | | | — | | | | — | | | | (22,066 | ) | | | 2,769,359 | | | | 112,349 | | | | — | |
DoubleLine Global Bond Fund Class I | | | 165,022 | | | | 1,415,770 | | | | 300,000 | | | | — | | | | — | | | | (82,053 | ) | | | 1,633,717 | | | | 25,351 | | | | — | |
| | | | | | | | | | | | | | | | | | | | | | | | | | | | | | | | | | | | |
Total | | | | | | | 3,807,195 | | | | 700,000 | | | | — | | | | — | | | | (104,119 | ) | | | 4,403,076 | | | | 137,700 | | | | — | |
| | | | | | | | | | | | | | | | | | | | | | | | | | | | | | | | | | | | |
See Notes to Financial Statements.
40
1290 FUNDS
1290 DOUBLELINE DYNAMIC ALLOCATION FUND
PORTFOLIO OF INVESTMENTS (Continued)
October 31, 2018
OTC Total return swap contracts outstanding as of October 31, 2018 (Note 1):
| | | | | | | | | | | | | | | | | | | | |
Reference Entity | | Payments Made by Fund | | Payments Received
by Fund | | Frequency of
Payments
Made/Received | | Counterparty | | Maturity
Date | | | Notional
Amount | | | Value and
Unrealized
Appreciation
(Depreciation)
($) | |
Shiller Barclays
CAPE US Sector II
ER USD Index | | 0.40% and decrease
in total return of index | | Increase in total return of index | | At maturity | | Barclays Bank plc | | | 5/28/2019 | | | USD | 12,000,000 | | | | 395,224 | |
| | | | | | | | | | | | | | | | | | | | |
| | | | | | | | | | | | | | | | | | | 395,224 | |
| | | | | | | | | | | | | | | | | | | | |
Shiller Barclays
CAPE US Sector
ER USD Index | | 0.47% and decrease
in total return of index | | Increase in total return of index | | At maturity | | Barclays Bank plc | | | 11/19/2018 | | | | USD 2,500,000 | | | | (114,075 | ) |
| | | | | | | | | | | | | | | | | | | | |
| | | | | | | | | | | | | | | | | | | (114,075 | ) |
| | | | | | | | | | | | | | | | | | | | |
| | | | | | | | | | | | | | | | | | | 281,149 | |
| | | | | | | | | | | | | | | | | | | | |
The following is a summary of the inputs used to value the Fund’s assets and liabilities carried at fair value as of October 31, 2018:
The inputs or methodology used for valuing securities are not necessarily an indication of the risk associated with investing in those securities.
Various inputs are used in determining the value of the Fund’s investments. These inputs are summarized in the three broad levels listed below:
| | | | | | | | | | | | | | | | |
| | | | | |
| Investment Type | | Level 1
Quoted Prices in
Active Markets for
Identical
Securities | | | Level 2
Significant Other
Observable Inputs
(including quoted prices
for similar securities,
interest rates,
prepayment speeds,
credit risk, etc.) | | | Level 3
Significant Unobservable
Inputs (including the
Fund’s own
assumptions in
determining the fair
value of investments) | | | Total | |
Assets: | |
Asset-Backed Securities | | $ | — | | | $ | 829,777 | | | $ | — | | | $ | 829,777 | |
Collateralized Mortgage Obligations | | | — | | | | 8,077,154 | | | | — | | | | 8,077,154 | |
Common Stocks | | | | | | | | | | | | | | | | |
Communication Services | | | 862,415 | | | | — | | | | — | | | | 862,415 | |
Consumer Discretionary | | | 1,474,349 | | | | — | | | | — | | | | 1,474,349 | |
Consumer Staples | | | 752,529 | | | | — | | | | — | | | | 752,529 | |
Energy | | | 943,658 | | | | — | | | | — | | | | 943,658 | |
Financials | | | 2,372,364 | | | | — | | | | — | | | | 2,372,364 | |
Health Care | | | 2,713,288 | | | | — | | | | — | | | | 2,713,288 | |
Industrials | | | 937,283 | | | | — | | | | — | | | | 937,283 | |
Information Technology | | | 3,506,964 | | | | — | | | | — | | | | 3,506,964 | |
Real Estate | | | 326,733 | | | | — | | | | — | | | | 326,733 | |
Corporate Bonds | | | | | | | | | | | | | | | | |
Communication Services | | | — | | | | 761,597 | | | | — | | | | 761,597 | |
Consumer Discretionary | | | — | | | | 737,417 | | | | — | | | | 737,417 | |
Consumer Staples | | | — | | | | 349,225 | | | | — | | | | 349,225 | |
Energy | | | — | | | | 1,045,577 | | | | — | | | | 1,045,577 | |
Financials | | | — | | | | 1,479,195 | | | | — | | | | 1,479,195 | |
Health Care | | | — | | | | 788,429 | | | | — | | | | 788,429 | |
Industrials | | | — | | | | 991,780 | | | | — | | | | 991,780 | |
Information Technology | | | — | | | | 532,467 | | | | — | | | | 532,467 | |
See Notes to Financial Statements.
41
1290 FUNDS
1290 DOUBLELINE DYNAMIC ALLOCATION FUND
PORTFOLIO OF INVESTMENTS (Continued)
October 31, 2018
| | | | | | | | | | | | | | | | |
| | | | | |
| Investment Type | | Level 1
Quoted Prices in
Active Markets for
Identical
Securities | | | Level 2
Significant Other
Observable Inputs
(including quoted prices
for similar securities,
interest rates,
prepayment speeds,
credit risk, etc.) | | | Level 3
Significant Unobservable
Inputs (including the
Fund’s own
assumptions in
determining the fair
value of investments) | | | Total | |
Materials | | $ | — | | | $ | 389,166 | | | $ | — | | | $ | 389,166 | |
Real Estate | | | — | | | | 349,253 | | | | — | | | | 349,253 | |
Utilities | | | — | | | | 315,819 | | | | — | | | | 315,819 | |
Investment Companies | | | 4,403,076 | | | | — | | | | — | | | | 4,403,076 | |
Mortgage-Backed Securities | | | — | | | | 1,754,416 | | | | — | | | | 1,754,416 | |
Short-Term Investments | | | | | | | | | | | | | | | | |
U.S. Treasury Obligations | | | — | | | | 15,902,260 | | | | — | | | | 15,902,260 | |
Total Return Swaps | | | — | | | | 395,224 | | | | — | | | | 395,224 | |
U.S. Treasury Obligations | | | — | | | | 4,969,173 | | | | — | | | | 4,969,173 | |
| | | | | | | | | | | | | | | | |
Total Assets | | $ | 18,292,659 | | | $ | 39,667,929 | | | $ | — | | | $ | 57,960,588 | |
| | | | | | | | | | | | | | | | |
|
Liabilities: | |
Total Return Swaps | | $ | — | | | $ | (114,075 | ) | | $ | — | | | $ | (114,075 | ) |
| | | | | | | | | | | | | | | | |
Total Liabilities | | $ | — | | | $ | (114,075 | ) | | $ | — | | | $ | (114,075 | ) |
| | | | | | | | | | | | | | | | |
Total | | $ | 18,292,659 | | | $ | 39,553,854 | | | $ | — | | | $ | 57,846,513 | |
| | | | | | | | | | | | | | | | |
Fair Values of Derivative Instruments as of October 31, 2018:
| | | | | | |
| | | Statements of Assets and Liabilities | |
Derivatives Not Accounted for as
Hedging Instrument^ | | Asset Derivatives | | Fair Value | |
Equity contracts | | Receivables, Net assets –
Unrealized appreciation | | $ | 395,224 | |
| | | | | | |
Total | | | | $ | 395,224 | |
| | | | | | |
| | |
| | | Liability Derivatives | | | |
Equity contracts | | Payables, Net assets –
Unrealized depreciation | | $ | (114,075 | ) |
| | | | | | |
Total | | | | $ | (114,075 | ) |
| | | | | | |
The Effect of Derivative Instruments on the Statement of Operations for the year ended October 31, 2018:
| | | | | | | | |
| Amount of Realized Gain or (Loss) on Derivatives Recognized in Income | |
Derivatives Not Accounted for as
Hedging Instruments^ | | Swaps | | | Total | |
Equity contracts | | $ | 1,398,271 | | | $ | 1,398,271 | |
| | | | | | | | |
Total | | $ | 1,398,271 | | | $ | 1,398,271 | |
| | | | | | | | |
| | | | | | | | |
| Amount of Unrealized Appreciation or (Depreciation) on Derivatives Recognized in Income | |
Derivatives Not Accounted for as
Hedging Instruments^ | | Swaps | | | Total | |
Equity contracts | | $ | (490,992 | ) | | $ | (490,992 | ) |
| | | | | | | | |
Total | | $ | (490,992 | ) | | $ | (490,992 | ) |
| | | | | | | | |
^ The Fund held swap contracts as a substitute for investing in conventional securities.
The Fund held swap contracts with an average notional value of approximately $13,423,000 during the year ended October 31, 2018.
See Notes to Financial Statements.
42
1290 FUNDS
1290 DOUBLELINE DYNAMIC ALLOCATION FUND
PORTFOLIO OF INVESTMENTS (Continued)
October 31, 2018
The following table presents the Fund’s gross derivative assets and liabilities by counterparty net of amounts available for offset under netting arrangements and any related collateral received or pledged by the Fund as of October 31, 2018:
| | | | | | | | | | | | | | | | |
Counterparty | | Gross Amount of
Derivative Assets
Presented in the
Statement of Assets
and Liabilities (a) | | | Derivatives
Available
for Offset | | | Collateral
Received | | | Net Amount Due
from Counterparty | |
Barclays Bank plc | | $ | 395,224 | | | $ | (114,075 | ) | | $ | (281,149 | )* | | $ | — | |
| | | | | | | | | | | | | | | | |
Total | | $ | 395,224 | | | $ | (114,075 | ) | | $ | (281,149 | )* | | $ | — | |
| | | | | | | | | | | | | | | | |
| | | | |
Counterparty | | Gross Amount of
Derivative Liabilities
Presented in the
Statement of Assets
and Liabilities (a) | | | Derivatives
Available
for Offset | | | Collateral
Pledged | | | Net Amount Due
to Counterparty | |
Barclays Bank plc. | | $ | 114,075 | | | $ | (114,075 | ) | | $ | — | | | $ | — | |
| | | | | | | | | | | | | | | | |
Total | | $ | 114,075 | | | $ | (114,075 | ) | | $ | — | | | $ | — | |
| | | | | | | | | | | | | | | | |
| * | The table above does not include the additional collateral received by the Fund. Total additional collateral received was $8,851. |
| (a) | For financial reporting purposes the Fund does not offset derivative assets and derivative liabilities subject to master netting arrangements in the Statement of Assets and Liabilities. |
Investment security transactions for the year ended October 31, 2018 were as follows:
| | | | |
Cost of Purchases: | | | | |
Long-term investments other than U.S. government debt securities | | $ | 21,589,506 | |
Long-term U.S. government debt securities | | | 11,572,813 | |
| | | | |
| | $ | 33,162,319 | |
| | | | |
Net Proceeds of Sales and Redemptions: | | | | |
Long-term investments other than U.S. government debt securities | | $ | 21,771,831 | |
Long-term U.S. government debt securities | | | 11,823,721 | |
| | | | |
| | $ | 33,595,552 | |
| | | | |
As of October 31, 2018, the gross unrealized appreciation (depreciation) of investments based on the aggregate cost of investments in securities and derivative instruments, if applicable, for Federal income tax purposes was as follows:
| | | | |
Aggregate gross unrealized appreciation | | $ | 2,527,519 | |
Aggregate gross unrealized depreciation | | | (1,908,850 | ) |
| | | | |
Net unrealized appreciation | | $ | 618,669 | |
| | | | |
Federal income tax cost of investments in securities and derivative instruments, if applicable | | $ | 57,227,844 | |
| | | | |
See Notes to Financial Statements.
43
1290 FUNDS
1290 DOUBLELINE DYNAMIC ALLOCATION FUND
STATEMENT OF ASSETS AND LIABILITIES
October 31, 2018
| | | | |
ASSETS | |
Investments in Securities, at value: | | | | |
Affiliated Issuers (Cost $4,425,000) | | $ | 4,403,076 | |
Unaffiliated Issuers (Cost $52,802,214) | | | 53,162,288 | |
Cash | | | 1,883,836 | |
Market value on OTC swap contracts | | | 395,224 | |
Cash held as collateral at broker for swaps | | | 290,000 | |
Dividends, interest and other receivables | | | 153,115 | |
Receivable for securities sold | | | 37,563 | |
Prepaid registration and filing fees | | | 14,496 | |
Receivable for Fund shares sold | | | 2,823 | |
Other assets | | | 719 | |
| | | | |
Total assets | | | 60,343,140 | |
| | | | |
LIABILITIES | |
Cash collateral due to broker for swaps | | | 290,000 | |
Market value on OTC swap contracts | | | 114,075 | |
Payable for Fund shares redeemed | | | 82,178 | |
Payable for securities purchased | | | 15,263 | |
Investment advisory fees payable | | | 15,175 | |
Administrative fees payable | | | 7,742 | |
Transfer agent fees payable | | | 6,596 | |
Distribution fees payable – Class A | | | 525 | |
Trustees’ fees payable | | | 364 | |
Distribution fees payable – Class R | | | 67 | |
Accrued expenses | | | 90,461 | |
| | | | |
Total liabilities | | | 622,446 | |
| | | | |
NET ASSETS | | $ | 59,720,694 | |
| | | | |
Net assets were comprised of: | |
Paid in capital | | $ | 56,596,634 | |
Total distributable earnings (loss) | | | 3,124,060 | |
| | | | |
Net assets | | $ | 59,720,694 | |
| | | | |
Class A | | | | |
Net asset value and redemption price per share, $2,439,574 / 229,954 shares outstanding (unlimited amount authorized: $0.001 par value) | | $ | 10.61 | |
Maximum sales charge (5.50% of offering price) | | | 0.62 | |
| | | | |
Maximum offering price per share | | $ | 11.23 | |
| | | | |
Class I | | | | |
Net asset value and redemption price per share, $57,125,529 / 5,372,184 shares outstanding (unlimited amount authorized: $0.001 par value) | | $ | 10.63 | |
| | | | |
Class R | | | | |
Net asset value and redemption price per share, $155,591 / 14,693 shares outstanding (unlimited amount authorized: $0.001 par value) | | $ | 10.59 | |
| | | | |
STATEMENT OF OPERATIONS
For the Year Ended October 31, 2018
| | | | |
INVESTMENT INCOME | |
Interest | | $ | 1,161,422 | |
Dividends ($137,700 of dividend income received from affiliates) | | | 376,863 | |
| | | | |
Total income | | | 1,538,285 | |
| | | | |
EXPENSES | |
Investment advisory fees | | | 448,229 | |
Professional fees | | | 116,930 | |
Administrative fees | | | 89,646 | |
Registration and filing fees | | | 44,129 | |
Printing and mailing expenses | | | 44,083 | |
Transfer agent fees | | | 40,650 | |
Custodian fees | | | 18,300 | |
Trustees’ fees | | | 6,289 | |
Distribution fees – Class A | | | 4,984 | |
Distribution fees – Class R | | | 682 | |
Miscellaneous | | | 35,026 | |
| | | | |
Gross expenses | | | 848,948 | |
Less: Waiver from investment adviser | | | (275,567 | ) |
| | | | |
Net expenses | | | 573,381 | |
| | | | |
NET INVESTMENT INCOME (LOSS) | | | 964,904 | |
| | | | |
REALIZED AND UNREALIZED GAIN (LOSS) | |
Realized gain (loss) on: | | | | |
Investments in securities | | | 294,453 | |
Swaps | | | 1,398,271 | |
| | | | |
Net realized gain (loss) | | | 1,692,724 | |
| | | | |
Change in unrealized appreciation (depreciation) on: | | | | |
Investments in securities ($(104,119) of change in unrealized appreciation (depreciation) from affiliates) | | | (1,323,185 | ) |
Swaps | | | (490,992 | ) |
| | | | |
Net change in unrealized appreciation (depreciation) | | | (1,814,177 | ) |
| | | | |
NET REALIZED AND UNREALIZED GAIN (LOSS) | | | (121,453 | ) |
| | | | |
NET INCREASE (DECREASE) IN NET ASSETS RESULTING FROM OPERATIONS | | $ | 843,451 | |
| | | | |
See Notes to Financial Statements.
44
1290 FUNDS
1290 DOUBLELINE DYNAMIC ALLOCATION FUND
STATEMENT OF CHANGES IN NET ASSETS
| | | | | | | | |
| | | Year Ended October 31, | |
| | 2018 | | | 2017 | |
INCREASE (DECREASE) IN NET ASSETS FROM OPERATIONS: | |
Net investment income (loss) | | $ | 964,904 | | | $ | 723,267 | |
Net realized gain (loss) | | | 1,692,724 | | | | 3,548,929 | |
Net change in unrealized appreciation (depreciation) | | | (1,814,177 | ) | | | 964,816 | |
| | | | | | | | |
NET INCREASE (DECREASE) IN NET ASSETS RESULTING FROM OPERATIONS | | | 843,451 | | | | 5,237,012 | |
| | | | | | | | |
Distributions to shareholders: (a) | | | | | | | | |
Class A | | | (83,272 | ) | | | (12,063 | ) |
Class I | | | (4,227,949 | ) | | | (1,416,871 | ) |
Class R | | | (7,506 | ) | | | (2,348 | ) |
| | | | | | | | |
Total distributions to shareholders | | | (4,318,727 | ) | | | (1,431,282 | ) |
| | | | | | | | |
CAPITAL SHARES TRANSACTIONS: | | | | | | | | |
Class A | | | | | | | | |
Capital shares sold [ 157,314 and 80,291 shares, respectively ] | | | 1,679,813 | | | | 877,567 | |
Capital shares issued in reinvestment of dividends [ 7,082 and 910 shares, respectively ] | | | 75,498 | | | | 9,497 | |
Capital shares repurchased [ (47,392) and (2,089) shares, respectively ] | | | (515,495 | ) | | | (22,784 | ) |
| | | | | | | | |
Total Class A transactions | | | 1,239,816 | | | | 864,280 | |
| | | | | | | | |
Class I | | | | | | | | |
Capital shares sold [ 161,547 and 185,130 shares, respectively ] | | | 1,758,509 | | | | 2,011,307 | |
Capital shares issued in reinvestment of dividends [ 20,595 and 2,773 shares, respectively ] | | | 219,547 | | | | 28,945 | |
Capital shares repurchased [ (51,690) and (15,151) shares, respectively ] | | | (554,783 | ) | | | (166,524 | ) |
| | | | | | | | |
Total Class I transactions | | | 1,423,273 | | | | 1,873,728 | |
| | | | | | | | |
Class R | | | | | | | | |
Capital shares sold [ 4,880 and 0 shares, respectively ] | | | 51,331 | | | | — | |
Capital shares issued in reinvestment of dividends [ 1 and 0# shares, respectively ] | | | 7 | | | | 2 | |
Capital shares repurchased [ (197) and 0 shares, respectively ] | | | (2,083 | ) | | | — | |
| | | | | | | | |
Total Class R transactions | | | 49,255 | | | | 2 | |
| | | | | | | | |
NET INCREASE (DECREASE) IN NET ASSETS RESULTING FROM CAPITAL SHARE TRANSACTIONS | | | 2,712,344 | | | | 2,738,010 | |
| | | | | | | | |
TOTAL INCREASE (DECREASE) IN NET ASSETS | | | (762,932 | ) | | | 6,543,740 | |
NET ASSETS: | |
Beginning of year | | | 60,483,626 | | | | 53,939,886 | |
| | | | | | | | |
End of year (b) | | $ | 59,720,694 | | | $ | 60,483,626 | |
| | | | | | | | |
# Number of shares is less than 0.5. | | | | | | | | |
(a) Prior year distributions to shareholders were made up of dividends from net investment income of $4,165, $562,783 and $667 for Classes A, I and R, respectively; and dividends from net realized capital gains of $7,898, $854,088 and $1,681 for Classes A, I and R, respectively. These amounts were reclassified to conform with the current year presentation. | |
(b) Includes accumulated undistributed (overdistributed) net investment income of $693,906 as of October 31, 2017. The SEC eliminated the requirement to disclose undistributed net investment income in 2018. | |
See Notes to Financial Statements.
45
1290 FUNDS
1290 DOUBLELINE DYNAMIC ALLOCATION FUND
FINANCIAL HIGHLIGHTS
| | | | | | | | | | | | |
| | | Year Ended October 31, | | | March 7, 2016* to
October 31, 2016 | |
| Class A | | 2018 | | | 2017 | |
Net asset value, beginning of period | | $ | 11.25 | | | $ | 10.53 | | | $ | 10.00 | |
| | | | | | | | | | | | |
Income (loss) from investment operations: | | | | | | | | | | | | |
Net investment income (loss) (e)(x) | | | 0.15 | | | | 0.11 | | | | 0.06 | |
Net realized and unrealized gain (loss) | | | (0.01 | ) | | | 0.87 | | | | 0.47 | |
| | | | | | | | | | | | |
Total from investment operations | | | 0.14 | | | | 0.98 | | | | 0.53 | |
| | | | | | | | | | | | |
Less distributions: | |
Dividends from net investment income | | | (0.13 | ) | | | (0.09 | ) | | | — | |
Distributions from net realized gains | | | (0.65 | ) | | | (0.17 | ) | | | — | |
| | | | | | | | | | | | |
Total dividends and distributions | | | (0.78 | ) | | | (0.26 | ) | | | — | |
| | | | | | | | | | | | |
Net asset value, end of period | | $ | 10.61 | | | $ | 11.25 | | | $ | 10.53 | |
| | | | | | | | | | | | |
Total return (b) | | | 1.19 | % | | | 9.46 | % | | | 5.30 | % |
| | | | | | | | | | | | |
Ratios/Supplemental Data: | |
Net assets, end of period (000’s) | | $ | 2,440 | | | $ | 1,271 | | | $ | 356 | |
Ratio of expenses to average net assets: | | | | | | | | | | | | |
After waivers (a)(f) | | | 1.20 | %(j) | | | 1.21 | % | | | 1.22 | % |
Before waivers (a)(f) | | | 1.66 | % | | | 1.75 | % | | | 1.85 | % |
Ratio of net investment income (loss) to average net assets: | | | | | | | | | | | | |
After waivers (a)(f)(x) | | | 1.39 | % | | | 1.02 | % | | | 0.89 | %(l) |
Before waivers (a)(f)(x) | | | 0.93 | % | | | 0.48 | % | | | 0.26 | %(l) |
Portfolio turnover rate (z)^ | | | 79 | % | | | 86 | % | | | 56 | % |
| | |
| | | Year Ended October 31, | | | March 7, 2016* to
October 31, 2016 | |
| Class I | | 2018 | | | 2017 | |
Net asset value, beginning of period | | $ | 11.27 | | | $ | 10.55 | | | $ | 10.00 | |
| | | | | | | | | | | | |
Income (loss) from investment operations: | | | | | | | | | | | | |
Net investment income (loss) (e)(x) | | | 0.18 | | | | 0.14 | | | | 0.08 | |
Net realized and unrealized gain (loss) | | | (0.01 | ) | | | 0.86 | | | | 0.47 | |
| | | | | | | | | | | | |
Total from investment operations | | | 0.17 | | | | 1.00 | | | | 0.55 | |
| | | | | | | | | | | | |
Less distributions: | |
Dividends from net investment income | | | (0.16 | ) | | | (0.11 | ) | | | — | |
Distributions from net realized gains | | | (0.65 | ) | | | (0.17 | ) | | | — | |
| | | | | | | | | | | | |
Total dividends and distributions | | | (0.81 | ) | | | (0.28 | ) | | | — | |
| | | | | | | | | | | | |
Net asset value, end of period | | $ | 10.63 | | | $ | 11.27 | | | $ | 10.55 | |
| | | | | | | | | | | | |
Total return (b) | | | 1.44 | % | | | 9.68 | % | | | 5.50 | % |
| | | | | | | | | | | | |
Ratios/Supplemental Data: | |
Net assets, end of period (000’s) | | $ | 57,126 | | | $ | 59,101 | | | $ | 53,478 | |
Ratio of expenses to average net assets: | | | | | | | | | | | | |
After waivers (a)(f) | | | 0.95 | %(j) | | | 0.96 | % | | | 0.97 | % |
Before waivers (a)(f) | | | 1.41 | % | | | 1.50 | % | | | 1.55 | % |
Ratio of net investment income (loss) to average net assets: | | | | | | | | | | | | |
After waivers (a)(f)(x) | | | 1.62 | % | | | 1.27 | % | | | 1.12 | %(l) |
Before waivers (a)(f)(x) | | | 1.16 | % | | | 0.72 | % | | | 0.55 | %(l) |
Portfolio turnover rate (z)^ | | | 79 | % | | | 86 | % | | | 56 | % |
See Notes to Financial Statements.
46
1290 FUNDS
1290 DOUBLELINE DYNAMIC ALLOCATION FUND
FINANCIAL HIGHLIGHTS (Continued)
| | | | | | | | | | | | |
| | | Year Ended October 31, | | | March 7, 2016* to
October 31, 2016 | |
| Class R | | 2018 | | | 2017 | |
Net asset value, beginning of period | | $ | 11.23 | | | $ | 10.52 | | | $ | 10.00 | |
| | | | | | | | | | | | |
Income (loss) from investment operations: | | | | | | | | | | | | |
Net investment income (loss) (e)(x) | | | 0.12 | | | | 0.08 | | | | 0.04 | |
Net realized and unrealized gain (loss) | | | (0.01 | ) | | | 0.87 | | | | 0.48 | |
| | | | | | | | | | | | |
Total from investment operations | | | 0.11 | | | | 0.95 | | | | 0.52 | |
| | | | | | | | | | | | |
Less distributions: | |
Dividends from net investment income | | | (0.10 | ) | | | (0.07 | ) | | | — | |
Distributions from net realized gains | | | (0.65 | ) | | | (0.17 | ) | | | — | |
| | | | | | | | | | | | |
Total dividends and distributions | | | (0.75 | ) | | | (0.24 | ) | | | — | |
| | | | | | | | | | | | |
Net asset value, end of period | | $ | 10.59 | | | $ | 11.23 | | | $ | 10.52 | |
| | | | | | | | | | | | |
Total return (b) | | | 0.93 | % | | | 9.15 | % | | | 5.20 | % |
| | | | | | | | | | | | |
Ratios/Supplemental Data: | |
Net assets, end of period (000’s) | | $ | 156 | | | $ | 112 | | | $ | 105 | |
Ratio of expenses to average net assets: | | | | | | | | | | | | |
After waivers (a)(f) | | | 1.45 | %(j) | | | 1.46 | % | | | 1.47 | % |
Before waivers (a)(f) | | | 1.91 | % | | | 2.01 | % | | | 2.05 | % |
Ratio of net investment income (loss) to average net assets: | | | | | | | | | | | | |
After waivers (a)(f)(x) | | | 1.13 | % | | | 0.77 | % | | | 0.62 | %(l) |
Before waivers (a)(f)(x) | | | 0.67 | % | | | 0.22 | % | | | 0.05 | %(l) |
Portfolio turnover rate (z)^ | | | 79 | % | | | 86 | % | | | 56 | % |
| * | Commencement of Operations. |
| ^ | Portfolio turnover rate excludes derivatives, if any. |
| (a) | Ratios for periods less than one year are annualized. Certain non-recurring expenses incurred by the Fund are not annualized for periods less than one year. |
| (b) | Total returns for periods less than one year are not annualized. |
| (e) | Net investment income (loss) per share is based on average shares outstanding. |
| (f) | Expenses do not include the expenses of the underlying funds (“indirect expenses”), if applicable. |
| (j) | Including direct and indirect expenses, the net expense ratio after waivers and reimbursements would be 1.25% for Class A, 1.00% for Class I and 1.50% for Class R. |
| (l) | The annualized ratio of net investment income to average net assets may not be indicative of operating results for a full year. |
| (x) | Recognition of net investment income is affected by the timing of dividend declarations by the underlying funds in which the Fund invests. |
| (z) | Portfolio turnover rate for periods less than one year is not annualized. |
See Notes to Financial Statements.
47
1290 GAMCO SMALL/MID CAP VALUE FUND (Unaudited)
INVESTMENT ADVISER
INVESTMENT SUB-ADVISER
| Ø | | GAMCO Asset Management, Inc. |
PERFORMANCE RESULTS
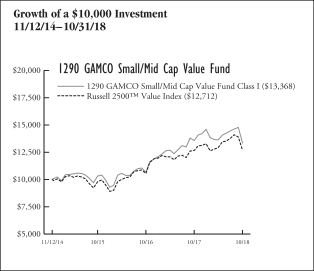
| | | | | | | | | | | | |
| Annualized Total Returns as of 10/31/18 | |
| | | | | | 1
Year | | | Since
Incept. | |
Fund – Class A Shares* | | | without Sales Charge | | | | (1.84 | )% | | | 7.32 | % |
| | | | with Sales Charge (a) | | | | (7.26 | ) | | | 5.80 | |
Fund – Class I Shares* | | | | | | | (1.60 | ) | | | 7.59 | |
Fund – Class R Shares* | | | | | | | (2.07 | ) | | | 7.06 | |
Fund – Class T Shares*† | | | without Sales Charge | | | | (1.60 | ) | | | 7.59 | |
| | | | with Sales Charge (b) | | | | (4.06 | ) | | | 6.90 | |
Russell 2500TM Value Index | | | | | | | 0.27 | | | | 6.24 | |
* Date of inception 11/12/14. † Class T Shares currently are not offered for sale. (a) A 5.50% front-end sales charge was deducted. (b) A 2.50% front-end sales charge was deducted. Returns for periods greater than one year are annualized. | |
The performance quoted is past performance and is not a guarantee of future results. Mutual funds are subject to certain market risks. Investment returns and principal value of an investment will fluctuate so that an investor’s shares, when redeemed, may be worth more or less than their original cost. Current performance may be higher or lower than the performance data shown. For the most current month-end performance data please call 1-888-310-0416 or visit www.1290Funds.com.
The graph illustrates comparative performance for $10,000 invested in the Class I Shares of the 1290 GAMCO Small/Mid Cap Value Fund and the Russell 2500TM Value Index from 11/12/14 to 10/31/18. The performance of the Russell 2500TM Value Index reflects an initial investment at the end of the month closest to the Fund’s inception. The performance of the Fund assumes reinvestment of all dividends and capital gain distributions, if any, and does not include a sales charge. The performance of the Russell 2500TM Value Index does not reflect the deduction of expenses or a sales charge associated with a mutual fund and has been adjusted to reflect reinvestment of all dividends, capital gain distributions, and interest of the securities included in the benchmark.
Fund performance may reflect the waiver of the Fund’s fees and reimbursement of expenses for certain periods since the inception date. Without these waivers and reimbursements, performance would have been lower. Also, performance shown in this section does not reflect the deduction of taxes that a shareholder would pay on Fund distributions or redemption of Fund shares.
PERFORMANCE SUMMARY
The Fund’s Class I shares returned (1.60)% for the year ended October 31, 2018. The Fund’s benchmark, the Russell 2500TM Value Index, returned 0.27% over the same year.
Overview — GAMCO Asset Management, Inc.
The market started off the period continuing a steady upward path fueled by tax reform, deregulation and the prospect of fiscal stimulus. Slow and steady economic growth with historically low interest rates has been the secret sauce for this bull market and the tax bill passed at the end of 2017 added some momentum. After an unprecedented stretch of investor complacency, the first quarter of 2018 saw volatility return with a vengeance. Investor psychology took an abrupt change in February, with a focus on the inflationary potential threat of global growth. During the second quarter, markets recouped first quarter losses to finish the first half of the year modestly higher. U.S. equities posted their best quarterly performance since the final quarter of 2013 during the third quarter. Stocks set a record high in late September as the market brushed off the escalating trade war, the undeterred Federal Reserve’s rising interest rate policy, and contentious midterm election uncertainties. In October, U.S. stocks reversed this trend, closing the month with the largest decline since 2011, as the same issues that had been ignored in September put the markets on edge.
Small cap stocks had stronger relative performance during the second quarter, though large cap stocks led the way for the majority of the period and for the trailing year ended in October. A handful of technology giants have driven broader market returns in recent years.
Fund Highlights
We buy businesses we believe are selling at a discount to their Private Market Value (the price an informed industrialist would pay for the entire company), with a catalyst in place that could potentially surface values. Our philosophy and process focuses on fundamental company research and individual stock selection.
We believe we are generally well-positioned for almost any economic environment. Our holdings have tended to be domestically focused with strong franchises and often pricing power. We have never been top-down allocators, trying to chase every trend. Rather, we rely on fundamental bottom-up research informed by our view of the shifting political and economic tides.
The Fund slightly trailed the Russell 2500 Value Index during this period. As you know, the Fund looks quite different from the index and occasionally we have seen periods where returns differ significantly.
48
1290 GAMCO SMALL/MID CAP VALUE FUND (Unaudited)
What helped performance during the year?
| • | | Teladoc Health, Inc., a leading telemedicine company, was up sharply as it delivered several consecutive quarters of robust results from both organic growth and rising overall revenues boosted by a series of acquisitions, as it builds market share within this unique space. |
| • | | Pandora Media, Inc. was up more than 50%, driven by strong results, plans to reduce customer acquisition costs and a takeover announcement by SIRIUS in September. |
| • | | Our overweighting in consumer staples, consumer discretionary and communication services companies, areas in which our firm has accumulated compounded knowledge over several decades, was our largest relative contributor to return for the period. |
What hurt performance during the year?
| • | | Our larger position in industrial companies, another area in which our firm has built deep knowledge over many years, was the largest detractor to performance for the period as concerns over trade rhetoric and tariffs disproportionately weighed on this area. |
| • | | The Fund’s underweighting in energy was also a detractor to performance as the price of crude oil rose nearly 20% for the period. |
| • | | ATM hardware maker Diebold Nixdorf, Inc. faced a challenging period after it made an ill-timed acquisition, structured the deal poorly and found itself in a precarious liquidity position which new management is addressing. |
| | | | |
Sector Weightings
as of October 31, 2018 | | % of
Net Assets | |
Industrials | | | 31.3 | % |
Communication Services | | | 18.9 | |
Health Care | | | 8.7 | |
Consumer Staples | | | 8.4 | |
Consumer Discretionary | | | 8.4 | |
Materials | | | 8.0 | |
Financials | | | 4.9 | |
Utilities | | | 3.4 | |
Investment Company | | | 2.8 | |
Energy | | | 1.7 | |
Information Technology | | | 1.7 | |
Real Estate | | | 1.3 | |
Cash and Other | | | 0.5 | |
| | | | | |
| | | | 100.0 | % |
| | | | | |
Holdings are subject to change without notice. | |
UNDERSTANDING YOUR EXPENSES:
As a shareholder of the Fund, you incur two types of costs:
(1) transaction costs, including applicable sales charges and redemption fees; and (2) ongoing costs, including investment advisory fees, distribution and/or service (12b-1) fees (in the case of Class A, Class R and Class T shares of the Fund), and other Fund expenses. These examples are intended to help you understand your ongoing costs (in dollars) of investing in the Fund and to compare these costs with the ongoing costs of investing in other mutual funds.
The examples are based on an investment of $1,000 invested at the beginning of the six-month period ended October 31, 2018 and held for the entire six-month period.
Actual Expenses
The first line of the following table provides information about actual account values and actual expenses. You may use the information in this line, together with the amount you invested, to estimate the expenses that you paid over the period. Simply divide your account value by $1,000 (for example, an $8,600 account value divided by $1,000 = 8.6), then multiply the result by the number in the first line under the heading entitled “Expenses Paid During Period” to estimate the expenses you paid on your account during this period.
Hypothetical Example for Comparison Purposes
The second line of the following table provides information about hypothetical account values and hypothetical expenses based on the Fund’s actual expense ratio and an assumed rate of return of 5% per year before expenses, which is not the Fund’s actual return. The hypothetical account values and expenses may not be used to estimate the actual ending account balance or expenses you paid for the period. You may use this information to compare the ongoing costs of investing in the Fund and other funds. To do so, compare this 5% hypothetical example with the 5% hypothetical examples that appear in the shareholder reports of the other funds.
Please note that the expenses shown in the table are meant to highlight your ongoing costs only and do not reflect any transactional costs, such as sales charges (loads), redemption fees, or exchange fees. Therefore, the second line of the table is useful in comparing ongoing costs only, and will not help you determine the relative total costs of owning different funds. In addition, if these transactional costs were included, your costs would have been higher.
49
1290 GAMCO SMALL/MID CAP VALUE FUND (Unaudited)
EXAMPLE
| | | | | | | | | | | | |
| | | Beginning
Account
Value
5/1/18 | | | Ending
Account
Value
10/31/18 | | | Expenses Paid
During
Period*
5/1/18 -
10/31/18 | |
Class A | | | | | | | | | | | | |
Actual | | | $1,000.00 | | | | $977.80 | | | | $6.17 | |
Hypothetical (5% average annual return before expenses) | | | 1,000.00 | | | | 1,018.96 | | | | 6.30 | |
Class I | | | | | | | | | | | | |
Actual | | | 1,000.00 | | | | 978.60 | | | | 4.92 | |
Hypothetical (5% average annual return before expenses) | | | 1,000.00 | | | | 1,020.23 | | | | 5.03 | |
Class R | | | | | | | | | | | | |
Actual | | | 1,000.00 | | | | 976.10 | | | | 7.42 | |
Hypothetical (5% average annual return before expenses) | | | 1,000.00 | | | | 1,017.70 | | | | 7.58 | |
Class T** | | | | | | | | | | | | |
Actual | | | 1,000.00 | | | | 978.60 | | | | 4.93 | |
Hypothetical (5% average annual return before expenses) | | | 1,000.00 | | | | 1,020.23 | | | | 5.03 | |
* Expenses are equal to the Fund’s Class A, I, R and T shares annualized expense ratios of 1.24%, 0.99%, 1.49% and 0.99%, respectively, multiplied by the average account value over the period, and multiplied by 184/365 (to reflect the one-half year period). ** Class T shares currently are not offered for sale. | |
50
1290 FUNDS
1290 GAMCO SMALL/MID CAP VALUE FUND
PORTFOLIO OF INVESTMENTS
October 31, 2018
| | | | | | | | |
| | | Number of
Shares | | | Value
(Note 1) | |
| | | | | | | | |
COMMON STOCKS: | | | | | | | | |
Communication Services (18.9%) | | | | | | | | |
Diversified Telecommunication Services (0.9%) | |
Intelsat SA* | | | 32,500 | | | $ | 846,950 | |
| | | | | | | | |
Entertainment (4.1%) | |
AMC Entertainment Holdings, Inc., Class A | | | 40,000 | | | | 770,400 | |
Entertainment One Ltd. | | | 90,000 | | | | 470,357 | |
Liberty Media Corp.-Liberty Braves, Class C* | | | 20,000 | | | | 518,000 | |
Madison Square Garden Co. (The), Class A* | | | 2,501 | | | | 691,827 | |
Pandora Media, Inc.* | | | 24,000 | | | | 204,000 | |
Viacom, Inc., Class B | | | 33,000 | | | | 1,055,340 | |
| | | | | | | | |
| | | | | | | 3,709,924 | |
| | | | | | | | |
Media (11.3%) | | | | | | | | |
AMC Networks, Inc., Class A* | | | 9,500 | | | | 556,510 | |
Clear Channel Outdoor Holdings, Inc., Class A | | | 195,000 | | | | 1,134,900 | |
comScore, Inc.* | | | 25,000 | | | | 398,750 | |
Corus Entertainment, Inc., Class B | | | 190,000 | | | | 715,865 | |
EW Scripps Co. (The), Class A | | | 52,000 | | | | 874,640 | |
Grupo Televisa SAB (ADR) | | | 42,000 | | | | 603,960 | |
JCDecaux SA | | | 12,500 | | | | 411,218 | |
Loral Space & Communications, Inc.* | | | 9,000 | | | | 401,940 | |
Meredith Corp. | | | 20,000 | | | | 1,031,200 | |
MSG Networks, Inc., Class A* | | | 32,000 | | | | 817,600 | |
Tribune Media Co., Class A | | | 80,000 | | | | 3,040,799 | |
WideOpenWest, Inc.* | | | 40,000 | | | | 389,600 | |
| | | | | | | | |
| | | | | | | 10,376,982 | |
| | | | | | | | |
Wireless Telecommunication Services (2.6%) | |
Gogo, Inc.* | | | 35,000 | | | | 200,200 | |
Millicom International Cellular SA | | | 8,000 | | | | 435,120 | |
Millicom International Cellular SA (SDR) | | | 8,000 | | | | 451,873 | |
United States Cellular Corp.* | | | 26,000 | | | | 1,242,020 | |
| | | | | | | | |
| | | | | | | 2,329,213 | |
| | | | | | | | |
Total Communication Services | | | | | | | 17,263,069 | |
| | | | | | | | |
Consumer Discretionary (8.4%) | | | | | |
Auto Components (1.0%) | | | | | | | | |
Brembo SpA | | | 2,500 | | | | 27,684 | |
Cooper Tire & Rubber Co. | | | 8,400 | | | | 259,476 | |
Dana, Inc. | | | 36,000 | | | | 560,520 | |
Lear Corp. | | | 400 | | | | 53,160 | |
| | | | | | | | |
| | | | | | | 900,840 | |
| | | | | | | | |
Diversified Consumer Services (2.3%) | | | | | |
H&R Block, Inc. | | | 52,000 | | | | 1,380,081 | |
ServiceMaster Global Holdings, Inc.* | | | 16,000 | | | | 686,080 | |
Universal Technical Institute, Inc.* | | | 16,000 | | | | 42,080 | |
| | | | | | | | |
| | | | | | | 2,108,241 | |
| | | | | | | | |
Hotels, Restaurants & Leisure (1.8%) | | | | | |
Cheesecake Factory, Inc. (The) | | | 9,000 | | | | 435,060 | |
Dover Motorsports, Inc. | | | 15,000 | | | | 32,250 | |
Eldorado Resorts, Inc.* | | | 6,000 | | | | 219,000 | |
Golden Entertainment, Inc.* | | | 16,000 | | | | 290,720 | |
| | | | | | | | |
Nathan’s Famous, Inc. | | | 5,000 | | | | 374,450 | |
Wynn Resorts Ltd. | | | 3,000 | | | | 301,800 | |
| | | | | | | | |
| | | | | | | 1,653,280 | |
| | | | | | | | |
Household Durables (1.3%) | | | | | | | | |
Bassett Furniture Industries, Inc. | | | 35,000 | | | | 691,250 | |
Hunter Douglas NV | | | 3,000 | | | | 200,398 | |
Lennar Corp., Class B | | | 7,300 | | | | 261,121 | |
| | | | | | | | |
| | | | | | | 1,152,769 | |
| | | | | | | | |
Internet & Direct Marketing Retail (0.5%) | |
Lands’ End, Inc.* | | | 9,000 | | | | 146,790 | |
zooplus AG* | | | 2,000 | | | | 331,040 | |
| | | | | | | | |
| | | | | | | 477,830 | |
| | | | | | | | |
Leisure Products (1.2%) | | | | | | | | |
Brunswick Corp. | | | 3,000 | | | | 155,970 | |
Mattel, Inc.* | | | 17,000 | | | | 230,860 | |
Polaris Industries, Inc. | | | 7,500 | | | | 667,350 | |
| | | | | | | | |
| | | | | | | 1,054,180 | |
| | | | | | | | |
Multiline Retail (0.1%) | | | | | | | | |
JC Penney Co., Inc.* | | | 66,000 | | | | 97,020 | |
| | | | | | | | |
Specialty Retail (0.2%) | | | | | | | | |
Aaron’s, Inc. | | | 800 | | | | 37,704 | |
Tractor Supply Co. | | | 1,800 | | | | 165,402 | |
| | | | | | | | |
| | | | | | | 203,106 | |
| | | | | | | | |
Total Consumer Discretionary | | | | | | | 7,647,266 | |
| | | | | | | | |
Consumer Staples (8.4%) | | | | | | | | |
Beverages (2.0%) | | | | | | | | |
Cott Corp. | | | 12,000 | | | | 180,480 | |
Davide Campari-Milano SpA | | | 33,000 | | | | 253,665 | |
National Beverage Corp.* | | | 800 | | | | 73,960 | |
Remy Cointreau SA | | | 11,000 | | | | 1,306,042 | |
| | | | | | | | |
| | | | | | | 1,814,147 | |
| | | | | | | | |
Food & Staples Retailing (1.8%) | | | | | | | | |
Casey’s General Stores, Inc. | | | 10,500 | | | | 1,324,155 | |
Ingles Markets, Inc., Class A | | | 9,500 | | | | 312,930 | |
| | | | | | | | |
| | | | | | | 1,637,085 | |
| | | | | | | | |
Food Products (3.6%) | | | | | | | | |
Bunge Ltd. | | | 8,500 | | | | 525,300 | |
Hain Celestial Group, Inc. (The)* | | | 56,049 | | | | 1,394,499 | |
JM Smucker Co. (The) | | | 9,000 | | | | 974,880 | |
McCormick & Co., Inc. | | | 1,800 | | | | 258,120 | |
Parmalat SpA | | | 60,000 | | | | 184,816 | |
| | | | | | | | |
| | | | | | | 3,337,615 | |
| | | | | | | | |
Household Products (0.5%) | | | | | | | | |
Energizer Holdings, Inc. | | | 5,500 | | | | 323,235 | |
Oil-Dri Corp. of America | | | 4,500 | | | | 139,185 | |
| | | | | | | | |
| | | | | | | 462,420 | |
| | | | | | | | |
Personal Products (0.5%) | | | | | | | | |
Avon Products, Inc.* | | | 50,000 | | | | 98,000 | |
Edgewell Personal Care Co.* | | | 7,000 | | | | 335,860 | |
| | | | | | | | |
| | | | | | | 433,860 | |
| | | | | | | | |
Total Consumer Staples | | | | | | | 7,685,127 | |
| | | | | | | | |
See Notes to Financial Statements.
51
1290 FUNDS
1290 GAMCO SMALL/MID CAP VALUE FUND
PORTFOLIO OF INVESTMENTS (Continued)
October 31, 2018
| | | | | | | | |
| | | Number of
Shares | | | Value
(Note 1) | |
| | | | | | | | |
Energy (1.7%) | | | | | | | | |
Energy Equipment & Services (1.7%) | | | | | |
Dril-Quip, Inc.* | | | 9,000 | | | $ | 383,040 | |
RPC, Inc. | | | 62,427 | | | | 928,914 | |
Weatherford International plc* | | | 200,000 | | | | 270,000 | |
| | | | | | | | |
Total Energy | | | | | | | 1,581,954 | |
| | | | | | | | |
Financials (4.9%) | | | | | | | | |
Banks (1.1%) | | | | | | | | |
Atlantic Capital Bancshares, Inc.* | | | 12,000 | | | | 180,840 | |
FCB Financial Holdings, Inc., Class A* | | | 8,000 | | | | 313,040 | |
Flushing Financial Corp. | | | 16,154 | | | | 366,534 | |
State Bank Financial Corp. | | | 7,000 | | | | 178,990 | |
| | | | | | | | |
| | | | | | | 1,039,404 | |
| | | | | | | | |
Capital Markets (3.8%) | | | | | | | | |
Cohen & Steers, Inc. | | | 1,800 | | | | 69,102 | |
Federated Investors, Inc., Class B | | | 95,005 | | | | 2,343,774 | |
Legg Mason, Inc. | | | 30,000 | | | | 846,600 | |
Waddell & Reed Financial, Inc., Class A | | | 7,000 | | | | 133,490 | |
| | | | | | | | |
| | | | | | | 3,392,966 | |
| | | | | | | | |
Total Financials | | | | | | | 4,432,370 | |
| | | | | | | | |
Health Care (8.7%) | | | | | | | | |
Biotechnology (0.6%) | | | | | | | | |
Loxo Oncology, Inc.* | | | 3,800 | | | | 580,108 | |
| | | | | | | | |
Health Care Equipment & Supplies (2.3%) | |
Cutera, Inc.* | | | 7,000 | | | | 142,100 | |
K2M Group Holdings, Inc.* | | | 70,000 | | | | 1,916,600 | |
| | | | | | | | |
| | | | | | | 2,058,700 | |
| | | | | | | | |
Health Care Providers & Services (3.2%) | |
LifePoint Health, Inc.* | | | 33,000 | | | | 2,140,379 | |
Patterson Cos., Inc. | | | 38,000 | | | | 858,040 | |
| | | | | | | | |
| | | | | | | 2,998,419 | |
| | | | | | | | |
Health Care Technology (2.5%) | | | | | | | | |
Evolent Health, Inc., Class A* | | | 39,500 | | | | 876,900 | |
Teladoc Health, Inc.* | | | 20,000 | | | | 1,386,800 | |
| | | | | | | | |
| | | | | | | 2,263,700 | |
| | | | | | | | |
Life Sciences Tools & Services (0.1%) | | | | | |
Bio-Rad Laboratories, Inc., Class A* | | | 300 | | | | 81,855 | |
| | | | | | | | |
Total Health Care | | | | | | | 7,982,782 | |
| | | | | | | | |
Industrials (31.3%) | | | | | | | | |
Aerospace & Defense (2.3%) | | | | | | | | |
AAR Corp. | | | 1,500 | | | | 71,370 | |
Aerojet Rocketdyne Holdings, Inc.* | | | 25,000 | | | | 883,000 | |
Moog, Inc., Class A | | | 10,500 | | | | 751,275 | |
Sparton Corp.* | | | 8,000 | | | | 99,040 | |
Textron, Inc. | | | 6,000 | | | | 321,780 | |
| | | | | | | | |
| | | | | | | 2,126,465 | |
| | | | | | | | |
Building Products (4.1%) | | | | | | | | |
Armstrong Flooring, Inc.* | | | 18,000 | | | | 279,900 | |
| | | | | | | | |
Griffon Corp. | | | 100,000 | | | | 1,212,000 | |
USG Corp. | | | 52,600 | | | | 2,220,772 | |
| | | | | | | | |
| | | | | | | 3,712,672 | |
| | | | | | | | |
Commercial Services & Supplies (1.1%) | | | | | |
Matthews International Corp., Class A | | | 18,000 | | | | 749,160 | |
Team, Inc.* | | | 14,000 | | | | 278,600 | |
| | | | | | | | |
| | | | | | | 1,027,760 | |
| | | | | | | | |
Construction & Engineering (0.3%) | | | | | |
frontdoor, Inc.* | | | 8,000 | | | | 272,400 | |
| | | | | | | | |
Electrical Equipment (0.4%) | | | | | | | | |
AMETEK, Inc. | | | 200 | | | | 13,416 | |
AZZ, Inc. | | | 8,000 | | | | 354,800 | |
| | | | | | | | |
| | | | | | | 368,216 | |
| | | | | | | | |
Machinery (17.1%) | | | | | | | | |
Astec Industries, Inc. | | | 50,000 | | | | 1,880,500 | |
CIRCOR International, Inc. | | | 80,000 | | | | 2,600,799 | |
CNH Industrial NV | | | 30,000 | | | | 311,700 | |
Eastern Co. (The) | | | 15,000 | | | | 424,500 | |
EnPro Industries, Inc. | | | 24,000 | | | | 1,492,800 | |
Evoqua Water Technologies Corp.* | | | 85,000 | | | | 816,000 | |
Federal Signal Corp. | | | 2,500 | | | | 54,975 | |
Flowserve Corp. | | | 34,000 | | | | 1,560,600 | |
Graco, Inc. | | | 4,500 | | | | 182,835 | |
ITT, Inc. | | | 1,000 | | | | 50,500 | |
Kennametal, Inc. | | | 25,000 | | | | 886,250 | |
Mueller Industries, Inc. | | | 35,000 | | | | 852,250 | |
Mueller Water Products, Inc., Class A | | | 28,000 | | | | 287,280 | |
Navistar International Corp.* | | | 14,000 | | | | 468,860 | |
Park-Ohio Holdings Corp. | | | 13,000 | | | | 430,040 | |
Toro Co. (The) | | | 6,000 | | | | 337,980 | |
Trinity Industries, Inc. | | | 44,000 | | | | 1,256,200 | |
Twin Disc, Inc.* | | | 45,000 | | | | 860,850 | |
Watts Water Technologies, Inc., Class A | | | 13,000 | | | | 910,650 | |
| | | | | | | | |
| | | | | | | 15,665,569 | |
| | | | | | | | |
Professional Services (1.6%) | | | | | | | | |
Dun & Bradstreet Corp. (The) | | | 10,000 | | | | 1,422,800 | |
| | | | | | | | |
Road & Rail (0.5%) | | | | | | | | |
Hertz Global Holdings, Inc.* | | | 30,000 | | | | 412,500 | |
| | | | | | | | |
Trading Companies & Distributors (2.8%) | | | | | |
Ashtead Group plc | | | 2,000 | | | | 49,437 | |
GATX Corp. | | | 8,000 | | | | 599,440 | |
Herc Holdings, Inc.* | | | 40,000 | | | | 1,282,400 | |
Kaman Corp. | | | 10,000 | | | | 635,200 | |
| | | | | | | | |
| | | | | | | 2,566,477 | |
| | | | | | | | |
Transportation Infrastructure (1.1%) | | | | | |
Macquarie Infrastructure Corp. | | | 26,500 | | | | 979,175 | |
| | | | | | | | |
Total Industrials | | | | | | | 28,554,034 | |
| | | | | | | | |
Information Technology (1.7%) | | | | | | | | |
Communications Equipment (0.1%) | | | | | |
Communications Systems, Inc. | | | 20,000 | | | | 58,000 | |
See Notes to Financial Statements.
52
1290 FUNDS
1290 GAMCO SMALL/MID CAP VALUE FUND
PORTFOLIO OF INVESTMENTS (Continued)
October 31, 2018
| | | | | | | | |
| | | Number of
Shares | | | Value
(Note 1) | |
| | | | | | | | |
EchoStar Corp., Class A* | | | 1,600 | | | $ | 64,880 | |
| | | | | | | | |
| | | | | | | 122,880 | |
| | | | | | | | |
Electronic Equipment, Instruments & Components (0.5%) | |
KEMET Corp.* | | | 10,000 | | | | 217,800 | |
Landis+Gyr Group AG* | | | 4,000 | | | | 242,692 | |
| | | | | | | | |
| | | | | | | 460,492 | |
| | | | | | | | |
IT Services (0.4%) | | | | | | | | |
Internap Corp.* | | | 37,000 | | | | 317,090 | |
MoneyGram International, Inc.* | | | 19,000 | | | | 80,560 | |
| | | | | | | | |
| | | | | | | 397,650 | |
| | | | | | | | |
Technology Hardware, Storage & Peripherals (0.7%) | |
Diebold Nixdorf, Inc. | | | 146,000 | | | | 569,400 | |
| | | | | | | | |
Total Information Technology | | | | | | | 1,550,422 | |
| | | | | | | | |
Materials (8.0%) | | | | | | | | |
Chemicals (5.0%) | | | | | | | | |
Chr Hansen Holding A/S | | | 1,200 | | | | 121,166 | |
Core Molding Technologies, Inc. | | | 55,000 | | | | 374,550 | |
GCP Applied Technologies, Inc.* | | | 55,000 | | | | 1,428,350 | |
HB Fuller Co. | | | 4,000 | | | | 177,840 | |
Platform Specialty Products Corp.* | | | 130,000 | | | | 1,406,600 | |
Scotts Miracle-Gro Co. (The) | | | 7,000 | | | | 467,180 | |
Tredegar Corp. | | | 15,000 | | | | 279,000 | |
Valvoline, Inc. | | | 18,000 | | | | 358,560 | |
| | | | | | | | |
| | | | | | | 4,613,246 | |
| | | | | | | | |
Containers & Packaging (1.6%) | | | | | | | | |
Greif, Inc., Class A | | | 22,000 | | | | 1,040,600 | |
Myers Industries, Inc. | | | 25,000 | | | | 396,500 | |
| | | | | | | | |
| | | | | | | 1,437,100 | |
| | | | | | | | |
Metals & Mining (0.8%) | | | | | | | | |
Ampco-Pittsburgh Corp.* | | | 18,000 | | | | 66,780 | |
Freeport-McMoRan, Inc. | | | 10,000 | | | | 116,500 | |
TimkenSteel Corp.* | | | 50,000 | | | | 581,500 | |
| | | | | | | | |
| | | | | | | 764,780 | |
| | | | | | | | |
Paper & Forest Products (0.6%) | | | | | | | | |
KapStone Paper and Packaging Corp. | | | 15,000 | | | | 525,000 | |
| | | | | | | | |
Total Materials | | | | | | | 7,340,126 | |
| | | | | | | | |
Real Estate (1.3%) | |
Equity Real Estate Investment Trusts (REITs) (1.0%) | |
Ryman Hospitality Properties, Inc. (REIT) | | | 6,000 | | | | 465,540 | |
Seritage Growth Properties (REIT), Class A | | | 10,500 | | | | 399,210 | |
| | | | | | | | |
| | | | | | | 864,750 | |
| | | | | | | | |
Real Estate Management & Development (0.3%) | |
St Joe Co. (The)* | | | 21,000 | | | | 318,990 | |
| | | | | | | | |
Total Real Estate | | | | | | | 1,183,740 | |
| | | | | | | | |
| | | | | | | | |
Utilities (3.4%) | | | | | | | | |
Electric Utilities (0.0%) | | | | | | | | |
El Paso Electric Co. | | | 200 | | | | 11,410 | |
| | | | | | | | |
Gas Utilities (1.2%) | | | | | | | | |
National Fuel Gas Co. | | | 20,000 | | | | 1,085,800 | |
| | | | | | | | |
Independent Power and Renewable Electricity Producers (1.0%) | |
AES Corp. | | | 60,000 | | | | 874,800 | |
| | | | | | | | |
Multi-Utilities (0.9%) | | | | | | | | |
Avista Corp. | | | 16,000 | | | | 822,720 | |
| | | | | | | | |
Water Utilities (0.3%) | | | | | | | | |
Connecticut Water Service, Inc. | | | 4,000 | | | | 276,480 | |
| | | | | | | | |
Total Utilities | | | | | | | 3,071,210 | |
| | | | | | | | |
Total Common Stocks (96.7%)
(Cost $92,427,972) | | | | | | | 88,292,100 | |
| | | | | | | | |
CONVERTIBLE PREFERRED STOCK: | | | | | |
Health Care (0.0%) | | | | | | | | |
Health Care Providers & Services (0.0%) | | | | | |
BioScrip, Inc.
0.000% (r)* | | | | | | | | |
(Cost $400) | | | 4 | | | | 226 | |
| | | | | | | | |
| | | Number of
Warrants | | | Value
(Note 1) | |
WARRANTS: | | | | | | | | |
Health Care (0.0%) | | | | | | | | |
Health Care Providers & Services (0.0%) | | | | | |
BioScrip, Inc., expiring
6/30/25 (r)*
(Cost $—) | | | 22 | | | | 4 | |
| | | | | | | | |
| | | Number of
Shares | | | Value
(Note 1) | |
SHORT-TERM INVESTMENT: | | | | | | | | |
Investment Company (2.8%) | | | | | | | | |
JPMorgan Prime Money Market Fund, IM Shares | | | 2,583,314 | | | | 2,583,831 | |
| | | | | | | | |
Total Short-Term Investment (2.8%)
(Cost $2,583,892) | | | | | | | 2,583,831 | |
| | | | | | | | |
Total Investments in Securities (99.5%)
(Cost $95,012,264) | | | | | | | 90,876,161 | |
Other Assets Less Liabilities (0.5%) | | | | | | | 464,716 | |
| | | | | | | | |
Net Assets (100%) | | | | | | $ | 91,340,877 | |
| | | | | | | | |
| (r) | Value determined using significant unobservable inputs. |
Glossary:
| | ADR | — American Depositary Receipt |
| | SDR | — Swedish Depositary Receipt |
See Notes to Financial Statements.
53
1290 FUNDS
1290 GAMCO SMALL/MID CAP VALUE FUND
PORTFOLIO OF INVESTMENTS (Continued)
October 31, 2018
The following is a summary of the inputs used to value the Fund’s assets and liabilities carried at fair value as of October 31, 2018:
The inputs or methodology used for valuing securities are not necessarily an indication of the risk associated with investing in those securities.
Various inputs are used in determining the value of the Fund’s investments. These inputs are summarized in the three broad levels listed below:
| | | | | | | | | | | | | | | | |
| | | | | |
| Investment Type | | Level 1
Quoted Prices in
Active Markets for
Identical
Securities | | | Level 2
Significant Other
Observable Inputs
(including quoted prices
for similar securities,
interest rates,
prepayment speeds,
credit risk, etc.) | | | Level 3
Significant Unobservable
Inputs (including the
Fund’s own assumptions in
determining the fair
value of investments) | | | Total | |
Assets: | |
Common Stocks | | | | | | | | | | | | | | | | |
Communication Services | | $ | 15,494,501 | | | $ | 1,768,568 | | | $ | — | | | $ | 17,263,069 | |
Consumer Discretionary | | | 7,046,064 | | | | 601,202 | | | | — | | | | 7,647,266 | |
Consumer Staples | | | 5,682,484 | | | | 2,002,643 | | | | — | | | | 7,685,127 | |
Energy | | | 1,581,954 | | | | — | | | | — | | | | 1,581,954 | |
Financials | | | 4,432,370 | | | | — | | | | — | | | | 4,432,370 | |
Health Care | | | 7,982,782 | | | | — | | | | — | | | | 7,982,782 | |
Industrials | | | 28,504,597 | | | | 49,437 | | | | — | | | | 28,554,034 | |
Information Technology | | | 1,307,730 | | | | 242,692 | | | | — | | | | 1,550,422 | |
Materials | | | 7,218,960 | | | | 121,166 | | | | — | | | | 7,340,126 | |
Real Estate | | | 1,183,740 | | | | — | | | | — | | | | 1,183,740 | |
Utilities | | | 3,071,210 | | | | — | | | | — | | | | 3,071,210 | |
Convertible Preferred Stock | | | | | | | | | | | | | | | | |
Health Care | | | — | | | | — | | | | 226 | | | | 226 | |
Short-Term Investment | | | | | | | | | | | | | | | | |
Investment Company | | | 2,583,831 | | | | — | | | | — | | | | 2,583,831 | |
Warrants | | | | | | | | | | | | | | | | |
Health Care | | | — | | | | — | | | | 4 | | | | 4 | |
| | | | | | | | | | | | | | | | |
Total Assets | | $ | 86,090,223 | | | $ | 4,785,708 | | | $ | 230 | | | $ | 90,876,161 | |
| | | | | | | | | | | | | | | | |
Total Liabilities | | $ | — | | | $ | — | | | $ | — | | | $ | — | |
| | | | | | | | | | | | | | | | |
Total | | $ | 86,090,223 | | | $ | 4,785,708 | | | $ | 230 | | | $ | 90,876,161 | |
| | | | | | | | | | | | | | | | |
The Fund held no derivatives contracts during the year ended October 31, 2018.
Investment security transactions for the year ended October 31, 2018 were as follows:
| | | | |
Cost of Purchases: | | | | |
Long-term investments other than U.S. government debt securities | | $ | 96,977,104 | |
Net Proceeds of Sales and Redemptions: | | | | |
Long-term investments other than U.S. government debt securities | | $ | 25,284,679 | |
As of October 31, 2018, the gross unrealized appreciation (depreciation) of investments based on the aggregate cost of investments in securities and derivative instruments, if applicable, for Federal income tax purposes was as follows:
| | | | |
Aggregate gross unrealized appreciation | | $ | 5,107,060 | |
Aggregate gross unrealized depreciation | | | (9,403,368 | ) |
| | | | |
Net unrealized depreciation | | $ | (4,296,308 | ) |
| | | | |
Federal income tax cost of investments in securities and derivative instruments, if applicable | | $ | 95,172,469 | |
| | | | |
For the year ended October 31, 2018, the Fund incurred approximately $36,046 as brokerage commissions with G. Research, an affiliated broker/dealer.
See Notes to Financial Statements.
54
1290 FUNDS
1290 GAMCO SMALL/MID CAP VALUE FUND
STATEMENT OF ASSETS AND LIABILITIES
October 31, 2018
| | | | |
| |
ASSETS | | | | |
Investments in Securities, at value (Cost $95,012,264) | | $ | 90,876,161 | |
Cash | | | 331,000 | |
Foreign cash (Cost $7,682) | | | 7,551 | |
Receivable for Fund shares sold | | | 460,661 | |
Receivable for securities sold | | | 50,281 | |
Prepaid registration and filing fees | | | 33,220 | |
Dividends, interest and other receivables | | | 25,672 | |
Other assets | | | 509 | |
| | | | |
Total assets | | | 91,785,055 | |
| | | | |
LIABILITIES | | | | |
Payable for securities purchased | | | 206,979 | |
Payable for Fund shares redeemed | | | 121,900 | |
Transfer agent fees payable | | | 15,724 | |
Administrative fees payable | | | 11,741 | |
Distribution fees payable – Class A | | | 789 | |
Distribution fees payable – Class R | | | 342 | |
Accrued expenses | | | 86,703 | |
| | | | |
Total liabilities | | | 444,178 | |
| | | | |
NET ASSETS | | $ | 91,340,877 | |
| | | | |
Net assets were comprised of: | | | | |
Paid in capital | | $ | 94,497,247 | |
Total distributable earnings (loss) | | | (3,156,370 | ) |
| | | | |
Net assets | | $ | 91,340,877 | |
| | | | |
Class A | | | | |
Net asset value and redemption price per share, $3,599,257 / 291,905 shares outstanding (unlimited amount authorized: $0.001 par value) | | $ | 12.33 | |
Maximum sales charge (5.50% of offering price) | | | 0.72 | |
| | | | |
Maximum offering price per share | | $ | 13.05 | |
| | | | |
Class I | | | | |
Net asset value and redemption price per share, $86,815,251 / 7,024,760 shares outstanding (unlimited amount authorized: $0.001 par value) | | $ | 12.36 | |
| | | | |
Class R | | | | |
Net asset value and redemption price per share, $800,550 / 65,299 shares outstanding (unlimited amount authorized: $0.001 par value) | | $ | 12.26 | |
| | | | |
Class T** | | | | |
Net asset value and redemption price per share, $125,819 / 10,179 shares outstanding (unlimited amount authorized: $0.001 par value) | | $ | 12.36 | |
Maximum sales charge (2.50% of offering price) | | | 0.32 | |
| | | | |
Maximum offering price per share | | $ | 12.68 | |
| | | | |
| ** | Class T shares currently are not offered for sale. |
STATEMENT OF OPERATIONS
For the Year Ended October 31, 2018
| | | | |
| |
INVESTMENT INCOME | | | | |
Dividends (net of $9,650 foreign withholding tax) | | $ | 860,264 | |
Interest | | | 4,297 | |
| | | | |
Total income | | | 864,561 | |
| | | | |
EXPENSES | | | | |
Investment advisory fees | | | 423,912 | |
Professional fees | | | 106,828 | |
Transfer agent fees | | | 98,500 | |
Administrative fees | | | 84,783 | |
Registration and filing fees | | | 48,009 | |
Printing and mailing expenses | | | 40,204 | |
Custodian fees | | | 14,000 | |
Distribution fees – Class A | | | 7,789 | |
Trustees’ fees | | | 5,368 | |
Distribution fees – Class R | | | 3,537 | |
Distribution fees – Class T** | | | 334 | |
Miscellaneous | | | 30,844 | |
| | | | |
Gross expenses | | | 864,108 | |
Less: Waiver from investment adviser | | | (292,540 | ) |
Waiver from distributor | | | (334 | ) |
| | | | |
Net expenses | | | 571,234 | |
| | | | |
NET INVESTMENT INCOME (LOSS) | | | 293,327 | |
| | | | |
REALIZED AND UNREALIZED GAIN (LOSS) | | | | |
Realized gain (loss) on: | | | | |
Investments in securities | | | 806,444 | |
Foreign currency transactions | | | (2,828 | ) |
| | | | |
Net realized gain (loss) | | | 803,616 | |
| | | | |
Change in unrealized appreciation (depreciation) on: | | | | |
Investments in securities | | | (6,520,313 | ) |
Foreign currency translations | | | (279 | ) |
| | | | |
Net change in unrealized appreciation (depreciation) | | | (6,520,592 | ) |
| | | | |
NET REALIZED AND UNREALIZED GAIN (LOSS) | | | (5,716,976 | ) |
| | | | |
NET INCREASE (DECREASE) IN NET ASSETS RESULTING FROM OPERATIONS | | $ | (5,423,649 | ) |
| | | | |
| ** | Class T shares currently are not offered for sale. |
See Notes to Financial Statements.
55
1290 FUNDS
1290 GAMCO SMALL/MID CAP VALUE FUND
STATEMENT OF CHANGES IN NET ASSETS
| | | | | | | | |
| | | Year Ended October 31, | |
| | 2018 | | | 2017 | |
INCREASE (DECREASE) IN NET ASSETS FROM OPERATIONS: | |
Net investment income (loss) | | $ | 293,327 | | | $ | 93,281 | |
Net realized gain (loss) | | | 803,616 | | | | 485,730 | |
Net change in unrealized appreciation (depreciation) | | | (6,520,592 | ) | | | 2,201,718 | |
| | | | | | | | |
NET INCREASE (DECREASE) IN NET ASSETS RESULTING FROM OPERATIONS | | | (5,423,649 | ) | | | 2,780,729 | |
| | | | | | | | |
Distributions to shareholders: (a) | | | | | | | | |
Class A | | | (45,934 | ) | | | (11,064 | ) |
Class I | | | (549,863 | ) | | | (129,492 | ) |
Class R | | | (12,578 | ) | | | (2,609 | ) |
Class T** | | | (3,105 | ) | | | (2,056 | ) |
| | | | | | | | |
Total distributions to shareholders | | | (611,480 | ) | | | (145,221 | ) |
| | | | | | | | |
CAPITAL SHARES TRANSACTIONS: | | | | | | | | |
Class A | | | | | | | | |
Capital shares sold [ 166,645 and 129,147 shares, respectively ] | | | 2,189,545 | | | | 1,544,085 | |
Capital shares issued in reinvestment of dividends [ 3,358 and 821 shares, respectively ] | | | 43,044 | | | | 9,245 | |
Capital shares repurchased [ (38,937) and (26,675) shares, respectively ] | | | (513,240 | ) | | | (309,281 | ) |
| | | | | | | | |
Total Class A transactions | | | 1,719,349 | | | | 1,244,049 | |
| | | | | | | | |
Class I | | | | | | | | |
Capital shares sold [ 5,718,892 and 1,161,285 shares, respectively ] | | | 75,982,055 | | | | 14,034,899 | |
Capital shares issued in reinvestment of dividends [ 37,602 and 7,547 shares, respectively ] | | | 482,439 | | | | 84,983 | |
Capital shares repurchased [ (389,765) and (97,331) shares, respectively ] | | | (5,160,624 | ) | | | (1,177,235 | ) |
| | | | | | | | |
Total Class I transactions | | | 71,303,870 | | | | 12,942,647 | |
| | | | | | | | |
Class R | | | | | | | | |
Capital shares sold [ 71,062 and 10,311 shares, respectively ] | | | 928,020 | | | | 123,872 | |
Capital shares issued in reinvestment of dividends [ 782 and 85 shares, respectively ] | | | 9,998 | | | | 953 | |
Capital shares repurchased [ (32,549) and (853) shares, respectively ] | | | (428,019 | ) | | | (10,195 | ) |
| | | | | | | | |
Total Class R transactions | | | 509,999 | | | | 114,630 | |
| | | | | | | | |
NET INCREASE (DECREASE) IN NET ASSETS RESULTING FROM CAPITAL SHARE TRANSACTIONS | | | 73,533,218 | | | | 14,301,326 | |
| | | | | | | | |
TOTAL INCREASE (DECREASE) IN NET ASSETS | | | 67,498,089 | | | | 16,936,834 | |
NET ASSETS: | | | | | | | | |
Beginning of year | | | 23,842,788 | | | | 6,905,954 | |
| | | | | | | | |
End of year (b) | | $ | 91,340,877 | | | $ | 23,842,788 | |
| | | | | | | | |
** Class T shares currently are not offered for sale. Class T shares were formerly known as Class C shares. | |
| | | | |
(a) Prior year distributions to shareholders were made up of dividends from net investment income of $959, $28,206, $— and $448 for Classes A, I, R and T, respectively; and dividends from net realized capital gains of $10,105, $101,286, $2,609 and $1,608 for Classes A, I, R and T, respectively. These amounts were reclassified to conform with the current year presentation. |
(b) Includes accumulated undistributed (overdistributed) net investment income of $84,482 as of October 31, 2017. The SEC eliminated the requirement to disclose undistributed net investment income in 2018. |
See Notes to Financial Statements.
56
1290 FUNDS
1290 GAMCO SMALL/MID CAP VALUE FUND
FINANCIAL HIGHLIGHTS
| | | | | | | | | | | | | | | | |
| | | Year Ended October 31, | | | November 12, 2014* to
October 31, 2015 | |
| Class A | | 2018 | | | 2017 | | | 2016 | |
Net asset value, beginning of period | | $ | 12.83 | | | $ | 10.28 | | | $ | 10.25 | | | $ | 10.00 | |
| | | | | | | | | | | | | | | | |
Income (loss) from investment operations: | | | | | | | | | | | | | | | | |
Net investment income (loss) (e) | | | 0.03 | | | | 0.06 | ## | | | 0.05 | | | | (0.01 | ) |
Net realized and unrealized gain (loss) | | | (0.25 | ) | | | 2.67 | | | | 0.25 | | | | 0.33 | |
| | | | | | | | | | | | | | | | |
Total from investment operations | | | (0.22 | ) | | | 2.73 | | | | 0.30 | | | | 0.32 | |
| | | | | | | | | | | | | | | | |
Less distributions: | | | | | | | | | | | | | | | | |
Dividends from net investment income | | | (0.03 | ) | | | (0.02 | ) | | | — | # | | | (0.07 | ) |
Distributions from net realized gains | | | (0.25 | ) | | | (0.16 | ) | | | (0.27 | ) | | | — | |
| | | | | | | | | | | | | | | | |
Total dividends and distributions | | | (0.28 | ) | | | (0.18 | ) | | | (0.27 | ) | | | (0.07 | ) |
| | | | | | | | | | | | | | | | |
Net asset value, end of period | | $ | 12.33 | | | $ | 12.83 | | | $ | 10.28 | | | $ | 10.25 | |
| | | | | | | | | | | | | | | | |
Total return (b) | | | (1.84 | )% | | | 26.72 | % | | | 3.08 | % | | | 3.20 | % |
| | | | | | | | | | | | | | | | |
Ratios/Supplemental Data: | | | | | | | | | | | | | | | | |
Net assets, end of period (000’s) | | $ | 3,599 | | | $ | 2,063 | | | $ | 591 | | | $ | 997 | |
Ratio of expenses to average net assets: | | | | | | | | | | | | | | | | |
After waivers and reimbursements (a)(f) | | | 1.24 | %(j) | | | 1.27 | % | | | 1.35 | % | | | 1.35 | % |
Before waivers and reimbursements (a)(f) | | | 1.79 | % | | | 2.72 | % | | | 4.38 | % | | | 9.28 | % |
Ratio of net investment income (loss) to average net assets: | | | | | | | | | | | | | | | | |
After waivers and reimbursements (a)(f) | | | 0.26 | % | | | 0.48 | %(aa) | | | 0.49 | % | | | (0.10 | )%(l) |
Before waivers and reimbursements (a)(f) | | | (0.28 | )% | | | (0.97 | )%(aa) | | | (2.53 | )% | | | (8.03 | )%(l) |
Portfolio turnover rate (z)^ | | | 49 | % | | | 88 | % | | | 76 | % | | | 95 | % |
| | |
| | | Year Ended October 31, | | | November 12, 2014* to
October 31, 2015 | |
| Class I | | 2018 | | | 2017 | | | 2016 | |
Net asset value, beginning of period | | $ | 12.86 | | | $ | 10.30 | | | $ | 10.27 | | | $ | 10.00 | |
| | | | | | | | | | | | | | | | |
Income (loss) from investment operations: | | | | | | | | | | | | | | | | |
Net investment income (loss) (e) | | | 0.07 | | | | 0.08 | ## | | | 0.05 | | | | 0.02 | |
Net realized and unrealized gain (loss) | | | (0.26 | ) | | | 2.68 | | | | 0.28 | | | | 0.32 | |
| | | | | | | | | | | | | | | | |
Total from investment operations | | | (0.19 | ) | | | 2.76 | | | | 0.33 | | | | 0.34 | |
| | | | | | | | | | | | | | | | |
Less distributions: | | | | | | | | | | | | | | | | |
Dividends from net investment income | | | (0.06 | ) | | | (0.04 | ) | | | (0.03 | ) | | | (0.07 | ) |
Distributions from net realized gains | | | (0.25 | ) | | | (0.16 | ) | | | (0.27 | ) | | | — | |
| | | | | | | | | | | | | | | | |
Total dividends and distributions | | | (0.31 | ) | | | (0.20 | ) | | | (0.30 | ) | | | (0.07 | ) |
| | | | | | | | | | | | | | | | |
Net asset value, end of period | | $ | 12.36 | | | $ | 12.86 | | | $ | 10.30 | | | $ | 10.27 | |
| | | | | | | | | | | | | | | | |
Total return (b) | | | (1.60 | )% | | | 27.09 | % | | | 3.34 | % | | | 3.43 | % |
| | | | | | | | | | | | | | | | |
Ratios/Supplemental Data: | | | | | | | | | | | | | | | | |
Net assets, end of period (000’s) | | $ | 86,815 | | | $ | 21,317 | | | $ | 6,041 | | | $ | 2,416 | |
Ratio of expenses to average net assets: | | | | | | | | | | | | | | | | |
After waivers and reimbursements (a)(f) | | | 0.99 | %(j) | | | 1.02 | % | | | 1.10 | % | | | 1.10 | % |
Before waivers and reimbursements (a)(f) | | | 1.51 | % | | | 2.47 | % | | | 4.09 | % | | | 8.56 | % |
Ratio of net investment income (loss) to average net assets: | | | | | | | | | | | | | | | | |
After waivers and reimbursements (a)(f) | | | 0.54 | % | | | 0.69 | %(bb) | | | 0.49 | % | | | 0.16 | %(l) |
Before waivers and reimbursements (a)(f) | | | 0.03 | % | | | (0.76 | )%(bb) | | | (2.51 | )% | | | (7.30 | )%(l) |
Portfolio turnover rate (z)^ | | | 49 | % | | | 88 | % | | | 76 | % | | | 95 | % |
See Notes to Financial Statements.
57
1290 FUNDS
1290 GAMCO SMALL/MID CAP VALUE FUND
FINANCIAL HIGHLIGHTS (Continued)
| | | | | | | | | | | | | | | | |
| | | Year Ended October 31, | | | November 12, 2014* to
October 31, 2015 | |
| Class R | | 2018 | | | 2017 | | | 2016 | |
Net asset value, beginning of period | | $ | 12.76 | | | $ | 10.23 | | | $ | 10.23 | | | $ | 10.00 | |
| | | | | | | | | | | | | | | | |
Income (loss) from investment operations: | | | | | | | | | | | | | | | | |
Net investment income (loss) (e) | | | — | # | | | 0.03 | ## | | | 0.04 | | | | (0.04 | ) |
Net realized and unrealized gain (loss) | | | (0.25 | ) | | | 2.66 | | | | 0.23 | | | | 0.34 | |
| | | | | | | | | | | | | | | | |
Total from investment operations | | | (0.25 | ) | | | 2.69 | | | | 0.27 | | | | 0.30 | |
| | | | | | | | | | | | | | | | |
Less distributions: | | | | | | | | | | | | | | | | |
Dividends from net investment income | | | — | | | | — | | | | — | | | | (0.07 | ) |
Distributions from net realized gains | | | (0.25 | ) | | | (0.16 | ) | | | (0.27 | ) | | | — | |
| | | | | | | | | | | | | | | | |
Total dividends and distributions | | | (0.25 | ) | | | (0.16 | ) | | | (0.27 | ) | | | (0.07 | ) |
| | | | | | | | | | | | | | | | |
Net asset value, end of period | | $ | 12.26 | | | $ | 12.76 | | | $ | 10.23 | | | $ | 10.23 | |
| | | | | | | | | | | | | | | | |
Total return (b) | | | (2.07 | )% | | | 26.49 | % | | | 2.77 | % | | | 2.96 | % |
| | | | | | | | | | | | | | | | |
Ratios/Supplemental Data: | | | | | | | | | | | | | | | | |
Net assets, end of period (000’s) | | $ | 801 | | | $ | 332 | | | $ | 168 | | | $ | 777 | |
Ratio of expenses to average net assets: | | | | | | | | | | | | | | | | |
After waivers and reimbursements (a)(f) | | | 1.49 | %(j) | | | 1.53 | % | | | 1.60 | % | | | 1.60 | % |
Before waivers and reimbursements (a)(f) | | | 2.05 | % | | | 3.00 | % | | | 4.65 | % | | | 9.73 | % |
Ratio of net investment income (loss) to average net assets: | | | | | | | | | | | | | | | | |
After waivers and reimbursements (a)(f) | | | 0.02 | % | | | 0.27 | %(cc) | | | 0.42 | % | | | (0.35 | )%(l) |
Before waivers and reimbursements (a)(f) | | | (0.54 | )% | | | (1.21 | )%(cc) | | | (2.64 | )% | | | (8.49 | )%(l) |
Portfolio turnover rate (z)^ | | | 49 | % | | | 88 | % | | | 76 | % | | | 95 | % |
| | |
| | | Year Ended October 31, | | | November 12, 2014* to
October 31, 2015 | |
| Class T** | | 2018 | | | 2017 | | | 2016 | |
Net asset value, beginning of period | | $ | 12.86 | | | $ | 10.30 | | | $ | 10.27 | | | $ | 10.00 | |
| | | | | | | | | | | | | | | | |
Income (loss) from investment operations: | | | | | | | | | | | | | | | | |
Net investment income (loss) (e) | | | 0.07 | | | | 0.11 | ## | | | 0.08 | | | | 0.01 | |
Net realized and unrealized gain (loss) | | | (0.26 | ) | | | 2.65 | | | | 0.25 | | | | 0.33 | |
| | | | | | | | | | | | | | | | |
Total from investment operations | | | (0.19 | ) | | | 2.76 | | | | 0.33 | | | | 0.34 | |
| | | | | | | | | | | | | | | | |
Less distributions: | | | | | | | | | | | | | | | | |
Dividends from net investment income | | | (0.06 | ) | | | (0.04 | ) | | | (0.03 | ) | | | (0.07 | ) |
Distributions from net realized gains | | | (0.25 | ) | | | (0.16 | ) | | | (0.27 | ) | | | — | |
| | | | | | | | | | | | | | | | |
Total dividends and distributions | | | (0.31 | ) | | | (0.20 | ) | | | (0.30 | ) | | | (0.07 | ) |
| | | | | | | | | | | | | | | | |
Net asset value, end of period | | $ | 12.36 | | | $ | 12.86 | | | $ | 10.30 | | | $ | 10.27 | |
| | | | | | | | | | | | | | | | |
Total return (b) | | | (1.60 | )% | | | 27.09 | % | | | 3.34 | % | | | 3.43 | % |
| | | | | | | | | | | | | | | | |
Ratios/Supplemental Data: | | | | | | | | | | | | | | | | |
Net assets, end of period (000’s) | | $ | 126 | | | $ | 131 | | | $ | 105 | | | $ | 259 | |
Ratio of expenses to average net assets: | | | | | | | | | | | | | | | | |
After waivers and reimbursements (a)(f) | | | 0.99 | %(j) | | | 1.03 | % | | | 1.10 | % | | | 1.10 | % |
Before waivers and reimbursements (a)(f) | | | 1.80 | % | | | 3.02 | % | | | 5.11 | % | | | 10.23 | % |
Ratio of net investment income (loss) to average net assets: | | | | | | | | | | | | | | | | |
After waivers and reimbursements (a)(f) | | | 0.50 | % | | | 0.89 | %(dd) | | | 0.77 | % | | | 0.15 | %(l) |
Before waivers and reimbursements (a)(f) | | | (0.31 | )% | | | (1.10 | )%(dd) | | | (3.23 | )% | | | (8.98 | )%(l) |
Portfolio turnover rate (z)^ | | | 49 | % | | | 88 | % | | | 76 | % | | | 95 | % |
See Notes to Financial Statements.
58
1290 FUNDS
1290 GAMCO SMALL/MID CAP VALUE FUND
FINANCIAL HIGHLIGHTS (Continued)
| * | Commencement of Operations. |
| ** | Class T shares currently are not offered for sale. Class T shares were formerly known as Class C shares. |
| # | Per share amount is less than $0.005. |
| ## | Includes income resulting from a special dividend. Without this dividend, the per share income amounts would be $0.02, $0.04, $(0.01) and $0.07 for Class A, Class I, Class R and Class T, respectively. |
| ^ | Portfolio turnover rate excludes derivatives, if any. |
| (a) | Ratios for periods less than one year are annualized. Certain non-recurring expenses incurred by the Fund are not annualized for periods less than one year. |
| (b) | Total returns for periods less than one year are not annualized. |
| (e) | Net investment income (loss) per share is based on average shares outstanding. |
| (f) | Expenses do not include the expenses of the underlying funds (“indirect expenses”), if applicable. |
| (j) | Including direct and indirect expenses, the net expense ratio after waivers and reimbursements would be 1.25% for Class A, 1.00% for Class I, 1.50% for Class R and 1.00% for Class T. |
| (l) | The annualized ratio of net investment income to average net assets may not be indicative of operating results for a full year. |
| (z) | Portfolio turnover rate for periods less than one year is not annualized. |
| (aa) | Includes income resulting from a special dividend. Without this dividend, the ratios for Class A would be 0.14% for income after waivers and reimbursements and (1.31)% before waivers and reimbursements. |
| (bb) | Includes income resulting from a special dividend. Without this dividend, the ratios for Class I would be 0.35% for income after waivers and reimbursements and (1.10)% before waivers and reimbursements. |
| (cc) | Includes income resulting from a special dividend. Without this dividend, the ratios for Class R would be (0.07)% for income after waivers and reimbursements and (1.55)% before waivers and reimbursements. |
| (dd) | Includes income resulting from a special dividend. Without this dividend, the ratios for Class T would be 0.55% for income after waivers and reimbursements and (1.44)% before waivers and reimbursements. |
See Notes to Financial Statements.
59
1290 GLOBAL TALENTS FUND (Unaudited)
INVESTMENT ADVISER
INVESTMENT SUB-ADVISER
| Ø | | AXA Investment Managers, Inc. |
PERFORMANCE RESULTS
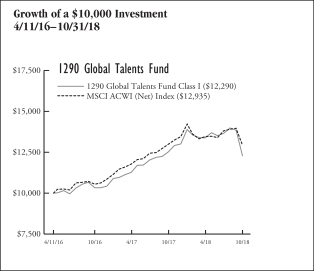
| | | | | | | | | | |
| Annualized Total Returns as of 10/31/18 | |
| | | | | 1
Year | | | Since
Incept. | |
Fund – Class A Shares* | | without Sales Charge | | | (2.25 | )% | | | 8.11 | % |
| | | with Sales Charge (a) | | | (7.60 | ) | | | 5.75 | |
Fund – Class I Shares* | | | | | (1.95 | ) | | | 8.40 | |
Fund – Class R Shares* | | | | | (2.42 | ) | | | 7.87 | |
MSCI ACWI (Net) Index | | | | | (0.52 | ) | | | 10.59 | |
* Date of inception 4/11/16. (a) A 5.50% front-end sales charge was deducted. Returns for periods greater than one year are annualized. | |
The performance quoted is past performance and is not a guarantee of future results. Mutual funds are subject to certain market risks. Investment returns and principal value of an investment will fluctuate so that an investor’s shares, when redeemed, may be worth more or less than their original cost. Current performance may be higher or lower than the performance data shown. For the most current month-end performance data please call 1-888-310-0416 or visit www.1290Funds.com.
The graph illustrates comparative performance for $10,000 invested in the Class I Shares of the 1290 Global Talents Fund and the MSCI ACWI (Net) Index from 4/11/16 to 10/31/18. The performance of the MSCI ACWI (Net) Index reflects an initial investment at the end of the month closest to the Fund’s inception. The performance of the Fund assumes reinvestment of all dividends and capital gain distributions, if any, and does not include a sales charge. The performance of the MSCI ACWI (Net) Index does not reflect the deduction of expenses or a sales charge associated with a mutual fund and has been adjusted to reflect reinvestment of all dividends, capital gain distributions, and interest of the securities included in the benchmark.
Fund performance may reflect the waiver of the Fund’s fees and reimbursement of expenses for certain periods since the inception date. Without these waivers and reimbursements, performance would have been lower. Also, performance shown in this section does not reflect the deduction of taxes that a shareholder would pay on Fund distributions or redemption of Fund shares.
PERFORMANCE SUMMARY
The Fund’s Class I shares returned (1.95)% for the year ended October 31, 2018. The Fund’s benchmark, the MSCI ACWI (Net) Index, returned (0.52)% over the same year.
Overview — AXA Investment Managers, Inc.
Global equities moved lower over the period. After experiencing a bull run in calendar year 2017, markets reached a peak at the end of January 2018 and sharply corrected in February. Markets bounced back rapidly from their lows, but not entirely, and largely moved sideways until the end of September. In October, markets experienced another sharp selloff. The market turmoil has been driven by a number of macro concerns around credit tightening and rising U.S. interest rates, escalating trade war tensions and its potential spillover effect on global demand, political uncertainty and the state of European affairs in particular around Italy, the United Kingdom and Germany. The rapid rise of oil prices has been another concern, particularly for emerging markets, although this has eased recently. After a period of synchronized global recovery, we are now seeing a number of economic indicators starting to cool off, in particular in China and Europe.
Fund Highlights
Over the period, the Fund closed a number of positions, including Anta Sports, Wells Fargo & Co., Starbucks Corp., O’Reilly Automotive, Reckitt Benckiser Group plc, Rakuten, Inc. and Hikma Pharmaceuticals. Naspers was swapped to gain direct exposure to Chinese Internet name Tencent Holdings Ltd., founded and led by Huateng Ma. Positions were also initiated in U.S. machine vision expert Cognex Corp., Japanese online retailer ZOZO, Inc., and Swedish safety solutions leader Assa Abloy AB. Chairman and founder Dr Robert Shillman owns 4.45% of Cognex Corp. Founder, president and head designer Yuzaku Maezawa owns 36% of his firm, ZOZO. The main insider in Assa Abloy is the Douglas family (through their holding Investment AB Latour which has a 9.5% stake in the business). Carl Douglas sits on Assa Abloy’s board.
What helped performance during the year?
| • | | Stock selection in health care was particularly strong. U.S. constant glucose monitoring devices manufacturer DexCom, Inc. performed very strongly as revenue growth accelerated and its addressable market remains very large. |
| • | | A number of technology related stocks performed strongly over the period. Amazon.com, Inc. continued to see robust sales as well as improved profitability. Apple, Inc. saw revenue growth continue to surprise positively as pricing and services make up for lower unit sales. Dassault Systemes SE gave an upbeat outlook for the short and medium term. |
60
1290 GLOBAL TALENTS FUND (Unaudited)
| • | | Japanese staples names performed well, such as cosmetics manufacturer Kose Corp. and diapers manufacturer Unicharm Corp., as Chinese demand in particular remains high for their products. |
| • | | Despite facing some headwinds, Ecolab, Inc. executed well and delivered solid organic growth. It counts among the top contributors for the period. |
What hurt performance during the year?
| • | | Stock selection among information technology in particular, but also in industrials and consumer staples, was a detractor to performance. |
| • | | In the technology space, IPG Photonics Corp. reversed its gains as Chinese and European demand for fiber lasers faltered. |
| • | | Chinese Internet names came under pressure as investors fear the impact of the U.S.-China trade war on the economy. A tightening regulatory environment in gaming put additional pressure on Naspers Ltd. |
| • | | U.S. Bank of the Ozarks Inc.’s share’s price suffered in a context of market anxiety around U.S. commercial real estate lending. The U.S. bank, which has an outstanding credit track record and boasts one of the highest return on assets of the industry, recorded a $46m charge due to two credit losses, which sparked a sharp selloff. The Fund still held the shares at period end as we believe the correction is overdone. |
| • | | Two European consumer staples names — Anheuser-Busch InBev SA/NV and Henkel AG & Co. KGaA — disappointed due to their weak organic growth and near term outlook. |
| | | | | | | | |
Sector Weightings
as of October 31, 2018 | | Market Value | | | % of
Net Assets | |
Information Technology | | | $4,490,213 | | | | 16.7 | % |
Financials | | | 4,187,768 | | | | 15.6 | |
Communication Services | | | 3,540,097 | | | | 13.2 | |
Health Care | | | 2,993,846 | | | | 11.1 | |
Consumer Staples | | | 2,927,896 | | | | 10.9 | |
Consumer Discretionary | | | 2,501,761 | | | | 9.3 | |
Industrials | | | 1,991,820 | | | | 7.4 | |
Energy | | | 1,545,977 | | | | 5.7 | |
Materials | | | 1,475,254 | | | | 5.5 | |
Investment Company | | | 657,504 | | | | 2.4 | |
Cash and Other | | | 590,526 | | | | 2.2 | |
| | | | | | | | | |
| | | | | | | | 100.0 | % |
| | | | | | | | | |
Holdings are subject to change without notice. | |
UNDERSTANDING YOUR EXPENSES:
As a shareholder of the Fund, you incur two types of costs:
(1) transaction costs, including applicable sales charges and redemption fees; and (2) ongoing costs, including investment advisory fees, distribution and/or service (12b-1) fees (in the case of Class A and Class R shares of the Fund), and other Fund expenses. These examples are intended to help you understand your ongoing costs (in dollars) of investing in the Fund and to compare these costs with the ongoing costs of investing in other mutual funds.
The examples are based on an investment of $1,000 invested at the beginning of the six-month period ended October 31, 2018 and held for the entire six-month period.
Actual Expenses
The first line of the following table provides information about actual account values and actual expenses. You may use the information in this line, together with the amount you invested, to estimate the expenses that you paid over the period. Simply divide your account value by $1,000 (for example, an $8,600 account value divided by $1,000 = 8.6), then multiply the result by the number in the first line under the heading entitled “Expenses Paid During Period” to estimate the expenses you paid on your account during this period.
Hypothetical Example for Comparison Purposes
The second line of the following table provides information about hypothetical account values and hypothetical expenses based on the Fund’s actual expense ratio and an assumed rate of return of 5% per year before expenses, which is not the Fund’s actual return. The hypothetical account values and expenses may not be used to estimate the actual ending account balance or expenses you paid for the period. You may use this information to compare the ongoing costs of investing in the Fund and other funds. To do so, compare this 5% hypothetical example with the 5% hypothetical examples that appear in the shareholder reports of the other funds.
Please note that the expenses shown in the table are meant to highlight your ongoing costs only and do not reflect any transactional costs, such as sales charges (loads), redemption fees, or exchange fees. Therefore, the second line of the table is useful in comparing ongoing costs only, and will not help you determine the relative total costs of owning different funds. In addition, if these transactional costs were included, your costs would have been higher.
61
1290 GLOBAL TALENTS FUND (Unaudited)
EXAMPLE
| | | | | | | | | | | | |
| | | Beginning
Account
Value
5/1/18 | | | Ending
Account
Value
10/31/18 | | | Expenses
Paid
During
Period*
5/1/18 -
10/31/18 | |
Class A | | | | | | | | | | | | |
Actual | | | $1,000.00 | | | | $916.40 | | | | $6.04 | |
Hypothetical (5% average annual return before expenses) | | | 1,000.00 | | | | 1,018.90 | | | | 6.36 | |
Class I | | | | | | | | | | | | |
Actual | | | 1,000.00 | | | | 917.40 | | | | 4.83 | |
Hypothetical (5% average annual return before expenses) | | | 1,000.00 | | | | 1,020.16 | | | | 5.09 | |
Class R | | | | | | | | | | | | |
Actual | | | 1,000.00 | | | | 915.20 | | | | 7.24 | |
Hypothetical (5% average annual return before expenses) | | | 1,000.00 | | | | 1,017.64 | | | | 7.63 | |
* Expenses are equal to the Fund’s Class A, I and R shares annualized expense ratios of 1.25%, 1.00% and 1.50%, respectively, multiplied by the average account value over the period, and multiplied by 184/365 (to reflect the one-half year period). | |
62
1290 FUNDS
1290 GLOBAL TALENTS FUND
PORTFOLIO OF INVESTMENTS
October 31, 2018
| | | | | | | | |
| | | Number of
Shares | | | Value
(Note 1) | |
| | | | | | | | |
COMMON STOCKS: | | | | | | | | |
Belgium (2.3%) | | | | | | | | |
Anheuser-Busch InBev SA/NV | | | 8,271 | | | $ | 609,464 | |
| | | | | | | | |
Chile (1.9%) | | | | | | | | |
Antofagasta plc | | | 51,550 | | | | 516,535 | |
| | | | | | | | |
China (4.7%) | | | | | | | | |
Alibaba Group Holding Ltd. (ADR)* | | | 4,555 | | | | 648,085 | |
Tencent Holdings Ltd. | | | 17,900 | | | | 606,722 | |
| | | | | | | | |
| | | | | | | 1,254,807 | |
| | | | | | | | |
Finland (1.4%) | | | | | | | | |
Sampo OYJ, Class A | | | 8,043 | | | | 370,301 | |
| | | | | | | | |
France (5.9%) | | | | | | | | |
Dassault Systemes SE | | | 6,353 | | | | 794,409 | |
Financiere de L’Odet SA | | | 479 | | | | 421,959 | |
Publicis Groupe SA | | | 6,494 | | | | 376,712 | |
| | | | | | | | |
| | | | | | | 1,593,080 | |
| | | | | | | | |
Germany (4.5%) | | | | | | | | |
Fresenius SE & Co. KGaA | | | 8,737 | | | | 556,810 | |
Henkel AG & Co. KGaA (Preference) (q) | | | 5,917 | | | | 647,146 | |
| | | | | | | | |
| | | | | | | 1,203,956 | |
| | | | | | | | |
Israel (2.4%) | | | | | | | | |
Check Point Software Technologies Ltd.* | | | 5,859 | | | | 650,349 | |
| | | | | | | | |
Japan (11.5%) | | | | | | | | |
Kose Corp. | | | 4,100 | | | | 609,066 | |
SoftBank Group Corp. | | | 11,000 | | | | 891,863 | |
THK Co. Ltd. | | | 20,600 | | | | 453,088 | |
Unicharm Corp. | | | 26,300 | | | | 713,664 | |
ZOZO, Inc. | | | 17,400 | | | | 417,257 | |
| | | | | | | | |
| | | | | | | 3,084,938 | |
| | | | | | | | |
Mexico (3.3%) | | | | | | | | |
Fomento Economico Mexicano SAB de CV | | | 41,000 | | | | 348,556 | |
Regional SAB de CV | | | 109,400 | | | | 532,802 | |
| | | | | | | | |
| | | | | | | 881,358 | |
| | | | | | | | |
Peru (2.3%) | | | | | | | | |
Credicorp Ltd. | | | 2,700 | | | | 609,417 | |
| | | | | | | | |
Spain (1.3%) | | | | | | | | |
Industria de Diseno Textil SA | | | 12,968 | | | | 365,752 | |
| | | | | | | | |
Sweden (1.4%) | | | | | | | | |
Assa Abloy AB, Class B | | | 19,259 | | | | 383,922 | |
| | | | | | | | |
Switzerland (2.9%) | | | | | | | | |
Roche Holding AG | | | 3,226 | | | | 782,783 | |
| | | | | | | | |
United States (49.6%) | | | | | | | | |
Alphabet, Inc., Class A* | | | 843 | | | | 919,359 | |
Amazon.com, Inc.* | | | 670 | | | | 1,070,667 | |
Apple, Inc. | | | 5,638 | | | | 1,233,933 | |
Bank of the Ozarks | | | 17,583 | | | | 481,071 | |
Berkshire Hathaway, Inc., Class B* | | | 5,463 | | | | 1,121,444 | |
BlackRock, Inc. | | | 1,256 | | | | 516,743 | |
Charles Schwab Corp. (The) | | | 12,024 | | | | 555,990 | |
| | | | | | | | |
Cognex Corp. | | | 10,286 | | | | 440,652 | |
Concho Resources, Inc.* | | | 5,275 | | | | 733,700 | |
DexCom, Inc.* | | | 5,797 | | | | 769,668 | |
Ecolab, Inc. | | | 6,260 | | | | 958,719 | |
EOG Resources, Inc. | | | 7,711 | | | | 812,277 | |
Facebook, Inc., Class A* | | | 4,911 | | | | 745,441 | |
FedEx Corp. | | | 3,326 | | | | 732,851 | |
IPG Photonics Corp.* | | | 3,787 | | | | 505,754 | |
Proofpoint, Inc.* | | | 5,341 | | | | 485,764 | |
QUALCOMM, Inc. | | | 6,032 | | | | 379,352 | |
Stryker Corp. | | | 5,453 | | | | 884,585 | |
| | | | | | | | |
| | | | | | | 13,347,970 | |
| | | | | | | | |
Total Common Stocks (95.4%)
(Cost $22,598,460) | | | | | | | 25,654,632 | |
| | | | | | | | |
| |
SHORT-TERM INVESTMENT: | | | | | |
Investment Company (2.4%) | | | | | | | | |
JPMorgan Prime Money Market Fund, IM Shares | | | 657,373 | | | | 657,504 | |
| | | | | | | | |
Total Short-Term Investment (2.4%)
(Cost $657,566) | | | | | | | 657,504 | |
| | | | | | | | |
Total Investments in Securities (97.8%)
(Cost $23,256,026) | | | | | | | 26,312,136 | |
Other Assets Less Liabilities (2.2%) | | | | | | | 590,526 | |
| | | | | | | | |
Net Assets (100%) | | | | | | $ | 26,902,662 | |
| | | | | | | | |
| (q) | Preference Shares are a special type of equity investment that shares in the earnings of the company, has limited voting rights, and receives a greater dividend than applicable Common Shares. |
Glossary:
| | ADR | — American Depositary Receipt |
| | | | | | | | |
Sector Weightings as of October 31, 2018 | | Market Value | | | % of
Net Assets | |
Information Technology | | | $4,490,213 | | | | 16.7 | % |
Financials | | | 4,187,768 | | | | 15.6 | |
Communication Services | | | 3,540,097 | | | | 13.2 | |
Health Care | | | 2,993,846 | | | | 11.1 | |
Consumer Staples | | | 2,927,896 | | | | 10.9 | |
Consumer Discretionary | | | 2,501,761 | | | | 9.3 | |
Industrials | | | 1,991,820 | | | | 7.4 | |
Energy | | | 1,545,977 | | | | 5.7 | |
Materials | | | 1,475,254 | | | | 5.5 | |
Investment Company | | | 657,504 | | | | 2.4 | |
Cash and Other | | | 590,526 | | | | 2.2 | |
| | | | | | | | | |
| | | | | | | | 100.0 | % |
| | | | | | | | | |
See Notes to Financial Statements.
63
1290 FUNDS
1290 GLOBAL TALENTS FUND
PORTFOLIO OF INVESTMENTS (Continued)
October 31, 2018
The following is a summary of the inputs used to value the Fund’s assets and liabilities carried at fair value as of October 31, 2018:
The inputs or methodology used for valuing securities are not necessarily an indication of the risk associated with investing in those securities.
Various inputs are used in determining the value of the Fund’s investments. These inputs are summarized in the three broad levels listed below:
| | | | | | | | | | | | | | | | |
| | | | | |
| Investment Type | | Level 1
Quoted Prices in
Active Markets for
Identical
Securities | | | Level 2
Significant Other
Observable Inputs
(including quoted prices
for similar securities,
interest rates,
prepayment speeds,
credit risk, etc.) | | | Level 3
Significant Unobservable
Inputs (including the
Fund’s own assumptions in
determining the fair
value of investments) | | | Total | |
Assets: | |
Common Stocks | | | | | | | | | | | | | | | | |
Belgium | | $ | — | | | $ | 609,464 | | | $ | — | | | $ | 609,464 | |
Chile | | | — | | | | 516,535 | | | | — | | | | 516,535 | |
China | | | 648,085 | | | | 606,722 | | | | — | | | | 1,254,807 | |
Finland | | | — | | | | 370,301 | | | | — | | | | 370,301 | |
France | | | — | | | | 1,593,080 | | | | — | | | | 1,593,080 | |
Germany | | | — | | | | 1,203,956 | | | | — | | | | 1,203,956 | |
Israel | | | 650,349 | | | | — | | | | — | | | | 650,349 | |
Japan | | | — | | | | 3,084,938 | | | | — | | | | 3,084,938 | |
Mexico | | | 881,358 | | | | — | | | | — | | | | 881,358 | |
Peru | | | 609,417 | | | | — | | | | — | | | | 609,417 | |
Spain | | | — | | | | 365,752 | | | | — | | | | 365,752 | |
Sweden | | | — | | | | 383,922 | | | | — | | | | 383,922 | |
Switzerland | | | — | | | | 782,783 | | | | — | | | | 782,783 | |
United States | | | 13,347,970 | | | | — | | | | — | | | | 13,347,970 | |
Short-Term Investment | | | | | | | | | | | | | | | | |
Investment Company | | | 657,504 | | | | — | | | | — | | | | 657,504 | |
| | | | | | | | | | | | | | | | |
Total Assets | | $ | 16,794,683 | | | $ | 9,517,453 | | | $ | — | | | $ | 26,312,136 | |
| | | | | | | | | | | | | | | | |
Total Liabilities | | $ | — | | | $ | — | | | $ | — | | | $ | — | |
| | | | | | | | | | | | | | | | |
Total | | $ | 16,794,683 | | | $ | 9,517,453 | | | $ | — | | | $ | 26,312,136 | |
| | | | | | | | | | | | | | | | |
The Effect of Derivative Instruments on the Statement of Operations for the year ended October 31, 2018:
| | | | | | | | |
| Amount of Realized Gain or (Loss) on Derivatives Recognized in Income | |
Derivatives Not Accounted for as
Hedging Instruments^ | | Forward
Foreign
Currency
Contracts | | | Total | |
Foreign exchange contracts | | $ | (6,394 | ) | | $ | (6,394 | ) |
| | | | | | | | |
Total | | $ | (6,394 | ) | | $ | (6,394 | ) |
| | | | | | | | |
^ The Fund held forward foreign currency contracts as hedging.
The Fund held forward foreign currency contracts with an average settlement value of approximately $111,000 for 8 days during the year ended October 31, 2018.
See Notes to Financial Statements.
64
1290 FUNDS
1290 GLOBAL TALENTS FUND
PORTFOLIO OF INVESTMENTS (Continued)
October 31, 2018
Investment security transactions for the year ended October 31, 2018 were as follows:
| | | | |
Cost of Purchases: | | | | |
Long-term investments other than U.S. government debt securities | | $ | 8,504,092 | |
Net Proceeds of Sales and Redemptions: | | | | |
Long-term investments other than U.S. government debt securities | | $ | 7,137,433 | |
As of October 31, 2018, the gross unrealized appreciation (depreciation) of investments based on the aggregate cost of investments in securities and derivative instruments, if applicable, for Federal income tax purposes was as follows:
| | | | |
Aggregate gross unrealized appreciation | | $ | 4,384,326 | |
Aggregate gross unrealized depreciation | | | (1,318,013 | ) |
| | | | |
Net unrealized appreciation | | $ | 3,066,313 | |
| | | | |
Federal income tax cost of investments in securities and derivative instruments, if applicable | | $ | 23,245,823 | |
| | | | |
See Notes to Financial Statements.
65
1290 FUNDS
1290 GLOBAL TALENTS FUND
STATEMENT OF ASSETS AND LIABILITIES
October 31, 2018
| | | | |
ASSETS | | | | |
Investments in Securities, at value (Cost $23,256,026) | | $ | 26,312,136 | |
Cash | | | 666,000 | |
Receivable for securities sold | | | 55,374 | |
Dividends, interest and other receivables | | | 37,507 | |
Prepaid registration and filing fees | | | 14,855 | |
Receivable for Fund shares sold | | | 7,828 | |
Other assets | | | 353 | |
| | | | |
Total assets | | | 27,094,053 | |
| | | | |
LIABILITIES | | | | |
Payable for securities purchased | | | 110,939 | |
Payable for Fund shares redeemed | | | 10,800 | |
Transfer agent fees payable | | | 4,830 | |
Administrative fees payable | | | 1,210 | |
Distribution fees payable – Class A | | | 284 | |
Distribution fees payable – Class R | | | 55 | |
Trustees’ fees payable | | | 22 | |
Accrued expenses | | | 63,251 | |
| | | | |
Total liabilities | | | 191,391 | |
| | | | |
NET ASSETS | | $ | 26,902,662 | |
| | | | |
Net assets were comprised of: | | | | |
Paid in capital | | $ | 22,558,843 | |
Total distributable earnings (loss) | | | 4,343,819 | |
| | | | |
Net assets | | $ | 26,902,662 | |
| | | | |
Class A | | | | |
Net asset value and redemption price per share, $1,269,517 / 104,373 shares outstanding (unlimited amount authorized: $0.001 par value) | | $ | 12.16 | |
Maximum sales charge (5.50% of offering price) | | | 0.71 | |
| | | | |
Maximum offering price per share | | $ | 12.87 | |
| | | | |
Class I | | | | |
Net asset value and redemption price per share, $25,510,687 / 2,087,234 shares outstanding (unlimited amount authorized: $0.001 par value) | | $ | 12.22 | |
| | | | |
Class R | | | | |
Net asset value and redemption price per share, $122,458 / 10,129 shares outstanding (unlimited amount authorized: $0.001 par value) | | $ | 12.09 | |
| | | | |
STATEMENT OF OPERATIONS
For the Year Ended October 31, 2018
| | | | |
INVESTMENT INCOME | | | | |
Dividends (net of $19,954 foreign withholding tax) | | $ | 317,559 | |
Interest | | | 4,515 | |
| | | | |
Total income | | | 322,074 | |
| | | | |
EXPENSES | | | | |
Investment advisory fees | | | 228,795 | |
Professional fees | | | 75,422 | |
Administrative fees | | | 42,899 | |
Registration and filing fees | | | 37,978 | |
Transfer agent fees | | | 29,000 | |
Printing and mailing expenses | | | 26,591 | |
Custodian fees | | | 14,000 | |
Trustees’ fees | | | 2,981 | |
Distribution fees – Class A | | | 2,944 | |
Distribution fees – Class R | | | 666 | |
Miscellaneous | | | 24,755 | |
| | | | |
Gross expenses | | | 486,031 | |
Less: Waiver from investment adviser | | | (196,463 | ) |
| | | | |
Net expenses | | | 289,568 | |
| | | | |
NET INVESTMENT INCOME (LOSS) | | | 32,506 | |
| | | | |
REALIZED AND UNREALIZED GAIN (LOSS) | | | | |
Realized gain (loss) on: | | | | |
Investments in securities | | | 1,333,830 | |
Forward foreign currency contracts | | | (6,394 | ) |
Foreign currency transactions | | | 7,389 | |
| | | | |
Net realized gain (loss) | | | 1,334,825 | |
| | | | |
Change in unrealized appreciation (depreciation) on: | | | | |
Investments in securities | | | (2,040,765 | ) |
Foreign currency translations | | | (920 | ) |
| | | | |
Net change in unrealized appreciation (depreciation) | | | (2,041,685 | ) |
| | | | |
NET REALIZED AND UNREALIZED GAIN (LOSS) | | | (706,860 | ) |
| | | | |
NET INCREASE (DECREASE) IN NET ASSETS RESULTING FROM OPERATIONS | | $ | (674,354 | ) |
| | | | |
See Notes to Financial Statements.
66
1290 FUNDS
1290 GLOBAL TALENTS FUND
STATEMENT OF CHANGES IN NET ASSETS
| | | | | | | | |
| | | Year Ended October 31, | |
| | | 2018 | | | 2017 | |
INCREASE (DECREASE) IN NET ASSETS FROM OPERATIONS: | | | | | | | | |
Net investment income (loss) | | $ | 32,506 | | | $ | 18,624 | |
Net realized gain (loss) | | | 1,334,825 | | | | (77,109 | ) |
Net change in unrealized appreciation (depreciation) | | | (2,041,685 | ) | | | 4,489,812 | |
| | | | | | | | |
NET INCREASE (DECREASE) IN NET ASSETS RESULTING FROM OPERATIONS | | | (674,354 | ) | | | 4,431,327 | |
| | | | | | | | |
Distributions to shareholders: (a) | | | | | | | | |
Class A | | | — | | | | (400 | ) |
Class I | | | (33,488 | ) | | | (90,624 | ) |
Class R | | | — | | | | (400 | ) |
| | | | | | | | |
Total distributions to shareholders | | | (33,488 | ) | | | (91,424 | ) |
| | | | | | | | |
CAPITAL SHARES TRANSACTIONS: | | | | | | | | |
Class A | | | | | | | | |
Capital shares sold [ 49,492 and 54,934 shares, respectively ] | | | 660,562 | | | | 651,538 | |
Capital shares issued in reinvestment of dividends [ 0 and 0# shares, respectively ] | | | — | | | | — | ## |
Capital shares repurchased [ (9,676) and (387) shares, respectively ] | | | (130,124 | ) | | | (4,720 | ) |
| | | | | | | | |
Total Class A transactions | | | 530,438 | | | | 646,818 | |
| | | | | | | | |
Class I | | | | | | | | |
Capital shares sold [ 86,207 and 25,104 shares, respectively ] | | | 1,178,073 | | | | 288,617 | |
Capital shares issued in reinvestment of dividends [ 33 and 13 shares, respectively ] | | | 422 | | | | 138 | |
Capital shares repurchased [ (2,640) and (2,117) shares, respectively ] | | | (35,891 | ) | | | (25,662 | ) |
| | | | | | | | |
Total Class I transactions | | | 1,142,604 | | | | 263,093 | |
| | | | | | | | |
Class R | | | | | | | | |
Capital shares sold [ 120 and 0 shares, respectively ] | | | 1,599 | | | | — | |
Capital shares issued in reinvestment of dividends [ 0 and 0# shares, respectively ] | | | — | | | | — | ## |
Capital shares repurchased [ 0# and 0 shares, respectively ] | | | (2 | ) | | | — | |
| | | | | | | | |
Total Class R transactions | | | 1,597 | | | | — | ## |
| | | | | | | | |
NET INCREASE (DECREASE) IN NET ASSETS RESULTING FROM CAPITAL SHARE TRANSACTIONS | | | 1,674,639 | | | | 909,911 | |
| | | | | | | | |
TOTAL INCREASE (DECREASE) IN NET ASSETS | | | 966,797 | | | | 5,249,814 | |
NET ASSETS: | | | | | | | | |
Beginning of year | | | 25,935,865 | | | | 20,686,051 | |
| | | | | | | | |
End of year (b) | | $ | 26,902,662 | | | $ | 25,935,865 | |
| | | | | | | | |
# Number of shares is less than 0.5. | | | | | | | | |
## Amount is less than $0.50. | | | | | | | | |
(a) Prior year distributions to shareholders were made up of dividends from net investment income of $—, $11,303 and $— for Classes A, I and R, respectively; and dividends from net realized capital gains of $400, $79,321 and $400 for Classes A, I and R, respectively. These amounts were reclassified to conform with the current year presentation. | |
(b) Includes accumulated undistributed (overdistributed) net investment income of $29,669 as of October 31, 2017. The SEC eliminated the requirement to disclose undistributed net investment income in 2018. | |
See Notes to Financial Statements.
67
1290 FUNDS
1290 GLOBAL TALENTS FUND
FINANCIAL HIGHLIGHTS
| | | | | | | | | | | | |
| | | Year Ended October 31, | | | April 11, 2016* to
October 31, 2016 | |
| Class A | | 2018 | | | 2017 | |
Net asset value, beginning of period | | $ | 12.44 | | | $ | 10.33 | | | $ | 10.00 | |
| | | | | | | | | | | | |
Income (loss) from investment operations: | | | | | | | | | | | | |
Net investment income (loss) (e) | | | (0.02 | ) | | | (0.03 | ) | | | (0.01 | ) |
Net realized and unrealized gain (loss) | | | (0.26 | ) | | | 2.18 | | | | 0.34 | |
| | | | | | | | | | | | |
Total from investment operations | | | (0.28 | ) | | | 2.15 | | | | 0.33 | |
| | | | | | | | | | | | |
Less distributions: | |
Distributions from net realized gains | | | — | | | | (0.04 | ) | | | — | |
| | | | | | | | | | | | |
Net asset value, end of period | | $ | 12.16 | | | $ | 12.44 | | | $ | 10.33 | |
| | | | | | | | | | | | |
Total return (b) | | | (2.25 | )% | | | 20.89 | % | | | 3.30 | % |
| | | | | | | | | | | | |
Ratios/Supplemental Data: | |
Net assets, end of period (000’s) | | $ | 1,270 | | | $ | 803 | | | $ | 103 | |
Ratio of expenses to average net assets: | | | | | | | | | | | | |
After waivers and reimbursements (a)(f) | | | 1.25 | % | | | 1.27 | % | | | 1.40 | % |
Before waivers and reimbursements (a)(f) | | | 1.94 | % | | | 2.13 | % | | | 2.31 | % |
Ratio of net investment income (loss) to average net assets: | | | | | | | | | | | | |
After waivers and reimbursements (a)(f) | | | (0.13 | )% | | | (0.25 | )% | | | (0.19 | )%(l) |
Before waivers and reimbursements (a)(f) | | | (0.82 | )% | | | (1.11 | )% | | | (1.10 | )%(l) |
Portfolio turnover rate (z)^ | | | 26 | % | | | 18 | % | | | 11 | % |
| | |
| | | Year Ended October 31, | | | April 11, 2016* to October 31, 2016 | |
| Class I | | 2018 | | | 2017 | |
Net asset value, beginning of period | | $ | 12.48 | | | $ | 10.34 | | | $ | 10.00 | |
| | | | | | | | | | | | |
Income (loss) from investment operations: | | | | | | | | | | | | |
Net investment income (loss) (e) | | | 0.02 | | | | 0.01 | | | | — | # |
Net realized and unrealized gain (loss) | | | (0.26 | ) | | | 2.18 | | | | 0.34 | |
| | | | | | | | | | | | |
Total from investment operations | | | (0.24 | ) | | | 2.19 | | | | 0.34 | |
| | | | | | | | | | | | |
Less distributions: | | | | | | | | | | | | |
Dividends from net investment income | | | (0.02 | ) | | | (0.01 | ) | | | — | |
Distributions from net realized gains | | | — | | | | (0.04 | ) | | | — | |
| | | | | | | | | | | | |
Total dividends and distributions | | | (0.02 | ) | | | (0.05 | ) | | | — | |
| | | | | | | | | | | | |
Net asset value, end of period | | $ | 12.22 | | | $ | 12.48 | | | $ | 10.34 | |
| | | | | | | | | | | | |
Total return (b) | | | (1.95 | )% | | | 21.23 | % | | | 3.40 | % |
| | | | | | | | | | | | |
Ratios/Supplemental Data: | |
Net assets, end of period (000’s) | | $ | 25,511 | | | $ | 25,009 | | | $ | 20,479 | |
Ratio of expenses to average net assets: | | | | | | | | | | | | |
After waivers and reimbursements (a)(f) | | | 1.00 | % | | | 1.05 | % | | | 1.15 | % |
Before waivers and reimbursements (a)(f) | | | 1.69 | % | | | 1.92 | % | | | 2.06 | % |
Ratio of net investment income (loss) to average net assets: | | | | | | | | | | | | |
After waivers and reimbursements (a)(f) | | | 0.13 | % | | | 0.09 | % | | | 0.06 | %(l) |
Before waivers and reimbursements (a)(f) | | | (0.56 | )% | | | (0.79 | )% | | | (0.85 | )%(l) |
Portfolio turnover rate (z)^ | | | 26 | % | | | 18 | % | | | 11 | % |
See Notes to Financial Statements.
68
1290 FUNDS
1290 GLOBAL TALENTS FUND
FINANCIAL HIGHLIGHTS (Continued)
| | | | | | | | | | | | |
| | | Year Ended October 31, | | | April 11, 2016* to
October 31, 2016 | |
| Class R | | 2018 | | | 2017 | |
Net asset value, beginning of period | | $ | 12.39 | | | $ | 10.31 | | | $ | 10.00 | |
| | | | | | | | | | | | |
Income (loss) from investment operations: | | | | | | | | | | | | |
Net investment income (loss) (e) | | | (0.05 | ) | | | (0.05 | ) | | | (0.03 | ) |
Net realized and unrealized gain (loss) | | | (0.25 | ) | | | 2.17 | | | | 0.34 | |
| | | | | | | | | | | | |
Total from investment operations | | | (0.30 | ) | | | 2.12 | | | | 0.31 | |
| | | | | | | | | | | | |
Less distributions: | |
Distributions from net realized gains | | | — | | | | (0.04 | ) | | | — | |
| | | | | | | | | | | | |
Net asset value, end of period | | $ | 12.09 | | | $ | 12.39 | | | $ | 10.31 | |
| | | | | | | | | | | | |
Total return (b) | | | (2.42 | )% | | | 20.64 | % | | | 3.10 | % |
| | | | | | | | | | | | |
Ratios/Supplemental Data: | |
Net assets, end of period (000’s) | | $ | 122 | | | $ | 124 | | | $ | 103 | |
Ratio of expenses to average net assets: | | | | | | | | | | | | |
After waivers and reimbursements (a)(f) | | | 1.50 | % | | | 1.55 | % | | | 1.65 | % |
Before waivers and reimbursements (a)(f) | | | 2.19 | % | | | 2.42 | % | | | 2.56 | % |
Ratio of net investment income (loss) to average net assets: | | | | | | | | | | | | |
After waivers and reimbursements (a)(f) | | | (0.37 | )% | | | (0.41 | )% | | | (0.44 | )%(l) |
Before waivers and reimbursements (a)(f) | | | (1.06 | )% | | | (1.29 | )% | | | (1.35 | )%(l) |
Portfolio turnover rate (z)^ | | | 26 | % | | | 18 | % | | | 11 | % |
| * | Commencement of Operations. |
| # | Per share amount is less than $0.005. |
| ^ | Portfolio turnover rate excludes derivatives, if any. |
| (a) | Ratios for periods less than one year are annualized. Certain non-recurring expenses incurred by the Fund are not annualized for periods less than one year. |
| (b) | Total returns for periods less than one year are not annualized. |
| (e) | Net investment income (loss) per share is based on average shares outstanding. |
| (f) | Expenses do not include the expenses of the underlying funds (“indirect expenses”), if applicable. |
| (l) | The annualized ratio of net investment income to average net assets may not be indicative of operating results for a full year. |
| (z) | Portfolio turnover rate for periods less than one year is not annualized. |
See Notes to Financial Statements.
69
1290 HIGH YIELD BOND FUND (Unaudited)
INVESTMENT ADVISER
INVESTMENT SUB-ADVISER
| Ø | | AXA Investment Managers, Inc. |
PERFORMANCE RESULTS

| | | | | | | | | | | | |
| Annualized Total Returns as of 10/31/18 | |
| | | | | | 1
Year | | | Since
Incept. | |
Fund – Class A Shares* | | | without Sales Charge | | | | 0.86 | % | | | 3.33 | % |
| | | | with Sales Charge (a | ) | | | (3.69 | ) | | | 2.14 | |
Fund – Class I Shares* | | | | | | | 1.09 | | | | 3.61 | |
Fund – Class R Shares* | | | | | | | 0.63 | | | | 3.08 | |
Fund – Class T Shares*† | | | without Sales Charge | | | | 1.09 | | | | 3.58 | |
| | | | with Sales Charge (b | ) | | | (1.44 | ) | | | 2.91 | |
ICE BofAML U.S. High Yield Index | | | | | | | 0.86 | | | | 4.46 | |
* Date of inception 11/12/14. † Class T Shares currently are not offered for sale. (a) A 4.50% front-end sales charge was deducted. (b) A 2.50% front-end sales charge was deducted. Returns for periods greater than one year are annualized. | |
The performance quoted is past performance and is not a guarantee of future results. Mutual funds are subject to certain market risks. Investment returns and principal value of an investment will fluctuate so that an investor’s shares, when redeemed, may be worth more or less than their original cost. Current performance may be higher or lower than the performance data shown. For the most current month-end performance data please call 1-888-310-0416 or visit www.1290Funds.com.
The graph illustrates comparative performance for $10,000 invested in the Class I Shares of the 1290 High Yield Bond Fund and the ICE BofAML U.S. High Yield Index from 11/12/14 to 10/31/18. The performance of the ICE BofAML U.S. High Yield Index reflects an initial investment at the end of the month closest to the Fund’s inception. The performance of the Fund assumes reinvestment of all dividends and capital gain distributions, if any, and does not include a sales charge. The performance of the ICE BofAML U.S. High Yield Index does not reflect the deduction of expenses or a sales charge associated with a mutual fund and has been adjusted to reflect reinvestment of all dividends, capital gain distributions, and interest of the securities included in the benchmark.
Fund performance may reflect the waiver of the Fund’s fees and reimbursement of expenses for certain periods since the inception date. Without these waivers and reimbursements, performance would have been lower. Also, performance shown in this section does not reflect the deduction of taxes that a shareholder would pay on Fund distributions or redemption of Fund shares.
PERFORMANCE SUMMARY
The Fund’s Class I shares returned 1.09% for the year ended October 31, 2018. The Fund’s benchmark, the ICE BofAML U.S. High Yield Index, returned 0.86% over the same year.
Overview — AXA Investment Managers, Inc.
The high yield market posted a small but positive return in the twelve-month period ended October 31, 2018, as the ICE BofAML U.S. High Yield Index generated a total return of 0.86% for the period. Returns in the period were driven by continued economic growth in the U.S., stable credit fundamentals and soft new issue volume, which supported secondary trading levels, partially offset by volatility in the stock market and rising interest rates. Flows in the high yield market were negative for the period, with $38.7 billion of outflows. The high yield new issue market priced $228.0 billion of new issues during the twelve-month period ended October 31, 2018, which is down materially from the $314.9 billion priced during the prior twelve-month period. The period saw $24.4 billion of high yield default volume, slightly higher than the $16.6 billion of high yield default volume in the prior twelve-month period. The par weighted high yield default rate ended the period at 2.02%, up from 1.18% in October 2017.
Fund Highlights
What helped performance during the year?
| • | | During the period the Fund’s macro risk positioning had a positive impact on relative performance. Specifically, the Fund’s overweight within the short duration segment of the market and its underweight within the higher quality, longer duration portion of the market both positively impacted performance. |
| • | | Fund performance benefited from participation in multiple new issues during the period which performed well post pricing. |
| • | | The Fund benefited from positive security selection within a number of sectors including services, leisure and technology. Both the Fund’s overweight within the health care sector and its underweight within the banking sector positively impacted relative performance during the period. |
| • | | The top contributors to return during the period were debt positions in Staples, Inc., Exela Intermediate LLC and Ellucian Company L.P. (Ensemble S Merger Sub, Inc.) Staples (Arch Merger) sells office supplies, furniture, and technology to businesses. Staples bonds performed well as the company reported earnings which exceeded expectations. Exela (Intermediate Co.) offers various automation services including software and technology solutions to companies across the banking, health care, insurance and other industries. The strong performance of Exela’s bonds was largely driven by the continued realization of synergies from the recent merger coupled with solid organic growth. Ellucian (Ensemble) |
70
1290 HIGH YIELD BOND FUND (Unaudited)
| | is a global Enterprise Resource Planning software provider specifically focused on the higher education end-market. Ellucian bonds were a top contributor during the period as the company continued to make progress in its shift toward a software as a service business model. |
What hurt performance during the year?
| • | | From a sector perspective, the Fund experienced negative security selection within the automotive sector due to the underperformance of American Tire Distributors (ATD) bonds. |
| • | | The bottom contributors to return during the period were debt positions in ATD, Sanchez Energy Corp. and Ziggo BV. ATD is the largest distributor of replacement tires in North America. ATD announced that suppliers Goodyear Tire and Bridgestone Tire would no longer be using ATD’s distribution network. These two suppliers combined made up approximately 25% of revenues for ATD. The sudden change in business prospects challenged our original investment thesis, and we sold out of the bonds by the end of June 2018 at a significant loss. Sanchez Energy is an exploration and production company with Eagle Ford Shale assets located in south Texas. Sanchez Energy unsecured bonds were a bottom contributor to return due to the company’s Comanche acquisition underperforming relative to expectations and due to the company issuing a secured bond during the period which is structurally senior to this existing unsecured bond. Ziggo provides cable television, internet and telephone service to both residential and commercial customers in the Netherlands. The company is a 50/50 joint venture of Vodafone and Liberty Global. Ziggo bonds were a bottom contributor due to negative operating trends in the Netherlands, driven by competitive pricing dynamics and regulatory headwinds. |
| | | | |
Fund Characteristics
As of October 31, 2018 | | | |
Weighted Average Life (Years) | | | 5.51 | |
Weighted Average Coupon (%) | | | 6.64 | |
Weighted Average Modified Duration (Years)* | | | 3.58 | |
Weighted Average Rating** | | | B2 | |
* Modified duration is a measure of the price sensitivity of the Fund to interest rate movements, taking into account specific features of the securities in which it invests. ** Weighted Average Rating has been provided by the Investment Sub-Adviser. A credit rating is an assessment provided by a nationally recognized statistical rating organization (NRSRO) of the creditworthiness of an issuer with respect to debt obligations, including specific securities, money market instruments or other debts. Ratings are measured on a scale that generally ranges from AAA (highest) to D (lowest); ratings are subject to change without notice. | |
| | | | |
Sector Weightings
as of October 31, 2018 | | % of
Net Assets | |
Communication Services | | | 17.1 | % |
Energy | | | 15.4 | |
Industrials | | | 14.8 | |
Health Care | | | 12.2 | |
Information Technology | | | 11.4 | |
Consumer Discretionary | | | 8.2 | |
Materials | | | 7.6 | |
Consumer Staples | | | 5.2 | |
Financials | | | 2.2 | |
Real Estate | | | 1.4 | |
Investment Company | | | 0.8 | |
Utilities | | | 0.5 | |
Cash and Other | | | 3.2 | |
| | | | | |
| | | | 100.0 | % |
| | | | | |
Holdings are subject to change without notice. | |
UNDERSTANDING YOUR EXPENSES:
As a shareholder of the Fund, you incur two types of costs:
(1) transaction costs, including applicable sales charges and redemption fees; and (2) ongoing costs, including investment advisory fees, distribution and/or service (12b-1) fees (in the case of Class A, Class R and Class T shares of the Fund), and other Fund expenses. These examples are intended to help you understand your ongoing costs (in dollars) of investing in the Fund and to compare these costs with the ongoing costs of investing in other mutual funds.
The examples are based on an investment of $1,000 invested at the beginning of the six-month period ended October 31, 2018 and held for the entire six-month period.
Actual Expenses
The first line of the following table provides information about actual account values and actual expenses. You may use the information in this line, together with the amount you invested, to estimate the expenses that you paid over the period. Simply divide your account value by $1,000 (for example, an $8,600 account value divided by $1,000 = 8.6), then multiply the result by the number in the first line under the heading entitled “Expenses Paid During Period” to estimate the expenses you paid on your account during this period.
71
1290 HIGH YIELD BOND FUND (Unaudited)
Hypothetical Example for Comparison Purposes
The second line of the following table provides information about hypothetical account values and hypothetical expenses based on the Fund’s actual expense ratio and an assumed rate of return of 5% per year before expenses, which is not the Fund’s actual return. The hypothetical account values and expenses may not be used to estimate the actual ending account balance or expenses you paid for the period. You may use this information to compare the ongoing costs of investing in the Fund and other funds. To do so, compare this 5% hypothetical example with the 5% hypothetical examples that appear in the shareholder reports of the other funds.
Please note that the expenses shown in the table are meant to highlight your ongoing costs only and do not reflect any transactional costs, such as sales charges (loads), redemption fees, or exchange fees. Therefore, the second line of the table is useful in comparing ongoing costs only, and will not help you determine the relative total costs of owning different funds. In addition, if these transactional costs were included, your costs would have been higher.
EXAMPLE
| | | | | | | | | | | | |
| | | Beginning
Account
Value
5/1/18 | | | Ending
Account
Value
10/31/18 | | | Expenses
Paid
During
Period*
5/1/18 -
10/31/18 | |
Class A | | | | | | | | | | | | |
Actual | | | $1,000.00 | | | | $1,006.20 | | | | $5.26 | |
Hypothetical (5% average annual return before expenses) | | | 1,000.00 | | | | 1,019.96 | | | | 5.30 | |
Class I | | | | | | | | | | | | |
Actual | | | 1,000.00 | | | | 1,007.50 | | | | 4.01 | |
Hypothetical (5% average annual return before expenses) | | | 1,000.00 | | | | 1,021.21 | | | | 4.03 | |
Class R | | | | | | | | | | | | |
Actual | | | 1,000.00 | | | | 1,005.00 | | | | 6.53 | |
Hypothetical (5% average annual return before expenses) | | | 1,000.00 | | | | 1,018.70 | | | | 6.57 | |
Class T** | | | | | | | | | | | | |
Actual | | | 1,000.00 | | | | 1,007.50 | | | | 4.01 | |
Hypothetical (5% average annual return before expenses) | | | 1,000.00 | | | | 1,021.21 | | | | 4.03 | |
* Expenses are equal to the Fund’s Class A, I, R and T shares annualized expense ratios of 1.04%, 0.79%, 1.29% and 0.79%, respectively, multiplied by the average account value over the period, and multiplied by 184/365 (to reflect the one-half year period). ** Class T shares currently are not offered for sale. | |
72
1290 FUNDS
1290 HIGH YIELD BOND FUND
PORTFOLIO OF INVESTMENTS
October 31, 2018
| | | | | | | | |
| | | Principal
Amount | | | Value
(Note 1) | |
| | | | | | | | |
LONG-TERM DEBT SECURITIES: | | | | | | | | |
Corporate Bonds (96.0%) | | | | | | | | |
Communication Services (17.1%) | | | | | | | | |
Diversified Telecommunication Services (6.1%) | |
CCO Holdings LLC | | | | | | | | |
5.250%, 3/15/21 | | $ | 95,000 | | | $ | 95,000 | |
5.250%, 9/30/22 | | | 197,000 | | | | 197,867 | |
5.125%, 5/1/23§ | | | 136,000 | | | | 135,157 | |
5.750%, 2/15/26§ | | | 145,000 | | | | 143,550 | |
5.875%, 5/1/27§ | | | 324,000 | | | | 317,941 | |
5.000%, 2/1/28§ | | | 108,000 | | | | 100,580 | |
CenturyLink, Inc. | | | | | | | | |
Series G | | | | | | | | |
6.875%, 1/15/28 | | | 90,000 | | | | 84,600 | |
Series W | | | | | | | | |
6.750%, 12/1/23 | | | 96,000 | | | | 97,805 | |
Cincinnati Bell, Inc. | | | | | | | | |
7.000%, 7/15/24§ | | | 167,000 | | | | 150,300 | |
Frontier Communications Corp. | | | | | | | | |
8.500%, 4/1/26§ | | | 70,000 | | | | 65,016 | |
Intelsat Jackson Holdings SA | | | | | | | | |
8.500%, 10/15/24 (b)§ | | | 74,000 | | | | 73,630 | |
Level 3 Financing, Inc. | | | | | | | | |
5.375%, 8/15/22 | | | 282,000 | | | | 282,000 | |
Sprint Capital Corp. | | | | | | | | |
6.900%, 5/1/19 | | | 60,000 | | | | 60,810 | |
8.750%, 3/15/32 | | | 110,000 | | | | 120,043 | |
Windstream Services LLC | | | | | | | | |
8.625%, 10/31/25§ | | | 112,000 | | | | 104,440 | |
| | | | | | | | |
| | | | | | | 2,028,739 | |
| | | | | | | | |
Entertainment (1.3%) | | | | | | | | |
Ascend Learning LLC | | | | | | | | |
6.875%, 8/1/25§ | | | 100,000 | | | | 99,250 | |
Live Nation Entertainment, Inc. | | | | | | | | |
4.875%, 11/1/24§ | | | 156,000 | | | | 149,760 | |
National CineMedia LLC | | | | | | | | |
6.000%, 4/15/22 | | | 126,000 | | | | 127,260 | |
Netflix, Inc. | | | | | | | | |
4.875%, 4/15/28 (b)§ | | | 78,000 | | | | 71,565 | |
| | | | | | | | |
| | | | | | | 447,835 | |
| | | | | | | | |
Interactive Media & Services (1.1%) | | | | | | | | |
Match Group, Inc. | | | | | | | | |
6.375%, 6/1/24 | | | 149,000 | | | | 154,960 | |
Rackspace Hosting, Inc. | | | | | | | | |
8.625%, 11/15/24§ | | | 231,000 | | | | 217,140 | |
| | | | | | | | |
| | | | | | | 372,100 | |
| | | | | | | | |
Media (5.3%) | | | | | | | | |
Altice Luxembourg SA | | | | | | | | |
7.750%, 5/15/22§ | | | 200,000 | | | | 186,260 | |
Cequel Communications Holdings I LLC | | | | | | | | |
5.125%, 12/15/21§ | | | 139,000 | | | | 138,625 | |
DISH DBS Corp. | | | | | | | | |
7.875%, 9/1/19 | | | 162,000 | | | | 166,276 | |
5.875%, 7/15/22 | | | 112,000 | | | | 105,840 | |
McGraw-Hill Global Education Holdings LLC | | | | | | | | |
7.875%, 5/15/24§ | | | 184,000 | | | | 156,860 | |
| | | | | | | | |
Meredith Corp. | | | | | | | | |
6.875%, 2/1/26§ | | | 180,000 | | | | 179,784 | |
Quebecor Media, Inc. | | | | | | | | |
5.750%, 1/15/23 | | | 59,000 | | | | 59,148 | |
Sirius XM Radio, Inc. | | | | | | | | |
6.000%, 7/15/24§ | | | 147,000 | | | | 150,278 | |
Tribune Media Co. | | | | | | | | |
5.875%, 7/15/22 | | | 68,000 | | | | 69,020 | |
Unitymedia GmbH | | | | | | | | |
6.125%, 1/15/25§ | | | 200,000 | | | | 205,500 | |
Ziggo Bond Co. BV | | | | | | | | |
6.000%, 1/15/27§ | | | 200,000 | | | | 178,000 | |
Ziggo BV | | | | | | | | |
5.500%, 1/15/27§ | | | 200,000 | | | | 183,500 | |
| | | | | | | | |
| | | | | | | 1,779,091 | |
| | | | | | | | |
Wireless Telecommunication Services (3.3%) | |
Digicel Ltd. | | | | | | | | |
6.000%, 4/15/21§ | | | 250,000 | | | | 226,875 | |
Sprint Communications, Inc. | | | | | | | | |
7.000%, 8/15/20 | | | 50,000 | | | | 52,000 | |
Sprint Corp. | | | | | | | | |
7.875%, 9/15/23 | | | 240,000 | | | | 256,200 | |
7.125%, 6/15/24 | | | 66,000 | | | | 67,485 | |
7.625%, 3/1/26 | | | 155,000 | | | | 161,200 | |
T-Mobile USA, Inc. | | | | | | | | |
6.000%, 3/1/23 | | | 171,000 | | | | 175,274 | |
6.000%, 4/15/24 | | | 64,000 | | | | 65,933 | |
6.375%, 3/1/25 | | | 94,000 | | | | 96,764 | |
| | | | | | | | |
| | | | | | | 1,101,731 | |
| | | | | | | | |
Total Communication Services | | | | | | | 5,729,496 | |
| | | | | | | | |
Consumer Discretionary (8.2%) | | | | | | | | |
Auto Components (0.5%) | | | | | | | | |
Icahn Enterprises LP | | | | | | | | |
6.000%, 8/1/20 | | | 78,000 | | | | 78,488 | |
6.375%, 12/15/25 | | | 82,000 | | | | 81,491 | |
| | | | | | | | |
| | | | | | | 159,979 | |
| | | | | | | | |
Distributors (0.9%) | | | | | | | | |
Core & Main LP | | | | | | | | |
6.125%, 8/15/25§ | | | 81,000 | | | | 76,140 | |
Univar USA, Inc. | | | | | | | | |
6.750%, 7/15/23§ | | | 231,000 | | | | 237,353 | |
| | | | | | | | |
| | | | | | | 313,493 | |
| | | | | | | | |
Hotels, Restaurants & Leisure (4.6%) | | | | | | | | |
1011778 BC ULC | | | | | | | | |
4.625%, 1/15/22§ | | | 282,000 | | | | 278,869 | |
4.250%, 5/15/24§ | | | 36,000 | | | | 33,840 | |
5.000%, 10/15/25§ | | | 173,000 | | | | 160,890 | |
Boyd Gaming Corp. | | | | | | | | |
6.000%, 8/15/26 | | | 105,000 | | | | 101,850 | |
Eldorado Resorts, Inc. | | | | | | | | |
7.000%, 8/1/23 | | | 200,000 | | | | 210,000 | |
6.000%, 9/15/26§ | | | 100,000 | | | | 98,190 | |
LTF Merger Sub, Inc. | | | | | | | | |
8.500%, 6/15/23§ | | | 212,000 | | | | 218,493 | |
MGM Resorts International | | | | | | | | |
8.625%, 2/1/19 | | | 85,000 | | | | 85,957 | |
6.625%, 12/15/21 | | | 18,000 | | | | 18,815 | |
See Notes to Financial Statements.
73
1290 FUNDS
1290 HIGH YIELD BOND FUND
PORTFOLIO OF INVESTMENTS (Continued)
October 31, 2018
| | | | | | | | |
| | | Principal
Amount | | | Value
(Note 1) | |
| | | | | | | | |
Scientific Games International, Inc. | | | | | | | | |
10.000%, 12/1/22 | | $ | 128,000 | | | $ | 133,926 | |
Silversea Cruise Finance Ltd. | | | | | | | | |
7.250%, 2/1/25§ | | | 57,000 | | | | 61,418 | |
Stars Group Holdings BV | | | | | | | | |
7.000%, 7/15/26§ | | | 103,000 | | | | 104,421 | |
| | | | | | | | |
| | | | | | | 1,506,669 | |
| | | | | | | | |
Household Durables (0.2%) | | | | | | | | |
William Lyon Homes, Inc. | | | | | | | | |
6.000%, 9/1/23 | | | 74,000 | | | | 67,436 | |
| | | | | | | | |
Multiline Retail (0.1%) | | | | | | | | |
Cumberland Farms, Inc. | | | | | | | | |
6.750%, 5/1/25§ | | | 45,000 | | | | 46,069 | |
| | | | | | | | |
Specialty Retail (1.9%) | | | | | | | | |
KGA Escrow LLC | | | | | | | | |
7.500%, 8/15/23§ | | | 168,000 | | | | 172,410 | |
Party City Holdings, Inc. | | | | | | | | |
6.625%, 8/1/26§ | | | 50,000 | | | | 48,565 | |
Penske Automotive Group, Inc. | | | | | | | | |
5.750%, 10/1/22 | | | 78,000 | | | | 79,076 | |
Staples, Inc. | | | | | | | | |
8.500%, 9/15/25§ | | | 367,000 | | | | 332,135 | |
| | | | | | | | |
| | | | | | | 632,186 | |
| | | | | | | | |
Total Consumer Discretionary | | | | | | | 2,725,832 | |
| | | | | | | | |
Consumer Staples (5.2%) | | | | | | | | |
Food & Staples Retailing (0.4%) | | | | | | | | |
Rite Aid Corp. | | | | | | | | |
6.125%, 4/1/23§ | | | 174,000 | | | | 147,796 | |
| | | | | | | | |
Food Products (2.8%) | | | | | | | | |
Clearwater Seafoods, Inc. | | | | | | | | |
6.875%, 5/1/25§ | | | 83,000 | | | | 78,954 | |
JBS USA Lux SA | | | | | | | | |
5.750%, 6/15/25§ | | | 137,000 | | | | 131,213 | |
6.750%, 2/15/28§ | | | 174,000 | | | | 167,692 | |
Lamb Weston Holdings, Inc. | | | | | | | | |
4.875%, 11/1/26§ | | | 87,000 | | | | 83,738 | |
Pilgrim’s Pride Corp. | | | | | | | | |
5.875%, 9/30/27§ | | | 180,000 | | | | 163,188 | |
Post Holdings, Inc. | | | | | | | | |
5.750%, 3/1/27§ | | | 223,000 | | | | 212,128 | |
5.625%, 1/15/28§ | | | 78,000 | | | | 73,250 | |
| | | | | | | | |
| | | | | | | 910,163 | |
| | | | | | | | |
Household Products (0.9%) | | | | | | | | |
Central Garden & Pet Co. | | | | | | | | |
6.125%, 11/15/23 | | | 86,000 | | | | 87,989 | |
Kronos Acquisition Holdings, Inc. | | | | | | | | |
9.000%, 8/15/23§ | | | 100,000 | | | | 87,500 | |
Spectrum Brands, Inc. | | | | | | | | |
6.625%, 11/15/22 | | | 135,000 | | | | 137,869 | |
| | | | | | | | |
| | | | | | | 313,358 | |
| | | | | | | | |
Personal Products (1.1%) | | | | | | | | |
First Quality Finance Co., Inc. | | | | | | | | |
4.625%, 5/15/21§ | | | 102,000 | | | | 99,960 | |
Prestige Brands, Inc. | | | | | | | | |
5.375%, 12/15/21§ | | | 62,000 | | | | 61,535 | |
| | | | | | | | |
6.375%, 3/1/24§ | | | 201,000 | | | | 198,749 | |
| | | | | | | | |
| | | | | | | 360,244 | |
| | | | | | | | |
Total Consumer Staples | | | | | | | 1,731,561 | |
| | | | | | | | |
Energy (15.4%) | | | | | | | | |
Energy Equipment & Services (0.6%) | | | | | | | | |
Nabors Industries, Inc. | | | | | | | | |
5.750%, 2/1/25 | | | 106,000 | | | | 97,520 | |
Precision Drilling Corp. | | | | | | | | |
7.750%, 12/15/23 | | | 106,000 | | | | 110,240 | |
| | | | | | | | |
| | | | | | | 207,760 | |
| | | | | | | | |
Oil, Gas & Consumable Fuels (14.8%) | |
American Midstream Partners LP | | | | | | | | |
9.500%, 12/15/21 (e)§ | | | 270,000 | | | | 264,263 | |
Antero Resources Corp. | | | | | | | | |
5.625%, 6/1/23 | | | 117,000 | | | | 116,415 | |
Ascent Resources Utica Holdings LLC | | | | | | | | |
10.000%, 4/1/22§ | | | 123,000 | | | | 135,300 | |
7.000%, 11/1/26§ | | | 178,000 | | | | 172,445 | |
Berry Petroleum Co. LLC | | | | | | | | |
7.000%, 2/15/26§ | | | 75,000 | | | | 74,438 | |
Blue Racer Midstream LLC | | | | | | | | |
6.125%, 11/15/22§ | | | 246,000 | | | | 250,919 | |
6.625%, 7/15/26§ | | | 132,000 | | | | 133,485 | |
Calumet Specialty Products Partners LP | | | | | | | | |
7.625%, 1/15/22 | | | 181,000 | | | | 173,760 | |
Chesapeake Energy Corp. | | | | | | | | |
7.000%, 10/1/24 | | | 98,000 | | | | 95,677 | |
Crestwood Midstream Partners LP | | | | | | | | |
6.250%, 4/1/23 | | | 164,000 | | | | 166,870 | |
CrownRock LP | | | | | | | | |
5.625%, 10/15/25§ | | | 142,000 | | | | 135,085 | |
Delek Logistics Partners LP | | | | | | | | |
6.750%, 5/15/25 | | | 175,000 | | | | 173,688 | |
Endeavor Energy Resources LP | | | | | | | | |
5.500%, 1/30/26§ | | | 56,000 | | | | 57,540 | |
Genesis Energy LP | | | | | | | | |
5.625%, 6/15/24 | | | 136,000 | | | | 123,760 | |
6.500%, 10/1/25 | | | 213,000 | | | | 196,492 | |
Gulfport Energy Corp. | | | | | | | | |
6.375%, 1/15/26 | | | 138,000 | | | | 128,340 | |
Hilcorp Energy I LP | | | | | | | | |
6.250%, 11/1/28 (b)§ | | | 136,000 | | | | 130,900 | |
Holly Energy Partners LP | | | | | | | | |
6.000%, 8/1/24§ | | | 86,000 | | | | 86,215 | |
Oasis Petroleum, Inc. | | | | | | | | |
6.875%, 3/15/22 | | | 68,000 | | | | 68,340 | |
6.250%, 5/1/26§ | | | 92,000 | | | | 90,160 | |
Parsley Energy LLC | | | | | | | | |
6.250%, 6/1/24§ | | | 128,000 | | | | 131,520 | |
5.625%, 10/15/27§ | | | 96,000 | | | | 94,512 | |
PBF Holding Co. LLC | | | | | | | | |
7.000%, 11/15/23 | | | 94,000 | | | | 97,187 | |
PBF Logistics LP | | | | | | | | |
6.875%, 5/15/23 | | | 328,000 | | | | 333,739 | |
Range Resources Corp. | | | | | | | | |
5.750%, 6/1/21 | | | 85,000 | | | | 86,169 | |
Sanchez Energy Corp. | | | | | | | | |
6.125%, 1/15/23 | | | 173,000 | | | | 64,443 | |
See Notes to Financial Statements.
74
1290 FUNDS
1290 HIGH YIELD BOND FUND
PORTFOLIO OF INVESTMENTS (Continued)
October 31, 2018
| | | | | | | | |
| | | Principal
Amount | | | Value
(Note 1) | |
| | | | | | | | |
7.250%, 2/15/23§ | | $ | 100,000 | | | $ | 91,500 | |
SemGroup Corp. | | | | | | | | |
5.625%, 7/15/22 | | | 154,000 | | | | 148,764 | |
5.625%, 11/15/23 | | | 100,000 | | | | 94,470 | |
SM Energy Co. | | | | | | | | |
6.750%, 9/15/26 | | | 98,000 | | | | 98,980 | |
Southern Star Central Corp. | | | | | | | | |
5.125%, 7/15/22§ | | | 190,000 | | | | 186,848 | |
Southwestern Energy Co. | | | | | | | | |
7.750%, 10/1/27 | | | 125,000 | | | | 127,500 | |
Summit Midstream Holdings LLC | | | | | | | | |
5.500%, 8/15/22 | | | 150,000 | | | | 148,125 | |
Targa Resources Partners LP | | | | | | | | |
6.750%, 3/15/24 | | | 155,000 | | | | 162,363 | |
TransMontaigne Partners LP | | | | | | | | |
6.125%, 2/15/26 | | | 124,000 | | | | 116,250 | |
Whiting Petroleum Corp. | | | | | | | | |
6.625%, 1/15/26 | | | 64,000 | | | | 64,160 | |
WPX Energy, Inc. | | | | | | | | |
5.750%, 6/1/26 | | | 98,000 | | | | 97,637 | |
| | | | | | | | |
| | | | | | | 4,918,259 | |
| | | | | | | | |
Total Energy | | | | | | | 5,126,019 | |
| | | | | | | | |
Financials (2.2%) | | | | | | | | |
Capital Markets (0.7%) | | | | | | | | |
Eagle Holding Co. II LLC | | | | | | | | |
7.625%, 5/15/22 PIK§ | | | 148,000 | | | | 149,110 | |
MSCI, Inc. | | | | | | | | |
5.375%, 5/15/27§ | | | 66,000 | | | | 65,340 | |
| | | | | | | | |
| | | | | | | 214,450 | |
| | | | | | | | |
Consumer Finance (0.6%) | | | | | | | | |
Ally Financial, Inc. | | | | | | | | |
4.625%, 5/19/22 | | | 92,000 | | | | 91,890 | |
Curo Group Holdings Corp. | | | | | | | | |
8.250%, 9/1/25 (b)§ | | | 20,000 | | | | 18,026 | |
Enova International, Inc. | | | | | | | | |
8.500%, 9/1/24§ | | | 110,000 | | | | 103,400 | |
| | | | | | | | |
| | | | | | | 213,316 | |
| | | | | | | | |
Diversified Financial Services (0.6%) | | | | | | | | |
Refinitiv US Holdings, Inc. | | | | | | | | |
8.250%, 11/15/26§ | | | 74,000 | | | | 71,876 | |
Verscend Escrow Corp. | | | | | | | | |
9.750%, 8/15/26§ | | | 120,000 | | | | 119,850 | |
| | | | | | | | |
| | | | | | | 191,726 | |
| | | | | | | | |
Thrifts & Mortgage Finance (0.3%) | | | | | | | | |
Freedom Mortgage Corp. | | | | | | | | |
8.250%, 4/15/25§ | | | 106,000 | | | | 98,050 | |
| | | | | | | | |
Total Financials | | | | | | | 717,542 | |
| | | | | | | | |
Health Care (12.2%) | | | | | | | | |
Biotechnology (0.7%) | | | | | | | | |
Sotera Health Topco, Inc. | | | | | | | | |
8.125%, 11/1/21 PIK§ | | | 222,000 | | | | 217,560 | |
| | | | | | | | |
Health Care Equipment & Supplies (0.4%) | |
Sotera Health Holdings LLC | | | | | | | | |
6.500%, 5/15/23§ | | | 132,000 | | | | 129,195 | |
| | | | | | | | |
| | | | | | | | |
Health Care Providers & Services (8.0%) | | | | | |
Centene Corp. | | | | | | | | |
6.125%, 2/15/24 | | | 159,000 | | | | 165,964 | |
Envision Healthcare Corp. | | | | | | | | |
8.750%, 10/15/26§ | | | 90,000 | | | | 87,300 | |
HCA, Inc. | | | | | | | | |
7.500%, 2/15/22 | | | 243,000 | | | | 263,486 | |
7.690%, 6/15/25 | | | 91,000 | | | | 99,645 | |
5.875%, 2/15/26 | | | 130,000 | | | | 132,977 | |
LifePoint Health, Inc. | | | | | | | | |
5.500%, 12/1/21 | | | 123,000 | | | | 124,697 | |
MPH Acquisition Holdings LLC | | | | | | | | |
7.125%, 6/1/24§ | | | 98,000 | | | | 99,607 | |
NVA Holdings, Inc. | | | | | | | | |
6.875%, 4/1/26§ | | | 185,000 | | | | 183,150 | |
Polaris Intermediate Corp. | | | | | | | | |
8.500%, 12/1/22 PIK§ | | | 224,000 | | | | 229,600 | |
Surgery Center Holdings, Inc. | | | | | | | | |
8.875%, 4/15/21§ | | | 95,000 | | | | 97,494 | |
6.750%, 7/1/25§ | | | 118,000 | | | | 111,215 | |
Syneos Health, Inc. | | | | | | | | |
7.500%, 10/1/24§ | | | 158,000 | | | | 166,888 | |
Team Health Holdings, Inc. | | | | | | | | |
6.375%, 2/1/25§ | | | 230,000 | | | | 197,800 | |
Tenet Healthcare Corp. | | | | | | | | |
7.500%, 1/1/22§ | | | 253,000 | | | | 263,752 | |
5.125%, 5/1/25 | | | 97,000 | | | | 93,198 | |
7.000%, 8/1/25 | | | 87,000 | | | | 85,338 | |
WellCare Health Plans, Inc. | | | | | | | | |
5.375%, 8/15/26§ | | | 118,000 | | | | 117,858 | |
West Street Merger Sub, Inc. | | | | | | | | |
6.375%, 9/1/25§ | | | 142,000 | | | | 133,665 | |
| | | | | | | | |
| | | | | | | 2,653,634 | |
| | | | | | | | |
Health Care Technology (0.5%) | | | | | | | | |
IQVIA, Inc. | | | | | | | | |
4.875%, 5/15/23§ | | | 184,000 | | | | 181,939 | |
| | | | | | | | |
Life Sciences Tools & Services (0.3%) | | | | | | | | |
Charles River Laboratories International, Inc. | | | | | | | | |
5.500%, 4/1/26§ | | | 94,000 | | | | 93,765 | |
| | | | | | | | |
Pharmaceuticals (2.3%) | | | | | | | | |
Bausch Health Cos., Inc. | | | | | | | | |
7.500%, 7/15/21§ | | | 98,000 | | | | 99,470 | |
6.125%, 4/15/25§ | | | 184,000 | | | | 169,225 | |
5.500%, 11/1/25§ | | | 149,000 | | | | 145,931 | |
9.250%, 4/1/26§ | | | 216,000 | | | | 226,259 | |
Catalent Pharma Solutions, Inc. | | | | | | | | |
4.875%, 1/15/26§ | | | 39,000 | | | | 36,613 | |
Endo Finance LLC | | | | | | | | |
7.250%, 1/15/22§ | | | 106,000 | | | | 100,573 | |
| | | | | | | | |
| | | | | | | 778,071 | |
| | | | | | | | |
Total Health Care | | | | | | | 4,054,164 | |
| | | | | | | | |
Industrials (14.8%) | | | | | | | | |
Aerospace & Defense (2.1%) | | | | | | | | |
Bombardier, Inc. | | | | | | | | |
8.750%, 12/1/21§ | | | 24,000 | | | | 25,860 | |
7.500%, 12/1/24§ | | | 167,000 | | | | 169,722 | |
See Notes to Financial Statements.
75
1290 FUNDS
1290 HIGH YIELD BOND FUND
PORTFOLIO OF INVESTMENTS (Continued)
October 31, 2018
| | | | | | | | |
| | | Principal
Amount | | | Value
(Note 1) | |
| | | | | | | | |
TransDigm, Inc. | | | | | | | | |
5.500%, 10/15/20 | | $ | 119,000 | | | $ | 118,703 | |
6.000%, 7/15/22 | | | 142,000 | | | | 142,354 | |
6.375%, 6/15/26 | | | 115,000 | | | | 112,700 | |
Triumph Group, Inc. | | | | | | | | |
7.750%, 8/15/25 | | | 155,000 | | | | 145,313 | |
| | | | | | | | |
| | | | | | | 714,652 | |
| | | | | | | | |
Building Products (2.0%) | | | | | | | | |
Masonite International Corp. | | | | | | | | |
5.625%, 3/15/23§ | | | 28,000 | | | | 27,826 | |
Standard Industries, Inc. | | | | | | | | |
5.500%, 2/15/23§ | | | 236,000 | | | | 231,870 | |
6.000%, 10/15/25§ | | | 132,000 | | | | 129,855 | |
Summit Materials LLC | | | | | | | | |
6.125%, 7/15/23 | | | 272,000 | | | | 265,200 | |
| | | | | | | | |
| | | | | | | 654,751 | |
| | | | | | | | |
Commercial Services & Supplies (3.9%) | | | | | |
ACCO Brands Corp. | | | | | | | | |
5.250%, 12/15/24§ | | | 133,000 | | | | 124,023 | |
APX Group, Inc. | | | | | | | | |
8.875%, 12/1/22 (b)§ | | | 114,000 | | | | 113,858 | |
Covanta Holding Corp. | | | | | | | | |
6.375%, 10/1/22 | | | 128,000 | | | | 130,560 | |
Hulk Finance Corp. | | | | | | | | |
7.000%, 6/1/26§ | | | 147,000 | | | | 135,791 | |
Matthews International Corp. | | | | | | | | |
5.250%, 12/1/25§ | | | 85,000 | | | | 79,586 | |
Multi-Color Corp. | | | | | | | | |
6.125%, 12/1/22§ | | | 163,000 | | | | 164,834 | |
4.875%, 11/1/25§ | | | 184,000 | | | | 169,969 | |
Nielsen Finance LLC | | | | | | | | |
5.000%, 4/15/22§ | | | 170,000 | | | | 165,750 | |
Prime Security Services Borrower LLC | | | | | | | | |
9.250%, 5/15/23§ | | | 207,000 | | | | 218,737 | |
| | | | | | | | |
| | | | | | | 1,303,108 | |
| | | | | | | | |
Construction & Engineering (0.8%) | | | | | | | | |
AECOM | | | | | | | | |
5.125%, 3/15/27 | | | 79,000 | | | | 73,470 | |
AECOM Global II LLC | | | | | | | | |
5.000%, 4/1/22 (e) | | | 95,000 | | | | 93,931 | |
New Enterprise Stone & Lime Co., Inc. | | | | | | | | |
6.250%, 3/15/26§ | | | 87,000 | | | | 84,825 | |
| | | | | | | | |
| | | | | | | 252,226 | |
| | | | | | | | |
Electrical Equipment (0.1%) | | | | | | | | |
Energizer Gamma Acquisition, Inc. | | | | | | | | |
6.375%, 7/15/26§ | | | 27,000 | | | | 27,000 | |
| | | | | | | | |
Machinery (1.6%) | | | | | | | | |
EnPro Industries, Inc. | | | | | | | | |
5.750%, 10/15/26 (b)§ | | | 104,000 | | | | 102,606 | |
Mueller Water Products, Inc. | | | | | | | | |
5.500%, 6/15/26§ | | | 52,000 | | | | 51,480 | |
Novelis Corp. | | | | | | | | |
6.250%, 8/15/24§ | | | 29,000 | | | | 28,529 | |
5.875%, 9/30/26§ | | | 76,000 | | | | 71,535 | |
Welbilt, Inc. | | | | | | | | |
9.500%, 2/15/24 | | | 272,000 | | | | 293,420 | |
| | | | | | | | |
| | | | | | | 547,570 | |
| | | | | | | | |
| | | | | | | | |
Professional Services (1.2%) | | | | | | | | |
IHS Markit Ltd. | | | | | | | | |
5.000%, 11/1/22§ | | | 41,000 | | | | 41,871 | |
Jaguar Holding Co. II | | | | | | | | |
6.375%, 8/1/23§ | | | 342,000 | | | | 341,898 | |
| | | | | | | | |
| | | | | | | 383,769 | |
| | | | | | | | |
Road & Rail (2.7%) | | | | | | | | |
DAE Funding LLC | | | | | | | | |
5.000%, 8/1/24§ | | | 190,000 | | | | 184,063 | |
Kenan Advantage Group, Inc. (The) | | | | | | | | |
7.875%, 7/31/23§ | | | 342,000 | | | | 347,985 | |
Park Aerospace Holdings Ltd. | | | | | | | | |
5.500%, 2/15/24§ | | | 132,000 | | | | 130,720 | |
Watco Cos. LLC | | | | | | | | |
6.375%, 4/1/23§ | | | 238,000 | | | | 241,284 | |
| | | | | | | | |
| | | | | | | 904,052 | |
| | | | | | | | |
Trading Companies & Distributors (0.4%) | |
Beacon Roofing Supply, Inc. | | | | | | | | |
6.375%, 10/1/23 | | | 58,000 | | | | 58,798 | |
International Lease Finance Corp. | | | | | | | | |
6.250%, 5/15/19 | | | 80,000 | | | | 81,397 | |
| | | | | | | | |
| | | | | | | 140,195 | |
| | | | | | | | |
Total Industrials | | | | | | | 4,927,323 | |
| | | | | | | | |
Information Technology (11.4%) | | | | | | | | |
Communications Equipment (0.6%) | | | | | | | | |
CommScope Technologies LLC | | | | | | | | |
6.000%, 6/15/25§ | | | 202,000 | | | | 196,445 | |
| | | | | | | | |
Electronic Equipment, Instruments & Components (0.6%) | |
Anixter, Inc. | | | | | | | | |
6.000%, 12/1/25 (b)§ | | | 84,000 | | | | 84,000 | |
Itron, Inc. | | | | | | | | |
5.000%, 1/15/26§ | | | 138,000 | | | | 128,519 | |
| | | | | | | | |
| | | | | | | 212,519 | |
| | | | | | | | |
IT Services (4.0%) | | | | | | | | |
Alliance Data Systems Corp. | | | | | | | | |
5.375%, 8/1/22§ | | | 275,000 | | | | 276,045 | |
Exela Intermediate LLC | | | | | | | | |
10.000%, 7/15/23§ | | | 174,000 | | | | 180,908 | |
First Data Corp. | | | | | | | | |
5.375%, 8/15/23§ | | | 32,000 | | | | 32,282 | |
7.000%, 12/1/23§ | | | 193,000 | | | | 200,141 | |
Gartner, Inc. | | | | | | | | |
5.125%, 4/1/25§ | | | 68,000 | | | | 67,408 | |
GTT Communications, Inc. | | | | | | | | |
7.875%, 12/31/24§ | | | 166,000 | | | | 156,256 | |
Unisys Corp. | | | | | | | | |
10.750%, 4/15/22§ | | | 85,000 | | | | 95,094 | |
Zayo Group LLC | | | | | | | | |
6.000%, 4/1/23 | | | 145,000 | | | | 147,987 | |
5.750%, 1/15/27§ | | | 184,000 | | | | 180,356 | |
| | | | | | | | |
| | | | | | | 1,336,477 | |
| | | | | | | | |
Software (4.0%) | | | | | | | | |
ACI Worldwide, Inc. | | | | | | | | |
5.750%, 8/15/26§ | | | 135,000 | | | | 134,838 | |
CDK Global, Inc. | | | | | | | | |
5.875%, 6/15/26 | | | 82,000 | | | | 82,615 | |
See Notes to Financial Statements.
76
1290 FUNDS
1290 HIGH YIELD BOND FUND
PORTFOLIO OF INVESTMENTS (Continued)
October 31, 2018
| | | | | | | | |
| | | Principal
Amount | | | Value
(Note 1) | |
| | | | | | | | |
Change Healthcare Holdings LLC | | | | | | | | |
5.750%, 3/1/25§ | | $ | 270,000 | | | $ | 264,276 | |
HNA Ecotech Panorama Cayman Co. Ltd. | | | | | | | | |
8.000%, 4/15/21§ | | | 120,000 | | | | 124,530 | |
Informatica LLC | | | | | | | | |
7.125%, 7/15/23§ | | | 120,000 | | | | 122,436 | |
Solera LLC | | | | | | | | |
10.500%, 3/1/24§ | | | 238,000 | | | | 256,594 | |
Sophia LP | | | | | | | | |
9.000%, 9/30/23§ | | | 318,000 | | | | 331,515 | |
| | | | | | | | |
| | | | | | | 1,316,804 | |
| | | | | | | | |
Technology Hardware, Storage & Peripherals (2.2%) | |
Dell International LLC | | | | | | | | |
5.875%, 6/15/21§ | | | 320,000 | | | | 325,217 | |
7.125%, 6/15/24§ | | | 137,000 | | | | 144,713 | |
Everi Payments, Inc. | | | | | | | | |
7.500%, 12/15/25§ | | | 130,000 | | | | 129,350 | |
NCR Corp. | | | | | | | | |
4.625%, 2/15/21 | | | 101,000 | | | | 99,232 | |
5.875%, 12/15/21 | | | 43,000 | | | | 43,056 | |
| | | | | | | | |
| | | | | | | 741,568 | |
| | | | | | | | |
Total Information Technology | | | | | | | 3,803,813 | |
| | | | | | | | |
Materials (7.6%) | | | | | | | | |
Chemicals (4.6%) | | | | | | | | |
Blue Cube Spinco, Inc. | | | | | | | | |
10.000%, 10/15/25 | | | 190,000 | | | | 215,175 | |
Huntsman International LLC | | | | | | | | |
4.875%, 11/15/20 | | | 72,000 | | | | 72,360 | |
INEOS Group Holdings SA | | | | | | | | |
5.625%, 8/1/24§ | | | 200,000 | | | | 189,500 | |
Koppers, Inc. | | | | | | | | |
6.000%, 2/15/25§ | | | 129,000 | | | | 123,518 | |
NOVA Chemicals Corp. | | | | | | | | |
4.875%, 6/1/24§ | | | 119,000 | | | | 109,337 | |
Nufarm Australia Ltd. | | | | | | | | |
5.750%, 4/30/26§ | | | 210,000 | | | | 195,825 | |
PQ Corp. | | | | | | | | |
6.750%, 11/15/22§ | | | 161,000 | | | | 165,830 | |
5.750%, 12/15/25§ | | | 136,000 | | | | 130,900 | |
Rayonier AM Products, Inc. | | | | | | | | |
5.500%, 6/1/24§ | | | 214,000 | | | | 200,157 | |
Starfruit Finco BV | | | | | | | | |
8.000%, 10/1/26§ | | | 150,000 | | | | 145,500 | |
| | | | | | | | |
| | | | | | | 1,548,102 | |
| | | | | | | | |
Containers & Packaging (3.0%) | | | | | | | | |
Berry Global, Inc. | | | | | | | | |
5.500%, 5/15/22 | | | 96,000 | | | | 96,240 | |
5.125%, 7/15/23 | | | 124,000 | | | | 123,070 | |
BWAY Holding Co. | | | | | | | | |
5.500%, 4/15/24§ | | | 118,000 | | | | 113,138 | |
7.250%, 4/15/25§ | | | 284,000 | | | | 269,460 | |
Flex Acquisition Co., Inc. | | | | | | | | |
7.875%, 7/15/26§ | | | 123,000 | | | | 118,584 | |
Owens-Brockway Glass Container, Inc. | | | | | | | | |
5.000%, 1/15/22§ | | | 66,000 | | | | 65,259 | |
Reynolds Group Issuer, Inc. | | | | | | | | |
5.750%, 10/15/20 | | | 96,911 | | | | 96,794 | |
| | | | | | | | |
W/S Packaging Holdings, Inc. | | | | | | | | |
9.000%, 4/15/23§ | | | 100,000 | | | | 101,813 | |
| | | | | | | | |
| | | | | | | 984,358 | |
| | | | | | | | |
Total Materials | | | | | | | 2,532,460 | |
| | | | | | | | |
Real Estate (1.4%) | | | | | | | | |
Equity Real Estate Investment Trusts (REITs) (0.6%) | |
Equinix, Inc. (REIT) | | | | | | | | |
5.875%, 1/15/26 | | | 90,000 | | | | 91,125 | |
SBA Communications Corp. (REIT) | | | | | | | | |
4.875%, 9/1/24 | | | 120,000 | | | | 115,200 | |
| | | | | | | | |
| | | | | | | 206,325 | |
| | | | | | | | |
Real Estate Management & Development (0.8%) | |
Greystar Real Estate Partners LLC | | | | | | | | |
5.750%, 12/1/25§ | | | 102,000 | | | | 99,195 | |
Howard Hughes Corp. (The) | | | | | | | | |
5.375%, 3/15/25§ | | | 166,000 | | | | 159,775 | |
| | | | | | | | |
| | | | | | | 258,970 | |
| | | | | | | | |
Total Real Estate | | | | | | | 465,295 | |
| | | | | | | | |
Utilities (0.5%) | | | | | | | | |
Independent Power and Renewable Electricity Producers (0.5%) | |
Calpine Corp. | | | | | | | | |
5.750%, 1/15/25 | | | 114,000 | | | | 102,007 | |
Talen Energy Supply LLC | | | | | | | | |
4.600%, 12/15/21 | | | 53,000 | | | | 49,688 | |
| | | | | | | | |
Total Utilities | | | | | | | 151,695 | |
| | | | | | | | |
Total Corporate Bonds | | | | | | | 31,965,200 | |
| | | | | | | | |
Total Long-Term Debt Securities (96.0%)
(Cost $32,704,569) | | | | | | | 31,965,200 | |
| | | | | | | | |
| | | Number
of Rights | | | Value (Note 1) | |
RIGHTS: | | | | | | | | |
Communication Services (0.0%) | | | | | | | | |
Wireless Telecommunication Services (0.0%) | |
T-Mobile US, Inc., CVR (r)* | | | 94,000 | | | | — | |
T-Mobile USA, Inc., CVR (r)* | | | 235,000 | | | | — | |
| | | | | | | | |
Total Rights (0.0%)
(Cost $—) | | | | | | | — | |
| | | | | | | | |
| | | Number of
Shares | | | Value (Note 1) | |
SHORT-TERM INVESTMENT: | | | | | | | | |
Investment Company (0.8%) | | | | | | | | |
JPMorgan Prime Money Market Fund, IM Shares | | | 276,652 | | | | 276,708 | |
| | | | | | | | |
Total Short-Term Investment (0.8%)
(Cost $276,711) | | | | | | | 276,708 | |
| | | | | | | | |
Total Investments in Securities (96.8%)
(Cost $32,981,280) | | | | | | | 32,241,908 | |
Other Assets Less Liabilities (3.2%) | | | | | | | 1,057,611 | |
| | | | | | | | |
Net Assets (100%) | | | | | | $ | 33,299,519 | |
| | | | | | | | |
See Notes to Financial Statements.
77
1290 FUNDS
1290 HIGH YIELD BOND FUND
PORTFOLIO OF INVESTMENTS (Continued)
October 31, 2018
| § | Securities exempt from registration under Rule 144A of the Securities Act of 1933. These securities may only be resold to qualified institutional buyers. At October 31, 2018, the market value of these securities amounted to $21,388,339 or 64.2% of net assets. Securities denoted with “§” but without “b” have been determined to be liquid under the guidelines established by the Board of Trustees. To the extent any securities might provide a right to demand registration, such rights have not been relied upon when determining liquidity. |
| (b) | Rule 144A Illiquid Security. At October 31, 2018, the market value of these securities amounted to $594,585 or 1.8% of net assets. |
| (e) | Step Bond — Coupon rate increases or decreases in increments to maturity. Rate disclosed is as of October 31, 2018. Maturity date disclosed is the ultimate maturity date. |
| (r) | Value determined using significant unobservable inputs. |
Glossary:
| | CVR | — Contingent Value Rights |
| | PIK | — Payment-in Kind Security |
The following is a summary of the inputs used to value the Fund’s assets and liabilities carried at fair value as of October 31, 2018:
The inputs or methodology used for valuing securities are not necessarily an indication of the risk associated with investing in those securities.
Various inputs are used in determining the value of the Fund’s investments. These inputs are summarized in the three broad levels listed below:
| | | | | | | | | | | | | | | | |
| | | | | |
| Investment Type | | Level 1
Quoted Prices in
Active Markets for
Identical
Securities | | | Level 2
Significant Other
Observable Inputs
(including quoted prices
for similar securities,
interest rates,
prepayment speeds,
credit risk, etc.) | | | Level 3
Significant Unobservable
Inputs (including the
Fund’s own
assumptions in
determining the fair
value of investments) | | | Total | |
Assets: | | | | | | | | | | | | | | | | |
Corporate Bonds | | | | | | | | | | | | | | | | |
Communication Services | | $ | — | | | $ | 5,729,496 | | | $ | — | | | $ | 5,729,496 | |
Consumer Discretionary | | | — | | | | 2,725,832 | | | | — | | | | 2,725,832 | |
Consumer Staples | | | — | | | | 1,731,561 | | | | — | | | | 1,731,561 | |
Energy | | | — | | | | 5,126,019 | | | | — | | | | 5,126,019 | |
Financials | | | — | | | | 717,542 | | | | — | | | | 717,542 | |
Health Care | | | — | | | | 4,054,164 | | | | — | | | | 4,054,164 | |
Industrials | | | — | | | | 4,927,323 | | | | — | | | | 4,927,323 | |
Information Technology | | | — | | | | 3,803,813 | | | | — | | | | 3,803,813 | |
Materials | | | — | | | | 2,532,460 | | | | — | | | | 2,532,460 | |
Real Estate | | | — | | | | 465,295 | | | | — | | | | 465,295 | |
Utilities | | | — | | | | 151,695 | | | | — | | | | 151,695 | |
Rights | | | | | | | | | | | | | | | | |
Communication Services | | | — | | | | — | | | | — | (a) | | | — | (a) |
Short-Term Investment | | | | | | | | | | | | | | | | |
Investment Company | | | 276,708 | | | | — | | | | — | | | | 276,708 | |
| | | | | | | | | | | | | | | | |
Total Assets | | $ | 276,708 | | | $ | 31,965,200 | | | $ | — | | | $ | 32,241,908 | |
| | | | | | | | | | | | | | | | |
Total Liabilities | | $ | — | | | $ | — | | | $ | — | | | $ | — | |
| | | | | | | | | | | | | | | | |
Total | | $ | 276,708 | | | $ | 31,965,200 | | | $ | — | | | $ | 32,241,908 | |
| | | | | | | | | | | | | | | | |
(a) Value is zero.
The Fund held no derivatives contracts during the year ended October 31, 2018.
Investment security transactions for the year ended October 31, 2018 were as follows:
| | | | |
Cost of Purchases: | | | | |
Long-term investments other than U.S. government debt securities | | $ | 17,887,072 | |
Net Proceeds of Sales and Redemptions: | | | | |
Long-term investments other than U.S. government debt securities | | $ | 14,275,071 | |
As of October 31, 2018, the gross unrealized appreciation (depreciation) of investments based on the aggregate cost of investments in securities and derivative instruments, if applicable, for Federal income tax purposes was as follows:
| | | | |
Aggregate gross unrealized appreciation | | $ | 231,213 | |
Aggregate gross unrealized depreciation | | | (972,158 | ) |
| | | | |
Net unrealized depreciation | | $ | (740,945 | ) |
| | | | |
Federal income tax cost of investments in securities and derivative instruments, if applicable | | $ | 32,982,853 | |
| | | | |
See Notes to Financial Statements.
78
1290 FUNDS
1290 HIGH YIELD BOND FUND
STATEMENT OF ASSETS AND LIABILITIES
October 31, 2018
| | | | |
ASSETS | |
Investments in Securities, at value (Cost $32,981,280) | | $ | 32,241,908 | |
Cash | | | 895,000 | |
Dividends, interest and other receivables | | | 550,842 | |
Receivable for securities sold | | | 89,295 | |
Prepaid registration and filing fees | | | 28,196 | |
Receivable for Fund shares sold | | | 87 | |
Other assets | | | 416 | |
| | | | |
Total assets | | | 33,805,744 | |
| | | | |
LIABILITIES | | | | |
Payable for securities purchased | | | 271,148 | |
Dividends and distributions payable | | | 130,006 | |
Payable for Fund shares redeemed | | | 16,560 | |
Transfer agent fees payable | | | 7,186 | |
Distribution fees payable – Class A | | | 535 | |
Distribution fees payable – Class R | | | 123 | |
Administrative fees payable | | | 9 | |
Accrued expenses | | | 80,658 | |
| | | | |
Total liabilities | | | 506,225 | |
| | | | |
NET ASSETS | | $ | 33,299,519 | |
| | | | |
Net assets were comprised of: | | | | |
Paid in capital | | $ | 36,583,276 | |
Total distributable earnings (loss) | | | (3,283,757 | ) |
| | | | |
Net assets | | $ | 33,299,519 | |
| | | | |
Class A | | | | |
Net asset value and redemption price per share, $2,499,954 / 279,884 shares outstanding (unlimited amount authorized: $0.001 par value) | | $ | 8.93 | |
Maximum sales charge (4.50% of offering price) | | | 0.42 | |
| | | | |
Maximum offering price per share | | $ | 9.35 | |
| | | | |
Class I | | | | |
Net asset value and redemption price per share, $30,385,895 / 3,400,405 shares outstanding (unlimited amount authorized: $0.001 par value) | | $ | 8.94 | |
| | | | |
Class R | | | | |
Net asset value and redemption price per share, $286,875 / 32,134 shares outstanding (unlimited amount authorized: $0.001 par value) | | $ | 8.93 | |
| | | | |
Class T** | | | | |
Net asset value and redemption price per share, $126,795 / 14,192 shares outstanding (unlimited amount authorized: $0.001 par value) | | $ | 8.93 | |
Maximum sales charge (2.50% of offering price) | | | 0.23 | |
| | | | |
Maximum offering price per share | | $ | 9.16 | |
| | | | |
| ** | Class T shares currently are not offered for sale. |
STATEMENT OF OPERATIONS
For the Year Ended October 31, 2018
| | | | |
INVESTMENT INCOME | |
Interest | | $ | 2,075,115 | |
Dividends | | | 9,234 | |
| | | | |
Total income | | | 2,084,349 | |
| | | | |
EXPENSES | | | | |
Investment advisory fees | | | 199,807 | |
Professional fees | | | 95,286 | |
Administrative fees | | | 49,952 | |
Registration and filing fees | | | 45,371 | |
Transfer agent fees | | | 43,600 | |
Printing and mailing expenses | | | 29,323 | |
Custodian fees | | | 14,700 | |
Distribution fees – Class A | | | 5,251 | |
Trustees’ fees | | | 3,494 | |
Distribution fees – Class R | | | 1,275 | |
Distribution fees – Class T** | | | 325 | |
Miscellaneous | | | 25,377 | |
| | | | |
Gross expenses | | | 513,761 | |
Less: Waiver from investment adviser | | | (241,959 | ) |
Waiver from distributor | | | (325 | ) |
| | | | |
Net expenses | | | 271,477 | |
| | | | |
NET INVESTMENT INCOME (LOSS) | | | 1,812,872 | |
| | | | |
REALIZED AND UNREALIZED GAIN (LOSS) | | | | |
Net realized gain (loss) on investments in securities | | | (192,330 | ) |
Net change in unrealized appreciation (depreciation) on investments in securities | | | (1,266,344 | ) |
| | | | |
NET REALIZED AND UNREALIZED GAIN (LOSS) | | | (1,458,674 | ) |
| | | | |
NET INCREASE (DECREASE) IN NET ASSETS RESULTING FROM OPERATIONS | | $ | 354,198 | |
| | | | |
| ** | Class T shares currently are not offered for sale. |
See Notes to Financial Statements.
79
1290 FUNDS
1290 HIGH YIELD BOND FUND
STATEMENT OF CHANGES IN NET ASSETS
| | | | | | | | |
| | | Year Ended October 31, | |
| | 2018 | | | 2017 | |
INCREASE (DECREASE) IN NET ASSETS FROM OPERATIONS: | |
Net investment income (loss) | | $ | 1,812,872 | | | $ | 1,669,790 | |
Net realized gain (loss) | | | (192,330 | ) | | | (323,232 | ) |
Net change in unrealized appreciation (depreciation) | | | (1,266,344 | ) | | | 1,356,734 | |
| | | | | | | | |
NET INCREASE (DECREASE) IN NET ASSETS RESULTING FROM OPERATIONS | | | 354,198 | | | | 2,703,292 | |
| | | | | | | | |
Distributions to shareholders: (a) | | | | | | | | |
Class A | | | (112,357 | ) | | | (29,312 | ) |
Class I | | | (1,686,328 | ) | | | (1,610,575 | ) |
Class R | | | (12,914 | ) | | | (10,366 | ) |
Class T** | | | (7,105 | ) | | | (7,245 | ) |
| | | | | | | | |
Total distributions to shareholders | | | (1,818,704 | ) | | | (1,657,498 | ) |
| | | | | | | | |
Tax return of capital: | | | | | | | | |
Class A | | | — | | | | (316 | ) |
Class I | | | — | | | | (17,372 | ) |
Class R | | | — | | | | (112 | ) |
Class T** | | | — | | | | (78 | ) |
| | | | | | | | |
Total | | | — | | | | (17,878 | ) |
| | | | | | | | |
CAPITAL SHARES TRANSACTIONS: | | | | | | | | |
Class A | | | | | | | | |
Capital shares sold [ 211,921 and 49,493 shares, respectively ] | | | 1,960,500 | | | | 460,006 | |
Capital shares issued in reinvestment of dividends [ 11,169 and 2,013 shares, respectively ] | | | 101,781 | | | | 18,727 | |
Capital shares repurchased [ (19,204) and (14,921) shares, respectively ] | | | (176,438 | ) | | | (139,448 | ) |
| | | | | | | | |
Total Class A transactions | | | 1,885,843 | | | | 339,285 | |
| | | | | | | | |
Class I | | | | | | | | |
Capital shares sold [ 230,876 and 194,981 shares, respectively ] | | | 2,137,440 | | | | 1,810,794 | |
Capital shares issued in reinvestment of dividends [ 21,171 and 9,568 shares, respectively ] | | | 193,221 | | | | 88,937 | |
Capital shares repurchased [ (84,844) and (45,605) shares, respectively ] | | | (777,869 | ) | | | (425,841 | ) |
| | | | | | | | |
Total Class I transactions | | | 1,552,792 | | | | 1,473,890 | |
| | | | | | | | |
Class R | | | | | | | | |
Capital shares sold [ 9,078 and 1,739 shares, respectively ] | | | 82,888 | | | | 16,288 | |
Capital shares issued in reinvestment of dividends [ 333 and 31 shares, respectively ] | | | 3,029 | | | | 287 | |
Capital shares repurchased [ (641) and (1) shares, respectively ] | | | (5,830 | ) | | | (10 | ) |
| | | | | | | | |
Total Class R transactions | | | 80,087 | | | | 16,565 | |
| | | | | | | | |
NET INCREASE (DECREASE) IN NET ASSETS RESULTING FROM CAPITAL SHARE TRANSACTIONS | | | 3,518,722 | | | | 1,829,740 | |
| | | | | | | | |
TOTAL INCREASE (DECREASE) IN NET ASSETS | | | 2,054,216 | | | | 2,857,656 | |
NET ASSETS: | | | | | | | | |
Beginning of year | | | 31,245,303 | | | | 28,387,647 | |
| | | | | | | | |
End of year (b) | | $ | 33,299,519 | | | $ | 31,245,303 | |
| | | | | | | | |
** Class T shares currently are not offered for sale. Class T shares were formerly known as Class C shares. | |
(a) Prior year distributions to shareholders were made up of dividends from net investment income of $29,312, $1,610,575, $10,366 and $7,245 for Classes A, I, R and T, respectively. These amounts were reclassified to conform with the current year presentation. | |
(b) Includes accumulated undistributed (overdistributed) net investment income of $(132,736) as of October 31, 2017. The SEC eliminated the requirement to disclose undistributed net investment income in 2018. | |
See Notes to Financial Statements.
80
1290 FUNDS
1290 HIGH YIELD BOND FUND
FINANCIAL HIGHLIGHTS
| | | | | | | | | | | | | | | | |
| | | Year Ended October 31, | | | November 12, 2014* to
October 31, 2015 | |
| Class A | | 2018 | | | 2017 | | | 2016 | |
Net asset value, beginning of period | | $ | 9.33 | | | $ | 9.01 | | | $ | 9.15 | | | $ | 10.00 | |
| | | | | | | | | | | | | | | | |
Income (loss) from investment operations: | | | | | | | | | | | | | | | | |
Net investment income (loss) (e) | | | 0.48 | | | | 0.49 | | | | 0.61 | | | | 0.59 | |
Net realized and unrealized gain (loss) | | | (0.40 | ) | | | 0.32 | | | | (0.09 | ) | | | (0.84 | ) |
| | | | | | | | | | | | | | | | |
Total from investment operations | | | 0.08 | | | | 0.81 | | | | 0.52 | | | | (0.25 | ) |
| | | | | | | | | | | | | | | | |
Less distributions: | | | | | | | | | | | | | | | | |
Dividends from net investment income | | | (0.48 | ) | | | (0.48 | ) | | | (0.65 | ) | | | (0.60 | ) |
Return of capital | | | — | | | | (0.01 | ) | | | (0.01 | ) | | | — | |
| | | | | | | | | | | | | | | | |
Total dividends and distributions | | | (0.48 | ) | | | (0.49 | ) | | | (0.66 | ) | | | (0.60 | ) |
| | | | | | | | | | | | | | | | |
Net asset value, end of period | | $ | 8.93 | | | $ | 9.33 | | | $ | 9.01 | | | $ | 9.15 | |
| | | | | | | | | | | | | | | | |
Total return (b) | | | 0.86 | % | | | 9.20 | % | | | 6.17 | % | | | (2.62 | )% |
| | | | | | | | | | | | | | | | |
Ratios/Supplemental Data: | | | | | | | | | | | | | | | | |
Net assets, end of period (000’s) | | $ | 2,500 | | | $ | 709 | | | $ | 355 | | | $ | 8,372 | |
Ratio of expenses to average net assets: | | | | | | | | | | | | | | | | |
After waivers and reimbursements (a)(f) | | | 1.04 | % | | | 1.06 | % | | | 1.06 | % | | | 1.05 | % |
Before waivers and reimbursements (a)(f) | | | 1.77 | % | | | 1.84 | % | | | 1.81 | % | | | 2.45 | % |
Ratio of net investment income (loss) to average net assets: | | | | | | | | | | | | | | | | |
After waivers and reimbursements (a)(f) | | | 5.20 | % | | | 5.26 | % | | | 7.06 | % | | | 6.39 | %(l) |
Before waivers and reimbursements (a)(f) | | | 4.47 | % | | | 4.48 | % | | | 6.31 | % | | | 4.99 | %(l) |
Portfolio turnover rate (z)^ | | | 45 | % | | | 54 | % | | | 79 | % | | | 57 | % |
| | |
| | | Year Ended October 31, | | | November 12, 2014* to
October 31, 2015 | |
| Class I | | 2018 | | | 2017 | | | 2016 | |
Net asset value, beginning of period | | $ | 9.34 | | | $ | 9.01 | | | $ | 9.15 | | | $ | 10.00 | |
| | | | | | | | | | | | | | | | |
Income (loss) from investment operations: | | | | | | | | | | | | | | | | |
Net investment income (loss) (e) | | | 0.50 | | | | 0.52 | | | | 0.58 | | | | 0.62 | |
Net realized and unrealized gain (loss) | | | (0.40 | ) | | | 0.33 | | | | (0.04 | ) | | | (0.85 | ) |
| | | | | | | | | | | | | | | | |
Total from investment operations | | | 0.10 | | | | 0.85 | | | | 0.54 | | | | (0.23 | ) |
| | | | | | | | | | | | | | | | |
Less distributions: | | | | | | | | | | | | | | | | |
Dividends from net investment income | | | (0.50 | ) | | | (0.51 | ) | | | (0.67 | ) | | | (0.62 | ) |
Return of capital | | | — | | | | (0.01 | ) | | | (0.01 | ) | | | — | |
| | | | | | | | | | | | | | | | |
Total dividends and distributions | | | (0.50 | ) | | | (0.52 | ) | | | (0.68 | ) | | | (0.62 | ) |
| | | | | | | | | | | | | | | | |
Net asset value, end of period | | $ | 8.94 | | | $ | 9.34 | | | $ | 9.01 | | | $ | 9.15 | |
| | | | | | | | | | | | | | | | |
Total return (b) | | | 1.09 | % | | | 9.58 | % | | | 6.44 | % | | | (2.39 | )% |
| | | | | | | | | | | | | | | | |
Ratios/Supplemental Data: | | | | | | | | | | | | | | | | |
Net assets, end of period (000’s) | | $ | 30,386 | | | $ | 30,185 | | | $ | 27,710 | | | $ | 8,395 | |
Ratio of expenses to average net assets: | | | | | | | | | | | | | | | | |
After waivers and reimbursements (a)(f) | | | 0.80 | % | | | 0.82 | % | | | 0.84 | % | | | 0.80 | % |
Before waivers and reimbursements (a)(f) | | | 1.52 | % | | | 1.58 | % | | | 1.53 | % | | | 2.20 | % |
Ratio of net investment income (loss) to average net assets: | | | | | | | | | | | | | | | | |
After waivers and reimbursements (a)(f) | | | 5.47 | % | | | 5.55 | % | | | 6.62 | % | | | 6.64 | %(l) |
Before waivers and reimbursements (a)(f) | | | 4.74 | % | | | 4.79 | % | | | 5.94 | % | | | 5.24 | %(l) |
Portfolio turnover rate (z)^ | | | 45 | % | | | 54 | % | | | 79 | % | | | 57 | % |
See Notes to Financial Statements.
81
1290 FUNDS
1290 HIGH YIELD BOND FUND
FINANCIAL HIGHLIGHTS (Continued)
| | | | | | | | | | | | | | | | |
| | | Year Ended October 31, | | | November 12, 2014* to
October 31, 2015 | |
| Class R | | 2018 | | | 2017 | | | 2016 | |
Net asset value, beginning of period | | $ | 9.33 | | | $ | 9.01 | | | $ | 9.15 | | | $ | 10.00 | |
| | | | | | | | | | | | | | | | |
Income (loss) from investment operations: | | | | | | | | | | | | | | | | |
Net investment income (loss) (e) | | | 0.45 | | | | 0.47 | | | | 0.59 | | | | 0.57 | |
Net realized and unrealized gain (loss) | | | (0.39 | ) | | | 0.32 | | | | (0.10 | ) | | | (0.85 | ) |
| | | | | | | | | | | | | | | | |
Total from investment operations | | | 0.06 | | | | 0.79 | | | | 0.49 | | | | (0.28 | ) |
| | | | | | | | | | | | | | | | |
Less distributions: | | | | | | | | | | | | | | | | |
Dividends from net investment income | | | (0.46 | ) | | | (0.46 | ) | | | (0.62 | ) | | | (0.57 | ) |
Return of capital | | | — | | | | (0.01 | ) | | | (0.01 | ) | | | — | |
| | | | | | | | | | | | | | | | |
Total dividends and distributions | | | (0.46 | ) | | | (0.47 | ) | | | (0.63 | ) | | | (0.57 | ) |
| | | | | | | | | | | | | | | | |
Net asset value, end of period | | $ | 8.93 | | | $ | 9.33 | | | $ | 9.01 | | | $ | 9.15 | |
| | | | | | | | | | | | | | | | |
Total return (b) | | | 0.63 | % | | | 8.95 | % | | | 5.91 | % | | | (2.86 | )% |
| | | | | | | | | | | | | | | | |
Ratios/Supplemental Data: | | | | | | | | | | | | | | | | |
Net assets, end of period (000’s) | | $ | 287 | | | $ | 218 | | | $ | 195 | | | $ | 8,339 | |
Ratio of expenses to average net assets: | | | | | | | | | | | | | | | | |
After waivers and reimbursements (a)(f) | | | 1.30 | % | | | 1.32 | % | | | 1.31 | % | | | 1.30 | % |
Before waivers and reimbursements (a)(f) | | | 2.02 | % | | | 2.08 | % | | | 2.06 | % | | | 2.70 | % |
Ratio of net investment income (loss) to average net assets: | | | | | | | | | | | | | | | | |
After waivers and reimbursements (a)(f) | | | 4.96 | % | | | 5.05 | % | | | 6.83 | % | | | 6.14 | %(l) |
Before waivers and reimbursements (a)(f) | | | 4.23 | % | | | 4.28 | % | | | 6.08 | % | | | 4.74 | %(l) |
Portfolio turnover rate (z)^ | | | 45 | % | | | 54 | % | | | 79 | % | | | 57 | % |
| | |
| | | Year Ended October 31, | | | November 12, 2014* to
October 31, 2015 | |
| Class T** | | 2018 | | | 2017 | | | 2016 | |
Net asset value, beginning of period | | $ | 9.33 | | | $ | 9.01 | | | $ | 9.15 | | | $ | 10.00 | |
| | | | | | | | | | | | | | | | |
Income (loss) from investment operations: | | | | | | | | | | | | | | | | |
Net investment income (loss) (e) | | | 0.50 | | | | 0.52 | | | | 0.63 | | | | 0.62 | |
Net realized and unrealized gain (loss) | | | (0.40 | ) | | | 0.32 | | | | (0.09 | ) | | | (0.85 | ) |
| | | | | | | | | | | | | | | | |
Total from investment operations | | | 0.10 | | | | 0.84 | | | | 0.54 | | | | (0.23 | ) |
| | | | | | | | | | | | | | | | |
Less distributions: | | | | | | | | | | | | | | | | |
Dividends from net investment income | | | (0.50 | ) | | | (0.51 | ) | | | (0.67 | ) | | | (0.62 | ) |
Return of capital | | | — | | | | (0.01 | ) | | | (0.01 | ) | | | — | |
| | | | | | | | | | | | | | | | |
Total dividends and distributions | | | (0.50 | ) | | | (0.52 | ) | | | (0.68 | ) | | | (0.62 | ) |
| | | | | | | | | | | | | | | | |
Net asset value, end of period | | $ | 8.93 | | | $ | 9.33 | | | $ | 9.01 | | | $ | 9.15 | |
| | | | | | | | | | | | | | | | |
Total return (b) | | | 1.09 | % | | | 9.46 | % | | | 6.44 | % | | | (2.39 | )% |
| | | | | | | | | | | | | | | | |
Ratios/Supplemental Data: | | | | | | | | | | | | | | | | |
Net assets, end of period (000’s) | | $ | 127 | | | $ | 132 | | | $ | 128 | | | $ | 2,783 | |
Ratio of expenses to average net assets: | | | | | | | | | | | | | | | | |
After waivers and reimbursements (a)(f) | | | 0.80 | % | | | 0.82 | % | | | 0.81 | % | | | 0.80 | % |
Before waivers and reimbursements (a)(f) | | | 1.77 | % | | | 2.08 | % | | | 2.56 | % | | | 3.20 | % |
Ratio of net investment income (loss) to average net assets: | | | | | | | | | | | | | | | | |
After waivers and reimbursements (a)(f) | | | 5.46 | % | | | 5.56 | % | | | 7.30 | % | | | 6.64 | %(l) |
Before waivers and reimbursements (a)(f) | | | 4.49 | % | | | 4.30 | % | | | 5.55 | % | | | 4.24 | %(l) |
Portfolio turnover rate (z)^ | | | 45 | % | | | 54 | % | | | 79 | % | | | 57 | % |
See Notes to Financial Statements.
82
1290 FUNDS
1290 HIGH YIELD BOND FUND
FINANCIAL HIGHLIGHTS (Continued)
| * | Commencement of Operations. |
| ** | Class T shares currently are not offered for sale. Class T shares were formerly known as Class C shares. |
| ^ | Portfolio turnover rate excludes derivatives, if any. |
| (a) | Ratios for periods less than one year are annualized. Certain non-recurring expenses incurred by the Fund are not annualized for periods less than one year. |
| (b) | Total returns for periods less than one year are not annualized. |
| (e) | Net investment income (loss) per share is based on average shares outstanding. |
| (f) | Expenses do not include the expenses of the underlying funds (“indirect expenses”), if applicable. |
| (l) | The annualized ratio of net investment income to average net assets may not be indicative of operating results for a full year. |
| (z) | Portfolio turnover rate for periods less than one year is not annualized. |
See Notes to Financial Statements.
83
1290 LOW VOLATILITY GLOBAL EQUITY FUND (Unaudited)
INVESTMENT ADVISER
PERFORMANCE RESULTS
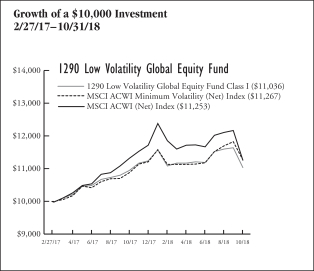
| | | | | | | | |
| Annualized Total Returns as of 10/31/18 | |
| | | 1
Year | | | Since
Incept. | |
Fund – Class I Shares* | | | 0.88 | % | | | 6.07 | % |
MSCI ACWI Minimum Volatility (Net) Index | | | 3.61 | | | | 7.39 | |
MSCI ACWI (Net) Index | | | (0.52 | ) | | | 7.31 | |
* Date of inception 2/27/17. Returns for periods greater than one year are annualized. | |
The performance quoted is past performance and is not a guarantee of future results. Mutual funds are subject to certain market risks. Investment returns and principal value of an investment will fluctuate so that an investor’s shares, when redeemed, may be worth more or less than their original cost. Current performance may be higher or lower than the performance data shown. For the most current month-end performance data please call 1-888-310-0416 or visit www.1290Funds.com.
The graph illustrates comparative performance for $10,000 invested in the Class I Shares of the 1290 Low Volatility Global Equity Fund and the MSCI ACWI Minimum Volatility (Net) Index and MSCI ACWI (Net) Index from 2/27/17 to 10/31/18. The performance of each of the MSCI ACWI Minimum Volatility (Net) Index and MSCI ACWI (Net) Index reflects an initial investment at the end of the month closest to the Fund’s inception. The performance of the Fund assumes reinvestment of all dividends and capital gain distributions, if any, and does not include a sales charge. The performance of the MSCI ACWI Minimum Volatility (Net) Index and MSCI ACWI (Net) Index does not reflect the deduction of expenses or a sales charge associated with a mutual fund and has been adjusted to reflect reinvestment of all dividends, capital gain distributions, and interest of the securities included in the benchmark.
Fund performance may reflect the waiver of the Fund’s fees and reimbursement of expenses for certain periods since the inception date. Without these waivers and reimbursements, performance would have been lower. Also, performance shown in this section does not reflect the deduction of taxes that a shareholder would pay on Fund distributions or redemption of Fund shares.
PERFORMANCE SUMMARY
The Fund’s Class I shares returned 0.88% for the year ended October 31, 2018. The Fund’s benchmarks, the MSCI ACWI Minimum Volatility (Net) Index and the MSCI ACWI (Net) Index, returned 3.61% and (0.52)%, respectively over the same year.
Fund Highlights
What helped performance during the year*?
| • | | Relative to the MSCI ACWI (Net) Index, stock selection within both developed and emerging markets contributed to Fund performance. Stock selection was positive among most sectors, especially within financials, consumer staples, and industrials. |
| • | | On a sector basis, relative to the MSCI ACWI Minimum Volatility (Net) Index, an underweight in communication services and stock selection within materials contributed to performance. |
What hurt performance during the year*?
| • | | Relative to the MSCI ACWI (Net) Index, an overweight in emerging markets and an underweight in domestic equities hurt performance. On a sector basis, stock selection and an underweight in information technology detracted from relative performance. |
| • | | Stock selection within domestic equities was the largest detractor to performance relative to both the MSCI ACWI Minimum Volatility (Net) and MSCI ACWI (Net) indices. |
| • | | Relative to the MSCI ACWI Minimum Volatility (Net) Index, stock selection in financials and an underweight in health care detracted from performance. On a regional basis, stock selection within emerging markets hurt relative performance. |
| * | The Fund does not hold a position in any single security directly but has exposure through ETFs. |
| | | | |
| Table by Asset Class (as a percentage of Total Investments in Securities) | |
| As of October 31, 2018 | | | |
Equity | | | 100.0 | % |
| | | | |
| Top 10 Holdings (as a percentage of Total Investments in Securities) | |
| As of October 31, 2018 | |
iShares Edge MSCI Min Vol Global ETF | | | 28.3 | % |
Invesco S&P International Developed Low Volatility ETF | | | 12.7 | |
iShares Edge MSCI Min Vol EAFE ETF | | | 12.5 | |
Invesco S&P MidCap Low Volatility ETF | | | 6.9 | |
iShares Edge MSCI Min Vol USA ETF | | | 6.8 | |
Invesco S&P 500 Low Volatility ETF | | | 6.8 | |
Invesco S&P 500 High Dividend Low Volatility UCITS ETF | | | 6.7 | |
iShares Edge MSCI Min Vol Emerging Markets ETF | | | 5.8 | |
Invesco S&P Emerging Markets Low Volatility ETF | | | 5.8 | |
Invesco S&P SmallCap Low Volatility ETF | | | 3.5 | |
Holdings are subject to change without notice. | | | | |
84
1290 LOW VOLATILITY GLOBAL EQUITY FUND (Unaudited)
UNDERSTANDING YOUR EXPENSES:
As a shareholder of the Fund, you incur two types of costs:
(1) transaction costs, including applicable sales charges and redemption fees; and (2) ongoing costs, including investment advisory fees, distribution and/or service (12b-1) fees and other Fund expenses. These examples are intended to help you understand your ongoing costs (in dollars) of investing in the Fund and to compare these costs with the ongoing costs of investing in other mutual funds.
The examples are based on an investment of $1,000 invested at the beginning of the six-month period ended October 31, 2018 and held for the entire six-month period.
Actual Expenses
The first line of the following table provides information about actual account values and actual expenses. You may use the information in this line, together with the amount you invested, to estimate the expenses that you paid over the period. Simply divide your account value by $1,000 (for example, an $8,600 account value divided by $1,000 = 8.6), then multiply the result by the number in the first line under the heading entitled “Expenses Paid During Period” to estimate the expenses you paid on your account during this period.
Hypothetical Example for Comparison Purposes
The second line of the following table provides information about hypothetical account values and hypothetical expenses based on the Fund’s actual expense ratio and an assumed rate of return of 5% per year before expenses, which is not the Fund’s actual return. The hypothetical account values and expenses may not be used to estimate the actual ending account balance or expenses you paid for the period. You may use this information to compare the ongoing costs of investing in the Fund and other funds. To do so, compare this 5% hypothetical example with the 5% hypothetical examples that appear in the shareholder reports of the other funds.
Please note that the expenses shown in the table are meant to highlight your ongoing costs only and do not reflect any transactional costs, such as sales charges (loads), redemption fees, or exchange fees. Therefore, the second line of the table is useful in comparing ongoing costs only, and will not help you determine the relative total costs of owning different funds. In addition, if these transactional costs were included, your costs would have been higher.
EXAMPLE
| | | | | | | | | | | | |
| | | Beginning
Account
Value
5/1/18 | | | Ending
Account
Value
10/31/18 | | | Expenses
Paid
During
Period*
5/1/18 -
10/31/18 | |
Class I | | | | | | | | | | | | |
Actual | | | $1,000.00 | | | | $988.10 | | | | $2.14 | |
Hypothetical (5% average annual return before expenses) | | | 1,000.00 | | | | 1,023.05 | | | | 2.18 | |
* Expenses are equal to the Fund’s Class I shares annualized expense ratio of 0.43%, multiplied by the average account value over the period, and multiplied by 184/365 (to reflect the one-half year period). | |
85
1290 FUNDS
1290 LOW VOLATILITY GLOBAL EQUITY FUND
PORTFOLIO OF INVESTMENTS
October 31, 2018
| | | | | | | | |
| | | Number of
Shares | | | Value
(Note 1) | |
| | | | | | | | |
EXCHANGE TRADED FUNDS (ETF): | |
Equity (100.5%) | |
Invesco S&P 500 High Dividend Low Volatility UCITS ETF | | | 4,830 | | | $ | 194,408 | |
Invesco S&P 500 Low Volatility ETF | | | 4,130 | | | | 198,199 | |
Invesco S&P Emerging Markets Low Volatility ETF | | | 7,280 | | | | 167,440 | |
Invesco S&P International Developed Low Volatility ETF | | | 12,060 | | | | 370,604 | |
Invesco S&P MidCap Low Volatility ETF | | | 4,330 | | | | 200,089 | |
Invesco S&P SmallCap Low Volatility ETF | | | 2,230 | | | | 102,535 | |
iShares Edge MSCI Min Vol EAFE ETF | | | 5,350 | | | | 365,191 | |
iShares Edge MSCI Min Vol Emerging Markets ETF | | | 3,080 | | | | 169,338 | |
| | | | | | | | |
iShares Edge MSCI Min Vol Global ETF | | | 9,820 | | | | 822,522 | |
iShares Edge MSCI Min Vol USA ETF | | | 3,630 | | | | 198,670 | |
SPDR SSGA US Large Cap Low Volatility Index ETF | | | 350 | | | | 32,554 | |
SPDR SSGA US Small Cap Low Volatility Index ETF | | | 990 | | | | 89,240 | |
| | | | | | | | |
Total Investments in
Securities (100.5%)
(Cost $2,760,954) | | | | | | | 2,910,790 | |
Other Assets Less
Liabilities (-0.5%) | | | | | | | (13,284 | ) |
| | | | | | | | |
Net Assets (100%) | | | | | | $ | 2,897,506 | |
| | | | | | | | |
The following is a summary of the inputs used to value the Fund’s assets and liabilities carried at fair value as of October 31, 2018:
The inputs or methodology used for valuing securities are not necessarily an indication of the risk associated with investing in those securities.
Various inputs are used in determining the value of the Fund’s investments. These inputs are summarized in the three broad levels listed below:
| | | | | | | | | | | | | | | | |
| | | | | |
| Investment Type | | Level 1
Quoted Prices in
Active Markets for
Identical
Securities | | | Level 2
Significant Other
Observable Inputs
(including quoted prices
for similar securities,
interest rates,
prepayment speeds,
credit risk, etc.) | | | Level 3
Significant Unobservable
Inputs (including the
Fund’s own
assumptions in
determining the fair
value of investments) | | | Total | |
Assets: | |
Exchange Traded Funds | |
Exchange Traded Funds | | $ | 2,910,790 | | | $ | — | | | $ | — | | | $ | 2,910,790 | |
| | | | | | | | | | | | | | | | |
Total Assets | | $ | 2,910,790 | | | $ | — | | | $ | — | | | $ | 2,910,790 | |
| | | | | | | | | | | | | | | | |
Total Liabilities | | $ | — | | | $ | — | | | $ | — | | | $ | — | |
| | | | | | | | | | | | | | | | |
Total | | $ | 2,910,790 | | | $ | — | | | $ | — | | | $ | 2,910,790 | |
| | | | | | | | | | | | | | | | |
The Fund held no derivatives contracts during the year ended October 31, 2018.
Investment security transactions for the year ended October 31, 2018 were as follows:
| | | | |
Cost of Purchases: | | | | |
Long-term investments other than U.S. government debt securities | | $ | 235,754 | |
Net Proceeds of Sales and Redemptions: | | | | |
Long-term investments other than U.S. government debt securities | | $ | 109,894 | |
See Notes to Financial Statements.
86
1290 FUNDS
1290 LOW VOLATILITY GLOBAL EQUITY FUND
PORTFOLIO OF INVESTMENTS (Continued)
October 31, 2018
As of October 31, 2018, the gross unrealized appreciation (depreciation) of investments based on the aggregate cost of investments in securities and derivative instruments, if applicable, for Federal income tax purposes was as follows:
| | | | |
Aggregate gross unrealized appreciation | | $ | 155,822 | |
Aggregate gross unrealized depreciation | | | (5,986 | ) |
| | | | |
Net unrealized appreciation | | $ | 149,836 | |
| | | | |
Federal income tax cost of investments in securities and derivative instruments, if applicable | | $ | 2,760,954 | |
| | | | |
See Notes to Financial Statements.
87
1290 FUNDS
1290 LOW VOLATILITY GLOBAL EQUITY FUND
STATEMENT OF ASSETS AND LIABILITIES
October 31, 2018
| | | | |
|
ASSETS | |
Investments in Securities, at value (Cost $2,760,954) | | $ | 2,910,790 | |
Cash | | | 14,725 | |
Receivable from investment adviser | | | 8,054 | |
Prepaid registration and filing fees | | | 5,549 | |
Other assets | | | 37 | |
| | | | |
Total assets | | | 2,939,155 | |
| | | | |
|
LIABILITIES | |
Accrued professional fees | | | 32,013 | |
Transfer agent fees payable | | | 1,599 | |
Trustees’ fees payable | | | 27 | |
Accrued expenses | | | 8,010 | |
| | | | |
Total liabilities | | | 41,649 | |
| | | | |
NET ASSETS | | $ | 2,897,506 | |
| | | | |
Net assets were comprised of: | |
Paid in capital | | $ | 2,693,730 | |
Total distributable earnings (loss) | | | 203,776 | |
| | | | |
Net assets | | $ | 2,897,506 | |
| | | | |
Class I | | | | |
Net asset value and redemption price per share, $2,897,506 / 267,983 shares outstanding (unlimited amount authorized: $0.001 par value) | | $ | 10.81 | |
| | | | |
STATEMENT OF OPERATIONS
For the Year Ended October 31, 2018
| | | | |
|
INVESTMENT INCOME | |
Dividends | | $ | 77,838 | |
Interest | | | 218 | |
| | | | |
Total income | | | 78,056 | |
| | | | |
EXPENSES | |
Professional fees | | | 40,311 | |
Registration and filing fees | | | 35,961 | |
Administrative fees | | | 30,000 | |
Investment advisory fees | | | 14,629 | |
Printing and mailing expenses | | | 10,575 | |
Transfer agent fees | | | 9,495 | |
Custodian fees | | | 2,900 | |
Offering costs | | | 2,668 | |
Trustees’ fees | | | 307 | |
Miscellaneous | | | 3,921 | |
| | | | |
Gross expenses | | | 150,767 | |
Less: Waiver from investment adviser | | | (44,629 | ) |
Reimbursementfrom investment adviser | | | (93,626 | ) |
| | | | |
Net expenses | | | 12,512 | |
| | | | |
NET INVESTMENT INCOME (LOSS) | | | 65,544 | |
| | | | |
REALIZED AND UNREALIZED GAIN (LOSS) | |
Net realized gain (loss) on investments in securities | | | 11,451 | |
Net distributions of realized gain received from underlying funds | | | 4,903 | |
| | | | |
Net realized gain (loss) | | | 16,354 | |
| | | | |
Net change in unrealized appreciation (depreciation) on investments in securities | | | (56,925 | ) |
| | | | |
NET REALIZED AND UNREALIZED GAIN (LOSS) | | | (40,571 | ) |
| | | | |
NET INCREASE (DECREASE) IN NET ASSETS RESULTING FROM OPERATIONS | | $ | 24,973 | |
| | | | |
See Notes to Financial Statements.
88
1290 FUNDS
1290 LOW VOLATILITY GLOBAL EQUITY FUND
STATEMENT OF CHANGES IN NET ASSETS
| | | | | | | | |
| | | Year Ended
October 31, 2018 | | | February 27, 2017* to
October 31, 2017 | |
INCREASE (DECREASE) IN NET ASSETS FROM OPERATIONS: | |
Net investment income (loss) | | $ | 65,544 | | | $ | 29,969 | |
Net realized gain (loss) | | | 16,354 | | | | 1,004 | |
Net change in unrealized appreciation (depreciation) | | | (56,925 | ) | | | 206,761 | |
| | | | | | | | |
NET INCREASE (DECREASE) IN NET ASSETS RESULTING FROM OPERATIONS | | | 24,973 | | | | 237,734 | |
| | | | | | | | |
Distributions to shareholders: | | | | | | | | |
Class I | | | (59,429 | ) | | | — | |
| | | | | | | | |
CAPITAL SHARES TRANSACTIONS: | | | | | | | | |
Class I | | | | | | | | |
Capital shares sold [ 13,323 and 259,325 shares, respectively ] | | | 146,974 | | | | 2,598,024 | |
Capital shares issued in reinvestment of dividends [ 223 and 0 shares, respectively ] | | | 2,429 | | | | — | |
Capital shares repurchased [ (4,888) and 0 shares, respectively ] | | | (53,199 | ) | | | — | |
| | | | | | | | |
NET INCREASE (DECREASE) IN NET ASSETS RESULTING FROM CAPITAL SHARE TRANSACTIONS | | | 96,204 | | | | 2,598,024 | |
| | | | | | | | |
TOTAL INCREASE (DECREASE) IN NET ASSETS | | | 61,748 | | | | 2,835,758 | |
NET ASSETS: | |
Beginning of period | | | 2,835,758 | | | | — | |
| | | | | | | | |
End of period (a) | | $ | 2,897,506 | | | $ | 2,835,758 | |
| | | | | | | | |
* Commencement of Operations. | | | | | | | | |
(a) Includes accumulated undistributed (overdistributed) net investment income of $30,152 as of October 31, 2017. The SEC eliminated the requirement to disclose undistributed net investment income in 2018. | |
See Notes to Financial Statements.
89
1290 FUNDS
1290 LOW VOLATILITY GLOBAL EQUITY FUND
FINANCIAL HIGHLIGHTS
| | | | | | | | |
| Class I | | Year Ended October 31, 2018 | | | February 27, 2017* to October 31, 2017 | |
Net asset value, beginning of period | | $ | 10.94 | | | $ | 10.00 | |
| | | | | | | | |
Income (loss) from investment operations: | | | | | | | | |
Net investment income (loss) (e)(x) | | | 0.25 | | | | 0.12 | |
Net realized and unrealized gain (loss) | | | (0.16 | ) | | | 0.82 | |
| | | | | | | | |
Total from investment operations | | | 0.09 | | | | 0.94 | |
| | | | | | | | |
Less distributions: | | | | | | | | |
Dividends from net investment income | | | (0.22 | ) | | | — | |
Distributions from net realized gains | | | — | # | | | — | |
| | | | | | | | |
Total dividends and distributions | | | (0.22 | ) | | | — | |
| | | | | | | | |
Net asset value, end of period | | $ | 10.81 | | | $ | 10.94 | |
| | | | | | | | |
Total return (b) | | | 0.88 | % | | | 9.40 | % |
| | | | | | | | |
Ratios/Supplemental Data: | | | | | | | | |
Net assets, end of period (000’s) | | $ | 2,898 | | | $ | 2,836 | |
Ratio of expenses to average net assets: | | | | | | | | |
After waivers and reimbursements (a)(f) | | | 0.43 | %(j) | | | 0.43 | %(j) |
Before waivers and reimbursements (a)(f) | | | 5.15 | % | | | 4.87 | % |
Ratio of net investment income (loss) to average net assets: | | | | | | | | |
After waivers and reimbursements (a)(f)(x) | | | 2.24 | % | | | 1.66 | %(l) |
Before waivers and reimbursements (a)(f)(x) | | | (2.49 | )% | | | (2.78 | )%(l) |
Portfolio turnover rate (z)^ | | | 4 | % | | | 0 | %‡ |
| * | Commencement of Operations. |
| # | Per share amount is less than $0.005. |
| ^ | Portfolio turnover rate excludes derivatives, if any. |
| (a) | Ratios for periods less than one year are annualized. Certain non-recurring expenses incurred by the Fund are not annualized for periods less than one year. |
| (b) | Total returns for periods less than one year are not annualized. |
| (e) | Net investment income (loss) per share is based on average shares outstanding. |
| (f) | Expenses do not include the expenses of the underlying funds (“indirect expenses”), if applicable. |
| (j) | Including direct and indirect expenses, the net expense ratio after waivers and reimbursements would be 0.65%. |
| (l) | The annualized ratio of net investment income to average net assets may not be indicative of operating results for a full year. |
| (x) | Recognition of net investment income is affected by the timing of dividend declarations by the underlying funds in which the Fund invests. |
| (z) | Portfolio turnover rate for periods less than one year is not annualized. |
See Notes to Financial Statements.
90
1290 MULTI-ALTERNATIVE STRATEGIES FUND (Unaudited)
INVESTMENT ADVISER
PERFORMANCE RESULTS
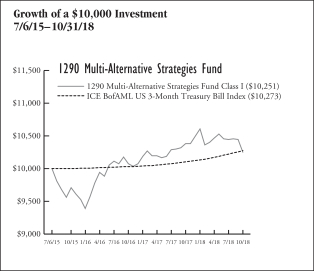
| | | | | | | | | | | | |
| Annualized Total Returns as of 10/31/18 | |
| | | | | | 1
Year | | | Since
Incept. | |
Fund – Class A Shares* | | | without Sales Charge | | | | (1.49 | )% | | | 0.50 | % |
| | | | with Sales Charge (a | ) | | | (6.87 | ) | | | (1.19 | ) |
Fund – Class I Shares* | | | | | | | (1.25 | ) | | | 0.75 | |
Fund – Class R Shares* | | | | | | | (1.79 | ) | | | 0.24 | |
ICE BofAML US 3-Month
Treasury Bill Index | | | | | | | 1.68 | | | | 0.81 | |
* Date of inception 7/6/15. (a) A 5.50% front-end sales charge was deducted. Returns for periods greater than one year are annualized. | |
The performance quoted is past performance and is not a guarantee of future results. Mutual funds are subject to certain market risks. Investment returns and principal value of an investment will fluctuate so that an investor’s shares, when redeemed, may be worth more or less than their original cost. Current performance may be higher or lower than the performance data shown. For the most current month-end performance data please call 1-888-310-0416 or visit www.1290Funds.com.
The graph illustrates comparative performance for $10,000 invested in the Class I Shares of the 1290 Multi-Alternative Strategies Fund and the ICE BofAML US 3-Month Treasury Bill Index from 7/6/15 to 10/31/18. The performance of the ICE BofAML US 3-Month Treasury Bill Index reflects an initial investment at the end of the month closest to the Fund’s inception. The performance of the Fund assumes reinvestment of all dividends and capital gain distributions, if any, and does not include a sales charge. The performance of the ICE BofAML US 3-Month Treasury Bill Index does not reflect the deduction of expenses or a sales charge associated with a mutual fund and has been adjusted to reflect reinvestment of all dividends, capital gain distributions, and interest of the securities included in the benchmark.
Fund performance may reflect the waiver of the Fund’s fees and reimbursement of expenses for certain periods since the inception date. Without these waivers and reimbursements, performance would have been lower. Also, performance shown in this section does not reflect the deduction of taxes that a shareholder would pay on Fund distributions or redemption of Fund shares.
PERFORMANCE SUMMARY
The Fund’s Class I shares returned (1.25)% for the year ended October 31, 2018. The Fund’s benchmark, the ICE BofAML US 3-Month Treasury Bill Index, returned 1.68% over the same year.
Fund Highlights
What helped performance during the year*?
| • | | Commodities were the top contributor to performance, mostly attributable to rising energy prices during the period, as global supply tightened. |
| • | | Convertible securities contributed to performance, driven by a positive equity market for the period. |
| • | | Currency strategies added to performance due to short positions in the Swedish Krona and the Euro, which depreciated during the period. |
What hurt performance during the year*?
| • | | Precious and base metals were the largest detractors to performance as the asset class continued to be hurt by trade tensions as well as the U.S. dollar strengthening. |
| • | | Multi-strategies detracted from performance due to poor performance in the sub strategies long/short equity and macro/managed futures. |
| • | | The value tilt within the long/short equity strategy negatively impacted performance as growth stocks outperformed value stocks during the period. |
| * | The Fund does not hold a position in any single security directly but has exposure through ETFs. |
| | | | |
Table by Asset Class (as a percentage of Total Investments in Securities) As of October 31, 2018 | |
Alternatives | | | 45.2 | % |
Fixed Income | | | 18.3 | |
Commodity | | | 16.7 | |
Equity | | | 10.5 | |
Specialty | | | 9.3 | |
| | | | |
Top 10 Holdings (as a percentage of Total Investments in Securities)
As of October 31, 2018 | |
Invesco DB G10 Currency Harvest Fund | | | 9.3 | % |
SPDR Bloomberg Barclays Convertible Securities ETF | | | 9.3 | |
IQ Merger Arbitrage ETF | | | 9.2 | |
WisdomTree Managed Futures Strategy Fund | | | 9.1 | |
JPMorgan Diversified Alternatives ETF | | | 9.0 | |
ProShares RAFI Long/Short | | | 9.0 | |
ProShares Hedge Replication ETF | | | 8.8 | |
Invesco DB Gold Fund | | | 7.6 | |
iShares Core US REIT ETF | | | 4.7 | |
Vanguard Short-Term Inflation-Protected Securities ETF | | | 4.6 | |
Holdings are subject to change without notice. | | | | |
91
1290 MULTI-ALTERNATIVE STRATEGIES FUND (Unaudited)
UNDERSTANDING YOUR EXPENSES:
As a shareholder of the Fund, you incur two types of costs:
(1) transaction costs, including applicable sales charges and redemption fees; and (2) ongoing costs, including investment advisory fees, distribution and/or service (12b-1) fees (in the case of Class A and Class R shares of the Fund), and other Fund expenses. These examples are intended to help you understand your ongoing costs (in dollars) of investing in the Fund and to compare these costs with the ongoing costs of investing in other mutual funds.
The examples are based on an investment of $1,000 invested at the beginning of the six-month period ended October 31, 2018 and held for the entire six-month period.
Actual Expenses
The first line of the following table provides information about actual account values and actual expenses. You may use the information in this line, together with the amount you invested, to estimate the expenses that you paid over the period. Simply divide your account value by $1,000 (for example, an $8,600 account value divided by $1,000 = 8.6), then multiply the result by the number in the first line under the heading entitled “Expenses Paid During Period” to estimate the expenses you paid on your account during this period.
Hypothetical Example for Comparison Purposes
The second line of the following table provides information about hypothetical account values and hypothetical expenses based on the Fund’s actual expense ratio and an assumed rate of return of 5% per year before expenses, which is not the Fund’s actual return. The hypothetical account values and expenses may not be used to estimate the actual ending account balance or expenses you paid for the period. You may use this information to compare the ongoing costs of investing in the Fund and other funds. To do so, compare this 5% hypothetical example with the 5% hypothetical examples that appear in the shareholder reports of the other funds.
Please note that the expenses shown in the table are meant to highlight your ongoing costs only and do not reflect any transactional costs, such as sales charges (loads), redemption fees, or exchange fees. Therefore, the second line of the table is useful in comparing ongoing costs only, and will not help you determine the relative total costs of owning different funds. In addition, if these transactional costs were included, your costs would have been higher.
EXAMPLE
| | | | | | | | | | | | |
| | | Beginning Account Value 5/1/18 | | | Ending Account Value 10/31/18 | | | Expenses Paid During Period* 5/1/18 - 10/31/18 | |
Class A | | | | | | | | | | | | |
Actual | | | $1,000.00 | | | | $978.50 | | | | $5.15 | |
Hypothetical (5% average annual return before expenses) | | | 1,000.00 | | | | 1,020.00 | | | | 5.25 | |
Class I | | | | | | | | | | | | |
Actual | | | 1,000.00 | | | | 979.50 | | | | 3.91 | |
Hypothetical (5% average annual return before expenses) | | | 1,000.00 | | | | 1,021.26 | | | | 3.99 | |
Class R | | | | | | | | | | | | |
Actual | | | 1,000.00 | | | | 977.50 | | | | 6.40 | |
Hypothetical (5% average annual return before expenses) | | | 1,000.00 | | | | 1,018.74 | | | | 6.53 | |
* Expenses are equal to the Fund’s Class A, I and R shares annualized expense ratios of 1.03%, 0.78% and 1.28%, respectively, multiplied by the average account value over the period, and multiplied by 184/365 (to reflect the one-half year period). | |
92
1290 FUNDS
1290 MULTI-ALTERNATIVE STRATEGIES FUND
PORTFOLIO OF INVESTMENTS
October 31, 2018
| | | | | | | | |
| | | Number of
Shares | | | Value
(Note 1) | |
EXCHANGE TRADED FUNDS (ETF): | |
Alternatives (45.1%) | |
IQ Merger Arbitrage ETF* | | | 55,080 | | | $ | 1,756,501 | |
JPMorgan Diversified Alternatives ETF | | | 70,820 | | | | 1,719,510 | |
ProShares Hedge Replication ETF | | | 38,360 | | | | 1,681,127 | |
ProShares RAFI Long/Short‡ | | | 47,080 | | | | 1,713,241 | |
WisdomTree Managed Futures Strategy Fund* | | | 42,840 | | | | 1,731,164 | |
| | | | | | | | |
Total Alternatives | | | | | | | 8,601,543 | |
| | | | | | | | |
Commodity (16.8%) | |
Invesco DB Base Metals Fund* | | | 16,440 | | | | 261,232 | |
Invesco DB Commodity Index Tracking Fund* | | | 49,390 | | | | 837,654 | |
Invesco DB Gold Fund* | | | 37,750 | | | | 1,442,428 | |
Invesco DB Silver Fund* | | | 4,020 | | | | 86,852 | |
iShares Commodities Select Strategy ETF | | | 15,120 | | | | 560,196 | |
| | | | | | | | |
Total Commodity | | | | | | | 3,188,362 | |
| | | | | | | | |
Specialty (9.3%) | |
Invesco DB G10 Currency Harvest Fund*‡ | | | 72,400 | | | | 1,772,352 | |
| | | | | | | | |
Equity (10.4%) | | | | | | | | |
iShares Core US REIT ETF | | | 19,260 | | | | 903,294 | |
iShares MSCI Global Agriculture Producers ETF | | | 9,870 | | | | 272,227 | |
Vanguard Global ex-U.S. Real Estate ETF | | | 15,370 | | | | 813,534 | |
| | | | | | | | |
Total Equity | | | | | | | 1,989,055 | |
| | | | | | | | |
Fixed Income (18.2%) | | | | | | | | |
iShares TIPS Bond ETF | | | 7,810 | | | | 850,040 | |
SPDR Bloomberg Barclays Convertible Securities ETF | | | 35,050 | | | | 1,760,912 | |
Vanguard Short-Term Inflation-Protected Securities ETF | | | 18,270 | | | | 879,883 | |
| | | | | | | | |
Total Fixed Income | | | | | | | 3,490,835 | |
| | | | | | | | |
Total Investments in Securities (99.8%)
(Cost $18,999,241) | | | | | | | 19,042,147 | |
Other Assets Less Liabilities (0.2%) | | | | | | | 41,228 | |
| | | | | | | | |
Net Assets (100%) | | | | | | $ | 19,083,375 | |
| | | | | | | | |
| ‡ | All, or a portion, of the security is an affiliated company as defined under the Investment Company Act of 1940. |
Investments in companies which were affiliates for the year ended October 31, 2018, were as follows:
| | | | | | | | | | | | | | | | | | | | | | | | | | | | | | | | | | | | |
Security Description | | Shares at
October 31,
2018 | | | Market Value
October 31,
2017 ($) | | | Purchases
at Cost ($) | | | Proceeds
from
Sales ($) | | | Net
Realized
Gain
(Loss) ($) | | | Change
in Unrealized
Appreciation/
(Depreciation)
($) | | | Market Value
October 31,
2018 ($) | | | Dividend/
Interest
Income
($) | | | Capital Gain
Distributions
($) | |
Invesco DB G10 Currency Harvest Fund (a)(b)* | | | 72,400 | | | | 1,529,465 | | | | 189,299 | | | | — | | | | — | | | | 53,588 | | | | 1,772,352 | | | | — | | | | — | |
ProShares RAFI Long/Short | | | 47,080 | | | | 1,537,888 | | | | 219,372 | | | | — | | | | — | | | | (44,019 | ) | | | 1,713,241 | | | | 26,549 | | | | — | |
| | | | | | | | | | | | | | | | | | | | | | | | | | | | | | | | | | | | |
Total | | | | | | | 3,067,353 | | | | 408,671 | | | | — | | | | — | | | | 9,569 | | | | 3,485,593 | | | | 26,549 | | | | — | |
| | | | | | | | | | | | | | | | | | | | | | | | | | | | | | | | | | | | |
| (a) | Not affiliated at October 31, 2017. |
| (b) | Formerly known as PowerShares DB G10 Currency Harvest Fund. |
See Notes to Financial Statements.
93
1290 FUNDS
1290 MULTI-ALTERNATIVE STRATEGIES FUND
PORTFOLIO OF INVESTMENTS (Continued)
October 31, 2018
The following is a summary of the inputs used to value the Fund’s assets and liabilities carried at fair value as of October 31, 2018:
The inputs or methodology used for valuing securities are not necessarily an indication of the risk associated with investing in those securities.
Various inputs are used in determining the value of the Fund’s investments. These inputs are summarized in the three broad levels listed below:
| | | | | | | | | | | | | | | | |
| | | | | |
| Investment Type | | Level 1
Quoted Prices in
Active Markets for
Identical
Securities | | | Level 2
Significant Other
Observable Inputs
(including quoted prices
for similar securities,
interest rates,
prepayment speeds,
credit risk, etc.) | | | Level 3
Significant Unobservable
Inputs (including the
Fund’s own assumptions in
determining the fair
value of investments) | | | Total | |
Assets: | | | | | | | | | | | | | | | | |
Exchange Traded Funds | | | | | | | | | | | | | | | | |
Exchange Traded Funds | | $ | 19,042,147 | | | $ | — | | | $ | — | | | $ | 19,042,147 | |
| | | | | | | | | | | | | | | | |
Total Assets | | $ | 19,042,147 | | | $ | — | | | $ | — | | | $ | 19,042,147 | |
| | | | | | | | | | | | | | | | |
Total Liabilities | | $ | — | | | $ | — | | | $ | — | | | $ | — | |
| | | | | | | | | | | | | | | | |
Total | | $ | 19,042,147 | | | $ | — | | | $ | — | | | $ | 19,042,147 | |
| | | | | | | | | | | | | | | | |
The Fund held no derivatives contracts during the year ended October 31, 2018.
Investment security transactions for the year ended October 31, 2018 were as follows:
| | | | |
Cost of Purchases: | | | | |
Long-term investments other than U.S. government debt securities | | $ | 3,250,404 | |
Net Proceeds of Sales and Redemptions: | | | | |
Long-term investments other than U.S. government debt securities | | $ | 852,684 | |
As of October 31, 2018, the gross unrealized appreciation (depreciation) of investments based on the aggregate cost of investments in securities and derivative instruments, if applicable, for Federal income tax purposes was as follows:
| | | | |
Aggregate gross unrealized appreciation | | $ | 415,241 | |
Aggregate gross unrealized depreciation | | | (502,188 | ) |
| | | | |
Net unrealized appreciation | | $ | (86,947 | ) |
| | | | |
Federal income tax cost of investments in securities and derivative instruments, if applicable | | $ | 19,129,094 | |
| | | | |
See Notes to Financial Statements.
94
1290 FUNDS
1290 MULTI-ALTERNATIVE STRATEGIES FUND
STATEMENT OF ASSETS AND LIABILITIES
October 31, 2018
| | | | |
|
ASSETS | |
Investments in Securities, at value: | | | | |
Affiliated Issuers (Cost $3,578,119) | | $ | 3,485,593 | |
Unaffiliated Issuers (Cost $15,421,122) | | | 15,556,554 | |
Cash | | | 186,839 | |
Receivable for Fund shares sold | | | 18,500 | |
Prepaid registration and filing fees | | | 15,295 | |
Other assets | | | 233 | |
| | | | |
Total assets | | | 19,263,014 | |
| | | | |
LIABILITIES | | | | |
Payable for Fund shares redeemed | | | 76,858 | |
Payable for securities purchased | | | 47,052 | |
Transfer agent fees payable | | | 6,124 | |
Administrative fees payable | | | 319 | |
Distribution fees payable – Class A | | | 176 | |
Distribution fees payable – Class R | | | 45 | |
Trustees’ fees payable | | | 19 | |
Accrued expenses | | | 49,046 | |
| | | | |
Total liabilities | | | 179,639 | |
| | | | |
NET ASSETS | | $ | 19,083,375 | |
| | | | |
Net assets were comprised of: | | | | |
Paid in capital | | $ | 18,995,393 | |
Total distributable earnings (loss) | | | 87,982 | |
| | | | |
Net assets | | $ | 19,083,375 | |
| | | | |
Class A | | | | |
Net asset value and redemption price per share, $827,032 / 82,556 shares outstanding (unlimited amount authorized: $0.001 par value) | | $ | 10.02 | |
Maximum sales charge (5.50% of offering price) | | | 0.58 | |
| | | | |
Maximum offering price per share | | $ | 10.60 | |
| | | | |
Class I | | | | |
Net asset value and redemption price per share, $18,151,045 / 1,808,427 shares outstanding (unlimited amount authorized: $0.001 par value) | | $ | 10.04 | |
| | | | |
Class R | | | | |
Net asset value and redemption price per share, $105,298 / 10,563 shares outstanding (unlimited amount authorized: $0.001 par value) | | $ | 9.97 | |
| | | | |
STATEMENT OF OPERATIONS
For the Year Ended October 31, 2018
| | | | |
| |
INVESTMENT INCOME | | | | |
Dividends ($26,549 of dividend income received from affiliates) | | $ | 264,804 | |
Interest | | | 1,647 | |
| | | | |
Total income | | | 266,451 | |
| | | | |
EXPENSES | | | | |
Investment advisory fees | | | 92,839 | |
Professional fees | | | 50,987 | |
Transfer agent fees | | | 36,150 | |
Registration and filing fees | | | 32,170 | |
Administrative fees | | | 30,000 | |
Printing and mailing expenses | | | 22,464 | |
Custodian fees | | | 6,200 | |
Trustees’ fees | | | 1,937 | |
Distribution fees – Class A | | | 1,852 | |
Distribution fees – Class R | | | 1,602 | |
Miscellaneous | | | 13,107 | |
| | | | |
Gross expenses | | | 289,308 | |
Less: Waiver from investment adviser | | | (122,839 | ) |
Reimbursement from investment adviser | | | (18,701 | ) |
| | | | |
Net expenses | | | 147,768 | |
| | | | |
NET INVESTMENT INCOME (LOSS) | | | 118,683 | |
| | | | |
REALIZED AND UNREALIZED GAIN (LOSS) | | | | |
Net realized gain (loss) on investments in securities | | | (452 | ) |
Net change in unrealized appreciation (depreciation) on investments in securities ($9,569 of change in unrealized appreciation (depreciation) from affiliates) | | | (379,307 | ) |
| | | | |
NET REALIZED AND UNREALIZED GAIN (LOSS) | | | (379,759 | ) |
| | | | |
NET INCREASE (DECREASE) IN NET ASSETS RESULTING FROM OPERATIONS | | $ | (261,076 | ) |
| | | | |
See Notes to Financial Statements.
95
1290 FUNDS
1290 MULTI-ALTERNATIVE STRATEGIES FUND
STATEMENT OF CHANGES IN NET ASSETS
| | | | | | | | |
| | | Year Ended October 31, | |
| | 2018 | | | 2017 | |
INCREASE (DECREASE) IN NET ASSETS FROM OPERATIONS: | |
Net investment income (loss) | | $ | 118,683 | | | $ | 67,997 | |
Net realized gain (loss) | | | (452 | ) | | | 23,672 | |
Net change in unrealized appreciation (depreciation) | | | (379,307 | ) | | | 373,523 | |
| | | | | | | | |
NET INCREASE (DECREASE) IN NET ASSETS RESULTING FROM OPERATIONS | | | (261,076 | ) | | | 465,192 | |
| | | | | | | | |
Distributions to shareholders: (a) | | | | | | | | |
Class A | | | (2,431 | ) | | | (1,817 | ) |
Class I | | | (102,929 | ) | | | (82,390 | ) |
Class R | | | (2,024 | ) | | | (118 | ) |
| | | | | | | | |
Total distributions to shareholders | | | (107,384 | ) | | | (84,325 | ) |
| | | | | | | | |
CAPITAL SHARES TRANSACTIONS: | | | | | | | | |
Class A | | | | | | | | |
Capital shares sold [ 24,928 and 27,123 shares, respectively ] | | | 254,309 | | | | 271,725 | |
Capital shares issued in reinvestment of dividends [ 201 and 147 shares, respectively ] | | | 2,048 | | | | 1,453 | |
Capital shares repurchased [ (7,078) and (3,886) shares, respectively ] | | | (72,391 | ) | | | (39,143 | ) |
| | | | | | | | |
Total Class A transactions | | | 183,966 | | | | 234,035 | |
| | | | | | | | |
Class I | | | | | | | | |
Capital shares sold [ 320,848 and 510,609 shares, respectively ] | | | 3,286,660 | | | | 5,131,940 | |
Capital shares issued in reinvestment of dividends [ 4,035 and 2,242 shares, respectively ] | | | 40,993 | | | | 22,218 | |
Capital shares repurchased [ (115,451) and (138,280) shares, respectively ] | | | (1,179,390 | ) | | | (1,393,024 | ) |
| | | | | | | | |
Total Class I transactions | | | 2,148,263 | | | | 3,761,134 | |
| | | | | | | | |
Class R | | | | | | | | |
Capital shares sold [ 44,922 and 130 shares, respectively ] | | | 456,502 | | | | 1,327 | |
Capital shares issued in reinvestment of dividends [ 162 and 0# shares, respectively ] | | | 1,641 | | | | 2 | |
Capital shares repurchased [ (44,791) and (1) shares, respectively ] | | | (460,156 | ) | | | (10 | ) |
| | | | | | | | |
Total Class R transactions | | | (2,013 | ) | | | 1,319 | |
| | | | | | | | |
NET INCREASE (DECREASE) IN NET ASSETS RESULTING FROM CAPITAL SHARE TRANSACTIONS | | | 2,330,216 | | | | 3,996,488 | |
| | | | | | | | |
TOTAL INCREASE (DECREASE) IN NET ASSETS | | | 1,961,756 | | | | 4,377,355 | |
NET ASSETS: | | | | | | | | |
Beginning of year | | | 17,121,619 | | | | 12,744,264 | |
| | | | | | | | |
End of year (b) | | $ | 19,083,375 | | | $ | 17,121,619 | |
| | | | | | | | |
# Number of shares is less than 0.5. | | | | | | | | |
(a) Prior year distributions to shareholders were made up of dividends from net investment income of $362, $43,293 and $— for Classes A, I and R, respectively; and dividends from net realized capital gains of $1,455, $39,097 and $118 for Classes A, I and R, respectively. These amounts were reclassified to conform with the current year presentation. | |
(b) Includes accumulated undistributed (overdistributed) net investment income of $— as of October 31, 2017. The SEC eliminated the requirement to disclose undistributed net investment income in 2018. | |
See Notes to Financial Statements.
96
1290 FUNDS
1290 MULTI-ALTERNATIVE STRATEGIES FUND
FINANCIAL HIGHLIGHTS
| | | | | | | | | | | | | | | | |
Class A | | Year Ended October 31, | | | July 6, 2015* to
October 31, 2015 | |
| | 2018 | | | 2017 | | | 2016 | |
Net asset value, beginning of period | | $ | 10.21 | | | $ | 9.97 | | | $ | 9.70 | | | $ | 10.00 | |
| | | | | | | | | | | | | | | | |
Income (loss) from investment operations: | | | | | | | | | | | | | | | | |
Net investment income (loss) (e)(x) | | | 0.04 | | | | 0.02 | | | | 0.01 | | | | (0.01 | ) |
Net realized and unrealized gain (loss) | | | (0.19 | ) | | | 0.26 | | | | 0.33 | | | | (0.29 | ) |
| | | | | | | | | | | | | | | | |
Total from investment operations | | | (0.15 | ) | | | 0.28 | | | | 0.34 | | | | (0.30 | ) |
| | | | | | | | | | | | | | | | |
Less distributions: | | | | | | | | | | | | | | | | |
Dividends from net investment income | | | — | | | | (0.01 | ) | | | (0.05 | ) | | | — | |
Distributions from net realized gains | | | (0.04 | ) | | | (0.03 | ) | | | — | | | | — | |
Return of capital | | | — | | | | — | | | | (0.02 | ) | | | — | |
| | | | | | | | | | | | | | | | |
Total dividends and distributions | | | (0.04 | ) | | | (0.04 | ) | | | (0.07 | ) | | | — | |
| | | | | | | | | | | | | | | | |
Net asset value, end of period | | $ | 10.02 | | | $ | 10.21 | | | $ | 9.97 | | | $ | 9.70 | |
| | | | | | | | | | | | | | | | |
Total return (b) | | | (1.49 | )% | | | 2.78 | % | | | 3.53 | % | | | (3.00 | )% |
| | | | | | | | | | | | | | | | |
Ratios/Supplemental Data: | | | | | | | | | | | | | | | | |
Net assets, end of period (000’s) | | $ | 827 | | | $ | 659 | | | $ | 410 | | | $ | 112 | |
Ratio of expenses to average net assets: | | | | | | | | | | | | | | | | |
After waivers and reimbursements (a)(f) | | | 1.03 | %(j) | | | 1.00 | %(j) | | | 0.98 | %(j) | | | 0.96 | %(j) |
Before waivers and reimbursements (a)(f) | | | 1.79 | % | | | 2.08 | % | | | 2.62 | % | | | 2.26 | % |
Ratio of net investment income (loss) to average net assets: | | | | | | | | | | | | | | | | |
After waivers and reimbursements (a)(f)(x) | | | 0.39 | % | | | 0.20 | % | | | 0.10 | % | | | (0.25 | )%(l) |
Before waivers and reimbursements (a)(f)(x) | | | (0.37 | )% | | | (0.88 | )% | | | (1.55 | )% | | | (1.55 | )%(l) |
Portfolio turnover rate (z)^ | | | 5 | % | | | 13 | % | | | 2 | % | | | 0 | % |
| | | | | | | | | | | | | | | | |
Class I | | Year Ended October 31, | | | July 6, 2015* to
October 31, 2015 | |
| | 2018 | | | 2017 | | | 2016 | |
Net asset value, beginning of period | | $ | 10.23 | | | $ | 9.99 | | | $ | 9.71 | | | $ | 10.00 | |
| | | | | | | | | | | | | | | | |
Income (loss) from investment operations: | | | | | | | | | | | | | | | | |
Net investment income (loss) (e)(x) | | | 0.07 | | | | 0.05 | | | | 0.05 | | | | — | # |
Net realized and unrealized gain (loss) | | | (0.20 | ) | | | 0.25 | | | | 0.31 | | | | (0.29 | ) |
| | | | | | | | | | | | | | | | |
Total from investment operations | | | (0.13 | ) | | | 0.30 | | | | 0.36 | | | | (0.29 | ) |
| | | | | | | | | | | | | | | | |
Less distributions: | | | | | | | | | | | | | | | | |
Dividends from net investment income | | | (0.02 | ) | | | (0.03 | ) | | | (0.05 | ) | | | — | |
Distributions from net realized gains | | | (0.04 | ) | | | (0.03 | ) | | | — | | | | — | |
Return of capital | | | — | | | | — | | | | (0.03 | ) | | | — | |
| | | | | | | | | | | | | | | | |
Total dividends and distributions | | | (0.06 | ) | | | (0.06 | ) | | | (0.08 | ) | �� | | — | |
| | | | | | | | | | | | | | | | |
Net asset value, end of period | | $ | 10.04 | | | $ | 10.23 | | | $ | 9.99 | | | $ | 9.71 | |
| | | | | | | | | | | | | | | | |
Total return (b) | | | (1.25 | )% | | | 3.04 | % | | | 3.76 | % | | | (2.90 | )% |
| | | | | | | | | | | | | | | | |
Ratios/Supplemental Data: | | | | | | | | | | | | | | | | |
Net assets, end of period (000’s) | | $ | 18,151 | | | $ | 16,358 | | | $ | 12,233 | | | $ | 9,591 | |
Ratio of expenses to average net assets: | | | | | | | | | | | | | | | | |
After waivers and reimbursements (a)(f) | | | 0.78 | %(j) | | | 0.75 | %(j) | | | 0.73 | %(j) | | | 0.72 | %(j) |
Before waivers and reimbursements (a)(f) | | | 1.54 | % | | | 1.82 | % | | | 2.24 | % | | | 1.97 | % |
Ratio of net investment income (loss) to average net assets: | | | | | | | | | | | | | | | | |
After waivers and reimbursements (a)(f)(x) | | | 0.66 | % | | | 0.45 | % | | | 0.50 | % | | | (0.03 | )%(l) |
Before waivers and reimbursements (a)(f)(x) | | | (0.11 | )% | | | (0.62 | )% | | | (1.02 | )% | | | (1.29 | )%(l) |
Portfolio turnover rate (z)^ | | | 5 | % | | | 13 | % | | | 2 | % | | | 0 | % |
See Notes to Financial Statements.
97
1290 FUNDS
1290 MULTI-ALTERNATIVE STRATEGIES FUND
FINANCIAL HIGHLIGHTS (Continued)
| | | | | | | | | | | | | | | | |
Class R | | Year Ended October 31, | | | July 6, 2015* to
October 31, 2015 | |
| | 2018 | | | 2017 | | | 2016 | |
Net asset value, beginning of period | | $ | 10.19 | | | $ | 9.95 | | | $ | 9.69 | | | $ | 10.00 | |
| | | | | | | | | | | | | | | | |
Income (loss) from investment operations: | | | | | | | | | | | | | | | | |
Net investment income (loss) (e)(x) | | | 0.03 | | | | — | # | | | — | # | | | (0.02 | ) |
Net realized and unrealized gain (loss) | | | (0.21 | ) | | | 0.27 | | | | 0.32 | | | | (0.29 | ) |
| | | | | | | | | | | | | | | | |
Total from investment operations | | | (0.18 | ) | | | 0.27 | | | | 0.32 | | | | (0.31 | ) |
| | | | | | | | | | | | | | | | |
Less distributions: | | | | | | | | | | | | | | | | |
Dividends from net investment income | | | — | | | | — | | | | (0.04 | ) | | | — | |
Distributions from net realized gains | | | (0.04 | ) | | | (0.03 | ) | | | — | | | | — | |
Return of capital | | | — | | | | — | | | | (0.02 | ) | | | — | |
| | | | | | | | | | | | | | | | |
Total dividends and distributions | | | (0.04 | ) | | | (0.03 | ) | | | (0.06 | ) | | | — | |
| | | | | | | | | | | | | | | | |
Net asset value, end of period | | $ | 9.97 | | | $ | 10.19 | | | $ | 9.95 | | | $ | 9.69 | |
| | | | | | | | | | | | | | | | |
Total return (b) | | | (1.79 | )% | | | 2.53 | % | | | 3.30 | % | | | (3.10 | )% |
| | | | | | | | | | | | | | | | |
Ratios/Supplemental Data: | | | | | | | | | | | | | | | | |
Net assets, end of period (000’s) | | $ | 105 | | | $ | 105 | | | $ | 101 | | | $ | 97 | |
Ratio of expenses to average net assets: | | | | | | | | | | | | | | | | |
After waivers and reimbursements (a)(f) | | | 1.26 | %(j) | | | 1.25 | %(j) | | | 1.22 | %(j) | | | 1.21 | %(j) |
Before waivers and reimbursements (a)(f) | | | 2.02 | % | | | 2.32 | % | | | 2.73 | % | | | 2.47 | % |
Ratio of net investment income (loss) to average net assets: | | | | | | | | | | | | | | | | |
After waivers and reimbursements (a)(f)(x) | | | 0.27 | % | | | (0.02 | )% | | | 0.02 | % | | | (0.53 | )%(l) |
Before waivers and reimbursements (a)(f)(x) | | | (0.49 | )% | | | (1.08 | )% | | | (1.50 | )% | | | (1.78 | )%(l) |
Portfolio turnover rate (z)^ | | | 5 | % | | | 13 | % | | | 2 | % | | | 0 | % |
| * | Commencement of Operations. |
| # | Per share amount is less than $0.005. |
| ^ | Portfolio turnover rate excludes derivatives, if any. |
| (a) | Ratios for periods less than one year are annualized. Certain non-recurring expenses incurred by the Fund are not annualized for periods less than one year. |
| (b) | Total returns for periods less than one year are not annualized. |
| (e) | Net investment income (loss) per share is based on average shares outstanding. |
| (f) | Expenses do not include the expenses of the underlying funds (“indirect expenses”), if applicable. |
| (j) | Including direct and indirect expenses, the net expense ratio after waivers and reimbursements would be 1.65% for Class A, 1.40% for Class I and 1.90% for Class R. |
| (l) | The annualized ratio of net investment income to average net assets may not be indicative of operating results for a full year. |
| (x) | Recognition of net investment income is affected by the timing of dividend declarations by the underlying funds in which the Fund invests. |
| (z) | Portfolio turnover rate for periods less than one year is not annualized. |
See Notes to Financial Statements.
98
1290 RETIREMENT 2020 FUND (Unaudited)
INVESTMENT ADVISER
PERFORMANCE RESULTS
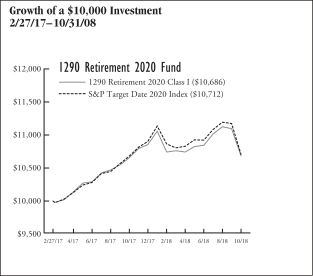
| | | | | | | | |
| Annualized Total Returns as of 10/31/18 | | | | | | |
| | | 1
Year | | | Since
Incept. | |
Fund – Class I Shares* | | | 0.24 | % | | | 4.04 | % |
S&P Target Date 2020 Index | | | 0.27 | | | | 4.20 | |
* Date of inception 2/27/17. Returns for periods greater than one year are annualized. | |
The performance quoted is past performance and is not a guarantee of future results. Mutual funds are subject to certain market risks. Investment returns and principal value of an investment will fluctuate so that an investor’s shares, when redeemed, may be worth more or less than their original cost. Current performance may be higher or lower than the performance data shown. For the most current month-end performance data please call 1-888-310-0416 or visit www.1290Funds.com.
The graph illustrates comparative performance for $10,000 invested in the Class I Shares of the 1290 Retirement 2020 Fund and the S&P Target Date 2020 Index from 2/27/17 to 10/31/18. The performance of the S&P Target Date 2020 Index reflects an initial investment at the end of the month closest to the Fund’s inception. The performance of the Fund assumes reinvestment of all dividends and capital gain distributions, if any, and does not include a sales charge. The performance of the S&P Target Date 2020 Index does not reflect the deduction of expenses or a sales charge associated with a mutual fund and has been adjusted to reflect reinvestment of all dividends, capital gain distributions, and interest of the securities included in the benchmark.
Fund performance may reflect the waiver of the Fund’s fees and reimbursement of expenses for certain periods since the inception date. Without these waivers and reimbursements, performance would have been lower. Also, performance shown in this section does not reflect the deduction of taxes that a shareholder would pay on Fund distributions or redemption of Fund shares.
PERFORMANCE SUMMARY
The Fund’s Class I shares returned 0.24% for the year ended October 31, 2018. The Fund’s benchmark, the S&P Target Date 2020 Index, returned 0.27% over the same year.
Overview
The Allocations Drive Performance
Each 1290 Retirement Fund’s (as defined in the Notes to the Financial Statements) performance will reflect the performance of the underlying asset classes and depend upon their percentage weighting within the Fund. Here’s why:
The 1290 Retirement Funds are managed to target a specific year of planned retirement. The Asset mix will become more conservative each year, until about 10 years after the target retirement year, when it will become relatively stable. The 1290 Retirement Funds balance the need for appreciation with the need for income as retirement approaches and focus on supporting an income stream over a long-term retirement withdrawal horizon.
To achieve its exposures, each 1290 Retirement Fund invests in exchange-traded funds (ETFs) representing various equity and bond asset classes. Because of this, each of the 1290 Retirement Funds’ performance will be a function of the asset class performance and the percentage weighting of each asset class in the 1290 Retirement Funds. Current target and actual allocations, as well as performance, are available in a separate quarterly Fund Fact Sheet.
Fund Highlights
What helped the 1290 Retirement Funds performance during the year*?
| • | | Within equities, U.S. large-cap and mid-cap equities exhibited positive returns and were the best performing asset class. U.S. small-cap equities also added modestly to each of the 1290 Retirement Funds’ performance. |
| • | | On the fixed income side, international bonds added to performance. |
| • | | Having exposure to ETFs that tend to be less volatile than the market as a whole helped buoy performance, especially within hard-hit emerging markets and developed-world sectors. |
What hurt the 1290 Retirement Funds performance during the year*?
| • | | Emerging market and international equities were the biggest detractors to performance for the period. |
| • | | U.S. fixed income (both core and high yield) had negative returns for the period. |
| * | The Fund does not hold a position in any single security directly but has exposure through ETFs. |
| | | | |
Table by Asset Class (as a percentage of Total Investments in Securities)
As of October 31, 2018 | |
Equity | | | 54.2 | % |
Fixed Income | | | 45.8 | |
99
1290 RETIREMENT 2020 FUND (Unaudited)
| | | | |
Top 10 Holdings (as a percentage of Total Investments in Securities)
As of October 31, 2018 | |
iShares Core U.S. Aggregate Bond ETF | | | 28.6 | % |
iShares Core S&P Total US Stock Market ETF | | | 18.6 | |
iShares TIPS Bond ETF | | | 6.9 | |
iShares Core MSCI EAFE ETF | | | 6.6 | |
iShares Edge MSCI Min Vol USA ETF | | | 6.2 | |
Invesco S&P 500 Low Volatility ETF | | | 6.1 | |
Vanguard Short-Term Bond ETF | | | 3.9 | |
Invesco S&P International Developed Low Volatility ETF | | | 3.4 | |
Invesco S&P MidCap Low Volatility ETF | | | 3.4 | |
iShares Edge MSCI Min Vol EAFE ETF | | | 3.4 | |
Holdings are subject to change without notice. | | | | |
UNDERSTANDING YOUR EXPENSES:
As a shareholder of the Fund, you incur two types of costs:
(1) transaction costs, including applicable sales charges and redemption fees; and (2) ongoing costs, including investment advisory fees, distribution and/or service (12b-1) fees and other Fund expenses. These examples are intended to help you understand your ongoing costs (in dollars) of investing in the Fund and to compare these costs with the ongoing costs of investing in other mutual funds.
The examples are based on an investment of $1,000 invested at the beginning of the six-month period ended October 31, 2018 and held for the entire six-month period.
Actual Expenses
The first line of the following table provides information about actual account values and actual expenses. You may use the information in this line, together with the amount you invested, to estimate the expenses that you paid over the period. Simply divide your account value by $1,000 (for example, an $8,600 account value divided by $1,000 = 8.6), then multiply the result by the number in the first line under the heading entitled “Expenses Paid During Period” to estimate the expenses you paid on your account during this period.
Hypothetical Example for Comparison Purposes
The second line of the following table provides information about hypothetical account values and hypothetical expenses based on the Fund’s actual expense ratio and an assumed rate of return of 5% per year before expenses, which is not the Fund’s actual return. The hypothetical account values and expenses may not be used to estimate the actual ending account balance or expenses you paid for the period. You may use this information to compare the ongoing costs of investing in the Fund and other funds. To do so, compare this 5% hypothetical example with the 5% hypothetical examples that appear in the shareholder reports of the other funds.
Please note that the expenses shown in the table are meant to highlight your ongoing costs only and do not reflect any transactional costs, such as sales charges (loads), redemption fees, or exchange fees. Therefore, the second line of the table is useful in comparing ongoing costs only, and will not help you determine the relative total costs of owning different funds. In addition, if these transactional costs were included, your costs would have been higher.
EXAMPLE
| | | | | | | | | | | | |
| | | Beginning
Account
Value
5/1/18 | | | Ending
Account
Value
10/31/18 | | | Expenses Paid During Period*
5/1/18 -
10/31/18 | |
Class I | |
Actual | | $ | 1,000.00 | | | $ | 994.30 | | | $ | 2.68 | |
Hypothetical (5% average annual return before expenses) | | | 1,000.00 | | | | 1,022.52 | | | | 2.72 | |
* Expenses are equal to the Fund’s Class I shares annualized expense ratio of 0.53%, multiplied by the average account value over the period, and multiplied by 184/365 (to reflect the one-half year period). | |
100
1290 FUNDS
1290 RETIREMENT 2020 FUND
PORTFOLIO OF INVESTMENTS
October 31, 2018
| | | | | | | | |
| | | Number of
Shares | | | Value
(Note 1) | |
| | | | | | | | |
EXCHANGE TRADED FUNDS (ETF): | |
Equity (53.9%) | |
Invesco S&P 500 Low Volatility ETF | | | 9,760 | | | $ | 468,382 | |
Invesco S&P Emerging Markets Low Volatility ETF | | | 2,680 | | | | 61,640 | |
Invesco S&P International Developed Low Volatility ETF | | | 8,520 | | | | 261,820 | |
Invesco S&P MidCap Low Volatility ETF | | | 5,650 | | | | 261,087 | |
Invesco S&P SmallCap Low Volatility ETF | | | 2,870 | | | | 131,963 | |
iShares Core MSCI EAFE ETF | | | 8,530 | | | | 501,393 | |
iShares Core MSCI Emerging Markets ETF | | | 2,500 | | | | 118,150 | |
iShares Core S&P Total US Stock Market ETF | | | 22,990 | | | | 1,419,173 | |
iShares Edge MSCI Min Vol EAFE ETF | | | 3,770 | | | | 257,340 | |
iShares Edge MSCI Min Vol Emerging Markets ETF | | | 990 | | | | 54,430 | |
iShares Edge MSCI Min Vol USA ETF | | | 8,680 | | | | 475,056 | |
| | | | | | | | |
SPDR SSGA US Small Cap Low Volatility Index ETF | | | 1,340 | | | | 120,789 | |
| | | | | | | | |
Total Equity | | | | | | | 4,131,223 | |
| | | | | | | | |
Fixed Income (45.6%) | | | | | | | | |
iShares Core U.S. Aggregate Bond ETF | | | 20,830 | | | | 2,178,610 | |
iShares TIPS Bond ETF | | | 4,800 | | | | 522,432 | |
SPDR Bloomberg Barclays High Yield Bond ETF | | | 6,870 | | | | 241,549 | |
Vanguard Short-Term Bond ETF | | | 3,800 | | | | 296,172 | |
Vanguard Total International Bond ETF | | | 4,570 | | | | 249,202 | |
| | | | | | | | |
Total Fixed Income | | | | | | | 3,487,965 | |
| | | | | | | | |
Total Investments in Securities (99.5%)
(Cost $7,677,184) | | | | | | | 7,619,188 | |
Other Assets Less Liabilities (0.5%) | | | | | | | 39,529 | |
| | | | | |
Net Assets (100%) | | | | | | $ | 7,658,717 | |
| | | | | | | | |
The following is a summary of the inputs used to value the Fund’s assets and liabilities carried at fair value as of October 31, 2018:
The inputs or methodology used for valuing securities are not necessarily an indication of the risk associated with investing in those securities.
Various inputs are used in determining the value of the Fund’s investments. These inputs are summarized in the three broad levels listed below:
| | | | | | | | | | | | | | | | |
| | | | | |
| Investment Type | | Level 1
Quoted Prices in
Active Markets for
Identical
Securities | | | Level 2
Significant Other
Observable Inputs
(including quoted prices
for similar securities,
interest rates,
prepayment speeds,
credit risk, etc.) | | | Level 3
Significant Unobservable
Inputs (including the
Fund’s own
assumptions in
determining the fair
value of investments) | | | Total | |
Assets: | | | | | |
Exchange Traded Funds | | | | | | | | | | | | | | | | |
Exchange Traded Funds | | $ | 7,619,188 | | | $ | — | | | $ | — | | | $ | 7,619,188 | |
| | | | | | | | | | | | | | | | |
Total Assets | | $ | 7,619,188 | | | $ | — | | | $ | — | | | $ | 7,619,188 | |
| | | | | | | | | | | | | | | | |
Total Liabilities | | $ | — | | | $ | — | | | $ | — | | | $ | — | |
| | | | | | | | | | | | | | | | |
Total | | $ | 7,619,188 | | | $ | — | | | $ | — | | | $ | 7,619,188 | |
| | | | | | | | | | | | | | | | |
The Fund held no derivatives contracts during the year ended October 31, 2018.
Investment security transactions for the year ended October 31, 2018 were as follows:
| | | | |
Cost of Purchases: | | | | |
Long-term investments other than U.S. government debt securities | | $ | 5,479,531 | |
Net Proceeds of Sales and Redemptions: | | | | |
Long-term investments other than U.S. government debt securities | | $ | 350,788 | |
See Notes to Financial Statements.
101
1290 FUNDS
1290 RETIREMENT 2020 FUND
PORTFOLIO OF INVESTMENTS (Continued)
October 31, 2018
As of October 31, 2018, the gross unrealized appreciation (depreciation) of investments based on the aggregate cost of investments in securities and derivative instruments, if applicable, for Federal income tax purposes was as follows:
| | | | |
Aggregate gross unrealized appreciation | | $ | 64,822 | |
Aggregate gross unrealized depreciation | | | (127,269 | ) |
| | | | |
Net unrealized depreciation | | $ | (62,447 | ) |
| | | | |
Federal income tax cost of investments in securities and derivative instruments, if applicable | | $ | 7,681,635 | |
| | | | |
See Notes to Financial Statements.
102
1290 FUNDS
1290 RETIREMENT 2020 FUND
STATEMENT OF ASSETS AND LIABILITIES
October 31, 2018
| | | | |
| |
ASSETS | | | | |
Investments in Securities, at value
(Cost $7,677,184) | | $ | 7,619,188 | |
Cash | | | 64,635 | |
Receivable from investment adviser | | | 11,790 | |
Prepaid registration and filing fees | | | 5,745 | |
Dividends, interest and other receivables | | | 243 | |
Other assets | | | 40 | |
| | | | |
Total assets | | | 7,701,641 | |
| | | | |
LIABILITIES | | | | |
Transfer agent fees payable | | | 1,398 | |
Accrued expenses | | | 41,526 | |
| | | | |
Total liabilities | | | 42,924 | |
| | | | |
NET ASSETS | | $ | 7,658,717 | |
| | | | |
Net assets were comprised of: | | | | |
Paid in capital | | $ | 7,626,551 | |
Total distributable earnings (loss) | | | 32,166 | |
| | | | |
Net assets | | $ | 7,658,717 | |
| | | | |
Class I | | | | |
Net asset value and redemption price per share, $7,658,717 / 729,939 shares outstanding (unlimited amount authorized: $0.001 par value) | | $ | 10.49 | |
| | | | |
STATEMENT OF OPERATIONS
For the Year Ended October 31, 2018
| | | | |
| |
INVESTMENT INCOME | | | | |
Dividends | | $ | 98,438 | |
Interest | | | 374 | |
| | | | |
Total income | | | 98,812 | |
| | | | |
EXPENSES | | | | |
Professional fees | | | 41,721 | |
Registration and filing fees | | | 36,346 | |
Administrative fees | | | 30,024 | |
Investment advisory fees | | | 20,485 | |
Printing and mailing expenses | | | 13,296 | |
Transfer agent fees | | | 7,260 | |
Custodian fees | | | 4,100 | |
Offering costs | | | 3,349 | |
Trustees’ fees | | | 383 | |
Miscellaneous | | | 4,118 | |
| | | | |
Gross expenses | | | 161,082 | |
Less: Waiver from investment adviser | | | (50,509 | ) |
Reimbursement from investment adviser | | | (88,696 | ) |
| | | | |
Net expenses | | | 21,877 | |
| | | | |
NET INVESTMENT INCOME (LOSS) | | | 76,935 | |
| | | | |
REALIZED AND UNREALIZED GAIN (LOSS) | | | | |
Net realized gain (loss) on investments in securities | | | 26,879 | |
Net distributions of realized gain received from underlying funds | | | 2,229 | |
| | | | |
Net realized gain (loss) | | | 29,108 | |
| | | | |
Net change in unrealized appreciation (depreciation) on investments in securities | | | (190,498 | ) |
| | | | |
NET REALIZED AND UNREALIZED GAIN (LOSS) | | | (161,390 | ) |
| | | | |
NET INCREASE (DECREASE) IN NET ASSETS RESULTING FROM OPERATIONS | | $ | (84,455 | ) |
| | | | |
See Notes to Financial Statements.
103
1290 FUNDS
1290 RETIREMENT 2020 FUND
STATEMENT OF CHANGES IN NET ASSETS
| | | | | | | | |
| | | Year Ended
October 31, 2018 | | | February 27, 2017* to
October 31, 2017 | |
INCREASE (DECREASE) IN NET ASSETS FROM OPERATIONS: | | | | | | | | |
Net investment income (loss) | | $ | 76,935 | | | $ | 28,816 | |
Net realized gain (loss) | | | 29,108 | | | | 3,916 | |
Net change in unrealized appreciation (depreciation) | | | (190,498 | ) | | | 132,502 | |
| | | | | | | | |
NET INCREASE (DECREASE) IN NET ASSETS RESULTING FROM OPERATIONS | | | (84,455 | ) | | | 165,234 | |
| | | | | | | | |
Distributions to shareholders: | | | | | | | | |
Class I | | | (49,502 | ) | | | — | |
| | | | | | | | |
CAPITAL SHARES TRANSACTIONS: | | | | | | | | |
Class I | | | | | | | | |
Capital shares sold [ 511,333 and 250,010 shares, respectively ] | | | 5,469,555 | | | | 2,500,100 | |
Capital shares issued in reinvestment of dividends [ 0# and 0 shares, respectively ] | | | 2 | | | | — | |
Capital shares repurchased [ (31,404) and 0 shares, respectively ] | | | (342,217 | ) | | | — | |
| | | | | | | | |
NET INCREASE (DECREASE) IN NET ASSETS RESULTING FROM CAPITAL SHARE TRANSACTIONS | | | 5,127,340 | | | | 2,500,100 | |
| | | | | | | | |
TOTAL INCREASE (DECREASE) IN NET ASSETS | | | 4,993,383 | | | | 2,665,334 | |
NET ASSETS: | | | | | | | | |
Beginning of period | | | 2,665,334 | | | | — | |
| | | | | | | | |
End of period (a) | | $ | 7,658,717 | | | $ | 2,665,334 | |
| | | | | | | | |
* Commencement of Operations. | |
# Number of shares is less than 0.5. | |
(a) Includes accumulated undistributed (overdistributed) net investment income of $29,042 as of October 31, 2017. The SEC eliminated the requirement to disclose undistributed net investment income in 2018. | |
See Notes to Financial Statements.
104
1290 FUNDS
1290 RETIREMENT 2020 FUND
FINANCIAL HIGHLIGHTS
| | | | | | | | |
| Class I | | Year Ended
October 31, 2018 | | | February 27, 2017* to
October 31, 2017 | |
Net asset value, beginning of period | | $ | 10.66 | | | $ | 10.00 | |
| | | | | | | | |
Income (loss) from investment operations: | | | | | | | | |
Net investment income (loss) (e)(x) | | | 0.20 | | | | 0.12 | |
Net realized and unrealized gain (loss) | | | (0.17 | ) | | | 0.54 | |
| | | | | | | | |
Total from investment operations | | | 0.03 | | | | 0.66 | |
| | | | | | | | |
Less distributions: | |
Dividends from net investment income | | | (0.18 | ) | | | — | |
Distributions from net realized gains | | | (0.02 | ) | | | — | |
| | | | | | | | |
Total dividends and distributions | | | (0.20 | ) | | | — | |
| | | | | | | | |
Net asset value, end of period | | $ | 10.49 | | | $ | 10.66 | |
| | | | | | | | |
Total return (b) | | | 0.24 | % | | | 6.60 | % |
| | | | | | | | |
Ratios/Supplemental Data: | |
Net assets, end of period (000’s) | | $ | 7,659 | | | $ | 2,665 | |
Ratio of expenses to average net assets: | | | | | | | | |
After waivers and reimbursements (a)(f) | | | 0.53 | %(j) | | | 0.53 | %(j) |
Before waivers and reimbursements (a)(f) | | | 3.93 | % | | | 5.32 | % |
Ratio of net investment income (loss) to average net assets: | | | | | | | | |
After waivers and reimbursements (a)(f)(x) | | | 1.88 | % | | | 1.66 | %(l) |
Before waivers and reimbursements (a)(f)(x) | | | (1.52 | )% | | | (3.13 | )%(l) |
Portfolio turnover rate (z)^ | | | 8 | % | | | 2 | % |
| * | Commencement of Operations. |
| ^ | Portfolio turnover rate excludes derivatives, if any. |
| (a) | Ratios for periods less than one year are annualized. Certain non-recurring expenses incurred by the Fund are not annualized for periods less than one year. |
| (b) | Total returns for periods less than one year are not annualized. |
| (e) | Net investment income (loss) per share is based on average shares outstanding. |
| (f) | Expenses do not include the expenses of the underlying funds (“indirect expenses”), if applicable. |
| (j) | Including direct and indirect expenses, the net expense ratio after waivers and reimbursements would be 0.65%. |
| (l) | The annualized ratio of net investment income to average net assets may not be indicative of operating results for a full year. |
| (x) | Recognition of net investment income is affected by the timing of dividend declarations by the underlying funds in which the Fund invests. |
| (z) | Portfolio turnover rate for periods less than one year is not annualized. |
See Notes to Financial Statements.
105
1290 RETIREMENT 2025 FUND (Unaudited)
INVESTMENT ADVISER
PERFORMANCE RESULTS

| | | | | | | | |
| Annualized Total Returns as of 10/31/18 | |
| | | 1
Year | | | Since
Incept. | |
Fund – Class I Shares* | | | 0.60 | % | | | 4.79 | % |
S&P Target Date 2025 Index | | | 0.40 | | | | 4.83 | |
* Date of inception 2/27/17. Returns for periods greater than one year are annualized. | |
|
The performance quoted is past performance and is not a guarantee of future results. Mutual funds are subject to certain market risks. Investment returns and principal value of an investment will fluctuate so that an investor’s shares, when redeemed, may be worth more or less than their original cost. Current performance may be higher or lower than the performance data shown. For the most current month-end performance data please call 1-888-310-0416 or visit www.1290Funds.com.
The graph illustrates comparative performance for $10,000 invested in the Class I Shares of the 1290 Retirement 2025 Fund and the S&P Target Date 2025 Index from 2/27/17 to 10/31/18. The performance of the S&P Target Date 2025 Index reflects an initial investment at the end of the month closest to the Fund’s inception. The performance of the Fund assumes reinvestment of all dividends and capital gain distributions, if any, and does not include a sales charge. The performance of the S&P Target Date 2025 Index does not reflect the deduction of expenses or a sales charge associated with a mutual fund and has been adjusted to reflect reinvestment of all dividends, capital gain distributions, and interest of the securities included in the benchmark.
Fund performance may reflect the waiver of the Fund’s fees and reimbursement of expenses for certain periods since the inception date. Without these waivers and reimbursements, performance would have been lower. Also, performance shown in this section does not reflect the deduction of taxes that a shareholder would pay on Fund distributions or redemption of Fund shares.
PERFORMANCE SUMMARY
The Fund’s Class I shares returned 0.60% for the year ended October 31, 2018. The Fund’s benchmark, the S&P Target Date 2025 Index, returned 0.40% over the same year.
Overview
The Allocations Drive Performance
Each 1290 Retirement Fund’s (as defined in the Notes to the Financial Statements) performance will reflect the performance of the underlying asset classes and depend upon their percentage weighting within the Fund. Here’s why:
The 1290 Retirement Funds are managed to target a specific year of planned retirement. The Asset mix will become more conservative each year, until about 10 years after the target retirement year, when it will become relatively stable. The 1290 Retirement Funds balance the need for appreciation with the need for income as retirement approaches and focus on supporting an income stream over a long-term retirement withdrawal horizon.
To achieve its exposures, each 1290 Retirement Fund invests in exchange-traded funds (ETFs) representing various equity and bond asset classes. Because of this, each of the 1290 Retirement Funds’ performance will be a function of the asset class performance and the percentage weighting of each asset class in the 1290 Retirement Funds. Current target and actual allocations, as well as performance, are available in a separate quarterly Fund Fact Sheet.
Fund Highlights
What helped the 1290 Retirement Funds performance during the year*?
| • | | Within equities, U.S. large-cap and mid-cap equities exhibited positive returns and were the best performing asset class. U.S. small-cap equities also added modestly to each of the 1290 Retirement Funds’ performance. |
| • | | On the fixed income side, international bonds added to performance. |
| • | | Having exposure to ETFs that tend to be less volatile than the market as a whole helped buoy performance, especially within hard-hit emerging markets and developed-world sectors. |
What hurt the 1290 Retirement Funds performance during the year*?
| • | | Emerging market and international equities were the biggest detractors to performance for the period. |
| • | | U.S. fixed income (both core and high yield) had negative returns for the period. |
| * | The Fund does not hold a position in any single security directly but has exposure through ETFs. |
| | | | |
Table by Asset Class (as a percentage of Total Investments in Securities) As of October 31, 2018 | |
Equity | | | 63.6 | % |
Fixed Income | | | 36.4 | |
106
1290 RETIREMENT 2025 FUND (Unaudited)
| | | | |
Top 10 Holdings (as a percentage of Total Investments in Securities)
As of October 31, 2018 | |
iShares Core U.S. Aggregate Bond ETF | | | 27.3 | % |
iShares Core S&P Total US Stock Market ETF | | | 21.4 | |
iShares Core MSCI EAFE ETF | | | 8.1 | |
Invesco S&P 500 Low Volatility ETF | | | 7.1 | |
iShares Edge MSCI Min Vol USA ETF | | | 6.9 | |
iShares TIPS Bond ETF | | | 5.1 | |
Invesco S&P International Developed Low Volatility ETF | | | 4.3 | |
iShares Edge MSCI Min Vol EAFE ETF | | | 4.3 | |
Invesco S&P MidCap Low Volatility ETF | | | 4.2 | |
Invesco S&P SmallCap Low Volatility ETF | | | 1.9 | |
Holdings are subject to change without notice. | | | | |
UNDERSTANDING YOUR EXPENSES:
As a shareholder of the Fund, you incur two types of costs:
(1) transaction costs, including applicable sales charges and redemption fees; and (2) ongoing costs, including investment advisory fees, distribution and/or service (12b-1) fees and other Fund expenses. These examples are intended to help you understand your ongoing costs (in dollars) of investing in the Fund and to compare these costs with the ongoing costs of investing in other mutual funds.
The examples are based on an investment of $1,000 invested at the beginning of the six-month period ended October 31, 2018 and held for the entire six-month period.
Actual Expenses
The first line of the following table provides information about actual account values and actual expenses. You may use the information in this line, together with the amount you invested, to estimate the expenses that you paid over the period. Simply divide your account value by $1,000 (for example, an $8,600 account value divided by $1,000 = 8.6), then multiply the result by the number in the first line under the heading entitled “Expenses Paid During Period” to estimate the expenses you paid on your account during this period.
Hypothetical Example for Comparison Purposes
The second line of the following table provides information about hypothetical account values and hypothetical expenses based on the Fund’s actual expense ratio and an assumed rate of return of 5% per year before expenses, which is not the Fund’s actual return. The hypothetical account values and expenses may not be used to estimate the actual ending account balance or expenses you paid for the period. You may use this information to compare the ongoing costs of investing in the Fund and other funds. To do so, compare this 5% hypothetical example with the 5% hypothetical examples that appear in the shareholder reports of the other funds.
Please note that the expenses shown in the table are meant to highlight your ongoing costs only and do not reflect any transactional costs, such as sales charges (loads), redemption fees, or exchange fees. Therefore, the second line of the table is useful in comparing ongoing costs only, and will not help you determine the relative total costs of owning different funds. In addition, if these transactional costs were included, your costs would have been higher.
EXAMPLE
| | | | | | | | | | | | |
| | | Beginning
Account
Value
5/1/18 | | | Ending
Account
Value
10/31/18 | | | Expenses
Paid
During
Period*
5/1/18 -
10/31/18 | |
Class I | | | | | | | | | | | | |
Actual | | $ | 1,000.00 | | | $ | 994.40 | | | $ | 2.70 | |
Hypothetical (5% average annual return before expenses) | | | 1,000.00 | | | | 1,022.50 | | | | 2.73 | |
* Expenses are equal to the Fund’s Class I shares annualized expense ratio of 0.54%, multiplied by the average account value over the period, and multiplied by 184/365 (to reflect the one-half year period). | |
107
1290 FUNDS
1290 RETIREMENT 2025 FUND
PORTFOLIO OF INVESTMENTS
October 31, 2018
| | | | | | | | |
| | | Number of
Shares | | | Value
(Note 1) | |
EXCHANGE TRADED FUNDS (ETF): | | | | | |
Equity (63.4%) | | | | | | | | |
Invesco S&P 500 Low Volatility ETF | | | 15,140 | | | $ | 726,569 | |
Invesco S&P Emerging Markets Low Volatility ETF | | | 4,030 | | | | 92,690 | |
Invesco S&P International Developed Low Volatility ETF | | | 14,310 | | | | 439,746 | |
Invesco S&P MidCap Low Volatility ETF | | | 9,250 | | | | 427,443 | |
Invesco S&P SmallCap Low Volatility ETF | | | 4,240 | | | | 194,955 | |
iShares Core MSCI EAFE ETF | | | 14,040 | | | | 825,271 | |
iShares Core MSCI Emerging Markets ETF | | | 3,910 | | | | 184,787 | |
iShares Core S&P Total US Stock Market ETF | | | 35,510 | | | | 2,192,032 | |
iShares Edge MSCI Min Vol EAFE ETF | | | 6,420 | | | | 438,229 | |
iShares Edge MSCI Min Vol Emerging Markets ETF | | | 1,800 | | | | 98,964 | |
iShares Edge MSCI Min Vol USA ETF | | | 12,890 | | | | 705,470 | |
SPDR SSGA US Small Cap Low Volatility Index ETF | | | 2,050 | | | | 184,789 | |
| | | | | | | | |
Total Equity | | | | | | | 6,510,945 | |
| | | | | | | | |
Fixed Income (36.2%) | | | | | | | | |
iShares Core U.S. Aggregate Bond ETF | | | 26,810 | | | | 2,804,057 | |
iShares TIPS Bond ETF | | | 4,820 | | | | 524,609 | |
SPDR Bloomberg Barclays High Yield Bond ETF | | | 3,560 | | | | 125,170 | |
Vanguard Short-Term Bond ETF | | | 1,980 | | | | 154,321 | |
Vanguard Total International Bond ETF | | | 2,310 | | | | 125,964 | |
| | | | | | | | |
Total Fixed Income | | | | | | | 3,734,121 | |
| | | | | | | | |
Total Investments in Securities (99.6%)
(Cost $10,378,420) | | | | | | | 10,245,066 | |
Other Assets Less Liabilities (0.4%) | | | | | | | 40,459 | |
| | | | | | | | |
Net Assets (100%) | | | | | | $ | 10,285,525 | |
| | | | | | | | |
The following is a summary of the inputs used to value the Fund’s assets and liabilities carried at fair value as of October 31, 2018:
The inputs or methodology used for valuing securities are not necessarily an indication of the risk associated with investing in those securities.
Various inputs are used in determining the value of the Fund’s investments. These inputs are summarized in the three broad levels listed below:
| | | | | | | | | | | | | | | | |
| | | | | |
| Investment Type | | Level 1
Quoted Prices in
Active Markets for
Identical
Securities | | | Level 2
Significant Other
Observable Inputs
(including quoted prices
for similar securities,
interest rates,
prepayment speeds,
credit risk, etc.) | | | Level 3
Significant Unobservable
Inputs (including the
Fund’s own
assumptions in
determining the fair
value of investments) | | | Total | |
Assets: | |
Exchange Traded Funds | | | | | | | | | | | | | | | | |
Exchange Traded Funds | | $ | 10,245,066 | | | $ | — | | | $ | — | | | $ | 10,245,066 | |
| | | | | | | | | | | | | | | | |
Total Assets | | $ | 10,245,066 | | | $ | — | | | $ | — | | | $ | 10,245,066 | |
| | | | | | | | | | | | | | | | |
Total Liabilities | | $ | — | | | $ | — | | | $ | — | | | $ | — | |
| | | | | | | | | | | | | | | | |
Total | | $ | 10,245,066 | | | $ | — | | | $ | — | | | $ | 10,245,066 | |
| | | | | | | | | | | | | | | | |
The Fund held no derivatives contracts during the year ended October 31, 2018.
Investment security transactions for the year ended October 31, 2018 were as follows:
| | | | |
Cost of Purchases: | | | | |
Long-term investments other than U.S. government debt securities | | $ | 8,036,849 | |
Net Proceeds of Sales and Redemptions: | | | | |
Long-term investments other than U.S. government debt securities | | $ | 201,564 | |
See Notes to Financial Statements.
108
1290 FUNDS
1290 RETIREMENT 2025 FUND
PORTFOLIO OF INVESTMENTS (Continued)
October 31, 2018
As of October 31, 2018, the gross unrealized appreciation (depreciation) of investments based on the aggregate cost of investments in securities and derivative instruments, if applicable, for Federal income tax purposes was as follows:
| | | | |
Aggregate gross unrealized appreciation | | $ | 66,526 | |
Aggregate gross unrealized depreciation | | | (201,022 | ) |
| | | | |
Net unrealized depreciation | | $ | (134,496 | ) |
| | | | |
Federal income tax cost of investments in securities and derivative instruments, if applicable | | $ | 10,379,562 | |
| | | | |
See Notes to Financial Statements.
109
1290 FUNDS
1290 RETIREMENT 2025 FUND
STATEMENT OF ASSETS AND LIABILITIES
October 31, 2018
| | | | |
ASSETS | | | | |
Investments in Securities, at value (Cost $10,378,420) | | $ | 10,245,066 | |
Cash | | | 64,817 | |
Receivable from investment adviser | | | 11,150 | |
Prepaid registration and filing fees | | | 5,883 | |
Receivable for Fund shares sold | | | 1,877 | |
Dividends, interest and other receivables | | | 466 | |
Other assets | | | 82 | |
| | | | |
Total assets | | | 10,329,341 | |
| | | | |
LIABILITIES | | | | |
Transfer agent fees payable | | | 1,398 | |
Accrued expenses | | | 42,418 | |
| | | | |
Total liabilities | | | 43,816 | |
| | | | |
NET ASSETS | | $ | 10,285,525 | |
| | | | |
Net assets were comprised of: | | | | |
Paid in capital | | $ | 10,309,910 | |
Total distributable earnings (loss) | | | (24,385 | ) |
| | | | |
Net assets | | $ | 10,285,525 | |
| | | | |
Class I | | | | |
Net asset value and redemption price per share, $10,285,525 / 968,120 shares outstanding (unlimited amount authorized: $0.001 par value) | | $ | 10.62 | |
| | | | |
STATEMENT OF OPERATIONS
For the Year Ended October 31, 2018
| | | | |
INVESTMENT INCOME | |
Dividends | | $ | 127,155 | |
Interest | | | 453 | |
| | | | |
Total income | | | 127,608 | |
| | | | |
EXPENSES | | | | |
Professional fees | | | 42,699 | |
Registration and filing fees | | | 36,361 | |
Administrative fees | | | 30,010 | |
Investment advisory fees | | | 26,066 | |
Printing and mailing expenses | | | 13,502 | |
Transfer agent fees | | | 7,260 | |
Custodian fees | | | 4,400 | |
Offering costs | | | 3,369 | |
Trustees’ fees | | | 474 | |
Miscellaneous | | | 4,469 | |
| | | | |
Gross expenses | | | 168,610 | |
Less: Waiver from investment adviser | | | (56,076 | ) |
Reimbursement from investment adviser | | | (84,571 | ) |
| | | | |
Net expenses | | | 27,963 | |
| | | | |
NET INVESTMENT INCOME (LOSS) | | | 99,645 | |
| | | | |
REALIZED AND UNREALIZED GAIN (LOSS) | | | | |
Net realized gain (loss) on investments in securities | | | 22,717 | |
Net distributions of realized gain received from underlying funds | | | 2,576 | |
| | | | |
Net realized gain (loss) | | | 25,293 | |
| | | | |
Net change in unrealized appreciation (depreciation) on investments in securities | | | (289,343 | ) |
| | | | |
NET REALIZED AND UNREALIZED GAIN (LOSS) | | | (264,050 | ) |
| | | | |
NET INCREASE (DECREASE) IN NET ASSETS RESULTING FROM OPERATIONS | | $ | (164,405 | ) |
| | | | |
See Notes to Financial Statements.
110
1290 FUNDS
1290 RETIREMENT 2025 FUND
STATEMENT OF CHANGES IN NET ASSETS
| | | | | | | | |
| | | Year Ended
October 31, 2018 | | | February 27, 2017* to
October 31, 2017 | |
INCREASE (DECREASE) IN NET ASSETS FROM OPERATIONS: | |
Net investment income (loss) | | $ | 99,645 | | | $ | 28,207 | |
Net realized gain (loss) | | | 25,293 | | | | 3,758 | |
Net change in unrealized appreciation (depreciation) | | | (289,343 | ) | | | 155,989 | |
| | | | | | | | |
NET INCREASE (DECREASE) IN NET ASSETS RESULTING FROM OPERATIONS | | | (164,405 | ) | | | 187,954 | |
| | | | | | | | |
Distributions to shareholders: | | | | | | | | |
Class I | | | (49,002 | ) | | | — | |
| | | | | | | | |
CAPITAL SHARES TRANSACTIONS: | | | | | | | | |
Class I | | | | | | | | |
Capital shares sold [ 736,783 and 250,010 shares, respectively ] | | | 8,015,082 | | | | 2,500,100 | |
Capital shares issued in reinvestment of dividends [ 0# and 0 shares, respectively ] | | | 2 | | | | — | |
Capital shares repurchased [ (18,673) and 0 shares, respectively ] | | | (204,206 | ) | | | — | |
| | | | | | | | |
NET INCREASE (DECREASE) IN NET ASSETS RESULTING FROM CAPITAL SHARE TRANSACTIONS | | | 7,810,878 | | | | 2,500,100 | |
| | | | | | | | |
TOTAL INCREASE (DECREASE) IN NET ASSETS | | | 7,597,471 | | | | 2,688,054 | |
NET ASSETS: | | | | | | | | |
Beginning of period | | | 2,688,054 | | | | — | |
| | | | | | | | |
End of period (a) | | $ | 10,285,525 | | | $ | 2,688,054 | |
| | | | | | | | |
* Commencement of Operations. | | | | | | | | |
# Number of shares is less than 0.5. | | | | | | | | |
(a) Includes accumulated undistributed (overdistributed) net investment income of $28,438 as of October 31, 2017. The SEC eliminated the requirement to disclose undistributed net investment income in 2018. | |
See Notes to Financial Statements.
111
1290 FUNDS
1290 RETIREMENT 2025 FUND
FINANCIAL HIGHLIGHTS
| | | | | | | | |
| Class I | | Year Ended October 31, 2018 | | | February 27, 2017* to
October 31, 2017 | |
Net asset value, beginning of period | | $ | 10.75 | | | $ | 10.00 | |
| | | | | | | | |
Income (loss) from investment operations: | | | | | | | | |
Net investment income (loss) (e)(x) | | | 0.21 | | | | 0.11 | |
Net realized and unrealized gain (loss) | | | (0.14 | ) | | | 0.64 | |
| | | | | | | | |
Total from investment operations | | | 0.07 | | | | 0.75 | |
| | | | | | | | |
Less distributions: | | | | | | | | |
Dividends from net investment income | | | (0.18 | ) | | | — | |
Distributions from net realized gains | | | (0.02 | ) | | | — | |
| | | | | | | | |
Total dividends and distributions | | | (0.20 | ) | | | — | |
| | | | | | | | |
Net asset value, end of period | | $ | 10.62 | | | $ | 10.75 | |
| | | | | | | | |
Total return (b) | | | 0.60 | % | | | 7.50 | % |
| | | | | | | | |
Ratios/Supplemental Data: | | | | | | | | |
Net assets, end of period (000’s) | | $ | 10,286 | | | $ | 2,688 | |
Ratio of expenses to average net assets: | | | | | | | | |
After waivers and reimbursements (a)(f) | | | 0.54 | %(j) | | | 0.53 | %(j) |
Before waivers and reimbursements (a)(f) | | | 3.23 | % | | | 5.30 | % |
Ratio of net investment income (loss) to average net assets: | | | | | | | | |
After waivers and reimbursements (a)(f)(x) | | | 1.91 | % | | | 1.62 | %(l) |
Before waivers and reimbursements (a)(f)(x) | | | (0.79 | )% | | | (3.15 | )%(l) |
Portfolio turnover rate (z)^ | | | 4 | % | | | 2 | % |
| * | Commencement of Operations. |
| ^ | Portfolio turnover rate excludes derivatives, if any. |
| (a) | Ratios for periods less than one year are annualized. Certain non-recurring expenses incurred by the Fund are not annualized for periods less than one year. |
| (b) | Total returns for periods less than one year are not annualized. |
| (e) | Net investment income (loss) per share is based on average shares outstanding. |
| (f) | Expenses do not include the expenses of the underlying funds (“indirect expenses”), if applicable. |
| (j) | Including direct and indirect expenses, the net expense ratio after waivers and reimbursements would be 0.65%. |
| (l) | The annualized ratio of net investment income to average net assets may not be indicative of operating results for a full year. |
| (x) | Recognition of net investment income is affected by the timing of dividend declarations by the underlying funds in which the Fund invests. |
| (z) | Portfolio turnover rate for periods less than one year is not annualized. |
See Notes to Financial Statements.
112
1290 RETIREMENT 2030 FUND (Unaudited)
INVESTMENT ADVISER
PERFORMANCE RESULTS
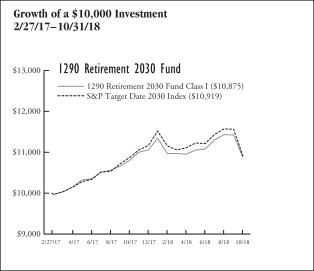
| | | | | | | | |
| Annualized Total Returns as of 10/31/18 | | | | |
| | | 1 Year | | | Since
Incept. | |
Fund – Class I Shares* | | | 0.70 | % | | | 5.14 | % |
S&P Target Date 2030 Index | | | 0.49 | | | | 5.39 | |
* Date of inception 2/27/17. Returns for periods greater than one year are annualized. | |
The performance quoted is past performance and is not a guarantee of future results. Mutual funds are subject to certain market risks. Investment returns and principal value of an investment will fluctuate so that an investor’s shares, when redeemed, may be worth more or less than their original cost. Current performance may be higher or lower than the performance data shown. For the most current month-end performance data please call 1-888-310-0416 or visit www.1290Funds.com.
The graph illustrates comparative performance for $10,000 invested in the Class I Shares of the 1290 Retirement 2030 Fund and the S&P Target Date 2030 Index from 2/27/17 to 10/31/18. The performance of the S&P Target Date 2030 Index reflects an initial investment at the end of the month closest to the Fund’s inception. The performance of the Fund assumes reinvestment of all dividends and capital gain distributions, if any, and does not include a sales charge. The performance of the S&P Target Date 2030 Index does not reflect the deduction of expenses or a sales charge associated with a mutual fund and has been adjusted to reflect reinvestment of all dividends, capital gain distributions, and interest of the securities included in the benchmark.
Fund performance may reflect the waiver of the Fund’s fees and reimbursement of expenses for certain periods since the inception date. Without these waivers and reimbursements, performance would have been lower. Also, performance shown in this section does not reflect the deduction of taxes that a shareholder would pay on Fund distributions or redemption of Fund shares.
PERFORMANCE SUMMARY
The Fund’s Class I shares returned 0.70% for the year ended October 31, 2018. The Fund’s benchmark, the S&P Target Date 2030 Index, returned 0.49% over the same year.
Overview
The Allocations Drive Performance
Each 1290 Retirement Fund’s (as defined in the Notes to the Financial Statements) performance will reflect the performance of the underlying asset classes and depend upon their percentage weighting within the Fund. Here’s why:
The 1290 Retirement Funds are managed to target a specific year of planned retirement. The Asset mix will become more conservative each year, until about 10 years after the target retirement year, when it will become relatively stable. The 1290 Retirement Funds balance the need for appreciation with the need for income as retirement approaches and focus on supporting an income stream over a long-term retirement withdrawal horizon.
To achieve its exposures, each 1290 Retirement Fund invests in exchange-traded funds (ETFs) representing various equity and bond asset classes. Because of this, each of the 1290 Retirement Funds’ performance will be a function of the asset class performance and the percentage weighting of each asset class in the 1290 Retirement Funds. Current target and actual allocations, as well as performance, are available in a separate quarterly Fund Fact Sheet.
Fund Highlights
What helped the 1290 Retirement Funds performance during the year*?
| • | | Within equities, U.S. large-cap and mid-cap equities exhibited positive returns and were the best performing asset class. U.S. small-cap equities also added modestly to each of the 1290 Retirement Funds’ performance. |
| • | | On the fixed income side, international bonds added to performance. |
| • | | Having exposure to ETFs that tend to be less volatile than the market as a whole helped buoy performance, especially within hard-hit emerging markets and developed-world sectors. |
What hurt the 1290 Retirement Funds performance during the year*?
| • | | Emerging market and international equities were the biggest detractors to performance for the period. |
| • | | U.S. fixed income (both core and high yield) had negative returns for the period. |
| * | The Fund does not hold a position in any single security directly but has exposure through ETFs. |
| | | | |
Table by Asset Class (as a percentage of Total Investments in Securities) As of October 31, 2018 | |
Equity | | | 71.7 | % |
Fixed Income | | | 28.3 | |
113
1290 RETIREMENT 2030 FUND (Unaudited)
| | | | |
Top 10 Holdings (as a percentage of Total Investments in Securities) As of October 31, 2018 | |
iShares Core S&P Total US Stock Market ETF | | | 24.3 | % |
iShares Core U.S. Aggregate Bond ETF | | | 24.1 | |
iShares Core MSCI EAFE ETF | | | 9.1 | |
iShares Edge MSCI Min Vol USA ETF | | | 8.3 | |
Invesco S&P 500 Low Volatility ETF | | | 8.1 | |
Invesco S&P International Developed Low Volatility ETF | | | 4.6 | |
iShares Edge MSCI Min Vol EAFE ETF | | | 4.5 | |
Invesco S&P MidCap Low Volatility ETF | | | 4.5 | |
iShares TIPS Bond ETF | | | 4.2 | |
iShares Core MSCI Emerging Markets ETF | | | 2.2 | |
| | |
Holdings are subject to change without notice. | | | | |
UNDERSTANDING YOUR EXPENSES:
As a shareholder of the Fund, you incur two types of costs:
(1) transaction costs, including applicable sales charges and redemption fees; and (2) ongoing costs, including investment advisory fees, distribution and/or service (12b-1) fees and other Fund expenses. These examples are intended to help you understand your ongoing costs (in dollars) of investing in the Fund and to compare these costs with the ongoing costs of investing in other mutual funds.
The examples are based on an investment of $1,000 invested at the beginning of the six-month period ended October 31, 2018 and held for the entire six-month period.
Actual Expenses
The first line of the following table provides information about actual account values and actual expenses. You may use the information in this line, together with the amount you invested, to estimate the expenses that you paid over the period. Simply divide your account value by $1,000 (for example, an $8,600 account value divided by $1,000 = 8.6), then multiply the result by the number in the first line under the heading entitled “Expenses Paid During Period” to estimate the expenses you paid on your account during this period.
Hypothetical Example for Comparison Purposes
The second line of the following table provides information about hypothetical account values and hypothetical expenses based on the Fund’s actual expense ratio and an assumed rate of return of 5% per year before expenses, which is not the Fund’s actual return. The hypothetical account values and expenses may not be used to estimate the actual ending account balance or expenses you paid for the period. You may use this information to compare the ongoing costs of investing in the Fund and other funds. To do so, compare this 5% hypothetical example with the 5% hypothetical examples that appear in the shareholder reports of the other funds.
Please note that the expenses shown in the table are meant to highlight your ongoing costs only and do not reflect any transactional costs, such as sales charges (loads), redemption fees, or exchange fees. Therefore, the second line of the table is useful in comparing ongoing costs only, and will not help you determine the relative total costs of owning different funds. In addition, if these transactional costs were included, your costs would have been higher.
EXAMPLE
| | | | | | | | | | | | |
| | | Beginning Account Value 5/1/18 | | | Ending Account Value 10/31/18 | | | Expenses Paid During Period* 5/1/18 - 10/31/18 | |
Class I | | | | | | | | | | | | |
Actual | | $ | 1,000.00 | | | $ | 992.60 | | | $ | 2.69 | |
Hypothetical (5% average annual return before expenses) | | | 1,000.00 | | | | 1,022.50 | | | | 2.73 | |
* Expenses are equal to the Fund’s Class I shares annualized expense ratio of 0.54%, multiplied by the average account value over the period, and multiplied by 184/365 (to reflect the one-half year period). | |
114
1290 FUNDS
1290 RETIREMENT 2030 FUND
PORTFOLIO OF INVESTMENTS
October 31, 2018
| | | | | | | | |
| | | Number of
Shares | | | Value
(Note 1) | |
| | | | | | | | |
EXCHANGE TRADED FUNDS (ETF): | |
Equity (71.7%) | |
Invesco S&P 500 Low Volatility ETF | | | 7,240 | | | $ | 347,448 | |
Invesco S&P Emerging Markets Low Volatility ETF | | | 2,010 | | | | 46,230 | |
Invesco S&P International Developed Low Volatility ETF | | | 6,350 | | | | 195,136 | |
Invesco S&P MidCap Low Volatility ETF | | | 4,160 | | | | 192,234 | |
Invesco S&P SmallCap Low Volatility ETF | | | 1,790 | | | | 82,304 | |
iShares Core MSCI EAFE ETF | | | 6,590 | | | | 387,360 | |
iShares Core MSCI Emerging Markets ETF | | | 1,990 | | | | 94,047 | |
iShares Core S&P Total US Stock Market ETF | | | 16,790 | | | | 1,036,446 | |
iShares Edge MSCI Min Vol EAFE ETF | | | 2,830 | | | | 193,176 | |
iShares Edge MSCI Min Vol Emerging Markets ETF | | | 840 | | | | 46,183 | |
| | | | | | | | |
iShares Edge MSCI Min Vol USA ETF | | | 6,510 | | | | 356,292 | |
SPDR SSGA US Small Cap Low Volatility Index ETF | | | 940 | | | | 84,733 | |
| | | | | | | | |
Total Equity | | | | | | | 3,061,589 | |
| | | | | | | | |
Fixed Income (28.2%) | | | | | | | | |
iShares Core U.S. Aggregate Bond ETF | | | 9,820 | | | | 1,027,073 | |
iShares TIPS Bond ETF | | | 1,640 | | | | 178,498 | |
| | | | | | | | |
Total Fixed Income | | | | | | | 1,205,571 | |
| | | | | | | | |
Total Investments in Securities (99.9%)
(Cost $4,199,259) | | | | | | | 4,267,160 | |
Other Assets Less Liabilities (0.1%) | | | | | | | 5,395 | |
| | | | | | | | |
Net Assets (100%) | | | | | | $ | 4,272,555 | |
| | | | | | | | |
The following is a summary of the inputs used to value the Fund’s assets and liabilities carried at fair value as of October 31, 2018:
The inputs or methodology used for valuing securities are not necessarily an indication of the risk associated with investing in those securities.
Various inputs are used in determining the value of the Fund’s investments. These inputs are summarized in the three broad levels listed below:
| | | | | | | | | | | | | | | | |
| | | | | |
| Investment Type | | Level 1
Quoted Prices in
Active Markets for
Identical
Securities | | | Level 2
Significant Other
Observable Inputs
(including quoted prices
for similar securities,
interest rates,
prepayment speeds,
credit risk, etc.) | | | Level 3
Significant Unobservable
Inputs (including the
Fund’s own
assumptions in
determining the fair
value of investments) | | | Total | |
Assets: | |
Exchange Traded Funds | |
Exchange Traded Funds | | $ | 4,267,160 | | | $ | — | | | $ | — | | | $ | 4,267,160 | |
| | | | | | | | | | | | | | | | |
Total Assets | | $ | 4,267,160 | | | $ | — | | | $ | — | | | $ | 4,267,160 | |
| | | | | | | | | | | | | | | | |
Total Liabilities | | $ | — | | | $ | — | | | $ | — | | | $ | — | |
| | | | | | | | | | | | | | | | |
Total | | $ | 4,267,160 | | | $ | — | | | $ | — | | | $ | 4,267,160 | |
| | | | | | | | | | | | | | | | |
The Fund held no derivatives contracts during the year ended October 31, 2018.
Investment security transactions for the year ended October 31, 2018 were as follows:
| | | | |
Cost of Purchases: | | | | |
Long-term investments other than U.S. government debt securities | | $ | 1,753,520 | |
Net Proceeds of Sales and Redemptions: | | | | |
Long-term investments other than U.S. government debt securities | | $ | 83,124 | |
See Notes to Financial Statements.
115
1290 FUNDS
1290 RETIREMENT 2030 FUND
PORTFOLIO OF INVESTMENTS (Continued)
October 31, 2018
As of October 31, 2018, the gross unrealized appreciation (depreciation) of investments based on the aggregate cost of investments in securities and derivative instruments, if applicable, for Federal income tax purposes was as follows:
| | | | |
Aggregate gross unrealized appreciation | | $ | 124,785 | |
Aggregate gross unrealized depreciation | | | (56,884 | ) |
| | | | |
Net unrealized appreciation | | $ | 67,901 | |
| | | | |
Federal income tax cost of investments in securities and derivative instruments, if applicable | | $ | 4,199,259 | |
| | | | |
See Notes to Financial Statements.
116
1290 FUNDS
1290 RETIREMENT 2030 FUND
STATEMENT OF ASSETS AND LIABILITIES
October 31, 2018
| | | | |
ASSETS | |
Investments in Securities, at value (Cost $4,199,259) | | $ | 4,267,160 | |
Cash | | | 30,162 | |
Receivable from investment adviser | | | 11,487 | |
Prepaid registration and filing fees | | | 5,683 | |
Receivable for Fund shares sold | | | 13 | |
Other assets | | | 33 | |
| | | | |
Total assets | | | 4,314,538 | |
| | | | |
|
LIABILITIES | |
Accrued professional fees | | | 32,428 | |
Transfer agent fees payable | | | 1,398 | |
Trustees’ fees payable | | | 10 | |
Accrued expenses | | | 8,147 | |
| | | | |
Total liabilities | | | 41,983 | |
| | | | |
NET ASSETS | | $ | 4,272,555 | |
| | | | |
Net assets were comprised of: | |
Paid in capital | | $ | 4,149,412 | |
Total distributable earnings (loss) | | | 123,143 | |
| | | | |
Net assets | | $ | 4,272,555 | |
| | | | |
Class I | | | | |
Net asset value and redemption price per share, $4,272,555 / 399,710 shares outstanding (unlimited amount authorized: $0.001 par value) | | $ | 10.69 | |
| | | | |
STATEMENT OF OPERATIONS
For the Year Ended October 31, 2018
| | | | |
INVESTMENT INCOME | |
Dividends | | $ | 75,406 | |
Interest | | | 278 | |
| | | | |
Total income | | | 75,684 | |
| | | | |
EXPENSES | |
Professional fees | | | 40,760 | |
Registration and filing fees | | | 36,341 | |
Administrative fees | | | 30,000 | |
Investment advisory fees | | | 16,303 | |
Printing and mailing expenses | | | 12,759 | |
Transfer agent fees | | | 7,260 | |
Offering costs | | | 3,370 | |
Custodian fees | | | 3,350 | |
Trustees’ fees | | | 327 | |
Miscellaneous | | | 3,920 | |
| | | | |
Gross expenses | | | 154,390 | |
Less: Waiver from investment adviser | | | (46,303 | ) |
Reimbursement from investment adviser | | | (90,600 | ) |
| | | | |
Net expenses | | | 17,487 | |
| | | | |
NET INVESTMENT INCOME (LOSS) | | | 58,197 | |
| | | | |
REALIZED AND UNREALIZED GAIN (LOSS) | |
Net realized gain (loss) on investments in securities | | | 10,877 | |
Net distributions of realized gain received from underlying funds | | | 2,774 | |
| | | | |
Net realized gain (loss) | | | 13,651 | |
| | | | |
Net change in unrealized appreciation (depreciation) on investments in securities | | | (103,899 | ) |
| | | | |
NET REALIZED AND UNREALIZED GAIN (LOSS) | | | (90,248 | ) |
| | | | |
NET INCREASE (DECREASE) IN NET ASSETS RESULTING FROM OPERATIONS | | $ | (32,051 | ) |
| | | | |
See Notes to Financial Statements.
117
1290 FUNDS
1290 RETIREMENT 2030 FUND
STATEMENT OF CHANGES IN NET ASSETS
| | | | | | | | |
| | | Year Ended
October 31, 2018 | | | February 27, 2017* to
October 31, 2017 | |
INCREASE (DECREASE) IN NET ASSETS FROM OPERATIONS: | |
Net investment income (loss) | | $ | 58,197 | | | $ | 27,868 | |
Net realized gain (loss) | | | 13,651 | | | | 1,501 | |
Net change in unrealized appreciation (depreciation) | | | (103,899 | ) | | | 171,800 | |
| | | | | | | | |
NET INCREASE (DECREASE) IN NET ASSETS RESULTING FROM OPERATIONS | | | (32,051 | ) | | | 201,169 | |
| | | | | | | | |
Distributions to shareholders: | | | | | | | | |
Class I | | | (46,752 | ) | | | — | |
| | | | | | | | |
CAPITAL SHARES TRANSACTIONS: | | | | | | | | |
Class I | | | | | | | | |
Capital shares sold [ 154,723 and 250,010 shares, respectively ] | | | 1,706,177 | | | | 2,500,100 | |
Capital shares issued in reinvestment of dividends [ 0# and 0 shares, respectively ] | | | 2 | | | | — | |
Capital shares repurchased [ (5,023) and 0 shares, respectively ] | | | (56,090 | ) | | | — | |
| | | | | | | | |
NET INCREASE (DECREASE) IN NET ASSETS RESULTING FROM CAPITAL SHARE TRANSACTIONS | | | 1,650,089 | | | | 2,500,100 | |
| | | | | | | | |
TOTAL INCREASE (DECREASE) IN NET ASSETS | | | 1,571,286 | | | | 2,701,269 | |
NET ASSETS: | |
Beginning of period | | | 2,701,269 | | | | — | |
| | | | | | | | |
End of period (a) | | $ | 4,272,555 | | | $ | 2,701,269 | |
| | | | | | | | |
* Commencement of Operations. | | | | | | | | |
# Number of shares is less than 0.5. | | | | | | | | |
(a) Includes accumulated undistributed (overdistributed) net investment income of $28,100 as of October 31, 2017. The SEC eliminated the requirement to disclose undistributed net investment income in 2018. | |
See Notes to Financial Statements.
118
1290 FUNDS
1290 RETIREMENT 2030 FUND
FINANCIAL HIGHLIGHTS
| | | | | | | | |
| Class I | | Year Ended October 31, 2018 | | | February 27, 2017* to October 31, 2017 | |
Net asset value, beginning of period | | $ | 10.80 | | | $ | 10.00 | |
| | | | | | | | |
Income (loss) from investment operations: | | | | | | | | |
Net investment income (loss) (e)(x) | | | 0.20 | | | | 0.11 | |
Net realized and unrealized gain (loss) | | | (0.12 | ) | | | 0.69 | |
| | | | | | | | |
Total from investment operations | | | 0.08 | | | | 0.80 | |
| | | | | | | | |
Less distributions: | | | | | | | | |
Dividends from net investment income | | | (0.18 | ) | | | — | |
Distributions from net realized gains | | | (0.01 | ) | | | — | |
| | | | | | | | |
Total dividends and distributions | | | (0.19 | ) | | | — | |
| | | | | | | | |
Net asset value, end of period | | $ | 10.69 | | | $ | 10.80 | |
| | | | | | | | |
Total return (b) | | | 0.70 | % | | | 8.00 | % |
| | | | | | | | |
Ratios/Supplemental Data: | | | | | | | | |
Net assets, end of period (000’s) | | $ | 4,273 | | | $ | 2,701 | |
Ratio of expenses to average net assets: | | | | | | | | |
After waivers and reimbursements (a)(f) | | | 0.54 | %(j) | | | 0.53 | %(j) |
Before waivers and reimbursements (a)(f) | | | 4.74 | % | | | 5.27 | % |
Ratio of net investment income (loss) to average net assets: | | | | | | | | |
After waivers and reimbursements (a)(f)(x) | | | 1.78 | % | | | 1.59 | %(l) |
Before waivers and reimbursements (a)(f)(x) | | | (2.41 | )% | | | (3.15 | )%(l) |
Portfolio turnover rate (z)^ | | | 3 | % | | | 1 | % |
| * | Commencement of Operations. |
| ^ | Portfolio turnover rate excludes derivatives, if any. |
| (a) | Ratios for periods less than one year are annualized. Certain non-recurring expenses incurred by the Fund are not annualized for periods less than one year. |
| (b) | Total returns for periods less than one year are not annualized. |
| (e) | Net investment income (loss) per share is based on average shares outstanding. |
| (f) | Expenses do not include the expenses of the underlying funds (“indirect expenses”), if applicable. |
| (j) | Including direct and indirect expenses, the net expense ratio after waivers and reimbursements would be 0.65%. |
| (l) | The annualized ratio of net investment income to average net assets may not be indicative of operating results for a full year. |
| (x) | Recognition of net investment income is affected by the timing of dividend declarations by the underlying funds in which the Fund invests. |
| (z) | Portfolio turnover rate for periods less than one year is not annualized. |
See Notes to Financial Statements.
119
1290 RETIREMENT 2035 FUND (Unaudited)
INVESTMENT ADVISER
PERFORMANCE RESULTS

| | | | | | | | |
| Annualized Total Returns as of 10/31/18 | | | | | | |
| | | 1
Year | | | Since
Incept. | |
Fund – Class I Shares* | | | 0.88 | % | | | 5.55 | % |
S&P Target Date 2035 Index | | | 0.55 | | | | 5.92 | |
* Date of inception 2/27/17. Returns for periods greater than one year are annualized. | |
The performance quoted is past performance and is not a guarantee of future results. Mutual funds are subject to certain market risks. Investment returns and principal value of an investment will fluctuate so that an investor’s shares, when redeemed, may be worth more or less than their original cost. Current performance may be higher or lower than the performance data shown. For the most current month-end performance data please call 1-888-310-0416 or visit www.1290Funds.com.
The graph illustrates comparative performance for $10,000 invested in the Class I Shares of the 1290 Retirement 2035 Fund and the S&P Target Date 2035 Index from 2/27/17 to 10/31/18. The performance of the S&P Target Date 2035 Index reflects an initial investment at the end of the month closest to the Fund’s inception. The performance of the Fund assumes reinvestment of all dividends and capital gain distributions, if any, and does not include a sales charge. The performance of the S&P Target Date 2035 Index does not reflect the deduction of expenses or a sales charge associated with a mutual fund and has been adjusted to reflect reinvestment of all dividends, capital gain distributions, and interest of the securities included in the benchmark.
Fund performance may reflect the waiver of the Fund’s fees and reimbursement of expenses for certain periods since the inception date. Without these waivers and reimbursements, performance would have been lower. Also, performance shown in this section does not reflect the deduction of taxes that a shareholder would pay on Fund distributions or redemption of Fund shares.
PERFORMANCE SUMMARY
The Fund’s Class I shares returned 0.88% for the year ended October 31, 2018. The Fund’s benchmark, the S&P Target Date 2035 Index, returned 0.55% over the same year.
Overview
The Allocations Drive Performance
Each 1290 Retirement Fund’s (as defined in the Notes to the Financial Statements) performance will reflect the performance of the underlying asset classes and depend upon their percentage weighting within the Fund. Here’s why:
The 1290 Retirement Funds are managed to target a specific year of planned retirement. The Asset mix will become more conservative each year, until about 10 years after the target retirement year, when it will become relatively stable. The 1290 Retirement Funds balance the need for appreciation with the need for income as retirement approaches and focus on supporting an income stream over a long-term retirement withdrawal horizon.
To achieve its exposures, each 1290 Retirement Fund invests in exchange-traded funds (ETFs) representing various equity and bond asset classes. Because of this, each of the 1290 Retirement Funds’ performance will be a function of the asset class performance and the percentage weighting of each asset class in the 1290 Retirement Funds. Current target and actual allocations, as well as performance, are available in a separate quarterly Fund Fact Sheet.
Fund Highlights
What helped the 1290 Retirement Funds performance during the year*?
| • | | Within equities, U.S. large-cap and mid-cap equities exhibited positive returns and were the best performing asset class. U.S. small-cap equities also added modestly to each of the 1290 Retirement Funds’ performance. |
| • | | On the fixed income side, international bonds added to performance. |
| • | | Having exposure to ETFs that tend to be less volatile than the market as a whole helped buoy performance, especially within hard-hit emerging markets and developed-world sectors. |
What hurt the 1290 Retirement Funds performance during the year*?
| • | | Emerging market and international equities were the biggest detractors to performance for the period. |
| • | | U.S. fixed income (both core and high yield) had negative returns for the period. |
| * | The Fund does not hold a position in any single security directly but has exposure through ETFs. |
| | | | |
Table by Asset Class (as a percentage of Total Investments in Securities) As of October 31, 2018 | |
Equity | | | 76.6 | % |
Fixed Income | | | 23.4 | |
120
1290 RETIREMENT 2035 FUND (Unaudited)
| | | | |
Top 10 Holdings (as a percentage of Total Investments in Securities) As of October 31, 2018 | |
iShares Core S&P Total US Stock Market ETF | | | 26.1 | % |
iShares Core U.S. Aggregate Bond ETF | | | 19.9 | |
iShares Core MSCI EAFE ETF | | | 9.4 | |
Invesco S&P 500 Low Volatility ETF | | | 8.8 | |
iShares Edge MSCI Min Vol USA ETF | | | 8.7 | |
Invesco S&P International Developed Low Volatility ETF | | | 4.9 | |
Invesco S&P MidCap Low Volatility ETF | | | 4.8 | |
iShares Edge MSCI Min Vol EAFE ETF | | | 4.8 | |
iShares TIPS Bond ETF | | | 3.6 | |
iShares Core MSCI Emerging Markets ETF | | | 2.2 | |
Holdings are subject to change without notice. | | | | |
UNDERSTANDING YOUR EXPENSES:
As a shareholder of the Fund, you incur two types of costs:
(1) transaction costs, including applicable sales charges and redemption fees; and (2) ongoing costs, including investment advisory fees, distribution and/or service (12b-1) fees and other Fund expenses. These examples are intended to help you understand your ongoing costs (in dollars) of investing in the Fund and to compare these costs with the ongoing costs of investing in other mutual funds.
The examples are based on an investment of $1,000 invested at the beginning of the six-month period ended October 31, 2018 and held for the entire six-month period.
Actual Expenses
The first line of the following table provides information about actual account values and actual expenses. You may use the information in this line, together with the amount you invested, to estimate the expenses that you paid over the period. Simply divide your account value by $1,000 (for example, an $8,600 account value divided by $1,000 = 8.6), then multiply the result by the number in the first line under the heading entitled “Expenses Paid During Period” to estimate the expenses you paid on your account during this period.
Hypothetical Example for Comparison Purposes
The second line of the following table provides information about hypothetical account values and hypothetical expenses based on the Fund’s actual expense ratio and an assumed rate of return of 5% per year before expenses, which is not the Fund’s actual return. The hypothetical account values and expenses may not be used to estimate the actual ending account balance or expenses you paid for the period. You may use this information to compare the ongoing costs of investing in the Fund and other funds. To do so, compare this 5% hypothetical example with the 5% hypothetical examples that appear in the shareholder reports of the other funds.
Please note that the expenses shown in the table are meant to highlight your ongoing costs only and do not reflect any transactional costs, such as sales charges (loads), redemption fees, or exchange fees. Therefore, the second line of the table is useful in comparing ongoing costs only, and will not help you determine the relative total costs of owning different funds. In addition, if these transactional costs were included, your costs would have been higher.
EXAMPLE
| | | | | | | | | | | | |
| | | Beginning Account Value
5/1/18 | | | Ending Account Value
10/31/18 | | | Expenses Paid During Period*
5/1/18 - 10/31/18 | |
Class I | |
Actual | | $ | 1,000.00 | | | $ | 992.60 | | | $ | 2.67 | |
Hypothetical (5% average annual return before expenses) | | | 1,000.00 | | | | 1,022.52 | | | | 2.71 | |
* Expenses are equal to the Fund’s Class I shares annualized expense ratio of 0.53%, multiplied by the average account value over the period, and multiplied by 184/365 (to reflect the one-half year period). | |
121
1290 FUNDS
1290 RETIREMENT 2035 FUND
PORTFOLIO OF INVESTMENTS
October 31, 2018
| | | | | | | | |
| | | Number of
Shares | | | Value
(Note 1) | |
| | | | | | | | |
EXCHANGE TRADED FUNDS (ETF): | |
Equity (75.6%) | |
Invesco S&P 500 Low Volatility ETF | | | 12,150 | | | $ | 583,079 | |
Invesco S&P Emerging Markets Low Volatility ETF | | | 3,350 | | | | 77,050 | |
Invesco S&P International Developed Low Volatility ETF | | | 10,550 | | | | 324,202 | |
Invesco S&P MidCap Low Volatility ETF | | | 6,850 | | | | 316,539 | |
Invesco S&P SmallCap Low Volatility ETF | | | 3,090 | | | | 142,078 | |
iShares Core MSCI EAFE ETF | | | 10,600 | | | | 623,068 | |
iShares Core MSCI Emerging Markets ETF | | | 3,110 | | | | 146,979 | |
iShares Core S&P Total US Stock Market ETF | | | 27,970 | | | | 1,726,587 | |
iShares Edge MSCI Min Vol EAFE ETF | | | 4,600 | | | | 313,996 | |
| | | | | | | | |
iShares Edge MSCI Min Vol Emerging Markets ETF | | | 1,450 | | | | 79,721 | |
iShares Edge MSCI Min Vol USA ETF | | | 10,510 | | | | 575,212 | |
SPDR SSGA US Small Cap Low Volatility Index ETF | | | 1,620 | | | | 146,028 | |
| | | | | | | | |
Total Equity | | | | | | | 5,054,539 | |
| | | | | | | | |
Fixed Income (23.1%) | | | | | | | | |
iShares Core U.S. Aggregate Bond ETF | | | 12,540 | | | | 1,311,559 | |
iShares TIPS Bond ETF | | | 2,170 | | | | 236,183 | |
| | | | | | | | |
Total Fixed Income | | | | | | | 1,547,742 | |
| | | | | | | | |
Total Investments in Securities (98.7%)
(Cost $6,589,169) | | | | | | | 6,602,281 | |
Other Assets Less Liabilities (1.3%) | | | | | | | 89,699 | |
| | | | | |
Net Assets (100%) | | | | | | $ | 6,691,980 | |
| | | | | | | | |
The following is a summary of the inputs used to value the Fund’s assets and liabilities carried at fair value as of October 31, 2018:
The inputs or methodology used for valuing securities are not necessarily an indication of the risk associated with investing in those securities.
Various inputs are used in determining the value of the Fund’s investments. These inputs are summarized in the three broad levels listed below:
| | | | | | | | | | | | | | | | |
| | | | | |
| Investment Type | | Level 1
Quoted Prices in
Active Markets for
Identical
Securities | | | Level 2
Significant Other
Observable Inputs
(including quoted prices
for similar securities,
interest rates,
prepayment speeds,
credit risk, etc.) | | | Level 3
Significant Unobservable
Inputs (including the
Fund’s own
assumptions in
determining the fair
value of investments) | | | Total | |
Assets: | | | | | |
Exchange Traded Funds | | | | | | | | | | | | | | | | |
Exchange Traded Funds | | $ | 6,602,281 | | | $ | — | | | $ | — | | | $ | 6,602,281 | |
| | | | | | | | | | | | | | | | |
Total Assets | | $ | 6,602,281 | | | $ | — | | | $ | — | | | $ | 6,602,281 | |
| | | | | | | | | | | | | | | | |
Total Liabilities | | $ | — | | | $ | — | | | $ | — | | | $ | — | |
| | | | | | | | | | | | | | | | |
Total | | $ | 6,602,281 | | | $ | — | | | $ | — | | | $ | 6,602,281 | |
| | | | | | | | | | | | | | | | |
The Fund held no derivatives contracts during the year ended October 31, 2018.
Investment security transactions for the year ended October 31, 2018 were as follows:
| | | | |
Cost of Purchases: | | | | |
Long-term investments other than U.S. government debt securities | | $ | 4,126,312 | |
Net Proceeds of Sales and Redemptions: | | | | |
Long-term investments other than U.S. government debt securities | | $ | 63,262 | |
See Notes to Financial Statements.
122
1290 FUNDS
1290 RETIREMENT 2035 FUND
PORTFOLIO OF INVESTMENTS (Continued)
October 31, 2018
As of October 31, 2018, the gross unrealized appreciation (depreciation) of investments based on the aggregate cost of investments in securities and derivative instruments, if applicable, for Federal income tax purposes was as follows:
| | | | |
Aggregate gross unrealized appreciation | | $ | 119,029 | |
Aggregate gross unrealized depreciation | | | (105,917 | ) |
| | | | |
Net unrealized appreciation | | $ | 13,112 | |
| | | | |
Federal income tax cost of investments in securities and derivative instruments, if applicable | | $ | 6,589,169 | |
| | | | |
See Notes to Financial Statements.
123
1290 FUNDS
1290 RETIREMENT 2035 FUND
STATEMENT OF ASSETS AND LIABILITIES
October 31, 2018
| | | | |
ASSETS | | | | |
Investments in Securities, at value (Cost $6,589,169) | | $ | 6,602,281 | |
Cash | | | 55,589 | |
Receivable for Fund shares sold | | | 59,365 | |
Receivable from investment adviser | | | 11,903 | |
Prepaid registration and filing fees | | | 5,751 | |
Dividends, interest and other receivables | | | 43 | |
Other assets | | | 35 | |
| | | | |
Total assets | | | 6,734,967 | |
| | | | |
LIABILITIES | | | | |
Transfer agent fees payable | | | 1,398 | |
Accrued expenses | | | 41,589 | |
| | | | |
Total liabilities | | | 42,987 | |
| | | | |
NET ASSETS | | $ | 6,691,980 | |
| | | | |
Net assets were comprised of: | | | | |
Paid in capital | | $ | 6,613,921 | |
Total distributable earnings (loss) | | | 78,059 | |
| | | | |
Net assets | | $ | 6,691,980 | |
| | | | |
Class I | | | | |
Net asset value and redemption price per share, $6,691,980 / 621,693 shares outstanding (unlimited amount authorized: $0.001 par value) | | $ | 10.76 | |
| | | | |
STATEMENT OF OPERATIONS
For the Year Ended October 31, 2018
| | | | |
INVESTMENT INCOME | | | | |
Dividends | | $ | 92,061 | |
Interest | | | 411 | |
| | | | |
Total income | | | 92,472 | |
| | | | |
EXPENSES | | | | |
Professional fees | | | 41,596 | |
Registration and filing fees | | | 36,355 | |
Administrative fees | | | 30,000 | |
Investment advisory fees | | | 20,408 | |
Printing and mailing expenses | | | 13,153 | |
Transfer agent fees | | | 7,260 | |
Custodian fees | | | 4,400 | |
Offering costs | | | 3,376 | |
Trustees’ fees | | | 391 | |
Miscellaneous | | | 4,119 | |
| | | | |
Gross expenses | | | 161,058 | |
Less: Waiver from investment adviser | | | (50,408 | ) |
Reimbursement from investment adviser | | | (88,913 | ) |
| | | | |
Net expenses | | | 21,737 | |
| | | | |
NET INVESTMENT INCOME (LOSS) | | | 70,735 | |
| | | | |
REALIZED AND UNREALIZED GAIN (LOSS) | | | | |
Net realized gain (loss) on investments in securities | | | 7,995 | |
Net distributions of realized gain received from underlying funds | | | 2,922 | |
| | | | |
Net realized gain (loss) | | | 10,917 | |
| | | | |
Net change in unrealized appreciation (depreciation) on investments in securities | | | (169,314 | ) |
| | | | |
NET REALIZED AND UNREALIZED GAIN (LOSS) | | | (158,397 | ) |
| | | | |
NET INCREASE (DECREASE) IN NET ASSETS RESULTING FROM OPERATIONS | | $ | (87,662 | ) |
| | | | |
See Notes to Financial Statements.
124
1290 FUNDS
1290 RETIREMENT 2035 FUND
STATEMENT OF CHANGES IN NET ASSETS
| | | | | | | | |
| | | Year Ended
October 31, 2018 | | | February 27, 2017* to
October 31, 2017 | |
INCREASE (DECREASE) IN NET ASSETS FROM OPERATIONS: | | | | | | | | |
Net investment income (loss) | | $ | 70,735 | | | $ | 27,656 | |
Net realized gain (loss) | | | 10,917 | | | | 1,501 | |
Net change in unrealized appreciation (depreciation) | | | (169,314 | ) | | | 182,426 | |
| | | | | | | | |
NET INCREASE (DECREASE) IN NET ASSETS RESULTING FROM OPERATIONS | | | (87,662 | ) | | | 211,583 | |
| | | | | | | | |
Distributions to shareholders: | | | | | | | | |
Class I | | | (46,752 | ) | | | — | |
| | | | | | | | |
CAPITAL SHARES TRANSACTIONS: | | | | | | | | |
Class I | | | | | | | | |
Capital shares sold [ 372,084 and 250,010 shares, respectively ] | | | 4,119,218 | | | | 2,500,100 | |
Capital shares issued in reinvestment of dividends [ 0# and 0 shares, respectively ] | | | 2 | | | | — | |
Capital shares repurchased [ (401) and 0 shares, respectively ] | | | (4,509 | ) | | | — | |
| | | | | | | | |
NET INCREASE (DECREASE) IN NET ASSETS RESULTING FROM CAPITAL SHARE TRANSACTIONS | | | 4,114,711 | | | | 2,500,100 | |
| | | | | | | | |
TOTAL INCREASE (DECREASE) IN NET ASSETS | | | 3,980,297 | | | | 2,711,683 | |
NET ASSETS: | | | | | | | | |
Beginning of period | | | 2,711,683 | | | | — | |
| | | | | | | | |
End of period (a) | | $ | 6,691,980 | | | $ | 2,711,683 | |
| | | | | | | | |
* Commencement of Operations. | | | | | | | | |
# Number of shares is less than 0.5. | | | | | | | | |
(a) Includes accumulated undistributed (overdistributed) net investment income of $27,883 as of October 31, 2017. The SEC eliminated the requirement to disclose undistributed net investment income in 2018. | |
See Notes to Financial Statements.
125
1290 FUNDS
1290 RETIREMENT 2035 FUND
FINANCIAL HIGHLIGHTS
| | | | | | | | |
| Class I | | Year Ended
October 31, 2018 | | | February 27, 2017* to
October 31, 2017 | |
Net asset value, beginning of period | | $ | 10.85 | | | $ | 10.00 | |
| | | | | | | | |
Income (loss) from investment operations: | | | | | | | | |
Net investment income (loss) (e)(x) | | | 0.19 | | | | 0.11 | |
Net realized and unrealized gain (loss) | | | (0.09 | ) | | | 0.74 | |
| | | | | | | | |
Total from investment operations | | | 0.10 | | | | 0.85 | |
| | | | | | | | |
Less distributions: | |
Dividends from net investment income | | | (0.18 | ) | | | — | |
Distributions from net realized gains | | | (0.01 | ) | | | — | |
| | | | | | | | |
Total dividends and distributions | | | (0.19 | ) | | | — | |
| | | | | | | | |
Net asset value, end of period | | $ | 10.76 | | | $ | 10.85 | |
| | | | | | | | |
Total return (b) | | | 0.88 | % | | | 8.50 | % |
| | | | | | | | |
Ratios/Supplemental Data: | |
Net assets, end of period (000’s) | | $ | 6,692 | | | $ | 2,712 | |
Ratio of expenses to average net assets: | | | | | | | | |
After waivers and reimbursements (a)(f) | | | 0.53 | %(j) | | | 0.53 | %(j) |
Before waivers and reimbursements (a)(f) | | | 3.95 | % | | | 5.28 | % |
Ratio of net investment income (loss) to average net assets: | | | | | | | | |
After waivers and reimbursements (a)(f)(x) | | | 1.73 | % | | | 1.58 | %(l) |
Before waivers and reimbursements (a)(f)(x) | | | (1.68 | )% | | | (3.17 | )%(l) |
Portfolio turnover rate (z)^ | | | 2 | % | | | 1 | % |
| * | Commencement of Operations. |
| ^ | Portfolio turnover rate excludes derivatives, if any. |
| (a) | Ratios for periods less than one year are annualized. Certain non-recurring expenses incurred by the Fund are not annualized for periods less than one year. |
| (b) | Total returns for periods less than one year are not annualized. |
| (e) | Net investment income (loss) per share is based on average shares outstanding. |
| (f) | Expenses do not include the expenses of the underlying funds (“indirect expenses”), if applicable. |
| (j) | Including direct and indirect expenses, the net expense ratio after waivers and reimbursements would be 0.65%. |
| (l) | The annualized ratio of net investment income to average net assets may not be indicative of operating results for a full year. |
| (x) | Recognition of net investment income is affected by the timing of dividend declarations by the underlying funds in which the Fund invests. |
| (z) | Portfolio turnover rate for periods less than one year is not annualized. |
See Notes to Financial Statements.
126
1290 RETIREMENT 2040 FUND (Unaudited)
INVESTMENT ADVISER
PERFORMANCE RESULTS
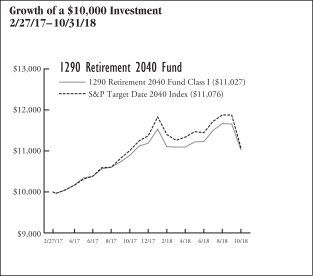
| | | | | | | | |
| Annualized Total Returns as of 10/31/18 | |
| | | 1
Year | | | Since
Incept. | |
Fund – Class I Shares* | | | 1.26 | % | | | 6.01 | % |
S&P Target Date 2040 Index | | | 0.63 | | | | 6.29 | |
* Date of inception 2/27/17. Returns for periods greater than one year are annualized. | |
The performance quoted is past performance and is not a guarantee of future results. Mutual funds are subject to certain market risks. Investment returns and principal value of an investment will fluctuate so that an investor’s shares, when redeemed, may be worth more or less than their original cost. Current performance may be higher or lower than the performance data shown. For the most current month-end performance data please call 1-888-310-0416 or visit www.1290Funds.com.
The graph illustrates comparative performance for $10,000 invested in the Class I Shares of the 1290 Retirement 2040 Fund and the S&P Target Date 2040 Index from 2/27/17 to 10/31/18. The performance of the S&P Target Date 2040 Index reflects an initial investment at the end of the month closest to the Fund’s inception. The performance of the Fund assumes reinvestment of all dividends and capital gain distributions, if any, and does not include a sales charge. The performance of the S&P Target Date 2040 Index does not reflect the deduction of expenses or a sales charge associated with a mutual fund and has been adjusted to reflect reinvestment of all dividends, capital gain distributions, and interest of the securities included in the benchmark.
Fund performance may reflect the waiver of the Fund’s fees and reimbursement of expenses for certain periods since the inception date. Without these waivers and reimbursements, performance would have been lower. Also, performance shown in this section does not reflect the deduction of taxes that a shareholder would pay on Fund distributions or redemption of Fund shares.
PERFORMANCE SUMMARY
The Fund’s Class I shares returned 1.26% for the year ended October 31, 2018. The Fund’s benchmark, the S&P Target Date 2040 Index, returned 0.63% over the same year.
Overview
The Allocations Drive Performance
Each 1290 Retirement Fund’s (as defined in the Notes to the Financial Statements) performance will reflect the performance of the underlying asset classes and depend upon their percentage weighting within the Fund. Here’s why:
The 1290 Retirement Funds are managed to target a specific year of planned retirement. The Asset mix will become more conservative each year, until about 10 years after the target retirement year, when it will become relatively stable. The 1290 Retirement Funds balance the need for appreciation with the need for income as retirement approaches and focus on supporting an income stream over a long-term retirement withdrawal horizon.
To achieve its exposures, each 1290 Retirement Fund invests in exchange-traded funds (ETFs) representing various equity and bond asset classes. Because of this, each of the 1290 Retirement Funds’ performance will be a function of the asset class performance and the percentage weighting of each asset class in the 1290 Retirement Funds. Current target and actual allocations, as well as performance, are available in a separate quarterly Fund Fact Sheet.
Fund Highlights
What helped the 1290 Retirement Funds performance during the year*?
| • | | Within equities, U.S. large-cap and mid-cap equities exhibited positive returns and were the best performing asset class. U.S. small-cap equities also added modestly to each of the 1290 Retirement Funds’ performance. |
| • | | On the fixed income side, international bonds added to performance. |
| • | | Having exposure to ETFs that tend to be less volatile than the market as a whole helped buoy performance, especially within hard-hit emerging markets and developed-world sectors. |
What hurt the 1290 Retirement Funds performance during the year*?
| • | | Emerging market and international equities were the biggest detractors to performance for the period. |
| • | | U.S. fixed income (both core and high yield) had negative returns for the period. |
| * | The Fund does not hold a position in any single security directly but has exposure through ETFs. |
| | | | |
Table by Asset Class (as a percentage of Total Investments in Securities) As of October 31, 2018 | |
Equity | | | 81.7 | % |
Fixed Income | | | 18.3 | |
127
1290 RETIREMENT 2040 FUND (Unaudited)
| | | | |
Top 10 Holdings (as a percentage of Total Investments in Securities) As of October 31, 2018 | |
iShares Core S&P Total US Stock Market ETF | | | 28.1 | % |
iShares Core U.S. Aggregate Bond ETF | | | 15.5 | |
iShares Core MSCI EAFE ETF | | | 10.1 | |
iShares Edge MSCI Min Vol USA ETF | | | 9.8 | |
Invesco S&P 500 Low Volatility ETF | | | 9.6 | |
Invesco S&P MidCap Low Volatility ETF | | | 5.3 | |
iShares Edge MSCI Min Vol EAFE ETF | | | 5.1 | |
Invesco S&P International Developed Low Volatility ETF | | | 5.0 | |
iShares TIPS Bond ETF | | | 2.7 | |
SPDR SSGA US Small Cap Low Volatility Index ETF | | | 2.3 | |
Holdings are subject to change without notice. | | | | |
UNDERSTANDING YOUR EXPENSES:
As a shareholder of the Fund, you incur two types of costs:
(1) transaction costs, including applicable sales charges and redemption fees; and (2) ongoing costs, including investment advisory fees, distribution and/or service (12b-1) fees and other Fund expenses. These examples are intended to help you understand your ongoing costs (in dollars) of investing in the Fund and to compare these costs with the ongoing costs of investing in other mutual funds.
The examples are based on an investment of $1,000 invested at the beginning of the six-month period ended October 31, 2018 and held for the entire six-month period.
Actual Expenses
The first line of the following table provides information about actual account values and actual expenses. You may use the information in this line, together with the amount you invested, to estimate the expenses that you paid over the period. Simply divide your account value by $1,000 (for example, an $8,600 account value divided by $1,000 = 8.6), then multiply the result by the number in the first line under the heading entitled “Expenses Paid During Period” to estimate the expenses you paid on your account during this period.
Hypothetical Example for Comparison Purposes
The second line of the following table provides information about hypothetical account values and hypothetical expenses based on the Fund’s actual expense ratio and an assumed rate of return of 5% per year before expenses, which is not the Fund’s actual return. The hypothetical account values and expenses may not be used to estimate the actual ending account balance or expenses you paid for the period. You may use this information to compare the ongoing costs of investing in the Fund and other funds. To do so, compare this 5% hypothetical example with the 5% hypothetical examples that appear in the shareholder reports of the other funds.
Please note that the expenses shown in the table are meant to highlight your ongoing costs only and do not reflect any transactional costs, such as sales charges (loads), redemption fees, or exchange fees. Therefore, the second line of the table is useful in comparing ongoing costs only, and will not help you determine the relative total costs of owning different funds. In addition, if these transactional costs were included, your costs would have been higher.
EXAMPLE
| | | | | | | | | | | | |
| | | Beginning
Account
Value
5/1/18 | | | Ending
Account
Value
10/31/18 | | | Expenses
Paid
During
Period*
5/1/18 -
10/31/18 | |
Class I | | | | | | | | | | | | |
Actual | | $ | 1,000.00 | | | $ | 994.50 | | | $ | 2.67 | |
Hypothetical (5% average annual return before expenses) | | | 1,000.00 | | | | 1,022.53 | | | | 2.70 | |
* Expenses are equal to the Fund’s Class I shares annualized expense ratio of 0.53%, multiplied by the average account value over the period, and multiplied by 184/365 (to reflect the one-half year period). | |
128
1290 FUNDS
1290 RETIREMENT 2040 FUND
PORTFOLIO OF INVESTMENTS
October 31, 2018
| | | | | | | | |
| | | Number of
Shares | | | Value
(Note 1) | |
| | | | | | | | |
EXCHANGE TRADED FUNDS (ETF): | | | | | |
Equity (81.9%) | | | | | | | | |
Invesco S&P 500 Low Volatility ETF | | | 5,860 | | | $ | 281,221 | |
Invesco S&P Emerging Markets Low Volatility ETF | | | 1,360 | | | | 31,280 | |
Invesco S&P International Developed Low Volatility ETF | | | 4,730 | | | | 145,353 | |
Invesco S&P MidCap Low Volatility ETF | | | 3,320 | | | | 153,417 | |
Invesco S&P SmallCap Low Volatility ETF | | | 1,400 | | | | 64,372 | |
iShares Core MSCI EAFE ETF | | | 5,010 | | | | 294,488 | |
iShares Core MSCI Emerging Markets ETF | | | 1,320 | | | | 62,383 | |
iShares Core S&P Total US Stock Market ETF | | | 13,330 | | | | 822,862 | |
iShares Edge MSCI Min Vol EAFE ETF | | | 2,170 | | | | 148,124 | |
| | | | | | | | |
iShares Edge MSCI Min Vol Emerging Markets ETF | | | 580 | | | | 31,888 | |
iShares Edge MSCI Min Vol USA ETF | | | 5,220 | | | | 285,691 | |
SPDR SSGA US Small Cap Low Volatility Index ETF | | | 740 | | | | 66,704 | |
| | | | | | | | |
Total Equity | | | | | | | 2,387,783 | |
| | | | | | | | |
Fixed Income (18.3%) | | | | | | | | |
iShares Core U.S. Aggregate Bond ETF | | | 4,340 | | | | 453,921 | |
iShares TIPS Bond ETF | | | 730 | | | | 79,453 | |
| | | | | | | | |
Total Fixed Income | | | | | | | 533,374 | |
| | | | | | | | |
Total Investments in Securities (100.2%)
(Cost $2,762,774) | | | | | | | 2,921,157 | |
Other Assets Less Liabilities (-0.2%) | | | | | | | (5,662 | ) |
| | | | | | | | |
Net Assets (100%) | | | | | | $ | 2,915,495 | |
| | | | | | | | |
The following is a summary of the inputs used to value the Fund’s assets and liabilities carried at fair value as of October 31, 2018:
The inputs or methodology used for valuing securities are not necessarily an indication of the risk associated with investing in those securities.
Various inputs are used in determining the value of the Fund’s investments. These inputs are summarized in the three broad levels listed below:
| | | | | | | | | | | | | | | | |
| | | | | |
| Investment Type | | Level 1
Quoted Prices in
Active Markets for
Identical
Securities | | | Level 2
Significant Other
Observable Inputs
(including quoted prices
for similar securities,
interest rates,
prepayment speeds,
credit risk, etc.) | | | Level 3
Significant Unobservable
Inputs (including the
Fund’s own
assumptions in
determining the fair
value of investments) | | | Total | |
Assets: | | | | | | | | | | | | | | | | |
Exchange Traded Funds | | | | | | | | | | | | | | | | |
Exchange Traded Funds | | $ | 2,921,157 | | | $ | — | | | $ | — | | | $ | 2,921,157 | |
| | | | | | | | | | | | | | | | |
Total Assets | | $ | 2,921,157 | | | $ | — | | | $ | — | | | $ | 2,921,157 | |
| | | | | | | | | | | | | | | | |
Total Liabilities | | $ | — | | | $ | — | | | $ | — | | | $ | — | |
| | | | | | | | | | | | | | | | |
Total | | $ | 2,921,157 | | | $ | — | | | $ | — | | | $ | 2,921,157 | |
| | | | | | | | | | | | | | | | |
The Fund held no derivatives contracts during the year ended October 31, 2018.
Investment security transactions for the year ended October 31, 2018 were as follows:
| | | | |
Cost of Purchases: | | | | |
Long-term investments other than U.S. government debt securities | | $ | 304,603 | |
Net Proceeds of Sales and Redemptions: | | | | |
Long-term investments other than U.S. government debt securities | | $ | 68,480 | |
As of October 31, 2018, the gross unrealized appreciation (depreciation) of investments based on the aggregate cost of investments in securities and derivative instruments, if applicable, for Federal income tax purposes was as follows:
| | | | |
Aggregate gross unrealized appreciation | | $ | 180,668 | |
Aggregate gross unrealized depreciation | | | (22,285 | ) |
| | | | |
Net unrealized appreciation | | $ | 158,383 | |
| | | | |
Federal income tax cost of investments in securities and derivative instruments, if applicable | | $ | 2,762,774 | |
| | | | |
See Notes to Financial Statements.
129
1290 FUNDS
1290 RETIREMENT 2040 FUND
STATEMENT OF ASSETS AND LIABILITIES
October 31, 2018
| | | | |
ASSETS | |
Investments in Securities, at value (Cost $2,762,774) | | $ | 2,921,157 | |
Cash | | | 18,342 | |
Receivable from investment adviser | | | 11,290 | |
Prepaid registration and filing fees | | | 5,632 | |
Receivable for Fund shares sold | | | 416 | |
Other assets | | | 34 | |
| | | | |
Total assets | | | 2,956,871 | |
| | | | |
LIABILITIES | | | | |
Accrued professional fees | | | 32,044 | |
Transfer agent fees payable | | | 1,294 | |
Trustees’ fees payable | | | 24 | |
Accrued expenses | | | 8,014 | |
| | | | |
Total liabilities | | | 41,376 | |
| | | | |
NET ASSETS | | $ | 2,915,495 | |
| | | | |
Net assets were comprised of: | | | | |
Paid in capital | | $ | 2,711,025 | |
Total distributable earnings (loss) | | | 204,470 | |
| | | | |
Net assets | | $ | 2,915,495 | |
| | | | |
Class I | | | | |
Net asset value and redemption price per share, $2,915,495 / 268,923 shares outstanding (unlimited amount authorized: $0.001 par value) | | $ | 10.84 | |
| | | | |
STATEMENT OF OPERATIONS
For the Year Ended October 31, 2018
| | | | |
INVESTMENT INCOME | |
Dividends | | $ | 65,962 | |
Interest | | | 218 | |
| | | | |
Total income | | | 66,180 | |
| | | | |
EXPENSES | | | | |
Professional fees | | | 40,318 | |
Registration and filing fees | | | 36,344 | |
Administrative fees | | | 30,000 | |
Investment advisory fees | | | 14,223 | |
Printing and mailing expenses | | | 12,721 | |
Transfer agent fees | | | 7,110 | |
Offering costs | | | 3,393 | |
Custodian fees | | | 2,900 | |
Trustees’ fees | | | 297 | |
Miscellaneous | | | 3,820 | |
| | | | |
Gross expenses | | | 151,126 | |
Less: Waiver from investment adviser | | | (44,223 | ) |
Reimbursement from investment adviser | | | (91,831 | ) |
| | | | |
Net expenses | | | 15,072 | |
| | | | |
NET INVESTMENT INCOME (LOSS) | | | 51,108 | |
| | | | |
REALIZED AND UNREALIZED GAIN (LOSS) | | | | |
Net realized gain (loss) on investments in securities | | | 9,248 | |
Net distributions of realized gain received from underlying funds | | | 3,071 | |
| | | | |
Net realized gain (loss) | | | 12,319 | |
| | | | |
Net change in unrealized appreciation (depreciation) on investments in securities | | | (34,838 | ) |
| | | | |
NET REALIZED AND UNREALIZED GAIN (LOSS) | | | (22,519 | ) |
| | | | |
NET INCREASE (DECREASE) IN NET ASSETS RESULTING FROM OPERATIONS | | $ | 28,589 | |
| | | | |
See Notes to Financial Statements.
130
1290 FUNDS
1290 RETIREMENT 2040 FUND
STATEMENT OF CHANGES IN NET ASSETS
| | | | | | | | |
| | | Year Ended
October 31, 2018 | | | February 27, 2017* to
October 31, 2017 | |
INCREASE (DECREASE) IN NET ASSETS FROM OPERATIONS: | |
Net investment income (loss) | | $ | 51,108 | | | $ | 27,461 | |
Net realized gain (loss) | | | 12,319 | | | | 1,501 | |
Net change in unrealized appreciation (depreciation) | | | (34,838 | ) | | | 193,221 | |
| | | | | | | | |
NET INCREASE (DECREASE) IN NET ASSETS RESULTING FROM OPERATIONS | | | 28,589 | | | | 222,183 | |
| | | | | | | | |
Distributions to shareholders: | | | | | | | | |
Class I | | | (47,002 | ) | | | — | |
| | | | | | | | |
CAPITAL SHARES TRANSACTIONS: | | | | | | | | |
Class I | | | | | | | | |
Capital shares sold [ 18,938 and 250,010 shares, respectively ] | | | 211,909 | | | | 2,500,100 | |
Capital shares issued in reinvestment of dividends [ 0# and 0 shares, respectively ] | | | 2 | | | | — | |
Capital shares repurchased [ (25) and 0 shares, respectively ] | | | (286 | ) | | | — | |
| | | | | | | | |
NET INCREASE (DECREASE) IN NET ASSETS RESULTING FROM CAPITAL SHARE TRANSACTIONS | | | 211,625 | | | | 2,500,100 | |
| | | | | | | | |
TOTAL INCREASE (DECREASE) IN NET ASSETS | | | 193,212 | | | | 2,722,283 | |
NET ASSETS: | | | | | | | | |
Beginning of period | | | 2,722,283 | | | | — | |
| | | | | | | | |
End of period (a) | | $ | 2,915,495 | | | $ | 2,722,283 | |
| | | | | | | | |
* Commencement of Operations. | | | | | | | | |
# Number of shares is less than 0.5. | | | | | | | | |
(a) Includes accumulated undistributed (overdistributed) net investment income of $27,683 as of October 31, 2017. The SEC eliminated the requirement to disclose undistributed net investment income in 2018. | |
See Notes to Financial Statements.
131
1290 FUNDS
1290 RETIREMENT 2040 FUND
FINANCIAL HIGHLIGHTS
| | | | | | | | |
| Class I | | Year Ended
October 31, 2018 | | | February 27, 2017* to
October 31, 2017 | |
Net asset value, beginning of period | | $ | 10.89 | | | $ | 10.00 | |
| | | | | | | | |
Income (loss) from investment operations: | | | | | | | | |
Net investment income (loss) (e)(x) | | | 0.20 | | | | 0.11 | |
Net realized and unrealized gain (loss) | | | (0.06 | ) | | | 0.78 | |
| | | | | | | | |
Total from investment operations | | | 0.14 | | | | 0.89 | |
| | | | | | | | |
Less distributions: | | | | | | | | |
Dividends from net investment income | | | (0.18 | ) | | | — | |
Distributions from net realized gains | | | (0.01 | ) | | | — | |
| | | | | | | | |
Total dividends and distributions | | | (0.19 | ) | | | — | |
| | | | | | | | |
Net asset value, end of period | | $ | 10.84 | | | $ | 10.89 | |
| | | | | | | | |
Total return (b) | | | 1.26 | % | | | 8.90 | % |
| | | | | | | | |
Ratios/Supplemental Data: | | | | | | | | |
Net assets, end of period (000’s) | | $ | 2,915 | | | $ | 2,722 | |
Ratio of expenses to average net assets: | | | | | | | | |
After waivers and reimbursements (a)(f) | | | 0.53 | %(j) | | | 0.53 | %(j) |
Before waivers and reimbursements (a)(f) | | | 5.31 | % | | | 5.28 | % |
Ratio of net investment income (loss) to average net assets: | | | | | | | | |
After waivers and reimbursements (a)(f)(x) | | | 1.80 | % | | | 1.57 | %(l) |
Before waivers and reimbursements (a)(f)(x) | | | (2.99 | )% | | | (3.18 | )%(l) |
Portfolio turnover rate (z)^ | | | 2 | % | | | 1 | % |
| * | Commencement of Operations. |
| ^ | Portfolio turnover rate excludes derivatives, if any. |
| (a) | Ratios for periods less than one year are annualized. Certain non-recurring expenses incurred by the Fund are not annualized for periods less than one year. |
| (b) | Total returns for periods less than one year are not annualized. |
| (e) | Net investment income (loss) per share is based on average shares outstanding. |
| (f) | Expenses do not include the expenses of the underlying funds (“indirect expenses”), if applicable. |
| (j) | Including direct and indirect expenses, the net expense ratio after waivers and reimbursements would be 0.65%. |
| (l) | The annualized ratio of net investment income to average net assets may not be indicative of operating results for a full year. |
| (x) | Recognition of net investment income is affected by the timing of dividend declarations by the underlying funds in which the Fund invests. |
| (z) | Portfolio turnover rate for periods less than one year is not annualized. |
See Notes to Financial Statements.
132
1290 RETIREMENT 2045 FUND (Unaudited)
INVESTMENT ADVISER
PERFORMANCE RESULTS

| | | | | | | | |
| Annualized Total Returns as of 10/31/18 | |
| | | 1 Year | | | Since Incept. | |
Fund – Class I Shares* | | | 1.53 | % | | | 6.42 | % |
S&P Target Date 2045 Index | | | 0.59 | | | | 6.47 | |
* Date of inception 2/27/17. Returns for periods greater than one year are annualized. | |
The performance quoted is past performance and is not a guarantee of future results. Mutual funds are subject to certain market risks. Investment returns and principal value of an investment will fluctuate so that an investor’s shares, when redeemed, may be worth more or less than their original cost. Current performance may be higher or lower than the performance data shown. For the most current month-end performance data please call 1-888-310-0416 or visit www.1290Funds.com.
The graph illustrates comparative performance for $10,000 invested in the Class I Shares of the 1290 Retirement 2045 Fund and the S&P Target Date 2045 Index from 2/27/17 to 10/31/18. The performance of the S&P Target Date 2045 Index reflects an initial investment at the end of the month closest to the Fund’s inception. The performance of the Fund assumes reinvestment of all dividends and capital gain distributions, if any, and does not include a sales charge. The performance of the S&P Target Date 2045 Index does not reflect the deduction of expenses or a sales charge associated with a mutual fund and has been adjusted to reflect reinvestment of all dividends, capital gain distributions, and interest of the securities included in the benchmark.
Fund performance may reflect the waiver of the Fund’s fees and reimbursement of expenses for certain periods since the inception date. Without these waivers and reimbursements, performance would have been lower. Also, performance shown in this section does not reflect the deduction of taxes that a shareholder would pay on Fund distributions or redemption of Fund shares.
PERFORMANCE SUMMARY
The Fund’s Class I shares returned 1.53% for the year ended October 31, 2018. The Fund’s benchmark, the S&P Target Date 2045 Index, returned 0.59% over the same year.
Overview
The Allocations Drive Performance
Each 1290 Retirement Fund’s (as defined in the Notes to the Financial Statements) performance will reflect the performance of the underlying asset classes and depend upon their percentage weighting within the Fund. Here’s why:
The 1290 Retirement Funds are managed to target a specific year of planned retirement. The Asset mix will become more conservative each year, until about 10 years after the target retirement year, when it will become relatively stable. The 1290 Retirement Funds balance the need for appreciation with the need for income as retirement approaches and focus on supporting an income stream over a long-term retirement withdrawal horizon.
To achieve its exposures, each 1290 Retirement Fund invests in exchange-traded funds (ETFs) representing various equity and bond asset classes. Because of this, each of the 1290 Retirement Funds’ performance will be a function of the asset class performance and the percentage weighting of each asset class in the 1290 Retirement Funds. Current target and actual allocations, as well as performance, are available in a separate quarterly Fund Fact Sheet.
Fund Highlights
What helped the 1290 Retirement Funds performance during the year*?
| • | | Within equities, U.S. large-cap and mid-cap equities exhibited positive returns and were the best performing asset class. U.S. small-cap equities also added modestly to each of the 1290 Retirement Funds’ performance. |
| • | | On the fixed income side, international bonds added to performance. |
| • | | Having exposure to ETFs that tend to be less volatile than the market as a whole helped buoy performance, especially within hard-hit emerging markets and developed-world sectors. |
What hurt the 1290 Retirement Funds performance during the year*?
| • | | Emerging market and international equities were the biggest detractors to performance for the period. |
| • | | U.S. fixed income (both core and high yield) had negative returns for the period. |
| * | The Fund does not hold a position in any single security directly but has exposure through ETFs. |
| | | | |
Table by Asset Class (as a percentage of Total Investments in Securities) As of October 31, 2018 | |
Equity | | | 86.9 | % |
Fixed Income | | | 13.1 | |
133
1290 RETIREMENT 2045 FUND (Unaudited)
| | | | |
Top 10 Holdings (as a percentage of Total Investments in Securities) As of October 31, 2018 | |
iShares Core S&P Total US Stock Market ETF | | | 30.0 | % |
iShares Core U.S. Aggregate Bond ETF | | | 11.2 | |
iShares Core MSCI EAFE ETF | | | 10.5 | |
Invesco S&P 500 Low Volatility ETF | | | 10.3 | |
iShares Edge MSCI Min Vol USA ETF | | | 10.3 | |
iShares Edge MSCI Min Vol EAFE ETF | | | 5.4 | |
Invesco S&P International Developed Low Volatility ETF | | | 5.3 | |
Invesco S&P MidCap Low Volatility ETF | | | 5.3 | |
iShares Core MSCI Emerging Markets ETF | | | 2.5 | |
SPDR SSGA US Small Cap Low Volatility Index ETF | | | 2.5 | |
| | |
Holdings are subject to change without notice. | | | | |
UNDERSTANDING YOUR EXPENSES:
As a shareholder of the Fund, you incur two types of costs:
(1) transaction costs, including applicable sales charges and redemption fees; and (2) ongoing costs, including investment advisory fees, distribution and/or service (12b-1) fees and other Fund expenses. These examples are intended to help you understand your ongoing costs (in dollars) of investing in the Fund and to compare these costs with the ongoing costs of investing in other mutual funds.
The examples are based on an investment of $1,000 invested at the beginning of the six-month period ended October 31, 2018 and held for the entire six-month period.
Actual Expenses
The first line of the following table provides information about actual account values and actual expenses. You may use the information in this line, together with the amount you invested, to estimate the expenses that you paid over the period. Simply divide your account value by $1,000 (for example, an $8,600 account value divided by $1,000 = 8.6), then multiply the result by the number in the first line under the heading entitled “Expenses Paid During Period” to estimate the expenses you paid on your account during this period.
Hypothetical Example for Comparison Purposes
The second line of the following table provides information about hypothetical account values and hypothetical expenses based on the Fund’s actual expense ratio and an assumed rate of return of 5% per year before expenses, which is not the Fund’s actual return. The hypothetical account values and expenses may not be used to estimate the actual ending account balance or expenses you paid for the period. You may use this information to compare the ongoing costs of investing in the Fund and other funds. To do so, compare this 5% hypothetical example with the 5% hypothetical examples that appear in the shareholder reports of the other funds.
Please note that the expenses shown in the table are meant to highlight your ongoing costs only and do not reflect any transactional costs, such as sales charges (loads), redemption fees, or exchange fees. Therefore, the second line of the table is useful in comparing ongoing costs only, and will not help you determine the relative total costs of owning different funds. In addition, if these transactional costs were included, your costs would have been higher.
EXAMPLE
| | | | | | | | | | | | |
| | | Beginning Account Value 5/1/18 | | | Ending Account Value 10/31/18 | | | Expenses Paid During Period* 5/1/18 - 10/31/18 | |
Class I | | | | | | | | | | | | |
Actual | | $ | 1,000.00 | | | $ | 994.50 | | | $ | 2.65 | |
Hypothetical (5% average annual return before expenses) | | | 1,000.00 | | | | 1,022.55 | | | | 2.69 | |
* Expenses are equal to the Fund’s Class I shares annualized expense ratio of 0.53%, multiplied by the average account value over the period, and multiplied by 184/365 (to reflect the one-half year period). | |
134
1290 FUNDS
1290 RETIREMENT 2045 FUND
PORTFOLIO OF INVESTMENTS
October 31, 2018
| | | | | | | | |
| | | Number of
Shares | | | Value
(Note 1) | |
| | | | | | | | |
EXCHANGE TRADED FUNDS (ETF): | |
Equity (86.6%) | | | | | | | | |
Invesco S&P 500 Low Volatility ETF | | | 8,240 | | | $ | 395,438 | |
Invesco S&P Emerging Markets Low Volatility ETF | | | 1,960 | | | | 45,080 | |
Invesco S&P International Developed Low Volatility ETF | | | 6,630 | | | | 203,740 | |
Invesco S&P MidCap Low Volatility ETF | | | 4,400 | | | | 203,324 | |
Invesco S&P SmallCap Low Volatility ETF | | | 1,890 | | | | 86,902 | |
iShares Core MSCI EAFE ETF | | | 6,830 | | | | 401,467 | |
iShares Core MSCI Emerging Markets ETF | | | 2,030 | | | | 95,938 | |
iShares Core S&P Total US Stock Market ETF | | | 18,570 | | | | 1,146,326 | |
iShares Edge MSCI Min Vol EAFE ETF | | | 3,040 | | | | 207,510 | |
| | | | | | | | |
iShares Edge MSCI Min Vol Emerging Markets ETF | | | 840 | | | | 46,183 | |
iShares Edge MSCI Min Vol USA ETF | | | 7,200 | | | | 394,056 | |
SPDR SSGA US Small Cap Low Volatility Index ETF | | | 1,040 | | | | 93,747 | |
| | | | | | | | |
Total Equity | | | | | | | 3,319,711 | |
| | | | | | | | |
Fixed Income (13.1%) | | | | | | | | |
iShares Core U.S. Aggregate Bond ETF | | | 4,080 | | | | 426,727 | |
iShares TIPS Bond ETF | | | 690 | | | | 75,100 | |
| | | | | | | | |
Total Fixed Income | | | | | | | 501,827 | |
| | | | | | | | |
Total Investments in Securities (99.7%)
(Cost $3,678,702) | | | | | | | 3,821,538 | |
Other Assets Less Liabilities (0.3%) | | | | | | | 12,391 | |
| | | | | | | | |
Net Assets (100%) | | | | | | $ | 3,833,929 | |
| | | | | | | | |
The following is a summary of the inputs used to value the Fund’s assets and liabilities carried at fair value as of October 31, 2018:
The inputs or methodology used for valuing securities are not necessarily an indication of the risk associated with investing in those securities.
Various inputs are used in determining the value of the Fund’s investments. These inputs are summarized in the three broad levels listed below:
| | | | | | | | | | | | | | | | |
| | | | | |
| Investment Type | | Level 1
Quoted Prices in
Active Markets for
Identical
Securities | | | Level 2
Significant Other
Observable Inputs
(including quoted prices
for similar securities,
interest rates,
prepayment speeds,
credit risk, etc.) | | | Level 3
Significant Unobservable
Inputs (including the
Fund’s own
assumptions in
determining the fair
value of investments) | | | Total | |
Assets: | |
Exchange Traded Funds | | | | | | | | | | | | | | | | |
Exchange Traded Funds | | $ | 3,821,538 | | | $ | — | | | $ | — | | | $ | 3,821,538 | |
| | | | | | | | | | | | | | | | |
Total Assets | | $ | 3,821,538 | | | $ | — | | | $ | — | | | $ | 3,821,538 | |
| | | | | | | | | | | | | | | | |
Total Liabilities | | $ | — | | | $ | — | | | $ | — | | | $ | — | |
| | | | | | | | | | | | | | | | |
Total | | $ | 3,821,538 | | | $ | — | | | $ | — | | | $ | 3,821,538 | |
| | | | | | | | | | | | | | | | |
The Fund held no derivatives contracts during the year ended October 31, 2018.
Investment security transactions for the year ended October 31, 2018 were as follows:
| | | | |
Cost of Purchases: | | | | |
Long-term investments other than U.S. government debt securities | | $ | 1,209,518 | |
Net Proceeds of Sales and Redemptions: | | | | |
Long-term investments other than U.S. government debt securities | | $ | 63,668 | |
See Notes to Financial Statements.
135
1290 FUNDS
1290 RETIREMENT 2045 FUND
PORTFOLIO OF INVESTMENTS (Continued)
October 31, 2018
As of October 31, 2018, the gross unrealized appreciation (depreciation) of investments based on the aggregate cost of investments in securities and derivative instruments, if applicable, for Federal income tax purposes was as follows:
| | | | |
Aggregate gross unrealized appreciation | | $ | 169,408 | |
Aggregate gross unrealized depreciation | | | (26,572 | ) |
| | | | |
Net unrealized appreciation | | $ | 142,836 | |
| | | | |
Federal income tax cost of investments in securities and derivative instruments, if applicable | | $ | 3,678,702 | |
| | | | |
See Notes to Financial Statements.
136
1290 FUNDS
1290 RETIREMENT 2045 FUND
STATEMENT OF ASSETS AND LIABILITIES
October 31, 2018
| | | | |
ASSETS | | | | |
Investments in Securities, at value (Cost $3,678,702) | | $ | 3,821,538 | |
Cash | | | 35,501 | |
Receivable from investment adviser | | | 11,864 | |
Prepaid registration and filing fees | | | 5,657 | |
Receivable for Fund shares sold | | | 1,278 | |
Other assets | | | 35 | |
| | | | |
Total assets | | | 3,875,873 | |
| | | | |
LIABILITIES | | | | |
Accrued professional fees | | | 32,262 | |
Transfer agent fees payable | | | 1,571 | |
Trustees’ fees payable | | | 22 | |
Accrued expenses | | | 8,089 | |
| | | | |
Total liabilities | | | 41,944 | |
| | | | |
NET ASSETS | | $ | 3,833,929 | |
| | | | |
Net assets were comprised of: | | | | |
Paid in capital | | $ | 3,641,458 | |
Total distributable earnings (loss) | | | 192,471 | |
| | | | |
Net assets | | $ | 3,833,929 | |
| | | | |
Class I | | | | |
Net asset value and redemption price per share, $3,833,929 / 351,466 shares outstanding (unlimited amount authorized: $0.001 par value) | | $ | 10.91 | |
| | | | |
STATEMENT OF OPERATIONS
For the Year Ended October 31, 2018
| | | | |
INVESTMENT INCOME | | | | |
Dividends | | $ | 71,653 | |
Interest | | | 318 | |
| | | | |
Total income | | | 71,971 | |
| | | | |
EXPENSES | | | | |
Professional fees | | | 40,624 | |
Registration and filing fees | | | 36,355 | |
Administrative fees | | | 30,000 | |
Investment advisory fees | | | 15,742 | |
Printing and mailing expenses | | | 12,908 | |
Transfer agent fees | | | 7,860 | |
Custodian fees | | | 3,500 | |
Offering costs | | | 3,374 | |
Trustees’ fees | | | 321 | |
Miscellaneous | | | 3,920 | |
| | | | |
Gross expenses | | | 154,604 | |
Less: Waiver from investment adviser | | | (45,742 | ) |
Reimbursement from investment adviser | | | (92,283 | ) |
| | | | |
Net expenses | | | 16,579 | |
| | | | |
NET INVESTMENT INCOME (LOSS) | | | 55,392 | |
| | | | |
REALIZED AND UNREALIZED GAIN (LOSS) | | | | |
Net realized gain (loss) on investments in securities | | | 8,592 | |
Net distributions of realized gain received from underlying funds | | | 3,269 | |
| | | | |
Net realized gain (loss) | | | 11,861 | |
| | | | |
Net change in unrealized appreciation (depreciation) on investments in securities | | | (61,892 | ) |
| | | | |
NET REALIZED AND UNREALIZED GAIN (LOSS) | | | (50,031 | ) |
| | | | |
NET INCREASE (DECREASE) IN NET ASSETS RESULTING FROM OPERATIONS | | $ | 5,361 | |
| | | | |
See Notes to Financial Statements.
137
1290 FUNDS
1290 RETIREMENT 2045 FUND
STATEMENT OF CHANGES IN NET ASSETS
| | | | | | | | |
| | | Year Ended
October 31, 2018 | | | February 27, 2017* to
October 31, 2017 | |
INCREASE (DECREASE) IN NET ASSETS FROM OPERATIONS: | |
Net investment income (loss) | | $ | 55,392 | | | $ | 27,281 | |
Net realized gain (loss) | | | 11,861 | | | | 1,501 | |
Net change in unrealized appreciation (depreciation) | | | (61,892 | ) | | | 204,728 | |
| | | | | | | | |
NET INCREASE (DECREASE) IN NET ASSETS RESULTING FROM OPERATIONS | | | 5,361 | | | | 233,510 | |
| | | | | | | | |
Distributions to shareholders: | | | | | | | | |
Class I | | | (47,142 | ) | | | — | |
| | | | | | | | |
CAPITAL SHARES TRANSACTIONS: | | | | | | | | |
Class I | | | | | | | | |
Capital shares sold [ 100,702 and 250,760 shares, respectively ] | | | 1,134,558 | | | | 2,507,600 | |
Capital shares issued in reinvestment of dividends [ 13 and 0 shares, respectively ] | | | 143 | | | | — | |
Capital shares repurchased [ (9) and 0 shares, respectively ] | | | (101 | ) | | | — | |
| | | | | | | | |
NET INCREASE (DECREASE) IN NET ASSETS RESULTING FROM CAPITAL SHARE TRANSACTIONS | | | 1,134,600 | | | | 2,507,600 | |
| | | | | | | | |
TOTAL INCREASE (DECREASE) IN NET ASSETS | | | 1,092,819 | | | | 2,741,110 | |
NET ASSETS: | |
Beginning of period | | | 2,741,110 | | | | — | |
| | | | | | | | |
End of period (a) | | $ | 3,833,929 | | | $ | 2,741,110 | |
| | | | | | | | |
* Commencement of Operations. | |
(a) Includes accumulated undistributed (overdistributed) net investment income of $27,504 as of October 31, 2017. The SEC eliminated the requirement to disclose undistributed net investment income in 2018. | |
See Notes to Financial Statements.
138
1290 FUNDS
1290 RETIREMENT 2045 FUND
FINANCIAL HIGHLIGHTS
| | | | | | | | |
| Class I | | Year Ended
October 31, 2018 | | | February 27, 2017* to
October 31, 2017 | |
Net asset value, beginning of period | | $ | 10.93 | | | $ | 10.00 | |
| | | | | | | | |
Income (loss) from investment operations: | | | | | | | | |
Net investment income (loss) (e)(x) | | | 0.20 | | | | 0.11 | |
Net realized and unrealized gain (loss) | | | (0.03 | ) | | | 0.82 | |
| | | | | | | | |
Total from investment operations | | | 0.17 | | | | 0.93 | |
| | | | | | | | |
Less distributions: | |
Dividends from net investment income | | | (0.18 | ) | | | — | |
Distributions from net realized gains | | | (0.01 | ) | | | — | |
| | | | | | | | |
Total dividends and distributions | | | (0.19 | ) | | | — | |
| | | | | | | | |
Net asset value, end of period | | $ | 10.91 | | | $ | 10.93 | |
| | | | | | | | |
Total return (b) | | | 1.53 | % | | | 9.30 | % |
| | | | | | | | |
Ratios/Supplemental Data: | |
Net assets, end of period (000’s) | | $ | 3,834 | | | $ | 2,741 | |
Ratio of expenses to average net assets: | | | | | | | | |
After waivers and reimbursements (a)(f) | | | 0.53 | %(j) | | | 0.52 | %(j) |
Before waivers and reimbursements (a)(f) | | | 4.91 | % | | | 5.29 | % |
Ratio of net investment income (loss) to average net assets: | | | | | | | | |
After waivers and reimbursements (a)(f)(x) | | | 1.76 | % | | | 1.55 | %(l) |
Before waivers and reimbursements (a)(f)(x) | | | (2.62 | )% | | | (3.22 | )%(l) |
Portfolio turnover rate (z)^ | | | 2 | % | | | 1 | % |
| * | Commencement of Operations. |
| ^ | Portfolio turnover rate excludes derivatives, if any. |
| (a) | Ratios for periods less than one year are annualized. Certain non-recurring expenses incurred by the Fund are not annualized for periods less than one year. |
| (b) | Total returns for periods less than one year are not annualized. |
| (e) | Net investment income (loss) per share is based on average shares outstanding. |
| (f) | Expenses do not include the expenses of the underlying funds (“indirect expenses”), if applicable. |
| (j) | Including direct and indirect expenses, the net expense ratio after waivers and reimbursements would be 0.65%. |
| (l) | The annualized ratio of net investment income to average net assets may not be indicative of operating results for a full year. |
| (x) | Recognition of net investment income is affected by the timing of dividend declarations by the underlying funds in which the Fund invests. |
| (z) | Portfolio turnover rate for periods less than one year is not annualized. |
See Notes to Financial Statements.
139
1290 RETIREMENT 2050 FUND (Unaudited)
INVESTMENT ADVISER
PERFORMANCE RESULTS
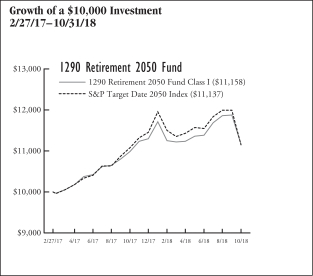
| | | | | | | | |
| Annualized Total Returns as of 10/31/18 | | | | | | |
| | | 1
Year | | | Since
Incept. | |
Fund – Class I Shares* | | | 1.63 | % | | | 6.77 | % |
S&P Target Date 2050 Index | | | 0.62 | | | | 6.65 | |
* Date of inception 2/27/17. Returns for periods greater than one year are annualized. | |
The performance quoted is past performance and is not a guarantee of future results. Mutual funds are subject to certain market risks. Investment returns and principal value of an investment will fluctuate so that an investor’s shares, when redeemed, may be worth more or less than their original cost. Current performance may be higher or lower than the performance data shown. For the most current month-end performance data please call 1-888-310-0416 or visit www.1290Funds.com.
The graph illustrates comparative performance for $10,000 invested in the Class I Shares of the 1290 Retirement 2050 Fund and the S&P Target Date 2050 Index from 2/27/17 to 10/31/18. The performance of the S&P Target Date 2050 Index reflects an initial investment at the end of the month closest to the Fund’s inception. The performance of the Fund assumes reinvestment of all dividends and capital gain distributions, if any, and does not include a sales charge. The performance of the S&P Target Date 2050 Index does not reflect the deduction of expenses or a sales charge associated with a mutual fund and has been adjusted to reflect reinvestment of all dividends, capital gain distributions, and interest of the securities included in the benchmark.
Fund performance may reflect the waiver of the Fund’s fees and reimbursement of expenses for certain periods since the inception date. Without these waivers and reimbursements, performance would have been lower. Also, performance shown in this section does not reflect the deduction of taxes that a shareholder would pay on Fund distributions or redemption of Fund shares.
PERFORMANCE SUMMARY
The Fund’s Class I shares returned 1.63% for the year ended October 31, 2018. The Fund’s benchmark, the S&P Target Date 2050 Index, returned 0.62% over the same year.
Overview
The Allocations Drive Performance
Each 1290 Retirement Fund’s (as defined in the Notes to the Financial Statements) performance will reflect the performance of the underlying asset classes and depend upon their percentage weighting within the Fund. Here’s why:
The 1290 Retirement Funds are managed to target a specific year of planned retirement. The Asset mix will become more conservative each year, until about 10 years after the target retirement year, when it will become relatively stable. The 1290 Retirement Funds balance the need for appreciation with the need for income as retirement approaches and focus on supporting an income stream over a long-term retirement withdrawal horizon.
To achieve its exposures, each 1290 Retirement Fund invests in exchange-traded funds (ETFs) representing various equity and bond asset classes. Because of this, each of the 1290 Retirement Funds’ performance will be a function of the asset class performance and the percentage weighting of each asset class in the 1290 Retirement Funds. Current target and actual allocations, as well as performance, are available in a separate quarterly Fund Fact Sheet.
Fund Highlights
What helped the 1290 Retirement Funds performance during the year*?
| • | | Within equities, U.S. large-cap and mid-cap equities exhibited positive returns and were the best performing asset class. U.S. small-cap equities also added modestly to each of the 1290 Retirement Funds’ performance. |
| • | | On the fixed income side, international bonds added to performance. |
| • | | Having exposure to ETFs that tend to be less volatile than the market as a whole helped buoy performance, especially within hard-hit emerging markets and developed-world sectors. |
What hurt the 1290 Retirement Funds performance during the year*?
| • | | Emerging market and international equities were the biggest detractors to performance for the period. |
| • | | U.S. fixed income (both core and high yield) had negative returns for the period. |
| * | The Fund does not hold a position in any single security directly but has exposure through ETFs. |
| | | | |
| Table by Asset Class (as a percentage of Total Investments in Securities) | |
| As of October 31, 2018 | |
Equity | | | 92.2 | % |
Fixed Income | | | 7.8 | |
140
1290 RETIREMENT 2050 FUND (Unaudited)
| | | | |
Top 10 Holdings (as a percentage of Total Investments in Securities) As of October 31, 2018 | |
iShares Core S&P Total US Stock Market ETF | | | 32.1 | % |
iShares Core MSCI EAFE ETF | | | 11.3 | |
iShares Edge MSCI Min Vol USA ETF | | | 11.1 | |
Invesco S&P 500 Low Volatility ETF | | | 10.8 | |
iShares Core U.S. Aggregate Bond ETF | | | 6.7 | |
iShares Edge MSCI Min Vol EAFE ETF | | | 5.7 | |
Invesco S&P MidCap Low Volatility ETF | | | 5.6 | |
Invesco S&P International Developed Low Volatility ETF | | | 5.6 | |
iShares Core MSCI Emerging Markets ETF | | | 2.6 | |
Invesco S&P SmallCap Low Volatility ETF | | | 2.5 | |
Holdings are subject to change without notice. | | | | |
UNDERSTANDING YOUR EXPENSES:
As a shareholder of the Fund, you incur two types of costs:
(1) transaction costs, including applicable sales charges and redemption fees; and (2) ongoing costs, including investment advisory fees, distribution and/or service (12b-1) fees and other Fund expenses. These examples are intended to help you understand your ongoing costs (in dollars) of investing in the Fund and to compare these costs with the ongoing costs of investing in other mutual funds.
The examples are based on an investment of $1,000 invested at the beginning of the six-month period ended October 31, 2018 and held for the entire six-month period.
Actual Expenses
The first line of the following table provides information about actual account values and actual expenses. You may use the information in this line, together with the amount you invested, to estimate the expenses that you paid over the period. Simply divide your account value by $1,000 (for example, an $8,600 account value divided by $1,000 = 8.6), then multiply the result by the number in the first line under the heading entitled “Expenses Paid During Period” to estimate the expenses you paid on your account during this period.
Hypothetical Example for Comparison Purposes
The second line of the following table provides information about hypothetical account values and hypothetical expenses based on the Fund’s actual expense ratio and an assumed rate of return of 5% per year before expenses, which is not the Fund’s actual return. The hypothetical account values and expenses may not be used to estimate the actual ending account balance or expenses you paid for the period. You may use this information to compare the ongoing costs of investing in the Fund and other funds. To do so, compare this 5% hypothetical example with the 5% hypothetical examples that appear in the shareholder reports of the other funds.
Please note that the expenses shown in the table are meant to highlight your ongoing costs only and do not reflect any transactional costs, such as sales charges (loads), redemption fees, or exchange fees. Therefore, the second line of the table is useful in comparing ongoing costs only, and will not help you determine the relative total costs of owning different funds. In addition, if these transactional costs were included, your costs would have been higher.
EXAMPLE
| | | | | | | | | | | | |
| | | Beginning
Account
Value
5/1/18 | | | Ending
Account
Value
10/31/18 | | | Expenses
Paid
During
Period*
5/1/18 -
10/31/18 | |
Class I | | | | | | | | | | | | |
Actual | | | $1,000.00 | | | | $993.70 | | | | $2.63 | |
Hypothetical (5% average annual return before expenses) | | | 1,000.00 | | | | 1,022.57 | | | | 2.67 | |
* Expenses are equal to the Fund’s Class I shares annualized expense ratio of 0.52%, multiplied by the average account value over the period, and multiplied by 184/365 (to reflect the one-half year period). | |
141
1290 FUNDS
1290 RETIREMENT 2050 FUND
PORTFOLIO OF INVESTMENTS
October 31, 2018
| | | | | | | | |
| | | Number of
Shares | | | Value
(Note 1) | |
| | | | | | | | |
EXCHANGE TRADED FUNDS (ETF): | | | | | | | | |
Equity (92.2%) | | | | | | | | |
Invesco S&P 500 Low Volatility ETF | | | 6,930 | | | $ | 332,571 | |
Invesco S&P Emerging Markets Low Volatility ETF | | | 1,760 | | | | 40,480 | |
Invesco S&P International Developed Low Volatility ETF | | | 5,620 | | | | 172,703 | |
Invesco S&P MidCap Low Volatility ETF | | | 3,740 | | | | 172,825 | |
Invesco S&P SmallCap Low Volatility ETF | | | 1,650 | | | | 75,867 | |
iShares Core MSCI EAFE ETF | | | 5,880 | | | | 345,626 | |
iShares Core MSCI Emerging Markets ETF | | | 1,690 | | | | 79,869 | |
iShares Core S&P Total US Stock Market ETF | | | 15,950 | | | | 984,595 | |
iShares Edge MSCI Min Vol EAFE ETF | | | 2,550 | | | | 174,063 | |
| | | | | | | | |
iShares Edge MSCI Min Vol Emerging Markets ETF | | | 650 | | | | 35,737 | |
iShares Edge MSCI Min Vol USA ETF | | | 6,210 | | | | 339,873 | |
SPDR SSGA US Small Cap Low Volatility Index ETF | | | 820 | | | | 73,916 | |
| | | | | | | | |
Total Equity | | | | | | | 2,828,125 | |
| | | | | | | | |
Fixed Income (7.8%) | | | | | | | | |
iShares Core U.S. Aggregate Bond ETF | | | 1,980 | | | | 207,088 | |
iShares TIPS Bond ETF | | | 310 | | | | 33,740 | |
| | | | | | | | |
Total Fixed Income | | | | | | | 240,828 | |
| | | | | | | | |
Total Investments in Securities (100.0%)
(Cost $2,879,765) | | | | | | | 3,068,953 | |
Other Assets Less Liabilities (0.0%) | | | | | | | (957 | ) |
| | | | | | | | |
Net Assets (100%) | | | | | | $ | 3,067,996 | |
| | | | | | | | |
The following is a summary of the inputs used to value the Fund’s assets and liabilities carried at fair value as of October 31, 2018:
The inputs or methodology used for valuing securities are not necessarily an indication of the risk associated with investing in those securities.
Various inputs are used in determining the value of the Fund’s investments. These inputs are summarized in the three broad levels listed below:
| | | | | | | | | | | | | | | | |
| | | | | |
| Investment Type | | Level 1
Quoted Prices in
Active Markets for
Identical
Securities | | | Level 2
Significant Other
Observable Inputs
(including quoted prices
for similar securities,
interest rates,
prepayment speeds,
credit risk, etc.) | | | Level 3
Significant Unobservable
Inputs (including the
Fund’s own
assumptions in
determining the fair
value of investments) | | | Total | |
Assets: | | | | | | | | | | | | | | | | |
Exchange Traded Funds | | | | | | | | | | | | | | | | |
Exchange Traded Funds | | $ | 3,068,953 | | | $ | — | | | $ | — | | | $ | 3,068,953 | |
| | | | | | | | | | | | | | | | |
Total Assets | | $ | 3,068,953 | | | $ | — | | | $ | — | | | $ | 3,068,953 | |
| | | | | | | | | | | | | | | | |
Total Liabilities | | $ | — | | | $ | — | | | $ | — | | | $ | — | |
| | | | | | | | | | | | | | | | |
Total | | $ | 3,068,953 | | | $ | — | | | $ | — | | | $ | 3,068,953 | |
| | | | | | | | | | | | | | | | |
The Fund held no derivatives contracts during the year ended October 31, 2018.
Investment security transactions for the year ended October 31, 2018 were as follows:
| | | | |
Cost of Purchases: | | | | |
Long-term investments other than U.S. government debt securities | | $ | 418,629 | |
Net Proceeds of Sales and Redemptions: | | | | |
Long-term investments other than U.S. government debt securities | | $ | 65,216 | |
See Notes to Financial Statements.
142
1290 FUNDS
1290 RETIREMENT 2050 FUND
PORTFOLIO OF INVESTMENTS (Continued)
October 31, 2018
As of October 31, 2018, the gross unrealized appreciation (depreciation) of investments based on the aggregate cost of investments in securities and derivative instruments, if applicable, for Federal income tax purposes was as follows:
| | | | |
Aggregate gross unrealized appreciation | | $ | 202,057 | |
Aggregate gross unrealized depreciation | | | (12,869 | ) |
| | | | |
Net unrealized appreciation | | $ | 189,188 | |
| | | | |
Federal income tax cost of investments in securities and derivative instruments, if applicable | | $ | 2,879,765 | |
| | | | |
See Notes to Financial Statements.
143
1290 FUNDS
1290 RETIREMENT 2050 FUND
STATEMENT OF ASSETS AND LIABILITIES
October 31, 2018
| | | | |
ASSETS | | | | |
Investments in Securities, at value (Cost $2,879,765) | | $ | 3,068,953 | |
Cash | | | 23,175 | |
Receivable from investment adviser | | | 11,706 | |
Prepaid registration and filing fees | | | 5,638 | |
Receivable for Fund shares sold | | | 99 | |
Other assets | | | 35 | |
| | | | |
Total assets | | | 3,109,606 | |
| | | | |
LIABILITIES | | | | |
Accrued professional fees | | | 32,051 | |
Transfer agent fees payable | | | 1,600 | |
Trustees’ fees payable | | | 24 | |
Accrued expenses | | | 7,935 | |
| | | | |
Total liabilities | | | 41,610 | |
| | | | |
NET ASSETS | | $ | 3,067,996 | |
| | | | |
Net assets were comprised of: | | | | |
Paid in capital | | $ | 2,832,128 | |
Total distributable earnings (loss) | | | 235,868 | |
| | | | |
Net assets | | $ | 3,067,996 | |
| | | | |
Class I | | | | |
Net asset value and redemption price per share, $3,067,996 / 279,549 shares outstanding (unlimited amount authorized: $0.001 par value) | | $ | 10.97 | |
| | | | |
STATEMENT OF OPERATIONS
For the Year Ended October 31, 2018
| | | | |
INVESTMENT INCOME | |
Dividends | | $ | 66,973 | |
Interest | | | 253 | |
| | | | |
Total income | | | 67,226 | |
| | | | |
EXPENSES | | | | |
Professional fees | | | 40,383 | |
Registration and filing fees | | | 36,352 | |
Administrative fees | | | 30,000 | |
Investment advisory fees | | | 14,627 | |
Printing and mailing expenses | | | 12,673 | |
Transfer agent fees | | | 7,510 | |
Offering costs | | | 3,369 | |
Custodian fees | | | 3,050 | |
Trustees’ fees | | | 305 | |
Miscellaneous | | | 3,819 | |
| | | | |
Gross expenses | | | 152,088 | |
Less: Waiver from investment adviser | | | (44,627 | ) |
Reimbursement from investment adviser | | | (92,154 | ) |
| | | | |
Net expenses | | | 15,307 | |
| | | | |
NET INVESTMENT INCOME (LOSS) | | | 51,919 | |
| | | | |
REALIZED AND UNREALIZED GAIN (LOSS) | | | | |
Net realized gain (loss) on investments in securities | | | 9,300 | |
Net distributions of realized gain received from underlying funds | | | 3,418 | |
| | | | |
Net realized gain (loss) | | | 12,718 | |
| | | | |
Net change in unrealized appreciation (depreciation) on investments in securities | | | (26,033 | ) |
| | | | |
NET REALIZED AND UNREALIZED GAIN (LOSS) | | | (13,315 | ) |
| | | | |
NET INCREASE (DECREASE) IN NET ASSETS RESULTING FROM OPERATIONS | | $ | 38,604 | |
| | | | |
See Notes to Financial Statements.
144
1290 FUNDS
1290 RETIREMENT 2050 FUND
STATEMENT OF CHANGES IN NET ASSETS
| | | | | | | | |
| | | Year Ended
October 31, 2018 | | | February 27, 2017* to
October 31, 2017 | |
INCREASE (DECREASE) IN NET ASSETS FROM OPERATIONS: | | | | | | | | |
Net investment income (loss) | | $ | 51,919 | | | $ | 27,083 | |
Net realized gain (loss) | | | 12,718 | | | | 1,502 | |
Net change in unrealized appreciation (depreciation) | | | (26,033 | ) | | | 215,221 | |
| | | | | | | | |
NET INCREASE (DECREASE) IN NET ASSETS RESULTING FROM OPERATIONS | | | 38,604 | | | | 243,806 | |
| | | | | | | | |
Distributions to shareholders: | | | | | | | | |
Class I | | | (47,252 | ) | | | — | |
| | | | | | | | |
CAPITAL SHARES TRANSACTIONS: | | | | | | | | |
Class I | | | | | | | | |
Capital shares sold [ 29,754 and 250,009 shares, respectively ] | | | 335,197 | | | | 2,500,100 | |
Capital shares issued in reinvestment of dividends [ 0# and 0 shares, respectively ] | | | 2 | | | | — | |
Capital shares repurchased [ (214) and 0 shares, respectively ] | | | (2,461 | ) | | | — | |
| | | | | | | | |
NET INCREASE (DECREASE) IN NET ASSETS RESULTING FROM CAPITAL SHARE TRANSACTIONS | | | 332,738 | | | | 2,500,100 | |
| | | | | | | | |
TOTAL INCREASE (DECREASE) IN NET ASSETS | | | 324,090 | | | | 2,743,906 | |
NET ASSETS: | | | | | | | | |
Beginning of period | | | 2,743,906 | | | | — | |
| | | | | | | | |
End of period (a) | | $ | 3,067,996 | | | $ | 2,743,906 | |
| | | | | | | | |
* Commencement of Operations. | | | | | | | | |
# Number of shares is less than 0.5. | | | | | | | | |
(a) Includes accumulated undistributed (overdistributed) net investment income of $27,303 as of October 31, 2017. The SEC eliminated the requirement to disclose undistributed net investment income in 2018. | |
See Notes to Financial Statements.
145
1290 FUNDS
1290 RETIREMENT 2050 FUND
FINANCIAL HIGHLIGHTS
| | | | | | | | |
| Class I | | Year Ended
October 31, 2018 | | | February 27, 2017* to
October 31, 2017 | |
Net asset value, beginning of period | | $ | 10.98 | | | $ | 10.00 | |
| | | | | | | | |
Income (loss) from investment operations: | | | | | | | | |
Net investment income (loss) (e)(x) | | | 0.20 | | | | 0.11 | |
Net realized and unrealized gain (loss) | | | (0.02 | ) | | | 0.87 | |
| | | | | | | | |
Total from investment operations | | | 0.18 | | | | 0.98 | |
| | | | | | | | |
Less distributions: | | | | | | | | |
Dividends from net investment income | | | (0.18 | ) | | | — | |
Distributions from net realized gains | | | (0.01 | ) | | | — | |
| | | | | | | | |
Total dividends and distributions | | | (0.19 | ) | | | — | |
| | | | | | | | |
Net asset value, end of period | | $ | 10.97 | | | $ | 10.98 | |
| | | | | | | | |
Total return (b) | | | 1.63 | % | | | 9.80 | % |
| | | | | | | | |
Ratios/Supplemental Data: | |
Net assets, end of period (000’s) | | $ | 3,068 | | | $ | 2,744 | |
Ratio of expenses to average net assets: | | | | | | | | |
After waivers and reimbursements (a)(f) | | | 0.52 | %(j) | | | 0.52 | %(j) |
Before waivers and reimbursements (a)(f) | | | 5.20 | % | | | 5.26 | % |
Ratio of net investment income (loss) to average net assets: | | | | | | | | |
After waivers and reimbursements (a)(f)(x) | | | 1.77 | % | | | 1.54 | %(l) |
Before waivers and reimbursements (a)(f)(x) | | | (2.90 | )% | | | (3.20 | )%(l) |
Portfolio turnover rate (z)^ | | | 2 | % | | | 1 | % |
| * | Commencement of Operations. |
| ^ | Portfolio turnover rate excludes derivatives, if any. |
| (a) | Ratios for periods less than one year are annualized. Certain non-recurring expenses incurred by the Fund are not annualized for periods less than one year. |
| (b) | Total returns for periods less than one year are not annualized. |
| (e) | Net investment income (loss) per share is based on average shares outstanding. |
| (f) | Expenses do not include the expenses of the underlying funds (“indirect expenses”), if applicable. |
| (j) | Including direct and indirect expenses, the net expense ratio after waivers and reimbursements would be 0.65%. |
| (l) | The annualized ratio of net investment income to average net assets may not be indicative of operating results for a full year. |
| (x) | Recognition of net investment income is affected by the timing of dividend declarations by the underlying funds in which the Fund invests. |
| (z) | Portfolio turnover rate for periods less than one year is not annualized. |
See Notes to Financial Statements.
146
1290 RETIREMENT 2055 FUND (Unaudited)
INVESTMENT ADVISER
PERFORMANCE RESULTS
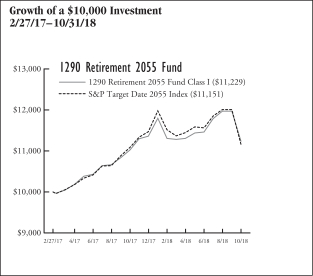
| | | | | | | | |
| Annualized Total Returns as of 10/31/18 | | | | | | |
| | | 1
Year | | | Since
Incept. | |
Fund – Class I Shares* | | | 1.90 | % | | | 7.17 | % |
S&P Target Date 2055 Index | | | 0.63 | | | | 6.73 | |
* Date of inception 2/27/17. Returns for periods greater than one year are annualized. | |
The performance quoted is past performance and is not a guarantee of future results. Mutual funds are subject to certain market risks. Investment returns and principal value of an investment will fluctuate so that an investor’s shares, when redeemed, may be worth more or less than their original cost. Current performance may be higher or lower than the performance data shown. For the most current month-end performance data please call 1-888-310-0416 or visit www.1290Funds.com.
The graph illustrates comparative performance for $10,000 invested in the Class I Shares of the 1290 Retirement 2055 Fund and the S&P Target Date 2055 Index from 2/27/17 to 10/31/18. The performance of the S&P Target Date 2055 Index reflects an initial investment at the end of the month closest to the Fund’s inception. The performance of the Fund assumes reinvestment of all dividends and capital gain distributions, if any, and does not include a sales charge. The performance of the S&P Target Date 2055 Index does not reflect the deduction of expenses or a sales charge associated with a mutual fund and has been adjusted to reflect reinvestment of all dividends, capital gain distributions, and interest of the securities included in the benchmark.
Fund performance may reflect the waiver of the Fund’s fees and reimbursement of expenses for certain periods since the inception date. Without these waivers and reimbursements, performance would have been lower. Also, performance shown in this section does not reflect the deduction of taxes that a shareholder would pay on Fund distributions or redemption of Fund shares.
PERFORMANCE SUMMARY
The Fund’s Class I shares returned 1.90% for the year ended October 31, 2018. The Fund’s benchmark, the S&P Target Date 2055 Index, returned 0.63% over the same year.
Overview
The Allocations Drive Performance
Each 1290 Retirement Fund’s (as defined in the Notes to the Financial Statements) performance will reflect the performance of the underlying asset classes and depend upon their percentage weighting within the Fund. Here’s why:
The 1290 Retirement Funds are managed to target a specific year of planned retirement. The Asset mix will become more conservative each year, until about 10 years after the target retirement year, when it will become relatively stable. The 1290 Retirement Funds balance the need for appreciation with the need for income as retirement approaches and focus on supporting an income stream over a long-term retirement withdrawal horizon.
To achieve its exposures, each 1290 Retirement Fund invests in exchange-traded funds (ETFs) representing various equity and bond asset classes. Because of this, each of the 1290 Retirement Funds’ performance will be a function of the asset class performance and the percentage weighting of each asset class in the 1290 Retirement Funds. Current target and actual allocations, as well as performance, are available in a separate quarterly Fund Fact Sheet.
Fund Highlights
What helped the 1290 Retirement Funds performance during the year*?
| • | | Within equities, U.S. large-cap and mid-cap equities exhibited positive returns and were the best performing asset class. U.S. small-cap equities also added modestly to each of the 1290 Retirement Funds’ performance. |
| • | | On the fixed income side, international bonds added to performance. |
| • | | Having exposure to ETFs that tend to be less volatile than the market as a whole helped buoy performance, especially within hard-hit emerging markets and developed-world sectors. |
What hurt the 1290 Retirement Funds performance during the year*?
| • | | Emerging market and international equities were the biggest detractors to performance for the period. |
| • | | U.S. fixed income (both core and high yield) had negative returns for the period. |
| * | The Fund does not hold a position in any single security directly but has exposure through ETFs. |
| | | | |
| Table by Asset Class (as a percentage of Total Investments in Securities) | |
| As of October 31, 2018 | | | |
Equity | | | 97.1 | % |
Fixed Income | | | 2.9 | |
147
1290 RETIREMENT 2055 FUND (Unaudited)
| | | | |
| Top 10 Holdings (as a percentage of Total Investments in Securities) | |
| As of October 31, 2018 | | | |
iShares Core S&P Total US Stock Market ETF | | | 33.8 | % |
iShares Core MSCI EAFE ETF | | | 11.8 | |
iShares Edge MSCI Min Vol USA ETF | | | 11.6 | |
Invesco S&P 500 Low Volatility ETF | | | 11.4 | |
iShares Edge MSCI Min Vol EAFE ETF | | | 6.0 | |
Invesco S&P MidCap Low Volatility ETF | | | 6.0 | |
Invesco S&P International Developed Low Volatility ETF | | | 5.9 | |
iShares Core MSCI Emerging Markets ETF | | | 2.7 | |
Invesco S&P SmallCap Low Volatility ETF | | | 2.7 | |
SPDR SSGA US Small Cap Low Volatility Index ETF | | | 2.6 | |
Holdings are subject to change without notice. | | | | |
UNDERSTANDING YOUR EXPENSES:
As a shareholder of the Fund, you incur two types of costs:
(1) transaction costs, including applicable sales charges and redemption fees; and (2) ongoing costs, including investment advisory fees, distribution and/or service (12b-1) fees and other Fund expenses. These examples are intended to help you understand your ongoing costs (in dollars) of investing in the Fund and to compare these costs with the ongoing costs of investing in other mutual funds.
The examples are based on an investment of $1,000 invested at the beginning of the six-month period ended October 31, 2018 and held for the entire six-month period.
Actual Expenses
The first line of the following table provides information about actual account values and actual expenses. You may use the information in this line, together with the amount you invested, to estimate the expenses that you paid over the period. Simply divide your account value by $1,000 (for example, an $8,600 account value divided by $1,000 = 8.6), then multiply the result by the number in the first line under the heading entitled “Expenses Paid During Period” to estimate the expenses you paid on your account during this period.
Hypothetical Example for Comparison Purposes
The second line of the following table provides information about hypothetical account values and hypothetical expenses based on the Fund’s actual expense ratio and an assumed rate of return of 5% per year before expenses, which is not the Fund’s actual return. The hypothetical account values and expenses may not be used to estimate the actual ending account balance or expenses you paid for the period. You may use this information to compare the ongoing costs of investing in the Fund and other funds. To do so, compare this 5% hypothetical example with the 5% hypothetical examples that appear in the shareholder reports of the other funds.
Please note that the expenses shown in the table are meant to highlight your ongoing costs only and do not reflect any transactional costs, such as sales charges (loads), redemption fees, or exchange fees. Therefore, the second line of the table is useful in comparing ongoing costs only, and will not help you determine the relative total costs of owning different funds. In addition, if these transactional costs were included, your costs would have been higher.
EXAMPLE
| | | | | | | | | | | | |
| | | Beginning
Account
Value
5/1/18 | | | Ending
Account
Value
10/31/18 | | | Expenses
Paid
During
Period*
5/1/18 -
10/31/18 | |
Class I | |
Actual | | | $1,000.00 | | | | $993.70 | | | | $2.61 | |
Hypothetical (5% average annual return before expenses) | | | 1,000.00 | | | | 1,022.58 | | | | 2.65 | |
* Expenses are equal to the Fund’s Class I shares annualized expense ratio of 0.52%, multiplied by the average account value over the period, and multiplied by 184/365 (to reflect the one-half year period). | |
148
1290 FUNDS
1290 RETIREMENT 2055 FUND
PORTFOLIO OF INVESTMENTS
October 31, 2018
| | | | | | | | |
| | | Number of
Shares | | | Value
(Note 1) | |
| | | | | | | | |
EXCHANGE TRADED FUNDS (ETF): | | | | | |
Equity (97.1%) | |
Invesco S&P 500 Low Volatility ETF | | | 6,950 | | | $ | 333,531 | |
Invesco S&P Emerging Markets Low Volatility ETF | | | 1,700 | | | | 39,100 | |
Invesco S&P International Developed Low Volatility ETF | | | 5,640 | | | | 173,317 | |
Invesco S&P MidCap Low Volatility ETF | | | 3,780 | | | | 174,674 | |
Invesco S&P SmallCap Low Volatility ETF | | | 1,690 | | | | 77,706 | |
iShares Core MSCI EAFE ETF | | | 5,830 | | | | 342,687 | |
iShares Core MSCI Emerging Markets ETF | | | 1,670 | | | | 78,924 | |
iShares Core S&P Total US Stock Market ETF | | | 15,940 | | | | 983,977 | |
iShares Edge MSCI Min Vol EAFE ETF | | | 2,570 | | | | 175,428 | |
| | | | | | | | |
iShares Edge MSCI Min Vol Emerging Markets ETF | | | 710 | | | | 39,036 | |
iShares Edge MSCI Min Vol USA ETF | | | 6,180 | | | | 338,231 | |
SPDR SSGA US Small Cap Low Volatility Index ETF | | | 850 | | | | 76,620 | |
| | | | | | | | |
Total Equity | | | | | | | 2,833,231 | |
| | | | | | | | |
Fixed Income (2.9%) | | | | | | | | |
iShares Core U.S. Aggregate Bond ETF | | | 660 | | | | 69,029 | |
iShares TIPS Bond ETF | | | 140 | | | | 15,238 | |
| | | | | | | | |
Total Fixed Income | | | | | | | 84,267 | |
| | | | | | | | |
Total Investments in Securities (100.0%)
(Cost $2,706,835) | | | | | | | 2,917,498 | |
Other Assets Less Liabilities (0.0%) | | | | | | | 692 | |
| | | | | |
Net Assets (100%) | | | | | | $ | 2,918,190 | |
| | | | | | | | |
The following is a summary of the inputs used to value the Fund’s assets and liabilities carried at fair value as of October 31, 2018:
The inputs or methodology used for valuing securities are not necessarily an indication of the risk associated with investing in those securities.
Various inputs are used in determining the value of the Fund’s investments. These inputs are summarized in the three broad levels listed below:
| | | | | | | | | | | | | | | | |
| | | | | |
| Investment Type | | Level 1
Quoted Prices in
Active Markets for
Identical
Securities | | | Level 2
Significant Other
Observable Inputs
(including quoted prices
for similar securities,
interest rates,
prepayment speeds,
credit risk, etc.) | | | Level 3
Significant Unobservable
Inputs (including the
Fund’s own
assumptions in
determining the fair
value of investments) | | | Total | |
Assets: | | | | | | | | | | | | | | | | |
Exchange Traded Funds | | | | | | | | | | | | | | | | |
Exchange Traded Funds | | $ | 2,917,498 | | | $ | — | | | $ | — | | | $ | 2,917,498 | |
| | | | | | | | | | | | | | | | |
Total Assets | | $ | 2,917,498 | | | $ | — | | | $ | — | | | $ | 2,917,498 | |
| | | | | | | | | | | | | | | | |
Total Liabilities | | $ | — | | | $ | — | | | $ | — | | | $ | — | |
| | | | | | | | | | | | | | | | |
Total | | $ | 2,917,498 | | | $ | — | | | $ | — | | | $ | 2,917,498 | |
| | | | | | | | | | | | | | | | |
The Fund held no derivatives contracts during the year ended October 31, 2018.
Investment security transactions for the year ended October 31, 2018 were as follows:
| | | | |
Cost of Purchases: | | | | |
Long-term investments other than U.S. government debt securities | | $ | 249,536 | |
Net Proceeds of Sales and Redemptions: | | | | |
Long-term investments other than U.S. government debt securities | | $ | 69,196 | |
See Notes to Financial Statements.
149
1290 FUNDS
1290 RETIREMENT 2055 FUND
PORTFOLIO OF INVESTMENTS (Continued)
October 31, 2018
As of October 31, 2018, the gross unrealized appreciation (depreciation) of investments based on the aggregate cost of investments in securities and derivative instruments, if applicable, for Federal income tax purposes was as follows:
| | | | |
Aggregate gross unrealized appreciation | | $ | 217,336 | |
Aggregate gross unrealized depreciation | | | (6,673 | ) |
| | | | |
Net unrealized appreciation | | $ | 210,663 | |
| | | | |
Federal income tax cost of investments in securities and derivative instruments, if applicable | | $ | 2,706,835 | |
| | | | |
See Notes to Financial Statements.
150
1290 FUNDS
1290 RETIREMENT 2055 FUND
STATEMENT OF ASSETS AND LIABILITIES
October 31, 2018
| | | | |
ASSETS | |
Investments in Securities, at value
(Cost $2,706,835) | | $ | 2,917,498 | |
Cash | | | 24,244 | |
Receivable from investment adviser | | | 11,607 | |
Prepaid registration and filing fees | | | 5,683 | |
Receivable for Fund shares sold | | | 549 | |
Other assets | | | 36 | |
| | | | |
Total assets | | | 2,959,617 | |
| | | | |
LIABILITIES | | | | |
Accrued professional fees | | | 32,040 | |
Transfer agent fees payable | | | 1,398 | |
Trustees’ fees payable | | | 26 | |
Accrued expenses | | | 7,963 | |
| | | | |
Total liabilities | | | 41,427 | |
| | | | |
NET ASSETS | | $ | 2,918,190 | |
| | | | |
Net assets were comprised of: | | | | |
Paid in capital | | $ | 2,662,268 | |
Total distributable earnings (loss) | | | 255,922 | |
| | | | |
Net assets | | $ | 2,918,190 | |
| | | | |
Class I | | | | |
Net asset value and redemption price per share, $2,918,190 / 264,304 shares outstanding (unlimited amount authorized: $0.001 par value) | | $ | 11.04 | |
| | | | |
STATEMENT OF OPERATIONS
For the Year Ended October 31, 2018
| | | | |
INVESTMENT INCOME | | | | |
Dividends | | $ | 64,699 | |
Interest | | | 230 | |
| | | | |
Total income | | | 64,929 | |
| | | | |
EXPENSES | | | | |
Professional fees | | | 40,354 | |
Registration and filing fees | | | 36,766 | |
Administrative fees | | | 30,000 | |
Investment advisory fees | | | 14,400 | |
Printing and mailing expenses | | | 12,742 | |
Transfer agent fees | | | 7,260 | |
Offering costs | | | 3,371 | |
Custodian fees | | | 2,800 | |
Trustees’ fees | | | 301 | |
Miscellaneous | | | 3,919 | |
| | | | |
Gross expenses | | | 151,913 | |
Less: Waiver from investment adviser | | | (44,400 | ) |
Reimbursement from investment adviser | | | (92,544 | ) |
| | | | |
Net expenses | | | 14,969 | |
| | | | |
NET INVESTMENT INCOME (LOSS) | | | 49,960 | |
| | | | |
REALIZED AND UNREALIZED GAIN (LOSS) | | | | |
Net realized gain (loss) on investments in securities | | | 9,823 | |
Net distributions of realized gain received from underlying funds | | | 3,616 | |
| | | | |
Net realized gain (loss) | | | 13,439 | |
| | | | |
Net change in unrealized appreciation (depreciation) on investments in securities | | | (15,674 | ) |
| | | | |
NET REALIZED AND UNREALIZED GAIN (LOSS) | | | (2,235 | ) |
| | | | |
NET INCREASE (DECREASE) IN NET ASSETS RESULTING FROM OPERATIONS | | $ | 47,725 | |
| | | | |
See Notes to Financial Statements.
151
1290 FUNDS
1290 RETIREMENT 2055 FUND
STATEMENT OF CHANGES IN NET ASSETS
| | | | | | | | |
| | | Year Ended
October 31, 2018 | | | February 27, 2017* to
October 31, 2017 | |
INCREASE (DECREASE) IN NET ASSETS FROM OPERATIONS: | | | | | | | | |
Net investment income (loss) | | $ | 49,960 | | | $ | 26,904 | |
Net realized gain (loss) | | | 13,439 | | | | 1,500 | |
Net change in unrealized appreciation (depreciation) | | | (15,674 | ) | | | 226,337 | |
| | | | | | | | |
NET INCREASE (DECREASE) IN NET ASSETS RESULTING FROM OPERATIONS | | | 47,725 | | | | 254,741 | |
| | | | | | | | |
Distributions to shareholders: | | | | | | | | |
Class I | | | (47,252 | ) | | | — | |
| | | | | | | | |
CAPITAL SHARES TRANSACTIONS: | | | | | | | | |
Class I | | | | | | | | |
Capital shares sold [ 14,321 and 250,009 shares, respectively ] | | | 163,155 | | | | 2,500,100 | |
Capital shares issued in reinvestment of dividends [ 0# and 0 shares, respectively ] | | | 2 | | | | — | |
Capital shares repurchased [ (26) and 0 shares, respectively ] | | | (281 | ) | | | — | |
| | | | | | | | |
NET INCREASE (DECREASE) IN NET ASSETS RESULTING FROM CAPITAL SHARE TRANSACTIONS | | | 162,876 | | | | 2,500,100 | |
| | | | | | | | |
TOTAL INCREASE (DECREASE) IN NET ASSETS | | | 163,349 | | | | 2,754,841 | |
NET ASSETS: | | | | | | | | |
Beginning of period | | | 2,754,841 | | | | — | |
| | | | | | | | |
End of period (a) | | $ | 2,918,190 | | | $ | 2,754,841 | |
| | | | | | | | |
* Commencement of Operations. | | | | | | | | |
# Number of shares is less than 0.5. | | | | | | | | |
(a) Includes accumulated undistributed (overdistributed) net investment income of $27,120 as of October 31, 2017. The SEC eliminated the requirement to disclose undistributed net investment income in 2018. | |
See Notes to Financial Statements.
152
1290 FUNDS
1290 RETIREMENT 2055 FUND
FINANCIAL HIGHLIGHTS
| | | | | | | | |
| Class I | | Year Ended
October 31, 2018 | | | February 27, 2017* to
October 31, 2017 | |
Net asset value, beginning of period | | $ | 11.02 | | | $ | 10.00 | |
| | | | | | | | |
Income (loss) from investment operations: | | | | | | | | |
Net investment income (loss) (e)(x) | | | 0.20 | | | | 0.11 | |
Net realized and unrealized gain (loss) | | | 0.01 | † | | | 0.91 | |
| | | | | | | | |
Total from investment operations | | | 0.21 | | | | 1.02 | |
| | | | | | | | |
Less distributions: | | | | | | | | |
Dividends from net investment income | | | (0.18 | ) | | | — | |
Distributions from net realized gains | | | (0.01 | ) | | | — | |
| | | | | | | | |
Total dividends and distributions | | | (0.19 | ) | | | — | |
| | | | | | | | |
Net asset value, end of period | | $ | 11.04 | | | $ | 11.02 | |
| | | | | | | | |
Total return (b) | | | 1.90 | % | | | 10.20 | % |
| | | | | | | | |
Ratios/Supplemental Data: | |
Net assets, end of period (000’s) | | $ | 2,918 | | | $ | 2,755 | |
Ratio of expenses to average net assets: | | | | | | | | |
After waivers and reimbursements (a)(f) | | | 0.52 | %(j) | | | 0.52 | %(j) |
Before waivers and reimbursements (a)(f) | | | 5.27 | % | | | 5.25 | % |
Ratio of net investment income (loss) to average net assets: | | | | | | | | |
After waivers and reimbursements (a)(f)(x) | | | 1.73 | % | | | 1.53 | %(l) |
Before waivers and reimbursements (a)(f)(x) | | | (3.02 | )% | | | (3.21 | )%(l) |
Portfolio turnover rate (z)^ | | | 2 | % | | | 1 | % |
| * | Commencement of Operations. |
| † | The amount shown for a share outstanding throughout the period does not accord with the aggregate net income and/or gain on investments for that period because of the timing of sales and repurchases of the Fund shares in relation to fluctuating market value of the investments in the Fund. |
| ^ | Portfolio turnover rate excludes derivatives, if any. |
| (a) | Ratios for periods less than one year are annualized. Certain non-recurring expenses incurred by the Fund are not annualized for periods less than one year. |
| (b) | Total returns for periods less than one year are not annualized. |
| (e) | Net investment income (loss) per share is based on average shares outstanding. |
| (f) | Expenses do not include the expenses of the underlying funds (“indirect expenses”), if applicable. |
| (j) | Including direct and indirect expenses, the net expense ratio after waivers and reimbursements would be 0.65%. |
| (l) | The annualized ratio of net investment income to average net assets may not be indicative of operating results for a full year. |
| (x) | Recognition of net investment income is affected by the timing of dividend declarations by the underlying funds in which the Fund invests. |
| (z) | Portfolio turnover rate for periods less than one year is not annualized. |
See Notes to Financial Statements.
153
1290 RETIREMENT 2060 FUND (Unaudited)
INVESTMENT ADVISER
PERFORMANCE RESULTS
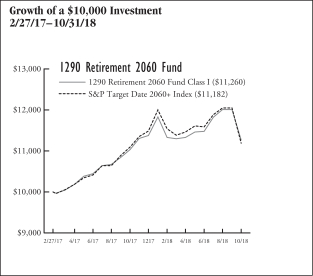
| | | | | | | | |
| Annualized Total Returns as of 10/31/18 | | | | | | |
| | | 1
Year | | | Since
Incept. | |
Fund – Class I Shares* | | | 2.09 | % | | | 7.35 | % |
S&P Target Date 2060+ Index | | | 0.81 | | | | 6.90 | |
* Date of inception 2/27/17. Returns for periods greater than one year are annualized. | |
The performance quoted is past performance and is not a guarantee of future results. Mutual funds are subject to certain market risks. Investment returns and principal value of an investment will fluctuate so that an investor’s shares, when redeemed, may be worth more or less than their original cost. Current performance may be higher or lower than the performance data shown. For the most current month-end performance data please call 1-888-310-0416 or visit www.1290Funds.com.
The graph illustrates comparative performance for $10,000 invested in the Class I Shares of the 1290 Retirement 2060 Fund and the S&P Target Date 2060+ Index from 2/27/17 to 10/31/18. The performance of the S&P Target Date 2060+ Index reflects an initial investment at the end of the month closest to the Fund’s inception. The performance of the Fund assumes reinvestment of all dividends and capital gain distributions, if any, and does not include a sales charge. The performance of the S&P Target Date 2060+ Index does not reflect the deduction of expenses or a sales charge associated with a mutual fund and has been adjusted to reflect reinvestment of all dividends, capital gain distributions, and interest of the securities included in the benchmark.
Fund performance may reflect the waiver of the Fund’s fees and reimbursement of expenses for certain periods since the inception date. Without these waivers and reimbursements, performance would have been lower. Also, performance shown in this section does not reflect the deduction of taxes that a shareholder would pay on Fund distributions or redemption of Fund shares.
PERFORMANCE SUMMARY
The Fund’s Class I shares returned 2.09% for the year ended October 31, 2018. The Fund’s benchmark, the S&P Target Date 2060+ Index, returned 0.81% over the same year.
Overview
The Allocations Drive Performance
Each 1290 Retirement Fund’s (as defined in the Notes to the Financial Statements) performance will reflect the performance of the underlying asset classes and depend upon their percentage weighting within the Fund. Here’s why:
The 1290 Retirement Funds are managed to target a specific year of planned retirement. The Asset mix will become more conservative each year, until about 10 years after the target retirement year, when it will become relatively stable. The 1290 Retirement Funds balance the need for appreciation with the need for income as retirement approaches and focus on supporting an income stream over a long-term retirement withdrawal horizon.
To achieve its exposures, each 1290 Retirement Fund invests in exchange-traded funds (ETFs) representing various equity and bond asset classes. Because of this, each of the 1290 Retirement Funds’ performance will be a function of the asset class performance and the percentage weighting of each asset class in the 1290 Retirement Funds. Current target and actual allocations, as well as performance, are available in a separate quarterly Fund Fact Sheet.
Fund Highlights
What helped the 1290 Retirement Funds performance during the year*?
| • | | Within equities, U.S. large-cap and mid-cap equities exhibited positive returns and were the best performing asset class. U.S. small-cap equities also added modestly to each of the 1290 Retirement Funds’ performance. |
| • | | Having exposure to ETFs that tend to be less volatile than the market as a whole helped buoy performance, especially within hard-hit emerging markets and developed-world sectors. |
What hurt the 1290 Retirement Funds performance during the year*?
| • | | Emerging market and international equities were the biggest detractors to performance for the period. |
| * | The Fund does not hold a position in any single security directly but has exposure through ETFs. |
| | | | |
Table by Asset Class (as a percentage of Total Investments in Securities)
As of October 31, 2018 | |
Equity | | | 100.0 | % |
154
1290 RETIREMENT 2060 FUND (Unaudited)
| | | | |
Top 10 Holdings (as a percentage of Total Investments in Securities)
As of October 31, 2018 | |
iShares Core S&P Total US Stock Market ETF | | | 35.1 | % |
iShares Edge MSCI Min Vol USA ETF | | | 12.2 | |
iShares Core MSCI EAFE ETF | | | 12.0 | |
Invesco S&P 500 Low Volatility ETF | | | 12.0 | |
Invesco S&P MidCap Low Volatility ETF | | | 6.2 | |
iShares Edge MSCI Min Vol EAFE ETF | | | 6.0 | |
Invesco S&P International Developed Low Volatility ETF | | | 6.0 | |
Invesco S&P SmallCap Low Volatility ETF | | | 2.7 | |
SPDR SSGA US Small Cap Low Volatility Index ETF | | | 2.7 | |
iShares Core MSCI Emerging Markets ETF | | | 2.6 | |
| | |
Holdings are subject to change without notice. | | | | |
UNDERSTANDING YOUR EXPENSES:
As a shareholder of the Fund, you incur two types of costs:
(1) transaction costs, including applicable sales charges and redemption fees; and (2) ongoing costs, including investment advisory fees, distribution and/or service (12b-1) fees and other Fund expenses. These examples are intended to help you understand your ongoing costs (in dollars) of investing in the Fund and to compare these costs with the ongoing costs of investing in other mutual funds.
The examples are based on an investment of $1,000 invested at the beginning of the six-month period ended October 31, 2018 and held for the entire six-month period.
Actual Expenses
The first line of the following table provides information about actual account values and actual expenses. You may use the information in this line, together with the amount you invested, to estimate the expenses that you paid over the period. Simply divide your account value by $1,000 (for example, an $8,600 account value divided by $1,000 = 8.6), then multiply the result by the number in the first line under the heading entitled “Expenses Paid During Period” to estimate the expenses you paid on your account during this period.
Hypothetical Example for Comparison Purposes
The second line of the following table provides information about hypothetical account values and hypothetical expenses based on the Fund’s actual expense ratio and an assumed rate of return of 5% per year before expenses, which is not the Fund’s actual return. The hypothetical account values and expenses may not be used to estimate the actual ending account balance or expenses you paid for the period. You may use this information to compare the ongoing costs of investing in the Fund and other funds. To do so, compare this 5% hypothetical example with the 5% hypothetical examples that appear in the shareholder reports of the other funds.
Please note that the expenses shown in the table are meant to highlight your ongoing costs only and do not reflect any transactional costs, such as sales charges (loads), redemption fees, or exchange fees. Therefore, the second line of the table is useful in comparing ongoing costs only, and will not help you determine the relative total costs of owning different funds. In addition, if these transactional costs were included, your costs would have been higher.
EXAMPLE
| | | | | | | | | | | | |
| | | Beginning
Account
Value
5/1/18 | | | Ending
Account
Value
10/31/18 | | | Expenses
Paid
During
Period*
5/1/18 -
10/31/18 | |
Class I | | | | | | | | | | | | |
Actual | | $ | 1,000.00 | | | $ | 994.60 | | | $ | 2.61 | |
Hypothetical (5% average annual return before expenses) | | | 1,000.00 | | | | 1,022.59 | | | | 2.64 | |
* Expenses are equal to the Fund’s Class I shares annualized expense ratio of 0.52%, multiplied by the average account value over the period, and multiplied by 184/365 (to reflect the one-half year period). | |
155
1290 FUNDS
1290 RETIREMENT 2060 FUND
PORTFOLIO OF INVESTMENTS
October 31, 2018
| | | | | | | | |
| | | Number of
Shares | | | Value
(Note 1) | |
| | | | | | | | |
EXCHANGE TRADED FUNDS (ETF): | |
Equity (100.2%) | | | | | | | | |
Invesco S&P 500 Low Volatility ETF | | | 7,210 | | | $ | 346,008 | |
Invesco S&P Emerging Markets Low Volatility ETF | | | 1,580 | | | | 36,340 | |
Invesco S&P International Developed Low Volatility ETF | | | 5,570 | | | | 171,166 | |
Invesco S&P MidCap Low Volatility ETF | | | 3,850 | | | | 177,909 | |
Invesco S&P SmallCap Low Volatility ETF | | | 1,710 | | | | 78,626 | |
iShares Core MSCI EAFE ETF | | | 5,890 | | | | 346,214 | |
iShares Core MSCI Emerging Markets ETF | | | 1,560 | | | | 73,726 | |
iShares Core S&P Total US Stock Market ETF | | | 16,270 | | | | 1,004,346 | |
| | | | | | | | |
iShares Edge MSCI Min Vol EAFE ETF | | | 2,540 | | | | 173,380 | |
iShares Edge MSCI Min Vol Emerging Markets ETF | | | 650 | | | | 35,737 | |
iShares Edge MSCI Min Vol USA ETF | | | 6,420 | | | | 351,367 | |
SPDR SSGA US Small Cap Low Volatility Index ETF | | | 870 | | | | 78,423 | |
| | | | | | | | |
Total Investments in
Securities (100.2%)
(Cost $2,652,422) | | | | | | | 2,873,242 | |
Other Assets Less
Liabilities (-0.2%) | | | | | | | (6,389 | ) |
| | | | | | | | |
Net Assets (100%) | | | | | | $ | 2,866,853 | |
| | | | | | | | |
The following is a summary of the inputs used to value the Fund’s assets and liabilities carried at fair value as of October 31, 2018:
The inputs or methodology used for valuing securities are not necessarily an indication of the risk associated with investing in those securities.
Various inputs are used in determining the value of the Fund’s investments. These inputs are summarized in the three broad levels listed below:
| | | | | | | | | | | | | | | | |
| | | | | |
| Investment Type | | Level 1
Quoted Prices in
Active Markets for
Identical
Securities | | | Level 2
Significant Other
Observable Inputs
(including quoted prices
for similar securities,
interest rates,
prepayment speeds,
credit risk, etc.) | | | Level 3
Significant Unobservable
Inputs (including the
Fund’s own
assumptions in
determining the fair
value of investments) | | | Total | |
Assets: | |
Exchange Traded Funds | | | | | | | | | | | | | | | | |
Exchange Traded Funds | | $ | 2,873,242 | | | $ | — | | | $ | — | | | $ | 2,873,242 | |
| | | | | | | | | | | | | | | | |
Total Assets | | $ | 2,873,242 | | | $ | — | | | $ | — | | | $ | 2,873,242 | |
| | | | | | | | | | | | | | | | |
Total Liabilities | | $ | — | | | $ | — | | | $ | — | | | $ | — | |
| | | | | | | | | | | | | | | | |
Total | | $ | 2,873,242 | | | $ | — | | | $ | — | | | $ | 2,873,242 | |
| | | | | | | | | | | | | | | | |
The Fund held no derivatives contracts during the year ended October 31, 2018.
Investment security transactions for the year ended October 31, 2018 were as follows:
| | | | |
Cost of Purchases: | | | | |
Long-term investments other than U.S. government debt securities | | $ | 182,388 | |
Net Proceeds of Sales and Redemptions: | | | | |
Long-term investments other than U.S. government debt securities | | $ | 53,661 | |
See Notes to Financial Statements.
156
1290 FUNDS
1290 RETIREMENT 2060 FUND
PORTFOLIO OF INVESTMENTS (Continued)
October 31, 2018
As of October 31, 2018, the gross unrealized appreciation (depreciation) of investments based on the aggregate cost of investments in securities and derivative instruments, if applicable, for Federal income tax purposes was as follows:
| | | | |
Aggregate gross unrealized appreciation | | $ | 223,547 | |
Aggregate gross unrealized depreciation | | | (2,727 | ) |
| | | | |
Net unrealized appreciation | | $ | 220,820 | |
| | | | |
Federal income tax cost of investments in securities and derivative instruments, if applicable | | $ | 2,652,422 | |
| | | | |
See Notes to Financial Statements.
157
1290 FUNDS
1290 RETIREMENT 2060 FUND
STATEMENT OF ASSETS AND LIABILITIES
October 31, 2018
| | | | |
|
ASSETS | |
Investments in Securities, at value
(Cost $2,652,422) | | $ | 2,873,242 | |
Cash | | | 17,923 | |
Receivable from investment adviser | | | 11,357 | |
Prepaid registration and filing fees | | | 5,634 | |
Other assets | | | 36 | |
| | | | |
Total assets | | | 2,908,192 | |
| | | | |
LIABILITIES | | | | |
Accrued professional fees | | | 32,045 | |
Transfer agent fees payable | | | 1,293 | |
Trustees’ fees payable | | | 26 | |
Accrued expenses | | | 7,975 | |
| | | | |
Total liabilities | | | 41,339 | |
| | | | |
NET ASSETS | | $ | 2,866,853 | |
| | | | |
Net assets were comprised of: | | | | |
Paid in capital | | $ | 2,603,650 | |
Total distributable earnings (loss) | | | 263,203 | |
| | | | |
Net assets | | $ | 2,866,853 | |
| | | | |
Class I | | | | |
Net asset value and redemption price per share, $2,866,853 / 259,086 shares outstanding (unlimited amount authorized: $0.001 par value) | | $ | 11.07 | |
| | | | |
STATEMENT OF OPERATIONS
For the Year Ended October 31, 2018
| | | | |
|
INVESTMENT INCOME | |
Dividends | | $ | 64,389 | |
Interest | | | 215 | |
| | | | |
Total income | | | 64,604 | |
| | | | |
EXPENSES | | | | |
Professional fees | | | 40,352 | |
Registration and filing fees | | | 36,351 | |
Administrative fees | | | 30,000 | |
Investment advisory fees | | | 14,345 | |
Printing and mailing expenses | | | 12,739 | |
Transfer agent fees | | | 7,060 | |
Offering costs | | | 3,392 | |
Custodian fees | | | 2,750 | |
Trustees’ fees | | | 300 | |
Miscellaneous | | | 3,919 | |
| | | | |
Gross expenses | | | 151,208 | |
Less: Waiver from investment adviser | | | (44,345 | ) |
Reimbursement from investment adviser | | | (91,984 | ) |
| | | | |
Net expenses | | | 14,879 | |
| | | | |
NET INVESTMENT INCOME (LOSS) | | | 49,725 | |
| | | | |
REALIZED AND UNREALIZED GAIN (LOSS) | | | | |
Net realized gain (loss) on investments in securities | | | 7,017 | |
Net distributions of realized gain received from underlying funds | | | 4,061 | |
| | | | |
Net realized gain (loss) | | | 11,078 | |
| | | | |
Net change in unrealized appreciation (depreciation) on investments in securities | | | (8,835 | ) |
| | | | |
NET REALIZED AND UNREALIZED GAIN (LOSS) | | | 2,243 | |
| | | | |
NET INCREASE (DECREASE) IN NET ASSETS RESULTING FROM OPERATIONS | | $ | 51,968 | |
| | | | |
See Notes to Financial Statements.
158
1290 FUNDS
1290 RETIREMENT 2060 FUND
STATEMENT OF CHANGES IN NET ASSETS
| | | | | | | | |
| | | Year Ended
October 31, 2018 | | | February 27, 2017* to
October 31, 2017 | |
INCREASE (DECREASE) IN NET ASSETS FROM OPERATIONS: | |
Net investment income (loss) | | $ | 49,725 | | | $ | 26,866 | |
Net realized gain (loss) | | | 11,078 | | | | 1,501 | |
Net change in unrealized appreciation (depreciation) | | | (8,835 | ) | | | 229,655 | |
| | | | | | | | |
NET INCREASE (DECREASE) IN NET ASSETS RESULTING FROM OPERATIONS | | | 51,968 | | | | 258,022 | |
| | | | | | | | |
Distributions to shareholders: | | | | | | | | |
Class I | | | (47,502 | ) | | | — | |
| | | | | | | | |
CAPITAL SHARES TRANSACTIONS: | | | | | | | | |
Class I | | | | | | | | |
Capital shares sold [ 9,241 and 250,009 shares, respectively ] | | | 106,171 | | | | 2,500,100 | |
Capital shares issued in reinvestment of dividends [ 0# and 0 shares, respectively ] | | | 2 | | | | — | |
Capital shares repurchased [ (164) and 0 shares, respectively ] | | | (1,908 | ) | | | — | |
| | | | | | | | |
NET INCREASE (DECREASE) IN NET ASSETS RESULTING FROM CAPITAL SHARE TRANSACTIONS | | | 104,265 | | | | 2,500,100 | |
| | | | | | | | |
TOTAL INCREASE (DECREASE) IN NET ASSETS | | | 108,731 | | | | 2,758,122 | |
NET ASSETS: | | | | | | | | |
Beginning of period | | | 2,758,122 | | | | — | |
| | | | | | | | |
End of period (a) | | $ | 2,866,853 | | | $ | 2,758,122 | |
| | | | | | | | |
* Commencement of Operations. | | | | | | | | |
# Number of shares is less than 0.5. | | | | | | | | |
(a) Includes accumulated undistributed (overdistributed) net investment income of $27,078 as of October 31, 2017. The SEC eliminated the requirement to disclose undistributed net investment income in 2018. | |
See Notes to Financial Statements.
159
1290 FUNDS
1290 RETIREMENT 2060 FUND
FINANCIAL HIGHLIGHTS
| | | | | | | | |
| Class I | | Year Ended
October 31, 2018 | | | February 27, 2017* to
October 31, 2017 | |
Net asset value, beginning of period | | $ | 11.03 | | | $ | 10.00 | |
| | | | | | | | |
Income (loss) from investment operations: | | | | | | | | |
Net investment income (loss) (e)(x) | | | 0.20 | | | | 0.11 | |
Net realized and unrealized gain (loss) | | | 0.03 | | | | 0.92 | |
| | | | | | | | |
Total from investment operations | | | 0.23 | | | | 1.03 | |
| | | | | | | | |
Less distributions: | | | | | | | | |
Dividends from net investment income | | | (0.18 | ) | | | — | |
Distributions from net realized gains | | | (0.01 | ) | | | — | |
| | | | | | | | |
Total dividends and distributions | | | (0.19 | ) | | | — | |
| | | | | | | | |
Net asset value, end of period | | $ | 11.07 | | | $ | 11.03 | |
| | | | | | | | |
Total return (b) | | | 2.09 | % | | | 10.30 | % |
| | | | | | | | |
Ratios/Supplemental Data: | | | | | | | | |
Net assets, end of period (000’s) | | $ | 2,867 | | | $ | 2,758 | |
Ratio of expenses to average net assets: | | | | | | | | |
After waivers and reimbursements (a)(f) | | | 0.52 | %(j) | | | 0.52 | %(j) |
Before waivers and reimbursements (a)(f) | | | 5.27 | % | | | 5.25 | % |
Ratio of net investment income (loss) to average net assets: | | | | | | | | |
After waivers and reimbursements (a)(f)(x) | | | 1.73 | % | | | 1.52 | %(l) |
Before waivers and reimbursements (a)(f)(x) | | | (3.02 | )% | | | (3.21 | )%(l) |
Portfolio turnover rate (z)^ | | | 2 | % | | | 1 | % |
| * | Commencement of Operations. |
| ^ | Portfolio turnover rate excludes derivatives, if any. |
| (a) | Ratios for periods less than one year are annualized. Certain non-recurring expenses incurred by the Fund are not annualized for periods less than one year. |
| (b) | Total returns for periods less than one year are not annualized. |
| (e) | Net investment income (loss) per share is based on average shares outstanding. |
| (f) | Expenses do not include the expenses of the underlying funds (“indirect expenses”), if applicable. |
| (j) | Including direct and indirect expenses, the net expense ratio after waivers and reimbursements would be 0.65%. |
| (l) | The annualized ratio of net investment income to average net assets may not be indicative of operating results for a full year. |
| (x) | Recognition of net investment income is affected by the timing of dividend declarations by the underlying funds in which the Fund invests. |
| (z) | Portfolio turnover rate for periods less than one year is not annualized. |
See Notes to Financial Statements.
160
1290 SMARTBETA EQUITY FUND (Unaudited)
INVESTMENT ADVISER
INVESTMENT SUB-ADVISER
| Ø | | AXA Rosenberg Investment Management LLC |
PERFORMANCE RESULTS
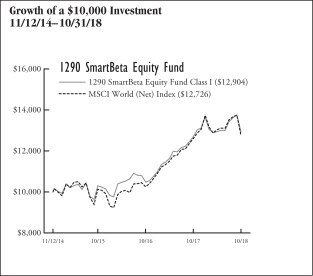
| | | | | | | | | | | | |
| Annualized Total Returns as of 10/31/18 | |
| | | | | | 1
Year | | | Since
Incept. | |
Fund – Class A Shares* | | | without Sales Charge | | | | 1.64 | % | | | 6.39 | % |
| | | | with Sales Charge (a) | | | | (3.94 | ) | | | 4.89 | |
Fund – Class I Shares* | | | | | | | 1.86 | | | | 6.64 | |
Fund – Class R Shares* | | | | | | | 1.39 | | | | 6.11 | |
Fund – Class T Shares*† | | | without Sales Charge | | | | 1.86 | | | | 6.64 | |
| | | | with Sales Charge (b | ) | | | (0.66 | ) | | | 5.95 | |
MSCI World (Net) Index | | | | | | | 1.16 | | | | 6.27 | |
* Date of inception 11/12/14. † Class T Shares currently are not offered for sale. (a) A 5.50% front-end sales charge was deducted. (b) A 2.50% front-end sales charge was deducted. Returns for periods greater than one year are annualized. | |
The performance quoted is past performance and is not a guarantee of future results. Mutual funds are subject to certain market risks. Investment returns and principal value of an investment will fluctuate so that an investor’s shares, when redeemed, may be worth more or less than their original cost. Current performance may be higher or lower than the performance data shown. For the most current month-end performance data please call 1-888-310-0416 or visit www.1290Funds.com.
The graph illustrates comparative performance for $10,000 invested in the Class I Shares of the 1290 SmartBeta Equity Fund and the MSCI World (Net) Index from 11/12/14 to 10/31/18. The performance of the MSCI World (Net) Index reflects an initial investment at the end of the month closest to the Fund’s inception. The performance of the Fund assumes reinvestment of all dividends and capital gain distributions, if any, and does not include a sales charge. The performance of the MSCI World (Net) Index does not reflect the deduction of expenses or a sales charge associated with a mutual fund and has been adjusted to reflect reinvestment of all dividends, capital gain distributions, and interest of the securities included in the benchmark.
Fund performance may reflect the waiver of the Fund’s fees and reimbursement of expenses for certain periods since the inception date. Without these waivers and reimbursements, performance would have been lower. Also, performance shown in this section does not reflect the deduction of taxes that a shareholder would pay on Fund distributions or redemption of Fund shares.
PERFORMANCE SUMMARY
The Fund’s Class I shares returned 1.86% for the year ended October 31, 2018. The Fund’s benchmark, the MSCI World (Net) Index, returned 1.16% over the same year.
Overview — AXA Rosenberg Investment Management LLC
During the period, markets continued to climb as the synchronized global economic expansion observed throughout much of 2017 helped to ease investors’ concerns around geopolitical uncertainty and other potential risks to the recent bull market. Buoyed by the strength of the U.S. economy, the Federal Reserve further increased interest rates, causing brief bouts of volatility in the first quarter of 2018 and again late in the reporting period. The latter turbulence led U.S. equities to pull back from a series of all-time highs reached earlier in the year, with technology stocks witnessing among the strongest reversals. Outside of the U.S. economic data was less positive during the period, particularly in Europe, where the European Central Bank hinted at an end to quantitative easing. Asian economies were impacted heavily by the rise in U.S. interest rates, a strong U.S. dollar and the increasingly protectionist policies of the Trump administration. In this context, emerging markets generally underperformed their developed peers, and large cap stocks in aggregate outperformed small.
At the sector level technology stocks outperformed over the full year, but their performance waned as the review period came to a close. Strong returns also came from the consumer discretionary sector, which includes many technology-related retailers; health care and energy stocks also outperformed. The weakest returns were reserved for defensive and high yielding sectors such as utilities, consumer staples and real estate.
Fund Highlights
The Fund outperformed the benchmark over the period, driven by the strategy’s exposure to high quality companies. While the Fund’s emphasis on low volatility went unrewarded for the year as a whole, it proved particularly beneficial when markets weakened late in the period.
What helped performance during the year?
| • | | The Fund’s bias toward stocks with superior earnings sustainability, a proprietary measure of earnings quality, saw stocks such as Adobe, Inc. and The TJX Cos., Inc. featured as top contributors to performance. |
| • | | An underweight to the communication utilities industry also contributed positively, including the below-benchmark exposure to Facebook, Inc. |
161
1290 SMARTBETA EQUITY FUND (Unaudited)
What hurt performance during the year?
| • | | The Fund’s low volatility factor exposure went unrewarded over the full period as defensive, low beta stocks were out of favor until the last quarter of the period. Avoiding large, more volatile names such as Apple, Inc. and Microsoft Corp. weighed on performance. |
| • | | The Fund’s lower-than-benchmark exposure to oil and gas companies detracted from performance as this area of the market rallied from previous weakness. |
| | | | |
Sector Weightings
as of October 31, 2018 | | % of
Net Assets | |
Financials | | | 18.8 | % |
Industrials | | | 16.7 | |
Consumer Staples | | | 12.9 | |
Health Care | | | 12.4 | |
Information Technology | | | 11.7 | |
Consumer Discretionary | | | 7.6 | |
Communication Services | | | 5.6 | |
Utilities | | | 4.7 | |
Real Estate | | | 4.1 | |
Materials | | | 2.6 | |
Energy | | | 2.2 | |
Cash and Other | | | 0.7 | |
| | | | | |
| | | | 100.0 | % |
| | | | | |
Holdings are subject to change without notice. | | | | |
UNDERSTANDING YOUR EXPENSES:
As a shareholder of the Fund, you incur two types of costs:
(1) transaction costs, including applicable sales charges and redemption fees; and (2) ongoing costs, including investment advisory fees, distribution and/or service (12b-1) fees (in the case of Class A, Class R and Class T shares of the Fund), and other Fund expenses. These examples are intended to help you understand your ongoing costs (in dollars) of investing in the Fund and to compare these costs with the ongoing costs of investing in other mutual funds.
The examples are based on an investment of $1,000 invested at the beginning of the six-month period ended October 31, 2018 and held for the entire six-month period.
Actual Expenses
The first line of the following table provides information about actual account values and actual expenses. You may use the information in this line, together with the amount you invested, to estimate the expenses that you paid over the period. Simply divide your account value by $1,000 (for example, an $8,600 account value divided by $1,000 = 8.6), then multiply the result by the number in the first line under the heading entitled “Expenses Paid During Period” to estimate the expenses you paid on your account during this period.
Hypothetical Example for Comparison Purposes
The second line of the following table provides information about hypothetical account values and hypothetical expenses based on the Fund’s actual expense ratio and an assumed rate of return of 5% per year before expenses, which is not the Fund’s actual return. The hypothetical account values and expenses may not be used to estimate the actual ending account balance or expenses you paid for the period. You may use this information to compare the ongoing costs of investing in the Fund and other funds. To do so, compare this 5% hypothetical example with the 5% hypothetical examples that appear in the shareholder reports of the other funds.
Please note that the expenses shown in the table are meant to highlight your ongoing costs only and do not reflect any transactional costs, such as sales charges (loads), redemption fees, or exchange fees. Therefore, the second line of the table is useful in comparing ongoing costs only, and will not help you determine the relative total costs of owning different funds. In addition, if these transactional costs were included, your costs would have been higher.
EXAMPLE
| | | | | | | | | | | | |
| | | Beginning
Account
Value
5/1/18 | | | Ending
Account
Value
10/31/18 | | | Expenses
Paid
During
Period*
5/1/18 -
10/31/18 | |
Class A | | | | | | | | | | | | |
Actual | | $ | 1,000.00 | | | $ | 998.30 | | | $ | 5.79 | |
Hypothetical (5% average annual return before expenses) | | | 1,000.00 | | | | 1,019.41 | | | | 5.85 | |
Class I | | | | | | | | | | | | |
Actual | | | 1,000.00 | | | | 999.20 | | | | 4.53 | |
Hypothetical (5% average annual return before expenses) | | | 1,000.00 | | | | 1,020.67 | | | | 4.58 | |
Class R | | | | | | | | | | | | |
Actual | | | 1,000.00 | | | | 996.70 | | | | 7.05 | |
Hypothetical (5% average annual return before expenses) | | | 1,000.00 | | | | 1,018.15 | | | | 7.12 | |
Class T** | | | | | | | | | | | | |
Actual | | | 1,000.00 | | | | 999.20 | | | | 4.53 | |
Hypothetical (5% average annual return before expenses) | | | 1,000.00 | | | | 1,020.67 | | | | 4.58 | |
* Expenses are equal to the Fund’s Class A, I, R and T shares annualized expense ratios of 1.15%, 0.90%, 1.40% and 0.90%, respectively, multiplied by the average account value over the period, and multiplied by 184/365 (to reflect the one-half year period). ** Class T shares currently are not offered for sale. | |
162
1290 FUNDS
1290 SMARTBETA EQUITY FUND
PORTFOLIO OF INVESTMENTS
October 31, 2018
| | | | | | | | |
| | | Number of
Shares | | | Value
(Note 1) | |
COMMON STOCKS: | | | | | | | | |
Communication Services (5.6%) | | | | | | | | |
Diversified Telecommunication Services (3.3%) | |
AT&T, Inc. | | | 2,737 | | | $ | 83,971 | |
BCE, Inc. | | | 1,200 | | | | 46,443 | |
Deutsche Telekom AG (Registered) | | | 4,900 | | | | 80,458 | |
Elisa OYJ | | | 600 | | | | 23,886 | |
Nippon Telegraph & Telephone Corp. | | | 900 | | | | 37,797 | |
Swisscom AG (Registered) | | | 120 | | | | 54,903 | |
Telenor ASA | | | 1,900 | | | | 34,799 | |
Telstra Corp. Ltd. | | | 15,300 | | | | 33,462 | |
Verizon Communications, Inc. | | | 3,300 | | | | 188,397 | |
| | | | | | | | |
| | | | | | | 584,116 | |
| | | | | | | | |
Entertainment (0.6%) | | | | | | | | |
Vivendi SA | | | 800 | | | | 19,329 | |
Walt Disney Co. (The) | | | 700 | | | | 80,381 | |
| | | | | | | | |
| | | | | | | 99,710 | |
| | | | | | | | |
Interactive Media & Services (0.2%) | | | | | |
Facebook, Inc., Class A* | | | 200 | | | | 30,358 | |
| | | | | | | | |
Media (0.9%) | | | | | | | | |
Comcast Corp., Class A | | | 2,900 | | | | 110,606 | |
Omnicom Group, Inc. | | | 800 | | | | 59,456 | |
| | | | | | | | |
| | | | | | | 170,062 | |
| | | | | | | | |
Wireless Telecommunication Services (0.6%) | | | | | |
KDDI Corp. | | | 1,200 | | | | 29,861 | |
NTT DOCOMO, Inc. | | | 2,700 | | | | 67,893 | |
Rogers Communications, Inc., Class B | | | 300 | | | | 15,449 | |
| | | | | | | | |
| | | | | | | 113,203 | |
| | | | | | | | |
Total Communication Services | | | | | | | 997,449 | |
| | | | | | | | |
Consumer Discretionary (7.6%) | | | | | | | | |
Auto Components (0.4%) | | | | | | | | |
Bridgestone Corp. | | | 600 | | | | 23,116 | |
Magna International, Inc. | | | 900 | | | | 44,308 | |
| | | | | | | | |
| | | | | | | 67,424 | |
| | | | | | | | |
Automobiles (0.4%) | | | | | | | | |
Bayerische Motoren Werke AG | | | 300 | | | | 25,878 | |
Subaru Corp. | | | 700 | | | | 18,880 | |
Suzuki Motor Corp. | | | 300 | | | | 14,968 | |
Yamaha Motor Co. Ltd. | | | 800 | | | | 18,911 | |
| | | | | | | | |
| | | | | | | 78,637 | |
| | | | | | | | |
Hotels, Restaurants & Leisure (2.3%) | | | | | | | | |
Carnival Corp. | | | 900 | | | | 50,436 | |
Compass Group plc | | | 1,923 | | | | 37,837 | |
Darden Restaurants, Inc. | | | 200 | | | | 21,310 | |
Domino’s Pizza, Inc. | | | 100 | | | | 26,879 | |
Hilton Worldwide Holdings, Inc. | | | 300 | | | | 21,351 | |
Marriott International, Inc., Class A | | | 100 | | | | 11,689 | |
Restaurant Brands International, Inc. | | | 500 | | | | 27,392 | |
Royal Caribbean Cruises Ltd. | | | 200 | | | | 20,946 | |
Starbucks Corp. | | | 1,700 | | | | 99,059 | |
Vail Resorts, Inc. | | | 100 | | | | 25,132 | |
Yum! Brands, Inc. | | | 700 | | | | 63,287 | |
| | | | | | | | |
| | | | | | | 405,318 | |
| | | | | | | | |
Household Durables (0.1%) | | | | | | | | |
DR Horton, Inc. | | | 500 | | | | 17,980 | |
| | | | | | | | |
Multiline Retail (0.5%) | | | | | | | | |
Dollar General Corp. | | | 500 | | | | 55,690 | |
Target Corp. | | | 500 | | | | 41,815 | |
| | | | | | | | |
| | | | | | | 97,505 | |
| | | | | | | | |
Specialty Retail (2.9%) | | | | | | | | |
Home Depot, Inc. (The) | | | 700 | | | | 123,116 | |
Industria de Diseno Textil SA | | | 2,000 | | | | 56,408 | |
Lowe’s Cos., Inc. | | | 600 | | | | 57,132 | |
Nitori Holdings Co. Ltd. | | | 100 | | | | 13,115 | |
O’Reilly Automotive, Inc.* | | | 200 | | | | 64,150 | |
Ross Stores, Inc. | | | 400 | | | | 39,600 | |
TJX Cos., Inc. (The) | | | 1,400 | | | | 153,832 | |
| | | | | | | | |
| | | | | | | 507,353 | |
| | | | | | | | |
Textiles, Apparel & Luxury Goods (1.0%) | | | | | |
Gildan Activewear, Inc. | | | 800 | | | | 23,913 | |
LVMH Moet Hennessy Louis Vuitton SE | | | 200 | | | | 60,591 | |
NIKE, Inc., Class B | | | 500 | | | | 37,520 | |
VF Corp. | | | 700 | | | | 58,016 | |
| | | | | | | | |
| | | | | | | 180,040 | |
| | | | | | | | |
Total Consumer Discretionary | | | | | | | 1,354,257 | |
| | | | | | | | |
Consumer Staples (12.9%) | | | | | | | | |
Beverages (3.9%) | | | | | | | | |
Brown-Forman Corp., Class B | | | 500 | | | | 23,170 | |
Coca-Cola Co. (The) | | | 4,800 | | | | 229,824 | |
Diageo plc | | | 2,400 | | | | 83,009 | |
Heineken NV | | | 800 | | | | 72,097 | |
Kirin Holdings Co. Ltd. | | | 1,000 | | | | 23,846 | |
Monster Beverage Corp.* | | | 500 | | | | 26,425 | |
PepsiCo, Inc. | | | 1,800 | | | | 202,284 | |
Pernod Ricard SA | | | 200 | | | | 30,517 | |
| | | | | | | | |
| | | | | | | 691,172 | |
| | | | | | | | |
Food & Staples Retailing (2.1%) | | | | | | | | |
Costco Wholesale Corp. | | | 600 | | | | 137,178 | |
Loblaw Cos. Ltd. | | | 300 | | | | 15,004 | |
Seven & i Holdings Co. Ltd. | | | 900 | | | | 38,947 | |
Sysco Corp. | | | 1,200 | | | | 85,596 | |
Walmart, Inc. | | | 300 | | | | 30,084 | |
Wesfarmers Ltd. | | | 500 | | | | 16,555 | |
Woolworths Group Ltd. | | | 2,200 | | | | 44,334 | |
| | | | | | | | |
| | | | | | | 367,698 | |
| | | | | | | | |
Food Products (2.1%) | | | | | | | | |
Hershey Co. (The) | | | 400 | | | | 42,860 | |
Kellogg Co. | | | 900 | | | | 58,932 | |
McCormick & Co., Inc. (Non-Voting) | | | 300 | | | | 43,200 | |
Mondelez International, Inc., Class A | | | 2,400 | | | | 100,752 | |
Nestle SA (Registered) | | | 1,400 | | | | 118,074 | |
| | | | | | | | |
| | | | | | | 363,818 | |
| | | | | | | | |
See Notes to Financial Statements.
163
1290 FUNDS
1290 SMARTBETA EQUITY FUND
PORTFOLIO OF INVESTMENTS (Continued)
October 31, 2018
| | | | | | | | |
| | | Number of
Shares | | | Value
(Note 1) | |
Household Products (2.9%) | | | | | | | | |
Church & Dwight Co., Inc. | | | 400 | | | $ | 23,748 | |
Clorox Co. (The) | | | 300 | | | | 44,535 | |
Colgate-Palmolive Co. | | | 1,300 | | | | 77,415 | |
Essity AB, Class B | | | 600 | | | | 13,687 | |
Henkel AG & Co. KGaA (Preference) (q) | | | 420 | | | | 45,935 | |
Kimberly-Clark Corp. | | | 800 | | | | 83,440 | |
Procter & Gamble Co. (The) | | | 2,600 | | | | 230,568 | |
| | | | | | | | |
| | | | | | | 519,328 | |
| | | | | | | | |
Personal Products (1.9%) | | | | | | | | |
Beiersdorf AG | | | 180 | | | | 18,632 | |
Estee Lauder Cos., Inc. (The), Class A | | | 400 | | | | 54,976 | |
Kao Corp. | | | 500 | | | | 33,249 | |
L’Oreal SA | | | 270 | | | | 60,802 | |
Unilever NV (CVA) | | | 2,000 | | | | 107,675 | |
Unilever plc | | | 1,300 | | | | 68,840 | |
| | | | | | | | |
| | | | | | | 344,174 | |
| | | | | | | | |
Total Consumer Staples | | | | | | | 2,286,190 | |
| | | | | | | | |
Energy (2.2%) | | | | | | | | |
Oil, Gas & Consumable Fuels (2.2%) | |
Caltex Australia Ltd. | | | 900 | | | | 18,030 | |
Eni SpA | | | 1,400 | | | | 24,900 | |
Exxon Mobil Corp. | | | 2,000 | | | | 159,360 | |
JXTG Holdings, Inc. | | | 2,700 | | | | 18,308 | |
Phillips 66 | | | 400 | | | | 41,128 | |
Snam SpA | | | 6,000 | | | | 24,759 | |
TOTAL SA | | | 1,400 | | | | 82,165 | |
Valero Energy Corp. | | | 300 | | | | 27,327 | |
| | | | | | | | |
Total Energy | | | | | | | 395,977 | |
| | | | | | | | |
Financials (18.8%) | | | | | | | | |
Banks (8.2%) | | | | | | | | |
Aozora Bank Ltd. | | | 1,000 | | | | 34,414 | |
Bank Hapoalim BM | | | 4,000 | | | | 27,018 | |
Bank Leumi Le-Israel BM | | | 3,000 | | | | 18,698 | |
Bank of Montreal | | | 1,400 | | | | 104,677 | |
Bank of Nova Scotia (The) | | | 1,300 | | | | 69,767 | |
Bankinter SA | | | 2,000 | | | | 16,400 | |
BB&T Corp. | | | 800 | | | | 39,328 | |
Canadian Imperial Bank of Commerce | | | 700 | | | | 60,447 | |
Citizens Financial Group, Inc. | | | 600 | | | | 22,410 | |
Commonwealth Bank of Australia | | | 1,200 | | | | 59,022 | |
DNB ASA | | | 900 | | | | 16,230 | |
Hang Seng Bank Ltd. | | | 1,400 | | | | 32,702 | |
Japan Post Bank Co. Ltd. | | | 1,500 | | | | 17,469 | |
JPMorgan Chase & Co. | | | 700 | | | | 76,314 | |
M&T Bank Corp. | | | 200 | | | | 33,082 | |
Mizrahi Tefahot Bank Ltd. | | | 1,800 | | | | 30,248 | |
National Bank of Canada | | | 900 | | | | 40,855 | |
Nordea Bank Abp | | | 2,000 | | | | 17,395 | |
Oversea-Chinese Banking Corp. Ltd. | | | 3,000 | | | | 23,317 | |
PNC Financial Services Group, Inc. (The) | | | 700 | | | | 89,943 | |
Royal Bank of Canada | | | 1,900 | | | | 138,439 | |
Skandinaviska Enskilda Banken AB, Class A | | | 6,000 | | | | 62,005 | |
SunTrust Banks, Inc. | | | 700 | | | | 43,862 | |
Svenska Handelsbanken AB, Class A | | | 4,000 | | | | 43,414 | |
Swedbank AB, Class A | | | 2,600 | | | | 58,461 | |
Toronto-Dominion Bank (The) | | | 2,900 | | | | 160,877 | |
United Overseas Bank Ltd. | | | 1,000 | | | | 17,639 | |
US Bancorp | | | 1,800 | | | | 94,086 | |
| | | | | | | | |
| | | | | | | 1,448,519 | |
| | | | | | | | |
Capital Markets (3.6%) | | | | | | | | |
Ameriprise Financial, Inc. | | | 300 | | | | 38,172 | |
ASX Ltd. | | | 400 | | | | 16,748 | |
Bank of New York Mellon Corp. (The) | | | 1,100 | | | | 52,063 | |
BlackRock, Inc. | | | 100 | | | | 41,142 | |
Brookfield Asset Management, Inc., Class A | | | 1,300 | | | | 53,049 | |
CME Group, Inc. | | | 500 | | | | 91,620 | |
Deutsche Boerse AG | | | 400 | | | | 50,655 | |
Intercontinental Exchange, Inc. | | | 1,000 | | | | 77,040 | |
MSCI, Inc. | | | 300 | | | | 45,114 | |
Nasdaq, Inc. | | | 200 | | | | 17,342 | |
Northern Trust Corp. | | | 400 | | | | 37,628 | |
S&P Global, Inc. | | | 500 | | | | 91,160 | |
T. Rowe Price Group, Inc. | | | 300 | | | | 29,097 | |
| | | | | | | | |
| | | | | | | 640,830 | |
| | | | | | | | |
Consumer Finance (0.3%) | | | | | | | | |
Ally Financial, Inc. | | | 800 | | | | 20,328 | |
Discover Financial Services | | | 400 | | | | 27,868 | |
| | | | | | | | |
| | | | | | | 48,196 | |
| | | | | | | | |
Diversified Financial Services (0.7%) | | | | | |
Berkshire Hathaway, Inc., Class B* | | | 600 | | | | 123,168 | |
| | | | | | | | |
Insurance (6.0%) | | | | | | | | |
Aflac, Inc. | | | 600 | | | | 25,842 | |
AIA Group Ltd. | | | 4,200 | | | | 31,945 | |
Allianz SE (Registered) | | | 500 | | | | 104,408 | |
Allstate Corp. (The) | | | 900 | | | | 86,148 | |
Aon plc | | | 400 | | | | 62,472 | |
Arch Capital Group Ltd.* | | | 600 | | | | 17,022 | |
Chubb Ltd. | | | 400 | | | | 49,964 | |
Cincinnati Financial Corp. | | | 300 | | | | 23,592 | |
Hartford Financial Services Group, Inc. (The) | | | 400 | | | | 18,168 | |
Legal & General Group plc | | | 8,000 | | | | 25,696 | |
Lincoln National Corp. | | | 400 | | | | 24,076 | |
Manulife Financial Corp. | | | 2,200 | | | | 34,643 | |
Marsh & McLennan Cos., Inc. | | | 1,300 | | | | 110,175 | |
Medibank Pvt Ltd. | | | 8,700 | | | | 17,218 | |
Progressive Corp. (The) | | | 1,600 | | | | 111,520 | |
Prudential Financial, Inc. | | | 400 | | | | 37,512 | |
Sampo OYJ, Class A | | | 1,600 | | | | 73,664 | |
Sun Life Financial, Inc. | | | 2,000 | | | | 73,243 | |
Swiss Life Holding AG (Registered)* | | | 40 | | | | 15,072 | |
Travelers Cos., Inc. (The) | | | 200 | | | | 25,026 | |
Willis Towers Watson plc | | | 300 | | | | 42,948 | |
See Notes to Financial Statements.
164
1290 FUNDS
1290 SMARTBETA EQUITY FUND
PORTFOLIO OF INVESTMENTS (Continued)
October 31, 2018
| | | | | | | | |
| | | Number of
Shares | | | Value
(Note 1) | |
Zurich Insurance Group AG* | | | 200 | | | $ | 62,058 | |
| | | | | | | | |
| | | | | | | 1,072,412 | |
| | | | | | | | |
Total Financials | | | | | | | 3,333,125 | |
| | | | | | | | |
Health Care (12.4%) | | | | | | | | |
Biotechnology (0.5%) | | | | | | | | |
AbbVie, Inc. | | | 800 | | | | 62,280 | |
CSL Ltd. | | | 200 | | | | 26,823 | |
| | | | | | | | |
| | | | | | | 89,103 | |
| | | | | | | | |
Health Care Equipment & Supplies (3.0%) | |
Baxter International, Inc. | | | 1,100 | | | | 68,761 | |
Coloplast A/S, Class B | | | 200 | | | | 18,643 | |
Danaher Corp. | | | 500 | | | | 49,700 | |
Edwards Lifesciences Corp.* | | | 300 | | | | 44,280 | |
Hoya Corp. | | | 400 | | | | 22,654 | |
IDEXX Laboratories, Inc.* | | | 200 | | | | 42,424 | |
Intuitive Surgical, Inc.* | | | 100 | | | | 52,118 | |
Medtronic plc | | | 1,600 | | | | 143,712 | |
Stryker Corp. | | | 600 | | | | 97,332 | |
| | | | | | | | |
| | | | | | | 539,624 | |
| | | | | | | | |
Health Care Providers & Services (3.1%) | |
Anthem, Inc. | | | 200 | | | | 55,114 | |
Cigna Corp. | | | 400 | | | | 85,524 | |
Express Scripts Holding Co.* | | | 500 | | | | 48,485 | |
Fresenius Medical Care AG & Co. KGaA | | | 200 | | | | 15,743 | |
HCA Healthcare, Inc. | | | 400 | | | | 53,412 | |
Humana, Inc. | | | 300 | | | | 96,123 | |
Quest Diagnostics, Inc. | | | 200 | | | | 18,822 | |
UnitedHealth Group, Inc. | | | 700 | | | | 182,945 | |
| | | | | | | | |
| | | | | | | 556,168 | |
| | | | | | | | |
Health Care Technology (0.1%) | | | | | | | | |
Cerner Corp.* | | | 300 | | | | 17,184 | |
| | | | | | | | |
Life Sciences Tools & Services (0.6%) | | | | | | | | |
Mettler-Toledo International, Inc.* | | | 100 | | | | 54,682 | |
Thermo Fisher Scientific, Inc. | | | 200 | | | | 46,730 | |
| | | | | | | | |
| | | | | | | 101,412 | |
| | | | | | | | |
Pharmaceuticals (5.1%) | | | | | | | | |
Astellas Pharma, Inc. | | | 3,000 | | | | 46,278 | |
Eli Lilly & Co. | | | 1,000 | | | | 108,440 | |
Johnson & Johnson | | | 1,600 | | | | 223,984 | |
Merck & Co., Inc. | | | 1,900 | | | | 139,859 | |
Novo Nordisk A/S, Class B | | | 800 | | | | 34,552 | |
Otsuka Holdings Co. Ltd. | | | 400 | | | | 19,112 | |
Pfizer, Inc. | | | 3,300 | | | | 142,098 | |
Roche Holding AG | | | 320 | | | | 77,647 | |
Shionogi & Co. Ltd. | | | 300 | | | | 19,169 | |
Takeda Pharmaceutical Co. Ltd. | | | 500 | | | | 20,204 | |
Zoetis, Inc. | | | 700 | | | | 63,105 | |
| | | | | | | | |
| | | | | | | 894,448 | |
| | | | | | | | |
Total Health Care | | | | | | | 2,197,939 | |
| | | | | | | | |
Industrials (16.7%) | |
Aerospace & Defense (4.6%) | |
BAE Systems plc | | | 4,500 | | | | 30,228 | |
Boeing Co. (The) | | | 300 | | | | 106,458 | |
General Dynamics Corp. | | | 500 | | | | 86,290 | |
Huntington Ingalls Industries, Inc. | | | 100 | | | | 21,848 | |
Lockheed Martin Corp. | | | 400 | | | | 117,540 | |
MTU Aero Engines AG | | | 100 | | | | 21,260 | |
Northrop Grumman Corp. | | | 500 | | | | 130,975 | |
Raytheon Co. | | | 600 | | | | 105,024 | |
Safran SA | | | 400 | | | | 51,525 | |
Thales SA | | | 200 | | | | 25,534 | |
TransDigm Group, Inc.* | | | 100 | | | | 33,025 | |
United Technologies Corp. | | | 700 | | | | 86,947 | |
| | | | | | | | |
| | | | | | | 816,654 | |
| | | | | | | | |
Air Freight & Logistics (1.0%) | |
Expeditors International of Washington, Inc. | | | 800 | | | | 53,744 | |
FedEx Corp. | | | 100 | | | | 22,034 | |
United Parcel Service, Inc., Class B | | | 900 | | | | 95,886 | |
| | | | | | | | |
| | | | | | | 171,664 | |
| | | | | | | | |
Building Products (0.5%) | |
Assa Abloy AB, Class B | | | 1,200 | | | | 23,922 | |
Daikin Industries Ltd. | | | 200 | | | | 23,149 | |
Geberit AG (Registered) | | | 80 | | | | 31,310 | |
Johnson Controls International plc | | | 500 | | | | 15,985 | |
| | | | | | | | |
| | | | | | | 94,366 | |
| | | | | | | | |
Commercial Services & Supplies (1.2%) | |
Brambles Ltd. | | | 5,100 | | | | 38,159 | |
Cintas Corp. | | | 200 | | | | 36,374 | |
Copart, Inc.* | | �� | 300 | | | | 14,673 | |
Dai Nippon Printing Co. Ltd. | | | 1,000 | | | | 22,409 | |
Republic Services, Inc. | | | 400 | | | | 29,072 | |
Waste Management, Inc. | | | 800 | | | | 71,576 | |
| | | | | | | | |
| | | | | | | 212,263 | |
| | | | | | | | |
Construction & Engineering (0.6%) | |
HOCHTIEF AG | | | 120 | | | | 17,811 | |
Obayashi Corp. | | | 2,000 | | | | 17,589 | |
Vinci SA | | | 500 | | | | 44,646 | |
WSP Global, Inc. | | | 400 | | | | 19,969 | |
| | | | | | | | |
| | | | | | | 100,015 | |
| | | | | | | | |
Electrical Equipment (0.4%) | |
ABB Ltd. (Registered) | | | 2,400 | | | | 48,247 | |
Legrand SA | | | 300 | | | | 19,609 | |
| | | | | | | | |
| | | | | | | 67,856 | |
| | | | | | | | |
Industrial Conglomerates (1.7%) | |
3M Co. | | | 500 | | | | 95,130 | |
Honeywell International, Inc. | | | 800 | | | | 115,856 | |
Roper Technologies, Inc. | | | 200 | | | | 56,580 | |
Siemens AG (Registered) | | | 240 | | | | 27,656 | |
| | | | | | | | |
| | | | | | | 295,222 | |
| | | | | | | | |
Machinery (2.0%) | |
ANDRITZ AG | | | 300 | | | | 15,509 | |
Atlas Copco AB, Class A* | | | 1,500 | | | | 37,081 | |
Epiroc AB, Class A* | | | 2,000 | | | | 17,542 | |
Fortive Corp. | | | 1,100 | | | | 81,675 | |
Hoshizaki Corp. | | | 300 | | | | 24,143 | |
Illinois Tool Works, Inc. | | | 500 | | | | 63,785 | |
Ingersoll-Rand plc | | | 300 | | | | 28,782 | |
See Notes to Financial Statements.
165
1290 FUNDS
1290 SMARTBETA EQUITY FUND
PORTFOLIO OF INVESTMENTS (Continued)
October 31, 2018
| | | | | | | | |
| | | Number of
Shares | | | Value
(Note 1) | |
Kone OYJ, Class B | | | 600 | | | $ | 29,228 | |
Sandvik AB | | | 2,000 | | | | 31,630 | |
Stanley Black & Decker, Inc. | | | 200 | | | | 23,304 | |
| | | | | | | | |
| | | | | | | 352,679 | |
| | | | | | | | |
Marine (0.1%) | |
Kuehne + Nagel International AG (Registered) | | | 180 | | | | 24,997 | |
| | | | | | | | |
Professional Services (0.8%) | |
SGS SA (Registered) | | | 17 | | | | 40,277 | |
TransUnion | | | 300 | | | | 19,725 | |
Verisk Analytics, Inc.* | | | 400 | | | | 47,936 | |
Wolters Kluwer NV | | | 600 | | | | 34,068 | |
| | | | | | | | |
| | | | | | | 142,006 | |
| | | | | | | | |
Road & Rail (2.2%) | |
Canadian National Railway Co. | | | 1,100 | | | | 94,036 | |
Canadian Pacific Railway Ltd. | | | 200 | | | | 41,015 | |
DSV A/S | | | 300 | | | | 24,092 | |
East Japan Railway Co. | | | 300 | | | | 26,196 | |
Hankyu Hanshin Holdings, Inc. | | | 1,000 | | | | 32,880 | |
Kintetsu Group Holdings Co. Ltd. | | | 1,000 | | | | 38,494 | |
MTR Corp. Ltd. | | | 4,000 | | | | 19,358 | |
Odakyu Electric Railway Co. Ltd. | | | 2,000 | | | | 42,167 | |
Union Pacific Corp. | | | 500 | | | | 73,110 | |
| | | | | | | | |
| | | | | | | 391,348 | |
| | | | | | | | |
Trading Companies & Distributors (1.3%) | |
Bunzl plc | | | 600 | | | | 17,709 | |
Fastenal Co. | | | 500 | | | | 25,705 | |
Ferguson plc | | | 473 | | | | 31,915 | |
ITOCHU Corp. | | | 1,500 | | | | 27,743 | |
Marubeni Corp. | | | 3,000 | | | | 24,244 | |
Mitsubishi Corp. | | | 1,200 | | | | 33,683 | |
Mitsui & Co. Ltd. | | | 1,900 | | | | 31,930 | |
Sumitomo Corp. | | | 2,300 | | | | 34,783 | |
| | | | | | | | |
| | | | | | | 227,712 | |
| | | | | | | | |
Transportation Infrastructure (0.3%) | |
Aena SME SA (m) | | | 270 | | | | 43,113 | |
Sydney Airport | | | 4,000 | | | | 18,272 | |
| | | | | | | | |
| | | | | | | 61,385 | |
| | | | | | | | |
Total Industrials | | | | | | | 2,958,167 | |
| | | | | | | | |
Information Technology (11.7%) | |
Communications Equipment (0.3%) | |
Cisco Systems, Inc. | | | 700 | | | | 32,025 | |
F5 Networks, Inc.* | | | 100 | | | | 17,528 | |
| | | | | | | | |
| | | | | | | 49,553 | |
| | | | | | | | |
Electronic Equipment, Instruments & Components (1.0%) | |
Amphenol Corp., Class A | | | 600 | | | | 53,700 | |
Hamamatsu Photonics KK | | | 500 | | | | 16,685 | |
Hexagon AB, Class B | | | 300 | | | | 14,686 | |
Hitachi Ltd. | | | 600 | | | | 18,325 | |
Keyence Corp. | | | 100 | | | | 48,721 | |
Kyocera Corp. | | | 400 | | | | 21,662 | |
Resideo Technologies, Inc.* | | | 133 | | | | 2,807 | |
| | | | | | | | |
| | | | | | | 176,586 | |
| | | | | | | | |
IT Services (5.4%) | |
Accenture plc, Class A | | | 800 | | | | 126,096 | |
Amadeus IT Group SA | | | 700 | | | | 56,443 | |
Automatic Data Processing, Inc. | | | 900 | | | | 129,672 | |
Broadridge Financial Solutions, Inc. | | | 200 | | | | 23,388 | |
CGI Group, Inc., Class A* | | | 900 | | | | 55,581 | |
Cognizant Technology Solutions Corp., Class A | | | 800 | | | | 55,224 | |
Fidelity National Information Services, Inc. | | | 300 | | | | 31,230 | |
Fiserv, Inc.* | | | 1,000 | | | | 79,300 | |
International Business Machines Corp. | | | 500 | | | | 57,715 | |
Mastercard, Inc., Class A | | | 600 | | | | 118,602 | |
Paychex, Inc. | | | 600 | | | | 39,294 | |
Visa, Inc., Class A | | | 1,100 | | | | 151,635 | |
Worldpay, Inc.* | | | 300 | | | | 27,552 | |
| | | | | | | | |
| | | | | | | 951,732 | |
| | | | | | | | |
Semiconductors & Semiconductor Equipment (1.4%) | |
ASML Holding NV | | | 120 | | | | 20,519 | |
Intel Corp. | | | 2,600 | | | | 121,888 | |
Texas Instruments, Inc. | | | 1,100 | | | | 102,113 | |
| | | | | | | | |
| | | | | | | 244,520 | |
| | | | | | | | |
Software (2.4%) | |
Adobe, Inc.* | | | 500 | | | | 122,880 | |
ANSYS, Inc.* | | | 100 | | | | 14,955 | |
CDK Global, Inc. | | | 300 | | | | 17,172 | |
Intuit, Inc. | | | 400 | | | | 84,400 | |
Oracle Corp. | | | 1,100 | | | | 53,724 | |
Red Hat, Inc.* | | | 200 | | | | 34,328 | |
SAP SE | | | 900 | | | | 96,453 | |
| | | | | | | | |
| | | | | | | 423,912 | |
| | | | | | | | |
Technology Hardware, Storage & Peripherals (1.2%) | |
Apple, Inc. | | | 600 | | | | 131,316 | |
Canon, Inc. | | | 1,300 | | | | 36,943 | |
FUJIFILM Holdings Corp. | | | 700 | | | | 30,232 | |
HP, Inc. | | | 1,100 | | | | 26,554 | |
| | | | | | | | |
| | | | | | | 225,045 | |
| | | | | | | | |
Total Information Technology | | | | | | | 2,071,348 | |
| | | | | | | | |
Materials (2.6%) | |
Chemicals (2.5%) | |
Asahi Kasei Corp. | | | 2,000 | | | | 23,955 | |
Chr Hansen Holding A/S | | | 200 | | | | 20,194 | |
Ecolab, Inc. | | | 700 | | | | 107,205 | |
EMS-Chemie Holding AG (Registered) | | | 60 | | | | 33,028 | |
Givaudan SA (Registered) | | | 15 | | | | 36,313 | |
Koninklijke DSM NV | | | 306 | | | | 26,796 | |
Novozymes A/S, Class B | | | 400 | | | | 19,758 | |
PPG Industries, Inc. | | | 500 | | | | 52,545 | |
Sherwin-Williams Co. (The) | | | 100 | | | | 39,347 | |
Shin-Etsu Chemical Co. Ltd. | | | 300 | | | | 25,053 | |
Sika AG (Registered) | | | 180 | | | | 23,079 | |
Symrise AG | | | 300 | | | | 25,195 | |
| | | | | | | | |
| | | | | | | 432,468 | |
| | | | | | | | |
See Notes to Financial Statements.
166
1290 FUNDS
1290 SMARTBETA EQUITY FUND
PORTFOLIO OF INVESTMENTS (Continued)
October 31, 2018
| | | | | | | | |
| | | Number of
Shares | | | Value
(Note 1) | |
Paper & Forest Products (0.1%) | |
UPM-Kymmene OYJ | | | 600 | | | $ | 19,296 | |
| | | | | | | | |
Total Materials | | | | | | | 451,764 | |
| | | | | | | | |
Real Estate (4.1%) | |
Equity Real Estate Investment Trusts (REITs) (3.5%) | |
Alexandria Real Estate Equities, Inc. (REIT) | | | 100 | | | | 12,223 | |
AvalonBay Communities, Inc. (REIT) | | | 400 | | | | 70,152 | |
Dexus (REIT) | | | 4,200 | | | | 30,415 | |
Equity Residential (REIT) | | | 900 | | | | 58,464 | |
Essex Property Trust, Inc. (REIT) | | | 100 | | | | 25,078 | |
Goodman Group (REIT) | | | 3,500 | | | | 25,758 | |
H&R REIT (REIT) | | | 1,400 | | | | 21,174 | |
Link REIT (REIT) | | | 2,000 | | | | 17,702 | |
Mirvac Group (REIT) | | | 13,600 | | | | 20,929 | |
Nippon Prologis REIT, Inc. (REIT) | | | 10 | | | | 20,153 | |
Nomura Real Estate Master Fund, Inc. (REIT) | | | 24 | | | | 31,106 | |
Prologis, Inc. (REIT) | | | 1,000 | | | | 64,470 | |
Public Storage (REIT) | | | 200 | | | | 41,094 | |
Simon Property Group, Inc. (REIT) | | | 600 | | | | 110,112 | |
Stockland (REIT) | | | 11,900 | | | | 30,457 | |
Unibail-Rodamco-Westfield (REIT) | | | 160 | | | | 29,021 | |
| | | | | | | | |
| | | | | | | 608,308 | |
| | | | | | | | |
Real Estate Management & Development (0.6%) | |
CBRE Group, Inc., Class A* | | | 600 | | | | 24,174 | |
Daiwa House Industry Co. Ltd. | | | 1,000 | | | | 30,090 | |
First Capital Realty, Inc. | | | 2,200 | | | | 32,822 | |
Mitsui Fudosan Co. Ltd. | | | 1,000 | | | | 22,469 | |
| | | | | | | | |
| | | | | | | 109,555 | |
| | | | | | | | |
Total Real Estate | | | | | | | 717,863 | |
| | | | | | | | |
Utilities (4.7%) | |
Electric Utilities (1.4%) | |
CLP Holdings Ltd. | | | 2,000 | | | | 22,406 | |
Enel SpA | | | 6,000 | | | | 29,439 | |
Eversource Energy | | | 900 | | | | 56,934 | |
Iberdrola SA | | | 9,000 | | | | 63,694 | |
Red Electrica Corp. SA | | | 2,000 | | | | 41,422 | |
SSE plc | | | 1,000 | | | | 14,569 | |
Terna Rete Elettrica Nazionale SpA | | | 4,000 | | | | 20,678 | |
| | | | | | | | |
| | | | | | | 249,142 | |
| | | | | | | | |
Gas Utilities (1.0%) | |
Atmos Energy Corp. | | | 500 | | | | 46,540 | |
Hong Kong & China Gas Co. Ltd. | | | 15,730 | | | | 29,966 | |
Osaka Gas Co. Ltd. | | | 2,000 | | | | 36,635 | |
Tokyo Gas Co. Ltd. | | | 2,000 | | | | 49,167 | |
UGI Corp. | | | 300 | | | | 15,918 | |
| | | | | | | | |
| | | | | | | 178,226 | |
| | | | | | | | |
Multi-Utilities (1.9%) | |
CenterPoint Energy, Inc. | | | 2,200 | | | | 59,422 | |
CMS Energy Corp. | | | 1,200 | | | | 59,424 | |
Consolidated Edison, Inc. | | | 600 | | | | 45,600 | |
DTE Energy Co. | | | 400 | | | | 44,960 | |
E.ON SE | | | 2,000 | | | | 19,377 | |
Public Service Enterprise Group, Inc. | | | 900 | | | | 48,087 | |
Sempra Energy | | | 600 | | | | 66,072 | |
| | | | | | | | |
| | | | | | | 342,942 | |
| | | | | | | | |
Water Utilities (0.4%) | |
American Water Works Co., Inc. | | | 700 | | | | 61,971 | |
| | | | | | | | |
Total Utilities | | | | | | | 832,281 | |
| | | | | | | | |
Total Investments in Securities (99.3%)
(Cost $16,003,748) | | | | | | | 17,596,360 | |
Other Assets Less Liabilities (0.7%) | | | | | | | 127,668 | |
| | | | | | | | |
Net Assets (100%) | | | | | | $ | 17,724,028 | |
| | | | | | | | |
| (m) | Regulation S is an exemption for securities offerings that are made outside of the United States and do not involve direct selling efforts in the United States. Resale restrictions may apply for purposes of the Securities Act of 1933. At October 31, 2018, the market value of these securities amounted to $43,113 or 0.2% of net assets. |
| (q) | Preference Shares are a special type of equity investment that shares in the earnings of the company, has limited voting rights, and receives a greater dividend than applicable Common Shares. |
Glossary:
| | | | |
Country Diversification
As a Percentage of Total Net Assets | |
Australia | | | 2.2 | % |
Austria | | | 0.1 | |
Canada | | | 6.6 | |
Denmark | | | 0.6 | |
Finland | | | 0.9 | |
France | | | 2.4 | |
Germany | | | 3.1 | |
Hong Kong | | | 0.9 | |
Israel | | | 0.4 | |
Italy | | | 0.6 | |
Japan | | | 7.4 | |
Netherlands | | | 0.9 | |
Norway | | | 0.3 | |
Singapore | | | 0.2 | |
Spain | | | 1.6 | |
Sweden | | | 1.7 | |
Switzerland | | | 3.2 | |
United Kingdom | | | 2.2 | |
United States | | | 64.0 | |
Cash and Other | | | 0.7 | |
| | | | | |
| | | | 100.0 | % |
| | | | | |
See Notes to Financial Statements.
167
1290 FUNDS
1290 SMARTBETA EQUITY FUND
PORTFOLIO OF INVESTMENTS (Continued)
October 31, 2018
The following is a summary of the inputs used to value the Fund’s assets and liabilities carried at fair value as of October 31, 2018:
The inputs or methodology used for valuing securities are not necessarily an indication of the risk associated with investing in those securities.
Various inputs are used in determining the value of the Fund’s investments. These inputs are summarized in the three broad levels listed below:
| | | | | | | | | | | | | | | | |
| | | | | |
| Investment Type | | Level 1
Quoted Prices in
Active Markets for
Identical
Securities | | | Level 2
Significant Other
Observable Inputs
(including quoted prices
for similar securities,
interest rates,
prepayment speeds,
credit risk, etc.) | | | Level 3
Significant Unobservable
Inputs (including the
Fund’s own
assumptions in
determining the fair
value of investments) | | | Total | |
Assets: | |
Common Stocks | | | | | | | | | | | | | | | | |
Communication Services | | $ | 615,061 | | | $ | 382,388 | | | $ | — | | | $ | 997,449 | |
Consumer Discretionary | | | 1,084,553 | | | | 269,704 | | | | — | | | | 1,354,257 | |
Consumer Staples | | | 1,509,991 | | | | 776,199 | | | | — | | | | 2,286,190 | |
Energy | | | 227,815 | | | | 168,162 | | | | — | | | | 395,977 | |
Financials | | | 2,461,229 | | | | 871,896 | | | | — | | | | 3,333,125 | |
Health Care | | | 1,897,114 | | | | 300,825 | | | | — | | | | 2,197,939 | |
Industrials | | | 1,814,059 | | | | 1,144,108 | | | | — | | | | 2,958,167 | |
Information Technology | | | 1,710,679 | | | | 360,669 | | | | — | | | | 2,071,348 | |
Materials | | | 199,097 | | | | 252,667 | | | | — | | | | 451,764 | |
Real Estate | | | 459,763 | | | | 258,100 | | | | — | | | | 717,863 | |
Utilities | | | 504,928 | | | | 327,353 | | | | — | | | | 832,281 | |
| | | | | | | | | | | | | | | | |
Total Assets | | $ | 12,484,289 | | | $ | 5,112,071 | | | $ | — | | | $ | 17,596,360 | |
| | | | | | | | | | | | | | | | |
Total Liabilities | | $ | — | | | $ | — | | | $ | — | | | $ | — | |
| | | | | | | | | | | | | | | | |
Total | | $ | 12,484,289 | | | $ | 5,112,071 | | | $ | — | | | $ | 17,596,360 | |
| | | | | | | | | | | | | | | | |
The Fund held no derivatives contracts during the year ended October 31, 2018.
Investment security transactions for the year ended October 31, 2018 were as follows:
| | | | |
Cost of Purchases: | | | | |
Long-term investments other than U.S. government debt securities | | $ | 10,665,091 | |
Net Proceeds of Sales and Redemptions: | | | | |
Long-term investments other than U.S. government debt securities | | $ | 7,924,931 | |
As of October 31, 2018, the gross unrealized appreciation (depreciation) of investments based on the aggregate cost of investments in securities and derivative instruments, if applicable, for Federal income tax purposes was as follows:
| | | | |
Aggregate gross unrealized appreciation | | $ | 2,122,122 | |
Aggregate gross unrealized depreciation | | | (544,868 | ) |
| | | | |
Net unrealized appreciation | | $ | 1,577,254 | |
| | | | |
Federal income tax cost of investments in securities and derivative instruments, if applicable | | $ | 16,019,106 | |
| | | | |
See Notes to Financial Statements.
168
1290 FUNDS
1290 SMARTBETA EQUITY FUND
STATEMENT OF ASSETS AND LIABILITIES
October 31, 2018
| | | | |
ASSETS | | | | |
Investments in Securities, at value (Cost $16,003,748) | | $ | 17,596,360 | |
Cash | | | 18,400 | |
Foreign cash (Cost $22,979) | | | 22,585 | |
Receivable for Fund shares sold | | | 51,757 | |
Dividends, interest and other receivables | | | 43,461 | |
Prepaid registration and filing fees | | | 25,977 | |
Receivable for securities sold | | | 22,940 | |
Due from Custodian | | | 16,087 | |
Receivable from investment adviser | | | 8,824 | |
Other assets | | | 202 | |
| | | | |
Total assets | | | 17,806,593 | |
| | | | |
LIABILITIES | | | | |
Payable for securities purchased | | | 16,087 | |
Transfer agent fees payable | | | 7,363 | |
Distribution fees payable – Class A | | | 235 | |
Distribution fees payable – Class R | | | 59 | |
Accrued expenses | | | 58,821 | |
| | | | |
Total liabilities | | | 82,565 | |
| | | | |
NET ASSETS | | $ | 17,724,028 | |
| | | | |
Net assets were comprised of: | | | | |
Paid in capital | | $ | 15,315,340 | |
Total distributable earnings (loss) | | | 2,408,688 | |
| | | | |
Net assets | | $ | 17,724,028 | |
| | | | |
Class A | | | | |
Net asset value and redemption price per share, $1,122,639 / 92,872 shares outstanding (unlimited amount authorized: $0.001 par value) | | $ | 12.09 | |
Maximum sales charge (5.50% of offering price) | | | 0.70 | |
| | | | |
Maximum offering price per share | | $ | 12.79 | |
| | | | |
Class I | | | | |
Net asset value and redemption price per share, $16,339,914 / 1,348,805 shares outstanding (unlimited amount authorized: $0.001 par value) | | $ | 12.11 | |
| | | | |
Class R | | | | |
Net asset value and redemption price per share, $136,329 / 11,304 shares outstanding (unlimited amount authorized: $0.001 par value) | | $ | 12.06 | |
| | | | |
Class T** | | | | |
Net asset value and redemption price per share, $125,146 / 10,332 shares outstanding (unlimited amount authorized: $0.001 par value) | | $ | 12.11 | |
Maximum sales charge (2.50% of offering price) | | | 0.31 | |
| | | | |
Maximum offering price per share | | $ | 12.42 | |
| | | | |
| ** | Class T shares currently are not offered for sale. |
STATEMENT OF OPERATIONS
For the Year Ended October 31, 2018
| | | | |
INVESTMENT INCOME | | | | |
Dividends (net of $23,647 foreign withholding tax) | | $ | 389,301 | |
Interest | | | 1,218 | |
| | | | |
Total income | | | 390,519 | |
| | | | |
EXPENSES | | | | |
Investment advisory fees | | | 115,219 | |
Professional fees | | | 64,062 | |
Transfer agent fees | | | 44,700 | |
Registration and filing fees | | | 41,712 | |
Administrative fees | | | 30,001 | |
Printing and mailing expenses | | | 20,350 | |
Custodian fees | | | 19,100 | |
Distribution fees – Class A | | | 2,104 | |
Trustees’ fees | | | 1,705 | |
Distribution fees – Class R | | | 697 | |
Distribution fees – Class T** | | | 320 | |
Miscellaneous | | | 19,487 | |
| | | | |
Gross expenses | | | 359,457 | |
Less: Waiver from investment adviser | | | (145,220 | ) |
Waiver from distributor | | | (320 | ) |
Reimbursement from investment adviser | | | (62,987 | ) |
| | | | |
Net expenses | | | 150,930 | |
| | | | |
NET INVESTMENT INCOME (LOSS) | | | 239,589 | |
| | | | |
REALIZED AND UNREALIZED GAIN (LOSS) | |
Realized gain (loss) on: | | | | |
Investments in securities | | | 640,666 | |
Foreign currency transactions | | | (3,774 | ) |
| | | | |
Net realized gain (loss) | | | 636,892 | |
| | | | |
Change in unrealized appreciation (depreciation) on: | | | | |
Investments in securities | | | (657,246 | ) |
Foreign currency translations | | | (574 | ) |
| | | | |
Net change in unrealized appreciation (depreciation) | | | (657,820 | ) |
| | | | |
NET REALIZED AND UNREALIZED GAIN (LOSS) | | | (20,928 | ) |
| | | | |
NET INCREASE (DECREASE) IN NET ASSETS RESULTING FROM OPERATIONS | | $ | 218,661 | |
| | | | |
| ** | Class T shares currently are not offered for sale. |
See Notes to Financial Statements.
169
1290 FUNDS
1290 SMARTBETA EQUITY FUND
STATEMENT OF CHANGES IN NET ASSETS
| | | | | | | | |
| | | Year Ended October 31, | |
| | 2018 | | | 2017 | |
INCREASE (DECREASE) IN NET ASSETS FROM OPERATIONS: | | | | | | | | |
Net investment income (loss) | | $ | 239,589 | | | $ | 191,617 | |
Net realized gain (loss) | | | 636,892 | | | | 340,172 | |
Net change in unrealized appreciation (depreciation) | | | (657,820 | ) | | | 1,939,370 | |
| | | | | | | | |
NET INCREASE (DECREASE) IN NET ASSETS RESULTING FROM OPERATIONS | | | 218,661 | | | | 2,471,159 | |
| | | | | | | | |
Distributions to shareholders: (a) | | | | | | | | |
Class A | | | (16,661 | ) | | | (3,272 | ) |
Class I | | | (426,857 | ) | | | (145,390 | ) |
Class R | | | (3,515 | ) | | | (929 | ) |
Class T** | | | (3,823 | ) | | | (1,415 | ) |
| | | | | | | | |
Total distributions to shareholders | | | (450,856 | ) | | | (151,006 | ) |
| | | | | | | | |
CAPITAL SHARES TRANSACTIONS: | | | | | | | | |
Class A | | | | | | | | |
Capital shares sold [ 51,694 and 34,018 shares, respectively ] | | | 633,484 | | | | 384,382 | |
Capital shares issued in reinvestment of dividends [ 1,060 and 199 shares, respectively ] | | | 12,925 | | | | 2,074 | |
Capital shares repurchased [ (15,913) and (4,468) shares, respectively ] | | | (196,268 | ) | | | (48,233 | ) |
| | | | | | | | |
Total Class A transactions | | | 450,141 | | | | 338,223 | |
| | | | | | | | |
Class I | | | | | | | | |
Capital shares sold [ 218,679 and 115,854 shares, respectively ] | | | 2,716,062 | | | | 1,304,358 | |
Capital shares issued in reinvestment of dividends [ 5,562 and 1,194 shares, respectively ] | | | 67,799 | | | | 12,441 | |
Capital shares repurchased [ (30,974) and (17,015) shares, respectively ] | | | (385,697 | ) | | | (196,125 | ) |
| | | | | | | | |
Total Class I transactions | | | 2,398,164 | | | | 1,120,674 | |
| | | | | | | | |
Class R | | | | | | | | |
Capital shares sold [ 72 and 30 shares, respectively ] | | | 888 | | | | 353 | |
Capital shares issued in reinvestment of dividends [ 12 and 3 shares, respectively ] | | | 139 | | | | 34 | |
Capital shares repurchased [ (3) and (46) shares, respectively ] | | | (31 | ) | | | (475 | ) |
| | | | | | | | |
Total Class R transactions | | | 996 | | | | (88 | ) |
| | | | | | | | |
NET INCREASE (DECREASE) IN NET ASSETS RESULTING FROM CAPITAL SHARE TRANSACTIONS | | | 2,849,301 | | | | 1,458,809 | |
| | | | | | | | |
TOTAL INCREASE (DECREASE) IN NET ASSETS | | | 2,617,106 | | | | 3,778,962 | |
NET ASSETS: | | | | | | | | |
Beginning of year | | | 15,106,922 | | | | 11,327,960 | |
| | | | | | | | |
End of year (b) | | $ | 17,724,028 | | | $ | 15,106,922 | |
| | | | | | | | |
** Class T shares currently are not offered for sale. Class T shares were formerly known as Class C shares. | | | | | | | | |
(a) Prior year distributions to shareholders were made up of dividends from net investment income of $3,272, $145,390, $929 and $1,415 for Classes A, I, R and T, respectively. These amounts were reclassified to conform with the current year presentation. | |
(b) Includes accumulated undistributed (overdistributed) net investment income of $165,180 as of October 31, 2017. The SEC eliminated the requirement to disclose undistributed net investment income in 2018. | |
See Notes to Financial Statements.
170
1290 FUNDS
1290 SMARTBETA EQUITY FUND
FINANCIAL HIGHLIGHTS
| | | | | | | | | | | | | | | | |
| | | Year Ended October 31, | | | November 12, 2014* to
October 31, 2015 | |
| Class A | | 2018 | | | 2017 | | | 2016 | |
Net asset value, beginning of period | | $ | 12.23 | | | $ | 10.25 | | | $ | 10.24 | | | $ | 10.00 | |
| | | | | | | | | | | | | | | | |
Income (loss) from investment operations: | | | | | | | | | | | | | | | | |
Net investment income (loss) (e) | | | 0.15 | | | | 0.13 | | | | 0.12 | ## | | | 0.11 | |
Net realized and unrealized gain (loss) | | | 0.06 | † | | | 1.96 | | | | 0.04 | | | | 0.16 | |
| | | | | | | | | | | | | | | | |
Total from investment operations | | | 0.21 | | | | 2.09 | | | | 0.16 | | | | 0.27 | |
| | | | | | | | | | | | | | | | |
Less distributions: | | | | | | | | | | | | | | | | |
Dividends from net investment income | | | (0.15 | ) | | | (0.11 | ) | | | (0.15 | ) | | | (0.03 | ) |
Distributions from net realized gains | | | (0.20 | ) | | | — | | | | — | | | | �� | |
| | | | | | | | | | | | | | | | |
Total dividends and distributions | | | (0.35 | ) | | | (0.11 | ) | | | (0.15 | ) | | | (0.03 | ) |
| | | | | | | | | | | | | | | | |
Net asset value, end of period | | $ | 12.09 | | | $ | 12.23 | | | $ | 10.25 | | | $ | 10.24 | |
| | | | | | | | | | | | | | | | |
Total return (b) | | | 1.64 | % | | | 20.58 | % | | | 1.58 | % | | | 2.70 | % |
| | | | | | | | | | | | | | | | |
Ratios/Supplemental Data: | | | | | | | | | | | | | | | | |
Net assets, end of period (000’s) | | $ | 1,123 | | | $ | 685 | | | $ | 269 | | | $ | 3,111 | |
Ratio of expenses to average net assets: | | | | | | | | | | | | | | | | |
After waivers and reimbursements (a)(f) | | | 1.15 | % | | | 1.20 | % | | | 1.35 | % | | | 1.35 | % |
Before waivers and reimbursements (a)(f) | | | 2.42 | % | | | 2.77 | % | | | 2.76 | % | | | 4.21 | % |
Ratio of net investment income (loss) to average net assets: | | | | | | | | | | | | | | | | |
After waivers and reimbursements (a)(f) | | | 1.21 | % | | | 1.17 | % | | | 1.23 | %(aa) | | | 1.14 | %(l) |
Before waivers and reimbursements (a)(f) | | | (0.06 | )% | | | (0.41 | )% | | | (0.18 | )%(aa) | | | (1.73 | )%(l) |
Portfolio turnover rate (z)^ | | | 49 | % | | | 41 | % | | | 27 | % | | | 29 | % |
| | |
| | | Year Ended October 31, | | | November 12, 2014* to
October 31, 2015 | |
| Class I | | 2018 | | | 2017 | | | 2016 | |
Net asset value, beginning of period | | $ | 12.25 | | | $ | 10.27 | | | $ | 10.26 | | | $ | 10.00 | |
| | | | | | | | | | | | | | | | |
Income (loss) from investment operations: | | | | | | | | | | | | | | | | |
Net investment income (loss) (e) | | | 0.18 | | | | 0.17 | | | | 0.15 | ## | | | 0.14 | |
Net realized and unrealized gain (loss) | | | 0.06 | † | | | 1.95 | | | | 0.03 | | | | 0.15 | |
| | | | | | | | | | | | | | | | |
Total from investment operations | | | 0.24 | | | | 2.12 | | | | 0.18 | | | | 0.29 | |
| | | | | | | | | | | | | | | | |
Less distributions: | | | | | | | | | | | | | | | | |
Dividends from net investment income | | | (0.18 | ) | | | (0.14 | ) | | | (0.17 | ) | | | (0.03 | ) |
Distributions from net realized gains | | | (0.20 | ) | | | — | | | | — | | | | — | |
| | | | | | | | | | | | | | | | |
Total dividends and distributions | | | (0.38 | ) | | | (0.14 | ) | | | (0.17 | ) | | | (0.03 | ) |
| | | | | | | | | | | | | | | | |
Net asset value, end of period | | $ | 12.11 | | | $ | 12.25 | | | $ | 10.27 | | | $ | 10.26 | |
| | | | | | | | | | | | | | | | |
Total return (b) | | | 1.86 | % | | | 20.85 | % | | | 1.84 | % | | | 2.94 | % |
| | | | | | | | | | | | | | | | |
Ratios/Supplemental Data: | | | | | | | | | | | | | | | | |
Net assets, end of period (000’s) | | $ | 16,340 | | | $ | 14,158 | | | $ | 10,838 | | | $ | 3,218 | |
Ratio of expenses to average net assets: | | | | | | | | | | | | | | | | |
After waivers and reimbursements (a)(f) | | | 0.90 | % | | | 0.96 | % | | | 1.10 | % | | | 1.10 | % |
Before waivers and reimbursements (a)(f) | | | 2.16 | % | | | 2.49 | % | | | 2.51 | % | | | 3.96 | % |
Ratio of net investment income (loss) to average net assets: | | | | | | | | | | | | | | | | |
After waivers and reimbursements (a)(f) | | | 1.47 | % | | | 1.48 | % | | | 1.44 | %(bb) | | | 1.38 | %(l) |
Before waivers and reimbursements (a)(f) | | | 0.21 | % | | | (0.05 | )% | | | 0.04 | %(bb) | | | (1.48 | )%(l) |
Portfolio turnover rate (z)^ | | | 49 | % | | | 41 | % | | | 27 | % | | | 29 | % |
See Notes to Financial Statements.
171
1290 FUNDS
1290 SMARTBETA EQUITY FUND
FINANCIAL HIGHLIGHTS (Continued)
| | | | | | | | | | | | | | | | |
| | | Year Ended October 31, | | | November 12, 2014* to
October 31, 2015 | |
| Class R | | 2018 | | | 2017 | | | 2016 | |
Net asset value, beginning of period | | $ | 12.20 | | | $ | 10.23 | | | $ | 10.22 | | | $ | 10.00 | |
| | | | | | | | | | | | | | | | |
Income (loss) from investment operations: | | | | | | | | | | | | | | | | |
Net investment income (loss) (e) | | | 0.12 | | | | 0.11 | | | | 0.10 | ## | | | 0.09 | |
Net realized and unrealized gain (loss) | | | 0.06 | † | | | 1.94 | | | | 0.03 | | | | 0.16 | |
| | | | | | | | | | | | | | | | |
Total from investment operations | | | 0.18 | | | | 2.05 | | | | 0.13 | | | | 0.25 | |
| | | | | | | | | | | | | | | | |
Less distributions: | | | | | | | | | | | | | | | | |
Dividends from net investment income | | | (0.12 | ) | | | (0.08 | ) | | | (0.12 | ) | | | (0.03 | ) |
Distributions from net realized gains | | | (0.20 | ) | | | — | | | | — | | | | — | |
| | | | | | | | | | | | | | | | |
Total dividends and distributions | | | (0.32 | ) | | | (0.08 | ) | | | (0.12 | ) | | | (0.03 | ) |
| | | | | | | | | | | | | | | | |
Net asset value, end of period | | $ | 12.06 | | | $ | 12.20 | | | $ | 10.23 | | | $ | 10.22 | |
| | | | | | | | | | | | | | | | |
Total return (b) | | | 1.39 | % | | | 20.21 | % | | | 1.32 | % | | | 2.47 | % |
| | | | | | | | | | | | | | | | |
Ratios/Supplemental Data: | | | | | | | | | | | | | | | | |
Net assets, end of period (000’s) | | $ | 136 | | | $ | 137 | | | $ | 115 | | | $ | 3,073 | |
Ratio of expenses to average net assets: | | | | | | | | | | | | | | | | |
After waivers and reimbursements (a)(f) | | | 1.40 | % | | | 1.46 | % | | | 1.60 | % | | | 1.60 | % |
Before waivers and reimbursements (a)(f) | | | 2.66 | % | | | 2.98 | % | | | 3.01 | % | | | 4.46 | % |
Ratio of net investment income (loss) to average net assets: | | | | | | | | | | | | | | | | |
After waivers and reimbursements (a)(f) | | | 0.98 | % | | | 0.98 | % | | | 0.98 | %(cc) | | | 0.89 | %(l) |
Before waivers and reimbursements (a)(f) | | | (0.29 | )% | | | (0.54 | )% | | | (0.43 | )%(cc) | | | (1.98 | )%(l) |
Portfolio turnover rate (z)^ | | | 49 | % | | | 41 | % | | | 27 | % | | | 29 | % |
| | |
| | | Year Ended October 31, | | | November 12, 2014* to
October 31, 2015 | |
| Class T** | | 2018 | | | 2017 | | | 2016 | |
Net asset value, beginning of period | | $ | 12.25 | | | $ | 10.27 | | | $ | 10.26 | | | $ | 10.00 | |
| | | | | | | | | | | | | | | | |
Income (loss) from investment operations: | | | | | | | | | | | | | | | | |
Net investment income (loss) (e) | | | 0.18 | | | | 0.17 | | | | 0.15 | ## | | | 0.14 | |
Net realized and unrealized gain (loss) | | | 0.06 | † | | | 1.95 | | | | 0.03 | | | | 0.15 | |
| | | | | | | | | | | | | | | | |
Total from investment operations | | | 0.24 | | | | 2.12 | | | | 0.18 | | | | 0.29 | |
| | | | | | | | | | | | | | | | |
Less distributions: | | | | | | | | | | | | | | | | |
Dividends from net investment income | | | (0.18 | ) | | | (0.14 | ) | | | (0.17 | ) | | | (0.03 | ) |
Distributions from net realized gains | | | (0.20 | ) | | | — | | | | — | | | | — | |
| | | | | | | | | | | | | | | | |
Total dividends and distributions | | | (0.38 | ) | | | (0.14 | ) | | | (0.17 | ) | | | (0.03 | ) |
| | | | | | | | | | | | | | | | |
Net asset value, end of period | | $ | 12.11 | | | $ | 12.25 | | | $ | 10.27 | | | $ | 10.26 | |
| | | | | | | | | | | | | | | | |
Total return (b) | | | 1.86 | % | | | 20.85 | % | | | 1.84 | % | | | 2.94 | % |
| | | | | | | | | | | | | | | | |
Ratios/Supplemental Data: | | | | | | | | | | | | | | | | |
Net assets, end of period (000’s) | | $ | 125 | | | $ | 127 | | | $ | 106 | | | $ | 1,029 | |
Ratio of expenses to average net assets: | | | | | | | | | | | | | | | | |
After waivers and reimbursements (a)(f) | | | 0.90 | % | | | 0.96 | % | | | 1.10 | % | | | 1.10 | % |
Before waivers and reimbursements (a)(f) | | | 2.41 | % | | | 2.96 | % | | | 3.51 | % | | | 4.96 | % |
Ratio of net investment income (loss) to average net assets: | | | | | | | | | | | | | | | | |
After waivers and reimbursements (a)(f) | | | 1.47 | % | | | 1.48 | % | | | 1.48 | %(dd) | | | 1.39 | %(l) |
Before waivers and reimbursements (a)(f) | | | (0.04 | )% | | | (0.52 | )% | | | (0.93 | )%(dd) | | | (2.48 | )%(l) |
Portfolio turnover rate (z)^ | | | 49 | % | | | 41 | % | | | 27 | % | | | 29 | % |
See Notes to Financial Statements.
172
1290 FUNDS
1290 SMARTBETA EQUITY FUND
FINANCIAL HIGHLIGHTS (Continued)
| * | Commencement of Operations. |
| ** | Class T shares currently are not offered for sale. Class T shares were formerly known as Class C shares. |
| † | The amount shown for a share outstanding throughout the period does not accord with the aggregate net income and/or gain on investments for that period because of the timing of sales and repurchases of the Fund shares in relation to fluctuating market value of the investments in the Fund. |
| ## | Includes income resulting from a special dividend. Without this dividend, the per share income amounts would be $0.08, $0.11, $0.06 and $0.11 for Class A, Class I, Class R and Class T, respectively. |
| ^ | Portfolio turnover rate excludes derivatives, if any. |
| (a) | Ratios for periods less than one year are annualized. Certain non-recurring expenses incurred by the Fund are not annualized for periods less than one year. |
| (b) | Total returns for periods less than one year are not annualized. |
| (e) | Net investment income (loss) per share is based on average shares outstanding. |
| (f) | Expenses do not include the expenses of the underlying funds (“indirect expenses”), if applicable. |
| (l) | The annualized ratio of net investment income to average net assets may not be indicative of operating results for a full year. |
| (z) | Portfolio turnover rate for periods less than one year is not annualized. |
| (aa) | Includes income resulting from a special dividend. Without this dividend, the ratios for Class A would be 0.85% for income after waivers and reimbursements and (0.56)% before waivers and reimbursements. |
| (bb) | Includes income resulting from a special dividend. Without this dividend, the ratios for Class I would be 1.07% for income after waivers and reimbursements and (0.34)% before waivers and reimbursements. |
| (cc) | Includes income resulting from a special dividend. Without this dividend, the ratios for Class R would be 0.61% for income after waivers and reimbursements and (0.80)% before waivers and reimbursements. |
| (dd) | Includes income resulting from a special dividend. Without this dividend, the ratios for Class T would be 1.11% for income after waivers and reimbursements and (1.30)% before waivers and reimbursements. |
See Notes to Financial Statements.
173
1290 FUNDS
NOTES TO FINANCIAL STATEMENTS
October 31, 2018
| Note 1 | Organization and Significant Accounting Policies |
1290 Funds (the “Trust”) was organized as a Delaware statutory trust on March 1, 2013 and is registered under the Investment Company Act of 1940, as amended (the “1940 Act”), as an open-end management investment company with eighteen diversified funds in operation (each, a “Fund” and collectively, the “Funds”). The investment adviser to each Fund is AXA Equitable Funds Management Group, LLC d/b/a 1290 Asset Managers® (“1290 Asset Managers” or “FMG LLC” or the “Adviser”), a wholly-owned subsidiary of AXA Equitable Life Insurance Company (“AXA Equitable”).
On June 8, 2018 and June 13, 2018, FMG LLC redeemed capital out of the 1290 Diversified Bond Fund (formerly known as the 1290 Unconstrained Bond Managers Fund) in the amount of $20,000,000 and $19,591,184, respectively, for Class I shares. On June 8, 2018 and June 13, 2018, FMG LLC contributed capital into the 1290 GAMCO Small/Mid Cap Value Fund in the amount of $20,000,000 and $19,591,184, respectively, for Class I shares.
The total amount of seed capital at the Funds’ commencement of operations is listed below:
| | | | | | | | | | | | |
Funds: | | Commencement
Date | | | Class | | | Seed Capital | |
1290 Low Volatility Global Equity | | | 2/27/17 | | | | Class I | | | $ | 2,500,000 | |
1290 Retirement 2020 | | | 2/27/17 | | | | Class I | | | | 2,500,000 | |
1290 Retirement 2025 | | | 2/27/17 | | | | Class I | | | | 2,500,000 | |
1290 Retirement 2030 | | | 2/27/17 | | | | Class I | | | | 2,500,000 | |
1290 Retirement 2035 | | | 2/27/17 | | | | Class I | | | | 2,500,000 | |
1290 Retirement 2040 | | | 2/27/17 | | | | Class I | | | | 2,500,000 | |
1290 Retirement 2045 | | | 2/27/17 | | | | Class I | | | | 2,500,000 | |
1290 Retirement 2050 | | | 2/27/17 | | | | Class I | | | | 2,500,000 | |
1290 Retirement 2055 | | | 2/27/17 | | | | Class I | | | | 2,500,000 | |
1290 Retirement 2060 | | | 2/27/17 | | | | Class I | | | | 2,500,000 | |
Under the Trust’s organizational documents, its officers and trustees are indemnified against certain liabilities arising out of the performance of their duties to the Trust. In addition, in the normal course of business, the Trust enters into contracts with vendors and others that provide for general indemnifications. A Fund’s maximum exposure under these arrangements is unknown as this would involve future claims that may be made against the Fund. However, based on experience, the Trust and management expect the risk of loss to be remote.
Each of the investment sub-advisers (each a “Sub-Adviser”) independently chooses and maintains a portfolio of securities for their respective Fund.
The 1290 Retirement 2020 Fund, 1290 Retirement 2025 Fund, 1290 Retirement 2030 Fund, 1290 Retirement 2035 Fund, 1290 Retirement 2040 Fund, 1290 Retirement 2045 Fund, 1290 Retirement 2050 Fund, 1290 Retirement 2055 Fund and the 1290 Retirement 2060 Fund (each, a “1290 Retirement Fund” and together, the “1290 Retirement Funds”) as well as 1290 Multi-Alternative Strategies Fund and 1290 Low Volatility Global Equity Fund are types of mutual funds often described as “fund-of-funds.” These Funds pursue their investment objectives by investing exclusively in other unaffiliated investment companies or exchange-traded funds (“ETFs”).
The Trust has authorized four classes of shares, Class A, Class I, Class R and Class T on behalf of each of the eighteen Funds. Class T shares are currently not offered for sale. Additionally, 1290 Low Volatility Global Equity Fund and each 1290 Retirement Fund currently only offer Class I shares for sale.
The Class A, Class R and Class T shares are subject to distribution fees imposed under distribution plans (“Distribution Plans”) adopted pursuant to Rule 12b-1 under the 1940 Act.
174
1290 FUNDS
NOTES TO FINANCIAL STATEMENTS (Continued)
October 31, 2018
Under the Trust’s multiple-class distribution system, all four classes of shares have identical voting, dividend, liquidation and other rights, other than the payment of distribution fees under the applicable Distribution Plan.
Additionally, Class A shares are sold at a maximum front-end sales charge of up to 4.50% for 1290 Convertible Securities Fund, 1290 Diversified Bond Fund (formerly 1290 Unconstrained Bond Managers Fund) and 1290 High Yield Bond Fund, and up to 5.50% for 1290 DoubleLine Dynamic Allocation Fund, 1290 GAMCO Small/Mid Cap Value Fund, 1290 Global Talents Fund, 1290 Low Volatility Global Equity Fund, 1290 Multi-Alternative Strategies Fund, 1290 SmartBeta Equity Fund and each 1290 Retirement Fund. Class A shares sold without a front-end sales charge are subject to a contingent deferred sales charge (“CDSC”) of 1% of the lesser of the original net asset value (“NAV”) of the redeemed shares at the time of purchase or the aggregate NAV of the redeemed shares at the time of redemption, if redeemed within 12 months of purchase. Class T shares are subject to a maximum front-end sales charge of up to 2.50%.
The investment objectives of each Fund are as follows:
1290 Convertible Securities Fund (sub-advised by Palisade Capital Management, L.L.C.) — Seeks a high level of total return.
1290 Diversified Bond Fund (sub-advised by Brandywine Global Investment Management, LLC (“Brandywine Global”)) — Seeks to maximize total return consisting of income and capital appreciation. On June 15, 2018, Brandywine Global replaced Pacific Investment Management Company LLC and TCW Investment Management Company LLC as the Sub-Adviser to the Fund.
1290 DoubleLine Dynamic Allocation Fund (sub-advised by DoubleLine Capital LP) — Seeks to achieve total return from long-term capital appreciation and income.
1290 GAMCO Small/Mid Cap Value Fund (sub-advised by GAMCO Asset Management Inc.) — Seeks to maximize capital appreciation.
1290 Global Talents Fund (sub-advised by AXA Investment Managers, Inc. (“AXA IM”), an affiliate of 1290 Asset Managers) — Seeks to provide long-term capital growth.
1290 High Yield Bond Fund (sub-advised by AXA IM) — Seeks to maximize current income.
1290 Low Volatility Global Equity Fund — Seeks long-term capital appreciation while managing portfolio volatility.
1290 Multi-Alternative Strategies Fund — Seeks long-term growth of capital.
1290 Retirement 2020 Fund — Seeks the highest total return over time consistent with its asset mix while managing portfolio volatility. Total return includes capital growth and income.
1290 Retirement 2025 Fund — Seeks the highest total return over time consistent with its asset mix while managing portfolio volatility. Total return includes capital growth and income.
1290 Retirement 2030 Fund — Seeks the highest total return over time consistent with its asset mix while managing portfolio volatility. Total return includes capital growth and income.
1290 Retirement 2035 Fund — Seeks the highest total return over time consistent with its asset mix while managing portfolio volatility. Total return includes capital growth and income.
1290 Retirement 2040 Fund — Seeks the highest total return over time consistent with its asset mix while managing portfolio volatility. Total return includes capital growth and income.
1290 Retirement 2045 Fund — Seeks the highest total return over time consistent with its asset mix while managing portfolio volatility. Total return includes capital growth and income.
1290 Retirement 2050 Fund — Seeks the highest total return over time consistent with its asset mix while managing portfolio volatility. Total return includes capital growth and income.
175
1290 FUNDS
NOTES TO FINANCIAL STATEMENTS (Continued)
October 31, 2018
1290 Retirement 2055 Fund — Seeks the highest total return over time consistent with its asset mix while managing portfolio volatility. Total return includes capital growth and income.
1290 Retirement 2060 Fund — Seeks the highest total return over time consistent with its asset mix while managing portfolio volatility. Total return includes capital growth and income.
1290 SmartBeta Equity Fund (sub-advised by AXA Rosenberg Investment Management LLC, an affiliate of 1290 Asset Managers) — Seeks to achieve long-term capital appreciation.
The following is a summary of the significant accounting policies of the Trust:
The preparation of financial statements in accordance with United States of America generally accepted accounting principles (“U.S. GAAP”) requires management to make estimates and assumptions that affect the reported amounts and disclosures. Actual results could differ from those estimates. The Funds are investment companies and, accordingly, follow the Investment Company accounting and reporting guidance of the Financial Accounting Standards Board Accounting Standards Codification Topic 946 — Investment Companies, which is part of U.S. GAAP.
In March 2017, the Financial Accounting Standards Board (“FASB”) issued Accounting Standards Update (“ASU”) No. 2017-08, Receivables — Nonrefundable Fees and Other Costs (Subtopic 310-20): Premium Amortization on Purchased Callable Debt Securities. The amendments in the ASU shorten the amortization period for certain callable debt securities, held at a premium, to be amortized to the earliest call date. The ASU does not require an accounting change for securities held at a discount; which continue to be amortized to maturity. The ASU is effective for fiscal years and interim periods within those fiscal years beginning after December 15, 2018. Management is currently evaluating the impact, if any, of applying this provision.
The Securities Exchange Commission (“SEC”) adopted changes to Regulation S-X to simplify the reporting of information by registered investment companies in financial statements. The amendments require presentation of the total, rather than the components, of distributable earnings on the Statement of Assets and Liabilities and also require presentation of the total, rather than the components, of distributions to shareholders, except for tax return of capital distributions, if any, on the Statement of Changes in Net Assets. The amendments also removed the requirement for parenthetical disclosure of undistributed net investment income on the Statement of Changes in Net Assets. These Regulation S-X amendments are reflected in the Funds’ financial statements for the year ended October 31, 2018. As a result of adopting these amendments, the distributions to shareholders in the October 31, 2017 Statement of Changes in Net Assets presented herein have been reclassified to conform to the current year presentation.
On August 28, 2018, the FASB issued ASU 2018-13, “Disclosure Framework — Changes to the Disclosure Requirements for Fair Value Measurement,” which amends the fair value measurement disclosure requirements under U.S. GAAP. The amendments of ASU 2018-13 include new, eliminated, and modified disclosure requirements. In addition, the amendments clarify that materiality is an appropriate consideration of entities when evaluating disclosure requirements. The ASU is effective for all entities for fiscal years beginning after December 15, 2019, including interim periods therein. An entity is permitted to early adopt any eliminated or modified disclosures upon issuance of this ASU and delay adoption of the new disclosures until their effective date. As such, the Funds have early adopted the eliminated and modified disclosures, as permitted by this ASU.
Valuation:
Equity securities (including securities issued by ETFs) listed on national securities exchanges are generally valued at the last sale price or official closing price on the date of valuation or, if there is no sale or official closing price, at the latest available bid price. Securities listed on the NASDAQ stock market will be valued using the NASDAQ Official Closing Price
176
1290 FUNDS
NOTES TO FINANCIAL STATEMENTS (Continued)
October 31, 2018
(“NOCP”). Generally, the NOCP will be the last sale price unless the reported trade for the security is outside the range of the bid/ask price. In such cases, the NOCP will be normalized to the nearer of the bid or ask price. Other unlisted stocks are generally valued at their last sale price or official closing price, or if there is no such price, at a bid price estimated by a broker.
Convertible preferred stocks listed on national securities exchanges are generally valued as of their last sale price or, if there is no sale, at the latest available bid price. Convertible bonds and unlisted convertible preferred stocks are generally valued using prices obtained from a pricing service for such investments or, if a pricing service price is not available, at bid prices obtained from one or more of the major dealers in such bonds or stocks. Where there is a discrepancy between dealers, values may be adjusted based on recent premium spreads to the underlying common stocks. Convertible bonds may be matrix-priced based upon the conversion value to the underlying common stocks and market premiums.
Mortgage-backed and asset-backed securities are generally valued at evaluated prices obtained from a pricing service where available, or at a bid price obtained from one or more of the major dealers in such securities. The pricing service may utilize data such as issuer type, coupon, cash flows, collateral performance, mortgage prepayment projection tables and Adjustable Rate Mortgage evaluations that incorporate index data, periodic and life caps, the next coupon reset date and the convertibility of the bond in making evaluations. If a quoted price is unavailable, an equivalent yield or yield spread quotes may be obtained from a broker and converted to a price.
Options that are traded on an exchange are generally valued at their last sale price or official closing price on the date of valuation. Options not traded on an exchange or actively traded are valued according to fair value methods. The market value of a put or call option will usually reflect, among other factors, the market price of the underlying security.
Corporate and Municipal bonds and notes are generally valued on the basis of prices provided by a pricing service. The pricing services may utilize many inputs that are observable in making evaluations which may include, but are not limited to, trading activity for similar securities, issuer details, yields, default rates, credit spreads, quoted prices and any developments related to the specific securities. However, when such prices are not available, such bonds and notes are generally valued at a bid price estimated by a broker.
U.S. Treasury securities and other obligations issued or guaranteed by the U.S. Government, its agencies or instrumentalities, are generally valued at prices obtained from a bond pricing service where available. The pricing service may utilize data received from active market makers and broker-dealers, yield curves and the spread over comparable U.S. Treasury issues in making evaluations.
Foreign securities, including foreign government securities, not traded directly in the U.S., or traded in American Depositary Receipts (“ADR”) or similar form, are generally valued at representative quoted prices from the primary exchange in the currency of the country of origin. Foreign currency is converted into U.S. dollar equivalent at current exchange rates.
Investments in shares of open-end investment companies (other than ETFs) held by a Fund are generally valued at the NAV of the shares of such funds as described in the underlying funds’ prospectuses.
Futures contracts are generally valued at their last settlement price or, if there is no sale, at the latest available bid price.
Centrally cleared swaps are priced using the value determined by the central counterparty (“CCP”) at the end of the day. If the CCP price is unavailable, a price provided by an approved pricing service will be used.
Swaptions are marked-to-market daily based upon values from third party vendors.
177
1290 FUNDS
NOTES TO FINANCIAL STATEMENTS (Continued)
October 31, 2018
Forward foreign currency contracts are generally valued by interpolating between the forward and spot currency rates as quoted by a pricing service as of a designated hour on the valuation date. The pricing service may utilize data such as actual trading information and foreign currency rates gathered from leading market makers and foreign currency trading centers throughout the world in making evaluations. Forward foreign currency contracts may be settled with the counterparty in U.S. Dollars without the delivery of foreign currency.
During the year ended October 31, 2018, the 1290 Diversified Bond Fund and 1290 Global Talents Fund held forward foreign currency contracts to either gain exposure to certain currencies, or enter into an economic hedge against changes in the values of securities held in the Fund, that do not qualify for hedge accounting under Accounting Standards Codification (“ASC”) 815. The Statement of Operations for each Fund reflects realized gains or losses, if any, in forward currency transactions and unrealized gains or losses in forward foreign currency transactions. Further information on the impact of these positions on the Funds’ financial statements can be found in the Statement of Operations and Portfolio of Investments for each Fund.
If market quotations are not readily available for a security or other financial instrument, such security and instrument shall be referred to the Trust’s Valuation Committee (“Committee”), which will value the asset in good faith pursuant to procedures (“Pricing Procedures”) adopted by the Board of Trustees of the Trust (the “Board”).
The Board is responsible for ensuring that appropriate valuation methods are used to price securities for the Funds. The Board has delegated the responsibility of calculating the NAVs of each of the Funds and classes pursuant to these Pricing Procedures to the Trust’s administrator, FMG LLC (in its capacity as administrator, the “Administrator”). The Administrator has entered into a sub-administration agreement with JPMorgan Chase Bank, N.A. (the “Sub-Administrator”), which assists in performing certain of the duties described herein. The Committee, established by the Board, determines the value of the Trust’s securities and assets for which market quotations are not readily available or for which valuation cannot otherwise be provided in accordance with procedures adopted by the Board. The Committee is comprised of senior employees from FMG LLC.
Due to the inherent uncertainty of valuations of such securities, the fair value may differ significantly from the values that would have been used had a ready market for such securities existed.
Various inputs are used in determining the value of the Trust’s assets or liabilities carried at fair value. These inputs are summarized in three broad levels below:
| | • | | Level 1 - quoted prices in active markets for identical assets |
| | • | | Level 2 - other significant observable inputs (including quoted prices of similar securities, interest rates, prepayment speeds, credit risk, etc.) |
| | • | | Level 3 - significant unobservable inputs (including the Fund’s own assumptions in determining the fair value of investments) |
A summary of inputs used to value each Fund’s assets and liabilities carried at fair value as of October 31, 2018, is included in the Portfolio of Investments for each Fund. Changes in valuation techniques may result in transfers in or out of an investment’s assigned level.
Transfers into and transfers out of Level 3, are included in the Level 3 reconciliation following the Portfolio of Investments for each Fund, if any. Transfers between levels may be due to a decline, or an increase, in market activity (e.g., frequency of trades), which may result in a lack of, or increase in, available observable market inputs to determine price.
The inputs or methodology used to value securities are not necessarily an indication of the risk associated with investing in those securities. An investment’s level within the fair value hierarchy is based on the lowest level of any input, both individually and in the aggregate, that is significant to the fair value measurement.
178
1290 FUNDS
NOTES TO FINANCIAL STATEMENTS (Continued)
October 31, 2018
The Committee has the ability to meet and review reports based on the valuation techniques used to value Level 3 securities. As part of a review, the Committee would consider obtaining updates from its pricing vendors and Sub-Advisers for fair valued securities. For example, with respect to model driven prices, the Committee could receive reports regarding a review and recalculation of pricing models and related discounts. For those securities which are valued based on broker quotes, the Committee may evaluate variances between existing broker quotes and any alternative broker quotes provided by a Sub-Adviser or other pricing source.
To substantiate unobservable inputs used in a fair valuation, the Secretary of the Committee can perform an independent verification as well as additional research for fair value notifications received from the pricing agents. Among other factors, particular areas of focus may include: description of security, historical pricing, intra-day price movement, last trade information, corporate actions, related securities, any available company news and announcements, any available trade data or other information. The Committee also notes the materiality of holdings and price changes on a Fund’s NAV.
The Committee reviews and considers changes in value for all fair valued securities that have occurred since the last review.
Pursuant to procedures approved by the Board, events or circumstances affecting the values of Fund securities that occur between the closing of their principal markets and the time the NAV is determined may be reflected in the Trust’s calculation of a NAV for each applicable Fund when the Adviser deems that the particular event or circumstance would materially affect such Fund’s NAV. The value and percentage, based on Total Investments in Securities, of the investments that applied these procedures on October 31, 2018 are as follows:
| | | | | | | | |
Funds: | | Market Value | | | Percentage of Total Investments | |
1290 GAMCO Small/Mid Cap Value | | $ | 4,050,388 | | | | 4.5 | % |
1290 Global Talents | | | 9,517,453 | | | | 36.2 | |
1290 SmartBeta Equity | | | 5,112,071 | | | | 29.1 | |
Security Transactions and Investment Income:
Securities transactions are recorded on the trade date net of brokerage fees, commissions, and transfer fees. Dividend income (net of withholding taxes) and distributions to shareholders are recorded on the ex-dividend date, except that certain dividends from foreign securities, if any, are recognized as soon as the Fund is informed of the ex-dividend date. Interest income (including amortization of premium and accretion of discount on long-term securities using the effective yield method) and interest expense are accrued daily. The Trust records paydown gains and losses realized on prepayments received on mortgage-backed securities as an adjustment to interest income.
The Funds record distributions received in excess of income from underlying investments as a reduction of cost of investments and/or realized gain. Such amounts are based on estimates if actual amounts are not available and actual amounts of income, realized gain and return of capital may differ from the estimated amounts. The Funds adjust the estimated amounts of components of distributions (and consequently its net investment income) as necessary once the issuers provide information about the actual composition of the distributions.
Realized gains and losses on the sale of investments are computed on the basis of the specific identified cost of the investments sold. Unrealized appreciation (depreciation) on investments and foreign currency denominated assets and liabilities, if any, is presented net of deferred taxes on unrealized appreciation in the Statements of Assets and Liabilities.
179
1290 FUNDS
NOTES TO FINANCIAL STATEMENTS (Continued)
October 31, 2018
Allocation of Expenses and Income:
Expenses attributable to a single Fund or class are charged to that Fund or class. Expenses of the Trust not attributable to a single Fund or class are charged to each Fund or class in proportion to the average net assets of each Fund or other appropriate allocation methods.
All income earned and expenses incurred by each Fund are borne on a pro-rata basis by each outstanding class of shares, based on the proportionate interest in the Fund represented by the daily net assets of such class, except for distribution fees which are charged on a class-specific basis.
Offering costs incurred in connection with the offering of shares of a Fund will be amortized and recorded as an expense on a straight line basis over 12 months from the date of the Fund’s commencement of public offering of shares.
Offering costs incurred during the year ended October 31, 2017 by the Funds shown below were:
| | | | |
Funds: | | Offering Costs | |
1290 Low Volatility Global Equity | | $ | 8,183 | |
1290 Retirement 2020 | | | 10,271 | |
1290 Retirement 2025 | | | 10,333 | |
1290 Retirement 2030 | | | 10,334 | |
1290 Retirement 2035 | | | 10,355 | |
1290 Retirement 2040 | | | 10,406 | |
1290 Retirement 2045 | | | 10,346 | |
1290 Retirement 2050 | | | 10,333 | |
1290 Retirement 2055 | | | 10,340 | |
1290 Retirement 2060 | | | 10,403 | |
For the year ended October 31, 2018, the amounts amortized were as follows:
| | | | |
Funds: | | Offering Costs | |
1290 Low Volatility Global Equity | | $ | 2,668 | |
1290 Retirement 2020 | | | 3,349 | |
1290 Retirement 2025 | | | 3,369 | |
1290 Retirement 2030 | | | 3,370 | |
1290 Retirement 2035 | | | 3,376 | |
1290 Retirement 2040 | | | 3,393 | |
1290 Retirement 2045 | | | 3,374 | |
1290 Retirement 2050 | | | 3,369 | |
1290 Retirement 2055 | | | 3,371 | |
1290 Retirement 2060 | | | 3,392 | |
Foreign Currency Valuation:
The books and records of the Trust are kept in U.S. dollars. Foreign currency amounts are translated into U.S. dollars at current exchange rates at the following dates:
(i) Market value of investment securities, other assets and liabilities — at the valuation date.
(ii) Purchases and sales of investment securities, income and expenses — at the date of such transactions.
The Funds do not isolate that portion of the results of operations resulting from changes in foreign exchange rates on investments from the fluctuations arising from changes in market prices of securities held. Such fluctuations are included with the net realized and unrealized gain or loss on investments.
180
1290 FUNDS
NOTES TO FINANCIAL STATEMENTS (Continued)
October 31, 2018
Reported realized foreign currency gains and losses arise from the disposition of foreign currency, currency gains or losses realized between the trade and settlement dates on securities transactions, and the difference between the amounts of dividends, interest and foreign withholding taxes recorded on each Fund’s books on the transaction date and the U.S. dollar equivalent of the amounts actually received or paid. These reported realized foreign currency gains and losses are included in Net realized gain (loss) on foreign currency transactions on the Statements of Operations. Unrealized foreign currency gains and losses arise from changes (due to changes in exchange rates) in the value of foreign currency and other assets and liabilities denominated in foreign currencies, which are held at period end and are included in Change in net unrealized appreciation/depreciation on foreign currency translations on the Statements of Operations.
Taxes:
Each Fund intends to comply with the requirements of the Internal Revenue Code of 1986, as amended, applicable to regulated investment companies (“RICs”) and to distribute substantially all of its net investment income and net realized capital gains to shareholders of each Fund. Therefore, no Federal, State and local income tax provisions are required.
The Funds are not aware of any tax positions for which it is reasonably possible that the total amounts of unrecognized tax benefits will significantly change in the next twelve months. However, the Funds’ conclusions may be subject to future review based on changes in, or the interpretation of, the accounting standards or tax laws and regulations. The Funds recognize interest and penalties, if any, related to uncertain tax positions as income tax expense in the Statements of Operations. During the year ended October 31, 2018, the Funds did not incur any interest or penalties. Each of the tax years in the three year period ended October 31, 2018 remains subject to examination by the Internal Revenue Service, state and local taxing authorities.
Dividends from net investment income, if any, are declared and distributed at least annually for all Funds (1290 Convertible Securities Fund, 1290 Diversified Bond Fund and 1290 High Yield Bond Fund declare and distribute monthly). Dividends to shareholders of a Fund to which such gains are attributable from net realized short-term and long-term capital gains are declared and distributed at least annually. All distributions are calculated on a tax basis and, as such, the amounts may differ from financial statement investment income and realized gains. Short-term capital gains and foreign currency gains are treated as capital gains for U.S. GAAP purposes but are considered ordinary income for tax purposes. Capital and net specified losses incurred after October 31st and within the taxable year are deemed to arise on the first business day of a Fund’s next taxable year. The tax character of distributions for the years ended October 31, 2018 and October 31, 2017 and the tax composition of undistributed ordinary income and undistributed long term gains at October 31, 2018 are presented in the following table. For the Funds, the cumulative timing differences related to the tax composition of undistributed ordinary income and long term gains are primarily due to wash sale loss deferrals (1290 GAMCO Small/Mid Cap Value and 1290 Retirement 2020), capital loss carryover (1290 Diversified Bond and 1290 High Yield Bond), distribution payable (1290 Convertible Securities, 1290 Diversified Bond and 1290 High Yield Bond), investments in contingent preferred debt (1290 Convertible Securities), investments in partnerships (1290 Multi-Alternative Strategies), mark to market of forward foreign currency contracts, mark to market of futures contracts, investments in notional principal contracts and straddle loss deferral (1290 Diversified Bond), deemed dividends on convertible debt (1290 Convertible Securities) and investments in PFICs (1290 SmartBeta Equity).
| | | | | | | | | | | | | | | | | | | | | | | | |
| | | Year Ended October 31, 2018 | | | As of October 31, 2018 | | | Year Ended October 31, 2017 | |
Funds: | | Distributed
Ordinary
Income | | | Distributed
Long Term
Gains | | | Accumulated
Undistributed
Ordinary
Income | | | Accumulated
Undistributed
Long Term
Gains | | | Distributed
Ordinary
Income | | | Distributed
Long Term
Gains | |
1290 Convertible Securities | | $ | 550,306 | | | $ | 245,075 | | | $ | 311,192 | | | $ | 830,949 | | | $ | 551,719 | | | $ | — | |
1290 Diversified Bond | | | 2,638,391 | | | | — | | | | — | | | | — | | | | 1,465,166 | | | | — | |
1290 DoubleLine Dynamic Allocation | | | 1,554,308 | | | | 2,764,419 | | | | 884,897 | | | | 1,620,494 | | | | 1,429,740 | | | | 1,542 | |
181
1290 FUNDS
NOTES TO FINANCIAL STATEMENTS (Continued)
October 31, 2018
| | | | | | | | | | | | | | | | | | | | | | | | |
| | | Year Ended October 31, 2018 | | | As of October 31, 2018 | | | Year Ended October 31, 2017 | |
Funds: | | Distributed
Ordinary
Income | | | Distributed
Long Term
Gains | | | Accumulated
Undistributed
Ordinary
Income | | | Accumulated
Undistributed
Long Term
Gains | | | Distributed
Ordinary
Income | | | Distributed
Long Term
Gains | |
1290 GAMCO Small/Mid Cap Value | | $ | 369,101 | | | $ | 242,379 | | | $ | 928,062 | | | $ | 212,068 | | | $ | 85,954 | | | $ | 59,267 | |
1290 Global Talents | | | 33,488 | | | | — | | | | 19,412 | | | | 1,258,680 | | | | 91,424 | | | | — | |
1290 High Yield Bond | | | 1,818,704 | | | | — | | | | 20,260 | | | | — | | | | 1,657,498 | | | | — | |
1290 Low Volatility Global Equity | | | 59,429 | | | | — | | | | 50,310 | | | | 3,630 | | | | — | | | | — | |
1290 Multi-Alternative Strategies | | | 38,183 | | | | 69,201 | | | | 153,289 | | | | 21,640 | | | | 77,890 | | | | 6,435 | |
1290 Retirement 2020 | | | 49,252 | | | | 250 | | | | 73,490 | | | | 21,123 | | | | — | | | | — | |
1290 Retirement 2025 | | | 49,002 | | | | — | | | | 96,153 | | | | 13,958 | | | | — | | | | — | |
1290 Retirement 2030 | | | 46,752 | | | | — | | | | 52,536 | | | | 2,706 | | | | — | | | | — | |
1290 Retirement 2035 | | | 46,752 | | | | — | | | | 64,183 | | | | 764 | | | | — | | | | — | |
1290 Retirement 2040 | | | 47,002 | | | | — | | | | 45,285 | | | | 802 | | | | — | | | | — | |
1290 Retirement 2045 | | | 47,142 | | | | — | | | | 48,781 | | | | 854 | | | | — | | | | — | |
1290 Retirement 2050 | | | 47,252 | | | | — | | | | 45,789 | | | | 891 | | | | — | | | | — | |
1290 Retirement 2055 | | | 47,252 | | | | — | | | | 44,313 | | | | 946 | | | | — | | | | — | |
1290 Retirement 2060 | | | 47,502 | | | | — | | | | 41,322 | | | | 1,061 | | | | — | | | | — | |
1290 SmartBeta Equity | | | 290,538 | | | | 160,318 | | | | 202,861 | | | | 629,306 | | | | 151,006 | | | | — | |
The following Fund had a Return of Capital during the year ended October 31, 2018:
| | | | |
Fund: | | Return of Capital | |
1290 Diversified Bond | | $ | 174,948 | |
Additionally, the following Fund had a Return of Capital during the year ended October 31, 2017:
| | | | |
Fund: | | Return of Capital | |
1290 High Yield Bond | | $ | 17,878 | |
Permanent book and tax differences relating to shareholder distributions resulted in reclassifications to undistributed (overdistributed) net investment income (loss), accumulated net realized gain (loss) and paid-in-capital at October 31, 2018 as follows:
| | | | | | | | | | | | |
Funds: | | Undistributed
Net Investment
Income (Loss) (a) | | | Accumulated
Net Realized
Gain (Loss) (a) | | | Paid In
Capital | |
1290 Convertible Securities | | $ | 340,155 | | | $ | (340,156 | ) | | $ | 1 | |
1290 Diversified Bond | | | 121,951 | | | | (72,366 | ) | | | (49,585 | ) |
1290 DoubleLine Dynamic Allocation | | | 35,943 | | | | (35,943 | ) | | | — | |
1290 GAMCO Small/Mid Cap Value | | | (9,357 | ) | | | 9,357 | | | | — | |
1290 Global Talents | | | 1,024 | | | | (1,024 | ) | | | — | |
1290 High Yield Bond | | | 65 | | | | (65 | ) | | | — | |
1290 Low Volatility Global Equity | | | 3,937 | | | | (3,622 | ) | | | (315 | ) |
1290 Multi-Alternative Strategies | | | 3,166 | | | | (1,706 | ) | | | (1,460 | ) |
1290 Retirement 2020 | | | 2,310 | | | | (1,647 | ) | | | (663 | ) |
1290 Retirement 2025 | | | 2,740 | | | | (1,903 | ) | | | (837 | ) |
1290 Retirement 2030 | | | 2,594 | | | | (2,049 | ) | | | (545 | ) |
1290 Retirement 2035 | | | 2,822 | | | | (2,159 | ) | | | (663 | ) |
1290 Retirement 2040 | | | 2,747 | | | | (2,269 | ) | | | (478 | ) |
1290 Retirement 2045 | | | 2,934 | | | | (2,415 | ) | | | (519 | ) |
1290 Retirement 2050 | | | 3,015 | | | | (2,525 | ) | | | (490 | ) |
182
1290 FUNDS
NOTES TO FINANCIAL STATEMENTS (Continued)
October 31, 2018
| | | | | | | | | | | | |
Funds: | | Undistributed
Net Investment
Income (Loss) (a) | | | Accumulated
Net Realized
Gain (Loss) (a) | | | Paid In
Capital | |
1290 Retirement 2055 | | $ | 3,163 | | | $ | (2,671 | ) | | $ | (492 | ) |
1290 Retirement 2060 | | | 3,503 | | | | (3,000 | ) | | | (503 | ) |
1290 SmartBeta Equity | | | (2,117 | ) | | | 2,117 | | | | — | |
| (a) | These components of net assets are included in Total Distributable Earnings (Loss) in the Statement of Assets and Liabilities. |
The significant permanent book and tax differences related to the adjustments above are investments in regulated investments companies (1290 Low Volatility Global Equity, 1290 Retirement 2040, 1290 Retirement 2045, 1290 Retirement 2050, 1290 Retirement 2055 and 1290 Retirement 2060), investments in contingent payment debt instruments (1290 Convertible Securities), investments in swaps, perpetual debt securities (1290 Diversified Bond), non-taxable dividends (1290 Convertible Securities), paydown reclass (1290 Diversified Bond and 1290 DoubleLine Dynamic Allocation), deemed dividends on convertible debt (1290 Convertible Securities) and reclassification of foreign currency gains and losses (1290 Diversified Bond and 1290 Global Talents).
Net capital losses recognized by the Funds may get carried forward indefinitely, and retain their character as short-term and/or long-term losses. The following Funds have capital losses incurred that will be carried forward as follows:
| | | | | | | | | | | | | | | | |
| | | Utilized | | | Losses Carried Forward | |
Funds: | | Short Term | | | Long Term | | | Short Term | | | Long Term | |
1290 Diversified Bond | | $ | 495,097 | | | $ | 121,748 | | | $ | 24,831 | | | $ | — | |
1290 Global Talents | | | 75,121 | | | | — | | | | — | | | | — | |
1290 High Yield Bond | | | — | | | | — | | | | 751,083 | | | | 1,653,226 | |
Sale-Buybacks:
The Funds may enter into financing transactions referred to as “sale-buybacks”. A sale-buyback transaction consists of a sale of a security by a Fund to a financial institution, the counterparty, with a simultaneous agreement to repurchase the same or substantially the same security at an agreed-upon price and date. The Fund is not entitled to receive principal and interest payments, if any, made on the security sold to the counterparty during the term of the agreement. The agreed-upon proceeds for securities to be repurchased by the Fund are reflected as a liability on the Fund’s Statement of Assets and Liabilities. The Fund will recognize net income represented by the price differential between the price received for the transferred security and the agreed-upon repurchase price. This is commonly referred to as the “price drop.” A price drop consists of: (i) the foregone interest and inflationary income adjustments, if any, the Fund would have otherwise received had the security not been sold; and (ii) the negotiated financing terms between the Fund and counterparty. Foregone interest and inflationary income adjustments, if any, are recorded as components of interest income on the Fund’s Statement of Operations. Interest payments based upon negotiated financing terms made by the Fund to counterparties are recorded as a component of interest expense on the Fund’s Statement of Operations. In periods of increased demand for the security, the Fund may receive a fee for use of the security by the counterparty, which may result in interest income to the Fund. None of the Funds had open sale-buybacks at October 31, 2018.
Accounting for Derivative Instruments:
Following is a description of how and why the Funds use derivative instruments, the type of derivatives utilized by the Funds during the reporting period, as well as the primary underlying risk exposures related to each instrument type. Derivatives accounted for as hedging instruments must be disclosed separately from those that do not qualify for hedge accounting. Even though the Funds may use derivatives in an attempt to achieve an economic hedge, the Fund’s derivatives are
183
1290 FUNDS
NOTES TO FINANCIAL STATEMENTS (Continued)
October 31, 2018
not accounted for as hedging instruments because the Funds account for their derivatives at fair value and record any changes in fair value in current period earnings in the Statements of Operations. All open derivative positions at period end are reflected on each respective Fund’s Portfolio of Investments. The volume of derivative activity, based on month-end notional amounts during the period is also noted in each respective Fund’s Portfolio of Investments. Portfolio securities are reserved and/or pledged with the custodian for current or potential derivative holdings as necessary throughout the year.
Options:
Certain Funds may write (sell) covered options as a hedge to provide protection against adverse movements in the price of securities in the Fund or to enhance investment performance. Certain Funds purchase and sell exchange traded options on foreign currencies. When a Fund writes an option, an amount equal to the premium received by the Fund is recorded as a liability and is subsequently adjusted on a daily basis to the current market price of the option written. Premiums received from writing options that expire unexercised are recognized as gains on the expiration date. Premiums received from writing options that are exercised or are cancelled in closing purchase transactions are offset against the cost of any securities purchased or added to the proceeds or netted against the amount paid on the transaction to determine the realized gain or loss. In writing options, a Fund must assume that the option may be exercised at any time prior to the expiration of its obligation as a writer, and that in such circumstances the net proceeds of the sale (or cost of) purchase of the underlying securities and currencies pursuant to the call or put option may be substantially below or above the prevailing market price. A Fund also has the additional risk of not being able to enter into a closing purchase transaction if a liquid secondary market does not exist and bears the risk of unfavorable changes in the price of the financial instruments underlying the options.
Certain Funds may purchase put options on securities to increase the Fund’s total investment return or to protect its holdings against a substantial decline in market value. The purchase of put options on securities will enable a Fund to preserve, at least partially, unrealized gains in an appreciated security in its Fund without actually selling the security. In addition, the Funds will continue to receive interest or dividend income on the security. The Funds may also purchase call options on securities to protect against substantial increases in prices of securities that Funds intend to purchase pending their ability to invest in an orderly manner in those securities. The Funds may sell put or call options they have previously purchased, which could result in a net gain or loss depending on whether the amount received on the sale is more or less than the premium and other transaction costs paid on the put or call option which was bought.
Futures Contracts, Options on Futures Contracts, Forward Commitments and Foreign Currency Contracts:
The futures contracts used by the Funds are agreements to buy or sell a financial instrument for a set price in the future. Options on futures contracts used by the Funds are rights to buy, or sell a futures contract for a set price in the future. Certain Funds buy or sell futures contracts for the purpose of protecting their Fund securities against future changes in interest rates and indices which might adversely affect the value of the Funds’ securities or the price of securities that they intend to purchase at a later date. Initial margin deposits are made upon entering into futures contracts and can be in cash, certain money market instruments, treasury securities or other liquid, high grade debt securities. During the period the futures contracts are open, changes in the market price of the contracts are recognized as unrealized gains or losses by “marking-to-market” at the end of each trading day. Variation margin payments on futures contracts are received or made, depending upon whether unrealized gains or losses are incurred. When the contract is closed, the Fund records a realized gain or loss equal to the difference between the proceeds from or cost of the closing transactions and the Fund’s basis in the contract. Should interest rates or indices move unexpectedly, the Fund may not achieve the anticipated benefits of the futures contracts and may incur a loss. The use of futures contracts transactions involves the risk of imperfect correlation in movements in the price of futures contracts, interest rates and the underlying hedged assets. Use of
184
1290 FUNDS
NOTES TO FINANCIAL STATEMENTS (Continued)
October 31, 2018
long futures contracts subjects the Funds to risk of loss in excess of the amounts shown on the Statements of Assets and Liabilities, up to the notional value of the futures contracts. Use of short futures contracts subjects the Funds to unlimited risk of loss. The Funds enter into futures contracts only on exchanges or boards of trade. The exchange or board of trade acts as the counterparty to each futures transaction; therefore, a Fund’s credit risk is limited to failure of the exchange or board of trade.
A Fund may make contracts to purchase or sell securities for a fixed price at a future date beyond customary settlement time (“forward commitments”). Funds may designate the segregation, either on their records or with the Trust’s custodian, of cash or other liquid securities in an amount sufficient to meet the purchase price, or may enter into offsetting contracts for the forward sale of other securities they own. These commitments are reported at market value in the financial statements. Forward commitments may be considered securities in themselves and involve a risk of loss if the value of the security to be purchased declines or if the value of the security to be sold increases prior to the settlement date, which is a risk in addition to the risk of decline in value of the Fund’s other assets. Where such purchases or sales are made through dealers, a Fund relies on the dealer to consummate the sale. The dealer’s failure to do so may result in the loss to a Fund of an advantageous yield or price. Market risk exists on these commitments to the same extent as if the securities were owned on a settled basis and gains and losses are recorded and reported in the same manner. However, during the commitment period, these investments earn no interest or dividends. The use of forward commitments may result in market risk to the Funds that is greater than if the Funds had engaged solely in transactions that settle in the customary time.
The Funds may be exposed to foreign currency risks associated with Fund investments. During the reporting period, the Funds entered into certain forward foreign currency contracts for the purchase or sale of a specific foreign currency at a fixed price on a future date to hedge or otherwise manage these exposures. Unrealized gains or losses on forward foreign currency contracts are recorded by the Funds on a daily basis and realized gains or losses are recorded on the settlement date of a contract.
Certain Funds may purchase foreign currency on a spot (or cash) basis. In addition, certain Funds enter into contracts to purchase or sell foreign currencies at a future date (“forward contracts”). A forward foreign currency contract is a commitment to purchase or sell a foreign currency at a future date at a negotiated forward rate. Daily fluctuations in the value of such contracts are recognized as unrealized appreciation or depreciation by “marking to market”. The gain or loss arising from the difference between the original contracts and the closing of such contracts is included in realized gains or losses from foreign currency transactions in the Statements of Operations of the Funds. The Sub-Advisers may engage in these forward contracts to protect against uncertainty in the level of future rates in connection with the purchase and sale of Fund securities (“transaction hedging”) and to protect the value of specific Fund positions (“position hedging”). The Funds also buy forward foreign currency contracts to gain exposure to currencies. The Funds are subject to off-balance sheet risk to the extent of the value of the contracts for purchase of foreign currency and in an unlimited amount for sales of foreign currency.
Swaps:
Swap agreements are two party contracts entered into primarily by institutional investors for periods ranging from a few weeks to more than one year. Swaps are marked-to-market daily based upon values from third party vendors, which may include a clearing counterparty, registered exchange, or quotations from market makers to the extent available. In the event that market quotes are not readily available and the swap cannot be valued pursuant to one of the valuation methods, the value of the swap will be determined in good faith by the Committee. Changes in market value, if any, are reflected as a component of net changes in unrealized appreciation (depreciation) on the Statements of Operations. Daily changes in valuation of centrally cleared
185
1290 FUNDS
NOTES TO FINANCIAL STATEMENTS (Continued)
October 31, 2018
swaps, if any, are recorded as a receivable or payable for the change in value as appropriate (“variation margin”) on the Statements of Assets and Liabilities. There is potential for swaps to be illiquid. Over-the-counter (“OTC”) swap payments received or made at the beginning of the measurement period are reflected as such on the Statements of Assets and Liabilities and represent premiums paid or received upon entering into the swap agreement to compensate for differences between the stated terms of the swap agreement and prevailing market conditions (credit spreads, currency exchange rates, interest rates, and other relevant factors). These upfront premiums are recorded as realized gains or losses on the Statement of Operations upon termination or maturity of the swap. A liquidation payment received or made at the termination of the swap is recorded as realized gain or loss on the Statement of Operations. Net periodic payments received or paid by a Fund are included as part of realized gains or losses on the Statement of Operations.
Total return swap agreements involve commitments where cash flows are exchanged based on the price of an underlying reference and based on a fixed or variable rate. Total return swap agreements may involve commitments to pay interest in exchange for a market-linked return. One counterparty pays out the total return of a specific reference asset, which may include an underlying equity, index, or bond, and in return receives a fixed or variable rate. At the maturity date, a net cash flow is exchanged where the total return is equivalent to the return of the underlying reference less a financing rate, if any. As a receiver, the Fund would receive payments based on any positive total return and would owe payments in the event of a negative total return. As the payer, the Fund would owe payments on any net positive total return, and would receive payment in the event of a negative total return. In connection with total return swap agreements, securities or cash may be identified as collateral or margin in accordance with the terms of the respective swap agreements to provide assets of value and recourse in the event of default or bankruptcy/insolvency.
Currency swaps involve the exchange by one party with another party of a series of payments in specified currencies. Currency swaps usually involve the delivery of the entire principal value of one designated currency in exchange for the other designated currency. Therefore, the entire principal value of a currency swap is subject to the risk that the other party to the swap will default on its contractual delivery obligations. In addition, a Fund may enter into currency swaps that involve an agreement to pay interest streams in one currency based on a specified index in exchange for receiving interest streams denominated in another currency. Currency swaps may involve initial and final exchanges that correspond to the agreed upon notional amount.
Interest rate swaps involve the exchange between two parties of payments calculated by reference to specified interest rates (e.g., an exchange of floating rate payments for fixed rate payments). The purchase of an interest rate cap entitles the purchaser, to the extent that a specified index exceeds a predetermined interest rate, to receive payments of interest on a notional principal amount from the party selling such interest rate cap. The purchase of an interest rate floor entitles the purchaser, to the extent that a specified index falls below a predetermined interest rate, to receive payments of interest on a notional principal amount from the party selling such interest rate floor. Caps and floors may be less liquid than swaps. In addition, the value of interest rate transactions will fluctuate based on changes in interest rates.
Credit default swap agreements involve greater risks than if a Fund had invested in the reference obligation directly since, in addition to general market risks, credit default swaps are subject to illiquidity risk, counterparty risk and credit risk. A Fund will enter into credit default swap agreements only with counterparties that meet certain standards of creditworthiness. A buyer generally also will lose its investment and recover nothing should no credit event occur and the swap is held to its termination date. If a credit event were to occur, the value of any deliverable obligation received by the seller, coupled with the upfront or periodic payments previously received, may be less than the full notional value it pays to the buyer, resulting in a loss of value to the seller. A Fund’s obligations under a credit default swap agreement will be accrued daily (offset against any amounts owing to the Fund). In connection with credit default swaps in which a Fund is the buyer, the Fund will segregate or “earmark” cash or assets
186
1290 FUNDS
NOTES TO FINANCIAL STATEMENTS (Continued)
October 31, 2018
determined to be liquid, or enter into certain offsetting positions, with a value at least equal to the Fund’s exposure (any accrued but unpaid net amounts owed by the Fund to any counterparty), on a marked-to-market basis. In connection with credit default swaps in which a Fund is the seller, the Fund will segregate or “earmark” cash or assets determined to be liquid, or enter into offsetting positions, with a value at least equal to the full notional amount of the swap (minus any amounts owed to the Fund). Such segregation or “earmarking” is intended to ensure that the Fund has assets available to satisfy its obligations with respect to the transaction and limit any potential leveraging of the Fund. Such segregation or “earmarking” will not limit the Fund’s exposure to loss. To the extent that credit default swaps are entered into for hedging purposes or are covered as described above, the Adviser believes such obligations do not constitute “senior securities” under the 1940 Act and, accordingly, will not treat them as being subject to the Fund’s senior security and borrowing restrictions.
In the case of a credit default swap sold by a Fund (i.e., where the Fund is selling credit default protection), the Fund may value the credit default swap at its notional amount in applying certain of the Fund’s investment policies and restrictions, but may value the credit default swap at market value for purposes of applying certain of the Fund’s other investment policies and restrictions.
An option on a swap agreement, also called a “swaption,” is an option that gives the buyer the right, but not the obligation, to enter into a swap on a future date in exchange for paying a market-based “premium.” A receiver swaption gives the owner the right to receive the total return of a specified asset, reference rate, or index. A payer swaption gives the owner the right to pay the total return of a specified asset, reference rate, or index. A purchaser of a swaption risks losing only the amount of the premium they have paid should they decide to let the option expire, whereas the seller of a swaption is subject to the risk that they will become obligated if the option is exercised. Swaptions also include options that allow an existing swap to be terminated or extended by one of the counterparties.
Collateral:
Collateral on OTC derivatives, centrally cleared derivatives and sale-buybacks may be in the form of cash or debt securities issued by the U.S. government or related agencies or foreign governments. Cash posted by a Fund is reflected as cash held as collateral at the broker in the accompanying financial statements and generally is restricted from withdrawal by the Fund; securities posted by a Fund are so noted in the accompanying Portfolio of Investments; both remain in the Fund’s assets. Collateral pledged by counterparties is not included in the Fund’s assets because the Fund does not obtain effective control over those assets. For OTC derivatives, collateral posted or received by the Fund is held in a segregated account at the respective counterparty or Fund’s custodian. A Fund will segregate assets determined to be liquid to cover its obligations under sale-buyback transactions. In the event the net exposure for sale-buybacks and certain derivatives trades exceeds $250,000 (on a per counterparty basis) the Fund will post additional collateral. As of October 31, 2018, no Fund was required to post additional collateral.
Market and Credit Risk:
A Fund’s investments in financial instruments expose the Fund to various risks such as, but not limited to, interest rate, foreign currency, forward commitments and equity risks.
Interest rate risk is the risk that fixed income securities will decline in value because of changes in interest rates. When nominal interest rates decline, the value of certain fixed-income securities held by a Fund generally rises. Conversely, when nominal interest rates rise, the value of certain fixed income securities held by a Fund generally decreases. A nominal interest rate can be described as the sum of a real interest rate and an expected inflation rate. Interest rate changes can be sudden and unpredictable, and a Fund may lose money if these changes are not anticipated by Fund management. A Fund may not be able to hedge against changes in interest rates or may choose not to do so for cost or other reasons. In addition, any hedges may not work as intended. Fixed income securities with longer durations tend to be more sensitive to changes in interest rates, usually making them more volatile than securities with shorter durations.
187
1290 FUNDS
NOTES TO FINANCIAL STATEMENTS (Continued)
October 31, 2018
Duration is useful primarily as a measure of the sensitivity of a security’s market price to interest rate (i.e., yield) movements. As of October 31, 2018, interest rates are near historic lows in the United States, and below zero in other parts of the world, including certain European countries and Japan. A Fund is subject to greater risk of rising interest rates due to these market conditions. A significant or rapid rise in interest rates could result in losses to the Fund.
Foreign (non-U.S.) securities in this report are classified by the country of risk of a holding.
If a Fund invests directly in foreign currencies or in securities that trade in, and receive revenues in, foreign currencies, or in financial derivatives that provide exposure to foreign currencies, it will be subject to the risk that those currencies will decline in value relative to the base currency of the Fund, or, in the case of hedging positions, that the Fund’s base currency will decline in value relative to the currency being hedged. Currency rates in foreign countries may fluctuate significantly over short periods of time for a number of reasons, including changes in interest rates, intervention (or the failure to intervene) by U.S. or foreign governments, central banks or supranational entities such as the International Monetary Fund, or by the imposition of currency controls or other political developments in the United States or abroad. As a result, a Fund’s investments in foreign currency denominated securities may reduce the Fund’s returns.
Forward commitments and forward foreign currency contracts involve elements of both market and credit risk in excess of the amounts reflected in the Statements of Assets and Liabilities. They are executed directly with the counterparty and not through an exchange and can be terminated only by agreement of both parties to such contracts. With respect to such transactions there is no daily margin settlement. There is also the risk that the security will not be issued or that the other party to the transaction will not meet its obligations. If this occurs, the Fund may lose both the investment opportunity for its assets if set aside to pay for the security and any gain in the security.
The market values of the Fund’s investments may decline due to general market conditions which are not specifically related to a particular company or issuer, such as real or perceived adverse economic conditions, changes in the general outlook for corporate earnings, changes in interest or currency rates or adverse investor sentiment generally. They may also decline due to factors which affect a particular industry or industries, such as labor shortages or increased production costs and competitive conditions within an industry. Equity securities and equity related investments generally have greater market price volatility than fixed income securities, although under certain market conditions fixed income securities may have comparable or greater price volatility. Credit ratings downgrades may also negatively affect securities held by a Fund. Even when markets perform well, there is no assurance that the investments held by a Fund will increase in value along with the broader market. In addition, market risk includes the risk that geopolitical events will disrupt the economy on a national or global level.
A Fund will be exposed to credit risk to parties with whom it trades and will also bear the risk of settlement default. A Fund seeks to minimize concentrations of credit risk by undertaking transactions with a large number of counterparties on recognized and reputable exchanges, where applicable. A Fund could lose money if the issuer or guarantor of a fixed income security, or the counterparty of a financial derivatives contract, repurchase agreement or a loan of portfolio securities or other transactions, is unable or unwilling, or is perceived (whether by market participants, rating agencies, pricing services or otherwise) as unable or unwilling to make timely principal and/or interest payments, or otherwise honor its obligations. Securities are subject to varying degrees of credit risk, which are often reflected in credit ratings.
Certain Funds may invest in below investment grade high-yield securities (commonly known as “junk bonds”). These securities are considered to be high risk investments. Securities rated below investment grade are speculative in nature, involve greater risk of default by the issuing entity and may be subject to greater market fluctuations than higher rated fixed income securities because such securities are generally unsecured and subordinated to other creditors’ claims. The retail secondary market for these “junk bonds” may be less liquid than that of higher rated securities and adverse economic conditions could make it difficult to sell certain securities or could result in lower prices than those used in calculating the Fund’s NAV.
188
1290 FUNDS
NOTES TO FINANCIAL STATEMENTS (Continued)
October 31, 2018
Because certain Funds invest in affiliated mutual funds, unaffiliated investment companies or ETFs, the Funds indirectly pay a portion of the expenses incurred by the underlying funds and ETFs. As a result, the cost of investing in the Funds may be higher than the cost of investing in a Fund that invests directly in individual securities and financial instruments. The Funds are also subject to certain risks related to the underlying funds’ and ETFs’ investments in securities and financial instruments (such as fixed income securities, including high yield, asset-backed and mortgage-related securities, equity securities, foreign and emerging markets securities, commodities and real estate securities) and the ability of the Fund to meet its investment objective will directly depend on the ability of the underlying fund or ETF to meet its investment objective. With respect to the Fund’s investments in ETFs, there is also the risk that an ETF’s performance may not match that of the relevant index. It is also possible that an active trading market for an ETF may not develop or be maintained, in which case the liquidity and value of the Fund’s investments in the ETF could be substantially and adversely affected. The extent to which the investment performance and risks associated with the Fund correlate to those of a particular underlying fund or ETF will depend upon the extent to which the Fund’s assets are allocated from time to time for investment in the underlying fund or ETF, which will vary.
Offsetting Assets and Liabilities:
The Funds may be subject to various netting arrangements with select counterparties (“Master Agreements”). Master Agreements govern the terms of certain transactions, and are intended to reduce the counterparty risk associated with relevant transactions by specifying credit protection mechanisms and providing standardization that is intended to improve legal certainty. As the Master Agreements are specific to unique operations of different asset types, they allow a Fund to close out and net its total exposure to counterparty in the event of a default with respect to all the transactions governed under a single Master Agreement with a counterparty. For financial reporting purposes the Statement of Assets and Liabilities generally show derivative assets and liabilities on a gross basis, which reflects the full risks and exposures prior to netting.
The Trust, on behalf of each Fund, has entered into an Investment Advisory Agreement (the “Advisory Agreement”) with the Adviser. Pursuant to the Advisory Agreement, the Adviser supervises the investment program for each Fund in accordance with each Fund’s investment objectives, policies and restrictions. The Adviser is paid a fee for these services. The fee is accrued daily and paid monthly based on the Fund’s average daily net assets, at an annual rate of:
| | |
Funds: | | Management Fees |
1290 Retirement 2020 | | 0.500% of average daily net assets |
1290 Retirement 2025 | | 0.500% of average daily net assets |
1290 Retirement 2030 | | 0.500% of average daily net assets |
1290 Retirement 2035 | | 0.500% of average daily net assets |
1290 Retirement 2040 | | 0.500% of average daily net assets |
1290 Retirement 2045 | | 0.500% of average daily net assets |
1290 Retirement 2050 | | 0.500% of average daily net assets |
1290 Retirement 2055 | | 0.500% of average daily net assets |
1290 Retirement 2060 | | 0.500% of average daily net assets |
| | | | | | | | | | | | | | | | | | | | |
| | | (as a percentage of average daily net assets) | |
Funds: | | First
$1 Billion | | | Next
$1 Billion | | | Next
$3 Billion | | | Next
$5 Billion | | | Thereafter | |
1290 DoubleLine Dynamic Allocation | | | 0.750 | % | | | 0.700 | % | | | 0.675 | % | | | 0.650 | % | | | 0.625 | % |
1290 GAMCO Small/Mid Cap Value | | | 0.750 | | | | 0.700 | | | | 0.675 | | | | 0.650 | | | | 0.625 | |
1290 Global Talents | | | 0.800 | | | | 0.750 | | | | 0.725 | | | | 0.700 | | | | 0.675 | |
1290 SmartBeta Equity | | | 0.700 | | | | 0.650 | | | | 0.625 | | | | 0.600 | | | | 0.575 | |
189
1290 FUNDS
NOTES TO FINANCIAL STATEMENTS (Continued)
October 31, 2018
| | | | | | | | | | | | | | | | |
| | | (as a percentage of average daily net assets) | |
Funds: | | First
$4 Billion | | | Next
$4 Billion | | | Next
$2 Billion | | | Thereafter | |
1290 Low Volatility Global Equity | | | 0.500 | % | | | 0.490 | % | | | 0.480 | % | | | 0.470 | % |
1290 Multi-Alternative Strategies | | | 0.500 | | | | 0.490 | | | | 0.480 | | | | 0.470 | |
| | | | | | | | | | | | |
| | | (as a percentage of average daily net assets) | |
Funds: | | First
$4 Billion | | | Next
$4 Billion | | | Thereafter | |
1290 Convertible Securities | | | 0.700 | % | | | 0.680 | % | | | 0.660 | % |
1290 Diversified Bond | | | 0.600 | | | | 0.580 | | | | 0.560 | |
1290 High Yield Bond | | | 0.600 | | | | 0.580 | | | | 0.560 | |
Prior to June 15, 2018 the following Funds’ management fees were as follows:
| | | | | | | | | | | | |
| | | (as a percentage of average daily net assets) | |
Funds: | | First
$4 Billion | | | Next
$4 Billion | | | Thereafter | |
1290 Diversified Bond | | | 0.800 | % | | | 0.780 | % | | | 0.760 | % |
On behalf of the Trust, the Adviser has entered into an investment sub-advisory agreement (“Sub-Advisory Agreements”) with each of the Sub-Advisers. Each of the Sub-Advisory Agreements obligates the Sub-Advisers for the respective Funds to: (i) continuously furnish investment programs for the Funds; (ii) place all orders for the purchase and sale of investments for the Funds with brokers or dealers selected by the Adviser or the respective Sub-Advisers; and (iii) perform certain limited related administrative functions in connection therewith. The Adviser pays the expenses of providing investment sub-advisory services to the Funds, including the fees of the Sub-Advisers of each Fund.
In addition to the advisory fee, each Fund pays the Administrator its proportionate share of an asset-based administration fee, which is equal to an annual rate of the greater of 0.15% of each Fund’s average daily net assets, or $30,000 per Fund (or $30,000 for each allocated portion (or sleeve) of a Fund, as applicable). The Administrator has contracted with the Sub-Administrator to provide, pursuant to a sub-administration agreement, the Funds with certain administrative services, including monitoring of Fund compliance and Fund accounting services.
The Trust, on behalf of the Funds, has entered into a distribution agreement (the “Distribution Agreement”) with ALPS Distributors, Inc. (“ALPS” or the “Distributor”), under which ALPS serves as Distributor for each Fund’s Class A, Class I, Class R and Class T shares. The Board has approved Distribution Plans pursuant to Rule 12b-1 under the 1940 Act for Class A, Class R and Class T shares for each Fund. Pursuant to the Distribution Plans, the Funds will pay the Distributor annual fees at the following rates:
| | | | |
Share Class: | | Distribution Fee and/or Service Fee
(as a % of average daily net
assets attributable to the class) | |
Class A | | | 0.25 | % |
Class R | | | 0.50 | |
Class T* | | | 0.25 | |
| * | The Distribution Fees for Class T shares are currently being waived. This waiver is voluntary and could be eliminated at any time. |
The Trust, on behalf of the Funds, has entered into a Transfer Agency and Service Agreement (the “Transfer Agency Agreement”) with DST Asset Manager Solutions, Inc. (“DST”), formerly known as Boston Financial Data Services. Pursuant to the Transfer Agency Agreement, DST is responsible for, among other things, the issuance, transfer and redemption of shares, the opening and maintenance of shareholder accounts, the handling of certain
190
1290 FUNDS
NOTES TO FINANCIAL STATEMENTS (Continued)
October 31, 2018
communications between shareholders and the Trust, and the payment of dividends and distributions payable by the Funds. Under the Transfer Agency Agreement, DST receives a monthly fee comprised of a fixed base fee plus a fee computed on the basis of the number of shareholder accounts it maintains for the Trust during the month.
The Trust, on behalf of the Funds, has entered into a Custody Agreement with JPMorgan Chase Bank, N.A. (in this capacity, the “Custodian”). The Custody Agreement provides for an annual fee based on the amount of assets under custody plus transaction charges. The Custodian serves as custodian of the Trust’s Fund securities and other assets. Under the terms of the Custody Agreement between the Trust and the Custodian, the Custodian maintains and deposits in each Fund’s account, cash, securities and other assets of the Funds. The Custodian is also required, upon the order of the Trust, to deliver securities held by the Custodian, and to make payments for securities purchased by the Trust. The Custodian has also entered into sub-custodian agreements with a number of foreign banks and clearing agencies, pursuant to which Fund securities purchased outside the United States are maintained in the custody of these entities. At year end, certain of the Funds maintain significant cash balances with the Custodian or its affiliates. These balances are presented as cash on each Fund’s Statement of Assets and Liabilities.
The Trust, on behalf of the Funds, has entered into an expense limitation agreement (the “Expense Limitation Agreement”) with 1290 Asset Managers whereby 1290 Asset Managers has contractually agreed to waive fees and/or reduce its fees to the extent that the aggregate expenses incurred by a Fund in any fiscal year, including but not limited to offering costs and investment advisory fees of the Adviser (but excluding interest, taxes, brokerage commissions, fees and expenses of other investment companies in which a Fund invests (except as noted in the table below), other expenditures that are capitalized in accordance with generally accepted accounting principles (other than offering costs), other extraordinary expenses not incurred in the ordinary course of such Fund’s business and amounts payable pursuant to a plan adopted in accordance with Rule 12b-1 under the 1940 Act) (“Fund Operating Expenses”), exceed the Maximum Annual Operating Expense Limit of:
| | | | |
| | | Total Expense Limited
For All Share Classes to
(% of daily net assets) | |
Funds: | | | |
1290 Convertible Securities** | | | 1.05 | % |
1290 Diversified Bond | | | 0.50 | |
1290 DoubleLine Dynamic Allocation*, ** | | | 1.00 | |
1290 GAMCO Small/Mid Cap Value* | | | 1.00 | |
1290 Global Talents | | | 1.00 | |
1290 High Yield Bond** | | | 0.80 | |
1290 Low Volatility Global Equity* | | | 0.65 | |
1290 Multi-Alternative Strategies* | | | 1.40 | |
1290 Retirement 2020* | | | 0.65 | |
1290 Retirement 2025* | | | 0.65 | |
1290 Retirement 2030* | | | 0.65 | |
1290 Retirement 2035* | | | 0.65 | |
1290 Retirement 2040* | | | 0.65 | |
1290 Retirement 2045* | | | 0.65 | |
1290 Retirement 2050* | | | 0.65 | |
1290 Retirement 2055* | | | 0.65 | |
1290 Retirement 2060* | | | 0.65 | |
1290 SmartBeta Equity | | | 0.90 | |
| * | Includes fees and expenses of other investment companies in which the Fund invests. Prior to June 13, 2018, for DoubleLine Dynamic Allocation and GAMCO Small/Mid Cap Value, such amounts were excluded from the Expense Limitation Agreement. |
191
1290 FUNDS
NOTES TO FINANCIAL STATEMENTS (Continued)
October 31, 2018
| ** | Effective October 1, 2018, the Adviser voluntarily agreed to forgo any amounts eligible for recoupment that were waived or reimbursed both prior to and subsequent to October 1, 2018 through December 31, 2018. |
Prior to June 15, 2018 the expense limitation was as follows:
| | | | |
| | | Total Expense Limited
For All Share Classes to
(% of daily net assets) | |
Fund: | | | |
1290 Diversified Bond | | | 1.00 | % |
1290 Asset Managers first waives its advisory fees, then waives its administration fees, and then reimburses the Fund’s expenses out of its own resources. Each Fund may at a later date reimburse to 1290 Asset Managers the advisory fees waived or other expenses assumed and paid for by 1290 Asset Managers pursuant to the Expense Limitation Agreement within three years of payments or waivers being recorded, provided such Fund has reached a sufficient asset size to permit such reimbursement to be made without causing the total annual expense ratio of each Fund to exceed the percentage limits mentioned above for the respective period. Consequently, no reimbursement by a Fund will be made unless: (i) the Fund’s total annual expense ratio is less than the respective percentages stated above for the respective period; and (ii) the payment of such reimbursement has been approved by the Board. Any reimbursement, called recoupment fees on the Statement of Operations of the Fund, will be based on the earliest fees waived or assumed by 1290 Asset Managers. During the year ended October 31, 2018, the Funds did not incur recoupment fees. At October 31, 2018, under the Expense Limitation Agreement, the amount that would be recoverable from each Fund is as follows:
| | | | | | | | | | | | | | | | |
| | | Amount Eligible Through | | | Total Eligible
For
Reimbursement | |
Funds: | | 2019 | | | 2020 | | | 2021 | |
1290 Diversified Bond | | $ | 294,316 | | | $ | 311,753 | | | $ | 350,461 | | | $ | 956,530 | |
1290 GAMCO Small/Mid Cap Value | | | 170,475 | | | | 198,074 | | | | 292,540 | | | | 661,089 | |
1290 Global Talents | | | 124,531 | | | | 198,217 | | | | 196,463 | | | | 519,211 | |
1290 Low Volatility Global Equity | | | — | | | | 93,099 | | | | 138,255 | | | | 231,354 | |
1290 Multi-Alternative Strategies | | | 167,229 | | | | 163,049 | | | | 141,540 | | | | 471,818 | |
1290 Retirement 2020 | | | — | | | | 96,299 | | | | 139,205 | | | | 235,504 | |
1290 Retirement 2025 | | | — | | | | 96,317 | | | | 140,647 | | | | 236,964 | |
1290 Retirement 2030 | | | — | | | | 95,969 | | | | 136,903 | | | | 232,872 | |
1290 Retirement 2035 | | | — | | | | 96,339 | | | | 139,321 | | | | 235,660 | |
1290 Retirement 2040 | | | — | | | | 96,423 | | | | 136,054 | | | | 232,477 | |
1290 Retirement 2045 | | | — | | | | 97,023 | | | | 138,025 | | | | 235,048 | |
1290 Retirement 2050 | | | — | | | | 96,472 | | | | 136,781 | | | | 233,253 | |
1290 Retirement 2055 | | | — | | | | 96,529 | | | | 136,944 | | | | 233,473 | |
1290 Retirement 2060 | | | — | | | | 96,563 | | | | 136,329 | | | | 232,892 | |
1290 SmartBeta Equity | | | 150,945 | | | | 198,111 | | | | 208,207 | | | | 557,263 | |
During the year ended October 31, 2018, the Distributor voluntarily waived distribution fees for the Funds’ Class T shares. These amounts as follows are not eligible for recoupment:
| | |
Funds: | | Voluntary Waivers |
1290 GAMCO Small/Mid Cap Value | | $334 |
1290 High Yield Bond | | 325 |
1290 SmartBeta Equity | | 320 |
192
1290 FUNDS
NOTES TO FINANCIAL STATEMENTS (Continued)
October 31, 2018
During the year ended October 31, 2018, FMG LLC voluntarily waived fees for certain Funds. The amounts waived were as follows and are not eligible for recoupment:
| | |
Funds: | | Voluntary Waivers |
1290 Convertible Securities | | $14,877 |
1290 DoubleLine Dynamic Allocation | | 23,535 |
1290 High Yield Bond | | 21,428 |
The Distributor receives sales charges on the Funds’ Class A and Class T shares and the proceeds of contingent deferred sales charges paid by the investor in connection with certain redemptions of the Funds’ Class A shares. The Distributor has advised the Funds that for the year ended October 31, 2018, the proceeds retained from sales and redemptions are as follows:
| | | | | | | | | | | | |
| | | Class A | | | Class T | |
Funds: | | Front End
Sales
Charge | | | Contingent
Deferred
Sales Charge | | | Front End
Sales
Charge | |
1290 Convertible Securities | | $ | 2,296 | | | $ | — | | | $ | — | |
1290 Diversified Bond | | | 1,113 | | | | — | | | | — | |
1290 DoubleLine Dynamic Allocation | | | 38,823 | | | | — | | | | — | |
1290 GAMCO Small/Mid Cap Value | | | 72,288 | | | | — | | | | — | |
1290 Global Talents | | | 26,258 | | | | — | | | | — | |
1290 High Yield Bond | | | 27,749 | | | | — | | | | — | |
1290 Multi-Alternative Strategies | | | 9,889 | | | | — | | | | — | |
1290 SmartBeta Equity | | | 21,036 | | | | — | | | | — | |
Sales loads and contingent deferred sales charges imposed on purchases and redemptions of Fund shares are retained by the Trust’s Distributors and do not represent expenses or income of the Funds.
| Note 4 | Percentage of Ownership by Affiliates |
At October 31, 2018, 1290 Asset Managers and AXA Equitable held investments in certain Funds as follows:
| | | | |
Funds: | | Percentage of
Ownership | |
1290 Convertible Securities | | | 90 | % |
1290 Diversified Bond | | | 92 | |
1290 DoubleLine Dynamic Allocation | | | 89 | |
1290 GAMCO Small/Mid Cap Value | | | 44 | |
1290 Global Talents | | | 91 | |
1290 High Yield Bond | | | 82 | |
1290 Low Volatility Global Equity | | | 93 | |
1290 Multi-Alternative Strategies | | | 53 | |
1290 Retirement 2020 | | | 99 | |
1290 Retirement 2025 | | | 95 | |
1290 Retirement 2030 | | | 96 | |
1290 Retirement 2035 | | | 97 | |
1290 Retirement 2040 | | | 100 | |
1290 Retirement 2045 | | | 97 | |
1290 Retirement 2050 | | | 96 | |
193
1290 FUNDS
NOTES TO FINANCIAL STATEMENTS (Concluded)
October 31, 2018
| | | | |
Funds: | | Percentage of
Ownership | |
1290 Retirement 2055 | | | 99 | % |
1290 Retirement 2060 | | | 100 | |
1290 SmartBeta Equity | | | 69 | |
The Adviser evaluated subsequent events from October 31, 2018, the date of these financial statements, through the date these financial statements were issued. The subsequent events include the following:
At a Special Meeting of Shareholders held on November 1, 2018, shareholders of the 1290 Retirement 2060 Fund approved a new investment advisory agreement between the Adviser and the Trust, on behalf of the 1290 Retirement 2060 Fund.
At a Special Meeting of Shareholders held on November 1, 2018, shareholders of the 1290 Retirement 2060 Fund approved a Change of Control Event prompted by the Sell-Down Plan and under certain circumstances, any future advisory agreements prompted by Change of Control Events that may occur as part of the Sell-Down Plan (as defined in the Proxy statement filed with the Securities and Exchange Commission (SEC) on September 21, 2018).
At a Special Meeting of Shareholders held on November 27, 2018, shareholders of the 1290 Retirement 2030 Fund approved a new investment advisory agreement between the Adviser and the Trust, on behalf of the 1290 Retirement 2030 Fund.
At a Special Meeting of Shareholders held on November 27, 2018, shareholders of the 1290 Retirement 2030 Fund approved a Change of Control Event prompted by the Sell-Down Plan and under certain circumstances, any future advisory agreements prompted by Change of Control Events that may occur as part of the Sell-Down Plan (as defined in the Proxy statement filed with the SEC on September 21, 2018).
At the December 5-6, 2018 regular meeting, the Board approved amendments to the Expense Limitation Agreement between 1290 Asset Managers and the Trust to be effective January 1, 2019 as follows:
| | | | |
Funds | | Total Expense Limited
For All Share Classes to
(% of daily net assets)** | |
1290 Convertible Securities Fund | | | 1.00 | % |
1290 DoubleLine Dynamic Allocation Fund | | | 0.95 | * |
1290 High Yield Bond Fund | | | 0.75 | |
| * | For purposes of calculating the Maximum Annual Operating Expense Limit, the fees and expenses of other investment companies and exchange-traded investment vehicles in which the Fund invests are included in Fund Operating Expenses. |
| ** | The other terms of the expense limitation agreement, as described in Note 2, remained the same. |
194
Report of Independent Registered Public Accounting Firm
To the Board of Trustees of 1290 Funds and Shareholders of each of the eighteen funds listed in the table below:
Opinions on the Financial Statements
We have audited the accompanying statements of assets and liabilities, including the schedules of investments, of each of the funds listed in the table below (constituting 1290 Funds, hereafter collectively referred to as the “Funds”) as of October 31, 2018, the related statements of operations and of changes in net assets for each of the periods indicated in the table below, including the related notes, and the financial highlights for each of the periods indicated therein (collectively referred to as the “financial statements”). In our opinion, the financial statements present fairly, in all material respects, the financial position of each of the Funds as of October 31, 2018, the results of each of their operations and the changes in each of their net assets for the periods indicated in the table below, and each of the financial highlights for each of the periods indicated therein, in conformity with accounting principles generally accepted in the United States of America.
| | |
| 1290 Convertible Securities Fund (1) | | 1290 Retirement 2025 Fund (2) |
| 1290 Diversified Bond Fund (1) | | 1290 Retirement 2030 Fund (2) |
| 1290 DoubleLine Dynamic Allocation Fund (1) | | 1290 Retirement 2035 Fund (2) |
| 1290 GAMCO Small/Mid Cap Value Fund (1) | | 1290 Retirement 2040 Fund (2) |
| 1290 Global Talents Fund (1) | | 1290 Retirement 2045 Fund (2) |
| 1290 High Yield Bond Fund (1) | | 1290 Retirement 2050 Fund (2) |
| 1290 Low Volatility Global Equity Fund (2) | | 1290 Retirement 2055 Fund (2) |
| 1290 Multi-Alternative Strategies Fund (1) | | 1290 Retirement 2060 Fund (2) |
| 1290 Retirement 2020 Fund (2) | | 1290 SmartBeta Equity Fund (1) |
| | (1) | Statement of operations for the year ended October 31, 2018 and statement of changes in net assets for each of the two years in the period ended October 31, 2018 |
| | (2) | Statement of operations for the year ended October 31, 2018 and statement of changes in net assets for the year ended October 31, 2018 and for the period February 27, 2017 (commencement of operations) through October 31, 2017 |
Basis for Opinions
These financial statements are the responsibility of the Funds’ management. Our responsibility is to express an opinion on the Funds’ financial statements based on our audits. We are a public accounting firm registered with the Public Company Accounting Oversight Board (United States) (“PCAOB”) and are required to be independent with respect to the Funds in accordance with the U.S. federal securities laws and the applicable rules and regulations of the Securities and Exchange Commission and the PCAOB.
We conducted our audits of these financial statements in accordance with the standards of the PCAOB. Those standards require that we plan and perform the audit to obtain reasonable assurance about whether the financial statements are free of material misstatement, whether due to error or fraud.
Our audits included performing procedures to assess the risks of material misstatement of the financial statements, whether due to error or fraud, and performing procedures that respond to those risks. Such procedures included examining, on a test basis, evidence regarding the amounts and disclosures in the financial statements. Our audits also included evaluating the accounting principles used and significant estimates made by management, as well as evaluating the overall presentation of the financial statements. Our procedures included confirmation of securities owned as of October 31, 2018 by correspondence with the custodian, transfer agents and brokers; when replies were not received from brokers, we performed other auditing procedures. We believe that our audits provide a reasonable basis for our opinions.
PricewaterhouseCoopers LLP
New York, New York
December 14, 2018
We have served as the auditor of one or more investment companies in the AXA FMG LLC — advised mutual fund complex since 1997.
195
1290 FUNDS
DISCLOSURE REGARDING ADVISORY CONTRACT APPROVALS
APPROVALS OF INVESTMENT ADVISORY AND INVESTMENT SUB-ADVISORY AGREEMENTS DURING THE SIX-MONTH PERIOD ENDED OCTOBER 31, 2018 (UNAUDITED)
At a meeting held on July 10-12, 2018, the Board of Trustees (the “Board”) of 1290 Funds (the “Trust”), including those Trustees who are not parties to any Agreement (as defined below) or “interested persons” (as that term is defined in the Investment Company Act of 1940, as amended (the “1940 Act”)) of such parties or the Trust (the “Independent Trustees”), considered and unanimously approved the renewal of the Investment Advisory Agreement (the “Advisory Agreement”) between the Trust and AXA Equitable Funds Management Group, LLC (d/b/a 1290 Asset Managers®) (“1290 Asset Managers” or the “Adviser”) and, as applicable, the renewal of the Investment Sub-Advisory Agreement (each, a “Sub-Advisory Agreement” and together with the Advisory Agreement, the “Agreements”) between the Adviser and each investment sub-adviser (each, a “Sub-Adviser” and together, the “Sub-Advisers”), as shown in the table below with respect to the Funds listed, for an additional one-year term.
| | |
Funds | | Agreement(s) Renewed by the Trust’s Board
with respect to the Funds |
1290 Low Volatility Global Equity Fund 1290 Multi-Alternative Strategies Fund | | Advisory Agreement with 1290 Asset Managers |
| |
1290 Retirement 2020 Fund 1290 Retirement 2025 Fund 1290 Retirement 2030 Fund 1290 Retirement 2035 Fund 1290 Retirement 2040 Fund 1290 Retirement 2045 Fund 1290 Retirement 2050 Fund 1290 Retirement 2055 Fund 1290 Retirement 2060 Fund (collectively, the “1290 Retirement Funds”) | | |
| |
1290 Convertible Securities Fund | | Advisory Agreement with 1290 Asset Managers Sub-Advisory Agreement with Palisade Capital Management LLC* |
| |
1290 Diversified Bond Fund (formerly 1290 Unconstrained Bond Managers Fund) | | Advisory Agreement with 1290 Asset Managers |
| |
1290 DoubleLine Dynamic Allocation Fund | | Advisory Agreement with 1290 Asset Managers Sub-Advisory Agreement with DoubleLine Capital LP and DoubleLine Equity LP* |
| |
1290 GAMCO Small/Mid Cap Value Fund | | Advisory Agreement with 1290 Asset Managers Sub-Advisory Agreement with GAMCO Asset Management, Inc.* |
| |
1290 Global Talents Fund | | Advisory Agreement with 1290 Asset Managers Sub-Advisory Agreement with AXA Investment Managers Inc. (“AXA IM”) |
| |
1290 High Yield Bond Fund | | Advisory Agreement with 1290 Asset Managers Sub-Advisory Agreement with AXA IM |
| |
1290 SmartBeta Equity Fund | | Advisory Agreement with 1290 Asset Managers Sub-Advisory Agreement with AXA Rosenberg Investment Management LLC (“AXA Rosenberg”) |
| * | New form of Sub-Advisory Agreement, as discussed below. |
196
In reaching its decision to renew the Agreement(s) with respect to each Fund, the Board considered the overall fairness of the Agreement and whether the Agreement was in the best interests of the Fund and its shareholders. The Board further considered all factors it deemed relevant with respect to each Fund, including: (1) the nature, quality and extent of the overall services to be provided to the Fund by the Adviser, the relevant Sub-Adviser and, where applicable, their respective affiliates, including the investment performance of the Fund; (2) the level of the Fund’s advisory fee and, where applicable, sub-advisory fee, and the Fund’s expense ratios relative to those of peer funds; (3) the costs of the services to be provided by, and the profits to be realized by, the Adviser and its affiliates from their relationships with the Fund; (4) the anticipated effect of growth and size on the Fund’s performance and expenses, including any potential economies of scale and, if so, whether any such economies of scale are equitably shared with shareholders; and (5) “fall-out” benefits that may accrue to the Adviser, the relevant Sub-Adviser and their respective affiliates (i.e., indirect benefits that they would not receive but for the existence of the Funds). In considering each Agreement, the Board did not identify any single factor or information as all-important or controlling, and each Trustee may have attributed different weight to each factor.
In connection with its deliberations, the Board took into account information (both written and oral) provided to the Board, including its various committees, throughout the year, as well as information provided specifically in connection with the annual renewal process. The Trustees also recognized that the fee arrangements for the Funds are in many cases the result of review and discussion between the Trustees and the Adviser in prior years and that their conclusions may be based, in part, on their consideration of these same arrangements in prior years.
Information provided and discussed throughout the year included investment performance reports and related financial and general market outlook information for each Fund, as well as periodic reports on, among other matters, brokerage allocation and execution; pricing and valuation; legal and compliance matters; shareholder and other services and support provided to the Funds by the Adviser, the relevant Sub-Adviser and their respective affiliates; actual and potential conflicts of interest that could impact the business operations of the Adviser and the Trust or affect the Adviser’s recommendations about Sub-Advisers; sales and marketing activity; risk management; and fixed income liquidity stress testing. In addition, the sub-groups of the Board’s Investment Committee, comprised of Independent Trustees, management representatives, and outside legal counsel, met in person and engaged in extensive discussions with Sub-Advisers during presentations made at routine quarterly Investment Committee meetings during the year.
Information provided and discussed specifically in connection with the annual renewal process included an extensive report prepared by Broadridge Financial Solutions Inc. (“Broadridge”), an independent provider of mutual fund industry data, as well as additional substantial material prepared by management. Broadridge provided its report directly to the Independent Trustees and included in its report comparative fee, expense, and investment performance information for each Fund. The materials provided by Broadridge in connection with the July 2018 annual renewal process reflected certain enhancements to the presentation and format of the materials provided by Broadridge in connection with the July 2017 annual renewal process. The enhancements were based on a review of the materials by the Independent Trustees, in consultation with their independent legal counsel, intended to ensure that the Independent Trustees continue to receive comparative fee, expense, and investment performance information in a format that enhances their review of the Funds’ investment advisory arrangements. The materials provided by Broadridge in connection with the 2017 annual renewal process had included additional and updated information requested by the Independent Trustees, in consultation with their independent legal counsel, following an extensive review of the materials provided by Broadridge (and its predecessor) in connection with prior meetings at which the Board had considered the annual renewal of investment advisory arrangements. The additional material prepared by management generally included Fund-by-Fund information showing each Fund’s average net assets; advisory fees and, where applicable, sub-advisory fees; expense ratios; expense limitation arrangements; investment performance (in addition to the performance information prepared by Broadridge); and profitability information, including information regarding the profitability of the Adviser’s operations on an overall Trust basis, as well as on a Fund-by-Fund basis. In addition, for each Fund, the Adviser and the relevant Sub-Adviser provided separate materials describing the Fund’s investment performance over various time periods and the services provided and the fees charged with respect to the Fund, and discussing whether the Fund had performed as expected over time and other matters.
197
The Independent Trustees met in advance of the meeting at which the Board approved the renewal of the Agreements to review the information provided and communicated follow-up questions for management to address at the renewal meeting. The Independent Trustees also met in executive sessions during the meeting to discuss the Agreements and the information provided. When invited, management representatives attended portions of the executive sessions to review and discuss matters relating to the Agreements and to provide additional information requested by the Independent Trustees. At the meeting and during the portions of the executive sessions attended by management, the Independent Trustees and management engaged in extensive discussions and negotiations regarding the Agreements. As noted below, as a result of these extensive discussions and negotiations, the Adviser agreed to implement lower, voluntary expense limitations for certain of the Funds. The Independent Trustees were assisted by independent legal counsel prior to and during the meeting and during their deliberations regarding the Agreements and also received from counsel materials addressing, among other things, the legal standards applicable to their consideration of the Agreements. In addition, the Independent Trustees reviewed information and met during the year to discuss information relevant to their annual consideration of the Agreements.
The Board also noted that the Trust is an affiliated investment company of EQ Advisors Trust and AXA Premier VIP Trust, which are also managed by the Adviser, and that all of the Board members also currently serve on the Boards of Trustees of EQ Advisors Trust and AXA Premier VIP Trust. The Board also noted that each Sub-Adviser currently serves as investment sub-adviser for one or more portfolios, or allocated portion(s) of portfolio(s), of EQ Advisors Trust (such Sub-Advisers together, the “EQAT Sub-Advisers”). The Trustees took into account information relating to the Adviser and the EQAT Sub-Advisers provided to the Trustees, in their capacities as Trustees of EQ Advisors Trust, at prior meetings of the Board of Trustees of EQ Advisors Trust, and the Trustees noted their experience and familiarity with the Adviser, the EQAT Sub-Advisers, and the portfolios of EQ Advisors Trust and AXA Premier VIP Trust gained from their service on the Boards of Trustees of EQ Advisors Trust, AXA Premier VIP Trust, and the Trust.
Although the Board approved the renewal of the Agreements for all of the Funds at the same Board meeting, the Board considered each Fund separately. In approving the renewal of the relevant Agreement(s) with respect to each Fund, each Trustee, including the Independent Trustees, on the basis of their business judgment after review of the information provided, determined that the advisory fee and, where applicable, sub-advisory fee were fair and reasonable and that the renewal of the Agreement(s) was in the best interests of the applicable Fund and its shareholders. Although the Board gave attention to all information provided, the following discusses some of the primary factors that the Board deemed relevant to its decision to renew the Agreements.
Nature, Quality and Extent of Services
The Board evaluated the nature, quality and extent of the overall services to be provided to each Fund and its shareholders by the Adviser, the relevant Sub-Adviser and, where applicable, their respective affiliates. In addition to the investment performance and expense information discussed below, the Board considered the Adviser’s and each relevant Sub-Adviser’s responsibilities with respect to each Fund and the Adviser’s and each relevant Sub-Adviser’s experience in serving as an investment adviser for the Fund(s) and for portfolios and accounts similar to the Fund(s) each advises, including, as applicable, portfolios or allocated portion(s) of portfolio(s) of EQ Advisors Trust and AXA Premier VIP Trust.
With respect to the Adviser, the Board considered that the Adviser is responsible for, among other things, developing investment strategies for the Funds (and the portions thereof); researching, selecting and hiring Sub-Advisers, conducting ongoing “due diligence” on and monitoring Sub-Advisers, and, when necessary or advisable, terminating or replacing Sub-Advisers; allocating and rebalancing Fund assets among Sub-Advisers; overseeing the selection of investments for the Funds (or the portions thereof) that the Sub-Advisers sub-advise; making investment decisions for the Funds (or the portions thereof) that it manages directly; monitoring and evaluating the performance of the Funds (or the portions thereof); monitoring the investment operations and composition of the Funds (or the portions thereof) and, in connection therewith, monitoring compliance with the Funds’ investment objectives, policies and restrictions, as well as the Funds’ compliance with applicable law and the Trust’s compliance policies and procedures; monitoring brokerage selection, commission and other trading costs, quality of execution, and other brokerage matters; coordinating and managing the flow of information and communications relating to the Funds among the Sub-Advisers and other applicable parties; coordinating responses to regulatory agency inquiries relating to the operations of the
198
Trust and coordinating litigation matters involving the Adviser and the Trust; and implementing Board directives as they relate to the Funds. The Board also considered information regarding the Adviser’s process for selecting and monitoring the Sub-Advisers and the other service providers to the Funds and its process for making investment decisions for the Funds (or the portions thereof) that it manages directly, as well as information regarding the qualifications and experience of, and resources available to, the personnel who perform those functions with respect to the Funds. The Board further considered that the Adviser also provides the Trust with personnel, including Trust officers, in connection with carrying out its responsibilities and is responsible for coordinating the development of new initiatives and evaluating the impact of proposed products and services on the Trust and its assets. The Board also considered that the Adviser has assumed significant entrepreneurial risk in sponsoring the Funds and that the Adviser also bears and assumes significant ongoing risks, including investment, operational, enterprise, litigation, regulatory and compliance risks, with respect to the Funds. The Board considered that the Adviser’s responsibilities include daily monitoring of investment, operational, enterprise, litigation, regulatory and compliance risks as they relate to the Funds. The Board also considered information regarding, and met regularly with the Trust’s Director of Risk to discuss, the Adviser’s ongoing risk management activities and reporting. The Board’s conclusion regarding the nature, quality and extent of the overall services to be provided by the Adviser also was based, in part, on the Trustees’ experience and familiarity, in their capacities as Trustees of EQ Advisors Trust and AXA Premier VIP Trust, with the Adviser serving as the investment manager for portfolios of EQ Advisors Trust and AXA Premier VIP Trust, and on periodic reports provided to the Trustees, in their capacities as Trustees of EQ Advisors Trust and AXA Premier VIP Trust, regarding the services provided by the Adviser to those other portfolios.
With respect to the Sub-Advisers, the Board considered that each Sub-Adviser, subject to the oversight of the Adviser, is responsible for making investment decisions for the Fund(s) (or the portion(s) thereof) that it sub-advises; placing with brokers or dealers orders for the purchase and sale of investments for the Fund(s) (or the portion(s) thereof) that it sub-advises; and performing certain related administrative functions. The Board also reviewed information regarding each Sub-Adviser’s process for selecting investments for the Fund(s) (or the portion(s) thereof) that it sub-advises, as well as information regarding the qualifications and experience of the Sub-Adviser’s portfolio managers who provide services to the Fund(s). The Board also considered information regarding each Sub-Adviser’s procedures for executing portfolio transactions for the Fund(s) (or the portion(s) thereof) that it sub-advises and procedures for selecting brokers and dealers and, where applicable, obtaining research from those brokers and dealers. The Board’s conclusion regarding the nature, quality and extent of the overall services to be provided by each EQAT Sub-Adviser also was based, in part, on the Trustees’ experience and familiarity, in their capacities as Trustees of EQ Advisors Trust, with the EQAT Sub-Adviser serving as an investment sub-adviser for one or more portfolios, or allocated portion(s) of portfolio(s), of EQ Advisors Trust, and on periodic reports provided to the Trustees, in their capacities as Trustees of EQ Advisors Trust, regarding the services provided by the EQAT Sub-Adviser to those other portfolios.
The Board also considered, among other factors, periodic reports provided to the Board regarding the services provided by the Adviser, the Sub-Advisers and, where applicable, their affiliates. In addition, the Board considered the allocation of Fund brokerage, including allocations to broker-dealers affiliated with the Adviser or a Sub-Adviser. The Board also considered the use of “soft” commission dollars to pay for research services, as applicable. In this regard, the Board also considered the Adviser’s and each Sub-Adviser’s trading experience and received information regarding how the Adviser and each Sub-Adviser seek to achieve “best execution” on behalf of a Fund, including a report by an independent portfolio trading analytical firm. The Board also considered the Trust’s Chief Compliance Officer’s evaluation of the Adviser’s and each Sub-Adviser’s compliance programs, policies and procedures, including those relating to cybersecurity, and any compliance matters involving the Adviser and any applicable Sub-Adviser that had been brought to the Board’s attention during the year. The Board members also factored into their review their experience and familiarity, in their capacities as Trustees of EQ Advisors Trust, with the Adviser’s and each EQAT Sub-Adviser’s compliance programs, policies, and procedures with respect to EQ Advisors Trust. In addition, the Board considered whether there were any pending lawsuits, enforcement proceedings or regulatory investigations involving the Adviser and the Sub-Advisers and reviewed information regarding the Adviser’s and each Sub-Adviser’s financial condition and history of operations and potential conflicts of interest in managing the Funds. In addition to periodic reports throughout the year, the Independent Trustees received information about business relationships that the Adviser and/or its affiliates, including AXA Equitable Life
199
Insurance Company, have with Sub-Advisers and/or their affiliates in addition to the relationships involving the Funds. In this regard, the Board also received materials regarding the policies and procedures adopted by the Adviser and the Trust to identify and mitigate actual and potential conflicts of interest, including conflicts that may arise in connection with those additional business relationships.
The Board also considered the benefits to shareholders from participation in a Fund sponsored by the Adviser, including the Adviser’s experience operating a large fund complex that offers a wide range of portfolios, sub-advisers and investment styles. The Board likewise considered that shareholders have chosen to invest in mutual funds sponsored by the Adviser. In addition, the Board considered the nature, quality and extent of the administrative, shareholder servicing and distribution support services that the Adviser and its affiliates provide to the Funds and their shareholders. The Board also noted that, throughout the past year, the Adviser and its affiliates had continued or undertaken initiatives intended to enhance various aspects of the Trust’s and the Board’s operations and shareholders’ experience with the mutual funds sponsored by the Adviser. The Board noted that, effective October 1, 2017, the Board had appointed the Lead Independent Trustee to serve as Chairman of the Board. The Board also noted that it had retained, effective September 1, 2018, two consultants to the Board who would be proposed for election as Independent Trustees later in 2018.
The Board also considered strategic and other actions taken by the Adviser in response to recent events within the mutual fund industry, including actions taken in response to regulatory initiatives, as well as other significant judicial and legislative developments affecting the mutual fund industry. The Board also considered strategic and other actions taken by the Adviser and the Sub-Advisers in response to recent market conditions and considered the overall performance of the Adviser and the Sub-Advisers in this context. In this regard, among other things, the Board also requested and received throughout the past year information from the Adviser and various service providers on various topics impacting all mutual funds, including pricing and valuation of portfolio securities; liquidity risk management; cybersecurity; new reporting and disclosure requirements for mutual funds; and auditor independence. The Board noted that certain of these topics may present significant challenges for mutual funds and result in an increase in the responsibilities of mutual fund service providers, including the Adviser.
The Board also considered that the Adviser had presented a new form of Sub-Advisory Agreement with three Sub-Advisers that are not affiliates of the Adviser. (These Sub-Advisory Agreements are indicated with an asterisk symbol (*) in the table above.) The Board noted that the new form of Sub-Advisory Agreement contains certain updated provisions that differ from the existing Sub-Advisory Agreements and that are part of the Adviser’s effort to update and standardize the terms of the investment sub-advisory agreements across the fund complex. The Board received from the Adviser a summary of substantive updates, as well as certain other changes, that were incorporated into the new form of Sub-Advisory Agreement. In this regard, the Board noted that, among other updates, the new form of Sub-Advisory Agreement includes a more detailed description of the Adviser’s responsibilities (or duties) with respect to a sub-advised Fund, including the duties for which the Adviser remains responsible in connection with the delegation of certain of its duties to a Sub-Adviser. The Board noted that there was no change to the services provided to a Fund, and no change to the sub-advisory fee paid by the Adviser to the relevant unaffiliated Sub-Adviser, under the new form of Sub-Advisory Agreement. The Board further noted that the Adviser had not presented a new form of Sub-Advisory Agreement with the Sub-Advisers that are affiliates of the Adviser (i.e., AXA IM and AXA Rosenberg) because the updates may be deemed to require the approval of not only the Board but also the relevant Funds’ shareholders.1
The Board also received from the Adviser a detailed update on matters that had been discussed at prior Board meetings regarding the potential impact on the Funds, and on the Adviser and its affiliates providing services to the Funds, of the announcement by AXA S.A. (“AXA”), the Adviser’s ultimate parent company, of its intention to sell its remaining ownership interest in its U.S. subsidiary, AXA Equitable Holdings, Inc. (“AEH”) — and, indirectly, the Adviser — through a series of sales of AEH’s common stock (the “Sell-Down Plan”) over time. Prior to the July 10-12, 2018 meeting, the Independent Trustees, through their independent legal counsel, provided to the Adviser a list of substantive follow-up inquiries relating
| 1 | The Adviser has received from the Securities and Exchange Commission an exemptive order that permits it, subject to the Board’s approval, to hire, terminate and replace sub-advisers and to amend investment sub-advisory agreements without obtaining shareholder approval. However, the Adviser may not enter into an investment sub-advisory agreement with an “affiliated person” (as that term is defined in the 1940 Act) unless the investment sub-advisory agreement with the affiliated sub-adviser, including compensation, is also approved by the affected Fund’s shareholders. |
200
specifically to the Sell-Down Plan and its potential impact on the Funds and the Trust’s service providers. The Adviser provided responses to the Independent Trustees’ inquiries orally and in a related presentation to the Board at the July 10-12, 2018 meeting. The Board considered the expected impact, if any, of the Sell-Down Plan on the operations, facilities, organization and personnel of the Adviser and the relevant Sub-Advisers; the ability of the Adviser and each Sub-Adviser to perform its duties after the Sell-Down Plan, including any changes to the level or quality of services provided to the respective Funds; the potential implications of any additional regulatory requirements imposed on the Adviser or the relevant Sub-Advisers or Funds following the Sell-Down Plan; and any anticipated changes to the investment and other practices of the Funds. In this regard, the Independent Trustees requested and received assurances that the Adviser and its affiliates: (1) are committed to maintaining appropriate levels of overall staffing, ongoing resources, and service quality; and (2) throughout the time period during which the Sell-Down Plan is implemented, will keep the Board apprised regarding material developments with respect to these matters. The Board considered that such services include, but are not limited to, portfolio management services, administrative services, and regulatory compliance services. The Board considered representations by the Adviser and its affiliates that their separation from AXA as contemplated by the Sell-Down Plan will not lead to a reduction in the quality or scope of these and other services provided by those firms to the Funds.
In connection with the discussion, the Board noted that the Adviser anticipates that one or more of the transactions contemplated by the Sell-Down Plan may cause an “assignment” (as that term is defined in the 1940 Act) of the Agreements with respect to the Funds, which would result in the automatic termination of the Agreements under the 1940 Act. The Board further noted that the Adviser intended to present for the Board’s consideration and approval at a meeting to be held on August 22, 2018, new investment advisory and investment sub-advisory agreements with respect to the Funds, as well as certain related actions, to ensure the continuation of services to the Funds, without interruption, as consummation of the Sell-Down Plan proceeds.2 In this regard, the Board noted that the Adviser intended to present (i) a new form of investment advisory agreement with the Trust, as well as a new form of investment sub-advisory agreement (as discussed above) with the affiliated Sub-Advisers, all of which agreements would also be subject to the approval of the affected Funds’ shareholders at a special shareholder meeting proposed to be held later in 2018, and (ii) a new form of investment sub-advisory agreement (as discussed above) with those unaffiliated Sub-Advisers for which the Adviser had not presented a new form of agreement at the July 10-12, 2018 meeting.
For purposes of evaluating the nature, quality and extent of the overall services provided to each Fund, the Board also took into account discussions with the Adviser and the relevant Sub-Adviser about Fund investment performance that occur at Board meetings throughout the year. In this regard, the Board noted that, as part of regularly scheduled Fund reviews and other detailed reports to the Board on Fund performance, the Board periodically considered information regarding each Fund’s performance over various time periods on both an absolute basis and relative to an appropriate broad-based securities market index (“benchmark”) and/or a custom blended index developed by the Adviser that comprises broad-based indexes (“blended benchmark”) and a peer group of other mutual funds deemed by Broadridge to be comparable to the Fund (“peer group”). The performance information generally included, among other information, annual total returns, average annual total returns, cumulative returns and/or rolling period total returns. The Board also considered certain information, reflected in Appendix A, provided to the Board regarding each Fund’s performance relative to a benchmark and/or a blended benchmark and a peer group for the one-year, three-year (as applicable) and since inception periods ended March 31, 2018. The Board noted that this information supplemented other performance information provided to the Board throughout the year and in connection with the annual renewal process. The Board also considered information, provided directly to the Board by Broadridge, regarding each Fund’s performance over various time periods relative to a benchmark and/or a blended benchmark and peer groups. The Board also took note of the relatively small size of each Fund and the likely impact that a Fund’s size has on its relative expenses and performance.
The Board also factored into its evaluation of each Fund’s performance the limitations inherent in Broadridge’s methodology for developing and constructing peer groups and determining, from year to year,
| 2 | A discussion of the process followed by the Board in its approval of these new investment advisory and investment sub-advisory agreements on August 22, 2018, including the information reviewed, certain material factors considered, and certain related conclusions reached, is provided elsewhere in this shareholder report. |
201
which mutual funds should be included in which peer groups, among other things. The Board also noted that the number of mutual funds included in a peer group may differ significantly from peer group to peer group and from year to year and that the constituent mutual funds included in a peer group also may differ from year to year, which, among other factors, can limit the relevance of the comparisons. While recognizing these inherent limitations, the Board believed the independent analysis conducted by Broadridge provided a useful measure of comparative performance.
In evaluating the Funds’ performance, the Board also took into account factors including general market conditions (including the amount of volatility in the market over the past year); the “style” in which the Funds are managed, as applicable, and whether that style is in or out of favor in the market; issuer-specific information; and fund cash flows. In this regard, the Board also noted how changes in time periods for performance calculations (e.g., whether a one-year period is from December to December or March to March) can significantly impact a Fund’s returns and peer ranking on a relative basis. The Board also considered that variations in performance among a Fund’s operating classes reflect variations in class expenses, which result in lower performance for higher expense classes.
With respect to the performance of the 1290 Low Volatility Global Equity Fund, the 1290 Multi-Alternative Strategies Fund, and each of the 1290 Retirement Funds, the Board considered that each Fund operates as a fund-of-funds and invests in exchange traded securities of other investment companies or investment vehicles (“ETFs”) and recognized, therefore, that each Fund’s performance is based, in part, on the total returns of the ETFs in which it invests. The Board also noted that the 1290 Multi-Alternative Strategies Fund had commenced operations on July 6, 2015, and the 1290 Low Volatility Global Equity Fund and each of the 1290 Retirement Funds had commenced operations on February 27, 2017, so each Fund had only a short operating history on which to evaluate performance.
With respect to the performance of the 1290 Convertible Securities, 1290 DoubleLine Dynamic Allocation, 1290 GAMCO Small/Mid Cap Value, 1290 Global Talents, 1290 High Yield Bond, and 1290 SmartBeta Equity Funds, the Board considered that each Fund is actively managed and advised by a single Sub-Adviser. The Board also noted that the 1290 GAMCO Small/Mid Cap Value, 1290 High Yield Bond, and 1290 SmartBeta Equity Funds had commenced operations on November 12, 2014, the 1290 Convertible Securities Fund had commenced operations on July 6, 2015, the 1290 DoubleLine Dynamic Allocation Fund had commenced operations on March 7, 2016, and the 1290 Global Talents Fund had commenced operations on April 11, 2016, so each Fund had only a short operating history on which to evaluate performance. The Board also noted that, prior to January 1, 2018, the 1290 SmartBeta Equity Fund did not integrate Environmental, Social and Governance filters into its portfolio construction process.
The Board also noted that, in connection with a restructuring of the 1290 Diversified Bond Fund on or about June 15, 2018, the Fund had replaced its two former sub-advisers with a new sub-adviser; changed its investment objective, policies and strategy, performance benchmark, and name; and changed its fee and expense structure. Furthermore, the Board noted that the performance information that had been provided to the Board, including the most recent performance information for the one-year and since inception periods ended March 31, 2018, was that of the Fund prior to its restructuring. The Board did not consider that prior performance as a significant factor in approving the renewal of the Fund’s Advisory Agreement.
For each Fund with at least three years of operating history as of March 31, 2018, the Board and the Adviser discussed the performance of the Fund in detail, including whether the Fund had performed as expected over time. The Board and the Adviser also discussed, where applicable, the reasons for a Fund’s underperformance for certain periods relative to its peer group and/or benchmark, as applicable, and efforts to improve the Fund’s performance. Where applicable, the Board also considered steps that the Adviser and the relevant Sub-Advisers had taken to address a Fund’s performance. In this regard, the Board noted that performance is only one of the factors that it deems relevant to its consideration of a Fund’s Agreements and that, after considering all relevant factors, it can reach a decision to renew an Agreement notwithstanding a Fund’s underperformance.
Based on its review, the Board determined, with respect to each Fund, that (i) the Fund and its shareholders would benefit from the Adviser’s and, where applicable, the relevant Sub-Adviser’s continued management of the Fund, and (ii) the nature, quality and extent of the overall services provided by the Adviser, the relevant Sub-Adviser and, where applicable, their respective affiliates were appropriate for the Fund in light of its investment objective(s) and, thus, supported a decision to approve the renewal of the Agreement(s).
202
Expenses
The Board considered each Fund’s advisory fee and, where applicable, sub-advisory fee, in light of the nature, quality and extent of the overall services provided by the Adviser and, where applicable, the relevant Sub-Adviser. The Board also reviewed comparative fee and expense information for each Fund provided directly to the Board by Broadridge. The information provided by Broadridge included an analysis of how each Fund’s contractual advisory fee, actual advisory fee, other expense components, and total expense ratio compared with those of peer groups of other mutual funds selected by Broadridge as constituting an appropriate expense comparison for the Fund (a Fund’s “Broadridge category”). For each Fund, Broadridge provided information on the Fund’s contractual advisory fee in comparison with the contractual advisory fee that would have been charged by other funds within a Broadridge category assuming the other funds were similar in size to the Fund, as well as information on the Fund’s actual advisory fee and total expense ratio in comparison with those of other funds within a Broadridge category. The advisory fee analysis includes within such fee any separate administrative fee paid by a fund, including the administrative fee a Fund paid to the Adviser in its capacity as administrator for the Fund. The contractual advisory fee analysis does not take into account any fee reimbursements or waivers, whereas the actual advisory fee analysis does take into account any advisory (including any administrative) fee reimbursements or waivers that benefit a fund. The total expense ratio represents a fund’s total net operating expenses and takes into account any expense reimbursements or fee waivers that benefit a fund. Broadridge provided, and the Board considered, total expense ratio comparisons both including and excluding any 12b-1 or non 12b-1 service fees and, as applicable, fees and expenses of any underlying funds in which a fund invests.
Except for the 1290 Diversified Bond Fund, the Broadridge expense data was based upon historical information taken from each Fund’s audited annual report for the period ended October 31, 2017. For the 1290 Diversified Bond Fund, the Broadridge expense data was based upon the Fund’s new fee and expense structure that went into effect on or about June 15, 2018, in connection with the Fund’s restructuring. Broadridge provided expense data for Class I shares of each Fund. The Board reviewed the expense data for Class I shares as a proxy for all of a Fund’s share classes. In this regard, the Board noted that the expenses for a Fund’s Class I shares are generally lower than the expenses for a Fund’s other share classes and that the expense comparisons may differ for different classes. Fund-specific contractual advisory fee and total expense ratio comparisons are provided below. The total expense ratio comparisons exclude any 12b-1 or non 12b-1 service fees and, except as noted below for the funds-of-funds, fees and expenses of any underlying funds in which a fund invests. The Board also took note of the relatively small size of each Fund and the likely impact that a Fund’s size has on its relative expenses.
The Board factored into its evaluation of each Fund’s fees and expenses the limitations inherent in Broadridge’s methodology for developing and constructing Broadridge categories and for determining, from year to year, which mutual funds should be included in which Broadridge categories, among other things. The Board recognized these inherent limitations and, taking into account commentary and supporting data presented by management, also recognized that comparisons between a Fund and other mutual funds in a Broadridge category may not be particularly relevant, given that in some cases a Fund may exhibit notable differences (for example, in its objective(s) and management techniques) when compared to other mutual funds in a Broadridge category. The Board also noted that the number of mutual funds included in a Broadridge category may be relatively small and may differ significantly from category to category and from year to year and that the constituent mutual funds included in a Broadridge category (as well as their respective advisory/administrative fees and total expense ratios) also may differ from year to year, which can limit the relevance of the comparisons. The Board also noted that there is no standard definition of advisory and administrative services, meaning that different mutual funds may receive different services, rendering fee and expense comparisons more difficult. Nonetheless, the Board believed that the independent analysis conducted by Broadridge assisted the Board in evaluating the reasonableness of each Fund’s advisory fee and total expense ratio. The Board also considered that all fees and expenses of each Fund are explicitly disclosed in Fund offering documents.
The Board also considered 1290 Low Volatility Global Equity Fund’s, 1290 Multi-Alternative Strategies Fund’s, and each 1290 Retirement Fund’s management fee rate relative to the management fee rates of other portfolios managed by the Adviser that, like the Funds, are structured as funds-of-funds, and noted that differences in the level of the fees reflected differences between a Fund and other funds-of-funds managed by the Adviser.
203
1290 Low Volatility Global Equity and 1290 Multi-Alternative Strategies Funds. The Board considered that the contractual advisory fee for each of the 1290 Low Volatility Global Equity and 1290 Multi-Alternative Strategies Funds was below the median for the Fund’s respective Broadridge category. The Board also considered that the total expense ratio for the Class I shares of each of these Funds was below the median for the Fund’s respective Broadridge category. For each of these funds-of-funds, the total expense ratio included the fees and expenses of the underlying funds in which the Fund invests.
1290 Diversified Bond, 1290 Global Talents, and 1290 SmartBeta Equity Funds. The Board considered that the contractual advisory fee for each of the 1290 Diversified Bond, 1290 Global Talents, and 1290 SmartBeta Equity Funds was above (but, in the case of the 1290 SmartBeta Equity Fund, within five basis points of) the median for the Fund’s respective Broadridge category. The Board also considered that the total expense ratio for the Class I shares of each of these Funds was below the median for the Fund’s respective Broadridge category.
1290 Convertible Securities, 1290 DoubleLine Dynamic Allocation, 1290 GAMCO Small/Mid Cap Value, and 1290 High Yield Bond Funds. The Board considered that the contractual advisory fee for each of the 1290 Convertible Securities, 1290 DoubleLine Dynamic Allocation, 1290 GAMCO Small/Mid Cap Value, and 1290 High Yield Bond Funds was above (but, in the case of the 1290 GAMCO Small/Mid Cap Value Fund, within five basis points of) the median for the Fund’s respective Broadridge category. The Board also considered that the total expense ratio for the Class I shares of each of these Funds was above (but, in the case of the 1290 GAMCO Small/Mid Cap Value Fund, within five basis points of) the median for the Fund’s respective Broadridge category.
1290 Retirement Funds. The Board considered that the contractual advisory fee for each of the 1290 Retirement Funds was above the median for the Fund’s respective Broadridge category. The Board also considered that the total expense ratio for the Class I shares of each of these Funds was below the median for the Fund’s respective Broadridge category. For each of these funds-of-funds, the total expense ratio included the fees and expenses of the underlying funds in which the Fund invests.
The Board further considered that the advisory fee rate schedules for all Funds other than the 1290 Retirement Funds include breakpoints that reduce the fee rate as a Fund’s assets increase above certain levels. The Board noted that any such reduction in a Fund’s effective advisory fee would result in corresponding reductions in the Fund’s total expense ratios. In addition, the Board considered that the Adviser had contractually agreed to make payments or waive all or a portion of its management, administrative and other fees so that each Fund’s total expense ratios do not exceed certain levels as set forth in its prospectus. In this regard, the Board also noted that the expense limitation arrangements for each of the 1290 DoubleLine Dynamic Allocation, 1290 GAMCO Small/Mid Cap Value, 1290 Low Volatility Global Equity, and 1290 Multi-Alternative Strategies Funds and each of the 1290 Retirement Funds include the fees and expenses of any underlying funds in which a Fund invests and, thus, such fees and expenses would not cause a Fund’s annual operating expenses to exceed its expense limitation. The Board noted that, as a result of these expense limitation arrangements, each Fund’s actual advisory fee was lower than its contractual advisory fee and was either at or below the median for the Fund’s respective Broadridge category.
The Board also considered that, after extensive discussions and negotiations with the Adviser, the Adviser had agreed, effective October 1, 2018, to implement lower, voluntary expense limitations for the 1290 Convertible Securities, 1290 DoubleLine Dynamic Allocation, and 1290 High Yield Bond Funds.
In addition, with respect to each sub-advised Fund, the Board further considered the relative levels of the sub-advisory fee paid to the relevant Sub-Adviser and the advisory fee retained by the Adviser in light of, among other factors, the services provided to the Fund by the Adviser and the relevant Sub-Adviser, and the information prepared by management regarding the level of profits realized by the Adviser in connection with its operation of the Fund. The Board also considered the sub-advisory fee paid to each Sub-Adviser in light of fees paid by similar portfolios advised by the Sub-Adviser.
Based on its review, the Board determined, with respect to each Fund, that the Adviser’s advisory fee is fair and reasonable, and the Board determined, with respect to each sub-advised Fund, that the Sub-Adviser’s sub-advisory fee is fair and reasonable.
204
Profitability and Costs
The Board also considered the level of profits realized by the Adviser and its affiliates in connection with the operation of each Fund. In this respect, the Board reviewed profitability information setting forth the overall profitability of the Trust to the Adviser and its affiliates, as well as the Adviser’s and its affiliates’ profits in providing management and other services to each of the individual Funds during the 12-month period ended December 31, 2017, which was the most recent fiscal year for the Adviser. The Board also took into account that the Adviser had launched the 1290 Funds retail fund complex in the third quarter of 2014 and, therefore, the Trust and the Funds had a relatively short operating history over which to review profitability information. The Board noted that it would continue periodically to review profitability as the Trust’s and the Funds’ operating histories lengthen.
In reviewing the profitability analysis, attention was given to the methodology the Adviser followed in allocating costs to each Fund. The Board recognized that cost allocation methodologies are inherently subjective and various cost allocation methodologies may each be reasonable while producing different results. In this regard, the Board noted that the Adviser had prepared the profitability analysis using a new cost allocation methodology that the Adviser had developed in an effort to, among other things, enhance transparency and address the fact that the Adviser may be unable to utilize the existing methodology in the near future due to the Sell-Down Plan discussed above. The Board also noted that it had received from the Adviser over the course of several Board meetings multiple presentations regarding the proposed methodology. In addition, the Board noted that, in consultation with and through their independent legal counsel, the Board’s Audit Committee had selected and engaged an outside consultant to conduct an assessment of the proposed cost allocation methodology prior to its being integrated into the Adviser’s profitability analysis in connection with the July 2018 annual renewal process. The Board took into account the consultant’s reported findings that, among other things, the proposed cost allocation methodology of the Adviser includes expense categories that are reasonable and consistent to the services the Adviser provides to the Funds, the expense categories reviewed are consistent with industry practices and related cost allocation methods, and the allocation of those expenses and associated logic for the allocation to management and administration related revenue categories appear reasonable and consistent with observed industry practices and other established standards. The Board also took into account management’s ongoing costs and expenditures in providing and improving services for the Funds, as well as the need to meet additional regulatory and compliance requirements resulting from changes in rules and other regulations and to adapt to other challenges impacting the mutual fund industry. In addition, the Board considered information prepared by management and from third party sources comparing the profitability of the Adviser on an overall basis to the profitability of other publicly held asset managers (including asset managers similar to the Adviser).
In addition, with respect to the sub-advised Funds, the Board also noted that the Board and the Adviser generally are aware of the fees charged by the Sub-Advisers to other clients (this information having been provided to the Board and the Adviser by the Sub-Advisers in conjunction with the proposed renewal of the Sub-Advisory Agreements) and that the Adviser believes that the fees agreed upon with the Sub-Advisers are reasonable in light of the nature, quality and extent of the investment sub-advisory services provided. The Adviser advised the Board that it does not regard Sub-Adviser profitability as meaningful to its evaluation of the Sub-Advisory Agreements. The Board acknowledged the Adviser’s view of Sub-Adviser profitability, noting the Board’s findings as to the reasonableness of the sub-advisory fees and that the fees paid to the Sub-Advisers are the product of negotiations with the Adviser and reflect levels of profitability acceptable to the Adviser and the Sub-Advisers based on the particular circumstances in each case for each of them. The Board further noted that each Sub-Adviser’s fee is paid by the Adviser and not the sub-advised Fund and that many responsibilities related to the advisory function are retained by the Adviser. The Board also noted that the sub-advisory fees paid by the Adviser to AXA IM and AXA Rosenberg, which are affiliates of the Adviser, are considered as possible fall-out benefits.
Based on its consideration of the factors above, the Board determined that the level of profits realized by the Adviser from providing services to each Fund was not excessive in view of the nature, quality and extent of the services provided.
205
Economies of Scale
The Board also considered whether economies of scale or efficiencies are realized by the Adviser as the Funds grow larger and the extent to which this is reflected in the level of management and administrative fees charged. While recognizing that any precise determination is inherently subject to assumptions and subjective assessments, the Board considered that any realized economies of scale or efficiencies may be shared with funds and their shareholders in a variety of ways, including: (i) breakpoints in the advisory fee or other fees so that a fund’s effective fee rate declines as the fund grows in size, (ii) subsidizing a fund’s expenses by making payments or waiving all or a portion of the advisory fee or other fees so that the fund’s total expense ratio does not exceed certain levels, (iii) setting the advisory fee or other fees so that a fund is priced to scale, which assumes that the fund has sufficient assets from inception to operate at a competitive fee rate without any fee waiver or expense reimbursement from the manager, and (iv) reinvestment in, and enhancements to, the services that the manager and its affiliates provide to a fund and its shareholders. The Board noted that the advisory fee rate schedules for all Funds other than the 1290 Retirement Funds include breakpoints that reduce the fee rate as Fund assets increase above certain levels. The Board also noted that the Adviser was subsidizing each Fund’s expenses by making payments or waiving all or a portion of its management, administrative and other fees so that the Fund’s total expense ratios do not exceed certain contractual levels as set forth in its prospectus. In this connection, the Board also considered that, after extensive discussions and negotiations with the Adviser, the Adviser had agreed, effective October 1, 2018, to implement lower, voluntary expense limitations for certain of the Funds, as noted above. In addition, the Board considered that the Adviser shares any realized economies of scale with the Funds in other ways, which may include setting a Fund’s fees so that they are priced to scale. The Board considered that the effect of this pricing strategy is that the Adviser could lose money in the early stages of a Fund’s operation (and bear the risk that the Fund will never become profitable), while shareholders of the Fund receive the benefit of economies of scale that the Adviser expects the Fund will achieve as it grows. The Board further considered that the Adviser shares any realized economies of scale with the Funds through reinvestment in, and enhancements to, the services that the Adviser and its affiliates provide to the Funds and their shareholders, such as hiring additional personnel, providing additional resources in areas relating to management and administration of the Funds, and investing in technology (including cybersecurity improvements).
In addition, the Board noted that the sub-advisory fee schedules for certain Sub-Advisers aggregate the assets managed by the Sub-Adviser in a Fund and in one or more other funds for which the Sub-Adviser serves as investment sub-adviser. The Board also noted that the sub-advisory fee schedules for certain Sub-Advisers include breakpoints that reduce the sub-advisory fee rate as applicable Fund assets under the Sub-Adviser’s management increase above certain levels. In this regard, the Board acknowledged that, at some levels, the breakpoints in a sub-advisory fee rate schedule may result in savings to the Adviser and not to shareholders. The Board also noted that the aggregation of assets may result in the affected Fund(s) reaching a breakpoint sooner than if the sub-advisory fee schedule did not aggregate assets, which also has the potential to benefit the Adviser.
Based on its consideration of the factors above and recognizing that the Funds have relatively short operating histories and relatively low asset levels to date, the Board concluded that there was a reasonable sharing of any realized economies of scale or efficiencies under the management, administrative and sub-advisory fee schedules at the present time.
Fall-Out and Other Benefits
The Board also considered the extent to which fall-out benefits may accrue to the Adviser and its affiliates. In this connection, the Board considered several possible fall-out benefits and other types of benefits, including the following. The Board noted that the Adviser also serves as the administrator for the Funds and receives compensation for acting in this capacity. In addition, the Board recognized that AXA IM and AXA Rosenberg, affiliates of the Adviser, serve as Sub-Advisers to certain of the Funds and receive sub-advisory fees that are paid by the Adviser out of the fees that it earns from those Funds. The Board also noted that AXA Distributors, LLC, also an affiliate of the Adviser, provides distribution support services for the Trust pursuant to an agreement with the Trust’s distributor, ALPS Distributors, Inc. AXA Distributors, LLC may receive from the Funds compensation (which may include payments pursuant to Rule 12b-1 plans with respect to their Class A, Class T (when offered for sale), and Class R shares) for providing shareholder services and selling activities, which could lead to growth in the Trust’s assets and corresponding benefits from
206
such growth, including economies of scale. The Board also recognized that other broker-dealers that are affiliated with the Adviser may sell, and earn sales commissions and/or other compensation with respect to, shares of the Funds. Further, the Board considered that Sanford C. Bernstein & Co., LLC, a registered broker-dealer, is an affiliate of the Adviser and may, from time to time, receive brokerage commissions from the Funds in connection with the purchase and sale of portfolio securities; provided, however, that those transactions, among other things, are consistent with seeking best execution. Based on its review, the Board determined that any “fall-out” benefits and other types of benefits that may accrue to the Adviser are fair and reasonable.
The Board also considered possible fall-out benefits and other types of benefits that may accrue to a Sub-Adviser, including the following. The Board considered that a Sub-Adviser, through its position as a Sub-Adviser to its respective Fund, may engage in soft dollar transactions. In addition, the Board considered that a Sub-Adviser may be affiliated with registered broker-dealers who may, from time to time, receive brokerage commissions from a Fund in connection with the purchase and sale of portfolio securities; provided, however, that those transactions, among other things, are consistent with seeking best execution. In cases where a Sub-Adviser’s affiliate executed a substantial portion of its respective Fund’s trades, the Board also considered the Sub-Adviser’s trading experience and discussed with the Adviser its monitoring of the Sub-Adviser’s brokerage selection, commission and other trading costs, and quality of execution. The Board also noted that certain Sub-Advisers serve or may serve as investment sub-advisers for other funds advised by the Adviser and receive sub-advisory fees with respect to those funds. The Board also recognized that a Sub-Adviser and its affiliates may sell, and earn sales commissions and/or other compensation with respect to, the Funds and other investment products issued by the Adviser or its affiliates. In addition, the Board noted that a Sub-Adviser may benefit from greater exposure in the marketplace with respect to the Sub-Adviser’s investment process and from expanding its level of assets under management, and a Sub-Adviser may derive benefits from its association with the Adviser. Based on its review, the Board determined that any “fall-out” benefits that may accrue to each Sub-Adviser are fair and reasonable.
Appendix A
The Board noted that the following information regarding each Fund’s performance relative to a benchmark and a peer group for the one-year, three-year (as applicable) and since inception periods ended March 31, 2018, supplemented other performance information provided to the Board throughout the year and in connection with the annual renewal process. The performance results may differ from the performance results for more recent periods.
1290 Funds Investment Performance
For the period ended March 31, 2018
| | | | | | | | | | | | | | | | | | | | | | | | | | | | |
| | | | | | 1 Year | | | 3 Year | | | Since Inception | |
| | | Inception
Date | | | Without
Sales
Charge | | | With
Sales
Charge | | | Without
Sales
Charge | | | With
Sales
Charge | | | Without
Sales
Charge | | | With
Sales
Charge | |
1290 GAMCO Small/Mid Cap Value Fund - Class A | | | 11/12/2014 | | | | 7.95 | % | | | 1.98 | % | | | 9.05 | % | | | 7.03 | % | | | 9.44 | % | | | 7.63 | % |
1290 GAMCO Small/Mid Cap Value Fund - Class T | | | 11/12/2014 | | | | 8.19 | | | | 5.46 | | | | 9.31 | | | | 8.38 | | | | 9.71 | | | | 8.88 | |
1290 GAMCO Small/Mid Cap Value Fund - Class I | | | 11/12/2014 | | | | 8.20 | | | | n/a | | | | 9.31 | | | | n/a | | | | 9.72 | | | | n/a | |
1290 GAMCO Small/Mid Cap Value Fund - Class R | | | 11/12/2014 | | | | 7.66 | | | | n/a | | | | 8.78 | | | | n/a | | | | 9.16 | | | | n/a | |
Lipper Small-Cap Core Funds | | | | | | | 9.31 | | | | n/a | | | | 7.24 | | | | n/a | | | | 8.31 | | | | n/a | |
Russell 2500 Value Index | | | | | | | 5.72 | | | | n/a | | | | 7.26 | | | | n/a | | | | 7.57 | | | | n/a | |
| | | | | | | |
1290 Convertible Securities Fund - Class A | | | 07/06/2015 | | | | 9.35 | | | | 4.45 | | | | | | | | | | | | 5.64 | | | | 3.89 | |
1290 Convertible Securities Fund - Class I | | | 07/06/2015 | | | | 9.62 | | | | n/a | | | | | | | | | | | | 5.91 | | | | n/a | |
1290 Convertible Securities Fund - Class R | | | 07/06/2015 | | | | 9.07 | | | | n/a | | | | | | | | | | | | 5.38 | | | | n/a | |
Lipper Convertible Securities Funds | | | | | | | 10.29 | | | | n/a | | | | | | | | | | | | 6.27 | | | | n/a | |
ICE B of A Merrill Lynch US Convertible Index | | | | | | | 10.57 | | | | n/a | | | | | | | | | | | | 7.14 | | | | n/a | |
207
| | | | | | | | | | | | | | | | | | | | | | | | | | | | |
| | | | | | 1 Year | | | 3 Year | | | Since Inception | |
| | | Inception
Date | | | Without
Sales
Charge | | | With
Sales
Charge | | | Without
Sales
Charge | | | With
Sales
Charge | | | Without
Sales
Charge | | | With
Sales
Charge | |
1290 Multi-Alternative Strategies Fund - Class A | | | 07/06/2015 | | | | 1.68 | % | | | (3.87 | ) % | | | | | | | | | | | 1.19 | % | | | (0.87 | ) % |
1290 Multi-Alternative Strategies Fund - Class I | | | 07/06/2015 | | | | 2.02 | | | | n/a | | | | | | | | | | | | 1.46 | | | | n/a | |
1290 Multi-Alternative Strategies Fund - Class R | | | 07/06/2015 | | | | 1.48 | | | | n/a | | | | | | | | | | | | 0.95 | | | | n/a | |
Lipper Alternative Multi-Strategy Funds | | | | | | | 1.65 | | | | n/a | | | | | | | | | | | | 1.03 | | | | n/a | |
ICE B of A Merrill Lynch US 3-Month Treasury Bill Index | | | | | | | 1.11 | | | | n/a | | | | | | | | | | | | 0.58 | | | | n/a | |
| | | | | | | |
1290 Global Talents Fund - Class A | | | 04/11/2016 | | | | 20.04 | | | | 13.48 | | | | | | | | | | | | 15.80 | | | | 12.54 | |
1290 Global Talents Fund - Class I | | | 04/11/2016 | | | | 20.34 | | | | n/a | | | | | | | | | | | | 16.09 | | | | n/a | |
1290 Global Talents Fund - Class R | | | 04/11/2016 | | | | 19.82 | | | | n/a | | | | | | | | | | | | 15.54 | | | | n/a | |
Lipper Global Multi-Cap Growth | | | | | | | 19.69 | | | | n/a | | | | | | | | | | | | 16.58 | | | | n/a | |
MSCI ACWI (Net) Index | | | | | | | 14.85 | | | | n/a | | | | | | | | | | | | 15.74 | | | | n/a | |
| | | | | | | |
1290 Low Volatility Global Equity Fund - Class I | | | 02/27/2017 | | | | 10.58 | | | | n/a | | | | | | | | | | | | 10.70 | | | | n/a | |
Lipper Global Multi-Cap Core | | | | | | | 14.42 | | | | n/a | | | | | | | | | | | | 14.74 | | | | n/a | |
MSCI ACWI Minimum Volatility (Net) Index | | | | | | | 10.65 | | | | n/a | | | | | | | | | | | | 10.34 | | | | n/a | |
MSCI ACWI (Net) Index | | | | | | | 14.85 | | | | n/a | | | | | | | | | | | | 14.66 | | | | n/a | |
| | | | | | | |
1290 SmartBeta Equity Fund - Class A | | | 11/12/2014 | | | | 12.20 | | | | 6.07 | | | | 7.79 | % | | | 5.79 | % | | | 7.48 | | | | 5.71 | |
1290 SmartBeta Equity Fund - Class T | | | 11/12/2014 | | | | 12.44 | | | | 9.66 | | | | 8.05 | | | | 7.15 | | | | 7.75 | | | | 6.94 | |
1290 SmartBeta Equity Fund - Class I | | | 11/12/2014 | | | | 12.44 | | | | n/a | | | | 8.05 | | | | n/a | | | | 7.75 | | | | n/a | |
1290 SmartBeta Equity Fund - Class R | | | 11/12/2014 | | | | 11.84 | | | | n/a | | | | 7.49 | | | | n/a | | | | 7.21 | | | | n/a | |
Lipper Global Large-Cap Core | | | | | | | 13.97 | | | | n/a | | | | 7.19 | | | | n/a | | | | 6.56 | | | | n/a | |
MSCI World (Net) Index | | | | | | | 13.59 | | | | n/a | | | | 7.97 | | | | n/a | | | | 7.72 | | | | n/a | |
| | | | | | | |
1290 High Yield Bond Fund - Class A | | | 11/12/2014 | | | | 3.74 | | | | (0.97 | ) | | | 4.07 | | | | 2.48 | | | | 3.59 | | | | 2.19 | |
1290 High Yield Bond Fund - Class T | | | 11/12/2014 | | | | 3.98 | | | | 1.35 | | | | 4.32 | | | | 3.45 | | | | 3.85 | | | | 3.06 | |
1290 High Yield Bond Fund - Class I | | | 11/12/2014 | | | | 3.98 | | | | n/a | | | | 4.36 | | | | n/a | | | | 3.88 | | | | n/a | |
1290 High Yield Bond Fund - Class R | | | 11/12/2014 | | | | 3.50 | | | | n/a | | | | 3.82 | | | | n/a | | | | 3.35 | | | | n/a | |
Lipper High Yield Funds | | | | | | | 3.25 | | | | n/a | | | | 3.91 | | | | n/a | | | | 3.67 | | | | n/a | |
ICE B of A Merrill Lynch US High Yield Index | | | | | | | 3.69 | | | | n/a | | | | 5.18 | | | | n/a | | | | 4.71 | | | | n/a | |
| | | | | | | |
1290 Diversified Bond Fund - Class A (f/k/a: 1290 Unconstrained Bond Fund) | | | 07/06/2015 | | | | 2.72 | | | | (1.91 | ) | | | | | | | | | | | 2.21 | | | | 0.51 | |
1290 Diversified Bond Fund - Class I (f/k/a: 1290 Unconstrained Bond Fund) | | | 07/06/2015 | | | | 2.96 | | | | n/a | | | | | | | | | | | | 2.47 | | | | n/a | |
1290 Diversified Bond Fund - Class R (f/k/a: 1290 Unconstrained Bond Fund) | | | 07/06/2015 | | | | 2.38 | | | | n/a | | | | | | | | | | | | 1.95 | | | | n/a | |
Lipper Alternative Credit Focus Funds | | | | | | | 2.92 | | | | n/a | | | | | | | | | | | | 2.88 | | | | n/a | |
ICE B of A Merrill Lynch USD 3-Month Deposit Offered Rate Constant Maturity Index | | | | | | | 1.21 | | | | n/a | | | | | | | | | | | | 0.80 | | | | n/a | |
| | | | | | | |
1290 DoubleLine Dynamic Allocation Fund - Class A | | | 03/07/2016 | | | | 4.81 | | | | (0.95 | ) | | | | | | | | | | | 7.54 | | | | 4.64 | |
1290 DoubleLine Dynamic Allocation Fund - Class I | | | 03/07/2016 | | | | 5.07 | | | | n/a | | | | | | | | | | | | 7.82 | | | | n/a | |
1290 DoubleLine Dynamic Allocation Fund - Class R | | | 03/07/2016 | | | | 4.46 | | | | n/a | | | | | | | | | | | | 7.25 | | | | n/a | |
Lipper Mixed-Asset Target Allocation Moderate Funds | | | | | | | 7.56 | | | | n/a | | | | | | | | | | | | 8.62 | | | | n/a | |
60% S&P 500 Index / 40% Bloomberg Barclays U.S. Aggregate Bond Index | | | | | | | 8.81 | | | | n/a | | | | | | | | | | | | 10.44 | | | | n/a | |
| | | | | | | |
1290 Retirement 2020 Fund - Class I | | | 02/27/2017 | | | | 7.46 | | | | n/a | | | | | | | | | | | | 7.03 | | | | n/a | |
Lipper Mixed-Asset Target 2020 Funds | | | | | | | 7.14 | | | | n/a | | | | | | | | | | | | 6.96 | | | | n/a | |
S&P Target Date 2020 Index | | | | | | | 7.80 | | | | n/a | | | | | | | | | | | | 7.41 | | | | n/a | |
208
| | | | | | | | | | | | | | | | | | | | | | | | | | | | |
| | | | | | 1 Year | | | 3 Year | | | Since Inception | |
| | | Inception
Date | | | Without
Sales
Charge | | | With
Sales
Charge | | | Without
Sales
Charge | | | With
Sales
Charge | | | Without
Sales
Charge | | | With
Sales
Charge | |
1290 Retirement 2025 Fund - Class I | | | 02/27/2017 | | | | 8.53 | % | | | n/a | | | | | | | | | | | | 8.11 | % | | | n/a | |
Lipper Mixed-Asset Target 2025 Funds | | | | | | | 8.65 | | | | n/a | | | | | | | | | | | | 8.50 | | | | n/a | |
S&P Target Date 2025 Index | | | | | | | 9.03 | | | | n/a | | | | | | | | | | | | 8.59 | | | | n/a | |
| | | | | | | |
1290 Retirement 2030 Fund - Class I | | | 02/27/2017 | | | | 9.34 | | | | n/a | | | | | | | | | | | | 8.86 | | | | n/a | |
Lipper Mixed-Asset Target 2030 Funds | | | | | | | 10.12 | | | | n/a | | | | | | | | | | | | 9.94 | | | | n/a | |
S&P Target Date 2030 Index | | | | | | | 10.19 | | | | n/a | | | | | | | | | | | | 9.69 | | | | n/a | |
| | | | | | | |
1290 Retirement 2035 Fund - Class I | | | 02/27/2017 | | | | 9.83 | | | | n/a | | | | | | | | | | | | 9.40 | | | | n/a | |
Lipper Mixed-Asset Target 2035 Funds | | | | | | | 11.74 | | | | n/a | | | | | | | | | | | | 11.57 | | | | n/a | |
S&P Target Date 2035 Index | | | | | | | 11.31 | | | | n/a | | | | | | | | | | | | 10.77 | | | | n/a | |
| | | | | | | |
1290 Retirement 2040 Fund - Class I | | | 02/27/2017 | | | | 10.44 | | | | n/a | | | | | | | | | | | | 9.96 | | | | n/a | |
Lipper Mixed-Asset Target 2040 Funds | | | | | | | 12.25 | | | | n/a | | | | | | | | | | | | 12.04 | | | | n/a | |
S&P Target Date 2040 Index | | | | | | | 12.07 | | | | n/a | | | | | | | | | | | | 11.49 | | | | n/a | |
| | | | | | | |
1290 Retirement 2045 Fund - Class I | | | 02/27/2017 | | | | 11.04 | | | | n/a | | | | | | | | | | | | 10.51 | | | | n/a | |
Lipper Mixed-Asset Target 2045 Funds | | | | | | | 13.10 | | | | n/a | | | | | | | | | | | | 12.94 | | | | n/a | |
S&P Target Date 2045 Index | | | | | | | 12.50 | | | | n/a | | | | | | | | | | | | 11.91 | | | | n/a | |
| | | | | | | |
1290 Retirement 2050 Fund - Class I | | | 02/27/2017 | | | | 11.54 | | | | n/a | | | | | | | | | | | | 11.07 | | | | n/a | |
Lipper Mixed-Asset Target 2050 Funds | | | | | | | 12.76 | | | | n/a | | | | | | | | | | | | 12.53 | | | | n/a | |
S&P Target Date 2050 Index | | | | | | | 12.83 | | | | n/a | | | | | | | | | | | | 12.26 | | | | n/a | |
| | | | | | | |
1290 Retirement 2055 Fund - Class I | | | 02/27/2017 | | | | 12.24 | | | | n/a | | | | | | | | | | | | 11.71 | | | | n/a | |
Lipper Mixed-Asset Target 2055+ Funds | | | | | | | 13.57 | | | | n/a | | | | | | | | | | | | 13.40 | | | | n/a | |
S&P Target Date 2055 Index | | | | | | | 13.00 | | | | n/a | | | | | | | | | | | | 12.43 | | | | n/a | |
| | | | | | | |
1290 Retirement 2060 Fund - Class I | | | 02/27/2017 | | | | 12.34 | | | | n/a | | | | | | | | | | | | 11.81 | | | | n/a | |
Lipper Mixed-Asset Target 2055+ Funds | | | | | | | 13.57 | | | | n/a | | | | | | | | | | | | 13.40 | | | | n/a | |
S&P Target Date 2060+ Index | | | | | | | 13.15 | | | | n/a | | | | | | | | | | | | 12.58 | | | | n/a | |
209
1290 FUNDS
DISCLOSURE REGARDING ADVISORY CONTRACT APPROVALS
APPROVALS OF INVESTMENT ADVISORY AND INVESTMENT SUB-ADVISORY AGREEMENTS DURING THE SIX-MONTH PERIOD ENDED OCTOBER 31, 2018 (UNAUDITED)
At an in-person meeting held on August 22, 2018, the Board of Trustees (the “Board”) of 1290 Funds (the “Trust”), including those Trustees who are not parties to any Current Agreement or New Agreement (as defined below) or “interested persons” (as that term is defined in the Investment Company Act of 1940, as amended (the “1940 Act”)) of such parties or the Trust (the “Independent Trustees”), considered and unanimously approved a new Investment Advisory Agreement (the “New Advisory Agreement”) between the Trust and AXA Equitable Funds Management Group, LLC (d/b/a 1290 Asset Managers®) (“1290 Asset Managers” or the “Adviser”) and, as applicable, new Investment Sub-Advisory Agreements (each, a “New Sub-Advisory Agreement” and together with the New Advisory Agreement, the “New Agreements”) between the Adviser and each investment sub-adviser (each, a “Sub-Adviser” and together, the “Sub-Advisers”), as shown in the table below with respect to the Funds listed.
| | |
Funds | | New Agreement(s) Approved by the Trust’s Board
with respect to the Funds |
1290 Low Volatility Global Equity Fund 1290 Multi-Alternative Strategies Fund | | New Advisory Agreement with 1290 Asset Managers* |
| |
1290 Retirement 2020 Fund 1290 Retirement 2025 Fund 1290 Retirement 2030 Fund 1290 Retirement 2035 Fund 1290 Retirement 2040 Fund 1290 Retirement 2045 Fund 1290 Retirement 2050 Fund 1290 Retirement 2055 Fund 1290 Retirement 2060 Fund (collectively, the “1290 Retirement Funds”) | | |
| |
1290 Convertible Securities Fund | | New Advisory Agreement with 1290 Asset Managers* New Sub-Advisory Agreement with Palisade Capital Management LLC |
| |
1290 Diversified Bond Fund (formerly 1290 Unconstrained Bond Managers Fund) | | New Advisory Agreement with 1290 Asset Managers* New Sub-Advisory Agreement with Brandywine Global Investment Management, LLC (“Brandywine”) |
| |
1290 DoubleLine Dynamic Allocation Fund | | New Advisory Agreement with 1290 Asset Managers* New Sub-Advisory Agreement with DoubleLine Capital LP and DoubleLine Equity LP |
| |
1290 GAMCO Small/Mid Cap Value Fund | | New Advisory Agreement with 1290 Asset Managers* New Sub-Advisory Agreement with GAMCO Asset Management, Inc. |
| |
1290 Global Talents Fund | | New Advisory Agreement with 1290 Asset Managers* New Sub-Advisory Agreement with AXA Investment Managers Inc. (“AXA IM”)* |
| |
1290 High Yield Bond Fund | | New Advisory Agreement with 1290 Asset Managers* New Sub-Advisory Agreement with AXA IM* |
| |
1290 SmartBeta Equity Fund | | New Advisory Agreement with 1290 Asset Managers* New Sub-Advisory Agreement with AXA Rosenberg Investment Management LLC (“AXA Rosenberg”)* |
| * | Subject to the approval of the affected Funds’ shareholders. |
210
The Board also determined to recommend that shareholders of each Fund approve the New Advisory Agreement and, as applicable and as required by a certain exemptive order granted to the Adviser, the New Sub-Advisory Agreement(s)1, as discussed below. As of the date of this shareholder report, the Funds’ shareholders have since approved the New Agreements at a special shareholder meeting held on October 25, 2018, and with respect to certain Funds, adjourned to November 1, November 8, November 15, and November 27, 2018.
On May 10, 2017, AXA S.A. (“AXA”) announced its intention to sell a minority stake in its U.S. subsidiary, AXA Equitable Holdings, Inc. (“AEH”), an entity through which AXA owns an indirect interest in the Adviser, via an initial public offering (“IPO”) and listing of AEH’s shares of common stock on the New York Stock Exchange. On November 13, 2017, AEH filed a Form S-1 registration statement with the U.S. Securities and Exchange Commission, confirming the May 2017 announcement. AXA has since announced its intention to sell its remaining ownership interest in AEH — and, indirectly, the Adviser — over time through a series of sales of AEH’s common stock (the “Sell-Down Plan”), subject to market conditions. The Sell-Down Plan also is subject to a lock-up period on sales by AXA of its remaining AEH common stock ending 180 days after the date of AEH’s Form S-1 registration statement filed May 2, 2018.
Section 15(a)(4) of the 1940 Act provides that any investment advisory agreement, including any investment sub-advisory agreement, must terminate automatically upon its “assignment.” As used in the 1940 Act, the term “assignment” includes any transfer of a controlling block of outstanding voting securities of an adviser or the parent company of an adviser. Such a transaction is often referred to as a “Change of Control Event.” The Sell-Down Plan contemplates one or more transactions that are expected to be treated as a direct or indirect “Change of Control Event” for the Adviser, which in turn would result in the automatic termination of the current Investment Advisory Agreement and, as applicable, the current Investment Sub-Advisory Agreements (collectively, the “Current Agreements”) for the Funds. The Board noted that the first of any Change of Control Events is not anticipated to occur prior to November 1, 2018.
In anticipation of the Sell-Down Plan, the Board met at a series of meetings, including meetings of the full Board and meetings of the Independent Trustees separately, commencing in June 2018 and concluding at the Board’s August 22, 2018 meeting, for purposes of, among other things, considering whether it would be in the best interests of each Fund and its shareholders to approve the New Advisory Agreement and, as applicable, the New Sub-Advisory Agreement(s). The decisions by the Board, including a majority of the Independent Trustees, to approve the New Advisory Agreement and, as applicable, the New Sub-Advisory Agreements — and to recommend that shareholders of each affected Fund approve the New Advisory Agreement and, as applicable and as required by the exemptive order granted to the Adviser, the New Sub-Advisory Agreement(s)2, as well as future agreements that may become effective upon certain Change of Control Events in the future — were based on the Board’s determination, acting in the exercise of its business judgment, that it would be in the best interests of the shareholders of each Fund for the Adviser and, as applicable, the Sub-Advisers to continue providing investment advisory, investment sub-advisory, and related services for the Funds, without interruption, as consummation of the Sell-Down Plan proceeds. The Board was aware that the implementation of the Sell-Down Plan may not result immediately in a Change of Control Event, but also recognized that the Sell-Down Plan contemplates a series of transactions that may be deemed to constitute one or more Change of Control Events in the future.
Prior to its approval of the New Agreements, the Board reviewed, among other matters, the nature, quality and extent of the services currently being provided by the Adviser and the Sub-Advisers under the
| 1 | Section 15 of the 1940 Act requires that any investment advisory agreement, including any investment sub-advisory agreement, with respect to a Fund be in writing and be approved initially by both the Board (including a majority of the Independent Trustees) and the Fund’s shareholders. The Adviser has received from the Securities and Exchange Commission an exemptive order that permits it, subject to the Board’s approval, to hire, terminate and replace sub-advisers and to amend investment sub-advisory agreements without obtaining shareholder approval. However, the Adviser may not enter into an investment sub-advisory agreement (e.g., a New Sub-Advisory Agreement) with an “affiliated person” (as that term is defined in the 1940 Act) unless the investment sub-advisory agreement with the affiliated sub-adviser, including compensation, is also approved by the affected Portfolio’s shareholders. AXA IM and AXA Rosenberg are affiliates of the Adviser. The Adviser intends to rely on the exemptive order to enter into New Sub-Advisory Agreements with the unaffiliated Sub-Advisers to the sub-advised Funds. |
| 2 | The Adviser has received from the Securities and Exchange Commission an exemptive order that permits it, subject to the Board’s approval, to hire, terminate and replace sub-advisers and to amend investment sub-advisory agreements without obtaining shareholder approval. However, the Adviser may not enter into an investment sub-advisory agreement with an “affiliated person” (as that term is defined in the 1940 Act) unless the investment sub-advisory agreement with the affiliated sub-adviser, including compensation, is also approved by the affected Fund’s shareholders. AXA IM and AXA Rosenberg are affiliates of the Adviser. |
211
Current Agreements and to be provided under the New Agreements. A substantial portion of this review was conducted as part of, and in conjunction with, the Board’s annual reviews of the Current Agreements, which (with the exception of the one Current Agreement noted below) were most recently approved for continuation at an in-person meeting of the Board held on July 10-12, 2018. During the review process that led to its approval of continuation of the Current Agreements, the Board was aware that it likely would be asked in the very near future to consider approval of the New Agreements. On July 10-12, 2018, the Board concluded, in light of all the factors it considered, that the approval of continuation of the Current Agreements was in the best interests of each Fund and its shareholders and that the fee rates set forth in the Current Agreements were fair and reasonable. The discussion of the process followed by the Board in its approval of the continuation of the Current Agreements on July 10-12, 2018, including the information reviewed, certain material factors considered, and certain related conclusions reached, is provided elsewhere in this shareholder report.
In connection with its approval of the New Agreements on August 22, 2018, the Board considered its conclusions in connection with its July 10-12, 2018 approvals of the Current Agreements that were subject to approval on that date, including the Board’s general satisfaction with the nature and quality of services being provided. The Board considered actions to be taken by the Adviser in connection with the July 10-12, 2018 approvals of the Current Agreements with respect to certain Funds in response to discussions with the Board in connection with those approvals. Also in connection with its August 22, 2018 approvals of the New Agreements, the Board considered a representation made to it on that date by the Adviser that there were no additional developments not already disclosed to the Board since July 10-12, 2018 that would be a material consideration to the Board in connection with its consideration of the New Agreements.
The Board also noted that Section 15(c) of the 1940 Act permits new investment advisory (including investment sub-advisory) agreements to have an initial term of two years from the date of execution and that, therefore, the Current Sub-Advisory Agreement between the Adviser and Brandywine with respect to the 1290 Diversified Bond Fund was not subject to the approval of continuation by the Board on July 10-12, 2018. In determining to approve the New Sub-Advisory Agreement between the Adviser and Brandywine with respect to the 1290 Diversified Bond Fund, the Board considered at its meeting on August 22, 2018 the same factors it reviewed and conclusions it reached in its initial review of the Current Sub-Advisory Agreement and focused its review on the potential impact of the Sell-Down Plan on the New Sub-Advisory Agreement and on these prior factors and conclusions. In this regard, the Board recognized that the Fund’s New Sub-Advisory Agreement is materially similar to its Current Sub-Advisory Agreement, including with respect to the fees payable and services provided thereunder.
In connection with its approval of the Funds’ New Agreements on August 22, 2018, the Board also noted that the Adviser had presented a new form of Sub-Advisory Agreement with the two Sub-Advisers that are affiliates of the Adviser (i.e., AXA IM and AXA Rosenberg), as well as with the unaffiliated Sub-Adviser for which the Adviser did not present a new form of Sub-Advisory Agreement at the Board’s July 10-12, 2018 meeting. The Board noted that the new form of agreement contains certain updated provisions that differ from the Current Sub-Advisory Agreements and that are part of the Adviser’s effort to update and standardize the terms of the investment sub-advisory agreements across the fund complex. The Board noted its familiarity with the new form of Sub-Advisory Agreement, as the Adviser had presented it to the Board at its July 10-12, 2018 meeting in connection with its approval of the continuation of the Current Sub-Advisory Agreements with three of the unaffiliated Sub-Advisers to the sub-advised Funds. In this regard the Board noted that there was no change to the services provided to a Fund, and no change to the sub-advisory fee paid by the Adviser to a relevant Sub-Adviser, under the new form of agreement.
The Board also concluded that approval by shareholders of both the New Agreements and future agreements that may become effective upon certain Change of Control Events in the future will permit the Funds to benefit from the continuation of services by the Adviser and its affiliates throughout the implementation of the Sell-Down Plan without the need for multiple shareholder meetings. Further, the Board concluded that it would be beneficial to the Funds to enter into the New Agreements after shareholder approval is obtained, regardless of whether a Change of Control Event were to occur, because the New Agreements would permit the Funds to operate under investment advisory and investment sub-advisory agreements that contain updated and standardized terms that are no less favorable than the terms of the Funds’ Current Agreements, thus promoting greater uniformity and efficiency across the fund complex. The Board considered the advice provided by legal counsel to the Funds and the Adviser, with
212
respect to the New Agreements, including advice relating to the process and timing of seeking shareholder approval of the New Agreements, and whether shareholder approvals would be required in connection with any future aspects of the Sell-Down Plan. The Board further considered that the Adviser and its affiliates agreed to bear all expenses associated with obtaining shareholder approval of the New Agreements.
In addition to the information it considered in approving the Current Agreements, in considering the New Agreements, the Board focused its review on, and requested and evaluated other information relating to, the potential impact of implementing the Sell-Down Plan on the operations, personnel, organizational structure, capitalization, and financial and other resources of the Adviser and its affiliates that render sub-advisory, administrative, distribution support, compliance, and other services to the Funds. When making its decisions on August 22, 2018, the Board took into account that the Adviser had discussed with the Board at prior Board meetings the potential impacts of the IPO and the Sell-Down Plan on the Funds and on the Adviser and its affiliates providing services to the Trust, and that the Independent Trustees, in consultation with their independent legal counsel, had requested additional information and regular updates from the Adviser specifically relating to the Sell-Down Plan. The Independent Trustees solicited and received from their legal counsel ongoing advice regarding the Board’s legal duties and, with assistance from their counsel, prepared written inquiries to the Adviser regarding the Sell-Down Plan, including details regarding AEH’s anticipated business plan for continuing operations after the implementation of the Sell-Down Plan and the occurrence of potential Change of Control Events. The Board received and evaluated responses from the Adviser and its affiliates pursuant to inquiries made on the Board’s behalf. These evaluations were conducted through meetings of the Independent Trustees (which, upon invitation, included one Board member who is not an Independent Trustee).
At its July 10-12 and August 22, 2018 meetings, the Board engaged in a review and analysis of additional information regarding the proposed Sell-Down Plan and related matters. This analysis focused on, among other matters, the expectations for continuity and stability of AEH and its subsidiaries throughout implementation of the Sell-Down Plan and thereafter. In this connection, the Board considered that the Sell-Down Plan is being implemented as a result of a business plan of AXA, a publicly held French holding company, that the Board generally has been satisfied with the nature and quality of the services provided to the Funds, including investment advisory, administrative, and support services, and that it would be in the Funds’ best interests to maintain continuity and stability of the services currently being provided. The Board carefully considered the Adviser’s anticipated future plans related to capitalization, operational matters, and the retention of current levels of staffing and related compensation structures, as well as the importance of the investment management operations within the AEH business structure going forward.
The Board also considered the anticipated divestiture by AXA of its U.S. subsidiary, AEH, under the Sell-Down Plan, as well as potential advantages of this divestiture to Fund investors (such as the continuity in U.S. asset management activities, continuity of key personnel, opportunities to grow the independent investment management operations and the importance of asset management operations to the future overall success of AEH), as well as potential disadvantages of this divestiture to Fund investors, such as the potential eventual loss of affiliation with the AXA name brand. The Board considered AEH’s anticipated ability to continue to use the “AXA” brand name for its asset management operations for a period of time following the consummation of the Sell-Down Plan, as well as the status of its planning to transition such operations to a new name. The Board further considered, among other matters: (1) the anticipated arrangements between AXA and AEH over the course of the Sell-Down Plan; (2) the anticipated use of potential proceeds of the capital that would be raised through the Form S-1 offering (including that portion of potential proceeds that may be retained by AXA and that portion that may be dedicated to the capitalization and operations of AEH, including its asset management operations); and (3) other information provided by the Adviser and its affiliates.
At its July 10-12 and August 22, 2018 meetings, the Board considered that, if shareholders approve the New Agreements, the Board currently expects to continue to conduct an annual investment advisory contracts review process consistent with the process it would have conducted had the Current Agreements continued in effect and not been replaced by the New Agreements, notwithstanding the two-year initial term set forth in the New Agreements. For example, if the New Agreements are approved by shareholders in 2018, the New Agreements normally would not need to be considered for renewal until 2020. However, the Board currently intends to conduct annual reviews of such contracts during 2019 and 2020, and the Adviser has consented to this process. Thus, the Board noted that it would be able to, and intends to, monitor on a regular basis the ability of the Adviser and its affiliates to comply with their undertakings to the Board and to monitor on an ongoing basis the quality of services to, and expenses of, the Funds.
213
Although the Board gave attention to all information provided, the following further discusses some of the factors that the Board deemed relevant to its decision to approve the New Agreements.
Nature, Quality and Extent of Services
In determining whether to approve the New Agreements for the Funds, the Independent Trustees evaluated the nature, quality and extent of the overall services to be provided to each Fund and its investors by the Adviser, the relevant Sub-Adviser(s) and, where applicable, their respective affiliates. The Board considered the expected impact, if any, of the Sell-Down Plan on the operations, facilities, organization and personnel of the Adviser and the relevant Sub-Advisers; the ability of the Adviser and each Sub-Adviser to perform its duties after the Sell-Down Plan, including any changes to the level or quality of services provided to the respective Funds; the potential implications of any additional regulatory requirements imposed on the Adviser or the relevant Sub-Advisers or Funds following the Sell-Down Plan; and any anticipated changes to the investment and other practices of the Funds. In this regard, the Independent Trustees requested and received assurances that the Adviser and its affiliates: (1) are committed to maintaining appropriate levels of overall staffing, ongoing resources, and service quality; and (2) throughout the time period during which the Sell-Down Plan is implemented, will keep the Board apprised regarding material developments with respect to these matters. The Board considered that such services include, but are not limited to, portfolio management services, administrative services, and regulatory compliance services. The Board considered representations by the Adviser and its affiliates that their separation from AXA as contemplated by the Sell-Down Plan will not lead to a reduction in the quality or scope of these and other services provided by those firms to the Funds. The Board also considered that the importance of the asset management operations to the overall success of AEH, as described by the Form S-1 registration statement filed by AEH, could provide a strong incentive to AEH to provide appropriate resource allocations to support those asset management operations. The Board also considered representations by the Adviser and its affiliates, including senior investment management personnel indicating that: (1) the Adviser, AXA IM, and AXA Rosenberg can be expected to provide services of the same nature, extent, and quality under the New Agreements as are provided thereby under the Current Agreements; and (2) the Sell-Down Plan is not expected to result in any changes to: (i) the management of the Funds, including the continuity of the Funds’ portfolio managers and other personnel responsible for the management operations of the Funds; or (ii) the investment objective of or the principal investment strategies used to manage any of the Funds.
The Board noted that there are no changes in the fees payable and services provided between the Current Agreements and the New Agreements. The Board considered representations by the Adviser and its affiliates, as well as related supporting documentation, indicating that the terms of the New Agreements, including the fees payable thereunder, are substantially similar to and, in any event, are no less favorable to the Funds than, the terms of the corresponding Current Agreements. The Board considered that, to the extent that the New Agreements do have changes, those changes are designed to benefit shareholders and/or to provide management, subject to Board supervision, with greater flexibility to manage the Funds in a manner consistent with stated investment objectives. The Board noted no changes were proposed to the allocation of responsibilities between the Adviser and any Sub-Adviser, and that the sub-advised Funds’ Sub-Advisers will continue to be responsible for day-to-day implementation of an investment program, making investment decisions and placing orders for the purchase and sale of securities, on behalf of the applicable Funds, subject to oversight of the Board and the Adviser.
With respect to the performance of the Funds, the Board considered its prior review, at its July 10-12, 2018 meeting, of peer group and benchmark investment performance comparison data relating to each Fund. The Board considered that the portfolio investment personnel responsible for the management of the respective Funds were expected to continue to manage the Funds following the completion of the Sell-Down Plan, and the investment strategies of the Funds were not expected to change as a result of the Sell-Down Plan. The key personnel who have responsibility for the Funds in each area, including portfolio management, investment oversight, fund management, fund operations, product management, legal/compliance and board support functions, are expected to be the same following the Sell-Down Plan. Notwithstanding the foregoing, the Board recognized that personnel changes may occur in the future in the ordinary course.
Based on their review, the Independent Trustees found that the nature, quality and extent of services to be provided to the Funds under each respective New Agreement were appropriate in light of each Fund’s investment objective and supported approval of the New Agreements.
214
Expenses
The Board considered each Fund’s advisory fee and, where applicable, sub-advisory fee(s), in light of the nature, quality and extent of the overall services provided by the Adviser and, where applicable, the relevant Sub-Adviser(s). With regard to this factor, the Board considered its prior review at its July 10-12, 2018 meeting, including its review of comparative fee and expense information for each Fund provided to the Board by Broadridge Financial Solutions Inc., an independent provider of mutual fund industry data, as well as additional substantial material prepared by management. The Board also considered that the fee schedule, including the breakpoint schedule (as applicable), for each Fund under its New Agreement(s) is identical to that under the corresponding Current Agreement(s). The Board also considered that, after extensive discussions and negotiations with the Adviser at the July 10-12, 2018 meeting, the Adviser had agreed, effective October 1, 2018, to implement lower, voluntary expense limitations for the 1290 Convertible Securities, 1290 DoubleLine Dynamic Allocation, and 1290 High Yield Bond Funds under the Current Agreements, and that such expense limitations would also apply under the New Agreements. The Board noted that the Adviser anticipates complying with the requirements of Section 15(f) of the 1940 Act3 with respect to any transaction under the Sell-Down Plan that is deemed to cause an assignment of the then-effective investment advisory or investment sub-advisory agreement for a Fund. In this regard, the Adviser has represented to the Board that it will use its best efforts to ensure that it and its affiliates will not take any action that imposes an “unfair burden” on the Funds as a result of the transaction or as a result of any express or implied terms, conditions or understandings applicable to the assignment, for so long as the requirements of Section 15(f) apply. Based on its review, the Board determined, with respect to each Fund, that the Adviser’s advisory fee and the Sub-Adviser’s sub-advisory fee, as applicable, under the New Agreements are fair and reasonable.
Profitability and Costs
With regard to this factor, the Board considered its prior review at its July 10-12, 2018 meeting, including its review of, among other things, profitability information setting forth the overall profitability of the Trust to the Adviser and its affiliates, as well as the Adviser’s and its affiliates’ profits in providing management and other services to each of the individual Funds during the 12-month period ended December 31, 2017. The Board recognized that it is difficult to predict with any degree of certainty the impact of the Sell-Down Plan on the Adviser’s profitability. The Board further considered that there were no changes to the advisory, sub-advisory or administration fees to be paid by any Fund as a result of the Sell-Down Plan. The Board concluded that the Adviser’s level of profitability for its advisory activities under the New Agreements would continue to be reasonable in light of the services provided.
Economies of Scale
With regard to this factor, the Board considered its prior review at its July 10-12, 2018 meeting, including its review of, among other things, the advisory and sub-advisory fee schedules, including the breakpoint schedules (as applicable), of the Funds, and noted that those schedules will not change under the New Agreements. The Board also considered that the contractual expense limitation arrangements that are currently in place for the Funds, including the lower, voluntary expense limitation arrangements effective October 1, 2018 for the 1290 Convertible Securities, 1290 DoubleLine Dynamic Allocation, and 1290 High Yield Bond Funds, will not change as a result of the Sell-Down Plan. Based on their review, including the considerations in the annual review of the Current Agreements, the Independent Trustees determined that the advisory and sub-advisory fee schedules, including the breakpoint schedules (as applicable), continue to be appropriate and desirable in ensuring that shareholders participate in the benefits derived from economies of scale under the New Agreements.
| 3 | Section 15(f) generally provides, in pertinent part, that affiliated persons of an adviser may receive any amount or benefit in connection with a sale of securities of, or a sale of any other interest in, such an adviser which results in an assignment of an investment advisory or sub-advisory agreement if, for a period of three years after the time of such a transaction, at least 75% of the members of the board of any investment company which it oversees are not “interested persons” (as defined in the 1940 Act) of the new or old investment adviser; and, if, for a two-year period, there is no “unfair burden” imposed on any such investment company as a result of the transaction or as a result of any express or implied terms, conditions or understandings applicable to the assignment. The Board of the Trust currently satisfies the 75% requirement of Section 15(f). |
215
Fall-Out and Other Benefits
With regard to this factor, the Board considered its prior review at its July 10-12, 2018 meeting, including its review of the possible fall-out benefits and other types of benefits that may accrue to the Adviser and its affiliates or to a Sub-Adviser. The Board noted that as the applicable policies and operations of the Adviser and its affiliates with respect to the Funds, and the applicable policies and operations of the Sub-Advisers with respect to the sub-advised Funds, were not anticipated to change significantly after the Sell-Down Plan, such fall-out benefits were expected to remain after the Sell-Down Plan. Based on its review, the Board determined that any “fall-out” benefits and other types of benefits that may accrue to the Adviser or the Sub-Advisers are fair and reasonable.
Conclusion
Based on the foregoing and other relevant considerations, at a meeting of the Board held on August 22, 2018, the Board, including a majority of the Independent Trustees, acting in the exercise of its business judgment, voted to approve the New Agreements and to recommend approval of the New Agreements by shareholders of the Funds. The Board concluded that, in light of all factors considered, the terms of the New Agreements, including fee rates, were fair and reasonable, and that it would be in the best interests of shareholders of each Fund to approve the New Agreements so as to enable there to be a continuation without interruption of the current services being provided by the current service providers pursuant to the Current Agreements. The Board noted that no one factor was determinative of its decisions which, instead, were premised upon the totality of factors considered. In this connection, the Board also noted that different Board members likely placed emphasis on different factors in reaching their individual conclusions to vote in favor of the New Agreements and to recommend approval of the New Agreements to shareholders.
216
Federal Income Tax Information (Unaudited)
| | | | | | | | | | | | | | | | |
Funds: | | 70% Dividend
Received
Deduction | | | Foreign
Taxes | | | Foreign
Source Income | | | Long Term
Capital Gain | |
1290 Convertible Securities | | | 0.00 | % | | $ | — | | | $ | — | | | $ | 245,075 | |
1290 Diversified Bond | | | 0.00 | | | | — | | | | — | | | | — | |
1290 DoubleLine Dynamic Allocation | | | 13.45 | | | | — | | | | — | | | | 2,764,419 | |
1290 GAMCO Small/Mid Cap Value | | | 100.00 | | | | — | | | | — | | | | 242,379 | |
1290 Global Talents | | | 100.00 | | | | — | | | | — | | | | — | |
1290 High Yield Bond | | | 0.00 | | | | — | | | | — | | | | — | |
1290 Low Volatility Global Equity | | | 22.93 | | | | 2,027 | | | | 30,693 | | | | — | |
1290 Multi-Alternative Strategies | | | 47.58 | | | | 302 | | | | 36,316 | | | | 69,201 | |
1290 Retirement 2020 | | | 16.93 | | | | 1,058 | | | | 18,808 | | | | 250 | |
1290 Retirement 2025 | | | 26.98 | | | | 1,816 | | | | 29,590 | | | | — | |
1290 Retirement 2030 | | | 20.38 | | | | 1,145 | | | | 18,524 | | | | — | |
1290 Retirement 2035 | | | 27.60 | | | | 1,451 | | | | 23,254 | | | | — | |
1290 Retirement 2040 | | | 21.26 | | | | 1,168 | | | | 18,927 | | | | — | |
1290 Retirement 2045 | | | 25.10 | | | | 1,328 | | | | 21,435 | | | | — | |
1290 Retirement 2050 | | | 25.11 | | | | 1,335 | | | | 21,592 | | | | — | |
1290 Retirement 2055 | | | 26.16 | | | | 1,345 | | | | 21,775 | | | | — | |
1290 Retirement 2060 | | | 26.83 | | | | 1,365 | | | | 22,117 | | | | — | |
1290 SmartBeta Equity | | | 96.07 | | | | — | | | | — | | | | 160,318 | |
217
MANAGEMENT OF THE TRUST (UNAUDITED)
The Trust’s Board is responsible for the overall management of the Trust and the Funds, including general supervision and review of the Funds’ investment activities and their conformity with federal and state law as well as the stated policies of the Funds. The Board elects the officers of the Trust who are responsible for administering the Trust’s day-to-day operations. The Trustees of the Trust are identified in the table below along with information as to their principal business occupations held during the last five years and certain other information are shown below.
The Trustees
| | | | | | | | | | |
Name, Address and
Year of Birth | | Position(s)
Held With
Fund | | Term of
Office** and
Length of
Time Served | | Principal Occupation(s) During Past 5 Years | | Number of
Funds in Fund
Complex
Overseen by Trustee† | | Other Directorships
Held by Trustee
During Past 5 Years |
| Interested Trustees |
Steven M. Joenk* 1290 Avenue of the Americas, New York, New York (1958) | | Trustee, President
and Chief Executive Officer | | From October 1, 2017 to present, Trustee, President and Chief Executive Officer and from June 9, 2014 through September 30, 2017, Trustee, Chairman, President and Chief Executive Officer | | From May 2011 to present, Chairman of the Board, Chief Executive Officer and President, 1290 Asset Managers; from April 2017 to present, Senior Vice President and Chief Investment Officer of AXA Financial, Inc.; from April 2017 to present, Managing Director and Chief Investment Officer and from September 1999 to April 2017, Managing Director, AXA Equitable Life Insurance Company (“AXA Equitable”); from September 2004 to April 2011, President, AXA Equitable’s Funds Management Group (“FMG”) unit; from July 2004 to October 1, 2013, Senior Vice President, MONY Life Insurance Company; from April 2017 to present, Senior Vice President and Chief Investment Officer and from July 2004 to April 2017, Senior Vice President, MONY Life Insurance Company of America; from April 2017 to present, Senior Vice President and Chief Investment Officer, PlanConnect, LLC; from July 2004 to present, Director, MONY Capital Management, Inc., Director and President, 1740 Advisers, Inc.; from July 2004 to January 2011, Director, Chairman of the Board and President, MONY Asset Management, Inc. and Enterprise Capital Management; from January 2005 to January 2011, Director, MONY Financial Resources of Americas Limited; and from November 2005 to present, Director MONY International Holdings, LLC. | | 138 | | None |
218
| | | | | | | | | | |
Name, Address and
Year of Birth | | Position(s)
Held With
Fund | | Term of
Office** and
Length of
Time Served | | Principal Occupation(s) During Past 5 Years | | Number of
Funds in Fund
Complex
Overseen by Trustee† | | Other Directorships
Held by Trustee
During Past 5 Years |
| Independent Trustees |
Mark A. Barnard c/o 1290 Funds 1290 Avenue of the Americas New York, NY 10104 (1949) | | Trustee | | From February 27, 2017 to present | | From 1995 to 1998, Manager of Private Investments, from 1998 to 2001, Director of Private Investments, and from 2001 to 2016, Managing Director – Private Investments, Howard Hughes Medical Institute; from 1985 to 1992, Assistant Director of Real Estate, and from 1992 to 1995, Associate Director of Real Estate, Massachusetts Institute of Technology. | | 138 | | None. |
Thomas W. Brock c/o 1290 Funds 1290 Avenue of the Americas New York, New York 10104
(1947) | | Trustee | | From January 1, 2016 to present | | From June 2016 to May 2017, Director, President and Chief Executive Officer and from January 2016 to June 2016 Director and interim President and Chief Executive Officer, Silver Bay Realty Trust Corp.; from 2006 to 2012, Chief Executive Officer and Co-Founder of Stone Harbor Investment Partners. | | 138 | | From December 2012 to January 2016, Lead Independent Director, Audit Committee Member and Compensation Committee Chair, Silver Bay Realty Trust Corp.; from 2016 to present, Chair and from 2005 to present, Director and Audit Committee Member, Liberty All-Star Funds (2); and from 2006 to 2012, Director, Stone Harbor Investment Funds (5). |
Michael B. Clement*** c/o 1290 Funds 1290 Avenue of the Americas New York, New York 10104
(1957) | | Trustee | | From
January 1, 2019 to present | | From 2011 to present, Professor of Accounting, most recently was appointed Department of Accounting Chair effective September 2018, and from 1997 to 2002, Assistant Professor, University of Texas; from 2002 to 2004, Vice President – Global Investment Research, Goldman Sachs; from 1988 to 1991, Vice President – Capital Planning and Analysis, and from 1982 to 1986, Manager – Audit Division, Citicorp; and from 1980 to 1982, Senior Assistant Accountant, Deloitte Haskins & Sells. | | 138 | | None. |
Donald E. Foley c/o 1290 Funds 1290 Avenue of the Americas New York, New York 10104
(1951) | | Trustee | | From June 9, 2014 to present | | From 2010 to 2011, Chairman of the Board and Chief Executive Officer, Wilmington Trust Corporation; from 1996 to 2010, Senior Vice President, Treasurer and Director of Tax, ITT Corporation; from 1989 to 1996, Assistant Treasurer, International Paper Company. | | 138 | | From 2011 to 2012 Director, and from 2012 to 2016, Advisory Committee Member, M&T Corporation; from 2007 to 2011, Director and member of the Audit Committee and Compensation Committee, Wilmington Trust Corporation; from 2008 to 2010, Advisory Board member, Northern Trust Company and Goldman Sachs Management Groups; from 2015 to present, Director, BioSig Technologies, Inc.; and from 2015 to present, Director, Wilmington Funds. |
219
| | | | | | | | | | |
Name, Address and
Year of Birth | | Position(s)
Held With
Fund | | Term of
Office** and
Length of
Time Served | | Principal Occupation(s) During Past 5 Years | | Number of
Funds in Fund
Complex
Overseen by Trustee† | | Other Directorships
Held by Trustee
During Past 5 Years |
Christopher P.A. Komisarjevsky c/o 1290 Funds 1290 Avenue of the Americas New York, New York 10104 (1945) | | Trustee | | From June 9, 2014 to present | | From 2006 to 2008, Senior Counselor for APCO Worldwide® (global communications consulting) and a member of its International Advisory Council; from 1998 to 2005, President and Chief Executive Officer, Burson-Marsteller Worldwide (public relations); from 1996 to 1998, President and Chief Executive Officer of Burson-Marsteller U.S.A. | | 138 | | None |
H. Thomas McMeekin c/o 1290 Funds 1290 Avenue of the Americas New York, New York 10104
(1953) | | Trustee | | From June 9, 2014 to present | | From 2015 to present, CEO of Blue Key Services, LLC., from 2000 to present, Managing Partner and Founder of Griffin Investments, LLC; from 2009 to 2012 Chief Investment Officer, AIG Life & Retirement and United Guaranty Corporation and Senior Managing Director of AIG Asset Management. | | 138 | | From 2015 to present, Director, Blue Key Services LLC; from 2012 to present, Director, Achaean Financial Group; from 2011 to 2012, Director, US Life Insurance Company in the City of New York. |
Gloria D. Reeg c/o 1290 Funds 1290 Avenue of the Americas New York, New York 10104 (1951) | | Trustee | | From February 27, 2017 to present | | From 2007 to 2016, Chief Investment Officer and Senior Vice President, New York-Presbyterian Hospital; from 2005 to 2007, Trustee and Treasurer, Casey Family Programs (foundation); from 2002 to 2004, Global Head of Fixed Income and Executive Director, Principal Global Investors (asset management firm); 1992 to 2000, Managing Director – Global Consulting, Russell Investment Group. | | 138 | | None. |
Gary S. Schpero c/o 1290 Funds 1290 Avenue of the Americas New York, New York 10104
(1953) | | Chairman of the Board | | From June 9, 2014 to present Independent Trustee, from October 1, 2017 to present, Chairman of the Board and from June 9, 2014 through September 2017, Lead Independent Trustee | | Prior to January 1, 2000, Partner of Simpson Thacher & Bartlett (law firm) and Managing Partner of the Investment Management and Investment Company Practice Group. | | 138 | | From May 2012 to present, Trustee, Blackstone/GSO Senior Floating Rate Term Fund and Blackstone/GSO Long – Short Credit Income Fund; from October 2012 to present, Trustee, Blackstone/GSO Strategic Credit Fund; from September 2017 to present, Trustee, Blackstone/GSO Floating Rate Enhanced Income Fund. |
220
| | | | | | | | | | |
Name, Address and
Year of Birth | | Position(s)
Held With
Fund | | Term of
Office** and
Length of
Time Served | | Principal Occupation(s) During Past 5 Years | | Number of
Funds in Fund
Complex
Overseen by Trustee† | | Other Directorships
Held by Trustee
During Past 5 Years |
Kathleen Stephansen*** c/o 1290 Funds 1290 Avenue of the Americas New York, New York 10104 (1954) | | Trustee | | From
January 1, 2019 to present | | From 2018 to present and in 2016, Senior Economic Advisor-Henderson Institute Center for Macroeconomics, Boston Consulting Group; From 2016 to 2018, Chief Economist, Huawei Technologies USA Inc.; from 2010 to 2016, held various positions at American International Group, including Chief Economist and Senior Managing Director and Senior Investment Strategies and Global Head of Sovereign Research – AIG Asset Management; from 2009 to 2010, Chief Economist and Managing Director, Aladdin Capital; from 2000 to 2009, Director and Head of Global Economics, Credit Suisse Securities (USA) LLC; and from 1984 to 2000, Co-Head of Economic Research and Chief International Economist, Donaldson, Lufkin & Jenrette Corporation. | | 138 | | None. |
Kenneth L. Walker c/o 1290 Funds 1290 Avenue of the Americas New York, New York 10104
(1952) | | Trustee | | From June 9, 2014 to present | | From May 2002 to January 2016, Partner, and from January 2016 to present, employee, The Capital Management Corporation (investment advisory firm). | | 138 | | None. |
Caroline L. Williams c/o 1290 Funds 1290 Avenue of the Americas New York, New York 10104 (1946) | | Trustee | | From June 9, 2014 to present | | From July 2010 to December 2012, Executive Vice President, from May 2005 to December 2007, Consultant and from May 2001 to May 2005, Chief Financial and Investment Officer, Nathan Cummings Foundation (non-profit organization); from 1988 to 1992, Managing Director, from 1982 to 1988, Senior Vice President, from 1978 to 1982, Vice President and from 1971 to 1976, Associate, Donaldson, Lufkin & Jenrette Securities Corporation (investment bank) from 1997 to 2009, Director, Hearst-Argyle Television. | | 138 | | None. |
| * | Affiliated with the Adviser. |
| ** | Each Trustee serves during the existence of the Trust until the next meeting of shareholders called for the purpose of electing Trustees and until the election and qualification of his or her successor or, if sooner, until he or she dies, declines to serve, resigns, retires, is removed, is incapacitated or is otherwise unable or unwilling to serve. Each Independent Trustee shall retire from the Board as of the last day of the calendar year in which he or she attains the age of 75 years. |
| *** | Mr. Clement and Ms. Stephansen each served as a consultant to the Board from September 1, 2018, through December 31, 2018. Mr. Clement and Ms. Stephansen will begin serving as Trustees of the Trust effective as of January 1, 2019. |
| † | The registered investment companies in the fund complex include the AXA Premier VIP Trust, EQ Advisors Trust and 1290 Funds. Mr. Joenk serves as Trustee, President and Chief Executive Officer for each of the registered investment companies in the fund complex. Mr. Schpero serves as Chairman of the Board for each such company. |
221
The Trust’s Officers
No officer of the Trust receives any compensation paid by the Trust. Each officer of the Trust is an employee of AXA Equitable, FMG LLC, and/or AXA Distributors, LLC (“AXA Distributors”). The Trust’s principal officers are:
| | | | | | |
Name, Address and
Year of Birth | | Position(s) Held
With Fund | | Term of Office and Length of Time Served* | | Principal Occupation(s) During Past 5 Years |
Steven M. Joenk 1290 Avenue of the Americas, New York, New York 10104
(1958) | | Trustee, President and Chief Executive Officer | | Trustee, President and Chief Executive Officer from June 2014 to present; Chairman of the Board from June 2014 through September 2017 | | From May 2011 to present, Chairman of the Board, Chief Executive Officer and President, 1290 Asset Managers; from April 2017 to present, Senior Vice President and Chief Investment Officer, AXA Financial, Inc.; from April 2017 to present, Managing Director and Chief Investment Officer and from September 1999 to April 2017, Managing Director, AXA Equitable; from September 2004 to April 2011, President, AXA Equitable’s Funds Management Group unit; from July 2004 to October 2013, Senior Vice President, MONY Life Insurance Company; from April 2017 to present, Senior Vice President and Chief Investment Officer, MONY Financial Services, Inc.; from April 2017 to present, Senior Vice President and Chief Investment Officer and from July 2004 to April 2017, Senior Vice President, MONY Life Insurance Company of America; from April 2017 to present, Senior Vice President and Chief Investment Officer, PlanConnect, LLC; from July 2004 to present, Director, MONY Capital Management, Inc. and Director and President, 1740 Advisers, Inc.; from July 2004 to January 2011, Director, Chairman of the Board and President, MONY Asset Management, Inc. and Enterprise Capital Management; from January 2005 to January 2011, Director, MONY Financial Resources of Americas Limited; and from November 2005 to present, Director MONY International Holdings, LLC. |
William MacGregor 1290 Avenue of the Americas, New York, New York 10104 (1975) | | Chief Legal Officer, Senior Vice President and Secretary | | Senior Vice President and Secretary from August
2018 to present; Chief Legal Officer from October 2018 to present | | From August 2018 to present, Managing Director and Associate General Counsel of AXA Equitable; Executive Vice President and Secretary of 1290 Asset Managers; from January 2017 to June 2018, Executive Director and Deputy General Counsel at UBS Business Solutions LLC; from July 2015 to June 2018, Executive Director and Deputy General Counsel at UBS Asset Management (Americas) Inc.; from June 2012 to July 2015, Senior Vice President, Secretary and Associate General Counsel of 1290 Asset Managers; from May 2008 to July 2015, Lead Director and Associate Counsel of AXA Equitable. |
Brian Walsh 1290 Avenue of the Americas, New York, New York 10104 (1968) | | Chief Financial Officer and Treasurer | | From June 2014 to present | | From May 2011 to present, Senior Vice President of 1290 Asset Managers; from February 2011 to present, member of the Board of Directors of 1290 Asset Managers; from February 2003 to present, Lead Director of AXA Equitable. |
222
| | | | | | |
Name, Address and
Year of Birth | | Position(s) Held
With Fund | | Term of Office and Length of Time Served* | | Principal Occupation(s) During Past 5 Years |
Kenneth Kozlowski 1290 Avenue of the Americas New York, New York 10104
(1961) | | Senior Vice President and Chief Investment Officer | | From June 2014 to present | | From June 2012 to present, Executive Vice President and Chief Investment Officer of 1290 Asset Managers; from May 2011 to June 2012, Senior Vice President of 1290 Asset Managers; from September 2011 to present, Managing Director of AXA Financial and AXA Equitable; from February 2001 to September 2011, Vice President of AXA Equitable; from July 2004 to January 2011, Director, Enterprise Capital Management, Inc. |
Joseph J. Paolo 1290 Avenue of the Americas, New York, New York 10104 (1970) | | Chief Compliance Officer and Vice President | | From June 2014 to present | | From May 2011 to present, Senior Vice President and Chief Compliance Officer of 1290 Asset Managers; from June 2007 to present, Lead Director of AXA Equitable and Chief Compliance Officer of AXA Equitable’s FMG. |
Alwi Chan 1290 Avenue of the Americas, New York, New York 10104
(1974) | | Vice President and Deputy Chief Investment Officer | | From June 2014 to present | | From June 2012 to present, Senior Vice President and Deputy Chief Investment Officer of 1290 Asset Managers; from May 2011 to June 2012, Vice President of 1290 Asset Managers; from February 2007 to present, Lead Director of AXA Equitable. |
James Kelly 1290 Avenue of the Americas, New York, New York 10104 (1968) | | Controller | | From June 2014 to present | | From May 2011 to present, Vice President of 1290 Asset Managers; from September 2008 to present, Senior Director of AXA Equitable; from March 2006 to September 2008, Assistant Vice President, AXA Equitable. |
Mary E. Cantwell 1290 Avenue of the Americas, New York, New York 10104
(1961) | | Vice President | | From June 2014 to present | | From June 2012 to present, Senior Vice President of 1290 Asset Managers; from February 2011 to present member of Board of Directors of 1290 Asset Managers; from May 2011 to June 2012, Vice President of 1290 Asset Managers; and from February 2001 to present, Lead Director, AXA Equitable. |
Roselle Ibanga 1290 Avenue of the Americas, New York, New York 10104 (1978) | | Assistant Controller | | From June 2014 to present | | From February 2009 to present, Director of AXA Equitable. |
Lisa Perrelli 1290 Avenue of the Americas, New York, New York 10104 (1974) | | Assistant Controller | | From June 2014 to present | | From November 2012 to present, Senior Director of AXA Equitable; from September 2008 to November 2012, Assistant Vice President of AXA Equitable. |
Kiesha T. Astwood-Smith, Esq. 1290 Avenue of the Americas, New York, New York 10104 (1973) | | Vice President and Assistant Secretary | | From September 2015 to present | | From December 2015 to present, Vice President, Assistant Secretary and Associate General Counsel of 1290 Asset Managers; from September 2015 to present, Senior Director and Counsel of AXA Equitable. From July 2006 to September 2015, Counsel of The Bank of New York Mellon; and from January 2010 to September 2015 Vice President and Assistant Secretary of the Dreyfus Family of Funds. |
Victoria Zozulya, Esq. 1290 Avenue of the Americas, New York, New York 10104 (1983) | | Vice President and Assistant Secretary | | From December 2018 to present. | | From September 2018 to present, Senior Director and Counsel of AXA Equitable; from May 2011 to March 2014, Compliance Analyst, and from March 2014 to August 2018, Vice President and Assistant General Counsel, Neuberger Berman. |
223
| | | | | | |
Name, Address and
Year of Birth | | Position(s) Held
With Fund | | Term of Office and Length of Time Served* | | Principal Occupation(s) During Past 5 Years |
Carla Byer 1290 Avenue of the Americas, New York, New York 10104 (1976) | | Vice President | | From June 2017 to present | | From April 2017 to present, Vice President of 1290 Asset Managers. From April 2014 through August 2016, Senior Vice President, Zealot Networks. From September 2008 through April 2012, Vice President of FMG LLC. |
Patricia Cox 1290 Avenue of the Americas, New York, New York 10104 (1958) | | Vice President and Anti-Money Laundering Compliance Officer | | From June 2014 to present | | From June 2014 to present, Vice President of 1290 Asset Managers; from April 2014 to present, Senior Director of AXA Equitable; Operations Consultant for Wells Real Estate Funds March 2009-September 2010; Director of Transfer Agent Operations for Wells Real Estate Funds October 2010 - March 2014; Senior VP of Operations for the AXA Enterprise Group of Funds August 2004-August 2008. |
Richard Guinnessey 1290 Avenue of the Americas, New York, New York 10104 (1963) | | Vice President | | From June 2014 to present | | From June 2012 to present, Vice President of 1290 Asset Managers; from September 2010 to present, Senior Director of AXA Equitable; from November 2005 to September 2010, Assistant Vice President of AXA Equitable. |
Miao Hu 1290 Avenue of the Americas, New York, New York 10104 (1978) | | Vice President | | From June 2016 to present | | From June 2016 to present, Vice President of 1290 Asset Managers; from December 2014 to present, Director of Portfolio Analytics of AXA Equitable; from November 2013 to December 2014, Lead Manager of Portfolio Analytics of AXA Equitable; from January 2011 to November 2013, Financial Services Sector Specialist of FactSet Research Systems. |
Michal Levy 1290 Avenue of the Americas, New York, New York 10104 (1979) | | Vice President | | From June 2016 to present | | From December 2014 to present, member of the Board of Directors; from March 2017 to present, Senior Vice President and Chief Operating Officer of 1290 Asset Managers; and from June 2014 to March 2017, Vice President of 1290 Asset Managers; from October 2013 to present, Senior Director of AXA Equitable; from October 2011 to October 2013, Assistant Vice President of AXA Equitable; and from October 2008 to October 2011, Vice President of Portfolio Valuation at Duff & Phelps. |
Xavier Poutas 1290 Avenue of the Americas, New York, New York 10104 (1977) | | Vice President | | From June 2016 to present | | From May 2011 to present, Assistant Portfolio Manager of 1290 Asset Managers and from June 27, 2016 to present, Vice President of 1290 Asset Managers; from September 2013 to present, Senior Director of AXA Equitable; and from November 2008 to August 2013, Director of AXA Equitable. |
Helen Lai 1290 Avenue of the Americas, New York, New York 10104 (1973) | | Assistant Vice President | | From June 2016 to present | | From March 2013 to present, Pricing and Valuation-Compliance of 1290 Asset Managers and Senior Manager, AXA Equitable; and from May 2009 to December 2012, HSBC, Hedge Fund Investor Services. |
224
| | | | | | |
Name, Address and
Year of Birth | | Position(s) Held
With Fund | | Term of Office and Length of Time Served* | | Principal Occupation(s) During Past 5 Years |
Jennifer Mastronardi 1290 Avenue of the Americas, New York, New York 10104 (1985) | | Assistant Vice President | | From June 2014 to present | | From February 2009 to present, Director of AXA Equitable; from April 2015 to present, Vice President of 1290 Asset Managers; from June 2007 to February 2009, Operations Associate in Managed Futures Department, Morgan Stanley. |
Faria Adam 1290 Avenue of the Americas, New York, New York 10104 (1968) | | Assistant Secretary | | From March 2016 to present | | From May 2015 to present, Lead Manager/Legal Assistant of AXA Equitable; and from 1999 to May 2015, Supervisory Paralegal at The Dreyfus Corporation, Bank of New York Mellon. |
Helen Espaillat 1290 Avenue of the Americas, New York, New York 10104 (1963) | | Assistant Secretary | | From June 2014 to present | | From July 2004 to present, Lead Manager/Legal Assistant for AXA Equitable and from March 2015 to present Assistant Vice President and Assistant Secretary of 1290 Asset Managers. |
Lorelei Fajardo 1290 Avenue of the Americas, New York, New York 10104 (1978) | | Assistant Secretary | | From June 2016 to present | | From July 2013 to present, Senior Manager/Legal Assistant of AXA Equitable; from July 2008 to June 2013, Lead Associate/Legal Assistant of AXA Equitable. |
| * | The officers in the table above (except Patricia Cox) hold similar positions with other registered investment companies in the fund complex. The registered investment companies in the fund complex include the Trust, AXA Premier VIP Trust and EQ Advisors Trust. |
| ** | Each officer is elected on an annual basis. |
225
PROXY VOTING RESULTS (UNAUDITED)
At a Special Meeting of Shareholders held on October 25, 2018, shareholders of each Fund listed below approved a new investment advisory agreement between AXA Equitable Funds Management Group, LLC dba 1290 Asset Managers® (the “Adviser”) and the Trust, on behalf of each Fund. The results of the shareholder vote are as follows:
| | | | | | | | | | | | | | | | |
Fund | | For | | | Against | | | Abstain | | | Broker
Non-Vote | |
1290 Convertible Securities Fund | | | 1,720,066.231 | | | | 290,700.168 | | | | 0.000 | | | | 148,324.153 | |
1290 Diversified Bond Fund | | | 2,971,699.979 | | | | 0.000 | | | | 0.000 | | | | 140,612.382 | |
1290 DoubleLine Dynamic Allocation Fund | | | 4,742,613.190 | | | | 0.000 | | | | 305,296.116 | | | | 448,392.171 | |
1290 GAMCO Small/Mid Cap Value Fund | | | 3,212,774.002 | | | | 184,066.337 | | | | 44,717.654 | | | | 2,729,453.660 | |
1290 Global Talents Fund | | | 2,004,193.286 | | | | 0.000 | | | | 0.000 | | | | 144,780.743 | |
1290 High Yield Bond Fund | | | 3,169,265.762 | | | | 0.000 | | | | 0.000 | | | | 515,031.866 | |
1290 Low Volatility Global Equity Fund | | | 252,252.000 | | | | 0.000 | | | | 0.000 | | | | 14,394.788 | |
1290 Multi-Alternative Strategies Fund | | | 905,558.076 | | | | 21,158.423 | | | | 144,648.845 | | | | N/A | |
1290 SmartBeta Equity Fund | | | 947,488.466 | | | | 0.000 | | | | 90,742.639 | | | | 329,885.174 | |
1290 Retirement 2020 Fund | | | 355,129.897 | | | | 0.000 | | | | 0.000 | | | | N/A | |
1290 Retirement 2025 Fund | | | 389,353.144 | | | | 0.000 | | | | 758.757 | | | | N/A | |
1290 Retirement 2035 Fund | | | 278,956.559 | | | | 0.000 | | | | 152.004 | | | | N/A | |
1290 Retirement 2040 Fund | | | 250,042.392 | | | | 0.000 | | | | 0.000 | | | | N/A | |
1290 Retirement 2045 Fund | | | 252,172.742 | | | | 0.000 | | | | 3,767.921 | | | | N/A | |
1290 Retirement 2050 Fund | | | 254,476.698 | | | | 0.000 | | | | 158.741 | | | | 606.061 | |
1290 Retirement 2055 Fund | | | 254,899.518 | | | | 0.000 | | | | 0.000 | | | | N/A | |
At a Special Meeting of Shareholders held on October 25, 2018, shareholders of each Fund listed below approved upon a Change of Control Event prompted by the Sell-Down Plan, a new investment advisory agreement between the Adviser and the Trust, on behalf of each Fund, and under certain circumstances, any future advisory agreements prompted by Change of Control Events that may occur as part of the Sell-Down Plan. The results of the shareholder vote are as follows:
| | | | | | | | | | | | | | | | |
Fund | | For | | | Against | | | Abstain | | | Broker
Non-Vote | |
1290 Convertible Securities Fund | | | 1,720,066.231 | | | | 290,700.168 | | | | 0.000 | | | | 148,324.153 | |
1290 Diversified Bond Fund | | | 2,971,699.979 | | | | 0.000 | | | | 0.000 | | | | 140,612.382 | |
1290 DoubleLine Dynamic Allocation Fund | | | 4,742,613.190 | | | | 0.000 | | | | 305,296.116 | | | | 448,392.171 | |
1290 GAMCO Small/Mid Cap Value Fund | | | 3,235,021.265 | | | | 161,819.074 | | | | 44,717.654 | | | | 2,729,453.660 | |
1290 Global Talents Fund | | | 2,004,193.286 | | | | 0.000 | | | | 0.000 | | | | 144,780.743 | |
1290 High Yield Bond Fund | | | 2,966,845.155 | | | | 202,420.607 | | | | 0.000 | | | | 515,031.866 | |
1290 Low Volatility Global Equity Fund | | | 252,252.000 | | | | 0.000 | | | | 0.000 | | | | 14,394.788 | |
1290 Multi-Alternative Strategies Fund | | | 926,716.500 | | | | 0.000 | | | | 144,648.844 | | | | N/A | |
1290 SmartBeta Equity Fund | | | 947,488.466 | | | | 90,742.639 | | | | 0.000 | | | | 329,885.174 | |
1290 Retirement 2020 Fund | | | 355,002.922 | | | | 126.975 | | | | 0.000 | | | | N/A | |
1290 Retirement 2025 Fund | | | 389,252.154 | | | | 100.990 | | | | 758.757 | | | | N/A | |
1290 Retirement 2035 Fund | | | 278,956.559 | | | | 0.000 | | | | 152.004 | | | | N/A | |
1290 Retirement 2040 Fund | | | 250,042.392 | | | | 0.000 | | | | 0.000 | | | | N/A | |
1290 Retirement 2045 Fund | | | 252,172.742 | | | | 0.000 | | | | 3,767.921 | | | | N/A | |
1290 Retirement 2050 Fund | | | 254,476.698 | | | | 0.000 | | | | 158.741 | | | | 606.061 | |
1290 Retirement 2055 Fund | | | 254,899.518 | | | | 0.000 | | | | 0.000 | | | | N/A | |
*******
226
At a Special Meeting of Shareholders held on October 25, 2018, shareholders of each of 1290 Global Talents Fund and 1290 High Yield Bond Fund approved a new investment sub-advisory agreement between the Adviser and AXA Investment Managers, Inc. (“AXA IM”) with respect to each of 1290 Global Talents Fund and 1290 High Yield Bond Fund. The results of the shareholder vote are as follows:
| | | | | | | | | | | | | | |
Fund | | For | | | Against | | | Abstain | | | Broker
Non-Vote |
1290 Global Talents Fund | | | 2,004,193.286 | | | | 0.000 | | | | 0.000 | | | 144,780.743 |
1290 High Yield Bond Fund | | | 3,169,265.762 | | | | 0.000 | | | | 0.000 | | | 515,031.866 |
At a Special Meeting of Shareholders held on October 25, 2018, shareholders of each of 1290 Global Talents Fund and 1290 High Yield Bond Fund approved upon a Change of Control Event prompted by the Sell-Down Plan, a new investment sub-advisory agreement between the Adviser and AXA IM with respect to each of 1290 Global Talents Fund and 1290 High Yield Bond Fund, and under certain circumstances, any future sub-advisory agreements prompted by Change of Control Events that may occur as part of the Sell-Down Plan. The results of the shareholder vote are as follows:
| | | | | | | | | | | | | | |
Fund | | For | | | Against | | | Abstain | | | Broker
Non-Vote |
1290 Global Talents Fund | | | 2,004,193.286 | | | | 0.000 | | | | 0.000 | | | 144,780.743 |
1290 High Yield Bond Fund | | | 2,966,845.155 | | | | 202,420.607 | | | | 0.000 | | | 515,031.866 |
*******
At a Special Meeting of Shareholders held on October 25, 2018, shareholders of the 1290 SmartBeta Equity Fund approved a new investment sub-advisory agreement between the Adviser and AXA Rosenberg Investment Management LLC (“AXA Rosenberg”) with respect to 1290 SmartBeta Equity Fund. The results of the shareholder vote are as follows:
| | | | | | | | | | | | | | |
Fund | | For | | | Against | | | Abstain | | | Broker
Non-Vote |
1290 SmartBeta Equity Fund | | | 947,488.466 | | | | 90,742.639 | | | | 0.000 | | | 329,885.174 |
At a Special Meeting of Shareholders held on October 25, 2018, shareholders of the 1290 SmartBeta Equity Fund approved upon a Change of Control Event prompted by the Sell-Down Plan, a new investment sub-advisory agreement between the Adviser and AXA Rosenberg with respect to 1290 SmartBeta Equity Fund, and under certain circumstances, any future sub-advisory agreements prompted by Change of Control Events that may occur as part of the Sell-Down Plan. The results of the shareholder vote are as follows:
| | | | | | | | | | | | | | |
Fund | | For | | | Against | | | Abstain | | | Broker
Non-Vote |
1290 SmartBeta Equity Fund | | | 947,488.466 | | | | 90,742.639 | | | | 0.000 | | | 329,885.174 |
*******
227
At a Special Meeting of Shareholders held on October 25, 2018, shareholders of the 1290 Convertible Securities Fund, 1290 Diversified Bond Fund, 1290 DoubleLine Dynamic Allocation Fund, 1290 GAMCO Small/Mid Cap Value Fund, 1290 Global Talents Fund, 1290 High Yield Bond Fund, 1290 Low Volatility Global Equity Fund, 1290 Multi-Alternative Strategies Fund, 1290 SmartBeta Equity Fund, 1290 Retirement 2020 Fund, 1290 Retirement 2025 Fund, 1290 Retirement 2030 Fund, 1290 Retirement 2035 Fund, 1290 Retirement 2040 Fund, 1290 Retirement 2045 Fund, 1290 Retirement 2050 Fund, 1290 Retirement 2055 Fund and 1290 Retirement 2060 Fund, approved the election of Steven M. Joenk, Mark A. Barnard, Thomas W. Brock, Michael B. Clement, Donald E. Foley, Christopher P.A. Komisarjevsky, H. Thomas McMeekin, Gloria D. Reeg, Gary S. Schpero, Kathleen Stephansen, Kenneth L. Walker and Caroline L. Williams to serve as the Board of Trustees of 1290 Funds. The results of the shareholder vote are as follows:
| | | | | | | | | | |
Shareholders of All Funds Vote Collectively | | For | | | Against | | | Abstain |
Mark A. Barnard | | | 27,752,457,427 | | | | 33,326.296 | | | N/A |
Thomas W. Brock | | | 27,750,971.351 | | | | 34,812.372 | | | N/A |
Michael B. Clement | | | 27,754,070.538 | | | | 31,713.185 | | | N/A |
Donald E. Foley | | | 27,709,298.374 | | | | 76,485.349 | | | N/A |
Steven M. Joenk | | | 27,750,971.351 | | | | 34,812.372 | | | N/A |
Christopher P.A. Komisarjevsky | | | 27,752,457.427 | | | | 33,326.296 | | | N/A |
H. Thomas McMeekin | | | 27,752,457.427 | | | | 33,326.296 | | | N/A |
Gloria D. Reeg | | | 27,754,070.538 | | | | 31,713,185 | | | N/A |
Gary S. Schpero | | | 27,698,372.774 | | | | 87,410.949 | | | N/A |
Kathleen Stephansen | | | 27,754,070.538 | | | | 31,713.185 | | | N/A |
Kenneth L. Walker | | | 27,754,070.538 | | | | 31,713.185 | | | N/A |
Caroline L. Williams | | | 27,749,358.240 | | | | 36,425.483 | | | N/A |
228
PROXY VOTING POLICIES AND PROCEDURES (UNAUDITED)
A description of the policies and procedures that the Funds use to determine how to vote proxies relating to portfolio securities is available (i) without charge, upon request, by calling a toll-free number at 1-888-310-0416 and (ii) on the Securities and Exchange Commission’s website at http://www.sec.gov. Information regarding how the Funds voted proxies relating to portfolio securities during the most recent 12-month period ended June 30 is available without charge (i) on the Trust’s website at www.1290Funds.com and (ii) on the Securities and Exchange Commission’s website at http://www.sec.gov.
QUARTERLY PORTFOLIO HOLDINGS INFORMATION (UNAUDITED)
The Funds file their complete schedules of portfolio holdings with the Securities and Exchange Commission for the first and third quarters of each fiscal year on Form N-Q. The Funds’ Forms N-Q are available on the Securities and Exchange Commission’s website at http://www.sec.gov. You may also review and obtain copies at the Securities and Exchange Commission’s Public Reference Room in Washington, D.C. Information about the Public Reference Room may be obtained by calling 1-800-SEC-0330.
229
| | |
Visit the Funds’ Website: 1290Funds.com | |  |
| | |
| Must be accompanied or preceded by a Prospectus. 1290 Funds are distributed by ALPS Distributors, Inc. | | DFIN#617677 AXA-1290AR103118 |
© 2018 AXA Equitable Life Insurance Company. All rights reserved.
1290 Avenue of the Americas, New York, NY 10104.

AXA Equitable Life Insurance Company
As of the end of the period covered by this report, the registrant has adopted a “code of ethics,” as defined in Item 2, that applies to the registrant’s principal executive officer, principal financial officer, principal accounting officer or controller, or persons performing similar functions. A copy of the registrant’s code of ethics is filed as an exhibit pursuant to Item 12(a)(1).
| Item 3. | Audit Committee Financial Expert. |
The registrant’s board of trustees has determined that Donald E. Foley, Kenneth L. Walker and Caroline L. Williams serve on its audit committee as “audit committee financial experts” as defined in Item 3. Ms. Williams and Messrs. Foley and Walker are considered to be “independent” for purposes of Item 3(a)(2).
| Item 4. | Principal Accountant Fees and Services. |
(a) Audit Fees for fiscal year 2018: $544,450 and for fiscal year 2017: $457,231.
(b) Audit-Related Fees for fiscal year 2018: $40,698 and for fiscal year 2017: $26,150.
(c) Tax Fees for fiscal year 2018: $228,200 and for fiscal year 2017: $112,889.
Tax fees include amounts related to tax compliance, tax advice and tax planning.
(d) All Other Fees for fiscal year 2018: $0 and for fiscal year 2017: $0.
All other fees include amounts related to consultation on or review of the registrant’s various regulatory filings.
(e)(1) The registrant’s audit committee has adopted policies and procedures relating to pre-approval of services performed by the registrant’s principal accountant for the registrant. Audit, audit-related and tax services provided to the registrant on an annual basis require pre-approval by the entire audit committee. In the event that the audit fees exceed the pre-approved estimated amount, the audit committee’s delegate, consisting of the audit committee chair, lead independent trustee, the registrant’s chief executive officer and chief financial officer, acting by at least two of such individuals, has the authority to increase the amount by up to 10% of the pre-approved amount. Any additional amount requires pre-approval by the entire audit committee. The audit committee chair or the lead independent trustee also has the authority to approve de minimis non-audit services (i.e., services in which the fee does not exceed $10,000 per engagement) to be provided by the registrant’s principal accountant for the registrant, provided that each such service is brought to the attention of the audit committee prior to the completion of the audit of the registrant’s financial statements.
(e)(2) None of the services included in (b) – (d) above were approved by the audit committee pursuant to paragraph (c)(7)(i)(C) of Rule 2-01 of Regulation S-X.
(f) Not applicable.
(g) For fiscal year 2018: $380,398 and for fiscal year 2017: $6,017,545.
(h) The registrant’s audit committee has considered and determined that the provision of non-audit services that were rendered to the registrant’s investment adviser (not including any sub-advisers whose role is primarily portfolio management and is subcontracted with or overseen by another investment adviser), and any entity controlling, controlled by, or under common control with the investment adviser that provides ongoing services to the registrant that were not pre-approved pursuant to paragraph (c)(7)(ii) of Rule 2-01 of Regulation S-X is compatible with maintaining the principal accountant’s independence.
| Item 5. | Audit Committee of Listed Registrants. |
Not applicable.
| Item 6. | Schedule of Investments. |
The Schedule of Investments is included as part of the annual report to Shareholders filed under Item 1 of this Form N-CSR.
| Item 7. | Disclosure of Proxy Voting Policies and Procedures for Closed-End Management Investment Companies. |
Not applicable.
| Item 8. | Portfolio Managers of Closed-End Management Investment Companies |
Not applicable.
| Item 9. | Purchases of Equity Securities by Closed-End Management Investment Company and Affiliated Purchasers. |
Not applicable.
| Item 10. | Submission of Matters to a Vote of Security Holders. |
There have been no material changes to the procedures by which shareholders may recommend nominees to the registrant’s board of trustees.
| Item 11. | Controls and Procedures. |
| (a) | The registrant’s principal executive and principal financial officers, or persons performing similar functions, have concluded that the registrant’s disclosure controls and procedures (as defined in Rule 30a-3(c) under the Investment Company Act of 1940, as amended (the “1940 Act”)) are effective as of a date within 90 days of the filing of this report that includes the |
| | disclosure required by this paragraph, based on the evaluation of these controls and procedures required by Rule 30a-3(b) under the 1940 Act and Rule 15d-15(b) under the Securities Exchange Act of 1934, as amended. |
| (b) | The registrant’s certifying officers are not aware of any changes in the registrant’s internal control over financial reporting (as defined in Rule 30a-3(d) under the 1940 Act) that occurred during the registrant’s second fiscal quarter of the period covered by this report that has materially affected, or is reasonably likely to materially affect, the registrant’s internal control over financial reporting. |
| Item 12. | Disclosure of Securities Lending Activities for Close-End Management Investment Companies. |
Not Applicable.
(a)(1) The Code of Ethics for Senior Officers of the Registrant is filed herewith.
(a)(2) Certifications pursuant to Section 302 of the Sarbanes-Oxley Act of 2002 are filed herewith.
(b) Certifications pursuant to Section 906 of the Sarbanes-Oxley Act of 2002 are filed herewith.
SIGNATURES
Pursuant to the requirements of the Securities Exchange Act of 1934 and the Investment Company Act of 1940, the registrant has duly caused this report to be signed on its behalf by the undersigned, thereunto duly authorized.
1290 FUNDS
| | |
| By: | | /s/ Steven M. Joenk |
| Steven M. Joenk |
| President and Chief Executive Officer |
| December 21, 2018 |
Pursuant to the requirements of the Securities Exchange Act of 1934 and the Investment Company Act of 1940, this report has been signed below by the following persons on behalf of the registrant and in the capacities and on the dates indicated.
|
/s/ Steven M. Joenk |
| Steven M. Joenk |
| President and Chief Executive Officer |
| December 21, 2018 |
|
/s/ Brian E. Walsh |
| Brian E. Walsh |
| Chief Financial Officer |
| December 21, 2018 |