UNITED STATES
SECURITIES AND EXCHANGE COMMISSION
Washington, D.C. 20549
FORM N-CSR
CERTIFIED SHAREHOLDER REPORT OF REGISTERED
MANAGEMENT INVESTMENT COMPANIES
Investment Company Act File Number 811-22959
1290 FUNDS
(Exact name of registrant as specified in charter)
1290 Avenue of the Americas
New York, New York 10104
(Address of principal executive offices)
PATRICIA LOUIE, ESQ.
Executive Vice President and General Counsel
AXA Equitable Funds Management Group, LLC
1290 Avenue of the Americas
New York, New York 10104
(Name and Address of Agent for Service)
Copies to:
MARK C. AMOROSI, ESQ.
K&L Gates LLP
1601 K Street N.W.
Washington, D.C. 20006
Registrant’s telephone number, including area code: (212) 554-1234
Date of fiscal year end: October 31
Date of reporting period: October 31, 2017
| Item 1. | Reports to Stockholders. |
The following is a copy of the report transmitted to shareholders pursuant to Rule 30e-1 under the Investment Company Act of 1940 (17 CFR 270.30e-1).

Annual Report
October 31, 2017
1290 Funds Annual Report
October 31, 2017
Table of Contents
Overview
Market Overview
Year Ended 10/31/17
Full year market commentary ending October 2017.
Over the course of the year, the global economy experienced relatively steady expansion, with low inflation and accommodating monetary policies.
In the U.S., for the first time in six years the Federal Reserve (Fed) raised the short-term interest rate in December 2016, then again in March and June of 2017, noting a strengthening labor market, moderate economic expansion and a stable unemployment rate. The appearance of hurricanes Harvey and Irma seemed to influence policy makers, as they deferred on a rate hike at the end of October 2017, choosing instead to start the process of “quantitative tightening,” and suggesting a rate hike was in the cards for December.
The European Central Bank (ECB) left its deposit rate unchanged, consistent with the last five quarters, and according to experts is looking for more sustained growth before tightening monetary policy. Inflation continued to be low as Europe experienced continued low unemployment, with strong corporate profits and economic growth driving equity rallies in Germany and France. The European political situation continued to offer challenges as Angela Merkel was reelected as German Chancellor, but lost important seats in the parliament. The U.K. political outlook was also uncertain, as news was dominated by the Brexit vote and, later, negotiations that produced little clarity on how the country would transition out. The U.K. began seeing late-cycle pressures, with deteriorating consumer expectations, rising inflation, and Brexit uncertainties.
In currencies, while the U.S. dollar gained strength after the presidential election, it weakened over the following quarters, helping emerging markets recover from losses at the end of 2016. Emerging markets continued to do well throughout 2017.
Against this backdrop, bonds experienced a sudden selloff in the U.S. Treasury market with the Trump election in November 2016, and again as the Fed raised rates in 2017. Most fixed-income categories rebounded, however, with lower-quality bonds leading the way. Despite an abundance of geopolitical risks, hurricanes and other headlines throughout the year, investors seemed to look for more risk in 2017, particularly in the emerging markets, as hard and local currency bond indices performed well.
Overall, with low volatility and decent earnings growth from corporations, investor confidence in the U.S. equity markets remained high and continued to drive gains. Investors started out the reporting period heavily focused on the outcome of the presidential election and the Fed’s plans. The election appeared to give investors a sense of confidence initially, and equities climbed to new highs late in 2016. However, as 2017 progressed, the domestic markets pulled back a bit, as the new administration faced challenges passing promised legislation. Nonetheless, all major U.S. equity categories were positive throughout the reporting period.
Small caps and growth stocks outperformed larger-capitalization and value-style stocks in the past 12 months.
Outside the U.S., equity markets showed improvement throughout the past year, as corporate earnings were upbeat in Europe and Japan, economic data was encouraging from China, and emerging markets profited from a lower dollar. Experts suggest that the primary drivers of international equity returns included the durability of U.S. growth and the timing of Fed tightening, concerns over China’s economic and global growth outlook, tensions over North Korea, the British referendum to exit the European Union, risk in the Middle East and the election and politics of President Trump. As these political uncertainties dissipated and economic growth improved, international stocks generally rose.
Overall, emerging markets produced robust returns — due to a weaker dollar but also faster earnings growth, and continued easing in global monetary policies. In Latin America, as Brazil cleaned house, with President Michel Temer cleared of corruption charges, its equity markets saw double digit returns as the country looks forward to the 2018 elections. Mexico’s central bank, on the other hand, hiked its benchmark rate to the highest level in eight years in response to continued rising inflation.
Source: AXA Equitable Funds Management Group, LLC doing business as 1290 Asset Managers®. As of 10/31/17.
This information is provided for general information only and is not intended to provide specific advice or recommendations for any individual investor.
PAST PERFORMANCE IS NO GUARANTEE OP FUTURE RESULTS. No investment is risk-free. Bond investments are subject to interest rate risk so that when interest rates rise, the prices of bonds can decrease and the investor can lose principal value. High yield bonds are subject to a high degree of credit and market risk. International securities carry additional risks including currency exchange fluctuation and different government regulations, economic conditions or accounting standards. Smaller company stocks involve a greater risk than is customarily associated with more established companies. Index performance is referenced for illustrative purposes only. You cannot invest directly in an index.
Fund holdings and sector allocations are subject to change. Please see the Portfolio of Investments for a complete list of fund holdings.
2
NOTES ON PERFORMANCE
Total Returns
Performance of the 1290 Funds as shown on the following pages compares each Fund’s performance to that of a broad-based securities index and, with respect to certain Funds, customized composite benchmarks. Each Fund’s rates of return are net of investment advisory fees and expenses of the Fund. Each Fund has a separate investment objective it seeks to achieve by following a separate investment policy. There is no guarantee that these objectives will be attained. The objectives and policies of each Fund will affect its return and its risk. Keep in mind that past performance is not an indication of future results.
Benchmarks
60% S&P 500® Index/40% Bloomberg Barclays U.S. Aggregate Bond Index is a hypothetical combination of unmanaged indexes. The composite index combines the total return of the S&P 500® Index at a weighting of 60% and the Bloomberg Barclays U.S. Aggregate Bond Index at a weighting of 40%.
Bloomberg Barclays U.S. Aggregate Bond Index covers the U.S. dollar denominated investment-grade, fixed-rate, taxable bond market of securities. The index includes bonds from the Treasury, government-related and corporate securities, agency fixed rate and hybrid adjustable mortgage pass through securities, asset-backed securities and commercial mortgage-backed securities.
ICE BofAML 3-Month U.S. Treasury Bill Index, formerly BofA Merrill Lynch 3-Month U.S. Treasury Bill Index, measures the returns of negotiable debt obligations issued by the U.S. government and backed by its full faith and credit, having a maturity of three months.
ICE BofAML U.S. Convertibles Index, formerly BofA Merrill Lynch All U.S. Convertibles Index, consists of U.S. dollar denominated investment grade and non-investment grade convertible securities sold into the U.S. market and publicly traded in the United States. The index constituents are market value weighted based on the convertible securities prices and outstanding shares, and the underlying index is rebalanced daily.
ICE BofAML US High Yield Index, formerly BofA Merrill Lynch U.S. High Yield Master II Index, tracks the performance of U.S. dollar denominated below investment grade corporate debt publicly issued in the U.S. domestic market. Qualifying securities must have at least 18 months to final maturity at the time of issuance, at least one year remaining term to final maturity as of the rebalancing date, a fixed coupon schedule and a minimum amount outstanding of $100 million. It is capitalization-weighted.
ICE BofAML USD 3-Month Deposit Offered Rate Constant Maturity Index, formerly known BofA Merrill Lynch USD 3-Month Deposit Offered Rate Constant Maturity Index, tracks the performance of a synthetic asset paying the London interbank offered rate (LIBOR) to a stated maturity. The index is based on the assumed purchase at par of a synthetic instrument having exactly its stated maturity and with a coupon equal to that day’s fixing rate. That issue is assumed to be sold the following business day (priced at a yield equal to the current day fixing rate) and rolled into a new instrument.
Morgan Stanley Capital International (MSCI) ACWI Minimum Volatility (Net) Index, aims to reflect the performance characteristics of a minimum variance strategy applied to large and mid cap equities across 23 developed markets and 23 emerging markets countries. The index is calculated by optimizing the MSCI ACWI Index, its parent index, in USD for the lowest absolute risk (within a given set of constraints). Historically, the index has shown lower beta and volatility characteristics relative to the MSCI ACWI Index.
Morgan Stanley Capital International (MSCI) ACWI (Net) Index, formerly Morgan Stanley Capital International (MSCI) AC World (Net) Index, is a free float-adjusted market capitalization weighted index that is designed to measure the equity market performance of 23 developed markets and 23 emerging markets. The index covers approximately 85% of global investment opportunities.
Morgan Stanley Capital International (MSCI) World (Net) Index is a free float-adjusted market capitalization weighted index that is designed to measure the equity market performance of developed markets. The index consists of 23 developed market country indexes.
Russell 2500™ Value Index measures the performance of those Russell 2500TM Index companies with lower price-to-book ratios and lower forecasted growth values. It is market-capitalization weighted.
Standard & Poor’s 500® Composite Stock Price Index (“S&P 500® Index”) is a weighted index of common stocks of 500 leading companies in leading industries of the U.S. economy, capturing 75% coverage of U.S. equities. The index is capitalization weighted, thereby giving greater weight to companies with the largest market capitalizations.
The Standard & Poor’s Target Date Index Series (each, an “S&P Target Date Index”) comprises eleven multi-asset class indices, each corresponding to a particular target retirement date. The asset allocation for each index in the series is determined once a year through survey of large fund management companies that offer target date products. Each index is fully investable, with varying levels of exposure to equities, fixed income and commodities.
Glossary
Derivative is a financial instrument with a price that is dependent upon or derived from one or more underlying assets.
Diversified spread is the sale of multiple, diversified futures contracts and the purchase of other multiple, diversified offsetting futures contracts. A spread tracks the difference between a long and short position.
Long position is the buying of a security or financial instrument such as a stock, commodity or currency with the expectation the asset will rise in value.
Mortgage backed security (MBS) is a type of asset-backed security that is secured by a mortgage or collection of mortgages.
Quantitative easing is the introduction of new money into the money supply by a central bank.
3
NOTES ON PERFORMANCE
Shiller Barclays Cyclically Adjusted Price-to-Earnings (CAPE) Total Return Index aims to identify undervalued sectors in the large-cap equity market based on a modified CAPE® ratio, which is designed to assess longer term equity valuations by using an inflation adjusted earnings horizon.
Smart beta defines a set of investment strategies that emphasize the use of alternative index construction rules to traditional market capitalization based indices.
Swap is a derivative contract through which two parties exchange financial instruments.
4
1290 CONVERTIBLE SECURITIES FUND (Unaudited)
INVESTMENT ADVISER
INVESTMENT SUB-ADVISER
| Ø | | Palisade Capital Management, L.L.C. |
PERFORMANCE RESULTS
| | | | | | | | | | |
| Annualized Total Returns as of 10/31/17 | |
| | | | | 1
Year | | | Since
Incept. | |
Fund – Class A Shares* | | without Sales Charge | | | 16.82 | % | | | 5.91 | % |
| | | with Sales Charge (a) | | | 11.57 | | | | 3.84 | |
Fund – Class I Shares* | | | | | 17.11 | | | | 6.18 | |
Fund – Class R Shares* | | | | | 16.53 | | | | 5.65 | |
ICE BofAML U.S. Convertibles Index | | | | | 18.13 | | | | 7.41 | |
* Date of inception 7/6/15. (a) A 4.50% front-end sales charge was deducted. Returns for periods greater than one year are annualized. | |
The performance quoted is past performance and is not a guarantee of future results. Mutual funds are subject to certain market risks. Investment returns and principal value of an investment will fluctuate so that an investor’s shares, when redeemed, may be worth more or less than their original cost. Current performance may be higher or lower than the performance data shown. For the most current month-end performance data please call 1-888-310-0416 or visit www.1290Funds.com.
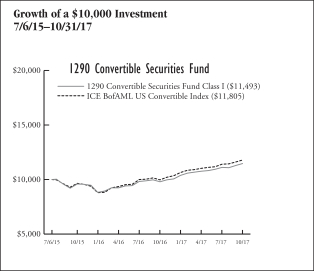
The graph illustrates comparative performance for $10,000 invested in the Class I Shares of the 1290 Convertible Securities Fund and the ICE BofAML All U.S. Convertibles Index from 7/6/15 to 10/31/17. The performance of the ICE BofAML All U.S. Convertibles Index reflects an initial investment at the end of the month closest to the Fund’s inception. The performance of the Fund assumes reinvestment of all dividends and capital gain distributions, if any, and does not include a sales charge. The performance of the ICE BofAML All U.S. Convertibles Index does not reflect the deduction of expenses or a sales charge associated with a mutual fund and has been adjusted to reflect reinvestment of all dividends, capital gain distributions, and interest of the securities included in the benchmark.
Fund performance may reflect the waiver of the Fund’s fees and reimbursement of expenses for certain periods since the inception date. Without these waivers and reimbursements, performance would have been lower. Also, performance shown in this section does not reflect the deduction of taxes that a shareholder would pay on Fund distributions or redemption of Fund shares.
PERFORMANCE SUMMARY
The Fund’s Class I shares returned 17.11% for the year ended October 31, 2017. The Fund’s benchmark, the ICE BofAML U.S. Convertibles Index, returned 18.13% over the same year.
Fund Overview — Palisade Capital Management, LLC
Whatever anxieties existed heading into the U.S. Presidential election seemed to have been swept aside with a surprising Trump victory in November 2016. Post-election euphoria, prompted by the prospect of pro-business legislative and tax reform and improving economic fundamentals, as evidenced by the strongest U.S. gross domestic product (GDP) growth in over two years, bolstered investor sentiment and market momentum throughout the year. All major U.S. equity indices closed 2016 near record highs. High yield markets, despite the headwind of three interest rate hikes by the Federal Reserve, also rallied to new highs.
As would be expected, convertibles benefited from this combination of positive equity and credit performance. The best performing sectors were the cyclically-sensitive technology, transportation, and consumer discretionary sectors while the lagging sectors were the more defensive energy, telecommunications, and consumer staples sectors. Healthcare also faced headwinds from the uncertain policy situation regarding attempts to repeal and replace the Affordable Care Act and as a result, slightly lagged the overall performance of the convertible market. As in the prior twelve-month period, large cap convertibles led the market higher, followed by small cap convertibles, which rebounded from their poor showing in the prior period. From a style perspective, growth convertibles benefited from the market’s risk-on mentality and outperformed value convertibles.
Fund Highlights
What helped performance during the year?
| • | | Strong security selection in the technology sector was a significant contributor to the Fund’s results for the period, led by Novellus Systems, Inc., two Micron Technology, Inc. holdings, NVIDIA Corporation, and The Priceline Group, Inc. |
| • | | XPO Logistics, Inc., in the transportation sector, posted triple-digit returns for the period, further boosting relative results. |
| • | | CalAtlantic, in the industrials sector, also helped bolster performance for the period. |
What hurt performance during the year?
| • | | Security selection in the telecommunications sector detracted from results, held back by a weak return from Frontier Communications Corp. |
| • | | Teva Pharmaceutical Industries Ltd., in the healthcare sector, produced a headwind for absolute results. |
| • | | In the energy sector, Southwestern Energy Company further held back results. |
5
1290 CONVERTIBLE SECURITIES FUND (Unaudited)
| | | | |
Fund Characteristics As of October 31, 2017 | | | |
Weighted Average Life (Years) | | | N/A | |
Weighted Average Coupon (%) | | | N/A | |
Weighted Average Modified Duration (Years)* | | | N/A | |
Weighted Average Rating** | | | BB | |
* Modified duration is a measure of the price sensitivity of the Fund to interest rate movements, taking into account specific features of the securities in which it invests. ** Weighted Average Rating has been provided by the Investment Sub-Adviser. A credit rating is an assessment provided by a nationally recognized statistical rating organization (NRSRO) of the creditworthiness of an issuer with respect to debt obligations, including specific securities, money market instruments or other debts. Ratings are measured on a scale that generally ranges from AAA (highest) to D (lowest); ratings are subject to change without notice. | |
| | | | |
Sector Weightings as of October 31, 2017 | | % of
Net Assets | |
Information Technology | | | 38.1 | % |
Health Care | | | 18.4 | |
Consumer Discretionary | | | 11.5 | |
Financials | | | 10.4 | |
Industrials | | | 7.2 | |
Energy | | | 4.8 | |
Telecommunication Services | | | 2.0 | |
Real Estate | | | 1.9 | |
Materials | | | 1.7 | |
Consumer Staples | | | 0.7 | |
Utilities | | | 0.5 | |
Investment Companies | | | 0.1 | |
Cash and Other | | | 2.7 | |
| | | | | |
| | | | 100.0 | % |
| | | | | |
Holdings are subject to change without notice. | | | | |
UNDERSTANDING YOUR EXPENSES:
As a shareholder of the Fund, you incur two types of costs:
(1) transaction costs, including applicable sales charges and redemption fees; and (2) ongoing costs, including investment advisory fees, distribution and/or service (12b-1) fees (in the case of Class A and Class R shares of the Fund), and other Fund expenses. These examples are intended to help you understand your ongoing costs (in dollars) of investing in the Fund and to compare these costs with the ongoing costs of investing in other mutual funds.
The examples are based on an investment of $1,000 invested at the beginning of the six-month period ended October 31, 2017 and held for the entire six-month period.
Actual Expenses
The first line of the following table provides information about actual account values and actual expenses. You may use the information in this line, together with the amount you invested, to estimate the expenses that you paid over the period. Simply divide your account value by $1,000 (for example, an $8,600 account value divided by $1,000 = 8.6), then multiply the result by the number in the first line under the heading entitled “Expenses Paid During Period” to estimate the expenses you paid on your account during this period.
Hypothetical Example for Comparison Purposes
The second line of the following table provides information about hypothetical account values and hypothetical expenses based on the Fund’s actual expense ratio and an assumed rate of return of 5% per year before expenses, which is not the Fund’s actual return. The hypothetical account values and expenses may not be used to estimate the actual ending account balance or expenses you paid for the period. You may use this information to compare the ongoing costs of investing in the Fund and other funds. To do so, compare this 5% hypothetical example with the 5% hypothetical examples that appear in the shareholder reports of the other funds.
Please note that the expenses shown in the table are meant to highlight your ongoing costs only and do not reflect any transactional costs, such as sales charges (loads), redemption fees, or exchange fees. Therefore, the second line of the table is useful in comparing ongoing costs only, and will not help you determine the relative total costs of owning different funds. In addition, if these transactional costs were included, your costs would have been higher.
EXAMPLE
| | | | | | | | | | | | |
| | | Beginning
Account
Value
5/1/17 | | | Ending
Account
Value
10/31/17 | | | Expenses Paid During Period*
5/1/17 - 10/31/17 | |
Class A | |
Actual | | | $1,000.00 | | | | $1,065.90 | | | | $6.77 | |
Hypothetical (5% average annual return before expenses) | | | 1,000.00 | | | | 1,018.65 | | | | 6.61 | |
Class I | | | | | | | | | | | | |
Actual | | | 1,000.00 | | | | 1,067.20 | | | | 5.47 | |
Hypothetical (5% average annual return before expenses) | | | 1,000.00 | | | | 1,019.91 | | | | 5.35 | |
Class R | | | | | | | | | | | | |
Actual | | | 1,000.00 | | | | 1,064.50 | | | | 8.07 | |
Hypothetical (5% average annual return before expenses) | | | 1,000.00 | | | | 1,017.39 | | | | 7.88 | |
* Expenses are equal to the Fund’s Class A, I and R shares annualized expense ratios of 1.30%, 1.05% and 1.55%, respectively, multiplied by the average account value over the period, and multiplied by 184/365 (to reflect the one-half year period). | |
6
1290 FUNDS
1290 CONVERTIBLE SECURITIES FUND
PORTFOLIO OF INVESTMENTS
October 31, 2017
| | | | | | | | |
| | | Principal
Amount | | | Value
(Note 1) | |
| | | | | | | | |
LONG-TERM DEBT SECURITIES: | | | | | |
Convertible Bonds (76.8%) | |
Consumer Discretionary (11.5%) | |
Automobiles (0.9%) | | | | | | | | |
Tesla, Inc. | | | | | | | | |
2.375%, 3/15/22 | | $ | 178,000 | | | $ | 216,048 | |
| | | | | | | | |
Hotels, Restaurants & Leisure (1.5%) | | | | | | | | |
Caesars Entertainment Corp. | | | | | | | | |
5.000%, 10/1/24 | | | 177,000 | | | | 347,362 | |
| | | | | | | | |
Household Durables (1.1%) | | | | | | | | |
CalAtlantic Group, Inc. | | | | | | | | |
1.625%, 5/15/18 | | | 168,000 | | | | 264,180 | |
| | | | | | | | |
Internet & Direct Marketing Retail (3.6%) | |
Ctrip.com International Ltd. | | | | | | | | |
1.250%, 9/15/22 | | | 45,000 | | | | 46,856 | |
IAC FinanceCo, Inc. | | | | | | | | |
0.875%, 10/1/22§ | | | 69,000 | | | | 74,477 | |
Liberty Expedia Holdings, Inc. | | | | | | | | |
1.000%, 6/30/47§ | | | 102,000 | | | | 104,295 | |
Priceline Group, Inc. (The) | | | | | | | | |
0.350%, 6/15/20 | | | 418,000 | | | | 621,775 | |
| | | | | | | | |
| | | | | | | 847,403 | |
| | | | | | | | |
Media (4.4%) | | | | | | | | |
DISH Network Corp. | | | | | | | | |
3.375%, 8/15/26 | | | 520,000 | | | | 559,325 | |
Liberty Interactive LLC | | | | | | | | |
1.750%, 9/30/46§ | | | 177,000 | | | | 199,899 | |
Liberty Media Corp. | | | | | | | | |
1.375%, 10/15/23 | | | 90,000 | | | | 107,901 | |
Liberty Media Corp.-Liberty Formula One | |
1.000%, 1/30/23§ | | | 71,000 | | | | 84,668 | |
Live Nation Entertainment, Inc. | | | | | | | | |
2.500%, 5/15/19 | | | 56,000 | | | | 74,025 | |
| | | | | | | | |
| | | | | | | 1,025,818 | |
| | | | | | | | |
Total Consumer Discretionary | | | | | | | 2,700,811 | |
| | | | | | | | |
Energy (3.6%) | | | | | | | | |
Energy Equipment & Services (1.4%) | |
Ensco Jersey Finance Ltd. | | | | | | | | |
3.000%, 1/31/24§ | | | 61,000 | | | | 51,545 | |
Nabors Industries, Inc. | | | | | | | | |
0.750%, 1/15/24§ | | | 119,000 | | | | 87,763 | |
SEACOR Holdings, Inc. | | | | | | | | |
3.000%, 11/15/28 | | | 57,000 | | | | 52,226 | |
Weatherford International Ltd. | | | | | | | | |
5.875%, 7/1/21 | | | 147,000 | | | | 148,286 | |
| | | | | | | | |
| | | | | | | 339,820 | |
| | | | | | | | |
Oil, Gas & Consumable Fuels (2.2%) | |
Cheniere Energy, Inc. | | | | | | | | |
4.250%, 3/15/45 | | | 120,000 | | | | 83,475 | |
Chesapeake Energy Corp. | | | | | | | | |
5.500%, 9/15/26§ | | | 139,000 | | | | 123,102 | |
PDC Energy, Inc. | | | | | | | | |
1.125%, 9/15/21 | | | 159,000 | | | | 155,224 | |
SM Energy Co. | | | | | | | | |
1.500%, 7/1/21 | | | 156,000 | | | | 149,662 | |
| | | | | | | | |
| | | | | | | 511,463 | |
| | | | | | | | |
Total Energy | | | | | | | 851,283 | |
| | | | | | | | |
| | | | | | | | |
Financials (3.1%) | | | | | | | | |
Capital Markets (0.1%) | |
New Mountain Finance Corp. | | | | | | | | |
5.000%, 6/15/19 | | | 31,000 | | | | 31,872 | |
| | | | | | | | |
Consumer Finance (0.5%) | | | | | | | | |
Encore Capital Group, Inc. | | | | | | | | |
3.250%, 3/15/22§ | | | 30,000 | | | | 35,662 | |
PRA Group, Inc. | | | | | | | | |
3.500%, 6/1/23§ | | | 99,000 | | | | 89,286 | |
| | | | | | | | |
| | | | | | | 124,948 | |
| | | | | | | | |
Insurance (1.2%) | | | | | | | | |
Fidelity National Financial, Inc. | | | | | | | | |
4.250%, 8/15/18 | | | 100,000 | | | | 289,124 | |
| | | | | | | | |
Mortgage Real Estate Investment Trusts (REITs) (0.6%) | |
Blackstone Mortgage Trust, Inc. (REIT) | |
4.375%, 5/5/22 | | | 66,000 | | | | 66,784 | |
Western Asset Mortgage Capital Corp. (REIT) | |
6.750%, 10/1/22 | | | 60,000 | | | | 59,512 | |
| | | | | | | | |
| | | | | | | 126,296 | |
| | | | | | | | |
Thrifts & Mortgage Finance (0.7%) | | | | | |
LendingTree, Inc. | | | | | | | | |
0.625%, 6/1/22§ | | | 106,000 | | | | 149,990 | |
| | | | | | | | |
Total Financials | | | | | | | 722,230 | |
| | | | | | | | |
Health Care (13.1%) | | | | | | | | |
Biotechnology (5.7%) | | | | | | | | |
Acorda Therapeutics, Inc. | | | | | | | | |
1.750%, 6/15/21 | | | 65,000 | | | | 60,084 | |
AMAG Pharmaceuticals, Inc. | | | | | | | | |
3.250%, 6/1/22 | | | 50,000 | | | | 45,625 | |
BioMarin Pharmaceutical, Inc. | | | | | | | | |
0.750%, 10/15/18 | | | 85,000 | | | | 89,622 | |
1.500%, 10/15/20 | | | 181,000 | | | | 205,322 | |
Clovis Oncology, Inc. | | | | | | | | |
2.500%, 9/15/21 | | | 83,000 | | | | 120,143 | |
Flexion Therapeutics, Inc. | | | | | | | | |
3.375%, 5/1/24 (b)§ | | | 144,000 | | | | 163,170 | |
Incyte Corp. | | | | | | | | |
1.250%, 11/15/20 | | | 75,000 | | | | 165,984 | |
Intercept Pharmaceuticals, Inc. | | | | | | | | |
3.250%, 7/1/23 | | | 29,000 | | | | 22,638 | |
Ionis Pharmaceuticals, Inc. | | | | | | | | |
1.000%, 11/15/21 | | | 128,000 | | | | 144,080 | |
Merrimack Pharmaceuticals, Inc. | | | | | | | | |
4.500%, 7/15/20 | | | 75,000 | | | | 67,500 | |
Neurocrine Biosciences, Inc. | | | | | | | | |
2.250%, 5/15/24§ | | | 65,000 | | | | 74,466 | |
Radius Health, Inc. | | | | | | | | |
3.000%, 9/1/24 | | | 60,000 | | | | 54,525 | |
TESARO, Inc. | | | | | | | | |
3.000%, 10/1/21 | | | 40,000 | | | | 134,750 | |
| | | | | | | | |
| | | | | | | 1,347,909 | |
| | | | | | | | |
Health Care Equipment & Supplies (1.6%) | | | | | |
DexCom, Inc. | | | | | | | | |
0.750%, 5/15/22§ | | | 60,000 | | | | 53,062 | |
Hologic, Inc. | | | | | | | | |
0.000%, 12/15/43 (e) | | | 83,000 | | | | 100,430 | |
See Notes to Financial Statements.
7
1290 FUNDS
1290 CONVERTIBLE SECURITIES FUND
PORTFOLIO OF INVESTMENTS (Continued)
October 31, 2017
| | | | | | | | |
| | | Principal
Amount | | | Value
(Note 1) | |
| | | | | | | | |
NuVasive, Inc. | | | | | | | | |
2.250%, 3/15/21 | | $ | 137,000 | | | $ | 158,578 | |
Wright Medical Group, Inc. | | | | | | | | |
2.000%, 2/15/20 | | | 58,000 | | | | 62,785 | |
| | | | | | | | |
| | | | | | | 374,855 | |
| | | | | | | | |
Health Care Providers & Services (1.5%) | |
Anthem, Inc. | | | | | | | | |
2.750%, 10/15/42 | | | 18,000 | | | | 51,480 | |
Molina Healthcare, Inc. | | | | | | | | |
1.125%, 1/15/20 | | | 120,000 | | | | 204,975 | |
1.625%, 8/15/44 | | | 26,000 | | | | 32,094 | |
Teladoc, Inc. | | | | | | | | |
3.000%, 12/15/22§ | | | 60,000 | | | | 64,537 | |
| | | | | | | | |
| | | | | | | 353,086 | |
| | | | | | | | |
Health Care Technology (0.6%) | |
Allscripts Healthcare Solutions, Inc. | |
1.250%, 7/1/20 | | | 105,000 | | | | 108,806 | |
Evolent Health, Inc. | | | | | | | | |
2.000%, 12/1/21§ | | | 22,000 | | | | 23,471 | |
| | | | | | | | |
| | | | | | | 132,277 | |
| | | | | | | | |
Pharmaceuticals (3.7%) | | | | | | | | |
Depomed, Inc. | | | | | | | | |
2.500%, 9/1/21 | | | 85,000 | | | | 61,412 | |
Dermira, Inc. | | | | | | | | |
3.000%, 5/15/22§ | | | 104,000 | | | | 112,775 | |
Horizon Pharma Investment Ltd. | |
2.500%, 3/15/22 | | | 125,000 | | | | 114,375 | |
Innoviva, Inc. | | | | | | | | |
2.125%, 1/15/23 | | | 136,000 | | | | 124,865 | |
Jazz Investments I Ltd. | | | | | | | | |
1.875%, 8/15/21 | | | 120,000 | | | | 123,450 | |
1.500%, 8/15/24§ | | | 59,000 | | | | 56,161 | |
Medicines Co. (The) | | | | | | | | |
2.500%, 1/15/22 | | | 131,000 | | | | 142,463 | |
Pacira Pharmaceuticals, Inc. | |
2.375%, 4/1/22§ | | | 131,000 | | | | 121,257 | |
| | | | | | | | |
| | | | | | | 856,758 | |
| | | | | | | | |
Total Health Care | | | | | | | 3,064,885 | |
| | | | | | | | |
Industrials (6.3%) | | | | | | | | |
Aerospace & Defense (0.3%) | |
Aerojet Rocketdyne Holdings, Inc. | |
2.250%, 12/15/23§ | | | 52,000 | | | | 71,793 | |
| | | | | | | | |
Air Freight & Logistics (0.6%) | |
Echo Global Logistics, Inc. | | | | | | | | |
2.500%, 5/1/20 | | | 139,000 | | | | 137,610 | |
| | | | | | | | |
Commercial Services & Supplies (0.2%) | |
Team, Inc. | | | | | | | | |
5.000%, 8/1/23§ | | | 57,000 | | | | 52,404 | |
| | | | | | | | |
Construction & Engineering (1.6%) | |
Dycom Industries, Inc. | | | | | | | | |
0.750%, 9/15/21 | | | 179,000 | | | | 207,864 | |
Tutor Perini Corp. | | | | | | | | |
2.875%, 6/15/21 | | | 143,000 | | | | 163,824 | |
| | | | | | | | |
| | | | | | | 371,688 | |
| | | | | | | | |
| | | | | | | | |
Machinery (2.2%) | | | | | | | | |
Chart Industries, Inc. | | | | | | | | |
2.000%, 8/1/18 | | | 208,000 | | | | 207,610 | |
Greenbrier Cos., Inc. (The) | |
3.500%, 4/1/18 | | | 30,000 | | | | 43,800 | |
2.875%, 2/1/24§ | | | 6,000 | | | | 7,016 | |
Meritor, Inc. | | | | | | | | |
3.250%, 10/15/37§ | | | 60,000 | | | | 64,200 | |
Navistar International Corp. | | | | | | | | |
4.750%, 4/15/19 | | | 121,000 | | | | 131,361 | |
Trinity Industries, Inc. | | | | | | | | |
3.875%, 6/1/36 | | | 37,000 | | | | 51,430 | |
| | | | | | | | |
| | | | | | | 505,417 | |
| | | | | | | | |
Professional Services (0.4%) | |
Huron Consulting Group, Inc. | |
1.250%, 10/1/19 | | | 95,000 | | | | 89,063 | |
| | | | | | | | |
Transportation Infrastructure (1.0%) | |
Macquarie Infrastructure Corp. | |
2.875%, 7/15/19 | | | 60,000 | | | | 63,075 | |
2.000%, 10/1/23 | | | 191,000 | | | | 183,121 | |
| | | | | | | | |
| | | | | | | 246,196 | |
| | | | | | | | |
Total Industrials | | | | | | | 1,474,171 | |
| | | | | | | | |
Information Technology (37.0%) | | | | | | | | |
Communications Equipment (2.8%) | |
CalAmp Corp. | | | | | | | | |
1.625%, 5/15/20 | | | 60,000 | | | | 63,900 | |
Ciena Corp. | | | | | | | | |
3.750%, 10/15/18 | | | 150,000 | | | | 177,375 | |
4.000%, 12/15/20 | | | 44,000 | | | | 57,667 | |
Finisar Corp. | | | | | | | | |
0.500%, 12/15/36§ | | | 81,000 | | | | 77,355 | |
Lumentum Holdings, Inc. | |
0.250%, 3/15/24§ | | | 59,000 | | | | 74,783 | |
Palo Alto Networks, Inc. | | | | | | | | |
(Zero Coupon), 7/1/19 | | | 145,000 | | | | 202,094 | |
| | | | | | | | |
| | | | | | | 653,174 | |
| | | | | | | | |
Electronic Equipment, Instruments & Components (1.4%) | |
Knowles Corp. | | | | | | | | |
3.250%, 11/1/21 | | | 59,000 | | | | 69,325 | |
TTM Technologies, Inc. | | | | | | | | |
1.750%, 12/15/20 | | | 105,000 | | | | 181,191 | |
Vishay Intertechnology, Inc. | | | | | | | | |
2.250%, 11/15/40 | | | 50,000 | | | | 86,375 | |
| | | | | | | | |
| | | | | | | 336,891 | |
| | | | | | | | |
Internet Software & Services (3.7%) | |
Akamai Technologies, Inc. | | | | | | | | |
(Zero Coupon), 2/15/19 | | | 61,000 | | | | 59,932 | |
Altaba, Inc. | | | | | | | | |
(Zero Coupon), 12/1/18 | | | 67,000 | | | | 92,125 | |
Cornerstone OnDemand, Inc. | | | | | | | | |
1.500%, 7/1/18 | | | 150,000 | | | | 150,937 | |
Pandora Media, Inc. | | | | | | | | |
1.750%, 12/1/20 | | | 110,000 | | | | 102,712 | |
Twitter, Inc. | | | | | | | | |
0.250%, 9/15/19 | | | 125,000 | | | | 118,438 | |
See Notes to Financial Statements.
8
1290 FUNDS
1290 CONVERTIBLE SECURITIES FUND
PORTFOLIO OF INVESTMENTS (Continued)
October 31, 2017
| | | | | | | | |
| | | Principal
Amount | | | Value
(Note 1) | |
| | | | | | | | |
VeriSign, Inc. | | | | | | | | |
4.702%, 8/15/37 | | $ | 100,000 | | | $ | 314,188 | |
Weibo Corp. | | | | | | | | |
1.250%, 11/15/22 (b)§ | | | 30,000 | | | | 31,275 | |
| | | | | | | | |
| | | | | | | 869,607 | |
| | | | | | | | |
IT Services (1.4%) | |
Blackhawk Network Holdings, Inc. | |
1.500%, 1/15/22 | | | 192,000 | | | | 192,120 | |
Cardtronics, Inc. | | | | | | | | |
1.000%, 12/1/20 | | | 41,000 | | | | 37,822 | |
CSG Systems International, Inc. | |
4.250%, 3/15/36 | | | 89,000 | | | | 96,454 | |
| | | | | | | | |
| | | | | | | 326,396 | |
| | | | | | | | |
Semiconductors & Semiconductor Equipment (17.7%) | |
Advanced Micro Devices, Inc. | | | | | | | | |
2.125%, 9/1/26 | | | 83,000 | | | | 130,829 | |
Inphi Corp. | | | | | | | | |
1.125%, 12/1/20 | | | 87,000 | | | | 107,771 | |
0.750%, 9/1/21 | | | 15,000 | | | | 15,610 | |
Integrated Device Technology, Inc. | |
0.875%, 11/15/22 | | | 150,000 | | | | 172,687 | |
Intel Corp.
3.250%, 8/1/39 | | | 226,000 | | | | 491,550 | |
Microchip Technology, Inc. | | | | | | | | |
1.625%, 2/15/25 | | | 137,000 | | | | 251,823 | |
1.625%, 2/15/27§ | | | 485,000 | | | | 610,797 | |
2.250%, 2/15/37§ | | | 12,000 | | | | 15,210 | |
Micron Technology, Inc. | | | | | | | | |
Series F
2.125%, 2/15/33 | | | 47,000 | | | | 190,085 | |
Series G
3.000%, 11/15/43 | | | 499,000 | | | | 773,450 | |
Novellus Systems, Inc.
2.625%, 5/15/41 | | | 109,000 | | | | 675,596 | |
NVIDIA Corp.
1.000%, 12/1/18 | | | 15,000 | | | | 153,872 | |
ON Semiconductor Corp.
1.000%, 12/1/20 | | | 120,000 | | | | 154,725 | |
Silicon Laboratories, Inc.
1.375%, 3/1/22§ | | | 12,000 | | | | 14,385 | |
Spansion LLC
2.000%, 9/1/20 | | | 56,000 | | | | 174,790 | |
SunPower Corp. | | | | | | | | |
0.750%, 6/1/18 | | | 56,000 | | | | 54,250 | |
4.000%, 1/15/23 | | | 30,000 | | | | 23,700 | |
Synaptics, Inc.
0.500%, 6/15/22§ | | | 61,000 | | | | 54,824 | |
Veeco Instruments, Inc.
2.700%, 1/15/23 | | | 72,000 | | | | 65,790 | |
| | | | | | | | |
| | | | | | | 4,131,744 | |
| | | | | | | | |
Software (9.7%) | |
Citrix Systems, Inc.
0.500%, 4/15/19 | | | 150,000 | | | | 183,937 | |
FireEye, Inc. | | | | | | | | |
Series A
1.000%, 6/1/35 | | | 148,000 | | | | 139,860 | |
HubSpot, Inc.
0.250%, 6/1/22§ | | | 61,000 | | | | 68,777 | |
| | | | | | | | |
Nuance Communications, Inc.
1.000%, 12/15/35 | | | 158,000 | | | | 145,064 | |
Proofpoint, Inc.
0.750%, 6/15/20 | | | 63,000 | | | | 81,152 | |
PROS Holdings, Inc.
2.000%, 12/1/19 | | | 80,000 | | | | 79,800 | |
RealPage, Inc.
1.500%, 11/15/22§ | | | 47,000 | | | | 57,663 | |
Red Hat, Inc.
0.250%, 10/1/19 | | | 118,000 | | | | 195,659 | |
Rovi Corp.
0.500%, 3/1/20 | | | 60,000 | | | | 58,275 | |
salesforce.com, Inc.
0.250%, 4/1/18 | | | 354,000 | | | | 543,832 | |
ServiceNow, Inc. | | | | | | | | |
(Zero Coupon), 11/1/18 | | | 70,000 | | | | 119,875 | |
(Zero Coupon), 6/1/22§ | | | 119,000 | | | | 133,429 | |
Synchronoss Technologies, Inc.
0.750%, 8/15/19 | | | 95,000 | | | | 88,766 | |
Take-Two Interactive Software, Inc.
1.000%, 7/1/18 | | | 30,000 | | | | 154,088 | |
Verint Systems, Inc.
1.500%, 6/1/21 | | | 129,000 | | | | 126,339 | |
Workday, Inc. | | | | | | | | |
0.750%, 7/15/18 | | | 59,000 | | | | 79,724 | |
0.250%, 10/1/22§ | | | 15,000 | | | | 15,159 | |
| | | | | | | | |
| | | | | | | 2,271,399 | |
| | | | | | | | |
Technology Hardware, Storage & Peripherals (0.3%) | |
Electronics For Imaging, Inc.
0.750%, 9/1/19 | | | 65,000 | | | | 63,375 | |
| | | | | | | | |
Total Information Technology | | | | | | | 8,652,586 | |
| | | | | | | | |
Materials (1.7%) | | | | | | | | |
Construction Materials (1.7%) | |
Cemex SAB de CV
3.720%, 3/15/20 | | | 365,000 | | | | 388,041 | |
| | | | | | | | |
Total Materials | | | | | | | 388,041 | |
| | | | | | | | |
Real Estate (0.5%) | | | | | | | | |
Equity Real Estate Investment Trusts (REITs) (0.5%) | |
Colony NorthStar, Inc. (REIT)
5.000%, 4/15/23 | | | 65,000 | | | | 66,869 | |
Starwood Waypoint Homes (REIT)
3.500%, 1/15/22§ | | | 54,000 | | | | 60,412 | |
| | | | | | | | |
Total Real Estate | | | | | | | 127,281 | |
| | | | | | | | |
Total Convertible Bonds | | | | | | | 17,981,288 | |
| | | | | | | | |
Total Long-Term Debt Securities (76.8%)
(Cost $16,102,693) | | | | 17,981,288 | |
| | | | | | | | |
| | | Number of
Shares | | | Value
(Note 1) | |
CONVERTIBLE PREFERRED STOCKS: | | | | | |
Consumer Staples (0.7%) | | | | | | | | |
Food Products (0.7%) | | | | | | | | |
Bunge Ltd.,
4.875% | | | 592 | | | | 61,686 | |
Post Holdings, Inc.,
2.500% | | | 595 | | | | 93,192 | |
| | | | | | | | |
Total Consumer Staples | | | | | | | 154,878 | |
| | | | | | | | |
See Notes to Financial Statements.
9
1290 FUNDS
1290 CONVERTIBLE SECURITIES FUND
PORTFOLIO OF INVESTMENTS (Continued)
October 31, 2017
| | | | | | | | |
| | | Number of
Shares | | | Value
(Note 1) | |
| | | | | | | | |
Energy (1.2%) | | | | | | | | |
Oil, Gas & Consumable Fuels (1.2%) | |
Hess Corp.,
8.000% | | | 1,390 | | | $ | 76,728 | |
Kinder Morgan, Inc., | | | | | | | | |
Series A
9.750% | | | 1,691 | | | | 63,582 | |
Southwestern Energy Co., | | | | | | | | |
Series B
6.250% | | | 4,000 | | | | 50,920 | |
WPX Energy, Inc., | | | | | | | | |
Series A
6.250% | | | 1,480 | | | | 75,776 | |
| | | | | | | | |
Total Energy | | | | | | | 267,006 | |
| | | | | | | | |
Financials (7.3%) | | | | | | | | |
Banks (7.1%) | | | | | | | | |
Bank of America Corp., | | | | | | | | |
Series L
7.250% | | | 292 | | | | 378,712 | |
Huntington Bancshares, Inc., | | | | | | | | |
Series A
8.500% | | | 347 | | | | 487,535 | |
Wells Fargo & Co., | | | | | | | | |
Series L
7.500% | | | 610 | | | | 799,100 | |
| | | | | | | | |
| | | | | | | 1,665,347 | |
| | | | | | | | |
Capital Markets (0.2%) | |
AMG Capital Trust II,
5.150% | | | 545 | | | | 32,973 | |
| | | | | | | | |
Total Financials | | | | | | | 1,698,320 | |
| | | | | | | | |
Health Care (5.3%) | | | | | | | | |
Health Care Equipment & Supplies (1.8%) | |
Becton Dickinson and Co., | | | | | | | | |
Series A
6.125% | | | 7,569 | | | | 429,692 | |
| | | | | | | | |
Health Care Providers & Services (1.6%) | |
Anthem, Inc.,
5.250% | | | 6,880 | | | | 366,567 | |
| | | | | | | | |
Pharmaceuticals (1.9%) | |
Allergan plc, | | | | | | | | |
Series A
5.500% | | | 703 | | | | 452,514 | |
| | | | | | | | |
Total Health Care | | | | | | | 1,248,773 | |
| | | | | | | | |
Industrials (0.9%) | | | | | | | | |
Commercial Services & Supplies (0.2%) | |
Stericycle, Inc.,
5.250% | | | 798 | | | | 45,438 | |
| | | | | | | | |
Machinery (0.7%) | |
Rexnord Corp., | | | | | | | | |
Series A
5.750% | | | 1,335 | | | | 76,816 | |
Stanley Black & Decker, Inc.,
5.375% | | | 802 | | | | 94,852 | |
| | | | | | | | |
| | | | | | | 171,668 | |
| | | | | | | | |
Total Industrials | | | | | | | 217,106 | |
| | | | | | | | |
| | | | | | | | |
Information Technology (1.1%) | |
Electronic Equipment, Instruments & Components (1.1%) | |
Belden, Inc.,
6.750% | | | 1,528 | | | | 164,214 | |
MTS Systems Corp.,
8.750% | | | 812 | | | | 95,751 | |
| | | | | | | | |
Total Information Technology | | | | | | | 259,965 | |
| | | | | | | | |
Real Estate (1.4%) | | | | | | | | |
Equity Real Estate Investment Trusts (REITs) (1.4%) | |
Crown Castle International Corp. (REIT), | | | | | | | | |
Series A
6.875% | | | 186 | | | | 204,195 | |
Welltower, Inc. (REIT), | | | | | | | | |
Series I
6.500% | | | 2,076 | | | | 127,321 | |
| | | | | | | | |
Total Real Estate | | | | | | | 331,516 | |
| | | | | | | | |
Telecommunication Services (2.0%) | | | | | | | | |
Diversified Telecommunication Services (0.3%) | |
Frontier Communications Corp., | | | | | | | | |
Series A
11.125% | | | 2,857 | | | | 56,797 | |
| | | | | | | | |
Wireless Telecommunication Services (1.7%) | |
T-Mobile US, Inc.,
5.500% | | | 4,167 | | | | 403,366 | |
| | | | | | | | |
Total Telecommunication Services | | | | | | | 460,163 | |
| | | | | | | | |
Utilities (0.5%) | | | | | | | | |
Electric Utilities (0.2%) | | | | | | | | |
NextEra Energy, Inc.,
6.123% | | | 1,095 | | | | 62,415 | |
| | | | | | | | |
Multi-Utilities (0.3%) | | | | | | | | |
Dominion Energy, Inc., | | | | | | | | |
Series A
6.750% | | | 1,210 | | | | 63,319 | |
| | | | | | | | |
Total Utilities | | | | | | | 125,734 | |
| | | | | | | | |
Total Convertible Preferred Stocks (20.4%)
(Cost $4,939,759) | | | | 4,763,461 | |
| | | | | | | | |
SHORT-TERM INVESTMENT: | | | | | |
Investment Company (0.1%) | | | | | | | | |
JPMorgan Prime Money Market Fund, IM Shares | | | 31,761 | | | | 31,767 | |
| | | | | | | | |
Total Short-Term Investment (0.1%)
(Cost $31,767) | | | | | | | 31,767 | |
| | | | | | | | |
Total Investments in
Securities (97.3%)
(Cost $21,074,219) | | | | | | | 22,776,516 | |
Other Assets Less
Liabilities (2.7%) | | | | | | | 639,103 | |
| | | | | | | | |
Net Assets (100%) | | | | | | $ | 23,415,619 | |
| | | | | | | | |
See Notes to Financial Statements.
10
1290 FUNDS
1290 CONVERTIBLE SECURITIES FUND
PORTFOLIO OF INVESTMENTS (Continued)
October 31, 2017
| § | Securities exempt from registration under Rule 144A of the Securities Act of 1933. These securities may only be resold to qualified institutional buyers. At October 31, 2017, the market value of these securities amounted to $3,079,068 or 13.1% of net assets. Securities denoted with “§” but without “b�� have been determined to be liquid under the guidelines established by the Board of Trustees. To the extent any securities might provide a right to demand registration, such rights have not been relied upon when determining liquidity. |
| (b) | Rule 144A Illiquid Security. At October 31, 2017, the market value of these securities amounted to $194,445 or 0.8% of net assets. |
| (e) | Step Bond — Coupon rate increases or decreases in increments to maturity. Rate disclosed is as of October 31, 2017. Maturity date disclosed is the ultimate maturity date. |
The following is a summary of the inputs used to value the Fund’s assets and liabilities carried at fair value as of October 31, 2017:
The inputs or methodology used for valuing securities are not necessarily an indication of the risk associated with investing in those securities.
Various inputs are used in determining the value of the Fund’s investments. These inputs are summarized in the three broad levels listed below:
| | | | | | | | | | | | | | | | |
| | | | | |
| Investment Type | | Level 1
Quoted Prices in
Active Markets for
Identical
Securities | | | Level 2
Significant Other
Observable Inputs
(including quoted prices
for similar securities,
interest rates,
prepayment speeds,
credit risk, etc.) | | | Level 3
Significant Unobservable
Inputs (including the
Fund’s own
assumptions in
determining the fair
value of investments) | | | Total | |
Assets: | | | | | | | | | | | | | | | | |
Convertible Bonds | | | | | | | | | | | | | | | | |
Consumer Discretionary | | $ | — | | | $ | 2,700,811 | | | $ | — | | | $ | 2,700,811 | |
Energy | | | — | | | | 851,283 | | | | — | | | | 851,283 | |
Financials | | | — | | | | 722,230 | | | | — | | | | 722,230 | |
Health Care | | | — | | | | 3,064,885 | | | | — | | | | 3,064,885 | |
Industrials | | | — | | | | 1,474,171 | | | | — | | | | 1,474,171 | |
Information Technology | | | — | | | | 8,652,586 | | | | — | | | | 8,652,586 | |
Materials | | | — | | | | 388,041 | | | | — | | | | 388,041 | |
Real Estate | | | — | | | | 127,281 | | | | — | | | | 127,281 | |
Convertible Preferred Stocks | | | | | | | | | | | | | | | | |
Consumer Staples | | | 61,686 | | | | 93,192 | | | | — | | | | 154,878 | |
Energy | | | 267,006 | | | | — | | | | — | | | | 267,006 | |
Financials | | | 1,665,347 | | | | 32,973 | | | | — | | | | 1,698,320 | |
Health Care | | | 1,248,773 | | | | — | | | | — | | | | 1,248,773 | |
Industrials | | | 217,106 | | | | — | | | | — | | | | 217,106 | |
Information Technology | | | 164,214 | | | | 95,751 | | | | — | | | | 259,965 | |
Real Estate | | | 331,516 | | | | — | | | | — | | | | 331,516 | |
Telecommunication Services | | | 460,163 | | | | — | | | | — | | | | 460,163 | |
Utilities | | | 125,734 | | | | — | | | | — | | | | 125,734 | |
Short-Term Investments | | | | | | | | | | | | | | | | |
Investment Companies | | | 31,767 | | | | — | | | | — | | | | 31,767 | |
| | | | | | | | | | | | | | | | |
Total Assets | | $ | 4,573,312 | | | $ | 18,203,204 | | | $ | — | | | $ | 22,776,516 | |
| | | | | | | | | | | | | | | | |
Total Liabilities | | $ | — | | | $ | — | | | $ | — | | | $ | — | |
| | | | | | | | | | | | | | | | |
Total | | $ | 4,573,312 | | | $ | 18,203,204 | | | $ | — | | | $ | 22,776,516 | |
| | | | | | | | | | | | | | | | |
There were no transfers between Levels 1, 2 or 3 during the year ended October 31, 2017.
The Fund held no derivatives contracts during the year ended October 31, 2017.
See Notes to Financial Statements.
11
1290 FUNDS
1290 CONVERTIBLE SECURITIES FUND
PORTFOLIO OF INVESTMENTS (Continued)
October 31, 2017
Investment security transactions for the year ended October 31, 2017 were as follows:
| | | | |
Cost of Purchases: | | | | |
Long-term investments other than U.S. government debt securities | | $ | 9,191,441 | |
Net Proceeds of Sales and Redemptions: | | | | |
Long-term investments other than U.S. government debt securities | | $ | 8,624,924 | |
As of October 31, 2017, the gross unrealized appreciation (depreciation) of investments based on the aggregate cost of investments in securities and derivative instruments, if applicable, for Federal income tax purposes was as follows:
| | | | |
Aggregate gross unrealized appreciation | | $ | 2,964,767 | |
Aggregate gross unrealized depreciation | | | (1,392,191 | ) |
| | | | |
Net unrealized appreciation | | $ | 1,572,576 | |
| | | | |
Federal income tax cost of investments in securities and derivative instruments, if applicable | | $ | 21,203,940 | |
| | | | |
See Notes to Financial Statements.
12
1290 FUNDS
1290 CONVERTIBLE SECURITIES FUND
STATEMENT OF ASSETS AND LIABILITIES
October 31, 2017
| | | | |
ASSETS | |
Investments in Securities, at value (Cost $21,074,219) | | $ | 22,776,516 | |
Cash | | | 646,000 | |
Receivable for securities sold | | | 223,637 | |
Dividends, interest and other receivables | | | 91,183 | |
Prepaid registration and filing fees | | | 16,801 | |
Other assets | | | 256 | |
| | | | |
Total assets | | | 23,754,393 | |
| | | | |
LIABILITIES | |
Payable for securities purchased | | | 226,848 | |
Dividends and distributions payable | | | 44,331 | |
Transfer agent fees payable | | | 3,345 | |
Administrative fees payable | | | 1,738 | |
Payable for Fund shares redeemed | | | 576 | |
Distribution fees payable – Class A | | | 91 | |
Distribution fees payable – Class R | | | 46 | |
Accrued expenses | | | 61,799 | |
| | | | |
Total liabilities | | | 338,774 | |
| | | | |
NET ASSETS | | $ | 23,415,619 | |
| | | | |
Net assets were comprised of: | |
Paid in capital | | $ | 21,381,225 | |
Accumulated undistributed net investment income (loss) | | | 99,779 | |
Accumulated undistributed net realized gain (loss) | | | 232,318 | |
Net unrealized appreciation (depreciation) | | | 1,702,297 | |
| | | | |
Net assets | | $ | 23,415,619 | |
| | | | |
Class A | | | | |
Net asset value and redemption price per share, $432,565 / 39,645 shares outstanding (unlimited amount authorized: $0.001 par value) | | $ | 10.91 | |
Maximum sales charge (4.50% of offering price) | | | 0.51 | |
| | | | |
Maximum offering price per share | | $ | 11.42 | |
| | | | |
Class I | | | | |
Net asset value and redemption price per share, $22,873,840 / 2,096,620 shares outstanding (unlimited amount authorized: $0.001 par value) | | $ | 10.91 | |
| | | | |
Class R | | | | |
Net asset value and redemption price per share, $109,214 / 10,010 shares outstanding (unlimited amount authorized: $0.001 par value) | | $ | 10.91 | |
| | | | |
STATEMENT OF OPERATIONS
For the Year Ended October 31, 2017
| | | | |
INVESTMENT INCOME | |
Dividends | | $ | 314,262 | |
Interest | | | 305,763 | |
| | | | |
Total income | | | 620,025 | |
| | | | |
EXPENSES | |
Investment advisory fees | | | 152,285 | |
Professional fees | | | 93,106 | |
Registration and filing fees | | | 38,400 | |
Transfer agent fees | | | 33,309 | |
Administrative fees | | | 32,633 | |
Printing and mailing expenses | | | 16,785 | |
Custodian fees | | | 5,700 | |
Trustees’ fees | | | 2,704 | |
Distribution fees – Class A | | | 1,018 | |
Distribution fees – Class R | | | 513 | |
Miscellaneous | | | 20,821 | |
| | | | |
Gross expenses | | | 397,274 | |
Less: Waiver from investment adviser | | | (166,977 | ) |
| | | | |
Net expenses | | | 230,297 | |
| | | | |
NET INVESTMENT INCOME (LOSS) | | | 389,728 | |
| | | | |
REALIZED AND UNREALIZED GAIN (LOSS) | |
Net realized gain (loss) on investments in securities | | | 835,244 | |
Net change in unrealized appreciation (depreciation) on investments in securities | | | 2,187,146 | |
| | | | |
NET REALIZED AND UNREALIZED GAIN (LOSS) | | | 3,022,390 | |
| | | | |
NET INCREASE (DECREASE) IN NET ASSETS RESULTING FROM OPERATIONS | | $ | 3,412,118 | |
| | | | |
See Notes to Financial Statements.
13
1290 FUNDS
1290 CONVERTIBLE SECURITIES FUND
STATEMENT OF CHANGES IN NET ASSETS
| | | | | | | | |
| | | Year Ended October 31, | |
| | 2017 | | | 2016 | |
INCREASE (DECREASE) IN NET ASSETS FROM OPERATIONS: | |
Net investment income (loss) | | $ | 389,728 | | | $ | 342,078 | |
Net realized gain (loss) | | | 835,244 | | | | (228,393 | ) |
Net change in unrealized appreciation (depreciation) | | | 2,187,146 | | | | 342,276 | |
| | | | | | | | |
NET INCREASE (DECREASE) IN NET ASSETS RESULTING FROM OPERATIONS | | | 3,412,118 | | | | 455,961 | |
| | | | | | | | |
DIVIDENDS: | | | | | | | | |
Dividends from net investment income | | | | | | | | |
Class A | | | (9,313 | ) | | | (5,611 | ) |
Class I | | | (540,307 | ) | | | (416,007 | ) |
Class R | | | (2,099 | ) | | | (1,584 | ) |
| | | | | | | | |
TOTAL DIVIDENDS | | | (551,719 | ) | | | (423,202 | ) |
| | | | | | | | |
CAPITAL SHARES TRANSACTIONS: | | | | | | | | |
Class A | | | | | | | | |
Capital shares sold [ 2,344 and 19,312 shares, respectively ] | | | 23,819 | | | | 180,592 | |
Capital shares issued in reinvestment of dividends [ 691 and 421 shares, respectively ] | | | 6,958 | | | | 3,933 | |
Capital shares repurchased [ (2,543) and (2,153) shares, respectively ] | | | (26,262 | ) | | | (18,620 | ) |
| | | | | | | | |
Total Class A transactions | | | 4,515 | | | | 165,905 | |
| | | | | | | | |
Class I | | | | | | | | |
Capital shares sold [ 64,823 and 64,253 shares, respectively ] | | | 666,975 | | | | 589,211 | |
Capital shares issued in reinvestment of dividends [ 2,258 and 1,062 shares, respectively ] | | | 22,933 | | | | 9,928 | |
Capital shares repurchased [ (18,804) and (12,302) shares, respectively ] | | | (192,919 | ) | | | (119,056 | ) |
| | | | | | | | |
Total Class I transactions | | | 496,989 | | | | 480,083 | |
| | | | | | | | |
Class R | | | | | | | | |
Capital shares sold [ 0 and 10 shares, respectively ] | | | — | | | | 100 | |
Capital shares issued in reinvestment of dividends [ 0# and 0 shares, respectively ] | | | 2 | | | | — | |
| | | | | | | | |
Total Class R transactions | | | 2 | | | | 100 | |
| | | | | | | | |
NET INCREASE (DECREASE) IN NET ASSETS RESULTING FROM CAPITAL SHARE TRANSACTIONS | | | 501,506 | | | | 646,088 | |
| | | | | | | | |
TOTAL INCREASE (DECREASE) IN NET ASSETS | | | 3,361,905 | | | | 678,847 | |
NET ASSETS: | |
Beginning of year | | | 20,053,714 | | | | 19,374,867 | |
| | | | | | | | |
End of year (a) | | $ | 23,415,619 | | | $ | 20,053,714 | |
| | | | | | | | |
(a) Includes accumulated undistributed (overdistributed) net investment income (loss) of | | $ | 99,779 | | | $ | 10,649 | |
| | | | | | | | |
# Number of shares is less than 0.5. | | | | | | | | |
See Notes to Financial Statements.
14
1290 FUNDS
1290 CONVERTIBLE SECURITIES FUND
FINANCIAL HIGHLIGHTS
| | | | | | | | | | | | |
| | | Year Ended October 31, | | | July 6, 2015* to
October 31, 2015 | |
| Class A | | 2017 | | | 2016 | | |
Net asset value, beginning of period | | $ | 9.56 | | | $ | 9.56 | | | $ | 10.00 | |
| | | | | | | | | | | | |
Income (loss) from investment operations: | | | | | | | | | | | | |
Net investment income (loss) (e) | | | 0.16 | | | | 0.14 | | | | 0.03 | |
Net realized and unrealized gain (loss) | | | 1.43 | | | | 0.04 | | | | (0.44 | ) |
| | | | | | | | | | | | |
Total from investment operations | | | 1.59 | | | | 0.18 | | | | (0.41 | ) |
| | | | | | | | | | | | |
Less distributions: | |
Dividends from net investment income | | | (0.24 | ) | | | (0.18 | ) | | | (0.03 | ) |
| | | | | | | | | | | | |
Net asset value, end of period | | $ | 10.91 | | | $ | 9.56 | | | $ | 9.56 | |
| | | | | | | | | | | | |
Total return (b) | | | 16.82 | % | | | 1.97 | % | | | (4.08 | )% |
| | | | | | | | | | | | |
Ratios/Supplemental Data: | |
Net assets, end of period (000’s) | | $ | 433 | | | $ | 374 | | | $ | 206 | |
Ratio of expenses to average net assets: | | | | | | | | | | | | |
After waivers and reimbursements (a)(f) | | | 1.30 | % | | | 1.30 | % | | | 1.30 | % |
Before waivers and reimbursements (a)(f) | | | 2.07 | % | | | 2.26 | % | | | 2.09 | % |
Ratio of net investment income (loss) to average net assets: | | | | | | | | | | | | |
After waivers and reimbursements (a)(f) | | | 1.54 | % | | | 1.49 | % | | | 1.09 | %(l) |
Before waivers and reimbursements (a)(f) | | | 0.78 | % | | | 0.52 | % | | | 0.30 | %(l) |
Portfolio turnover rate (z)^ | | | 41 | % | | | 32 | % | | | 6 | % |
| | |
| | | Year Ended October 31, | | | July 6, 2015* to
October 31, 2015 | |
| Class I | | 2017 | | | 2016 | | |
Net asset value, beginning of period | | $ | 9.56 | | | $ | 9.56 | | | $ | 10.00 | |
| | | | | | | | | | | | |
Income (loss) from investment operations: | | | | | | | | | | | | |
Net investment income (loss) (e) | | | 0.18 | | | | 0.17 | | | | 0.04 | |
Net realized and unrealized gain (loss) | | | 1.43 | | | | 0.04 | | | | (0.44 | ) |
| | | | | | | | | | | | |
Total from investment operations | | | 1.61 | | | | 0.21 | | | | (0.40 | ) |
| | | | | | | | | | | | |
Less distributions: | |
Dividends from net investment income | | | (0.26 | ) | | | (0.21 | ) | | | (0.04 | ) |
| | | | | | | | | | | | |
Net asset value, end of period | | $ | 10.91 | | | $ | 9.56 | | | $ | 9.56 | |
| | | | | | | | | | | | |
Total return (b) | | | 17.11 | % | | | 2.23 | % | | | (4.00 | )% |
| | | | | | | | | | | | |
Ratios/Supplemental Data: | |
Net assets, end of period (000’s) | | $ | 22,874 | | | $ | 19,584 | | | $ | 19,073 | |
Ratio of expenses to average net assets: | | | | | | | | | | | | |
After waivers and reimbursements (a)(f) | | | 1.05 | % | | | 1.05 | % | | | 1.05 | % |
Before waivers and reimbursements (a)(f) | | | 1.82 | % | | | 1.99 | % | | | 1.72 | % |
Ratio of net investment income (loss) to average net assets: | | | | | | | | | | | | |
After waivers and reimbursements (a)(f) | | | 1.80 | % | | | 1.78 | % | | | 1.37 | %(l) |
Before waivers and reimbursements (a)(f) | | | 1.03 | % | | | 0.84 | % | | | 0.70 | %(l) |
Portfolio turnover rate (z)^ | | | 41 | % | | | 32 | % | | | 6 | % |
See Notes to Financial Statements.
15
1290 FUNDS
1290 CONVERTIBLE SECURITIES FUND
FINANCIAL HIGHLIGHTS (Continued)
| | | | | | | | | | | | |
| | | Year Ended October 31, | | | July 6, 2015* to
October 31, 2015 | |
| Class R | | 2017 | | | 2016 | | |
Net asset value, beginning of period | | $ | 9.56 | | | $ | 9.56 | | | $ | 10.00 | |
| | | | | | | | | | | | |
Income (loss) from investment operations: | | | | | | | | | | | | |
Net investment income (loss) (e) | | | 0.13 | | | | 0.12 | | | | 0.03 | |
Net realized and unrealized gain (loss) | | | 1.43 | | | | 0.04 | | | | (0.45 | ) |
| | | | | | | | | | | | |
Total from investment operations | | | 1.56 | | | | 0.16 | | | | (0.42 | ) |
| | | | | | | | | | | | |
Less distributions: | |
Dividends from net investment income | | | (0.21 | ) | | | (0.16 | ) | | | (0.02 | ) |
| | | | | | | | | | | | |
Net asset value, end of period | | $ | 10.91 | | | $ | 9.56 | | | $ | 9.56 | |
| | | | | | | | | | | | |
Total return (b) | | | 16.53 | % | | | 1.72 | % | | | (4.16 | )% |
| | | | | | | | | | | | |
Ratios/Supplemental Data: | |
Net assets, end of period (000’s) | | $ | 109 | | | $ | 96 | | | $ | 96 | |
Ratio of expenses to average net assets: | | | | | | | | | | | | |
After waivers and reimbursements (a)(f) | | | 1.55 | % | | | 1.55 | % | | | 1.55 | % |
Before waivers and reimbursements (a)(f) | | | 2.32 | % | | | 2.49 | % | | | 2.22 | % |
Ratio of net investment income (loss) to average net assets: | | | | | | | | | | | | |
After waivers and reimbursements (a)(f) | | | 1.30 | % | | | 1.28 | % | | | 0.87 | %(l) |
Before waivers and reimbursements (a)(f) | | | 0.53 | % | | | 0.34 | % | | | 0.20 | %(l) |
Portfolio turnover rate (z)^ | | | 41 | % | | | 32 | % | | | 6 | % |
| * | Commencement of Operations. |
| ^ | Portfolio turnover rate excludes derivatives, if any. |
| (a) | Ratios for periods less than one year are annualized. Certain non-recurring expenses incurred by the Fund are not annualized for periods less than one year. |
| (b) | Total returns for periods less than one year are not annualized. |
| (e) | Net investment income (loss) per share is based on average shares outstanding. |
| (f) | Expenses do not include the expenses of the underlying funds (“indirect expenses”), if applicable. |
| (l) | The annualized ratio of net investment income to average net assets may not be indicative of operating results for a full year. |
| (z) | Portfolio turnover rate for periods less than one year is not annualized. |
See Notes to Financial Statements.
16
1290 DOUBLELINE DYNAMIC ALLOCATION FUND (Unaudited)
INVESTMENT ADVISER
INVESTMENT SUB-ADVISER
PERFORMANCE RESULTS
| | | | | | | | | | |
| Annualized Total Returns as of 10/31/17 | |
| | | | | 1
Year | | | Since
Incept. | |
Fund – Class A Shares* | | without Sales Charge | | | 9.46 | % | | | 8.98 | % |
| | | with Sales Charge (a) | | | 3.47 | | | | 5.32 | |
Fund – Class I Shares* | | | | | 9.77 | | | | 9.29 | |
Fund – Class R Shares* | | | | | 9.15 | | | | 8.73 | |
60% S&P 500® Index/40% Bloomberg Barclays U.S. Aggregate Bond Index | | | | | 14.08 | | | | 12.10 | |
S&P 500® Index | | | | | 23.63 | | | | 18.88 | |
Bloomberg Barclays U.S. Aggregate Bond Index | | | | | 0.90 | | | | 2.49 | |
* Date of inception 3/7/16. (a) A 5.50% front-end sales charge was deducted. Returns for periods greater than one year are annualized. | |
The performance quoted is past performance and is not a guarantee of future results. Mutual funds are subject to certain market risks. Investment returns and principal value of an investment will fluctuate so that an investor’s shares, when redeemed, may be worth more or less than their original cost. Current performance may be higher or lower than the performance data shown. For the most current month-end performance data please call 1-888-310-0416 or visit www.1290Funds.com.
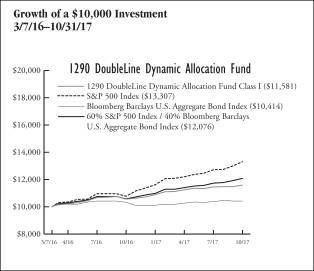
The graph illustrates comparative performance for $10,000 invested in the Class I Shares of the 1290 DoubleLine Dynamic Allocation Fund and the 60% S&P 500® Index/40% Bloomberg Barclays U.S. Aggregate Bond Index, the S&P 500® Index and the Bloomberg Barclays U.S. Aggregate Bond Index from 3/7/16 to 10/31/17. The performance of each of the 60% S&P 500® Index/40% Bloomberg Barclays U.S. Aggregate Bond Index, the S&P 500® Index and the Bloomberg Barclays U.S. Aggregate Bond Index reflects an initial investment at the end of the month closest to the Fund’s inception. The performance of the Fund assumes reinvestment of all dividends and capital gain distributions, if any, and does not include a sales charge. The performance of the 60% S&P 500® Index/40% Bloomberg Barclays U.S. Aggregate Bond Index, the S&P 500® Index and the Bloomberg Barclays U.S. Aggregate Bond Index does not reflect the deduction of expenses or a sales charge associated with a mutual fund and has been adjusted to reflect reinvestment of all dividends, capital gain distributions, and interest of the securities included in the benchmark.
Fund performance may reflect the waiver of the Fund’s fees and reimbursement of expenses for certain periods since the inception date. Without these waivers and reimbursements, performance would have been lower. Also, performance shown in this section does not reflect the deduction of taxes that a shareholder would pay on Fund distributions or redemption of Fund shares.
PERFORMANCE SUMMARY
The Fund’s Class I shares returned 9.77% for the year ended October 31, 2017. The Fund’s benchmarks, the 60% S&P 500® Index/40% Bloomberg Barclays U.S. Aggregate Bond Index, the S&P 500® Index and the Bloomberg Barclays U.S. Aggregate Bond Index returned 14.08%, 23.63 % and 0.90%, respectively over the same year.
Fund Highlights
Throughout the twelve-month period ended October 31, 2017, the Fund carried an allocation to U.S. equities of approximately 55%, with the balance of 45% invested in fixed income. This underweight allocation to equities, relative to a benchmark allocation of 60% equities and 40% fixed income, hurt the Fund’s relative returns. With valuations extended, rates low, and volatility muted a fairly conservative positioning was maintained in the Fund, both in the allocation to equities and in the investments within the respective fixed income and equity sleeves. Within the equity allocation, a fairly balanced allocation was maintained between the actively managed sleeve and the sleeve with exposure to the Shiller Barclays Cyclically Adjusted Price-to-Earnings (“CAPE”) Sector Index (“Index”). The Index is exposed at all times to four of the cheapest sectors of the S&P 500 Index, as measured by a variant of the CAPE ratio.
The Fund’s fixed income sleeve returned approximately 2.3%, outperforming the Bloomberg Barclays U.S. Aggregate Bond Index. Every sector within the fixed income sleeve provided positive returns, led by emerging markets fixed income, bank loans and investment grade corporate bonds.
The active equity sleeve of the Fund returned approximately 18.1%, trailing the S&P 500 Index’s total return of 23.6%. Healthcare, utilities and real estate were the greatest positive contributors to relative returns. In the healthcare sector, this was due to security selection, while in the utilities and real estate sectors it was due to an underweight allocation to these relatively weak sectors. Returns relative to the benchmark were hurt most by the industrial, energy and technology sectors — in each case due to security selection.
The Fund’s sleeve with exposure to the CAPE Index provided returns roughly in line with the S&P 500 Index. Over the course of the twelve-month period, the Index was exposed to the following sectors: consumer discretionary, consumer staples, energy, healthcare, industrials and technology.
17
1290 DOUBLELINE DYNAMIC ALLOCATION FUND (Unaudited)
| | | | |
Fund Characteristics As of October 31, 2017 | | | |
Weighted Average Life (Years) | | | 6.36 | |
Weighted Average Coupon (%) | | | 3.23 | |
Weighted Average Modified Duration (Years)* | | | 4.79 | |
Weighted Average Rating** | | | A2 | |
* Modified duration is a measure of the price sensitivity of the Fund to interest rate movements, taking into account specific features of the securities in which it invests. ** Weighted Average Rating has been provided by the Investment Sub-Adviser. A credit rating is an assessment provided by a nationally recognized statistical rating organization (NRSRO) of the creditworthiness of an issuer with respect to debt obligations, including specific securities, money market instruments or other debts. Ratings are measured on a scale that generally ranges from AAA (highest) to D (lowest); ratings are subject to change without notice. | |
| | | | |
Sector Weightings as of October 31, 2017 | | % of
Net Assets | |
U.S. Treasury Obligations | | | 33.7 | % |
Collateralized Mortgage Obligations | | | 12.4 | |
Information Technology | | | 7.0 | |
Investment Companies | | | 6.3 | |
Financials | | | 6.2 | |
Mortgage-Backed Securities | | | 6.1 | |
Health Care | | | 5.7 | |
Consumer Discretionary | | | 5.1 | |
Consumer Staples | | | 2.8 | |
Energy | | | 2.6 | |
Industrials | | | 2.5 | |
Asset-Backed Securities | | | 1.8 | |
Telecommunication Services | | | 1.6 | |
Materials | | | 1.0 | |
Utilities | | | 0.8 | |
Real Estate | | | 0.4 | |
Foreign Government Security | | | 0.1 | |
Cash and Other | | | 3.9 | |
| | | | | |
| | | | 100.0 | % |
| | | | | |
Holdings are subject to change without notice. | | | | |
UNDERSTANDING YOUR EXPENSES:
As a shareholder of the Fund, you incur two types of costs:
(1) transaction costs, including applicable sales charges and redemption fees; and (2) ongoing costs, including investment advisory fees, distribution and/or service (12b-1) fees (in the case of Class A and Class R shares of the Fund), and other Fund expenses. These examples are intended to help you understand your ongoing costs (in dollars) of investing in the Fund and to compare these costs with the ongoing costs of investing in other mutual funds.
The examples are based on an investment of $1,000 invested at the beginning of the six-month period ended October 31, 2017 and held for the entire six-month period.
Actual Expenses
The first line of the following table provides information about actual account values and actual expenses. You may use the information in this line, together with the amount you invested, to estimate the expenses that you paid over the period. Simply divide your account value by $1,000 (for example, an $8,600 account value divided by $1,000 = 8.6), then multiply the result by the number in the first line under the heading entitled “Expenses Paid During Period” to estimate the expenses you paid on your account during this period.
Hypothetical Example for Comparison Purposes
The second line of the following table provides information about hypothetical account values and hypothetical expenses based on the Fund’s actual expense ratio and an assumed rate of return of 5% per year before expenses, which is not the Fund’s actual return. The hypothetical account values and expenses may not be used to estimate the actual ending account balance or expenses you paid for the period. You may use this information to compare the ongoing costs of investing in the Fund and other funds. To do so, compare this 5% hypothetical example with the 5% hypothetical examples that appear in the shareholder reports of the other funds.
Please note that the expenses shown in the table are meant to highlight your ongoing costs only and do not reflect any transactional costs, such as sales charges (loads), redemption fees, or exchange fees. Therefore, the second line of the table is useful in comparing ongoing costs only, and will not help you determine the relative total costs of owning different funds. In addition, if these transactional costs were included, your costs would have been higher.
EXAMPLE
| | | | | | | | | | | | |
| | | Beginning
Account
Value
5/1/17 | | | Ending
Account
Value
10/31/17 | | | Expenses Paid During Period*
5/1/17 - 10/31/17 | |
Class A | |
Actual | | | $1,000.00 | | | | $1,030.20 | | | | $6.17 | |
Hypothetical (5% average annual return before expenses) | | | 1,000.00 | | | | 1,019.13 | | | | 6.13 | |
Class I | | | | | | | | | | | | |
Actual | | | 1,000.00 | | | | 1,032.00 | | | | 4.89 | |
Hypothetical (5% average annual return before expenses) | | | 1,000.00 | | | | 1,020.39 | | | | 4.87 | |
Class R | | | | | | | | | | | | |
Actual | | | 1,000.00 | | | | 1,028.40 | | | | 7.44 | |
Hypothetical (5% average annual return before expenses) | | | 1,000.00 | | | | 1,017.87 | | | | 7.40 | |
* Expenses are equal to the Fund’s Class A, I and R shares annualized expense ratios of 1.21%, 0.96% and 1.46%, respectively, multiplied by the average account value over the period, and multiplied by 184/365 (to reflect the one-half year period). | |
18
1290 FUNDS
1290 DOUBLELINE DYNAMIC ALLOCATION FUND
PORTFOLIO OF INVESTMENTS
October 31, 2017
| | | | | | | | |
| | | Principal
Amount | | | Value
(Note 1) | |
| | | | | | | | |
LONG-TERM DEBT SECURITIES: | |
Asset-Backed Securities (1.8%) | |
VOLT LIV LLC, | | | | | | | | |
Series 2017-NPL1 A1
3.500%, 2/25/47 (e)§ | | $ | 519,010 | | | $ | 519,739 | |
VOLT LVIII LLC, | | | | | | | | |
Series 2017-NPL5 A1
3.375%, 5/28/47 (e)§ | | | 564,174 | | | | 565,063 | |
| | | | | | | | |
Total Asset-Backed Securities | | | | | | | 1,084,802 | |
| | | | | | | | |
Collateralized Mortgage Obligations (12.4%) | |
CHL Mortgage Pass-Through Trust, | |
Series 2006-OA5 2A1
1.438%, 4/25/46 (l) | | | 984,055 | | | | 856,499 | |
FHLMC, | | | | | | | | |
Series 3998 AZ
4.000%, 2/15/42 | | | 1,253,939 | | | | 1,324,991 | |
FirstKey Mortgage Trust, | | | | | | | | |
Series 2014-1 A8
3.500%, 11/25/44 (l)§ | | | 421,156 | | | | 428,479 | |
FNMA, | | | | | | | | |
Series 2013-41 SC
4.144%, 5/25/43 (l) | | | 1,199,297 | | | | 990,213 | |
Series 2013-5 EZ
2.000%, 8/25/42 | | | 800,942 | | | | 730,612 | |
Series 2017-13 ML
3.000%, 8/25/41 | | | 956,588 | | | | 969,980 | |
Series 2017-4 CH
3.000%, 6/25/42 | | | 227,469 | | | | 232,565 | |
New Residential Mortgage Loan Trust, | |
Series 2016-1A A1
3.750%, 3/25/56 (l)§ | | | 646,646 | | | | 665,999 | |
RALI Trust, | | | | | | | | |
Series 2006-QS4 A10
6.000%, 4/25/36 | | | 806,588 | | | | 732,530 | |
Wells Fargo Mortgage Backed Securities Trust, | |
Series 2007-7 A1
6.000%, 6/25/37 | | | 579,408 | | | | 577,359 | |
| | | | | | | | |
Total Collateralized Mortgage Obligations | | | | | | | 7,509,227 | |
| | | | | | | | |
Corporate Bonds (13.9%) | |
Consumer Discretionary (2.2%) | |
Auto Components (0.2%) | |
Dana Financing Luxembourg Sarl | |
5.750%, 4/15/25§ | | | 55,000 | | | | 58,300 | |
Delphi Technologies plc | | | | | | | | |
5.000%, 10/1/25§ | | | 65,000 | | | | 65,039 | |
| | | | | | | | |
| | | | | | | 123,339 | |
| | | | | | | | |
Automobiles (0.1%) | |
Ford Motor Co. | | | | | | | | |
7.450%, 7/16/31 | | | 40,000 | | | | 52,007 | |
General Motors Co. | | | | | | | | |
(ICE LIBOR USD 3 Month + 0.80%), 2.112%, 8/7/20 (k) | | | 20,000 | | | | 20,012 | |
| | | | | | | | |
| | | | | | | 72,019 | |
| | | | | | | | |
Hotels, Restaurants & Leisure (1.0%) | |
1011778 BC ULC | | | | | | | | |
4.250%, 5/15/24§ | | | 65,000 | | | | 65,406 | |
| | | | | | | | |
Constellation Merger Sub, Inc. | | | | | | | | |
8.500%, 9/15/25§ | | | 35,000 | | | | 34,737 | |
CRC Escrow Issuer LLC | | | | | | | | |
5.250%, 10/15/25 (b)§ | | | 70,000 | | | | 70,441 | |
Eldorado Resorts, Inc. | | | | | | | | |
6.000%, 4/1/25 | | | 65,000 | | | | 68,737 | |
GLP Capital LP | | | | | | | | |
5.375%, 4/15/26 | | | 55,000 | | | | 59,538 | |
Golden Nugget, Inc. | | | | | | | | |
6.750%, 10/15/24 (b)§ | | | 35,000 | | | | 35,613 | |
Hilton Domestic Operating Co., Inc. | |
4.250%, 9/1/24 | | | 65,000 | | | | 66,300 | |
Pinnacle Entertainment, Inc. | | | | | | | | |
5.625%, 5/1/24 | | | 80,000 | | | | 82,900 | |
Six Flags Entertainment Corp. | | | | | | | | |
4.875%, 7/31/24§ | | | 65,000 | | | | 66,872 | |
Viking Cruises Ltd. | | | | | | | | |
5.875%, 9/15/27§ | | | 65,000 | | | | 65,325 | |
| | | | | | | | |
| | | | | | | 615,869 | |
| | | | | | | | |
Internet & Direct Marketing Retail (0.2%) | |
Amazon.com, Inc. | | | | | | | | |
4.050%, 8/22/47§ | | | 50,000 | | | | 51,440 | |
Netflix, Inc. | | | | | | | | |
4.875%, 4/15/28 (b)§ | | | 30,000 | | | | 29,820 | |
| | | | | | | | |
| | | | | | | 81,260 | |
| | | | | | | | |
Leisure Products (0.0%) | |
Hasbro, Inc. | | | | | | | | |
3.500%, 9/15/27 | | | 15,000 | | | | 14,833 | |
| | | | | | | | |
Media (0.4%) | |
Cengage Learning, Inc. | | | | | | | | |
9.500%, 6/15/24§ | | | 60,000 | | | | 54,000 | |
Charter Communications Operating LLC | |
4.908%, 7/23/25 | | | 45,000 | | | | 47,880 | |
Comcast Corp. | | | | | | | | |
4.200%, 8/15/34 | | | 40,000 | | | | 42,730 | |
4.400%, 8/15/35 | | | 5,000 | | | | 5,472 | |
Omnicom Group, Inc. | | | | | | | | |
3.600%, 4/15/26 | | | 100,000 | | | | 101,410 | |
| | | | | | | | |
| | | | | | | 251,492 | |
| | | | | | | | |
Specialty Retail (0.3%) | |
Beacon Escrow Corp. | | | | | | | | |
4.875%, 11/1/25 (b)§ | | | 35,000 | | | | 35,427 | |
Home Depot, Inc. (The) | | | | | | | | |
3.000%, 4/1/26 | | | 50,000 | | | | 50,436 | |
Lowe’s Cos., Inc. | | | | | | | | |
3.100%, 5/3/27 | | | 25,000 | | | | 25,054 | |
PetSmart, Inc. | | | | | | | | |
7.125%, 3/15/23§ | | | 40,000 | | | | 30,600 | |
5.875%, 6/1/25§ | | | 30,000 | | | | 26,175 | |
| | | | | | | | |
| | | | | | | 167,692 | |
| | | | | | | | |
Total Consumer Discretionary | | | | | | | 1,326,504 | |
| | | | | | | | |
Consumer Staples (1.2%) | |
Beverages (0.1%) | |
Anheuser-Busch InBev Finance, Inc. | |
4.900%, 2/1/46 | | | 45,000 | | | | 50,276 | |
| | | | | | | | |
See Notes to Financial Statements.
19
1290 FUNDS
1290 DOUBLELINE DYNAMIC ALLOCATION FUND
PORTFOLIO OF INVESTMENTS (Continued)
October 31, 2017
| | | | | | | | |
| | | Principal
Amount | | | Value
(Note 1) | |
| | | | | | | | |
Food & Staples Retailing (0.2%) | |
Kroger Co. (The) | | | | | | | | |
6.150%, 1/15/20 | | $ | 5,000 | | | $ | 5,401 | |
3.400%, 4/15/22 | | | 50,000 | | | | 51,543 | |
Sysco Corp. | | | | | | | | |
3.250%, 7/15/27 | | | 50,000 | | | | 50,052 | |
| | | | | | | | |
| | | | | | | 106,996 | |
| | | | | | | | |
Food Products (0.7%) | |
JBS USA LUX SA | | | | | | | | |
7.250%, 6/1/21§ | | | 65,000 | | | | 66,266 | |
Kraft Heinz Foods Co. | | | | | | | | |
2.000%, 7/2/18 | | | 50,000 | | | | 50,072 | |
Pilgrim’s Pride Corp. | | | | | | | | |
5.750%, 3/15/25§ | | | 65,000 | | | | 68,822 | |
Post Holdings, Inc. | | | | | | | | |
5.500%, 3/1/25§ | | | 65,000 | | | | 67,519 | |
Smithfield Foods, Inc. | | | | | | | | |
4.250%, 2/1/27§ | | | 55,000 | | | | 56,281 | |
Unilever Capital Corp. | | | | | | | | |
2.900%, 5/5/27 | | | 100,000 | | | | 99,205 | |
| | | | | | | | |
| | | | | | | 408,165 | |
| | | | | | | | |
Household Products (0.1%) | |
Kronos Acquisition Holdings, Inc. | |
9.000%, 8/15/23§ | | | 65,000 | | | | 62,160 | |
| | | | | | | | |
Tobacco (0.1%) | |
BAT Capital Corp. | | | | | | | | |
(ICE LIBOR USD 3 Month + 0.88%), 2.195%, 8/15/22 (k)§ | | | 10,000 | | | | 10,065 | |
Reynolds American, Inc. | | | | | | | | |
4.000%, 6/12/22 | | | 60,000 | | | | 63,231 | |
| | | | | | | | |
| | | | | | | 73,296 | |
| | | | | | | | |
Total Consumer Staples | | | | | | | 700,893 | |
| | | | | | | | |
Energy (1.4%) | | | | | | | | |
Energy Equipment & Services (0.1%) | |
FTS International, Inc. | | | | | | | | |
6.250%, 5/1/22 | | | 35,000 | | | | 33,996 | |
Schlumberger Holdings Corp. | | | | | | | | |
2.350%, 12/21/18§ | | | 25,000 | | | | 25,118 | |
Transocean, Inc. | | | | | | | | |
7.500%, 1/15/26 (b)§ | | | 10,000 | | | | 10,288 | |
| | | | | | | | |
| | | | | | | 69,402 | |
| | | | | | | | |
Oil, Gas & Consumable Fuels (1.3%) | |
Canadian Natural Resources Ltd. | |
2.950%, 1/15/23 | | | 80,000 | | | | 80,329 | |
Cheniere Energy Partners LP | | | | | | | | |
5.250%, 10/1/25§ | | | 65,000 | | | | 66,872 | |
CrownRock LP | | | | | | | | |
5.625%, 10/15/25 (b)§ | | | 35,000 | | | | 35,437 | |
Enable Midstream Partners LP | | | | | | | | |
4.400%, 3/15/27 | | | 50,000 | | | | 51,152 | |
Energy Transfer LP | | | | | | | | |
4.750%, 1/15/26 | | | 45,000 | | | | 47,361 | |
4.200%, 4/15/27 | | | 5,000 | | | | 5,068 | |
Kinder Morgan Energy Partners LP | |
6.950%, 1/15/38 | | | 45,000 | | | | 55,277 | |
| | | | | | | | |
MEG Energy Corp. | | | | | | | | |
7.000%, 3/31/24§ | | | 20,000 | | | | 18,176 | |
NGL Energy Partners LP | | | | | | | | |
7.500%, 11/1/23 | | | 55,000 | | | | 54,862 | |
Peabody Energy Corp. | | | | | | | | |
6.000%, 3/31/22§ | | | 65,000 | | | | 67,031 | |
Petroleos Mexicanos | | | | | | | | |
6.750%, 9/21/47 | | | 25,000 | | | | 25,768 | |
Phillips 66 | | | | | | | | |
5.875%, 5/1/42 | | | 22,000 | | | | 27,518 | |
Sanchez Energy Corp. | | | | | | | | |
6.125%, 1/15/23 | | | 80,000 | | | | 66,800 | |
SM Energy Co. | | | | | | | | |
5.000%, 1/15/24 | | | 65,000 | | | | 62,237 | |
Valero Energy Corp. | | | | | | | | |
6.625%, 6/15/37 | | | 20,000 | | | | 25,584 | |
Vine Oil & Gas LP | | | | | | | | |
8.750%, 4/15/23 (b)§ | | | 30,000 | | | | 29,271 | |
Williams Partners LP | | | | | | | | |
3.750%, 6/15/27 | | | 30,000 | | | | 30,108 | |
| | | | | | | | |
| | | | | | | 748,851 | |
| | | | | | | | |
Total Energy | | | | | | | 818,253 | |
| | | | | | | | |
Financials (2.1%) | | | | | | | | |
Banks (0.6%) | | | | | | | | |
Citigroup, Inc. | | | | | | | | |
(ICE LIBOR USD 3 Month + 1.10%), 2.414%, 5/17/24 (k) | | | 105,000 | | | | 105,791 | |
Commonwealth Bank of Australia | |
2.750%, 3/10/22§ | | | 75,000 | | | | 75,753 | |
MUFG Americas Holdings Corp. | |
1.625%, 2/9/18 | | | 15,000 | | | | 14,998 | |
2.250%, 2/10/20 | | | 10,000 | | | | 10,023 | |
Sumitomo Mitsui Financial Group, Inc. | |
2.934%, 3/9/21 | | | 50,000 | | | | 50,768 | |
2.058%, 7/14/21 | | | 30,000 | | | | 29,493 | |
Westpac Banking Corp. | | | | | | | | |
2.600%, 11/23/20 | | | 40,000 | | | | 40,448 | |
2.000%, 8/19/21 | | | 15,000 | | | | 14,809 | |
2.500%, 6/28/22 | | | 5,000 | | | | 5,002 | |
| | | | | | | | |
| | | | | | | 347,085 | |
| | | | | | | | |
Capital Markets (0.2%) | | | | | | | | |
Morgan Stanley | | | | | | | | |
2.750%, 5/19/22 | | | 50,000 | | | | 50,126 | |
(ICE LIBOR USD 3 Month + 1.34%), 3.591%, 7/22/28 (k) | | | 55,000 | | | | 55,364 | |
S&P Global, Inc. | | | | | | | | |
4.400%, 2/15/26 | | | 20,000 | | | | 21,613 | |
| | | | | | | | |
| | | | | | | 127,103 | |
| | | | | | | | |
Consumer Finance (0.6%) | | | | | | | | |
Ally Financial, Inc. | | | | | | | | |
4.125%, 3/30/20 | | | 40,000 | | | | 41,352 | |
4.250%, 4/15/21 | | | 5,000 | | | | 5,200 | |
American Express Co. | | | | | | | | |
2.500%, 8/1/22 | | | 55,000 | | | | 54,816 | |
American Express Credit Corp. | | | | | | | | |
2.250%, 5/5/21 | | | 20,000 | | | | 19,999 | |
2.700%, 3/3/22 | | | 40,000 | | | | 40,423 | |
See Notes to Financial Statements.
20
1290 FUNDS
1290 DOUBLELINE DYNAMIC ALLOCATION FUND
PORTFOLIO OF INVESTMENTS (Continued)
October 31, 2017
| | | | | | | | |
| | | Principal
Amount | | | Value
(Note 1) | |
| | | | | | | | |
Discover Financial Services | | | | | | | | |
4.100%, 2/9/27 | | $ | 100,000 | | | $ | 102,563 | |
General Motors Financial Co., Inc. | |
3.950%, 4/13/24 | | | 75,000 | | | | 77,326 | |
Synchrony Financial | | | | | | | | |
3.000%, 8/15/19 | | | 50,000 | | | | 50,713 | |
| | | | | | | | |
| | | | | | | 392,392 | |
| | | | | | | | |
Diversified Financial Services (0.2%) | |
ASP AMC Merger Sub, Inc. | | | | | | | | |
8.000%, 5/15/25§ | | | 65,000 | | | | 63,050 | |
National Rural Utilities Cooperative Finance Corp. | |
2.000%, 1/27/20 | | | 35,000 | | | | 34,976 | |
| | | | | | | | |
| | | | | | | 98,026 | |
| | | | | | | | |
Insurance (0.5%) | | | | | | | | |
Alliant Holdings Intermediate LLC | |
8.250%, 8/1/23§ | | | 55,000 | | | | 58,300 | |
Athene Global Funding | | | | | | | | |
3.000%, 7/1/22§ | | | 50,000 | | | | 49,830 | |
Brighthouse Financial, Inc. | | | | | | | | |
3.700%, 6/22/27§ | | | 50,000 | | | | 49,159 | |
Liberty Mutual Group, Inc. | | | | | | | | |
6.500%, 5/1/42§ | | | 60,000 | | | | 78,861 | |
New York Life Global Funding | |
2.300%, 6/10/22§ | | | 20,000 | | | | 19,911 | |
2.900%, 1/17/24§ | | | 30,000 | | | | 30,218 | |
Nuveen Finance LLC | | | | | | | | |
2.950%, 11/1/19§ | | | 46,000 | | | | 46,663 | |
| | | | | | | | |
| | | | | | | 332,942 | |
| | | | | | | | |
Total Financials | | | | | | | 1,297,548 | |
| | | | | | | | |
Health Care (1.6%) | |
Biotechnology (0.1%) | |
AbbVie, Inc. | | | | | | | | |
4.700%, 5/14/45 | | | 60,000 | | | | 65,115 | |
| | | | | | | | |
Health Care Equipment & Supplies (0.3%) | |
Avantor, Inc. | | | | | | | | |
6.000%, 10/1/24§ | | | 35,000 | | | | 35,700 | |
9.000%, 10/1/25§ | | | 30,000 | | | | 30,300 | |
Becton Dickinson and Co. | | | | | | | | |
2.894%, 6/6/22 | | | 75,000 | | | | 75,188 | |
Zimmer Biomet Holdings, Inc. | |
2.700%, 4/1/20 | | | 50,000 | | | | 50,416 | |
| | | | | | | | |
| | | | | | | 191,604 | |
| | | | | | | | |
Health Care Providers & Services (0.6%) | |
Anthem, Inc. | | | | | | | | |
2.300%, 7/15/18 | | | 50,000 | | | | 50,181 | |
Cardinal Health, Inc. | | | | | | | | |
4.368%, 6/15/47 | | | 50,000 | | | | 49,853 | |
Centene Corp. | | | | | | | | |
4.750%, 1/15/25 | | | 65,000 | | | | 66,950 | |
CHS/Community Health Systems, Inc. | |
6.250%, 3/31/23 | | | 70,000 | | | | 67,375 | |
Express Scripts Holding Co. | | | | | | | | |
3.400%, 3/1/27 | | | 40,000 | | | | 39,284 | |
Tenet Healthcare Corp. | | | | | | | | |
8.125%, 4/1/22 | | | 55,000 | | | | 55,275 | |
| | | | | | | | |
Universal Hospital Services, Inc. | |
7.625%, 8/15/20 | | | 55,000 | | | | 55,619 | |
| | | | | | | | |
| | | | | | | 384,537 | |
| | | | | | | | |
Pharmaceuticals (0.6%) | |
Allergan Funding SCS | | | | | | | | |
2.350%, 3/12/18 | | | 65,000 | | | | 65,150 | |
AstraZeneca plc | | | | | | | | |
2.375%, 11/16/20 | | | 25,000 | | | | 25,092 | |
2.375%, 6/12/22 | | | 30,000 | | | | 29,733 | |
Shire Acquisitions Investments Ireland DAC | |
2.875%, 9/23/23 | | | 50,000 | | | | 49,394 | |
Teva Pharmaceutical Finance Netherlands III BV | |
2.800%, 7/21/23 | | | 110,000 | | | | 101,202 | |
Valeant Pharmaceuticals International, Inc. | |
5.500%, 11/1/25 (b)§ | | | 70,000 | | | | 71,575 | |
| | | | | | | | |
| | | | | | | 342,146 | |
| | | | | | | | |
Total Health Care | | | | | | | 983,402 | |
| | | | | | | | |
Industrials (1.2%) | |
Aerospace & Defense (0.3%) | |
Boeing Co. (The) | | | | | | | | |
6.875%, 3/15/39 | | | 21,000 | | | | 30,698 | |
Lockheed Martin Corp. | |
4.700%, 5/15/46 | | | 70,000 | | | | 79,429 | |
Triumph Group, Inc. | | | | | | | | |
7.750%, 8/15/25§ | | | 45,000 | | | | 48,150 | |
| | | | | | | | |
| | | | | | | 158,277 | |
| | | | | | | | |
Air Freight & Logistics (0.1%) | |
FedEx Corp. | | | | | | | | |
4.750%, 11/15/45 | | | 45,000 | | | | 49,194 | |
| | | | | | | | |
Airlines (0.0%) | | | | | | | | |
Delta Air Lines, Inc. | | | | | | | | |
3.625%, 3/15/22 | | | 25,000 | | | | 25,665 | |
| | | | | | | | |
Commercial Services & Supplies (0.2%) | |
Harland Clarke Holdings Corp. | |
8.375%, 8/15/22 (b)§ | | | 20,000 | | | | 21,026 | |
Prime Security Services Borrower LLC | |
9.250%, 5/15/23§ | | | 60,000 | | | | 66,528 | |
Waste Management, Inc. | | | | | | | | |
4.100%, 3/1/45 | | | 35,000 | | | | 36,770 | |
| | | | | | | | |
| | | | | | | 124,324 | |
| | | | | | | | |
Construction & Engineering (0.1%) | |
Brand Industrial Services, Inc. | | | | | | | | |
8.500%, 7/15/25 (b)§ | | | 45,000 | | | | 47,588 | |
| | | | | | | | |
Machinery (0.1%) | |
BlueLine Rental Finance Corp. | |
9.250%, 3/15/24§ | | | 55,000 | | | | 59,675 | |
| | | | | | | | |
Road & Rail (0.4%) | |
Burlington Northern Santa Fe LLC | |
4.550%, 9/1/44 | | | 55,000 | | | | 61,917 | |
CSX Corp. | | | | | | | | |
3.800%, 11/1/46 | | | 50,000 | | | | 48,666 | |
DAE Funding LLC | | | | | | | | |
5.000%, 8/1/24§ | | | 60,000 | | | | 61,275 | |
See Notes to Financial Statements.
21
1290 FUNDS
1290 DOUBLELINE DYNAMIC ALLOCATION FUND
PORTFOLIO OF INVESTMENTS (Continued)
October 31, 2017
| | | | | | | | |
| | | Principal
Amount | | | Value
(Note 1) | |
| | | | | | | | |
Penske Truck Leasing Co. LP | |
4.200%, 4/1/27§ | | $ | 100,000 | | | $ | 104,812 | |
| | | | | | | | |
| | | | | | | 276,670 | |
| | | | | | | | |
Total Industrials | | | | | | | 741,393 | |
| | | | | | | | |
Information Technology (1.4%) | |
Communications Equipment (0.1%) | |
CB Escrow Corp. | | | | | | | | |
8.000%, 10/15/25§ | | | 15,000 | | | | 15,562 | |
Riverbed Technology, Inc. | |
8.875%, 3/1/23§ | | | 35,000 | | | | 31,325 | |
| | | | | | | | |
| | | | | | | 46,887 | |
| | | | | | | | |
Electronic Equipment, Instruments & Components (0.2%) | |
Arrow Electronics, Inc. | |
3.875%, 1/12/28 | | | 105,000 | | | | 104,441 | |
| | | | | | | | |
Internet Software & Services (0.1%) | |
eBay, Inc. | | | | | | | | |
2.750%, 1/30/23 | | | 55,000 | | | | 55,031 | |
GTT Communications, Inc. | | | | | | | | |
7.875%, 12/31/24§ | | | 40,000 | | | | 42,652 | |
| | | | | | | | |
| | | | | | | 97,683 | |
| | | | | | | | |
IT Services (0.0%) | |
Fidelity National Information Services, Inc. | |
3.625%, 10/15/20 | | | 20,000 | | | | 20,727 | |
| | | | | | | | |
Semiconductors & Semiconductor Equipment (0.3%) | |
Applied Materials, Inc. | | | | | | | | |
4.350%, 4/1/47 | | | 50,000 | | | | 54,416 | |
Broadcom Corp. | | | | | | | | |
3.625%, 1/15/24§ | | | 100,000 | | | | 103,385 | |
Maxim Integrated Products, Inc. | |
3.450%, 6/15/27 | | | 25,000 | | | | 25,261 | |
| | | | | | | | |
| | | | | | | 183,062 | |
| | | | | | | | |
Software (0.7%) | |
Genesys Telecommunications Laboratories, Inc. | |
10.000%, 11/30/24§ | | | 55,000 | | | | 62,081 | |
Microsoft Corp. | | | | | | | | |
4.450%, 11/3/45 | | | 45,000 | | | | 51,348 | |
Oracle Corp. | | | | | | | | |
4.125%, 5/15/45 | | | 100,000 | | | | 105,202 | |
Solera LLC | | | | | | | | |
10.500%, 3/1/24§ | | | 25,000 | | | | 28,360 | |
Sophia LP | | | | | | | | |
9.000%, 9/30/23§ | | | 55,000 | | | | 57,200 | |
VMware, Inc. | | | | | | | | |
2.950%, 8/21/22 | | | 100,000 | | | | 100,290 | |
| | | | | | | | |
| | | | | | | 404,481 | |
| | | | | | | | |
Total Information Technology | | | | | | | 857,281 | |
| | | | | | | | |
Materials (0.6%) | | | | | | | | |
Chemicals (0.2%) | |
Ashland LLC | | | | | | | | |
4.750%, 8/15/22 | | | 60,000 | | | | 63,312 | |
Hexion, Inc. | | | | | | | | |
10.375%, 2/1/22§ | | | 65,000 | | | | 61,185 | |
| | | | | | | | |
| | | | | | | 124,497 | |
| | | | | | | | |
| | | | | | | | |
Containers & Packaging (0.1%) | |
International Paper Co. | |
3.000%, 2/15/27 | | | 25,000 | | | | 24,273 | |
Plastipak Holdings, Inc. | |
6.250%, 10/15/25 (b)§ | | | 30,000 | | | | 30,594 | |
| | | | | | | | |
| | | | | | | 54,867 | |
| | | | | | | | |
Metals & Mining (0.2%) | |
Signode Industrial Group Lux SA | |
6.375%, 5/1/22§ | | | 60,000 | | | | 62,328 | |
Vale Overseas Ltd. | |
5.875%, 6/10/21 | | | 35,000 | | | | 38,369 | |
| | | | | | | | |
| | | | | | | 100,697 | |
| | | | | | | | |
Paper & Forest Products (0.1%) | |
Georgia-Pacific LLC | | | | | | | | |
3.600%, 3/1/25§ | | | 95,000 | | | | 97,947 | |
| | | | | | | | |
Total Materials | | | | | | | 378,008 | |
| | | | | | | | |
Real Estate (0.4%) | | | | | | | | |
Equity Real Estate Investment Trusts (REITs) (0.4%) | |
American Tower Corp. (REIT) | |
3.550%, 7/15/27 | | | 55,000 | | | | 54,717 | |
Boston Properties LP (REIT) | |
4.125%, 5/15/21 | | | 45,000 | | | | 47,520 | |
Crown Castle International Corp. (REIT) | | | | | | | | |
3.650%, 9/1/27 | | | 50,000 | | | | 49,736 | |
ESH Hospitality, Inc. (REIT) | |
5.250%, 5/1/25§ | | | 65,000 | | | | 67,197 | |
| | | | | | | | |
Total Real Estate | | | | | | | 219,170 | |
| | | | | | | | |
Telecommunication Services (1.0%) | | | | | | | | |
Diversified Telecommunication Services (1.0%) | |
AT&T, Inc. | | | | | | | | |
5.250%, 3/1/37 | | | 135,000 | | | | 140,243 | |
British Telecommunications plc | |
5.950%, 1/15/18 | | | 100,000 | | | | 100,880 | |
CCO Holdings LLC | | | | | | | | |
5.000%, 2/1/28§ | | | 50,000 | | | | 49,625 | |
Cincinnati Bell, Inc. | |
7.000%, 7/15/24§ | | | 50,000 | | | | 50,000 | |
Frontier Communications Corp. | |
8.500%, 4/15/20 | | | 35,000 | | | | 34,562 | |
Intelsat Jackson Holdings SA | |
7.250%, 10/15/20 | | | 60,000 | | | | 57,600 | |
Orange SA | | | | | | | | |
2.750%, 2/6/19 | | | 50,000 | | | | 50,550 | |
Telesat Canada | | | | | | | | |
8.875%, 11/15/24§ | | | 50,000 | | | | 56,000 | |
Verizon Communications, Inc. | |
4.400%, 11/1/34 | | | 50,000 | | | | 50,054 | |
| | | | | | | | |
| | |
Total Telecommunication Services | | | | | | | 589,514 | |
| | | | | | | | |
Utilities (0.8%) | |
Electric Utilities (0.7%) | |
Duke Energy Corp. | | | | | | | | |
3.750%, 9/1/46 | | | 15,000 | | | | 14,589 | |
3.950%, 8/15/47 | | | 20,000 | | | | 19,895 | |
See Notes to Financial Statements.
22
1290 FUNDS
1290 DOUBLELINE DYNAMIC ALLOCATION FUND
PORTFOLIO OF INVESTMENTS (Continued)
October 31, 2017
| | | | | | | | |
| | | Principal
Amount | | | Value
(Note 1) | |
| | | | | | | | |
Duke Energy Progress LLC | |
4.150%, 12/1/44 | | $ | 45,000 | | | $ | 48,426 | |
Exelon Corp. | | | | | | | | |
3.400%, 4/15/26 | | | 100,000 | | | | 100,919 | |
Fortis, Inc. | | | | | | | | |
2.100%, 10/4/21 | | | 55,000 | | | | 53,843 | |
NextEra Energy Capital Holdings, Inc. | |
3.550%, 5/1/27 | | | 25,000 | | | | 25,757 | |
NextEra Energy Operating Partners LP | |
4.500%, 9/15/27§ | | | 65,000 | | | | 65,325 | |
Southern Co. (The) | | | | | | | | |
2.450%, 9/1/18 | | | 75,000 | | | | 75,468 | |
| | | | | | | | |
| | | | | | | 404,222 | |
| | | | | | | | |
Multi-Utilities (0.1%) | |
Berkshire Hathaway Energy Co. | |
6.500%, 9/15/37 | | | 70,000 | | | | 94,938 | |
| | | | | | | | |
Total Utilities | | | | | | | 499,160 | |
| | | | | | | | |
| | |
Total Corporate Bonds | | | | | | | 8,411,126 | |
| | | | | | | | |
Foreign Government Security (0.1%) | |
United Mexican States | |
4.000%, 10/2/23 | | | 80,000 | | | | 83,800 | |
| | | | | | | | |
| | |
Total Foreign Government Security | | | | | | | 83,800 | |
| | | | | | | | |
Mortgage-Backed Securities (6.1%) | |
FHLMC | | | | | | | | |
3.000%, 3/1/46 | | | 831,619 | | | | 833,633 | |
3.500%, 5/1/46 | | | 805,535 | | | | 820,796 | |
3.000%, 9/1/46 | | | 740,645 | | | | 742,207 | |
FNMA | | | | | | | | |
3.500%, 7/1/42 | | | 411,575 | | | | 428,151 | |
3.000%, 9/1/46 | | | 835,812 | | | | 837,346 | |
| | | | | | | | |
| | |
Total Mortgage-Backed Securities | | | | | | | 3,662,133 | |
| | | | | | | | |
U.S. Treasury Obligations (8.9%) | |
U.S. Treasury Bonds | |
2.750%, 11/15/42 | | | 100,000 | | | | 98,461 | |
3.625%, 8/15/43 | | | 90,000 | | | | 102,965 | |
2.875%, 8/15/45 | | | 110,000 | | | | 110,172 | |
U.S. Treasury Inflation Linked Notes | |
0.125%, 4/15/22 TIPS | | | 161,528 | | | | 161,263 | |
U.S. Treasury Notes | | | | | | | | |
0.750%, 10/31/18 | | | 1,200,000 | | | | 1,191,258 | |
1.250%, 11/30/18 | | | 70,000 | | | | 69,809 | |
1.125%, 1/15/19 | | | 120,000 | | | | 119,456 | |
2.000%, 8/31/21 | | | 400,000 | | | | 401,797 | |
1.125%, 9/30/21 | | | 340,000 | | | | 330,278 | |
1.250%, 10/31/21 | | | 410,000 | | | | 399,878 | |
1.750%, 11/30/21 | | | 400,000 | | | | 397,563 | |
2.000%, 12/31/21 | | | 240,000 | | | | 240,750 | |
1.875%, 1/31/22 | | | 410,000 | | | | 408,975 | |
1.750%, 3/31/22 | | | 490,000 | | | | 485,712 | |
1.875%, 8/31/24 | | | 680,000 | | | | 665,338 | |
2.375%, 5/15/27 | | | 200,000 | | | | 200,109 | |
| | | | | | | | |
Total U.S. Treasury Obligations | | | | | | | 5,383,784 | |
| | | | | | | | |
Total Long-Term Debt Securities (43.2%)
(Cost $26,247,640) | | | | | | | 26,134,872 | |
| | | | | | | | |
| | | Number of
Shares | | | Value
(Note 1) | |
| | | | | | | | |
COMMON STOCKS: | | | | | | | | |
Consumer Discretionary (2.9%) | | | | | | | | |
Automobiles (0.5%) | | | | | | | | |
General Motors Co. | | | 6,745 | | | | 289,900 | |
| | | | | | | | |
Hotels, Restaurants & Leisure (0.3%) | |
Starbucks Corp. | | | 3,180 | | | | 174,392 | |
| | | | | | | | |
Internet & Direct Marketing Retail (1.1%) | |
Amazon.com, Inc.* | | | 414 | | | | 457,586 | |
JD.com, Inc. (ADR)* | | | 5,335 | | | | 200,169 | |
| | | | | | | | |
| | | | | | | 657,755 | |
| | | | | | | | |
Media (0.7%) | | | | | | | | |
Discovery Communications, Inc., Class A* | | | 9,019 | | | | 170,279 | |
Twenty-First Century Fox, Inc., Class A | | | 10,056 | | | | 262,964 | |
| | | | | | | | |
| | | | | | | 433,243 | |
| | | | | | | | |
Specialty Retail (0.3%) | | | | | | | | |
L Brands, Inc. | | | 4,054 | | | | 174,484 | |
| | | | | | | | |
Total Consumer Discretionary | | | | | | | 1,729,774 | |
| | | | | | | | |
Consumer Staples (1.6%) | | | | | | | | |
Food & Staples Retailing (1.1%) | | | | | | | | |
CVS Health Corp. | | | 1,910 | | | | 130,892 | |
Kroger Co. (The) | | | 12,620 | | | | 261,234 | |
Wal-Mart Stores, Inc. | | | 3,392 | | | | 296,156 | |
| | | | | | | | |
| | | | | | | 688,282 | |
| | | | | | | | |
Tobacco (0.5%) | | | | | | | | |
Philip Morris International, Inc. | | | 2,699 | | | | 282,423 | |
| | | | | | | | |
Total Consumer Staples | | | | | | | 970,705 | |
| | | | | | | | |
Energy (1.2%) | | | | | | | | |
Energy Equipment & Services (0.2%) | |
Halliburton Co. | | | 3,576 | | | | 152,838 | |
| | | | | | | | |
Oil, Gas & Consumable Fuels (1.0%) | |
Apache Corp. | | | 3,741 | | | | 154,765 | |
Exxon Mobil Corp. | | | 1,084 | | | | 90,351 | |
Newfield Exploration Co.* | | | 6,382 | | | | 196,502 | |
Pioneer Natural Resources Co. | | | 979 | | | | 146,527 | |
| | | | | | | | |
| | | | | | | 588,145 | |
| | | | | | | | |
Total Energy | | | | | | | 740,983 | |
| | | | | | | | |
Financials (4.1%) | | | | | | | | |
Banks (2.2%) | | | | | | | | |
Citigroup, Inc. | | | 7,393 | | | | 543,386 | |
JPMorgan Chase & Co. | | | 4,830 | | | | 485,946 | |
Wells Fargo & Co. | | | 5,415 | | | | 303,998 | |
| | | | | | | | |
| | | | | | | 1,333,330 | |
| | | | | | | | |
Capital Markets (0.3%) | | | | | | | | |
Intercontinental Exchange, Inc. | | | 3,269 | | | | 216,081 | |
| | | | | | | | |
Diversified Financial Services (0.5%) | |
Leucadia National Corp. | | | 11,919 | | | | 301,550 | |
| | | | | | | | |
Insurance (1.1%) | | | | | | | | |
Chubb Ltd. | | | 1,717 | | | | 258,958 | |
See Notes to Financial Statements.
23
1290 FUNDS
1290 DOUBLELINE DYNAMIC ALLOCATION FUND
PORTFOLIO OF INVESTMENTS (Continued)
October 31, 2017
| | | | | | | | |
| | | Number of
Shares | | | Value
(Note 1) | |
| | | | | | | | |
MetLife, Inc. | | | 7,141 | | | $ | 382,615 | |
| | | | | | | | |
| | | | | | | 641,573 | |
| | | | | | | | |
Total Financials | | | | | | | 2,492,534 | |
| | | | | | | | |
Health Care (4.1%) | | | | | | | | |
Biotechnology (0.6%) | | | | | | | | |
Amgen, Inc. | | | 1,979 | | | | 346,760 | |
| | | | | | | | |
Health Care Equipment & Supplies (0.6%) | |
Abbott Laboratories | | | 7,034 | | | | 381,454 | |
| | | | | | | | |
Health Care Providers & Services (0.9%) | |
Cigna Corp. | | | 1,934 | | | | 381,423 | |
Express Scripts Holding Co.* | | | 2,161 | | | | 132,448 | |
| | | | | | | | |
| | | | | | | 513,871 | |
| | | | | | | | |
Pharmaceuticals (2.0%) | | | | | | | | |
AstraZeneca plc (ADR) | | | 8,105 | | | | 279,622 | |
Bristol-Myers Squibb Co. | | | 4,401 | | | | 271,366 | |
Novartis AG (ADR) | | | 3,413 | | | | 281,846 | |
Roche Holding AG (ADR) | | | 4,040 | | | | 116,817 | |
Sanofi (ADR) | | | 5,858 | | | | 276,966 | |
| | | | | | | | |
| | | | | | | 1,226,617 | |
| | | | | | | | |
Total Health Care | | | | | | | 2,468,702 | |
| | | | | | | | |
Industrials (1.3%) | | | | | | | | |
Electrical Equipment (0.5%) | | | | | | | | |
Eaton Corp. plc | | | 3,825 | | | | 306,076 | |
| | | | | | | | |
Industrial Conglomerates (0.4%) | | | | | | | | |
General Electric Co. | | | 12,557 | | | | 253,149 | |
| | | | | | | | |
Trading Companies & Distributors (0.4%) | |
MSC Industrial Direct Co., Inc., Class A | | | 2,983 | | | | 247,291 | |
| | | | | | | | |
Total Industrials | | | | | | | 806,516 | |
| | | | | | | | |
Information Technology (5.6%) | | | | | | | | |
Communications Equipment (0.6%) | | | | | | | | |
Juniper Networks, Inc. | | | 4,599 | | | | 114,193 | |
Telefonaktiebolaget LM Ericsson (ADR) | | | 39,039 | | | | 243,994 | |
| | | | | | | | |
| | | | | | | 358,187 | |
| | | | | | | | |
Internet Software & Services (1.1%) | | | | | | | | |
Alphabet, Inc., Class A* | | | 639 | | | | 660,113 | |
| | | | | | | | |
IT Services (2.1%) | | | | | | | | |
Cognizant Technology Solutions Corp., Class A | | | 4,623 | | | | 349,823 | |
Leidos Holdings, Inc. | | | 3,598 | | | | 224,947 | |
PayPal Holdings, Inc.* | | | 5,964 | | | | 432,748 | |
Visa, Inc., Class A | | | 2,381 | | | | 261,862 | |
| | | | | | | | |
| | | | | | | 1,269,380 | |
| | | | | | | | |
Semiconductors & Semiconductor Equipment (0.4%) | |
QUALCOMM, Inc. | | | 4,359 | | | | 222,353 | |
| | | | | | | | |
Software (0.8%) | | | | | | | | |
Microsoft Corp. | | | 2,032 | | | | 169,022 | |
Oracle Corp. | | | 6,836 | | | | 347,952 | |
| | | | | | | | |
| | | | | | | 516,974 | |
| | | | | | | | |
| | | | | | | | |
Technology Hardware, Storage & Peripherals (0.6%) | |
Apple, Inc. | | | 2,075 | | | | 350,758 | |
| | | | | | | | |
Total Information Technology | | | | | | | 3,377,765 | |
| | | | | | | | |
Materials (0.4%) | | | | | | | | |
Construction Materials (0.4%) | | | | | | | | |
Cemex SAB de CV (ADR)* | | | 28,026 | | | | 227,291 | |
| | | | | | | | |
Total Materials | | | | | | | 227,291 | |
| | | | | | | | |
Telecommunication Services (0.6%) | |
Diversified Telecommunication Services (0.6%) | |
Verizon Communications, Inc. | | | 7,133 | | | | 341,457 | |
| | | | | | | | |
Total Telecommunication Services | | | | | | | 341,457 | |
| | | | | | | | |
Total Common Stocks (21.8%)
(Cost $11,462,778) | | | | | | | 13,155,727 | |
| | | | | | | | |
INVESTMENT COMPANIES: | |
DoubleLine Floating Rate Fund‡ | | | 240,586 | | | | 2,391,425 | |
DoubleLine Global Bond Fund‡ | | | 135,610 | | | | 1,415,770 | |
| | | | | | | | |
Total Investment Companies (6.3%)
(Cost $3,725,000) | | | | | | | 3,807,195 | |
| | | | | | | | |
| | | Principal
Amount | | | Value
(Note 1) | |
SHORT-TERM INVESTMENTS: | |
U.S. Treasury Obligations (24.8%) | | | | | | | | |
U.S. Treasury Bills | | | | | | | | |
0.96%, 12/7/17 (p) | | $ | 840,000 | | | | 839,171 | |
1.07%, 1/18/18 (p) | | | 6,000,000 | | | | 5,985,994 | |
1.11%, 2/1/18 (p) | | | 6,500,000 | | | | 6,481,355 | |
1.17%, 3/8/18 (p) | | | 1,710,000 | | | | 1,702,912 | |
| | | | | | | | |
Total U.S. Treasury Obligations | | | | | | | 15,009,432 | |
| | | | | | | | |
Total Short-Term Investments (24.8%)
(Cost $15,010,473) | | | | | | | 15,009,432 | |
| | | | | | | | |
Total Investments in Securities (96.1%)
(Cost $56,445,891) | | | | | | | 58,107,226 | |
Other Assets Less Liabilities (3.9%) | | | | | | | 2,376,400 | |
| | | | | | | | |
Net Assets (100%) | | | | | | $ | 60,483,626 | |
| | | | | | | | |
| ‡ | All, or a portion, of the security is an affiliated company as defined under the Investment Company Act of 1940. |
| § | Securities exempt from registration under Rule 144A of the Securities Act of 1933. These securities may only be resold to qualified institutional buyers. At October 31, 2017, the market value of these securities amounted to $5,350,921 or 8.8% of net assets. Securities denoted with “§” but without “b” have been determined to be liquid under the guidelines established by the Board of Trustees. To the extent any securities might provide a right to demand registration, such rights have not been relied upon when determining liquidity. |
| (b) | Rule 144A Illiquid Security. At October 31, 2017, the market value of these securities amounted to $417,080 or 0.7% of net assets. |
See Notes to Financial Statements.
24
1290 FUNDS
1290 DOUBLELINE DYNAMIC ALLOCATION FUND
PORTFOLIO OF INVESTMENTS (Continued)
October 31, 2017
| (e) | Step Bond — Coupon rate increases or decreases in increments to maturity. Rate disclosed is as of October 31, 2017. Maturity date disclosed is the ultimate maturity date. |
| (k) | Variable or floating rate security, linked to the referenced benchmark. The interest rate shown was the current rate as of October 31, 2017. |
| (l) | Variable or floating rate security, the interest rate of which adjusts periodically based on changes in current interest rates and prepayments on the underlying pool of assets. The interest rate shown was the current rate as of October 31, 2017. |
| | | | | | |
| | Glossary: |
| | ADR | | — | | American Depositary Receipt |
| | CAPE | | — | | Cyclically Adjusted Price Earnings |
| | FHLMC | | — | | Federal Home Loan Mortgage Corp. |
| | FNMA | | — | | Federal National Mortgage Association |
| | ICE | | — | | Intercontinental Exchange |
| | LIBOR | | — | | London Interbank Offered Rate |
| | TIPS | | — | | Treasury Inflation Protected Security |
| | USD | | — | | United States Dollar |
Investments in companies which were affiliates for the year ended October 31, 2017, were as follows:
| | | | | | | | | | | | | | | | | | | | | | | | | | | | | | | | | | | | |
Security Description | | Shares at
October 31,
2017 | | | Market Value
October 31,
2016 ($) | | | Purchases
at Cost ($) | | | Proceeds
from
Sales ($) | | | Net
Realized
Gain
(Loss) ($) | | | Change
in Unrealized
Appreciation/
(Depreciation)
($) | | | Market Value
October 31,
2017 ($) | | | Dividend/
Interest
Income
($) | | | Capital Gain
Distributions
($) | |
DoubleLine Floating Rate Fund | | | 240,586 | | | | 1,780,607 | | | | 600,000 | | | | — | | | | — | | | | 10,818 | | | | 2,391,425 | | | | 67,641 | | | | — | |
DoubleLine Global Bond Fund | | | 135,610 | | | | 774,063 | | | | 600,000 | | | | — | | | | — | | | | 41,707 | | | | 1,415,770 | | | | 9,493 | | | | — | |
| | | | | | | | | | | | | | | | | | | | | | | | | | | | | | | | | | | | |
Total | | | | | | | 2,554,670 | | | | 1,200,000 | | | | — | | | | — | | | | 52,525 | | | | 3,807,195 | | | | 77,134 | | | | — | |
| | | | | | | | | | | | | | | | | | | | | | | | | | | | | | | | | | | | |
OTC Total return swap contracts outstanding as of October 31, 2017 (Note 1):
| | | | | | | | | | | | | | | | | | | | |
Reference Entity | | Payments Made
by Fund | | Payments
Received by Fund | | Frequency of
Payments Made/
Received | | Counterparty | | Maturity
Date | | | Notional
Amount | | | Value and
Unrealized
Appreciation
(Depreciation)
($) | |
Shiller Barclays CAPE US Sector ER USD Index | | 0.47% and decrease in total return of index | | Increase in total return of index | | At maturity | | Barclays Bank plc | | | 12/18/2017 | | | USD | 2,500,000 | | | | 5,559 | |
Shiller Barclays CAPE US Sector II ER USD Index | | 0.40% and decrease in total return of index | | Increase in total return of index | | At maturity | | Barclays Bank plc | | | 4/30/2018 | | | USD | 11,000,000 | | | | 766,582 | |
| | | �� | | | | | | | | | | | | | | | | | |
| | | | | | | | | | | | | | | | | | | 772,141 | |
| | | | | | | | | | | | | | | | | | | | |
See Notes to Financial Statements.
25
1290 FUNDS
1290 DOUBLELINE DYNAMIC ALLOCATION FUND
PORTFOLIO OF INVESTMENTS (Continued)
October 31, 2017
The following is a summary of the inputs used to value the Fund’s assets and liabilities carried at fair value as of October 31, 2017:
The inputs or methodology used for valuing securities are not necessarily an indication of the risk associated with investing in those securities.
Various inputs are used in determining the value of the Fund’s investments. These inputs are summarized in the three broad levels listed below:
| | | | | | | | | | | | | | | | |
| | | | | |
| Investment Type | | Level 1
Quoted Prices in
Active Markets for
Identical
Securities | | | Level 2
Significant Other
Observable Inputs
(including quoted prices
for similar securities,
interest rates,
prepayment speeds,
credit risk, etc.) | | | Level 3
Significant Unobservable
Inputs (including the
Fund’s own
assumptions in
determining the fair
value of investments) | | | Total | |
Assets: | | | | | | | | | | | | | | | | |
Asset-Backed Securities | | $ | — | | | $ | 1,084,802 | | | $ | — | | | $ | 1,084,802 | |
Collateralized Mortgage Obligations | | | — | | | | 7,509,227 | | | | — | | | | 7,509,227 | |
Common Stocks | | | | | | | | | | | | | | | | |
Consumer Discretionary | | | 1,729,774 | | | | — | | | | — | | | | 1,729,774 | |
Consumer Staples | | | 970,705 | | | | — | | | | — | | | | 970,705 | |
Energy | | | 740,983 | | | | — | | | | — | | | | 740,983 | |
Financials | | | 2,492,534 | | | | — | | | | — | | | | 2,492,534 | |
Health Care | | | 2,468,702 | | | | — | | | | — | | | | 2,468,702 | |
Industrials | | | 806,516 | | | | — | | | | — | | | | 806,516 | |
Information Technology | | | 3,377,765 | | | | — | | | | — | | | | 3,377,765 | |
Materials | | | 227,291 | | | | — | | | | — | | | | 227,291 | |
Telecommunication Services | | | 341,457 | | | | — | | | | — | | | | 341,457 | |
Corporate Bonds | | | | | | | | | | | | | | | | |
Consumer Discretionary | | | — | | | | 1,326,504 | | | | — | | | | 1,326,504 | |
Consumer Staples | | | — | | | | 700,893 | | | | — | | | | 700,893 | |
Energy | | | — | | | | 818,253 | | | | — | | | | 818,253 | |
Financials | | | — | | | | 1,297,548 | | | | — | | | | 1,297,548 | |
Health Care | | | — | | | | 983,402 | | | | — | | | | 983,402 | |
Industrials | | | — | | | | 741,393 | | | | — | | | | 741,393 | |
Information Technology | | | — | | | | 857,281 | | | | — | | | | 857,281 | |
Materials | | | — | | | | 378,008 | | | | — | | | | 378,008 | |
Real Estate | | | — | | | | 219,170 | | | | — | | | | 219,170 | |
Telecommunication Services | | | — | | | | 589,514 | | | | — | | | | 589,514 | |
Utilities | | | — | | | | 499,160 | | | | — | | | | 499,160 | |
Foreign Government Security | | | — | | | | 83,800 | | | | — | | | | 83,800 | |
Investment Companies | | | 3,807,195 | | | | — | | | | — | | | | 3,807,195 | |
Mortgage-Backed Securities | | | — | | | | 3,662,133 | | | | — | | | | 3,662,133 | |
Short-Term Investments | | | | | | | | | | | | | | | | |
U.S. Treasury Obligations | | | — | | | | 15,009,432 | | | | — | | | | 15,009,432 | |
Total Return Swaps | | | — | | | | 772,141 | | | | — | | | | 772,141 | |
U.S. Treasury Obligations | | | — | | | | 5,383,784 | | | | — | | | | 5,383,784 | |
| | | | | | | | | | | | | | | | |
Total Assets | | $ | 16,962,922 | | | $ | 41,916,445 | | | $ | — | | | $ | 58,879,367 | |
| | | | | | | | | | | | | | | | |
Total Liabilities | | $ | — | | | $ | — | | | $ | — | | | $ | — | |
| | | | | | | | | | | | | | | | |
Total | | $ | 16,962,922 | | | $ | 41,916,445 | | | $ | — | | | $ | 58,879,367 | |
| | | | | | | | | | | | | | | | |
There were no transfers between Levels 1, 2 or 3 during the year ended October 31, 2017.
See Notes to Financial Statements.
26
1290 FUNDS
1290 DOUBLELINE DYNAMIC ALLOCATION FUND
PORTFOLIO OF INVESTMENTS (Continued)
October 31, 2017
Fair Values of Derivative Instruments as of October 31, 2017:
| | | | | | |
| | | Statement of Assets and Liabilities | |
Derivatives Not Accounted for as
Hedging Instrument^ | | Asset Derivatives | | Fair Value | |
Equity contracts | | Receivables, Net assets –
Unrealized appreciation | | $ | 772,141 | |
| | | | | | |
The Effect of Derivative Instruments on the Statement of Operations for the year ended October 31, 2017:
| | | | |
| Amount of Realized Gain or (Loss) on Derivatives Recognized in Income | |
Derivatives Not Accounted for as
Hedging Instruments^ | | Swaps | |
Equity contracts | | $ | 2,943,665 | |
| | | | |
| | | | |
| Amount of Unrealized Appreciation or (Depreciation) on Derivatives Recognized in Income | |
| | | | |
Derivatives Not Accounted for as
Hedging Instruments^ | | Swaps | |
Equity contracts | | $ | (83,875 | ) |
| | | | |
^ The Fund held swap contracts as a substitute for investing in conventional securities.
The Fund held swap contracts with an average notional value of approximately $12,804,000 during the year ended October 31, 2017.
The following table presents the Fund’s gross derivative assets and liabilities by counterparty net of amounts available for offset under netting arrangements and any related collateral received or pledged by the Fund as of October 31, 2017:
| | | | | | | | | | | | | | | | |
Counterparty | | Gross Amount of
Derivative Assets
Presented in the
Statement of Assets
and Liabilities (a) | | | Derivatives
Available
for Offset | | | Financial
Instruments
Received | | | Net Amount Due
from Counterparty | |
Barclays Bank plc | | $ | 772,141 | | | $ | — | | | $ | (606,753 | ) | | $ | 165,388 | |
| | | | | | | | | | | | | | | | |
| (a) | For financial reporting purposes the Fund does not offset derivative assets and derivative liabilities subject to master netting arrangements in the Statement of Assets and Liabilities. |
Investment security transactions for the year ended October 31, 2017 were as follows:
| | | | |
Cost of Purchases: | | | | |
Long-term investments other than U.S. government debt securities | | $ | 22,908,110 | |
Long-term U.S. government debt securities | | | 15,812,594 | |
| | | | |
| | $ | 38,720,704 | |
| | | | |
Net Proceeds of Sales and Redemptions: | | | | |
Long-term investments other than U.S. government debt securities | | $ | 19,012,079 | |
Long-term U.S. government debt securities | | | 17,044,860 | |
| | | | |
| | $ | 36,056,939 | |
| | | | |
See Notes to Financial Statements.
27
1290 FUNDS
1290 DOUBLELINE DYNAMIC ALLOCATION FUND
PORTFOLIO OF INVESTMENTS (Continued)
October 31, 2017
As of October 31, 2017, the gross unrealized appreciation (depreciation) of investments based on the aggregate cost of investments in securities and derivative instruments, if applicable, for Federal income tax purposes was as follows:
| | | | |
Aggregate gross unrealized appreciation | | $ | 3,350,412 | |
Aggregate gross unrealized depreciation | | | (919,527 | ) |
| | | | |
Net unrealized appreciation | | $ | 2,430,885 | |
| | | | |
Federal income tax cost of investments in securities and derivative instruments, if applicable | | $ | 56,448,482 | |
| | | | |
See Notes to Financial Statements.
28
1290 FUNDS
1290 DOUBLELINE DYNAMIC ALLOCATION FUND
STATEMENT OF ASSETS AND LIABILITIES
October 31, 2017
| | | | |
ASSETS | |
Investments in Securities, at value: | | | | |
Affiliated Issuers (Cost $3,725,000) | | $ | 3,807,195 | |
Unaffiliated Issuers (Cost $52,720,891) | | | 54,300,031 | |
Cash | | | 1,664,803 | |
Market value on OTC swap contracts | | | 772,141 | |
Dividends, interest and other receivables | | | 156,343 | |
Receivable for securities sold | | | 21,716 | |
Prepaid registration and filing fees | | | 17,133 | |
Receivable for Fund shares sold | | | 4,047 | |
Other assets | | | 770 | |
| | | | |
Total assets | | | 60,744,179 | |
| | | | |
LIABILITIES | |
Payable for securities purchased | | | 119,610 | |
Payable for Fund shares redeemed | | | 25,000 | |
Investment advisory fees payable | | | 22,305 | |
Administrative fees payable | | | 7,680 | |
Transfer agent fees payable | | | 3,444 | |
Trustees’ fees payable | | | 279 | |
Distribution fees payable – Class A | | | 253 | |
Distribution fees payable – Class R | | | 48 | |
Accrued expenses | | | 81,934 | |
| | | | |
Total liabilities | | | 260,553 | |
| | | | |
NET ASSETS | | $ | 60,483,626 | |
| | | | |
Net assets were comprised of: | |
Paid in capital | | $ | 53,884,290 | |
Accumulated undistributed net investment income (loss) | | | 693,906 | |
Accumulated undistributed net realized gain (loss) | | | 3,471,954 | |
Net unrealized appreciation (depreciation) | | | 2,433,476 | |
| | | | |
Net assets | | $ | 60,483,626 | |
| | | | |
Class A | | | | |
Net asset value and redemption price per share, $1,270,731 / 112,950 shares outstanding (unlimited amount authorized: $0.001 par value) | | $ | 11.25 | |
Maximum sales charge (5.50% of offering price) | | | 0.65 | |
| | | | |
Maximum offering price per share | | $ | 11.90 | |
| | | | |
Class I | | | | |
Net asset value and redemption price per share, $59,100,501 / 5,241,732 shares outstanding (unlimited amount authorized: $0.001 par value) | | $ | 11.27 | |
| | | | |
Class R | | | | |
Net asset value and redemption price per share, $112,394 / 10,009 shares outstanding (unlimited amount authorized: $0.001 par value) | | $ | 11.23 | |
| | | | |
STATEMENT OF OPERATIONS
For the Year Ended October 31, 2017
| | | | |
INVESTMENT INCOME | |
Interest | | $ | 942,379 | |
Dividends ($77,134 of dividend income received from affiliates) | | | 331,956 | |
| | | | |
Total income | | | 1,274,335 | |
| | | | |
EXPENSES | |
Investment advisory fees | | | 428,649 | |
Professional fees | | | 149,709 | |
Administrative fees | | | 85,730 | |
Registration and filing fees | | | 55,465 | |
Transfer agent fees | | | 38,781 | |
Printing and mailing expenses | | | 24,923 | |
Offering costs | | | 23,308 | |
Custodian fees | | | 9,550 | |
Trustees’ fees | | | 7,102 | |
Distribution fees – Class A | | | 1,904 | |
Distribution fees – Class R | | | 544 | |
Miscellaneous | | | 37,285 | |
| | | | |
Gross expenses | | | 862,950 | |
Less: Waiver from investment adviser | | | (290,339 | ) |
Reimbursement from sub-adviser | | | (21,543 | ) |
| | | | |
Net expenses | | | 551,068 | |
| | | | |
NET INVESTMENT INCOME (LOSS) | | | 723,267 | |
| | | | |
REALIZED AND UNREALIZED GAIN (LOSS) | |
Realized gain (loss) on: | | | | |
Investments in securities | | | 605,264 | |
Swaps | | | 2,943,665 | |
| | | | |
Net realized gain (loss) | | | 3,548,929 | |
| | | | |
Change in unrealized appreciation (depreciation) on: | | | | |
Investments in securities ($52,525 of change in unrealized appreciation (depreciation) from affiliates) | | | 1,048,691 | |
Swaps | | | (83,875 | ) |
| | | | |
Net change in unrealized appreciation (depreciation) | | | 964,816 | |
| | | | |
NET REALIZED AND UNREALIZED GAIN (LOSS) | | | 4,513,745 | |
| | | | |
NET INCREASE (DECREASE) IN NET ASSETS RESULTING FROM OPERATIONS | | $ | 5,237,012 | |
| | | | |
See Notes to Financial Statements.
29
1290 FUNDS
1290 DOUBLELINE DYNAMIC ALLOCATION FUND
STATEMENT OF CHANGES IN NET ASSETS
| | | | | | | | |
| | | Year Ended
October 31, 2017 | | | March 7, 2016* to
October 31, 2016 | |
INCREASE (DECREASE) IN NET ASSETS FROM OPERATIONS: | |
Net investment income (loss) | | $ | 723,267 | | | $ | 385,224 | |
Net realized gain (loss) | | | 3,548,929 | | | | 899,333 | |
Net change in unrealized appreciation (depreciation) | | | 964,816 | | | | 1,468,660 | |
| | | | | | | | |
NET INCREASE (DECREASE) IN NET ASSETS RESULTING FROM OPERATIONS | | | 5,237,012 | | | | 2,753,217 | |
| | | | | | | | |
DIVIDENDS AND DISTRIBUTIONS: | | | | | | | | |
Dividends from net investment income | | | | | | | | |
Class A | | | (4,165 | ) | | | — | |
Class I | | | (562,783 | ) | | | — | |
Class R | | | (667 | ) | | | — | |
| | | | | | | | |
| | | (567,615 | ) | | | — | |
| | | | | | | | |
Distributions from net realized capital gains | | | | | | | | |
Class A | | | (7,898 | ) | | | — | |
Class I | | | (854,088 | ) | | | — | |
Class R | | | (1,681 | ) | | | — | |
| | | | | | | | |
| | | (863,667 | ) | | | — | |
| | | | | | | | |
TOTAL DIVIDENDS AND DISTRIBUTIONS | | | (1,431,282 | ) | | | — | |
| | | | | | | | |
CAPITAL SHARES TRANSACTIONS: | | | | | | | | |
Class A | | | | | | | | |
Capital shares sold [ 80,291 and 34,035 shares, respectively ] | | | 877,567 | | | | 351,466 | |
Capital shares issued in reinvestment of dividends [ 910 and 0 shares, respectively ] | | | 9,497 | | | | — | |
Capital shares repurchased [ (2,089) and (197) shares, respectively ] | | | (22,784 | ) | | | (2,108 | ) |
| | | | | | | | |
Total Class A transactions | | | 864,280 | | | | 349,358 | |
| | | | | | | | |
Class I | | | | | | | | |
Capital shares sold [ 185,130 and 5,068,980 shares, respectively ] | | | 2,011,307 | | | | 50,737,212 | |
Capital shares issued in reinvestment of dividends [ 2,773 and 0 shares, respectively ] | | | 28,945 | | | | — | |
Capital shares repurchased [ (15,151) and 0 shares, respectively ] | | | (166,524 | ) | | | — | |
| | | | | | | | |
Total Class I transactions | | | 1,873,728 | | | | 50,737,212 | |
| | | | | | | | |
Class R | | | | | | | | |
Capital shares sold [ 0 and 10,009 shares, respectively ] | | | — | | | | 100,099 | |
Capital shares issued in reinvestment of dividends [ 0# and 0 shares, respectively ] | | | 2 | | | | — | |
| | | | | | | | |
Total Class R transactions | | | 2 | | | | 100,099 | |
| | | | | | | | |
NET INCREASE (DECREASE) IN NET ASSETS RESULTING FROM CAPITAL SHARE TRANSACTIONS | | | 2,738,010 | | | | 51,186,669 | |
| | | | | | | | |
TOTAL INCREASE (DECREASE) IN NET ASSETS | | | 6,543,740 | | | | 53,939,886 | |
NET ASSETS: | |
Beginning of period | | | 53,939,886 | | | | — | |
| | | | | | | | |
End of period (a) | | $ | 60,483,626 | | | $ | 53,939,886 | |
| | | | | | | | |
(a) Includes accumulated undistributed (overdistributed) net investment income (loss) of | | $ | 693,906 | | | $ | 434,938 | |
| | | | | | | | |
* The Fund commenced operations on March 7, 2016. | | | | | | | | |
# Number of shares is less than 0.5. | | | | | | | | |
See Notes to Financial Statements.
30
1290 FUNDS
1290 DOUBLELINE DYNAMIC ALLOCATION FUND
FINANCIAL HIGHLIGHTS
| | | | | | | | |
| Class A | | Year Ended
October 31, 2017 | | | March 7, 2016* to
October 31, 2016 | |
Net asset value, beginning of period | | $ | 10.53 | | | $ | 10.00 | |
| | | | | | | | |
Income (loss) from investment operations: | | | | | | | | |
Net investment income (loss) (e) | | | 0.11 | | | | 0.06 | |
Net realized and unrealized gain (loss) | | | 0.87 | | | | 0.47 | |
| | | | | | | | |
Total from investment operations | | | 0.98 | | | | 0.53 | |
| | | | | | | | |
Less distributions: | | | | | | | | |
Dividends from net investment income | | | (0.09 | ) | | | — | |
Distributions from net realized gains | | | (0.17 | ) | | | — | |
| | | | | | | | |
Total dividends and distributions | | | (0.26 | ) | | | — | |
| | | | | | | | |
Net asset value, end of period | | $ | 11.25 | | | $ | 10.53 | |
| | | | | | | | |
Total return (b) | | | 9.46 | % | | | 5.30 | % |
| | | | | | | | |
Ratios/Supplemental Data: | | | | | | | | |
Net assets, end of period (000’s) | | $ | 1,271 | | | $ | 356 | |
Ratio of expenses to average net assets: | | | | | | | | |
After waivers (a)(f) | | | 1.21 | % | | | 1.22 | % |
Before waivers (a)(f) | | | 1.75 | % | | | 1.85 | % |
Ratio of net investment income (loss) to average net assets: | | | | | | | | |
After waivers (a)(f) | | | 1.02 | % | | | 0.89 | %(l) |
Before waivers (a)(f) | | | 0.48 | % | | | 0.26 | %(l) |
Portfolio turnover rate (z)^ | | | 86 | % | | | 56 | % |
| | |
| Class I | | Year Ended
October 31, 2017 | | | March 7, 2016* to
October 31, 2016 | |
Net asset value, beginning of period | | $ | 10.55 | | | $ | 10.00 | |
| | | | | | | | |
Income (loss) from investment operations: | | | | | | | | |
Net investment income (loss) (e) | | | 0.14 | | | | 0.08 | |
Net realized and unrealized gain (loss) | | | 0.86 | | | | 0.47 | |
| | | | | | | | |
Total from investment operations | | | 1.00 | | | | 0.55 | |
| | | | | | | | |
Less distributions: | | | | | | | | |
Dividends from net investment income | | | (0.11 | ) | | | — | |
Distributions from net realized gains | | | (0.17 | ) | | | — | |
| | | | | | | | |
Total dividends and distributions | | | (0.28 | ) | | | — | |
| | | | | | | | |
Net asset value, end of period | | $ | 11.27 | | | $ | 10.55 | |
| | | | | | | | |
Total return (b) | | | 9.68 | % | | | 5.50 | % |
| | | | | | | | |
Ratios/Supplemental Data: | | | | | | | | |
Net assets, end of period (000’s) | | $ | 59,101 | | | $ | 53,478 | |
Ratio of expenses to average net assets: | | | | | | | | |
After waivers (a)(f) | | | 0.96 | % | | | 0.97 | % |
Before waivers (a)(f) | | | 1.50 | % | | | 1.55 | % |
Ratio of net investment income (loss) to average net assets: | | | | | | | | |
After waivers (a)(f) | | | 1.27 | % | | | 1.12 | %(l) |
Before waivers (a)(f) | | | 0.72 | % | | | 0.55 | %(l) |
Portfolio turnover rate (z)^ | | | 86 | % | | | 56 | % |
See Notes to Financial Statements.
31
1290 FUNDS
1290 DOUBLELINE DYNAMIC ALLOCATION FUND
FINANCIAL HIGHLIGHTS (Continued)
| | | | | | | | |
| Class R | | Year Ended
October 31, 2017 | | | March 7, 2016* to
October 31, 2016 | |
Net asset value, beginning of period | | $ | 10.52 | | | $ | 10.00 | |
| | | | | | | | |
Income (loss) from investment operations: | | | | | | | | |
Net investment income (loss) (e) | | | 0.08 | | | | 0.04 | |
Net realized and unrealized gain (loss) | | | 0.87 | | | | 0.48 | |
| | | | | | | | |
Total from investment operations | | | 0.95 | | | | 0.52 | |
| | | | | | | | |
Less distributions: | | | | | | | | |
Dividends from net investment income | | | (0.07 | ) | | | — | |
Distributions from net realized gains | | | (0.17 | ) | | | — | |
| | | | | | | | |
Total dividends and distributions | | | (0.24 | ) | | | — | |
| | | | | | | | |
Net asset value, end of period | | $ | 11.23 | | | $ | 10.52 | |
| | | | | | | | |
Total return (b) | | | 9.15 | % | | | 5.20 | % |
| | | | | | | | |
Ratios/Supplemental Data: | | | | | | | | |
Net assets, end of period (000’s) | | $ | 112 | | | $ | 105 | |
Ratio of expenses to average net assets: | | | | | | | | |
After waivers (a)(f) | | | 1.46 | % | | | 1.47 | % |
Before waivers (a)(f) | | | 2.01 | % | | | 2.05 | % |
Ratio of net investment income (loss) to average net assets: | | | | | | | | |
After waivers (a)(f) | | | 0.77 | % | | | 0.62 | %(l) |
Before waivers (a)(f) | | | 0.22 | % | | | 0.05 | %(l) |
Portfolio turnover rate (z)^ | | | 86 | % | | | 56 | % |
| * | Commencement of Operations. |
| ^ | Portfolio turnover rate excludes derivatives, if any. |
| (a) | Ratios for periods less than one year are annualized. Certain non-recurring expenses incurred by the Fund are not annualized for periods less than one year. |
| (b) | Total returns for periods less than one year are not annualized. |
| (e) | Net investment income (loss) per share is based on average shares outstanding. |
| (f) | Expenses do not include the expenses of the underlying funds (“indirect expenses”), if applicable. |
| (l) | The annualized ratio of net investment income to average net assets may not be indicative of operating results for a full year. |
| (z) | Portfolio turnover rate for periods less than one year is not annualized. |
See Notes to Financial Statements.
32
1290 GAMCO SMALL/MID CAP VALUE FUND (Unaudited)
INVESTMENT ADVISER
INVESTMENT SUB-ADVISER
| Ø | | GAMCO Asset Management, Inc. |
PERFORMANCE RESULTS
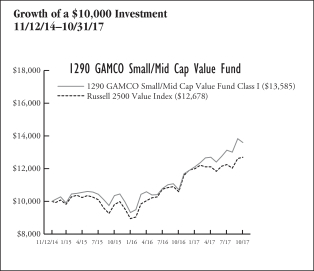
| | | | | | | | | | |
| Annualized Total Returns as of 10/31/17 | |
| | | | | 1
Year | | | Since
Incept. | |
Fund – Class A Shares* | | without Sales Charge | | | 26.72 | % | | | 10.59 | % |
| | | with Sales Charge (a) | | | 19.73 | | | | 8.51 | |
Fund – Class I Shares* | | | | | 27.09 | | | | 10.88 | |
Fund – Class R Shares* | | | | | 26.49 | | | | 10.32 | |
Fund – Class T Shares*† | | without Sales Charge | | | 27.09 | | | | 10.88 | |
| | | with Sales Charge (b) | | | 23.96 | | | | 9.92 | |
Russell 2500TM Value Index | | | | | 19.97 | | | | 8.33 | |
* Date of inception 11/12/14. † Class T Shares currently are not offered for sale. Class T shares were formerly known as Class C shares. (a) A 5.50% front-end sales charge was deducted. (b) A 2.50% front-end sales charge was deducted. Returns for periods greater than one year are annualized. | |
The performance quoted is past performance and is not a guarantee of future results. Mutual funds are subject to certain market risks. Investment returns and principal value of an investment will fluctuate so that an investor’s shares, when redeemed, may be worth more or less than their original cost. Current performance may be higher or lower than the performance data shown. For the most current month-end performance data please call 1-888-310-0416 or visit www.1290Funds.com.
The graph illustrates comparative performance for $10,000 invested in the Class I Shares of the 1290 GAMCO Small/Mid Cap Value Fund and the Russell 2500TM Value Index from 11/12/14 to 10/31/17. The performance of the Russell 2500TM Value Index reflects an initial investment at the end of the month closest to the Fund’s inception. The performance of the Fund assumes reinvestment of all dividends and capital gain distributions, if any, and does not include a sales charge. The performance of the Russell 2500TM Value Index does not reflect the deduction of expenses or a sales charge associated with a mutual fund and has been adjusted to reflect reinvestment of all dividends, capital gain distributions, and interest of the securities included in the benchmark.
Fund performance may reflect the waiver of the Fund’s fees and reimbursement of expenses for certain periods since the inception date. Without these waivers and reimbursements, performance would have been lower. Also, performance shown in this section does not reflect the deduction of taxes that a shareholder would pay on Fund distributions or redemption of Fund shares.
PERFORMANCE SUMMARY
The Fund’s Class I shares returned 27.09% for the year ended October 31, 2017. The Fund’s benchmark, the Russell 2500TM Value Index, returned 19.97% over the same year.
Fund Overview — GAMCO Asset Management, Inc.
We buy businesses we believe are selling at a discount to their Private Market Value (the price an informed industrialist would pay for the entire company), with a catalyst in place that could potentially surface values. Our philosophy and process focuses on fundamental company research and individual stock selection. The Fund is significantly different than its benchmark index, and performance will often not closely track it.
The Fund outperformed its benchmark for the year ended October 31, 2017. The Fund’s higher than benchmark weightings in our firm’s areas of core competency (consumer discretionary, consumer staples and industrials) drove its outperformance for the period, more than tripling the contribution to performance from these sectors in the benchmark.
Fund Highlights
What helped performance during the year?
| • | | Internap Corp., a data center and cloud computing company, more than tripled during the period under the direction of a new CEO and we believe it is in the early stages of a turnaround. |
| • | | Navistar International Corp. rose over 70% mainly due to strong earnings results. The company returned to profitability with robust operational performance across the board, amidst an improving North American Class 8 heavy truck demand backdrop. |
| • | | National Beverage Corp., whose brands include La Croix sugar free sparkling water, was up over 60% during the period and is a natural beneficiary of healthier consumer preferences, particularly among millennials. The company posted strong performance for the period despite a recent pullback as a competitor was acquired by The Coca Cola Co. in October 2017. |
| • | | Sevcon Inc., a maker of battery chargers and controls for electric and hybrid cars, was up over 80% during the period as BorgWarner Inc. announced it would buy the company for $22 a share during the third quarter. We sold this security during the year. |
33
1290 GAMCO SMALL/MID CAP VALUE FUND (Unaudited)
What hurt performance during the year?
| • | | MSG Networks, Inc. was off for the period as it lost subscribers due to pressure on the traditional pay-TV bundle. We do not expect subscriber loss to accelerate and believe there are several logical buyers for MSG Networks’ sports focused content. |
| • | | Edgewell Personal Care Co.’s top line remains under pressure following disappointing organic sales in the previous quarter. Management has indicated that the industry environment remains challenged with continued heightened pressure, particularly in the Wet Shave and Feminine Care categories. |
| • | | Ingles Markets, Inc., a grocery store chain operator in the southeast U.S., was down during the period as traditional grocery stores weighed the impact of the Amazon/Whole Foods deal on the industry. |
| • | | Financials holdings were propelled down as the Federal Reserve raised rates in December 2016 and then twice so far this year, revising expectations for the end of a multi-decade decline in interest rates. The unveiling of a tax overhaul plan at the end of the third quarter also gave bank stocks a tailwind. The Fund’s exposure to financials, which is less than that in the benchmark, was a detractor from relative performance for the period. |
| | | | |
Sector Weightings
as of October 31, 2017 | | % of
Net Assets | |
Industrials | | | 27.1 | % |
Consumer Discretionary | | | 19.1 | |
Consumer Staples | | | 10.2 | |
Materials | | | 10.2 | |
Health Care | | | 6.8 | |
Information Technology | | | 5.9 | |
Investment Companies | | | 4.0 | |
Telecommunication Services | | | 3.6 | |
Financials | | | 3.3 | |
Utilities | | | 3.0 | |
Energy | | | 2.4 | |
Real Estate | | | 2.0 | |
Cash and Other | | | 2.4 | |
| | | | | |
| | | | 100.0 | % |
| | | | | |
Holdings are subject to change without notice. | |
UNDERSTANDING YOUR EXPENSES:
As a shareholder of the Fund, you incur two types of costs:
(1) transaction costs, including applicable sales charges and redemption fees; and (2) ongoing costs, including investment advisory fees, distribution and/or service (12b-1) fees (in the case of Class A, Class R and Class T shares of the Fund), and other Fund expenses. These examples are intended to help you understand your ongoing costs (in dollars) of investing in the Fund and to compare these costs with the ongoing costs of investing in other mutual funds.
The examples are based on an investment of $1,000 invested at the beginning of the six-month period ended October 31, 2017 and held for the entire six-month period.
Actual Expenses
The first line of the following table provides information about actual account values and actual expenses. You may use the information in this line, together with the amount you invested, to estimate the expenses that you paid over the period. Simply divide your account value by $1,000 (for example, an $8,600 account value divided by $1,000 = 8.6), then multiply the result by the number in the first line under the heading entitled “Expenses Paid During Period” to estimate the expenses you paid on your account during this period.
Hypothetical Example for Comparison Purposes
The second line of the following table provides information about hypothetical account values and hypothetical expenses based on the Fund’s actual expense ratio and an assumed rate of return of 5% per year before expenses, which is not the Fund’s actual return. The hypothetical account values and expenses may not be used to estimate the actual ending account balance or expenses you paid for the period. You may use this information to compare the ongoing costs of investing in the Fund and other funds. To do so, compare this 5% hypothetical example with the 5% hypothetical examples that appear in the shareholder reports of the other funds.
Please note that the expenses shown in the table are meant to highlight your ongoing costs only and do not reflect any transactional costs, such as sales charges (loads), redemption fees, or exchange fees. Therefore, the second line of the table is useful in comparing ongoing costs only, and will not help you determine the relative total costs of owning different funds. In addition, if these transactional costs were included, your costs would have been higher.
EXAMPLE
| | | | | | | | | | | | |
| | | Beginning
Account
Value
5/1/17 | | | Ending
Account
Value
10/31/17 | | | Expenses
Paid
During
Period*
5/1/17 -
10/31/17 | |
Class A | |
Actual | | | $1,000.00 | | | | $1,068.30 | | | | $6.52 | |
Hypothetical (5% average annual return before expenses) | | | 1,000.00 | | | | 1,018.90 | | | | 6.36 | |
Class I | |
Actual | | | 1,000.00 | | | | 1,069.90 | | | | 5.22 | |
Hypothetical (5% average annual return before expenses) | | | 1,000.00 | | | | 1,020.16 | | | | 5.09 | |
Class R | |
Actual | | | 1,000.00 | | | | 1,066.90 | | | | 7.81 | |
Hypothetical (5% average annual return before expenses) | | | 1,000.00 | | | | 1,017.64 | | | | 7.63 | |
Class T** | |
Actual | | | 1,000.00 | | | | 1,069.90 | | | | 5.22 | |
Hypothetical (5% average annual return before expenses) | | | 1,000.00 | | | | 1,020.16 | | | | 5.09 | |
* Expenses are equal to the Fund’s Class A, I, R and T shares annualized expense ratios of 1.25%, 1.00%, 1.50% and 1.00%, respectively, multiplied by the average account value over the period, and multiplied by 184/365 (to reflect the one-half year period). ** Class T shares currently are not offered for sale. Class T shares were formerly known as Class C shares. | |
34
1290 FUNDS
1290 GAMCO SMALL/MID CAP VALUE FUND
PORTFOLIO OF INVESTMENTS
October 31, 2017
| | | | | | | | |
| | | Number of
Shares | | | Value
(Note 1) | |
| | | | | | | | |
COMMON STOCKS: | |
Consumer Discretionary (19.1%) | |
Auto Components (1.9%) | |
Brembo SpA | | | 2,500 | | | $ | 41,294 | |
Dana, Inc. | | | 9,500 | | | | 289,655 | |
Lear Corp. | | | 400 | | | | 70,236 | |
Superior Industries International, Inc. | | | 4,000 | | | | 62,200 | |
| | | | | | | | |
| | | | | | | 463,385 | |
| | | | | | | | |
Diversified Consumer Services (0.2%) | |
Universal Technical Institute, Inc.* | | | 16,000 | | | | 53,280 | |
| | | | | | | | |
Hotels, Restaurants & Leisure (3.3%) | |
Cheesecake Factory, Inc. (The) | | | 4,500 | | | | 201,330 | |
Golden Entertainment, Inc.* | | | 5,000 | | | | 133,400 | |
Nathan’s Famous, Inc.* | | | 3,000 | | | | 243,300 | |
Wynn Resorts Ltd. | | | 1,400 | | | | 206,486 | |
| | | | | | | | |
| | | | | | | 784,516 | |
| | | | | | | | |
Household Durables (2.7%) | |
Bassett Furniture Industries, Inc. | | | 7,000 | | | | 271,600 | |
Hunter Douglas NV | | | 2,000 | | | | 161,937 | |
La-Z-Boy, Inc. | | | 2,500 | | | | 67,375 | |
Lennar Corp., Class B | | | 3,000 | | | | 143,850 | |
| | | | | | | | |
| | | | | | | 644,762 | |
| | | | | | | | |
Internet & Direct Marketing Retail (0.3%) | |
Lands’ End, Inc.* | | | 7,000 | | | | 76,300 | |
| | | | | | | | |
Media (8.6%) | |
Beasley Broadcast Group, Inc., Class A | | | 500 | | | | 4,725 | |
Clear Channel Outdoor Holdings, Inc., Class A | | | 14,000 | | | | 53,200 | |
EW Scripps Co. (The), Class A* | | | 14,000 | | | | 242,760 | |
JCDecaux SA | | | 4,000 | | | | 153,061 | |
Liberty Media Corp.-Liberty Braves, Class C* | | | 7,000 | | | | 165,270 | |
Loral Space & Communications, Inc.* | | | 1,500 | | | | 70,725 | |
Madison Square Garden Co. (The), Class A* | | | 901 | | | | 200,644 | |
Meredith Corp. | | | 400 | | | | 21,200 | |
MSG Networks, Inc., Class A* | | | 5,000 | | | | 86,750 | |
Salem Media Group, Inc. | | | 3,000 | | | | 19,200 | |
Tribune Media Co., Class A | | | 12,000 | | | | 491,160 | |
Viacom, Inc., Class B | | | 21,500 | | | | 516,646 | |
| | | | | | | | |
| | | | | | | 2,025,341 | |
| | | | | | | | |
Multiline Retail (0.3%) | |
JC Penney Co., Inc.* | | | 15,000 | | | | 42,000 | |
Macy’s, Inc. | | | 1,500 | | | | 28,140 | |
| | | | | | | | |
| | | | | | | 70,140 | |
| | | | | | | | |
Specialty Retail (1.8%) | |
Aaron’s, Inc. | | | 800 | | | | 29,440 | |
Advance Auto Parts, Inc. | | | 1,000 | | | | 81,740 | |
Tractor Supply Co. | | | 5,300 | | | | 319,378 | |
| | | | | | | | |
| | | | | | | 430,558 | |
| | | | | | | | |
Total Consumer Discretionary | | | | | | | 4,548,282 | |
| | | | | | | | |
| | | | | | | | |
Consumer Staples (10.2%) | |
Beverages (2.1%) | |
Cott Corp. | | | 12,000 | | | | 180,000 | |
Davide Campari-Milano SpA | | | 24,000 | | | | 192,340 | |
National Beverage Corp. | | | 800 | | | | 78,320 | |
Remy Cointreau SA | | | 400 | | | | 51,952 | |
| | | | | | | | |
| | | | | | | 502,612 | |
| | | | | | | | |
Food & Staples Retailing (1.0%) | |
Ingles Markets, Inc., Class A | | | 10,000 | | | | 233,000 | |
| | | | | | | | |
Food Products (4.1%) | |
Bob Evans Farms, Inc. | | | 6,000 | | | | 463,140 | |
Maple Leaf Foods, Inc. | | | 5,000 | | | | 129,680 | |
McCormick & Co., Inc. | | | 1,800 | | | | 179,604 | |
Snyder’s-Lance, Inc. | | | 5,500 | | | | 206,965 | |
| | | | | | | | |
| | | | | | | 979,389 | |
| | | | | | | | |
Household Products (1.9%) | |
Energizer Holdings, Inc. | | | 5,500 | | | | 236,445 | |
Oil-Dri Corp. of America | | | 5,000 | | | | 210,050 | |
| | | | | | | | |
| | | | | | | 446,495 | |
| | | | | | | | |
Personal Products (1.1%) | |
Avon Products, Inc.* | | | 22,000 | | | | 50,160 | |
Edgewell Personal Care Co.* | | | 3,300 | | | | 214,269 | |
| | | | | | | | |
| | | | | | | 264,429 | |
| | | | | | | | |
Total Consumer Staples | | | | | | | 2,425,925 | |
| | | | | | | | |
Energy (2.4%) | |
Energy Equipment & Services (2.4%) | |
Dril-Quip, Inc.* | | | 8,500 | | | | 357,850 | |
Weatherford International plc* | | | 60,000 | | | | 208,200 | |
| | | | | | | | |
Total Energy | | | | | | | 566,050 | |
| | | | | | | | |
Financials (3.3%) | |
Banks (2.4%) | |
Atlantic Capital Bancshares, Inc.* | | | 2,000 | | | | 32,900 | |
FCB Financial Holdings, Inc., Class A* | | | 3,400 | | | | 158,780 | |
Flushing Financial Corp. | | | 7,022 | | | | 210,520 | |
State Bank Financial Corp. | | | 6,000 | | | | 173,460 | |
| | | | | | | | |
| | | | | | | 575,660 | |
| | | | | | | | |
Capital Markets (0.9%) | |
Cohen & Steers, Inc. | | | 1,800 | | | | 78,282 | |
Waddell & Reed Financial, Inc., Class A | | | 7,000 | | | | 130,830 | |
| | | | | | | | |
| | | | | | | 209,112 | |
| | | | | | | | |
Total Financials | | | | | | | 784,772 | |
| | | | | | | | |
Health Care (6.8%) | |
Health Care Equipment & Supplies (1.6%) | |
Exactech, Inc.* | | | 4,000 | | | | 167,400 | |
K2M Group Holdings, Inc.* | | | 11,000 | | | | 216,590 | |
| | | | | | | | |
| | | | | | | 383,990 | |
| | | | | | | | |
Health Care Providers & Services (2.7%) | |
Kindred Healthcare, Inc.* | | | 10,000 | | | | 60,500 | |
Patterson Cos., Inc. | | | 4,000 | | | | 148,000 | |
Teladoc, Inc.* | | | 13,000 | | | | 429,650 | |
| | | | | | | | |
| | | | | | | 638,150 | |
| | | | | | | | |
See Notes to Financial Statements.
35
1290 FUNDS
1290 GAMCO SMALL/MID CAP VALUE FUND
PORTFOLIO OF INVESTMENTS (Continued)
October 31, 2017
| | | | | | | | |
| | | Number of
Shares | | | Value
(Note 1) | |
| | | | | | | | |
Health Care Technology (2.2%) | |
Evolent Health, Inc., Class A* | | | 33,000 | | | $ | 536,250 | |
| | | | | | | | |
Life Sciences Tools & Services (0.3%) | |
Bio-Rad Laboratories, Inc., Class A* | | | 300 | | | | 65,937 | |
| | | | | | | | |
Total Health Care | | | | | | | 1,624,327 | |
| | | | | | | | |
Industrials (27.1%) | |
Aerospace & Defense (4.4%) | |
Aerojet Rocketdyne Holdings, Inc.* | | | 4,000 | | | | 126,320 | |
Orbital ATK, Inc. | | | 5,000 | | | | 664,650 | |
Textron, Inc. | | | 5,500 | | | | 290,070 | |
| | | | | | | | |
| | | | | | | 1,081,040 | |
| | | | | | | | |
Building Products (1.1%) | |
Armstrong Flooring, Inc.* | | | 9,300 | | | | 137,640 | |
Griffon Corp. | | | 5,500 | | | | 124,025 | |
| | | | | | | | |
| | | | | | | 261,665 | |
| | | | | | | | |
Commercial Services & Supplies (0.7%) | |
Team, Inc.* | | | 13,000 | | | | 159,900 | |
| | | | | | | | |
Construction & Engineering (0.2%) | |
Layne Christensen Co.* | | | 3,000 | | | | 39,630 | |
| | | | | | | | |
Electrical Equipment (0.1%) | |
AMETEK, Inc. | | | 200 | | | | 13,498 | |
| | | | | | | | |
Machinery (14.5%) | |
Astec Industries, Inc. | | | 5,200 | | | | 270,140 | |
CNH Industrial NV | | | 24,000 | | | | 304,800 | |
Eastern Co. (The) | | | 10,500 | | | | 303,450 | |
EnPro Industries, Inc. | | | 4,000 | | | | 334,960 | |
Federal Signal Corp. | | | 2,500 | | | | 53,375 | |
Flowserve Corp. | | | 8,500 | | | | 374,595 | |
Graco, Inc. | | | 1,500 | | | | 197,685 | |
ITT, Inc. | | | 1,000 | | | | 46,640 | |
Mueller Industries, Inc. | | | 11,500 | | | | 399,625 | |
Mueller Water Products, Inc., Class A | | | 20,000 | | | | 238,800 | |
Navistar International Corp.* | | | 12,000 | | | | 507,721 | |
Trinity Industries, Inc. | | | 3,500 | | | | 113,820 | |
Twin Disc, Inc.* | | | 16,000 | | | | 341,600 | |
| | | | | | | | |
| | | | | | | 3,487,211 | |
| | | | | | | | |
Road & Rail (1.8%) | |
Hertz Global Holdings, Inc.* | | | 17,000 | | | | 422,790 | |
| | | | | | | | |
Trading Companies & Distributors (4.3%) | |
Ashtead Group plc | | | 2,000 | | | | 51,532 | |
GATX Corp. | | | 4,500 | | | | 267,345 | |
Herc Holdings, Inc.* | | | 10,000 | | | | 484,600 | |
Kaman Corp. | | | 4,000 | | | | 223,760 | |
| | | | | | | | |
| | | | | | | 1,027,237 | |
| | | | | | | | |
Total Industrials | | | | | | | 6,492,971 | |
| | | | | | | | |
Information Technology (5.9%) | |
Communications Equipment (0.5%) | |
Communications Systems, Inc. | | | 17,000 | | | | 73,610 | |
EchoStar Corp., Class A* | | | 1,000 | | | | 55,950 | |
| | | | | | | | |
| | | | | | | 129,560 | |
| | | | | | | | |
| | | | | | | | |
Internet Software & Services (3.6%) | |
Bankrate, Inc.* | | | 20,000 | | | | 278,000 | |
comScore, Inc.* | | | 6,500 | | | | 194,155 | |
Gogo, Inc.* | | | 13,000 | | | | 129,220 | |
Internap Corp.* | | | 50,000 | | | | 232,500 | |
| | | | | | | | |
| | | | | | | 833,875 | |
| | | | | | | | |
IT Services (0.2%) | |
MoneyGram International, Inc.* | | | 3,000 | | | | 46,650 | |
| | | | | | | | |
Software (1.0%) | |
BroadSoft, Inc.* | | | 1,500 | | | | 82,275 | |
Silver Spring Networks, Inc.* | | | 10,000 | | | | 161,200 | |
| | | | | | | | |
| | | | | | | 243,475 | |
| | | | | | | | |
Technology Hardware, Storage & Peripherals (0.6%) | |
Diebold Nixdorf, Inc. | | | 7,500 | | | | 144,750 | |
| | | | | | | | |
Total Information Technology | | | | | | | 1,398,310 | |
| | | | | | | | |
Materials (10.2%) | |
Chemicals (6.0%) | |
Calgon Carbon Corp. | | | 10,000 | | | | 217,000 | |
Chr Hansen Holding A/S | | | 1,200 | | | | 105,005 | |
GCP Applied Technologies, Inc.* | | | 14,000 | | | | 409,500 | |
Tredegar Corp. | | | 15,000 | | | | 290,250 | |
Valvoline, Inc. | | | 16,500 | | | | 396,330 | |
| | | | | | | | |
| | | | | | | 1,418,085 | |
| | | | | | | | |
Containers & Packaging (1.1%) | |
Myers Industries, Inc. | | | 12,500 | | | | 270,000 | |
| | | | | | | | |
Metals & Mining (3.1%) | |
Allegheny Technologies, Inc.* | | | 1,000 | | | | 25,180 | |
Ampco-Pittsburgh Corp. | | | 4,500 | | | | 74,475 | |
Dominion Diamond Corp. | | | 4,000 | | | | 57,000 | |
Freeport-McMoRan, Inc.* | | | 10,000 | | | | 139,800 | |
Materion Corp. | | | 600 | | | | 30,810 | |
TimkenSteel Corp.* | | | 29,000 | | | | 406,000 | |
| | | | | | | | |
| | | | | | | 733,265 | |
| | | | | | | | |
Total Materials | | | | | | | 2,421,350 | |
| | | | | | | | |
Real Estate (2.0%) | |
Equity Real Estate Investment Trusts (REITs) (2.0%) | |
Ryman Hospitality Properties, Inc. (REIT) | | | 6,500 | | | | 429,845 | |
Seritage Growth Properties (REIT), Class A | | | 1,200 | | | | 49,356 | |
| | | | | | | | |
Total Real Estate | | | | | | | 479,201 | |
| | | | | | | | |
Telecommunication Services (3.6%) | |
Diversified Telecommunication Services (0.2%) | |
Cincinnati Bell, Inc.* | | | 3,000 | | | | 57,300 | |
| | | | | | | | |
Wireless Telecommunication Services (3.4%) | |
Millicom International Cellular SA | | | 3,000 | | | | 194,280 | |
Millicom International Cellular SA (SDR) | | | 5,000 | | | | 319,829 | |
United States Cellular Corp.* | | | 8,000 | | | | 292,720 | |
| | | | | | | | |
| | | | | | | 806,829 | |
| | | | | | | | |
Total Telecommunication Services | | | | | | | 864,129 | |
| | | | | | | | |
See Notes to Financial Statements.
36
1290 FUNDS
1290 GAMCO SMALL/MID CAP VALUE FUND
PORTFOLIO OF INVESTMENTS (Continued)
October 31, 2017
| | | | | | | | |
| | | Number of
Shares | | | Value
(Note 1) | |
| | | | | | | | |
Utilities (3.0%) | |
Electric Utilities (0.3%) | |
El Paso Electric Co. | | | 200 | | | $ | 11,500 | |
Westar Energy, Inc. | | | 1,000 | | | | 53,480 | |
| | | | | | | | |
| | | | | | | 64,980 | |
| | | | | | | | |
Gas Utilities (2.1%) | |
National Fuel Gas Co. | | | 8,500 | | | | 493,425 | |
| | | | | | | | |
Independent Power and Renewable Electricity Producers (0.6%) | |
Calpine Corp.* | | | 10,000 | | | | 149,400 | |
| | | | | | | | |
Total Utilities | | | | | | | 707,805 | |
| | | | | | | | |
Total Common Stocks (93.6%)
(Cost $19,928,656) | | | | | | | 22,313,122 | |
| | | | | | | | |
CONVERTIBLE PREFERRED STOCK: | |
Health Care (0.0%) | |
Health Care Providers & Services (0.0%) | |
BioScrip, Inc.0.000% (r)*
(Cost $400) | | | 4 | | | | 189 | |
| | | | | | | | |
| | | Number of
Warrants | | | Value
(Note 1) | |
WARRANTS: | |
Health Care (0.0%) | |
Health Care Providers & Services (0.0%) | |
BioScrip, Inc., expiring 6/30/25 (r)*
(Cost $—) | | | 22 | | | | 7 | |
| | | | | | | | |
| | | Number of
Shares | | | Value
(Note 1) | |
| | | | | | | | |
SHORT-TERM INVESTMENT: | |
Investment Company (4.0%) | |
JPMorgan Prime Money Market Fund, IM Shares | | | 957,591 | | | $ | 957,782 | |
| | | | | | | | |
Total Short-Term Investment (4.0%)
(Cost $957,834) | | | | | | | 957,782 | |
| | | | | |
Total Investments in Securities (97.6%)
(Cost $20,886,890) | | | | | | | 23,271,100 | |
Other Assets Less Liabilities (2.4%) | | | | | | | 571,688 | |
| | | | | |
Net Assets (100%) | | | | | | $ | 23,842,788 | |
| | | | | | | | |
| (r) | Value determined using significant unobservable inputs. |
Glossary:
| | SDR | — Swedish Depositary Receipt |
The following is a summary of the inputs used to value the Fund’s assets and liabilities carried at fair value as of October 31, 2017:
The inputs or methodology used for valuing securities are not necessarily an indication of the risk associated with investing in those securities.
Various inputs are used in determining the value of the Fund’s investments. These inputs are summarized in the three broad levels listed below:
| | | | | | | | | | | | | | | | |
| | | | | |
| Investment Type | | Level 1
Quoted Prices in
Active Markets for
Identical
Securities | | | Level 2
Significant Other
Observable Inputs
(including quoted prices
for similar securities,
interest rates,
prepayment speeds,
credit risk, etc.) (a) | | | Level 3
Significant Unobservable
Inputs (including the
Fund’s own
assumptions in
determining the fair
value of investments) | | | Total | |
Assets: | | | | | | | | | | | | | | | | |
Common Stocks | | | | | | | | | | | | | | | | |
Consumer Discretionary | | $ | 4,191,990 | | | $ | 356,292 | | | $ | — | | | $ | 4,548,282 | |
Consumer Staples | | | 2,002,029 | | | | 423,896 | | | | — | | | | 2,425,925 | |
Energy | | | 566,050 | | | | — | | | | — | | | | 566,050 | |
Financials | | | 784,772 | | | | — | | | | — | | | | 784,772 | |
Health Care | | | 1,624,327 | | | | — | | | | — | | | | 1,624,327 | |
Industrials | | | 6,137,989 | | | | 354,982 | | | | — | | | | 6,492,971 | |
Information Technology | | | 1,324,700 | | | | 73,610 | | | | — | | | | 1,398,310 | |
Materials | | | 2,316,345 | | | | 105,005 | | | | — | | | | 2,421,350 | |
Real Estate | | | 479,201 | | | | — | | | | — | | | | 479,201 | |
Telecommunication Services | | | 350,020 | | | | 514,109 | | | | — | | | | 864,129 | |
Utilities | | | 707,805 | | | | — | | | | — | | | | 707,805 | |
See Notes to Financial Statements.
37
1290 FUNDS
1290 GAMCO SMALL/MID CAP VALUE FUND
PORTFOLIO OF INVESTMENTS (Continued)
October 31, 2017
| | | | | | | | | | | | | | | | |
| | | | | |
| Investment Type | | Level 1
Quoted Prices in
Active Markets for
Identical
Securities | | | Level 2
Significant Other
Observable Inputs
(including quoted prices
for similar securities,
interest rates,
prepayment speeds,
credit risk, etc.) (a) | | | Level 3
Significant Unobservable
Inputs (including the
Fund’s own
assumptions in
determining the fair
value of investments) | | | Total | |
Convertible Preferred Stocks | | | | | | | | | | | | | | | | |
Health Care | | $ | — | | | $ | — | | | $ | 189 | | | $ | 189 | |
Short-Term Investments | | | | | | | | | | | | | | | | |
Investment Companies | | | 957,782 | | | | — | | | | — | | | | 957,782 | |
Warrants | | | | | | | | | | | | | | | | |
Health Care | | | — | | | | — | | | | 7 | | | | 7 | |
| | | | | | | | | | | | | | | | |
Total Assets | | $ | 21,443,010 | | | $ | 1,827,894 | | | $ | 196 | | | $ | 23,271,100 | |
| | | | | | | | | | | | | | | | |
Total Liabilities | | $ | — | | | $ | — | | | $ | — | | | $ | — | |
| | | | | | | | | | | | | | | | |
Total | | $ | 21,443,010 | | | $ | 1,827,894 | | | $ | 196 | | | $ | 23,271,100 | |
| | | | | | | | | | | | | | | | |
(a) A security with a market value of $194,280 transferred from Level 1 to Level 2 at the end of the period due to inactive trading.
There were no additional transfers between Levels 1, 2 or 3 during the year ended October 31, 2017.
The Fund held no derivatives contracts during the year ended October 31, 2017.
Investment security transactions for the year ended October 31, 2017 were as follows:
| | | | |
Cost of Purchases: | | | | |
Long-term investments other than U.S. government debt securities | | $ | 24,669,370 | |
Net Proceeds of Sales and Redemptions: | | | | |
Long-term investments other than U.S. government debt securities | | $ | 11,518,943 | |
As of October 31, 2017, the gross unrealized appreciation (depreciation) of investments based on the aggregate cost of investments in securities and derivative instruments, if applicable, for Federal income tax purposes was as follows:
| | | | |
Aggregate gross unrealized appreciation | | $ | 3,072,623 | |
Aggregate gross unrealized depreciation | | | (771,590 | ) |
| | | | |
Net unrealized appreciation | | $ | 2,301,033 | |
| | | | |
Federal income tax cost of investments in securities and derivative instruments, if applicable | | $ | 20,970,067 | |
| | | | |
For the year ended October 31, 2017, the Fund incurred approximately $22,449 as brokerage commissions with G. Research, an affiliated broker/dealer.
See Notes to Financial Statements.
38
1290 FUNDS
1290 GAMCO SMALL/MID CAP VALUE FUND
STATEMENT OF ASSETS AND LIABILITIES
October 31, 2017
| | | | |
ASSETS | |
Investments in Securities, at value (Cost $20,886,890) | | $ | 23,271,100 | |
Cash | | | 331,000 | |
Foreign cash (Cost $7,906) | | | 7,972 | |
Receivable for Fund shares sold | | | 265,014 | |
Prepaid registration and filing fees | | | 24,631 | |
Dividends, interest and other receivables | | | 5,930 | |
Receivable from investment adviser | | | 1,498 | |
Other assets | | | 146 | |
| | | | |
Total assets | | | 23,907,291 | |
| | | | |
LIABILITIES | |
Payable for Fund shares redeemed | | | 7,412 | |
Transfer agent fees payable | | | 6,713 | |
Distribution fees payable – Class A | | | 430 | |
Trustees’ fees payable | | | 237 | |
Distribution fees payable – Class R | | | 142 | |
Accrued expenses | | | 49,569 | |
| | | | |
Total liabilities | | | 64,503 | |
| | | | |
NET ASSETS | | $ | 23,842,788 | |
| | | | |
Net assets were comprised of: | |
Paid in capital | | $ | 20,964,029 | |
Accumulated undistributed net investment income (loss) | | | 84,482 | |
Accumulated undistributed net realized gain (loss) | | | 409,980 | |
Net unrealized appreciation (depreciation) | | | 2,384,297 | |
| | | | |
Net assets | | $ | 23,842,788 | |
| | | | |
Class A | | | | |
Net asset value and redemption price per share, $2,063,349 / 160,839 shares outstanding (unlimited amount authorized: $0.001 par value) | | $ | 12.83 | |
Maximum sales charge (5.50% of offering price) | | | 0.75 | |
| | | | |
Maximum offering price per share | | $ | 13.58 | |
| | | | |
Class I | | | | |
Net asset value and redemption price per share, $21,316,810 / 1,658,031 shares outstanding (unlimited amount authorized: $0.001 par value) | | $ | 12.86 | |
| | | | |
Class R | | | | |
Net asset value and redemption price per share, $331,755 / 26,004 shares outstanding (unlimited amount authorized: $0.001 par value) | | $ | 12.76 | |
| | | | |
Class T** | | | | |
Net asset value and redemption price per share, $130,874 / 10,179 shares outstanding (unlimited amount authorized: $0.001 par value) | | $ | 12.86 | |
Maximum sales charge (2.50% of offering price) | | | 0.33 | |
| | | | |
Maximum offering price per share | | $ | 13.19 | |
| | | | |
| ** | Class T shares currently are not offered for sale. Class T shares were formerly known as Class C shares. |
STATEMENT OF OPERATIONS
For the Year Ended October 31, 2017
| | | | |
INVESTMENT INCOME | |
Dividends (net of $4,016 foreign withholding tax) | | $ | 239,431 | |
Interest | | | 1,482 | |
| | | | |
Total income | | | 240,913 | |
| | | | |
EXPENSES | |
Investment advisory fees | | | 105,295 | |
Professional fees | | | 68,561 | |
Transfer agent fees | | | 66,800 | |
Registration and filing fees | | | 39,734 | |
Administrative fees | | | 30,010 | |
Printing and mailing expenses | | | 12,733 | |
Custodian fees | | | 8,950 | |
Distribution fees – Class A | | | 3,114 | |
Trustees’ fees | | | 1,866 | |
Distribution fees – Class R | | | 1,164 | |
Distribution fees – Class T** | | | 586 | |
Miscellaneous | | | 12,681 | |
| | | | |
Gross expenses | | | 351,494 | |
Less: Waiver from investment adviser | | | (135,305 | ) |
Waiver from distributor | | | (586 | ) |
Reimbursement from investment adviser | | | (67,971 | ) |
| | | | |
Net expenses | | | 147,632 | |
| | | | |
NET INVESTMENT INCOME (LOSS) | | | 93,281 | |
| | | | |
REALIZED AND UNREALIZED GAIN (LOSS) | |
Realized gain (loss) on: | | | | |
Investments in securities | | | 485,474 | |
Foreign currency transactions | | | 256 | |
| | | | |
Net realized gain (loss) | | | 485,730 | |
| | | | |
Change in unrealized appreciation (depreciation) on: | | | | |
Investments in securities | | | 2,201,305 | |
Foreign currency translations | | | 413 | |
| | | | |
Net change in unrealized appreciation (depreciation) | | | 2,201,718 | |
| | | | |
NET REALIZED AND UNREALIZED GAIN (LOSS) | | | 2,687,448 | |
| | | | |
NET INCREASE (DECREASE) IN NET ASSETS RESULTING FROM OPERATIONS | | $ | 2,780,729 | |
| | | | |
| ** | Class T shares currently are not offered for sale. Class T shares were formerly known as Class C shares. |
See Notes to Financial Statements.
39
1290 FUNDS
1290 GAMCO SMALL/MID CAP VALUE FUND
STATEMENT OF CHANGES IN NET ASSETS
| | | | | | | | |
| | | Year Ended October 31, | |
| | 2017 | | | 2016 | |
INCREASE (DECREASE) IN NET ASSETS FROM OPERATIONS: | |
Net investment income (loss) | | $ | 93,281 | | | $ | 27,959 | |
Net realized gain (loss) | | | 485,730 | | | | 46,079 | |
Net change in unrealized appreciation (depreciation) | | | 2,201,718 | | | | 224,914 | |
| | | | | | | | |
NET INCREASE (DECREASE) IN NET ASSETS RESULTING FROM OPERATIONS | | | 2,780,729 | | | | 298,952 | |
| | | | | | | | |
DIVIDENDS AND DISTRIBUTIONS: | | | | | | | | |
Dividends from net investment income | | | | | | | | |
Class A | | | (959 | ) | | | (103 | ) |
Class I | | | (28,206 | ) | | | (6,325 | ) |
Class T** | | | (448 | ) | | | (655 | ) |
| | | | | | | | |
| | | (29,613 | ) | | | (7,083 | ) |
| | | | | | | | |
Distributions from net realized capital gains | | | | | | | | |
Class A | | | (10,105 | ) | | | (27,401 | ) |
Class I | | | (101,286 | ) | | | (64,471 | ) |
Class R | | | (2,609 | ) | | | (20,133 | ) |
Class T** | | | (1,608 | ) | | | (6,672 | ) |
| | | | | | | | |
| | | (115,608 | ) | | | (118,677 | ) |
| | | | | | | | |
TOTAL DIVIDENDS AND DISTRIBUTIONS | | | (145,221 | ) | | | (125,760 | ) |
| | | | | | | | |
CAPITAL SHARES TRANSACTIONS: | | | | | | | | |
Class A | | | | | | | | |
Capital shares sold [ 129,147 and 27,904 shares, respectively ] | | | 1,544,085 | | | | 282,598 | |
Capital shares issued in reinvestment of dividends [ 821 and 774 shares, respectively ] | | | 9,245 | | | | 7,419 | |
Capital shares repurchased [ (26,675) and (68,347) shares, respectively ] | | | (309,281 | ) | | | (687,343 | ) |
| | | | | | | | |
Total Class A transactions | | | 1,244,049 | | | | (397,326 | ) |
| | | | | | | | |
Class I | | | | | | | | |
Capital shares sold [ 1,161,285 and 376,825 shares, respectively ] | | | 14,034,899 | | | | 3,682,275 | |
Capital shares issued in reinvestment of dividends [ 7,547 and 5,089 shares, respectively ] | | | 84,983 | | | | 48,758 | |
Capital shares repurchased [ (97,331) and (30,498) shares, respectively ] | | | (1,177,235 | ) | | | (304,732 | ) |
| | | | | | | | |
Total Class I transactions | | | 12,942,647 | | | | 3,426,301 | |
| | | | | | | | |
Class R | | | | | | | | |
Capital shares sold [ 10,311 and 5,476 shares, respectively ] | | | 123,872 | | | | 57,323 | |
Capital shares issued in reinvestment of dividends [ 85 and 14 shares, respectively ] | | | 953 | | | | 129 | |
Capital shares repurchased [ (853) and (65,003) shares, respectively ] | | | (10,195 | ) | | | (651,126 | ) |
| | | | | | | | |
Total Class R transactions | | | 114,630 | | | | (593,674 | ) |
| | | | | | | | |
Class T** | | | | | | | | |
Capital shares repurchased [ 0 and (15,000) shares, respectively ] | | | — | | | | (150,789 | ) |
| | | | | | | | |
Total Class T transactions | | | — | | | | (150,789 | ) |
| | | | | | | | |
NET INCREASE (DECREASE) IN NET ASSETS RESULTING FROM CAPITAL SHARE TRANSACTIONS | | | 14,301,326 | | | | 2,284,512 | |
| | | | | | | | |
TOTAL INCREASE (DECREASE) IN NET ASSETS | | | 16,936,834 | | | | 2,457,704 | |
NET ASSETS: | |
Beginning of year | | | 6,905,954 | | | | 4,448,250 | |
| | | | | | | | |
End of year (a) | | $ | 23,842,788 | | | $ | 6,905,954 | |
| | | | | | | | |
(a) Includes accumulated undistributed (overdistributed) net investment income (loss) of | | $ | 84,482 | | | $ | 23,337 | |
| | | | | | | | |
** Class T shares currently are not offered for sale. Class T shares were formerly known as Class C shares. | | | | | | | | |
See Notes to Financial Statements.
40
1290 FUNDS
1290 GAMCO SMALL/MID CAP VALUE FUND
FINANCIAL HIGHLIGHTS
| | | | | | | | | | | | |
| | | Year Ended October 31, | | | November 12, 2014* to
October 31, 2015 | |
| Class A | | 2017 | | | 2016 | | |
Net asset value, beginning of period | | $ | 10.28 | | | $ | 10.25 | | | $ | 10.00 | |
| | | | | | | | | | | | |
Income (loss) from investment operations: | | | | | | | | | | | | |
Net investment income (loss) (e) | | | 0.06 | ## | | | 0.05 | | | | (0.01 | ) |
Net realized and unrealized gain (loss) | | | 2.67 | | | | 0.25 | | | | 0.33 | |
| | | | | | | | | | | | |
Total from investment operations | | | 2.73 | | | | 0.30 | | | | 0.32 | |
| | | | | | | | | | | | |
Less distributions: | | | | | | | | | | | | |
Dividends from net investment income | | | (0.02 | ) | | | — | # | | | (0.07 | ) |
Distributions from net realized gains | | | (0.16 | ) | | | (0.27 | ) | | | — | |
| | | | | | | | | | | | |
Total dividends and distributions | | | (0.18 | ) | | | (0.27 | ) | | | (0.07 | ) |
| | | | | | | | | | | | |
Net asset value, end of period | | $ | 12.83 | | | $ | 10.28 | | | $ | 10.25 | |
| | | | | | | | | | | | |
Total return (b) | | | 26.72 | % | | | 3.08 | % | | | 3.20 | % |
| | | | | | | | | | | | |
Ratios/Supplemental Data: | | | | | | | | | | | | |
Net assets, end of period (000’s) | | $ | 2,063 | | | $ | 591 | | | $ | 997 | |
Ratio of expenses to average net assets: | | | | | | | | | | | | |
After waivers and reimbursements (a)(f) | | | 1.27 | % | | | 1.35 | % | | | 1.35 | % |
Before waivers and reimbursements (a)(f) | | | 2.72 | % | | | 4.38 | % | | | 9.28 | % |
Ratio of net investment income (loss) to average net assets: | | | | | | | | | | | | |
After waivers and reimbursements (a)(f) | | | 0.48 | %(aa) | | | 0.49 | % | | | (0.10 | )%(l) |
Before waivers and reimbursements (a)(f) | | | (0.97 | )%(aa) | | | (2.53 | )% | | | (8.03 | )%(l) |
Portfolio turnover rate (z)^ | | | 88 | % | | | 76 | % | | | 95 | % |
| | |
| | | Year Ended October 31, | | | November 12, 2014* to October 31, 2015 | |
| Class I | | 2017 | | | 2016 | | |
Net asset value, beginning of period | | $ | 10.30 | | | $ | 10.27 | | | $ | 10.00 | |
| | | | | | | | | | | | |
Income (loss) from investment operations: | | | | | | | | | | | | |
Net investment income (loss) (e) | | | 0.08 | ## | | | 0.05 | | | | 0.02 | |
Net realized and unrealized gain (loss) | | | 2.68 | | | | 0.28 | | | | 0.32 | |
| | | | | | | | | | | | |
Total from investment operations | | | 2.76 | | | | 0.33 | | | | 0.34 | |
| | | | | | | | | | | | |
Less distributions: | | | | | | | | | | | | |
Dividends from net investment income | | | (0.04 | ) | | | (0.03 | ) | | | (0.07 | ) |
Distributions from net realized gains | | | (0.16 | ) | | | (0.27 | ) | | | — | |
| | | | | | | | | | | | |
Total dividends and distributions | | | (0.20 | ) | | | (0.30 | ) | | | (0.07 | ) |
| | | | | | | | | | | | |
Net asset value, end of period | | $ | 12.86 | | | $ | 10.30 | | | $ | 10.27 | |
| | | | | | | | | | | | |
Total return (b) | | | 27.09 | % | | | 3.34 | % | | | 3.43 | % |
| | | | | | | | | | | | |
Ratios/Supplemental Data: | | | | | | | | | | | | |
Net assets, end of period (000’s) | | $ | 21,317 | | | $ | 6,041 | | | $ | 2,416 | |
Ratio of expenses to average net assets: | | | | | | | | | | | | |
After waivers and reimbursements (a)(f) | | | 1.02 | % | | | 1.10 | % | | | 1.10 | % |
Before waivers and reimbursements (a)(f) | | | 2.47 | % | | | 4.09 | % | | | 8.56 | % |
Ratio of net investment income (loss) to average net assets: | | | | | | | | | | | | |
After waivers and reimbursements (a)(f) | | | 0.69 | %(bb) | | | 0.49 | % | | | 0.16 | %(l) |
Before waivers and reimbursements (a)(f) | | | (0.76 | )%(bb) | | | (2.51 | )% | | | (7.30 | )%(l) |
Portfolio turnover rate (z)^ | | | 88 | % | | | 76 | % | | | 95 | % |
See Notes to Financial Statements.
41
1290 FUNDS
1290 GAMCO SMALL/MID CAP VALUE FUND
FINANCIAL HIGHLIGHTS (Continued)
| | | | | | | | | | | | |
| | | Year Ended October 31, | | | November 12, 2014* to
October 31, 2015 | |
| Class R | | 2017 | | | 2016 | | |
Net asset value, beginning of period | | $ | 10.23 | | | $ | 10.23 | | | $ | 10.00 | |
| | | | | | | | | | | | |
Income (loss) from investment operations: | | | | | | | | | | | | |
Net investment income (loss) (e) | | | 0.03 | ## | | | 0.04 | | | | (0.04 | ) |
Net realized and unrealized gain (loss) | | | 2.66 | | | | 0.23 | | | | 0.34 | |
| | | | | | | | | | | | |
Total from investment operations | | | 2.69 | | | | 0.27 | | | | 0.30 | |
| | | | | | | | | | | | |
Less distributions: | | | | | | | | | | | | |
Dividends from net investment income | | | — | | | | — | | | | (0.07 | ) |
Distributions from net realized gains | | | (0.16 | ) | | | (0.27 | ) | | | — | |
| | | | | | | | | | | | |
Total dividends and distributions | | | (0.16 | ) | | | (0.27 | ) | | | (0.07 | ) |
| | | | | | | | | | | | |
Net asset value, end of period | | $ | 12.76 | | | $ | 10.23 | | | $ | 10.23 | |
| | | | | | | | | | | | |
Total return (b) | | | 26.49 | % | | | 2.77 | % | | | 2.96 | % |
| | | | | | | | | | | | |
Ratios/Supplemental Data: | | | | | | | | | | | | |
Net assets, end of period (000’s) | | $ | 332 | | | $ | 168 | | | $ | 777 | |
Ratio of expenses to average net assets: | | | | | | | | | | | | |
After waivers and reimbursements (a)(f) | | | 1.53 | % | | | 1.60 | % | | | 1.60 | % |
Before waivers and reimbursements (a)(f) | | | 3.00 | % | | | 4.65 | % | | | 9.73 | % |
Ratio of net investment income (loss) to average net assets: | | | | | | | | | | | | |
After waivers and reimbursements (a)(f) | | | 0.27 | %(cc) | | | 0.42 | % | | | (0.35 | )%(l) |
Before waivers and reimbursements (a)(f) | | | (1.21 | )%(cc) | | | (2.64 | )% | | | (8.49 | )%(l) |
Portfolio turnover rate (z)^ | | | 88 | % | | | 76 | % | | | 95 | % |
| | |
| | | Year Ended October 31, | | | November 12, 2014* to October 31, 2015 | |
| Class T** | | 2017 | | | 2016 | | |
Net asset value, beginning of period | | $ | 10.30 | | | $ | 10.27 | | | $ | 10.00 | |
| | | | | | | | | | | | |
Income (loss) from investment operations: | | | | | | | | | | | | |
Net investment income (loss) (e) | | | 0.11 | ## | | | 0.08 | | | | 0.01 | |
Net realized and unrealized gain (loss) | | | 2.65 | | | | 0.25 | | | | 0.33 | |
| | | | | | | | | | | | |
Total from investment operations | | | 2.76 | | | | 0.33 | | | | 0.34 | |
| | | | | | | | | | | | |
Less distributions: | | | | | | | | | | | | |
Dividends from net investment income | | | (0.04 | ) | | | (0.03 | ) | | | (0.07 | ) |
Distributions from net realized gains | | | (0.16 | ) | | | (0.27 | ) | | | — | |
| | | | | | | | | | | | |
Total dividends and distributions | | | (0.20 | ) | | | (0.30 | ) | | | (0.07 | ) |
| | | | | | | | | | | | |
Net asset value, end of period | | $ | 12.86 | | | $ | 10.30 | | | $ | 10.27 | |
| | | | | | | | | | | | |
Total return (b) | | | 27.09 | % | | | 3.34 | % | | | 3.43 | % |
| | | | | | | | | | | | |
Ratios/Supplemental Data: | | | | | | | | | | | | |
Net assets, end of period (000’s) | | $ | 131 | | | $ | 105 | | | $ | 259 | |
Ratio of expenses to average net assets: | | | | | | | | | | | | |
After waivers and reimbursements (a)(f) | | | 1.03 | % | | | 1.10 | % | | | 1.10 | % |
Before waivers and reimbursements (a)(f) | | | 3.02 | % | | | 5.11 | % | | | 10.23 | % |
Ratio of net investment income (loss) to average net assets: | | | | | | | | | | | | |
After waivers and reimbursements (a)(f) | | | 0.89 | %(dd) | | | 0.77 | % | | | 0.15 | %(l) |
Before waivers and reimbursements (a)(f) | | | (1.10 | )%(dd) | | | (3.23 | )% | | | (8.98 | )%(l) |
Portfolio turnover rate (z)^ | | | 88 | % | | | 76 | % | | | 95 | % |
See Notes to Financial Statements.
42
1290 FUNDS
1290 GAMCO SMALL/MID CAP VALUE FUND
FINANCIAL HIGHLIGHTS (Continued)
| * | Commencement of Operations. |
| ** | Class T shares currently are not offered for sale. Class T shares were formerly known as Class C shares. |
| # | Per share amount is less than $0.005. |
| ## | Includes income resulting from a special dividend. Without this dividend, the per share income amounts would be $0.02, $0.04, ($0.01) and $0.07 for Class A, Class I, Class R and Class T, respectively. |
| ^ | Portfolio turnover rate excludes derivatives, if any. |
| (a) | Ratios for periods less than one year are annualized. Certain non-recurring expenses incurred by the Fund are not annualized for periods less than one year. |
| (b) | Total returns for periods less than one year are not annualized. |
| (e) | Net investment income (loss) per share is based on average shares outstanding. |
| (f) | Expenses do not include the expenses of the underlying funds (“indirect expenses”), if applicable. |
| (l) | The annualized ratio of net investment income to average net assets may not be indicative of operating results for a full year. |
| (z) | Portfolio turnover rate for periods less than one year is not annualized. |
| (aa) | Includes income resulting from a special dividend. Without this dividend, the ratios for Class A would be 0.14% for income after waivers and reimbursements and (1.31)% before waivers and reimbursements. |
| (bb) | Includes income resulting from a special dividend. Without this dividend, the ratios for Class I would be 0.35% for income after waivers and reimbursements and (1.10)% before waivers and reimbursements. |
| (cc) | Includes income resulting from a special dividend. Without this dividend, the ratios for Class R would be (0.07)% for income after waivers and reimbursements and (1.55)% before waivers and reimbursements. |
| (dd) | Includes income resulting from a special dividend. Without this dividend, the ratios for Class T would be 0.55% for income after waivers and reimbursements and (1.44)% before waivers and reimbursements. |
See Notes to Financial Statements.
43
1290 GLOBAL TALENTS FUND (Unaudited)
INVESTMENT ADVISER
INVESTMENT SUB-ADVISERS
| Ø | | AXA Investment Managers, Inc. |
PERFORMANCE RESULTS
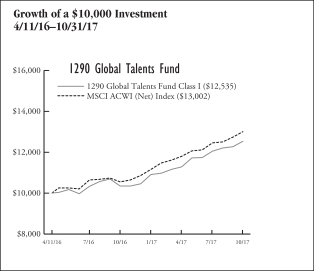
| | | | | | | | | | |
| Annualized Total Returns as of 10/31/17 | |
| | | | | 1
Year | | | Since
Incept. | |
Fund – Class A Shares* | | without Sales Charge | | | 20.89 | % | | | 15.35 | % |
| | | with Sales Charge (a) | | | 14.25 | | | | 11.24 | |
Fund – Class I Shares* | | | | | 21.23 | | | | 15.62 | |
Fund – Class R Shares* | | | | | 20.64 | | | | 15.05 | |
MSCI ACWI (Net) Index | | | | | 23.20 | | | | 18.38 | |
* Date of inception 4/11/16. (a) A 5.50% front-end sales charge was deducted. Returns for periods greater than one year are annualized. | |
The performance quoted is past performance and is not a guarantee of future results. Mutual funds are subject to certain market risks. Investment returns and principal value of an investment will fluctuate so that an investor’s shares, when redeemed, may be worth more or less than their original cost. Current performance may be higher or lower than the performance data shown. For the most current month-end performance data please call 1-888-310-0416 or visit www.1290Funds.com.
The graph illustrates comparative performance for $10,000 invested in the Class I Shares of the 1290 Global Talents Fund and the MSCI ACWI (Net) Index from 4/11/16 to 10/31/17. The performance of the MSCI ACWI (Net) Index reflects an initial investment at the end of the month closest to the Fund’s inception. The performance of the Fund assumes reinvestment of all dividends and capital gain distributions, if any, and does not include a sales charge. The performance of the MSCI ACWI (Net) Index does not reflect the deduction of expenses or a sales charge associated with a mutual fund and has been adjusted to reflect reinvestment of all dividends, capital gain distributions, and interest of the securities included in the benchmark.
Fund performance may reflect the waiver of the Fund’s fees and reimbursement of expenses for certain periods since the inception date. Without these waivers and reimbursements, performance would have been lower. Also, performance shown in this section does not reflect the deduction of taxes that a shareholder would pay on Fund distributions or redemption of Fund shares.
PERFORMANCE SUMMARY
The Fund’s Class I shares returned 21.23% for the year ended October 31, 2017. The Fund’s benchmark, the MSCI ACWI (Net) Index, returned 23.20% over the same year.
Fund Overview — AXA Investment Managers, Inc.
The global equities markets performed strongly over the twelve-month period ended October 31, 2017. While political risk remained heightened (North Korea, European elections, Brexit, Trump presidency), the world economic backdrop continued to improve with a synchronized recovery across regions. Emerging markets led the market growth. Performance across sectors was positive. The information technology sector was the stellar performer, with momentum sustained by corporate earnings’ forecasts. The financial, industrial and material sectors also performed very strongly. The telecommunications, energy and consumer staples sectors were the laggards. Telecommunications and consumer staples continued to see pricing pressure and weak growth prospects, while energy was dampened by weakening oil prices.
We continued to consolidate the number of holdings in the Fund and exited a number of companies over the period. We sold companies when valuation looked full (Iliad SA, Christian Dior Inc., Hella KGaA Hueck & Co., Gilead Sciences, Inc.), the founders left the firm (Alexion Pharmaceuticals Inc.) or their future outlook looked compromised (Cerner Corporation, Oracle Corporation, Luxottica Group, Chipotle Mexican Grill, Inc., Synchronoss Technologies, Inc. and Magnit PJSC). Over the same period, the Fund bought U.S. information technology security player Proofpoint, Inc., and French media group Publicis Groupe.
Fund Highlights
What helped performance during the year?
| • | | The Fund outperformed the benchmark most notably in three sectors: industrials, telecommunications and consumer discretionary. |
| • | | Within telecommunications, SoftBank Group Corp. performed very strongly, in part due to the announcement of their $100 billion Vision Fund (technology). |
| • | | Within industrials, THK Co. Ltd. and Financiere de L’Odet performed particularly strongly. |
| • | | Within consumer discretionary, while there were declines among some of the U.S. consumer holdings, this was more than offset by strong performance from ANTA Sports Products Ltd., Hella KGaA Hueck & Co., Naspers Ltd., Christian Dior Inc. and Amazon.com, Inc. |
44
1290 GLOBAL TALENTS FUND (Unaudited)
What hurt performance during the year?
| • | | The Fund lagged the benchmark most markedly in the healthcare sector. The Fund was also slightly behind the benchmark in the consumer staples and financials sectors. |
| • | | Within consumer staples, performance was dragged down by Russian retailer Magnit PJSC, due to weakening traffic trends, and to a lesser extent by Japanese diaper manufacturer Unicharm Corp., facing fiercer competition in developing markets. |
| • | | Within financials, the main detractor was Mexican bank Banregio Grupo Financiero SAB de CV. |
| • | | Within healthcare, DexCom, Inc. and Hikma Pharmaceuticals plc share prices both declined. |
| | | | | | | | |
Sector Weightings
as of October 31, 2017 | | Market Value | | | % of
Net Assets | |
Information Technology | | | $5,728,196 | | | | 22.1 | % |
Financials | | | 4,558,128 | | | | 17.6 | |
Consumer Discretionary | | | 4,109,645 | | | | 15.8 | |
Consumer Staples | | | 2,763,223 | | | | 10.7 | |
Health Care | | | 2,621,265 | | | | 10.1 | |
Industrials | | | 1,737,102 | | | | 6.7 | |
Energy | | | 1,202,414 | | | | 4.6 | |
Materials | | | 1,196,783 | | | | 4.6 | |
Telecommunication Services | | | 787,327 | | | | 3.0 | |
Investment Companies | | | 226,642 | | | | 0.9 | |
Cash and Other | | | 1,005,140 | | | | 3.9 | |
| | | | | | | | | |
| | | | | | | | 100.0 | % |
| | | | | | | | | |
Holdings are subject to change without notice. | |
UNDERSTANDING YOUR EXPENSES:
As a shareholder of the Fund, you incur two types of costs:
(1) transaction costs, including applicable sales charges and redemption fees; and (2) ongoing costs, including investment advisory fees, distribution and/or service (12b-1) fees (in the case of Class A and Class R shares of the Fund), and other Fund expenses. These examples are intended to help you understand your ongoing costs (in dollars) of investing in the Fund and to compare these costs with the ongoing costs of investing in other mutual funds.
The examples are based on an investment of $1,000 invested at the beginning of the six-month period ended October 31, 2017 and held for the entire six-month period.
Actual Expenses
The first line of the following table provides information about actual account values and actual expenses. You may use the information in this line, together with the amount you invested, to estimate the expenses that you paid over the period. Simply divide your account value by $1,000 (for example, an $8,600 account value divided by $1,000 = 8.6), then multiply the result by the number in the first line under the heading entitled “Expenses Paid During Period” to estimate the expenses you paid on your account during this period.
Hypothetical Example for Comparison Purposes
The second line of the following table provides information about hypothetical account values and hypothetical expenses based on the Fund’s actual expense ratio and an assumed rate of return of 5% per year before expenses, which is not the Fund’s actual return. The hypothetical account values and expenses may not be used to estimate the actual ending account balance or expenses you paid for the period. You may use this information to compare the ongoing costs of investing in the Fund and other funds. To do so, compare this 5% hypothetical example with the 5% hypothetical examples that appear in the shareholder reports of the other funds.
Please note that the expenses shown in the table are meant to highlight your ongoing costs only and do not reflect any transactional costs, such as sales charges (loads), redemption fees, or exchange fees. Therefore, the second line of the table is useful in comparing ongoing costs only, and will not help you determine the relative total costs of owning different funds. In addition, if these transactional costs were included, your costs would have been higher.
EXAMPLE
| | | | | | | | | | | | |
| | | Beginning
Account
Value
5/1/17 | | | Ending
Account
Value
10/31/17 | | | Expenses
Paid
During
Period*
5/1/17 -
10/31/17 | |
Class A | |
Actual | | | $1,000.00 | | | | $1,109.70 | | | | $6.65 | |
Hypothetical (5% average annual return before expenses) | | | 1,000.00 | | | | 1,018.90 | | | | 6.36 | |
Class I | |
Actual | | | 1,000.00 | | | | 1,111.30 | | | | 5.32 | |
Hypothetical (5% average annual return before expenses) | | | 1,000.00 | | | | 1,020.16 | | | | 5.09 | |
Class R | |
Actual | | | 1,000.00 | | | | 1,108.20 | | | | 7.97 | |
Hypothetical (5% average annual return before expenses) | | | 1,000.00 | | | | 1,017.64 | | | | 7.63 | |
* Expenses are equal to the Fund’s Class A, I and R shares annualized expense ratios of 1.25%, 1.00% and 1.50%, respectively, multiplied by the average account value over the period, and multiplied by 184/365 (to reflect the one-half year period). | |
45
1290 FUNDS
1290 GLOBAL TALENTS FUND
PORTFOLIO OF INVESTMENTS
October 31, 2017
| | | | | | | | |
| | | Number of
Shares | | | Value
(Note 1) | |
| | | | | | | | |
COMMON STOCKS: | | | | | | | | |
Belgium (1.7%) | |
Anheuser-Busch InBev SA/NV | | | 3,626 | | | $ | 443,705 | |
| | | | | | | | |
Chile (2.0%) | |
Antofagasta plc | | | 41,933 | | | | 531,593 | |
| | | | | | | | |
China (5.5%) | |
Alibaba Group Holding Ltd. (ADR)* | | | 4,441 | | | | 821,096 | |
ANTA Sports Products Ltd. | | | 136,000 | | | | 608,404 | |
| | | | | | | | |
| | | | | | | 1,429,500 | |
| | | | | | | | |
Finland (1.3%) | |
Sampo OYJ, Class A | | | 6,543 | | | | 342,820 | |
| | | | | | | | |
France (5.2%) | |
Dassault Systemes SE | | | 5,167 | | | | 548,732 | |
Financiere de L’Odet | | | 474 | | | | 517,327 | |
Publicis Groupe SA | | | 4,500 | | | | 293,332 | |
| | | | | | | | |
| | | | | | | 1,359,391 | |
| | | | | | | | |
Germany (4.2%) | |
Fresenius SE & Co. KGaA | | | 7,106 | | | | 593,574 | |
Henkel AG & Co. KGaA (Preference)(q) | | | 3,442 | | | | 483,134 | |
| | | | | | | | |
| | | | | | | 1,076,708 | |
| | | | | | | | |
Israel (2.2%) | |
Check Point Software Technologies Ltd.* | | | 4,767 | | | | 561,124 | |
| | | | | | | | |
Japan (11.1%) | |
Kose Corp. | | | 5,500 | | | | 664,131 | |
Rakuten, Inc. | | | 30,900 | | | | 328,553 | |
SoftBank Group Corp. | | | 9,000 | | | | 787,327 | |
THK Co. Ltd. | | | 16,800 | | | | 608,733 | |
Unicharm Corp. | | | 21,300 | | | | 481,898 | |
| | | | | | | | |
| | | | | | | 2,870,642 | |
| | | | | | | | |
Jordan (1.3%) | |
Hikma Pharmaceuticals plc | | | 21,366 | | | | 330,311 | |
| | | | | | | | |
Mexico (3.0%) | |
Banregio Grupo Financiero SAB de CV | | | 89,000 | | | | 473,463 | |
Fomento Economico Mexicano SAB de CV | | | 33,400 | | | | 291,583 | |
| | | | | | | | |
| | | | | | | 765,046 | |
| | | | | | | | |
Peru (1.8%) | |
Credicorp Ltd. | | | 2,195 | | | | 459,721 | |
| | | | | | | | |
South Africa (2.6%) | |
Naspers Ltd., Class N | | | 2,765 | | | | 673,711 | |
| | | | | | | | |
Spain (1.5%) | |
Industria de Diseno Textil SA | | | 10,549 | | | | 394,383 | |
| | | | | | | | |
Switzerland (2.3%) | |
Roche Holding AG | | | 2,624 | | | | 606,257 | |
| | | | | | | | |
United Kingdom (1.5%) | |
Reckitt Benckiser Group plc | | | 4,458 | | | | 398,772 | |
| | | | | | | | |
United States (48.0%) | |
Alphabet, Inc., Class A* | | | 686 | | | | 708,665 | |
| | | | | | | | |
Amazon.com, Inc.* | | | 827 | | | | 914,067 | |
Apple, Inc. | | | 4,305 | | | | 727,717 | |
Bank of the Ozarks, Inc. | | | 12,140 | | | | 565,967 | |
Berkshire Hathaway, Inc., Class B* | | | 4,443 | | | | 830,574 | |
BlackRock, Inc. | | | 1,022 | | | | 481,188 | |
Charles Schwab Corp. (The) | | | 17,354 | | | | 778,153 | |
Concho Resources, Inc.* | | | 4,292 | | | | 576,029 | |
DexCom, Inc.* | | | 8,983 | | | | 403,965 | |
Ecolab, Inc. | | | 5,091 | | | | 665,190 | |
EOG Resources, Inc. | | | 6,272 | | | | 626,385 | |
Facebook, Inc., Class A* | | | 3,994 | | | | 719,160 | |
FedEx Corp. | | | 2,706 | | | | 611,042 | |
IPG Photonics Corp.* | | | 4,638 | | | | 987,477 | |
O’Reilly Automotive, Inc.* | | | 2,183 | | | | 460,504 | |
Proofpoint, Inc.* | | | 4,345 | | | | 401,521 | |
QUALCOMM, Inc. | | | 4,954 | | | | 252,704 | |
Starbucks Corp. | | | 7,963 | | | | 436,691 | |
Stryker Corp. | | | 4,437 | | | | 687,158 | |
Wells Fargo & Co. | | | 11,155 | | | | 626,242 | |
| | | | | | | | |
| | | | | | | 12,460,399 | |
| | | | | | | | |
Total Common Stocks (95.2%)
(Cost $19,607,208) | | | | | | | 24,704,083 | |
| | | | | | | | |
SHORT-TERM INVESTMENT: | | | | | | | | |
Investment Company (0.9%) | |
JPMorgan Prime Money Market Fund, IM Shares | | | 226,597 | | | | 226,642 | |
| | | | | | | | |
Total Short-Term Investment (0.9%)
(Cost $226,642) | | | | | | | 226,642 | |
| | | | | | | | |
Total Investments in Securities (96.1%)
(Cost $19,833,850) | | | | | | | 24,930,725 | |
Other Assets Less Liabilities (3.9%) | | | | | | | 1,005,140 | |
| | | | | |
Net Assets (100%) | | | | | | $ | 25,935,865 | |
| | | | | | | | |
| (q) | Preference Shares are a special type of equity investment that shares in the earnings of the company, has limited voting rights, and receives a greater dividend than applicable Common Shares. |
Glossary:
| | ADR | — American Depositary Receipt |
See Notes to Financial Statements.
46
1290 FUNDS
1290 GLOBAL TALENTS FUND
PORTFOLIO OF INVESTMENTS (Continued)
October 31, 2017
| | | | | | | | |
Sector Weightings
as of October 31, 2017 | | Market Value | | | % of
Net Assets | |
Information Technology | | $ | 5,728,196 | | | | 22.1 | % |
Financials | | | 4,558,128 | | | | 17.6 | |
Consumer Discretionary | | | 4,109,645 | | | | 15.8 | |
Consumer Staples | | | 2,763,223 | | | | 10.7 | |
Health Care | | | 2,621,265 | | | | 10.1 | |
Industrials | | | 1,737,102 | | | | 6.7 | |
Energy | | | 1,202,414 | | | | 4.6 | |
Materials | | | 1,196,783 | | | | 4.6 | |
Telecommunication Services | | | 787,327 | | | | 3.0 | |
Investment Companies | | | 226,642 | | | | 0.9 | |
Cash and Other | | | 1,005,140 | | | | 3.9 | |
| | | | | | | | | |
| | | | | | | | 100.0 | % |
| | | | | | | | | |
Holdings are subject to change without notice. | |
The following is a summary of the inputs used to value the Fund’s assets and liabilities carried at fair value as of October 31, 2017:
The inputs or methodology used for valuing securities are not necessarily an indication of the risk associated with investing in those securities.
Various inputs are used in determining the value of the Fund’s investments. These inputs are summarized in the three broad levels listed below:
| | | | | | | | | | | | | | | | |
| | | | | |
| Investment Type | | Level 1
Quoted Prices in
Active Markets for
Identical
Securities | | | Level 2
Significant Other
Observable Inputs
(including quoted prices
for similar securities,
interest rates,
prepayment speeds,
credit risk, etc.) | | | Level 3
Significant Unobservable
Inputs (including the
Fund’s own
assumptions in
determining the fair
value of investments) | | | Total | |
Assets: | | | | | | | | | | | | | | | | |
Common Stocks | | | | | | | | | | | | | | | | |
Consumer Discretionary | | $ | 1,811,262 | | | $ | 2,298,383 | | | $ | — | | | $ | 4,109,645 | |
Consumer Staples | | | 291,583 | | | | 2,471,640 | | | | — | | | | 2,763,223 | |
Energy | | | 1,202,414 | | | | — | | | | — | | | | 1,202,414 | |
Financials | | | 4,215,308 | | | | 342,820 | | | | — | | | | 4,558,128 | |
Health Care | | | 1,091,123 | | | | 1,530,142 | | | | — | | | | 2,621,265 | |
Industrials | | | 611,042 | | | | 1,126,060 | | | | — | | | | 1,737,102 | |
Information Technology | | | 5,179,464 | | | | 548,732 | | | | — | | | | 5,728,196 | |
Materials | | | 665,190 | | | | 531,593 | | | | — | | | | 1,196,783 | |
Telecommunication Services | | | — | | | | 787,327 | | | | — | | | | 787,327 | |
Short-Term Investments | | | | | | | | | | | | | | | | |
Investment Companies | | | 226,642 | | | | — | | | | — | | | | 226,642 | |
| | | | | | | | | | | | | | | | |
Total Assets | | $ | 15,294,028 | | | $ | 9,636,697 | | | $ | — | | | $ | 24,930,725 | |
| | | | | | | | | | | | | | | | |
Total Liabilities | | $ | — | | | $ | — | | | $ | — | | | $ | — | |
| | | | | | | | | | | | | | | | |
Total | | $ | 15,294,028 | | | $ | 9,636,697 | | | $ | — | | | $ | 24,930,725 | |
| | | | | | | | | | | | | | | | |
There were no transfers between Levels 1, 2 or 3 during the year ended October 31, 2017.
The Fund held no derivatives contracts during the year ended October 31, 2017.
See Notes to Financial Statements.
47
1290 FUNDS
1290 GLOBAL TALENTS FUND
PORTFOLIO OF INVESTMENTS (Continued)
October 31, 2017
Investment security transactions for the year ended October 31, 2017 were as follows:
| | | | |
Cost of Purchases: | | | | |
Long-term investments other than U.S. government debt securities | | $ | 4,046,162 | |
Net Proceeds of Sales and Redemptions: | | | | |
Long-term investments other than U.S. government debt securities | | $ | 3,982,155 | |
As of October 31, 2017, the gross unrealized appreciation (depreciation) of investments based on the aggregate cost of investments in securities and derivative instruments, if applicable, for Federal income tax purposes was as follows:
| | | | |
Aggregate gross unrealized appreciation | | $ | 5,865,986 | |
Aggregate gross unrealized depreciation | | | (769,207 | ) |
| | | | |
Net unrealized appreciation | | $ | 5,096,779 | |
| | | | |
Federal income tax cost of investments in securities and derivative instruments, if applicable | | $ | 19,833,946 | |
| | | | |
See Notes to Financial Statements.
48
1290 FUNDS
1290 GLOBAL TALENTS FUND
STATEMENT OF ASSETS AND LIABILITIES
October 31, 2017
| | | | |
ASSETS | |
Investments in Securities, at value (Cost $19,833,850) | | $ | 24,930,725 | |
Cash | | | 666,000 | |
Receivable for securities sold | | | 292,258 | |
Receivable for Fund shares sold | | | 68,943 | |
Dividends, interest and other receivables | | | 28,644 | |
Prepaid registration and filing fees | | | 13,400 | |
Other assets | | | 318 | |
| | | | |
Total assets | | | 26,000,288 | |
| | | | |
LIABILITIES | |
Investment advisory fees payable | | | 4,032 | |
Administrative fees payable | | | 3,265 | |
Transfer agent fees payable | | | 2,832 | |
Distribution fees payable – Class A | | | 152 | |
Distribution fees payable – Class R | | | 52 | |
Accrued expenses | | | 54,090 | |
| | | | |
Total liabilities | | | 64,423 | |
| | | | |
NET ASSETS | | $ | 25,935,865 | |
| | | | |
Net assets were comprised of: | |
Paid in capital | | $ | 20,884,204 | |
Accumulated undistributed net investment income (loss) | | | 29,669 | |
Accumulated undistributed net realized gain (loss) | | | (75,217 | ) |
Net unrealized appreciation (depreciation) | | | 5,097,209 | |
| | | | |
Net assets | | $ | 25,935,865 | |
| | | | |
Class A | | | | |
Net asset value and redemption price per share, $802,795 / 64,557 shares outstanding (unlimited amount authorized: $0.001 par value) | | $ | 12.44 | |
Maximum sales charge (5.50% of offering price) | | | 0.72 | |
| | | | |
Maximum offering price per share | | $ | 13.16 | |
| | | | |
Class I | | | | |
Net asset value and redemption price per share, $25,009,035 / 2,003,634 shares outstanding (unlimited amount authorized: $0.001 par value) | | $ | 12.48 | |
| | | | |
Class R | | | | |
Net asset value and redemption price per share, $124,035 / 10,009 shares outstanding (unlimited amount authorized: $0.001 par value) | | $ | 12.39 | |
| | | | |
STATEMENT OF OPERATIONS
For the Year Ended October 31, 2017
| | | | |
INVESTMENT INCOME | |
Dividends (net of $14,653 foreign withholding tax) | | $ | 259,502 | |
Interest | | | 1,037 | |
| | | | |
Total income | | | 260,539 | |
| | | | |
EXPENSES | |
Investment advisory fees | | | 183,919 | |
Professional fees | | | 84,672 | |
Registration and filing fees | | | 45,082 | |
Administrative fees | | | 34,485 | |
Transfer agent fees | | | 28,930 | |
Offering costs | | | 15,233 | |
Custodian fees | | | 10,800 | |
Printing and mailing expenses | | | 10,149 | |
Trustees’ fees | | | 2,882 | |
Distribution fees – Class A | | | 730 | |
Distribution fees – Class R | | | 565 | |
Miscellaneous | | | 25,709 | |
| | | | |
Gross expenses | | | 443,156 | |
Less: Waiver from investment adviser | | | (201,241 | ) |
| | | | |
Net expenses | | | 241,915 | |
| | | | |
NET INVESTMENT INCOME (LOSS) | | | 18,624 | |
| | | | |
REALIZED AND UNREALIZED GAIN (LOSS) | |
Realized gain (loss) on: | | | | |
Investments in securities | | | (75,121 | ) |
Foreign currency transactions | | | (1,988 | ) |
| | | | |
Net realized gain (loss) | | | (77,109 | ) |
| | | | |
Change in unrealized appreciation (depreciation) on: | | | | |
Investments in securities | | | 4,489,150 | |
Foreign currency translations | | | 662 | |
| | | | |
Net change in unrealized appreciation (depreciation) | | | 4,489,812 | |
| | | | |
NET REALIZED AND UNREALIZED GAIN (LOSS) | | | 4,412,703 | |
| | | | |
NET INCREASE (DECREASE) IN NET ASSETS RESULTING FROM OPERATIONS | | $ | 4,431,327 | |
| | | | |
See Notes to Financial Statements.
49
1290 FUNDS
1290 GLOBAL TALENTS FUND
STATEMENT OF CHANGES IN NET ASSETS
| | | | | | | | |
| | | Year Ended
October 31, 2017 | | | April 11, 2016* to
October 31, 2016 | |
INCREASE (DECREASE) IN NET ASSETS FROM OPERATIONS: | |
Net investment income (loss) | | $ | 18,624 | | | $ | 6,413 | |
Net realized gain (loss) | | | (77,109 | ) | | | 65,542 | |
Net change in unrealized appreciation (depreciation) | | | 4,489,812 | | | | 607,397 | |
| | | | | | | | |
NET INCREASE (DECREASE) IN NET ASSETS RESULTING FROM OPERATIONS | | | 4,431,327 | | | | 679,352 | |
| | | | | | | | |
DIVIDENDS AND DISTRIBUTIONS: | | | | | | | | |
Dividends from net investment income | | | | | | | | |
Class I | | | (11,303 | ) | | | — | |
| | | | | | | | |
| | | (11,303 | ) | | | — | |
| | | | | | | | |
Distributions from net realized capital gains | | | | | | | | |
Class A | | | (400 | ) | | | — | |
Class I | | | (79,321 | ) | | | — | |
Class R | | | (400 | ) | | | — | |
| | | | | | | | |
| | | (80,121 | ) | | | — | |
| | | | | | | | |
TOTAL DIVIDENDS AND DISTRIBUTIONS | | | (91,424 | ) | | | — | |
| | | | | | | | |
CAPITAL SHARES TRANSACTIONS: | | | | | | | | |
Class A | | | | | | | | |
Capital shares sold [ 54,934 and 10,010 shares, respectively ] | | | 651,538 | | | | 100,100 | |
Capital shares issued in reinvestment of dividends [ 0# and 0 shares, respectively ] | | | — | ## | | | — | |
Capital shares repurchased [ (387) and 0 shares, respectively ] | | | (4,720 | ) | | | — | |
| | | | | | | | |
Total Class A transactions | | | 646,818 | | | | 100,100 | |
| | | | | | | | |
Class I | | | | | | | | |
Capital shares sold [ 25,104 and 1,980,634 shares, respectively ] | | | 288,617 | | | | 19,806,500 | |
Capital shares issued in reinvestment of dividends [ 13 and 0 shares, respectively ] | | | 138 | | | | — | |
Capital shares repurchased [ (2,117) and 0 shares, respectively ] | | | (25,662 | ) | | | — | |
| | | | | | | | |
Total Class I transactions | | | 263,093 | | | | 19,806,500 | |
| | | | | | | | |
Class R | | | | | | | | |
Capital shares sold [ 0 and 10,009 shares, respectively ] | | | — | | | | 100,099 | |
Capital shares issued in reinvestment of dividends [ 0# and 0 shares, respectively ] | | | — | ## | | | — | |
| | | | | | | | |
Total Class R transactions | | | — | ## | | | 100,099 | |
| | | | | | | | |
NET INCREASE (DECREASE) IN NET ASSETS RESULTING FROM CAPITAL SHARE TRANSACTIONS | | | 909,911 | | | | 20,006,699 | |
| | | | | | | | |
TOTAL INCREASE (DECREASE) IN NET ASSETS | | | 5,249,814 | | | | 20,686,051 | |
NET ASSETS: | |
Beginning of period | | | 20,686,051 | | | | — | |
| | | | | | | | |
End of period (a) | | $ | 25,935,865 | | | $ | 20,686,051 | |
| | | | | | | | |
(a) Includes accumulated undistributed (overdistributed) net investment income (loss) of | | $ | 29,669 | | | $ | 11,105 | |
| | | | | | | | |
* The Fund commenced operations on April 11, 2016. | | | | | | | | |
# Number of shares is less than 0.5. | | | | | | | | |
## Amount is less than $0.50. | | | | | | | | |
See Notes to Financial Statements.
50
1290 FUNDS
1290 GLOBAL TALENTS FUND
FINANCIAL HIGHLIGHTS
| | | | | | | | |
| Class A | | Year Ended
October 31, 2017 | | | April 11, 2016* to
October 31, 2016 | |
Net asset value, beginning of period | | $ | 10.33 | | | $ | 10.00 | |
| | | | | | | | |
Income (loss) from investment operations: | | | | | | | | |
Net investment income (loss) (e) | | | (0.03 | ) | | | (0.01 | ) |
Net realized and unrealized gain (loss) | | | 2.18 | | | | 0.34 | |
| | | | | | | | |
Total from investment operations | | | 2.15 | | | | 0.33 | |
| | | | | | | | |
Less distributions: | | | | | | | | |
Distributions from net realized gains | | | (0.04 | ) | | | — | |
| | | | | | | | |
Net asset value, end of period | | $ | 12.44 | | | $ | 10.33 | |
| | | | | | | | |
Total return (b) | | | 20.89 | % | | | 3.30 | % |
| | | | | | | | |
Ratios/Supplemental Data: | | | | | | | | |
Net assets, end of period (000’s) | | $ | 803 | | | $ | 103 | |
Ratio of expenses to average net assets: | | | | | | | | |
After waivers and reimbursements (a)(f) | | | 1.27 | % | | | 1.40 | % |
Before waivers and reimbursements (a)(f) | | | 2.13 | % | | | 2.31 | % |
Ratio of net investment income (loss) to average net assets: | | | | | | | | |
After waivers and reimbursements (a)(f) | | | (0.25 | )% | | | (0.19 | )%(l) |
Before waivers and reimbursements (a)(f) | | | (1.11 | )% | | | (1.10 | )%(l) |
Portfolio turnover rate (z)^ | | | 18 | % | | | 11 | % |
| | |
| Class I | | Year Ended
October 31, 2017 | | | April 11, 2016* to
October 31, 2016 | |
Net asset value, beginning of period | | $ | 10.34 | | | $ | 10.00 | |
| | | | | | | | |
Income (loss) from investment operations: | | | | | | | | |
Net investment income (loss) (e) | | | 0.01 | | | | — | # |
Net realized and unrealized gain (loss) | | | 2.18 | | | | 0.34 | |
| | | | | | | | |
Total from investment operations | | | 2.19 | | | | 0.34 | |
| | | | | | | | |
Less distributions: | | | | | | | | |
Dividends from net investment income | | | (0.01 | ) | | | — | |
Distributions from net realized gains | | | (0.04 | ) | | | — | |
| | | | | | | | |
Total dividends and distributions | | | (0.05 | ) | | | — | |
| | | | | | | | |
Net asset value, end of period | | $ | 12.48 | | | $ | 10.34 | |
| | | | | | | | |
Total return (b) | | | 21.23 | % | | | 3.40 | % |
| | | | | | | | |
Ratios/Supplemental Data: | | | | | | | | |
Net assets, end of period (000’s) | | $ | 25,009 | | | $ | 20,479 | |
Ratio of expenses to average net assets: | | | | | | | | |
After waivers and reimbursements (a)(f) | | | 1.05 | % | | | 1.15 | % |
Before waivers and reimbursements (a)(f) | | | 1.92 | % | | | 2.06 | % |
Ratio of net investment income (loss) to average net assets: | | | | | | | | |
After waivers and reimbursements (a)(f) | | | 0.09 | % | | | 0.06 | %(l) |
Before waivers and reimbursements (a)(f) | | | (0.79 | )% | | | (0.85 | )%(l) |
Portfolio turnover rate (z)^ | | | 18 | % | | | 11 | % |
See Notes to Financial Statements.
51
1290 FUNDS
1290 GLOBAL TALENTS FUND
FINANCIAL HIGHLIGHTS (Continued)
| | | | | | | | |
| Class R | | Year Ended
October 31, 2017 | | | April 11, 2016* to
October 31, 2016 | |
Net asset value, beginning of period | | $ | 10.31 | | | $ | 10.00 | |
| | | | | | | | |
Income (loss) from investment operations: | | | | | | | | |
Net investment income (loss) (e) | | | (0.05 | ) | | | (0.03 | ) |
Net realized and unrealized gain (loss) | | | 2.17 | | | | 0.34 | |
| | | | | | | | |
Total from investment operations | | | 2.12 | | | | 0.31 | |
| | | | | | | | |
Less distributions: | | | | | | | | |
Distributions from net realized gains | | | (0.04 | ) | | | — | |
| | | | | | | | |
Net asset value, end of period | | $ | 12.39 | | | $ | 10.31 | |
| | | | | | | | |
Total return (b) | | | 20.64 | % | | | 3.10 | % |
| | | | | | | | |
Ratios/Supplemental Data: | | | | | | | | |
Net assets, end of period (000’s) | | $ | 124 | | | $ | 103 | |
Ratio of expenses to average net assets: | | | | | | | | |
After waivers and reimbursements (a)(f) | | | 1.55 | % | | | 1.65 | % |
Before waivers and reimbursements (a)(f) | | | 2.42 | % | | | 2.56 | % |
Ratio of net investment income (loss) to average net assets: | | | | | | | | |
After waivers and reimbursements (a)(f) | | | (0.41 | )% | | | (0.44 | )%(l) |
Before waivers and reimbursements (a)(f) | | | (1.29 | )% | | | (1.35 | )%(l) |
Portfolio turnover rate (z)^ | | | 18 | % | | | 11 | % |
| * | Commencement of Operations. |
| # | Per share amount is less than $0.005. |
| ^ | Portfolio turnover rate excludes derivatives, if any. |
| (a) | Ratios for periods less than one year are annualized. Certain non-recurring expenses incurred by the Fund are not annualized for periods less than one year. |
| (b) | Total returns for periods less than one year are not annualized. |
| (e) | Net investment income (loss) per share is based on average shares outstanding. |
| (f) | Expenses do not include the expenses of the underlying funds (“indirect expenses”), if applicable. |
| (l) | The annualized ratio of net investment income to average net assets may not be indicative of operating results for a full year. |
| (z) | Portfolio turnover rate for periods less than one year is not annualized. |
See Notes to Financial Statements.
52
1290 HIGH YIELD BOND FUND (Unaudited)
INVESTMENT ADVISER
INVESTMENT SUB-ADVISER
| Ø | | AXA Investment Managers, Inc. |
PERFORMANCE RESULTS
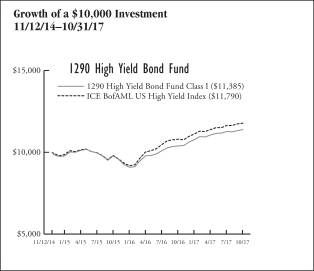
| | | | | | | | | | |
| Annualized Total Returns as of 10/31/17 | |
| | | | | 1
Year | | | Since
Incept. | |
Fund – Class A Shares* | | without Sales Charge | | | 9.20 | % | | | 4.17 | % |
| | | with Sales Charge (a) | | | 4.34 | | | | 2.57 | |
Fund – Class I Shares* | | | | | 9.58 | | | | 4.47 | |
Fund – Class R Shares* | | | | | 8.95 | | | | 3.92 | |
Fund – Class T Shares*† | | without Sales Charge | | | 9.46 | | | | 4.43 | |
| | | with Sales Charge (b) | | | 6.74 | | | | 3.53 | |
ICE BofAML US High Yield Index | | | | | 9.14 | | | | 5.71 | |
* Date of inception 11/12/14. † Class T Shares currently are not offered for sale. Class T shares were formerly known as Class C shares. (a) A 4.50% front-end sales charge was deducted. (b) A 2.50% front-end sales charge was deducted. Returns for periods greater than one year are annualized. | |
The performance quoted is past performance and is not a guarantee of future results. Mutual funds are subject to certain market risks. Investment returns and principal value of an investment will fluctuate so that an investor’s shares, when redeemed, may be worth more or less than their original cost. Current performance may be higher or lower than the performance data shown. For the most current month-end performance data please call 1-888-310-0416 or visit www.1290Funds.com.
The graph illustrates comparative performance for $10,000 invested in the Class I Shares of the 1290 High Yield Bond Fund and the ICE BofAML US High Yield Index from 11/12/14 to 10/31/17. The performance of the ICE BofAML US High Yield Index reflects an initial investment at the end of the month closest to the Fund’s inception. The performance of the Fund assumes reinvestment of all dividends and capital gain distributions, if any, and does not include a sales charge. The performance of the ICE BofAML US High Yield Index does not reflect the deduction of expenses or a sales charge associated with a mutual fund and has been adjusted to reflect reinvestment of all dividends, capital gain distributions, and interest of the securities included in the benchmark.
Fund performance may reflect the waiver of the Fund’s fees and reimbursement of expenses for certain periods since the inception date. Without these waivers and reimbursements, performance would have been lower. Also, performance shown in this section does not reflect the deduction of taxes that a shareholder would pay on Fund distributions or redemption of Fund shares.
PERFORMANCE SUMMARY
The Fund’s Class I shares returned 9.58% for the year ended October 31, 2017. The Fund’s benchmark, the ICE BofAML US High Yield Index, returned 9.14% over the same year.
Fund Overview — AXA Investment Managers, Inc.
The high yield market posted a positive return in the twelve-month period ended October 31, 2017. Returns were driven by improved commodity prices, including both oil and metals, receding global macro concerns and rising stock prices. Flows into the high yield market were negative for the period, with $7.7 billion of outflows. The high yield new issue market priced $314.9 billion of new issues during the twelve-months ended October 31, 2017, which compares favorably to the $279.0 billion priced during the same period last year. The period saw $16.6 billion of high yield default volume, materially lower than the $49.4 billion of high yield default volume in the same period last year. The par weighted high yield default rate ended the period at 1.18%, down from 3.59% in October 2016.
Fund Highlights
What helped performance during the year?
| • | | During the one-year period ended October 31, 2017, the Fund’s relative performance benefited from positive security selection, particularly within the higher yielding portion of the market. Both the Fund’s overweight positioning within the higher yielding portion of the market and the Fund’s underweight positioning within the higher quality, lower yielding segment of the market had positive impacts on relative performance. Fund performance benefited from participation in multiple new issues during the period, which performed well post pricing. |
| • | | From a sector perspective, the Fund experienced positive security selection in a number of sectors including the financial services and telecommunications sectors. During the period, relative performance benefited from the Fund’s underweight positioning within the underperforming retail sector. |
53
1290 HIGH YIELD BOND FUND (Unaudited)
| • | | The top contributors to performance during the period were debt positions in CURO Financial Technologies Corp. (Speedy Cash), Ace Cash Express, Inc. and Intelsat Inc. Speedy Cash and Ace Cash Express are both consumer bonds focused, specialty finance companies. Speedy Cash and Ace Cash Express bonds were both top contributors to performance during the period as investors focused on the potential for less regulation in this sector following the outcome of the U.S. presidential election. Additionally, Speedy Cash bonds performed well in part due to this bond being called as part of a larger refinancing of the company’s debt. Intelsat is a global satellite services company. Intelsat bonds were a top contributor to performance during the period due to a proposed merger and acquisition transaction, which ultimately did not occur, and due to earnings trends stabilizing, which enabled the company to access the capital markets at more senior portions of its capital structure. |
What hurt performance during the year?
| • | | The Fund’s performance was hurt by negative security selection within the higher quality, lower yielding portion of the market. The Fund’s overweight positioning within the more defensive, short duration portion of the market was a drag on performance. |
| • | | Negative security selection in certain sectors including basic industry, healthcare and energy was detrimental to performance. The Fund’s underweight positioning within the outperforming energy and basic industry sectors detracted from relative performance. |
| • | | The bottom contributors to performance during the period were debt positions in Concordia International, Staples Inc. and The Fresh Market. Concordia International is a pharmaceutical company. Concordia’s bonds were a bottom contributor to performance during the period due to the company’s weak earnings and guidance as well as continued investor concerns regarding potential financial penalties and regulatory changes in certain markets which could negatively impact the pricing of Concordia’s products. Staples Inc. is the largest business to business distributor of office products and related items in the U.S. Staples bonds were a bottom contributor to performance during the period due to investor concerns regarding the potential for Amazon to change the competitive dynamics of the industry. Also, Staples bonds were pressured because of negative investor sentiment within the sector and due to investor concerns regarding Staples’ future earnings following weak earnings reported by a competitor. The Fresh Market is a natural and gourmet grocer mainly focused in the southeastern U.S. Fresh Market bonds were a bottom contributor to performance during the period due to the company reporting weaker than expected earnings and management announcing a pause of its previous strategy of price investment and store remodels amidst the uncertain outlook in the grocery space following Amazon’s acquisition of Whole Foods Market. |
| | | | |
Fund Characteristics As of October 31, 2017 | | | |
Weighted Average Life (Years) | | | 5.57 | |
Weighted Average Coupon (%) | | | 6.88 | |
Weighted Average Modified Duration (Years)* | | | 2.73 | |
Weighted Average Rating** | | | B2 | |
* Modified duration is a measure of the price sensitivity of the Fund to interest rate movements, taking into account specific features of the securities in which it invests. ** Weighted Average Rating has been provided by the Investment Sub-Adviser. A credit rating is an assessment provided by a nationally recognized statistical rating organization (NRSRO) of the creditworthiness of an issuer with respect to debt obligations, including specific securities, money market instruments or other debts. Ratings are measured on a scale that generally ranges from AAA (highest) to D (lowest); ratings are subject to change without notice. | |
| | | | |
Sector Weightings
as of October 31, 2017 | | % of
Net Assets | |
Consumer Discretionary | | | 15.3 | % |
Industrials | | | 14.4 | |
Energy | | | 13.4 | |
Information Technology | | | 12.5 | |
Telecommunication Services | | | 11.4 | |
Health Care | | | 10.8 | |
Materials | | | 6.5 | |
Consumer Staples | | | 5.0 | |
Financials | | | 3.6 | |
Real Estate | | | 1.9 | |
Investment Companies | | | 1.2 | |
Utilities | | | 0.9 | |
Cash and Other | | | 3.1 | |
| | | | | |
| | | | 100.0 | % |
| | | | | |
Holdings are subject to change without notice. | |
UNDERSTANDING YOUR EXPENSES:
As a shareholder of the Fund, you incur two types of costs:
(1) transaction costs, including applicable sales charges and redemption fees; and (2) ongoing costs, including investment advisory fees, distribution and/or service (12b-1) fees (in the case of Class A, Class R and Class T shares of the Fund), and other Fund expenses. These examples are intended to help you understand your ongoing costs (in dollars) of investing in the Fund and to compare these costs with the ongoing costs of investing in other mutual funds.
The examples are based on an investment of $1,000 invested at the beginning of the six-month period ended October 31, 2017 and held for the entire six-month period.
54
1290 HIGH YIELD BOND FUND (Unaudited)
Actual Expenses
The first line of the following table provides information about actual account values and actual expenses. You may use the information in this line, together with the amount you invested, to estimate the expenses that you paid over the period. Simply divide your account value by $1,000 (for example, an $8,600 account value divided by $1,000 = 8.6), then multiply the result by the number in the first line under the heading entitled “Expenses Paid During Period” to estimate the expenses you paid on your account during this period.
Hypothetical Example for Comparison Purposes
The second line of the following table provides information about hypothetical account values and hypothetical expenses based on the Fund’s actual expense ratio and an assumed rate of return of 5% per year before expenses, which is not the Fund’s actual return. The hypothetical account values and expenses may not be used to estimate the actual ending account balance or expenses you paid for the period. You may use this information to compare the ongoing costs of investing in the Fund and other funds. To do so, compare this 5% hypothetical example with the 5% hypothetical examples that appear in the shareholder reports of the other funds.
Please note that the expenses shown in the table are meant to highlight your ongoing costs only and do not reflect any transactional costs, such as sales charges (loads), redemption fees, or exchange fees. Therefore, the second line of the table is useful in comparing ongoing costs only, and will not help you determine the relative total costs of owning different funds. In addition, if these transactional costs were included, your costs would have been higher.
EXAMPLE
| | | | | | | | | | | | |
| | | Beginning
Account
Value
5/1/17 | | | Ending
Account
Value
10/31/17 | | | Expenses
Paid
During
Period*
5/1/17 -
10/31/17 | |
Class A | | | | | | | | | | | | |
Actual | | | $1,000.00 | | | | $1,027.30 | | | | $5.37 | |
Hypothetical (5% average annual return before expenses) | | | 1,000.00 | | | | 1,019.91 | | | | 5.35 | |
Class I | | | | | | | | | | | | |
Actual | | | 1,000.00 | | | | 1,029.70 | | | | 4.09 | |
Hypothetical (5% average annual return before expenses) | | | 1,000.00 | | | | 1,021.17 | | | | 4.08 | |
Class R | | | | | | | | | | | | |
Actual | | | 1,000.00 | | | | 1,027.10 | | | | 6.64 | |
Hypothetical (5% average annual return before expenses) | | | 1,000.00 | | | | 1,018.65 | | | | 6.61 | |
Class T** | | | | | | | | | | | | |
Actual | | | 1,000.00 | | | | 1,028.60 | | | | 4.09 | |
Hypothetical (5% average annual return before expenses) | | | 1,000.00 | | | | 1,021.17 | | | | 4.08 | |
* Expenses are equal to the Fund’s Class A, I, R and T shares annualized expense ratios of 1.05%, 0.80%, 1.30% and 0.80%, respectively, multiplied by the average account value over the period, and multiplied by 184/365 (to reflect the one-half year period). ** Class T shares currently are not offered for sale. Class T shares were formerly known as Class C shares. | |
55
1290 FUNDS
1290 HIGH YIELD BOND FUND
PORTFOLIO OF INVESTMENTS
October 31, 2017
| | | | | | | | |
| | | Principal
Amount | | | Value
(Note 1) | |
| | | | | | | | |
LONG-TERM DEBT SECURITIES: | | | | | | | | |
Corporate Bonds (95.7%) | | | | | | | | |
Consumer Discretionary (15.3%) | | | | | | | | |
Distributors (1.1%) | |
American Tire Distributors, Inc.
10.250%, 3/1/22§ | | $ | 220,000 | | | $ | 229,636 | |
Univar USA, Inc.
6.750%, 7/15/23§ | | | 108,000 | | | | 113,805 | |
| | | | | | | | |
| | | | | | | 343,441 | |
| | | | | | | | |
Hotels, Restaurants & Leisure (2.6%) | |
1011778 BC ULC | | | | | | | | |
4.625%, 1/15/22§ | | | 225,000 | | | | 230,243 | |
5.000%, 10/15/25§ | | | 115,000 | | | | 116,725 | |
Eldorado Resorts, Inc.
7.000%, 8/1/23 | | | 114,000 | | | | 122,835 | |
LTF Merger Sub, Inc.
8.500%, 6/15/23§ | | | 202,000 | | | | 213,615 | |
MGM Resorts International
8.625%, 2/1/19 | | | 85,000 | | | | 91,056 | |
Silversea Cruise Finance Ltd.
7.250%, 2/1/25§ | | | 41,000 | | | | 44,075 | |
| | | | | | | | |
| | | | | | | 818,549 | |
| | | | | | | | |
Household Durables (1.0%) | |
American Greetings Corp.
7.875%, 2/15/25§ | | | 115,000 | | | | 124,918 | |
Mattamy Group Corp.
6.500%, 10/1/25§ | | | 90,000 | | | | 93,600 | |
PulteGroup, Inc.
5.000%, 1/15/27 | | | 90,000 | | | | 94,388 | |
| | | | | | | | |
| | | | | | | 312,906 | |
| | | | | | | | |
Media (8.9%) | |
Altice Financing SA
7.500%, 5/15/26§ | | | 200,000 | | | | 219,380 | |
Altice Luxembourg SA
7.750%, 5/15/22§ | | | 200,000 | | | | 211,760 | |
AMC Entertainment Holdings, Inc.
6.125%, 5/15/27 | | | 94,000 | | | | 92,825 | |
Cablevision Systems Corp.
7.750%, 4/15/18 | | | 185,000 | | | | 189,181 | |
Cequel Communications Holdings I LLC | | | | | | | | |
6.375%, 9/15/20§ | | | 228,000 | | | | 232,582 | |
5.125%, 12/15/21§ | | | 121,000 | | | | 123,456 | |
Cinemark USA, Inc.
4.875%, 6/1/23 | | | 45,000 | | | | 45,788 | |
CSC Holdings LLC
7.875%, 2/15/18 | | | 80,000 | | | | 81,208 | |
DISH DBS Corp.
7.875%, 9/1/19 | | | 142,000 | | | | 153,431 | |
Lions Gate Entertainment Corp.
5.875%, 11/1/24§ | | | 102,000 | | | | 108,120 | |
Live Nation Entertainment, Inc.
4.875%, 11/1/24§ | | | 65,000 | | | | 67,113 | |
McGraw-Hill Global Education Holdings LLC
7.875%, 5/15/24§ | | | 109,000 | | | | 109,545 | |
MHGE Parent LLC
8.500%, 8/1/19 PIK§ | | | 230,000 | | | | 229,723 | |
| | | | | | | | |
National CineMedia LLC
6.000%, 4/15/22 | | | 92,000 | | | | 93,725 | |
Regal Entertainment Group
5.750%, 3/15/22 | | | 134,000 | | | | 139,025 | |
Tribune Media Co.
5.875%, 7/15/22 | | | 48,000 | | | | 49,800 | |
Unitymedia GmbH
6.125%, 1/15/25§ | | | 200,000 | | | | 213,580 | |
Ziggo Bond Finance BV
6.000%, 1/15/27§ | | | 200,000 | | | | 203,375 | |
Ziggo Secured Finance BV
5.500%, 1/15/27§ | | | 200,000 | | | | 204,000 | |
| | | | | | | | |
| | | | | | | 2,767,617 | |
| | | | | | | | |
Multiline Retail (0.4%) | |
Cumberland Farms, Inc.
6.750%, 5/1/25§ | | | 45,000 | | | | 47,871 | |
Dollar Tree, Inc.
5.250%, 3/1/20 | | | 85,000 | | | | 87,019 | |
| | | | | | | | |
| | | | | | | 134,890 | |
| | | | | | | | |
Specialty Retail (1.3%) | |
L Brands, Inc.
6.750%, 7/1/36 | | | 60,000 | | | | 58,800 | |
Penske Automotive Group, Inc.
5.750%, 10/1/22 | | | 85,000 | | | | 87,686 | |
Staples, Inc.
8.500%, 9/15/25§ | | | 285,000 | | | | 251,513 | |
| | | | | | | | |
| | | | | | | 397,999 | |
| | | | | | | | |
Total Consumer Discretionary | | | | | | | 4,775,402 | |
| | | | | | | | |
Consumer Staples (5.0%) | | | | | | | | |
Beverages (0.3%) | |
DS Services of America, Inc.
10.000%, 9/1/21§ | | | 80,000 | | | | 84,000 | |
| | | | | | | | |
Food & Staples Retailing (1.5%) | |
Fresh Market, Inc. (The)
9.750%, 5/1/23§ | | | 106,000 | | | | 59,890 | |
Rite Aid Corp. | | | | | | | | |
9.250%, 3/15/20 | | | 130,000 | | | | 132,197 | |
6.750%, 6/15/21 | | | 158,000 | | | | 156,420 | |
6.125%, 4/1/23§ | | | 140,000 | | | | 130,200 | |
| | | | | | | | |
| | | | | | | 478,707 | |
| | | | | | | | |
Food Products (2.5%) | |
Clearwater Seafoods, Inc.
6.875%, 5/1/25§ | | | 73,000 | | | | 77,334 | |
JBS USA LUX SA | | | | | | | | |
8.250%, 2/1/20§ | | | 115,000 | | | | 116,578 | |
5.750%, 6/15/25§ | | | 195,000 | | | | 190,122 | |
Lamb Weston Holdings, Inc.
4.875%, 11/1/26§ | | | 73,000 | | | | 76,559 | |
Pilgrim’s Pride Corp.
5.875%, 9/30/27§ | | | 76,000 | | | | 78,956 | |
Post Holdings, Inc. | | | | | | | | |
6.000%, 12/15/22§ | | | 55,000 | | | | 57,681 | |
5.750%, 3/1/27§ | | | 150,000 | | | | 156,150 | |
| | | | | | | | |
| | | | | | | 753,380 | |
| | | | | | | | |
See Notes to Financial Statements.
56
1290 FUNDS
1290 HIGH YIELD BOND FUND
PORTFOLIO OF INVESTMENTS (Continued)
October 31, 2017
| | | | | | | | |
| | | Principal
Amount | | | Value
(Note 1) | |
| | | | | | | | |
Household Products (0.4%) | |
Spectrum Brands, Inc.
6.625%, 11/15/22 | | $ | 135,000 | | | $ | 140,330 | |
| | | | | | | | |
Personal Products (0.3%) | |
Prestige Brands, Inc.
6.375%, 3/1/24§ | | | 101,000 | | | | 107,565 | |
| | | | | | | | |
Total Consumer Staples | | | | | | | 1,563,982 | |
| | | | | | | | |
Energy (13.4%) | | | | | | | | |
Energy Equipment & Services (0.7%) | |
Nabors Industries, Inc.
5.500%, 1/15/23 | | | 61,000 | | | | 58,560 | |
Precision Drilling Corp. | | | | | | | | |
6.625%, 11/15/20 | | | 35,875 | | | | 36,278 | |
7.750%, 12/15/23 | | | 106,000 | | | | 108,788 | |
| | | | | | | | |
| | | | | | | 203,626 | |
| | | | | | | | |
Oil, Gas & Consumable Fuels (12.7%) | |
American Midstream Partners LP
8.500%, 12/15/21§ | | | 147,000 | | | | 152,972 | |
Andeavor Logistics LP
6.125%, 10/15/21 | | | 167,000 | | | | 172,010 | |
Antero Resources Corp.
5.625%, 6/1/23 | | | 107,000 | | | | 112,083 | |
Blue Racer Midstream LLC
6.125%, 11/15/22§ | | | 246,000 | | | | 255,839 | |
Calumet Specialty Products Partners LP
7.625%, 1/15/22 | | | 145,000 | | | | 142,463 | |
Carrizo Oil & Gas, Inc.
6.250%, 4/15/23 | | | 60,000 | | | | 61,200 | |
Crestwood Midstream Partners LP | | | | | | | | |
6.250%, 4/1/23 | | | 124,000 | | | | 129,115 | |
5.750%, 4/1/25 | | | 74,000 | | | | 75,850 | |
CrownRock LP
5.625%, 10/15/25 (b)§ | | | 160,000 | | | | 162,000 | |
Delek Logistics Partners LP
6.750%, 5/15/25§ | | | 135,000 | | | | 137,025 | |
Genesis Energy LP | | | | | | | | |
5.625%, 6/15/24 | | | 88,000 | | | | 87,120 | |
6.500%, 10/1/25 | | | 143,000 | | | | 144,787 | |
Gulfport Energy Corp.
6.375%, 1/15/26 (b)§ | | | 90,000 | | | | 90,846 | |
Holly Energy Partners LP
6.000%, 8/1/24§ | | | 56,000 | | | | 58,555 | |
MEG Energy Corp.
6.500%, 1/15/25§ | | | 58,000 | | | | 57,710 | |
Oasis Petroleum, Inc.
6.875%, 3/15/22 | | | 100,000 | | | | 102,500 | |
Parsley Energy LLC | | | | | | | | |
6.250%, 6/1/24§ | | | 100,000 | | | | 106,375 | |
5.625%, 10/15/27 (b)§ | | | 96,000 | | | | 99,062 | |
PBF Holding Co. LLC
7.000%, 11/15/23 | | | 105,000 | | | | 109,074 | |
PBF Logistics LP | | | | | | | | |
6.875%, 5/15/23 (b)§ | | | 70,000 | | | | 72,231 | |
6.875%, 5/15/23 | | | 214,000 | | | | 220,821 | |
PDC Energy, Inc.
7.750%, 10/15/22 | | | 102,000 | | | | 106,335 | |
Range Resources Corp.
5.750%, 6/1/21 | | | 85,000 | | | | 87,652 | |
| | | | | | | | |
Rice Energy, Inc.
7.250%, 5/1/23 | | | 100,000 | | | | 107,500 | |
RSP Permian, Inc.
6.625%, 10/1/22 | | | 206,000 | | | | 217,073 | |
Sanchez Energy Corp.
6.125%, 1/15/23 | | | 110,000 | | | | 91,850 | |
SemGroup Corp. | | | | | | | | |
5.625%, 7/15/22 | | | 110,000 | | | | 108,075 | |
5.625%, 11/15/23 | | | 75,000 | | | | 73,313 | |
SM Energy Co.
6.750%, 9/15/26 | | | 109,000 | | | | 111,867 | |
Southern Star Central Corp.
5.125%, 7/15/22§ | | | 110,000 | | | | 114,557 | |
Southwestern Energy Co.
7.750%, 10/1/27 | | | 75,000 | | | | 77,835 | |
Summit Midstream Holdings LLC
5.500%, 8/15/22 | | | 150,000 | | | | 151,875 | |
Targa Resources Partners LP
6.750%, 3/15/24 | | | 95,000 | | | | 102,420 | |
Whiting Petroleum Corp.
5.000%, 3/15/19 | | | 80,000 | | | | 80,800 | |
| | | | | | | | |
| | | | | | | 3,980,790 | |
| | | | | | | | |
Total Energy | | | | | | | 4,184,416 | |
| | | | | | | | |
Financials (3.6%) | | | | | | | | |
Capital Markets (0.3%) | |
Eagle Holding Co. II LLC
7.625%, 5/15/22 PIK§ | | | 98,000 | | | | 100,940 | |
| | | | | | | | |
Consumer Finance (1.4%) | |
Ally Financial, Inc.
4.625%, 5/19/22 | | | 102,000 | | | | 107,610 | |
Enova International, Inc. | | | | | | | | |
9.750%, 6/1/21 | | | 60,000 | | | | 63,788 | |
8.500%, 9/1/24§ | | | 125,000 | | | | 125,390 | |
TMX Finance LLC
8.500%, 9/15/18§ | | | 137,000 | | | | 126,040 | |
| | | | | | | | |
| | | | | | | 422,828 | |
| | | | | | | | |
Insurance (1.0%) | | | | | | | | |
Hub Holdings LLC
8.125%, 7/15/19 PIK§ | | | 175,000 | | | | 175,656 | |
HUB International Ltd.
7.875%, 10/1/21§ | | | 125,000 | | | | 130,000 | |
| | | | | | | | |
| | | | | | | 305,656 | |
| | | | | | | | |
Thrifts & Mortgage Finance (0.9%) | |
Stearns Holdings LLC
9.375%, 8/15/20§ | | | 271,000 | | | | 282,518 | |
| | | | | | | | |
Total Financials | | | | | | | 1,111,942 | |
| | | | | | | | |
Health Care (10.8%) | | | | | | | | |
Biotechnology (0.4%) | |
Sterigenics-Nordion Topco LLC
8.125%, 11/1/21 PIK§ | | | 116,000 | | | | 118,175 | |
| | | | | | | | |
Health Care Equipment & Supplies (1.4%) | |
Alere, Inc.
7.250%, 7/1/18 | | | 160,000 | | | | 160,000 | |
Greatbatch Ltd.
9.125%, 11/1/23§ | | | 168,000 | | | | 182,385 | |
See Notes to Financial Statements.
57
1290 FUNDS
1290 HIGH YIELD BOND FUND
PORTFOLIO OF INVESTMENTS (Continued)
October 31, 2017
| | | | | | | | |
| | | Principal
Amount | | | Value
(Note 1) | |
| | | | | | | | |
Sterigenics-Nordion Holdings LLC
6.500%, 5/15/23§ | | $ | 84,000 | | | $ | 87,780 | |
| | | | | | | | |
| | | | | | | 430,165 | |
| | | | | | | | |
Health Care Providers & Services (6.3%) | |
Centene Corp.
6.125%, 2/15/24 | | | 95,000 | | | | 102,125 | |
Envision Healthcare Corp. | | | | | | | | |
5.625%, 7/15/22 | | | 22,000 | | | | 22,330 | |
6.250%, 12/1/24§ | | | 57,000 | | | | 59,494 | |
HCA, Inc. | | | | | | | | |
7.500%, 2/15/22 | | | 195,000 | | | | 221,324 | |
7.690%, 6/15/25 | | | 91,000 | | | | 103,285 | |
5.875%, 2/15/26 | | | 85,000 | | | | 89,148 | |
4.500%, 2/15/27 | | | 150,000 | | | | 151,125 | |
LifePoint Health, Inc.
5.500%, 12/1/21 | | | 123,000 | | | | 125,460 | |
MPH Acquisition Holdings LLC
7.125%, 6/1/24§ | | | 100,000 | | | | 107,770 | |
RegionalCare Hospital Partners Holdings, Inc.
8.250%, 5/1/23§ | | | 167,000 | | | | 175,768 | |
SP Finco LLC
6.750%, 7/1/25§ | | | 92,000 | | | | 83,318 | |
Surgery Center Holdings, Inc.
8.875%, 4/15/21§ | | | 70,000 | | | | 71,316 | |
Team Health Holdings, Inc.
6.375%, 2/1/25§ | | | 137,000 | | | | 126,383 | |
Tenet Healthcare Corp. | | | | | | | | |
7.500%, 1/1/22§ | | | 173,000 | | | | 182,514 | |
5.125%, 5/1/25§ | | | 69,000 | | | | 66,930 | |
7.000%, 8/1/25§ | | | 69,000 | | | | 63,135 | |
WellCare Health Plans, Inc.
5.250%, 4/1/25 | | | 95,000 | | | | 100,284 | |
West Street Merger Sub, Inc.
6.375%, 9/1/25§ | | | 108,000 | | | | 109,890 | |
| | | | | | | | |
| | | | | | | 1,961,599 | |
| | | | | | | | |
Health Care Technology (0.5%) | | | | | | | | |
Quintiles IMS, Inc.
4.875%, 5/15/23§ | | | 159,000 | | | | 165,758 | |
| | | | | | | | |
Pharmaceuticals (2.2%) | | | | | | | | |
Endo Finance LLC
7.250%, 1/15/22§ | | | 128,000 | | | | 117,760 | |
inVentiv Group Holdings, Inc.
7.500%, 10/1/24§ | | | 128,000 | | | | 141,120 | |
Valeant Pharmaceuticals International, Inc. | |
6.375%, 10/15/20§ | | | 7,000 | | | | 6,957 | |
7.500%, 7/15/21§ | | | 120,000 | | | | 118,050 | |
6.500%, 3/15/22§ | | | 70,000 | | | | 74,116 | |
6.125%, 4/15/25§ | | | 185,000 | | | | 155,399 | |
5.500%, 11/1/25 (b)§ | | | 75,000 | | | | 76,688 | |
| | | | | | | | |
| | | | | | | 690,090 | |
| | | | | | | | |
Total Health Care | | | | | | | 3,365,787 | |
| | | | | | | | |
Industrials (14.4%) | | | | | | | | |
Aerospace & Defense (1.1%) | | | | | | | | |
Spirit AeroSystems, Inc.
5.250%, 3/15/22 | | | 60,000 | | | | 62,411 | |
TransDigm, Inc. | | | | | | | | |
5.500%, 10/15/20 | | | 63,000 | | | | 63,945 | |
| | | | | | | | |
6.000%, 7/15/22 | | | 107,000 | | | | 111,414 | |
Triumph Group, Inc.
7.750%, 8/15/25§ | | | 100,000 | | | | 107,000 | |
| | | | | | | | |
| | | | | | | 344,770 | |
| | | | | | | | |
Airlines (0.9%) | | | | | | | | |
Intrepid Aviation Group Holdings LLC
6.875%, 2/15/19§ | | | 278,000 | | | | 274,178 | |
| | | | | | | | |
Building Products (2.0%) | | | | | | | | |
Builders FirstSource, Inc.
10.750%, 8/15/23§ | | | 100,000 | | | | 114,125 | |
Standard Industries, Inc. | | | | | | | | |
5.500%, 2/15/23§ | | | 216,000 | | | | 227,880 | |
6.000%, 10/15/25§ | | | 90,000 | | | | 97,200 | |
Summit Materials LLC
6.125%, 7/15/23 | | | 172,000 | | | | 178,880 | |
| | | | | | | | |
| | | | | | | 618,085 | |
| | | | | | | | |
Commercial Services & Supplies (2.7%) | |
ACCO Brands Corp.
5.250%, 12/15/24§ | | | 120,000 | | | | 124,650 | |
APX Group, Inc.
8.875%, 12/1/22 (b)§ | | | 114,000 | | | | 122,408 | |
Covanta Holding Corp. | | | | | | | | |
6.375%, 10/1/22 | | | 70,000 | | | | 71,838 | |
5.875%, 7/1/25 | | | 47,000 | | | | 46,530 | |
Multi-Color Corp. | | | | | | | | |
6.125%, 12/1/22§ | | | 135,000 | | | | 140,737 | |
4.875%, 11/1/25§ | | | 66,000 | | | | 66,580 | |
Nielsen Finance LLC
5.000%, 4/15/22§ | | | 106,000 | | | | 109,180 | |
Prime Security Services Borrower LLC
9.250%, 5/15/23§ | | | 160,000 | | | | 177,408 | |
| | | | | | | | |
| | | | | | | 859,331 | |
| | | | | | | | |
Construction & Engineering (1.7%) | |
AECOM
5.750%, 10/15/22 | | | 178,000 | | | | 186,241 | |
AECOM Global II LLC
5.000%, 4/1/22 | | | 95,000 | | | | 98,503 | |
Michael Baker Holdings LLC
8.875%, 4/15/19 PIK§ | | | 81,999 | | | | 82,102 | |
Michael Baker International LLC
8.250%, 10/15/18§ | | | 175,000 | | | | 175,000 | |
| | | | | | | | |
| | | | | | | 541,846 | |
| | | | | | | | |
Machinery (1.6%) | | | | | | | | |
Novelis Corp.
5.875%, 9/30/26§ | | | 136,000 | | | | 140,162 | |
Shape Technologies Group, Inc.
7.625%, 2/1/20§ | | | 145,000 | | | | 149,350 | |
Welbilt, Inc.
9.500%, 2/15/24 | | | 172,000 | | | | 195,650 | |
| | | | | | | | |
| | | | | | | 485,162 | |
| | | | | | | | |
Professional Services (1.0%) | | | | | | | | |
Jaguar Holding Co. II
6.375%, 8/1/23§ | | | 290,000 | | | | 302,325 | |
| | | | | | | | |
See Notes to Financial Statements.
58
1290 FUNDS
1290 HIGH YIELD BOND FUND
PORTFOLIO OF INVESTMENTS (Continued)
October 31, 2017
| | | | | | | | |
| | | Principal
Amount | | | Value
(Note 1) | |
| | | | | | | | |
Road & Rail (3.1%) | | | | | | | | |
DAE Funding LLC
5.000%, 8/1/24§ | | $ | 144,000 | | | $ | 147,060 | |
Kenan Advantage Group, Inc. (The)
7.875%, 7/31/23§ | | | 292,000 | | | | 302,949 | |
Neovia Logistics Services LLC
8.875%, 8/1/20§ | | | 245,000 | | | | 205,800 | |
Park Aerospace Holdings Ltd.
5.500%, 2/15/24§ | | | 162,000 | | | | 168,075 | |
Watco Cos. LLC
6.375%, 4/1/23§ | | | 160,000 | | | | 165,500 | |
| | | | | | | | |
| | | | | | | 989,384 | |
| | | | | | | | |
Trading Companies & Distributors (0.3%) | |
International Lease Finance Corp.
6.250%, 5/15/19 | | | 80,000 | | | | 84,764 | |
| | | | | | | | |
Total Industrials | | | | | | | 4,499,845 | |
| | | | | | | | |
Information Technology (12.5%) | |
Communications Equipment (0.8%) | |
Aegis Merger Sub, Inc.
10.250%, 2/15/23§ | | | 99,000 | | | | 107,910 | |
CommScope Technologies LLC
6.000%, 6/15/25§ | | | 130,000 | | | | 137,644 | |
| | | | | | | | |
| | | | | | | 245,554 | |
| | | | | | | | |
Internet Software & Services (2.0%) | |
Bankrate, Inc.
6.125%, 8/15/18§ | | | 94,000 | | | | 94,000 | |
GTT Communications, Inc.
7.875%, 12/31/24§ | | | 138,000 | | | | 147,149 | |
Match Group, Inc.
6.375%, 6/1/24 | | | 85,000 | | | | 92,225 | |
Rackspace Hosting, Inc.
8.625%, 11/15/24§ | | | 159,000 | | | | 167,443 | |
Zayo Group LLC
5.750%, 1/15/27§ | | | 124,000 | | | | 130,820 | |
| | | | | | | | |
| | | | | | | 631,637 | |
| | | | | | | | |
IT Services (2.4%) | | | | | | | | |
Alliance Data Systems Corp. | | | | | | | | |
6.375%, 4/1/20§ | | | 50,000 | | | | 50,500 | |
5.375%, 8/1/22§ | | | 245,000 | | | | 249,899 | |
Exela Intermediate LLC | | | | | | | | |
10.000%, 7/15/23§ | | | 115,000 | | | | 110,400 | |
First Data Corp. | | | | | | | | |
7.000%, 12/1/23§ | | | 153,000 | | | | 163,710 | |
Gartner, Inc. | | | | | | | | |
5.125%, 4/1/25§ | | | 63,000 | | | | 66,547 | |
Unisys Corp. | | | | | | | | |
10.750%, 4/15/22§ | | | 85,000 | | | | 94,563 | |
| | | | | | | | |
| | | | | | | 735,619 | |
| | | | | | | | |
Semiconductors & Semiconductor Equipment (0.9%) | |
NXP BV | | | | | | | | |
4.625%, 6/1/23§ | | | 270,000 | | | | 289,575 | |
| | | | | | | | |
Software (4.7%) | | | | | | | | |
Ascend Learning LLC | | | | | | | | |
6.875%, 8/1/25§ | | | 53,000 | | | | 55,385 | |
BCP Singapore VI Cayman Financing Co. Ltd. | |
8.000%, 4/15/21§ | | | 120,000 | | | | 126,600 | |
| | | | | | | | |
BMC Software, Inc. | | | | | | | | |
7.250%, 6/1/18 | | | 39,000 | | | | 39,644 | |
Boxer Parent Co., Inc. | | | | | | | | |
9.750%, 10/15/19 PIK§ | | | 259,000 | | | | 258,838 | |
Change Healthcare Holdings LLC | |
5.750%, 3/1/25§ | | | 175,000 | | | | 178,938 | |
CURO Financial Technologies Corp. | |
12.000%, 3/1/22§ | | | 208,000 | | | | 228,800 | |
CURO Financial Technologies Corp. | |
12.000%, 3/1/22 (b)§ | | | 80,000 | | | | 86,600 | |
Informatica LLC | | | | | | | | |
7.125%, 7/15/23§ | | | 105,000 | | | | 106,969 | |
Solera LLC | | | | | | | | |
10.500%, 3/1/24§ | | | 82,000 | | | | 93,019 | |
Sophia LP | | | | | | | | |
9.000%, 9/30/23§ | | | 290,000 | | | | 301,600 | |
| | | | | | | | |
| | | | | | | 1,476,393 | |
| | | | | | | | |
Technology Hardware, Storage & Peripherals (1.7%) | |
Dell International LLC | | | | | | | | |
5.875%, 6/15/21§ | | | 282,000 | | | | 295,042 | |
7.125%, 6/15/24§ | | | 107,000 | | | | 118,107 | |
NCR Corp. | | | | | | | | |
4.625%, 2/15/21 | | | 75,000 | | | | 75,937 | |
5.875%, 12/15/21 | | | 43,000 | | | | 44,344 | |
| | | | | | | | |
| | | | | | | 533,430 | |
| | | | | | | | |
Total Information Technology | | | | | | | 3,912,208 | |
| | | | | | | | |
Materials (6.5%) | | | | | | | | |
Chemicals (4.3%) | | | | | | | | |
Blue Cube Spinco, Inc. | | | | | | | | |
10.000%, 10/15/25 | | | 82,000 | | | | 99,802 | |
Huntsman International LLC | | | | | | | | |
4.875%, 11/15/20 | | | 98,000 | | | | 102,533 | |
INEOS Group Holdings SA | | | | | | | | |
5.625%, 8/1/24§ | | | 200,000 | | | | 208,250 | |
Koppers, Inc. | | | | | | | | |
6.000%, 2/15/25§ | | | 101,000 | | | | 108,323 | |
NOVA Chemicals Corp. | | | | | | | | |
4.875%, 6/1/24§ | | | 95,000 | | | | 96,311 | |
Nufarm Australia Ltd. | | | | | | | | |
6.375%, 10/15/19§ | | | 215,000 | | | | 218,763 | |
PQ Corp. | | | | | | | | |
8.500%, 11/1/22§ | | | 162,000 | | | | 168,682 | |
6.750%, 11/15/22§ | | | 85,000 | | | | 91,853 | |
Rayonier AM Products, Inc. | | | | | | | | |
5.500%, 6/1/24§ | | | 260,000 | | | | 252,362 | |
| | | | | | | | |
| | | | | | | 1,346,879 | |
| | | | | | | | |
Containers & Packaging (1.8%) | | | | | | | | |
Berry Global, Inc. | | | | | | | | |
5.125%, 7/15/23 | | | 86,000 | | | | 90,300 | |
BWAY Holding Co. | | | | | | | | |
5.500%, 4/15/24§ | | | 115,000 | | | | 119,750 | |
7.250%, 4/15/25§ | | | 235,000 | | | | 243,812 | |
Reynolds Group Issuer, Inc. | | | | | | | | |
5.750%, 10/15/20 | | | 100,000 | | | | 101,750 | |
| | | | | | | | |
| | | | | | | 555,612 | |
| | | | | | | | |
Metals & Mining (0.4%) | | | | | | | | |
ArcelorMittal | | | | | | | | |
7.500%, 10/15/39 | | | 105,000 | | | | 131,124 | |
| | | | | | | | |
Total Materials | | | | | | | 2,033,615 | |
| | | | | | | | |
See Notes to Financial Statements.
59
1290 FUNDS
1290 HIGH YIELD BOND FUND
PORTFOLIO OF INVESTMENTS (Continued)
October 31, 2017
| | | | | | | | |
| | | Principal
Amount | | | Value
(Note 1) | |
| | | | | | | | |
Real Estate (1.9%) | | | | | | | | |
Equity Real Estate Investment Trusts (REITs) (0.8%) | |
Equinix, Inc. (REIT) | | | | | | | | |
5.875%, 1/15/26 | | $ | 90,000 | | | $ | 97,541 | |
SBA Communications Corp. (REIT) | |
4.875%, 9/1/24 | | | 90,000 | | | | 92,588 | |
Uniti Group LP (REIT) | | | | | | | | |
7.125%, 12/15/24§ | | | 69,000 | | | | 63,653 | |
| | | | | | | | |
| | | | | | | 253,782 | |
| | | | | | | | |
Real Estate Management & Development (1.1%) | |
Greystar Real Estate Partners LLC | | | | | | | | |
8.250%, 12/1/22§ | | | 155,000 | | | | 165,137 | |
Howard Hughes Corp. (The) | | | | | | | | |
5.375%, 3/15/25§ | | | 160,000 | | | | 164,400 | |
| | | | | | | | |
| | | | | | | 329,537 | |
| | | | | | | | |
Total Real Estate | | | | | | | 583,319 | |
| | | | | | | | |
Telecommunication Services (11.4%) | |
Diversified Telecommunication Services (7.3%) | |
CCO Holdings LLC | | | | | | | | |
5.250%, 3/15/21 | | | 95,000 | | | | 97,493 | |
5.250%, 9/30/22 | | | 97,000 | | | | 99,910 | |
5.125%, 5/1/23§ | | | 220,000 | | | | 229,349 | |
5.750%, 2/15/26§ | | | 135,000 | | | | 141,143 | |
5.875%, 5/1/27§ | | | 210,000 | | | | 220,437 | |
CenturyLink, Inc. | | | | | | | | |
Series G
6.875%, 1/15/28 | | | 90,000 | | | | 89,658 | |
Series W
6.750%, 12/1/23 | | | 30,000 | | | | 31,209 | |
Cincinnati Bell, Inc. | | | | | | | | |
7.000%, 7/15/24§ | | | 132,000 | | | | 132,000 | |
Frontier Communications Corp. | | | | | | | | |
6.250%, 9/15/21 | | | 41,000 | | | | 33,620 | |
Intelsat Jackson Holdings SA | | | | | | | | |
7.250%, 10/15/20 | | | 240,000 | | | | 230,400 | |
Intelsat Luxembourg SA | | | | | | | | |
8.125%, 6/1/23 | | | 155,000 | | | | 94,647 | |
Level 3 Financing, Inc. | | | | | | | | |
5.375%, 8/15/22 | | | 188,000 | | | | 193,523 | |
SFR Group SA | | | | | | | | |
6.000%, 5/15/22§ | | | 200,000 | | | | 208,500 | |
Sprint Capital Corp. | | | | | | | | |
6.900%, 5/1/19 | | | 60,000 | | | | 63,078 | |
8.750%, 3/15/32 | | | 185,000 | | | | 223,850 | |
Windstream Services LLC | | | | | | | | |
7.750%, 10/15/20 | | | 220,000 | | | | 196,900 | |
| | | | | | | | |
| | | | | | | 2,285,717 | |
| | | | | | | | |
Wireless Telecommunication Services (4.1%) | |
Digicel Group Ltd. | | | | | | | | |
8.250%, 9/30/20§ | | | 215,000 | | | | 212,393 | |
Digicel Ltd. | | | | | | | | |
6.000%, 4/15/21§ | | | 250,000 | | | | 245,938 | |
Sprint Communications, Inc. | | | | | | | | |
7.000%, 8/15/20 | | | 50,000 | | | | 53,750 | |
Sprint Corp. | | | | | | | | |
7.875%, 9/15/23 | | | 255,000 | | | | 285,446 | |
7.125%, 6/15/24 | | | 115,000 | | | | 124,304 | |
| | | | | | | | |
T-Mobile USA, Inc. | | | | | | | | |
6.000%, 3/1/23 | | | 171,000 | | | | 180,191 | |
6.375%, 3/1/25 | | | 80,000 | | | | 86,400 | |
5.375%, 4/15/27 | | | 90,000 | | | | 97,313 | |
| | | | | | | | |
| | | | | | | 1,285,735 | |
| | | | | | | | |
Total Telecommunication Services | | | | | | | 3,571,452 | |
| | | | | | | | |
Utilities (0.9%) | | | | | | | | |
Independent Power and Renewable Electricity Producers (0.7%) | |
Calpine Corp. | | | | | | | | |
5.750%, 1/15/25 | | | 90,000 | | | | 85,302 | |
Talen Energy Supply LLC | | | | | | | | |
6.500%, 5/1/18 | | | 71,000 | | | | 72,065 | |
4.600%, 12/15/21 | | | 88,000 | | | | 80,194 | |
| | | | | | | | |
| | | | | | | 237,561 | |
| | | | | | | | |
Water Utilities (0.2%) | | | | | | | | |
Core & Main LP | | | | | | | | |
6.125%, 8/15/25§ | | | 53,000 | | | | 53,928 | |
| | | | | | | | |
Total Utilities | | | | | | | 291,489 | |
| | | | | | | | |
Total Corporate Bonds | | | | | | | 29,893,457 | |
| | | | | | | | |
Total Long-Term Debt
Securities (95.7%)
(Cost $29,366,459) | | | | | | | 29,893,457 | |
| | | | | | | | |
| | | Number of Shares | | | Value
(Note 1) | |
SHORT-TERM INVESTMENT: | | | | | | | | |
Investment Company (1.2%) | | | | | | | | |
JPMorgan Prime Money Market Fund, IM Shares | | | 371,799 | | | | 371,873 | |
| | | | | | | | |
Total Short-Term Investment (1.2%)
(Cost $371,899) | | | | | | | 371,873 | |
| | | | | | | | |
Total Investments in Securities (96.9%)
(Cost $29,738,358) | | | | | | | 30,265,330 | |
Other Assets Less Liabilities (3.1%) | | | | | | | 979,973 | |
| | | | | | | | |
Net Assets (100%) | | | | | | $ | 31,245,303 | |
| | | | | | | | |
| § | Securities exempt from registration under Rule 144A of the Securities Act of 1933. These securities may only be resold to qualified institutional buyers. At October 31, 2017, the market value of these securities amounted to $19,466,803 or 62.3% of net assets. Securities denoted with “§” but without “b” have been determined to be liquid under the guidelines established by the Board of Trustees. To the extent any securities might provide a right to demand registration, such rights have not been relied upon when determining liquidity. |
| (b) | Rule 144A Illiquid Security. At October 31, 2017, the market value of these securities amounted to $709,835 or 2.3% of net assets. |
Glossary:
| | PIK | — Payment-in Kind Security |
See Notes to Financial Statements.
60
1290 FUNDS
1290 HIGH YIELD BOND FUND
PORTFOLIO OF INVESTMENTS (Continued)
October 31, 2017
| | | | |
Country Diversification As a Percentage of Total Net Assets | |
Australia | | | 0.7 | % |
Brazil | | | 1.0 | |
Canada | | | 2.9 | |
China | | | 0.4 | |
France | | | 0.7 | |
Germany | | | 0.7 | |
Ireland | | | 0.5 | |
Jamaica | | | 1.5 | |
Luxembourg | | | 3.5 | |
Netherlands | | | 2.2 | |
New Zealand | | | 0.3 | |
United Arab Emirates | | | 0.5 | |
United States | | | 82.0 | |
Cash and Other | | | 3.1 | |
| | | | | |
| | | | 100.0 | % |
| | | | | |
The following is a summary of the inputs used to value the Fund’s assets and liabilities carried at fair value as of October 31, 2017:
The inputs or methodology used for valuing securities are not necessarily an indication of the risk associated with investing in those securities.
Various inputs are used in determining the value of the Fund’s investments. These inputs are summarized in the three broad levels listed below:
| | | | | | | | | | | | | | | | |
| | | | | |
| Investment Type | | Level 1
Quoted Prices in
Active Markets for
Identical
Securities | | | Level 2
Significant Other
Observable Inputs
(including quoted prices
for similar securities,
interest rates,
prepayment speeds,
credit risk, etc.) | | | Level 3
Significant Unobservable
Inputs (including the
Fund’s own
assumptions in
determining the fair
value of investments) | | | Total | |
Assets: | |
Corporate Bonds | | | | | | | | | | | | | | | | |
Consumer Discretionary | | $ | — | | | $ | 4,775,402 | | | $ | — | | | $ | 4,775,402 | |
Consumer Staples | | | — | | | | 1,563,982 | | | | — | | | | 1,563,982 | |
Energy | | | — | | | | 4,184,416 | | | | — | | | | 4,184,416 | |
Financials | | | — | | | | 1,111,942 | | | | — | | | | 1,111,942 | |
Health Care | | | — | | | | 3,365,787 | | | | — | | | | 3,365,787 | |
Industrials | | | — | | | | 4,499,845 | | | | — | | | | 4,499,845 | |
Information Technology | | | — | | | | 3,912,208 | | | | — | | | | 3,912,208 | |
Materials | | | — | | | | 2,033,615 | | | | — | | | | 2,033,615 | |
Real Estate | | | — | | | | 583,319 | | | | — | | | | 583,319 | |
Telecommunication Services | | | — | | | | 3,571,452 | | | | — | | | | 3,571,452 | |
Utilities | | | — | | | | 291,489 | | | | — | | | | 291,489 | |
Short-Term Investments | | | | | | | | | | | | | | | | |
Investment Companies | | | 371,873 | | | | — | | | | — | | | | 371,873 | |
| | | | | | | | | | | | | | | | |
Total Assets | | $ | 371,873 | | | $ | 29,893,457 | | | $ | — | | | $ | 30,265,330 | |
| | | | | | | | | | | | | | | | |
Total Liabilities | | $ | — | | | $ | — | | | $ | — | | | $ | — | |
| | | | | | | | | | | | | | | | |
Total | | $ | 371,873 | | | $ | 29,893,457 | | | $ | — | | | $ | 30,265,330 | |
| | | | | | | | | | | | | | | | |
There were no transfers between Levels 1, 2 or 3 during the year ended October 31, 2017.
See Notes to Financial Statements.
61
1290 FUNDS
1290 HIGH YIELD BOND FUND
PORTFOLIO OF INVESTMENTS (Continued)
October 31, 2017
The Fund held no derivatives contracts during the year ended October 31, 2017.
Investment security transactions for the year ended October 31, 2017 were as follows:
| | | | |
Cost of Purchases: | | | | |
Long-term investments other than U.S. government debt securities | | $ | 17,671,405 | |
Net Proceeds of Sales and Redemptions: | | | | |
Long-term investments other than U.S. government debt securities | | $ | 15,356,185 | |
As of October 31, 2017, the gross unrealized appreciation (depreciation) of investments based on the aggregate cost of investments in securities and derivative instruments, if applicable, for Federal income tax purposes was as follows:
| | | | |
Aggregate gross unrealized appreciation | | $ | 875,369 | |
Aggregate gross unrealized depreciation | | | (349,970 | ) |
| | | | |
Net unrealized appreciation | | $ | 525,399 | |
| | | | |
Federal income tax cost of investments in securities and derivative instruments, if applicable | | $ | 29,739,931 | |
| | | | |
See Notes to Financial Statements.
62
1290 FUNDS
1290 HIGH YIELD BOND FUND
STATEMENT OF ASSETS AND LIABILITIES
October 31, 2017
| | | | |
ASSETS | |
Investments in Securities, at value (Cost $29,738,358) | | $ | 30,265,330 | |
Cash | | | 895,000 | |
Dividends, interest and other receivables | | | 497,947 | |
Due from Custodian | | | 127,450 | |
Receivable for securities sold | | | 30,313 | |
Prepaid registration and filing fees | | | 25,174 | |
Receivable for Fund shares sold | | | 1,000 | |
Other assets | | | 301 | |
| | | | |
Total assets | | | 31,842,515 | |
| | | | |
LIABILITIES | |
Payable for securities purchased | | | 277,368 | |
Dividends and distributions payable | | | 132,736 | |
Payable for Fund shares redeemed | | | 106,491 | |
Transfer agent fees payable | | | 4,633 | |
Administrative fees payable | | | 3,992 | |
Investment advisory fees payable | | | 224 | |
Distribution fees payable – Class A | | | 162 | |
Distribution fees payable – Class R | | | 92 | |
Accrued expenses | | | 71,514 | |
| | | | |
Total liabilities | | | 597,212 | |
| | | | |
NET ASSETS | | $ | 31,245,303 | |
| | | | |
Net assets were comprised of: | |
Paid in capital | | $ | 33,064,554 | |
Accumulated undistributed net investment income (loss) | | | (132,736 | ) |
Accumulated undistributed net realized gain (loss) | | | (2,213,487 | ) |
Net unrealized appreciation (depreciation) | | | 526,972 | |
| | | | |
Net assets | | $ | 31,245,303 | |
| | | | |
Class A | | | | |
Net asset value and redemption price per share, $709,429 / 75,998 shares outstanding (unlimited amount authorized: $0.001 par value) | | $ | 9.33 | |
Maximum sales charge (4.50% of offering price) | | | 0.44 | |
| | | | |
Maximum offering price per share | | $ | 9.77 | |
| | | | |
Class I | | | | |
Net asset value and redemption price per share, $30,185,378 / 3,233,202 shares outstanding (unlimited amount authorized: $0.001 par value) | | $ | 9.34 | |
| | | | |
Class R | | | | |
Net asset value and redemption price per share, $218,023 / 23,364 shares outstanding (unlimited amount authorized: $0.001 par value) | | $ | 9.33 | |
| | | | |
Class T** | | | | |
Net asset value and redemption price per share, $132,473 / 14,192 shares outstanding (unlimited amount authorized: $0.001 par value) | | $ | 9.33 | |
Maximum sales charge (2.50% of offering price) | | | 0.24 | |
| | | | |
Maximum offering price per share | | $ | 9.57 | |
| | | | |
| ** | Class T shares currently are not offered for sale. Class T shares were formerly known as Class C shares. |
STATEMENT OF OPERATIONS
For the Year Ended October 31, 2017
| | | | |
INVESTMENT INCOME | |
Interest | | $ | 1,912,896 | |
Dividends | | | 5,058 | |
| | | | |
Total income | | | 1,917,954 | |
| | | | |
EXPENSES | |
Investment advisory fees | | | 180,615 | |
Professional fees | | | 113,485 | |
Administrative fees | | | 45,154 | |
Transfer agent fees | | | 44,630 | |
Registration and filing fees | | | 41,920 | |
Printing and mailing expenses | | | 13,816 | |
Custodian fees | | | 10,050 | |
Trustees’ fees | | | 3,728 | |
Distribution fees – Class A | | | 1,394 | |
Distribution fees – Class R | | | 1,025 | |
Distribution fees – Class T** | | | 648 | |
Miscellaneous | | | 23,663 | |
| | | | |
Gross expenses | | | 480,128 | |
Less: Waiver from investment adviser | | | (225,769 | ) |
Waiver from distributor | | | (648 | ) |
Reimbursement from investment adviser | | | (5,547 | ) |
| | | | |
Net expenses | | | 248,164 | |
| | | | |
NET INVESTMENT INCOME (LOSS) | | | 1,669,790 | |
| | | | |
REALIZED AND UNREALIZED GAIN (LOSS) | |
Net realized gain (loss) on investments in securities | | | (323,232 | ) |
Net change in unrealized appreciation (depreciation) on investments in securities | | | 1,356,734 | |
| | | | |
NET REALIZED AND UNREALIZED GAIN (LOSS) | | | 1,033,502 | |
| | | | |
NET INCREASE (DECREASE) IN NET ASSETS RESULTING FROM OPERATIONS | | $ | 2,703,292 | |
| | | | |
| ** | Class T shares currently are not offered for sale. Class T shares were formerly known as Class C shares. |
See Notes to Financial Statements.
63
1290 FUNDS
1290 HIGH YIELD BOND FUND
STATEMENT OF CHANGES IN NET ASSETS
| | | | | | | | |
| | | Year Ended October 31, | |
| | 2017 | | | 2016 | |
INCREASE (DECREASE) IN NET ASSETS FROM OPERATIONS: | |
Net investment income (loss) | | $ | 1,669,790 | | | $ | 1,819,249 | |
Net realized gain (loss) | | | (323,232 | ) | | | (1,392,638 | ) |
Net change in unrealized appreciation (depreciation) | | | 1,356,734 | | | | 1,253,717 | |
| | | | | | | | |
NET INCREASE (DECREASE) IN NET ASSETS RESULTING FROM OPERATIONS | | | 2,703,292 | | | | 1,680,328 | |
| | | | | | | | |
DIVIDENDS AND DISTRIBUTIONS: | | | | | | | | |
Dividends from net investment income | | | | | | | | |
Class A | | | (29,312 | ) | | | (314,511 | ) |
Class I | | | (1,610,575 | ) | | | (1,325,494 | ) |
Class R | | | (10,366 | ) | | | (299,260 | ) |
Class T** | | | (7,245 | ) | | | (107,745 | ) |
| | | | | | | | |
| | | (1,657,498 | ) | | | (2,047,010 | ) |
| | | | | | | | |
Return of capital | | | | | | | | |
Class A | | | (316 | ) | | | (2,634 | ) |
Class I | | | (17,372 | ) | | | (11,101 | ) |
Class R | | | (112 | ) | | | (2,506 | ) |
Class T** | | | (78 | ) | | | (903 | ) |
| | | | | | | | |
| | | (17,878 | ) | | | (17,144 | ) |
| | | | | | | | |
TOTAL DIVIDENDS AND DISTRIBUTIONS | | | (1,675,376 | ) | | | (2,064,154 | ) |
| | | | | | | | |
CAPITAL SHARES TRANSACTIONS: | | | | | | | | |
Class A | | | | | | | | |
Capital shares sold [ 49,493 and 13,888 shares, respectively ] | | | 460,006 | | | | 118,653 | |
Capital shares issued in reinvestment of dividends [ 2,013 and 797 shares, respectively ] | | | 18,727 | | | | 7,002 | |
Capital shares repurchased [ (14,921) and (890,407) shares, respectively ] | | | (139,448 | ) | | | (7,602,598 | ) |
| | | | | | | | |
Total Class A transactions | | | 339,285 | | | | (7,476,943 | ) |
| | | | | | | | |
Class I | | | | | | | | |
Capital shares sold [ 194,981 and 2,155,057 shares, respectively ] | | | 1,810,794 | | | | 18,424,957 | |
Capital shares issued in reinvestment of dividends [ 9,568 and 2,680 shares, respectively ] | | | 88,937 | | | | 23,683 | |
Capital shares repurchased [ (45,605) and (1,232) shares, respectively ] | | | (425,841 | ) | | | (14,555 | ) |
| | | | | | | | |
Total Class I transactions | | | 1,473,890 | | | | 18,434,085 | |
| | | | | | | | |
Class R | | | | | | | | |
Capital shares sold [ 1,739 and 12 shares, respectively ] | | | 16,288 | | | | 100 | |
Capital shares issued in reinvestment of dividends [ 31 and 0 shares, respectively ] | | | 287 | | | | — | |
Capital shares repurchased [ (1) and (890,000) shares, respectively ] | | | (10 | ) | | | (7,598,807 | ) |
| | | | | | | | |
Total Class R transactions | | | 16,565 | | | | (7,598,707 | ) |
| | | | | | | | |
Class T** | | | | | | | | |
Capital shares repurchased [ 0 and (290,000) shares, respectively ] | | | — | | | | (2,475,997 | ) |
| | | | | | | | |
Total Class T transactions | | | — | | | | (2,475,997 | ) |
| | | | | | | | |
NET INCREASE (DECREASE) IN NET ASSETS RESULTING FROM CAPITAL SHARE TRANSACTIONS | | | 1,829,740 | | | | 882,438 | |
| | | | | | | | |
TOTAL INCREASE (DECREASE) IN NET ASSETS | | | 2,857,656 | | | | 498,612 | |
NET ASSETS: | |
Beginning of year | | | 28,387,647 | | | | 27,889,035 | |
| | | | | | | | |
End of year (a) | | $ | 31,245,303 | | | $ | 28,387,647 | |
| | | | | | | | |
(a) Includes accumulated undistributed (overdistributed) net investment income (loss) of | | $ | (132,736 | ) | | $ | (145,209 | ) |
| | | | | | | | |
** Class T shares currently are not offered for sale. Class T shares were formerly known as Class C shares. | | | | | | | | |
See Notes to Financial Statements.
64
1290 FUNDS
1290 HIGH YIELD BOND FUND
FINANCIAL HIGHLIGHTS
| | | | | | | | | | | | |
| | | Year Ended October 31, | | | November 12, 2014* to
October 31, 2015 | |
| Class A | | 2017 | | | 2016 | | |
Net asset value, beginning of period | | $ | 9.01 | | | $ | 9.15 | | | $ | 10.00 | |
| | | | | | | | | | | | |
Income (loss) from investment operations: | | | | | | | | | | | | |
Net investment income (loss) (e) | | | 0.49 | | | | 0.61 | | | | 0.59 | |
Net realized and unrealized gain (loss) | | | 0.32 | | | | (0.09 | ) | | | (0.84 | ) |
| | | | | | | | | | | | |
Total from investment operations | | | 0.81 | | | | 0.52 | | | | (0.25 | ) |
| | | | | | | | | | | | |
Less distributions: | | | | | | | | | | | | |
Dividends from net investment income | | | (0.48 | ) | | | (0.65 | ) | | | (0.60 | ) |
Return of capital | | | (0.01 | ) | | | (0.01 | ) | | | — | |
| | | | | | | | | | | | |
Total dividends and distributions | | | (0.49 | ) | | | (0.66 | ) | | | (0.60 | ) |
| | | | | | | | | | | | |
Net asset value, end of period | | $ | 9.33 | | | $ | 9.01 | | | $ | 9.15 | |
| | | | | | | | | | | | |
Total return (b) | | | 9.20 | % | | | 6.17 | % | | | (2.62 | )% |
| | | | | | | | | | | | |
Ratios/Supplemental Data: | | | | | | | | | | | | |
Net assets, end of period (000’s) | | $ | 709 | | | $ | 355 | | | $ | 8,372 | |
Ratio of expenses to average net assets: | | | | | | | | | | | | |
After waivers and reimbursements (a)(f) | | | 1.06 | % | | | 1.06 | % | | | 1.05 | % |
Before waivers and reimbursements (a)(f) | | | 1.84 | % | | | 1.81 | % | | | 2.45 | % |
Ratio of net investment income (loss) to average net assets: | | | | | | | | | | | | |
After waivers and reimbursements (a)(f) | | | 5.26 | % | | | 7.06 | % | | | 6.39 | %(l) |
Before waivers and reimbursements (a)(f) | | | 4.48 | % | | | 6.31 | % | | | 4.99 | %(l) |
Portfolio turnover rate (z)^ | | | 54 | % | | | 79 | % | | | 57 | % |
| | |
| | | Year Ended October 31, | | | November 12, 2014* to October 31, 2015 | |
| Class I | | 2017 | | | 2016 | | |
Net asset value, beginning of period | | $ | 9.01 | | | $ | 9.15 | | | $ | 10.00 | |
| | | | | | | | | | | | |
Income (loss) from investment operations: | | | | | | | | | | | | |
Net investment income (loss) (e) | | | 0.52 | | | | 0.58 | | | | 0.62 | |
Net realized and unrealized gain (loss) | | | 0.33 | | | | (0.04 | ) | | | (0.85 | ) |
| | | | | | | | | | | | |
Total from investment operations | | | 0.85 | | | | 0.54 | | | | (0.23 | ) |
| | | | | | | | | | | | |
Less distributions: | | | | | | | | | | | | |
Dividends from net investment income | | | (0.51 | ) | | | (0.67 | ) | | | (0.62 | ) |
Return of capital | | | (0.01 | ) | | | (0.01 | ) | | | — | |
| | | | | | | | | | | | |
Total dividends and distributions | | | (0.52 | ) | | | (0.68 | ) | | | (0.62 | ) |
| | | | | | | | | | | | |
Net asset value, end of period | | $ | 9.34 | | | $ | 9.01 | | | $ | 9.15 | |
| | | | | | | | | | | | |
Total return (b) | | | 9.58 | % | | | 6.44 | % | | | (2.39 | )% |
| | | | | | | | | | | | |
Ratios/Supplemental Data: | | | | | | | | | | | | |
Net assets, end of period (000’s) | | $ | 30,185 | | | $ | 27,710 | | | $ | 8,395 | |
Ratio of expenses to average net assets: | | | | | | | | | | | | |
After waivers and reimbursements (a)(f) | | | 0.82 | % | | | 0.84 | % | | | 0.80 | % |
Before waivers and reimbursements (a)(f) | | | 1.58 | % | | | 1.53 | % | | | 2.20 | % |
Ratio of net investment income (loss) to average net assets: | | | | | | | | | | | | |
After waivers and reimbursements (a)(f) | | | 5.55 | % | | | 6.62 | % | | | 6.64 | %(l) |
Before waivers and reimbursements (a)(f) | | | 4.79 | % | | | 5.94 | % | | | 5.24 | %(l) |
Portfolio turnover rate (z)^ | | | 54 | % | | | 79 | % | | | 57 | % |
See Notes to Financial Statements.
65
1290 FUNDS
1290 HIGH YIELD BOND FUND
FINANCIAL HIGHLIGHTS (Continued)
| | | | | | | | | | | | |
| | | Year Ended October 31, | | | November 12, 2014* to
October 31, 2015 | |
| Class R | | 2017 | | | 2016 | | |
Net asset value, beginning of period | | $ | 9.01 | | | $ | 9.15 | | | $ | 10.00 | |
| | | | | | | | | | | | |
Income (loss) from investment operations: | | | | | | | | | | | | |
Net investment income (loss) (e) | | | 0.47 | | | | 0.59 | | | | 0.57 | |
Net realized and unrealized gain (loss) | | | 0.32 | | | | (0.10 | ) | | | (0.85 | ) |
| | | | | | | | | | | | |
Total from investment operations | | | 0.79 | | | | 0.49 | | | | (0.28 | ) |
| | | | | | | | | | | | |
Less distributions: | | | | | | | | | | | | |
Dividends from net investment income | | | (0.46 | ) | | | (0.62 | ) | | | (0.57 | ) |
Return of capital | | | (0.01 | ) | | | (0.01 | ) | | | — | |
| | | | | | | | | | | | |
Total dividends and distributions | | | (0.47 | ) | | | (0.63 | ) | | | (0.57 | ) |
| | | | | | | | | | | | |
Net asset value, end of period | | $ | 9.33 | | | $ | 9.01 | | | $ | 9.15 | |
| | | | | | | | | | | | |
Total return (b) | | | 8.95 | % | | | 5.91 | % | | | (2.86 | )% |
| | | | | | | | | | | | |
Ratios/Supplemental Data: | | | | | | | | | | | | |
Net assets, end of period (000’s) | | $ | 218 | | | $ | 195 | | | $ | 8,339 | |
Ratio of expenses to average net assets: | | | | | | | | | | | | |
After waivers and reimbursements (a)(f) | | | 1.32 | % | | | 1.31 | % | | | 1.30 | % |
Before waivers and reimbursements (a)(f) | | | 2.08 | % | | | 2.06 | % | | | 2.70 | % |
Ratio of net investment income (loss) to average net assets: | | | | | | | | | | | | |
After waivers and reimbursements (a)(f) | | | 5.05 | % | | | 6.83 | % | | | 6.14 | %(l) |
Before waivers and reimbursements (a)(f) | | | 4.28 | % | | | 6.08 | % | | | 4.74 | %(l) |
Portfolio turnover rate (z)^ | | | 54 | % | | | 79 | % | | | 57 | % |
| | |
| | | Year Ended October 31, | | | November 12, 2014* to October 31, 2015 | |
| Class T** | | 2017 | | | 2016 | | |
Net asset value, beginning of period | | $ | 9.01 | | | $ | 9.15 | | | $ | 10.00 | |
| | | | | | | | | | | | |
Income (loss) from investment operations: | | | | | | | | | | | | |
Net investment income (loss) (e) | | | 0.52 | | | | 0.63 | | | | 0.62 | |
Net realized and unrealized gain (loss) | | | 0.32 | | | | (0.09 | ) | | | (0.85 | ) |
| | | | | | | | | | | | |
Total from investment operations | | | 0.84 | | | | 0.54 | | | | (0.23 | ) |
| | | | | | | | | | | | |
Less distributions: | | | | | | | | | | | | |
Dividends from net investment income | | | (0.51 | ) | | | (0.67 | ) | | | (0.62 | ) |
Return of capital | | | (0.01 | ) | | | (0.01 | ) | | | — | |
| | | | | | | | | | | | |
Total dividends and distributions | | | (0.52 | ) | | | (0.68 | ) | | | (0.62 | ) |
| | | | | | | | | | | | |
Net asset value, end of period | | $ | 9.33 | | | $ | 9.01 | | | $ | 9.15 | |
| | | | | | | | | | | | |
Total return (b) | | | 9.46 | % | | | 6.44 | % | | | (2.39 | )% |
| | | | | | | | | | | | |
Ratios/Supplemental Data: | | | | | | | | | | | | |
Net assets, end of period (000’s) | | $ | 132 | | | $ | 128 | | | $ | 2,783 | |
Ratio of expenses to average net assets: | | | | | | | | | | | | |
After waivers and reimbursements (a)(f) | | | 0.82 | % | | | 0.81 | % | | | 0.80 | % |
Before waivers and reimbursements (a)(f) | | | 2.08 | % | | | 2.56 | % | | | 3.20 | % |
Ratio of net investment income (loss) to average net assets: | | | | | | | | | | | | |
After waivers and reimbursements (a)(f) | | | 5.56 | % | | | 7.30 | % | | | 6.64 | %(l) |
Before waivers and reimbursements (a)(f) | | | 4.30 | % | | | 5.55 | % | | | 4.24 | %(l) |
Portfolio turnover rate (z)^ | | | 54 | % | | | 79 | % | | | 57 | % |
| * | Commencement of Operations. |
| ** | Class T shares currently are not offered for sale. Class T shares were formerly known as Class C shares. |
| ^ | Portfolio turnover rate excludes derivatives, if any. |
| (a) | Ratios for periods less than one year are annualized. Certain non-recurring expenses incurred by the Fund are not annualized for periods less than one year. |
| (b) | Total returns for periods less than one year are not annualized. |
| (e) | Net investment income (loss) per share is based on average shares outstanding. |
| (f) | Expenses do not include the expenses of the underlying funds (“indirect expenses”), if applicable. |
| (l) | The annualized ratio of net investment income to average net assets may not be indicative of operating results for a full year. |
| (z) | Portfolio turnover rate for periods less than one year is not annualized. |
See Notes to Financial Statements.
66
1290 LOW VOLATILITY GLOBAL EQUITY FUND (Unaudited)
INVESTMENT ADVISER
PERFORMANCE RESULTS
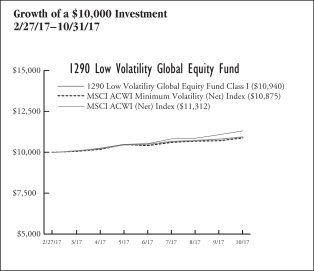
| | | | |
| Total Returns as of 10/31/17 | | | |
| | | Since
Incept. | |
Fund – Class I Shares* | | | 9.40 | % |
MSCI ACWI Minimum Volatility (Net) Index | | | 8.75 | |
MSCI ACWI (Net) Index | | | 13.12 | |
* Date of inception 2/27/17. Returns for periods less than one year are not annualized. | |
The performance quoted is past performance and is not a guarantee of future results. Mutual funds are subject to certain market risks. Investment returns and principal value of an investment will fluctuate so that an investor’s shares, when redeemed, may be worth more or less than their original cost. Current performance may be higher or lower than the performance data shown. For the most current month-end performance data please call 1-888-310-0416 or visit www.1290Funds.com.
The graph illustrates comparative performance for $10,000 invested in the Class I Shares of the 1290 Low Volatility Global Equity Fund and the MSCI ACWI Minimum Volatility (Net) Index and MSCI ACWI (Net) Index from 2/27/17 to 10/31/17. The performance of each of the MSCI ACWI Minimum Volatility (Net) Index and MSCI ACWI (Net) Index reflects an initial investment at the end of the month closest to the Fund’s inception. The performance of the Fund assumes reinvestment of all dividends and capital gain distributions, if any, and does not include a sales charge. The performance of the MSCI ACWI Minimum Volatility (Net) Index and MSCI ACWI (Net) Index does not reflect the deduction of expenses or a sales charge associated with a mutual fund and has been adjusted to reflect reinvestment of all dividends, capital gain distributions, and interest of the securities included in the benchmark.
Fund performance may reflect the waiver of the Fund’s fees and reimbursement of expenses for certain periods since the inception date. Without these waivers and reimbursements, performance would have been lower. Also, performance shown in this section does not reflect the deduction of taxes that a shareholder would pay on Fund distributions or redemption of Fund shares.
PERFORMANCE SUMMARY
The Fund’s Class I shares returned 9.40% for the period ended October 31, 2017. The Fund’s benchmarks, the MSCI ACWI Minimum Volatility (Net) Index and the MSCI ACWI (Net) Index, returned 8.75% and 13.12%, respectively over the same period.
Overview
Since February 2017, global equities have risen, despite geopolitical friction and the shift to less accommodative monetary policies. In the U.S., however, where political uncertainty around tax reform and high equity valuations exacted a toll, returns lagged those of the rest of the world. Volatility remained historically low throughout the period, as measured by the Chicago Board Options Exchange Market Volatility Index. In this environment, all of the Fund’s holdings in low-volatility equity exchange-traded funds produced positive returns in line with their benchmarks. The biggest contributors to returns were the international developed markets and the emerging markets. The U.S. also produced positive returns.
| | | | |
Table by Asset Class (as a percentage of Total Investments in Securities) As of October 31, 2017 | |
Equity | | | 100.0 | % |
| | | | |
Top 10 Holdings (as a percentage of Total Investments in Securities) As of October 31, 2017 | |
iShares Edge MSCI Min Vol Global Fund | | | 28.0 | % |
PowerShares S&P International Developed Low Volatility Portfolio | | | 12.8 | |
iShares Edge MSCI Min Vol EAFE Fund | | | 12.7 | |
iShares Edge MSCI Min Vol USA Fund | | | 7.0 | |
PowerShares S&P 500 Low Volatility Portfolio | | | 7.0 | |
PowerShares S&P 500 High Dividend Low Volatility Portfolio | | | 7.0 | |
PowerShares S&P MidCap Low Volatility Portfolio | | | 6.9 | |
iShares Edge MSCI Min Vol Emerging Markets Fund | | | 6.0 | |
PowerShares S&P Emerging Markets Low Volatility Portfolio | | | 5.8 | |
PowerShares S&P SmallCap Low Volatility Portfolio | | | 3.4 | |
| |
Holdings are subject to change without notice. | |
67
1290 LOW VOLATILITY GLOBAL EQUITY FUND (Unaudited)
UNDERSTANDING YOUR EXPENSES:
As a shareholder of the Fund, you incur two types of costs:
(1) transaction costs, including applicable sales charges and redemption fees; and (2) ongoing costs, including investment advisory fees, distribution and/or service (12b-1) fees and other Fund expenses. These examples are intended to help you understand your ongoing costs (in dollars) of investing in the Fund and to compare these costs with the ongoing costs of investing in other mutual funds.
The examples are based on an investment of $1,000 invested at the beginning of the six-month period ended October 31, 2017 and held for the entire six-month period.
Actual Expenses
The first line of the following table provides information about actual account values and actual expenses. You may use the information in this line, together with the amount you invested, to estimate the expenses that you paid over the period. Simply divide your account value by $1,000 (for example, an $8,600 account value divided by $1,000 = 8.6), then multiply the result by the number in the first line under the heading entitled “Expenses Paid During Period” to estimate the expenses you paid on your account during this period.
Hypothetical Example for Comparison Purposes
The second line of the following table provides information about hypothetical account values and hypothetical expenses based on the Fund’s actual expense ratio and an assumed rate of return of 5% per year before expenses, which is not the Fund’s actual return. The hypothetical account values and expenses may not be used to estimate the actual ending account balance or expenses you paid for the period. You may use this information to compare the ongoing costs of investing in the Fund and other funds. To do so, compare this 5% hypothetical example with the 5% hypothetical examples that appear in the shareholder reports of the other funds.
Please note that the expenses shown in the table are meant to highlight your ongoing costs only and do not reflect any transactional costs, such as sales charges (loads), redemption fees, or exchange fees. Therefore, the second line of the table is useful in comparing ongoing costs only, and will not help you determine the relative total costs of owning different funds. In addition, if these transactional costs were included, your costs would have been higher.
EXAMPLE
| | | | | | | | | | | | |
| | | Beginning
Account
Value
5/1/17 | | | Ending
Account
Value
10/31/17 | | | Expenses
Paid
During
Period*
5/1/17 -
10/31/17 | |
Class I | |
Actual | | | $1,000.00 | | | | $1,071.50 | | | | $2.23 | |
Hypothetical (5% average annual return before expenses) | | | 1,000.00 | | | | 1,023.05 | | | | 2.18 | |
* Expenses are equal to the Fund’s Class I shares annualized expense ratio of 0.43%, multiplied by the average account value over the period, and multiplied by 184/365 (to reflect the one-half year period). | |
68
1290 FUNDS
1290 LOW VOLATILITY GLOBAL EQUITY FUND
PORTFOLIO OF INVESTMENTS
October 31, 2017
| | | | | | | | |
| | | Number of
Shares | | | Value
(Note 1) | |
| | | | | | | | |
EXCHANGE TRADED FUNDS (ETF): | |
iShares Edge MSCI Min Vol EAFE Fund | | | 5,000 | | | $ | 358,900 | |
iShares Edge MSCI Min Vol Emerging Markets Fund | | | 2,870 | | | | 169,875 | |
iShares Edge MSCI Min Vol Global Fund | | | 9,640 | | | | 796,263 | |
iShares Edge MSCI Min Vol USA Fund | | | 3,880 | | | | 199,122 | |
PowerShares S&P 500 High Dividend Low Volatility Portfolio | | | 4,790 | | | | 197,396 | |
PowerShares S&P 500 Low Volatility Portfolio | | | 4,260 | | | | 198,218 | |
PowerShares S&P Emerging Markets Low Volatility Portfolio | | | 6,670 | | | | 164,082 | |
| | | | | | | | |
PowerShares S&P International Developed Low Volatility Portfolio | | | 10,850 | | | | 361,196 | |
PowerShares S&P MidCap Low Volatility Portfolio | | | 4,330 | | | | 194,980 | |
PowerShares S&P SmallCap Low Volatility Portfolio | | | 2,050 | | | | 95,223 | |
SPDR SSGA US Small Cap Low Volatility Index Fund | | | 990 | | | | 95,149 | |
| | | | | | | | |
Total Investments in Securities (99.8%)
(Cost $2,623,643) | | | | | | | 2,830,404 | |
Other Assets Less Liabilities (0.2%) | | | | | | | 5,354 | |
| | | | | |
Net Assets (100%) | | | | | | $ | 2,835,758 | |
| | | | | | | | |
The following is a summary of the inputs used to value the Fund’s assets and liabilities carried at fair value as of October 31, 2017:
The inputs or methodology used for valuing securities are not necessarily an indication of the risk associated with investing in those securities.
Various inputs are used in determining the value of the Fund’s investments. These inputs are summarized in the three broad levels listed below:
| | | | | | | | | | | | | | | | |
| | | | | |
| Investment Type | | Level 1
Quoted Prices in
Active Markets for
Identical
Securities | | | Level 2
Significant Other
Observable Inputs
(including quoted prices
for similar securities,
interest rates,
prepayment speeds,
credit risk, etc.) | | | Level 3
Significant Unobservable
Inputs (including the
Fund’s own
assumptions in
determining the fair
value of investments) | | | Total | |
Assets: | | | | | |
Exchange Traded Funds | | | | | | | | | | | | | | | | |
Exchange Traded Funds | | $ | 2,830,404 | | | $ | — | | | $ | — | | | $ | 2,830,404 | |
| | | | | | | | | | | | | | | | |
Total Assets | | $ | 2,830,404 | | | $ | — | | | $ | — | | | $ | 2,830,404 | |
| | | | | | | | | | | | | | | | |
Total Liabilities | | $ | — | | | $ | — | | | $ | — | | | $ | — | |
| | | | | | | | | | | | | | | | |
Total | | $ | 2,830,404 | | | $ | — | | | $ | — | | | $ | 2,830,404 | |
| | | | | | | | | | | | | | | | |
There were no transfers between Levels 1, 2 or 3 during the period ended October 31, 2017.
The Fund held no derivatives contracts during the period ended October 31, 2017.
Investment security transactions for the period ended October 31, 2017 were as follows:
| | | | |
Cost of Purchases: | |
Long-term investments other than U.S. government debt securities | | $ | 2,632,643 | |
Net Proceeds of Sales and Redemptions: | | | | |
Long-term investments other than U.S. government debt securities | | $ | 10,003 | |
As of October 31, 2017, the gross unrealized appreciation (depreciation) of investments based on the aggregate cost of investments in securities and derivative instruments, if applicable, for Federal income tax purposes was as follows:
| | | | |
Aggregate gross unrealized appreciation | | $ | 206,761 | |
Aggregate gross unrealized depreciation | | | — | |
| | | | |
Net unrealized appreciation | | $ | 206,761 | |
| | | | |
Federal income tax cost of investments in securities and derivative instruments, if applicable | | $ | 2,623,643 | |
| | | | |
See Notes to Financial Statements.
69
1290 FUNDS
1290 LOW VOLATILITY GLOBAL EQUITY FUND
STATEMENT OF ASSETS AND LIABILITIES
October 31, 2017
| | | | |
ASSETS | |
Investments in Securities, at value (Cost $2,623,643) | | $ | 2,830,404 | |
Cash | | | 6,853 | |
Prepaid registration and filing fees | | | 22,074 | |
Receivable from investment adviser | | | 9,815 | |
Deferred offering cost | | | 2,668 | |
Other assets | | | 35 | |
| | | | |
Total assets | | | 2,871,849 | |
| | | | |
LIABILITIES | |
Accrued audit fee | | | 32,740 | |
Transfer agent fees payable | | | 841 | |
Trustees’ fees payable | | | 24 | |
Accrued expenses | | | 2,486 | |
| | | | |
Total liabilities | | | 36,091 | |
| | | | |
NET ASSETS | | $ | 2,835,758 | |
| | | | |
Net assets were comprised of: | |
Paid in capital | | $ | 2,597,841 | |
Accumulated undistributed net investment income (loss) | | | 30,152 | |
Accumulated undistributed net realized gain (loss) | | | 1,004 | |
Net unrealized appreciation (depreciation) | | | 206,761 | |
| | | | |
Net assets | | $ | 2,835,758 | |
| | | | |
Class I | | | | |
Net asset value and redemption price per share, $2,835,758 / 259,325 shares outstanding (unlimited amount authorized: $0.001 par value) | | $ | 10.94 | |
| | | | |
STATEMENT OF OPERATIONS
For the Period Ended October 31, 2017*
| | | | |
INVESTMENT INCOME | |
Dividends | | $ | 37,551 | |
Interest | | | 120 | |
| | | | |
Total income | | | 37,671 | |
| | | | |
EXPENSES | |
Professional fees | | | 42,960 | |
Administrative fees | | | 20,219 | |
Investment advisory fees | | | 8,999 | |
Registration and filing fees | | | 8,731 | |
Transfer agent fees | | | 6,649 | |
Offering costs | | | 5,515 | |
Custodian fees | | | 1,590 | |
Printing and mailing expenses | | | 1,515 | |
Trustees’ fees | | | 240 | |
Miscellaneous | | | 4,383 | |
| | | | |
Gross expenses | | | 100,801 | |
Less: Waiver from investment adviser | | | (29,218 | ) |
Reimbursement from investment adviser | | | (63,881 | ) |
| | | | |
Net expenses | | | 7,702 | |
| | | | |
NET INVESTMENT INCOME (LOSS) | | | 29,969 | |
| | | | |
REALIZED AND UNREALIZED GAIN (LOSS) | |
Net realized gain (loss) on investments in securities | | | 1,004 | |
Net change in unrealized appreciation (depreciation) on investments in securities | | | 206,761 | |
| | | | |
NET REALIZED AND UNREALIZED GAIN (LOSS) | | | 207,765 | |
| | | | |
NET INCREASE (DECREASE) IN NET ASSETS RESULTING FROM OPERATIONS | | $ | 237,734 | |
| | | | |
| * | The Fund commenced operations on February 27, 2017. |
| | | | |
| STATEMENT OF CHANGES IN NET ASSETS | | February 27, 2017* to
October 31, 2017 | |
INCREASE (DECREASE) IN NET ASSETS FROM OPERATIONS: | |
Net investment income (loss) | | $ | 29,969 | |
Net realized gain (loss) | | | 1,004 | |
Net change in unrealized appreciation (depreciation) | | | 206,761 | |
| | | | |
NET INCREASE (DECREASE) IN NET ASSETS RESULTING FROM OPERATIONS | | | 237,734 | |
| | | | |
CAPITAL SHARES TRANSACTIONS: | | | | |
Class I | | | | |
Capital shares sold [ 259,325 shares] | | | 2,598,024 | |
| | | | |
NET INCREASE (DECREASE) IN NET ASSETS RESULTING FROM CAPITAL SHARE TRANSACTIONS | | | 2,598,024 | |
| | | | |
TOTAL INCREASE (DECREASE) IN NET ASSETS | | | 2,835,758 | |
NET ASSETS: | |
Beginning of period | | | — | |
| | | | |
End of period (a) | | $ | 2,835,758 | |
| | | | |
(a) Includes accumulated undistributed (overdistributed) net investment income (loss) of | | $ | 30,152 | |
| | | | |
* The Fund commenced operations on February 27, 2017. | | | | |
See Notes to Financial Statements.
70
1290 FUNDS
1290 LOW VOLATILITY GLOBAL EQUITY FUND
FINANCIAL HIGHLIGHTS
| | | | |
| Class I | | February 27, 2017* to
October 31, 2017 | |
Net asset value, beginning of period | | $ | 10.00 | |
| | | | |
Income (loss) from investment operations: | | | | |
Net investment income (loss) (e)(x) | | | 0.12 | |
Net realized and unrealized gain (loss) | | | 0.82 | |
| | | | |
Total from investment operations | | | 0.94 | |
| | | | |
Net asset value, end of period | | $ | 10.94 | |
| | | | |
Total return (b) | | | 9.40 | % |
| | | | |
Ratios/Supplemental Data: | | | | |
Net assets, end of period (000’s) | | $ | 2,836 | |
Ratio of expenses to average net assets: | | | | |
After waivers and reimbursements (a)(f) | | | 0.43 | %(j) |
Before waivers and reimbursements (a)(f) | | | 4.87 | % |
Ratio of net investment income (loss) to average net assets: | | | | |
After waivers and reimbursements (a)(f)(x) | | | 1.66 | %(l) |
Before waivers and reimbursements (a)(f)(x) | | | (2.78 | )%(l) |
Portfolio turnover rate (z)^ | | | 0 | %‡ |
| * | Commencement of Operations. |
| ^ | Portfolio turnover rate excludes derivatives, if any. |
| (a) | Ratios for periods less than one year are annualized. Certain non-recurring expenses incurred by the Fund are not annualized for periods less than one year. |
| (b) | Total returns for periods less than one year are not annualized. |
| (e) | Net investment income (loss) per share is based on average shares outstanding. |
| (f) | Expenses do not include the expenses of the underlying funds (“indirect expenses”), if applicable. |
| (j) | Including direct and indirect expenses, the net expense ratio after waivers and reimbursements would be 0.65%. |
| (l) | The annualized ratio of net investment income to average net assets may not be indicative of operating results for a full year. |
| (x) | Recognition of net investment income is affected by the timing of dividend declarations by the underlying funds in which the Fund invests. |
| (z) | Portfolio turnover rate for periods less than one year is not annualized. |
See Notes to Financial Statements.
71
1290 MULTI-ALTERNATIVE STRATEGIES FUND (Unaudited)
INVESTMENT ADVISER
PERFORMANCE RESULTS
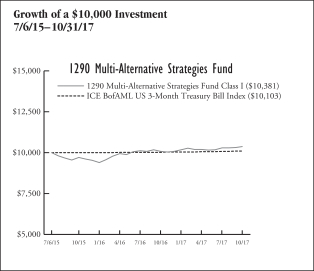
| | | | | | | | | | |
| Annualized Total Returns as of 10/31/17 | |
| | | | | 1
Year | | | Since
Incept. | |
Fund – Class A Shares* | | without Sales Charge | | | 2.78 | % | | | 1.37 | % |
| | | with Sales Charge (a) | | | (2.87 | ) | | | (1.06 | ) |
Fund – Class I Shares* | | | | | 3.04 | | | | 1.62 | |
Fund – Class R Shares* | | | | | 2.53 | | | | 1.13 | |
ICE BofAML US 3-Month Treasury Bill Index | | | | | 0.72 | | | | 0.44 | |
* Date of inception 7/6/15. (a) A 5.50% front-end sales charge was deducted. Returns for periods greater than one year are annualized. | |
The performance quoted is past performance and is not a guarantee of future results. Mutual funds are subject to certain market risks. Investment returns and principal value of an investment will fluctuate so that an investor’s shares, when redeemed, may be worth more or less than their original cost. Current performance may be higher or lower than the performance data shown. For the most current month-end performance data please call 1-888-310-0416 or visit www.1290Funds.com.
The graph illustrates comparative performance for $10,000 invested in the Class I Shares of the 1290 Multi-Alternative Strategies Fund and the ICE BofAML US 3-Month Treasury Bill Index from 7/6/15 to 10/31/17. The performance of the ICE BofAML US 3-Month Treasury Bill Index reflects an initial investment at the end of the month closest to the Fund’s inception. The performance of the Fund assumes reinvestment of all dividends and capital gain distributions, if any, and does not include a sales charge. The performance of the ICE BofAML US 3-Month Treasury Bill Index does not reflect the deduction of expenses or a sales charge associated with a mutual fund and has been adjusted to reflect reinvestment of all dividends, capital gain distributions, and interest of the securities included in the benchmark.
Fund performance may reflect the waiver of the Fund’s fees and reimbursement of expenses for certain periods since the inception date. Without these waivers and reimbursements, performance would have been lower. Also, performance shown in this section does not reflect the deduction of taxes that a shareholder would pay on Fund distributions or redemption of Fund shares.
PERFORMANCE SUMMARY
The Fund’s Class I shares returned 3.04% for the year ended October 31, 2017. The Fund’s benchmark, the ICE BofAML US 3-Month Treasury Bill Index, returned 0.72% over the same year.
Overview
A strong global equity market and modest economic growth drove mixed performance in alternative asset classes and strategies during the twelve-month period ended October 31, 2017. The Fund benefited from its allocations to economically sensitive sectors and strategies while interest-rate and currency sensitive sectors were among those that somewhat held back returns.
| | |
| What helped performance during the year? |
| |
| Convertibles | | Convertibles performed well due to strong performance in the equity market. |
| |
| |
| Real Estate | | Global Real Estate benefited from solid REIT fundamentals, strong broad-based growth, and low inflation. US REITs underperformed their global counterparts, but still had positive performance during the period. |
| |
| |
Commodities | | Commodities profited from an optimistic global economic outlook. Livestock and industrials and metals had strong performance, with double digit returns during the period, while oil prices recovered from lows in Q2 2017. |
| |
|
| What hurt performance during the year? |
| |
| Managed Futures | | Managed Futures underperformed during the period largely due to positioning in precious metals, soybean and natural gas futures. |
| |
| Currency | | The Currency strategy underperformed due to weakness in the U.S. dollar. |
| | | | |
Table by Asset Class (as a percentage of Total Investments in Securities) As of October 31, 2017 | |
Alternatives | | | 86.5 | % |
Fixed Income | | | 9.1 | |
Equity | | | 4.4 | |
72
1290 MULTI-ALTERNATIVE STRATEGIES FUND (Unaudited)
| | | | |
Top 10 Holdings (as a percentage of Total Investments in Securities) As of October 31, 2017 | |
WisdomTree Managed Futures Strategy Fund | | | 9.2 | % |
iShares TIPS Bond Fund | | | 9.1 | |
ProShares Hedge Replication Fund | | | 9.1 | |
IQ Merger Arbitrage Fund | | | 9.1 | |
SPDR Bloomberg Barclays Convertible Securities Fund | | | 9.0 | |
ProShares RAFI Long/Short | | | 9.0 | |
PowerShares DB G10 Currency Harvest Fund | | | 9.0 | |
JPMorgan Diversified Alternatives ETF | | | 8.9 | |
PowerShares DB Gold Fund | | | 7.2 | |
Vanguard Global ex-U.S. Real Estate ETF | | | 4.7 | |
Holdings are subject to change without notice. | |
UNDERSTANDING YOUR EXPENSES:
As a shareholder of the Fund, you incur two types of costs:
(1) transaction costs, including applicable sales charges and redemption fees; and (2) ongoing costs, including investment advisory fees, distribution and/or service (12b-1) fees (in the case of Class A and Class R shares of the Fund), and other Fund expenses. These examples are intended to help you understand your ongoing costs (in dollars) of investing in the Fund and to compare these costs with the ongoing costs of investing in other mutual funds.
The examples are based on an investment of $1,000 invested at the beginning of the six-month period ended October 31, 2017 and held for the entire six-month period.
Actual Expenses
The first line of the following table provides information about actual account values and actual expenses. You may use the information in this line, together with the amount you invested, to estimate the expenses that you paid over the period. Simply divide your account value by $1,000 (for example, an $8,600 account value divided by $1,000 = 8.6), then multiply the result by the number in the first line under the heading entitled “Expenses Paid During Period” to estimate the expenses you paid on your account during this period.
Hypothetical Example for Comparison Purposes
The second line of the following table provides information about hypothetical account values and hypothetical expenses based on the Fund’s actual expense ratio and an assumed rate of return of 5% per year before expenses, which is not the Fund’s actual return. The hypothetical account values and expenses may not be used to estimate the actual ending account balance or expenses you paid for the period. You may use this information to compare the ongoing costs of investing in the Fund and other funds. To do so, compare this 5% hypothetical example with the 5% hypothetical examples that appear in the shareholder reports of the other funds.
Please note that the expenses shown in the table are meant to highlight your ongoing costs only and do not reflect any transactional costs, such as sales charges (loads), redemption fees, or exchange fees. Therefore, the second line of the table is useful in comparing ongoing costs only, and will not help you determine the relative total costs of owning different funds. In addition, if these transactional costs were included, your costs would have been higher.
EXAMPLE
| | | | | | | | | | | | |
| | | Beginning
Account
Value
5/1/17 | | | Ending
Account
Value
10/31/17 | | | Expenses
Paid
During
Period*
5/1/17 -
10/31/17 | |
Class A | | | | | | | | | | | | |
Actual | | | $1,000.00 | | | | $1,016.90 | | | | $5.14 | |
Hypothetical (5% average annual return before expenses) | | | 1,000.00 | | | | 1,020.11 | | | | 5.15 | |
Class I | | | | | | | | | | | | |
Actual | | | 1,000.00 | | | | 1,017.90 | | | | 3.87 | |
Hypothetical (5% average annual return before expenses) | | | 1,000.00 | | | | 1,021.37 | | | | 3.88 | |
Class R | | | | | | | | | | | | |
Actual | | | 1,000.00 | | | | 1,016.00 | | | | 6.41 | |
Hypothetical (5% average annual return before expenses) | | | 1,000.00 | | | | 1,018.85 | | | | 6.41 | |
* Expenses are equal to the Fund’s Class A, I and R shares annualized expense ratios of 1.01%, 0.76% and 1.26%, respectively, multiplied by the average account value over the period, and multiplied by 184/365 (to reflect the one-half year period). | |
73
1290 FUNDS
1290 MULTI-ALTERNATIVE STRATEGIES FUND
PORTFOLIO OF INVESTMENTS
October 31, 2017
| | | | | | | | |
| | | Number of
Shares | | | Value
(Note 1) | |
| | | | | | | | |
EXCHANGE TRADED FUNDS (ETF): | |
IQ Merger Arbitrage Fund | | | 49,920 | | | $ | 1,548,518 | |
iShares Commodities Select Strategy Fund | | | 14,130 | | | | 508,115 | |
iShares Core US REIT Fund | | | 15,400 | | | | 751,366 | |
iShares MSCI Global Agriculture Producers Fund | | | 9,870 | | | | 284,355 | |
iShares TIPS Bond Fund | | | 13,670 | | | | 1,555,646 | |
JPMorgan Diversified Alternatives ETF | | | 58,120 | | | | 1,519,257 | |
PowerShares DB Base Metals Fund* | | | 12,760 | | | | 240,398 | |
PowerShares DB Commodity Index Tracking Fund* | | | 49,390 | | | | 790,734 | |
PowerShares DB G10 Currency Harvest Fund* | | | 64,480 | | | | 1,529,465 | |
PowerShares DB Gold Fund* | | | 30,460 | | | | 1,230,889 | |
PowerShares DB Silver Fund* | | | 3,300 | | | | 84,546 | |
ProShares Hedge Replication Fund* | | | 34,380 | | | | 1,549,809 | |
| | | | | | | | |
ProShares RAFI Long/Short‡ | | | 41,120 | | | | 1,537,888 | |
SPDR Bloomberg Barclays Convertible Securities Fund | | | 29,700 | | | | 1,538,163 | |
Vanguard Global ex-U.S. Real Estate ETF | | | 13,270 | | | | 791,688 | |
WisdomTree Managed Futures Strategy Fund* | | | 39,830 | | | | 1,566,072 | |
| | | | | | | | |
Total Investments in Securities (99.4%)
(Cost $16,604,696) | | | | | | | 17,026,909 | |
Other Assets Less Liabilities (0.6%) | | | | | | | 94,710 | |
| | | | | |
Net Assets (100%) | | | | | | $ | 17,121,619 | |
| | | | | | | | |
| ‡ | All, or a portion, of the security is an affiliated company as defined under the Investment Company Act of 1940. |
Investments in companies which were affiliates for the year ended October 31, 2017, were as follows:
| | | | | | | | | | | | | | | | | | | | | | | | | | | | | | | | | | | | |
Security Description | | Shares at
October 31,
2017 | | | Market Value
October 31,
2016 ($) | | | Purchases
at Cost ($) | | | Proceeds
from
Sales ($) | | | Net
Realized
Gain
(Loss) ($) | | | Change
in Unrealized
Appreciation/
(Depreciation)
($) | | | Market Value
October 31,
2017 ($) | | | Dividend/
Interest
Income
($) | | | Capital Gain
Distributions
($) | |
PowerShares Multi-Strategy Alternative Portfolio* | | | — | | | | 1,039,635 | | | | — | | | | (1,022,850 | ) | | | (23,472 | ) | | | 6,687 | | | | — | | | | 15,628 | | | | — | |
ProShares RAFI Long/Short** | | | 41,120 | | | | 1,077,309 | | | | 520,910 | | | | — | | | | — | | | | (60,331 | ) | | | 1,537,888 | | | | 20,586 | | | | — | |
| | | | | | | | | | | | | | | | | | | | | | | | | | | | | | | | | |
Total | | | | | | | 2,116,944 | | | | 520,910 | | | | (1,022,850 | ) | | | (23,472 | ) | | | (53,644 | ) | | | 1,537,888 | | | | 36,214 | | | | — | |
| | | | | | | | | | | | | | | | | | | | | | | | | | | | | | | | | |
| * | Not affiliated at October 31, 2017. |
| ** | Not affiliated at October 31, 2016. |
See Notes to Financial Statements.
74
1290 FUNDS
1290 MULTI-ALTERNATIVE STRATEGIES FUND
PORTFOLIO OF INVESTMENTS (Continued)
October 31, 2017
The following is a summary of the inputs used to value the Fund’s assets and liabilities carried at fair value as of October 31, 2017:
The inputs or methodology used for valuing securities are not necessarily an indication of the risk associated with investing in those securities.
Various inputs are used in determining the value of the Fund’s investments. These inputs are summarized in the three broad levels listed below:
| | | | | | | | | | | | | | | | |
| | | | | |
| Investment Type | | Level 1
Quoted Prices in
Active Markets for
Identical
Securities | | | Level 2
Significant Other
Observable Inputs
(including quoted prices
for similar securities,
interest rates,
prepayment speeds,
credit risk, etc.) | | | Level 3
Significant Unobservable
Inputs (including the
Fund’s own assumptions in determining the fair value of investments) | | | Total | |
Assets: | | | | | |
Exchange Traded Funds | | | | | | | | | | | | | | | | |
Exchange Traded Funds | | $ | 17,026,909 | | | $ | — | | | $ | — | | | $ | 17,026,909 | |
| | | | | | | | | | | | | | | | |
Total Assets | | $ | 17,026,909 | | | $ | — | | | $ | — | | | $ | 17,026,909 | |
| | | | | | | | | | | | | | | | |
Total Liabilities | | $ | — | | | $ | — | | | $ | — | | | $ | — | |
| | | | | | | | | | | | | | | | |
Total | | $ | 17,026,909 | | | $ | — | | | $ | — | | | $ | 17,026,909 | |
| | | | | | | | | | | | | | | | |
There were no transfers between Levels 1, 2 or 3 during the year ended October 31, 2017.
The Fund held no derivatives contracts during the year ended October 31, 2017.
Investment security transactions for the year ended October 31, 2017 were as follows:
| | | | |
Cost of Purchases: | | | | |
Long-term investments other than U.S. government debt securities | | $ | 6,104,560 | |
Net Proceeds of Sales and Redemptions: | | | | |
Long-term investments other than U.S. government debt securities | | $ | 2,017,483 | |
As of October 31, 2017, the gross unrealized appreciation (depreciation) of investments based on the aggregate cost of investments in securities and derivative instruments, if applicable, for Federal income tax purposes was as follows:
| | | | |
Aggregate gross unrealized appreciation | | $ | 604,297 | |
Aggregate gross unrealized depreciation | | | (216,008 | ) |
| | | | |
Net unrealized appreciation | | $ | 388,289 | |
| | | | |
Federal income tax cost of investments in securities and derivative instruments, if applicable | | $ | 16,638,620 | |
| | | | |
See Notes to Financial Statements.
75
1290 FUNDS
1290 MULTI-ALTERNATIVE STRATEGIES FUND
STATEMENT OF ASSETS AND LIABILITIES
October 31, 2017
| | | | |
ASSETS | |
Investments in Securities, at value: | | | | |
Affiliated Issuers (Cost $1,635,026) | | $ | 1,537,888 | |
Unaffiliated Issuers (Cost $14,969,670) | | | 15,489,021 | |
Cash | | | 123,381 | |
Receivable for Fund shares sold | | | 35,981 | |
Prepaid registration and filing fees | | | 13,978 | |
Receivable from investment adviser | | | 10,165 | |
Other assets | | | 282 | |
| | | | |
Total assets | | | 17,210,696 | |
| | | | |
LIABILITIES | |
Payable for securities purchased | | | 37,408 | |
Transfer agent fees payable | | | 4,215 | |
Payable for Fund shares redeemed | | | 1,834 | |
Distribution fees payable – Class A | | | 139 | |
Distribution fees payable – Class R | | | 44 | |
Trustees’ fees payable | | | 5 | |
Accrued expenses | | | 45,432 | |
| | | | |
Total liabilities | | | 89,077 | |
| | | | |
NET ASSETS | | $ | 17,121,619 | |
| | | | |
Net assets were comprised of: | |
Paid in capital | | $ | 16,666,637 | |
Accumulated undistributed net investment income (loss) | | | — | |
Accumulated undistributed net realized gain (loss) | | | 32,769 | |
Net unrealized appreciation (depreciation) | | | 422,213 | |
| | | | |
Net assets | | $ | 17,121,619 | |
| | | | |
Class A | | | | |
Net asset value and redemption price per share, $658,707 / 64,505 shares outstanding (unlimited amount authorized: $0.001 par value) | | $ | 10.21 | |
Maximum sales charge (5.50% of offering price) | | | 0.59 | |
| | | | |
Maximum offering price per share | | $ | 10.80 | |
| | | | |
Class I | | | | |
Net asset value and redemption price per share, $16,358,276 / 1,598,995 shares outstanding (unlimited amount authorized: $0.001 par value) | | $ | 10.23 | |
| | | | |
Class R | | | | |
Net asset value and redemption price per share, $104,636 / 10,270 shares outstanding (unlimited amount authorized: $0.001 par value) | | $ | 10.19 | |
| | | | |
STATEMENT OF OPERATIONS
For the Year Ended October 31, 2017
| | | | |
INVESTMENT INCOME | |
Dividends ($36,214 of dividend income received from affiliates) | | $ | 185,718 | |
Interest | | | 849 | |
| | | | |
Total income | | | 186,567 | |
| | | | |
EXPENSES | |
Investment advisory fees | | | 77,427 | |
Professional fees | | | 70,286 | |
Transfer agent fees | | | 38,550 | |
Registration and filing fees | | | 36,996 | |
Administrative fees | | | 30,005 | |
Printing and mailing expenses | | | 11,955 | |
Custodian fees | | | 3,950 | |
Trustees’ fees | | | 1,912 | |
Distribution fees – Class A | | | 1,411 | |
Distribution fees – Class R | | | 509 | |
Miscellaneous | | | 10,964 | |
| | | | |
Gross expenses | | | 283,965 | |
Less: Waiver from investment adviser | | | (107,432 | ) |
Reimbursement from investment adviser | | | (57,963 | ) |
| | | | |
Net expenses | | | 118,570 | |
| | | | |
NET INVESTMENT INCOME (LOSS) | | | 67,997 | |
| | | | |
REALIZED AND UNREALIZED GAIN (LOSS) | |
Net realized gain (loss) on investments in securities ($(23,472) of realized gain (loss) from affiliates) | | | 23,672 | |
Net change in unrealized appreciation (depreciation) on investments in securities ($(53,644) of change in unrealized appreciation (depreciation) from affiliates) | | | 373,523 | |
| | | | |
NET REALIZED AND UNREALIZED GAIN (LOSS) | | | 397,195 | |
| | | | |
NET INCREASE (DECREASE) IN NET ASSETS RESULTING FROM OPERATIONS | | $ | 465,192 | |
| | | | |
See Notes to Financial Statements.
76
1290 FUNDS
1290 MULTI-ALTERNATIVE STRATEGIES FUND
STATEMENT OF CHANGES IN NET ASSETS
| | | | | | | | |
| | | Year Ended October 31, | |
| | 2017 | | | 2016 | |
INCREASE (DECREASE) IN NET ASSETS FROM OPERATIONS: | |
Net investment income (loss) | | $ | 67,997 | | | $ | 53,432 | |
Net realized gain (loss) | | | 23,672 | | | | 17,876 | |
Net change in unrealized appreciation (depreciation) | | | 373,523 | | | | 339,945 | |
| | | | | | | | |
NET INCREASE (DECREASE) IN NET ASSETS RESULTING FROM OPERATIONS | | | 465,192 | | | | 411,253 | |
| | | | | | | | |
DIVIDENDS AND DISTRIBUTIONS: | | | | | | | | |
Dividends from net investment income | | | | | | | | |
Class A | | | (362 | ) | | | (549 | ) |
Class I | | | (43,293 | ) | | | (56,312 | ) |
Class R | | | — | | | | (382 | ) |
| | | | | | | | |
| | | (43,655 | ) | | | (57,243 | ) |
| | | | | | | | |
Distributions from net realized capital gains | | | | | | | | |
Class A | | | (1,455 | ) | | | — | |
Class I | | | (39,097 | ) | | | — | |
Class R | | | (118 | ) | | | — | |
| | | | | | | | |
| | | (40,670 | ) | | | — | |
| | | | | | | | |
Return of capital | | | | | | | | |
Class A | | | — | | | | (269 | ) |
Class I | | | — | | | | (27,633 | ) |
Class R | | | — | | | | (187 | ) |
| | | | | | | | |
| | | — | | | | (28,089 | ) |
| | | | | | | | |
TOTAL DIVIDENDS AND DISTRIBUTIONS | | | (84,325 | ) | | | (85,332 | ) |
| | | | | | | | |
CAPITAL SHARES TRANSACTIONS: | | | | | | | | |
Class A | | | | | | | | |
Capital shares sold [ 27,123 and 29,608 shares, respectively ] | | | 271,725 | | | | 295,245 | |
Capital shares issued in reinvestment of dividends [ 147 and 14 shares, respectively ] | | | 1,453 | | | | 132 | |
Capital shares repurchased [ (3,886) and 0 shares, respectively ] | | | (39,143 | ) | | | — | |
| | | | | | | | |
Total Class A transactions | | | 234,035 | | | | 295,377 | |
| | | | | | | | |
Class I | | | | | | | | |
Capital shares sold [ 510,609 and 241,172 shares, respectively ] | | | 5,131,940 | | | | 2,369,178 | |
Capital shares issued in reinvestment of dividends [ 2,242 and 555 shares, respectively ] | | | 22,218 | | | | 5,251 | |
Capital shares repurchased [ (138,280) and (5,192) shares, respectively ] | | | (1,393,024 | ) | | | (51,841 | ) |
| | | | | | | | |
Total Class I transactions | | | 3,761,134 | | | | 2,322,588 | |
| | | | | | | | |
Class R | | | | | | | | |
Capital shares sold [ 130 and 141 shares, respectively ] | | | 1,327 | | | | 1,398 | |
Capital shares issued in reinvestment of dividends [ 0# and 0 shares, respectively ] | | | 2 | | | | — | |
Capital shares repurchased [ (1) and 0# shares, respectively ] | | | (10 | ) | | | (1 | ) |
| | | | | | | | |
Total Class R transactions | | | 1,319 | | | | 1,397 | |
| | | | | | | | |
NET INCREASE (DECREASE) IN NET ASSETS RESULTING FROM CAPITAL SHARE TRANSACTIONS | | | 3,996,488 | | | | 2,619,362 | |
| | | | | | | | |
TOTAL INCREASE (DECREASE) IN NET ASSETS | | | 4,377,355 | | | | 2,945,283 | |
NET ASSETS: | |
Beginning of year | | | 12,744,264 | | | | 9,798,981 | |
| | | | | | | | |
End of year (a) | | $ | 17,121,619 | | | $ | 12,744,264 | |
| | | | | | | | |
(a) Includes accumulated undistributed (overdistributed) net investment income (loss) of | | $ | — | | | $ | 667 | |
| | | | | | | | |
# Number of shares is less than 0.5. | | | | | | | | |
See Notes to Financial Statements.
77
1290 FUNDS
1290 MULTI-ALTERNATIVE STRATEGIES FUND
FINANCIAL HIGHLIGHTS
| | | | | | | | | | | | |
| | | Year Ended October 31, | | | July 6, 2015* to
October 31, 2015 | |
| Class A | | 2017 | | | 2016 | | |
Net asset value, beginning of period | | $ | 9.97 | | | $ | 9.70 | | | $ | 10.00 | |
| | | | | | | | | | | | |
Income (loss) from investment operations: | | | | | | | | | | | | |
Net investment income (loss) (e)(x) | | | 0.02 | | | | 0.01 | | | | (0.01 | ) |
Net realized and unrealized gain (loss) | | | 0.26 | | | | 0.33 | | | | (0.29 | ) |
| | | | | | | | | | | | |
Total from investment operations | | | 0.28 | | | | 0.34 | | | | (0.30 | ) |
| | | | | | | | | | | | |
Less distributions: | | | | | | | | | | | | |
Dividends from net investment income | | | (0.01 | ) | | | (0.05 | ) | | | — | |
Distributions from realized gains | | | (0.03 | ) | | | — | | | | — | |
Return of capital | | | — | | | | (0.02 | ) | | | — | |
| | | | | | | | | | | | |
Total dividends and distributions | | | (0.04 | ) | | | (0.07 | ) | | | — | |
| | | | | | | | | | | | |
Net asset value, end of period | | $ | 10.21 | | | $ | 9.97 | | | $ | 9.70 | |
| | | | | | | | | | | | |
Total return (b) | | | 2.78 | % | | | 3.53 | % | | | (3.00 | )% |
| | | | | | | | | | | | |
Ratios/Supplemental Data: | | | | | | | | | | | | |
Net assets, end of period (000’s) | | $ | 659 | | | $ | 410 | | | $ | 112 | |
Ratio of expenses to average net assets: | | | | | | | | | | | | |
After waivers and reimbursements (a)(f) | | | 1.00 | %(j) | | | 0.98 | %(j) | | | 0.96 | %(j) |
Before waivers and reimbursements (a)(f) | | | 2.08 | % | | | 2.62 | % | | | 2.26 | % |
Ratio of net investment income (loss) to average net assets: | | | | | | | | | | | | |
After waivers and reimbursements (a)(f)(x) | | | 0.20 | % | | | 0.10 | % | | | (0.25 | )%(l) |
Before waivers and reimbursements (a)(f)(x) | | | (0.88 | )% | | | (1.55 | )% | | | (1.55 | )%(l) |
Portfolio turnover rate (z)^ | | | 13 | % | | | 2 | % | | | 0 | % |
| | |
| | | Year Ended October 31, | | | July 6, 2015* to
October 31, 2015 | |
| Class I | | 2017 | | | 2016 | | |
Net asset value, beginning of period | | $ | 9.99 | | | $ | 9.71 | | | $ | 10.00 | |
| | | | | | | | | | | | |
Income (loss) from investment operations: | | | | | | | | | | | | |
Net investment income (loss) (e)(x) | | | 0.05 | | | | 0.05 | | | | — | # |
Net realized and unrealized gain (loss) | | | 0.25 | | | | 0.31 | | | | (0.29 | ) |
| | | | | | | | | | | | |
Total from investment operations | | | 0.30 | | | | 0.36 | | | | (0.29 | ) |
| | | | | | | | | | | | |
Less distributions: | | | | | | | | | | | | |
Dividends from net investment income | | | (0.03 | ) | | | (0.05 | ) | | | — | |
Distributions from realized gains | | | (0.03 | ) | | | — | | | | — | |
Return of capital | | | — | | | | (0.03 | ) | | | — | |
| | | | | | | | | | | | |
Total dividends and distributions | | | (0.06 | ) | | | (0.08 | ) | | | — | |
| | | | | | | | | | | | |
Net asset value, end of period | | $ | 10.23 | | | $ | 9.99 | | | $ | 9.71 | |
| | | | | | | | | | | | |
Total return (b) | | | 3.04 | % | | | 3.76 | % | | | (2.90 | )% |
| | | | | | | | | | | | |
Ratios/Supplemental Data: | | | | | | | | | | | | |
Net assets, end of period (000’s) | | $ | 16,358 | | | $ | 12,233 | | | $ | 9,591 | |
Ratio of expenses to average net assets: | | | | | | | | | | | | |
After waivers and reimbursements (a)(f) | | | 0.75 | %(j) | | | 0.73 | %(j) | | | 0.72 | %(j) |
Before waivers and reimbursements (a)(f) | | | 1.82 | % | | | 2.24 | % | | | 1.97 | % |
Ratio of net investment income (loss) to average net assets: | | | | | | | | | | | | |
After waivers and reimbursements (a)(f)(x) | | | 0.45 | % | | | 0.50 | % | | | (0.03 | )%(l) |
Before waivers and reimbursements (a)(f)(x) | | | (0.62 | )% | | | (1.02 | )% | | | (1.29 | )%(l) |
Portfolio turnover rate (z)^ | | | 13 | % | | | 2 | % | | | 0 | % |
See Notes to Financial Statements.
78
1290 FUNDS
1290 MULTI-ALTERNATIVE STRATEGIES FUND
FINANCIAL HIGHLIGHTS (Continued)
| | | | | | | | | | | | |
| | | Year Ended October 31, | | | July 6, 2015* to
October 31, 2015 | |
| Class R | | 2017 | | | 2016 | | |
Net asset value, beginning of period | | $ | 9.95 | | | $ | 9.69 | | | $ | 10.00 | |
| | | | | | | | | | | | |
Income (loss) from investment operations: | | | | | | | | | | | | |
Net investment income (loss) (e)(x) | | | — | # | | | — | # | | | (0.02 | ) |
Net realized and unrealized gain (loss) | | | 0.27 | | | | 0.32 | | | | (0.29 | ) |
| | | | | | | | | | | | |
Total from investment operations | | | 0.27 | | | | 0.32 | | | | (0.31 | ) |
| | | | | | | | | | | | |
Less distributions: | | | | | | | | | | | | |
Dividends from net investment income | | | — | | | | (0.04 | ) | | | — | |
Distributions from realized gains | | | (0.03 | ) | | | — | | | | — | |
Return of capital | | | — | | | | (0.02 | ) | | | — | |
| | | | | | | | | | | | |
Total dividends and distributions | | | (0.03 | ) | | | (0.06 | ) | | | — | |
| | | | | | | | | | | | |
Net asset value, end of period | | $ | 10.19 | | | $ | 9.95 | | | $ | 9.69 | |
| | | | | | | | | | | | |
Total return (b) | | | 2.53 | % | | | 3.30 | % | | | (3.10 | )% |
| | | | | | | | | | | | |
Ratios/Supplemental Data: | | | | | | | | | | | | |
Net assets, end of period (000’s) | | $ | 105 | | | $ | 101 | | | $ | 97 | |
Ratio of expenses to average net assets: | | | | | | | | | | | | |
After waivers and reimbursements (a)(f) | | | 1.25 | %(j) | | | 1.22 | %(j) | | | 1.21 | %(j) |
Before waivers and reimbursements (a)(f) | | | 2.32 | % | | | 2.73 | % | | | 2.47 | % |
Ratio of net investment income (loss) to average net assets: | | | | | | | | | | | | |
After waivers and reimbursements (a)(f)(x) | | | (0.02 | )% | | | 0.02 | % | | | (0.53 | )%(l) |
Before waivers and reimbursements (a)(f)(x) | | | (1.08 | )% | | | (1.50 | )% | | | (1.78 | )%(l) |
Portfolio turnover rate (z)^ | | | 13 | % | | | 2 | % | | | 0 | % |
| * | Commencement of Operations. |
| # | Per share amount is less than $0.005. |
| ^ | Portfolio turnover rate excludes derivatives, if any. |
| (a) | Ratios for periods less than one year are annualized. Certain non-recurring expenses incurred by the Fund are not annualized for periods less than one year. |
| (b) | Total returns for periods less than one year are not annualized. |
| (e) | Net investment income (loss) per share is based on average shares outstanding. |
| (f) | Expenses do not include the expenses of the underlying funds (“indirect expenses”), if applicable. |
| (j) | Including direct and indirect expenses, the net expense ratio after waivers and reimbursements would be 1.65% for Class A, 1.40% for Class I and 1.90% for Class R. |
| (l) | The annualized ratio of net investment income to average net assets may not be indicative of operating results for a full year. |
| (x) | Recognition of net investment income is affected by the timing of dividend declarations by the underlying funds in which the Fund invests. |
| (z) | Portfolio turnover rate for periods less than one year is not annualized. |
See Notes to Financial Statements.
79
1290 RETIREMENT 2020 FUND (Unaudited)
INVESTMENT ADVISER
PERFORMANCE RESULTS

| | | | |
| Total Returns as of 10/31/17 | | | |
| | | Since
Incept. | |
Fund – Class I Shares* | | | 6.60 | % |
S&P Target Date 2020 Index | | | 6.83 | |
* Date of inception 2/27/17. Returns for periods less than one year are not annualized. | | | | |
The performance quoted is past performance and is not a guarantee of future results. Mutual funds are subject to certain market risks. Investment returns and principal value of an investment will fluctuate so that an investor’s shares, when redeemed, may be worth more or less than their original cost. Current performance may be higher or lower than the performance data shown. For the most current month-end performance data please call 1-888-310-0416 or visit www.1290Funds.com.
The graph illustrates comparative performance for $10,000 invested in the Class I Shares of the 1290 Retirement 2020 Fund and the S&P Target Date 2020 Index from 2/27/17 to 10/31/17. The performance of the S&P Target Date 2020 Index reflects an initial investment at the end of the month closest to the Fund’s inception. The performance of the Fund assumes reinvestment of all dividends and capital gain distributions, if any, and does not include a sales charge. The performance of the S&P Target Date 2020 Index does not reflect the deduction of expenses or a sales charge associated with a mutual fund and has been adjusted to reflect reinvestment of all dividends, capital gain distributions, and interest of the securities included in the benchmark.
Fund performance may reflect the waiver of the Fund’s fees and reimbursement of expenses for certain periods since the inception date. Without these waivers and reimbursements, performance would have been lower. Also, performance shown in this section does not reflect the deduction of taxes that a shareholder would pay on Fund distributions or redemption of Fund shares.
PERFORMANCE SUMMARY
The Fund’s Class I shares returned 6.60% for the period ended October 31, 2017. The Fund’s benchmark, the S&P Target Date 2020 Index, returned 6.83% over the same period.
Overview
The Allocations Drive Performance
Each 1290 Retirement Fund’s (as defined in the Notes to the Financial Statements) performance will reflect the performance of the underlying asset classes and depend upon their percentage weighting within the Fund. Here’s why:
The 1290 Retirement Funds are managed to target a specific year of planned retirement. The asset mix will become more conservative each year, until about 10 years after the target retirement year, when it will become relatively stable. The 1290 Retirement Funds balance the need for appreciation with the need for income as retirement approaches, and focus on supporting an income stream over a long-term retirement withdrawal horizon.
To achieve its exposures, each 1290 Retirement Fund invests in ETFs representing various equity and bond asset classes. So the 1290 Retirement Funds’ performance will be a function of the asset class performance and the percentage weighting of each in the 1290 Retirement Funds. Current target and actual allocations, as well as performance, are available in an accompanying quarterly Fund Fact Sheet.
What helped the 1290 Retirement Funds performance since inception?
All of the holdings contributed positively to returns since inception of the 1290 Retirement Funds on 3/1/2017.
| • | | Emerging market and international equities were the strongest performers. |
| • | | Among U.S. equities, large-cap stocks outperformed mid- and small-caps. |
What hurt the 1290 Retirement Funds performance since inception?
| • | | From a relative standpoint, bonds were a drag on performance. Only the higher-yielding and ‘riskier’ bond markets produced more than modest returns. |
| | | | |
Table by Asset Class (as a percentage of Total Investments in Securities) As of October 31, 2017 | |
Equity | | | 57.4 | % |
Fixed Income | | | 42.6 | |
80
1290 RETIREMENT 2020 FUND (Unaudited)
| | | | |
Top 10 Holdings (as a percentage of Total Investments in Securities) As of October 31, 2017 | |
iShares Core U.S. Aggregate Bond Fund | | | 28.1 | % |
iShares Core S&P Total US Stock Market Fund | | | 19.7 | |
iShares Core MSCI EAFE Fund | | | 7.2 | |
iShares Edge MSCI Min Vol USA Fund | | | 6.6 | |
PowerShares S&P 500 Low Volatility Portfolio | | | 6.4 | |
iShares TIPS Bond Fund | | | 6.3 | |
PowerShares S&P International Developed Low Volatility Portfolio | | | 3.7 | |
PowerShares S&P MidCap Low Volatility Portfolio | | | 3.5 | |
iShares Edge MSCI Min Vol EAFE Fund | | | 3.5 | |
Vanguard Short-Term Bond ETF | | | 3.3 | |
| |
Holdings are subject to change without notice. | |
UNDERSTANDING YOUR EXPENSES:
As a shareholder of the Fund, you incur two types of costs:
(1) transaction costs, including applicable sales charges and redemption fees; and (2) ongoing costs, including investment advisory fees, distribution and/or service (12b-1) fees and other Fund expenses. These examples are intended to help you understand your ongoing costs (in dollars) of investing in the Fund and to compare these costs with the ongoing costs of investing in other mutual funds.
The examples are based on an investment of $1,000 invested at the beginning of the six-month period ended October 31, 2017 and held for the entire six-month period.
Actual Expenses
The first line of the following table provides information about actual account values and actual expenses. You may use the information in this line, together with the amount you invested, to estimate the expenses that you paid over the period. Simply divide your account value by $1,000 (for example, an $8,600 account value divided by $1,000 = 8.6), then multiply the result by the number in the first line under the heading entitled “Expenses Paid During Period” to estimate the expenses you paid on your account during this period.
Hypothetical Example for Comparison Purposes
The second line of the following table provides information about hypothetical account values and hypothetical expenses based on the Fund’s actual expense ratio and an assumed rate of return of 5% per year before expenses, which is not the Fund’s actual return. The hypothetical account values and expenses may not be used to estimate the actual ending account balance or expenses you paid for the period. You may use this information to compare the ongoing costs of investing in the Fund and other funds. To do so, compare this 5% hypothetical example with the 5% hypothetical examples that appear in the shareholder reports of the other funds.
Please note that the expenses shown in the table are meant to highlight your ongoing costs only and do not reflect any transactional costs, such as sales charges (loads), redemption fees, or exchange fees. Therefore, the second line of the table is useful in comparing ongoing costs only, and will not help you determine the relative total costs of owning different funds. In addition, if these transactional costs were included, your costs would have been higher.
EXAMPLE
| | | | | | | | | | | | |
| | | Beginning
Account
Value
5/1/17 | | | Ending
Account
Value
10/31/17 | | | Expenses
Paid
During
Period*
5/1/17 -
10/31/17 | |
Class I | |
Actual | | | $1,000.00 | | | | $1,051.30 | | | | $2.74 | |
Hypothetical (5% average annual return before expenses) | | | 1,000.00 | | | | 1,022.53 | | | | 2.71 | |
* Expenses are equal to the Fund’s Class I shares annualized expense ratio of 0.53%, multiplied by the average account value over the period, and multiplied by 184/365 (to reflect the one-half year period). | |
81
1290 FUNDS
1290 RETIREMENT 2020 FUND
PORTFOLIO OF INVESTMENTS
October 31, 2017
| | | | | | | | |
| | | Number of
Shares | | | Value
(Note 1) | |
| | | | | | | | |
EXCHANGE TRADED FUNDS (ETF): | |
iShares Core MSCI EAFE Fund | | | 2,940 | | | $ | 191,835 | |
iShares Core MSCI Emerging Markets Fund | | | 830 | | | | 46,297 | |
iShares Core S&P Total US Stock Market Fund | | | 8,880 | | | | 523,210 | |
iShares Core U.S. Aggregate Bond Fund | | | 6,810 | | | | 745,490 | |
iShares Edge MSCI Min Vol EAFE Fund | | | 1,300 | | | | 93,314 | |
iShares Edge MSCI Min Vol Emerging Markets Fund | | | 400 | | | | 23,676 | |
iShares Edge MSCI Min Vol USA Fund | | | 3,400 | | | | 174,488 | |
iShares TIPS Bond Fund | | | 1,460 | | | | 166,148 | |
PowerShares S&P 500 Low Volatility Portfolio | | | 3,630 | | | | 168,904 | |
PowerShares S&P Emerging Markets Low Volatility Portfolio | | | 940 | | | | 23,124 | |
| | | | | | | | |
PowerShares S&P International Developed Low Volatility Portfolio | | | 2,960 | | | | 98,538 | |
PowerShares S&P MidCap Low Volatility Portfolio | | | 2,090 | | | | 94,113 | |
PowerShares S&P SmallCap Low Volatility Portfolio | | | 970 | | | | 45,057 | |
SPDR Bloomberg Barclays High Yield Bond Fund | | | 1,730 | | | | 64,425 | |
SPDR SSGA US Small Cap Low Volatility Index Fund | | | 450 | | | | 43,250 | |
Vanguard Short-Term Bond ETF | | | 1,090 | | | | 86,862 | |
Vanguard Total International Bond ETF | | | 1,190 | | | | 65,307 | |
| | | | | | | | |
Total Investments in Securities (99.6%)
(Cost $2,521,536) | | | | | | | 2,654,038 | |
Other Assets Less Liabilities (0.4%) | | | | | | | 11,296 | |
| | | | | |
Net Assets (100%) | | | | | | $ | 2,665,334 | |
| | | | | | | | |
The following is a summary of the inputs used to value the Fund’s assets and liabilities carried at fair value as of October 31, 2017:
The inputs or methodology used for valuing securities are not necessarily an indication of the risk associated with investing in those securities.
Various inputs are used in determining the value of the Fund’s investments. These inputs are summarized in the three broad levels listed below:
| | | | | | | | | | | | | | | | |
| | | | | |
| Investment Type | | Level 1
Quoted Prices in
Active Markets for
Identical
Securities | | | Level 2
Significant Other
Observable Inputs
(including quoted prices
for similar securities,
interest rates,
prepayment speeds,
credit risk, etc.) | | | Level 3
Significant Unobservable
Inputs (including the
Fund’s own assumptions in determining the fair value of investments) | | | Total | |
Assets: | | | | | |
Exchange Traded Funds | | | | | |
Exchange Traded Funds | | $ | 2,654,038 | | | $ | — | | | $ | — | | | $ | 2,654,038 | |
| | | | | | | | | | | | | | | | |
Total Assets | | $ | 2,654,038 | | | $ | — | | | $ | — | | | $ | 2,654,038 | |
| | | | | | | | | | | | | | | | |
Total Liabilities | | $ | — | | | $ | — | | | $ | — | | | $ | — | |
| | | | | | | | | | | | | | | | |
Total | | $ | 2,654,038 | | | $ | — | | | $ | — | | | $ | 2,654,038 | |
| | | | | | | | | | | | | | | | |
There were no transfers between Levels 1, 2 or 3 during the period ended October 31, 2017.
The Fund held no derivatives contracts during the period ended October 31, 2017.
Investment security transactions for the period ended October 31, 2017 were as follows:
| | | | |
Cost of Purchases: | | | | |
Long-term investments other than U.S. government debt securities | | $ | 2,565,744 | |
Net Proceeds of Sales and Redemptions: | | | | |
Long-term investments other than U.S. government debt securities | | $ | 48,121 | |
See Notes to Financial Statements.
82
1290 FUNDS
1290 RETIREMENT 2020 FUND
PORTFOLIO OF INVESTMENTS (Continued)
October 31, 2017
As of October 31, 2017, the gross unrealized appreciation (depreciation) of investments based on the aggregate cost of investments in securities and derivative instruments, if applicable, for Federal income tax purposes was as follows:
| | | | |
Aggregate gross unrealized appreciation | | $ | 133,840 | |
Aggregate gross unrealized depreciation | | | (1,338 | ) |
| | | | |
Net unrealized appreciation | | $ | 132,502 | |
| | | | |
Federal income tax cost of investments in securities and derivative instruments, if applicable | | $ | 2,521,536 | |
| | | | |
See Notes to Financial Statements.
83
1290 FUNDS
1290 RETIREMENT 2020 FUND
STATEMENT OF ASSETS AND LIABILITIES
October 31, 2017
| | | | |
ASSETS | |
Investments in Securities, at value (Cost $2,521,536) | | $ | 2,654,038 | |
Cash | | | 5,605 | |
Prepaid registration and filing fees | | | 22,287 | |
Receivable from investment adviser | | | 15,790 | |
Deferred offering cost | | | 3,349 | |
Other assets | | | 34 | |
| | | | |
Total assets | | | 2,701,103 | |
| | | | |
LIABILITIES | |
Accrued audit fee | | | 32,740 | |
Transfer agent fees payable | | | 713 | |
Trustees’ fees payable | | | 23 | |
Accrued expenses | | | 2,293 | |
| | | | |
Total liabilities | | | 35,769 | |
| | | | |
NET ASSETS | | $ | 2,665,334 | |
| | | | |
Net assets were comprised of: | |
Paid in capital | | $ | 2,499,874 | |
Accumulated undistributed net investment income (loss) | | | 29,042 | |
Accumulated undistributed net realized gain (loss) | | | 3,916 | |
Net unrealized appreciation (depreciation) | | | 132,502 | |
| | | | |
Net assets | | $ | 2,665,334 | |
| | | | |
Class I | | | | |
Net asset value and redemption price per share, $2,665,334 / 250,010 shares outstanding (unlimited amount authorized: $0.001 par value) | | $ | 10.66 | |
| | | | |
STATEMENT OF OPERATIONS
For the Period Ended October 31, 2017*
| | | | |
INVESTMENT INCOME | |
Dividends | | $ | 37,961 | |
Interest | | | 52 | |
| | | | |
Total income | | | 38,013 | |
| | | | |
EXPENSES | |
Professional fees | | | 48,849 | |
Administrative fees | | | 20,219 | |
Registration and filing fees | | | 8,817 | |
Investment advisory fees | | | 8,681 | |
Offering costs | | | 6,922 | |
Transfer agent fees | | | 4,149 | |
Printing and mailing expenses | | | 2,189 | |
Custodian fees | | | 1,450 | |
Trustees’ fees | | | 231 | |
Miscellaneous | | | 3,989 | |
| | | | |
Gross expenses | | | 105,496 | |
Less: Waiver from investment adviser | | | (28,900 | ) |
Reimbursement from investment adviser | | | (67,399 | ) |
| | | | |
Net expenses | | | 9,197 | |
| | | | |
NET INVESTMENT INCOME (LOSS) | | | 28,816 | |
| | | | |
REALIZED AND UNREALIZED GAIN (LOSS) | |
Net realized gain (loss) on investments in securities | | | 3,914 | |
Net distributions of realized gain received from underlying funds | | | 2 | |
| | | | |
Net realized gain (loss) | | | 3,916 | |
| | | | |
Net change in unrealized appreciation (depreciation) on investments in securities | | | 132,502 | |
| | | | |
NET REALIZED AND UNREALIZED GAIN (LOSS) | | | 136,418 | |
| | | | |
NET INCREASE (DECREASE) IN NET ASSETS RESULTING FROM OPERATIONS | | $ | 165,234 | |
| | | | |
| * | The Fund commenced operations on February 27, 2017. |
| | | | |
| STATEMENT OF CHANGES IN NET ASSETS | | February 27, 2017* to
October 31, 2017 | |
INCREASE (DECREASE) IN NET ASSETS FROM OPERATIONS: | |
Net investment income (loss) | | $ | 28,816 | |
Net realized gain (loss) | | | 3,916 | |
Net change in unrealized appreciation (depreciation) | | | 132,502 | |
| | | | |
NET INCREASE (DECREASE) IN NET ASSETS RESULTING FROM OPERATIONS | | | 165,234 | |
| | | | |
CAPITAL SHARES TRANSACTIONS: | | | | |
Class I | | | | |
Capital shares sold [ 250,010 shares] | | | 2,500,100 | |
| | | | |
NET INCREASE (DECREASE) IN NET ASSETS RESULTING FROM CAPITAL SHARE TRANSACTIONS | | | 2,500,100 | |
| | | | |
TOTAL INCREASE (DECREASE) IN NET ASSETS | | | 2,665,334 | |
NET ASSETS: | |
Beginning of period | | | — | |
| | | | |
End of period (a) | | $ | 2,665,334 | |
| | | | |
(a) Includes accumulated undistributed (overdistributed) net investment income (loss) of | | $ | 29,042 | |
| | | | |
* The Fund commenced operations on February 27, 2017. | | | | |
See Notes to Financial Statements.
84
1290 FUNDS
1290 RETIREMENT 2020 FUND
FINANCIAL HIGHLIGHTS
| | | | |
| Class I | | February 27, 2017* to October 31, 2017 | |
Net asset value, beginning of period | | $ | 10.00 | |
| | | | |
Income (loss) from investment operations: | | | | |
Net investment income (loss) (e)(x) | | | 0.12 | |
Net realized and unrealized gain (loss) | | | 0.54 | |
| | | | |
Total from investment operations | | | 0.66 | |
| | | | |
Net asset value, end of period | | $ | 10.66 | |
| | | | |
Total return (b) | | | 6.60 | % |
| | | | |
Ratios/Supplemental Data: | | | | |
Net assets, end of period (000’s) | | $ | 2,665 | |
Ratio of expenses to average net assets: | | | | |
After waivers and reimbursements (a)(f) | | | 0.53 | %(j) |
Before waivers and reimbursements (a)(f) | | | 5.32 | % |
Ratio of net investment income (loss) to average net assets: | | | | |
After waivers and reimbursements (a)(f)(x) | | | 1.66 | %(l) |
Before waivers and reimbursements (a)(f)(x) | | | (3.13 | )%(l) |
Portfolio turnover rate (z)^ | | | 2 | % |
| * | Commencement of Operations. |
| ^ | Portfolio turnover rate excludes derivatives, if any. |
| (a) | Ratios for periods less than one year are annualized. Certain non-recurring expenses incurred by the Fund are not annualized for periods less than one year. |
| (b) | Total returns for periods less than one year are not annualized. |
| (e) | Net investment income (loss) per share is based on average shares outstanding. |
| (f) | Expenses do not include the expenses of the underlying funds (“indirect expenses”), if applicable. |
| (j) | Including direct and indirect expenses, the net expense ratio after waivers and reimbursements would be 0.65%. |
| (l) | The annualized ratio of net investment income to average net assets may not be indicative of operating results for a full year. |
| (x) | Recognition of net investment income is affected by the timing of dividend declarations by the underlying funds in which the Fund invests. |
| (z) | Portfolio turnover rate for periods less than one year is not annualized. |
See Notes to Financial Statements.
85
1290 RETIREMENT 2025 FUND (Unaudited)
INVESTMENT ADVISER
PERFORMANCE RESULTS
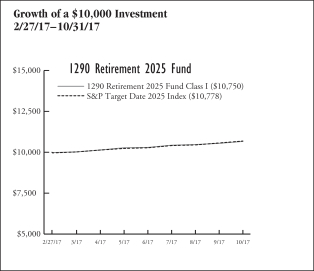
| | | | |
| Total Returns as of 10/31/17 | | | |
| | | Since
Incept. | |
Fund – Class I Shares* | | | 7.50 | % |
S&P Target Date 2025 Index | | | 7.78 | |
* Date of inception 2/27/17. Returns for periods less than one year are not annualized. | |
The performance quoted is past performance and is not a guarantee of future results. Mutual funds are subject to certain market risks. Investment returns and principal value of an investment will fluctuate so that an investor’s shares, when redeemed, may be worth more or less than their original cost. Current performance may be higher or lower than the performance data shown. For the most current month-end performance data please call 1-888-310-0416 or visit www.1290Funds.com.
The graph illustrates comparative performance for $10,000 invested in the Class I Shares of the 1290 Retirement 2025 Fund and the S&P Target Date 2025 Index from 2/27/17 to 10/31/17. The performance of the S&P Target Date 2025 Index reflects an initial investment at the end of the month closest to the Fund’s inception. The performance of the Fund assumes reinvestment of all dividends and capital gain distributions, if any, and does not include a sales charge. The performance of the S&P Target Date 2025 Index does not reflect the deduction of expenses or a sales charge associated with a mutual fund and has been adjusted to reflect reinvestment of all dividends, capital gain distributions, and interest of the securities included in the benchmark.
Fund performance may reflect the waiver of the Fund’s fees and reimbursement of expenses for certain periods since the inception date. Without these waivers and reimbursements, performance would have been lower. Also, performance shown in this section does not reflect the deduction of taxes that a shareholder would pay on Fund distributions or redemption of Fund shares.
PERFORMANCE SUMMARY
The Fund’s Class I shares returned 7.50% for the period ended October 31, 2017. The Fund’s benchmark, the S&P Target Date 2025 Index, returned 7.78% over the same period.
Overview
The Allocations Drive Performance
Each 1290 Retirement Fund’s (as defined in the Notes to the Financial Statements) performance will reflect the performance of the underlying asset classes and depend upon their percentage weighting within the Fund. Here’s why:
The 1290 Retirement Funds are managed to target a specific year of planned retirement. The asset mix will become more conservative each year, until about 10 years after the target retirement year, when it will become relatively stable. The 1290 Retirement Funds balance the need for appreciation with the need for income as retirement approaches, and focus on supporting an income stream over a long-term retirement withdrawal horizon.
To achieve its exposures, each 1290 Retirement Fund invests in ETFs representing various equity and bond asset classes. So the 1290 Retirement Funds’ performance will be a function of the asset class performance and the percentage weighting of each in the 1290 Retirement Funds. Current target and actual allocations, as well as performance, are available in an accompanying quarterly Fund Fact Sheet.
What helped the 1290 Retirement Funds performance since inception?
All of the holdings contributed positively to returns since inception of the 1290 Retirement Funds on 3/1/2017.
| • | | Emerging market and international equities were the strongest performers. |
| • | | Among U.S. equities, large-cap stocks outperformed mid- and small-caps. |
What hurt the 1290 Retirement Funds performance since inception?
| • | | From a relative standpoint, bonds were a drag on performance. Only the higher-yielding and ‘riskier’ bond markets produced more than modest returns. |
| | | | |
Table by Asset Class (as a percentage of Total Investments in Securities) As of October 31, 2017 | |
Equity | | | 67.4 | % |
Fixed Income | | | 32.6 | |
86
1290 RETIREMENT 2025 FUND (Unaudited)
| | | | |
Top 10 Holdings (as a percentage of Total Investments in Securities) As of October 31, 2017 | |
iShares Core U.S. Aggregate Bond Fund | | | 26.0 | % |
iShares Core S&P Total US Stock Market Fund | | | 22.9 | |
iShares Core MSCI EAFE Fund | | | 8.8 | |
iShares Edge MSCI Min Vol USA Fund | | | 7.5 | |
PowerShares S&P 500 Low Volatility Portfolio | | | 7.5 | |
iShares TIPS Bond Fund | | | 4.9 | |
PowerShares S&P International Developed Low Volatility Portfolio | | | 4.5 | |
PowerShares S&P MidCap Low Volatility Portfolio | | | 4.2 | |
iShares Edge MSCI Min Vol EAFE Fund | | | 4.2 | |
iShares Core MSCI Emerging Markets Fund | | | 2.0 | |
| | |
Holdings are subject to change without notice. | | | | |
UNDERSTANDING YOUR EXPENSES:
As a shareholder of the Fund, you incur two types of costs:
(1) transaction costs, including applicable sales charges and redemption fees; and (2) ongoing costs, including investment advisory fees, distribution and/or service (12b-1) fees and other Fund expenses. These examples are intended to help you understand your ongoing costs (in dollars) of investing in the Fund and to compare these costs with the ongoing costs of investing in other mutual funds.
The examples are based on an investment of $1,000 invested at the beginning of the six-month period ended October 31, 2017 and held for the entire six-month period.
Actual Expenses
The first line of the following table provides information about actual account values and actual expenses. You may use the information in this line, together with the amount you invested, to estimate the expenses that you paid over the period. Simply divide your account value by $1,000 (for example, an $8,600 account value divided by $1,000 = 8.6), then multiply the result by the number in the first line under the heading entitled “Expenses Paid During Period” to estimate the expenses you paid on your account during this period.
Hypothetical Example for Comparison Purposes
The second line of the following table provides information about hypothetical account values and hypothetical expenses based on the Fund’s actual expense ratio and an assumed rate of return of 5% per year before expenses, which is not the Fund’s actual return. The hypothetical account values and expenses may not be used to estimate the actual ending account balance or expenses you paid for the period. You may use this information to compare the ongoing costs of investing in the Fund and other funds. To do so, compare this 5% hypothetical example with the 5% hypothetical examples that appear in the shareholder reports of the other funds.
Please note that the expenses shown in the table are meant to highlight your ongoing costs only and do not reflect any transactional costs, such as sales charges (loads), redemption fees, or exchange fees. Therefore, the second line of the table is useful in comparing ongoing costs only, and will not help you determine the relative total costs of owning different funds. In addition, if these transactional costs were included, your costs would have been higher.
EXAMPLE
| | | | | | | | | | | | |
| | | Beginning
Account
Value
5/1/17 | | | Ending
Account
Value
10/31/17 | | | Expenses
Paid
During
Period*
5/1/17 -
10/31/17 | |
Class I | |
Actual | | | $1,000.00 | | | | $1,059.10 | | | | $2.77 | |
Hypothetical (5% average annual return before expenses) | | | 1,000.00 | | | | 1,022.52 | | | | 2.72 | |
* Expenses are equal to the Fund’s Class I shares annualized expense ratio of 0.53%, multiplied by the average account value over the period, and multiplied by 184/365 (to reflect the one-half year period). | |
87
1290 FUNDS
1290 RETIREMENT 2025 FUND
PORTFOLIO OF INVESTMENTS
October 31, 2017
| | | | | | | | |
| | | Number of
Shares | | | Value
(Note 1) | |
| | | | | | | | |
EXCHANGE TRADED FUNDS (ETF): | |
iShares Core MSCI EAFE Fund | | | 3,610 | | | $ | 235,553 | |
iShares Core MSCI Emerging Markets Fund | | | 960 | | | | 53,549 | |
iShares Core S&P Total US Stock Market Fund | | | 10,400 | | | | 612,768 | |
iShares Core U.S. Aggregate Bond Fund | | | 6,360 | | | | 696,228 | |
iShares Edge MSCI Min Vol EAFE Fund | | | 1,570 | | | | 112,695 | |
iShares Edge MSCI Min Vol Emerging Markets Fund | | | 460 | | | | 27,227 | |
iShares Edge MSCI Min Vol USA Fund | | | 3,920 | | | | 201,174 | |
iShares TIPS Bond Fund | | | 1,160 | | | | 132,008 | |
PowerShares S&P 500 Low Volatility Portfolio | | | 4,310 | | | | 200,544 | |
PowerShares S&P Emerging Markets Low Volatility Portfolio | | | 1,080 | | | | 26,568 | |
| | | | | | | | |
PowerShares S&P International Developed Low Volatility Portfolio | | | 3,580 | | | | 119,178 | |
PowerShares S&P MidCap Low Volatility Portfolio | | | 2,520 | | | | 113,476 | |
PowerShares S&P SmallCap Low Volatility Portfolio | | | 1,110 | | | | 51,560 | |
SPDR Bloomberg Barclays High Yield Bond Fund | | | 330 | | | | 12,289 | |
SPDR SSGA US Small Cap Low Volatility Index Fund | | | 520 | | | | 49,977 | |
Vanguard Short-Term Bond ETF | | | 210 | | | | 16,735 | |
Vanguard Total International Bond ETF | | | 270 | | | | 14,818 | |
| | | | | | | | |
Total Investments in Securities (99.6%)
(Cost $2,520,358) | | | | | | | 2,676,347 | |
Other Assets Less Liabilities (0.4%) | | | | | | | 11,707 | |
| | | | | |
Net Assets (100%) | | | | | | $ | 2,688,054 | |
| | | | | | | | |
The following is a summary of the inputs used to value the Fund’s assets and liabilities carried at fair value as of October 31, 2017:
The inputs or methodology used for valuing securities are not necessarily an indication of the risk associated with investing in those securities.
Various inputs are used in determining the value of the Fund’s investments. These inputs are summarized in the three broad levels listed below:
| | | | | | | | | | | | | | | | |
| | | | | |
| Investment Type | | Level 1
Quoted Prices in
Active Markets for
Identical
Securities | | | Level 2
Significant Other
Observable Inputs
(including quoted prices
for similar securities,
interest rates,
prepayment speeds,
credit risk, etc.) | | | Level 3
Significant Unobservable
Inputs (including the
Fund’s own assumptions in determining the fair value of investments) | | | Total | |
Assets: | | | | | |
Exchange Traded Funds: | | | | | | | | | | | | | | | | |
Exchange Traded Funds | | $ | 2,676,347 | | | $ | — | | | $ | — | | | $ | 2,676,347 | |
| | | | | | | | | | | | | | | | |
Total Assets | | $ | 2,676,347 | | | $ | — | | | $ | — | | | $ | 2,676,347 | |
| | | | | | | | | | | | | | | | |
Total Liabilities | | $ | — | | | $ | — | | | $ | — | | | $ | — | |
| | | | | | | | | | | | | | | | |
Total | | $ | 2,676,347 | | | $ | — | | | $ | — | | | $ | 2,676,347 | |
| | | | | | | | | | | | | | | | |
There were no transfers between Levels 1, 2 or 3 during the period ended October 31, 2017.
The Fund held no derivatives contracts during the period ended October 31, 2017.
Investment security transactions for the period ended October 31, 2017 were as follows:
| | | | |
Cost of Purchases: | | | | |
Long-term investments other than U.S. government debt securities | | $ | 2,559,892 | |
Net Proceeds of Sales and Redemptions: | | | | |
Long-term investments other than U.S. government debt securities | | $ | 43,292 | |
See Notes to Financial Statements.
88
1290 FUNDS
1290 RETIREMENT 2025 FUND
PORTFOLIO OF INVESTMENTS (Continued)
October 31, 2017
As of October 31, 2017, the gross unrealized appreciation (depreciation) of investments based on the aggregate cost of investments in securities and derivative instruments, if applicable, for Federal income tax purposes was as follows:
| | | | |
Aggregate gross unrealized appreciation | | $ | 156,921 | |
Aggregate gross unrealized depreciation | | | (932 | ) |
| | | | |
Net unrealized appreciation | | $ | 155,989 | |
| | | | |
Federal income tax cost of investments in securities and derivative instruments, if applicable | | $ | 2,520,358 | |
| | | | |
See Notes to Financial Statements.
89
1290 FUNDS
1290 RETIREMENT 2025 FUND
STATEMENT OF ASSETS AND LIABILITIES
October 31, 2017
| | | | |
ASSETS | |
Investments in Securities, at value (Cost $2,520,358) | | $ | 2,676,347 | |
Cash | | | 5,970 | |
Prepaid registration and filing fees | | | 22,287 | |
Receivable from investment adviser | | | 15,832 | |
Deferred offering cost | | | 3,369 | |
Other assets | | | 35 | |
| | | | |
Total assets | | | 2,723,840 | |
| | | | |
LIABILITIES | |
Accrued audit fee | | | 32,740 | |
Transfer agent fees payable | | | 713 | |
Trustees’ fees payable | | | 23 | |
Accrued expenses | | | 2,310 | |
| | | | |
Total liabilities | | | 35,786 | |
| | | | |
NET ASSETS | | $ | 2,688,054 | |
| | | | |
Net assets were comprised of: | |
Paid in capital | | $ | 2,499,869 | |
Accumulated undistributed net investment income (loss) | | | 28,438 | |
Accumulated undistributed net realized gain (loss) | | | 3,758 | |
Net unrealized appreciation (depreciation) | | | 155,989 | |
| | | | |
Net assets | | $ | 2,688,054 | |
| | | | |
Class I | | | | |
Net asset value and redemption price per share, $2,688,054 / 250,010 shares outstanding (unlimited amount authorized: $0.001 par value) | | $ | 10.75 | |
| | | | |
STATEMENT OF OPERATIONS
For the Period Ended October 31, 2017*
| | | | |
INVESTMENT INCOME | |
Dividends | | $ | 37,434 | |
Interest | | | 52 | |
| | | | |
Total income | | | 37,486 | |
| | | | |
EXPENSES | |
Professional fees | | | 48,860 | |
Administrative fees | | | 20,220 | |
Registration and filing fees | | | 8,817 | |
Investment advisory fees | | | 8,715 | |
Offering costs | | | 6,964 | |
Transfer agent fees | | | 4,149 | |
Printing and mailing expenses | | | 2,191 | |
Custodian fees | | | 1,460 | |
Trustees’ fees | | | 231 | |
Miscellaneous | | | 3,989 | |
| | | | |
Gross expenses | | | 105,596 | |
Less: Waiver from investment adviser | | | (28,935 | ) |
Reimbursement from investment adviser | | | (67,382 | ) |
| | | | |
Net expenses | | | 9,279 | |
| | | | |
NET INVESTMENT INCOME (LOSS) | | | 28,207 | |
| | | | |
REALIZED AND UNREALIZED GAIN (LOSS) | |
Net Realized gain (loss) on: | | | | |
Investments in securities | | | 3,757 | |
Net distributions of realized gain received from underlying funds | | | 1 | |
| | | | |
Net realized gain (loss) | | | 3,758 | |
| | | | |
Net change in unrealized appreciation (depreciation) on investments in securities | | | 155,989 | |
| | | | |
NET REALIZED AND UNREALIZED GAIN (LOSS) | | | 159,747 | |
| | | | |
NET INCREASE (DECREASE) IN NET ASSETS RESULTING FROM OPERATIONS | | $ | 187,954 | |
| | | | |
| * | The Fund commenced operations on February 27, 2017. |
| | | | |
| STATEMENT OF CHANGES IN NET ASSETS | | February 27, 2017* to
October 31, 2017 | |
INCREASE (DECREASE) IN NET ASSETS FROM OPERATIONS: | |
Net investment income (loss) | | $ | 28,207 | |
Net realized gain (loss) | | | 3,758 | |
Net change in unrealized appreciation (depreciation) | | | 155,989 | |
| | | | |
NET INCREASE (DECREASE) IN NET ASSETS RESULTING FROM OPERATIONS | | | 187,954 | |
| | | | |
CAPITAL SHARES TRANSACTIONS: | | | | |
Class I | | | | |
Capital shares sold [ 250,010 shares] | | | 2,500,100 | |
| | | | |
NET INCREASE (DECREASE) IN NET ASSETS RESULTING FROM CAPITAL SHARE TRANSACTIONS | | | 2,500,100 | |
| | | | |
TOTAL INCREASE (DECREASE) IN NET ASSETS | | | 2,688,054 | |
NET ASSETS: | |
Beginning of period | | | — | |
| | | | |
End of period (a) | | $ | 2,688,054 | |
| | | | |
(a) Includes accumulated undistributed (overdistributed) net investment income (loss) of | | $ | 28,438 | |
| | | | |
* The Fund commenced operations on February 27, 2017. | | | | |
See Notes to Financial Statements.
90
1290 FUNDS
1290 RETIREMENT 2025 FUND
FINANCIAL HIGHLIGHTS
| | | | |
| Class I | | February 27, 2017* to
October 31, 2017 | |
Net asset value, beginning of period | | $ | 10.00 | |
| | | | |
Income (loss) from investment operations: | | | | |
Net investment income (loss) (e)(x) | | | 0.11 | |
Net realized and unrealized gain (loss) | | | 0.64 | |
| | | | |
Total from investment operations | | | 0.75 | |
| | | | |
Net asset value, end of period | | $ | 10.75 | |
| | | | |
Total return (b) | | | 7.50 | % |
| | | | |
Ratios/Supplemental Data: | | | | |
Net assets, end of period (000’s) | | $ | 2,688 | |
Ratio of expenses to average net assets: | | | | |
After waivers and reimbursements (a)(f) | | | 0.53 | %(j) |
Before waivers and reimbursements (a)(f) | | | 5.30 | % |
Ratio of net investment income (loss) to average net assets: | | | | |
After waivers and reimbursements (a)(f)(x) | | | 1.62 | %(l) |
Before waivers and reimbursements (a)(f)(x) | | | (3.15 | )%(l) |
Portfolio turnover rate (z)^ | | | 2 | % |
| * | Commencement of Operations. |
| ^ | Portfolio turnover rate excludes derivatives, if any. |
| (a) | Ratios for periods less than one year are annualized. Certain non-recurring expenses incurred by the Fund are not annualized for periods less than one year. |
| (b) | Total returns for periods less than one year are not annualized. |
| (e) | Net investment income (loss) per share is based on average shares outstanding. |
| (f) | Expenses do not include the expenses of the underlying funds (“indirect expenses”), if applicable. |
| (j) | Including direct and indirect expenses, the net expense ratio after waivers and reimbursements would be 0.65%. |
| (l) | The annualized ratio of net investment income to average net assets may not be indicative of operating results for a full year. |
| (x) | Recognition of net investment income is affected by the timing of dividend declarations by the underlying funds in which the Fund invests. |
| (z) | Portfolio turnover rate for periods less than one year is not annualized. |
See Notes to Financial Statements.
91
1290 RETIREMENT 2030 FUND (Unaudited)
INVESTMENT ADVISER
PERFORMANCE RESULTS

| | | | |
| Total Returns as of 10/31/17 | | | |
| | | Since
Incept. | |
Fund – Class I Shares* | | | 8.00 | % |
S&P Target Date 2030 Index | | | 8.65 | |
* Date of inception 2/27/17. Returns for periods less than one year are not annualized. | |
The performance quoted is past performance and is not a guarantee of future results. Mutual funds are subject to certain market risks. Investment returns and principal value of an investment will fluctuate so that an investor’s shares, when redeemed, may be worth more or less than their original cost. Current performance may be higher or lower than the performance data shown. For the most current month-end performance data please call 1-888-310-0416 or visit www.1290Funds.com.
The graph illustrates comparative performance for $10,000 invested in the Class I Shares of the 1290 Retirement 2030 Fund and the S&P Target Date 2030 Index from 2/27/17 to 10/31/17. The performance of the S&P Target Date 2030 Index reflects an initial investment at the end of the month closest to the Fund’s inception. The performance of the Fund assumes reinvestment of all dividends and capital gain distributions, if any, and does not include a sales charge. The performance of the S&P Target Date 2030 Index does not reflect the deduction of expenses or a sales charge associated with a mutual fund and has been adjusted to reflect reinvestment of all dividends, capital gain distributions, and interest of the securities included in the benchmark.
Fund performance may reflect the waiver of the Fund’s fees and reimbursement of expenses for certain periods since the inception date. Without these waivers and reimbursements, performance would have been lower. Also, performance shown in this section does not reflect the deduction of taxes that a shareholder would pay on Fund distributions or redemption of Fund shares.
PERFORMANCE SUMMARY
The Fund’s Class I shares returned 8.00% for the period ended October 31, 2017. The Fund’s benchmark, the S&P Target Date 2030 Index, returned 8.65% over the same period.
Overview
The Allocations Drive Performance
Each 1290 Retirement Fund’s (as defined in the Notes to the Financial Statements) performance will reflect the performance of the underlying asset classes and depend upon their percentage weighting within the Fund. Here’s why:
The 1290 Retirement Funds are managed to target a specific year of planned retirement. The asset mix will become more conservative each year, until about 10 years after the target retirement year, when it will become relatively stable. The 1290 Retirement Funds balance the need for appreciation with the need for income as retirement approaches, and focus on supporting an income stream over a long-term retirement withdrawal horizon.
To achieve its exposures, each 1290 Retirement Fund invests in ETFs representing various equity and bond asset classes. So the 1290 Retirement Funds’ performance will be a function of the asset class performance and the percentage weighting of each in the 1290 Retirement Funds. Current target and actual allocations, as well as performance, are available in an accompanying quarterly Fund Fact Sheet.
What helped the 1290 Retirement Funds performance since inception?
All of the holdings contributed positively to returns since inception of the 1290 Retirement Funds on 3/1/2017.
| • | | Emerging market and international equities were the strongest performers. |
| • | | Among U.S. equities, large-cap stocks outperformed mid- and small-caps. |
What hurt the 1290 Retirement Funds performance since inception?
| • | | From a relative standpoint, bonds were a drag on performance. Only the higher-yielding and ‘riskier’ bond markets produced more than modest returns. |
| | | | |
Table by Asset Class (as a percentage of Total Investments in Securities) As of October 31, 2017 | |
Equity | | | 74.2 | % |
Fixed Income | | | 25.8 | |
| | | | |
Top 10 Holdings (as a percentage of Total Investments in Securities) As of October 31, 2017 | |
iShares Core S&P Total US Stock Market Fund | | | 25.5 | % |
iShares Core U.S. Aggregate Bond Fund | | | 22.1 | |
iShares Core MSCI EAFE Fund | | | 9.5 | |
iShares Edge MSCI Min Vol USA Fund | | | 8.2 | |
PowerShares S&P 500 Low Volatility Portfolio | | | 8.2 | |
iShares Edge MSCI Min Vol EAFE Fund | | | 4.8 | |
PowerShares S&P International Developed Low Volatility Portfolio | | | 4.8 | |
PowerShares S&P MidCap Low Volatility Portfolio | | | 4.6 | |
iShares TIPS Bond Fund | | | 3.7 | |
iShares Core MSCI Emerging Markets Fund | | | 2.3 | |
| | |
Holdings are subject to change without notice. | | | | |
92
1290 RETIREMENT 2030 FUND (Unaudited)
UNDERSTANDING YOUR EXPENSES:
As a shareholder of the Fund, you incur two types of costs:
(1) transaction costs, including applicable sales charges and redemption fees; and (2) ongoing costs, including investment advisory fees, distribution and/or service (12b-1) fees and other Fund expenses. These examples are intended to help you understand your ongoing costs (in dollars) of investing in the Fund and to compare these costs with the ongoing costs of investing in other mutual funds.
The examples are based on an investment of $1,000 invested at the beginning of the six-month period ended October 31, 2017 and held for the entire six-month period.
Actual Expenses
The first line of the following table provides information about actual account values and actual expenses. You may use the information in this line, together with the amount you invested, to estimate the expenses that you paid over the period. Simply divide your account value by $1,000 (for example, an $8,600 account value divided by $1,000 = 8.6), then multiply the result by the number in the first line under the heading entitled “Expenses Paid During Period” to estimate the expenses you paid on your account during this period.
Hypothetical Example for Comparison Purposes
The second line of the following table provides information about hypothetical account values and hypothetical expenses based on the Fund’s actual expense ratio and an assumed rate of return of 5% per year before expenses, which is not the Fund’s actual return. The hypothetical account values and expenses may not be used to estimate the actual ending account balance or expenses you paid for the period. You may use this information to compare the ongoing costs of investing in the Fund and other funds. To do so, compare this 5% hypothetical example with the 5% hypothetical examples that appear in the shareholder reports of the other funds.
Please note that the expenses shown in the table are meant to highlight your ongoing costs only and do not reflect any transactional costs, such as sales charges (loads), redemption fees, or exchange fees. Therefore, the second line of the table is useful in comparing ongoing costs only, and will not help you determine the relative total costs of owning different funds. In addition, if these transactional costs were included, your costs would have been higher.
EXAMPLE
| | | | | | | | | | | | |
| | | Beginning
Account
Value
5/1/17 | | | Ending
Account
Value
10/31/17 | | | Expenses
Paid
During
Period*
5/1/17 -
10/31/17 | |
Class I | |
Actual | | | $1,000.00 | | | | $1,063.00 | | | | $2.77 | |
Hypothetical (5% average annual return before expenses) | | | 1,000.00 | | | | 1,022.52 | | | | 2.71 | |
* Expenses are equal to the Fund’s Class I shares annualized expense ratio of 0.53%, multiplied by the average account value over the period, and multiplied by 184/365 (to reflect the one-half year period). | |
93
1290 FUNDS
1290 RETIREMENT 2030 FUND
PORTFOLIO OF INVESTMENTS
October 31, 2017
| | | | | | | | |
| | | Number of
Shares | | | Value
(Note 1) | |
| | | | | | | | |
EXCHANGE TRADED FUNDS (ETF): | |
iShares Core MSCI EAFE Fund | | | 3,910 | | | $ | 255,128 | |
iShares Core MSCI Emerging Markets Fund | | | 1,120 | | | | 62,474 | |
iShares Core S&P Total US Stock Market Fund | | | 11,660 | | | | 687,006 | |
iShares Core U.S. Aggregate Bond Fund | | | 5,440 | | | | 595,517 | |
iShares Edge MSCI Min Vol EAFE Fund | | | 1,810 | | | | 129,922 | |
iShares Edge MSCI Min Vol Emerging Markets Fund | | | 500 | | | | 29,595 | |
iShares Edge MSCI Min Vol USA Fund | | | 4,310 | | | | 221,189 | |
iShares TIPS Bond Fund | | | 870 | | | | 99,006 | |
PowerShares S&P 500 Low Volatility Portfolio | | | 4,740 | | | | 220,552 | |
| | | | | | | | |
PowerShares S&P Emerging Markets Low Volatility Portfolio | | | 1,160 | | | | 28,536 | |
PowerShares S&P International Developed Low Volatility Portfolio | | | 3,870 | | | | 128,832 | |
PowerShares S&P MidCap Low Volatility Portfolio | | | 2,730 | | | | 122,932 | |
PowerShares S&P SmallCap Low Volatility Portfolio | | | 1,190 | | | | 55,276 | |
SPDR SSGA US Small Cap Low Volatility Index Fund | | | 560 | | | | 53,822 | |
| | | | | | | | |
Total Investments in Securities (99.6%) (Cost $2,517,987) | | | | | | | 2,689,787 | |
Other Assets Less Liabilities (0.4%) | | | | | | | 11,482 | |
| | | | | |
Net Assets (100%) | | | | | | $ | 2,701,269 | |
| | | | | | | | |
The following is a summary of the inputs used to value the Fund’s assets and liabilities carried at fair value as of October 31, 2017:
The inputs or methodology used for valuing securities are not necessarily an indication of the risk associated with investing in those securities.
Various inputs are used in determining the value of the Fund’s investments. These inputs are summarized in the three broad levels listed below:
| | | | | | | | | | | | | | | | |
| | | | | |
| Investment Type | | Level 1
Quoted Prices in
Active Markets for
Identical
Securities | | | Level 2
Significant Other
Observable Inputs
(including quoted prices
for similar securities,
interest rates,
prepayment speeds,
credit risk, etc.) | | | Level 3
Significant Unobservable
Inputs (including the
Fund’s own
assumptions in
determining the fair
value of investments) | | | Total | |
Assets: | | | | | | | | | | | | | | | | |
Exchange Traded Funds | | | | | | | | | | | | | | | | |
Exchange Traded Funds | | $ | 2,689,787 | | | $ | — | | | $ | — | | | $ | 2,689,787 | |
| | | | | | | | | | | | | | | | |
Total Assets | | $ | 2,689,787 | | | $ | — | | | $ | — | | | $ | 2,689,787 | |
| | | | | | | | | | | | | | | | |
Total Liabilities | | $ | — | | | $ | — | | | $ | — | | | $ | — | |
| | | | | | | | | | | | | | | | |
Total | | $ | 2,689,787 | | | $ | — | | | $ | — | | | $ | 2,689,787 | |
| | | | | | | | | | | | | | | | |
There were no transfers between Levels 1, 2 or 3 during the period ended October 31, 2017.
The Fund held no derivatives contracts during the period ended October 31, 2017.
Investment security transactions for the period ended October 31, 2017 were as follows:
| | | | |
Cost of Purchases: | | | | |
Long-term investments other than U.S. government debt securities | | $ | 2,532,038 | |
Net Proceeds of Sales and Redemptions: | | | | |
Long-term investments other than U.S. government debt securities | | $ | 15,553 | |
See Notes to Financial Statements.
94
1290 FUNDS
1290 RETIREMENT 2030 FUND
PORTFOLIO OF INVESTMENTS (Continued)
October 31, 2017
As of October 31, 2017, the gross unrealized appreciation (depreciation) of investments based on the aggregate cost of investments in securities and derivative instruments, if applicable, for Federal income tax purposes was as follows:
| | | | |
Aggregate gross unrealized appreciation | | $ | 172,549 | |
Aggregate gross unrealized depreciation | | | (749 | ) |
| | | | |
Net unrealized appreciation | | $ | 171,800 | |
| | | | |
Federal income tax cost of investments in securities and derivative instruments, if applicable | | $ | 2,517,987 | |
| | | | |
See Notes to Financial Statements.
95
1290 FUNDS
1290 RETIREMENT 2030 FUND
STATEMENT OF ASSETS AND LIABILITIES
October 31, 2017
| | | | |
ASSETS | |
Investments in Securities, at value (Cost $2,517,987) | | $ | 2,689,787 | |
Cash | | | 6,007 | |
Prepaid registration and filing fees | | | 22,287 | |
Receivable from investment adviser | | | 15,540 | |
Deferred offering cost | | | 3,370 | |
Other assets | | | 35 | |
| | | | |
Total assets | | | 2,737,026 | |
| | | | |
LIABILITIES | |
Accrued audit fee | | | 32,740 | |
Transfer agent fees payable | | | 713 | |
Trustees’ fees payable | | | 23 | |
Accrued expenses | | | 2,281 | |
| | | | |
Total liabilities | | | 35,757 | |
| | | | |
NET ASSETS | | $ | 2,701,269 | |
| | | | |
Net assets were comprised of: | |
Paid in capital | | $ | 2,499,868 | |
Accumulated undistributed net investment income (loss) | | | 28,100 | |
Accumulated undistributed net realized gain (loss) | | | 1,501 | |
Net unrealized appreciation (depreciation) | | | 171,800 | |
| | | | |
Net assets | | $ | 2,701,269 | |
| | | | |
Class I | | | | |
Net asset value and redemption price per share, $2,701,269 / 250,010 shares outstanding (unlimited amount authorized: $0.001 par value) | | $ | 10.80 | |
| | | | |
STATEMENT OF OPERATIONS
For the Period Ended October 31, 2017*
| | | | |
INVESTMENT INCOME | |
Dividends | | $ | 37,088 | |
Interest | | | 52 | |
| | | | |
Total income | | | 37,140 | |
| | | | |
EXPENSES | |
Professional fees | | | 48,866 | |
Administrative fees | | | 20,220 | |
Registration and filing fees | | | 8,817 | |
Investment advisory fees | | | 8,733 | |
Offering costs | | | 6,964 | |
Transfer agent fees | | | 4,149 | |
Printing and mailing expenses | | | 2,193 | |
Custodian fees | | | 1,100 | |
Trustees’ fees | | | 232 | |
Miscellaneous | | | 3,967 | |
| | | | |
Gross expenses | | | 105,241 | |
Less: Waiver from investment adviser | | | (28,953 | ) |
Reimbursement from investment adviser | | | (67,016 | ) |
| | | | |
Net expenses | | | 9,272 | |
| | | | |
NET INVESTMENT INCOME (LOSS) | | | 27,868 | |
| | | | |
REALIZED AND UNREALIZED GAIN (LOSS) | |
Net realized gain (loss) on investments in securities | | | 1,501 | |
Net change in unrealized appreciation (depreciation) on investments in securities | | | 171,800 | |
| | | | |
NET REALIZED AND UNREALIZED GAIN (LOSS) | | | 173,301 | |
| | | | |
NET INCREASE (DECREASE) IN NET ASSETS RESULTING FROM OPERATIONS | | $ | 201,169 | |
| | | | |
| * | The Fund commenced operations on February 27, 2017. |
| | | | |
| STATEMENT OF CHANGES IN NET ASSETS | | February 27, 2017* to
October 31, 2017 | |
INCREASE (DECREASE) IN NET ASSETS FROM OPERATIONS: | |
Net investment income (loss) | | $ | 27,868 | |
Net realized gain (loss) | | | 1,501 | |
Net change in unrealized appreciation (depreciation) | | | 171,800 | |
| | | | |
NET INCREASE (DECREASE) IN NET ASSETS RESULTING FROM OPERATIONS | | | 201,169 | |
| | | | |
CAPITAL SHARES TRANSACTIONS: | | | | |
Class I | | | | |
Capital shares sold [ 250,010 shares] | | | 2,500,100 | |
| | | | |
NET INCREASE (DECREASE) IN NET ASSETS RESULTING FROM CAPITAL SHARE TRANSACTIONS | | | 2,500,100 | |
| | | | |
TOTAL INCREASE (DECREASE) IN NET ASSETS | | | 2,701,269 | |
NET ASSETS: | |
Beginning of period | | | — | |
| | | | |
End of period (a) | | $ | 2,701,269 | |
| | | | |
(a) Includes accumulated undistributed (overdistributed) net investment income (loss) of | | $ | 28,100 | |
| | | | |
* The Fund commenced operations on February 27, 2017. | | | | |
See Notes to Financial Statements.
96
1290 FUNDS
1290 RETIREMENT 2030 FUND
FINANCIAL HIGHLIGHTS
| | | | |
| Class I | | February 27, 2017* to
October 31, 2017 | |
Net asset value, beginning of period | | $ | 10.00 | |
| | | | |
Income (loss) from investment operations: | | | | |
Net investment income (loss) (e)(x) | | | 0.11 | |
Net realized and unrealized gain (loss) | | | 0.69 | |
| | | | |
Total from investment operations | | | 0.80 | |
| | | | |
Net asset value, end of period | | $ | 10.80 | |
| | | | |
Total return (b) | | | 8.00 | % |
| | | | |
Ratios/Supplemental Data: | | | | |
Net assets, end of period (000’s) | | $ | 2,701 | |
Ratio of expenses to average net assets: | | | | |
After waivers and reimbursements (a)(f) | | | 0.53 | %(j) |
Before waivers and reimbursements (a)(f) | | | 5.27 | % |
Ratio of net investment income (loss) to average net assets: | | | | |
After waivers and reimbursements (a)(f)(x) | | | 1.59 | %(l) |
Before waivers and reimbursements (a)(f)(x) | | | (3.15 | )%(l) |
Portfolio turnover rate (z)^ | | | 1 | % |
| * | Commencement of Operations. |
| ^ | Portfolio turnover rate excludes derivatives, if any. |
| (a) | Ratios for periods less than one year are annualized. Certain non-recurring expenses incurred by the Fund are not annualized for periods less than one year. |
| (b) | Total returns for periods less than one year are not annualized. |
| (e) | Net investment income (loss) per share is based on average shares outstanding. |
| (f) | Expenses do not include the expenses of the underlying funds (“indirect expenses”), if applicable. |
| (j) | Including direct and indirect expenses, the net expense ratio after waivers and reimbursements would be 0.65%. |
| (l) | The annualized ratio of net investment income to average net assets may not be indicative of operating results for a full year. |
| (x) | Recognition of net investment income is affected by the timing of dividend declarations by the underlying funds in which the Fund invests. |
| (z) | Portfolio turnover rate for periods less than one year is not annualized. |
See Notes to Financial Statements.
97
1290 RETIREMENT 2035 FUND (Unaudited)
INVESTMENT ADVISER
PERFORMANCE RESULTS

| | | | |
| Total Returns as of 10/31/17 | | | |
| | | Since
Incept. | |
Fund – Class I Shares* | | | 8.50 | % |
S&P Target Date 2035 Index | | | 9.51 | |
* Date of inception 2/27/17. Returns for periods less than one year are not annualized. | |
The performance quoted is past performance and is not a guarantee of future results. Mutual funds are subject to certain market risks. Investment returns and principal value of an investment will fluctuate so that an investor’s shares, when redeemed, may be worth more or less than their original cost. Current performance may be higher or lower than the performance data shown. For the most current month-end performance data please call 1-888-310-0416 or visit www.1290Funds.com.
The graph illustrates comparative performance for $10,000 invested in the Class I Shares of the 1290 Retirement 2035 Fund and the S&P Target Date 2035 Index from 2/27/17 to 10/31/17. The performance of the S&P Target Date 2035 Index reflects an initial investment at the end of the month closest to the Fund’s inception. The performance of the Fund assumes reinvestment of all dividends and capital gain distributions, if any, and does not include a sales charge. The performance of the S&P Target Date 2035 Index does not reflect the deduction of expenses or a sales charge associated with a mutual fund and has been adjusted to reflect reinvestment of all dividends, capital gain distributions, and interest of the securities included in the benchmark.
Fund performance may reflect the waiver of the Fund’s fees and reimbursement of expenses for certain periods since the inception date. Without these waivers and reimbursements, performance would have been lower. Also, performance shown in this section does not reflect the deduction of taxes that a shareholder would pay on Fund distributions or redemption of Fund shares.
PERFORMANCE SUMMARY
The Fund’s Class I shares returned 8.50% for the period ended October 31, 2017. The Fund’s benchmark, the S&P Target Date 2035 Index, returned 9.51% over the same period.
Overview
The Allocations Drive Performance
Each 1290 Retirement Fund’s (as defined in the Notes to the Financial Statements) performance will reflect the performance of the underlying asset classes and depend upon their percentage weighting within the Fund. Here’s why:
The 1290 Retirement Funds are managed to target a specific year of planned retirement. The asset mix will become more conservative each year, until about 10 years after the target retirement year, when it will become relatively stable. The 1290 Retirement Funds balance the need for appreciation with the need for income as retirement approaches, and focus on supporting an income stream over a long-term retirement withdrawal horizon.
To achieve its exposures, each 1290 Retirement Fund invests in ETFs representing various equity and bond asset classes. So the 1290 Retirement Funds’ performance will be a function of the asset class performance and the percentage weighting of each in the 1290 Retirement Funds. Current target and actual allocations, as well as performance, are available in an accompanying quarterly Fund Fact Sheet.
What helped the 1290 Retirement Funds performance since inception?
All of the holdings contributed positively to returns since inception of the 1290 Retirement Funds on 3/1/2017.
| • | | Emerging market and international equities were the strongest performers. |
| • | | Among U.S. equities, large-cap stocks outperformed mid- and small-caps. |
What hurt the 1290 Retirement Funds performance since inception?
| • | | From a relative standpoint, bonds were a drag on performance. Only the higher-yielding and ‘riskier’ bond markets produced more than modest returns. |
| | | | |
Table by Asset Class (as a percentage of Total Investments in Securities) As of October 31, 2017 | |
Equity | | | 78.9 | % |
Fixed Income | | | 21.1 | |
98
1290 RETIREMENT 2035 FUND (Unaudited)
| | | | |
Top 10 Holdings (as a percentage of Total Investments in Securities) As of October 31, 2017 | |
iShares Core S&P Total US Stock Market Fund | | | 27.3 | % |
iShares Core U.S. Aggregate Bond Fund | | | 18.1 | |
iShares Core MSCI EAFE Fund | | | 10.0 | |
iShares Edge MSCI Min Vol USA Fund | | | 8.9 | |
PowerShares S&P 500 Low Volatility Portfolio | | | 8.8 | |
iShares Edge MSCI Min Vol EAFE Fund | | | 5.1 | |
PowerShares S&P International Developed Low Volatility Portfolio | | | 5.0 | |
PowerShares S&P MidCap Low Volatility Portfolio | | | 4.8 | |
iShares TIPS Bond | | | 3.0 | |
iShares Core MSCI Emerging Markets Fund | | | 2.4 | |
| | |
Holdings are subject to change without notice. | | | | |
UNDERSTANDING YOUR EXPENSES:
As a shareholder of the Fund, you incur two types of costs:
(1) transaction costs, including applicable sales charges and redemption fees; and (2) ongoing costs, including investment advisory fees, distribution and/or service (12b-1) fees and other Fund expenses. These examples are intended to help you understand your ongoing costs (in dollars) of investing in the Fund and to compare these costs with the ongoing costs of investing in other mutual funds.
The examples are based on an investment of $1,000 invested at the beginning of the six-month period ended October 31, 2017 and held for the entire six-month period.
Actual Expenses
The first line of the following table provides information about actual account values and actual expenses. You may use the information in this line, together with the amount you invested, to estimate the expenses that you paid over the period. Simply divide your account value by $1,000 (for example, an $8,600 account value divided by $1,000 = 8.6), then multiply the result by the number in the first line under the heading entitled “Expenses Paid During Period” to estimate the expenses you paid on your account during this period.
Hypothetical Example for Comparison Purposes
The second line of the following table provides information about hypothetical account values and hypothetical expenses based on the Fund’s actual expense ratio and an assumed rate of return of 5% per year before expenses, which is not the Fund’s actual return. The hypothetical account values and expenses may not be used to estimate the actual ending account balance or expenses you paid for the period. You may use this information to compare the ongoing costs of investing in the Fund and other funds. To do so, compare this 5% hypothetical example with the 5% hypothetical examples that appear in the shareholder reports of the other funds.
Please note that the expenses shown in the table are meant to highlight your ongoing costs only and do not reflect any transactional costs, such as sales charges (loads), redemption fees, or exchange fees. Therefore, the second line of the table is useful in comparing ongoing costs only, and will not help you determine the relative total costs of owning different funds. In addition, if these transactional costs were included, your costs would have been higher.
EXAMPLE
| | | | | | | | | | | | |
| | | Beginning
Account
Value
5/1/17 | | | Ending
Account
Value
10/31/17 | | | Expenses
Paid
During
Period*
5/1/17 -
10/31/17 | |
Class I | |
Actual | | | $1,000.00 | | | | $1,067.90 | | | | $2.76 | |
Hypothetical (5% average annual return before expenses) | | | 1,000.00 | | | | 1,022.54 | | | | 2.70 | |
* Expenses are equal to the Fund’s Class I shares annualized expense ratio of 0.53%, multiplied by the average account value over the period, and multiplied by 184/365 (to reflect the one-half year period). | |
99
1290 FUNDS
1290 RETIREMENT 2035 FUND
PORTFOLIO OF INVESTMENTS
October 31, 2017
| | | | | | | | |
| | | Number of
Shares | | | Value
(Note 1) | |
| | | | | | | | |
EXCHANGE TRADED FUNDS (ETF): | |
iShares Core MSCI EAFE Fund | | | 4,130 | | | $ | 269,483 | |
iShares Core MSCI Emerging Markets Fund | | | 1,180 | | | | 65,820 | |
iShares Core S&P Total US Stock Market Fund | | | 12,520 | | | | 737,678 | |
iShares Core U.S. Aggregate Bond Fund | | | 4,470 | | | | 489,331 | |
iShares Edge MSCI Min Vol EAFE Fund | | | 1,910 | | | | 137,100 | |
iShares Edge MSCI Min Vol Emerging Markets Fund | | | 530 | | | | 31,371 | |
iShares Edge MSCI Min Vol USA Fund | | | 4,660 | | | | 239,151 | |
iShares TIPS Bond Fund | | | 710 | | | | 80,798 | |
PowerShares S&P 500 Low Volatility Portfolio | | | 5,130 | | | | 238,699 | |
| | | | | | | | |
PowerShares S&P Emerging Markets Low Volatility Portfolio | | | 1,230 | | | | 30,258 | |
PowerShares S&P International Developed Low Volatility Portfolio | | | 4,080 | | | | 135,823 | |
PowerShares S&P MidCap Low Volatility Portfolio | | | 2,870 | | | | 129,236 | |
PowerShares S&P SmallCap Low Volatility Portfolio | | | 1,270 | | | | 58,992 | |
SPDR SSGA US Small Cap Low Volatility Index Fund | | | 590 | | | | 56,705 | |
| | | | | | | | |
Total Investments in Securities (99.6%)
(Cost $2,518,019) | | | | | | | 2,700,445 | |
Other Assets Less Liabilities (0.4%) | | | | | | | 11,238 | |
| | | | | |
Net Assets (100%) | | | | | | $ | 2,711,683 | |
| | | | | | | | |
The following is a summary of the inputs used to value the Fund’s assets and liabilities carried at fair value as of October 31, 2017:
The inputs or methodology used for valuing securities are not necessarily an indication of the risk associated with investing in those securities.
Various inputs are used in determining the value of the Fund’s investments. These inputs are summarized in the three broad levels listed below:
| | | | | | | | | | | | | | | | |
| | | | | |
| Investment Type | | Level 1
Quoted Prices in
Active Markets for
Identical
Securities | | | Level 2
Significant Other
Observable Inputs
(including quoted prices
for similar securities,
interest rates,
prepayment speeds,
credit risk, etc.) | | | Level 3
Significant Unobservable
Inputs (including the
Fund’s own assumptions in determining the fair value of investments) | | | Total | |
Assets: | | | | | |
Exchange Traded Funds | | | | | | | | | | | | | | | | |
Exchange Traded Funds | | $ | 2,700,445 | | | $ | — | | | $ | — | | | $ | 2,700,445 | |
| | | | | | | | | | | | | | | | |
Total Assets | | $ | 2,700,445 | | | $ | — | | | $ | — | | | $ | 2,700,445 | |
| | | | | | | | | | | | | | | | |
Total Liabilities | | $ | — | | | $ | — | | | $ | — | | | $ | — | |
| | | | | | | | | | | | | | | | |
Total | | $ | 2,700,445 | | | $ | — | | | $ | — | | | $ | 2,700,445 | |
| | | | | | | | | | | | | | | | |
There were no transfers between Levels 1, 2 or 3 during the period ended October 31, 2017.
The Fund held no derivatives contracts during the period ended October 31, 2017.
Investment security transactions for the period ended October 31, 2017 were as follows:
| | | | |
Cost of Purchases: | | | | |
Long-term investments other than U.S. government debt securities | | $ | 2,532,071 | |
Net Proceeds of Sales and Redemptions: | | | | |
Long-term investments other than U.S. government debt securities | | $ | 15,553 | |
See Notes to Financial Statements.
100
1290 FUNDS
1290 RETIREMENT 2035 FUND
PORTFOLIO OF INVESTMENTS (Continued)
October 31, 2017
As of October 31, 2017, the gross unrealized appreciation (depreciation) of investments based on the aggregate cost of investments in securities and derivative instruments, if applicable, for Federal income tax purposes was as follows:
| | | | |
Aggregate gross unrealized appreciation | | $ | 183,037 | |
Aggregate gross unrealized depreciation | | | (611 | ) |
| | | | |
Net unrealized appreciation | | $ | 182,426 | |
| | | | |
Federal income tax cost of investments in securities and derivative instruments, if applicable | | $ | 2,518,019 | |
| | | | |
See Notes to Financial Statements.
101
1290 FUNDS
1290 RETIREMENT 2035 FUND
STATEMENT OF ASSETS AND LIABILITIES
October 31, 2017
| | | | |
ASSETS | |
Investments in Securities, at value (Cost $2,518,019) | | $ | 2,700,445 | |
Cash | | | 5,481 | |
Prepaid registration and filing fees | | | 22,287 | |
Receivable from investment adviser | | | 15,819 | |
Deferred offering cost | | | 3,376 | |
Other assets | | | 35 | |
| | | | |
Total assets | | | 2,747,443 | |
| | | | |
LIABILITIES | |
Accrued audit fee | | | 32,740 | |
Transfer agent fees payable | | | 713 | |
Trustees’ fees payable | | | 23 | |
Accrued expenses | | | 2,284 | |
| | | | |
Total liabilities | | | 35,760 | |
| | | | |
NET ASSETS | | $ | 2,711,683 | |
| | | | |
Net assets were comprised of: | |
Paid in capital | | $ | 2,499,873 | |
Accumulated undistributed net investment income (loss) | | | 27,883 | |
Accumulated undistributed net realized gain (loss) | | | 1,501 | |
Net unrealized appreciation (depreciation) | | | 182,426 | |
| | | | |
Net assets | | $ | 2,711,683 | |
| | | | |
Class I | | | | |
Net asset value and redemption price per share, $2,711,683 / 250,010 shares outstanding (unlimited amount authorized: $0.001 par value) | | $ | 10.85 | |
| | | | |
STATEMENT OF OPERATIONS
For the Period Ended October 31, 2017*
| | | | |
INVESTMENT INCOME | |
Dividends | | $ | 36,848 | |
Interest | | | 53 | |
| | | | |
Total income | | | 36,901 | |
| | | | |
EXPENSES | |
Professional fees | | | 48,870 | |
Administrative fees | | | 20,219 | |
Registration and filing fees | | | 8,817 | |
Investment advisory fees | | | 8,747 | |
Offering costs | | | 6,979 | |
Transfer agent fees | | | 4,149 | |
Printing and mailing expenses | | | 2,194 | |
Custodian fees | | | 1,410 | |
Trustees’ fees | | | 232 | |
Miscellaneous | | | 3,967 | |
| | | | |
Gross expenses | | | 105,584 | |
Less: Waiver from investment adviser | | | (28,966 | ) |
Reimbursement from investment adviser | | | (67,373 | ) |
| | | | |
Net expenses | | | 9,245 | |
| | | | |
NET INVESTMENT INCOME (LOSS) | | | 27,656 | |
| | | | |
REALIZED AND UNREALIZED GAIN (LOSS) | |
Net realized gain (loss) on investments in securities | | | 1,501 | |
Net change in unrealized appreciation (depreciation) on investments in securities | | | 182,426 | |
| | | | |
NET REALIZED AND UNREALIZED GAIN (LOSS) | | | 183,927 | |
| | | | |
NET INCREASE (DECREASE) IN NET ASSETS RESULTING FROM OPERATIONS | | $ | 211,583 | |
| | | | |
| * | The Fund commenced operations on February 27, 2017. |
| | | | |
| STATEMENT OF CHANGES IN NET ASSETS | | February 27, 2017* to
October 31, 2017 | |
INCREASE (DECREASE) IN NET ASSETS FROM OPERATIONS: | |
Net investment income (loss) | | $ | 27,656 | |
Net realized gain (loss) | | | 1,501 | |
Net change in unrealized appreciation (depreciation) | | | 182,426 | |
| | | | |
NET INCREASE (DECREASE) IN NET ASSETS RESULTING FROM OPERATIONS | | | 211,583 | |
| | | | |
CAPITAL SHARES TRANSACTIONS: | | | | |
Class I | | | | |
Capital shares sold [ 250,010 shares] | | | 2,500,100 | |
| | | | |
NET INCREASE (DECREASE) IN NET ASSETS RESULTING FROM CAPITAL SHARE TRANSACTIONS | | | 2,500,100 | |
| | | | |
TOTAL INCREASE (DECREASE) IN NET ASSETS | | | 2,711,683 | |
NET ASSETS: | |
Beginning of period | | | — | |
| | | | |
End of period (a) | | $ | 2,711,683 | |
| | | | |
(a) Includes accumulated undistributed (overdistributed) net investment income (loss) of | | $ | 27,883 | |
| | | | |
* The Fund commenced operations on February 27, 2017. | | | | |
See Notes to Financial Statements.
102
1290 FUNDS
1290 RETIREMENT 2035 FUND
FINANCIAL HIGHLIGHTS
| | | | |
| Class I | | February 27, 2017* to
October 31, 2017 | |
Net asset value, beginning of period | | $ | 10.00 | |
| | | | |
Income (loss) from investment operations: | | | | |
Net investment income (loss) (e)(x) | | | 0.11 | |
Net realized and unrealized gain (loss) | | | 0.74 | |
| | | | |
Total from investment operations | | | 0.85 | |
| | | | |
Net asset value, end of period | | $ | 10.85 | |
| | | | |
Total return (b) | | | 8.50 | % |
| | | | |
Ratios/Supplemental Data: | | | | |
Net assets, end of period (000’s) | | $ | 2,712 | |
Ratio of expenses to average net assets: | | | | |
After waivers and reimbursements (a)(f) | | | 0.53 | %(j) |
Before waivers and reimbursements (a)(f) | | | 5.28 | % |
Ratio of net investment income (loss) to average net assets: | | | | |
After waivers and reimbursements (a)(f)(x) | | | 1.58 | %(l) |
Before waivers and reimbursements (a)(f)(x) | | | (3.17 | )%(l) |
Portfolio turnover rate (z)^ | | | 1 | % |
| * | Commencement of Operations. |
| ^ | Portfolio turnover rate excludes derivatives, if any. |
| (a) | Ratios for periods less than one year are annualized. Certain non-recurring expenses incurred by the Fund are not annualized for periods less than one year. |
| (b) | Total returns for periods less than one year are not annualized. |
| (e) | Net investment income (loss) per share is based on average shares outstanding. |
| (f) | Expenses do not include the expenses of the underlying funds (“indirect expenses”), if applicable. |
| (j) | Including direct and indirect expenses, the net expense ratio after waivers and reimbursements would be 0.65%. |
| (l) | The annualized ratio of net investment income to average net assets may not be indicative of operating results for a full year. |
| (x) | Recognition of net investment income is affected by the timing of dividend declarations by the underlying funds in which the Fund invests. |
| (z) | Portfolio turnover rate for periods less than one year is not annualized. |
See Notes to Financial Statements.
103
1290 RETIREMENT 2040 FUND (Unaudited)
INVESTMENT ADVISER
PERFORMANCE RESULTS

| | | | |
| Total Returns as of 10/31/17 | | | |
| | | Since
Incept. | |
Fund – Class I Shares* | | | 8.90 | % |
S&P Target Date 2040 Index | | | 10.07 | |
* Date of inception 2/27/17. Returns for periods less than one year are not annualized. | | | | |
The performance quoted is past performance and is not a guarantee of future results. Mutual funds are subject to certain market risks. Investment returns and principal value of an investment will fluctuate so that an investor’s shares, when redeemed, may be worth more or less than their original cost. Current performance may be higher or lower than the performance data shown. For the most current month-end performance data please call 1-888-310-0416 or visit www.1290Funds.com.
The graph illustrates comparative performance for $10,000 invested in the Class I Shares of the 1290 Retirement 2040 Fund and the S&P Target Date 2040 Index from 2/27/17 to 10/31/17. The performance of the S&P Target Date 2040 Index reflects an initial investment at the end of the month closest to the Fund’s inception. The performance of the Fund assumes reinvestment of all dividends and capital gain distributions, if any, and does not include a sales charge. The performance of the S&P Target Date 2040 Index does not reflect the deduction of expenses or a sales charge associated with a mutual fund and has been adjusted to reflect reinvestment of all dividends, capital gain distributions, and interest of the securities included in the benchmark.
Fund performance may reflect the waiver of the Fund’s fees and reimbursement of expenses for certain periods since the inception date. Without these waivers and reimbursements, performance would have been lower. Also, performance shown in this section does not reflect the deduction of taxes that a shareholder would pay on Fund distributions or redemption of Fund shares.
PERFORMANCE SUMMARY
The Fund’s Class I shares returned 8.90% for the period ended October 31, 2017. The Fund’s benchmark, the S&P Target Date 2040 Index, returned 10.07% over the same period.
Overview
The Allocations Drive Performance
Each 1290 Retirement Fund’s (as defined in the Notes to the Financial Statements) performance will reflect the performance of the underlying asset classes and depend upon their percentage weighting within the Fund. Here’s why:
The 1290 Retirement Funds are managed to target a specific year of planned retirement. The asset mix will become more conservative each year, until about 10 years after the target retirement year, when it will become relatively stable. The 1290 Retirement Funds balance the need for appreciation with the need for income as retirement approaches, and focus on supporting an income stream over a long-term retirement withdrawal horizon.
To achieve its exposures, each 1290 Retirement Fund invests in ETFs representing various equity and bond asset classes. So the 1290 Retirement Funds’ performance will be a function of the asset class performance and the percentage weighting of each in the 1290 Retirement Funds. Current target and actual allocations, as well as performance, are available in an accompanying quarterly Fund Fact Sheet.
What helped the 1290 Retirement Funds performance since inception?
All of the holdings contributed positively to returns since inception of the 1290 Retirement Funds on 3/1/2017.
| • | | Emerging market and international equities were the strongest performers. |
| • | | Among U.S. equities, large-cap stocks outperformed mid- and small-caps. |
What hurt the 1290 Retirement Funds performance since inception?
| • | | From a relative standpoint, bonds were a drag on performance. Only the higher-yielding and ‘riskier’ bond markets produced more than modest returns. |
| | | | |
| Table by Asset Class (as a percentage of Total Investments in Securities) | |
| As of October 31, 2017 | | | |
Equity | | | 83.6 | % |
Fixed Income | | | 16.4 | |
104
1290 RETIREMENT 2040 FUND (Unaudited)
| | | | |
| Top 10 Holdings (as a percentage of Total Investments in Securities) | |
| As of October 31, 2017 | | | |
iShares Core S&P Total US Stock Market Fund | | | 29.0 | % |
iShares Core U.S. Aggregate Bond Fund | | | 14.1 | |
iShares Core MSCI EAFE Fund | | | 10.5 | |
iShares Edge MSCI Min Vol USA Fund | | | 9.5 | |
PowerShares S&P 500 Low Volatility Portfolio | | | 9.5 | |
iShares Edge MSCI Min Vol EAFE Fund | | | 5.3 | |
PowerShares S&P International Developed Low Volatility Portfolio | | | 5.3 | |
PowerShares S&P MidCap Low Volatility Portfolio | | | 5.0 | |
iShares Core MSCI Emerging Markets Fund | | | 2.6 | |
iShares TIPS Bond Fund | | | 2.3 | |
| | |
Holdings are subject to change without notice. | | | | |
UNDERSTANDING YOUR EXPENSES:
As a shareholder of the Fund, you incur two types of costs:
(1) transaction costs, including applicable sales charges and redemption fees; and (2) ongoing costs, including investment advisory fees, distribution and/or service (12b-1) fees and other Fund expenses. These examples are intended to help you understand your ongoing costs (in dollars) of investing in the Fund and to compare these costs with the ongoing costs of investing in other mutual funds.
The examples are based on an investment of $1,000 invested at the beginning of the six-month period ended October 31, 2017 and held for the entire six-month period.
Actual Expenses
The first line of the following table provides information about actual account values and actual expenses. You may use the information in this line, together with the amount you invested, to estimate the expenses that you paid over the period. Simply divide your account value by $1,000 (for example, an $8,600 account value divided by $1,000 = 8.6), then multiply the result by the number in the first line under the heading entitled “Expenses Paid During Period” to estimate the expenses you paid on your account during this period.
Hypothetical Example for Comparison Purposes
The second line of the following table provides information about hypothetical account values and hypothetical expenses based on the Fund’s actual expense ratio and an assumed rate of return of 5% per year before expenses, which is not the Fund’s actual return. The hypothetical account values and expenses may not be used to estimate the actual ending account balance or expenses you paid for the period. You may use this information to compare the ongoing costs of investing in the Fund and other funds. To do so, compare this 5% hypothetical example with the 5% hypothetical examples that appear in the shareholder reports of the other funds.
Please note that the expenses shown in the table are meant to highlight your ongoing costs only and do not reflect any transactional costs, such as sales charges (loads), redemption fees, or exchange fees. Therefore, the second line of the table is useful in comparing ongoing costs only, and will not help you determine the relative total costs of owning different funds. In addition, if these transactional costs were included, your costs would have been higher.
EXAMPLE
| | | | | | | | | | | | |
| | | Beginning
Account
Value
5/1/17 | | | Ending
Account
Value
10/31/17 | | | Expenses Paid During Period*
5/1/17 - 10/31/17 | |
Class I | |
Actual | | | $1,000.00 | | | | $1,070.80 | | | | $2.75 | |
Hypothetical (5% average annual return before expenses) | | | 1,000.00 | | | | 1,022.55 | | | | 2.69 | |
* Expenses are equal to the Fund’s Class I shares annualized expense ratio of 0.53%, multiplied by the average account value over the period, and multiplied by 184/365 (to reflect the one-half year period). | |
105
1290 FUNDS
1290 RETIREMENT 2040 FUND
PORTFOLIO OF INVESTMENTS
October 31, 2017
| | | | | | | | |
| | | Number of
Shares | | | Value
(Note 1) | |
| | | | | | | | |
EXCHANGE TRADED FUNDS (ETF): | |
iShares Core MSCI EAFE Fund | | | 4,350 | | | $ | 283,838 | |
iShares Core MSCI Emerging Markets Fund | | | 1,250 | | | | 69,725 | |
iShares Core S&P Total US Stock Market Fund | | | 13,380 | | | | 788,349 | |
iShares Core U.S. Aggregate Bond Fund | | | 3,480 | | | | 380,955 | |
iShares Edge MSCI Min Vol EAFE Fund | | | 2,010 | | | | 144,278 | |
iShares Edge MSCI Min Vol Emerging Markets Fund | | | 560 | | | | 33,146 | |
iShares Edge MSCI Min Vol USA Fund | | | 5,030 | | | | 258,140 | |
iShares TIPS Bond Fund | | | 550 | | | | 62,590 | |
PowerShares S&P 500 Low Volatility Portfolio | | | 5,530 | | | | 257,311 | |
| | | | | | | | |
PowerShares S&P Emerging Markets Low Volatility Portfolio | | | 1,300 | | | | 31,980 | |
PowerShares S&P International Developed Low Volatility Portfolio | | | 4,280 | | | | 142,481 | |
PowerShares S&P MidCap Low Volatility Portfolio | | | 3,020 | | | | 135,991 | |
PowerShares S&P SmallCap Low Volatility Portfolio | | | 1,340 | | | | 62,243 | |
SPDR SSGA US Small Cap Low Volatility Index Fund | | | 620 | | | | 59,588 | |
| | | | | | | | |
Total Investments in Securities (99.6%)
(Cost $2,517,394) | | | | | | | 2,710,615 | |
Other Assets Less Liabilities (0.4%) | | | | | | | 11,668 | |
| | | | | |
Net Assets (100%) | | | | | | $ | 2,722,283 | |
| | | | | | | | |
The following is a summary of the inputs used to value the Fund’s assets and liabilities carried at fair value as of October 31, 2017:
The inputs or methodology used for valuing securities are not necessarily an indication of the risk associated with investing in those securities.
Various inputs are used in determining the value of the Fund’s investments. These inputs are summarized in the three broad levels listed below:
| | | | | | | | | | | | | | | | |
| | | | | |
| Investment Type | | Level 1
Quoted Prices in
Active Markets for
Identical
Securities | | | Level 2
Significant Other
Observable Inputs
(including quoted prices
for similar securities,
interest rates,
prepayment speeds,
credit risk, etc.) | | | Level 3
Significant Unobservable
Inputs (including the
Fund’s own
assumptions in
determining the fair
value of investments) | | | Total | |
Assets: | | | | | | | | | | | | | | | | |
Exchange Traded Funds | | | | | | | | | | | | | | | | |
Exchange Traded Funds | | $ | 2,710,615 | | | $ | — | | | $ | — | | | $ | 2,710,615 | |
| | | | | | | | | | | | | | | | |
Total Assets | | $ | 2,710,615 | | | $ | — | | | $ | — | | | $ | 2,710,615 | |
| | | | | | | | | | | | | | | | |
Total Liabilities | | $ | — | | | $ | — | | | $ | — | | | $ | — | |
| | | | | | | | | | | | | | | | |
Total | | $ | 2,710,615 | | | $ | — | | | $ | — | | | $ | 2,710,615 | |
| | | | | | | | | | | | | | | | |
There were no transfers between Levels 1, 2 or 3 during the period ended October 31, 2017.
The Fund held no derivatives contracts during the period ended October 31, 2017.
Investment security transactions for the period ended October 31, 2017 were as follows:
| | | | |
Cost of Purchases: | | | | |
Long-term investments other than U.S. government debt securities | | $ | 2,531,446 | |
Net Proceeds of Sales and Redemptions: | | | | |
Long-term investments other than U.S. government debt securities | | $ | 15,553 | |
See Notes to Financial Statements.
106
1290 FUNDS
1290 RETIREMENT 2040 FUND
PORTFOLIO OF INVESTMENTS (Continued)
October 31, 2017
As of October 31, 2017, the gross unrealized appreciation (depreciation) of investments based on the aggregate cost of investments in securities and derivative instruments, if applicable, for Federal income tax purposes was as follows:
| | | | |
Aggregate gross unrealized appreciation | | $ | 193,693 | |
Aggregate gross unrealized depreciation | | | (472 | ) |
| | | | |
Net unrealized appreciation | | $ | 193,221 | |
| | | | |
Federal income tax cost of investments in securities and derivative instruments, if applicable | | $ | 2,517,394 | |
| | | | |
See Notes to Financial Statements.
107
1290 FUNDS
1290 RETIREMENT 2040 FUND
STATEMENT OF ASSETS AND LIABILITIES
October 31, 2017
| | | | |
ASSETS | |
Investments in Securities, at value (Cost $2,517,394) | | $ | 2,710,615 | |
Cash | | | 5,888 | |
Prepaid registration and filing fees | | | 22,287 | |
Receivable from investment adviser | | | 15,828 | |
Deferred offering cost | | | 3,393 | |
Other assets | | | 35 | |
| | | | |
Total assets | | | 2,758,046 | |
| | | | |
LIABILITIES | |
Accrued audit fee | | | 32,740 | |
Transfer agent fees payable | | | 713 | |
Trustees’ fees payable | | | 23 | |
Accrued expenses | | | 2,287 | |
| | | | |
Total liabilities | | | 35,763 | |
| | | | |
NET ASSETS | | $ | 2,722,283 | |
| | | | |
Net assets were comprised of: | |
Paid in capital | | $ | 2,499,878 | |
Accumulated undistributed net investment income (loss) | | | 27,683 | |
Accumulated undistributed net realized gain (loss) | | | 1,501 | |
Net unrealized appreciation (depreciation) | | | 193,221 | |
| | | | |
Net assets | | $ | 2,722,283 | |
| | | | |
Class I | | | | |
Net asset value and redemption price per share, $2,722,283 / 250,010 shares outstanding (unlimited amount authorized: $0.001 par value) | | $ | 10.89 | |
| | | | |
STATEMENT OF OPERATIONS
For the Period Ended October 31, 2017*
| | | | |
INVESTMENT INCOME | |
Dividends | | $ | 36,625 | |
Interest | | | 53 | |
| | | | |
Total income | | | 36,678 | |
| | | | |
EXPENSES | |
Professional fees | | | 48,874 | |
Administrative fees | | | 20,219 | |
Registration and filing fees | | | 8,817 | |
Investment advisory fees | | | 8,762 | |
Offering costs | | | 7,013 | |
Transfer agent fees | | | 4,149 | |
Printing and mailing expenses | | | 2,194 | |
Custodian fees | | | 1,410 | |
Trustees’ fees | | | 233 | |
Miscellaneous | | | 3,969 | |
| | | | |
Gross expenses | | | 105,640 | |
Less: Waiver from investment adviser | | | (28,981 | ) |
Reimbursement from investment adviser | | | (67,442 | ) |
| | | | |
Net expenses | | | 9,217 | |
| | | | |
NET INVESTMENT INCOME (LOSS) | | | 27,461 | |
| | | | |
REALIZED AND UNREALIZED GAIN (LOSS) | |
Net realized gain (loss) on investments in securities | | | 1,501 | |
Net change in unrealized appreciation (depreciation) on investments in securities | | | 193,221 | |
| | | | |
NET REALIZED AND UNREALIZED GAIN (LOSS) | | | 194,722 | |
| | | | |
NET INCREASE (DECREASE) IN NET ASSETS RESULTING FROM OPERATIONS | | $ | 222,183 | |
| | | | |
| * | The Fund commenced operations on February 27, 2017. |
| | | | |
| STATEMENT OF CHANGES IN NET ASSETS | | February 27, 2017* to
October 31, 2017 | |
INCREASE (DECREASE) IN NET ASSETS FROM OPERATIONS: | |
Net investment income (loss) | | $ | 27,461 | |
Net realized gain (loss) | | | 1,501 | |
Net change in unrealized appreciation (depreciation) | | | 193,221 | |
| | | | |
NET INCREASE (DECREASE) IN NET ASSETS RESULTING FROM OPERATIONS | | | 222,183 | |
| | | | |
CAPITAL SHARES TRANSACTIONS: | | | | |
Class I | | | | |
Capital shares sold [ 250,010 shares] | | | 2,500,100 | |
| | | | |
NET INCREASE (DECREASE) IN NET ASSETS RESULTING FROM CAPITAL SHARE TRANSACTIONS | | | 2,500,100 | |
| | | | |
TOTAL INCREASE (DECREASE) IN NET ASSETS | | | 2,722,283 | |
NET ASSETS: | |
Beginning of period | | | — | |
| | | | |
End of period (a) | | $ | 2,722,283 | |
| | | | |
(a) Includes accumulated undistributed (overdistributed) net investment income (loss) of | | $ | 27,683 | |
| | | | |
* The Fund commenced operations on February 27, 2017. | | | | |
See Notes to Financial Statements.
108
1290 FUNDS
1290 RETIREMENT 2040 FUND
FINANCIAL HIGHLIGHTS
| | | | |
| Class I | | February 27, 2017* to
October 31, 2017 | |
Net asset value, beginning of period | | $ | 10.00 | |
| | | | |
Income (loss) from investment operations: | | | | |
Net investment income (loss) (e)(x) | | | 0.11 | |
Net realized and unrealized gain (loss) | | | 0.78 | |
| | | | |
Total from investment operations | | | 0.89 | |
| | | | |
Net asset value, end of period | | $ | 10.89 | |
| | | | |
Total return (b) | | | 8.90 | % |
| | | | |
Ratios/Supplemental Data: | | | | |
Net assets, end of period (000’s) | | $ | 2,722 | |
Ratio of expenses to average net assets: | | | | |
After waivers and reimbursements (a)(f) | | | 0.53 | %(j) |
Before waivers and reimbursements (a)(f) | | | 5.28 | % |
Ratio of net investment income (loss) to average net assets: | | | | |
After waivers and reimbursements (a)(f)(x) | | | 1.57 | %(l) |
Before waivers and reimbursements (a)(f)(x) | | | (3.18 | )%(l) |
Portfolio turnover rate (z)^ | | | 1 | % |
| * | Commencement of Operations. |
| ^ | Portfolio turnover rate excludes derivatives, if any. |
| (a) | Ratios for periods less than one year are annualized. Certain non-recurring expenses incurred by the Fund are not annualized for periods less than one year. |
| (b) | Total returns for periods less than one year are not annualized. |
| (e) | Net investment income (loss) per share is based on average shares outstanding. |
| (f) | Expenses do not include the expenses of the underlying funds (“indirect expenses”), if applicable. |
| (j) | Including direct and indirect expenses, the net expense ratio after waivers and reimbursements would be 0.65%. |
| (l) | The annualized ratio of net investment income to average net assets may not be indicative of operating results for a full year. |
| (x) | Recognition of net investment income is affected by the timing of dividend declarations by the underlying funds in which the Fund invests. |
| (z) | Portfolio turnover rate for periods less than one year is not annualized. |
See Notes to Financial Statements.
109
1290 RETIREMENT 2045 FUND (Unaudited)
INVESTMENT ADVISER
PERFORMANCE RESULTS

| | | | |
| Total Returns as of 10/31/17 | | | |
| | | Since
Incept. | |
Fund – Class I Shares* | | | 9.30 | % |
S&P Target Date 2045 Index | | | 10.41 | |
* Date of inception 2/27/17. Returns for periods less than one year are not annualized. | | | | |
The performance quoted is past performance and is not a guarantee of future results. Mutual funds are subject to certain market risks. Investment returns and principal value of an investment will fluctuate so that an investor’s shares, when redeemed, may be worth more or less than their original cost. Current performance may be higher or lower than the performance data shown. For the most current month-end performance data please call 1-888-310-0416 or visit www.1290Funds.com.
The graph illustrates comparative performance for $10,000 invested in the Class I Shares of the 1290 Retirement 2045 Fund and the S&P Target Date 2045 Index from 2/27/17 to 10/31/17. The performance of the S&P Target Date 2045 Index reflects an initial investment at the end of the month closest to the Fund’s inception. The performance of the Fund assumes reinvestment of all dividends and capital gain distributions, if any, and does not include a sales charge. The performance of the S&P Target Date 2045 Index does not reflect the deduction of expenses or a sales charge associated with a mutual fund and has been adjusted to reflect reinvestment of all dividends, capital gain distributions, and interest of the securities included in the benchmark.
Fund performance may reflect the waiver of the Fund’s fees and reimbursement of expenses for certain periods since the inception date. Without these waivers and reimbursements, performance would have been lower. Also, performance shown in this section does not reflect the deduction of taxes that a shareholder would pay on Fund distributions or redemption of Fund shares.
PERFORMANCE SUMMARY
The Fund’s Class I shares returned 9.30% for the period ended October 31, 2017. The Fund’s benchmark, the S&P Target Date 2045 Index, returned 10.41% over the same period.
Overview
The Allocations Drive Performance
Each 1290 Retirement Fund’s (as defined in the Notes to the Financial Statements) performance will reflect the performance of the underlying asset classes and depend upon their percentage weighting within the Fund. Here’s why:
The 1290 Retirement Funds are managed to target a specific year of planned retirement. The asset mix will become more conservative each year, until about 10 years after the target retirement year, when it will become relatively stable. The 1290 Retirement Funds balance the need for appreciation with the need for income as retirement approaches, and focus on supporting an income stream over a long-term retirement withdrawal horizon.
To achieve its exposures, each 1290 Retirement Fund invests in ETFs representing various equity and bond asset classes. So the 1290 Retirement Funds’ performance will be a function of the asset class performance and the percentage weighting of each in the 1290 Retirement Funds. Current target and actual allocations, as well as performance, are available in an accompanying quarterly Fund Fact Sheet.
What helped the 1290 Retirement Funds performance since inception?
All of the holdings contributed positively to returns since inception of the 1290 Retirement Funds on 3/1/2017.
| • | | Emerging market and international equities were the strongest performers. |
| • | | Among U.S. equities, large-cap stocks outperformed mid- and small-caps. |
What hurt the 1290 Retirement Funds performance since inception?
| • | | From a relative standpoint, bonds were a drag on performance. Only the higher-yielding and ‘riskier’ bond markets produced more than modest returns. |
| | | | |
| Table by Asset Class (as a percentage of Total Investments in Securities) | |
| As of October 31, 2017 | | | |
Equity | | | 88.4 | % |
Fixed Income | | | 11.6 | |
110
1290 RETIREMENT 2045 FUND (Unaudited)
| | | | |
| Top 10 Holdings (as a percentage of Total Investments in Securities) | |
| As of October 31, 2017 | | | |
iShares Core S&P Total US Stock Market Fund | | | 31.0 | % |
iShares Core MSCI EAFE Fund | | | 10.9 | |
iShares Edge MSCI Min Vol USA Fund | | | 10.1 | |
PowerShares S&P 500 Low Volatility Portfolio | | | 10.1 | |
iShares Core U.S. Aggregate Bond Fund | | | 9.9 | |
iShares Edge MSCI Min Vol EAFE Fund | | | 5.5 | |
PowerShares S&P International Developed Low Volatility Portfolio | | | 5.5 | |
PowerShares S&P MidCap Low Volatility Portfolio | | | 5.4 | |
iShares Core MSCI Emerging Markets Fund | | | 2.7 | |
PowerShares S&P SmallCap Low Volatility Portfolio | | | 2.4 | |
| | |
Holdings are subject to change without notice. | | | | |
UNDERSTANDING YOUR EXPENSES:
As a shareholder of the Fund, you incur two types of costs:
(1) transaction costs, including applicable sales charges and redemption fees; and (2) ongoing costs, including investment advisory fees, distribution and/or service (12b-1) fees and other Fund expenses. These examples are intended to help you understand your ongoing costs (in dollars) of investing in the Fund and to compare these costs with the ongoing costs of investing in other mutual funds.
The examples are based on an investment of $1,000 invested at the beginning of the six-month period ended October 31, 2017 and held for the entire six-month period.
Actual Expenses
The first line of the following table provides information about actual account values and actual expenses. You may use the information in this line, together with the amount you invested, to estimate the expenses that you paid over the period. Simply divide your account value by $1,000 (for example, an $8,600 account value divided by $1,000 = 8.6), then multiply the result by the number in the first line under the heading entitled “Expenses Paid During Period” to estimate the expenses you paid on your account during this period.
Hypothetical Example for Comparison Purposes
The second line of the following table provides information about hypothetical account values and hypothetical expenses based on the Fund’s actual expense ratio and an assumed rate of return of 5% per year before expenses, which is not the Fund’s actual return. The hypothetical account values and expenses may not be used to estimate the actual ending account balance or expenses you paid for the period. You may use this information to compare the ongoing costs of investing in the Fund and other funds. To do so, compare this 5% hypothetical example with the 5% hypothetical examples that appear in the shareholder reports of the other funds.
Please note that the expenses shown in the table are meant to highlight your ongoing costs only and do not reflect any transactional costs, such as sales charges (loads), redemption fees, or exchange fees. Therefore, the second line of the table is useful in comparing ongoing costs only, and will not help you determine the relative total costs of owning different funds. In addition, if these transactional costs were included, your costs would have been higher.
EXAMPLE
| | | | | | | | | | | | |
| | | Beginning
Account
Value
5/1/17 | | | Ending
Account
Value
10/31/17 | | | Expenses Paid During Period*
5/1/17 - 10/31/17 | |
Class I | |
Actual | | | $1,000.00 | | | | $1,074.70 | | | | $2.74 | |
Hypothetical (5% average annual return before expenses) | | | 1,000.00 | | | | 1,022.56 | | | | 2.67 | |
* Expenses are equal to the Fund’s Class I shares annualized expense ratio of 0.52%, multiplied by the average account value over the period, and multiplied by 184/365 (to reflect the one-half year period). | �� |
111
1290 FUNDS
1290 RETIREMENT 2045 FUND
PORTFOLIO OF INVESTMENTS
October 31, 2017
| | | | | | | | |
| | | Number of
Shares | | | Value
(Note 1) | |
| | | | | | | | |
EXCHANGE TRADED FUNDS (ETF): | |
iShares Core MSCI EAFE Fund | | | 4,570 | | | $ | 298,192 | |
iShares Core MSCI Emerging Markets Fund | | | 1,320 | | | | 73,630 | |
iShares Core S&P Total US Stock Market Fund | | | 14,370 | | | | 846,679 | |
iShares Core U.S. Aggregate Bond Fund | | | 2,460 | | | | 269,296 | |
iShares Edge MSCI Min Vol EAFE Fund | | | 2,100 | | | | 150,738 | |
iShares Edge MSCI Min Vol Emerging Markets Fund | | | 590 | | | | 34,922 | |
iShares Edge MSCI Min Vol USA Fund | | | 5,380 | | | | 276,102 | |
iShares TIPS Bond Fund | | | 400 | | | | 45,520 | |
PowerShares S&P 500 Low Volatility Portfolio | | | 5,920 | | | | 275,458 | |
| | | | | | | | |
PowerShares S&P Emerging Markets Low Volatility Portfolio | | | 1,370 | | | | 33,702 | |
PowerShares S&P International Developed Low Volatility Portfolio | | | 4,490 | | | | 149,472 | |
PowerShares S&P MidCap Low Volatility Portfolio | | | 3,250 | | | | 146,348 | |
PowerShares S&P SmallCap Low Volatility Portfolio | | | 1,410 | | | | 65,495 | |
SPDR SSGA US Small Cap Low Volatility Index Fund | | | 660 | | | | 63,433 | |
| | | | | | | | |
Total Investments in Securities (99.6%)
(Cost $2,524,259) | | | | | | | 2,728,987 | |
Other Assets Less Liabilities (0.4%) | | | | | | | 12,123 | |
| | | | | |
Net Assets (100%) | | | | | | $ | 2,741,110 | |
| | | | | | | | |
The following is a summary of the inputs used to value the Fund’s assets and liabilities carried at fair value as of October 31, 2017:
The inputs or methodology used for valuing securities are not necessarily an indication of the risk associated with investing in those securities.
Various inputs are used in determining the value of the Fund’s investments. These inputs are summarized in the three broad levels listed below:
| | | | | | | | | | | | | | | | |
| | | | | |
| Investment Type | | Level 1
Quoted Prices in
Active Markets for
Identical
Securities | | | Level 2
Significant Other
Observable Inputs
(including quoted prices
for similar securities,
interest rates,
prepayment speeds,
credit risk, etc.) | | | Level 3
Significant Unobservable
Inputs (including the
Fund’s own assumptions in
determining the fair
value of investments) | | | Total | |
Assets: | | | | | | | | | | | | | | | | |
Exchange Traded Funds | | | | | | | | | | | | | | | | |
Exchange Traded Funds | | $ | 2,728,987 | | | $ | — | | | $ | — | | | $ | 2,728,987 | |
| | | | | | | | | | | | | | | | |
Total Assets | | $ | 2,728,987 | | | $ | — | | | $ | — | | | $ | 2,728,987 | |
| | | | | | | | | | | | | | | | |
Total Liabilities | | $ | — | | | $ | — | | | $ | — | | | $ | — | |
| | | | | | | | | | | | | | | | |
Total | | $ | 2,728,987 | | | $ | — | | | $ | — | | | $ | 2,728,987 | |
| | | | | | | | | | | | | | | | |
There were no transfers between Levels 1, 2 or 3 during the period ended October 31, 2017.
The Fund held no derivatives contracts during the period ended October 31, 2017.
Investment security transactions for the period ended October 31, 2017 were as follows:
| | | | |
Cost of Purchases: | | | | |
Long-term investments other than U.S. government debt securities | | $ | 2,538,311 | |
Net Proceeds of Sales and Redemptions: | | | | |
Long-term investments other than U.S. government debt securities | | $ | 15,553 | |
See Notes to Financial Statements.
112
1290 FUNDS
1290 RETIREMENT 2045 FUND
PORTFOLIO OF INVESTMENTS (Continued)
October 31, 2017
As of October 31, 2017, the gross unrealized appreciation (depreciation) of investments based on the aggregate cost of investments in securities and derivative instruments, if applicable, for Federal income tax purposes was as follows:
| | | | |
Aggregate gross unrealized appreciation | | $ | 205,040 | |
Aggregate gross unrealized depreciation | | | (312 | ) |
| | | | |
Net unrealized appreciation | | $ | 204,728 | |
| | | | |
Federal income tax cost of investments in securities and derivative instruments, if applicable | | $ | 2,524,259 | |
| | | | |
See Notes to Financial Statements.
113
1290 FUNDS
1290 RETIREMENT 2045 FUND
STATEMENT OF ASSETS AND LIABILITIES
October 31, 2017
| | | | |
ASSETS | |
Investments in Securities, at value (Cost $2,524,259) | | $ | 2,728,987 | |
Cash | | | 6,416 | |
Prepaid registration and filing fees | | | 22,293 | |
Receivable from investment adviser | | | 15,930 | |
Deferred offering cost | | | 3,374 | |
Other assets | | | 35 | |
| | | | |
Total assets | | | 2,777,035 | |
| | | | |
LIABILITIES | |
Accrued audit fee | | | 32,740 | |
Transfer agent fees payable | | | 891 | |
Trustees’ fees payable | | | 23 | |
Accrued expenses | | | 2,271 | |
| | | | |
Total liabilities | | | 35,925 | |
| | | | |
NET ASSETS | | $ | 2,741,110 | |
| | | | |
Net assets were comprised of: | |
Paid in capital | | $ | 2,507,377 | |
Accumulated undistributed net investment income (loss) | | | 27,504 | |
Accumulated undistributed net realized gain (loss) | | | 1,501 | |
Net unrealized appreciation (depreciation) | | | 204,728 | |
| | | | |
Net assets | | $ | 2,741,110 | |
| | | | |
Class I | | | | |
Net asset value and redemption price per share, $2,741,110 / 250,760 shares outstanding (unlimited amount authorized: $0.001 par value) | | $ | 10.93 | |
| | | | |
STATEMENT OF OPERATIONS
For the Period Ended October 31, 2017*
| | | | |
INVESTMENT INCOME | |
Dividends | | $ | 36,447 | |
Interest | | | 53 | |
| | | | |
Total income | | | 36,500 | |
| | | | |
EXPENSES | |
Professional fees | | | 48,886 | |
Administrative fees | | | 20,219 | |
Registration and filing fees | | | 8,818 | |
Investment advisory fees | | | 8,799 | |
Offering costs | | | 6,972 | |
Transfer agent fees | | | 4,749 | |
Printing and mailing expenses | | | 2,198 | |
Custodian fees | | | 1,400 | |
Trustees’ fees | | | 234 | |
Miscellaneous | | | 3,967 | |
| | | | |
Gross expenses | | | 106,242 | |
Less: Waiver from investment adviser | | | (29,018 | ) |
Reimbursement from investment adviser | | | (68,005 | ) |
| | | | |
Net expenses | | | 9,219 | |
| | | | |
NET INVESTMENT INCOME (LOSS) | | | 27,281 | |
| | | | |
REALIZED AND UNREALIZED GAIN (LOSS) | |
Net realized gain (loss) on investments in securities | | | 1,501 | |
Net change in unrealized appreciation (depreciation) on investments in securities | | | 204,728 | |
| | | | |
NET REALIZED AND UNREALIZED GAIN (LOSS) | | | 206,229 | |
| | | | |
NET INCREASE (DECREASE) IN NET ASSETS RESULTING FROM OPERATIONS | | $ | 233,510 | |
| | | | |
| * | The Fund commenced operations on February 27, 2017. |
| | | | |
| STATEMENT OF CHANGES IN NET ASSETS | | February 27, 2017* to
October 31, 2017 | |
INCREASE (DECREASE) IN NET ASSETS FROM OPERATIONS: | |
Net investment income (loss) | | $ | 27,281 | |
Net realized gain (loss) | | | 1,501 | |
Net change in unrealized appreciation (depreciation) | | | 204,728 | |
| | | | |
NET INCREASE (DECREASE) IN NET ASSETS RESULTING FROM OPERATIONS | | | 233,510 | |
| | | | |
CAPITAL SHARES TRANSACTIONS: | | | | |
Class I | | | | |
Capital shares sold [ 250,760 shares] | | | 2,507,600 | |
| | | | |
NET INCREASE (DECREASE) IN NET ASSETS RESULTING FROM CAPITAL SHARE TRANSACTIONS | | | 2,507,600 | |
| | | | |
TOTAL INCREASE (DECREASE) IN NET ASSETS | | | 2,741,110 | |
NET ASSETS: | |
Beginning of period | | | — | |
| | | | |
End of period (a) | | $ | 2,741,110 | |
| | | | |
(a) Includes accumulated undistributed (overdistributed) net investment income (loss) of | | $ | 27,504 | |
| | | | |
* The Fund commenced operations on February 27, 2017. | | | | |
See Notes to Financial Statements.
114
1290 FUNDS
1290 RETIREMENT 2045 FUND
FINANCIAL HIGHLIGHTS
| | | | |
| Class I | | February 27, 2017* to
October 31, 2017 | |
Net asset value, beginning of period | | $ | 10.00 | |
| | | | |
Income (loss) from investment operations: | | | | |
Net investment income (loss) (e)(x) | | | 0.11 | |
Net realized and unrealized gain (loss) | | | 0.82 | |
| | | | |
Total from investment operations | | | 0.93 | |
| | | | |
Net asset value, end of period | | $ | 10.93 | |
| | | | |
Total return (b) | | | 9.30 | % |
| | | | |
Ratios/Supplemental Data: | | | | |
Net assets, end of period (000’s) | | $ | 2,741 | |
Ratio of expenses to average net assets: | | | | |
After waivers and reimbursements (a)(f) | | | 0.52 | %(j) |
Before waivers and reimbursements (a)(f) | | | 5.29 | % |
Ratio of net investment income (loss) to average net assets: | | | | |
After waivers and reimbursements (a)(f)(x) | | | 1.55 | %(l) |
Before waivers and reimbursements (a)(f)(x) | | | (3.22 | )%(l) |
Portfolio turnover rate (z)^ | | | 1 | % |
| * | Commencement of Operations. |
| ^ | Portfolio turnover rate excludes derivatives, if any. |
| (a) | Ratios for periods less than one year are annualized. Certain non-recurring expenses incurred by the Fund are not annualized for periods less than one year. |
| (b) | Total returns for periods less than one year are not annualized. |
| (e) | Net investment income (loss) per share is based on average shares outstanding. |
| (f) | Expenses do not include the expenses of the underlying funds (“indirect expenses”), if applicable. |
| (j) | Including direct and indirect expenses, the net expense ratio after waivers and reimbursements would be 0.65%. |
| (l) | The annualized ratio of net investment income to average net assets may not be indicative of operating results for a full year. |
| (x) | Recognition of net investment income is affected by the timing of dividend declarations by the underlying funds in which the Fund invests. |
| (z) | Portfolio turnover rate for periods less than one year is not annualized. |
See Notes to Financial Statements.
115
1290 RETIREMENT 2050 FUND (Unaudited)
INVESTMENT ADVISER
PERFORMANCE RESULTS

| | | | |
| Total Returns as of 10/31/17 | | | |
| | | Since
Incept. | |
Fund – Class I Shares* | | | 9.80 | % |
S&P Target Date 2050 Index | | | 10.68 | |
* Date of inception 2/27/17. Returns for periods less than one year are not annualized. | | | | |
The performance quoted is past performance and is not a guarantee of future results. Mutual funds are subject to certain market risks. Investment returns and principal value of an investment will fluctuate so that an investor’s shares, when redeemed, may be worth more or less than their original cost. Current performance may be higher or lower than the performance data shown. For the most current month-end performance data please call 1-888-310-0416 or visit www.1290Funds.com.
The graph illustrates comparative performance for $10,000 invested in the Class I Shares of the 1290 Retirement 2050 Fund and the S&P Target Date 2050 Index from 2/27/17 to 10/31/17. The performance of the S&P Target Date 2050 Index reflects an initial investment at the end of the month closest to the Fund’s inception. The performance of the Fund assumes reinvestment of all dividends and capital gain distributions, if any, and does not include a sales charge. The performance of the S&P Target Date 2050 Index does not reflect the deduction of expenses or a sales charge associated with a mutual fund and has been adjusted to reflect reinvestment of all dividends, capital gain distributions, and interest of the securities included in the benchmark.
Fund performance may reflect the waiver of the Fund’s fees and reimbursement of expenses for certain periods since the inception date. Without these waivers and reimbursements, performance would have been lower. Also, performance shown in this section does not reflect the deduction of taxes that a shareholder would pay on Fund distributions or redemption of Fund shares.
PERFORMANCE SUMMARY
The Fund’s Class I shares returned 9.80% for the period ended October 31, 2017. The Fund’s benchmark, the S&P Target Date 2050 Index, returned 10.68% over the same period.
Overview
The Allocations Drive Performance
Each 1290 Retirement Fund’s (as defined in the Notes to the Financial Statements) performance will reflect the performance of the underlying asset classes and depend upon their percentage weighting within the Fund. Here’s why:
The 1290 Retirement Funds are managed to target a specific year of planned retirement. The asset mix will become more conservative each year, until about 10 years after the target retirement year, when it will become relatively stable. The 1290 Retirement Funds balance the need for appreciation with the need for income as retirement approaches, and focus on supporting an income stream over a long-term retirement withdrawal horizon.
To achieve its exposures, each 1290 Retirement Fund invests in ETFs representing various equity and bond asset classes. So the 1290 Retirement Funds’ performance will be a function of the asset class performance and the percentage weighting of each in the 1290 Retirement Funds. Current target and actual allocations, as well as performance, are available in an accompanying quarterly Fund Fact Sheet.
What helped the 1290 Retirement Funds performance since inception?
All of the holdings contributed positively to returns since inception of the 1290 Retirement Funds on 3/1/2017.
| • | | Emerging market and international equities were the strongest performers. |
| • | | Among U.S. equities, large-cap stocks outperformed mid- and small-caps. |
What hurt the 1290 Retirement Funds performance since inception?
| • | | From a relative standpoint, bonds were a drag on performance. Only the higher-yielding and ‘riskier’ bond markets produced more than modest returns. |
| | | | |
| Table by Asset Class (as a percentage of Total Investments in Securities) | |
| As of October 31, 2017 | | | |
Equity | | | 93.3 | % |
Fixed Income | | | 6.7 | |
116
1290 RETIREMENT 2050 FUND (Unaudited)
| | | | |
| Top 10 Holdings (as a percentage of Total Investments in Securities) | |
| As of October 31, 2017 | | | |
iShares Core S&P Total US Stock Market Fund | | | 32.8 | % |
iShares Core MSCI EAFE Fund | | | 11.6 | |
iShares Edge MSCI Min Vol USA Fund | | | 10.7 | |
PowerShares S&P 500 Low Volatility Portfolio | | | 10.7 | |
iShares Edge MSCI Min Vol EAFE Fund | | | 5.8 | |
PowerShares S&P International Developed Low Volatility Portfolio | | | 5.8 | |
iShares Core U.S. Aggregate Bond Fund | | | 5.7 | |
PowerShares S&P MidCap Low Volatility Portfolio | | | 5.6 | |
iShares Core MSCI Emerging Markets Fund | | | 2.8 | |
PowerShares S&P SmallCap Low Volatility Portfolio | | | 2.5 | |
| | |
Holdings are subject to change without notice. | | | | |
UNDERSTANDING YOUR EXPENSES:
As a shareholder of the Fund, you incur two types of costs:
(1) transaction costs, including applicable sales charges and redemption fees; and (2) ongoing costs, including investment advisory fees, distribution and/or service (12b-1) fees and other Fund expenses. These examples are intended to help you understand your ongoing costs (in dollars) of investing in the Fund and to compare these costs with the ongoing costs of investing in other mutual funds.
The examples are based on an investment of $1,000 invested at the beginning of the six-month period ended October 31, 2017 and held for the entire six-month period.
Actual Expenses
The first line of the following table provides information about actual account values and actual expenses. You may use the information in this line, together with the amount you invested, to estimate the expenses that you paid over the period. Simply divide your account value by $1,000 (for example, an $8,600 account value divided by $1,000 = 8.6), then multiply the result by the number in the first line under the heading entitled “Expenses Paid During Period” to estimate the expenses you paid on your account during this period.
Hypothetical Example for Comparison Purposes
The second line of the following table provides information about hypothetical account values and hypothetical expenses based on the Fund’s actual expense ratio and an assumed rate of return of 5% per year before expenses, which is not the Fund’s actual return. The hypothetical account values and expenses may not be used to estimate the actual ending account balance or expenses you paid for the period. You may use this information to compare the ongoing costs of investing in the Fund and other funds. To do so, compare this 5% hypothetical example with the 5% hypothetical examples that appear in the shareholder reports of the other funds.
Please note that the expenses shown in the table are meant to highlight your ongoing costs only and do not reflect any transactional costs, such as sales charges (loads), redemption fees, or exchange fees. Therefore, the second line of the table is useful in comparing ongoing costs only, and will not help you determine the relative total costs of owning different funds. In addition, if these transactional costs were included, your costs would have been higher.
EXAMPLE
| | | | | | | | | | | | |
| | | Beginning
Account
Value
5/1/17 | | | Ending
Account
Value
10/31/17 | | | Expenses Paid During Period*
5/1/17 - 10/31/17 | |
Class I | |
Actual | | | $1,000.00 | | | | $1,078.60 | | | | $2.73 | |
Hypothetical (5% average annual return before expenses) | | | 1,000.00 | | | | 1,022.58 | | | | 2.66 | |
* Expenses are equal to the Fund’s Class I shares annualized expense ratio of 0.52%, multiplied by the average account value over the period, and multiplied by 184/365 (to reflect the one-half year period). | |
117
1290 FUNDS
1290 RETIREMENT 2050 FUND
PORTFOLIO OF INVESTMENTS
October 31, 2017
| | | | | | | | |
| | | Number of
Shares | | | Value
(Note 1) | |
| | | | | | | | |
EXCHANGE TRADED FUNDS (ETF): | |
iShares Core MSCI EAFE Fund | | | 4,830 | | | $ | 315,157 | |
iShares Core MSCI Emerging Markets Fund | | | 1,390 | | | | 77,534 | |
iShares Core S&P Total US Stock Market Fund | | | 15,180 | | | | 894,405 | |
iShares Core U.S. Aggregate Bond Fund | | | 1,430 | | | | 156,542 | |
iShares Edge MSCI Min Vol EAFE Fund | | | 2,220 | | | | 159,352 | |
iShares Edge MSCI Min Vol Emerging Markets Fund | | | 620 | | | | 36,698 | |
iShares Edge MSCI Min Vol USA Fund | | | 5,690 | | | | 292,010 | |
iShares TIPS Bond Fund | | | 230 | | | | 26,174 | |
PowerShares S&P 500 Low Volatility Portfolio | | | 6,270 | | | | 291,743 | |
| | | | | | | | |
PowerShares S&P Emerging Markets Low Volatility Portfolio | | | 1,450 | | | | 35,670 | |
PowerShares S&P International Developed Low Volatility Portfolio | | | 4,730 | | | | 157,462 | |
PowerShares S&P MidCap Low Volatility Portfolio | | | 3,420 | | | | 154,003 | |
PowerShares S&P SmallCap Low Volatility Portfolio | | | 1,490 | | | | 69,211 | |
SPDR SSGA US Small Cap Low Volatility Index Fund | | | 690 | | | | 66,316 | |
| | | | | | | | |
Total Investments in Securities (99.6%)
(Cost $2,517,056) | | | | | | | 2,732,277 | |
Other Assets Less Liabilities (0.4%) | | | | | | | 11,629 | |
| | | | | | | | |
Net Assets (100%) | | | | | | $ | 2,743,906 | |
| | | | | | | | |
The following is a summary of the inputs used to value the Fund’s assets and liabilities carried at fair value as of October 31, 2017:
The inputs or methodology used for valuing securities are not necessarily an indication of the risk associated with investing in those securities.
Various inputs are used in determining the value of the Fund’s investments. These inputs are summarized in the three broad levels listed below:
| | | | | | | | | | | | | | | | |
| | | | | |
| Investment Type | | Level 1
Quoted Prices in Active Markets for
Identical
Securities | | | Level 2
Significant Other
Observable Inputs
(including quoted prices
for similar securities,
interest rates,
prepayment speeds,
credit risk, etc.) | | | Level 3
Significant Unobservable
Inputs (including the
Fund’s own assumptions in
determining the fair
value of investments) | | | Total | |
Assets: | | | | | | | | | | | | | | | | |
Exchange Traded Funds | | | | | | | | | | | | | | | | |
Exchange Traded Funds | | $ | 2,732,277 | | | $ | — | | | $ | — | | | $ | 2,732,277 | |
| | | | | | | | | | | | | | | | |
Total Assets | | $ | 2,732,277 | | | $ | — | | | $ | — | | | $ | 2,732,277 | |
| | | | | | | | | | | | | | | | |
Total Liabilities | | $ | — | | | $ | — | | | $ | — | | | $ | — | |
| | | | | | | | | | | | | | | | |
Total | | $ | 2,732,277 | | | $ | — | | | $ | — | | | $ | 2,732,277 | |
| | | | | | | | | | | | | | | | |
There were no transfers between Levels 1, 2 or 3 during the period ended October 31, 2017.
The Fund held no derivatives contracts during the period ended October 31, 2017.
Investment security transactions for the period ended October 31, 2017 were as follows:
| | | | |
Cost of Purchases: | | | | |
Long-term investments other than U.S. government debt securities | | $ | 2,531,107 | |
Net Proceeds of Sales and Redemptions: | | | | |
Long-term investments other than U.S. government debt securities | | $ | 15,553 | |
See Notes to Financial Statements.
118
1290 FUNDS
1290 RETIREMENT 2050 FUND
PORTFOLIO OF INVESTMENTS (Continued)
October 31, 2017
As of October 31, 2017, the gross unrealized appreciation (depreciation) of investments based on the aggregate cost of investments in securities and derivative instruments, if applicable, for Federal income tax purposes was as follows:
| | | | |
Aggregate gross unrealized appreciation | | $ | 215,361 | |
Aggregate gross unrealized depreciation | | | (140 | ) |
| | | | |
Net unrealized appreciation | | $ | 215,221 | |
| | | | |
Federal income tax cost of investments in securities and derivative instruments, if applicable | | $ | 2,517,056 | |
| | | | |
See Notes to Financial Statements.
119
1290 FUNDS
1290 RETIREMENT 2050 FUND
STATEMENT OF ASSETS AND LIABILITIES
October 31, 2017
| | | | |
ASSETS | |
Investments in Securities, at value (Cost $2,517,056) | | $ | 2,732,277 | |
Cash | | | 5,867 | |
Prepaid registration and filing fees | | | 22,292 | |
Receivable from investment adviser | | | 15,832 | |
Deferred offering cost | | | 3,369 | |
Other assets | | | 35 | |
| | | | |
Total assets | | | 2,779,672 | |
| | | | |
LIABILITIES | |
Accrued audit fee | | | 32,740 | |
Transfer agent fees payable | | | 713 | |
Trustees’ fees payable | | | 24 | |
Accrued expenses | | | 2,289 | |
| | | | |
Total liabilities | | | 35,766 | |
| | | | |
NET ASSETS | | $ | 2,743,906 | |
| | | | |
Net assets were comprised of: | |
Paid in capital | | $ | 2,499,880 | |
Accumulated undistributed net investment income (loss) | | | 27,303 | |
Accumulated undistributed net realized gain (loss) | | | 1,502 | |
Net unrealized appreciation (depreciation) | | | 215,221 | |
| | | | |
Net assets | | $ | 2,743,906 | |
| | | | |
Class I | | | | |
Net asset value and redemption price per share, $2,743,906 / 250,009 shares outstanding (unlimited amount authorized: $0.001 par value) | | $ | 10.98 | |
| | | | |
STATEMENT OF OPERATIONS
For the Period Ended October 31, 2017*
| | | | |
INVESTMENT INCOME | |
Dividends | | $ | 36,191 | |
Interest | | | 52 | |
| | | | |
Total income | | | 36,243 | |
| | | | |
EXPENSES | |
Professional fees | | | 48,883 | |
Administrative fees | | | 20,220 | |
Registration and filing fees | | | 8,817 | |
Investment advisory fees | | | 8,790 | |
Offering costs | | | 6,964 | |
Transfer agent fees | | | 4,149 | |
Printing and mailing expenses | | | 2,197 | |
Custodian fees | | | 1,410 | |
Trustees’ fees | | | 234 | |
Miscellaneous | | | 3,968 | |
| | | | |
Gross expenses | | | 105,632 | |
Less: Waiver from investment adviser | | | (29,010 | ) |
Reimbursement from investment adviser | | | (67,462 | ) |
| | | | |
Net expenses | | | 9,160 | |
| | | | |
NET INVESTMENT INCOME (LOSS) | | | 27,083 | |
| | | | |
REALIZED AND UNREALIZED GAIN (LOSS) | |
Net realized gain (loss) on investments in securities | | | 1,502 | |
Net change in unrealized appreciation (depreciation) on investments in securities | | | 215,221 | |
| | | | |
NET REALIZED AND UNREALIZED GAIN (LOSS) | | | 216,723 | |
| | | | |
NET INCREASE (DECREASE) IN NET ASSETS RESULTING FROM OPERATIONS | | $ | 243,806 | |
| | | | |
| * | The Fund commenced operations on February 27, 2017. |
| | | | |
| STATEMENT OF CHANGES IN NET ASSETS | | February 27, 2017* to
October 31, 2017 | |
INCREASE (DECREASE) IN NET ASSETS FROM OPERATIONS: | |
Net investment income (loss) | | $ | 27,083 | |
Net realized gain (loss) | | | 1,502 | |
Net change in unrealized appreciation (depreciation) | | | 215,221 | |
| | | | |
NET INCREASE (DECREASE) IN NET ASSETS RESULTING FROM OPERATIONS | | | 243,806 | |
| | | | |
CAPITAL SHARES TRANSACTIONS: | | | | |
Class I | | | | |
Capital shares sold [ 250,009 shares] | | | 2,500,100 | |
| | | | |
NET INCREASE (DECREASE) IN NET ASSETS RESULTING FROM CAPITAL SHARE TRANSACTIONS | | | 2,500,100 | |
| | | | |
TOTAL INCREASE (DECREASE) IN NET ASSETS | | | 2,743,906 | |
NET ASSETS: | |
Beginning of period | | | — | |
| | | | |
End of period (a) | | $ | 2,743,906 | |
| | | | |
(a) Includes accumulated undistributed (overdistributed) net investment income (loss) of | | $ | 27,303 | |
| | | | |
* The Fund commenced operations on February 27, 2017. | | | | |
See Notes to Financial Statements.
120
1290 FUNDS
1290 RETIREMENT 2050 FUND
FINANCIAL HIGHLIGHTS
| | | | |
| Class I | | February 27, 2017* to October 31, 2017 | |
Net asset value, beginning of period | | $ | 10.00 | |
| | | | |
Income (loss) from investment operations: | | | | |
Net investment income (loss) (e)(x) | | | 0.11 | |
Net realized and unrealized gain (loss) | | | 0.87 | |
| | | | |
Total from investment operations | | | 0.98 | |
| | | | |
Net asset value, end of period | | $ | 10.98 | |
| | | | |
Total return (b) | | | 9.80 | % |
| | | | |
Ratios/Supplemental Data: | | | | |
Net assets, end of period (000’s) | | $ | 2,744 | |
Ratio of expenses to average net assets: | | | | |
After waivers and reimbursements (a)(f) | | | 0.52 | %(j) |
Before waivers and reimbursements (a)(f) | | | 5.26 | % |
Ratio of net investment income (loss) to average net assets: | | | | |
After waivers and reimbursements (a)(f)(x) | | | 1.54 | %(l) |
Before waivers and reimbursements (a)(f)(x) | | | (3.20 | )%(l) |
Portfolio turnover rate (z)^ | | | 1 | % |
| * | Commencement of Operations. |
| ^ | Portfolio turnover rate excludes derivatives, if any. |
| (a) | Ratios for periods less than one year are annualized. Certain non-recurring expenses incurred by the Fund are not annualized for periods less than one year. |
| (b) | Total returns for periods less than one year are not annualized. |
| (e) | Net investment income (loss) per share is based on average shares outstanding. |
| (f) | Expenses do not include the expenses of the underlying funds (“indirect expenses”), if applicable. |
| (j) | Including direct and indirect expenses, the net expense ratio after waivers and reimbursements would be 0.65%. |
| (l) | The annualized ratio of net investment income to average net assets may not be indicative of operating results for a full year. |
| (x) | Recognition of net investment income is affected by the timing of dividend declarations by the underlying funds in which the Fund invests. |
| (z) | Portfolio turnover rate for periods less than one year is not annualized. |
See Notes to Financial Statements.
121
1290 RETIREMENT 2055 FUND (Unaudited)
INVESTMENT ADVISER
PERFORMANCE RESULTS

| | | | |
| Total Returns as of 10/31/17 | | | |
| | | Since
Incept. | |
Fund – Class I Shares* | | | 10.20 | % |
S&P Target Date 2055 Index | | | 10.82 | |
* Date of inception 2/27/17. Returns for periods less than one year are not annualized. | | | | |
The performance quoted is past performance and is not a guarantee of future results. Mutual funds are subject to certain market risks. Investment returns and principal value of an investment will fluctuate so that an investor’s shares, when redeemed, may be worth more or less than their original cost. Current performance may be higher or lower than the performance data shown. For the most current month-end performance data please call 1-888-310-0416 or visit www.1290Funds.com.
The graph illustrates comparative performance for $10,000 invested in the Class I Shares of the 1290 Retirement 2055 Fund and the S&P Target Date 2055 Index from 2/27/17 to 10/31/17. The performance of the S&P Target Date 2055 Index reflects an initial investment at the end of the month closest to the Fund’s inception. The performance of the Fund assumes reinvestment of all dividends and capital gain distributions, if any, and does not include a sales charge. The performance of the S&P Target Date 2055 Index does not reflect the deduction of expenses or a sales charge associated with a mutual fund and has been adjusted to reflect reinvestment of all dividends, capital gain distributions, and interest of the securities included in the benchmark.
Fund performance may reflect the waiver of the Fund’s fees and reimbursement of expenses for certain periods since the inception date. Without these waivers and reimbursements, performance would have been lower. Also, performance shown in this section does not reflect the deduction of taxes that a shareholder would pay on Fund distributions or redemption of Fund shares.
PERFORMANCE SUMMARY
The Fund’s Class I shares returned 10.20% for the period ended October 31, 2017. The Fund’s benchmark, the S&P Target Date 2055 Index, returned 10.82% over the same period.
Overview
The Allocations Drive Performance
Each 1290 Retirement Fund’s (as defined in the Notes to the Financial Statements) performance will reflect the performance of the underlying asset classes and depend upon their percentage weighting within the Fund. Here’s why:
The 1290 Retirement Funds are managed to target a specific year of planned retirement. The asset mix will become more conservative each year, until about 10 years after the target retirement year, when it will become relatively stable. The 1290 Retirement Funds balance the need for appreciation with the need for income as retirement approaches, and focus on supporting an income stream over a long-term retirement withdrawal horizon.
To achieve its exposures, each 1290 Retirement Fund invests in ETFs representing various equity and bond asset classes. So the 1290 Retirement Funds’ performance will be a function of the asset class performance and the percentage weighting of each in the 1290 Retirement Funds. Current target and actual allocations, as well as performance, are available in an accompanying quarterly Fund Fact Sheet.
What helped the 1290 Retirement Funds performance since inception?
All of the holdings contributed positively to returns since inception of the 1290 Retirement Funds on 3/1/2017.
| • | | Emerging market and international equities were the strongest performers. |
| • | | Among U.S. equities, large-cap stocks outperformed mid- and small-caps. |
What hurt the 1290 Retirement Funds performance since inception?
| • | | From a relative standpoint, bonds were a drag on performance. Only the higher-yielding and ‘riskier’ bond markets produced more than modest returns. |
| | | | |
| Table by Asset Class (as a percentage of Total Investments in Securities) | |
| As of October 31, 2017 | | | |
Equity | | | 98.2 | % |
Fixed Income | | | 1.8 | |
122
1290 RETIREMENT 2055 FUND (Unaudited)
| | | | |
| Top 10 Holdings (as a percentage of Investments in Securities) | |
| As of October 31, 2017 | | | |
iShares Core S&P Total US Stock Market Fund | | | 34.2 | % |
iShares Core MSCI EAFE Fund | | | 12.1 | |
PowerShares S&P 500 Low Volatility Portfolio | | | 11.4 | |
iShares Edge MSCI Min Vol USA Fund | | | 11.4 | |
iShares Edge MSCI Min Vol EAFE Fund | | | 6.1 | |
PowerShares S&P International Developed Low Volatility Portfolio | | | 6.0 | |
PowerShares S&P MidCap Low Volatility Portfolio | | | 5.9 | |
iShares Core MSCI Emerging Markets Fund | | | 3.0 | |
PowerShares S&P SmallCap Low Volatility Portfolio | | | 2.7 | |
SPDR SSGA US Small Cap Low Volatility Index Fund | | | 2.6 | |
| | |
Holdings are subject to change without notice. | | | | |
UNDERSTANDING YOUR EXPENSES:
As a shareholder of the Fund, you incur two types of costs:
(1) transaction costs, including applicable sales charges and redemption fees; and (2) ongoing costs, including investment advisory fees, distribution and/or service (12b-1) fees and other Fund expenses. These examples are intended to help you understand your ongoing costs (in dollars) of investing in the Fund and to compare these costs with the ongoing costs of investing in other mutual funds.
The examples are based on an investment of $1,000 invested at the beginning of the six-month period ended October 31, 2017 and held for the entire six-month period.
Actual Expenses
The first line of the following table provides information about actual account values and actual expenses. You may use the information in this line, together with the amount you invested, to estimate the expenses that you paid over the period. Simply divide your account value by $1,000 (for example, an $8,600 account value divided by $1,000 = 8.6), then multiply the result by the number in the first line under the heading entitled “Expenses Paid During Period” to estimate the expenses you paid on your account during this period.
Hypothetical Example for Comparison Purposes
The second line of the following table provides information about hypothetical account values and hypothetical expenses based on the Fund’s actual expense ratio and an assumed rate of return of 5% per year before expenses, which is not the Fund’s actual return. The hypothetical account values and expenses may not be used to estimate the actual ending account balance or expenses you paid for the period. You may use this information to compare the ongoing costs of investing in the Fund and other funds. To do so, compare this 5% hypothetical example with the 5% hypothetical examples that appear in the shareholder reports of the other funds.
Please note that the expenses shown in the table are meant to highlight your ongoing costs only and do not reflect any transactional costs, such as sales charges (loads), redemption fees, or exchange fees. Therefore, the second line of the table is useful in comparing ongoing costs only, and will not help you determine the relative total costs of owning different funds. In addition, if these transactional costs were included, your costs would have been higher.
EXAMPLE
| | | | | | | | | | | | |
| | | Beginning
Account
Value
5/1/17 | | | Ending
Account
Value
10/31/17 | | | Expenses Paid During Period*
5/1/17 - 10/31/17 | |
Class I | |
Actual | | | $1,000.00 | | | | $1,081.50 | | | | $2.72 | |
Hypothetical (5% average annual return before expenses) | | | 1,000.00 | | | | 1,022.59 | | | | 2.65 | |
* Expenses are equal to the Fund’s Class I shares annualized expense ratio of 0.52%, multiplied by the average account value over the period, and multiplied by 184/365 (to reflect the one-half year period). | |
123
1290 FUNDS
1290 RETIREMENT 2055 FUND
PORTFOLIO OF INVESTMENTS
October 31, 2017
| | | | | | | | |
| | | Number of
Shares | | | Value
(Note 1) | |
| | | | | | | | |
EXCHANGE TRADED FUNDS (ETF): | |
iShares Core MSCI EAFE Fund | | | 5,100 | | | $ | 332,775 | |
iShares Core MSCI Emerging Markets Fund | | | 1,460 | | | | 81,439 | |
iShares Core S&P Total US Stock Market Fund | | | 15,980 | | | | 941,542 | |
iShares Core U.S. Aggregate Bond Fund | | | 370 | | | | 40,504 | |
iShares Edge MSCI Min Vol EAFE Fund | | | 2,340 | | | | 167,965 | |
iShares Edge MSCI Min Vol Emerging Markets Fund | | | 650 | | | | 38,474 | |
iShares Edge MSCI Min Vol USA Fund | | | 6,070 | | | | 311,512 | |
iShares TIPS Bond Fund | | | 70 | | | | 7,966 | |
PowerShares S&P 500 Low Volatility Portfolio | | | 6,710 | | | | 312,216 | |
| | | | | | | | |
PowerShares S&P Emerging Markets Low Volatility Portfolio | | | 1,530 | | | | 37,638 | |
PowerShares S&P International Developed Low Volatility Portfolio | | | 4,980 | | | | 165,784 | |
PowerShares S&P MidCap Low Volatility Portfolio | | | 3,600 | | | | 162,108 | |
PowerShares S&P SmallCap Low Volatility Portfolio | | | 1,570 | | | | 72,927 | |
SPDR SSGA US Small Cap Low Volatility Index Fund | | | 730 | | | | 70,160 | |
| | | | | | | | |
Total Investments in Securities (99.6%)
(Cost $2,516,673) | | | | | | | 2,743,010 | |
Other Assets Less Liabilities (0.4%) | | | | | | | 11,831 | |
| | | | | |
Net Assets (100%) | | | | | | $ | 2,754,841 | |
| | | | | | | | |
The following is a summary of the inputs used to value the Fund’s assets and liabilities carried at fair value as of October 31, 2017:
The inputs or methodology used for valuing securities are not necessarily an indication of the risk associated with investing in those securities.
Various inputs are used in determining the value of the Fund’s investments. These inputs are summarized in the three broad levels listed below:
| | | | | | | | | | | | | | | | |
| | | | | |
| Investment Type | | Level 1
Quoted Prices in
Active Markets for
Identical
Securities | | | Level 2
Significant Other
Observable Inputs
(including quoted prices
for similar securities,
interest rates,
prepayment speeds,
credit risk, etc.) | | | Level 3
Significant Unobservable
Inputs (including the
Fund’s own assumptions in determining the fair
value of investments) | | | Total | |
Assets: | | | | | |
Exchange Traded Funds | | | | | | | | | | | | | | | | |
Exchange Traded Funds | | $ | 2,743,010 | | | $ | — | | | $ | — | | | $ | 2,743,010 | |
| | | | | | | | | | | | | | | | |
Total Assets | | $ | 2,743,010 | | | $ | — | | | $ | — | | | $ | 2,743,010 | |
| | | | | | | | | | | | | | | | |
Total Liabilities | | $ | — | | | $ | — | | | $ | — | | | $ | — | |
| | | | | | | | | | | | | | | | |
Total | | $ | 2,743,010 | | | $ | — | | | $ | — | | | $ | 2,743,010 | |
| | | | | | | | | | | | | | | | |
There were no transfers between Levels 1, 2 or 3 during the period ended October 31, 2017.
The Fund held no derivatives contracts during the period ended October 31, 2017.
Investment security transactions for the period ended October 31, 2017 were as follows:
| | | | |
Cost of Purchases: | |
Long-term investments other than U.S. government debt securities | | $ | 2,530,725 | |
Net Proceeds of Sales and Redemptions: | | | | |
Long-term investments other than U.S. government debt securities | | $ | 15,553 | |
See Notes to Financial Statements.
124
1290 FUNDS
1290 RETIREMENT 2055 FUND
PORTFOLIO OF INVESTMENTS (Continued)
October 31, 2017
As of October 31, 2017, the gross unrealized appreciation (depreciation) of investments based on the aggregate cost of investments in securities and derivative instruments, if applicable, for Federal income tax purposes was as follows:
| | | | |
Aggregate gross unrealized appreciation | | $ | 226,338 | |
Aggregate gross unrealized depreciation | | | (1 | ) |
| | | | |
Net unrealized appreciation | | $ | 226,337 | |
| | | | |
Federal income tax cost of investments in securities and derivative instruments, if applicable | | $ | 2,516,673 | |
| | | | |
See Notes to Financial Statements.
125
1290 FUNDS
1290 RETIREMENT 2055 FUND
STATEMENT OF ASSETS AND LIABILITIES
October 31, 2017
| | | | |
ASSETS | |
Investments in Securities, at value (Cost $2,516,673) | | $ | 2,743,010 | |
Cash | | | 5,747 | |
Prepaid registration and filing fees | | | 22,608 | |
Receivable from investment adviser | | | 15,841 | |
Deferred offering cost | | | 3,371 | |
Other assets | | | 35 | |
| | | | |
Total assets | | | 2,790,612 | |
| | | | |
LIABILITIES | |
Accrued audit fee | | | 32,740 | |
Transfer agent fees payable | | | 713 | |
Trustees’ fees payable | | | 24 | |
Accrued expenses | | | 2,294 | |
| | | | |
Total liabilities | | | 35,771 | |
| | | | |
NET ASSETS | | $ | 2,754,841 | |
| | | | |
Net assets were comprised of: | |
Paid in capital | | $ | 2,499,884 | |
Accumulated undistributed net investment income (loss) | | | 27,120 | |
Accumulated undistributed net realized gain (loss) | | | 1,500 | |
Net unrealized appreciation (depreciation) | | | 226,337 | |
| | | | |
Net assets | | $ | 2,754,841 | |
| | | | |
Class I | | | | |
Net asset value and redemption price per share, $2,754,841 / 250,009 shares outstanding (unlimited amount authorized: $0.001 par value) | | $ | 11.02 | |
| | | | |
STATEMENT OF OPERATIONS
For the Period Ended October 31, 2017*
| | | | |
INVESTMENT INCOME | |
Dividends | | $ | 35,983 | |
Interest | | | 51 | |
| | | | |
Total income | | | 36,034 | |
| | | | |
EXPENSES | |
Professional fees | | | 48,888 | |
Administrative fees | | | 20,220 | |
Registration and filing fees | | | 8,819 | |
Investment advisory fees | | | 8,805 | |
Offering costs | | | 6,969 | |
Transfer agent fees | | | 4,149 | |
Printing and mailing expenses | | | 2,197 | |
Custodian fees | | | 1,410 | |
Trustees’ fees | | | 235 | |
Miscellaneous | | | 3,967 | |
| | | | |
Gross expenses | | | 105,659 | |
Less: Waiver from investment adviser | | | (29,025 | ) |
Reimbursement from investment adviser | | | (67,504 | ) |
| | | | |
Net expenses | | | 9,130 | |
| | | | |
NET INVESTMENT INCOME (LOSS) | | | 26,904 | |
| | | | |
REALIZED AND UNREALIZED GAIN (LOSS) | |
Net realized gain (loss) on investments in securities | | | 1,500 | |
Net change in unrealized appreciation (depreciation) on investments in securities | | | 226,337 | |
| | | | |
NET REALIZED AND UNREALIZED GAIN (LOSS) | | | 227,837 | |
| | | | |
NET INCREASE (DECREASE) IN NET ASSETS RESULTING FROM OPERATIONS | | $ | 254,741 | |
| | | | |
| * | The Fund commenced operations on February 27, 2017. |
| | | | |
| STATEMENT OF CHANGES IN NET ASSETS | | February 27, 2017* to
October 31, 2017 | |
INCREASE (DECREASE) IN NET ASSETS FROM OPERATIONS: | |
Net investment income (loss) | | $ | 26,904 | |
Net realized gain (loss) | | | 1,500 | |
Net change in unrealized appreciation (depreciation) | | | 226,337 | |
| | | | |
NET INCREASE (DECREASE) IN NET ASSETS RESULTING FROM OPERATIONS | | | 254,741 | |
| | | | |
CAPITAL SHARES TRANSACTIONS: | | | | |
Class I | | | | |
Capital shares sold [ 250,009 shares] | | | 2,500,100 | |
| | | | |
NET INCREASE (DECREASE) IN NET ASSETS RESULTING FROM CAPITAL SHARE TRANSACTIONS | | | 2,500,100 | |
| | | | |
TOTAL INCREASE (DECREASE) IN NET ASSETS | | | 2,754,841 | |
NET ASSETS: | |
Beginning of period | | | — | |
| | | | |
End of period (a) | | $ | 2,754,841 | |
| | | | |
(a) Includes accumulated undistributed (overdistributed) net investment income (loss) of | | $ | 27,120 | |
| | | | |
* The Fund commenced operations on February 27, 2017. | | | | |
See Notes to Financial Statements.
126
1290 FUNDS
1290 RETIREMENT 2055 FUND
FINANCIAL HIGHLIGHTS
| | | | |
| Class I | | February 27, 2017* to October 31, 2017 | |
Net asset value, beginning of period | | $ | 10.00 | |
| | | | |
Income (loss) from investment operations: | | | | |
Net investment income (loss) (e)(x) | | | 0.11 | |
Net realized and unrealized gain (loss) | | | 0.91 | |
| | | | |
Total from investment operations | | | 1.02 | |
| | | | |
Net asset value, end of period | | $ | 11.02 | |
| | | | |
Total return (b) | | | 10.20 | % |
| | | | |
Ratios/Supplemental Data: | | | | |
Net assets, end of period (000’s) | | $ | 2,755 | |
Ratio of expenses to average net assets: | | | | |
After waivers and reimbursements (a)(f) | | | 0.52 | %(j) |
Before waivers and reimbursements (a)(f) | | | 5.25 | % |
Ratio of net investment income (loss) to average net assets: | | | | |
After waivers and reimbursements (a)(f)(x) | | | 1.53 | %(l) |
Before waivers and reimbursements (a)(f)(x) | | | (3.21 | )%(l) |
Portfolio turnover rate (z)^ | | | 1 | % |
| * | Commencement of Operations. |
| ^ | Portfolio turnover rate excludes derivatives, if any. |
| (a) | Ratios for periods less than one year are annualized. Certain non-recurring expenses incurred by the Fund are not annualized for periods less than one year. |
| (b) | Total returns for periods less than one year are not annualized. |
| (e) | Net investment income (loss) per share is based on average shares outstanding. |
| (f) | Expenses do not include the expenses of the underlying funds (“indirect expenses”), if applicable. |
| (j) | Including direct and indirect expenses, the net expense ratio after waivers and reimbursements would be 0.65%. |
| (l) | The annualized ratio of net investment income to average net assets may not be indicative of operating results for a full year. |
| (x) | Recognition of net investment income is affected by the timing of dividend declarations by the underlying funds in which the Fund invests. |
| (z) | Portfolio turnover rate for periods less than one year is not annualized. |
See Notes to Financial Statements.
127
1290 RETIREMENT 2060 FUND (Unaudited)
INVESTMENT ADVISER
PERFORMANCE RESULTS
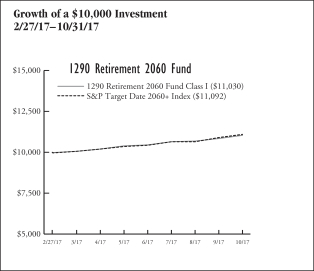
| | | | |
| Total Returns as of 10/31/17 | | | |
| | | Since
Incept. | |
Fund – Class I Shares* | | | 10.30 | % |
S&P Target Date 2060+ Index | | | 10.92 | |
* Date of inception 2/27/17. Returns for periods less than one year are not annualized. | | | | |
The performance quoted is past performance and is not a guarantee of future results. Mutual funds are subject to certain market risks. Investment returns and principal value of an investment will fluctuate so that an investor’s shares, when redeemed, may be worth more or less than their original cost. Current performance may be higher or lower than the performance data shown. For the most current month-end performance data please call 1-888-310-0416 or visit www.1290Funds.com.
The graph illustrates comparative performance for $10,000 invested in the Class I Shares of the 1290 Retirement 2060 Fund and the S&P Target Date 2060+ Index from 2/27/17 to 10/31/17. The performance of the S&P Target Date 2060+ Index reflects an initial investment at the end of the month closest to the Fund’s inception. The performance of the Fund assumes reinvestment of all dividends and capital gain distributions, if any, and does not include a sales charge. The performance of the S&P Target Date 2060+ Index does not reflect the deduction of expenses or a sales charge associated with a mutual fund and has been adjusted to reflect reinvestment of all dividends, capital gain distributions, and interest of the securities included in the benchmark.
Fund performance may reflect the waiver of the Fund’s fees and reimbursement of expenses for certain periods since the inception date. Without these waivers and reimbursements, performance would have been lower. Also, performance shown in this section does not reflect the deduction of taxes that a shareholder would pay on Fund distributions or redemption of Fund shares.
PERFORMANCE SUMMARY
The Fund’s Class I shares returned 10.30% for the period ended October 31, 2017. The Fund’s benchmark, the S&P Target Date 2060+ Index, returned 10.92% over the same period.
Overview
The Allocations Drive Performance
Each 1290 Retirement Fund’s (as defined in the Notes to the Financial Statements) performance will reflect the performance of the underlying asset classes and depend upon their percentage weighting within the Fund. Here’s why:
The 1290 Retirement Funds are managed to target a specific year of planned retirement. The asset mix will become more conservative each year, until about 10 years after the target retirement year, when it will become relatively stable. The 1290 Retirement Funds balance the need for appreciation with the need for income as retirement approaches, and focus on supporting an income stream over a long-term retirement withdrawal horizon.
To achieve its exposures, each 1290 Retirement Fund invests in ETFs representing various equity and bond asset classes. So the 1290 Retirement Funds’ performance will be a function of the asset class performance and the percentage weighting of each in the 1290 Retirement Funds. Current target and actual allocations, as well as performance, are available in an accompanying quarterly Fund Fact Sheet.
All of the holdings contributed positively to returns since inception of the 1290 Retirement Funds on 3/1/2017.
| • | | Emerging market and international equities were the strongest performers. |
| • | | Among U.S. equities, large-cap stocks outperformed mid- and small-caps. |
| | | | |
| Table by Asset Class (as a percentage of Total Investments in Securities) | |
| As of October 31, 2017 | | | |
Equity | | | 100.0 | % |
128
1290 RETIREMENT 2060 FUND (Unaudited)
| | | | |
| Top 10 Holdings (as a percentage of Total Investments in Securities) | |
| As of October 31, 2017 | | | |
iShares Core S&P Total US Stock Market Fund | | | 34.8 | % |
iShares Core MSCI EAFE Fund | | | 12.2 | |
PowerShares S&P 500 Low Volatility Portfolio | | | 11.5 | |
iShares Edge MSCI Min Vol USA Fund | | | 11.5 | |
iShares Edge MSCI Min Vol EAFE Fund | | | 6.2 | |
PowerShares S&P International Developed Low Volatility Portfolio | | | 6.1 | |
PowerShares S&P MidCap Low Volatility Portfolio | | | 6.0 | |
iShares Core MSCI Emerging Markets Fund | | | 3.0 | |
PowerShares S&P SmallCap Low Volatility Portfolio | | | 3.0 | |
SPDR SSGA US Small Cap Low Volatility Index Fund | | | 2.9 | |
| | |
Holdings are subject to change without notice. | | | | |
UNDERSTANDING YOUR EXPENSES:
As a shareholder of the Fund, you incur two types of costs:
(1) transaction costs, including applicable sales charges and redemption fees; and (2) ongoing costs, including investment advisory fees, distribution and/or service (12b-1) fees and other Fund expenses. These examples are intended to help you understand your ongoing costs (in dollars) of investing in the Fund and to compare these costs with the ongoing costs of investing in other mutual funds.
The examples are based on an investment of $1,000 invested at the beginning of the six-month period ended October 31, 2017 and held for the entire six-month period.
Actual Expenses
The first line of the following table provides information about actual account values and actual expenses. You may use the information in this line, together with the amount you invested, to estimate the expenses that you paid over the period. Simply divide your account value by $1,000 (for example, an $8,600 account value divided by $1,000 = 8.6), then multiply the result by the number in the first line under the heading entitled “Expenses Paid During Period” to estimate the expenses you paid on your account during this period.
Hypothetical Example for Comparison Purposes
The second line of the following table provides information about hypothetical account values and hypothetical expenses based on the Fund’s actual expense ratio and an assumed rate of return of 5% per year before expenses, which is not the Fund’s actual return. The hypothetical account values and expenses may not be used to estimate the actual ending account balance or expenses you paid for the period. You may use this information to compare the ongoing costs of investing in the Fund and other funds. To do so, compare this 5% hypothetical example with the 5% hypothetical examples that appear in the shareholder reports of the other funds.
Please note that the expenses shown in the table are meant to highlight your ongoing costs only and do not reflect any transactional costs, such as sales charges (loads), redemption fees, or exchange fees. Therefore, the second line of the table is useful in comparing ongoing costs only, and will not help you determine the relative total costs of owning different funds. In addition, if these transactional costs were included, your costs would have been higher.
EXAMPLE
| | | | | | | | | | | | |
| | | Beginning
Account
Value
5/1/17 | | | Ending
Account
Value
10/31/17 | | | Expenses Paid During Period*
5/1/17 - 10/31/17 | |
Class I | |
Actual | | | $1,000.00 | | | | $1,082.40 | | | | $2.72 | |
Hypothetical (5% average annual return before expenses) | | | 1,000.00 | | | | 1,022.59 | | | | 2.64 | |
* Expenses are equal to the Fund’s Class I shares annualized expense ratio of 0.52%, multiplied by the average account value over the period, and multiplied by 184/365 (to reflect the one-half year period). | |
129
1290 FUNDS
1290 RETIREMENT 2060 FUND
PORTFOLIO OF INVESTMENTS
October 31, 2017
| | | | | | | | |
| | | Number of
Shares | | | Value
(Note 1) | |
| | | | | | | | |
EXCHANGE TRADED FUNDS (ETF): | |
iShares Core MSCI EAFE Fund | | | 5,160 | | | $ | 336,690 | |
iShares Core MSCI Emerging Markets Fund | | | 1,480 | | | | 82,554 | |
iShares Core S&P Total US Stock Market Fund | | | 16,280 | | | | 959,218 | |
iShares Edge MSCI Min Vol EAFE Fund | | | 2,360 | | | | 169,401 | |
iShares Edge MSCI Min Vol Emerging Markets Fund | | | 660 | | | | 39,065 | |
iShares Edge MSCI Min Vol USA Fund | | | 6,130 | | | | 314,592 | |
PowerShares S&P 500 Low Volatility Portfolio | | | 6,780 | | | | 315,473 | |
PowerShares S&P Emerging Markets Low Volatility Portfolio | | | 1,540 | | | | 37,884 | |
| | | | | | | | |
PowerShares S&P International Developed Low Volatility Portfolio | | | 5,030 | | | | 167,449 | |
PowerShares S&P MidCap Low Volatility Portfolio | | | 3,640 | | | | 163,909 | |
PowerShares S&P SmallCap Low Volatility Portfolio | | | 1,750 | | | | 81,288 | |
SPDR SSGA US Small Cap Low Volatility Index Fund | | | 820 | | | | 78,810 | |
| | | | | | | | |
Total Investments in Securities (99.6%)
(Cost $2,516,678) | | | | | | | 2,746,333 | |
Other Assets Less Liabilities (0.4%) | | | | | | | 11,789 | |
| | | | | |
Net Assets (100%) | | | | | | $ | 2,758,122 | |
| | | | | | | | |
The following is a summary of the inputs used to value the Fund’s assets and liabilities carried at fair value as of October 31, 2017:
The inputs or methodology used for valuing securities are not necessarily an indication of the risk associated with investing in those securities.
Various inputs are used in determining the value of the Fund’s investments. These inputs are summarized in the three broad levels listed below:
| | | | | | | | | | | | | | | | |
| | | | | |
| Investment Type | | Level 1
Quoted Prices in
Active Markets for
Identical
Securities | | | Level 2
Significant Other
Observable Inputs
(including quoted prices
for similar securities,
interest rates,
prepayment speeds,
credit risk, etc.) | | | Level 3
Significant Unobservable
Inputs (including the
Fund’s own assumptions in
determining the fair
value of investments) | | | Total | |
Assets: | | | | | | | | | | | | | | | | |
Exchange Traded Funds | | | | | | | | | | | | | | | | |
Exchange Traded Funds | | $ | 2,746,333 | | | $ | — | | | $ | — | | | $ | 2,746,333 | |
| | | | | | | | | | | | | | | | |
Total Assets | | $ | 2,746,333 | | | $ | — | | | $ | — | | | $ | 2,746,333 | |
| | | | | | | | | | | | | | | | |
Total Liabilities | | $ | — | | | $ | — | | | $ | — | | | $ | — | |
| | | | | | | | | | | | | | | | |
Total | | $ | 2,746,333 | | | $ | — | | | $ | — | | | $ | 2,746,333 | |
| | | | | | | | | | | | | | | | |
There were no transfers between Levels 1, 2 or 3 during the period ended October 31, 2017.
The Fund held no derivatives contracts during the period ended October 31, 2017.
Investment security transactions for the period ended October 31, 2017 were as follows:
| | | | |
Cost of Purchases: | |
Long-term investments other than U.S. government debt securities | | $ | 2,530,729 | |
Net Proceeds of Sales and Redemptions: | | | | |
Long-term investments other than U.S. government debt securities | | $ | 15,553 | |
As of October 31, 2017, the gross unrealized appreciation (depreciation) of investments based on the aggregate cost of investments in securities and derivative instruments, if applicable, for Federal income tax purposes was as follows:
| | | | |
Aggregate gross unrealized appreciation | | $ | 229,655 | |
Aggregate gross unrealized depreciation | | | — | |
| | | | |
Net unrealized appreciation | | $ | 229,655 | |
| | | | |
Federal income tax cost of investments in securities and derivative instruments, if applicable | | $ | 2,516,678 | |
| | | | |
See Notes to Financial Statements.
130
1290 FUNDS
1290 RETIREMENT 2060 FUND
STATEMENT OF ASSETS AND LIABILITIES
October 31, 2017
| | | | |
ASSETS | |
Investments in Securities, at value (Cost $2,516,678) | | $ | 2,746,333 | |
Cash | | | 5,961 | |
Prepaid registration and filing fees | | | 22,292 | |
Receivable from investment adviser | | | 15,869 | |
Deferred offering cost | | | 3,392 | |
Other assets | | | 35 | |
| | | | |
Total assets | | | 2,793,882 | |
| | | | |
LIABILITIES | |
Accrued audit fee | | | 32,740 | |
Transfer agent fees payable | | | 713 | |
Trustees’ fees payable | | | 24 | |
Accrued expenses | | | 2,283 | |
| | | | |
Total liabilities | | | 35,760 | |
| | | | |
NET ASSETS | | $ | 2,758,122 | |
| | | | |
Net assets were comprised of: | |
Paid in capital | | $ | 2,499,888 | |
Accumulated undistributed net investment income (loss) | | | 27,078 | |
Accumulated undistributed net realized gain (loss) | | | 1,501 | |
Net unrealized appreciation (depreciation) | | | 229,655 | |
| | | | |
Net assets | | $ | 2,758,122 | |
| | | | |
Class I | | | | |
Net asset value and redemption price per share, $2,758,122 / 250,009 shares outstanding (unlimited amount authorized: $0.001 par value) | | $ | 11.03 | |
| | | | |
STATEMENT OF OPERATIONS
For the Period Ended October 31, 2017*
| | | | |
INVESTMENT INCOME | |
Dividends | | $ | 35,937 | |
Interest | | | 51 | |
| | | | |
Total income | | | 35,988 | |
| | | | |
EXPENSES | |
Professional fees | | | 48,889 | |
Administrative fees | | | 20,219 | |
Registration and filing fees | | | 8,817 | |
Investment advisory fees | | | 8,809 | |
Offering costs | | | 7,011 | |
Transfer agent fees | | | 4,149 | |
Printing and mailing expenses | | | 2,198 | |
Custodian fees | | | 1,400 | |
Trustees’ fees | | | 235 | |
Miscellaneous | | | 3,958 | |
| | | | |
Gross expenses | | | 105,685 | |
Less: Waiver from investment adviser | | | (29,028 | ) |
Reimbursement from investment adviser | | | (67,535 | ) |
| | | | |
Net expenses | | | 9,122 | |
| | | | |
NET INVESTMENT INCOME (LOSS) | | | 26,866 | |
| | | | |
REALIZED AND UNREALIZED GAIN (LOSS) | |
Net realized gain (loss) on investments in securities | | | 1,501 | |
Net change in unrealized appreciation (depreciation) on investments in securities | | | 229,655 | |
| | | | |
NET REALIZED AND UNREALIZED GAIN (LOSS) | | | 231,156 | |
| | | | |
NET INCREASE (DECREASE) IN NET ASSETS RESULTING FROM OPERATIONS | | $ | 258,022 | |
| | | | |
| * | The Fund commenced operations on February 27, 2017. |
| | | | |
| STATEMENT OF CHANGES IN NET ASSETS | | February 27, 2017* to
October 31, 2017 | |
INCREASE (DECREASE) IN NET ASSETS FROM OPERATIONS: | |
Net investment income (loss) | | $ | 26,866 | |
Net realized gain (loss) | | | 1,501 | |
Net change in unrealized appreciation (depreciation) | | | 229,655 | |
| | | | |
NET INCREASE (DECREASE) IN NET ASSETS RESULTING FROM OPERATIONS | | | 258,022 | |
| | | | |
CAPITAL SHARES TRANSACTIONS: | | | | |
Class I | | | | |
Capital shares sold [ 250,009 shares] | | | 2,500,100 | |
| | | | |
NET INCREASE (DECREASE) IN NET ASSETS RESULTING FROM CAPITAL SHARE TRANSACTIONS | | | 2,500,100 | |
| | | | |
TOTAL INCREASE (DECREASE) IN NET ASSETS | | | 2,758,122 | |
NET ASSETS: | |
Beginning of period | | | — | |
| | | | |
End of period (a) | | $ | 2,758,122 | |
| | | | |
(a) Includes accumulated undistributed (overdistributed) net investment income (loss) of | | $ | 27,078 | |
| | | | |
* The Fund commenced operations on February 27, 2017. | | | | |
See Notes to Financial Statements.
131
1290 FUNDS
1290 RETIREMENT 2060 FUND
FINANCIAL HIGHLIGHTS
| | | | |
| Class I | | February 27, 2017* to October 31, 2017 | |
Net asset value, beginning of period | | $ | 10.00 | |
| | | | |
Income (loss) from investment operations: | | | | |
Net investment income (loss) (e)(x) | | | 0.11 | |
Net realized and unrealized gain (loss) | | | 0.92 | |
| | | | |
Total from investment operations | | | 1.03 | |
| | | | |
Net asset value, end of period | | $ | 11.03 | |
| | | | |
Total return (b) | | | 10.30 | % |
| | | | |
Ratios/Supplemental Data: | | | | |
Net assets, end of period (000’s) | | $ | 2,758 | |
Ratio of expenses to average net assets: | | | | |
After waivers and reimbursements (a)(f) | | | 0.52 | %(j) |
Before waivers and reimbursements (a)(f) | | | 5.25 | % |
Ratio of net investment income (loss) to average net assets: | | | | |
After waivers and reimbursements (a)(f)(x) | | | 1.52 | %(l) |
Before waivers and reimbursements (a)(f)(x) | | | (3.21 | )%(l) |
Portfolio turnover rate (z)^ | | | 1 | % |
| * | Commencement of Operations. |
| ^ | Portfolio turnover rate excludes derivatives, if any. |
| (a) | Ratios for periods less than one year are annualized. Certain non-recurring expenses incurred by the Fund are not annualized for periods less than one year. |
| (b) | Total returns for periods less than one year are not annualized. |
| (e) | Net investment income (loss) per share is based on average shares outstanding. |
| (f) | Expenses do not include the expenses of the underlying funds (“indirect expenses”), if applicable. |
| (j) | Including direct and indirect expenses, the net expense ratio after waivers and reimbursements would be 0.65%. |
| (l) | The annualized ratio of net investment income to average net assets may not be indicative of operating results for a full year. |
| (x) | Recognition of net investment income is affected by the timing of dividend declarations by the underlying funds in which the Fund invests. |
| (z) | Portfolio turnover rate for periods less than one year is not annualized. |
See Notes to Financial Statements.
132
1290 SMARTBETA EQUITY FUND (Unaudited)
INVESTMENT ADVISER
INVESTMENT SUB-ADVISER
| Ø | | AXA Rosenberg Investment Management LLC |
PERFORMANCE RESULTS
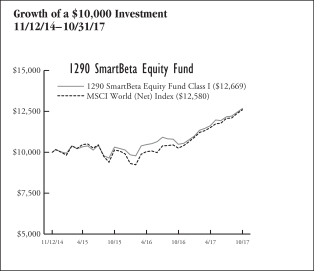
| | | | | | | | | | | | |
| Annualized Total Returns as of 10/31/17 | |
| | | | | | 1
Year | | | Since
Incept. | |
Fund – Class A Shares* | | | without Sales Charge | | | | 20.58 | % | | | 8.04 | % |
| | | | with Sales Charge (a) | | | | 13.91 | | | | 6.01 | |
Fund – Class I Shares* | | | | | | | 20.85 | | | | 8.30 | |
Fund – Class R Shares* | | | | | | | 20.21 | | | | 7.75 | |
Fund – Class T Shares*† | | | without Sales Charge | | | | 20.85 | | | | 8.30 | |
| | | | with Sales Charge (b) | | | | 17.86 | | | | 7.37 | |
MSCI World (Net) Index | | | | | | | 22.77 | | | | 8.04 | |
* Date of inception 11/12/14. † Class T Shares currently are not offered for sale. Class T shares were formerly known as Class C shares. (a) A 5.50% front-end sales charge was deducted. (b) A 2.50% front-end sales charge was deducted. Returns for periods greater than one year are annualized. | |
The performance quoted is past performance and is not a guarantee of future results. Mutual funds are subject to certain market risks. Investment returns and principal value of an investment will fluctuate so that an investor’s shares, when redeemed, may be worth more or less than their original cost. Current performance may be higher or lower than the performance data shown. For the most current month-end performance data please call 1-888-310-0416 or visit www.1290Funds.com.
The graph illustrates comparative performance for $10,000 invested in the Class I Shares of the 1290 SmartBeta Equity Fund and the MSCI World (Net) Index from 11/12/14 to 10/31/17. The performance of the MSCI World (Net) Index reflects an initial investment at the end of the month closest to the Fund’s inception. The performance of the Fund assumes reinvestment of all dividends and capital gain distributions, if any, and does not include a sales charge. The performance of the MSCI World (Net) Index does not reflect the deduction of expenses or a sales charge associated with a mutual fund and has been adjusted to reflect reinvestment of all dividends, capital gain distributions, and interest of the securities included in the benchmark.
Fund performance may reflect the waiver of the Fund’s fees and reimbursement of expenses for certain periods since the inception date. Without these waivers and reimbursements, performance would have been lower. Also, performance shown in this section does not reflect the deduction of taxes that a shareholder would pay on Fund distributions or redemption of Fund shares.
PERFORMANCE SUMMARY
The Fund’s Class I shares returned 20.85% for the year ended October 31, 2017. The Fund’s benchmark, the MSCI World (Net) Index, returned 22.77% over the same year.
Fund Overview — AXA Rosenberg Investment Management LLC
Equity markets delivered positive returns over the twelve-month period ended October 31, 2017, as investors discounted rising political risk and preferred to focus on improving macroeconomic trends globally. Against a generally positive backdrop, risk aversion was low and areas more sensitive to improving macroeconomic trends performed strongly. Financials, technology and materials were the best-performing sectors, while consumer staples, energy and telecommunications delivered the weakest returns over the full period. Investors’ increased appetite for risk and a higher interest rate environment proved challenging for low volatility investors and the factor underperformed over the period. Elsewhere, quality and value performed strongly, although the performance of value styles reversed through the period, rallying strongly after the U.S. election and then falling back in the second half of 2017 until rising global bond yields helped boost value stocks at the end of the review period.
Fund Highlights
The Fund modestly underperformed the broad market index over the past year. The strategy’s low volatility exposure was unrewarded but the focus on quality helped the Fund keep pace with strongly rising markets.
What helped performance during the year?
| • | | The Fund’s bias toward stocks with superior earnings sustainability — a proprietary measure of earnings quality — has been rewarded overall. The positions in McDonald’s Corp. and Nvidia Corp. were among the higher-quality names which contributed positively to active performance. |
| • | | The Fund’s lower-than-benchmark exposure to the energy sector proved beneficial. |
133
1290 SMARTBETA EQUITY FUND (Unaudited)
What hurt performance during the year?
| • | | The Fund’s avoidance of companies with higher volatility weighed on performance as stocks exhibiting low-volatility characteristics underperformed in an environment where investors have been willing to shift into riskier parts of the market. At the individual stock level, a number of higher volatility information technology and financials names appeared in the top detractors including Apple, Inc., Citigroup, Inc. and Facebook, Inc. |
| • | | Driven by the defensive profile of the sector, the Fund had an overweight exposure to the consumer staples sector, which weighed on performance. |
| | | | |
Sector Weightings as of October 31, 2017 | | % of
Net Assets | |
Industrials | | | 17.5 | % |
Financials | | | 15.9 | |
Consumer Staples | | | 14.3 | |
Information Technology | | | 12.3 | |
Health Care | | | 11.7 | |
Consumer Discretionary | | | 9.2 | |
Utilities | | | 6.0 | |
Materials | | | 4.2 | |
Telecommunication Services | | | 2.6 | |
Real Estate | | | 2.5 | |
Energy | | | 2.3 | |
Cash and Other | | | 1.5 | |
| | | | | |
| | | | 100.0 | % |
| | | | | |
Holdings are subject to change without notice. | | | | |
UNDERSTANDING YOUR EXPENSES:
As a shareholder of the Fund, you incur two types of costs:
(1) transaction costs, including applicable sales charges and redemption fees; and (2) ongoing costs, including investment advisory fees, distribution and/or service (12b-1) fees (in the case of Class A, Class R and Class T shares of the Fund), and other Fund expenses. These examples are intended to help you understand your ongoing costs (in dollars) of investing in the Fund and to compare these costs with the ongoing costs of investing in other mutual funds.
The examples are based on an investment of $1,000 invested at the beginning of the six-month period ended October 31, 2017 and held for the entire six-month period.
Actual Expenses
The first line of the following table provides information about actual account values and actual expenses. You may use the information in this line, together with the amount you invested, to estimate the expenses that you paid over the period. Simply divide your account value by $1,000 (for example, an $8,600 account value divided by $1,000 = 8.6), then multiply the result by the number in the first line under the heading entitled “Expenses Paid During Period” to estimate the expenses you paid on your account during this period.
Hypothetical Example for Comparison Purposes
The second line of the following table provides information about hypothetical account values and hypothetical expenses based on the Fund’s actual expense ratio and an assumed rate of return of 5% per year before expenses, which is not the Fund’s actual return. The hypothetical account values and expenses may not be used to estimate the actual ending account balance or expenses you paid for the period. You may use this information to compare the ongoing costs of investing in the Fund and other funds. To do so, compare this 5% hypothetical example with the 5% hypothetical examples that appear in the shareholder reports of the other funds.
Please note that the expenses shown in the table are meant to highlight your ongoing costs only and do not reflect any transactional costs, such as sales charges (loads), redemption fees, or exchange fees. Therefore, the second line of the table is useful in comparing ongoing costs only, and will not help you determine the relative total costs of owning different funds. In addition, if these transactional costs were included, your costs would have been higher.
EXAMPLE
| | | | | | | | | | | | |
| | | Beginning
Account
Value
5/1/17 | | | Ending
Account
Value
10/31/17 | | | Expenses Paid During Period*
5/1/17 - 10/31/17 | |
Class A | |
Actual | | | $1,000.00 | | | | $1,089.00 | | | | $6.06 | |
Hypothetical (5% average annual return before expenses) | | | 1,000.00 | | | | 1,019.41 | | | | 5.85 | |
Class I | |
Actual | | | 1,000.00 | | | | 1,090.80 | | | | 4.74 | |
Hypothetical (5% average annual return before expenses) | | | 1,000.00 | | | | 1,020.67 | | | | 4.58 | |
Class R | |
Actual | | | 1,000.00 | | | | 1,087.30 | | | | 7.37 | |
Hypothetical (5% average annual return before expenses) | | | 1,000.00 | | | | 1,018.15 | | | | 7.12 | |
Class T** | |
Actual | | | 1,000.00 | | | | 1,090.80 | | | | 4.74 | |
Hypothetical (5% average annual return before expenses) | | | 1,000.00 | | | | 1,020.67 | | | | 4.58 | |
* Expenses are equal to the Fund’s Class A, I, R and T shares annualized expense ratios of 1.15%, 0.90%, 1.40% and 0.90%, respectively, multiplied by the average account value over the period, and multiplied by 184/365 (to reflect the one-half year period). ** Class T shares currently are not offered for sale. Class T shares were formerly known as Class C shares. | |
134
1290 FUNDS
1290 SMARTBETA EQUITY FUND
PORTFOLIO OF INVESTMENTS
October 31, 2017
| | | | | | | | |
| | | Number of
Shares | | | Value
(Note 1) | |
| | | | | | | | |
COMMON STOCKS: | | | | | | | | |
Consumer Discretionary (9.2%) | | | | | | | | |
Auto Components (0.9%) | | | | | | | | |
Bridgestone Corp. | | | 600 | | | $ | 28,442 | |
Continental AG | | | 100 | | | | 25,382 | |
Magna International, Inc. | | | 900 | | | | 49,099 | |
Sumitomo Electric Industries Ltd. | | | 800 | | | | 13,519 | |
Valeo SA | | | 270 | | | | 18,273 | |
| | | | | | | | |
| | | | | | | 134,715 | |
| | | | | | | | |
Automobiles (0.5%) | | | | | | | | |
Bayerische Motoren Werke AG | | | 300 | | | | 30,577 | |
Daimler AG (Registered) | | | 400 | | | | 33,217 | |
Suzuki Motor Corp. | | | 300 | | | | 16,292 | |
| | | | | | | | |
| | | | | | | 80,086 | |
| | | | | | | | |
Distributors (0.2%) | | | | | | | | |
Genuine Parts Co. | | | 300 | | | | 26,469 | |
| | | | | | | | |
Hotels, Restaurants & Leisure (1.4%) | | | | | | | | |
Aramark | | | 300 | | | | 13,107 | |
Aristocrat Leisure Ltd. | | | 900 | | | | 16,221 | |
Compass Group plc | | | 1,923 | | | | 42,218 | |
Domino’s Pizza, Inc. | | | 100 | | | | 18,300 | |
Marriott International, Inc., Class A | | | 200 | | | | 23,896 | |
Restaurant Brands International, Inc. | | | 500 | | | | 32,304 | |
Sodexo SA | | | 200 | | | | 25,452 | |
Whitbread plc | | | 200 | | | | 9,810 | |
Yum Brands, Inc. | | | 400 | | | | 29,780 | |
| | | | | | | | |
| | | | | | | 211,088 | |
| | | | | | | | |
Household Durables (0.4%) | | | | | | | | |
Mohawk Industries, Inc.* | | | 100 | | | | 26,176 | |
Sekisui Chemical Co. Ltd. | | | 1,000 | | | | 20,017 | |
Sekisui House Ltd. | | | 1,000 | | | | 18,566 | |
Techtronic Industries Co. Ltd. | | | 500 | | | | 2,932 | |
| | | | | | | | |
| | | | | | | 67,691 | |
| | | | | | | | |
Leisure Products (0.1%) | | | | | | | | |
Bandai Namco Holdings, Inc. | | | 200 | | | | 6,816 | |
Hasbro, Inc. | | | 100 | | | | 9,259 | |
| | | | | | | | |
| | | | | | | 16,075 | |
| | | | | | | | |
Media (1.2%) | | | | | | | | |
CBS Corp. (Non-Voting), Class B | | | 500 | | | | 28,060 | |
Comcast Corp., Class A | | | 2,300 | | | | 82,869 | |
Omnicom Group, Inc. | | | 200 | | | | 13,438 | |
Walt Disney Co. (The) | | | 600 | | | | 58,686 | |
| | | | | | | | |
| | | | | | | 183,053 | |
| | | | | | | | |
Multiline Retail (0.3%) | | | | | | | | |
Dollarama, Inc. | | | 400 | | | | 44,527 | |
| | | | | | | | |
Specialty Retail (3.0%) | | | | | | | | |
AutoZone, Inc.* | | | 100 | | | | 58,950 | |
Hennes & Mauritz AB, Class B | | | 1,200 | | | | 30,130 | |
Home Depot, Inc. (The) | | | 700 | | | | 116,046 | |
Industria de Diseno Textil SA | | | 1,200 | | | | 44,863 | |
Lowe’s Cos., Inc. | | | 600 | | | | 47,970 | |
Nitori Holdings Co. Ltd. | | | 100 | | | | 14,472 | |
Ross Stores, Inc. | | | 500 | | | | 31,745 | |
| | | | | | | | |
TJX Cos., Inc. (The) | | | 1,100 | | | | 76,780 | |
Ulta Beauty, Inc.* | | | 100 | | | | 20,179 | |
USS Co. Ltd. | | | 500 | | | | 10,026 | |
| | | | | | | | |
| | | | | | | 451,161 | |
| | | | | | | | |
Textiles, Apparel & Luxury Goods (1.2%) | |
adidas AG | | | 150 | | | | 33,382 | |
LVMH Moet Hennessy Louis Vuitton SE | | | 200 | | | | 59,663 | |
NIKE, Inc., Class B | | | 1,000 | | | | 54,990 | |
VF Corp. | | | 400 | | | | 27,860 | |
| | | | | | | | |
| | | | | | | 175,895 | |
| | | | | | | | |
Total Consumer Discretionary | | | | | | | 1,390,760 | |
| | | | | | | | |
Consumer Staples (14.3%) | | | | | | | | |
Beverages (3.6%) | | | | | | | | |
Brown-Forman Corp., Class B | | | 400 | | | | 22,808 | |
Coca-Cola Co. (The) | | | 3,000 | | | | 137,940 | |
Constellation Brands, Inc., Class A | | | 100 | | | | 21,909 | |
Diageo plc | | | 2,400 | | | | 81,984 | |
Dr Pepper Snapple Group, Inc. | | | 300 | | | | 25,698 | |
Heineken NV | | | 300 | | | | 29,236 | |
Kirin Holdings Co. Ltd. | | | 1,000 | | | | 23,785 | |
Monster Beverage Corp.* | | | 500 | | | | 28,965 | |
PepsiCo, Inc. | | | 1,100 | | | | 121,253 | |
Pernod Ricard SA | | | 200 | | | | 29,995 | |
Suntory Beverage & Food Ltd. | | | 300 | | | | 13,693 | |
| | | | | | | | |
| | | | | | | 537,266 | |
| | | | | | | | |
Food & Staples Retailing (2.5%) | | | | | | | | |
Alimentation Couche-Tard, Inc., Class B | | | 400 | | | | 18,755 | |
Costco Wholesale Corp. | | | 500 | | | | 80,540 | |
CVS Health Corp. | | | 800 | | | | 54,824 | |
Seven & i Holdings Co. Ltd. | | | 900 | | | | 36,188 | |
Sysco Corp. | | | 1,200 | | | | 66,744 | |
Walgreens Boots Alliance, Inc. | | | 400 | | | | 26,508 | |
Wal-Mart Stores, Inc. | | | 600 | | | | 52,386 | |
Wesfarmers Ltd. | | | 400 | | | | 12,797 | |
Woolworths Ltd. | | | 1,400 | | | | 27,730 | |
| | | | | | | | |
| | | | | | | 376,472 | |
| | | | | | | | |
Food Products (2.6%) | | | | | | | | |
Associated British Foods plc | | | 400 | | | | 17,702 | |
Conagra Brands, Inc. | | | 400 | | | | 13,664 | |
Danone SA | | | 800 | | | | 65,362 | |
Hershey Co. (The) | | | 200 | | | | 21,236 | |
Kellogg Co. | | | 400 | | | | 25,012 | |
Kraft Heinz Co. (The) | | | 500 | | | | 38,665 | |
McCormick & Co., Inc. (Non-Voting) | | | 200 | | | | 19,906 | |
MEIJI Holdings Co. Ltd. | | | 100 | | | | 8,144 | |
Mondelez International, Inc., Class A | | | 1,600 | | | | 66,288 | |
Nestle SA (Registered) | | | 1,200 | | | | 100,917 | |
Tyson Foods, Inc., Class A | | | 300 | | | | 21,873 | |
| | | | | | | | |
| | | | | | | 398,769 | |
| | | | | | | | |
Household Products (2.5%) | | | | | | | | |
Church & Dwight Co., Inc. | | | 400 | | | | 18,068 | |
Clorox Co. (The) | | | 300 | | | | 37,959 | |
See Notes to Financial Statements.
135
1290 FUNDS
1290 SMARTBETA EQUITY FUND
PORTFOLIO OF INVESTMENTS (Continued)
October 31, 2017
| | | | | | | | |
| | | Number of
Shares | | | Value
(Note 1) | |
| | | | | | | | |
Colgate-Palmolive Co. | | | 700 | | | $ | 49,315 | |
Essity AB, Class B* | | | 500 | | | | 14,949 | |
Henkel AG & Co. KGaA (Preference)(q) | | | 400 | | | | 56,146 | |
Kimberly-Clark Corp. | | | 600 | | | | 67,506 | |
Procter & Gamble Co. (The) | | | 1,600 | | | | 138,144 | |
| | | | | | | | |
| | | | | | | 382,087 | |
| | | | | | | | |
Personal Products (1.9%) | | | | | | | | |
Beiersdorf AG | | | 200 | | | | 22,435 | |
Estee Lauder Cos., Inc. (The), Class A | | | 200 | | | | 22,362 | |
Kao Corp. | | | 500 | | | | 30,060 | |
L’Oreal SA | | | 270 | | | | 60,087 | |
Unilever NV (CVA) | | | 1,400 | | | | 81,385 | |
Unilever plc | | | 1,300 | | | | 73,717 | |
| | | | | | | | |
| | | | | | | 290,046 | |
| | | | | | | | |
Tobacco (1.2%) | | | | | | | | |
Altria Group, Inc. | | | 1,400 | | | | 89,908 | |
British American Tobacco plc | | | 900 | | | | 58,225 | |
Japan Tobacco, Inc. | | | 1,000 | | | | 32,953 | |
| | | | | | | | |
| | | | | | | 181,086 | |
| | | | | | | | |
Total Consumer Staples | | | | | | | 2,165,726 | |
| | | | | | | | |
Energy (2.3%) | | | | | | | | |
Oil, Gas & Consumable Fuels (2.3%) | |
Exxon Mobil Corp. | | | 1,400 | | | | 116,690 | |
Snam SpA | | | 6,000 | | | | 30,654 | |
Suncor Energy, Inc. | | | 800 | | | | 27,161 | |
TOTAL SA | | | 1,400 | | | | 78,066 | |
TransCanada Corp. | | | 1,800 | | | | 85,458 | |
| | | | | | | | |
Total Energy | | | | | | | 338,029 | |
| | | | | | | | |
Financials (15.9%) | | | | | | | | |
Banks (6.8%) | |
Bank Hapoalim BM | | | 2,000 | | | | 14,154 | |
Bank of America Corp. | | | 1,300 | | | | 35,607 | |
Bank of Montreal | | | 1,200 | | | | 91,928 | |
Bank of Nova Scotia (The) | | | 900 | | | | 58,098 | |
BB&T Corp. | | | 800 | | | | 39,392 | |
Canadian Imperial Bank of Commerce | | | 700 | | | | 61,617 | |
Commonwealth Bank of Australia | | | 400 | | | | 23,766 | |
Danske Bank A/S | | | 400 | | | | 15,259 | |
DBS Group Holdings Ltd. | | | 1,000 | | | | 16,712 | |
Hang Seng Bank Ltd. | | | 1,400 | | | | 33,145 | |
KBC Group NV | | | 200 | | | | 16,613 | |
M&T Bank Corp. | | | 200 | | | | 33,354 | |
National Bank of Canada | | | 400 | | | | 19,413 | |
Oversea-Chinese Banking Corp. Ltd. | | | 1,000 | | | | 8,730 | |
PNC Financial Services Group, Inc. (The) | | | 500 | | | | 68,395 | |
Royal Bank of Canada | | | 1,200 | | | | 93,825 | |
Skandinaviska Enskilda Banken AB, Class A | | | 2,000 | | | | 24,655 | |
Svenska Handelsbanken AB, Class A | | | 2,000 | | | | 28,668 | |
Swedbank AB, Class A | | | 1,200 | | | | 29,786 | |
Toronto-Dominion Bank (The) | | | 2,200 | | | | 125,066 | |
| | | | | | | | |
US Bancorp | | | 1,800 | | | | 97,884 | |
Wells Fargo & Co. | | | 1,600 | | | | 89,824 | |
| | | | | | | | |
| | | | | | | 1,025,891 | |
| | | | | | | | |
Capital Markets (2.6%) | |
Ameriprise Financial, Inc. | | | 300 | | | | 46,962 | |
ASX Ltd. | | | 200 | | | | 8,263 | |
Bank of New York Mellon Corp. (The) | | | 700 | | | | 36,015 | |
BlackRock, Inc. | | | 100 | | | | 47,083 | |
CME Group, Inc. | | | 500 | | | | 68,585 | |
Intercontinental Exchange, Inc. | | | 200 | | | | 13,220 | |
Macquarie Group Ltd. | | | 200 | | | | 15,054 | |
MSCI, Inc. | | | 300 | | | | 35,208 | |
Northern Trust Corp. | | | 200 | | | | 18,704 | |
S&P Global, Inc. | | | 200 | | | | 31,294 | |
Singapore Exchange Ltd. | | | 1,000 | | | | 5,627 | |
St James’s Place plc | | | 800 | | | | 12,506 | |
T. Rowe Price Group, Inc. | | | 300 | | | | 27,870 | |
Thomson Reuters Corp. | | | 700 | | | | 32,729 | |
| | | | | | | | |
| | | | | | | 399,120 | |
| | | | | | | | |
Consumer Finance (0.4%) | |
American Express Co. | | | 600 | | | | 57,312 | |
| | | | | | | | |
Insurance (6.1%) | |
Aflac, Inc. | | | 300 | | | | 25,167 | |
AIA Group Ltd. | | | 4,200 | | | | 31,602 | |
Allianz SE (Registered) | | | 300 | | | | 69,664 | |
Allstate Corp. (The) | | | 400 | | | | 37,544 | |
Aon plc | | | 400 | | | | 57,372 | |
Arch Capital Group Ltd.* | | | 200 | | | | 19,928 | |
Assicurazioni Generali SpA | | | 1,000 | | | | 18,218 | |
Baloise Holding AG (Registered) | | | 90 | | | | 14,190 | |
Cincinnati Financial Corp. | | | 300 | | | | 21,051 | |
Everest Re Group Ltd. | | | 100 | | | | 23,745 | |
Hannover Rueck SE | | | 100 | | | | 12,540 | |
Intact Financial Corp. | | | 400 | | | | 32,695 | |
Legal & General Group plc | | | 8,000 | | | | 28,369 | |
Lincoln National Corp. | | | 400 | | | | 30,312 | |
Marsh & McLennan Cos., Inc. | | | 900 | | | | 72,837 | |
Medibank Pvt Ltd. | | | 1,800 | | | | 4,229 | |
MS&AD Insurance Group Holdings, Inc. | | | 300 | | | | 10,118 | |
Muenchener Rueckversicherungs-Gesellschaft AG in Muenchen (Registered) | | | 250 | | | | 55,927 | |
Principal Financial Group, Inc. | | | 600 | | | | 39,510 | |
Progressive Corp. (The) | | | 1,200 | | | | 58,380 | |
Prudential Financial, Inc. | | | 400 | | | | 44,184 | |
Sampo OYJ, Class A | | | 600 | | | | 31,437 | |
SCOR SE | | | 400 | | | | 16,609 | |
Sompo Holdings, Inc. | | | 300 | | | | 11,976 | |
Sun Life Financial, Inc. | | | 800 | | | | 31,161 | |
Suncorp Group Ltd. | | | 2,900 | | | | 30,141 | |
Swiss Re AG | | | 400 | | | | 37,629 | |
Tokio Marine Holdings, Inc. | | | 500 | | | | 21,349 | |
Zurich Insurance Group AG | | | 120 | | | | 36,626 | |
| | | | | | | | |
| | | | | | | 924,510 | |
| | | | | | | | |
Total Financials | | | | | | | 2,406,833 | |
| | | | | | | | |
See Notes to Financial Statements.
136
1290 FUNDS
1290 SMARTBETA EQUITY FUND
PORTFOLIO OF INVESTMENTS (Continued)
October 31, 2017
| | | | | | | | |
| | | Number of
Shares | | | Value
(Note 1) | |
| | | | | | | | |
Health Care (11.7%) | | | | | | | | |
Biotechnology (1.1%) | |
AbbVie, Inc. | | | 700 | | | $ | 63,175 | |
Amgen, Inc. | | | 400 | | | | 70,088 | |
CSL Ltd. | | | 200 | | | | 21,266 | |
Gilead Sciences, Inc. | | | 200 | | | | 14,992 | |
| | | | | | | | |
| | | | | | | 169,521 | |
| | | | | | | | |
Health Care Equipment & Supplies (2.7%) | |
Baxter International, Inc. | | | 700 | | | | 45,129 | |
Becton Dickinson and Co. | | | 200 | | | | 41,734 | |
Cochlear Ltd. | | | 100 | | | | 13,464 | |
Coloplast A/S, Class B | | | 200 | | | | 17,595 | |
CR Bard, Inc. | | | 100 | | | | 32,707 | |
Danaher Corp. | | | 500 | | | | 46,135 | |
Hoya Corp. | | | 400 | | | | 21,596 | |
IDEXX Laboratories, Inc.* | | | 100 | | | | 16,617 | |
Medtronic plc | | | 400 | | | | 32,208 | |
Smith & Nephew plc | | | 800 | | | | 15,098 | |
Stryker Corp. | | | 600 | | | | 92,922 | |
Sysmex Corp. | | | 200 | | | | 13,597 | |
Teleflex, Inc. | | | 100 | | | | 23,698 | |
| | | | | | | | |
| | | | | | | 412,500 | |
| | | | | | | | |
Health Care Providers & Services (2.2%) | |
Aetna, Inc. | | | 200 | | | | 34,006 | |
Cigna Corp. | | | 200 | | | | 39,444 | |
Fresenius Medical Care AG & Co. KGaA | | | 200 | | | | 19,341 | |
Fresenius SE & Co. KGaA | | | 300 | | | | 25,060 | |
HCA Healthcare, Inc.* | | | 400 | | | | 30,260 | |
Henry Schein, Inc.* | | | 200 | | | | 15,720 | |
Humana, Inc. | | | 100 | | | | 25,535 | |
UnitedHealth Group, Inc. | | | 700 | | | | 147,154 | |
| | | | | | | | |
| | | | | | | 336,520 | |
| | | | | | | | |
Health Care Technology (0.2%) | |
Cerner Corp.* | | | 300 | | | | 20,256 | |
| | | | | | | | |
Life Sciences Tools & Services (0.7%) | |
Mettler-Toledo International, Inc.* | | | 100 | | | | 68,263 | |
Thermo Fisher Scientific, Inc. | | | 200 | | | | 38,766 | |
| | | | | | | | |
| | | | | | | 107,029 | |
| | | | | | | | |
Pharmaceuticals (4.8%) | |
Astellas Pharma, Inc. | | | 1,400 | | | | 18,573 | |
Bayer AG (Registered) | | | 490 | | | | 63,756 | |
Eli Lilly & Co. | | | 900 | | | | 73,746 | |
Johnson & Johnson | | | 1,200 | | | | 167,292 | |
Merck & Co., Inc. | | | 1,900 | | | | 104,671 | |
Mitsubishi Tanabe Pharma Corp. | | | 700 | | | | 15,354 | |
Novo Nordisk A/S, Class B | | | 800 | | | | 39,798 | |
Orion OYJ, Class B | | | 200 | | | | 8,201 | |
Pfizer, Inc. | | | 2,900 | | | | 101,674 | |
Roche Holding AG | | | 240 | | | | 55,450 | |
Sanofi | | | 200 | | | | 18,938 | |
Takeda Pharmaceutical Co. Ltd. | | | 500 | | | | 28,121 | |
Zoetis, Inc. | | | 400 | | | | 25,528 | |
| | | | | | | | |
| | | | | | | 721,102 | |
| | | | | | | | |
Total Health Care | | | | | | | 1,766,928 | |
| | | | | | | | |
| | | | | | | | |
Industrials (17.5%) | | | | | | | | |
Aerospace & Defense (3.9%) | |
Boeing Co. (The) | | | 400 | | | | 103,192 | |
General Dynamics Corp. | | | 400 | | | | 81,192 | |
Lockheed Martin Corp. | | | 300 | | | | 92,448 | |
Northrop Grumman Corp. | | | 300 | | | | 88,659 | |
Raytheon Co. | | | 400 | | | | 72,080 | |
Rockwell Collins, Inc. | | | 200 | | | | 27,120 | |
Safran SA | | | 400 | | | | 42,135 | |
Thales SA | | | 200 | | | | 20,846 | |
United Technologies Corp. | | | 500 | | | | 59,880 | |
| | | | | | | | |
| | | | | | | 587,552 | |
| | | | | | | | |
Air Freight & Logistics (1.1%) | |
Deutsche Post AG (Registered) | | | 1,200 | | | | 54,962 | |
United Parcel Service, Inc., Class B | | | 900 | | | | 105,777 | |
| | | | | | | | |
| | | | | | | 160,739 | |
| | | | | | | | |
Building Products (0.6%) | |
Assa Abloy AB, Class B | | | 1,200 | | | | 25,329 | |
Daikin Industries Ltd. | | | 200 | | | | 21,934 | |
Geberit AG (Registered) | | | 50 | | | | 22,633 | |
Masco Corp. | | | 500 | | | | 19,910 | |
| | | | | | | | |
| | | | | | | 89,806 | |
| | | | | | | | |
Commercial Services & Supplies (1.1%) | |
Cintas Corp. | | | 200 | | | | 29,808 | |
Dai Nippon Printing Co. Ltd. | | | 500 | | | | 11,895 | |
Republic Services, Inc. | | | 400 | | | | 26,028 | |
Waste Connections, Inc. | | | 400 | | | | 28,268 | |
Waste Management, Inc. | | | 800 | | | | 65,736 | |
| | | | | | | | |
| | | | | | | 161,735 | |
| | | | | | | | |
Construction & Engineering (0.6%) | |
Obayashi Corp. | | | 1,000 | | | | 13,016 | |
Skanska AB, Class B | | | 600 | | | | 13,166 | |
Taisei Corp. | | | 200 | | | | 11,028 | |
Vinci SA | | | 500 | | | | 48,953 | |
| | | | | | | | |
| | | | | | | 86,163 | |
| | | | | | | | |
Electrical Equipment (0.8%) | |
ABB Ltd. (Registered) | | | 1,200 | | | | 31,370 | |
Legrand SA | | | 300 | | | | 22,285 | |
Nidec Corp. | | | 100 | | | | 13,187 | |
Rockwell Automation, Inc. | | | 300 | | | | 60,246 | |
| | | | | | | | |
| | | | | | | 127,088 | |
| | | | | | | | |
Industrial Conglomerates (2.3%) | |
3M Co. | | | 500 | | | | 115,095 | |
Honeywell International, Inc. | | | 800 | | | | 115,328 | |
Roper Technologies, Inc. | | | 200 | | | | 51,634 | |
Siemens AG (Registered) | | | 400 | | | | 57,078 | |
Smiths Group plc | | | 600 | | | | 12,519 | |
| | | | | | | | |
| | | | | | | 351,654 | |
| | | | | | | | |
Machinery (2.5%) | |
Atlas Copco AB, Class A | | | 1,000 | | | | 43,862 | |
Cummins, Inc. | | | 200 | | | | 35,376 | |
FANUC Corp. | | | 100 | | | | 23,192 | |
Fortive Corp. | | | 700 | | | | 50,582 | |
Illinois Tool Works, Inc. | | | 500 | | | | 78,260 | |
Kone OYJ, Class B | | | 600 | | | | 32,478 | |
See Notes to Financial Statements.
137
1290 FUNDS
1290 SMARTBETA EQUITY FUND
PORTFOLIO OF INVESTMENTS (Continued)
October 31, 2017
| | | | | | | | |
| | | Number of
Shares | | | Value
(Note 1) | |
| | | | | | | | |
Sandvik AB | | | 2,000 | | | $ | 36,528 | |
Schindler Holding AG | | | 70 | | | | 15,864 | |
Stanley Black & Decker, Inc. | | | 200 | | | | 32,310 | |
Volvo AB, Class B | | | 1,800 | | | | 35,671 | |
| | | | | | | | |
| | | | | | | 384,123 | |
| | | | | | | | |
Professional Services (0.8%) | |
Adecco Group AG (Registered)* | | | 200 | | | | 15,867 | |
Experian plc | | | 400 | | | | 8,426 | |
Intertek Group plc | | | 200 | | | | 14,410 | |
SGS SA (Registered) | | | 7 | | | | 17,289 | |
Verisk Analytics, Inc.* | | | 400 | | | | 34,020 | |
Wolters Kluwer NV | | | 600 | | | | 29,410 | |
| | | | | | | | |
| | | | | | | 119,422 | |
| | | | | | | | |
Road & Rail (2.1%) | |
Canadian National Railway Co. | | | 1,200 | | | | 96,560 | |
Canadian Pacific Railway Ltd. | | | 200 | | | | 34,677 | |
DSV A/S | | | 300 | | | | 23,199 | |
East Japan Railway Co. | | | 300 | | | | 28,943 | |
Hankyu Hanshin Holdings, Inc. | | | 400 | | | | 15,496 | |
Kintetsu Group Holdings Co. Ltd. | | | 300 | | | | 11,477 | |
Tobu Railway Co. Ltd. | | | 600 | | | | 17,519 | |
Union Pacific Corp. | | | 600 | | | | 69,474 | |
West Japan Railway Co. | | | 300 | | | | 21,036 | |
| | | | | | | | |
| | | | | | | 318,381 | |
| | | | | | | | |
Trading Companies & Distributors (1.4%) | |
Brenntag AG | | | 200 | | | | 11,326 | |
Bunzl plc | | | 600 | | | | 18,687 | |
Fastenal Co. | | | 500 | | | | 23,485 | |
Ferguson plc | | | 500 | | | | 34,964 | |
ITOCHU Corp. | | | 1,500 | | | | 26,094 | |
Marubeni Corp. | | | 3,000 | | | | 19,965 | |
Mitsubishi Corp. | | | 1,200 | | | | 27,951 | |
Mitsui & Co. Ltd. | | | 1,900 | | | | 28,223 | |
Sumitomo Corp. | | | 1,200 | | | | 17,239 | |
| | | | | | | | |
| | | | | | | 207,934 | |
| | | | | | | | |
Transportation Infrastructure (0.3%) | |
Aena SME SA(m) | | | 150 | | | | 27,519 | |
Atlantia SpA | | | 500 | | | | 16,308 | |
| | | | | | | | |
| | | | | | | 43,827 | |
| | | | | | | | |
Total Industrials | | | | | | | 2,638,424 | |
| | | | | | | | |
Information Technology (12.3%) | | | | | | | | |
Electronic Equipment, Instruments & Components (0.9%) | |
Amphenol Corp., Class A | | | 600 | | | | 52,200 | |
Keyence Corp. | | | 100 | | | | 55,257 | |
Kyocera Corp. | | | 400 | | | | 26,535 | |
| | | | | | | | |
| | | | | | | 133,992 | |
| | | | | | | | |
Internet Software & Services (1.1%) | |
Alphabet, Inc., Class A* | | | 120 | | | | 123,965 | |
Facebook, Inc., Class A* | | | 200 | | | | 36,012 | |
| | | | | | | | |
| | | | | | | 159,977 | |
| | | | | | | | |
IT Services (5.2%) | |
Accenture plc, Class A | | | 500 | | | | 71,180 | |
Amadeus IT Group SA | | | 400 | | | | 27,141 | |
Atos SE | | | 100 | | | | 15,539 | |
Automatic Data Processing, Inc. | | | 700 | | | | 81,382 | |
| | | | | | | | |
Broadridge Financial Solutions, Inc. | | | 200 | | | | 17,184 | |
CGI Group, Inc., Class A* | | | 600 | | | | 31,881 | |
Cognizant Technology Solutions Corp., Class A | | | 500 | | | | 37,835 | |
Fidelity National Information Services, Inc. | | | 300 | | | | 27,828 | |
Fiserv, Inc.* | | | 500 | | | | 64,715 | |
International Business Machines Corp. | | | 300 | | | | 46,218 | |
Mastercard, Inc., Class A | | | 800 | | | | 119,016 | |
Nomura Research Institute Ltd. | | | 300 | | | | 12,625 | |
Paychex, Inc. | | | 600 | | | | 38,274 | |
PayPal Holdings, Inc.* | | | 700 | | | | 50,792 | |
Visa, Inc., Class A | | | 1,300 | | | | 142,974 | |
| | | | | | | | |
| | | | | | | 784,584 | |
| | | | | | | | |
Semiconductors & Semiconductor Equipment (1.6%) | |
Infineon Technologies AG | | | 1,000 | | | | 27,380 | |
Intel Corp. | | | 2,000 | | | | 90,980 | |
KLA-Tencor Corp. | | | 200 | | | | 21,778 | |
Texas Instruments, Inc. | | | 1,100 | | | | 106,359 | |
| | | | | | | | |
| | | | | | | 246,497 | |
| | | | | | | | |
Software (2.2%) | |
Adobe Systems, Inc.* | | | 300 | | | | 52,548 | |
ANSYS, Inc.* | | | 100 | | | | 13,671 | |
Check Point Software Technologies Ltd.* | | | 100 | | | | 11,771 | |
Electronic Arts, Inc.* | | | 400 | | | | 47,840 | |
Intuit, Inc. | | | 400 | | | | 60,408 | |
Oracle Corp. | | | 1,200 | | | | 61,080 | |
Sage Group plc (The) | | | 800 | | | | 7,921 | |
SAP SE | | | 600 | | | | 68,256 | |
Synopsys, Inc.* | | | 200 | | | | 17,304 | |
| | | | | | | | |
| | | | | | | 340,799 | |
| | | | | | | | |
Technology Hardware, Storage & Peripherals (1.3%) | |
Apple, Inc. | | | 700 | | | | 118,328 | |
Canon, Inc. | | | 1,300 | | | | 48,510 | |
FUJIFILM Holdings Corp. | | | 700 | | | | 28,479 | |
| | | | | | | | |
| | | | | | | 195,317 | |
| | | | | | | | |
Total Information Technology | | | | | | | 1,861,166 | |
| | | | | | | | |
Materials (4.2%) | | | | | | | | |
Chemicals (4.0%) | |
Air Products & Chemicals, Inc. | | | 200 | | | | 31,886 | |
Asahi Kasei Corp. | | | 2,000 | | | | 24,080 | |
BASF SE | | | 100 | | | | 10,905 | |
Celanese Corp. | | | 100 | | | | 10,431 | |
DowDuPont, Inc. | | | 700 | | | | 50,617 | |
Ecolab, Inc. | | | 500 | | | | 65,330 | |
Givaudan SA (Registered) | | | 18 | | | | 40,199 | |
International Flavors & Fragrances, Inc. | | | 100 | | | | 14,742 | |
Kuraray Co. Ltd. | | | 600 | | | | 11,730 | |
LyondellBasell Industries NV, Class A | | | 400 | | | | 41,412 | |
Mitsubishi Chemical Holdings Corp. | | | 2,000 | | | | 20,712 | |
Nitto Denko Corp. | | | 300 | | | | 27,716 | |
See Notes to Financial Statements.
138
1290 FUNDS
1290 SMARTBETA EQUITY FUND
PORTFOLIO OF INVESTMENTS (Continued)
October 31, 2017
| | | | | | | | |
| | | Number of
Shares | | | Value
(Note 1) | |
| | | | | | | | |
Novozymes A/S, Class B | | | 400 | | | $ | 22,091 | |
PPG Industries, Inc. | | | 300 | | | | 34,872 | |
Praxair, Inc. | | | 500 | | | | 73,060 | |
Sherwin-Williams Co. (The) | | | 100 | | | | 39,515 | |
Shin-Etsu Chemical Co. Ltd. | | | 300 | | | | 31,423 | |
Sika AG | | | 3 | | | | 22,207 | |
Sumitomo Chemical Co. Ltd. | | | 5,000 | | | | 34,915 | |
| | | | | | | | |
| | | | | | | 607,843 | |
| | | | | | | | |
Construction Materials (0.2%) | | | | | | | | |
Boral Ltd. | | | 2,200 | | | | 12,039 | |
Vulcan Materials Co. | | | 100 | | | | 12,175 | |
| | | | | | | | |
| | | | | | | 24,214 | |
| | | | | | | | |
Total Materials | | | | | | | 632,057 | |
| | | | | | | | |
Real Estate (2.5%) | |
Equity Real Estate Investment Trusts (REITs) (1.8%) | |
AvalonBay Communities, Inc. (REIT) | | | 100 | | | | 18,133 | |
Dexus (REIT) | | | 1,200 | | | | 8,973 | |
Goodman Group (REIT) | | | 3,500 | | | | 22,394 | |
GPT Group (The) (REIT) | | | 3,000 | | | | 11,687 | |
Link REIT (REIT) | | | 2,000 | | | | 16,805 | |
Mirvac Group (REIT) | | | 4,100 | | | | 7,562 | |
Prologis, Inc. (REIT) | | | 200 | | | | 12,916 | |
Public Storage (REIT) | | | 200 | | | | 41,450 | |
Scentre Group (REIT) | | | 3,400 | | | | 10,461 | |
Simon Property Group, Inc. (REIT) | | | 300 | | | | 46,599 | |
Stockland (REIT) | | | 4,500 | | | | 15,567 | |
Unibail-Rodamco SE (REIT) | | | 160 | | | | 40,043 | |
Vornado Realty Trust (REIT) | | | 200 | | | | 14,972 | |
| | | | | | | | |
| | | | | | | 267,562 | |
| | | | | | | | |
Real Estate Management & Development (0.7%) | |
Daito Trust Construction Co. Ltd. | | | 100 | | | | 17,444 | |
Daiwa House Industry Co. Ltd. | | | 1,000 | | | | 36,410 | |
Mitsui Fudosan Co. Ltd. | | | 1,000 | | | | 23,095 | |
Sumitomo Realty & Development Co. Ltd. | | | 1,000 | | | | 33,112 | |
| | | | | | | | |
| | | | | | | 110,061 | |
| | | | | | | | |
Total Real Estate | | | | | | | 377,623 | |
| | | | | | | | |
Telecommunication Services (2.6%) | | | | | | | | |
Diversified Telecommunication Services (2.4%) | |
AT&T, Inc. | | | 2,900 | | | | 97,585 | |
Nippon Telegraph & Telephone Corp. | | | 900 | | | | 43,320 | |
Singapore Telecommunications Ltd. | | | 10,000 | | | | 27,511 | |
Swisscom AG (Registered) | | | 60 | | | | 30,311 | |
Telefonica SA | | | 3,000 | | | | 31,472 | |
Telenor ASA | | | 1,000 | | | | 21,242 | |
Telia Co. AB | | | 3,000 | | | | 13,886 | |
Telstra Corp. Ltd. | | | 6,300 | | | | 17,069 | |
Verizon Communications, Inc. | | | 1,500 | | | | 71,805 | |
| | | | | | | | |
| | | | | | | 354,201 | |
| | | | | | | | |
Wireless Telecommunication Services (0.2%) | |
KDDI Corp. | | | 1,200 | | | | 31,914 | |
| | | | | | | | |
Total Telecommunication Services | | | | | | | 386,115 | |
| | | | | | | | |
| | | | | | | | |
Utilities (6.0%) | | | | | | | | |
Electric Utilities (3.6%) | |
American Electric Power Co., Inc. | | | 600 | | | | 44,646 | |
CLP Holdings Ltd. | | | 2,000 | | | | 20,342 | |
Duke Energy Corp. | | | 600 | | | | 52,986 | |
Enel SpA | | | 6,000 | | | | 37,217 | |
Eversource Energy | | | 300 | | | | 18,792 | |
Fortis, Inc. | | | 500 | | | | 18,413 | |
Iberdrola SA | | | 4,000 | | | | 32,327 | |
NextEra Energy, Inc. | | | 400 | | | | 62,028 | |
PG&E Corp. | | | 400 | | | | 23,108 | |
PPL Corp. | | | 1,100 | | | | 41,316 | |
Red Electrica Corp. SA | | | 1,000 | | | | 22,144 | |
Southern Co. (The) | | | 1,600 | | | | 83,520 | |
SSE plc | | | 2,000 | | | | 36,710 | |
Terna Rete Elettrica Nazionale SpA | | | 3,000 | | | | 18,102 | |
Xcel Energy, Inc. | | | 800 | | | | 39,616 | |
| | | | | | | | |
| | | | | | | 551,267 | |
| | | | | | | | |
Gas Utilities (0.4%) | |
Hong Kong & China Gas Co. Ltd. | | | 14,300 | | | | 27,092 | |
Osaka Gas Co. Ltd. | | | 600 | | | | 11,548 | |
UGI Corp. | | | 300 | | | | 14,358 | |
| | | | | | | | |
| | | | | | | 52,998 | |
| | | | | | | | |
Multi-Utilities (1.8%) | |
AGL Energy Ltd. | | | 1,200 | | | | 23,209 | |
Ameren Corp. | | | 300 | | | | 18,597 | |
CenterPoint Energy, Inc. | | | 500 | | | | 14,790 | |
CMS Energy Corp. | | | 400 | | | | 19,348 | |
Consolidated Edison, Inc. | | | 200 | | | | 17,210 | |
Dominion Energy, Inc. | | | 900 | | | | 73,026 | |
DTE Energy Co. | | | 300 | | | | 33,138 | |
NiSource, Inc. | | | 500 | | | | 13,185 | |
Sempra Energy | | | 500 | | | | 58,750 | |
| | | | | | | | |
| | | | | | | 271,253 | |
| | | | | | | | |
Water Utilities (0.2%) | |
American Water Works Co., Inc. | | | 300 | | | | 26,328 | |
Severn Trent plc | | | 300 | | | | 8,411 | |
| | | | | | | | |
| | | | | | | 34,739 | |
| | | | | | | | |
Total Utilities | | | | | | | 910,257 | |
| | | | | | | | |
Total Investments in Securities (98.5%)
(Cost $12,624,060) | | | | | | | 14,873,918 | |
Other Assets Less Liabilities (1.5%) | | | | | | | 233,004 | |
| | | | | | | | |
Net Assets (100%) | | | | | | $ | 15,106,922 | |
| | | | | | | | |
See Notes to Financial Statements.
139
1290 FUNDS
1290 SMARTBETA EQUITY FUND
PORTFOLIO OF INVESTMENTS (Continued)
October 31, 2017
| (m) | Regulation S is an exemption for securities offerings that are made outside of the United States and do not involve direct selling efforts in the United States. Resale restrictions may apply for purposes of the Securities Act of 1933. At October 31, 2017, the market value of these securities amounted to $27,519 or 0.2% of net assets. |
| (q) | Preference Shares are a special type of equity investment that shares in the earnings of the company, has limited voting rights, and receives a greater dividend than applicable Common Shares. |
Glossary:
| | | | |
Country Diversification
As a Percentage of Total Net Assets | | | |
Australia | | | 2.0 | % |
Belgium | | | 0.1 | |
Canada | | | 6.7 | |
Denmark | | | 0.8 | |
Finland | | | 0.5 | |
France | | | 3.7 | |
Germany | | | 4.5 | |
Hong Kong | | | 0.9 | |
Israel | | | 0.2 | |
Italy | | | 0.8 | |
Japan | | | 8.2 | |
Netherlands | | | 0.4 | |
Norway | | | 0.1 | |
Singapore | | | 0.4 | |
Spain | | | 1.2 | |
Sweden | | | 2.0 | |
Switzerland | | | 3.1 | |
United Kingdom | | | 3.5 | |
United States | | | 59.4 | |
Cash and Other | | | 1.5 | |
| | | | | |
| | | | 100.0 | % |
| | | | | |
The following is a summary of the inputs used to value the Fund’s assets and liabilities carried at fair value as of October 31, 2017:
The inputs or methodology used for valuing securities are not necessarily an indication of the risk associated with investing in those securities.
Various inputs are used in determining the value of the Fund’s investments. These inputs are summarized in the three broad levels listed below:
| | | | | | | | | | | | | | | | |
| | | | | |
| Investment Type | | Level 1
Quoted Prices in
Active Markets for
Identical
Securities | | | Level 2
Significant Other
Observable Inputs
(including quoted prices
for similar securities,
interest rates,
prepayment speeds,
credit risk, etc.) | | | Level 3
Significant Unobservable
Inputs (including the
Fund’s own
assumptions in
determining the fair
value of investments) | | | Total | |
Assets: | | | | | | | | | | | | | | | | |
Common Stocks | | | | | | | | | | | | | | | | |
Consumer Discretionary | | $ | 890,489 | | | $ | 500,271 | | | $ | — | | | $ | 1,390,760 | |
Consumer Staples | | | 1,288,236 | | | | 877,490 | | | | — | | | | 2,165,726 | |
Energy | | | 229,309 | | | | 108,720 | | | | — | | | | 338,029 | |
Financials | | | 1,723,270 | | | | 683,563 | | | | — | | | | 2,406,833 | |
Health Care | | | 1,371,720 | | | | 395,208 | | | | — | | | | 1,766,928 | |
Industrials | | | 1,597,144 | | | | 1,041,280 | | | | — | | | | 2,638,424 | |
Information Technology | | | 1,543,523 | | | | 317,643 | | | | — | | | | 1,861,166 | |
Materials | | | 374,040 | | | | 258,017 | | | | — | | | | 632,057 | |
Real Estate | | | 134,070 | | | | 243,553 | | | | — | | | | 377,623 | |
Telecommunication Services | | | 169,390 | | | | 216,725 | | | | — | | | | 386,115 | |
Utilities | | | 673,155 | | | | 237,102 | | | | — | | | | 910,257 | |
| | | | | | | | | | | | | | | | |
Total Assets | | $ | 9,994,346 | | | $ | 4,879,572 | | | $ | — | | | $ | 14,873,918 | |
| | | | | | | | | | | | | | | | |
Total Liabilities | | $ | — | | | $ | — | | | $ | — | | | $ | — | |
| | | | | | | | | | | | | | | | |
Total | | $ | 9,994,346 | | | $ | 4,879,572 | | | $ | — | | | $ | 14,873,918 | |
| | | | | | | | | | | | | | | | |
There were no transfers between Levels 1, 2 or 3 during the year ended October 31, 2017.
See Notes to Financial Statements.
140
1290 FUNDS
1290 SMARTBETA EQUITY FUND
PORTFOLIO OF INVESTMENTS (Continued)
October 31, 2017
The Fund held no derivatives contracts during the year ended October 31, 2017.
Investment security transactions for the year ended October 31, 2017 were as follows:
| | | | |
Cost of Purchases: | | | | |
Long-term investments other than U.S. government debt securities | | $ | 6,700,706 | |
Net Proceeds of Sales and Redemptions: | | | | |
Long-term investments other than U.S. government debt securities | | $ | 5,345,624 | |
As of October 31, 2017, the gross unrealized appreciation (depreciation) of investments based on the aggregate cost of investments in securities and derivative instruments, if applicable, for Federal income tax purposes was as follows:
| | | | |
Aggregate gross unrealized appreciation | | $ | 2,396,461 | |
Aggregate gross unrealized depreciation | | | (172,500 | ) |
| | | | |
Net unrealized appreciation | | $ | 2,223,961 | |
| | | | |
Federal income tax cost of investments in securities and derivative instruments, if applicable | | $ | 12,649,957 | |
| | | | |
See Notes to Financial Statements.
141
1290 FUNDS
1290 SMARTBETA EQUITY FUND
STATEMENT OF ASSETS AND LIABILITIES
October 31, 2017
| | | | |
ASSETS | |
Investments in Securities, at value (Cost $12,624,060) | | $ | 14,873,918 | |
Cash | | | 175,784 | |
Foreign cash (Cost $29,913) | | | 29,642 | |
Dividends, interest and other receivables | | | 31,016 | |
Prepaid registration and filing fees | | | 22,706 | |
Receivable for Fund shares sold | | | 21,659 | |
Receivable from investment adviser | | | 5,463 | |
Other assets | | | 134 | |
| | | | |
Total assets | | | 15,160,322 | |
| | | | |
LIABILITIES | |
Transfer agent fees payable | | | 4,536 | |
Payable for Fund shares redeemed | | | 260 | |
Distribution fees payable – Class A | | | 142 | |
Distribution fees payable – Class R | | | 58 | |
Accrued expenses | | | 48,404 | |
| | | | |
Total liabilities | | | 53,400 | |
| | | | |
NET ASSETS | | $ | 15,106,922 | |
| | | | |
Net assets were comprised of: | |
Paid in capital | | $ | 12,466,039 | |
Accumulated undistributed net investment income (loss) | | | 165,180 | |
Accumulated undistributed net realized gain (loss) | | | 226,004 | |
Net unrealized appreciation (depreciation) | | | 2,249,699 | |
| | | | |
Net assets | | $ | 15,106,922 | |
| | | | |
Class A | | | | |
Net asset value and redemption price per share, $685,288 / 56,031 shares outstanding (unlimited amount authorized: $0.001 par value) | | $ | 12.23 | |
Maximum sales charge (5.50% of offering price) | | | 0.71 | |
| | | | |
Maximum offering price per share | | $ | 12.94 | |
| | | | |
Class I | | | | |
Net asset value and redemption price per share, $14,158,103 / 1,155,538 shares outstanding (unlimited amount authorized: $0.001 par value) | | $ | 12.25 | |
| | | | |
Class R | | | | |
Net asset value and redemption price per share, $136,959 / 11,223 shares outstanding (unlimited amount authorized: $0.001 par value) | | $ | 12.20 | |
| | | | |
Class T** | | | | |
Net asset value and redemption price per share, $126,572 / 10,332 shares outstanding (unlimited amount authorized: $0.001 par value) | | $ | 12.25 | |
Maximum sales charge (2.50% of offering price) | | | 0.31 | |
| | | | |
Maximum offering price per share | | $ | 12.56 | |
| | | | |
| ** | Class T shares currently are not offered for sale. Class T shares were formerly known as Class C shares. |
STATEMENT OF OPERATIONS
For the Year Ended October 31, 2017
| | | | |
INVESTMENT INCOME | |
Dividends (net of $17,188 foreign withholding tax) | | $ | 318,878 | |
Interest | | | 91 | |
| | | | |
Total income | | | 318,969 | |
| | | | |
EXPENSES | |
Investment advisory fees | | | 91,589 | |
Professional fees | | | 69,540 | |
Transfer agent fees | | | 48,600 | |
Registration and filing fees | | | 39,460 | |
Administrative fees | | | 30,003 | |
Custodian fees | | | 17,300 | |
Printing and mailing expenses | | | 8,553 | |
Trustees’ fees | | | 1,639 | |
Distribution fees – Class A | | | 1,091 | |
Distribution fees – Class R | | | 627 | |
Distribution fees – Class T** | | | 557 | |
Miscellaneous | | | 18,925 | |
| | | | |
Gross expenses | | | 327,884 | |
Less: Waiver from investment adviser | | | (121,592 | ) |
Waiver from distributor | | | (557 | ) |
Reimbursement from investment adviser | | | (78,383 | ) |
| | | | |
Net expenses | | | 127,352 | |
| | | | |
NET INVESTMENT INCOME (LOSS) | | | 191,617 | |
| | | | |
REALIZED AND UNREALIZED GAIN (LOSS) | |
Realized gain (loss) on: | | | | |
Investments in securities | | | 339,623 | |
Foreign currency transactions | | | 549 | |
| | | | |
Net realized gain (loss) | | | 340,172 | |
| | | | |
Change in unrealized appreciation (depreciation) on: | | | | |
Investments in securities | | | 1,939,037 | |
Foreign currency translations | | | 333 | |
| | | | |
Net change in unrealized appreciation (depreciation) | | | 1,939,370 | |
| | | | |
NET REALIZED AND UNREALIZED GAIN (LOSS) | | | 2,279,542 | |
| | | | |
NET INCREASE (DECREASE) IN NET ASSETS RESULTING FROM OPERATIONS | | $ | 2,471,159 | |
| | | | |
| ** | Class T shares currently are not offered for sale. Class T shares were formerly known as Class C shares. |
See Notes to Financial Statements.
142
1290 FUNDS
1290 SMARTBETA EQUITY FUND
STATEMENT OF CHANGES IN NET ASSETS
| | | | | | | | |
| | | Year Ended October 31, | |
| | 2017 | | | 2016 | |
INCREASE (DECREASE) IN NET ASSETS FROM OPERATIONS: | |
Net investment income (loss) | | $ | 191,617 | | | $ | 145,786 | |
Net realized gain (loss) | | | 340,172 | | | | (84,951 | ) |
Net change in unrealized appreciation (depreciation) | | | 1,939,370 | | | | 118,992 | |
| | | | | | | | |
NET INCREASE (DECREASE) IN NET ASSETS RESULTING FROM OPERATIONS | | | 2,471,159 | | | | 179,827 | |
| | | | | | | | |
DIVIDENDS: | | | | | | | | |
Dividends from net investment income | | | | | | | | |
Class A | | | (3,272 | ) | | | (45,245 | ) |
Class I | | | (145,390 | ) | | | (54,271 | ) |
Class R | | | (929 | ) | | | (36,365 | ) |
Class T** | | | (1,415 | ) | | | (17,317 | ) |
| | | | | | | | |
TOTAL DIVIDENDS | | | (151,006 | ) | | | (153,198 | ) |
| | | | | | | | |
CAPITAL SHARES TRANSACTIONS: | | | | | | | | |
Class A | | | | | | | | |
Capital shares sold [ 34,018 and 12,294 shares, respectively ] | | | 384,382 | | | | 124,475 | |
Capital shares issued in reinvestment of dividends [ 199 and 111 shares, respectively ] | | | 2,074 | | | | 1,104 | |
Capital shares repurchased [ (4,468) and (290,014) shares, respectively ] | | | (48,233 | ) | | | (2,947,306 | ) |
| | | | | | | | |
Total Class A transactions | | | 338,223 | | | | (2,821,727 | ) |
| | | | | | | | |
Class I | | | | | | | | |
Capital shares sold [ 115,854 and 743,273 shares, respectively ] | | | 1,304,358 | | | | 7,563,544 | |
Capital shares issued in reinvestment of dividends [ 1,194 and 234 shares, respectively ] | | | 12,441 | | | | 2,319 | |
Capital shares repurchased [ (17,015) and (1,720) shares, respectively ] | | | (196,125 | ) | | | (18,417 | ) |
| | | | | | | | |
Total Class I transactions | | | 1,120,674 | | | | 7,547,446 | |
| | | | | | | | |
Class R | | | | | | | | |
Capital shares sold [ 30 and 450 shares, respectively ] | | | 353 | | | | 4,614 | |
Capital shares issued in reinvestment of dividends [ 3 and 0 shares, respectively ] | | | 34 | | | | — | |
Capital shares repurchased [ (46) and (290,001) shares, respectively ] | | | (475 | ) | | | (2,945,548 | ) |
| | | | | | | | |
Total Class R transactions | | | (88 | ) | | | (2,940,934 | ) |
| | | | | | | | |
Class T** | | | | | | | | |
Capital shares repurchased [ 0 and (90,000) shares, respectively ] | | | — | | | | (915,126 | ) |
| | | | | | | | |
Total Class T transactions | | | — | | | | (915,126 | ) |
| | | | | | | | |
NET INCREASE (DECREASE) IN NET ASSETS RESULTING FROM CAPITAL SHARE TRANSACTIONS | | | 1,458,809 | | | | 869,659 | |
| | | | | | | | |
TOTAL INCREASE (DECREASE) IN NET ASSETS | | | 3,778,962 | | | | 896,288 | |
NET ASSETS: | |
Beginning of year | | | 11,327,960 | | | | 10,431,672 | |
| | | | | | | | |
End of year (a) | | $ | 15,106,922 | | | $ | 11,327,960 | |
| | | | | | | | |
(a) Includes accumulated undistributed (overdistributed) net investment income (loss) of | | $ | 165,180 | | | $ | 124,302 | |
| | | | | | | | |
** Class T shares currently are not offered for sale. Class T shares were formerly known as Class C shares. | | | | | | | | |
See Notes to Financial Statements.
143
1290 FUNDS
1290 SMARTBETA EQUITY FUND
FINANCIAL HIGHLIGHTS
| | | | | | | | | | | | |
| | | Year Ended October 31, | | | November 12, 2014* to
October 31, 2015 | |
| Class A | | 2017 | | | 2016 | | |
Net asset value, beginning of period | | $ | 10.25 | | | $ | 10.24 | | | $ | 10.00 | |
| | | | | | | | | | | | |
Income (loss) from investment operations: | | | | | | | | | | | | |
Net investment income (loss) (e) | | | 0.13 | | | | 0.12 | ## | | | 0.11 | |
Net realized and unrealized gain (loss) | | | 1.96 | | | | 0.04 | | | | 0.16 | |
| | | | | | | | | | | | |
Total from investment operations | | | 2.09 | | | | 0.16 | | | | 0.27 | |
| | | | | | | | | | | | |
Less distributions: | | | | | | | | | | | | |
Dividends from net investment income | | | (0.11 | ) | | | (0.15 | ) | | | (0.03 | ) |
| | | | | | | | | | | | |
Net asset value, end of period | | $ | 12.23 | | | $ | 10.25 | | | $ | 10.24 | |
| | | | | | | | | | | | |
Total return (b) | | | 20.58 | % | | | 1.58 | % | | | 2.70 | % |
| | | | | | | | | | | | |
Ratios/Supplemental Data: | | | | | | | | | | | | |
Net assets, end of period (000’s) | | $ | 685 | | | $ | 269 | | | $ | 3,111 | |
Ratio of expenses to average net assets: | | | | | | | | | | | | |
After waivers and reimbursements (a)(f) | | | 1.20 | % | | | 1.35 | % | | | 1.35 | % |
Before waivers and reimbursements (a)(f) | | | 2.77 | % | | | 2.76 | % | | | 4.21 | % |
Ratio of net investment income (loss) to average net assets: | | | | | | | | | | | | |
After waivers and reimbursements (a)(f) | | | 1.17 | % | | | 1.23 | %(aa) | | | 1.14 | %(l) |
Before waivers and reimbursements (a)(f) | | | (0.41 | )% | | | (0.18 | )%(aa) | | | (1.73 | )%(l) |
Portfolio turnover rate (z)^ | | | 41 | % | | | 27 | % | | | 29 | % |
| | |
| | | Year Ended October 31, | | | November 12, 2014* to October 31, 2015 | |
| Class I | | 2017 | | | 2016 | | |
Net asset value, beginning of period | | $ | 10.27 | | | $ | 10.26 | | | $ | 10.00 | |
| | | | | | | | | | | | |
Income (loss) from investment operations: | | | | | | | | | | | | |
Net investment income (loss) (e) | | | 0.17 | | | | 0.15 | ## | | | 0.14 | |
Net realized and unrealized gain (loss) | | | 1.95 | | | | 0.03 | | | | 0.15 | |
| | | | | | | | | | | | |
Total from investment operations | | | 2.12 | | | | 0.18 | | | | 0.29 | |
| | | | | | | | | | | | |
Less distributions: | | | | | | | | | | | | |
Dividends from net investment income | | | (0.14 | ) | | | (0.17 | ) | | | (0.03 | ) |
| | | | | | | | | | | | |
Net asset value, end of period | | $ | 12.25 | | | $ | 10.27 | | | $ | 10.26 | |
| | | | | | | | | | | | |
Total return (b) | | | 20.85 | % | | | 1.84 | % | | | 2.94 | % |
| | | | | | | | | | | | |
Ratios/Supplemental Data: | | | | | | | | | | | | |
Net assets, end of period (000’s) | | $ | 14,158 | | | $ | 10,838 | | | $ | 3,218 | |
Ratio of expenses to average net assets: | | | | | | | | | | | | |
After waivers and reimbursements (a)(f) | | | 0.96 | % | | | 1.10 | % | | | 1.10 | % |
Before waivers and reimbursements (a)(f) | | | 2.49 | % | | | 2.51 | % | | | 3.96 | % |
Ratio of net investment income (loss) to average net assets: | | | | | | | | | | | | |
After waivers and reimbursements (a)(f) | | | 1.48 | % | | | 1.44 | %(bb) | | | 1.38 | %(l) |
Before waivers and reimbursements (a)(f) | | | (0.05 | )% | | | 0.04 | %(bb) | | | (1.48 | )%(l) |
Portfolio turnover rate (z)^ | | | 41 | % | | | 27 | % | | | 29 | % |
See Notes to Financial Statements.
144
1290 FUNDS
1290 SMARTBETA EQUITY FUND
FINANCIAL HIGHLIGHTS (Continued)
| | | | | | | | | | | | |
| | | Year Ended October 31, | | | November 12, 2014* to
October 31, 2015 | |
| Class R | | 2017 | | | 2016 | | |
Net asset value, beginning of period | | $ | 10.23 | | | $ | 10.22 | | | $ | 10.00 | |
| | | | | | | | | | | | |
Income (loss) from investment operations: | | | | | | | | | | | | |
Net investment income (loss) (e) | | | 0.11 | | | | 0.10 | ## | | | 0.09 | |
Net realized and unrealized gain (loss) | | | 1.94 | | | | 0.03 | | | | 0.16 | |
| | | | | | | | | | | | |
Total from investment operations | | | 2.05 | | | | 0.13 | | | | 0.25 | |
| | | | | | | | | | | | |
Less distributions: | | | | | | | | | | | | |
Dividends from net investment income | | | (0.08 | ) | | | (0.12 | ) | | | (0.03 | ) |
| | | | | | | | | | | | |
Net asset value, end of period | | $ | 12.20 | | | $ | 10.23 | | | $ | 10.22 | |
| | | | | | | | | | | | |
Total return (b) | | | 20.21 | % | | | 1.32 | % | | | 2.47 | % |
| | | | | | | | | | | | |
Ratios/Supplemental Data: | | | | | | | | | | | | |
Net assets, end of period (000’s) | | $ | 137 | | | $ | 115 | | | $ | 3,073 | |
Ratio of expenses to average net assets: | | | | | | | | | | | | |
After waivers and reimbursements (a)(f) | | | 1.46 | % | | | 1.60 | % | | | 1.60 | % |
Before waivers and reimbursements (a)(f) | | | 2.98 | % | | | 3.01 | % | | | 4.46 | % |
Ratio of net investment income (loss) to average net assets: | | | | | | | | | | | | |
After waivers and reimbursements (a)(f) | | | 0.98 | % | | | 0.98 | %(cc) | | | 0.89 | %(l) |
Before waivers and reimbursements (a)(f) | | | (0.54 | )% | | | (0.43 | )%(cc) | | | (1.98 | )%(l) |
Portfolio turnover rate (z)^ | | | 41 | % | | | 27 | % | | | 29 | % |
| | |
| | | Year Ended October 31, | | | November 12, 2014* to October 31, 2015 | |
| Class T** | | 2017 | | | 2016 | | |
Net asset value, beginning of period | | $ | 10.27 | | | $ | 10.26 | | | $ | 10.00 | |
| | | | | | | | | | | | |
Income (loss) from investment operations: | | | | | | | | | | | | |
Net investment income (loss) (e) | | | 0.17 | | | | 0.15 | ## | | | 0.14 | |
Net realized and unrealized gain (loss) | | | 1.95 | | | | 0.03 | | | | 0.15 | |
| | �� | | | | | | | | | | |
Total from investment operations | | | 2.12 | | | | 0.18 | | | | 0.29 | |
| | | | | | | | | | | | |
Less distributions: | | | | | | | | | | | | |
Dividends from net investment income | | | (0.14 | ) | | | (0.17 | ) | | | (0.03 | ) |
| | | | | | | | | | | | |
Net asset value, end of period | | $ | 12.25 | | | $ | 10.27 | | | $ | 10.26 | |
| | | | | | | | | | | | |
Total return (b) | | | 20.85 | % | | | 1.84 | % | | | 2.94 | % |
| | | | | | | | | | | | |
Ratios/Supplemental Data: | | | | | | | | | | | | |
Net assets, end of period (000’s) | | $ | 127 | | | $ | 106 | | | $ | 1,029 | |
Ratio of expenses to average net assets: | | | | | | | | | | | | |
After waivers and reimbursements (a)(f) | | | 0.96 | % | | | 1.10 | % | | | 1.10 | % |
Before waivers and reimbursements (a)(f) | | | 2.96 | % | | | 3.51 | % | | | 4.96 | % |
Ratio of net investment income (loss) to average net assets: | | | | | | | | | | | | |
After waivers and reimbursements (a)(f) | | | 1.48 | % | | | 1.48 | %(dd) | | | 1.39 | %(l) |
Before waivers and reimbursements (a)(f) | | | (0.52 | )% | | | (0.93 | )%(dd) | | | (2.48 | )%(l) |
Portfolio turnover rate (z)^ | | | 41 | % | | | 27 | % | | | 29 | % |
See Notes to Financial Statements.
145
1290 FUNDS
1290 SMARTBETA EQUITY FUND
FINANCIAL HIGHLIGHTS (Continued)
| * | Commencement of Operations. |
| ** | Class T shares currently are not offered for sale. Class T shares were formerly known as Class C shares. |
| ## | Includes income resulting from a special dividend. Without this dividend, the per share income amounts would be $0.08, $0.11, $0.06 and $0.11 for Class A, Class I, Class R and Class T, respectively. |
| ^ | Portfolio turnover rate excludes derivatives, if any. |
| (a) | Ratios for periods less than one year are annualized. Certain non-recurring expenses incurred by the Fund are not annualized for periods less than one year. |
| (b) | Total returns for periods less than one year are not annualized. |
| (e) | Net investment income (loss) per share is based on average shares outstanding. |
| (f) | Expenses do not include the expenses of the underlying funds (“indirect expenses”), if applicable. |
| (l) | The annualized ratio of net investment income to average net assets may not be indicative of operating results for a full year. |
| (z) | Portfolio turnover rate for periods less than one year is not annualized. |
| (aa) | Includes income resulting from a special dividend. Without this dividend, the ratios for Class A would be 0.85% for income after waivers and reimbursements and (0.56)% before waivers and reimbursements. |
| (bb) | Includes income resulting from a special dividend. Without this dividend, the ratios for Class I would be 1.07% for income after waivers and reimbursements and (0.34)% before waivers and reimbursements. |
| (cc) | Includes income resulting from a special dividend. Without this dividend, the ratios for Class R would be 0.61% for income after waivers and reimbursements and (0.80)% before waivers and reimbursements. |
| (dd) | Includes income resulting from a special dividend. Without this dividend, the ratios for Class T would be 1.11% for income after waivers and reimbursements and (1.30)% before waivers and reimbursements. |
See Notes to Financial Statements.
146
1290 UNCONSTRAINED BOND MANAGERS FUND (Unaudited)
INVESTMENT ADVISER
INVESTMENT SUB-ADVISERS
| Ø | | Pacific Investment Management Company LLC (PIMCO) |
| Ø | | TCW Investment Management Company |
PERFORMANCE RESULTS
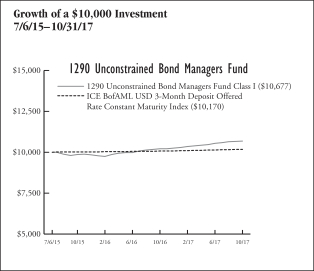
| | | | | | | | | | |
| Annualized Total Returns as of 10/31/17 | |
| | | | | 1
Year | | | Since
Incept. | |
Fund – Class A Shares* | | without Sales Charge | | | 4.25 | % | | | 2.59 | % |
| | | with Sales Charge (a) | | | (0.48 | ) | | | 0.58 | |
Fund – Class I Shares* | | | | | 4.58 | | | | 2.86 | |
Fund – Class R Shares* | | | | | 4.04 | | | | 2.33 | |
ICE BofAML USD 3-Month Deposit Offered Rate Constant Maturity Index | | | | | 1.06 | | | | 0.73 | |
* Date of inception 7/6/15. (a) A 4.50% front-end sales charge was deducted. Returns for periods greater than one year are annualized. | |
The performance quoted is past performance and is not a guarantee of future results. Mutual funds are subject to certain market risks. Investment returns and principal value of an investment will fluctuate so that an investor’s shares, when redeemed, may be worth more or less than their original cost. Current performance may be higher or lower than the performance data shown. For the most current month-end performance data please call 1-888-310-0416 or visit www.1290Funds.com.
The graph illustrates comparative performance for $10,000 invested in the Class I Shares of the 1290 Unconstrained Bond Managers Fund and the ICE BofAML USD 3-Month Deposit Offered Rate Constant Maturity Index from 7/6/15 to 10/31/17. The performance of the ICE BofAML USD 3-Month Deposit Offered Rate Constant Maturity Index reflects an initial investment at the end of the month closest to the Fund’s inception. The performance of the Fund assumes reinvestment of all dividends and capital gain distributions, if any, and does not include a sales charge. The performance of the ICE BofAML USD 3-Month Deposit Offered Rate Constant Maturity Index does not reflect the deduction of expenses or a sales charge associated with a mutual fund and has been adjusted to reflect reinvestment of all dividends, capital gain distributions, and interest of the securities included in the benchmark.
Fund performance may reflect the waiver of the Fund’s fees and reimbursement of expenses for certain periods since the inception date. Without these waivers and reimbursements, performance would have been lower. Also, performance shown in this section does not reflect the deduction of taxes that a shareholder would pay on Fund distributions or redemption of Fund shares.
PERFORMANCE SUMMARY
The Fund’s Class I shares returned 4.58% for the year ended October 31, 2017. The Fund’s benchmark, the ICE BofAML USD 3-Month Deposit Offered Rate Constant Maturity Index, returned 1.06% over the same year.
Pacific Investment Management Company LLC (PIMCO)
Fund Highlights
What helped performance during the year?
| • | | Select holdings of non-agency mortgages contributed to performance. |
| • | | Exposure to investment grade and high yield corporate credit spread, most notably to financials, aided performance for the period. |
| • | | Positions in local and U.S. dollar-denominated emerging market debt added to performance. |
| • | | Tactical currency positioning, particularly within the Russian ruble, Mexican peso, and Japanese yen, was beneficial to performance. |
| • | | Treasury Inflation-Protected Securities (TIPS) held in lieu of nominal Treasuries added to performance. |
What hurt performance during the year?
| • | | U.S. interest rate strategies were detrimental for performance during the period. |
| • | | Shorting a basket of Asian emerging market currencies versus the U.S. dollar detracted from performance. |
Derivatives Summary
During the twelve-month period ended October 31, 2017, the AXA Unconstrained Bond Managers Fund (“the Fund”) sold credit protection through credit default swaps to obtain exposure to the credit risk of individual securities or to the broader investment grade, high yield, or emerging market sectors. The Fund also purchased credit protection during the period to reduce credit exposure to individual issuers, reduce broader credit risk, or to take advantage of the basis between the credit default swap and cash bond market. The Fund entered into interest rate swaps to manage nominal or real interest rate exposure in various global markets or as a substitute for cash bond exposure. The Fund entered into futures contracts to manage interest rate exposure, as a substitute for cash bond exposure, and/or for purposes of liquidity. Interest
147
1290 UNCONSTRAINED BOND MANAGERS FUND (Unaudited)
rate swaps and futures allow the portfolio manager to effectively manage risk and gain or reduce exposure by targeting specific markets and areas of the yield curve that may not otherwise be accessible through the use of cash bonds. The Fund sold/wrote options and swaptions on futures, currencies, volatility, and swaps and also purchased options and swaptions as a means of capitalizing on anticipated changes in market volatility or to generate income. Lastly, the Fund purchased and sold foreign currency contracts in connection with settling planned purchases or sales of securities, to hedge the currency exposure associated with some or all of the Fund’s securities, and/or as a part of a tactical investment strategy.
TCW Investment Management Company
Fund Highlights
What helped performance during the year?
| • | | Performance was driven by the allocation to non-agency mortgage-backed securities (MBS) (particularly bonds backed by alt-A and subprime collateral), which have benefited from solid demand and continued improvements in fundamentals such as higher home prices and lower loan-to-value ratios. |
| • | | The next largest contribution came from the exposure to corporate credit, given the considerable outperformance for the sector during the period. In particular, the Fund’s consumer non-cyclicals, communications, and banking credits contributed to performance, and the small allocation to high yield credit was a positive as well. |
| • | | Further contributions came from the allocation to floating rate government guaranteed student loan asset-backed securities (ABS) and commercial MBS holdings. A small position in Japanese Government Bond T-bills, with the Yen exposure fully hedged out using a Dollar-Yen cross currency swap, added to performance. |
What hurt performance during the year?
| • | | With the increase in Treasury rates over the period, the impact of duration was negative. |
| | | | |
Fund Characteristics As of October 31, 2017 | | | |
Weighted Average Life (Years) | | | 2.96 | |
Weighted Average Coupon (%) | | | 3.10 | |
Weighted Average Modified Duration (Years)* | | | 1.49 | |
Weighted Average Rating** | | | A | |
* Modified duration is a measure of the price sensitivity of the Fund to interest rate movements, taking into account specific features of the securities in which it invests. ** Weighted Average Rating has been provided by the Investment Sub-Adviser. A credit rating is an assessment provided by a nationally recognized statistical rating organization (NRSRO) of the creditworthiness of an issuer with respect to debt obligations, including specific securities, money market instruments or other debts. Ratings are measured on a scale that generally ranges from AAA (highest) to D (lowest); ratings are subject to change without notice. | |
| | | | |
Sector Weightings as of October 31, 2017 | | % of
Net Assets | |
Asset Backed Securities | | | 23.8 | % |
U.S. Treasury Obligations | | | 20.0 | |
Financials | | | 11.9 | |
Collateralized Mortgage Obligations | | | 10.8 | |
Commercial Mortgage-Backed Securities | | | 9.2 | |
Foreign Government Securities | | | 4.7 | |
Mortgage-Backed Securities | | | 2.9 | |
U.S. Government Agency Securities | | | 2.4 | |
Health Care | | | 2.2 | |
Energy | | | 1.9 | |
Telecommunication Services | | | 1.5 | |
Consumer Discretionary | | | 1.4 | |
Utilities | | | 1.2 | |
Real Estate | | | 1.1 | |
Consumer Staples | | | 0.8 | |
Municipal Bonds | | | 0.8 | |
Information Technology | | | 0.7 | |
Industrials | | | 0.7 | |
Materials | | | 0.4 | |
Options Purchased | | | 0.1 | |
Cash and Other | | | 1.5 | |
| | | | | |
| | | | 100.0 | % |
| | | | | |
Holdings are subject to change without notice. | | | | |
UNDERSTANDING YOUR EXPENSES:
As a shareholder of the Fund, you incur two types of costs:
(1) transaction costs, including applicable sales charges and redemption fees; and (2) ongoing costs, including investment advisory fees, distribution and/or service (12b-1) fees (in the case of Class A and Class R shares of the Fund), and other Fund expenses. These examples are intended to help you understand your ongoing costs (in dollars) of investing in the Fund and to compare these costs with the ongoing costs of investing in other mutual funds.
The examples are based on an investment of $1,000 invested at the beginning of the six-month period ended October 31, 2017 and held for the entire six-month period.
Actual Expenses
The first line of the following table provides information about actual account values and actual expenses. You may use the information in this line, together with the amount you invested, to estimate the expenses that you paid over the period. Simply divide your account value by $1,000 (for example, an $8,600 account value divided by $1,000 = 8.6), then multiply the result by the number in the first line under the heading entitled “Expenses Paid During Period” to estimate the expenses you paid on your account during this period.
148
1290 UNCONSTRAINED BOND MANAGERS FUND (Unaudited)
Hypothetical Example for Comparison Purposes
The second line of the following table provides information about hypothetical account values and hypothetical expenses based on the Fund’s actual expense ratio and an assumed rate of return of 5% per year before expenses, which is not the Fund’s actual return. The hypothetical account values and expenses may not be used to estimate the actual ending account balance or expenses you paid for the period. You may use this information to compare the ongoing costs of investing in the Fund and other funds. To do so, compare this 5% hypothetical example with the 5% hypothetical examples that appear in the shareholder reports of the other funds.
Please note that the expenses shown in the table are meant to highlight your ongoing costs only and do not reflect any transactional costs, such as sales charges (loads), redemption fees, or exchange fees. Therefore, the second line of the table is useful in comparing ongoing costs only, and will not help you determine the relative total costs of owning different funds. In addition, if these transactional costs were included, your costs would have been higher.
EXAMPLE
| | | | | | | | | | | | |
| | | Beginning
Account
Value
5/1/17 | | | Ending
Account
Value
10/31/17 | | | Expenses Paid During Period*
5/1/17 - 10/31/17 | |
Class A | |
Actual | | | $1,000.00 | | | | $1,022.70 | | | | $6.37 | |
Hypothetical (5% average annual return before expenses) | | | 1,000.00 | | | | 1,018.90 | | | | 6.36 | |
Class I | |
Actual | | | 1,000.00 | | | | 1,025.00 | | | | 5.10 | |
Hypothetical (5% average annual return before expenses) | | | 1,000.00 | | | | 1,020.16 | | | | 5.09 | |
Class R | |
Actual | | | 1,000.00 | | | | 1,021.40 | | | | 7.64 | |
Hypothetical (5% average annual return before expenses) | | | 1,000.00 | | | | 1,017.64 | | | | 7.63 | |
* Expenses are equal to the Fund’s Class A, I and R shares annualized expense ratios of 1.25%, 1.00% and 1.50%, respectively, multiplied by the average account value over the period, and multiplied by 184/365 (to reflect the one-half year period). | |
149
1290 FUNDS
1290 UNCONSTRAINED BOND MANAGERS FUND
PORTFOLIO OF INVESTMENTS
October 31, 2017
| | | | | | | | |
| | | Principal
Amount | | | Value
(Note 1) | |
| | | | | | | | |
LONG-TERM DEBT SECURITIES: | |
Asset-Backed Securities (23.8%) | |
ABFC Trust, | | | | | | | | |
Series 2006-OPT1 A2
1.378%, 9/25/36 (l) | | $ | 160,327 | | | $ | 152,419 | |
Series 2007-NC1 A2
1.538%, 5/25/37 (l)§ | | | 250,000 | | | | 216,728 | |
ACE Securities Corp. Home Equity Loan Trust, | |
Series 2005-HE6 M1
1.708%, 10/25/35 (l) | | | 200,000 | | | | 199,326 | |
American Airlines Pass-Through Trust, | |
Series 2011-1 A
5.250%, 1/31/21 | | | 101,927 | | | | 108,437 | |
Ameriquest Mortgage Securities, Inc. Asset-Backed Pass-Through Certificates, | |
Series 2004-R9 M2
2.213%, 10/25/34 (l) | | | 95,444 | | | | 95,702 | |
Series 2005-R11 A1
1.468%, 1/25/36 (l) | | | 139,728 | | | | 139,826 | |
AMMC CLO 17 Ltd., | |
Series 2015-17A A1
2.915%, 11/15/27 (l)§ | | | 90,000 | | | | 90,378 | |
Argent Securities Trust, | |
Series 2006-M1 A1
1.388%, 7/25/36 (l) | | | 98,275 | | | | 81,327 | |
Babson CLO Ltd., | |
Series 2014-3A AR
2.679%, 1/15/26 (l)§ | | | 90,000 | | | | 90,768 | |
Series 2014-IA A1R
2.513%, 7/20/25 (l)§ | | | 90,000 | | | | 90,304 | |
Ballyrock CLO LLC, | |
Series 2014-1A A1R
2.457%, 10/20/26 (l)§ | | | 90,000 | | | | 90,086 | |
Bayview Opportunity Master Fund IIIa Trust, | |
Series 2017-RN7 A1
3.105%, 9/28/32 (b)(e)§ | | | 197,541 | | | | 197,703 | |
Bear Stearns Asset-Backed Securities I Trust, | |
Series 2005-HE11 M2
1.912%, 11/25/35 (l) | | | 200,000 | | | | 199,717 | |
Series 2007-HE2 2A2
1.348%, 2/25/37 (l) | | | 176,230 | | | | 179,300 | |
BlueMountain CLO Ltd., | |
Series 2015-1A A1R
2.689%, 4/13/27 (l)§ | | | 90,000 | | | | 90,636 | |
Brazos Higher Education Authority, Inc., | |
Series 2011-1 A2
2.117%, 2/25/30 (l) | | | 41,496 | | | | 41,698 | |
Cedar Funding V CLO Ltd., | |
Series 2016-5A A1
2.963%, 7/17/28 (l)§ | | | 90,000 | | | | 90,215 | |
Chase Funding Trust, | |
Series 2002-3 2A1
1.878%, 8/25/32 (l) | | | 4,008 | | | | 3,762 | |
Citigroup Mortgage Loan Trust, | |
Series 2006-HE2 A2C
1.388%, 8/25/36 (l) | | | 9,108 | | | | 9,101 | |
Series 2007-AHL1 A2B
1.378%, 12/25/36 (l) | | | 178,674 | | | | 172,221 | |
Series 2007-AMC1 A1
1.398%, 12/25/36 (l)§ | | | 189,455 | | | | 120,977 | |
| | | | | | | | |
Series 2007-FS1 1A1
4.633%, 10/25/37 (e)§ | | | 237,701 | | | | 237,585 | |
Citigroup Mortgage Loan Trust, Asset-Backed Pass-Through Certificates, | |
Series 2005-OPT3 M2
1.913%, 5/25/35 (l) | | | 41,498 | | | | 41,568 | |
Citigroup Mortgage Loan Trust, Inc., | |
Series 2007-AMC3 A1
1.498%, 3/25/37 (l)§ | | | 148,731 | | | | 131,600 | |
Countrywide Asset-Backed Certificates, | |
Series 2002-3 1A1
1.978%, 5/25/32 (l) | | | 7,975 | | | | 7,760 | |
Series 2006-26 1A
1.378%, 6/25/37 (l) | | | 148,400 | | | | 134,801 | |
Series 2007-2 1A
1.378%, 8/25/37 (l) | | | 287,519 | | | | 238,176 | |
Series 2007-9 1A
1.438%, 6/25/47 (l) | | | 362,467 | | | | 307,229 | |
CWABS Asset-Backed Certificates Trust, | |
Series 2004-15 MV4
2.513%, 4/25/35 (l) | | | 163,168 | | | | 164,262 | |
Series 2005-3 MV5
1.908%, 8/25/35 (l) | | | 200,000 | | | | 200,902 | |
Series 2006-14 2A2
1.388%, 2/25/37 (l) | | | 107,649 | | | | 106,999 | |
Delta Air Lines Pass-Through Trust, | |
Series 2002-1 G-1
6.718%, 1/2/23 | | | 100,187 | | | | 111,455 | |
Dryden 41 Senior Loan Fund, | |
Series 2015-41A A
2.859%, 1/15/28 (l)§ | | | 90,000 | | | | 90,103 | |
Eaton Vance CLO Ltd., | |
Series 2014-1A AR
2.559%, 7/15/26 (l)§ | | | 90,000 | | | | 90,473 | |
Education Loan Asset-Backed Trust I, | |
Series 2013-1 A1
2.038%, 6/25/26 (l)§ | | | 88,935 | | | | 89,026 | |
Figueroa CLO Ltd., | |
Series 2013-2A A1R
2.575%, 6/20/27 (l)§ | | | 100,000 | | | | 100,485 | |
Finn Square CLO Ltd., | |
Series 2012-1A A1R
2.538%, 12/24/23 (l)§ | | | 75,400 | | | | 75,594 | |
First Franklin Mortgage Loan Trust, | |
Series 2005-FF10 A5
1.598%, 11/25/35 (l) | | | 500,000 | | | | 469,521 | |
Series 2005-FF5 M2
1.973%, 5/25/35 (l) | | | 79,442 | | | | 79,780 | |
Series 2006-FF10 A4
1.388%, 7/25/36 (l) | | | 144,196 | | | | 143,580 | |
First NLC Trust, | |
Series 2007-1 A3
1.418%, 8/25/37 (l)§ | | | 206,885 | | | | 134,431 | |
Flagship CLO VIII Ltd., | |
Series 2014-8A AR
2.609%, 1/16/26 (l)§ | | | 90,000 | | | | 90,325 | |
Flatiron CLO Ltd., | |
Series 2014-1A A1R
2.533%, 7/17/26 (l)§ | | | 250,000 | | | | 251,660 | |
Greenpoint Manufactured Housing, | |
Series 2000-1 A4
8.140%, 3/20/30 (l) | | | 139,795 | | | | 145,759 | |
See Notes to Financial Statements.
150
1290 FUNDS
1290 UNCONSTRAINED BOND MANAGERS FUND
PORTFOLIO OF INVESTMENTS (Continued)
October 31, 2017
| | | | | | | | |
| | | Principal
Amount | | | Value
(Note 1) | |
| | | | | | | | |
GSAMP Trust, | |
Series 2006-FM3 A2C
1.438%, 11/25/36 (l) | | $ | 279,907 | | | $ | 167,463 | |
Halcyon Loan Advisors Funding Ltd., | |
Series 2015-1A AR
2.283%, 4/20/27 (b)(l)§ | | | 250,000 | | | | 250,000 | |
Home Equity Asset Trust, | |
Series 2005-3 M5
1.928%, 8/25/35 (l) | | | 200,000 | | | | 177,481 | |
HSI Asset Securitization Corp. Trust, | |
Series 2006-HE1 2A1
1.288%, 10/25/36 (l) | | | 33,590 | | | | 17,049 | |
Series 2006-OPT3 3A4
1.508%, 2/25/36 (l) | | | 180,000 | | | | 176,867 | |
J.G. Wentworth XXXVIII LLC, | |
Series 2017-1A A
3.990%, 8/16/60§ | | | 174,019 | | | | 177,082 | |
JP Morgan Mortgage Acquisition Corp., | |
Series 2006-FRE2 M1
1.578%, 2/25/36 (l) | | | 200,000 | | | | 188,167 | |
JP Morgan Mortgage Acquisition Trust, | |
Series 2006-WMC2 A1
1.373%, 7/25/36 (l) | | | 147,098 | | | | 115,149 | |
Series 2007-CH1 AV5
1.478%, 11/25/36 (l) | | | 79,082 | | | | 79,030 | |
Series 2007-CH4 A4
1.398%, 1/25/36 (l) | | | 492,818 | | | | 487,184 | |
Limerock CLO III LLC, | |
Series 2014-3A A1R
2.563%, 10/20/26 (l)§ | | | 90,000 | | | | 90,340 | |
Long Beach Mortgage Loan Trust, | |
Series 2005-1 M2
2.033%, 2/25/35 (l) | | | 44,852 | | | | 44,954 | |
Series 2005-2 M4
2.168%, 4/25/35 (l) | | | 127,480 | | | | 128,379 | |
Series 2005-3 1A
1.758%, 8/25/45 (l) | | | 190,981 | | | | 180,108 | |
Series 2006-10 2A2
1.348%, 11/25/36 (l) | | | 468,859 | | | | 235,145 | |
MASTR Asset-Backed Securities Trust, | |
Series 2006-HE1 A4
1.528%, 1/25/36 (l) | | | 203,699 | | | | 203,290 | |
Mastr Specialized Loan Trust, | |
Series 2007-1 A
1.608%, 1/25/37 (l)§ | | | 366,277 | | | | 224,374 | |
Mill Creek II CLO Ltd., | |
Series 2016-1A A
3.113%, 4/20/28 (l)§ | | | 90,000 | | | | 91,896 | |
MONROE CAPITAL BSL CLO Ltd., | |
Series 2015-1A AR
2.435%, 5/22/27 (l)§ | | | 200,000 | | | | 199,998 | |
Morgan Stanley ABS Capital I, Inc. Trust, | |
Series 2006-NC5 A2D
1.468%, 10/25/36 (l) | | | 166,874 | | | | 110,010 | |
Series 2007-HE3 A2A
1.298%, 12/25/36 (l) | | | 572,228 | | | | 356,930 | |
Series 2007-NC2 A1
1.368%, 2/25/37 (l)§ | | | 174,520 | | | | 140,565 | |
Morgan Stanley Home Equity Loan Trust, | |
Series 2006-3 A4
1.498%, 4/25/36 (l) | | | 391,641 | | | | 307,145 | |
| | | | | | | | |
Series 2007-1 A3
1.378%, 12/25/36 (l) | | | 296,656 | | | | 163,636 | |
Navient Student Loan Trust, | |
Series 2014-1 A3
1.748%, 6/25/31 (l) | | | 170,000 | | | | 169,429 | |
Series 2014-2 A
1.878%, 3/25/83 (l) | | | 131,467 | | | | 130,426 | |
Series 2014-3 A
1.858%, 3/25/83 (l) | | | 169,789 | | | | 167,423 | |
Series 2014-4 A
1.858%, 3/25/83 (l) | | | 202,422 | | | | 199,583 | |
Series 2015-2 A3
1.808%, 11/26/40 (l) | | | 115,000 | | | | 114,691 | |
Series 2016-2A A3
2.738%, 6/25/65 (l)§ | | | 215,000 | | | | 221,269 | |
Series 2017-1A A3
2.388%, 7/26/66 (l)§ | | | 180,000 | | | | 183,443 | |
Series 2017-3X A3
2.288%, 7/26/66 (l)(m) | | | 180,000 | | | | 181,426 | |
Nelnet Student Loan Trust, | |
Series 2005-4 B
1.603%, 9/22/35 (l) | | | 113,399 | | | | 97,315 | |
Series 2006-2 B
1.567%, 1/25/38 (l) | | | 94,138 | | | | 80,135 | |
Series 2007-1 A3
1.387%, 5/27/25 (l) | | | 180,000 | | | | 178,213 | |
Series 2014-2A A3
2.088%, 7/27/37 (l)§ | | | 200,000 | | | | 196,780 | |
Series 2014-4A A2
2.188%, 11/25/48 (l)§ | | | 85,000 | | | | 83,135 | |
Nomura Home Equity Loan, Inc. Home Equity Loan Trust, | |
Series 2006-HE2 A4
1.508%, 3/25/36 (l) | | | 205,000 | | | | 192,825 | |
NovaStar Mortgage Funding Trust, | |
Series 2005-2 M1
1.883%, 10/25/35 (l) | | | 32,902 | | | | 32,979 | |
OFSI Fund VII Ltd., | |
Series 2014-7A AR
2.254%, 10/18/26 (b)(l)§ | | | 100,000 | | | | 100,617 | |
Option One Mortgage Loan Trust, | |
Series 2005-1 A4
2.038%, 2/25/35 (l) | | | 62,286 | | | | 62,545 | |
OZLM IX Ltd., | |
Series 2014-9A A1R
2.583%, 1/20/27 (l)§ | | | 200,000 | | | | 200,928 | |
RAMP Trust, | |
Series 2007-RS2 A3
1.608%, 5/25/37 (l) | | | 178,924 | | | | 140,446 | |
RASC Trust, | | | | | | | | |
Series 2005-KS10 M1
1.648%, 11/25/35 (l) | | | 106,933 | | | | 107,288 | |
Series 2005-KS7 M3
1.958%, 8/25/35 (l) | | | 60,977 | | | | 61,043 | |
Series 2006-KS9 AI3
1.398%, 11/25/36 (l) | | | 243,762 | | | | 228,687 | |
Saratoga Investment Corp. CLO Ltd., | | | | | | | | |
Series 2013-1A A1R
2.913%, 10/20/25 (l)§ | | | 250,000 | | | | 251,984 | |
Securitized Asset-Backed Receivables LLC Trust, | |
Series 2005-FR5 M1
1.898%, 8/25/35 (l) | | | 165,405 | | | | 105,046 | |
See Notes to Financial Statements.
151
1290 FUNDS
1290 UNCONSTRAINED BOND MANAGERS FUND
PORTFOLIO OF INVESTMENTS (Continued)
October 31, 2017
| | | | | | | | |
| | | Principal
Amount | | | Value
(Note 1) | |
| | | | | | | | |
SG Mortgage Securities Trust, | | | | | | | | |
Series 2007-NC1 A2
1.478%, 12/25/36 (l)§ | | $ | 239,514 | | | $ | 152,824 | |
SLM Student Loan Trust, | | | | | | | | |
Series 2004-2 B
1.837%, 7/25/39 (l) | | | 106,232 | | | | 98,418 | |
Series 2004-8 B
1.827%, 1/25/40 (l) | | | 31,984 | | | | 29,754 | |
Series 2005-8 A5
1.537%, 1/25/40 (l) | | | 200,000 | | | | 192,757 | |
Series 2007-6 B
2.217%, 4/27/43 (l) | | | 138,669 | | | | 130,950 | |
Series 2008-2 B
2.567%, 1/25/83 (l) | | | 160,000 | | | | 150,440 | |
Series 2008-3 B
2.567%, 4/26/83 (l) | | | 65,000 | | | | 61,803 | |
Series 2008-4 B
3.217%, 4/25/73 (l) | | | 120,000 | | | | 117,158 | |
Series 2008-7 B
3.217%, 7/26/83 (l) | | | 65,000 | | | | 64,561 | |
Series 2008-9 B
3.617%, 10/25/83 (l) | | | 70,000 | | | | 70,786 | |
Series 2012-7 B
3.038%, 9/25/43 (l) | | | 100,000 | | | | 94,984 | |
Series 2013-4 A
1.788%, 6/25/43 (l) | | | 128,081 | | | | 128,930 | |
Sound Point CLO VIII Ltd., | |
Series 2015-1A AR
2.219%, 4/15/27 (b)(l)§ | | | 250,000 | | | | 249,875 | |
Soundview Home Loan Trust, | |
Series 2007-OPT1 2A1
1.318%, 6/25/37 (l) | | | 228,223 | | | | 169,006 | |
Series 2007-OPT2 1A1
1.408%, 7/25/37 (l) | | | 115,311 | | | | 100,742 | |
SpringCastle America Funding LLC, | |
Series 2016-AA A
3.050%, 4/25/29§ | | | 142,768 | | | | 143,513 | |
Structured Asset Investment Loan Trust, | |
Series 2006-1 A3
1.438%, 1/25/36 (l) | | | 68,392 | | | | 68,314 | |
Structured Asset Securities Corp. Mortgage Loan Trust, | |
Series 2005-WF4 M6
1.908%, 11/25/35 (l) | | | 500,000 | | | | 466,318 | |
Series 2006-GEL4 A3
1.537%, 10/25/36 (l)§ | | | 156,196 | | | | 152,495 | |
THL Credit Wind River CLO Ltd., | |
Series 2014-2A A2
2.809%, 7/15/26 (l)§ | | | 250,000 | | | | 250,205 | |
Vermont Student Assistance Corp., | |
Series 2012-1 A
1.942%, 7/28/34 (l) | | | 43,055 | | | | 42,654 | |
Voya CLO Ltd., | |
Series 2013-3A A1R
2.404%, 1/18/26 (l)§ | | | 65,000 | | | | 65,021 | |
Wells Fargo Home Equity Asset-Backed Securities Trust, | |
Series 2007-2 A3
1.468%, 4/25/37 (l) | | | 153,857 | | | | 147,031 | |
WhiteHorse VI Ltd., | |
Series 2012-1A A1R
2.511%, 2/3/25 (l)§ | | | 124,640 | | | | 124,640 | |
| | | | | | | | |
Total Asset-Backed Securities | | | | | | | 16,976,782 | |
| | | | | | | | |
| | | | | | | | |
Collateralized Mortgage Obligations (10.8%) | |
Alternative Loan Trust, | |
Series 2005-76 1A1
2.424%, 1/25/36 (l) | | | 119,255 | | | | 117,521 | |
Series 2006-HY12 A5
3.370%, 8/25/36 (l) | | | 113,534 | | | | 116,245 | |
Series 2006-OA19 A1
1.419%, 2/20/47 (l) | | | 337,817 | | | | 279,895 | |
Bear Stearns ALT-A Trust, | |
Series 2004-9 3A1
3.410%, 9/25/34 (l) | | | 108,225 | | | | 105,249 | |
Series 2005-10 22A1
3.430%, 1/25/36 (l) | | | 259,474 | | | | 250,724 | |
Series 2005-2 2A4
3.349%, 4/25/35 (l) | | | 102,050 | | | | 100,577 | |
CHL Mortgage Pass-Through Trust, | |
Series 2005-3 1A2
1.818%, 4/25/35 (l) | | | 126,469 | | | | 119,653 | |
Series 2006-21 A8
5.750%, 2/25/37 | | | 87,378 | | | | 77,210 | |
CIM Trust, | |
Series 2015-4AG A1
3.237%, 10/25/57 (l)§ | | | 111,864 | | | | 111,982 | |
Series 2017-7 A
3.000%, 4/25/57 (b)(l)§ | | | 160,000 | | | | 161,105 | |
Citigroup Mortgage Loan Trust, | |
Series 2015-2 1A1
1.438%, 6/25/47 (l)§ | | | 114,966 | | | | 114,984 | |
CSMC Mortgage-Backed Trust, | |
Series 2007-1 5A1
1.838%, 2/25/37 (l) | | | 126,608 | | | | 85,640 | |
Deutsche Alt-A Securities Mortgage Loan Trust, | |
Series 2007-2 2A1
1.538%, 9/25/47 (l) | | | 144,939 | | | | 124,984 | |
DSLA Mortgage Loan Trust, | |
Series 2006-AR2 2A1A
1.438%, 10/19/36 (l) | | | 152,692 | | | | 135,098 | |
FHLMC, | |
Series 4638 UF
2.235%, 9/15/44 (l) | | | 166,351 | | | | 167,820 | |
First Horizon Alternative Mortgage Securities Trust, | |
Series 2006-AA7 A1
3.197%, 1/25/37 (l) | | | 134,793 | | | | 119,737 | |
First Horizon Mortgage Pass-Through Trust, | |
Series 2005-AR4 2A1
3.341%, 10/25/35 (l) | | | 142,005 | | | | 135,304 | |
GNMA, | |
Series 2017-136 IO
5.000%, 9/20/47 IO | | | 745,636 | | | | 110,435 | |
GSR Mortgage Loan Trust, | |
Series 2005-AR7 6A1
3.607%, 11/25/35 (l) | | | 94,480 | | | | 93,255 | |
Impac CMB Trust, | |
Series 2005-1 1A1
1.758%, 4/25/35 (l) | | | 80,470 | | | | 76,567 | |
Impac Secured Assets Trust, | |
Series 2007-2 1A1A
1.348%, 5/25/37 (l) | | | 140,587 | | | | 123,871 | |
IndyMac INDX Mortgage Loan Trust, | |
Series 2004-AR6 6A1
3.744%, 10/25/34 (l) | | | 65,817 | | | | 65,179 | |
See Notes to Financial Statements.
152
1290 FUNDS
1290 UNCONSTRAINED BOND MANAGERS FUND
PORTFOLIO OF INVESTMENTS (Continued)
October 31, 2017
| | | | | | | | |
| | | Principal
Amount | | | Value
(Note 1) | |
| | | | | | | | |
Series 2006-AR4 A1A
1.448%, 5/25/46 (l) | | $ | 209,470 | | | $ | 199,721 | |
Series 2007-AR15 2A1
3.537%, 8/25/37 (l) | | | 232,451 | | | | 202,712 | |
JP Morgan Mortgage Trust, | |
Series 2006-A2 5A3
3.446%, 11/25/33 (l) | | | 49,031 | | | | 49,854 | |
Lehman XS Trust, | |
Series 2005-5N 3A1A
1.538%, 11/25/35 (l) | | | 135,681 | | | | 130,047 | |
Series 2007-4N 1A2A
1.398%, 3/25/47 (l) | | | 247,159 | | | | 239,250 | |
Merrill Lynch Mortgage Investors Trust, | |
Series 2004-HB1 A3
3.081%, 4/25/29 (l) | | | 120,233 | | | | 118,537 | |
Series 2005-A9 2A1E
3.472%, 12/25/35 (l) | | | 108,151 | | | | 107,351 | |
Series 2006-2 2A
3.155%, 5/25/36 (l) | | | 98,297 | | | | 99,199 | |
RALI Trust, | |
Series 2006-QA10 A2
1.418%, 12/25/36 (l) | | | 166,324 | | | | 157,692 | |
Series 2006-QA2 1A1
1.488%, 2/25/36 (l) | | | 203,213 | | | | 162,423 | |
Series 2006-QA5 1A1
1.418%, 7/25/36 (l) | | | 218,712 | | | | 149,770 | |
Residential Asset Securitization Trust, | |
Series 2005-A10 A4
5.500%, 9/25/35 | | | 112,236 | | | | 105,749 | |
Sequoia Mortgage Trust, | |
Series 2004-12 A1
1.779%, 1/20/35 (l) | | | 102,035 | | | | 93,813 | |
Series 2004-6 A1
2.769%, 7/20/34 (l) | | | 112,146 | | | | 110,828 | |
Structured Adjustable Rate Mortgage Loan Trust, | |
Series 2004-20 1A1
3.376%, 1/25/35 (l) | | | 150,188 | | | | 146,785 | |
Series 2004-8 3A
3.432%, 7/25/34 (l) | | | 121,883 | | | | 121,570 | |
Series 2005-12 3A1
3.370%, 6/25/35 (l) | | | 109,202 | | | | 101,955 | |
Series 2005-15 1A1
3.414%, 7/25/35 (l) | | | 137,516 | | | | 114,219 | |
Series 2005-16XS A1
1.578%, 8/25/35 (l) | | | 96,388 | | | | 95,527 | |
Series 2005-17 5A1
3.374%, 8/25/35 (l) | | | 117,846 | | | | 98,525 | |
Structured Asset Mortgage Investments II Trust, | |
Series 2006-AR6 1A3
1.428%, 7/25/46 (l) | | | 419,092 | | | | 362,539 | |
Series 2006-AR7 A10
1.438%, 8/25/36 (l) | | | 119,733 | | | | 129,644 | |
Wachovia Mortgage Loan Trust, | |
Series 2006-AMN1 A3
1.478%, 8/25/36 (l) | | | 197,027 | | | | 124,971 | |
WaMu Mortgage Pass-Through Certificates Trust, | |
Series 2005-AR11 A1A
1.558%, 8/25/45 (l) | | | 127,444 | | | | 127,488 | |
Series 2005-AR13 A1A1
1.528%, 10/25/45 (l) | | | 195,288 | | | | 195,973 | |
Series 2005-AR8 2A1A
1.528%, 7/25/45 (l) | | | 124,127 | | | | 122,266 | |
| | | | | | | | |
Series 2006-AR3 A1A
1.944%, 2/25/46 (l) | | | 155,233 | | | | 151,923 | |
Series 2007-HY3 1A1
2.859%, 3/25/37 (l) | | | 142,794 | | | | 127,917 | |
Washington Mutual Mortgage Pass-Through Certificates WMALT Trust, | |
Series 2007-OA1 2A
1.664%, 12/25/46 (l) | | | 247,684 | | | | 196,146 | |
Wells Fargo Mortgage Backed Securities Trust, | |
Series 2004-DD 1A1
3.120%, 1/25/35 (l) | | | 116,244 | | | | 120,395 | |
Series 2004-I 1A1
3.465%, 7/25/34 (l) | | | 39,489 | | | | 40,271 | |
Series 2006-AR10 5A6
3.376%, 7/25/36 (l) | | | 179,774 | | | | 180,974 | |
Series 2006-AR12 1A1
3.753%, 9/25/36 (l) | | | 96,222 | | | | 96,062 | |
Series 2006-AR4 1A1
3.348%, 4/25/36 (l) | | | 104,192 | | | | 97,865 | |
Series 2006-AR8 2A3
3.574%, 4/25/36 (l) | | | 133,005 | | | | 134,319 | |
Series 2006-AR8 3A2
3.172%, 4/25/36 (l) | | | 102,980 | | | | 101,700 | |
| | | | | | | | |
Total Collateralized Mortgage Obligations | | | | | | | 7,709,015 | |
| | | | | | | | |
Commercial Mortgage-Backed Securities (9.2%) | |
BAMLL Trust, | | | | | | | | |
Series 2011-FSHN A
4.420%, 7/11/33 (b)§ | | | 35,000 | | | | 37,471 | |
Banc of America Commercial Mortgage Trust, | |
Series 2007-5 AM
5.772%, 2/10/51 (l) | | | 129,540 | | | | 130,172 | |
Bayview Commercial Asset Trust, | |
Series 2004-3 A1
1.608%, 1/25/35 (l)§ | | | 128,723 | | | | 122,423 | |
Bear Stearns Commercial Mortgage Securities Trust, | |
Series 2004-PWR4 X
0.107%, 6/11/41 IO (b)(l)§ | | | 6,273,853 | | | | 16,035 | |
CIM Trust, | | | | | | | | |
3.000%, 12/25/65 | | | 180,000 | | | | 180,100 | |
COMM Mortgage Trust, | |
Series 2012-CR5 XA
1.708%, 12/10/45 IO (l) | | | 486,008 | | | | 29,002 | |
Series 2013-LC6 A2
1.906%, 1/10/46 | | | 9,393 | | | | 9,393 | |
Series 2014-CR17 A2
3.012%, 5/10/47 | | | 180,000 | | | | 182,483 | |
Series 2014-LC15 A2
2.840%, 4/10/47 | | | 180,000 | | | | 182,001 | |
Series 2015-DC1 A2
2.870%, 2/10/48 | | | 150,000 | | | | 152,463 | |
DBUBS Mortgage Trust, | |
Series 2011-LC3A XA
0.378%, 8/10/44 IO (l)§ | | | 1,993,115 | | | | 21,468 | |
FHLMC Multifamily Structured Pass-Through Certificates, | |
Series K005 AX
1.353%, 11/25/19 IO (l) | | | 1,051,959 | | | | 25,794 | |
Series K007 X1
1.219%, 4/25/20 IO (l) | | | 750,260 | | | | 15,648 | |
See Notes to Financial Statements.
153
1290 FUNDS
1290 UNCONSTRAINED BOND MANAGERS FUND
PORTFOLIO OF INVESTMENTS (Continued)
October 31, 2017
| | | | | | | | |
| | | Principal
Amount | | | Value
(Note 1) | |
| | | | | | | | |
Series K719 X1
0.457%, 6/25/22 IO (l) | | $ | 1,567,329 | | | $ | 19,829 | |
Series KC01 X1
0.714%, 12/25/22 IO (l) | | | 1,547,418 | | | | 36,130 | |
Series KF02 A2
1.782%, 7/25/20 (l) | | | 81,775 | | | | 81,829 | |
Series KF02 A3
1.862%, 7/25/20 (l) | | | 199,450 | | | | 199,568 | |
Series KF04 A
1.542%, 6/25/21 (l) | | | 138,812 | | | | 138,638 | |
Series KF08 A
1.532%, 1/25/22 (l) | | | 163,883 | | | | 164,036 | |
Series KF09 A
1.612%, 5/25/22 (l) | | | 185,308 | | | | 185,105 | |
Series KF10 A
1.612%, 7/25/22 (l) | | | 173,689 | | | | 173,634 | |
Series KF34 A
1.592%, 8/25/24 (l) | | | 74,999 | | | | 74,859 | |
Series KJ04 A1
1.376%, 10/25/20 | | | 262,063 | | | | 260,126 | |
Series KJ05 A1
1.418%, 5/25/21 | | | 271,970 | | | | 269,321 | |
Series KJ13 A1
2.055%, 9/25/21 | | | 167,533 | | | | 167,770 | |
Series KS01 X1
1.331%, 1/25/23 IO (l) | | | 490,363 | | | | 23,392 | |
Series KS07 X
0.653%, 9/25/25 IO (l) | | | 1,500,000 | | | | 64,954 | |
FNMA ACES, | | | | | | | | |
Series 2009-M2 X
1.815%, 1/25/19 IO (l) | | | 797,589 | | | | 12,348 | |
Series 2010-M3 A3
4.332%, 3/25/20 (l) | | | 177,799 | | | | 185,015 | |
Series 2010-M4 X
0.885%, 6/25/20 IO (l) | | | 2,587,539 | | | | 46,825 | |
Series 2010-M5 X
1.097%, 7/25/20 IO (l) | | | 348,760 | | | | 8,117 | |
Series 2011-M5 X
1.259%, 7/25/21 IO (l) | | | 1,148,911 | | | | 41,005 | |
Series 2011-M7 A2
2.578%, 9/25/18 | | | 63,550 | | | | 63,718 | |
Series 2012-M17 X2
0.503%, 11/25/22 IO (l) | | | 2,219,963 | | | | 37,057 | |
Series 2013-M14 FA
1.588%, 8/25/18 (l) | | | 112,477 | | | | 112,534 | |
Series 2013-M4 ASQ2
1.451%, 2/25/18 | | | 51,458 | | | | 51,391 | |
Series 2014-M12 FA
1.531%, 10/25/21 (l) | | | 30,832 | | | | 30,595 | |
Series 2014-M6 X2
0.186%, 5/25/21 IO (l) | | | 4,730,721 | | | | 26,967 | |
Series 2015-M4 FA
1.445%, 9/25/18 (l) | | | 64,396 | | | | 64,296 | |
Series 2016-M13 FA
1.901%, 11/25/23 (l) | | | 161,514 | | | | 161,488 | |
Series 2016-M2 X3
1.966%, 4/25/36 IO (l) | | | 462,795 | | | | 29,686 | |
Series 2017-M11 FA
1.701%, 9/25/24 (l) | | | 159,860 | | | | 159,679 | |
FREMF Mortgage Trust, | |
Series 2013-K713 X2A
0.100%, 4/25/46 IO§ | | | 14,310,125 | | | | 25,021 | |
| | | | | | | | |
FREMF Multifamily Aggregation Risk Transfer Trust, | |
Series 2017-KT01 A
1.558%, 2/25/20 (l) | | | 180,000 | | | | 180,436 | |
GE Business Loan Trust, | |
Series 2005-1A A3
1.489%, 6/15/33 (l)§ | | | 83,670 | | | | 82,007 | |
Series 2007-1A A
1.409%, 4/16/35 (l)§ | | | 87,522 | | | | 84,716 | |
GNMA, | | | | | | | | |
Series 2011-9 D
3.515%, 4/16/44 (l) | | | 70,000 | | | | 71,983 | |
Series 2012-112 IO
0.311%, 2/16/53 IO (l) | | | 1,113,277 | | | | 26,628 | |
Series 2014-125 IO
0.973%, 11/16/54 IO (l) | | | 710,692 | | | | 46,810 | |
GRACE Mortgage Trust, | |
Series 2014-GRCE A
3.369%, 6/10/28§ | | | 35,000 | | | | 36,118 | |
GS Mortgage Securities Corp. II, | |
Series 2013-KING A
2.706%, 12/10/27§ | | | 33,230 | | | | 33,558 | |
GS Mortgage Securities Corp. Trust, | |
Series 2012-ALOH A
3.551%, 4/10/34 (b)§ | | | 35,000 | | | | 36,498 | |
Series 2012-SHOP A
2.933%, 6/5/31§ | | | 35,000 | | | | 35,387 | |
Series 2017-GPTX XCP
0.786%, 5/10/34 IO (b)(l)§ | | | 1,500,000 | | | | 30,083 | |
GS Mortgage Securities Trust, | |
Series 2010-C1 X
1.383%, 8/10/43 IO (b)(l)§ | | | 485,918 | | | | 15,202 | |
Series 2010-C2 A1
3.849%, 12/10/43§ | | | 69,091 | | | | 70,726 | |
Series 2012-GC6 XA
1.957%, 1/10/45 IO (l)§ | | | 768,645 | | | | 51,230 | |
Series 2013-GC13 A2
2.812%, 7/10/46 | | | 44,308 | | | | 44,486 | |
Series 2013-GC13 XA
0.172%, 7/10/46 IO (l) | | | 4,401,797 | | | | 21,097 | |
JP Morgan Chase Commercial Mortgage Securities Trust, | |
Series 2007-C1 A4
5.716%, 2/15/51 | | | 27,542 | | | | 27,520 | |
Series 2010-C1 XA
1.386%, 6/15/43 IO (b)(l)§ | | | 1,225,716 | | | | 29,668 | |
Series 2010-C2 A2
3.616%, 11/15/43§ | | | 65,798 | | | | 66,567 | |
Series 2011-C3 A3
4.388%, 2/15/46§ | | | 74,554 | | | | 75,368 | |
Series 2011-C3 XA
1.021%, 2/15/46 IO (b)(l)§ | | | 341,065 | | | | 7,476 | |
Series 2012-C6 XA
1.584%, 5/15/45 IO (l) | | | 583,822 | | | | 35,076 | |
Series 2012-C8 XA
1.810%, 10/15/45 IO (l) | | | 613,153 | | | | 39,663 | |
Series 2012-CBX A3
3.139%, 6/15/45 | | | 94,967 | | | | 95,783 | |
Series 2012-CBX XA
1.647%, 6/15/45 IO (l) | | | 649,817 | | | | 31,076 | |
Series 2012-HSBC A
3.093%, 7/5/32§ | | | 34,807 | | | | 35,672 | |
Series 2013-C13 XA
0.510%, 1/15/46 IO (l) | | | 3,172,363 | | | | 23,385 | |
See Notes to Financial Statements.
154
1290 FUNDS
1290 UNCONSTRAINED BOND MANAGERS FUND
PORTFOLIO OF INVESTMENTS (Continued)
October 31, 2017
| | | | | | | | |
| | | Principal
Amount | | | Value
(Note 1) | |
| | | | | | | | |
JPMBB Commercial Mortgage Securities Trust, | |
Series 2013-C12 XA
0.660%, 7/15/45 IO (l) | | $ | 2,089,751 | | | $ | 43,708 | |
Series 2013-C14 XA
0.765%, 8/15/46 IO (l) | | | 2,166,502 | | | | 51,471 | |
Series 2013-C15 A2
2.977%, 11/15/45 | | | 68,235 | | | | 68,732 | |
Series 2013-C15 XA
1.256%, 11/15/45 IO (l) | | | 868,067 | | | | 38,253 | |
Lehman Brothers Small Balance Commercial Mortgage Trust, | |
Series 2005-2A 1A
1.488%, 9/25/30 (l)§ | | | 42,241 | | | | 42,070 | |
Merrill Lynch Mortgage Trust, | |
Series 2007-C1 A1A
5.814%, 6/12/50 (l) | | | 10,088 | | | | 10,167 | |
Morgan Stanley Bank of America Merrill Lynch Trust, | |
Series 2013-C7 A2
1.863%, 2/15/46 | | | 148,281 | | | | 148,241 | |
Series 2013-C7 A4
2.918%, 2/15/46 | | | 45,000 | | | | 45,751 | |
Series 2013-C7 XA
1.479%, 2/15/46 IO (l) | | | 891,091 | | | | 47,836 | |
Series 2014-C14 A2
2.916%, 2/15/47 | | | 158,615 | | | | 160,351 | |
Morgan Stanley Capital I Trust, | |
Series 2011-C1 A3
4.700%, 9/15/47§ | | | 16,885 | | | | 16,985 | |
Series 2013-WLSR A
2.695%, 1/11/32 (b)§ | | | 40,000 | | | | 40,208 | |
Series 2014-MP A
3.469%, 8/11/33§ | | | 35,000 | | | | 36,147 | |
OBP Depositor LLC Trust, | |
Series 2010-OBP A
4.646%, 7/15/45§ | | | 30,000 | | | | 31,880 | |
RBS Commercial Funding, Inc. Trust, | |
Series 2013-GSP A
3.834%, 1/13/32 (b)(l)§ | | | 35,000 | | | | 36,494 | |
SFAVE Commercial Mortgage Securities Trust, | |
Series 2015-5AVE XA
0.453%, 1/5/43 IO (b)(l)§ | | | 525,000 | | | | 28,536 | |
VNDO Mortgage Trust, | |
Series 2012-6AVE A
2.996%, 11/15/30§ | | | 62,000 | | | | 62,938 | |
Series 2013-PENN A
3.808%, 12/13/29§ | | | 35,000 | | | | 36,403 | |
Wachovia Bank Commercial Mortgage Trust, | |
Series 2007-C31 AJ
5.660%, 4/15/47 (l) | | | 42,721 | | | | 43,382 | |
WFRBS Commercial Mortgage Trust, | |
Series 2011-C3 A3
3.998%, 3/15/44§ | | | 158,365 | | | | 160,517 | |
Series 2013-C13 A2
1.964%, 5/15/45 | | | 50,000 | | | | 50,002 | |
Series 2014-C23 XA
0.666%, 10/15/57 IO (l) | | | 914,880 | | | | 29,134 | |
| | | | | | | | |
Total Commercial Mortgage-Backed Securities | | | | | | | 6,582,811 | |
| | | | | | | | |
| | | | | | | | |
Corporate Bonds (23.4%) | | | | | | | | |
Consumer Discretionary (1.3%) | | | | | |
Automobiles (0.1%) | |
General Motors Co. | | | | | | | | |
3.500%, 10/2/18 | | | 50,000 | | | | 50,717 | |
4.875%, 10/2/23 | | | 40,000 | | | | 43,614 | |
| | | | | | | | |
| | | | | | | 94,331 | |
| | | | | | | | |
Diversified Consumer Services (0.0%) | |
Midas Intermediate Holdco II LLC | | | | | | | | |
7.875%, 10/1/22§ | | | 25,000 | | | | 25,250 | |
| | | | | | | | |
Hotels, Restaurants & Leisure (0.2%) | |
1011778 BC ULC | | | | | | | | |
4.250%, 5/15/24§ | | | 28,000 | | | | 28,175 | |
Churchill Downs, Inc. | | | | | | | | |
5.375%, 12/15/21 | | | 35,000 | | | | 36,008 | |
GLP Capital LP | | | | | | | | |
5.375%, 4/15/26 | | | 19,000 | | | | 20,567 | |
Golden Nugget, Inc. | | | | | | | | |
6.750%, 10/15/24 (b)§ | | | 44,000 | | | | 44,770 | |
KFC Holding Co. | | | | | | | | |
5.000%, 6/1/24§ | | | 7,000 | | | | 7,377 | |
Sugarhouse HSP Gaming Prop Mezz LP | |
5.875%, 5/15/25§ | | | 35,000 | | | | 33,950 | |
| | | | | | | | |
| | | | | | | 170,847 | |
| | | | | | | | |
Internet & Direct Marketing Retail (0.2%) | |
Amazon.com, Inc.
4.050%, 8/22/47§ | | | 100,000 | | | | 102,880 | |
| | | | | | | | |
Media (0.7%) | |
21st Century Fox America, Inc.
8.875%, 4/26/23 | | | 80,000 | | | | 102,396 | |
Altice Financing SA
7.500%, 5/15/26§ | | | 200,000 | | | | 219,380 | |
AMC Networks, Inc.
4.750%, 8/1/25 | | | 17,000 | | | | 16,980 | |
Cable One, Inc.
5.750%, 6/15/22§ | | | 35,000 | | | | 36,575 | |
Cequel Communications Holdings I LLC | |
6.375%, 9/15/20§ | | | 13,000 | | | | 13,261 | |
Charter Communications Operating LLC | |
6.484%, 10/23/45 | | | 90,000 | | | | 103,500 | |
DISH DBS Corp.
5.875%, 7/15/22 | | | 17,000 | | | | 17,107 | |
Sirius XM Radio, Inc.
3.875%, 8/1/22§ | | | 18,000 | | | | 18,338 | |
| | | | | | | | |
| | | | | | | 527,537 | |
| | | | | | | | |
Multiline Retail (0.1%) | |
Cumberland Farms, Inc.
6.750%, 5/1/25§ | | | 36,000 | | | | 38,297 | |
| | | | | | | | |
Total Consumer Discretionary | | | | | | | 959,142 | |
| | | | | | | | |
Consumer Staples (0.8%) | | | | | |
Beverages (0.2%) | |
Anheuser-Busch InBev Finance, Inc.
4.900%, 2/1/46 | | | 69,000 | | | | 77,091 | |
Constellation Brands, Inc.
6.000%, 5/1/22 | | | 53,000 | | | | 60,268 | |
See Notes to Financial Statements.
155
1290 FUNDS
1290 UNCONSTRAINED BOND MANAGERS FUND
PORTFOLIO OF INVESTMENTS (Continued)
October 31, 2017
| | | | | | | | |
| | | Principal
Amount | | | Value
(Note 1) | |
| | | | | | | | |
DS Services of America, Inc.
10.000%, 9/1/21§ | | $ | 25,000 | | | $ | 26,250 | |
| | | | | | | | |
| | | | | | | 163,609 | |
| | | | | | | | |
Food & Staples Retailing (0.3%) | �� |
Alimentation Couche-Tard, Inc.
3.550%, 7/26/27§ | | | 45,000 | | | | 45,188 | |
Walgreens Boots Alliance, Inc.
3.800%, 11/18/24 | | | 110,000 | | | | 112,725 | |
4.800%, 11/18/44 | | | 30,000 | | | | 31,292 | |
| | | | | | | | |
| | | | | | | 189,205 | |
| | | | | | | | |
Food Products (0.2%) | |
Chobani LLC
7.500%, 4/15/25§ | | | 15,000 | | | | 16,295 | |
Kraft Heinz Foods Co.
3.000%, 6/1/26 | | | 70,000 | | | | 67,656 | |
Pilgrim’s Pride Corp.
5.875%, 9/30/27§ | | | 17,000 | | | | 17,661 | |
Post Holdings, Inc.
5.000%, 8/15/26§ | | | 5,000 | | | | 5,025 | |
5.750%, 3/1/27§ | | | 18,000 | | | | 18,738 | |
| | | | | | | | |
| | | | | | | 125,375 | |
| | | | | | | | |
Household Products (0.0%) | |
Central Garden & Pet Co.
6.125%, 11/15/23 | | | 20,000 | | | | 21,325 | |
| | | | | | | | |
Personal Products (0.1%) | |
First Quality Finance Co., Inc.
4.625%, 5/15/21§ | | | 24,000 | | | | 24,271 | |
5.000%, 7/1/25§ | | | 10,000 | | | | 10,288 | |
High Ridge Brands Co.
8.875%, 3/15/25§ | | | 20,000 | | | | 18,500 | |
| | | | | | | | |
| | | | | | | 53,059 | |
| | | | | | | | |
Total Consumer Staples | | | | | | | 552,573 | |
| | | | | | | | |
Energy (1.8%) | | | | | |
Energy Equipment & Services (0.0%) | |
Transocean Proteus Ltd.
6.250%, 12/1/24§ | | | 19,950 | | | | 20,974 | |
| | | | | | | | |
Oil, Gas & Consumable Fuels (1.8%) | |
Antero Resources Corp.
5.000%, 3/1/25 | | | 10,000 | | | | 10,163 | |
Cheniere Corpus Christi Holdings LLC
5.125%, 6/30/27§ | | | 10,000 | | | | 10,325 | |
CrownRock LP
5.625%, 10/15/25 (b)§ | | | 10,000 | | | | 10,125 | |
Diamondback Energy, Inc.
5.375%, 5/31/25 | | | 10,000 | | | | 10,437 | |
Enbridge Energy Partners LP
5.875%, 10/15/25 | | | 40,000 | | | | 45,797 | |
Enbridge, Inc. | | | | | | | | |
(ICE LIBOR USD 3 Month + 0.40%), 1.750%, 1/10/20 (k) | | | 100,000 | | | | 100,024 | |
(ICE LIBOR USD 3 Month + 0.70%), 2.020%, 6/15/20 (k) | | | 50,000 | | | | 50,300 | |
Energy Transfer Equity LP
4.250%, 3/15/23 | | | 18,000 | | | | 18,315 | |
| | | | | | | | |
Energy Transfer LP
5.000%, 10/1/22 | | | 150,000 | | | | 162,267 | |
Gulfport Energy Corp.
6.375%, 5/15/25 | | | 5,000 | | | | 5,056 | |
Murphy Oil Corp.
5.750%, 8/15/25 | | | 100,000 | | | | 103,750 | |
Newfield Exploration Co.
5.625%, 7/1/24 | | | 17,000 | | | | 18,382 | |
Parsley Energy LLC
5.375%, 1/15/25§ | | | 7,000 | | | | 7,105 | |
5.625%, 10/15/27 (b)§ | | | 25,000 | | | | 25,797 | |
Petrobras Global Finance BV
5.999%, 1/27/28§ | | | 233,000 | | | | 235,913 | |
Plains All American Pipeline LP
3.650%, 6/1/22 | | | 40,000 | | | | 40,292 | |
QEP Resources, Inc.
5.375%, 10/1/22 | | | 3,000 | | | | 2,993 | |
5.250%, 5/1/23 | | | 12,000 | | | | 11,850 | |
Rockies Express Pipeline LLC
5.625%, 4/15/20§ | | | 18,000 | | | | 19,080 | |
Sabine Pass Liquefaction LLC
5.000%, 3/15/27 | | | 100,000 | | | | 107,611 | |
Spectra Energy Partners LP | | | | | | | | |
(ICE LIBOR USD 3 Month + 0.70%), 2.016%, 6/5/20 (k) | | | 100,000 | | | | 100,594 | |
Texas Eastern Transmission LP
2.800%, 10/15/22§ | | | 100,000 | | | | 99,606 | |
Williams Partners LP
3.600%, 3/15/22 | | | 90,000 | | | | 92,631 | |
| | | | | | | | |
| | | | | | | 1,288,413 | |
| | | | | | | | |
Total Energy | | | | | | | 1,309,387 | |
| | | | | | | | |
Financials (11.9%) | | | | | |
Banks (8.7%) | |
Bank of America Corp.
6.875%, 4/25/18 | | | 105,000 | | | | 107,776 | |
5.650%, 5/1/18 | | | 275,000 | | | | 280,295 | |
7.625%, 6/1/19 | | | 175,000 | | | | 189,801 | |
3.300%, 1/11/23 | | | 400,000 | | | | 409,393 | |
3.875%, 8/1/25 | | | 300,000 | | | | 314,905 | |
(ICE LIBOR USD 3 Month + 1.09%), 3.093%, 10/1/25 (k) | | | 55,000 | | | | 54,709 | |
(ICE LIBOR USD 3 Month + 1.51%), 3.705%, 4/24/28 (k) | | | 125,000 | | | | 127,649 | |
Barclays Bank plc
7.625%, 11/21/22 | | | 200,000 | | | | 229,960 | |
Barclays plc | | | | | | | | |
(USD Swap Semi 5 Year + 6.71%), 8.250%, 12/15/18 (k)(y) | | | 100,000 | | | | 106,400 | |
Citigroup, Inc.
6.125%, 11/21/17 | | | 90,000 | | | | 90,225 | |
1.800%, 2/5/18 | | | 100,000 | | | | 100,013 | |
6.125%, 5/15/18 | | | 125,000 | | | | 127,876 | |
2.500%, 9/26/18 | | | 150,000 | | | | 150,823 | |
(ICE LIBOR USD 3 Month + 1.39%), 3.668%, 7/24/28 (k) | | | 125,000 | | | | 126,370 | |
Credit Suisse Group Funding Guernsey Ltd. | |
3.750%, 3/26/25 | | | 250,000 | | | | 256,798 | |
Discover Bank
2.000%, 2/21/18 | | | 75,000 | | | | 75,080 | |
See Notes to Financial Statements.
156
1290 FUNDS
1290 UNCONSTRAINED BOND MANAGERS FUND
PORTFOLIO OF INVESTMENTS (Continued)
October 31, 2017
| | | | | | | | |
| | | Principal
Amount | | | Value
(Note 1) | |
| | | | | | | | |
HBOS plc
6.750%, 5/21/18§ | | $ | 100,000 | | | $ | 102,542 | |
HSBC Holdings plc | | | | | | | | |
(EUR Swap Annual 5 Year + 5.34%), 6.000%, 9/29/23 (k)(m)(y) | | EUR | 200,000 | | | | 275,196 | |
JPMorgan Chase & Co.
2.550%, 10/29/20 | | $ | 105,000 | | | | 105,873 | |
(ICE LIBOR USD 3 Month + 1.48%), 2.796%, 3/1/21 (k) | | | 200,000 | | | | 206,345 | |
3.900%, 7/15/25 | | | 175,000 | | | | 184,264 | |
Series 1
(ICE LIBOR USD 3 Month + 3.47%), 7.900%, 4/30/18 (k)(y) | | | 200,000 | | | | 205,500 | |
KBC Bank NV | | | | | | | | |
(USD Swap Semi 5 Year + 7.10%), 8.000%, 1/25/23 (k)(m) | | | 200,000 | | | | 202,000 | |
Lloyds Banking Group plc | | | | | | | | |
(GBP Swap 5 Year + 5.01%), 7.625%, 6/27/23 (k)(m)(y) | | GBP | 200,000 | | | | 302,288 | |
2.907%, 11/7/23 | | $ | 200,000 | | | | 200,000 | |
Mitsubishi UFJ Financial Group, Inc.
2.190%, 9/13/21 | | | 100,000 | | | | 98,771 | |
Mizuho Financial Group, Inc. | | | | | | | | |
(ICE LIBOR USD 3 Month + 1.14%), 2.457%, 9/13/21 (k) | | | 100,000 | | | | 101,504 | |
Royal Bank of Scotland Group plc | | | | | | | | |
(USD Swap Semi 5 Year + 5.80%), 7.500%, 8/10/20 (k)(y) | | | 100,000 | | | | 107,400 | |
Santander Holdings USA, Inc. | | | | | | | | |
(ICE LIBOR USD 3 Month + 1.45%), 2.767%, 11/24/17 (k) | | | 200,000 | | | | 200,164 | |
Santander UK Group Holdings plc
2.875%, 10/16/20 | | | 85,000 | | | | 86,036 | |
Santander UK plc
2.500%, 3/14/19 | | | 200,000 | | | | 201,522 | |
Societe Generale SA | | | | | | | | |
(USD Swap Semi 5 Year + 6.24%), 7.375%, 9/13/21 (k)(y)§ | | | 100,000 | | | | 110,160 | |
Standard Chartered plc | | | | | | | | |
(ICE LIBOR USD 3 Month + 1.13%), 2.446%, 8/19/19 (k)§ | | | 200,000 | | | | 202,410 | |
Toronto-Dominion Bank (The) | | | | | | | | |
(ICE LIBOR USD 3 Month + 1.00%), 2.350%, 4/7/21 (k) | | | 100,000 | | | | 101,718 | |
Wells Fargo & Co.
2.600%, 7/22/20 | | | 100,000 | | | | 101,004 | |
3.000%, 4/22/26 | | | 85,000 | | | | 83,215 | |
(ICE LIBOR USD 3 Month + 1.31%), 3.584%, 5/22/28 (k) | | | 280,000 | | | | 282,649 | |
| | | | | | | | |
| | | | | | | 6,208,634 | |
| | | | | | | | |
Capital Markets (2.2%) | |
Blackstone CQP Holdco LP
6.500%, 3/20/21§ | | | 50,000 | | | | 50,400 | |
| | | | | | | | |
Deutsche Bank AG
4.250%, 10/14/21 | | | 200,000 | | | | 209,258 | |
Goldman Sachs Group, Inc. (The)
6.150%, 4/1/18 | | | 115,000 | | | | 117,079 | |
(ICE LIBOR USD 3 Month + 1.10%), 2.415%, 11/15/18 (k) | | | 100,000 | | | | 100,864 | |
3.850%, 7/8/24 | | | 245,000 | | | | 255,309 | |
3.500%, 1/23/25 | | | 100,000 | | | | 101,667 | |
Morgan Stanley
5.625%, 9/23/19 | | | 200,000 | | | | 212,706 | |
(ICE LIBOR USD 3 Month + 0.93%), 2.293%, 7/22/22 (k) | | | 100,000 | | | | 100,490 | |
Series 3NC2
(ICE LIBOR USD 3 Month + 0.80%), 2.109%, 2/14/20 (k) | | | 125,000 | | | | 125,477 | |
Series F 3.875%, 4/29/24 | | | 100,000 | | | | 104,992 | |
UBS AG | | | | | | | | |
(ICE LIBOR USD 3 Month + 0.32%), 1.637%, 12/7/18 (k)§ | | | 200,000 | | | | 200,253 | |
| | | | | | | | |
| | | | | | | 1,578,495 | |
| | | | | | | | |
Consumer Finance (0.9%) | |
American Express Co.
7.000%, 3/19/18 | | | 150,000 | | | | 153,041 | |
Ford Motor Credit Co. LLC
2.145%, 1/9/18 | | | 100,000 | | | | 100,080 | |
3.157%, 8/4/20 | | | 200,000 | | | | 203,944 | |
Navient Corp.
5.875%, 3/25/21 | | | 100,000 | | | | 105,250 | |
OneMain Financial Holdings LLC
6.750%, 12/15/19§ | | | 100,000 | | | | 103,750 | |
| | | | | | | | |
| | | | | | | 666,065 | |
| | | | | | | | |
Diversified Financial Services (0.1%) | |
Shell International Finance BV
3.250%, 5/11/25 | | | 50,000 | | | | 51,334 | |
| | | | | | | | |
Total Financials | | | | | | | 8,504,528 | |
| | | | | | | | |
Health Care (2.2%) | | | | | |
Biotechnology (0.5%) | |
AbbVie, Inc.
3.600%, 5/14/25 | | | 100,000 | | | | 102,814 | |
4.700%, 5/14/45 | | | 35,000 | | | | 37,984 | |
Amgen, Inc.
4.663%, 6/15/51 | | | 100,000 | | | | 108,144 | |
Celgene Corp.
5.000%, 8/15/45 | | | 50,000 | | | | 55,057 | |
Gilead Sciences, Inc.
4.500%, 2/1/45 | | | 50,000 | | | | 54,104 | |
| | | | | | | | |
| | | | | | | 358,103 | |
| | | | | | | | |
Health Care Equipment & Supplies (0.3%) | |
Boston Scientific Corp.
3.850%, 5/15/25 | | | 100,000 | | | | 103,758 | |
Hill-Rom Holdings, Inc.
5.750%, 9/1/23§ | | | 20,000 | | | | 21,100 | |
Zimmer Biomet Holdings, Inc.
3.550%, 4/1/25 | | | 100,000 | | | | 101,912 | |
| | | | | | | | |
| | | | | | | 226,770 | |
| | | | | | | | |
See Notes to Financial Statements.
157
1290 FUNDS
1290 UNCONSTRAINED BOND MANAGERS FUND
PORTFOLIO OF INVESTMENTS (Continued)
October 31, 2017
| | | | | | | | |
| | | Principal
Amount | | | Value
(Note 1) | |
| | | | | | | | |
Health Care Providers & Services (1.1%) | |
Aetna, Inc.
1.500%, 11/15/17 | | $ | 150,000 | | | $ | 149,985 | |
Anthem, Inc.
1.875%, 1/15/18 | | | 100,000 | | | | 100,080 | |
Cardinal Health, Inc.
2.616%, 6/15/22 | | | 50,000 | | | | 49,546 | |
Centene Corp.
4.750%, 1/15/25 | | | 35,000 | | | | 36,050 | |
Cigna Corp.
3.050%, 10/15/27 | | | 55,000 | | | | 53,463 | |
DaVita, Inc.
5.125%, 7/15/24 | | | 25,000 | | | | 25,193 | |
5.000%, 5/1/25 | | | 10,000 | | | | 9,878 | |
Fresenius Medical Care US Finance II, Inc. | |
5.625%, 7/31/19§ | | | 100,000 | | | | 105,682 | |
HCA, Inc.
4.750%, 5/1/23 | | | 84,000 | | | | 87,931 | |
Molina Healthcare, Inc.
5.375%, 11/15/22 | | | 18,000 | | | | 18,693 | |
4.875%, 6/15/25§ | | | 18,000 | | | | 17,865 | |
SP Finco LLC
6.750%, 7/1/25§ | | | 11,000 | | | | 9,962 | |
Tenet Healthcare Corp.
4.500%, 4/1/21 | | | 28,000 | | | | 28,350 | |
UnitedHealth Group, Inc.
6.000%, 2/15/18 | | | 100,000 | | | | 101,216 | |
WellCare Health Plans, Inc.
5.250%, 4/1/25 | | | 13,000 | | | | 13,723 | |
| | | | | | | | |
| | | | | | | 807,617 | |
| | | | | | | | |
Health Care Technology (0.1%) | |
Quintiles IMS, Inc.
4.875%, 5/15/23§ | | | 25,000 | | | | 26,062 | |
| | | | | | | | |
Pharmaceuticals (0.2%) | |
Allergan Funding SCS
3.800%, 3/15/25 | | | 70,000 | | | | 71,743 | |
Valeant Pharmaceuticals International, Inc. | |
5.500%, 3/1/23§ | | | 40,000 | | | | 33,552 | |
6.125%, 4/15/25§ | | | 58,000 | | | | 48,720 | |
| | | | | | | | |
| | | | | | | 154,015 | |
| | | | | | | | |
Total Health Care | | | | | | | 1,572,567 | |
| | | | | | | | |
Industrials (0.7%) | | | | | |
Aerospace & Defense (0.2%) | |
United Technologies Corp.
1.778%, 5/4/18 (e) | | | 125,000 | | | | 124,982 | |
| | | | | | | | |
Building Products (0.1%) | |
Standard Industries, Inc.
5.125%, 2/15/21§ | | | 35,000 | | | | 36,138 | |
| | | | | | | | |
Commercial Services & Supplies (0.2%) | |
Brink’s Co. (The)
4.625%, 10/15/27 (b)§ | | | 15,000 | | | | 14,927 | |
Clean Harbors, Inc.
5.125%, 6/1/21 | | | 28,000 | | | | 28,455 | |
KAR Auction Services, Inc.
5.125%, 6/1/25§ | | | 10,000 | | | | 10,325 | |
Waste Management, Inc.
6.100%, 3/15/18 | | | 75,000 | | | | 76,200 | |
| | | | | | | | |
| | | | | | | 129,907 | |
| | | | | | | | |
| | | | | | | | |
Professional Services (0.0%) | |
IHS Markit Ltd.
5.000%, 11/1/22§ | | | 15,000 | | | | 16,083 | |
| | | | | | | | |
Trading Companies & Distributors (0.2%) | |
International Lease Finance Corp.
7.125%, 9/1/18§ | | | 150,000 | | | | 156,135 | |
| | | | | | | | |
Total Industrials | | | | | | | 463,245 | |
| | | | | | | | |
Information Technology (0.5%) | | | | | |
Internet Software & Services (0.0%) | |
GTT Communications, Inc.
7.875%, 12/31/24§ | | | 9,000 | | | | 9,597 | |
Zayo Group LLC
5.750%, 1/15/27§ | | | 9,000 | | | | 9,495 | |
| | | | | | | | |
| | | | | | | 19,092 | |
| | | | | | | | |
IT Services (0.0%) | |
First Data Corp.
5.000%, 1/15/24§ | | | 22,000 | | | | 22,880 | |
| | | | | | | | |
Semiconductors & Semiconductor Equipment (0.2%) | |
Broadcom Corp.
3.000%, 1/15/22§ | | | 100,000 | | | | 101,148 | |
| | | | | | | | |
Software (0.2%) | |
CDK Global, Inc.
4.875%, 6/1/27§ | | | 8,000 | | | | 8,335 | |
Change Healthcare Holdings LLC
5.750%, 3/1/25§ | | | 33,000 | | | | 33,742 | |
Microsoft Corp.
4.450%, 11/3/45 | | | 70,000 | | | | 79,875 | |
| | | | | | | | |
| | | | | | | 121,952 | |
| | | | | | | | |
Technology Hardware, Storage & Peripherals (0.1%) | |
EMC Corp.
2.650%, 6/1/20 | | | 100,000 | | | | 99,000 | |
| | | | | | | | |
Total Information Technology | | | | | | | 364,072 | |
| | | | | | | | |
Materials (0.4%) | | | | | |
Chemicals (0.1%) | |
Valvoline, Inc.
5.500%, 7/15/24§ | | | 30,000 | | | | 31,875 | |
| | | | | | | | |
Containers & Packaging (0.3%) | |
Amcor Finance USA, Inc.
3.625%, 4/28/26§ | | | 100,000 | | | | 99,155 | |
Crown Americas LLC
4.250%, 9/30/26 | | | 28,000 | | | | 27,966 | |
Reynolds Group Issuer, Inc.
5.750%, 10/15/20 | | | 52,000 | | | | 52,910 | |
(ICE LIBOR USD 3 Month + 3.50%), 4.859%, 7/15/21 (b)(k)§ | | | 18,000 | | | | 18,293 | |
Sealed Air Corp.
5.250%, 4/1/23§ | | | 35,000 | | | | 37,537 | |
| | | | | | | | |
| | | | | | | 235,861 | |
| | | | | | | | |
Total Materials | | | | | | | 267,736 | |
| | | | | | | | |
Real Estate (1.1%) | | | | | |
Equity Real Estate Investment Trusts (REITs) (1.1%) | |
Boston Properties LP (REIT)
2.750%, 10/1/26 | | | 55,000 | | | | 52,073 | |
See Notes to Financial Statements.
158
1290 FUNDS
1290 UNCONSTRAINED BOND MANAGERS FUND
PORTFOLIO OF INVESTMENTS (Continued)
October 31, 2017
| | | | | | | | |
| | | Principal
Amount | | | Value
(Note 1) | |
| | | | | | | | |
Crown Castle International Corp. (REIT) | |
3.200%, 9/1/24 | | $ | 55,000 | | | $ | 54,563 | |
HCP, Inc. (REIT)
3.875%, 8/15/24 | | | 75,000 | | | | 77,070 | |
MGM Growth Properties Operating Partnership LP (REIT) | |
5.625%, 5/1/24 | | | 17,000 | | | | 18,339 | |
SBA Communications Corp. (REIT)
4.000%, 10/1/22§ | | | 35,000 | | | | 35,525 | |
Ventas Realty LP (REIT)
4.125%, 1/15/26 | | | 125,000 | | | | 130,320 | |
VEREIT Operating Partnership LP (REIT) | |
3.000%, 2/6/19 | | | 35,000 | | | | 35,278 | |
WEA Finance LLC (REIT)
2.700%, 9/17/19§ | | | 200,000 | | | | 201,646 | |
Welltower, Inc. (REIT)
3.750%, 3/15/23 | | | 150,000 | | | | 155,994 | |
| | | | | | | | |
Total Real Estate | | | | | | | 760,808 | |
| | | | | | | | |
Telecommunication Services (1.5%) | | | | | | | | |
Diversified Telecommunication Services (1.4%) | |
AT&T, Inc.
3.400%, 5/15/25 | | | 70,000 | | | | 69,169 | |
4.900%, 8/14/37 | | | 35,000 | | | | 34,923 | |
4.350%, 6/15/45 | | | 75,000 | | | | 66,511 | |
5.450%, 3/1/47 | | | 55,000 | | | | 57,446 | |
CCO Holdings LLC
5.125%, 5/1/27§ | | | 35,000 | | | | 35,350 | |
5.000%, 2/1/28 (b)§ | | | 25,000 | | | | 24,812 | |
Intelsat Jackson Holdings SA
5.500%, 8/1/23 | | | 60,000 | | | | 51,150 | |
Level 3 Financing, Inc.
5.625%, 2/1/23 | | | 25,000 | | | | 25,812 | |
5.125%, 5/1/23 | | | 10,000 | | | | 10,213 | |
Qualitytech LP
4.750%, 11/15/25 (b)§ | | | 18,000 | | | | 18,333 | |
Qwest Corp.
6.750%, 12/1/21 | | | 22,000 | | | | 24,365 | |
Sprint Capital Corp.
6.900%, 5/1/19 | | | 200,000 | | | | 210,260 | |
Verizon Communications, Inc.
3.376%, 2/15/25§ | | | 199,000 | | | | 200,210 | |
4.862%, 8/21/46 | | | 125,000 | | | | 125,761 | |
| | | | | | | | |
| | | | | | | 954,315 | |
| | | | | | | | |
Wireless Telecommunication Services (0.1%) | |
Sprint Communications, Inc.
9.000%, 11/15/18§ | | | 65,000 | | | | 68,900 | |
T-Mobile USA, Inc.
4.000%, 4/15/22 | | | 8,000 | | | | 8,290 | |
6.836%, 4/28/23 | | | 15,000 | | | | 15,844 | |
| | | | | | | | |
| | | | | | | 93,034 | |
| | | | | | | | |
Total Telecommunication Services | | | | | | | 1,047,349 | |
| | | | | | | | |
Utilities (1.2%) | | | | | |
Electric Utilities (0.7%) | |
Jersey Central Power & Light Co.
6.400%, 5/15/36 | | | 100,000 | | | | 123,077 | |
| | | | | | | | |
Kansas City Power & Light Co.
3.150%, 3/15/23 | | | 135,000 | | | | 137,951 | |
NextEra Energy Operating Partners LP | |
4.250%, 9/15/24§ | | | 20,000 | | | | 20,176 | |
Northern States Power Co.
4.125%, 5/15/44 | | | 100,000 | | | | 107,309 | |
Public Service Co. of New Mexico | |
3.850%, 8/1/25 | | | 100,000 | | | | 103,368 | |
| | | | | | | | |
| | | | | | | 491,881 | |
| | | | | | | | |
Gas Utilities (0.3%) | |
Perusahaan Gas Negara Persero Tbk. PT | |
5.125%, 5/16/24§ | | | 200,000 | | | | 217,250 | |
| | | | | | | | |
Multi-Utilities (0.2%) | |
Berkshire Hathaway Energy Co.
5.150%, 11/15/43 | | | 100,000 | | | | 119,474 | |
Sempra Energy | | | | | | | | |
(ICE LIBOR USD 3 Month + 0.45%), 1.809%, 3/15/21 (k) | | | 50,000 | | | | 50,100 | |
| | | | | | | | |
| | | | | | | 169,574 | |
| | | | | | | | |
Total Utilities | | | | | | | 878,705 | |
| | | | | | | | |
Total Corporate Bonds | | | | | | | 16,680,112 | |
| | | | | | | | |
Foreign Government Securities (1.5%) | |
Autonomous Community of Catalonia | |
4.900%, 9/15/21 | | EUR | 100,000 | | | | 121,787 | |
Federative Republic of Brazil
2.625%, 1/5/23 | | $ | 200,000 | | | | 193,500 | |
Republic of Argentina
26.250%, 6/21/20 | | ARS | 2,400,000 | | | | 145,681 | |
Republic of Chile
2.250%, 10/30/22 | | $ | 215,000 | | | | 213,065 | |
Republic of Croatia
6.625%, 7/14/20 (m) | | | 100,000 | | | | 109,375 | |
Republic of Peru
6.150%, 8/12/32 (m) | | PEN | 200,000 | | | | 63,832 | |
Saudi Government Bond
3.250%, 10/26/26 (m) | | $ | 200,000 | | | | 196,750 | |
| | | | | | | | |
Total Foreign Government Securities | | | | | | | 1,043,990 | |
| | | | | | | | |
Loan Participations (0.4%) | |
Consumer Discretionary (0.1%) | | | | | |
Media (0.1%) | |
Charter Communications Operating LLC | |
(USD 1 Month LIBOR + 2.25%), 3.500%, 1/15/24 (k) | | | 98,500 | | | | 99,143 | |
| | | | | | | | |
Total Consumer Discretionary | | | | | | | 99,143 | |
| | | | | | | | |
Energy (0.1%) | | | | | |
Oil, Gas & Consumable Fuels (0.1%) | |
Petroleo Global Trading BV
(USD 6 Month LIBOR + 2.14%), 3.597%, 2/19/20 (k) | | | 100,000 | | | | 98,000 | |
| | | | | | | | |
Total Energy | | | | | | | 98,000 | |
| | | | | | | | |
See Notes to Financial Statements.
159
1290 FUNDS
1290 UNCONSTRAINED BOND MANAGERS FUND
PORTFOLIO OF INVESTMENTS (Continued)
October 31, 2017
| | | | | | | | |
| | | Principal
Amount | | | Value
(Note 1) | |
| | | | | | | | |
Information Technology (0.2%) | |
Semiconductors & Semiconductor Equipment (0.2%) | |
Energy Future Intermediate Holding Co. LLC | |
(USD 1 Month LIBOR + 3.00%), 4.242, 6/30/18 (k) | | $ | 100,000 | | | $ | 100,531 | |
| | | | | | | | |
Total Information Technology | | | | | | | 100,531 | |
| | | | | | | | |
Total Loan Participations | | | | | | | 297,674 | |
| | | | | | | | |
Mortgage-Backed Securities (2.9%) | |
FNMA
2.800%, 3/1/18 | | | 159,394 | | | | 159,248 | |
4.550%, 10/1/19 | | | 75,073 | | | | 78,138 | |
4.910%, 10/1/19 | | | 61,896 | | | | 64,690 | |
4.730%, 2/1/20 | | | 78,427 | | | | 81,398 | |
3.416%, 10/1/20 | | | 157,085 | | | | 162,348 | |
3.915%, 10/1/20 | | | 102,693 | | | | 107,493 | |
3.310%, 11/1/20 | | | 85,000 | | | | 87,711 | |
3.762%, 12/1/20 | | | 68,367 | | | | 71,366 | |
2.761%, 4/1/21 | | | 68,473 | | | | 69,708 | |
4.381%, 6/1/21 | | | 157,760 | | | | 168,644 | |
4.500%, 8/1/21 | | | 80,000 | | | | 86,104 | |
3.300%, 12/1/21 | | | 173,010 | | | | 179,269 | |
2.900%, 6/1/22 | | | 71,871 | | | | 73,527 | |
2.210%, 9/1/26 | | | 220,000 | | | | 210,582 | |
3.110%, 2/1/28 | | | 115,000 | | | | 116,298 | |
3.259%, 2/1/28 | | | 45,000 | | | | 46,189 | |
3.200%, 3/1/31 | | | 222,141 | | | | 225,787 | |
3.480%, 11/1/35 | | | 55,000 | | | | 56,684 | |
| | | | | | | | |
Total Mortgage-Backed Securities | | | | | | | 2,045,184 | |
| | | | | | | | |
Municipal Bonds (0.8%) | |
City of New York Transitional Finance Authority, Future Tax Secured Bonds, Revenue Bonds, Subseries G3 | |
5.267%, 5/1/27 | | | 115,000 | | | | 135,092 | |
City of New York, General Obligation Bonds, Series D | |
5.985%, 12/1/36 | | | 100,000 | | | | 128,557 | |
Commonwealth of Puerto Rico, General Obligation Bonds | |
5.000%, 7/1/41 (h) | | | 50,000 | | | | 14,625 | |
State of California, High Speed Passenger Train, General Obligation Bonds, Series B | |
2.193%, 4/1/47 | | | 150,000 | | | | 150,748 | |
Texas Public Finance Authority, Windstorm Insurance Association Premium, Revenue Bonds | |
8.250%, 7/1/24 | | | 100,000 | | | | 104,048 | |
Tobacco Settlement Finance Authority | | | | | |
(Zero Coupon), 6/1/47 | | | 300,000 | | | | 15,861 | |
| | | | | | | | |
Total Municipal Bonds | | | | | | | 548,931 | |
| | | | | | | | |
U.S. Treasury Obligations (14.4%) | |
U.S. Treasury Inflation Linked Notes
0.125%, 7/15/24 TIPS | | | 1,034,000 | | | | 1,021,571 | |
U.S. Treasury Notes
1.875%, 9/30/22 | | | 415,000 | | | | 412,309 | |
1.875%, 10/31/22 | | | 3,500,000 | | | | 3,474,981 | |
1.375%, 8/31/23 | | | 500,000 | | | | 479,590 | |
2.250%, 12/31/23 | | | 450,000 | | | | 452,496 | |
2.250%, 1/31/24 | | | 150,000 | | | | 150,732 | |
2.000%, 4/30/24 | | | 400,000 | | | | 395,422 | |
2.500%, 5/15/24 | | | 100,000 | | | | 101,871 | |
| | | | | | | | |
2.000%, 5/31/24 | | | 2,600,000 | | | | 2,568,820 | |
2.125%, 7/31/24 | | | 400,000 | | | | 397,891 | |
2.375%, 8/15/24 | | | 500,000 | | | | 505,039 | |
2.375%, 5/15/27 | | | 300,000 | | | | 300,164 | |
| | | | | | | | |
Total U.S. Treasury Obligations | | | | | | | 10,260,886 | |
| | | | | | | | |
Total Long-Term Debt Securities (87.2%)
(Cost $60,459,894) | | | | | | | 62,145,385 | |
| | | | | |
SHORT-TERM INVESTMENTS: | |
Certificates of Deposit (0.5%) | |
Barclays Bank plc | |
(ICE LIBOR USD 3 Month + 0.75%), 2.07%, 12/6/17 (k) | | | 200,000 | | | | 200,126 | |
1.94%, 9/4/18 | | | 150,000 | | | | 150,220 | |
| | | | | | | | |
Total Certificates of Deposit | | | | | | | 350,346 | |
| | | | | |
Foreign Government Treasury Bills (3.2%) | |
Argentina Treasury Bills
4.28%, 1/26/18 (p) | | | 100,000 | | | | 98,990 | |
3.30%, 5/24/18 (p) | | | 100,000 | | | | 98,180 | |
Japanese Treasury Bills | |
(0.07)%, 11/6/17 (p) | | JPY | 40,000,000 | | | | 351,791 | |
(0.12)%, 1/10/18 (p) | | | 120,000,000 | | | | 1,055,612 | |
(0.12)%, 1/29/18 (p) | | | 75,000,000 | | | | 659,804 | |
| | | | | | | | |
Total Foreign Government Treasury Bills | | | | | | | 2,264,377 | |
| | | | | |
U.S. Government Agency Securities (2.4%) | |
FHLB
0.92%, 11/13/17 (o)(p) | | $ | 700,000 | | | | 699,767 | |
1.01%, 12/13/17 (o)(p) | | | 1,000,000 | | | | 998,791 | |
| | | | | | | | |
Total U.S. Government Agency Securities | | | | | | | 1,698,558 | |
| | | | | |
U.S. Treasury Obligations (5.6%) | |
U.S. Treasury Bills
0.97%, 11/30/17 (p) | | | 2,300,000 | | | | 2,298,147 | |
1.05%, 1/11/18 (p) | | | 495,000 | | | | 493,965 | |
1.08%, 1/25/18 (p) | | | 300,000 | | | | 299,228 | |
1.11%, 2/1/18 (p) | | | 900,000 | | | | 897,419 | |
1.16%, 3/1/18#(p) | | | 40,000 | | | | 39,845 | |
| | | | | | | | |
Total U.S. Treasury Obligations | | | | | | | 4,028,604 | |
| | | | | |
Total Short-Term Investments (11.7%)
(Cost $8,373,378) | | | | | | | 8,341,885 | |
| | | | | |
See Notes to Financial Statements.
160
1290 FUNDS
1290 UNCONSTRAINED BOND MANAGERS FUND
PORTFOLIO OF INVESTMENTS (Continued)
October 31, 2017
| | | | | | | | |
| | | Number of
Contracts | | | Value
(Note 1) | |
| | | | | | | | |
OPTIONS PURCHASED: | | | | | | | | |
Call Options Purchased (0.1%) | |
Call Interest Rate Swaptions Purchased Payable (0.1%) | |
30 years, December 2018 @
3.05% v. 3 Month LIBOR
Exercise Price: USD 3.05
Notional Amount: USD 1,150,000 Counterparty : Bank of America* | | | 1,150,000 | | | $ | 30,063 | |
| | | | | | | | |
Total Options Purchased (0.1%)
(Cost $55,932) | | | | | | | 30,063 | |
| | | | | | | | |
Total Investments in Securities (99.0%)
(Cost $68,889,204) | | | | | | | 70,517,333 | |
Other Assets Less Liabilities (1.0%) | | | | | | | 748,288 | |
| | | | | |
Net Assets (100%) | | | | | | $ | 71,265,621 | |
| | | | | | | | |
| § | Securities exempt from registration under Rule 144A of the Securities Act of 1933. These securities may only be resold to qualified institutional buyers. At October 31, 2017, the market value of these securities amounted to $11,352,723 or 15.9% of net assets. Securities denoted with “§” but without “b” have been determined to be liquid under the guidelines established by the Board of Trustees. To the extent any securities might provide a right to demand registration, such rights have not been relied upon when determining liquidity. |
| # | All, or a portion of security held by broker as collateral for financial futures contracts, with a total collateral value of $39,845. |
| (b) | Rule 144A Illiquid Security. At October 31, 2017, the market value of these securities amounted to $1,394,028 or 2.0% of net assets. |
| (e) | Step Bond - Coupon rate increases or decreases in increments to maturity. Rate disclosed is as of October 31, 2017. Maturity date disclosed is the ultimate maturity date. |
| (h) | Defaulted security. A security is classified as defaulted if the issuer files for bankruptcy or fails to make a scheduled interest or principal payment within the grace period set forth in the security’s governing documents. |
| (k) | Variable or floating rate security, linked to the referenced benchmark. The interest rate shown was the current rate as of October 31, 2017. |
| (l) | Variable or floating rate security, the interest rate of which adjusts periodically based on changes in current interest rates and prepayments on the underlying pool of assets. The interest rate shown was the current rate as of October 31, 2017. |
| (m) | Regulation S is an exemption for securities offerings that are made outside of the United States and do not involve direct selling efforts in the United States. Resale restrictions may apply for purposes of the Securities Act of 1933. At October 31, 2017, the market value of these securities amounted to $1,330,867 or 1.9% of net assets. |
| (o) | Discount Note Security. Effective rate calculated as of October 31, 2017. |
| (y) | Securities are perpetual and, thus, do not have a predetermined maturity date. The coupon rate for these securities are fixed for a period of time and may be structured to adjust thereafter. The date shown, if applicable, reflects the next call date. The coupon rate shown is the rate in effect as of October 31, 2017. |
| | | | | | |
| | Glossary: |
| | ARS | | — | | Argentine Peso |
| | AUD | | — | | Australian Dollar |
| | BRL | | — | | Brazilian Real |
| | CAD | | — | | Canadian Dollar |
| | CLO | | — | | Collateralized Loan Obligation |
| | COP | | — | | Colombia Peso |
| | EGP | | — | | Egyptian Pound |
| | EUR | | — | | European Currency Unit |
| | EURIBOR | | — | | Euro Interbank Offered Rate |
| | FHLB | | — | | Federal Home Loan Bank |
| | FHLMC | | — | | Federal Home Loan Mortgage Corp. |
| | FNMA | | — | | Federal National Mortgage Association |
| | GBP | | — | | British Pound |
| | GNMA | | — | | Government National Mortgage Association |
| | ICE | | — | | Intercontinental Exchange |
| | IO | | — | | Interest Only |
| | JPY | | — | | Japanese Yen |
| | KRW | | — | | Korean Republic Won |
| | LIBOR | | — | | London Interbank Offered Rate |
| | MXN | | — | | Mexican Peso |
| | PEN | | — | | Peru Nuevo Sol |
| | RUB | | — | | Russian Ruble |
| | SGD | | — | | Singapore Dollar |
| | TIIE | | — | | Interbank Equilibrium Interest Rate |
| | TIPS | | — | | Treasury Inflation Protected Security |
| | TRY | | — | | Turkish Lira |
| | TWD | | — | | New Taiwan Dollar |
| | USD | | — | | United States Dollar |
Futures contracts outstanding as of October 31, 2017 (Note 1):
| | | | | | | | | | | | | | | | | | | | |
Description | | Number of
Contracts | | | Expiration
Date | | | Trading Currency | | | Notional Amount
($) | | | Value and
Unrealized
Appreciation
(Depreciation) ($) | |
Long Contracts | |
Euro-Bund | | | 4 | | | | 12/2017 | | | | EUR | | | | 758,317 | | | | 6,179 | |
U.S. Treasury 10 Year Note | | | 5 | | | | 12/2017 | | | | USD | | | | 624,688 | | | | (12,818 | ) |
U.S. Treasury 5 Year Note | | | 33 | | | | 12/2017 | | | | USD | | | | 3,867,187 | | | | (27,595 | ) |
| | | | | | | | | | | | | | | | | | | | |
| | | | | | | | | | | | | | | | | | | (34,234 | ) |
| | | | | | | | | | | | | | | | | | | | |
See Notes to Financial Statements.
161
1290 FUNDS
1290 UNCONSTRAINED BOND MANAGERS FUND
PORTFOLIO OF INVESTMENTS (Continued)
October 31, 2017
| | | | | | | | | | | | | | | | | | | | |
Description | | Number of
Contracts | | | Expiration
Date | | | Trading Currency | | | Notional Amount
($) | | | Value and
Unrealized
Appreciation
(Depreciation) ($) | |
Short Contracts | |
Euro-Bobl | | | (2 | ) | | | 12/2017 | | | | EUR | | | | (307,008 | ) | | | (303 | ) |
Euro-OAT | | | (5 | ) | | | 12/2017 | | | | EUR | | | | (917,086 | ) | | | (9,262 | ) |
U.S. Treasury 10 Year Note | | | (12 | ) | | | 12/2017 | | | | USD | | | | (1,499,250 | ) | | | 21,725 | |
U.S. Treasury Long Bond | | | (1 | ) | | | 12/2017 | | | | USD | | | | (152,469 | ) | | | 2,788 | |
U.S. Treasury Ultra Bond | | | (3 | ) | | | 12/2017 | | | | USD | | | | (494,344 | ) | | | 12,462 | |
3 Month Eurodollar | | | (16 | ) | | | 6/2019 | | | | USD | | | | (3,918,599 | ) | | | 4,566 | |
| | | | | | | | | | | | | | | | | | | | |
| | | | | | | | | | | | | | | | | | | 31,976 | |
| | | | | | | | | | | | | | | | | | | | |
| | | | | | | | | | | | | | | | | | | (2,258 | ) |
| | | | | | | | | | | | | | | | | | | | |
Forward foreign currency contracts outstanding as of October 31, 2017 (Note 1):
| | | | | | | | | | | | | | | | | | | | |
Currency Purchased | | | Currency Sold | | | Counterparty | | Settlement Date | | | Unrealized
Appreciation
(Depreciation) ($) | |
USD | | | 108,655 | | | COP | | | 327,596,000 | | | Credit Suisse** | | | 11/1/2017 | | | | 966 | |
EUR | | | 647,000 | | | USD | | | 751,216 | | | Bank of America | | | 11/2/2017 | | | | 2,442 | |
USD | | | 174,173 | | | AUD | | | 223,000 | | | JPMorgan Chase Bank | | | 11/2/2017 | | | | 3,500 | |
USD | | | 190,269 | | | CAD | | | 238,000 | | | JPMorgan Chase Bank | | | 11/2/2017 | | | | 5,787 | |
USD | | | 759,714 | | | EUR | | | 647,000 | | | Bank of America | | | 11/2/2017 | | | | 6,056 | |
USD | | | 303,601 | | | GBP | | | 228,000 | | | Credit Suisse | | | 11/2/2017 | | | | 783 | |
BRL | | | 892,562 | | | USD | | | 272,380 | | | Deutsche Bank AG** | | | 11/3/2017 | | | | 419 | |
USD | | | 274,255 | | | BRL | | | 892,562 | | | Deutsche Bank AG** | | | 11/3/2017 | | | | 1,456 | |
USD | | | 362,795 | | | JPY | | | 40,000,000 | | | JPMorgan Chase Bank | | | 11/6/2017 | | | | 10,952 | |
USD | | | 272,850 | | | SGD | | | 369,766 | | | Deutsche Bank AG | | | 12/4/2017 | | | | 1,514 | |
USD | | | 1,069,872 | | | JPY | | | 120,000,000 | | | Goldman Sachs International | | | 1/10/2018 | | | | 10,569 | |
USD | | | 670,151 | | | JPY | | | 75,000,000 | | | Goldman Sachs International | | | 1/29/2018 | | | | 7,454 | |
EGP | | | 3,722,000 | | | USD | | | 200,000 | | | Bank of America** | | | 4/26/2018 | | | | 642 | |
EGP | | | 1,470,190 | | | USD | | | 79,000 | | | JPMorgan Chase Bank** | | | 4/30/2018 | | | | 162 | |
| | | | | | | | | | | | | | | | | | | | |
Total unrealized appreciation | | | | | | | 52,702 | |
| | | | | | | | |
COP | | | 327,596,000 | | | USD | | | 108,125 | | | Bank of America** | | | 11/1/2017 | | | | (435 | ) |
BRL | | | 892,562 | | | USD | | | 283,551 | | | JPMorgan Chase Bank** | | | 11/3/2017 | | | | (10,751 | ) |
USD | | | 272,380 | | | BRL | | | 892,562 | | | JPMorgan Chase Bank** | | | 11/3/2017 | | | | (419 | ) |
TRY | | | 643,000 | | | USD | | | 176,610 | | | Bank of America | | | 11/15/2017 | | | | (7,755 | ) |
BRL | | | 892,562 | | | USD | | | 273,194 | | | Deutsche Bank AG** | | | 12/4/2017 | | | | (1,523 | ) |
USD | | | 752,472 | | | EUR | | | 647,000 | | | Bank of America | | | 12/4/2017 | | | | (2,534 | ) |
USD | | | 264,467 | | | KRW | | | 300,444,720 | | | JPMorgan Chase Bank** | | | 12/4/2017 | | | | (3,744 | ) |
USD | | | 262,844 | | | TWD | | | 7,928,680 | | | Credit Suisse** | | | 12/4/2017 | | | | (440 | ) |
ARS | | | 420,240 | | | USD | | | 23,208 | | | JPMorgan Chase Bank** | | | 12/13/2017 | | | | (3 | ) |
MXN | | | 443,607 | | | USD | | | 23,000 | | | Bank of America | | | 12/15/2017 | | | | (38 | ) |
MXN | | | 4,590,826 | | | USD | | | 238,000 | | | JPMorgan Chase Bank | | | 12/15/2017 | | | | (369 | ) |
RUB | | | 10,492,510 | | | USD | | | 179,191 | | | Credit Suisse** | | | 1/19/2018 | | | | (2,152 | ) |
COP | | | 327,596,000 | | | USD | | | 107,673 | | | Credit Suisse** | | | 1/31/2018 | | | | (881 | ) |
ARS | | | 3,210,880 | | | USD | | | 173,000 | | | Bank of America** | | | 2/14/2018 | | | | (2,331 | ) |
USD | | | 100,000 | | | EGP | | | 1,861,000 | | | Bank of America** | | | 4/26/2018 | | | | (321 | ) |
| | | | | | | | | | | | | | | | | | | | |
Total unrealized depreciation | | | | (33,696 | ) |
| | | | | | | | | | | | | | | | | | | | |
Net unrealized appreciation | | | | 19,006 | |
| | | | | | | | | | | | | | | | | | | | |
| ** | Non-deliverable forward. |
See Notes to Financial Statements.
162
1290 FUNDS
1290 UNCONSTRAINED BOND MANAGERS FUND
PORTFOLIO OF INVESTMENTS (Continued)
October 31, 2017
Written Call Options Contracts as of October 31, 2017 (Note 1):
| | | | | | | | | | | | | | | | | | | | | | |
Description | | Counterparty | | Number of
Contracts | | | Notional Amount | | | Exercise Price | | | Expiration
Date | | | Value ($) | |
Foreign Exchange MXN/USD | | Bank of America | | | 200,000 | | | USD | (200,000 | ) | | USD | 19.75 | | | | 11/29/2017 | | | | (1,067 | ) |
Foreign Exchange RUB/USD | | Deutsche Bank AG | | | 200,000 | | | USD | (200,000 | ) | | USD | 59.50 | | | | 11/29/2017 | | | | (1,248 | ) |
U.S. Treasury 10 Year Note | | Exchange Traded | | | 6 | | | USD | (600,000 | ) | | USD | 126.50 | | | | 11/24/2017 | | | | (375 | ) |
| | | | | | | | | | | | | | | | | | | | | | |
| | | | | | | | | | | | | | | | (2,690 | ) |
| | | | | | | | | | | | | | | | | |
Written Put Options Contracts as of October 31, 2017 (Note 1):
| | | | | | | | | | | | | | | | | | | | | | |
Description | | Counterparty | | Number of
Contracts | | | Notional Amount | | | Exercise Price | | | Expiration
Date | | | Value ($) | |
5 years, December 2018 @
2.70% v. 3 Month LIBOR | | Bank of America | | | 5,800,000 | | | USD | (5,800,000 | ) | | USD | 2.70 | | | | 12/14/2023 | | | | (34,909 | ) |
Euro-Bund | | Exchange Traded | | | 2 | | | EUR | (200,000 | ) | | EUR | 159.00 | | | | 11/24/2017 | | | | (70 | ) |
U.S. Treasury 10 Year Note | | Exchange Traded | | | 9 | | | USD | (900,000 | ) | | USD | 122.50 | | | | 12/22/2017 | | | | (1,266 | ) |
U.S. Treasury 10 Year Note | | Exchange Traded | | | 6 | | | USD | (600,000 | ) | | USD | 124.00 | | | | 11/24/2017 | | | | (1,031 | ) |
| | | | | | | | | | | | | | | | | | | | | | |
| | | | | | | | | | | | | | | | (37,276 | ) |
| | | | | | | | | | | | | | | | | |
Total Written Options Contracts (Premiums Received ($69,895)) | | | | (39,966 | ) |
| | | | | |
OTC Credit default swap contracts outstanding — sell protection as of October 31, 2017 (Note 1):
| | | | | | | | | | | | | | | | | | | | | | | | | | | | | | | | |
Reference
Obligation/Index | | Financing
Rate Paid /
(Received)
by the
Fund (%) | | | Frequency of
Payments
Made/
Received | | Counterparty | | Maturity
Date | | | Implied
Credit
Spread
(%) | | | Notional
Amount | | | Upfront
Payments
(Receipts)
($) | | | Unrealized
Appreciation
(Depreciation)
($) | | | Value ($) | |
Republic of Colombia | | | 1.00 | | | Quarterly | | Bank of America | | | 6/20/2022 | | | | 0.98 | | | USD | 200,000 | | | | (2,822 | ) | | | 3,239 | | | | 417 | |
United Mexican States | | | 1.00 | | | Quarterly | | Bank of America | | | 12/20/2021 | | | | 0.81 | | | USD | 100,000 | | | | (3,183 | ) | | | 4,037 | | | | 854 | |
| | | | | | | | | | | | | | | | | | | | | | | | | | | | | | | | |
| | | | | | | | | | | | | | | | | | | | | | | (6,005 | ) | | | 7,276 | | | | 1,271 | |
| | | | | | | | | | | | | | | | | | | | | | | | | | | | | | | | |
Federative Republic of Brazil | | | 1.00 | | | Quarterly | | Bank of America | | | 6/20/2022 | | | | 1.53 | | | USD | 100,000 | | | | (5,878 | ) | | | 3,705 | | | | (2,173 | ) |
| | | | | | | | | | | | | | | | | | | | | | | | | | | | | | | | |
| | | | | | | | | | | | | | | | | | | | | | | (5,878 | ) | | | 3,705 | | | | (2,173 | ) |
| | | | | | | | | | | | | | | | | | | | | | | | | | | | | | | | |
| | | | | | | | | | | | | | | | | | | | | | | (11,883 | ) | | | 10,981 | | | | (902 | ) |
| | | | | | | | | | | | | | | | | | | | | | | | | | | | | | | | |
Centrally Cleared Credit default swap contracts outstanding — buy protection as of October 31, 2017 (Note 1):
| | | | | | | | | | | | | | | | | | | | | | | | | | | | | | | | |
| |
Reference Obligation/Index | | Financing
Rate Paid /
(Received)
by the
Fund (%) | | | Frequency of
Payments
Made/
Received | | | Maturity
Date | | | Implied
Credit
Spread
(%) | | | Notional
Amount | | | Upfront
Payments
(Receipts)
($) | | | Unrealized
Appreciation
(Depreciation)
($) | | | Value ($) | |
CDX North America High Yield Index | | | 5.00 | | | | Quarterly | | | | 12/20/2022 | | | | 3.11 | | | USD | 100,000 | | | | (8,088 | ) | | | (874 | ) | | | (8,962 | ) |
iTraxx Europe | | | 1.00 | | | | Quarterly | | | | 12/20/2022 | | | | 0.50 | | | EUR | 350,000 | | | | (9,001 | ) | | | (1,861 | ) | | | (10,862 | ) |
iTraxx Europe Senior Financials | | | 1.00 | | | | Quarterly | | | | 6/20/2022 | | | | 0.40 | | | EUR | 300,000 | | | | (1,613 | ) | | | (8,570 | ) | | | (10,183 | ) |
| | | | | | | | | | | | | | | | | | | | | | | | | | | | | | | | |
| | | | | | | | | | | | | | | | | | | | | | | (18,702 | ) | | | (11,305 | ) | | | (30,007 | ) |
| | | | | | | | | | | | | | | | | | | | | | | | | | | | | | | | |
See Notes to Financial Statements.
163
1290 FUNDS
1290 UNCONSTRAINED BOND MANAGERS FUND
PORTFOLIO OF INVESTMENTS (Continued)
October 31, 2017
Centrally Cleared Credit default swap contracts outstanding — sell protection as of October 31, 2017 (Note 1):
| | | | | | | | | | | | | | | | | | | | | | | | | | | | | | | | |
Reference Obligation/Index | | Financing
Rate Paid /
(Received)
by the
Fund (%) | | | Frequency of
Payments
Made/
Received | | | Maturity
Date | | | Implied
Credit
Spread
(%) | | | Notional
Amount | | | Upfront
Payments
(Receipts)
($) | | | Unrealized
Appreciation
(Depreciation)
($) | | | Value ($) | |
Airbus Group SE | | | 1.00 | | | | Quarterly | | | | 12/20/2017 | | | | 0.06 | | | EUR | 50,000 | | | | 44 | | | | 100 | | | | 144 | |
| | | | | | | | | | | | | | | | | | | | | | | | | | | | | | | | |
| | | | | | | | | | | | | | | | | | | | | | | 44 | | | | 100 | | | | 144 | |
| | | | | | | | | | | | | | | | | | | | | | | | | | | | | | | | |
Centrally Cleared Interest rate swap contracts outstanding as of October 31, 2017 (Note 1):
| | | | | | | | | | | | | | | | | | | | | | | | | | |
Floating Rate Index1 | | Fixed Rate | | Pay/
Receive
Floating
Rate | | | Maturity
Date | | | Notional
Amount | | | Upfront
Payments
(Receipts)
($) | | | Unrealized
Appreciation
(Depreciation)
($) | | | Value ($) | |
3 Month LIBOR quarterly | | 2.00% semi-annually | | | Pay | | | | 12/16/2020 | | | USD | 1,400,000 | | | | 9,851 | | | | 925 | | | | 10,776 | |
3 Month LIBOR quarterly | | 2.25% semi-annually | | | Receive | | | | 9/14/2046 | | | USD | 120,000 | | | | 11,124 | | | | (2,635 | ) | | | 8,489 | |
3 Month LIBOR quarterly | | 1.75% semi-annually | | | Receive | | | | 12/21/2023 | | | USD | 2,600,000 | | | | 59,291 | | | | (11,121 | ) | | | 48,170 | |
3 Month LIBOR quarterly | | 1.50% semi-annually | | | Receive | | | | 6/21/2027 | | | USD | 1,200,000 | | | | 95,227 | | | | (12,509 | ) | | | 82,718 | |
3 Month LIBOR quarterly | | 1.75% semi-annually | | | Receive | | | | 12/21/2026 | | | USD | 2,300,000 | | | | 114,677 | | | | (18,012 | ) | | | 96,665 | |
6 Month EURIBOR semi-annually | | 0.50% annually | | | Pay | | | | 3/21/2023 | | | EUR | 1,600,000 | | | | 20,840 | | | | (1,154 | ) | | | 19,686 | |
6 Month EURIBOR semi-annually | | 1.50% annually | | | Receive | | | | 3/21/2048 | | | EUR | 300,000 | | | | (3,213 | ) | | | 9,299 | | | | 6,086 | |
6 Month LIBOR semi-annually | | 1.00% semi-annually | | | Receive | | | | 3/21/2023 | | | GBP | 1,400,000 | | | | 15,719 | | | | 8 | | | | 15,727 | |
| | | | | | | | | | | | | | | | | | | | | | | | | | |
| | | | | | | | | | | | | | | | | 323,516 | | | | (35,199 | ) | | | 288,317 | |
| | | | | | | | | | | | | | | | | | | | | | | | | | |
3 Month LIBOR quarterly | | 1.25% semi-annually | | | Receive | | | | 6/15/2018 | | | USD | 5,700,000 | | | | (2,790 | ) | | | (4,312 | ) | | | (7,102 | ) |
3 Month LIBOR quarterly | | 1.75% semi-annually | | | Receive | | | | 12/16/2018 | | | USD | 7,000,000 | | | | (36,185 | ) | | | (4,955 | ) | | | (41,140 | ) |
3 Month LIBOR quarterly | | 2.30% semi-annually | | | Receive | | | | 12/3/2025 | | | USD | 700,000 | | | | (2,008 | ) | | | (5,081 | ) | | | (7,089 | ) |
4 Week TIIE monthly | | 7.35% monthly | | | Pay | | | | 9/30/2027 | | | MXN | 4,800,000 | | | | (2,726 | ) | | | 849 | | | | (1,877 | ) |
6 Month LIBOR semi-annually | | 2.00% semi-annually | | | Receive | | | | 3/18/2022 | | | GBP | 200,000 | | | | (12,539 | ) | | | 1,269 | | | | (11,270 | ) |
6 Month LIBOR semi-annually | | 0.30% semi-annually | | | Receive | | | | 3/18/2026 | | | JPY | 90,000,000 | | | | 333 | | | | (5,601 | ) | | | (5,268 | ) |
| | | | | | | | | | | | | | | | | | | | | | | | | | |
| | | | | | | | | | | | | | | | | (55,915 | ) | | | (17,831 | ) | | | (73,746 | ) |
| | | | | | | | | | | | | | | | | | | | | | | | | | |
| | | | | | | | | | | | | | | | | 267,601 | | | | (53,030 | ) | | | 214,571 | |
| | | | | | | | | | | | | | | | | | | | | | | | | | |
| 1 | Value of floating rate index at October 31, 2017 was as follows: |
| | | | |
Floating Rate Index | | Value | |
3 Month LIBOR USD | | | 1.38 | % |
6 Month EURIBOR EUR | | | (0.27 | )% |
6 Month LIBOR GBP | | | 0.56 | % |
6 Month LIBOR JPY | | | (0.00 | )% |
4 Week TIIE | | | 7.00 | % |
See Notes to Financial Statements.
164
1290 FUNDS
1290 UNCONSTRAINED BOND MANAGERS FUND
PORTFOLIO OF INVESTMENTS (Continued)
October 31, 2017
The following is a summary of the inputs used to value the Fund’s assets and liabilities carried at fair value as of October 31, 2017:
The inputs or methodology used for valuing securities are not necessarily an indication of the risk associated with investing in those securities.
Various inputs are used in determining the value of the Fund’s investments. These inputs are summarized in the three broad levels listed below:
| | | | | | | | | | | | | | | | |
| | | | | |
| Investment Type | | Level 1
Quoted Prices in
Active Markets for
Identical
Securities | | | Level 2
Significant Other
Observable Inputs
(including quoted prices
for similar securities,
interest rates,
prepayment speeds,
credit risk, etc.) (a) | | | Level 3
Significant Unobservable
Inputs (including the
Fund’s own
assumptions in
determining the fair
value of investments) | | | Total | |
Assets: | | | | | | | | | | | | | | | | |
Asset-Backed Securities | | $ | — | | | $ | 16,976,782 | | | $ | — | | | $ | 16,976,782 | |
Centrally Cleared Credit Default Swaps | | | — | | | | 100 | | | | — | | | | 100 | |
Centrally Cleared Interest Rate Swaps | | | — | | | | 12,350 | | | | — | | | | 12,350 | |
Collateralized Mortgage Obligations | | | — | | | | 7,709,015 | | | | — | | | | 7,709,015 | |
Commercial Mortgage-Backed Securities | | | — | | | | 6,582,811 | | | | — | | | | 6,582,811 | |
Corporate Bonds | | | | | | | | | | | | | | | | |
Consumer Discretionary | | | — | | | | 959,142 | | | | — | | | | 959,142 | |
Consumer Staples | | | — | | | | 552,573 | | | | — | | | | 552,573 | |
Energy | | | — | | | | 1,309,387 | | | | — | | | | 1,309,387 | |
Financials | | | — | | | | 8,504,528 | | | | — | | | | 8,504,528 | |
Health Care | | | — | | | | 1,572,567 | | | | — | | | | 1,572,567 | |
Industrials | | | — | | | | 463,245 | | | | — | | | | 463,245 | |
Information Technology | | | — | | | | 364,072 | | | | — | | | | 364,072 | |
Materials | | | — | | | | 267,736 | | | | — | | | | 267,736 | |
Real Estate | | | — | | | | 760,808 | | | | — | | | | 760,808 | |
Telecommunication Services | | | — | | | | 1,047,349 | | | | — | | | | 1,047,349 | |
Utilities | | | — | | | | 878,705 | | | | — | | | | 878,705 | |
Credit Default Swaps | | | — | | | | 10,981 | | | | — | | | | 10,981 | |
Foreign Government Securities | | | — | | | | 1,043,990 | | | | — | | | | 1,043,990 | |
Forward Currency Contracts | | | — | | | | 52,702 | | | | — | | | | 52,702 | |
Futures | | | 47,720 | | | | — | | | | — | | | | 47,720 | |
Loan Participations | | | | | | | | | | | | | | | | |
Consumer Discretionary | | | — | | | | 99,143 | | | | — | | | | 99,143 | |
Energy | | | — | | | | 98,000 | | | | — | | | | 98,000 | |
Information Technology | | | — | | | | 100,531 | | | | — | | | | 100,531 | |
Mortgage-Backed Securities | | | — | | | | 2,045,184 | | | | — | | | | 2,045,184 | |
Municipal Bonds | | | — | | | | 548,931 | | | | — | | | | 548,931 | |
Options Purchased | | | | | | | | | | | — | | | | | |
Call Options Purchased | | | — | | | | 30,063 | | | | — | | | | 30,063 | |
Short-Term Investments | | | | | | | | | | | | | | | | |
Certificates of Deposit | | | — | | | | 350,346 | | | | — | | | | 350,346 | |
Foreign Government Treasury Bills | | | — | | | | 2,264,377 | | | | — | | | | 2,264,377 | |
U.S. Government Agency Securities | | | — | | | | 1,698,558 | | | | — | | | | 1,698,558 | |
U.S. Treasury Obligations | | | — | | | | 4,028,604 | | | | — | | | | 4,028,604 | |
U.S. Treasury Obligations | | | — | | | | 10,260,886 | | | | — | | | | 10,260,886 | |
| | | | | | | | | | | | | | | | |
Total Assets | | $ | 47,720 | | | $ | 70,593,466 | | | $ | — | | | $ | 70,641,186 | |
| | | | | | | | | | | | | | | | |
See Notes to Financial Statements.
165
1290 FUNDS
1290 UNCONSTRAINED BOND MANAGERS FUND
PORTFOLIO OF INVESTMENTS (Continued)
October 31, 2017
| | | | | | | | | | | | | | | | |
| | | | | |
| Investment Type | | Level 1
Quoted Prices in
Active Markets for
Identical
Securities | | | Level 2
Significant Other
Observable Inputs
(including quoted prices
for similar securities,
interest rates,
prepayment speeds,
credit risk, etc.) (a) | | | Level 3
Significant Unobservable
Inputs (including the
Fund’s own
assumptions in
determining the fair
value of investments) | | | Total | |
Liabilities: | | | | | | | | | | | | | | | | |
Centrally Cleared Credit Default Swaps | | $ | — | | | $ | (11,305 | ) | | $ | — | | | $ | (11,305 | ) |
Centrally Cleared Interest Rate Swaps | | | — | | | | (65,380 | ) | | | — | | | | (65,380 | ) |
Forward Currency Contracts | | | — | | | | (33,696 | ) | | | — | | | | (33,696 | ) |
Futures | | | (49,978 | ) | | | — | | | | — | | | | (49,978 | ) |
Options Written | | | | | | | | | | | | | | | | |
Call Options Written | | | (375 | ) | | | (2,315 | ) | | | — | | | | (2,690 | ) |
Put Options Written | | | (2,367 | ) | | | (34,909 | ) | | | — | | | | (37,276 | ) |
| | | | | | | | | | | | | | | | |
Total Liabilities | | $ | (52,720 | ) | | $ | (147,605 | ) | | $ | — | | | $ | (200,325 | ) |
| | | | | | | | | | | | | | | | |
Total | | $ | (5,000 | ) | | $ | 70,445,861 | | | $ | — | | | $ | 70,440,861 | |
| | | | | | | | | | | | | | | | |
(a) A security with a market value of $124,640 transferred from Level 3 to Level 2 at the end of the period due to active trading.
There were no additional transfers between Levels 1, 2 or 3 during the year ended October 31, 2017.
Fair Values of Derivative Instruments as of October 31, 2017:
| | | | | | |
| | | Statement of Assets and Liabilities | |
Derivatives Not Accounted for as
Hedging Instrument*^ | | Asset Derivatives | | Fair Value | |
Interest rate contracts | | Receivables, Net assets – Unrealized appreciation | | $ | 90,133 | |
Foreign exchange contracts | | Receivables | | | 52,702 | |
Credit contracts | | Receivables | | | 11,081 | |
| | | | | | |
Total | | | | $ | 153,916 | |
| | | | | | |
| | |
| | | Liability Derivatives | | | |
Interest rate contracts | | Payables, Net assets – Unrealized depreciation | | $ | (153,009 | ) |
Foreign exchange contracts | | Payables | | | (36,011 | ) |
Credit contracts | | Payables | | | (11,305 | ) |
| | | | | | |
Total | | | | $ | (200,325 | ) |
| | | | | | |
The Effect of Derivative Instruments on the Statement of Operations for the year ended October 31, 2017:
| | | | | | | | | | | | | | | | | | | | |
| Amount of Realized Gain or (Loss) on Derivatives Recognized in Income | |
Derivatives Not Accounted for as
Hedging Instruments^ | | Options | | | Futures | | | Forward
Foreign
Currency
Contracts | | | Swaps | | | Total | |
Interest rate contracts | | $ | 42,249 | | | $ | (22,097 | ) | | $ | — | | | $ | 726,292 | | | $ | 746,444 | |
Foreign exchange contracts | | | 2,764 | | | | — | | | | 371,424 | | | | — | | | | 374,188 | |
Credit contracts | | | — | | | | — | | | | — | | | | 2,963 | | | | 2,963 | |
Commodity contracts | | | (187 | ) | | | — | | | | — | | | | — | | | | (187 | ) |
| | | | | | | | | | | | | | | | | | | | |
Total | | $ | 44,826 | | | $ | (22,097 | ) | | $ | 371,424 | | | $ | 729,255 | | | $ | 1,123,408 | |
| | | | | | | | | | | | | | | | | | | | |
See Notes to Financial Statements.
166
1290 FUNDS
1290 UNCONSTRAINED BOND MANAGERS FUND
PORTFOLIO OF INVESTMENTS (Continued)
October 31, 2017
| | | | | | | | | | | | | | | | | | | | |
| Amount of Unrealized Appreciation or (Depreciation) on Derivatives Recognized in Income | |
Derivatives Not Accounted for
as Hedging Instruments^ | | Options | | | Futures | | | Forward
Foreign
Currency
Contracts | | | Swaps | | | Total | |
Interest rate contracts | | $ | 934 | | | $ | (38,941 | ) | | $ | — | | | $ | (99,476 | ) | | $ | (137,483 | ) |
Foreign exchange contracts | | | (387 | ) | | | — | | | | (106,826 | ) | | | — | | | | (107,213 | ) |
Credit contracts | | | — | | | | — | | | | — | | | | (3,002 | ) | | | (3,002 | ) |
| | | | | | | | | | | | | | | | | | | | |
Total | | $ | 547 | | | $ | (38,941 | ) | | $ | (106,826 | ) | | $ | (102,478 | ) | | $ | (247,698 | ) |
| | | | | | | | | | | | | | | | | | | | |
* Includes cumulative appreciation / depreciation of futures contracts and centrally cleared swaps as reported in the Portfolio of Investments. Only current day’s variation margin is reported within the Statement of Assets and Liabilities.
^ The Fund held options, forward foreign currency, futures and swap contracts as a substitute for investing in conventional securities, hedging and in an attempt to enhance returns.
The Fund held forward foreign currency contracts with an average settlement value of approximately $8,525,000, options with an average notional balance of approximately $109,000, swaps with an average notional balance of approximately $26,536,000 and futures contracts with an average notional balance of approximately $15,813,000 during the year ended October 31, 2017.
The following table presents the Fund’s gross derivative assets and liabilities by counterparty net of amounts available for offset under netting arrangements and any related collateral received or pledged by the Fund as of October 31, 2017:
| | | | | | | | | | | | | | | | |
Counterparty | | Gross Amount of
Derivative Assets
Presented in the
Statement of Assets
and Liabilities (a) | | | Derivatives
Available
for Offset | | | Collateral
Received | | | Net Amount Due
from Counterparty | |
Bank of America | | $ | 50,184 | | | $ | (49,390 | ) | | $ | — | | | $ | 794 | |
Credit Suisse | | | 1,749 | | | | (1,749 | ) | | | — | | | | — | |
Deutsche Bank AG | | | 3,389 | | | | (2,771 | ) | | | — | | | | 618 | |
Goldman Sachs International | | | 18,023 | | | | — | | | | — | | | | 18,023 | |
JPMorgan Chase Bank | | | 20,401 | | | | (15,286 | ) | | | — | | | | 5,115 | |
| | | | | | | | | | | | | | | | |
Total | | $ | 93,746 | | | $ | (69,196 | ) | | $ | — | | | $ | 24,550 | |
| | | | | | | | | | | | | | | | |
| | | | |
Counterparty | | Gross Amount of
Derivative Liabilities
Presented in the
Statement of Assets
and Liabilities (a) | | | Derivatives
Available
for Offset | | | Collateral
Pledged | | | Net Amount Due
to Counterparty | |
Bank of America | | $ | 49,390 | | | $ | (49,390 | ) | | $ | — | | | $ | — | |
Credit Suisse | | | 3,473 | | | | (1,749 | ) | | | — | | | | 1,724 | |
Deutsche Bank AG | | | 2,771 | | | | (2,771 | ) | | | — | | | | — | |
JPMorgan Chase Bank | | | 15,286 | | | | (15,286 | ) | | | — | | | | — | |
| | | | | | | | | | | | | | | | |
Total | | $ | 70,920 | | | $ | (69,196 | ) | | $ | — | | | $ | 1,724 | |
| | | | | | | | | | | | | | | | |
| (a) | For financial reporting purposes the Fund does not offset derivative assets and derivative liabilities subject to master netting arrangements in the Statement of Assets and Liabilities. |
Pertaining to Sale-Buyback transactions, the average amount of borrowings while outstanding for 56 days during the year ended October 31, 2017, was approximately $1,710,000 at a weighted average interest rate of 0.73%.
See Notes to Financial Statements.
167
1290 FUNDS
1290 UNCONSTRAINED BOND MANAGERS FUND
PORTFOLIO OF INVESTMENTS (Continued)
October 31, 2017
Investment security transactions for the year ended October 31, 2017 were as follows:
| | | | |
Cost of Purchases: | | | | |
Long-term investments other than U.S. government debt securities | | $ | 65,693,473 | |
Long-term U.S. government debt securities | | | 9,387,449 | |
| | | | |
| | $ | 75,080,922 | |
| | | | |
Net Proceeds of Sales and Redemptions: | | | | |
Long-term investments other than U.S. government debt securities | | $ | 67,881,051 | |
Long-term U.S. government debt securities | | | 9,398,803 | |
| | | | |
| | $ | 77,279,854 | |
| | | | |
As of October 31, 2017, the gross unrealized appreciation (depreciation) of investments based on the aggregate cost of investments in securities and derivative instruments, if applicable, for Federal income tax purposes was as follows:
| | | | |
Aggregate gross unrealized appreciation | | $ | 2,189,633 | |
Aggregate gross unrealized depreciation | | | (590,538 | ) |
| | | | |
Net unrealized appreciation | | $ | 1,599,095 | |
| | | | |
Federal income tax cost of investments in securities and derivative instruments, if applicable | | $ | 69,078,826 | |
| | | | |
See Notes to Financial Statements.
168
1290 FUNDS
1290 UNCONSTRAINED BOND MANAGERS FUND
STATEMENT OF ASSETS AND LIABILITIES
October 31, 2017
| | | | |
ASSETS | |
Investments in Securities, at value (Cost $68,889,204) | | $ | 70,517,333 | |
Cash | | | 478,463 | |
Foreign cash (Cost $48,715) | | | 47,783 | |
Cash held as collateral at broker for swaps | | | 312,000 | |
Cash held as collateral at broker for futures | | | 52,000 | |
Receivable for forward commitments | | | 2,156,371 | |
Dividends, interest and other receivables | | | 308,220 | |
Receivable for securities sold | | | 217,483 | |
Unrealized appreciation on forward foreign currency contracts | | | 52,702 | |
Due from broker for futures variation margin | | | 31,352 | |
Due from Custodian | | | 25,284 | |
Prepaid registration and filing fees | | | 18,834 | |
Variation Margin on Centrally Cleared Swaps | | | 14,186 | |
Market value on OTC swap contracts (Premiums received $6,005) | | | 1,271 | |
Other assets | | | 867 | |
| | | | |
Total assets | | | 74,234,149 | |
| | | | |
LIABILITIES | |
Payable for forward commitments | | | 2,157,441 | |
Payable for securities purchased | | | 459,757 | |
Dividends and distributions payable | | | 142,035 | |
Options written, at value (Premiums received $69,895) | | | 39,966 | |
Unrealized depreciation on forward foreign currency contracts | | | 33,696 | |
Investment advisory fees payable | | | 19,514 | |
Administrative fees payable | | | 9,085 | |
Transfer agent fees payable | | | 2,892 | |
Market value on OTC swap contracts (Premiums received $5,878) | | | 2,173 | |
Distribution fees payable – Class R | | | 43 | |
Distribution fees payable – Class A | | | 24 | |
Payable for Fund shares redeemed | | | 10 | |
Accrued expenses | | | 101,892 | |
| | | | |
Total liabilities | | | 2,968,528 | |
| | | | |
NET ASSETS | | $ | 71,265,621 | |
| | | | |
Net assets were comprised of: | |
Paid in capital | | $ | 69,191,529 | |
Accumulated undistributed net investment income (loss) | | | 1,108,187 | |
Accumulated undistributed net realized gain (loss) | | | (654,461 | ) |
Net unrealized appreciation (depreciation) | | | 1,620,366 | |
| | | | |
Net assets | | $ | 71,265,621 | |
| | | | |
Class A | | | | |
Net asset value and redemption price per share, $111,367 / 11,004 shares outstanding (unlimited amount authorized: $0.001 par value) | | $ | 10.12 | |
Maximum sales charge (4.50% of offering price) | | | 0.48 | |
| | | | |
Maximum offering price per share | | $ | 10.60 | |
| | | | |
Class I | | | | |
Net asset value and redemption price per share, $71,053,033 / 7,014,698 shares outstanding (unlimited amount authorized: $0.001 par value) | | $ | 10.13 | |
| | | | |
Class R | | | | |
Net asset value and redemption price per share, $101,221 / 10,010 shares outstanding (unlimited amount authorized: $0.001 par value) | | $ | 10.11 | |
| | | | |
STATEMENT OF OPERATIONS
For the Year Ended October 31, 2017
| | | | |
INVESTMENT INCOME | |
Interest | | $ | 2,273,681 | |
Dividends | | | 321 | |
| | | | |
Total income | | | 2,274,002 | |
| | | | |
EXPENSES | |
Investment advisory fees | | | 562,353 | |
Professional fees | | | 180,958 | |
Administrative fees | | | 105,442 | |
Printing and mailing expenses | | | 51,753 | |
Registration and filing fees | | | 42,201 | |
Transfer agent fees | | | 29,945 | |
Custodian fees | | | 23,200 | |
Trustees’ fees | | | 8,701 | |
Distribution fees – Class R | | | 500 | |
Distribution fees – Class A | | | 275 | |
Miscellaneous | | | 54,809 | |
| | | | |
Gross expenses | | | 1,060,137 | |
Less: Waiver from investment adviser | | | (321,778 | ) |
| | | | |
Net expenses | | | 738,359 | |
| | | | |
NET INVESTMENT INCOME (LOSS) | | | 1,535,643 | |
| | | | |
REALIZED AND UNREALIZED GAIN (LOSS) | |
Realized gain (loss) on: | | | | |
Investments in securities | | | (44,910 | ) |
Futures contracts | | | (22,097 | ) |
Forward foreign currency contracts | | | 371,424 | |
Foreign currency transactions | | | 27,219 | |
Swaps | | | 729,255 | |
Options written | | | 63,606 | |
Securities sold short | | | 7,848 | |
| | | | |
Net realized gain (loss) | | | 1,132,345 | |
| | | | |
Change in unrealized appreciation (depreciation) on: | | | | |
Investments in securities | | | 716,620 | |
Futures contracts | | | (38,941 | ) |
Forward foreign currency contracts | | | (106,826 | ) |
Foreign currency translations | | | (9,580 | ) |
Swaps | | | (102,478 | ) |
Options written | | | (1,937 | ) |
Securities sold short | | | (2,273 | ) |
| | | | |
Net change in unrealized appreciation (depreciation) | | | 454,585 | |
| | | | |
NET REALIZED AND UNREALIZED GAIN (LOSS) | | | 1,586,930 | |
| | | | |
NET INCREASE (DECREASE) IN NET ASSETS RESULTING FROM OPERATIONS | | $ | 3,122,573 | |
| | | | |
See Notes to Financial Statements.
169
1290 FUNDS
1290 UNCONSTRAINED BOND MANAGERS FUND
STATEMENT OF CHANGES IN NET ASSETS
| | | | | | | | |
| | | Year Ended October 31, | |
| | 2017 | | | 2016 | |
INCREASE (DECREASE) IN NET ASSETS FROM OPERATIONS: | |
Net investment income (loss) | | $ | 1,535,643 | | | $ | 1,318,044 | |
Net realized gain (loss) | | | 1,132,345 | | | | (781,949 | ) |
Net change in unrealized appreciation (depreciation) | | | 454,585 | | | | 1,920,814 | |
| | | | | | | | |
NET INCREASE (DECREASE) IN NET ASSETS RESULTING FROM OPERATIONS | | | 3,122,573 | | | | 2,456,909 | |
| | | | | | | | |
DIVIDENDS AND DISTRIBUTIONS: | | | | | | | | |
Dividends from net investment income | | | | | | | | |
Class A | | | (2,049 | ) | | | (1,093 | ) |
Class I | | | (1,461,459 | ) | | | (774,527 | ) |
Class R | | | (1,658 | ) | | | (929 | ) |
| | | | | | | | |
| | | (1,465,166 | ) | | | (776,549 | ) |
| | | | | | | | |
Return of capital | | | | | | | | |
Class A | | | — | | | | (1,669 | ) |
Class I | | | — | | | | (1,182,210 | ) |
Class R | | | — | | | | (1,417 | ) |
| | | | | | | | |
| | | — | | | | (1,185,296 | ) |
| | | | | | | | |
TOTAL DIVIDENDS AND DISTRIBUTIONS | | | (1,465,166 | ) | | | (1,961,845 | ) |
| | | | | | | | |
CAPITAL SHARES TRANSACTIONS: | | | | | | | | |
Class A | | | | | | | | |
Capital shares sold [ 0 and 966 shares, respectively ] | | | — | | | | 9,460 | |
Capital shares issued in reinvestment of dividends [ 18 and 20 shares, respectively ] | | | 185 | | | | 194 | |
| | | | | | | | |
Total Class A transactions | | | 185 | | | | 9,654 | |
| | | | | | | | |
Class I | | | | | | | | |
Capital shares sold [ 24,214 and 25,890 shares, respectively ] | | | 241,700 | | | | 253,672 | |
Capital shares issued in reinvestment of dividends [ 542 and 453 shares, respectively ] | | | 5,431 | | | | 4,449 | |
Capital shares repurchased [ (16,969) and (280) shares, respectively ] | | | (167,959 | ) | | | (2,750 | ) |
| | | | | | | | |
Total Class I transactions | | | 79,172 | | | | 255,371 | |
| | | | | | | | |
Class R | | | | | | | | |
Capital shares sold [ 0 and 10 shares, respectively ] | | | — | | | | 100 | |
Capital shares issued in reinvestment of dividends [ 0# and 0 shares, respectively ] | | | 2 | | | | — | |
| | | | | | | | |
Total Class R transactions | | | 2 | | | | 100 | |
| | | | | | | | |
NET INCREASE (DECREASE) IN NET ASSETS RESULTING FROM CAPITAL SHARE TRANSACTIONS | | | 79,359 | | | | 265,125 | |
| | | | | | | | |
TOTAL INCREASE (DECREASE) IN NET ASSETS | | | 1,736,766 | | | | 760,189 | |
NET ASSETS: | |
Beginning of year | | | 69,528,855 | | | | 68,768,666 | |
| | | | | | | | |
End of year (a) | | $ | 71,265,621 | | | $ | 69,528,855 | |
| | | | | | | | |
(a) Includes accumulated undistributed (overdistributed) net investment income (loss) of | | $ | 1,108,187 | | | $ | (189,400 | ) |
| | | | | | | | |
# Number of shares is less than 0.5. | | | | | | | | |
See Notes to Financial Statements.
170
1290 FUNDS
1290 UNCONSTRAINED BOND MANAGERS FUND
FINANCIAL HIGHLIGHTS
| | | | | | | | | | | | |
| | | Year Ended October 31, | | | July 6, 2015* to
October 31, 2015 | |
| Class A | | 2017 | | | 2016 | | |
Net asset value, beginning of period | | $ | 9.89 | | | $ | 9.82 | | | $ | 10.00 | |
| | | | | | | | | | | | |
Income (loss) from investment operations: | | | | | | | | | | | | |
Net investment income (loss) (e) | | | 0.19 | | | | 0.16 | | | | 0.01 | |
Net realized and unrealized gain (loss) | | | 0.23 | | | | 0.17 | | | | (0.16 | ) |
| | | | | | | | | | | | |
Total from investment operations | | | 0.42 | | | | 0.33 | | | | (0.15 | ) |
| | | | | | | | | | | | |
Less distributions: | | | | | | | | | | | | |
Dividends from net investment income | | | (0.19 | ) | | | (0.10 | ) | | | (0.03 | ) |
Return of capital | | | — | | | | (0.16 | ) | | | — | |
| | | | | | | | | | | | |
Total dividends and distributions | | | (0.19 | ) | | | (0.26 | ) | | | (0.03 | ) |
| | | | | | | | | | | | |
Net asset value, end of period | | $ | 10.12 | | | $ | 9.89 | | | $ | 9.82 | |
| | | | | | | | | | | | |
Total return (b) | | | 4.25 | % | | | 3.39 | % | | | (1.54 | )% |
| | | | | | | | | | | | |
Ratios/Supplemental Data: | | | | | | | | | | | | |
Net assets, end of period (000’s) | | $ | 111 | | | $ | 109 | | | $ | 98 | |
Ratio of expenses to average net assets: | | | | | | | | | | | | |
After waivers (a)(f) | | | 1.30 | % | | | 1.40 | % | | | 1.40 | % |
Before waivers (a)(f) | | | 1.76 | % | | | 1.84 | % | | | 1.62 | % |
Ratio of net investment income (loss) to average net assets: | | | | | | | | | | | | |
After waivers (a)(f) | | | 1.93 | % | | | 1.68 | % | | | 0.37 | %(l) |
Before waivers (a)(f) | | | 1.48 | % | | | 1.24 | % | | | 0.15 | %(l) |
Portfolio turnover rate (z)^ | | | 117 | % | | | 152 | % | | | 77 | % |
| | |
| | | Year Ended October 31, | | | July 6, 2015* to
October 31, 2015 | |
| Class I | | 2017 | | | 2016 | | |
Net asset value, beginning of period | | $ | 9.89 | | | $ | 9.82 | | | $ | 10.00 | |
| | | | | | | | | | | | |
Income (loss) from investment operations: | | | | | | | | | | | | |
Net investment income (loss) (e) | | | 0.22 | | | | 0.19 | | | | 0.02 | |
Net realized and unrealized gain (loss) | | | 0.23 | | | | 0.16 | | | | (0.17 | ) |
| | | | | | | | | | | | |
Total from investment operations | | | 0.45 | | | | 0.35 | | | | (0.15 | ) |
| | | | | | | | | | | | |
Less distributions: | | | | | | | | | | | | |
Dividends from net investment income | | | (0.21 | ) | | | (0.11 | ) | | | (0.03 | ) |
Return of capital | | | — | | | | (0.17 | ) | | | — | |
| | | | | | | | | | | | |
Total dividends and distributions | | | (0.21 | ) | | | (0.28 | ) | | | (0.03 | ) |
| | | | | | | | | | | | |
Net asset value, end of period | | $ | 10.13 | | | $ | 9.89 | | | $ | 9.82 | |
| | | | | | | | | | | | |
Total return (b) | | | 4.58 | % | | | 3.63 | % | | | (1.49 | )% |
| | | | | | | | | | | | |
Ratios/Supplemental Data: | | | | | | | | | | | | |
Net assets, end of period (000’s) | | $ | 71,053 | | | $ | 69,321 | | | $ | 68,572 | |
Ratio of expenses to average net assets: | | | | | | | | | | | | |
After waivers (a)(f) | | | 1.05 | % | | | 1.15 | % | | | 1.15 | % |
Before waivers (a)(f) | | | 1.51 | % | | | 1.58 | % | | | 1.36 | % |
Ratio of net investment income (loss) to average net assets: | | | | | | | | | | | | |
After waivers (a)(f) | | | 2.18 | % | | | 1.92 | % | | | 0.68 | %(l) |
Before waivers (a)(f) | | | 1.73 | % | | | 1.49 | % | | | 0.47 | %(l) |
Portfolio turnover rate (z)^ | | | 117 | % | | | 152 | % | | | 77 | % |
See Notes to Financial Statements.
171
1290 FUNDS
1290 UNCONSTRAINED BOND MANAGERS FUND
FINANCIAL HIGHLIGHTS (Continued)
| | | | | | | | | | | | |
| | | Year Ended October 31, | | | July 6, 2015* to
October 31, 2015 | |
| Class R | | 2017 | | | 2016 | | |
Net asset value, beginning of period | | $ | 9.88 | | | $ | 9.82 | | | $ | 10.00 | |
| | | | | | | | | | | | |
Income (loss) from investment operations: | | | | | | | | | | | | |
Net investment income (loss) (e) | | | 0.17 | | | | 0.14 | | | | — | # |
Net realized and unrealized gain (loss) | | | 0.23 | | | | 0.15 | | | | (0.16 | ) |
| | | | | | | | | | | | |
Total from investment operations | | | 0.40 | | | | 0.29 | | | | (0.16 | ) |
| | | | | | | | | | | | |
Less distributions: | | | | | | | | | | | | |
Dividends from net investment income | | | (0.17 | ) | | | (0.09 | ) | | | (0.02 | ) |
Return of capital | | | — | | | | (0.14 | ) | | | — | |
| | | | | | | | | | | | |
Total dividends and distributions | | | (0.17 | ) | | | (0.23 | ) | | | (0.02 | ) |
| | | | | | | | | | | | |
Net asset value, end of period | | $ | 10.11 | | | $ | 9.88 | | | $ | 9.82 | |
| | | | | | | | | | | | |
Total return (b) | | | 4.04 | % | | | 3.05 | % | | | (1.60 | )% |
| | | | | | | | | | | | |
Ratios/Supplemental Data: | | | | | | | | | | | | |
Net assets, end of period (000’s) | | $ | 101 | | | $ | 99 | | | $ | 98 | |
Ratio of expenses to average net assets: | | | | | | | | | | | | |
After waivers (a)(f) | | | 1.55 | % | | | 1.65 | % | | | 1.65 | % |
Before waivers (a)(f) | | | 2.01 | % | | | 2.08 | % | | | 1.88 | % |
Ratio of net investment income (loss) to average net assets: | | | | | | | | | | | | |
After waivers (a)(f) | | | 1.68 | % | | | 1.42 | % | | | 0.12 | %(l) |
Before waivers (a)(f) | | | 1.23 | % | | | 0.99 | % | | | (0.11 | )%(l) |
Portfolio turnover rate (z)^ | | | 117 | % | | | 152 | % | | | 77 | % |
| * | Commencement of Operations. |
| # | Per share amount is less than $0.005. |
| ^ | Portfolio turnover rate excludes derivatives, if any. |
| (a) | Ratios for periods less than one year are annualized. Certain non-recurring expenses incurred by the Fund are not annualized for periods less than one year. |
| (b) | Total returns for periods less than one year are not annualized. |
| (e) | Net investment income (loss) per share is based on average shares outstanding. |
| (f) | Expenses do not include the expenses of the underlying funds (“indirect expenses”), if applicable. |
| (l) | The annualized ratio of net investment income to average net assets may not be indicative of operating results for a full year. |
| (z) | Portfolio turnover rate for periods less than one year is not annualized. |
See Notes to Financial Statements.
172
1290 FUNDS
NOTES TO FINANCIAL STATEMENTS
October 31, 2017
| Note 1 | Organization and Significant Accounting Policies |
1290 Funds (the “Trust”) was organized as a Delaware statutory trust on March 1, 2013 and is registered under the Investment Company Act of 1940, as amended (the “1940 Act”), as an open-end management investment company with eighteen diversified funds in operation (each, a “Fund” and collectively, the “Funds”). The investment adviser to each Fund is AXA Equitable Funds Management Group, LLC d/b/a 1290 Asset Managers® (“1290 Asset Managers” or “FMG LLC” or the “Adviser”), a wholly-owned subsidiary of AXA Equitable Life Insurance Company (“AXA Equitable”).
The total amount of seed capital at the Funds’ commencement of operations for the periods ended October 31, 2017 and 2016 is listed below:
| | | | | | | | | | |
Funds: | | Commencement
Date | | | Class | | Seed Capital | |
1290 Low Volatility Global Equity | | | 2/27/17 | | | Class I | | $ | 2,500,000 | |
1290 Retirement 2020 | | | 2/27/17 | | | Class I | | | 2,500,000 | |
1290 Retirement 2025 | | | 2/27/17 | | | Class I | | | 2,500,000 | |
1290 Retirement 2030 | | | 2/27/17 | | | Class I | | | 2,500,000 | |
1290 Retirement 2035 | | | 2/27/17 | | | Class I | | | 2,500,000 | |
1290 Retirement 2040 | | | 2/27/17 | | | Class I | | | 2,500,000 | |
1290 Retirement 2045 | | | 2/27/17 | | | Class I | | | 2,500,000 | |
1290 Retirement 2050 | | | 2/27/17 | | | Class I | | | 2,500,000 | |
1290 Retirement 2055 | | | 2/27/17 | | | Class I | | | 2,500,000 | |
1290 Retirement 2060 | | | 2/27/17 | | | Class I | | | 2,500,000 | |
1290 DoubleLine Dynamic Allocation | | | 3/7/16 | | | Class A | | | 100,000 | |
1290 DoubleLine Dynamic Allocation | | | 3/7/16 | | | Class I | | | 49,800,000 | |
1290 DoubleLine Dynamic Allocation | | | 3/7/16 | | | Class R | | | 100,000 | |
1290 Global Talents | | | 4/11/16 | | | Class A | | | 100,000 | |
1290 Global Talents | | | 4/11/16 | | | Class I | | | 19,800,000 | |
1290 Global Talents | | | 4/11/16 | | | Class R | | | 100,000 | |
Under the Trust’s organizational documents, its officers and trustees are indemnified against certain liabilities arising out of the performance of their duties to the Trust. In addition, in the normal course of business, the Trust enters into contracts with vendors and others that provide for general indemnifications. The Trust’s maximum exposure under these arrangements is unknown as this would involve future claims that may be made against the Trust. However, based on experience, the Trust and management expect the risk of loss to be remote.
Each of the investment sub-advisers (each a “Sub-Adviser”) independently chooses and maintains a portfolio of securities for their respective Fund.
The 1290 Retirement 2020 Fund, 1290 Retirement 2025 Fund, 1290 Retirement 2030 Fund, 1290 Retirement 2035 Fund, 1290 Retirement 2040 Fund, 1290 Retirement 2045 Fund, 1290 Retirement 2050 Fund, 1290 Retirement 2055 Fund and the 1290 Retirement 2060 Fund (each, a “1290 Retirement Fund” and together, the “1290 Retirement Funds”) as well as 1290 Multi-Alternative Strategies Fund and 1290 Low Volatility Global Equity Fund are types of mutual funds often described as “fund-of-funds.” These Funds pursue their investment objectives by investing exclusively in other unaffiliated investment companies or exchange-traded funds (“ETFs”).
The Trust has authorized four classes of shares, Class A, Class I, Class R and Class T on behalf of each of the eighteen Funds. Class C shares of each Fund (except 1290 Low Volatility Global Equity Fund and each 1290 Retirement Fund) were redesignated as Class T shares on March 1, 2017. Class T shares currently are not offered for sale. Additionally, 1290 Low Volatility Global Equity Fund and each 1290 Retirement Fund currently only offer Class I shares for sale.
173
1290 FUNDS
NOTES TO FINANCIAL STATEMENTS (Continued)
October 31, 2017
The Class A, Class R and Class T shares are subject to distribution fees imposed under distribution plans (“Distribution Plans”) adopted pursuant to Rule 12b-1 under the 1940 Act. Under the Trust’s multiple-class distribution system, all four classes of shares have identical voting, dividend, liquidation and other rights, other than the payment of distribution fees under the applicable Distribution Plan.
Additionally, Class A shares are sold at a maximum front-end sales charge of up to 4.50% for 1290 Convertible Securities Fund, 1290 High Yield Bond Fund and 1290 Unconstrained Bond Managers Fund, and up to 5.50% for 1290 DoubleLine Dynamic Allocation Fund, 1290 GAMCO Small/Mid Cap Value Fund, 1290 Global Talents Fund, 1290 Low Volatility Global Equity, 1290 Multi-Alternative Strategies Fund, 1290 SmartBeta Equity Fund and each 1290 Retirement Fund. Class A shares sold without a front-end sales charge are subject to a contingent deferred sales charge (“CDSC”) of 1% of the lesser of the original net asset value (“NAV”) of the redeemed shares at the time of purchase or the aggregate NAV of the redeemed shares at the time of redemption, if redeemed within 12 months of purchase. Class T shares are subject to a maximum front-end sales charge of up to 2.50%.
1290 High Yield Bond Fund shares that are held for 30 calendar days or less are subject to a 2.00% redemption fee based on the current NAV on all classes subject to certain exceptions as described in the Fund’s prospectus. No such redemption fees were assessed during the year ended October 31, 2017. At a meeting held September 19-20, 2017, the Board approved that 1290 High Yield Bond Fund will no longer impose a redemption fee to be effective January 1, 2018.
The investment objectives of each Fund are as follows:
1290 Convertible Securities Fund (sub-advised by Palisade Capital Management, L.L.C.) — Seeks a high level of total return.
1290 DoubleLine Dynamic Allocation Fund (sub-advised by DoubleLine Capital LP) — Seeks to achieve total return from long-term capital appreciation and income.
1290 GAMCO Small/Mid Cap Value Fund (sub-advised by GAMCO Asset Management Inc.) — Seeks to maximize capital appreciation.
1290 Global Talents Fund (sub-advised by AXA Investment Managers, Inc. (“AXA IM”), an affiliate of 1290 Asset Managers) — Seeks to provide long-term capital growth.
1290 High Yield Bond Fund (sub-advised by AXA IM) — Seeks to maximize current income.
1290 Low Volatility Global Equity Fund — Seeks long-term capital appreciation while managing portfolio volatility.
1290 Multi-Alternative Strategies Fund — Seeks long-term growth of capital.
1290 Retirement 2020 Fund — Seeks the highest total return (including capital growth and income) over time consistent with its asset mix while managing portfolio volatility.
1290 Retirement 2025 Fund — Seeks the highest total return (including capital growth and income) over time consistent with its asset mix while managing portfolio volatility.
1290 Retirement 2030 Fund — Seeks the highest total return (including capital growth and income) over time consistent with its asset mix while managing portfolio volatility.
1290 Retirement 2035 Fund — Seeks the highest total return (including capital growth and income) over time consistent with its asset mix while managing portfolio volatility.
1290 Retirement 2040 Fund — Seeks the highest total return (including capital growth and income) over time consistent with its asset mix while managing portfolio volatility.
174
1290 FUNDS
NOTES TO FINANCIAL STATEMENTS (Continued)
October 31, 2017
1290 Retirement 2045 Fund — Seeks the highest total return (including capital growth and income) over time consistent with its asset mix while managing portfolio volatility.
1290 Retirement 2050 Fund — Seeks the highest total return (including capital growth and income) over time consistent with its asset mix while managing portfolio volatility.
1290 Retirement 2055 Fund — Seeks the highest total return (including capital growth and income) over time consistent with its asset mix while managing portfolio volatility.
1290 Retirement 2060 Fund — Seeks the highest total return (including capital growth and income) over time consistent with its asset mix while managing portfolio volatility.
1290 SmartBeta Equity Fund (sub-advised by AXA Rosenberg Investment Management LLC, an affiliate of 1290 Asset Managers) — Seeks to achieve long-term capital appreciation.
1290 Unconstrained Bond Managers Fund (sub-advised by Pacific Investment Management Company LLC and TCW Investment Management Company) — Seeks to achieve maximum current income and total return over a full market cycle through opportunistic sector allocation.
The following is a summary of the significant accounting policies of the Trust:
The preparation of financial statements in accordance with United States of America generally accepted accounting principles (“U.S. GAAP”) requires management to make estimates and assumptions that affect the reported amounts and disclosures. Actual results could differ from those estimates. The Funds are investment companies and, accordingly, follow the Investment Company accounting and reporting guidance of the Financial Accounting Standards Board Accounting Standards Codification Topic 946 — Investment Companies, which is part of U.S. GAAP.
In October 2016, the Securities and Exchange Commission (“SEC”) issued a new rule, Investment Company Reporting Modernization, which, among other provisions, amends Regulation S-X to require standardized, enhanced disclosures, particularly related to derivatives, in Investment Company financial statements. Compliance with the guidance became effective for financial statements filed with the SEC on or after August 1, 2017. The Funds’ adoption of this rule, effective with these financial statements prepared as of October 31, 2017, had no effect on the Portfolios’ net assets or results of operations.
In March 2017, the Financial Accounting Standards Board (“FASB”) issued Accounting Standards Update (“ASU”) No. 2017-08, Receivables — Nonrefundable Fees and Other Costs (Subtopic 310-20): Premium Amortization on Purchased Callable Debt Securities. The amendments in the ASU shorten the amortization period for certain callable debt securities, held at a premium, to be amortized to the earliest call date. The ASU does not require an accounting change for securities held at a discount; which continue to be amortized to maturity. The ASU is effective for fiscal years and interim periods within those fiscal years beginning after December 15, 2018. Management is currently evaluating the impact, if any, of applying this provision.
Valuation:
Equity securities (including securities issued by ETFs) listed on national securities exchanges are generally valued at the last sale price or official closing price on the date of valuation or, if there is no sale or official closing price, at the latest available bid price. Securities listed on the NASDAQ stock market will be valued using the NASDAQ Official Closing Price (“NOCP”). Generally, the NOCP will be the last sale price unless the reported trade for the security is outside the range of the bid/ask price. In such cases, the NOCP will be normalized to the nearer of the bid or ask price. Other unlisted stocks are generally valued at their last sale price or official closing price, or if there is no such price, at a bid price estimated by a broker.
175
1290 FUNDS
NOTES TO FINANCIAL STATEMENTS (Continued)
October 31, 2017
Convertible preferred stocks listed on national securities exchanges are generally valued as of their last sale price or, if there is no sale, at the latest available bid price. Convertible bonds and unlisted convertible preferred stocks are generally valued using prices obtained from a pricing service for such investments or, if a pricing service price is not available, at bid prices obtained from one or more of the major dealers in such bonds or stocks. Where there is a discrepancy between dealers, values may be adjusted based on recent premium spreads to the underlying common stocks. Convertible bonds may be matrix-priced based upon the conversion value to the underlying common stocks and market premiums.
Mortgage-backed and asset-backed securities are generally valued at evaluated prices obtained from a pricing service where available, or at a bid price obtained from one or more of the major dealers in such securities. The pricing service may utilize data such as issuer type, coupon, cash flows, collateral performance, mortgage prepayment projection tables and Adjustable Rate Mortgage evaluations that incorporate index data, periodic and life caps, the next coupon reset date and the convertibility of the bond in making evaluations. If a quoted price is unavailable, an equivalent yield or yield spread quotes will be obtained from a broker and converted to a price.
Options that are traded on an exchange are generally valued at their last sale price or official closing price on the date of valuation. Options not traded on an exchange or actively traded are valued according to fair value methods. The market value of a put or call option will usually reflect, among other factors, the market price of the underlying security.
Corporate and Municipal bonds and notes are generally valued on the basis of prices provided by a pricing service. The pricing services may utilize many inputs that are observable in making evaluations which may include, but are not limited to, trading activity for similar securities, issuer details, yields, default rates, credit spreads, quoted prices and any developments related to the specific securities. However, when such prices are not available, such bonds and notes are valued at a bid price estimated by a broker.
U.S. Treasury securities and other obligations issued or guaranteed by the U.S. Government, its agencies or instrumentalities, are generally valued at prices obtained from a bond pricing service where available. The pricing service may utilize data received from active market makers and broker dealers, yield curves and the spread over comparable U.S. Treasury issues in making evaluations.
Foreign securities, including foreign government securities, not traded directly in the U.S., or traded in American Depositary Receipts (“ADR”) or similar form, are generally valued at representative quoted prices from the primary exchange in the currency of the country of origin. Foreign currency is converted into U.S. dollar equivalent at current exchange rates.
Investments in shares of open-end investment companies (other than ETFs) held by a Fund are generally valued at the NAV of the shares of such funds as described in the underlying funds’ prospectuses.
Futures contracts are generally valued at their last settlement price or, if there is no sale, at the latest available bid price.
Centrally cleared swaps are priced using the value determined by the central counterparty (“CCP”) at the end of the day. If the CCP price is unavailable, a price provided by an approved pricing service will be used.
Swaptions are marked-to-market daily based upon values from third party vendors.
Forward foreign currency contracts are generally valued by interpolating between the forward and spot currency rates as quoted by a pricing service as of a designated hour on the valuation date. The pricing service may utilize data such as actual trading information and foreign currency rates gathered from leading market makers and foreign currency trading
176
1290 FUNDS
NOTES TO FINANCIAL STATEMENTS (Continued)
October 31, 2017
centers throughout the world in making evaluations. Forward foreign currency contracts may be settled with the counterparty in U.S. Dollars without the delivery of foreign currency.
During the year ended October 31, 2017, the 1290 Unconstrained Bond Managers Fund held forward foreign currency contracts to either gain exposure to certain currencies, or enter into an economic hedge against changes in the values of securities held in the Fund, that do not qualify for hedge accounting under Accounting Standards Codification (“ASC”) 815. The Statement of Operations for each Fund reflects realized gains or losses, if any, in forward currency transactions and unrealized gains or losses in forward foreign currency transactions. Further information on the impact of these positions on the Funds’ financial statements can be found in the Statement of Operations and Portfolio of Investments for each Fund.
If market quotations are not readily available for a security or other financial instrument, such security and instrument shall be referred to the Trust’s Valuation Committee (“Committee”), which will value the asset in good faith pursuant to procedures (“Pricing Procedures”) adopted by the Board of Trustees of the Trust (the “Board”).
The Board is responsible for ensuring that appropriate valuation methods are used to price securities for the Funds. The Board has delegated the responsibility of calculating the NAVs of the Funds and classes pursuant to these Pricing Procedures to the Trust’s administrator, FMG LLC (in its capacity as administrator, the “Administrator”). The Administrator has entered into a sub-administration agreement with JPMorgan Chase Bank, N.A. (the “Sub-Administrator”) to assist in performing certain of the duties described herein. The Committee, established by the Board, determines the value of the Trust’s securities and assets for which market quotations are not readily available or for which valuation cannot otherwise be provided in accordance with procedures adopted by the Board. The Committee is comprised of senior employees from FMG LLC.
Due to the inherent uncertainty of valuations of such securities, the fair value may differ significantly from the values that would have been used had a ready market for such securities existed.
Various inputs are used in determining the value of the Trust’s assets or liabilities carried at fair value. These inputs are summarized in three broad levels below:
| | • | | Level 1 - quoted prices in active markets for identical assets |
| | • | | Level 2 - other significant observable inputs (including quoted prices of similar securities, interest rates, prepayment speeds, credit risk, etc.) |
| | • | | Level 3 - significant unobservable inputs (including the Fund’s own assumptions in determining the fair value of investments) |
A summary of inputs used to value each Fund’s assets and liabilities carried at fair value as of October 31, 2017, is included in the Portfolios of Investments. Changes in valuation techniques may result in transfers in or out of an investment’s assigned level. The Funds’ policy is to recognize transfers into and transfers out of the valuation levels as of the end of the reporting period.
Transfers between levels are included after the Summary of Level 1, Level 2 and Level 3 inputs, following the Portfolio of Investments for each Fund. Transfers between levels may be due to a decline or an increase in market activity (e.g., frequency of trades), which may result in a lack of, or increase in, available observable market inputs to determine price.
Transfers into and transfers out of Level 3 are included in the Level 3 reconciliation following the Portfolio of Investments for each Fund.
The inputs or methodology used to value securities are not necessarily an indication of the risk associated with investing in those securities. An investment’s level within the fair value hierarchy is based on the lowest level of any input, both individually and in the aggregate, that is significant to the fair value measurement.
177
1290 FUNDS
NOTES TO FINANCIAL STATEMENTS (Continued)
October 31, 2017
The Committee has the ability to meet and review reports based on the valuation techniques used to value Level 3 securities. As part of a review, the Committee would consider obtaining updates from its pricing vendors and Sub-Advisers for fair valued securities. For example, with respect to model driven prices, the Committee could receive reports regarding a review and recalculation of pricing models and related discounts. For those securities which are valued based on broker quotes, the Committee may evaluate variances between existing broker quotes and any alternative broker quotes provided by a Sub-Adviser or other pricing source.
To substantiate unobservable inputs used in a fair valuation, the Secretary of the Committee can perform an independent verification as well as additional research for fair value notifications received from the pricing agents. Among other factors, particular areas of focus may include: description of security, historical pricing, intra-day price movement, last trade information, corporate actions, related securities, any available company news and announcements and any available trade data or other information. The Committee also notes the materiality of holdings and price changes on a Fund’s NAV.
The Committee reviews and considers changes in value for all fair valued securities that have occurred since the last review.
Pursuant to procedures approved by the Board, events or circumstances affecting the values of Fund securities that occur between the closing of their principal markets and the time the NAV is determined may be reflected in the Trust’s calculation of a NAV for each applicable Fund when the Adviser deems that the particular event or circumstance would materially affect such Fund’s NAV. None of the Funds applied these procedures on October 31, 2017.
Security Transactions and Investment Income:
Securities transactions are recorded on the trade date net of brokerage fees, commissions, and transfer fees. Dividend income (net of withholding taxes) and distributions to shareholders are recorded on the ex-dividend date, except that certain dividends from foreign securities, if any, are recognized as soon as the Fund is informed of the ex-dividend date. Interest income (including amortization of premium and accretion of discount on long-term securities using the effective yield method) and interest expense are accrued daily. The Trust records paydown gains and losses realized on prepayments received on mortgage-backed securities as an adjustment to interest income.
The Funds record distributions received in excess of income from underlying investments as a reduction of cost of investments and/or realized gain. Such amounts are based on estimates if actual amounts are not available and actual amounts of income, realized gain and return of capital may differ from the estimated amounts. The Funds adjust the estimated amounts of components of distributions (and consequently its net investment income) as necessary once the issuers provide information about the actual composition of the distributions.
Realized gains and losses on the sale of investments are computed on the basis of the specific identified cost of the investments sold. Unrealized appreciation (depreciation) on investments and foreign currency denominated assets and liabilities, if any, is presented net of deferred taxes on unrealized appreciation in the Statements of Assets and Liabilities.
Allocation of Expenses and Income:
Expenses attributable to a single Fund or class are charged to that Fund or class. Expenses of the Trust not attributable to a single Fund or class are charged to each Fund or class in proportion to the average net assets of each Fund or other appropriate allocation methods.
All income earned and expenses incurred by each Fund are borne on a pro-rata basis by each outstanding class of shares, based on the proportionate interest in the Fund represented by the daily net assets of such class, except for distribution fees which are charged on a class-specific basis.
178
1290 FUNDS
NOTES TO FINANCIAL STATEMENTS (Continued)
October 31, 2017
Offering costs incurred in connection with the offering of shares of a Fund will be amortized and recorded as an expense on a straight line basis over 12 months from the date of the Fund’s commencement of public offering of shares.
Offering costs incurred during the year ended October 31, 2016 by the Funds shown below were:
| | | | |
Funds: | | Offering Costs | |
1290 Global Talents | | $ | 34,321 | |
1290 DoubleLine Dynamic Allocation | | | 66,986 | |
Additionally, offering costs incurred during the year ended October 31, 2017 by the Funds shown below were:
| | | | |
Funds: | | Offering Costs | |
1290 Low Volatility Global Equity | | $ | 8,183 | |
1290 Retirement 2020 | | | 10,271 | |
1290 Retirement 2025 | | | 10,333 | |
1290 Retirement 2030 | | | 10,334 | |
1290 Retirement 2035 | | | 10,355 | |
1290 Retirement 2040 | | | 10,406 | |
1290 Retirement 2045 | | | 10,346 | |
1290 Retirement 2050 | | | 10,333 | |
1290 Retirement 2055 | | | 10,340 | |
1290 Retirement 2060 | | | 10,403 | |
Foreign Currency Valuation:
The books and records of the Trust are kept in U.S. dollars. Foreign currency amounts are translated into U.S. dollars at current exchange rates at the following dates:
(i) market value of investment securities, other assets and liabilities — at the valuation date.
(ii) purchases and sales of investment securities, income and expenses — at the date of such transactions.
The Funds do not isolate that portion of the results of operations resulting from changes in foreign exchange rates on investments from the fluctuations arising from changes in market prices of securities held. Such fluctuations are included with the net realized and unrealized gain or loss on investments.
Reported realized foreign currency gains and losses arise from the disposition of foreign currency, currency gains or losses realized between the trade and settlement dates on securities transactions, and the difference between the amounts of dividends, interest and foreign withholding taxes recorded on each Fund’s books on the transaction date and the U.S. dollar equivalent of the amounts actually received or paid. These reported realized foreign currency gains and losses are included in Net realized gain (loss) on foreign currency transactions on the Statements of Operations. Unrealized foreign currency gains and losses arise from changes (due to changes in exchange rates) in the value of foreign currency and other assets and liabilities denominated in foreign currencies, which are held at period end and are included in Change in net unrealized appreciation/depreciation on foreign currency translations on the Statements of Operations.
Taxes:
Each Fund intends to comply with the requirements of the Internal Revenue Code of 1986, as amended, applicable to regulated investment companies (“RICs”) and to distribute substantially all of its net investment income and net realized capital gains to shareholders. Therefore, no Federal, State and local income tax provision are required.
179
1290 FUNDS
NOTES TO FINANCIAL STATEMENTS (Continued)
October 31, 2017
The Funds are not aware of any tax positions for which it is reasonably possible that the total amounts of unrecognized tax benefits will significantly change in the next twelve months. However, the Funds’ conclusions may be subject to future review based on changes in, or the interpretation of, the accounting standards or tax laws and regulations. The Funds recognize interest and penalties, if any, related to uncertain tax positions as income tax expense in the Statements of Operations. During the year ended October 31, 2017, the Funds did not incur any interest or penalties. Each of the tax years in the three year period ended October 31, 2017 remains subject to examination by the Internal Revenue Service, state and local taxing authorities.
Dividends from net investment income, if any, are declared and distributed at least annually for all Funds (1290 Convertible Securities Fund, 1290 High Yield Bond Fund and 1290 Unconstrained Bond Managers Fund declare and distribute monthly). Dividends to shareholders of the Fund to which such gains are attributable from net realized short-term and long-term capital gains are declared and distributed at least annually. All distributions are calculated on a tax basis and, as such, the amounts may differ from financial statement investment income and realized gains. Short-term capital gains and foreign currency gains are treated as capital gains for U.S. GAAP purposes but are considered ordinary income for tax purposes. Capital and net specified losses incurred after October 31st and within the taxable year are deemed to arise on the first business day of a Fund’s next taxable year. The tax character of distributions for the years ended October 31, 2017 and October 31, 2016 and the tax composition of undistributed ordinary income and undistributed long term gains at October 31, 2017 are presented in the following table. For the Funds, the cumulative timing differences related to the tax composition of undistributed ordinary income and long term gains are primarily due to capital loss carryforwards (1290 High Yield Bond and 1290 Unconstrained Bond Managers).
| | | | | | | | | | | | | | | | | | | | | | | | |
| | | Year Ended October 31, 2017 | | | As of October 31, 2017 | | | Year Ended October 31, 2016 | |
Funds: | | Distributed
Ordinary
Income | | | Distributed
Long Term
Gains | | | Accumulated
Undistributed
Ordinary
Income | | | Accumulated
Undistributed
Long Term
Gains | | | Distributed
Ordinary
Income | | | Distributed
Long Term
Gains | |
1290 Convertible Securities | | $ | 551,719 | | | $ | — | | | $ | 273,831 | | | $ | 232,318 | | | $ | 423,202 | | | $ | — | |
1290 DoubleLine Dynamic Allocation | | | 1,429,740 | | | | 1,542 | | | | 1,404,530 | | | | 2,763,921 | | | | — | | | | — | |
1290 GAMCO Small/Mid Cap Value | | | 85,954 | | | | 59,267 | | | | 336,941 | | | | 240,698 | | | | 125,312 | | | | 448 | |
1290 Global Talents | | | 91,424 | | | | — | | | | 29,669 | | | | — | | | | — | | | | — | |
1290 High Yield Bond | | | 1,657,498 | | | | — | | | | — | | | | — | | | | 2,047,010 | | | | — | |
1290 Low Volatility Global Equity | | | — | | | | — | | | | 31,156 | | | | — | | | | — | | | | — | |
1290 Multi-Alternative Strategies | | | 77,890 | | | | 6,435 | | | | — | | | | 66,693 | | | | 57,243 | | | | — | |
1290 Retirement 2020 | | | — | | | | — | | | | 32,956 | | | | 2 | | | | — | | | | — | |
1290 Retirement 2025 | | | — | | | | — | | | | 32,196 | | | | — | | | | — | | | | — | |
1290 Retirement 2030 | | | — | | | | — | | | | 29,601 | | | | — | | | | — | | | | — | |
1290 Retirement 2035 | | | — | | | | — | | | | 29,384 | | | | — | | | | — | | | | — | |
1290 Retirement 2040 | | | — | | | | — | | | | 29,184 | | | | — | | | | — | | | | — | |
1290 Retirement 2045 | | | — | | | | — | | | | 29,005 | | | | — | | | | — | | | | — | |
1290 Retirement 2050 | | | — | | | | — | | | | 28,805 | | | | — | | | | — | | | | — | |
1290 Retirement 2055 | | | — | | | | — | | | | 28,620 | | | | — | | | | — | | | | — | |
1290 Retirement 2060 | | | — | | | | — | | | | 28,579 | | | | — | | | | — | | | | — | |
1290 SmartBeta Equity | | | 151,006 | | | | — | | | | 257,775 | | | | 159,306 | | | | 153,198 | | | | — | |
1290 Unconstrained Bond Managers | | | 1,465,166 | | | | — | | | | 1,281,866 | | | | — | | | | 776,549 | | | | — | |
180
1290 FUNDS
NOTES TO FINANCIAL STATEMENTS (Continued)
October 31, 2017
The following Funds had a Return of Capital during the year ended October 31, 2017:
| | | | |
Funds: | | Return of Capital | |
1290 High Yield Bond | | $ | 17,878 | |
Additionally, the following Funds had a Return of Capital during the year ended October 31, 2016:
| | | | |
Funds: | | Return of Capital | |
1290 High Yield Bond | | $ | 17,144 | |
1290 Multi-Alternative Strategies | | | 28,089 | |
1290 Unconstrained Bond Managers | | | 1,185,296 | |
Permanent book and tax differences relating to shareholder distributions resulted in reclassifications to undistributed (overdistributed) net investment income (loss), accumulated net realized gain (loss) and paid-in-capital at October 31, 2017 as follows:
| | | | | | | | | | | | |
Funds: | | Undistributed
Net Investment
Income (Loss) | | | Accumulated
Net Realized
Gain (Loss) | | | Paid In
Capital | |
1290 Convertible Securities | | $ | 251,121 | | | $ | (251,121 | ) | | $ | — | |
1290 DoubleLine Dynamic Allocation | | | 103,316 | | | | (80,008 | ) | | | (23,308 | ) |
1290 GAMCO Small/Mid Cap Value | | | (2,523 | ) | | | 2,523 | | | | — | |
1290 Global Talents | | | 11,243 | | | | 3,990 | | | | (15,233 | ) |
1290 High Yield Bond | | | 181 | | | | (181 | ) | | | — | |
1290 Low Volatility Global Equity | | | 183 | | | | — | | | | (183 | ) |
1290 Multi-Alternative Strategies | | | (25,009 | ) | | | 25,009 | | | | — | |
1290 Retirement 2020 | | | 226 | | | | — | | | | (226 | ) |
1290 Retirement 2025 | | | 231 | | | | — | | | | (231 | ) |
1290 Retirement 2030 | | | 232 | | | | — | | | | (232 | ) |
1290 Retirement 2035 | | | 227 | | | | — | | | | (227 | ) |
1290 Retirement 2040 | | | 222 | | | | — | | | | (222 | ) |
1290 Retirement 2045 | | | 223 | | | | — | | | | (223 | ) |
1290 Retirement 2050 | | | 220 | | | | — | | | | (220 | ) |
1290 Retirement 2055 | | | 216 | | | | — | | | | (216 | ) |
1290 Retirement 2060 | | | 212 | | | | — | | | | (212 | ) |
1290 SmartBeta Equity | | | 267 | | | | (267 | ) | | | — | |
1290 Unconstrained Bond Managers | | | 1,227,110 | | | | (1,220,282 | ) | | | (6,828 | ) |
The significant permanent book and tax differences related to the adjustments above are convertible preferred debt instrument interest accrual adjustments (1290 Convertible Securities), reclassification of foreign currency gains and losses (1290 Unconstrained Bond Managers) and reclassification of swap income (1290 Unconstrained Bond Managers).
Under the Regulated Investment Company Modernization Act of 2010 (the “RIC Mod Act”), net capital losses recognized by the Funds may get carried forward indefinitely, and retain their character as short-term and/or long-term losses. The following Funds have losses incurred that will be carried forward under the provisions of the RIC Mod Act as follows:
| | | | | | | | | | | | | | | | |
| | | Utilized | | | Losses Carried Forward | |
Funds: | | Short Term | | | Long Term | | | Short Term | | | Long Term | |
1290 Convertible Securities | | $ | 359,661 | | | $ | — | | | $ | — | | | $ | — | |
1290 Global Talents | | | — | | | | — | | | | 75,121 | | | | — | |
181
1290 FUNDS
NOTES TO FINANCIAL STATEMENTS (Continued)
October 31, 2017
| | | | | | | | | | | | | | | | |
| | | Utilized | | | Losses Carried Forward | |
Funds: | | Short Term | | | Long Term | | | Short Term | | | Long Term | |
1290 High Yield Bond | | $ | 21,298 | | | $ | — | | | $ | 712,913 | | | $ | 1,499,001 | |
1290 Multi-Alternative Strategies | | | 73,941 | | | | 72,576 | | | | — | | | | — | |
1290 SmartBeta Equity | | | 64,666 | | | | 34,390 | | | | — | | | | — | |
1290 Unconstrained Bond Managers | | | — | | | | — | | | | 487,903 | | | | 121,136 | |
Sale-Buybacks:
The Funds may enter into financing transactions referred to as “sale-buybacks”. A sale-buyback transaction consists of a sale of a security by a Fund to a financial institution, the counterparty, with a simultaneous agreement to repurchase the same or substantially the same security at an agreed-upon price and date. The Fund is not entitled to receive principal and interest payments, if any, made on the security sold to the counterparty during the term of the agreement. The agreed-upon proceeds for securities to be repurchased by the Fund are reflected as a liability on the Fund’s Statement of Assets and Liabilities. The Fund will recognize net income represented by the price differential between the price received for the transferred security and the agreed-upon repurchase price. This is commonly referred to as the “price drop.” A price drop consists of: (i) the foregone interest and inflationary income adjustments, if any, the Fund would have otherwise received had the security not been sold; and (ii) the negotiated financing terms between the Fund and counterparty. Foregone interest and inflationary income adjustments, if any, are recorded as components of interest income on the Fund’s Statement of Operations. Interest payments based upon negotiated financing terms made by the Fund to counterparties are recorded as a component of interest expense on the Fund’s Statement of Operations. In periods of increased demand for the security, the Fund may receive a fee for use of the security by the counterparty, which may result in interest income to the Fund. The Fund will segregate assets determined to be liquid to cover its obligations under sale-buyback transactions. In the event the net exposure for sale-buybacks and certain derivatives trades exceeds $250,000 (on a per counterparty basis) the Fund will post additional collateral. None of the Funds had open sale-buybacks at October 31, 2017.
Accounting for Derivative Instruments:
Following is a description of how and why the Funds use derivative instruments, the type of derivatives utilized by the Funds during the reporting period, as well as the primary underlying risk exposures related to each instrument type. Derivatives accounted for as hedging instruments must be disclosed separately from those that do not qualify for hedge accounting. Even though the Funds may use derivatives in an attempt to achieve an economic hedge, the Fund’s derivatives are not accounted for as hedging instruments because the Funds account for their derivatives at fair value and record any changes in fair value in current period earnings in the Statements of Operations. All open derivative positions at period end are reflected on each respective Fund’s Portfolio of Investments. The volume of derivative activity, based on month-end notional amounts during the period is also noted in each respective Fund’s Portfolio of Investments. Portfolio securities are reserved and/or pledged with the custodian for current or potential derivative holdings as necessary throughout the year.
Options:
Certain Funds may write (sell) covered options as a hedge to provide protection against adverse movements in the price of securities in the Fund or to enhance investment performance. Certain Funds purchase and sell exchange traded options on foreign currencies. When a Fund writes an option, an amount equal to the premium received by the Fund is recorded as a liability and is subsequently adjusted on a daily basis to the current market price of the option written. Premiums received from writing options that expire unexercised are recognized as gains on the expiration date. Premiums received from writing options that are exercised or are cancelled in
182
1290 FUNDS
NOTES TO FINANCIAL STATEMENTS (Continued)
October 31, 2017
closing purchase transactions are offset against the cost of any securities purchased or added to the proceeds or netted against the amount paid on the transaction to determine the realized gain or loss. In writing options, a Fund must assume that the option may be exercised at any time prior to the expiration of its obligation as a writer, and that in such circumstances the net proceeds of the sale (or cost of purchase) of the underlying securities and currencies pursuant to the call or put option may be substantially below or above the prevailing market price. A Fund also has the additional risk of not being able to enter into a closing purchase transaction if a liquid secondary market does not exist and bears the risk of unfavorable changes in the price of the financial instruments underlying the options.
Certain Funds may purchase put options on securities to increase the Fund’s total investment return or to protect its holdings against a substantial decline in market value. The purchase of put options on securities will enable a Fund to preserve, at least partially, unrealized gains in an appreciated security in its Fund without actually selling the security. In addition, the Funds will continue to receive interest or dividend income on the security. The Funds may also purchase call options on securities to protect against substantial increases in prices of securities that Funds intend to purchase pending their ability to invest in an orderly manner in those securities. The Funds may sell put or call options they have previously purchased, which could result in a net gain or loss depending on whether the amount received on the sale is more or less than the premium and other transaction costs paid on the put or call option which was bought.
Futures Contracts, Options on Futures Contracts, Forward Commitments and Foreign Currency Contracts:
The futures contracts used by the Funds are agreements to buy or sell a financial instrument for a set price in the future. Options on futures contracts used by the Funds are rights to buy, or sell a futures contract for a set price in the future. Certain Funds buy or sell futures contracts for the purpose of protecting their Fund securities against future changes in interest rates and indices which might adversely affect the value of the Funds’ securities or the price of securities that they intend to purchase at a later date. Initial margin deposits are made upon entering into futures contracts and can be in cash, certain money market instruments, treasury securities or other liquid, high grade debt securities. During the period the futures contracts are open, changes in the market price of the contracts are recognized as unrealized gains or losses by “marking-to-market” at the end of each trading day. Variation margin payments on futures contracts are received or made, depending upon whether unrealized gains or losses are incurred. When the contract is closed, the Fund records a realized gain or loss equal to the difference between the proceeds from or cost of the closing transactions and the Fund’s basis in the contract. Should interest rates or indices move unexpectedly, the Fund may not achieve the anticipated benefits of the futures contracts and may incur a loss. The use of futures contracts transactions involves the risk of imperfect correlation in movements in the price of futures contracts, interest rates and the underlying hedged assets. Use of long futures contracts subjects the Funds to risk of loss in excess of the amounts shown on the Statements of Assets and Liabilities, up to the notional value of the futures contracts. Use of short futures contracts subjects the Funds to unlimited risk of loss. The Funds enter into futures contracts only on exchanges or boards of trade. The exchange or board of trade acts as the counterparty to each futures transaction; therefore, a Fund’s credit risk is limited to failure of the exchange or board of trade.
A Fund may make contracts to purchase or sell securities for a fixed price at a future date beyond customary settlement time (“forward commitments”). Funds may designate the segregation, either on their records or with the Trust’s custodian, of cash or other liquid securities in an amount sufficient to meet the purchase price, or may enter into offsetting contracts for the forward sale of other securities they own. These commitments are reported at market value in the financial statements. Forward commitments may be considered securities in
183
1290 FUNDS
NOTES TO FINANCIAL STATEMENTS (Continued)
October 31, 2017
themselves and involve a risk of loss if the value of the security to be purchased declines or if the value of the security to be sold increases prior to the settlement date, which is a risk in addition to the risk of decline in value of the Fund’s other assets. Where such purchases or sales are made through dealers, a Fund relies on the dealer to consummate the sale. The dealer’s failure to do so may result in the loss to a Fund of an advantageous yield or price. Market risk exists on these commitments to the same extent as if the securities were owned on a settled basis and gains and losses are recorded and reported in the same manner. However, during the commitment period, these investments earn no interest or dividends. The use of forward commitments may result in market risk to the Funds that is greater than if the Funds had engaged solely in transactions that settle in the customary time.
The Funds may be exposed to foreign currency risks associated with Fund investments. During the reporting period, the Funds entered into certain forward foreign currency contracts for the purchase or sale of a specific foreign currency at a fixed price on a future date to hedge or otherwise manage these exposures. Unrealized gains or losses on forward foreign currency contracts are recorded by the Funds on a daily basis and realized gains or losses are recorded on the settlement date of a contract.
A Fund may purchase foreign currency on a spot (or cash) basis. In addition, a Fund may enter into contracts to purchase or sell foreign currencies at a future date (“forward contracts”). A forward foreign currency contract is a commitment to purchase or sell a foreign currency at a future date at a negotiated forward rate. Daily fluctuations in the value of such contracts are recognized as unrealized appreciation or depreciation by “marking-to-market”. The gain or loss arising from the difference between the original contracts and the closing of such contracts is included in realized gains or losses from foreign currency transactions in the Statements of Operations of the Funds. The Sub-Advisers may engage in these forward contracts to protect against uncertainty in the level of future exchange rates in connection with the purchase and sale of Fund securities (“transaction hedging”) and to protect the value of specific Fund positions (“position hedging”). The Funds also buy forward foreign currency contracts to gain exposure to currencies. The Funds are subject to off-balance sheet risk to the extent of the value of the contracts for purchase of foreign currency and in an unlimited amount for sales of foreign currency.
Swaps:
Swap agreements are two party contracts entered into primarily by institutional investors for periods ranging from a few weeks to more than one year. Swaps are marked-to-market daily based upon values from third party vendors, which may include a clearing counterparty, registered exchange, or quotations from market makers to the extent available. In the event that market quotes are not readily available and the swap cannot be valued pursuant to one of the valuation methods, the value of the swap will be determined in good faith by the Committee. Changes in market value, if any, are reflected as a component of net changes in unrealized appreciation (depreciation) on the Statements of Operations. Daily changes in valuation of centrally cleared swaps, if any, are recorded as a receivable or payable for the change in value as appropriate (“variation margin”) on the Statements of Assets and Liabilities. There is potential for swaps to be illiquid. Over-the-counter (“OTC”) swap payments received or made at the beginning of the measurement period are reflected as such on the Statements of Assets and Liabilities and represent premiums paid or received upon entering into the swap agreement to compensate for differences between the stated terms of the swap agreement and prevailing market conditions (credit spreads, currency exchange rates, interest rates, and other relevant factors). These upfront premiums are recorded as realized gains or losses on the Statement of Operations upon termination or maturity of the swap. A liquidation payment received or made at the termination of the swap is recorded as realized gain or loss on the Statement of Operations. Net periodic payments received or paid by a Fund are included as part of realized gains or losses on the Statement of Operations.
184
1290 FUNDS
NOTES TO FINANCIAL STATEMENTS (Continued)
October 31, 2017
Currency swaps involve the exchange by one party with another party of a series of payments in specified currencies. Currency swaps usually involve the delivery of the entire principal value of one designated currency in exchange for the other designated currency. Therefore, the entire principal value of a currency swap is subject to the risk that the other party to the swap will default on its contractual delivery obligations. In addition, a Fund may enter into currency swaps that involve an agreement to pay interest streams in one currency based on a specified index in exchange for receiving interest streams denominated in another currency. Currency swaps may involve initial and final exchanges that correspond to the agreed upon notional amount.
Interest rate swaps involve the exchange between two parties of payments calculated by reference to specified interest rates (e.g., an exchange of floating rate payments for fixed rate payments). The purchase of an interest rate cap entitles the purchaser, to the extent that a specified index exceeds a predetermined interest rate, to receive payments of interest on a notional principal amount from the party selling such interest rate cap. The purchase of an interest rate floor entitles the purchaser, to the extent that a specified index falls below a predetermined interest rate, to receive payments of interest on a notional principal amount from the party selling such interest rate floor. Caps and floors may be less liquid than swaps. In addition, the value of interest rate transactions will fluctuate based on changes in interest rates.
Credit default swap agreements involve greater risks than if a Fund had invested in the reference obligation directly since, in addition to general market risks, credit default swaps are subject to illiquidity risk, counterparty risk and credit risk. A Fund will enter into credit default swap agreements only with counterparties that meet certain standards of creditworthiness. A buyer generally also will lose its investment and recover nothing should no credit event occur and the swap is held to its termination date. If a credit event were to occur, the value of any deliverable obligation received by the seller, coupled with the upfront or periodic payments previously received, may be less than the full notional value it pays to the buyer, resulting in a loss of value to the seller. A Fund’s obligations under a credit default swap agreement will be accrued daily (offset against any amounts owing to the Fund). In connection with credit default swaps in which a Fund is the buyer, the Fund will segregate or “earmark” cash or assets determined to be liquid, or enter into certain offsetting positions, with a value at least equal to the Fund’s exposure (any accrued but unpaid net amounts owed by the Fund to any counterparty), on a marked-to-market basis. In connection with credit default swaps in which a Fund is the seller, the Fund will segregate or “earmark” cash or assets determined to be liquid, or enter into offsetting positions, with a value at least equal to the full notional amount of the swap (minus any amounts owed to the Fund). Such segregation or “earmarking” is intended to ensure that the Fund has assets available to satisfy its obligations with respect to the transaction and limit any potential leveraging of the Fund. Such segregation or “earmarking” will not limit the Fund’s exposure to loss. To the extent that credit default swaps are entered into for hedging purposes or are covered as described above, the Adviser believes such obligations do not constitute “senior securities” under the 1940 Act and, accordingly, will not treat them as being subject to the Fund’s senior security and borrowing restrictions.
In the case of a credit default swap sold by a Fund (i.e., where the Fund is selling credit default protection), the Fund may value the credit default swap at its notional amount in applying certain of the Fund’s investment policies and restrictions, but may value the credit default swap at market value for purposes of applying certain of the Fund’s other investment policies and restrictions.
An option on a swap agreement, also called a “swaption,” is an option that gives the buyer the right, but not the obligation, to enter into a swap on a future date in exchange for paying a market-based “premium.” A receiver swaption gives the owner the right to receive the total return of a specified asset, reference rate, or index. A payer swaption gives the owner the right to pay the total return of a specified asset, reference rate, or index. A purchaser of a swaption
185
1290 FUNDS
NOTES TO FINANCIAL STATEMENTS (Continued)
October 31, 2017
risks losing only the amount of the premium they have paid should they decide to let the option expire, whereas the seller of a swaption is subject to the risk that they will become obligated if the option is exercised. Swaptions also include options that allow an existing swap to be terminated or extended by one of the counterparties.
Collateral:
Collateral on OTC derivatives and centrally cleared derivatives may be in the form of cash or debt securities issued by the U.S. government or related agencies. Cash posted by a Fund is reflected as cash held as collateral at the broker in the accompanying financial statements and generally is restricted from withdrawal by the Fund; securities posted by a Fund are so noted in the accompanying Portfolio of Investments; both remain in the Fund’s assets. Collateral pledged by counterparties is not included in the Fund’s assets because the Fund does not obtain effective control over those assets. For OTC derivatives, collateral posted or received by the Fund is held in a segregated account at the respective counterparty or Fund’s custodian. As of October 31, 2017, collateral pledged by counterparties to 1290 DoubleLine Dynamic Allocation for OTC derivatives consisted of $606,753 in the form of a U.S. Treasury Bill.
Market and Credit Risk:
A Fund’s investments in financial instruments expose the Fund to various risks such as, but not limited to, interest rate, foreign currency, forward commitments and equity risks.
Interest rate risk is the risk that fixed income securities will decline in value because of changes in interest rates. When nominal interest rates decline, the value of certain fixed-income securities held by a Fund generally rises. Conversely, when nominal interest rates rise, the value of certain fixed income securities held by a Fund generally decreases. A nominal interest rate can be described as the sum of a real interest rate and an expected inflation rate. Interest rate changes can be sudden and unpredictable, and a Fund may lose money if these changes are not anticipated by Fund management. A Fund may not be able to hedge against changes in interest rates or may choose not to do so for cost or other reasons. In addition, any hedges may not work as intended. Fixed income securities with longer durations tend to be more sensitive to changes in interest rates, usually making them more volatile than securities with shorter durations. Duration is useful primarily as a measure of the sensitivity of a security’s market price to interest rate (i.e. yield) movements. As of October 31, 2017, interest rates are near historic lows in the United States, and below zero in other parts of the world, including certain European countries and Japan. A Fund is subject to greater risk of rising interest rates due to these market conditions. A significant or rapid rise in interest rates could result in losses to the Fund.
Foreign (non-U.S.) securities in this report are classified by the country of risk of a holding.
If a Fund invests directly in foreign currencies or in securities that trade in, and receive revenues in, foreign currencies, or in financial derivatives that provide exposure to foreign currencies, it will be subject to the risk that those currencies will decline in value relative to the base currency of the Fund, or, in the case of hedging positions, that the Fund’s base currency will decline in value relative to the currency being hedged. Currency rates in foreign countries may fluctuate significantly over short periods of time for a number of reasons, including changes in interest rates, intervention (or the failure to intervene) by U.S. or foreign governments, central banks or supranational entities such as the International Monetary Fund, or by the imposition of currency controls or other political developments in the United States or abroad. As a result, a Fund’s investments in foreign currency denominated securities may reduce the Fund’s returns.
Forward commitments and forward foreign currency contracts involve elements of both market and credit risk in excess of the amounts reflected in the Statements of Assets and Liabilities. They are executed directly with the counterparty and not through an exchange and can be terminated only by agreement of both parties to such contracts. With respect to such
186
1290 FUNDS
NOTES TO FINANCIAL STATEMENTS (Continued)
October 31, 2017
transactions there is no daily margin settlement. There is also the risk that the security will not be issued or that the other party to the transaction will not meet its obligations. If this occurs, the Fund may lose both the investment opportunity for its assets if set aside to pay for the security and any gain in the security.
The market values of the Fund’s investments may decline due to general market conditions which are not specifically related to a particular company or issuer, such as real or perceived adverse economic conditions, changes in the general outlook for corporate earnings, changes in interest or currency rates or adverse investor sentiment generally. They may also decline due to factors which affect a particular industry or industries, such as labor shortages or increased production costs and competitive conditions within an industry. Equity securities and equity related investments generally have greater market price volatility than fixed income securities, although under certain market conditions fixed income securities may have comparable or greater price volatility. Credit ratings downgrades may also negatively affect securities held by a Fund. Even when markets perform well, there is no assurance that the investments held by a Fund will increase in value along with the broader market. In addition, market risk includes the risk that geopolitical events will disrupt the economy on a national or global level.
A Fund will be exposed to credit risk to parties with whom it trades and will also bear the risk of settlement default. A Fund seeks to minimize concentrations of credit risk by undertaking transactions with a large number of counterparties on recognized and reputable exchanges, where applicable. A Fund could lose money if the issuer or guarantor of a fixed income security, or the counterparty of a financial derivatives contract, repurchase agreement or a loan of portfolio securities or other transactions, is unable or unwilling, or is perceived (whether by market participants, rating agencies, pricing services or otherwise) as unable or unwilling to make timely principal and/or interest payments, or otherwise honor its obligations. Securities are subject to varying degrees of credit risk, which are often reflected in credit ratings.
Certain Funds may invest in below investment grade high-yield securities (commonly known as “junk bonds”). These securities are considered to be high risk investments. Securities rated below investment grade are speculative in nature, involve greater risk of default by the issuing entity and may be subject to greater market fluctuations than higher rated fixed income securities because such securities are generally unsecured and subordinated to other creditors’ claims. The retail secondary market for these “junk bonds” may be less liquid than that of higher rated securities and adverse economic conditions could make it difficult to sell certain securities or could result in lower prices than those used in calculating the Fund’s NAV.
Because certain Funds invest in affiliated mutual funds, unaffiliated investment companies or ETFs, the Funds indirectly pay a portion of the expenses incurred by the underlying funds and ETFs. As a result, the cost of investing in the Funds may be higher than the cost of investing in a Fund that invests directly in individual securities and financial instruments. The Funds are also subject to certain risks related to the underlying funds’ and ETFs’ investments in securities and financial instruments such as fixed income securities, including high yield, asset-backed and mortgage-related securities; equity securities, foreign and emerging markets securities, commodities and real estate securities. These securities are subject to risks specific to their structure, sector with their individual investment strategies including futures, forward currency contracts, options, swaps, and other derivatives, which are also subject to specific risks related to their structure, sector or market and may be riskier than investments in other types of securities.
Offsetting Assets and Liabilities:
The Funds may be subject to various netting arrangements with select counterparties (“Master Agreements”). Master Agreements govern the terms of certain transactions, and are intended to reduce the counterparty risk associated with relevant transactions by specifying credit protection mechanisms and providing standardization that is intended to improve legal certainty. As the Master Agreements are specific to unique operations of different asset types,
187
1290 FUNDS
NOTES TO FINANCIAL STATEMENTS (Continued)
October 31, 2017
they allow a Fund to close out and net its total exposure to a counterparty in the event of a default with respect to all the transactions governed under a single Master Agreement with a counterparty. For financial reporting purposes the Statement of Assets and Liabilities generally show derivative assets and liabilities on a gross basis, which reflects the full risks and exposures prior to netting.
The Trust, on behalf of each Fund, has entered into an Investment Advisory Agreement (the “Advisory Agreement”) with the Adviser. Pursuant to the Advisory Agreement, the Adviser supervises the investment program for each Fund in accordance with each Fund’s investment objectives, policies and restrictions. The Adviser is paid a fee for these services. The fee is accrued daily and paid monthly based on the Fund’s average daily net assets, at an annual rate of:
| | |
Funds: | | Management Fees |
1290 Retirement 2020 | | 0.500% of average daily net assets |
1290 Retirement 2025 | | 0.500% of average daily net assets |
1290 Retirement 2030 | | 0.500% of average daily net assets |
1290 Retirement 2035 | | 0.500% of average daily net assets |
1290 Retirement 2040 | | 0.500% of average daily net assets |
1290 Retirement 2045 | | 0.500% of average daily net assets |
1290 Retirement 2050 | | 0.500% of average daily net assets |
1290 Retirement 2055 | | 0.500% of average daily net assets |
1290 Retirement 2060 | | 0.500% of average daily net assets |
| | | | | | | | | | | | | | | | | | | | |
| | | (as a percentage of average daily net assets) | |
Funds: | | First
$1 Billion | | | Next
$1 Billion | | | Next
$3 Billion | | | Next
$5 Billion | | | Thereafter | |
1290 DoubleLine Dynamic Allocation | | | 0.750 | % | | | 0.700 | % | | | 0.675 | % | | | 0.650 | % | | | 0.625 | % |
1290 GAMCO Small/Mid Cap Value | | | 0.750 | | | | 0.700 | | | | 0.675 | | | | 0.650 | | | | 0.625 | |
1290 Global Talents | | | 0.800 | | | | 0.750 | | | | 0.725 | | | | 0.700 | | | | 0.675 | |
1290 SmartBeta Equity | | | 0.700 | | | | 0.650 | | | | 0.625 | | | | 0.600 | | | | 0.575 | |
| | | | | | | | | | | | | | | | |
| | | (as a percentage of average daily net assets) | |
Funds: | | First
$4 Billion | | | Next
$4 Billion | | | Next
$2 Billion | | | Thereafter | |
1290 Multi-Alternative Strategies | | | 0.500 | % | | | 0.490 | % | | | 0.480 | % | | | 0.470 | % |
1290 Low Volatility Global Equity | | | 0.500 | | | | 0.490 | | | | 0.480 | | | | 0.470 | |
| | | | | | | | | | | | |
| | | (as a percentage of average daily net assets) | |
Funds: | | First
$4 Billion | | | Next
$4 Billion | | | Thereafter | |
1290 Convertible Securities | | | 0.700 | % | | | 0.680 | % | | | 0.660 | % |
1290 High Yield Bond | | | 0.600 | | | | 0.580 | | | | 0.560 | |
1290 Unconstrained Bond Managers | | | 0.800 | | | | 0.780 | | | | 0.760 | |
On behalf of the Trust, the Adviser has entered into an investment sub-advisory agreement (“Sub-Advisory Agreements”) with each of the Sub-Advisers. Each of the Sub-Advisory Agreements obligates the Sub-Advisers for the respective Funds to: (i) continuously furnish investment programs for the Funds; (ii) place all orders for the purchase and sale of investments for the Funds with brokers or dealers selected by the Adviser or the respective Sub-Advisers; and (iii) perform certain limited related administrative functions in connection therewith. The Adviser pays the expenses of providing investment sub-advisory services to the Funds, including the fees of the Sub-Advisers of each Fund.
188
1290 FUNDS
NOTES TO FINANCIAL STATEMENTS (Continued)
October 31, 2017
In addition to the advisory fee, each Fund pays the Administrator its proportionate share of an asset-based administration fee, which is equal to an annual rate of the greater of 0.15% of each Fund’s average daily net assets, or $30,000 per Fund (or $30,000 for each allocated portion (or sleeve) of a Fund, as applicable). The Administrator has contracted with the Sub-Administrator to provide, pursuant to a sub-administration agreement, the Funds with certain administrative services, including monitoring of Fund compliance and Fund accounting services.
The Trust, on behalf of the Funds, has entered into a distribution agreement (the “Distribution Agreement”) with ALPS Distributors, Inc. (“ALPS” or the “Distributor”), under which ALPS serves as Distributor for each Fund’s Class A, Class I, Class R and Class T shares. The Board has approved Distribution Plans pursuant to Rule 12b-1 under the 1940 Act for Class A, Class R and Class T shares for each Fund. Pursuant to the Distribution Plans, the Funds will pay the Distributor annual fees at the following rates:
| | |
Share Class: | | Distribution Fee and/or Service Fee (as a % of average daily net assets attributable to the class) |
Class A | | 0.25% |
Class R | | 0.50 |
Class T* | | 0.25 |
| * | The Distribution Fees for Class T shares are currently being waived. This waiver is voluntary and could be eliminated at any time. Prior to March 1, 2017, the rate for Class T shares (when they were known as Class C shares) was 1.00%. |
The Trust, on behalf of the Funds, has entered into a Transfer Agency and Service Agreement (the “Transfer Agency Agreement”) with Boston Financial Data Services (“BFDS”). Pursuant to the Transfer Agency Agreement, BFDS is responsible for, among other things, the issuance, transfer and redemption of shares, the opening and maintenance of shareholder accounts, the handling of certain communications between shareholders and the Trust, and the payment of dividends and distributions payable by the Funds. Under the Transfer Agency Agreement, BFDS receives a monthly fee comprised of a fixed base fee plus a fee computed on the basis of the number of shareholder accounts it maintains for the Trust during the month.
The Trust has entered into a Custody Agreement with JPMorgan Chase Bank, N.A. (in this capacity, the “Custodian”). The Custody Agreement provides for an annual fee based on the amount of assets under custody plus transaction charges. The Custodian serves as custodian of the Trust’s Fund securities and other assets. Under the terms of the Custody Agreement between the Trust and the Custodian, the Custodian maintains and deposits in each Fund’s account, cash, securities and other assets of the Funds. The Custodian is also required, upon the order of the Trust, to deliver securities held by the Custodian, and to make payments for securities purchased by the Trust. The Custodian has also entered into sub-custodian agreements with a number of foreign banks and clearing agencies, pursuant to which Fund securities purchased outside the United States are maintained in the custody of these entities. At year end, certain of the Funds maintained a significant cash balance with the Custodian or its affiliates. These balances are presented as cash on each Fund’s Statement of Assets and Liabilities.
The Trust, on behalf of the Funds, has entered into an expense limitation agreement (the “Expense Limitation Agreement”) with 1290 Asset Managers whereby 1290 Asset Managers has contractually agreed to waive fees and/or reduce its fees to the extent that the aggregate expenses incurred by a Fund in any fiscal year, including but not limited to offering costs and investment advisory fees of the Adviser (but excluding interest, taxes, brokerage commissions, fees and expenses of other investment companies in which a Fund invests, other expenditures that are capitalized in accordance with generally accepted accounting principles (other than
189
1290 FUNDS
NOTES TO FINANCIAL STATEMENTS (Continued)
October 31, 2017
offering costs), other extraordinary expenses not incurred in the ordinary course of such Fund’s business and amounts payable pursuant to a plan adopted in accordance with Rule 12b-1 under the 1940 Act) (“Fund Operating Expenses”), exceed the Maximum Annual Operating Expense Limit of:
| | | | | | | | | | | | | | | | |
| | | Total Expense Limited to (% of daily net assets) | |
Funds: | | Class A | | | Class I | | | Class R | | | Class T** | |
1290 Convertible Securities | | | 1.05 | % | | | 1.05 | % | | | 1.05 | % | | | 1.05 | % |
1290 DoubleLine Dynamic Allocation | | | 1.00 | | | | 1.00 | | | | 1.00 | | | | 1.00 | |
1290 GAMCO Small/Mid Cap Value | | | 1.00 | | | | 1.00 | | | | 1.00 | | | | 1.00 | |
1290 Global Talents | | | 1.00 | | | | 1.00 | | | | 1.00 | | | | 1.00 | |
1290 High Yield Bond | | | 0.80 | | | | 0.80 | | | | 0.80 | | | | 0.80 | |
1290 Low Volatility Global Equity* | | | 0.65 | | | | 0.65 | | | | 0.65 | | | | 0.65 | |
1290 Multi-Alternative Strategies* | | | 1.40 | | | | 1.40 | | | | 1.40 | | | | 1.40 | |
1290 Retirement 2020* | | | 0.65 | | | | 0.65 | | | | 0.65 | | | | 0.65 | |
1290 Retirement 2025* | | | 0.65 | | | | 0.65 | | | | 0.65 | | | | 0.65 | |
1290 Retirement 2030* | | | 0.65 | | | | 0.65 | | | | 0.65 | | | | 0.65 | |
1290 Retirement 2035* | | | 0.65 | | | | 0.65 | | | | 0.65 | | | | 0.65 | |
1290 Retirement 2040* | | | 0.65 | | | | 0.65 | | | | 0.65 | | | | 0.65 | |
1290 Retirement 2045* | | | 0.65 | | | | 0.65 | | | | 0.65 | | | | 0.65 | |
1290 Retirement 2050* | | | 0.65 | | | | 0.65 | | | | 0.65 | | | | 0.65 | |
1290 Retirement 2055* | | | 0.65 | | | | 0.65 | | | | 0.65 | | | | 0.65 | |
1290 Retirement 2060* | | | 0.65 | | | | 0.65 | | | | 0.65 | | | | 0.65 | |
1290 SmartBeta Equity | | | 0.90 | | | | 0.90 | | | | 0.90 | | | | 0.90 | |
1290 Unconstrained Bond Managers | | | 1.00 | | | | 1.00 | | | | 1.00 | | | | 1.00 | |
| * | Includes fees and expenses of other investment companies in which the Fund invests. |
| ** | Class T shares were known as Class C shares prior to March 1, 2017. |
Prior to March 1, 2017, 1290 Asset Managers had contractually agreed to the following expense limitations:
| | | | | | | | | | | | | | | | |
| | | Total Expense Limited to (% of daily net assets) | |
Funds: | | Class A | | | Class I | | | Class R | | | Class T* | |
1290 GAMCO Small/Mid Cap Value | | | 1.10 | % | | | 1.10 | % | | | 1.10 | % | | | 1.10 | % |
1290 Global Talents | | | 1.15 | | | | 1.15 | | | | 1.15 | | | | 1.15 | |
1290 High Yield Bond | | | 0.85 | | | | 0.85 | | | | 0.85 | | | | 0.85 | |
1290 SmartBeta Equity | | | 1.10 | | | | 1.10 | | | | 1.10 | | | | 1.10 | |
1290 Unconstrained Bond Managers | | | 1.15 | | | | 1.15 | | | | 1.15 | | | | 1.15 | |
| * | Class T shares were known as Class C shares prior to March 1, 2017. |
1290 Asset Managers first waives its advisory fees, then waives its administration fees, and then reimburses the Fund’s expenses out of its own resources. Each Fund may at a later date reimburse to 1290 Asset Managers the advisory fees waived or other expenses assumed and paid for by 1290 Asset Managers pursuant to the Expense Limitation Agreement within three years of payments or waivers being recorded, provided such Fund has reached a sufficient asset size to permit such reimbursement to be made without causing the total annual expense ratio of each Fund to exceed the percentage limits mentioned above for the respective period. Consequently, no reimbursement by a Fund will be made unless: (i) the Fund’s total annual expense ratio is less than the respective percentages stated above for the respective period; and (ii) the payment of such reimbursement has been approved by the Board. Any reimbursement, called recoupment fees on the Statement of Operations of the Fund, will be based on the earliest fees waived or
190
1290 FUNDS
NOTES TO FINANCIAL STATEMENTS (Continued)
October 31, 2017
assumed by 1290 Asset Managers. During the year ended October 31, 2017, the Funds did not incur recoupment fees. At October 31, 2017, under the Expense Limitation Agreement, the amount that would be recoverable from each Fund is as follows:
| | | | | | | | | | | | | | | | |
| | | Amount Eligible through | | | Total Eligible
For
Reimbursement | |
Funds: | | 2018 | | | 2019 | | | 2020 | | |
1290 Convertible Securities | | $ | 79,383 | | | $ | 181,764 | | | $ | 163,842 | | | $ | 424,989 | |
1290 DoubleLine Dynamic Allocation | | | — | | | | 206,816 | | | | 282,307 | | | | 489,123 | |
1290 GAMCO Small/Mid Cap Value | | | 256,568 | | | | 170,475 | | | | 198,074 | | | | 625,117 | |
1290 Global Talents | | | — | | | | 124,531 | | | | 198,217 | | | | 322,748 | |
1290 High Yield Bond | | | 398,213 | | | | 190,254 | | | | 227,000 | | | | 815,467 | |
1290 Low Volatility Global Equity | | | — | | | | — | | | | 93,099 | | | | 93,099 | |
1290 Multi-Alternative Strategies | | | 67,806 | | | | 167,229 | | | | 163,049 | | | | 398,084 | |
1290 Retirement 2020 | | | — | | | | — | | | | 96,299 | | | | 96,299 | |
1290 Retirement 2025 | | | — | | | | — | | | | 96,317 | | | | 96,317 | |
1290 Retirement 2030 | | | — | | | | — | | | | 95,969 | | | | 95,969 | |
1290 Retirement 2035 | | | — | | | | — | | | | 96,339 | | | | 96,339 | |
1290 Retirement 2040 | | | — | | | | — | | | | 96,423 | | | | 96,423 | |
1290 Retirement 2045 | | | — | | | | — | | | | 97,023 | | | | 97,023 | |
1290 Retirement 2050 | | | — | | | | — | | | | 96,472 | | | | 96,472 | |
1290 Retirement 2055 | | | — | | | | — | | | | 96,529 | | | | 96,529 | |
1290 Retirement 2060 | | | — | | | | — | | | | 96,563 | | | | 96,563 | |
1290 SmartBeta Equity | | | 283,924 | | | | 150,945 | | | | 198,111 | | | | 632,980 | |
1290 Unconstrained Bond Managers | | | 80,587 | | | | 294,316 | | | | 311,753 | | | | 686,656 | |
During the year ended October 31, 2017, the Distributor voluntarily waived distribution fees for the Funds’ Class T shares. These amounts as follows are not eligible for recoupment:
| | |
Funds: | | Voluntary Waivers |
1290 GAMCO Small/Mid Cap Value | | $586 |
1290 High Yield Bond | | 648 |
1290 SmartBeta Equity | | 557 |
During the year ended October 31, 2017, FMG LLC voluntarily waived fees for certain Funds. The amounts waived were as follows and are not eligible for recoupment:
| | |
Funds: | | Voluntary Waivers |
1290 Convertible Securities | | $ 3,135 |
1290 DoubleLine Dynamic Allocation | | 7,962 |
1290 GAMCO Small/Mid Cap Value | | 5,202 |
1290 Global Talents | | 3,024 |
1290 High Yield Bond | | 4,316 |
1290 Multi-Alternative Strategies | | 2,346 |
1290 SmartBeta Equity | | 1,864 |
1290 Unconstrained Bond Managers | | 10,025 |
During the year ended October 31, 2017, DoubleLine Capital LP reimbursed 1290 DoubleLine Dynamic Allocation Fund $21,613 of investment management fees from the DoubleLine Floating Rate Fund and the DoubleLine Global Bond Fund, which are underlying investments in this Fund. This reimbursement is not eligible for recoupment.
191
1290 FUNDS
NOTES TO FINANCIAL STATEMENTS (Continued)
October 31, 2017
The Distributor receives sales charges on the Funds’ Class A and Class T shares and the proceeds of contingent deferred sales charges paid by the investor in connection with certain redemptions of the Funds’ Class A shares. The Distributor has advised the Funds that for the year ended October 31, 2017, the proceeds retained from sales and redemptions are as follows:
| | | | | | | | | | | | |
| | | Class A | | | Class T | |
Funds: | | Front End
Sales
Charge | | | Contingent
Deferred
Sales Charge | | | Front End
Sales
Charge | |
1290 Convertible Securities | | $ | 975 | | | $ | — | | | $ | — | |
1290 DoubleLine Dynamic Allocation | | | 28,743 | | | | — | | | | — | |
1290 GAMCO Small/Mid Cap Value | | | 40,396 | | | | — | | | | — | |
1290 Global Talents | | | 23,557 | | | | — | | | | — | |
1290 High Yield Bond | | | 11,286 | | | | — | | | | — | |
1290 Multi-Alternative Strategies | | | 19,343 | | | | — | | | | — | |
1290 SmartBeta Equity | | | 13,675 | | | | — | | | | — | |
Sales loads and contingent deferred sales charges imposed on purchases and redemptions of Fund shares are retained by the Trust’s Distributors and do not represent expenses or income of the Funds.
| Note 4 | Percentage of Ownership by Affiliates |
At October 31, 2017, 1290 Asset Managers held investments in each of the Funds as follows:
| | | | |
Funds: | | Percentage of
Ownership | |
1290 Convertible Securities | | | 93.20 | % |
1290 Doubleline Dynamic Allocation | | | 93.17 | |
1290 GAMCO Small/ Mid Cap Value | | | 13.56 | |
1290 Global Talents | | | 96.23 | |
1290 High Yield Bond | | | 90.88 | |
1290 Low Volatility Global Equity | | | 96.40 | |
1290 Multi-Alternative Strategies | | | 59.75 | |
1290 Retirement 2020 | | | 100.00 | |
1290 Retirement 2025 | | | 100.00 | |
1290 Retirement 2030 | | | 100.00 | |
1290 Retirement 2035 | | | 100.00 | |
1290 Retirement 2040 | | | 100.00 | |
1290 Retirement 2045 | | | 99.70 | |
1290 Retirement 2050 | | | 100.00 | |
1290 Retirement 2055 | | | 100.00 | |
1290 Retirement 2060 | | | 100.00 | |
1290 SmartBeta Equity | | | 81.28 | |
1290 Unconstrained Bond Managers | | | 99.49 | |
The Adviser evaluated subsequent events from October 31, 2017, the date of these financial statements, through the date these financial statements were issued. There were no subsequent events to disclose.
192
1290 FUNDS
NOTES TO FINANCIAL STATEMENTS (Concluded)
October 31, 2017
In July 2011, a lawsuit was filed in the United States District Court of the District of New Jersey, entitled Mary Ann Sivolella v. AXA Equitable Life Insurance Company and AXA Equitable Funds Management Group, LLC (“Sivolella Litigation’’). The lawsuit was filed derivatively on behalf of eight Portfolios of EQ Advisors Trust (a separate Trust) advised by the Adviser. The lawsuit seeks recovery under Section 36(b) of the 1940 Act, for alleged excessive fees paid to the Adviser and AXA Equitable (the “Defendants”) for investment management services. The Plaintiff seeks recovery of the alleged overpayments, or alternatively, rescission of the contracts and restitution of all fees paid, interest, costs and fees. In October 2011, the Adviser and AXA Equitable filed a motion to dismiss the complaint. In November 2011, the Plaintiff filed an Amended Complaint seeking the same relief and in December 2011, the Defendants filed a motion to dismiss the Amended Complaint. In September 2012, the United States District Court for the District of New Jersey denied the motion to dismiss the Amended Complaint.
In January 2013, a second lawsuit against the Adviser was filed in the United States District Court for the District of New Jersey by a group of Plaintiffs asserting substantially similar claims under Section 36(b) and seeking substantially similar damages as in the Sivolella Litigation. The lawsuit, entitled Glenn D. Sanford, et al. v. AXA Equitable Funds Management Group, LLC (“Sanford Litigation”), was filed derivatively on behalf of certain Portfolios of EQ Advisors Trust advised by the Adviser. The Sanford Litigation does not involve any of the Funds. In light of the similarities of the allegations in the Sivolella and Sanford Litigations, the parties agreed to consolidate the two lawsuits.
In April 2013, the Plaintiffs in the Sivolella and Sanford Litigations amended the complaints to add additional claims under Section 36(b) of the 1940 Act for recovery of alleged excessive fees paid to the Adviser in its capacity as the Administrator of EQ Advisors Trust (a separate Trust). The Plaintiffs seek recovery of the alleged overpayments, or alternatively, rescission of the contract and restitution of the excessive fees paid, interest, costs, and fees. In January 2015, Plaintiffs and Defendants filed motions for summary judgment and other pre-trial motions, which were denied by the Court in August 2015.
The non-jury trial commenced in January 2016 and testimony concluded in February 2016. Closing arguments occurred in June 2016 following post-trial briefing. On August 25, 2016, the Court issued its decision in favor of the Adviser and AXA Equitable, finding that the Plaintiffs had failed to meet their burden to demonstrate that the Adviser and AXA Equitable breached their fiduciary duty in violation of Section 36(b) or show any actual damages. In September 2016, the Plaintiffs filed a motion to amend the trial opinion and to amend or make new findings of fact and/or conclusions of law, which was denied by the Court in December 2016. In December 2016, Plaintiffs filed a notice to appeal the Court’s decision to the United States Court of Appeals for the Third Circuit.
None of the Funds within the Trust are a party to the Sivolella or Sanford Litigations and any potential damages would be the responsibility of the Defendants. Therefore, no liability for litigation relating to these matters has been accrued in the financial statements of the Funds.
193
Report of Independent Registered Public Accounting Firm
To the Board of Trustees of 1290 Funds and Shareholders of 1290 Convertible Securities Fund, 1290 DoubleLine Dynamic Allocation Fund, 1290 GAMCO Small/Mid Cap Value Fund, 1290 Global Talents Fund, 1290 High Yield Bond Fund, 1290 Low Volatility Global Equity Fund, 1290 Multi-Alternatives Strategies Fund, 1290 Retirement 2020 Fund, 1290 Retirement 2025 Fund, 1290 Retirement 2030 Fund, 1290 Retirement 2035 Fund, 1290 Retirement 2040 Fund, 1290 Retirement 2045 Fund, 1290 Retirement 2050 Fund, 1290 Retirement 2055 Fund, 1290 Retirement 2060 Fund, 1290 SmartBeta Equity Fund and 1290 Unconstrained Bond Managers Fund:
In our opinion, the accompanying statements of assets and liabilities, including the portfolios of investments, and the related statements of operations and of changes in net assets and the financial highlights present fairly, in all material respects, the financial position of each of the portfolios constituting 1290 Funds (hereafter referred to as the “Trust”) as of October 31, 2017, and the results of each of their operations, the changes in each of their net assets and the financial highlights for each of the periods indicated, in conformity with accounting principles generally accepted in the United States of America. These financial statements and financial highlights (hereafter referred to as “financial statements”) are the responsibility of the Trust’s management. Our responsibility is to express an opinion on these financial statements based on our audits. We conducted our audits of these financial statements in accordance with the standards of the Public Company Accounting Oversight Board (United States). Those standards require that we plan and perform the audit to obtain reasonable assurance about whether the financial statements are free of material misstatement. An audit includes examining, on a test basis, evidence supporting the amounts and disclosures in the financial statements, assessing the accounting principles used and significant estimates made by management, and evaluating the overall financial statement presentation. We believe that our audits, which included confirmation of securities as of October 31, 2017 by correspondence with the custodian, transfer agents, agent banks and brokers, provide a reasonable basis for our opinion.
PricewaterhouseCoopers LLP
New York, New York
December 15, 2017
194
1290 FUNDS
DISCLOSURE REGARDING ADVISORY CONTRACT APPROVALS
APPROVALS OF INVESTMENT ADVISORY AND INVESTMENT SUB-ADVISORY AGREEMENTS DURING THE SIX-MONTH PERIOD ENDED OCTOBER 31, 2017 (UNAUDITED)
At a meeting held on July 18-20, 2017, the Board of Trustees (the “Board”) of 1290 Funds (the “Trust”), including those Trustees who are not parties to any Agreement (as defined below) or “interested persons” (as that term is defined in the Investment Company Act of 1940, as amended) of such parties or the Trust (the “Independent Trustees”), considered and unanimously approved the renewal of the Investment Advisory Agreement (the “Advisory Agreement”) with AXA Equitable Funds Management Group, LLC (d/b/a 1290 Asset Managers®) (“1290 Asset Managers” or the “Adviser”) and, as applicable, the renewal of the Investment Sub-Advisory Agreement(s) (each, a “Sub-Advisory Agreement” and together with the Advisory Agreement, the “Agreements”) between the Adviser and each investment sub-adviser (each, a “Sub-Adviser” and together, the “Sub-Advisers”), as shown in the table below with respect to the Funds listed, for an additional one-year term.
| | |
Funds | | Agreement(s) Renewed by the Trust’s Board
with respect to the Funds |
1290 Multi-Alternative Strategies Fund 1290 Retirement 2020 Fund 1290 Retirement 2025 Fund 1290 Retirement 2030 Fund 1290 Retirement 2035 Fund 1290 Retirement 2040 Fund 1290 Retirement 2045 Fund 1290 Retirement 2050 Fund 1290 Retirement 2055 Fund 1290 Retirement 2060 Fund (collectively, the “1290 Retirement Funds”) | | Advisory Agreement with 1290 Asset Managers |
| |
1290 Convertible Securities Fund | | Advisory Agreement with 1290 Asset Managers Sub-Advisory Agreement with Palisade Capital Management LLC |
| |
1290 DoubleLine Dynamic Allocation Fund | | Advisory Agreement with 1290 Asset Managers Sub-Advisory Agreement with DoubleLine Capital LP |
| |
1290 GAMCO Small/Mid Cap Value Fund | | Advisory Agreement with 1290 Asset Managers Sub-Advisory Agreement with GAMCO Asset Management, Inc. (“GAMCO”) |
| |
1290 Global Talents Fund | | Advisory Agreement with 1290 Asset Managers Sub-Advisory Agreement with AXA Investment Managers Inc. (“AXA IM”) |
| |
1290 High Yield Bond Fund | | Advisory Agreement with 1290 Asset Managers Sub-Advisory Agreement with AXA IM |
| |
1290 SmartBeta Equity Fund | | Advisory Agreement with 1290 Asset Managers Sub-Advisory Agreement with AXA Rosenberg Investment Management LLC (“AXA Rosenberg”) |
| |
1290 Unconstrained Bond Managers Fund | | Advisory Agreement with 1290 Asset Managers Sub-Advisory Agreement with Pacific Investment Management Company, LLC Sub-Advisory Agreement with TCW Investment Management Company (“TCW”) |
In reaching its decision to renew the Agreement(s) with respect to each Fund, the Board considered the overall fairness of the Agreement and whether the Agreement was in the best interests of the Fund and its
195
shareholders. The Board further considered all factors it deemed relevant with respect to each Fund, including: (1) the nature, quality and extent of the overall services to be provided to the Fund by the Adviser, the relevant Sub-Adviser(s) and, where applicable, their respective affiliates, including the investment performance of the Fund; (2) the level of the Fund’s advisory fee and, where applicable, sub-advisory fee(s), and the Fund’s expense ratios relative to those of peer funds; (3) the costs of the services to be provided by, and the profits to be realized by, the Adviser and its affiliates from their relationships with the Fund; (4) the anticipated effect of growth and size on the Fund’s performance and expenses, including any potential economies of scale and, if so, whether any such economies of scale are equitably shared with shareholders; and (5) “fall-out” benefits that may accrue to the Adviser, the relevant Sub-Adviser(s) and their respective affiliates (i.e., indirect benefits that the Adviser or its affiliates would not receive but for the existence of the Funds). In considering each Agreement, the Board did not identify any single factor or information as all-important or controlling, and each Trustee may have attributed different weight to each factor.
In connection with its deliberations, the Board took into account information (both written and oral) provided to the Board, including its various committees, throughout the year, as well as information provided specifically in connection with the annual renewal process. The Trustees also recognized that the fee arrangements for the Funds are in many cases the result of review and discussion in prior years between the Trustees and the Adviser and that their conclusions may be based, in part, on their consideration of these same arrangements in prior years.
Information provided and discussed throughout the year included investment performance reports and related financial and general market outlook information for each Fund, as well as periodic reports on, among other matters, brokerage allocation and execution; pricing and valuation; legal and compliance matters; shareholder and other services and support provided to the Funds by the Adviser, the relevant Sub-Adviser(s) and their respective affiliates; sales and marketing activity; and risk management. In addition, the sub-groups of the Board’s Investment Committee, comprised of Independent Trustees, management representatives, and outside legal counsel, met individually and engaged in extensive discussions with Sub-Advisers during in-person presentations made throughout the year.
Information provided and discussed specifically in connection with the annual renewal process included an extensive report prepared by Broadridge Financial Solutions Inc. (“Broadridge”), an independent provider of mutual fund industry data, as well as additional substantial material prepared by management. Broadridge provided its report directly to the Independent Trustees and included in its report comparative fee and expense information for each Fund and comparative investment performance information for each Fund with at least one year of operating history as of March 31, 2017. Over the course of the year prior to the July 2017 meeting, the Independent Trustees, in consultation with their independent legal counsel, engaged in an extensive review of the materials provided by Broadridge (and its predecessor) in connection with prior meetings at which the Board had considered the annual renewal of investment advisory arrangements. The materials provided by Broadridge in connection with the July 2017 meeting included additional and updated information requested by the Independent Trustees as a result of this review. The additional material prepared by management generally included Fund-by-Fund information showing each Fund’s average net assets; advisory fees and, where applicable, sub-advisory fees; expense ratios; expense limitation arrangements; investment performance (in addition to the performance information prepared by Broadridge); and profitability information, including information regarding the profitability of the Adviser’s operations on an overall Trust basis, as well as on a Fund-by-Fund basis. In addition, for each Fund, the Adviser and the relevant Sub-Adviser(s) provided separate materials describing the Fund’s investment performance over various time periods and the services provided and the fees charged with respect to the Fund, and discussing whether the Fund had performed as expected over time and other matters.
The Independent Trustees met in advance of the meeting at which the Board approved the renewal of the Agreements to review the information provided and communicated follow-up questions for management to address at the renewal meeting. The Independent Trustees also met in executive sessions during the meeting to discuss the Agreements and the information provided. When invited, management representatives attended portions of the executive sessions to review and discuss matters relating to the Agreements and to provide additional information requested by the Independent Trustees. At the meeting and during the portions of the executive sessions attended by management, the Independent Trustees and management engaged in extensive discussions regarding the Agreements. The Independent Trustees were assisted by independent legal counsel prior to and during the meeting and during their deliberations regarding the Agreements and also received
196
from counsel materials addressing, among other things, the legal standards applicable to their consideration of the Agreements. In addition, the Independent Trustees reviewed information and met during the year to discuss information relevant to their annual consideration of the Agreements.
The Board also noted that the Trust is an affiliated investment company of EQ Advisors Trust, which is also managed by the Adviser, and that all of the Board members also currently serve on the Board of Trustees of EQ Advisors Trust. The Board also noted that each Sub-Adviser other than TCW currently serves as investment sub-adviser for one or more portfolios, or allocated portion(s) of portfolio(s), of EQ Advisors Trust (such Sub-Advisers together, the “EQAT Sub-Advisers”). The Trustees took into account information relating to the Adviser and the EQAT Sub-Advisers provided to the Trustees, in their capacities as Trustees of EQ Advisors Trust, at prior meetings of the Board of Trustees of EQ Advisors Trust, and the Trustees noted their experience and familiarity with the Adviser, the EQAT Sub-Advisers, and the portfolios of EQ Advisors Trust gained from their service on the Boards of Trustees of EQ Advisors Trust and the Trust.
Although the Board approved the renewal of the Agreements for all of the Funds at the same Board meeting, the Board considered each Fund separately. In approving the renewal of the relevant Agreement(s) with respect to each Fund, each Trustee, including the Independent Trustees, on the basis of their business judgment after review of all information, determined that the advisory fee and, where applicable, sub-advisory fee(s) were fair and reasonable and that the renewal of the Agreement(s) was in the best interests of the applicable Fund and its shareholders. Although the Board gave attention to all information provided, the following discusses some of the primary factors that the Board deemed relevant to its decision to renew the Agreements.
Nature, Quality and Extent of Services
The Board evaluated the nature, quality and extent of the overall services to be provided to each Fund and its shareholders by the Adviser, the relevant Sub-Adviser(s) and, where applicable, their respective affiliates. In addition to the investment performance and expense information discussed below, the Board considered the Adviser’s and each relevant Sub-Adviser’s responsibilities with respect to each Fund and the Adviser’s and each relevant Sub-Adviser’s experience in serving as an investment adviser for the Fund(s) and for portfolios and accounts similar to the Fund(s) each advises, including, as applicable, portfolios or allocated portion(s) of portfolio(s) of EQ Advisors Trust.
With respect to the Adviser, the Board considered that the Adviser is responsible for, among other things, developing investment strategies for the Funds (and the portions thereof); researching, selecting and hiring Sub-Advisers, conducting ongoing “due diligence” on and monitoring Sub-Advisers, and, when necessary or advisable, terminating or replacing Sub-Advisers; allocating and rebalancing Fund assets among Sub-Advisers; overseeing the selection of investments for the Funds (or the portions thereof) that the Sub-Advisers sub-advise; making investment decisions for the Funds (or the portions thereof) that it manages directly; monitoring and evaluating the performance of the Funds (or the portions thereof); monitoring the investment operations and composition of the Funds (or the portions thereof) and, in connection therewith, monitoring compliance with the Funds’ investment objectives, policies and restrictions, as well as the Funds’ compliance with applicable law and the Trust’s compliance policies and procedures; monitoring brokerage selection, commission and other trading costs, quality of execution, and other brokerage matters; coordinating and managing the flow of information and communications relating to the Funds among the Sub-Advisers and other applicable parties; coordinating responses to regulatory agency inquiries relating to the operations of the Trust and coordinating litigation matters involving the Adviser and the Trust; and implementing Board directives as they relate to the Funds. The Board also considered information regarding the Adviser’s process for selecting and monitoring the Sub-Advisers and the other service providers to the Funds and its process for making investment decisions for the Funds (or the portions thereof) that it manages directly, as well as information regarding the qualifications and experience of, and resources available to, the personnel who perform those functions with respect to the Funds. The Board further considered that the Adviser also provides the Trust with personnel, including Trust officers, in connection with carrying out its responsibilities and is responsible for coordinating the development of new initiatives and evaluating the impact of proposed products and services on the Trust and its assets. The Board also considered that the Adviser has assumed significant entrepreneurial risk in sponsoring the Funds and that the Adviser also bears and assumes significant ongoing risks, including investment, operational, enterprise, litigation, regulatory and compliance risks, with respect to the Funds. The Board considered that the Adviser’s responsibilities include daily
197
monitoring of investment, operational, enterprise, litigation, regulatory and compliance risks as they relate to the Funds. The Board also considered information regarding the Adviser’s ongoing risk management activities. The Board’s conclusion regarding the nature, quality and extent of the overall services to be provided by the Adviser also was based, in part, on the Trustees’ experience and familiarity, in their capacities as Trustees of EQ Advisors Trust, with the Adviser serving as the investment manager for portfolios of EQ Advisors Trust, and on periodic reports provided to the Trustees, in their capacities as Trustees of EQ Advisors Trust, regarding the services provided by the Adviser to those other portfolios.
With respect to the Sub-Advisers, the Board considered that each Sub-Adviser, subject to the oversight of the Adviser, is responsible for making investment decisions for the Fund(s) (or the portion(s) thereof) that it sub-advises; placing with brokers or dealers orders for the purchase and sale of investments for the Fund(s) (or the portion(s) thereof) that it sub-advises; and performing certain related administrative functions. The Board also reviewed information regarding each Sub-Adviser’s process for selecting investments for the Fund(s) (or the portion(s) thereof) that it sub-advises, as well as information regarding the qualifications and experience of the Sub-Adviser’s portfolio managers who provide services to the Fund(s). The Board also considered information regarding each Sub-Adviser’s procedures for executing portfolio transactions for the Fund(s) (or the portion(s) thereof) that it sub-advises and procedures for selecting brokers and dealers and, where applicable, obtaining research from those brokers and dealers. The Board’s conclusion regarding the nature, quality and extent of the overall services to be provided by each EQAT Sub-Adviser also was based, in part, on the Trustees’ experience and familiarity, in their capacities as Trustees of EQ Advisors Trust, with the EQAT Sub-Adviser serving as an investment sub-adviser for one or more portfolios, or allocated portion(s) of portfolio(s), of EQ Advisors Trust, and on periodic reports provided to the Trustees, in their capacities as Trustees of EQ Advisors Trust, regarding the services provided by the EQAT Sub-Adviser to those other portfolios.
The Board also considered, among other factors, periodic reports provided to the Board regarding the services provided by the Adviser, the Sub-Advisers and, where applicable, their affiliates. In addition, the Board considered the allocation of Fund brokerage, including allocations to broker-dealers affiliated with the Adviser or a Sub-Adviser. The Board also considered the use of “soft” commission dollars to pay for research services, as applicable. In this regard, the Board also considered the Adviser’s and each Sub-Adviser’s trading experience and received information regarding how the Adviser and each Sub-Adviser seek to achieve “best execution” on behalf of a Fund, including a report by an independent portfolio trading analytical firm. The Board also considered the Funds’ Chief Compliance Officer’s evaluation of the Adviser’s and each Sub-Adviser’s compliance programs, policies and procedures, and any compliance matters involving the Adviser and any applicable Sub-Adviser that had been brought to the Board’s attention during the year. The Board members also factored into their review their experience and familiarity, in their capacities as Trustees of EQ Advisors Trust, with the Adviser’s and each EQAT Sub-Adviser’s compliance programs, policies, and procedures with respect to EQ Advisors Trust. In addition, the Board considered whether there were any pending lawsuits, enforcement proceedings or regulatory investigations involving the Adviser and the Sub-Advisers and reviewed information regarding the Adviser’s and each Sub-Adviser’s financial condition and history of operations and potential conflicts of interest in managing the Funds. The Independent Trustees also requested and received a formal presentation about business relationships that the Adviser and/or its affiliates, including AXA Equitable Life Insurance Company, have with Sub-Advisers and/or their affiliates in addition to the relationships involving the Funds. In this regard, the Board also received presentations about the policies and procedures adopted by the Adviser and the Trust to identify and mitigate potential conflicts of interest, including conflicts that may arise in connection with those additional business relationships.
The Board also considered the benefits to shareholders from participation in a Fund sponsored by the Adviser, including the Adviser’s experience operating a large fund complex that offers a wide range of portfolios, sub-advisers and investment styles. The Board likewise considered that shareholders have chosen to invest in mutual funds sponsored by the Adviser. In addition, the Board considered the nature, quality and extent of the administrative, shareholder servicing and distribution support services that the Adviser and its affiliates provide to the Funds and their shareholders. The Board also noted that, throughout the past year, the Adviser and its affiliates had continued or undertaken initiatives intended to enhance various aspects of the Trust’s and the Board’s operations and shareholders’ experience with the mutual funds sponsored by the Adviser.
198
The Board also considered strategic and other actions taken by the Adviser in response to recent events within the mutual fund industry, including actions taken in response to financial regulatory reform and other regulatory initiatives, as well as other significant developments within the mutual fund industry. The Board also considered strategic and other actions taken by the Adviser and the Sub-Advisers in response to recent market conditions and considered the overall performance of the Adviser and the Sub-Advisers in this context. In this regard, among other things, the Board also requested and received throughout the past year information from the Adviser and various service providers on various topics impacting all mutual funds, including pricing and valuation of portfolio securities; liquidity risk management; cybersecurity; and new reporting and disclosure requirements for mutual funds. The Board noted that certain of these topics may present significant challenges for mutual funds and result in an increase in the responsibilities of mutual fund service providers, including the Adviser.
For purposes of evaluating the nature, quality and extent of the overall services provided to each Fund, the Board also took into account discussions with the Adviser and the relevant Sub-Adviser(s) about Fund investment performance that occur at Board meetings throughout the year. In this regard, the Board noted that, as part of regularly scheduled Fund reviews and other detailed reports to the Board on Fund performance, the Board periodically considered information regarding each Fund’s performance over various time periods on both an absolute basis and relative to an appropriate broad-based securities market index (“benchmark”) and a peer group of other mutual funds deemed by Broadridge to be comparable to the Fund (“peer group”). The Board also considered Appendix A, which includes certain information provided to the Board regarding each Fund’s performance relative to a benchmark and a peer group for the one-year (as applicable) and since inception periods ended March 31, 2017. The Board noted that this information supplemented other performance information provided to the Board throughout the year and in connection with the annual renewal process. The Board also noted that each of the 1290 GAMCO Small/Mid Cap Value, 1290 High Yield Bond and 1290 SmartBeta Equity Funds had commenced operations on November 12, 2014; each of the 1290 Convertible Securities, 1290 Multi-Alternative Strategies, and 1290 Unconstrained Bond Managers Funds had commenced operations on July 6, 2015; the 1290 DoubleLine Dynamic Allocation Fund had commenced operations on March 7, 2016; the 1290 Global Talents Fund had commenced operations on April 11, 2016; and each of the 1290 Retirement Funds had commenced operations on February 27, 2017, so each Fund had only a short operating history on which to evaluate performance. For each Fund with at least one year of operating history as of March 31, 2017, the Board also considered information, provided directly by Broadridge, regarding a Fund’s performance over various time periods relative to a benchmark and peer groups. The Board also took note of the relatively small size of each Fund and the likely impact that a Fund’s size has on its relative expenses and performance.
The Board also factored into its evaluation of each Fund’s performance the limitations inherent in Broadridge’s methodology for developing and constructing peer groups and determining, from year to year, which mutual funds should be included in which peer groups, among other things. The Board also noted that the number of mutual funds included in a peer group may be relatively small and may differ significantly from peer group to peer group and from year to year and that the constituent mutual funds included in a peer group also may differ from year to year, which can limit the relevance of the comparisons. While recognizing these inherent limitations, the Board believed the independent analysis conducted by Broadridge provided a useful measure of comparative performance.
In evaluating the Funds’ performance, the Board also took into account factors including general market conditions (including the amount of volatility in the market over the past year); the “style” in which the Funds are managed, as applicable, and whether that style is in or out of favor in the market; issuer-specific information; and fund cash flows. The Board also considered that variations in performance among a Fund’s operating classes reflect variations in class expenses, which result in lower performance for higher expense classes.
With respect to the performance of the 1290 Multi-Alternative Strategies Fund and each of the 1290 Retirement Funds, the Board also considered that each Fund operates as a fund-of-funds and invests in exchange traded securities of other investment companies or investment vehicles (“ETFs”) and recognized, therefore, that each Fund’s performance is based, in part, on the total returns of the ETFs in which it invests.
Based on its review, the Board determined, with respect to each Fund, that (i) the Fund and its shareholders would benefit from the Adviser’s and each relevant Sub-Adviser’s continued management of the
199
Fund, and (ii) the nature, quality and extent of the overall services provided by the Adviser, the relevant Sub-Adviser(s) and, where applicable, their respective affiliates were appropriate for the Fund in light of its investment objective(s) and, thus, supported a decision to approve the renewal of the Agreement(s).
Expenses
The Board considered each Fund’s advisory fee and, where applicable, sub-advisory fee(s), in light of the nature, quality and extent of the overall services provided by the Adviser and, where applicable, the relevant Sub-Adviser(s). The Board also reviewed comparative fee and expense information for each Fund provided to the Board by Broadridge. The information provided by Broadridge included an analysis of how each Fund’s contractual advisory fee, actual advisory fee, other expense components, and total expense ratio compared with those of peer groups of other mutual funds selected by Broadridge as constituting an appropriate expense comparison for the Fund (a Fund’s “Broadridge category”). For each Fund, Broadridge provided information on the Fund’s contractual advisory fee in comparison with the contractual advisory fee that would have been charged by other funds within a Broadridge category assuming the other funds were similar in size to the Fund, as well as information on the Fund’s actual advisory fee and total expense ratio in comparison with those of other funds within a Broadridge category. The advisory fee analysis includes within such fee any separate administrative fee paid by a fund, including the administrative fee a Fund paid to the Adviser in its capacity as administrator for the Fund. The contractual advisory fee analysis does not take into account any fee reimbursements or waivers, whereas the actual advisory fee analysis does take into account any advisory (including any administrative) fee reimbursements or waivers that benefit a fund. The total expense ratio represents a fund’s total net operating expenses and takes into account any expense reimbursements or fee waivers that benefit a fund. Broadridge provided, and the Board considered, total expense ratio comparisons both including and excluding any 12b-1 or non 12b-1 service fees and fees and expenses of any underlying funds in which a fund invests.
Except for the 1290 Retirement Funds, the Broadridge expense data was based upon historical information taken from each Fund’s audited annual report for the period ended October 31, 2016. For the 1290 Retirement Funds, which commenced operations on February 27, 2017, the Broadridge expense data was based upon information taken from each Fund’s most recent prospectus. Broadridge provided expense data for Class I shares of each Fund. The Board reviewed the expense data for Class I shares as a proxy for all of a Fund’s share classes. In this regard, the Board noted that the expenses for a Fund’s Class I shares are generally lower than the expenses for a Fund’s other share classes and that the expense comparisons may differ for different classes. Fund-specific contractual advisory fee and total expense ratio comparisons are provided below. The total expense ratio comparisons exclude any 12b-1 or non 12b-1 service fees and, except as noted below, fees and expenses of any underlying funds in which a fund invests. The Board also took note of the relatively small size of each Fund and the likely impact that a Fund’s size has on its relative expenses.
The Board factored into its evaluation of each Fund’s fees and expenses the limitations inherent in Broadridge’s methodology for developing and constructing Broadridge categories and for determining, from year to year, which mutual funds should be included in which Broadridge categories, among other things. The Board recognized these inherent limitations and, taking into account commentary and supporting data presented by management, also recognized that comparisons between a Fund and other mutual funds in a Broadridge category may not be particularly relevant, given that in some cases a Fund may exhibit notable differences (for example, in its objective(s) and management techniques) when compared to other mutual funds in a Broadridge category. The Board also noted that the number of mutual funds included in a Broadridge category may be relatively small and may differ significantly from category to category and from year to year and that the constituent mutual funds included in a Broadridge category (as well as their respective advisory/administrative fees and total expense ratios) also may differ from year to year, which can limit the relevance of the comparisons. Nonetheless, the Board believed that the independent analysis conducted by Broadridge assisted the Board in evaluating the reasonableness of each Fund’s advisory fee and total expense ratio. The Board also considered that all fees and expenses of each Fund are explicitly disclosed in Fund offering documents.
The Board also considered 1290 Multi-Alternative Strategies Fund’s and each 1290 Retirement Fund’s management fee rate relative to the management fee rates of other portfolios managed by the Adviser that, like the Funds, are structured as funds-of-funds, and noted that differences in the level of the fees reflected differences between a Fund and other funds-of-funds managed by the Adviser.
200
1290 Multi-Alternative Strategies Fund. The Board considered that the contractual advisory fee for the 1290 Multi-Alternative Strategies Fund was at the median for the Fund’s Broadridge category. The Board also considered that the total expense ratio for the Class I shares of the Fund was in line with the median for the Fund’s Broadridge category.
1290 Convertible Securities, 1290 GAMCO Small/Mid Cap Value, and 1290 SmartBeta Equity Funds. The Board considered that the contractual advisory fee for each of the 1290 Convertible Securities, 1290 GAMCO Small/Mid Cap Value, and 1290 SmartBeta Equity Funds was at the median for the Fund’s respective Broadridge category. The Board also considered that the total expense ratio for the Class I shares of each of these Funds was above the median for the Fund’s respective Broadridge category.
1290 High Yield Bond and 1290 Unconstrained Bond Managers Funds. The Board considered that the contractual advisory fee for each of the 1290 High Yield Bond and 1290 Unconstrained Bond Managers Funds was above (but within five basis points of) the median for the Fund’s respective Broadridge category. The Board also considered that the total expense ratio for the Class I shares of each of these Funds was above the median for the Fund’s respective Broadridge category.
1290 DoubleLine Dynamic Allocation and 1290 Global Talents Funds. The Board considered that the contractual advisory fee for each of the 1290 DoubleLine Dynamic Allocation and 1290 Global Talents Funds was above the median for the Fund’s respective Broadridge category. The Board also considered that the total expense ratio for the Class I shares of each of these Funds was above the median for the Fund’s respective Broadridge category.
1290 Retirement Funds. The Board considered that the contractual advisory fee for each of the 1290 Retirement Funds was above the median for the Fund’s respective Broadridge category. The Board also considered that the total expense ratio for the Class I shares of each of these Funds was above the median for the Fund’s respective Broadridge category. For each of these Funds, the total expense ratio included the fees and expenses of the underlying funds in which the Fund invests.
The Board further considered that the advisory fee rate schedules for all Funds other than the 1290 Retirement Funds include breakpoints that reduce the fee rate as a Fund’s assets increase above certain levels. The Board noted that any such reduction in a Fund’s effective advisory fee would result in corresponding reductions in the Fund’s total expense ratios. In addition, the Board considered that the Adviser had contractually agreed to make payments or waive all or a portion of its management, administrative and other fees so that each Fund’s total expense ratios do not exceed certain levels as set forth in its prospectus. In this regard, the Board also noted that the expense limitation arrangements for the 1290 Multi-Alternative Strategies Fund and each of the 1290 Retirement Funds include the fees and expenses of the underlying portfolios in which a Fund invests and, thus, such fees and expenses would not cause a Fund’s annual operating expenses to exceed its expense limitation. The Board noted that, as a result of these expense limitation arrangements, each Fund’s actual advisory fee was lower than its contractual advisory fee and was either at or below the median for the Fund’s respective Broadridge category.
In addition, with respect to each sub-advised Fund, the Board further considered the relative levels of the sub-advisory fee(s) paid to the relevant Sub-Adviser(s) and the advisory fee retained by the Adviser in light of, among other factors, the services provided to the Fund by the Adviser and the relevant Sub-Adviser(s), and the information prepared by management regarding the level of profits realized by the Adviser in connection with its operation of the Fund. The Board also considered the sub-advisory fee paid to each Sub-Adviser in light of fees paid by similar portfolios advised by the Sub-Adviser.
In addition, with respect to the 1290 GAMCO Small/Mid Cap Value Fund, after considering, among other things, the relative levels of the sub-advisory fee to be paid by the Adviser to GAMCO and the management fee to be retained by the Adviser, the Board approved, effective September 1, 2017, an amendment to the Sub-Advisory Agreement with GAMCO that is expected to lower the sub-advisory fee paid by the Adviser to GAMCO with respect to that Fund.
Based on its review, the Board determined, with respect to each Fund, that the Adviser’s advisory fee is fair and reasonable, and the Board determined, with respect to each sub-advised Fund, that each Sub-Adviser’s sub-advisory fee is fair and reasonable.
201
Profitability and Costs
The Board also considered the level of profits realized by the Adviser and its affiliates in connection with the operation of each Fund. In this respect, the Board reviewed profitability information setting forth the overall profitability of the Trust to the Adviser and its affiliates, as well as the Adviser’s and its affiliates’ profits in providing management and other services to each of the individual Funds during the 12-month period ended December 31, 2016, which was the most recent fiscal year for the Adviser. The Board also took into account that the Adviser had launched the 1290 Funds retail fund complex in the third quarter of 2014 and, therefore, the Trust and the Funds had a relatively short operating history over which to review profitability information. The Board noted that it would continue periodically to review profitability as the Trust’s and the Funds’ operating histories lengthen.
In reviewing the analysis, attention was given to the methodology followed in allocating costs to each Fund, it being recognized that allocation methodologies are inherently subjective and various allocation methodologies may each be reasonable while producing different results. In this respect, the Board noted that, while being continuously refined and reflecting changes in the Adviser’s and its affiliates’ cost accounting and other appropriate adjustments, the cost allocation methodology (which includes the expenses attributable to the services that AXA Equitable Life Insurance Company provides to support the Adviser in its role as investment adviser and administrator for the Funds) was consistent with that followed in the profitability report presentation for the Funds made the prior year to the Board and in the profitability report presentations for the portfolios of EQ Advisors Trust made this year and in prior years to the Board members in their capacities as Trustees of EQ Advisors Trust. The Board also took into account management’s ongoing costs and expenditures in providing and improving services for the Funds, as well as the need to meet additional regulatory and compliance requirements resulting from changes in rules and other regulations and to adapt to other challenges impacting the mutual fund industry. In addition, the Board considered information prepared by management and from third party sources comparing the profitability of the Adviser on an overall basis to the profitability of other publicly held asset managers (including asset managers similar to the Adviser).
In addition, with respect to the sub-advised Funds, the Board also noted that the Board and the Adviser generally are aware of the fees charged by the Sub-Advisers to other clients (this information having been provided to the Board and the Adviser by the Sub-Advisers in conjunction with the proposed renewal of the Sub-Advisory Agreements) and that the Adviser believes that the fees agreed upon with the Sub-Advisers are reasonable in light of the nature, quality and extent of the investment sub-advisory services provided. The Adviser advised the Board that it does not regard Sub-Adviser profitability as meaningful to its evaluation of the Sub-Advisory Agreements. The Board acknowledged the Adviser’s view of Sub-Adviser profitability, noting the Board’s findings as to the reasonableness of the sub-advisory fees and that the fees paid to the Sub-Advisers are the product of negotiations with the Adviser and reflect levels of profitability acceptable to the Adviser and the Sub-Advisers based on the particular circumstances in each case for each of them. The Board further noted that each Sub-Adviser’s fee is paid by the Adviser and not the sub-advised Fund. The Board also noted that the sub-advisory fees paid by the Adviser to AXA IM and AXA Rosenberg, which are affiliates of the Adviser, are considered as possible fall-out benefits.
Based on its consideration of the factors above, the Board determined that the level of profits realized by the Adviser from providing services to each Fund was not excessive in view of the nature, quality and extent of the services provided.
Economies of Scale
The Board also considered whether economies of scale or efficiencies are realized by the Adviser as the Funds grow larger and the extent to which this is reflected in the level of management and administrative fees charged. While recognizing that any precise determination is inherently subject to assumptions and subjective assessments, the Board considered that any realized economies of scale or efficiencies may be shared with funds and their shareholders in a variety of ways, including: (i) breakpoints in the advisory fee or other fees so that a fund’s effective fee rate declines as the fund grows in size, (ii) subsidizing a fund’s expenses by making payments or waiving all or a portion of the advisory fee or other fees so that the fund’s total expense ratio does not exceed certain levels, (iii) setting the advisory fee or other fees so that a fund is priced to scale, which
202
assumes that the fund has sufficient assets from inception to operate at a competitive fee rate without any fee waiver or expense reimbursement from the manager, and (iv) reinvestment in, and enhancements to, the services that the manager and its affiliates provide to a fund and its shareholders. The Board noted that the advisory fee rate schedules for all Funds other than the 1290 Retirement Funds include breakpoints that reduce the fee rate as Fund assets increase above certain levels. The Board also noted that the Adviser was subsidizing each Fund’s expenses by making payments or waiving all or a portion of its management, administrative and other fees so that the Fund’s total expense ratios do not exceed certain contractual levels as set forth in its prospectus. In addition, the Board considered that the Adviser shares any realized economies of scale with the Funds in other ways, which may include setting a Fund’s fees so that they are priced to scale. The Board considered that the effect of this pricing strategy is that the Adviser could lose money in the early stages of a Fund’s operation (and bear the risk that the Fund will never become profitable), while shareholders of the Fund receive the benefit of economies of scale that the Adviser expects the Fund will achieve as it grows. The Board further considered that the Adviser shares any realized economies of scale with the Funds through reinvestment in, and enhancements to, the services that the Adviser and its affiliates provide to the Funds and their shareholders, such as hiring additional personnel and providing additional resources in areas relating to management and administration of the Funds. In addition, the Board noted that the sub-advisory fee schedules for certain Sub-Advisers aggregate the assets managed by the Sub-Adviser in a Fund and in one or more other funds for which the Sub-Adviser serves as investment sub-adviser. The Board also noted that the sub-advisory fee schedules for certain Sub-Advisers include breakpoints that reduce the sub-advisory fee rate as applicable Fund assets under the Sub-Adviser’s management increase above certain levels. In this regard, the Board acknowledged that, at some levels, the breakpoints in a sub-advisory fee rate schedule may result in savings to the Adviser and not to shareholders. Based on its consideration of the factors above and recognizing that the Funds have relatively short operating histories and relatively low asset levels to date, the Board concluded that there was a reasonable sharing of any realized economies of scale or efficiencies under the management, administrative and sub-advisory fee schedules at the present time.
Fall-Out and Other Benefits
The Board also considered the extent to which fall-out benefits may accrue to the Adviser and its affiliates. In this connection, the Board considered several possible fall-out benefits and other types of benefits, including the following. The Board noted that the Adviser also serves as the administrator for the Funds and receives compensation for acting in this capacity. In addition, the Board recognized that AXA IM and AXA Rosenberg, affiliates of the Adviser, serve as Sub-Advisers to certain of the Funds and receive sub-advisory fees that are paid by the Adviser out of the fees that it earns from those Funds. The Board also noted that AXA Distributors, LLC, also an affiliate of the Adviser, provides distribution support services for the Trust pursuant to an agreement with the Trust’s distributor, ALPS Distributors, Inc. AXA Distributors, LLC may receive from the Funds compensation (which may include payments pursuant to Rule 12b-1 plans with respect to their Class A, Class T (when offered for sale), and Class R shares) for providing shareholder services and selling activities, which could lead to growth in the Trust’s assets and corresponding benefits from such growth, including economies of scale. The Board also recognized that other broker-dealers that are affiliated with the Adviser may sell, and earn sales commissions and/or other compensation with respect to, shares of the Funds. Further, the Board considered that Sanford C. Bernstein & Co., LLC, a registered broker-dealer, is an affiliate of the Adviser and may, from time to time, receive brokerage commissions from the Funds in connection with the purchase and sale of portfolio securities; provided, however, that those transactions, among other things, are consistent with seeking best execution. Based on its review, the Board determined that any “fall-out” benefits and other types of benefits that may accrue to the Adviser are fair and reasonable.
The Board also considered possible fall-out benefits and other types of benefits that may accrue to a Sub-Adviser, including the following. The Board considered that a Sub-Adviser, through its position as a Sub-Adviser to its respective Fund, may engage in soft dollar transactions. In addition, the Board considered that a Sub-Adviser may be affiliated with registered broker-dealers who may, from time to time, receive brokerage commissions from the Funds in connection with the purchase and sale of portfolio securities; provided, however, that those transactions, among other things, are consistent with seeking best execution. The Board also noted that certain Sub-Advisers serve or may serve as investment sub-advisers for other funds advised by the Adviser and receive sub-advisory fees with respect to those funds. The Board also recognized that a Sub-
203
Adviser and its affiliates may sell, and earn sales commissions and/or other compensation with respect to, the Funds and other investment products issued by the Adviser or its affiliates. In addition, the Board noted that a Sub-Adviser may benefit from greater exposure in the marketplace with respect to the Sub-Adviser’s investment process and from expanding its level of assets under management, and a Sub-Adviser may derive benefits from its association with the Adviser. Based on its review, the Board determined that any “fall-out” benefits that may accrue to each Sub-Adviser are fair and reasonable.
Appendix A
The Board noted that the following information regarding each Fund’s performance relative to a benchmark and a peer group for the one-year (as applicable) and since inception periods ended March 31, 2017, supplemented other performance information provided to the Board throughout the year and in connection with the annual renewal process. The performance results may differ from the performance results for more recent periods.
1290 Funds Investment Performance
For the periods ended March 31, 2017
| | | | | | | | | | | | | | | | | | | | |
| | | | | | 1 Year | | | Since Inception | |
| | | Inception
Date | | | Without
Sales
Charge | | | Without
Sales
Charge | | | With
Sales
Charge | | | Without
Sales
Charge | |
1290 GAMCO Small/Mid Cap Value - Class A | | | 11/12/2014 | | | | 20.83 | % | | | 14.24 | % | | | 10.07 | % | | | 7.49 | % |
1290 GAMCO Small/Mid Cap Value - Class T | | | 11/12/2014 | | | | 21.24 | | | | 18.18 | | | | 10.36 | | | | 9.17 | |
| | | | | |
1290 GAMCO Small/Mid Cap Value - Class I | | | 11/12/2014 | | | | 21.24 | | | | N/A | | | | 10.36 | | | | N/A | |
1290 GAMCO Small/Mid Cap Value - Class R | | | 11/12/2014 | | | | 20.53 | | | | N/A | | | | 9.80 | | | | N/A | |
Lipper Small-Cap Core Funds | | | | | | | 21.99 | | | | N/A | | | | 7.77 | | | | N/A | |
Russell 2500 Value Index | | | | | | | 23.13 | | | | N/A | | | | 8.35 | | | | N/A | |
| | | | | |
1290 Convertible Securities - Class A | | | 07/06/2015 | | | | 15.00 | | | | 9.82 | | | | 3.57 | | | | 0.87 | |
1290 Convertible Securities - Class I | | | 07/06/2015 | | | | 15.28 | | | | N/A | | | | 3.83 | | | | N/A | |
1290 Convertible Securities - Class R | | | 07/06/2015 | | | | 14.71 | | | | N/A | | | | 3.31 | | | | N/A | |
Lipper Convertible Securities Funds | | | | | | | 14.65 | | | | N/A | | | | 3.63 | | | | N/A | |
BofA Merrill Lynch All U.S. Convertibles Index | | | | | | | 18.12 | | | | N/A | | | | 5.22 | | | | N/A | |
| | | | | |
1290 Multi-Alternative Strategies - Class A | | | 07/06/2015 | | | | 4.10 | | | | (1.59 | ) | | | 0.92 | | | | (2.30 | ) |
1290 Multi-Alternative Strategies - Class I | | | 07/06/2015 | | | | 4.25 | | | | N/A | | | | 1.14 | | | | N/A | |
1290 Multi-Alternative Strategies- Class R | | | 07/06/2015 | | | | 3.84 | | | | N/A | | | | 0.64 | | | | N/A | |
Lipper Alternative Multi-Strategy Funds | | | | | | | 3.54 | | | | N/A | | | | 0.29 | | | | N/A | |
BofA Merrill Lynch 3-Month U.S. Treasury Bill Index | | | | | | | 0.36 | | | | N/A | | | | 0.27 | | | | N/A | |
| | | | | |
1290 Global Talents - Class A | | | 04/11/2016 | | | | | | | | | | | | 11.23 | | | | 5.13 | |
1290 Global Talents - Class I | | | 04/11/2016 | | | | | | | | | | | | 11.49 | | | | N/A | |
1290 Global Talents - Class R | | | 04/11/2016 | | | | | | | | | | | | 10.92 | | | | N/A | |
Lipper Global Multi-Cap Growth | | | | | | | | | | | | | | | 12.17 | | | | N/A | |
MSCI ACWI (Net) Index | | | | | | | | | | | | | | | 16.14 | | | | N/A | |
| | | | | |
1290 Low Volatility Global Equity - Class I | | | 02/27/2017 | | | | | | | | | | | | 1.00 | | | | N/A | |
Lipper Global Multi-Cap Core | | | | | | | | | | | | | | | 1.29 | | | | N/A | |
MSCI ACWI Minimum Volatility (Net) Index | | | | | | | | | | | | | | | 0.59 | | | | N/A | |
MSCI ACWI (Net) Index | | | | | | | | | | | | | | | 1.04 | | | | N/A | |
| | | | | |
1290 SmartBeta Equity - Class A | | | 11/12/2014 | | | | 10.01 | | | | 3.97 | | | | 5.56 | | | | 3.09 | |
1290 SmartBeta Equity - Class T | | | 11/12/2014 | | | | 10.28 | | | | 7.53 | | | | 5.85 | | | | 4.71 | |
| | | | | |
1290 SmartBeta Equity - Class I | | | 11/12/2014 | | | | 10.28 | | | | N/A | | | | 5.85 | | | | N/A | |
1290 SmartBeta Equity - Class R | | | 11/12/2014 | | | | 9.72 | | | | N/A | | | | 5.32 | | | | N/A | |
204
| | | | | | | | | | | | | | | | | | | | |
| | | | | | 1 Year | | | Since Inception | |
| | | Inception
Date | | | Without
Sales
Charge | | | Without
Sales
Charge | | | With
Sales
Charge | | | Without
Sales
Charge | |
Lipper Global Large-Cap Core | | | | | | | 12.64 | % | | | N/A | | | | 3.66 | % | | | N/A | |
MSCI World (Net) Index | | | | | | | 14.77 | | | | N/A | | | | 5.35 | | | | N/A | |
| | | | | |
1290 High Yield Bond - Class A | | | 11/12/2014 | | | | 14.93 | | | | 9.79 | % | | | 3.53 | | | | 1.55 | % |
1290 High Yield Bond - Class T | | | 11/12/2014 | | | | 15.21 | | | | 12.31 | | | | 3.79 | | | | 2.68 | |
1290 High Yield Bond - Class I | | | 11/12/2014 | | | | 15.33 | | | | N/A | | | | 3.83 | | | | N/A | |
1290 High Yield Bond - Class R | | | 11/12/2014 | | | | 14.67 | | | | | | | | 3.28 | | | | N/A | |
Lipper High Yield Funds | | | | | | | 13.30 | | | | N/A | | | | 3.89 | | | | N/A | |
BofA Merrill Lynch High Yield Master II Index | | | | | | | 16.88 | | | | N/A | | | | 5.15 | | | | N/A | |
| | | | | |
1290 Unconstrained Bond Managers - Class A | | | 07/06/2015 | | | | 5.21 | | | | 0.45 | | | | 1.91 | | | | (0.74 | ) |
1290 Unconstrained Bond Managers - Class I | | | 07/06/2015 | | | | 5.45 | | | | N/A | | | | 2.19 | | | | N/A | |
1290 Unconstrained Bond Managers - Class R | | | 07/06/2015 | | | | 4.97 | | | | N/A | | | | 1.70 | | | | N/A | |
Lipper Alternative Credit Focus Funds | | | | | | | 6.69 | | | | N/A | | | | 2.55 | | | | N/A | |
BofA Merrill Lynch USD 3-Month Deposit Offered Rate Constant Maturity Index | | | | | | | 0.74 | | | | N/A | | | | 0.57 | | | | N/A | |
| | | | | |
1290 DoubleLine Dynamic Allocation - Class A | | | 03/07/2016 | | | | 8.90 | | | | 2.93 | | | | 10.16 | | | | 4.48 | |
1290 DoubleLine Dynamic Allocation - Class I | | | 03/07/2016 | | | | 9.23 | | | | | | | | 10.47 | | | | N/A | |
1290 DoubleLine Dynamic Allocation - Class R | | | 03/07/2016 | | | | 8.67 | | | | | | | | 9.94 | | | | N/A | |
Lipper Mixed-Asset Target Alloc Moderate Funds | | | | | | | 3.84 | | | | N/A | | | | 9.86 | | | | N/A | |
60% S&P 500 Index / 40% Bloomberg Barclays U.S. Aggregate Bond Index | | | | | | | 10.26 | | | | N/A | | | | 12.00 | | | | N/A | |
| | | | | |
1290 Retirement 2020 - Class I | | | 02/27/2017 | | | | | | | | | | | | 0.20 | | | | N/A | |
Lipper Mixed-Asset Target 2020 Funds | | | | | | | | | | | | | | | 0.39 | | | | N/A | |
S&P Target Date 2020 Index | | | | | | | | | | | | | | | 0.27 | | | | N/A | |
| | | | | |
1290 Retirement 2025 - Class I | | | 02/27/2017 | | | | | | | | | | | | 0.30 | | | | N/A | |
Lipper Mixed-Asset Target 2025 Funds | | | | | | | | | | | | | | | 0.54 | | | | N/A | |
S&P Target Date 2025 Index | | | | | | | | | | | | | | | 0.32 | | | | N/A | |
| | | | | |
1290 Retirement 2030 - Class I | | | 02/27/2017 | | | | | | | | | | | | 0.30 | | | | N/A | |
Lipper Mixed-Asset Target 2030 Funds | | | | | | | | | | | | | | | 0.61 | | | | N/A | |
S&P Target Date 2030 Index | | | | | | | | | | | | | | | 0.36 | | | | N/A | |
| | | | | |
1290 Retirement 2035 - Class I | | | 02/27/2017 | | | | | | | | | | | | 0.40 | | | | N/A | |
Lipper Mixed-Asset Target 2035 Funds | | | | | | | | | | | | | | | 0.78 | | | | N/A | |
S&P Target Date 2035 Index | | | | | | | | | | | | | | | 0.41 | | | | N/A | |
| | | | | |
1290 Retirement 2040 - Class I | | | 02/27/2017 | | | | | | | | | | | | 0.40 | | | | N/A | |
Lipper Mixed-Asset Target 2040 Funds | | | | | | | | | | | | | | | 0.76 | | | | N/A | |
S&P Target Date 2040 Index | | | | | | | | | | | | | | | 0.44 | | | | N/A | |
| | | | | |
1290 Retirement 2045 - Class I | | | 02/27/2017 | | | | | | | | | | | | 0.40 | | | | N/A | |
Lipper Mixed-Asset Target 2045 Funds | | | | | | | | | | | | | | | 0.88 | | | | N/A | |
S&P Target Date 2045 Index | | | | | | | | | | | | | | | 0.47 | | | | N/A | |
| | | | | |
1290 Retirement 2050 - Class I | | | 02/27/2017 | | | | | | | | | | | | 0.50 | | | | N/A | |
Lipper Mixed-Asset Target 2050 Funds | | | | | | | | | | | | | | | 0.80 | | | | N/A | |
S&P Target Date 2050 Index | | | | | | | | | | | | | | | 0.50 | | | | N/A | |
| | | | | |
1290 Retirement 2055 - Class I | | | 02/27/2017 | | | | | | | | | | | | 0.50 | | | | N/A | |
Lipper Mixed-Asset Target 2055+ Funds | | | | | | | | | | | | | | | 0.91 | | | | N/A | |
S&P Target Date 2055 Index | | | | | | | | | | | | | | | 0.52 | | | | N/A | |
| | | | | |
1290 Retirement 2060 - Class I | | | 02/27/2017 | | | | | | | | | | | | 0.50 | | | | N/A | |
Lipper Mixed-Asset Target 2055+ Funds | | | | | | | | | | | | | | | 0.91 | | | | N/A | |
S&P Target Date 2060+ Index | | | | | | | | | | | | | | | 0.54 | | | | N/A | |
205
Federal Income Tax Information (Unaudited)
| | | | | | | | | | | | | | | | |
Funds: | | 70% Dividend
Received
Deduction | | | Foreign
Taxes | | | Foreign
Source Income | | | Long Term
Capital Gain | |
1290 Convertible Securities | | | 0.00 | % | | $ | — | | | $ | — | | | $ | — | |
1290 DoubleLine Dynamic Allocation | | | 1.33 | | | | — | | | | — | | | | 1,542 | |
1290 GAMCO Small/Mid Cap Value | | | 85.57 | | | | — | | | | — | | | | 59,267 | |
1290 Global Talents | | | 0.00 | | | | — | | | | — | | | | — | |
1290 High Yield Bond | | | 0.00 | | | | — | | | | — | | | | — | |
1290 Low Volatility Global Equity | | | 0.00 | | | | — | | | | — | | | | — | |
1290 Multi-Alternative Strategies | | | 0.00 | | | | — | | | | — | | | | 6,435 | |
1290 Retirement 2020 | | | 0.00 | | | | — | | | | — | | | | — | |
1290 Retirement 2025 | | | 0.00 | | | | — | | | | — | | | | — | |
1290 Retirement 2030 | | | 0.00 | | | | — | | | | — | | | | — | |
1290 Retirement 2035 | | | 0.00 | | | | — | | | | — | | | | — | |
1290 Retirement 2040 | | | 0.00 | | | | — | | | | — | | | | — | |
1290 Retirement 2045 | | | 0.00 | | | | — | | | | — | | | | — | |
1290 Retirement 2050 | | | 0.00 | | | | — | | | | — | | | | — | |
1290 Retirement 2055 | | | 0.00 | | | | — | | | | — | | | | — | |
1290 Retirement 2060 | | | 0.00 | | | | — | | | | — | | | | — | |
1290 SmartBeta Equity | | | 89.81 | | | | — | | | | — | | | | — | |
1290 Unconstrained Bond Managers | | | 0.00 | | | | — | | | | — | | | | — | |
206
MANAGEMENT OF THE TRUST (UNAUDITED)
The Trust’s Board is responsible for the overall management of the Trust and the Funds, including general supervision and review of the Funds’ investment activities and their conformity with federal and state law as well as the stated policies of the Funds. The Board elects the officers of the Trust who are responsible for administering the Trust’s day-to-day operations. The Trustees of the Trust are identified in the table below along with information as to their principal business occupations held during the last five years and certain other information are shown below.
The Trustees
| | | | | | | | | | |
Name, Address and
Year of Birth | | Position(s) Held
With Fund | | Term of Office**
and Length of
Time Served | | Principal Occupation(s)
During Past 5 Years | | Number of
Portfolios
in Fund
Complex
Overseen
by Trustee† | | Other Directorships
Held by Trustee During Past 5 Years |
| Interested Trustees |
Steven M. Joenk* 1290 Avenue of the Americas, New York, New York
(1958) | | Trustee, President and Chief Executive Officer | | From October 1, 2017 to present, Trustee, President and Chief Executive Officer and from June 9, 2014 through September 2017, and Chairman of the Board from June 9, 2014 through September 2017 | | From May 2011 to present, Director, President, Chief Executive Officer and Chairman, FMG LLC; from September 1999 to present, Managing Director, AXA Equitable; from September 2004 to April 2011, President, AXA Equitable’s Funds Management Group (“FMG”) unit; from July 2004 to October 1, 2013, Senior Vice President, MONY Life Insurance Company; from July 2004 to present, Senior Vice President, MONY Life Insurance Company of America and Director, MONY Capital Management, Inc., Director and President, 1740 Advisers, Inc.; Director, Chairman of the Board and President, MONY Asset Management, Inc. and Enterprise Capital Management (from July 2004 to January 2011); from January 2005 to January 2011, Director, MONY Financial Resources of Americas Limited; and from November 2005 to present, Director MONY International Holdings, LLC. | | 121 | | None. |
| * | Affiliated with the Adviser and/or the Distributor. |
207
| | | | | | | | | | |
Name, Address and
Year of Birth | | Position(s) Held
With Fund | | Term of Office**
and Length of
Time Served | | Principal Occupation(s)
During Past 5 Years | | Number of
Portfolios
in Fund
Complex
Overseen
by Trustee† | | Other Directorships
Held by Trustee |
| Independent Trustees |
Mark A. Barnard c/o 1290 Funds 1290 Avenue of the Americas New York, New York 10104 (1949) | | Trustee | | From February 27, 2017 to present | | From 1995 to 1998, Manager of Private Investments, from 1998 to 2001, Director of Private Investments, and from 2001 to present, Managing Director — Private Investments, Howard Hughes Medical Institute; from 1985 to 1992, Assistant Director of Real Estate, and from 1992 to 1995, Associate Director of Real Estate, Massachusetts Institute of Technology. | | 121 | | None. |
Thomas W. Brock c/o 1290 Funds 1290 Avenue of the Americas, New York, New York 10104 (1949) | | Trustee | | From January 1, 2016 to present | | From June 2016 to May 2017, Director and President and Chief Executive Officer and from January 2016 to June 2016, Director and interim President and Chief Executive Officer, Silver Bay Realty Trust Corp.; from 2006 to 2012, Chief Executive Officer and Co-Founder of Stone Harbor Investment Partners. | | 121 | | From December 2012 to January, 2016, Lead Independent Director, Audit Committee Member and Compensation Committee Chair, Silver Bay Realty Trust Corp.; from 2016 to present, Chair and from 2005 to present, Director and Audit Committee Member, Liberty All- Star Funds (2); and from 2006 to 2012, Director, Stone Harbor Investment Funds (5). |
Donald E. Foley c/o 1290 Funds 1290 Avenue of the Americas, New York, New York 10104 (1951) | | Trustee | | From June 9, 2014 to present | | From 2010 to 2011, Chairman of the Board and Chief Executive Officer, Wilmington Trust Corporation; from 1996 to 2010, Senior Vice President, Treasurer and Director of Tax ITT Corporation; from 1989 to 1996, Assistant Treasurer, International Paper Company. | | 121 | | From 2011 to 2012, Director, and from 2012 to 2016, Advisory Committee Member, M&T Corporation; from
2007 to 2011, Director and member of the Audit Committee and Compensation Committee, Wilmington Trust Corporation; from 2008 to 2010, Advisory Board member, Northern Trust Company and Goldman Sachs Management Groups; from 2015 to present, Director, BioSig Technologies Inc.; and from 2015 to present, Director, Wilmington Funds. |
208
| | | | | | | | | | |
Name, Address and
Year of Birth | | Position(s) Held
With Fund | | Term of Office**
and Length of
Time Served | | Principal Occupation(s)
During Past 5 Years | | Number of
Portfolios
in Fund
Complex
Overseen
by Trustee† | | Other Directorships
Held by Trustee |
| Independent Trustees (Continued) |
Christopher P.A. Komisarjevsky c/o 1290 Funds 1290 Avenue of the Americas, New York, New York 10104 (1945) | | Trustee | | From June 9, 2014 to present | | From 2006 to 2008, Senior Counselor for APCO Worldwide® (global communications consulting) and a member of its International Advisory Council; from 1998 to 2005, President and Chief Executive Officer, Burson-Marsteller Worldwide (public relations); from 1996 to 1998, President and Chief Executive Officer of Burson-Marsteller U.S.A. | | 121 | | None. |
H. Thomas McMeekin c/o 1290 Funds 1290 Avenue of the Americas, New York, New York 10104 (1953) | | Trustee | | From June 9, 2014 to present | | From 2015 to present, CEO of Blue Key Services, LLC; from 2000 to present, Managing Partner and Founder of Griffin Investments, LLC; from 2009 to 2012, Chief Investment Officer, AIG Life & Retirement and United Guaranty Corporation and Senior Managing Director of AIG Asset Management. | | 121 | | From 2015 to present, Director, Blue Key Services LLC; From 2012 to present, Director Achaean Financial Group; from 2011 to 2012, Director US Life Insurance Company in the City of New York. |
Gloria D. Reeg c/o 1290 Funds 1290 Avenue of the Americas New York, New York 10104 (1951) | | Trustee | | From February 27, 2017 to present | | From 2007 to 2016, Chief Investment Officer and Senior Vice President, New York-Presbyterian Hospital; from 2005 to 2007, Trustee and Treasurer, Casey Family Programs (foundation); from 2002 to 2004, Global Head of Fixed Income and Executive Director, Principal Global Investors (asset management firm); from 1992 to 2000, Managing Director — Global Consulting, Russell Investment Group. | | 121 | | None. |
Gary S. Schpero c/o 1290 Funds 1290 Avenue of the Americas, New York, New York 10104 (1953) | | Chairman of the Board | | From June 9, 2014 to present, Independent Trustee; from October 1, 2017 to present, Chairman of the Board and from June 9, 2014 through September 2017, Lead Independent Trustee | | Prior to January 1, 2000, Partner of Simpson Thacher & Bartlett (law firm) and Managing Partner of the Investment Management and Investment Company Practice Group. | | 121 | | From May 2012 to present, Trustee, Blackstone/GSO Senior Floating Rate Term Fund and Blackstone/GSO Long–Short Credit Income Fund; from October 2012 to present, Trustee, Blackstone/GSO Strategic Credit Fund; from September 2017 to present, Trustee, Blackstone/GSO Floating Rate Enhanced Income Fund. |
209
| | | | | | | | | | |
Name, Address and
Year of Birth | | Position(s) Held
With Fund | | Term of Office**
and Length of
Time Served | | Principal Occupation(s)
During Past 5 Years | | Number of
Portfolios
in Fund
Complex
Overseen
by Trustee† | | Other Directorships
Held by Trustee |
| Independent Trustees (Continued) |
Kenneth L. Walker c/o 1290 Funds 1290 Avenue of the Americas, New York, New York 10104 (1952) | | Trustee | | From June 9, 2014 to present | | From May 2002 to March 2016, Partner and from March 2016 to present, employee, The Capital Management Corporation (investment advisory firm). | | 121 | | None. |
Caroline L. Williams c/o 1290 Funds 1290 Avenue of the Americas, New York, New York 10104 (1946) | | Trustee | | From June 9, 2014 to present | | From July 2010 to December 2012, Executive Vice President, from May 2005 to December 2007, Consultant and from May 2001 to May 2005, Chief Financial and Investment Officer, Nathan Cummings Foundation (non-profit organization); from 1988 to 1992, Managing Director, from 1982 to 1988, Senior Vice President, from 1978 to 1982, Vice President and from 1971 to 1976, Associate, Donaldson, Lufkin & Jenrette Securities Corporation (investment bank); and from 1997 to 2009, Director, Hearst-Argyle Television. | | 121 | | None. |
| ** | Each Trustee serves during the existence of the Trust until the next meeting of shareholders called for the purpose of electing Trustees and until the election and qualification of his or her successor or, if sooner, until he or she dies, declines to serve, resigns, retires, is removed, is incapacitated or is otherwise unable or unwilling to serve. Each Independent Trustee shall retire from the Board as of the last day of the calendar year in which he or she attains the age of 75 years. |
| † | The registered investment companies in the fund complex include AXA Premier VIP Trust, 1290 Funds and the Trust. Mr. Joenk serves as Trustee, President and Chief Executive Officer for each of the registered investment companies in the fund complex. |
Additional information about the Trustees is available in the Funds’ Statement of Additional Information, which can be obtained, without charge, by calling 1-888-310-0416.
210
The Trust’s Officers
No officer of the Trust receives any compensation paid by the Trust. Each officer of the Trust is an employee of AXA Equitable, FMG LLC, and/or AXA Distributors, LLC (“AXA Distributors”). The Trust’s principal officers are:
| | | | | | |
Name, Address and
Year of Birth | | Position(s) Held
With Fund* | | Term of Office
and Length of
Time Served** | | Principal Occupation(s)
During Past 5 Years |
| Officers |
Steven M. Joenk 1290 Avenue of the Americas, New York, New York 10104 (1958) | | Trustee, President and Chief Executive Officer | | Trustee, President and Chief Executive Officer from June 10, 2014 to present; Chairman of the Board from June 10, 2014 through September 2017 | | From May 2011 to present, Director, President, Chief Executive Officer and Chairman, FMG LLC; from September 1999 to present, Managing Director, AXA Equitable; from September 2004 to April 2011, President, AXA Equitable’s FMG; from July 2004 to October 1, 2013, Senior Vice President, MONY Life Insurance Company; from July 2004 to present, Senior Vice President, MONY Life Insurance Company of America and Director, MONY Capital Management, Inc., Director and President, 1740 Advisers, Inc.; Director, Chairman of the Board and President, MONY Asset Management, Inc. and Enterprise Capital Management (from July 2004 to January 2011); from January 2005 to January 2011, Director, MONY Financial Resources of Americas Limited; and from November 2005 to present, Director, MONY International Holdings, LLC. |
Patricia Louie, Esq. 1290 Avenue of the Americas, New York, New York 10104 (1955) | | Senior Vice President, Chief Legal Officer and Secretary | | From June 10, 2014 to present | | From June 2012 to present, Executive Vice President and General Counsel of FMG LLC; from May 2011 to June 2012, Senior Vice President and Corporate Counsel of FMG LLC; from February 2011 to present Managing Director and Associate General Counsel of AXA Financial and AXA Equitable; from May 2003 to February 2011, Vice President and Associate General Counsel of AXA Financial and AXA Equitable. |
Brian Walsh Newport Center, 525 Washington Boulevard, 30th Floor, Jersey City, New Jersey 07310-1606 (1968) | | Chief Financial Officer and Treasurer | | From June 10, 2014 to present | | From May 2011 to present, Senior Vice President of FMG LLC; from February 2003 to present, Lead Director of AXA Equitable. |
Kenneth Kozlowski 1290 Avenue of the Americas New York, New York 10104 (1961) | | Senior Vice President and Chief Investment Officer | | From June 10, 2014 to present | | From June 2012 to present, Executive Vice President and Chief Investment Officer of FMG LLC; from May 2011 to June 2012, Senior Vice President of FMG LLC; from September 2011 to present, Managing Director of AXA Financial and AXA Equitable; from February 2001 to September 2011, Vice President AXA Financial and AXA Equitable; from July 2004 to January 2011, Director, Enterprise Capital Management, Inc. |
Alwi Chan 1290 Avenue of the Americas, New York, New York 10104 (1974) | | Vice President and Deputy Chief Investment Officer | | From June 10, 2014 to present | | From June 2012 to present, Senior Vice President and Deputy Chief Investment Officer of FMG LLC; from May 2011 to June 2012, Vice President of FMG LLC; from February 2007 to present, Lead Director, AXA Equitable. |
James Kelly Newport Center, 525 Washington Boulevard, 30th Floor, Jersey City, New Jersey 07310-1606 (1968) | | Controller | | From June 10, 2014 to present | | From May 2011 to present, Vice President of FMG LLC; from September 2008 to present, Senior Director of AXA Equitable; from March 2006 to September 2008, Assistant Vice President, AXA Equitable. |
211
| | | | | | |
Name, Address and
Year of Birth | | Position(s) Held
With Fund* | | Term of Office
and Length of
Time Served** | | Principal Occupation(s)
During Past 5 Years |
| Officers (Continued) |
Mary E. Cantwell 1290 Avenue of the Americas, New York, New York 10104 (1961) | | Vice President | | From June 10, 2014 to present | | From June 2012 to present, Senior Vice President of FMG LLC; from February 2011 to present, member of Board of Directors of FMG LLC; from May 2011 to June 2012, Vice President of FMG LLC; from February 2001 to present, Lead Director, AXA Equitable; from July 2004 to January 2011, a Director of Enterprise Capital Management, Inc. |
Roselle Ibanga Newport Center, 525 Washington Boulevard, 30th Floor, Jersey City, New Jersey 07310-1606 (1978) | | Assistant Controller | | From June 10, 2014 to present | | From February 2009 to present, Director of AXA Equitable. |
Lisa Perrelli Newport Center, 525 Washington Boulevard, 30th Floor, Jersey City, New Jersey 07310-1606 (1974) | | Assistant Controller | | From June 10, 2014 to present | | From November 2012 to present, Senior Director of AXA Equitable; from September 2008 to November 2012, Assistant Vice President of AXA Equitable. |
Anthony Geron, Esq. 1290 Avenue of the Americas, New York, New York 10104 (1971) | | Vice President and Assistant Secretary | | From June 10, 2014 to present | | From August 2015 to present, Senior Vice President, Secretary and Associate General Counsel of FMG LLC and Lead Director and Associate General Counsel of AXA Equitable; from June 2014 to August 2015, Vice President, Assistant Secretary and Associate General Counsel of FMG LLC; from May 2014 to August 2015, Senior Director and Counsel of AXA Equitable; and from October 2007 to May 2014, Associate of Willkie Farr & Gallagher LLP. |
Kiesha T. Astwood-Smith, Esq. 1290 Avenue of the Americas, New York, New York 10104 (1973) | | Vice President and Assistant Secretary | | From September
2015 to present | | From December 2015 to present, Vice President, Assistant Secretary and Associate General Counsel of FMG LLC; from September 2015 to present, Senior Director and Counsel of AXA Equitable. From July 2006 to September 2015, Counsel of The Bank of New York Mellon; and from January 2010 to September 2015, Vice President and Assistant Secretary of the Dreyfus Family of Funds. |
Joseph J. Paolo 1290 Avenue of the Americas, New York, New York 10104 (1970) | | Chief Compliance Officer and Vice President | | From June 10, 2014 to present | | From May 2011 to present, Senior Vice President and Chief Compliance Officer of FMG LLC; from June 2007 to present, Lead Director of AXA Equitable and Chief Compliance Officer of AXA Equitable’s FMG. |
Carla Byer 1290 Avenue of the Americas, New York, New York 10104 (1976) | | Vice President | | From June 2017 to present | | From April 2017 to present, Vice President of FMG LLC; from April 2014 through August 2016, Senior Vice President, Zealot Networks; from September 2008 through April 2012, Vice President of FMG LLC. |
Patricia Cox 1290 Avenue of the Americas, New York, New York 10104 (1958) | | Vice President and Anti-Money Laundering Compliance Officer | | From June 10, 2014 to present | | From June 2014 to present, Vice President of FMG LLC; from April 2014 to present, Senior Director of AXA Equitable; from March 2009 through September 2010, Operations Consultant for Wells Real Estate Funds; from October 2010 through March 2014, Director of Transfer Agent Operations, Wells Real Estate Funds; and from August 2004 through August 2008, Senior VP of Operations, AXA Enterprise Group of Funds. |
Richard Guinnessey 1290 Avenue of the Americas, New York, New York 10104 (1963) | | Vice President | | From June 10, 2014 to present | | From June 2012 to present, Vice President of FMG LLC; from September 2010 to present Senior Director of AXA Equitable; from November 2005 to September 2010, Assistant Vice President of AXA Equitable. |
Miao Hu 1290 Avenue of the Americas, New York, New York 10104 (1978) | | Vice President | | From June 15, 2016 to present | | From December 2014 to present, Director of Portfolio Analytics of FMG LLC; from November 2013 to December 2014, Lead Manager of Portfolio Analytics of FMG LLC; from January 2011 to November 2013, Financial Services Sector Specialist of FactSet Research Systems. |
212
| | | | | | |
Name, Address and
Year of Birth | | Position(s) Held
With Fund* | | Term of Office
and Length of
Time Served** | | Principal Occupation(s)
During Past 5 Years |
| Officers (Continued) |
Michal Levy 1290 Avenue of the Americas, New York, New York 10104 (1979) | | Vice President | | From June 15, 2016 to present | | From December 2014 to present, member of the Board of Directors; from March 2017 to present, Senior Vice President and Chief Operating Officer of FMG LLC; from June 2014 to March 2017, Vice President of FMG LLC; from October 2013 to present, Senior Director and Chief Operating Officer of FMG LLC; from October 2011 to October 2013, Assistant Vice President of AXA Equitable; and from October 2008 to October 2011, Vice President of Portfolio Valuation at Duff & Phelps. |
Xavier Poutas 1290 Avenue of the Americas, New York, New York 10104 (1977) | | Vice President | | From June 15, 2016 to present | | From May 2011 to present, Assistant Portfolio Manager of FMG LLC; from September 2013 to present, Senior Director of AXA Equitable; and from November 2008 to August 2013, Director of AXA Equitable. |
Helen Lai 1290 Avenue of the Americas, New York, New York 10104 (1973) | | Assistant Vice President | | From June 15, 2016 to present | | From March 2013 to present, Pricing and Valuation- Compliance of FMG LLC and Senior Manager, AXA Equitable; and from May 2009 to December 2012, HSBC, Hedge Fund Investor Services. |
Jennifer Mastronardi 1290 Avenue of the Americas, New York, New York 10104 (1985) | | Assistant Vice President | | From June 10, 2014 to present | | From February 2009 to present, Director of AXA Equitable; from June 2007 to February 2009, Operations Associate in Managed Futures Department, Morgan Stanley. |
Helen Espaillat 1290 Avenue of the Americas, New York, New York 10104 (1963) | | Assistant Secretary | | From June 10, 2014 to present | | From July 2004 to present, Lead Manager/Legal Assistant for AXA Equitable and from March 2015 to present, Assistant Vice President and Assistant Secretary of FMG LLC. |
Faria Adam 1290 Avenue of the Americas, New York, New York 10104 (1968) | | Assistant Secretary | | From March 3, 2016 to present | | From May 2015 to present, Lead Manager/Legal Assistant of AXA Equitable; and from 1999 to 2015, Supervisory Paralegal at The Dreyfus Corporation, Bank of New York Mellon. |
Lorelei Fajardo 1290 Avenue of the Americas, New York, New York 10104 (1978) | | Assistant Secretary | | From June 15, 2016 to present | | From July 2013 to present, Senior Manager/Legal Assistant of AXA Equitable; from July 2008 to June 2013, Lead Associate/Legal Assistant of AXA Equitable. |
Kathleen Chapman 1290 Avenue of the Americas, New York, New York 10104 (1954) | | Assistant Secretary | | From June 10, 2014 to present | | From April 2014 to present, Lead Manager/ Senior Legal Assistant of AXA Equitable; from March 2011 to April 2014 Mutual Funds Regulatory Manager of GE Asset Management Incorporated and from 2005 to March 2011 Vice President and Senior Paralegal of Allianz Global Investors of America L.P. |
| * | The officers in the table above (except Ms. Cox) hold similar positions with other registered investment companies in the fund complex. The registered investment companies in the fund complex include the Trust, AXA Premier VIP Trust and EQ Advisors Trust. |
| ** | Each officer is elected on an annual basis. |
213
PROXY VOTING POLICIES AND PROCEDURES (UNAUDITED)
A description of the policies and procedures that the Funds use to determine how to vote proxies relating to portfolio securities is available (i) without charge, upon request, by calling a toll-free number at 1-888-310-0416 and (ii) on the Securities and Exchange Commission’s website at http://www.sec.gov. Information regarding how the Funds voted proxies relating to portfolio securities during the most recent 12-month period ended June 30 is available without charge (i) on the Trust’s website at www.1290Funds.com and (ii) on the Securities and Exchange Commission’s website at http://www.sec.gov.
QUARTERLY PORTFOLIO HOLDINGS INFORMATION (UNAUDITED)
The Funds file their complete schedules of portfolio holdings with the Securities and Exchange Commission for the first and third quarters of each fiscal year on Form N-Q. The Funds’ Forms N-Q are available on the Securities and Exchange Commission’s website at http://www.sec.gov. You may also review and obtain copies at the Securities and Exchange Commission’s Public Reference Room in Washington, D.C. Information about the Public Reference Room may be obtained by calling 1-800-SEC-0330.
214
| | |
Visit the Funds’ Website: 1290Funds.com | |  |
| | |
| Must be accompanied or preceded by a Prospectus. 1290 Funds are distributed by ALPS Distributors, Inc. | | DFS#468022 |

AXA Equitable Life Insurance Company
As of the end of the period covered by this report, the registrant has adopted a “code of ethics,” as defined in Item 2, that applies to the registrant’s principal executive officer, principal financial officer, principal accounting officer or controller, or persons performing similar functions. A copy of the registrant’s code of ethics is filed as an exhibit pursuant to Item 12(a)(1).
| Item 3. | Audit Committee Financial Expert. |
The registrant’s board of trustees has determined that Donald E. Foley, Kenneth L. Walker and Caroline L. Williams serve on its audit committee as “audit committee financial experts” as defined in Item 3. Ms. Williams and Messrs. Foley and Walker are considered to be “independent” for purposes of Item 3(a)(2).
| Item 4. | Principal Accountant Fees and Services. |
(a) Audit Fees for fiscal year 2017: $457,231 and fiscal year 2016: $229,712.
(b) Audit-Related Fees for fiscal year 2017: $26,150 and fiscal year 2016: $16,735.
(c) Tax Fees for fiscal year 2017: $112,889 and fiscal year 2016: $91,186.
Tax fees include amounts related to tax compliance, tax advice and tax planning.
(d) All Other Fees for fiscal year 2017: $0 and fiscal year 2016: $0.
All other fees include amounts related to consultation on or review of the registrant’s various regulatory filings.
(e)(1) The registrant’s audit committee has adopted policies and procedures relating to pre-approval of services performed by the registrant’s principal accountant for the registrant. Audit, audit-related and tax services provided to the registrant on an annual basis require pre-approval by the entire audit committee. In the event that the audit fees exceed the pre-approved estimated amount, the audit committee’s delegate, consisting of the audit committee chair, lead independent trustee, the registrant’s chief executive officer and chief financial officer, acting by at least two of such individuals, has the authority to increase the amount by up to 10% of the pre-approved amount. Any additional amount requires pre-approval by the entire audit committee. The audit committee chair or the lead independent trustee also has the authority to approve de minimis non-audit services (i.e., services in which the fee does not exceed $10,000 per engagement) to be provided by the registrant’s principal accountant for the registrant, provided that each such service is brought to the attention of the audit committee prior to the completion of the audit of the registrant’s financial statements.
(e)(2) None of the services included in (b) – (d) above were approved by the audit committee pursuant to paragraph (c)(7)(i)(C) of Rule 2-01 of Regulation S-X.
(f) Not applicable.
(g) For fiscal year 2017: $6,017,545 and fiscal year 2016: $5,534,709.
(h) The registrant’s audit committee has considered and determined that the provision of non-audit services that were rendered to the registrant’s investment adviser (not including any sub-advisers whose role is primarily portfolio management and is subcontracted with or overseen by another investment adviser), and any entity controlling, controlled by, or under common control with the investment adviser that provides ongoing services to the registrant that were not pre-approved pursuant to paragraph (c)(7)(ii) of Rule 2-01 of Regulation S-X is compatible with maintaining the principal accountant’s independence.
| Item 5. | Audit Committee of Listed Registrants. |
Not applicable.
| Item 6. | Schedule of Investments. |
The Schedule of Investments is included as part of the annual report to Shareholders filed under Item 1 of this Form N-CSR.
| Item 7. | Disclosure of Proxy Voting Policies and Procedures for Closed-End Management Investment Companies. |
Not applicable.
| Item 8. | Portfolio Managers of Closed-End Management Investment Companies |
Not applicable.
| Item 9. | Purchases of Equity Securities by Closed-End Management Investment Company and Affiliated Purchasers. |
Not applicable.
| Item 10. | Submission of Matters to a Vote of Security Holders. |
There have been no material changes to the procedures by which shareholders may recommend nominees to the registrant’s board of trustees.
| Item 11. | Controls and Procedures. |
| (a) | The registrant’s principal executive and principal financial officers, or persons performing similar functions, have concluded that the registrant’s disclosure controls and procedures (as defined in Rule 30a-3(c) under the Investment Company Act of 1940, as amended (the “1940 |
| | Act”)) are effective as of a date within 90 days of the filing of this report that includes the disclosure required by this paragraph, based on the evaluation of these controls and procedures required by Rule 30a-3(b) under the 1940 Act and Rule 15d-15(b) under the Securities Exchange Act of 1934, as amended. |
| (b) | The registrant’s certifying officers are not aware of any changes in the registrant’s internal control over financial reporting (as defined in Rule 30a-3(d) under the 1940 Act) that occurred during the registrant’s second fiscal quarter of the period covered by this report that has materially affected, or is reasonably likely to materially affect, the registrant’s internal control over financial reporting. |
(a)(1) The Code of Ethics for Senior Officers of the Registrant is filed herewith.
(a)(2) Certifications pursuant to Section 302 of the Sarbanes-Oxley Act of 2002 are filed herewith.
(b) Certifications pursuant to Section 906 of the Sarbanes-Oxley Act of 2002 are filed herewith.
SIGNATURES
Pursuant to the requirements of the Securities Exchange Act of 1934 and the Investment Company Act of 1940, the registrant has duly caused this report to be signed on its behalf by the undersigned, thereunto duly authorized.
| | |
| |
| By: | | /s/ Steven M. Joenk |
| | Steven M. Joenk |
| | President and Chief Executive Officer |
| | December 28, 2017 |
Pursuant to the requirements of the Securities Exchange Act of 1934 and the Investment Company Act of 1940, this report has been signed below by the following persons on behalf of the registrant and in the capacities and on the dates indicated.
| | | | |
/s/ Steven M. Joenk | | | | |
| Steven M. Joenk | | | | |
| President and Chief Executive Officer | | | | |
| December 28, 2017 | | | | |
| | |
/s/ Brian E. Walsh | | | | |
| Brian E. Walsh | | | | |
| Chief Financial Officer | | | | |
| December 28, 2017 | | | | |