UNITED STATES
SECURITIES AND EXCHANGE COMMISSION
Washington, D.C. 20549
FORM N-CSR
CERTIFIED SHAREHOLDER REPORT OF REGISTERED
MANAGEMENT INVESTMENT COMPANIES
Investment Company Act File Number 811-22959
1290 FUNDS
(Exact name of registrant as specified in charter)
1290 Avenue of the Americas
New York, New York 10104
(Address of principal executive offices)
PATRICIA LOUIE, ESQ.
Executive Vice President and General Counsel
AXA Equitable Funds Management Group, LLC
1290 Avenue of the Americas
New York, New York 10104
(Name and Address of Agent for Service)
Copies to:
MARK C. AMOROSI, ESQ.
K&L Gates LLP
1601 K Street N.W.
Washington, D.C. 20006
Registrant’s telephone number, including area code: (212) 554-1234
Date of fiscal year end: October 31
Date of reporting period: October 31, 2015
| Item 1. | Reports to Stockholders. |
The following is a copy of the report transmitted to shareholders pursuant to Rule 30e-1 under the Investment Company Act of 1940 (17 CFR 270.30e-1).

Annual Report
October 31, 2015
1290 Funds Annual Report
October 31, 2015
Table of Contents
Overview
Market Overview for the Year Ended October 31, 2015
Economy
Early in the period, global economic growth continued at a slow and uneven pace. In late 2014, plunging oil prices appeared to rattle the credit markets, pressured emerging-market currencies and added to deflationary pressures in Europe and Japan. Early in 2015, global deflation fears appeared gradually to recede as oil prices firmed and the outlook for growth appeared to brighten, particularly for developed economies. After a slow start to the year, the U.S. economy continued to show signs of strength early in 2015. Beginning in May markets seemed captivated by events in Greece, where the debt crisis worsened sharply, and China, where equity markets had a tumultuous second quarter and policymakers expanded their easing efforts. While investors initially appeared to expect the U.S. Federal Reserve to increase the federal funds rate towards the end of 2015, an economic slowdown materializing in China, and a higher level of global currency volatility following changes in the Chinese yuan peg prompted the Federal Reserve to hold rates at current levels during its September meeting.
Fixed Income
Beginning in 2014, bond markets turned more volatile, apparently in reaction to growth trends and monetary policies in the world’s biggest economies heading in different directions. The U.S. Treasury yield curve flattened in 2014, and the 10-year U.S. Treasury ended the year roughly 0.86% below where it started. The high yield market, represented by the BofA Merrill Lynch U.S. High Yield Master II Index, posted negative total returns in the fourth quarter of 2014. Experts believe that returns in the high yield market were largely impacted by the sharp drop in oil prices in the second half of 2014, as the energy sector, a large proportion of the high-yield market, sharply underperformed the broader market. In the first half of 2015, global deflation fears appeared gradually to recede. Over the first six months of the year, global interest rates rose and yield curves steepened, while risk assets such as equities, high yield and emerging markets ended the period on a weaker note. During the third quarter, yields initially moved slightly lower, but as worries of a slowing world economy persisted, bonds that trade at a yield spread compared to U.S. Treasuries came under pressure and all spread sectors underperformed. The declining yield backdrop coupled with slowing economy concerns allowed longer maturity bonds to perform the best.
U.S. Equity
Twelve months ago, the U.S. economy was among the few globally that appeared to produce clear, self-sustaining growth, and this positive economic data, coupled with strong corporate earnings, combined to produce squarely positive U.S. equity returns in 2014. The first half of 2015 saw a complete turnaround. U.S. stocks experienced a difficult period, selling off in the first quarter as lower oil prices punished the energy sector and market participants digested the negative impact of a stronger dollar on the earnings of large global exporting companies. Uncertainties about the fitful pace of the U.S. recovery, the strength of the U.S. dollar and the path of U.S. interest rates kept U.S. stocks in a tight trading range throughout the second quarter. In the third quarter, the continuing slowdown in China’s economic growth became a bigger source of investor anxiety after Chinese stocks began to slide in July, and market participants appeared to fear that the economic slowdown was deepening. Such growth headwinds led to sharp losses across U.S. equity markets, with the large-cap S&P 500® Index producing its worst quarterly decline since 2011, the small-cap Russell 2000® Index dropping nearly twice as much, and the broad market Russell 3000® Index falling around the same amount as the large-cap benchmark.
International Equity
At the end of 2014, the divergence in global central bank policies became a major theme in equity markets and the strong appreciation in the U.S. dollar pressured commodity prices. Oil prices in particular plunged as a global supply-and-demand imbalance materialized. While lower prices were harmful to economies that rely heavily on oil exports, international stocks rebounded in early 2015 to provide strong returns through April. However, global sentiment seemed to shift around May, as Greece’s debt troubles dominated headlines. Global equity markets saw their steepest declines in several years in the third quarter of 2015 as concerns around the Chinese economy and U.S. monetary policy intensified and the MSCI World (Net) Index fell. Volatility also returned with a vengeance as investors confronted an increasingly uncertain outlook for global growth. Although all major markets ended lower in local currency terms, developing country stock indices were particularly hard hit, especially those exposed to continued falls in commodity prices.
Source: AXA Equitable-Funds Management Group, LLC doing business as 1290 Asset Managers®, as of 10/31/15.
This Information is provided for general information only and is not intended to provide specific advice or recommendations for any individual investor.
PAST PERFORMANCE IS NO GUARANTEE OF FUTURE RESULTS. No Investment is risk-free. International securities carry additional risks including currency exchange fluctuation and different government regulations, economic conditions or accounting standards. Smaller company stocks involve a greater risk than is customarily associated with more established companies. Bond Investments are subject to interest rate risk so that when interest rates rise, the price of bonds can decrease and the investor can lose principal value. High Yield bonds are subject to a high degree of credit and market risk. Index performance is shown for illustrative purposes only. You cannot invest directly in an index.
2
NOTES ON PERFORMANCE (Unaudited)
Total Returns
Performance of the 1290 Funds as shown on the following pages compares each Fund’s performance to that of a broad-based securities index. Each of the Fund’s rates of return is net of investment advisory fees and expenses of the Fund. Each of the 1290 Funds has a separate investment objective it seeks to achieve by following a separate investment policy. There is no guarantee that these objectives will be attained. The objectives and policies of each Fund will affect its return and its risk. Keep in mind that past performance is not an indication of future results.
Growth of $10,000 Investment
The charts shown on the following pages illustrate the total value of an assumed investment in Class I shares of each Fund of the 1290 Funds. The periods illustrated are from the inception dates shown through October 31, 2015. These results assume reinvestment of dividends and capital gains distributions. The total value shown for each Fund reflects management fees and operating expenses of the Funds and 12b-1 fees which are applicable to Class A, Class C and Class R shares. 12b-1 fees are not applicable to Class I shares. Results should not be considered representative of future gains or losses.
Current and future holdings are subject to risk. Holdings subject to change.
The Benchmarks
Broad-based securities indices are unmanaged and are not subject to fees and expenses typically associated with actively-managed funds. An investment cannot be made directly in a broad-based securities index. Comparisons with these benchmarks, therefore, are of limited use. They are included because they are widely known and may help you to understand the universe of securities from which each Fund is likely to select its holdings.
BofA Merrill Lynch 3-Month U.S. Treasury Bill Index is an index which measures the returns of negotiable debt obligations issued by the U.S. government and backed by its full faith and credit, having a maturity of three months.
BofA Merrill Lynch All U.S. Convertibles Index consists of convertible bonds traded in the U.S. dollar denominated investment grade and non investment grade convertible securities sold into the U.S. market and publicly traded in the United States. The Index constituents are market value weighted based on the convertible securities prices and outstanding shares, and the underlying index is rebalanced daily.
BofA Merrill Lynch U.S. High Yield Master II Index is an index which tracks the performance of U.S. dollar denominated below investment grade corporate debt publicly issued in the U.S. domestic market. Qualifying securities must have at least 18 months to final maturity at the time of issuance, at least one year remaining term to final maturity as of the rebalancing date, a fixed coupon schedule and a minimum amount outstanding of $100 million. It is capitalization-weighted.
BofA Merrill Lynch U.S. Dollar 3-Month LIBOR Constant Maturity Index is an index which tracks the performance of a synthetic asset paying the London interbank offered rate (LIBOR) to a stated maturity. The index is based on the assumed purchase at par of a synthetic instrument having exactly its stated maturity and with a coupon equal to that day’s fixing rate. That issue is assumed to be sold the following business day (priced at a yield equal to the current day fixing rate) and rolled into a new instrument.
The Morgan Stanley Capital International (MSCI) World Growth Index captures large- and mid-cap securities exhibiting overall growth style characteristics across 23 developed markets.
MSCI World (Net) Index is a free float-adjusted market capitalization weighted index that is designed to measure the equity market performance of the 24 developed markets.
MSCI World Small Cap Index captures small-cap representation across 23 Developed Markets.
The MSCI World Value Index captures large- and mid-cap securities exhibiting overall value style characteristics across 23 developed markets.
Russell 2000® Index is an unmanaged index which measures the performance of approximately 2000 of the smallest companies in the Russell 3000® Index, which represents approximately 10% of the total market capitalization of the Russell 3000® Index. It is market-capitalization weighted.
Russell 2500™ Value Index is an unmanaged index which contains those Russell 2500 securities (the bottom 500 securities in the Russell 1000® Index and all 2,000 securities in the Russell 2000® Index) with a less-than-average growth orientation. Securities in this index tend to exhibit lower price-to-book and price-earnings ratios, higher dividend yields and lower forecasted growth values than the growth universe.
Russell 3000® Index measures the performance of the 3,000 largest U.S. companies based on total market capitalization, which represents approximately 98% of the investable U.S. equity market. It is market-capitalization weighted.
S&P 500® Index is a weighted index of common stocks of 500 leading companies in leading industries of the U.S. economy, capturing 75% coverage of U.S. equities. The index is capitalization weighted, thereby giving greater weight to companies with the largest market capitalizations.
3
1290 CONVERTIBLE SECURITIES FUND (Unaudited)
INVESTMENT ADVISER
INVESTMENT SUB-ADVISER
| Ø | | Palisade Capital Management, LLC |
PERFORMANCE RESULTS
| | | | | | |
| Total Returns as of 10/31/15 | | | |
| | | | | Since
Incept. | |
Fund – Class A Shares* | | without Sales Charge | | | (4.08 | )% |
| | | with Sales Charge (a) | | | (8.38 | ) |
Fund – Class I Shares* | | | | | (4.00 | ) |
Fund – Class R Shares* | | | | | (4.16 | ) |
BofA Merrill Lynch All U.S. Convertibles Index | | | | | (3.41 | ) |
* Date of inception 7/6/15. (a) A 4.50% front-end sales charge was deducted. Returns for periods less than one year are not annualized. | |
The performance quoted is past performance and is not a guarantee of future results. Mutual funds are subject to certain market risks. Investment returns and principal value of an investment will fluctuate so that an investor’s shares, when redeemed, may be worth more or less than their original cost. Current performance may be higher or lower than the performance data shown. For the most current month-end performance data please call 1-888-310-0416 or visit www.1290Funds.com.
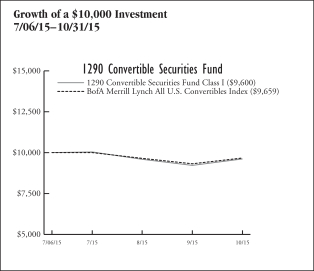
The graph illustrates comparative performance for $10,000 invested in the Class I Shares of the 1290 Convertible Securities Fund and the BofA Merrill Lynch All U.S. Convertibles Index from 7/06/15 to 10/31/15. The performance of the BofA Merrill Lynch All U.S. Convertibles Index reflects an initial investment at the end of the month closest to the Fund’s inception. The performance of the Fund assumes reinvestment of all dividends and capital gain distributions, if any, and does not include a sales charge. The performance of the BofA Merrill Lynch All U.S. Convertibles Index does not reflect the deduction of expenses or a sales charge associated with a mutual fund and has been adjusted to reflect reinvestment of all dividends, capital gain distributions, and interest of the securities included in the benchmark.
Fund performance may reflect the waiver of the Fund’s fees and reimbursement of expenses for certain periods since the inception date. Without these waivers and reimbursements, performance would have been lower. Also, performance shown in this section does not reflect the deduction of taxes that a shareholder would pay on Fund distributions or redemption of Fund shares.
PERFORMANCE SUMMARY
The Fund’s Class I shares returned (4.00)% for the period ended October 31, 2015. The Fund’s benchmark, the BofA Merrill Lynch All U.S. Convertibles Index, returned (3.41)% over the same period.
Fund Overview — Palisade Capital Management, LLC
During the period July 6, 2015 through October 31, 2015, U.S. convertibles witnessed increased volatility as global growth concerns emerged amidst a rout in commodities and ongoing uncertainty regarding the direction of U.S. monetary policy. While convertibles performed as expected in terms of downside capture, the underlying equities of convertibles declined more than both the S&P 500® Index and the Russell 2000® Index. Convertibles were negatively impacted by controversial headlines on drug pricing and biotech, leading to profit-taking across a previously resilient health care sector. Meanwhile, the energy and materials sectors continued to exhibit weakness.
As a result of recent declines, the average price within the U.S. convertibles universe has retreated closer to par. The average price as a percentage of par value is near its lowest since the end of 2011. At these levels, we view convertibles as offering a very attractive potential risk/reward tradeoff.
After a strong start at the beginning of the year, convertible new issuance has more recently suffered from the summer doldrums and increased volatility. We would expect new convertible issuance to reaccelerate as interest rates still remain low and equity markets remain elevated (albeit down from recent highs).
Fund Highlights
What helped performance since inception through October 31, 2015:
| • | | An underweight to the energy sector provided a benefit to performance compared to the benchmark. Energy remains an area of weakness as oversupply concerns persist. |
| • | | Strong selection in the financial sector was a positive contributor. The relative safety of highly rated convertible preferred securities with good yields offered capital protection during a period of equity volatility. Returns were aided by overweight positions in Huntington Bancshares Inc., Wells Fargo Co., and KeyCorp preferred securities. |
| • | | Within the industrials sector, not owning Wesco International, Inc. was a positive, as investors fretting about a slowing economy sold off industrial companies. |
What hurt performance since inception through October 31, 2015:
| • | | Health care continued to be a challenging sector as both an overweighted allocation and weak stock selection negatively impacted results. With the potential for increased government scrutiny of drug pricing, investors took the opportunity to take profits in what had been one of the strongest sectors year-to-date. |
| • | | Weak stock selection among technology stocks was a detractor from results. An overweighted position in SunEdison, Inc. was a headwind as concerns about an overly complex capital structure led to a sharp decline. |
| | | | |
Fund Characteristics
As of October 31, 2015 | | | |
30 Day SEC Yield (Class I) | | | 0.61 | % |
30 Day Unsubsidized Yield (Class I) | | | (1.25 | )% |
4
1290 CONVERTIBLE SECURITIES FUND (Unaudited)
| | | | |
Sector Weightings
as of October 31, 2015 | | % of
Net Assets | |
Information Technology | | | 30.0 | % |
Health Care | | | 24.7 | |
Financials | | | 15.5 | |
Consumer Discretionary | | | 12.8 | |
Industrials | | | 6.0 | |
Telecommunication Services | | | 2.4 | |
Consumer Staples | | | 1.7 | |
Energy | | | 0.9 | |
Materials | | | 0.7 | |
Utilities | | | 0.4 | |
Cash and Other | | | 4.9 | |
| | | | | |
| | | | 100.0 | % |
| | | | | |
Holdings are subject to change without notice. | | | | |
UNDERSTANDING YOUR EXPENSES:
As a shareholder of the Fund, you incur two types of costs:
(1) transaction costs, including applicable sales charges and redemption fees; and (2) ongoing costs, including investment advisory fees, distribution and/or service (12b-1) fees (in the case of Class A, Class C and Class R shares of the Trust), and other Fund expenses. These examples are intended to help you understand your ongoing costs (in dollars) of investing in the Fund and to compare these costs with the ongoing costs of investing in other mutual funds.
The examples are based on an investment of $1,000 invested at the beginning of the six-month period ended October 31, 2015 and held for the entire six-month period.
Actual Expenses
The first line of the following table provides information about actual account values and actual expenses. You may use the information in this line, together with the amount you invested, to estimate the expenses that you paid over the period. Simply divide your account value by $1,000 (for example, an $8,600 account value divided by $1,000 = 8.6), then multiply the result by the number in the first line under the heading entitled ‘‘Expenses Paid During Period’’ to estimate the expenses you paid on your account during this period.
Hypothetical Example for Comparison Purposes
The second line of the following table provides information about hypothetical account values and hypothetical expenses based on the Fund’s actual expense ratio and an assumed rate of return of 5% per year before expenses, which is not the Fund’s actual return. The hypothetical account values and expenses may not be used to estimate the actual ending account balance or expenses you paid for the period. You may use this information to compare the ongoing costs of investing in the Fund and other funds. To do so, compare this 5% hypothetical example with the 5% hypothetical examples that appear in the shareholder reports of the other funds.
Please note that the expenses shown in the table are meant to highlight your ongoing costs only and do not reflect any transactional costs, such as sales charges (loads), redemption fees, or exchange fees. Therefore, the second line of the table is useful in comparing ongoing costs only, and will not help you determine the relative total costs of owning different funds. In addition, if these transactional costs were included, your costs would have been higher.
Please note that while the Fund Commenced Operations on July 6, 2015, the ‘Hypothetical Expenses Paid during the period’ reflect projected activity for the full six months for the purpose of comparability.
EXAMPLE
| | | | | | | | | | | | |
| | | Beginning
Account
Value
5/1/15† | | | Ending
Account
Value
10/31/15 | | | Expenses
Paid
During
Period*
5/1/15 -
10/31/15 | |
Class A | |
Actual | | | $1,000.00 | | | | $959.22 | | | | $4.07 | |
Hypothetical (5% average annual return before expenses) | | | 1,000.00 | | | | 1,018.67 | | | | 6.60 | |
Class I | | | | | | | | | | | | |
Actual | | | 1,000.00 | | | | 959.98 | | | | 3.30 | |
Hypothetical (5% average annual return before expenses) | | | 1,000.00 | | | | 1,019.91 | | | | 5.35 | |
Class R | | | | | | | | | | | | |
Actual | | | 1,000.00 | | | | 958.45 | | | | 4.87 | |
Hypothetical (5% average annual return before expenses) | | | 1,000.00 | | | | 1,017.39 | | | | 7.88 | |
† Commenced operations on July 6, 2015. * Expenses are equal to the Fund’s Class A, I and R shares annualized expense ratios of 1.30%, 1.05% and 1.55%, respectively, multiplied by the average account value over the period, and multiplied by 184/365 for the hypothetical example (to reflect the one-half year period), and multiplied by 117/365 for the actual example (to reflect the actual number of days in the period). | |
5
1290 FUNDS
1290 CONVERTIBLE SECURITIES FUND
PORTFOLIO OF INVESTMENTS
October 31, 2015
| | | | | | | | |
| | | Principal
Amount | | | Value
(Note 1) | |
| | | | | | | | |
LONG-TERM DEBT SECURITIES: | |
Convertible Bonds (72.7%) | |
Consumer Discretionary (12.8%) | |
Automobiles (2.2%) | | | | | | | | |
Fiat Chrysler Automobiles N.V.
Series FCAU
7.875%, 12/15/16 | | $ | 290,000 | | | $ | 356,700 | |
Tesla Motors, Inc. | | | | | | | | |
1.500%, 6/1/18 | | | 40,000 | | | | 69,250 | |
| | | | | | | | |
| | | | | | | 425,950 | |
| | | | | | | | |
Household Durables (3.3%) | | | | | | | | |
CalAtlantic Group, Inc. | | | | | | | | |
1.625%, 5/15/18 | | | 200,000 | | | | 265,125 | |
Jarden Corp. | | | | | | | | |
1.875%, 9/15/18 | | | 180,000 | | | | 268,875 | |
Lennar Corp. | | | | | | | | |
3.250%, 11/15/21§ | | | 45,000 | | | | 95,935 | |
| | | | | | | | |
| | | | | | | 629,935 | |
| | | | | | | | |
Internet & Catalog Retail (2.7%) | | | | | | | | |
HomeAway, Inc. | | | | | | | | |
0.125%, 4/1/19 | | | 94,000 | | | | 90,005 | |
Priceline Group, Inc. | | | | | | | | |
1.000%, 3/15/18 | | | 273,000 | | | | 433,217 | |
| | | | | | | | |
| | | | | | | 523,222 | |
| | | | | | | | |
Media (3.4%) | | | | | | | | |
Liberty Interactive LLC | | | | | | | | |
0.750%, 3/30/43 | | | 175,000 | | | | 278,031 | |
1.000%, 9/30/43§ | | | 143,951 | | | | 132,885 | |
Liberty Media Corp. | | | | | | | | |
1.375%, 10/15/23 | | | 190,000 | | | | 194,394 | |
Live Nation Entertainment, Inc. | | | | | | | | |
2.500%, 5/15/19 | | | 56,000 | | | | 60,410 | |
| | | | | | | | |
| | | | | | | 665,720 | |
| | | | | | | | |
Specialty Retail (1.2%) | | | | | | | | |
GNC Holdings, Inc. | | | | | | | | |
1.500%, 8/15/20§ | | | 82,000 | | | | 67,240 | |
Restoration Hardware Holdings, Inc. | | | | | | | | |
(Zero Coupon), 6/15/19§ | | | 160,000 | | | | 169,200 | |
| | | | | | | | |
| | | | | | | 236,440 | |
| | | | | | | | |
Total Consumer Discretionary | | | | | | | 2,481,267 | |
| | | | | | | | |
Energy (0.4%) | | | | | | | | |
Oil, Gas & Consumable Fuels (0.4%) | | | | | |
Cheniere Energy, Inc. | | | | | |
4.250%, 3/15/45 | | | 120,000 | | | | 74,325 | |
| | | | | | | | |
Total Energy | | | | | | | 74,325 | |
| | | | | | | | |
Financials (4.7%) | | | | | | | | |
Capital Markets (0.1%) | | | | | |
Walter Investment Management Corp. | | | | | |
4.500%, 11/1/19 | | | 30,000 | | | | 21,488 | |
| | | | | | | | |
Diversified Financial Services (0.5%) | | | | | |
Horizon Pharma Investment Ltd. | | | | | |
2.500%, 3/15/22§ | | | 125,000 | | | | 107,656 | |
| | | | | | | | |
| | | | | | | | |
Insurance (1.0%) | | | | | | | | |
Fidelity National Financial, Inc. | | | | | | | | |
4.250%, 8/15/18 | | $ | 100,000 | | | $ | 195,437 | |
| | | | | | | | |
Real Estate Investment Trusts (REITs) (3.1%) | | | | | |
Colony Capital, Inc. | | | | | |
5.000%, 4/15/23 | | | 65,000 | | | | 64,472 | |
iStar, Inc. | | | | | | | | |
3.000%, 11/15/16 | | | 150,000 | | | | 176,437 | |
Starwood Property Trust, Inc. | | | | | | | | |
3.750%, 10/15/17 | | | 200,000 | | | | 198,375 | |
4.000%, 1/15/19 | | | 50,000 | | | | 51,156 | |
Starwood Waypoint Residential Trust | | | | | | | | |
4.500%, 10/15/17 | | | 100,000 | | | | 102,438 | |
| | | | | | | | |
| | | | | | | 592,878 | |
| | | | | | | | |
Total Financials | | | | | | | 917,459 | |
| | | | | | | | |
Health Care (20.0%) | | | | | | | | |
Biotechnology (8.9%) | | | | | | | | |
Acorda Therapeutics, Inc. | | | | | | | | |
1.750%, 6/15/21 | | | 65,000 | | | | 69,062 | |
AMAG Pharmaceuticals, Inc. | | | | | | | | |
2.500%, 2/15/19 | | | 33,000 | | | | 53,584 | |
ARIAD Pharmaceuticals, Inc. | | | | | | | | |
3.625%, 6/15/19§ | | | 82,000 | | | | 85,946 | |
BioMarin Pharmaceutical, Inc. | | | | | | | | |
0.750%, 10/15/18 | | | 85,000 | | | | 119,425 | |
1.500%, 10/15/20 | | | 120,000 | | | | 174,150 | |
Cepheid, Inc. | | | | | | | | |
1.250%, 2/1/21 | | | 163,000 | | | | 146,089 | |
Clovis Oncology, Inc. | | | | | | | | |
2.500%, 9/15/21 | | | 83,000 | | | | 148,881 | |
Emergent BioSolutions, Inc. | | | | | | | | |
2.875%, 1/15/21 | | | 38,000 | | | | 46,693 | |
Gilead Sciences, Inc. | | | | | | | | |
1.625%, 5/1/16 | | | 50,000 | | | | 238,750 | |
Immunomedics, Inc. | | | | | | | | |
4.750%, 2/15/20§ | | | 35,000 | | | | 28,394 | |
Incyte Corp. | | | | | | | | |
0.375%, 11/15/18 | | | 35,000 | | | | 80,762 | |
1.250%, 11/15/20 | | | 75,000 | | | | 174,797 | |
Ironwood Pharmaceuticals, Inc. | | | | | | | | |
2.250%, 6/15/22§ | | | 114,000 | | | | 106,661 | |
Isis Pharmaceuticals, Inc. | | | | | | | | |
1.000%, 11/15/21§ | | | 100,000 | | | | 99,813 | |
Merrimack Pharmaceuticals, Inc. | | | | | | | | |
4.500%, 7/15/20 | | | 75,000 | | | | 125,297 | |
TESARO, Inc. | | | | | | | | |
3.000%, 10/1/21 | | | 14,000 | | | | 21,306 | |
| | | | | | | | |
| | | | | | | 1,719,610 | |
| | | | | | | | |
Health Care Equipment & Supplies (2.4%) | | | | | |
HeartWare International, Inc. | | | | | |
1.750%, 12/15/21§ | | | 70,000 | | | | 56,919 | |
Hologic, Inc. | | | | | | | | |
2.000%, 12/15/37 (e) | | | 55,000 | | | | 93,741 | |
Insulet Corp. | | | | | | | | |
2.000%, 6/15/19 | | | 60,000 | | | | 57,525 | |
Integra LifeSciences Holdings Corp. | | | | | | | | |
1.625%, 12/15/16 | | | 115,000 | | | | 136,634 | |
See Notes to Financial Statements.
6
1290 FUNDS
1290 CONVERTIBLE SECURITIES FUND
PORTFOLIO OF INVESTMENTS (Continued)
October 31, 2015
| | | | | | | | |
| | | Principal
Amount | | | Value
(Note 1) | |
| | | | | | | | |
NuVasive, Inc. | | | | | | | | |
2.750%, 7/1/17 | | $ | 48,000 | | | $ | 60,270 | |
Wright Medical Group, Inc. | | | | | | | | |
2.000%, 2/15/20§ | | | 58,000 | | | | 54,810 | |
| | | | | | | | |
| | | | | | | 459,899 | |
| | | | | | | | |
Health Care Providers & Services (4.2%) | | | | | |
Anthem, Inc. | | | | | |
2.750%, 10/15/42 | | | 175,000 | | | | 329,109 | |
Brookdale Senior Living, Inc. | | | | | | | | |
2.750%, 6/15/18 | | | 55,000 | | | | 57,269 | |
HealthSouth Corp. | | | | | | | | |
2.000%, 12/1/43 | | | 148,000 | | | | 161,227 | |
Molina Healthcare, Inc. | | | | | | | | |
1.125%, 1/15/20 | | | 120,000 | | | | 191,475 | |
Trinity Biotech Investment Ltd. | | | | | | | | |
4.000%, 4/1/45§ | | | 100,000 | | | | 86,563 | |
| | | | | | | | |
| | | | | | | 825,643 | |
| | | | | | | | |
Life Sciences Tools & Services (0.9%) | | | | | | | | |
Illumina, Inc. | | | | | | | | |
0.250%, 3/15/16 | | | 70,000 | | | | 119,525 | |
Sequenom, Inc. | | | | | | | | |
5.000%, 1/1/18 | | | 60,000 | | | | 49,350 | |
| | | | | | | | |
| | | | | | | 168,875 | |
| | | | | | | | |
Pharmaceuticals (3.6%) | | | | | | | | |
Jazz Investments I Ltd. | | | | | | | | |
1.875%, 8/15/21 | | | 120,000 | | | | 127,275 | |
Medicines Co. | | | | | | | | |
1.375%, 6/1/17 | | | 53,000 | | | | 71,119 | |
Pacira Pharmaceuticals, Inc. | | | | | | | | |
3.250%, 2/1/19 | | | 70,000 | | | | 146,081 | |
Teva Pharmaceutical Finance Co. LLC | | | | | | | | |
0.250%, 2/1/26 | | | 175,000 | | | | 248,719 | |
Theravance, Inc. | | | | | | | | |
2.125%, 1/15/23 | | | 136,000 | | | | 98,515 | |
| | | | | | | | |
| | | | | | | 691,709 | |
| | | | | | | | |
| | |
Total Health Care | | | | | | | 3,865,736 | |
| | | | | | | | |
Industrials (4.8%) | | | | | | | | |
Air Freight & Logistics (1.0%) | | | | | | | | |
Atlas Air Worldwide Holdings, Inc. | | | | | | | | |
2.250%, 6/1/22 | | | 33,000 | | | | 27,782 | |
Echo Global Logistics, Inc. | | | | | | | | |
2.500%, 5/1/20 | | | 73,000 | | | | 68,802 | |
XPO Logistics, Inc. | | | | | | | | |
4.500%, 10/1/17 | | | 60,000 | | | | 104,325 | |
| | | | | | | | |
| | | | | | | 200,909 | |
| | | | | | | | |
Airlines (1.6%) | | | | | | | | |
AirTran Holdings, Inc. | | | | | | | | |
5.250%, 11/1/16 | | | 100,000 | | | | 313,750 | |
| | | | | | | | |
Construction & Engineering (0.1%) | | | | | | | | |
Dycom Industries, Inc. | | | | | | | | |
0.750%, 9/15/21§ | | | 20,000 | | | | 20,775 | |
| | | | | | | | |
Machinery (1.1%) | | | | | | | | |
Greenbrier Cos., Inc. | | | | | | | | |
3.500%, 4/1/18 | | | 90,000 | | | | 107,719 | |
| | | | | | | | |
Trinity Industries, Inc. | | | | | | | | |
3.875%, 6/1/36 | | $ | 80,000 | | | $ | 103,300 | |
| | | | | | | | |
| | | | | | | 211,019 | |
| | | | | | | | |
Professional Services (0.6%) | | | | | | | | |
Huron Consulting Group, Inc. | | | | | | | | |
1.250%, 10/1/19 | | | 130,000 | | | | 120,656 | |
| | | | | | | | |
Transportation Infrastructure (0.4%) | | | | | | | | |
Macquarie Infrastructure Corp. | | | | | | | | |
2.875%, 7/15/19 | | | 60,000 | | | | 69,713 | |
| | | | | | | | |
| | |
Total Industrials | | | | | | | 936,822 | |
| | | | | | | | |
Information Technology (30.0%) | | | | | | | | |
Communications Equipment (3.1%) | | | | | | | | |
CalAmp Corp. | | | | | | | | |
1.625%, 5/15/20§ | | | 60,000 | | | | 58,237 | |
Ciena Corp. | | | | | | | | |
3.750%, 10/15/18§ | | | 150,000 | | | | 206,062 | |
4.000%, 12/15/20 | | | 140,000 | | | | 199,238 | |
Palo Alto Networks, Inc. | | | | | | | | |
(Zero Coupon), 7/1/19 | | | 60,000 | | | | 92,813 | |
Viavi Solutions, Inc. | | | | | | | | |
0.625%, 8/15/33 | | | 50,000 | | | | 47,531 | |
| | | | | | | | |
| | | | | | | 603,881 | |
| | | | | | | | |
Electronic Equipment, Instruments & Components (0.6%) | | | | | |
TTM Technologies, Inc. | | | | | | | | |
1.750%, 12/15/20 | | | 65,000 | | | | 62,319 | |
Vishay Intertechnology, Inc. | | | | | | | | |
2.250%, 11/15/40 | | | 50,000 | | | | 43,562 | |
| | | | | | | | |
| | | | | | | 105,881 | |
| | | | | | | | |
Internet Software & Services (4.4%) | | | | | | | | |
Cornerstone OnDemand, Inc. | | | | | | | | |
1.500%, 7/1/18 | | | 150,000 | | | | 147,750 | |
LinkedIn Corp. | | | | | | | | |
0.500%, 11/1/19§ | | | 150,000 | | | | 162,844 | |
Twitter, Inc. | | | | | | | | |
0.250%, 9/15/19 | | | 125,000 | | | | 110,781 | |
VeriSign, Inc. | | | | | | | | |
4.297%, 8/15/37 | | | 100,000 | | | | 237,375 | |
Yahoo!, Inc. | | | | | | | | |
(Zero Coupon), 12/1/18 | | | 190,000 | | | | 189,644 | |
| | | | | | | | |
| | | | | | | 848,394 | |
| | | | | | | | |
IT Services (0.3%) | | | | | | | | |
Cardtronics, Inc. | | | | | | | | |
1.000%, 12/1/20 | | | 65,000 | | | | 61,588 | |
| | | | | | | | |
Semiconductors & Semiconductor Equipment (11.5%) | | | | | |
Microchip Technology, Inc. | | | | | | | | |
1.625%, 2/15/25§ | | | 97,000 | | | | 100,577 | |
2.125%, 12/15/37 | | | 95,000 | | | | 186,378 | |
Micron Technology, Inc. | | | | | | | | |
2.375%, 5/1/32 | | | 90,000 | | | | 161,662 | |
3.000%, 11/15/43 | | | 400,000 | | | | 362,000 | |
Novellus Systems, Inc. | | | | | | | | |
2.625%, 5/15/41 | | | 180,000 | | | | 409,837 | |
NXP Semiconductors N.V. | | | | | | | | |
1.000%, 12/1/19§ | | | 155,000 | | | | 166,044 | |
See Notes to Financial Statements.
7
1290 FUNDS
1290 CONVERTIBLE SECURITIES FUND
PORTFOLIO OF INVESTMENTS (Continued)
October 31, 2015
| | | | | | | | |
| | | Principal
Amount | | | Value
(Note 1) | |
| | | | | | | | |
ON Semiconductor Corp. | | | | | | | | |
1.000%, 12/1/20§ | | $ | 120,000 | | | $ | 117,900 | |
2.625%, 12/15/26 | | | 215,000 | | | | 257,194 | |
Spansion LLC | | | | | | | | |
2.000%, 9/1/20 | | | 27,000 | | | | 52,971 | |
SunEdison, Inc. | | | | | | | | |
2.000%, 10/1/18 | | | 14,000 | | | | 10,640 | |
0.250%, 1/15/20§ | | | 250,000 | | | | 132,344 | |
2.750%, 1/1/21 | | | 60,000 | | | | 42,150 | |
Xilinx, Inc. | | | | | | | | |
2.625%, 6/15/17 | | | 135,000 | | | | 222,581 | |
| | | | | | | | |
| | | | | | | 2,222,278 | |
| | | | | | | | |
Software (7.9%) | | | | | | | | |
Citrix Systems, Inc. | | | | | | | | |
0.500%, 4/15/19 | | | 150,000 | | | | 170,625 | |
Electronic Arts, Inc. | | | | | | | | |
0.750%, 7/15/16 | | | 40,000 | | | | 90,200 | |
FireEye, Inc. | | | | | | | | |
1.000%, 6/1/35§ | | | 148,000 | | | | 128,020 | |
1.625%, 6/1/35§ | | | 35,000 | | | | 29,509 | |
Proofpoint, Inc. | | | | | | | | |
1.250%, 12/15/18 | | | 12,000 | | | | 22,140 | |
0.750%, 6/15/20§ | | | 30,000 | | | | 33,637 | |
PROS Holdings, Inc. | | | | | | | | |
2.000%, 12/1/19§ | | | 80,000 | | | | 79,850 | |
Rovi Corp. | | | | | | | | |
0.500%, 3/1/20§ | | | 60,000 | | | | 44,775 | |
Salesforce.com, Inc. | | | | | | | | |
0.250%, 4/1/18 | | | 340,000 | | | | 440,937 | |
ServiceNow, Inc. | | | | | | | | |
(Zero Coupon), 11/1/18 | | | 70,000 | | | | 87,106 | |
Synchronoss Technologies, Inc. | | | | | | | | |
0.750%, 8/15/19 | | | 95,000 | | | | 96,841 | |
Take-Two Interactive Software, Inc. | | | | | | | | |
1.750%, 12/1/16 | | | 143,000 | | | | 250,876 | |
Verint Systems, Inc. | | | | | | | | |
1.500%, 6/1/21 | | | 60,000 | | | | 60,563 | |
| | | | | | | | |
| | | | | | | 1,535,079 | |
| | | | | | | | |
Technology Hardware, Storage & Peripherals (2.2%) | | | | | |
Electronics For Imaging, Inc. | | | | | | | | |
0.750%, 9/1/19 | | | 65,000 | | | | 69,266 | |
SanDisk Corp. | | | | | | | | |
1.500%, 8/15/17 | | | 227,000 | | | | 362,065 | |
| | | | | | | | |
| | | | | | | 431,331 | |
| | | | | | | | |
Total Information Technology | | | | | | | 5,808,432 | |
| | | | | | | | |
Total Convertible Bonds | | | | | | | 14,084,041 | |
| | | | | | | | |
Total Long-Term Debt Securities (72.7%)
(Cost $14,764,600) | | | | | | | 14,084,041 | |
| | | | | | | | |
| | | Number of
Shares | | | Value
(Note 1) | |
CONVERTIBLE PREFERRED STOCKS: | | | | | |
Consumer Staples (1.7%) | | | | | | | | |
Food Products (1.7%) | | | | | | | | |
Tyson Foods, Inc. | | | | | | | | |
4.750% | | | 6,150 | | | | 321,953 | |
| | | | | | | | |
Total Consumer Staples | | | | | | | 321,953 | |
| | | | | | | | |
| | | | | | | | |
Energy (0.5%) | | | | | | | | |
Oil, Gas & Consumable Fuels (0.5%) | | | | | |
Southwestern Energy Co. | | | | | | | | |
6.250% | | | 3,064 | | | $ | 85,915 | |
| | | | | | | | |
Total Energy | | | | | | | 85,915 | |
| | | | | | | | |
Financials (10.8%) | | | | | | | | |
Banks (7.9%) | | | | | | | | |
Bank of America Corp. | | | | | | | | |
7.250% | | | 225 | | | | 248,625 | |
Huntington Bancshares, Inc./Ohio | | | | | | | | |
8.500% | | | 350 | | | | 469,000 | |
KeyCorp | | | | | | | | |
7.750% | | | 1,350 | | | | 173,812 | |
Wells Fargo & Co. | | | | | | | | |
7.500% | | | 550 | | | | 651,750 | |
| | | | | | | | |
| | | | | | | 1,543,187 | |
| | | | | | | | |
Real Estate Investment Trusts (REITs) (2.9%) | | | | | | | | |
Crown Castle International Corp. | | | | | | | | |
4.500% | | | 2,500 | | | | 265,675 | |
Welltower, Inc. | | | | | | | | |
6.500% | | | 1,779 | | | | 105,157 | |
Weyerhaeuser Co. | | | | | | | | |
6.375% | | | 3,695 | | | | 185,452 | |
| | | | | | | | |
| | | | | | | 556,284 | |
| | | | | | | | |
Total Financials | | | | | | | 2,099,471 | |
| | | | | | | | |
Health Care (4.7%) | | | | | | | | |
Health Care Equipment & Supplies (0.8%) | | | | | |
Alere, Inc. | | | | | | | | |
3.000% | | | 500 | | | | 160,750 | |
| | | | | | | | |
Health Care Providers & Services (0.7%) | | | | | |
Anthem, Inc. | | | | | | | | |
5.250% | | | 2,880 | | | | 134,035 | |
| | | | | | | | |
Pharmaceuticals (3.2%) | | | | | | | | |
Allergan plc | | | | | | | | |
5.500% | | | 583 | | | | 610,185 | |
| | | | | | | | |
Total Health Care | | | | | | | 904,970 | |
| | | | | | | | |
Industrials (1.2%) | |
Commercial Services & Supplies (0.2%) | | | | | |
Stericycle, Inc. | | | | | | | | |
5.250% | | | 330 | | | | 30,763 | |
| | | | | | | | |
Machinery (1.0%) | | | | | | | | |
Stanley Black & Decker, Inc. | | | | | | | | |
6.250% | | | 1,700 | | | | 204,102 | |
| | | | | | | | |
Total Industrials | | | | | | | 234,865 | |
| | | | | | | | |
Materials (0.7%) | | | | | | | | |
Metals & Mining (0.7%) | | | | | | | | |
Alcoa, Inc. | | | | | | | | |
5.375% | | | 4,400 | | | | 139,172 | |
| | | | | | | | |
Total Materials | | | | | | | 139,172 | |
| | | | | | | | |
Telecommunication Services (2.4%) | | | | | | | | |
Diversified Telecommunication Services (1.2%) | | | | | |
Frontier Communications Corp. | | | | | | | | |
11.125% | | | 2,305 | | | | 228,494 | |
| | | | | | | | |
See Notes to Financial Statements.
8
1290 FUNDS
1290 CONVERTIBLE SECURITIES FUND
PORTFOLIO OF INVESTMENTS (Continued)
October 31, 2015
| | | | | | | | |
| | | Number of
Shares | | | Value
(Note 1) | |
| | | | | | | | |
Wireless Telecommunication Services (1.2%) | | | | | |
T-Mobile U.S., Inc. | | | | | | | | |
5.500% | | | 3,677 | | | $ | 244,484 | |
| | | | | | | | |
Total Telecommunication Services | | | | | | | 472,978 | |
| | | | | | | | |
Utilities (0.4%) | | | | | | | | |
Electric Utilities (0.4%) | | | | | | | | |
NextEra Energy, Inc. | | | | | | | | |
5.799% | | | 1,400 | | | | 77,028 | |
| | | | | | | | |
Total Utilities | | | | | | | 77,028 | |
| | | | | | | | |
Total Convertible Preferred Stocks (22.4%)
(Cost $4,482,918) | | | | | | | 4,336,352 | |
| | | | | | | | |
Total Investments (95.1%)
(Cost $19,247,518) | | | | | | | 18,420,393 | |
Other Assets Less Liabilities (4.9%) | | | | | | | 954,474 | |
| | | | | | | | |
Net Assets (100%) | | | | | | $ | 19,374,867 | |
| | | | | | | | |
| § | Securities exempt from registration under Rule 144A of the Securities Act of 1933. These securities may only be resold to qualified institutional buyers. At October 31, 2015, the market value of these securities amounted to $2,372,596 or 12.2% of net assets. Securities denoted with “§” but without “b” have been determined to be liquid under the guidelines established by the Board of Trustees. To the extent any securities might provide a right to demand registration, such rights have not been relied upon when determining liquidity. |
| (e) | Step Bond—Coupon rate increases in increments to maturity. Rate disclosed is as of October 31, 2015. Maturity date disclosed is the ultimate maturity date. |
The following is a summary of the inputs used to value the Fund’s assets and liabilities carried at fair value as of October 31, 2015:
The inputs or methodology used for valuing securities are not necessarily an indication of the risk associated with investing in those securities.
Various inputs are used in determining the value of the Fund’s investments. These inputs are summarized in the three broad levels listed below:
| | | | | | | | | | | | | | | | |
| | | | | |
| Investment Type | | Level 1
Quoted Prices in
Active Markets for
Identical
Securities | | | Level 2
Significant Other
Observable Inputs
(including quoted prices
for similar securities,
interest rates,
prepayment speeds,
credit risk, etc.) | | | Level 3
Significant Unobservable
Inputs (including the
Fund’s own
assumptions in
determining the fair
value of investments) | | | Total | |
Assets: | | | | | | | | | | | | | | | | |
Convertible Bonds | | | | | | | | | | | | | | | | |
Consumer Discretionary | | $ | 356,700 | | | $ | 2,124,567 | | | $ | — | | | $ | 2,481,267 | |
Energy | | | — | | | | 74,325 | | | | — | | | | 74,325 | |
Financials | | | — | | | | 917,459 | | | | — | | | | 917,459 | |
Health Care | | | — | | | | 3,865,736 | | | | — | | | | 3,865,736 | |
Industrials | | | — | | | | 936,822 | | | | — | | | | 936,822 | |
Information Technology | | | — | | | | 5,808,432 | | | | — | | | | 5,808,432 | |
Convertible Preferred Stocks | | | | | | | | | | | | | | | | |
Consumer Staples | | | 321,953 | | | | — | | | | — | | | | 321,953 | |
Energy | | | 85,915 | | | | — | | | | — | | | | 85,915 | |
Financials | | | 1,925,659 | | | | 173,812 | | | | — | | | | 2,099,471 | |
Health Care | | | 904,970 | | | | — | | | | — | | | | 904,970 | |
Industrials | | | 234,865 | | | | — | | | | — | | | | 234,865 | |
Materials | | | 139,172 | | | | — | | | | — | | | | 139,172 | |
Telecommunication Services | | | 472,978 | | | | — | | | | — | | | | 472,978 | |
Utilities | | | 77,028 | | | | — | | | | — | | | | 77,028 | |
| | | | | | | | | | | | | | | | |
Total Assets | | $ | 4,519,240 | | | $ | 13,901,153 | | | $ | — | | | $ | 18,420,393 | |
| | | | | | | | | | | | | | | | |
Total Liabilities | | $ | — | | | $ | — | | | $ | — | | | $ | — | |
| | | | | | | | | | | | | | | | |
Total | | $ | 4,519,240 | | | $ | 13,901,153 | | | $ | — | | | $ | 18,420,393 | |
| | | | | | | | | | | | | | | | |
There were no transfers between Levels 1, 2 or 3 during the period ended October 31, 2015.
See Notes to Financial Statements.
9
1290 FUNDS
1290 CONVERTIBLE SECURITIES FUND
PORTFOLIO OF INVESTMENTS (Continued)
October 31, 2015
The Fund held no derivatives contracts during the period ended October 31, 2015.
Investment security transactions for the period ended October 31, 2015 were as follows:
| | | | |
Cost of Purchases: | | | | |
Long-term investments other than U.S. government debt securities | | $ | 19,901,495 | |
Net Proceeds of Sales and Redemptions: | | | | |
Long-term investments other than U.S. government debt securities | | $ | 1,042,268 | |
As of October 31, 2015, the gross unrealized appreciation (depreciation) of investments based on the aggregate cost of investments for Federal income tax purposes was as follows:
| | | | |
Aggregate gross unrealized appreciation | | $ | 516,558 | |
Aggregate gross unrealized depreciation | | | (1,377,350 | ) |
| | | | |
Net unrealized depreciation | | $ | (860,792 | ) |
| | | | |
Federal income tax cost of investments | | $ | 19,281,185 | |
| | | | |
See Notes to Financial Statements.
10
1290 FUNDS
1290 CONVERTIBLE SECURITIES FUND
STATEMENT OF ASSETS AND LIABILITIES
October 31, 2015
| | | | |
ASSETS | | | | |
Investments at value (Cost $19,247,518) | | $ | 18,420,393 | |
Cash | | | 909,183 | |
Dividends, interest and other receivables | | | 82,306 | |
Receivable for securities sold | | | 29,009 | |
Deferred offering cost | | | 18,618 | |
Receivable from investment adviser | | | 16,401 | |
Receivable for Fund shares sold | | | 2,858 | |
| | | | |
Total assets | | | 19,478,768 | |
| | | | |
LIABILITIES | | | | |
Dividends payable | | | 28,697 | |
Payable for securities purchased | | | 8,300 | |
Transfer agent fees payable | | | 3,099 | |
Trustees’ fees payable | | | 139 | |
Distribution fees payable – Class A | | | 43 | |
Distribution fees payable – Class R | | | 40 | |
Payable for Fund shares redeemed | | | 35 | |
Accrued expenses | | | 63,548 | |
| | | | |
Total liabilities | | | 103,901 | |
| | | | |
NET ASSETS | | $ | 19,374,867 | |
| | | | |
Net assets were comprised of: | | | | |
Paid in capital | | $ | 20,251,287 | |
Accumulated undistributed net investment income (loss) | | | 11,618 | |
Accumulated undistributed net realized gain (loss) on investments | | | (60,913 | ) |
Net unrealized appreciation (depreciation) on investments | | | (827,125 | ) |
| | | | |
Net assets | | $ | 19,374,867 | |
| | | | |
Class A | | | | |
Net asset value and redemption price per share, $206,241 / 21,573 shares outstanding (unlimited amount authorized: $0.001 par value) | | $ | 9.56 | |
Maximum sales charge (4.50% of offering price) | | | 0.45 | |
| | | | |
Maximum offering price per share | | $ | 10.01 | |
| | | | |
Class I | | | | |
Net asset value and redemption price per share, $19,073,038 / 1,995,330 shares outstanding (unlimited amount authorized: $0.001 par value) | | $ | 9.56 | |
| | | | |
Class R | | | | |
Net asset value and redemption price per share, $95,588 / 10,000 shares outstanding (unlimited amount authorized: $0.001 par value) | | $ | 9.56 | |
| | | | |
STATEMENT OF OPERATIONS
For the Period Ended October 31, 2015*
| | | | |
INVESTMENT INCOME | | | | |
Interest | | $ | 74,796 | |
Dividends | | | 75,891 | |
| | | | |
Total income | | | 150,687 | |
| | | | |
EXPENSES | | | | |
Professional fees | | | 61,840 | |
Investment advisory fees | | | 43,648 | |
Administrative fees | | | 9,617 | |
Offering costs | | | 8,748 | |
Transfer agent fees | | | 6,405 | |
Printing and mailing expenses | | | 4,434 | |
Custodian fees | | | 2,400 | |
Trustees’ fees | | | 553 | |
Registration and filing fees | | | 184 | |
Distribution fees – Class R | | | 155 | |
Distribution fees – Class A | | | 118 | |
Miscellaneous | | | 7,000 | |
| | | | |
Gross expenses | | | 145,102 | |
Less: Waiver from investment adviser | | | (53,265 | ) |
Reimbursement from investment adviser | | | (26,118 | ) |
| | | | |
Net expenses | | | 65,719 | |
| | | | |
NET INVESTMENT INCOME (LOSS) | | | 84,968 | |
| | | | |
REALIZED AND UNREALIZED GAIN (LOSS) | | | | |
Net realized gain (loss) on investments | | | (60,843 | ) |
Net change in unrealized appreciation (depreciation) on investments | | | (827,125 | ) |
| | | | |
NET REALIZED AND UNREALIZED GAIN (LOSS) | | | (887,968 | ) |
| | | | |
NET INCREASE (DECREASE) IN NET ASSETS RESULTING FROM OPERATIONS | | $ | (803,000 | ) |
| | | | |
| * | The Fund commenced operations on July 6, 2015. |
See Notes to Financial Statements.
11
1290 FUNDS
1290 CONVERTIBLE SECURITIES FUND
STATEMENT OF CHANGES IN NET ASSETS
| | | | |
| | | July 6, 2015* to
October 31, 2015 | |
INCREASE (DECREASE) IN NET ASSETS FROM OPERATIONS: | | | | |
Net investment income (loss) | | $ | 84,968 | |
Net realized gain (loss) on investments | | | (60,843 | ) |
Net change in unrealized appreciation (depreciation) on investments | | | (827,125 | ) |
| | | | |
NET INCREASE (DECREASE) IN NET ASSETS RESULTING FROM OPERATIONS | | | (803,000 | ) |
| | | | |
DIVIDENDS: | | | | |
Dividends from net investment income | | | | |
Class A | | | (554 | ) |
Class I | | | (79,072 | ) |
Class R | | | (245 | ) |
| | | | |
TOTAL DIVIDENDS: | | | (79,871 | ) |
| | | | |
CAPITAL SHARES TRANSACTIONS: | | | | |
Class A | | | | |
Capital shares sold [ 21,551 shares ] | | | 211,375 | |
Capital shares issued in reinvestment of dividends [ 24 shares ] | | | 232 | |
Capital shares repurchased [ (2) shares ] | | | (19 | ) |
| | | | |
Total Class A transactions | | | 211,588 | |
| | | | |
Class I | | | | |
Capital shares sold [ 1,995,307 shares ] | | | 19,945,930 | |
Capital shares issued in reinvestment of dividends [ 28 shares ] | | | 268 | |
Capital shares repurchased [ (5) shares ] | | | (48 | ) |
| | | | |
Total Class I transactions | | | 19,946,150 | |
| | | | |
Class R | | | | |
Capital shares sold [ 10,000 shares ] | | | 100,000 | |
| | | | |
Total Class R transactions | | | 100,000 | |
| | | | |
NET INCREASE (DECREASE) IN NET ASSETS RESULTING FROM CAPITAL SHARE TRANSACTIONS | | | 20,257,738 | |
| | | | |
TOTAL INCREASE (DECREASE) IN NET ASSETS | | | 19,374,867 | |
NET ASSETS: | | | | |
Beginning of period | | | — | |
| | | | |
End of period (a) | | $ | 19,374,867 | |
| | | | |
(a) Includes accumulated undistributed (overdistributed) net investment income (loss) of | | $ | 11,618 | |
| | | | |
* The Fund commenced operations on July 6, 2015. | | | | |
See Notes to Financial Statements.
12
1290 FUNDS
1290 CONVERTIBLE SECURITIES FUND
FINANCIAL HIGHLIGHTS
| | | | |
| Class A | | July 6, 2015* to
October 31, 2015 | |
Net asset value, beginning of period | | $ | 10.00 | |
| | | | |
Income (loss) from investment operations: | | | | |
Net investment income (loss) (e) | | | 0.03 | |
Net realized and unrealized gain (loss) on investments | | | (0.44 | ) |
| | | | |
Total from investment operations | | | (0.41 | ) |
| | | | |
Less distributions: | | | | |
Dividends from net investment income | | | (0.03 | ) |
| | | | |
Net asset value, end of period | | $ | 9.56 | |
| | | | |
Total return (b) | | | (4.08 | )% |
| | | | |
Ratios/Supplemental Data: | | | | |
Net assets, end of period (000’s) | | $ | 206 | |
Ratio of expenses to average net assets: | | | | |
After waivers and reimbursements (a) | | | 1.30 | % |
Before waivers and reimbursements (a) | | | 2.09 | % |
Ratio of net investment income (loss) to average net assets: | | | | |
After waivers and reimbursements (a) | | | 1.09 | %(l) |
Before waivers and reimbursements (a) | | | 0.30 | %(l) |
Portfolio turnover rate (z)^ | | | 6 | % |
| |
| Class I | | July 6, 2015* to
October 31, 2015 | |
Net asset value, beginning of period | | $ | 10.00 | |
| | | | |
Income (loss) from investment operations: | | | | |
Net investment income (loss) (e) | | | 0.04 | |
Net realized and unrealized gain (loss) on investments | | | (0.44 | ) |
| | | | |
Total from investment operations | | | (0.40 | ) |
| | | | |
Less distributions: | | | | |
Dividends from net investment income | | | (0.04 | ) |
| | | | |
Net asset value, end of period | | $ | 9.56 | |
| | | | |
Total return (b) | | | (4.00 | )% |
| | | | |
Ratios/Supplemental Data: | | | | |
Net assets, end of period (000’s) | | $ | 19,073 | |
Ratio of expenses to average net assets: | | | | |
After waivers and reimbursements (a) | | | 1.05 | % |
Before waivers and reimbursements (a) | | | 1.72 | % |
Ratio of net investment income (loss) to average net assets: | | | | |
After waivers and reimbursements (a) | | | 1.37 | %(l) |
Before waivers and reimbursements (a) | | | 0.70 | %(l) |
Portfolio turnover rate (z)^ | | | 6 | % |
See Notes to Financial Statements.
13
1290 FUNDS
1290 CONVERTIBLE SECURITIES FUND
FINANCIAL HIGHLIGHTS (Continued)
| | | | |
| Class R | | July 6, 2015* to
October 31, 2015 | |
Net asset value, beginning of period | | $ | 10.00 | |
| | | | |
Income (loss) from investment operations: | | | | |
Net investment income (loss) (e) | | | 0.03 | |
Net realized and unrealized gain (loss) on investments | | | (0.45 | ) |
| | | | |
Total from investment operations | | | (0.42 | ) |
| | | | |
Less distributions: | | | | |
Dividends from net investment income | | | (0.02 | ) |
| | | | |
Net asset value, end of period | | $ | 9.56 | |
| | | | |
Total return (b) | | | (4.16 | )% |
| | | | |
Ratios/Supplemental Data: | | | | |
Net assets, end of period (000’s) | | $ | 96 | |
Ratio of expenses to average net assets: | | | | |
After waivers and reimbursements (a) | | | 1.55 | % |
Before waivers and reimbursements (a) | | | 2.22 | % |
Ratio of net investment income (loss) to average net assets: | | | | |
After waivers and reimbursements (a) | | | 0.87 | %(l) |
Before waivers and reimbursements (a) | | | 0.20 | %(l) |
Portfolio turnover rate (z)^ | | | 6 | % |
| * | Commencement of Operations. |
| ^ | Portfolio turnover rate excludes derivatives, if any. |
| (a) | Ratios for periods less than one year are annualized. |
| (b) | Total returns for periods less than one year are not annualized. |
| (e) | Net investment income (loss) per share is based on average shares outstanding. |
| (l) | The annualized ratio of net investment income to average net assets may not be indicative of operating results for a full year. |
| (z) | Portfolio turnover rate for periods less than one year is not annualized. |
See Notes to Financial Statements.
14
1290 GAMCO SMALL/MID CAP VALUE FUND (Unaudited)
INVESTMENT ADVISER
INVESTMENT SUB-ADVISER
| Ø | | GAMCO Asset Management, Inc. |
PERFORMANCE RESULTS
| | | | | | |
| Total Returns as of 10/31/15 | | | |
| | | | | Since
Incept. | |
Fund – Class A Shares* | | without Sales Charge | | | 3.20 | % |
| | | with Sales Charge (a) | | | (2.46 | ) |
Fund – Class C Shares* | | without Sales Charge | | | 3.43 | |
| | | with Sales Charge | | | 2.43 | |
Fund – Class I Shares* | | | | | 3.43 | |
Fund – Class R Shares* | | | | | 2.96 | |
Russell 2500TM Value Index | | | | | (1.95 | ) |
* Date of inception 11/12/14. (a) A 5.50% front-end sales charge was deducted. Returns for periods less than one year are not annualized. | |
The performance quoted is past performance and is not a guarantee of future results. Mutual funds are subject to certain market risks. Investment returns and principal value of an investment will fluctuate so that an investor’s shares, when redeemed, may be worth more or less than their original cost. Current performance may be higher or lower than the performance data shown. For the most current month-end performance data please call 1-888-310-0416 or visit www.1290Funds.com.
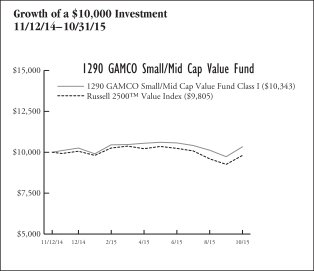
The graph illustrates comparative performance for $10,000 invested in the Class I Shares of the 1290 GAMCO Small/Mid Cap Value Fund and the Russell 2500™ Value Index from 11/12/14 to 10/31/15. The performance of the Russell 2500™ Value Index reflects an initial investment at the end of the month closest to the Fund’s inception. The performance of the Fund assumes reinvestment of all dividends and capital gain distributions, if any, and does not include a sales charge. The performance of the Russell 2500™ Value Index does not reflect the deduction of expenses or a sales charge associated with a mutual fund and has been adjusted to reflect reinvestment of dividends, capital gain distributions, and interest of the securities included in the benchmark.
Fund performance may reflect the waiver of the Fund’s fees and reimbursement of expenses for certain periods since the inception date. Without these waivers and reimbursements, performance would have been lower. Also, performance shown in this section does not reflect the deduction of taxes that a shareholder would pay on Fund distributions or redemption of Fund shares.
PERFORMANCE SUMMARY
The Fund’s Class I shares returned 3.43% for the period ended October 31, 2015. The Fund’s benchmark, the Russell 2500TM Value Index, returned (1.95)% over the same period.
Fund Overview — GAMCO Asset Management, Inc.
During the period November 12, 2014 through October 31, 2015, U.S. Stocks experienced the most volatile times in many years. The Fund invests 80% of its assets in companies with small (market cap less than $3 billion) and mid (market cap between $3 billion and $12 billion) size capitalization at the time of investment. Up to 20% of the Fund may invest in non-U.S. stocks. A bottom up, company-specific process seeks to identify companies selling with a margin of safety — at a discount to their Private Market Value (PMV). The PMV is the price an informed industrialist would pay for the entire company. A catalyst or event to surface the value is identified prior to purchase. The research process is global, intense, focused and consistent. Analysts follow industries in which we have accumulated knowledge over a long period of time.
Fund Highlights
During the period, small- and mid-cap stocks declined slightly, reflecting concerns over future interest-rate hikes.
What helped performance since inception through October 31, 2015:
| • | | It was a strong period for merger and acquisition activity. Several holdings have benefitted from takeover announcements: Cameron International Corp. (by Schlumberger), Precision Castparts (by Warren Buffett’s Berkshire Hathaway Inc.), Cablevision Systems Corp. (by French telecommunications operator Altice Luxembourg S.A.), and Pep Boys (by Bridgestone Corp.). |
| • | | Other types of financial engineering such as combinations, buybacks, spinoffs and splits in H & R Block, Madison Square Garden Co., EW Scripps Co./Journal Communications, Graham Holdings and Energizer Holdings, Inc. also benefitted the Fund during the period. |
What hurt performance since inception through October 31, 2015:
| • | | A slower economy, especially in China, as well as foreign currency exposure resulted in the declines of many industrial holdings that serve the auto, aerospace and energy markets. |
| • | | Lower oil and gas prices caused lower earnings expectations for limited energy and utility holdings. |
| • | | Several media holdings declined on concerns about subscriber losses and a cautious view of the U.S. advertising market. |
15
1290 GAMCO SMALL/MID CAP VALUE FUND (Unaudited)
| | | | |
Sector Weightings
as of October 31, 2015 | | % of
Net Assets | |
Industrials | | | 23.7 | % |
Consumer Discretionary | | | 18.8 | |
Financials | | | 13.2 | |
Materials | | | 11.6 | |
Consumer Staples | | | 6.7 | |
Information Technology | | | 6.6 | |
Telecommunication Services | | | 4.2 | |
Utilities | | | 4.1 | |
Investment Company | | | 3.1 | |
Energy | | | 1.1 | |
Health Care | | | 0.7 | |
Cash and Other | | | 6.2 | |
| | | | | |
| | | | 100.0 | % |
| | | | | |
Holdings are subject to change without notice. | | | | |
UNDERSTANDING YOUR EXPENSES:
As a shareholder of the Fund, you incur two types of costs:
(1) transaction costs, including applicable sales charges and redemption fees; and (2) ongoing costs, including investment advisory fees, distribution and/or service (12b-1) fees (in the case of Class A, Class C and Class R shares of the Trust), and other Fund expenses. These examples are intended to help you understand your ongoing costs (in dollars) of investing in the Fund and to compare these costs with the ongoing costs of investing in other mutual funds.
The examples are based on an investment of $1,000 invested at the beginning of the six-month period ended October 31, 2015 and held for the entire six-month period.
Actual Expenses
The first line of the following table provides information about actual account values and actual expenses. You may use the information in this line, together with the amount you invested, to estimate the expenses that you paid over the period. Simply divide your account value by $1,000 (for example, an $8,600 account value divided by $1,000 = 8.6), then multiply the result by the number in the first line under the heading entitled ‘‘Expenses Paid During Period’’ to estimate the expenses you paid on your account during this period.
Hypothetical Example for Comparison Purposes
The second line of the following table provides information about hypothetical account values and hypothetical expenses based on the Fund’s actual expense ratio and an assumed rate of return of 5% per year before expenses, which is not the Fund’s actual return. The hypothetical account values and expenses may not be used to estimate the actual ending account balance or expenses you paid for the period. You may use this information to compare the ongoing costs of investing in the Fund and other funds. To do so, compare this 5% hypothetical example with the 5% hypothetical examples that appear in the shareholder reports of the other funds.
Please note that the expenses shown in the table are meant to highlight your ongoing costs only and do not reflect any transactional costs, such as sales charges (loads), redemption fees, or exchange fees. Therefore, the second line of the table is useful in comparing ongoing costs only, and will not help you determine the relative total costs of owning different funds. In addition, if these transactional costs were included, your costs would have been higher.
EXAMPLE
| | | | | | | | | | | | |
| | | Beginning
Account
Value
5/1/15 | | | Ending
Account
Value
10/31/15 | | | Expenses
Paid
During
Period*
5/1/15 -
10/31/15 | |
Class A | | | | | | | | | | | | |
Actual | | | $1,000.00 | | | | $979.92 | | | | $6.74 | |
Hypothetical (5% average annual return before expenses) | | | 1,000.00 | | | | 1,018.40 | | | | 6.87 | |
Class C** | | | | | | | | | | | | |
Actual | | | 1,000.00 | | | | 980.90 | | | | 5.49 | |
Hypothetical (5% average annual return before expenses) | | | 1,000.00 | | | | 1,019.66 | | | | 5.60 | |
Class I | | | | | | | | | | | | |
Actual | | | 1,000.00 | | | | 980.90 | | | | 5.49 | |
Hypothetical (5% average annual return before expenses) | | | 1,000.00 | | | | 1,019.66 | | | | 5.60 | |
Class R | | | | | | | | | | | | |
Actual | | | 1,000.00 | | | | 978.95 | | | | 7.98 | |
Hypothetical (5% average annual return before expenses) | | | 1,000.00 | | | | 1,017.14 | | | | 8.13 | |
* Expenses are equal to the Fund’s Class A, C, I and R shares annualized expense ratios of 1.35%, 1.10%, 1.10% and 1.60%, respectively, multiplied by the average account value over the period, and multiplied by 184/365 (to reflect the one-half year period). ** Class C shares currently are not offered for sale. | |
16
1290 FUNDS
1290 GAMCO SMALL/MID CAP VALUE FUND
PORTFOLIO OF INVESTMENTS
October 31, 2015
| | | | | | | | |
| | | Number of
Shares | | | Value
(Note 1) | |
| | | | | | | | |
COMMON STOCKS: | | | | | | | | |
Consumer Discretionary (18.8%) | | | | | | | | |
Auto Components (4.7%) | |
Brembo S.p.A. | | | 1,000 | | | $ | 44,085 | |
Dana Holding Corp. | | | 2,600 | | | | 43,680 | |
Federal-Mogul Holdings Corp.* | | | 13,000 | | | | 100,750 | |
Superior Industries International, Inc. | | | 1,000 | | | | 19,680 | |
| | | | | | | | |
| | | | | | | 208,195 | |
| | | | | | | | |
Hotels, Restaurants & Leisure (1.3%) | |
Cheesecake Factory, Inc. | | | 1,200 | | | | 57,840 | |
| | | | | | | | |
Household Durables (1.5%) | |
Hunter Douglas N.V. | | | 1,600 | | | | 66,419 | |
| | | | | | | | |
Media (6.2%) | |
Cablevision Systems Corp. – New York Group, Class A | | | 2,000 | | | | 65,180 | |
Clear Channel Outdoor Holdings, Inc., Class A* | | | 1,000 | | | | 7,480 | |
EW Scripps Co., Class A | | | 3,300 | | | | 72,798 | |
Interpublic Group of Cos., Inc. | | | 1,500 | | | | 34,395 | |
Madison Square Garden Co., Class A* | | | 100 | | | | 17,850 | |
Meredith Corp. | | | 800 | | | | 37,616 | |
MSG Networks, Inc., Class A* | | | 300 | | | | 6,156 | |
Salem Media Group, Inc. | | | 5,008 | | | | 31,500 | |
| | | | | | | | |
| | | | | | | 272,975 | |
| | | | | | | | |
Multiline Retail (0.4%) | |
J.C. Penney Co., Inc.* | | | 2,000 | | | | 18,340 | |
| | | | | | | | |
Specialty Retail (4.7%) | |
Aaron’s, Inc. | | | 800 | | | | 19,736 | |
CST Brands, Inc. | | | 3,000 | | | | 107,790 | |
Pep Boys-Manny, Moe & Jack* | | | 5,500 | | | | 82,720 | |
| | | | | | | | |
| | | | | | | 210,246 | |
| | | | | | | | |
Total Consumer Discretionary | | | | | | | 834,015 | |
| | | | | | | | |
Consumer Staples (6.7%) | | | | | | | | |
Beverages (1.7%) | |
Cott Corp. | | | 3,000 | | | | 31,350 | |
Davide Campari-Milano S.p.A. | | | 2,000 | | | | 17,132 | |
Remy Cointreau S.A. | | | 400 | | | | 27,883 | |
| | | | | | | | |
| | | | | | | 76,365 | |
| | | | | | | | |
Food & Staples Retailing (0.7%) | |
Ingles Markets, Inc., Class A | | | 600 | | | | 29,964 | |
| | | | | | | | |
Food Products (2.5%) | |
Maple Leaf Foods, Inc. | | | 2,600 | | | | 41,339 | |
Snyder’s-Lance, Inc. | | | 2,000 | | | | 71,080 | |
| | | | | | | | |
| | | | | | | 112,419 | |
| | | | | | | | |
Household Products (0.2%) | |
Energizer Holdings, Inc. | | | 200 | | | | 8,566 | |
| | | | | | | | |
Personal Products (1.6%) | |
Avon Products, Inc. | | | 5,000 | | | | 20,150 | |
Edgewell Personal Care Co. | | | 600 | | | | 50,826 | |
| | | | | | | | |
| | | | | | | 70,976 | |
| | | | | | | | |
Total Consumer Staples | | | | | | | 298,290 | |
| | | | | | | | |
| | | | | | | | |
Energy (1.1%) | | | | | | | | |
Energy Equipment & Services (1.1%) | |
Cameron International Corp.* | | | 700 | | | $ | 47,607 | |
| | | | | | | | |
Total Energy | | | | | | | 47,607 | |
| | | | | | | | |
Financials (13.2%) | | | | | | | | |
Banks (1.9%) | |
FCB Financial Holdings, Inc., Class A* | | | 1,000 | | | | 35,560 | |
Flushing Financial Corp. | | | 2,400 | | | | 50,496 | |
| | | | | | | | |
| | | | | | | 86,056 | |
| | | | | | | | |
Capital Markets (1.5%) | |
Cohen & Steers, Inc. | | | 1,400 | | | | 42,826 | |
Janus Capital Group, Inc. | | | 1,500 | | | | 23,295 | |
| | | | | | | | |
| | | | | | | 66,121 | |
| | | | | | | | |
Insurance (4.8%) | |
National Interstate Corp. | | | 1,200 | | | | 34,440 | |
PartnerReinsurance Ltd. | | | 500 | | | | 69,500 | |
StanCorp Financial Group, Inc. | | | 800 | | | | 91,776 | |
W. R. Berkley Corp. | | | 300 | | | | 16,749 | |
| | | | | | | | |
| | | | | | | 212,465 | |
| | | | | | | | |
Real Estate Investment Trusts (REITs) (5.0%) | |
BioMed Realty Trust, Inc. (REIT) | | | 3,000 | | | | 70,230 | |
Ryman Hospitality Properties, Inc. (REIT) | | | 1,300 | | | | 68,380 | |
Strategic Hotels & Resorts, Inc. (REIT)* | | | 6,000 | | | | 84,600 | |
| | | | | | | | |
| | | | | | | 223,210 | |
| | | | | | | | |
Total Financials | | | | | | | 587,852 | |
| | | | | | | | |
Health Care (0.7%) | | | | | | | | |
Health Care Providers & Services (0.7%) | |
BioScrip, Inc.* | | | 1,500 | | | | 2,955 | |
Patterson Cos., Inc. | | | 600 | | | | 28,440 | |
| | | | | | | | |
Total Health Care | | | | | | | 31,395 | |
| | | | | | | | |
Industrials (23.7%) | | | | | | | | |
Aerospace & Defense (1.6%) | |
B/E Aerospace, Inc. | | | 1,000 | | | | 46,950 | |
Textron, Inc. | | | 600 | | | | 25,302 | |
| | | | | | | | |
| | | | | | | 72,252 | |
| | | | | | | | |
Building Products (0.9%) | |
A.O. Smith Corp. | | | 500 | | | | 38,410 | |
| | | | | | | | |
Commercial Services & Supplies (1.4%) | |
Brink’s Co. | | | 2,000 | | | | 61,960 | |
| | | | | | | | |
Construction & Engineering (0.3%) | |
Layne Christensen Co.* | | | 2,000 | | | | 12,680 | |
| | | | | | | | |
Machinery (13.8%) | |
Eastern Co. | | | 1,800 | | | | 30,186 | |
EnPro Industries, Inc. | | | 1,400 | | | | 68,754 | |
Federal Signal Corp. | | | 2,500 | | | | 37,650 | |
Graco, Inc. | | | 1,800 | | | | 132,120 | |
ITT Corp. | | | 800 | | | | 31,664 | |
Mueller Industries, Inc. | | | 4,000 | | | | 126,080 | |
Mueller Water Products, Inc., Class A | | | 3,500 | | | | 30,800 | |
See Notes to Financial Statements.
17
1290 FUNDS
1290 GAMCO SMALL/MID CAP VALUE FUND
PORTFOLIO OF INVESTMENTS (Continued)
October 31, 2015
| | | | | | | | |
| | | Number of
Shares | | | Value
(Note 1) | |
| | | | | | | | |
Navistar International Corp.* | | | 6,500 | | | $ | 79,950 | |
Twin Disc, Inc. | | | 1,800 | | | | 21,204 | |
Xylem, Inc. | | | 1,500 | | | | 54,615 | |
| | | | | | | | |
| | | | | | | 613,023 | |
| | | | | | | | |
Road & Rail (2.4%) | |
Hertz Global Holdings, Inc.* | | | 5,500 | | | | 107,250 | |
| | | | | | | | |
Trading Companies & Distributors (3.3%) | |
GATX Corp. | | | 1,500 | | | | 70,050 | |
Kaman Corp. | | | 2,000 | | | | 77,780 | |
| | | | | | | | |
| | | | | | | 147,830 | |
| | | | | | | | |
Total Industrials | | | | | | | 1,053,405 | |
| | | | | | | | |
Information Technology (6.6%) | | | | | | | | |
Communications Equipment (0.5%) | | | | | | | | |
EchoStar Corp., Class A* | | | 500 | | | | 22,415 | |
| | | | | | | | |
Internet Software & Services (2.8%) | | | | | | | | |
Gogo, Inc.* | | | 3,200 | | | | 45,216 | |
Internap Corp.* | | | 12,000 | | | | 81,120 | |
| | | | | | | | |
| | | | | | | 126,336 | |
| | | | | | | | |
Semiconductors & Semiconductor Equipment (2.3%) | |
Altera Corp. | | | 1,000 | | | | 52,550 | |
PMC-Sierra, Inc.* | | | 4,000 | | | | 47,680 | |
Sevcon, Inc.* | | | 100 | | | | 918 | |
| | | | | | | | |
| | | | | | | 101,148 | |
| | | | | | | | |
Technology Hardware, Storage & Peripherals (1.0%) | |
Diebold, Inc. | | | 1,200 | | | | 44,244 | |
| | | | | | | | |
Total Information Technology | | | | | | | 294,143 | |
| | | | | | | | |
Materials (11.6%) | | | | | | | | |
Chemicals (9.2%) | | | | | | | | |
Ashland, Inc. | | | 400 | | | | 43,888 | |
Chemtura Corp.* | | | 2,200 | | | | 70,268 | |
Chr Hansen Holding A/S | | | 1,200 | | | | 72,116 | |
Cytec Industries, Inc. | | | 1,000 | | | | 74,420 | |
Hawkins, Inc. | | | 1,400 | | | | 58,016 | |
International Flavors & Fragrances, Inc. | | | 300 | | | | 34,818 | |
Tredegar Corp. | | | 4,000 | | | | 57,040 | |
| | | | | | | | |
| | | | | | | 410,566 | |
| | | | | | | | |
Containers & Packaging (1.0%) | | | | | | | | |
Myers Industries, Inc. | | | 3,000 | | | | 46,830 | |
| | | | | | | | |
Metals & Mining (0.9%) | | | | | | | | |
Ampco-Pittsburgh Corp. | | | 3,300 | | | | 38,247 | |
| | | | | | | | |
Paper & Forest Products (0.5%) | | | | | | | | |
Wausau Paper Corp. | | | 2,000 | | | | 20,420 | |
| | | | | | | | |
Total Materials | | | | | | | 516,063 | |
| | | | | | | | |
Telecommunication Services (4.2%) | | | | | | | | |
Diversified Telecommunication Services (1.0%) | | | | | |
Cable & Wireless Communications plc | | | 40,000 | | | | 45,385 | |
| | | | | | | | |
Wireless Telecommunication Services (3.2%) | | | | | |
Millicom International Cellular S.A. | | | 1,000 | | | | 56,200 | |
Millicom International Cellular S.A. (SDR) | | | 1,200 | | | | 66,998 | |
| | | | | | | | |
U.S. Cellular Corp.* | | | 500 | | | $ | 20,370 | |
| | | | | | | | |
| | | | | | | 143,568 | |
| | | | | | | | |
Total Telecommunication Services | | | | | | | 188,953 | |
| | | | | | | | |
Utilities (4.1%) | | | | | | | | |
Electric Utilities (1.1%) | | | | | | | | |
El Paso Electric Co. | | | 200 | | | | 7,734 | |
Hawaiian Electric Industries, Inc. | | | 1,500 | | | | 43,890 | |
| | | | | | | | |
| | | | | | | 51,624 | |
| | | | | | | | |
Gas Utilities (3.0%) | | | | | | | | |
National Fuel Gas Co. | | | 1,200 | | | | 63,036 | |
Piedmont Natural Gas Co., Inc. | | | 1,200 | | | | 68,772 | |
| | | | | | | | |
| | | | | | | 131,808 | |
| | | | | | | | |
Total Utilities | | | | | | | 183,432 | |
| | | | | | | | |
Total Common Stocks (90.7%)
(Cost $4,077,303) | | | | | | | 4,035,155 | |
| | | | | | | | |
| |
CONVERTIBLE PREFERRED STOCK: | | | | | |
Health Care (0.0%) | | | | | | | | |
Health Care Providers & Services (0.0%) | | | | | |
BioScrip, Inc.
0.000%*† | | | 4 | | | | 227 | |
| | | | | | | | |
Total Convertible Preferred Stock (0.0%)
(Cost $400) | | | | | | | 227 | |
| | | | | | | | |
| | | Number of
Warrants | | | Value
(Note 1) | |
WARRANTS: | | | | | | | | |
Health Care (0.0%) | | | | | | | | |
Health Care Providers & Services (0.0%) | | | | | |
BioScrip, Inc., expiring 6/30/25*† | | | 22 | | | | 14 | |
| | | | | | | | |
Total Health Care | | | | | | | 14 | |
| | | | | | | | |
Total Warrants (0.0%)
(Cost $—) | | | | | | | 14 | |
| | | | | | | | |
| | | Number of
Shares | | | Value
(Note 1) | |
SHORT-TERM INVESTMENT: | | | | | |
Investment Company (3.1%) | | | | | | | | |
JPMorgan Prime Money Market Fund, Institutional Class Shares | | | 136,606 | | | | 136,606 | |
| | | | | | | | |
Total Short-Term Investment (3.1%)
(Cost $136,606) | | | | | | | 136,606 | |
| | | | | | | | |
Total Investments (93.8%)
(Cost $4,214,309) | | | | | | | 4,172,002 | |
Other Assets Less Liabilities (6.2%) | | | | | | | 276,248 | |
| | | | | | | | |
Net Assets (100%) | | | | | | $ | 4,448,250 | |
| | | | | | | | |
| † | Securities (totaling $241 or 0.0% of net assets) held at fair value by management. |
Glossary:
| | SDR | — Swedish Depositary Receipt |
See Notes to Financial Statements.
18
1290 FUNDS
1290 GAMCO SMALL/MID CAP VALUE FUND
PORTFOLIO OF INVESTMENTS (Continued)
October 31, 2015
The following is a summary of the inputs used to value the Fund’s assets and liabilities carried at fair value as of October 31, 2015:
The inputs or methodology used for valuing securities are not necessarily an indication of the risk associated with investing in those securities.
Various inputs are used in determining the value of the Fund’s investments. These inputs are summarized in the three broad levels listed below:
| | | | | | | | | | | | | | | | |
| | | | | |
| Investment Type | | Level 1
Quoted Prices in
Active Markets for
Identical
Securities | | | Level 2 Significant Other
Observable Inputs
(including quoted prices
for similar securities,
interest rates,
prepayment speeds,
credit risk, etc.) | | | Level 3
Significant Unobservable
Inputs (including the
Fund’s own
assumptions in
determining the fair
value of investments) | | | Total | |
Assets: | | | | | | | | | | | | | | | | |
Common Stocks | | | | | | | | | | | | | | | | |
Consumer Discretionary | | $ | 723,511 | | | $ | 110,504 | | | $ | — | | | $ | 834,015 | |
Consumer Staples | | | 253,275 | | | | 45,015 | | | | — | | | | 298,290 | |
Energy | | | 47,607 | | | | — | | | | — | | | | 47,607 | |
Financials | | | 587,852 | | | | — | | | | — | | | | 587,852 | |
Health Care | | | 31,395 | | | | — | | | | — | | | | 31,395 | |
Industrials | | | 1,053,405 | | | | — | | | | — | | | | 1,053,405 | |
Information Technology | | | 293,225 | | | | 918 | | | | — | | | | 294,143 | |
Materials | | | 443,947 | | | | 72,116 | | | | — | | | | 516,063 | |
Telecommunication Services | | | 76,570 | | | | 112,383 | | | | — | | | | 188,953 | |
Utilities | | | 183,432 | | | | — | | | | — | | | | 183,432 | |
Convertible Preferred Stocks | | | | | | | | | | | | | | | | |
Health Care | | | — | | | | — | | | | 227 | | | | 227 | |
Short-Term Investments | | | 136,606 | | | | — | | | | — | | | | 136,606 | |
Warrants | | | | | | | | | | | | | | | | |
Health Care | | | — | | | | — | | | | 14 | | | | 14 | |
| | | | | | | | | | | | | | | | |
Total Assets | | $ | 3,830,825 | | | $ | 340,936 | | | $ | 241 | | | $ | 4,172,002 | |
| | | | | | | | | | | | | | | | |
Total Liabilities | | $ | — | | | $ | — | | | $ | — | | | $ | — | |
| | | | | | | | | | | | | | | | |
Total | | $ | 3,830,825 | | | $ | 340,936 | | | $ | 241 | | | $ | 4,172,002 | |
| | | | | | | | | | | | | | | | |
There were no transfers between Levels 1, 2 or 3 during the period ended October 31, 2015.
Fair Values of Derivative Instruments as of October 31, 2015:
The Effect of Derivative Instruments on the Statement of Operations for the period ended October 31, 2015:
| | | | | | | | |
| Amount of Realized Gain or (Loss) on Derivatives Recognized in Income | |
Derivatives Not Accounted for as
Hedging Instruments^ | | Forward
Foreign
Currency
Contracts | | | Total | |
Foreign exchange contracts | | $ | 196 | | | $ | 196 | |
| | | | | | | | |
^ The Fund held forward foreign currency contracts as hedging.
The Fund held forward foreign currency contracts with an average settlement value of approximately $16,000, during the period ended October 31, 2015.
See Notes to Financial Statements.
19
1290 FUNDS
1290 GAMCO SMALL/MID CAP VALUE FUND
PORTFOLIO OF INVESTMENTS (Continued)
October 31, 2015
Investment security transactions for the period ended October 31, 2015 were as follows:
| | | | |
Cost of Purchases: | | | | |
Long-term investments other than U.S. government debt securities | | $ | 6,925,766 | |
Net Proceeds of Sales and Redemptions: | | | | |
Long-term investments other than U.S. government debt securities | | $ | 2,958,123 | |
As of October 31, 2015, the gross unrealized appreciation (depreciation) of investments based on the aggregate cost of investments for Federal income tax purposes was as follows:
| | | | |
Aggregate gross unrealized appreciation | | $ | 240,927 | |
Aggregate gross unrealized depreciation | | | (291,067 | ) |
| | | | |
Net unrealized depreciation | | $ | (50,140 | ) |
| | | | |
Federal income tax cost of investments | | $ | 4,222,142 | |
| | | | |
For the period ended October 31, 2015, the Fund incurred approximately $4,567 as brokerage commissions with Gabelli & Co. an affiliated broker/dealer.
See Notes to Financial Statements.
20
1290 FUNDS
1290 GAMCO SMALL/MID CAP VALUE FUND
STATEMENT OF ASSETS AND LIABILITIES
October 31, 2015
| | | | |
ASSETS | |
Investments at value (Cost $4,214,309) | | $ | 4,172,002 | |
Cash | | | 233,000 | |
Foreign cash (Cost $1,698) | | | 1,680 | |
Receivable for Fund shares sold | | | 86,454 | |
Receivable from investment adviser | | | 20,830 | |
Deferred offering cost | | | 4,499 | |
Dividends, interest and other receivables | | | 873 | |
Other assets | | | 17 | |
| | | | |
Total assets | | | 4,519,355 | |
| | | | |
LIABILITIES | | | | |
Payable for securities purchased | | | 37,255 | |
Transfer agent fees payable | | | 4,947 | |
Distribution fees payable – Class R | | | 325 | |
Distribution fees payable – Class A | | | 208 | |
Trustees’ fees payable | | | 32 | |
Accrued expenses | | | 28,338 | |
| | | | |
Total liabilities | | | 71,105 | |
| | | | |
NET ASSETS | | $ | 4,448,250 | |
| | | | |
Net assets were comprised of: | | | | |
Paid in capital | | $ | 4,379,943 | |
Accumulated undistributed net investment income (loss) | | | 351 | |
Accumulated undistributed net realized gain (loss) on investments and foreign currency transactions | | | 110,291 | |
Net unrealized appreciation (depreciation) on investments and foreign currency translations | | | (42,335 | ) |
| | | | |
Net assets | | $ | 4,448,250 | |
| | | | |
Class A | | | | |
Net asset value and redemption price per share, $996,704 / 97,215 shares outstanding (unlimited amount authorized: $0.001 par value) | | $ | 10.25 | |
Maximum sales charge (5.50% of offering price) | | | 0.60 | |
| | | | |
Maximum offering price per share | | $ | 10.85 | |
| | | | |
Class C** | | | | |
Net asset value per share, $258,673 / 25,179 shares outstanding (unlimited amount authorized: $0.001 par value) (a) | | $ | 10.27 | |
| | | | |
Class I | | | | |
Net asset value and redemption price per share, $2,415,576 / 235,114 shares outstanding (unlimited amount authorized: $0.001 par value) | | $ | 10.27 | |
| | | | |
Class R | | | | |
Net asset value and redemption price per share, $777,297 / 75,974 shares outstanding (unlimited amount authorized: $0.001 par value) | | $ | 10.23 | |
| | | | |
| (a) | Redemption price for Class C shares varies based on length of time the shares are held. |
STATEMENT OF OPERATIONS
For the Period Ended October 31, 2015*
| | | | |
INVESTMENT INCOME | |
Dividends (net of $1,735 foreign withholding tax) | | $ | 41,024 | |
Interest | | | 198 | |
| | | | |
Total income | | | 41,222 | |
| | | | |
EXPENSES | | | | |
Offering costs | | | 132,350 | |
Professional fees | | | 58,226 | |
Administrative fees | | | 31,926 | |
Investment advisory fees | | | 24,614 | |
Transfer agent fees | | | 20,250 | |
Custodian fees | | | 5,000 | |
Registration and filing fees | | | 4,088 | |
Distribution fees – Class R | | | 3,765 | |
Distribution fees – Class C | | | 2,503 | |
Printing and mailing expenses | | | 2,310 | |
Distribution fees – Class A | | | 2,116 | |
Trustees’ fees | | | 1,484 | |
Miscellaneous | | | 12,968 | |
| | | | |
Gross expenses | | | 301,600 | |
Less: Waiver from investment adviser | | | (56,540 | ) |
Waiver from distributor | | | (2,503 | ) |
Reimbursement from investment adviser | | | (200,572 | ) |
| | | | |
Net expenses | | | 41,985 | |
| | | | |
NET INVESTMENT INCOME (LOSS) | | | (763 | ) |
| | | | |
REALIZED AND UNREALIZED GAIN (LOSS) | | | | |
Realized gain (loss) on: | | | | |
Investments | | | 110,088 | |
Foreign currency transactions | | | (1,425 | ) |
| | | | |
Net realized gain (loss) | | | 108,663 | |
| | | | |
Change in unrealized appreciation (depreciation) on: | | | | |
Investments | | | (42,307 | ) |
Foreign currency translations | | | (28 | ) |
| | | | |
Net change in unrealized appreciation (depreciation) | | | (42,335 | ) |
| | | | |
NET REALIZED AND UNREALIZED GAIN (LOSS) | | | 66,328 | |
| | | | |
NET INCREASE (DECREASE) IN NET ASSETS RESULTING FROM OPERATIONS | | $ | 65,565 | |
| | | | |
| * | The Fund commenced operations on November 12, 2014. |
| ** | Class C shares currently are not offered for sale. |
See Notes to Financial Statements.
21
1290 FUNDS
1290 GAMCO SMALL/MID CAP VALUE FUND
STATEMENT OF CHANGES IN NET ASSETS
| | | | |
| | | November 12, 2014* to
October 31, 2015 | |
INCREASE (DECREASE) IN NET ASSETS FROM OPERATIONS: | |
Net investment income (loss) | | $ | (763 | ) |
Net realized gain (loss) on investments and foreign currency transactions | | | 108,663 | |
Net change in unrealized appreciation (depreciation) on investments and foreign currency translations | | | (42,335 | ) |
| | | | |
NET INCREASE (DECREASE) IN NET ASSETS RESULTING FROM OPERATIONS | | | 65,565 | |
| | | | |
DIVIDENDS : | | | | |
Dividends from net investment income | | | | |
Class A | | | (5,222 | ) |
Class C | | | (1,822 | ) |
Class I | | | (6,867 | ) |
Class R | | | (4,943 | ) |
| | | | |
TOTAL DIVIDENDS : | | | (18,854 | ) |
| | | | |
CAPITAL SHARES TRANSACTIONS: | | | | |
Class A | | | | |
Capital shares sold [ 97,654 shares ] | | | 984,337 | |
Capital shares issued in reinvestment of dividends [ 512 shares ] | | | 5,222 | |
Capital shares repurchased [ (3,951) shares ] | | | (38,838 | ) |
| | | | |
Total Class A transactions | | | 950,721 | |
| | | | |
Class C** | | | | |
Capital shares sold [ 25,000 shares ] | | | 250,000 | |
Capital shares issued in reinvestment of dividends [ 179 shares ] | | | 1,822 | |
Capital shares repurchased [ (1,000) shares ] | | | (9,800 | ) |
| | | | |
Total Class C transactions | | | 242,022 | |
| | | | |
Class I | | | | |
Capital shares sold [ 242,308 shares ] | | | 2,480,175 | |
Capital shares issued in reinvestment of dividends [ 674 shares ] | | | 6,867 | |
Capital shares repurchased [ (10,868) shares ] | | | (108,719 | ) |
| | | | |
Total Class I transactions | | | 2,378,323 | |
| | | | |
Class R | | | | |
Capital shares sold [ 75,489 shares ] | | | 754,900 | |
Capital shares issued in reinvestment of dividends [ 485 shares ] | | | 4,943 | |
Capital shares repurchased [ (3,000) shares ] | | | (29,370 | ) |
| | | | |
Total Class R transactions | | | 730,473 | |
| | | | |
NET INCREASE (DECREASE) IN NET ASSETS RESULTING FROM CAPITAL SHARE TRANSACTIONS | | | 4,301,539 | |
| | | | |
TOTAL INCREASE (DECREASE) IN NET ASSETS | | | 4,348,250 | |
NET ASSETS: | | | | |
Beginning of period | | | 100,000 | |
| | | | |
End of period (a) | | $ | 4,448,250 | |
| | | | |
(a) Includes accumulated undistributed (overdistributed) net investment income (loss) of | | $ | 351 | |
| | | | |
* The Fund commenced operations on November 12, 2014. | | | | |
** Class C shares currently are not offered for sale. | | | | |
See Notes to Financial Statements.
22
1290 FUNDS
1290 GAMCO SMALL/MID CAP VALUE FUND
FINANCIAL HIGHLIGHTS
| | | | |
| Class A | | November 12, 2014* to
October 31, 2015 | |
Net asset value, beginning of period | | $ | 10.00 | |
| | | | |
Income (loss) from investment operations: | | | | |
Net investment income (loss) (e) | | | (0.01 | ) |
Net realized and unrealized gain (loss) on investments and foreign currency transactions | | | 0.33 | |
| | | | |
Total from investment operations | | | 0.32 | |
| | | | |
Less distributions: | | | | |
Dividends from net investment income | | | (0.07 | ) |
| | | | |
Net asset value, end of period | | $ | 10.25 | |
| | | | |
Total return (b) | | | 3.20 | % |
| | | | |
Ratios/Supplemental Data: | | | | |
Net assets, end of period (000’s) | | $ | 997 | |
Ratio of expenses to average net assets: | | | | |
After waivers and reimbursements (a) | | | 1.35 | % |
Before waivers and reimbursements (a) | | | 9.28 | % |
Ratio of net investment income (loss) to average net assets: | | | | |
After waivers and reimbursements (a) | | | (0.10 | )%(l) |
Before waivers and reimbursements (a) | | | (8.03 | )%(l) |
Portfolio turnover rate (z)^ | | | 95 | % |
| |
| Class C** | | November 12, 2014* to
October 31, 2015 | |
Net asset value, beginning of period | | $ | 10.00 | |
| | | | |
Income (loss) from investment operations: | | | | |
Net investment income (loss) (e) | | | 0.01 | |
Net realized and unrealized gain (loss) on investments and foreign currency transactions | | | 0.33 | |
| | | | |
Total from investment operations | | | 0.34 | |
| | | | |
Less distributions: | | | | |
Dividends from net investment income | | | (0.07 | ) |
| | | | |
Net asset value, end of period | | $ | 10.27 | |
| | | | |
Total return (b) | | | 3.43 | % |
| | | | |
Ratios/Supplemental Data: | | | | |
Net assets, end of period (000’s) | | $ | 259 | |
Ratio of expenses to average net assets: | | | | |
After waivers and reimbursements (a) | | | 1.10 | % |
Before waivers and reimbursements (a) | | | 10.23 | % |
Ratio of net investment income (loss) to average net assets: | | | | |
After waivers and reimbursements (a) | | | 0.15 | %(l) |
Before waivers and reimbursements (a) | | | (8.98 | )%(l) |
Portfolio turnover rate (z)^ | | | 95 | % |
See Notes to Financial Statements.
23
1290 FUNDS
1290 GAMCO SMALL/MID CAP VALUE FUND
FINANCIAL HIGHLIGHTS (Continued)
| | | | |
| Class I | | November 12, 2014* to
October 31, 2015 | |
Net asset value, beginning of period | | $ | 10.00 | |
| | | | |
Income (loss) from investment operations: | | | | |
Net investment income (loss) (e) | | | 0.02 | |
Net realized and unrealized gain (loss) on investments and foreign currency transactions | | | 0.32 | |
| | | | |
Total from investment operations | | | 0.34 | |
| | | | |
Less distributions: | | | | |
Dividends from net investment income | | | (0.07 | ) |
| | | | |
Net asset value, end of period | | $ | 10.27 | |
| | | | |
Total return (b) | | | 3.43 | % |
| | | | |
Ratios/Supplemental Data: | | | | |
Net assets, end of period (000’s) | | $ | 2,416 | |
Ratio of expenses to average net assets: | | | | |
After waivers and reimbursements (a) | | | 1.10 | % |
Before waivers and reimbursements (a) | | | 8.56 | % |
Ratio of net investment income (loss) to average net assets: | | | | |
After waivers and reimbursements (a) | | | 0.16 | %(l) |
Before waivers and reimbursements (a) | | | (7.30 | )%(l) |
Portfolio turnover rate (z)^ | | | 95 | % |
| |
| Class R | | November 12, 2014* to
October 31, 2015 | |
Net asset value, beginning of period | | $ | 10.00 | |
| | | | |
Income (loss) from investment operations: | | | | |
Net investment income (loss) (e) | | | (0.04 | ) |
Net realized and unrealized gain (loss) on investments and foreign currency transactions | | | 0.34 | |
| | | | |
Total from investment operations | | | 0.30 | |
| | | | |
Less distributions: | | | | |
Dividends from net investment income | | | (0.07 | ) |
| | | | |
Net asset value, end of period | | $ | 10.23 | |
| | | | |
Total return (b) | | | 2.96 | % |
| | | | |
Ratios/Supplemental Data: | | | | |
Net assets, end of period (000’s) | | $ | 777 | |
Ratio of expenses to average net assets: | | | | |
After waivers and reimbursements (a) | | | 1.60 | % |
Before waivers and reimbursements (a) | | | 9.73 | % |
Ratio of net investment income (loss) to average net assets: | | | | |
After waivers and reimbursements (a) | | | (0.35 | )%(l) |
Before waivers and reimbursements (a) | | | (8.49 | )%(l) |
Portfolio turnover rate (z)^ | | | 95 | % |
| * | Commencement of Operations. |
| ** | Class C shares currently are not offered for sale. |
| ^ | Portfolio turnover rate excludes derivatives, if any. |
| (a) | Ratios for periods less than one year are annualized. |
| (b) | Total returns for periods less than one year are not annualized. |
| (e) | Net investment income (loss) per share is based on average shares outstanding. |
| (l) | The annualized ratio of net investment income to average net assets may not be indicative of operating results for a full year. |
| (z) | Portfolio turnover rate for periods less than one year is not annualized. |
See Notes to Financial Statements.
24
1290 GLOBAL EQUITY MANAGERS FUND (Unaudited)
INVESTMENT ADVISER
INVESTMENT SUB-ADVISERS
| Ø | | Templeton Investment Counsel, LLC |
PERFORMANCE RESULTS
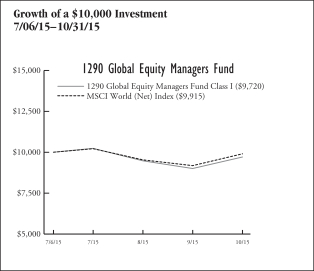
| | | | | | |
| Total Returns as of 10/31/15 | | | | | |
| | | | | Since
Incept. | |
Fund – Class A Shares* | | without Sales Charge | | | (2.90 | )% |
| | | with Sales Charge (a) | | | (8.22 | ) |
Fund – Class I Shares* | | | | | (2.80 | ) |
Fund – Class R Shares* | | | | | (3.00 | ) |
MSCI World (Net) Index | | | | | (0.85 | ) |
* Date of inception 7/6/15. (a) A 5.50% front-end sales charge was deducted. Returns for periods less than one year are not annualized. | |
The performance quoted is past performance and is not a guarantee of future results. Mutual funds are subject to certain market risks. Investment returns and principal value of an investment will fluctuate so that an investor’s shares, when redeemed, may be worth more or less than their original cost. Current performance may be higher or lower than the performance data shown. For the most current month-end performance data please call 1-888-310-0416 or visit www.1290Funds.com.
The graph illustrates comparative performance for $10,000 invested in the Class I Shares of the 1290 Global Equity Managers Fund and the MSCI World (Net) Index from 07/06/15 to 10/31/15. The performance of the MSCI World (Net) Index reflects an initial investment at the end of the month closest to the Fund’s inception. The performance of the Fund assumes reinvestment of all dividends and capital gain distributions, if any, and does not include a sales charge. The performance of the MSCI World (Net) Index does not reflect the deduction of expenses or a sales charge associated with a mutual fund and has been adjusted to reflect reinvestment of dividends, capital gain distributions, and interest of the securities included in the benchmark.
Fund performance may reflect the waiver of the Fund’s fees and reimbursement of expenses for certain periods since the inception date. Without these waivers and reimbursements, performance would have been lower. Also, performance shown in this section does not reflect the deduction of taxes that a shareholder would pay on Fund distributions or redemption of Fund shares.
PERFORMANCE SUMMARY
The Fund’s Class I shares returned (2.80)% for the period ended October 31, 2015. The Fund’s benchmark, the MSCI World (Net) Index, returned (0.85)% over the same period.
OppenheimerFunds, Inc.
Fund Overview — OppenheimerFunds, Inc.
During the period July 6, 2015 through October 31, 2015, numerous concerns resulted in market volatility, including the impact of slowing Chinese growth on commodities prices and the global economy, Greece’s debt situation, the strength of the U.S. dollar, along with the timing and impact of U.S. interest rate hikes. These factors created risk on/risk off market environments which tended to obscure fundamentals and increase market volatility. While we do not disregard macro events, our main focus tends to be on the microeconomic characteristics of individual companies and their valuations. Regardless of how macro events unfold, we believe companies with strong, durable economic traits, purchased at sensible prices, are likely to have good long-run returns.
Fund Highlights
What helped performance since inception through October 31, 2015:
| • | | Alphabet, Inc., the new holding company vehicle for what was previously known as Google, rallied in the third quarter of 2015 as the company announced much stronger than expected earnings. It also reorganized the structure of the company in a way which we believe will make it easier for investors to see the value in its core businesses and more easily assess the progress of their developing ones. |
| • | | Maxim Integrated Products, Inc. is an analog circuit maker whose products serve the communications, computing, consumer and industrial markets. The company performed well this reporting period. |
| • | | Inditex is the world’s largest apparel retailer. It reported a 26% increase in net profit over the first half of 2015, helped by strong sales. |
What hurt performance since inception through October 31, 2015:
| • | | Materials are dominated by commodity businesses, few of which have the structural drivers we like. Our exposure there is low and that was a negative relative to benchmark. |
| • | | Celldex Therapeutics, Inc. is a biotech company focused on oncology. The FDA declined to grant accelerated approval for a treatment the company is developing for brain tumors. We did not expect Celldex to receive accelerated FDA approval on the limited data set it had amassed thus far, and we continue to like the prospects for Celldex. |
| • | | SunEdison, Inc. is a position we initiated in August, in a period of sharp decline in its share price. The company is a developer of technologies in the field of solar power. In recent months concerns developed about the durability of their finances. |
| • | | Clinical-stage biotechnology company bluebird bio, Inc. experienced declines this reporting period. |
25
1290 GLOBAL EQUITY MANAGERS FUND (Unaudited)
Templeton Investment Counsel, LLC
Fund Overview — Templeton Investment Counsel, LLC
At the beginning of the period July 6, 2015 through October 31, 2015, risk aversion spiked alongside volatility, resulting in weak performance of economically sensitive stocks, an extended slide for emerging market equities and currencies, and a continuation of the longest commodity decline on record. These trends largely reversed during the final month as investors took advantage of what seemed to be oversold market conditions. Against that backdrop, the Fund maintained a full and diverse array of stocks from sectors and regions around the world which we believe are undervalued. We believe that while stocks are vulnerable to near-term volatility, the asset class globally has the potential for long-term gains. Within equities, value-oriented stocks remain particularly attractive, in our analysis. Value, which has historically outperformed more often than not, is currently lagging growth by the greatest magnitude and duration on record. We feel that quality stocks, which have been bid up by investors seeking a safe haven, are the most expensive relative to value on record, while growth stocks, which have attracted a scarcity premium in a lackluster economic environment, are the most expensive relative to value since the height of the technology, media and telecommunications bubble. After such a pronounced and extended period of underperformance for value stocks, we expect that the eventual normalization of these historical trends could be supportive of value-oriented equities.
Fund Highlights
What helped performance since inception through October 31, 2015:
| • | | Stock selection in health care and energy contributed to performance relative to the benchmark. Stock selection and an underweighting in materials also benefited results. Stock selection in the information technology sector was particularly strong as U.S. software firm Microsoft Corp., U.S. diversified technology company Alphabet, Inc. (Google’s new parent) and South Korean semiconductor and consumer electronics manufacturer Samsung Electronics Co. were among the Fund’s top contributors. |
| • | | From a regional standpoint, stock selection and an overweighting in the solidly performing eurozone contributed, as did an off-benchmark allocation in South Korea. |
What hurt performance since inception through October 31, 2015:
| • | | Stock selection and an underweighted position in consumer staples detracted from performance relative to the benchmark as risk-averse investors sought safety in the traditionally defensive sector. |
| • | | Stock selection in financials, telecommunications and consumer discretionary also hurt the Fund. Notable laggards from these sectors included U.K. lender Standard Chartered plc, U.S. retailer Macy’s, Inc. and U.K. mobile operator Vodafone Group plc. |
| • | | Stock selection and an underweighting in the U.S., stock selection in the U.K. and an overweighting in China detracted from a regional perspective. |
| | | | | | | | |
Sector Weightings as of October 31, 2015 | | Market Value | | | % of
Net Assets | |
Financials | | | $6,433,898 | | | | 22.1 | % |
Information Technology | | | 5,247,862 | | | | 18.0 | |
Health Care | | | 4,968,720 | | | | 17.0 | |
Consumer Discretionary | | | 3,849,117 | | | | 13.2 | |
Industrials | | | 2,755,667 | | | | 9.4 | |
Energy | | | 1,887,981 | | | | 6.5 | |
Consumer Staples | | | 1,514,095 | | | | 5.2 | |
Telecommunication Services | | | 892,275 | | | | 3.1 | |
Materials | | | 848,004 | | | | 2.9 | |
Cash and Other | | | 765,192 | | | | 2.6 | |
| | | | | | | | | |
| | | | | | | | 100.0 | % |
| | | | | | | | | |
Holdings are subject to change without notice. | | | | | |
UNDERSTANDING YOUR EXPENSES:
As a shareholder of the Fund, you incur two types of costs:
(1) transaction costs, including applicable sales charges and redemption fees; and (2) ongoing costs, including investment advisory fees, distribution and/or service (12b-1) fees (in the case of (in the case of Class A, Class C and Class R shares of the Trust), and other Fund expenses. These examples are intended to help you understand your ongoing costs (in dollars) of investing in the Fund and to compare these costs with the ongoing costs of investing in other mutual funds.
The examples are based on an investment of $1,000 invested at the beginning of the six-month period ended October 31, 2015 and held for the entire six-month period.
Actual Expenses
The first line of the following table provides information about actual account values and actual expenses. You may use the information in this line, together with the amount you invested, to estimate the expenses that you paid over the period. Simply divide your account value by $1,000 (for example, an $8,600 account value divided by $1,000 = 8.6), then multiply the result by the number in the first line under the heading entitled ‘‘Expenses Paid During Period’’ to estimate the expenses you paid on your account during this period.
Hypothetical Example for Comparison Purposes
The second line of the following table provides information about hypothetical account values and hypothetical expenses based on the Fund’s actual expense ratio and an assumed rate of return of 5% per year before expenses, which is not the Fund’s actual return. The hypothetical account values and expenses may not be used to estimate the actual ending account balance or expenses you paid for the period. You may use this information to compare the ongoing costs of investing in the Fund and other funds. To do so, compare this 5% hypothetical example with the 5% hypothetical examples that appear in the shareholder reports of the other funds.
Please note that the expenses shown in the table are meant to highlight your ongoing costs only and do not reflect any transactional costs, such as sales charges (loads), redemption fees, or exchange fees. Therefore, the second line of the table is useful in comparing ongoing costs only, and will not help you determine the relative total costs of owning different funds. In addition, if these transactional costs were included, your costs would have been higher.
26
1290 GLOBAL EQUITY MANAGERS FUND (Unaudited)
Please note that while the Fund Commenced Operations on July 6, 2015, the ‘Hypothetical Expenses Paid during the period’ reflect projected activity for the full six months for the purpose of comparability.
EXAMPLE
| | | | | | | | | | | | |
| | | Beginning
Account
Value
5/1/15† | | | Ending
Account
Value
10/31/15 | | | Expenses
Paid During
Period*
5/1/15 -
10/31/15 | |
Class A | |
Actual | | | $1,000.00 | | | | $971.00 | | | | $4.41 | |
Hypothetical (5% average annual return before expenses) | | | 1,000.00 | | | | 1,018.18 | | | | 7.09 | |
Class I | | | | | | | | | | | | |
Actual | | | 1,000.00 | | | | 972.00 | | | | 3.63 | |
Hypothetical (5% average annual return before expenses) | | | 1,000.00 | | | | 1,019.41 | | | | 5.85 | |
Class R | | | | | | | | | | | | |
Actual | | | 1,000.00 | | | | 970.00 | | | | 5.21 | |
Hypothetical (5% average annual return before expenses) | | | 1,000.00 | | | | 1,016.89 | | | | 8.39 | |
† Commenced operations on July 6, 2015. * Expenses are equal to the Fund’s Class A, I and R shares annualized expense ratios of 1.40%, 1.15% and 1.65%, respectively, multiplied by the average account value over the period, and multiplied by 184/365 for the hypothetical example (to reflect the one-half year period), and multiplied by 117/365 for the actual example (to reflect the actual number of days in the period). | |
27
1290 FUNDS
1290 GLOBAL EQUITY MANAGERS FUND
PORTFOLIO OF INVESTMENTS
October 31, 2015
| | | | | | | | |
| | | Number of
Shares | | | Value
(Note 1) | |
| | | | | | | | |
COMMON STOCKS: | | | | | | | | |
Brazil (0.6%) | | | | | | | | |
Ambev S.A. (ADR) | | | 5,120 | | | $ | 24,935 | |
Embraer S.A. (ADR) | | | 5,582 | | | | 163,943 | |
| | | | | | | | |
| | | | | | | 188,878 | |
| | | | | | | | |
Canada (0.4%) | | | | | | | | |
Suncor Energy, Inc. | | | 3,800 | | | | 113,076 | |
| | | | | | | | |
Cayman Islands (0.0%) | | | | | | | | |
Theravance Biopharma, Inc.* | | | 840 | | | | 12,558 | |
| | | | | | | | |
China (1.7%) | | | | | | | | |
China Life Insurance Co., Ltd., Class H | | | 21,000 | | | | 76,001 | |
CRRC Corp., Ltd., Class H* | | | 69,000 | | | | 88,402 | |
JD.com, Inc. (ADR)* | | | 5,110 | | | | 141,138 | |
Qihoo 360 Technology Co., Ltd. (ADR)* | | | 1,080 | | | | 61,657 | |
Sinopharm Group Co., Ltd., Class H | | | 19,600 | | | | 81,176 | |
Weichai Power Co., Ltd., Class H | | | 44,000 | | | | 47,005 | |
| | | | | | | | |
| | | | | | | 495,379 | |
| | | | | | | | |
Denmark (0.1%) | | | | | | | | |
FLSmidth & Co. A/S | | | 904 | | | | 34,228 | |
| | | | | | | | |
France (7.0%) | | | | | | | | |
Airbus Group SE | | | 4,870 | | | | 339,312 | |
BNP Paribas S.A. | | | 4,380 | | | | 266,158 | |
Cie de Saint-Gobain | | | 3,350 | | | | 140,649 | |
Cie Generale des Etablissements Michelin | | | 1,440 | | | | 143,465 | |
Kering | | | 1,010 | | | | 187,199 | |
LVMH Moet Hennessy Louis Vuitton SE | | | 1,560 | | | | 290,941 | |
Sanofi S.A. | | | 1,800 | | | | 181,805 | |
Societe Generale S.A. | | | 2,880 | | | | 133,995 | |
Technip S.A. | | | 3,920 | | | | 204,776 | |
Total S.A. | | | 3,100 | | | | 150,487 | |
| | | | | | | | |
| | | | | | | 2,038,787 | |
| | | | | | | | |
Germany (7.1%) | | | | | | | | |
Allianz SE (Registered) | | | 1,465 | | | | 256,711 | |
Bayer AG (Registered) | | | 2,748 | | | | 366,700 | |
Bayerische Motoren Werke (BMW) AG (Preference) (q) | | | 3,200 | | | | 259,025 | |
Deutsche Bank AG (Registered) | | | 5,180 | | | | 145,082 | |
Deutsche Lufthansa AG (Registered)* | | | 6,440 | | | | 95,108 | |
HeidelbergCement AG | | | 1,040 | | | | 77,516 | |
Linde AG | | | 782 | | | | 135,653 | |
Merck KGaA | | | 1,110 | | | | 108,427 | |
Muenchener Rueckversicherungs-Gesellschaft AG in Muenchen (Registered) | | | 490 | | | | 97,797 | |
SAP SE | | | 4,631 | | | | 366,047 | |
Siemens AG (Registered) | | | 1,620 | | | | 163,001 | |
| | | | | | | | |
| | | | | | | 2,071,067 | |
| | | | | | | | |
Hong Kong (1.4%) | | | | | | | | |
Cheung Kong Property Holdings Ltd. | | | 7,000 | | | | 49,222 | |
China Mobile Ltd. | | | 6,500 | | | | 77,826 | |
| | | | | | | | |
CK Hutchison Holdings Ltd. | | | 5,000 | | | $ | 68,704 | |
Haier Electronics Group Co., Ltd. | | | 37,000 | | | | 71,798 | |
Swire Pacific Ltd., Class A | | | 5,000 | | | | 58,060 | |
Swire Properties Ltd. | | | 23,000 | | | | 69,292 | |
| | | | | | | | |
| | | | | | | 394,902 | |
| | | | | | | | |
India (0.7%) | | | | | | | | |
ICICI Bank Ltd. (ADR) | | | 22,550 | | | | 194,381 | |
| | | | | | | | |
Ireland (1.1%) | | | | | | | | |
CRH plc | | | 7,990 | | | | 218,425 | |
Shire plc | | | 1,340 | | | | 101,738 | |
| | | | | | | | |
| | | | | | | 320,163 | |
| | | | | | | | |
Israel (0.8%) | | | | | | | | |
Teva Pharmaceutical Industries Ltd. (ADR) | | | 3,898 | | | | 230,723 | |
| | | | | | | | |
Italy (2.0%) | | | | | | | | |
Banca Monte dei Paschi di Siena S.p.A.* | | | 36,680 | | | | 67,440 | |
Brunello Cucinelli S.p.A. | | | 2,410 | | | | 43,648 | |
Eni S.p.A. | | | 6,531 | | | | 106,722 | |
Ferrari N.V.* | | | 260 | | | | 13,112 | |
Intesa Sanpaolo S.p.A. | | | 25,145 | | | | 87,597 | |
Prysmian S.p.A. | | | 2,716 | | | | 58,688 | |
Tod’s S.p.A. | | | 765 | | | | 64,144 | |
UniCredit S.p.A. | | | 21,348 | | | | 138,035 | |
| | | | | | | | |
| | | | | | | 579,386 | |
| | | | | | | | |
Japan (9.0%) | | | | | | | | |
Dai-ichi Life Insurance Co., Ltd. | | | 11,700 | | | | 205,068 | |
FANUC Corp. | | | 600 | | | | 107,177 | |
KDDI Corp. | | | 8,400 | | | | 205,075 | |
Keyence Corp. | | | 400 | | | | 210,757 | |
Konica Minolta, Inc. | | | 9,900 | | | | 102,634 | |
Kyocera Corp. | | | 3,300 | | | | 150,492 | |
Murata Manufacturing Co., Ltd. | | | 2,200 | | | | 316,408 | |
Nidec Corp. | | | 3,000 | | | | 228,052 | |
Nintendo Co., Ltd. | | | 200 | | | | 32,286 | |
Nissan Motor Co., Ltd. | | | 24,200 | | | | 253,993 | |
Nomura Holdings, Inc. | | | 11,800 | | | | 74,866 | |
SoftBank Group Corp. | | | 1,900 | | | | 107,022 | |
Sumitomo Mitsui Financial Group, Inc. | | | 4,000 | | | | 161,100 | |
Suntory Beverage & Food Ltd. | | | 3,800 | | | | 154,620 | |
Suzuki Motor Corp. | | | 2,300 | | | | 76,050 | |
Toshiba Corp.* | | | 25,000 | | | | 71,082 | |
Toyota Motor Corp. | | | 2,800 | | | | 173,309 | |
| | | | | | | | |
| | | | | | | 2,629,991 | |
| | | | | | | | |
Mexico (0.3%) | | | | | | | | |
Fomento Economico Mexicano S.A.B. de C.V. (ADR) | | | 820 | | | | 81,254 | |
| | | | | | | | |
Netherlands (2.6%) | | | | | | | | |
Akzo Nobel N.V. | | | 2,070 | | | | 146,706 | |
ING Groep N.V. (CVA) | | | 14,640 | | | | 213,069 | |
NN Group N.V. | | | 2,340 | | | | 73,516 | |
QIAGEN N.V.* | | | 3,350 | | | | 81,265 | |
Royal Dutch Shell plc, Class B | | | 5,160 | | | | 135,229 | |
SBM Offshore N.V.* | | | 7,690 | | | | 105,408 | |
| | | | | | | | |
| | | | | | | 755,193 | |
| | | | | | | | |
See Notes to Financial Statements.
28
1290 FUNDS
1290 GLOBAL EQUITY MANAGERS FUND
PORTFOLIO OF INVESTMENTS (Continued)
October 31, 2015
| | | | | | | | |
| | | Number of
Shares | | | Value
(Note 1) | |
| | | | | | | | |
Norway (0.4%) | | | | | | | | |
Statoil ASA | | | 3,070 | | | $ | 49,211 | |
Telenor ASA | | | 3,510 | | | | 66,220 | |
| | | | | | | | |
| | | | | | | 115,431 | |
| | | | | | | | |
Portugal (0.2%) | | | | | | | | |
Galp Energia SGPS S.A. | | | 6,670 | | | | 72,151 | |
| | | | | | | | |
Russia (0.2%) | | | | | | | | |
MMC Norilsk Nickel PJSC (ADR) | | | 4,061 | | | | 60,509 | |
| | | | | | | | |
Singapore (0.7%) | | | | | | | | |
DBS Group Holdings Ltd. | | | 6,200 | | | | 76,432 | |
Singapore Telecommunications Ltd. | | | 40,500 | | | | 115,062 | |
| | | | | | | | |
| | | | | | | 191,494 | |
| | | | | | | | |
South Korea (1.8%) | | | | | | | | |
Hana Financial Group, Inc. | | | 2,186 | | | | 53,305 | |
Hyundai Mobis Co., Ltd. | | | 430 | | | | 90,522 | |
KB Financial Group, Inc. (ADR) | | | 2,090 | | | | 65,898 | |
POSCO (ADR) | | | 1,327 | | | | 53,120 | |
Samsung Electronics Co., Ltd. (GDR) (b) | | | 460 | | | | 275,310 | |
| | | | | | | | |
| | | | | | | 538,155 | |
| | | | | | | | |
Spain (2.3%) | | | | | | | | |
Banco Bilbao Vizcaya Argentaria S.A. | | | 15,337 | | | | 132,224 | |
Industria de Diseno Textil S.A. | | | 7,921 | | | | 297,066 | |
Repsol S.A. | | | 5,994 | | | | 75,635 | |
Telefonica S.A. | | | 11,692 | | | | 154,671 | |
| | | | | | | | |
| | | | | | | 659,596 | |
| | | | | �� | | | |
Sweden (1.9%) | | | | | | | | |
Assa Abloy AB, Class B | | | 11,629 | | | | 231,395 | |
Getinge AB, Class B | | | 4,750 | | | | 118,923 | |
Telefonaktiebolaget LM Ericsson, Class B | | | 20,736 | | | | 202,298 | |
| | | | | | | | |
| | | | | | | 552,616 | |
| | | | | | | | |
Switzerland (5.3%) | | | | | | | | |
ACE Ltd. | | | 1,080 | | | | 122,623 | |
Credit Suisse Group AG (Registered)* | | | 13,889 | | | | 346,786 | |
Glencore plc* | | | 46,600 | | | | 80,818 | |
Nestle S.A. (Registered) | | | 1,966 | | | | 150,366 | |
Novartis AG (Registered) | | | 1,140 | | | | 103,626 | |
Roche Holding AG | | | 1,285 | | | | 348,794 | |
Swiss Reinsurance AG | | | 1,270 | | | | 118,077 | |
UBS Group AG (Registered) | | | 14,186 | | | | 283,878 | |
| | | | | | | | |
| | | | | | | 1,554,968 | |
| | | | | | | | |
Taiwan (0.2%) | | | | | | | | |
Taiwan Semiconductor Manufacturing Co., Ltd. (ADR) | | | 2,591 | | | | 56,898 | |
| | | | | | | | |
Thailand (0.3%) | | | | | | | | |
Bangkok Bank PCL (NVDR) | | | 17,300 | | | | 81,472 | |
| | | | | | | | |
United Kingdom (8.8%) | | | | | | | | |
Aviva plc | | | 19,360 | | | | 145,049 | |
BAE Systems plc | | | 11,720 | | | | 79,551 | |
Barclays plc | | | 45,820 | | | | 163,876 | |
| | | | | | | | |
BG Group plc | | | 6,300 | | | $ | 99,549 | |
BP plc | | | 33,430 | | | | 199,134 | |
Circassia Pharmaceuticals plc* | | | 24,240 | | | | 104,669 | |
Earthport plc* | | | 54,020 | | | | 32,478 | |
GlaxoSmithKline plc | | | 8,940 | | | | 193,636 | |
HSBC Holdings plc | | | 18,000 | | | | 141,666 | |
Kingfisher plc | | | 27,500 | | | | 149,693 | |
Lloyds Banking Group plc | | | 90,570 | | | | 102,944 | |
Noble Corp. plc | | | 8,460 | | | | 113,956 | |
Prudential plc | | | 11,140 | | | | 260,864 | |
Sky plc | | | 7,810 | | | | 131,957 | |
Standard Chartered plc | | | 6,070 | | | | 67,505 | |
Tesco plc* | | | 46,470 | | | | 131,313 | |
Unilever plc | | | 5,990 | | | | 267,145 | |
Vodafone Group plc | | | 50,380 | | | | 166,399 | |
| | | | | | | | |
| | | | | | | 2,551,384 | |
| | | | | | | | |
United States (40.5%) | | | | | | | | |
3M Co. | | | 1,330 | | | | 209,089 | |
ACADIA Pharmaceuticals, Inc.* | | | 2,590 | | | | 90,184 | |
Adobe Systems, Inc.* | | | 3,370 | | | | 298,784 | |
Aetna, Inc. | | | 2,950 | | | | 338,601 | |
Allergan plc* | | | 910 | | | | 280,708 | |
Alphabet, Inc., Class A* | | | 610 | | | | 449,808 | |
Alphabet, Inc., Class C* | | | 420 | | | | 298,540 | |
Altera Corp. | | | 5,590 | | | | 293,755 | |
American Express Co. | | | 950 | | | | 69,597 | |
American International Group, Inc. | | | 1,680 | | | | 105,941 | |
Amgen, Inc. | | | 1,440 | | | | 227,779 | |
Anthem, Inc. | | | 1,690 | | | | 235,164 | |
Applied Materials, Inc. | | | 6,950 | | | | 116,552 | |
Baker Hughes, Inc. | | | 2,870 | | | | 151,192 | |
Best Buy Co., Inc. | | | 2,230 | | | | 78,117 | |
Biogen, Inc.* | | | 490 | | | | 142,350 | |
BioMarin Pharmaceutical, Inc.* | | | 1,110 | | | | 129,914 | |
Bluebird Bio, Inc.* | | | 890 | | | | 68,646 | |
Capital One Financial Corp. | | | 2,040 | | | | 160,956 | |
Celldex Therapeutics, Inc.* | | | 6,850 | | | | 82,611 | |
Chesapeake Energy Corp. | | | 4,170 | | | | 29,732 | |
Chevron Corp. | | | 1,360 | | | | 123,597 | |
Cigna Corp. | | | 250 | | | | 33,510 | |
Cisco Systems, Inc. | | | 4,660 | | | | 134,441 | |
Citigroup, Inc. | | | 9,310 | | | | 495,013 | |
Clovis Oncology, Inc.* | | | 950 | | | | 94,915 | |
Colgate-Palmolive Co. | | | 4,530 | | | | 300,566 | |
Comcast Corp., Class A | | | 3,740 | | | | 234,535 | |
CVS Health Corp. | | | 2,040 | | | | 201,511 | |
eBay, Inc.* | | | 5,600 | | | | 156,240 | |
Eli Lilly & Co. | | | 1,040 | | | | 84,833 | |
Emerson Electric Co. | | | 2,000 | | | | 94,460 | |
Facebook, Inc., Class A* | | | 2,520 | | | | 256,964 | |
FedEx Corp. | | | 430 | | | | 67,102 | |
FNF Group | | | 3,150 | | | | 111,132 | |
Foot Locker, Inc. | | | 1,660 | | | | 112,465 | |
General Motors Co. | | | 2,480 | | | | 86,577 | |
Gilead Sciences, Inc. | | | 4,180 | | | | 451,983 | |
Goldman Sachs Group, Inc. | | | 1,180 | | | | 221,250 | |
Halliburton Co. | | | 4,120 | | | | 158,126 | |
Hewlett-Packard Co. | | | 2,190 | | | | 59,042 | |
Humana, Inc. | | | 30 | | | | 5,359 | |
See Notes to Financial Statements.
29
1290 FUNDS
1290 GLOBAL EQUITY MANAGERS FUND
PORTFOLIO OF INVESTMENTS (Continued)
October 31, 2015
| | | | | | | | |
| | | Number of
Shares | | | Value
(Note 1) | |
| | | | | | | | |
International Game Technology plc | | | 4,300 | | | $ | 69,746 | |
Intuit, Inc. | | | 2,730 | | | | 265,984 | |
JPMorgan Chase & Co. | | | 3,080 | | | | 197,890 | |
Knowles Corp.* | | | 5,260 | | | | 87,632 | |
LyondellBasell Industries N.V., Class A | | | 810 | | | | 75,257 | |
MacroGenics, Inc.* | | | 2,170 | | | | 67,422 | |
Macy’s, Inc. | | | 1,330 | | | | 67,803 | |
Maxim Integrated Products, Inc. | | | 7,500 | | | | 307,350 | |
McDonald’s Corp. | | | 780 | | | | 87,555 | |
McGraw Hill Financial, Inc. | | | 3,860 | | | | 357,590 | |
Medivation, Inc.* | | | 1,160 | | | | 48,790 | |
Merck & Co., Inc. | | | 1,690 | | | | 92,375 | |
Microsoft Corp. | | | 6,410 | | | | 337,422 | |
Morgan Stanley | | | 1,920 | | | | 63,302 | |
News Corp., Class A | | | 5,130 | | | | 79,002 | |
Oracle Corp. | | | 2,240 | | | | 87,002 | |
PayPal Holdings, Inc.* | | | 5,600 | | | | 201,656 | |
Pfizer, Inc. | | | 4,260 | | | | 144,073 | |
Rockwell Collins, Inc. | | | 860 | | | | 74,579 | |
St. Jude Medical, Inc. | | | 1,430 | | | | 91,248 | |
Stanley Black & Decker, Inc. | | | 900 | | | | 95,382 | |
SunEdison, Inc.* | | | 12,250 | | | | 89,425 | |
SunTrust Banks, Inc./Georgia | | | 2,920 | | | | 121,238 | |
Tiffany & Co. | | | 2,160 | | | | 178,070 | |
Twenty-First Century Fox, Inc., Class A | | | 3,470 | | | | 106,494 | |
United Parcel Service, Inc., Class B | | | 2,900 | | | | 298,758 | |
Vertex Pharmaceuticals, Inc.* | | | 540 | | | | 67,360 | |
Walgreens Boots Alliance, Inc. | | | 2,390 | | | | 202,385 | |
Walt Disney Co. | | | 3,180 | | | | 361,693 | |
Zimmer Biomet Holdings, Inc. | | | 1,500 | | | | 156,855 | |
| | | | | | | | |
| | | | | | | 11,822,979 | |
| | | | | | | | |
Total Investments (97.4%)
(Cost $29,153,539) | | | | | | | 28,397,619 | |
Other Assets Less Liabilities (2.6%) | | | | | | | 765,192 | |
| | | | | | | | |
Net Assets (100%) | | | | | | $ | 29,162,811 | |
| | | | | | | | |
| (q) | Preference Shares are a special type of equity investment that shares in the earnings of the company, has limited voting rights, and receives a greater dividend than applicable Common Shares. |
Glossary:
| | ADR | — American Depositary Receipt |
| | CVA | — Dutch Certification |
| | GDR | — Global Depositary Receipt |
| | NVDR | — Non-Voting Depositary Receipt |
| | | | | | | | |
Sector Weightings as of October 31, 2015 | | Market Value | | | % of
Net Assets | |
Financials | | | $6,433,898 | | | | 22.1 | % |
Information Technology | | | 5,247,862 | | | | 18.0 | |
Health Care | | | 4,968,720 | | | | 17.0 | |
Consumer Discretionary | | | 3,849,117 | | | | 13.2 | |
Industrials | | | 2,755,667 | | | | 9.4 | |
Energy | | | 1,887,981 | | | | 6.5 | |
Consumer Staples | | | 1,514,095 | | | | 5.2 | |
Telecommunication Services | | | 892,275 | | | | 3.1 | |
Materials | | | 848,004 | | | | 2.9 | |
Cash and Other | | | 765,192 | | | | 2.6 | |
| | | | | | | | | |
| | | | | | | | 100.0 | % |
| | | | | | | | | |
Holdings are subject to change without notice. | | | | | |
The following is a summary of the inputs used to value the Fund’s assets and liabilities carried at fair value as of October 31, 2015:
The inputs or methodology used for valuing securities are not necessarily an indication of the risk associated with investing in those securities.
See Notes to Financial Statements.
30
1290 FUNDS
1290 GLOBAL EQUITY MANAGERS FUND
PORTFOLIO OF INVESTMENTS (Continued)
October 31, 2015
Various inputs are used in determining the value of the Fund’s investments. These inputs are summarized in the three broad levels listed below:
| | | | | | | | | | | | | | | | |
| | | | | |
| Investment Type | | Level 1
Quoted Prices in
Active Markets for
Identical
Securities | | | Level 2
Significant Other
Observable Inputs
(including quoted prices
for similar securities,
interest rates,
prepayment speeds,
credit risk, etc.) | | | Level 3
Significant Unobservable
Inputs (including the
Fund’s own
assumptions in
determining the fair
value of investments) | | | Total | |
Assets: | |
Common Stocks | | | | | | | | | | | | | | | | |
Consumer Discretionary | | $ | 1,616,307 | | | $ | 2,232,810 | | | $ | — | | | $ | 3,849,117 | |
Consumer Staples | | | 810,651 | | | | 703,444 | | | | — | | | | 1,514,095 | |
Energy | | | 689,679 | | | | 1,198,302 | | | | — | | | | 1,887,981 | |
Financials | | | 2,286,811 | | | | 4,147,087 | | | | — | | | | 6,433,898 | |
Health Care | | | 3,177,961 | | | | 1,790,759 | | | | — | | | | 4,968,720 | |
Industrials | | | 1,003,313 | | | | 1,752,354 | | | | — | | | | 2,755,667 | |
Information Technology | | | 3,559,152 | | | | 1,688,710 | | | | — | | | | 5,247,862 | |
Materials | | | 188,886 | | | | 659,118 | | | | — | | | | 848,004 | |
Telecommunication Services | | | — | | | | 892,275 | | | | — | | | | 892,275 | |
| | | | | | | | | | | | | | | | |
Total Assets | | $ | 13,332,760 | | | $ | 15,064,859 | | | $ | — | | | $ | 28,397,619 | |
| | | | | | | | | | | | | | | | |
Total Liabilities | | $ | — | | | $ | — | | | $ | — | | | $ | — | |
| | | | | | | | | | | | | | | | |
Total | | $ | 13,332,760 | | | $ | 15,064,859 | | | $ | — | | | $ | 28,397,619 | |
| | | | | | | | | | | | | | | | |
There were no transfers between Levels 1, 2 or 3 during the period ended October 31, 2015.
Fair Values of Derivative Instruments as of October 31, 2015:
The Effect of Derivative Instruments on the Statement of Operations for the period ended October 31, 2015:
| | | | | | | | |
Amount of Realized Gain or (Loss) on Derivatives Recognized in Income | |
Derivatives Not Accounted for as Hedging Instruments^ | | Forward
Foreign
Currency
Contracts | | | Total | |
| | |
| | |
| | |
Foreign exchange contracts | | $ | (6,800 | ) | | $ | (6,800 | ) |
| | | | | | | | |
^ The Fund held forward foreign currency contracts as hedging.
The Fund held forward foreign currency contracts with an average settlement value of approximately $100, for one month during the period ended October 31, 2015.
Investment security transactions for the period ended October 31, 2015 were as follows:
| | | | |
Cost of Purchases: | | | | |
Long-term investments other than U.S. government debt securities | | $ | 30,164,513 | |
Net Proceeds of Sales and Redemptions: | | | | |
Long-term investments other than U.S. government debt securities | | $ | 917,021 | |
As of October 31, 2015, the gross unrealized appreciation (depreciation) of investments based on the aggregate cost of investments for Federal income tax purposes was as follows:
| | | | |
Aggregate gross unrealized appreciation | | $ | 894,406 | |
Aggregate gross unrealized depreciation | | | (1,672,191 | ) |
| | | | |
Net unrealized depreciation | | $ | (777,785 | ) |
| | | | |
Federal income tax cost of investments | | $ | 29,175,404 | |
| | | | |
For the period ended October 31, 2015, the Fund incurred approximately $761 as brokerage commissions with Sanford C. Bernstein & Co., LLC,. an affiliated broker/dealer.
See Notes to Financial Statements.
31
1290 FUNDS
1290 GLOBAL EQUITY MANAGERS FUND
STATEMENT OF ASSETS AND LIABILITIES
October 31, 2015
| | | | |
ASSETS | | | | |
Investments at value (Cost $29,153,539) | | $ | 28,397,619 | |
Cash | | | 728,283 | |
Foreign cash (Cost $27,688) | | | 27,642 | |
Dividends, interest and other receivables | | | 35,881 | |
Deferred offering cost | | | 18,558 | |
Receivable from investment adviser | | | 12,510 | |
| | | | |
Total assets | | | 29,220,493 | |
| | | | |
LIABILITIES | | | | |
Transfer agent fees payable | | | 3,188 | |
Trustees’ fees payable | | | 201 | |
Distribution fees payable – Class R | | | 40 | |
Distribution fees payable – Class A | | | 21 | |
Accrued expenses | | | 54,232 | |
| | | | |
Total liabilities | | | 57,682 | |
| | | | |
NET ASSETS | | $ | 29,162,811 | |
| | | | |
Net assets were comprised of: | | | | |
Paid in capital | | $ | 30,001,851 | |
Accumulated undistributed net investment
income (loss) | | | 12,390 | |
Accumulated undistributed net realized gain (loss) on investments and foreign currency transactions | | | (95,351 | ) |
Net unrealized appreciation (depreciation) on investments and foreign currency translations | | | (756,079 | ) |
| | | | |
Net assets | | $ | 29,162,811 | |
| | | | |
Class A | | | | |
Net asset value and redemption price per share, $102,219 / 10,528 shares outstanding (unlimited amount authorized: $0.001 par value) | | $ | 9.71 | |
Maximum sales charge (5.50% of offering price) | | | 0.57 | |
| | | | |
Maximum offering price per share | | $ | 10.28 | |
| | | | |
Class I | | | | |
Net asset value and redemption price per share, $28,963,573 / 2,980,580 shares outstanding (unlimited amount authorized: $0.001 par value) | | $ | 9.72 | |
| | | | |
Class R | | | | |
Net asset value and redemption price per share, $97,019 / 10,000 shares outstanding (unlimited amount authorized: $0.001 par value) | | $ | 9.70 | |
| | | | |
STATEMENT OF OPERATIONS
For the Period Ended October 31, 2015*
| | | | |
INVESTMENT INCOME | |
Dividends (net of $5,224 foreign withholding tax) | | $ | 129,072 | |
Interest | | | 502 | |
| | | | |
Total income | | | 129,574 | |
| | | | |
EXPENSES | | | | |
Investment advisory fees | | | 74,532 | |
Professional fees | | | 55,490 | |
Administrative fees | | | 19,235 | |
Custodian fees | | | 10,500 | |
Offering costs | | | 8,720 | |
Printing and mailing expenses | | | 6,769 | |
Transfer agent fees | | | 6,405 | |
Trustees’ fees | | | 833 | |
Registration and filing fees | | | 184 | |
Distribution fees – Class R | | | 155 | |
Distribution fees – Class A | | | 80 | |
Miscellaneous | | | 4,825 | |
| | | | |
Gross expenses | | | 187,728 | |
Less: Waiver from investment adviser | | | (80,380 | ) |
| | | | |
Net expenses | | | 107,348 | |
| | | | |
NET INVESTMENT INCOME (LOSS) | | | 22,226 | |
| | | | |
REALIZED AND UNREALIZED GAIN (LOSS) | | | | |
Realized gain (loss) on: | | | | |
Investments | | | (95,351 | ) |
Foreign currency transactions | | | (18,735 | ) |
| | | | |
Net realized gain (loss) | | | (114,086 | ) |
| | | | |
Change in unrealized appreciation (depreciation) on: | | | | |
Investments | | | (755,920 | ) |
Foreign currency translations | | | (159 | ) |
| | | | |
Net change in unrealized appreciation (depreciation) | | | (756,079 | ) |
| | | | |
NET REALIZED AND UNREALIZED GAIN (LOSS) | | | (870,165 | ) |
| | | | |
NET INCREASE (DECREASE) IN NET ASSETS RESULTING FROM OPERATIONS | | $ | (847,939 | ) |
| | | | |
| * | The Fund commenced operations on July 6, 2015. |
See Notes to Financial Statements.
32
1290 FUNDS
1290 GLOBAL EQUITY MANAGERS FUND
STATEMENT OF CHANGES IN NET ASSETS
| | | | |
| | | July 6, 2015* to
October 31, 2015 | |
INCREASE (DECREASE) IN NET ASSETS FROM OPERATIONS: | |
Net investment income (loss) | | $ | 22,226 | |
Net realized gain (loss) on investments and foreign currency transactions | | | (114,086 | ) |
Net change in unrealized appreciation (depreciation) on investments and foreign currency translations | | | (756,079 | ) |
| | | | |
NET INCREASE (DECREASE) IN NET ASSETS RESULTING FROM OPERATIONS | | | (847,939 | ) |
| | | | |
CAPITAL SHARES TRANSACTIONS: | | | | |
Class A | | | | |
Capital shares sold [ 10,528 shares ] | | | 105,000 | |
| | | | |
Total Class A transactions | | | 105,000 | |
| | | | |
Class I | | | | |
Capital shares sold [ 2,980,580 shares ] | | | 29,805,750 | |
| | | | |
Total Class I transactions | | | 29,805,750 | |
| | | | |
Class R | | | | |
Capital shares sold [ 10,000 shares ] | | | 100,000 | |
| | | | |
Total Class R transactions | | | 100,000 | |
| | | | |
NET INCREASE (DECREASE) IN NET ASSETS RESULTING FROM CAPITAL SHARE TRANSACTIONS | | | 30,010,750 | |
| | | | |
TOTAL INCREASE (DECREASE) IN NET ASSETS | | | 29,162,811 | |
NET ASSETS: | | | | |
Beginning of period | | | — | |
| | | | |
End of period (a) | | $ | 29,162,811 | |
| | | | |
(a) Includes accumulated undistributed (overdistributed) net investment income (loss) of | | $ | 12,390 | |
| | | | |
* The Fund commenced operations on July 6, 2015. | | | | |
See Notes to Financial Statements.
33
1290 FUNDS
1290 GLOBAL EQUITY MANAGERS FUND
FINANCIAL HIGHLIGHTS
| | | | |
| Class A | | July 6, 2015* to
October 31, 2015 | |
Net asset value, beginning of period | | $ | 10.00 | |
| | | | |
Income (loss) from investment operations: | | | | |
Net investment income (loss) (e) | | | — | # |
Net realized and unrealized gain (loss) on investments and foreign currency transactions | | | (0.29 | ) |
| | | | |
Total from investment operations | | | (0.29 | ) |
| | | | |
Net asset value, end of period | | $ | 9.71 | |
| | | | |
Total return (b) | | | (2.90 | )% |
| | | | |
Ratios/Supplemental Data: | | | | |
Net assets, end of period (000’s) | | $ | 102 | |
Ratio of expenses to average net assets: | | | | |
After waivers (a) | | | 1.40 | % |
Before waivers (a) | | | 1.93 | % |
Ratio of net investment income (loss) to average net assets: | | | | |
After waivers (a) | | | — | %‡‡(l) |
Before waivers (a) | | | (0.54 | )%(l) |
Portfolio turnover rate (z)^ | | | 3 | % |
| |
| Class I | | July 6, 2015* to
October 31, 2015 | |
Net asset value, beginning of period | | $ | 10.00 | |
| | | | |
Income (loss) from investment operations: | | | | |
Net investment income (loss) (e) | | | 0.01 | |
Net realized and unrealized gain (loss) on investments and foreign currency transactions | | | (0.29 | ) |
| | | | |
Total from investment operations | | | (0.28 | ) |
| | | | |
Net asset value, end of period | | $ | 9.72 | |
| | | | |
Total return (b) | | | (2.80 | )% |
| | | | |
Ratios/Supplemental Data: | | | | |
Net assets, end of period (000’s) | | $ | 28,964 | |
Ratio of expenses to average net assets: | | | | |
After waivers (a) | | | 1.15 | % |
Before waivers (a) | | | 1.68 | % |
Ratio of net investment income (loss) to average net assets: | | | | |
After waivers (a) | | | 0.24 | %(l) |
Before waivers (a) | | | (0.28 | )%(l) |
Portfolio turnover rate (z)^ | | | 3 | % |
See Notes to Financial Statements.
34
1290 FUNDS
1290 GLOBAL EQUITY MANAGERS FUND
FINANCIAL HIGHLIGHTS (Continued)
| | | | |
| Class R | | July 6, 2015* to October 31, 2015 | |
Net asset value, beginning of period | | $ | 10.00 | |
| | | | |
Income (loss) from investment operations: | | | | |
Net investment income (loss) (e) | | | (0.01 | ) |
Net realized and unrealized gain (loss) on investments and foreign currency transactions | | | (0.29 | ) |
| | | | |
Total from investment operations | | | (0.30 | ) |
| | | | |
Net asset value, end of period | | $ | 9.70 | |
| | | | |
Total return (b) | | | (3.00 | )% |
| | | | |
Ratios/Supplemental Data: | | | | |
Net assets, end of period (000’s) | | $ | 97 | |
Ratio of expenses to average net assets: | | | | |
After waivers (a) | | | 1.65 | % |
Before waivers (a) | | | 2.18 | % |
Ratio of net investment income (loss) to average net assets: | | | | |
After waivers (a) | | | (0.26 | )%(l) |
Before waivers (a) | | | (0.78 | )%(l) |
Portfolio turnover rate (z)^ | | | 3 | % |
| * | Commencement of Operations. |
| ‡‡ | Amount is less than 0.005%. |
| # | Per share amount is less than $0.005. |
| ^ | Portfolio turnover rate excludes derivatives, if any. |
| (a) | Ratios for periods less than one year are annualized. |
| (b) | Total returns for periods less than one year are not annualized. |
| (e) | Net investment income (loss) per share is based on average shares outstanding. |
| (l) | The annualized ratio of net investment income to average net assets may not be indicative of operating results for a full year. |
| (z) | Portfolio turnover rate for periods less than one year is not annualized. |
See Notes to Financial Statements.
35
1290 HIGH YIELD BOND FUND (Unaudited)
INVESTMENT ADVISER
INVESTMENT SUB-ADVISER
| Ø | | AXA Investment Managers, Inc. |
PERFORMANCE RESULTS
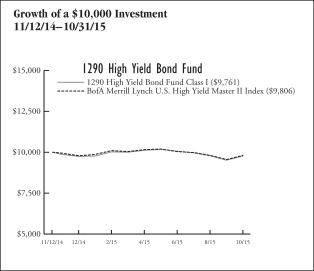
| | | | | | |
| Total Returns as of 10/31/15 | | | | | |
| | | | | Since Incept. | |
Fund – Class A Shares* | | without Sales Charge | | | (2.62 | )% |
| | | with Sales Charge (a) | | | (6.99 | ) |
Fund – Class C Shares* | | without Sales Charge | | | (2.39 | ) |
| | | with Sales Charge (b) | | | (3.30 | ) |
Fund – Class I Shares * | | | | | (2.39 | ) |
Fund – Class R Shares * | | | | | (2.86 | ) |
BofA Merrill Lynch U.S. High Yield Master II Index | | | | | (1.94 | ) |
* Date of inception 11/12/14. (a) A 4.50% front-end sales charge was deducted. (b) A 1.00% sales charge was deducted. Returns for periods less than one year are not annualized. | |
The performance quoted is past performance and is not a guarantee of future results. Mutual funds are subject to certain market risks. Investment returns and principal value of an investment will fluctuate so that an investor’s shares, when redeemed, may be worth more or less than their original cost. Current performance may be higher or lower than the performance data shown. For the most current month-end performance data please call 1-888-310-0416 or visit www.1290Funds.com.
The graph illustrates comparative performance for $10,000 invested in the Class I Shares of the 1290 High Yield Bond Fund and BofA Merrill Lynch U.S. High Yield Master II Index from 11/12/14 to 10/31/15. The performance of the BofA Merrill Lynch U.S. High Yield Master II Index reflects an initial investment at the end of the month closest to the Fund’s inception. The performance of the Fund assumes reinvestment of all dividends and capital gain distributions, if any, and does not include a sales charge. The performance of the BofA Merrill Lynch U.S. High Yield Master II Index does not reflect the deduction of expenses or a sales charge associated with a mutual fund and has been adjusted to reflect reinvestment of dividends, capital gain distributions, and interest of the securities included in the benchmark.
Fund performance may reflect the waiver of the Fund’s fees and reimbursement of expenses for certain periods since the inception date. Without these waivers and reimbursements, performance would have been lower. Also, performance shown in this section does not reflect the deduction of taxes that a shareholder would pay on Fund distributions or redemption of Fund shares.
PERFORMANCE SUMMARY
The Fund’s Class I shares returned (2.39)% for the period ended October 31, 2015. The Fund’s benchmark, the BofA Merrill Lynch U.S. High Yield Master II Index, returned (1.94)% over the same period.
Fund Overview — AXA Investment Managers, Inc.
During the period November 12, 2014 through October 31, 2015, the U.S. high yield market posted a negative total return. Returns in the U.S. high yield market were impacted by a number of factors including sharp declines in commodity prices, investor concerns regarding global economic growth and speculation regarding a potential shift in the U.S. Federal Reserve policy. During this time period, within U.S. high yield, more highly rated bonds outperformed lower rated bonds. On a sector basis, during this time period, the energy sector underperformed significantly, while the consumer goods sector was the best-performing. Outflows from high yield funds have fallen dramatically versus this time period last year, as have new issues. While there has been an increase in the number of defaults, the dollar value is less than half of what it was for the same period last year.
Fund Highlights
What helped performance since inception through October 31, 2015:
| • | | The Fund’s relative outperformance was driven by positive security selection, particularly within the highest-yielding and shortest duration segments of the market. |
| • | | The Fund’s relative performance benefitted from an overweight within the defensive shortest duration segment of the market, which outperformed. Fund performance also benefitted from participation in multiple new issues which performed well. |
| • | | From a sector perspective, the Fund’s outperformance was driven by positive security selection, particularly within the basic industry and energy sectors. |
| • | | Relative performance benefitted from an overweight position within the technology and electronics sector, which outperformed the broader market during the period. |
| • | | Sitel Worldwide bonds were a top contributor to return during the period due to the company being acquired, resulting in Sitel’s bonds being called at a premium to par during the period. |
| • | | BI-LO LLC is a regional supermarket company with a geographic focus in the southeastern United States. BI-LO bonds were a top contributor to return during the period as investors gained confidence in the company’s new management team and the company posted multiple quarters of improved results. |
| • | | Pacnet is a global fiber network data company with a focus on Asian Pacific markets. Pacnet bonds were a top contributor to return during the period due to the company being acquired by Telstra Corp., Ltd., an investment grade-rated, Australian-based telecommunications company. |
What hurt performance since inception through October 31, 2015:
| • | | The Fund’s macro positioning throughout the risk spectrum of the high yield market was detrimental to performance. Specifically, the Fund’s |
36
1290 HIGH YIELD BOND FUND (Unaudited)
| | overweight to the highest-yielding portion of the market had a negative impact on relative performance as this segment of the market underperformed the broader market during the period. In addition, the Fund’s underweighted position within the better quality, more interest-rate sensitive portion of the market had a negative impact on relative performance as this segment outperformed. |
| • | | Negative security selection within the financial services and telecommunications sectors detracted during the period. |
| • | | The Fund’s underweight exposure to the banking sector detracted from relative performance as this sector outperformed. |
| • | | Penn Virginia Corporation is an exploration and production company focused on the Eagle Ford region. Penn Virginia bonds were a bottom contributor to return during the period due to weakness in commodity prices as well as investors focusing on the potential risk of additional secured debt being added to the capital structure in the future. |
| • | | Intelsat Jackson Holdings S.A. is a leading provider of satellite services. Intelsat bonds were a bottom contributor to return during the period due to the company reporting earnings and guidance which were below market expectations. |
| • | | ACE Cash Express, Inc. is a consumer-focused, specialty finance company. Ace Cash bonds were a bottom contributor to return during the period due to continued regulatory uncertainty within the specialty finance sector. |
| | | | |
Fund Characteristics As of October 31, 2015 | |
Weighted Average Life (Years) | | | 5.72 | |
Weighted Average Coupon (%) | | | 7.39 | |
Weighted Average Modified Duration (Years)* | | | 3.53 | |
30 Day SEC Yield (Class I) | | | 7.38 | % |
30 Day Unsubsidized Yield (Class I) | | | 6.09 | % |
* Modified duration is a measure of the price sensitivity of the Fund to interest rate movements, taking into account specific features of the securities in which it invests. | |
| | | | |
Fund Composition as of October 31, 2015 | | % of Net Assets | |
Industrials | | | 15.4 | % |
Consumer Discretionary | | | 13.8 | |
Energy | | | 12.4 | |
Financials | | | 11.2 | |
Telecommunication Services | | | 10.1 | |
Information Technology | | | 9.1 | |
Materials | | | 7.8 | |
Health Care | | | 6.4 | |
Consumer Staples | | | 5.8 | |
Investment Company | | | 3.7 | |
Utilities | | | 2.1 | |
Cash and Other | | | 2.2 | |
| | | | | |
| | | | 100.0 | % |
| | | | | |
Holdings are subject to change without notice. | | | | |
UNDERSTANDING YOUR EXPENSES:
As a shareholder of the Fund, you incur two types of costs:
(1) transaction costs, including applicable sales charges and redemption fees; and (2) ongoing costs, including investment advisory fees, distribution and/or service (12b-1) fees (in the case of Class A, Class C and Class R shares of the Trust), and other Fund expenses. These examples are intended to help you understand your ongoing costs (in dollars) of investing in the Fund and to compare these costs with the ongoing costs of investing in other mutual funds.
The examples are based on an investment of $1,000 invested at the beginning of the six-month period ended October 31, 2015 and held for the entire six-month period.
Actual Expenses
The first line of the following table provides information about actual account values and actual expenses. You may use the information in this line, together with the amount you invested, to estimate the expenses that you paid over the period. Simply divide your account value by $1,000 (for example, an $8,600 account value divided by $1,000 = 8.6), then multiply the result by the number in the first line under the heading entitled ‘‘Expenses Paid During Period’’ to estimate the expenses you paid on your account during this period.
Hypothetical Example for Comparison Purposes
The second line of the following table provides information about hypothetical account values and hypothetical expenses based on the Fund’s actual expense ratio and an assumed rate of return of 5% per year before expenses, which is not the Fund’s actual return. The hypothetical account values and expenses may not be used to estimate the actual ending account balance or expenses you paid for the period. You may use this information to compare the ongoing costs of investing in the Fund and other funds. To do so, compare this 5% hypothetical example with the 5% hypothetical examples that appear in the shareholder reports of the other funds.
Please note that the expenses shown in the table are meant to highlight your ongoing costs only and do not reflect any transactional costs, such as sales charges (loads), redemption fees, or exchange fees. Therefore, the second line of the table is useful in comparing ongoing costs only, and will not help you determine the relative total costs of owning different funds. In addition, if these transactional costs were included, your costs would have been higher.
EXAMPLE
| | | | | | | | | | | | |
| | | Beginning
Account
Value
5/1/15 | | | Ending
Account
Value
10/31/15 | | | Expenses
Paid
During
Period*
5/1/15 -
10/31/15 | |
Class A | |
Actual | | | $1,000.00 | | | | $963.17 | | | | $5.20 | |
Hypothetical (5% average annual return before expenses) | | | 1,000.00 | | | | 1,019.91 | | | | 5.35 | |
Class C** | | | | | | | | | | | | |
Actual | | | 1,000.00 | | | | 964.40 | | | | 3.96 | |
Hypothetical (5% average annual return before expenses) | | | 1,000.00 | | | | 1,021.17 | | | | 4.08 | |
Class I | | | | | | | | | | | | |
Actual | | | 1,000.00 | | | | 964.40 | | | | 3.96 | |
Hypothetical (5% average annual return before expenses) | | | 1,000.00 | | | | 1,021.17 | | | | 4.08 | |
Class R | |
Actual | | | 1,000.00 | | | | 961.95 | | | | 6.43 | |
Hypothetical (5% average annual return before expenses) | | | 1,000.00 | | | | 1,018.65 | | | | 6.61 | |
* Expenses are equal to the Fund’s Class A, C, I and R shares annualized expense ratios of 1.05%, 0.80%, 0.80% and 1.30%, respectively, multiplied by the average account value over the period, and multiplied by 184/365 (to reflect the one-half year period). ** Class C shares currently are not offered for sale. | |
37
1290 FUNDS
1290 HIGH YIELD BOND FUND
PORTFOLIO OF INVESTMENTS
October 31, 2015
| | | | | | | | |
| | | Principal Amount | | | Value (Note 1) | |
| | | | | | | | |
LONG-TERM DEBT SECURITIES: | |
Corporate Bonds (94.1%) | |
Consumer Discretionary (13.8%) | |
Auto Components (0.5%) | | | | | | | | |
ZF North America Capital, Inc. | | | | | | | | |
4.500%, 4/29/22§ | | $ | 150,000 | | | $ | 151,035 | |
| | | | | | | | |
Distributors (0.4%) | | | | | |
American Tire Distributors, Inc. | | | | | | | | |
10.250%, 3/1/22§ | | | 110,000 | | | | 111,100 | |
| | | | | | | | |
Diversified Consumer Services (0.4%) | | | | | |
ServiceMaster Co. LLC | | | | | | | | |
7.450%, 8/15/27 | | | 100,000 | | | | 102,000 | |
| | | | | | | | |
Hotels, Restaurants & Leisure (3.9%) | | | | | |
Eldorado Resorts, Inc. | | | | | | | | |
7.000%, 8/1/23§ | | | 87,000 | | | | 88,305 | |
LTF Merger Sub, Inc. | | | | | | | | |
8.500%, 6/15/23§ | | | 107,000 | | | | 107,000 | |
MGM Resorts International | |
11.375%, 3/1/18 | | | 245,000 | | | | 287,875 | |
Pinnacle Entertainment, Inc. | |
6.375%, 8/1/21 | | | 87,000 | | | | 92,872 | |
Royal Caribbean Cruises Ltd. | |
5.250%, 11/15/22 | | | 90,000 | | | | 95,175 | |
7.500%, 10/15/27 | | | 80,000 | | | | 93,200 | |
Viking Cruises Ltd. | |
8.500%, 10/15/22§ | | | 225,000 | | | | 245,250 | |
6.250%, 5/15/25§ | | | 66,000 | | | | 64,845 | |
| | | | | | | | |
| | | | | | | 1,074,522 | |
| | | | | | | | |
Household Durables (1.0%) | | | | | |
American Greetings Corp. | |
7.375%, 12/1/21 | | | 40,000 | | | | 42,050 | |
Century Intermediate Holding Co. 2 | |
9.750%, 2/15/19 PIK§ | | | 90,000 | | | | 93,037 | |
Mattamy Group Corp. | |
6.500%, 11/15/20§ | | | 95,000 | | | | 93,756 | |
Taylor Morrison Communities, Inc./Monarch Communities, Inc. | | | | | |
5.625%, 3/1/24§ | | | 65,000 | | | | 64,025 | |
| | | | | | | | |
| | | | | | | 292,868 | |
| | | | | | | | |
Media (6.6%) | | | | | |
Acosta, Inc. | |
7.750%, 10/1/22§ | | | 120,000 | | | | 116,100 | |
Altice Luxembourg S.A. | |
7.750%, 5/15/22§ | | | 200,000 | | | | 192,500 | |
Cablevision Systems Corp. | |
7.750%, 4/15/18 | | | 85,000 | | | | 89,250 | |
Cequel Communications Holdings I LLC/Cequel Capital Corp. | | | | | |
5.125%, 12/15/21§ | | | 125,000 | | | | 120,250 | |
CSC Holdings LLC | |
5.250%, 6/1/24 | | | 104,000 | | | | 91,468 | |
DISH DBS Corp. | |
5.875%, 11/15/24 | | | 120,000 | | | | 114,780 | |
Gray Television, Inc. | |
7.500%, 10/1/20 | | | 85,000 | | | | 88,825 | |
Igloo Holdings Corp. | |
8.250%, 12/15/17 PIK§ | | | 300,000 | | | | 301,500 | |
Interactive Data Corp. | |
5.875%, 4/15/19§ | | | 90,000 | | | | 90,562 | |
McGraw-Hill Global Education Holdings LLC/McGraw-Hill Global Education Finance | | | | | |
9.750%, 4/1/21 | | | 95,000 | | | | 104,025 | |
| | | | | | | | |
MHGE Parent LLC/MHGE Parent Finance, Inc. | | | | | |
8.500%, 8/1/19§ | | $ | 281,000 | | | $ | 285,918 | |
Nexstar Broadcasting, Inc. | |
6.875%, 11/15/20 | | | 95,000 | | | | 98,211 | |
6.125%, 2/15/22§ | | | 21,000 | | | | 20,685 | |
Sirius XM Radio, Inc. | |
5.375%, 4/15/25§ | | | 115,000 | | | | 117,737 | |
| | | | | | | | |
| | | | | | | 1,831,811 | |
| | | | | | | | |
Multiline Retail (0.3%) | | | | | |
99 Cents Only Stores LLC | |
11.000%, 12/15/19 | | | 140,000 | | | | 72,800 | |
| | | | | | | | |
Specialty Retail (0.7%) | | | | | |
Hot Topic, Inc. | |
9.250%, 6/15/21§ | | | 83,000 | | | | 80,095 | |
L Brands, Inc. | |
6.875%, 11/1/35 (b)§ | | | 122,000 | | | | 126,423 | |
| | | | | | | | |
| | | | | | | 206,518 | |
| | | | | | | | |
Total Consumer Discretionary | | | | | | | 3,842,654 | |
| | | | | | | | |
Consumer Staples (5.8%) | | | | | | | | |
Beverages (0.9%) | | | | | | | | |
Constellation Brands, Inc. | |
4.750%, 11/15/24 | | | 90,000 | | | | 93,600 | |
Innovation Ventures LLC/Innovation Ventures Finance Corp. | | | | | |
9.500%, 8/15/19§ | | | 162,000 | | | | 169,290 | |
| | | | | | | | |
| | | | | | | 262,890 | |
| | | | | | | | |
Food & Staples Retailing (3.1%) | | | | | |
BI-LO LLC/BI-LO Finance Corp. | |
8.625%, 9/15/18 PIK§ | | | 201,000 | | | | 183,413 | |
CVS Health Corp. | |
5.000%, 12/1/24 (b)§ | | | 90,000 | | | | 99,967 | |
Petco Holdings, Inc. | |
8.500%, 10/15/17 PIK§ | | | 240,000 | | | | 242,700 | |
Rite Aid Corp. | |
9.250%, 3/15/20 | | | 100,000 | | | | 107,380 | |
6.125%, 4/1/23§ | | | 100,000 | | | | 108,125 | |
U.S. Foods, Inc. | |
8.500%, 6/30/19 | | | 115,000 | | | | 119,462 | |
| | | | | | | | |
| | | | | | | 861,047 | |
| | | | | | | | |
Food Products (1.6%) | | | | | |
JBS USA LLC/JBS USA Finance, Inc. | |
8.250%, 2/1/20§ | | | 140,000 | | | | 146,475 | |
5.750%, 6/15/25§ | | | 154,000 | | | | 149,188 | |
Post Holdings, Inc. | |
7.750%, 3/15/24§ | | | 94,000 | | | | 100,580 | |
8.000%, 7/15/25§ | | | 36,000 | | | | 39,060 | |
| | | | | | | | |
| | | | | | | 435,303 | |
| | | | | | | | |
Household Products (0.2%) | | | | | |
Sun Products Corp. | | | | | | | | |
7.750%, 3/15/21§ | | | 68,000 | | | | 63,498 | |
| | | | | | | | |
Total Consumer Staples | | | | | | | 1,622,738 | |
| | | | | | | | |
Energy (12.4%) | | | | | | | | |
Oil, Gas & Consumable Fuels (12.4%) | | | | | |
American Energy — Woodford LLC/AEW Finance Corp. | | | | | |
12.000%, 12/30/20 PIK§ | | | 63,000 | | | | 23,940 | |
See Notes to Financial Statements.
38
1290 FUNDS
1290 HIGH YIELD BOND FUND
PORTFOLIO OF INVESTMENTS (Continued)
October 31, 2015
| | | | | | | | |
| | | Principal Amount | | | Value (Note 1) | |
| | | | | | | | |
Antero Resources Corp. | |
5.625%, 6/1/23§ | | $ | 132,000 | | | $ | 121,440 | |
Artsonig Pty Ltd. | |
11.500%, 4/1/19 PIK (b)§ | | | 134,832 | | | | 10,112 | |
Blue Racer Midstream LLC/Blue Racer Finance Corp. | | | | | |
6.125%, 11/15/22§ | | | 136,000 | | | | 127,133 | |
Calumet Specialty Products Partners LP/Calumet Finance Corp. | | | | | |
7.625%, 1/15/22 | | | 130,000 | | | | 125,775 | |
7.750%, 4/15/23§ | | | 107,000 | | | | 99,510 | |
Carrizo Oil & Gas, Inc. | |
6.250%, 4/15/23 | | | 85,000 | | | | 80,537 | |
Chaparral Energy, Inc. | | | | | | | | |
9.875%, 10/1/20 | | | 115,000 | | | | 41,400 | |
Concho Resources, Inc. | | | | | | | | |
7.000%, 1/15/21 | | | 120,000 | | | | 124,200 | |
Crestwood Midstream Partners LP/Crestwood Midstream Finance Corp. | | | | | |
6.125%, 3/1/22 | | | 115,000 | | | | 99,187 | |
6.250%, 4/1/23§ | | | 109,000 | | | | 92,923 | |
Diamondback Energy, Inc. | | | | | | | | |
7.625%, 10/1/21 | | | 53,000 | | | | 56,445 | |
Eclipse Resources Corp. | | | | | | | | |
8.875%, 7/15/23§ | | | 110,000 | | | | 86,075 | |
Endeavor Energy Resources LP/EER Finance, Inc. | | | | | |
8.125%, 9/15/23§ | | | 34,000 | | | | 33,660 | |
EP Energy LLC/Everest Acquisition Finance, Inc. | | | | | |
9.375%, 5/1/20 | | | 31,000 | | | | 27,047 | |
6.375%, 6/15/23 | | | 155,000 | | | | 117,025 | |
Genesis Energy LP/Genesis Energy Finance Corp. | | | | | |
5.750%, 2/15/21 | | | 180,000 | | | | 168,300 | |
6.750%, 8/1/22 | | | 40,000 | | | | 38,950 | |
6.000%, 5/15/23 | | | 69,000 | | | | 62,790 | |
5.625%, 6/15/24 | | | 125,000 | | | | 110,475 | |
Linn Energy LLC/Linn Energy Finance Corp. | | | | | |
7.750%, 2/1/21 | | | 81,000 | | | | 18,225 | |
Oasis Petroleum, Inc. | | | | | | | | |
6.875%, 3/15/22 | | | 115,000 | | | | 98,325 | |
ONEOK, Inc. | | | | | | | | |
7.500%, 9/1/23 | | | 120,000 | | | | 118,800 | |
Parsley Energy LLC/Parsley Finance Corp. | | | | | |
7.500%, 2/15/22 (b)§ | | | 35,000 | | | | 35,131 | |
PBF Logistics LP/PBF Logistics Finance Corp. | | | | | |
6.875%, 5/15/23§ | | | 139,000 | | | | 128,575 | |
Rice Energy, Inc. | | | | | | | | |
7.250%, 5/1/23§ | | | 65,000 | | | | 60,775 | |
Rose Rock Midstream LP/Rose Rock
Finance Corp. | | | | | |
5.625%, 7/15/22 | | | 120,000 | | | | 103,200 | |
5.625%, 11/15/23§ | | | 94,000 | | | | 80,370 | |
RSP Permian, Inc. | | | | | | | | |
6.625%, 10/1/22§ | | | 31,000 | | | | 30,613 | |
Sanchez Energy Corp. | | | | | | | | |
7.750%, 6/15/21 | | | 90,000 | | | | 71,550 | |
Summit Midstream Holdings LLC/Summit Midstream Finance Corp. | | | | | |
7.500%, 7/1/21 | | | 95,000 | | | | 92,150 | |
5.500%, 8/15/22 | | | 120,000 | | | | 107,100 | |
Targa Resources Partners LP/Targa Resources Partners Finance Corp. | | | | | |
6.875%, 2/1/21 | | | 155,000 | | | | 156,163 | |
6.750%, 3/15/24§ | | | 90,000 | | | | 88,425 | |
Tesoro Logistics LP/Tesoro Logistics Finance Corp. | |
6.250%, 10/15/22§ | | | 58,000 | | | | 60,465 | |
| | | | | | | | |
Ultra Petroleum Corp. | | | | | | | | |
5.750%, 12/15/18§ | | $ | 64,000 | | | $ | 43,040 | |
6.125%, 10/1/24§ | | | 150,000 | | | | 81,000 | |
Western Refining Logistics LP/WNRL Finance Corp. | | | | | |
7.500%, 2/15/23 | | | 171,000 | | | | 173,565 | |
Whiting Canadian Holding Co. ULC | | | | | | | | |
8.125%, 12/1/19 | | | 170,000 | | | | 172,550 | |
Whiting Petroleum Corp. | | | | | | | | |
5.750%, 3/15/21 | | | 90,000 | | | | 83,817 | |
| | | | | | | | |
Total Energy | | | | | | | 3,450,763 | |
| | | | | | | | |
Financials (11.2%) | | | | | | | | |
Banks (0.3%) | | | | | | | | |
Creditcorp. | | | | | | | | |
12.000%, 7/15/18§ | | | 113,000 | | | | 83,196 | |
| | | | | | | | |
Consumer Finance (2.0%) | | | | | | | | |
AerCap Ireland Capital Ltd./AerCap Global Aviation Trust | | | | | |
4.500%, 5/15/21 | | | 170,000 | | | | 173,825 | |
4.625%, 7/1/22 | | | 150,000 | | | | 153,195 | |
Ally Financial, Inc. | | | | | | | | |
4.625%, 5/19/22 | | | 92,000 | | | | 95,680 | |
Speedy Cash Intermediate Holdings Corp. | |
10.750%, 5/15/18§ | | | 26,000 | | | | 18,525 | |
TMX Finance LLC/TitleMax Finance Corp. | |
8.500%, 9/15/18§ | | | 163,000 | | | | 127,955 | |
| | | | | | | | |
| | | | | | | 569,180 | |
| | | | | | | | |
Diversified Financial Services (5.6%) | | | | | | | | |
ACE Cash Express, Inc. | | | | | | | | |
11.000%, 2/1/19§ | | | 375,000 | | | | 123,750 | |
Alphabet Holding Co., Inc. | | | | | | | | |
7.750%, 11/1/17 PIK | | | 175,000 | | | | 172,812 | |
DFC Finance Corp. | | | | | | | | |
10.500%, 6/15/20§ | | | 274,000 | | | | 188,375 | |
James Hardie International Finance Ltd. | |
5.875%, 2/15/23§ | | | 200,000 | | | | 207,500 | |
MSCI, Inc. | | | | | | | | |
5.750%, 8/15/25§ | | | 100,000 | | | | 105,500 | |
Nielsen Finance LLC/Nielsen Finance Co. | |
5.000%, 4/15/22§ | | | 129,000 | | | | 130,458 | |
Opal Acquisition, Inc. | | | | | | | | |
8.875%, 12/15/21§ | | | 155,000 | | | | 141,825 | |
Prospect Holding Co. LLC/Prospect Holding Finance Co. | | | | | |
10.250%, 10/1/18§ | | | 155,000 | | | | 75,950 | |
Speedy Group Holdings Corp. | | | | | | | | |
12.000%, 11/15/17§ | | | 230,000 | | | | 165,600 | |
Stearns Holdings LLC | | | | | | | | |
9.375%, 8/15/20§ | | | 261,000 | | | | 262,958 | |
| | | | | | | | |
| | | | | | | 1,574,728 | |
| | | | | | | | |
Insurance (1.9%) | | | | | | | | |
American Equity Investment Life Holding Co. | |
6.625%, 7/15/21 | | | 140,000 | | | | 146,348 | |
Hub Holdings LLC/Hub Holdings Finance, Inc. | |
8.125%, 7/15/19 PIK§ | | | 143,000 | | | | 139,068 | |
HUB International Ltd. | | | | | | | | |
7.875%, 10/1/21§ | | | 231,000 | | | | 230,422 | |
| | | | | | | | |
| | | | | | | 515,838 | |
| | | | | | | | |
Real Estate Investment Trusts (REITs) (0.4%) | | | | | |
Equinix, Inc. | | | | | | | | |
5.750%, 1/1/25 | | | 100,000 | | | | 104,500 | |
| | | | | | | | |
See Notes to Financial Statements.
39
1290 FUNDS
1290 HIGH YIELD BOND FUND
PORTFOLIO OF INVESTMENTS (Continued)
October 31, 2015
| | | | | | | | |
| | | Principal Amount | | | Value (Note 1) | |
| | | | | | | | |
Real Estate Management & Development (1.0%) | | | | | |
Crescent Resources LLC/Crescent Ventures, Inc. | | | | | |
10.250%, 8/15/17§ | | $ | 70,000 | | | $ | 71,050 | |
Greystar Real Estate Partners LLC | | | | | | | | |
8.250%, 12/1/22§ | | | 100,000 | | | | 105,000 | |
Howard Hughes Corp. | | | | | | | | |
6.875%, 10/1/21§ | | | 94,000 | | | | 97,760 | |
| | | | | | | | |
| | | | | | | 273,810 | |
| | | | | | | | |
Total Financials | | | | | | | 3,121,252 | |
| | | | | | | | |
Health Care (6.4%) | | | | | | | | |
Health Care Equipment & Supplies (1.2%) | | | | | |
Greatbatch Ltd. | | | | | | | | |
9.125%, 11/1/23 (b)§ | | | 90,000 | | | | 92,250 | |
Hill-Rom Holdings, Inc. | | | | | | | | |
5.750%, 9/1/23§ | | | 47,000 | | | | 47,999 | |
Immucor, Inc. | | | | | | | | |
11.125%, 8/15/19 | | | 185,000 | | | | 189,625 | |
| | | | | | | | |
| | | | | | | 329,874 | |
| | | | | | | | |
Health Care Providers & Services (1.3%) | | | | | |
Acadia Healthcare Co., Inc. | | | | | | | | |
5.625%, 2/15/23§ | | | 64,000 | | | | 64,160 | |
CHS/Community Health Systems, Inc. | | | | | | | | |
6.875%, 2/1/22 | | | 85,000 | | | | 85,637 | |
HCA, Inc. | | | | | | | | |
7.690%, 6/15/25 | | | 41,000 | | | | 45,305 | |
IASIS Healthcare LLC/IASIS Capital Corp. | | | | | |
8.375%, 5/15/19 | | | 80,000 | | | | 81,800 | |
Tenet Healthcare Corp. | | | | | | | | |
8.000%, 8/1/20 | | | 12,000 | | | | 12,420 | |
8.125%, 4/1/22 | | | 80,000 | | | | 84,560 | |
| | | | | | | | |
| | | | | | | 373,882 | |
| | | | | | | | |
Life Sciences Tools & Services (0.2%) | | | | | |
Sterigenics-Nordion Holdings LLC | | | | | | | | |
6.500%, 5/15/23§ | | | 42,000 | | | | 42,394 | |
| | | | | | | | |
Pharmaceuticals (3.7%) | | | | | | | | |
Capsugel S.A. | | | | | | | | |
7.000%, 5/15/19 PIK§ | | | 295,000 | | | | 297,212 | |
Concordia Healthcare Corp. | | | | | | | | |
9.500%, 10/21/22 (b)§ | | | 25,000 | | | | 24,500 | |
7.000%, 4/15/23§ | | | 120,000 | | | | 104,700 | |
DBx Holdings B.V. | | | | | | | | |
7.500%, 2/1/22§ | | | 86,000 | | | | 87,720 | |
JLL/Delta Dutch Pledgeco B.V. | | | | | | | | |
8.750%, 5/1/20 PIK§ | | | 186,000 | | | | 187,395 | |
Valeant Pharmaceuticals International, Inc. | |
7.000%, 10/1/20§ | | | 30,000 | | | | 27,825 | |
7.500%, 7/15/21§ | | | 140,000 | | | | 128,100 | |
6.125%, 4/15/25§ | | | 205,000 | | | | 172,979 | |
| | | | | | | | |
| | | | | | | 1,030,431 | |
| | | | | | | | |
Total Health Care | | | | | | | 1,776,581 | |
| | | | | | | | |
Industrials (15.4%) | | | | | | | | |
Aerospace & Defense (2.2%) | | | | | | | | |
Bombardier, Inc. | | | | | | | | |
6.125%, 1/15/23§ | | | 80,000 | | | | 62,000 | |
7.500%, 3/15/25§ | | | 157,000 | | | | 122,460 | |
DynCorp International, Inc. | | | | | | | | |
10.375%, 7/1/17 | | | 315,000 | | | | 248,850 | |
| | | | | | | | |
TransDigm, Inc. | | | | | | | | |
7.500%, 7/15/21 | | $ | 100,000 | | | $ | 105,250 | |
6.500%, 7/15/24 | | | 85,000 | | | | 86,487 | |
| | | | | | | | |
| | | | | | | 625,047 | |
| | | | | | | | |
Air Freight & Logistics (0.6%) | | | | | | | | |
DH Services Luxembourg Sarl | | | | | | | | |
7.750%, 12/15/20§ | | | 153,000 | | | | 157,590 | |
| | | | | | | | |
Building Products (1.2%) | | | | | | | | |
Building Materials Corp. of America | | | | | | | | |
6.000%, 10/15/25§ | | | 140,000 | | | | 149,100 | |
Nortek, Inc. | | | | | | | | |
8.500%, 4/15/21 | | | 180,000 | | | | 190,800 | |
| | | | | | | | |
| | | | | | | 339,900 | |
| | | | | | | | |
Commercial Services & Supplies (1.4%) | | | | | |
Covanta Holding Corp. | | | | | | | | |
5.875%, 3/1/24 | | | 80,000 | | | | 79,200 | |
Jaguar Holding Co. II/Pharmaceutical Product Development LLC | | | | | |
6.375%, 8/1/23§ | | | 84,000 | | | | 84,000 | |
Multi-Color Corp. | | | | | | | | |
6.125%, 12/1/22§ | | | 69,000 | | | | 70,811 | |
Mustang Merger Corp. | | | | | | | | |
8.500%, 8/15/21§ | | | 150,000 | | | | 157,313 | |
| | | | | | | | |
| | | | | | | 391,324 | |
| | | | | | | | |
Construction & Engineering (1.5%) | | | | | | | | |
Michael Baker Holdings LLC/Micahel Baker Finance Corp. | | | | | |
8.875%, 4/15/19 PIK§ | | | 94,331 | | | | 76,880 | |
Michael Baker International LLC/CDL Acquisition Co., Inc. | | | | | | | | |
8.250%, 10/15/18§ | | | 180,000 | | | | 169,200 | |
Tutor Perini Corp. | | | | | | | | |
7.625%, 11/1/18 | | | 175,000 | | | | 178,500 | |
| | | | | | | | |
| | | | | | | 424,580 | |
| | | | | | | | |
Electrical Equipment (1.1%) | | | | | | | | |
Global Brass & Copper, Inc. | | | | | | | | |
9.500%, 6/1/19 | | | 195,000 | | | | 209,625 | |
International Wire Group Holdings, Inc. | |
8.500%, 10/15/17§ | | | 100,000 | | | | 103,000 | |
| | | | | | | | |
| | | | | | | 312,625 | |
| | | | | | | | |
Machinery (2.2%) | | | | | | | | |
Case New Holland Industrial, Inc. | | | | | | | | |
7.875%, 12/1/17 | | | 80,000 | | | | 86,600 | |
Park-Ohio Industries, Inc. | | | | | | | | |
8.125%, 4/1/21 | | | 165,000 | | | | 172,837 | |
SPL Logistics Escrow LLC/SPL Logistics
Finance Corp. | | | | | |
8.875%, 8/1/20§ | | | 185,000 | | | | 196,100 | |
Waterjet Holdings, Inc. | | | | | | | | |
7.625%, 2/1/20§ | | | 145,000 | | | | 146,813 | |
| | | | | | | | |
| | | | | | | 602,350 | |
| | | | | | | | |
Road & Rail (1.7%) | | | | | | | | |
Neovia Logistics Intermediate Holdings LLC/Logistics Intermediate Finance Corp. | | | | | |
10.000%, 2/15/18 PIK§ | | | 138,000 | | | | 138,690 | |
OPE KAG Finance Sub, Inc. | | | | | | | | |
7.875%, 7/31/23§ | | | 132,000 | | | | 137,280 | |
Watco Cos. LLC/Watco Finance Corp. | | | | | | | | |
6.375%, 4/1/23§ | | | 190,000 | | | | 190,000 | |
| | | | | | | | |
| | | | | | | 465,970 | |
| | | | | | | | |
See Notes to Financial Statements.
40
1290 FUNDS
1290 HIGH YIELD BOND FUND
PORTFOLIO OF INVESTMENTS (Continued)
October 31, 2015
| | | | | | | | |
| | | Principal Amount | | | Value (Note 1) | |
| | | | | | | | |
Trading Companies & Distributors (2.6%) | | | | | |
Beacon Roofing Supply, Inc. | | | | | | | | |
6.375%, 10/1/23§ | | $ | 39,000 | | | $ | 41,048 | |
HD Supply, Inc. | | | | | | | | |
7.500%, 7/15/20 | | | 100,000 | | | | 106,250 | |
11.500%, 7/15/20 | | | 165,000 | | | | 186,450 | |
International Lease Finance Corp. | | | | | | | | |
8.625%, 1/15/22 | | | 170,000 | | | | 208,454 | |
Intrepid Aviation Group Holdings LLC/Intrepid Finance Co. | | | | | |
6.875%, 2/15/19§ | | | 155,000 | | | | 135,431 | |
Optimas OE Solutions Holding LLC/Optimas OE Solutions, Inc. | | | | | |
8.625%, 6/1/21§ | | | 40,000 | | | | 38,075 | |
| | | | | | | | |
| | | | | | | 715,708 | |
| | | | | | | | |
Transportation Infrastructure (0.9%) | | | | | | | | |
Aguila 3 S.A. | | | | | | | | |
7.875%, 1/31/18§ | | | 245,000 | | | | 248,522 | |
| | | | | | | | |
Total Industrials | | | | | | | 4,283,616 | |
| | | | | | | | |
Information Technology (9.1%) | | | | | | | | |
Communications Equipment (0.9%) | | | | | | | | |
Aegis Merger Sub, Inc. | | | | | | | | |
10.250%, 2/15/23§ | | | 116,000 | | | | 118,320 | |
CommScope Technologies Finance LLC | | | | | |
6.000%, 6/15/25§ | | | 133,000 | | | | 134,995 | |
| | | | | | | | |
| | | | | | | 253,315 | |
| | | | | | | | |
Electronic Equipment, Instruments & Components (1.0%) | |
Brightstar Corp. | | | | | | | | |
7.250%, 8/1/18§ | | | 100,000 | | | | 104,000 | |
CPI International, Inc. | | | | | | | | |
8.750%, 2/15/18 | | | 165,000 | | | | 165,825 | |
| | | | | | | | |
| | | | | | | 269,825 | |
| | | | | | | | |
Internet Software & Services (0.3%) | |
j2 Global, Inc. | | | | | | | | |
8.000%, 8/1/20 | | | 85,000 | | | | 90,525 | |
| | | | | | | | |
IT Services (1.3%) | |
Alliance Data Systems Corp. | | | | | | | | |
5.375%, 8/1/22§ | | | 146,000 | | | | 148,008 | |
SRA International, Inc. | | | | | | | | |
11.000%, 10/1/19 | | | 198,000 | | | | 208,890 | |
| | | | | | | | |
| | | | | | | 356,898 | |
| | | | | | | | |
Semiconductors & Semiconductor Equipment (0.5%) | |
Advanced Micro Devices, Inc. | | | | | | | | |
6.750%, 3/1/19 | | | 190,000 | | | | 146,300 | |
| | | | | | | | |
Software (4.8%) | |
Audatex North America, Inc. | | | | | | | | |
6.000%, 6/15/21§ | | | 110,000 | | | | 110,000 | |
6.125%, 11/1/23§ | | | 177,000 | | | | 178,327 | |
BCP Singapore VI Cayman Financing Co., Ltd. | | | | | |
8.000%, 4/15/21§ | | | 155,000 | | | | 135,625 | |
BMC Software Finance, Inc. | | | | | | | | |
8.125%, 7/15/21§ | | | 125,000 | | | | 96,875 | |
BMC Software, Inc. | | | | | | | | |
7.250%, 6/1/18 | | | 35,000 | | | | 30,800 | |
Boxer Parent Co., Inc. | | | | | | | | |
9.000%, 10/15/19 PIK§ | | | 325,000 | | | | 234,000 | |
Ensemble S Merger Sub, Inc. | | | | | | | | |
9.000%, 9/30/23§ | | | 191,000 | | | | 190,761 | |
| | | | | | | | |
Infor Software Parent LLC/Infor Software Parent, Inc. | | | | | |
7.125%, 5/1/21 PIK§ | | $ | 93,000 | | | $ | 80,501 | |
Infor U.S., Inc. | | | | | | | | |
5.750%, 8/15/20 (b)§ | | | 45,000 | | | | 45,900 | |
6.500%, 5/15/22§ | | | 125,000 | | | | 118,438 | |
Italics Merger Sub, Inc. | | | | | | | | |
7.125%, 7/15/23§ | | | 118,000 | | | | 117,056 | |
| | | | | | | | |
| | | | | | | 1,338,283 | |
| | | | | | | | |
Technology Hardware, Storage & Peripherals (0.3%) | |
NCR Corp. | | | | | | | | |
6.375%, 12/15/23 | | | 85,000 | | | | 86,700 | |
| | | | | | | | |
Total Information Technology | | | | | | | 2,541,846 | |
| | | | | | | | |
Materials (7.8%) | | | | | | | | |
Chemicals (2.1%) | |
Eco Services Operations LLC/Eco Finance Corp. | | | | | |
8.500%, 11/1/22§ | | | 117,000 | | | | 104,130 | |
Nexeo Solutions LLC/Nexeo Solutions Finance Corp. | | | | | |
8.375%, 3/1/18 | | | 156,000 | | | | 142,740 | |
Rayonier AM Products, Inc. | | | | | | | | |
5.500%, 6/1/24§ | | | 252,000 | | | | 195,930 | |
Rentech Nitrogen Partners LP/Rentech Nitrogen Finance Corp. | | | | | |
6.500%, 4/15/21§ | | | 145,000 | | | | 145,000 | |
| | | | | | | | |
| | | | | | | 587,800 | |
| | | | | | | | |
Commercial Services & Supplies (0.6%) | |
Nufarm Australia Ltd. | | | | | | | | |
6.375%, 10/15/19§ | | | 165,000 | | | | 164,175 | |
| | | | | | | | |
Construction Materials (0.5%) | |
Summit Materials LLC/Summit Materials Finance Corp. | | | | | |
10.500%, 1/31/20 | | | 50,000 | | | | 53,000 | |
6.125%, 7/15/23 | | | 94,000 | | | | 93,765 | |
| | | | | | | | |
| | | | | | | 146,765 | |
| | | | | | | | |
Containers & Packaging (1.8%) | |
Berry Plastics Corp. | | | | | | | | |
6.000%, 10/15/22 (b)§ | | | 49,000 | | | | 51,328 | |
5.125%, 7/15/23 | | | 36,000 | | | | 35,550 | |
BWAY Holding Co. | | | | | | | | |
9.125%, 8/15/21§ | | | 280,000 | | | | 272,300 | |
Coveris Holding Corp. | | | | | | | | |
10.000%, 6/1/18§ | | | 150,000 | | | | 148,500 | |
| | | | | | | | |
| | | | | | | 507,678 | |
| | | | | | | | |
Metals & Mining (2.8%) | |
ArcelorMittal S.A. | | | | | | | | |
7.000%, 2/25/22 | | | 140,000 | | | | 133,084 | |
7.750%, 10/15/39 | | | 170,000 | | | | 145,350 | |
Barminco Finance Pty Ltd. | | | | | | | | |
9.000%, 6/1/18§ | | | 125,000 | | | | 97,500 | |
HudBay Minerals, Inc. | | | | | | | | |
9.500%, 10/1/20 | | | 145,000 | | | | 126,150 | |
Prince Mineral Holding Corp. | | | | | | | | |
11.500%, 12/15/19§ | | | 160,000 | | | | 134,000 | |
WireCo WorldGroup, Inc. | | | | | | | | |
9.500%, 5/15/17 | | | 160,000 | | | | 145,600 | |
| | | | | | | | |
| | | | | | | 781,684 | |
| | | | | | | | |
Total Materials | | | | | | | 2,188,102 | |
| | | | | | | | |
See Notes to Financial Statements.
41
1290 FUNDS
1290 HIGH YIELD BOND FUND
PORTFOLIO OF INVESTMENTS (Continued)
October 31, 2015
| | | | | | | | |
| | | Principal Amount | | | Value (Note 1) | |
| | | | | | | | |
Telecommunication Services (10.1%) | | | | | | | | |
Diversified Telecommunication Services (5.7%) | |
CCO Holdings LLC/CCO Holdings Capital Corp. | | | | | | | | |
5.875%, 5/1/27§ | | $ | 235,000 | | | $ | 235,141 | |
Columbus International, Inc. | | | | | | | | |
7.375%, 3/30/21§ | | | 200,000 | | | | 208,000 | |
Intelsat Jackson Holdings S.A. | | | | | | | | |
7.250%, 10/15/20 | | | 160,000 | | | | 146,000 | |
Intelsat Luxembourg S.A. | | | | | | | | |
8.125%, 6/1/23 | | | 304,000 | | | | 180,880 | |
Level 3 Financing, Inc. | | | | | | | | |
5.625%, 2/1/23 | | | 85,000 | | | | 87,550 | |
5.375%, 1/15/24 (b)§ | | | 90,000 | | | | 90,563 | |
Sprint Capital Corp. | | | | | | | | |
8.750%, 3/15/32 | | | 256,000 | | | | 230,400 | |
Telesat Canada/Telesat LLC | | | | | | | | |
6.000%, 5/15/17§ | | | 255,000 | | | | 258,825 | |
Windstream Services LLC | | | | | | | | |
7.750%, 10/15/20 | | | 67,000 | | | | 60,387 | |
6.375%, 8/1/23 | | | 110,000 | | | | 87,175 | |
| | | | | | | | |
| | | | | | | 1,584,921 | |
| | | | | | | | |
Wireless Telecommunication Services (4.4%) | |
Altice Financing S.A. | | | | | | | | |
6.625%, 2/15/23§ | | | 200,000 | | | | 200,500 | |
Digicel Group Ltd. | | | | | | | | |
8.250%, 9/30/20§ | | | 215,000 | | | | 190,275 | |
Digicel Ltd. | | | | | | | | |
6.750%, 3/1/23§ | | | 200,000 | | | | 183,018 | |
Sprint Corp. | | | | | | | | |
7.875%, 9/15/23 | | | 300,000 | | | | 277,500 | |
7.125%, 6/15/24 | | | 160,000 | | | | 140,496 | |
Syniverse Holdings, Inc. | | | | | | | | |
9.125%, 1/15/19 | | | 65,000 | | | | 54,600 | |
T-Mobile USA, Inc. | | | | | | | | |
6.500%, 1/15/24 | | | 85,000 | | | | 85,212 | |
6.375%, 3/1/25 | | | 105,000 | | | | 105,000 | |
| | | | | | | | |
| | | | | | | 1,236,601 | |
| | | | | | | | |
Total Telecommunication Services | | | | | | | 2,821,522 | |
| | | | | | | | |
Utilities (2.1%) | |
Independent Power and Renewable Electricity Producers (2.1%) | |
AES Corp. | | | | | | | | |
8.000%, 10/15/17 | | | 100,000 | | | | 107,000 | |
5.500%, 4/15/25 | | | 100,000 | | | | 92,500 | |
Dynegy, Inc. | | | | | | | | |
7.625%, 11/1/24 | | | 180,000 | | | | 180,450 | |
Talen Energy Supply LLC | | | | | | | | |
4.600%, 12/15/21 | | | 160,000 | | | | 137,300 | |
6.500%, 6/1/25§ | | | 94,000 | | | | 83,190 | |
| | | | | | | | |
Total Utilities | | | | | | | 600,440 | |
| | | | | | | | |
Total Corporate Bonds | | | | | | | 26,249,514 | |
| | | | | | | | |
Total Long-Term Debt Securities (94.1%)
(Cost $28,332,993) | | | | | | | 26,249,514 | |
| | | | | | | | |
| | | Number of
Shares | | | Value
(Note 1) | |
| | | | | | | | |
SHORT-TERM INVESTMENT: | | | | | | | | |
Investment Company (3.7%) | | | | | | | | |
JPMorgan Prime Money Market Fund, Institutional Class Shares | | | 1,024,167 | | | $ | 1,024,167 | |
| | | | | | | | |
Total Short-Term Investment (3.7%)
(Cost $1,024,167) | | | | | | | 1,024,167 | |
| | | | | | | | |
Total Investments (97.8%)
(Cost $29,357,160) | | | | | | | 27,273,681 | |
Other Assets Less Liabilities (2.2%) | | | | | | | 615,354 | |
| | | | | | | | |
Net Assets (100%) | | | | | | $ | 27,889,035 | |
| | | | | | | | |
| § | Securities exempt from registration under Rule 144A of the Securities Act of 1933. These securities may only be resold to qualified institutional buyers. At October 31, 2015, the market value of these securities amounted to $15,527,226 or 55.7% of net assets. Securities denoted with “§” but without “b” have been determined to be liquid under the guidelines established by the Board of Trustees. To the extent any securities might provide a right to demand registration, such rights have not been relied upon when determining liquidity. |
Glossary:
| | PIK | — Payment-in Kind Security |
| | | | |
Country Diversification
As a Percentage of Total Net Assets | |
Australia | | | 1.0 | % |
Barbados | | | 0.7 | |
Bermuda | | | 2.4 | |
Canada | | | 5.0 | |
Cayman Islands | | | 0.5 | |
Ireland | | | 1.9 | |
Liberia | | | 0.7 | |
Luxembourg | | | 6.1 | |
Netherlands | | | 1.0 | |
United States | | | 78.5 | |
Cash and Other | | | 2.2 | |
| | | | | |
| | | | 100.0 | % |
| | | | | |
See Notes to Financial Statements.
42
1290 FUNDS
1290 HIGH YIELD BOND FUND
PORTFOLIO OF INVESTMENTS (Continued)
October 31, 2015
The following is a summary of the inputs used to value the Fund’s assets and liabilities carried at fair value as of October 31, 2015:
The inputs or methodology used for valuing securities are not necessarily an indication of the risk associated with investing in those securities.
Various inputs are used in determining the value of the Fund’s investments. These inputs are summarized in the three broad levels listed below:
| | | | | | | | | | | | | | | | |
| | | | | |
| Investment Type | | Level 1
Quoted Prices in Active Markets for Identical Securities | | | Level 2
Significant Other Observable Inputs (including quoted prices for similar securities, interest rates, prepayment speeds, credit risk, etc.) | | | Level 3
Significant Unobservable Inputs (including the Fund’s own assumptions in determining the fair value of investments) | | | Total | |
Assets: | |
Corporate Bonds | | | | | | | | | | | | | | | | |
Consumer Discretionary | | $ | — | | | $ | 3,842,654 | | | $ | — | | | $ | 3,842,654 | |
Consumer Staples | | | — | | | | 1,622,738 | | | | — | | | | 1,622,738 | |
Energy | | | — | | | | 3,450,763 | | | | — | | | | 3,450,763 | |
Financials | | | — | | | | 3,121,252 | | | | — | | | | 3,121,252 | |
Health Care | | | — | | | | 1,776,581 | | | | — | | | | 1,776,581 | |
Industrials | | | — | | | | 4,283,616 | | | | — | | | | 4,283,616 | |
Information Technology | | | — | | | | 2,541,846 | | | | — | | | | 2,541,846 | |
Materials | | | — | | | | 2,188,102 | | | | — | | | | 2,188,102 | |
Telecommunication Services | | | — | | | | 2,821,522 | | | | — | | | | 2,821,522 | |
Utilities | | | — | | | | 600,440 | | | | — | | | | 600,440 | |
Short-Term Investments | | | 1,024,167 | | | | — | | | | — | | | | 1,024,167 | |
| | | | | | | | | | | | | | | | |
Total Assets | | $ | 1,024,167 | | | $ | 26,249,514 | | | $ | — | | | $ | 27,273,681 | |
| | | | | | | | | | | | | | | | |
Total Liabilities | | $ | — | | | $ | — | | | $ | — | | | $ | — | |
| | | | | | | | | | | | | | | | |
Total | | $ | 1,024,167 | | | $ | 26,249,514 | | | $ | — | | | $ | 27,273,681 | |
| | | | | | | | | | | | | | | | |
There were no transfers between Levels 1, 2 or 3 during the period ended October 31, 2015.
The Fund held no derivatives contracts during the period ended October 31, 2015.
Investment security transactions for the period ended October 31, 2015 were as follows:
| | | | |
Cost of Purchases: | | | | |
Long-term investments other than U.S. government debt securities | | $ | 44,713,582 | |
Net Proceeds of Sales and Redemptions: | | | | |
Long-term investments other than U.S. government debt securities | | $ | 15,835,231 | |
As of October 31, 2015, the gross unrealized appreciation (depreciation) of investments based on the aggregate cost of investments for Federal income tax purposes was as follows:
| | | | |
Aggregate gross unrealized appreciation | | $ | 185,402 | |
Aggregate gross unrealized depreciation | | | (2,273,974 | ) |
| | | | |
Net unrealized depreciation | | $ | (2,088,572 | ) |
| | | | |
Federal income tax cost of investments | | $ | 29,362,253 | |
| | | | |
See Notes to Financial Statements.
43
1290 FUNDS
1290 HIGH YIELD BOND FUND
STATEMENT OF ASSETS AND LIABILITIES
October 31, 2015
| | | | |
|
ASSETS | |
Investments at value (Cost $29,357,160) | | $ | 27,273,681 | |
Cash | | | 526,000 | |
Dividends, interest and other receivables | | | 530,508 | |
Receivable for securities sold | | | 176,840 | |
Receivable from investment adviser | | | 11,991 | |
Deferred offering cost | | | 4,517 | |
Receivable for Fund shares sold | | | 441 | |
Other assets | | | 158 | |
| | | | |
Total assets | | | 28,524,136 | |
| | | | |
LIABILITIES | | | | |
Payable for securities purchased | | | 386,134 | |
Dividends and distributions payable | | | 160,978 | |
Transfer agent fees payable | | | 4,568 | |
Distribution fees payable – Class R | | | 3,528 | |
Distribution fees payable – Class A | | | 1,771 | |
Trustees’ fees payable | | | 198 | |
Payable for Fund shares redeemed | | | 95 | |
Accrued expenses | | | 77,829 | |
| | | | |
Total liabilities | | | 635,101 | |
| | | | |
NET ASSETS | | $ | 27,889,035 | |
| | | | |
Net assets were comprised of: | | | | |
Paid in capital | | $ | 30,391,915 | |
Accumulated undistributed net investment income (loss) | | | 78,035 | |
Accumulated undistributed net realized gain (loss) on investments | | | (497,436 | ) |
Net unrealized appreciation (depreciation) on investments | | | (2,083,479 | ) |
| | | | |
Net assets | | $ | 27,889,035 | |
| | | | |
Class A | | | | |
Net asset value and redemption price per share, $8,371,680 / 915,135 shares outstanding (unlimited amount authorized: $0.001 par value) | | $ | 9.15 | |
Maximum sales charge (4.50% of offering price) | | | 0.43 | |
| | | | |
Maximum offering price per share | | $ | 9.58 | |
| | | | |
Class C** | | | | |
Net asset value per share, $2,782,714 / 304,192 shares outstanding (unlimited amount authorized: $0.001 par value) (a) | | $ | 9.15 | |
| | | | |
Class I | | | | |
Net asset value and redemption price per share, $8,395,483 / 917,753 shares outstanding (unlimited amount authorized: $0.001 par value) | | $ | 9.15 | |
| | | | |
Class R | | | | |
Net asset value and redemption price per share, $8,339,158 / 911,583 shares outstanding (unlimited amount authorized: $0.001 par value) | | $ | 9.15 | |
| | | | |
| ** | Class C shares currently are not offered for sale. |
| (a) | Redemption price for Class C shares varies based on length of time the shares are held. |
STATEMENT OF OPERATIONS
For the Period Ended October 31, 2015*
| | | | |
|
INVESTMENT INCOME | |
Interest | | $ | 2,104,149 | |
Dividends | | | 370 | |
| | | | |
Total income | | | 2,104,519 | |
| | | | |
EXPENSES | | | | |
Investment advisory fees | | | 169,756 | |
Professional fees | | | 167,753 | |
Offering costs | | | 132,809 | |
Administrative fees | | | 61,342 | |
Distribution fees – Class R | | | 42,361 | |
Distribution fees – Class C | | | 28,272 | |
Printing and mailing expenses | | | 22,415 | |
Distribution fees – Class A | | | 21,221 | |
Transfer agent fees | | | 16,615 | |
Trustees’ fees | | | 15,065 | |
Custodian fees | | | 8,000 | |
Registration and filing fees | | | 4,098 | |
Miscellaneous | | | 27,171 | |
| | | | |
Gross expenses | | | 716,878 | |
Less: Waiver from investment adviser | | | (231,098 | ) |
Waiver from distributor | | | (28,272 | ) |
Reimbursement from investment adviser | | | (167,659 | ) |
| | | | |
Net expenses | | | 289,849 | |
| | | | |
NET INVESTMENT INCOME (LOSS) | | | 1,814,670 | |
| | | | |
REALIZED AND UNREALIZED GAIN (LOSS) | | | | |
Net realized gain (loss) on investments | | | (497,436 | ) |
Net change in unrealized appreciation (depreciation) on investments | | | (2,083,479 | ) |
| | | | |
NET REALIZED AND UNREALIZED GAIN (LOSS) | | | (2,580,915 | ) |
| | | | |
NET INCREASE (DECREASE) IN NET ASSETS RESULTING FROM OPERATIONS | | $ | (766,245 | ) |
| | | | |
| * | The Fund commenced operations on November 12, 2014. |
See Notes to Financial Statements.
44
1290 FUNDS
1290 HIGH YIELD BOND FUND
STATEMENT OF CHANGES IN NET ASSETS
| | | | |
| | | November 12, 2014* to
October 31, 2015 | |
INCREASE (DECREASE) IN NET ASSETS FROM OPERATIONS: | |
Net investment income (loss) | | $ | 1,814,670 | |
Net realized gain (loss) on investments | | | (497,436 | ) |
Net change in unrealized appreciation (depreciation) on investments | | | (2,083,479 | ) |
| | | | |
NET INCREASE (DECREASE) IN NET ASSETS RESULTING FROM OPERATIONS | | | (766,245 | ) |
| | | | |
DIVIDENDS : | | | | |
Dividends from net investment income | | | | |
Class A | | | (543,877 | ) |
Class C | | | (188,219 | ) |
Class I | | | (566,312 | ) |
Class R | | | (521,731 | ) |
| | | | |
TOTAL DIVIDENDS : | | | (1,820,139 | ) |
| | | | |
CAPITAL SHARES TRANSACTIONS: | | | | |
Class A | | | | |
Capital shares sold [ 903,006 shares ] | | | 9,028,852 | |
Capital shares issued in reinvestment of dividends [ 12,168 shares ] | | | 117,753 | |
Capital shares repurchased [ (3,039) shares ] | | | (28,864 | ) |
| | | | |
Total Class A transactions | | | 9,117,741 | |
| | | | |
Class C** | | | | |
Capital shares sold [ 300,000 shares ] | | | 3,000,000 | |
Capital shares issued in reinvestment of dividends [ 4,194 shares ] | | | 40,595 | |
Capital shares repurchased [ (1,002) shares ] | | | (9,518 | ) |
| | | | |
Total Class C transactions | | | 3,031,077 | |
| | | | |
Class I | | | | |
Capital shares sold [ 905,016 shares ] | | | 9,048,244 | |
Capital shares issued in reinvestment of dividends [ 12,757 shares ] | | | 123,438 | |
Capital shares repurchased [ (3,020) shares ] | | | (28,690 | ) |
| | | | |
Total Class I transactions | | | 9,142,992 | |
| | | | |
Class R | | | | |
Capital shares sold [ 899,999 shares ] | | | 9,000,000 | |
Capital shares issued in reinvestment of dividends [ 11,589 shares ] | | | 112,157 | |
Capital shares repurchased [ (3,005) shares ] | | | (28,548 | ) |
| | | | |
Total Class R transactions | | | 9,083,609 | |
| | | | |
NET INCREASE (DECREASE) IN NET ASSETS RESULTING FROM CAPITAL SHARE TRANSACTIONS | | | 30,375,419 | |
| | | | |
TOTAL INCREASE (DECREASE) IN NET ASSETS | | | 27,789,035 | |
NET ASSETS: | | | | |
Beginning of period | | | 100,000 | |
| | | | |
End of period (a) | | $ | 27,889,035 | |
| | | | |
(a) Includes accumulated undistributed (overdistributed) net investment income (loss) of | | $ | 78,035 | |
| | | | |
* The Fund commenced operations on November 12, 2014. ** Class C shares currently are not offered for sale. | | | | |
See Notes to Financial Statements.
45
1290 FUNDS
1290 HIGH YIELD BOND FUND
FINANCIAL HIGHLIGHTS
| | | | |
| Class A | | November 12, 2014* to
October 31, 2015 | |
Net asset value, beginning of period | | $ | 10.00 | |
| | | | |
Income (loss) from investment operations: | | | | |
Net investment income (loss) (e) | | | 0.59 | |
Net realized and unrealized gain (loss) on investments | | | (0.84 | ) |
| | | | |
Total from investment operations | | | (0.25 | ) |
| | | | |
Less distributions: | | | | |
Dividends from net investment income | | | (0.60 | ) |
| | | | |
Net asset value, end of period | | $ | 9.15 | |
| | | | |
Total return (b) | | | (2.62 | )% |
| | | | |
Ratios/Supplemental Data: | | | | |
Net assets, end of period (000’s) | | $ | 8,372 | |
Ratio of expenses to average net assets: | | | | |
After waivers and reimbursements (a) | | | 1.05 | % |
Before waivers and reimbursements (a) | | | 2.45 | % |
Ratio of net investment income (loss) to average net assets: | | | | |
After waivers and reimbursements (a) | | | 6.39 | %(l) |
Before waivers and reimbursements (a) | | | 4.99 | %(l) |
Portfolio turnover rate (z)^ | | | 57 | % |
| |
| Class C** | | November 12, 2014* to
October 31, 2015 | |
Net asset value, beginning of period | | $ | 10.00 | |
| | | | |
Income (loss) from investment operations: | | | | |
Net investment income (loss) (e) | | | 0.62 | |
Net realized and unrealized gain (loss) on investments | | | (0.85 | ) |
| | | | |
Total from investment operations | | | (0.23 | ) |
| | | | |
Less distributions: | | | | |
Dividends from net investment income | | | (0.62 | ) |
| | | | |
Net asset value, end of period | | $ | 9.15 | |
| | | | |
Total return (b) | | | (2.39 | )% |
| | | | |
Ratios/Supplemental Data: | | | | |
Net assets, end of period (000’s) | | $ | 2,783 | |
Ratio of expenses to average net assets: | | | | |
After waivers and reimbursements (a) | | | 0.80 | % |
Before waivers and reimbursements (a) | | | 3.20 | % |
Ratio of net investment income (loss) to average net assets: | | | | |
After waivers and reimbursements (a) | | | 6.64 | %(l) |
Before waivers and reimbursements (a) | | | 4.24 | %(l) |
Portfolio turnover rate (z)^ | | | 57 | % |
See Notes to Financial Statements.
46
1290 FUNDS
1290 HIGH YIELD BOND FUND
FINANCIAL HIGHLIGHTS (Continued)
| | | | |
| Class I | | November 12, 2014* to
October 31, 2015 | |
Net asset value, beginning of period | | $ | 10.00 | |
| | | | |
Income (loss) from investment operations: | | | | |
Net investment income (loss) (e) | | | 0.62 | |
Net realized and unrealized gain (loss) on investments | | | (0.85 | ) |
| | | | |
Total from investment operations | | | (0.23 | ) |
| | | | |
Less distributions: | | | | |
Dividends from net investment income | | | (0.62 | ) |
| | | | |
Net asset value, end of period | | $ | 9.15 | |
| | | | |
Total return (b) | | | (2.39 | )% |
| | | | |
Ratios/Supplemental Data: | | | | |
Net assets, end of period (000’s) | | $ | 8,395 | |
Ratio of expenses to average net assets: | | | | |
After waivers and reimbursements (a) | | | 0.80 | % |
Before waivers and reimbursements (a) | | | 2.20 | % |
Ratio of net investment income (loss) to average net assets: | | | | |
After waivers and reimbursements (a) | | | 6.64 | %(l) |
Before waivers and reimbursements (a) | | | 5.24 | %(l) |
Portfolio turnover rate (z)^ | | | 57 | % |
| |
| Class R | | November 12, 2014* to
October 31, 2015 | |
Net asset value, beginning of period | | $ | 10.00 | |
| | | | |
Income (loss) from investment operations: | | | | |
Net investment income (loss) (e) | | | 0.57 | |
Net realized and unrealized gain (loss) on investments | | | (0.85 | ) |
| | | | |
Total from investment operations | | | (0.28 | ) |
| | | | |
Less distributions: | | | | |
Dividends from net investment income | | | (0.57 | ) |
| | | | |
Net asset value, end of period | | $ | 9.15 | |
| | | | |
Total return (b) | | | (2.86 | )% |
| | | | |
Ratios/Supplemental Data: | | | | |
Net assets, end of period (000’s) | | $ | 8,339 | |
Ratio of expenses to average net assets: | | | | |
After waivers and reimbursements (a) | | | 1.30 | % |
Before waivers and reimbursements (a) | | | 2.70 | % |
Ratio of net investment income (loss) to average net assets: | | | | |
After waivers and reimbursements (a) | | | 6.14 | %(l) |
Before waivers and reimbursements (a) | | | 4.74 | %(l) |
Portfolio turnover rate (z)^ | | | 57 | % |
| * | Commencement of Operations. |
| ** | Class C shares currently are not offered for sale. |
| ^ | Portfolio turnover rate excludes derivatives, if any. |
| (a) | Ratios for periods less than one year are annualized. |
| (b) | Total returns for periods less than one year are not annualized. |
| (e) | Net investment income (loss) per share is based on average shares outstanding. |
| (l) | The annualized ratio of net investment income to average net assets may not be indicative of operating results for a full year. |
| (z) | Portfolio turnover rate for periods less than one year is not annualized. |
See Notes to Financial Statements.
47
1290 MULTI-ALTERNATIVE STRATEGIES FUND (Unaudited)
INVESTMENT ADVISER
PERFORMANCE RESULTS
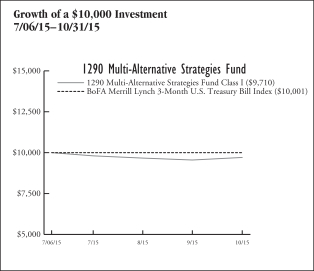
| | | | | | |
| Total Returns as of 10/31/15 | | | | | |
| | | | | Since
Incept. | |
Fund – Class A Shares* | | without Sales Charge | | | (3.00 | )% |
| | | with Sales Charge (a) | | | (8.32 | ) |
Fund – Class I Shares* | | | | | (2.90 | ) |
Fund – Class R Shares* | | | | | (3.10 | ) |
BofA Merrill Lynch 3-Month U.S. Treasury Bill Index | | | | | 0.01 | |
* Date of inception 7/6/15. (a) A 5.50% front-end sales charge was deducted. Returns for periods less than one year are not annualized. | |
The performance quoted is past performance and is not a guarantee of future results. Mutual funds are subject to certain market risks. Investment returns and principal value of an investment will fluctuate so that an investor’s shares, when redeemed, may be worth more or less than their original cost. Current performance may be higher or lower than the performance data shown. For the most current month-end performance data please call 1-888-310-0416 or visit www.1290Funds.com.
The graph illustrates comparative performance for $10,000 invested in the Class I Shares of the 1290 Multi-Alternative Strategies Fund and BofA Merrill Lynch 3-month U.S. Treasury Bill Index from 07/06/15 to 10/31/15. The performance of BoFA Merrill Lynch 3-month U.S. Treasury Bill Index reflects an initial investment at the end of the month closest to the Fund’s inception. The performance of the Fund assumes reinvestment of all dividends and capital gain distributions, if any, and does not include a sales charge. The performance of BoFA Merrill Lynch 3-month U.S. Treasury Bill Index does not reflect the deduction of expenses or a sales charge associated with a mutual fund and has been adjusted to reflect reinvestment of dividends, capital gain distributions, and interest of the securities included in the benchmark.
Fund performance may reflect the waiver of the Fund’s fees and reimbursement of expenses for certain periods since the inception date. Without these waivers and reimbursements, performance would have been lower. Also, performance shown in this section does not reflect the deduction of taxes that a shareholder would pay on Fund distributions or redemption of Fund shares.
PERFORMANCE SUMMARY
The Fund’s Class I shares returned (2.90)% for the period ended October 31, 2015. The Fund’s benchmark, the BofA Merrill Lynch
3-Month U.S. Treasury Bill Index, returned 0.01% over the same period.
Fund Overview
During the period July 6, 2015 through October 31, 2015, as the global stock and bond markets reacted to negative news from China and other parts of the developing world, nontraditional asset classes underperformed the broad equity market, which was up modestly. As is typical, alternative and nontraditional strategies and asset classes had a low correlation to traditional stock and bond markets. Additionally, bonds rose roughly in line with stocks, but commodities and metals dropped severely. Although equity gains were minimal, there was a lot of volatility in trading. Alternative strategies were measurably less volatile than the equity market during the period.
Fund Highlights
What helped performance since inception through October 31, 2015:
| • | | The Fund’s real estate holdings added to performance, specifically Vanguard REIT ETF, which benefitted from the moderate U.S. economic outlook, as well as continued low interest rates. |
| • | | The Fund’s convertible security holdings, while modestly negative for the period, provided a cushion against losses. |
What hurt performance since inception through October 31, 2015:
| • | | The Fund’s holdings in commodity ETFs, including Poweshares DB Commodity Index Tracking Fund, fell on concern over the global economic outlook and the rising dollar. |
| • | | Base metals also sagged, as the global growth outlook softened. PowerShares DB Base Metals Fund fell significantly during the period. |
| | | | |
| Top 10 Holdings (as a percentage of Total Investment Companies) | |
| As of October 31, 2015 | | | |
PowerShares DB G10 Currency Harvest Fund | | | 9.3 | % |
ProShares Hedge Replication ETF | | | 9.2 | |
iShares® TIPS Bond ETF | | | 9.1 | |
SPDR® Barclays Convertible Securities ETF | | | 9.1 | |
PowerShares Multi-Strategy Alternative Portfolio | | | 9.1 | |
WisdomTree Managed Futures Strategy Fund | | | 9.1 | |
IQ Merger Arbitrage ETF | | | 9.0 | |
ProShares RAFI Long/Short | | | 8.9 | |
PowerShares DB Gold Fund | | | 7.2 | |
Vanguard REIT ETF | | | 4.8 | |
Holdings are subject to change without notice. | | | | |
48
1290 MULTI-ALTERNATIVE STRATEGIES FUND (Unaudited)
UNDERSTANDING YOUR EXPENSES:
As a shareholder of the Fund, you incur two types of costs:
(1) transaction costs, including applicable sales charges and redemption fees; and (2) ongoing costs, including investment advisory fees, distribution and/or service (12b-1) fees (in the case of Class A, Class C and Class R shares of the Trust), and other Fund expenses. These examples are intended to help you understand your ongoing costs (in dollars) of investing in the Fund and to compare these costs with the ongoing costs of investing in other mutual funds.
The examples are based on an investment of $1,000 invested at the beginning of the six-month period ended October 31, 2015 and held for the entire six-month period.
Actual Expenses
The first line of the following table provides information about actual account values and actual expenses. You may use the information in this line, together with the amount you invested, to estimate the expenses that you paid over the period. Simply divide your account value by $1,000 (for example, an $8,600 account value divided by $1,000 = 8.6), then multiply the result by the number in the first line under the heading entitled ‘‘Expenses Paid During Period’’ to estimate the expenses you paid on your account during this period.
Hypothetical Example for Comparison Purposes
The second line of the following table provides information about hypothetical account values and hypothetical expenses based on the Fund’s actual expense ratio and an assumed rate of return of 5% per year before expenses, which is not the Fund’s actual return. The hypothetical account values and expenses may not be used to estimate the actual ending account balance or expenses you paid for the period. You may use this information to compare the ongoing costs of investing in the Fund and other funds. To do so, compare this 5% hypothetical example with the 5% hypothetical examples that appear in the shareholder reports of the other funds.
Please note that the expenses shown in the table are meant to highlight your ongoing costs only and do not reflect any transactional costs, such as sales charges (loads), redemption fees, or exchange fees. Therefore, the second line of the table is useful in comparing ongoing costs only, and will not help you determine the relative total costs of owning different funds. In addition, if these transactional costs were included, your costs would have been higher.
Please note that while the Fund Commenced Operations on July 6, 2015, the ‘Hypothetical Expenses Paid during the period’ reflect projected activity for the full six months for the purpose of comparability.
EXAMPLE
| | | | | | | | | | | | |
| | | Beginning
Account
Value
5/1/15† | | | Ending
Account
Value
10/31/15 | | | Expenses Paid During Period* 5/1/15 -
10/31/15 | |
Class A | | | | | | | | | | | | |
Actual | | | $1,000.00 | | | | $970.00 | | | | $3.05 | |
Hypothetical (5% average annual return before expenses) | | | 1,000.00 | | | | 1,020.34 | | | | 4.91 | |
Class I | | | | | | | | | | | | |
Actual | | | 1,000.00 | | | | 971.00 | | | | 2.26 | |
Hypothetical (5% average annual return before expenses) | | | 1,000.00 | | | | 1,021.59 | | | | 3.65 | |
Class R | | | | | | | | | | | | |
Actual | | | 1,000.00 | | | | 969.00 | | | | 3.83 | |
Hypothetical (5% average annual return before expenses) | | | 1,000.00 | | | | 1,019.09 | | | | 6.17 | |
† Commenced operations on July 6, 2015. * Expenses are equal to the Fund’s Class A, I and R shares annualized expense ratios of 0.96%, 0.72% and 1.21%, respectively, multiplied by the average account value over the period, and multiplied by 184/365 for the hypothetical example (to reflect the one-half year period), and multiplied by 117/365 for the actual example (to reflect the actual number of days in the period). | |
49
1290 FUNDS
1290 MULTI-ALTERNATIVE STRATEGIES FUND
PORTFOLIO OF INVESTMENTS
October 31, 2015
| | | | | | | | |
| | | Number of
Shares | | | Value
(Note 1) | |
| | | | | | | | |
INVESTMENT COMPANIES: | | | | | | | | |
Exchange Traded Funds (ETFs)(99.2%) | | | | | |
IQ Merger Arbitrage ETF* | | | 31,620 | | | $ | 871,763 | |
iShares® Commodities Select Strategy ETF | | | 9,010 | | | | 296,519 | |
iShares® MSCI Global Agriculture Producers ETF | | | 6,380 | | | | 147,946 | |
iShares® TIPS Bond ETF | | | 8,020 | | | | 889,899 | |
PowerShares DB Base Metals Fund* | | | 9,450 | | | | 117,463 | |
PowerShares DB Commodity Index Tracking Fund* | | | 27,930 | | | | 424,536 | |
PowerShares DB G10 Currency Harvest Fund* | | | 38,920 | | | | 900,220 | |
PowerShares DB Gold Fund* | | | 18,780 | | | | 702,372 | |
PowerShares DB Silver Fund* | | | 1,800 | | | | 44,506 | |
PowerShares Multi-Strategy Alternative Portfolio*‡ | | | 39,070 | | | | 882,982 | |
| | | | | | | | |
ProShares Hedge Replication ETF* | | | 21,080 | | | $ | 896,532 | |
ProShares RAFI Long/Short | | | 22,260 | | | | 865,384 | |
SPDR® Barclays Convertible Securities ETF | | | 19,100 | | | | 889,296 | |
Vanguard Global ex-U.S. Real Estate ETF | | | 8,270 | | | | 442,859 | |
Vanguard REIT ETF | | | 5,880 | | | | 469,753 | |
WisdomTree Managed Futures Strategy Fund* | | | 21,360 | | | | 882,382 | |
| | | | | | | | |
Total Investments (99.2%)
(Cost $10,015,667) | | | | | | | 9,724,412 | |
Other Assets Less Liabilities (0.8%) | | | | | | | 74,569 | |
| | | | | | | | |
Net Assets (100%) | | | | | | $ | 9,798,981 | |
| | | | | | | | |
| ‡ | Affiliated company as defined under the Investment Company Act of 1940. |
Investments in companies which were affiliates for the period ended October 31, 2015, were as follows:
| | | | | | | | | | | | | | | | | | | | | | | | |
Securities | | Value
July 6, 2015 | | | Purchases
at Cost | | | Sales
at Cost | | | Value
October 31, 2015 | | | Dividend
Income | | | Realized
Gain (Loss)† | |
PowerShares Multi-Strategy Alternative Portfolio | | $ | — | | | $ | 905,322 | | | $ | — | | | $ | 882,982 | | | $ | — | | | $ | — | |
| | | | | | | | | | | | | | | | | | | | | | | | |
| † | When applicable, realized gain includes net distributions of realized gain received from Underlying Funds. |
The following is a summary of the inputs used to value the Fund’s assets and liabilities carried at fair value as of October 31, 2015:
The inputs or methodology used for valuing securities are not necessarily an indication of the risk associated with investing in those securities.
Various inputs are used in determining the value of the Fund’s investments. These inputs are summarized in the three broad levels listed below:
| | | | | | | | | | | | | | | | |
| | | | | |
| Investment Type | | Level 1
Quoted Prices in
Active Markets for Identical Securities | | | Level 2
Significant Other Observable Inputs (including quoted prices
for similar securities, interest rates,
prepayment speeds, credit risk, etc.) | | | Level 3
Significant Unobservable Inputs (including the Fund’s own assumptions in determining the fair
value of investments) | | | Total | |
Assets: | |
Investment Companies | | | | | | | | | | | | | | | | |
Exchange Traded Funds (ETFs) | | $ | 9,724,412 | | | $ | — | | | $ | — | | | $ | 9,724,412 | |
| | | | | | | | | | | | | | | | |
Total Assets | | $ | 9,724,412 | | | $ | — | | | $ | — | | | $ | 9,724,412 | |
| | | | | | | | | | | | | | | | |
Total Liabilities | | $ | — | | | $ | — | | | $ | — | | | $ | — | |
| | | | | | | | | | | | | | | | |
Total | | $ | 9,724,412 | | | $ | — | | | $ | — | | | $ | 9,724,412 | |
| | | | | | | | | | | | | | | | |
There were no transfers between Levels 1, 2 or 3 during the period ended October 31, 2015.
See Notes to Financial Statements.
50
1290 FUNDS
1290 MULTI-ALTERNATIVE STRATEGIES FUND
PORTFOLIO OF INVESTMENTS (Continued)
October 31, 2015
The Fund held no derivatives contracts during the period ended October 31, 2015.
Investment security transactions for the period ended October 31, 2015 were as follows:
| | | | |
Cost of Purchases: | | | | |
Investment Companies | | $ | 10,015,667 | |
Net Proceeds of Sales and Redemptions: | | | | |
Investment Companies | | $ | — | |
As of October 31, 2015, the gross unrealized appreciation (depreciation) of investments based on the aggregate cost of investments for Federal income tax purposes was as follows:
| | | | |
Aggregate gross unrealized appreciation | | $ | 19,117 | |
Aggregate gross unrealized depreciation | | | (310,372 | ) |
| | | | |
Net unrealized depreciation | | $ | (291,255 | ) |
| | | | |
Federal income tax cost of investments | | $ | 10,015,667 | |
| | | | |
See Notes to Financial Statements.
51
1290 FUNDS
1290 MULTI-ALTERNATIVE STRATEGIES FUND
STATEMENT OF ASSETS AND LIABILITIES
October 31, 2015
| | | | |
ASSETS | | | | |
Affiliated Issuers (Cost $905,322) | | $ | 882,982 | |
Unaffiliated Issuers (Cost $9,110,345) | | | 8,841,430 | |
Cash | | | 84,477 | |
Deferred offering cost | | | 18,917 | |
Receivable from investment adviser | | | 16,397 | |
| | | | |
Total assets | | | 9,844,203 | |
| | | | |
LIABILITIES | | | | |
Transfer agent fees payable | | | 3,144 | |
Trustees’ fees payable | | | 77 | |
Distribution fees payable – Class R | | | 41 | |
Distribution fees payable – Class A | | | 24 | |
Accrued expenses | | | 41,936 | |
| | | | |
Total liabilities | | | 45,222 | |
| | | | |
NET ASSETS | | $ | 9,798,981 | |
| | | | |
Net assets were comprised of: | | | | |
Paid in capital | | $ | 10,088,234 | |
Accumulated undistributed net investment income (loss) | | | 2,002 | |
Accumulated undistributed net realized gain (loss) on investments | | | — | |
Net unrealized appreciation (depreciation) on investments | | | (291,255 | ) |
| | | | |
Net assets | | $ | 9,798,981 | |
| | | | |
Class A | | | | |
Net asset value and redemption price per share, $111,539 / 11,499 shares outstanding (unlimited amount authorized: $0.001 par value) | | $ | 9.70 | |
Maximum sales charge (5.50% of offering price) | | | 0.57 | |
| | | | |
Maximum offering price per share | | $ | 10.27 | |
| | | | |
Class I | | | | |
Net asset value and redemption price per share, $9,590,514 / 987,889 shares outstanding (unlimited amount authorized: $0.001 par value) | | $ | 9.71 | |
| | | | |
Class R | | | | |
Net asset value and redemption price per share, $96,928 / 10,000 shares outstanding (unlimited amount authorized: $0.001 par value) | | $ | 9.69 | |
| | | | |
STATEMENT OF OPERATIONS
For the Period Ended October 31, 2015*
| | | | |
INVESTMENT INCOME | | | | |
Dividends | | $ | 21,282 | |
Interest | | | 124 | |
| | | | |
Total income | | | 21,406 | |
| | | | |
EXPENSES | | | | |
Professional fees | | | 45,065 | |
Investment management fees | | | 15,647 | |
Administrative fees | | | 9,616 | |
Offering costs | | | 8,888 | |
Transfer agent fees | | | 6,405 | |
Printing and mailing expenses | | | 2,182 | |
Custodian fees | | | 600 | |
Trustees’ fees | | | 280 | |
Registration and filing fees | | | 184 | |
Distribution fees – Class R | | | 156 | |
Distribution fees – Class A | | | 83 | |
Miscellaneous | | | 1,351 | |
| | | | |
Gross expenses | | | 90,457 | |
Less: Waiver from investment adviser | | | (25,263 | ) |
Reimbursement from investment manager | | | (42,543 | ) |
| | | | |
Net expenses | | | 22,651 | |
| | | | |
NET INVESTMENT INCOME (LOSS) | | | (1,245 | ) |
| | | | |
REALIZED AND UNREALIZED GAIN (LOSS) | | | | |
Net change in unrealized appreciation (depreciation) on investments (($22,340) of change in unrealized appreciation (depreciation) from affiliates) | | | (291,255 | ) |
| | | | |
NET REALIZED AND UNREALIZED GAIN (LOSS) | | | (291,255 | ) |
| | | | |
NET INCREASE (DECREASE) IN NET ASSETS RESULTING FROM OPERATIONS | | $ | (292,500 | ) |
| | | | |
| * | The Fund commenced operations on July 6, 2015. |
See Notes to Financial Statements.
52
1290 FUNDS
1290 MULTI-ALTERNATIVE STRATEGIES FUND
STATEMENT OF CHANGES IN NET ASSETS
| | | | |
| | | July 6, 2015* to
October 31, 2015 | |
INCREASE (DECREASE) IN NET ASSETS FROM OPERATIONS: | | | | |
Net investment income (loss) | | $ | (1,245 | ) |
Net change in unrealized appreciation (depreciation) on investments | | | (291,255 | ) |
| | | | |
NET INCREASE (DECREASE) IN NET ASSETS RESULTING FROM OPERATIONS | | | (292,500 | ) |
| | | | |
CAPITAL SHARES TRANSACTIONS: | | | | |
Class A | | | | |
Capital shares sold [ 11,499 shares ] | | | 114,431 | |
| | | | |
Total Class A transactions | | | 114,431 | |
| | | | |
Class I | | | | |
Capital shares sold [ 987,889 shares ] | | | 9,877,050 | |
| | | | |
Total Class I transactions | | | 9,877,050 | |
| | | | |
Class R | | | | |
Capital shares sold [ 10,000 shares ] | | | 100,000 | |
| | | | |
Total Class R transactions | | | 100,000 | |
| | | | |
NET INCREASE (DECREASE) IN NET ASSETS RESULTING FROM CAPITAL SHARE TRANSACTIONS | | | 10,091,481 | |
| | | | |
TOTAL INCREASE (DECREASE) IN NET ASSETS | | | 9,798,981 | |
NET ASSETS: | | | | |
Beginning of period | | | — | |
| | | | |
End of period (a) | | $ | 9,798,981 | |
| | | | |
(a) Includes accumulated undistributed (overdistributed) net investment income (loss) of | | $ | 2,002 | |
| | | | |
* The Fund commenced operations on July 6, 2015. | | | | |
See Notes to Financial Statements.
53
1290 FUNDS
1290 MULTI-ALTERNATIVE STRATEGIES FUND
FINANCIAL HIGHLIGHTS
| | | | |
| Class A | | July 6, 2015* to
October 31, 2015 | |
Net asset value, beginning of period | | $ | 10.00 | |
| | | | |
Income (loss) from investment operations: | | | | |
Net investment income (loss) (e)(x) | | | (0.01 | ) |
Net realized and unrealized gain (loss) on investments | | | (0.29 | ) |
| | | | |
Total from investment operations | | | (0.30 | ) |
| | | | |
Net asset value, end of period | | $ | 9.70 | |
| | | | |
Total return (b) | | | (3.00 | )% |
| | | | |
Ratios/Supplemental Data: | | | | |
Net assets, end of period (000’s) | | $ | 112 | |
Ratio of expenses to average net assets: | | | | |
After waivers and reimbursements (a)(f)(j) | | | 0.96 | % |
Before waivers and reimbursements (a)(f) | | | 2.26 | % |
Ratio of net investment income (loss) to average net assets: | | | | |
After waivers and reimbursements (a)(f)(x) | | | (0.25 | )%(l) |
Before waivers and reimbursements (a)(f)(x) | | | (1.55 | )%(l) |
Portfolio turnover rate (z)^ | | | 0 | % |
| |
| Class I | | July 6, 2015* to
October 31, 2015 | |
Net asset value, beginning of period | | $ | 10.00 | |
| | | | |
Income (loss) from investment operations: | | | | |
Net investment income (loss) (e)(x) | | | — | # |
Net realized and unrealized gain (loss) on investments | | | (0.29 | ) |
| | | | |
Total from investment operations | | | (0.29 | ) |
| | | | |
Net asset value, end of period | | $ | 9.71 | |
| | | | |
Total return (b) | | | (2.90 | )% |
| | | | |
Ratios/Supplemental Data: | | | | |
Net assets, end of period (000’s) | | $ | 9,591 | |
Ratio of expenses to average net assets: | | | | |
After waivers and reimbursements (a)(f)(j) | | | 0.72 | % |
Before waivers and reimbursements (a)(f) | | | 1.97 | % |
Ratio of net investment income (loss) to average net assets: | | | | |
After waivers and reimbursements (a)(f)(x) | | | (0.03 | )%(l) |
Before waivers and reimbursements (a)(f)(x) | | | (1.29 | )%(l) |
Portfolio turnover rate (z)^ | | | 0 | % |
See Notes to Financial Statements.
54
1290 FUNDS
1290 MULTI-ALTERNATIVE STRATEGIES FUND
FINANCIAL HIGHLIGHTS (Continued)
| | | | |
| Class R | | July 6, 2015* to
October 31, 2015 | |
Net asset value, beginning of period | | $ | 10.00 | |
| | | | |
Income (loss) from investment operations: | | | | |
Net investment income (loss) (e)(x) | | | (0.02 | ) |
Net realized and unrealized gain (loss) on investments | | | (0.29 | ) |
| | | | |
Total from investment operations | | | (0.31 | ) |
| | | | |
Net asset value, end of period | | $ | 9.69 | |
| | | | |
Total return (b) | | | (3.10 | )% |
| | | | |
Ratios/Supplemental Data: | | | | |
Net assets, end of period (000’s) | | $ | 97 | |
Ratio of expenses to average net assets: | | | | |
After waivers and reimbursements (a)(f)(j) | | | 1.21 | % |
Before waivers and reimbursements (a)(f) | | | 2.47 | % |
Ratio of net investment income (loss) to average net assets: | | | | |
After waivers and reimbursements (a)(f)(x) | | | (0.53 | )%(l) |
Before waivers and reimbursements (a)(f)(x) | | | (1.78 | )%(l) |
Portfolio turnover rate (z)^ | | | 0 | % |
| * | Commencement of Operations. |
| # | Per share amount is less than $0.005. |
| ^ | Portfolio turnover rate excludes derivatives, if any. |
| (a) | Ratios for periods less than one year are annualized. |
| (b) | Total returns for periods less than one year are not annualized. |
| (e) | Net investment income (loss) per share is based on average shares outstanding. |
| (f) | Expenses do not include the expenses of the underlying funds (“indirect expenses”). |
| (j) | Including direct and indirect expenses, the net expense ratio after waivers would be 1.65% for Class A, 1.40% for Class I and 1.90% for Class R. |
| (l) | The annualized ratio of net investment income to average net assets may not be indicative of operating results for a full year. |
| (x) | Recognition of net investment income is affected by the timing of dividend declarations by the underlying funds in which the Fund invests. |
| (z) | Portfolio turnover rate for periods less than one year is not annualized. |
See Notes to Financial Statements.
55
1290 SMARTBETA EQUITY FUND (Unaudited)
INVESTMENT ADVISER
INVESTMENT SUB-ADVISER
| Ø | | AXA Rosenberg Investment Management LLC |
PERFORMANCE RESULTS
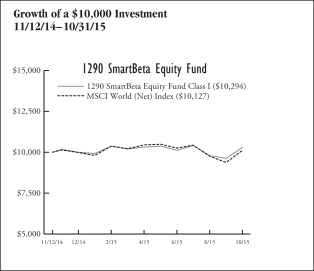
| | | | | | |
| Total Returns as of 10/31/15 | | | |
| | | | | Since
Incept. | |
Fund – Class A Shares* | | without Sales Charge | | | 2.70 | % |
| | | with Sales Charge (a) | | | (2.93 | ) |
Fund – Class C Shares* | | without Sales Charge | | | 2.94 | |
| | | with Sales Charge (b) | | | 1.94 | |
Fund – Class I Shares * | | | | | 2.94 | |
Fund – Class R Shares * | | | | | 2.47 | |
MSCI World (Net) Index | | | | | 1.27 | |
* Date of inception 11/12/14. (a) A 5.50% front-end sales charge was deducted. (b) A 1.00% front end sales charge was deducted. Returns for periods less than one year are not annualized. | |
The performance quoted is past performance and is not a guarantee of future results. Mutual funds are subject to certain market risks. Investment returns and principal value of an investment will fluctuate so that an investor’s shares, when redeemed, may be worth more or less than their original cost. Current performance may be higher or lower than the performance data shown. For the most current month-end performance data please call 1-888-310-0416 or visit www.1290Funds.com.
The graph illustrates comparative performance for $10,000 invested in the Class I Shares of the 1290 SmartBeta Equity Fund and MSCI World (Net) Index from 11/12/14 to 10/31/15. The performance of MSCI World (Net) Index reflects an initial investment at the end of the month closest to the Fund’s inception. The performance of the Fund assumes reinvestment of all dividends and capital gain distributions, if any, and does not include a sales charge. The performance of MSCI World (Net) Index does not reflect the deduction of expenses or a sales charge associated with a mutual fund and has been adjusted to reflect reinvestment of dividends, capital gain distributions, and interest of the securities included in the benchmark.
Fund performance may reflect the waiver of the Fund’s fees and reimbursement of expenses for certain periods since the inception date. Without these waivers and reimbursements, performance would have been lower. Also, performance shown in this section does not reflect the deduction of taxes that a shareholder would pay on Fund distributions or redemption of Fund shares.
PERFORMANCE SUMMARY
The Fund’s Class I shares returned 2.94% for the period ended October 31, 2015. The Fund’s benchmark, the MSCI World (Net) Index, returned 1.27% over the same period.
Fund Overview — AXA Rosenberg Investment Management LLC
During the period from November 12, 2014 through October 31, 2015, economic sector leadership was with consumer discretionary and consumer staples names, and to a lesser extent, information technology. The energy sector was the big loser, underperforming the broad index by more than 20%. Within the sector, the oil distribution companies fared slightly better than the drilling and integrated oil firms, but none were spared the pain. Along broad style dimensions, Growth outperformed Value by a dramatic margin, with the MSCI World Growth Index beating the Value Index by 9.6%. Global large cap stocks outperformed global small caps by 1.7%, as measured by the MSCI World Index versus the MSCI World Small Cap Index.
The SmartBeta strategy is designed to better navigate the market over a full cycle. Our aim is to build portfolios with reduced exposure to names with unattractive risk/reward profiles. To this end, we attempt to avoid the portions of the equity market that have unattractive earnings sustainability prospects, as well as many stocks that are among the most volatile. By doing so we seek to deliver a better Sharpe Ratio than the cap-weighted market index by generating positive excess return with approximately 80% of total market volatility over a full market cycle.
Fund Highlights
What helped performance since inception through October 31, 2015:
| • | | Over the period, positions in high earnings quality names like Eli Lilly & Co., Starbucks Corp., AutoZone, Inc. and Costco Wholesale Corp. were among the strongest contributors to the Fund’s performance. |
| • | | In the energy sector, the strategy’s intentional avoidance of the most volatile firms, and the bias away from many of the mega-cap companies, led to lower-than-market weights in many of the larger energy names. |
| • | | Generally, the greater-than-benchmark exposure to consumer staples was helpful during a period in which investors periodically sought safety and predictability. The strategy’s focus on gaining exposure to low volatility, high earnings quality companies led to this positioning. Holdings in Altria Group, Inc. and Mondelez International, Inc. are examples of consumer staples stocks that helped the Fund’s performance over the period. |
What hurt performance since inception through October 31, 2015:
| • | | Some of the top detractors from relative performance came from the information technology sector and were not held (or held at lower-than-benchmark weight) because they were perceived by the manager as too volatile or speculative. Stocks like Amazon, Alphabet, Inc. and Facebook Inc. all managed to produce very strong returns over the period. The Fund was hurt by its avoidance of these stocks. |
56
1290 SMARTBETA EQUITY FUND (Unaudited)
| | | | |
Sector Weightings
as of October 31, 2015 | | % of
Net Assets | |
Consumer Staples | | | 18.8 | % |
Financials | | | 15.9 | |
Health Care | | | 14.0 | |
Industrials | | | 13.5 | |
Consumer Discretionary | | | 13.1 | |
Information Technology | | | 9.2 | |
Utilities | | | 5.8 | |
Materials | | | 3.6 | |
Telecommunication Services | | | 2.6 | |
Energy | | | 2.5 | |
Investment Company | | | 0.5 | |
Cash and Other | | | 0.5 | |
| | | | | |
| | | | 100.0 | % |
| | | | | |
Holdings are subject to change without notice. | | | | |
UNDERSTANDING YOUR EXPENSES:
As a shareholder of the Fund, you incur two types of costs:
(1) transaction costs, including applicable sales charges and redemption fees; and (2) ongoing costs, including investment advisory fees, distribution and/or service (12b-1) fees (in the case of Class A, Class C and Class R shares of the Trust), and other Fund expenses. These examples are intended to help you understand your ongoing costs (in dollars) of investing in the Fund and to compare these costs with the ongoing costs of investing in other mutual funds.
The examples are based on an investment of $1,000 invested at the beginning of the six-month period ended October 31, 2015 and held for the entire six-month period.
Actual Expenses
The first line of the following table provides information about actual account values and actual expenses. You may use the information in this line, together with the amount you invested, to estimate the expenses that you paid over the period. Simply divide your account value by $1,000 (for example, an $8,600 account value divided by $1,000 = 8.6), then multiply the result by the number in the first line under the heading entitled ‘‘Expenses Paid During Period’’ to estimate the expenses you paid on your account during this period.
Hypothetical Example for Comparison Purposes
The second line of the following table provides information about hypothetical account values and hypothetical expenses based on the Fund’s actual expense ratio and an assumed rate of return of 5% per year before expenses, which is not the Fund’s actual return. The hypothetical account values and expenses may not be used to estimate the actual ending account balance or expenses you paid for the period. You may use this information to compare the ongoing costs of investing in the Fund and other funds. To do so, compare this 5% hypothetical example with the 5% hypothetical examples that appear in the shareholder reports of the other funds.
Please note that the expenses shown in the table are meant to highlight your ongoing costs only and do not reflect any transactional costs, such as sales charges (loads), redemption fees, or exchange fees. Therefore, the second line of the table is useful in comparing ongoing costs only, and will not help you determine the relative total costs of owning different funds. In addition, if these transactional costs were included, your costs would have been higher.
EXAMPLE
| | | | | | | | | | | | |
| | | Beginning
Account
Value
5/1/15 | | | Ending
Account
Value
10/31/15 | | | Expenses
Paid
During
Period*
5/1/15 -
10/31/15 | |
Class A | | | | | | | | | | | | |
Actual | | | $1,000.00 | | | | $997.08 | | | | $6.80 | |
Hypothetical (5% average annual return before expenses) | | | 1,000.00 | | | | 1,018.40 | | | | 6.87 | |
Class C** | | | | | | | | | | | | |
Actual | | | 1,000.00 | | | | 998.05 | | | | 5.54 | |
Hypothetical (5% average annual return before expenses) | | | 1,000.00 | | | | 1,019.66 | | | | 5.60 | |
Class I | | | | | | | | | | | | |
Actual | | | 1,000.00 | | | | 998.05 | | | | 5.54 | |
Hypothetical (5% average annual return before expenses) | | | 1,000.00 | | | | 1,019.66 | | | | 5.60 | |
Class R | | | | | | | | | | | | |
Actual | | | 1,000.00 | | | | 996.10 | | | | 8.05 | |
Hypothetical (5% average annual return before expenses) | | | 1,000.00 | | | | 1,017.14 | | | | 8.13 | |
* Expenses are equal to the Fund’s Class A, C, I and R shares annualized expense ratios of 1.35%, 1.10%, 1.10% and 1.60%, respectively, multiplied by the average account value over the period, and multiplied by 184/365 (to reflect the one-half year period). ** Class C shares currently are not offered for sale. | |
57
1290 FUNDS
1290 SMARTBETA EQUITY FUND
PORTFOLIO OF INVESTMENTS
October 31, 2015
| | | | | | | | |
| | | Number of
Shares | | | Value (Note 1) | |
| | | | | | | | |
COMMON STOCKS: | | | | | | | | |
Consumer Discretionary (13.1%) | |
Auto Components (0.7%) | |
Bridgestone Corp. | | | 600 | | | $ | 22,256 | |
Continental AG | | | 70 | | | | 16,834 | |
Delphi Automotive plc | | | 200 | | | | 16,638 | |
Denso Corp. | | | 100 | | | | 4,692 | |
Magna International, Inc. | | | 200 | | | | 10,548 | |
| | | | | | | | |
| | | | | | | 70,968 | |
| | | | | | | | |
Automobiles (1.4%) | | | | | | | | |
Bayerische Motoren Werke (BMW) AG | | | 200 | | | | 20,533 | |
Daimler AG (Registered) | | | 200 | | | | 17,368 | |
Ford Motor Co. | | | 1,100 | | | | 16,291 | |
Fuji Heavy Industries Ltd. | | | 400 | | | | 15,672 | |
General Motors Co. | | | 900 | | | | 31,419 | |
Harley-Davidson, Inc. | | | 100 | | | | 4,945 | |
Isuzu Motors Ltd. | | | 1,000 | | | | 11,780 | |
Suzuki Motor Corp. | | | 200 | | | | 6,613 | |
Toyota Motor Corp. | | | 300 | | | | 18,569 | |
| | | | | | | | |
| | | | | | | 143,190 | |
| | | | | | | | |
Distributors (0.2%) | |
Genuine Parts Co. | | | 200 | | | | 18,152 | |
| | | | | | | | |
Hotels, Restaurants & Leisure (2.4%) | |
Compass Group plc | | | 2,000 | | | | 34,501 | |
InterContinental Hotels Group plc | | | 200 | | | | 8,019 | |
Las Vegas Sands Corp. | | | 300 | | | | 14,853 | |
McDonald’s Corp. | | | 800 | | | | 89,800 | |
Oriental Land Co., Ltd. | | | 100 | | | | 6,118 | |
Sodexo S.A. | | | 100 | | | | 8,904 | |
Starbucks Corp. | | | 800 | | | | 50,056 | |
Tatts Group Ltd. | | | 2,200 | | | | 6,213 | |
Whitbread plc | | | 200 | | | | 15,311 | |
Yum! Brands, Inc. | | | 300 | | | | 21,273 | |
| | | | | | | | |
| | | | | | | 255,048 | |
| | | | | | | | |
Household Durables (0.3%) | |
Barratt Developments plc | | | 800 | | | | 7,554 | |
Newell Rubbermaid, Inc. | | | 200 | | | | 8,486 | |
Persimmon plc* | | | 300 | | | | 9,222 | |
Taylor Wimpey plc | | | 3,000 | | | | 9,157 | |
Techtronic Industries Co., Ltd. | | | 500 | | | | 1,835 | |
| | | | | | | | |
| | | | | | | 36,254 | |
| | | | | | | | |
Internet & Catalog Retail (0.0%) | |
Rakuten, Inc. | | | 100 | | | | 1,398 | |
| | | | | | | | |
Leisure Products (0.2%) | |
Shimano, Inc. | | | 100 | | | | 15,895 | |
| | | | | | | | |
Media (2.3%) | |
Comcast Corp., Class A | | | 300 | | | | 18,786 | |
DISH Network Corp., Class A* | | | 200 | | | | 12,594 | |
ITV plc | | | 2,000 | | | | 7,782 | |
Omnicom Group, Inc. | | | 200 | | | | 14,984 | |
ProSiebenSat.1 Media SE | | | 200 | | | | 10,818 | |
Publicis Groupe S.A. | | | 200 | | | | 12,989 | |
SES S.A. (FDR) | | | 400 | | | | 11,826 | |
Shaw Communications, Inc., Class B | | | 400 | | | | 8,305 | |
Singapore Press Holdings Ltd. | | | 2,000 | | | | 5,696 | |
| | | | | | | | |
Sky plc | | | 600 | | | $ | 10,138 | |
Thomson Reuters Corp. | | | 500 | | | | 20,526 | |
Twenty-First Century Fox, Inc., Class A | | | 900 | | | | 27,621 | |
Walt Disney Co. | | | 400 | | | | 45,496 | |
Wolters Kluwer N.V. | | | 400 | | | | 13,546 | |
WPP plc | | | 800 | | | | 17,981 | |
| | | | | | | | |
| | | | | | | 239,088 | |
| | | | | | | | |
Multiline Retail (0.5%) | |
Dollar General Corp. | | | 200 | | | | 13,554 | |
Dollar Tree, Inc.* | | | 200 | | | | 13,098 | |
Macy’s, Inc. | | | 100 | | | | 5,098 | |
Next plc | | | 160 | | | | 19,732 | |
| | | | | | | | |
| | | | | | | 51,482 | |
| | | | | | | | |
Specialty Retail (3.8%) | |
AutoZone, Inc.* | | | 100 | | | | 78,441 | |
Bed Bath & Beyond, Inc.* | | | 200 | | | | 11,926 | |
Hennes & Mauritz AB, Class B | | | 500 | | | | 19,448 | |
Home Depot, Inc. | | | 600 | | | | 74,184 | |
Industria de Diseno Textil S.A. | | | 1,000 | | | | 37,504 | |
L Brands, Inc. | | | 200 | | | | 19,196 | |
Lowe’s Cos., Inc. | | | 400 | | | | 29,532 | |
Nitori Holdings Co., Ltd. | | | 100 | | | | 7,864 | |
O’Reilly Automotive, Inc.* | | | 100 | | | | 27,626 | |
Ross Stores, Inc. | | | 400 | | | | 20,232 | |
TJX Cos., Inc. | | | 800 | | | | 58,552 | |
Tractor Supply Co. | | | 100 | | | | 9,239 | |
USS Co., Ltd. | | | 400 | | | | 7,130 | |
| | | | | | | | |
| | | | | | | 400,874 | |
| | | | | | | | |
Textiles, Apparel & Luxury Goods (1.3%) | |
Burberry Group plc | | | 400 | | | | 8,189 | |
Cie Financiere Richemont S.A. (Registered) | | | 200 | | | | 17,158 | |
Hanesbrands, Inc. | | | 300 | | | | 9,582 | |
Hermes International | | | 2 | | | | 770 | |
Hugo Boss AG | | | 100 | | | | 10,292 | |
Luxottica Group S.p.A. | | | 300 | | | | 21,031 | |
NIKE, Inc., Class B | | | 300 | | | | 39,309 | |
Under Armour, Inc., Class A* | | | 100 | | | | 9,508 | |
VF Corp. | | | 300 | | | | 20,256 | |
| | | | | | | | |
| | | | | | | 136,095 | |
| | | | | | | | |
Total Consumer Discretionary | | | | | | | 1,368,444 | |
| | | | | | | | |
Consumer Staples (18.8%) | | | | | | | | |
Beverages (4.5%) | |
Anheuser-Busch InBev S.A./N.V. | | | 400 | | | | 47,813 | |
Asahi Group Holdings Ltd. | | | 600 | | | | 18,631 | |
Brown-Forman Corp., Class B | | | 200 | | | | 21,236 | |
Coca-Cola Co. | | | 2,100 | | | | 88,935 | |
Constellation Brands, Inc., Class A | | | 100 | | | | 13,480 | |
Diageo plc | | | 2,100 | | | | 60,814 | |
Dr. Pepper Snapple Group, Inc. | | | 300 | | | | 26,811 | |
Heineken N.V. | | | 200 | | | | 18,281 | |
Molson Coors Brewing Co., Class B | | | 100 | | | | 8,810 | |
Monster Beverage Corp.* | | | 100 | | | | 13,632 | |
PepsiCo, Inc. | | | 900 | | | | 91,971 | |
Pernod-Ricard S.A. | | | 200 | | | | 23,576 | |
See Notes to Financial Statements.
58
1290 FUNDS
1290 SMARTBETA EQUITY FUND
PORTFOLIO OF INVESTMENTS (Continued)
October 31, 2015
| | | | | | | | |
| | | Number of
Shares | | | Value (Note 1) | |
| | | | | | | | |
SABMiller plc | | | 600 | | | $ | 36,952 | |
| | | | | | | | |
| | | | | | | 470,942 | |
| | | | | | | | |
Food & Staples Retailing (3.3%) | |
Aeon Co., Ltd. | | | 300 | | | | 4,473 | |
Alimentation Couche-Tard, Inc., Class B | | | 300 | | | | 12,905 | |
Costco Wholesale Corp. | | | 500 | | | | 79,060 | |
CVS Health Corp. | | | 600 | | | | 59,268 | |
Koninklijke Ahold N.V. | | | 600 | | | | 12,219 | |
Kroger Co. | | | 800 | | | | 30,240 | |
Lawson, Inc. | | | 100 | | | | 7,450 | |
Seven & i Holdings Co., Ltd. | | | 700 | | | | 31,969 | |
Sysco Corp. | | | 900 | | | | 37,125 | |
Wal-Mart Stores, Inc. | | | 800 | | | | 45,792 | |
Wesfarmers Ltd. | | | 400 | | | | 11,241 | |
Woolworths Ltd. | | | 600 | | | | 10,316 | |
| | | | | | | | |
| | | | | | | 342,058 | |
| | | | | | | | |
Food Products (3.4%) | |
Associated British Foods plc | | | 200 | | | | 10,652 | |
ConAgra Foods, Inc. | | | 200 | | | | 8,110 | |
Danone S.A. | | | 200 | | | | 13,946 | |
General Mills, Inc. | | | 800 | | | | 46,488 | |
Hershey Co. | | | 200 | | | | 17,738 | |
Hormel Foods Corp. | | | 200 | | | | 13,510 | |
J.M. Smucker Co. | | | 100 | | | | 11,739 | |
Kellogg Co. | | | 300 | | | | 21,156 | |
Kerry Group plc, Class A | | | 300 | | | | 24,396 | |
McCormick & Co., Inc. (Non-Voting) | | | 200 | | | | 16,796 | |
Mead Johnson Nutrition Co. | | | 200 | | | | 16,400 | |
Mondelez International, Inc., Class A | | | 1,600 | | | | 73,856 | |
Nestle S.A. (Registered) | | | 1,000 | | | | 76,483 | |
| | | | | | | | |
| | | | | | | 351,270 | |
| | | | | | | | |
Household Products (3.3%) | |
Church & Dwight Co., Inc. | | | 200 | | | | 17,218 | |
Clorox Co. | | | 200 | | | | 24,388 | |
Colgate-Palmolive Co. | | | 900 | | | | 59,715 | |
Henkel AG & Co. KGaA (Preference) (q) | | | 300 | | | | 32,561 | |
Kimberly-Clark Corp. | | | 500 | | | | 59,855 | |
Procter & Gamble Co. | | | 1,200 | | | | 91,656 | |
Reckitt Benckiser Group plc | | | 600 | | | | 58,679 | |
Unicharm Corp. | | | 300 | | | | 6,452 | |
| | | | | | | | |
| | | | | | | 350,524 | |
| | | | | | | | |
Personal Products (2.0%) | |
Beiersdorf AG | | | 100 | | | | 9,504 | |
Estee Lauder Cos., Inc., Class A | | | 200 | | | | 16,092 | |
Kao Corp. | | | 600 | | | | 31,022 | |
L’Oreal S.A. | | | 270 | | | | 49,301 | |
Unilever N.V. (CVA) | | | 1,200 | | | | 54,261 | |
Unilever plc | | | 1,200 | | | | 53,518 | |
| | | | | | | | |
| | | | | | | 213,698 | |
| | | | | | | | |
Tobacco (2.3%) | |
Altria Group, Inc. | | | 1,300 | | | | 78,611 | |
British American Tobacco plc | | | 900 | | | | 53,549 | |
Imperial Tobacco Group plc | | | 400 | | | | 21,576 | |
| | | | | | | | |
Japan Tobacco, Inc. | | | 600 | | | $ | 20,938 | |
Philip Morris International, Inc. | | | 700 | | | | 61,880 | |
| | | | | | | | |
| | | | | | | 236,554 | |
| | | | | | | | |
Total Consumer Staples | | | | | | | 1,965,046 | |
| | | | | | | | |
Energy (2.5%) | |
Oil, Gas & Consumable Fuels (2.5%) | |
Chevron Corp. | | | 200 | | | | 18,176 | |
Exxon Mobil Corp. | | | 1,200 | | | | 99,288 | |
Phillips 66 | | | 300 | | | | 26,715 | |
Royal Dutch Shell plc, Class A | | | 1,540 | | | | 40,355 | |
Spectra Energy Corp. | | | 700 | | | | 19,999 | |
Total S.A. | | | 300 | | | | 14,563 | |
TransCanada Corp. | | | 900 | | | | 30,285 | |
Woodside Petroleum Ltd. | | | 300 | | | | 6,334 | |
| | | | | | | | |
Total Energy | | | | | | | 255,715 | |
| | | | | | | | |
Financials (15.9%) | |
Banks (7.2%) | |
Australia & New Zealand Banking Group Ltd. | | | 600 | | | | 11,642 | |
Bank of Montreal | | | 800 | | | | 46,522 | |
Bank of Nova Scotia | | | 1,200 | | | | 56,430 | |
Bank of Yokohama Ltd. | | | 2,000 | | | | 12,585 | |
BB&T Corp. | | | 300 | | | | 11,145 | |
Canadian Imperial Bank of Commerce | | | 500 | | | | 38,345 | |
Commonwealth Bank of Australia | | | 400 | | | | 21,886 | |
Danske Bank A/S | | | 500 | | | | 13,749 | |
DBS Group Holdings Ltd. | | | 1,000 | | | | 12,328 | |
Fukuoka Financial Group, Inc. | | | 1,000 | | | | 5,312 | |
Hang Seng Bank Ltd. | | | 900 | | | | 16,559 | |
HSBC Holdings plc | | | 3,000 | | | | 23,475 | |
Lloyds Banking Group plc | | | 14,000 | | | | 15,913 | |
M&T Bank Corp. | | | 100 | | | | 11,985 | |
Mitsubishi UFJ Financial Group, Inc. | | | 2,800 | | | | 18,345 | |
Mizuho Financial Group, Inc. | | | 5,100 | | | | 10,579 | |
National Bank of Canada | | | 500 | | | | 16,561 | |
Oversea-Chinese Banking Corp., Ltd. | | | 2,000 | | | | 12,892 | |
PNC Financial Services Group, Inc. | | | 400 | | | | 36,104 | |
Resona Holdings, Inc. | | | 1,300 | | | | 6,933 | |
Royal Bank of Canada | | | 1,200 | | | | 68,617 | |
Shizuoka Bank Ltd. | | | 1,000 | | | | 10,127 | |
Sumitomo Mitsui Financial Group, Inc. | | | 400 | | | | 16,110 | |
Svenska Handelsbanken AB, Class A | | | 1,200 | | | | 16,321 | |
Swedbank AB, Class A | | | 800 | | | | 18,362 | |
Toronto-Dominion Bank | | | 1,600 | | | | 65,684 | |
U.S. Bancorp | | | 1,600 | | | | 67,488 | |
United Overseas Bank Ltd. | | | 1,000 | | | | 14,512 | |
Wells Fargo & Co. | | | 1,300 | | | | 70,382 | |
| | | | | | | | |
| | | | | | | 746,893 | |
| | | | | | | | |
Capital Markets (0.4%) | |
Franklin Resources, Inc. | | | 300 | | | | 12,228 | |
T. Rowe Price Group, Inc. | | | 200 | | | | 15,124 | |
UBS Group AG (Registered) | | | 800 | | | | 16,009 | |
| | | | | | | | |
| | | | | | | 43,361 | |
| | | | | | | | |
See Notes to Financial Statements.
59
1290 FUNDS
1290 SMARTBETA EQUITY FUND
PORTFOLIO OF INVESTMENTS (Continued)
October 31, 2015
| | | | | | | | |
| | | Number of
Shares | | | Value (Note 1) | |
| | | | | | | | |
Consumer Finance (0.8%) | |
American Express Co. | | | 800 | | | $ | 58,608 | |
Discover Financial Services | | | 400 | | | | 22,488 | |
| | | | | | | | |
| | | | | | | 81,096 | |
| | | | | | | | |
Diversified Financial Services (1.4%) | |
Berkshire Hathaway, Inc., Class B* | | | 700 | | | | 95,214 | |
Deutsche Boerse AG | | | 200 | | | | 18,419 | |
McGraw Hill Financial, Inc. | | | 200 | | | | 18,528 | |
Moody’s Corp. | | | 100 | | | | 9,616 | |
Singapore Exchange Ltd. | | | 1,000 | | | | 5,268 | |
| | | | | | | | |
| | | | | | | 147,045 | |
| | | | | | | | |
Insurance (3.7%) | |
AIA Group Ltd. | | | 3,400 | | | | 20,004 | |
Allianz SE (Registered) | | | 160 | | | | 28,037 | |
Aon plc | | | 200 | | | | 18,662 | |
Arch Capital Group Ltd.* | | | 200 | | | | 14,978 | |
Chubb Corp. | | | 200 | | | | 25,870 | |
Cincinnati Financial Corp. | | | 200 | | | | 12,046 | |
Hannover Rueck SE | | | 100 | | | | 11,568 | |
Intact Financial Corp. | | | 100 | | | | 7,142 | |
Legal & General Group plc | | | 2,000 | | | | 8,066 | |
Marsh & McLennan Cos., Inc. | | | 700 | | | | 39,018 | |
Muenchener Rueckversicherungs-Gesellschaft AG in Muenchen (Registered) | | | 140 | | | | 27,942 | |
Progressive Corp. | | | 800 | | | | 26,504 | |
Prudential plc | | | 900 | | | | 21,075 | |
Sampo Oyj, Class A | | | 600 | | | | 29,347 | |
SCOR SE | | | 400 | | | | 14,898 | |
Suncorp Group Ltd. | | | 300 | | | | 2,805 | |
Swiss Reinsurance AG | | | 200 | | | | 18,595 | |
T&D Holdings, Inc. | | | 400 | | | | 5,310 | |
Tokio Marine Holdings, Inc. | | | 300 | | | | 11,665 | |
Travelers Cos., Inc. | | | 300 | | | | 33,867 | |
Zurich Insurance Group AG* | | | 50 | | | | 13,218 | |
| | | | | | | | |
| | | | | | | 390,617 | |
| | | | | | | | |
Real Estate Investment Trusts (REITs) (1.7%) | |
British Land Co. plc (REIT) | | | 700 | | | | 9,394 | |
Dexus Property Group (REIT) | | | 1,200 | | | | 6,623 | |
Equity Residential (REIT) | | | 200 | | | | 15,464 | |
Goodman Group (REIT) | | | 900 | | | | 3,896 | |
GPT Group (REIT) | | | 3,000 | | | | 10,204 | |
Land Securities Group plc (REIT) | | | 400 | | | | 8,257 | |
Mirvac Group (REIT) | | | 4,800 | | | | 6,178 | |
Public Storage (REIT) | | | 100 | | | | 22,946 | |
Scentre Group (REIT) | | | 5,300 | | | | 15,647 | |
Simon Property Group, Inc. (REIT) | | | 300 | | | | 60,438 | |
Unibail-Rodamco SE (REIT) | | | 50 | | | | 13,971 | |
| | | | | | | | |
| | | | | | | 173,018 | |
| | | | | | | | |
Real Estate Management & Development (0.7%) | |
Brookfield Asset Management, Inc., Class A | | | 700 | | | | 24,454 | |
Daito Trust Construction Co., Ltd. | | | 100 | | | | 10,889 | |
Daiwa House Industry Co., Ltd. | | | 1,000 | | | | 26,485 | |
Swiss Prime Site AG (Registered)* | | | 200 | | | | 15,297 | |
| | | | | | | | |
| | | | | | | 77,125 | |
| | | | | | | | |
Total Financials | | | | | | | 1,659,155 | |
| | | | | | | | |
| | | | | | | | |
Health Care (14.0%) | |
Biotechnology (1.8%) | |
Actelion Ltd. (Registered)* | | | 100 | | | $ | 13,901 | |
Amgen, Inc. | | | 300 | | | | 47,454 | |
Biogen, Inc.* | | | 100 | | | | 29,051 | |
Celgene Corp.* | | | 300 | | | | 36,813 | |
CSL Ltd. | | | 200 | | | | 13,376 | |
Gilead Sciences, Inc. | | | 400 | | | | 43,252 | |
| | | | | | | | |
| | | | | | | 183,847 | |
| | | | | | | | |
Health Care Equipment & Supplies (2.3%) | |
Baxter International, Inc. | | | 600 | | | | 22,434 | |
Becton, Dickinson and Co. | | | 200 | | | | 28,504 | |
C.R. Bard, Inc. | | | 100 | | | | 18,635 | |
Coloplast A/S, Class B | | | 200 | | | | 14,349 | |
Edwards Lifesciences Corp.* | | | 100 | | | | 15,715 | |
Essilor International S.A. | | | 200 | | | | 26,304 | |
Hoya Corp. | | | 400 | | | | 16,670 | |
Medtronic plc | | | 600 | | | | 44,352 | |
Smith & Nephew plc | | | 1,000 | | | | 17,112 | |
St. Jude Medical, Inc. | | | 200 | | | | 12,762 | |
Stryker Corp. | | | 200 | | | | 19,124 | |
Sysmex Corp. | | | 100 | | | | 5,776 | |
| | | | | | | | |
| | | | | | | 241,737 | |
| | | | | | | | |
Health Care Providers & Services (2.5%) | |
Aetna, Inc. | | | 100 | | | | 11,478 | |
Cardinal Health, Inc. | | | 500 | | | | 41,100 | |
Cigna Corp. | | | 100 | | | | 13,404 | |
Fresenius Medical Care AG & Co. KGaA | | | 200 | | | | 18,010 | |
Fresenius SE & Co. KGaA | | | 400 | | | | 29,361 | |
HCA Holdings, Inc.* | | | 200 | | | | 13,758 | |
Henry Schein, Inc.* | | | 100 | | | | 15,171 | |
Laboratory Corp. of America Holdings* | | | 100 | | | | 12,274 | |
McKesson Corp. | | | 200 | | | | 35,760 | |
Ramsay Health Care Ltd. | | | 100 | | | | 4,422 | |
Sonic Healthcare Ltd. | | | 300 | | | | 4,124 | |
UnitedHealth Group, Inc. | | | 500 | | | | 58,890 | |
| | | | | | | | |
| | | | | | | 257,752 | |
| | | | | | | | |
Life Sciences Tools & Services (0.3%) | |
Thermo Fisher Scientific, Inc. | | | 100 | | | | 13,078 | |
Waters Corp.* | | | 100 | | | | 12,780 | |
| | | | | | | | |
| | | | | | | 25,858 | |
| | | | | | | | |
Pharmaceuticals (7.1%) | |
AbbVie, Inc. | | | 400 | | | | 23,820 | |
Astellas Pharma, Inc. | | | 400 | | | | 5,851 | |
AstraZeneca plc | | | 300 | | | | 19,195 | |
Bayer AG (Registered) | | | 360 | | | | 48,039 | |
Bristol-Myers Squibb Co. | | | 400 | | | | 26,380 | |
Daiichi Sankyo Co., Ltd. | | | 700 | | | | 13,832 | |
Eli Lilly & Co. | | | 900 | | | | 73,413 | |
GlaxoSmithKline plc | | | 2,400 | | | | 51,983 | |
Johnson & Johnson | | | 1,000 | | | | 101,030 | |
Merck & Co., Inc. | | | 1,200 | | | | 65,592 | |
Novartis AG (Registered) | | | 600 | | | | 54,540 | |
Novo Nordisk A/S, Class B | | | 800 | | | | 42,498 | |
Otsuka Holdings Co., Ltd. | | | 400 | | | | 13,405 | |
Pfizer, Inc. | | | 2,700 | | | | 91,314 | |
See Notes to Financial Statements.
60
1290 FUNDS
1290 SMARTBETA EQUITY FUND
PORTFOLIO OF INVESTMENTS (Continued)
October 31, 2015
| | | | | | | | |
| | | Number of
Shares | | | Value (Note 1) | |
| | | | | | | | |
Roche Holding AG | | | 200 | | | $ | 54,287 | |
Sanofi S.A. | | | 200 | | | | 20,201 | |
Shire plc | | | 300 | | | | 22,777 | |
Zoetis, Inc. | | | 400 | | | | 17,204 | |
| | | | | | | | |
| | | | | | | 745,361 | |
| | | | | | | | |
Total Health Care | | | | | | | 1,454,555 | |
| | | | | | | | |
Industrials (13.5%) | |
Aerospace & Defense (3.9%) | |
Airbus Group SE | | | 400 | | | | 27,870 | |
BAE Systems plc | | | 2,000 | | | | 13,575 | |
Boeing Co. | | | 400 | | | | 59,228 | |
General Dynamics Corp. | | | 200 | | | | 29,716 | |
Honeywell International, Inc. | | | 400 | | | | 41,312 | |
Lockheed Martin Corp. | | | 300 | | | | 65,949 | |
Northrop Grumman Corp. | | | 300 | | | | 56,325 | |
Raytheon Co. | | | 300 | | | | 35,220 | |
Rockwell Collins, Inc. | | | 100 | | | | 8,672 | |
Rolls-Royce Holdings plc* | | | 800 | | | | 8,479 | |
Safran S.A. | | | 200 | | | | 15,199 | |
Singapore Technologies Engineering Ltd. | | | 2,000 | | | | 4,726 | |
United Technologies Corp. | | | 400 | | | | 39,364 | |
| | | | | | | | |
| | | | | | | 405,635 | |
| | | | | | | | |
Air Freight & Logistics (0.9%) | |
Deutsche Post AG (Registered) | | | 800 | | | | 23,814 | |
United Parcel Service, Inc., Class B | | | 700 | | | | 72,114 | |
Yamato Holdings Co., Ltd. | | | 100 | | | | 1,981 | |
| | | | | | | | |
| | | | | | | 97,909 | |
| | | | | | | | |
Building Products (0.5%) | |
Assa Abloy AB, Class B | | | 1,200 | | | | 23,878 | |
Daikin Industries Ltd. | | | 200 | | | | 12,994 | |
Geberit AG (Registered) | | | 50 | | | | 16,151 | |
| | | | | | | | |
| | | | | | | 53,023 | |
| | | | | | | | |
Commercial Services & Supplies (0.9%) | |
Brambles Ltd. | | | 1,300 | | | | 9,623 | |
Cintas Corp. | | | 100 | | | | 9,309 | |
Republic Services, Inc. | | | 300 | | | | 13,122 | |
Secom Co., Ltd. | | | 300 | | | | 20,180 | |
Stericycle, Inc.* | | | 100 | | | | 12,137 | |
Waste Management, Inc. | | | 500 | | | | 26,880 | |
| | | | | | | | |
| | | | | | | 91,251 | |
| | | | | | | | |
Construction & Engineering (0.1%) | |
Vinci S.A. | | | 200 | | | | 13,499 | |
| | | | | | | | |
Electrical Equipment (0.7%) | |
AMETEK, Inc. | | | 200 | | | | 10,964 | |
Emerson Electric Co. | | | 500 | | | | 23,615 | |
Legrand S.A. | | | 300 | | | | 16,475 | |
Mitsubishi Electric Corp. | | | 1,000 | | | | 10,525 | |
Rockwell Automation, Inc. | | | 100 | | | | 10,916 | |
| | | | | | | | |
| | | | | | | 72,495 | |
| | | | | | | | |
Industrial Conglomerates (1.3%) | |
3M Co. | | | 400 | | | | 62,884 | |
CK Hutchison Holdings Ltd. | | | 684 | | | | 9,399 | |
Danaher Corp. | | | 100 | | | | 9,331 | |
Roper Technologies, Inc. | | | 100 | | | | 18,635 | |
| | | | | | | | |
Siemens AG (Registered) | | | 300 | | | $ | 30,185 | |
| | | | | | | | |
| | | | | | | 130,434 | |
| | | | | | | | |
Machinery (1.6%) | |
Atlas Copco AB, Class A | | | 700 | | | | 18,271 | |
Cummins, Inc. | | | 100 | | | | 10,351 | |
Deere & Co. | | | 200 | | | | 15,600 | |
FANUC Corp. | | | 100 | | | | 17,863 | |
Illinois Tool Works, Inc. | | | 300 | | | | 27,582 | |
Kone Oyj, Class B | | | 300 | | | | 12,820 | |
Kubota Corp. | | | 1,000 | | | | 15,671 | |
Makita Corp. | | | 100 | | | | 5,527 | |
Schindler Holding AG | | | 100 | | | | 16,247 | |
SMC Corp. | | | 100 | | | | 25,972 | |
| | | | | | | | |
| | | | | | | 165,904 | |
| | | | | | | | |
Professional Services (0.6%) | |
Capita plc | | | 500 | | | | 9,828 | |
Equifax, Inc. | | | 200 | | | | 21,314 | |
Experian plc | | | 400 | | | | 6,832 | |
SGS S.A. (Registered) | | | 7 | | | | 13,342 | |
Verisk Analytics, Inc.* | | | 200 | | | | 14,322 | |
| | | | | | | | |
| | | | | | | 65,638 | |
| | | | | | | | |
Road & Rail (2.4%) | |
Aurizon Holdings Ltd. | | | 3,000 | | | | 11,060 | |
Canadian National Railway Co. | | | 900 | | | | 54,973 | |
Canadian Pacific Railway Ltd. | | | 100 | | | | 14,053 | |
Central Japan Railway Co. | | | 100 | | | | 18,397 | |
ComfortDelGro Corp., Ltd. | | | 3,000 | | | | 6,510 | |
East Japan Railway Co. | | | 300 | | | | 28,764 | |
Hankyu Hanshin Holdings, Inc. | | | 1,000 | | | | 6,555 | |
Keio Corp. | | | 1,000 | | | | 8,196 | |
MTR Corp., Ltd. | | | 2,500 | | | | 11,354 | |
Nagoya Railroad Co., Ltd. | | | 1,000 | | | | 4,160 | |
Odakyu Electric Railway Co., Ltd. | | | 1,000 | | | | 9,845 | |
Union Pacific Corp. | | | 600 | | | | 53,610 | |
West Japan Railway Co. | | | 300 | | | | 21,207 | |
| | | | | | | | |
| | | | | | | 248,684 | |
| | | | | | | | |
Trading Companies & Distributors (0.6%) | |
Brenntag AG | | | 200 | | | | 12,085 | |
Bunzl plc | | | 600 | | | | 17,195 | |
Fastenal Co. | | | 200 | | | | 7,832 | |
Marubeni Corp. | | | 1,000 | | | | 5,821 | |
W.W. Grainger, Inc. | | | 100 | | | | 21,000 | |
| | | | | | | | |
| | | | | | | 63,933 | |
| | | | | | | | |
Total Industrials | | | | | | | 1,408,405 | |
| | | | | | | | |
Information Technology (9.2%) | | | | | | | | |
Communications Equipment (0.8%) | |
Cisco Systems, Inc. | | | 1,500 | | | | 43,275 | |
Motorola Solutions, Inc. | | | 100 | | | | 6,997 | |
QUALCOMM, Inc. | | | 600 | | | | 35,652 | |
| | | | | | | | |
| | | | | | | 85,924 | |
| | | | | | | | |
Electronic Equipment, Instruments & Components (0.4%) | |
Amphenol Corp., Class A | | | 300 | | | | 16,266 | |
Murata Manufacturing Co., Ltd. | | | 100 | | | | 14,382 | |
Omron Corp. | | | 200 | | | | 6,688 | |
| | | | | | | | |
| | | | | | | 37,336 | |
| | | | | | | | |
See Notes to Financial Statements.
61
1290 FUNDS
1290 SMARTBETA EQUITY FUND
PORTFOLIO OF INVESTMENTS (Continued)
October 31, 2015
| | | | | | | | |
| | | Number of
Shares | | | Value (Note 1) | |
| | | | | | | | |
Internet Software & Services (0.3%) | |
Alphabet, Inc., Class A* | | | 30 | | | $ | 22,122 | |
Yahoo! Japan Corp. | | | 1,300 | | | | 5,548 | |
| | | | | | | | |
| | | | | | | 27,670 | |
| | | | | | | | |
IT Services (4.2%) | |
Accenture plc, Class A | | | 400 | | | | 42,880 | |
Amadeus IT Holding S.A., Class A | | | 400 | | | | 17,049 | |
Automatic Data Processing, Inc. | | | 600 | | | | 52,194 | |
Cognizant Technology Solutions Corp., Class A* | | | 400 | | | | 27,244 | |
Fidelity National Information Services, Inc. | | | 300 | | | | 21,876 | |
Fiserv, Inc.* | | | 300 | | | | 28,953 | |
International Business Machines Corp. | | | 500 | | | | 70,040 | |
MasterCard, Inc., Class A | | | 600 | | | | 59,394 | |
Paychex, Inc. | | | 500 | | | | 25,790 | |
Total System Services, Inc. | | | 200 | | | | 10,490 | |
Visa, Inc., Class A | | | 1,100 | | | | 85,338 | |
| | | | | | | | |
| | | | | | | 441,248 | |
| | | | | | | | |
Semiconductors & Semiconductor Equipment (0.9%) | |
ARM Holdings plc | | | 1,200 | | | | 18,962 | |
Avago Technologies Ltd. | | | 200 | | | | 24,626 | |
Linear Technology Corp. | | | 200 | | | | 8,884 | |
Texas Instruments, Inc. | | | 600 | | | | 34,032 | |
Xilinx, Inc. | | | 200 | | | | 9,524 | |
| | | | | | | | |
| | | | | | | 96,028 | |
| | | | | | | | |
Software (2.0%) | |
Dassault Systemes S.A. | | | 200 | | | | 15,800 | |
Electronic Arts, Inc.* | | | 100 | | | | 7,207 | |
Intuit, Inc. | | | 200 | | | | 19,486 | |
Microsoft Corp. | | | 1,300 | | | | 68,432 | |
Oracle Corp. | | | 1,000 | | | | 38,840 | |
SAP SE | | | 600 | | | | 47,425 | |
Synopsys, Inc.* | | | 200 | | | | 9,996 | |
| | | | | | | | |
| | | | | | | 207,186 | |
| | | | | | | | |
Technology Hardware, Storage & Peripherals (0.6%) | |
Apple, Inc. | | | 500 | | | | 59,750 | |
Canon, Inc. | | | 200 | | | | 6,033 | |
| | | | | | | | |
| | | | | | | 65,783 | |
| | | | | | | | |
Total Information Technology | | | | | | | 961,175 | |
| | | | | | | | |
Materials (3.6%) | |
Chemicals (3.4%) | |
Air Liquide S.A. | | | 300 | | | | 38,895 | |
Air Products and Chemicals, Inc. | | | 100 | | | | 13,898 | |
Asahi Kasei Corp. | | | 2,000 | | | | 12,372 | |
CF Industries Holdings, Inc. | | | 200 | | | | 10,154 | |
E.I. du Pont de Nemours & Co. | | | 400 | | | | 25,360 | |
Ecolab, Inc. | | | 400 | | | | 48,140 | |
Givaudan S.A. (Registered)* | | | 9 | | | | 16,116 | |
International Flavors & Fragrances, Inc. | | | 100 | | | | 11,606 | |
Linde AG | | | 140 | | | | 24,286 | |
Monsanto Co. | | | 300 | | | | 27,966 | |
Novozymes A/S, Class B | | | 400 | | | | 18,548 | |
| | | | | | | | |
PPG Industries, Inc. | | | 100 | | | $ | 10,426 | |
Praxair, Inc. | | | 400 | | | | 44,436 | |
Sherwin-Williams Co. | | | 100 | | | | 26,683 | |
Shin-Etsu Chemical Co., Ltd. | | | 200 | | | | 11,990 | |
Symrise AG | | | 200 | | | | 13,174 | |
| | | | | | | | |
| | | | | | | 354,050 | |
| | | | | | | | |
Containers & Packaging (0.2%) | |
Amcor Ltd. | | | 1,500 | | | | 14,601 | |
Ball Corp. | | | 100 | | | | 6,850 | |
| | | | | | | | |
| | | | | | | 21,451 | |
| | | | | | | | |
Total Materials | | | | | | | 375,501 | |
| | | | | | | | |
Telecommunication Services (2.6%) | |
Diversified Telecommunication Services (2.0%) | |
AT&T, Inc. | | | 1,500 | | | | 50,265 | |
BT Group plc | | | 4,000 | | | | 28,674 | |
Deutsche Telekom AG (Registered) | | | 700 | | | | 13,090 | |
Nippon Telegraph & Telephone Corp. | | | 600 | | | | 22,305 | |
Singapore Telecommunications Ltd. | | | 7,000 | | | | 19,887 | |
Swisscom AG (Registered) | | | 30 | | | | 15,479 | |
Telenor ASA | | | 900 | | | | 16,979 | |
TeliaSonera AB | | | 3,000 | | | | 15,355 | |
Telstra Corp., Ltd. | | | 4,900 | | | | 18,869 | |
Verizon Communications, Inc. | | | 200 | | | | 9,376 | |
| | | | | | | | |
| | | | | | | 210,279 | |
| | | | | | | | |
Wireless Telecommunication Services (0.6%) | |
KDDI Corp. | | | 600 | | | | 14,648 | |
NTT DOCOMO, Inc. | | | 1,600 | | | | 31,259 | |
Rogers Communications, Inc., Class B | | | 300 | | | | 11,937 | |
SoftBank Group Corp. | | | 100 | | | | 5,633 | |
| | | | | | | | |
| | | | | | | 63,477 | |
| | | | | | | | |
Total Telecommunication Services | | | | | | | 273,756 | |
| | | | | | | | |
Utilities (5.8%) | | | | | | | | |
Electric Utilities (3.0%) | | | | | | | | |
American Electric Power Co., Inc. | | | 400 | | | | 22,660 | |
CLP Holdings Ltd. | | | 2,000 | | | | 17,418 | |
Duke Energy Corp. | | | 500 | | | | 35,735 | |
Eversource Energy | | | 500 | | | | 25,470 | |
NextEra Energy, Inc. | | | 500 | | | | 51,330 | |
PPL Corp. | | | 600 | | | | 20,640 | |
Red Electrica Corporacion S.A. | | | 200 | | | | 17,638 | |
Southern Co. | | | 1,200 | | | | 54,120 | |
SSE plc | | | 1,200 | | | | 28,026 | |
Terna Rete Elettrica Nazionale S.p.A. | | | 3,000 | | | | 15,268 | |
Xcel Energy, Inc. | | | 600 | | | | 21,378 | |
| | | | | | | | |
| | | | | | | 309,683 | |
| | | | | | | | |
Gas Utilities (0.5%) | | | | | | | | |
Hong Kong & China Gas Co., Ltd. | | | 4,400 | | | | 8,936 | |
Osaka Gas Co., Ltd. | | | 3,000 | | | | 11,889 | |
Snam S.p.A. | | | 3,000 | | | | 15,538 | |
See Notes to Financial Statements.
62
1290 FUNDS
1290 SMARTBETA EQUITY FUND
PORTFOLIO OF INVESTMENTS (Continued)
October 31, 2015
| | | | | | | | |
| | | Number of
Shares | | | Value (Note 1) | |
| | | | | | | | |
Tokyo Gas Co., Ltd. | | | 3,000 | | | $ | 14,956 | |
| | | | | | | | |
| | | | | | | 51,319 | |
| | | | | | | | |
Multi-Utilities (2.1%) | | | | | | | | |
AGL Energy Ltd. | | | 600 | | | | 7,158 | |
CMS Energy Corp. | | | 300 | | | | 10,821 | |
Consolidated Edison, Inc. | | | 300 | | | | 19,725 | |
Dominion Resources, Inc. | | | 800 | | | | 57,144 | |
DTE Energy Co. | | | 200 | | | | 16,318 | |
National Grid plc | | | 3,000 | | | | 42,770 | |
Public Service Enterprise Group, Inc. | | | 300 | | | | 12,387 | |
Sempra Energy | | | 400 | | | | 40,964 | |
WEC Energy Group, Inc. | | | 300 | | | | 15,468 | |
| | | | | | | | |
| | | | | | | 222,755 | |
| | | | | | | | |
Water Utilities (0.2%) | | | | | | | | |
American Water Works Co., Inc. | | | 200 | | | | 11,472 | |
Severn Trent plc | | | 300 | | | | 10,374 | |
| | | | | | | | |
| | | | | | | 21,846 | |
| | | | | | | | |
Total Utilities | | | | | | | 605,603 | |
| | | | | | | | |
Total Common Stocks (99.0%)
(Cost $10,136,813) | | | | | | | 10,327,355 | |
| | | | | | | | |
| | |
PREFERRED STOCK: | | | | | | | | |
Industrials (0.0%) | | | | | | | | |
Aerospace & Defense (0.0%) | | | | | | | | |
Rolls-Royce Holdings plc
0.000%*† | | | 74,160 | | | | 115 | |
| | | | | | | | |
Total Preferred Stock (0.0%)
(Cost $114) | | | | | | | 115 | |
| | | | | | | | |
| | |
SHORT-TERM INVESTMENT: | | | | | | | | |
Investment Company (0.5%) | | | | | | | | |
JPMorgan Prime Money Market Fund, Institutional Class Shares | | | 53,997 | | | | 53,997 | |
| | | | | | | | |
Total Short-Term Investment (0.5%)
(Cost $53,997) | | | | | | | 53,997 | |
| | | | | | | | |
Total Investments (99.5%)
(Cost $10,190,924) | | | | | | | 10,381,467 | |
Other Assets Less Liabilities (0.5%) | | | | | | | 50,205 | |
| | | | | | | | |
Net Assets (100%) | | | | | | $ | 10,431,672 | |
| | | | | | | | |
| † | Security (totaling $115 or 0.0% of net assets) held at fair value by management. |
| (q) | Preference Shares are a special type of equity investment that shares in the earnings of the company, has limited voting rights, and receives a greater dividend than applicable Common Shares. |
Glossary:
| | FDR | — Finnish Depositary Receipt |
| | | | |
Country Diversification
As a Percentage of Total Net Assets | | | |
Australia | | | 1.9 | % |
Belgium | | | 0.5 | |
Bermuda | | | 0.1 | |
Canada | | | 4.5 | |
Denmark | | | 0.9 | |
Finland | | | 0.4 | |
France | | | 3.1 | |
Germany | | | 4.4 | |
Hong Kong | | | 0.8 | |
Ireland | | | 1.3 | |
Italy | | | 0.5 | |
Japan | | | 7.7 | |
Luxembourg | | | 0.1 | |
Netherlands | | | 0.8 | |
Norway | | | 0.2 | |
Singapore | | | 1.0 | |
Spain | | | 0.7 | |
Sweden | | | 1.1 | |
Switzerland | | | 3.4 | |
United Kingdom | | | 8.5 | |
United States | | | 57.6 | |
Cash and Other | | | 0.5 | |
| | | | | |
| | | | 100.0 | % |
| | | | | |
See Notes to Financial Statements.
63
1290 FUNDS
1290 SMARTBETA EQUITY FUND
PORTFOLIO OF INVESTMENTS (Continued)
October 31, 2015
The following is a summary of the inputs used to value the Fund’s assets and liabilities carried at fair value as of October 31, 2015:
The inputs or methodology used for valuing securities are not necessarily an indication of the risk associated with investing in those securities.
Various inputs are used in determining the value of the Fund’s investments. These inputs are summarized in the three broad levels listed below:
| | | | | | | | | | | | | | | | |
| | | | | |
| Investment Type | | Level 1
Quoted Prices in
Active Markets for
Identical
Securities | | | Level 2
Significant Other
Observable Inputs
(including quoted prices
for similar securities,
interest rates,
prepayment speeds,
credit risk, etc.) | | | Level 3
Significant Unobservable
Inputs (including the
Fund’s own
assumptions in
determining the fair
value of investments) | | | Total | |
Assets: | | | | | | | | | | | | | | | | |
Common Stocks | | | | | | | | | | | | | | | | |
Consumer Discretionary | | $ | 870,106 | | | $ | 498,338 | | | $ | — | | | $ | 1,368,444 | |
Consumer Staples | | | 1,164,473 | | | | 800,573 | | | | — | | | | 1,965,046 | |
Energy | | | 194,463 | | | | 61,252 | | | | — | | | | 255,715 | |
Financials | | | 1,022,458 | | | | 636,697 | | | | — | | | | 1,659,155 | |
Health Care | | | 944,542 | | | | 510,013 | | | | — | | | | 1,454,555 | |
Industrials | | | 846,330 | | | | 562,075 | | | | — | | | | 1,408,405 | |
Information Technology | | | 829,288 | | | | 131,887 | | | | — | | | | 961,175 | |
Materials | | | 225,519 | | | | 149,982 | | | | — | | | | 375,501 | |
Telecommunication Services | | | 71,578 | | | | 202,178 | | | | — | | | | 273,756 | |
Utilities | | | 415,632 | | | | 189,971 | | | | — | | | | 605,603 | |
Preferred Stocks | | | | | | | | | | | | | | | | |
Industrials | | | — | | | | — | | | | 115 | | | | 115 | |
Short-Term Investments | | | 53,997 | | | | — | | | | — | | | | 53,997 | |
| | | | | | | | | | | | | | | | |
Total Assets | | $ | 6,638,386 | | | $ | 3,742,966 | | | $ | 115 | | | $ | 10,381,467 | |
| | | | | | | | | | | | | | | | |
Total Liabilities | | $ | — | | | $ | — | | | $ | — | | | $ | — | |
| | | | | | | | | | | | | | | | |
Total | | $ | 6,638,386 | | | $ | 3,742,966 | | | $ | 115 | | | $ | 10,381,467 | |
| | | | | | | | | | | | | | | | |
There were no transfers between Levels 1, 2 or 3 during the period ended October 31, 2015.
The Fund held no derivatives contracts during the period ended October 31, 2015.
Investment security transactions for the period ended October 31, 2015 were as follows:
| | | | |
Cost of Purchases: | | | | |
Long-term investments other than U.S. government debt securities | | $ | 13,046,242 | |
Net Proceeds of Sales and Redemptions: | | | | |
Long-term investments other than U.S. government debt securities | | $ | 2,888,147 | |
As of October 31, 2015, the gross unrealized appreciation (depreciation) of investments based on the aggregate cost of investments for Federal income tax purposes was as follows:
| | | | |
Aggregate gross unrealized appreciation | | $ | 675,538 | |
Aggregate gross unrealized depreciation | | | (487,250 | ) |
| | | | |
Net unrealized appreciation | | $ | 188,288 | |
| | | | |
Federal income tax cost of investments | | $ | 10,193,179 | |
| | | | |
See Notes to Financial Statements.
64
1290 FUNDS
1290 SMARTBETA EQUITY FUND
STATEMENT OF ASSETS AND LIABILITIES
October 31, 2015
| | | | |
ASSETS | |
Investments at value (Cost $10,190,924) | | $ | 10,381,467 | |
Cash | | | 5,000 | |
Foreign cash (Cost $50,993) | | | 51,862 | |
Receivable from investment adviser | | | 20,432 | |
Dividends, interest and other receivables | | | 18,699 | |
Deferred offering cost | | | 4,501 | |
Receivable for Fund shares sold | | | 3,366 | |
Other assets | | | 54 | |
| | | | |
Total assets | | | 10,485,381 | |
| | | | |
LIABILITIES | | | | |
Transfer agent fees payable | | | 4,513 | |
Payable for Fund shares redeemed | | | 3,389 | |
Distribution fees payable – Class R | | | 1,278 | |
Distribution fees payable – Class A | | | 646 | |
Trustees’ fees payable | | | 15 | |
Accrued expenses | | | 43,868 | |
| | | | |
Total liabilities | | | 53,709 | |
| | | | |
NET ASSETS | | $ | 10,431,672 | |
| | | | |
Net assets were comprised of: | | | | |
Paid in capital | | $ | 10,140,814 | |
Accumulated undistributed net investment income (loss) | | | 127,326 | |
Accumulated undistributed net realized gain (loss) on investments and foreign currency transactions | | | (27,805 | ) |
Net unrealized appreciation (depreciation) on investments and foreign currency translations | | | 191,337 | |
| | | | |
Net assets | | $ | 10,431,672 | |
| | | | |
Class A | | | | |
Net asset value and redemption price per share, $3,111,083 / 303,891 shares outstanding (unlimited amount authorized: $0.001 par value) | | $ | 10.24 | |
Maximum sales charge (5.50% of offering price) | | | 0.60 | |
| | | | |
Maximum offering price per share | | $ | 10.84 | |
| | | | |
Class C** | | | | |
Net asset value per share, $1,029,275 / 100,332 shares outstanding (unlimited amount authorized: $0.001 par value) (a) | | $ | 10.26 | |
| | | | |
Class I | | | | |
Net asset value and redemption price per share, $3,218,364 / 313,718 shares outstanding (unlimited amount authorized: $0.001 par value) | | $ | 10.26 | |
| | | | |
Class R | | | | |
Net asset value and redemption price per share, $3,072,950 / 300,787 shares outstanding (unlimited amount authorized: $0.001 par value) | | $ | 10.22 | |
| | | | |
| ** | Class C shares currently are not offered for sale. |
| (a) | Redemption price for Class C shares varies based on length of time the shares are held. |
STATEMENT OF OPERATIONS
For the Period Ended October 31, 2015*
| | | | |
INVESTMENT INCOME | |
Dividends (net of $11,417 foreign withholding tax) | | $ | 245,494 | |
Interest | | | 13 | |
| | | | |
Total income | | | 245,507 | |
| | | | |
EXPENSES | | | | |
Offering costs | | | 132,390 | |
Professional fees | | | 87,380 | |
Investment advisory fees | | | 69,160 | |
Administrative fees | | | 38,703 | |
Transfer agent fees | | | 16,735 | |
Distribution fees – Class R | | | 14,723 | |
Custodian fees | | | 12,900 | |
Distribution fees – Class C | | | 9,839 | |
Printing and mailing expenses | | | 7,718 | |
Distribution fees – Class A | | | 7,388 | |
Trustees’ fees | | | 5,159 | |
Registration and filing fees | | | 4,090 | |
Miscellaneous | | | 18,924 | |
| | | | |
Gross expenses | | | 425,109 | |
Less: Waiver from investment adviser | | | (107,863 | ) |
Waiver from distributor | | | (9,839 | ) |
Reimbursement from investment adviser | | | (176,606 | ) |
| | | | |
Net expenses | | | 130,801 | |
| | | | |
NET INVESTMENT INCOME (LOSS) | | | 114,706 | |
| | | | |
REALIZED AND UNREALIZED GAIN (LOSS) | | | | |
Realized gain (loss) on: | | | | |
Investments | | | (27,544 | ) |
Foreign currency transactions | | | (8,018 | ) |
| | | | |
Net realized gain (loss) | | | (35,562 | ) |
| | | | |
Change in unrealized appreciation (depreciation) on: | | | | |
Investments | | | 190,543 | |
Foreign currency translations | | | 794 | |
| | | | |
Net change in unrealized appreciation (depreciation) | | | 191,337 | |
| | | | |
NET REALIZED AND UNREALIZED GAIN (LOSS) | | | 155,775 | |
| | | | |
NET INCREASE (DECREASE) IN NET ASSETS RESULTING FROM OPERATIONS | | $ | 270,481 | |
| | | | |
| * | The Fund commenced operations on November 12, 2014. |
See Notes to Financial Statements.
65
1290 FUNDS
1290 SMARTBETA EQUITY FUND
STATEMENT OF CHANGES IN NET ASSETS
| | | | |
| | | November 12, 2014* to
October 31, 2015 | |
INCREASE (DECREASE) IN NET ASSETS FROM OPERATIONS: | |
Net investment income (loss) | | $ | 114,706 | |
Net realized gain (loss) on investments and foreign currency transactions | | | (35,562 | ) |
Net change in unrealized appreciation (depreciation) on investments and foreign currency translations | | | 191,337 | |
| | | | |
NET INCREASE (DECREASE) IN NET ASSETS RESULTING FROM OPERATIONS | | | 270,481 | |
| | | | |
DIVIDENDS: | | | | |
Dividends from net investment income | | | | |
Class A | | | (8,917 | ) |
Class C | | | (3,310 | ) |
Class I | | | (9,973 | ) |
Class R | | | (7,860 | ) |
| | | | |
TOTAL DIVIDENDS: | | | (30,060 | ) |
| | | | |
CAPITAL SHARES TRANSACTIONS: | | | | |
Class A | | | | |
Capital shares sold [ 302,997 shares ] | | | 3,029,603 | |
Capital shares issued in reinvestment of dividends [ 894 shares ] | | | 8,917 | |
Capital shares repurchased [ (3,000) shares ] | | | (29,250 | ) |
| | | | |
Total Class A transactions | | | 3,009,270 | |
| | | | |
Class C** | | | | |
Capital shares sold [ 100,000 shares ] | | | 1,000,000 | |
Capital shares issued in reinvestment of dividends [ 332 shares ] | | | 3,310 | |
Capital shares repurchased [ (1,000) shares ] | | | (9,760 | ) |
| | | | |
Total Class C transactions | | | 993,550 | |
| | | | |
Class I | | | | |
Capital shares sold [ 313,048 shares ] | | | 3,132,516 | |
Capital shares issued in reinvestment of dividends [ 999 shares ] | | | 9,973 | |
Capital shares repurchased [ (3,329) shares ] | | | (32,668 | ) |
| | | | |
Total Class I transactions | | | 3,109,821 | |
| | | | |
Class R | | | | |
Capital shares sold [ 300,000 shares ] | | | 3,000,000 | |
Capital shares issued in reinvestment of dividends [ 787 shares ] | | | 7,860 | |
Capital shares repurchased [ (3,000) shares ] | | | (29,250 | ) |
| | | | |
Total Class R transactions | | | 2,978,610 | |
| | | | |
NET INCREASE (DECREASE) IN NET ASSETS RESULTING FROM CAPITAL SHARE TRANSACTIONS | | | 10,091,251 | |
| | | | |
TOTAL INCREASE (DECREASE) IN NET ASSETS | | | 10,331,672 | |
NET ASSETS: | | | | |
Beginning of period | | | 100,000 | |
| | | | |
End of period (a) | | $ | 10,431,672 | |
| | | | |
(a) Includes accumulated undistributed (overdistributed) net investment income (loss) of | | $ | 127,326 | |
| | | | |
* The Fund commenced operations on November 12, 2014. | | | | |
** Class C shares currently are not offered for sale. | | | | |
See Notes to Financial Statements.
66
1290 FUNDS
1290 SMARTBETA EQUITY FUND
FINANCIAL HIGHLIGHTS
| | | | |
| Class A | | November 12, 2014* to
October 31, 2015 | |
Net asset value, beginning of period | | $ | 10.00 | |
| | | | |
Income (loss) from investment operations: | | | | |
Net investment income (loss) (e) | | | 0.11 | |
Net realized and unrealized gain (loss) on investments and foreign currency transactions | | | 0.16 | |
| | | | |
Total from investment operations | | | 0.27 | |
| | | | |
Less distributions: | | | | |
Dividends from net investment income | | | (0.03 | ) |
| | | | |
Net asset value, end of period | | $ | 10.24 | |
| | | | |
Total return (b) | | | 2.70 | % |
| | | | |
Ratios/Supplemental Data: | | | | |
Net assets, end of period (000’s) | | $ | 3,111 | |
Ratio of expenses to average net assets: | | | | |
After waivers and reimbursements (a) | | | 1.35 | % |
Before waivers and reimbursements (a) | | | 4.21 | % |
Ratio of net investment income (loss) to average net assets: | | | | |
After waivers and reimbursements (a) | | | 1.14 | %(l) |
Before waivers and reimbursements (a) | | | (1.73 | )%(l) |
Portfolio turnover rate (z)^ | | | 29 | % |
| |
| Class C** | | November 12, 2014* to
October 31, 2015 | |
Net asset value, beginning of period | | $ | 10.00 | |
| | | | |
Income (loss) from investment operations: | | | | |
Net investment income (loss) (e) | | | 0.14 | |
Net realized and unrealized gain (loss) on investments and foreign currency transactions | | | 0.15 | |
| | | | |
Total from investment operations | | | 0.29 | |
| | | | |
Less distributions: | | | | |
Dividends from net investment income | | | (0.03 | ) |
| | | | |
Net asset value, end of period | | $ | 10.26 | |
| | | | |
Total return (b) | | | 2.94 | % |
| | | | |
Ratios/Supplemental Data: | | | | |
Net assets, end of period (000’s) | | $ | 1,029 | |
Ratio of expenses to average net assets: | | | | |
After waivers and reimbursements (a) | | | 1.10 | % |
Before waivers and reimbursements (a) | | | 4.96 | % |
Ratio of net investment income (loss) to average net assets: | | | | |
After waivers and reimbursements (a) | | | 1.39 | %(l) |
Before waivers and reimbursements (a) | | | (2.48 | )%(l) |
Portfolio turnover rate (z)^ | | | 29 | % |
See Notes to Financial Statements.
67
1290 FUNDS
1290 SMARTBETA EQUITY FUND
FINANCIAL HIGHLIGHTS (Continued)
| | | | |
| Class I | | November 12, 2014* to
October 31, 2015 | |
Net asset value, beginning of period | | $ | 10.00 | |
| | | | |
Income (loss) from investment operations: | | | | |
Net investment income (loss) (e) | | | 0.14 | |
Net realized and unrealized gain (loss) on investments and foreign currency transactions | | | 0.15 | |
| | | | |
Total from investment operations | | | 0.29 | |
| | | | |
Less distributions: | | | | |
Dividends from net investment income | | | (0.03 | ) |
| | | | |
Net asset value, end of period | | $ | 10.26 | |
| | | | |
Total return (b) | | | 2.94 | % |
| | | | |
Ratios/Supplemental Data: | | | | |
Net assets, end of period (000’s) | | $ | 3,218 | |
Ratio of expenses to average net assets: | | | | |
After waivers and reimbursements (a) | | | 1.10 | % |
Before waivers and reimbursements (a) | | | 3.96 | % |
Ratio of net investment income (loss) to average net assets: | | | | |
After waivers and reimbursements (a) | | | 1.38 | %(l) |
Before waivers and reimbursements (a) | | | (1.48 | )%(l) |
Portfolio turnover rate (z)^ | | | 29 | % |
| |
| Class R | | November 12, 2014* to
October 31, 2015 | |
Net asset value, beginning of period | | $ | 10.00 | |
| | | | |
Income (loss) from investment operations: | | | | |
Net investment income (loss) (e) | | | 0.09 | |
Net realized and unrealized gain (loss) on investments and foreign currency transactions | | | 0.16 | |
| | | | |
Total from investment operations | | | 0.25 | |
| | | | |
Less distributions: | | | | |
Dividends from net investment income | | | (0.03 | ) |
| | | | |
Net asset value, end of period | | $ | 10.22 | |
| | | | |
Total return (b) | | | 2.47 | % |
| | | | |
Ratios/Supplemental Data: | | | | |
Net assets, end of period (000’s) | | $ | 3,073 | |
Ratio of expenses to average net assets: | | | | |
After waivers and reimbursements (a) | | | 1.60 | % |
Before waivers and reimbursements (a) | | | 4.46 | % |
Ratio of net investment income (loss) to average net assets: | | | | |
After waivers and reimbursements (a) | | | 0.89 | %(l) |
Before waivers and reimbursements (a) | | | (1.98 | )%(l) |
Portfolio turnover rate (z)^ | | | 29 | % |
| * | Commencement of Operations. |
| ** | Class C shares currently are not offered for sale. |
| ^ | Portfolio turnover rate excludes derivatives, if any. |
| (a) | Ratios for periods less than one year are annualized. |
| (b) | Total returns for periods less than one year are not annualized. |
| (e) | Net investment income (loss) per share is based on average shares outstanding. |
| (l) | The annualized ratio of net investment income to average net assets may not be indicative of operating results for a full year. |
| (z) | Portfolio turnover rate for periods less than one year is not annualized. |
See Notes to Financial Statements.
68
1290 UNCONSTRAINED BOND MANAGERS FUND (Unaudited)
INVESTMENT ADVISER
INVESTMENT SUB-ADVISERS
| Ø | | Pacific Investment Management Company LLC (PIMCO) |
| Ø | | TCW Investment Management Company |
PERFORMANCE RESULTS
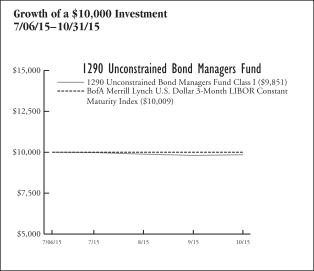
| | | | | | |
| Total Returns as of 10/31/15 | |
| | | | | Since
Incept. | |
Fund – Class A Shares* | | without Sales Charge | | | (1.54 | )% |
| | | with Sales Charge (a) | | | (5.96 | ) |
Fund – Class I Shares* | | | | | (1.49 | ) |
Fund – Class R Shares* | | | | | (1.60 | ) |
BofA Merrill Lynch U.S. Dollar 3-Month LIBOR Constant Maturity Index | | | | | 0.09 | |
* Date of inception 7/6/15. (a) A 4.50% front-end sales charge was deducted. Returns for periods less than one year are not annualized. | |
The performance quoted is past performance and is not a guarantee of future results. Mutual funds are subject to certain market risks. Investment returns and principal value of an investment will fluctuate so that an investor’s shares, when redeemed, may be worth more or less than their original cost. Current performance may be higher or lower than the performance data shown. For the most current month-end performance data please call 1-888-310-0416 or visit www.1290Funds.com.
The graph illustrates comparative performance for $10,000 invested in the Class I Shares of the 1290 Unconstrained Bond Managers Fund and BofA Merrill Lynch U.S. Dollar 3-Month LIBOR Constant Maturity Index from 7/06/15 to 10/31/15. The performance of BofA Merrill Lynch U.S. Dollar 3-Month LIBOR Constant Maturity Index reflects an initial investment at the end of the month closest to the Fund’s inception. The performance of the Fund assumes reinvestment of all dividends, capital gains distributions, and interest, if any, and does not include a sales charge. The performance of BofA Merrill Lynch U.S. Dollar 3-Month LIBOR Constant Maturity Index does not reflect the deduction of expenses or a sales charge associated with a mutual fund and has been adjusted to reflect reinvestment of dividends, capital gain distributions, and interest of the securities included in the benchmark.
Fund performance may reflect the waiver of the Fund’s fees and reimbursement of expenses for certain periods since the inception date. Without these waivers and reimbursements, performance would have been lower. Also, performance shown in this section does not reflect the deduction of taxes that a shareholder would pay on Fund distributions or redemption of Fund shares.
PERFORMANCE SUMMARY
The Fund’s Class I shares returned (1.49)% for the period ended October 31, 2015. The Fund’s benchmark, the BofA Merrill Lynch U.S. Dollar 3-Month LIBOR Constant Maturity Index, returned 0.09% over the same period.
Pacific Investment Management Company LLC (PIMCO)
Fund Highlights
What helped performance since inception through October 31, 2015:
| • | | Long-term bonds from the peripheral European countries, particularly Italy, Spain and Greece, contributed to performance as spreads tightened following a positive Greece resolution and improved core European economic conditions. |
| • | | The Fund’s long peripheral European spread exposure, which was partly facilitated using interest rate swaps and futures, was positive for returns. |
| • | | U.S. dollar exposure versus a basket of emerging markets currencies, which depreciated against the dollar over the period, added to performance. |
What hurt performance since inception through October 31, 2015:
| • | | The Fund utilized derivative instruments in order to attain specific exposures and manage portfolio risk. Exposure to Brazilian local rates, achieved partially through interest rate swaps, was negative for performance, as yields rose sharply amid a combination of economic and political concerns. Corporate credit strategies, facilitated in part by credit default swaps, detracted from performance, as spreads widened due to heightened market volatility. Index credit default swaps contributed slightly to the fund’s underperformance. Finally, short U.S. duration exposure, partially executed through Eurodollar futures, detracted from performance, as rates rallied amid negative market sentiment stemming from global growth concerns. Money market futures, used to express views on the front-end of the nominal U.S. interest rate curve, detracted slightly from performance. |
| • | | Exposure to Treasury Inflation-Protected Securities (TIPS) hurt performance as breakevens fell alongside declining oil prices. |
| • | | U.S. dollar exposure versus the Japanese yen and euro was also negative, as those currencies strengthened against the U.S. dollar. |
| • | | Corporate credit exposure, particularly among U.S. industrials and financials, was detrimental as spreads widened. |
69
1290 UNCONSTRAINED BOND MANAGERS FUND (Unaudited)
TCW Investment Management Company (TCW)
Fund Highlights
What helped performance since inception through October 31, 2015:
| • | | Contributions to performance were driven primarily by an allocation to non-agency residential mortgage backed securities (RMBS) and non-agency commercial mortgage backed securities (CMBS). Non-agency CMBS outpaced duration-matched Treasuries while non-agency RMBS prices moved higher on continued improvements in fundamentals such as increased prepayment activity and declining delinquencies. |
| • | | Exposure to investment grade corporates was also positive with banking, cable satellite, and electric utilities contributing most. |
| • | | The Fund held futures as a method of managing duration. Since inception, these securities had a negligible impact on returns. |
What hurt performance since inception through October 31, 2015:
| • | | Issue selection for pharmaceuticals modestly detracted from returns as idiosyncratic risks affected several company names in the sector. |
| • | | Another drag on performance was the allocation to government guaranteed student loan asset backed securities as spreads widened in the third quarter due to fears of potential downgrades by rating agencies. |
| | | | |
Fund Characteristics As of October 31, 2015 | | | |
Weighted Average Life (Years) | | | 2.56 | |
Weighted Average Coupon (%) | | | 1.93 | |
Weighted Average Modified Duration (Years)* | | | 0.51 | |
30 day SEC Yield (Class I) | | | 0.96 | % |
30 Day Unsubsidized Yield (Class I) | | | 0.23 | % |
* Modified duration is a measure of the price sensitivity of the Fund to interest rate movements, taking into account specific features of the securities in which it invests. | |
| | | | |
Fund Composition
as of October 31, 2015 | | % of
Net Assets | |
Asset-Backed and Mortgage-Backed Securities | | | 37.6 | % |
Financials | | | 11.0 | |
Government Securities | | | 6.6 | |
Health Care | | | 1.6 | |
Energy | | | 1.2 | |
Utilities | | | 1.2 | |
Telecommunication Services | | | 1.1 | |
Industrials | | | 1.1 | |
Consumer Discretionary | | | 0.4 | |
Option Purchased | | | 0.2 | |
Consumer Staples | | | 0.2 | |
Information Technology | | | 0.2 | |
Materials | | | 0.1 | |
Cash and Other | | | 37.5 | |
| | | | | |
| | | | 100.0 | % |
| | | | | |
Holdings are subject to change without notice. | | | | |
UNDERSTANDING YOUR EXPENSES:
As a shareholder of the Fund, you incur two types of costs:
(1) transaction costs, including applicable sales charges and redemption fees; and (2) ongoing costs, including investment advisory fees, distribution and/or service (12b-1) fees (in the case of Class A, Class C and Class R shares of the Trust), and other Fund expenses. These examples are intended to help you understand your ongoing costs (in dollars) of investing in the Fund and to compare these costs with the ongoing costs of investing in other mutual funds.
The examples are based on an investment of $1,000 invested at the beginning of the six-month period ended October 31, 2015 and held for the entire six-month period.
Actual Expenses
The first line of the following table provides information about actual account values and actual expenses. You may use the information in this line, together with the amount you invested, to estimate the expenses that you paid over the period. Simply divide your account value by $1,000 (for example, an $8,600 account value divided by $1,000 = 8.6), then multiply the result by the number in the first line under the heading entitled ‘‘Expenses Paid During Period’’ to estimate the expenses you paid on your account during this period.
Hypothetical Example for Comparison Purposes
The second line of the following table provides information about hypothetical account values and hypothetical expenses based on the Fund’s actual expense ratio and an assumed rate of return of 5% per year before expenses, which is not the Fund’s actual return. The hypothetical account values and expenses may not be used to estimate the actual ending account balance or expenses you paid for the period. You may use this information to compare the ongoing costs of investing in the Fund and other funds. To do so, compare this 5% hypothetical example with the 5% hypothetical examples that appear in the shareholder reports of the other funds.
Please note that the expenses shown in the table are meant to highlight your ongoing costs only and do not reflect any transactional costs, such as sales charges (loads), redemption fees, or exchange fees. Therefore, the second line of the table is useful in comparing ongoing costs only, and will not help you determine the relative total costs of owning different funds. In addition, if these transactional costs were included, your costs would have been higher.
Please note that while the Fund Commenced Operations on July 6, 2015, the ‘Hypothetical Expenses Paid during the period’ reflect projected activity for the full six months for the purpose of comparability.
70
1290 UNCONSTRAINED BOND MANAGERS FUND (Unaudited)
EXAMPLE
| | | | | | | | | | | | |
| | | Beginning
Account
Value
5/1/15† | | | Ending
Account
Value
10/31/15 | | | Expenses
Paid
During
Period*
5/1/15 -
10/31/15 | |
Class A | | | | | | | | | | | | |
Actual | | | $1,000.00 | | | | $984.60 | | | | $4.44 | |
Hypothetical (5% average annual return before expenses) | | | 1,000.00 | | | | 1,018.17 | | | | 7.10 | |
Class I | | | | | | | | | | | | |
Actual | | | 1,000.00 | | | | 985.10 | | | | 3.67 | |
Hypothetical (5% average annual return before expenses) | | | 1,000.00 | | | | 1,019.39 | | | | 5.88 | |
Class R | | | | | | | | | | | | |
Actual | | | 1,000.00 | | | | 984.00 | | | | 5.25 | |
Hypothetical (5% average annual return before expenses) | | | 1,000.00 | | | | 1,016.88 | | | | 8.39 | |
† Commenced operations on July 6, 2015. * Expenses are equal to the Fund’s Class A, I and R shares annualized expense ratios of 1.40%, 1.15% and 1.65%, respectively, multiplied by the average account value over the period, and multiplied by 184/365 for the hypothetical example (to reflect the one-half year period), and multiplied by 117/365 the actual example (to reflect the actual number of days in the period). | |
71
1290 FUNDS
1290 UNCONSTRAINED BOND MANAGERS FUND
PORTFOLIO OF INVESTMENTS
October 31, 2015
| | | | | | | | |
| | | Principal
Amount | | | Value
(Note 1) | |
| | | | | | | | |
LONG-TERM DEBT SECURITIES: | | | | | |
Asset-Backed and Mortgage-Backed Securities (37.6%) | |
Asset-Backed Securities (16.9%) | | | | | | | | |
ABFC Trust,
Series 2007-NC1 A2
0.497%, 5/25/37 (l)§ | | $ | 250,000 | | | $ | 183,676 | |
ACE Securities Corp. Home Equity Loan Trust,
Series 2005-HE6 M1
0.667%, 10/25/35 (l) | | | 200,000 | | | | 168,716 | |
Ameriquest Mortgage Securities, Inc. Asset-Backed Pass-Through Ctfs Ser 2004-R9,
Series 2004-R9 M2
1.172%, 10/25/34 (l) | | | 175,000 | | | | 173,148 | |
BA Credit Card Trust,
Series 2014-A2 A
0.466%, 9/16/19 (l) | | | 90,000 | | | | 89,847 | |
Babson CLO Ltd.,
Series 2014-IIA A
1.707%, 10/17/26 (l)§ | | | 90,000 | | | | 89,155 | |
Bear Stearns Asset Backed Securities I Trust,
Series 2007-HE2 2A2
0.307%, 2/25/37 (l) | | | 340,248 | | | | 324,963 | |
Chase Funding Trust,
Series 2002-3 2A1
0.837%, 8/25/32 (l) | | | 4,869 | | | | 4,504 | |
Citigroup Mortgage Loan Trust, | | | | | | | | |
Series 2005-OPT3 M2
0.647%, 5/25/35 (l) | | | 190,000 | | | | 185,942 | |
Series 2007-AMC1 A1
0.357%, 12/25/36 (l)§ | | | 247,066 | | | | 164,691 | |
Series 2007-AMC3 A1
0.457%, 3/25/37 (l)§ | | | 203,824 | | | | 162,893 | |
Series 2007-FS1 1A1
4.620%, 10/25/37 (e)§ | | | 348,532 | | | | 339,014 | |
Series 2015-2 1A1
0.394%, 6/25/47 (l)§ | | | 182,876 | | | | 172,920 | |
Countrywide Asset-Backed Certificates, | | | | | | | | |
Series 2002-3 1A1
0.937%, 5/25/32 (l) | | | 8,875 | | | | 7,982 | |
Series 2006-26 1A
0.337%, 6/25/37 (l) | | | 211,129 | | | | 159,317 | |
Series 2007-2 1A
0.337%, 8/25/37 (l) | | | 426,752 | | | | 335,656 | |
Series 2007-9 1A
0.397%, 6/25/47 (l) | | | 510,115 | | | | 374,155 | |
CWABS Asset-Backed Certificates Trust, | | | | | | | | |
Series 2005-3 MV5
0.867%, 8/25/35 (l) | | | 200,000 | | | | 178,526 | |
Series 2006-14 2A2
0.347%, 2/25/37 (l) | | | 384,583 | | | | 362,339 | |
Series 2006-18 2A2
0.357%, 3/25/37 (l) | | | 498,865 | | | | 457,595 | |
Dryden XXXI Senior Loan Fund,
Series 2014-31A A
1.667%, 4/18/26 (l)§ | | | 85,000 | | | | 84,187 | |
| | | | | | | | |
Education Loan Asset-Backed
Trust I,
Series 2013-1 A1
0.997%, 6/25/26 (l)§ | | $ | 165,276 | | | $ | 163,350 | |
First Franklin Mortgage Loan Trust, | | | | | | | | |
Series 2005-FF10 A5
0.557%, 11/25/35 (l) | | | 500,000 | | | | 348,700 | |
Series 2005-FF5 M2
0.932%, 5/25/35 (l) | | | 180,782 | | | | 176,334 | |
Series 2006-FF10 A4
0.347%, 7/25/36 (l) | | | 166,107 | | | | 159,220 | |
Flatiron CLO Ltd.,
Series 2014-1A A1
1.695%, 7/17/26 (l)§ | | | 85,000 | | | | 84,070 | |
Greenpoint Manufactured Housing,
Series 2000-1 A4
8.140%, 3/20/30 (l) | | | 168,399 | | | | 177,015 | |
GSAMP Trust,
Series 2006-FM3 A2C
0.397%, 11/25/36 (l) | | | 323,987 | | | | 182,177 | |
Home Equity Asset Trust,
Series 2005-3 M5
1.232%, 8/25/35 (l) | | | 200,000 | | | | 160,489 | |
Honda Auto Receivables 2015-2 Owner Trust,
Series 2015-2 A2
0.690%, 8/21/17 | | | 90,000 | | | | 89,937 | |
HSI Asset Securitization Corp. Trust,
Series 2006-HE1 2A1
0.247%, 10/25/36 (l) | | | 39,449 | | | | 21,233 | |
JP Morgan Mortgage Acquisition Trust, | | | | | | | | |
Series 2006-FRE2 M1
0.537%, 2/25/36 (l) | | | 200,000 | | | | 151,440 | |
Series 2006-WMC2 A1
0.332%, 7/25/36 (l) | | | 176,431 | | | | 125,102 | |
Series 2007-CH1 AV5
0.437%, 11/25/36 (l) | | | 175,000 | | | | 172,510 | |
Long Beach Mortgage Loan Trust, | | | | | | | | |
Series 2005-2 M4
1.127%, 4/25/35 (l) | | | 180,000 | | | | 175,063 | |
Series 2005-3 1A
0.457%, 8/25/45 (l) | | | 225,805 | | | | 175,218 | |
Series 2006-10 2A2
0.307%, 11/25/36 (l) | | | 522,887 | | | | 226,614 | |
MASTR Asset Backed Securities Trust,
Series 2006-HE1 A4
0.487%, 1/25/36 (l) | | | 370,000 | | | | 354,113 | |
MASTR Specialized Loan Trust,
Series 2007-1 A
0.567%, 1/25/37 (l)§ | | | 412,905 | | | | 264,585 | |
Morgan Stanley ABS Capital I, Inc. Trust, | | | | | | | | |
Series 2007-HE3 A2A
0.257%, 12/25/36 (l) | | | 675,228 | | | | 396,963 | |
Series 2007-NC2 A1
0.327%, 2/25/37 (l)§ | | | 218,844 | | | | 169,595 | |
See Notes to Financial Statements.
72
1290 FUNDS
1290 UNCONSTRAINED BOND MANAGERS FUND
PORTFOLIO OF INVESTMENTS (Continued)
October 31, 2015
| | | | | | | | |
| | | Principal
Amount | | | Value
(Note 1) | |
| | | | | | | | |
Morgan Stanley Home Equity Loan Trust, | | | | | | | | |
Series 2006-3 A4
0.457%, 4/25/36 (l) | | $ | 474,618 | | | $ | 337,113 | |
Series 2007-1 A3
0.337%, 12/25/36 (l) | | | 336,019 | | | | 186,717 | |
Navient Student Loan Trust, | | | | | | | | |
Series 2014-1 A3
0.707%, 6/25/31 (l) | | | 170,000 | | | | 166,924 | |
Series 2014-2 A
0.837%, 3/25/43 (l) | | | 159,539 | | | | 149,759 | |
Nelnet Student Loan Trust,
Series 2014-4A A2
1.147%, 11/25/43 (l)§ | | | 85,000 | | | | 77,730 | |
Nissan Auto Receivables 2015-A Owner Trust,
Series 2015-A A2
0.670%, 9/15/17 | | | 90,000 | | | | 89,986 | |
Nomura Home Equity Loan, Inc. Home Equity Loan Trust,
Series 2006-HE2 A4
0.467%, 3/25/36 (l) | | | 205,000 | | | | 173,976 | |
NovaStar Mortgage Funding Trust,
Series 2005-2 M1
0.842%, 10/25/35 (l) | | | 157,135 | | | | 156,886 | |
RASC Trust, | | | | | | | | |
Series 2005-KS10 M1
0.607%, 11/25/35 (l) | | | 180,000 | | | | 174,024 | |
Series 2005-KS7 M3
0.677%, 8/25/35 (l) | | | 180,000 | | | | 176,730 | |
Series 2006-KS9 AI3
0.357%, 11/25/36 (l) | | | 391,425 | | | | 348,530 | |
SG Mortgage Securities Trust, | | | | | | | | |
Series 2007-NC1 A2
0.437%, 12/25/36 (l)§ | | | 287,665 | | | | 177,041 | |
SLM Student Loan Trust, | | | | | | | | |
Series 2006-9 A5
0.420%, 1/26/26 (l) | | | 150,000 | | | | 146,727 | |
Series 2008-2 B
1.520%, 1/25/29 (l) | | | 100,000 | | | | 80,710 | |
Series 2008-3 A3
1.320%, 10/25/21 (l) | | | 169,655 | | | | 166,066 | |
Series 2008-5 A4
2.020%, 7/25/23 (l) | | | 170,000 | | | | 171,227 | |
Series 2012-7 B
1.997%, 9/25/43 (l) | | | 100,000 | | | | 88,368 | |
Series 2013-4 A
0.747%, 6/25/27 (l) | | | 183,795 | | | | 177,865 | |
Soundview Home Loan Trust, | | | | | | | | |
Series 2007-OPT1 2A1
0.277%, 6/25/37 (l) | | | 262,997 | | | | 157,251 | |
Structured Asset Securities Corp. Mortgage Loan Trust, | |
Series 2005-WF4 M6
0.867%, 11/25/35 (l) | | | 500,000 | | | | 369,206 | |
Toyota Auto Receivables 2014-B Owner Trust, | |
Series 2014-B A3
0.760%, 3/15/18 | | | 90,000 | | | | 90,018 | |
Wells Fargo Home Equity Asset-Backed Securities Trust, | |
Series 2007-2 A3
0.427%, 4/25/37 (l) | | | 200,000 | | | | 165,422 | |
| | | | | | | | |
| | | | 11,621,230 | |
| | | | | | | | |
| | | | | | | | |
Non-Agency CMO (20.7%) | | | | | | | | |
Alternative Loan Trust, | | | | | | | | |
Series 2005-76 1A1
1.702%, 1/25/36 (l) | | $ | 175,800 | | | $ | 160,194 | |
Series 2006-HY12 A5
3.579%, 8/25/36 (l) | | | 171,144 | | | | 162,218 | |
Series 2006-OA19 A1
0.374%, 2/20/47 (l) | | | 465,262 | | | | 341,077 | |
Banc of America Commercial Mortgage Trust, | |
Series 2006-3 A4
5.889%, 7/10/44 (l) | | | 222,514 | | | | 225,334 | |
Series 2006-4 A4
5.634%, 7/10/46 | | | 214,444 | | | | 217,574 | |
Series 2006-6 A2
5.309%, 10/10/45 | | | 40,688 | | | | 40,855 | |
Series 2006-6 A4
5.356%, 10/10/45 | | | 125,000 | | | | 127,667 | |
Series 2007-2 AAB
5.570%, 4/10/49 (l) | | | 70,106 | | | | 70,367 | |
Bayview Commercial Asset Trust, | | | | | | | | |
Series 2004-3 A1
0.567%, 1/25/35 (l)§ | | | 179,243 | | | | 165,717 | |
Bear Stearns ALT-A Trust, | | | | | | | | |
Series 2005-10 22A1
2.554%, 1/25/36 (l) | | | 382,707 | | | | 327,016 | |
Series 2005-2 2A4
2.523%, 4/25/35 (l) | | | 167,230 | | | | 157,190 | |
CIM Trust, | | | | | | | | |
Series 15-4AG
2.193%, 10/25/57 (b)§† | | | 170,000 | | | | 167,654 | |
COMM Mortgage Trust, | | | | | | | | |
Series 2010-C1 A1
3.156%, 7/10/46§ | | | 13,860 | | | | 13,858 | |
Series 2012-9W57 A
2.365%, 2/10/29§ | | | 60,000 | | | | 60,710 | |
Countrywide Home Loan Mortgage Pass-Through Trust, | |
Series 2005-3 1A2
0.487%, 4/25/35 (l) | | | 189,776 | | | | 161,072 | |
First Horizon Alternative Mortgage Securities Trust, | |
Series 2006-AA7 A1
2.258%, 1/25/37 (l) | | | 198,217 | | | | 158,174 | |
First Horizon Mortgage Pass-Through Trust, | |
Series 2005-AR4 2A1
2.662%, 10/25/35 (l) | | | 195,497 | | | | 173,184 | |
GE Business Loan Trust, | | | | | | | | |
Series 2005-1A A3
0.446%, 6/15/33 (l)§ | | | 163,109 | | | | 158,134 | |
Series 2007-1A A
0.366%, 4/16/35 (l)§ | | | 175,748 | | | | 167,294 | |
GE Capital Commercial Mortgage Corp., | | | | | | | | |
Series 2005-C4 A4
5.385%, 11/10/45 (l) | | | 7,305 | | | | 7,302 | |
Series 2006-C1 A1A
5.284%, 3/10/44 (l) | | | 190,381 | | | | 191,290 | |
GMAC Commercial Mortgage Securities, Inc., | |
Series 2006-C1 A1A
5.233%, 11/10/45 (l) | | | 127,183 | | | | 127,071 | |
Series 2006-C1 A4
5.238%, 11/10/45 (l) | | | 26,355 | | | | 26,355 | |
See Notes to Financial Statements.
73
1290 FUNDS
1290 UNCONSTRAINED BOND MANAGERS FUND
PORTFOLIO OF INVESTMENTS (Continued)
October 31, 2015
| | | | | | | | |
| | | Principal
Amount | | | Value
(Note 1) | |
| | | | | | | | |
GS Mortgage Securities Trust, | | | | | | | | |
Series 2012-GC6 A2
2.539%, 1/10/45 | | $ | 170,000 | | | $ | 171,605 | |
Series 2012-GC6 XA
2.068%, 1/10/45 IO (l)§ | | | 872,904 | | | | 80,642 | |
GSR Mortgage Loan Trust, | | | | | | | | |
Series 2005-AR7 6A1
2.936%, 11/25/35 (l) | | | 167,605 | | | | 163,994 | |
IndyMac INDX Mortgage Loan Trust, | | | | | | | | |
Series 2004-AR6 6A1
2.746%, 10/25/34 (l) | | | 149,452 | | | | 147,765 | |
Series 2006-AR4 A1A
0.407%, 5/25/46 (l) | | | 273,038 | | | | 232,527 | |
Series 2007-AR15 2A1
4.171%, 8/25/37 (l) | | | 317,836 | | | | 249,141 | |
JP Morgan Chase Commercial Mortgage Securities Trust, | | | | | |
Series 2006-CB14 A4
5.481%, 12/12/44 (l) | | | 25,664 | | | | 25,674 | |
Series 2006-CB15 A4
5.814%, 6/12/43 (l) | | | 168,754 | | | | 171,300 | |
Series 2006-CB16 A4
5.552%, 5/12/45 | | | 178,912 | | | | 182,094 | |
Series 2006-LDP7 A4
5.911%, 4/15/45 (l) | | | 228,630 | | | | 231,413 | |
Series 2006-LDP8 A4
5.399%, 5/15/45 | | | 190,030 | | | | 192,924 | |
Series 2006-LDP9 A1A
5.257%, 5/15/47 | | | 121,102 | | | | 124,096 | |
Series 2010-C2 A2
3.616%, 11/15/43 (b)§ | | | 180,000 | | | | 186,751 | |
Series 2010-CNTR A1
3.300%, 8/5/32§ | | | 98,836 | | | | 102,247 | |
Series 2011-C3 A3
4.388%, 2/15/46§ | | | 165,000 | | | | 174,403 | |
Series 2011-C4 A2
3.341%, 7/15/46§ | | | 169,625 | | | | 170,529 | |
Series 2011-PLSD A1
2.190%, 11/13/28§ | | | 92,309 | | | | 92,722 | |
Series 2011-PLSD A2
3.364%, 11/13/28§ | | | 175,000 | | | | 178,365 | |
Lehman Brothers Small Balance Commercial, | | | | | |
Series 2005-2A 1A
0.447%, 9/25/30 (l)§ | | | 166,744 | | | | 153,544 | |
Lehman XS Trust, | | | | | |
Series 2005-5N 3A1A
0.497%, 11/25/35 (l) | | | 184,839 | | | | 156,767 | |
Series 2007-4N 1A2A
0.357%, 3/25/47 (l) | | | 432,285 | | | | 343,648 | |
Merrill Lynch Mortgage Investors Trust, | | | | | |
Series 2004-HB1 A3
2.155%, 4/25/29 (l) | | | 181,804 | | | | 177,616 | |
Series 2005-A9 2A1E
2.662%, 12/25/35 (l) | | | 175,886 | | | | 162,733 | |
Merrill Lynch Mortgage Trust, | | | | | |
Series 2005-LC1 AM
5.301%, 1/12/44 (l) | | | 80,000 | | | | 80,200 | |
Series 2006-C1 A4
5.674%, 5/12/39 (l) | | | 260,000 | | | | 261,658 | |
Series 2007-C1 A3
5.837%, 6/12/50 (l) | | | 118,888 | | | | 118,689 | |
| | | | | | | | |
ML-CFC Commercial Mortgage Trust, | | | | | |
Series 2007-6 A2
5.331%, 3/12/51 | | $ | 144,354 | | | $ | 144,354 | |
Morgan Stanley Capital I Trust, | | | | | |
Series 2005-T17 AJ
4.840%, 12/13/41 (l) | | | 24,926 | | | | 24,896 | |
Series 2006-HQ8 A4
5.415%, 3/12/44 (l) | | | 21,907 | | | | 21,907 | |
Series 2007-IQ14 A2
5.610%, 4/15/49 | | | 183,997 | | | | 184,263 | |
Series 2007-IQ14 A4
5.692%, 4/15/49 (l) | | | 170,000 | | | | 176,883 | |
Series 2011-C3 A2
3.224%, 7/15/49 | | | 344,665 | | | | 348,740 | |
OBP Depositor LLC Trust, | | | | | |
Series 2010-OBP A
4.646%, 7/15/45§ | | | 30,000 | | | | 32,953 | |
RALI Trust, | | | | | |
Series 2006-QA2 1A1
0.447%, 2/25/36 (l) | | | 289,972 | | | | 196,888 | |
Series 2006-QA5 1A1
0.377%, 7/25/36 (l) | | | 279,481 | | | | 178,615 | |
Residential Asset Securitization Trust, | | | | | |
Series 2005-A10 A4
5.500%, 9/25/35 | | | 148,391 | | | | 131,225 | |
Sequoia Mortgage Trust, | | | | | |
Series 2004-12 A1
0.734%, 1/20/35 (l) | | | 172,425 | | | | 155,652 | |
Series 2004-6 A1
1.880%, 7/20/34 (l) | | | 168,321 | | | | 161,179 | |
Structured Adjustable Rate Mortgage Loan Trust, | | | | | |
Series 2004-20 1A1
2.470%, 1/25/35 (l) | | | 194,075 | | | | 184,384 | |
Series 2005-12 3A1
2.517%, 6/25/35 (l) | | | 162,604 | | | | 150,097 | |
Series 2005-15 1A1
2.551%, 7/25/35 (l) | | | 211,551 | | | | 168,066 | |
Series 2005-16XS A1
0.537%, 8/25/35 (l) | | | 175,988 | | | | 159,348 | |
Series 2005-17 5A1
5.150%, 8/25/35 (l) | | | 201,214 | | | | 178,623 | |
Structured Asset Mortgage Investments II Trust, | | | | | |
Series 2006-AR6 1A3
0.387%, 7/25/46 (l) | | | 579,041 | | | | 381,420 | |
Series 2006-AR7 A10
0.397%, 8/25/36 (l) | | | 222,358 | | | | 183,309 | |
Wachovia Bank Commercial Mortgage Trust, | | | | | |
Series 2004-C11 A5
5.169%, 1/15/41 (l) | | | 189,081 | | | | 188,905 | |
Series 2005-C17 G
5.607%, 3/15/42 (l)§ | | | 56,369 | | | | 56,369 | |
Series 2006-C23 A4
5.418%, 1/15/45 (l) | | | 6,727 | | | | 6,727 | |
Series 2006-C26 A3
6.011%, 6/15/45 (l) | | | 131,000 | | | | 132,684 | |
Series 2007-C30 A3
5.246%, 12/15/43 | | | 50,667 | | | | 50,745 | |
Series 2007-C30 A5
5.342%, 12/15/43 | | | 175,000 | | | | 180,987 | |
Series 2007-C30 APB
5.294%, 12/15/43 | | | 81,200 | | | | 81,650 | |
See Notes to Financial Statements.
74
1290 FUNDS
1290 UNCONSTRAINED BOND MANAGERS FUND
PORTFOLIO OF INVESTMENTS (Continued)
October 31, 2015
| | | | | | | | |
| | | Principal
Amount | | | Value
(Note 1) | |
| | | | | | | | |
Series 2007-C32 A2
5.708%, 6/15/49 (l) | | $ | 179,324 | | | $ | 180,340 | |
Series 2007-C32 APB
5.713%, 6/15/49 (l) | | | 152,286 | | | | 154,070 | |
Wachovia Mortgage Loan Trust, | | | | | |
Series 2006-AMN1 A3
0.437%, 8/25/36 (l) | | | 256,860 | | | | 166,781 | |
WaMu Mortgage Pass-Through Certificates Trust, | | | | | |
Series 2005-AR11 A1A
0.517%, 8/25/45 (l) | | | 175,042 | | | | 161,802 | |
Series 2005-AR13 A1A1
0.487%, 10/25/45 (l) | | | 175,143 | | | | 162,885 | |
Series 2005-AR8 2A1A
0.487%, 7/25/45 (l) | | | 176,910 | | | | 165,207 | |
Series 2006-AR3 A1A
1.222%, 2/25/46 (l) | | | 182,255 | | | | 165,950 | |
Series 2007-HY3 1A1
2.088%, 3/25/37 (l) | | | 194,897 | | | | 161,422 | |
Washington Mutual Mortgage Pass-Through Certificates WMALT Trust, | | | | | |
Series 2007-OA1 2A
0.942%, 12/25/46 (l) | | | 327,809 | | | | 219,234 | |
Wells Fargo Mortgage Backed Securities Trust, | | | | | |
Series 2006-AR10 5A6
2.737%, 7/25/36 (l) | | | 333,872 | | | | 314,168 | |
Series 2006-AR12 1A1
2.735%, 9/25/36 (l) | | | 176,778 | | | | 167,222 | |
Series 2006-AR4 1A1
5.842%, 4/25/36 (l) | | | 164,163 | | | | 154,475 | |
WF-RBS Commercial Mortgage Trust, | | | | | |
Series 2011-C2 A2
3.791%, 2/15/44§ | | | 123,940 | | | | 124,050 | |
Series 2011-C3 A2
3.240%, 3/15/44§ | | | 148,918 | | | | 149,906 | |
Series 2011-C4 A2
3.454%, 6/15/44§ | | | 199,041 | | | | 200,667 | |
| | | | | | | | |
| | | | 14,249,402 | |
| | | | | | | | |
Total Asset-Backed and Mortgage-Backed Securities | | | | | | | 25,870,632 | |
| | | | | | | | |
Corporate Bonds (18.1%) | | | | | | | | |
Consumer Discretionary (0.4%) | | | | | | | | |
Hotels, Restaurants & Leisure (0.1%) | | | | | |
Churchill Downs, Inc.
5.375%, 12/15/21 | | | 34,000 | | | | 35,020 | |
Hilton Worldwide Finance LLC/Hilton Worldwide Finance Corp. | | | | | |
5.625%, 10/15/21 | | | 70,000 | | | | 73,444 | |
| | | | | | | | |
| | | | | | | 108,464 | |
| | | | | | | | |
Media (0.3%) | |
CCO Safari II LLC | | | | | |
6.484%, 10/23/45§ | | | 90,000 | | | | 93,222 | |
Charter Communications/CCO Safari III LLC Term Loan | | | | | |
4.000%, 1/23/23 | | | 100,000 | | | | 99,797 | |
| | | | | | | | |
| | | | | | | 193,019 | |
| | | | | | | | |
Total Consumer Discretionary | | | | | | | 301,483 | |
| | | | | | | | |
| | | | | | | | |
Consumer Staples (0.2%) | |
Beverages (0.1%) | |
DS Services of America, Inc. | | | | | |
10.000%, 9/1/21 (b)§ | | $ | 35,000 | | | $ | 40,267 | |
| | | | | | | | |
Food & Staples Retailing (0.1%) | |
CVS Health Corp. | | | | | |
4.875%, 7/20/35 | | | 70,000 | | | | 73,257 | |
| | | | | | | | |
Total Consumer Staples | | | | | | | 113,524 | |
| | | | | | | | |
Energy (1.2%) | |
Oil, Gas & Consumable Fuels (1.2%) | |
Boardwalk Pipelines LP | | | | | |
5.750%, 9/15/19 | | | 100,000 | | | | 104,563 | |
BP Capital Markets plc | | | | | |
3.506%, 3/17/25 | | | 70,000 | | | | 70,455 | |
Enbridge Energy Partners LP | | | | | |
5.875%, 10/15/25 | | | 40,000 | | | | 40,148 | |
Petrobras Global Finance B.V. | | | | | |
3.500%, 2/6/17 | | | 100,000 | | | | 96,250 | |
7.875%, 3/15/19 | | | 200,000 | | | | 189,500 | |
Regency Energy Partners LP/Regency Energy Finance Corp. | | | | | |
5.000%, 10/1/22 | | | 150,000 | | | | 145,296 | |
Sabine Pass LNG LP | | | | | |
7.500%, 11/30/16 | | | 100,000 | | | | 103,190 | |
Texas Eastern Transmission LP | | | | | |
2.800%, 10/15/22§ | | | 100,000 | | | | 94,542 | |
| | | | | | | | |
Total Energy | | | | | | | 843,944 | |
| | | | | | | | |
Financials (11.0%) | |
Banks (5.7%) | |
ABN AMRO Bank N.V. | | | | | |
4.750%, 7/28/25§ | | | 200,000 | | | | 201,975 | |
Bank of America Corp. | | | | | |
3.875%, 8/1/25 | | | 600,000 | | | | 610,058 | |
Barclays Bank plc | | | | | |
5.000%, 9/22/16 | | | 75,000 | | | | 77,614 | |
7.625%, 11/21/22 | | | 200,000 | | | | 228,260 | |
Capital One Bank USA N.A. | | | | | |
1.150%, 11/21/16 | | | 140,000 | | | | 139,581 | |
CIT Group, Inc. | | | | | |
5.250%, 3/15/18 | | | 35,000 | | | | 36,708 | |
Citigroup, Inc. | | | | | |
5.300%, 1/7/16 | | | 100,000 | | | | 100,795 | |
1.300%, 11/15/16 | | | 175,000 | | | | 175,473 | |
5.950%, 12/31/49 (l) | | | 200,000 | | | | 192,600 | |
Cooperatieve Centrale Raiffeisen-Boerenleenbank B.A. | |
8.375%, 12/31/49 (l)(m) | | | 100,000 | | | | 104,250 | |
Credit Agricole S.A. | | | | | |
7.500%, 4/29/49 (l)(m) | | GBP | 100,000 | | | | 151,092 | |
Credit Suisse Group Funding Guernsey Ltd. | | | | | |
3.750%, 3/26/25§ | | $ | 250,000 | | | | 244,185 | |
Discover Bank/Delaware | | | | | |
2.000%, 2/21/18 | | | 75,000 | | | | 74,582 | |
HBOS plc | | | | | |
1.027%, 9/30/16 (l) | | | 75,000 | | | | 74,625 | |
HSBC Holdings plc | | | | | |
6.375%, 12/31/49 (l) | | | 200,000 | | | | 198,500 | |
ICICI Bank Ltd. | | | | | |
6.375%, 4/30/22 (l)(m) | | | 100,000 | | | | 102,592 | |
See Notes to Financial Statements.
75
1290 FUNDS
1290 UNCONSTRAINED BOND MANAGERS FUND
PORTFOLIO OF INVESTMENTS (Continued)
October 31, 2015
| | | | | | | | |
| | | Principal
Amount | | | Value
(Note 1) | |
| | | | | | | | |
JPMorgan Chase & Co. | | | | | |
3.150%, 7/5/16 | | $ | 150,000 | | | $ | 152,366 | |
2.550%, 10/29/20 | | | 105,000 | | | | 104,559 | |
3.900%, 7/15/25 | | | 375,000 | | | | 384,013 | |
KBC Bank N.V. | | | | | |
8.000%, 1/25/23 (l)(m) | | | 200,000 | | | | 221,000 | |
Royal Bank of Scotland Group plc | | | | | |
1.875%, 3/31/17 | | | 90,000 | | | | 89,775 | |
7.500%, 12/31/49 (l) | | | 100,000 | | | | 103,500 | |
Santander UK Group Holdings plc | | | | | |
2.875%, 10/16/20 | | | 85,000 | | | | 85,123 | |
Wells Fargo & Co. | | | | | |
2.600%, 7/22/20 | | | 100,000 | | | | 100,834 | |
| | | | | | | | |
| | | | | | | 3,954,060 | |
| | | | | | | | |
Capital Markets (1.8%) | |
Goldman Sachs Group, Inc. | | | | | |
0.769%, 3/22/16 (l) | | | 350,000 | | | | 350,047 | |
3.500%, 1/23/25 | | | 100,000 | | | | 98,662 | |
Morgan Stanley | | | | | |
5.550%, 4/27/17 | | | 100,000 | | | | 105,877 | |
5.625%, 9/23/19 | | | 200,000 | | | | 223,319 | |
3.875%, 4/29/24 | | | 100,000 | | | | 102,783 | |
UBS AG | | | | | |
5.875%, 7/15/16 | | | 135,000 | | | | 139,330 | |
7.250%, 2/22/22 (l)(m) | | | 200,000 | | | | 209,000 | |
| | | | | | | | |
| | | | | | | 1,229,018 | |
| | | | | | | | |
Consumer Finance (0.7%) | |
American Express Credit Corp. | | | | | |
2.800%, 9/19/16 | | | 100,000 | | | | 101,816 | |
Ford Motor Credit Co. LLC | | | | | |
8.000%, 12/15/16 | | | 150,000 | | | | 160,286 | |
3.157%, 8/4/20 | | | 200,000 | | | | 202,145 | |
| | | | | | | | |
| | | | | | | 464,247 | |
| | | | | | | | |
Diversified Financial Services (0.6%) | |
Bank of America N.A. | | | | | |
5.300%, 3/15/17 | | | 300,000 | | | | 314,609 | |
Fresenius Medical Care U.S. Finance II, Inc. | | | | | |
4.750%, 10/15/24§ | | | 50,000 | | | | 50,500 | |
Shell International Finance B.V. | | | | | |
3.250%, 5/11/25 | | | 50,000 | | | | 49,951 | |
| | | | | | | | |
| | | | | | | 415,060 | |
| | | | | | | | |
Insurance (0.1%) | |
ZFS Finance USA Trust II | | | | | |
6.450%, 12/15/65 (l)(b)§ | | | 100,000 | | | | 101,000 | |
| | | | | | | | |
Real Estate Investment Trusts (REITs) (2.1%) | |
AvalonBay Communities, Inc. | | | | | |
5.750%, 9/15/16 | | | 150,000 | | | | 155,711 | |
DDR Corp. | | | | | |
9.625%, 3/15/16 | | | 100,000 | | | | 102,937 | |
ERP Operating LP | | | | | |
5.125%, 3/15/16 | | | 175,000 | | | | 177,758 | |
HCP, Inc. | | | | | |
6.300%, 9/15/16 | | | 200,000 | | | | 208,027 | |
Realty Income Corp. | | | | | |
5.500%, 11/15/15 | | | 140,000 | | | | 140,183 | |
Reckson Operating Partnership LP | | | | | |
6.000%, 3/31/16 | | | 150,000 | | | | 152,847 | |
| | | | | | | | |
Ventas Realty LP | | | | | |
4.125%, 1/15/26 | | $ | 125,000 | | | $ | 124,883 | |
WEA Finance LLC/Westfield UK & Europe Finance plc | | | | | |
2.700%, 9/17/19§ | | | 200,000 | | | | 198,879 | |
Welltower, Inc. | | | | | |
3.625%, 3/15/16 | | | 175,000 | | | | 176,806 | |
| | | | | | | | |
| | | | | | | 1,438,031 | |
| | | | | | | | |
Total Financials | | | | | | | 7,601,416 | |
| | | | | | | | |
Health Care (1.6%) | |
Biotechnology (0.3%) | |
Amgen, Inc. | | | | | |
2.300%, 6/15/16 | | | 125,000 | | | | 126,145 | |
Biogen, Inc. | | | | | |
3.625%, 9/15/22 | | | 55,000 | | | | 55,953 | |
Gilead Sciences, Inc. | | | | | |
4.500%, 2/1/45 | | | 50,000 | | | | 48,498 | |
| | | | | | | | |
| | | | | | | 230,596 | |
| | | | | | | | |
Health Care Equipment & Supplies (0.5%) | |
BioMed Realty LP | | | | | |
3.850%, 4/15/16 | | | 150,000 | | | | 151,222 | |
Boston Scientific Corp. | | | | | |
3.850%, 5/15/25 | | | 100,000 | | | | 99,466 | |
Zimmer Biomet Holdings, Inc. | | | | | |
3.550%, 4/1/25 | | | 100,000 | | | | 98,411 | |
| | | | | | | | |
| | | | | | | 349,099 | |
| | | | | | | | |
Health Care Providers & Services (0.3%) | |
DaVita HealthCare Partners, Inc. | | | | | |
5.000%, 5/1/25 | | | 100,000 | | | | 99,270 | |
HCA, Inc. | | | | | |
4.750%, 5/1/23 | | | 70,000 | | | | 72,100 | |
Tenet Healthcare Corp. | | | | | |
3.837%, 6/15/20 (l)§ | | | 35,000 | | | | 34,839 | |
| | | | | | | | |
| | | | | | | 206,209 | |
| | | | | | | | |
Pharmaceuticals (0.5%) | |
AbbVie, Inc. | | | | | |
1.200%, 11/6/15 | | | 100,000 | | | | 100,004 | |
3.600%, 5/14/25 | | | 100,000 | | | | 98,079 | |
Actavis Funding SCS | | | | | |
3.800%, 3/15/25 | | | 70,000 | | | | 69,377 | |
Valeant Pharmaceuticals International, Inc. | | | | | |
5.500%, 3/1/23§ | | | 50,000 | | | | 42,000 | |
| | | | | | | | |
| | | | | | | 309,460 | |
| | | | | | | | |
Total Health Care | | | | | | | 1,095,364 | |
| | | | | | | | |
Industrials (1.1%) | |
Airlines (0.8%) | |
American Airlines, Inc. | | | | | |
5.250%, 1/31/21 | | | 135,969 | | | | 145,657 | |
Continental Airlines Pass Through Trust | | | | | |
6.648%, 3/15/19 | | | 126,228 | | | | 129,936 | |
Delta Air Lines, Inc. | | | | | |
6.718%, 1/2/23 | | | 185,194 | | | | 211,006 | |
United Airlines, Inc., Class A | | | | | |
9.750%, 1/15/17 | | | 78,874 | | | | 84,149 | |
| | | | | | | | |
| | | | | | | 570,748 | |
| | | | | | | | |
See Notes to Financial Statements.
76
1290 FUNDS
1290 UNCONSTRAINED BOND MANAGERS FUND
PORTFOLIO OF INVESTMENTS (Continued)
October 31, 2015
| | | | | | | | |
| | | Principal
Amount | | | Value
(Note 1) | |
| | | | | | | | |
Trading Companies & Distributors (0.3%) | |
International Lease Finance Corp. | | | | | |
7.125%, 9/1/18§ | | $ | 150,000 | | | $ | 166,125 | |
| | | | | | | | |
Total Industrials | | | | | | | 736,873 | |
| | | | | | | | |
Information Technology (0.2%) | |
IT Services (0.1%) | |
First Data Corp. | | | | | |
5.375%, 8/15/23§ | | | 35,000 | | | | 35,612 | |
| | | | | | | | |
Software (0.1%) | |
Microsoft Corp. | | | | | |
4.450%, 11/3/45 | | | 70,000 | | | | 70,975 | |
| | | | | | | | |
Total Information Technology | | | | | | | 106,587 | |
| | | | | | | | |
Materials (0.1%) | |
Containers & Packaging (0.1%) | |
Reynolds Group Issuer, Inc./Reynolds Group Issuer LLC/Reynolds Group Issuer (Luxembourg) | | | | | |
5.750%, 10/15/20 | | | 70,000 | | | | 72,716 | |
| | | | | | | | |
Total Materials | | | | | | | 72,716 | |
| | | | | | | | |
Telecommunication Services (1.1%) | | | | | | | | |
Diversified Telecommunication Services (0.9%) | |
AT&T, Inc. | | | | | |
0.699%, 2/12/16 (l) | | | 100,000 | | | | 99,957 | |
4.350%, 6/15/45 | | | 75,000 | | | | 64,935 | |
CCO Holdings LLC/CCO Holdings Capital Corp. | | | | | |
6.500%, 4/30/21 | | | 50,000 | | | | 52,595 | |
5.125%, 5/1/23§ | | | 20,000 | | | | 19,925 | |
Intelsat Jackson Holdings S.A. | | | | | |
7.250%, 4/1/19 | | | 17,000 | | | | 15,980 | |
Verizon Communications, Inc. | | | | | |
2.500%, 9/15/16 | | | 50,000 | | | | 50,645 | |
5.150%, 9/15/23 | | | 200,000 | | | | 222,944 | |
4.862%, 8/21/46 | | | 125,000 | | | | 119,545 | |
| | | | | | | | |
| | | | | | | 646,526 | |
| | | | | | | | |
Wireless Telecommunication Services (0.2%) | |
Sprint Communications, Inc. | | | | | |
9.000%, 11/15/18§ | | | 30,000 | | | | 32,985 | |
Sprint Corp. | | | | | |
7.875%, 9/15/23 | | | 35,000 | | | | 32,375 | |
T-Mobile USA, Inc. | | | | | |
6.250%, 4/1/21 | | | 35,000 | | | | 36,134 | |
| | | | | | | | |
| | | | | | | 101,494 | |
| | | | | | | | |
Total Telecommunication Services | | | | | | | 748,020 | |
| | | | | | | | |
Utilities (1.2%) | |
Electric Utilities (0.7%) | |
Duke Energy Progress LLC | | | | | |
3.250%, 8/15/25 | | | 100,000 | | | | 101,907 | |
Florida Power & Light Co. | | | | | |
4.050%, 10/1/44 | | | 100,000 | | | | 99,955 | |
Jersey Central Power & Light Co. | | | | | |
5.625%, 5/1/16 | | | 100,000 | | | | 101,959 | |
Northern States Power Co. | | | | | |
4.125%, 5/15/44 | | | 100,000 | | | | 99,479 | |
| | | | | | | | |
Public Service Co. of New Mexico | | | | | |
3.850%, 8/1/25 | | $ | 100,000 | | | $ | 99,812 | |
| | | | | | | | |
| | | | | | | 503,112 | |
| | | | | | | | |
Gas Utilities (0.3%) | |
Perusahaan Gas Negara Persero Tbk PT | | | | | |
5.125%, 5/16/24§ | | | 200,000 | | | | 196,400 | |
| | | | | | | | |
Multi-Utilities (0.2%) | |
Berkshire Hathaway Energy Co. | | | | | |
5.150%, 11/15/43 | | | 100,000 | | | | 107,519 | |
| | | | | | | | |
Total Utilities | | | | | | | 807,031 | |
| | | | | | | | |
Total Corporate Bonds | | | | | | | 12,426,958 | |
| | | | | | | | |
Government Securities (15.8%) | |
Agency CMO (7.5%) | |
Federal Farm Credit Bank | | | | | |
0.400%, 5/30/17 (l) | | | 350,000 | | | | 349,571 | |
0.275%, 12/28/16 | | | 285,000 | | | | 286,197 | |
Federal Home Loan Mortgage Corp. | | | | | |
0.199%, 4/20/17 (l) | | | 350,000 | | | | 349,974 | |
Federal National Mortgage Association | | | | | |
0.214%, 7/20/17 (l) | | | 350,000 | | | | 349,456 | |
0.204%, 10/5/17 (l) | | | 350,000 | | | | 349,321 | |
2.800%, 3/1/18 | | | 167,816 | | | | 172,574 | |
0.455%, 5/25/18 (l) | | | 275,785 | | | | 275,658 | |
0.425%, 6/25/18 (l) | | | 236,378 | | | | 236,201 | |
3.790%, 10/1/19 | | | 81,909 | | | | 87,509 | |
4.550%, 10/1/19 | | | 78,005 | | | | 85,459 | |
4.910%, 10/1/19 | | | 64,292 | | | | 71,162 | |
4.520%, 11/1/19 | | | 64,705 | | | | 70,912 | |
0.540%, 4/25/20 (l) | | | 174,599 | | | | 174,417 | |
3.414%, 10/1/20 | | | 84,278 | | | | 89,919 | |
3.619%, 12/1/20 | | | 81,154 | | | | 86,879 | |
3.766%, 12/1/20 | | | 80,132 | | | | 86,235 | |
1.234%, 7/25/21 IO (l) | | | 1,421,504 | | | | 83,174 | |
0.505%, 10/25/21 (l) | | | 62,219 | | | | 62,473 | |
FHLMC Multifamily Structured Pass Through Certificates | | | | | |
1.168%, 4/25/20 IO (l) | | | 917,127 | | | | 35,259 | |
0.747%, 7/25/20 (l) | | | 121,455 | | | | 121,800 | |
0.579%, 5/25/22 (l) | | | 174,955 | | | | 174,955 | |
0.456%, 6/25/22 IO (l) | | | 1,589,894 | | | | 33,893 | |
Government National Mortgage Association | | | | | |
2.800%, 1/16/34 | | | 157,657 | | | | 158,404 | |
2.450%, 2/16/39 | | | 75,252 | | | | 75,641 | |
3.810%, 8/16/39 | | | 96,592 | | | | 96,971 | |
3.992%, 9/16/43 | | | 170,526 | | | | 174,331 | |
3.500%, 3/15/45 | | | 983,413 | | | | 1,031,008 | |
| | | | | | | | |
| | | | 5,169,353 | |
| | | | | | | | |
Foreign Governments (2.5%) | |
Hellenic Republic Government Bond | | | | | |
3.375%, 7/17/17 (b)(m) | | EUR | 200,000 | | | | 202,468 | |
3.800%, 8/8/17 | | JPY | 5,000,000 | | | | 36,499 | |
4.750%, 4/17/19 (m) | | EUR | 100,000 | | | | 100,149 | |
Republic of Croatia | | | | | |
6.625%, 7/14/20 (m) | | $ | 100,000 | | | | 108,600 | |
Republic of Slovenia | | | | | |
5.850%, 5/10/23 (m) | | | 300,000 | | | | 345,316 | |
Romanian Government International Bond | | | | | |
4.875%, 1/22/24 (m) | | | 90,000 | | | | 97,875 | |
See Notes to Financial Statements.
77
1290 FUNDS
1290 UNCONSTRAINED BOND MANAGERS FUND
PORTFOLIO OF INVESTMENTS (Continued)
October 31, 2015
| | | | | | | | |
| | | Principal
Amount | | | Value
(Note 1) | |
| | | | | | | | |
Spain Government Bond | | | | | |
5.150%, 10/31/44 (b)(m) | | EUR | 400,000 | | | $ | 643,957 | |
United Mexican States | | | | | |
3.500%, 1/21/21 | | $ | 200,000 | | | | 205,750 | |
| | | | | | | | |
| | | | 1,740,614 | |
| | | | | | | | |
Municipal Bonds (0.4%) | |
City of New York, General Obligation Bonds Series D | | | | | |
5.985%, 12/1/36 | | | 100,000 | | | | 121,782 | |
New York City Transitional Finance Authority | | | | | |
5.267%, 5/1/27 | | | 115,000 | | | | 132,410 | |
| | | | | | | | |
| | | | 254,192 | |
| | | | | | | | |
U.S. Treasuries (5.4%) | |
U.S. Treasury Bonds | | | | | |
0.750%, 2/15/45 TIPS | | | 151,806 | | | | 135,000 | |
3.000%, 5/15/45 | | | 200,000 | | | | 202,356 | |
U.S. Treasury Notes | | | | | |
0.097%, 7/31/17#(l) | | | 600,000 | | | | 599,340 | |
0.125%, 7/15/24 TIPS | | | 2,910,614 | | | | 2,788,620 | |
| | | | | | | | |
| | | | 3,725,316 | |
| | | | | | | | |
Total Government Securities | | | | | | | 10,889,475 | |
| | | | | | | | |
Total Long-Term Debt Securities (71.5%)
(Cost $49,145,541) | | | | | | | 49,187,065 | |
| | | | | | | | |
SHORT-TERM INVESTMENTS: | | | | | |
Government Securities (27.4%) | | | | | | | | |
Federal Home Loan Bank | | | | | |
0.09%, 11/30/15 (o)(p) | | | 230,000 | | | | 229,982 | |
0.11%, 1/14/16 (o)(p) | | | 335,000 | | | | 334,921 | |
0.12%, 1/15/16 (o)(p) | | | 100,000 | | | | 99,975 | |
Federal Home Loan Mortgage Corp. | | | | | |
0.10%, 1/6/16 (o)(p) | | | 1,330,000 | | | | 1,329,760 | |
0.10%, 1/8/16 (o)(p) | | | 1,325,000 | | | | 1,324,743 | |
0.22%, 2/22/16 (o)(p) | | | 400,000 | | | | 399,720 | |
Federal National Mortgage Association | | | | | |
0.15%, 2/2/16 (o)(p) | | | 100,000 | | | | 99,960 | |
0.18%, 2/8/16 (o)(p) | | | 100,000 | | | | 99,951 | |
U.S. Treasury Bills | |
0.07%, 1/7/16#(p) | | | 1,445,000 | | | | 1,444,815 | |
0.08%, 1/14/16 (p) | | | 13,490,000 | | | | 13,487,677 | |
0.10%, 2/4/16#(p) | | | 10,000 | | | | 9,997 | |
| | | | | | | | |
Total Government Securities | | | | | | | 18,861,501 | |
| | | | | | | | |
Total Short-Term
Investments (27.4%)
(Cost $18,859,982) | | | | | | | 18,861,501 | |
| | | | | | | | |
| | | Number of
Contracts | | | Value
(Note 1) | |
OPTIONS PURCHASED: | | | | | | | | |
Call Option Purchased (0.0%) | | | | | | | | |
Foreign Currency Option November 2015 USD versus JPY | | | | | |
(Strike Price: JPY 122.50)* | | | 300,000 | | | | 549 | |
| | | | | | | | |
| | | | | | | 549 | |
| | | | | | | | |
Interest Rate Swaptions Purchased (0.2%) | |
Call Interest Rate Swaptions Purchased Payable (0.1%) | |
JPMorgan Chase & Co. | |
30 years, September 2016 @ 3.35% v. 3 Month LIBOR* | | | 300,000 | | | | 4,449 | |
| | | | | | | | |
Deutsche Bank AG | |
1 year, February 2019 @ 2.90%
v. 3 Month LIBOR* | | | 7,600,000 | | | $ | 1,019 | |
JPMorgan Chase & Co. | |
30 years, November 2017 @ 3.75% v. 3 Month LIBOR* | | | 1,500,000 | | | | 35,718 | |
| | | | | | | | |
| | | | | | | 41,186 | |
| | | | | | | | |
Put Interest Rate Swaptions Purchased Receivable (0.1%) | |
Credit Suisse | | | | |
5 years, September 2016 @ 1.50% v. 3 Month LIBOR* | | | 3,500,000 | | | | 26,431 | |
Deutsche Bank AG | | | | |
2 years, January 2016 @ 0.95%
v. 3 Month LIBOR* | | | 3,700,000 | | | | 7,560 | |
JPMorgan Chase & Co. | | | | |
2 years, December 2015 @ 0.95% v. 3 Month LIBOR* | | | 13,900,000 | | | | 26,892 | |
| | | | | | | | |
| | | | | | | 60,883 | |
| | | | | | | | |
Put Options Purchased (0.0%) | | | | | | | | |
Foreign Currency Option December 2015 EUR versus USD | | | | | |
(Strike Price: USD 1.09)* | | | 613,000 | | | | 5,378 | |
Foreign Currency Option August 2016 USD versus CNY | | | | | |
(Strike Price: CNY 6.41)* | | | 500,000 | | | | 7,085 | |
| | | | | | | | |
| | | | | | | 12,463 | |
| | | | | | | | |
Total Options Purchased (0.2%)
(Cost $139,371) | | | | | | | 115,081 | |
| | | | | | | | |
Total Investments Before Options Written and Securities Sold
Short (99.1%)
(Cost $68,144,894) | | | | | | | 68,163,647 | |
| | | | | | | | |
OPTIONS WRITTEN: | | | | | | | | |
Call Options Written (0.0%) | | | | | | | | |
Credit Default Swap Index Option (CDX.NA.IG-24 5-Year Index) | | | | | | | | |
November 2015 @ 0.95%* | | | (300,000 | ) | | | (81 | ) |
Foreign Currency Option December 2015 EUR versus USD | | | | | | | | |
(Strike Price: USD 1.15)* | | | (613,000 | ) | | | (612 | ) |
Foreign Currency Option August 2016 USD versus CNY | | | | | | | | |
(Strike Price: CNY 6.90)* | | | (500,000 | ) | | | (4,893 | ) |
| | | | | | | | |
| | | | | | | (5,586 | ) |
| | | | | | | | |
Interest Rate Swaptions Written (-0.2%) | | | | | |
Call Interest Rate Swaptions Written Payable (-0.2%) | | | | | | | | |
Credit Suisse | | | | | | | | |
30 years, September 2016 @ 2.27% v. 3 Month LIBOR* | | | (800,000 | ) | | | (26,057 | ) |
JPMorgan Chase & Co. | | | | | | | | |
10 years, December 2015 @ 2.30% v. 3 Month LIBOR* | | | (3,000,000 | ) | | | (62,735 | ) |
30 years, September 2016 @ 2.25% v. 3 Month LIBOR* | | | (300,000 | ) | | | (9,484 | ) |
| | | | | | | | |
| | | | | | | (98,276 | ) |
| | | | | | | | |
Put Interest Rate Swaptions Written Receivable (0.0%) | | | | | | | | |
Deutsche Bank AG | | | | | | | | |
1 year, February 2016 @ 2.50%
v. 3 Month LIBOR* | | | (7,900,000 | ) | | | (1,263 | ) |
See Notes to Financial Statements.
78
1290 FUNDS
1290 UNCONSTRAINED BOND MANAGERS FUND
PORTFOLIO OF INVESTMENTS (Continued)
October 31, 2015
| | | | | | | | |
| | | Number of
Contracts | | | Value
(Note 1) | |
| | | | | | | | |
JPMorgan Chase & Co. | | | | | | | | |
5 years, November 2017 @ 3.53%
v. 3 Month LIBOR* | | | (6,500,000 | ) | | $ | (33,065 | ) |
| | | | | | | | |
| | | | | | | (34,328 | ) |
| | | | | | | | |
Put Options Written (0.0%) | | | | | | | | |
Credit Default Swap Index Option (CDX.NA.IG-24 5-Year Index) | | | | | | | | |
November 2015 @ 0.70%* | | | (300,000 | ) | | | (33 | ) |
November 2015 @ 1.10%* | | | (500,000 | ) | | | (19 | ) |
Foreign Currency Option December 2015
EUR versus USD | | | | | |
(Strike Price: USD 1.05)* | | | (613,000 | ) | | | (826 | ) |
| | | | | | | | |
| | | | | | | (878 | ) |
| | | | | | | | |
Total Options Written (-0.2%)
(Premiums Received $160,261) | | | | | | | (139,068 | ) |
| | | | | | | | |
Total Investments before Securities Sold Short (98.9%)
(Cost $67,984,633) | | | | | | | 68,024,579 | |
| | | | | | | | |
| | | Principal
Amount | | | Value
(Note 1) | |
SECURITIES SOLD SHORT: | | | | | | | | |
Agency CMO (-9.2%) | | | | | | | | |
Federal National Mortgage Association | | | | | |
3.000%, 11/25/45 TBA | | $ | (1,000,000 | ) | | | (1,010,860 | ) |
3.500%, 11/25/45 TBA | | | (2,000,000 | ) | | | (2,081,718 | ) |
4.000%, 11/25/45 TBA | | | (3,000,000 | ) | | | (3,193,828 | ) |
| | | | | | | | |
Total Securities Sold Short (-9.2%)
(Proceeds Received $6,297,656) | | | | | | | (6,286,406 | ) |
| | | | | | | | |
Total Investments after Options Written and Securities Sold Short (89.7%)
(Cost $61,686,977) | | | | | | | 61,738,173 | |
Other Assets Less
Liabilities (10.3%) | | | | | | | 7,030,493 | |
| | | | | | | | |
Net Assets (100%) | | | | | | $ | 68,768,666 | |
| | | | | | | | |
| † | Security (totaling $167,654 or 0.2% of net assets) held at fair value by management. |
| # | All, or a portion of security held by broker as collateral for financial futures and or swaps contracts with a total collateral value of $312,996. |
| § | Securities exempt from registration under Rule 144A of the Securities Act of 1933. These securities may only be resold to qualified institutional buyers. At October 31, 2015, the market value of these securities amounted to $6,121,878 or 8.9% of net assets. Securities denoted with “§” but without “b” have been determined to be liquid under the guidelines established by the Board of Trustees. To the extent any securities might provide a right to demand registration, such rights have not been relied upon when determining liquidity. |
| (e) | Step Bond - Coupon rate increases in increments to maturity. Rate disclosed is as of October 31, 2015. Maturity date disclosed is the ultimate maturity date. |
| (l) | Floating Rate Security. Rate disclosed is as of October 31, 2015. |
| (m) | Regulation S is an exemption for securities offerings that are made outside of the United States and do not involve direct selling efforts in the United States. Resale restrictions may apply for purposes of the Securities Act of 1933. At October 31, 2015, the market value of these securities amounted to $2,286,299 or 3.3% of net assets. |
| (o) | Discount Note Security. Effective rate calculated as of October 31, 2015. |
Glossary:
| | CMO | — Collateralized Mortgage Obligation |
| | EUR | — European Currency Unit |
| | TBA | — To Be Announced; Security is subject to delayed delivery |
| | TIPS | — Treasury Inflation Protected Security |
At October 31, 2015, the Portfolio had the following futures contracts open: (Note 1)
| | | | | | | | | | | | | | | | | | | | |
Purchases | | Number of
Contracts | | | Expiration
Date | | | Original
Value | | | Value at
10/31/2015 | | | Unrealized
Appreciation/
(Depreciation) | |
10 Year U.S. Treasury Notes | | | 1 | | | | December-15 | | | $ | 128,469 | | | $ | 127,688 | | | $ | (781 | ) |
5 Year U.S. Treasury Notes | | | 14 | | | | December-15 | | | | 1,686,016 | | | | 1,676,828 | | | | (9,188 | ) |
90 Day Eurodollar | | | 34 | | | | December-15 | | | | 8,466,850 | | | | 8,465,575 | | | | (1,275 | ) |
Euro-BTP | | | 3 | | | | December-15 | | | | 441,062 | | | | 458,356 | | | | 17,294 | |
Euro-Bund | | | 4 | | | | December-15 | | | | 692,693 | | | | 691,504 | | | | (1,189 | ) |
| | | | | | | | | | | | | | | | | | | | |
| | | | | | | | | | | | | | | | | | $ | 4,861 | |
| | | | | | | | | | | | | | | | | | | | |
Sales | | | | | | | | | | | | | | | |
10 Year U.S. Treasury Notes | | | 2 | | | | December-15 | | | $ | 255,683 | | | $ | 255,375 | | | $ | 308 | |
90 Day Eurodollar | | | 7 | | | | June-16 | | | | 1,739,150 | | | | 1,738,012 | | | | 1,138 | |
90 Day Eurodollar | | | 7 | | | | September-16 | | | | 1,736,613 | | | | 1,735,213 | | | | 1,400 | |
90 Day Eurodollar | | | 69 | | | | December-16 | | | | 17,091,300 | | | | 17,075,775 | | | | 15,525 | |
90 Day Eurodollar | | | 7 | | | | March-17 | | | | 1,731,537 | | | | 1,729,875 | | | | 1,662 | |
Long Gilt Bond | | | 1 | | | | December-15 | | | | 182,105 | | | | 181,524 | | | | 581 | |
U.S. Long Bond | | | 2 | | | | December-15 | | | | 309,076 | | | | 312,875 | | | | (3,799 | ) |
U.S. Ultra Bond | | | 2 | | | | December-15 | | | | 316,730 | | | | 319,500 | | | | (2,770 | ) |
| | | | | | | | | | | | | | | | | | | | |
| | | | | | | | | | | | | | | | | | $ | 14,045 | |
| | | | | | | | | | | | | | | | | | | | |
| | | | | | | | | | | | | | | | | | $ | 18,906 | |
| | | | | | | | | | | | | | | | | | | | |
See Notes to Financial Statements.
79
1290 FUNDS
1290 UNCONSTRAINED BOND MANAGERS FUND
PORTFOLIO OF INVESTMENTS (Continued)
October 31, 2015
At October 31, 2015, the Portfolio had outstanding foreign currency contracts to buy/sell foreign currencies as follows: (Note 1)
| | | | | | | | | | | | | | | | | | |
Foreign Currency Buy Contracts | | Counterparty | | Local
Contract Buy
Amount
(000’s) | | | U.S. $
Current
Value | | | U.S. $
Settlement
Value | | | Unrealized
Appreciation/
(Depreciation) | |
Australian Dollar vs. U.S. Dollar, expiring 11/3/15 | | Bank of America | | | 502 | | | $ | 357,976 | | | $ | 357,926 | | | $ | 50 | |
Brazilian Real vs. U.S. Dollar, expiring 12/2/15 | | Bank of America | | | 52 | | | | 13,258 | | | | 13,000 | | | | 258 | |
Brazilian Real vs. U.S. Dollar, expiring 12/2/15 | | Deutsche Bank AG | | | 584 | | | | 149,904 | | | | 147,000 | | | | 2,904 | |
Chinese Renminbi vs. U.S. Dollar, expiring 11/3/15 | | Bank of America | | | 5,310 | | | | 840,446 | | | | 835,552 | | | | 4,894 | |
European Union Euro vs. U.S. Dollar, expiring 11/12/15 | | Bank of America | | | 624 | | | | 686,255 | | | | 697,774 | | | | (11,519 | ) |
European Union Euro vs. U.S. Dollar, expiring 11/12/15 | | Bank of America | | | 490 | | | | 538,886 | | | | 553,438 | | | | (14,552 | ) |
European Union Euro vs. U.S. Dollar, expiring 11/12/15 | | JPMorgan Chase Bank | | | 23 | | | | 25,295 | | | | 26,299 | | | | (1,004 | ) |
European Union Euro vs. U.S. Dollar, expiring 11/12/15 | | JPMorgan Chase Bank | | | 298 | | | | 327,731 | | | | 331,379 | | | | (3,648 | ) |
European Union Euro vs. U.S. Dollar, expiring 11/12/15 | | JPMorgan Chase Bank | | | 22 | | | | 24,195 | | | | 24,225 | | | | (30 | ) |
Japanese Yen vs. U.S. Dollar, expiring 11/4/15 | | Credit Suisse | | | 145,200 | | | | 1,203,292 | | | | 1,211,313 | | | | (8,021 | ) |
Japanese Yen vs. U.S. Dollar, expiring 11/4/15 | | Goldman Sachs Group, Inc. | | | 4,821 | | | | 39,955 | | | | 40,000 | | | | (45 | ) |
Japanese Yen vs. U.S. Dollar, expiring 11/4/15 | | JPMorgan Chase Bank | | | 34,719 | | | | 287,721 | | | | 288,000 | | | | (279 | ) |
Japanese Yen vs. U.S. Dollar, expiring 11/4/15 | | JPMorgan Chase Bank | | | 145,200 | | | | 1,203,292 | | | | 1,202,770 | | | | 522 | |
Japanese Yen vs. U.S. Dollar, expiring 11/4/15 | | JPMorgan Chase Bank | | | 34,714 | | | | 287,678 | | | | 288,000 | | | | (322 | ) |
Japanese Yen vs. U.S. Dollar, expiring 11/12/15 | | JPMorgan Chase Bank | | | 140,200 | | | | 1,161,936 | | | | 1,167,141 | | | | (5,205 | ) |
Korean Won vs. U.S. Dollar, expiring 11/27/15 | | Credit Suisse | | | 31,642 | | | | 27,732 | | | | 28,000 | | | | (268 | ) |
Korean Won vs. U.S. Dollar, expiring 11/27/15 | | Credit Suisse | | | 122,062 | | | | 106,980 | | | | 108,000 | | | | (1,020 | ) |
Korean Won vs. U.S. Dollar, expiring 11/27/15 | | Credit Suisse | | | 245,622 | | | | 215,275 | | | | 217,000 | | | | (1,725 | ) |
Korean Won vs. U.S. Dollar, expiring 11/27/15 | | Credit Suisse | | | 122,040 | | | | 106,961 | | | | 108,000 | | | | (1,039 | ) |
Korean Won vs. U.S. Dollar, expiring 1/21/16 | | Bank of America | | | 193,789 | | | | 169,542 | | | | 171,000 | | | | (1,458 | ) |
Korean Won vs. U.S. Dollar, expiring 1/21/16 | | Deutsche Bank AG | | | 521,366 | | | | 456,132 | | | | 458,444 | | | | (2,312 | ) |
Mexican Peso vs. U.S. Dollar, expiring 12/18/15 | | JPMorgan Chase Bank | | | 780 | | | | 47,066 | | | | 46,429 | | | | 637 | |
Singapore Dollar vs. U.S. Dollar, expiring 12/10/15 | | Credit Suisse | | | 48 | | | | 34,220 | | | | 34,765 | | | | (545 | ) |
| | | | | | | | | | | | | | | | | | |
| | | | | | | | | | | | | | | | $ | (43,727 | ) |
| | | | | | | | | | | | | | | | | | |
| | | | | | | | | | | | | | | | | | |
Foreign Currency Sell Contracts | | Counterparty | | Local
Contract Sell
Amount
(000’s) | | | U.S. $
Settlement
Value | | | U.S. $
Current
Value | | | Unrealized
Appreciation/
(Depreciation) | |
Australian Dollar vs. U.S. Dollar, expiring 11/3/15 | | Deutsche Bank AG | | | 502 | | | $ | 349,980 | | | $ | 357,976 | | | $ | (7,996 | ) |
Australian Dollar vs. U.S. Dollar, expiring 12/2/15 | | Bank of America | | | 502 | | | | 357,419 | | | | 357,440 | | | | (21 | ) |
British Pound vs. U.S. Dollar, expiring 11/12/15 | | JPMorgan Chase Bank | | | 115 | | | | 176,354 | | | | 177,274 | | | | (920 | ) |
British Pound vs. U.S. Dollar, expiring 11/12/15 | | JPMorgan Chase Bank | | | 5 | | | | 7,610 | | | | 7,708 | | | | (98 | ) |
Canadian Dollar vs. U.S. Dollar, expiring 11/12/15 | | Deutsche Bank AG | | | 85 | | | | 64,503 | | | | 65,001 | | | | (498 | ) |
Chinese Renminbi vs. U.S. Dollar, expiring 11/3/15 | | Credit Suisse | | | 2,575 | | | | 419,000 | | | | 407,526 | | | | 11,474 | |
Chinese Renminbi vs. U.S. Dollar, expiring 11/3/15 | | Deutsche Bank AG | | | 2,735 | | | | 445,000 | | | | 432,920 | | | | 12,080 | |
Chinese Renminbi vs. U.S. Dollar,
expiring 11/16/15 | | Bank of America | | | 5,310 | | | | 833,781 | | | | 839,831 | | | | (6,050 | ) |
Chinese Renminbi vs. U.S. Dollar,
expiring 11/16/15 | | Bank of America | | | 2,218 | | | | 347,586 | | | | 350,768 | | | | (3,182 | ) |
Chinese Renminbi vs. U.S. Dollar,
expiring 11/16/15 | | Credit Suisse | | | 2,365 | | | | 364,832 | | | | 374,115 | | | | (9,283 | ) |
Chinese Renminbi vs. U.S. Dollar,
expiring 8/19/16 | | Bank of America | | | 1,972 | | | | 300,000 | | | | 307,877 | | | | (7,877 | ) |
Chinese Renminbi vs. U.S. Dollar,
expiring 8/19/16 | | Deutsche Bank AG | | | 1,313 | | | | 200,000 | | | | 205,002 | | | | (5,002 | ) |
See Notes to Financial Statements.
80
1290 FUNDS
1290 UNCONSTRAINED BOND MANAGERS FUND
PORTFOLIO OF INVESTMENTS (Continued)
October 31, 2015
| | | | | | | | | | | | | | | | | | |
Foreign Currency Sell Contracts | | Counterparty | | Local
Contract Sell
Amount
(000’s) | | | U.S. $
Settlement
Value | | | U.S. $
Current
Value | | | Unrealized
Appreciation/
(Depreciation) | |
European Union Euro vs. U.S. Dollar, expiring 11/12/15 | | JPMorgan Chase Bank | | | 20 | | | $ | 21,922 | | | $ | 21,995 | | | $ | (73 | ) |
European Union Euro vs. U.S. Dollar, expiring 11/12/15 | | JPMorgan Chase Bank | | | 17 | | | | 19,203 | | | | 18,696 | | | | 507 | |
European Union Euro vs. U.S. Dollar, expiring 11/12/15 | | JPMorgan Chase Bank | | | 13 | | | | 14,961 | | | | 14,297 | | | | 664 | |
European Union Euro vs. U.S. Dollar, expiring 11/12/15 | | JPMorgan Chase Bank | | | 2,225 | | | | 2,481,163 | | | | 2,446,983 | | | | 34,180 | |
European Union Euro vs. U.S. Dollar, expiring 11/12/15 | | JPMorgan Chase Bank | | | 289 | | | | 321,082 | | | | 317,833 | | | | 3,249 | |
Japanese Yen vs. U.S. Dollar, expiring 11/4/15 | | Credit Suisse | | | 145,200 | | | | 1,211,313 | | | | 1,203,292 | | | | 8,021 | |
Japanese Yen vs. U.S. Dollar, expiring 11/4/15 | | Deutsche Bank AG | | | 145,200 | | | | 1,208,320 | | | | 1,203,292 | | | | 5,028 | |
Japanese Yen vs. U.S. Dollar, expiring 11/12/15 | | JPMorgan Chase Bank | | | 40,300 | | | | 334,615 | | | | 333,994 | | | | 621 | |
Japanese Yen vs. U.S. Dollar, expiring 11/12/15 | | JPMorgan Chase Bank | | | 33,400 | | | | 277,305 | | | | 276,809 | | | | 496 | |
Japanese Yen vs. U.S. Dollar, expiring 12/2/15 | | JPMorgan Chase Bank | | | 145,200 | | | | 1,203,112 | | | | 1,203,587 | | | | (475 | ) |
Korean Won vs. U.S. Dollar, expiring 11/27/15 | | Deutsche Bank AG | | | 521,366 | | | | 459,191 | | | | 456,948 | | | | 2,243 | |
Korean Won vs. U.S. Dollar, expiring 1/21/16 | | JPMorgan Chase Bank | | | 716,326 | | | | 609,017 | | | | 626,698 | | | | (17,681 | ) |
Mexican Peso vs. U.S. Dollar, expiring 12/18/15 | | Credit Suisse | | | 610 | | | | 35,825 | | | | 36,801 | | | | (976 | ) |
Singapore Dollar vs. U.S. Dollar, expiring 12/10/15 | | JPMorgan Chase Bank | | | 609 | | | | 422,933 | | | | 433,912 | | | | (10,979 | ) |
Taiwan Dollar vs. U.S. Dollar, expiring 12/4/15 | | JPMorgan Chase Bank | | | 8,502 | | | | 259,208 | | | | 261,908 | | | | (2,700 | ) |
| | | | | | | | | | | | | | | | | | |
| | | | | | | | | | | | | | | | $ | 4,752 | |
| | | | | | | | | | | | | | | | | | |
| | | | | | | | | | | | | | | | $ | (38,975) | |
| | | | | | | | | | | | | | | | | | |
Options Written:
Options written through the period ended October 31, 2015 were as follows:
| | | | | | | | |
| | | Total
Number of
Contracts | | | Total
Premiums
Received | |
Options Outstanding – Beginning of Period | | | — | | | $ | — | |
Options Written | | | 21,326,000 | | | | 160,261 | |
Options Terminated in Closing Purchase Transactions | | | — | | | | — | |
Options Expired | | | — | | | | — | |
Options Exercised | | | — | | | | — | |
| | | | | | | | |
Options Outstanding – End of Period | | | 21,326,000 | | | $ | 160,261 | |
| | | | | | | | |
Centrally Cleared Credit Default Swap Index Contracts-Sell Protection
| | | | | | | | | | | | | | | | | | | | | | | | | | | | | | |
Swap Counterparty | | Reference Obligation | | Contract
Annual
Fixed
Rate | | | Notional
Amount | | | Upfront
Premium
Received
(Paid) | | | Maturity
Date | | | Implied Credit
Spreads as of
10/31/15 | | | Unrealized
Appreciation/
(Depreciation) | | | Market
Value | |
Credit Suisse | | CDX North America High Yield Index | | | 5 | % | | $ | 400,000 | | | $ | 10,092 | | | | 12/20/20 | | | | 0.430 | % | | $ | 4,716 | | | $ | 14,808 | |
Credit Suisse | | CDX North America High Yield Index | | | 5 | | | | 100,000 | | | | (140 | ) | | | 12/20/20 | | | | 0.430 | | | | 3,842 | | | | 3,702 | |
Credit Suisse | | CDX North America High Yield Index | | | 5 | | | | 100,000 | | | | 30 | | | | 12/20/20 | | | | 0.430 | | | | 3,673 | | | | 3,703 | |
Credit Suisse | | CDX North America High Yield Index | | | 5 | | | | 100,000 | | | | 1,303 | | | | 12/20/20 | | | | 0.430 | | | | 2,400 | | | | 3,703 | |
Credit Suisse | | CDX North America High Yield Index | | | 5 | | | | 100,000 | | | | 1,828 | | | | 12/20/20 | | | | 0.430 | | | | 1,875 | | | | 3,703 | |
Credit Suisse | | CDX North America High Yield Index | | | 5 | | | | 100,000 | | | | 2,055 | | | | 12/20/20 | | | | 0.430 | | | | 1,647 | | | | 3,702 | |
Credit Suisse | | CDX North America High Yield Index | | | 5 | | | | 100,000 | | | | 1,928 | | | | 12/20/20 | | | | 0.430 | | | | 1,774 | | | | 3,702 | |
Credit Suisse | | CDX North America High Yield Index | | | 5 | | | | 100,000 | | | | 2,686 | | | | 12/20/20 | | | | 0.430 | | | | 1,016 | | | | 3,702 | |
See Notes to Financial Statements.
81
1290 FUNDS
1290 UNCONSTRAINED BOND MANAGERS FUND
PORTFOLIO OF INVESTMENTS (Continued)
October 31, 2015
| | | | | | | | | | | | | | | | | | | | | | | | | | | | | | |
Swap Counterparty | | Reference Obligation | | Contract
Annual
Fixed
Rate | | | Notional
Amount | | | Upfront
Premium
Received
(Paid) | | | Maturity
Date | | | Implied Credit
Spreads as of
10/31/15 | | | Unrealized
Appreciation/
(Depreciation) | | | Market
Value | |
Credit Suisse | | CDX North America High Yield Index | | | 5 | % | | $ | 100,000 | | | | 3,032 | | | | 12/20/20 | | | | 0.430 | % | | $ | 670 | | | $ | 3,702 | |
Credit Suisse | | CDX North America High Yield Index | | | 5 | | | | 100,000 | | | | 2,809 | | | | 12/20/20 | | | | 0.430 | | | | 893 | | | | 3,702 | |
Morgan Stanley | | CDX North America High Yield Index | | | 5 | | | | 1,600,000 | | | | 107,667 | | | | 6/20/20 | | | | 0.036 | | | | (7,674 | ) | | | 99,993 | |
Morgan Stanley | | CDX North America Investment Grade Index | | | 1 | | | | 2,100,000 | | | | 32,665 | | | | 6/20/20 | | | | 0.007 | | | | (6,665 | ) | | | 26,000 | |
Morgan Stanley | | CDX North America Investment Grade Index | | | 1 | | | | 2,200,000 | | | | 20,162 | | | | 12/20/20 | | | | 0.008 | | | | 5,112 | | | | 25,274 | |
Morgan Stanley | | CDX North America High Yield Index | | | 5 | | | | 300,000 | | | | 10,373 | | | | 6/20/20 | | | | 0.036 | | | | 8,376 | | | | 18,749 | |
Morgan Stanley | | CDX North America Investment Grade Index | | | 1 | | | | 1,000,000 | | | | 8,030 | | | | 12/20/20 | | | | 0.008 | | | | 3,458 | | | | 11,488 | |
Morgan Stanley | | CDX North America Investment Grade Index | | | 1 | | | | 900,000 | | | | 2,303 | | | | 12/20/20 | | | | 0.008 | | | | 8,037 | | | | 10,340 | |
Morgan Stanley | | CDX North America Investment Grade Index | | | 1 | | | | 400,000 | | | | 3,920 | | | | 12/20/20 | | | | 0.008 | | | | 675 | | | | 4,595 | |
Morgan Stanley | | CDX North America Investment Grade Index | | | 1 | | | | 400,000 | | | | 3,865 | | | | 12/20/20 | | | | 0.008 | | | | 731 | | | | 4,596 | |
Morgan Stanley | | CDX North America Investment Grade Index | | | 1 | | | | 300,000 | | | | 2,200 | | | | 12/20/20 | | | | 0.008 | | | | 1,246 | | | | 3,446 | |
Morgan Stanley | | CDX North America Investment Grade Index | | | 1 | | | | 300,000 | | | | 2,890 | | | | 12/20/20 | | | | 0.008 | | | | 556 | | | | 3,446 | |
Morgan Stanley | | CDX North America Investment Grade Index | | | 1 | | | | 300,000 | | | | 3,276 | | | | 12/20/20 | | | | 0.008 | | | | 170 | | | | 3,446 | |
Morgan Stanley | | CDX North America Investment Grade Index | | | 1 | | | | 200,000 | | | | 1,695 | | | | 12/20/20 | | | | 0.008 | | | | 603 | | | | 2,298 | |
Morgan Stanley | | CDX North America Investment Grade Index | | | 1 | | | | 200,000 | | | | 1,833 | | | | 12/20/20 | | | | 0.008 | | | | 464 | | | | 2,297 | |
| | | | | | | | | | | | | | | | | | | | | | | | | | | | | | |
| | | | | | | | | | | | $ | 226,502 | | | | | | | | | | | $ | 37,595 | | | $ | 264,097 | |
| | | | | | | | | | | | | | | | | | | | | | | | | | | | | | |
Inflation-Linked Swaps
| | | | | | | | | | | | | | | | | | | | | | | | |
| | | Rates Exchange | | | | | | | | | | |
Swap Counterparty | | Payments Made
by the Fund | | Payments Received
by the Fund | | Notional Amount | | | Termination
Date | | | Upfront Premium
Received (Paid) | | | Unrealized
Appreciation/
(Depreciation) | | | Market
Value | |
Deutsche Bank AG | | 0.74% | | HICPXT Index | | EUR | 2,200,000 | | | | 1/26/20 | | | $ | 18,927 | | | $ | (17,947 | ) | | $ | 980 | |
Deutsche Bank AG | | 1 month UK-RPI | | 3.55% | | GBP | 200,000 | | | | 12/11/44 | | | | — | | | | 24,231 | | | | 24,231 | |
| | | | | | | | | | | | | | | | | | | | | | | | |
| | | | | | | | | | | | | | $ | 18,927 | | | $ | 6,284 | | | $ | 25,211 | |
| | | | | | | | | | | | | | | | | | | | | | | | |
Glossary:
| | HICPXT | — Harmonised Index of Consumer Prices ex Tobacco |
| | UK-RPI | — United Kingdom Retail Price Index |
See Notes to Financial Statements.
82
1290 FUNDS
1290 UNCONSTRAINED BOND MANAGERS FUND
PORTFOLIO OF INVESTMENTS (Continued)
October 31, 2015
Interest Rate Swaps
| | | | | | | | | | | | | | | | | | | | | | | | | | |
Swap Counterparty | | Payments Made
by the Fund | | | Payments Received
by the Fund | | Notional Amount | | | Termination
Date | | | Upfront Premium
Received (Paid) | | | Unrealized
Appreciation/
(Depreciation) | | | Market
Value | |
| | | Rates Type | | | | | | | | | | | | | | | |
Bank of America | | | 1 Day CDI | | | 12.230% | | BRL | 8,832,543 | | | | 1/4/21 | | | $ | 37,891 | | | $ | (483,447 | ) | | $ | (445,556 | ) |
Credit Suisse | | | 1 Day CDI | | | 12.560% | | | 445,947 | | | | 1/4/21 | | | | (96 | ) | | | (19,746 | ) | | | (19,842 | ) |
Deutsche Bank AG | | | 1 Day CDI | | | 12.600% | | | 2,423,314 | | | | 1/4/21 | | | | 206 | | | | (98,714 | ) | | | (98,508 | ) |
Deutsche Bank AG | | | 1 Day CDI | | | 12.810% | | | 149,796 | | | | 1/4/21 | | | | (66 | ) | | | (5,938 | ) | | | (6,004 | ) |
| | | | | | | | | | | | | | | | | | | | | | | | | | |
| | | | | | | | | | | | | | | | $ | 37,935 | | | $ | (607,845 | ) | | $ | (569,910 | ) |
| | | | | | | | | | | | | | | | | | | | | | | | | | |
Centrally Cleared Interest Rate Swaps
| | | | | | | | | | | | | | | | | | | | | | | | |
Swap Counterparty | | Payments Made
by the Fund | | Payments Received by the Fund | | Notional Amount | | | Termination
Date | | | Upfront
Premium
Received
(Paid) | | | Unrealized
Appreciation/
(Depreciation) | | | Market
Value | |
| | | Rates Type | | | | | | | | | | | | | | | |
Goldman Sachs & Co. | | 1.50% semi-annually | | 3 month LIBOR quarterly | | $ | 3,300,000 | | | | 12/16/17 | | | $ | (38,339 | ) | | $ | 338 | | | $ | (38,001 | ) |
Goldman Sachs & Co. | | 2.750% semi-annually | | 3 month LIBOR quarterly | | | 300,000 | | | | 12/16/45 | | | | (7,869 | ) | | | (4,636 | ) | | | (12,505 | ) |
Goldman Sachs & Co. | | 2.250% semi-annually | | 3 month LIBOR quarterly | | | 600,000 | | | | 12/16/22 | | | | (378 | ) | | | (16,115 | ) | | | (16,493 | ) |
Goldman Sachs & Co. | | 2.750% semi-annually | | 3 month LIBOR quarterly | | | 200,000 | | | | 12/16/45 | | | | (1,328 | ) | | | (7,009 | ) | | | (8,337 | ) |
Goldman Sachs & Co. | | 2.750% semi-annually | | 3 month LIBOR quarterly | | | 150,000 | | | | 12/16/45 | | | | (4,262 | ) | | | (1,991 | ) | | | (6,253 | ) |
Morgan Stanley | | 2.0% semi-annually | | 6 month LIBOR semi-annually | | GBP | 400,000 | | | | 3/18/22 | | | | (5,612 | ) | | | (8,218 | ) | | | (13,830 | ) |
Morgan Stanley | | 0.750% annually | | 6 month EURIBOR semi-annually | | EUR | 1,100,000 | | | | 9/16/25 | | | | 43,428 | | | | (28,371 | ) | | | 15,057 | |
UBS AG | | 1.750% semi-annually | | 3 month LIBOR quarterly | | $ | 6,600,000 | | | | 12/14/17 | | | | (47,269 | ) | | | 12,192 | | | | (35,077 | ) |
UBS AG | | 3 month LIBOR quarterly | | 2.0% semi-annually | | | 700,000 | | | | 12/16/20 | | | | 12,637 | | | | 2,368 | | | | 15,005 | |
UBS AG | | 3 month LIBOR quarterly | | 2.0% semi-annually | | | 700,000 | | | | 12/16/20 | | | | 17,499 | | | | (2,494 | ) | | | 15,005 | |
UBS AG | | 3 month LIBOR quarterly | | 2.50% semi-annually | | | 800,000 | | | | 12/16/25 | | | | 24,441 | | | | 4,720 | | | | 29,161 | |
UBS AG | | 1.750% semi-annually | | 3 month LIBOR quarterly | | | 13,600,000 | | | | 12/14/17 | | | | (14,902 | ) | | | (57,378 | ) | | | (72,280 | ) |
UBS AG | | 3 month LIBOR quarterly | | 2.250% semi-annually | | | 1,300,000 | | | | 12/16/22 | | | | (3,572 | ) | | | 39,306 | | | | 35,734 | |
UBS AG | | 1.250% semi-annually | | 3 month LIBOR quarterly | | | 25,000,000 | | | | 12/16/16 | | | | (78,503 | ) | | | (76,550 | ) | | | (155,053 | ) |
UBS AG | | 4 Week TIIE monthly | | 5.680% monthly | | MXN | 10,600,000 | | | | 11/9/21 | | | | 151 | | | | 1,393 | | | | 1,544 | |
UBS AG | | 2.750% semi-annually | | 3 month LIBOR quarterly | | $ | 100,000 | | | | 12/16/45 | | | | 581 | | | | (4,749 | ) | | | (4,168 | ) |
UBS AG | | 1.750% semi-annually | | 3 month LIBOR quarterly | | | 7,000,000 | | | | 12/16/18 | | | | (60,531 | ) | | | (59,152 | ) | | | (119,683 | ) |
UBS AG | | 2.750% semi-annually | | 3 month LIBOR quarterly | | | 200,000 | | | | 12/16/45 | | | | (1,850 | ) | | | (6,486 | ) | | | (8,336 | ) |
UBS AG | | 2.750% semi-annually | | 3 month LIBOR quarterly | | | 200,000 | | | | 12/16/45 | | | | (994 | ) | | | (7,342 | ) | | | (8,336 | ) |
UBS AG | | 2.750% semi-annually | | 3 month LIBOR quarterly | | | 200,000 | | | | 12/16/45 | | | | (1,241 | ) | | | (7,096 | ) | | | (8,337 | ) |
UBS AG | | 3 month LIBOR quarterly | | 2.250% semi-annually | | | 600,000 | | | | 12/16/22 | | | | (616 | ) | | | 17,109 | | | | 16,493 | |
| | | | | | | | | | | | | | | | | | | | | | | | |
| | | | | | | | | | | | | | $ | (168,529 | ) | | $ | (210,161 | ) | | $ | (378,690 | ) |
| | | | | | | | | | | | | | | | | | | | | | | | |
See Notes to Financial Statements.
83
1290 FUNDS
1290 UNCONSTRAINED BOND MANAGERS FUND
PORTFOLIO OF INVESTMENTS (Continued)
October 31, 2015
The following is a summary of the inputs used to value the Fund’s assets and liabilities carried at fair value as of October 31, 2015:
The inputs or methodology used for valuing securities are not necessarily an indication of the risk associated with investing in those securities.
Various inputs are used in determining the value of the Fund’s investments. These inputs are summarized in the three broad levels listed below:
| | | | | | | | | | | | | | | | |
| | | | | |
| Investment Type | | Level 1
Quoted Prices in
Active Markets for
Identical
Securities | | | Level 2
Significant Other
Observable Inputs
(including quoted prices
for similar securities,
interest rates,
prepayment speeds,
credit risk, etc.) | | | Level 3
Significant Unobservable
Inputs (including the
Fund’s own
assumptions in
determining the fair
value of investments) | | | Total | |
Assets: | | | | | | | | | | | | | | | | |
Asset-Backed and Mortgage-Backed Securities | | | | | | | | | | | | | | | | |
Asset-Backed Securities | | $ | — | | | $ | 11,621,230 | | | $ | — | | | $ | 11,621,230 | |
Non-Agency CMO | | | — | | | | 14,081,748 | | | | 167,654 | | | | 14,249,402 | |
Centrally Cleared Interest Rate Swaps | | | — | | | | 77,426 | | | | — | | | | 77,426 | |
Corporate Bonds | | | | | | | | | | | | | | | | |
Consumer Discretionary | | | — | | | | 301,483 | | | | — | | | | 301,483 | |
Consumer Staples | | | — | | | | 113,524 | | | | — | | | | 113,524 | |
Energy | | | — | | | | 843,944 | | | | — | | | | 843,944 | |
Financials | | | — | | | | 7,601,416 | | | | — | | | | 7,601,416 | |
Health Care | | | — | | | | 1,095,364 | | | | — | | | | 1,095,364 | |
Industrials | | | — | | | | 736,873 | | | | — | | | | 736,873 | |
Information Technology | | | — | | | | 106,587 | | | | — | | | | 106,587 | |
Materials | | | — | | | | 72,716 | | | | — | | | | 72,716 | |
Telecommunication Services | | | — | | | | 748,020 | | | | — | | | | 748,020 | |
Utilities | | | — | | | | 807,031 | | | | — | | | | 807,031 | |
Credit Default Swaps | | | — | | | | 51,934 | | | | — | | | | 51,934 | |
Forward Currency Contracts | | | — | | | | 87,828 | | | | — | | | | 87,828 | |
Futures | | | 37,908 | | | | — | | | | — | | | | 37,908 | |
Government Securities | | | | | | | | | | | | | | | | |
Agency CMO | | | — | | | | 5,169,353 | | | | — | | | | 5,169,353 | |
Foreign Governments | | | — | | | | 1,740,614 | | | | — | | | | 1,740,614 | |
Municipal Bonds | | | — | | | | 254,192 | | | | — | | | | 254,192 | |
U.S. Treasuries | | | — | | | | 3,725,316 | | | | — | | | | 3,725,316 | |
Inflation-linked Swaps | | | — | | | | 24,231 | | | | — | | | | 24,231 | |
Options Purchased | | | | | | | | | | | | | | | | |
Call Options Purchased | | | — | | | | 549 | | | | — | | | | 549 | |
Interest Rate Swaptions Purchased | | | — | | | | 102,069 | | | | — | | | | 102,069 | |
Put Options Purchased | | | — | | | | 12,463 | | | | — | | | | 12,463 | |
Short-Term Investments | | | — | | | | 18,861,501 | | | | — | | | | 18,861,501 | |
| | | | | | | | | | | | | | | | |
Total Assets | | $ | 37,908 | | | $ | 68,237,412 | | | $ | 167,654 | | | $ | 68,442,974 | |
| | | | | | | | | | | | | | | | |
| | | | |
Liabilities: | | | | | | | | | | | | | | | | |
Centrally Cleared Interest Rate Swaps | | $ | — | | | $ | (287,587 | ) | | $ | — | | | $ | (287,587 | ) |
Credit Default Swaps | | | — | | | | (14,339 | ) | | | — | | | | (14,339 | ) |
Forward Currency Contracts | | | — | | | | (126,803 | ) | | | — | | | | (126,803 | ) |
Futures | | | (19,002 | ) | | | — | | | | — | | | | (19,002 | ) |
Government Securities | | | | | | | | | | | | | | | | |
Agency CMO | | | — | | | | (6,286,406 | ) | | | — | | | | (6,286,406 | ) |
Inflation-linked Swaps | | | — | | | | (17,947 | ) | | | — | | | | (17,947 | ) |
Interest Rate Swaps | | | — | | | | (607,845 | ) | | | — | | | | (607,845 | ) |
Options Written | | | | | | | | | | | | | | | | |
Call Options Written | | | — | | | | (5,586 | ) | | | — | | | | (5,586 | ) |
Interest Rate Swaptions Written | | | — | | | | (132,604 | ) | | | — | | | | (132,604 | ) |
Put Options Written | | | — | | | | (878 | ) | | | — | | | | (878 | ) |
| | | | | | | | | | | | | | | | |
Total Liabilities | | $ | (19,002 | ) | | $ | (7,479,995 | ) | | $ | — | | | $ | (7,498,997 | ) |
| | | | | | | | | | | | | | | | |
Total | | $ | 18,906 | | | $ | 60,757,417 | | | $ | 167,654 | | | $ | 60,943,977 | |
| | | | | | | | | | | | | | | | |
There were no transfers between Levels 1, 2 or 3 during the period ended October 31, 2015.
See Notes to Financial Statements.
84
1290 FUNDS
1290 UNCONSTRAINED BOND MANAGERS FUND
PORTFOLIO OF INVESTMENTS (Continued)
October 31, 2015
Fair Values of Derivative Instruments as of October 31, 2015:
| | | | | | |
| | | Statement of Assets and Liabilities | |
Derivatives Not Accounted for as
Hedging Instruments*^ | | Asset Derivatives | | Fair Value | |
Interest rate contracts | | Receivables, Net assets -
Unrealized appreciation | | $ | 241,634 | |
Foreign exchange contracts | | Receivables | | | 100,840 | |
Credit contracts | | Receivables | | | 51,934 | |
| | | | | | |
Total | | | | $ | 394,408 | |
| | | | | | |
| | |
| | | Liability Derivatives | | | |
Interest rate contracts | | Payables, Net assets - Unrealized depreciation | | $ | (1,064,985 | ) |
Foreign exchange contracts | | Payables | | | (133,134 | ) |
Credit contracts | | Payables | | | (14,472 | ) |
| | | | | | |
Total | | | | $ | (1,212,591 | ) |
| | | | | | |
The Effect of Derivative Instruments on the Statement of Operations for the period ended October 31, 2015:
| | | | | | | | | | | | | | | | | | | | |
| Amount of Realized Gain or (Loss) on Derivatives Recognized in Income | |
Derivatives Not Accounted for as Hedging Instruments^ | | Options | | | Futures | | | Forward
Foreign
Currency
Contracts | | | Swaps | | | Total | |
Interest rate contracts | | $ | (1,650 | ) | | $ | (64,774 | ) | | $ | — | | | $ | (107,216 | ) | | $ | (173,640 | ) |
Foreign exchange contracts | | | 4,695 | | | | — | | | | (69,207 | ) | | | — | | | | (64,512 | ) |
Credit contracts | | | (560 | ) | | | — | | | | — | | | | (88,507 | ) | | | (89,067 | ) |
| | | | | | | | | | | | | | | | | | | | |
Total | | $ | 2,485 | | | $ | (64,774 | ) | | $ | (69,207 | ) | | $ | (195,723 | ) | | $ | (327,219 | ) |
| | | | | | | | | | | | | | | | | | | | |
| | | | | | | | | | | | | | | | | | | | |
| Amount of Unrealized Appreciation or (Depreciation) on Derivatives Recognized in Income | |
Derivatives Not Accounted for as Hedging Instruments^ | | Options | | | Futures | | | Forward
Foreign
Currency
Contracts | | | Swaps | | | Total | |
Interest rate contracts | | $ | (12,741 | ) | | $ | 18,906 | | | $ | — | | | $ | (811,722 | ) | | $ | (805,557 | ) |
Foreign exchange contracts | | | 8,272 | | | | — | | | | (38,975 | ) | | | — | | | | (30,703 | ) |
Credit contracts | | | 1,372 | | | | — | | | | — | | | | 37,595 | | | | 38,967 | |
| | | | | | | | | | | | | | | | | | | | |
Total | | $ | (3,097 | ) | | $ | 18,906 | | | $ | (38,975 | ) | | $ | (774,127 | ) | | $ | (797,293 | ) |
| | | | | | | | | | | | | | | | | | | | |
* Includes cumulative appreciation / depreciation of futures contracts and centrally cleared swaps as reported in the Portfolio of Investments. Only current day’s variation margin is reported within the Statement of Assets and Liabilities.
^ The Fund held options, forward foreign currency, futures and swap contracts as a substitute for investing in conventional securities, hedging and in an attempt to enhance returns
The Fund held forward foreign currency contracts with an average settlement value of approximately $16,888,000 for four months, options with an average notional balance of approximately $251,000 for four months, swaps with an average notional balance of approximately $85,744,000 for four months and futures contracts with an average notional balance of approximately $35,248,000 for four months, during the period ended October 31, 2015.
See Notes to Financial Statements.
85
1290 FUNDS
1290 UNCONSTRAINED BOND MANAGERS FUND
PORTFOLIO OF INVESTMENTS (Continued)
October 31, 2015
The following table presents the Portfolio’s gross derivative assets and liabilities by counterparty net of amounts available for offset under netting arrangements and any related collateral received or pledged by the Portfolio as of October 31, 2015:
| | | | | | | | | | | | | | | | |
Counterparty | | Gross Amount of
Derivative Assets
Presented in the
Statement of Assets
and Liabilities (a) | | | Derivatives
Available
for Offset | | | Collateral
Received | | | Net Amount Due
from Counterparty | |
Bank of America | | $ | 10,580 | | | $ | (10,580 | ) | | $ | — | | | $ | — | |
Credit Suisse | | | 45,926 | | | | (45,926 | ) | | | — | | | | — | |
Deutsche Bank AG | | | 62,150 | | | | (62,150 | ) | | | — | | | | — | |
JPMorgan Chase Bank | | | 108,484 | | | | (108,484 | ) | | | — | | | | — | |
| | | | | | | | | | | | | | | | |
Total | | $ | 227,140 | | | $ | (227,140 | ) | | $ | — | | | $ | — | |
| | | | | | | | | | | | | | | | |
| | | | |
Counterparty | | Gross Amount of
Derivative Liabilities
Presented in the
Statement of Assets
and Liabilities (a) | | | Derivatives
Available
for Offset | | | Collateral
Pledged | | | Net Amount Due
to Counterparty | |
Bank of America | | $ | 529,544 | | | $ | (10,580 | ) | | $ | 293,000 | | | $ | 225,964 | |
Credit Suisse | | | 68,680 | | | | (45,926 | ) | | | — | | | | 22,754 | |
Deutsche Bank AG | | | 144,563 | | | | (62,150 | ) | | | — | | | | 82,413 | |
Goldman Sachs & Co | | | 45 | | | | — | | | | — | | | | 45 | |
JPMorgan Chase Bank | | | 148,831 | | | | (108,484 | ) | | | — | | | | 40,347 | |
| | | | | | | | | | | | | | | | |
Total | | $ | 891,663 | | | $ | (227,140 | ) | | $ | 293,000 | | | $ | 371,523 | |
| | | | | | | | | | | | | | | | |
| (a) | For financial reporting purposes the Portfolio does not offset derivative assets and derivative liabilities subject to master netting arrangements in the Statement of Assets and Liabilities. |
Investment security transactions for the period ended October 31, 2015 were as follows:
| | | | |
Cost of Purchases: | | | | |
Long-term investments other than U.S. government debt securities | | $ | 66,523,338 | |
Long-term U.S. government debt securities | | | 6,042,893 | |
| | | | |
| | $ | 72,566,231 | |
| | | | |
Net Proceeds of Sales and Redemptions: | | | | |
Long-term investments other than U.S. government debt securities | | $ | 29,479,270 | |
Long-term U.S. government debt securities | | | 2,285,450 | |
| | | | |
| | $ | 31,764,720 | |
| | | | |
As of October 31, 2015, the gross unrealized appreciation (depreciation) of investments based on the aggregate cost of investments for Federal income tax purposes was as follows:
| | | | |
Aggregate gross unrealized appreciation | | $ | 370,219 | |
Aggregate gross unrealized depreciation | | | (352,204 | ) |
| | | | |
Net unrealized appreciation | | $ | 18,015 | |
| | | | |
Federal income tax cost of investments | | $ | 68,145,632 | |
| | | | |
See Notes to Financial Statements.
86
1290 FUNDS
1290 UNCONSTRAINED BOND MANAGERS FUND
STATEMENT OF ASSETS AND LIABILITIES
October 31, 2015
| | | | |
| |
ASSETS | | | | |
Investments at value (Cost $68,144,894) | | $ | 68,163,647 | |
Cash | | | 1,040,832 | |
Foreign cash (Cost $26,155) | | | 26,187 | |
Cash held as collateral at broker | | | 710,000 | |
Receivable for forward commitments | | | 6,297,656 | |
Receivable for securities sold | | | 2,303,391 | |
Variation Margin on Centrally Cleared Swaps | | | 39,377 | |
Dividends, interest and other receivables | | | 242,729 | |
Due from Custodian | | | 176,300 | |
Unrealized appreciation on forward foreign currency contracts | | | 87,828 | |
Deferred offering cost | | | 18,799 | |
Market value on OTC swap contracts (Premiums received $18,927) | | | 25,211 | |
Due from broker for futures variation margin | | | 3,519 | |
Receivable for Fund Shares sold | | | 18 | |
| | | | |
Total assets | | | 79,135,494 | |
| | | | |
LIABILITIES | | | | |
Securities sold short (Proceeds received $6,297,656) | | | 6,286,406 | |
Payable for securities purchased | | | 2,952,627 | |
Market value on OTC swap contracts (Premiums received $37,935) | | | 569,910 | |
Dividends and distributions payable | | | 147,656 | |
Options written, at value (Premiums received $160,261) | | | 139,068 | |
Unrealized depreciation on forward foreign currency contracts | | | 126,803 | |
Payable for return of cash collateral on swap contracts | | | 60,000 | |
Administrative fees payable | | | 8,767 | |
Investment management fees payable | | | 4,978 | |
Transfer agent fees payable | | | 3,134 | |
Payable for interest purchased | | | 592 | |
Trustees’ fees payable | | | 497 | |
Distribution fees payable – Class R | | | 42 | |
Distribution fees payable – Class A | | | 21 | |
Accrued expenses | | | 66,327 | |
| | | | |
Total liabilities | | | 10,366,828 | |
| | | | |
NET ASSETS | | $ | 68,768,666 | |
| | | | |
Net assets were comprised of: | | | | |
Paid in capital | | | 69,999,409 | |
Accumulated undistributed net investment income (loss) | | | (6,331 | ) |
Accumulated undistributed net realized gain (loss) on investments, securities sold short, options written, futures, swaps and foreign currency transactions | | | (469,379 | ) |
Net unrealized appreciation (depreciation) on investments, securities sold short, options written, futures, swaps and foreign currency translations | | | (755,033 | ) |
| | | | |
Net assets | | $ | 68,768,666 | |
| | | | |
Class A | | | | |
Net asset value and redemption price per share, $98,195 / 10,000 shares outstanding (unlimited amount authorized: $0.001 par value) | | $ | 9.82 | |
Maximum sales charge (4.50% of offering price) | | | 0.46 | |
| | | | |
Maximum offering price per share | | $ | 10.28 | |
| | | | |
Class I | | | | |
Net asset value and redemption price per share, $68,572,298 / 6,980,848 shares outstanding (unlimited amount authorized: $0.001 par value) | | $ | 9.82 | |
| | | | |
Class R | | | | |
Net asset value and redemption price per share, $98,173 / 10,000 shares outstanding (unlimited amount authorized: $0.001 par value) | | $ | 9.82 | |
| | | | |
See Notes to Financial Statements.
87
1290 FUNDS
1290 UNCONSTRAINED BOND MANAGERS FUND
STATEMENT OF OPERATIONS
For the Period Ended October 31, 2015*
| | | | |
INVESTMENT INCOME | |
Interest | | $ | 380,427 | |
| | | | |
EXPENSES | | | | |
Investment advisory fees | | | 166,357 | |
Professional fees | | | 69,902 | |
Administrative fees | | | 31,192 | |
Printing and mailing expenses | | | 15,272 | |
Custodian fees | | | 10,500 | |
Offering costs | | | 8,834 | |
Transfer agent fees | | | 6,305 | |
Trustees’ fees | | | 1,941 | |
Registration and filing fees | | | 184 | |
Distribution fees – Class R | | | 158 | |
Distribution fees – Class A | | | 79 | |
Miscellaneous | | | 9,198 | |
| | | | |
Gross expenses | | | 319,922 | |
Less: Waiver from investment adviser | | | (80,587 | ) |
| | | | |
Net expenses | | | 239,335 | |
| | | | |
NET INVESTMENT INCOME (LOSS) | | | 141,092 | |
| | | | |
REALIZED AND UNREALIZED GAIN (LOSS) | | | | |
Realized gain (loss) on: | | | | |
Investments | | | 21,315 | |
Futures | | | (64,774 | ) |
Foreign currency transactions | | | (82,348 | ) |
Swaps | | | (195,723 | ) |
Options written | | | 4,695 | |
Securities sold short | | | (88,633 | ) |
| | | | |
Net realized gain (loss) | | | (405,468 | ) |
| | | | |
Change in unrealized appreciation (depreciation) on: | | | | |
Investments | | | 18,753 | |
Futures | | | 18,906 | |
Foreign currency translations | | | (51,008 | ) |
Swaps | | | (774,127 | ) |
Options written | | | 21,193 | |
Securities sold short | | | 11,250 | |
| | | | |
Net change in unrealized appreciation (depreciation) | | | (755,033 | ) |
| | | | |
NET REALIZED AND UNREALIZED GAIN (LOSS) | | | (1,160,501 | ) |
| | | | |
NET INCREASE (DECREASE) IN NET ASSETS RESULTING FROM OPERATIONS | | $ | (1,019,409 | ) |
| | | | |
| * | The Fund commenced operations on July 6, 2015. |
See Notes to Financial Statements.
88
1290 FUNDS
1290 UNCONSTRAINED BOND MANAGERS FUND
STATEMENT OF CHANGES IN NET ASSETS
| | | | |
| | | July 6, 2015* to
October 31, 2015 | |
INCREASE (DECREASE) IN NET ASSETS FROM OPERATIONS: | |
Net investment income (loss) | | $ | 141,092 | |
Net realized gain (loss) on investments, securities sold short, options written, futures and foreign currency transactions | | | (405,468 | ) |
Net change in unrealized appreciation (depreciation) on investments, securities sold short, options written, futures and foreign currency translations | | | (755,033 | ) |
| | | | |
NET INCREASE (DECREASE) IN NET ASSETS RESULTING FROM OPERATIONS | | | (1,019,409 | ) |
| | | | |
DIVIDENDS : | | | | |
Dividends from net investment income | | | | |
Class A | | | (256 | ) |
Class I | | | (219,894 | ) |
Class R | | | (199 | ) |
| | | | |
TOTAL DIVIDENDS : | | | (220,349 | ) |
| | | | |
CAPITAL SHARES TRANSACTIONS: | | | | |
Class A | | | | |
Capital shares sold [ 10,000 shares ] | | | 100,000 | |
| | | | |
Total Class A transactions | | | 100,000 | |
| | | | |
Class I | | | | |
Capital shares sold [ 6,980,847 shares ] | | | 69,808,418 | |
Capital shares issued in reinvestment of dividends [ 1 shares ] | | | 6 | |
| | | | |
Total Class I transactions | | | 69,808,424 | |
| | | | |
Class R | | | | |
Capital shares sold [ 10,000 shares ] | | | 100,000 | |
| | | | |
Total Class R transactions | | | 100,000 | |
| | | | |
NET INCREASE (DECREASE) IN NET ASSETS RESULTING FROM CAPITAL SHARE
TRANSACTIONS | | | 70,008,424 | |
| | | | |
TOTAL INCREASE (DECREASE) IN NET ASSETS | | | 68,768,666 | |
NET ASSETS: | | | | |
Beginning of period | | | — | |
| | | | |
End of period (a) | | $ | 68,768,666 | |
| | | | |
(a) Includes accumulated undistributed (overdistributed) net investment income (loss) of | | $ | (6,331 | ) |
| | | | |
* The Fund commenced operations on July 6, 2015. | | | | |
See Notes to Financial Statements.
89
1290 FUNDS
1290 UNCONSTRAINED BOND MANAGERS FUND
FINANCIAL HIGHLIGHTS
| | | | |
| Class A | | July 6, 2015* to October 31, 2015 | |
Net asset value, beginning of period | | $ | 10.00 | |
| | | | |
Income (loss) from investment operations: | | | | |
Net investment income (loss) (e) | | | 0.01 | |
Net realized and unrealized gain (loss) on investments, securities sold short, options written, futures and foreign currency transactions | | | (0.16 | ) |
| | | | |
Total from investment operations | | | (0.15 | ) |
| | | | |
Less distributions: | | | | |
Dividends from net investment income | | | (0.03 | ) |
| | | | |
Net asset value, end of period | | $ | 9.82 | |
| | | | |
Total return (b) | | | (1.54 | )% |
| | | | |
Ratios/Supplemental Data: | | | | |
Net assets, end of period (000’s) | | $ | 98 | |
Ratio of expenses to average net assets: | | | | |
After waivers (a) | | | 1.40 | % |
Before waivers (a) | | | 1.62 | % |
Ratio of net investment income (loss) to average net assets: | | | | |
After waivers (a) | | | 0.37 | %(l) |
Before waivers (a) | | | 0.15 | %(l) |
Portfolio turnover rate (z)^ | | | 77 | % |
| |
| Class I | | July 6, 2015* to October 31, 2015 | |
Net asset value, beginning of period | | $ | 10.00 | |
| | | | |
Income (loss) from investment operations: | | | | |
Net investment income (loss) (e) | | | 0.02 | |
Net realized and unrealized gain (loss) on investments, securities sold short, options written, futures and foreign currency transactions | | | (0.17 | ) |
| | | | |
Total from investment operations | | | (0.15 | ) |
| | | | |
Less distributions: | | | | |
Dividends from net investment income | | | (0.03 | ) |
| | | | |
Net asset value, end of period | | $ | 9.82 | |
| | | | |
Total return (b) | | | (1.49 | )% |
| | | | |
Ratios/Supplemental Data: | | | | |
Net assets, end of period (000’s) | | $ | 68,572 | |
Ratio of expenses to average net assets: | | | | |
After waivers (a) | | | 1.15 | % |
Before waivers (a) | | | 1.36 | % |
Ratio of net investment income (loss) to average net assets: | | | | |
After waivers (a) | | | 0.68 | %(l) |
Before waivers (a) | | | 0.47 | %(l) |
Portfolio turnover rate (z)^ | | | 77 | % |
See Notes to Financial Statements.
90
1290 FUNDS
1290 UNCONSTRAINED BOND MANAGERS FUND
FINANCIAL HIGHLIGHTS (Continued)
| | | | |
| Class R | | July 6, 2015* to October 31, 2015 | |
Net asset value, beginning of period | | $ | 10.00 | |
| | | | |
Income (loss) from investment operations: | | | | |
Net investment income (loss) (e) | | | — | # |
Net realized and unrealized gain (loss) on investments, securities sold short, options written, futures and foreign currency transactions | | | (0.16 | ) |
| | | | |
Total from investment operations | | | (0.16 | ) |
| | | | |
Less distributions: | | | | |
Dividends from net investment income | | | (0.02 | ) |
| | | | |
Net asset value, end of period | | $ | 9.82 | |
| | | | |
Total return (b) | | | (1.60 | )% |
| | | | |
Ratios/Supplemental Data: | | | | |
Net assets, end of period (000’s) | | $ | 98 | |
Ratio of expenses to average net assets: | | | | |
After waivers (a) | | | 1.65 | % |
Before waivers (a) | | | 1.88 | % |
Ratio of net investment income (loss) to average net assets: | | | | |
After waivers (a) | | | 0.12 | %(l) |
Before waivers (a) | | | (0.11 | )%(l) |
Portfolio turnover rate (z)^. | | | 77 | % |
| * | Commencement of Operations. |
| # | Per share amount is less than $0.005. |
| ^ | Portfolio turnover rate excludes derivatives, if any. |
| (a) | Ratios for periods less than one year are annualized. |
| (b) | Total returns for periods less than one year are not annualized. |
| (e) | Net investment income (loss) per share is based on average shares outstanding. |
| (l) | The annualized ratio of net investment income to average net assets may not be indicative of operating results for a full year. |
| (z) | Portfolio turnover rate for periods less than one year is not annualized. |
See Notes to Financial Statements.
91
1290 FUNDS
NOTES TO FINANCIAL STATEMENTS
October 31, 2015
| Note 1 | Organization and Significant Accounting Policies |
1290 Funds (the “Trust”) was organized as a Delaware statutory trust on March 1, 2013 and is registered under the Investment Company Act of 1940, as amended (the “1940 Act”), as an open-end management investment company with seven diversified funds in operation (each a “Fund” and collectively, the “Funds”). The investment adviser to each Fund is AXA Equitable Funds Management Group, LLC d/b/a 1290 Asset Managers® (“1290 Asset Managers” or “FMG LLC” or the “Adviser”), a wholly-owned subsidiary of AXA Equitable Life Insurance Company (“AXA Equitable”).
The total amount of seed capital at the Funds’ commencement of operations is listed below:
| | | | | | | | |
Funds: | | Commencement Date | | Class | | Seed capital | |
1290 Convertible Securities | | 7/6/15 | | Class A | | $ | 100,000 | |
1290 Convertible Securities | | 7/6/15 | | Class I | | | 19,800,000 | |
1290 Convertible Securities | | 7/6/15 | | Class R | | | 100,000 | |
1290 GAMCO Small/Mid Cap Value | | 11/12/14 | | Class A | | | 780,000 | |
1290 GAMCO Small/Mid Cap Value | | 11/12/14 | | Class C | | | 260,000 | |
1290 GAMCO Small/Mid Cap Value | | 11/12/14 | | Class I | | | 780,000 | |
1290 GAMCO Small/Mid Cap Value | | 11/12/14 | | Class R | | | 780,000 | |
1290 Global Equity Managers | | 7/6/15 | | Class A | | | 100,000 | |
1290 Global Equity Managers | | 7/6/15 | | Class I | | | 29,800,000 | |
1290 Global Equity Managers | | 7/6/15 | | Class R | | | 100,000 | |
1290 High Yield Bond | | 11/12/14 | | Class A | | | 9,030,000 | |
1290 High Yield Bond | | 11/12/14 | | Class C | | | 3,010,000 | |
1290 High Yield Bond | | 11/12/14 | | Class I | | | 9,030,000 | |
1290 High Yield Bond | | 11/12/14 | | Class R | | | 9,030,000 | |
1290 Multi-Alternative Strategies | | 7/6/15 | | Class A | | | 100,000 | |
1290 Multi-Alternative Strategies | | 7/6/15 | | Class I | | | 9,800,000 | |
1290 Multi-Alternative Strategies | | 7/6/15 | | Class R | | | 100,000 | |
1290 SmartBeta Equity | | 11/12/14 | | Class A | | | 3,030,000 | |
1290 SmartBeta Equity | | 11/12/14 | | Class C | | | 1,010,000 | |
1290 SmartBeta Equity | | 11/12/14 | | Class I | | | 3,030,000 | |
1290 SmartBeta Equity | | 11/12/14 | | Class R | | | 3,030,000 | |
1290 Unconstrained Bond Managers | | 7/6/15 | | Class A | | | 100,000 | |
1290 Unconstrained Bond Managers | | 7/6/15 | | Class I | | | 35,800,000 | |
1290 Unconstrained Bond Managers | | 7/6/15 | | Class R | | | 100,000 | |
Under the Trust’s organizational documents, its officers and trustees are indemnified against certain liabilities arising out of the performance of their duties to the Trust. In addition, in the normal course of business, the Trust enters into contracts with vendors and others that provide for general indemnifications. The Trust’s maximum exposure under these arrangements is unknown as this would involve future claims that may be made against the Trust. However, based on experience, the Trust and management expect the risk of loss to be remote.
Each of the investment sub-advisers (each a “Sub-Adviser”) independently chooses and maintains a portfolio of securities for their respective Fund.
The Trust issues four classes of shares, Class A, Class C, Class I and Class R on behalf of the following seven Funds: 1290 Convertible Securities Fund, 1290 GAMCO Small/Mid Cap Value Fund, 1290 Global Equity Managers Fund, 1290 High Yield Bond Fund, 1290 Multi-Alternative Strategies Fund, 1290 SmartBeta Equity Fund and 1290 Unconstrained Bond Managers Fund. Class C shares currently are not offered for sale.
The Class A, Class C and Class R shares are subject to distribution fees imposed under distribution plans (“Distribution Plans”) adopted pursuant to Rule 12b-1 under the 1940 Act. Under
92
1290 FUNDS
NOTES TO FINANCIAL STATEMENTS (Continued)
October 31, 2015
the Trust’s multiple-class distribution system, all four classes of shares have identical voting, dividend, liquidation and other rights, other than the payment of distribution fees under the applicable Distribution Plan.
Additionally, Class A shares are sold at a maximum front-end sales charge of up to 4.50% for 1290 Convertible Securities Fund, 1290 High Yield Bond Fund and 1290 Unconstrained Bond Managers Fund, and up to 5.50% for 1290 GAMCO Small/Mid Cap Value Fund, 1290 Global Equity Managers Fund, 1290 Multi-Alternative Strategies Fund and 1290 SmartBeta Equity Fund. Class A shares sold without a front-end sales charge are subject to a contingent deferred sales charge (“CDSC”) of 1% of the lesser of net asset value of the redeemed shares at the time of purchase or the net asset value of the redeemed shares at the time of redemption, if redeemed within 12 months of purchase. Class C shares are subject to a CDSC of 1% of the lesser of net asset value of the redeemed shares at the time of purchase or the net asset value of the redeemed shares at the time of redemption, if redeemed within 12 months of purchase.
1290 High Yield Bond Fund shares that are held for one month or less are subject to a 2.00% redemption fee based on the current net asset value on all classes subject to certain exceptions as described in the Fund’s prospectus. No such redemption fees were assessed during the period ended October 31, 2015.
The investment objectives of each Fund are as follows:
1290 Convertible Securities Fund (sub-advised by Palisade Capital Management, LLC) — Seeks a high level of total return.
1290 GAMCO Small/Mid Cap Value Fund (sub-advised by GAMCO Asset Management, Inc.) — Seeks to maximize capital appreciation.
1290 Global Equity Managers Fund (sub-advised by OppenheimerFunds, Inc. and Templeton Investment Counsel, LLC) — Seeks to achieve long-term growth of capital.
1290 High Yield Bond Fund (sub-advised by AXA Investment Managers, Inc., an affiliate of 1290 Asset Managers) — Seeks to maximize current income.
1290 Multi-Alternative Strategies Fund — Seeks long-term growth of capital.
1290 SmartBeta Equity Fund (sub-advised by AXA Rosenberg Investment Management LLC, an affiliate of 1290 Asset Managers) — Seeks to achieve long-term capital appreciation.
1290 Unconstrained Bond Managers Fund (sub-advised by Pacific Investment Management Company LLC and TCW Investment Management Company) — Seeks to achieve maximum current income and total return over a full market cycle through opportunistic sector allocation.
The following is a summary of the significant accounting policies of the Trust:
The preparation of financial statements in accordance with United States of America generally accepted accounting principles (“U.S. GAAP”) requires management to make estimates and assumptions that affect the reported amounts and disclosures. Actual results could differ from those estimates. The Funds are investment companies and, accordingly, follow the investment company accounting and reporting guidance of the Financial Accounting Standards Board Accounting Standards Codification Topic 946 — Investment Companies, which is part of U.S. GAAP.
Valuation:
Equity securities (including securities issued by exchange-traded funds (“ETFs”)) listed on national securities exchanges are valued at the last sale price or official closing price on the date of valuation or, if there is no sale or official closing price, at the latest available bid price. Securities listed on the NASDAQ stock market will be valued using the NASDAQ Official Closing Price (“NOCP”). Generally, the NOCP will be the last sale price unless the reported trade for the security is outside the range of the bid/ask price. In such cases, the NOCP will be normalized to the nearer of the bid or ask price. Other unlisted stocks are valued at their last sale price or official closing price, or if there is no such price, at a bid price estimated by a broker.
93
1290 FUNDS
NOTES TO FINANCIAL STATEMENTS (Continued)
October 31, 2015
Corporate bonds and notes are generally valued on the basis of prices provided by a pricing service. The pricing service may utilize many factors in making evaluations, trading in similar groups of securities and any developments related to specific securities. However, when such prices are not available, such bonds and notes are valued at a bid price estimated by a broker.
Convertible preferred stocks listed on national securities exchanges are valued as of their last sale price or, if there is no sale, at the latest available bid price. Convertible bonds and unlisted convertible preferred stocks are valued using prices obtained from a pricing service for such investments or, if a pricing service price is not available, at bid prices obtained from one or more of the major dealers in such bonds or stocks. Where there is a discrepancy between dealers, values may be adjusted based on recent premium spreads to the underlying common stocks. Convertible bonds may be matrix-priced based upon the conversion value to the underlying common stocks and market premiums.
Mortgage-backed and asset-backed securities are valued at evaluated prices obtained from a pricing service where available, or at a bid price obtained from one or more of the major dealers in such securities. The pricing service may utilize data such as issuer type, coupon, cash flows, collateral performance, mortgage prepayment projection tables and Adjustable Rate Mortgage evaluations that incorporate index data, periodic and life caps, the next coupon reset date and the convertibility of the bond in making evaluations. If a quoted price is unavailable, an equivalent yield or yield spread quotes will be obtained from a broker and converted to a price.
Options that are traded on an exchange are generally valued at their last sale price or official closing price on the date of valuation. Options not traded on an exchange or actively traded are valued according to fair value methods. The market value of a put or call option will usually reflect, among other factors, the market price of the underlying security.
Corporate and Municipal bonds and notes are generally valued on the basis of prices provided by a pricing service. The pricing service may utilize many factors in making evaluations, trading in similar groups of securities and any developments related to specific securities. However, when such prices are not available, such bonds and notes are valued at a bid price estimated by a broker.
U.S. Treasury securities and other obligations issued or guaranteed by the U.S. Government, its agencies or instrumentalities, are valued at prices obtained from a bond pricing service where available. The pricing service may utilize data received from active market makers and broker dealers, yield curves and the spread over comparable U.S. Treasury issues in making evaluations.
Foreign securities, including foreign government securities, not traded directly in the U.S., or traded in American Depositary Receipts (“ADR”) or similar form, are valued at representative quoted prices from the primary exchange in the currency of the country of origin. Foreign currency is converted into U.S. dollar equivalent at current exchange rates.
Investments in shares of open-end investment companies (other than ETFs) held by a Fund will be valued at the net asset value of the shares of such funds as described in these Funds’ prospectuses.
Futures contracts are valued at their last settlement price or, if there is no sale, at the latest available bid price.
Centrally cleared swaps are priced using the value determined by the central counterparty (“CCP”) at the end of the day. If the CCP price is unavailable, a price provided by an approved pricing service will be used.
Forward foreign exchange contracts are valued by interpolating between the forward and spot currency rates as quoted by a pricing service as of a designated hour on the valuation date. The pricing service may utilize data such as actual trading information and foreign currency exchange rates gathered from leading market makers and foreign currency exchange trading centers throughout the world in making evaluations.
94
1290 FUNDS
NOTES TO FINANCIAL STATEMENTS (Continued)
October 31, 2015
During the period ended October 31, 2015, the 1290 Unconstrained Bond Managers Fund held forward foreign currency contracts to either gain exposure to certain currencies, or enter into an economic hedge against changes in the values of securities held in the Fund, that do not qualify for hedge accounting under Accounting Standards Codification (“ASC”) 815. The Statement of Operations for each Fund reflects realized gains or losses, if any, in forward currency transactions and unrealized gains or losses in forward currency exchange transactions. Further information on the impact of these positions on the Funds’ financial statements can be found in the Statement of Operations and Portfolio of Investments for each Fund.
If market quotations are not readily available for a security or other financial instruments, such securities and instruments shall be referred to the Trust’s Valuation Committee (“Committee”), who will value the assets in good faith pursuant to procedures (“Pricing Procedures”) adopted by the Board of Trustees of the Trust (the “Board”).
The Board is responsible for ensuring that appropriate valuation methods are used to price securities for the Funds. The Board has delegated the responsibility of calculating the NAVs of the Funds and classes pursuant to these Pricing Procedures to the Trust’s administrator, FMG LLC (in its capacity as administrator, the “Administrator”). The Administrator has entered into a sub-administration agreement with JPMorgan Chase Bank, N.A. (the “Sub-Administrator”) to assist in performing certain of the duties described herein. The Committee determines the value of the Trust’s securities and assets for which market quotations are not readily available or for which valuation cannot otherwise be provided in accordance with procedures adopted by the Board. The Committee is comprised of senior employees from FMG LLC.
Due to the inherent uncertainty of valuations of such securities, the fair value may differ significantly from the values that would have been used had a ready market for such securities existed.
Various inputs are used in determining the value of the Trust’s assets or liabilities carried at fair value. These inputs are summarized in three broad levels below:
| | • | | Level 1 - quoted prices in active markets for identical assets |
| | • | | Level 2 - other significant observable inputs (including quoted prices of similar securities, interest rates, prepayment speeds, credit risk, etc.) |
| | • | | Level 3 - significant unobservable inputs (including the Fund’s own assumptions in determining the fair value of investments) |
A summary of inputs used to value each Fund’s assets and liabilities carried at fair value as of October 31, 2015 is included in the Portfolios of Investments. Changes in valuation techniques may result in transfers in or out of an investment’s assigned level. The Funds’ policy is to recognize transfers into and transfers out of the valuation levels as of the end of the reporting period. Transfers between levels are included after the Summary of Level 1, Level 2 and Level 3 inputs, following the Portfolio of Investments for each Fund. Transfers between levels may be due to a decline or an increase in market activity (e.g., frequency of trades), which may result in a lack of, or increase in, available market inputs to determine price.
The inputs or methodology used to value securities are not necessarily an indication of the risk associated with investing in those securities. An investment’s level within the fair value hierarchy is based on the lowest level of any input, both individually and in the aggregate, that is significant to the fair value measurement.
The Committee meets and reviews reports based on the valuation technique used to value each particular Level 3 security. In connection with this review, the Committee obtains, when available, updates from its pricing vendors and Sub-Advisers for each fair valued security. For example, with respect to model driven prices, the Committee receives a report regarding a review and recalculation of pricing models and related discounts. For securities valued based on broker quotes, the Committee
��
95
1290 FUNDS
NOTES TO FINANCIAL STATEMENTS (Continued)
October 31, 2015
evaluates variances between existing broker quotes and any alternative broker quotes provided by a Sub-Adviser or other pricing source.
To substantiate unobservable inputs used in fair valuation, the Secretary of the Committee performs an independent verification and additional research for all fair value notifications received from its pricing agent. Among other factors, particular areas of focus include: description of security, historical pricing, intra-day price movement, last trade information, corporate actions, related securities, any available company news and announcements and any available trade data or other information. The Committee also notes the materiality of holdings and price changes on a Fund’s NAV.
The Committee reviews and considers changes in value for all fair valued securities that have occurred since the last review.
Pursuant to procedures approved by the Board, events or circumstances affecting the values of Fund securities that occur between the closing of their principal markets and the time the net asset value is determined may be reflected in the Trust’s calculation of NAV for each applicable Fund when the Adviser deems that the particular event or circumstance would materially affect such Fund’s NAV. None of the Funds applied these procedures on October 31, 2015.
Security Transactions and Investment Income:
Securities transactions are recorded on the trade date net of brokerage fees, commissions, and transfer fees. Dividend income (net of withholding tax) and distributions to shareholders are recorded on the ex-dividend date, except that certain dividends from foreign securities, if any, are recognized as soon as the Fund is informed of the ex-dividend date. Interest income (including amortization of premium and accretion of discount on long-term securities using the effective yield method) and interest expense are accrued daily. The Trust records paydown gains and losses realized on prepayments received on mortgage-backed securities as an adjustment to interest income.
The Funds record distributions received in excess of income from underlying investments as a reduction of cost of investments and/or realized gain. Such amounts are based on estimates if actual amounts are not available and actual amounts of income, realized gain and return of capital may differ from the estimated amounts. The Funds adjust the estimated amounts of components of distributions (and consequently its net investment income) as necessary once the issuers provide information about the actual composition of the distributions.
Realized gains and losses on the sale of investments are computed on the basis of the specific identified cost of the investments sold. Unrealized appreciation (depreciation) on investments and foreign currency denominated assets and liabilities, if any, is presented net of deferred taxes on unrealized appreciation in the Statements of Assets and Liabilities.
Allocation of Expenses and Income:
Expenses attributable to a single Fund or class are charged to that Fund or class. Expenses of the Trust not attributable to a single Fund or class are charged to each Fund or class in proportion to the average net assets of each Fund or other appropriate allocation methods. Prior to the commencement of operations of the Trust, the following funds incurred both offering and organizational costs as detailed in the below tables. As the organizational costs were incurred prior to the commencement of operations, they are not reflected in the current period’s Statement of Operations.
| | | | |
Offering costs Funds | | Amount | |
1290 GAMCO Small/Mid Cap Value | | $ | 112,451 | |
1290 High Yield Bond | | | 112,451 | |
1290 SmartBeta Equity | | | 112,452 | |
96
1290 FUNDS
NOTES TO FINANCIAL STATEMENTS (Continued)
October 31, 2015
| | | | |
Organizational costs Funds | | Amount | |
1290 GAMCO Small/Mid Cap Value | | $ | 117,416 | |
1290 High Yield Bond | | | 117,416 | |
1290 SmartBeta Equity | | | 117,417 | |
Additionally, the following Funds incurred Offering costs during the period ended October 31, 2015 as follows:
| | | | |
Offering costs Funds | | Amount | |
1290 Convertible Securities | | $ | 27,366 | |
1290 GAMCO Small/Mid Cap Value | | | 24,398 | |
1290 Global Equity Managers | | | 27,278 | |
1290 High Yield Bond | | | 24,875 | |
1290 Multi-Alternative Strategies | | | 27,805 | |
1290 SmartBeta Equity | | | 24,439 | |
1290 Unconstrained Bond Managers | | | 27,633 | |
Offering costs incurred in connection with the offering of shares of the Funds will be amortized and recorded as an expense on a straight line basis over 12 months from the date of the Funds commencement of public offering of shares. Organizational expenses, incurred prior to the Funds’ commencement of the public offering of shares, during the period ended October 31, 2014 were reimbursed by the Adviser.
All income earned and expenses incurred by each Fund are borne on a pro-rata basis by each outstanding class of shares, based on the proportionate interest in the Fund represented by the daily net assets of such class, except for distribution fees which are charged on a class-specific basis.
Foreign Currency Valuation:
The books and records of the Trust are kept in U.S. dollars. Foreign currency amounts are translated into U.S. dollars at current exchange rates at the following dates:
(i) market value of investment securities, other assets and liabilities — at the valuation date.
(ii) purchases and sales of investment securities, income and expenses — at the date of such transactions.
The Funds do not isolate that portion of the results of operations resulting from changes in foreign exchange rates on investments from the fluctuations arising from changes in market prices of securities held. Such fluctuations are included with the net realized and unrealized gain or loss on investments.
Net currency gains or losses realized and unrealized as a result of differences between interest or dividends, withholding taxes, security payables/receivables, forward foreign currency exchange contracts and foreign cash recorded on a Fund’s books and the U.S. dollar equivalent amount actually received or paid are presented under foreign currency transactions and foreign currency translations in the realized and unrealized gains and losses section, respectively, of the Statements of Operations of the Funds. Net realized gains (losses) on foreign currency transactions represent net foreign exchange gains (losses) from forward foreign currency contracts, disposition of foreign currencies, currency gains or losses realized between the trade and settlement dates on securities transactions, and the difference between the amount of investment income and foreign withholding taxes recorded on a Fund’s books and the U.S. dollar equivalent of amounts actually received or paid.
Taxes:
The Funds intend to comply with the requirements of the Internal Revenue Code of 1986, as amended, applicable to regulated investment companies (“RICs”) and to distribute substantially all
97
1290 FUNDS
NOTES TO FINANCIAL STATEMENTS (Continued)
October 31, 2015
of its net investment income and net realized capital gains to shareholders of each Fund. Therefore, no Federal, State and local income tax provision are required.
The Funds are not aware of any tax positions for which it is reasonably possible that the total amounts of unrecognized tax benefits will significantly change in the next twelve months. However, the Funds’ conclusions may be subject to future review based on changes in, or the interpretation of, the accounting standards or tax laws and regulations. The Funds recognize interest and penalties, if any, related to uncertain tax positions as income tax expense in the statements of Operations. During the period ended October 31, 2015, the Funds did not incur any interest or penalties. The tax year for the period ended October 31, 2015 remains subject to examination by the Internal Revenue Service, State and local taxing authorities.
Dividends from net investment income, if any, are declared and distributed at least annually for all Funds (1290 Convertible Securities Fund, 1290 High Yield Bond Fund and 1290 Unconstrained Bond Managers Fund declare and distribute monthly). Dividends from net realized short-term and long-term capital gains are declared and distributed at least annually. All distributions are calculated on a tax basis and, as such, the amounts may differ from financial statement investment income and realized gains. Short-term capital gains and foreign currency gains are treated as capital gains for U.S. GAAP purposes but are considered ordinary income for tax purposes. Capital and net specified losses incurred after October 31st and within the taxable year are deemed to arise on the first business day of the Fund’s next taxable year. The tax character of distributions for the period ended October 31, 2015 and the tax composition of undistributed ordinary income and undistributed long term gains for the period ended October 31, 2015 are presented in the following table. For the Funds, the cumulative timing differences related to the tax composition of undistributed ordinary income and long term gains are primarily due to Distributions Payable (1290 High Yield Bond) and Losses Carried Forward (1290 High Yield Bond and 1290 Unconstrained Bond Managers).
| | | | | | | | | | | | |
| | | Year Ended October 31, 2015 | |
Funds: | | Distributed
Ordinary
Income | | | Accumulated
Undistributed
Ordinary
Income | | | Accumulated
Undistributed
Long Term
Gains | |
1290 Convertible Securities | | $ | 79,871 | | | $ | 64,906 | | | $ | — | |
1290 GAMCO Small/Mid Cap Value | | | 18,854 | | | | 118,272 | | | | 203 | |
1290 Global Equity Managers | | | — | | | | 34,029 | | | | — | |
1290 High Yield Bond | | | 1,820,139 | | | | 239,013 | | | | — | |
1290 Multi-Alternative Strategies | | | — | | | | 2,002 | | | | — | |
1290 SmartBeta Equity | | | 30,060 | | | | 127,923 | | | | — | |
1290 Unconstrained Bond Managers | | | 220,349 | | | | 28,490 | | | | — | |
Permanent book and tax differences relating to shareholder distributions resulted in reclassifications to undistributed (overdistributed) net investment income (loss), accumulated net realized gain (loss) and paid-in-capital at period ended October 31, 2015 as follows:
| | | | | | | | | | | | |
Funds: | | Undistributed
Net Investment
Income (Loss) | | | Accumulated
Net Realized
Gain (Loss) | | | Paid In
Capital | |
1290 Convertible Securities | | $ | 6,521 | | | $ | (70 | ) | | $ | (6,451 | ) |
1290 GAMCO Small/Mid Cap Value | | | 19,968 | | | | 1,628 | | | | (21,596 | ) |
1290 Global Equity Managers | | | (9,836 | ) | | | 18,735 | | | | (8,899 | ) |
1290 High Yield Bond | | | 83,504 | | | | — | | | | (83,504 | ) |
1290 Multi-Alternative Strategies | | | 3,247 | | | | — | | | | (3,247 | ) |
1290 SmartBeta Equity | | | 42,680 | | | | 7,757 | | | | (50,437 | ) |
1290 Unconstrained Bond Managers | | | 72,926 | | | | (63,911 | ) | | | (9,015 | ) |
The significant permanent book and tax differences related to the adjustments above are related to Non-deductible offering costs (1290 GAMCO Small/Mid Cap Value and 1290 SmartBeta Equity).
98
1290 FUNDS
NOTES TO FINANCIAL STATEMENTS (Continued)
October 31, 2015
Under the Regulated Investment Company Modernization Act of 2010 (the “RIC Mod Act”), net capital losses recognized by the Funds may get carried forward indefinitely, and retain their character as short-term and/or long term losses. The following Funds have losses incurred that will be carried forward under the provisions of the RIC Mod Act as follows:
| | | | | | | | |
| | | Losses Carried Forward | |
Funds | | Short Term | | | Long Term | |
1290 Convertible Securities | | $ | 51,837 | | | $ | — | |
1290 Global Equity Managers | | | 95,125 | | | | — | |
1290 High Yield Bond | | | 492,343 | | | | — | |
1290 SmartBeta Equity | | | 26,147 | | | | — | |
1290 Unconstrained Bond Managers | | | 278,307 | | | | 21,356 | |
Sale-Buybacks:
A sale-buyback transaction consists of a sale of a security by a Fund to a financial institution, the counterparty, with a simultaneous agreement to repurchase the same or substantially the same security at an agreed-upon price and date. The Fund is not entitled to receive principal and interest payments, if any, made on the security sold to the counterparty during the term of the agreement. The agreed-upon proceeds for securities to be repurchased by the Fund are reflected as a liability on the Fund’s Statement of Assets and Liabilities. The Fund will recognize net income represented by the price differential between the price received for the transferred security and the agreed-upon repurchase price. This is commonly referred to as the “price drop.” A price drop consists of: (i) the foregone interest and inflationary income adjustments, if any, the Fund would have otherwise received had the security not been sold; and (ii) the negotiated financing terms between the Fund and counterparty. Foregone interest and inflationary income adjustments, if any, are recorded as components of interest income on the Fund’s Statement of Operations. Interest payments based upon negotiated financing terms made by the Fund to counterparties are recorded as a component of interest expense on the Fund’s Statement of Operations. In periods of increased demand for the security, the Fund may receive a fee for use of the security by the counterparty, which may result in interest income to the Fund. The Fund will segregate assets determined to be liquid to cover its obligations under sale-buyback transactions. None of the Funds had open sale-buybacks at October 31, 2015.
Accounting for Derivative Instruments:
Following is a description of how and why the Funds use derivative instruments, the type of derivatives utilized by the Funds during the reporting period, as well as the primary underlying risk exposures related to each instrument type. Derivatives accounted for as hedging instruments must be disclosed separately from those that do not qualify for hedge accounting. Even though the Funds may use derivatives in an attempt to achieve an economic hedge, the Fund’s derivatives may not be accounted for as hedging instruments because the Funds account for their derivatives at fair value and record any changes in fair value in current period earnings. All open derivative positions at period end are reflected on each respective Fund’s Portfolio of Investments. The volume of derivative activity, based on month-end notional amounts during the period is also noted in each respective Funds’ Portfolio of Investments. Portfolio securities are reserved and/or pledged with the custodian for current or potential derivative holdings as necessary throughout the year.
Options:
Certain Funds write (sell) covered options as a hedge to provide protection against adverse movements in the price of securities in the Fund or to enhance investment performance. Certain Funds purchase and sell exchange traded options on foreign currencies. When a Fund writes an option, an amount equal to the premium received by the Fund is recorded as a liability and is subsequently adjusted on a daily basis to the current market price of the option written. Premiums
99
1290 FUNDS
NOTES TO FINANCIAL STATEMENTS (Continued)
October 31, 2015
received from writing options that expire unexercised are recognized as gains on the expiration date. Premiums received from writing options that are exercised or are cancelled in closing purchase transactions are offset against the cost of any securities purchased or added to the proceeds or netted against the amount paid on the transaction to determine the realized gain or loss. In writing options, a Fund must assume that the option may be exercised at any time prior to the expiration of its obligation as a writer, and that in such circumstances the net proceeds of the sale (or cost of) purchase of the underlying securities and currencies pursuant to the call or put option may be substantially below or above the prevailing market price. A Fund also has the additional risk of not being able to enter into a closing purchase transaction if a liquid secondary market does not exist and bears the risk of unfavorable changes in the price of the financial instruments underlying the options.
Certain Funds may purchase put options on securities to increase the Fund’s total investment return or to protect its holdings against a substantial decline in market value. The purchase of put options on securities will enable a Fund to preserve, at least partially, unrealized gains in an appreciated security in its Fund without actually selling the security. In addition, the Funds will continue to receive interest or dividend income on the security. The Funds may also purchase call options on securities to protect against substantial increases in prices of securities that Funds intend to purchase pending their ability to invest in an orderly manner in those securities. The Funds may sell put or call options they have previously purchased, which could result in a net gain or loss depending on whether the amount received on the sale is more or less than the premium and other transaction costs paid on the put or call option which was bought.
Futures Contracts, Options on Futures Contracts, Forward Commitments and Foreign Currency Exchange Contracts:
The futures contracts used by the Funds are agreements to buy or sell a financial instrument for a set price in the future. Options on futures contracts used by the Funds are rights to buy, or sell a futures contract for a set price in the future. Certain Funds buy or sell futures contracts for the purpose of protecting their Fund securities against future changes in interest rates and indices which might adversely affect the value of the Funds’ securities or the price of securities that they intend to purchase at a later date. Initial margin deposits are made upon entering into futures contracts and can be in cash, certain money market instruments, treasury securities or other liquid, high grade debt securities. During the period the futures contracts are open, changes in the market price of the contracts are recognized as unrealized gains or losses by “marking-to-market” at the end of each trading day. Variation margin payments on futures contracts are received or made, depending upon whether unrealized gains or losses are incurred. When the contract is closed, the Fund records a realized gain or loss equal to the difference between the proceeds from or cost of the closing transactions and the Fund’s basis in the contract. Should interest rates or indices move unexpectedly, the Fund may not achieve the anticipated benefits of the futures contracts and may incur a loss. The use of futures contracts transactions involves the risk of imperfect correlation in movements in the price of futures contracts, interest rates and the underlying hedged assets. Use of long futures contracts subjects the Funds to risk of loss in excess of the amounts shown on the Statements of Assets and Liabilities, up to the notional value of the futures contracts. Use of short futures contracts subjects the Funds to unlimited risk of loss. The Funds enter into futures contracts only on exchanges or boards of trade. The exchange or board of trade acts as the counterparty to each futures transaction; therefore, a Fund’s credit risk is limited to failure of the exchange or board of trade.
A Fund may make contracts to purchase or sell securities for a fixed price at a future date beyond customary settlement time (“forward commitments”). Funds may designate the segregation, either on their records or with the Trust’s custodian, of cash or other liquid securities in an amount sufficient to meet the purchase price, or may enter into offsetting contracts for the forward sale of other securities they own. These commitments are reported at market value in the financial statements. Forward commitments may be considered securities in themselves and involve a risk of loss if the value of the security to be purchased declines or if the value of the security to be sold increases prior to the settlement date, which is a risk in addition to the risk of decline in value of the
100
1290 FUNDS
NOTES TO FINANCIAL STATEMENTS (Continued)
October 31, 2015
Fund’s other assets. Where such purchases or sales are made through dealers, a Fund relies on the dealer to consummate the sale. The dealer’s failure to do so may result in the loss to a Fund of an advantageous yield or price. Market risk exists on these commitments to the same extent as if the securities were owned on a settled basis and gains and losses are recorded and reported in the same manner. However, during the commitment period, these investments earn no interest or dividends. The use of forward commitments may result in market risk to the Funds that is greater than if the Funds had engaged solely in transactions that settle in the customary time.
The Funds may be exposed to foreign currency risks associated with Fund investments. During the reporting period, the Funds entered into certain forward foreign currency exchange contracts for the purchase or sale of a specific foreign currency at a fixed price on a future date to hedge or otherwise manage these exposures. Unrealized gains or losses on forward foreign currency exchange contracts are recorded by the Funds on a daily basis and realized gains or losses are recorded on the settlement date of a contract.
A Fund may purchase foreign currency on a spot (or cash) basis. In addition, a Fund may enter into contracts to purchase or sell foreign currencies at a future date (“forward contracts”). A forward foreign currency exchange contract is a commitment to purchase or sell a foreign currency at a future date at a negotiated forward rate. Daily fluctuations in the value of such contracts are recognized as unrealized appreciation or depreciation by “marking to market”. The gain or loss arising from the difference between the original contracts and the closing of such contracts is included in realized gains or losses from foreign currency transactions in the Statements of Operations of the Funds. The Sub-Advisers may engage in these forward contracts to protect against uncertainty in the level of future exchange rates in connection with the purchase and sale of Fund securities (“transaction hedging”) and to protect the value of specific Fund positions (“position hedging”). The Funds also buy forward foreign currency exchange contracts to gain exposure to currencies. The Funds are subject to off-balance sheet risk to the extent of the value of the contracts for purchase of foreign currency and in an unlimited amount for sales of foreign currency.
Swaps:
Swap agreements are two party contracts entered into primarily by institutional investors for periods ranging from a few weeks to more than one year. Swaps are marked to-market daily based upon values from third party vendors, which may include a registered exchange, or quotations from market makers to the extent available. In the event that market quotes are not readily available and the swap cannot be valued pursuant to one of the valuation methods, the value of the swap will be determined in good faith by the Committee. Changes in market value, if any, are reflected as a component of net changes in unrealized appreciation/ (depreciation) on the Statements of Operations. Daily changes in valuation of centrally cleared swaps, if any, are recorded as a receivable or payable for the change in value as appropriate (“variation margin”) on the Statements of Assets and Liabilities. There is potential for swaps to be illiquid. Over-the-counter (“OTC”) swap payments received or made at the beginning of the measurement period are reflected as such on the Statements of Assets and Liabilities and represent premiums paid or received upon entering into the swap agreement to compensate for differences between the stated terms of the swap agreement and prevailing market conditions (credit spreads, currency exchange rates, interest rates, and other relevant factors). These upfront premiums are recorded as realized gains or losses on the Statement of Operations upon termination or maturity of the swap. A liquidation payment received or made at the termination of the swap is recorded as realized gain or loss on the Statement of Operations. Net periodic payments received or paid by a Fund are included as part of realized gains or losses on the Statement of Operations.
Currency swaps involve the exchange by one party with another party of a series of payments in specified currencies. Currency swaps usually involve the delivery of the entire principal value of one designated currency in exchange for the other designated currency. Therefore, the entire principal value of a currency swap is subject to the risk that the other party to the swap will default on its contractual delivery obligations. In addition, a Fund may enter into currency swaps that involve an
101
1290 FUNDS
NOTES TO FINANCIAL STATEMENTS (Continued)
October 31, 2015
agreement to pay interest streams in one currency based on a specified index in exchange for receiving interest streams denominated in another currency. Currency swaps may involve initial and final exchanges that correspond to the agreed upon notional amount.
Interest rate swaps involve the exchange between two parties of payments calculated by reference to specified interest rates (e.g., an exchange of floating rate payments for fixed rate payments). The purchase of an interest rate cap entitles the purchaser, to the extent that a specified index exceeds a predetermined interest rate, to receive payments of interest on a notional principal amount from the party selling such interest rate cap. The purchase of an interest rate floor entitles the purchaser, to the extent that a specified index falls below a predetermined interest rate, to receive payments of interest on a notional principal amount from the party selling such interest rate floor. Caps and floors may be less liquid than swaps. In addition, the value of interest rate transactions will fluctuate based on changes in interest rates.
Credit default swap agreements involve greater risks than if a Fund had invested in the reference obligation directly since, in addition to general market risks, credit default swaps are subject to illiquidity risk, counterparty risk and credit risk. A Fund will enter into credit default swap agreements only with counterparties that meet certain standards of creditworthiness. A buyer generally also will lose its investment and recover nothing should no credit event occur and the swap is held to its termination date. If a credit event were to occur, the value of any deliverable obligation received by the seller, coupled with the upfront or periodic payments previously received, may be less than the full notional value it pays to the buyer, resulting in a loss of value to the seller. A Fund’s obligations under a credit default swap agreement will be accrued daily (offset against any amounts owing to the Fund). In connection with credit default swaps in which a Fund is the buyer, the Fund will segregate or “earmark” cash or assets determined to be liquid, or enter into certain offsetting positions, with a value at least equal to the Fund’s exposure (any accrued but unpaid net amounts owed by the Fund to any counterparty), on a marked-to-market basis. In connection with credit default swaps in which a Fund is the seller, the Fund will segregate or “earmark” cash or assets determined to be liquid, or enter into offsetting positions, with a value at least equal to the full notional amount of the swap (minus any amounts owed to the Fund). Such segregation or “earmarking” is intended to ensure that the Fund has assets available to satisfy its obligations with respect to the transaction and limit any potential leveraging of the Fund. Such segregation or “earmarking” will not limit the Fund’s exposure to loss. To the extent that credit default swaps are entered into for hedging purposes or are covered as described above, the Adviser believes such obligations do not constitute “senior securities” under the 1940 Act and, accordingly, will not treat them as being subject to the Fund’s senior security and borrowing restrictions.
In the case of a credit default swap sold by a Fund (i.e., where the Fund is selling credit default protection), the Fund may value the credit default swap at its notional amount in applying certain of the Fund’s investment policies and restrictions, but may value the credit default swap at market value for purposes of applying certain of the Fund’s other investment policies and restrictions.
An option on a swap agreement, also called a “swaption,” is an option that gives the buyer the right, but not the obligation, to enter into a swap on a future date in exchange for paying a market-based “premium.” A receive swaption gives the owner the right to receive the total return of a specified asset, reference rate, or index. A payer swaption gives the owner the right to pay the total return of a specified asset, reference rate, or index. A purchaser of a swaption risks losing only the amount of the premium it has paid should it decide to let the option expire, whereas the seller of a swaption is subject to the risk that it will become obligated if the option is exercised. Swaptions also include options that allow an existing swap to be terminated or extended by one of the counterparties.
Market and Credit Risk:
A Fund’s investments in financial instruments expose the Fund to various risks such as, but not limited to, interest rate, foreign currency, forward commitments and equity risks.
102
1290 FUNDS
NOTES TO FINANCIAL STATEMENTS (Continued)
October 31, 2015
Interest rate risk is the risk that fixed income securities will decline in value because of changes in interest rates. As nominal interest rates decline the value of a certain fixed-income securities of a Fund is likely to rise. Conversely, as nominal interest rates rise, the value of certain fixed income securities held by a Fund is likely to decrease. A nominal interest rate can be described as the sum of a real interest rate and an expected inflation rate. Interest rate changes can be sudden and unpredictable, and a Fund may lose money if these changes are not anticipated by Fund management. A Fund may not be able to hedge against changes in interest rates or may choose not to do so for cost or other reasons. In addition, any hedges may not work as intended. Fixed income securities with longer durations tend to be more sensitive to changes in interest rates, usually making them more volatile than securities with shorter durations. Duration is useful primarily as a measure of the sensitivity of a security’s market price to interest rate (i.e. yield) movements.
Foreign (non U.S.) securities in this report are classified by the country of incorporation of a holding. In certain instances, a security’s country of incorporation may be different from its country of economic exposure.
If a Fund invests directly in foreign currencies or in securities that trade in, and receive revenues in, foreign currencies, or in financial derivatives that provide exposure to foreign currencies, it will be subject to the risk that those currencies will decline in value relative to the base currency of the Fund, or, in the case of hedging positions, that the Fund’s base currency will decline in value relative to the currency being hedged. Currency rates in foreign countries may fluctuate significantly over short periods of time for a number of reasons, including changes in interest rates, intervention (or the failure to intervene) by U.S. or foreign governments, central banks or supranational entities such as the International Monetary Fund, or by the imposition of currency controls or other political developments in the United States or abroad. As a result, a Fund’s investments in foreign currency denominated securities may reduce the Fund’s returns.
Forward commitments and forward foreign currency exchange contracts involve elements of both market and credit risk in excess of the amounts reflected in the Statements of Assets and Liabilities. They are executed directly with the counterparty and not through an exchange and can be terminated only by agreement of both parties to such contracts. With respect to such transactions there is no daily margin settlement. There is also the risk that the security will not be issued or that the other party to the transaction will not meet its obligations. If this occurs, the Fund may lose both the investment opportunity for its assets if set aside to pay for the security and any gain in the security.
The market values of the Fund’s investments may decline due to general market conditions which are not specifically related to a particular company or issuer, such as real or perceived adverse economic conditions, changes in the general outlook for corporate earnings, changes in interest or currency rates or adverse investor sentiment generally. They may also decline due to factors which affect a particular industry or industries, such as labor shortages or increased production costs and competitive conditions within an industry. Equity securities and equity related investments generally have greater market price volatility than fixed income securities, although under certain market conditions fixed income securities may have comparable or greater price volatility. Credit ratings downgrades may also negatively affect securities held by a Fund. Even when markets perform well, there is no assurance that the investments held by a Fund will increase in value along with the broader market. In addition, market risk includes the risk that geopolitical events will disrupt the economy on a national or global level.
A Fund will be exposed to credit risk to parties with whom it trades and will also bear the risk of settlement default. A Fund seeks to minimize concentrations of credit risk by undertaking transactions with a large number of counterparties on recognized and reputable exchanges, where applicable. A Fund could lose money if the issuer or guarantor of a fixed income security, or the counterparty of a financial derivatives contract, repurchase agreement or a loan of portfolio securities, is unable or unwilling, or is perceived (whether by market participants, rating agencies,
103
1290 FUNDS
NOTES TO FINANCIAL STATEMENTS (Continued)
October 31, 2015
pricing services or otherwise) as unable or unwilling to make timely principal and/or interest payments, or to otherwise honor its obligations. Securities are subject to varying degrees of credit risk, which are often reflected in credit ratings.
Certain Funds may invest in below investment grade high-yield securities (“junk bonds”). These securities are considered to be high risk investments. Securities rated below investment grade are speculative in nature, involve greater risk of default by the issuing entity and may be subject to greater market fluctuations than higher rated fixed income securities because such securities are generally unsecured and subordinated to other creditors’ claims. The retail secondary market for these “junk bonds” may be less liquid than that of higher rated securities and adverse economic conditions could make it difficult to sell certain securities or could result in lower prices than those used in calculating the Fund’s net asset value.
Offsetting Assets and Liabilities:
The Funds may be subject to various netting arrangements with select counterparties (“Master Agreements”). Master Agreements govern the terms of certain transactions, and are intended to reduce the counterparty risk associated with relevant transactions by specifying credit protection mechanisms and providing standardization that is intended to improve legal certainty. As the Master Agreements are specific to unique operations of different asset types, they allow a Fund to close out and net its total exposure to a counterparty in the event of a default with respect to all the transactions governed under a single Master Agreement with a counterparty. For financial reporting purposes the Statement of Assets and Liabilities generally show derivative assets and liabilities on a gross basis, which reflects the full risks and exposures prior to netting.
Note 2 Agreements
The Trust, on behalf of each Fund, has entered into an Investment Advisory Agreement (the “Advisory Agreement”) with the Adviser. Pursuant to the Advisory Agreement, the Adviser supervises the investment program for each Fund in accordance with each Fund’s investment objectives, policies and restrictions. The Adviser is paid a fee for these services. The fee is accrued daily and paid monthly based on the Fund’s average daily net assets, at an annual rate of:
| | | | | | | | | | | | | | | | | | | | |
| | | (as a percentage of average daily net assets) | |
Funds: | | First
$1 Billion | | | Next
$1 Billion | | | Next
$3 Billion | | | Next
$5 Billion | | | Thereafter | |
1290 GAMCO Small/Mid Cap Value | | | 0.750 | % | | | 0.700 | % | | | 0.675 | % | | | 0.650 | % | | | 0.625 | % |
1290 Global Equity Managers | | | 0.800 | | | | 0.750 | | | | 0.725 | | | | 0.700 | | | | 0.675 | |
1290 SmartBeta Equity | | | 0.700 | | | | 0.650 | | | | 0.625 | | | | 0.600 | | | | 0.575 | |
| | | | | | | | | | | | | | | | |
| | | (as a percentage of average daily net assets) | |
Fund: | | First
$4 Billion | | | Next
$4 Billion | | | Next
$2 Billion | | | Thereafter | |
1290 Multi-Alternative Strategies | | | 0.500 | % | | | 0.490 | % | | | 0.480 | % | | | 0.470 | % |
| | | | | | | | | | | | |
| | | (as a percentage of average daily net assets) | |
Funds: | | First
$4 Billion | | | Next
$4 Billion | | | Thereafter | |
1290 Convertible Securities | | | 0.700 | % | | | 0.680 | % | | | 0.660 | % |
1290 High Yield Bond | | | 0.600 | | | | 0.580 | | | | 0.560 | |
1290 Unconstrained Bond Managers | | | 0.800 | | | | 0.780 | | | | 0.760 | |
On behalf of the Trust, the Adviser has entered into an investment sub-advisory agreement (“Sub-Advisory Agreements”) with each of the Sub-Advisers. Each of the Sub-Advisory Agreements obligates the Sub-Advisers for the respective Funds to: (i) continuously furnish investment programs for the Funds; (ii) place all orders for the purchase and sale of investments for the Funds with brokers
104
1290 FUNDS
NOTES TO FINANCIAL STATEMENTS (Continued)
October 31, 2015
or dealers selected by the Adviser or the respective Sub-Advisers; and (iii) perform certain limited related administrative functions in connection therewith. The Adviser pays the expenses of providing investment sub-advisory services to the Funds, including the fees of the Sub-Advisers of each Fund.
In addition to the advisory fee, each Fund pays the Administrator its proportionate share of an asset-based administration fee, which is equal to an annual rate of the greater of 0.15% of each Fund’s average daily net assets, or $30,000 per Fund (or $30,000 for each allocated portion (or sleeve) of a Fund, as applicable). The Administrator has contracted with the Sub-Administrator to provide, pursuant to a sub-administration agreement, the Funds with certain administrative services, including monitoring of Fund compliance and Fund accounting services.
Prior to July 1, 2015, each Fund paid the Administrator its proportionate share of an asset-based administration fee, which is equal to an annual rate of 0.15% of each Fund’s average daily net assets plus $30,000 per Fund and $30,000 for each allocated portion (or sleeve) of a Fund, as applicable.
The Trust, on behalf of the Funds, has entered into a distribution agreement (the “Distribution Agreement”) with ALPS Distributors, Inc. (“ALPS” or the “Distributor”), under which ALPS serves as Distributor for each Fund’s Class A, Class C, Class I and Class R shares. The Board has approved Distribution Plans pursuant to Rule 12b-1 under the 1940 Act for Class A, Class C, and Class R shares for each Fund. Pursuant to the Distribution Plans, the Funds will pay the Distributor annual fees at the following rates:
| | | | |
Share Class | | Distribution Fee and/or Service Fee
(as a % of average daily net
assets attributable to the class) | |
Class A | | | 0.25 | % |
Class C | | | 1.00 | %* |
Class R | | | 0.50 | % |
| * | The Distribution Fees for Class C shares are currently being waived. This waiver is voluntary and could be eliminated at any time. |
The Trust, on behalf of the Funds, has entered into a Transfer Agency and Service Agreement (the “Transfer Agency Agreement”) with Boston Financial Data Services (“BFDS”). Pursuant to the Transfer Agency Agreement, BFDS is responsible for, among other things, the issuance, transfer and redemption of shares, the opening and maintenance of shareholder accounts, the handling of certain communications between shareholders and the Trust, and the payment of dividends and distributions payable by the Funds. Under the Transfer Agency Agreement, BFDS receives a monthly fee comprised of a fixed base fee plus a fee computed on the basis of the number of shareholder accounts it maintains for the Trust during the month.
The Trust has entered into a Custody Agreement with JPMorgan Chase Bank, N.A. (in this capacity, the “Custodian”). The Custody Agreement provides for an annual fee based on the amount of assets under custody plus transaction charges. The Custodian serves as custodian of the Trust’s Fund securities and other assets. Under the terms of the Custody Agreement between the Trust and the Custodian, the Custodian maintains and deposits in each Fund’s account, cash, securities and other assets of the Funds. The Custodian is also required, upon the order of the Trust, to deliver securities held by the Custodian, and to make payments for securities purchased by the Trust. The Custodian has also entered into sub-custodian agreements with a number of foreign banks and clearing agencies, pursuant to which Fund securities purchased outside the United States are maintained in the custody of these entities.
The Trust, on behalf of the Funds, has entered into an organizational expenses agreement (the “Organizational Expenses Agreement”) with the Adviser. Pursuant to the Organizational Expenses Agreement, the Adviser shall pay all of the organizational expenses of the Trust (including expenses incurred prior to the effective date of the Organizational Expenses Agreement). The Adviser is entitled to be reimbursed for organizational costs paid by the Adviser within one year after the commencement of a public offering of shares subject to the expense limitation agreement noted below.
105
1290 FUNDS
NOTES TO FINANCIAL STATEMENTS (Continued)
October 31, 2015
The Trust, on behalf of the Funds, has entered into an expense limitation agreement (the “Expense Limitation Agreement”) with 1290 Asset Managers whereby 1290 Asset Managers has contractually agreed to waive fees and/or reduce its fees to the extent that the aggregate expenses incurred by a Fund in any fiscal year, including but not limited to organizational and offering costs and investment advisory fees of the Adviser (but excluding interest, taxes, brokerage commissions, fees and expenses of other investment companies in which a Fund invests, other expenditures that are capitalized in accordance with generally accepted accounting principles (other than offering costs), other extraordinary expenses not incurred in the ordinary course of such Fund��s business and amounts payable pursuant to a plan adopted in accordance with Rule 12b-1 under the 1940 Act) (“Fund Operating Expenses”), exceed the Maximum Annual Operating Expense Limit of:
| | | | | | | | | | | | | | | | |
Funds | | Total Expense Limited to (% of daily net assets) | |
| | Class A | | | Class C | | | Class I | | | Class R | |
1290 Convertible Securities | | | 1.05 | % | | | 1.05 | % | | | 1.05 | % | | | 1.05 | % |
1290 GAMCO Small/Mid Cap Value | | | 1.10 | % | | | 1.10 | % | | | 1.10 | % | | | 1.10 | % |
1290 Global Equity Managers | | | 1.15 | % | | | 1.15 | % | | | 1.15 | % | | | 1.15 | % |
1290 High Yield Bond | | | 0.80 | % | | | 0.80 | % | | | 0.80 | % | | | 0.80 | % |
1290 Multi-Alternative Strategies* | | | 1.40 | % | | | 1.40 | % | | | 1.40 | % | | | 1.40 | % |
1290 SmartBeta Equity | | | 1.10 | % | | | 1.10 | % | | | 1.10 | % | | | 1.10 | % |
1290 Unconstrained Bond Managers | | | 1.15 | % | | | 1.15 | % | | | 1.15 | % | | | 1.15 | % |
| * | Includes fees and expenses of other investment companies in which the Fund invests. |
1290 Asset Managers first waives its advisory fees, then waives its administration fees, and then reimburses the Fund’s expenses out of its own resources. Each Fund may at a later date reimburse to 1290 Asset Managers the advisory fees waived or other expenses assumed and paid for by 1290 Asset Managers pursuant to the Expense Limitation Agreement within the prior three fiscal years, provided such Fund has reached a sufficient asset size to permit such reimbursement to be made without causing the total annual expense ratio of each Fund to exceed the percentage limits mentioned above for the respective period. Consequently, no reimbursement by a Fund will be made unless: (i) the Fund’s total annual expense ratio is less than the respective percentages stated above for the respective period; and (ii) the payment of such reimbursement has been approved by the Board. Any reimbursement, called recoupment fees on the Statement of Operations of the Fund, will be based on the earliest fees waived or assumed by 1290 Asset Managers. During the period ended October 31, 2015, 1290 Asset Managers did not receive recoupment for any of the Funds within the Trust. At October 31, 2015, under the Expense Limitation Agreement, the amount that would be recoverable from each Fund is as follows:
| | | | | | | | | | | | | | | | |
| | | Amount Eligible through | | | Total Eligible
For
Reimbursement | |
Funds: | | 2016 | | | 2017 | | | 2018 | | |
1290 Convertible Securities | | $ | — | | | $ | — | | | $ | 79,383 | | | $ | 79,383 | |
1290 GAMCO Small/Mid Cap Value | | | — | | | | — | | | | 256,568 | | | | 256,568 | |
1290 Global Equity Managers | | | — | | | | — | | | | 80,380 | | | | 80,380 | |
1290 High Yield Bond | | | — | | | | — | | | | 398,213 | | | | 398,213 | |
1290 Multi-Alternative Strategies | | | — | | | | — | | | | 67,806 | | | | 67,806 | |
1290 SmartBeta Equity | | | — | | | | — | | | | 283,924 | | | | 283,924 | |
1290 Unconstrained Bond Managers | | | — | | | | — | | | | 80,587 | | | | 80,587 | |
During the period ended October 31, 2015, the Distributor voluntarily waived Distribution fees for the Funds’ Class C shares. These amounts as follows are not eligible for recoupment:
| | | | |
Funds: | | Voluntary Waivers | |
1290 GAMCO Small/Mid Cap Value | | $ | 2,503 | |
1290 High Yield Bond | | | 28,272 | |
1290 SmartBeta Equity | | | 9,839 | |
106
1290 FUNDS
NOTES TO FINANCIAL STATEMENTS (Continued)
October 31, 2015
If during a Fund’s fiscal year, Fund Operating Expenses, including all organizational expenses, that at any time during the prior three fiscal years (prior one year after commencement of operations with respect to organizational expenses) received a fee waiver or reduction from 1290 Asset Managers, are less than the percentage limits mentioned above, 1290 Asset Managers is entitled to be reimbursed by such share class up to the lesser of (a) the amount of fees waived or reduced and (b) the amount by which the expense limit for that share class exceeds the Fund Operating Expenses of the share class for the current fiscal year.
The Distributor received sales charges on the Fund’s Class A shares and the proceeds of contingent deferred sales charges paid by the investor in connection with certain redemptions of the Fund’s Class A and Class C shares. The Distributor has advised the Funds that for the period ended October 31, 2015, the proceeds retained from sales and redemptions are as follows:
| | | | | | | | | | | | |
| | | Class A | | | Class C
Contingent
deferred sales
charge | |
Funds: | | Front End
sales charge | | | Contingent
deferred
sales charge | | |
1290 Convertible Securities | | $ | 2,250 | | | $ | — | | | $ | — | |
1290 GAMCO Small/Mid Cap Value | | | 6,387 | | | | — | | | | — | |
1290 High Yield Bond | | | 700 | | | | — | | | | — | |
1290 Multi-Alternative Strategies | | | 488 | | | | — | | | | — | |
1290 SmartBeta Equity | | | 787 | | | | — | | | | — | |
Sales loads and contingent deferred sales charges imposed on purchases and redemptions of Fund shares are retained by the Trust’s Distributors and do not represent expenses or income of the Funds.
| Note 4 | Percentage of Ownership by Affiliates |
At October 31, 2015, 1290 Asset Managers held investments in each of the Funds as follows:
| | | | |
Funds | | Percentage of
Ownership | |
1290 Convertible Securities | | | 98.7 | % |
1290 GAMCO Small/Mid Cap Value | | | 58.0 | |
1290 Global Equity Managers | | | 100.0 | |
1290 High Yield Bond | | | 99.7 | |
1290 Multi-Alternative Strategies | | | 99.1 | |
1290 SmartBeta Equity | | | 98.5 | |
1290 Unconstrained Bond Managers | | | 100.0 | |
The Adviser evaluated subsequent events from October 31, 2015, the date of these financial statements, through the date these financial statements were issued and available. The subsequent events include the following:
At a meeting held on December 9-10, 2015, the Board approved a proposed amendment to the expense cap of the 1290 High Yield Bond Fund. The current expense caps for Class A, Class C, Class R and Class I are 1.05%, 1.80%, 1.30% and 0.80% respectively (inclusive of Rule 12b-1 fees). Effective March 1, 2016, the new expense caps for Class A, Class C, Class R and Class I are 1.10%, 1.85%, 1.35% and 0.85% respectively (inclusive of Rule 12b-1 fees).
107
1290 FUNDS
NOTES TO FINANCIAL STATEMENTS (Concluded)
October 31, 2015
In July 2011, a lawsuit was filed in the United States District Court of the District of New Jersey, entitled Mary Ann Sivolella v. AXA Equitable Life Insurance Company and AXA Equitable Funds Management Group, LLC (“Sivolella Litigation”). The lawsuit was filed derivatively on behalf of eight Portfolios of EQ Advisors Trust (a separate Trust) advised by the Adviser. The lawsuit seeks recovery under Section 36(b) of the 1940 Act, for alleged excessive fees paid to the Adviser and AXA Equitable (the “Defendants”) for investment management services. The Plaintiff seeks recovery of the alleged overpayments, or alternatively, rescission of the contracts and restitution of all fees paid, interest, costs and fees. In November 2011, the Plaintiff filed an Amended Complaint seeking the same relief and in December 2011, the Defendants filed a motion to dismiss the Amended Complaint. In September 2012, the United States District Court for the District of New Jersey denied the motion to dismiss the Amended Complaint.
In January 2013, a second lawsuit against the Adviser was filed in the United States District Court for the District of New Jersey by a group of Plaintiffs asserting substantially similar claims under Section 36(b) and seeking substantially similar damages as in the Sivolella Litigation. The lawsuit, entitled Glenn D. Sanford, et al. v. AXA Equitable Funds Management Group, LLC (“Sanford Litigation”), was filed derivatively on behalf of certain Portfolios of EQ Advisors Trust advised by the Adviser. The Sanford Litigation does not involve any of the Funds. In light of the similarities of the allegations in the Sivolella and Sanford Litigations, the court consolidated the two lawsuits.
In April 2013, the Plaintiffs in the Sivolella and Sanford Litigations amended the complaints to add additional claims under Section 36(b) of the 1940 Act for recovery of alleged excessive fees paid to the Adviser in its capacity as the Administrator of the EQ Advisors Trust (a separate Trust). The Plaintiffs seek recovery of the alleged overpayments, or alternatively, rescission of the contract and restitution of the excessive fees paid, interest, costs, and fees. In January 2015, Defendants filed a motion for summary judgment as well as various motions to strike certain of the Plaintiffs’ experts in the Sivolella and Sanford Litigations. Also in January 2015, two Plaintiffs in the Sanford Litigation filed a motion for partial summary judgment relating to the EQ/Core Bond Index Portfolio, a portfolio of EQ Advisors Trust, as well as motions in limine to bar admission of certain documents and preclude the testimony of one of Defendants’ experts.
None of the Funds within the Trust are a party to the Sivolella or Sanford Litigations and any potential damages would be the responsibility of the Defendants. Therefore, no liability for litigation relating to these matters has been accrued in the financial statements of the Funds.
108
Report of Independent Registered Public Accounting Firm
To the Board of Trustees and Shareholders of the 1290 Funds:
In our opinion, the accompanying statements of assets and liabilities, including the portfolios of investments, and the related statements of operations and of changes in net assets and the financial highlights present fairly, in all material respects, the financial position of each of the funds of 1290 Funds listed in the Table of Contents to the Annual Report in which these financial statements appear (collectively referred to as the “Trust”) at October 31, 2015, the results of each of their operations, the changes in each of their net assets and the financial highlights for each of the periods presented, in conformity with accounting principles generally accepted in the United States of America. These financial statements and financial highlights (hereafter referred to as “financial statements”) are the responsibility of the Trust’s management. Our responsibility is to express an opinion on these financial statements based on our audits. We conducted our audits of these financial statements in accordance with the standards of the Public Company Accounting Oversight Board (United States). Those standards require that we plan and perform the audit to obtain reasonable assurance about whether the financial statements are free of material misstatement. An audit includes examining, on a test basis, evidence supporting the amounts and disclosures in the financial statements, assessing the accounting principles used and significant estimates made by management, and evaluating the overall financial statement presentation. We believe that our audits, which included confirmation of securities at October 31, 2015 by correspondence with the custodian, transfer agents, agent banks and brokers, provide a reasonable basis for our opinion.
PricewaterhouseCoopers LLP
New York, New York
December 21, 2015
109
1290 FUNDS
DISCLOSURE REGARDING ADVISORY CONTRACT APPROVALS
APPROVALS OF INVESTMENT ADVISORY AND INVESTMENT SUB-ADVISORY AGREEMENTS DURING THE FISCAL PERIOD ENDED OCTOBER 31, 2015 (UNAUDITED)
At a meeting held on June 2-4, 2015, the Board of Trustees (the “Board”) of 1290 Funds (the “Trust”), including those Trustees who are not parties to any Agreement (as defined below) or “interested persons” (as that term is defined in the Investment Company Act of 1940, as amended) of such parties or the Trust (the “Independent Trustees”), considered and unanimously approved an Investment Advisory Agreement (the “Advisory Agreement”) with AXA Equitable Funds Management Group, LLC (d/b/a 1290 Asset Managers®) (“1290 Asset Managers” or the “Adviser”) and the Investment Sub-Advisory Agreements (each, a “Sub-Advisory Agreement” and together with the Advisory Agreement, the “Agreements”) between the Adviser and each investment sub-adviser (each, a “Sub-Adviser” and together, the “Sub-Advisers”) as shown in the table below with respect to the Funds listed, each a newly-created portfolio of the Trust.
| | |
Funds
| | Agreements Approved by the Trust’s Board
with respect to the Funds |
1290 Global Equity Managers Fund | | Advisory Agreement with 1290 Asset Managers Sub-Advisory Agreement with OppenheimerFunds, Inc. (“Oppenheimer”) Sub-Advisory Agreement with Templeton Investment Counsel, LLC (“Templeton”) |
| |
1290 Convertible Securities Fund | | Advisory Agreement with 1290 Asset Managers Sub-Advisory Agreement with Palisade Capital Management, LLC (“Palisade”) |
| |
1290 Unconstrained Bond Managers Fund | | Advisory Agreement with 1290 Asset Managers Sub-Advisory Agreement with Pacific Investment Management Company (“PIMCO”) Sub-Advisory Agreement with TCW Investment Management Company |
The Board noted that the Trust is an affiliated investment company of EQ Advisors Trust, which is also managed by the Adviser, and that all of the Board members also currently serve on the Board of Trustees of EQ Advisors Trust. The Board also noted that four of the proposed Sub-Advisers — Oppenheimer, Palisade, PIMCO and Templeton (the “Existing Sub-Advisers”) — also currently serve as investment sub-advisers for one or more portfolios, or allocated portion(s) of portfolio(s), of EQ Advisors Trust, including (as applicable) an EQ Portfolio (as defined below).
1290 Global Equity Managers Fund. The Board noted that the Adviser currently serves as the investment manager for EQ/Oppenheimer Global Portfolio, AXA Global Equity Managed Volatility Portfolio and AXA/Templeton Global Equity Managed Volatility Portfolio, each a portfolio of EQ Advisors Trust (each, an “EQ Portfolio”). The Board also noted that the Adviser would manage the Fund in a manner similar to the manner in which the Adviser currently manages each such EQ Portfolio. The Board also noted that Oppenheimer currently serves as investment sub-adviser for EQ/Oppenheimer Global Portfolio and an allocated portion of AXA Global Equity Managed Volatility Portfolio and would serve as investment sub-adviser for an allocated portion of the Fund using the same investment strategies and styles. The Board also noted that Templeton currently serves as an investment sub-adviser for AXA/Templeton Global Equity Managed Volatility Portfolio and would serve as investment sub-adviser for an allocated portion of the Fund using the same investment strategies and styles.
1290 Convertible Securities Fund. The Board noted that the Adviser currently serves as the investment manager for EQ/Convertible Securities Portfolio, a portfolio of EQ Advisors Trust (an “EQ Portfolio”). The Board also noted that the Adviser would manage the Fund in a manner similar to the manner in which the Adviser currently manages that EQ Portfolio. The Board also noted that Palisade currently serves as investment sub-adviser for EQ/Convertible Securities Portfolio and would serve as investment sub-adviser for the Fund using the same investment strategy and style.
110
1290 Unconstrained Bond Managers Fund. The Board noted that the Adviser currently serves as the investment manager for EQ/PIMCO Global Real Return Portfolio, a portfolio of EQ Advisors Trust (an “EQ Portfolio”). The Board also noted that the Adviser would manage the Fund in a manner similar to the manner in which the Adviser currently manages that EQ Portfolio. The Board also noted that PIMCO currently serves as investment sub-adviser for EQ/PIMCO Global Real Return Portfolio and would serve as investment sub-adviser for an allocated portion of the Fund utilizing similar investment processes.
All Funds. In reaching its decision to approve each Agreement with respect to each Fund, the Board considered the overall fairness of the Agreement and whether the Agreement was in the best interests of the Fund and its shareholders. The Board further considered all factors it deemed relevant with respect to each Fund and Agreement, including: (1) the nature, quality and extent of the overall services to be provided to the Fund by the Adviser, the relevant proposed Sub-Adviser and, where applicable, their respective affiliates; (2) information regarding the risk/return profile of the Fund and comparative performance information; (3) the level of the Fund’s proposed advisory fee and sub-advisory fee, and the Fund’s expense ratios relative to those of peer funds; (4) the anticipated costs of the services to be provided by, and the estimated profits to be realized by, the Adviser and its affiliates from their relationships with the Fund; (5) the anticipated effect of growth and size on the Fund’s performance and expenses, including any potential economies of scale; and (6) the “fall out” benefits to be realized by the Adviser, the relevant proposed Sub-Adviser, and their respective affiliates (i.e., any direct or indirect benefits to be derived by the Adviser, the relevant proposed Sub-Adviser, and their respective affiliates from their relationships with the Trust). In considering each Agreement, the Board did not identify any single factor or information as all-important or controlling and each Trustee may have attributed different weight to each factor.
In connection with its deliberations, the Board took into account information prepared by the Adviser and the proposed Sub-Advisers, including memoranda and other materials addressing the factors set out above, and provided to the Trustees in connection with the meeting. The Board also took into account information provided to the Trustees at prior Board meetings. The Board also took into account information relating to the Adviser, the Existing Sub-Advisers, and the EQ Portfolios provided to the Trustees, in their capacities as Trustees of EQ Advisors Trust, at prior meetings of the Board of Trustees of EQ Advisors Trust, and the Trustees noted their experience and familiarity with the Adviser, the EQ Portfolios and the Funds derived from their years of service on the Boards of EQ Advisors Trust and the Trust. The information provided to the Trustees described, among other things, each Fund’s investment strategies and risks, the services to be provided by the Adviser and the proposed Sub-Advisers, as well as the Adviser’s and the proposed Sub-Advisers’ investment personnel, proposed advisory and sub-advisory fees, expense ratios, risk/return profile information and comparative performance information, expense limitation arrangements, and other matters. During the meeting, the Trustees met with senior representatives of the Adviser to discuss the Agreements and the information provided. The Independent Trustees met in advance of, and in executive session during, the meeting at which the Board approved the Agreements to review the information provided. At the meeting, the Independent Trustees and management engaged in extensive discussions regarding the Agreements. The Independent Trustees were assisted by independent counsel during the meeting and during their deliberations regarding the Agreements, and also received materials discussing the legal standards applicable to their consideration of the Agreements. Although the Board approved the Agreements for all of the Funds at the same Board meeting, the Board considered each Fund separately. In approving the relevant Agreements with respect to each Fund, the Board, including the Independent Trustees, determined that the proposed advisory and sub-advisory fees were fair and reasonable and that the approval of the Agreements was in the best interests of the applicable Fund and its shareholders. Although the Board gave attention to all information provided, the following discusses some of the primary factors that the Board deemed relevant to its decision to approve the Agreements.
Nature, Quality and Extent of Services. The Board evaluated the nature, quality and extent of the overall services to be provided to each Fund and its shareholders by the Adviser, the relevant proposed Sub-Adviser(s) and, where applicable, their respective affiliates. In addition to the comparative performance information discussed below, the Board considered the Adviser’s and each relevant proposed Sub-Adviser’s responsibilities with respect to a Fund (or portion thereof where the Sub-Adviser would manage an allocated portion of the Fund).
With respect to the Adviser, the Board considered that the Adviser would be responsible for, among other things, developing investment strategies for the Funds (and the portions thereof); researching, conducting “due diligence” on, selecting and monitoring the proposed Sub-Advisers; overseeing the proposed Sub-Advisers’ selection of investments for the Funds (or the portions thereof); monitoring and evaluating the performance of the Funds (or the portions thereof); monitoring the investment operations and composition of the Funds (or the portions thereof)
111
and, in connection therewith, monitoring compliance with the Funds’ investment objectives, policies and restrictions, as well as the Funds’ compliance with applicable law; monitoring brokerage selection, commission and other trading costs, quality of execution, and other brokerage matters; coordinating and managing the flow of information and communications relating to the Funds among the proposed Sub-Advisers and other applicable parties; and implementing Board directives as they relate to the Funds. The Board also considered information regarding the Adviser’s process for selecting and monitoring the proposed Sub-Advisers, as well as information regarding the backgrounds of the personnel who would perform those functions with respect to the Funds. The Board also considered that the Adviser’s responsibilities would include daily monitoring of investment, operational, enterprise, legal, regulatory and compliance risks as they relate to the Funds, and considered information regarding the Adviser’s ongoing risk management activities. The Board also considered that the Adviser has assumed significant entrepreneurial and other risk in launching the Funds. The Board’s conclusion regarding the nature, quality and extent of the overall services to be provided by the Adviser also was based, in part, on (i) the Board’s experience and familiarity with the Adviser serving as the investment adviser for the other funds of the Trust, and on periodic reports provided to the Board regarding the services provided by the Adviser to those other portfolios, and (ii) the Trustees’ experience and familiarity, in their capacities as Trustees of EQ Advisors Trust, with the Adviser serving as the investment manager for portfolios of EQ Advisors Trust, including the EQ Portfolios, and on periodic reports provided to the Trustees, in their capacities as Trustees of EQ Advisors Trust, regarding the services provided by the Adviser to those other portfolios.
With respect to the proposed Sub-Advisers, the Board considered that, subject to the oversight of the Adviser, each proposed Sub-Adviser would be responsible for making investment decisions for the Fund (or the portion thereof) that it would sub-advise; placing with brokers or dealers all orders for the purchase and sale of investments for the Fund (or the portion thereof) that it would sub-advise; and performing certain related administrative functions. The Board also reviewed information regarding each proposed Sub-Adviser’s process for selecting investments for the Fund (or the portion thereof) that it would sub-advise, as well as information regarding the background of the proposed Sub-Adviser’s portfolio manager(s) who would provide services to the Fund. In addition, the Board received information regarding each proposed Sub-Adviser’s trading experience and how each proposed Sub-Adviser would seek to achieve ‘best execution’ on behalf of the Fund that it would sub-advise. The Board’s conclusion regarding the nature, quality and extent of the overall services to be provided by each Existing Sub-Adviser also was based, in part, on the Trustees’ experience and familiarity, in their capacities as Trustees of EQ Advisors Trust, with the Existing Sub-Adviser serving as an investment sub-adviser for one or more portfolios, or allocated portion(s) of portfolio(s), of EQ Advisors Trust (including, as applicable, an EQ Portfolio) and on periodic reports provided to the Trustees, in their capacities as Trustees of EQ Advisors Trust, regarding the services provided by the Existing Sub-Adviser to those other portfolios.
The Board members also considered the Funds’ Chief Compliance Officer’s evaluation of the Sub-Advisers’ compliance programs, policies, and procedures with respect to the Funds and factored into their review their experience and familiarity with the Adviser’s compliance program, policies, and procedures with respect to the Trust and their experience and familiarity, in their capacities as Trustees of EQ Advisors Trust, with the Adviser’s and the Existing Sub-Advisers’ compliance programs, policies, and procedures with respect to EQ Advisors Trust. The Board also considered whether there were any pending lawsuits, enforcement proceedings or regulatory investigations involving the Adviser or the proposed Sub-Advisers and reviewed information regarding the Adviser’s and the proposed Sub-Advisers’ financial condition and history of operations and potential conflicts of interest in managing the Funds.
The Board also considered the benefits that would be provided to shareholders from participation in a Fund advised by the Adviser, including the Adviser’s experience operating a large fund complex that offers a wide range of portfolios, sub-advisers and investment styles. In addition, the Board considered the nature, quality and extent of the administrative, shareholder servicing and distribution services that the Adviser and its affiliates would provide to the Funds and their shareholders.
Based on its review, the Board determined, with respect to each Fund, that the nature, quality and extent of the overall services to be provided by the Adviser and the relevant proposed Sub-Adviser(s) were appropriate for the Fund in light of its investment objectives and, thus, supported a decision to approve the Agreements.
Investment Performance. The Board noted that the Funds did not have any performance history as they were newly organized and had not commenced operations as of the date of the meeting. With respect to approval of the Advisory Agreement, the Board received and reviewed risk/return profile information for each Fund based on its
112
investment objectives, policies and anticipated investments. The Board also considered the Adviser’s expertise, resources, proposed methodology and personnel for managing the Funds and its experience managing the other portfolios of the Trust, as well as portfolios of EQ Advisors Trust, including the EQ Portfolios.
With respect to approval of each Sub-Advisory Agreement, the Board received and reviewed performance data relating to the relevant proposed Sub-Adviser’s management of other funds and/or accounts, including (as applicable) portfolios of EQ Advisors Trust (including the EQ Portfolios), with substantially similar investment objectives, policies, and strategies as the Fund (or the portion thereof) that it would sub-advise, as compared to an appropriate benchmark. The Board members also noted that they had reviewed the performance and investment process of each Existing Sub-Adviser through their oversight of each Existing Sub-Adviser’s management of one or more portfolios, or allocated portion(s) of portfolio(s), of EQ Advisors Trust since the Existing Sub-Adviser’s appointment to the other portfolio(s). The Board generally considered long-term performance to be more important than short-term performance. The Board also considered each proposed Sub-Adviser’s expertise, resources, proposed investment strategy, and personnel for advising the Fund (or the portion thereof) that it would sub-advise.
Based on its review, the Board determined, with respect to each Fund, that the performance data and related information presented supported a decision to approve the Agreements.
Expenses. The Board considered each Fund’s proposed advisory fee and sub-advisory fee(s) in light of the nature, quality and extent of the overall services to be provided by the Adviser and the relevant proposed Sub-Adviser(s). In addition, the Board considered the relative levels of the sub-advisory fee to be paid to a proposed Sub-Adviser with respect to a Fund and the advisory fee to be retained by the Adviser in light of, among other factors, the services provided to the Fund by the Adviser and the proposed Sub-Adviser. The Board considered that all fees and expenses of each Fund are explicitly disclosed in the Fund’s offering documents.
With respect to the Advisory Agreement, the Board also considered the Funds’ proposed advisory fee schedules relative to the advisory fee schedules of other portfolios managed by the Adviser. The Board also considered information provided by the Adviser comparing the proposed advisory fee rate and expense ratios for each Fund to the advisory fee rates and expense ratios for comparable funds, including information compiled by Lipper, Inc., an independent organization. The Board further considered that the proposed advisory fee schedule for each Fund includes breakpoints that would reduce the advisory fee rate as Fund assets increase above certain levels. The Board noted that any such reduction in a Fund’s advisory fee would result in corresponding reductions in the Fund’s total expense ratios. In addition, the Board further considered that the Adviser had contractually agreed to make payments or waive all or a portion of its advisory, administrative and other fees so that each Fund’s total expense ratios do not exceed certain levels as set forth in its prospectus. The Board also noted that, to the extent that the Adviser waives fees pursuant to these expense limitation arrangements, each Fund’s actual advisory fee may be lower than that Fund’s contractual advisory fee. Based on its review, the Board determined that the Adviser’s proposed fee for each Fund is fair and reasonable.
With respect to the Sub-Advisory Agreements, the Board also considered the proposed sub-advisory fees in light of the fees that the proposed Sub-Advisers charge under other advisory agreements with other clients. With respect to each of 1290 Global Equity Managers Fund and 1290 Convertible Securities Fund, the Board noted that the proposed sub-advisory fee for each proposed Sub-Adviser is the same as the sub-advisory fee that the Sub-Adviser currently charges to the respective EQ Portfolio for which the Sub-Adviser currently serves as an investment sub-adviser using the same investment mandate. The Board also noted that the sub-advisory fee schedule for each of Oppenheimer, Palisade and Templeton aggregates the assets managed by the proposed Sub-Adviser in the Fund (or the portion thereof) that it would sub-advise and in one or more portfolios of EQ Advisors Trust for which the Adviser serves as investment manager and the proposed Sub-Adviser serves as investment sub-adviser. The Board further noted that the Adviser, and not a Fund, would pay the relevant proposed Sub-Adviser and that the proposed sub-advisory fee was negotiated between the relevant proposed Sub-Adviser and the Adviser. Moreover, the Board noted that the Adviser generally is aware of the fees charged by sub-advisers to other clients and that the Adviser believes that the fees agreed upon with each proposed Sub-Adviser are reasonable in light of the quality of the investment sub-advisory services to be provided. Based on its review, the Board determined, with respect to each Fund (or portion thereof), that the proposed sub-advisory fee for the relevant proposed Sub-Adviser is fair and reasonable.
Profitability and Costs. The Board also considered the anticipated level of profits to be realized by the Adviser in connection with the operation of each Fund. The Adviser represented that, as new funds with no prior operations, the Funds were not expected to be profitable to the Adviser initially because of their anticipated small initial asset
113
base. As a result, the Board noted that it periodically would evaluate profitability as the assets of the Funds increase over time. With respect to the Sub-Advisory Agreements, the Board considered, with respect to each Fund, the estimated impact of the proposed advisory fee on the profitability of the Adviser. The Adviser advised the Board that it does not regard Sub-Adviser profitability as meaningful to its evaluation of the Sub-Advisory Agreements. The Board acknowledged the Adviser’s view of Sub-Adviser profitability, noting the Board’s findings as to the reasonableness of the aggregate advisory fees and that the fee paid to each proposed Sub-Adviser is the product of negotiations with the Adviser and reflects levels of profitability acceptable to the Adviser and the proposed Sub-Adviser based on the particular circumstances in each case for each of them. The Board further noted that each proposed Sub-Adviser’s fee will be paid by the Adviser and not the Fund.
Economies of Scale. The Board also considered whether economies of scale or efficiencies would be realized as a Fund grows larger and the extent to which this is reflected in the proposed advisory and sub-advisory fee schedules for the Fund. While recognizing that any precise determination is inherently subject to assumptions and subjective assessments, the Board considered that any economies of scale or efficiencies may be shared with funds and their shareholders in a variety of ways, including: (i) breakpoints in the advisory fee or other fees so that a fund’s effective fee rate declines as the fund grows in size, (ii) subsidizing a fund’s expenses by making payments or waiving all or a portion of the advisory fee or other fees so that the fund’s total expense ratio does not exceed certain levels, (iii) setting the advisory fee or other fees so that a fund is priced to scale, which assumes that the fund has sufficient assets from inception to operate at a competitive fee rate without any fee waiver or expense reimbursement from the adviser, and (iv) reinvestment in, and enhancements to, the services that an adviser and its affiliates provide to a fund and its shareholders. The Board noted that the proposed advisory fee schedule for each Fund includes breakpoints that would reduce the advisory fee rate as Fund assets increase above certain levels. In addition, the Board noted that the Adviser had agreed to assume certain expenses of each Fund by making payments or waiving all or a portion of its advisory, administrative and other fees so that each Fund’s total expense ratios do not exceed certain levels as set forth in the prospectus in light of the fact that each Fund is a new portfolio and initially would not have sufficient assets to maintain its expense ratios at competitive levels. The Board also considered that the Adviser could potentially share economies of scale or efficiencies with the Funds through reinvestment in, and enhancements to, the services that the Adviser and its affiliates provide over time, such as hiring additional personnel and providing additional resources in areas that would be relevant to the management and administration of the Funds. In connection with its deliberations regarding the Sub-Advisory Agreements, the Board noted that the proposed sub-advisory fee schedule for each of the proposed Sub-Advisers (other than PIMCO) includes breakpoints that would reduce the sub-advisory fee rate as Fund assets under the proposed Sub-Adviser’s management increase above certain levels. The Board also noted that the sub-advisory fee schedule for each of Oppenheimer, Palisade and Templeton aggregates the assets managed by the proposed Sub-Adviser in the Fund (or the portion thereof) that it would sub-advise and in one or more portfolios of EQ Advisors Trust for which the Adviser serves as investment manager and the proposed Sub-Adviser serves as investment sub-adviser. The Board again noted that the sub-advisory fees are paid by the Adviser out of its assets and not from a Fund’s assets. The Board considered these factors, and the relationship they bear to the fee structure charged to a Fund by the Adviser, and concluded that there would be a reasonable sharing of benefits from any economies of scale or efficiencies with the Funds once they commence operations and at reasonably anticipated asset levels. The Board noted, however, that it would monitor future growth in Fund assets to determine whether economies of scale or efficiencies continued to be reflected in the Funds’ fee arrangements.
Fall-Out Benefits. The Board also considered the extent to which the Adviser and its affiliates might derive ancillary benefits from Fund operations, including the following. The Board noted that the Adviser also would serve as the administrator for the Funds and would receive compensation for acting in this capacity. The Board also noted that AXA Distributors, LLC, an affiliate of the Adviser, provides distribution support services for the Trust. AXA Distributors, LLC may receive compensation from the Funds (which may include payments pursuant to Rule 12b-1 plans with respect to their Class A, Class C (when offered for sale), and Class R shares) for providing shareholder services and selling activities, which could lead to growth in the Trust’s assets and corresponding benefits from such growth, including economies of scale. The Board also recognized that other broker-dealers that are affiliated with the Adviser may sell, and earn sales commissions and/or other compensation with respect to, shares of the Funds. Further, the Board considered that Sanford C. Bernstein & Co., LLC, a registered broker-dealer, is an affiliate of the Adviser and may, from time to time, receive brokerage commissions from the Funds in connection with the purchase and sale of portfolio securities; provided, however, that those transactions, among other things, must be consistent with seeking best execution. Based on its review, the Board determined that any “fall-out” benefits that may accrue to the Adviser are fair and reasonable.
114
The Board also noted that each proposed Sub-Adviser may derive ancillary benefits from Fund operations. For example, a proposed Sub-Adviser, through its position as a Sub-Adviser to a Fund, may engage in soft dollar transactions. The Board considered information regarding each proposed Sub-Adviser’s procedures for executing portfolio transactions for the Fund (or the portion thereof) that it would sub-advise and each proposed Sub-Adviser’s policies and procedures for selecting brokers and dealers and obtaining research from those brokers and dealers. In addition, the Board considered that a proposed Sub-Adviser may be affiliated with registered broker-dealers who may, from time to time, receive brokerage commissions from the Funds in connection with the purchase and sale of portfolio securities; provided, however, that those transactions, among other things, must be consistent with seeking best execution. The Board also noted that the proposed Sub-Advisers serve or may serve as investment sub-advisers for other funds advised by the Adviser and receive sub-advisory fees with respect to those funds. The Board also recognized that the proposed Sub-Advisers and their affiliates may sell, and earn sales commissions and/or other compensation with respect to, the Funds and other investment products issued by the Adviser or its affiliates. In addition, the Board noted that a proposed Sub-Adviser may benefit from greater exposure in the marketplace with respect to the proposed Sub-Adviser’s investment process and from expanding its level of assets under management, and may derive benefits from its association with the Adviser. Based on its review, the Board determined that any “fall-out” benefits that may accrue to each proposed Sub-Adviser are fair and reasonable.
115
APPROVAL OF INVESTMENT ADVISORY AGREEMENT DURING THE FISCAL PERIOD
ENDED OCTOBER 31, 2015 (UNAUDITED)
At a meeting held on June 2-4, 2015, the Board of Trustees (the “Board”) of 1290 Funds (the “Trust”), including those Trustees who are not parties to the Agreement (as defined below) or “interested persons” (as that term is defined in the Investment Company Act of 1940, as amended) of such parties or the Trust (the “Independent Trustees”), considered and unanimously approved an Investment Advisory Agreement (the “Agreement”) with AXA Equitable Funds Management Group, LLC (d/b/a 1290 Asset Managers®) (“1290 Asset Managers” or the “Adviser”) with respect to 1290 Multi-Alternative Strategies Fund (the “Fund”), a newly-created portfolio of the Trust.
The Board noted that the Trust is an affiliated investment company of EQ Advisors Trust, which is also managed by the Adviser, and that all of the Board members also currently serve on the Board of Trustees of EQ Advisors Trust.
In reaching its decision to approve the Agreement, the Board considered the overall fairness of the Agreement and whether the Agreement was in the best interests of the Fund and its shareholders. The Board further considered all factors it deemed relevant with respect to the Fund and the Agreement, including: (1) the nature, quality and extent of the overall services to be provided to the Fund by the Adviser and its affiliates; (2) information regarding the risk/return profile of the Fund; (3) the level of the Fund’s proposed advisory fee and the Fund’s expense ratios relative to those of peer funds; (4) the anticipated costs of the services to be provided by, and the estimated profits to be realized by, the Adviser and its affiliates from their relationships with the Fund; (5) the anticipated effect of growth and size on the Fund’s performance and expenses, including any potential economies of scale; and (6) the “fall out” benefits to be realized by the Adviser and its affiliates (i.e., any direct or indirect benefits to be derived by the Adviser and its affiliates from their relationships with the Trust). In considering the Agreement, the Board did not identify any single factor or information as all-important or controlling and each Trustee may have attributed different weight to each factor.
In connection with its deliberations, the Board took into account information prepared by the Adviser, including memoranda and other materials addressing the factors set out above, and provided to the Trustees in connection with the meeting. The Board also took into account information provided to the Trustees at prior Board meetings. The Board also took into account information relating to the Adviser provided to the Trustees, in their capacities as Trustees of EQ Advisors Trust, at prior meetings of the Board of Trustees of EQ Advisors Trust, and the Trustees noted their experience and familiarity with the Adviser and the Fund derived from their years of service on the Boards of EQ Advisors Trust and the Trust. The information provided to the Trustees described, among other things, the Fund’s investment strategies and risks, the services to be provided by the Adviser, as well as the Adviser’s investment personnel, proposed advisory fee, expense ratios, risk/return profile information, expense limitation arrangements, and other matters. During the meeting, the Trustees met with senior representatives of the Adviser to discuss the Agreement and the information provided. The Independent Trustees met in advance of, and in executive session during, the meeting at which the Board approved the Agreement to review the information provided. At the meeting, the Independent Trustees and management engaged in extensive discussions regarding the Agreement. The Independent Trustees were assisted by independent counsel during the meeting and during their deliberations regarding the Agreement, and also received materials discussing the legal standards applicable to their consideration of the Agreement. In approving the Agreement, the Board, including the Independent Trustees, determined that the proposed advisory fee was fair and reasonable and that the approval of the Agreement was in the best interests of the Fund and its shareholders. Although the Board gave attention to all information provided, the following discusses some of the primary factors that the Board deemed relevant to its decision to approve the Agreement.
Nature, Quality and Extent of Services. The Board evaluated the nature, quality and extent of the overall services to be provided to the Fund and its shareholders by the Adviser and its affiliates. The Board considered the Adviser’s responsibilities with respect to the Fund. The Board also considered the Adviser’s experience in serving as the investment adviser for the other portfolios of the Trust and, based on the Board members’ service as Trustees of EQ Advisors Trust, the Adviser’s experience in serving as the investment manager for portfolios of EQ Advisors Trust, including portfolios that, like the Fund, are structured as funds-of-funds. The Board considered that the Adviser would be responsible for, among other things, developing investment strategies for the Fund; making investment decisions for the Fund; monitoring and evaluating the performance of the Fund; monitoring the investment operations and composition of the Fund and, in connection therewith, monitoring compliance with the Fund’s investment objectives, policies and restrictions, as well as the Fund’s compliance with applicable law; placing all orders for the purchase or sale of investments for the Fund; coordinating and managing the flow of information and
116
communications relating to the Fund among the applicable parties; and implementing Board directives as they relate to the Fund. The Board also considered information regarding the Adviser’s process for making investment decisions for the Fund, as well as information regarding the backgrounds of the personnel who would manage the Fund. The Board also considered that the Adviser’s responsibilities would include daily monitoring of investment, operational, enterprise, legal, regulatory and compliance risks as they relate to the Fund, and considered information regarding the Adviser’s ongoing risk management activities. The Board also considered that the Adviser has assumed significant entrepreneurial and other risk in launching the Fund. The Board’s conclusion regarding the nature, quality and extent of the overall services to be provided by the Adviser also was based, in part, on (i) the Board’s experience and familiarity with the Adviser serving as the investment adviser for the other funds of the Trust, and on periodic reports provided to the Board regarding the services provided by the Adviser to those other portfolios, and (ii) the Trustees’ experience and familiarity, in their capacities as Trustees of EQ Advisors Trust, with the Adviser serving as the investment manager for portfolios of EQ Advisors Trust, and on periodic reports provided to the Trustees, in their capacities as Trustees of EQ Advisors Trust, regarding the services provided by the Adviser to those other portfolios.
The Board members also factored into their review their experience and familiarity with the Adviser’s compliance program, policies, and procedures with respect to the Trust and their experience and familiarity, in their capacities as Trustees of EQ Advisors Trust, with the Adviser’s compliance program, policies, and procedures with respect to EQ Advisors Trust. The Board also considered whether there were any pending lawsuits, enforcement proceedings or regulatory investigations involving the Adviser and reviewed information regarding the Adviser’s financial condition and history of operations and potential conflicts of interest in managing the Fund.
The Board also considered the benefits that would be provided to shareholders from participation in a Fund advised by the Adviser, including the Adviser’s experience operating a large fund complex that offers a wide range of portfolios, sub-advisers and investment styles. In addition, the Board considered the nature, quality and extent of the administrative, shareholder servicing and distribution services that the Adviser and its affiliates would provide to the Fund and its shareholders.
Based on its review, the Board determined that the nature, quality and extent of the overall services to be provided by the Adviser were appropriate for the Fund in light of its investment objectives and, thus, supported a decision to approve the Agreement.
Investment Performance. The Board noted that the Fund did not have any performance history as it was newly organized and had not commenced operations as of the date of the meeting. Because the Fund had not yet commenced operations, the Board did not consider any performance information for the Fund. However, the Board received and reviewed risk/return profile information for the Fund based on its investment objectives and policies and its anticipated investments and asset allocations. The Board also considered the Adviser’s expertise, resources, proposed methodology and personnel for managing the Fund and its experience managing the other portfolios of the Trust, as well as portfolios of EQ Advisors Trust, including portfolios that, like the Fund, are structured as funds-of-funds. Based on its review, the Board determined that the information presented supported a decision to approve the Agreement.
Expenses. The Board considered the Fund’s proposed advisory fee in light of the nature, quality and extent of the overall services to be provided by the Adviser. The Board also considered the Fund’s proposed advisory fee schedule relative to the advisory fee schedules of other portfolios managed by the Adviser. The Board also considered information provided by the Adviser comparing the proposed advisory fee rate and expense ratios for the Fund to the advisory fee rates and expense ratios for comparable funds, including information compiled by Lipper, Inc., an independent organization. The Board further considered that the proposed advisory fee schedule for the Fund includes breakpoints that would reduce the advisory fee rate as Fund assets increase above certain levels. The Board noted that any such reduction in the Fund’s advisory fee would result in corresponding reductions in the Fund’s total expense ratios. In addition, the Board further considered that the Adviser had contractually agreed to make payments or waive all or a portion of its advisory, administrative and other fees so that the Fund’s total expense ratios do not exceed certain levels as set forth in its prospectus. The Board also noted that, to the extent that the Adviser waives fees pursuant to these expense limitation arrangements, the Fund’s actual advisory fee may be lower than the Fund’s contractual advisory fee. The Board considered that all fees and expenses of the Fund are explicitly disclosed in the Fund’s offering documents. Based on its review, the Board determined that the Adviser’s proposed fee for the Fund is fair and reasonable.
117
Profitability and Costs. The Board also considered the anticipated level of profits to be realized by the Adviser in connection with the operation of the Fund. The Adviser represented that, as a new fund with no prior operations, the Fund was not expected to be profitable to the Adviser initially because of its anticipated small initial asset base. As a result, the Board noted that it periodically would evaluate profitability as the assets of the Fund increase over time.
Economies of Scale. The Board also considered whether economies of scale or efficiencies would be realized as the Fund grows larger and the extent to which this is reflected in the proposed advisory fee schedule for the Fund. While recognizing that any precise determination is inherently subject to assumptions and subjective assessments, the Board considered that any economies of scale or efficiencies may be shared with funds and their shareholders in a variety of ways, including: (i) breakpoints in the advisory fee or other fees so that a fund’s effective fee rate declines as the fund grows in size, (ii) subsidizing a fund’s expenses by making payments or waiving all or a portion of the advisory fee or other fees so that the fund’s total expense ratio does not exceed certain levels, (iii) setting the advisory fee or other fees so that a fund is priced to scale, which assumes that the fund has sufficient assets from inception to operate at a competitive fee rate without any fee waiver or expense reimbursement from the adviser, and (iv) reinvestment in, and enhancements to, the services that an adviser and its affiliates provide to a fund and its shareholders. The Board noted that the proposed advisory fee schedule for the Fund includes breakpoints that would reduce the advisory fee rate as Fund assets increase above certain levels. In addition, the Board noted that the Adviser had agreed to assume certain expenses of the Fund by making payments or waiving all or a portion of its advisory, administrative and other fees so that the Fund’s total expense ratios do not exceed certain levels as set forth in the prospectus in light of the fact that the Fund is a new portfolio and initially would not have sufficient assets to maintain its expense ratios at competitive levels. The Board also considered that the Adviser could potentially share economies of scale or efficiencies with the Fund through reinvestment in, and enhancements to, the services that the Adviser and its affiliates provide over time, such as hiring additional personnel and providing additional resources in areas that would be relevant to the management and administration of the Fund. The Board considered these factors, and the relationship they bear to the fee structure charged to the Fund by the Adviser, and concluded that there would be a reasonable sharing of benefits from any economies of scale or efficiencies with the Fund once it commences operations and at reasonably anticipated asset levels. The Board noted, however, that it would monitor future growth in Fund assets to determine whether economies of scale or efficiencies continued to be reflected in the Fund’s fee arrangements.
Fall-Out Benefits. The Board also considered the extent to which the Adviser and its affiliates might derive ancillary benefits from Fund operations, including the following. The Board noted that the Adviser also would serve as the administrator for the Fund and would receive compensation for acting in this capacity. The Board also noted that AXA Distributors, LLC, an affiliate of the Adviser, provides distribution support services for the Trust. AXA Distributors, LLC may receive compensation from the Fund (which may include payments pursuant to Rule 12b-1 plans with respect to its Class A, Class C (when offered for sale), and Class R shares) for providing shareholder services and selling activities, which could lead to growth in the Trust’s assets and corresponding benefits from such growth, including economies of scale. The Board also recognized that other broker-dealers that are affiliated with the Adviser may sell, and earn sales commissions and/or other compensation with respect to, shares of the Fund. Based on its review, the Board determined that any “fall-out” benefits that may accrue to the Adviser are fair and reasonable.
118
Federal Income Tax Information (Unaudited)
For the period ended October 31, 2015, the percentage of dividends paid that qualify for the 70% dividends received deductions for corporate shareholders, foreign taxes which are expected to be passed through to shareholders for foreign tax credits, gross income derived from sources within foreign countries, and long-term capital gain dividends for the purpose of the dividend paid deduction on its Federal income tax return were as follows:
| | | | | | | | | | | | |
Funds | | 70% Dividend
Received
Deduction | | | Foreign
Taxes | | | Foreign
Source Income | |
1290 Convertible Securities | | | 43.00 | % | | $ | — | | | $ | — | |
1290 GAMCO Small/Mid Cap Value | | | 20.59 | | | | — | | | | — | |
1290 Global Equity Managers | | | 0.00 | | | | 5,224 | | | | 83,405 | |
1290 High Yield Bond | | | 0.00 | | | | — | | | | — | |
1290 Multi-Alternative Strategies | | | 0.00 | | | | — | | | | — | |
1290 SmartBeta Equity | | | 79.68 | | | | — | | | | — | |
1290 Unconstrained Bond Managers | | | 0.00 | | | | — | | | | — | |
119
MANAGEMENT OF THE TRUST (UNAUDITED)
The Trust’s Board is responsible for the overall management of the Trust and the Funds, including general supervision and review of the Funds’ investment activities and their conformity with federal and state law as well as the stated policies of the Funds. The Board elects the officers of the Trust who are responsible for administering the Trust’s day-to-day operations. The Trustees of the Trust are identified in the table below along with information as to their principal business occupations held during the last five years and certain other information are shown below.
The Trustees
| | | | | | | | | | |
Name, Address and
Year of Birth | | Position(s) Held
With Fund | | Term of Office**
and Length of
Time Served | | Principal Occupation(s)
During Past 5 Years | | Number of
Portfolios
in Fund
Complex
Overseen
by Trustee† | | Other Directorships
Held by Trustee During Past 5 Years |
| Interested Trustees |
Steven M. Joenk* 1290 Avenue of the Americas, New York, New York
(1958) | | Trustee, Chairman, President and Chief Executive Officer | | Trustee, Chairman from September 2004 to present, Chief Executive Officer, President from December 2002 to present | | From May 2011 to present, President, Chief Executive Officer and Chairman, FMG LLC; from September 1999 to present, Managing Director, AXA Equitable; from September 2004 to April 2011, President, AXA Equitable’s Funds Management Group (“FMG”) unit; from July 2004 to October 1, 2013, Senior Vice President, MONY Life Insurance Company; from July 2004 to present, Senior Vice President MONY Life Insurance Company of America and Director, MONY Capital Management, Inc., Director and President, 1740 Advisers, Inc.; Director, Chairman of the Board and President, MONY Asset Management, Inc. and Enterprise Capital Management (from July 2004 to January 2011); from January 2005 to January 2011, Director, MONY Financial Resources of Americas Limited; and from November 2005 to present, Director MONY International Holdings, LLC. | | 122 | | None |
| * | Affiliated with the Manager and/or the Distributor. |
120
| | | | | | | | | | |
Name, Address and
Year of Birth | | Position(s) Held
With Fund | | Term of Office**
and Length of
Time Served | | Principal Occupation(s)
During Past 5 Years | | Number of
Portfolios
in Fund
Complex
Overseen
by Trustee† | | Other Directorships
Held by Trustee |
| Independent Trustees |
Donald E. Foley c/o EQ Advisors Trust 1290 Avenue of the Americas New York, New York 10104 (1951) | | Trustee | | From January 1, 2014 to present | | Retired. From 2010 to 2011, Chairman of the Board and Chief Executive Officer, Wilmington Trust Corporation; from 1996 to 2010, Senior Vice President, Treasurer and Director of Tax ITT Corporation; from 1989 to 1996, Assistant Treasurer, International Paper Company. | | 93 | | From 2011 to 2012, Director, and from 2012 to present, Advisory Committee Member M&T Corporation; from
2007 to 2011, Director and member of the Audit Committee and Compensation Committee, Wilmington Trust Corporation; from 2008 to 2010, Advisory Board member Northern Trust Company and Goldman Sachs Management Groups. |
Christopher P.A. Komisarjevsky c/o EQ Advisors Trust 1290 Avenue of the Americas New York, New York 10104 (1945) | | Trustee | | From March 1997 to present | | From 2006 to 2008, Senior Counselor for APCO Worldwide® (global communications consulting) and a member of its International Advisory Council; from 1998 to 2005, President and Chief Executive Officer, Burson-Marsteller Worldwide (public relations); from 1996 to 1998, President and Chief Executive Officer of Burson-Marsteller U.S.A. | | 93 | | None |
H. Thomas McMeekin c/o EQ Advisors Trust 1290 Avenue of the Americas New York, New York 10104 (1953) | | Trustee | | From January 1, 2014 to present | | Retired. From 2000 to present, Managing Partner and Founder of Griffin Investments, LLC; from 2009 to 2012 Chief Investment Officer, AIG Life & Retirement and United Guaranty Corporation and Senior Managing Director of AIG Asset Management. | | 93 | | From 2012 to present, Director Achaean Financial Group; from 2011 to 2012, Director US Life Insurance Company in the City of New York. |
Harvey Rosenthal c/o EQ Advisors Trust 1290 Avenue of the Americas New York, New York 10104 (1942) | | Trustee | | From March 1997 to present | | Retired. From 1994 to 1996, President and Chief Operating Officer of Melville Corporation; from 1984 to 1994, President and Chief Executive Officer of the CVS Division of Melville Corporation. | | 93 | | From 1997 to 2012, Director, LoJack Corporation. |
121
| | | | | | | | | | |
Name, Address and
Year of Birth | | Position(s) Held
With Fund | | Term of Office**
and Length of
Time Served | | Principal Occupation(s)
During Past 5 Years | | Number of
Portfolios
in Fund
Complex
Overseen
by Trustee† | | Other Directorships
Held by Trustee |
| Independent Trustees (Continued) |
Gary S. Schpero c/o EQ Advisors Trust 1290 Avenue of the Americas New York, New York 10104 (1953) | | Lead Independent Trustee | | From May 2000 to present; from September
2011 to present, Lead Independent Trustee | | Retired. Prior to January 1, 2000, Partner of Simpson Thacher & Bartlett (law firm) and Managing Partner of the Investment Management and Investment Company Practice Group. | | 93 | | From May 2012 to present, Trustee, Blackstone/GSO Senior Floating Rate Term Fund and Blackstone/GSO Long –Short Credit Income Fund; from October 2012 to present, Trustee, Blackstone/GSO Strategic Credit Fund. |
Kenneth L. Walker c/o EQ Advisors Trust 1290 Avenue of the Americas New York, New York 10104 (1952) | | Trustee | | From January 2012 to present | | From May 2002 to present, Partner, The Capital Management Corporation (investment advisory firm). | | 93 | | None. |
Caroline L. Williams c/o EQ Advisors Trust 1290 Avenue of the Americas New York, New York 10104 (1946) | | Trustee | | From January 2012 to present | | From July 2010 to December 2012, Executive Vice President, from May 2005 to December 2007, Consultant and from May 2001 to May 2005, Chief Financial and Investment Officer, Nathan Cummings Foundation (non-profit organization); from 1988 to 1992, Managing Director, from 1982 to 1988, Senior Vice President, from 1978 to 1982, Vice President and from 1971 to 1976, Associate, Donaldson, Lufkin & Jenrette Securities Corporation (investment bank). | | 93 | | From 1997 to 2009, Director, Hearst-Argyle Television. |
| ** | Each Trustee serves until his or her resignation or retirement. |
| † | The registered investment companies in the fund complex include AXA Premier VIP Trust, 1290 Funds and the Trust. Mr. Joenk serves as Trustee, President and Chief Executive Officer for each of the registered investment companies in the fund complex, as well as Chairman for each such company. |
Additional information about the Trustees is available in the Funds’ Statement of Additional Information, which can be obtained, without charge, by calling 1-888-310-0416.
122
The Trust’s Officers
No officer of the Trust receives any compensation paid by the Trust. Each officer of the Trust is an employee of AXA Equitable, FMG LLC, and/or AXA Distributors, LLC (“AXA Distributors”). The Trust’s principal officers are:
| | | | | | |
Name, Address and
Year of Birth | | Position(s) Held
With Fund* | | Term of Office
and Length of
Time Served** | | Principal Occupation(s)
During Past 5 Years |
| Officers |
Steven M. Joenk 1290 Avenue of the Americas, New York, New York 10104 (1958) | | Trustee, Chairman, President and Chief Executive Officer | | From September 2004 to present, Trustee and Chairman and from December 2002 to present, Chief Executive Officer and President. | | From May 2011 to present, Director, President, Chief Executive Officer and Chairman, FMG LLC; from September 1999 to present, Managing Director, AXA Equitable; from September 2004 to April 2011, President, AXA Equitable’s FMG; from July 2004 to October 1, 2013, Senior Vice President, MONY Life Insurance Company; from July 2004 to present, Senior Vice President MONY Life Insurance Company of America and Director, MONY Capital Management, Inc., Director and President, 1740 Advisers, Inc.; Director, Chairman of the Board and President, MONY Asset Management, Inc. and Enterprise Capital Management (from July 2004 to January 2011); from January 2005 to January 2011, Director, MONY Financial Resources of Americas Limited; and from November 2005 to present, Director MONY International Holdings, LLC. |
Patricia Louie, Esq. 1290 Avenue of the Americas, New York, New York 10104 (1955) | | Vice President and Secretary | | From July 1999 to Present | | From June 2012 to present, Executive Vice President and General Counsel of FMG LLC; from May 2011 to June 2012, Senior Vice President and Corporate Counsel of FMG LLC; from February 2011 to present Managing Director and Associate General Counsel of AXA Financial and AXA Equitable; from May 2003 to February 2011, Vice President and Associate General Counsel of AXA Financial and AXA Equitable. |
Brian Walsh Newport Center, 525 Washington Boulevard, 30th Floor, Jersey City, New Jersey 07310-1606 (1968) | | Chief Financial Officer and Treasurer | | From June 2007 to present | | From May 2011 to present, Senior Vice President of FMG LLC; from February 2003 to present, Lead Director of AXA Financial and AXA Equitable. |
Kenneth Kozlowski 1290 Avenue of the Americas New York, New York 10104 (1961) | | Vice President | | From June 2010 to present | | From June 2012 to present, Executive Vice President and Chief Investment Officer of FMG LLC; from May 2011 to June 2012, Senior Vice President of FMG LLC; from September 2011 to present Managing Director of AXA Financial and AXA Equitable; from February 2001 to September 2011, Vice President AXA Financial and AXA Equitable; from July 2004 to January 2011, Director, Enterprise Capital Management, Inc. |
Alwi Chan 1290 Avenue of the Americas, New York, New York 10104 (1974) | | Vice President | | From June 2007 to present | | From June 2012 to present, Senior Vice President and Deputy Chief Investment Officer of FMG LLC; from May 2011 to June 2012, Vice President of FMG LLC; from February 2007 to present, Lead Director, AXA Financial and AXA Equitable. |
123
| | | | | | |
Name, Address and
Year of Birth | | Position(s) Held
With Fund* | | Term of Office
and Length of
Time Served** | | Principal Occupation(s)
During Past 5 Years |
| Officers (Continued) |
James Kelly Newport Center, 525 Washington Boulevard, 30th Floor, Jersey City, New Jersey 07310-1606 (1968) | | Controller | | From June 2007 to present | | From May 2011 to present, Vice President of FMG LLC; from September 2008 to present, Senior Director of AXA Equitable; from March 2006 to September 2008, Assistant Vice President, AXA Financial and AXA Equitable. |
Mary E. Cantwell 1290 Avenue of the Americas, New York, New York 10104 (1961) | | Vice President | | From July 1999 to Present | | From June 2012 to present, Senior Vice President of FMG LLC; from May 2011 to June 2012, Vice President of FMG LLC; from February 2001 to present, Lead Director, AXA Financial; from July 2004 to January 2011, a Director of Enterprise Capital Management, Inc. |
Roselle Ibanga Newport Center, 525 Washington Boulevard, 30th Floor, Jersey City, New Jersey 07310-1606 (1978) | | Assistant Controller | | From March 2009 to present | | From February 2009 to present, Director of AXA Equitable; from December 2008 to February 2009, Director of AXA Equitable’s FMG. |
Lisa Perrelli Newport Center, 525 Washington Boulevard, 30th Floor, Jersey City, New Jersey 07310-1606 (1974) | | Assistant Controller | | From March 2009 to present | | From November 2012 to present, Senior Director of AXA Equitable; from September 2008 to November 2012, Assistant Vice President of AXA Equitable; from February 2008 to September 2008, Director of AXA Equitable’s FMG. |
Anthony Geron, Esq. 1290 Avenue of the Americas, New York, New York 10104 (1971) | | Vice President and Assistant Secretary | | From July,
2014 to present | | From June 2014 to present, Vice President, Assistant Secretary and Associate General Counsel of FMG LLC; from May 2014 to present, Senior Director and Counsel of AXA Equitable; from October 2007 to May 2014 Associate of Willkie Farr & Gallagher LLP. |
Michael Weiner, Esq. 1290 Avenue of the Americas, New York, New York 10104 (1982) | | Vice President and Assistant Secretary | | From July,
2014 to present | | From June 2014 to present, Vice President, Assistant Secretary and Associate General Counsel of FMG LLC; from May 2014 to present, Senior Director and Counsel of AXA Equitable; from October 2007 to April 2014 Associate of Milbank, Tweed, Hadley & McCloy LLP. |
Kiesha T. Astwood-Smith, Esq. 1290 Avenue of the Americas, New York, New York 10104 (1973) | | Vice President and Assistant Secretary | | From September
2015 to present | | From September 2015 to present, Senior Director and Counsel of AXA Equitable. From July 2006 to September 2015, Counsel of The Bank of New York Mellon; and from January 2010 to September 2015, Vice President and Assistant Secretary of the Dreyfus Family of Funds. |
Joseph J. Paolo 1290 Avenue of the Americas, New York, New York 10104 (1970) | | Chief Compliance Officer, Vice President and Anti-Money Laundering Compliance Officer | | Chief Compliance Officer from May 2007, Vice President and Anti-Money Laundering Compliance Officer from November 2005 to Present | | From May 2011 to present, Senior Vice President and Chief Compliance Officer of FMG LLC; from June 2007 to present, Lead Director of AXA Equitable and Chief Compliance Officer of AXA’s FMG. |
Richard Guinnessey 1290 Avenue of the Americas, New York, New York 10104 (1963) | | Vice President | | From March 2011 to present | | From June 2012 to present, Senior Director of FMG LLC; from September 2010 to present Senior Director of AXA Equitable; from November 2005 to September 2010 Assistant Vice President of AXA Equitable. |
Jennifer Mastronardi 1290 Avenue of the Americas, New York, New York 10104 (1985) | | Assistant Vice President | | From March 2012 to present | | From February 2009 to present, Director of AXA Equitable; from June 2007 to February 2009, Operations Associate in Managed Futures Department, Morgan Stanley. |
124
| | | | | | |
Name, Address and
Year of Birth | | Position(s) Held
With Fund* | | Term of Office
and Length of
Time Served** | | Principal Occupation(s)
During Past 5 Years |
| Officers (Continued) |
Paraskevou Charalambous 1290 Avenue of the Americas, New York, New York 10104 (1962) | | Assistant Secretary | | From November 2005 to present | | From March 2000 to present, Lead Manager/Senior Legal Assistant for AXA Equitable. |
Helen Espaillat 1290 Avenue of the Americas, New York, New York 10104 (1963) | | Assistant Secretary | | From March 2009 to present | | From July 2004 to present, Senior Manager/Legal Assistant for AXA Equitable. |
| * | The officers in the table above (except Ms. Charalambous and Ms. Espaillat) hold similar positions with two other registered investment companies in the fund complex. The registered investment companies in the fund complex include 1290 Funds, AXA Premier VIP Trust and the Trust. |
| ** | Each officer is elected on an annual basis. |
125
PROXY VOTING POLICIES AND PROCEDURES (UNAUDITED)
A description of the policies and procedures that the Funds use to determine how to vote proxies relating to portfolio securities is available (i) without charge, upon request, by calling a toll-free number at 1-888-310-0416 and (ii) on the Securities and Exchange Commission’s website at http://www.sec.gov. Information regarding how the Funds voted proxies relating to portfolio securities during the most recent 12-month period ended June 30 is available without charge (i) on the Trust’s website at www.1290Funds.com and (ii) on the Securities and Exchange Commission’s website at http://www.sec.gov.
QUARTERLY PORTFOLIO HOLDINGS INFORMATION (UNAUDITED)
The Funds file their complete schedules of portfolio holdings with the Securities and Exchange Commission for the first and third quarters of each fiscal year on Form N-Q. The Funds’ Forms N-Q are available on the Securities and Exchange Commission’s website at http://www.sec.gov. You may also review and obtain copies at the Securities and Exchange Commission’s Public Reference Room in Washington, D.C. Information about the Public Reference Room may be obtained by calling 1-800-SEC-0330.
126
| | |
Visit the Funds’ Website: 1290Funds.com | |  |
| | |
| Must be accompanied or preceded by a Prospectus. 1290 Funds are distributed by ALPS Distributors, Inc. | | RRD#92918 |

AXA Equitable Life Insurance Company
As of the end of the period covered by this report, the registrant has adopted a “code of ethics,” as defined in Item 2, that applies to the registrant’s principal executive officer, principal financial officer, principal accounting officer or controller, or persons performing similar functions. A copy of the registrant’s code of ethics is filed as an exhibit pursuant to Item 12(a)(1).
| Item 3. | Audit Committee Financial Expert. |
The registrant’s board of trustees has determined that Donald E. Foley, Kenneth L. Walker and Caroline L. Williams serve on its audit committee as “audit committee financial experts” as defined in Item 3. Ms. Williams and Messrs. Foley and Walker are considered to be “independent” for purposes of Item 3(a)(2).
| Item 4. | Principal Accountant Fees and Services. |
| (a) | Audit Fees for fiscal year 2015 was $0 and $37,500 for fiscal year 2014. |
| (b) | Audit-Related Fees for fiscal year 2015 was $0 and $0 for fiscal year 2014. |
| (c) | Tax Fees for fiscal year 2015 was $9,600 and $0 for fiscal year 2014. |
Tax fees include amounts related to tax compliance, tax advice and tax planning.
| (d) | All Other Fees for fiscal year 2015 was $0 and $0 for fiscal year 2014. |
All other fees include amounts related to consultation on or review of the registrant’s various regulatory filings.
(e)(1)
The registrant’s audit committee has adopted policies and procedures relating to pre-approval of services performed by the registrant’s principal accountant for the registrant. Audit, audit-related and tax services provided to the registrant on an annual basis require pre-approval by the entire audit committee. In the event that the audit fees exceed the pre-approved estimated amount, the audit committee’s delegate, consisting of the audit committee chair, lead independent trustee, the registrant’s chief executive officer and chief financial officer, acting by at least two of such individuals, has the authority to increase the amount by up to 10% of the pre-approved amount. Any additional amount requires pre-approval by the entire audit committee. The audit committee chair or the lead independent trustee also has the authority to approve de minimis non-audit services (i.e., services in which the fee does not
exceed $10,000 per engagement) to be provided by the registrant’s principal accountant for the registrant, provided that each such service is brought to the attention of the audit committee prior to the completion of the audit of the registrant’s financial statements.
(e)(2) None of the services included in (b) – (d) above were approved by the audit committee pursuant to paragraph (c)(7)(i)(C) of Rule 2-01 of Regulation S-X.
| (g) | For fiscal year 2015 was $6,068,456 and $6,651,655 for fiscal year 2014. |
| (h) | The registrant’s audit committee has considered and determined that the provision of non-audit services that were rendered to the registrant’s investment adviser (not including any sub-advisers whose role is primarily portfolio management and is subcontracted with or overseen by another investment adviser), and any entity controlling, controlled by, or under common control with the investment adviser that provides ongoing services to the registrant that were not pre-approved pursuant to paragraph (c)(7)(ii) of Rule 2-01 of Regulation S-X is compatible with maintaining the principal accountant’s independence. |
| Item 5. | Audit Committee of Listed Registrants. |
Not applicable.
| Item 6. | Schedule of Investments. |
The Schedule of Investments is included as part of the annual report to Shareholders filed under Item 1 of this Form N-CSR.
| Item 7. | Disclosure of Proxy Voting Policies and Procedures for Closed-End Management Investment Companies. |
Not applicable.
| Item 8. | Portfolio Managers of Closed-End Management Investment Companies |
Not applicable.
| Item 9. | Purchases of Equity Securities by Closed-End Management Investment Company and Affiliated Purchasers. |
Not applicable.
| Item 10. | Submission of Matters to a Vote of Security Holders. |
There have been no material changes to the procedures by which shareholders may recommend nominees to the registrant’s board of trustees.
| Item 11. | Controls and Procedures. |
| (a) | The registrant’s principal executive and principal financial officers, or persons performing similar functions, have concluded that the registrant’s disclosure controls and procedures (as defined in Rule 30a-3(c) under the Investment Company Act of 1940, as amended (the “1940 Act”)) are effective as of a date within 90 days of the filing of this report that includes the disclosure required by this paragraph, based on the evaluation of these controls and procedures required by Rule 30a-3(b) under the 1940 Act and Rule 15d-15(b) under the Securities Exchange Act of 1934, as amended. |
| (b) | The registrant’s certifying officers are not aware of any changes in the registrant’s internal control over financial reporting (as defined in Rule 30a-3(d) under the 1940 Act) that occurred during the registrant’s second fiscal quarter of the period covered by this report that has materially affected, or is reasonably likely to materially affect, the registrant’s internal control over financial reporting. |
| (a)(1) | The Code of Ethics for Senior Officers of the Registrant is filed herewith. |
| (a)(2) | Certifications pursuant to Section 302 of the Sarbanes-Oxley Act of 2002 are filed herewith. |
| (b) | Certifications pursuant to Section 906 of the Sarbanes-Oxley Act of 2002 are filed herewith. |
SIGNATURES
Pursuant to the requirements of the Securities Exchange Act of 1934 and the Investment Company Act of 1940, the registrant has duly caused this report to be signed on its behalf by the undersigned, thereunto duly authorized.
1290 FUNDS
| | |
| By: | | /s/ Steven M. Joenk |
| Steven M. Joenk |
| President and Chief Executive Officer |
| December 30, 2015 |
Pursuant to the requirements of the Securities Exchange Act of 1934 and the Investment Company Act of 1940, this report has been signed below by the following persons on behalf of the registrant and in the capacities and on the dates indicated.
|
/s/ Steven M. Joenk |
| Steven M. Joenk |
| President and Chief Executive Officer |
| December 30, 2015 |
|
/s/ Brian E. Walsh |
| Brian E. Walsh |
| Chief Financial Officer |
| December 30, 2015 |