| OMB APPROVAL |
OMB Number: 3235-0570
Expires: January 31, 2017
Estimated average burden hours per response: 20.6 |
UNITED STATES
SECURITIES AND EXCHANGE COMMISSION
Washington, D.C. 20549
FORM N-CSR
CERTIFIED SHAREHOLDER REPORT OF REGISTERED
MANAGEMENT INVESTMENT COMPANIES
| Investment Company Act file number | 811-22960 | |
| Eubel Brady & Suttman Mutual Fund Trust |
| (Exact name of registrant as specified in charter) |
| 225 Pictoria Drive, Suite 450 Cincinnati, Ohio | 45246 |
| (Address of principal executive offices) | (Zip code) |
Wade R. Bridge, Esq.
| 225 Pictoria Drive, Suite 450 Cincinnati, Ohio 45246 |
| (Name and address of agent for service) |
| Registrant's telephone number, including area code: | (513) 587-3400 | |
| Date of fiscal year end: | July 31 | |
| | | |
| Date of reporting period: | January 31, 2015 | |
Form N-CSR is to be used by management investment companies to file reports with the Commission not later than 10 days after the transmission to stockholders of any report that is required to be transmitted to stockholders under Rule 30e-1 under the Investment Company Act of 1940 (17 CFR 270.30e-1). The Commission may use the information provided on Form N-CSR in its regulatory, disclosure review, inspection, and policymaking roles.
A registrant is required to disclose the information specified by Form N-CSR, and the Commission will make this information public. A registrant is not required to respond to the collection of information contained in Form N-CSR unless the Form displays a currently valid Office of Management and Budget ("OMB") control number. Please direct comments concerning the accuracy of the information collection burden estimate and any suggestions for reducing the burden to Secretary, Securities and Exchange Commission, 450 Fifth Street, NW, Washington, DC 20549-0609. The OMB has reviewed this collection of information under the clearance requirements of 44 U.S.C. § 3507.
Item 1. Reports to Stockholders.
Eubel Brady & Suttman
Income and Appreciation Fund
Ticker Symbol: EBSZX
Eubel Brady & Suttman
Income Fund
Ticker Symbol: EBSFX
Each a series of the
Eubel Brady & Suttman Mutual Fund Trust
SEMI-ANNUAL REPORT
January 31, 2015
(Unaudited)
EUBEL BRADY & SUTTMAN MUTUAL FUND TRUST
| LETTER TO OUR SHAREHOLDERS | March 24, 2015 |
Dear Shareholders:
In this inaugural letter we discuss the formation of the EBS Funds, review results since inception and offer our perspective on the current environment as it relates to the Funds. We hope the viewpoints shared below are informative.
Formation of Funds – We believe our motivation for forming the Funds was different than that of most Registered Investment Advisors (“RIA”). Most RIAs form mutual funds and make them available to the public in hopes of having assets find their way into the funds through various channels where investors are largely unknown to the manager. Our motivation was different. It was primarily about how to better serve those who already entrust us with their capital (current clients), rather than those who may entrust us with their capital in the future (potential clients). Supporting this notion is the fact that only RIA clients of Eubel Brady & Suttman Asset Management, Inc. (“EBS”) are permitted to invest in these Funds. Would we enjoy working with new RIA clients? Sure, after we get to know them and determine if we are a good fit for their needs.
We believed that the Funds would significantly increase the depth and breadth of our investment opportunity set and improve liquidity for clients. Those assumptions have held true thus far in practice, which is good. Forming the Funds was a sizable project, but they came together nicely. As of period end, the heavy lifting and migration of assets into the Funds is largely complete.
Results Since Inception – Since inception (September 30, 2014) through January 31, 2015, the EBS Income and Appreciation Fund (“EBSZX”) and the EBS Income Fund (“EBSFX”) have produced a cumulative, total return of (0.46%) and (0.11%), respectively.
During the period, yields of shorter term securities similar to the types owned by the Funds have increased marginally, putting slight downward pressure on prices. Given the Funds’ bias toward shorter maturity corporate bonds, they performed as we would expect in that environment.
Our Perspective – In light of the current ultra-low yield environment, it is hard to envision a probable scenario where yields are materially lower several years from now. As such, the Funds are structured with an eye toward higher yields in the future.
We are more comfortable selectively taking credit risk on the short end of the yield curve than extending maturities to enhance yield, at this juncture. The Funds’ sensitivity to interest rates is modest, in our view. The Funds’ holdings are diversified, and there is no significant concentration within any one economic sector.
Both Funds participated in their first bank loan during the period. While not material in size, the investment itself is symbolic of the added flexibility the fund structure offers.
Within EBSZX, convertible exposure is lower than we prefer. This is largely due to, again, an ultra-low yield environment and stock prices that seem generally high relative to underlying values. Pickings are slim within the convertible universe, for now.
We welcome your questions, comments or both and may be reached at 800-391-1223. As always, we appreciate your trust and confidence in our firm.
Sincerely,
The EBS Research Group
Important Disclosures – Performance data quoted in this letter or the report itself represents past performance. Past performance does not guarantee future results. The value of an investor’s shares will fluctuate, and may be worth more or less than the original cost when redeemed. Current performance may be higher or lower than performance quoted herein. Performance data, current to the most recent month end, is available by calling 1-800-391-1223.
The information in this “Letter To Our Shareholders” represents the opinion of the author and is not intended to be a forecast or investment advice. This publication does not constitute an offer or solicitation of any transaction in any securities. Information contained in this publication has been obtained from sources believed to be reliable, but has not been independently verified by EBS. Please note that any discussion of fund holdings, fund performance and views expressed are as of January 31, 2015 (except if otherwise stated) and are subject to change without notice.
EUBEL BRADY & SUTTMAN MUTUAL FUND TRUST
PORTFOLIO INFORMATION
January 31, 2015 (Unaudited)
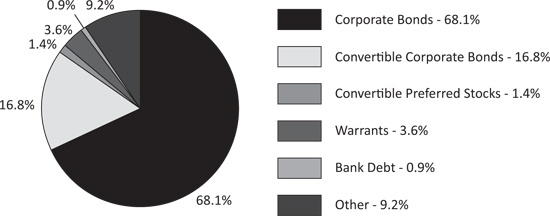
Eubel Brady & Suttman Income and Appreciation Fund
Asset Allocation (% of Net Assets)
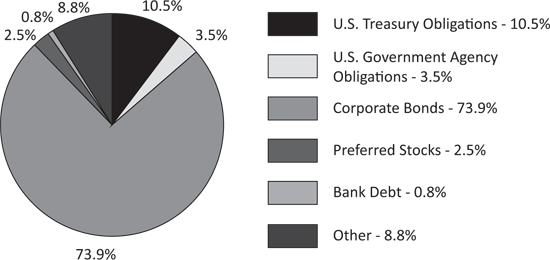
Eubel Brady & Suttman Income Fund
Asset Allocation (% of Net Assets)
EUBEL BRADY & SUTTMAN INCOME AND APPRECIATION FUND
SCHEDULE OF INVESTMENTS
January 31, 2015 (Unaudited)
| CORPORATE BONDS — 68.1% | | Coupon | Maturity | | Par Value | | | Value | |
| Consumer Discretionary — 20.5% | | | | | | | | | | |
| Gannet Co., Inc. | | | 10.000 | % | 04/01/16 | | $ | 2,156,000 | | | $ | 2,350,040 | |
| Hanesbrands, Inc. | | | 6.375 | % | 12/15/20 | | | 2,230,000 | | | | 2,357,110 | |
| Hyatt Hotels Corp. | | | 3.875 | % | 08/15/16 | | | 1,700,000 | | | | 1,765,057 | |
| Kohl's Corp. | | | 6.250 | % | 12/15/17 | | | 1,670,000 | | | | 1,874,490 | |
| Marriott International, Inc. | | | 3.375 | % | 10/15/20 | | | 2,220,000 | | | | 2,336,710 | |
| Sears Holdings Corp. | | | 6.625 | % | 10/15/18 | | | 1,600,000 | | | | 1,476,000 | |
| Sherwin-Williams Co. | | | 1.350 | % | 12/15/17 | | | 2,000,000 | | | | 1,991,606 | |
| Time Warner Cable, Inc. | | | 6.750 | % | 07/01/18 | | | 1,776,000 | | | | 2,054,306 | |
| | | | | | | | | | | | | 16,205,319 | |
| Consumer Staples — 5.2% | | | | | | | | | | | | | |
| Altria Group, Inc. | | | 4.125 | % | 09/11/15 | | | 2,500,000 | | | | 2,554,860 | |
| Kroger Co. (The) | | | 2.200 | % | 01/15/17 | | | 1,500,000 | | | | 1,529,943 | |
| | | | | | | | | | | | | 4,084,803 | |
| Energy — 4.9% | | | | | | | | | | | | | |
| Boardwalk Pipelines, LLC | | | 5.875 | % | 11/15/16 | | | 1,500,000 | | | | 1,592,965 | |
| CONSOL Energy, Inc. | | | 8.250 | % | 04/01/20 | | | 2,300,000 | | | | 2,308,625 | |
| | | | | | | | | | | | | 3,901,590 | |
| Financials — 19.1% | | | | | | | | | | | | | |
| Aflac, Inc. | | | 8.500 | % | 05/15/19 | | | 1,400,000 | | | | 1,773,691 | |
| American Financial Group, Inc. | | | 9.875 | % | 06/15/19 | | | 800,000 | | | | 1,042,022 | |
| American International Group, Inc. | | | 5.050 | % | 10/01/15 | | | 1,640,000 | | | | 1,686,120 | |
| Capital One Bank USA, N.A. | | | 2.150 | % | 11/21/18 | | | 1,380,000 | | | | 1,395,028 | |
| Citigroup, Inc. | | | 4.700 | % | 05/29/15 | | | 1,800,000 | | | | 1,823,873 | |
| Genworth Holdings, Inc. | | | 6.515 | % | 05/22/18 | | | 1,397,000 | | | | 1,411,125 | |
| Goldman Sachs Group, Inc. | | | 3.700 | % | 08/01/15 | | | 980,000 | | | | 994,300 | |
Goldman Sachs Group, Inc. (a) | | | 1.042 | % | 12/15/17 | | | 820,000 | | | | 821,142 | |
| Jefferies Group, LLC | | | 3.875 | % | 11/09/15 | | | 625,000 | | | | 635,971 | |
| JPMorgan Chase & Co. | | | 5.250 | % | 05/01/15 | | | 175,000 | | | | 176,750 | |
| Leucadia National Corp. | | | 8.125 | % | 09/15/15 | | | 1,500,000 | | | | 1,562,813 | |
| Zions Bancorp. | | | 5.650 | % | 11/15/23 | | | 1,700,000 | | | | 1,779,703 | |
| | | | | | | | | | | | | 15,102,538 | |
| Health Care — 2.3% | | | | | | | | | | | | | |
| Anthem, Inc. | | | 2.375 | % | 02/15/17 | | | 1,800,000 | | | | 1,842,295 | |
| | | | | | | | | | | | | | |
| Industrials — 0.9% | | | | | | | | | | | | | |
| Caterpillar, Inc. | | | 7.900 | % | 12/15/18 | | | 600,000 | | | | 736,313 | |
EUBEL BRADY & SUTTMAN INCOME AND APPRECIATION FUND
SCHEDULE OF INVESTMENTS (Continued)
| CORPORATE BONDS — 68.1% (Continued) | | Coupon | Maturity | | Par Value | | | Value | |
| Information Technology — 10.4% | | | | | | | | | | |
| Avnet, Inc. | | | 6.000 | % | 09/01/15 | | $ | 1,650,000 | | | $ | 1,694,870 | |
| Avnet, Inc. | | | 6.625 | % | 09/15/16 | | | 632,000 | | | | 681,433 | |
| FLIR Systems, Inc. | | | 3.750 | % | 09/01/16 | | | 1,700,000 | | | | 1,756,337 | |
| Hewlett-Packard Co. | | | 3.000 | % | 09/15/16 | | | 2,300,000 | | | | 2,367,636 | |
| Xerox Corp. | | | 4.250 | % | 02/15/15 | | | 1,700,000 | | | | 1,702,193 | |
| | | | | | | | | | | | | 8,202,469 | |
| Materials — 4.8% | | | | | | | | | | | | | |
| Ball Corp. | | | 6.750 | % | 09/15/20 | | | 1,970,000 | | | | 2,046,830 | |
| Transocean, Inc. | | | 5.050 | % | 12/15/16 | | | 1,800,000 | | | | 1,777,500 | |
| | | | | | | | | | | | | 3,824,330 | |
Total Corporate Bonds (Cost $53,778,918) | | | | | | | | | | | $ | 53,899,657 | |
| CONVERTIBLE CORPORATE BONDS — 16.8% | | Coupon | Maturity | | Par Value | | | Value | |
| Financials — 10.6% | | | | | | | | | | |
| Ares Capital Corp. | | | 5.750 | % | 02/01/16 | | $ | 2,278,000 | | | $ | 2,346,340 | |
| Jefferies Group, LLC | | | 3.875 | % | 11/01/29 | | | 2,000,000 | | | | 2,057,500 | |
| RAIT Financial Trust | | | 4.000 | % | 10/01/33 | | | 2,166,000 | | | | 1,818,086 | |
| Redwood Trust, Inc. | | | 4.625 | % | 04/15/18 | | | 2,275,000 | | | | 2,202,484 | |
| | | | | | | | | | | | | 8,424,410 | |
| Information Technology — 3.4% | | | | | | | | | | | | | |
Bridgeline Digital, Inc. (b) | | | 10.000 | % | 09/30/16 | | | 1,000,000 | | | | 1,000,000 | |
| SanDisk Corp. | | | 1.500 | % | 08/15/17 | | | 1,085,000 | | | | 1,681,072 | |
| | | | | | | | | | | | | 2,681,072 | |
| Materials — 2.8% | | | | | | | | | | | | | |
| RTI International Metals, Inc. | | | 1.625 | % | 10/15/19 | | | 2,370,000 | | | | 2,187,806 | |
| | | | | | | | | | | | | | |
Total Convertible Corporate Bonds (Cost $13,357,120) | | | | | | | | | | | $ | 13,293,288 | |
| CONVERTIBLE PREFERRED STOCKS — 1.4% | | Shares | | | Value | |
| DecisionPoint Systems, Inc., 8.00%, Series D | | | 84,532 | | | $ | 760,788 | |
DecisionPoint Systems, Inc., 10.00%, Series E (b) | | | 33,717 | | | | 337,170 | |
Total Preferred Stocks (Cost $1,168,603) | | | | | | $ | 1,097,958 | |
EUBEL BRADY & SUTTMAN INCOME AND APPRECIATION FUND
SCHEDULE OF INVESTMENTS (Continued)
| WARRANTS — 3.6% | | Shares | | | Value | |
Capital One Financial Corp. (c) | | | 13,200 | | | $ | 415,140 | |
First Financial Bancorp (c) | | | 67,850 | | | | 383,353 | |
Hartford Financial Services Group, Inc. (c) | | | 45,200 | | | | 1,398,940 | |
Lincoln National Corp. (c) | | | 16,260 | | | | 674,790 | |
Total Warrants (Cost $1,659,481) | | | | | | $ | 2,872,223 | |
| BANK DEBT — 0.9% | | Coupon | Maturity | | Par Value | | | Value | |
NCP Finance Limited Partnership (a)(b) | | | 6.000 | % | 09/30/16 | | $ | 655,281 | | | $ | 655,281 | |
NCP Finance Limited Partnership (a)(b) | | | 4.171 | % | 09/30/16 | | | 101,124 | | | | 101,124 | |
Total Bank Debt (Cost $756,405) | | | | | | | | | | | $ | 756,405 | |
| MONEY MARKET FUNDS — 8.0% | | Shares | | | Value | |
Invesco Short-Term Investments Trust - Treasury Portfolio - Institutional Shares, 0.01%(d) (Cost $6,307,977) | | | 6,307,977 | | | $ | 6,307,977 | |
| | | | | | | | | |
Total Investments at Value — 98.8% (Cost $77,028,504) | | | | | | $ | 78,227,508 | |
| | | | | | | | | |
| Other Assets in Excess of Liabilities — 1.2% | | | | | | | 920,886 | |
| | | | | | | | | |
| Net Assets — 100.0% | | | | | | $ | 79,148,394 | |
| (a) | Variable rate security. The rate shown is the effective interest rate as of January 31, 2015. |
| (b) | Security value has been determined in good faith pursuant to procedures adopted by the Board of Trustees. The total value of such securities is $2,093,575 at January 31, 2015, representing 2.6% of net assets (Note 1). |
| (c) | Non-income producing security. |
| (d) | The rate shown is the 7-day effective yield as of January 31, 2015. |
See accompanying notes to financial statements.
EUBEL BRADY & SUTTMAN INCOME FUND
SCHEDULE OF INVESTMENTS
January 31, 2015 (Unaudited)
| U.S. TREASURY OBLIGATIONS — 10.5% | | Coupon | Maturity | | Par Value | | | Value | |
| U.S. Treasury Notes | | | 0.375 | % | 04/30/16 | | $ | 2,200,000 | | | $ | 2,202,922 | |
| U.S. Treasury Notes | | | 0.500 | % | 06/15/16 | | | 2,200,000 | | | | 2,206,186 | |
| U.S. Treasury Notes | | | 0.625 | % | 08/15/16 | | | 2,200,000 | | | | 2,209,282 | |
| U.S. Treasury Notes | | | 0.625 | % | 12/15/16 | | | 2,200,000 | | | | 2,207,046 | |
| U.S. Treasury Notes | | | 0.875 | % | 08/15/17 | | | 1,320,000 | | | | 1,327,631 | |
| U.S. Treasury Notes | | | 1.500 | % | 08/31/18 | | | 2,190,000 | | | | 2,232,773 | |
Total U.S. Treasury Obligations (Cost $12,368,517) | | | | | | | | | | | $ | 12,385,840 | |
| U.S. GOVERNMENT AGENCY OBLIGATIONS — 3.5% | Coupon | Maturity | | Par Value | | | Value | |
| Federal Home Loan Bank — 0.5% | | | | | | | | | | |
| Federal Home Loan Bank | | | 5.000 | % | 12/09/16 | | $ | 500,000 | | | $ | 540,026 | |
| | | | | | | | | | | | | | |
| Federal National Mortgage Association — 3.0% | | | | | | | | | | | | | |
| Federal National Mortgage Association | | | 1.375 | % | 11/15/16 | | | 2,200,000 | | | | 2,234,476 | |
| Federal National Mortgage Association | | | 1.250 | % | 01/30/17 | | | 1,300,000 | | | | 1,317,552 | |
| | | | | | | | | | | | | 3,552,028 | |
Total U.S. Government Agency Obligations (Cost $4,092,752) | | | | | | | | $ | 4,092,054 | |
| CORPORATE BONDS — 73.9% | | Coupon | Maturity | | Par Value | | | Value | |
| Consumer Discretionary — 20.9% | | | | | | | | | | |
| AutoZone, Inc. | | | 5.500 | % | 11/15/15 | | $ | 360,000 | | | $ | 373,512 | |
| AutoZone, Inc. | | | 6.950 | % | 06/15/16 | | | 1,248,000 | | | | 1,350,256 | |
| Gannet Co., Inc. | | | 10.000 | % | 04/01/16 | | | 2,810,000 | | | | 3,062,900 | |
| Hanesbrands, Inc. | | | 6.375 | % | 12/15/20 | | | 2,898,000 | | | | 3,063,186 | |
| Hyatt Hotels Corp. | | | 3.875 | % | 08/15/16 | | | 1,597,000 | | | | 1,658,116 | |
| Kohl's Corp. | | | 6.250 | % | 12/15/17 | | | 2,526,000 | | | | 2,835,306 | |
| Marriott International, Inc. | | | 3.375 | % | 10/15/20 | | | 3,250,000 | | | | 3,420,859 | |
| Sherwin-Williams Co. | | | 1.350 | % | 12/15/17 | | | 2,930,000 | | | | 2,917,703 | |
EUBEL BRADY & SUTTMAN INCOME FUND
SCHEDULE OF INVESTMENTS (Continued)
| CORPORATE BONDS — 73.9% (Continued) | | Coupon | Maturity | | Par Value | | | Value | |
| Consumer Discretionary — 20.9% (Continued) | | | | | | | | | | |
| Time Warner Cable, Inc. | | | 6.750 | % | 07/01/18 | | $ | 2,500,000 | | | $ | 2,891,760 | |
| Whirlpool Corp. | | | 1.650 | % | 11/01/17 | | | 2,910,000 | | | | 2,934,019 | |
| | | | | | | | | | | | | 24,507,617 | |
| Consumer Staples — 4.7% | | | | | | | | | | | | | |
| Altria Group, Inc. | | | 4.125 | % | 09/11/15 | | | 3,000,000 | | | | 3,065,832 | |
| Kroger Co. (The) | | | 2.200 | % | 01/15/17 | | | 2,200,000 | | | | 2,243,917 | |
| Safeway, Inc. | | | 3.400 | % | 12/01/16 | | | 271,000 | | | | 277,049 | |
| | | | | | | | | | | | | 5,586,798 | |
| Energy — 4.9% | | | | | | | | | | | | | |
| Boardwalk Pipelines, LLC | | | 5.875 | % | 11/15/16 | | | 2,300,000 | | | | 2,442,547 | |
| CONSOL Energy, Inc. | | | 8.250 | % | 04/01/20 | | | 3,370,000 | | | | 3,382,638 | |
| | | | | | | | | | | | | 5,825,185 | |
| Financials — 23.8% | | | | | | | | | | | | | |
| Aflac, Inc. | | | 8.500 | % | 05/15/19 | | | 1,909,000 | | | | 2,418,554 | |
| American Financial Group, Inc. | | | 9.875 | % | 06/15/19 | | | 1,203,000 | | | | 1,566,941 | |
| American International Group, Inc. | | | 5.050 | % | 10/01/15 | | | 2,500,000 | | | | 2,570,305 | |
| Bank of America Corp. | | | 4.500 | % | 04/01/15 | | | 2,230,000 | | | | 2,243,982 | |
| Capital One Bank USA, N.A. | | | 2.150 | % | 11/21/18 | | | 560,000 | | | | 566,099 | |
| Citigroup, Inc. | | | 4.700 | % | 05/29/15 | | | 2,210,000 | | | | 2,239,311 | |
| CNA Financial Corp. | | | 6.950 | % | 01/15/18 | | | 50,000 | | | | 57,037 | |
| Fairfax Financial Holdings Ltd. | | | 7.375 | % | 04/15/18 | | | 279,000 | | | | 316,135 | |
| Genworth Holdings, Inc. | | | 6.515 | % | 05/22/18 | | | 2,200,000 | | | | 2,222,244 | |
| Goldman Sachs Group, Inc. | | | 3.700 | % | 08/01/15 | | | 1,076,000 | | | | 1,091,701 | |
Goldman Sachs Group, Inc. (a) | | | 1.042 | % | 12/15/17 | | | 1,180,000 | | | | 1,181,644 | |
| Hartford Financial Services Group, Inc. | | | 6.300 | % | 03/15/18 | | | 158,000 | | | | 179,715 | |
| Jefferies Group, LLC | | | 3.875 | % | 11/09/15 | | | 3,637,000 | | | | 3,700,840 | |
| JPMorgan Chase & Co. | | | 5.250 | % | 05/01/15 | | | 2,235,000 | | | | 2,257,350 | |
| Leucadia National Corp. | | | 8.125 | % | 09/15/15 | | | 2,150,000 | | | | 2,240,031 | |
| Lion Connecticut Holdings, Inc. | | | 7.250 | % | 08/15/23 | | | 25,000 | | | | 32,098 | |
| Reinsurance Group of America, Inc. | | | 5.625 | % | 03/15/17 | | | 287,000 | | | | 311,037 | |
| Weyerhaeuser Co. | | | 6.950 | % | 08/01/17 | | | 10,000 | | | | 11,255 | |
| Zions Bancorp. | | | 5.650 | % | 11/15/23 | | | 2,600,000 | | | | 2,721,898 | |
| | | | | | | | | | | | | 27,928,177 | |
EUBEL BRADY & SUTTMAN INCOME FUND
SCHEDULE OF INVESTMENTS (Continued)
| CORPORATE BONDS — 73.9% (Continued) | | Coupon | Maturity | | Par Value | | | Value | |
| Health Care — 3.2% | | | | | | | | | | |
| Anthem, Inc. | | | 1.250 | % | 09/10/15 | | $ | 935,000 | | | $ | 937,808 | |
| McKesson Corp. | | | 0.950 | % | 12/04/15 | | | 2,800,000 | | | | 2,807,935 | |
| | | | | | | | | | | | | 3,745,743 | |
| Industrials — 1.0% | | | | | | | | | | | | | |
| Caterpillar, Inc. | | | 7.900 | % | 12/15/18 | | | 991,000 | | | | 1,216,143 | |
| | | | | | | | | | | | | | |
| Information Technology — 10.5% | | | | | | | | | | | | | |
| Avnet, Inc. | | | 6.000 | % | 09/01/15 | | | 1,900,000 | | | | 1,951,668 | |
| Avnet, Inc. | | | 6.625 | % | 09/15/16 | | | 1,364,000 | | | | 1,470,688 | |
| FLIR Systems, Inc. | | | 3.750 | % | 09/01/16 | | | 2,472,000 | | | | 2,553,920 | |
| Hewlett-Packard Co. | | | 2.200 | % | 12/01/15 | | | 727,000 | | | | 734,775 | |
| Hewlett-Packard Co. | | | 3.000 | % | 09/15/16 | | | 2,550,000 | | | | 2,624,988 | |
| Hewlett-Packard Co. | | | 2.600 | % | 09/15/17 | | | 47,000 | | | | 48,332 | |
| Xerox Corp. | | | 4.250 | % | 02/15/15 | | | 2,900,000 | | | | 2,903,741 | |
| | | | | | | | | | | | | 12,288,112 | |
| Materials — 4.9% | | | | | | | | | | | | | |
| Ball Corp. | | | 6.750 | % | 09/15/20 | | | 2,835,000 | | | | 2,945,565 | |
| Transocean, Inc. | | | 5.050 | % | 12/15/16 | | | 2,800,000 | | | | 2,765,000 | |
| | | | | | | | | | | | | 5,710,565 | |
Utilities — 0.0% (b) | | | | | | | | | | | | | |
| Pennsylvania Electric Co. | | | 6.625 | % | 04/01/19 | | | 15,000 | | | | 17,359 | |
| | | | | | | | | | | | | | |
Total Corporate Bonds (Cost $86,531,279) | | | | | | | | | | | $ | 86,825,699 | |
| PREFERRED STOCKS — 2.5% | | Shares | | | Value | |
| MetLife, Inc., 6.50%, Series B | | | 67,000 | | | $ | 1,748,030 | |
| RAIT Financial Trust, 7.75%, Series A | | | 49,019 | | | | 1,176,456 | |
Total Preferred Stocks (Cost $2,795,253) | | | | | | $ | 2,924,486 | |
| BANK DEBT — 0.8% | | Coupon | Maturity | | Par Value | | | Value | |
NCP Finance Limited Partnership (a)(c) | | | 6.000 | % | 09/30/16 | | $ | 800,899 | | | $ | 800,899 | |
NCP Finance Limited Partnership (a)(c) | | | 4.171 | % | 09/30/16 | | | 123,596 | | | | 123,596 | |
Total Bank Debt (Cost $924,495) | | | | | | | | | | | $ | 924,495 | |
EUBEL BRADY & SUTTMAN INCOME FUND
SCHEDULE OF INVESTMENTS (Continued)
| MONEY MARKET FUNDS — 7.7% | | Shares | | | Value | |
Invesco Short-Term Investments Trust - Treasury Portfolio - Institutional Shares, 0.01%(d) (Cost $9,041,418) | | | 9,041,418 | | | $ | 9,041,418 | |
| | | | | | | | | |
Total Investments at Value — 98.9% (Cost $115,753,714) | | | | | | $ | 116,193,992 | |
| | | | | | | | | |
| Other Assets in Excess of Liabilities — 1.1% | | | | | | | 1,285,608 | |
| | | | | | | | | |
| Net Assets — 100.0% | | | | | | $ | 117,479,600 | |
| (a) | Variable rate security. The rate shown is the effective interest rate as of January 31, 2015. |
| (b) | Percentage rounds to less than 0.1%. |
| (c) | Security value has been determined in good faith pursuant to procedures adopted by the Board of Trustees. The total value of such securities is $924,495 at January 31, 2015, representing 0.8% of net assets (Note 1). |
| (d) | The rate shown is the 7-day effective yield as of January 31, 2015. |
See accompanying notes to financial statements.
EUBEL BRADY & SUTTMAN MUTUAL FUND TRUST
STATEMENTS OF ASSETS AND LIABILITIES
January 31, 2015 (Unaudited)
| | | Eubel Brady & Suttman Income and Appreciation Fund | | | Eubel Brady & Suttman Income Fund | |
| ASSETS | | | | | | |
| Investments in securities: | | | | | | |
| At acquisition cost | | $ | 77,028,504 | | | $ | 115,753,714 | |
| At value (Note 2) | | $ | 78,227,508 | | | $ | 116,193,992 | |
| Dividends and interest receivable | | | 950,358 | | | | 1,152,537 | |
| Receivable for capital shares sold | | | — | | | | 217,492 | |
| Other assets | | | 16,976 | | | | 18,209 | |
| Total assets | | | 79,194,842 | | | | 117,582,230 | |
| | | | | | | | | |
| LIABILITIES | | | | | | | | |
| Distributions payable | | | 796 | | | | 2,146 | |
| Payable for capital shares redeemed | | | 30,707 | | | | 74,222 | |
| Payable to administrator (Note 3) | | | 6,730 | | | | 9,460 | |
| Other accrued expenses | | | 8,215 | | | | 16,802 | |
| Total liabilities | | | 46,448 | | | | 102,630 | |
| | | | | | | | | |
| NET ASSETS | | $ | 79,148,394 | | | $ | 117,479,600 | |
| | | | | | | | | |
| NET ASSETS CONSIST OF: | | | | | | | | |
| Paid-in capital | | $ | 77,945,518 | | | $ | 117,029,021 | |
| Accumulated net investment income | | | 355 | | | | 1,010 | |
| Accumulated net realized gains from security transactions | | | 3,517 | | | | 9,291 | |
| Net unrealized appreciation on investments | | | 1,199,004 | | | | 440,278 | |
| NET ASSETS | | $ | 79,148,394 | | | $ | 117,479,600 | |
| | | | | | | | | |
| Shares of beneficial interest outstanding (unlimited number of shares authorized, no par value) | | | 8,009,570 | | | | 11,814,423 | |
| | | | | | | | | |
| Net asset value, offering price and redemption price per share (Note 2) | | $ | 9.88 | | | $ | 9.94 | |
See accompanying notes to financial statements.
EUBEL BRADY & SUTTMAN MUTUAL FUND TRUST
STATEMENTS OF OPERATIONS
For the Period Ended January 31, 2015 (a) (Unaudited)
| | | Eubel Brady & Suttman Income and Appreciation Fund | | | Eubel Brady & Suttman Income Fund | |
| INVESTMENT INCOME | | | | | | |
| Dividend income | | $ | 34,192 | | | $ | 30,758 | |
| Interest | | | 550,210 | | | | 548,089 | |
| Total investment income | | | 584,402 | | | | 578,847 | |
| | | | | | | | | |
| EXPENSES | | | | | | | | |
| Administration fees (Note 3) | | | 22,580 | | | | 30,790 | |
| Registration fees | | | 15,434 | | | | 20,800 | |
| Shareholder servicing fees (Note 3) | | | 7,628 | | | | 11,314 | |
| Trustees’ fees and expenses (Note 3) | | | 3,283 | | | | 3,283 | |
| Custody and bank service fees | | | 2,741 | | | | 3,695 | |
| Professional fees | | | 2,829 | | | | 2,829 | |
| Other expenses | | | 729 | | | | 3,795 | |
| Total expenses | | | 55,224 | | | | 76,506 | |
| | | | | | | | | |
| NET INVESTMENT INCOME | | | 529,178 | | | | 502,341 | |
| | | | | | | | | |
| REALIZED AND UNREALIZED GAINS (LOSSES) ON INVESTMENTS | | | | | | | | |
| Net realized gains from investment transactions | | | 3,517 | | | | 9,291 | |
| Net change in unrealized appreciation/depreciation on investments | | | (985,913 | ) | | | (564,149 | ) |
| NET REALIZED AND UNREALIZED LOSSES ON INVESTMENTS | | | (982,396 | ) | | | (554,858 | ) |
| | | | | | | | | |
| NET DECREASE IN NET ASSETS FROM OPERATIONS | | $ | (453,218 | ) | | $ | (52,517 | ) |
| (a) | Represents the period from the commencement of operations (September 30, 2014) through January 31, 2015. |
See accompanying notes to financial statements.
EUBEL BRADY & SUTTMAN INCOME AND APPRECIATION FUND
STATEMENT OF CHANGES IN NET ASSETS
| | | Period Ended
January 31,
2015 (a) (Unaudited) | |
| FROM OPERATIONS | | | |
| Net investment income | | $ | 529,178 | |
| Net realized gains from investment transactions | | | 3,517 | |
| Net change in unrealized appreciation/depreciation on investments | | | (985,913 | ) |
| Net decrease in net assets from operations | | | (453,218 | ) |
| | | | | |
| DISTRIBUTIONS TO SHAREHOLDERS | | | | |
| From net investment income | | | (528,823 | ) |
| | | | | |
| CAPITAL SHARE TRANSACTIONS | | | | |
| Shares issued from reorganization (Note 1) | | | 53,446,239 | |
| Proceeds from shares sold | | | 33,583,269 | |
| Net asset value of shares issued in reinvestment of distributions to shareholders | | | 527,072 | |
| Payments for shares redeemed | | | (7,476,145 | ) |
| Net increase from capital share transactions | | | 80,080,435 | |
| | | | | |
| TOTAL INCREASE IN NET ASSETS | | | 79,098,394 | |
| | | | | |
| NET ASSETS | | | | |
| Beginning of period | | | 50,000 | |
| End of period | | $ | 79,148,394 | |
| | | | | |
| ACCUMULATED NET INVESTMENT INCOME | | $ | 355 | |
| | | | | |
| CAPITAL SHARE ACTIVITY | | | | |
| Shares issued from reorganization (Note 1) | | | 5,344,624 | |
| Shares sold | | | 3,355,289 | |
| Shares reinvested | | | 52,803 | |
| Shares redeemed | | | (748,146 | ) |
| Net increase in shares outstanding | | | 8,004,570 | |
| Shares outstanding at beginning of period | | | 5,000 | |
| Shares outstanding at end of period | | | 8,009,570 | |
| (a) | Represents the period from the commencement of operations (September 30, 2014) through January 31, 2015. |
See accompanying notes to financial statements.
EUBEL BRADY & SUTTMAN INCOME FUND
STATEMENT OF CHANGES IN NET ASSETS
| | | Period Ended
January 31,
2015 (a) (Unaudited) | |
| FROM OPERATIONS | | | |
| Net investment income | | $ | 502,341 | |
| Net realized gains from investment transactions | | | 9,291 | |
| Net change in unrealized appreciation/depreciation on investments | | | (564,149 | ) |
| Net decrease in net assets from operations | | | (52,517 | ) |
| | | | | |
| DISTRIBUTIONS TO SHAREHOLDERS | | | | |
| From net investment income | | | (501,331 | ) |
| | | | | |
| CAPITAL SHARE TRANSACTIONS | | | | |
| Proceeds from shares sold | | | 121,267,903 | |
| Net asset value of shares issued in reinvestment of distributions to shareholders | | | 496,640 | |
| Payments for shares redeemed | | | (3,781,095 | ) |
| Net increase from capital share transactions | | | 117,983,448 | |
| | | | | |
| TOTAL INCREASE IN NET ASSETS | | | 117,429,600 | |
| | | | | |
| NET ASSETS | | | | |
| Beginning of period | | | 50,000 | |
| End of period | | $ | 117,479,600 | |
| | | | | |
| ACCUMULATED NET INVESTMENT INCOME | | $ | 1,010 | |
| | | | | |
| CAPITAL SHARE ACTIVITY | | | | |
| Shares sold | | | 12,139,251 | |
| Shares reinvested | | | 49,898 | |
| Shares redeemed | | | (379,726 | ) |
| Net increase in shares outstanding | | | 11,809,423 | |
| Shares outstanding at beginning of period | | | 5,000 | |
| Shares outstanding at end of period | | | 11,814,423 | |
| (a) | Represents the period from the commencement of operations (September 30, 2014) through January 31, 2015. |
See accompanying notes to financial statements.
EUBEL BRADY & SUTTMAN INCOME AND APPRECIATION FUND
FINANCIAL HIGHLIGHTS
Per Share Data for a Share Outstanding Throughout the Period
| | | Period Ended
January 31, 2015 (a)
(Unaudited) | |
| Net asset value at beginning of period | | $ | 10.00 | |
| | | | | |
| Income (loss) from investment operations: | | | | |
| Net investment income | | | 0.07 | |
| Net realized and unrealized losses on investments | | | (0.12 | ) |
| Total from investment operations | | | (0.05 | ) |
| | | | | |
| Less distributions from: | | | | |
| Net investment income | | | (0.07 | ) |
| | | | | |
| Net asset value at end of period | | $ | 9.88 | |
| | | | | |
Total return (b) | | | (0.46% | )(c) |
| | | | | |
| Net assets at end of period (000’s) | | $ | 79,148 | |
| | | | | |
| Ratios/supplementary data: | | | | |
| | | | | |
| Ratio of total expenses to average net assets | | | 0.25 | %(d) |
| | | | | |
| Ratio of net investment income to average net assets | | | 2.39 | %(d) |
| | | | | |
| Portfolio turnover rate | | | 10 | %(c) |
| (a) | Represents the period from the commencement of operations (September 30, 2014) through January 31, 2015. |
| (b) | Total return is a measure of the change in value of an investment in the Fund over the period covered, which assumes any dividends or capital gains distributions are reinvested in shares of the Fund. The return shown does not reflect the deduction of taxes a shareholder would pay on Fund distributions or the redemption of Fund shares. |
See accompanying notes to financial statements.
EUBEL BRADY & SUTTMAN INCOME FUND
FINANCIAL HIGHLIGHTS
Per Share Data for a Share Outstanding Throughout the Period
| | | Period Ended
January 31, 2015 (a)
(Unaudited) | |
| Net asset value at beginning of period | | $ | 10.00 | |
| | | | | |
| Income (loss) from investment operations: | | | | |
| Net investment income | | | 0.05 | |
| Net realized and unrealized losses on investments | | | (0.06 | ) |
| Total from investment operations | | | (0.01 | ) |
| | | | | |
| Less distributions from: | | | | |
| Net investment income | | | (0.05 | ) |
| | | | | |
| Net asset value at end of period | | $ | 9.94 | |
| | | | | |
Total return (b) | | | (0.11% | )(c) |
| | | | | |
| Net assets at end of period (000’s) | | $ | 117,480 | |
| | | | | |
| Ratios/supplementary data: | | | | |
| | | | | |
| Ratio of total expenses to average net assets | | | 0.25 | %(d) |
| | | | | |
| Ratio of net investment income to average net assets | | | 1.63 | %(d) |
| | | | | |
| Portfolio turnover rate | | | 5 | %(c) |
| (a) | Represents the period from the commencement of operations (September 30, 2014) through January 31, 2015. |
| (b) | Total return is a measure of the change in value of an investment in the Fund over the period covered, which assumes any dividends or capital gains distributions are reinvested in shares of the Fund. The return shown does not reflect the deduction of taxes a shareholder would pay on Fund distributions or the redemption of Fund shares. |
See accompanying notes to financial statements.
EUBEL BRADY & SUTTMAN MUTUAL FUND TRUST
NOTES TO FINANCIAL STATEMENTS
January 31, 2015 (Unaudited)
1. Organization
Eubel Brady & Suttman Income and Appreciation Fund (“Income and Appreciation Fund”) and Eubel Brady & Suttman Income Fund (“Income Fund”) (individually, a “Fund” and collectively, the “Funds”) are each a no-load diversified series of Eubel Brady & Suttman Mutual Fund Trust (the “Trust”), an open-end management investment company organized as a Ohio statutory trust on April 17, 2014. On August 1, 2014, 5,000 shares of each Fund were issued for cash, at $10.00 per share, to a Principal of Eubel Brady & Suttman Asset Management, Inc. (the “Adviser”), the investment adviser to the Funds.
On September 30, 2014, the EBS Convertible Fund I, L.P. (the “Partnership”) reorganized into the Income and Appreciation Fund. The reorganization of net assets and unrealized appreciation from this tax-free transaction was as follows:
| Date of Contribution | | Net Assets | | | Shares Issued | | | Net Unrealized Appreciation on Investments | |
| September 30, 2014 | | $ | 53,446,239 | | | | 5,344,624 | | | $ | 2,184,917 | |
After the Income and Appreciation Fund acquired the net assets of the Partnership in exchange for Fund shares, both Funds began operations on September 30, 2014.
The investment objective of the Income and Appreciation Fund is to seek to provide total return through a combination of current income and capital appreciation.
The investment objective of the Income Fund is to preserve capital, produce income and maximize total return.
2. Significant Accounting Policies
As an investment company, as defined in Financial Accounting Standards Board (“FASB”) Accounting Standards Update 2013-08, the Funds follow accounting and reporting guidance under FASB Accounting Standards Codification Topic 946, “Financial Services – Investment Companies.”
The following summarizes the significant accounting policies of the Funds. The policies are in conformity with accounting principles generally accepted in the United States of America (“GAAP”).
Securities Valuation — The Funds typically use a pricing service to determine the market value of their fixed income securities. A pricing service utilizes electronic data processing techniques based on yield spreads relating to securities with similar characteristics to determine prices for normal institutional-size trading units of fixed income securities without regard to sale or bid prices. Securities that are traded on any stock exchange
EUBEL BRADY & SUTTMAN MUTUAL FUND TRUST
NOTES TO FINANCIAL STATEMENTS (Continued)
are generally valued at the last quoted sale price. Lacking a last sale price, an exchange traded security is generally valued by the pricing service at its last bid price. Securities traded on NASDAQ are generally valued at the NASDAQ Official Closing Price.
If the Adviser determines that a price provided by the pricing service does not accurately reflect the market value of the securities, when prices are not readily available from a pricing service or when restricted or illiquid securities are being valued, securities are valued at fair value as determined in good faith by the Adviser in conformity with guidelines adopted by and subject to review by the Board of Trustees of the Trust (the “Board”).
GAAP establishes a single authoritative definition of fair value, sets out a framework for measuring fair value and requires additional disclosures about fair value measurements.
Various inputs are used in determining the value of each Fund’s investments. These inputs are summarized in the three broad levels listed below:
| • | Level 1 – quoted prices in active markets for identical securities |
| • | Level 2 – other significant observable inputs |
| • | Level 3 – significant unobservable inputs |
Fixed income securities held by the Funds are classified as Level 2 since the values are typically provided by an independent pricing service that utilizes various “other significant observable inputs” as discussed above. The inputs or methodology used are not necessarily an indication of the risks associated with investing in those securities. The inputs used to measure fair value may fall into different levels of the fair value hierarchy. In such cases, for disclosure purposes, the level in the fair value hierarchy within which the fair value measurement falls in its entirety is based on the lowest level input that is significant to the fair value measurement.
The following is a summary of the inputs used to value each Fund’s investments as of January 31, 2015 by security type:
| Eubel Brady & Suttman Income and Appreciation Fund: | |
| | | Level 1 | | | Level 2 | | | Level 3 | | | Total | |
| Corporate Bonds | | $ | — | | | $ | 53,899,657 | | | $ | — | | | $ | 53,899,657 | |
| Convertible Corporate Bonds | | | — | | | | 13,293,288 | | | | — | | | | 13,293,288 | |
| Convertible Preferred Stocks | | | 760,788 | | | | 337,170 | | | | — | | | | 1,097,958 | |
| Warrants | | | 2,872,223 | | | | — | | | | — | | | | 2,872,223 | |
| Bank debt | | | — | | | | 756,405 | | | | — | | | | 756,405 | |
| Money Market Funds | | | 6,307,977 | | | | — | | | | — | | | | 6,307,977 | |
| Total | | $ | 9,940,988 | | | $ | 68,286,520 | | | $ | — | | | $ | 78,227,508 | |
EUBEL BRADY & SUTTMAN MUTUAL FUND TRUST
NOTES TO FINANCIAL STATEMENTS (Continued)
| Eubel Brady & Suttman Income Fund: | |
| | | Level 1 | | | Level 2 | | | Level 3 | | | Total | |
| U.S. Treasury Obligations | | $ | — | | | $ | 12,385,840 | | | $ | — | | | $ | 12,385,840 | |
| U.S. Government Agency Obligations | | | — | | | | 4,092,054 | | | | — | | | | 4,092,054 | |
| Corporate Bonds | | | — | | | | 86,825,699 | | | | — | | | | 86,825,699 | |
| Preferred Stocks | | | 2,924,486 | | | | — | | | | — | | | | 2,924,486 | |
| Bank debt | | | — | | | | 924,495 | | | | — | | | | 924,495 | |
| Money Market Funds | | | 9,041,418 | | | | — | | | | — | | | | 9,041,418 | |
| Total | | $ | 11,965,904 | | | $ | 104,228,088 | | | $ | — | | | $ | 116,193,992 | |
As of January 31, 2015, the Funds did not have any transfers in and out of any Level. There were no Level 3 securities or derivative instruments held by the Funds as of January 31, 2015. It is the Funds’ policy to recognize transfers into and out of any Level at the end of the reporting period.
Share valuation — The net asset value per share of each Fund is calculated daily by dividing the total value of its assets, less liabilities, by the number of shares outstanding. The offering price and redemption price per share of each Fund is equal to its net asset value per share.
Estimates — The preparation of financial statements in conformity with GAAP requires management to make estimates and assumptions that affect the reported amounts of assets and liabilities and disclosures of contingent assets and liabilities at the date of the financial statements and the reported amounts of increases and decreases in net assets from operations during the reporting period. Actual results could differ from those estimates.
Security Transactions, Investment Income and Realized Gains and Losses — Investment transactions are accounted for on trade date. Dividend income is recorded on the ex-dividend date. Interest income is recorded as earned. Discounts and premiums on fixed income securities are amortized using the effective interest method. Gains and losses on securities sold are determined on a specific identification basis.
Distributions to Shareholders — Distributions to shareholders of net investment income, if any, are paid monthly. Capital gain distributions, if any, are distributed to shareholders annually. Distributions are based on amounts calculated in accordance with applicable federal income tax regulations, which may differ from GAAP. These differences are due primarily to differing treatments of income and gains on various investment securities held by the Funds, timing differences and differing
EUBEL BRADY & SUTTMAN MUTUAL FUND TRUST
NOTES TO FINANCIAL STATEMENTS (Continued)
characterizations of distributions made by the Funds. Dividends and distributions are recorded on the ex-dividend date. The tax character of distributions paid by each Fund for the period ended January 31, 2015 was ordinary income.
Federal income tax — Each Fund intends to qualify each year as a “regulated investment company” under Subchapter M of the Internal Revenue Code of 1986 (the “Code”). Qualification generally will relieve the Funds of liability for federal income taxes to the extent 100% of their net investment income and net realized gains are distributed in accordance with the Code. Accordingly, no provision for income taxes has been made.
In order to avoid imposition of the excise tax applicable to regulated investment companies, it is also each Fund’s intention to declare as dividends in each calendar year at least 98% of its net investment income (earned during the calendar year) and 98.2% of its net realized capital gains (earned during the twelve months ended October 31) plus undistributed amounts from prior years.
The following information is computed on a tax basis for each item as of January 31, 2015:
| | | EBS
Income and Appreciation
Fund | | | EBS
Income
Fund | |
| Tax cost of portfolio investments | | $ | 77,028,504 | | | $ | 115,753,714 | |
| Gross unrealized appreciation | | $ | 2,584,879 | | | $ | 1,109,999 | |
| Gross unrealized depreciation | | | (1,385,875 | ) | | | (669,721 | ) |
| Net unrealized appreciation on investments | | | 1,199,004 | | | | 440,278 | |
| Accumulated ordinary income | | | 1,151 | | | | 3,156 | |
| Other gains | | | 3,517 | | | | 9,291 | |
| Other temporary differences | | | (796 | ) | | | (2,146 | ) |
| Accumulated earnings | | $ | 1,202,876 | | | $ | 450,579 | |
During the period ended January 31, 2015, the Income and Appreciation Fund and the Income Fund received securities resulting from in-kind subscriptions with unrealized appreciation of $2,184,917 and $1,004,427, respectively. The Funds reclassified these amounts from paid-in capital to unrealized appreciation in the component of net assets on the Statements of Assets and Liabilities. Such reclassifications, the result of permanent differences between the financial statement and income tax reporting requirements, had no effect on each Fund’s net assets or net asset value per share.
EUBEL BRADY & SUTTMAN MUTUAL FUND TRUST
NOTES TO FINANCIAL STATEMENTS (Continued)
The Funds recognize the tax benefits or expenses of uncertain tax positions only when the position is “more likely than not” to be sustained assuming examination by tax authorities. Management has reviewed each Fund’s tax positions for the current tax year (tax year ending July 31, 2015) and has concluded that no provision for unrecognized tax benefits or expenses is required in these financial statements and does not expect this to change over the next year. Each Fund identifies its major tax jurisdiction as U.S. Federal.
3. Transactions with Related Parties
Certain officers of the Trust are also officers of the Adviser, or of Ultimus Fund Solutions, LLC (“Ultimus”), the administrative services agent, shareholder servicing and transfer agent, and accounting services agent for the Funds, or of Ultimus Fund Distributors, LLC (the “Distributor”), the principal underwriter and exclusive agent for the distribution of shares of the Funds.
Investment Adviser — Under the terms of the Management Agreement between the Trust and the Adviser, the Adviser manages each Fund’s investments subject to oversight by the Board. The Funds do not pay the Adviser investment advisory fees under the terms of the Management Agreement. However, prior to investing in a Fund, a prospective shareholder must enter into an investment advisory agreement with the Adviser that calls for the payment of an advisory fee based upon a percentage of all assets (including shares of the Funds) managed by the Adviser on behalf of the prospective shareholder. The fee schedule may be negotiable at the time the account is opened and is generally based upon the value of assets held in the client’s account and the style of management.
The Adviser has entered into an agreement with the Funds under which it has agreed to reimburse Fund expenses to the extent necessary to limit total annual operating expenses (excluding brokerage costs, taxes, interest, acquired fund fees and expenses, expenses incurred pursuant to the Funds’ Shareholder Servicing Plan and extraordinary expenses) to an amount not exceeding 0.35% of each Fund’s average daily net assets. “Operating expenses” do not include organization or offering costs of each Fund, which the Adviser has otherwise agreed to pay. Any payments by the Adviser of expenses which are a Fund’s obligation are subject to repayment by the Fund for a period of 3 years following the fiscal year in which such expenses were paid, provided that the repayment does not cause the Fund’s total annual operating expenses to exceed 0.35% of average daily net assets. This agreement is currently in effect until December 1, 2016. No expense reimbursements were required during the period ended January 31, 2015.
EUBEL BRADY & SUTTMAN MUTUAL FUND TRUST
NOTES TO FINANCIAL STATEMENTS (Continued)
Other Service Providers — Ultimus provides fund administration, fund accounting and transfer agency services to each Fund. The Funds pay Ultimus fees in accordance with the agreements for such services. In addition, the Funds pay out-of-pocket expenses including, but not limited to postage, supplies and costs of pricing the Funds’ portfolio securities.
Shareholder Service Plan — The Funds have adopted a Shareholder Servicing Plan. The Plan allows each Fund to make payments to financial organizations (including payments directly to the Adviser and the Distributor) for providing account administration and account maintenance services to Fund shareholders. The annual service fee may not exceed an amount equal to 0.25% of each Fund’s average daily net assets. During the period ended January 31, 2015, the Income and Appreciation Fund and the Income Fund paid $7,628 and $11,314, respectively, for such services.
Compensation of Trustees — Trustees and officers affiliated with the Adviser or Ultimus are not compensated by the Trust for their services. Each Trustee who is not an affiliated person of the Adviser or Ultimus (“Independent Trustee”) receives from the Trust a fee of $1,000 for attendance at each meeting of the Board, payable quarterly, in addition to reimbursement of travel and other expenses incurred in attending the meetings. The Chairman of the Audit and Governance Committee receives an additional annual fee of $1,000.
4. Securities Transactions
During the period ended January 31, 2015, cost of purchases and proceeds from sales and maturities of investment securities, other than short-term investments and U.S. government securities, totaled $66,379,460 and $5,786,236, respectively, for the Income and Appreciation Fund and $75,799,631 and $4,147,733, respectively, for the Income Fund.
5. Contingencies and Commitments
The Funds indemnify the Trust’s officers and Trustees for certain liabilities that might arise from their performance of their duties to the Funds. Additionally, in the normal course of business the Funds enter into contracts that contain a variety of representations and warranties and which provide general indemnifications. The Funds’ maximum exposure under these arrangements is unknown, as this would involve future claims that may be made against the Funds that have not yet occurred. However, based on experience, the Funds expect the risk of loss to be remote.
EUBEL BRADY & SUTTMAN MUTUAL FUND TRUST
NOTES TO FINANCIAL STATEMENTS (Continued)
6. Subsequent Events
The Funds are required to recognize in the financial statements the effects of all subsequent events that provide additional evidence about conditions that existed as of the date of the Statements of Assets and Liabilities. For non-recognized subsequent events that must be disclosed to keep the financial statements from being misleading, the Funds are required to disclose the nature of the event as well as an estimate of its financial effect, or a statement that such an estimate cannot be made. Management has evaluated subsequent events through the issuance of these financial statements and has noted no such events.
EUBEL BRADY & SUTTMAN MUTUAL FUND TRUST
ABOUT YOUR FUNDS’ EXPENSES (Unaudited)
We believe it is important for you to understand the impact of costs on your investment. All mutual funds have operating expenses. As a shareholder of the Funds, you incur ongoing costs, including shareholder servicing fees and other operating expenses. These ongoing costs, which are deducted from each Fund’s gross income, directly reduce the investment return of the Funds.
A mutual fund’s ongoing costs are expressed as a percentage of its average net assets. This figure is known as the expense ratio. The following examples are intended to help you understand the ongoing costs (in dollars) of investing in the Funds and to compare these costs with the ongoing costs of investing in other mutual funds. The examples below are based on an investment of $1,000 made at the beginning of the period shown and held for the entire period (September 30, 2014 through January 31, 2015).
The table below illustrates each Fund’s ongoing costs in two ways:
Actual fund return – This section helps you to estimate the actual expenses that you paid over the period. The “Ending Account Value” shown is derived from each Fund’s actual return, and the third column shows the dollar amount of operating expenses that would have been paid by an investor who started with $1,000 in each Fund. You may use the information here, together with the amount you invested, to estimate the expenses that you paid over the period.
To do so, simply divide your account value by $1,000 (for example, an $8,600 account value divided by $1,000 = 8.6), then multiply the result by the number given for the Funds under the heading “Expenses Paid During Period.”
Hypothetical 5% return – This section is intended to help you compare the Funds’ ongoing costs with those of other mutual funds. It assumes that each Fund had an annual return of 5% before expenses during the period shown, but that the expense ratio is unchanged. In this case, because the returns used are not the Funds’ actual returns, the results do not apply to your investment. The example is useful in making comparisons because the Securities and Exchange Commission (“SEC”) requires all mutual funds to calculate expenses based on a 5% return. You can assess each Fund’s ongoing costs by comparing this hypothetical example with the hypothetical examples that appear in shareholder reports of other funds.
Note that expenses shown in the table are meant to highlight and help you compare ongoing costs only. The Funds do not charge transaction fees, such as purchase or redemption fees, nor do they impose any sales loads.
The calculations assume no shares were bought or sold during the period. Your actual costs may have been higher or lower, depending on the amount of your investment and the timing of any purchases or redemptions.
EUBEL BRADY & SUTTMAN MUTUAL FUND TRUST
ABOUT YOUR FUNDS’ EXPENSES (Unaudited) (Continued)
More information about the Funds’ expenses can be found in this report. For additional information on operating expenses and other shareholder costs, please refer to each Fund’s prospectus.
| | Beginning
Account Value
August 1, 2014(a) | Ending
Account Value
January 31, 2015 | Net
Expense
Ratio(b) | Expenses
Paid During Period(c) |
| EBS Income & Appreciation Fund | | | |
| Actual | $1,000.00 | $995.40 | 0.25% | $0.84 |
| Hypothetical 5% Return (before expenses) | $1,000.00 | $1,023.95 | 0.25% | $1.28 |
| EBS Income Fund | | | | |
| Actual | $1,000.00 | $998.90 | 0.25% | $0.84 |
| Hypothetical 5% Return (before expenses) | $1,000.00 | $1,023.95 | 0.25% | $1.28 |
| (a) | Beginning Account Value is as of September 30, 2014 (date of commencement of operations) for the Actual return information. |
| (b) | Annualized, based on each Fund's expenses for the period September 30, 2014 through January 31, 2015. |
| (c) | Expenses are equal to the Funds' annualized expense ratio multiplied by the average account value over the period, multiplied by 123/365 (to reflect the period since inception) and 184/365 (to reflect the one-half year period), for Actual and Hypothetical Return information, respectively. |
EUBEL BRADY & SUTTMAN MUTUAL FUND TRUST
OTHER INFORMATION (Unaudited)
The Trust files a complete listing of portfolio holdings for the Funds with the SEC as of the end of the first and third quarters of each fiscal year on Form N-Q. These filings are available upon request by calling 1-800-391-1223. Furthermore, you may obtain a copy of the filings on the SEC’s website at http://www.sec.gov. The Trust’s Forms N-Q may also be reviewed and copied at the SEC’s Public Reference Room in Washington, DC, and information on the operation of the Public Reference Room may be obtained by calling 1-800-SEC-0330.
A description of the policies and procedures that the Funds use to vote proxies relating to portfolio securities is available without charge upon request by calling toll-free 1-800-391-1223, or on the U.S. Securities and Exchange Commission (“SEC”) website at http://www.sec.gov. Information regarding how the Funds voted proxies relating to portfolio securities during the period ended June 30, 2015 will be available without charge upon request no later than August 31, 2015 by calling toll-free 1-800-391-1223, or on the SEC’s website at http://www.sec.gov.
EUBEL BRADY & SUTTMAN MUTUAL FUND TRUST
APPROVAL OF INVESTMENT ADVISORY AGREEMENT
(Unaudited)
The Board of Trustees, including all of the Independent Trustees voting separately, has reviewed and approved the Investment Advisory Agreement, on behalf of Eubel Brady & Suttman Income and Appreciation Fund (the “Income and Appreciation Fund”) and Eubel Brady & Suttman Income Fund (the “Income Fund”) (the Income and Appreciation Fund and the Income Fund are referred to collectively as the “Funds”), with the Adviser. Approval took place at an in-person meeting held on July 15, 2014, at which all Trustees were present, including all of the Independent Trustees.
In the course of their consideration of the Investment Advisory Agreement, the Independent Trustees were advised by independent legal counsel and received materials from such counsel discussing the legal standards for their consideration of the proposed approval of the Investment Advisory Agreement on behalf of the Funds. The Independent Trustees received and reviewed a substantial amount of information provided by the Adviser in response to requests of independent legal counsel. Prior to voting, the Independent Trustees met with and asked questions of representatives of the Adviser and also met separately with their independent legal counsel.
In considering the Investment Advisory Agreement and reaching their conclusions with respect to the Investment Advisory Agreement, the Trustees reviewed and analyzed various factors that they determined were relevant, including the factors described below.
Nature, Extent and Quality of Services
The Trustees received and considered various data and information regarding the nature, extent and quality of services to be provided to the Funds by the Adviser. The most recent Form ADV for the Adviser was reviewed by the Trustees. The Trustees specifically reviewed the qualifications, background and responsibilities of the members of the Adviser’s portfolio management team who will oversee the day-to-day investment management and operations of the Funds. The Trustees considered the Adviser’s process for identifying investment opportunities and noted that all investment decisions are made at the portfolio management team level. The Trustees discussed the support resources available for investment research, compliance and operations. The Trustees were mindful that the investment process that will be used by the Adviser in managing the Funds is similar to that used to manage certain of the Adviser’s other managed accounts. After further discussion, the Board concluded that it was satisfied with the nature, extent and quality of the investment advisory services to be provided to the Funds by the Adviser.
EUBEL BRADY & SUTTMAN MUTUAL FUND TRUST
APPROVAL OF INVESTMENT ADVISORY AGREEMENT
(Unaudited) (Continued)
Expenses and Performance
The Trustees considered information regarding each Fund’s projected expense ratio and its various components, including the Adviser’s decision not to charge an advisory fee at the Fund level and the Adviser’s decision to cap each Fund’s annual operating expense. They also considered comparisons of these fees to the expense information for each Fund’s peer group, as presented by management. The Income and Appreciation Fund’s overall expense ratio was compared to funds within the Morningstar category of “Convertible Bond Funds.” The Trustees noted that the overall expense ratio of the Income and Appreciation Fund, which did not include a charge for advisory fees paid at the client account level, will be lower than the average expense ratio for Convertible Bond Funds. The Trustees also considered the range of advisory fees charged by the Adviser at the client account level and applied that range to the overall expense ratio of the Income and Appreciation Fund to estimate total costs to underlying shareholders. The Income Fund’s overall expense ratio was compared to funds within the Morningstar category of “Multisector Bond Funds.” The Trustees noted that the overall expense ratio of the Income Fund, which did not include a charge for advisory fees at the client account level, will be lower than the average expense ratio for Multisector Bond Funds. The Trustees also considered the range of advisory fees charged by the Adviser at the client account level and applied that range to the overall expense ratio of the Income Fund to estimate total costs to underlying shareholders. The Trustees also observed that, under the expense cap arrangements agreed to by the Adviser, shareholders of each Fund are guaranteed a competitive expense ratio during the infancy stages (first two years) of the Funds. The Trustees concluded that the expense ratio for each Fund was reasonable in relation to the average ratios for the peer groups presented.
The Trustees noted that because the Funds have not commenced operations, they do not have a performance record to consider. Instead, the Trustees considered the Adviser’s separate account performance record with respect to its strategies that are similar to the Funds. The Trustees were informed that the performance results of the Adviser’s separately managed accounts were prepared in compliance with the GIPS standards. The Trustees noted that the separate account performance record for its fixed income strategy outperformed its benchmark for all periods reported ended December 31, 2013. It was further noted by the Trustees that the separately managed account performance for its convertible strategy outperformed its benchmark for the one year period but trailed for the since inception period ended December 31, 2013. The Trustees discussed the limitations associated with mutual fund and separately managed account performance comparisons. The Trustees concluded that, despite the limitations with such comparisons, the Adviser has demonstrated a good performance record for those separately managed accounts that are similar to the investment strategies for the Funds.
EUBEL BRADY & SUTTMAN MUTUAL FUND TRUST
APPROVAL OF INVESTMENT ADVISORY AGREEMENT
(Unaudited) (Continued)
Investment Advisory Fee Rates
The Trustees reviewed and considered the proposed contractual investment advisory fee rate payable by each Fund to the Adviser for investment advisory services. They took note that no advisory fee is being contemplated for the Funds, rather the Adviser will be compensated by each client under the terms described in its client agreement. The Trustees reviewed and considered the range of advisory fees payable to the Adviser for separately managed account services and compared such information with the fees charged by the other funds in the relevant peer group for each Fund. The Trustees concluded that the advisory fee ranges for the separately managed accounts were reasonable in relation to the average rates for the peer groups presented.
Profitability
The Trustees discussed the projected profits of the Adviser and the other ancillary benefits that the Adviser may receive with regard to providing advisory services to the Funds and concluded that, in light of the fact that each client of the Adviser negotiates his own advisory fee, these factors were of limited importance.
Economies of Scale
The Trustees discussed economies of scale, noting that the Funds do not pay a direct advisory fee, and have not had an opportunity to recognize any economies of scale at this stage. The Trustees were mindful of the Adviser’s projected asset levels and observed that as the Funds grow in assets, this factor will become more relevant to their consideration process. The Trustees noted that the Adviser has generally provided for breakpoints in its advisory fees charged at the client account level, thus, allowing its clients to recognize economies of scale as their accounts grow.
Conclusion
After consideration of these and other factors, the Trustees, including all of the Independent Trustees, concluded that approval of the Investment Advisory Agreement with the Adviser was in the best interest of the Funds and their respective shareholders.
Not required
| Item3. | Audit Committee Financial Expert. |
Not required
| Item4. | Principal Accountant Fees and Services. |
Not required
| Item5. | Audit Committee of Listed Registrants. |
Not applicable
| Item6. | Schedule of Investments. |
| (a) | Not applicable [schedule filed with Item 1] |
| Item7. | Disclosure of Proxy Voting Policies and Procedures for Closed-End Management Investment Companies. |
Not applicable
| Item 8. | Portfolio Managers of Closed-End Management Investment Companies. |
Not applicable
| Item9. | Purchases of Equity Securities by Closed-End Management Investment Company and Affiliated Purchasers. |
Not applicable
| Item10. | Submission of Matters to a Vote of Security Holders. |
The registrant’s Committee of Independent Trustees shall review shareholder recommendations for nominations to fill vacancies on the registrant’s board of trustees if such recommendations are submitted in writing and addressed to the Committee at the registrant’s offices. The Committee may adopt, by resolution, a policy regarding its procedures for considering candidates for the board of trustees, including any recommended by shareholders.
| Item11. | Controls and Procedures. |
(a) Based on their evaluation of the registrant’s disclosure controls and procedures (as defined in Rule 30a-3(c) under the Investment Company Act of 1940) as of a date within 90 days of the filing date of this report, the registrant’s principal executive officer and principal financial officer have concluded that such disclosure controls and procedures are reasonably designed and are operating effectively to ensure that material information relating to the registrant, including its consolidated subsidiaries, is made known to them by others within those entities, particularly during the period in which this report is being prepared, and that the information required in filings on Form N-CSR is recorded, processed, summarized, and reported on a timely basis.
(b) There were no changes in the registrant’s internal control over financial reporting (as defined in Rule 30a-3(d) under the Investment Company Act of 1940) that occurred during the second fiscal quarter of the period covered by this report that have materially affected, or are reasonably likely to materially affect, the registrant’s internal control over financial reporting.
File the exhibits listed below as part of this Form. Letter or number the exhibits in the sequence indicated.
(a)(1) Any code of ethics, or amendment thereto, that is the subject of the disclosure required by Item 2, to the extent that the registrant intends to satisfy the Item 2 requirements through filing of an exhibit: Not required
(a)(2) A separate certification for each principal executive officer and principal financial officer of the registrant as required by Rule 30a-2(a) under the Act (17 CFR 270.30a-2(a)): Attached hereto
(a)(3) Any written solicitation to purchase securities under Rule 23c-1 under the Act (17 CFR 270.23c-1) sent or given during the period covered by the report by or on behalf of the registrant to 10 or more persons: Not applicable
(b) Certifications required by Rule 30a-2(b) under the Act (17 CFR 270.30a-2(b)): Attached hereto
| Exhibit 99.CERT | Certifications required by Rule 30a-2(a) under the Act |
| Exhibit 99.906CERT | Certifications required by Rule 30a-2(b) under the Act |
SIGNATURES
Pursuant to the requirements of the Securities Exchange Act of 1934 and the Investment Company Act of 1940, the registrant has duly caused this report to be signed on its behalf by the undersigned, thereunto duly authorized.
| (Registrant) | Eubel Brady & Suttman Mutual Fund Trust | |
| | | | |
| By (Signature and Title)* | /s/ Scott E. Lundy | |
| | | Scott E. Lundy, President | |
| | | | |
| Date | March 26, 2015 | | |
| | | | |
| Pursuant to the requirements of the Securities Exchange Act of 1934 and the Investment Company Act of 1940, this report has been signed below by the following persons on behalf of the registrant and in the capacities and on the dates indicated. |
| | | | |
| By (Signature and Title)* | /s/ Scott E. Lundy | |
| | | Scott E. Lundy, President | |
| | | | |
| Date | March 26, 2015 | | |
| | | | |
| By (Signature and Title)* | /s/ Theresa M. Bridge | |
| | | Theresa M. Bridge, Treasurer | |
| | | | |
| Date | March 26, 2015 | | |
* Print the name and title of each signing officer under his or her signature.