| OMB APPROVAL |
OMB Number: 3235-0570
Expires: January 31, 2017
Estimated average burden hours per response: 20.6 |
UNITED STATES
SECURITIES AND EXCHANGE COMMISSION
Washington, D.C. 20549
FORM N-CSR
CERTIFIED SHAREHOLDER REPORT OF REGISTERED
MANAGEMENT INVESTMENT COMPANIES
| Investment Company Act file number | 811-22960 | |
| Eubel Brady & Suttman Mutual Fund Trust |
| (Exact name of registrant as specified in charter) |
| 225 Pictoria Drive, Suite 450 | Cincinnati, Ohio 45246 |
| (Address of principal executive offices) | (Zip code) |
Wade R. Bridge, Esq.
| 225 Pictoria Drive, Suite 450 Cincinnati, Ohio 45246 |
| (Name and address of agent for service) |
| Registrant's telephone number, including area code: | (513) 587-3400 | |
| Date of fiscal year end: | July 31 | |
| | | |
| Date of reporting period: | January 31, 2016 | |
Form N-CSR is to be used by management investment companies to file reports with the Commission not later than 10 days after the transmission to stockholders of any report that is required to be transmitted to stockholders under Rule 30e-1 under the Investment Company Act of 1940 (17 CFR 270.30e-1). The Commission may use the information provided on Form N-CSR in its regulatory, disclosure review, inspection, and policymaking roles.
A registrant is required to disclose the information specified by Form N-CSR, and the Commission will make this information public. A registrant is not required to respond to the collection of information contained in Form N-CSR unless the Form displays a currently valid Office of Management and Budget ("OMB") control number. Please direct comments concerning the accuracy of the information collection burden estimate and any suggestions for reducing the burden to the Secretary, Securities and Exchange Commission, 450 Fifth Street, NW, Washington, DC 20549-0609. The OMB has reviewed this collection of information under the clearance requirements of 44 U.S.C. § 3507.
Item 1. Reports to Stockholders.

Eubel Brady & Suttman
Income and Appreciation Fund
Ticker Symbol: EBSZX
Eubel Brady & Suttman
Income Fund
Ticker Symbol: EBSFX
Each a series of the
Eubel Brady & Suttman Mutual Fund Trust
SEMI-ANNUAL REPORT
January 31, 2016
(Unaudited)
EUBEL BRADY & SUTTMAN MUTUAL FUND TRUST LETTER TO OUR SHAREHOLDERS | January 31, 2016 |
Dear Shareholders:
The confluence of low yields and increased volatility has made for tough sledding within the fixed-income universe. Low commodity prices have negatively impacted segments of the bond market, including several of the Funds’ holdings. Turmoil often creates opportunities and can set the stage for improved returns in subsequent periods. We believe this to be the scenario unfolding and are encouraged by the increasing number of compelling investment candidates.
In this semi-annual report letter, we discuss the current environment, review our investment philosophy and results, and share our perspective. The content that follows offers insight into the Funds’ share price behavior and our thought process.
Current Environment – We believe there are three key elements contributing to increased volatility within U.S. fixed-income markets: liquidity, yield and risk appetite.
Liquidity, the ability to facilitate the purchase or sale of an asset without causing drastic changes in the asset’s price, is more constrained today among corporate issues as compared to the pre-2008 period in part due to the regulatory environment, in our view. All things being equal, prices swing more wildly in a less liquid environment.
Yields, the amounts of cash returned to owners of fixed-income (in this case) securities in percentage terms, have been extremely low for a number of years in large part due to the Federal Reserve’s (the “Fed”) near zero short-term interest rate policy. With the symbolic 25 basis point increase in the Fed Fund’s rate to a range between 0.25% and 0.50% last December, the beginning of the end of an extraordinary era appeared to be underway, yet the pace of future rate hikes seems less definitive at present. In some respects, markets often behave like children on a sugar high. When the candy is taken away they become cranky, and then stabilize.
In spite of their paltry yields, many foreign investors find U.S. Treasuries attractive as they seek a safe haven from global turmoil, and in some instances negative yields. This has resulted in strong demand for Treasuries, putting more downward pressure on yields, especially in maturities greater than five years. Although yields on the shorter end of the yield curve have been range bound for a while, those on the long end have actually declined subsequent to the Fed’s increase in short-term rates making for a flatter yield curve.
Risk appetite, the amount and type of risk an organization (or market) is willing to take to meet an objective, appears to be shifting. The credit spread, or difference in yield between a U.S. Treasury (in this case) and a corporate bond of similar maturity, has widened as U.S. Government yields have generally declined and corporate yields increased, making corporate bonds weaker performers for the most part. Higher yields result in lower prices for outstanding bonds. In some cases, the prices may have fallen too far. This is not uncommon during volatile periods when market sentiment shifts rapidly.
1
The debt of commodity related companies has experienced more downside volatility in recent months, as compared to other sectors of the fixed-income market. In spite of the Funds’ modest exposure, they have felt some impact.
In regards to convertible securities, we believe U.S. equity markets were generally overvalued during the semi-annual period with small- and mid-cap companies being the most richly priced relative to earnings and cash-flow. This, in conjunction with many convertibles’ equity sensitivity, limited the number of interesting convertible opportunities which kept our exposure relatively low. Recent declines in equity markets may provide fresh opportunities. When attractively priced convertibles are not available for purchase, we generally hold non-convertible corporate bonds.
Investment Philosophy – Managing risks so that investors are being adequately compensated for them is an important element of our bottom-up investment philosophy. Interest rates are extremely difficult to accurately forecast over time, as evidenced by the Fed’s current inability to agree on raising or lowering rates or to stay with a plan for extended periods of time. We do not attempt such a fruitless endeavor. In our view, flexibility in portfolio management can support long-term success. As such, each Fund has latitude with respect to maturity, duration (price sensitivity to a change in interest rates) and credit quality (among other factors). This flexibility allows us to invest where we find the most value, rather than being confined to specific maturity, duration and credit rating targets. Since we are not mandated to manage to a specific maturity or duration target, we can and often do hold bonds to maturity. We believe this provides our Funds an advantage over those which are more restricted. In addition, with the Funds’ investor base being comprised solely of EBS clients, fund flows should be considerably more stable than those of funds open to the general public. This, too, can provide the Funds with advantages relative to those which may have their assets under management fluctuate wildly at the whims of unknown investors’ emotions. Each Fund held fewer than 100 securities at period-end, but maintained good diversification in our view. Many other funds hold hundreds of securities. In our opinion, holding fewer “eggs” in our basket allows us to be selective, and provide close oversight. Because the composition of the EBS Funds will often be materially different than their benchmarks, you should expect their returns to diverge from them, often significantly. Lastly, neither Fund uses leverage (borrows money) to make investments.
Results For Various Periods Ended January 31, 2016 – Since inception (September 30, 2014) through January 31, 2016, the EBS Income and Appreciation Fund (“EBSZX”) posted a total return of -4.05%, while its primary benchmark, the BofA Merrill Lynch U.S. Yield Alternatives Index, returned -10.59%. On a one year basis, the Fund declined 4.95% and the index declined 12.37%. On a six month basis, the Fund declined 5.74% and the index declined 11.14%. Many investors may view this as a success, but we have found it hard to spend relative dollars. In the long-run, we believe absolute returns count the most.
The primary factors contributing to EBSZX’s outperformance since inception and over the last 12 and six months are described below:
| | ● | EBSZX’s investment in non-convertible securities contributed to its relative outperformance as |
2
those assets generally performed better than those comprising the index, on average.
| | ● | Although our exposure to commodity related companies is modest, there was some negative impact as yields generally increased on their debt due to the declining price of commodities and related weakness in the companies’ financial results. Increasing yields put downward pressure on the price of associated debt. |
We believe EBSZX is positioned well to capitalize on additional convertible investments should they become available at prices we find compelling. The odds for making additional investments are improving.
Since inception (September 30, 2014) through January 31, 2016, the EBS Income Fund (“EBSFX”) logged a total return of -1.14%, while its primary benchmark, the BofA Merrill Lynch U.S. Corporate & Government Master Index, was up 2.80%. On a one year basis, the Fund declined 1.41% and the index declined 0.87%. On a six month basis, the Fund declined 1.73% and the index was up 1.25%.
The primary factors contributing to EBSFX’s underperformance since inception and over the last 12 and six months are described below:
| | ● | EBSFX’s weighted average maturity and duration (price sensitivity to a change in interest rates) were consistently shorter than that of its benchmark, and it had less exposure to Government & Agency debt. Yields on corporate bonds owned by EBSFX increased on average, putting pressure on prices. Yields of securities with the largest impact on the benchmark declined on average, lifting their prices (think Government & Agency) and its return. |
| | ● | EBSFX’s primary reason for lagging its benchmark was due to it having less exposure to low yielding U.S. Government & Agency debt which often benefits from a global flight to safety. This can drive yields down and prices up. |
Our Perspective – In light of the current low yield environment, it is hard to envision a probable scenario where yields are materially lower several years from now. As such, the Funds are structured with an eye toward higher yields in the future.
Today, we are more comfortable selectively taking credit risk on the short end of the yield curve than increasing interest rate risk by extending maturities to enhance yield.
Both Funds sensitivity to interest rates is modest and each Fund’s portfolio is diversified, in our view.
Convertible exposure within EBSZX is lower than we prefer, and is largely due to a low yield environment and stock prices that seem generally high relative to underlying values as previously mentioned. Again, with recent downside market volatility, the odds of finding convertible issues meeting our criteria are increasing.
Both Funds are positioned well to capitalize on opportunities, in our view.
We welcome your questions, comments or both and may be reached at 800-391-1223. As always, we appreciate your trust and confidence in our firm.
Sincerely,
The EBS Research Group
3
Important Disclosures – Performance data quoted in this letter or the report itself represents past performance. Past performance does not guarantee future results. The value of an investor’s shares will fluctuate, and may be worth more or less than the original cost when redeemed. Current performance may be higher or lower than performance quoted herein. Performance data, current to the most recent month end, is available by calling 1-800-391-1223.
The information in this “Letter To Our Shareholders” represents the opinion of the author and is not intended to be a forecast or investment advice. This publication does not constitute an offer or solicitation of any transaction in any securities. Information contained in this publication has been obtained from sources believed to be reliable, but has not been independently verified by EBS. Please note that any discussion of fund holdings, fund performance and views expressed are as of January 31, 2016 (except if otherwise stated) and are subject to change without notice.
4
EUBEL BRADY & SUTTMAN MUTUAL FUND TRUST
PORTFOLIO INFORMATION
January 31, 2016 (Unaudited)
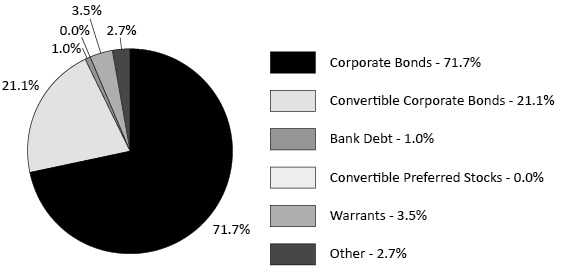
Eubel Brady & Suttman Income and Appreciation Fund
Asset Allocation (% of Net Assets)
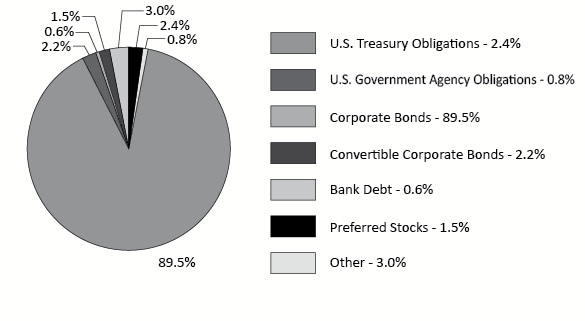
Eubel Brady & Suttman Income Fund
Asset Allocation (% of Net Assets)
5
EUBEL BRADY & SUTTMAN INCOME AND APPRECIATION FUND
SCHEDULE OF INVESTMENTS
January 31, 2016 (Unaudited) |
CORPORATE BONDS — 71.7% | | Coupon | | Maturity | | Par Value | | | Value | |
Consumer Discretionary — 18.1% | | | | | | | | | | |
Gannet Co., Inc. | | 10.000% | | 04/01/16 | | $ | 2,156,000 | | | $ | 2,182,950 | |
Hanesbrands, Inc. | | 6.375% | | 12/15/20 | | | 2,230,000 | | | | 2,313,893 | |
Hyatt Hotels Corp. | | 3.875% | | 08/15/16 | | | 1,700,000 | | | | 1,720,721 | |
Marriott International, Inc. | | 3.375% | | 10/15/20 | | | 2,220,000 | | | | 2,294,146 | |
Time Warner Cable, Inc. | | 6.750% | | 07/01/18 | | | 2,100,000 | | | | 2,293,876 | |
Whirlpool Corp. | | 1.650% | | 11/01/17 | | | 2,400,000 | | | | 2,393,856 | |
| | | | | | | | | | | | 13,199,442 | |
Consumer Staples — 6.7% | | | | | | | | | | | | |
Dr Pepper Snapple Group, Inc. | | 6.820% | | 05/01/18 | | | 2,170,000 | | | | 2,414,635 | |
Kroger Co. (The) | | 2.200% | | 01/15/17 | | | 2,500,000 | | | | 2,522,645 | |
| | | | | | | | | | | | 4,937,280 | |
Energy — 8.3% | | | | | | | | | | | | |
Boardwalk Pipelines, LLC | | 5.875% | | 11/15/16 | | | 1,500,000 | | | | 1,500,915 | |
Boardwalk Pipelines, LLC | | 5.500% | | 02/01/17 | | | 500,000 | | | | 495,868 | |
CONSOL Energy, Inc. | | 5.875% | | 04/15/22 | | | 2,600,000 | | | | 1,680,250 | |
Transocean, Inc. | | 5.800% | | 12/15/16 | | | 2,439,000 | | | | 2,365,830 | |
| | | | | | | | | | | | 6,042,863 | |
Financials — 12.2% | | | | | | | | | | | | |
American Financial Group, Inc. | | 9.875% | | 06/15/19 | | | 800,000 | | | | 978,472 | |
Capital One Bank USA, N.A. | | 2.150% | | 11/21/18 | | | 1,380,000 | | | | 1,381,299 | |
Genworth Holdings, Inc. | | 6.515% | | 05/22/18 | | | 1,397,000 | | | | 1,142,047 | |
Goldman Sachs Group, Inc. (a) | | 1.312% | | 12/15/17 | | | 820,000 | | | | 818,137 | |
Icahn Enterprises Finance Corp. | | 3.500% | | 03/15/17 | | | 2,300,000 | | | | 2,282,750 | |
Zions Bancorp. | | 5.650% | | 11/15/23 | | | 2,300,000 | | | | 2,329,210 | |
| | | | | | | | | | | | 8,931,915 | |
Health Care — 3.3% | | | | | | | | | | | | |
WellPoint, Inc. | | 2.375% | | 02/15/17 | | | 2,400,000 | | | | 2,422,193 | |
| | | | | | | | | | | | | |
Industrials — 4.4% | | | | | | | | | | | | |
Caterpillar, Inc. | | 7.900% | | 12/15/18 | | | 708,000 | | | | 827,432 | |
United Rentals North America, Inc. | | 7.375% | | 05/15/20 | | | 2,290,000 | | | | 2,358,700 | |
| | | | | | | | | | | | 3,186,132 | |
Information Technology — 7.0% | | | | | | | | | | | | |
Avnet, Inc. | | 6.625% | | 09/15/16 | | | 632,000 | | | | 650,634 | |
FLIR Systems, Inc. | | 3.750% | | 09/01/16 | | | 2,172,000 | | | | 2,199,410 | |
Xerox Corp. | | 6.350% | | 05/15/18 | | | 2,110,000 | | | | 2,250,885 | |
| | | | | | | | | | | | 5,100,929 | |
Materials — 6.3% | | | | | | | | | | | | |
Sherwin-Williams Co. | | 1.350% | | 12/15/17 | | | 2,430,000 | | | | 2,420,098 | |
Steel Dynamics, Inc. | | 5.125% | | 10/01/21 | | | 2,350,000 | | | | 2,191,375 | |
| | | | | | | | | | | | 4,611,473 | |
See accompanying notes to financial statements.
6
EUBEL BRADY & SUTTMAN INCOME AND APPRECIATION FUND
SCHEDULE OF INVESTMENTS (Continued) |
CORPORATE BONDS — 71.7% (Continued) | | Coupon | | Maturity | | Par Value | | | Value | |
Telecommunication Services — 5.4% | | | | | | | | | | |
América Móvil S.A.B de C.V. | | 2.375% | | 09/08/16 | | $ | 2,400,000 | | | $ | 2,405,971 | |
AT&T, Inc. | | 2.400% | | 08/15/16 | | | 1,500,000 | | | | 1,510,090 | |
| | | | | | | | | | | | 3,916,061 | |
Total Corporate Bonds (Cost $53,394,052) | | | | | | | | | | $ | 52,348,288 | |
CONVERTIBLE CORPORATE BONDS — 21.1% | | Coupon | | Maturity | | Par Value | | | Value | |
Energy — 3.4% | | | | | | | | | | |
Chesapeake Energy Corp. | | 2.500% | | 05/15/37 | | $ | 2,600,000 | | | $ | 1,228,500 | |
Hornbeck Offshore Services, Inc. | | 1.500% | | 09/01/19 | | | 2,370,000 | | | | 1,245,731 | |
| | | | | | | | | | | | 2,474,231 | |
Financials — 10.9% | | | | | | | | | | | | |
Ares Capital Corp. | | 5.750% | | 02/01/16 | | | 2,278,000 | | | | 2,278,000 | |
Jefferies Group, LLC | | 3.875% | | 11/01/29 | | | 2,000,000 | | | | 1,977,500 | |
RAIT Financial Trust | | 4.000% | | 10/01/33 | | | 2,166,000 | | | | 1,615,024 | |
Redwood Trust, Inc. | | 4.625% | | 04/15/18 | | | 2,275,000 | | | | 2,098,687 | |
| | | | | | | | | | | | 7,969,211 | |
Industrials — 0.3% | | | | | | | | | | | | |
Horsehead Holding Corp. | | 3.800% | | 07/01/17 | | | 1,375,000 | | | | 199,375 | |
| | | | | | | | | | | | | |
Information Technology — 3.5% | | | | | | | | | | | | |
Bridgeline Digital, Inc. (b)(c) | | 11.500% | | 03/01/17 | | | 1,000,000 | | | | 819,800 | |
Intel Corp. | | 2.950% | | 12/15/35 | | | 1,400,000 | | | | 1,715,000 | |
| | | | | | | | | | | | 2,534,800 | |
Materials — 3.0% | | | | | | | | | | | | |
RTI International Metals, Inc. | | 1.625% | | 10/15/19 | | | 2,370,000 | | | | 2,212,988 | |
| | | | | | | | | | | | | |
Total Convertible Corporate Bonds (Cost $19,638,981) | | | | | | | | | | $ | 15,390,605 | |
See accompanying notes to financial statements.
7
EUBEL BRADY & SUTTMAN INCOME AND APPRECIATION FUND
SCHEDULE OF INVESTMENTS (Continued) |
BANK DEBT — 1.0% | | Coupon | | Maturity | | Par Value | | | Value | |
NCP Finance Limited Partnership (a)(b)(c) | | 4.423% | | 02/04/16 | | $ | 90,909 | | | $ | 90,891 | |
NCP Finance Limited Partnership (a)(b)(c) | | 4.423% | | 02/08/16 | | | 181,818 | | | | 181,782 | |
NCP Finance Limited Partnership (a)(b)(c) | | 6.250% | | 09/30/16 | | | 454,545 | | | | 452,273 | |
Total Bank Debt (Cost $727,273) | | | | | | | | | | $ | 724,946 | |
CONVERTIBLE PREFERRED STOCKS — 0.0% | | Shares | | | Value | |
DecisionPoint Systems, Inc., 8.00%, Series D (b)(c) | | | 84,532 | | | $ | 0 | |
DecisionPoint Systems, Inc., 10.00%, Series E (b)(c) | | | 33,717 | | | | 0 | |
Total Preferred Stocks (Cost $1,168,602) | | | | | | $ | 0 | |
WARRANTS — 3.5% | | Shares | | | Value | |
Capital One Financial Corp., $42.074, expires 11/14/18 | | | 13,200 | | | $ | 333,168 | |
First Financial Bancorp, $12.202, expires 12/23/18 | | | 67,850 | | | | 283,613 | |
Hartford Financial Services Group, Inc., $9.264, expires 06/26/19 | | | 45,200 | | | | 1,464,480 | |
Lincoln National Corp., $10.255, expires 07/10/19 | | | 16,260 | | | | 504,060 | |
Total Warrants (Cost $1,659,481) | | | | | | $ | 2,585,321 | |
MONEY MARKET FUNDS — 1.5% | | Shares | | | Value | |
Invesco Short-Term Investments Trust - Treasury Portfolio - Institutional Shares, 0.02% (d) (Cost $1,107,120) | | | 1,107,120 | | | $ | 1,107,120 | |
| | | | | | | | | |
Total Investments at Value — 98.8% (Cost $77,695,509) | | | | | | $ | 72,156,280 | |
| | | | | | | | | |
Other Assets in Excess of Liabilities — 1.2% | | | | | | | 890,729 | |
| | | | | | | | | |
Net Assets — 100.0% | | | | | | $ | 73,047,009 | |
(a) | Variable rate security. The rate shown is the effective interest rate as of January 31, 2016. |
(b) | Security has been fair valued in good faith by the Adviser in conformity with quidelines adopted by and subject to review by the Board of Trustees. The total value of such securities is $1,544,746 at January 31, 2016, representing 2.1% of net assets (Note 2). |
(c) | Illiquid security. Total value of illiquid securities held as of January 31, 2016 was $1,544,746, representing 2.1% of net assets. |
(d) | The rate shown is the 7-day effective yield as of January 31, 2016. |
See accompanying notes to financial statements. |
8
EUBEL BRADY & SUTTMAN INCOME FUND
SCHEDULE OF INVESTMENTS
January 31, 2016 (Unaudited) |
U.S. TREASURY OBLIGATIONS — 2.4% | | Coupon | | Maturity | | Par Value | | | Value | |
U.S. Treasury Notes | | 0.750% | | 06/30/17 | | $ | 2,200,000 | | | $ | 2,200,774 | |
U.S. Treasury Notes | | 1.500% | | 08/31/18 | | | 1,490,000 | | | | 1,512,757 | |
Total U.S. Treasury Obligations (Cost $3,700,642) | | | | | | | | | | $ | 3,713,531 | |
U.S. GOVERNMENT AGENCY OBLIGATIONS — 0.8% | | Coupon | | Maturity | | Par Value | | | Value | |
Federal National Mortgage Association (Cost $1,308,406) | | 1.250% | | 01/30/17 | | $ | 1,300,000 | | | $ | 1,307,267 | |
CORPORATE BONDS — 89.5% | | Coupon | | Maturity | | Par Value | | | Value | |
Consumer Discretionary — 17.2% | | | | | | | | | | |
AutoZone, Inc. | | 6.950% | | 06/15/16 | | $ | 3,748,000 | | | $ | 3,828,095 | |
Gannet Co., Inc. | | 10.000% | | 04/01/16 | | | 2,810,000 | | | | 2,845,125 | |
Gannet Co., Inc. | | 5.125% | | 07/15/20 | | | 1,375,000 | | | | 1,423,125 | |
Hanesbrands, Inc. | | 6.375% | | 12/15/20 | | | 4,300,000 | | | | 4,461,766 | |
Hyatt Hotels Corp. | | 3.875% | | 08/15/16 | | | 1,597,000 | | | | 1,616,466 | |
Macy’s Retail Holdings, Inc. | | 5.900% | | 12/01/16 | | | 707,000 | | | | 733,261 | |
Marriott International, Inc. | | 3.375% | | 10/15/20 | | | 3,250,000 | | | | 3,358,547 | |
Time Warner Cable, Inc. | | 6.750% | | 07/01/18 | | | 4,200,000 | | | | 4,587,752 | |
Whirlpool Corp. | | 1.650% | | 11/01/17 | | | 3,825,000 | | | | 3,815,208 | |
| | | | | | | | | | | | 26,669,345 | |
Consumer Staples — 12.1% | | | | | | | | | | | | |
Dr Pepper Snapple Group, Inc. | | 6.820% | | 05/01/18 | | | 3,756,000 | | | | 4,179,433 | |
General Mills, Inc. | | 1.400% | | 10/20/17 | | | 4,770,000 | | | | 4,770,029 | |
Kraft Foods Group, Inc. | | 2.250% | | 06/05/17 | | | 4,252,000 | | | | 4,288,746 | |
Kroger Co. (The) | | 2.200% | | 01/15/17 | | | 2,800,000 | | | | 2,825,362 | |
Kroger Co. (The) | | 2.950% | | 11/01/21 | | | 2,500,000 | | | | 2,533,867 | |
Safeway, Inc. | | 3.400% | | 12/01/16 | | | 271,000 | | | | 267,612 | |
| | | | | | | | | | | | 18,865,049 | |
See accompanying notes to financial statements.
9
EUBEL BRADY & SUTTMAN INCOME FUND
SCHEDULE OF INVESTMENTS (Continued) |
CORPORATE BONDS — 89.5% (Continued) | | Coupon | | Maturity | | Par Value | | | Value | |
Energy — 9.1% | | | | | | | | | | |
Boardwalk Pipelines, LLC | | 5.875% | | 11/15/16 | | $ | 2,300,000 | | | $ | 2,301,403 | |
Boardwalk Pipelines, LLC | | 5.500% | | 02/01/17 | | | 1,500,000 | | | | 1,487,603 | |
Chesapeake Energy Corp. | | 8.000% | | 12/15/22 | | | 4,365,000 | | | | 1,866,038 | |
CONSOL Energy, Inc. | | 5.875% | | 04/15/22 | | | 5,400,000 | | | | 3,489,750 | |
Transocean, Inc. | | 5.800% | | 12/15/16 | | | 5,060,000 | | | | 4,908,200 | |
| | | | | | | | | | | | 14,052,994 | |
Financials — 16.0% | | | | | | | | | | | | |
American Financial Group, Inc. | | 9.875% | | 06/15/19 | | | 1,203,000 | | | | 1,471,377 | |
Capital One Bank USA, N.A. | | 2.150% | | 11/21/18 | | | 560,000 | | | | 560,527 | |
CNA Financial Corp. | | 6.950% | | 01/15/18 | | | 50,000 | | | | 54,184 | |
Fairfax Financial Holdings Ltd. | | 7.375% | | 04/15/18 | | | 279,000 | | | | 300,129 | |
Genworth Holdings, Inc. | | 6.515% | | 05/22/18 | | | 2,200,000 | | | | 1,798,500 | |
Goldman Sachs Group, Inc. (a) | | 1.312% | | 12/15/17 | | | 4,880,000 | | | | 4,868,913 | |
Hartford Financial Services Group, Inc. | | 6.300% | | 03/15/18 | | | 158,000 | | | | 172,474 | |
Icahn Enterprises Finance Corp. | | 3.500% | | 03/15/17 | | | 4,900,000 | | | | 4,863,250 | |
Jefferies Group, LLC | | 5.125% | | 04/13/18 | | | 4,000,000 | | | | 4,153,988 | |
Reinsurance Group of America, Inc. | | 5.625% | | 03/15/17 | | | 287,000 | | | | 298,769 | |
Voya Holdings, Inc. | | 7.250% | | 08/15/23 | | | 25,000 | | | | 31,166 | |
Weyerhaeuser Co. | | 6.950% | | 08/01/17 | | | 1,659,000 | | | | 1,771,137 | |
Zions Bancorp. | | 5.650% | | 11/15/23 | | | 4,500,000 | | | | 4,557,150 | |
| | | | | | | | | | | | 24,901,564 | |
Health Care — 7.9% | | | | | | | | | | | | |
Actavis Funding SCS | | 1.850% | | 03/01/17 | | | 5,000,000 | | | | 5,018,220 | |
Teva Pharmaceutical Finance Company B.V. | | 2.400% | | 11/10/16 | | | 4,750,000 | | | | 4,788,432 | |
WellPoint, Inc. | | 2.375% | | 02/15/17 | | | 2,400,000 | | | | 2,422,193 | |
| | | | | | | | | | | | 12,228,845 | |
Industrials — 5.5% | | | | | | | | | | | | |
Caterpillar, Inc. | | 7.900% | | 12/15/18 | | | 3,276,000 | | | | 3,828,628 | |
United Rentals North America, Inc. | | 7.375% | | 05/15/20 | | | 4,520,000 | | | | 4,655,600 | |
| | | | | | | | | | | | 8,484,228 | |
Information Technology — 9.3% | | | | | | | | | | | | |
Avnet, Inc. | | 6.625% | | 09/15/16 | | | 4,761,000 | | | | 4,901,373 | |
FLIR Systems, Inc. | | 3.750% | | 09/01/16 | | | 4,900,000 | | | | 4,961,838 | |
Xerox Corp. | | 6.350% | | 05/15/18 | | | 4,337,000 | | | | 4,626,582 | |
| | | | | | | | | | | | 14,489,793 | |
Materials — 5.3% | | | | | | | | | | | | |
Sherwin-Williams Co. | | 1.350% | | 12/15/17 | | | 4,000,000 | | | | 3,983,700 | |
Steel Dynamics, Inc. | | 5.125% | | 10/01/21 | | | 4,607,000 | | | | 4,296,028 | |
| | | | | | | | | | | | 8,279,728 | |
See accompanying notes to financial statements
10
EUBEL BRADY & SUTTMAN INCOME FUND
SCHEDULE OF INVESTMENTS (Continued) |
CORPORATE BONDS — 89.5% (Continued) | | Coupon | | Maturity | | Par Value | | | Value | |
Telecommunication Services — 7.1% | | | | | | | | | | |
América Móvil S.A.B de C.V. | | 2.375% | | 09/08/16 | | $ | 5,000,000 | | | $ | 5,012,440 | |
AT&T, Inc. | | 2.400% | | 08/15/16 | | | 3,500,000 | | | | 3,523,544 | |
Qwest Corp. | | 8.375% | | 05/01/16 | | | 2,450,000 | | | | 2,484,474 | |
| | | | | | | | | | | | 11,020,458 | |
Utilities — 0.0% (b) | | | | | | | | | | | | |
Pennsylvania Electric Co. | | 6.625% | | 04/01/19 | | | 15,000 | | | | 16,246 | |
| | | | | | | | | | | | | |
Total Corporate Bonds (Cost $144,031,858) | | | | | | | | | | $ | 139,008,250 | |
CONVERTIBLE CORPORATE BONDS — 2.2% | | Coupon | | Maturity | | Par Value | | | Value | |
Information Technology — 2.2% | | | | | | | | | | |
Intel Corp. (Cost $3,326,160) | | 2.950% | | 12/15/35 | | $ | 2,800,000 | | | $ | 3,430,000 | |
BANK DEBT — 0.6% | | Coupon | | Maturity | | Par Value | | | Value | |
NCP Finance Limited Partnership (a)(c)(d) | | 4.423% | | 02/04/16 | | $ | 111,111 | | | $ | 111,089 | |
NCP Finance Limited Partnership (a)(c)(d) | | 4.423% | | 02/08/16 | | | 222,222 | | | | 222,178 | |
NCP Finance Limited Partnership (a)(c)(d) | | 6.250% | | 09/30/16 | | | 555,556 | | | | 552,777 | |
Total Bank Debt (Cost $888,889) | | | | | | | | | | $ | 886,044 | |
PREFERRED STOCKS — 1.5% | | Shares | | | Value | |
RAIT Financial Trust, 7.75%, Series A (Cost $2,946,070) | | | 135,000 | | | $ | 2,286,900 | |
See accompanying notes to financial statements.
11
EUBEL BRADY & SUTTMAN INCOME FUND
SCHEDULE OF INVESTMENTS (Continued) |
MONEY MARKET FUNDS — 1.9% | | Shares | | | Value | |
Invesco Short-Term Investments Trust - Treasury Portfolio - Institutional Shares, 0.18% (e) (Cost $3,024,712) | | | 3,024,712 | | | $ | 3,024,712 | |
| | | | | | | | | |
Total Investments at Value — 98.9% (Cost $159,226,737) | | | | | | $ | 153,656,704 | |
| | | | | | | | | |
Other Assets in Excess of Liabilities — 1.1% | | | | | | | 1,635,389 | |
| | | | | | | | | |
Net Assets — 100.0% | | | | | | $ | 155,292,093 | |
(a) | Variable rate security. The rate shown is the effective interest rate as of January 31, 2016. |
(b) | Percentage rounds to less than 0.1%. |
(c) | Security has been fair valued in good faith by the Adviser in conformity with quidelines adopted by and subject to review by the Board of Trustees. The total value of such securities is $886,044 at January 31, 2016, representing 0.6% of net assets (Note 2). |
(d) | Illiquid security. Total value of illiquid securities held as of January 31, 2016 was $886,044, representing 0.6% of net assets. |
(e) | The rate shown is the 7-day effective yield as of January 31, 2016. |
See accompanying notes to financial statements. |
12
EUBEL BRADY & SUTTMAN MUTUAL FUND TRUST
STATEMENTS OF ASSETS AND LIABILITIES
January 31, 2016 (Unaudited) |
| | Eubel Brady
& Suttman
Income and
Appreciation
Fund | | | Eubel Brady
& Suttman
Income Fund | |
ASSETS | | | | | | |
Investments in securities: | | | | | | |
At acquisition cost | | $ | 77,695,509 | | | $ | 159,226,737 | |
At value (Note 2) | | $ | 72,156,280 | | | $ | 153,656,704 | |
Dividends and interest receivable | | | 880,716 | | | | 1,642,696 | |
Other assets | | | 21,993 | | | | 23,352 | |
Total assets | | | 73,058,989 | | | | 155,322,752 | |
| | | | | | | | | |
LIABILITIES | | | | | | | | |
Distributions payable | | | 248 | | | | 1,238 | |
Payable for capital shares redeemed | | | 69 | | | | 1,354 | |
Payable to administrator (Note 4) | | | 6,240 | | | | 13,370 | |
Other accrued expenses | | | 5,423 | | | | 14,697 | |
Total liabilities | | | 11,980 | | | | 30,659 | |
| | | | | | | | | |
NET ASSETS | | $ | 73,047,009 | | | $ | 155,292,093 | |
| | | | | | | | | |
NET ASSETS CONSIST OF: | | | | | | | | |
Paid-in capital | | $ | 78,585,261 | | | $ | 160,883,104 | |
Accumulated net investment income | | | 636 | | | | 1,049 | |
Accumulated net realized gains (losses) from security transactions | | | 341 | | | | (22,027 | ) |
Net unrealized depreciation on investments | | | (5,539,229 | ) | | | (5,570,033 | ) |
NET ASSETS | | $ | 73,047,009 | | | $ | 155,292,093 | |
| | | | | | | | | |
Shares of beneficial interest outstanding (unlimited number of shares authorized, no par value) | | | 8,063,253 | | | | 16,200,121 | |
| | | | | | | | | |
Net asset value, offering price and redemption price per share (Note 2) | | $ | 9.06 | | | $ | 9.59 | |
See accompanying notes to financial statements. |
13
EUBEL BRADY & SUTTMAN MUTUAL FUND TRUST
STATEMENTS OF OPERATIONS
For the Six Months Ended January 31, 2016 (Unaudited) |
| | Eubel Brady
& Suttman
Income and
Appreciation
Fund | | | Eubel Brady
& Suttman
Income Fund | |
INVESTMENT INCOME | | | | | | |
Dividends | | $ | 3,041 | | | $ | 118,258 | |
Interest | | | 1,218,589 | | | | 1,939,360 | |
Total investment income | | | 1,221,630 | | | | 2,057,618 | |
| | | | | | | | | |
EXPENSES | | | | | | | | |
Administration fees (Note 4) | | | 39,519 | | | | 82,409 | |
Shareholder servicing fees (Note 4) | | | 15,971 | | | | 32,914 | |
Professional fees | | | 15,033 | | | | 15,033 | |
Registration and filing fees | | | 9,619 | | | | 9,795 | |
Custody and bank service fees | | | 3,784 | | | | 7,651 | |
Trustees’ fees and expenses (Note 4) | | | 4,955 | | | | 4,955 | |
Pricing costs | | | 3,155 | | | | 4,620 | |
Printing of shareholder reports | | | 3,035 | | | | 3,026 | |
Insurance expense | | | 1,832 | | | | 1,401 | |
Postage and supplies | | | 1,289 | | | | 1,314 | |
Other expenses | | | 657 | | | | 5,173 | |
Total expenses | | | 98,849 | | | | 168,291 | |
| | | | | | | | | |
NET INVESTMENT INCOME | | | 1,122,781 | | | | 1,889,327 | |
| | | | | | | | | |
REALIZED AND UNREALIZED GAINS (LOSSES) ON INVESTMENTS | | | | | | | | |
Net realized gains (losses) from investment transactions | | | 781,017 | | | | (7,636 | ) |
Net change in unrealized appreciation (depreciation) on investments | | | (6,467,596 | ) | | | (4,862,328 | ) |
NET REALIZED AND UNREALIZED LOSSES ON INVESTMENTS | | | (5,686,579 | ) | | | (4,869,964 | ) |
| | | | | | | | | |
NET DECREASE IN NET ASSETS FROM OPERATIONS | | $ | (4,563,798 | ) | | $ | (2,980,637 | ) |
See accompanying notes to financial statements. |
14
EUBEL BRADY & SUTTMAN INCOME AND APPRECIATION FUND
STATEMENTS OF CHANGES IN NET ASSETS |
| | Six Months Ended January 31, 2016 (Unaudited) | | | Period Ended July 31, 2015 (a) | |
FROM OPERATIONS | | | | | | |
Net investment income | | $ | 1,122,781 | | | $ | 1,475,206 | |
Net realized gains (losses) from investment transactions | | | 781,017 | | | | (46,229 | ) |
Net change in unrealized appreciation (depreciation) on investments | | | (6,467,596 | ) | | | (1,256,550 | ) |
Net increase (decrease) in net assets from operations | | | (4,563,798 | ) | | | 172,427 | |
| | | | | | | | | |
DISTRIBUTIONS TO SHAREHOLDERS | | | | | | | | |
From net investment income | | | (1,128,097 | ) | | | (1,469,254 | ) |
From net realized gains on investments | | | (734,447 | ) | | | — | |
Decrease in net assets from distribution to shareholders | | | (1,862,544 | ) | | | (1,469,254 | ) |
| | | | | | | | | |
CAPITAL SHARE TRANSACTIONS | | | | | | | | |
Shares issued from reorganization (Note 1) | | | — | | | | 53,446,239 | |
Proceeds from shares sold | | | 3,548,739 | | | | 44,540,073 | |
Net asset value of shares issued in reinvestment of distributions to shareholders | | | 1,857,065 | | | | 1,462,219 | |
Payments for shares redeemed | | | (8,580,572 | ) | | | (15,553,585 | ) |
Net increase (decrease) from capital share transactions | | | (3,174,768 | ) | | | 83,894,946 | |
| | | | | | | | | |
TOTAL INCREASE (DECREASE) IN NET ASSETS | | | (9,601,110 | ) | | | 82,598,119 | |
| | | | | | | | | |
NET ASSETS | | | | | | | | |
Beginning of period | | | 82,648,119 | | | | 50,000 | |
End of period | | $ | 73,047,009 | | | $ | 82,648,119 | |
| | | | | | | | | |
ACCUMULATED NET INVESTMENT INCOME | | $ | 636 | | | $ | 5,952 | |
| | | | | | | | | |
CAPITAL SHARE ACTIVITY | | | | | | | | |
Shares issued from reorganization (Note 1) | | | — | | | | 5,344,624 | |
Shares sold | | | 376,247 | | | | 4,454,587 | |
Shares reinvested | | | 198,287 | | | | 146,798 | |
Shares redeemed | | | (903,368 | ) | | | (1,558,922 | ) |
Net increase (decrease) in shares outstanding | | | (328,834 | ) | | | 8,387,087 | |
Shares outstanding at beginning of period | | | 8,392,087 | | | | 5,000 | |
Shares outstanding at end of period | | | 8,063,253 | | | | 8,392,087 | |
(a) | Represents the period from the commencement of operations (September 30, 2014) through July 31, 2015. |
See accompanying notes to financial statements. |
15
EUBEL BRADY & SUTTMAN INCOME FUND
STATEMENTS OF CHANGES IN NET ASSETS |
| | Six Months Ended January 31, 2016 (Unaudited) | | | Period Ended July 31, 2015 (a) | |
FROM OPERATIONS | | | | | | |
Net investment income | | $ | 1,889,327 | | | $ | 1,780,830 | |
Net realized gains (losses) from investment transactions | | | (7,636 | ) | | | 259,510 | |
Net change in unrealized appreciation (depreciation) on investments | | | (4,862,328 | ) | | | (1,712,132 | ) |
Net increase (decrease) in net assets from operations | | | (2,980,637 | ) | | | 328,208 | |
| | | | | | | | | |
DISTRIBUTIONS TO SHAREHOLDERS | | | | | | | | |
From net investment income | | | (1,890,750 | ) | | | (1,778,358 | ) |
From net realized gains on investments | | | (273,901 | ) | | | — | |
Decrease in net assets from distributions to shareholders | | | (2,164,651 | ) | | | (1,778,358 | ) |
| | | | | | | | | |
CAPITAL SHARE TRANSACTIONS | | | | | | | | |
Proceeds from shares sold | | | 16,175,037 | | | | 176,544,173 | |
Net asset value of shares issued in reinvestment of distributions to shareholders | | | 2,144,371 | | | | 1,757,232 | |
Payments for shares redeemed | | | (20,876,472 | ) | | | (13,906,810 | ) |
Net increase (decrease) from capital share transactions | | | (2,557,064 | ) | | | 164,394,595 | |
| | | | | | | | | |
TOTAL INCREASE (DECREASE) IN NET ASSETS | | | (7,702,352 | ) | | | 162,944,445 | |
| | | | | | | | | |
NET ASSETS | | | | | | | | |
Beginning of period | | | 162,994,445 | | | | 50,000 | |
End of period | | $ | 155,292,093 | | | $ | 162,994,445 | |
| | | | | | | | | |
ACCUMULATED NET INVESTMENT INCOME | | $ | 1,049 | | | $ | 2,472 | |
| | | | | | | | | |
CAPITAL SHARE ACTIVITY | | | | | | | | |
Shares sold | | | 1,648,248 | | | | 17,692,634 | |
Shares reinvested | | | 220,447 | | | | 176,840 | |
Shares redeemed | | | (2,144,326 | ) | | | (1,398,722 | ) |
Net increase (decrease) in shares outstanding | | | (275,631 | ) | | | 16,470,752 | |
Shares outstanding at beginning of period | | | 16,475,752 | | | | 5,000 | |
Shares outstanding at end of period | | | 16,200,121 | | | | 16,475,752 | |
(a) | Represents the period from the commencement of operations (September 30, 2014) through July 31, 2015. |
See accompanying notes to financial statements. |
16
EUBEL BRADY & SUTTMAN INCOME AND APPRECIATION FUND
FINANCIAL HIGHLIGHTS |
Per Share Data for a Share Outstanding Throughout Each Period | |
| | Six Months Ended January 31, 2016 (Unaudited) | | | Period Ended July 31, 2015 (a) | |
Net asset value at beginning of period | | $ | 9.85 | | | $ | 10.00 | |
| | | | | | | | | |
Income (loss) from investment operations: | | | | | | | | |
Net investment income | | | 0.14 | | | | 0.19 | |
Net realized and unrealized losses on investments | | | (0.70 | ) | | | (0.15 | ) |
Total from investment operations | | | (0.56 | ) | | | 0.04 | |
| | | | | | | | | |
Less distributions from: | | | | | | | | |
Net investment income | | | (0.14 | ) | | | (0.19 | ) |
From net realized gains on investments | | | (0.09 | ) | | | — | |
Total distributions | | | (0.23 | ) | | | (0.19 | ) |
| | | | | | | | | |
Net asset value at end of period | | $ | 9.06 | | | $ | 9.85 | |
| | | | | | | | | |
Total return (b) | | | (5.74 | %)(c) | | | 0.38 | %(c) |
| | | | | | | | | |
Net assets at end of period (000’s) | | $ | 73,047 | | | $ | 82,648 | |
| | | | | | | | | |
Ratios/supplementary data: | | | | | | | | |
| | | | | | | | | |
Ratio of total expenses to average net assets | | | 0.25 | %(d) | | | 0.25 | %(d) |
| | | | | | | | | |
Ratio of net investment income to average net assets | | | 2.85 | %(d) | | | 2.34 | %(d) |
| | | | | | | | | |
Portfolio turnover rate | | | 10 | %(c) | | | 27 | %(c) |
(a) | Represents the period from the commencement of operations (September 30, 2014) through July 31, 2015. |
(b) | Total return is a measure of the change in value of an investment in the Fund over the period covered, which assumes any dividends or capital gains distributions are reinvested in shares of the Fund. The returns shown do not reflect the deduction of taxes a shareholder would pay on Fund distributions or the redemption of Fund shares. |
(c) | Not annualized. |
(d) | Annualized. |
See accompanying notes to financial statements. |
17
EUBEL BRADY & SUTTMAN INCOME FUND
FINANCIAL HIGHLIGHTS |
Per Share Data for a Share Outstanding Throughout Each Period | |
| | Six Months Ended January 31, 2016 (Unaudited) | | | Period Ended July 31, 2015 (a) | |
Net asset value at beginning of period | | $ | 9.89 | | | $ | 10.00 | |
| | | | | | | | | |
Income (loss) from investment operations: | | | | | | | | |
Net investment income | | | 0.11 | | | | 0.13 | |
Net realized and unrealized losses on investments | | | (0.28 | ) | | | (0.11 | ) |
Total from investment operations | | | (0.17 | ) | | | 0.02 | |
| | | | | | | | | |
Less distributions from: | | | | | | | | |
Net investment income | | | (0.11 | ) | | | (0.13 | ) |
From net realized gains on investments | | | (0.02 | ) | | | — | |
Total distributions | | | (0.13 | ) | | | (0.13 | ) |
| | | | | | | | | |
Net asset value at end of period | | $ | 9.59 | | | $ | 9.89 | |
| | | | | | | | | |
Total return (b) | | | (1.73% | )(c) | | | 0.22 | %(c) |
| | | | | | | | | |
Net assets at end of period (000’s) | | $ | 155,292 | | | $ | 162,994 | |
| | | | | | | | | |
Ratios/supplementary data: | | | | | | | | |
| | | | | | | | | |
Ratio of total expenses to average net assets | | | 0.20 | %(d) | | | 0.22 | %(d) |
| | | | | | | | | |
Ratio of net investment income to average net assets | | | 2.30 | %(d) | | | 1.70 | %(d) |
| | | | | | | | | |
Portfolio turnover rate | | | 18 | %(c) | | | 27 | %(c) |
(a) | Represents the period from the commencement of operations (September 30, 2014) through July 31, 2015. |
(b) | Total return is a measure of the change in value of an investment in the Fund over the period covered, which assumes any dividends or capital gains distributions are reinvested in shares of the Fund. The returns shown do not reflect the deduction of taxes a shareholder would pay on Fund distributions or the redemption of Fund shares. |
(c) | Not annualized. |
(d) | Annualized. |
See accompanying notes to financial statements. |
18
EUBEL BRADY & SUTTMAN MUTUAL FUND TRUST
NOTES TO FINANCIAL STATEMENTS
January 31, 2016 (Unaudited)
1. Organization
Eubel Brady & Suttman Income and Appreciation Fund (“Income and Appreciation Fund”) and Eubel Brady & Suttman Income Fund (“Income Fund”) (individually, a “Fund” and collectively, the “Funds”) are each a no-load diversified series of Eubel Brady & Suttman Mutual Fund Trust (the “Trust”), an open-end management investment company organized as an Ohio business trust on April 22, 2014. On August 1, 2014, 5,000 shares of each Fund were issued for cash, at $10.00 per share, to a Principal of Eubel Brady & Suttman Asset Management, Inc. (the “Adviser”), the investment adviser to the Funds.
On September 30, 2014, the EBS Convertible Fund I, L.P. (the “Partnership”) reorganized into the Income and Appreciation Fund and the Income Fund accepted cash and securities from clients of the Adviser, which were recorded at their current value. The net assets contributed, shares issued and net unrealized appreciation resulting from these tax-free transactions were as follows:
Fund
|
Date of Contribution
| |
Net Assets
| | |
Shares Issued
| | | Net Unrealized
Appreciation on
Investments | |
Income and Appreciation Fund | September 30, 2014 | | $ | 53,446,239 | | | | 5,344,624 | | | $ | 2,184,917 | |
Income Fund | September 30, 2014 | | $ | 24,006,977 | | | | 2,400,698 | | | $ | 1,004,427 | |
After the Income and Appreciation Fund acquired the net assets of the Partnership and the Income Fund acquired the cash and securities of the Adviser’s clients in exchange for Fund shares, both Funds began operations on September 30, 2014. As these transactions were determined to be non-taxable transactions by management, the Funds elected to retain the securities’ original cost basis for financial reporting purposes. The amortized cost of the contributed securities as of September 30, 2014, was $35,401,507 and $22,632,713 for the Income and Appreciation Fund and the Income Fund, respectively, resulting in unrealized appreciation on investments of $2,184,917 and $1,004,427, respectively, for the Income and Appreciation Fund and the Income Fund as of that date.
The investment objective of the Income and Appreciation Fund is to seek to provide total return through a combination of current income and capital appreciation.
The investment objective of the Income Fund is to preserve capital, produce income and maximize total return.
All costs incurred by the Funds in connection with their organization and offering of shares were borne by the Adviser. Such expenses are not subject to repayment by the Funds to the Adviser.
19
EUBEL BRADY & SUTTMAN MUTUAL FUND TRUST
NOTES TO FINANCIAL STATEMENTS (Continued) |
2. Significant Accounting Policies
As an investment company, as defined in Financial Accounting Standards Board (“FASB”) Accounting Standards Update 2013-08, the Funds follow accounting and reporting guidance under FASB Accounting Standards Codification Topic 946, “Financial Services – Investment Companies.”
The following summarizes the significant accounting policies of the Funds. The policies are in conformity with accounting principles generally accepted in the United States of America (“GAAP”).
Securities Valuation — The Funds typically use an independent pricing service to determine the value of their securities. For fixed-income securities, the pricing service will utilize electronic data processing techniques based on yield spreads relating to securities with similar characteristics to determine prices for normal institutional-size trading units of fixed income securities without regard to sale or bid prices. Securities that are traded on any stock exchange are generally valued at the last quoted sale price. Lacking a last sale price, an exchange traded security is generally valued by the pricing service at its last bid price. Securities traded on NASDAQ are generally valued at the NASDAQ Official Closing Price. Investments representing shares of other investment companies are valued at their net asset value as reported by such companies.
If the Adviser determines that a price provided by the pricing service does not accurately reflect the market value of the securities, when prices are not readily available from the pricing service or when restricted or illiquid securities are being valued, securities are valued at fair value as determined in good faith by the Adviser in conformity with guidelines adopted by and subject to review by the Board of Trustees of the Trust (the “Board”).
GAAP establishes a single authoritative definition of fair value, sets out a framework for measuring fair value and requires additional disclosures about fair value measurements.
Various inputs are used in determining the value of each Fund’s investments. These inputs are summarized in the three broad levels listed below:
| | ● | Level 1 – quoted prices in active markets for identical securities |
| | ● | Level 2 – other significant observable inputs |
| | ● | Level 3 – significant unobservable inputs |
Certain fixed income securities held by the Funds are classified as Level 2 since the values are typically provided by an independent pricing service that utilizes various “other significant observable inputs” as discussed above. Certain other fixed income securities, including convertible preferred stocks and bonds and bank debt held by the Funds, are classified as Level 3 since the values for these securities are based
20
EUBEL BRADY & SUTTMAN MUTUAL FUND TRUST
NOTES TO FINANCIAL STATEMENTS (Continued) |
on prices derived from one or more significant inputs that are unobservable. The inputs or methodology used are not necessarily an indication of the risks associated with investing in those securities. The inputs used to measure fair value may fall into different levels of the fair value hierarchy. In such cases, for disclosure purposes, the level in the fair value hierarchy within which the fair value measurement falls in its entirety is based on the lowest level input that is significant to the fair value measurement.
The following is a summary of the inputs used to value each Fund’s investments as of January 31, 2016 by security type:
Income and Appreciation Fund: | |
| | Level 1 | | | Level 2 | | | Level 3 | | | Total | |
Corporate Bonds | | $ | — | | | $ | 52,348,288 | | | $ | — | | | $ | 52,348,288 | |
Convertible Corporate Bonds | | | — | | | | 14,570,805 | | | | 819,800 | | | | 15,390,605 | |
Bank Debt | | | — | | | | — | | | | 724,946 | | | | 724,946 | |
Convertible Preferred Stocks | | | — | | | | — | | | | 0 | * | | | 0 | * |
Warrants | | | 2,585,321 | | | | — | | | | — | | | | 2,585,321 | |
Money Market Funds | | | 1,107,120 | | | | — | | | | — | | | | 1,107,120 | |
Total | | $ | 3,692,441 | | | $ | 66,919,093 | | | $ | 1,544,746 | | | $ | 72,156,280 | |
Income Fund: | |
| | Level 1 | | | Level 2 | | | Level 3 | | | Total | |
U.S. Treasury Obligations | | $ | — | | | $ | 3,713,531 | | | $ | — | | | $ | 3,713,531 | |
U.S. Government Agency Obligations | | | — | | | | 1,307,267 | | | | — | | | | 1,307,267 | |
Corporate Bonds | | | — | | | | 139,008,250 | | | | — | | | | 139,008,250 | |
Convertible Corporate Bonds | | | — | | | | 3,430,000 | | | | — | | | | 3,430,000 | |
Bank Debt | | | — | | | | — | | | | 886,044 | | | | 886,044 | |
Preferred Stocks | | | 2,286,900 | | | | — | | | | — | | | | 2,286,900 | |
Money Market Funds | | | 3,024,712 | | | | — | | | | — | | | | 3,024,712 | |
Total | | $ | 5,311,612 | | | $ | 147,459,048 | | | $ | 886,044 | | | $ | 153,656,704 | |
* | Income and Appreciation Fund holds Convertible Preferred Stocks which have been fair valued at $0. |
As of January 31, 2016, the Funds did not have any transfers into and out of any Level. It is the Funds’ policy to recognize transfers into and out of any Level at the end of the reporting period.
21
EUBEL BRADY & SUTTMAN MUTUAL FUND TRUST
NOTES TO FINANCIAL STATEMENTS (Continued) |
The following is a reconciliation of Level 3 investments of the Funds for which significant unobservable inputs were used to determine fair value for the period ended January 31, 2016.
Income and Appreciation Fund | |
Investments in Securities | | Balance as of
July 31,
2015 | | | Purchases | | | Sales | | | Balance as of
January 31,
2016 | | | Net change in unrealized app/ dep included in the Statements of Operations attributable to Level 3 investments held at January 31, 2016 | |
Convertible Corporate Bonds | | $ | 1,000,000 | | | $ | — | | | $ | — | | | $ | 819,800 | | | $ | (180,200 | ) |
Bank debt | | | 950,562 | | | | 727,273 | | | | (950,562 | ) | | | 724,946 | | | | (2,327 | ) |
Convertible Preferred Stocks | | | 364,173 | | | | — | | | | — | | | | 0 | * | | | (364,173 | ) |
Total | | $ | 2,314,735 | | | $ | 727,273 | | | $ | (950,562 | ) | | $ | 1,544,746 | | | $ | (546,700 | ) |
Income Fund | |
Investments in Securities | | Balance as of
July 31,
2015 | | | Purchases | | | Sales | | | Balance as of
January 31,
2016 | | | Net change in unrealized app/ dep included in the Statements of Operations attributable to Level 3 investments held at January 31, 2016 | |
Bank debt | | $ | 1,161,798 | | | $ | 888,889 | | | $ | (1,161,798 | ) | | $ | 886,044 | | | $ | (2,845 | ) |
* | Income and Appreciation Fund holds Convertible Preferred Stocks which have been fair valued at $0. |
22
EUBEL BRADY & SUTTMAN MUTUAL FUND TRUST
NOTES TO FINANCIAL STATEMENTS (Continued) |
The following table summarizes the valuation techniques used and unobservable inputs developed by the Adviser in conformity with guidelines adopted by and subject to review by the Board to determine the fair value of the Level 3 investments.
Income and Appreciation Fund | |
| | Fair Value at
January 31,
2016 | | Valuation Technique | | Unobservable Input1 | | Range | | | Weighted Average of Unobservable Inputs | |
Convertible Corporate Bonds | | $ | 819,800 | | DCF Model | | Discount Rate | | 30.67% | | | N/A | |
Bank Debt | | $ | 724,946 | | DCF Model | | Discount Rate | | 5.18-7.00% | | | 6.31% | |
Convertible Preferred Stocks | | $ | 0 | | Management’s Estimate of Future Cash Flows | | N/A | | N/A | | | N/A | |
Income Fund | |
| | Fair Value at
January 31,
2016 | | Valuation Technique | | Unobservable Input1 | | Range | | | Weighted Average of Unobservable Inputs | |
Bank Debt | | $ | 886,044 | | DCF Model | | Discount Rate | | 5.18-7.00% | | | 6.31% | |
1 | Significant increases and decreases on the unobservable inputs used to determine fair value of Level 3 assets could result in significantly higher or lower fair value measurements. |
There were no derivative instruments held by the Funds during the six months ended January 31, 2016.
Share Valuation — The net asset value per share of each Fund is calculated daily by dividing the total value of its assets, less liabilities, by the number of shares outstanding. The offering price and redemption price per share of each Fund is equal to its net asset value per share.
Estimates — The preparation of financial statements in conformity with GAAP requires management to make estimates and assumptions that affect the reported amounts of assets and liabilities and disclosures of contingent assets and liabilities at the date of the financial statements and the reported amounts of increases and decreases in net assets from operations during the reporting period. Actual results could differ from those estimates.
23
EUBEL BRADY & SUTTMAN MUTUAL FUND TRUST
NOTES TO FINANCIAL STATEMENTS (Continued) |
Security Transactions, Investment Income and Realized Capital Gains and Losses — Security transactions are accounted for on trade date. Dividend income is recorded on the ex-dividend date. Interest income is recorded as earned. Discounts and premiums on fixed income securities are amortized using the effective interest method. Gains and losses on securities sold are determined on a specific identification basis.
Expenses — Expenses of the Trust that are directly identifiable to a specific Fund are charged to that Fund. Expenses which are not readily identifiable to a specific Fund are allocated in such a manner as deemed equitable.
Distributions to Shareholders — Distributions to shareholders of net investment income, if any, are paid monthly. Capital gain distributions, if any, are distributed to shareholders annually. Distributions are based on amounts calculated in accordance with applicable federal income tax regulations, which may differ from GAAP. These differences are due primarily to differing treatments of income and realized capital gains on various investment securities held by the Funds, timing differences and differing characterizations of distributions made by the Funds. Dividends and distributions are recorded on the ex-dividend date. The tax character of distributions paid by each Fund for the periods ended January 31, 2016 and July 31, 2015 was as follows:
Periods Ended | Ordinary
Income | Long-Term
Capital Gains | Total
Distributions |
Income and Appreciation Fund: | | |
January 31, 2016 | $1,128,097 | $734,447 | $1,862,544 |
July 31, 2015 | $1,469,254 | $ — | $1,469,254 |
Income Fund: | | | |
January 31, 2016 | $1,902,441 | $262,210 | $2,164,651 |
July 31, 2015 | $1,778,358 | $ — | $1,778,358 |
Federal Income Tax — Each Fund has qualified and intends to continue to qualify each year as a “regulated investment company” under Subchapter M of the Internal Revenue Code of 1986 (the “Code”). Qualification generally will relieve the Funds of liability for federal income taxes to the extent 100% of their net investment income and net realized capital gains are distributed in accordance with the Code. Accordingly, no provision for income taxes has been made.
In order to avoid imposition of the excise tax applicable to regulated investment companies, it is also each Fund’s intention to declare as dividends in each calendar year at least 98% of its net investment income (earned during the calendar year) and 98.2% of its net realized capital gains (earned during the twelve months ended October 31) plus undistributed amounts from prior years.
24
EUBEL BRADY & SUTTMAN MUTUAL FUND TRUST
NOTES TO FINANCIAL STATEMENTS (Continued) |
The following information is computed on a tax basis for each item as of January 31, 2016:
| | Income and Appreciation
Fund | | | Income
Fund | |
Tax cost of portfolio investments | | $ | 77,695,509 | | | $ | 159,226,737 | |
Gross unrealized appreciation | | $ | 1,558,929 | | | $ | 480,229 | |
Gross unrealized depreciation | | | (7,098,158 | ) | | | (6,050,262 | ) |
Net unrealized depreciation on investments | | | (5,539,229 | ) | | | (5,570,033 | ) |
Accumulated ordinary income | | | 884 | | | | 2,287 | |
Capital loss carryforward | | | (46,229 | ) | | | — | |
Other gains (losses) | | | 46,570 | | | | (22,027 | ) |
Other temporary differences | | | (248 | ) | | | (1,238 | ) |
Accumulated deficit | | $ | (5,538,252 | ) | | $ | (5,591,011 | ) |
As of July 31, 2015, the Income and Appreciation Fund has a short-term capital loss carryforward for federal income tax purposes of $46,229. This capital loss carryforward may be carried forward indefinitely and is available to offset realized capital gains in the current and future years, thereby reducing future taxable capital gain distributions.
The Funds recognize the tax benefits or expenses of uncertain tax positions only when the position is “more likely than not” to be sustained assuming examination by tax authorities. Management has reviewed each Fund’s tax positions for the current and all open tax years (tax year ending July 31, 2015) and has concluded that no provision for unrecognized tax benefits or expenses is required in these financial statements. Each Fund identifies its major tax jurisdiction as U.S. Federal.
3. Unfunded Loan Commitment
At January 31, 2016, unfunded loan commitments for the Funds were as follows:
Fund | Borrower | | Unfunded
Commitment | |
Income and Appreciation Fund | NCP Finance Limited Partnership | | $ | 1,522,727 | |
Income Fund | NCP Finance Limited Partnership | | $ | 1,861,111 | |
Pursuant to an Asset-Based Lending Credit Agreement between the Funds and NCP Finance Limited Partnership (the “Borrower”), the Borrower has agreed to pay the Funds a commitment fee equal to 0.50% of the average daily unfunded commitment balance.
25
EUBEL BRADY & SUTTMAN MUTUAL FUND TRUST
NOTES TO FINANCIAL STATEMENTS (Continued) |
4. Transactions with Related Parties
Certain officers of the Trust are also officers of the Adviser, of Ultimus Fund Solutions, LLC (“Ultimus”), the administrative services agent, shareholder servicing and transfer agent, and accounting services agent for the Funds, or of Ultimus Fund Distributors, LLC (the “Distributor”), the principal underwriter and exclusive agent for the distribution of shares of the Funds.
Investment Adviser — Under the terms of the Management Agreement between the Trust and the Adviser, the Adviser manages each Fund’s investments subject to oversight by the Board. The Funds do not pay the Adviser investment advisory fees under the terms of the Management Agreement. However, prior to investing in a Fund, a prospective shareholder must enter into an investment advisory agreement with the Adviser that calls for the payment of an advisory fee based upon a percentage of all assets (including shares of the Funds) managed by the Adviser on behalf of the prospective shareholder. The fee schedule may be negotiable at the time the account is opened and is generally based upon the value of assets held in the client’s account and the style of management.
The Adviser has entered into an agreement with the Funds under which it has agreed to reimburse Fund expenses to the extent necessary to limit total annual operating expenses (excluding brokerage costs, taxes, interest, acquired fund fees and expenses, expenses incurred pursuant to the Funds’ Shareholder Servicing Plan and extraordinary expenses) to an amount not exceeding 0.35% of each Fund’s average daily net assets. “Operating expenses” do not include organization or offering costs of each Fund, which the Adviser has otherwise agreed to pay. Any payments by the Adviser of expenses which are a Fund’s obligation are subject to repayment by the Fund for a period of three years following the fiscal year in which such expenses were paid, provided that the repayment does not cause the Fund’s total annual operating expenses to exceed 0.35% of average daily net assets. This agreement is currently in effect until December 1, 2016. No expense reimbursements were required during the six months ended January 31, 2016.
Other Service Providers — Ultimus provides fund administration, fund accounting and transfer agency services to each Fund. The Funds pay Ultimus fees in accordance with the agreements for such services. In addition, the Funds pay out-of-pocket expenses including, but not limited to postage, supplies and costs of pricing the Funds’ portfolio securities.
Shareholder Servicing Plan — The Funds have adopted a Shareholder Servicing Plan (the “Plan”) which allows each Fund to make payments to financial organizations (including payments directly to the Adviser and the Distributor) for providing account administration and account maintenance services to Fund shareholders. The annual service fee may not exceed an amount equal to 0.25% of each Fund’s average daily net
26
EUBEL BRADY & SUTTMAN MUTUAL FUND TRUST
NOTES TO FINANCIAL STATEMENTS (Continued) |
assets. During the six months ended January 31, 2016, the Income and Appreciation Fund and the Income Fund paid $15,971 and $32,914, respectively, pursuant to the Plan.
Compensation of Trustees — Trustees and officers affiliated with the Adviser or Ultimus are not compensated by the Trust for their services. Each Trustee who is not an affiliated person of the Adviser or Ultimus (“Independent Trustee”) receives from the Trust a fee of $1,000 for attendance at each meeting of the Board, in addition to reimbursement of travel and other expenses incurred in attending the meetings. The Chairman of the Audit and Governance Committee receives an additional annual fee of $1,000.
5. Securities Transactions
During the six months ended January 31, 2016, cost of purchases and proceeds from sales and maturities of investment securities, other than short-term investments and U.S. government securities, were as follows:
| | Income and
Appreciation
Fund | | | Income
Fund | |
Purchases of investment securities | | $ | 7,307,146 | | | $ | 30,229,142 | |
Proceeds from sales and maturities of investment securities | | $ | 8,563,995 | | | $ | 17,959,580 | |
During the six months ended January 31, 2016, cost of purchases and proceeds from sales and maturities of U.S. government long-term securities were as follows:
| | Income and
Appreciation
Fund | | | Income
Fund | |
Purchases of investment securities | | $ | — | | | $ | — | |
Proceeds from sales and maturities of investment securities | | $ | — | | | $ | 9,160,221 | |
27
EUBEL BRADY & SUTTMAN MUTUAL FUND TRUST
NOTES TO FINANCIAL STATEMENTS (Continued) |
6. Contingencies and Commitments
The Funds indemnify the Trust’s officers and Trustees for certain liabilities that might arise from their performance of their duties to the Funds. Additionally, in the normal course of business the Funds enter into contracts that contain a variety of representations and warranties and which provide general indemnifications. The Funds’ maximum exposure under these arrangements is unknown, as this would involve future claims that may be made against the Funds that have not yet occurred. However, based on experience, the Funds expect the risk of loss to be remote.
7. Sector Risk
If a Fund has significant investments in the securities of issuers in industries within a particular sector, any development affecting that sector will have greater impact on the value of the net assets of the Fund than would be the case if the Fund did not have significant investments in that sector. In addition, this may increase the risk of loss of an investment in the Fund and increase the volatility of the Fund’s net asset value per share. From time to time, circumstances may affect a particular sector and the companies within such sector. For instance, economic or market factors, regulation or deregulation, and technological or other developments may negatively impact all companies in a particular sector and therefore the value of the Fund’s portfolio will be adversely affected. As of January 31, 2016, the Income and Appreciation Fund had 26.6% of the value of its net assets invested in securities within the Financials sector.
8. Subsequent Events
The Funds are required to recognize in the financial statements the effects of all subsequent events that provide additional evidence about conditions that existed as of the date of the Statements of Assets and Liabilities. For non-recognized subsequent events that must be disclosed to keep the financial statements from being misleading, the Funds are required to disclose the nature of the event as well as an estimate of its financial effect, or a statement that such an estimate cannot be made. Management has evaluated subsequent events through the issuance of these financial statements and has noted no such events have occurred.
28
EUBEL BRADY & SUTTMAN MUTUAL FUND TRUST
ABOUT YOUR FUNDS’ EXPENSES (Unaudited) |
We believe it is important for you to understand the impact of costs on your investment. All mutual funds have operating expenses. As a shareholder of the Funds, you incur ongoing costs, including shareholder servicing fees and other operating expenses. These ongoing costs, which are deducted from each Fund’s gross income, directly reduce the investment return of the Funds.
A mutual fund’s ongoing costs are expressed as a percentage of its average net assets. This figure is known as the expense ratio. The following examples are intended to help you understand the ongoing costs (in dollars) of investing in the Funds and to compare these costs with the ongoing costs of investing in other mutual funds. The examples below are based on an investment of $1,000 made at the beginning of the period shown and held for the entire period (August 1, 2015 through January 31, 2016).
The table below illustrates each Fund’s ongoing costs in two ways:
Actual fund return – This section helps you to estimate the actual expenses that you paid over the period. The “Ending Account Value” shown is derived from each Fund’s actual return, and the fourth column shows the dollar amount of operating expenses that would have been paid by an investor who started with $1,000 in each Fund. You may use the information here, together with the amount you invested, to estimate the expenses that you paid over the period.
To do so, simply divide your account value by $1,000 (for example, an $8,600 account value divided by $1,000 = 8.6), then multiply the result by the number given for the Funds under the heading “Expenses Paid During Period.”
Hypothetical 5% return – This section is intended to help you compare the Funds’ ongoing costs with those of other mutual funds. It assumes that each Fund had an annual return of 5% before expenses during the period shown, but that the expense ratio is unchanged. In this case, because the returns used are not the Funds’ actual returns, the results do not apply to your investment. The example is useful in making comparisons because the Securities and Exchange Commission (“SEC”) requires all mutual funds to calculate expenses based on a 5% return. You can assess each Fund’s ongoing costs by comparing this hypothetical example with the hypothetical examples that appear in shareholder reports of other funds.
Note that expenses shown in the table are meant to highlight and help you compare ongoing costs only. The Funds do not charge transaction fees, such as purchase or redemption fees, nor do they impose any sales loads.
The calculations assume no shares were bought or sold during the period. Your actual costs may have been higher or lower, depending on the amount of your investment and the timing of any purchases or redemptions.
29
EUBEL BRADY & SUTTMAN MUTUAL FUND TRUST
ABOUT YOUR FUNDS’ EXPENSES (Unaudited) (Continued) |
More information about the Funds’ expenses can be found in this report. For additional information on operating expenses and other shareholder costs, please refer to the Funds’ prospectus.
| Beginning
Account Value
August 1, 2015 | Ending
Account Value
January 31, 2016 | Net
Expense
Ratio(a) | Expenses
Paid During
Period(b) |
Income & Appreciation Fund | | | |
Actual | $1,000.00 | $942.60 | 0.25% | $1.22 |
Hypothetical 5% Return (before expenses) | $1,000.00 | $1,023.88 | 0.25% | $1.27 |
Income Fund | | | | |
Actual | $1,000.00 | $982.70 | 0.20% | $1.00 |
Hypothetical 5% Return (before expenses) | $1,000.00 | $1,024.13 | 0.20% | $1.02 |
(a) | Annualized, based on each Fund’s most recent one-half year expenses. |
(b) | Expenses are equal to each Fund’s annualized expense ratio multiplied by the average account value over the period, multiplied by 184/366 (to reflect the one-half year period). |
30
EUBEL BRADY & SUTTMAN MUTUAL FUND TRUST
OTHER INFORMATION (Unaudited) |
The Trust files a complete listing of portfolio holdings for the Funds with the SEC as of the end of the first and third quarters of each fiscal year on Form N-Q. These filings are available upon request by calling 1-800-391-1223. Furthermore, you may obtain a copy of the filings on the SEC’s website at http://www.sec.gov. The Trust’s Forms N-Q may also be reviewed and copied at the SEC’s Public Reference Room in Washington, DC, and information on the operation of the Public Reference Room may be obtained by calling 1-800-SEC-0330.
A description of the policies and procedures that the Funds use to vote proxies relating to portfolio securities is available without charge upon request by calling toll-free 1-800-391-1223, or on the SEC’s website at http://www.sec.gov. Information regarding how the Funds voted proxies relating to portfolio securities during the most recent 12-month period ended June 30 is also available without charge upon request by calling toll-free 1-800-391-1223, or on the SEC’s website at http://www.sec.gov.
31
This page intentionally left blank.
This page intentionally left blank.
Item 2. Code of Ethics.
Not required
Item 3. Audit Committee Financial Expert.
Not required
Item 4. Principal Accountant Fees and Services.
Not required
Item 5. Audit Committee of Listed Registrants.
Not applicable
Item 6. Schedule of Investments.
| (a) | Not applicable [schedule filed with Item 1] |
Item 7. Disclosure of Proxy Voting Policies and Procedures for Closed-End Management Investment Companies.
Not applicable
Item 8. Portfolio Managers of Closed-End Management Investment Companies.
Not applicable
Item 9. Purchases of Equity Securities by Closed-End Management Investment Company and Affiliated Purchasers.
Not applicable
Item 10. Submission of Matters to a Vote of Security Holders.
The registrant’s Committee of Independent Trustees shall review shareholder recommendations for nominations to fill vacancies on the registrant’s board of trustees if such recommendations are submitted in writing and addressed to the Committee at the registrant’s offices. The Committee may adopt, by resolution, a policy regarding its procedures for considering candidates for the board of trustees, including any recommended by shareholders.
Item 11. Controls and Procedures.
(a) Based on their evaluation of the registrant’s disclosure controls and procedures (as defined in Rule 30a-3(c) under the Investment Company Act of 1940) as of a date within 90 days of the filing date of this report, the registrant’s principal executive officer and principal financial officer have concluded that such disclosure controls and procedures are reasonably designed and are operating effectively to ensure that material information relating to the registrant, including its consolidated subsidiaries, is made known to them by others within those entities, particularly during the period in which this report is being prepared, and that the information required in filings on Form N-CSR is recorded, processed, summarized, and reported on a timely basis.
(b) There were no changes in the registrant’s internal control over financial reporting (as defined in Rule 30a-3(d) under the Investment Company Act of 1940) that occurred during the second fiscal quarter of the period covered by this report that have materially affected, or are reasonably likely to materially affect, the registrant’s internal control over financial reporting.
Item 12. Exhibits.
File the exhibits listed below as part of this Form. Letter or number the exhibits in the sequence indicated.
(a)(1) Any code of ethics, or amendment thereto, that is the subject of the disclosure required by Item 2, to the extent that the registrant intends to satisfy the Item 2 requirements through filing of an exhibit: Not required
(a)(2) A separate certification for each principal executive officer and principal financial officer of the registrant as required by Rule 30a-2(a) under the Act (17 CFR 270.30a-2(a)): Attached hereto
(a)(3) Any written solicitation to purchase securities under Rule 23c-1 under the Act (17 CFR 270.23c-1) sent or given during the period covered by the report by or on behalf of the registrant to 10 or more persons: Not applicable
(b) Certifications required by Rule 30a-2(b) under the Act (17 CFR 270.30a-2(b)): Attached hereto
| Exhibit 99.CERT | Certifications required by Rule 30a-2(a) under the Act |
| Exhibit 99.906CERT | Certifications required by Rule 30a-2(b) under the Act |
SIGNATURES
Pursuant to the requirements of the Securities Exchange Act of 1934 and the Investment Company Act of 1940, the registrant has duly caused this report to be signed on its behalf by the undersigned, thereunto duly authorized.
| (Registrant) | Eubel Brady & Suttman Mutual Fund Trust | |
| | | | |
| By (Signature and Title)* | /s/ Scott E. Lundy | |
| | | Scott E. Lundy, President | |
| | | | |
| Date | April 4, 2016 | | |
| | | | |
| Pursuant to the requirements of the Securities Exchange Act of 1934 and the Investment Company Act of 1940, this report has been signed below by the following persons on behalf of the registrant and in the capacities and on the dates indicated. |
| | | | |
| By (Signature and Title)* | /s/ Scott E. Lundy | |
| | | Scott E. Lundy, President | |
| | | | |
| Date | April 4, 2016 | | |
| | | | |
| By (Signature and Title)* | /s/ Theresa M. Bridge | |
| | | Theresa M. Bridge, Treasurer | |
| | | | |
| Date | April 4, 2016 | | |
| * | Print the name and title of each signing officer under his or her signature. |