Wade R. Bridge, Esq.
Form N-CSR is to be used by management investment companies to file reports with the Commission not later than 10 days after the transmission to stockholders of any report that is required to be transmitted to stockholders under Rule 30e-1 under the Investment Company Act of 1940 (17 CFR 270.30e-1). The Commission may use the information provided on Form N-CSR in its regulatory, disclosure review, inspection, and policymaking roles.
A registrant is required to disclose the information specified by Form N-CSR, and the Commission will make this information public. A registrant is not required to respond to the collection of information contained in Form N-CSR unless the Form displays a currently valid Office of Management and Budget ("OMB") control number. Please direct comments concerning the accuracy of the information collection burden estimate and any suggestions for reducing the burden to Secretary, Securities and Exchange Commission, 450 Fifth Street, NW, Washington, DC 20549-0609. The OMB has reviewed this collection of information under the clearance requirements of 44 U.S.C. § 3507.
Item 1. Reports to Stockholders.
Eubel Brady & Suttman
Income and Appreciation Fund
Ticker Symbol: EBSZX
Eubel Brady & Suttman
Income Fund
Ticker Symbol: EBSFX
Each a series of the
Eubel Brady & Suttman Mutual Fund Trust
ANNUAL REPORT
July 31, 2016
EUBEL BRADY & SUTTMAN MUTUAL FUND TRUST |
LETTER TO OUR SHAREHOLDERS | July 31, 2016 |
Dear Shareholders:
The first four months of the Funds’ fiscal year ended July 31, 2016 were rather quiet as compared to the final eight months. The pace of commodity price declines generally accelerated from December through mid-February, as did fear of a recession. We were pleased with how the Funds held up during that volatile stretch. Then, investor sentiment started improving as commodity prices began lifting from their nadir. Fear of a recession subsided, credit spreads began narrowing and yields declined further. These factors contributed to solid results during the second half of the fiscal year.
In this second annual letter we provide a review of the 2016 Fiscal Year, our investment philosophy and the flexibility provided for within the Funds, and each Fund’s results for various periods ended July 31, 2016. Additionally, we discuss primary factors that contributed to each Fund’s performance relative to its benchmark. We conclude the letter by offering our perspective on the current environment as it relates to the Funds.
A Review of the 2016 Fiscal Year – In the early weeks of the fiscal year, global turmoil helped steer capital toward U.S. Treasuries, driving their yields lower. Corporate bonds generally remained steady and credit spreads widened as a result. Stress within the energy space, due to weak commodity prices and poor financial results, began spreading to bonds in other sectors.
During the October to December stretch, the yield on the 2-Year Treasury rose to 0.93%, the highest level since early 2010 (as the Fed communicated plans for a December “lift off”). The Fed increased overnight rates for the first time in nearly a decade, to a range of 0.25% to 0.50% and provided guidance that contemplated four rate increases in 2016. Treasury yields subsequently rose across the curve, with the largest increases on the one to two year segment.
Interestingly, Treasury yields began to decline soon thereafter as markets began fretting about uncertain economic growth and central bank policy. The Bank of Japan surprised global markets when it implemented a negative interest rate policy, and kept the door open to further cuts. It was anticipated that the European Central Bank would take their rates further into negative territory and continue bond purchases. Foreign capital in search of higher yields flowed into U.S. Treasuries, putting downward pressure on their yields.
Commodity price declines accelerated in December through mid-February when fear of a global recession and non-investment grade yields generally peaked.
As noted, investor sentiment began improving in mid-February as oil and commodity prices in general began rising. Investment and non-investment grade credit spreads began to narrow.
In early March, the European Central Bank furthered the positive shift in investor sentiment when it embarked on additional extraordinary monetary policy (i.e. corporate bond purchases). The Federal Reserve left overnight rates unchanged and committee members collectively lowered their outlook for
1
additional rate hikes in 2016. Treasury and corporate yields generally declined on the news, with non-investment grade yields declining the most (lifting prices markedly).
Corporate bonds of all credit qualities generally posted positive results in the April to July period with the 10-Year and 30-Year Treasury logging new all-time low yields of 1.37% and 2.11%, respectively, on July 8. The combination of further declining yields and narrowing credit spreads boosted fixed-income prices on average for the Funds and bond markets.
Investment Philosophy – Managing risks so that investors are being adequately compensated for them is an important element of our bottom-up investment philosophy. In our view, flexibility in portfolio management can support long-term success. As such, each Fund has latitude with respect to maturity, duration (price sensitivity to a change in interest rates) and credit quality (among other factors). This flexibility allows us to invest where we find the most value, rather than being confined to specific maturity, duration and credit rating targets.
Importantly, since we are not managing to a specific maturity or duration target, we can and often do hold bonds to maturity. We believe this provides our Funds an advantage over those which are more constrained.
In addition, with the Funds’ investor base being comprised of EBS clients, fund flows are considerably more stable than those of funds open to the general public. This, too, can provide the Funds an advantage relative to those which may have their assets under management fluctuate wildly at the whims of unknown investors’ emotions. When investors exit a fund en masse, it can result in forced selling at an inopportune time. However, it can also provide investing opportunities for investors with capital available.
Each Fund held fewer than 60 securities at fiscal year-end, but maintained good diversification in our view. Many funds hold hundreds of securities. In our opinion, holding fewer securities allows us to be more selective, and provide closer oversight.
Because the composition of the EBS Funds will often be materially different than their benchmarks, you should expect their returns to diverge from them, at times significantly. Lastly, neither Fund uses leverage (borrows money) to make investments.
Results For Various Periods Ended July 31, 2016 – Since inception (September 30, 2014) through July 31, 2016, the EBS Income and Appreciation Fund (“EBSZX”) posted an average annual total return of 1.59%, while its primary benchmark, the BofA Merrill Lynch U.S. Yield Alternatives Index, had an average annual total return of -2.10%. On a one year basis, the Fund returned 2.55% and the benchmark returned -0.74%. On a six months basis, the Fund returned 8.79% and the benchmark returned 11.71%.
The primary factors contributing to EBSZX’s outperformance since inception and on a one year basis are described below:
| | ● | EBSZX’s investment in non-convertible securities contributed to its relative outperformance as those assets generally performed better than those comprising the benchmark. |
2
| | ● | Only having modest exposure to commodity-related companies benefited the Fund during the December to mid-February period (when commodity prices were declining and associated companies’ financial results were suffering). Yields and credit spreads on debt for the group increased and widened, respectively, during that stretch of time. As a result, the price of associated debt declined. |
The primary factors contributing to EBSZX’s underperformance during the last six months are described below:
| | ● | While EBSZX outperformed the benchmark as commodity prices were searching for stability in mid-February, once commodity prices began rising, yields for the group declined and credit spreads narrowed. These factors contributed to the benchmark’s performance outpacing the Fund. |
We believe EBSZX is positioned well to capitalize on additional convertible investments should they become available at prices we find compelling.
Since inception (September 30, 2014) through July 31, 2016, the EBS Income Fund (“EBSFX”) logged an average annual total return of 2.06%, while its primary benchmark, the BofA Merrill Lynch U.S. Corporate & Government Master Index had an average annual total return of 5.06%. On a one year basis, the Fund returned 3.58% and the benchmark 6.82%. On a six month basis, the Fund returned 5.41% and the benchmark 5.50%.
The primary factors contributing to EBSFX’s underperformance since inception and over the last twelve and six months are described below:
| | ● | EBSFX’s weighted average maturity and duration (price sensitivity to a change in interest rates) were consistently shorter than that of its benchmark, and it had less exposure to Government & Agency debt. Yields of securities with the largest impact on the benchmark declined on average, lifting their prices (think Government & Agency) and its return. |
| | ● | EBSFX’s primary reason for lagging its benchmark was due to less exposure to low-yielding U.S. Government & Agency debt which benefited from a global flight to safety. This drove yields down and prices up. |
Our Perspective – In light of the continuing low yield environment, it is hard to envision a probable scenario where yields are materially lower several years from now. As such, the Funds are structured with an eye toward higher yields in the future.
We remain more comfortable selectively taking credit risk on the short end of the yield curve than increasing interest rate risk by extending maturities to enhance yield.
Both Funds’ sensitivity to interest rates is modest and each Fund’s portfolio is diversified, in our view.
3
Convertible exposure within EBSZX remains lower than we prefer, yet we selectively increased it during the fiscal year. The continued modest allocation is largely due to the low yield environment and stock prices that seem generally high relative to underlying values.
Both Funds remain well positioned to capitalize on opportunities, in our view.
We welcome your questions, comments or both and may be reached at 800-391-1223. As always, we appreciate your trust and confidence in our firm.
Sincerely,
The EBS Research Group
Important Disclosures – Performance data quoted in this letter or the report itself represents past performance. Past performance does not guarantee future results. The value of an investor’s shares will fluctuate, and may be worth more or less than the original cost when redeemed. Current performance may be higher or lower than performance quoted herein. Performance data, current to the most recent month end, is available by calling 1-800-391-1223.
The information in this “Letter To Our Shareholders” represents the opinion of the author and is not intended to be a forecast or investment advice. This publication does not constitute an offer or solicitation of any transaction in any securities. Information contained in this publication has been obtained from sources believed to be reliable, but has not been independently verified by EBS. Please note that any discussion of fund holdings, fund performance and views expressed are as of July 31, 2016 (except if otherwise stated) and are subject to change without notice.
4
EUBEL BRADY & SUTTMAN INCOME AND APPRECIATION FUND
PERFORMANCE INFORMATION
July 31, 2016 (Unaudited)
Comparison of the Change in Value of a $10,000 Investment in
Eubel Brady & Suttman Income and Appreciation Fund versus
the BofA Merrill Lynch U.S. Yield Alternatives Index, the BofA Merrill Lynch U.S. Total
Return Alternatives Index and the BofA Merrill Lynch 1-10 Year Corporate Index
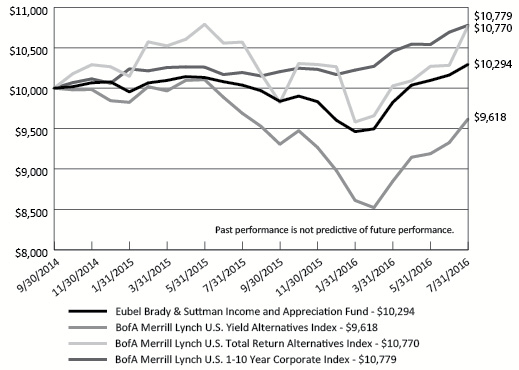
Average Annual Total Returns(a) For the periods ended July 31, 2016 |
| | 1 Year | Since
Inception(b) |
Eubel Brady & Suttman Income and Appreciation Fund | 2.55% | 1.59% |
BofA Merrill Lynch U.S. Yield Alternatives Index* | (0.74%) | (2.10%) |
BofA Merrill Lynch U.S. Total Return Alternatives Index* | 1.89% | 4.13% |
BofA Merrill Lynch 1-10 Year Corporate Index* | 5.74% | 4.18% |
(a) | Total return is a measure of the change in value of an investment in the Fund over the period covered, which assumes dividends or distributions, if any, are reinvested in shares of the Fund. |
(b) | Represents the period from the commencement of operations (September 30, 2014) through July 31, 2016. |
* | The BofA Merrill Lynch U.S. Yield Alternatives Index tracks the performance of U.S. dollar denominated convertible debt. The BofA Merrill Lynch U.S. Total Return Alternatives Index tracks the performance of U.S. dollar denominated convertible debt with more equity sensitivity than typically found in the Yield Alternatives Index, on average. The BofA Merrill Lynch 1-10 Year Corporate Index tracks the performance of U.S. dollar denominated investment grade corporate debt publicly issued in the U.S. domestic market with a remaining term to final maturity less than 10 years. The Fund does not invest solely in securities included in these indices and may invest in other types of bonds and securities. |
The performance in the chart represents past performance. Current performance may be higher or lower than the performance data presented above. Investment return and principal value will fluctuate, so that shares, when redeemed, may be worth more or less than their original cost. As of the Fund’s prospectus dated December 1, 2015, the Fund’s total operating expense ratio was 0.25% of the Fund’s average daily net assets.
5
EUBEL BRADY & SUTTMAN INCOME FUND
PERFORMANCE INFORMATION
July 31, 2016 (Unaudited)
Comparison of the Change in Value of a $10,000 Investment in
Eubel Brady & Suttman Income Fund versus
the BofA Merrill Lynch U.S. Corporate & Government Master Index and
the BofA Merrill Lynch U.S. Corporate & Government 1-10 Yrs Index
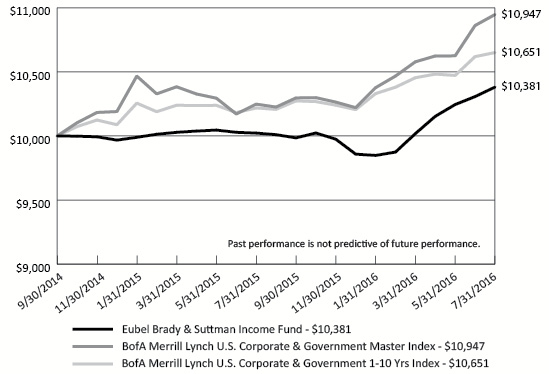
Average Annual Total Returns(a) For the periods ended July 31, 2016 |
| | 1 Year | Since
Inception(b) |
Eubel Brady & Suttman Income Fund | 3.58% | 2.06% |
BofA Merrill Lynch U.S. Corporate & Government Master Index* | 6.82% | 5.06% |
BofA Merrill Lynch U.S. Corporate & Government 1-10 Yrs Index* | 4.23% | 3.50% |
(a) | Total return is a measure of the change in value of an investment in the Fund over the period covered, which assumes dividends or distributions, if any, are reinvested in shares of the Fund. |
(b) | Represents the period from the commencement of operations (September 30, 2014) through July 31, 2016. |
* | The BofA Merrill Lynch U.S. Corporate & Government Master Index tracks the performance of U.S. dollar denominated investment grade debt publicly issued in the U.S. domestic market, including U.S. Treasury, U.S. agency, foreign government, supranational and corporate securities. The BofA Merrill Lynch U.S. Corporate & Government 1-10 Yrs Index tracks the performance of U.S. dollar denominated investment grade debt publicly issued in the U.S. domestic market, including U.S. Treasury, U.S. agency, foreign government, supranational and corporate securities with a remaining term to final maturity less than 10 years. The Fund does not invest solely in securities included in these indices and may invest in other types of bonds and securities. |
The performance in the chart represents past performance. Current performance may be higher or lower than the performance data presented above. Investment return and principal value will fluctuate, so that shares, when redeemed, may be worth more or less than their original cost. As of the Fund’s prospectus dated December 1, 2015, the Fund’s total operating expense ratio was 0.22% of the Fund’s average daily net assets.
6
EUBEL BRADY & SUTTMAN MUTUAL FUND TRUST
PORTFOLIO INFORMATION
July 31, 2016 (Unaudited)
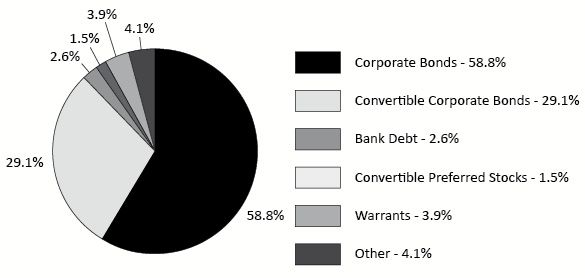
Eubel Brady & Suttman Income and Appreciation Fund
Asset Allocation (% of Net Assets)
Eubel Brady & Suttman Income Fund
Asset Allocation (% of Net Assets)

7
EUBEL BRADY & SUTTMAN INCOME AND APPRECIATION FUND
SCHEDULE OF INVESTMENTS
July 31, 2016 | |
CORPORATE BONDS — 58.8% | | Coupon | Maturity | | Par Value | | | Value | |
Consumer Discretionary — 8.9% | | | | | | | | | | |
Marriott International, Inc. | | 3.375 | % | 10/15/20 | | $ | 2,220,000 | | | $ | 2,328,836 | |
Time Warner Cable, Inc. | | 6.750 | % | 07/01/18 | | | 2,100,000 | | | | 2,302,446 | |
Whirlpool Corp. | | 1.650 | % | 11/01/17 | | | 2,400,000 | | | | 2,410,886 | |
| | | | | | | | | | | | 7,042,168 | |
Consumer Staples — 3.0% | | | | | | | | | | | | |
Dr Pepper Snapple Group, Inc. | | 6.820 | % | 05/01/18 | | | 2,170,000 | | | | 2,371,450 | |
| | | | | | | | | | | | | |
Energy — 8.6% | | | | | | | | | | | | |
Boardwalk Pipelines, LLC | | 5.875 | % | 11/15/16 | | | 1,500,000 | | | | 1,515,801 | |
Boardwalk Pipelines, LLC | | 5.500 | % | 02/01/17 | | | 500,000 | | | | 508,676 | |
CONSOL Energy, Inc. | | 5.875 | % | 04/15/22 | | | 2,600,000 | | | | 2,372,500 | |
Transocean, Inc. | | 5.800 | % | 12/15/16 | | | 2,439,000 | | | | 2,445,098 | |
| | | | | | | | | | | | 6,842,075 | |
Financials — 14.7% | | | | | | | | | | | | |
American Financial Group, Inc. | | 9.875 | % | 06/15/19 | | | 800,000 | | | | 963,500 | |
Capital One Bank USA, N.A. | | 2.150 | % | 11/21/18 | | | 1,380,000 | | | | 1,391,450 | |
Genworth Holdings, Inc. | | 6.515 | % | 05/22/18 | | | 1,397,000 | | | | 1,398,746 | |
Goldman Sachs Group, Inc. (a) | | 1.452 | % | 12/15/17 | | | 820,000 | | | | 821,010 | |
Icahn Enterprises Finance Corp. | | 3.500 | % | 03/15/17 | | | 2,300,000 | | | | 2,294,250 | |
Pershing Square Holdings, Ltd. | | 5.500 | % | 07/15/22 | | | 2,500,000 | | | | 2,437,500 | |
Zions Bancorp. | | 5.650 | % | 11/15/23 | | | 2,300,000 | | | | 2,311,500 | |
| | | | | | | | | | | | 11,617,956 | |
Health Care — 5.9% | | | | | | | | | | | | |
Thermo Fisher Scientific, Inc. | | 1.300 | % | 02/01/17 | | | 2,300,000 | | | | 2,301,258 | |
WellPoint, Inc. | | 2.375 | % | 02/15/17 | | | 2,400,000 | | | | 2,415,257 | |
| | | | | | | | | | | | 4,716,515 | |
Industrials — 4.8% | | | | | | | | | | | | |
Caterpillar, Inc. | | 7.900 | % | 12/15/18 | | | 708,000 | | | | 817,211 | |
Eaton Corp. | | 1.500 | % | 11/02/17 | | | 1,691,000 | | | | 1,696,787 | |
Stanley Black & Decker, Inc. | | 2.451 | % | 11/17/18 | | | 650,000 | | | | 665,325 | |
United Rentals North America, Inc. | | 7.375 | % | 05/15/20 | | | 606,000 | | | | 629,573 | |
| | | | | | | | | | | | 3,808,896 | |
Information Technology — 3.7% | | | | | | | | | | | | |
Avnet, Inc. | | 6.625 | % | 09/15/16 | | | 632,000 | | | | 635,769 | |
Xerox Corp. | | 6.350 | % | 05/15/18 | | | 2,110,000 | | | | 2,264,593 | |
| | | | | | | | | | | | 2,900,362 | |
Materials — 6.2% | | | | | | | | | | | | |
Sherwin-Williams Co. | | 1.350 | % | 12/15/17 | | | 2,430,000 | | | | 2,435,669 | |
Steel Dynamics, Inc. | | 5.125 | % | 10/01/21 | | | 2,350,000 | | | | 2,444,000 | |
| | | | | | | | | | | | 4,879,669 | |
See accompanying notes to financial statements.
8
EUBEL BRADY & SUTTMAN INCOME AND APPRECIATION FUND
SCHEDULE OF INVESTMENTS (Continued) | |
CORPORATE BONDS — 58.8% (Continued) | | Coupon | Maturity | | Par Value | | | Value | |
Telecommunication Services — 3.0% | | | | | | | | | | |
América Móvil S.A.B de C.V. | | 2.375 | % | 09/08/16 | | $ | 2,400,000 | | | $ | 2,403,879 | |
Total Corporate Bonds (Cost $45,883,406) | | | | | | | | | | $ | 46,582,970 | |
| |
CONVERTIBLE CORPORATE BONDS — 29.1% | | Coupon | Maturity | | Par Value | | | Value | |
Energy — 4.9% | | | | | | | | | | |
Chesapeake Energy Corp. | | 2.500 | % | 05/15/37 | | $ | 2,600,000 | | | $ | 2,466,750 | |
Hornbeck Offshore Services, Inc. | | 1.500 | % | 09/01/19 | | | 2,370,000 | | | | 1,376,081 | |
| | | | | | | | | | | | 3,842,831 | |
Financials — 10.2% | | | | | | | | | | | | |
Ares Capital Corp. | | 4.875 | % | 03/15/17 | | | 1,800,000 | | | | 1,829,250 | |
Jefferies Group, LLC | | 3.875 | % | 11/01/29 | | | 2,000,000 | | | | 2,037,500 | |
RAIT Financial Trust | | 4.000 | % | 10/01/33 | | | 2,166,000 | | | | 1,969,706 | |
Redwood Trust, Inc. | | 4.625 | % | 04/15/18 | | | 2,275,000 | | | | 2,275,000 | |
| | | | | | | | | | | | 8,111,456 | |
Industrials — 4.5% | | | | | | | | | | | | |
Chart Industries, Inc. | | 2.000 | % | 08/01/18 | | | 1,500,000 | | | | 1,453,125 | |
Horsehead Holding Corp. (d) | | 3.800 | % | 07/01/17 | | | 1,375,000 | | | �� | 55,000 | |
Trinity Industries, Inc. | | 3.875 | % | 06/01/36 | | | 1,700,000 | | | | 2,034,687 | |
| | | | | | | | | | | | 3,542,812 | |
Information Technology — 6.2% | | | | | | | | | | | | |
Bridgeline Digital, Inc. (b)(c) | | 11.500 | % | 03/01/17 | | | 739,000 | | | | 760,599 | |
Intel Corp. | | 2.950 | % | 12/15/35 | | | 1,400,000 | | | | 1,838,375 | |
LinkedIn Corp. | | 0.500 | % | 11/01/19 | | | 2,350,000 | | | | 2,326,500 | |
| | | | | | | | | | | | 4,925,474 | |
Materials — 3.3% | | | | | | | | | | | | |
RTI International Metals, Inc. | | 1.625 | % | 10/15/19 | | | 2,370,000 | | | | 2,615,888 | |
| | | | | | | | | | | | | |
Total Convertible Corporate Bonds(Cost $24,216,335) | | | | | | | | | | $ | 23,038,461 | |
See accompanying notes to financial statements.
9
EUBEL BRADY & SUTTMAN INCOME AND APPRECIATION FUND
SCHEDULE OF INVESTMENTS (Continued) | |
BANK DEBT — 2.6% | | Coupon | Maturity | | Par Value | | | Value | |
NCP Finance Limited Partnership (a)(b)(c) | | 4.481 | % | 08/12/16 | | $ | 86,022 | | | $ | 86,044 | |
NCP Finance Limited Partnership (a)(b)(c) | | 4.483 | % | 08/15/16 | | | 86,022 | | | | 86,049 | |
NCP Finance Limited Partnership (a)(b)(c) | | 4.487 | % | 08/19/16 | | | 154,839 | | | | 154,901 | |
NCP Finance Limited Partnership (a)(b)(c) | | 4.496 | % | 08/26/16 | | | 43,011 | | | | 43,034 | |
NCP Finance Limited Partnership (a)(c) | | 11.000 | % | 09/30/18 | | | 1,695,035 | | | | 1,593,333 | |
NCP Finance Limited Partnership (a)(b)(c) | | 6.250 | % | 05/24/19 | | | 86,022 | | | | 87,498 | |
Total Bank Debt (Cost $2,121,464) | | | | | | | | | | $ | 2,050,859 | |
| |
CONVERTIBLE PREFERRED STOCKS — 1.5% | | Shares | | | Value | |
Air Industries Group (c) (Cost $1,200,000) | | | 120,000 | | | $ | 1,200,000 | |
| |
WARRANTS — 3.9% | | Shares | | | Value | |
Capital One Financial Corp., $42.04, expires 11/14/18 (d) | | | 13,200 | | | $ | 362,472 | |
First Financial Bancorp, $12.202, expires 12/23/18 (d) | | | 67,850 | | | | 653,395 | |
Hartford Financial Services Group, Inc., $9.197, expires 06/26/19 (d) | | | 45,200 | | | | 1,472,616 | |
Lincoln National Corp., $10.126, expires 07/10/19 (d) | | | 16,260 | | | | 586,173 | |
Total Warrants (Cost $1,659,481) | | | | | | $ | 3,074,656 | |
See accompanying notes to financial statements.
10
EUBEL BRADY & SUTTMAN INCOME AND APPRECIATION FUND
SCHEDULE OF INVESTMENTS (Continued) | |
MONEY MARKET FUNDS — 2.9% | | Shares | | | Value | |
Invesco Short-Term Investments Trust - Treasury Portfolio - Institutional Shares, 0.23%(e) (Cost $2,312,908) | | | 2,312,908 | | | $ | 2,312,908 | |
| | | | | | | | | |
Total Investments at Value — 98.8% (Cost $77,393,594) | | | | | | $ | 78,259,854 | |
| | | | | | | | | |
Other Assets in Excess of Liabilities — 1.2% | | | | | | | 992,727 | |
| | | | | | | | | |
Net Assets — 100.0% | | | | | | $ | 79,252,581 | |
(a) | Variable rate security. The rate shown is the effective interest rate as of July 31, 2016. |
(b) | Security has been fair valued in good faith by the Adviser in conformity with guidelines adopted by and subject to review by the Board of Trustees. The total value of such securities is $1,218,125 at July 31, 2016, representing 1.5% of net assets (Note 2). |
(c) | Illiquid security. Total fair value of illiquid securities held as of July 31, 2016 was $4,011,458, representing 5.0% of net assets. |
(d) | Non-income producing security. |
(e) | The rate shown is the 7-day effective yield as of July 31, 2016. |
See accompanying notes to financial statements. |
11
EUBEL BRADY & SUTTMAN INCOME FUND
SCHEDULE OF INVESTMENTS
July 31, 2016 | |
U.S. TREASURY
OBLIGATIONS — 2.3% | | Coupon | Maturity | | Par Value | | | Value | |
U.S. Treasury Notes | | 0.750 | % | 06/30/17 | | $ | 2,200,000 | | | $ | 2,203,179 | |
U.S. Treasury Notes | | 1.500 | % | 08/31/18 | | | 1,490,000 | | | | 1,515,202 | |
Total U.S. Treasury Obligations (Cost $3,698,756) | | | | | | | | | | $ | 3,718,381 | |
| |
CORPORATE BONDS — 87.6% | | Coupon | Maturity | | Par Value | | | Value | |
Consumer Discretionary — 8.7% | | | | | | | | | | |
Gannet Co., Inc. | | 5.125 | % | 07/15/20 | | $ | 1,375,000 | | | $ | 1,426,769 | |
Macy's Retail Holdings, Inc. | | 5.900 | % | 12/01/16 | | | 707,000 | | | | 718,572 | |
Marriott International, Inc. | | 3.375 | % | 10/15/20 | | | 3,250,000 | | | | 3,409,331 | |
Time Warner Cable, Inc. | | 6.750 | % | 07/01/18 | | | 4,200,000 | | | | 4,604,893 | |
Whirlpool Corp. | | 1.650 | % | 11/01/17 | | | 3,825,000 | | | | 3,842,350 | |
| | | | | | | | | | | | 14,001,915 | |
Consumer Staples — 11.8% | | | | | | | | | | | | |
Dr Pepper Snapple Group, Inc. | | 6.820 | % | 05/01/18 | | | 3,756,000 | | | | 4,104,684 | |
General Mills, Inc. | | 1.400 | % | 10/20/17 | | | 4,770,000 | | | | 4,794,995 | |
Kraft Foods Group, Inc. | | 2.250 | % | 06/05/17 | | | 4,252,000 | | | | 4,290,208 | |
Kroger Co. (The) | | 2.200 | % | 01/15/17 | | | 2,800,000 | | | | 2,815,834 | |
Kroger Co. (The) | | 2.950 | % | 11/01/21 | | | 2,500,000 | | | | 2,642,563 | |
Safeway, Inc. | | 3.400 | % | 12/01/16 | | | 271,000 | | | | 270,323 | |
| | | | | | | | | | | | 18,918,607 | |
Energy — 11.0% | | | | | | | | | | | | |
Boardwalk Pipelines, LLC | | 5.875 | % | 11/15/16 | | | 2,300,000 | | | | 2,324,228 | |
Boardwalk Pipelines, LLC | | 5.500 | % | 02/01/17 | | | 1,500,000 | | | | 1,526,030 | |
Chesapeake Energy Corp. | | 8.000 | % | 12/15/22 | | | 4,365,000 | | | | 3,797,550 | |
CONSOL Energy, Inc. | | 5.875 | % | 04/15/22 | | | 5,400,000 | | | | 4,927,500 | |
Transocean, Inc. | | 5.800 | % | 12/15/16 | | | 5,060,000 | | | | 5,072,650 | |
| | | | | | | | | | | | 17,647,958 | |
Financials — 20.8% | | | | | | | | | | | | |
American Financial Group, Inc. | | 9.875 | % | 06/15/19 | | | 1,203,000 | | | | 1,448,863 | |
Bank of America Corporation | | 5.300 | % | 03/15/17 | | | 3,180,000 | | | | 3,261,004 | |
Capital One Bank USA, N.A. | | 2.150 | % | 11/21/18 | | | 560,000 | | | | 564,646 | |
CNA Financial Corp. | | 6.950 | % | 01/15/18 | | | 50,000 | | | | 53,295 | |
Fairfax Financial Holdings Ltd. | | 7.375 | % | 04/15/18 | | | 279,000 | | | | 301,563 | |
Genworth Holdings, Inc. | | 6.515 | % | 05/22/18 | | | 2,200,000 | | | | 2,202,750 | |
Goldman Sachs Group, Inc. (a) | | 1.452 | % | 12/15/17 | | | 4,880,000 | | | | 4,886,012 | |
Hartford Financial Services Group, Inc. | | 6.300 | % | 03/15/18 | | | 158,000 | | | | 169,240 | |
Icahn Enterprises Finance Corp. | | 3.500 | % | 03/15/17 | | | 4,900,000 | | | | 4,887,750 | |
See accompanying notes to financial statements.
12
EUBEL BRADY & SUTTMAN INCOME FUND
SCHEDULE OF INVESTMENTS (Continued) | |
CORPORATE BONDS – 87.6% (Continued) | | Coupon | Maturity | | Par Value | | | Value | |
Financials — 20.8% (Continued) | | | | | | | | | | |
Jefferies Group, LLC | | 5.125 | % | 04/13/18 | | $ | 4,000,000 | | | $ | 4,177,640 | |
Pershing Square Holdings, Ltd. | | 5.500 | % | 07/15/22 | | | 5,000,000 | | | | 4,875,000 | |
Reinsurance Group of America, Inc. | | 5.625 | % | 03/15/17 | | | 287,000 | | | | 294,072 | |
Weyerhaeuser Co. | | 6.950 | % | 08/01/17 | | | 1,659,000 | | | | 1,740,102 | |
Zions Bancorp. | | 5.650 | % | 11/15/23 | | | 4,500,000 | | | | 4,522,500 | |
| | | | | | | | | | | | 33,384,437 | |
Health Care — 9.6% | | | | | | | | | | | | |
Actavis Funding SCS | | 1.850 | % | 03/01/17 | | | 5,000,000 | | | | 5,016,755 | |
Teva Pharmaceutical Finance Co. B.V. | | 2.400 | % | 11/10/16 | | | 4,750,000 | | | | 4,771,185 | |
Thermo Fisher Scientific, Inc. | | 1.300 | % | 02/01/17 | | | 3,283,000 | | | | 3,284,795 | |
WellPoint, Inc. | | 2.375 | % | 02/15/17 | | | 2,400,000 | | | | 2,415,257 | |
| | | | | | | | | | | | 15,487,992 | |
Industrials — 9.0% | | | | | | | | | | | | |
Caterpillar, Inc. | | 7.900 | % | 12/15/18 | | | 3,276,000 | | | | 3,781,333 | |
Eaton Corp. | | 1.500 | % | 11/02/17 | | | 4,700,000 | | | | 4,716,083 | |
Stanley Black & Decker, Inc. | | 2.451 | % | 11/17/18 | | | 4,605,000 | | | | 4,713,568 | |
United Rentals North America, Inc. | | 7.375 | % | 05/15/20 | | | 1,196,000 | | | | 1,242,524 | |
| | | | | | | | | | | | 14,453,508 | |
Information Technology — 5.9% | | | | | | | | | | | | |
Avnet, Inc. | | 6.625 | % | 09/15/16 | | | 4,761,000 | | | | 4,789,390 | |
Xerox Corp. | | 6.350 | % | 05/15/18 | | | 4,337,000 | | | | 4,654,759 | |
| | | | | | | | | | | | 9,444,149 | |
Materials — 5.5% | | | | | | | | | | | | |
Sherwin-Williams Co. | | 1.350 | % | 12/15/17 | | | 4,000,000 | | | | 4,009,332 | |
Steel Dynamics, Inc. | | 5.125 | % | 10/01/21 | | | 4,607,000 | | | | 4,791,280 | |
| | | | | | | | | | | | 8,800,612 | |
Telecommunication Services — 5.3% | | | | | | | | | | | | |
América Móvil S.A.B de C.V. | | 2.375 | % | 09/08/16 | | | 5,000,000 | | | | 5,008,080 | |
AT&T, Inc. | | 2.400 | % | 08/15/16 | | | 3,500,000 | | | | 3,501,732 | |
| | | | | | | | | | | | 8,509,812 | |
Utilities — 0.0% (b) | | | | | | | | | | | | |
Pennsylvania Electric Co. | | 6.625 | % | 04/01/19 | | | 15,000 | | | | 16,406 | |
| | | | | | | | | | | | | |
Total Corporate Bonds (Cost $140,051,292) | | | | | | | | | | $ | 140,665,396 | |
See accompanying notes to financial statements.
13
EUBEL BRADY & SUTTMAN INCOME FUND
SCHEDULE OF INVESTMENTS (Continued) | |
BANK DEBT — 2.0% | | Coupon | Maturity | | Par Value | | | Value | |
NCP Finance Limited Partnership (a)(c)(d) | | 4.481 | % | 08/12/16 | | $ | 451,613 | | | $ | 451,731 | |
NCP Finance Limited Partnership (a)(c)(d) | | 4.483 | % | 08/15/16 | | | 451,613 | | | | 451,757 | |
NCP Finance Limited Partnership (a)(c)(d) | | 4.487 | % | 08/19/16 | | | 812,903 | | | | 813,228 | |
NCP Finance Limited Partnership (a)(c)(d) | | 4.496 | % | 08/26/16 | | | 225,806 | | | | 225,930 | |
NCP Finance Limited Partnership (a)(d) | | 11.000 | % | 09/30/18 | | | 797,664 | | | | 749,804 | |
NCP Finance Limited Partnership (a)(c)(d) | | 6.250 | % | 05/24/19 | | | 451,613 | | | | 459,366 | |
Total Bank Debt (Cost $3,177,336) | | | | | | | | | | $ | 3,151,816 | |
| |
PREFERRED STOCKS — 1.7% | | Shares | | | Value | |
RAIT Financial Trust, 7.75%, Series A (Cost $2,946,070) | | | 135,000 | | | $ | 2,791,800 | |
| |
MONEY MARKET FUNDS — 5.5% | | Shares | | | Value | |
Invesco Short-Term Investments Trust - Treasury Portfolio - Institutional Shares, 0.23%(e) (Cost $8,829,264) | | | 8,829,264 | | | $ | 8,829,264 | |
| | | | | | | | | |
Total Investments at Value — 99.1% (Cost $158,702,718) | | | | | | $ | 159,156,657 | |
| | | | | | | | | |
Other Assets in Excess of Liabilities — 0.9% | | | | | | | 1,383,255 | |
| | | | | | | | | |
Net Assets — 100.0% | | | | | | $ | 160,539,912 | |
(a) | Variable rate security. The rate shown is the effective interest rate as of July 31, 2016. |
(b) | Percentage rounds to less than 0.1%. |
(c) | Security has been fair valued in good faith by the Adviser in conformity with guidelines adopted by and subject to review by the Board of Trustees. The total value of such securities is $2,402,012 at July 31, 2016, representing 1.5% of net assets (Note 2). |
(d) | Illiquid security. Total fair value of illiquid securities held as of July 31, 2016 was $3,151,816, representing 2.0% of net assets. |
(e) | The rate shown is the 7-day effective yield as of July 31, 2016. |
See accompanying notes to financial statements. |
14
EUBEL BRADY & SUTTMAN MUTUAL FUND TRUST
STATEMENTS OF ASSETS AND LIABILITIES
July 31, 2016 | |
| | Eubel Brady
& Suttman
Income and
Appreciation
Fund | | | Eubel Brady
& Suttman
Income Fund | |
ASSETS | | | | | | |
Investments in securities: | | | | | | |
At acquisition cost | | $ | 77,393,594 | | | $ | 158,702,718 | |
At value (Note 2) | | $ | 78,259,854 | | | $ | 159,156,657 | |
Dividends and interest receivable | | | 709,802 | | | | 1,405,334 | |
Receivable for investment securities sold | | | 329,577 | | | | — | |
Receivable for capital shares sold | | | — | | | | 5,484 | |
Other assets | | | 5,647 | | | | 6,477 | |
Total assets | | | 79,304,880 | | | | 160,573,952 | |
| | | | | | | | | |
LIABILITIES | | | | | | | | |
Distributions payable | | | 243 | | | | 1,262 | |
Payable for capital shares redeemed | | | 35,100 | | | | 1,496 | |
Payable to administrator (Note 4) | | | 6,700 | | | | 13,580 | |
Other accrued expenses | | | 10,256 | | | | 17,702 | |
Total liabilities | | | 52,299 | | | | 34,040 | |
| | | | | | | | | |
NET ASSETS | | $ | 79,252,581 | | | $ | 160,539,912 | |
| | | | | | | | | |
NET ASSETS CONSIST OF: | | | | | | | | |
Paid-in capital | | $ | 79,542,491 | | | $ | 159,991,554 | |
Undistributed net investment income | | | 109,743 | | | | 3,650 | |
Accumulated net realized gains (losses) from security transactions | | | (1,265,913 | ) | | | 90,769 | |
Net unrealized appreciation on investments | | | 866,260 | | | | 453,939 | |
NET ASSETS | | $ | 79,252,581 | | | $ | 160,539,912 | |
| | | | | | | | | |
Shares of beneficial interest outstanding (unlimited number of shares authorized, no par value) | | | 8,164,079 | | | | 16,105,258 | |
| | | | | | | | | |
Net asset value, offering price and redemption price per share (Note 2) | | $ | 9.71 | | | $ | 9.97 | |
See accompanying notes to financial statements. |
15
EUBEL BRADY & SUTTMAN MUTUAL FUND TRUST
STATEMENTS OF OPERATIONS
For the Year Ended July 31, 2016 | |
| | Eubel Brady
& Suttman
Income and
Appreciation
Fund | | | Eubel Brady
& Suttman
Income Fund | |
INVESTMENT INCOME | | | | | | |
Dividends | | $ | 19,141 | | | $ | 304,214 | |
Interest | | | 2,455,780 | | | | 4,083,896 | |
Total investment income | | | 2,474,921 | | | | 4,388,110 | |
| | | | | | | | | |
EXPENSES | | | | | | | | |
Administration fees (Note 4) | | | 77,853 | | | | 160,793 | |
Shareholder servicing fees (Note 4) | | | 31,045 | | | | 63,769 | |
Professional fees | | | 30,822 | | | | 30,822 | |
Registration and filing fees | | | 17,894 | | | | 19,631 | |
Custody and bank service fees | | | 7,967 | | | | 14,870 | |
Pricing costs | | | 6,457 | | | | 9,090 | |
Trustees’ fees and expenses (Note 4) | | | 7,705 | | | | 7,705 | |
Printing of shareholder reports | | | 4,205 | | | | 4,195 | |
Insurance expense | | | 4,612 | | | | 3,750 | |
Postage and supplies | | | 1,495 | | | | 1,528 | |
Other expenses | | | 4,144 | | | | 3,935 | |
Total expenses | | | 194,199 | | | | 320,088 | |
| | | | | | | | | |
NET INVESTMENT INCOME | | | 2,280,722 | | | | 4,068,022 | |
| | | | | | | | | |
REALIZED AND UNREALIZED GAINS (LOSSES) ON INVESTMENTS | | | | | | | | |
Net realized gains (losses) from investment transactions | | | (378,570 | ) | | | 105,160 | |
Net change in unrealized appreciation (depreciation) on investments | | | (62,107 | ) | | | 1,161,644 | |
NET REALIZED AND UNREALIZED GAINS (LOSSES) ON INVESTMENTS | | | (440,677 | ) | | | 1,266,804 | |
| | | | | | | | | |
NET INCREASE IN NET ASSETS FROM OPERATIONS | | $ | 1,840,045 | | | $ | 5,334,826 | |
See accompanying notes to financial statements. |
16
EUBEL BRADY & SUTTMAN INCOME AND APPRECIATION FUND
STATEMENTS OF CHANGES IN NET ASSETS | |
| | Year Ended
July 31,
2016 | | | Period Ended July 31,
2015 (a) | |
FROM OPERATIONS | | | | | | |
Net investment income | | $ | 2,280,722 | | | $ | 1,475,206 | |
Net realized losses from investment transactions | | | (378,570 | ) | | | (46,229 | ) |
Net change in unrealized appreciation (depreciation) on investments | | | (62,107 | ) | | | (1,256,550 | ) |
Net increase in net assets from operations | | | 1,840,045 | | | | 172,427 | |
| | | | | | | | | |
DISTRIBUTIONS TO SHAREHOLDERS | | | | | | | | |
From net investment income | | | (2,283,598 | ) | | | (1,469,254 | ) |
From net realized gains on investments | | | (734,447 | ) | | | — | |
Decrease in net assets from distribution to shareholders | | | (3,018,045 | ) | | | (1,469,254 | ) |
| | | | | | | | | |
CAPITAL SHARE TRANSACTIONS | | | | | | | | |
Shares issued from reorganization (Note 1) | | | — | | | | 53,446,239 | |
Proceeds from shares sold | | | 10,612,353 | | | | 44,540,073 | |
Net asset value of shares issued in reinvestment of distributions to shareholders | | | 3,011,131 | | | | 1,462,219 | |
Payments for shares redeemed | | | (15,841,022 | ) | | | (15,553,585 | ) |
Net increase (decrease) from capital share transactions | | | (2,217,538 | ) | | | 83,894,946 | |
| | | | | | | | | |
TOTAL INCREASE (DECREASE) IN NET ASSETS | | | (3,395,538 | ) | | | 82,598,119 | |
| | | | | | | | | |
NET ASSETS | | | | | | | | |
Beginning of period | | | 82,648,119 | | | | 50,000 | |
End of period | | $ | 79,252,581 | | | $ | 82,648,119 | |
| | | | | | | | | |
UNDISTRIBUTED NET INVESTMENT INCOME | | $ | 109,743 | | | $ | 5,952 | |
| | | | | | | | | |
CAPITAL SHARE ACTIVITY | | | | | | | | |
Shares issued from reorganization (Note 1) | | | — | | | | 5,344,624 | |
Shares sold | | | 1,124,870 | | | | 4,454,587 | |
Shares reinvested | | | 320,066 | | | | 146,798 | |
Shares redeemed | | | (1,672,944 | ) | | | (1,558,922 | ) |
Net increase (decrease) in shares outstanding | | | (228,008 | ) | | | 8,387,087 | |
Shares outstanding at beginning of period | | | 8,392,087 | | | | 5,000 | |
Shares outstanding at end of period | | | 8,164,079 | | | | 8,392,087 | |
(a) | Represents the period from the commencement of operations (September 30, 2014) through July 31, 2015. |
See accompanying notes to financial statements. |
17
EUBEL BRADY & SUTTMAN INCOME FUND
STATEMENTS OF CHANGES IN NET ASSETS | |
| | Year Ended
July 31,
2016 | | | Period Ended July 31,
2015 (a) | |
FROM OPERATIONS | | | | | | |
Net investment income | | $ | 4,068,022 | | | $ | 1,780,830 | |
Net realized gains from investment transactions | | | 105,160 | | | | 259,510 | |
Net change in unrealized appreciation (depreciation) on investments | | | 1,161,644 | | | | (1,712,132 | ) |
Net increase in net assets from operations | | | 5,334,826 | | | | 328,208 | |
| | | | | | | | | |
DISTRIBUTIONS TO SHAREHOLDERS | | | | | | | | |
From net investment income | | | (4,066,844 | ) | | | (1,778,358 | ) |
From net realized gains on investments | | | (273,901 | ) | | | — | |
Decrease in net assets from distributions to shareholders | | | (4,340,745 | ) | | | (1,778,358 | ) |
| | | | | | | | | |
CAPITAL SHARE TRANSACTIONS | | | | | | | | |
Proceeds from shares sold | | | 27,264,814 | | | | 176,544,173 | |
Net asset value of shares issued in reinvestment of distributions to shareholders | | | 4,312,325 | | | | 1,757,232 | |
Payments for shares redeemed | | | (35,025,753 | ) | | | (13,906,810 | ) |
Net increase (decrease) from capital share transactions | | | (3,448,614 | ) | | | 164,394,595 | |
| | | | | | | | | |
TOTAL INCREASE (DECREASE) IN NET ASSETS | | | (2,454,533 | ) | | | 162,944,445 | |
| | | | | | | | | |
NET ASSETS | | | | | | | | |
Beginning of period | | | 162,994,445 | | | | 50,000 | |
End of period | | $ | 160,539,912 | | | $ | 162,994,445 | |
| | | | | | | | | |
UNDISTRIBUTED NET INVESTMENT INCOME | | $ | 3,650 | | | $ | 2,472 | |
| | | | | | | | | |
CAPITAL SHARE ACTIVITY | | | | | | | | |
Shares sold | | | 2,780,954 | | | | 17,692,634 | |
Shares reinvested | | | 441,452 | | | | 176,840 | |
Shares redeemed | | | (3,592,900 | ) | | | (1,398,722 | ) |
Net increase (decrease) in shares outstanding | | | (370,494 | ) | | | 16,470,752 | |
Shares outstanding at beginning of period | | | 16,475,752 | | | | 5,000 | |
Shares outstanding at end of period | | | 16,105,258 | | | | 16,475,752 | |
(a) | Represents the period from the commencement of operations (September 30, 2014) through July 31, 2015. |
See accompanying notes to financial statements. |
18
EUBEL BRADY & SUTTMAN INCOME AND APPRECIATION FUND
FINANCIAL HIGHLIGHTS | |
Per Share Data for a Share Outstanding Throughout Each Period | |
| | Year Ended
July 31,
2016 | | | Period Ended July 31,
2015 (a) | |
Net asset value at beginning of period | | $ | 9.85 | | | $ | 10.00 | |
| | | | | | | | | |
Income (loss) from investment operations: | | | | | | | | |
Net investment income | | | 0.28 | | | | 0.19 | |
Net realized and unrealized losses on investments | | | (0.05 | ) | | | (0.15 | ) |
Total from investment operations | | | 0.23 | | | | 0.04 | |
| | | | | | | | | |
Less distributions from: | | | | | | | | |
Net investment income | | | (0.28 | ) | | | (0.19 | ) |
From net realized gains on investments | | | (0.09 | ) | | | — | |
Total distributions | | | (0.37 | ) | | | (0.19 | ) |
| | | | | | | | | |
Net asset value at end of period | | $ | 9.71 | | | $ | 9.85 | |
| | | | | | | | | |
Total return (b) | | | 2.55 | % | | | 0.38 | %(c) |
| | | | | | | | | |
Net assets at end of period (000’s) | | $ | 79,253 | | | $ | 82,648 | |
| | | | | | | | | |
Ratios/supplementary data: | | | | | | | | |
| | | | | | | | | |
Ratio of total expenses to average net assets | | | 0.25 | % | | | 0.25 | %(d) |
| | | | | | | | | |
Ratio of net investment income to average net assets | | | 2.94 | % | | | 2.34 | %(d) |
| | | | | | | | | |
Portfolio turnover rate | | | 33 | % | | | 27 | %(c) |
(a) | Represents the period from the commencement of operations (September 30, 2014) through July 31, 2015. |
(b) | Total return is a measure of the change in value of an investment in the Fund over the period covered, which assumes any dividends or capital gains distributions are reinvested in shares of the Fund. The returns shown do not reflect the deduction of taxes a shareholder would pay on Fund distributions or the redemption of Fund shares. |
(c) | Not annualized. |
(d) | Annualized. |
See accompanying notes to financial statements. |
19
EUBEL BRADY & SUTTMAN INCOME FUND
FINANCIAL HIGHLIGHTS | |
Per Share Data for a Share Outstanding Throughout Each Period | |
| | Year Ended
July 31,
2016 | | | Period Ended
July 31,
2015 (a) | |
Net asset value at beginning of period | | $ | 9.89 | | | $ | 10.00 | |
| | | | | | | | | |
Income (loss) from investment operations: | | | | | | | | |
Net investment income | | | 0.25 | | | | 0.13 | |
Net realized and unrealized gains (losses) on investments | | | 0.10 | | | | (0.11 | ) |
Total from investment operations | | | 0.35 | | | | 0.02 | |
| | | | | | | | | |
Less distributions from: | | | | | | | | |
Net investment income | | | (0.25 | ) | | | (0.13 | ) |
From net realized gains on investments | | | (0.02 | ) | | | — | |
Total distributions | | | (0.27 | ) | | | (0.13 | ) |
| | | | | | | | | |
Net asset value at end of period | | $ | 9.97 | | | $ | 9.89 | |
| | | | | | | | | |
Total return (b) | | | 3.58 | % | | | 0.22 | %(c) |
| | | | | | | | | |
Net assets at end of period (000’s) | | $ | 160,540 | | | $ | 162,994 | |
| | | | | | | | | |
Ratios/supplementary data: | | | | | | | | |
| | | | | | | | | |
Ratio of total expenses to average net assets | | | 0.20 | % | | | 0.22 | %(d) |
| | | | | | | | | |
Ratio of net investment income to average net assets | | | 2.54 | % | | | 1.70 | %(d) |
| | | | | | | | | |
Portfolio turnover rate | | | 35 | % | | | 27 | %(c) |
(a) | Represents the period from the commencement of operations (September 30, 2014) through July 31, 2015. |
(b) | Total return is a measure of the change in value of an investment in the Fund over the period covered, which assumes any dividends or capital gains distributions are reinvested in shares of the Fund. The returns shown do not reflect the deduction of taxes a shareholder would pay on Fund distributions or the redemption of Fund shares. |
(c) | Not annualized. |
(d) | Annualized. |
See accompanying notes to financial statements. |
20
EUBEL BRADY & SUTTMAN MUTUAL FUND TRUST
NOTES TO FINANCIAL STATEMENTS
July 31, 2016
1. Organization
Eubel Brady & Suttman Income and Appreciation Fund (“EBS Income and Appreciation Fund”) and Eubel Brady & Suttman Income Fund (“EBS Income Fund”) (individually, a “Fund” and collectively, the “Funds”) are each a no-load diversified series of Eubel Brady & Suttman Mutual Fund Trust (the “Trust”), an open-end management investment company organized as an Ohio business trust on April 22, 2014. On August 1, 2014, 5,000 shares of each Fund were issued for cash, at $10.00 per share, to a Principal of Eubel Brady & Suttman Asset Management, Inc. (the “Adviser”), the investment adviser to the Funds.
On September 30, 2014, the EBS Convertible Fund I, L.P. (the “Partnership”) reorganized into the EBS Income and Appreciation Fund and the EBS Income Fund accepted cash and securities from clients of the Adviser, which were recorded at their current value. The net assets contributed, shares issued and net unrealized appreciation resulting from these tax-free transactions were as follows:
Fund | Date of Contribution | | Net Assets | | | Shares Issued | | | Net Unrealized
Appreciation on
Investments | |
EBS Income and Appreciation Fund | September 30, 2014 | | $ | 53,446,239 | | | | 5,344,624 | | | $ | 2,184,917 | |
EBS Income Fund | September 30, 2014 | | $ | 24,006,977 | | | | 2,400,698 | | | $ | 1,004,427 | |
After the EBS Income and Appreciation Fund acquired the assets and liabilities of the Partnership and the EBS Income Fund acquired the cash and securities of the Adviser’s clients in exchange for Fund shares, both Funds began operations on September 30, 2014. As these transactions were determined to be non-taxable transactions by management, the Funds elected to retain the securities’ original cost basis for financial reporting purposes. The amortized cost of the contributed securities as of September 30, 2014, was $35,401,507 and $22,632,713 for the EBS Income and Appreciation Fund and the EBS Income Fund, respectively, resulting in unrealized appreciation on investments of $2,184,917 and $1,004,427, respectively, for the EBS Income and Appreciation Fund and the EBS Income Fund as of that date.
The investment objective of the EBS Income and Appreciation Fund is to seek to provide total return through a combination of current income and capital appreciation.
The investment objective of the EBS Income Fund is to preserve capital, produce income and maximize total return.
21
EUBEL BRADY & SUTTMAN MUTUAL FUND TRUST
NOTES TO FINANCIAL STATEMENTS (Continued) |
All costs incurred by the Funds in connection with their organization and offering of shares were borne by the Adviser. Such expenses are not subject to repayment by the Funds to the Adviser.
2. Significant Accounting Policies
As an investment company, as defined in Financial Accounting Standards Board (“FASB”) Accounting Standards Update 2013-08, the Funds follow accounting and reporting guidance under FASB Accounting Standards Codification Topic 946, “Financial Services – Investment Companies.”
The following summarizes the significant accounting policies of the Funds. The policies are in conformity with accounting principles generally accepted in the United States of America (“GAAP”).
Securities Valuation — The Funds typically use an independent pricing service to determine the value of their securities. For fixed-income securities, the pricing service will utilize electronic data processing techniques based on yield spreads relating to securities with similar characteristics to determine prices for normal institutional-size trading units of fixed income securities without regard to sale or bid prices. Securities that are traded on any stock exchange are generally valued at the last quoted sale price. Lacking a last sale price, an exchange traded security is generally valued by the pricing service at its last bid price. Securities traded on NASDAQ are generally valued at the NASDAQ Official Closing Price. Investments representing shares of other open-end investment companies are valued at their net asset value (“NAV”) as reported by such companies.
If the Adviser determines that a price provided by the pricing service does not accurately reflect the market value of the securities, when prices are not readily available from the pricing service or when restricted or illiquid securities are being valued, securities are valued at fair value as determined in good faith by the Adviser in conformity with guidelines adopted by and subject to review by the Board of Trustees of the Trust (the “Board”).
GAAP establishes a single authoritative definition of fair value, sets out a framework for measuring fair value and requires additional disclosures about fair value measurements.
Various inputs are used in determining the value of each Fund’s investments. These inputs are summarized in the three broad levels listed below:
| | ● | Level 1 – quoted prices in active markets for identical securities |
| | ● | Level 2 – other significant observable inputs |
| | ● | Level 3 – significant unobservable inputs |
22
EUBEL BRADY & SUTTMAN MUTUAL FUND TRUST
NOTES TO FINANCIAL STATEMENTS (Continued) |
Certain fixed income securities held by the Funds are classified as Level 2 since the values are typically provided by an independent pricing service that utilizes various “other significant observable inputs” as discussed above. Certain other fixed income securities, including convertible bonds and bank debt held by the Funds, are classified as Level 3 since the values for these securities are based on prices derived from one or more significant inputs that are unobservable. The inputs or methodology used are not necessarily an indication of the risks associated with investing in those securities. The inputs used to measure fair value may fall into different levels of the fair value hierarchy. In such cases, for disclosure purposes, the level in the fair value hierarchy within which the fair value measurement falls in its entirety is based on the lowest level input that is significant to the fair value measurement.
The following is a summary of the inputs used to value each Fund’s investments as of July 31, 2016 by security type:
EBS Income and Appreciation Fund: | |
| | Level 1 | | | Level 2 | | | Level 3 | | | Total | |
Corporate Bonds | | $ | — | | | $ | 46,582,970 | | | $ | — | | | $ | 46,582,970 | |
Convertible
Corporate Bonds | | | — | | | | 22,277,862 | | | | 760,599 | | | | 23,038,461 | |
Bank Debt | | | — | | | | 1,593,333 | | | | 457,526 | | | | 2,050,859 | |
Convertible
Preferred Stocks | | | — | | | | 1,200,000 | | | | — | | | | 1,200,000 | |
Warrants | | | 3,074,656 | | | | — | | | | — | | | | 3,074,656 | |
Money Market Funds | | | 2,312,908 | | | | — | | | | — | | | | 2,312,908 | |
Total | | $ | 5,387,564 | | | $ | 71,654,165 | | | $ | 1,218,125 | | | $ | 78,259,854 | |
EBS Income Fund: | |
| | Level 1 | | | Level 2 | | | Level 3 | | | Total | |
U.S. Treasury Obligations | | $ | — | | | $ | 3,718,381 | | | $ | — | | | $ | 3,718,381 | |
Corporate Bonds | | | — | | | | 140,665,396 | | | | — | | | | 140,665,396 | |
Bank Debt | | | — | | | | 749,804 | | | | 2,402,012 | | | | 3,151,816 | |
Preferred Stocks | | | 2,791,800 | | | | — | | | | — | | | | 2,791,800 | |
Money Market Funds | | | 8,829,264 | | | | — | | | | — | | | | 8,829,264 | |
Total | | $ | 11,621,064 | | | $ | 145,133,581 | | | $ | 2,402,012 | | | $ | 159,156,657 | |
As of July 31, 2016, the Funds did not have any transfers into and out of any Level. It is the Funds’ policy to recognize transfers into and out of any Level at the end of the reporting period.
23
EUBEL BRADY & SUTTMAN MUTUAL FUND TRUST
NOTES TO FINANCIAL STATEMENTS (Continued) |
The following is a reconciliation of Level 3 investments of the Funds for which significant unobservable inputs were used to determine fair value for the period ended July 31, 2016:
EBS Income and Appreciation Fund | |
Investments in Securities | | Balance as of
July 31, 2015 | | | Purchases | | | Sales | | | Realized gain (loss) | | | Net change in unrealized appreciation (depreciation) | | | Balance as of
July 31, 2016 | |
Convertible Corporate Bonds | | $ | 1,000,000 | | | $ | — | | | $ | (327,618 | ) | | $ | 66,618 | | | $ | 21,599 | | | $ | 760,599 | |
Bank Debt | | | 950,562 | | | | 7,500,686 | | | | (7,995,334 | ) | | | — | | | | 1,612 | | | | 457,526 | |
Convertible Preferred Stocks | | | 364,173 | | | | — | | | | (26,565 | ) | | | (1,142,037 | ) | | | 804,429 | | | | — | |
Total | | $ | 2,314,735 | | | $ | 7,500,686 | | | $ | (8,349,517 | ) | | $ | (1,075,419 | ) | | $ | 827,640 | | | $ | 1,218,125 | |
EBS Income Fund | |
Investments in Securities | Balance as of
July 31, 2015 | | Purchases | | Sales | | Realized Gain (Loss) | | Net change in unrealized appreciation (depreciation) | | Balance as of
July 31, 2016 | |
Bank Debt | | $ | 1,161,798 | | | $ | 13,355,809 | | | $ | (12,124,059 | ) | | $ | — | | | $ | 8,464 | | | $ | 2,402,012 | |
The total change in unrealized appreciation (depreciation) included in the statements of operations attributable to Level 3 investments still held at July 31, 2016 is $23,211 and $8,464 for the EBS Income and Appreciation Fund and EBS Income Fund, respectively.
24
EUBEL BRADY & SUTTMAN MUTUAL FUND TRUST
NOTES TO FINANCIAL STATEMENTS (Continued) |
The following table summarizes the valuation techniques used and unobservable inputs developed by the Adviser in conformity with guidelines adopted by and subject to review by the Board to determine the fair value of the Level 3 investments.
EBS Income and Appreciation Fund | |
| | Fair Value at July 31, 2016 | | Valuation Technique | Unobservable Input1 | | Range | | Weighted Average of Unobservable Inputs | |
Convertible Corporate Bonds | $ | 760,599 | | DCF Model+Option | Discount Rate | | 17.23 | % | | | N/A | |
| | | | | | | Liquidity Discount | | 19.95 | % | | | N/A | |
Bank Debt | | $ | 457,526 | | DCF Model | Discount Rate | | 3.78%-5.59% | | | 4.14% | |
EBS Income Fund | |
| | Fair Value at July 31, 2016 | | Valuation Technique | Unobservable Input1 | | Range | | Weighted Average of Unobservable Inputs | |
Bank Debt | | $ | 2,402,012 | | DCF Model | Discount Rate | | 3.78%-5.59% | | | 4.14% | |
DCF - Discounted Cash Flow |
1 | Significant increases and decreases on the unobservable inputs used to determine fair value of Level 3 assets could result in significantly higher or lower fair value measurements. An increase to the unobservable input would result in a decrease to the fair value. A decrease to the unobservable input would have the opposite effect. |
The Valuation Technique for each Fund for the Bank Debt held was changed from Price at Face Value as of July 31, 2015 to Discounted Cash Flow Model as of July 31, 2016. The change in technique was done to provide a more reasonable approach to the fair valuation of these securities.
There were no derivative instruments held by the Funds during the year ended July 31, 2016.
Share Valuation — The NAV per share of each Fund is calculated daily by dividing the total value of its assets, less liabilities, by the number of shares outstanding. The offering price and redemption price per share of each Fund is equal to its NAV per share.
Estimates — The preparation of financial statements in conformity with GAAP requires management to make estimates and assumptions that affect the reported amounts of assets and liabilities and disclosures of contingent assets and liabilities
25
EUBEL BRADY & SUTTMAN MUTUAL FUND TRUST
NOTES TO FINANCIAL STATEMENTS (Continued) |
at the date of the financial statements and the reported amounts of increases and decreases in net assets from operations during the reporting period. Actual results could differ from those estimates.
Security Transactions, Investment Income and Realized Capital Gains and Losses — Security transactions are accounted for on trade date. Dividend income is recorded on the ex-dividend date. Interest income is recorded as earned. Discounts and premiums on fixed income securities are amortized using the effective interest method. Realized capital gains and losses on securities sold are determined on a specific identification basis.
Expenses — Expenses of the Trust that are directly identifiable to a specific Fund are charged to that Fund. Expenses which are not readily identifiable to a specific Fund are allocated in such a manner as deemed equitable.
Distributions to Shareholders — Distributions to shareholders of net investment income, if any, are paid monthly. Capital gain distributions, if any, are distributed to shareholders annually. Distributions are based on amounts calculated in accordance with applicable federal income tax regulations, which may differ from GAAP. These differences are due primarily to differing treatments of income and realized capital gains on various investment securities held by the Funds, timing differences and differing characterizations of distributions made by the Funds. Dividends and distributions are recorded on the ex-dividend date. The tax character of distributions paid by each Fund for the periods ended July 31, 2016 and 2015 was as follows:
Period Ended | | Ordinary
Income | | | Long-Term
Capital Gains | | | Total
Distributions | |
EBS Income and Appreciation Fund: | | | | | | | |
July 31, 2016 | | $ | 2,283,598 | | | $ | 734,447 | | | $ | 3,018,045 | |
July 31, 2015 | | $ | 1,469,254 | | | $ | — | | | $ | 1,469,254 | |
EBS Income Fund: | | | | | | | | | | | | |
July 31, 2016 | | $ | 4,081,235 | | | $ | 259,510 | | | $ | 4,340,745 | |
July 31, 2015 | | $ | 1,778,358 | | | $ | — | | | $ | 1,778,358 | |
Federal Income Tax — Each Fund has qualified and intends to continue to qualify each year as a “regulated investment company” under Subchapter M of the Internal Revenue Code of 1986 (the “Code”). Qualification generally will relieve the Funds of liability for federal income taxes to the extent 100% of their net investment income and net realized capital gains are distributed in accordance with the Code.
In order to avoid imposition of the excise tax applicable to regulated investment companies, it is also each Fund’s intention to declare as dividends in each calendar year at least 98% of its net investment income (earned during the calendar year) and 98.2% of its net realized capital gains (earned during the twelve months ended October 31) plus undistributed amounts from prior years.
26
EUBEL BRADY & SUTTMAN MUTUAL FUND TRUST
NOTES TO FINANCIAL STATEMENTS (Continued) |
The following information is computed on a tax basis for each item as of July 31, 2016:
| | EBS Income and Appreciation
Fund | | | EBS Income
Fund | |
Tax cost of portfolio investments | | $ | 77,472,421 | | | $ | 158,702,718 | |
Gross unrealized appreciation | | $ | 3,479,874 | | | $ | 1,961,617 | |
Gross unrealized depreciation | | | (2,692,441 | ) | | | (1,507,678 | ) |
Net unrealized appreciation on investments | | | 787,433 | | | | 453,939 | |
Undistributed ordinary income | | | 109,986 | | | | 95,681 | |
Accumulated capital and other losses | | | (1,187,086 | ) | | | — | |
Other temporary differences | | | (243 | ) | | | (1,262 | ) |
Accumulated earnings (deficit) | | $ | (289,910 | ) | | $ | 548,358 | |
Certain capital losses incurred after October 31, 2015 and within the current taxable year are deemed to arise on the first business day of a Fund’s next taxable year. For the year ended July 31, 2016, the EBS Income and Appreciation Fund deferred until August 1, 2016 post-October capital losses in the amount of $1,187,086.
During the year ended July 31, 2016, the EBS Income and Appreciation Fund utilized short-term capital loss carryforwards for federal income tax purposes in the amount of $46,229.
For the year ended July 31, 2016, EBS Income and Appreciation Fund made the following reclassification as a result of permanent differences between the financial statement and income tax reporting requirements due to book versus tax differences relating to the recognition of income on convertible bonds:
Undistributed net investment income | | $ | 106,667 | |
Accumulated net realized losses from security transactions | | $ | (106,667 | ) |
Such reclassification has no effect on the Fund’s total net assets or its net asset value per share.
The Funds recognize the tax benefits or expenses of uncertain tax positions only when the position is “more likely than not” to be sustained assuming examination by tax authorities. Management has reviewed each Fund’s tax positions for all open tax years (tax years ended July 31, 2015 and July 31, 2016) and has concluded that no provision for unrecognized tax benefits or expenses is required in these financial statements. Each Fund identifies its major tax jurisdiction as U.S. Federal.
27
EUBEL BRADY & SUTTMAN MUTUAL FUND TRUST
NOTES TO FINANCIAL STATEMENTS (Continued) |
3. Unfunded Loan Commitment
At July 31, 2016, unfunded loan commitments for the Funds were as follows:
Fund | Borrower | | Unfunded
Commitment | |
EBS Income and Appreciation Fund | NCP Finance Limited Partnership | | $ | 344,086 | |
EBS Income Fund | NCP Finance Limited Partnership | | $ | 1,806,452 | |
Pursuant to an Asset-Based Lending Credit Agreement between the Funds and NCP Finance Limited Partnership (the “Borrower”), the Borrower has agreed to pay the Funds a commitment fee equal to 0.50% of the average daily unfunded commitment balance.
4. Transactions with Related Parties
Certain officers of the Trust are also officers of the Adviser, of Ultimus Fund Solutions, LLC (“Ultimus”), the administrative services agent, shareholder servicing and transfer agent, and accounting services agent for the Funds, or of Ultimus Fund Distributors, LLC (the “Distributor”), the principal underwriter and exclusive agent for the distribution of shares of the Funds.
Investment Adviser — Under the terms of the Management Agreement between the Trust and the Adviser, the Adviser manages each Fund’s investments subject to oversight by the Board. The Funds do not pay the Adviser investment advisory fees under the terms of the Management Agreement. However, prior to investing in a Fund, a prospective shareholder must enter into an investment advisory agreement with the Adviser that calls for the payment of an advisory fee based upon a percentage of all assets (including shares of the Funds) managed by the Adviser on behalf of the prospective shareholder. The fee schedule may be negotiable at the time the account is opened and is generally based upon the value of assets held in the client’s account and the style of management.
The Adviser has entered into an agreement with the Funds under which it has agreed to reimburse Fund expenses to the extent necessary to limit total annual operating expenses (excluding brokerage costs, taxes, interest, acquired fund fees and expenses, expenses incurred pursuant to the Funds’ Shareholder Servicing Plan and extraordinary expenses) to an amount not exceeding 0.35% of each Fund’s average daily net assets. “Operating expenses” do not include organization or offering costs of each Fund, which the Adviser has otherwise agreed to pay. Any payments by the Adviser of expenses which are a Fund’s obligation are subject to repayment by the Fund for a period of three years following the fiscal year in which such expenses were paid, provided that the repayment does not cause
28
EUBEL BRADY & SUTTMAN MUTUAL FUND TRUST
NOTES TO FINANCIAL STATEMENTS (Continued) |
the Fund’s total annual operating expenses to exceed 0.35% of average daily net assets. This agreement is currently in effect until December 1, 2017. No expense reimbursements were required during the periods ended July 31, 2016 and 2015.
Other Service Providers — Ultimus provides fund administration, fund accounting and transfer agency services to each Fund. The Funds pay Ultimus fees in accordance with the agreements for such services. In addition, the Funds pay out-of-pocket expenses including, but not limited to, postage, supplies and costs of pricing the Funds’ portfolio securities.
Shareholder Servicing Plan — The Funds have adopted a Shareholder Servicing Plan (the “Plan”) which allows each Fund to make payments to financial organizations (including payments directly to the Adviser and the Distributor) for providing account administration and account maintenance services to Fund shareholders. The annual service fee may not exceed an amount equal to 0.25% of each Fund’s average daily net assets. During the year ended July 31, 2016, the EBS Income and Appreciation Fund and the EBS Income Fund paid $31,045 and $63,769, respectively, pursuant to the Plan.
Compensation of Trustees — Trustees and officers affiliated with the Adviser or Ultimus are not compensated by the Trust for their services. Each Trustee who is not an affiliated person of the Adviser or Ultimus (“Independent Trustee”) receives from the Trust a fee of $1,000 for attendance at each meeting of the Board, in addition to reimbursement of travel and other expenses incurred in attending the meetings. The Chairman of the Audit and Governance Committee receives an additional annual fee of $1,000.
5. Securities Transactions
During the year ended July 31, 2016, cost of purchases and proceeds from sales and maturities of investment securities, other than short-term investments and U.S. government securities, were as follows:
| | EBS Income and
Appreciation
Fund | | | EBS Income
Fund | |
Purchases of investment securities | | $ | 24,070,089 | | | $ | 53,478,403 | |
Proceeds from sales and maturities of investment securities | | $ | 26,843,164 | | | $ | 45,697,708 | |
29
EUBEL BRADY & SUTTMAN MUTUAL FUND TRUST
NOTES TO FINANCIAL STATEMENTS (Continued) |
During the year ended July 31, 2016, cost of purchases and proceeds from sales and maturities of U.S. government long-term securities were as follows:
| | EBS Income and
Appreciation
Fund | | | EBS Income
Fund | |
Purchases of investment securities | | $ | — | | | $ | — | |
Proceeds from sales and maturities of U.S. government securities | | $ | — | | | $ | 10,465,291 | |
6. Contingencies and Commitments
The Funds indemnify the Trust’s officers and Trustees for certain liabilities that might arise from the performance of their duties to the Funds. Additionally, in the normal course of business the Funds enter into contracts that contain a variety of representations and warranties and which provide general indemnifications. The Funds’ maximum exposure under these arrangements is unknown, as this would involve future claims that may be made against the Funds that have not yet occurred. However, based on experience, the Funds expect the risk of loss to be remote.
7. Sector Risk
If a Fund has significant investments in the securities of issuers in industries within a particular sector, any development affecting that sector will have greater impact on the value of the net assets of the Fund than would be the case if the Fund did not have significant investments in that sector. In addition, this may increase the risk of loss of an investment in the Fund and increase the volatility of the Fund’s NAV per share. From time to time, circumstances may affect a particular sector and the companies within such sector. For instance, economic or market factors, regulation or deregulation, and technological or other developments may negatively impact all companies in a particular sector and therefore the value of the Fund’s portfolio will be adversely affected. As of July 31, 2016, the EBS Income and Appreciation Fund had 31.4% of the value of its net assets invested in securities within the Financials sector.
8. Subsequent Events
The Funds are required to recognize in the financial statements the effects of all subsequent events that provide additional evidence about conditions that existed as of the date of the Statements of Assets and Liabilities. For non-recognized subsequent events that must be disclosed to keep the financial statements from being misleading, the Funds are required to disclose the nature of the event as well as an estimate of its financial effect, or a statement that such an estimate cannot be made. Management has evaluated subsequent events through the issuance of these financial statements and has noted no such events have occurred.
30
EUBEL BRADY & SUTTMAN MUTUAL FUND TRUST
REPORT OF INDEPENDENT REGISTERED
PUBLIC ACCOUNTING FIRM |
To the Shareholders and Board of Trustees of
Eubel Brady & Suttman Mutual Fund Trust
We have audited the accompanying statements of assets and liabilities, including the schedules of investments, of Eubel Brady & Suttman Mutual Fund Trust, comprising Eubel Brady & Suttman Income and Appreciation Fund and Eubel Brady & Suttman Income Fund (the “Funds”) as of July 31, 2016, and the related statements of operations for the year then ended, and the statements of changes in net assets and financial highlights for each of the two periods in the period then ended. These financial statements and financial highlights are the responsibility of the Funds’ management. Our responsibility is to express an opinion on these financial statements and financial highlights based on our audits.
We conducted our audits in accordance with the standards of the Public Company Accounting Oversight Board (United States). Those standards require that we plan and perform the audit to obtain reasonable assurance about whether the financial statements and financial highlights are free of material misstatement. An audit includes examining, on a test basis, evidence supporting the amounts and disclosures in the financial statements. Our procedures included confirmation of securities owned as of July 31, 2016, by correspondence with the custodian and brokers. An audit also includes assessing the accounting principles used and significant estimates made by management, as well as evaluating the overall financial statement presentation. We believe that our audits provides a reasonable basis for our opinion.
In our opinion, the financial statements and financial highlights referred to above present fairly, in all material respects, the financial position of each of the Funds constituting Eubel Brady & Suttman Mutual Fund Trust as of July 31, 2016, the results of their operations for the year then ended, and the changes in their net assets and the financial highlights for each of the two periods in the period then ended, in conformity with accounting principles generally accepted in the United States of America.
COHEN & COMPANY, LTD.
Cleveland, Ohio
September 23, 2016
31
EUBEL BRADY & SUTTMAN MUTUAL FUND TRUST
ABOUT YOUR FUNDS’ EXPENSES (Unaudited) |
We believe it is important for you to understand the impact of costs on your investment. All mutual funds have operating expenses. As a shareholder of the Funds, you incur ongoing costs, including shareholder servicing fees and other operating expenses. These ongoing costs, which are deducted from each Fund’s gross income, directly reduce the investment return of the Funds.
A mutual fund’s ongoing costs are expressed as a percentage of its average net assets. This figure is known as the expense ratio. The following examples are intended to help you understand the ongoing costs (in dollars) of investing in the Funds and to compare these costs with the ongoing costs of investing in other mutual funds. The examples below are based on an investment of $1,000 made at the beginning of the period shown and held for the entire period (February 1, 2016 through July 31, 2016).
The table below illustrates each Fund’s ongoing costs in two ways:
Actual fund return – This section helps you to estimate the actual expenses that you paid over the period. The “Ending Account Value” shown is derived from each Fund’s actual return, and the fourth column shows the dollar amount of operating expenses that would have been paid by an investor who started with $1,000 in each Fund. You may use the information here, together with the amount you invested, to estimate the expenses that you paid over the period.
To do so, simply divide your account value by $1,000 (for example, an $8,600 account value divided by $1,000 = 8.6), then multiply the result by the number given for the Funds under the heading “Expenses Paid During Period.”
Hypothetical 5% return – This section is intended to help you compare the Funds’ ongoing costs with those of other mutual funds. It assumes that each Fund had an annual return of 5% before expenses during the period shown, but that the expense ratio is unchanged. In this case, because the returns used are not the Funds’ actual returns, the results do not apply to your investment. The example is useful in making comparisons because the Securities and Exchange Commission (“SEC”) requires all mutual funds to calculate expenses based on a 5% return. You can assess each Fund’s ongoing costs by comparing this hypothetical example with the hypothetical examples that appear in shareholder reports of other funds.
Note that expenses shown in the table are meant to highlight and help you compare ongoing costs only. The Funds do not charge transaction fees, such as purchase or redemption fees, nor do they impose any sales loads.
The calculations assume no shares were bought or sold during the period. Your actual costs may have been higher or lower, depending on the amount of your investment and the timing of any purchases or redemptions.
32
EUBEL BRADY & SUTTMAN MUTUAL FUND TRUST
ABOUT YOUR FUNDS’ EXPENSES (Unaudited) (Continued) |
More information about the Funds’ expenses can be found in this report. For additional information on operating expenses and other shareholder costs, please refer to the Funds’ prospectus.
| Beginning
Account Value
February 1, 2016 | Ending
Account Value
July 31, 2016 | Expense
Ratio(a) | Expenses
Paid During
Period(b) |
EBS Income & Appreciation Fund | | | |
Based on Actual Fund Return | $ 1,000.00 | $ 1,087.90 | 0.25% | $1.30 |
Based on Hypothetical 5% Fund Return (before expenses) | $ 1,000.00 | $ 1,023.62 | 0.25% | $1.26 |
EBS Income Fund | | | | |
Based on Actual Fund Return | $ 1,000.00 | $ 1,054.10 | 0.19% | $0.97 |
Based on Hypothetical 5% Fund Return (before expenses) | $ 1,000.00 | $ 1,023.92 | 0.19% | $0.96 |
(a) | Annualized, based on the Fund’s most recent one-half year expenses. |
(b) | Expenses are equal to the Fund’s annualized expense ratio multiplied by the average account value over the period, multiplied by 182/366 (to reflect the one-half year period). |
33
EUBEL BRADY & SUTTMAN MUTUAL FUND TRUST
OTHER INFORMATION (Unaudited) |
The Trust files a complete listing of portfolio holdings for the Funds with the SEC as of the end of the first and third quarters of each fiscal year on Form N-Q. These filings are available upon request by calling 1-800-391-1223. Furthermore, you may obtain a copy of the filings on the SEC’s website at http://www.sec.gov. The Trust’s Forms N-Q may also be reviewed and copied at the SEC’s Public Reference Room in Washington, DC, and information on the operation of the Public Reference Room may be obtained by calling 1-800-SEC-0330.
A description of the policies and procedures that the Funds use to vote proxies relating to portfolio securities is available without charge upon request by calling toll-free 1-800-391-1223, or on the SEC’s website at http://www.sec.gov. Information regarding how the Funds voted proxies relating to portfolio securities during the most recent 12-month period ended June 30 is also available without charge upon request by calling toll-free 1-800-391-1223, or on the SEC’s website at http://www.sec.gov.
FEDERAL TAX INFORMATION (Unaudited)
For the fiscal year ended July 31, 2016, certain dividends paid by the Funds may be treated as qualified dividends subject to a reduced tax rate. EBS Income and Appreciation Fund and EBS Income Fund intend to designate up to a maximum amount of $2,283,598 and $4,081,235, respectively, as qualified dividend income. Additionally, EBS Income and Appreciation Fund and EBS Income Fund intend to designate $734,447 and $259,510, respectively, as long-term capital gain distributions. Complete information will be computed and reported in conjunction with your 2016 Form 1099-DIV.
34
EUBEL BRADY & SUTTMAN MUTUAL FUND TRUST
BOARD OF TRUSTEES AND EXECUTIVE OFFICERS
(Unaudited) |
The Board of Trustees has overall responsibility for management of the Trust’s affairs. The Trustees serve during the lifetime of the Trust and until its termination, or until death, resignation, retirement, or removal. The Trustees, in turn, elect the officers of the Trust to actively supervise its day-to-day operations. The officers have been elected for an annual term. The following are the Trustees and executive officers of the Trust:
Name, Address and
Date of Birth | Length of
Time Served | Position(s)
Held with
Trust | Principal Occupation(s)
During Past 5 Years and
Directorships of Public
Companies Within Past 5 Years | Number of
Portfolios in
Fund Complex
Overseen
by Trustee |
Interested Trustees: | | | | |
Scott E. Lundy, CFP* c/o Eubel Brady & Suttman 10100 Innovation Drive, Ste. 410 Dayton, OH 45342 Year of birth: 1976 | Since
July 2014 | President
and Trustee | Vice President and Principal of Eubel Brady & Suttman Asset Management, Inc., the Funds’ investment adviser, since 2003; Chief Compliance Officer of Eubel Brady & Suttman Asset Management, Inc., since March 2016 | 2 |
Independent Trustees: |
Robert A. Goering c/o Eubel Brady & Suttman 10100 Innovation Drive, Ste. 410 Dayton, OH 45342 Year of birth: 1960 | Since
July 2014 | Trustee | Partner of Goering & Goering, LLC (law firm) from November 1986 to present; Hamilton County Ohio Treasurer from February 1991 to present; Adjunct Professor at Salmon P. Chase College of Law (August 2005 to present). | 2 |
Christopher C. Young c/o Eubel Brady & Suttman 10100 Innovation Drive, Ste. 410 Dayton, OH 45342 Year of birth: 1962 | Since
July 2014/ July 2016 | Trustee and Chairman | Vice President, Sales of Noranda Aluminum (aluminum manufacturer) from January 2014 to present; director of Noranda Aluminum from 2010 to 2013. | 2 |
35
EUBEL BRADY & SUTTMAN MUTUAL FUND TRUST
BOARD OF TRUSTEES AND EXECUTIVE OFFICERS
(Unaudited) (Continued) |
Name, Address and
Date of Birth | Length of
Time Served | Position(s)
Held with
Trust | Principal Occupation(s) During Past
5 Years and Directorships of Public
Companies Within Past 5 Years |
Executive Officers: | | | |
Terri L. King, IACCP® Eubel Brady & Suttman 10100 Innovation Drive, Ste. 410 Dayton, OH 45342 Year of Birth: 1961 | Since
July 2014 | Chief Compliance Officer | Compliance Manager of Eubel Brady & Suttman Asset Management, Inc., the Funds’ investment adviser, since 2003 |
Theresa M. Bridge Ultimus Fund Solutions, LLC 225 Pictoria Drive Suite 450 Cincinnati, OH 45246 Year of Birth: 1969 | Since
July 2014 | Treasurer | Vice President-Director of Financial Administration of Ultimus Fund Solutions, LLC |
Ronald L. Eubel Eubel Brady & Suttman 10100 Innovation Drive, Ste. 410 Dayton, OH 45342 Year of Birth: 1960 | Since
July 2014 | Secretary | Co-Chief Investment Officer and Principal of Eubel Brady & Suttman Asset Management, Inc., the Funds’ investment adviser, since 1993 |
* | Scott E. Lundy, as an affiliated person of Eubel Brady & Suttman Asset Management, Inc, the Funds’ investment adviser, is considered an “interested person” of the Trust within the meaning of Section 2(a)(19) under the 1940 Act. |
Additional information about members of the Board and executive officers is available in the Funds’ Statement of Additional Information (“SAI”). To obtain a free copy of the SAI, please call 1-800-391-1223.
36
EUBEL BRADY & SUTTMAN MUTUAL FUND TRUST
APPROVAL OF INVESTMENT ADVISORY AGREEMENT
(Unaudited) |
The Board of Trustees, including all of the Independent Trustees voting separately, has reviewed and approved the continuance of the Investment Advisory Agreement between the Trust, on behalf of the Eubel Brady & Suttman Income and Appreciation Fund (the “Income and Appreciation Fund”) and the Eubel Brady & Suttman Income Fund (the “Income Fund”) (the Income and Appreciation Fund and the Income Fund are referred to collectively as the “Funds”), and the Adviser. Approval took place at an in-person meeting held on July 13, 2016, at which all Trustees were present, including all of the Independent Trustees.
In the course of their consideration of the continuation of the Investment Advisory Agreement, the Independent Trustees were advised by independent legal counsel and received materials from such counsel discussing the legal standards for their consideration of the proposed approval of the continuation of the Investment Advisory Agreement on behalf of the Funds. The Independent Trustees received and reviewed a substantial amount of information provided by the Adviser in response to requests from independent legal counsel. Prior to voting, the Independent Trustees met with and asked questions of representatives of the Adviser and also met separately with their independent legal counsel.
In considering the Investment Advisory Agreement and reaching their conclusions with respect to the continuation of the Investment Advisory Agreement, the Trustees reviewed and analyzed various factors that they determined were relevant, including the factors described below.
Nature, Extent and Quality of Services
The Trustees received and considered various data and information regarding the nature, extent and quality of services to be provided to the Funds by the Adviser. The most recent Form ADV for the Adviser was reviewed by the Trustees. The Trustees specifically reviewed the qualifications, background and responsibilities of the members of the Adviser’s portfolio management team who oversee the day-to-day investment management and operations of the Funds. The Trustees considered the Adviser’s process for identifying investment opportunities and noted that all investment decisions are made at the portfolio management team level. The Trustees discussed the support resources available for investment research, compliance and operations. The Trustees discussed the Adviser’s allocation of resources to its business continuity planning, noting that the Adviser has developed a comprehensive plan. The Trustees also considered the Adviser’s efforts as it relates to cyber security. The Trustees were mindful that the investment process used by the Adviser in managing the Funds is similar to that used to manage certain of the Adviser’s other managed accounts. After further discussion, the Board concluded that it was satisfied with the nature, extent and quality of the investment advisory services to be provided to the Funds by the Adviser.
37
EUBEL BRADY & SUTTMAN MUTUAL FUND TRUST
APPROVAL OF INVESTMENT ADVISORY AGREEMENT
(Unaudited) (Continued) |
Expenses and Performance
The Trustees next considered information regarding each Fund’s expense ratio and its various components, including the Adviser’s decision not to charge an advisory fee at the Fund level and the Adviser’s decision to cap each Fund’s annual operating expense. They also considered comparisons of the Funds’ fees to the fee information for each Fund’s peer group. The Appreciation Fund’s overall expense ratio was compared to funds within the Morningstar category of “Convertible Bond Funds.” The Trustees noted that the overall expense ratio of the Appreciation Fund, which did not include a charge for advisory fees paid at the client account level, is lower than the average expense ratio for Convertible Bond Funds. The Trustees also considered the range of advisory fees charged by the Adviser at the client account level and applied that range to the overall expense ratio of the Appreciation Fund to estimate total costs to underlying shareholders. The Income Fund’s overall expense ratio was compared to funds within the Morningstar category of “Multisector Bond Funds.” The Trustees noted that the overall expense ratio of the Income Fund, which did not include a charge for advisory fees at the client account level, is lower than the average expense ratio for Multisector Bond Funds. The Trustees also considered the range of advisory fees charged by the Adviser at the client account level and applied that range to the overall expense ratio of the Income Fund to estimate total costs to underlying shareholders. The Trustees observed that the Adviser has committed to extending the expense cap arrangement with each Fund for an additional annual period. The Trustees concluded that the expense ratio for each Fund, which included an estimated advisory fee charged at the client account level, was reasonable in relation to the average expense ratios for the peer groups presented.
The Trustees next discussed each Fund’s performance record for various periods ended March 31, 2016. The Trustees observed that the Appreciation Fund outperformed the BofA Merrill Lynch U.S. Yield Alternatives Index (the “Alternatives Index”) and the average fund in the Morningstar Convertible Bond Funds category for the year ended March 31, 2016. The Trustees further noted that the Appreciation Fund outperformed the Alternatives Index for the since inception period ended March 31, 2016. The Trustees next considered the Income Fund’s performance and compared it to the BofA Merrill Lynch U.S. Corporate & Government Master Index (the “Master Index”) and the Morningstar Multisector Bond Funds category. The Trustees observed that the Income Fund trailed the Master Index for the year ended March 31, 2016 but outperformed the average fund within its Morningstar peer group for the same period. The Trustees further considered that the Income Fund trailed the Master Index for the since inception period ended March 31, 2016. The Trustees then discussed the performance of the Adviser’s separately managed account (“SMA”) strategies that hold shares of the
38
EUBEL BRADY & SUTTMAN MUTUAL FUND TRUST
APPROVAL OF INVESTMENT ADVISORY AGREEMENT
(Unaudited) (Continued) |
Funds. The Trustees also noted that the Adviser does not sub-advise any accounts with similar investment objectives as the Funds. The Trustees concluded that the Adviser has demonstrated a satisfactory performance record for each Fund.
Investment Advisory Fee Rates
The Trustees considered the Adviser’s decision to not charge an investment advisory fee at the Fund level. They noted that the Adviser is being compensated by each client under the terms described in their respective client agreement. The Trustees reviewed and considered the range of advisory fees payable to the Adviser for SMA services and compared such information with the fees charged by the other funds in the relevant Morningstar peer group for each Fund. The Trustees concluded that the advisory fee ranges charged at the SMA level were reasonable in relation to the average rates for the peer groups presented, and the client generally received more services for their fees.
Profitability
The Trustees considered the fact the Funds’ assets were previously managed by the Adviser outside of the mutual fund structure and that shareholders in the Funds are not charged an advisory fee at the Fund level, resulting in the Funds being essentially revenue neutral to the Adviser. The Trustees discussed the profits of the Adviser and the other ancillary benefits that the Adviser receives with regard to providing advisory services to the Funds and concluded that, in light of the fact that each SMA client of the Adviser negotiates his/her own advisory fee, these profits are not excessive.
Economies of Scale
The Trustees discussed economies of scale, noting that the Funds do not pay a direct advisory fee, and that each Fund is operating below the agreed upon expense cap. The Trustees discussed the Adviser’s initial projection of asset levels for the Funds, observing that the Adviser was able to grow each Fund’s assets as projected. The Trustees noted that the Adviser has generally provided for breakpoints in its advisory fees charged at the client account level, thus, allowing its clients to recognize economies of scale as their accounts grow.
Conclusion
After consideration of these and other factors, the Trustees, including all of the Independent Trustees, concluded that the continuance of the Investment Advisory Agreement with the Adviser for another annual period was in the best interest of the Funds and their respective shareholders.
39
This page intentionally left blank.
This page intentionally left blank.
As of the end of the period covered by this report, the registrant has adopted a code of ethics that applies to the registrant’s principal executive officer, principal financial officer, principal accounting officer or controller, or persons performing similar functions, regardless of whether these individuals are employed by the registrant or a third party. Pursuant to Item 12(a)(1), a copy of registrant’s code of ethics is filed as an exhibit to this Form N-CSR. During the period covered by this report, the code of ethics has not been amended, and the registrant has not granted any waivers, including implicit waivers, from the provisions of the code of ethics.
The registrant’s board of trustees has determined that the registrant does not have an audit committee financial expert serving on its audit committee. The audit committee determined that, although none of its members meet the technical definition of an audit committee financial expert, the members have sufficient financial expertise to address any issues that are likely to come before the committee.
The registrant has not adopted procedures by which shareholders may recommend nominees to the registrant’s board of trustees.
(a) Based on their evaluation of the registrant’s disclosure controls and procedures (as defined in Rule 30a-3(c) under the Investment Company Act of 1940) as of a date within 90 days of the filing date of this report, the registrant’s principal executive officer and principal financial officer have concluded that such disclosure controls and procedures are reasonably designed and are operating effectively to ensure that material information relating to the registrant, including its consolidated subsidiaries, is made known to them by others within those entities, particularly during the period in which this report is being prepared, and that the information required in filings on Form N-CSR is recorded, processed, summarized, and reported on a timely basis.
(b) There were no changes in the registrant’s internal control over financial reporting (as defined in Rule 30a-3(d) under the Investment Company Act of 1940) that occurred during the second fiscal quarter of the period covered by this report that have materially affected, or are reasonably likely to materially affect, the registrant’s internal control over financial reporting.
File the exhibits listed below as part of this Form. Letter or number the exhibits in the sequence indicated.
(a)(1) Any code of ethics, or amendment thereto, that is the subject of the disclosure required by Item 2, to the extent that the registrant intends to satisfy the Item 2 requirements through filing of an exhibit: Attached hereto
(a)(2) A separate certification for each principal executive officer and principal financial officer of the registrant as required by Rule 30a-2(a) under the Act (17 CFR 270.30a-2(a)): Attached hereto
(a)(3) Any written solicitation to purchase securities under Rule 23c-1 under the Act (17 CFR 270.23c-1) sent or given during the period covered by the report by or on behalf of the registrant to 10 or more persons: Not applicable
(b) Certifications required by Rule 30a-2(b) under the Act (17 CFR 270.30a-2(b)): Attached hereto
Pursuant to the requirements of the Securities Exchange Act of 1934 and the Investment Company Act of 1940, the registrant has duly caused this report to be signed on its behalf by the undersigned, thereunto duly authorized.