| | OMB APPROVAL |
| | OMB Number: 3235-0570
Expires: August 31, 2020
Estimated average burden hours per response: 20.6 |
UNITED STATES
SECURITIES AND EXCHANGE COMMISSION
Washington, D.C. 20549
FORM N-CSR
CERTIFIED SHAREHOLDER REPORT OF REGISTERED
MANAGEMENT INVESTMENT COMPANIES
| Investment Company Act file number | 811-22960 | |
| Eubel Brady & Suttman Mutual Fund Trust |
| (Exact name of registrant as specified in charter) |
| 225 Pictoria Drive, Suite 450 | Cincinnati, Ohio 45246 |
| (Address of principal executive offices) | (Zip code) |
Carol J. Highsmith
| 225 Pictoria Drive, Suite 450 Cincinnati, Ohio 45246 |
| (Name and address of agent for service) |
| Registrant's telephone number, including area code: | (513) 587-3400 | |
| Date of fiscal year end: | July 31 | |
| | | |
| Date of reporting period: | July 31, 2019 | |
Form N-CSR is to be used by management investment companies to file reports with the Commission not later than 10 days after the transmission to stockholders of any report that is required to be transmitted to stockholders under Rule 30e-1 under the Investment Company Act of 1940 (17 CFR 270.30e-1). The Commission may use the information provided on Form N-CSR in its regulatory, disclosure review, inspection, and policymaking roles.
A registrant is required to disclose the information specified by Form N-CSR, and the Commission will make this information public. A registrant is not required to respond to the collection of information contained in Form N-CSR unless the Form displays a currently valid Office of Management and Budget (“OMB”) control number. Please direct comments concerning the accuracy of the information collection burden estimate and any suggestions for reducing the burden to Secretary, Securities and Exchange Commission, 450 Fifth Street, NW, Washington, DC 20549-0609. The OMB has reviewed this collection of information under the clearance requirements of 44 U.S.C. § 3507.
Item 1. Reports to Stockholders.
Eubel Brady & Suttman
Income and Appreciation Fund
Ticker Symbol: EBSZX
Eubel Brady & Suttman
Income Fund
Ticker Symbol: EBSFX
Each a series of the
Eubel Brady & Suttman Mutual Fund Trust
ANNUAL REPORT
July 31, 2019
Beginning on January 1, 2021, as permitted by regulations adopted by the U.S. Securities and Exchange Commission, paper copies of the Funds’ shareholder reports like this one may no longer be sent by mail, unless you specifically request paper copies of the reports from the Funds or from your financial intermediary, such as a broker-dealer or bank. Instead, the reports may be made available on a website, and you will be notified by mail each time a report is posted and provided with a website link to access the report.
If you have already elected to receive shareholder reports electronically, you will not be affected by this change and you need not take any action. You may elect to receive shareholder reports and other communications from the Funds electronically by contacting the Funds at 1-800-391-1223 or, if you own these shares through a financial intermediary, by contacting your financial intermediary.
You may elect to receive all future reports in paper free of charge. You can inform the Funds that you wish to continue receiving paper copies of your shareholder reports by contacting the Funds at 1-800-391-1223. If you own shares through a financial intermediary, you may contact your financial intermediary to elect to continue to receive paper copies of your shareholder reports. Your election to receive reports in paper will apply to both series of the Eubel Brady & Suttman Mutual Fund Trust.
EUBEL BRADY & SUTTMAN MUTUAL FUND TRUST |
LETTER TO OUR SHAREHOLDERS | July 31, 2019 |
Dear Shareholders:
We worked hard to think of an intriguing, curiosity piquing opening line for this year’s letter that would surely bring you to the edge of your seat. After all, many humans like excitement – you know, the kind fed by 24-hour news channels and social media. However, after pondering for a nanosecond, we decided against trying to make the facts bigger than life. Assessing facts as they are and adhering to our process is more our speed. Geopolitical and monetary policy crosscurrents were numerous during the period. Staying focused on important factors was crucial as we navigated uncertain terrain during the year. Our bottom-up, value-oriented approach to investing generated results during the period that we believe were commensurate with the risk taken.
A Review of the 2019 Fiscal Year –From our vantage point, there were six overarching factors during the period: The Federal Reserve, December selloff, The Pivot, Trade Negotiations, Interest Rate Disparity and Normalization of Monetary Policy.
The Federal Reserve (the “Fed”) – The Fed was on centerstage for most of the fiscal year. Perceiving that the pace of economic growth was accelerating, it increased the Fed Funds rate 0.25% in September and December. Additionally, in December Fed Chairman Powell set the stage for additional rate increases in 2019 and made his now infamous “autopilot” comment regarding the monthly reduction of the Fed’s balance sheet. As a reminder, increasing short-term interest rates and shrinking the balance sheet are restrictive monetary measures.
December Selloff – Following a runup in yields during the first half of fiscal year 2019, where the 10-Year Treasury reached peak levels not seen since 2017, fixed-income and equity market participants vehemently expressed their displeasure during the latter part of December: Treasury yields declined, credit spreads widened and equity markets retrenched notably. For a brief period, credit (and equity) markets got a little cheaper but certainly never reached bargain status. This selloff was broader than the one that occurred in late 2015 which was largely related to commodities – oil & gas and metals & mining.
The Pivot – Then came January. Between the market’s reaction and, perhaps, the President’s heckling – Fed Chairman Powell clarified his position: further rate increases and balance sheet reductions would be a function of data and patience, as opposed to foregone conclusions. Yields declined, credit spreads tightened and equity markets lifted – in spite of weakening economic data. At fiscal year-end, the yield curve remains inverted – short-term rates yielding more than long-term – an atypical scenario often associated with future economic weakness.
Trade Negotiations – The U.S. and China continued their negotiations throughout the fiscal year with numerous highs and lows. At present, neither side is budging much and the associated uncertainty is increasingly weighing on consumer sentiment, as well as business conditions. At one point when negotiations with China went off the rail, there was talk of
1
placing tariffs on Mexican imports and European autos. Instability isn’t good for near term economic growth, in our view.
Interest Rate Disparity – With an estimated $13 trillion of global bonds posting negative yields, as of fiscal year-end, the U.S.’s low positive yields look very attractive to many global investors. It’s a potentially interesting scenario: the more attractive U.S. bonds are to foreign investors, the more foreign investors bid up prices – lowering yields further.
Normalization of Monetary Policy – In last year’s letter, we commented that “normalization of monetary policy continued throughout the fiscal year as the Fed continued to increase short-term interest rates and allow increasing amounts of its bond portfolio to run off monthly.” In July 2019, the Fed lowered the Fed Funds target rate by 0.25% to a range of 2.00% - 2.25%, the first rate cut since 2008 – in an attempt to sustain the expansion. From today’s vantage point, the probability of monetary policy returning to a pre-2008 state anytime soon seems increasingly low. Traversing uncharted terrain is likely the new normal.
Investment Philosophy – Managing risks so that investors are being adequately compensated for them is an important element of our bottom-up investment philosophy. Flexibility in portfolio management can support long-term success, in our view. As such, each Fund has latitude with respect to maturity, duration (price sensitivity to a change in interest rates) and credit quality (among other factors). Essentially, we can invest where we find the most value.
Importantly, since we are not managing to a specific maturity or duration target, we can and often do hold bonds to maturity. We believe this provides our Funds an advantage over those which are more constrained and are constantly repositioning their portfolio to remain within a mandate.
Furthermore, with the Funds’ investor base being comprised of EBS clients, fund flows are considerably more stable than those of funds open to the general public. This, too, can provide the Funds advantages relative to those which may have assets under management fluctuate wildly at the whims of unknown investors’ emotions. For example, when investors exit a fund en masse during a time of panic, it can result in forced selling at an inopportune time. However, this same event can provide investment opportunities for investors with capital available (e.g., the Funds).
Each Fund held fewer than 50 securities at fiscal year-end but maintained good diversification in our view. Generally speaking, we are inclined to hold fewer rather than more securities. We believe this allows us to be more selective and provide closer oversight.
The composition of the EBS Funds will often be materially different than their benchmarks. You should expect their returns to diverge from the benchmarks – at times significantly. Lastly, neither Fund uses leverage (borrows money) to make investments.
Results For Various Periods Ended July 31, 2019 – Since inception (September 30, 2014) through July 31, 2019, theEBS Income and Appreciation Fund (“EBSZX”) posted a total annualized return of 2.68%, while its primary benchmark, the ICE BofA Merrill Lynch U.S. Yield Alternatives Index, returned 3.44%. On a three-year basis, the Fund returned 3.35% and the benchmark 6.97%. On a one-year basis, the Fund returned 2.82% and the benchmark returned 5.34%. On a six-month basis, the Fund returned 2.97% and the benchmark returned 5.39%.
2
The primary factors contributing to EBSZX’s underperformance relative to its benchmark are described below:
| | ● | EBSZX’s investment in non-convertible securities contributed to its relative underperformance as those assets are not as sensitive to underlying equities as those largely comprising the benchmark. |
| | ● | Equities appreciated in each period boosting the more equity sensitive benchmark more than the Fund. |
We believe EBSZX, holding liquid assets, is positioned well to capitalize on convertible investments should they become available at prices we find compelling.
Since inception (September 30, 2014) through July 31, 2019, the EBS Income Fund (“EBSFX”) logged a total annualized return of 2.32%, while its primary benchmark, the ICE BofA Merrill Lynch U.S. Corporate & Government Master Index was up 3.28%. On a three-year basis, the Fund returned 2.48% and the benchmark 2.20%. On a one-year basis, the Fund returned 3.86% and the benchmark 8.77%. On a six-month basis, the Fund returned 2.61% and the benchmark 5.99%.
The primary factors contributing to EBSFX’s underperformance relative to its benchmark, in each period except the three-year, are described below:
| | ● | EBSFX has a shorter duration and less Government & Agency debt exposure than its benchmark. As such, the Fund did not benefit as much as the benchmark from declining yields. |
| | ● | Fixed-income prices generally move inversely to yields and instruments with longer maturities are more sensitive to movements in yield. Yields of securities with the largest impact on the benchmark declined on average, positively impacting prices and the benchmark’s return. |
Our Perspective – With consumer and business confidence waning and continued global interest rate disparity, we would not be surprised to see lower short-term interest rates and more volatility in the coming fiscal year. The U.S. – China trade dispute is contributing to global economic weakness and with so much at stake; neither country wants to blink first. There can be long-term benefits to prevailing, yet there will likely be short to intermediate term challenges (e.g. certain aspects of agriculture). A quick and mutually beneficial agreement would be ideal.
Given the current structure of the yield curve, we remain focused on shorter maturities and continue to be more comfortable selectively taking credit risk to enhance yield rather than extending maturities. We believe that shorter maturities provide navigational flexibility.
Convertible exposure within EBSZX remains much lower than we prefer. The continued modest allocation is largely due to the low yield environment and stock prices that seem generally high relative to underlying values.
We continue to have a defensive bias and believe both Funds are well positioned to capitalize on opportunities as they arise.
Feel free to call (800-391-1223) with questions, comments or both. We appreciate your trust and confidence in our firm.
Sincerely,
The EBS Research Group
3
Important Disclosures – Performance data quoted in this letter or the report itself represents past performance. Past performance does not guarantee future results. The value of an investor’s shares will fluctuate, and may be worth more or less than the original cost when redeemed. Current performance may be higher or lower than performance quoted herein. Performance data, current to the most recent month end, is available by calling 1-800-391-1223.
The information in this “Letter To Our Shareholders” represents the opinion of the author and is not intended to be a forecast or investment advice. This publication does not constitute an offer or solicitation of any transaction in any securities. Information contained in this publication has been obtained from sources believed to be reliable, but has not been independently verified by EBS. Please note that any discussion of fund holdings, fund performance and views expressed are as of July 31, 2019 (except if otherwise stated) and are subject to change without notice.
4
EUBEL BRADY & SUTTMAN INCOME AND APPRECIATION FUND
PERFORMANCE INFORMATION
July 31, 2019 (Unaudited)
Comparison of the Change in Value of a $10,000 Investment in
Eubel Brady & Suttman Income and Appreciation Fund versus the ICE BofA Merrill Lynch U.S. Yield Alternatives Index, the ICE BofA Merrill Lynch U.S. Total Return Alternatives Index and the ICE BofA Merrill Lynch 1-10 Year Corporate Index
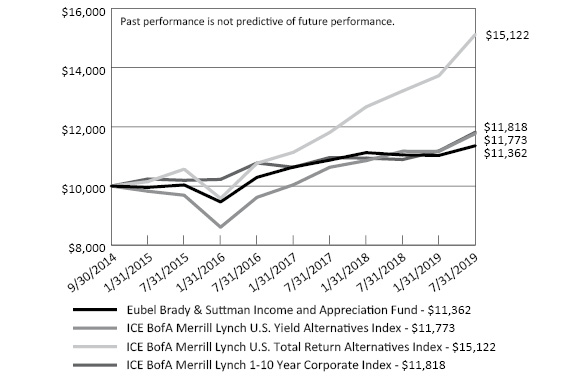
Average Annual Total Returns(a) For the periods ended July 31, 2019 | |
| | 1 Year | 3 Years | Since
Inception(b) | |
Eubel Brady & Suttman Income and Appreciation Fund | 2.82% | 3.35% | 2.68% | |
ICE BofA Merrill Lynch U.S. Yield Alternatives Index* | 5.34% | 6.97% | 3.44% | |
ICE BofA Merrill Lynch U.S. Total Return Alternatives Index* | 14.47% | 11.98% | 8.93% | |
ICE BofA Merrill Lynch 1-10 Year Corporate Index* | 8.46% | 3.12% | 3.52% | |
(a) | Total return is a measure of the change in value of an investment in the Fund over the periods covered, which assumes dividends or distributions, if any, are reinvested in shares of the Fund. |
(b) | Represents the period from the commencement of operations (September 30, 2014) through July 31, 2019. |
* | The ICE BofA Merrill Lynch U.S. Yield Alternatives Index tracks the performance of U.S. dollar denominated convertible debt. The ICE BofA Merrill Lynch U.S. Total Return Alternatives Index tracks the performance of U.S. dollar denominated convertible debt with more equity sensitivity than typically found in the Yield Alternatives Index, on average. The ICE BofA Merrill Lynch 1-10 Year Corporate Index tracks the performance of U.S. dollar denominated investment grade corporate debt publicly issued in the U.S. domestic market with a remaining term to final maturity less than 10 years. The Fund does not invest solely in securities included in these indices and may invest in other types of securities. |
The performance in the chart represents past performance. Performance shown above does not reflect the deduction of taxes a shareholder would pay on fund distributions or the redemption of shares. Current performance may be higher or lower than the performance data presented above. Investment return and principal value will fluctuate; shares, when redeemed, may be worth more or less than their original cost. As presented in the Fund’s prospectus dated December 1, 2018, the Fund’s total operating expense ratio was 0.25% of the Fund’s average daily net assets. Each Index is unmanaged and does not reflect the deduction of fees associated with a mutual fund. The Fund’s performance reflects the deduction of these fees. Investors cannot invest directly in an index.
5
EUBEL BRADY & SUTTMAN INCOME FUND
PERFORMANCE INFORMATION
July 31, 2019 (Unaudited)
Comparison of the Change in Value of a $10,000 Investment in
Eubel Brady & Suttman Income Fund versus
the ICE BofA Merrill Lynch U.S. Corporate & Government Master Index and
the ICE BofA Merrill Lynch U.S. Corporate & Government 1-10 Yrs Index
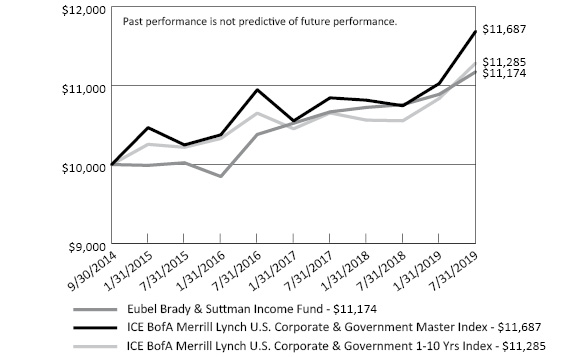
Average Annual Total Returns(a) For the periods ended July 31, 2019 | |
| | 1 Year | 3 Years | Since
Inception(b) | |
Eubel Brady & Suttman Income Fund | 3.86% | 2.48% | 2.32% | |
ICE BofA Merrill Lynch U.S. Corporate & Government Master Index* | 8.77% | 2.20% | 3.28% | |
ICE BofA Merrill Lynch U.S. Corporate & Government 1-10 Yrs Index* | 6.92% | 1.95% | 2.53% | |
(a) | Total return is a measure of the change in value of an investment in the Fund over the periods covered, which assumes dividends or distributions, if any, are reinvested in shares of the Fund. |
(b) | Represents the period from the commencement of operations (September 30, 2014) through July 31, 2019. |
* | The ICE BofA Merrill Lynch U.S. Corporate & Government Master Index tracks the performance of U.S. dollar denominated investment grade debt publicly issued in the U.S. domestic market, including U.S. Treasury, U.S. agency, foreign government, supranational and corporate securities. The ICE BofA Merrill Lynch U.S. Corporate & Government 1-10 Yrs Index tracks the performance of U.S. dollar denominated investment grade debt publicly issued in the U.S. domestic market, including U.S. Treasury, U.S. agency, foreign government, supranational and corporate securities with a remaining term to final maturity less than 10 years. The Fund does not invest solely in securities included in these indices and may invest in other types of securities. |
The performance in the chart represents past performance. Performance shown above does not reflect the deduction of taxes a shareholder would pay on fund distributions or the redemption of shares. Current performance may be higher or lower than the performance data presented above. Investment return and principal value will fluctuate; shares, when redeemed, may be worth more or less than their original cost. As presented in the Fund’s prospectus dated December 1, 2018, the Fund’s total operating expense ratio was 0.20% of the Fund’s average daily net assets. Each Index is unmanaged and does not reflect the deduction of fees associated with a mutual fund. The Fund’s performance reflects the deduction of these fees. Investors cannot invest directly in an index.
6
EUBEL BRADY & SUTTMAN MUTUAL FUND TRUST
PORTFOLIO INFORMATION
July 31, 2019 (Unaudited)
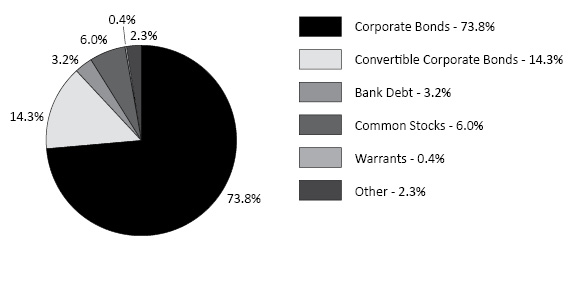
Eubel Brady & Suttman Income and Appreciation Fund
Asset Allocation (% of Net Assets)
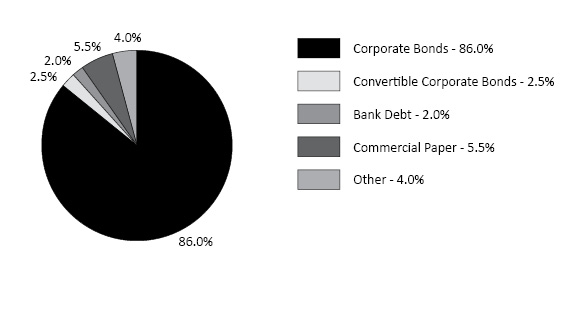
Eubel Brady & Suttman Income Fund
Asset Allocation (% of Net Assets)
7
EUBEL BRADY & SUTTMAN INCOME AND APPRECIATION FUND
SCHEDULE OF INVESTMENTS
July 31, 2019 |
CORPORATE BONDS — 73.8% | | Coupon | | | Maturity | | | Par Value | | | Value | |
Communication Services — 4.6% | | | | | | | | | | | | | | | | |
Discovery Communications, Inc. (3MO LIBOR + 71) (a) | | | 3.097 | % | | | 09/20/19 | | | $ | 2,000,000 | | | $ | 2,001,620 | |
Verizon Communications, Inc. (3MO LIBOR + 100) (a) | | | 3.410 | % | | | 03/16/22 | | | | 2,100,000 | | | | 2,132,527 | |
| | | | | | | | | | | | | | | | 4,134,147 | |
Consumer Discretionary — 7.4% | | | | | | | | | | | | | | | | |
Lennar Corporation | | | 2.950 | % | | | 11/29/20 | | | | 2,600,000 | | | | 2,600,000 | |
Marriott International, Inc. | | | 3.375 | % | | | 10/15/20 | | | | 2,220,000 | | | | 2,238,045 | |
Silversea Cruise Finance Ltd., 144A | | | 7.250 | % | | | 02/01/25 | | | | 1,600,000 | | | | 1,710,000 | |
| | | | | | | | | | | | | | | | 6,548,045 | |
Consumer Staples — 1.8% | | | | | | | | | | | | | | | | |
Mead Johnson Nutrition Company | | | 3.000 | % | | | 11/15/20 | | | | 1,596,000 | | | | 1,608,400 | |
| | | | | | | | | | | | | | | | | |
Energy — 5.2% | | | | | | | | | | | | | | | | |
CNX Resources Corporation | | | 5.875 | % | | | 04/15/22 | | | | 2,600,000 | | | | 2,477,410 | |
CONSOL Energy, Inc., 144A | | | 11.000 | % | | | 11/15/25 | | | | 2,000,000 | | | | 2,120,000 | |
| | | | | | | | | | | | | | | | 4,597,410 | |
Financials — 10.2% | | | | | | | | | | | | | | | | |
American International Group, Inc. | | | 3.300 | % | | | 03/01/21 | | | | 1,700,000 | | | | 1,722,466 | |
Goldman Sachs Group, Inc. (The) (3MO LIBOR + 100) (a) | | | 3.283 | % | | | 07/24/23 | | | | 2,500,000 | | | | 2,514,328 | |
Pershing Square Holdings Ltd., 144A | | | 5.500 | % | | | 07/15/22 | | | | 2,500,000 | | | | 2,617,500 | |
Prospect Capital Corporation | | | 5.000 | % | | | 07/15/23 | | | | 2,200,000 | | | | 2,192,335 | |
| | | | | | | | | | | | | | | | 9,046,629 | |
Health Care — 11.3% | | | | | | | | | | | | | | | | |
Allergan Funding SCS | | | 3.000 | % | | | 03/12/20 | | | | 2,300,000 | | | | 2,304,895 | |
Anthem, Inc. | | | 4.350 | % | | | 08/15/20 | | | | 605,000 | | | | 616,795 | |
Becton, Dickinson and Company (3MO LIBOR + 103) (a) | | | 3.504 | % | | | 06/06/22 | | | | 2,615,000 | | | | 2,635,918 | |
CVS Health Corporation | | | 2.800 | % | | | 07/20/20 | | | | 1,900,000 | | | | 1,903,634 | |
Zimmer Biomet Holdings, Inc. | | | 2.700 | % | | | 04/01/20 | | | | 2,600,000 | | | | 2,602,086 | |
| | | | | | | | | | | | | | | | 10,063,328 | |
Industrials — 11.3% | | | | | | | | | | | | | | | | |
General Electric Company (3MO LIBOR + 100) (a) | | | 3.410 | % | | | 03/15/23 | | | | 1,000,000 | | | | 993,643 | |
Icahn Enterprises, L.P. | | | 6.000 | % | | | 08/01/20 | | | | 2,390,000 | | | | 2,390,000 | |
See accompanying notes to financial statements.
8
EUBEL BRADY & SUTTMAN INCOME AND APPRECIATION FUND
SCHEDULE OF INVESTMENTS (Continued) |
CORPORATE BONDS — 73.8% (Continued) | | Coupon | | | Maturity | | | Par Value | | | Value | |
Industrials — 11.3% (Continued) | | | | | | | | | | | | | | | | |
Molex Electronics Technologies, LLC, 144A | | | 2.878 | % | | | 04/15/20 | | | $ | 2,700,000 | | | $ | 2,700,381 | |
Roper Technologies, Inc. | | | 2.800 | % | | | 12/15/21 | | | | 2,700,000 | | | | 2,714,941 | |
Ryder System, Inc. | | | 2.450 | % | | | 09/03/19 | | | | 1,243,000 | | | | 1,242,746 | |
| | | | | | | | | | | | | | | | 10,041,711 | |
Information Technology — 4.6% | | | | | | | | | | | | | | | | |
FLIR Systems, Inc. | | | 3.125 | % | | | 06/15/21 | | | | 2,034,000 | | | | 2,051,892 | |
Hewlett Packard Enterprise Company, 144A | | | 2.100 | % | | | 10/04/19 | | | | 2,000,000 | | | | 1,997,985 | |
| | | | | | | | | | | | | | | | 4,049,877 | |
Materials — 14.6% | | | | | | | | | | | | | | | | |
Avnet, Inc. | | | 3.750 | % | | | 12/01/21 | | | | 2,600,000 | | | | 2,648,273 | |
Ball Corporation | | | 4.375 | % | | | 12/15/20 | | | | 1,800,000 | | | | 1,833,750 | |
Ball Corporation | | | 5.000 | % | | | 03/15/22 | | | | 556,000 | | | | 582,299 | |
DowDuPont, Inc. | | | 3.766 | % | | | 11/15/20 | | | | 945,000 | | | | 961,098 | |
Methanex Corporation | | | 5.250 | % | | | 03/01/22 | | | | 1,641,000 | | | | 1,712,690 | |
Sherwin-Williams Company (The) | | | 2.250 | % | | | 05/15/20 | | | | 2,665,000 | | | | 2,660,344 | |
Steel Dynamics, Inc. | | | 5.125 | % | | | 10/01/21 | | | | 2,600,000 | | | | 2,606,500 | |
| | | | | | | | | | | | | | | | 13,004,954 | |
Utilities — 2.8% | | | | | | | | | | | | | | | | |
Southern Company (The) | | | 2.350 | % | | | 07/01/21 | | | | 2,495,000 | | | | 2,487,685 | |
| | | | | | | | | | | | | | | | | |
Total Corporate Bonds (Cost $64,932,651) | | | | | | | | | | | | | | $ | 65,582,186 | |
|
CONVERTIBLE CORPORATE BONDS — 14.3% | | Coupon | | | Maturity | | | Par Value | | | Value | |
Communication Services — 3.6% | | | | | | | | | | | | | | | | |
Gannett Company, Inc. | | | 4.750 | % | | | 04/15/24 | | | $ | 3,000,000 | | | $ | 3,164,438 | |
| | | | | | | | | | | | | | | | | |
Financials — 2.3% | | | | | | | | | | | | | | | | |
Ares Capital Corporation | | | 3.750 | % | | | 02/01/22 | | | | 2,000,000 | | | | 2,053,750 | |
| | | | | | | | | | | | | | | | | |
Industrials — 2.7% | | | | | | | | | | | | | | | | |
Arconic, Inc. | | | 1.625 | % | | | 10/15/19 | | | | 2,370,000 | | | | 2,377,217 | |
See accompanying notes to financial statements.
9
EUBEL BRADY & SUTTMAN INCOME AND APPRECIATION FUND
SCHEDULE OF INVESTMENTS (Continued) |
CONVERTIBLE CORPORATE BONDS — 14.3% (Continued) | | Coupon | | | Maturity | | | Par Value | | | Value | |
Information Technology — 2.7% | | | | | | | | | | | | | | | | |
Twitter, Inc. | | | 0.250 | % | | | 09/15/19 | | | $ | 2,400,000 | | | $ | 2,391,459 | |
| | | | | | | | | | | | | | | | | |
Real Estate — 3.0% | | | | | | | | | | | | | | | | |
Redwood Trust, Inc. | | | 4.750 | % | | | 08/15/23 | | | | 2,700,000 | | | | 2,691,351 | |
| | | | | | | | | | | | | | | | | |
Total Convertible Corporate Bonds (Cost $12,601,674) | | | | | | | | | | | | | | $ | 12,678,215 | |
|
BANK DEBT — 3.2% | | Coupon | | | Maturity | | | Par Value | | | Value | |
Financials — 2.7% | | | | | | | | | | | | | | | | |
NCP Finance Limited Partnership Sr. Revolving Loan (1MO LIBOR + 400) (a)(b)(c) | | | 6.402 | % | | | 12/21/20 | | | $ | 469,368 | | | $ | 469,368 | |
NCP Finance Limited Partnership Sr. Term Loan (1MO LIBOR + 400) (a)(b)(c) | | | 6.402 | % | | | 12/21/20 | | | | 1,846,154 | | | | 1,897,010 | |
| | | | | | | | | | | | | | | | 2,366,378 | |
Materials — 0.5% | | | | | | | | | | | | | | | | |
Ball Metalpack Finco, LLC (3MO LIBOR + 450) (a) | | | 7.022 | % | | | 07/31/25 | | | | 495,000 | | | | 483,244 | |
| | | | | | | | | | | | | | | | | |
Total Bank Debt (Cost $2,808,047) | | | | | | | | | | | | | | $ | 2,849,622 | |
|
COMMON STOCKS — 6.0% | | Shares | | | Value | |
Financials — 4.9% | | | | | | | | |
Capital One Financial Corporation | | | 9,904 | | | $ | 915,328 | |
Hartford Financial Services Group, Inc. (The) | | | 41,269 | | | | 2,378,332 | |
Lincoln National Corporation | | | 15,673 | | | | 1,024,074 | |
| | | | | | | | 4,317,734 | |
Industrials — 1.1% | | | | | | | | |
Air Industries Group (d) | | | 936,789 | | | | 983,628 | |
| | | | | | | | | |
Total Common Stocks (Cost $2,702,952) | | | | | | $ | 5,301,362 | |
See accompanying notes to financial statements.
10
EUBEL BRADY & SUTTMAN INCOME AND APPRECIATION FUND
SCHEDULE OF INVESTMENTS (Continued) |
WARRANTS — 0.4% | | Shares | | | Value | |
Financials — 0.4% | | | | | | | | |
American International Group, Inc., $43.118, expires 01/19/21 (d) | | | 26,500 | | | $ | 387,960 | |
| | | | | | | | | |
Industrials — 0.0% (e) | | | | | | | | |
American Zinc Recycling, LLC, $630.227, expires 09/30/22 (b)(c)(d) | | | 965 | | | | 10 | |
| | | | | | | | | |
Total Warrants (Cost $1,803,660) | | | | | | $ | 387,970 | |
|
MONEY MARKET FUNDS — 1.4% | | Shares | | | Value | |
Invesco Short-Term Investments Trust - Treasury Portfolio - Institutional Class, 2.13% (f) (Cost $1,217,008) | | | 1,217,008 | | | $ | 1,217,008 | |
| | | | | | | | | |
Total Investments at Value — 99.1% (Cost $86,065,992) | | | | | | $ | 88,016,363 | |
| | | | | | | | | |
Other Assets in Excess of Liabilities — 0.9% | | | | | | | 779,498 | |
| | | | | | | | | |
Net Assets — 100.0% | | | | | | $ | 88,795,861 | |
144A - | Security was purchased in a transaction exempt from registration in compliance with Rule 144A of the Securities Act of 1933. This security may be resold in transactions exempt from registration, normally to qualified institutional buyers. The total value of such securities is $11,145,866 as of July 31, 2019, representing 12.6% of net assets. |
LIBOR - | London Interbank Offered Rate. |
(a) | Variable rate security. Interest rate resets periodically. The rate shown is the effective interest rate as of July 31, 2019. For securities based on a published reference rate and spread, the reference rate and spread (in basis points) are indicated parenthetically. |
(b) | Security has been fair valued in good faith by the Adviser in conformity with guidelines adopted by and subject to review by the Board of Trustees. The total value of such securities is $2,366,388 as of July 31, 2019, representing 2.7% of net assets (Note 2). |
(c) | Illiquid security. The total value of such securities was $2,366,388 as of July 31, 2019, representing 2.7% of net assets (Note 2). |
(d) | Non-income producing security. |
(e) | Percentage rounds to less than 0.1%. |
(f) | The rate shown is the 7-day effective yield as of July 31, 2019. |
See accompanying notes to financial statements. |
11
EUBEL BRADY & SUTTMAN INCOME FUND
SCHEDULE OF INVESTMENTS
July 31, 2019 |
CORPORATE BONDS — 86.0% | | Coupon | | | Maturity | | | Par Value | | | Value | |
Communication Services — 6.0% | | | | | | | | | | | | | | | | |
Discovery Communications, Inc. (3MO LIBOR + 71) (a) | | | 3.097 | % | | | 09/20/19 | | | $ | 5,500,000 | | | $ | 5,504,455 | |
Gannett Company, Inc. | | | 5.125 | % | | | 07/15/20 | | | | 1,375,000 | | | | 1,373,584 | |
Verizon Communications, Inc. (3MO LIBOR + 100) (a) | | | 3.410 | % | | | 03/16/22 | | | | 5,000,000 | | | | 5,077,445 | |
| | | | | | | | | | | | | | | | 11,955,484 | |
Consumer Discretionary — 9.5% | | | | | | | | | | | | | | | | |
AutoZone, Inc. | | | 4.000 | % | | | 11/15/20 | | | | 3,000,000 | | | | 3,049,080 | |
Lennar Corporation | | | 2.950 | % | | | 11/29/20 | | | | 6,000,000 | | | | 6,000,000 | |
Marriott International, Inc. | | | 3.375 | % | | | 10/15/20 | | | | 3,250,000 | | | | 3,276,416 | |
Marriott International, Inc. | | | 2.300 | % | | | 01/15/22 | | | | 2,000,000 | | | | 1,990,210 | |
Silversea Cruise Finance Ltd., 144A | | | 7.250 | % | | | 02/01/25 | | | | 4,500,000 | | | | 4,809,375 | |
| | | | | | | | | | | | | | | | 19,125,081 | |
Consumer Staples — 7.5% | | | | | | | | | | | | | | | | |
Kroger Company (The) | | | 2.950 | % | | | 11/01/21 | | | | 5,206,000 | | | | 5,255,474 | |
Kuerig Dr Pepper, Inc. | | | 3.551 | % | | | 05/25/21 | | | | 5,000,000 | | | | 5,092,544 | |
Mondelēz International, Inc., 144A | | | 2.000 | % | | | 10/28/21 | | | | 4,720,000 | | | | 4,671,803 | |
| | | | | | | | | | | | | | | | 15,019,821 | |
Energy — 4.5% | | | | | | | | | | | | | | | | |
CNX Resources Corporation | | | 5.875 | % | | | 04/15/22 | | | | 5,400,000 | | | | 5,145,390 | |
CONSOL Energy, Inc., 144A | | | 11.000 | % | | | 11/15/25 | | | | 3,700,000 | | | | 3,922,000 | |
| | | | | | | | | | | | | | | | 9,067,390 | |
Financials — 14.2% | | | | | | | | | | | | | | | | |
American International Group, Inc. | | | 6.400 | % | | | 12/15/20 | | | | 3,232,000 | | | | 3,404,322 | |
Bank of the Ozarks, Inc. (a) | | | 5.500 | % | | | 07/01/26 | | | | 3,732,000 | | | | 3,793,045 | |
Barclays Bank plc (3MO LIBOR + 211) (a) | | | 4.655 | % | | | 08/10/21 | | | | 2,684,000 | | | | 2,745,851 | |
Barclays Bank plc (a) | | | 3.000 | % | | | 07/27/22 | | | | 3,000,000 | | | | 2,962,990 | |
Goldman Sachs Group, Inc. (The) (3MO LIBOR + 100) (a) | | | 3.283 | % | | | 07/24/23 | | | | 5,500,000 | | | | 5,531,520 | |
Pershing Square Holdings Ltd., 144A | | | 5.500 | % | | | 07/15/22 | | | | 5,000,000 | | | | 5,235,000 | |
Prospect Capital Corporation | | | 5.000 | % | | | 07/15/23 | | | | 4,800,000 | | | | 4,783,277 | |
| | | | | | | | | | | | | | | | 28,456,005 | |
See accompanying notes to financial statements.
12
EUBEL BRADY & SUTTMAN INCOME FUND
SCHEDULE OF INVESTMENTS (Continued) |
CORPORATE BONDS — 86.0% (Continued) | | Coupon | | | Maturity | | | Par Value | | | Value | |
Health Care — 12.8% | | | | | | | | | | | | | | | | |
Amgen, Inc. (3MO LIBOR + 45) (a) | | | 2.985 | % | | | 05/11/20 | | | $ | 3,078,000 | | | $ | 3,084,547 | |
Anthem, Inc. | | | 4.350 | % | | | 08/15/20 | | | | 1,000,000 | | | | 1,019,497 | |
Becton Dickinson and Company (3MO LIBOR + 103) (a) | | | 3.504 | % | | | 06/06/22 | | | | 5,825,000 | | | | 5,871,595 | |
CVS Health Corporation | | | 2.800 | % | | | 07/20/20 | | | | 4,200,000 | | | | 4,208,033 | |
Medtronic, Inc. (3MO LIBOR + 80) (a) | | | 3.210 | % | | | 03/15/20 | | | | 5,500,000 | | | | 5,523,546 | |
Zimmer Biomet Holdings, Inc. | | | 2.700 | % | | | 04/01/20 | | | | 6,000,000 | | | | 6,004,813 | |
| | | | | | | | | | | | | | | | 25,712,031 | |
Industrials — 16.7% | | | | | | | | | | | | | | | | |
BorgWarner, Inc. | | | 8.000 | % | | | 10/01/19 | | | | 2,790,000 | | | | 2,813,269 | |
Caterpillar, Inc. | | | 2.600 | % | | | 06/26/22 | | | | 2,691,000 | | | | 2,722,120 | |
CSX Corporation | | | 3.700 | % | | | 10/30/20 | | | | 2,094,000 | | | | 2,122,374 | |
General Electric Company (3MO LIBOR + 100) (a) | | | 3.410 | % | | | 03/15/23 | | | | 5,000,000 | | | | 4,968,217 | |
Icahn Enterprises, L.P. | | | 6.000 | % | | | 08/01/20 | | | | 5,000,000 | | | | 5,000,000 | |
Molex Electronics Technologies, LLC, 144A | | | 2.878 | % | | | 04/15/20 | | | | 5,900,000 | | | | 5,900,831 | |
Penske Truck Leasing Company, L.P., 144A | | | 2.700 | % | | | 03/14/23 | | | | 5,000,000 | | | | 4,999,984 | |
Roper Technologies, Inc. | | | 2.800 | % | | | 12/15/21 | | | | 4,903,000 | | | | 4,930,131 | |
| | | | | | | | | | | | | | | | 33,456,926 | |
Information Technology — 3.8% | | | | | | | | | | | | | | | | |
FLIR Systems, Inc. | | | 3.125 | % | | | 06/15/21 | | | | 2,700,000 | | | | 2,723,750 | |
Hewlett Packard Enterprise Company, 144A | | | 2.100 | % | | | 10/04/19 | | | | 5,000,000 | | | | 4,994,963 | |
| | | | | | | | | | | | | | | | 7,718,713 | |
Materials — 10.5% | | | | | | | | | | | | | | | | |
Ball Corporation | | | 4.375 | % | | | 12/15/20 | | | | 5,150,000 | | | | 5,246,563 | |
Cabot Corporation | | | 3.700 | % | | | 07/15/22 | | | | 3,980,000 | | | | 4,063,983 | |
Methanex Corporation | | | 5.250 | % | | | 03/01/22 | | | | 5,680,000 | | | | 5,928,140 | |
Steel Dynamics, Inc. | | | 5.125 | % | | | 10/01/21 | | | | 5,767,000 | | | | 5,781,417 | |
| | | | | | | | | | | | | | | | 21,020,103 | |
Utilities — 0.5% | | | | | | | | | | | | | | | | |
Southern Company (The) | | | 2.350 | % | | | 07/01/21 | | | | 1,000,000 | | | | 997,068 | |
| | | | | | | | | | | | | | | | | |
Total Corporate Bonds(Cost $170,776,767) | | | | | | | | | | | | | | $ | 172,528,622 | |
See accompanying notes to financial statements.
13
EUBEL BRADY & SUTTMAN INCOME FUND
SCHEDULE OF INVESTMENTS (Continued) |
CONVERTIBLE CORPORATE BONDS — 2.5% | | Coupon | | | Maturity | | | Par Value | | | Value | |
Real Estate — 2.5% | | | | | | | | | | | | | | | | |
RWT Holdings, Inc. (Cost $5,100,000) | | | 5.625 | % | | | 11/15/19 | | | $ | 5,000,000 | | | $ | 5,025,123 | |
|
BANK DEBT — 2.0% | | Coupon | | | Maturity | | | Par Value | | | Value | |
Financials — 2.0% | | | | | | | | | | | | | | | | |
NCP Finance Limited Partnership Sr. Revolving Loan (1MO LIBOR + 400) (a)(b)(c) | | | 6.402 | % | | | 12/21/20 | | | $ | 782,280 | | | $ | 782,280 | |
NCP Finance Limited Partnership Sr. Term Loan (1MO LIBOR + 400) (a)(b)(c) | | | 6.402 | % | | | 12/21/20 | | | | 3,076,923 | | | | 3,161,683 | |
Total Bank Debt (Cost $3,859,203) | | | | | | | | | | | | | | $ | 3,943,963 | |
|
PREFERRED STOCKS — 0.0% (d) | | Shares | | | Value | |
Real Estate — 0.0% (d) | | | | | | | | |
RAIT Financial Trust, 7.75%, Series A (Cost $2,946,070) (e)(f) | | | 135,000 | | | $ | 114,750 | |
|
MONEY MARKET FUNDS — 3.2% | | Shares | | | Value | |
Invesco Short-Term Investments Trust - Treasury Portfolio - Institutional Class, 2.13% (g) (Cost $6,521,284) | | | 6,521,284 | | | $ | 6,521,284 | |
See accompanying notes to financial statements.
14
EUBEL BRADY & SUTTMAN INCOME FUND
SCHEDULE OF INVESTMENTS (Continued) |
COMMERCIAL PAPER — 5.5% (h) | | Par Value | | | Value | |
Boston Scientific Corporation, 2.66%, due 08/13/19 | | $ | 1,000,000 | | | $ | 999,127 | |
Catholic Health Initiative, 2.64%, due 08/02/19 | | | 2,000,000 | | | | 1,999,855 | |
Cigna Corporation, 2.51%, due 08/06/19 | | | 5,000,000 | | | | 4,998,278 | |
Mondelēz International, Inc., 2.53%, due 08/09/19 | | | 3,000,000 | | | | 2,998,333 | |
Total Commercial Paper (Cost $10,995,593) | | | | | | | 10,995,593 | |
| | | | | | | | | |
Total Investments at Value — 99.2% (Cost $200,198,917) | | | | | | | 199,129,335 | |
| | | | | | | | | |
Other Assets in Excess of Liabilities — 0.8% | | | | | | | 1,586,354 | |
| | | | | | | | | |
Net Assets — 100.0% | | | | | | $ | 200,715,689 | |
144A - | Security was purchased in a transaction exempt from registration in compliance with Rule 144A of the Securities Act of 1933. This security may be resold in transactions exempt from registration, normally to qualified institutional buyers. The total value of such securities is $34,533,956 as of July 31, 2019, representing 17.2% of net assets. |
LIBOR - | London Interbank Offered Rate. |
(a) | Variable rate security. Interest rate resets periodically. The rate shown is the effective interest rate as of July 31, 2019. For securities based on a published reference rate and spread, the reference rate and spread (in basis points) are indicated parenthetically. Certain variable rate securities are not based on a published reference rate and spread but adjust at predetermined dates to stated coupon rates set forth in the offering documents. These securities, therefore, do not indicate a reference rate and spread. |
(b) | Security has been fair valued in good faith by the Adviser in conformity with guidelines adopted by and subject to review by the Board of Trustees. The total value of such securities is $3,943,963 as of July 31, 2019, representing 2.0% of net assets (Note 2). |
(c) | Illiquid security. The total value of such securities was $3,943,963 as of July 31, 2019, representing 2.0% of net assets (Note 2). |
(d) | Percentage rounds to less than 0.1%. |
(e) | Security has a perpetual maturity. |
(f) | Non-income producing security. |
(g) | The rate shown is the 7-day effective yield as of July 31, 2019. |
(h) | The rate shown is the annualized yield at the time of purchase, not a coupon rate. |
See accompanying notes to financial statements. |
15
EUBEL BRADY & SUTTMAN MUTUAL FUND TRUST
STATEMENTS OF ASSETS AND LIABILITIES
July 31, 2019 |
| | Eubel Brady
& Suttman
Income and
Appreciation
Fund | | | Eubel Brady
& Suttman
Income Fund | |
ASSETS | | | | | | | | |
Investments in securities: | | | | | | | | |
At cost | | $ | 86,065,992 | | | $ | 200,198,917 | |
At value (Note 2) | | $ | 88,016,363 | | | $ | 199,129,335 | |
Capital shares receivable | | | 9,997 | | | | 48,901 | |
Dividends and interest receivable | | | 777,425 | | | | 1,594,198 | |
Other assets | | | 8,770 | | | | 13,704 | |
Total assets | | | 88,812,555 | | | | 200,786,138 | |
| | | | | | | | | |
LIABILITIES | | | | | | | | |
Payable for capital shares redeemed | | | 368 | | | | 39,942 | |
Payable to administrator (Note 4) | | | 7,500 | | | | 16,970 | |
Other accrued expenses | | | 8,826 | | | | 13,537 | |
Total liabilities | | | 16,694 | | | | 70,449 | |
| | | | | | | | | |
NET ASSETS | | $ | 88,795,861 | | | $ | 200,715,689 | |
| | | | | | | | | |
NET ASSETS CONSIST OF: | | | | | | | | |
Paid-in capital | | $ | 88,438,251 | | | $ | 202,510,859 | |
Accumulated earnings (deficit) | | | 357,610 | | | | (1,795,170 | ) |
NET ASSETS | | $ | 88,795,861 | | | $ | 200,715,689 | |
| | | | | | | | | |
Shares of beneficial interest outstanding (unlimited number of shares authorized, no par value) | | | 9,051,970 | | | | 20,364,016 | |
| | | | | | | | | |
Net asset value, offering price and redemption price per share (Note 2) | | $ | 9.81 | | | $ | 9.86 | |
See accompanying notes to financial statements.
16
EUBEL BRADY & SUTTMAN MUTUAL FUND TRUST
STATEMENTS OF OPERATIONS
For the Year Ended July 31, 2019 |
| | Eubel Brady
& Suttman
Income and
Appreciation
Fund | | | Eubel Brady
& Suttman
Income Fund | |
INVESTMENT INCOME | | | | | | | | |
Dividends | | $ | 79,762 | | | $ | 101,005 | |
Interest | | | 2,998,304 | | | | 7,007,601 | |
Total investment income | | | 3,078,066 | | | | 7,108,606 | |
| | | | | | | | | |
EXPENSES | | | | | | | | |
Administration fees (Note 4) | | | 85,080 | | | | 193,391 | |
Shareholder servicing fees (Note 6) | | | 35,088 | | | | 79,613 | |
Legal fees | | | 26,426 | | | | 26,426 | |
Registration and filing fees | | | 22,382 | | | | 23,808 | |
Custody and bank service fees | | | 14,417 | | | | 23,592 | |
Audit and tax services fees | | | 18,500 | | | | 18,500 | |
Trustees’ fees and expenses (Note 4) | | | 15,696 | | | | 15,696 | |
Insurance expense | | | 5,411 | | | | 10,240 | |
Pricing fees | | | 5,542 | | | | 6,492 | |
Printing of shareholder reports | | | 2,222 | | | | 2,222 | |
Other expenses | | | 8,247 | | | | 5,359 | |
Total expenses | | | 239,011 | | | | 405,339 | |
| | | | | | | | | |
NET INVESTMENT INCOME | | | 2,839,055 | | | | 6,703,267 | |
| | | | | | | | | |
REALIZED AND UNREALIZED GAINS (LOSSES) ON INVESTMENTS | | | | | | | | |
Net realized losses from investment transactions | | | (1,359,240 | ) | | | (60,927 | ) |
Net change in unrealized appreciation (depreciation) on investments | | | 861,516 | | | | 800,875 | |
NET REALIZED AND UNREALIZED GAINS (LOSSES) ON INVESTMENTS | | | (497,724 | ) | | | 739,948 | |
| | | | | | | | | |
NET INCREASE IN NET ASSETS RESULTING FROM OPERATIONS | | $ | 2,341,331 | | | $ | 7,443,215 | |
See accompanying notes to financial statements.
17
EUBEL BRADY & SUTTMAN INCOME AND APPRECIATION FUND
STATEMENTS OF CHANGES IN NET ASSETS |
| | Year Ended
July 31,
2019 | | | Year Ended
July 31,
2018 (a) | |
FROM OPERATIONS | | | | | | | | |
Net investment income | | $ | 2,839,055 | | | $ | 2,376,720 | |
Net realized gains (losses) from investment transactions | | | (1,359,240 | ) | | | 1,207,387 | |
Net change in unrealized appreciation (depreciation) on investments | | | 861,516 | | | | (2,176,681 | ) |
Net increase in net assets resulting from operations | | | 2,341,331 | | | | 1,407,426 | |
| | | | | | | | | |
DISTRIBUTIONS TO SHAREHOLDERS (Note 2) | | | (2,872,948 | ) | | | (2,368,980 | ) |
| | | | | | | | | |
CAPITAL SHARE TRANSACTIONS | | | | | | | | |
Proceeds from shares sold | | | 8,785,208 | | | | 10,197,211 | |
Net asset value of shares issued in reinvestment of distributions to shareholders | | | 2,869,462 | | | | 2,358,907 | |
Payments for shares redeemed | | | (10,645,575 | ) | | | (8,245,531 | ) |
Net increase in net assets from capital share transactions | | | 1,009,095 | | | | 4,310,587 | |
| | | | | | | | | |
TOTAL INCREASE IN NET ASSETS | | | 477,478 | | | | 3,349,033 | |
| | | | | | | | | |
NET ASSETS | | | | | | | | |
Beginning of year | | | 88,318,383 | | | | 84,969,350 | |
End of year | | $ | 88,795,861 | | | $ | 88,318,383 | |
| | | | | | | | | |
CAPITAL SHARES ACTIVITY | | | | | | | | |
Shares sold | | | 902,768 | | | | 1,019,619 | |
Shares reinvested | | | 295,344 | | | | 237,575 | |
Shares redeemed | | | (1,100,004 | ) | | | (829,447 | ) |
Net increase in shares outstanding | | | 98,108 | | | | 427,747 | |
Shares outstanding at beginning of year | | | 8,953,862 | | | | 8,526,115 | |
Shares outstanding at end of year | | | 9,051,970 | | | | 8,953,862 | |
(a) | The presentation of Distributions to Shareholders has been updated to reflect the changes prescribed in amendments to Regulation S-X, effective November 5, 2018 (Note 2). For the year ended July 31, 2018, distributions to shareholders was from net investment income. As of July 31, 2018, undistributed net investment income was $7,412. |
See accompanying notes to financial statements. |
18
EUBEL BRADY & SUTTMAN INCOME FUND
STATEMENTS OF CHANGES IN NET ASSETS |
| | Year Ended
July 31,
2019 | | | Year Ended
July 31,
2018 (a) | |
FROM OPERATIONS | | | | | | | | |
Net investment income | | $ | 6,703,267 | | | $ | 5,202,224 | |
Net realized gains (losses) from investment transactions | | | (60,927 | ) | | | 6,647 | |
Net change in unrealized appreciation (depreciation) on investments | | | 800,875 | | | | (3,625,374 | ) |
Net increase in net assets resulting from operations | | | 7,443,215 | | | | 1,583,497 | |
| | | | | | | | | |
DISTRIBUTIONS TO SHAREHOLDERS (Note 2) | | | (6,717,506 | ) | | | (5,184,851 | ) |
| | | | | | | | | |
CAPITAL SHARE TRANSACTIONS | | | | | | | | |
Proceeds from shares sold | | | 33,771,307 | | | | 37,276,711 | |
Net asset value of shares issued in reinvestment of distributions to shareholders | | | 6,698,963 | | | | 5,131,182 | |
Payments for shares redeemed | | | (39,382,888 | ) | | | (25,860,676 | ) |
Net increase in net assets from capital share transactions | | | 1,087,382 | | | | 16,547,217 | |
| | | | | | | | | |
TOTAL INCREASE IN NET ASSETS | | | 1,813,091 | | | | 12,945,863 | |
| | | | | | | | | |
NET ASSETS | | | | | | | | |
Beginning of year | | | 198,902,598 | | | | 185,956,735 | |
End of year | | $ | 200,715,689 | | | $ | 198,902,598 | |
| | | | | | | | | |
CAPITAL SHARES ACTIVITY | | | | | | | | |
Shares sold | | | 3,449,122 | | | | 3,761,225 | |
Shares reinvested | | | 683,725 | | | | 519,444 | |
Shares redeemed | | | (4,032,376 | ) | | | (2,611,669 | ) |
Net increase in shares outstanding | | | 100,471 | | | | 1,669,000 | |
Shares outstanding at beginning of year | | | 20,263,545 | | | | 18,594,545 | |
Shares outstanding at end of year | | | 20,364,016 | | | | 20,263,545 | |
(a) | The presentation of Distributions to Shareholders has been updated to reflect the changes prescribed in amendments to Regulation S-X, effective November 5, 2018 (Note 2). For the year ended July 31, 2018, distributions to shareholders was from net investment income. As of July 31, 2018, undistributed net investment income was $17,922. |
See accompanying notes to financial statements. |
19
EUBEL BRADY & SUTTMAN INCOME AND APPRECIATION FUND
FINANCIAL HIGHLIGHTS |
Per Share Data for a Share Outstanding Throughout Each Period |
| | Year Ended
July 31,
2019 | | | Year Ended
July 31,
2018 | | | Year Ended
July 31,
2017 | | | Year Ended
July 31,
2016 | | | Period Ended
July 31,
2015 (a) | |
Net asset value at beginning of period | | $ | 9.86 | | | $ | 9.97 | | | $ | 9.71 | | | $ | 9.85 | | | $ | 10.00 | |
| | | | | | | | | | | | | | | | | | | | | |
Income (loss) from investment operations: | | | | | | | | | | | | | | | | | | | | |
Net investment income | | | 0.32 | | | | 0.27 | | | | 0.27 | | | | 0.28 | | | | 0.19 | |
Net realized and unrealized gains (losses) on investments | | | (0.05 | ) | | | (0.11 | ) | | | 0.27 | | | | (0.05 | ) | | | (0.15 | ) |
Total from investment operations | | | 0.27 | | | | 0.16 | | | | 0.54 | | | | 0.23 | | | | 0.04 | |
| | | | | | | | | | | | | | | | | | | | | |
Less distributions from: | | | | | | | | | | | | | | | | | | | | |
Net investment income | | | (0.32 | ) | | | (0.27 | ) | | | (0.28 | ) | | | (0.28 | ) | | | (0.19 | ) |
Net realized gains on investments | | | — | | | | — | | | | — | | | | (0.09 | ) | | | — | |
Total distributions | | | (0.32 | ) | | | (0.27 | ) | | | (0.28 | ) | | | (0.37 | ) | | | (0.19 | ) |
| | | | | | | | | | | | | | | | | | | | | |
Net asset value at end of period | | $ | 9.81 | | | $ | 9.86 | | | $ | 9.97 | | | $ | 9.71 | | | $ | 9.85 | |
| | | | | | | | | | | | | | | | | | | | | |
Total return (b) | | | 2.82 | % | | | 1.61 | % | | | 5.65 | % | | | 2.55 | % | | | 0.38 | %(c) |
| | | | | | | | | | | | | | | | | | | | | |
Net assets at end of period (000’s) | | $ | 88,796 | | | $ | 88,318 | | | $ | 84,969 | | | $ | 79,253 | | | $ | 82,648 | |
| | | | | | | | | | | | | | | | | | | | | |
Ratios/supplementary data: | | | | | | | | | | | | | | | | | | | | |
| | | | | | | | | | | | | | | | | | | | | |
Ratio of total expenses to average net assets | | | 0.27 | % | | | 0.25 | % | | | 0.26 | % | | | 0.25 | % | | | 0.25 | %(d) |
| | | | | | | | | | | | | | | | | | | | | |
Ratio of net investment income to average net assets | | | 3.24 | % | | | 2.71 | % | | | 2.72 | % | | | 2.94 | % | | | 2.34 | %(d) |
| | | | | | | | | | | | | | | | | | | | | |
Portfolio turnover rate | | | 16 | % | | | 60 | % | | | 42 | % | | | 33 | % | | | 27 | %(c) |
(a) | Represents the period from the commencement of operations (September 30, 2014) through July 31, 2015. |
(b) | Total return is a measure of the change in value of an investment in the Fund over the periods covered, which assumes any dividends or capital gains distributions are reinvested in shares of the Fund. The returns shown do not reflect the deduction of taxes a shareholder would pay on Fund distributions or the redemption of Fund shares. |
(c) | Not annualized. |
(d) | Annualized. |
See accompanying notes to financial statements. |
20
EUBEL BRADY & SUTTMAN INCOME FUND
FINANCIAL HIGHLIGHTS |
Per Share Data for a Share Outstanding Throughout Each Period |
| | Year Ended
July 31,
2019 | | | Year Ended
July 31,
2018 | | | Year Ended
July 31,
2017 | | | Year Ended
July 31,
2016 | | | Period Ended
July 31,
2015 (a) | |
Net asset value at beginning of period | | $ | 9.82 | | | $ | 10.00 | | | $ | 9.97 | | | $ | 9.89 | | | $ | 10.00 | |
| | | | | | | | | | | | | | | | | | | | | |
Income (loss) from investment operations: | | | | | | | | | | | | | | | | | | | | |
Net investment income | | | 0.33 | | | | 0.27 | | | | 0.24 | | | | 0.25 | | | | 0.13 | |
Net realized and unrealized gains (losses) on investments | | | 0.04 | | | | (0.19 | ) | | | 0.04 | | | | 0.10 | | | | (0.11 | ) |
Total from investment operations | | | 0.37 | | | | 0.08 | | | | 0.28 | | | | 0.35 | | | | 0.02 | |
| | | | | | | | | | | | | | | | | | | | | |
Less distributions from: | | | | | | | | | | | | | | | | | | | | |
Net investment income | | | (0.33 | ) | | | (0.26 | ) | | | (0.24 | ) | | | (0.25 | ) | | | (0.13 | ) |
Net realized gains on investments | | | — | | | | — | | | | (0.01 | ) | | | (0.02 | ) | | | — | |
Total distributions | | | (0.33 | ) | | | (0.26 | ) | | | (0.25 | ) | | | (0.27 | ) | | | (0.13 | ) |
| | | | | | | | | | | | | | | | | | | | | |
Net asset value at end of period | | $ | 9.86 | | | $ | 9.82 | | | $ | 10.00 | | | $ | 9.97 | | | $ | 9.89 | |
| | | | | | | | | | | | | | | | | | | | | |
Total return (b) | | | 3.86 | % | | | 0.86 | % | | | 2.75 | % | | | 3.58 | % | | | 0.22 | %(c) |
| | | | | | | | | | | | | | | | | | | | | |
Net assets at end of period (000’s) | | $ | 200,716 | | | $ | 198,903 | | | $ | 185,957 | | | $ | 160,540 | | | $ | 162,994 | |
| | | | | | | | | | | | | | | | | | | | | |
Ratios/supplementary data: | | | | | | | | | | | | | | | | | | | | |
| | | | | | | | | | | | | | | | | | | | | |
Ratio of total expenses to average net assets | | | 0.20 | % | | | 0.20 | % | | | 0.20 | % | | | 0.20 | % | | | 0.22 | %(d) |
| | | | | | | | | | | | | | | | | | | | | |
Ratio of net investment income to average net assets | | | 3.37 | % | | | 2.69 | % | | | 2.36 | % | | | 2.54 | % | | | 1.70 | %(d) |
| | | | | | | | | | | | | | | | | | | | | |
Portfolio turnover rate | | | 19 | % | | | 65 | % | | | 40 | % | | | 35 | % | | | 27 | %(c) |
(a) | Represents the period from the commencement of operations (September 30, 2014) through July 31, 2015. |
(b) | Total return is a measure of the change in value of an investment in the Fund over the periods covered, which assumes any dividends or capital gains distributions are reinvested in shares of the Fund. The returns shown do not reflect the deduction of taxes a shareholder would pay on Fund distributions or the redemption of Fund shares. |
(c) | Not annualized. |
(d) | Annualized. |
See accompanying notes to financial statements. |
21
EUBEL BRADY & SUTTMAN MUTUAL FUND TRUST
NOTES TO FINANCIAL STATEMENTS
July 31, 2019
1. Organization
Eubel Brady & Suttman Income and Appreciation Fund (“EBS Income and Appreciation Fund”) and Eubel Brady & Suttman Income Fund (“EBS Income Fund”) (individually, a “Fund” and collectively, the “Funds”) are each a no-load diversified series of Eubel Brady & Suttman Mutual Fund Trust (the “Trust”), an open-end management investment company organized as an Ohio business trust on April 22, 2014.
The investment objective of EBS Income and Appreciation Fund is to provide total return through a combination of current income and capital appreciation.
The investment objective of EBS Income Fund is to preserve capital, produce income and maximize total return.
2. Significant Accounting Policies
In August 2018, the U.S. Securities and Exchange Commission (the “SEC”) adopted regulations that eliminated or amended disclosure requirements that were redundant or outdated in light of changes in SEC requirements, accounting principles generally accepted in the United States of America (“GAAP”), International Financial Reporting Standards or changes in technology or the business environment. These regulations were effective November 5, 2018, and the Funds are complying with them effective with these financial statements.
The Funds follow accounting and reporting guidance under Financial Accounting Standards Board (“FASB”) Accounting Standards Codification (“ASC”) Topic 946, “Financial Services – Investment Companies.” The following is a summary of significant accounting policies followed by the Funds. These policies are in conformity with GAAP.
New Accounting Pronouncements — In March 2017, FASB issued Accounting Standards Update No. 2017-08 (“ASU 2017-08”), “Receivables – Nonrefundable Fees and Other Costs (Subtopic 310-20): Premium Amortization on Purchased Callable Debt Securities.” ASU 2017-08 shortens the amortization period for certain callable debt securities, held at a premium, to be amortized to the earliest call date. ASU 2017-08 does not require an accounting change for securities held at a discount, which continues to accrete to maturity. ASU 2017-08 is effective for fiscal years and interim periods within those fiscal years beginning after December 15, 2018. Management is currently evaluating the impact, if any, of applying ASU 2017-08.
In August 2018, FASB issued Accounting Standards Update No. 2018-13 (“ASU 2018-13”), “Disclosure Framework – Changes to the Disclosure Requirements for Fair Value Measurement,” which amends the fair value measurement disclosure requirements of ASC Topic 820 (“ASC 820”), “Fair Value Measurement.” ASU 2018-
22
EUBEL BRADY & SUTTMAN MUTUAL FUND TRUST
NOTES TO FINANCIAL STATEMENTS (Continued)
13 includes new, eliminated, and modified disclosure requirements for ASC 820. In addition, ASU 2018-13 clarifies that materiality is an appropriate consideration when evaluating disclosure requirements. ASU 2018-13 is effective for fiscal years beginning after December 15, 2019, including interim periods therein. Early adoption is permitted and the Funds have adopted ASU 2018-13 with these financial statements.
Securities Valuation — Securities that are traded on any stock exchange are generally valued at the last quoted sale price. Lacking a last sale price, an exchange traded security is generally valued at its last bid price. Securities traded on NASDAQ are generally valued at the NASDAQ Official Closing Price. Investments representing shares of other open-end investment companies, including money market funds, are valued at their net asset value (“NAV”) as reported by such companies. The Funds typically use an independent pricing service to determine the value of their fixed income securities. The pricing service utilizes electronic data processing techniques based on yield spreads relating to securities with similar characteristics to determine prices for normal institutional-size trading units of fixed income securities without regard to sale or bid prices. Commercial paper may be valued at amortized cost, which under normal circumstances approximates market value.
If Eubel Brady & Suttman Asset Management, Inc. (the “Adviser”), the investment adviser to the Funds, determines that a price provided by the pricing service does not accurately reflect the market value of the securities, when prices are not readily available from the pricing service or when restricted or illiquid securities are being valued, securities are valued at fair value as determined in good faith by the Adviser in conformity with guidelines adopted by and subject to review by the Board of Trustees of the Trust (the “Board”).
GAAP establishes a single authoritative definition of fair value, sets out a framework for measuring fair value and requires additional disclosures about fair value measurements.
Various inputs are used in determining the value of each Fund’s investments. These inputs are summarized in the three broad levels listed below:
● Level 1 – quoted prices in active markets for identical securities
● Level 2 – other significant observable inputs
● Level 3 – significant unobservable inputs
Certain fixed income securities held by the Funds are classified as Level 2 since the values are typically provided by an independent pricing service that utilizes various “other significant observable inputs” as discussed above. Other fixed income securities, including certain bank debt held by the Funds, are classified as Level 3 since the values for these securities are based on prices derived from one or more
23
EUBEL BRADY & SUTTMAN MUTUAL FUND TRUST
NOTES TO FINANCIAL STATEMENTS (Continued)
significant inputs that are unobservable. The inputs or methodology used are not necessarily an indication of the risks associated with investing in those securities. The inputs used to measure fair value may fall into different levels of the fair value hierarchy. In such cases, for disclosure purposes, the level in the fair value hierarchy within which the fair value measurement falls in its entirety is based on the lowest level input that is significant to the fair value measurement.
The following is a summary of the inputs used to value each Fund’s investments as of July 31, 2019 by security type:
EBS Income and Appreciation Fund: |
| | Level 1 | | | Level 2 | | | Level 3 | | | Total | |
Corporate Bonds | | $ | — | | | $ | 65,582,186 | | | $ | — | | | $ | 65,582,186 | |
Convertible Corporate Bonds | | | — | | | | 12,678,215 | | | | — | | | | 12,678,215 | |
Bank Debt | | | — | | | | 483,244 | | | | 2,366,378 | | | | 2,849,622 | |
Common Stocks | | | 5,301,362 | | | | — | | | | — | | | | 5,301,362 | |
Warrants | | | 387,960 | | | | — | | | | 10 | | | | 387,970 | |
Money Market Funds | | | 1,217,008 | | | | — | | | | — | | | | 1,217,008 | |
Total | | $ | 6,906,330 | | | $ | 78,743,645 | | | $ | 2,366,388 | | | $ | 88,016,363 | |
EBS Income Fund: |
| | Level 1 | | | Level 2 | | | Level 3 | | | Total | |
Corporate Bonds | | $ | — | | | $ | 172,528,622 | | | $ | — | | | $ | 172,528,622 | |
Convertible Corporate Bonds | | | — | | | | 5,025,123 | | | | — | | | | 5,025,123 | |
Bank Debt | | | — | | | | — | | | | 3,943,963 | | | | 3,943,963 | |
Preferred Stocks | | | 114,750 | | | | — | | | | — | | | | 114,750 | |
Money Market Funds | | | 6,521,284 | | | | — | | | | — | | | | 6,521,284 | |
Commercial Paper | | | — | | | | 10,995,593 | | | | — | | | | 10,995,593 | |
Total | | $ | 6,636,034 | | | $ | 188,549,338 | | | $ | 3,943,963 | | | $ | 199,129,335 | |
24
EUBEL BRADY & SUTTMAN MUTUAL FUND TRUST
NOTES TO FINANCIAL STATEMENTS (Continued)
The following is a reconciliation of Level 3 investments of the Funds for which significant unobservable inputs were used to determine fair value for the year ended July 31, 2019:
EBS Income and Appreciation Fund |
Investments
in Securities | | Value
as of
July 31,
2018 | | | Purchases | | | Sales/
Maturities | | | Realized
gains (loss) | | | Net change
in unrealized
appreciation
(depreciation) | | | Value
as of
July 31,
2019 | |
Bank Debt | | $ | 2,711,847 | | | $ | 731,169 | | | $ | (1,098,493 | ) | | $ | — | | | $ | 21,855 | | | $ | 2,366,378 | |
Warrants | | | 10 | | | | — | | | | — | | | | — | | | | — | | | | 10 | |
Total | | $ | 2,711,857 | | | $ | 731,169 | | | $ | (1,098,493 | ) | | $ | — | | | $ | 21,855 | | | $ | 2,366,388 | |
EBS Income Fund |
Investments
in Securities | | Value
as of
July 31,
2018 | | | Purchases | | | Sales/
Maturities | | | Realized
gains (loss) | | | Net change
in unrealized
appreciation
(depreciation) | | | Value
as of
July 31,
2019 | |
Bank Debt | | $ | 4,519,745 | | | $ | 1,218,615 | | | $ | (1,830,822 | ) | | $ | — | | | $ | 36,425 | | | $ | 3,943,963 | |
The total change in unrealized appreciation (depreciation) included in the Statements of Operations attributable to Level 3 investments still held at July 31, 2019 is $21,855 and $36,425 for EBS Income and Appreciation Fund and EBS Income Fund, respectively.
The following table summarizes the valuation techniques used and unobservable inputs developed by the Adviser in conformity with guidelines adopted by and subject to review by the Board to determine the fair value of the Level 3 investments.
EBS Income and Appreciation Fund |
| | Fair Value at
July 31,
2019 | | Valuation
Technique | Unobservable
Input1 | Value | Weighted
Average of
Unobservable
Inputs |
Bank Debt | | $ | 2,366,378 | | DCF Model | Discount Rate | 4.352% | N/A |
Warrants | | $ | 10 | | Management’s Estimate of Future Cash Flows | N/A | N/A | N/A |
25
EUBEL BRADY & SUTTMAN MUTUAL FUND TRUST
NOTES TO FINANCIAL STATEMENTS (Continued)
EBS Income Fund |
| | Fair Value at
July 31,
2019 | | Valuation
Technique | Unobservable
Input1 | Value | Weighted
Average of
Unobservable
Inputs |
Bank Debt | | $ | 3,943,963 | | DCF Model | Discount Rate | 4.352% | N/A |
DCF - Discounted Cash Flow |
1 | Significant increases and decreases in the unobservable inputs used to determine fair value of Level 3 assets could result in significantly higher or lower fair value measurements. An increase to the unobservable input would result in a decrease to the fair value. A decrease to the unobservable input would have the opposite effect. |
There were no derivative instruments held by the Funds as of or during the year ended July 31, 2019.
Share Valuation — The NAV per share of each Fund is calculated daily by dividing the total value of its assets, less liabilities, by the number of shares outstanding. The offering price and redemption price per share of each Fund is equal to its NAV per share.
Estimates — The preparation of financial statements in conformity with GAAP requires management to make estimates and assumptions that affect the reported amounts of assets and liabilities and disclosures of contingent assets and liabilities at the date of the financial statements and the reported amounts of increases and decreases in net assets from operations during the reporting period. Actual results could differ from those estimates.
Investment Income, Investment Transactions and Realized Capital Gains and Losses — Dividend income is recorded on the ex-dividend date. Interest income is recorded as earned. Discounts and premiums on fixed income securities are amortized using the effective interest method. Investment transactions are accounted for on trade date. Realized capital gains and losses on investments sold are determined on a specific identification basis.
Expenses — Expenses of the Trust that are directly identifiable to a specific Fund are charged to that Fund. Expenses which are not readily identifiable to a specific Fund are allocated in such a manner as deemed equitable.
Distributions to Shareholders — Distributions to shareholders of net investment income, if any, are paid monthly. Capital gain distributions, if any, are distributed to shareholders annually. Distributions are based on amounts calculated in accordance with applicable federal income tax regulations, which may differ from GAAP. These differences are due primarily to differing treatments of income and realized capital gains on various investment securities held by the Funds, timing
26
EUBEL BRADY & SUTTMAN MUTUAL FUND TRUST
NOTES TO FINANCIAL STATEMENTS (Continued)
differences and differing characterizations of distributions made by the Funds. Dividends and distributions are recorded on the ex-dividend date. The tax character of distributions paid by each Fund during the years ended July 31, 2019 and 2018 was ordinary income.
Federal Income Tax — Each Fund has qualified and intends to continue to qualify each year as a “regulated investment company” under Subchapter M of the Internal Revenue Code of 1986, as amended (the “Code”). Qualification generally will relieve the Funds of liability for federal income taxes to the extent 100% of their net investment income and net realized capital gains are distributed in accordance with the Code.
In order to avoid imposition of the excise tax applicable to regulated investment companies, it is also each Fund’s intention to declare as dividends in each calendar year at least 98% of its net investment income (earned during the calendar year) and 98.2% of its net realized capital gains (earned during the twelve months ended October 31) plus undistributed amounts from prior years.
The following information is computed on a tax basis for each item as of July 31, 2019:
| | EBS Income and
Appreciation
Fund | | | EBS Income
Fund | |
Tax cost of portfolio investments | | $ | 86,114,911 | | | $ | 200,198,917 | |
Gross unrealized appreciation | | $ | 3,818,100 | | | $ | 2,079,454 | |
Gross unrealized depreciation | | | (1,916,648 | ) | | | (3,149,036 | ) |
Net unrealized appreciation (depreciation) on investments | | | 1,901,452 | | | | (1,069,582 | ) |
Undistributed ordinary income | | | 23,778 | | | | 3,683 | |
Accumulated capital and other losses | | | (1,567,620 | ) | | | (729,271 | ) |
Accumulated earnings (deficit) | | $ | 357,610 | | | $ | (1,795,170 | ) |
The difference between the federal income tax cost of portfolio investments and the Schedule of Investments cost for EBS Income and Appreciation Fund is due to certain timing differences in the recognition of capital gains or losses under income tax regulations and GAAP. These “book/tax” differences are temporary in nature and are primarily due to basis adjustments related to the Fund’s holdings in convertible bonds.
27
EUBEL BRADY & SUTTMAN MUTUAL FUND TRUST
NOTES TO FINANCIAL STATEMENTS (Continued)
As of July 31, 2019, the Funds had the following capital loss carryforwards (“CLCFs”) for federal income tax purposes:
| | EBS Income and
Appreciation
Fund | | | EBS Income
Fund | |
Short-term | | $ | 514,874 | | | $ | 595,584 | |
Long-term | | | 1,052,746 | | | | 133,687 | |
| | | $ | 1,567,620 | | | $ | 729,271 | |
These CLCFs, which do not expire, may be utilized in future years to offset net realized capital gains, if any, prior to distributing such gains to shareholders.
The Funds recognize the tax benefits or expenses of uncertain tax positions only when the position is “more likely than not” to be sustained assuming examination by tax authorities. Management has reviewed each Fund’s tax positions for all open tax years (generally, three years) and has concluded that no provision for unrecognized tax benefits or expenses is required in these financial statements. Each Fund identifies its major tax jurisdiction as U.S. Federal.
3. Unfunded Loan Commitment
At July 31, 2019, unfunded loan commitments for the Funds were as follows:
Fund | Borrower | | Unfunded
Commitment | |
EBS Income and Appreciation Fund | NCP Finance Limited Partnership | | $ | 684,478 | |
EBS Income Fund | NCP Finance Limited Partnership | | $ | 1,140,797 | |
Pursuant to an Asset-Based Lending Credit Agreement between the Funds and NCP Finance Limited Partnership (the “Borrower”), the Borrower has agreed to pay the Funds a commitment fee equal to 0.25% of the average daily unfunded commitment balance, which is included within interest income on the Statements of Operations.
4. Transactions with Related Parties
Certain officers of the Trust are also officers of the Adviser, of Ultimus Fund Solutions, LLC (“Ultimus”), the administrative services agent, shareholder servicing and transfer agent, and accounting services agent for the Funds, or of Ultimus Fund Distributors, LLC (the “Distributor”), the principal underwriter and exclusive agent for the distribution of shares of the Funds.
Investment Adviser — Under the terms of the Management Agreement between the Trust and the Adviser, the Adviser manages each Fund’s investments subject to oversight by the Board. The Funds do not pay the Adviser investment advisory
28
EUBEL BRADY & SUTTMAN MUTUAL FUND TRUST
NOTES TO FINANCIAL STATEMENTS (Continued)
fees under the Management Agreement. However, prior to investing in a Fund, a prospective shareholder must enter into an investment advisory agreement with the Adviser that calls for the payment of an advisory fee based upon a percentage of all assets (including shares of the Funds) managed by the Adviser on behalf of the prospective shareholder. The fee schedule may be negotiable at the time the account is opened and is generally based upon the value of assets held in the client’s account and the style of management.
The Adviser has entered into an agreement with the Funds under which it has agreed to reimburse Fund expenses to the extent necessary to limit total annual operating expenses (excluding brokerage costs, taxes, interest, acquired fund fees and expenses, expenses incurred pursuant to the Funds’ Shareholder Servicing Plan and extraordinary expenses) to an amount not exceeding 0.35% of each Fund’s average daily net assets. Any payments by the Adviser of expenses which are a Fund’s obligation are subject to repayment by the Fund for a period of three years following the fiscal year in which such expenses were paid, provided that the repayment does not cause the Fund’s total annual operating expenses to exceed 0.35% of average daily net assets. This agreement is currently in effect until December 1, 2019. No expense reimbursements were required during the year ended July 31, 2019.
Administrator — Ultimus provides administration, fund accounting and transfer agency services to each Fund. The Funds pay Ultimus fees in accordance with the agreements for such services. In addition, the Funds pay out-of-pocket expenses including, but not limited to, postage, supplies and costs of pricing the Funds’ portfolio securities.
Compensation of Trustees — Trustees and officers affiliated with the Adviser or Ultimus are not compensated by the Funds for their services. Effective January 1, 2019, each Trustee who is not an interested person of the Trust (“Independent Trustee”) receives from the Funds a fee of $2,625 for attendance at each meeting of the Board, in addition to reimbursement of travel and other expenses incurred in attending the meetings. The Chairman of the Audit and Governance Committee receives an additional annual fee of $1,000, paid quarterly. Prior to January 1, 2019, each Independent Trustee received from the Funds a fee of $2,063 for attendance at each meeting of the Board, in addition to reimbursement of travel and other expenses incurred in attending the meetings.
29
EUBEL BRADY & SUTTMAN MUTUAL FUND TRUST
NOTES TO FINANCIAL STATEMENTS (Continued)
5. Securities Transactions
During the year ended July 31, 2019, cost of purchases and proceeds from sales and maturities of investment securities, other than short-term investments and U.S. government securities, were as follows:
| | EBS Income and
Appreciation
Fund | | | EBS Income
Fund | |
Purchases of investment securities | | $ | 18,679,027 | | | $ | 35,481,061 | |
Proceeds from sales and maturities of investment securities | | $ | 13,483,437 | | | $ | 42,492,427 | |
During the year ended July 31, 2019, there were no purchases or sales and maturities from U.S. government long-term securities for the Funds.
6. Shareholder Servicing Plan
The Funds have adopted a Shareholder Servicing Plan (the “Plan”) which allows each Fund to make payments to financial organizations (including payments directly to the Adviser and the Distributor) for providing account administration and account maintenance services to Fund shareholders. The annual fees paid under the Plan may not exceed an amount equal to 0.25% of each Fund’s average daily net assets. During the year ended July 31, 2019, EBS Income and Appreciation Fund and EBS Income Fund incurred $35,088 and $79,613, respectively, of shareholder servicing fees pursuant to the Plan. No payments were made to the Adviser or the Distributor during the year ended July 31, 2019.
7. Contingencies and Commitments
The Funds indemnify the Trust’s officers and Trustees for certain liabilities that might arise from the performance of their duties to the Funds. Additionally, in the normal course of business the Funds enter into contracts that contain a variety of representations and warranties and which provide general indemnifications. The Funds’ maximum exposure under these arrangements is unknown, as this would involve future claims that may be made against the Funds that have not yet occurred. However, based on experience, the Funds expect the risk of loss to be remote.
30
EUBEL BRADY & SUTTMAN MUTUAL FUND TRUST
NOTES TO FINANCIAL STATEMENTS (Continued)
8. Subsequent Events
The Funds are required to recognize in the financial statements the effects of all subsequent events that provide additional evidence about conditions that existed as of the date of the Statements of Assets and Liabilities. For non-recognized subsequent events that must be disclosed to keep the financial statements from being misleading, the Funds are required to disclose the nature of the event as well as an estimate of its financial effect, or a statement that such an estimate cannot be made. Management has evaluated subsequent events through the issuance of these financial statements and has noted no such events.
31
EUBEL BRADY & SUTTMAN MUTUAL FUND TRUST
REPORT OF INDEPENDENT REGISTERED
PUBLIC ACCOUNTING FIRM
To the Shareholders and Board of Trustees of
Eubel Brady & Suttman Mutual Fund Trust
Opinion on the Financial Statements
We have audited the accompanying statements of assets and liabilities, including the schedules of investments, of Eubel Brady & Suttman Mutual Fund Trust, comprising Eubel Brady & Suttman Income and Appreciation Fund and Eubel Brady & Suttman Income Fund (the “Funds”), as of July 31, 2019, and the related statements of operations for the year then ended, the statements of changes in net assets for each of the two years in the period then ended, including the related notes, and the financial highlights for each of the five periods in the period then ended (collectively referred to as the “financial statements”). In our opinion, the financial statements present fairly, in all material respects, the financial position of each of the Funds as of July 31, 2019, the results of their operations for the year then ended, the changes in their net assets for each of the two years in the period then ended, and the financial highlights for each of the five periods in the period then ended, in conformity with accounting principles generally accepted in the United States of America.
Basis for Opinion
These financial statements are the responsibility of the Funds’ management. Our responsibility is to express an opinion on the Funds’ financial statements based on our audits. We are a public accounting firm registered with the Public Company Accounting Oversight Board (United States) (“PCAOB”) and are required to be independent with respect to the Funds in accordance with the U.S. federal securities laws and the applicable rules and regulations of the Securities and Exchange Commission and the PCAOB.
We conducted our audits in accordance with the standards of the PCAOB. Those standards require that we plan and perform the audit to obtain reasonable assurance about whether the financial statements are free of material misstatement, whether due to error or fraud.
Our audits included performing procedures to assess the risks of material misstatement of the financial statements, whether due to error or fraud, and performing procedures that respond to those risks. Such procedures included examining, on a test basis, evidence regarding the amounts and disclosures in the financial statements. Our procedures included confirmation of securities owned as of July 31, 2019, by correspondence with the custodian and brokers. Our audits also included evaluating the accounting principles used and significant estimates made by management, as well as evaluating the overall presentation of the financial statements. We believe that our audits provide a reasonable basis for our opinion.
We have served as the Funds’ auditor since 2014.
COHEN & COMPANY, LTD.
Cleveland, Ohio
September 26, 2019
32
EUBEL BRADY & SUTTMAN MUTUAL FUND TRUST
ABOUT YOUR FUNDS’ EXPENSES (Unaudited)
We believe it is important for you to understand the impact of costs on your investment. All mutual funds have operating expenses. As a shareholder of the Funds, you incur ongoing costs, including shareholder servicing fees and other operating expenses. These ongoing costs, which are deducted from each Fund’s gross income, directly reduce the investment return of the Funds.
A mutual fund’s ongoing costs are expressed as a percentage of its average net assets. This figure is known as the expense ratio. The following examples are intended to help you understand the ongoing costs (in dollars) of investing in the Funds and to compare these costs with the ongoing costs of investing in other mutual funds. The examples below are based on an investment of $1,000 made at the beginning of the period shown and held for the entire period (February 1, 2019 through July 31, 2019).
The table below illustrates each Fund’s ongoing costs in two ways:
Actual fund return – This section helps you to estimate the actual expenses that you paid over the period. The “Ending Account Value” shown is based on each Fund’s actual return, and the fourth column shows the dollar amount of operating expenses that would have been paid by an investor who started with $1,000 in each Fund. You may use the information here, together with the amount you invested, to estimate the expenses that you paid over the period.
To do so, simply divide your account value by $1,000 (for example, an $8,600 account value divided by $1,000 = 8.6), then multiply the result by the number given for the Funds under the heading “Expenses Paid During Period.”
Hypothetical 5% return – This section is intended to help you compare the Funds’ ongoing costs with those of other mutual funds. It assumes that each Fund had an annual return of 5% before expenses during the period shown, but that the expense ratio is unchanged. In this case, because the returns used are not the Funds’ actual returns, the results do not apply to your investment. The example is useful in making comparisons because the SEC requires all mutual funds to calculate expenses based on a 5% return. You can assess each Fund’s ongoing costs by comparing this hypothetical example with the hypothetical examples that appear in shareholder reports of other funds.
Note that expenses shown in the table are meant to highlight and help you compare ongoing costs only. They will not help you determine the relative total costs of owning different funds. The Funds do not charge transaction fees, such as purchase or redemption fees, nor do they impose any sales loads.
The calculations assume no shares were bought or sold during the period. Your actual costs may have been higher or lower, depending on the amount of your investment and the timing of any purchases or redemptions.
33
EUBEL BRADY & SUTTMAN MUTUAL FUND TRUST
ABOUT YOUR FUNDS’ EXPENSES (Unaudited) (Continued)
More information about the Funds’ expenses can be found in this report. For additional information on operating expenses and other shareholder costs, please refer to the Funds’ prospectus.
| Beginning
Account Value
February 1, 2019 | Ending
Account Value
July 31, 2019 | Expense
Ratio(a) | Expenses
Paid During
Period(b) |
EBS Income and Appreciation Fund | | | |
Based on Actual Fund Return | $ 1,000.00 | $ 1,029.70 | 0.27% | $1.36 |
Based on Hypothetical 5% Fund Return (before expenses) | $ 1,000.00 | $ 1,023.46 | 0.27% | $1.35 |
EBS Income Fund | | | | |
Based on Actual Fund Return | $ 1,000.00 | $ 1,026.10 | 0.20% | $1.00 |
Based on Hypothetical 5% Fund Return (before expenses) | $ 1,000.00 | $ 1,023.80 | 0.20% | $1.00 |
(a) | Annualized, based on each Fund’s most recent one-half year expenses. |
(b) | Expenses are equal to each Fund’s annualized expense ratio multiplied by the average account value over the period, multiplied by 181/365 (to reflect the one-half year period). |
34
EUBEL BRADY & SUTTMAN MUTUAL FUND TRUST
OTHER INFORMATION (Unaudited)
The Trust files a complete listing of portfolio holdings for the Funds with the SEC as of the end of the first and third quarters of each fiscal year on Form N-Q. These filings are available upon request by calling 1-800-391-1223. Furthermore, you may obtain a copy of the filings on the SEC’s website at www.sec.gov.
A description of the policies and procedures that the Funds use to vote proxies relating to portfolio securities is available without charge upon request by calling toll-free 1-800-391-1223, or on the SEC’s website at www.sec.gov. Information regarding how the Funds voted proxies relating to portfolio securities during the most recent 12-month period ended June 30 is also available without charge upon request by calling toll-free 1-800-391-1223, or on the SEC’s website at www.sec.gov.
FEDERAL TAX INFORMATION (Unaudited)
For the fiscal year ended July 31, 2019, certain dividends paid by the Funds may be treated as qualified dividends subject to a reduced tax rate. EBS Income and Appreciation Fund and EBS Income Fund intend to designate up to a maximum amount of $2,872,948 and $6,717,506, respectively, as qualified dividend income. Complete information will be computed and reported in conjunction with your 2019 Form 1099-DIV.
35
EUBEL BRADY & SUTTMAN MUTUAL FUND TRUST
BOARD OF TRUSTEES AND EXECUTIVE OFFICERS
(Unaudited)
The Board has overall responsibility for management of the Trust’s affairs. The Trustees serve during the lifetime of the Trust and until its termination, or until death, resignation, retirement, or removal. The Trustees, in turn, elect the officers of the Trust to actively supervise its day-to-day operations. The officers have been elected for an annual term. The following are the Trustees and executive officers of the Trust:
Name, Address and
Date of Birth | Length of
Time Served | Position(s)
Held with
Trust | Principal Occupation(s)
During Past 5 Years and
Directorships of Public
Companies Within Past 5 Years | Number of
Portfolios in
Fund Complex
Overseen
by Trustee |
Interested Trustees: | | | | |
Scott E. Lundy, CFP* c/o Eubel Brady & Suttman 10100 Innovation Drive, Ste. 410 Dayton, OH 45342 Year of birth: 1976 | Since
July 2014 | President
and Trustee | Executive Vice President and Principal of Eubel Brady & Suttman Asset Management, Inc., the Funds’ investment adviser, since 2003; Chief Compliance Officer of Eubel Brady & Suttman Asset Management, Inc. from March 2016 to March 2019 | 2 |
Independent Trustees: |
Robert A. Goering c/o Eubel Brady & Suttman 10100 Innovation Drive, Ste. 410 Dayton, OH 45342 Year of birth: 1960 | Since
July 2014 | Trustee | Partner of Goering & Goering, LLC (law firm) from November 1986 to present; Hamilton County Ohio Treasurer from February 1991 to present; Adjunct Professor at Salmon P. Chase College of Law from August 2005 to present | 2 |
Christopher C. Young c/o Eubel Brady & Suttman 10100 Innovation Drive, Ste. 410 Dayton, OH 45342 Year of birth: 1962 | Since
July 2014/July 2016 | Trustee and Chairman | Vice President, Sales of New Day Aluminum (aluminum manufacturer) from October 2016 to present (purchaser of Noranda Aluminum where he worked as Vice President, Sales from January 2014 until October 2016 and as a director from 2010 to 2013) | 2 |
36
EUBEL BRADY & SUTTMAN MUTUAL FUND TRUST
BOARD OF TRUSTEES AND EXECUTIVE OFFICERS
(Unaudited) (Continued)
Name, Address and
Date of Birth | Length of
Time Served | Position(s)
Held with
Trust | Principal Occupation(s)
During Past 5 Years and
Directorships of Public
Companies Within Past 5 Years | Number of
Portfolios in
Fund Complex
Overseen
by Trustee |
Virginia A. Boeckman c/o Eubel Brady & Suttman 10100 Innovation Drive, Suite 410 Dayton, OH 45342 Year of birth: 1960 | Since March 2017 | Trustee | Manager, SAP Finance Application Development & Support for CareSource Ohio (non-profit managed healthcare provider) from January 2017 to present; Senior Project Manager, Finance at LexisNexis (an information service provider) from 2008 to 2017 | 2 |
Name, Address and
Date of Birth | Length of
Time Served | Position(s)
Held with
Trust | Principal Occupation(s)
During Past 5 Years |
Executive Officers: | | | |
Terri L. King, IACCP® Eubel Brady & Suttman 10100 Innovation Drive, Ste. 410 Dayton, OH 45342 Year of Birth: 1961 | Since
July 2014 | Chief Compliance Officer | Chief Compliance Officer of Eubel Brady & Suttman Asset Management, Inc., the Funds’ investment adviser from March 2019 to present; Compliance Manager from February 2016 to March 2019 |
Theresa M. Bridge Ultimus Fund Solutions, LLC 225 Pictoria Drive Suite 450 Cincinnati, OH 45246 Year of Birth: 1969 | Since
July 2014 | Treasurer | Vice President-Director of Financial Administration of Ultimus Fund Solutions, LLC |
Ronald L. Eubel Eubel Brady & Suttman 10100 Innovation Drive, Ste. 410 Dayton, OH 45342 Year of Birth: 1960 | Since
July 2014 | Secretary | Co-Chief Investment Officer and Principal of Eubel Brady & Suttman Asset Management, Inc., the Funds’ investment adviser |
* | Scott E. Lundy, as an affiliated person of Eubel Brady & Suttman Asset Management, Inc, the Funds’ investment adviser, is considered an “interested person” of the Trust within the meaning of Section 2(a)(19) of the Investment Company Act of 1940. |
Additional information about members of the Board and executive officers is available in the Funds’ Statement of Additional Information (“SAI”). To obtain a free copy of the SAI, please call 1-800-391-1223.
37
EUBEL BRADY & SUTTMAN MUTUAL FUND TRUST
APPROVAL OF INVESTMENT ADVISORY AGREEMENT
(Unaudited)
The Board of Trustees, including all of the Independent Trustees voting separately, has reviewed and approved the continuance of the Investment Advisory Agreement between the Trust, on behalf of the Eubel Brady & Suttman Income and Appreciation Fund (the “Appreciation Fund”) and the Eubel Brady & Suttman Income Fund (the “Income Fund”) (the Income and Appreciation Fund and the Income Fund are referred to collectively as the “Funds”), and the Adviser. Approval took place at an in-person meeting held on July 8, 2019, at which all Trustees were present, including all of the Independent Trustees.
In the course of their consideration of the continuation of the Investment Advisory Agreement, the Independent Trustees were advised by independent legal counsel and received materials from such counsel discussing the legal standards for their consideration of the proposed approval of the continuation of the Investment Advisory Agreement on behalf of the Funds. The Independent Trustees received and reviewed a substantial amount of information provided by the Adviser in response to requests from independent legal counsel. Prior to voting, the Independent Trustees met with and asked questions of representatives of the Adviser and also met separately with their independent legal counsel.
In considering the Investment Advisory Agreement and reaching their conclusions with respect to the continuation of the Investment Advisory Agreement, the Trustees reviewed and analyzed various factors that they determined were relevant, including the factors described below.
Nature, Extent and Quality of Services
The Trustees received and considered various data and information regarding the nature, extent and quality of services provided to the Funds by the Adviser. The Trustees specifically considered the depth and quality of the investment management process utilized for the Funds and noted the process for identifying investment opportunities is made collaboratively by a team of portfolio managers. The Trustees considered the experience and responsibilities of the members of the Adviser’s portfolio management team who oversee the daily investment management and operations of the Funds. The Trustees considered that the Adviser is a research-oriented firm that has demonstrated consistency in its investment approach for the Funds. The Trustees further considered that the Adviser’s value-oriented investment process for the Funds emphasizes a long-term investment horizon. The Trustees considered the various services in addition to portfolio management that the Adviser provides the Funds relating to risk management and portfolio trading. After further discussion, the Board concluded that it was satisfied with the nature, extent and quality of the investment advisory services provided to the Funds by the Adviser.
38
EUBEL BRADY & SUTTMAN MUTUAL FUND TRUST
APPROVAL OF INVESTMENT ADVISORY AGREEMENT
(Unaudited) (Continued)
Expenses and Performance
The Trustees next considered information regarding each Fund’s expense ratio and also considered comparisons of the Funds’ fees to the fee information for each Fund’s peer group, as presented by management. The Appreciation Fund’s overall expense ratio was compared to funds within the Morningstar category of “Convertible Bond Funds” (no load). The Trustees noted that the overall expense ratio of the Appreciation Fund, which does not include a charge for advisory fees paid at the client account level, is lower than the average expense ratio for Convertible Bond Funds. The Trustees also considered the range of advisory fees charged by the Adviser at the client account level and applied that range to the overall expense ratio of the Appreciation Fund to estimate total costs to underlying shareholders. The Income Fund’s overall expense ratio was compared to funds within the Morningstar category of “Multisector Bond Funds” (no load). The Trustees noted that the overall expense ratio of the Income Fund, which did not include a charge for advisory fees at the client account level, is lower than the average expense ratio for Multisector Bond Funds. The Trustees also considered the range of advisory fees charged by the Adviser at the client account level and applied that range to the overall expense ratio of the Income Fund to estimate total costs to underlying shareholders. The Trustees also observed that the Adviser has committed to extending the expense cap arrangement with each Fund for an additional annual period. The Trustees found that the expense ratio for each Fund, which included an estimated advisory fee charged at the client account level, was within the range of the average expense ratios for the peer groups presented and concluded that each Fund’s expense ratio was reasonable, especially when the additional services provided to clients are considered.
The Trustees next discussed each Fund’s performance record over short and longer-term periods ended March 31, 2019. The Trustees noted that they had compared each Fund’s performance with the performance of its benchmark indices and Morningstar category for the year ended March 31, 2019, and discussed with the Adviser the reasons for the underperformance of the Funds during this and longer-term periods. The Trustees noted that because of the Adviser’s preference for selectively taking on credit risk at the short end of the yield curve, rather than extending maturities to increase each Fund’s yield, the Funds have a tendency to lag the performance of their peers in certain market environments. The Trustees acknowledged that the investment processes for the Funds are not identical to those of the other funds in their Morningstar category. They were mindful that (i) the lack of opportunities in the convertible securities market has impacted the Appreciation Fund’s ranking among funds in the Morningstar Convertible category; and (ii) the Multisector Bond category includes a wide range of fixed income investments, including high yield investments, and does not separate funds based upon maturity or duration. The Trustees then discussed the performance of the Adviser’s SMA strategies that hold shares of the
39
EUBEL BRADY & SUTTMAN MUTUAL FUND TRUST
APPROVAL OF INVESTMENT ADVISORY AGREEMENT
(Unaudited) (Continued)
Funds. The Trustees noted that the Adviser does not sub-advise any accounts with similar investment objectives as the Funds. The Trustees concluded that the Adviser has demonstrated a satisfactory performance record for each Fund.
Investment Advisory Fee Rates
The Trustees considered that the Adviser is being compensated by each client under the terms described in their respective SMA client agreements and the Adviser does not charge an investment advisory fee at the Fund level. The Trustees reviewed and considered the range of advisory fees payable to the Adviser for SMA services and compared such information with the fees charged by the other funds in the relevant Morningstar peer group for each Fund. The Trustees concluded that the advisory fee ranges charged at the SMA account level were reasonable in relation to the average rates for the peer groups presented, and the clients generally received more services for their fees.
Profitability
The Trustees reviewed information regarding the Adviser’s cost of providing services to the Funds and the methods that were used to determine profitability. They discussed the profits of the Adviser and the other ancillary benefits that the Adviser receives with regard to providing advisory services to the Funds and concluded that, in light of the fact that each SMA client of the Adviser negotiates his/her own advisory fee, these profits are not excessive.
Economies of Scale
The Trustees discussed economies of scale, noting that the Funds do not pay a direct advisory fee, and that each Fund is operating below the agreed upon expense cap. The Trustees noted that the Adviser has generally provided for breakpoints in its advisory fees charged at the client account level, thus allowing its clients to recognize economies of scale as their accounts grow.
40
This page intentionally left blank.
As of the end of the period covered by this report, the registrant has adopted a code of ethics that applies to the registrant’s principal executive officer, principal financial officer, principal accounting officer or controller, or persons performing similar functions, regardless of whether these individuals are employed by the registrant or a third party. Pursuant to Item 12(a)(1), a copy of registrant’s code of ethics is filed as an exhibit to this Form N-CSR. During the period covered by this report, the code of ethics has not been amended, and the registrant has not granted any waivers, including implicit waivers, from the provisions of the code of ethics.
| Item 3. | Audit Committee Financial Expert. |
The registrant’s board of trustees has determined that the registrant has at least one audit committee financial expert serving on its audit committee. The name of the audit committee financial expert is Virginia A. Boeckman. Ms. Boeckman is “independent” for purposes of this item.
| Item 4. | Principal Accountant Fees and Services. |
| (a) | Audit Fees. The aggregate fees billed for professional services rendered by the principal accountant for the audit of the registrant’s annual financial statements or for services that are normally provided by the accountant in connection with statutory and regulatory filings or engagements were $29,600 and $29,000 with respect to the registrant’s fiscal years ended July 31, 2019 and July 31, 2018, respectively. |
| (b) | Audit-Related Fees. No fees were billed in the last fiscal year for assurance and related services by the principal accountant that are reasonably related to the performance of the audit of the registrant’s financial statements and are not reported under paragraph (a) of this Item. |
| (c) | Tax Fees. The aggregate fees billed for professional services rendered by the principal accountant for tax compliance, tax advice, and tax planning were $6,000 and $6,000 with respect to the registrant’s fiscal years ended July 31, 2019, and July 31, 2018, respectively. The services comprising these fees are the preparation of the registrant’s federal income and excise tax returns. |
| (d) | All Other Fees. No fees were billed in the last fiscal year for products and services provided by the principal accountant, other than the services reported in paragraphs (a) through (c) of this Item. |
| (e)(1) | The audit committee has not adopted pre-approval policies and procedures described in paragraph (c)(7) of Rule 2-01 of Regulation S-X. |
| (e)(2) | None of the services described in paragraph (b) through (d) of this Item were approved by the audit committee pursuant to paragraph (c)(7)(i)(C) of Rule 2-01 of Regulation S-X. |
| (f) | Less than 50% of hours expended on the principal accountant’s engagement to audit the registrant’s financial statements for the most recent fiscal year were attributed to work performed by persons other than the principal accountant’s full-time, permanent employees. |
| (g) | During the fiscal years ended July 31, 2019 and July 31, 2018, aggregate non-audit fees of $6,000 and $6,000, respectively, were billed by the registrant’s principal accountant for services rendered to the registrant. No non-audit fees were billed in the last fiscal year by the registrant’s principal accountant for services rendered to the registrant’s investment adviser (not including any sub-adviser whose role is primarily portfolio management and is subcontracted with or overseen by another investment adviser), and any entity controlling, controlled by, or under common control with the adviser that provides ongoing services to the registrant. |
| (h) | The principal accountant has not provided any non-audit services to the registrant’s investment adviser (not including any sub-adviser whose role is primarily portfolio management and is subcontracted with or overseen by another investment adviser), and any entity controlling, controlled by, or under common control with the investment adviser that provides ongoing services to the registrant. |
| Item 5. | Audit Committee of Listed Registrants. |
Not applicable
| Item 6. | Schedule of Investments. |
| (a) | Not applicable [schedule filed with Item 1] |
| Item 7. | Disclosure of Proxy Voting Policies and Procedures for Closed-End Management Investment Companies. |
Not applicable
| Item 8. | Portfolio Managers of Closed-End Management Investment Companies. |
Not applicable
| Item 9. | Purchases of Equity Securities by Closed-End Management Investment Company and Affiliated Purchasers. |
Not applicable
| Item 10. | Submission of Matters to a Vote of Security Holders. |
The registrant has not adopted procedures by which shareholders may recommend nominees to the registrant’s board of trustees.
| Item 11. | Controls and Procedures. |
(a) Based on their evaluation of the registrant’s disclosure controls and procedures (as defined in Rule 30a-3(c) under the Investment Company Act of 1940) as of a date within 90 days of the filing date of this report, the registrant’s principal executive officer and principal financial officer have concluded that such disclosure controls and procedures are reasonably designed and are operating effectively to ensure that material information relating to the registrant, including its consolidated subsidiaries, is made known to them by others within those entities, particularly during the period in which this report is being prepared, and that the information required in filings on Form N-CSR is recorded, processed, summarized, and reported on a timely basis.
(b) There were no changes in the registrant’s internal control over financial reporting (as defined in Rule 30a-3(d) under the Investment Company Act of 1940) that occurred during the second fiscal quarter of the period covered by this report that have materially affected, or are reasonably likely to materially affect, the registrant’s internal control over financial reporting.
| Item 12. | Disclosure of Securities Lending Activities for Closed-End Management Investment Companies. |
Not applicable.
File the exhibits listed below as part of this Form. Letter or number the exhibits in the sequence indicated.
(a)(1) Any code of ethics, or amendment thereto, that is the subject of the disclosure required by Item 2, to the extent that the registrant intends to satisfy the Item 2 requirements through filing of an exhibit: Attached hereto
(a)(2) A separate certification for each principal executive officer and principal financial officer of the registrant as required by Rule 30a-2(a) under the Act (17 CFR 270.30a-2(a)): Attached hereto
(a)(3) Any written solicitation to purchase securities under Rule 23c-1 under the Act (17 CFR 270.23c-1) sent or given during the period covered by the report by or on behalf of the registrant to 10 or more persons: Not applicable
(a)(4) Change in the registrant’s independent public accountants: Not applicable.
(b) Certifications required by Rule 30a-2(b) under the Act (17 CFR 270.30a-2(b)): Attached hereto
| Exhibit 99.CODE ETH | Code of Ethics |
| | |
| Exhibit 99.CERT | Certifications required by Rule 30a-2(a) under the Act |
| | |
| Exhibit 99.906CERT | Certifications required by Rule 30a-2(b) under the Act |
SIGNATURES
Pursuant to the requirements of the Securities Exchange Act of 1934 and the Investment Company Act of 1940, the registrant has duly caused this report to be signed on its behalf by the undersigned, thereunto duly authorized.
| (Registrant) | Eubel Brady & Suttman Mutual Fund Trust | | |
| | | | |
| By (Signature and Title)* | /s/ Scott E. Lundy | |
| | | Scott E. Lundy, President | |
| | | | |
| Date | October 3, 2019 | | |
| | | | |
| Pursuant to the requirements of the Securities Exchange Act of 1934 and the Investment Company Act of 1940, this report has been signed below by the following persons on behalf of the registrant and in the capacities and on the dates indicated. |
| | | | |
| By (Signature and Title)* | /s/ Scott E. Lundy | |
| | | Scott E. Lundy, President | |
| | | | |
| Date | October 3, 2019 | | |
| | | | |
| By (Signature and Title)* | /s/ Theresa M. Bridge | |
| | | Theresa M. Bridge, Treasurer | |
| | | | |
| Date | October 3, 2019 | | |
| * | Print the name and title of each signing officer under his or her signature. |