| | OMB APPROVAL |
| | OMB Number: 3235-0570
Expires: August 31, 2020
Estimated average burden hours per response: 20.6
|
UNITED STATES
SECURITIES AND EXCHANGE COMMISSION
Washington, D.C. 20549
FORM N-CSR
CERTIFIED SHAREHOLDER REPORT OF REGISTERED
MANAGEMENT INVESTMENT COMPANIES
| Investment Company Act file number | 811-22960 | |
| Eubel Brady & Suttman Mutual Fund Trust |
| (Exact name of registrant as specified in charter) |
| 225 Pictoria Drive, Suite 450 | Cincinnati, Ohio 45246 |
| (Address of principal executive offices) | (Zip code) |
Carol J. Highsmith, Esq.
| 225 Pictoria Drive, Suite 450 Cincinnati, Ohio 45246 |
| (Name and address of agent for service) |
| Registrant's telephone number, including area code: | (513) 587-3400 | |
| Date of fiscal year end: | July 31 | |
| | | |
| Date of reporting period: | January 31, 2020 | |
Form N-CSR is to be used by management investment companies to file reports with the Commission not later than 10 days after the transmission to stockholders of any report that is required to be transmitted to stockholders under Rule 30e-1 under the Investment Company Act of 1940 (17 CFR 270.30e-1). The Commission may use the information provided on Form N-CSR in its regulatory, disclosure review, inspection, and policymaking roles.
A registrant is required to disclose the information specified by Form N-CSR, and the Commission will make this information public. A registrant is not required to respond to the collection of information contained in Form N-CSR unless the Form displays a currently valid Office of Management and Budget ("OMB") control number. Please direct comments concerning the accuracy of the information collection burden estimate and any suggestions for reducing the burden to the Secretary, Securities and Exchange Commission, 450 Fifth Street, NW, Washington, DC 20549-0609. The OMB has reviewed this collection of information under the clearance requirements of 44 U.S.C. § 3507.
Item 1. Reports to Stockholders.
Eubel Brady & Suttman
Income and Appreciation Fund
Ticker Symbol: EBSZX
Eubel Brady & Suttman
Income Fund
Ticker Symbol: EBSFX
Each a series of the
Eubel Brady & Suttman Mutual Fund Trust
SEMI-ANNUAL REPORT
January 31, 2020
(Unaudited)
Beginning on January 1, 2021, as permitted by regulations adopted by the U.S. Securities and Exchange Commission, paper copies of the Funds’ shareholder reports like this one may no longer be sent by mail, unless you specifically request paper copies of the reports from the Funds or from your financial intermediary, such as a broker-dealer or bank. Instead, the reports may be made available on a website, and you will be notified by mail each time a report is posted and provided with a website link to access the report.
If you have already elected to receive shareholder reports electronically, you will not be affected by this change and you need not take any action. You may elect to receive shareholder reports and other communications from the Funds electronically by contacting the Funds at 1-800-391-1223 or, if you own these shares through a financial intermediary, by contacting your financial intermediary.
You may elect to receive all future reports in paper free of charge. You can inform the Funds that you wish to continue receiving paper copies of your shareholder reports by contacting the Funds at 1-800-391-1223. If you own shares through a financial intermediary, you may contact your financial intermediary to elect to continue to receive paper copies of your shareholder reports. Your election to receive reports in paper will apply to both series of the Eubel Brady & Suttman Mutual Fund Trust.
EUBEL BRADY & SUTTMAN MUTUAL FUND TRUST |
LETTER TO OUR SHAREHOLDERS | January 31, 2020 |
Dear Shareholders:
We navigated a challenging fixed-income environment during the six months ended January 31, 2020, as the threat of economic weakness persisted and the Federal Reserve (the “Fed”) responded by lowering the Fed Funds rate 75 basis points to a range of 1.50% to 1.75%. Trade tensions weighed on economic activity early in the period and the Coronavirus was a burgeoning worry in the final stretch.
Treasury and investment grade yields declined across the maturity spectrum and credit spreads tightened. The yield curve was generally flat during most of the period, yet inverted – short-term rates higher than longer term rates – in the final weeks. Yield is usually increased by extending maturities, adding credit risk or a combination thereof. Extending maturities in the current environment is unappealing, so we have increased our exposure to 30 day investment grade commercial paper which generally yields more than two year BBBs and selectively taken a limited amount of credit risk.
We discuss the current environment, review our investment philosophy and results, and share our perspective below. Feel free to give us a call with questions, comments or both.
Current Environment – We believe three central themes summarize the period: the Fed, U.S. – China trade and a divergence in global synchronous growth.
The Fed decreased the target federal funds rate by 0.25% in August, September and October of 2019 which initially eliminated the yield curve inversion; however, in the final weeks of January 2020 the inversion returned as global economies became ensnared in fear of the Coronavirus. An inverted yield curve is atypical and often portends a recession in the coming months. In addition to lowering rates to spur the economy, the Fed also began purchasing an estimated $60 billion per month of Treasury Bills in October 2019 to regain control of overnight funding rates in short-term money markets after rates briefly spiked to around 10% in September.
U.S. – China trade negotiations continued with spirited enthusiasm during the final months of 2019 and led to a phase one trade deal in January 2020. Phase one calls for the U.S. to reduce some recently implemented tariffs, and for China to purchase more U.S. agriculture products and put in place stronger intellectual property laws.
Divergence in global synchronous growth began in earnest around mid-2018 and continues as of this writing. General economic weakness prevailed throughout Europe, China and the Middle-East with the U.S. economy being a bright spot. Although the U.S. unemployment rate remains low and the service sector strong, there is anecdotal evidence of stress forming in some corners of the manufacturing sector. Based on the Fed’s response to an inverted yield curve earlier in the Funds’ fiscal year, more accommodation could be on the horizon.
Regarding convertible securities in particular, 2019 U.S. issuance of $53.1 billion was the highest since 2008. Pricing was generally aggressive with
1
average coupons coming in under 2% and initial conversion premiums reaching 34% at year’s end. Increasing volatility, tight credit spreads, higher stock prices and strong investor demand were all contributing factors. New issues were generally unattractive.
We believe U.S. equity markets remained generally high relative to underlying values during the semi-annual period. This, in conjunction with many convertibles’ equity sensitivity, limited the number of interesting convertible opportunities, which kept our exposure relatively low. When attractively priced convertibles are not available for purchase, we generally hold non-convertible corporate bonds. If equity markets weaken in the future, those convertibles issued on rich initial terms may become more interesting.
Investment Philosophy – Managing risks so that investors are adequately compensated for them is an important element of our bottom-up investment philosophy. Interest rates are extremely difficult to accurately forecast over time, so we don’t make precise forecasts. However, we are cognizant of interest rate levels.
In our view, flexibility in portfolio management can support long-term success. Therefore, each Fund has latitude with respect to maturity, duration (price sensitivity to a change in interest rates) and credit quality (among other factors). This flexibility allows us to invest where we find the most value, rather than being confined to specific maturity, duration and credit rating targets (boxes, if you will). Being largely unconstrained allows us to hold bonds to maturity, and we often do so. We like the flexibility and believe it provides the Funds an advantage over those confined to specific mandates. As you may recall, only EBS clients are permitted to invest in the Funds. This provides a more stable asset base as compared to funds open to the general public. Each Fund held fewer than 50 securities at period-end, yet maintained good diversification in our view. While many funds hold hundreds of securities, we believe holding fewer securities allows us to be more selective. The composition of the EBS Funds will often be materially different than their benchmarks. As such, you should expect the Funds’ returns to diverge from their benchmarks, often significantly. Lastly, neither Fund uses leverage (borrows money) to make investments.
Results For Various Periods Ended January 31, 2020 – Since inception (September 30, 2014) through January 31, 2020, theEubel Brady & Suttman Income and Appreciation Fund (“EBSZX”) posted an average annual total return of 2.68%, while its primary benchmark, the ICE BofA Merrill Lynch U.S. Yield Alternatives Index (the “Index”), returned 4.45% (annualized) over the same period. During the three-year period ended January 31, 2020; the Fund returned 2.68% per year and the Index 7.90%. Over the year ended January 31, 2020, the Fund returned 4.39% and the Index returned 12.91%. Over the six-month period ended January 31, 2020, the Fund increased 1.38% and the Index 7.13%.
The primary factors contributing to EBSZX’s underperformance in the aforementioned periods ended January 31, 2020 are described below:
| | ● | EBSZX’s investment in non-convertible securities coupled with short duration corporate bonds contributed to the Fund’s relative underperformance. Equity and fixed-income markets worked against its allocation to convertible and non-convertible bond exposure resulting in underperformance relative to |
2
its convertible benchmark. The Fund’s minimal equity sensitivity only benefited it slightly as equity markets lifted. Given current equity valuations, the Fund is positioned more defensively.
We believe EBSZX is positioned well to capitalize on additional convertible investments should they become available at prices we find compelling. For the time being, we remain very selective.
Since inception (September 30, 2014) through January 31, 2020, the Eubel Brady & Suttman Income Fund (“EBSFX”) logged an average annual total return of 2.37%, while its primary benchmark, the ICE BofA Merrill Lynch U.S. Corporate & Government Master Index (the “Index”) was up 3.90% (annualized) over the same period. During the three-year period ended January 31, 2020, the Fund returned 2.49% and the Index 5.14%. Over the year ended January 31, 2020, the Fund increased 4.04% and the Index 11.24%. Over the six-month period ended January 31, 2020, the Fund increased 1.40% and the Index appreciated 4.95%.
The primary factors contributing to EBSFX’s underperformance during the aforementioned periods ended January 31, 2020 are described below:
| | ● | EBSFX’s primary reasons for underperforming during the periods were, in part, due to its weighted average maturity and duration (price sensitivity to a change in interest rates) being shorter than its benchmark and it had less exposure to Government & Agency debt. Due to its greater exposure to Government & Agency debt and longer average duration, the benchmark benefited more from declining yields than did the Fund. |
Our Perspective – In light of the current environment where short-term instruments have similar or greater yields than longer ones, we are inclined to continue focusing on shorter maturities. Using Treasury yields as an example, on January 31, 2020, the 3-Year Treasury yielded 1.3% and the 10-Year yielded 1.5%. Said differently, an investor can capture roughly 87% (1.3%/1.5%) of the 10-Year yield while only going out three years. Even more interesting though, is that three-month Treasuries yielded 1.5% at period-end. Keeping maturities relatively short, on average, allows us to manage interest rate risk and provides flexibility in navigating changing credit conditions.
Although we routinely assess higher yielding credits, narrow spreads (lack of risk premium) have significantly reduced the probability of finding durable credits at attractive yields.
Both Funds’ sensitivity to interest rates remains modest and each Fund’s portfolio is diversified, in our view.
Convertible exposure within EBSZX is lower than we prefer, and is largely due to a low yield environment and stock prices that seem generally less attractive relative to underlying values as previously mentioned. The hunt for value continues, yet we believe exercising patience has served the Funds well thus far and remains prudent. Both Funds are positioned well to capitalize on opportunities, in our view.
We welcome your questions, comments or both and may be reached at 1-800-391-1223. As always, we appreciate your trust and confidence in our firm.
Sincerely,
The EBS Research Group
3
Important Disclosures – Performance data quoted in this letter or the report itself represents past performance. Past performance does not guarantee future results. The value of an investor’s shares will fluctuate, and may be worth more or less than the original cost when redeemed. Current performance may be higher or lower than performance quoted herein. Performance data, current to the most recent month end, is available by calling 1-800-391-1223.
The information in this “Letter To Our Shareholders” represents the opinion of the author and is not intended to be a forecast or investment advice. This publication does not constitute an offer or solicitation of any transaction in any securities. Information contained in this publication has been obtained from sources believed to be reliable, but has not been independently verified by EBS. Please note that any discussion of fund holdings, fund performance and views expressed are as of January 31, 2020 (except if otherwise stated) and are subject to change without notice.
4
EUBEL BRADY & SUTTMAN MUTUAL FUND TRUST
PORTFOLIO INFORMATION
January 31, 2020 (Unaudited)
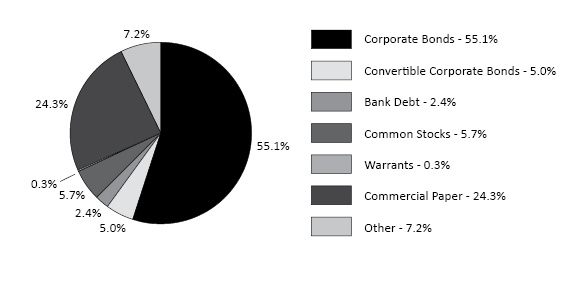
Eubel Brady & Suttman Income and Appreciation Fund
Asset Allocation (% of Net Assets)
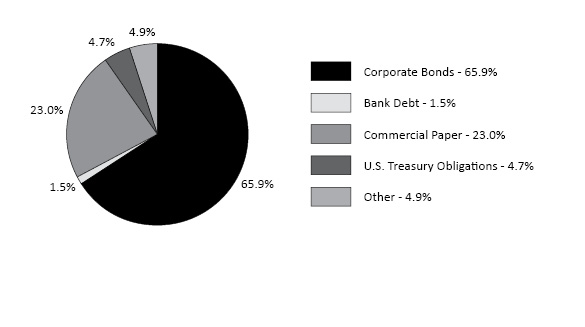
Eubel Brady & Suttman Income Fund
Asset Allocation (% of Net Assets)
5
EUBEL BRADY & SUTTMAN INCOME AND APPRECIATION FUND
SCHEDULE OF INVESTMENTS
January 31, 2020 (Unaudited) |
CORPORATE BONDS — 55.1% | | Coupon | | | Maturity | | | Par Value | | | Value | |
Communication Services — 2.2% | | | | | | | | | | | | | | | | |
Verizon Communications, Inc. (3MO LIBOR + 100) (a) | | | 2.894 | % | | | 03/16/22 | | | $ | 2,100,000 | | | $ | 2,134,235 | |
| | | | | | | | | | | | | | | | | |
Consumer Discretionary — 6.7% | | | | | | | | | | | | | | | | |
Lennar Corporation | | | 2.950 | % | | | 11/29/20 | | | | 2,600,000 | | | | 2,606,500 | |
Marriott International, Inc. | | | 3.375 | % | | | 10/15/20 | | | | 2,220,000 | | | | 2,235,470 | |
Silversea Cruise Finance Ltd., 144A | | | 7.250 | % | | | 02/01/25 | | | | 1,600,000 | | | | 1,688,320 | |
| �� | | | | | | | | | | | | | | | 6,530,290 | |
Consumer Staples — 1.6% | | | | | | | | | | | | | | | | |
Mead Johnson Nutrition Company | | | 3.000 | % | | | 11/15/20 | | | | 1,596,000 | | | | 1,611,478 | |
| | | | | | | | | | | | | | | | | |
Energy — 4.1% | | | | | | | | | | | | | | | | |
CNX Resources Corporation | | | 5.875 | % | | | 04/15/22 | | | | 2,600,000 | | | | 2,567,500 | |
CONSOL Energy, Inc., 144A | | | 11.000 | % | | | 11/15/25 | | | | 2,000,000 | | | | 1,390,000 | |
| | | | | | | | | | | | | | | | 3,957,500 | |
Financials — 9.8% | | | | | | | | | | | | | | | | |
American International Group, Inc. | | | 3.300 | % | | | 03/01/21 | | | | 1,700,000 | | | | 1,726,519 | |
CNG Holdings, Inc., 144A | | | 12.500 | % | | | 06/15/24 | | | | 2,700,000 | | | | 2,565,000 | |
Goldman Sachs Group, Inc. (The) (3MO LIBOR + 100) (a) | | | 2.801 | % | | | 07/24/23 | | | | 2,500,000 | | | | 2,530,112 | |
Pershing Square Holdings Ltd., 144A | | | 5.500 | % | | | 07/15/22 | | | | 2,500,000 | | | | 2,642,875 | |
| | | | | | | | | | | | | | | | 9,464,506 | |
Health Care — 10.4% | | | | | | | | | | | | | | | | |
Allergan Funding SCS | | | 3.000 | % | | | 03/12/20 | | | | 2,300,000 | | | | 2,300,668 | |
Anthem, Inc. | | | 4.350 | % | | | 08/15/20 | | | | 605,000 | | | | 612,914 | |
Becton, Dickinson and Company (3MO LIBOR + 103) (a) | | | 2.917 | % | | | 06/06/22 | | | | 2,615,000 | | | | 2,635,126 | |
CVS Health Corporation | | | 2.800 | % | | | 07/20/20 | | | | 1,900,000 | | | | 1,906,835 | |
Zimmer Biomet Holdings, Inc. | | | 2.700 | % | | | 04/01/20 | | | | 2,600,000 | | | | 2,601,638 | |
| | | | | | | | | | | | | | | | 10,057,181 | |
Industrials — 6.7% | | | | | | | | | | | | | | | | |
General Electric Company (3MO LIBOR + 100) (a) | | | 2.894 | % | | | 03/15/23 | | | | 1,000,000 | | | | 1,008,240 | |
Molex Electronics Technologies, LLC, 144A | | | 2.878 | % | | | 04/15/20 | | | | 2,700,000 | | | | 2,702,708 | |
Roper Technologies, Inc. | | | 2.800 | % | | | 12/15/21 | | | | 2,700,000 | | | | 2,748,081 | |
| | | | | | | | | | | | | | | | 6,459,029 | |
See accompanying notes to financial statements.
6
EUBEL BRADY & SUTTMAN INCOME AND APPRECIATION FUND
SCHEDULE OF INVESTMENTS (Continued) |
CORPORATE BONDS — 55.1% (Continued) | | Coupon | | | Maturity | | | Par Value | | | Value | |
Information Technology — 2.1% | | | | | | | | | | | | | | | | |
FLIR Systems, Inc. | | | 3.125 | % | | | 06/15/21 | | | $ | 2,034,000 | | | $ | 2,060,127 | |
| | | | | | | | | | | | | | | | | |
Materials — 8.9% | | | | | | | | | | | | | | | | |
Avnet, Inc. | | | 3.750 | % | | | 12/01/21 | | | | 2,600,000 | | | | 2,669,596 | |
Ball Corporation | | | 5.000 | % | | | 03/15/22 | | | | 556,000 | | | | 587,275 | |
DowDuPont, Inc. | | | 3.766 | % | | | 11/15/20 | | | | 945,000 | | | | 959,069 | |
Methanex Corporation | | | 5.250 | % | | | 03/01/22 | | | | 1,641,000 | | | | 1,734,219 | |
Sherwin-Williams Company (The) | | | 2.250 | % | | | 05/15/20 | | | | 2,665,000 | | | | 2,667,975 | |
| | | | | | | | | | | | | | | | 8,618,134 | |
Utilities — 2.6% | | | | | | | | | | | | | | | | |
Southern Company (The) | | | 2.350 | % | | | 07/01/21 | | | | 2,495,000 | | | | 2,513,129 | |
| | | | | | | | | | | | | | | | | |
Total Corporate Bonds (Cost $53,254,440) | | | | | | | | | | | | | | $ | 53,405,609 | |
|
CONVERTIBLE CORPORATE BONDS — 5.0% | | Coupon | | | Maturity | | | Par Value | | | Value | |
Financials — 2.1% | | | | | | | | | | | | | | | | |
Ares Capital Corporation | | | 3.750 | % | | | 02/01/22 | | | $ | 2,000,000 | | | $ | 2,042,113 | |
| | | | | | | | | | | | | | | | | |
Real Estate — 2.9% | | | | | | | | | | | | | | | | |
Redwood Trust, Inc. | | | 4.750 | % | | | 08/15/23 | | | | 2,700,000 | | | | 2,806,567 | |
| | | | | | | | | | | | | | | | | |
Total Convertible Corporate Bonds (Cost $4,665,250) | | | | | | | | | | | | | | $ | 4,848,680 | |
See accompanying notes to financial statements.
7
EUBEL BRADY & SUTTMAN INCOME AND APPRECIATION FUND
SCHEDULE OF INVESTMENTS (Continued) |
BANK DEBT — 2.4% | | Coupon | | | Maturity | | | Par Value | | | Value | |
Financials — 2.0% | | | | | | | | | | | | | | | | |
NCP Finance Limited Partnership Sr. Revolving Loan (1MO LIBOR + 400) (a)(b)(c) | | | 5.781 | % | | | 12/21/20 | | | $ | 11,048 | | | $ | 11,048 | |
NCP Finance Limited Partnership Sr. Term Loan (1MO LIBOR + 400) (a)(b)(c) | | | 5.781 | % | | | 12/21/20 | | | | 1,846,154 | | | | 1,888,333 | |
| | | | | | | | | | | | | | | | 1,899,381 | |
Materials — 0.4% | | | | | | | | | | | | | | | | |
Ball Metalpack Finco, LLC (3MO LIBOR + 450) (a) | | | 6.409 | % | | | 07/31/25 | | | | 492,500 | | | | 435,862 | |
| | | | | | | | | | | | | | | | | |
Total Bank Debt (Cost $2,347,239) | | | | | | | | | | | | | | $ | 2,335,243 | |
|
COMMON STOCKS — 5.7% | | Shares | | | Value | |
Financials — 4.4% | | | | | | | | |
Capital One Financial Corporation | | | 9,904 | | | $ | 988,419 | |
Hartford Financial Services Group, Inc. (The) | | | 41,269 | | | | 2,446,427 | |
Lincoln National Corporation | | | 15,673 | | | | 853,865 | |
| | | | | | | | 4,288,711 | |
Industrials — 1.3% | | | | | | | | |
Air Industries Group (d) | | | 754,026 | | | | 1,198,901 | |
| | | | | | | | | |
Total Common Stocks (Cost $2,428,808) | | | | | | $ | 5,487,612 | |
|
WARRANTS — 0.3% | | Shares | | | Value | |
Financials — 0.3% | | | | | | | | |
American International Group, Inc., $42.9413, expires 01/19/21 (d) | | | 26,500 | | | $ | 240,885 | |
| | | | | | | | | |
Industrials — 0.0% (e) | | | | | | | | |
American Zinc Recycling, LLC, $630.227, expires 09/30/22 (b)(c)(d) | | | 965 | | | | 10 | |
| | | | | | | | | |
Total Warrants (Cost $1,803,660) | | | | | | $ | 240,895 | |
See accompanying notes to financial statements.
8
EUBEL BRADY & SUTTMAN INCOME AND APPRECIATION FUND
SCHEDULE OF INVESTMENTS (Continued) |
COMMERCIAL PAPER — 24.3% (f) | | Par Value | | | Value | |
Consolidated Edison Corporation, 1.76%, due 02/06/20 | | $ | 2,500,000 | | | $ | 2,499,399 | |
Dominion Gas Holdings, LLC, 1.88%, due 02/03/20 | | | 3,000,000 | | | | 2,999,692 | |
FMC Technologies, Inc., 2.08%, due 02/03/20 | | | 2,500,000 | | | | 2,499,715 | |
Glencore Funding, LLC, 1.90%, due 02/10/20 | | | 3,000,000 | | | | 2,998,598 | |
Koch Industries, Inc., 1.60%, due 02/20/20 | | | 3,000,000 | | | | 2,997,498 | |
Kuerig Dr Pepper, Inc., 1.81%, due 02/06/20 | | | 3,000,000 | | | | 2,999,258 | |
Mondelēz International, Inc., 1.76%, due 02/14/20 | | | 1,050,000 | | | | 1,049,344 | |
Nasdaq, Inc., 1.78%, due 02/06/20 | | | 2,500,000 | | | | 2,499,393 | |
Walgreens Boots Alliance, Inc., 1.88%, due 03/06/20 | | | 3,000,000 | | | | 2,994,758 | |
Total Commercial Paper (Cost $23,537,655) | | | | | | $ | 23,537,655 | |
|
MONEY MARKET FUNDS — 6.4% | | Shares | | | Value | |
Invesco Short-Term Investments Trust - Treasury Portfolio - Institutional Class, 1.47% (g) (Cost $6,236,032) | | | 6,236,032 | | | $ | 6,236,032 | |
| | | | | | | | | |
Total Investments at Value — 99.2% (Cost $94,273,084) | | | | | | $ | 96,091,726 | |
| | | | | | | | | |
Other Assets in Excess of Liabilities — 0.8% | | | | | | | 762,768 | |
| | | | | | | | | |
Net Assets — 100.0% | | | | | | $ | 96,854,494 | |
144A - | Security was purchased in a transaction exempt from registration in compliance with Rule 144A of the Securities Act of 1933. This security may be resold in transactions exempt from registration, normally to qualified institutional buyers. The total value of such securities is $10,988,903 as of January 31, 2020, representing 11.3% of net assets. |
LIBOR - | London Interbank Offered Rate. |
(a) | Variable rate security. Interest rate resets periodically. The rate shown is the effective interest rate as of January 31, 2020. The reference rate and spread (in basis points) for these securities are indicated parenthetically. |
(b) | Security has been fair valued using significant unobservable inputs in good faith by the Adviser in conformity with guidelines adopted by and subject to review by the Board of Trustees. The total value of such securities is $1,899,391 as of January 31, 2020, representing 2.0% of net assets (Note 2). |
(c) | Illiquid security. The total fair value of these securities as of January 31, 2020 was $1,899,391, representing 2.0% of net assets. |
(d) | Non-income producing security. |
(e) | Percentage rounds to less than 0.1%. |
(f) | The rate shown is the annualized yield at the time of purchase, not a coupon rate. |
(g) | The rate shown is the 7-day effective yield as of January 31, 2020. |
See accompanying notes to financial statements. |
9
EUBEL BRADY & SUTTMAN INCOME FUND
SCHEDULE OF INVESTMENTS
January 31, 2020 (Unaudited) |
CORPORATE BONDS — 65.9% | | Coupon | | | Maturity | | | Par Value | | | Value | |
Communication Services — 2.7% | | | | | | | | | | | | | | | | |
Gannett Company, Inc. | | | 5.125 | % | | | 07/15/20 | | | $ | 707,000 | | | $ | 707,354 | |
Verizon Communications, Inc. (3MO LIBOR + 100) (a) | | | 2.894 | % | | | 03/16/22 | | | | 5,000,000 | | | | 5,081,511 | |
| | | | | | | | | | | | | | | | 5,788,865 | |
Consumer Discretionary — 8.9% | | | | | | | | | | | | | | | | |
AutoZone, Inc. | | | 4.000 | % | | | 11/15/20 | | | | 3,000,000 | | | | 3,032,787 | |
Lennar Corporation | | | 2.950 | % | | | 11/29/20 | | | | 6,000,000 | | | | 6,015,000 | |
Marriott International, Inc. | | | 3.375 | % | | | 10/15/20 | | | | 3,250,000 | | | | 3,272,648 | |
Marriott International, Inc. | | | 2.300 | % | | | 01/15/22 | �� | | | 2,000,000 | | | | 2,015,958 | |
Silversea Cruise Finance Ltd., 144A | | | 7.250 | % | | | 02/01/25 | | | | 4,500,000 | | | | 4,748,400 | |
| | | | | | | | | | | | | | | | 19,084,793 | |
Consumer Staples — 7.1% | | | | | | | | | | | | | | | | |
Kroger Company (The) | | | 2.950 | % | | | 11/01/21 | | | | 5,206,000 | | | | 5,302,850 | |
Kuerig Dr Pepper, Inc. | | | 3.551 | % | | | 05/25/21 | | | | 5,000,000 | | | | 5,116,031 | |
Mondelēz International, Inc., 144A | | | 2.000 | % | | | 10/28/21 | | | | 4,720,000 | | | | 4,737,593 | |
| | | | | | | | | | | | | | | | 15,156,474 | |
Energy — 3.7% | | | | | | | | | | | | | | | | |
CNX Resources Corporation | | | 5.875 | % | | | 04/15/22 | | | | 5,400,000 | | | | 5,332,500 | |
CONSOL Energy, Inc., 144A | | | 11.000 | % | | | 11/15/25 | | | | 3,700,000 | | | | 2,571,500 | |
| | | | | | | | | | | | | | | | 7,904,000 | |
Financials — 12.5% | | | | | | | | | | | | | | | | |
American International Group, Inc. | | | 6.400 | % | | | 12/15/20 | | | | 3,232,000 | | | | 3,360,324 | |
Bank of the Ozarks, Inc. (a) | | | 5.500 | % | | | 07/01/26 | | | | 3,732,000 | | | | 3,830,171 | |
Barclays Bank plc (3MO LIBOR + 211) (a) | | | 4.011 | % | | | 08/10/21 | | | | 2,684,000 | | | | 2,746,762 | |
CNG Holdings, Inc., 144A | | | 12.500 | % | | | 06/15/24 | | | | 6,300,000 | | | | 5,985,000 | |
Goldman Sachs Group, Inc. (The) (3MO LIBOR + 100) (a) | | | 2.801 | % | | | 07/24/23 | | | | 5,500,000 | | | | 5,566,246 | |
Pershing Square Holdings Ltd., 144A | | | 5.500 | % | | | 07/15/22 | | | | 5,000,000 | | | | 5,285,750 | |
| | | | | | | | | | | | | | | | 26,774,253 | |
See accompanying notes to financial statements.
10
EUBEL BRADY & SUTTMAN INCOME FUND
SCHEDULE OF INVESTMENTS (Continued) |
CORPORATE BONDS — 65.9% (Continued) | | Coupon | | | Maturity | | | Par Value | | | Value | |
Health Care — 12.0% | | | | | | | | | | | | | | | | |
Amgen, Inc. (3MO LIBOR + 45) (a) | | | 2.351 | % | | | 05/11/20 | | | $ | 3,078,000 | | | $ | 3,081,151 | |
Anthem, Inc. | | | 4.350 | % | | | 08/15/20 | | | | 1,000,000 | | | | 1,013,082 | |
Becton Dickinson and Company (3MO LIBOR + 103) (a) | | | 2.917 | % | | | 06/06/22 | | | | 5,825,000 | | | | 5,869,832 | |
CVS Health Corporation | | | 2.800 | % | | | 07/20/20 | | | | 4,200,000 | | | | 4,215,108 | |
Medtronic, Inc. (3MO LIBOR + 80) (a) | | | 2.694 | % | | | 03/15/20 | | | | 5,500,000 | | | | 5,505,511 | |
Zimmer Biomet Holdings, Inc. | | | 2.700 | % | | | 04/01/20 | | | | 6,000,000 | | | | 6,003,780 | |
| | | | | | | | | | | | | | | | 25,688,464 | |
Industrials — 11.1% | | | | | | | | | | | | | | | | |
Caterpillar, Inc. | | | 2.600 | % | | | 06/26/22 | | | | 2,691,000 | | | | 2,745,618 | |
General Electric Company (3MO LIBOR + 100) (a) | | | 2.894 | % | | | 03/15/23 | | | | 5,000,000 | | | | 5,041,199 | |
Molex Electronics Technologies, LLC, 144A | | | 2.878 | % | | | 04/15/20 | | | | 5,900,000 | | | | 5,905,917 | |
Penske Truck Leasing Company, L.P., 144A | | | 2.700 | % | | | 03/14/23 | | | | 5,000,000 | | | | 5,104,202 | |
Roper Technologies, Inc. | | | 2.800 | % | | | 12/15/21 | | | | 4,903,000 | | | | 4,990,313 | |
| | | | | | | | | | | | | | | | 23,787,249 | |
Information Technology — 1.3% | | | | | | | | | | | | | | | | |
FLIR Systems, Inc. | | | 3.125 | % | | | 06/15/21 | | | | 2,700,000 | | | | 2,734,682 | |
| | | | | | | | | | | | | | | | | |
Materials — 4.7% | | | | | | | | | | | | | | | | |
Cabot Corporation | | | 3.700 | % | | | 07/15/22 | | | | 3,980,000 | | | | 4,146,664 | |
Methanex Corporation | | | 5.250 | % | | | 03/01/22 | | | | 5,680,000 | | | | 6,002,658 | |
| | | | | | | | | | | | | | | | 10,149,322 | |
Utilities — 1.9% | | | | | | | | | | | | | | | | |
Duke Energy Florida, LLC (3MO LIBOR + 25) (a) | | | 2.167 | % | | | 11/26/21 | | | | 3,000,000 | | | | 3,006,179 | |
Southern Company (The) | | | 2.350 | % | | | 07/01/21 | | | | 1,000,000 | | | | 1,007,266 | |
| | | | | | | | | | | | | | | | 4,013,445 | |
Total Corporate Bonds (Cost $139,825,259) | | | | | | | | | | | | | | $ | 141,081,547 | |
See accompanying notes to financial statements.
11
EUBEL BRADY & SUTTMAN INCOME FUND
SCHEDULE OF INVESTMENTS (Continued) |
BANK DEBT — 1.5% | | Coupon | | | Maturity | | | Par Value | | | Value | |
Financials — 1.5% | | | | | | | | | | | | | | | | |
NCP Finance Limited Partnership Sr. Revolving Loan (1MO LIBOR + 400) (a)(b)(c) | | | 5.781 | % | | | 12/21/20 | | | $ | 18,413 | | | $ | 18,413 | |
NCP Finance Limited Partnership Sr. Term Loan (1MO LIBOR + 400) (a)(b)(c) | | | 5.781 | % | | | 12/21/20 | | | | 3,076,923 | | | | 3,147,222 | |
Total Bank Debt (Cost $3,095,336) | | | | | | | | | | | | | | $ | 3,165,635 | |
|
COMMERCIAL PAPER — 23.0% (d) | | Par Value | | | Value | |
Anheuser-Busch InBev Finance, Inc., 1.73%, due 02/25/20 | | $ | 6,000,000 | | | $ | 5,993,200 | |
Berkshire Hathaway, Inc., 1.66%, due 02/03/20 | | | 2,197,000 | | | | 2,196,800 | |
Dominion Gas Holdings, LLC, 1.88%, due 02/03/20 | | | 6,000,000 | | | | 5,999,383 | |
FMC Technologies, Inc., 2.08%, due 02/03/20 | | | 6,000,000 | | | | 5,999,316 | |
Glencore Funding, LLC, 1.90%, due 02/10/20 | | | 6,000,000 | | | | 5,997,195 | |
Koch Industries, Inc., 1.60%, due 02/20/20 | | | 6,000,000 | | | | 5,994,997 | |
Kuerig Dr Pepper, Inc., 1.72%, due 02/05/20 | | | 1,100,000 | | | | 1,099,792 | |
Nasdaq, Inc., 1.78%, due 02/06/20 | | | 5,000,000 | | | | 4,998,785 | |
Southern Company Gas Capital Corporation, 1.77%, due 02/03/20 | | | 6,000,000 | | | | 5,999,420 | |
Walgreens Boots Alliance, Inc., 1.88%, due 03/06/20 | | | 5,000,000 | | | | 4,991,264 | |
Total Commercial Paper (Cost $49,270,152) | | | | | | $ | 49,270,152 | |
See accompanying notes to financial statements.
12
EUBEL BRADY & SUTTMAN INCOME FUND
SCHEDULE OF INVESTMENTS (Continued) |
U.S. TREASURY OBLIGATIONS — 4.7% (d) | | Par Value | | | Value | |
U.S. Treasury Bill, 1.51%, due 02/25/20 (Cost $9,990,050) | | $ | 10,000,000 | | | $ | 9,991,131 | |
|
MONEY MARKET FUNDS — 4.3% | | Shares | | | Value | |
Invesco Short-Term Investments Trust - Treasury Portfolio - Institutional Class, 1.47% (e) (Cost $9,221,958) | | | 9,221,958 | | | $ | 9,221,958 | |
| | | | | | | | | |
Total Investments at Value — 99.4% (Cost $211,402,755) | | | | | | $ | 212,730,423 | |
| | | | | | | | | |
Other Assets in Excess of Liabilities — 0.6% | | | | | | | 1,228,656 | |
| | | | | | | | | |
Net Assets — 100.0% | | | | | | $ | 213,959,079 | |
144A - | Security was purchased in a transaction exempt from registration in compliance with Rule 144A of the Securities Act of 1933. This security may be resold in transactions exempt from registration, normally to qualified institutional buyers. The total value of such securities is $34,338,362 as of January 31, 2020, representing 16.0% of net assets. |
LIBOR - | London Interbank Offered Rate. |
(a) | Variable rate security. Interest rate resets periodically. The rate shown is the effective interest rate as of January 31, 2020. For securities based on a published reference rate and spread, the reference rate and spread (in basis points) are indicated parenthetically. Certain variable rate securities are not based on a published reference rate and spread but adjust at predetermined dates to stated coupon rates set forth in the offering documents. These securities, therefore, do not indicate a reference rate and spread. |
(b) | Security has been fair valued using significant unobservable inputs in good faith by the Adviser in conformity with guidelines adopted by and subject to review by the Board of Trustees. The total value of such securities is $3,165,635 as of January 31, 2020, representing 1.5% of net assets (Note 2). |
(c) | Illiquid security. The total fair value of these securities as of January 31, 2020 was $3,165,635, representing 1.5% of net assets. |
(d) | The rate shown is the annualized yield at the time of purchase, not a coupon rate. |
(e) | The rate shown is the 7-day effective yield as of January 31, 2020. |
See accompanying notes to financial statements. |
13
EUBEL BRADY & SUTTMAN MUTUAL FUND TRUST
STATEMENTS OF ASSETS AND LIABILITIES
January 31, 2020 (Unaudited) |
| | Eubel Brady
& Suttman
Income and
Appreciation
Fund | | | Eubel Brady
& Suttman
Income Fund | |
ASSETS | | | | | | | | |
Investments in securities: | | | | | | | | |
At cost | | $ | 94,273,084 | | | $ | 211,402,755 | |
At value (Note 2) | | $ | 96,091,726 | | | $ | 212,730,423 | |
Receivable for capital shares sold | | | 9,034 | | | | 90,931 | |
Receivable for investment securities sold | | | 169,180 | | | | — | |
Dividends and interest receivable | | | 612,275 | | | | 1,211,264 | |
Other assets | | | 17,904 | | | | 18,397 | |
Total assets | | | 96,900,119 | | | | 214,051,015 | |
| | | | | | | | | |
LIABILITIES | | | | | | | | |
Payable for capital shares redeemed | | | 398 | | | | 1,947 | |
Payable to administrator (Note 4) | | | 23,640 | | | | 52,020 | |
Accrued Trustee fees | | | 4,062 | | | | 4,062 | |
Other accrued expenses | | | 17,525 | | | | 33,097 | |
Total liabilities | | | 45,625 | | | | 91,936 | |
| | | | | | | | | |
CONTINGENCIES AND COMMITMENTS (Note 7) | | | — | | | | — | |
| | | | | | | | | |
NET ASSETS | | $ | 96,854,494 | | | $ | 213,959,079 | |
| | | | | | | | | |
NET ASSETS CONSIST OF: | | | | | | | | |
Paid-in capital | | $ | 96,771,428 | | | $ | 216,270,456 | |
Accumulated earnings (deficit) | | | 83,066 | | | | (2,311,377 | ) |
NET ASSETS | | $ | 96,854,494 | | | $ | 213,959,079 | |
| | | | | | | | | |
Shares of beneficial interest outstanding (unlimited number of shares authorized, no par value) | | | 9,901,776 | | | | 21,762,144 | |
| | | | | | | | | |
Net asset value, offering price and redemption price per share (Note 2) | | $ | 9.78 | | | $ | 9.83 | |
See accompanying notes to financial statements.
14
EUBEL BRADY & SUTTMAN MUTUAL FUND TRUST
STATEMENTS OF OPERATIONS
For the Six Months Ended January 31, 2020 (Unaudited) |
| | Eubel Brady
& Suttman
Income and
Appreciation
Fund | | | Eubel Brady
& Suttman
Income Fund | |
INVESTMENT INCOME | | | | | | | | |
Dividends | | $ | 84,284 | | | $ | 79,948 | |
Interest | | | 1,557,187 | | | | 3,599,038 | |
Total investment income | | | 1,641,471 | | | | 3,678,986 | |
| | | | | | | | | |
EXPENSES | | | | | | | | |
Administration fees (Note 4) | | | 45,067 | | | | 100,798 | |
Shareholder servicing fees (Note 6) | | | 18,453 | | | | 41,273 | |
Registration and filing fees | | | 12,639 | | | | 14,068 | |
Legal fees | | | 12,946 | | | | 12,946 | |
Custody and bank service fees | | | 7,894 | | | | 12,598 | |
Audit and tax services fees | | | 8,850 | | | | 8,850 | |
Trustees’ fees (Note 4) | | | 8,125 | | | | 8,125 | |
Insurance expense | | | 3,675 | | | | 7,349 | |
Pricing fees | | | 2,717 | | | | 3,133 | |
Postage and supplies | | | 2,125 | | | | 2,623 | |
Printing of shareholder reports | | | 1,391 | | | | 1,391 | |
Other expenses | | | 1,592 | | | | 2,324 | |
Total expenses | | | 125,474 | | | | 215,478 | |
| | | | | | | | | |
NET INVESTMENT INCOME | | | 1,515,997 | | | | 3,463,508 | |
| | | | | | | | | |
REALIZED AND UNREALIZED GAINS (LOSSES) ON INVESTMENTS | | | | | | | | |
Net realized losses from investment transactions | | | (123,789 | ) | | | (2,906,726 | ) |
Net change in unrealized appreciation (depreciation) on investments | | | (131,729 | ) | | | 2,397,250 | |
NET REALIZED AND UNREALIZED LOSSES ON INVESTMENTS | | | (255,518 | ) | | | (509,476 | ) |
| | | | | | | | | |
NET INCREASE IN NET ASSETS RESULTING FROM OPERATIONS | | $ | 1,260,479 | | | $ | 2,954,032 | |
See accompanying notes to financial statements.
15
EUBEL BRADY & SUTTMAN INCOME AND APPRECIATION FUND
STATEMENTS OF CHANGES IN NET ASSETS |
| | Six Months
Ended
January 31,
2020
(Unaudited) | | | Year Ended
July 31,
2019 | |
FROM OPERATIONS | | | | | | | | |
Net investment income | | $ | 1,515,997 | | | $ | 2,839,055 | |
Net realized losses from investment transactions | | | (123,789 | ) | | | (1,359,240 | ) |
Net change in unrealized appreciation (depreciation) on investments | | | (131,729 | ) | | | 861,516 | |
Net increase in net assets resulting from operations | | | 1,260,479 | | | | 2,341,331 | |
| | | | | | | | | |
DISTRIBUTIONS TO SHAREHOLDERS (Note 2) | | | (1,535,023 | ) | | | (2,872,948 | ) |
| | | | | | | | | |
CAPITAL SHARE TRANSACTIONS | | | | | | | | |
Proceeds from shares sold | | | 12,114,356 | | | | 8,785,208 | |
Net asset value of shares issued in reinvestment of distributions to shareholders | | | 1,534,361 | | | | 2,869,462 | |
Payments for shares redeemed | | | (5,315,540 | ) | | | (10,645,575 | ) |
Net increase in net assets from captial share transactions | | | 8,333,177 | | | | 1,009,095 | |
| | | | | | | | | |
TOTAL INCREASE IN NET ASSETS | | | 8,058,633 | | | | 477,478 | |
| | | | | | | | | |
NET ASSETS | | | | | | | | |
Beginning of period | | | 88,795,861 | | | | 88,318,383 | |
End of period | | $ | 96,854,494 | | | $ | 88,795,861 | |
| | | | | | | | | |
CAPITAL SHARES ACTIVITY | | | | | | | | |
Shares sold | | | 1,234,375 | | | | 902,768 | |
Shares reinvested | | | 156,387 | | | | 295,344 | |
Shares redeemed | | | (540,956 | ) | | | (1,100,004 | ) |
Net increase in shares outstanding | | | 849,806 | | | | 98,108 | |
Shares outstanding at beginning of period | | | 9,051,970 | | | | 8,953,862 | |
Shares outstanding at end of period | | | 9,901,776 | | | | 9,051,970 | |
See accompanying notes to financial statements.
16
EUBEL BRADY & SUTTMAN INCOME FUND
STATEMENTS OF CHANGES IN NET ASSETS |
| | Six Months
Ended
January 31,
2020
(Unaudited) | | | Year Ended
July 31,
2019 | |
FROM OPERATIONS | | | | | | | | |
Net investment income | | $ | 3,463,508 | | | $ | 6,703,267 | |
Net realized losses from investment transactions | | | (2,906,726 | ) | | | (60,927 | ) |
Net change in unrealized appreciation (depreciation) on investments | | | 2,397,250 | | | | 800,875 | |
Net increase in net assets resulting from operations | | | 2,954,032 | | | | 7,443,215 | |
| | | | | | | | | |
DISTRIBUTIONS TO SHAREHOLDERS (Note 2) | | | (3,470,239 | ) | | | (6,717,506 | ) |
| | | | | | | | | |
CAPITAL SHARE TRANSACTIONS | | | | | | | | |
Proceeds from shares sold | | | 28,129,118 | | | | 33,771,307 | |
Net asset value of shares issued in reinvestment of distributions to shareholders | | | 3,466,405 | | | | 6,698,963 | |
Payments for shares redeemed | | | (17,835,926 | ) | | | (39,382,888 | ) |
Net increase in net assets from captial share transactions | | | 13,759,597 | | | | 1,087,382 | |
| | | | | | | | | |
TOTAL INCREASE IN NET ASSETS | | | 13,243,390 | | | | 1,813,091 | |
| | | | | | | | | |
NET ASSETS | | | | | | | | |
Beginning of period | | | 200,715,689 | | | | 198,902,598 | |
End of period | | $ | 213,959,079 | | | $ | 200,715,689 | |
| | | | | | | | | |
CAPITAL SHARES ACTIVITY | | | | | | | | |
Shares sold | | | 2,855,599 | | | | 3,449,122 | |
Shares reinvested | | | 352,100 | | | | 683,725 | |
Shares redeemed | | | (1,809,571 | ) | | | (4,032,376 | ) |
Net increase in shares outstanding | | | 1,398,128 | | | | 100,471 | |
Shares outstanding at beginning of period | | | 20,364,016 | | | | 20,263,545 | |
Shares outstanding at end of period | | | 21,762,144 | | | | 20,364,016 | |
See accompanying notes to financial statements.
17
EUBEL BRADY & SUTTMAN INCOME AND APPRECIATION FUND
FINANCIAL HIGHLIGHTS |
Per Share Data for a Share Outstanding Throughout Each Period |
| | Six Months
Ended
January 31,
2020
(Unaudited) | | | Year Ended
July 31,
2019 | | | Year Ended
July 31,
2018 | | | Year Ended
July 31,
2017 | | | Year Ended
July 31,
2016 | | | Period
Ended
July 31,
2015 (a) | |
Net asset value at beginning of period | | $ | 9.81 | | | $ | 9.86 | | | $ | 9.97 | | | $ | 9.71 | | | $ | 9.85 | | | $ | 10.00 | |
| | | | | | | | | | | | | | | | | | | | | | | | | |
Income (loss) from investment operations: | | | | | | | | | | | | | | | | | | | | | | | | |
Net investment income | | | 0.16 | | | | 0.32 | | | | 0.27 | | | | 0.27 | | | | 0.28 | | | | 0.19 | |
Net realized and unrealized gains (losses) on investments | | | (0.03 | ) | | | (0.05 | ) | | | (0.11 | ) | | | 0.27 | | | | (0.05 | ) | | | (0.15 | ) |
Total from investment operations | | | 0.13 | | | | 0.27 | | | | 0.16 | | | | 0.54 | | | | 0.23 | | | | 0.04 | |
| | | | | | | | | | | | | | | | | | | | | | | | | |
Less distributions from: | | | | | | | | | | | | | | | | | | | | | | | | |
Net investment income | | | (0.16 | ) | | | (0.32 | ) | | | (0.27 | ) | | | (0.28 | ) | | | (0.28 | ) | | | (0.19 | ) |
Net realized gains on investments | | | — | | | | — | | | | — | | | | — | | | | (0.09 | ) | | | — | |
Total distributions | | | (0.16 | ) | | | (0.32 | ) | | | (0.27 | ) | | | (0.28 | ) | | | (0.37 | ) | | | (0.19 | ) |
| | | | | | | | | | | | | | | | | | | | | | | | | |
Net asset value at end of period | | $ | 9.78 | | | $ | 9.81 | | | $ | 9.86 | | | $ | 9.97 | | | $ | 9.71 | | | $ | 9.85 | |
| | | | | | | | | | | | | | | | | | | | | | | | | |
Total return (b) | | | 1.38 | %(c) | | | 2.82 | % | | | 1.61 | % | | | 5.65 | % | | | 2.55 | % | | | 0.38 | %(c) |
| | | | | | | | | | | | | | | | | | | | | | | | | |
Net assets at end of period (000’s) | | $ | 96,854 | | | $ | 88,796 | | | $ | 88,318 | | | $ | 84,969 | | | $ | 79,253 | | | $ | 82,648 | |
| | | | | | | | | | | | | | | | | | | | | | | | | |
Ratios/supplementary data: | | | | | | | | | | | | | | | | | | | | | | | | |
| | | | | | | | | | | | | | | | | | | | | | | | | |
Ratio of total expenses to average net assets | | | 0.27 | %(d) | | | 0.27 | % | | | 0.25 | % | | | 0.26 | % | | | 0.25 | % | | | 0.25 | %(d) |
| | | | | | | | | | | | | | | | | | | | | | | | | |
Ratio of net investment income to average net assets | | | 3.29 | %(d) | | | 3.24 | % | | | 2.71 | % | | | 2.72 | % | | | 2.94 | % | | | 2.34 | %(d) |
| | | | | | | | | | | | | | | | | | | | | | | | | |
Portfolio turnover rate | | | 7 | %(c) | | | 16 | % | | | 60 | % | | | 42 | % | | | 33 | % | | | 27 | %(c) |
(a) | Represents the period from the commencement of operations (September 30, 2014) through July 31, 2015. |
(b) | Total return is a measure of the change in value of an investment in the Fund over the periods covered, which assumes any dividends or capital gains distributions are reinvested in shares of the Fund. The returns shown do not reflect the deduction of taxes a shareholder would pay on Fund distributions or the redemption of Fund shares. |
(c) | Not annualized. |
(d) | Annualized. |
See accompanying notes to financial statements. |
18
EUBEL BRADY & SUTTMAN INCOME FUND
FINANCIAL HIGHLIGHTS |
Per Share Data for a Share Outstanding Throughout Each Period |
| | Six Months
Ended
January 31,
2020
(Unaudited) | | | Year Ended
July 31,
2019 | | | Year Ended
July 31,
2018 | | | Year Ended
July 31,
2017 | | | Year Ended
July 31,
2016 | | | Period
Ended
July 31,
2015 (a) | |
Net asset value at beginning of period | | $ | 9.86 | | | $ | 9.82 | | | $ | 10.00 | | | $ | 9.97 | | | $ | 9.89 | | | $ | 10.00 | |
| | | | | | | | | | | | | | | | | | | | | | | | | |
Income (loss) from investment operations: | | | | | | | | | | | | | | | | | | | | | | | | |
Net investment income | | | 0.17 | | | | 0.33 | | | | 0.27 | | | | 0.24 | | | | 0.25 | | | | 0.13 | |
Net realized and unrealized gains (losses) on investments | | | (0.03 | ) | | | 0.04 | | | | (0.19 | ) | | | 0.04 | | | | 0.10 | | | | (0.11 | ) |
Total from investment operations | | | 0.14 | | | | 0.37 | | | | 0.08 | | | | 0.28 | | | | 0.35 | | | | 0.02 | |
| | | | | | | | | | | | | | | | | | | | | | | | | |
Less distributions from: | | | | | | | | | | | | | | | | | | | | | | | | |
Net investment income | | | (0.17 | ) | | | (0.33 | ) | | | (0.26 | ) | | | (0.24 | ) | | | (0.25 | ) | | | (0.13 | ) |
Net realized gains on investments | | | — | | | | — | | | | — | | | | (0.01 | ) | | | (0.02 | ) | | | — | |
Total distributions | | | (0.17 | ) | | | (0.33 | ) | | | (0.26 | ) | | | (0.25 | ) | | | (0.27 | ) | | | (0.13 | ) |
| | | | | | | | | | | | | | | | | | | | | | | | | |
Net asset value at end of period | | $ | 9.83 | | | $ | 9.86 | | | $ | 9.82 | | | $ | 10.00 | | | $ | 9.97 | | | $ | 9.89 | |
| | | | | | | | | | | | | | | | | | | | | | | | | |
Total return (b) | | | 1.40 | %(c) | | | 3.86 | % | | | 0.86 | % | | | 2.75 | % | | | 3.58 | % | | | 0.22 | %(c) |
| | | | | | | | | | | | | | | | | | | | | | | | | |
Net assets at end of period (000’s) | | $ | 213,959 | | | $ | 200,716 | | | $ | 198,903 | | | $ | 185,957 | | | $ | 160,540 | | | $ | 162,994 | |
| | | | | | | | | | | | | | | | | | | | | | | | | |
Ratios/supplementary data: | | | | | | | | | | | | | | | | | | | | | | | | |
| | | | | | | | | | | | | | | | | | | | | | | | | |
Ratio of total expenses to average net assets | | | 0.21 | %(d) | | | 0.20 | % | | | 0.20 | % | | | 0.20 | % | | | 0.20 | % | | | 0.22 | %(d) |
| | | | | | | | | | | | | | | | | | | | | | | | | |
Ratio of net investment income to average net assets | | | 3.36 | %(d) | | | 3.37 | % | | | 2.69 | % | | | 2.36 | % | | | 2.54 | % | | | 1.70 | %(d) |
| | | | | | | | | | | | | | | | | | | | | | | | | |
Portfolio turnover rate | | | 10 | %(c) | | | 19 | % | | | 65 | % | | | 40 | % | | | 35 | % | | | 27 | %(c) |
(a) | Represents the period from the commencement of operations (September 30, 2014) through July 31, 2015. |
(b) | Total return is a measure of the change in value of an investment in the Fund over the periods covered, which assumes any dividends or capital gains distributions are reinvested in shares of the Fund. The returns shown do not reflect the deduction of taxes a shareholder would pay on Fund distributions or the redemption of Fund shares. |
(c) | Not annualized. |
(d) | Annualized. |
See accompanying notes to financial statements. |
19
EUBEL BRADY & SUTTMAN MUTUAL FUND TRUST
NOTES TO FINANCIAL STATEMENTS
January 31, 2020 (Unaudited)
1. Organization
Eubel Brady & Suttman Income and Appreciation Fund (“EBS Income and Appreciation Fund”) and Eubel Brady & Suttman Income Fund (“EBS Income Fund”) (individually, a “Fund” and collectively, the “Funds”) are each a no-load diversified series of Eubel Brady & Suttman Mutual Fund Trust (the “Trust”), an open-end management investment company organized as an Ohio business trust on April 22, 2014.
The investment objective of EBS Income and Appreciation Fund is to provide total return through a combination of current income and capital appreciation.
The investment objective of EBS Income Fund is to preserve capital, produce income and maximize total return.
2. Significant Accounting Policies
The Funds follow accounting and reporting guidance under Financial Accounting Standards Board Accounting Standards Codification Topic 946, “Financial Services – Investment Companies.” The following is a summary of significant accounting policies followed by the Funds. These policies are in conformity with accounting principles generally accepted in the United States of America (“GAAP”).
New Accounting Pronouncement — In March 2017, FASB issued Accounting Standards Update No. 2017-08 (“ASU 2017-08”), “Receivables – Nonrefundable Fees and Other Costs (Subtopic 310-20): Premium Amortization on Purchased Callable Debt Securities.” ASU 2017-08 shortens the amortization period for certain callable debt securities, held at a premium, to be amortized to the earliest call date. ASU 2017-08 does not require an accounting change for securities held at a discount, which continues to accrete to maturity. ASU 2017-08 is effective for fiscal years and interim periods within those fiscal years beginning after December 15, 2018. The Funds are complying with ASU 2017-08 and the impact is not deemed to be material to the Funds.
Securities Valuation — Securities that are traded on any stock exchange are generally valued at the last quoted sale price. Lacking a last sale price, an exchange traded security is generally valued at its last bid price. Securities traded on NASDAQ are generally valued at the NASDAQ Official Closing Price. Investments representing shares of other open-end investment companies, including money market funds, are valued at their net asset value (“NAV”) as reported by such companies. The Funds typically use an independent pricing service to determine the value of their fixed income securities. The pricing service utilizes electronic data processing techniques based on yield spreads relating to securities with similar characteristics
20
EUBEL BRADY & SUTTMAN MUTUAL FUND TRUST
NOTES TO FINANCIAL STATEMENTS (Continued)
to determine prices for normal institutional-size trading units of fixed income securities without regard to sale or bid prices. Commercial paper may be valued at amortized cost, which under normal circumstances approximates market value.
If Eubel Brady & Suttman Asset Management, Inc. (the “Adviser”), the investment adviser to the Funds, determines that a price provided by the pricing service does not accurately reflect the market value of the securities, when prices are not readily available from the pricing service or when restricted or illiquid securities are being valued, securities are valued at fair value as determined in good faith by the Adviser in conformity with guidelines adopted by and subject to review by the Board of Trustees of the Trust (the “Board”).
GAAP establishes a single authoritative definition of fair value, sets out a framework for measuring fair value and requires additional disclosures about fair value measurements.
Various inputs are used in determining the value of each Fund’s investments. These inputs are summarized in the three broad levels listed below:
● Level 1 – quoted prices in active markets for identical securities
● Level 2 – other significant observable inputs
● Level 3 – significant unobservable inputs
Certain fixed income securities held by the Funds are classified as Level 2 since the values are typically provided by an independent pricing service that utilizes various “other significant observable inputs” as discussed above. Other fixed income securities, including certain bank debt held by the Funds, are classified as Level 3 since the values for these securities are based on prices derived from one or more significant inputs that are unobservable. The inputs or methodology used are not necessarily an indication of the risks associated with investing in those securities. The inputs used to measure fair value may fall into different levels of the fair value hierarchy. In such cases, for disclosure purposes, the level in the fair value hierarchy within which the fair value measurement falls in its entirety is based on the lowest level input that is significant to the fair value measurement.
21
EUBEL BRADY & SUTTMAN MUTUAL FUND TRUST
NOTES TO FINANCIAL STATEMENTS (Continued)
The following is a summary of the inputs used to value each Fund’s investments as of January 31, 2020 by security type:
EBS Income and Appreciation Fund: |
| | Level 1 | | | Level 2 | | | Level 3 | | | Total | |
Corporate Bonds | | $ | — | | | $ | 53,405,609 | | | $ | — | | | $ | 53,405,609 | |
Convertible Corporate Bonds | | | — | | | | 4,848,680 | | | | — | | | | 4,848,680 | |
Bank Debt | | | — | | | | 435,862 | | | | 1,899,381 | | | | 2,335,243 | |
Common Stocks | | | 5,487,612 | | | | — | | | | — | | | | 5,487,612 | |
Warrants | | | 240,885 | | | | — | | | | 10 | | | | 240,895 | |
Commercial Paper | | | — | | | | 23,537,655 | | | | — | | | | 23,537,655 | |
Money Market Funds | | | 6,236,032 | | | | — | | | | — | | | | 6,236,032 | |
Total | | $ | 11,964,529 | | | $ | 82,227,806 | | | $ | 1,899,391 | | | $ | 96,091,726 | |
EBS Income Fund: |
| | Level 1 | | | Level 2 | | | Level 3 | | | Total | |
Corporate Bonds | | $ | — | | | $ | 141,081,547 | | | $ | — | | | $ | 141,081,547 | |
Bank Debt | | | — | | | | — | | | | 3,165,635 | | | | 3,165,635 | |
Commercial Paper | | | — | | | | 49,270,152 | | | | — | | | | 49,270,152 | |
U.S. Treasury Obligations | | | — | | | | 9,991,131 | | | | — | | | | 9,991,131 | |
Money Market Funds | | | 9,221,958 | | | | — | | | | — | | | | 9,221,958 | |
Total | | $ | 9,221,958 | | | $ | 200,342,830 | | | $ | 3,165,635 | | | $ | 212,730,423 | |
The following is a reconciliation of Level 3 investments of the Funds for which significant unobservable inputs were used to determine fair value for the six months ended January 31, 2020:
EBS Income and Appreciation Fund |
Investments
in Securities | | Value
as of
July 31,
2019 | | | Purchases | | | Sales/
maturities | | | Realized
gain (loss) | | | Net change
in unrealized
appreciation
(depreciation) | | | Value
as of
January 31,
2020 | |
Bank Debt | | $ | 2,366,378 | | | $ | 223,314 | | | $ | (681,635 | ) | | $ | — | | | $ | (8,676 | ) | | $ | 1,899,381 | |
Warrants | | | 10 | | | | — | | | | — | | | | — | | | | — | | | | 10 | |
Total | | $ | 2,366,388 | | | $ | 223,314 | | | $ | (681,635 | ) | | $ | — | | | $ | (8,676 | ) | | $ | 1,899,391 | |
22
EUBEL BRADY & SUTTMAN MUTUAL FUND TRUST
NOTES TO FINANCIAL STATEMENTS (Continued)
EBS Income Fund |
Investments
in Securities | | Value
as of
July 31,
2019 | | | Purchases | | | Sales/
maturities | | | Realized
gain (loss) | | | Net change
in unrealized
appreciation
(depreciation) | | | Value
as of
January 31,
2020 | |
Bank Debt | | $ | 3,943,963 | | | $ | 372,191 | | | $ | (1,136,058 | ) | | $ | — | | | $ | (14,461 | ) | | $ | 3,165,635 | |
The total change in unrealized appreciation (depreciation) included on the Statements of Operations attributable to Level 3 investments still held at January 31, 2020 is ($8,676) and ($14,461) for EBS Income and Appreciation Fund and EBS Income Fund, respectively.
The following table summarizes the valuation techniques used and unobservable inputs developed by the Adviser in conformity with guidelines adopted by and subject to review by the Board to determine the fair value of the Level 3 investments.
EBS Income and Appreciation Fund |
| | Fair Value at
January 31,
2020 | | Valuation
Technique | Unobservable
Input1 | Value/
Range | Weighted
Average of
Unobservable
Inputs |
Bank Debt | | $ | 1,899,381 | | DCF Model | Discount Rate2 | 3.14% | N/A |
Warrants | | $ | 10 | | Management’s Estimate of Future Cash Flows | N/A | N/A | N/A |
EBS Income Fund |
| | Fair Value at
January 31,
2020 | | Valuation
Technique | Unobservable
Input1 | Value/
Range | Weighted
Average of
Unobservable
Inputs |
Bank Debt | | $ | 3,165,635 | | DCF Model | Discount Rate2 | 3.14% | N/A |
DCF - Discounted Cash Flow |
1 | Significant increases and decreases in the unobservable inputs used to determine fair value of Level 3 assets could result in significantly higher or lower fair value measurements. An increase to the unobservable input would result in a decrease to the fair value. A decrease to the unobservable input would have the opposite effect. |
2 | The Discount Rate used is determined by the Adviser by employing a reference benchmark, adjusted by a credit spread. |
There were no derivative instruments held by the Funds as of or during the six months ended January 31, 2020.
23
EUBEL BRADY & SUTTMAN MUTUAL FUND TRUST
NOTES TO FINANCIAL STATEMENTS (Continued)
Share Valuation — The NAV per share of each Fund is calculated daily by dividing the total value of its assets, less liabilities, by the number of shares outstanding. The offering price and redemption price per share of each Fund is equal to its NAV per share.
Estimates — The preparation of financial statements in conformity with GAAP requires management to make estimates and assumptions that affect the reported amounts of assets and liabilities and disclosures of contingent assets and liabilities at the date of the financial statements and the reported amounts of increases and decreases in net assets from operations during the reporting period. Actual results could differ from those estimates.
Investment Income, Investment Transactions and Realized Capital Gains and Losses — Dividend income is recorded on the ex-dividend date. Non-cash dividends included in dividend income, if any, are recorded at the fair market value of the security received. Interest income is recorded as earned. Discounts and premiums on fixed income securities are amortized using the effective interest method. Investment transactions are accounted for on trade date. Realized capital gains and losses on investments sold are determined on a specific identification basis.
Expenses — Expenses of the Trust that are directly identifiable to a specific Fund are charged to that Fund. Expenses which are not readily identifiable to a specific Fund are allocated in such a manner as deemed equitable.
Distributions to Shareholders — Distributions to shareholders of net investment income, if any, are paid monthly. Capital gain distributions, if any, are distributed to shareholders annually. Distributions are based on amounts calculated in accordance with applicable federal income tax regulations, which may differ from GAAP. These differences are due primarily to differing treatments of income and realized capital gains on various investment securities held by the Funds, timing differences and differing characterizations of distributions made by the Funds. Dividends and distributions are recorded on the ex-dividend date. The tax character of distributions paid by each Fund during the periods ended January 31, 2020 and July 31, 2019 was ordinary income.
Federal Income Tax — Each Fund has qualified and intends to continue to qualify each year as a “regulated investment company” under Subchapter M of the Internal Revenue Code of 1986, as amended (the “Code”). Qualification generally will relieve the Funds of liability for federal income taxes to the extent 100% of their net investment income and net realized capital gains are distributed in accordance with the Code.
24
EUBEL BRADY & SUTTMAN MUTUAL FUND TRUST
NOTES TO FINANCIAL STATEMENTS (Continued)
In order to avoid imposition of the excise tax applicable to regulated investment companies, it is also each Fund’s intention to declare as dividends in each calendar year at least 98% of its net investment income (earned during the calendar year) and 98.2% of its net realized capital gains (earned during the twelve months ended October 31) plus undistributed amounts from prior years.
The following information is computed on a tax basis for each item as of January 31, 2020:
| | EBS Income and
Appreciation
Fund | | | EBS Income
Fund | |
Tax cost of portfolio investments | | $ | 94,322,003 | | | $ | 211,402,755 | |
Gross unrealized appreciation | | $ | 4,129,292 | | | $ | 2,690,823 | |
Gross unrealized depreciation | | | (2,359,569 | ) | | | (1,363,155 | ) |
Net unrealized appreciation on investments | | | 1,769,723 | | | | 1,327,668 | |
Capital loss carryforwards | | | (1,567,620 | ) | | | (729,271 | ) |
Other losses | | | (119,037 | ) | | | (2,909,774 | ) |
Accumulated earnings (deficit) | | $ | 83,066 | | | $ | (2,311,377 | ) |
The difference between the federal income tax cost of portfolio investments and the Schedule of Investments cost for EBS Income and Appreciation Fund is due to certain timing differences in the recognition of capital gains or losses under income tax regulations and GAAP. These “book/tax” differences are temporary in nature and are primarily due to basis adjustments related to the Fund’s holdings in convertible bonds.
As of July 31, 2019, the Funds had the following capital loss carryforwards (“CLCFs”) for federal income tax purposes:
| | EBS Income and
Appreciation
Fund | | | EBS Income
Fund | |
Short-term | | $ | 514,874 | | | $ | 595,584 | |
Long-term | | | 1,052,746 | | | | 133,687 | |
| | | $ | 1,567,620 | | | $ | 729,271 | |
These CLCFs, which do not expire, may be utilized in the current and future years to offset net realized capital gains, if any, prior to distributing such gains to shareholders.
The Funds recognize the tax benefits or expenses of uncertain tax positions only when the position is “more likely than not” to be sustained assuming examination by tax authorities. Management has reviewed each Fund’s tax positions for the
25
EUBEL BRADY & SUTTMAN MUTUAL FUND TRUST
NOTES TO FINANCIAL STATEMENTS (Continued)
current and all open tax years (generally, three years) and has concluded that no provision for unrecognized tax benefits or expenses is required in these financial statements. Each Fund identifies its major tax jurisdiction as U.S. Federal.
3. Unfunded Loan Commitment
At January 31, 2020, unfunded loan commitments for the Funds were as follows:
Fund | Borrower | | Unfunded
Commitment | |
EBS Income and Appreciation Fund | NCP Finance Limited Partnership | | $ | 1,142,798 | |
EBS Income Fund | NCP Finance Limited Partnership | | $ | 1,904,654 | |
Pursuant to an Asset-Based Lending Credit Agreement between the Funds and NCP Finance Limited Partnership (the “Borrower”), the Borrower has agreed to pay the Funds a commitment fee equal to 0.25% of the average daily unfunded commitment balance, which is included within interest income on the Statements of Operations.
4. Transactions with Related Parties
Certain officers of the Trust are also officers of the Adviser, of Ultimus Fund Solutions, LLC (“Ultimus”), the administrative services agent, shareholder servicing and transfer agent, and accounting services agent for the Funds, or of Ultimus Fund Distributors, LLC (the “Distributor”), the principal underwriter and exclusive agent for the distribution of shares of the Funds.
Investment Adviser — Under the terms of the Management Agreement between the Trust and the Adviser, the Adviser manages each Fund’s investments subject to oversight by the Board. The Funds do not pay the Adviser investment advisory fees under the Management Agreement. However, prior to investing in a Fund, a prospective shareholder must enter into an investment advisory agreement with the Adviser that calls for the payment of an advisory fee based upon a percentage of all assets (including shares of the Funds) managed by the Adviser on behalf of the prospective shareholder. The fee schedule may be negotiable at the time the account is opened and is generally based upon the value of assets held in the client’s account and the style of management.
The Adviser has entered into an agreement with the Funds under which it has agreed to reimburse Fund expenses to the extent necessary to limit total annual operating expenses (excluding brokerage costs, taxes, interest, acquired fund fees and expenses, expenses incurred pursuant to the Funds’ Shareholder Servicing Plan and extraordinary expenses) to an amount not exceeding 0.35% of each Fund’s average daily net assets. Any payments by the Adviser of expenses which are a Fund’s obligation are subject to repayment by the Fund for a period of three years following the date on which such expenses were paid, provided that the repayment
26
EUBEL BRADY & SUTTMAN MUTUAL FUND TRUST
NOTES TO FINANCIAL STATEMENTS (Continued)
does not cause the Fund’s total annual operating expenses to exceed the lesser of: (i) the expense limitation in effect at the time such expenses were reimbursed; and (ii) the expense limitation in effect at the time the Adviser seeks reimbursement of such expenses. This agreement is currently in effect until December 1, 2020. No expense reimbursements were required during the six months ended January 31, 2020.
Administrator — Ultimus provides administration, fund accounting and transfer agency services to each Fund. The Funds pay Ultimus fees in accordance with the agreements for such services. In addition, the Funds pay out-of-pocket expenses including, but not limited to, postage, supplies and costs related to the pricing of the Funds’ portfolio securities.
Compensation of Trustees — Trustees and officers affiliated with the Adviser or Ultimus are not compensated by the Funds for their services. Each Trustee who is not an interested person of the Trust receives from the Funds a fee of $2,625 for attendance at each meeting of the Board, in addition to reimbursement of travel and other expenses incurred in attending the meetings. The Chairman of the Audit and Governance Committee receives an additional annual fee of $1,000, paid quarterly.
5. Securities Transactions
During the six months ended January 31, 2020, cost of purchases and proceeds from sales and maturities of investment securities, other than short-term investments and U.S. government securities, were as follows:
| | EBS Income and
Appreciation
Fund | | | EBS Income
Fund | |
Purchases of investment securities | | $ | 2,775,564 | | | $ | 9,327,441 | |
Proceeds from sales and maturities of investment securities | | $ | 23,016,827 | | | $ | 46,089,142 | |
During the six months ended January 31, 2020, there were no purchases or sales and maturities from U.S. government long-term securities for the Funds.
27
EUBEL BRADY & SUTTMAN MUTUAL FUND TRUST
NOTES TO FINANCIAL STATEMENTS (Continued)
6. Shareholder Servicing Plan
The Funds have adopted a Shareholder Servicing Plan (the “Plan”) which allows each Fund to make payments to financial organizations (including payments directly to the Adviser and the Distributor) for providing account administration and account maintenance services to Fund shareholders. The annual fees paid under the Plan may not exceed an amount equal to 0.25% of each Fund’s average daily net assets. During the six months ended January 31, 2020, EBS Income and Appreciation Fund and EBS Income Fund incurred $18,453 and $41,273, respectively, of shareholder servicing fees pursuant to the Plan. No payments were made to the Adviser or the Distributor during the six months ended January 31, 2020.
7. Contingencies and Commitments
The Funds indemnify the Trust’s officers and Trustees for certain liabilities that might arise from the performance of their duties to the Funds. Additionally, in the normal course of business the Funds enter into contracts that contain a variety of representations and warranties and which provide general indemnifications. The Funds’ maximum exposure under these arrangements is unknown, as this would involve future claims that may be made against the Funds that have not yet occurred. However, based on experience, the Funds expect the risk of loss to be remote.
8. Subsequent Events
The Funds are required to recognize in the financial statements the effects of all subsequent events that provide additional evidence about conditions that existed as of the date of the Statements of Assets and Liabilities. For non-recognized subsequent events that must be disclosed to keep the financial statements from being misleading, the Funds are required to disclose the nature of the event as well as an estimate of its financial effect, or a statement that such an estimate cannot be made. Management has evaluated subsequent events through the issuance of these financial statements and has noted no such events.
28
EUBEL BRADY & SUTTMAN MUTUAL FUND TRUST
ABOUT YOUR FUNDS’ EXPENSES (Unaudited)
We believe it is important for you to understand the impact of costs on your investment. All mutual funds have operating expenses. As a shareholder of the Funds, you incur ongoing costs, including shareholder servicing fees and other operating expenses. These ongoing costs, which are deducted from each Fund’s gross income, directly reduce the investment return of the Funds.
A mutual fund’s ongoing costs are expressed as a percentage of its average net assets. This figure is known as the expense ratio. The following examples are intended to help you understand the ongoing costs (in dollars) of investing in the Funds and to compare these costs with the ongoing costs of investing in other mutual funds. The examples below are based on an investment of $1,000 made at the beginning of the period shown and held for the entire period (August 1, 2019 through January 31, 2020).
The table below illustrates each Fund’s ongoing costs in two ways:
Actual fund return – This section helps you to estimate the actual expenses that you paid over the period. The “Ending Account Value” shown is based on each Fund’s actual return, and the fourth column shows the dollar amount of operating expenses that would have been paid by an investor who started with $1,000 in each Fund. You may use the information here, together with the amount you invested, to estimate the expenses that you paid over the period.
To do so, simply divide your account value by $1,000 (for example, an $8,600 account value divided by $1,000 = 8.6), then multiply the result by the number given for the Funds under the heading “Expenses Paid During Period.”
Hypothetical 5% return – This section is intended to help you compare the Funds’ ongoing costs with those of other mutual funds. It assumes that each Fund had an annual return of 5% before expenses during the period shown, but that the expense ratio is unchanged. In this case, because the returns used are not the Funds’ actual returns, the results do not apply to your investment. The example is useful in making comparisons because the U.S. Securities and Exchange Commission (the “SEC”) requires all mutual funds to calculate expenses based on a 5% return. You can assess each Fund’s ongoing costs by comparing this hypothetical example with the hypothetical examples that appear in shareholder reports of other funds.
Note that expenses shown in the table are meant to highlight and help you compare ongoing costs only. They will not help you determine the relative total costs of owning different funds. The Funds do not charge transaction fees, such as purchase or redemption fees, nor do they impose any sales loads.
The calculations assume no shares were bought or sold during the period. Your actual costs may have been higher or lower, depending on the amount of your investment and the timing of any purchases or redemptions.
29
EUBEL BRADY & SUTTMAN MUTUAL FUND TRUST
ABOUT YOUR FUNDS’ EXPENSES (Unaudited) (Continued)
More information about the Funds’ expenses can be found in this report. For additional information on operating expenses and other shareholder costs, please refer to the Funds’ prospectus.
| Beginning
Account Value
August 1, 2019 | Ending
Account Value
January 31, 2020 | Expense
Ratio(a) | Expenses
Paid During
Period(b) |
EBS Income and Appreciation Fund | | | |
Based on Actual Fund Return | $ 1,000.00 | $ 1,013.80 | 0.27% | $1.37 |
Based on Hypothetical 5% Fund Return (before expenses) | $ 1,000.00 | $ 1,023.78 | 0.27% | $1.37 |
EBS Income Fund | | | | |
Based on Actual Fund Return | $ 1,000.00 | $ 1,014.00 | 0.21% | $1.06 |
Based on Hypothetical 5% Fund Return (before expenses) | $ 1,000.00 | $ 1,024.08 | 0.21% | $1.07 |
(a) | Annualized, based on each Fund’s most recent one-half year expenses. |
(b) | Expenses are equal to each Fund’s annualized expense ratio multiplied by the average account value over the period, multiplied by 184/366 (to reflect the one-half year period). |
30
EUBEL BRADY & SUTTMAN MUTUAL FUND TRUST
OTHER INFORMATION (Unaudited)
The Trust files a complete listing of portfolio holdings for the Funds with the SEC as of the end of the first and third quarters of each fiscal year on Form N-Q or as an exhibit to its report on Form N-Q’s successor form, Form N-PORT. These filings are available upon request by calling 1-800-391-1223. Furthermore, you may obtain a copy of the filings on the SEC’s website at www.sec.gov.
A description of the policies and procedures that the Funds use to vote proxies relating to portfolio securities is available without charge upon request by calling toll-free 1-800-391-1223, or on the SEC’s website at www.sec.gov. Information regarding how the Funds voted proxies relating to portfolio securities during the most recent 12-month period ended June 30 is also available without charge upon request by calling toll-free 1-800-391-1223, or on the SEC’s website at www.sec.gov.
31
This page intentionally left blank.
This page intentionally left blank.
Item 2. Code of Ethics.
Not required
Item 3. Audit Committee Financial Expert.
Not required
Item 4. Principal Accountant Fees and Services.
Not required
Item 5. Audit Committee of Listed Registrants.
Not applicable
Item 6. Schedule of Investments.
| (a) | Not applicable [schedule filed with Item 1] |
Item 7. Disclosure of Proxy Voting Policies and Procedures for Closed-End Management Investment Companies.
Not applicable
| Item 8. | Portfolio Managers of Closed-End Management Investment Companies. |
Not applicable
| Item 9. | Purchases of Equity Securities by Closed-End Management Investment Company and Affiliated Purchasers. |
Not applicable
| Item 10. | Submission of Matters to a Vote of Security Holders. |
The registrant’s Audit and Governance Committee shall review shareholder recommendations for nominations to fill vacancies on the registrant’s board of trustees if such recommendations are submitted in writing and addressed to the Committee at the registrant’s offices. The Committee may adopt, by resolution, a policy regarding its procedures for considering candidates for the board of trustees, including any recommended by shareholders.
| Item 11. | Controls and Procedures. |
(a) Based on their evaluation of the registrant’s disclosure controls and procedures (as defined in Rule 30a-3(c) under the Investment Company Act of 1940) as of a date within 90 days of the filing date of this report, the registrant’s principal executive officer and principal financial officer have concluded that such disclosure controls and procedures are reasonably designed and are operating effectively to ensure that material information relating to the registrant, including its consolidated subsidiaries, is made known to them by others within those entities, particularly during the period in which this report is being prepared, and that the information required in filings on Form N-CSR is recorded, processed, summarized, and reported on a timely basis.
(b) There were no changes in the registrant’s internal control over financial reporting (as defined in Rule 30a-3(d) under the Investment Company Act of 1940) that occurred during the second fiscal quarter of the period covered by this report that have materially affected, or are reasonably likely to materially affect, the registrant’s internal control over financial reporting.
| Item 12. | Disclosure of Securities Lending Activities for Closed-End Management Investment Companies. |
Not applicable
File the exhibits listed below as part of this Form. Letter or number the exhibits in the sequence indicated.
(a)(1) Any code of ethics, or amendment thereto, that is the subject of the disclosure required by Item 2, to the extent that the registrant intends to satisfy the Item 2 requirements through filing of an exhibit: Not required
(a)(2) A separate certification for each principal executive officer and principal financial officer of the registrant as required by Rule 30a-2(a) under the Act (17 CFR 270.30a-2(a)): Attached hereto
(a)(3) Any written solicitation to purchase securities under Rule 23c-1 under the Act (17 CFR 270.23c-1) sent or given during the period covered by the report by or on behalf of the registrant to 10 or more persons: Not applicable
(a)(4) Change in the registrant’s independent public accountants. Not applicable
(b) Certifications required by Rule 30a-2(b) under the Act (17 CFR 270.30a-2(b)): Attached hereto
SIGNATURES
Pursuant to the requirements of the Securities Exchange Act of 1934 and the Investment Company Act of 1940, the registrant has duly caused this report to be signed on its behalf by the undersigned, thereunto duly authorized.
| (Registrant) | Eubel Brady & Suttman Mutual Fund Trust | |
| | | | |
| By (Signature and Title)* | /s/ Scott E. Lundy | |
| | | Scott E. Lundy, President | |
| | | | |
| Date | April 3, 2020 | | |
| | | | |
| Pursuant to the requirements of the Securities Exchange Act of 1934 and the Investment Company Act of 1940, this report has been signed below by the following persons on behalf of the registrant and in the capacities and on the dates indicated. |
| | | | |
| By (Signature and Title)* | /s/ Scott E. Lundy | |
| | | Scott E. Lundy, President | |
| | | | |
| Date | April 3, 2020 | | |
| | | | |
| By (Signature and Title)* | /s/ Theresa M. Bridge | |
| | | Theresa M. Bridge, Treasurer and Principal Financial Officer | |
| | | | |
| Date | April 3, 2020 | | |
| * | Print the name and title of each signing officer under his or her signature. |