UNITED STATES
SECURITIES AND EXCHANGE COMMISSION
Washington, D.C. 20549
FORM N-CSR
CERTIFIED SHAREHOLDER REPORT OF REGISTERED
MANAGEMENT INVESTMENT COMPANIES
| Investment Company Act file number | 811-22960 | |
| Eubel Brady & Suttman Mutual Fund Trust |
| (Exact name of registrant as specified in charter) |
| 225 Pictoria Drive, Suite 450 | Cincinnati, Ohio 45246 |
| (Address of principal executive offices) | (Zip code) |
Carol J. Highsmith, Esq.
| 225 Pictoria Drive, Suite 450 Cincinnati, Ohio 45246 |
| (Name and address of agent for service) |
| Registrant's telephone number, including area code: | (513) 587-3400 | |
| Date of fiscal year end: | July 31 | |
| | | |
| Date of reporting period: | January 31, 2024 | |
Form N-CSR is to be used by management investment companies to file reports with the Commission not later than 10 days after the transmission to stockholders of any report that is required to be transmitted to stockholders under Rule 30e-1 under the Investment Company Act of 1940 (17 CFR 270.30e-1). The Commission may use the information provided on Form N-CSR in its regulatory, disclosure review, inspection, and policymaking roles.
A registrant is required to disclose the information specified by Form N-CSR, and the Commission will make this information public. A registrant is not required to respond to the collection of information contained in Form N-CSR unless the Form displays a currently valid Office of Management and Budget ("OMB") control number. Please direct comments concerning the accuracy of the information collection burden estimate and any suggestions for reducing the burden to the Secretary, Securities and Exchange Commission, 450 Fifth Street, NW, Washington, DC 20549-0609. The OMB has reviewed this collection of information under the clearance requirements of 44 U.S.C. § 3507.
Item 1. Reports to Stockholders.
| | | |
| | | |
| | | |
| | | |
| | | |
| | | |
| | | |
| | | |
| | | |
| | | |
| | | |
| | | |
| |  | |
| | | |
| | | |
| | | |
| | | |
| | | |
| | | |
| | | |
| | Eubel Brady & Suttman | |
| | Income and Appreciation Fund | |
| | Ticker Symbol: EBSZX | |
| | | |
| | Eubel Brady & Suttman | |
| | Income Fund | |
| | Ticker Symbol: EBSFX | |
| | | |
| | | |
| | | |
| | | |
| | | |
| | | |
| | | |
| | Each a series of the | |
| | Eubel Brady & Suttman Mutual Fund Trust | |
| | | |
| | | |
| | | |
| | | |
| | | |
| | | |
| | | |
| | SEMI-ANNUAL REPORT | |
| | January 31, 2024 | |
| | (Unaudited) | |
| | | |
| | | |
| | | |
| | | |
| | | |
| | | |
| | | |
| | | |
| | | |
| EUBEL BRADY & SUTTMAN MUTUAL FUND TRUST | |
| LETTER TO OUR SHAREHOLDERS | January 31, 2024 |
Dear Shareholders:
Fixed-income yields fluctuated wildly during the semi-annual period ended January 31, 2024, with the 10-Year Treasury peaking at 4.99% in October 2023 before retrenching to 3.91% at period-end. When all was said and done, the 10-Year Treasury Yield declined 0.05% and the 2-Year declined 0.67% for the period. A lot of movement during, but little change for the period.
The Federal Reserve (the “Fed”) remained committed to reining in inflation, held the Fed Funds rate steady and took a data dependent approach to telegraphing its plans for lowering rates. Crosscurrents were numerous during the period with some consumers feeling the pinch of elevated inflation and higher interest rates while industrial and infrastructure related economic activity was generally robust. Each Fund had a strong finish in absolute terms, in our view.
We discuss the current environment, review our investment philosophy and results, and share our perspective below. Feel free to give us a call with questions, comments or both.
A Review of the Semi-Annual Period –
The period was framed by political uncertainty at home and abroad, crosscurrents and recovery from the worst bond bear market going back to 1811 (roughly 212 years).
Political uncertainty was elevated at home and abroad, with key elections impacting an estimated 50% of Gross Domestic Product (“GDP”), globally, in the year ahead. This ambiguity, in our view, contributed to volatility as market participants began weighing the potential impact of 2024 election outcomes, especially those in the U.S., Taiwan, Russia and the European Union. The evolving U.S. Presidential race was contentious during the period and is almost certain to become more so as November 2024 draws near.
Instability in the Middle East could have also been a contributing factor as trade in the Red Sea has been disrupted by Houthi militant attacks on shipping vessels. Diverting goods to other routes can cost
more and ultimately has an inflationary effect. Fortunately, the current level of U.S. energy production has mitigated the impact on oil prices of uncertainty in that region, which is good. Unrest in the Middle East 20 years ago would have likely resulted in much higher oil prices, essentially resulting in a tax on economic activity.
Crosscurrents or conflicting tendencies were numerous with interest rates under pressure due to declining headline inflation and recessionary signals but countered by solid economic data and tight labor markets. Credit spreads or the difference in yield between a corporate credit and a U.S. Treasury of the same maturity, on the one hand, were under pressure due to strong credit fundamentals and economic momentum and on the other hand, were balanced by recessionary risks and tighter lending conditions. Conflicting signal-induced-volatility often creates opportunities for nimble investors (like the Funds) and we
were able to increase exposure to some existing holdings and add new ones, for the benefit of long-term investors.
Recovery from the worst bond market in more than 200 years seemingly began during the period. Longer duration Treasurys (i.e. those with maturities of 10 years or more) suffered a roughly 48% decline from the peak (low point in yields) in March 2020 to the trough (high point in yields) in October 2023, but finished the semi-annual period strong as yields declined from October 2023 into period-end, boosting the total return (income, plus price change) notably. Even though each Fund has a modest duration or sensitivity to interest rates and did not suffer the same fate as longer-dated strategies when yields rocketed higher, they benefited from the tailwind of declining yields.
To put the magnitude of the aforementioned Treasury decline into perspective, it surpassed the 39% average loss of the seven U.S. equity bear markets since 1970 (bear market defined as a decline of 20% or more from its last all-time high of the S&P 500 Index) and nearly tied the peak to trough decline of the S&P 500 during the dot-com era. In many respects, this is analogous to a 500-year flood – rare.
Within EBSZX, convertible exposure contracted about 180 basis points (a basis point is 1/100th of a percent) to 48.8% at period-end. When attractively priced convertibles meeting our criteria are not available for purchase, we generally hold non-convertible corporate bonds in EBSZX.
Investment Philosophy – Managing risks so that investors are adequately compensated for them is an important element of our bottom-up investment
philosophy. Interest rates are extremely difficult to accurately forecast over time, so we refrain from doing so. We are, however, cognizant of interest rate levels.
In our view, flexibility in portfolio management can support long-term success. Therefore, each Fund has latitude with respect to maturity, duration (price sensitivity to a change in interest rates) and credit quality, among other factors. This flexibility allows us to invest where we find the most value, rather than being confined to specific maturity, duration and credit rating targets (boxes, if you will). Being largely unconstrained allows us to hold bonds to maturity, and we often do so. We believe this flexibility provides the Funds an advantage over those geared toward a specific mandate. Only EBS clients are permitted to invest in the Funds, providing a more stable asset base as compared to funds open to the general public.
Each Fund held around 50 securities at period-end, yet maintained good diversification in our view. While many funds hold hundreds of securities, we believe a narrower focus is more advantageous. The composition of the EBS Funds will often be materially different than their benchmarks. As such, you should expect the Funds’ returns to diverge from their benchmarks, often significantly. Neither Fund uses leverage (borrows money) to make investments.
Results For Various Periods Ended January 31, 2024 – Since inception (September 30, 2014) through January 31, 2024, the Eubel Brady & Suttman Income and Appreciation Fund (“EBSZX”) posted an average annual total return of 3.21%, while its primary benchmark, the ICE BofA U.S. Yield Alternatives Index (the “Index”), returned 3.69% (annualized) over the same period. During the five-
year period ended January 31, 2024, the Fund returned 4.01% per year and the Index 4.65%. During the three-year period ended January 31, 2024, the Fund returned 2.87% per year and the Index -0.48%. Over the year ended January 31, 2024, the Fund returned 5.55% and the Index 6.05%. Over the six-month period ended January 31, 2024, the Fund increased 4.27% and the Index 1.52%.
The primary factors contributing to EBSZX’s outperformance during the six-month and three-year periods and underperformance in other periods ended January 31, 2024, are described below:
| ● | EBSZX’s investment in short-duration non-convertible securities and underweight allocation to convertibles contributed to its outperformance relative to its primary benchmark during the six-month and three-year periods. |
| ● | The Fund’s modest equity sensitivity benefited it commensurately as equity markets lifted in other periods, but not enough to keep pace with the more equity sensitive benchmark over the one-year, five-year and since-inception periods. |
We believe EBSZX is positioned well to capitalize on additional convertible investments should downside volatility serve up more opportunities at compelling prices. Through our lens, the environment for convertibles meeting our criteria became more challenging during the period as equity valuations expanded.
Since inception (September 30, 2014) through January 31, 2024, the Eubel Brady & Suttman Income Fund (“EBSFX”) logged an average annual total return of 2.31%, while its primary benchmark, the ICE BofA U.S. Corporate & Government Master Index (the “ICE Index”) increased
1.64% per annum over the same period. During the five-year period ended January 31, 2024, the Fund returned 2.60% per annum and the ICE Index 1.08% per annum. During the three-year period ended January 31, 2024, the Fund returned 1.53% per annum and the ICE Index -3.32% per annum. Over the year ended January 31, 2024, the Fund increased 5.52% and the ICE Index 2.39%. Over the six-month period ended January 31, 2024, the Fund returned 4.52% and the ICE Index 3.24%.
The primary factors contributing to EBSFX’s outperformance during all periods ended January 31, 2024, are described below:
| ● | EBSFX’s primary reason for outperforming in all periods was due to its portfolio having, on average, shorter maturities than its primary benchmark. |
| ● | As Treasury yields rose in recent years, their prices declined, negatively impacting the primary benchmark more than the Fund. |
Our Perspective – After roughly two years of battling inflation, the Fed’s efforts have reduced the rate of inflation from the blistering 9.1% level in June 2022 to 3.4% in December 2023. While this progress is notable, 3.4% is still well-above the Fed’s 2% average target. Structural changes in supply chains along with stimulative Congressional measures and a taxing regulatory environment increase the odds, in our opinion, of above-target inflation levels continuing for an extended period of time.
The “consensus” view is that there will be several quarter-point interest rate cuts in 2024. Absent weaker economic data to support this view, the beginning of the
interest rate cutting cycle may be delayed and the pace of cuts once it starts may not be as swift as currently anticipated.
A premature reduction in interest rates could cause a spike in inflation, undoing progress made to date and leading to price instability. The Fed seems committed to not repeating this mistake of decades past and will likely continue down a more conservative path.
As a reminder, we do not attempt to forecast interest rates but are aware of general interest rate levels. Our focus is on constructing the Funds’ portfolios from the bottom-up, one credit/security at a time while being mindful of the weighted credit and interest rate exposure. While we are not inclined to take significant credit and/or interest rate risk at the Fund level, we will selectively take those risks at the individual security level when the potential return outweighs the perceived risk.
We remain focused on shorter maturities and investment grade issues, on average, and look forward to navigating a likely fluid fixed-income environment in the coming quarters.
If downside equity market volatility increases, our currently short convertible security shopping list can expand. We would enjoy that opportunity.
As always, we welcome your questions, comments or both and may be reached at 1-800-391-1223. Thank you for embracing a value-oriented investment philosophy and for your trust and confidence in our firm.
Sincerely,
The EBS Research Group
Important Disclosures – Performance data quoted in this letter or the report itself represents past performance. Past performance does not guarantee future results. The value of an investor’s shares will fluctuate and may be worth more or less than the original cost when redeemed. Current performance may be higher or lower than performance quoted herein. Performance data, current to the most recent month end, is available by calling 1-800-391-1223.
The information in this “Letter To Our Shareholders” represents the opinion of the author and is not intended to be a forecast or investment advice. This publication does not constitute an offer or solicitation of any transaction in any securities. Information contained in this publication has been obtained from sources believed to be reliable but has not been independently verified by EBS. Please note that any discussion of fund holdings, fund performance and views expressed are as of January 31, 2024 (except if otherwise stated) and are subject to change without notice.
| EUBEL BRADY & SUTTMAN MUTUAL FUND TRUST |
| PORTFOLIO INFORMATION |
| January 31, 2024 (Unaudited) |
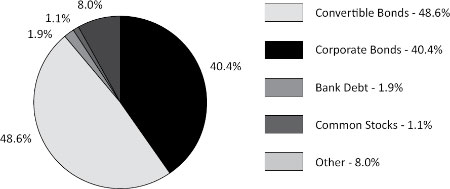
Eubel Brady & Suttman Income and Appreciation Fund
Asset Allocation (% of Net Assets)
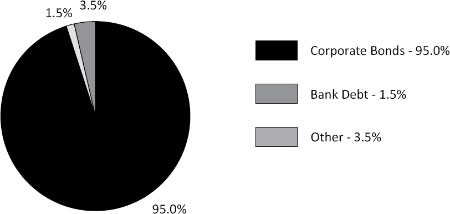
Eubel Brady & Suttman Income Fund
Asset Allocation (% of Net Assets)
| EUBEL BRADY & SUTTMAN INCOME AND APPRECIATION FUND |
| SCHEDULE OF INVESTMENTS |
| January 31, 2024 (Unaudited) |
| CORPORATE BONDS — 40.4% | | Coupon | | Maturity | | Par Value | | | Value | |
| Communications — 4.3% | | | | | | | | | | | | |
| Discovery Communications, LLC | | 3.800% | | 03/13/24 | | $ | 2,085,000 | | | $ | 2,078,787 | |
| Discovery Communications, LLC | | 3.950% | | 06/15/25 | | | 5,000,000 | | | | 4,903,616 | |
| | | | | | | | | | | | 6,982,403 | |
| Consumer Discretionary — 1.9% | | | | | | | | | | | | |
| Marriott International, Inc., Series KK | | 4.900% | | 04/15/29 | | | 3,000,000 | | | | 3,016,923 | |
| | | | | | | | | | | | | |
| Consumer Staples — 3.9% | | | | | | | | | | | | |
| Kroger Company (The) | | 2.650% | | 10/15/26 | | | 2,000,000 | | | | 1,891,328 | |
| Walgreens Boots Alliance, Inc. | | 3.200% | | 04/15/30 | | | 5,000,000 | | | | 4,394,023 | |
| | | | | | | | | | | | 6,285,351 | |
| Energy — 0.6% | | | | | | | | | | | | |
| Exxon Mobil Corporation | | 3.043% | | 03/01/26 | | | 1,000,000 | | | | 972,069 | |
| | | | | | | | | | | | | |
| Financials — 14.0% | | | | | | | | | | | | |
| Bank of America Corporation (TSFR3M + 396.661, effective 09/05/24) (a)(b) | | 6.250% | | 12/31/49 | | | 2,000,000 | | | | 1,990,444 | |
| Bank OZK (TSFR3M + 209, effective 10/01/26) (a) | | 2.750% | | 10/01/31 | | | 4,130,000 | | | | 3,469,903 | |
| Charles Schwab Corporation (The) | | 0.900% | | 03/11/26 | | | 3,000,000 | | | | 2,764,069 | |
| CNG Holdings, Inc., 144A | | 14.500% | | 06/30/26 | | | 2,492,000 | | | | 2,124,430 | |
| First Maryland Capital I (TSFR3M + 126.161) (a) | | 6.576% | | 01/15/27 | | | 2,000,000 | | | | 1,865,851 | |
| Markel Group, Inc. (H15T5Y + 566.2, effective 06/01/25) (a)(b) | | 6.000% | | 12/31/49 | | | 5,000,000 | | | | 4,941,724 | |
| NCP SNIP (c)(d) | | 13.500% | | 12/31/25 | | | 1,800,000 | | | | 1,745,467 | |
| Southern Bancshares (N.C.), Inc., 144A (TSFR3M + 241, effective 06/30/26) (a) | | 3.125% | | 06/30/31 | | | 2,200,000 | | | | 1,786,026 | |
| Truist Financial Corporation (TSFR3M + 93.161) (a) | | 6.311% | | 05/15/27 | | | 2,000,000 | | | | 1,899,976 | |
| | | | | | | | | | | | 22,587,890 | |
| Health Care — 8.1% | | | | | | | | | | | | |
| Danaher Corporation | | 2.200% | | 11/15/24 | | | 1,492,000 | | | | 1,456,831 | |
| Laboratory Corporation of America Holdings | | 3.600% | | 02/01/25 | | | 4,500,000 | | | | 4,426,411 | |
| McKesson Corporation | | 0.900% | | 12/03/25 | | | 3,900,000 | | | | 3,633,422 | |
| Thermo Fisher Scientific, Inc. | | 1.215% | | 10/18/24 | | | 3,600,000 | | | | 3,499,232 | |
| | | | | | | | | | | | 13,015,896 | |
See accompanying notes to financial statements.
| EUBEL BRADY & SUTTMAN INCOME AND APPRECIATION FUND |
| SCHEDULE OF INVESTMENTS (Continued) |
| CORPORATE BONDS — 40.4% (Continued) | | Coupon | | Maturity | | Par Value | | | Value | |
| Industrials — 0.5% | | | | | | | | | | |
| Republic Services, Inc. | | 2.500% | | 08/15/24 | | $ | 849,000 | | | $ | 836,153 | |
| | | | | | | | | | | | | |
| Materials — 2.0% | | | | | | | | | | | | |
| DowDuPont, Inc. | | 4.493% | | 11/15/25 | | | 1,345,000 | | | | 1,334,315 | |
| Steel Dynamics, Inc. | | 2.800% | | 12/15/24 | | | 2,000,000 | | | | 1,957,189 | |
| | | | | | | | | | | | 3,291,504 | |
| Technology — 3.4% | | | | | | | | | | | | |
| Micron Technology, Inc. | | 6.750% | | 11/01/29 | | | 5,000,000 | | | | 5,392,636 | |
| | | | | | | | | | | | | |
| Utilities — 1.7% | | | | | | | | | | | | |
| American Electric Power Company, Inc. | | 2.031% | | 03/15/24 | | | 2,680,000 | | | | 2,667,521 | |
| | | | | | | | | | | | | |
| Total Corporate Bonds | | | | | | | | | | | | |
| (Cost $67,200,863) | | | | | | | | | | $ | 65,048,346 | |
| | | | | | | | | | | | | |
| CONVERTIBLE BONDS — 48.6% | | Coupon | | Maturity | | Par Value | | | Value | |
| Communications — 11.2% | | | | | | | | | | | | |
| Airbnb, Inc. | | 0.000% | | 03/15/26 | | $ | 6,000,000 | | | $ | 5,445,000 | |
| Dish Network Corporation | | 2.375% | | 03/15/24 | | | 2,000,000 | | | | 1,953,800 | |
| Spotify USA, Inc. | | 0.000% | | 03/15/26 | | | 6,000,000 | | | | 5,362,500 | |
| TripAdvisor, Inc. | | 0.250% | | 04/01/26 | | | 6,000,000 | | | | 5,280,000 | |
| | | | | | | | | | | | 18,041,300 | |
| Consumer Discretionary — 16.7% | | | | | | | | | | | | |
| Chegg, Inc. | | 0.125% | | 03/15/25 | | | 3,000,000 | | | | 2,779,500 | |
| Chegg, Inc. | | 0.000% | | 09/01/26 | | | 3,000,000 | | | | 2,493,900 | |
| Etsy, Inc. | | 0.125% | | 09/01/27 | | | 3,000,000 | | | | 2,478,900 | |
| Etsy, Inc. | | 0.250% | | 06/15/28 | | | 4,000,000 | | | | 3,145,200 | |
| Ford Motor Company | | 0.000% | | 03/15/26 | | | 5,000,000 | | | | 4,896,750 | |
| Guess Inc., 144A | | 3.750% | | 04/15/28 | | | 5,000,000 | | | | 5,415,500 | |
| Patrick Industries, Inc. | | 1.750% | | 12/01/28 | | | 5,000,000 | | | | 5,665,500 | |
| | | | | | | | | | | | 26,875,250 | |
| Financials — 5.1% | | | | | | | | | | | | |
| Prospect Capital Corporation | | 6.375% | | 03/01/25 | | | 3,272,000 | | | | 3,255,460 | |
| Redwood Trust, Inc. | | 5.625% | | 07/15/24 | | | 5,000,000 | | | | 4,924,994 | |
| | | | | | | | | | | | 8,180,454 | |
See accompanying notes to financial statements.
| EUBEL BRADY & SUTTMAN INCOME AND APPRECIATION FUND |
| SCHEDULE OF INVESTMENTS (Continued) |
| CONVERTIBLE BONDS — 48.6% (Continued) | | Coupon | | Maturity | | Par Value | | | Value | |
| Industrials — 3.1% | | | | | | | | | | |
| Winnebago Industries, Inc., 144A | | 3.250% | | 01/15/30 | | $ | 5,000,000 | | | $ | 5,102,500 | |
| | | | | | | | | | | | | |
| Technology — 12.5% | | | | | | | | | | | | |
| Bentley Systems, Inc. | | 0.125% | | 01/15/26 | | | 5,000,000 | | | | 4,897,000 | |
| Envestnet, Inc. | | 0.750% | | 08/15/25 | | | 5,500,000 | | | | 5,147,944 | |
| Guidewire Software, Inc. | | 1.250% | | 03/15/25 | | | 5,000,000 | | | | 5,577,500 | |
| John Bean Technologies Corporation | | 0.250% | | 05/15/26 | | | 5,000,000 | | | | 4,515,500 | |
| | | | | | | | | | | | 20,137,944 | |
| Total Convertible Bonds | | | | | | | | | | | | |
| (Cost $77,629,292) | | | | | | | | | | $ | 78,337,448 | |
| | | | | | | | | | | | | |
| BANK DEBT — 1.9% | | Coupon | | Maturity | | Par Value | | | Value | |
| Financials — 1.9% | | | | | | | | | | | | |
| NCP SPV Texas, L.P. Revolving Loan (Prime + 225) (a)(c)(d) | | | | | | | | | | | | |
| (Cost $2,912,764) | | 10.750% | | 09/22/24 | | $ | 2,912,764 | | | $ | 3,006,441 | |
| | | | | | | | | | | | | |
| COMMON STOCKS — 1.1% | | | | | | Shares | | | Value | |
| Financials — 1.1% | | | | | | | | | | | | |
| Capital One Financial Corporation | | | | | | | 9,904 | | | $ | 1,340,209 | |
| Lincoln National Corporation | | | | | | | 15,673 | | | | 430,224 | |
| Total Common Stocks (Cost $934,971) | | | | | | | | | | $ | 1,770,433 | |
See accompanying notes to financial statements.
| EUBEL BRADY & SUTTMAN INCOME AND APPRECIATION FUND |
| SCHEDULE OF INVESTMENTS (Continued) |
| MONEY MARKET FUNDS — 10.4% | | Shares | | | Value | |
| Invesco Short-Term Investments Trust - Treasury Portfolio - Institutional Class, 5.24% (e) (Cost $16,827,028) | | | 16,827,028 | | | $ | 16,827,028 | |
| | | | | | | | | |
| Total Investments at Value — 102.4% (Cost $165,504,918) | | | | | | $ | 164,989,696 | |
| | | | | | | | | |
| Liabilities in Excess of Other Assets — (2.4%) | | | | | | | (3,932,907 | ) |
| | | | | | | | | |
| Net Assets — 100.0% | | | | | | $ | 161,056,789 | |
| 144A - | Security was purchased in a transaction exempt from registration in compliance with Rule 144A of the Securities Act of 1933. This security may be resold in transactions exempt from registration, normally to qualified institutional buyers. The total value of such securities is $14,428,456 as of January 31, 2024, representing 9.0% of net assets. |
| H15T5Y - | U.S. Treasury yield curve rate for U.S. Treasury note with a constant maturity of 5 years. |
| TSFR - | CME Term Secured Overnight Financing Rate (SOFR). |
| (a) | Variable rate security. Interest rate resets periodically. The rate shown is the effective interest rate as of January 31, 2024. For securities based on a published reference rate and spread, the reference rate and spread (in basis points) are indicated parenthetically. |
| (b) | Security has a perpetual maturity. |
| (c) | Illiquid security. The total fair value of these securities as of January 31, 2024 was $4,751,908, representing 3.0% of net assets. |
| (d) | Security has been valued using significant unobservable inputs in good faith by the Adviser in conformity with guidelines adopted by and subject to review by the Board of Trustees. The total value of such securities is $4,751,908 as of January 31, 2024, representing 3.0% of net assets. |
| (e) | The rate shown is the 7-day effective yield as of January 31, 2024. |
See accompanying notes to financial statements.
| EUBEL BRADY & SUTTMAN INCOME FUND |
| SCHEDULE OF INVESTMENTS |
| January 31, 2024 (Unaudited) |
| CORPORATE BONDS — 95.0% | | Coupon | | Maturity | | Par Value | | | Value | |
| Communications — 4.2% | | | | | | | | | | | | |
| Discovery Communications, LLC | | 3.950% | | 06/15/25 | | $ | 6,851,000 | | | $ | 6,718,935 | |
| Discovery Communications, LLC | | 4.900% | | 03/11/26 | | | 4,000,000 | | | | 3,986,278 | |
| VeriSign, Inc. | | 4.750% | | 07/15/27 | | | 6,000,000 | | | | 5,951,704 | |
| | | | | | | | | | | | 16,656,917 | |
| Consumer Discretionary — 9.0% | | | | | | | | | | | | |
| General Motors Financial Company, Inc. | | 4.350% | | 01/17/27 | | | 2,100,000 | | | | 2,067,939 | |
| LKQ Corporation | | 5.750% | | 06/15/28 | | | 11,000,000 | | | | 11,221,584 | |
| Marriott International, Inc., Series KK | | 4.900% | | 04/15/29 | | | 11,000,000 | | | | 11,062,051 | |
| Mohawk Industries, Inc. | | 5.850% | | 09/18/28 | | | 11,000,000 | | | | 11,395,193 | |
| | | | | | | | | | | | 35,746,767 | |
| Consumer Staples — 8.5% | | | | | | | | | | | | |
| J.M. Smucker Company (The) | | 3.375% | | 12/15/27 | | | 8,500,000 | | | | 8,141,094 | |
| Kroger Company (The) | | 2.650% | | 10/15/26 | | | 11,098,000 | | | | 10,494,979 | |
| Mondelez International, Inc. | | 2.125% | | 03/17/24 | | | 10,544,000 | | | | 10,495,709 | |
| Walgreens Boots Alliance, Inc. | | 3.800% | | 11/18/24 | | | 4,900,000 | | | | 4,825,909 | |
| | | | | | | | | | | | 33,957,691 | |
| Energy — 0.9% | | | | | | | | | | | | |
| AEP Texas Central Company, Series G, 144A | | 3.850% | | 10/01/25 | | | 3,750,000 | | | | 3,645,656 | |
| | | | | | | | | | | | | |
| Financials — 27.7% | | | | | | | | | | | | |
| American Express Company | | 2.250% | | 03/04/25 | | | 11,500,000 | | | | 11,144,466 | |
| Bank of America Corporation (TSFR3M + 396.661, effective 09/05/24) (a)(b) | | 6.250% | | 12/31/49 | | | 9,450,000 | | | | 9,404,849 | |
| Bank OZK (TSFR3M + 209, effective 10/01/26) (a) | | 2.750% | | 10/01/31 | | | 12,250,000 | | | | 10,292,086 | |
| Charles Schwab Corporation (The) | | 0.900% | | 03/11/26 | | | 12,000,000 | | | | 11,056,276 | |
| CNG Holdings, Inc., 144A | | 14.500% | | 06/30/26 | | | 3,969,000 | | | | 3,383,573 | |
| First Maryland Capital I (TSFR3M + 126.161) (a) | | 6.576% | | 01/15/27 | | | 5,000,000 | | | | 4,664,626 | |
| Loews Corporation | | 3.750% | | 04/01/26 | | | 12,000,000 | | | | 11,714,083 | |
| Markel Group, Inc. (H15T5Y + 566.2, effective 06/01/25) (a)(b) | | 6.000% | | 12/31/49 | | | 12,000,000 | | | | 11,860,136 | |
| Morgan Stanley, Series I (SOFR + 166.9, effective 07/17/25) (a) | | 4.679% | | 07/17/26 | | | 8,000,000 | | | | 7,946,293 | |
| MSCI, Inc., 144A | | 4.000% | | 11/15/29 | | | 9,000,000 | | | | 8,363,093 | |
| NCP SNIP (c)(d) | | 13.500% | | 12/31/25 | | | 5,725,000 | | | | 5,551,555 | |
See accompanying notes to financial statements.
| EUBEL BRADY & SUTTMAN INCOME FUND |
| SCHEDULE OF INVESTMENTS (Continued) |
| CORPORATE BONDS — 95.0% (Continued) | | Coupon | | Maturity | | Par Value | | | Value | |
| Financials — 27.7% (Continued) | | | | | | | | | | | | |
| Southern Bancshares (N.C.), Inc., 144A (TSFR3M + 241, effective 06/30/26) (a) | | 3.125% | | 06/30/31 | | $ | 5,800,000 | | | $ | 4,708,615 | |
| Truist Financial Corporation (TSFR3M + 93.161) (a) | | 6.311% | | 05/15/27 | | | 5,788,000 | | | | 5,498,529 | |
| Wells Fargo & Company, Series Q | | 4.150% | | 01/24/29 | | | 5,000,000 | | | | 4,852,877 | |
| | | | | | | | | | | | 110,441,057 | |
| Health Care — 16.6% | | | | | | | | | | | | |
| Danaher Corporation | | 2.200% | | 11/15/24 | | | 858,000 | | | | 837,776 | |
| Edwards Lifesciences Corporation | | 4.300% | | 06/15/28 | | | 11,400,000 | | | | 11,234,054 | |
| Humana, Inc. | | 3.950% | | 03/15/27 | | | 4,500,000 | | | | 4,390,890 | |
| Laboratory Corporation of America Holdings | | 3.600% | | 02/01/25 | | | 13,500,000 | | | | 13,279,235 | |
| McKesson Corporation | | 0.900% | | 12/03/25 | | | 12,065,000 | | | | 11,240,316 | |
| Stryker Corporation | | 3.375% | | 11/01/25 | | | 2,530,000 | | | | 2,467,719 | |
| Stryker Corporation | | 3.650% | | 03/07/28 | | | 6,000,000 | | | | 5,795,583 | |
| Thermo Fisher Scientific, Inc. | | 1.215% | | 10/18/24 | | | 5,815,000 | | | | 5,652,231 | |
| Zimmer Biomet Holdings, Inc. | | 1.450% | | 11/22/24 | | | 11,500,000 | | | | 11,138,721 | |
| | | | | | | | | | | | 66,036,525 | |
| Industrials — 13.0% | | | | | | | | | | | | |
| HEICO Corporation | | 5.250% | | 08/01/28 | | | 10,900,000 | | | | 11,093,729 | |
| Penske Truck Leasing Company, L.P., 144A | | 5.700% | | 02/01/28 | | | 11,000,000 | | | | 11,235,334 | |
| Penske Truck Leasing Company, L.P., 144A | | 3.350% | | 11/01/29 | | | 3,000,000 | | | | 2,685,610 | |
| Raytheon Technology Corporation | | 3.950% | | 08/16/25 | | | 9,775,000 | | | | 9,651,051 | |
| Roper Technologies, Inc. | | 3.800% | | 12/15/26 | | | 4,933,000 | | | | 4,823,676 | |
| Timken Company (The) | | 4.500% | | 12/15/28 | | | 12,433,000 | | | | 12,182,818 | |
| | | | | | | | | | | | 51,672,218 | |
| Materials — 7.1% | | | | | | | | | | | | |
| Ball Corporation | | 5.250% | | 07/01/25 | | | 8,836,000 | | | | 8,802,663 | |
| Kennametal, Inc. | | 4.625% | | 06/15/28 | | | 3,600,000 | | | | 3,523,212 | |
| Sherwin-Williams Company (The) | | 3.450% | | 06/01/27 | | | 5,000,000 | | | | 4,821,589 | |
| Steel Dynamics, Inc. | | 2.800% | | 12/15/24 | | | 11,271,000 | | | | 11,029,741 | |
| | | | | | | | | | | | 28,177,205 | |
See accompanying notes to financial statements.
| EUBEL BRADY & SUTTMAN INCOME FUND |
| SCHEDULE OF INVESTMENTS (Continued) |
| CORPORATE BONDS — 95.0% (Continued) | | Coupon | | Maturity | | Par Value | | | Value | |
| Technology — 8.0% | | | | | | | | | | | | |
| Fidelity National Information Services, Inc. | | 4.700% | | 07/15/27 | | $ | 5,000,000 | | | $ | 5,014,055 | |
| Hewlett Packard Enterprise Company | | 4.900% | | 10/15/25 | | | 11,231,000 | | | | 11,189,108 | |
| Keysight Technologies, Inc. | | 4.600% | | 04/06/27 | | | 3,614,000 | | | | 3,593,293 | |
| Micron Technology, Inc. | | 6.750% | | 11/01/29 | | | 5,000,000 | | | | 5,392,636 | |
| Western Digital Corporation | | 4.750% | | 02/15/26 | | | 7,000,000 | | | | 6,828,535 | |
| | | | | | | | | | | | 32,017,627 | |
| Total Corporate Bonds | | | | | | | | | | | | |
| (Cost $384,751,252) | | | | | | | | | | $ | 378,351,663 | |
| | | | | | | | | | | | | |
| BANK DEBT — 1.5% | | Coupon | | Maturity | | Par Value | | | Value | |
| Financials — 1.5% | | | | | | | | | | | | |
| NCP SPV Texas, L.P. Revolving Loan (Prime + 225) (a)(c)(d) (Cost $5,913,793) | | 10.750% | | 09/22/24 | | $ | 5,913,793 | | | $ | 6,103,986 | |
See accompanying notes to financial statements.
| EUBEL BRADY & SUTTMAN INCOME FUND |
| SCHEDULE OF INVESTMENTS (Continued) |
| MONEY MARKET FUNDS — 2.5% | | Shares | | | Value | |
| Invesco Short-Term Investments Trust - Treasury Portfolio - Institutional Class, 5.24% (e) (Cost $9,862,152) | | | 9,862,152 | | | $ | 9,862,152 | |
| | | | | | | | | |
| Total Investments at Value — 99.0% (Cost $400,527,197) | | | | | | $ | 394,317,801 | |
| | | | | | | | | |
| Other Assets in Excess of Liabilities — 1.0% | | | | | | | 4,063,331 | |
| | | | | | | | | |
| Net Assets — 100.0% | | | | | | $ | 398,381,132 | |
| 144A - | Security was purchased in a transaction exempt from registration in compliance with Rule 144A of the Securities Act of 1933. This security may be resold in transactions exempt from registration, normally to qualified institutional buyers. The total value of such securities is $34,021,881 as of January 31, 2024, representing 8.5% of net assets. |
| | |
| H15T5Y - | U.S. Treasury yield curve rate for U.S. Treasury note with a constant maturity of 5 years. |
| | |
| SOFR - | Secured Overnight Financing Rate. |
| | |
| TSFR - | CME Term Secured Overnight Financing Rate (SOFR). |
| (a) | Variable rate security. Interest rate resets periodically. The rate shown is the effective interest rate as of January 31, 2024. For securities based on a published reference rate and spread, the reference rate and spread (in basis points) are indicated parenthetically. |
| | |
| (b) | Security has a perpetual maturity. |
| | |
| (c) | Illiquid security. The total fair value of these securities as of January 31, 2024 was $11,655,541, representing 2.9% of net assets. |
| | |
| (d) | Security has been valued using significant unobservable inputs in good faith by the Adviser in conformity with guidelines adopted by and subject to review by the Board of Trustees. The total value of such securities is $11,655,541 as of January 31, 2024, representing 2.9% of net assets. |
| | |
| (e) | The rate shown is the 7-day effective yield as of January 31, 2024. |
See accompanying notes to financial statements.
| EUBEL BRADY & SUTTMAN MUTUAL FUND TRUST |
| STATEMENTS OF ASSETS AND LIABILITIES |
| January 31, 2024 (Unaudited) |
| | | Eubel Brady | | | | |
| | | & Suttman | | | | |
| | | Income and | | | Eubel Brady | |
| | | Appreciation | | | & Suttman | |
| | | Fund | | | Income Fund | |
| ASSETS | | | | | | | | |
| Investments in securities: | | | | | | | | |
| At cost | | $ | 165,504,918 | | | $ | 400,527,197 | |
| At value (Note 2) | | | 164,989,696 | | | | 394,317,801 | |
| Dividends and interest receivable | | | 983,881 | | | | 4,162,521 | |
| Other assets | | | 21,848 | | | | 22,679 | |
| Total assets | | | 165,995,425 | | | | 398,503,001 | |
| | | | | | | | | |
| LIABILITIES | | | | | | | | |
| Distributions payable | | | 109 | | | | 1,335 | |
| Payable for capital shares redeemed | | | 4,360 | | | | 63,388 | |
| Payable for investment securities purchased | | | 4,905,431 | | | | — | |
| Payable to administrator (Note 4) | | | 13,710 | | | | 30,320 | |
| Accrued shareholder servicing fees (Note 6) | | | 5,420 | | | | 13,340 | |
| Other accrued expenses | | | 9,606 | | | | 13,486 | |
| Total liabilities | | | 4,938,636 | | | | 121,869 | |
| | | | | | | | | |
| NET ASSETS | | $ | 161,056,789 | | | $ | 398,381,132 | |
| | | | | | | | | |
| NET ASSETS CONSIST OF: | | | | | | | | |
| Paid-in capital | | $ | 162,870,444 | | | $ | 413,805,100 | |
| Accumulated deficit | | | (1,813,655 | ) | | | (15,423,968 | ) |
| NET ASSETS | | $ | 161,056,789 | | | $ | 398,381,132 | |
| | | | | | | | | |
| Shares of beneficial interest outstanding (unlimited number of shares authorized, no par value) | | | 16,694,792 | | | | 41,807,414 | |
| | | | | | | | | |
| Net asset value, offering price and redemption price per share (Note 2) | | $ | 9.65 | | | $ | 9.53 | |
See accompanying notes to financial statements.
| EUBEL BRADY & SUTTMAN MUTUAL FUND TRUST |
| STATEMENTS OF OPERATIONS |
| For the Six Months Ended January 31, 2024 (Unaudited) |
| | | Eubel Brady | | | | |
| | | & Suttman | | | | |
| | | Income and | | | Eubel Brady | |
| | | Appreciation | | | & Suttman | |
| | | Fund | | | Income Fund | |
| INVESTMENT INCOME | | | | | | | | |
| Dividends | | $ | 284,485 | | | $ | 272,598 | |
| Interest | | | 3,469,612 | | | | 9,029,276 | |
| Total investment income | | | 3,754,097 | | | | 9,301,874 | |
| | | | | | | | | |
| EXPENSES | | | | | | | | |
| Administration fees (Note 4) | | | 69,305 | | | | 169,566 | |
| Shareholder servicing fees (Note 6) | | | 31,434 | | | | 78,388 | |
| Registration and filing fees | | | 18,727 | | | | 19,277 | |
| Custody and bank service fees | | | 7,466 | | | | 16,944 | |
| Legal fees | | | 9,351 | | | | 9,351 | |
| Trustees’ fees and expenses (Note 4) | | | 9,140 | | | | 9,140 | |
| Audit and tax services fees | | | 9,000 | | | | 9,000 | |
| Insurance expense | | | 3,913 | | | | 8,391 | |
| Shareholder reporting expenses | | | 4,353 | | | | 4,353 | |
| Pricing fees | | | 3,055 | | | | 3,531 | |
| Postage and supplies | | | 998 | | | | 975 | |
| Other expenses | | | 2,710 | | | | 3,260 | |
| Total expenses | | | 169,452 | | | | 332,176 | |
| | | | | | | | | |
| NET INVESTMENT INCOME | | | 3,584,645 | | | | 8,969,698 | |
| | | | | | | | | |
| REALIZED AND UNREALIZED GAINS (LOSSES) ON INVESTMENTS | | | | | | | | |
| Net realized losses from investment transactions | | | (859,571 | ) | | | (465,261 | ) |
| Net change in unrealized appreciation (depreciation) on investments | | | 3,898,697 | | | | 8,821,438 | |
| NET REALIZED AND UNREALIZED GAINS ON INVESTMENTS | | | 3,039,126 | | | | 8,356,177 | |
| | | | | | | | | |
| NET INCREASE IN NET ASSETS RESULTING FROM OPERATIONS | | $ | 6,623,771 | | | $ | 17,325,875 | |
See accompanying notes to financial statements.
| EUBEL BRADY & SUTTMAN INCOME AND APPRECIATION FUND |
| STATEMENTS OF CHANGES IN NET ASSETS |
| | | Six Months | | | | |
| | | Ended | | | Year | |
| | | January 31, | | | Ended | |
| | | 2024 | | | July 31, | |
| | | (Unaudited) | | | 2023 | |
| FROM OPERATIONS | | | | | | | | |
| Net investment income | | $ | 3,584,645 | | | $ | 5,801,266 | |
| Net realized gains (losses) from investment transactions | | | (859,571 | ) | | | 503,667 | |
| Net change in unrealized appreciation (depreciation) on investments | | | 3,898,697 | | | | (1,401,240 | ) |
| Net increase in net assets resulting from operations | | | 6,623,771 | | | | 4,903,693 | |
| | | | | | | | | |
| DISTRIBUTIONS TO SHAREHOLDERS (Note 2) | | | (4,417,470 | ) | | | (6,837,115 | ) |
| | | | | | | | | |
| CAPITAL SHARE TRANSACTIONS | | | | | | | | |
| Proceeds from shares sold | | | 8,066,053 | | | | 46,279,196 | |
| Net asset value of shares issued in reinvestment of distributions to shareholders | | | 4,415,755 | | | | 6,834,369 | |
| Payments for shares redeemed | | | (6,248,172 | ) | | | (19,444,937 | ) |
| Net increase in net assets from capital share transactions | | | 6,233,636 | | | | 33,668,628 | |
| | | | | | | | | |
| TOTAL INCREASE IN NET ASSETS | | | 8,439,937 | | | | 31,735,206 | |
| | | | | | | | | |
| NET ASSETS | | | | | | | | |
| Beginning of period | | | 152,616,852 | | | | 120,881,646 | |
| End of period | | $ | 161,056,789 | | | $ | 152,616,852 | |
| | | | | | | | | |
| CAPITAL SHARES ACTIVITY | | | | | | | | |
| Shares sold | | | 849,991 | | | | 4,830,649 | |
| Shares reinvested | | | 465,614 | | | | 722,749 | |
| Shares redeemed | | | (659,138 | ) | | | (2,044,408 | ) |
| Net increase in shares outstanding | | | 656,467 | | | | 3,508,990 | |
| Shares outstanding at beginning of period | | | 16,038,325 | | | | 12,529,335 | |
| Shares outstanding at end of period | | | 16,694,792 | | | | 16,038,325 | |
See accompanying notes to financial statements.
| EUBEL BRADY & SUTTMAN INCOME FUND |
| STATEMENTS OF CHANGES IN NET ASSETS |
| | | Six Months | | | | |
| | | Ended | | | Year | |
| | | January 31, | | | Ended | |
| | | 2024 | | | July 31, | |
| | | (Unaudited) | | | 2023 | |
| FROM OPERATIONS | | | | | | | | |
| Net investment income | | $ | 8,969,698 | | | $ | 13,663,030 | |
| Net realized losses from investment transactions | | | (465,261 | ) | | | (4,661,213 | ) |
| Net change in unrealized appreciation (depreciation) on investments | | | 8,821,438 | | | | (3,438,547 | ) |
| Net increase in net assets resulting from operations | | | 17,325,875 | | | | 5,563,270 | |
| | | | | | | | | |
| DISTRIBUTIONS TO SHAREHOLDERS (Note 2) | | | (8,967,076 | ) | | | (13,663,699 | ) |
| | | | | | | | | |
| CAPITAL SHARE TRANSACTIONS | | | | | | | | |
| Proceeds from shares sold | | | 26,111,365 | | | | 85,137,219 | |
| Net asset value of shares issued in reinvestment of distributions to shareholders | | | 8,958,964 | | | | 13,650,744 | |
| Payments for shares redeemed | | | (25,900,135 | ) | | | (60,591,352 | ) |
| Net increase in net assets from capital share transactions | | | 9,170,194 | | | | 38,196,611 | |
| | | | | | | | | |
| TOTAL INCREASE IN NET ASSETS | | | 17,528,993 | | | | 30,096,182 | |
| | | | | | | | | |
| NET ASSETS | | | | | | | | |
| Beginning of period | | | 380,852,139 | | | | 350,755,957 | |
| End of period | | $ | 398,381,132 | | | $ | 380,852,139 | |
| | | | | | | | | |
| CAPITAL SHARES ACTIVITY | | | | | | | | |
| Shares sold | | | 2,790,427 | | | | 9,055,097 | |
| Shares reinvested | | | 957,442 | | | | 1,459,944 | |
| Shares redeemed | | | (2,761,818 | ) | | | (6,458,022 | ) |
| Net increase in shares outstanding | | | 986,051 | | | | 4,057,019 | |
| Shares outstanding at beginning of period | | | 40,821,363 | | | | 36,764,344 | |
| Shares outstanding at end of period | | | 41,807,414 | | | | 40,821,363 | |
See accompanying notes to financial statements.
| EUBEL BRADY & SUTTMAN INCOME AND APPRECIATION FUND |
| FINANCIAL HIGHLIGHTS |
| |
| Per Share Data for a Share Outstanding Throughout Each Period |
| | | Six Months | | | | | | | | | | | | | | | | |
| | | Ended | | | | | | | | | | | | | | | | |
| | | January 31, | | | Year Ended | | | Year Ended | | | Year Ended | | | Year Ended | | | Year Ended | |
| | | 2024 | | | July 31, | | | July 31, | | | July 31, | | | July 31, | | | July 31, | |
| | | (Unaudited) | | | 2023 | | | 2022 | | | 2021 | | | 2020 | | | 2019 | |
| Net asset value at beginning of period | | $ | 9.52 | | | $ | 9.65 | | | $ | 10.32 | | | $ | 9.76 | | | $ | 9.81 | | | $ | 9.86 | |
| Income (loss) from investment operations: | | | | | | | | | | | | | | | | | | | | | | | | |
| Net investment income | | | 0.22 | | | | 0.37 | | | | 0.25 | | | | 0.26 | | | | 0.34 | | | | 0.32 | |
| Net realized and unrealized gains (losses) on investments | | | 0.18 | | | | (0.07 | ) | | | (0.49 | ) | | | 0.63 | | | | (0.05 | ) | | | (0.05 | ) |
| Total from investment operations | | | 0.40 | | | | 0.30 | | | | (0.24 | ) | | | 0.89 | | | | 0.29 | | | | 0.27 | |
| Less distributions from: | | | | | | | | | | | | | | | | | | | | | | | | |
| Net investment income | | | (0.24 | ) | | | (0.37 | ) | | | (0.25 | ) | | | (0.27 | ) | | | (0.34 | ) | | | (0.32 | ) |
| Net realized gains on investments | | | (0.03 | ) | | | (0.06 | ) | | | (0.18 | ) | | | (0.06 | ) | | | — | | | | — | |
| Total distributions | | | (0.27 | ) | | | (0.43 | ) | | | (0.43 | ) | | | (0.33 | ) | | | (0.34 | ) | | | (0.32 | ) |
| Net asset value at end of period | | $ | 9.65 | | | $ | 9.52 | | | $ | 9.65 | | | $ | 10.32 | | | $ | 9.76 | | | $ | 9.81 | |
| Total return (a) | | | 4.27 | % (b) | | | 3.24 | % | | | (2.39 | %) | | | 9.20 | % | | | 3.04 | % | | | 2.82 | % |
| Net assets at end of period (000’s) | | $ | 161,057 | | | $ | 152,617 | | | $ | 120,882 | | | $ | 118,185 | | | $ | 101,634 | | | $ | 88,796 | |
| Ratios/supplementary data: | | | | | | | | | | | | | | | | | | | | | | | | |
| Ratio of total expenses to average net assets | | | 0.22 | % (c) | | | 0.22 | % | | | 0.25 | % | | | 0.26 | % | | | 0.27 | % | | | 0.27 | % |
| Ratio of net investment income to average net assets | | | 4.57 | % (c) | | | 3.91 | % | | | 2.47 | % | | | 2.59 | % | | | 3.48 | % | | | 3.24 | % |
| Portfolio turnover rate | | | 17 | % (b) | | | 23 | % | | | 33 | % | | | 50 | % | | | 45 | % | | | 16 | % |
| (a) | Total return is a measure of the change in value of an investment in the Fund over the periods covered, which assumes any dividends or capital gains distributions are reinvested in shares of the Fund. The returns shown do not reflect the deduction of taxes a shareholder would pay on Fund distributions or the redemption of Fund shares. |
See accompanying notes to financial statements.
| EUBEL BRADY & SUTTMAN INCOME FUND |
| FINANCIAL HIGHLIGHTS |
Per Share Data for a Share Outstanding Throughout Each Period
| | | Six Months | | | | | | | | | | | | | | | | |
| | | Ended | | | | | | | | | | | | | | | | |
| | | January 31, | | | Year Ended | | | Year Ended | | | Year Ended | | | Year Ended | | | Year Ended | |
| | | 2024 | | | July 31, | | | July 31, | | | July 31, | | | July 31, | | | July 31, | |
| | | (Unaudited) | | | 2023 | | | 2022 | | | 2021 | | | 2020 | | | 2019 | |
| Net asset value at beginning of period | | $ | 9.33 | | | $ | 9.54 | | | $ | 9.97 | | | $ | 9.85 | | | $ | 9.86 | | | $ | 9.82 | |
| Income (loss) from investment operations: | | | | | | | | | | | | | | | | | | | | | | | | |
| Net investment income | | | 0.22 | | | | 0.34 | | | | 0.19 | | | | 0.21 | | | | 0.35 | | | | 0.33 | |
| Net realized and unrealized gains (losses) on investments | | | 0.20 | | | | (0.21 | ) | | | (0.43 | ) | | | 0.12 | | | | (0.01 | ) | | | 0.04 | |
| Total from investment operations | | | 0.42 | | | | 0.13 | | | | (0.24 | ) | | | 0.33 | | | | 0.34 | | | | 0.37 | |
| Less distributions from net investment income | | | (0.22 | ) | | | (0.34 | ) | | | (0.19 | ) | | | (0.21 | ) | | | (0.35 | ) | | | (0.33 | ) |
| Net asset value at end of period | | $ | 9.53 | | | $ | 9.33 | | | $ | 9.54 | | | $ | 9.97 | | | $ | 9.85 | | | $ | 9.86 | |
| Total return (a) | | | 4.52 | % (b) | | | 1.46 | % | | | (2.40 | %) | | | 3.43 | % | | | 3.49 | % | | | 3.86 | % |
| Net assets at end of period (000’s) | | $ | 398,381 | | | $ | 380,852 | | | $ | 350,756 | | | $ | 311,539 | | | $ | 203,495 | | | $ | 200,716 | |
| Ratios/supplementary data: | | | | | | | | | | | | | | | | | | | | | | | | |
| Ratio of total expenses to average net assets | | | 0.17 | % (c) | | | 0.17 | % | | | 0.18 | % | | | 0.20 | % | | | 0.21 | % | | | 0.20 | % |
| Ratio of net investment income to average net assets | | | 4.59 | % (c) | | | 3.69 | % | | | 2.01 | % | | | 2.13 | % | | | 3.51 | % | | | 3.37 | % |
| Portfolio turnover rate | | | 6 | % (b) | | | 40 | % | | | 50 | % | | | 33 | % | | | 27 | % | | | 19 | % |
| (a) | Total return is a measure of the change in value of an investment in the Fund over the periods covered, which assumes any dividends or capital gains distributions are reinvested in shares of the Fund. The returns shown do not reflect the deduction of taxes a shareholder would pay on Fund distributions or the redemption of Fund shares. |
See accompanying notes to financial statements.
| EUBEL BRADY & SUTTMAN MUTUAL FUND TRUST |
| NOTES TO FINANCIAL STATEMENTS |
| January 31, 2024 (Unaudited) |
Eubel Brady & Suttman Income and Appreciation Fund (“EBS Income and Appreciation Fund”) and Eubel Brady & Suttman Income Fund (“EBS Income Fund”) (individually, a “Fund” and collectively, the “Funds”) are each a no-load diversified series of Eubel Brady & Suttman Mutual Fund Trust (the “Trust”), an open-end management investment company organized as an Ohio business trust on April 22, 2014.
The investment objective of EBS Income and Appreciation Fund is to provide total return through a combination of current income and capital appreciation.
The investment objective of EBS Income Fund is to preserve capital, produce income and maximize total return.
| 2. | Significant Accounting Policies |
The Funds follow accounting and reporting guidance under Financial Accounting Standards Board (“FASB”) Accounting Standards Codification Topic 946, “Financial Services – Investment Companies,” including Accounting Standards Update 2013- 08. The following is a summary of significant accounting policies followed by the Funds. These policies are in conformity with accounting principles generally accepted in the United States of America (“GAAP”).
Regulatory update – Tailored Shareholder Reports for Mutual Funds and Exchange-Traded Funds (“ETFs”) – Effective January 24, 2023, the Securities and Exchange Commission (the “SEC”) adopted rule and form amendments to require mutual funds and ETFs to transmit concise and visually engaging streamlined annual and semi-annual reports to shareholders that highlight key information. Other information, including financial statements, will no longer appear in a streamlined shareholder report but must be available online, delivered free of charge upon request, and filed on a semi-annual basis on Form N-CSR. The rule and form amendments have a compliance date of July 24, 2024. At this time, management is evaluating the impact of these amendments on the shareholder reports for the Funds.
Securities Valuation – Securities that are traded on any stock exchange are generally valued at the last quoted sale price. Lacking a last sale price, an exchange traded security is generally valued at its last bid price. Securities traded on NASDAQ are generally valued at the NASDAQ Official Closing Price. Investments representing shares of other open-end investment companies, including money market funds, are valued at their net asset value (“NAV”) as reported by such companies. The Funds typically use an independent pricing service to determine the value of their fixed income securities. The pricing service utilizes electronic data processing
| EUBEL BRADY & SUTTMAN MUTUAL FUND |
| TRUST NOTES TO FINANCIAL STATEMENTS (Continued) |
techniques based on yield spreads relating to securities with similar characteristics to determine prices for normal institutional-size trading units of fixed income securities without regard to sale or bid prices. Commercial paper may be valued at amortized cost, which under normal circumstances approximates market value.
If Eubel Brady & Suttman Asset Management, Inc. (the “Adviser”), the investment adviser to the Funds and the Valuation Designee, determines that a price provided by the pricing service does not accurately reflect the market value of the securities or, when prices are not readily available from the pricing service, securities are valued at fair value as determined in good faith by the Valuation Designee in conformity with guidelines adopted by and subject to review by the Board of Trustees of the Trust (the “Board”).
GAAP establishes a single authoritative definition of fair value, sets out a framework for measuring fair value and requires additional disclosures about fair value measurements.
Various inputs are used in determining the value of each Fund’s investments. These inputs are summarized in the three broad levels listed below:
| ● | Level 1 – quoted prices in active markets for identical securities |
| ● | Level 2 – other significant observable inputs |
| ● | Level 3 – significant unobservable inputs |
Certain fixed income securities held by the Funds are classified as Level 2 since the values are typically provided by an independent pricing service that utilizes various “other significant observable inputs” as discussed above. Other fixed income securities (including certain corporate bonds and bank debt) held by the Funds, are classified as Level 3 since the values for these securities are based on prices derived from one or more significant inputs that are unobservable. The inputs or methodology used are not necessarily an indication of the risks associated with investing in those securities. The inputs used to measure fair value may fall into different levels of the fair value hierarchy. In such cases, for disclosure purposes, the level in the fair value hierarchy within which the fair value measurement falls in its entirety is based on the lowest level input that is significant to the fair value measurement.
| EUBEL BRADY & SUTTMAN MUTUAL FUND TRUST |
| NOTES TO FINANCIAL STATEMENTS (Continued) |
The following is a summary of each Fund’s investments and the inputs used to value the investments as of January 31, 2024 by security type:
| EBS Income and Appreciation Fund: | | | | | | | | | | | | |
| | | Level 1 | | | Level 2 | | | Level 3 | | | Total | |
| Corporate Bonds | | $ | — | | | $ | 63,302,879 | | | $ | 1,745,467 | | | $ | 65,048,346 | |
| Convertible Bonds | | | — | | | | 78,337,448 | | | | — | | | | 78,337,448 | |
| Bank Debt | | | — | | | | — | | | | 3,006,441 | | | | 3,006,441 | |
| Common Stocks | | | 1,770,433 | | | | — | | | | — | | | | 1,770,433 | |
| Money Market Funds | | | 16,827,028 | | | | — | | | | — | | | | 16,827,028 | |
| Total | | $ | 18,597,461 | | | $ | 141,640,327 | | | $ | 4,751,908 | | | $ | 164,989,696 | |
| | | | | | | | | | | | | | | | | |
| | | | | | | | | | | | | | | | | |
| EBS Income Fund: | | | | | | | | | | | | |
| | | Level 1 | | | Level 2 | | | Level 3 | | | Total | |
| Corporate Bonds | | $ | — | | | $ | 372,800,108 | | | $ | 5,551,555 | | | $ | 378,351,663 | |
| Bank Debt | | | — | | | | — | | | | 6,103,986 | | | | 6,103,986 | |
| Money Market Funds | | | 9,862,152 | | | | — | | | | — | | | | 9,862,152 | |
| Total | | $ | 9,862,152 | | | $ | 372,800,108 | | | $ | 11,655,541 | | | $ | 394,317,801 | |
| | | | | | | | | | | | | | | | | |
| | | | | | | | | | | | | | | | | |
The following is a reconciliation of Level 3 investments of the Funds for which significant unobservable inputs were used to determine fair value for the six months ended January 31, 2024:
| EBS Income and Appreciation Fund | |
| | | | | | | | | | | | Net change | | | Value | |
| | | Value as of | | | | | | | | | in unrealized | | | as of | |
| | | July 31, | | | | | | Sales/ | | | appreciation | | | January 31, | |
| Investments in Securities | | 2023 | | | Purchases | | | maturities | | | (depreciation) | | | 2024 | |
| Corporate Bonds | | $ | 1,697,076 | | | $ | — | | | $ | — | | | $ | 48,391 | | | $ | 1,745,467 | |
| Bank Debt | | | 3,250,604 | | | | 322,632 | | | | (527,158 | ) | | | (39,637 | ) | | | 3,006,441 | |
| Total | | $ | 4,947,680 | | | $ | 322,632 | | | $ | (527,158 | ) | | $ | 8,754 | | | $ | 4,751,908 | |
| | | | | | | | | | | | | | | | | | | | | |
| | | | | | | | | | | | | | | | | | | | | |
| EBS Income Fund | |
| | | | | | | | | | | | Net change | | | Value | |
| | | Value as of | | | | | | | | | in unrealized | | | as of | |
| | | July 31, | | | | | | Sales/ | | | appreciation | | | January 31, | |
| Investments in Securities | | 2023 | | | Purchases | | | maturities | | | (depreciation) | | | 2024 | |
| Corporate Bonds | | $ | 5,397,644 | | | $ | — | | | $ | — | | | $ | 153,911 | | | $ | 5,551,555 | |
| Bank Debt | | | 6,599,710 | | | | 655,041 | | | | (1,070,291 | ) | | | (80,474 | ) | | | 6,103,986 | |
| Total | | $ | 11,997,354 | | | $ | 655,041 | | | $ | (1,070,291 | ) | | $ | 73,437 | | | $ | 11,655,541 | |
| | | | | | | | | | | | | | | | | | | | | |
| EUBEL BRADY & SUTTMAN MUTUAL FUND TRUST |
| NOTES TO FINANCIAL STATEMENTS (Continued) |
The total change in unrealized appreciation (depreciation) included on the Statements of Operations attributable to Level 3 investments still held at January 31, 2024 is $8,754 and $73,437 for EBS Income and Appreciation Fund and EBS Income Fund, respectively.
The following table summarizes the valuation techniques used and unobservable inputs developed by the Valuation Designee in conformity with guidelines adopted by and subject to review by the Board to determine the fair value of the Level 3 investments.
| EBS Income and Appreciation Fund |
| | | | | | | | | | | | Weighted |
| | | Fair Value at | | | | | | | | | Average of |
| | | January 31, | | | Valuation | | Unobservable | | Value/ | | Unobservable |
| | | 2024 | | | Technique | | Input1 | | Range | | Inputs |
| Corporate Bonds | | $ | 1,745,467 | | | Management’s Estimate of Future Cash Flows | | Discount Rate2 | | 15.326% | | N/A |
| Bank Debt | | $ | 3,006,441 | | | DCF Model | | Discount Rate2 | | 5.649% | | N/A |
| | | | | | | | | | | | | |
| EBS Income Fund |
| | | | | | | | | | | | Weighted |
| | | Fair Value at | | | | | | | | | Average of |
| | | January 31, | | | Valuation | | Unobservable | | Value/ | | Unobservable |
| | | 2024 | | | Technique | | Input1 | | Range | | Inputs |
| Corporate Bonds | | $ | 5,551,555 | | | Management’s Estimate of Future Cash Flows | | Discount Rate2 | | 15.326% | | N/A |
| Bank Debt | | $ | 6,103,986 | | | DCF Model | | Discount Rate2 | | 5.649% | | N/A |
DCF - Discounted Cash Flow
| 1 | Significant increases and decreases on the unobservable inputs used to determine fair value of Level 3 assets could result in significantly higher or lower fair value measurements. An increase to the unobservable input would result in a decrease to the fair value. A decrease to the unobservable input would have the opposite effect. |
| 2 | The Discount Rate used is determined by the Adviser by employing a reference benchmark, adjusted by a credit spread. |
There were no derivative instruments held by the Funds as of or during the six months ended January 31, 2024.
Share Valuation — The NAV per share of each Fund is calculated daily by dividing the total value of its assets, less liabilities, by the number of shares outstanding. The offering price and redemption price per share of each Fund is equal to its NAV per share.
| EUBEL BRADY & SUTTMAN MUTUAL FUND TRUST |
| NOTES TO FINANCIAL STATEMENTS (Continued) |
Estimates — The preparation of financial statements in conformity with GAAP requires management to make estimates and assumptions that affect the reported amounts of assets and liabilities and disclosures of contingent assets and liabilities at the date of the financial statements and the reported amounts of increases and decreases in net assets from operations during the reporting period. Actual results could differ from those estimates.
Investment Income, Investment Transactions and Realized Capital Gains and Losses — Dividend income is recorded on the ex-dividend date. Non-cash dividends included in dividend income, if any, are recorded at the fair market value of the security received. Interest income is recorded as earned. Discounts and premiums on fixed income securities are amortized using the effective interest method. Investment transactions are accounted for on trade date. Realized capital gains and losses on investments sold are determined on a specific identification basis.
Expenses — Expenses of the Trust that are directly identifiable to a specific Fund are charged to that Fund. Expenses which are not readily identifiable to a specific Fund are allocated in such a manner as deemed equitable.
Distributions to Shareholders — Distributions to shareholders of net investment income, if any, are paid monthly. Capital gain distributions, if any, are distributed to shareholders annually. Distributions are based on amounts calculated in accordance with applicable federal income tax regulations, which may differ from GAAP. These differences are due primarily to differing treatments of income and realized capital gains on various investment securities held by the Funds, timing differences and differing characterizations of distributions made by the Funds. Dividends and distributions are recorded on the ex-dividend date. The tax character of distributions paid during the periods ended January 31, 2024 and July 31, 2023 was as follows:
| | | | | | | | Long-Term | | | Total | |
| | | Periods Ended | | Ordinary Income | | | Capital Gains | | | Distributions | |
| Eubel Brady & Suttman | | | | | | | | | | | | | | |
| Income and Appreciation Fund | | 1/31/2024 | | $ | 4,128,141 | | | $ | 289,329 | | | $ | 4,417,470 | |
| | | 7/31/2023 | | $ | 5,832,210 | | | $ | 1,004,905 | | | $ | 6,837,115 | |
| | | | | | | | | | | | | | |
| Eubel Brady & Suttman Income Fund | | 1/31/2024 | | $ | 8,967,076 | | | $ | — | | | $ | 8,967,076 | |
| | | 7/31/2023 | | $ | 13,663,699 | | | $ | — | | | $ | 13,663,699 | |
Federal Income Tax — Each Fund has qualified and intends to continue to qualify each year as a “regulated investment company” under Subchapter M of the Internal Revenue Code of 1986, as amended (the “Code”). Qualification generally will
| EUBEL BRADY & SUTTMAN MUTUAL FUND TRUST |
| NOTES TO FINANCIAL STATEMENTS (Continued) |
relieve the Funds of liability for federal income taxes to the extent 100% of their net investment income and net realized capital gains are distributed in accordance with the Code.
In order to avoid imposition of the excise tax applicable to regulated investment companies, it is also each Fund’s intention to declare as dividends in each calendar year at least 98% of its net investment income (earned during the calendar year) and 98.2% of its net realized capital gains (earned during the twelve months ended October 31) plus undistributed amounts from prior years.
The following information is computed on a tax basis for each item as of July 31, 2023:
| | | EBS | | | | |
| | | Income and | | | EBS | |
| | | Appreciation | | | Income | |
| | | Fund | | | Fund | |
| Tax cost of investments | | $ | 156,505,126 | | | $ | 392,155,750 | |
| Gross unrealized appreciation | | $ | 2,059,170 | | | $ | 555,755 | |
| Gross unrealized depreciation | | | (6,904,917 | ) | | | (15,586,589 | ) |
| Net unrealized depreciation on investments | | | (4,845,747 | ) | | | (15,030,834 | ) |
| Undistributed ordinary income | | | 537,468 | | | | — | |
| Undistributed long-term gains | | | 288,323 | | | | — | |
| Accumulated capital and other losses | | | — | | | | (8,751,933 | ) |
| Accumulated deficit | | $ | (4,019,956 | ) | | $ | (23,782,767 | ) |
| | | | | | | | | |
The federal tax cost, unrealized appreciation (depreciation) as of January 31, 2024 is as follows:
| | | EBS | | | | |
| | | Income and | | | EBS | |
| | | Appreciation | | | Income | |
| | | Fund | | | Fund | |
| Tax cost of investments | | $ | 165,936,746 | | | $ | 400,527,197 | |
| Gross unrealized appreciation | | $ | 3,607,429 | | | $ | 3,311,839 | |
| Gross unrealized depreciation | | | (4,554,479 | ) | | | (9,521,235 | ) |
| Net unrealized depreciation on investments | | | (947,050 | ) | | | (6,209,396 | ) |
| | | | | | | | | |
The difference between the federal income tax cost of investments and the Schedule of Investments cost for EBS Income and Appreciation Fund is due to certain timing differences in the recognition of capital gains or losses under income tax regulations and GAAP. These “book/tax” differences are temporary in nature and are primarily due to basis adjustments related to the Fund’s holdings in convertible bonds.
| EUBEL BRADY & SUTTMAN MUTUAL FUND TRUST |
| NOTES TO FINANCIAL STATEMENTS (Continued) |
As of July 31, 2023, the Funds had the following capital loss carryforwards (“CLCFs”) for federal income tax purposes:
| | | EBS Income and | | | | |
| | | Appreciation | | | EBS Income | |
| | | Fund | | | Fund | |
| Short-term | | $ | — | | | $ | 1,970,027 | |
| Long-term | | | — | | | | 6,781,906 | |
| | | $ | — | | | $ | 8,751,933 | |
| | | | | | | | | |
These CLCFs, which do not expire, may be utilized in the current and future years to offset net realized capital gains, if any, prior to distributing such gains to shareholders.
The Funds recognize the tax benefits or expenses of uncertain tax positions only when the position is “more likely than not” to be sustained assuming examination by tax authorities. Management has reviewed each Fund’s tax positions for the current and all open tax years (generally, three years) and has concluded that no provision for unrecognized tax benefits or expenses is required in these financial statements. Each Fund identifies its major tax jurisdiction as U.S. Federal.
The Funds recognize interest and penalties, if any, related to unrecognized tax benefits as income tax expenses on the Statements of Operations.
| 3. | Unfunded Loan Commitment |
At January 31, 2024, unfunded loan commitments for the Funds were as follows:
| | | | | Unfunded | |
| Fund | | Borrower | | Commitment | |
| EBS Income and Appreciation Fund | | NCP Finance Limited Partnership | | $ | 387,236 | |
| EBS Income Fund | | NCP Finance Limited Partnership | | $ | 786,207 | |
Pursuant to an Asset-Based Lending Credit Agreement between the Funds and NCP SVP Texas, L.P. (the “Borrower”), the Borrower has agreed to pay the Funds a commitment fee equal to 0.25% of the average daily unfunded commitment balance, which is included within interest income on the Statements of Operations.
| 4. | Transactions with Related Parties |
Certain officers of the Trust are also officers of the Adviser, of Ultimus Fund Solutions, LLC (“Ultimus”), the administrative services agent, shareholder servicing and transfer agent, and accounting services agent for the Funds, or of Ultimus Fund Distributors, LLC (the “Distributor”), the principal underwriter and exclusive agent for the distribution of shares of the Funds.
| EUBEL BRADY & SUTTMAN MUTUAL FUND TRUST |
| NOTES TO FINANCIAL STATEMENTS (Continued) |
Investment Adviser – Under the terms of the Management Agreement between the Trust and the Adviser, the Adviser manages each Fund’s investments subject to oversight by the Board. The Funds do not pay the Adviser investment advisory fees under the Management Agreement. However, prior to investing in a Fund, a prospective shareholder must enter into an investment advisory agreement with the Adviser that calls for the payment of an advisory fee based upon a percentage of all assets (including shares of the Funds) managed by the Adviser on behalf of the prospective shareholder. The fee schedule may be negotiable at the time the account is opened and is generally based upon the value of assets held in the client’s account and the style of management.
The Adviser has entered into an agreement with the Funds under which it has agreed to reimburse Fund expenses to the extent necessary to limit total annual operating expenses (excluding brokerage costs, taxes, interest, acquired fund fees and expenses, expenses incurred pursuant to the Funds’ Shareholder Servicing Plan and extraordinary expenses) to an amount not exceeding 0.35% of each Fund’s average daily net assets. Any payments by the Adviser of expenses which are a Fund’s obligation are subject to repayment by the Fund for a period of three years following the date on which such expenses were paid, provided that the repayment does not cause the Fund’s total annual operating expenses to exceed the lesser of: (i) the expense limitation in effect at the time such expenses were reimbursed; and (ii) the expense limitation in effect at the time the Adviser seeks reimbursement of such expenses. This agreement is currently in effect until December 1, 2024. No expense reimbursements were required during the six months ended January 31, 2024.
Administrator – Ultimus provides administration, fund accounting and transfer agency services to each Fund. The Funds pay Ultimus fees in accordance with the agreements for such services. In addition, the Funds pay out-of-pocket expenses including, but not limited to, postage, supplies and certain costs related to the pricing of the Funds’ portfolio securities.
Compensation of Trustees – Trustees and officers affiliated with the Adviser or Ultimus are not compensated by the Funds for their services. Effective January 1, 2024, each Trustee who is not an interested person of the Trust receives from the Funds a fee of $3,281 for attendance at each meeting of the Board, in addition to reimbursement of travel and other expenses incurred in attending the meetings. The Chairperson of the Audit and Governance Committee receives an additional annual fee of $1,250, paid quarterly. Prior to January 1, 2024, each Independent Trustee received from the Funds a fee of $2,625 for attendance at each meeting of the Board, in addition to reimbursement of travel and other expenses incurred in attending the meetings. The Chairperson of the Audit and Governance Committee received an additional annual fee of $1,000, paid quarterly.
| EUBEL BRADY & SUTTMAN MUTUAL FUND TRUST |
| NOTES TO FINANCIAL STATEMENTS (Continued) |
| 5. | Securities Transactions |
During the six months ended January 31, 2024, cost of purchases and proceeds from sales and maturities of investment securities, other than short-term investments and U.S. government securities, were as follows:
| | | EBS Income and | | | | |
| | | Appreciation | | | EBS Income | |
| | | Fund | | | Fund | |
| Purchases of investment securities | | $ | 26,046,610 | | | $ | 34,302,706 | |
| Proceeds from sales and maturities of investment securities | | $ | 23,567,368 | | | $ | 23,203,371 | |
| | | | | | | | | |
During the six months ended January 31, 2024, there were no purchases or sales and maturities from U.S. government long-term securities for the Funds.
| 6. | Shareholder Servicing Plan |
The Funds have adopted a Shareholder Servicing Plan (the “Plan”) which allows each Fund to make payments to financial organizations (including payments directly to the Adviser and the Distributor) for providing account administration and account maintenance services to Fund shareholders. The annual fees paid under the Plan may not exceed an amount equal to 0.25% of each Fund’s average daily net assets. During the six months ended January 31, 2024, EBS Income and Appreciation Fund and EBS Income Fund incurred $31,434 and $78,388, respectively, of shareholder servicing fees pursuant to the Plan. No payments were made to the Adviser or the Distributor during the six months ended January 31, 2024.
| 7. | Contingencies and Commitments |
The Funds indemnify the Trust’s officers and Trustees for certain liabilities that might arise from the performance of their duties to the Funds. Additionally, in the normal course of business the Funds enter into contracts that contain a variety of representations and warranties and which provide general indemnifications. The Funds’ maximum exposure under these arrangements is unknown, as this would involve future claims that may be made against the Funds that have not yet occurred. However, based on experience, the Funds expect the risk of loss to be remote.
If a Fund has significant investments in the securities of issuers in industries within a particular sector, any development affecting that sector will have a greater impact on the value of the net assets of the Fund than would be the case if the Fund did not have significant investments in that sector. In addition, this may increase the risk
| EUBEL BRADY & SUTTMAN MUTUAL FUND TRUST |
| NOTES TO FINANCIAL STATEMENTS (Continued) |
of loss of an investment in the Fund and increase the volatility of the Fund’s NAV per share. From time to time, circumstances may affect a particular sector and the companies within such sector. For instance, economic or market factors, regulation or deregulation, and technological or other developments may negatively impact all companies in a particular sector and therefore the value of the Fund’s portfolio will be adversely affected. As of January 31, 2024, EBS Income Fund had 29.2% of the value of its net assets invested in securities within the Financials sector.
The Funds are required to recognize in the financial statements the effects of all subsequent events that provide additional evidence about conditions that existed as of the date of the Statements of Assets and Liabilities. For non-recognized subsequent events that must be disclosed to keep the financial statements from being misleading, the Funds are required to disclose the nature of the event as well as an estimate of its financial effect, or a statement that such an estimate cannot be made. Management has evaluated subsequent events through the issuance of these financial statements and has noted no such events.
| EUBEL BRADY & SUTTMAN MUTUAL FUND TRUST |
| ABOUT YOUR FUNDS’ EXPENSES (Unaudited) |
We believe it is important for you to understand the impact of costs on your investment. All mutual funds have operating expenses. As a shareholder of the Funds, you incur ongoing costs, including shareholder servicing fees and other operating expenses. These ongoing costs, which are deducted from each Fund’s gross income, directly reduce the investment return of the Funds.
A mutual fund’s ongoing costs are expressed as a percentage of its average net assets. This figure is known as the expense ratio. The following examples are intended to help you understand the ongoing costs (in dollars) of investing in the Funds and to compare these costs with the ongoing costs of investing in other mutual funds. The examples below are based on an investment of $1,000 made at the beginning of the period shown and held for the entire period (August 1, 2023 through January 31, 2024).
The table below illustrates each Fund’s ongoing costs in two ways:
Actual fund return – This section helps you to estimate the actual expenses that you paid over the period. The “Ending Account Value” shown is based on each Fund’s actual return, and the fourth column shows the dollar amount of operating expenses that would have been paid by an investor who started with $1,000 in each Fund. You may use the information here, together with the amount you invested, to estimate the expenses that you paid over the period.
To do so, simply divide your account value by $1,000 (for example, an $8,600 account value divided by $1,000 = 8.6), then multiply the result by the number given for the Funds under the heading “Expenses Paid During Period.”
Hypothetical 5% return – This section is intended to help you compare the Funds’ ongoing costs with those of other mutual funds. It assumes that each Fund had an annual return of 5% before expenses during the period shown, but that the expense ratio is unchanged. In this case, because the returns used are not the Funds’ actual returns, the results do not apply to your investment. The example is useful in making comparisons because the U.S. Securities and Exchange Commission (the “SEC”) requires all mutual funds to calculate expenses based on a 5% return. You can assess each Fund’s ongoing costs by comparing this hypothetical example with the hypothetical examples that appear in shareholder reports of other funds.
Note that expenses shown in the table are meant to highlight and help you compare ongoing costs only. They will not help you determine the relative total costs of owning different funds. The Funds do not charge transaction fees, such as purchase or redemption fees, nor do they impose any sales loads.
The calculations assume no shares were bought or sold during the period. Your actual costs may have been higher or lower, depending on the amount of your investment and the timing of any purchases or redemptions.
| EUBEL BRADY & SUTTMAN MUTUAL FUND TRUST |
| ABOUT YOUR FUNDS’ EXPENSES (Unaudited) (Continued) |
More information about the Funds’ expenses can be found in this report. For additional information on operating expenses and other shareholder costs, please refer to the Funds’ prospectus.
| | Beginning | Ending | | Expenses |
| | Account Value | Account Value | Expense | Paid During |
| | August 1, 2023 | January 31, 2024 | Ratio(a) | Period(b) |
| EBS Income and Appreciation Fund | | | | |
| Based on Actual Fund Return | $1,000.00 | $1,042.70 | 0.22% | $1.13 |
| Based on Hypothetical 5% Fund Return (before expenses) | $1,000.00 | $1,024.03 | 0.22% | $1.12 |
| | | | | |
| EBS Income Fund | | | | |
| Based on Actual Fund Return | $1,000.00 | $1,045.20 | 0.17% | $0.87 |
| Based on Hypothetical 5% Fund Return (before expenses) | $1,000.00 | $1,024.28 | 0.17% | $0.87 |
| (a) | Annualized, based on each Fund’s most recent one-half year expenses. |
| (b) | Expenses are equal to each Fund’s annualized expense ratio multiplied by the average account value over the period, multiplied by 184/366 (to reflect the one-half year period). |
| EUBEL BRADY & SUTTMAN MUTUAL FUND TRUST |
| LIQUIDITY RISK MANAGEMENT PROGRAM (Unaudited) |
The Funds have adopted and implemented a written liquidity risk management program as required by Rule 22e-4 (the “Liquidity Rule”) under the Investment Company Act of 1940. The program is reasonably designed to assess, manage, and periodically review each Fund’s liquidity risk, taking into consideration, among other factors, the Fund’s investment strategies and the liquidity of its portfolio investments during normal and reasonably foreseeable stressed conditions; its short and long-term cash flow projections; and its cash holdings and access to other funding sources. The Board of Trustees approved the appointment of a Liquidity Risk Management Program Administrator (the “Liquidity Administrator”), which includes representatives from the Adviser. The Liquidity Administrator is responsible for the administration of the program and its policies and procedures and for reporting to the Board on at least an annual basis regarding the program’s operation, adequacy and effectiveness, as well as any material changes to the program. The Liquidity Administrator assessed each Fund’s liquidity risk profile and the adequacy and effectiveness of the liquidity risk management program’s operations during the period from June 1, 2022 through May 31, 2023 (the “Review Period”) in order to prepare a written report for the Board of Trustees (the “Report”) for consideration at its meeting held on September 20, 2023. During the Review Period, neither of the Funds experienced unusual stress or disruption to its operations from any purchase and redemption activity. Also, during the Review Period each Fund held adequate levels of cash and highly liquid investments to meet shareholder redemption activities in accordance with applicable requirements. The Report concluded that the Funds’ liquidity risk management program is reasonably designed to prevent violations of the Liquidity Rule and was effectively implemented during the Review Period.
| EUBEL BRADY & SUTTMAN MUTUAL FUND TRUST |
| OTHER INFORMATION (Unaudited) |
The Trust files a complete listing of portfolio holdings for the Funds with the SEC as of the end of the first and third quarters of each fiscal year as an exhibit to Form N-PORT. These filings are available upon request by calling 1-800-391-1223. Furthermore, you may obtain a copy of the filings on the SEC’s website at www.sec.gov.
A description of the policies and procedures that the Funds use to vote proxies relating to portfolio securities is available without charge upon request by calling toll-free 1-800-391-1223, or on the SEC’s website at www.sec.gov. Information regarding how the Funds voted proxies relating to portfolio securities during the most recent 12-month period ended June 30 is also available without charge upon request by calling toll-free 1-800-391-1223, or on the SEC’s website at www.sec.gov.
EBS-SAR-24
Item 2. Code of Ethics.
Not required
Item 3. Audit Committee Financial Expert.
Not required
Item 4. Principal Accountant Fees and Services.
Not required
Item 5. Audit Committee of Listed Registrants.
Not applicable
Item 6. Schedule of Investments.
| (a) | Not applicable [schedule filed with Item 1] |
Item 7. Disclosure of Proxy Voting Policies and Procedures for Closed-End Management Investment Companies.
Not applicable
| Item 8. | Portfolio Managers of Closed-End Management Investment Companies. |
Not applicable
Item 9. Purchases of Equity Securities by Closed-End Management Investment Company and Affiliated Purchasers.
Not applicable
Item 10. Submission of Matters to a Vote of Security Holders.
The registrant’s Audit and Governance Committee shall review shareholder recommendations for nominations to fill vacancies on the registrant’s board of trustees if such recommendations are submitted in writing and addressed to the Committee at the registrant’s offices. The Committee may adopt, by resolution, a policy regarding its procedures for considering candidates for the board of trustees, including any recommended by shareholders.
Item 11. Controls and Procedures.
(a) Based on their evaluation of the registrant’s disclosure controls and procedures (as defined in Rule 30a-3(c) under the Investment Company Act of 1940) as of a date within 90 days of the filing date of this report, the registrant’s principal executive officer and principal financial officer have concluded that such disclosure controls and procedures are reasonably designed and are operating effectively to ensure that material information relating to the registrant, including its consolidated subsidiaries, is made known to them by others within those entities, particularly during the period in which this report is being prepared, and that the information required in filings on Form N-CSR is recorded, processed, summarized, and reported on a timely basis.
(b) There were no changes in the registrant’s internal control over financial reporting (as defined in Rule 30a-3(d) under the Investment Company Act of 1940) that occurred during the period covered by this report that have materially affected, or are reasonably likely to materially affect, the registrant’s internal control over financial reporting.
Item 12. Disclosure of Securities Lending Activities for Closed-End Management Investment Companies.
Not applicable
File the exhibits listed below as part of this Form. Letter or number the exhibits in the sequence indicated.
(a)(1) Any code of ethics, or amendment thereto, that is the subject of the disclosure required by Item 2, to the extent that the registrant intends to satisfy the Item 2 requirements through filing of an exhibit: Not required
(a)(2) A separate certification for each principal executive officer and principal financial officer of the registrant as required by Rule 30a-2(a) under the Act (17 CFR 270.30a-2(a)): Attached hereto
(1) Not applicable
(2) Change in the registrant’s independent public accountants. Not applicable
(b) Certifications required by Rule 30a-2(b) under the Act (17 CFR 270.30a-2(b)): Attached hereto
Exhibit 99.CERT Certifications required by Rule 30a-2(a) under the Act
Exhibit 99.906CERT Certifications required by Rule 30a-2(b) under the Act
SIGNATURES
Pursuant to the requirements of the Securities Exchange Act of 1934 and the Investment Company Act of 1940, the registrant has duly caused this report to be signed on its behalf by the undersigned, thereunto duly authorized.
| (Registrant) | Eubel Brady & Suttman Mutual Fund Trust | | |
| | | | |
| By (Signature and Title)* | /s/ Scott E. Lundy | |
| | | Scott E. Lundy, President | |
| | | | |
| Date | March 28, 2024 | | |
| | | | |
| Pursuant to the requirements of the Securities Exchange Act of 1934 and the Investment Company Act of 1940, this report has been signed below by the following persons on behalf of the registrant and in the capacities and on the dates indicated. |
| | | | |
| By (Signature and Title)* | /s/ Scott E. Lundy | |
| | | Scott E. Lundy, President | |
| | | | |
| Date | March 28, 2024 | | |
| | | | |
| By (Signature and Title)* | /s/ Angela A. Simmons | |
| | | Angela A. Simmons, Treasurer | |
| | | | |
| Date | March 28, 2024 | | |
* Print the name and title of each signing officer under his or her signature.