Exhibit 99.3
Investor Presentation
August 2017
Safe Harbor Statements
FORWARD LOOKING STATEMENTS
All statements, other than statements of historical fact, included in this presentation are statements of “forward-looking statements” by Commerce Union Bancshares, Inc. (“Commerce Union”) within the meaning of Section 27A of the Securities Act of 1933, as amended, and Section 21E of the Securities
Exchange Act of 1934, as amended, and are made pursuant to the safe harbor provisions of the Private Securities Litigation Reform Act of 1995. The words “believe,” “anticipate,” “expect,” “may,” “will,” “assume,” “should,” “predict,” “could,” “would,” “intend,” “targets,” “estimates,” “projects,” “plans,” “potential” and other similar words and expressions of the future are intended to identify such forward-looking statements, but other statements not based on historical information may also be considered forward-looking, including statements about the benefits to Commerce Union of the proposed merger of
Commerce Union and Community First, Inc. (“Community First”), Commerce Union’s future financial and operating results (including the anticipated impact of the proposed merger of Commerce Union and Community First on the combined company’s earnings per share and tangible book value) and Commerce Union’s plans, objectives and intentions.
All forward-looking statements are subject to risks, uncertainties and other factors that may cause the actual results, performance or achievements of Commerce Union and Community First to differ materially from any results, performance, or achievements expressed or implied by such forward-looking statements. Such factors include, among others, these specifically described in Item 1A of Part I of Commerce Union’s Annual Report on Form10-K for the fiscal year ended December 31, 2016, as well as the following: (1) the risk that Commerce Union may not enter into the proposed merger with Community First, (2) the risk that the cost savings and any revenue synergies from the proposed merger of Commerce Union and Community First (if it is consummated) may not be realized or take longer than anticipated to be realized, (3) the ability of Commerce Union and Community First to meet expectations regarding the timing and completion and accounting and tax treatment of the proposed merger, (4) the effect of the announcement of the proposed merger on employee and customer relationships and operating results (including, without limitation, difficulties in maintaining relationships with employees and customers), (5) the risk that integration of Community First’s operations with those of Commerce Union will be materially delayed or will be more costly or difficult than expected, (6) the occurrence of any event, change or other circumstances that could give rise to the termination of the merger agreement, (7) the amount of the costs, fees, expenses, and charges related to the proposed merger, (8) reputational risk and the reaction of the parties’ customers, suppliers, employees or other business partners to the proposed merger, (9) the failure of the closing conditions to be satisfied, or any unexpected delay in closing the proposed merger, (10) the possibility that the proposed merger may be more expensive to complete than anticipated, including as a result of unexpected factors or events, (11) the dilution caused by Commerce Union’s issuance of additional shares of its common stock in the proposed merger and the private placement, (12) the possibility that our asset quality will decline or that we experience greater loan losses than anticipated, (13) the potential for increased levels of other real estate, primarily as a result of foreclosures, (14) the impact of liquidity needs on our results of operations and financial condition, (15) competition from financial institutions and other financial service providers, (16) economic conditions in the local markets where we operate, (17) our ability to retain the services of key personnel, (18) our ability to adapt to technological changes, (19) the risks that our cost of funding could increase, (20) negative developments in our mortgage banking services, including declines in our mortgage originations or profitability due to rising interest rates and increased competition and regulation, our or third parties’ failure to satisfy mortgage servicing obligations, and the possibility that we are required to repurchase mortgage loans or indemnify buyers of mortgage loans, (21) our ability to monitor the performance of third party service providers that provide material services to our business, (22) system failures, data security breaches, including as a result of cyber-attacks, or failures to prevent breaches of our network security, (23) fluctuations in the securities markets and their impact on the securities held in our securities portfolio, and (24) general competitive, economic, political and market conditions. Additional factors which could affect the forward-looking statements can be found in Commerce Union’s annual report on Form10-K, quarterly reports on Form10-Q, and current reports on Form8-K filed with the SEC and available on the
SEC’s website at http://www.sec.gov. Commerce Union believes the forward-looking statements contained herein are reasonable; however, undue reliance should not be placed on any forward-looking statements, which are based on current expectations and speak only as of the date that they are made. Commerce Union disclaims any obligation to update or revise any forward-looking statements contained in this presentation, which speak only as of the date hereof, whether as a result of new information, future events or otherwise.
2
Safe Harbor Statements
NOTICE TO PROSPECTIVE INVESTORS
The information contained herein is a summary and it is not complete. It has been prepared for use only in connection with a private placement (the
“Placement”) of securities (the “Securities”) of Commerce Union. The Securities have not been registered under the Securities Act of 1933, as amended (the “Securities Act”), in a private placement exempt from registration under the Securities Act and other applicable securities laws, and may not be reoffered orre-sold absent registration or an applicable exemptions from the registration requirements. The Securities are not a deposit or an account that is insured by the Federal Deposit Insurance Corporation (“FDIC”) or any other government agency.
The information contained herein is being furnished solely for the purpose of enabling prospective investors to determine whether they wish to proceed with further investigation of Commerce Union and the Placement. As it is a summary, such information is not intended to and does not contain all the information that you will require to form the basis of any investment decision. The information contained herein speaks as of the date hereof. Neither the delivery of this information or any eventual sale of the Securities shall, under any circumstances, imply that the information contained herein is correct as of any future date or that there has been no change in Commerce Union’s business affairs described herein after the date hereof. Nothing contained herein is, or should be relied upon as, a promise or representation as to future performance. Neither Commerce Union nor any of its affiliates undertakes any obligation to update or revise this presentation. Commerce Union anticipates providing you with the opportunity to ask questions, receive answers, obtain additional information, and complete your own due diligence review concerning Commerce Union and the Placement prior to entering into any agreement to purchase Securities. By accepting delivery of the information contained herein, you agree to undertake and rely on your own independent investigation and analysis and consult with your own attorneys, accountants, and other professional advisors regarding Commerce Union and the merits and risks of an investment in the Securities, including all related legal, investment, tax, and other matters.
Commerce Union shall not have any liability for any information included herein or otherwise made available in connection with the Placement, except for liabilities expressly assumed by Commerce Union in the securities purchase agreement and the related documentation for each purchase of Securities. The information contained herein does not constitute an offer to sell or a solicitation of an offer to purchase the Securities described herein nor shall there be any sale of such Securities in any state or other jurisdiction in which such an offer or solicitation is not permitted or would be unlawful. Each investor must comply with all legal requirements in each jurisdiction in which it purchases, offers, or sells the Securities, and must obtain any consent, approval, or permission required by it in connection with the Securities or the Placement. Commerce Union does not make any representation or warranty regarding, and has no responsibility for, the legality of an investment in the Securities under any investment, securities, or similar laws.
THE SECURITIES HAVE NOT BEEN APPROVED OR DISAPPROVED BY THE SECURITIES AND EXCHANGE COMMISSION (“SEC”), THE FDIC,
OR ANY OTHER GOVERNMENT AGENCY, NOR HAS THE SEC, THE FDIC, OR ANY OTHER GOVERNMENT AGENCY PASSED ON THE ADEQUACY OR ACCURACY OF THIS PRESENTATION. ANY REPRESENTATION TO THE CONTRARY IS UNLAWFUL.
3
Safe Harbor Statements
NON-GAAP FINANCIAL MEASURES
This investor presentation contains certain financial measures that are not measures recognized under U.S. generally accepted accounting principles
(GAAP) and, therefore, are considerednon-GAAP financial measures. Commerce Union’s and Community First’s management use thesenon-GAAP financial measures in their analysis of the performance, financial condition, and efficiency of operations of their respective entities. Management of Commerce Union believes that thesenon-GAAP financial measures provide a greater understanding of ongoing operations, enhance comparability of results with prior periods, and demonstrate the effects of significant gains and charges in the current period. Management also believes that investors find thesenon-GAAP financial measures useful as they assist investors in understanding underlying operating performance and the analysis of ongoing operating trends. However, thenon-GAAP financial measures discussed herein should not be considered in isolation or as a substitute for the most directly comparable or other financial measures calculated in accordance with GAAP. Moreover, the manner in which thenon-GAAP financial measures discussed herein are calculated may differ from that of other companies reporting measures with similar names. You should understand how such other banking organizations calculate their financial measures similar to, or with names similar to, thenon-GAAP financial measures we have discussed herein when comparing suchnon-GAAP financial measures.
This presentation contains certainnon-GAAP financial measures, including, without limitation, tangible assets, tangible book value, tangible common equity, return on average tangible common equity, tangible common equity to assets, efficiency ratio, core income return on average assets, and core income return on average equity. A reconciliation of thesenon-GAAP financial measures to the most directly comparable GAAP measures are provided in
the appendix to this presentation.
4
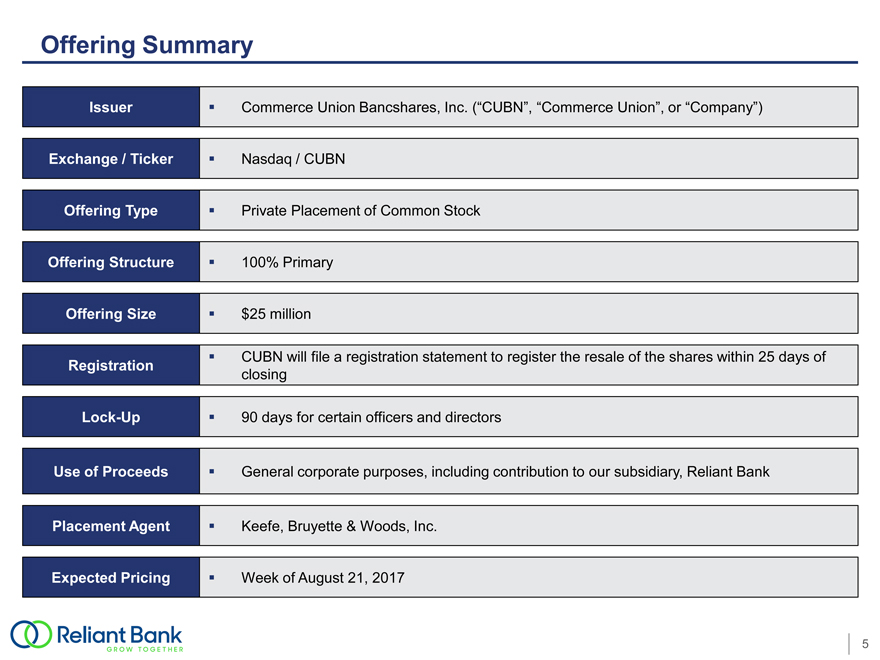
Offering Summary
Issuer Commerce Union Bancshares, Inc. (“CUBN”, “Commerce Union”, or “Company”)
Exchange / Ticker Nasdaq / CUBN
Offering Type Private Placement of Common Stock
Offering Structure 100% Primary
Offering Size $25 million
CUBN will file a registration statement to register the resale of the shares within 25 days of
Registration closing
Lock-Up 90 days for certain officers and directors
Use of Proceeds General corporate purposes, including contribution to our subsidiary, Reliant Bank
Placement Agent Keefe, Bruyette & Woods, Inc.
Expected Pricing Week of August 21, 2017
5

Company Overview
August 2017
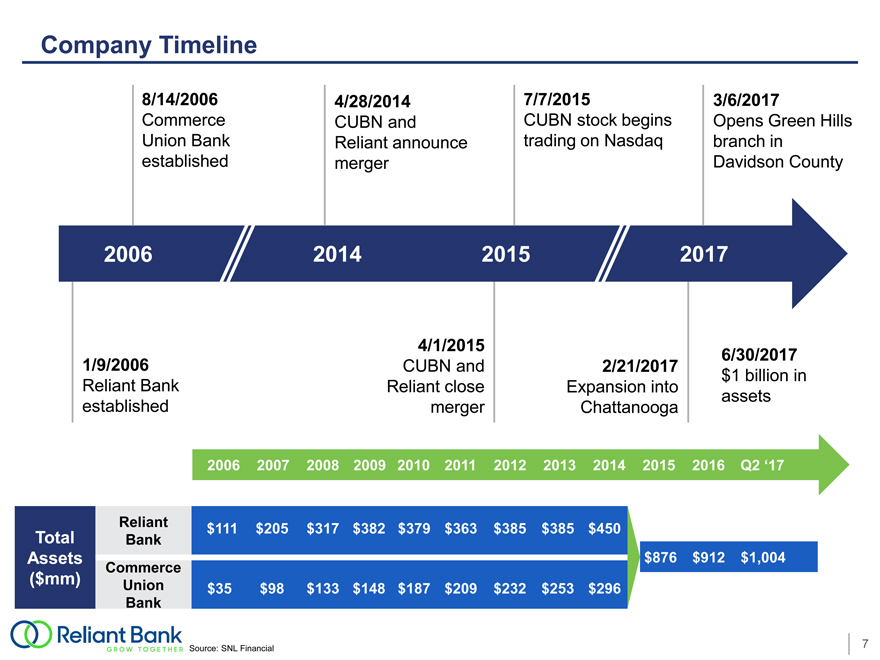
Company Timeline
8/14/2006 4/28/2014 7/7/20153/6/2017
Commerce CUBN and CUBN stock beginsOpens Green Hills
Union Bank Reliant announce trading on Nasdaqbranch in
established merger Davidson County

Reliant Bank Franchise Overview
Key Franchise Highlights
Commercially oriented bank headquartered in Brentwood, Tennessee
Focused on fast growing Middle Tennessee markets coupled with recent expansion into Chattanooga, Tennessee
14th largest bank by deposits in the Nashville MSA(1) and 6th largest community bank(2) by deposits headquartered in the Nashville MSA Concentrated on building banking relationships; 80% of top 50 loan relationships have related deposits at the bank Experienced management team with extensive local market knowledge 12.5% insider ownership amongst management and the board of directors
Source: SNL Financial
Financial data as of or for the three months ended 6/30/17; ownership data as of 7/31/17; pricing data as of 8/15/17
Note: CUBN reserves / loans excludes mortgage loans held for sale
(1) The Nashville-Davidson-Murfreesboro-Franklin Metropolitan Statistical Area (the “Nashville MSA”)
(2) Community bank defined as institutions with total assets less than $10 billion 8
(3) Refer to appendix for “Reconciliation ofnon-GAAP financial measures”
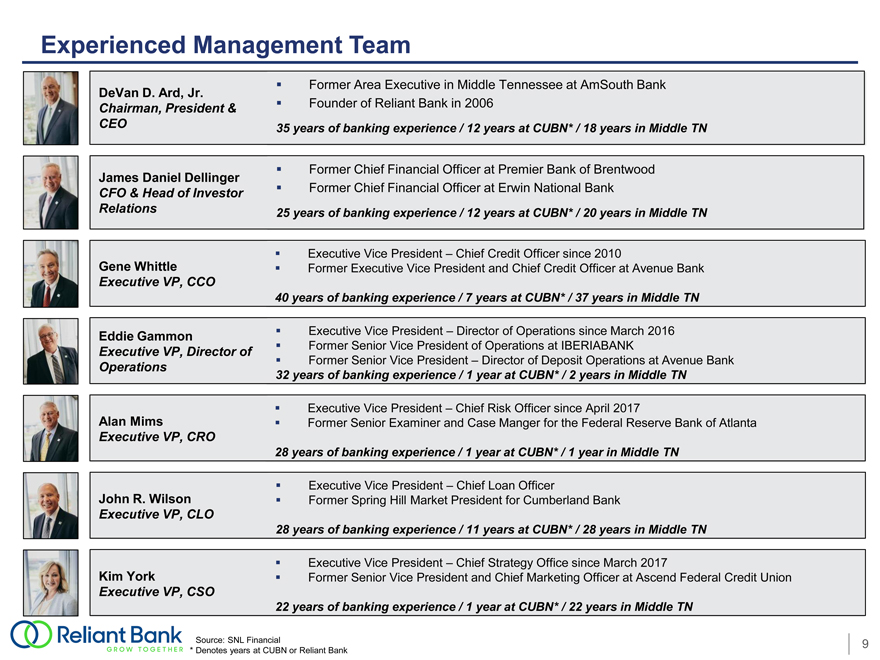
Experienced Management Team
DeVan D. Ard, Jr. Former Area Executive in Middle Tennessee at AmSouth Bank
Chairman, President & Founder of Reliant Bank in 2006
CEO 35 years of banking experience / 12 years at CUBN* / 18 years in Middle TN
James Daniel Dellinger
CFO & Head of Investor Relations
Gene Whittle
Executive VP, CCO
Eddie Gammon
Executive VP, Director of Operations
Alan Mims
Executive VP, CRO
John R. Wilson
Executive VP, CLO
Kim York
Executive VP, CSO
Former Chief Financial Officer at Premier Bank of Brentwood
Former Chief Financial Officer at Erwin National Bank
25 years of banking experience / 12 years at CUBN* / 20 years in Middle TN
Executive Vice President – Chief Credit Officer since 2010
Former Executive Vice President and Chief Credit Officer at Avenue Bank
40 years of banking experience / 7 years at CUBN* / 37 years in Middle TN
Executive Vice President – Director of Operations since March 2016
Former Senior Vice President of Operations at IBERIABANK
Former Senior Vice President – Director of Deposit Operations at Avenue Bank
32 years of banking experience / 1 year at CUBN* / 2 years in Middle TN
Executive Vice President – Chief Risk Officer since April 2017
Former Senior Examiner and Case Manger for the Federal Reserve Bank of Atlanta
28 years of banking experience / 1 year at CUBN* / 1 year in Middle TN
Executive Vice President – Chief Loan Officer
Former Spring Hill Market President for Cumberland Bank
28 years of banking experience / 11 years at CUBN* / 28 years in Middle TN
Executive Vice President – Chief Strategy Office since March 2017
Former Senior Vice President and Chief Marketing Officer at Ascend Federal Credit Union
22 years of banking experience / 1 year at CUBN* / 22 years in Middle TN
Source: SNL Financial 9 * Denotes years at CUBN or Reliant Bank
Brand Standards Critical to Our Success
Integrity
Trust
Responsiveness
Dependability
Individual Service
Progressiveness
Community
10
Nashville Deposit Market Share
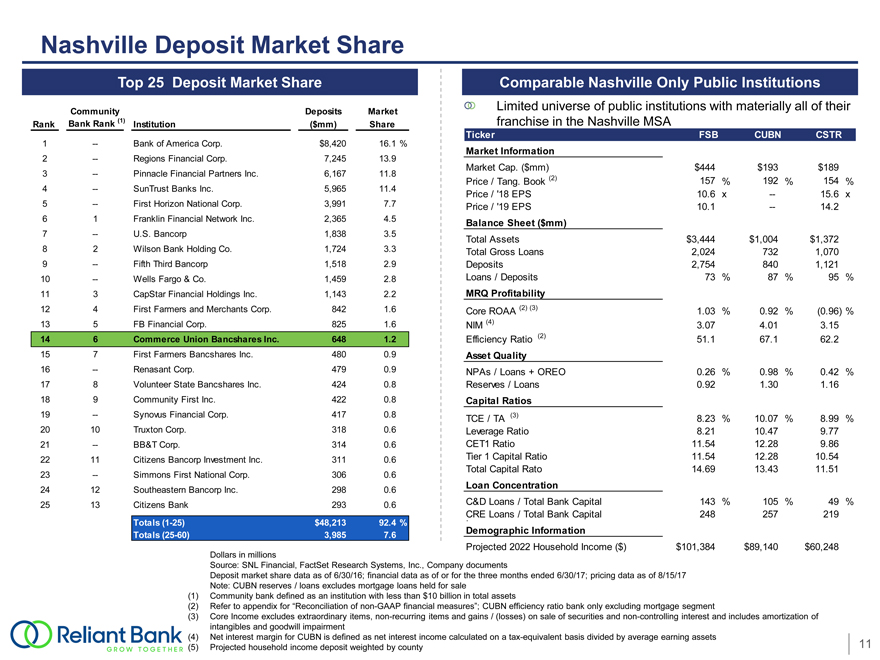
Top 25 Deposit Market Share Comparable Nashville Only Public Institutions
Community DepositsMarketLimited universe of public institutions with materially all of their
Rank Bank Rank (1) Institution($mm)Sharefranchise in the Nashville MSA
TickerFSBCUBNCSTR
1 — Bank of America Corp.$8,42016.1%
Market Information
2 — Regions Financial Corp.7,24513.9
Market Cap. ($mm)$444$193$189
3 — Pinnacle Financial Partners Inc.6,16711.8
Price / Tang. Book (2)157%192%154%
4 — SunTrust Banks Inc.5,96511.4Price / ‘18 EPS10.6x—15.6x
5 — First Horizon National Corp.3,9917.7Price / ‘19 EPS10.1—14.2
6 1 Franklin Financial Network Inc.2,3654.5Balance Sheet ($mm)
7 — U.S. Bancorp1,8383.5Total Assets$3,444$1,004$1,372
8 2 Wilson Bank Holding Co.1,7243.3Total Gross Loans2,0247321,070
9 — Fifth Third Bancorp1,5182.9Deposits2,7548401,121
10 — Wells Fargo & Co.1,4592.8Loans / Deposits73%87%95%
11 3 CapStar Financial Holdings Inc.1,1432.2MRQ Profitability
12 4 First Farmers and Merchants Corp.8421.6Core ROAA (2) (3)1.03%0.92%(0.96) %
13 5 FB Financial Corp.8251.6NIM (4)3.074.013.15
14 6 Commerce Union Bancshares Inc.6481.2Efficiency Ratio (2)51.167.162.2
15 7 First Farmers Bancshares Inc.4800.9Asset Quality
16 — Renasant Corp.4790.9NPAs / Loans + OREO0.26%0.98%0.42%
17 8 Volunteer State Bancshares Inc.4240.8Reserves / Loans0.921.301.16
18 9 Community First Inc.4220.8Capital Ratios
19 — Synovus Financial Corp.4170.8TCE / TA (3)8.23%10.07%8.99%
20 10 Truxton Corp.3180.6Leverage Ratio8.2110.479.77
21 — BB&T Corp.3140.6CET1 Ratio11.5412.289.86
22 11 Citizens Bancorp Investment Inc.3110.6Tier 1 Capital Ratio11.5412.2810.54
23 — Simmons First National Corp.3060.6Total Capital Rato14.6913.4311.51
24 12 Southeastern Bancorp Inc.2980.6Loan Concentration
25 13 Citizens Bank2930.6C&D Loans / Total Bank Capital143%105%49%
CRE Loans / Total Bank Capital248257219
Totals(1-25) $48,21392.4%
Totals(25-60) 3,9857.6Demographic Information
Projected 2022 Household Income ($)$101,384$89,140$60,248
Dollars in millions
Source: SNL Financial, FactSet Research Systems, Inc., Company documents
Deposit market share data as of 6/30/16; financial data as of or for the three months ended 6/30/17; pricing data as of 8/15/17
Note: CUBN reserves / loans excludes mortgage loans held for sale
(1) Community bank defined as an institution with less than $10 billion in total assets
(2) Refer to appendix for “Reconciliation ofnon-GAAP financial measures”; CUBN efficiency ratio bank only excluding mortgage segment
(3) Core Income excludes extraordinary items,non-recurring items and gains / (losses) on sale of securities andnon-controlling interest and includes amortization of
intangibles and goodwill impairment
(4) Net interest margin for CUBN is defined as net interest income calculated on atax-equivalent basis divided by average earning assets
(5) Projected household income deposit weighted by county 11
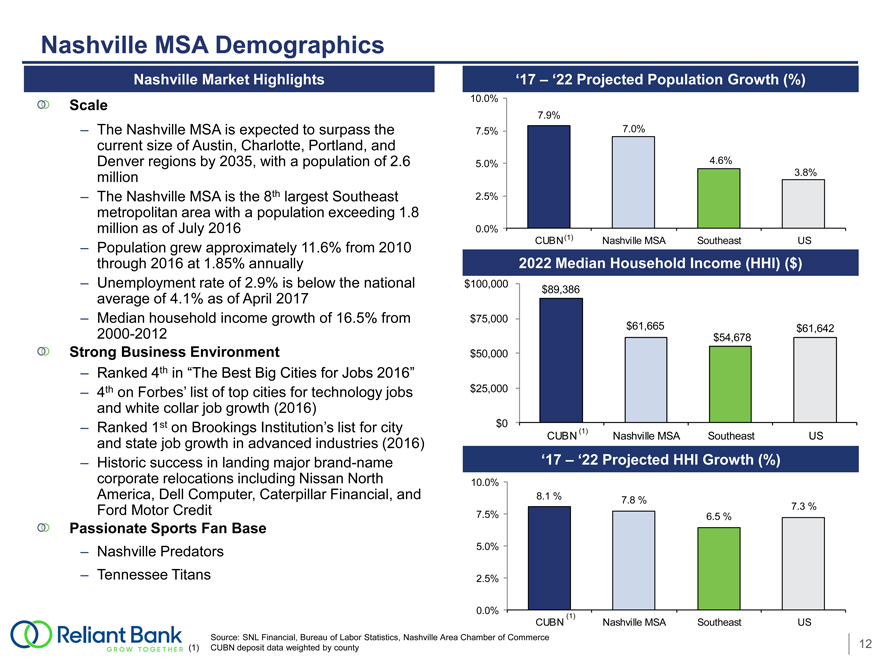
Nashville MSA Demographics
Nashville Market Highlights ‘17 ’22 Projected Population Growth (%)
Scale 10.0%
7.9%
The Nashville MSA is expected to surpass the current size of Austin, Charlotte, Portland, and Denver regions by 2035, with a population of 2.6 million
The Nashville MSA is the 8th largest Southeast metropolitan area with a population exceeding 1.8 million as of July 2016
Population grew approximately 11.6% from 2010 through 2016 at 1.85% annually
Unemployment rate of 2.9% is below the national average of 4.1% as of April 2017
Median household income growth of 16.5% from 2000-2012
Strong Business Environment $50,000
â’ Ranked 4th in “The Best Big Cities for Jobs 2016”
â’ 4th on Forbes’ list of top cities for technology jobs $25,000
and white collar job growth (2016)
â’ Ranked 1st on Brookings Institution’s list for city $0(1)
and state job growth in advanced industries (2016) CUBNNashville MSASoutheastUS
â’ Historic success in landing major brand-name ‘17 – ‘22 Projected HHI Growth (%)
corporate relocations including Nissan North 10.0%
America, Dell Computer, Caterpillar Financial, and 8.1 %7.8 %
Ford Motor Credit 7.5% 6.5 %7.3 %
Passionate Sports Fan Base
– Nashville Predators 5.0%
– Tennessee Titans 2.5%
0.0%
(1)
CUBN Nashville MSA Southeast US
Source: SNL Financial, Bureau of Labor Statistics, Nashville Area Chamber of Commerce
(1) CUBN deposit data weighted by county 12

Lending Platform
% of Loans by Market (1)
Gross Loans Portfolio Composition
Other TN Loan Portfolio Amount% of Total
3% 1-4 Family Construction $49.66.8%
Other C&D 63.68.7
Agricultural Related Loans 39.25.4
Outside of HELOCs 63.28.6
TN 1-4 Family—First Lien 118.116.1
6% 1-4 Family—Junior Lien 3.80.5
Nashville Multifamily4.10.6
MSA Owner-Occupied CRE89.212.2
Non Owner-Occupied CRE 156.321.4
91% C&I114.915.7
State & Political 11.51.6
Consumer & Other 18.52.5
Gross Loans & Leases $732.0100.0%
Mortgage Loans Held for Sale $12.0
Loans Held for Investment $719.9
Dollars in millions Yield on Total Loans: 4.73%
Source: SNL Financial, Company documents
Data as of or for the three months ended 6/30/17
Note: Loan portfolio composition utilizes call report categories based on collateral type
(1) Based upon borrower address 13
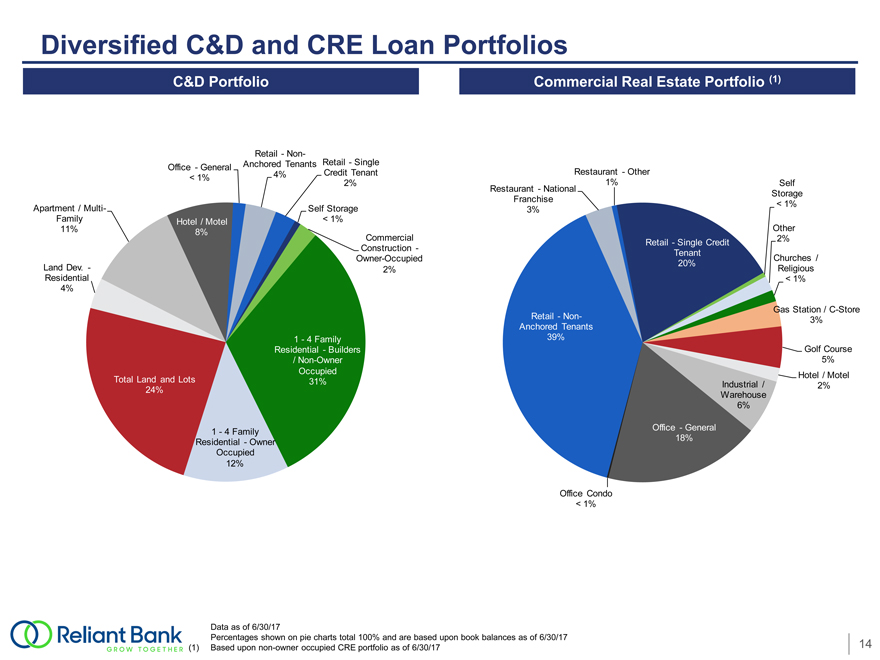
Diversified C&D and CRE Loan Portfolios
Commercial Real Estate Portfolio
(1)
Self
Storage
< 1%
Other
2%
Churches /
Religious
< 1%
Gas Station /C-Store 3%
Data as of 6/30/17
Percentages shown on pie charts total 100% and are based upon book balances as of 6/30/17
(1) Based uponnon-owner occupied CRE portfolio as of 6/30/17 14
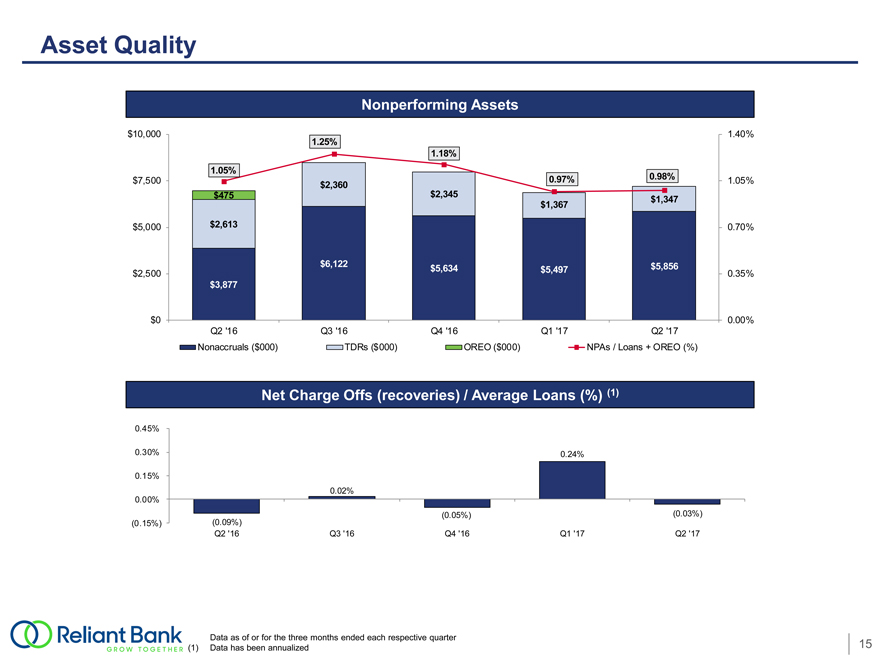
Data as of or for the three months ended each respective quarter
(1) Data has been annualized 15
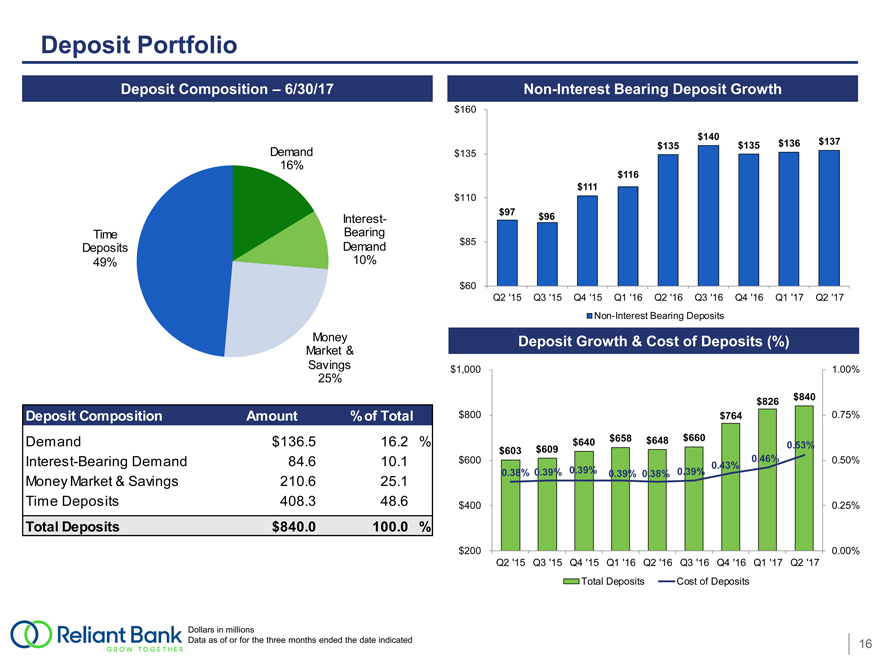
Deposit Portfolio
Non-Interest Bearing Deposit Growth
$ 160
$140
$135 $135$136$137
$ 135
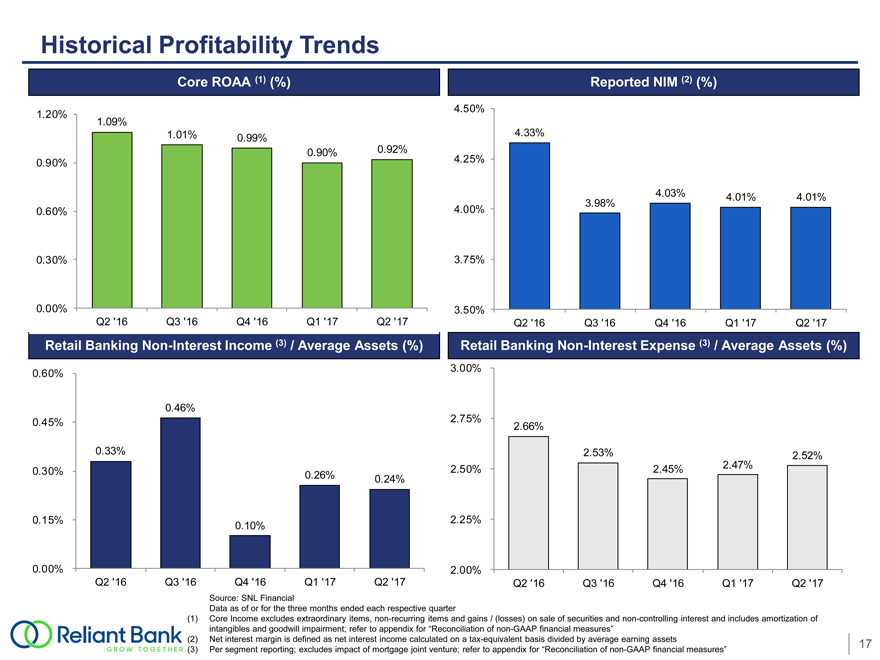
Historical Profitability Trends
Source: SNL Financial
Data as of or for the three months ended each respective quarter
Core Income excludes extraordinary items,non-recurring items and gains / (losses) on sale of securities andnon-controlling interest and includes amortization of intangibles and goodwill impairment; refer to appendix for “Reconciliation ofnon-GAAP financial measures”
(2) Net interest margin is defined as net interest income calculated on atax-equivalent basis divided by average earning assets 17
(3) Per segment reporting; excludes impact of mortgage joint venture; refer to appendix for “Reconciliation ofnon-GAAP financial measures”
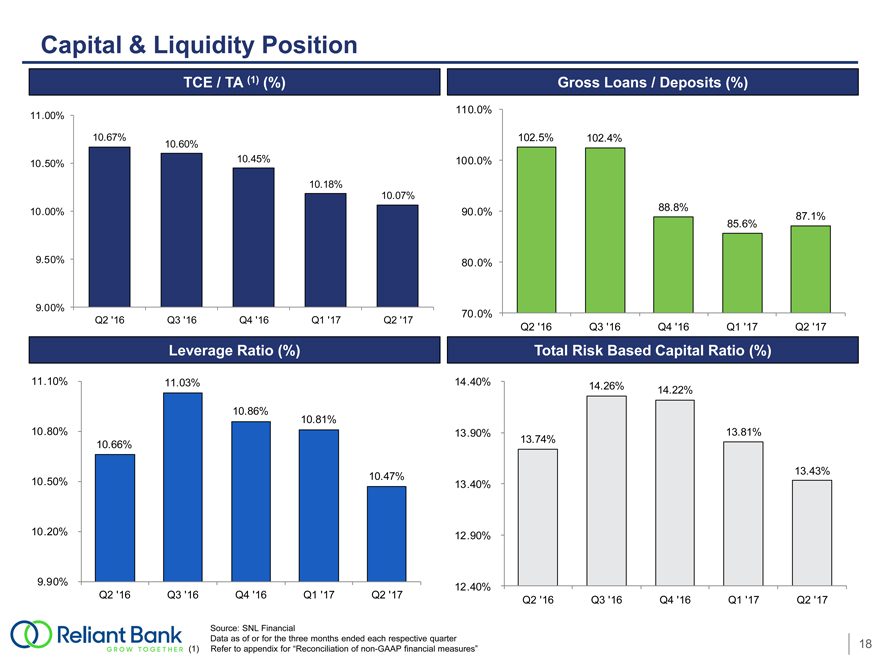
Capital & Liquidity Position
Gross Loans / Deposits (%)
Source: SNL Financial
Data as of or for the three months ended each respective quarter 18
(1) Refer to appendix for “Reconciliation ofnon-GAAP financial measures”
Merger of Commerce Union Bancshares, Inc. & Community First, Inc.
August 2017
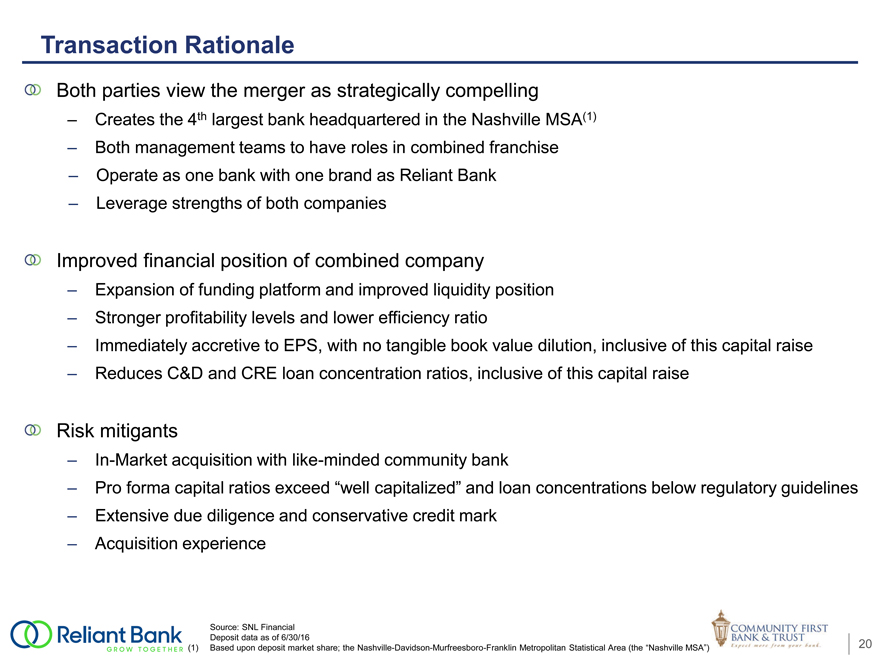
Transaction Rationale
Both parties view the merger as strategically compelling
Creates the 4th largest bank headquartered in the Nashville MSA(1)
Both management teams to have roles in combined franchise
Operate as one bank with one brand as Reliant Bank
Leverage strengths of both companies
Improved financial position of combined company
Expansion of funding platform and improved liquidity position
Stronger profitability levels and lower efficiency ratio
Immediately accretive to EPS, with no tangible book value dilution, inclusive of this capital raise
Reduces C&D and CRE loan concentration ratios, inclusive of this capital raise
Risk mitigants
In-Market acquisition with like-minded community bank
Pro forma capital ratios exceed “well capitalized” and loan concentrations below regulatory guidelines
Extensive due diligence and conservative credit mark
Acquisition experience
Source: SNL Financial
Deposit data as of 6/30/16
(1) Based upon deposit market share; the Nashville-Davidson-Murfreesboro-Franklin Metropolitan Statistical Area (the “Nashville MSA”) 20
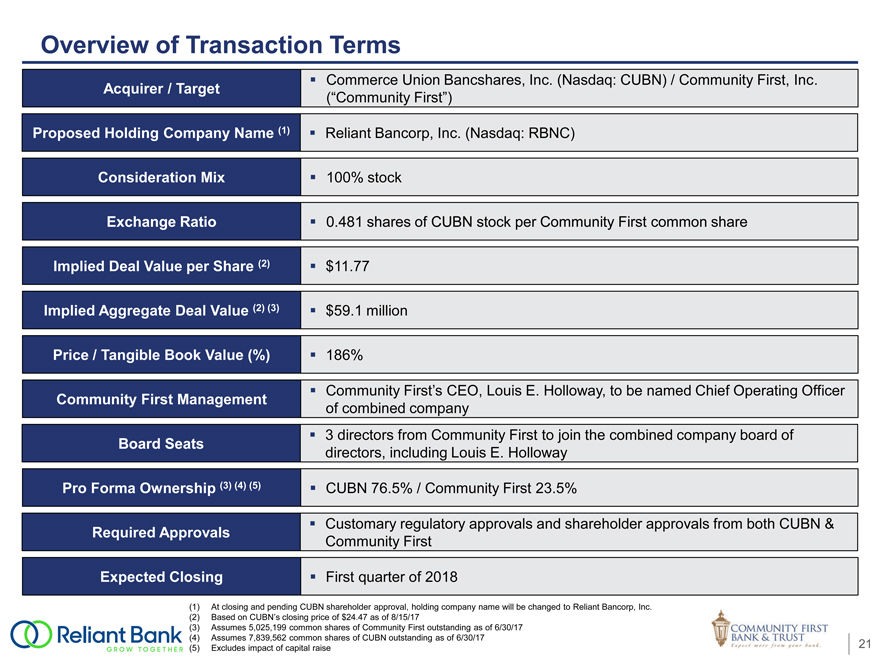
Overview of Transaction Terms
Proposed Holding Company Name (1) Reliant Bancorp, Inc. (Nasdaq: RBNC)
Consideration Mix 100% stock
Exchange Ratio 0.481 shares of CUBN stock per Community First common share
Implied Deal Value per Share (2) $11.77
Implied Aggregate Deal Value (2) (3) $59.1 million
Price / Tangible Book Value (%) 186%
Community First Management Community First’s CEO, Louis E. Holloway, to be named Chief Operating Officer
of combined company
3 directors from Community First to join the combined company board of
Board Seats directors, including Louis E. Holloway
Pro Forma Ownership (3) (4) (5) CUBN 76.5% / Community First 23.5%
Required Approvals Customary regulatory approvals and shareholder approvals from both CUBN &
Community First
Expected Closing First quarter of 2018
(1) At closing and pending CUBN shareholder approval, holding company name will be changed to Reliant Bancorp, Inc.
(2) Based on CUBN’s closing price of $24.47 as of 8/15/17
(3) Assumes 5,025,199 common shares of Community First outstanding as of 6/30/17
(4) Assumes 7,839,562 common shares of CUBN outstanding as of 6/30/17
(5) Excludes impact of capital raise 21
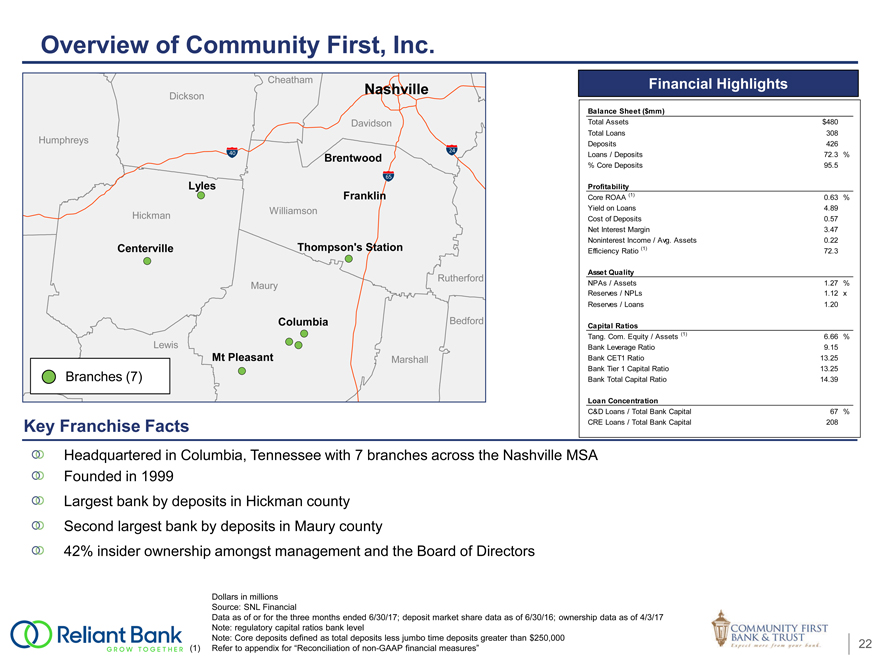
Overview of Community First, Inc.
Financial Highlights
Balance Sheet ($mm)
Total Assets $480
Total Loans 308
Deposits 426
Loans / Deposits 72.3 %
% Core Deposits 95.5
Profitability
Core ROAA (1) 0.63 %
Yield on Loans 4.89
Cost of Deposits 0.57
Net Interest Margin 3.47
Noninterest Income / Avg. Assets 0.22
Efficiency Ratio (1) 72.3
Asset Quality
NPAs / Assets 1.27 %
Reserves / NPLs 1.12 x
Reserves / Loans 1.20
Capital Ratios
Tang. Com. Equity / Assets (1) 6.66 %
Bank Leverage Ratio 9.15
Bank CET1 Ratio 13.25
Bank Tier 1 Capital Ratio 13.25
Bank Total Capital Ratio 14.39
Loan Concentration
C&D Loans / Total Bank Capital 67 %
CRE Loans / Total Bank Capital 208

Improvement in Community First’s Loan Portfolio December 31, 2007 June 30, 2017 Consumer & Consumer & 1-4 Family Other Other Construction C&I Non Ow ner- C&I 5% 2% 4% 10% Occupied 6% Other C&D 1-4 Family Non Ow ner- CRE 6% Construction Occupied 18% Agricultural 11% CRE Related 12% Loans 3% Ow ner- HELOCs Occupied 3% CRE Other C&D Ow ner- Portfolio 11% 20% Occupied CRE Multifamily 21% < 1% 1-4 Family -Loan Agricultural First Lien 1-4 Family -Related 34% Junior Lien HELOCs Loans < 1% Multifamily 1-4 Family -1-4 Family - 8% 2% < 1% Junior Lien First Lien < 1% 18% Total Loans: $448 million Total Loans: $308 million Consistent Reduction in Problem Credits Since 2011 $74 $80 $65 $54 mm) $60 $46 $ $39 ( $40 $30 $18 $13 $20 $11 $6 $5 NPAs $0 2008 2009 2010 2011 2012 2013 2014 2015 2016 Q1 ‘17 Q2 ‘17 $15 $13 $10 $11 mm) $10 $7 $ $5 $3 $2 $2 ( $0 $0 $0 NCOs ($5) ($1) ($0) 2008 2009 2010 2011 2012 2013 2014 2015 2016 Q1 ‘17 Q2 ‘17 Source: SNL Financial Data as of or for the twelve months ended for each respective year; Q1 ‘17 and Q2 ‘17 data as of the three months ended 3/31/17 and 6/30/17, respectively 23 Note: NPAs defined as nonaccrual loans and leases, renegotiated loans and leases and other real estate owned
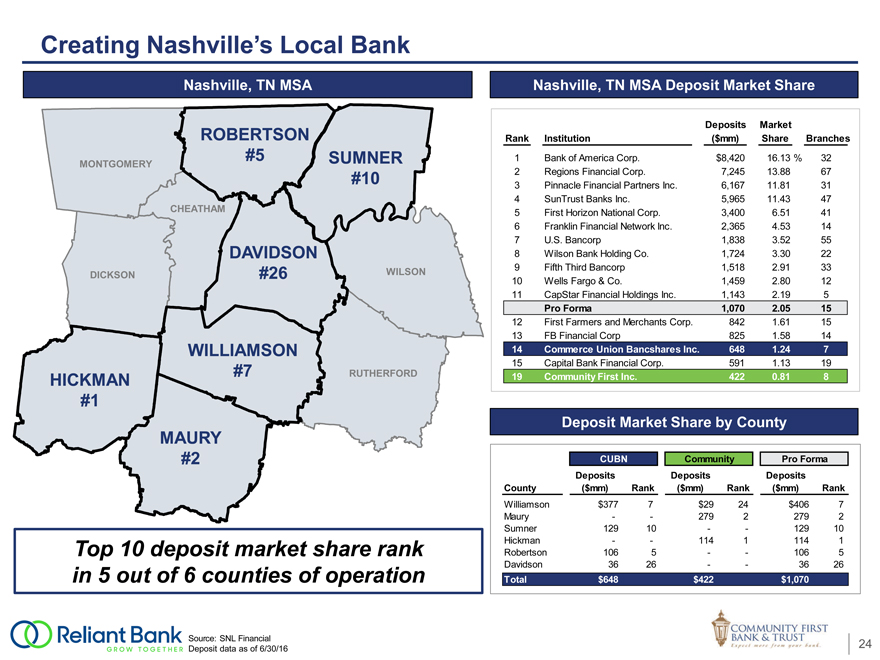
Creating Nashville’s Local Bank
Nashville, TN MSA Nashville, TN MSA Deposit Market Share
Deposits Market
ROBERTSON RankInstitution($mm)ShareBranches
#5 SUMNER 1Bank of America Corp.$8,42016.13%32
MONTGOMERY
#10 2Regions Financial Corp.7,24513.8867
3Pinnacle Financial Partners Inc.6,16711.8131
4SunTrust Banks Inc.5,96511.4347
CHEATHAM 5First Horizon National Corp.3,4006.5141
6Franklin Financial Network Inc.2,3654.5314
7U.S. Bancorp1,8383.5255
DAVIDSON 8Wilson Bank Holding Co.1,7243.3022
9Fifth Third Bancorp1,5182.9133
DICKSON #26 WILSON10Wells Fargo & Co.1,4592.8012
11CapStar Financial Holdings Inc.1,1432.195
Pro Forma1,0702.0515
12First Farmers and Merchants Corp.8421.6115
13FB Financial Corp8251.5814
WILLIAMSON 14Commerce Union Bancshares Inc.6481.247
15Capital Bank Financial Corp.5911.1319
HICKMAN #7 RUTHERFORD19Community First Inc.4220.818
Source: SNL Financial 24
Deposit data as of 6/30/16
Superior Franchise Demographics
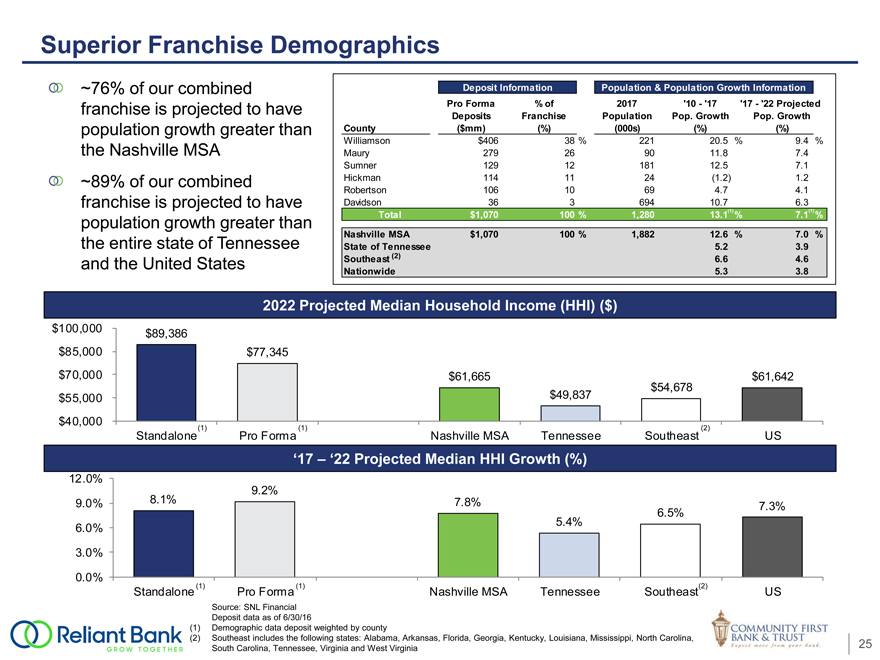
~76% of our combined Deposit InformationPopulation & Population Growth Information
franchise is projected to have Pro Forma% of2017’10—‘17’17—‘22 Projected
Deposits FranchisePopulationPop. GrowthPop. Growth
population growth greater than County ($mm)(%)(000s)(%)(%)
Williamson $406 38%22120.5%9.4%
the Nashville MSA Maury 279269011.87.4
Sumner 129 1218112.57.1
~89% of our combined Hickman 1141124(1.2)1.2
Robertson 106 10694.74.1
franchise is projected to have Davidson 36369410.76.3
Total $1,070 100%1,28013.1 (1) %7.1 (1) %
population growth greater than
Nashville MSA $1,070 100%1,88212.6%7.0%
the entire state of Tennessee State of Tennessee 5.23.9
and the United States Southeast (2) 6.64.6
Nationwide 5.33.8
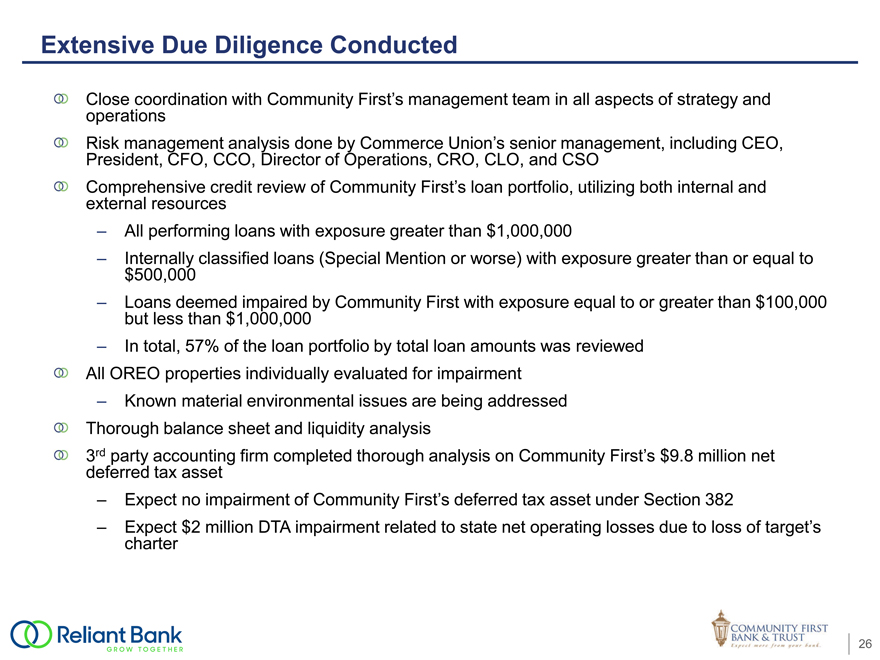
Extensive Due Diligence Conducted
Close coordination with Community First’s management team in all aspects of strategy and operations
Risk management analysis done by Commerce Union’s senior management, including CEO,
President, CFO, CCO, Director of Operations, CRO, CLO, and CSO
Comprehensive credit review of Community First’s loan portfolio, utilizing both internal and external resources
All performing loans with exposure greater than $1,000,000
Internally classified loans (Special Mention or worse) with exposure greater than or equal to $500,000
Loans deemed impaired by Community First with exposure equal to or greater than $100,000 but less than $1,000,000
In total, 57% of the loan portfolio by total loan amounts was reviewed
All OREO properties individually evaluated for impairment Known material environmental issues are being addressed Thorough balance sheet and liquidity analysis
3rd party accounting firm completed thorough analysis on Community First’s $9.8 million net deferred tax asset
Expect no impairment of Community First’s deferred tax asset under Section 382
Expect $2 million DTA impairment related to state net operating losses due to loss of target’s charter
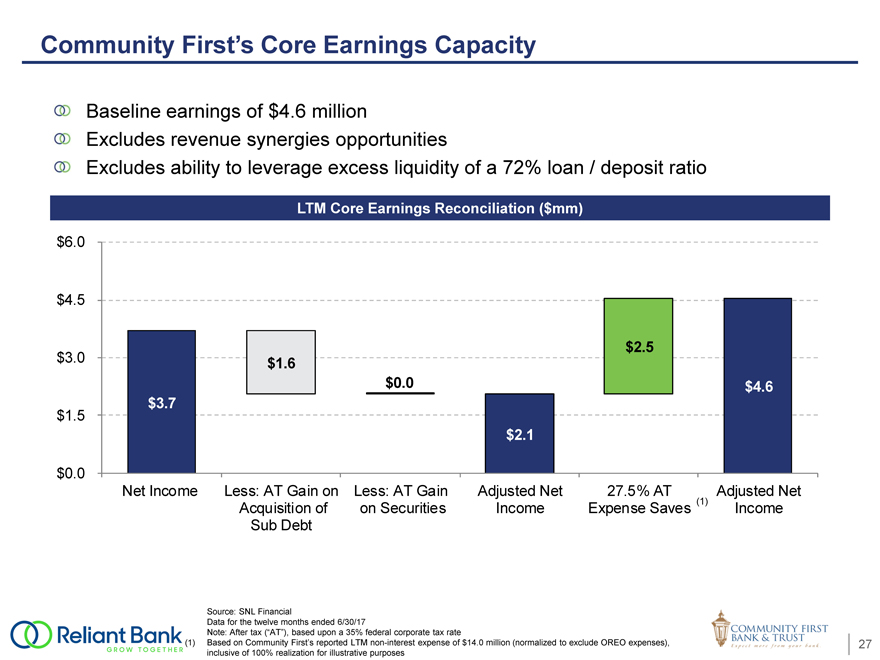
Community First’s Core Earnings Capacity
Net Income Less: AT Gain on Less: AT GainAdjusted Net27.5% ATAdjusted Net
Acquisition of on Securities IncomeExpense Saves (1)Income
Sub Debt
Source: SNL Financial
Data for the twelve months ended 6/30/17
Note: After tax (“AT”), based upon a 35% federal corporate tax rate
(1) Based on Community First’s reported LTMnon-interest expense of $14.0 million (normalized to exclude OREO expenses), 27
inclusive of 100% realization for illustrative purposes
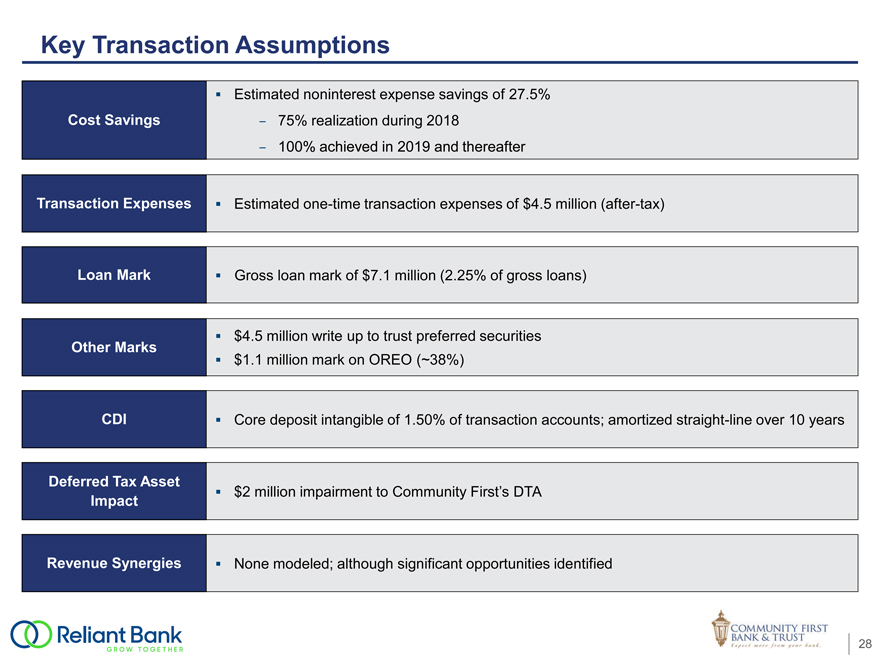
Key Transaction Assumptions
Transaction Expenses Estimatedone-time transaction expenses of $4.5 million(after-tax)
Loan Mark Gross loan mark of $7.1 million (2.25% of gross loans)
$4.5 million write up to trust preferred securities
Other Marks
$1.1 million mark on OREO (~38%)
CDI Core deposit intangible of 1.50% of transaction accounts; amortized straight-line over 10 years
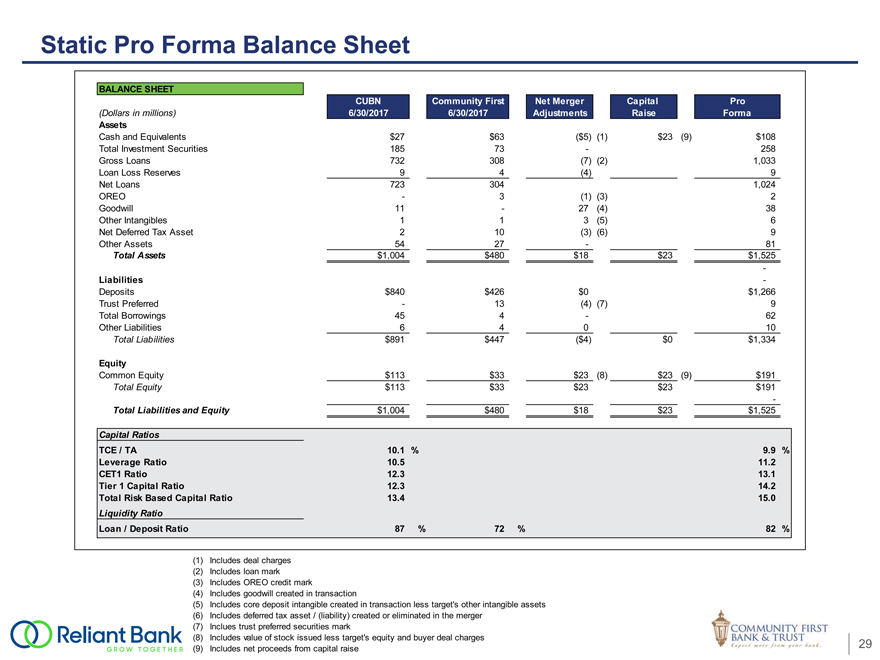
Static Pro Forma Balance Sheet
BALANCE SHEET
CUBN Community FirstNet MergerCapitalPro
(Dollars in millions) 6/30/2017 6/30/2017AdjustmentsRaiseForma
Assets
Cash and Equivalents $27$63($5)(1)$23(9)$108
Total Investment Securities 18573-258
Gross Loans 732308(7)(2)1,033
Loan Loss Reserves 94(4)9
Net Loans 7233041,024
OREO -3(1)(3)2
Goodwill 11-27(4)38
Other Intangibles 113(5)6
Net Deferred Tax Asset 210(3)(6)9
Other Assets 5427-81
Total Assets $1,004$480$18$23$1,525
-
Liabilities -
Deposits $840$426$0$1,266
Trust Preferred -13(4)(7)9
Total Borrowings 454-62
Other Liabilities 64010
Total Liabilities $891$447($4)$0$1,334
Equity
Common Equity $113$33$23(8)$23(9)$191
Total Equity $113$33$23$23$191
-
Total Liabilities and Equity $1,004 $480$18$23$1,525
Capital Ratios
TCE / TA 10.1%9.9%
Leverage Ratio 10.511.2
CET1 Ratio 12.313.1
Tier 1 Capital Ratio 12.314.2
Total Risk Based Capital Ratio 13.4 15.0
Liquidity Ratio
Loan / Deposit Ratio 87%72%82%
(1) Includes deal charges
(2) Includes loan mark
(3) Includes OREO credit mark
(4) Includes goodwill created in transaction
(5) Includes core deposit intangible created in transaction less target’s other intangible assets
(6) Includes deferred tax asset / (liability) created or eliminated in the merger
(7) Inclues trust preferred securities mark
(8) Includes value of stock issued less target’s equity and buyer deal charges
(9) Includes net proceeds from capital raise 29
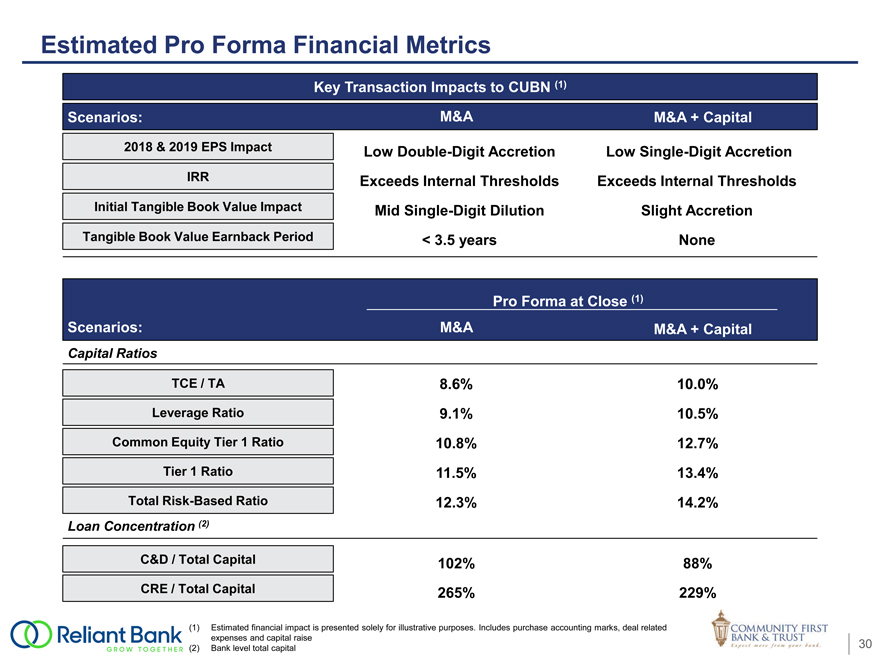
Estimated Pro Forma Financial Metrics
Key Transaction Impacts to CUBN (1)
Scenarios: M&A M&A + Capital
2018 & 2019 EPS Impact Low Double-Digit Accretion Low Single-Digit Accretion
IRR Exceeds Internal Thresholds Exceeds Internal Thresholds
Initial Tangible Book Value Impact Mid Single-Digit Dilution Slight Accretion
Tangible Book Value Earnback Period < 3.5 years None
Pro Forma at Close (1)
Scenarios: M&A M&A + Capital
Capital Ratios
TCE / TA 8.6% 10.0%
Leverage Ratio 9.1% 10.5%
Common Equity Tier 1 Ratio 10.8% 12.7%
Tier 1 Ratio 11.5% 13.4%
Total Risk-Based Ratio 12.3% 14.2%
Loan Concentration (2)
C&D / Total Capital 102% 88%
CRE / Total Capital 265% 229%
(1) Estimated financial impact is presented solely for illustrative purposes. Includes purchase accounting marks, deal related
expenses and capital raise
(2) Bank level total capital 30
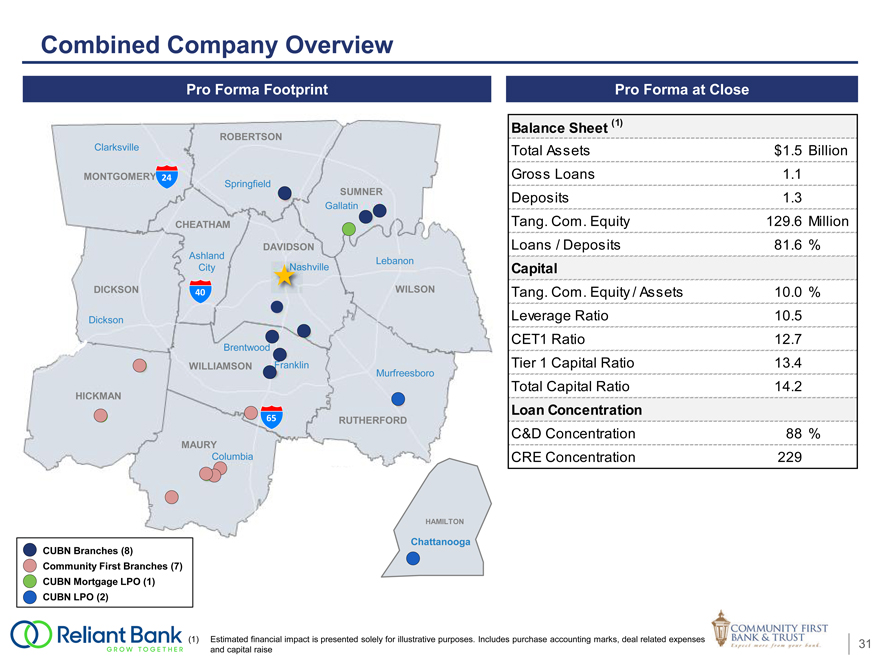
Combined Company Overview
Pro Forma Footprint Pro Forma at Close
Balance Sheet (1)
ROBERTSON
Clarksville Total Assets $1.5 Billion MONTGOMERY 24 Springfield Gross Loans 1.1 SUMNER Deposits 1.3
Gallatin
CHEATHAM Tang. Com. Equity 129.6 Million DAVIDSON Loans / Deposits 81.6 %
Ashland
Lebanon
City shville Capital
DICKSON 40 WILSON Tang. Com. Equity / Assets 10.0 % Dickson Leverage Ratio 10.5 CET1 Ratio 12.7
Brentwood
WILLIAMSON Franklin Murfreesboro Tier 1 Capital Ratio 13.4 HICKMAN Total Capital Ratio 14.2
Loan Concentration
65 RUTHERFORD
C&D Concentration 88 %
MAURY
Columbia CRE Concentration 229
HAMILTON
CUBN Branches (8) Chattanooga Community First Branches (7) CUBN Mortgage LPO (1) CUBN LPO (2)
(1) Estimated financial impact is presented solely for illustrative purposes. Includes purchase accounting marks, deal related expenses and capital raise 31
Summary
Ideal combination of strategic and financial attractiveness to all parties
Will create long-term value for both Commerce Union & Community First shareholders
Creates an incredibly valuable Tennessee bank
Concentration in one of the most attractive metropolitan markets of Nashville
Increasing exposure into the Chattanooga market
Experienced management team and dedicated board of directors with ties to the local
community
Pro forma organization combines individuals from both Commerce Union & Community First
Combined company offers enhanced growth and profitability outlook Lower risk, givenin-market acquisition and significant due diligence Positions company well for the future
Appendix
August 2017
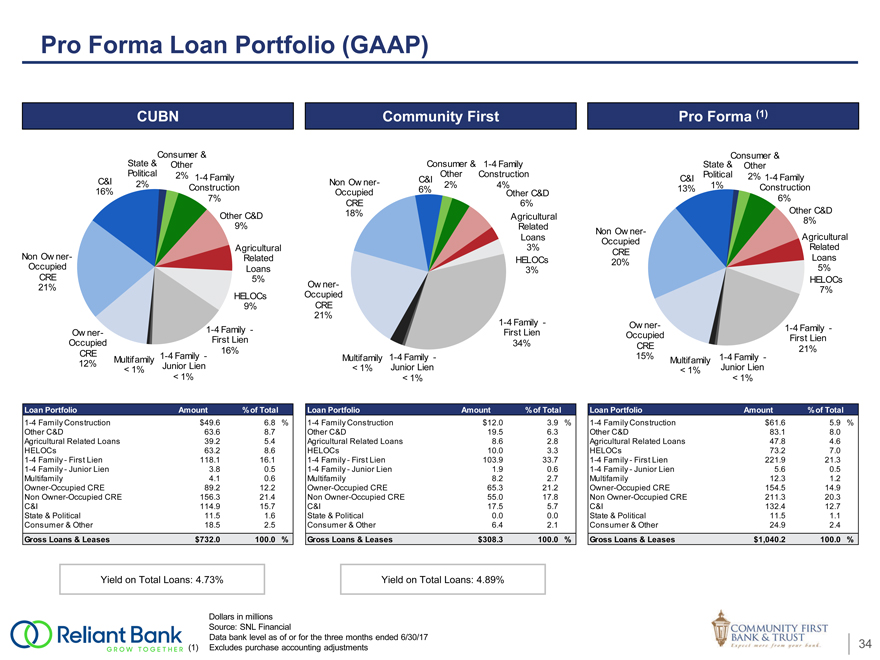
Pro Forma Loan Portfolio (GAAP) CUBN Community First Pro Forma (1) State & Consumer & Consumer & Other Consumer & 1-4 Family State & Other Political 2% Other Construction Political 2% 1-4 Family C&I C&I 1-4 Family C&I 2% Non Ow ner- 2% 4% 1% Construction 6% 13% Construction 16% Occupied Other C&D 7% 6% CRE 6% Other C&D Other C&D 18% Agricultural 8% 9% Related Non Ow ner- Loans Agricultural Occupied Agricultural 3% Related CRE Non Ow ner- Related HELOCs Loans 20% Occupied Loans 3% 5% CRE 5% HELOCs 21% Ow ner-7% HELOCs Occupied 9% CRE 21% 1-4 Family - Ow ner- 1-4 Family - 1-4 Family -Ow ner- First Lien Occupied First Lien First Lien Occupied 34% CRE 16% 21% CRE 1-4 Family - 1-4 Family - 15% 1-4 Family -Multifamily Multifamily Multifamily 12% Junior Lien Junior Lien Junior Lien < 1% < 1% < 1% < 1% < 1% < 1% Loan Portfolio Amount % of Total Loan Portfolio Amount % of Total Loan Portfolio Amount % of Total 1-4 Family Construction $49.6 6.8 % 1-4 Family Construction $12.0 3.9 % 1-4 Family Construction $61.6 5.9 % Other C&D 63.6 8.7 Other C&D 19.5 6.3 Other C&D 83.1 8.0 Agricultural Related Loans 39.2 5.4 Agricultural Related Loans 8.6 2.8 Agricultural Related Loans 47.8 4.6 HELOCs 63.2 8.6 HELOCs 10.0 3.3 HELOCs 73.2 7.0 1-4 Family - First Lien 118.1 16.1 1-4 Family - First Lien 103.9 33.7 1-4 Family - First Lien 221.9 21.3 1-4 Family - Junior Lien 3.8 0.5 1-4 Family - Junior Lien 1.9 0.6 1-4 Family - Junior Lien 5.6 0.5 Multifamily 4.1 0.6 Multifamily 8.2 2.7 Multifamily 12.3 1.2 Owner-Occupied CRE 89.2 12.2 Owner-Occupied CRE 65.3 21.2 Owner-Occupied CRE 154.5 14.9 Non Owner-Occupied CRE 156.3 21.4 Non Owner-Occupied CRE 55.0 17.8 Non Owner-Occupied CRE 211.3 20.3 C&I 114.9 15.7 C&I 17.5 5.7 C&I 132.4 12.7 State & Political 11.5 1.6 State & Political 0.0 0.0 State & Political 11.5 1.1 Consumer & Other 18.5 2.5 Consumer & Other 6.4 2.1 Consumer & Other 24.9 2.4 Gross Loans & Leases $732.0 100.0 % Gross Loans & Leases $308.3 100.0 % Gross Loans & Leases $1,040.2 100.0 % Yield on Total Loans: 4.73% Yield on Total Loans: 4.89% Dollars in millions Source: SNL Financial Data bank level as of or for the three months ended 6/30/17 (1) Excludes purchase accounting adjustments 34
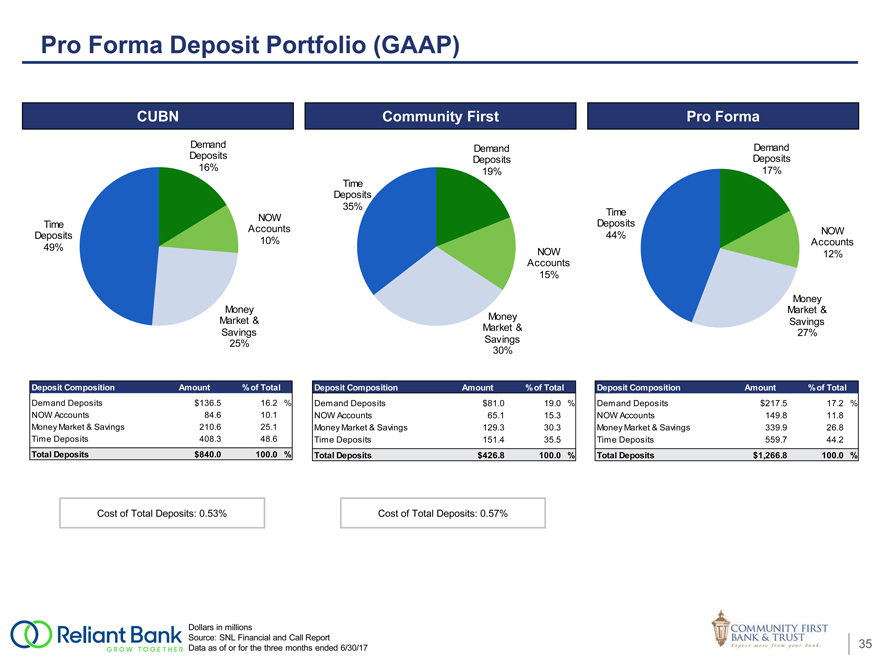
Pro Forma Deposit Portfolio (GAAP)
CUBN
Demand
Deposits
16%
NOW
Time Accounts
Deposits 10%
49%
Money
Market &
Savings
25%
Deposit Composition Amount % of Total
Demand Deposits $136.5 16.2%
NOW Accounts 84.610.1
Money Market & Savings 210.625.1
Time Deposits 408.348.6
Total Deposits $840.0 100.0%
Cost of Total Deposits: 0.53%
Cost of Total Deposits: 0.57%
Dollars in millions
Source: SNL Financial and Call Report
Data as of or for the three months ended 6/30/17 35
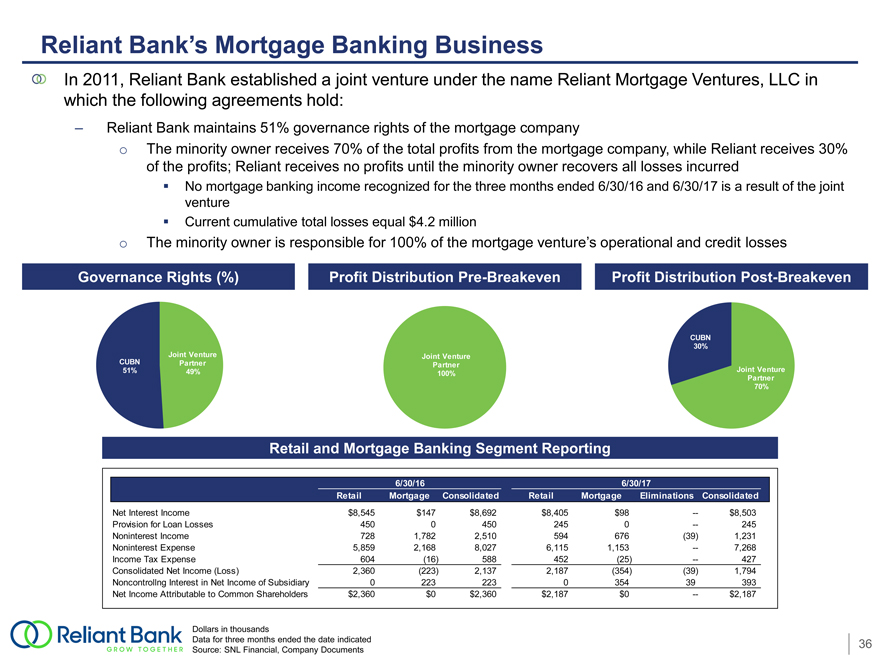
Reliant Bank’s Mortgage Banking Business
In 2011, Reliant Bank established a joint venture under the name Reliant Mortgage Ventures, LLC in which the following agreements hold:
Reliant Bank maintains 51% governance rights of the mortgage company
The minority owner receives 70% of the total profits from the mortgage company, while Reliant receives 30% of the profits; Reliant receives no profits until the minority owner recovers all losses incurred
No mortgage banking income recognized for the three months ended 6/30/16 and 6/30/17 is a result of the joint venture
Current cumulative total losses equal $4.2 million
The minority owner is responsible for 100% of the mortgage venture’s operational and credit losses
Governance Rights (%)
Profit DistributionPre-Breakeven
Profit Distribution Post-Breakeven
Retail and Mortgage Banking Segment Reporting
6/30/16 6/30/17
Retail Mortgage ConsolidatedRetailMortgageEliminations Consolidated
Net Interest Income $8,545 $147$8,692$8,405$98—$8,503
Provision for Loan Losses 450 04502450—245
Noninterest Income 728 1,7822,510594676(39)1,231
Noninterest Expense 5,859 2,1688,0276,1151,153—7,268
Income Tax Expense 604 (16)588452(25)—427
Consolidated Net Income (Loss) 2,360 (223)2,1372,187(354)(39)1,794
Noncontrollng Interest in Net Income of Subsidiary 0 223223035439393
Net Income Attributable to Common Shareholders $2,360 $0$2,360$2,187$0—$2,187
Dollars in thousands
Data for three months ended the date indicated 36
Source: SNL Financial, Company Documents
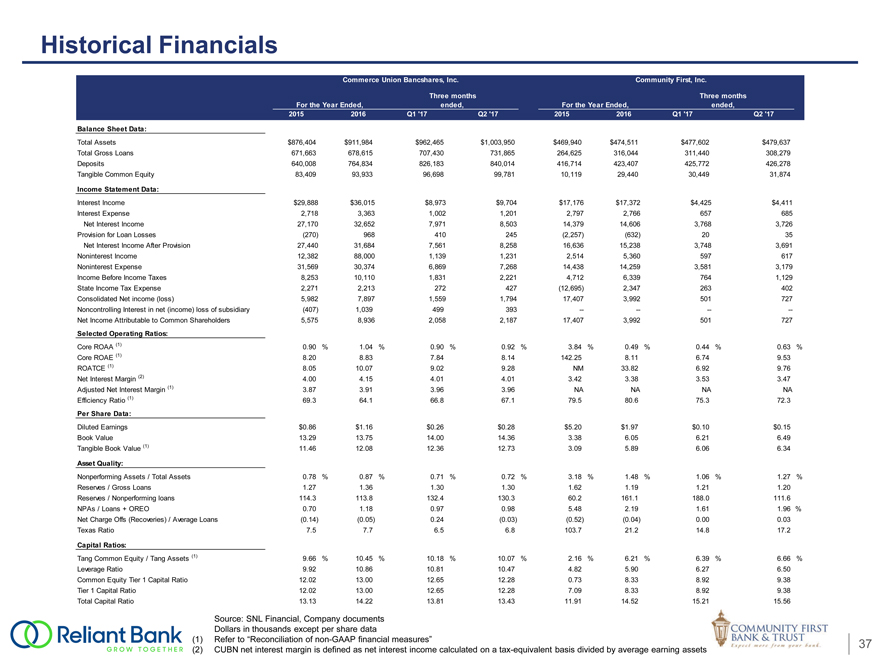
Historical Financials
Commerce Union Bancshares, Inc.Community First, Inc.
Three monthsThree months
For the Year Ended, ended,For the Year Ended,ended,
2015 2016Q1 ‘17Q2 ‘1720152016Q1 ‘17Q2 ‘17
Balance Sheet Data:
Total Assets $876,404 $911,984$962,465$1,003,950$469,940$474,511$477,602$479,637
Total Gross Loans 671,663 678,615707,430731,865264,625316,044311,440308,279
Deposits 640,008 764,834826,183840,014416,714423,407425,772426,278
Tangible Common Equity 83,409 93,93396,69899,78110,11929,44030,44931,874
Income Statement Data:
Interest Income $29,888 $36,015$8,973$9,704$17,176$17,372$4,425$4,411
Interest Expense 2,718 3,3631,0021,2012,7972,766657685
Net Interest Income 27,170 32,6527,9718,50314,37914,6063,7683,726
Provision for Loan Losses (270) 968410245(2,257)(632)2035
Net Interest Income After Provision 27,440 31,6847,5618,25816,63615,2383,7483,691
Noninterest Income 12,382 88,0001,1391,2312,5145,360597617
Noninterest Expense 31,569 30,3746,8697,26814,43814,2593,5813,179
Income Before Income Taxes 8,253 10,1101,8312,2214,7126,3397641,129
State Income Tax Expense 2,271 2,213272427(12,695)2,347263402
Consolidated Net income (loss) 5,982 7,8971,5591,79417,4073,992501727
Noncontrolling Interest in net (income) loss of subsidiary (407) 1,039499393————
Net Income Attributable to Common Shareholders 5,575 8,9362,0582,18717,4073,992501727
Selected Operating Ratios:
Core ROAA (1) 0.90 %1.04%0.90%0.92%3.84%0.49%0.44%0.63%
Core ROAE (1) 8.20 8.837.848.14142.258.116.749.53
ROATCE (1) 8.05 10.079.029.28NM33.826.929.76
Net Interest Margin (2) 4.00 4.154.014.013.423.383.533.47
Adjusted Net Interest Margin (1) 3.87 3.913.963.96NANANANA
Efficiency Ratio (1) 69.3 64.166.867.179.580.675.372.3
Per Share Data:
Diluted Earnings $0.86 $1.16$0.26$0.28$5.20$1.97$0.10$0.15
Book Value 13.29 13.7514.0014.363.386.056.216.49
Tangible Book Value (1) 11.46 12.0812.3612.733.095.896.066.34
Asset Quality:
Nonperforming Assets / Total Assets 0.78 %0.87%0.71%0.72%3.18%1.48%1.06%1.27%
Reserves / Gross Loans 1.27 1.361.301.301.621.191.211.20
Reserves / Nonperforming loans 114.3 113.8132.4130.360.2161.1188.0111.6
NPAs / Loans + OREO 0.70 1.180.970.985.482.191.611.96%
Net Charge Offs (Recoveries) / Average Loans (0.14) (0.05)0.24(0.03)(0.52)(0.04)0.000.03
Texas Ratio 7.5 7.76.56.8103.721.214.817.2
Capital Ratios:
Tang Common Equity / Tang Assets (1) 9.66 %10.45%10.18%10.07%2.16%6.21%6.39%6.66%
Leverage Ratio 9.92 10.8610.8110.474.825.906.276.50
Common Equity Tier 1 Capital Ratio 12.02 13.0012.6512.280.738.338.929.38
Tier 1 Capital Ratio 12.02 13.0012.6512.287.098.338.929.38
Total Capital Ratio 13.13 14.2213.8113.4311.9114.5215.2115.56
Source: SNL Financial, Company documents
Dollars in thousands except per share data
(1) Refer to “Reconciliation ofnon-GAAP financial measures” 37
(2) CUBN net interest margin is defined as net interest income calculated on atax-equivalent basis divided by average earning assets
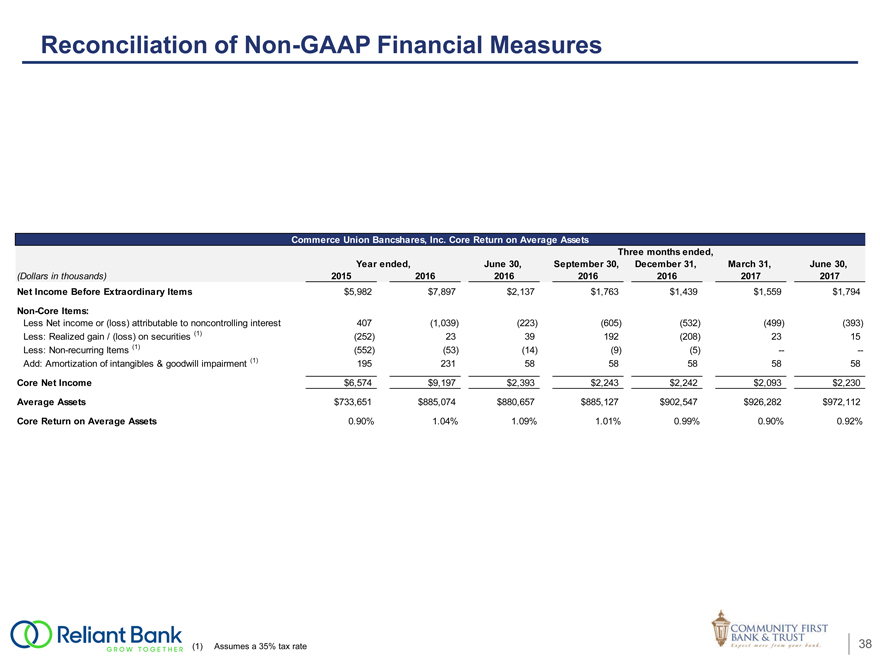
Reconciliation ofNon-GAAP Financial Measures
Commerce Union Bancshares, Inc. Core Return on Average Assets
Three months ended,
Year ended, June 30,September 30,December 31,March 31,June 30,
(Dollars in thousands) 2015 201620162016201620172017
Net Income Before Extraordinary Items $5,982 $7,897$2,137$1,763$1,439$1,559$1,794
Non-Core Items:
Less Net income or (loss) attributable to noncontrolling interest 407 (1,039)(223)(605)(532)(499)(393)
Less: Realized gain / (loss) on securities (1) (252) 2339192(208)2315
Less:Non-recurring Items (1) (552) (53)(14)(9)(5)——
Add: Amortization of intangibles & goodwill impairment (1) 195 2315858585858
Core Net Income $6,574 $9,197$2,393$2,243$2,242$2,093$2,230
Average Assets $733,651 $885,074$880,657$885,127$902,547$926,282$972,112
Core Return on Average Assets 0.90% 1.04%1.09%1.01%0.99%0.90%0.92%
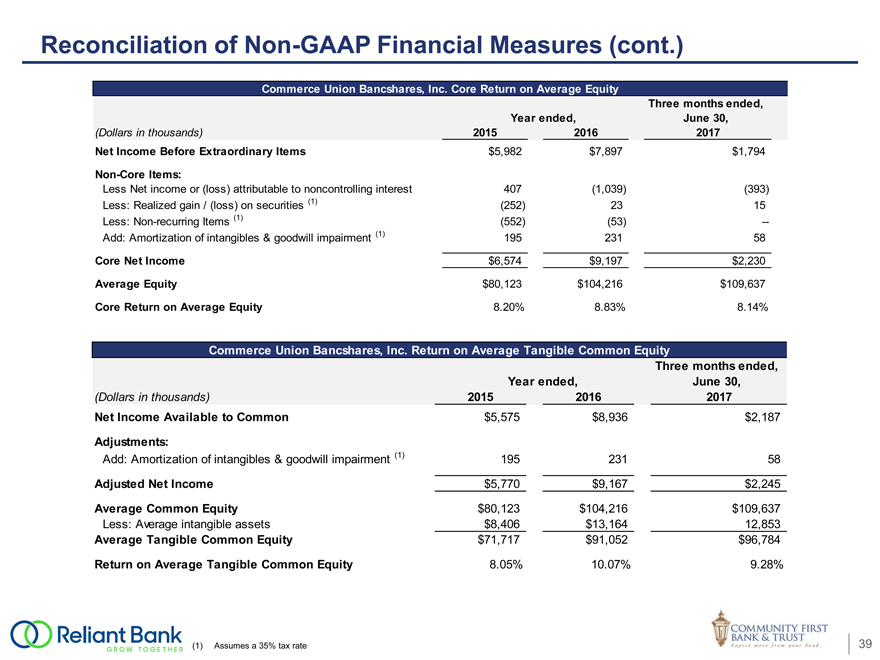
Reconciliation ofNon-GAAP Financial Measures (cont.)
Commerce Union Bancshares, Inc. Core Return on Average Equity
Three months ended,
Year ended, June 30,
(Dollars in thousands) 2015 20162017
Net Income Before Extraordinary Items $5,982 $7,897$1,794
Non-Core Items:
Less Net income or (loss) attributable to noncontrolling interest 407 (1,039)(393)
Less: Realized gain / (loss) on securities (1) (252) 2315
Less:Non-recurring Items (1) (552) (53)—
Add: Amortization of intangibles & goodwill impairment (1) 195 23158
Core Net Income $6,574 $9,197$2,230
Average Equity $80,123 $104,216$109,637
Core Return on Average Equity 8.20% 8.83%8.14%
Commerce Union Bancshares, Inc. Return on Average Tangible Common Equity
Three months ended,
Year ended, June 30,
(Dollars in thousands) 2015 20162017
Net Income Available to Common $5,575 $8,936$2,187
Adjustments:
Add: Amortization of intangibles & goodwill impairment (1) 195 23158
Adjusted Net Income $5,770 $9,167$2,245
Average Common Equity $80,123 $104,216$109,637
Less: Average intangible assets $8,406 $13,16412,853
Average Tangible Common Equity $71,717 $91,052$96,784
Return on Average Tangible Common Equity 8.05% 10.07%9.28%

Reconciliation ofNon-GAAP Financial Measures (cont.)
Community First, Inc. Core Return on Average Assets
Threemonths ended,
Year ended, June 30,
(Dollars in thousands) 2015 20162017
Net Income Before Extraordinary Items $17,407 $3,992$727
Non-Core Items:
Less Net income or (loss) attributable to noncontrolling interest — ——
Less: Realized gain / (loss) on securities (1) 7 147—
Less:Non-recurring Items (1) — 1625—
Add: Amortization of intangibles & goodwill impairment (1) 89 8923
Core Net Income $17,490 $2,309$750
Average Assets $454,953 $473,741$476,783
Core Return on Average Assets 3.84% 0.49%0.63%
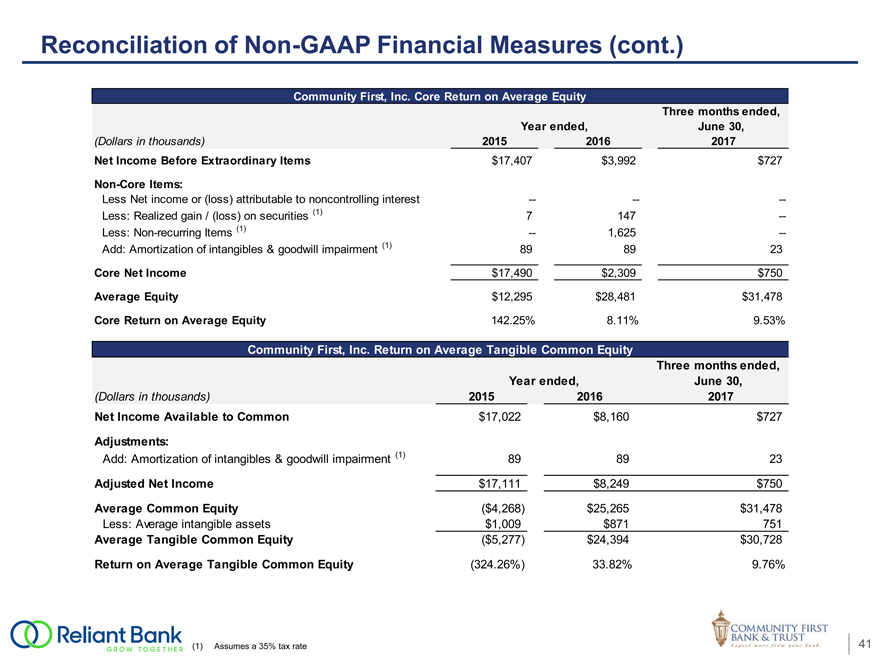
Reconciliation ofNon-GAAP Financial Measures (cont.)
Community First, Inc. Core Return on Average Equity
Threemonths ended,
Year ended, June 30,
(Dollars in thousands) 2015 20162017
Net Income Before Extraordinary Items $17,407 $3,992$727
Non-Core Items:
Less Net income or (loss) attributable to noncontrolling interest — ——
Less: Realized gain / (loss) on securities (1) 7 147—
Less:Non-recurring Items (1) — 1,625—
Add: Amortization of intangibles & goodwill impairment (1) 89 8923
Core Net Income $17,490 $2,309$750
Average Equity $12,295 $28,481$31,478
Core Return on Average Equity 142.25% 8.11%9.53%
Community First, Inc. Return on Average Tangible Common Equity
Threemonths ended,
Year ended, June 30,
(Dollars in thousands) 2015 20162017
Net Income Available to Common $17,022 $8,160$727
Adjustments:
Add: Amortization of intangibles & goodwill impairment (1) 89 8923
Adjusted Net Income $17,111 $8,249$750
Average Common Equity ($4,268) $25,265$31,478
Less: Average intangible assets $1,009 $871751
Average Tangible Common Equity ($5,277) $24,394$30,728
Return on Average Tangible Common Equity (324.26%) 33.82%9.76%
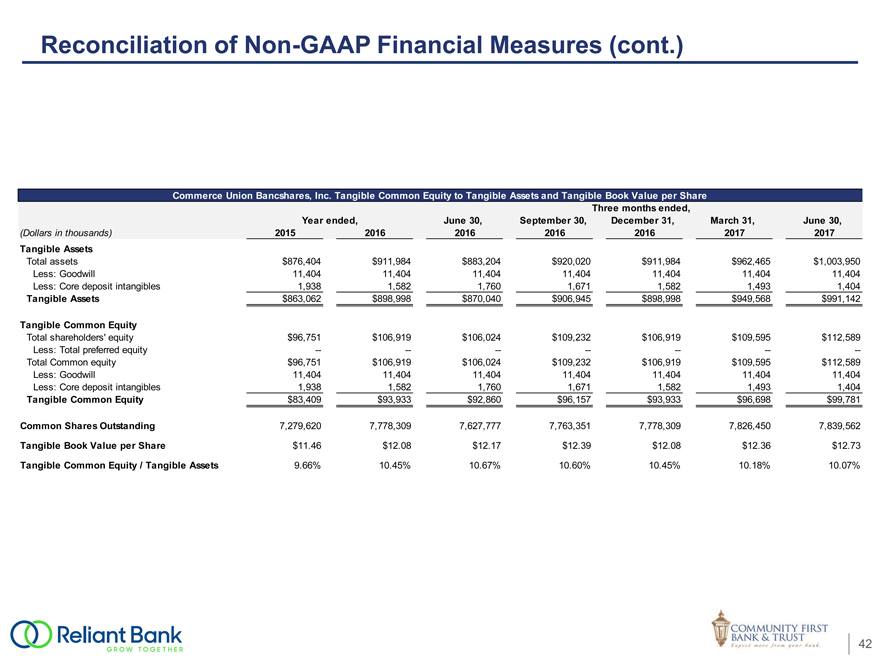
Reconciliation ofNon-GAAP Financial Measures (cont.)
Commerce Union Bancshares, Inc. Tangible Common Equity to Tangible Assets and Tangible Book Value per Share
Three months ended,
Year ended, June 30,September 30,December 31,March 31,June 30,
(Dollars in thousands) 2015 201620162016201620172017
Tangible Assets
Total assets $876,404 $911,984$883,204$920,020$911,984$962,465$1,003,950
Less: Goodwill 11,404 11,40411,40411,40411,40411,40411,404
Less: Core deposit intangibles 1,938 1,5821,7601,6711,5821,4931,404
Tangible Assets $863,062 $898,998$870,040$906,945$898,998$949,568$991,142
Tangible Common Equity
Total shareholders’ equity $96,751 $106,919$106,024$109,232$106,919$109,595$112,589
Less: Total preferred equity — ——————
Total Common equity $96,751 $106,919$106,024$109,232$106,919$109,595$112,589
Less: Goodwill 11,404 11,40411,40411,40411,40411,40411,404
Less: Core deposit intangibles 1,938 1,5821,7601,6711,5821,4931,404
Tangible Common Equity $83,409 $93,933$92,860$96,157$93,933$96,698$99,781
Common Shares Outstanding 7,279,620 7,778,3097,627,7777,763,3517,778,3097,826,4507,839,562
Tangible Book Value per Share $11.46 $12.08$12.17$12.39$12.08$12.36$12.73
Tangible Common Equity / Tangible Assets 9.66% 10.45%10.67%10.60%10.45%10.18%10.07%
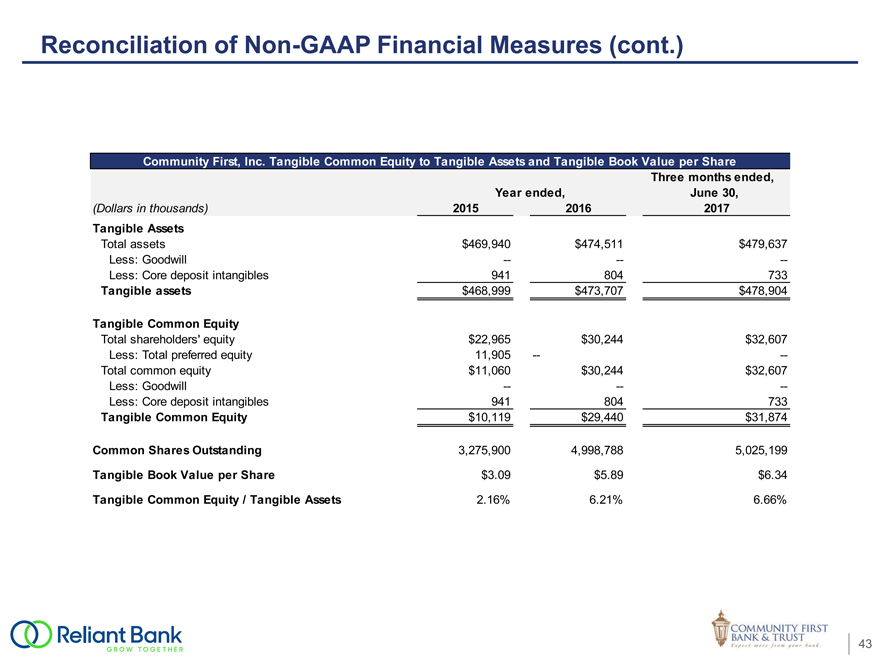
Reconciliation ofNon-GAAP Financial Measures (cont.)
Community First, Inc. Tangible Common Equity to Tangible Assets and Tangible Book Value per Share Three months ended, Year ended, June 30,
(Dollars in thousands) 2015 20162017
Tangible Assets
Total assets $469,940 $474,511$479,637
Less: Goodwill — ——
Less: Core deposit intangibles 941 804733
Tangible assets $468,999 $473,707$478,904
Tangible Common Equity
Total shareholders’ equity $22,965 $30,244$32,607
Less: Total preferred equity 11,905 ——
Total common equity $11,060 $30,244$32,607
Less: Goodwill — ——
Less: Core deposit intangibles 941 804733
Tangible Common Equity $10,119 $29,440$31,874
Common Shares Outstanding 3,275,900 4,998,7885,025,199
Tangible Book Value per Share $3.09 $5.89$6.34
Tangible Common Equity / Tangible Assets 2.16% 6.21%6.66%
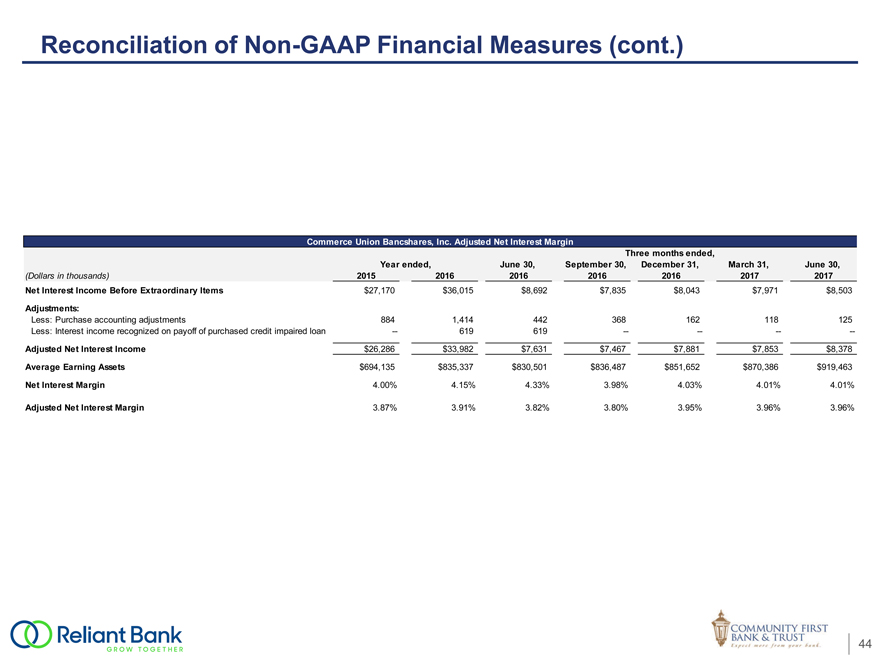
Reconciliation ofNon-GAAP Financial Measures (cont.)
Commerce Union Bancshares, Inc. Adjusted Net Interest Margin
Three months ended,
Year ended, June 30,September 30,December 31,March 31,June 30,
(Dollars in thousands) 2015 201620162016201620172017
Net Interest Income Before Extraordinary Items $27,170 $36,015$8,692$7,835$8,043$7,971$8,503
Adjustments:
Less: Purchase accounting adjustments 884 1,414442368162118125
Less: Interest income recognized on payoff of purchased credit impaired loan — 619619————
Adjusted Net Interest Income $26,286 $33,982$7,631$7,467$7,881$7,853$8,378
Average Earning Assets $694,135 $835,337$830,501$836,487$851,652$870,386$919,463
Net Interest Margin 4.00% 4.15%4.33%3.98%4.03%4.01%4.01%
Adjusted Net Interest Margin 3.87% 3.91%3.82%3.80%3.95%3.96%3.96%
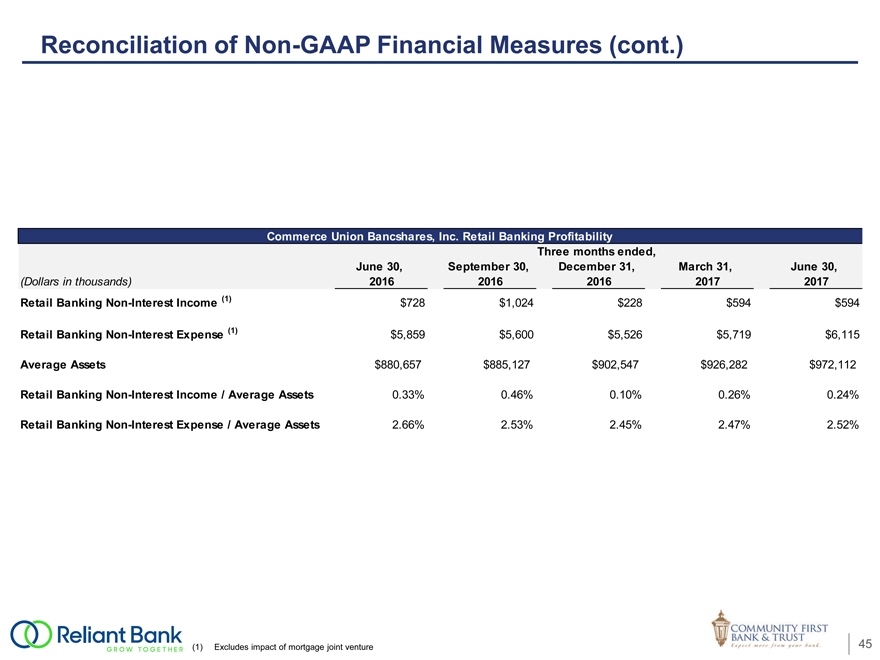
Reconciliation ofNon-GAAP Financial Measures (cont.)
Commerce Union Bancshares, Inc. Retail Banking Profitability
Three months ended,
June 30, September 30, December 31,March 31,June 30,
(Dollars in thousands) 2016 2016201620172017
Retail BankingNon-Interest Income (1) $728 $1,024$228$594$594
Retail BankingNon-Interest Expense (1) $5,859 $5,600$5,526$5,719$6,115
Average Assets $880,657 $885,127$902,547$926,282$972,112
Retail BankingNon-Interest Income / Average Assets 0.33% 0.46%0.10%0.26%0.24%
Retail BankingNon-Interest Expense / Average Assets 2.66% 2.53%2.45%2.47%2.52%
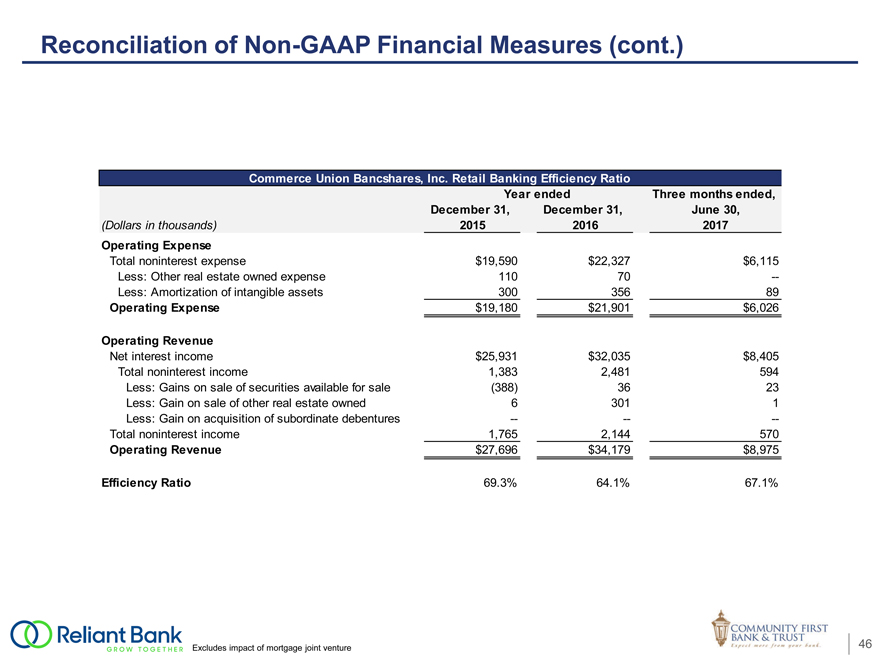
Reconciliation ofNon-GAAP Financial Measures (cont.)
Commerce Union Bancshares, Inc. Retail Banking Efficiency Ratio
Year ended Three months ended,
December 31, December 31,June 30,
(Dollars in thousands) 2015 20162017
Operating Expense
Total noninterest expense $19,590 $22,327$6,115
Less: Other real estate owned expense 110 70—
Less: Amortization of intangible assets 300 35689
Operating Expense $19,180 $21,901$6,026
Operating Revenue
Net interest income $25,931 $32,035$8,405
Total noninterest income 1,383 2,481594
Less: Gains on sale of securities available for sale (388) 3623
Less: Gain on sale of other real estate owned 63011
Less: Gain on acquisition of subordinate debentures ———
Total noninterest income 1,765 2,144570
Operating Revenue $27,696 $34,179$8,975
Efficiency Ratio 69.3% 64.1%67.1%
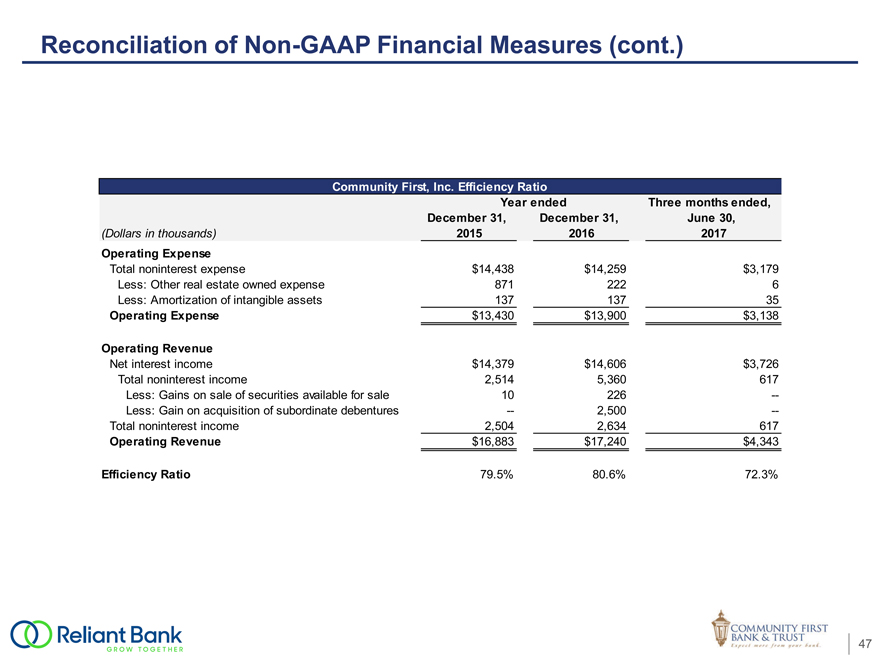
Reconciliation ofNon-GAAP Financial Measures (cont.)
Community First, Inc. Efficiency Ratio
Year ended Three months ended,
December 31, December 31, June 30,
(Dollars in thousands) 2015 20162017
Operating Expense
Total noninterest expense $14,438 $14,259$3,179
Less: Other real estate owned expense 871 2226
Less: Amortization of intangible assets 137 13735
Operating Expense $13,430 $13,900$3,138
Operating Revenue
Net interest income $14,379 $14,606$3,726
Total noninterest income 2,514 5,360617
Less: Gains on sale of securities available for sale 10 226—
Less: Gain on acquisition of subordinate debentures — 2,500—
Total noninterest income 2,504 2,634617
Operating Revenue $16,883 $17,240$4,343
Efficiency Ratio 79.5% 80.6%72.3%
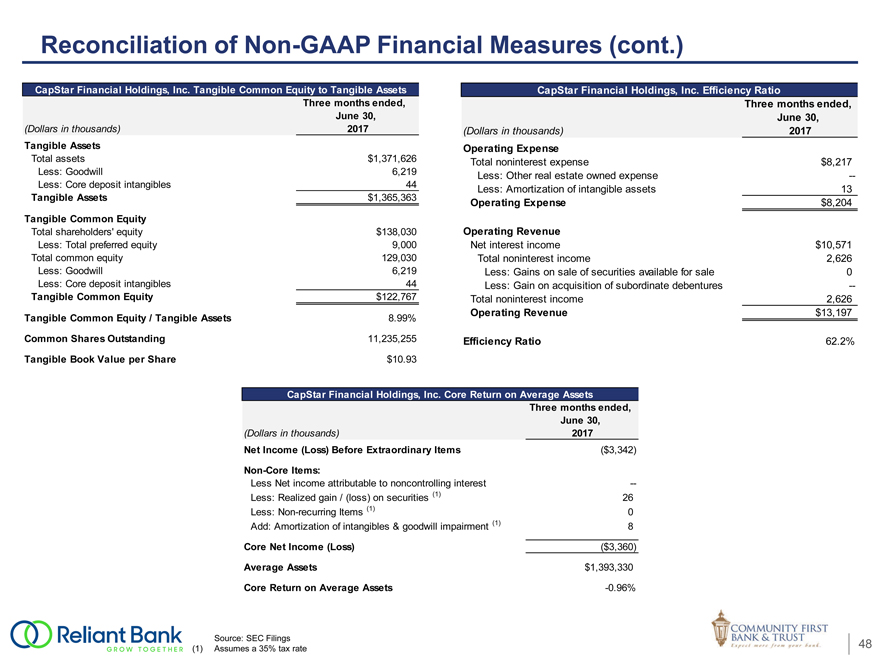
Reconciliation ofNon-GAAP Financial Measures (cont.)
CapStar Financial Holdings, Inc. Tangible Common Equity to Tangible Assets CapStar Financial Holdings, Inc. Efficiency Ratio
Three months ended, Three months ended,
June 30, June 30,
(Dollars in thousands) 2017 (Dollars in thousands)2017
Tangible Assets Operating Expense
Total assets $1,371,626 Total noninterest expense$8,217
Less: Goodwill 6,219 Less: Other real estate owned expense—
Less: Core deposit intangibles 44 Less: Amortization of intangible assets13
Tangible Assets $1,365,363 Operating Expense$8,204
Tangible Common Equity
Total shareholders’ equity $138,030 Operating Revenue
Less: Total preferred equity 9,000 Net interest income$10,571
Total common equity 129,030 Total noninterest income2,626
Less: Goodwill 6,219 Less: Gains on sale of securities available for sale0
Less: Core deposit intangibles 44 Less: Gain on acquisition of subordinate debentures—
Tangible Common Equity $122,767 Total noninterest income2,626
Tangible Common Equity / Tangible Assets 8.99% Operating Revenue$13,197
Common Shares Outstanding 11,235,255 Efficiency Ratio62.2%
Tangible Book Value per Share $10.93
CapStar Financial Holdings, Inc. Core Return on Average Assets
Three months ended,
June 30,
(Dollars in thousands) 2017
Net Income (Loss) Before Extraordinary Items ($3,342)
Non-Core Items:
Less Net income attributable to noncontrolling interest —
Less: Realized gain / (loss) on securities (1) 26
Less:Non-recurring Items (1) 0
Add: Amortization of intangibles & goodwill impairment (1) 8
Core Net Income (Loss) ($3,360)
Average Assets $1,393,330
Core Return on Average Assets -0.96%
Source: SEC Filings
(1) Assumes a 35% tax rate 48
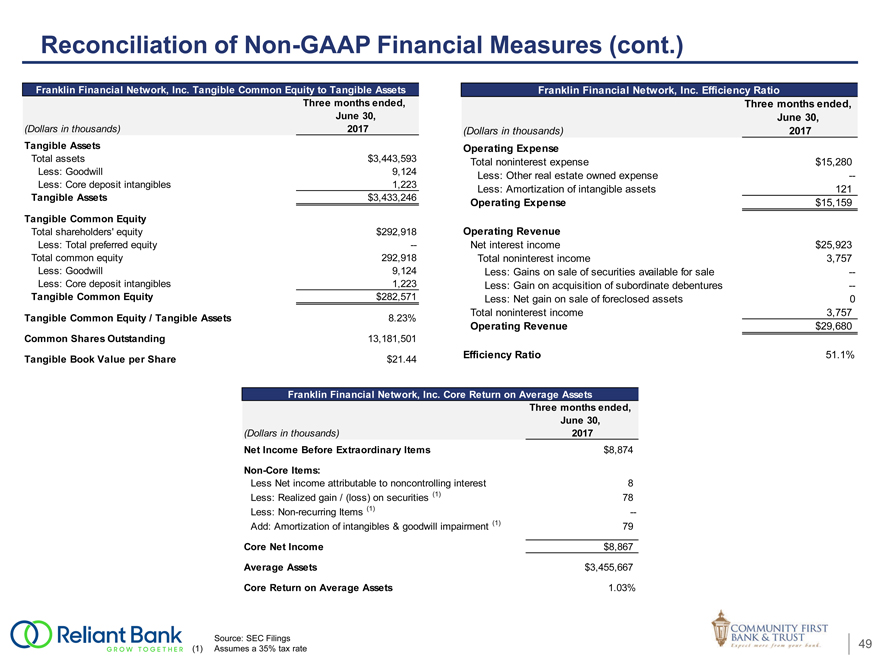
Reconciliation ofNon-GAAP Financial Measures (cont.)
Franklin Financial Network, Inc. Tangible Common Equity to Tangible Assets Franklin Financial Network, Inc. Efficiency Ratio
Three months ended, Three months ended,
June 30, June 30,
(Dollars in thousands) 2017 (Dollars in thousands)2017
Tangible Assets Operating Expense
Total assets $3,443,593 Total noninterest expense$15,280
Less: Goodwill 9,124 Less: Other real estate owned expense—
Less: Core deposit intangibles 1,223 Less: Amortization of intangible assets121
Tangible Assets $3,433,246 Operating Expense$15,159
Tangible Common Equity
Total shareholders’ equity $292,918 Operating Revenue
Less: Total preferred equity — Net interest income$25,923
Total common equity 292,918 Total noninterest income3,757
Less: Goodwill 9,124 Less: Gains on sale of securities available for sale—
Less: Core deposit intangibles 1,223 Less:Gain on acquisition of subordinate debentures—
Tangible Common Equity $282,571 Less:Net gain on sale of foreclosed assets0
Tangible Common Equity / Tangible Assets 8.23% Total noninterest income3,757
Operating Revenue $29,680
Common Shares Outstanding 13,181,501
Tangible Book Value per Share $21.44 Efficiency Ratio51.1%
Franklin Financial Network, Inc. Core Return on Average Assets
Three months ended,
June 30,
(Dollars in thousands) 2017
Net Income Before Extraordinary Items $8,874
Non-Core Items:
Less Net income attributable to noncontrolling interest 8
Less: Realized gain / (loss) on securities (1) 78
Less:Non-recurring Items (1) —
Add: Amortization of intangibles & goodwill impairment (1) 79
Core Net Income $8,867
Average Assets $3,455,667
Core Return on Average Assets 1.03%
Source: SEC Filings
(1) Assumes a 35% tax rate 49