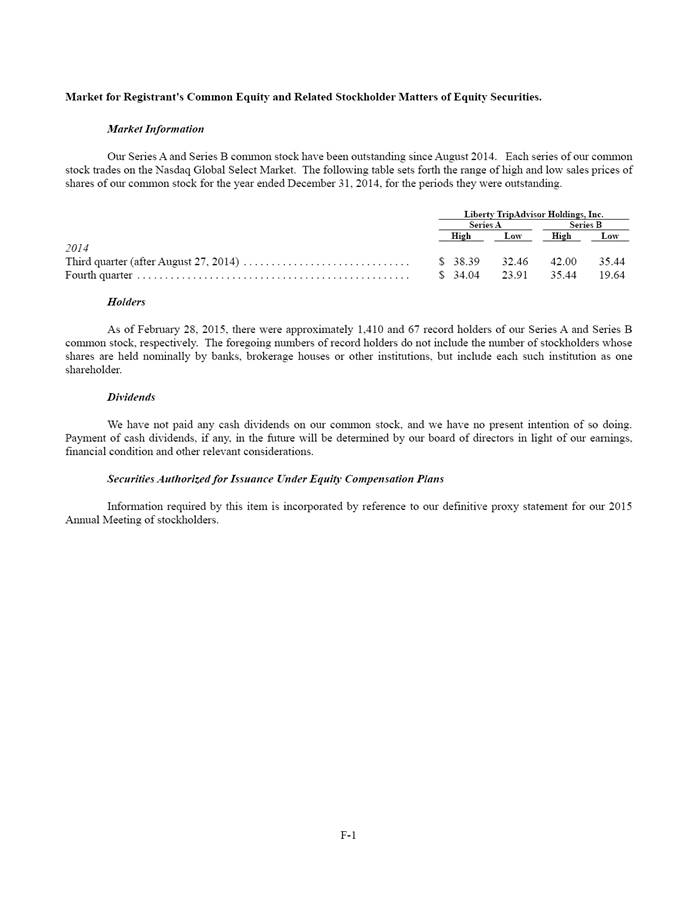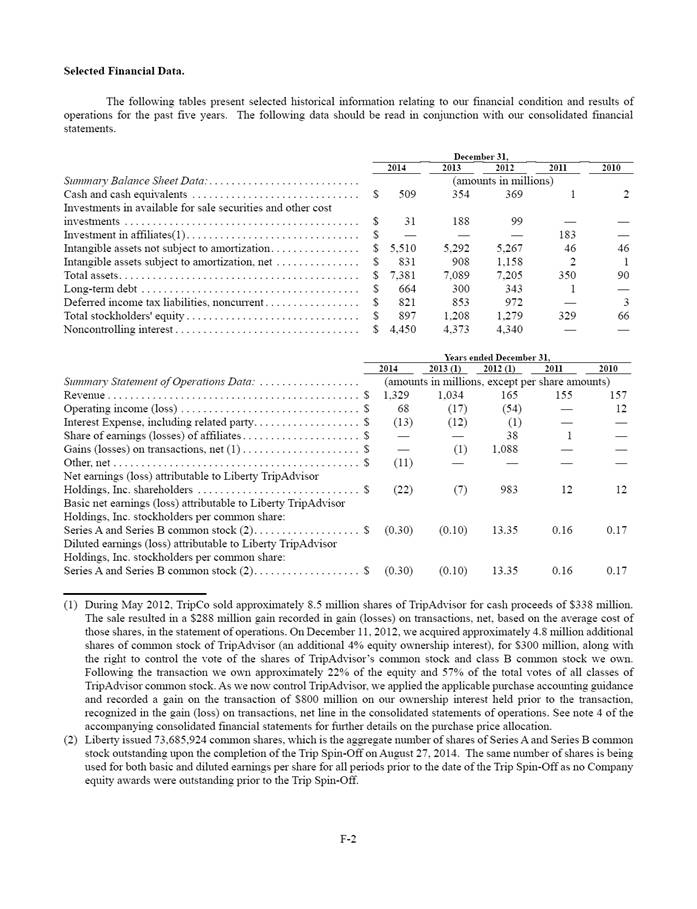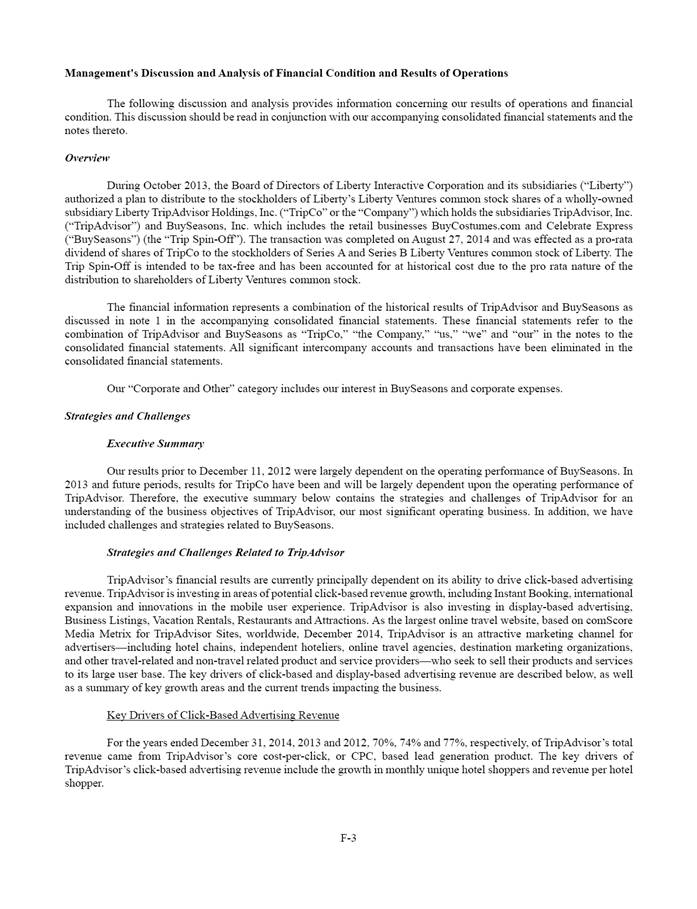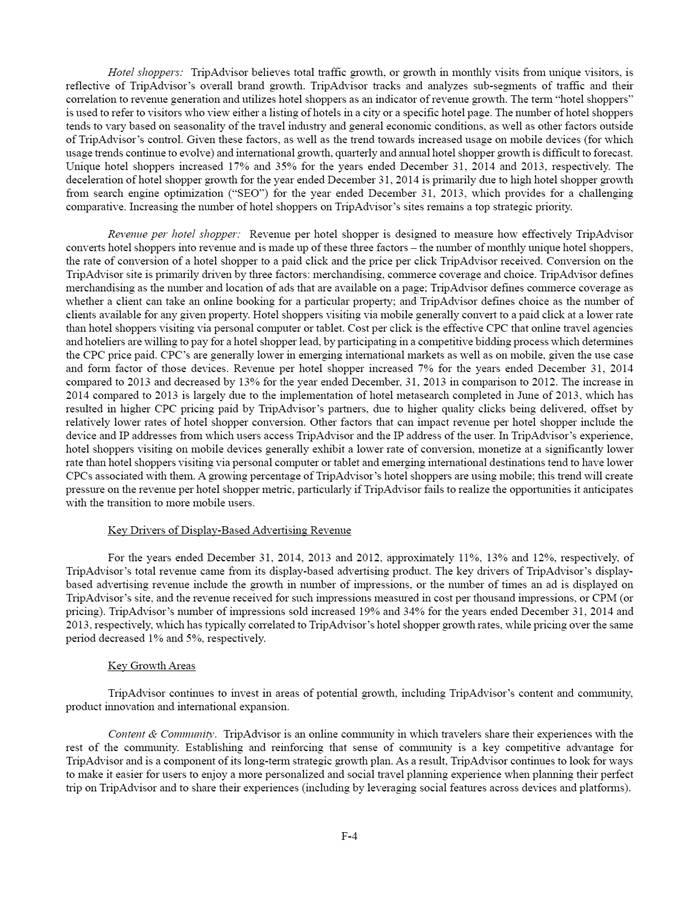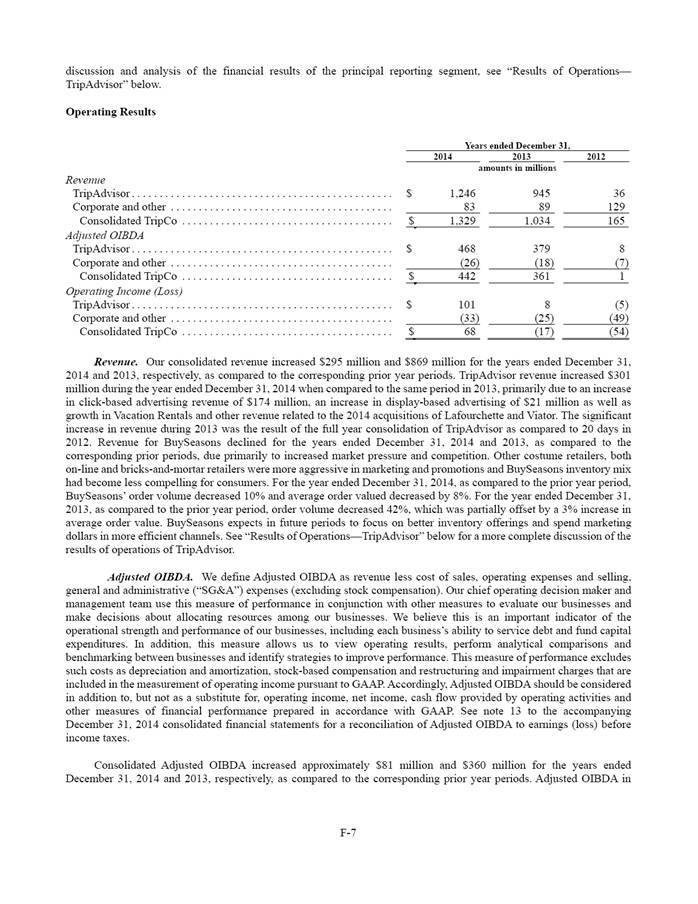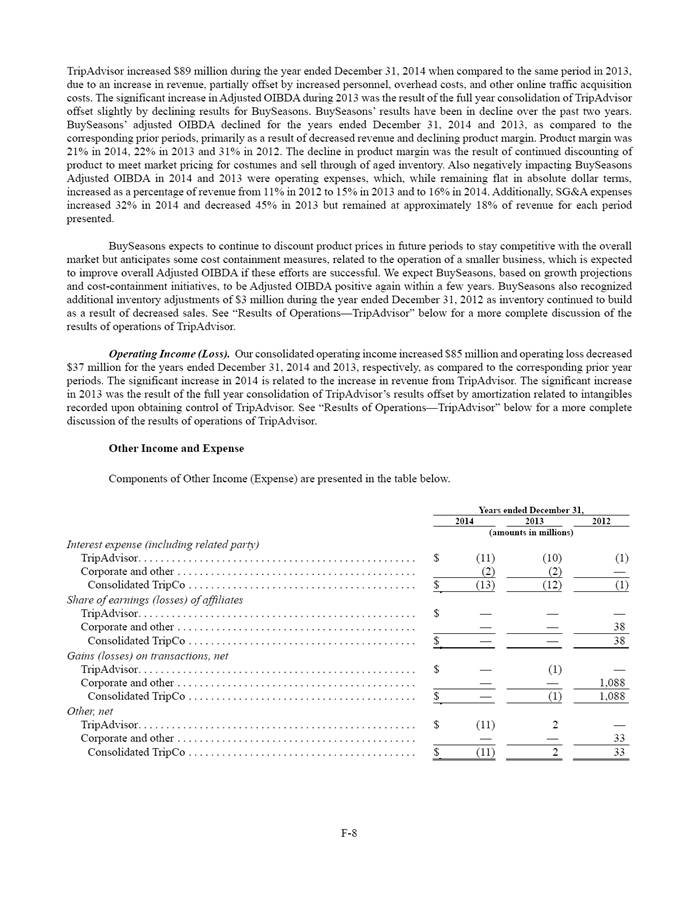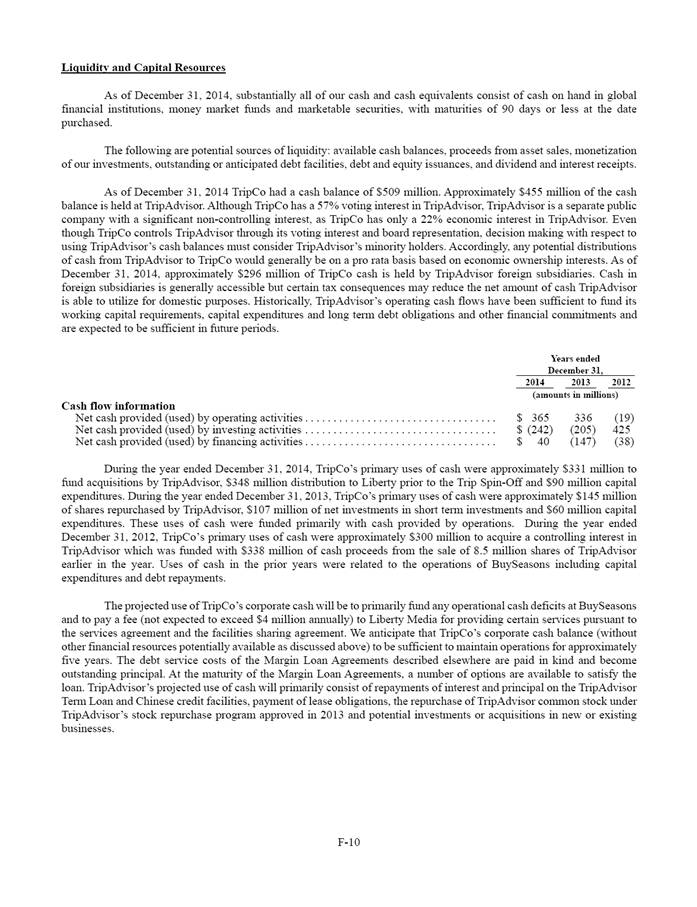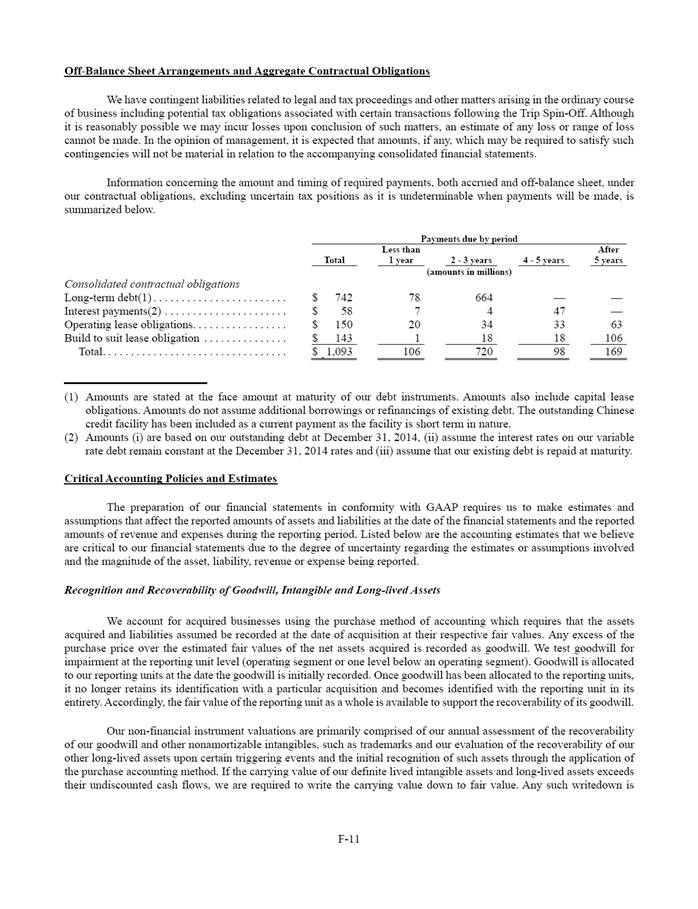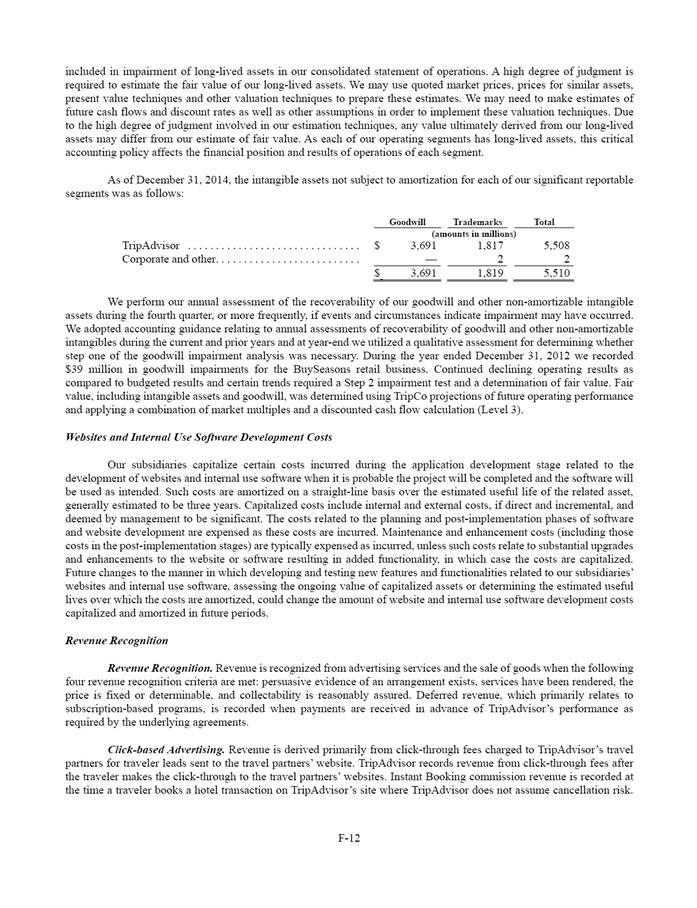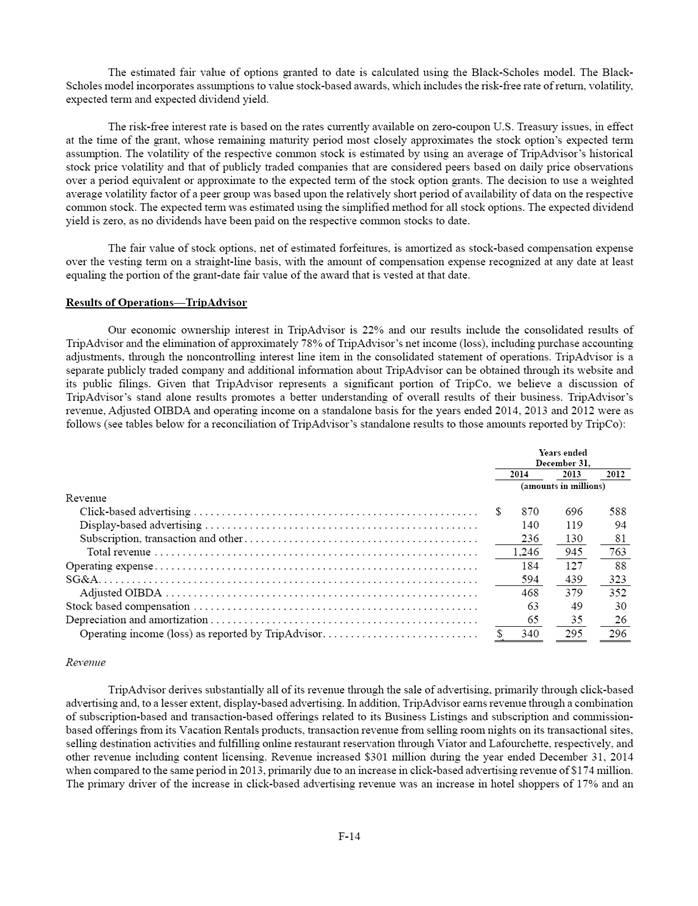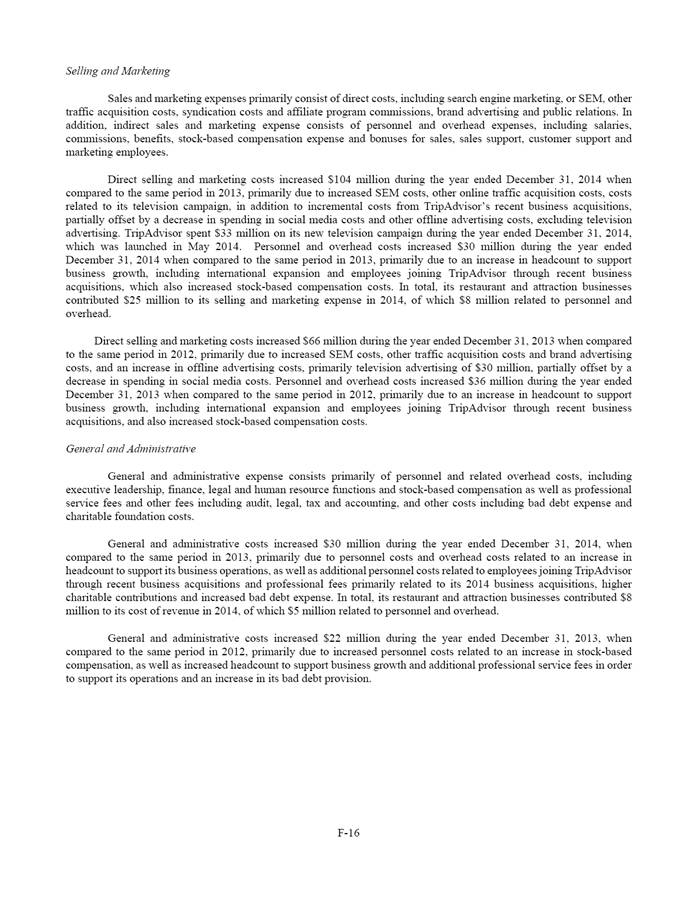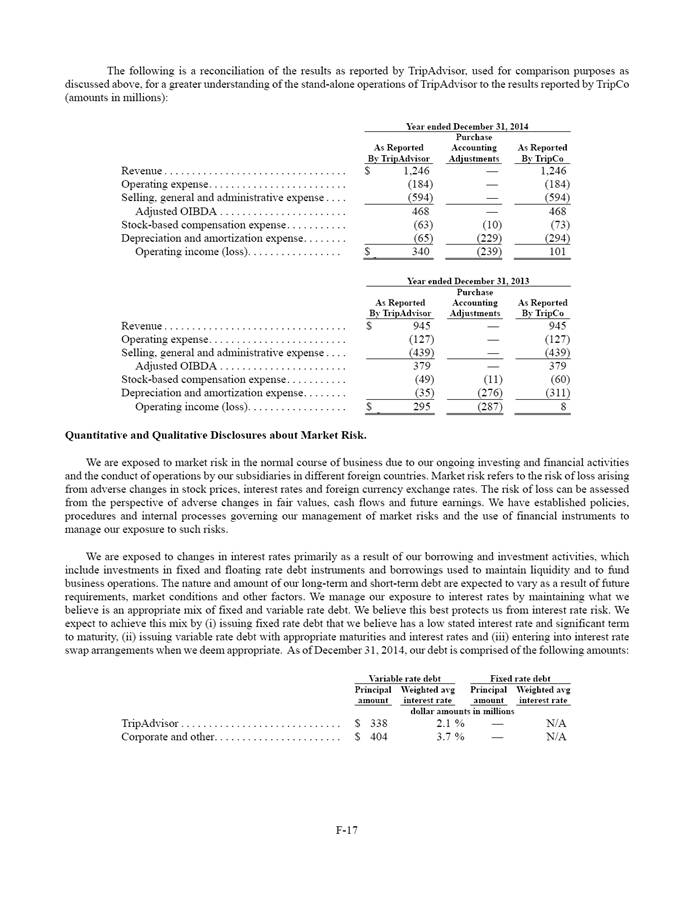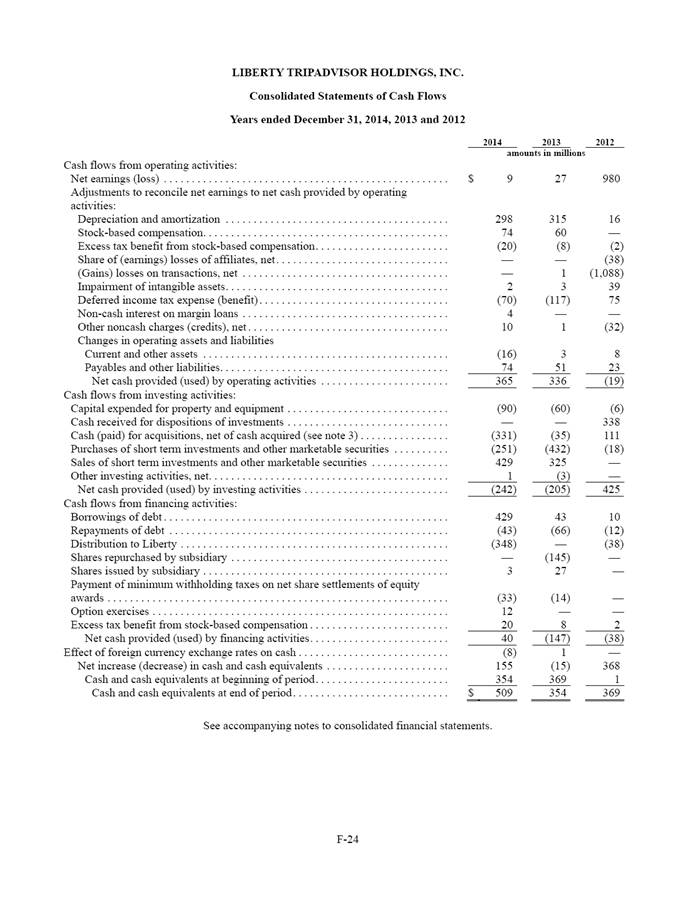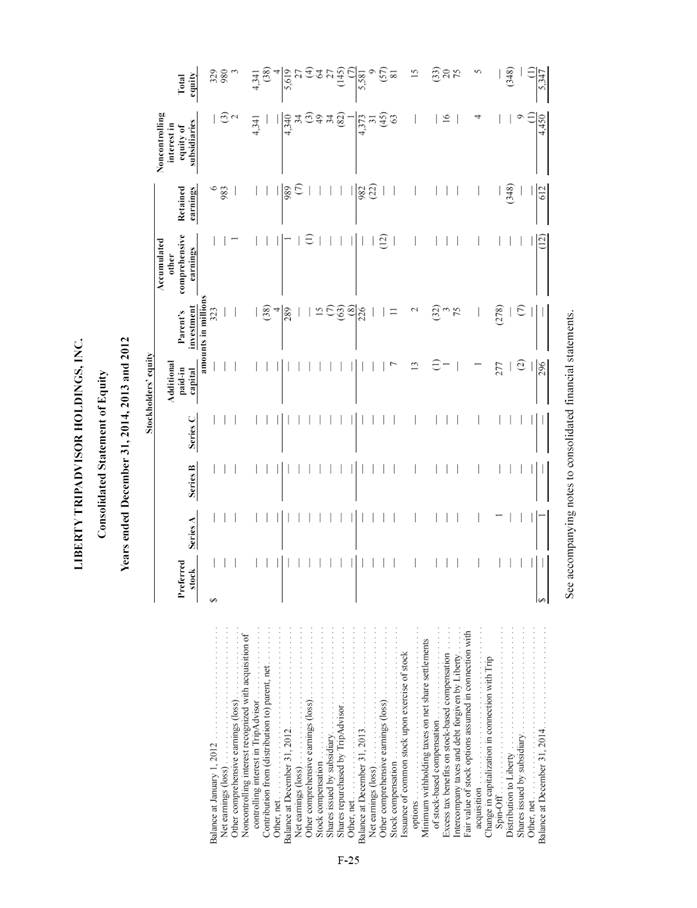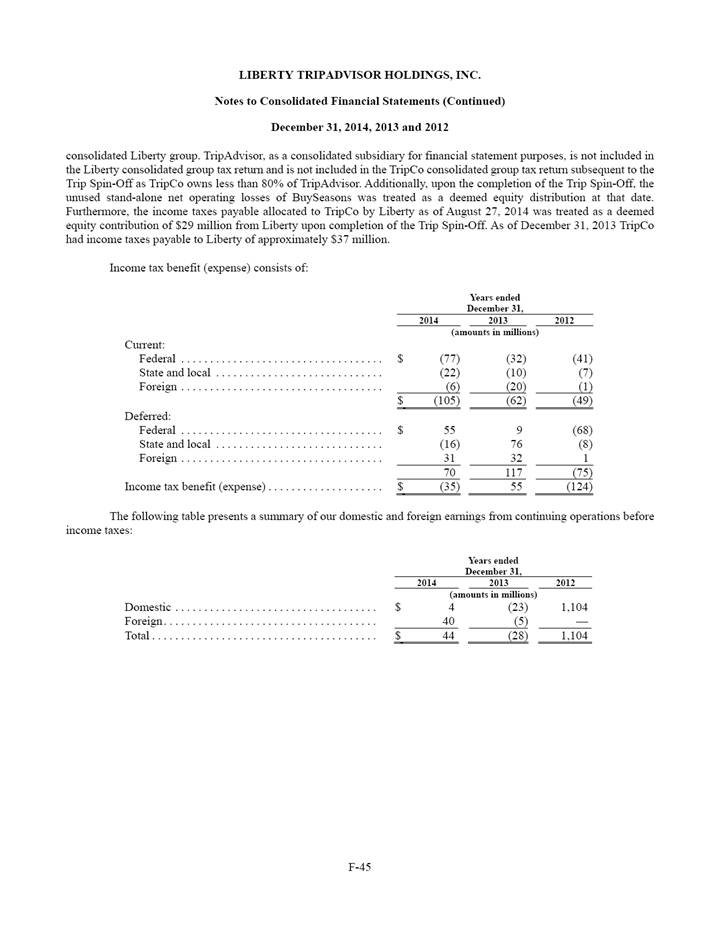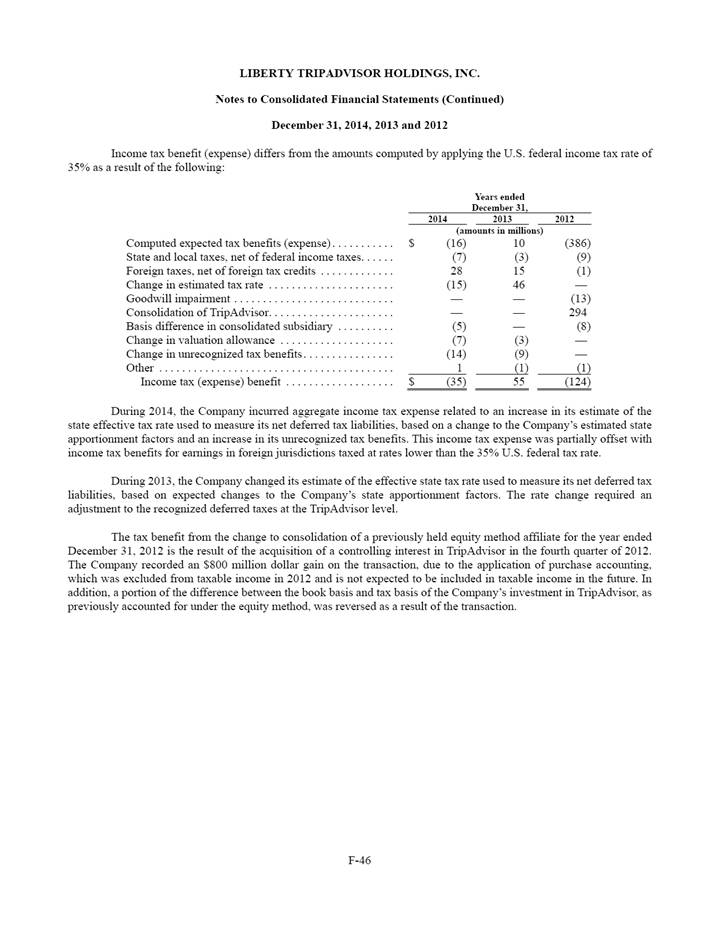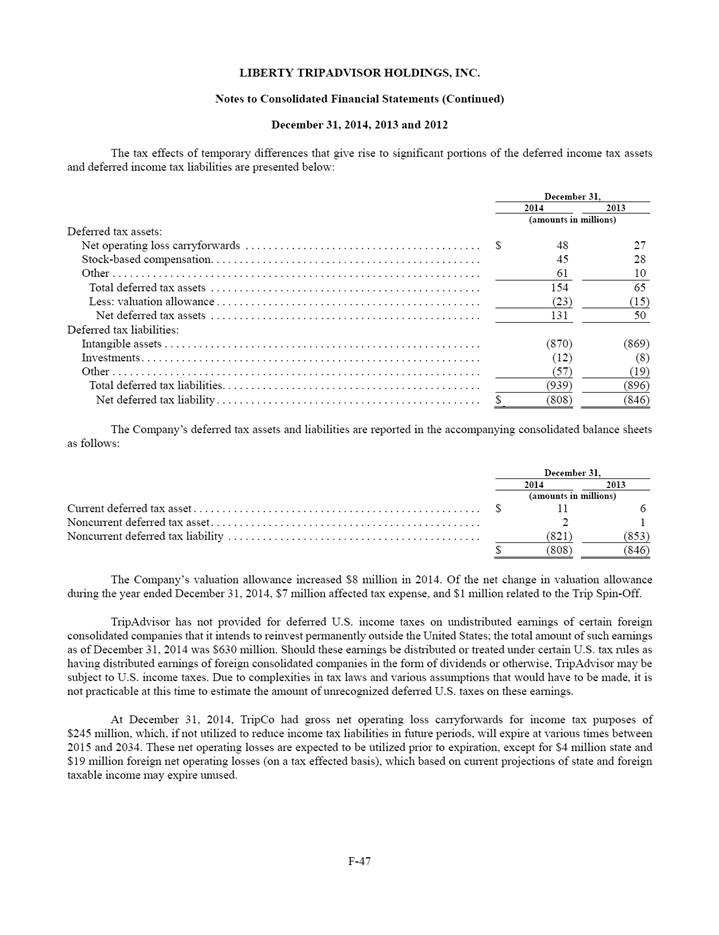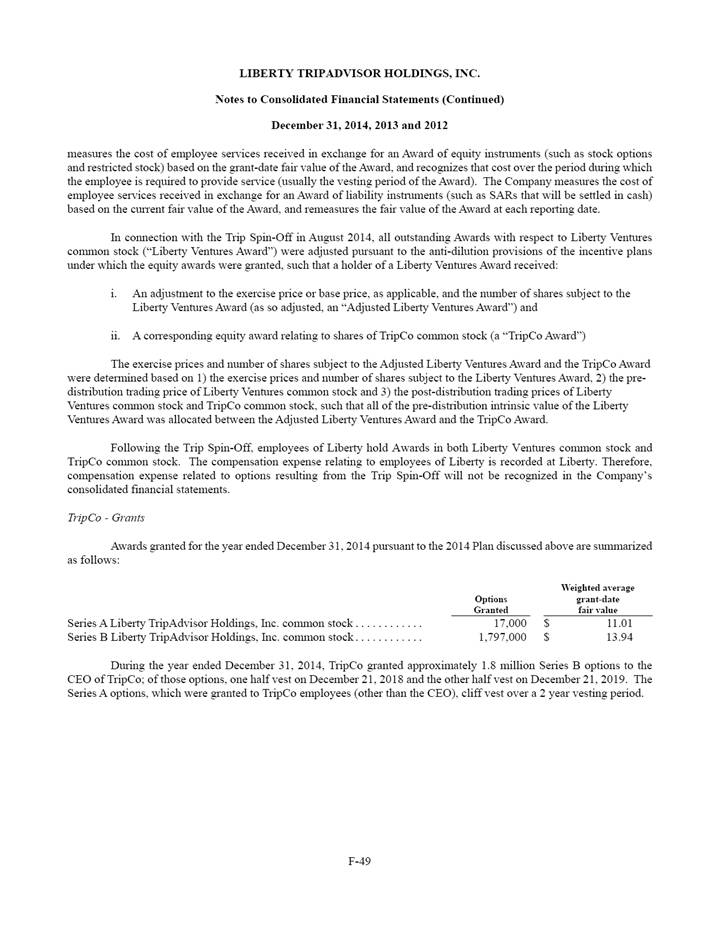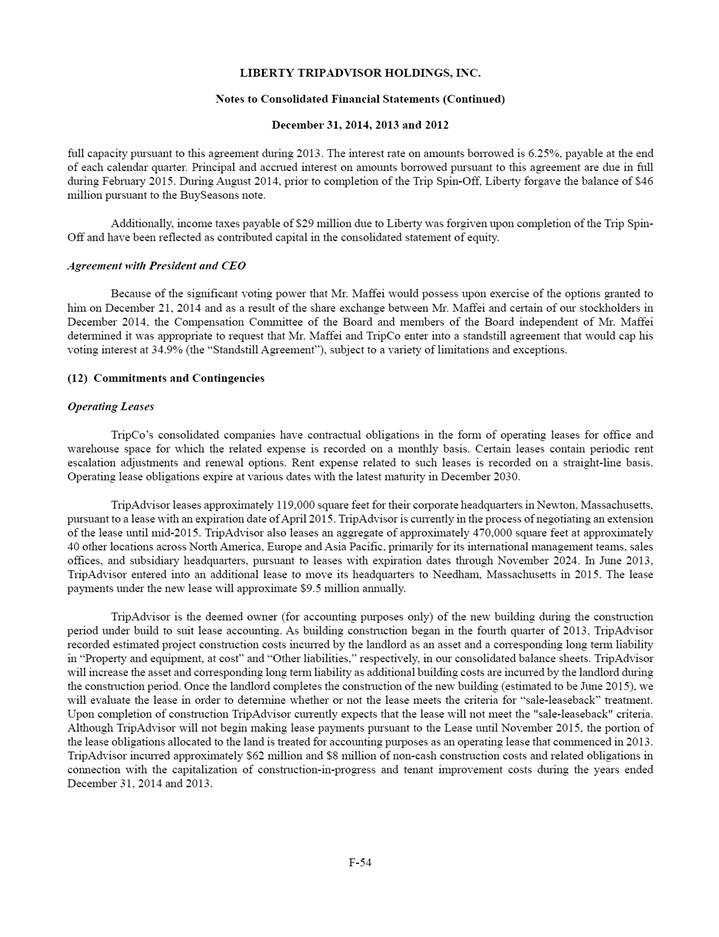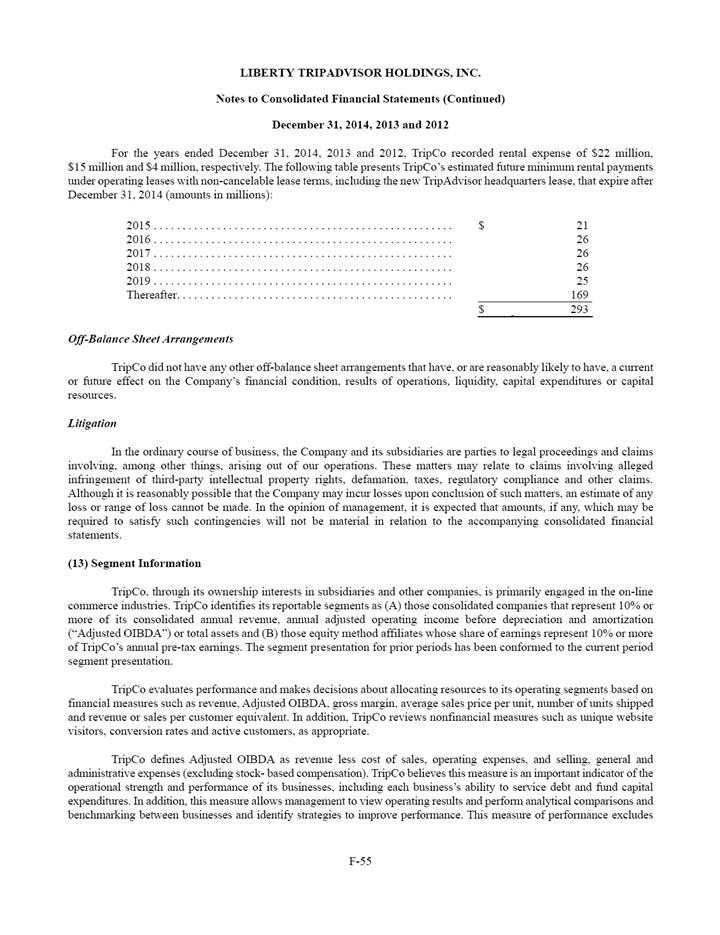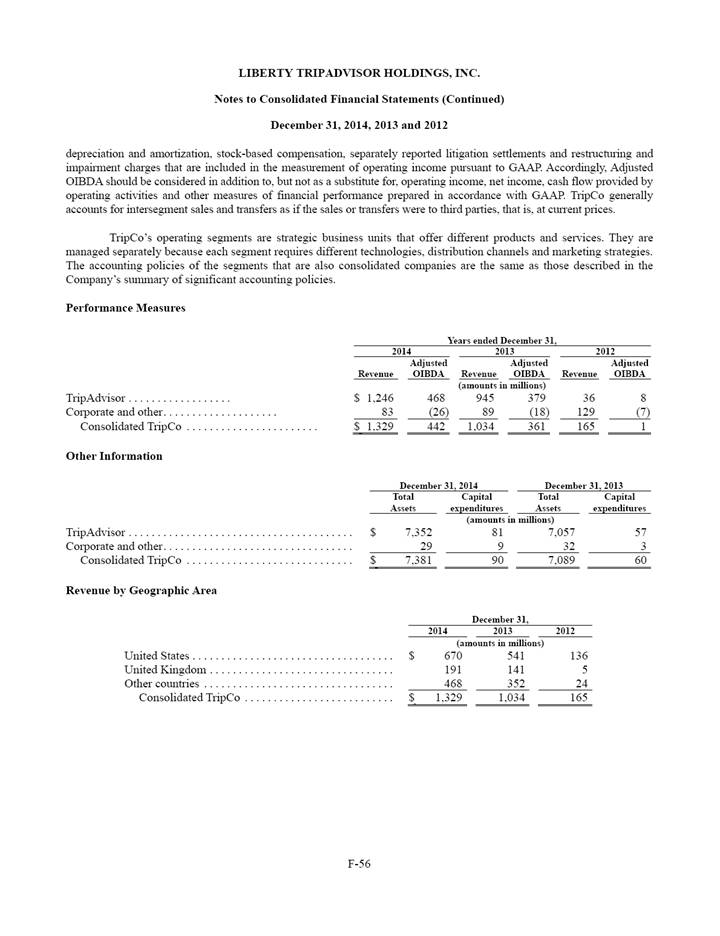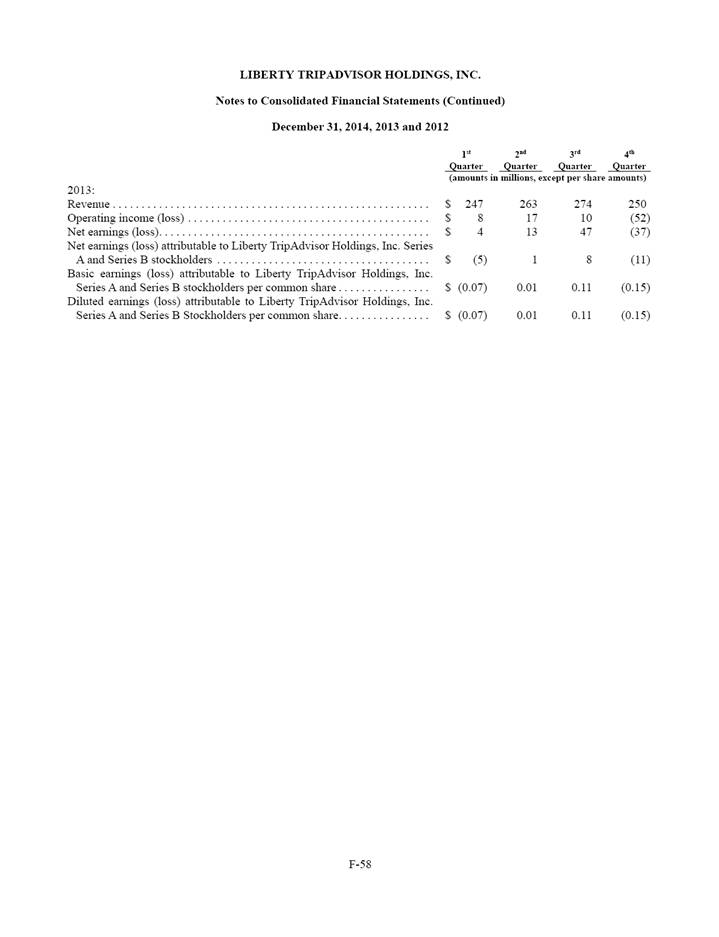
| increase in revenue per hotel shopper of 7% for the year ended December 31, 2014. Display-based advertising increased by $21 million during the year ended December 31, 2014, primarily as a result of a 19% increase in the number of impressions sold when compared to the same period in 2013, primarily due to increased sales productivity, advertising technology improvements that have enhanced marketers’ ability to target, coupled with worldwide growth particularly in emerging markets, partially offset by a decrease in pricing by 1% for the same period. Subscription, transaction and other revenue increased by $106 million during the year ended December 31, 2014, primarily due to growth in its Business Listings and Vacation Rentals products, as well as revenue generated by the businesses it acquired during 2014 of $43 million. Revenue increased $182 million during the year ended December 31, 2013 when compared to the same period in 2012, primarily due to an increase in click-based advertising revenue of $108 million. The primary driver of the increase in click-based advertising revenue was an increase in hotel shoppers of 35% for the year ended December 31, 2013, partially offset by lower revenue per hotel shopper of 13% for the year ended December 31, 2013, primarily due to a combination of lower user conversion related to our transition to hotel metasearch, growth in hotel shoppers on smartphones, which have a lower monetization rate than desktops and tablets, and growth in emerging international markets that are currently monetizing at lower levels than TripAdvisor’s mature markets. Display-based advertising increased by $25 million during the year ended December 31, 2013, primarily as a result of a 34% increase in the number of impressions sold due to increased sales productivity coupled with its new Delayed Ad Call product, and worldwide growth particularly in emerging markets when compared to the same period in 2013, partially offset by a decrease in pricing by 5% for the year ended December 31, 2013. Subscription, transaction and other revenue increased by $49 million during the year ended December 31, 2013, primarily due to growth in its Business Listings and Vacation Rentals products. TripAdvisor’s international revenue represented 52%, 51%, and 49% of its total revenue during the years ended December 31, 2014, 2013, and 2012, respectively. TripAdvisor’s increase in international revenue, in absolute dollars and as a percentage of total revenue, is primarily due to additional investment in international expansion and growth in international hotel shoppers. See note 13 in the accompanying consolidated financial statements for further details of revenue by geographic area. Adjusted OIBDA Adjusted OIBDA as a percentage of revenue has declined year over year as TripAdvisor continues to invest in the business and the brand. The primary expenses that drive Adjusted OIBDA results are operating expense (primarily technology and content costs), sales and marketing and general and administrative expense. Technology and Content Technology and content expenses consist of personnel and overhead expenses, including salaries and benefits, stock-based compensation expense and bonuses for salaried employees and contractors engaged in the design, development, testing, content support and maintenance of the TripAdvisor website and its mobile apps. Other costs include licensing, maintenance expense, computer supply and technology hardware. Technology and content costs increased $40 million during the year ended December 31, 2014 when compared to the same period in 2013, primarily due to increased personnel costs from increased headcount to support business growth, including international expansion and enhanced site features, as well as additional personnel costs related to employees joining us through recent business acquisitions and also increased stock-based compensation costs. In total, its restaurant and attraction businesses contributed $6 million to its technology and content expense in 2014, of which $4 million related to personnel and overhead. Technology and content costs increased $44 million during the year ended December 31, 2013 when compared to the same period in 2012, primarily due to increased personnel costs from increased headcount to support business growth, including international expansion, enhanced site features, extending its products onto smartphone and tablet platforms, and development of its hotel metasearch product, as well as an increase in stock based compensation and additional personnel costs related to employees joining TripAdvisor through recent business acquisitions. F-15 |
