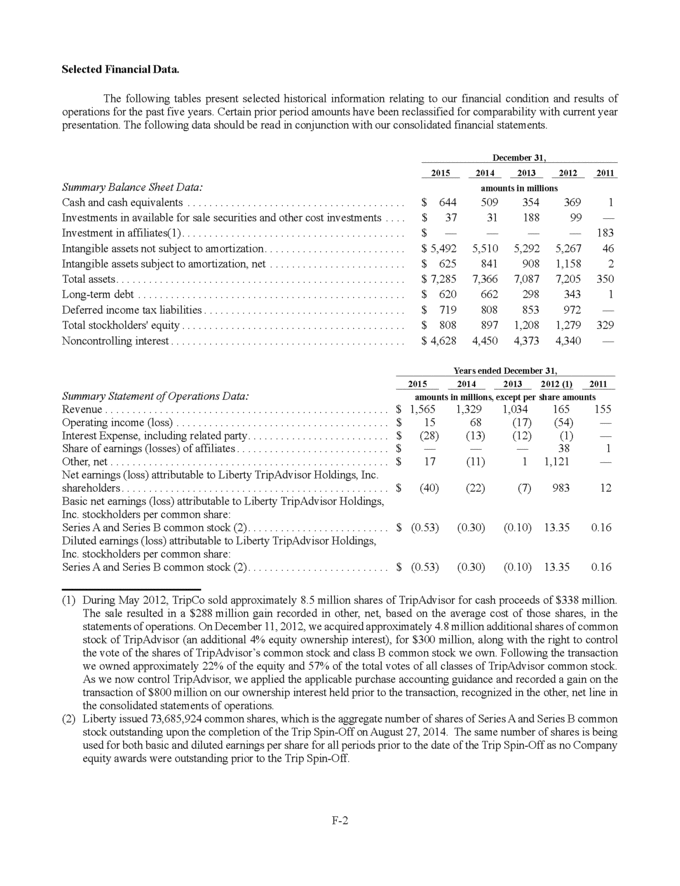
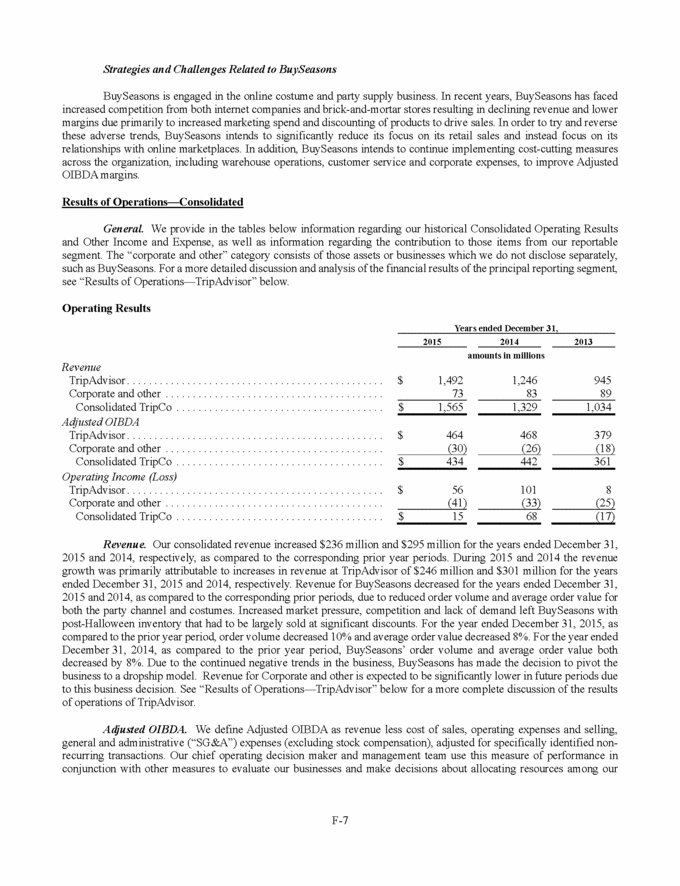
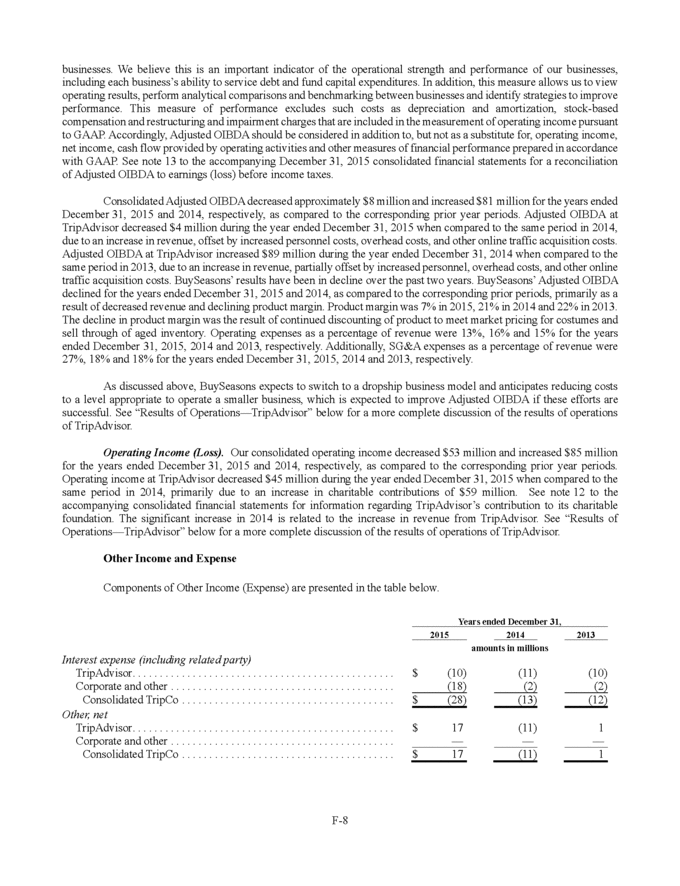
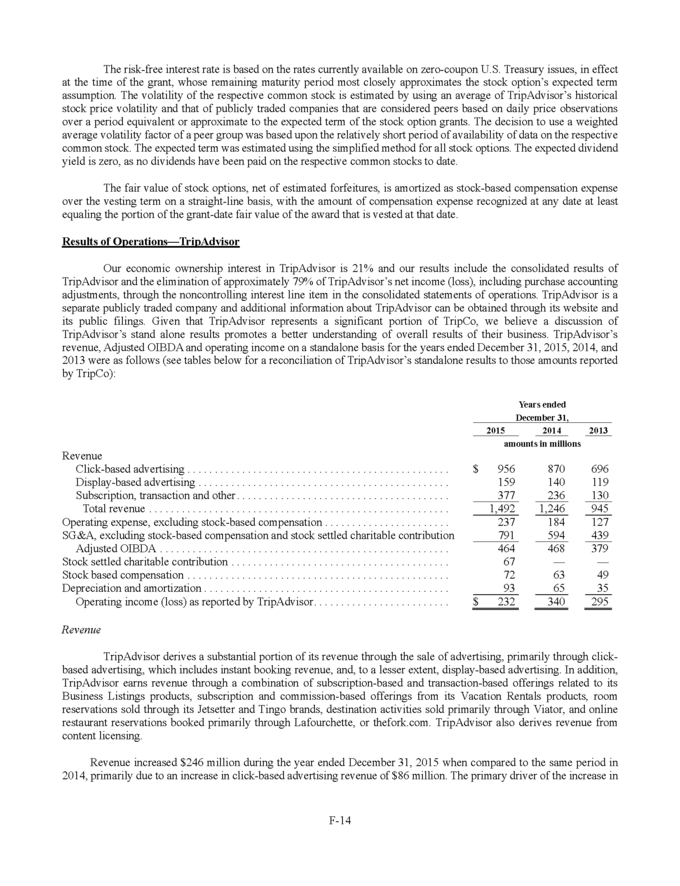
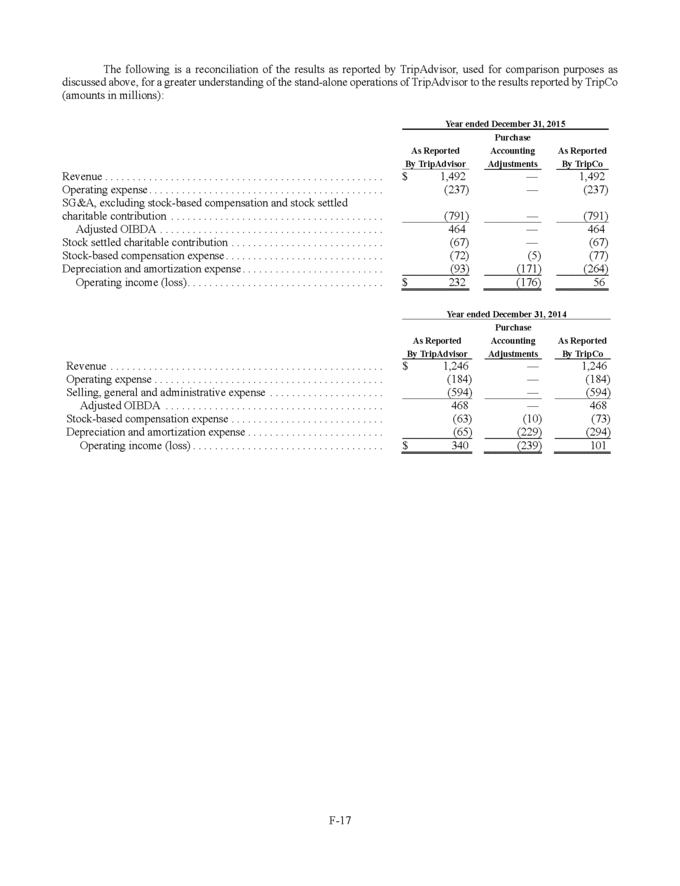
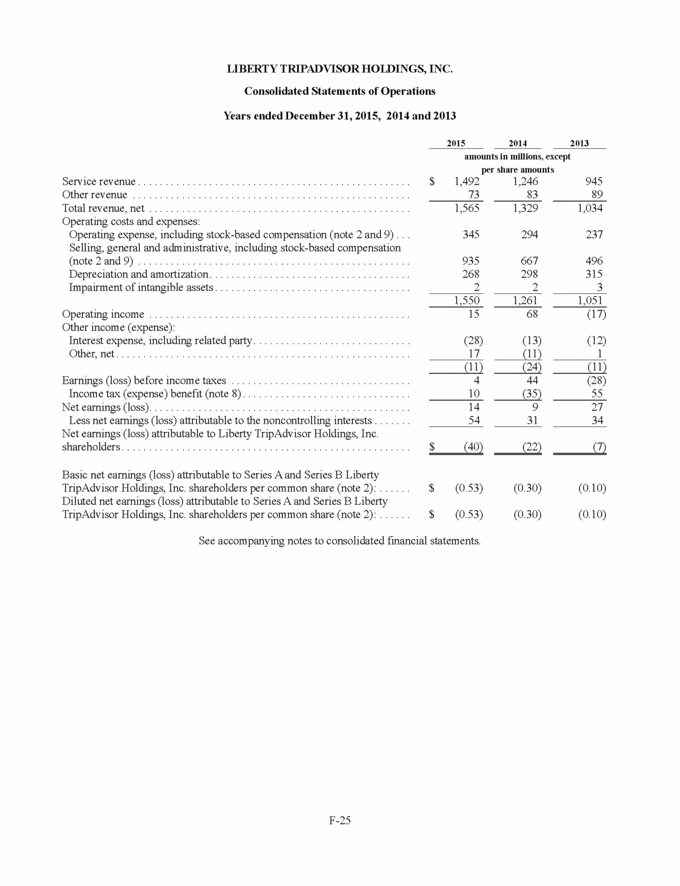
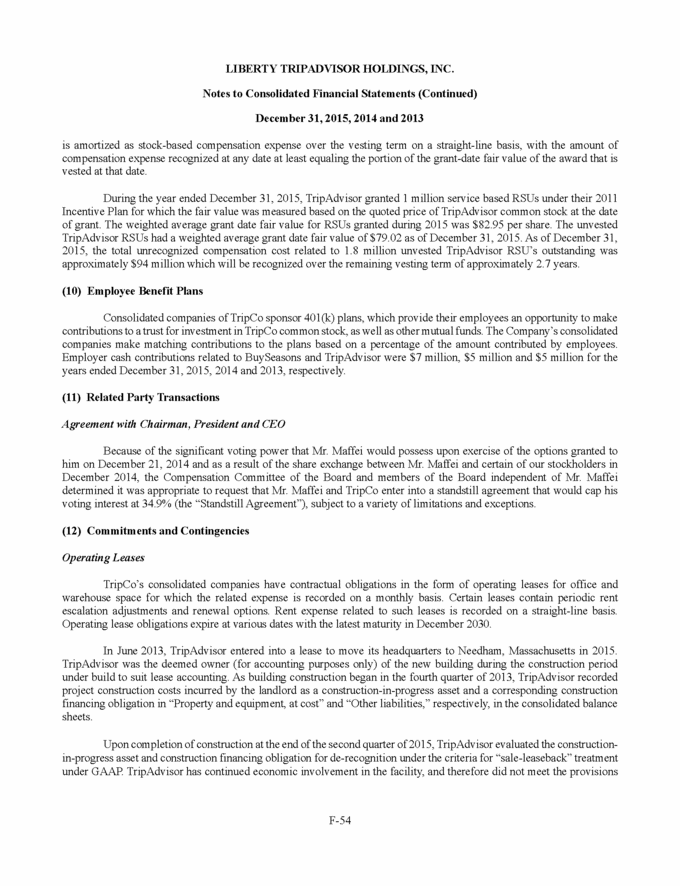
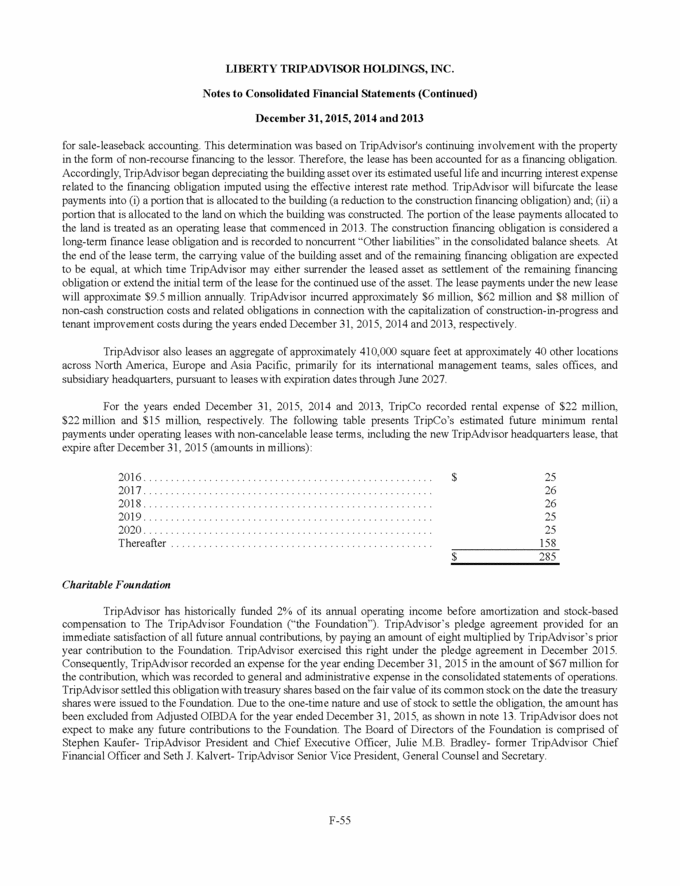
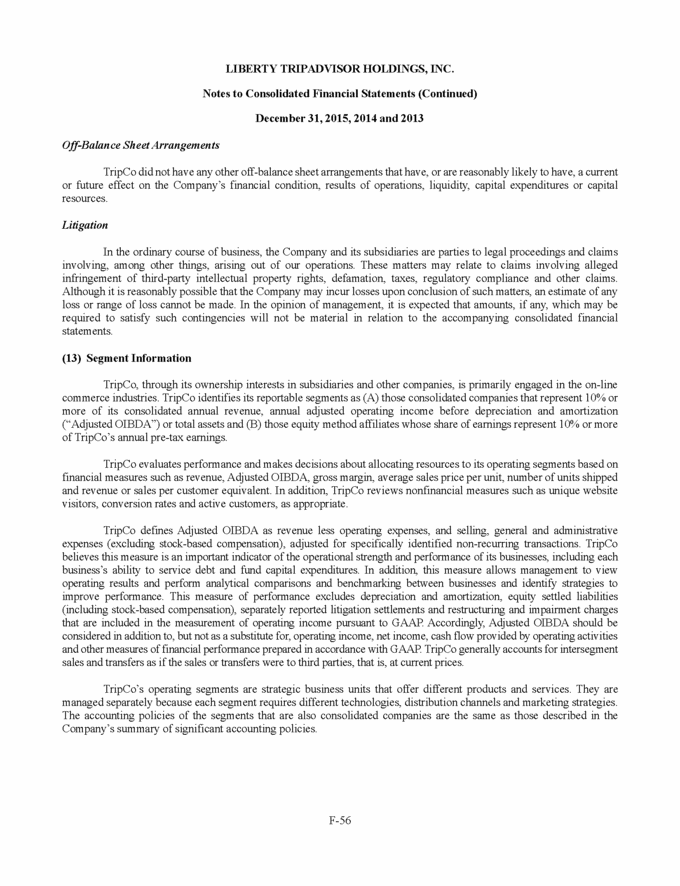
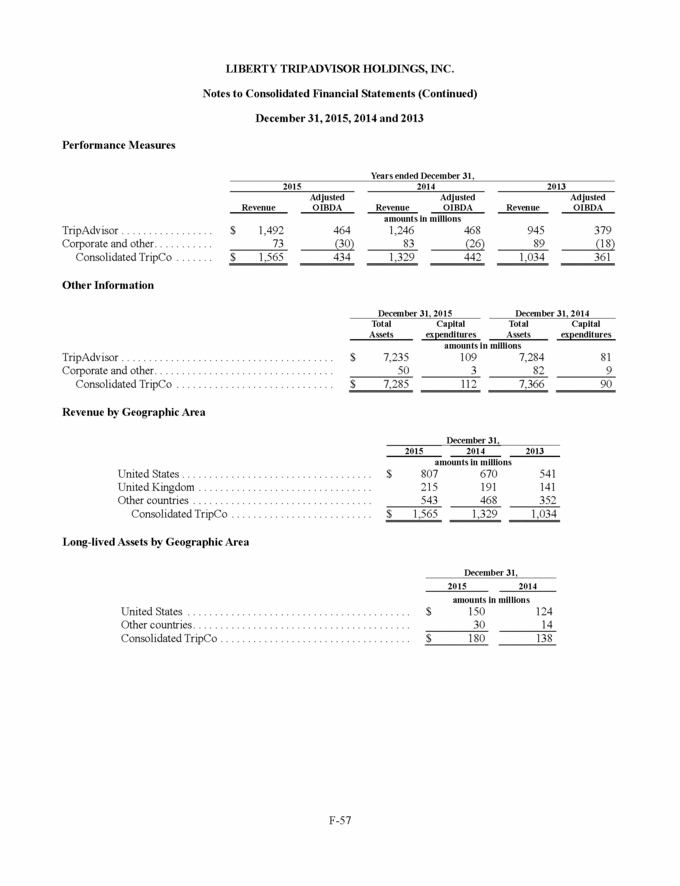
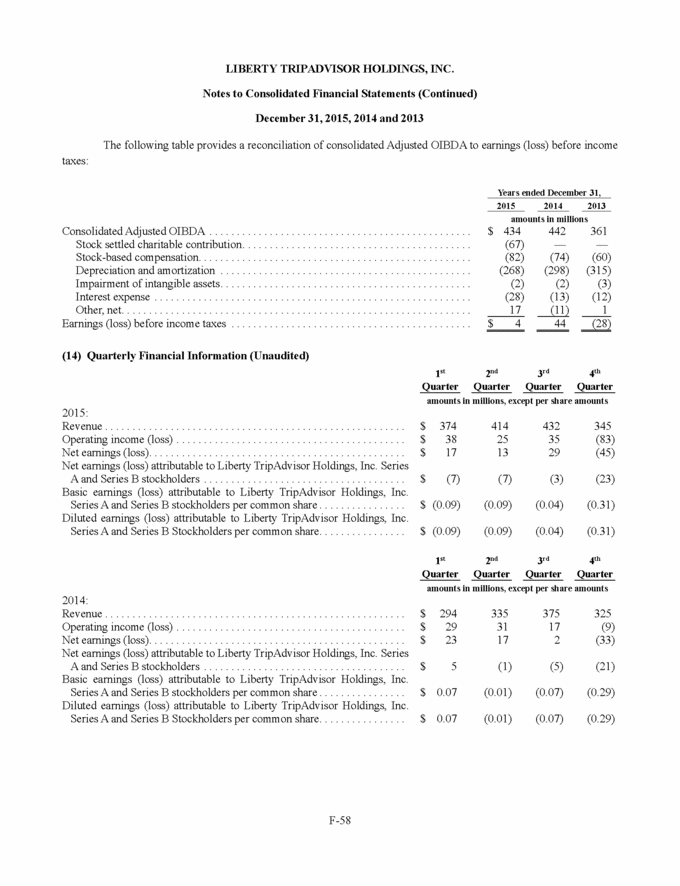
click-based advertising revenue was an increase in hotel shoppers of 16%, partially offset by a decrease in revenue per hotel shopper of 6% for the year ended December 31, 2015. The decline in revenue per hotel shopper was primarily due to pricing pressure experienced during 2015, particularly in the second half of the year; which includes the impact from (i) product changes, such as TripAdvisor’s decision to accelerate the rollout of its instant booking feature to its US and UK markets on all devices in the third quarter of 2015, (ii) the prolonged weakness of the Euro, which has decreased TripAdvisor’s CPCs, and (iii) a growing number of hotel shoppers visiting TripAdvisor’s websites on mobile devices. Display-based advertising increased by $19 million during the year ended December 31, 2015, primarily as a result of a 14% increase in the number of impressions sold when compared to the same period in 2014, partially offset by a decrease in pricing by 1% for the same period. Subscription, transaction and other revenue increased by $141 million during the year ended December 31, 2015, primarily due to growth in Attractions, Restaurants, Business Listings, and Vacation Rentals, which was driven by incremental revenue due to inclusion of acquisitions for the full year ended December 31, 2015 of $96 million, related to its Attraction and Restaurant businesses (most prominently Viator and Lafourchette). Revenue increased $301 million during the year ended December 31, 2014 when compared to the same period in 2013, primarily due to an increase in click-based advertising revenue of $174 million. The primary driver of the increase in click-based advertising revenue was an increase in hotel shoppers of 10% and an increase in revenue per hotel shopper of 15% for the year ended December 31, 2014. Display-based advertising increased by $21 million during the year ended December 31, 2014, primarily as a result of a 19% increase in the number of impressions sold when compared to the same period in 2013, partially offset by a decrease in pricing by 1% for the same period. Subscription, transaction and other revenue increased by $106 million during the year ended December 31, 2014, primarily due to growth in its Business Listings and Vacation Rentals products, as well as revenue generated by the businesses it acquired during 2014 of $43 million. TripAdvisor’s international revenue represented 50%, 52% and 51% of its total revenue during the years ended December 31, 2015, 2014 and 2013, respectively. Although international revenue increased, TripAdvisor’s international revenue growth rate decelerated and international revenue, as a percentage of total revenue, declined slightly during the year ended December 31, 2015 when compared to the same periods in 2014 and 2013, primarily due to the impact of fluctuations in foreign exchange rates, specifically the prolonged weakness of the Euro, in addition to TripAdvisor’s accelerated rollout of instant booking in the U.K. during 2015 and generally lower CPCs, or monetization, in markets outside the U.S. overall. See note 13 in the accompanying consolidated financial statements for further details of revenue by geographic area. Adjusted OIBDA Adjusted OIBDA as a percentage of revenue has declined year over year as TripAdvisor continues to invest in the business and the brand. The primary expenses that drive Adjusted OIBDA results are operating expense (primarily technology and content costs), sales and marketing and general and administrative expense. Operating Expense The most significant driver of operating expense are technology and content costs, which increased $35 million during the year ended December 31, 2015 when compared to the same period in 2014, primarily due to increased personnel costs from increased headcount to support business growth, including international expansion and enhanced site features, as well as incremental personnel costs related to TripAdvisor’s 2014 business acquisitions in Attractions and Restaurants. Technology and content costs increased $34 million during the year ended December 31, 2014 when compared to the same period in 2013, primarily due to increased personnel costs from increased headcount to support business growth, including international expansion and enhanced site features, as well as additional personnel costs related to employees joining TripAdvisor through business acquisitions. Selling and Marketing Sales and marketing expenses primarily consist of direct costs, including search engine marketing, or SEM, other traffic acquisition costs, syndication costs and affiliate program commissions, brand advertising and public relations. In
