united states
securities and exchange commission
washington, d.c. 20549
form n-csr
certified shareholder report of registered management
investment companies
Investment Company Act file number 811-22963
iCapital KKR Private Markets Fund
(Exact name of registrant as specified in charter)
60 East 42nd Street, 26th Floor, New York, NY 10165
(Address of principal executive offices) (Zip code)
Kyle Hartley, iCapital Registered Fund Adviser LLC
60 East 42nd Street, 26th Floor, New York, NY 10165
(Name and address of agent for service)
Registrant's telephone number, including area code: (646) 214-7277
Date of fiscal year end: 3/31
Date of reporting period: 3/31/23
Item 1. Reports to Stockholders.
iCapital KKR Private Markets Fund
March 31, 2023
Table of Contents
| Letter to Shareholders (Unaudited) | 1 |
| Report of Independent Registered Public Accounting Firm | 5 |
| Portfolio Review (Unaudited) | 6 |
| Consolidated Portfolio of Investments | 7 |
| Consolidated Statement of Assets and Liabilities | 9 |
| Consolidated Statement of Operations | 10 |
| Consolidated Statements of Changes in Net Assets | 11 |
| Consolidated Statement of Cash Flows | 12 |
| Consolidated Statements of Financial Highlights | 13 |
| Notes to Consolidated Financial Statements | 14 |
| Approval of Investment Advisory And Sub-Advisory Agreements (Unaudited) | 26 |
| Supplemental Information | 28 |
| Privacy Notice | 31 |
Letter to Shareholders
Annual Report for the iCapital KKR Private Markets Fund (the “Fund”)
Twelve-Month Period Ended March 31, 2023
Fund Update
In our annual update last year, we introduced the innovative Direct Access arrangement that we pioneered with KKR. Direct Access provides the Fund with the opportunity to invest in each buyout and growth equity transaction on a deal-by-deal basis at lower economics than a primary investment, which means the Fund will no longer need to make sizable primary commitments going forward. We are excited to share that the Fund is expanding Direct Access to include the sourcing of investment opportunities from two additional underlying managers focused on private equity – Vista Equity Partners (“Vista”) and Warburg Pincus.1 We believe this unique combination of well-known and established brands creates an even more compelling value proposition while maintaining underlying manager visibility.
After the close of business on June 12, 2023:
| ● | The Fund will become the only concentrated multi-manager tender offer fund. |
| ● | The Fund’s name will be changed to the iDirect Private Markets Fund. |
| ● | Each underlying manager has agreed to make a $25 million subscription to the Fund, which is close to the maximum amount each manager can invest, demonstrating their commitment to the private wealth market and strengthens their alignment with Shareholders. |
When we considered expanding Direct Access to include other high-quality underlying managers, one goal was to complement KKR’s main focus on larger cap companies. Growth equity was a natural addition. Warburg Pincus is one of the world’s largest global growth investment firms, investing not only traditional growth equity, but also in high growth buyout deals. Since inception, Warburg Pincus’ goal has been to support scaled, durable, thriving businesses, and it has a track record of investing across company stages, industry sectors, geographies, and market cycles.
Another goal was to introduce a global, industry-focused manager to complement the multi-sector approaches of KKR and Warburg Pincus. The software industry is one of the largest and fastest growing in the world, playing an increasingly important role in many sectors. By 2026, it is projected that there will be over 106,000 software companies and, if current trends remain, more than 96% of them will be private.2 Vista is the largest, longest-tenured, and most active private equity firm dedicated to investing in enterprise software and data companies.
The combination of KKR, Vista and Warburg Pincus is intended to deliver complementary exposure across buyout and growth equity investment opportunities, globally. The underlying managers typically invest in companies with enterprise values ranging from $250 million up to $5+ billion, diversified across many industries including Software, Health Care, Industrials, Financial Services, Consumer, and Business
| 1 | A prospectus supplement containing this change was filed with the SEC on April 13, 2023, which will become effective on June 12, 2023. |
| 2 | Source: Gartner. Proprietary research as of December 2022. |
Services. Together, these three firms have over 600 investment professionals located in over 40 offices around the world.3
Complementary Exposures from Three Leading4 Private Equity Brands
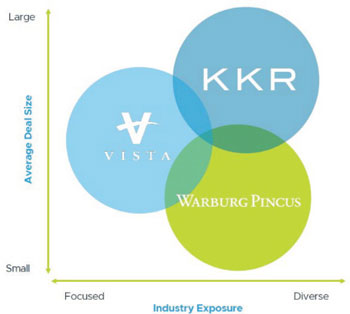
For illustrative purposes only
The Fund completed its first Direct Access investment with KKR in October 2022. Through March 31, 2023, the Fund made eight Direct Access investments totaling $42 million. These investments span multiple sectors such as Information Technology, Industrials and Consumer Staples and span multiple countries such as the US, Germany and India. As we introduce Direct Access with Vista and Warburg Pincus, we will continue to evaluate investment opportunities on a deal-by-deal basis in pursuit of long-term capital appreciation for the Fund. Going forward, the Fund will predominately invest through Direct Access.
Market Overview
The one-year period ended March 31, 2023, was difficult for broad markets due in part to rising interest rates. Activity across private equity once again followed a similar sentiment to public equities as the asset class grappled with the fastest tightening cycle in 40-plus years. By the middle of 2022 deal activity started to slow, driven by higher interest rates and lower public market multiples. The decline was mainly seen in buyouts, while add-ons and growth equity investments showed an uptick. U.S. PE dealmaking declined 19.5% for the year in 2022 but remained well above the quarterly pace that preceded the robust levels in 2020 and 2021.5
As we moved into Q1 2023 deal volume continued to be moderate. 2,177 U.S. private equity deals closed in Q1 with a total deal value of $261.4 billion, according to Pitchbook.6 The banking system also came under stress during the period after the collapse of several US regional banks and Credit Suisse. This had a significant impact on the venture capital world and disrupted public equity and fixed income markets
| 3 | Source: iCapital, as of December 31, 2022 |
| 4 | Source: PE International, 2022. Based on largest fundraisers over a 5-year period. KKR, Vista and Warburg Pincus are all included in the top fifteen firms. |
| 5 | Source: Pitchbook 2022 Annual US PE Breakdown |
| 6 | Source: Pitchbook Q1 2023 US PE Breakdown |
more broadly. While activity remained above the pre -COVID-19 averages of roughly 1,400 deals and $180 billion in deal value, the trend is still flat-to-down for the year.
In this period of transition to a higher rate environment, private equity firms are finding ways to adjust to complete deals. Deals are getting smaller with many coming in the form of add-ons, which can deliver revenue synergies. Growth equity deals, which allow PE firms to apply active management despite minority ownership, also saw an uptick. Buying smaller pieces of larger companies saw a resurgence, and robust activity also continued in big take-private deals. As markets have shifted, the Fund continues to find compelling opportunities to deploy capital.
Fund Overview as of March 31, 2023
Over the twelve months ended March 31, 2023, the Fund generated returns of -5.66% for the Class I shares and -6.20% for the Class A shares, compared to -7.44% for the MSCI All Country World Index (“MSCI ACWI”). Fund performance was negatively impacted by underlying portfolio companies in the Information Technology sector including a mobile app technology platform and a semiconductor manufacturer. These negative results were partially offset by a positive contribution from an underlying portfolio company in the Financials sector that provides insurance solutions to professionals. An underlying portfolio company in the Industrials sector that manufactures garage doors also experienced a meaningful uplift after KKR reached an agreement to sell the company in the second quarter of 2022.
For the applicable period since iCapital was appointed Adviser (2/28/21) through March 31, 2023, the Fund generated a return of 9.41% for the Class I shares and 8.79% for the Class A shares, compared to 0.93% for the MSCI ACWI.
The iCapital KKR Private Markets Fund launched at the end of July 2015. Since inception through March 2023, Class I Shares have generated annualized returns of 9.13% and Class A shares have generated annualized returns of 8.44%, compared to 7.53% for the MSCI ACWI over the same period. Despite this attractive level of outperformance, these annualized returns have been negatively impacted by high levels of historical net cash, which ranged from approximately 30% to 50% of net assets between mid-2016 and mid-2018. With Direct Access in place, the Fund now invests on a deal-by-deal basis, which can help mitigate the prospect of cash drag going forward.
In terms of portfolio activity over the twelve-month period ended March 31 2023, the Fund executed $110.8 million in capital calls and received $64.2 million in distributions.
With respect to diversification as of March 31, 2023, some quantitative examples include:
| ● | Style7 – 82.1% Buyout, 12.8% Growth Equity, 3.0% Real Estate, 2.1% Other |
| ● | Type7 – 41.0% Primary Investments, 26.8% Secondary Investments, 24.7% Co-investments, 7.4% Direct Access Investments |
| ● | Geographies7 – 63.4% Americas, 18.6% Asia, 18.0% Europe |
| ● | Sectors8 – 26.8% Information Technology, 19.6% Health Care, 11.2% Financials, 10.7% Industrials |
We appreciate your continued partnership and look forward to pursuing the opportunities ahead.
| 7 | By value of the private equity portfolio plus unfunded commitments. Totals may not add to 100 due to rounding. |
| 8 | By fair value in underlying investments. Includes the top four sectors only. |
NOTES TO PERFORMANCE
Returns for Class A and Class I shares are net of fees and based on NAV. Includes reinvestment of dividends and distributions.
Returns for periods greater than one year are annualized.
Class A shares are subject to a maximum sales load of 3.5%. Class I shares have no sales load.
The inception date of both the Fund’s Class A shares (including predecessor feeder fund shares), and Class I shares (as re-classified), is 07/31/2015.
The total annual fund expense ratio, gross of any fee waivers or expense reimbursements, is 3.18% for Class A shares and 2.58% for Class I shares as of the most recent Prospectus dated June 8, 2022, as supplemented. See the Prospectus for more information. The performance data quoted represents past performance, which is no guarantee of future results. Current performance may be lower or higher than the performance data shown above. Investment return and share price will fluctuate, so that shares, when sold, may be worth more or less than their original cost. The returns reflect any expense limitation and reimbursement agreement in place at the time, without which, the performance in certain periods would have been lower or higher. The Fund’s performance, especially for short periods of time, should not be the sole factor in making your investment decision. For the period from the Fund’s inception through May 31, 2016, the returns of Class A shares reflect the performance of the prior feeder fund; and the returns of Class I shares reflect the performance of the Fund prior to its issuance of multiple share classes and reclassification of existing shares. From June 1, 2016 forward, the returns reflect the performance of Class A and Class I shares, respectively, of the iCapital KKR Private Markets Fund (formerly known as the Altegris KKR Commitments Master Fund). As of February 12, 2021, iCapital Registered Fund Adviser LLC (the “Advisor”) is the investment adviser to the Fund. Prior to February 12, 2021, the Fund was managed by a different investment adviser.
INDEX DESCRIPTION
The index shown is for general market comparisons and are not meant to represent any actual fund. An index is unmanaged and not available for direct investment.
MSCI All-Country World Index. The MSCI ACWI captures large and mid-cap representation across 23 Developed Markets and 24 Emerging Markets countries. With more than 2,800 constituents, the index covers approximately 85% of the global investable equity opportunity set.
RISKS AND IMPORTANT CONSIDERATIONS
This material is being provided for informational purposes only. The author’s assessments do not constitute investment research and the views expressed are not intended to be and should not be relied upon as investment advice. The opinions are based on market conditions as of the date of writing and are subject to change without notice.
Past performance is not indicative of future results. There is no guarantee that any forecasts made will come to pass. There can be no assurance that any investment product or strategy, including diversification, will achieve its objectives, generate profits or avoid losses.
It is important to note that all investments carry a certain degree of risk including the possible loss of principal and performance may be affected by different market cycles. Complex or alternative strategies may not be suitable for every investor and the value of a portfolio will fluctuate based on the value of the underlying securities.
There are significant differences between public and private equity investments, which include but are not limited to, the fact that public equity investments have a lower barrier to entry. There is also greater access to information about public companies. Private equity investments typically have a longer time horizon than public equity investments before profits, if any, are realized. Public equity investments provide far greater liquidity, whereas private equity investments, like those made by the Fund, are considered highly illiquid.
 | Deloitte & Touche LLP
111 South Wacker Drive
Chicago, IL 60606-4301
USA Tel:+1 312 486 1000
Fax:+1 312 486 1486
www.deloitte.com |
| | |
To the shareholders and the Board of Trustees of iCapital KKR Private Markets Fund:
Opinion on the Consolidated Financial Statements and Consolidated Financial Highlights
We have audited the accompanying consolidated statement of assets and liabilities of iCapital KKR Private Markets Fund (the “Fund”), including the consolidated portfolio of investments, as of March 31, 2023, the related consolidated statements of operations and cash flows for the year then ended, the consolidated statements of changes in net assets for each of the two years in the period then ended, the consolidated financial highlights for each of the five years in the period then ended, and the related notes. In our opinion, the consolidated financial statements and consolidated financial highlights present fairly, in all material respects, the consolidated financial position of the Fund as of March 31, 2023, and the results of its consolidated operations and its consolidated cash flows for the year then ended, the consolidated changes in its net assets for each of the two years in the period then ended, and the consolidated financial highlights for each of the five years in the period then ended in conformity with accounting principles generally accepted in the United States of America.
Basis for Opinion
These consolidated financial statements and consolidated financial highlights are the responsibility of the Fund’s management. Our responsibility is to express an opinion on the Fund’s consolidated financial statements and consolidated financial highlights based on our audits. We are a public accounting firm registered with the Public Company Accounting Oversight Board (United States) (PCAOB) and are required to be independent with respect to the Fund in accordance with the U.S. federal securities laws and the applicable rules and regulations of the Securities and Exchange Commission and the PCAOB.
We conducted our audits in accordance with the standards of the PCAOB. Those standards require that we plan and perform the audit to obtain reasonable assurance about whether the consolidated financial statements and consolidated financial highlights are free of material misstatement, whether due to error or fraud. The Fund is not required to have, nor were we engaged to perform, an audit of its internal control over financial reporting. As part of our audits we are required to obtain an understanding of internal control over financial reporting but not for the purpose of expressing an opinion on the effectiveness of the Fund’s internal control over financial reporting. Accordingly, we express no such opinion.
Our audits included performing procedures to assess the risks of material misstatement of the consolidated financial statements and consolidated financial highlights, whether due to error or fraud, and performing procedures that respond to those risks. Such procedures included examining, on a test basis, evidence regarding the amounts and disclosures in the consolidated financial statements and consolidated financial highlights. Our audits also included evaluating the accounting principles used and significant estimates made by management, as well as evaluating the overall presentation of the consolidated financial statements and consolidated financial highlights. Our procedures included confirmation of securities owned as of March 31, 2023, by correspondence with the custodian and underlying fund managers and advisers; when replies were not received from brokers, we performed other auditing procedures. We believe that our audits provide a reasonable basis for our opinion.

May 30, 2023
We have served as the auditor of iCapital KKR Private Markets Fund since 2014.
| iCapital KKR Private Markets Fund |
| PORTFOLIO REVIEW (Unaudited) |
| March 31, 2023 |
| |
The table below shows the total returns for iCapital KKR Private Markets Fund and MSCI All Country World Index for the same time periods ended March 31, 2023 (1)
| | | | | Annualized |
| | | Annualized | Annualized | Since Inception |
| | One Year | Three Year | Five Year | July 31, 2015 2 |
| iCapital KKR Private Markets Fund - Class A | (6.20)% | 13.83% | 8.36% | 8.44% |
| iCapital KKR Private Markets Fund - Class A with sales load 3 | (9.49)% | 12.48% | 7.59% | 7.93% |
| iCapital KKR Private Markets Fund - Class I | (5.66)% | (14.52)% | 9.00% | 9.13% |
| MSCI AC World Index Net 4 | (7.44)% | 15.36% | 6.93% | 7.53% |
| | | | | |
| 1 | The Performance data quoted is historical. Past performance is no guarantee of future results. Current performance may be higher or lower than the performance data quoted. The principal value and investment return of an investment will fluctuate so that your shares, when redeemed, may be worth more or less than their original cost. The returns shown do not reflect the deduction of taxes that a shareholder would pay on Fund distributions or on the redemptions of Fund shares. Per the fee table in the Fund’s June 8, 2022 prospectus, the total annual operating expense are 3.18% and 2.58% for the Fund’s Class A and Class I shares, respectively. For performance information current to the most recent month-end, please call 1-212-994-7333. |
| 2 | The inception date of both the Fund’s Class A shares (including predecessor feeder fund shares), and Class I Shares (as re-classified), is July 31, 2015. The Fund was reorganized as of June 1, 2016 to offer the Class A and Class I shares. |
| 3 | Total return is calculated using the maximum sales load of 3.50%. |
| 4 | The MSCI All Country World Index (ACWI) is a market-cap-weighted global equity index that tracks emerging and developed markets. It currently monitors more than 2,900 large- and mid-cap stocks in 47 countries. The index is unmanaged, is not available for investment and does not incur fees. |
Comparison of the Change in Value of a $25,000 Investment | July 31, 2015–March 31, 2023
Past performance is not necessarily indicative of future results.
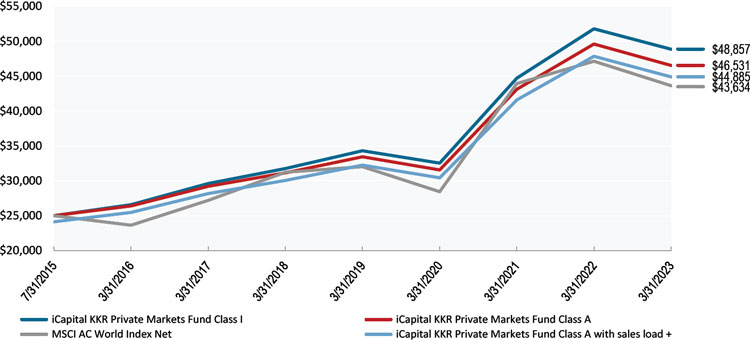
| + | Initial investment has been adjusted for the maximum sales load of 3.50%. |
| Holdings by Asset Type | | % of Net Assets | |
| Investment Interests: | | | | |
| Primary Investments | | | 37.72 | % |
| Co-Investments | | | 31.87 | % |
| Secondary Investments | | | 23.62 | % |
| Equity Investments: | | | | |
| Preferred Stocks | | | 0.57 | % |
| Short-Term Investments | | | 10.77 | % |
| Liabilities in Excess of other Assets | | | (4.55 | )% |
| Total | | | 100.00 | % |
| iCapital KKR Private Markets Fund |
| CONSOLIDATED PORTFOLIO OF INVESTMENTS |
| March 31, 2023 |
| | | | | | | | | | | | | | | Initial |
| | | | | Geographic | | | | | | | | | | Acquisition |
| | | Investment Style | | Region | | Cost | | | Fair Value | | | % of Net Assets | | Date |
| INVESTMENT INTERESTS - 93.78% | | | | | | | | | | | | | | | | |
| CO-INVESTMENTS (a) - 31.87% | | | | | | | | | | | | | | | | |
| Durational Consumer SPV IV GP, L.P.* | | Buyout | | Americas | | $ | 2,247,955 | | | $ | 2,004,504 | | | 0.36% | | 2/8/2022 |
| Independence Energy Co-Invest L.P. (b) * | | Buyout | | Americas | | | 9,084,208 | | | | 4,143,888 | | | 0.74% | | 2/26/2018 |
| KKR Atlantic Co-Invest L.P. * | | Buyout | | Americas | | | 10,000,000 | | | | 10,000,350 | | | 1.79% | | 7/22/2022 |
| KKR Banff Co-Invest L.P. * | | Buyout | | Americas | | | 10,000,000 | | | | 18,000,004 | | | 3.22% | | 9/28/2018 |
| KKR Byzantium Infrastructure Co-Invest L.P. * | | Infrastructure | | Europe | | | 6,435,450 | | | | 7,274,479 | | | 1.30% | | 10/3/2017 |
| KKR Cape Co-Invest L.P. * | | Growth | | Americas | | | 5,000,000 | | | | 5,000,000 | | | 0.89% | | 11/12/2021 |
| KKR Caribou Co-Invest L.P. * | | Growth | | Americas | | | 525,000 | | | | — | | | 0.00% | | 2/26/2018 |
| KKR Enterprise Co-Invest AIV B L.P. * | | Buyout | | Americas | | | 2,294,701 | | | | 1,649,274 | | | 0.29% | | 7/14/2020 |
| KKR Enterprise Co-Invest L.P. * | | Buyout | | Americas | | | 20,000,000 | | | | — | | | 0.00% | | 9/6/2018 |
| KKR Gamma Co-Invest L.P. * | | Growth | | Americas | | | 3,000,000 | | | | 3,001,290 | | | 0.54% | | 8/29/2022 |
| KKR Inception Co-Invest, L.P. * | | Growth | | Europe | | | 10,932,650 | | | | 11,109,975 | | | 1.98% | | 11/28/2022 |
| KKR Olympus Co-Invest, L.P. * | | Buyout | | Europe | | | 5,000,000 | | | | 5,000,290 | | | 0.89% | | 3/21/2022 |
| KKR Pegasus Co-Invest L.P. * | | Buyout | | Europe | | | 5,098,500 | | | | 5,419,592 | | | 0.97% | | 7/7/2022 |
| KKR Prosvasi 2022 L.P. (b) * | | Buyout | | Global | | | 42,749,603 | | | | 43,297,249 | | | 7.73% | | 10/26/2022 |
| KKR Renovate Co-Invest L.P. * | | Buyout | | Asia | | | 5,000,000 | | | | 5,001,885 | | | 0.89% | | 3/21/2022 |
| KKR Sigma Co-Invest L.P. * | | Buyout | | Europe | | | 7,500,000 | | | | 11,602,610 | | | 2.07% | | 6/11/2018 |
| KKR Sprint Co-Invest L.P. | | Buyout | | Europe | | | 2,901,000 | | | | 3,251,729 | | | 0.58% | | 9/27/2022 |
| LC Sports Pte. Ltd. | | Buyout | | Asia | | | 2,282,797 | | | | 1,829,963 | | | 0.33% | | 11/2/2018 |
| Nutraceutical Investco LP (c) * | | Buyout | | Americas | | | 1,492,769 | | | | 1,488,245 | | | 0.27% | | 7/15/2019 |
| Uno Co-Invest L.P. * | | Buyout | | Americas | | | 15,000,000 | | | | 37,500,000 | | | 6.70% | | 6/7/2017 |
| WestCap Hopper 2021 Co-Invest, LLC * | | Growth | | Americas | | | 1,536,175 | | | | 1,872,800 | | | 0.33% | | 9/23/2021 |
| TOTAL CO-INVESTMENTS | | | | | | $ | 168,080,808 | | | $ | 178,448,127 | | | 31.87% | | |
| | | | | | | | | | | | | | | | | |
| INVESTMENT FUNDS (a) - 61.35% | | | | | | | | | | | | | | | | |
| PRIMARY INVESTMENTS - 37.72% | | | | | | | | | | | | | | | | |
| Bridge Growth Partners (Parallel), L.P. * | | Growth | | Americas | | $ | 887,709 | | | $ | 1,352,722 | | | 0.24% | | 2/23/2016 |
| KKR Americas Fund XII L.P. | | Buyout | | Americas | | | 62,036,980 | | | | 84,805,107 | | | 15.15% | | 3/31/2017 |
| KKR Asian Fund III L.P. | | Buyout | | Asia | | | 49,206,114 | | | | 67,730,925 | | | 12.10% | | 3/31/2017 |
| KKR European Fund IV, L.P. * | | Buyout | | Europe | | | 3,227,406 | | | | 3,979,213 | | | 0.71% | | 12/17/2015 |
| KKR European Fund V (USD) SCSp | | Buyout | | Europe | | | 25,433,896 | | | | 27,069,898 | | | 4.83% | | 11/5/2018 |
| KKR Health Care Strategic Growth Fund L.P. * | | Growth | | Americas | | | 12,037,213 | | | | 14,437,832 | | | 2.58% | | 8/4/2017 |
| KKR Next Generation Technology Growth Fund II SCSp (b) * | | Growth | | Americas | | | 4,565,883 | | | | 5,391,761 | | | 0.96% | | 7/11/2019 |
| L Catterton Asia 3 LP * | | Buyout | | Asia | | | 1,858,168 | | | | 1,208,268 | | | 0.22% | | 12/4/2018 |
| Oak Hill Capital Partners IV, L.P. | | Buyout | | Americas | | | 583,582 | | | | 615,550 | | | 0.11% | | 3/31/2017 |
| Providence Strategic Growth Europe L.P. (b) | | Growth | | Europe | | | 949,057 | | | | 1,226,876 | | | 0.22% | | 11/11/2019 |
| RB Equity Fund II-A, L.P. * | | Growth | | Americas | | | 933,945 | | | | 1,314,278 | | | 0.23% | | 12/3/2018 |
| The Resolute Fund IV, L.P. | | Buyout | | Americas | | | 805,356 | | | | 2,054,105 | | | 0.37% | | 9/28/2018 |
| TOTAL PRIMARY INVESTMENTS | | | | | | | 162,525,309 | | | | 211,186,535 | | | 37.72% | | |
| | | | | | | | | | | | | | | | | |
| SECONDARY INVESTMENTS - 23.63% | | | | | | | | | | | | | | | | |
| AEA EXC CF L.P. * | | Buyout | | Americas | | $ | 4,481,813 | | | $ | 4,449,223 | | | 0.79% | | 8/11/2022 |
| Artisan Partners Asset Management, Inc. TRA (c,d) | | Credit | | Americas | | | 2,685,753 | | | | 3,229,339 | | | 0.58% | | 10/12/2018 |
| Bain Capital Empire Holdings, L.P. * | | Buyout | | Americas | | | 4,377,604 | | | | 4,335,633 | | | 0.77% | | 6/29/2018 |
| Charles River Partnership XIII, L.P. * | | Growth | | Americas | | | 29,180 | | | | 201,012 | | | 0.04% | | 6/29/2018 |
| Eurazeo Capital IV A SCSp | | Buyout | | Europe | | | 2,411,794 | | | | 2,915,658 | | | 0.52% | | 1/28/2019 |
| Eurazeo Capital IV D SCSp | | Buyout | | Europe | | | 923,029 | | | | 491,968 | | | 0.09% | | 1/28/2019 |
| Foundation Capital V, L.P. * | | Growth | | Americas | | | 3,410 | | | | 153,073 | | | 0.03% | | 6/29/2018 |
| Foundation Capital VI, L.P. * | | Growth | | Americas | | | 161,147 | | | | 222,666 | | | 0.04% | | 6/29/2018 |
| Foundation Capital VII, L.P. * | | Growth | | Americas | | | 585,577 | | | | 1,013,970 | | | 0.18% | | 6/29/2018 |
| Foundation Capital VIII, L.P. * | | Growth | | Americas | | | 717,895 | | | | 2,211,763 | | | 0.39% | | 6/29/2018 |
| GA Continuity Fund I, L.P. | | Buyout | | Americas | | | 4,054,120 | | | | 4,975,921 | | | 0.89% | | 6/22/2021 |
| Icon Partners V, L.P. (c) * | | Buyout | | Americas | | | 4,474,173 | | | | 4,695,520 | | | 0.84% | | 12/22/2021 |
| KKR 2006 Fund L.P . | | Buyout | | Americas | | | 8,695,589 | | | | (400 | ) | | 0.00% | | 12/31/2015 |
| KKR 2006 Fund (Overseas) L.P. | | Buyout | | Americas | | | 7,718,334 | | | | 63,061 | | | 0.01% | | 12/31/2015 |
| KKR Asian Fund L.P. * | | Buyout | | Asia | | | 1,757,641 | | | | (230,042 | ) | | -0.04% | | 12/29/2016 |
| KKR Asian Fund (Ireland III MIT) I L.P. * | | Buyout | | Asia | | | 1,088,708 | | | | 249,125 | | | 0.04% | | 12/29/2016 |
| KKR Asian Fund II Private Investors Offshore, L.P. (c) | | Buyout | | Asia | | | 3,285,391 | | | | 1,468,971 | | | 0.26% | | 9/30/2017 |
| KKR China Growth Fund, L.P. * | | Growth | | Asia | | | 12,533,193 | | | | 5,647,383 | | | 1.01% | | 6/29/2018 |
| KKR European Fund III, L.P. * | | Buyout | | Europe | | | 1,622,121 | | | | 882,146 | | | 0.15% | | 12/31/2015 |
| KKR Gaudi Investors L.P. * | | Buyout | | Europe | | | 8,626,190 | | | | 10,124,652 | | | 1.81% | | 5/4/2017 |
| KKR Indigo Equity Partners A L.P. (b) * | | Buyout | | Americas | | | 15,198,047 | | | | 15,113,647 | | | 2.70% | | 6/8/2022 |
| KKR Lending Partners II L.P. (b) | | Credit | | Americas | | | 1,778,762 | | | | 648,395 | | | 0.12% | | 3/31/2017 |
| KKR North America Fund XI L.P. (b) | | Buyout | | Americas | | | 14,978,647 | | | | 10,862,852 | | | 1.94% | | 10/29/2015 |
| KKR North America Fund XI (Wave) L.P. (b) * | | Buyout | | Americas | | | 1,158,120 | | | | 203,913 | | | 0.04% | | 10/29/2015 |
| KKR Real Estate Partners Americas II L.P. | | Real Estate | | Americas | | | 16,080,180 | | | | 12,143,425 | | | 2.17% | | 5/31/2018 |
| L Catterton VIII Offshore, L.P. (b) * | | Buyout | | Americas | | | 2,606,870 | | | | 2,655,758 | | | 0.47% | | 9/27/2019 |
| Lime Rock Partners IV AF, L.P. | | Buyout | | Americas | | | 4,836,789 | | | | 8,383,807 | | | 1.50% | | 6/21/2018 |
| Menlo Ventures IX LP * | | Growth | | Americas | | | 38,532 | | | | 66,425 | | | 0.01% | | 12/31/2017 |
| Menlo Ventures X LP * | | Growth | | Americas | | | 2,493,985 | | | | 153,063 | | | 0.03% | | 12/31/2017 |
See accompanying notes to consolidated financial statements.
| iCapital KKR Private Markets Fund |
| CONSOLIDATED PORTFOLIO OF INVESTMENTS (Continued) |
| March 31, 2023 |
| | | | | | | | | | | | | | | Initial |
| | | | | Geographic | | | | | | | | | | Acquisition |
| | | Investment Style | | Region | | Cost | | | Fair Value | | | % of Net Assets | | Date |
| SECONDARY INVESTMENTS (Continued) - 23.63% | | | | | | | | | | | | | | | | |
| Menlo Ventures XI LP * | | Growth | | Americas | | $ | 5,016,768 | | | $ | 1,095,084 | | | 0.20% | | 12/31/2017 |
| Oak Hill Capital Partners III, L.P. | | Buyout | | Americas | | | 729,608 | | | | — | | | 0.00% | ** | 3/17/2017 |
| Orchid Asia III, L.P. (c) | | Buyout | | Asia | | | 772,348 | | | | 236,307 | | | 0.04% | | 8/15/2016 |
| Pegasus WSJLL Fund, L.P. (c) * | | Buyout | | Americas | | | 5,138,971 | | | | 6,000,038 | | | 1.07% | | 12/14/2021 |
| Pueblo Co-Invest-A LP | | Growth | | Americas | | | 3,070,653 | | | | 6,328,610 | | | 1.13% | | 6/25/2019 |
| RB Equity Fund I-A LP * | | Growth | | Americas | | | 3,357,498 | | | | 8,601,352 | | | 1.54% | | 12/31/2018 |
| The Resolute Fund II Continuation Fund, L.P. | | Buyout | | Americas | | | 3,211,760 | | | | 5,346,247 | | | 0.95% | | 8/31/2018 |
| Warburg Pincus XI (Asia), L.P. * | | Growth | | Asia | | | 6,902,405 | | | | 4,487,805 | | | 0.80% | | 9/30/2017 |
| WP DVT, L.P. * | | Buyout | | Americas | | | 2,072,750 | | | | 2,167,647 | | | 0.39% | | 3/11/2022 |
| Yorktown Energy Partners IX, L.P. (b) | | Buyout | | Americas | | | 285,406 | | | | 180,909 | | | 0.03% | | 9/30/2018 |
| Yorktown Energy Partners VII, L.P. (b) | | Buyout | | Americas | | | — | | | | — | | | 0.00% | | 9/30/2018 |
| Yorktown Energy Partners VIII, L.P. (b) | | Buyout | | Americas | | | 505,170 | | | | 198,401 | | | 0.04% | | 9/30/2018 |
| Yorktown Energy Partners X, L.P. (b) | | Buyout | | Americas | | | 453,853 | | | | 304,267 | | | 0.05% | | 9/30/2018 |
| TOTAL SECONDARY INVESTMENTS | | | | | | | 160,919,784 | | | | 132,278,594 | | | 23.62% | | |
| | | | | | | | | | | | | | | | | |
| TOTAL INVESTMENT FUNDS | | | | | | $ | 323,445,093 | | | $ | 343,465,129 | | | 61.34% | | |
| | | | | | | | | | | | | | | | | |
| | | Shares | | | | | | | | | | | | |
| EQUITY INVESTMENTS - 0.57% | | | | | | | | | | | | | | | | |
| PREFERRED STOCKS (a) - 0.57% | | | | | | | | | | | | | | | | |
| FINANCIAL - 0.37% | | | | | | | | | | | | | | | | |
| New York Digital Investment Group, LLC (b,c) * | | 74 | | Americas | | $ | 2,000,000 | | | $ | 2,000,000 | | | 0.37% | | 2/25/2022 |
| | | | | | | | | | | | | | | | | |
| INFORMATION TECHNOLOGY - 0.20% | | | | | | | | | | | | | | | | |
| InvestX DSF Holdings XXIII LLC (c) * | | 2,000,000 | | Americas | | | 2,081,171 | | | | 1,099,342 | | | 0.20% | | 2/16/2022 |
| | | | | | | | | | | | | | | | | |
| TOTAL PREFERRED STOCKS | | | | | | $ | 4,081,171 | | | $ | 3,099,342 | | | 0.57% | | |
| | | | | | | | | | | | | | | | | |
| TOTAL INVESTMENT INTERESTS | | | | | | $ | 495,607,072 | | | $ | 525,012,598 | | | 93.78% | | |
| | | Principal | | | | | | | | | | | |
| | | Amount | | | | | | | | | | | |
| SHORT-TERM INVESTMENT - 10.77% | | | | | | | | | | | | | | | | |
| MONEY MARKET FUND - 10.77% | | | | | | | | | | | | | | | | |
| Fidelity Treasury Portfolio - Class I 4.70%^^ (b) | | $ | 60,376,395 | | | $ | 60,376,395 | | | $ | 60,376,395 | | | 10.77% | | 8/24/2022 |
| TOTAL SHORT-TERM INVESTMENTS | | | | | | $ | 60,376,395 | | | $ | 60,376,395 | | | 10.77% | | |
| | | | | | | | | | | | | | | | | |
| TOTAL INVESTMENTS - 104.55% (Cost - $ 555,983,467) (e) | | | | | | | | | | $ | 585,388,993 | | | | | |
| LIABILITIES IN EXCESS OF OTHER ASSETS - (4.55%) | | | | | | | | | | | (25,464,260 | ) | | | | |
| NET ASSETS - 100.00% | | | | | | | | | | $ | 559,924,733 | | | | | |
| | | | | | | | | | | | | | | | | |
| ** | Rounds to less than 0.005% |
| ^^ | Yield disclosed is the seven day effective yield as of March 31, 2023. |
| (a) | Securities restricted to resale represents $525,012,598 or 90.5% of net assets. |
| (b) | All or part of these investments are holdings of iKF, LLC, a wholly-owned subsidiary of the Fund. |
| (c) | The fair value of this investment is determined using significant unobservable inputs and is classified as level 3 on the GAAP hierarchy. |
| (d) | Artisan Partners Asset Management TRA - A tax receivable agreement (“TRA”) with Artisan Partners Asset Management (NYSE: APAM) was acquired from a private equity fund in a secondary transaction |
| (e) | The fair value of total investments consists of the following regions (excluding short-term investments): |
| | | Cost | | | Fair Value | | | % of Net Assets | |
| Americas | | $ | 287,109,611 | | | $ | 303,735,673 | | | | 54.25 | % |
| Asia | | | 84,686,765 | | | | 87,630,590 | | | | 15.65 | % |
| Global | | | 42,749,603 | | | | 43,297,249 | | | | 7.74 | % |
| Europe | | | 81,061,093 | | | | 90,349,086 | | | | 16.14 | % |
| Total Investments | | $ | 495,607,072 | | | $ | 525,012,598 | | | | 93.78 | % |
| | | | | | | | | | | | | |
See accompanying notes to consolidated financial statements.
| iCapital KKR Private Markets Fund |
| CONSOLIDATED STATEMENT OF ASSETS AND LIABILITIES |
| March 31, 2023 |
| ASSETS | | | | |
| Investments: | | | | |
| Investments at fair value (cost $555,983,467) | | $ | 585,388,993 | |
| Cash (1) | | | 9,256,332 | |
| Interest Income receivable | | | 226,326 | |
| Prepaid expenses and other assets | | | 18,301 | |
| TOTAL ASSETS | | $ | 594,889,952 | |
| | | | | |
| LIABILITIES | | | | |
| Payable for Fund shares repurchased | | $ | 20,054,440 | |
| Subscriptions received in advance | | | 8,878,857 | |
| Deferred tax liability | | | 800,287 | |
| Current tax payable | | | 3,572,239 | |
| Accrued Expenses: | | | | |
| Service fees payable to related parties | | | 383,485 | |
| Management fee payable to Adviser | | | 616,538 | |
| Distribution and Servicing fees payable to Distributor | | | 195,145 | |
| Audit Fees | | | 189,320 | |
| Legal Fees | | | 110,485 | |
| Line of credit fees payable (2) | | | 55,787 | |
| Directors fees | | | 52,697 | |
| Custody fees | | | 50,461 | |
| Other | | | 5,478 | |
| TOTAL LIABILITIES (3) | | | 34,965,219 | |
| | | | | |
| NET ASSETS | | $ | 559,924,733 | |
| | | | | |
| Composition of Net Assets: | | | | |
| Paid-in capital | | $ | 489,821,878 | |
| Accumulated earnings | | | 70,102,855 | |
| NET ASSETS | | $ | 559,924,733 | |
| | | | | |
| Class A Shares: | | | | |
| Net Assets | | $ | 321,908,790 | |
| Shares of beneficial interest outstanding [$0 par value] | | | 21,621,469 | |
| Net asset value (Net Assets ÷ Shares Outstanding) and redemption price per share | | $ | 14.89 | |
| Maximum offering price per share (net asset value plus maximum sales load of 3.50%) | | $ | 15.43 | |
| | | | | |
| Class I Shares: | | | | |
| Net Assets | | $ | 238,015,943 | |
| Shares of beneficial interest outstanding [$0 par value] | | | 7,366,067 | |
| Net asset value (Net Assets ÷ Shares Outstanding), offering price and redemption price per share | | $ | 32.31 | |
| | | | | |
| (1) | Includes cash and cash held in escrow |
| (2) | Includes amortization of debt issuance costs and commitment fees |
| (3) | Commitments and contingencies (See Notes 2 and 7) |
See accompanying notes to consolidated financial statements.
| iCapital KKR Private Markets Fund |
| CONSOLIDATED STATEMENT OF OPERATIONS |
| For the Year Ended March 31, 2023 |
| INVESTMENT INCOME | | | | |
| Dividend distributions from underlying investments | | $ | 8,072,575 | |
| Interest income | | | 1,378,535 | |
| TOTAL INVESTMENT INCOME | | | 9,451,110 | |
| | | | | |
| EXPENSES | | | | |
| Management fees | | | 5,018,553 | |
| Tax expense | | | 2,055,504 | |
| Distribution and Servicing fees - Class A | | | 2,018,454 | |
| Sub-Accounting and Sub-Transfer Agent fees | | | 545,496 | |
| Line of credit fees (1) | | | 428,843 | |
| Legal fees | | | 418,000 | |
| Administrative services fees | | | 335,461 | |
| Trustees fees and expenses | | | 220,411 | |
| Audit and tax fees | | | 175,958 | |
| Printing and postage expenses | | | 124,088 | |
| Custodian fees | | | 103,003 | |
| Accounting services fees | | | 83,739 | |
| Transfer Agent fees | | | 75,480 | |
| Registration fees | | | 39,653 | |
| Chief Compliance Officer fees | | | 34,233 | |
| Other | | | 133,632 | |
| TOTAL EXPENSES | | | 11,810,508 | |
| | | | | |
| NET INVESTMENT LOSS | | | (2,359,398 | ) |
| | | | | |
| NET REALIZED AND UNREALIZED GAIN/(LOSS) ON INVESTMENTS | | | | |
| Capital gain distributions from underlying investments | | | 39,856,373 | |
| Net realized gain/(loss) from investments | | | 8,580 | |
| | | | | |
| Net change in unrealized appreciation/(depreciation) on investments | | | (74,661,694 | ) |
| Net change in deferred tax liability | | | 2,758,540 | |
| Net change in unrealized appreciation/(depreciation) on investments, net of deferred taxes | | | (71,903,154 | ) |
| NET REALIZED AND UNREALIZED LOSS ON INVESTMENTS | | | (32,038,201 | ) |
| | | | | |
| NET DECREASE IN NET ASSETS RESULTING FROM OPERATIONS | | $ | (34,397,599 | ) |
| | | | | |
(1) Includes amortization of debt issuance costs and commitment fees
See accompanying notes to consolidated financial statements.
| iCapital KKR Private Markets Fund |
| CONSOLIDATED STATEMENTS OF CHANGES IN NET ASSETS |
| | | For the Fiscal | | | For the Fiscal | |
| | | Year Ended | | | Year Ended | |
| | | March 31, 2023 | | | March 31, 2022 | |
| INCREASE/(DECREASE) IN NET ASSETS FROM OPERATIONS | | | | | | | | |
| Net investment (loss) | | $ | (2,359,398 | ) | | $ | (1,216,503 | ) |
| Net capital gain distributions from underlying investments | | | 39,856,373 | | | | 53,307,288 | |
| Net realized gain/(loss) from investments | | | 8,580 | | | | (179,763 | ) |
| Net change in unrealized appreciation/(depreciation) on investments, net of taxes | | | (71,903,154 | ) | | | 18,578,713 | |
| Net increase/(decrease) in net assets resulting from operations | | | (34,397,599 | ) | | | 70,489,735 | |
| | | | | | | | | |
| DISTRIBUTIONS TO INVESTORS | | | | | | | | |
| Class A | | | (39,481,252 | ) | | | (20,877,488 | ) |
| Class I | | | (27,812,116 | ) | | | (10,412,681 | ) |
| Total Distributions to Investors | | | (67,293,368 | ) | | | (31,290,169 | ) |
| | | | | | | | | |
| BENEFICIAL INTEREST TRANSACTIONS | | | | | | | | |
| Proceeds from shares sold | | | | | | | | |
| Class A | | | 10,677,483 | | | | 9,108,710 | |
| Class I | | | 84,478,201 | | | | 30,954,598 | |
| Reinvestment of distributions | | | | | | | | |
| Class A | | | 37,656,415 | | | | 19,987,738 | |
| Class I | | | 24,112,029 | | | | 9,546,519 | |
| Repurchase of shares | | | | | | | | |
| Class A | | | (22,001,188 | ) | | | (14,228,132 | ) |
| Class I | | | (20,497,072 | ) (1) | | | (4,606,290 | ) |
| Total Increase in Net Assets from Shares of Beneficial Interest (2) | | | 114,425,868 | | | | 50,763,143 | |
| | | | | | | | | |
| NET INCREASE IN NET ASSETS FROM BENEFICIAL INTEREST TRANSACTIONS | | | 12,734,901 | | | | 89,962,709 | |
| | | | | | | | | |
| NET ASSETS | | | | | | | | |
| Beginning of Year | | | 547,189,832 | | | | 457,227,123 | |
| End of Year | | $ | 559,924,733 | | | $ | 547,189,832 | |
| | | | | | | | | |
| SHARE ACTIVITY | | | | | | | | |
| Class A: | | | | | | | | |
| Shares Sold | | | 658,970 | | | | 506,976 | |
| Shares Reinvested | | | 2,387,328 | | | | 1,123,110 | |
| Shares Repurchased | | | (1,422,880 | ) | | | (791,665 | ) |
| Net Increase in Shares Outstanding (2) | | | 1,623,418 | | | | 838,421 | |
| | | | | | | | | |
| Class I: | | | | | | | | |
| Shares Sold | | | 2,395,340 | | | | 791,236 | |
| Shares Reinvested | | | 706,822 | | | | 247,169 | |
| Shares Repurchased | | | (621,402 | ) | | | (118,888 | ) |
| Net Increase in Shares Outstanding (2) | | | 2,480,760 | | | | 919,517 | |
| | | | | | | | | |
| (1) | Early repurchase fee of $1,440 is netted against the total repurchase of shares. |
| (2) | Includes exchanges of shares between Class A and Class I |
See accompanying notes to consolidated financial statements.
| iCapital KKR Private Markets Fund |
| CONSOLIDATED STATEMENT OF CASH FLOWS |
| For the Year Ended March 31, 2023 |
| CASH FLOWS FROM OPERATING ACTIVITIES | | | | |
| Net decrease in net assets resulting from operations | | $ | (34,397,599 | ) |
| Adjustments to reconcile net decrease in net assets resulting from operations to net cash used in operating activities: | | | | |
| Purchase of investments | | | (121,349,552 | ) |
| Sales of investments | | | 60,597 | |
| Net purchases of short-term investments | | | (11,338,612 | ) |
| Net change in unrealized appreciation/depreciation on investments, net of deferred taxes | | | 71,903,154 | |
| Return of capital from underlying investments | | | 27,311,014 | |
| Net realized gains from investments | | | (8,580 | ) |
| Increase in prepaid expenses and other assets | | | (2,830 | ) |
| Decrease in interest, dividends and distributions receivables | | | 3,657,342 | |
| Decrease in current tax payable | | | 1,342,684 | |
| Increase in payable due to Adviser | | | 205,123 | |
| Decrease in service fees payable to related parties | | | (286,382 | ) |
| Increase in distribution and servicing fees payable to Distributor | | | 12,194 | |
| Decrease in line of credit fees | | | (122,075 | ) |
| Decrease in accrued expenses and other liabilities | | | (245,677 | ) |
| Net cash used in operating activities | | | (63,259,199 | ) |
| | | | | |
| CASH FLOWS FROM FINANCING ACTIVITIES | | | | |
| Proceeds from Shares issued, net of change in subscriptions received in advance | | | 95,771,324 | |
| Payment of Shares repurchased, net of change in payable for Shares repurchased | | | (26,555,066 | ) |
| Distributions paid to shareholders, net of reinvested distributions | | | (5,524,924 | ) |
| Net cash provided by financing activities | | | 63,691,334 | |
| | | | | |
| NET INCREASE IN CASH | | | 432,135 | |
| CASH - BEGINNING OF YEAR (1) | | | 8,824,197 | |
| CASH - END OF YEAR (1) | | $ | 9,256,332 | |
| | | | | |
| (1) Includes cash and cash held in escrow. | | | | |
| | | | | |
| SUPPLEMENTAL NON-CASH DISCLOSURE INFORMATION: | | | | |
| | | | | |
| Reinvestment of distributions to shareholders | | $ | 61,768,444 | |
| In-kind investment transfer between Investment Funds | | $ | 10,200,049 | |
| Exchanges out of Class A (72,997 shares) | | $ | (1,178,243 | ) |
| Exchanges into Class I (33,554 shares) | | $ | 1,178,243 | |
| | | | | |
See accompanying notes to consolidated financial statements.
| iCapital KKR Private Markets Fund |
| CONSOLIDATED STATEMENTS OF FINANCIAL HIGHLIGHTS |
| |
| Per Unit Data and Ratios for a Share of Beneficial Interest Outstanding Throughout each Fiscal Year End |
| | | Class A (1) | |
| | | | | | | | | | | | | | | | |
| | | Year Ended | | | Year Ended | | | Year Ended | | | Year Ended | | | Year Ended | |
| | | March 31, 2023 | | | March 31, 2022 | | | March 31, 2021 | | | March 31, 2020 | | | March 31, 2019 | |
| Net asset value, beginning of year | | $ | 17.87 | | | $ | 16.49 | | | $ | 12.59 | | | $ | 13.86 | | | $ | 13.72 | |
| | | | | | | | | | | | | | | | | | | | | |
| Gain (Loss) from investment operations: | | | | | | | | | | | | | | | | | | | | |
| Net investment income/(loss) (3) | | | (0.10 | ) | | | (0.08 | ) | | | 0.13 | | | | (0.03 | ) | | | (0.23 | ) |
| Net realized and unrealized gain/(loss) on investments | | | (0.95 | ) | | | 2.55 | | | | 4.35 | | | | (0.71 | ) | | | 1.20 | |
| Net increase/(decrease) in net assets resulting from operations | | | (1.05 | ) | | | 2.47 | | | | 4.48 | | | | (0.74 | ) | | | 0.97 | |
| | | | | | | | | | | | | | | | | | | | | |
| Less distributions to Investors from: | | | | | | | | | | | | | | | | | | | | |
| Net investment income | | | (0.37 | ) | | | (0.01 | ) | | | — | | | | — | | | | — | |
| Net realized gain on investments | | | (1.56 | ) | | | (1.08 | ) | | | (0.58 | ) | | | (0.53 | ) | | | (0.83 | ) |
| Total distributions | | | (1.93 | ) | | | (1.09 | ) | | | (0.58 | ) | | | (0.53 | ) | | | (0.83 | ) |
| | | | | | | | | | | | | | | | | | | | | |
| Net asset value, end of year | | $ | 14.89 | | | $ | 17.87 | | | $ | 16.49 | | | $ | 12.59 | | | $ | 13.86 | |
| | | | | | | | | | | | | | | | | | | | | |
| Total Return (4) | | | (6.20 | )% | | | 15.06 | % | | | 36.67 | % | | | (5.64 | )% | | | 7.35 | % |
| | | | | | | | | | | | | | | | | | | | | |
| Net assets, end of year (000s) | | $ | 321,909 | | | $ | 357,390 | | | $ | 315,874 | | | $ | 261,763 | | | $ | 297,902 | |
| | | | | | | | | | | | | | | | | | | | | |
| Ratios/Supplemental Data: | | | | | | | | | | | | | | | | | | | | |
| | | | | | | | | | | | | | | | | | | | | |
| Ratio of gross expenses to average net assets (5,6) | | | 2.35 | % | | | 2.85 | % | | | 2.35 | % (7) | | | 2.62 | % | | | 2.40 | % |
| Ratio of net expenses to average net assets (6) | | | 2.35 | % | | | 2.85 | % | | | 2.35 | % (7) | | | 2.62 | % (8) | | | 2.49 | % (8) |
| Ratio of net investment income/(loss) to average net assets | | | (0.64 | )% | | | (0.45 | )% | | | 0.94 | % | | | (0.20 | )% | | | (1.66 | )% |
| | | | | | | | | | | | | | | | | | | | | |
| Portfolio Turnover Rate | | | 0 | % | | | 0 | % | | | 0 | % | | | 0 | % | | | 1 | % |
| | | | | | | | | | | | | | | | | | | | | |
| | | Class I (2) | |
| | | | |
| | | Year Ended | | | Year Ended | | | Year Ended | | | Year Ended | | | Year Ended | |
| | | March 31, 2023 | | | March 31, 2022 | | | March 31, 2021 | | | March 31, 2020 | | | March 31, 2019 | |
| Net asset value, beginning of year | | $ | 38.85 | | | $ | 35.64 | | | $ | 27.05 | | | $ | 29.62 | | | $ | 29.15 | |
| | | | | | | | | | | | | | | | | | | | | |
| Gain (Loss) from investment operations: | | | | | | | | | | | | | | | | | | | | |
| Net investment income/(loss) (3) | | | (0.03 | ) | | | 0.08 | | | | 0.45 | | | | 0.10 | | | | (0.32 | ) |
| Net realized and unrealized gain/(loss) on investments | | | (2.05 | ) | | | 5.50 | | | | 9.40 | | | | (1.54 | ) | | | 2.56 | |
| Net increase/(decrease) in net assets resulting from operations | | | (2.08 | ) | | | 5.58 | | | | 9.85 | | | | (1.44 | ) | | | 2.24 | |
| | | | | | | | | | | | | | | | | | | | | |
| Less distributions to Investors from: | | | | | | | | | | | | | | | | | | | | |
| Net investment income | | | (1.06 | ) | | | (0.04 | ) | | | — | | | | — | | | | — | |
| Net realized gain on investments | | | (3.40 | ) | | | (2.33 | ) | | | (1.26 | ) | | | (1.13 | ) | | | (1.77 | ) |
| Total distributions | | | (4.46 | ) | | | (2.37 | ) | | | (1.26 | ) | | | (1.13 | ) | | | (1.77 | ) |
| | | | | | | | | | | | | | | | | | | | | |
| Net asset value, end of year | | $ | 32.31 | | | $ | 38.85 | | | $ | 35.64 | | | $ | 27.05 | | | $ | 29.62 | |
| | | | | | | | | | | | | | | | | | | | | |
| Total Return (4) | | | (5.66 | )% | | | 15.79 | % | | | 37.48 | % | | | (5.13 | )% | | | 7.98 | % |
| | | | | | | | | | | | | | | | | | | | | |
| Net assets, end of year (000s) | | $ | 238,016 | | | $ | 189,800 | | | $ | 141,353 | | | $ | 107,528 | | | $ | 109,643 | |
| | | | | | | | | | | | | | | | | | | | | |
| Ratios/Supplemental Data: | | | | | | | | | | | | | | | | | | | | |
| | | | | | | | | | | | | | | | | | | | | |
| Ratio of gross expenses to average net assets (5,6) | | | 1.75 | % | | | 2.25 | % | | | 1.74 | % (7) | | | 2.03 | % | | | 1.81 | % |
| Ratio of net expenses to average net assets (6) | | | 1.75 | % | | | 2.25 | % | | | 1.74 | % (7) | | | 2.11 | % (8) | | | 1.89 | % (8) |
| Ratio of net investment income/(loss) to average net assets | | | -0.08 | % | | | 0.21 | % | | | 1.54 | % | | | (0.36 | )% | | | (1.07 | )% |
| | | | | | | | | | | | | | | | | | | | | |
| Portfolio Turnover Rate | | | 0 | % | | | 0 | % | | | 0 | % | | | 0 | % | | | 1 | % |
| | | | | | | | | | | | | | | | | | | | | |
| (1) | Class A commenced operation on June 1, 2016. |
| (2) | The Fund commenced operations on July 31, 2015. |
| (3) | Per share amounts calculated using the average shares method, which more appropriately presents the per share data for the year. |
| (4) | Total returns shown exclude the effect of applicable sales charges and tender fees and assumes reinvestment of all distributions. |
| (5) | Represents the ratio of expenses to average net assets absent fee waivers and/or expense reimbursements by the Advisor. |
| (6) | Expense Ratios do not include the expenses paid on the Investment Interests. |
| (7) | The Fund estimates its tax expense on iKF, LLC, a wholly owned subsidiary. Due to the timing of tax estimates the Fund had a tax over payment from 2020 that reduced the gross and net expense ratios. Without this reduction the gross and net expenses ratios would have been 2.47% and 1.86% for Class A and I, respectively. |
| (8) | The net expense ratio is greater than gross expense ratio due to the expenses recaptured. See Note 4 in the notes to consolidated financial statements. |
See accompanying notes to consolidated financial statements.
| iCapital KKR Private Markets Fund |
| NOTES TO CONSOLIDATED FINANCIAL STATEMENTS |
| Match 31, 2023 |
iCapital KKR Private Markets Fund (the “Fund”) is organized as a Delaware limited liability company that commenced operations on July 31, 2015 and is registered under the Investment Company Act of 1940, as amended (the “1940 Act”), as a closed-end, non-diversified investment management company. iCapital Registered Fund Adviser LLC (the “Adviser’’ or “iRFA”), an affiliate of Institutional Capital Network, Inc. (“iCapital”), serves as the Fund’s investment adviser. The Fund currently offers two separate classes of shares of beneficial interest, designated Class A and Class I (each, “Shares”) on a continuous basis at the net asset value (“NAV”) per share plus any applicable sales loads.
The minimum investment for an investor in the Fund is $25,000. Class A shares are offered at NAV plus a maximum sales charge of 3.50% and are subject to an annual distribution and servicing fee payable monthly. Class I shares are sold at NAV without an initial sales charge and are not subject to a distribution or shareholder servicing fees. All classes of shares have equal voting privileges except that each class has exclusive voting rights with respect to its service and/or distribution plans. The Fund’s income, expenses (other than class specific distribution fees) and realized and unrealized gains and losses are allocated proportionately each month based upon the relative net assets of each class.
The Fund’s investment objective is to seek long-term capital appreciation. The Fund invests and/or makes capital commitments of at least 80% of its assets in or to private equity investments of any type, sponsored or advised by Kohlberg Kravis Roberts & Co. Inc. or an affiliate thereof (collectively, “KKR”), including primary offerings and secondary acquisitions of interests in alternative investment funds that pursue private equity strategies (“Investment Funds”) and co-investment opportunities, including Direct Access Co-Investments (“Direct Access”) and Syndicated Co-Investments (“Co-Investments”), in operating companies (“Co-Investment Opportunities” and, together with Investment Funds and Equity Securities, “Investment Interests”) presented by such KKR Investment Funds or by KKR including through special purpose vehicles of which KKR serves as general partner. However, the Fund may at any time determine to allocate its assets to investments not sponsored or issued by, or otherwise linked to, KKR or its affiliates and to strategies and asset classes not representative of private equity.
Consolidation of a Subsidiary – The consolidated financial statements of the Fund include iKF, LLC (“iKF”), a limited liability company and wholly owned subsidiary of the Fund. All intercompany accounts and transactions have been eliminated. As of March 31, 2023, the net assets of iKF were $45,162,810, which is 8.07% of the Fund’s consolidated net assets.
| 2. | SIGNIFICANT ACCOUNTING POLICIES |
The following is a summary of significant accounting policies followed by the Fund in the preparation of its financial statements. The policies are in conformity with U.S. generally accepted accounting principles (“U.S. GAAP”). The preparation of the financial statements requires management to make estimates and assumptions that affect the reported amounts of assets and liabilities and disclosure of contingent assets and liabilities at the date of the financial statements and the reported amounts of income and expenses for the year then ended. Actual results could differ from those estimates. The Fund qualifies as an investment company under U.S. GAAP and follows the accounting and reporting guidance applicable to investment companies in the Financial Accounting Standards Board (“FASB”) Accounting Standards Codification (“ASC”) Topic 946, Financial Services – Investment Companies (“ASC Topic 946”), and therefore is applying the specialized accounting and reporting guidance in ASC Topic 946.
Investment Interests Valuation – The Fund has adopted valuation procedures pursuant to which it will fair value its Co-Investment Opportunities and Investment Funds. These valuation procedures, which have been approved by the Board of Trustees (the “Board”), provide that the unaudited valuations determined by the general partner, managing member or affiliated investment adviser of the Investment Interests (the “Investment Managers”) will be reviewed by the Adviser. The Fund will generally rely on such valuations even in instances where an Investment Manager may have a conflict of interest in valuing the securities. Furthermore, the Investment Interests will typically provide the Adviser with estimated NAVs or other valuation information on a quarterly basis, and such data will be subject to revision through the end of each Investment Interests annual audit. While such information generally is provided on a quarterly basis, the Fund calculates its NAV and issues shares on a monthly basis.
| iCapital KKR Private Markets Fund |
| NOTES TO CONSOLIDATED FINANCIAL STATEMENTS (Continued) |
| March 31, 2023 |
The fair value of the investment in the portfolio is determined at the date of the Consolidated Statement of Assets and Liabilities. The Fund follows the guidance set forth under ASC Topic 820, Fair Value Measurements (“ASC Topic 820”), and defines fair value as the price that would be received to sell an asset or paid to transfer a liability in an orderly transaction between market participants at the measurement date.
Pursuant to Rule 2a-5 under the 1940 Act, effective September 30, 2022, the Board designated the Adviser as the Fund’s Valuation Designee to perform the Fund’s fair value procedures. Under the Board’s general supervision. As the Fund’s Valuation Designee, the Adviser is responsible for the assessment and management of valuation risks, establishment and application of fair value methodologies, testing of fair value methodologies, and overseeing pricing services. The Adviser’s Pricing Committee, which is comprised of representatives of the Adviser meets monthly, or as needed, to determine the value of the Fund’s investments. The Pricing Committee may enlist independent valuation firms to provide third-party valuation consulting services. The Adviser certifies to the Board that the Fund’s valuation policy and procedures are properly followed. Any revision or updates of the valuation policies and procedures must be approved by the Board. Other than the designation of the Adviser as the Valuation Designee, the Funds’ adoption of the Rule 2a-5 did not impact how the Fund determines fair value of its investments.
The Fund utilizes various methods to measure the fair value of its investments. U.S. GAAP establishes a hierarchy of valuation techniques based on whether the inputs to those valuation techniques are observable or unobservable. In accordance with ASC Topic 820, these inputs are summarized below:
Level 1 – Unadjusted quoted prices in active markets for identical assets and liabilities.
Level 2 – Observable inputs other than quoted prices included in Level 1 that are observable for the asset or liability, either directly or indirectly. These inputs may include quoted prices for the identical instrument in an inactive market for similar instruments, and fair value is determined through the use of models or other valuation methodologies.
Level 3 – Unobservable inputs for the asset or liability, to the extent relevant observable inputs are not available; representing the Fund’s own assumptions about the assumptions a market participant would use in valuing the asset or liability and based on the best information available.
The availability of observable inputs can vary from security to security and is affected by a wide variety of factors, including, for example, the type of security, whether the security is new and not yet established in the marketplace, the liquidity of markets, and other characteristics particular to the security. The categorization of Level 2 or Level 3 is based on the significance of the unobservable inputs to the overall valuation. To the extent that valuation is based on models or inputs that are less observable or unobservable in the market, the determination of fair value requires more judgment. Accordingly, the degree of judgment exercised in determining fair value is greatest for investments categorized in Level 3.
The inputs used to measure fair value may fall into different levels of the fair value hierarchy. In such cases, for disclosure purposes, the level in the fair value hierarchy within which the fair value measurement falls in its entirety, is determined based on the lowest level input that is significant to the fair value measurement.
| iCapital KKR Private Markets Fund |
| NOTES TO CONSOLIDATED FINANCIAL STATEMENTS (Continued) |
| March 31, 2023 |
The inputs or methodology used for valuing investments are not necessarily an indication of the risk associated with investing in those investments. The following tables summarize the inputs used to value the Fund’s investments by fair value hierarchy as of March 31, 2023:
| | | | | | | | | | | | Investments Valued | | | | |
| | | Level 1 | | | Level 2 | | | Level 3 | | | at NAV * | | | Total | |
| Investment Interests | | | | | | | | | | | | | | | | | | | | |
| Investment Funds | | | | | | | | | | | | | | | | | | | | |
| Primary Investments | | $ | — | | | $ | — | | | $ | — | | | $ | 211,186,535 | | | $ | 211,186,535 | |
| Secondary Investments | | | — | | | | — | | | | 15,630,175 | | | | 116,648,419 | | | | 132,278,594 | |
| Co-Investments | | | — | | | | — | | | | 1,488,245 | | | | 176,959,882 | | | | 178,448,127 | |
| Equity Investments Preferred Stock | | | — | | | | — | | | | 3,099,342 | | | | — | | | | 3,099,342 | |
| Short-Term Investments | | | 60,376,395 | | | | — | | | | — | | | | — | | | | 60,376,395 | |
| Total Investments: | | $ | 60,376,395 | | | $ | — | | | $ | 20,217,762 | | | $ | 504,794,836 | | | $ | 585,388,993 | |
* Investments valued using NAV as the practical expedient, an indicator of fair value, are listed in a separate column to permit reconciliation to totals presented on the Consolidated Statement of Assets and Liabilities.
The following table is a reconciliation of assets in which Level 3 inputs were used in determining value:
| | | | | | | | | | | | Capital gain | | | | | | | | | | | | | |
| | | | | | | | | Proceeds from | | | distributions | | | Change in | | | | | | | | | | |
| | | | | | | | | sales and | | | from | | | unrealized | | | | | | | | | | |
| | | Beginning Balance | | | Cost of | | | principal | | | underlying | | | appreciation/ | | | Transfers into | | | Transfers out of | | | Ending Balance | |
| | | 3/31/2022 | | | purchases | | | paydowns | | | investments | | | (depreciation) | | | Level 3 | | | Level 3 | | | 3/31/2023 | |
| Investment Interests | | | | | | | | | | | | | | | | | | | | | | | | | | | | | | | | |
| Investment Funds | | | | | | | | | | | | | | | | | | | | | | | | | | | | | | | | |
| Secondary Investments | | $ | 19,689,410 | | | $ | 1,019,594 | | | $ | (2,567,914 | ) | | $ | 1,781,830 | | | $ | (1,225,659 | ) | | $ | 6,000,038 | | | $ | (9,067,124 | ) | | $ | 15,630,175 | |
| Co-Investments | | | 1,619,871 | | | | 133,718 | | | | — | | | | — | | | | (265,344 | ) | | | — | | | | — | | | | 1,488,245 | |
| Equity Investments Preferred Stock | | | 4,000,000 | | | | — | | | | — | | | | — | | | | (900,658 | ) | | | — | | | | — | | | | 3,099,342 | |
| Total Investments | | $ | 25,309,281 | | | $ | 1,153,312 | | | $ | (2,567,914 | ) | | $ | 1,781,830 | | | $ | (2,391,661 | ) | | $ | 6,000,038 | | | $ | (9,067,124 | ) | | $ | 20,217,762 | |
| | | | | | | | | | | | | | | | | | | | | | | | | | | | | | | | | |
Transfers to and from Level 3 occurred due to an increase/decrease in the significance of an unobservable input to the estimate of fair value as of and during the year ended March 31, 2023 due to timing of the investment interests net asset value.
The following table is a summary of the valuation techniques and unobservable inputs used in the fair value measurements as of March 31, 2023:
| | | Fair Value as of | | | | | | | Single Input or Range |
| Investment Type | | 3/31/2023 | | | Valuation Technique(s) | | Unobservable Input(s) | | of Inputs |
| Equity Investments | | $ | 2,000,000 | | | Cost Method | | N/A | | N/A |
| Preferred Stock | | | 1,099,342 | | | Market Approach | | Comparable Transaction Price | | $752.39 per share |
| Secondary Investment (Artisan Partners Asset Management, Inc Tax Receivable Agreement) | | | 3,229,339 | | | Discounted cash flow | | Discount factor* Tax rate ** | | 17%
24.42% |
| Secondary Investments | | | 12,400,836 | | | Adjusted reported investment net asset value | | Fair value adjustment*** | | N/A |
| Co-Investments | | | 1,488,245 | | | Adjusted reported investment net asset value | | Fair value adjustment*** | | N/A |
| Total | | $ | 20,217,762 | | | | | | | |
| * | An increase in the input would indicate a decrease in fair value. |
| ** | An increase in the input would indicate an increase in fair value. |
| *** | The significant unobservable input applied to fair value adjusted investments, in part or in whole, is the application of a beta to a benchmark. The benchmark used is a world market index and the beta is calculated through analysis which is backtested by the Adviser. As of March 31, 2023, the beta applied was 33%. An increase of the beta would indicate an increase in the effect of the input to the fair value. |
| iCapital KKR Private Markets Fund |
| NOTES TO CONSOLIDATED FINANCIAL STATEMENTS (Continued) |
| March 31, 2023 |
The valuation process involved in Level 3 measurements is designed to subject the valuation of the investments to an appropriate level of consistency, oversight and review. The valuation of the Fund’s Level 3 investments relies on evaluations of multiple observable and unobservable inputs including financial and operating data; company specific developments, stock prices, earnings and tax rates; market valuations of comparable companies; analysis of market segments; and model projections. The output of these evaluations is typically reviewed and approved by the pricing committee for which the Fund receives information surrounding their valuation process and, in some circumstances, the valuation analysis.
Investments Valued at NAV – ASC Topic 820 permits a reporting entity to measure the fair value of an Investment Interest that does not have a readily determinable fair value based on the NAV per share, or its equivalent, of the Investment Interest as a practical expedient, without further adjustment, unless it is probable that the investment would be sold at a value significantly different than the NAV. If the practical expedient NAV is not as of the reporting entity’s measurement date, then the NAV should be adjusted to reflect any significant events that may change the valuation. In using the NAV as a practical expedient, certain attributes of the investment that may impact its fair value are not considered in measuring fair value.
Attributes of those investments include the investment strategies of the investment and may also include, but are not limited to, restrictions on the investor’s ability to redeem its investments at the measurement date and any unfunded commitments. The Fund is permitted to invest in alternative investments that do not have a readily determinable fair value and, as such, has elected to use the NAV as calculated on the reporting entity’s measurement date as the fair value of the investment.
Adjustments to the NAV provided by the Adviser would be considered if the practical expedient NAV was not as of the Fund’s measurement date; if it was probable that the alternative investment would be sold at a value materially different than the reported expedient NAV; or if it was determined by the Fund’s valuation policies and procedures that the private investment is not being reported at fair value.
A listing of the Investment Interests held by the Fund and their attributes, as of March 31, 2023, are shown in the table below:
| | | | | | | | | | | | | | | Notice | | Redemption |
| Investment | | | | | | | Unfunded | | | Remaining | | Redemption | | Period (In | | Restrictions |
| Interests | | Investment Style | | Fair Value | | | Commitments | | | Life | | Frequency * | | Days) | | Terms ** |
| Investment Interests - Buyout | | Investments in nonpublic companies; the acquisition of the company uses some percentage of debt. | | $ | 423,727,878 | | | $ | 42,329,482 | | | N/A | | None | | N/A | | N/A |
| Investment Interests - Growth | | Investments in nonpublic companies; the acquisition of the company that create value through profitable revenue. | | $ | 74,889,740 | | | $ | 6,660,483 | | | N/A | | None | | N/A | | N/A |
| Investment Interests - Other | | Investments in nonpublic companies; strategies may include infrastructure, real estate, energy and direct lending/mezzanine, private equity fund of funds | | $ | 23,295,638 | | | $ | 6,063,718 | | | N/A | | None | | N/A | | N/A |
| Equity Investments -Preferred | | Direct investments in nonpublic companies; the acquisition of companies that create value through growth characteristics. | | $ | 3,099,342 | | | $ | — | | | N/A | | None | | N/A | | N/A |
| * | The information summarized in the table above represents the general terms for the specified asset class. Individual Investment Interests may have terms that are more or less restrictive than those terms indicated for the asset class as a whole. In addition, most Investment Interests have the flexibility, as provided for in their constituent documents, to modify and waive such terms. |
| ** | Distributions from Investment Interests occur at irregular intervals, and the exact timing of distributions from Investment Interests cannot be determined. It is estimated that distributions will occur over the life of the Investment Interests. |
| iCapital KKR Private Markets Fund |
| NOTES TO CONSOLIDATED FINANCIAL STATEMENTS (Continued) |
| March 31, 2023 |
Unfunded Commitments – As of March 31, 2023, the Fund had total unfunded commitments of $55,053,683 which consisted of $42,329,482 Investment Interest-Buyout, $6,660,483 Investment Interest-Growth Equity and $6,063,718 Investment Interest – Other. The Fund expects to fulfill these unfunded commitments through the use of cash, liquid investments, future distributions from Investment Funds and line of credit proceeds.
Security Transactions and Related Income – Security transactions are accounted for on a trade date basis. Interest income is recognized on an accrual basis. Dividend income is recorded on the ex-dividend date. Realized gains or losses from sales of securities are determined by comparing the identified cost of the security lot sold with the net sales proceeds. The Fund bears all expenses incurred in the course of its operations and expenses are recorded on an accrual basis
The Fund does not invest directly in marketable securities; however, from time to time, the Investment Interests may make distributions of marketable securities to the Fund. Upon receipt, these marketable securities are initially recorded at their fair values at the date of distribution from the Investment Interests. Thereafter, these marketable securities are carried at their estimated fair value, which is the closing price. The net realized gain/(loss) from these securities is recorded in the Consolidated Statement of Operations, if any, represents the difference between the proceeds received from the sale of these marketable securities and the amount at which these marketable securities were initially recorded using the identified cost basis method.
Dividends and Distributions to Shareholders – Dividends from net investment income are declared and distributed at least annually and are recorded on ex-dividend date. Distributable net realized capital gains are declared and distributed at least annually. Dividends from net investment income and distributions from net realized gains are determined in accordance with federal income tax regulations, which may differ from GAAP. These “book/tax” differences are considered either temporary or permanent in nature. To the extent these differences are permanent in nature, such amounts are reclassified within the composition of net assets based on their federal tax-basis treatment; temporary differences do not require reclassification.
Federal Income Taxes – The Fund’s policy is to continue to qualify as a Regulated Investment Company (“RIC”) by complying with the provisions of the Internal Revenue Code that are applicable to RICs and to distribute substantially all of its taxable income and net realized (after reduction for capital loss carryforwards) gains to shareholders. Therefore, no federal income tax provision has been recorded for the Fund.
The Fund recognizes the tax benefits of uncertain tax positions only where the position is “more likely than not” to be sustained assuming examination by tax authorities in accordance with the FASB ASC 740, Accounting for Uncertainty in Income Taxes. Management has analyzed the Fund’s tax positions and has concluded that no liability for unrecognized tax benefits should be recorded related to uncertain tax positions expected to be taken on returns filed for open tax year ended September 30, 2020 through September 30, 2022 or expected to be taken in the Fund’s September 30, 2023 tax return. The Fund identifies its major tax jurisdictions as U.S. Federal and foreign jurisdictions where the Fund makes significant investments. However, the Fund is not aware of any uncertain tax positions for which it is reasonably possible that the total amounts of unrecognized tax benefits will change materially in the next twelve months.
iKF, the wholly owned subsidiary of the Fund, is a domestic limited liability company that has elected to be treated as a C Corporation for federal and state income tax purposes. State tax returns are filed in various states in which an economic presence exists. Current state taxes consist of income taxes, franchise taxes, business taxes, excise taxes or gross receipts taxes, depending on the state in which the returns are filed. Income taxes are charged based on apportioned income for each state.
iKF recognizes deferred income taxes for differences in the basis of assets and liabilities for financial and income tax purposes. Deferred tax assets are recognized for deductible temporary differences, tax credit carryforwards or net operating loss carryforwards and deferred tax liabilities are recognized for taxable temporary differences. Deferred tax assets are reduced by a valuation allowance when, in the opinion of the Adviser, it is more likely than not that some portion or all of the deferred tax assets will not be realized. Deferred tax assets and liabilities are adjusted for the effects of changes in tax laws and the rates on the date of enactment.
| iCapital KKR Private Markets Fund |
| NOTES TO CONSOLIDATED FINANCIAL STATEMENTS (Continued) |
| March 31, 2023 |
When tax returns are filed, some positions taken may be sustained upon examination by the taxing authorities, while other positions are subject to uncertainty about the merits of the position taken or the amount of the position that would be sustained. The Adviser considers the likelihood of changes by taxing authorities in its filed income tax returns and recognizes a liability for or discloses potential changes that it believes are more likely than not to occur upon examination by taxing authorities.
The Adviser has not identified any uncertain tax positions in filed income tax returns that require recognition or disclosure in the accompanying consolidated financial statements. iKF’s income federal tax returns for the past three years and state tax returns for the past four years are subject to examination by taxing authorities and may change upon examination. iKF recognizes interest and penalties, if any, related to unrecognized tax benefits in operating expense. No interest expense or penalties were recognized during the years ended March 31, 2023 and 2022.
The estimated provision for (benefit from) income taxes for the year ended March 31, 2023 and 2022 consist of the following:
| Current: | | 2023 | | | 2022 | |
| Federal | | $ | 2,516,380 | | | $ | 1,551,033 | |
| State | | | 1,055,858 | | | | 678,522 | |
| | | | 3,572,238 | | | | 2,229,555 | |
| Deferred: | | | | | | | | |
| Federal | | | 563,744 | | | | 2,475,767 | |
| State | | | 236,543 | | | | 1,083,060 | |
| | | | 800,287 | | | | 3,558,827 | |
| Estimated provision for income taxes | | $ | 4,372,525 | | | $ | 5,788,382 | |
Deferred income taxes reflect the net tax effect of temporary differences between the carrying amount of assets and liabilities for financial reporting and tax purposes.
At March 31, 2023 and 2022, components of the estimated deferred tax assets and liabilities are as follows:
| | | 2023 | | | 2022 | |
| Deferred tax assets: | | $ | — | | | $ | — | |
| Deferred tax liabilities: | | | | | | | | |
| Net unrealized gains on investment securities | | | (800,287 | ) | | | (3,558,827 | ) |
| Net deferred tax (liabilities) | | $ | (800,287 | ) | | $ | (3,558,827 | ) |
Total income tax expense/(benefit) (current and deferred) differs from the amount computed by applying the federal statutory income tax rate of 21% to net investment income and realized and unrealized gain/(loss) on investments before taxes as follows:
| iKF, LLC | | As of March 31, 2023 | | | As of March 31, 2022 | |
| Income taxes at statutory rate | | $ | 1,609,775 | | | $ | 3,693,570 | |
| State income tax benefit (net of federal benefit) | | | 1,020,997 | | | | 1,391,650 | |
| Book to tax period adjustment | | | 1,741,753 | | | | 703,162 | |
| Provision for income taxes | | $ | 4,372,525 | | | $ | 5,788,382 | |
| iCapital KKR Private Markets Fund |
| NOTES TO CONSOLIDATED FINANCIAL STATEMENTS (Continued) |
| March 31, 2023 |
Cash and Cash Held in Escrow – Cash consists of monies held at UMB Bank, N.A. Such cash may exceed federally insured limits. The Fund has not experienced any losses in such accounts and does not believe it is exposed to any significant credit risk on such accounts. There are no restrictions on the cash held by the Fund. Cash held in escrow represents monies received in advance of the effective date of an Investor’s subscription. The monies are deposited with the Fund’s transfer agent and will be released from escrow on the effective date of the subscription. The transfer agent holds escrow monies at First National Bank of Omaha.
Short-Term Investments – Short-term investments represent investments in high quality money market instruments and money market mutual funds, and are recorded at NAV per share which approximates fair value. Money market instruments are high quality, short-term fixed-income obligations, which generally have remaining maturities of one year or less and may include U.S. Government securities, commercial paper, certificates of deposit and bankers acceptances issued by domestic branches of U.S. banks that are members of the Federal Deposit Insurance Corporation, and repurchase agreements.
Foreign Currency Translations – All assets and liabilities denominated in foreign currencies are translated into U.S. Dollars based on the rate of exchange of such currencies against U.S. Dollars on the date of valuation. Purchases and sales of securities and income and expenses are translated at the rate of exchange quoted on the respective date that such transactions are recorded. The Fund does not isolate that portion of the results of operations resulting from changes in foreign exchange rates on investments from the fluctuations arising from changes in market prices of securities held. Such fluctuations are included with the net realized and unrealized gain or loss on investments in the Consolidated Statement of Operations.
Indemnification – The Fund indemnifies its officers and trustees for certain liabilities that may arise from the performance of their duties to the Fund. Additionally, in the normal course of business, the Fund enters into contracts that contain a variety of representations and warranties and which provide general indemnities. The Fund’s maximum exposure under these arrangements is unknown, as this would involve future claims that may be made against the Fund that have not yet occurred. However, based on experience, the risk of loss due to these warranties and indemnities appears to be remote.
| 3. | INVESTMENT TRANSACTIONS AND ASSOCIATED RISKS |
Investment Transactions – For the year ended March 31, 2023, the cost of purchases and proceeds from sales or other disposition of investments excluding short-term investments amounted to $121,349,552 and $60,597, respectively.
Associated Risks – During the normal course of business, the Fund may purchase, sell or hold various investments, which may result in certain risks, the amount of which is not apparent from the financial statements.
General Economic and Market Conditions. The value of the Fund’s total net assets should be expected to fluctuate. To the extent that the Fund’s portfolio is concentrated in securities of a single issuer or issuers in a single sector or geographic region, the risk of any investment decision is increased. An Investment Fund’s use of leverage is likely to cause the Fund’s average net assets to appreciate or depreciate at a greater rate than if leverage were not used.
The Fund’s portfolio can be significantly impacted by general economic and political conditions, global and domestic market and industry-specific economic conditions. Political developments, cybersecurity attacks, natural disasters, public health crises (including the global outbreak of the coronavirus (“COVID-19”)) and other events outside of the Fund’s control can also adversely impact the Fund and its portfolio in material respects. For example, if any of these events occurred it may have an impact on the Fund’s fair value measurements, financing arrangements or its ability to achieve its investment objectives which could have a material impact.
Private Equity Investments. Private equity is a common term for investments that are typically made in private or public companies through privately negotiated transactions, and generally involve equity related financing which is intended to bring about some kind of change in an operating company (e.g., providing growth capital, recapitalizing a company or financing an acquisition). Private equity funds, often organized as limited partnerships, are the most common vehicles for making private equity investments, although the Fund may also co-invest directly in an operating company in conjunction with an Investment Fund. The investments held by private equity funds and the co-investments made by the Fund involve the same types of risks associated with an investment in any operating company.
| iCapital KKR Private Markets Fund |
| NOTES TO CONSOLIDATED FINANCIAL STATEMENTS (Continued) |
| March 31, 2023 |
However, due to the private nature of these investments, there are no readily available market quotations and tend to be illiquid and highly speculative. Such investments are valued by the Fund at fair value as determined pursuant to the policies and procedures approved by the Board. The value at which the Fund’s investments can be liquidated may differ from the fair value determined by the Fund. Private equity has generally been dependent on the availability of debt or equity financing to fund the acquisitions of their investments. Depending on market conditions, however, the availability of such financing may be reduced dramatically, which may limit the ability of private equity funds to obtain the required financing or may reduce their expected rate of return.
Illiquidity of Investment Fund Interests. There is no regular market for interests in Investment Funds, which typically must be sold in privately negotiated transactions. Any such sales would likely require the consent of the applicable Investment Fund and could occur at a discount to the stated NAV. If the Adviser determines to cause the Fund to sell its interests in an Investment Fund, the Fund may be unable to sell such interests quickly, if at all, and could therefore be obligated to continue to hold such interests for an extended period of time.
Fees, Expenses, and Incentive Allocations. Investment Sponsors who operate Investment Funds in which the Fund invests may receive fees for their services. The fees indirectly borne by the Fund may include a portion of the Investment Funds asset-based fees, incentive allocations, carried interest or fees and operating expenses. These fees are deducted directly from the Investment Funds assets in accordance with their governing documents. Some or all of the Investment Funds in which the Fund invests charge carried interest, incentive fees or allocations based on the Investment Funds’ performance. The Investment Funds in which the Fund invests generally charge a management fee of 1% to 2% annually of committed or net invested capital, and approximately 15% to 25% of net profits as a carried interest allocation.
Please refer to the Fund’s prospectus and statement of additional information for a full listing of risks associated with investing in the Fund.
| 4. | INVESTMENT ADVISORY AGREEMENT, TRANSACTIONS WITH RELATED PARTIES AND OTHER FEES |
The Fund pays the Adviser a monthly fee of 0.075% (0.90% on an annualized basis) of the Fund’s month-end net asset value (the “Management Fee”). The Management Fee is an expense paid out of the Fund’s net assets and is computed based on the value of the net assets of the Fund as of the close of business on the last business day of each month (including any assets in respect of Shares that will be repurchased as of the end of the month). The Management Fee is in addition to the asset-based fees and incentive fees paid by the Investment Funds to the Investment Managers and indirectly borne by investors in the Fund. The Fund incurred $5,018,553 in Management Fees for the year ended March 31, 2023, which is included in the Consolidated Statement of Operations. As of March 31, 2023 the payable due to the Adviser for Management Fees was $616,538.
As outlined in the Fund’s prospectus, the Adviser has an “Expense Limitation and Reimbursement Agreement” with the Fund through August 1, 2023 (the “Limitation Period”) to limit the amount of “Specified Expenses” (as described herein) borne by the Fund in respect of Class A and Class I shares, for any fiscal year, to an amount not to exceed 0.55% per annum of the Fund’s net assets attributed to Class A and Class I shares, respectively. “Specified Expenses” is defined to include all expenses incurred in the business of the Fund, provided that the following expenses are excluded from the definition of Specified Expenses: (i) the Management Fee and underlying Investment Fund expenses (including contribution requirements for investments, expenses and management fees); (ii) interest expense and any other expenses incurred in connection with the Fund’s credit facility; (iii) expenses incurred in connection with secondary offerings and Co-Investment Opportunities and other investment-related expenses of the Fund; (iv) Distribution and Servicing Fees in respect of any Class of shares; (v) taxes; and (vi) extraordinary expenses including tax expenses. This agreement may be renewed by the mutual agreement of the Adviser and the Fund for successive terms. Unless so renewed, this agreement will terminate automatically at the end of the Limitation Period. This agreement will also terminate automatically upon the termination of the investment advisory agreement between the Adviser and the Fund unless a new investment advisory agreement with the Adviser becomes effective upon such termination. To the extent that Specified Expenses in respect of any Class of shares for any month exceed the Expense Cap applicable to a Class of shares (the “Excess Expenses”), the Adviser will pay the Fund for expenses to eliminate such excess.
| iCapital KKR Private Markets Fund |
| NOTES TO CONSOLIDATED FINANCIAL STATEMENTS (Continued) |
| March 31, 2023 |
To the extent that the Adviser pays Excess Expenses in respect of a Class of shares, it is permitted to receive reimbursement for any expense amounts previously paid by the Adviser, for a period not to exceed three years from the date in which such expenses were paid by the Adviser on a monthly basis, even if such reimbursement occurs after the termination of the Limitation Period, provided that the Specified Expenses in respect of the applicable Class of shares have fallen to a level below the Expense Cap of the Class and the reimbursement amount does not raise the level of Specified Expenses in respect of a Class of shares in the month the reimbursement is being made to a level that exceeds the Expense Cap of the Class. For the year ended March 31, 2023, the Fund did not waive or reimburse excess expenses paid by the Adviser.
The Fund has adopted a Distribution and Service Plan Agreement (the “Plan”) for Class A and Class I shares pursuant to Rule 12b-1 under the 1940 Act. Pursuant to the Plan, the Fund pays a monthly fee out of the net assets of Class A shares at the annual rate of 0.60% of the aggregate net asset value of the Class A shares, determined and accrued as of the last day of each calendar month (before any repurchase of shares) (the “Distribution and Servicing Fee”).
The Distribution and Servicing Fee is paid to iCapital Securities, LLC, an affiliate of the Adviser, as the distributor of the shares (the “Distributor”) to provide compensation for ongoing distribution-related activities or services and/or maintenance of the Fund’s shareholder accounts, not otherwise required to be provided by the Adviser. Class I shares are not subject to the Distribution and Servicing Fee. During the year ended March 31, 2023, pursuant to the Plan, Class A shares incurred $2,018,454 in Distribution and Servicing Fees paid to iCapital Securities, which are included in the Consolidated Statement of Operations. As of March 31, 2023, Distribution and Servicing Fees payable to the Distributor was $195,145.
The Fund reimburses the Adviser for certain sub-accounting and sub-transfer agency fees at 0.15% of the net assets of applicable shareholder accounts for the fees payable by the Adviser to identified service providers. During the year ended March 31, 2023, the Fund reimbursed the Adviser $545,496 of sub-accounting and sub-transfer agency fees reimbursed to the Adviser pursuant to this arrangement which are recorded in transfer agent fees in the Consolidated Statement of Operations.
The Board provides supervision of the affairs of the Fund. The Trustees of the Fund who are not affiliated with the Adviser receive an annual retainer and per meeting fees for regular and special meetings and are reimbursed for out-of-pocket expenses incurred while carrying out their duties as Board members. The Chairperson of the Board and the Audit Committee Chair receive additional annual retainers. The Trustees do not receive any pension or retirement benefits from the Fund. Trustee fees and expenses incurred for the year ended March 31, 2023, are included in the Consolidated Statement of Operations.
Ultimus Fund Solutions (“UFS”)
UFS provides administration, fund accounting, and transfer agent services to the Fund. Pursuant to the servicing agreement with UFS, the Fund pays UFS customary fees for providing such services to the Fund. During the year ended March 31, 2023, certain officers of the Fund were also officers of UFS and are not paid any fees directly by the Fund for serving in such capacities. For the year ended March 31, 2023, the Fund incurred $335,461 of administrative service fees, $75,480 of transfer agent fees, and $83,739 of fund accounting fees, which are included in the Consolidated Statement of Operations. As of March 31, 2023, service fees payable to related parties includes a payable of $75,419 due to UFS for administration, transfer agent fees and fund accounting fees.
Northern Lights Compliance Services, LLC (“NLCS”)
NLCS, a related party of UFS, provides compliance services and a chief compliance officer, pursuant to a consulting agreement between NLCS and the Fund. For the year ended March 31, 2023, the Fund incurred $34,233 in NLCS customary fees which are included in chief compliance officer fees on the Consolidated Statement of Operations. As of March 31, 2023, service fees payable to related parties includes a payable of $9,006 due to NLCS for chief compliance officer fees.
Blu Giant, LLC (“Blu Giant”),
Blu Giant, a related party of UFS, provides EDGAR conversion and filing services as well as print management services for the Fund on an ad-hoc basis. For the year ended March 31, 2023, the Fund incurred $124,088 of printing and postage expenses, which are included in the Consolidated Statement of Operations. As of March 31, 2023, services fees payable to related parties payable includes a payable of $27,566 due to Blu Giant for printing and postage expenses.
| iCapital KKR Private Markets Fund |
| NOTES TO CONSOLIDATED FINANCIAL STATEMENTS (Continued) |
| March 31, 2023 |
The Fund may from time to time, offer to repurchase shares pursuant to written tenders by shareholders. For the year ended March 31, 2023, the Adviser recommended and intends to continue to recommend to the Board (subject to its discretion) that the Fund offer to repurchase shares from shareholders on a quarterly basis in an amount not to exceed 5% of the Fund’s net asset value. In determining whether the Fund should offer to repurchase shares from shareholders, the Board considers the recommendation of the Adviser. The Adviser expects that, generally, it will recommend to the Board that the Fund offer to repurchase shares from shareholders quarterly, with such repurchases to occur as of each March 31, June 30, September 30 and December 31. Each repurchase offer will generally commence approximately 45 days prior to the applicable repurchase date. Any repurchase of shares from a shareholder which are held for less than one year (on a first-in, first-out basis) will be subject to an “Early Repurchase Fee” equal to 2.00% of the net asset value of any such shares repurchased by the Fund. There is no minimum number of shares which must be repurchased in any repurchase offer. For the fiscal year ended March 31, 2023, the early repurchase fees were $1,440. This amount is netted against the Shares Repurchased in the Statement of Changes in Net Assets.
During the year ended March 31, 2023, the Fund repurchased tendered shares as follows:
| | | Repurchase | | | | | Number of | | | Net Asset | | | Repurchase | | | Shares Outstanding on | |
| | | Offer | | | % of Shares | | Shares | | | Value of | | | Value of | | | Repurchase Date, Before | |
| Repurchase Date | | Amount | | | Tendered | | Tendered | | | Shares Tendered | | | Shares Tendered | | | Repurchase | |
| June 30, 2022 | | | | | | | | | | | | | | | | | | | | | | |
| Class A | | | | | | 1.64% | | | 346,579 | | | $ | 16.10 | | | $ | 5,579,916 | | | | 21,137,852 | |
| Class I | | | | | | 1.74% | | | 99,923 | | | $ | 35.06 | | | $ | 3,503,295 | | | | 5,730,793 | |
| Total | | $ | 26,661,757 | | | | | | | | | | | | | $ | 9,083,211 | | | | | |
| September 30, 2022 (1) | | | | | | | | | | | | | | | | | | | | | | |
| Class A | | | | | | 1.11% | | | 231,375 | | | $ | 15.86 | | | $ | 3,669,607 | | | | 20,865,394 | |
| Class I | | | | | | 1.15% | | | 71,045 | | | $ | 34.59 | | | $ | 2,457,453 | | | | 6,183,575 | |
| Total | | $ | 27,420,645 | | | | | | | | | | | | | $ | 6,127,060 | | | | | |
| December 31, 2022 (1) | | | | | | | | | | | | | | | | | | | | | | |
| Class A | | | | | | 0.96% | | | 212,146 | | | $ | 14.82 | | | $ | 3,143,998 | | | | 22,168,880 | |
| Class I | | | | | | 1.25% | | | 90,638 | | | $ | 32.12 | | | $ | 2,911,308 | | | | 7,252,427 | |
| Total | | $ | 27,384,333 | | | | | | | | | | | | | $ | 6,055,306 | | | | | |
| March 31, 2023 | | | | | | | | | | | | | | | | | | | | | | |
| Class A | | | | | | 2.55% | | | 566,113 | | | $ | 14.89 | | | $ | 8,429,424 | | | | 22,187,582 | |
| Class I | | | | | | 4.66% | | | 359,796 | | | $ | 32.31 | | | $ | 11,625,016 | | | | 7,725,863 | |
| Total | | $ | 28,843,487 | | | | | | | | | | | | | $ | 20,054,440 | | | | | |
| (1) | Net of early redemption fee |
| 6. | DISTRIBUTIONS TO SHAREHOLDERS AND TAX COMPONENTS OF CAPITAL |
As of March 31, 2023, the Fund continues to qualify as a RIC. Since September 30, 2022, the Fund has estimated earnings of $1,017,958 amount of income, $6,262,143 amount of capital gain, and $6,391,494 amount of returned capital from investments. The Fund made distributions of $15,769,293 from ordinary income and $23,904,604 from realized gains. Amounts are subject to change through the end of the Fund’s tax year through September 30, 2023.
| iCapital KKR Private Markets Fund |
| NOTES TO CONSOLIDATED FINANCIAL STATEMENTS (Continued) |
| March 31, 2023 |
The Fund’s tax year-end is September 30, 2022: as such, the information in this section is as of the Fund’s tax year end.
The tax character of Fund distributions paid for the tax years ended September 30, 2022, and September 30, 2021 was as follows:
| | | Tax Year Ended | | | Tax Year Ended | |
| | | September 30, 2022 | | | September 30, 2021 | |
| Ordinary Income | | | — | | | | — | |
| Long-Term Capital Gain | | $ | 51,396,318 | | | $ | 16,840,577 | |
| Return of Capital | | | — | | | | — | |
| | | $ | 51,396,318 | | | $ | 16,840,577 | |
As of September 30, 2022, the components of accumulated earnings/(deficit) on a tax basis were as follows:
| Undistributed | | | Undistributed | | | Post October Loss | | | Capital Loss | | | Other | | | Unrealized | | | Total | |
| Ordinary | | | Long-Term | | | and | | | Carry | | | Book/Tax | | | Appreciation/ | | | Accumulated | |
| Income | | | Gains | | | Late Year Loss | | | Forwards | | | Differences | | | (Depreciation) | | | Earnings/(Deficits) | |
| $ | 5,664,128 | | | $ | 33,908,054 | | | $ | — | | | $ | — | | | $ | 23,311,006 | | | $ | 44,862,022 | | | $ | 107,745,210 | |
The difference between book basis and tax basis accumulated ordinary income/(loss) and other book/tax differences are primarily attributable to the unamortized portion of organization expenses for tax purposes and adjustments for partnerships, passive foreign investment companies, C-corporations with return of capital distributions and the Fund’s wholly-owned subsidiary.
Permanent book and tax differences, primarily attributable to the tax treatment of net operating losses resulted in reclassification for the tax year ended September 30, 2022 as follows:
| | | | Accumulated | |
| Paid-In Capital | | | Earnings/(Losses) | |
| $ | (88,818 | ) | | $ | 88,818 | |
These reclassifications have no effect on net assets.
The cost of investments for federal income tax purposes is adjusted for items of taxable income allocated to the Fund from the Investment Funds. The allocated taxable income is reported to the Fund by the Investment Funds on Schedule K-1. The Fund has not yet received all such Schedule K-1s for the year ended December 31, 2022 (the underlying Investment Funds’ year-end); therefore, the tax basis of investments for 2022 will not be finalized by the Fund until after the fiscal period end.
| 7. | COMMITMENTS AND CONTINGENCIES |
Revolving Credit Agreement
Effective March 3, 2023, the Fund entered into a revolving credit agreement (“Credit Facility”) with Royal Bank of Canada (the “Lender”). The Credit Facility has a maximum borrowing limit of $40 million (“Committed Loan Limit”) and has a maturity date of March 1, 2024. The Fund has access to the Credit Facility for working capital to manage liquidity, including providing financing for the Fund’s acquisition of Investment interests. The Credit Facility has an interest rate which is dependent upon the effective borrowing date (“Borrowing Date”); if a Loan is requested three business days prior to the Borrowing Date, the applicable interest rate is 3 Month Secured Overnight Financing Rate (“SOFR”) plus 1.30% per annum, if a Loan is requested less than three days prior to the Borrowing Date, the applicable interest rate is Prime Rate plus 1.30% per annum. The Fund pays the Lender a Facility Fee of 1.15% based upon the Committed Loan Limit. Prior to February 10, 2023, Credit Suisse AG provided the Fund with a similar revolving credit facility. For the period February 10, 2023 to March 2, 2023, the Fund did not have access to a revolving line of credit facility.
| iCapital KKR Private Markets Fund |
| NOTES TO CONSOLIDATED FINANCIAL STATEMENTS (Continued) |
| March 31, 2023 |
For the year ended March 31, 2023, the Fund incurred $408,343 in commitment fees, which are included in the line of credit fees in the Consolidated Statement of Operations. The Fund did not utilize the line of credit during the year ended March 31, 2023.
The Fund has determined that no material events or transactions occurred through the issuance date of the Fund’s financial statements which require an additional disclosure in or adjustment to the Fund’s financial statements except for the following:
The Advisor and the Board approved the changes expanding Direct Access to include the sourcing of investment opportunities from two additional underlying managers focused on private equity - Vista Equity Partners and Warburg Pincus. These changes were approved on March 27, 2023, and a prospectus supplement containing the changes was filed on April 13, 2023. The prospectus supplement is subject to approval by the SEC but is expected to be effective on June 13, 2023.
| iCapital KKR Private Markets Fund |
| SUPPLEMENTAL INFORMATION (Unaudited) |
| March 31, 2023 |
Approval of Investment Advisory and Sub-Advisory Agreement
At a meeting held on January 30, 2023 (the “Meeting”), the Board of Trustees (the “Board”) of iCapital KKR Private Markets Fund (the “Fund”), including each of the trustees that are not “interested persons” of the Fund (the “Independent Trustees”), as such term is defined under Section 2(a)(19) of the Investment Company Act of 1940, as amended (the “1940 Act”), considered the annual approval of the investment advisory agreement (the “Advisory Agreement”) between iCapital Registered Fund Adviser, LLC (“iCapital” or the “Adviser”) and the Fund.
In connection with the Board’s consideration of each of the Agreements, the Board received written materials in advance of the Meeting, which included information regarding: (a) a description of the Adviser’s investment management personnel; (b) an overview of the Adviser’s operations and financial condition; (c) a comparison of the Fund’s advisory fee and overall expenses with those of comparable closed end investment funds registered under the 1940 Act; (d) the level of profitability from the Adviser’s fund-related operations; (e) the compliance policies and procedures of the Adviser including policies and procedures for personal securities transactions; and (f) information regarding the performance of the Fund compared to other comparable closed end investment funds registered under the 1940 Act, relevant benchmark indices, and the historical performance of other 1940 Act registered funds managed by the Adviser.
Matters considered by the Board in connection with its approval of the Agreement included, among others, the following:
Nature, Extent and Quality of Services. The Board reviewed materials provided by iCapital RFA related to the Advisory Agreement with respect to the Fund, including: the Advisory Agreement; a description of the manner in which investment decisions are to be made and executed; an overview of the personnel that will perform services for the Fund and their background and experience; a review of the financial condition of iCapital RFA; information regarding risk management processes and liquidity management; the compliance policies and procedures of iCapital RFA, including its business continuity and cybersecurity policies and a code of ethics that contained provisions reasonably necessary to prevent Access Persons, as that term is defined in Rule 17j-1 under the 1940 Act, from engaging in conduct prohibited by Rule 17j-1(b); and iCapital’s compliance and regulatory history.
The Board reviewed the portfolio capabilities of iCapital RFA and its parent company’s ability to deliver performance consistent with what shareholders are accustomed. The Board also considered the chief compliance officer’s statement that he had reviewed the compliance policies and procedures of iCapital RFA and concluded that its compliance program is reasonably designed to prevent and detect violations of the Federal Securities Laws (as defined in Rule 38a-1 under the 1940 Act) and complies with Rule 38a-1 under the 1940 Act. Based on this review, the Board concluded that the range and quality of services provided by iCapital RFA to the Fund under the Advisory Agreement would be at the same or improved levels and were expected to be satisfactory.
Performance. The Board considered the Fund’s performance for six-month and one-year periods ended September 30, 2022, as well as a common reporting period (October 1, 2015 to September 30, 2022) as compared to the Fund’s primary benchmark index, the MSCI All-Country World Total Return Index (“MSCI ACWI”), and for other externally managed closed-end funds with investment objectives and strategies comparable to those of the Fund for the period those funds have been in operation (the “Peer Funds”).
| iCapital KKR Private Markets Fund |
| SUPPLEMENTAL INFORMATION (Unaudited) (Continued) |
| March 31, 2023 |
The Board also reviewed information prepared by iCapital RFA regarding the Fund’s returns on invested capital (“ROIC”) compared to that of each of the Peer Funds and found that for both the one-year period ended September 30, 2022, the ROIC for both the Fund and the Peer Funds varied, but that over the common reporting period the Fund’s ROIC exceeded the mean ROIC of the Peer Funds for the same period. The Board concluded that based on the performance of the Fund, iCapital RFA’s performance was consistent and indicated that the firm had the ability to provide an acceptable level of investment returns for the Fund and its shareholders.
Advisory Fees. As to the costs of the services to be provided, the Board considered a comparison prepared by iCapital RFA of the Fund’s advisory fee and net expenses to those of the Peer Funds. The Board considered that iCapital RFA charged an annualized advisory fee of 0.90% of the Fund’s average net assets, which was lower than the mean advisory fee of the Peer Funds. The Board also considered the Fund’s net expense ratio as compared to that of the Peer Funds and noted that the Fund’s 2.25% expense ratio was higher than the mean net expense ratio of the Peer Funds, but not the highest of the Peer Funds. The Board concluded that the contractual advisory fee was not unreasonable, and that the Fund’s overall expense ratio was acceptable.
Profitability. The Board noted the Fund’s net profitability is reasonable and not excessive given the complexity of this Fund.
Economies of Scale. The Board determined that based on the Fund’s current asset size and complexity, and expense limitation agreement with iCapital RFA, economies of scale that would require breakpoints had not been realized at this time.
Conclusion. Mr. Gersten reported that the Board, having requested and received such information from iCapital RFA as it believed reasonably necessary to evaluate the terms of the Advisory Agreement and having been advised by independent counsel that the Independent Board had appropriately considered and weighed all relevant factors, determined that the renewal of the Advisory Agreement is in the best interests of the Fund and its shareholders. In considering the Advisory Agreement, the Board did not identify any one factor as all important and each Trustee may have considered different factors as more important.
| iCapital KKR Private Markets Fund |
| SUPPLEMENTAL INFORMATION (Unaudited) (Continued) |
| March 31, 2023 |
| Name, Age and Address | Position(s) Held
with Registrant | Length of
Time Served* | Principal
Occupation(s)
During Past
5 Years | Number
of
Portfolios
Overseen
in Fund
Complex | Other Trusteeships/
Directorships Held
Outside the Fund
Complex** |
| Interested Trustee |
Nick Veronis
One Grand Central Place
60 East 42nd Street, 26th Floor
New York, NY 10165 | Trustee and President | Indefinite Length — Since 2021 | Co-Founder and Managing Partner of iCapital Network | 1 | None |
The executive officers of the Fund, their ages, addresses, positions held, lengths of time served and their principal business occupations during the past five years are shown below.
iCapital KKR Private Markets Fund |
| SUPPLEMENTAL INFORMATION (Unaudited) (Continued) |
| March 31, 2023 |
| Independent Trustees |
Mark Garbin
c/o iCapital KKR Private Markets
Fund
One Grand Central Place
60 East 42nd Street, 26th Floor
New York, NY 10165 | Trustee | Indefinite Length — Since Inception | Managing Principal, Coherent Capital Management LLC (since 2008), Independent Director, OCHEE LP (2021-present) | 1 | Northern Lights Fund Trust (since 2013); Northern Lights Variable Trust (since 2013); Forethought Variable Insurance Trust (since 2013); OHA Mortgage Strategies Fund (offshore), Ltd. (2014 - 2017); Two Roads Shared Trust (since 2012); Carlyle Tactical Private Credit Fund (since March 2018) and OHA CLO Enhanced Equity II Genpar LLP (since 2021) |
Mark D. Gersten
c/o iCapital KKR Private Markets
Fund
One Grand Central Place
60 East 42nd Street, 26th Floor
New York, NY 10165 | Trustee | Indefinite Length — Since Inception | Independent Consultant (since 2012) | 1 | Trustee of Schroder Global Series Trust (2012-2017), Northern Lights Fund Trust (since 2013), Northern Lights Variable Trust (since 2013), Two Roads Shared Trust (since 2012), Ramius Archview Credit and Distressed Fund (2015-2017) |
Neil M. Kaufman
c/o iCapital KKR Private
Markets Fund
One Grand Central Place
60 East 42nd Street, 26th Floor
New York, NY 10165 | Trustee | Indefinite Length — Since Inception | Managing Member, Kaufman McGowan PLLC (legal services)(since 2016) | 1 | Trustee of Two Roads Shared Trust (since 2012) |
Anita K. Krug
c/o iCapital KKR Private
Markets Fund
One Grand Central Place
60 East 42nd Street, 26th Floor
New York, NY 10165 | Trustee | Indefinite Length — Since Inception | Dean & Professor (since 2019) Chicago Kent Law School; Interim Vice Chancellor for Academic Affairs (2018-2019) University of Washington Bothell; Interim Dean (2017- 2018), Professor (2016-2019), Associate Professor (2014-2016); and Assistant Professor (2010-2014), University of Washington School of Law | 1 | Trustee of Two Roads Shared Trust (since 2012) and Centerstone Investors Trust (since 2016) |
| iCapital KKR Private Markets Fund |
| SUPPLEMENTAL INFORMATION (Unaudited) (Continued) |
| March 31, 2023 |
| Name, Age and Address | Position(s) Held
with Registrant | Term of Office and
Length of Time
Served* | Principal
Occupation(s)
During Past 5 Years |
| Officers |
William Kimme
c/o Northern Lights Compliance Services. LLC
4221 North 203rd Street, Suite 100
Elkhorn, NE 68022 | Anti-Money Laundering Officer and Chief Compliance Officer | Indefinite Length — Since 2019 (Chief Compliance Officer and Anti-Money Laundering Officer) | Senior Compliance Officer of Northern Lights Compliance Services, LLC (since 2011) |
Swan Cheng
c/o iCapital KKR Private Markets Fund
One Grand Central Place
60 East 42nd Street, 26th Floor
New York, NY 10165 | Principal Financial Officer and Principal Accounting Officer | Indefinite Length- Since 2023 | Vice President, Corporate Finance, iCapital (August 2020-Present) and Head of Finance and Accounting, Artivest (October 2013- August 2020) |
Kyle Hartley
c/o iCapital KKR Private Markets Fund
One Grand Central Place
60 East 42nd Street, 26th Floor
New York, NY 10165 | Treasurer | Indefinite Length — Since 2021 | Managing Director and Head of Hedge Fund Finance and Operations, Institutional Capital Networks Inc (since 2017) and CFO and COO of Lone Star Value Management (2013-2017) |
Stephen Jacobs
c/o iCapital KKR Private Markets Fund
One Grand Central Place
60 East 42nd Street, 26th Floor
New York, NY 10165 | Secretary | Indefinite Length — Since 2021 | General Counsel, Institutional Capital Networks Inc (since 2019) and Chief Operating Partner and Co-Chair of the Corporate Department, Herrick Feinstein LLP (2016- 2019) |
Timothy Burdick
c/o iCapital KKR Private Markets Fund
One Grand Central Place
60 East 42nd Street, 26th Floor
New York, NY 10165 | Assistant Secretary | Indefinite Length — Since 2022 | Vice President and Managing Counsel, Ultimus Fund Solutions, LLC (2022 – present); Assistant Vice President and Counsel, Ultimus Fund Solutions, LLC (2019 – 2022); Senior Program Compliance Manager, CJ Affiliate (2016 – 2019). |
| * | Each officer serves an indefinite term, until his or her successor is elected. |
The Funds SAI Includes additional information about the Trustees and is available free of charge, upon request, by calling toll-free at 1-212-994-7400.
PRIVACY NOTICE
| What does iCapital KKR Private Markets Fund (the “Fund”) do with your personal Information? |
Why? | Financial companies choose how they share your personal information. Federal law gives consumers the right to limit some but not all sharing. Federal law also requires us to tell you how we collect, share, and protect your personal information. Please read this notice carefully to understand what we do. |
| | |
What? | The types of personal information we collect and share depend on the product or service you have with us. This information can include: ● Social Security number and wire transfer instructions ● Account transactions and transaction history ● Investment experience and purchase history When you are no longer our customer, we continue to share your information as described in this notice. |
| | |
How? | All financial companies need to share customers’ personal information to run their everyday business. In the section below, we list the reasons financial companies can share their customers’ personal information; the reasons the Fund chooses to share; and whether you can limit this sharing. |
| Reasons we can share your personal information | Does the
Fund
share? | Can you
limit
this
sharing? |
| | | |
For our everyday business purposes Such as to process your transactions, maintain your account(s), respond to court orders and legal investigations, or report to credit bureaus | Yes | No |
| | | |
For our marketing purposes To offer our products and services to you | No | We don’t share |
| | | |
| For joint marketing with other financial companies | No | We don’t share |
| | | |
For our affiliates’ everyday business purposes Information about your transactions and records | No | We don’t share |
| | | |
For our affiliates’ everyday business purposes Information about your creditworthiness | No | We don’t share |
| | | |
For non-affiliates to market to you | No | We don’t share |
| Questions? | Call 1-888-524-9441 |
| What we do |
| | |
How does the Fund protect my personal information? | To protect your personal information from unauthorized access and use, we use security measures that comply with federal law. These measures include computer safeguards and secured files and buildings. Our service providers are held accountable for adhering to strict policies and procedures to prevent any misuse of your non-public personal information. |
| | |
| How does the Fund collect my personal information? | We collect your personal information, for example, when you ● Open an account or deposit money ● Direct us to buy securities or direct us to sell your securities ● Seek advice about your investments We also collect your personal information from others, such as credit bureaus, affiliates or other companies. |
| | |
Why can’t I limit all sharing? | Federal law gives you the right to limit only: ● Sharing for affiliates’ everyday business purposes—information about your creditworthiness ● Affiliates from using your information to market to you ● Sharing for non-affiliates to market to you State laws and individual companies may give you additional rights to limit sharing. |
| | |
| Definitions |
| |
| Affiliates | Companies related by common ownership or control. They can be financial and non-financial companies. ● The Fund does not share with our affiliates. |
| | |
| Non-affiliates | Companies not related by common ownership or control. They can be financial and non-financial companies ● The Fund does not share with non-affiliates so they can market to you. |
| | |
| Joint marketing | A formal agreement between non-affiliated financial companies that together market financial products or services to you. ● The Fund doesn’t jointly market. |
iCapital KKR Private Markets Fund
SUPPLEMENTAL INFORMATION (Unaudited)
March 31, 2023
PROXY VOTING POLICY
Information regarding how the Fund voted proxies relating to portfolio securities for the most recent twelve month period ended June 30 as well as a description of the policies and procedures that the Fund uses to determine how to vote proxies is available without charge, upon request, by calling 1-877-772-5838 or by referring to the Security and Exchange Commission’s (“SEC”) website at http://www.sec.gov.
PORTFOLIO HOLDINGS
The Fund files its complete schedule of portfolio holdings with the SEC for the first and third quarters of each fiscal year on Form N-PORT. Form N-PORT is available on the SEC’s website at http://www.sec.gov and may be reviewed and copied at the SEC’s Public Reference Room in Washington, DC (1-800-SEC-0330). The information on Form N-PORT is available without charge, upon request, by calling 1-877-772-5838.
| INVESTMENT ADVISOR |
| iCapital Registered Fund Adviser LLC. |
| 60 East 42nd Street, 26th Floor |
| New York, NY 10165 |
| |
| ADMINISTRATOR |
| Ultimus Fund Solutions, LLC |
| 225 Pictoria Drive, Suite 450 |
| Cincinnati, OH 45246 |
| |
| |
| |
| iCapital-AR23 |
Item 2. Code of Ethics. See attached
(a) As of the end of the period covered by this report, the registrant has adopted a code of ethics that applies to the registrant's principal executive officer, principal financial officer, principal accounting officer or controller, or persons performing similar functions, regardless of whether these individuals are employed by the registrant or a third party.
(b) For purposes of this item, “code of ethics” means written standards that are reasonably designed to deter wrongdoing and to promote:
| (1) | Honest and ethical conduct, including the ethical handling of actual or apparent conflicts of interest between personal and professional relationships; |
| (2) | Full, fair, accurate, timely, and understandable disclosure in reports and documents that a registrant files with, or submits to, the Commission and in other public communications made by the registrant; |
| | (3) | Compliance with applicable governmental laws, rules, and regulations; |
| (4) | The prompt internal reporting of violations of the code to an appropriate person or persons identified in the code; and |
| | (5) | Accountability for adherence to the code. |
(c) Amendments: During the period covered by the report, there have not been any amendments to the provisions of the code of ethics.
(d) Waivers: During the period covered by the report, the registrant has not granted any express or implicit waivers from the provisions of the code of ethics.
(e) The Code of Ethics is not posted on Registrant’ website.
(f) A copy of the Code of Ethics is attached as an exhibit.
Item 3. Audit Committee Financial Expert. (a) The Registrant’s board of trustees has determined that Mark Gersten is a financial expert, as defined in Item 3 of Form N-CSR. Mark Gersten is independent for purposes of this Item.
Item 4. Principal Accountant Fees and Services.
2023- $102,000
2022- $102,000
2021- None
2023- $62,900
2022 -$58,958
Preparation of Federal & State income tax returns, assistance with calculation of required income, capital gain and excise distributions and preparation of Federal excise tax returns.
2023 – None
2022 – None
| (e) | (1) Audit Committee’s Pre-Approval Policies |
The registrant’s Audit Committee is required to pre-approve all audit services and, when appropriate, any non-audit services (including audit-related, tax and all other services) to the registrant. The registrant’s Audit Committee also is required to pre-approve, when appropriate, any non-audit services (including audit-related, tax and all other services) to its adviser, or any entity controlling, controlled by or under common control with the adviser that provides ongoing services to the registrant, to the extent that the services may be determined to have an impact on the operations or financial reporting of the registrant. Services are reviewed on an engagement by engagement basis by the Audit Committee.
| (2) | Percentages of Services Approved by the Audit Committee |
| | | | 2023 | | | | 2022 | |
| Audit-Related Fees: | | | 100 | % | | | 100 | % |
| Tax Fees: | | | 100 | % | | | 100 | % |
| All Other Fees: | | | 100 | % | | | 100 | % |
| (f) | During the audit of registrant's financial statements for the most recent fiscal year, less than 50 percent of the hours expended on the principal accountant's engagement were attributed to work performed by persons other than the principal accountant's full-time, permanent employees. |
| (g) | The aggregate non-audit fees billed by the registrant's accountant for services rendered to the registrant, and rendered to the registrant's investment adviser (not including any sub-adviser whose role is primarily portfolio management and is subcontracted with or overseen by another investment adviser), and any entity controlling, controlled by, or under common control with the adviser that provides ongoing services to the registrant: |
2023 - $62,900
2022 - $58,958
(h) The registrant's audit committee has considered whether the provision of non-audit services to the registrant's investment adviser (not including any sub-adviser whose role is primarily portfolio management and is subcontracted with or overseen by another investment adviser), and any entity controlling, controlled by, or under common control with the investment adviser that provides ongoing services to the registrant, that were not pre-approved pursuant to paragraph (c)(7)(ii) of Rule 2-01 of Regulation S-X, is compatible with maintaining the principal accountant's independence.
Item 5. Audit Committee of Listed Registrants. Not Applicable.
Item 6. Schedule of Investments. Schedule of investments in securities of unaffiliated issuers is included under Item 1.
Item 7. Disclosure of Proxy Voting Policies and Procedures for Closed-End Funds.
(a) Investments in the Investment Funds do not typically convey traditional voting rights, and the occurrence of corporate governance or other consent or voting matters for this type of investment is substantially less than that encountered in connection with registered equity securities. On occasion, however, the Fund may receive notices or proposals from the Investment Funds seeking the consent of or voting by holders (“proxies”). The Fund has delegated any voting of proxies in respect of portfolio holdings to the Adviser to vote the proxies in accordance with the Adviser’s proxy voting guidelines and procedures. In general, the Adviser believes that voting proxies in accordance with the policies described below will be in the best interests of the Fund.
(b) The Adviser will generally vote to support management recommendations relating to routine matters, such as the election of board members (where no corporate governance issues are implicated) or the selection of independent auditors. The Adviser will generally vote in favor of management or investor proposals that the Adviser believes will maintain or strengthen the shared interests of investors and management, increase value for investors and maintain or increase the rights of investors. On non-routine matters, the Adviser will generally vote in favor of management proposals for mergers or reorganizations and investor rights plans, so long as it believes such proposals are in the best economic interests of the Fund. In exercising its voting discretion, the Adviser will seek to avoid any direct or indirect conflict of interest presented by the voting decision. If any substantive aspect or foreseeable result of the matter to be voted on presents an actual or potential conflict of interest involving the Adviser, the Adviser will make written disclosure of the conflict to the Independent Trustees indicating how the Adviser proposes to vote on the matter and its reasons for doing so.
(c) The Fund intends to hold its interests in the Investment Funds in non-voting form. Where only voting securities are available for purchase by the Fund, in all, or substantially all, instances, the Fund will seek to create by contract the same result as owning a non-voting security by entering into a contract, typically before the initial purchase, to relinquish the right to vote in respect of its investment.
Item 8. Portfolio Managers of Closed-End Management Investment Companies.
The personnel of the Advisers who have primary responsibility for management of the Fund are Nicholas Veronis and David Shyu.
Nicholas Veronis
Nicholas is a Co-Founder and one of the Managing Partners of iCapital Network, Inc., where he is Head of Portfolio Management. He spent 11 years at Veronis Suhler Stevenson (VSS), a middle market private equity firm where he was a Managing Director responsible for originating and structuring investment opportunities. At VSS, he specialized in the business information services sector and helped spearhead the firm’s investment strategy in the financial software and data sector, including its investment in Ipreo. Nicholas was previously an operating advisor to Atlas Advisors, an independent investment bank based in New York. He began his career as a financial journalist for The Boston Business Journal, was a reporter for The Star-Ledger, and a Senior Associate in the New Media Division of Newhouse Newspapers. He holds a BA in economics from Trinity College and FINRA Series 7, 79, and 63 licenses.
David Shyu
David Shyu is a Co-Portfolio Manager of the Fund. Prior to iCapital, Mr. Shyu was a Director of Newbury Partners, responsible for the origination, valuation, execution and monitoring of secondary investments and co-investments. Prior to Newbury, Mr. Shyu was as an Associate in the Secondary Group at Auda Private Equity. Previously, Mr. Shyu worked as an analyst at Goldman Sachs. Mr. Shyu graduated cum laude from Princeton University with a BSE in Operations Research and Financial Engineering.
Item 9. Purchases of Equity Securities by Closed-End Funds. None
Item 10. Submission of Matters to a Vote of Security Holders. None
Item 11. Controls and Procedures.
(a) Based on an evaluation of the Registrant’s disclosure controls and procedures as of a date within 90 days of filing date of this Form N-CSR, the principal executive officer and principal financial officer, or persons performing similar functions, of the Registrant have concluded that the disclosure controls and procedures of the Registrant are reasonably designed to ensure that the information required in filings on Form N-CSR is recorded, processed, summarized, and reported by the filing date, including that information required to be disclosed is accumulated and communicated to the Registrant’s management, including the Registrant’s principal executive officer and principal financial officer, or persons performing similar functions, as appropriate to allow timely decisions regarding required disclosure.
(b) There were no significant changes in the Registrant’s internal control over financial reporting that occurred during the Registrant’s last fiscal half-year that have materially affected, or are reasonably likely to materially affect, the Registrant’s internal control over financial reporting.
Item 12. Disclosure of Securities Lending Activities for Closed-End Management Investment Companies. None
Item 13. Exhibits.
(a)(1) Code of Ethics filed herewith
(a)(2) Certifications required by Section 302 of the Sarbanes-Oxley Act of 2002 (and Item 11(a)(2) of Form N-CSR) are filed herewith.
(a)(3) Not applicable.
| (c) | We consent to the incorporation by reference in Registration Statement No. 333-219332 on Form N-2 of our report dated May 30, 2023, relating to the consolidated financial statements and consolidated financial highlights of iCapital KKR Private Markets Fund appearing in this Annual Report on Form N-CSR of iCapital KKR Private Markets Fund for the year ended March 31, 2023. |
/S/ DELOITTE & TOUCHE LLP
Chicago, Illinois
May 30, 2023
SIGNATURES
Pursuant to the requirements of the Securities Exchange Act of 1934 and the Investment Company Act of 1940, the registrant has duly caused this report to be signed on its behalf by the undersigned, thereunto duly authorized.
(Registrant) iCapital KKR Private Markets Fund
By (Signature and Title)
/s/Nicholas Veronis
Nicholas Veronis, President/Principal Executive Officer
Date 6/5/2023
Pursuant to the requirements of the Securities Exchange Act of 1934 and the Investment Company Act of 1940, this report has been signed below by the following persons on behalf of the registrant and in the capacities and on the dates indicated.
By (Signature and Title)
/s/Nicholas Veronis
Nicholas Veronis, President/Principal Executive Officer
Date 6/5/2023
By (Signature and Title)
/s/Kyle Hartley
Kyle Hartley, Treasurer/
Date 6/5/2023