UNITED STATES
SECURITIES AND EXCHANGE COMMISSION
Washington, D.C. 20549
FORM N-CSR
CERTIFIED SHAREHOLDER REPORT OF REGISTERED
MANAGEMENT INVESTMENT COMPANIES
Investment Company Act file number 811-22967
Nuveen Minnesota Municipal Income Fund
(Exact name of registrant as specified in charter)
Nuveen Investments
333 West Wacker Drive
Chicago, IL 60606
(Address of principal executive offices) (Zip code)
Kevin J. McCarthy
Nuveen Investments
333 West Wacker Drive
Chicago, IL 60606
(Name and address of agent for service)
Registrant's telephone number, including area code: (312) 917-7700
Date of fiscal year end: May 31
Date of reporting period: November 30, 2014
Form N-CSR is to be used by management investment companies to file reports with the Commission not later than 10 days after the transmission to stockholders of any report that is required to be transmitted to stockholders under Rule 30e-1 under the Investment Company Act of 1940 (17 CFR 270.30e-1). The Commission may use the information provided on Form N-CSR in its regulatory, disclosure review, inspection, and policymaking roles.
A registrant is required to disclose the information specified by Form N-CSR, and the Commission will make this information public. A registrant is not required to respond to the collection of information contained in Form N-CSR unless the Form displays a currently valid Office of Management and Budget ("OMB") control number. Please direct comments concerning the accuracy of the information collection burden estimate and any suggestions for reducing the burden to Secretary, Securities and Exchange Commission, 450 Fifth Street, NW, Washington, DC 20549-0609. The OMB has reviewed this collection of information under the clearance requirements of 44 U.S.C. ss. 3507.
ITEM 1. REPORTS TO STOCKHOLDERS.
Nuveen Investments to be acquired by TIAA-CREF
On October 1, 2014, TIAA-CREF completed its previously announced acquisition of Nuveen Investments, Inc., the parent company of your fund’s investment adviser, Nuveen Fund Advisors, LLC (“NFAL”) and the Nuveen affiliates that act as sub-advisers to the majority of the Nuveen Funds. TIAA-CREF is a national financial services organization with approximately $840 billion in assets under management as of October 1, 2014 and is a leading provider of retirement services in the academic, research, medical and cultural fields. Nuveen expects to operate as a separate subsidiary within TIAA-CREF’s asset management business. Nuveen’s existing leadership and key investment teams have remained in place following the transaction.
NFAL and your fund’s sub-adviser(s) continue to manage your fund according to the same objectives and policies as before, and there have been no changes to your fund’s operations.
Table of Contents
| Chairman’s Letter to Shareholders | 4 |
| | |
| Portfolio Managers’ Comments | 5 |
| | |
| Fund Leverage | 9 |
| | |
| Common Share Information | 11 |
| | |
| Risk Considerations | 13 |
| | |
| Performance Overview and Holding Summaries | 14 |
| | |
| Shareholder Meeting Report | 20 |
| | |
| Portfolios of Investments | 21 |
| | |
| Statement of Assets and Liabilities | 63 |
| | |
| Statement of Operations | 65 |
| | |
| Statement of Changes in Net Assets | 67 |
| | |
| Statement of Cash Flows | 70 |
| | |
| Financial Highlights | 72 |
| | |
| Notes to Financial Statements | 81 |
| | |
| Additional Fund Information | 99 |
| | |
| Glossary of Terms Used in this Report | 100 |
| | |
| Reinvest Automatically, Easily and Conveniently | 102 |
| | |
| Annual Investment Management Agreement Approval Process | 103 |
| | |
Chairman’s Letter to Shareholders
Dear Shareholders,
Over the past year, global financial markets were generally strong as stocks of many countries rose due to strengthening economies and abundant central bank support. A low and stable interest rate environment allowed the bond market to generate modest but positive returns.
More recently, markets have been less certain as economic growth is strengthening in some parts of the world, but in other areas recovery has been slow or uneven at best. Despite increasing market volatility, geopolitical turmoil and concerns over rising rates, better-than-expected earnings results and economic data have supported U.S. stocks. Europe continues to face challenges as disappointing growth and inflation measures led the European Central Bank to further cut interest rates. Japan is suffering from the burden of the recent consumption tax as the government’s structural reforms continue to steadily progress. Flare-ups in hotspots, such as the ongoing Russia-Ukraine conflict and Middle East, have not yet been able to derail the markets, though that remains a possibility. With all the challenges facing the markets, accommodative monetary policy around the world has helped lessen the impact of these events.
It is in such changeable markets that professional investment management is most important. Investment teams who have experienced challenging markets in the past understand how their asset class can behave in rapidly changing times. Remaining committed to their investment disciplines during these times is a critical component to achieving long-term success. In fact, many strong investment track records are established during challenging periods because experienced investment teams understand that volatile markets place a premium on companies and investment ideas that can weather the short-term volatility. By maintaining appropriate time horizons, diversification and relying on practiced investment teams, we believe that investors can achieve their long-term investment objectives.
As always, I encourage you to communicate with your financial consultant if you have any questions about your investment in a Nuveen Fund. On behalf of the other members of the Nuveen Fund Board, we look forward to continuing to earn your trust in the months and years ahead.
William J. Schneider
Chairman of the Board
January 23, 2015
Portfolio Managers’ Comments
Nuveen Georgia Dividend Advantage Municipal Fund 2 (NKG)
Nuveen Maryland Premium Income Municipal Fund (NMY)
Nuveen Minnesota Municipal Income Fund (NMS)
Nuveen Missouri Premium Income Municipal Fund (NOM)
Nuveen North Carolina Premium Income Municipal Fund (NNC)
Nuveen Virginia Premium Income Municipal Fund (NPV)
These Funds feature portfolio management by Nuveen Asset Management, LLC, an affiliate of Nuveen Investments, Inc. Portfolio managers Daniel J. Close, CFA, Thomas C. Spalding, CFA, Douglas J. White, CFA and Christopher L. Drahn, CFA, discuss key investment strategies and the six-month performance of these six Nuveen Funds. Dan has managed the Nuveen Georgia and North Carolina Funds since 2007. Tom assumed portfolio management responsibility for the Maryland and Virginia Funds in 2011, Doug has managed the Minnesota Fund since 1993 and Chris has managed the Missouri Fund since 2011.
Fund Mergers
The Nuveen Minnesota Municipal Income Fund (NMS), which commenced operations on October 6, 2014, was formed from the merger of Minnesota Municipal Income Portfolio Inc. (MXA) and First American Minnesota Municipal Income Fund II (MXN) (the Mergers), both of which had been managed by U.S. Bancorp Asset Management, Inc. and sub-advised by Nuveen Fund Advisors, LLC and Nuveen Asset Management, LLC. MXA is treated as the survivor of the Mergers for accounting and performance reporting purposes. Accordingly, all performance and other information shown for NMS for periods prior to October 6, 2014, is that of MXA. MXA’s previous fiscal year end was June 30, 2014, and therefore NMS’s reporting period for this report is from July 1, 2014 through November 30, 2014.
What key strategies were used to manage the Funds during the reporting period ended November 30, 2014?
Falling long-term interest rates helped municipal bonds rally during the reporting period. Additional tailwinds came from a supportive fundamental backdrop and demand continuing to outpace supply. In this environment, bond issuers sought to take advantage of declining rates by retiring older bonds and replacing them with newer debt issued at lower rates. The national municipal market saw an increase in the number of current calls during the reporting period. However, individual states experienced varying levels of call activity. Overall, the Funds continued to seek bonds with long-term potential, while managing interest rate risk and keeping the Funds fully invested.
Certain statements in this report are forward-looking statements. Discussions of specific investments are for illustration only and are not intended as recommendations of individual investments. The forward-looking statements and other views expressed herein are those of the portfolio managers as of the date of this report. Actual future results or occurrences may differ significantly from those anticipated in any forward-looking statements, and the views expressed herein are subject to change at any time, due to numerous market and other factors. The Funds disclaim any obligation to update publicly or revise any forward-looking statements or views expressed herein.
Ratings shown are the highest rating given by one of the following national rating agencies: Standard & Poor’s (S&P), Moody’s Investors Service, Inc. (Moody’s) or Fitch, Inc. (Fitch). Credit ratings are subject to change. AAA, AA, A and BBB are investment grade ratings; BB, B, CCC, CC, C and D are below investment grade ratings. Certain bonds backed by U.S. government or agency securities are regarded as having an implied rating equal to the rating of such securities. Holdings designated N/R are not rated by these national rating agencies.
Bond insurance guarantees only the payment of principal and interest on the bond when due, and not the value of the bonds themselves, which will fluctuate with the bond market and the financial success of the issuer and the insurer. Insurance relates specifically to the bonds in the portfolio and not to the share prices of a Fund. No representation is made as to the insurers’ ability to meet their commitments.
Refer to the Glossary of Terms Used in this Report for further definition of the terms used within this section.
Portfolio Managers’ Comments (continued)
In NMY, NMS and NKG, buying activity was fairly muted. In Maryland, we sought bonds with intermediate to longer maturities and medium to lower credit quality, but new issuance in the state during this reporting period tended to be of higher quality and shorter maturity. That being said, we did find two credits with structure and terms that appealed to our strategy, Western Maryland Health and Howard County Housing. New issues of attractive revenue bonds in Minnesota were also relatively scarce, as has typically been the case in this state. We were able to purchase a handful of new issues in the public power and charter school sectors, as well as a few secondary market issues in the health care and transportation sectors in NMS to help keep it fully invested. NKG also stayed fully invested with the purchases of two local general obligation (GO) bonds, one water and sewer bond and one higher education bond, all in the intermediate to longer maturity range.
The other three Funds saw more diversified buying opportunities during the reporting period. In Virginia, purchases for NPV came from the new issue and secondary markets and were mostly in longer dated credits. Additions to the portfolio included bonds issued for the University of Virginia, Metropolitan Washington D.C. Airports Authority and Winchester Economic Development Authority for Valley Health System, as well as various state and local issuing authorities. Buying activity in NOM during the reporting period represented a range of sectors and credit ratings (AA, A, BBB and non-rated). Our largest purchase was a AA-rated Excelsior Springs sales tax revenue bond. In the electric utility sector, we added a Missouri Joint Municipal Electric Utility Commission Plum Point Project credit. We also bought bonds in the hospital and senior living care credit sectors. In NNC, we bought two higher education bonds, two airport bonds, two appropriation bonds and one water and sewer bond.
In addition, we established a portfolio hedge in both NKG and NNC by purchasing a credit default swap on the debt obligations of the U.S. territory of Puerto Rico. We have previously noted a correlation between the credit quality of Puerto Rico bonds and that of the overall high yield municipal bond market. Given that these portfolios regularly maintain a meaningful stake in BBB-rated and below investment grade rated bonds, we saw this as a way to reduce the Funds’ overall risk while continuing to take advantage of opportunities to invest in the lower quality portion of the market. During the reporting period, these swaps had a negligible impact on performance.
Generally, the cash to finance the Funds’ purchases came from bonds that were called or, in the case of NMY, NOM and NPV, sold from our Puerto Rico exposure. In NNC, the market’s recent strength provided us an opportunity to sell low coupon structures in the health care sector, using the proceeds to buy premium coupon structures in appropriation bonds. Selling activity in NKG and NMS was overall muted during the reporting period.
How did the Funds perform during the reporting period ended November 30, 2014?
The tables in each Fund’s Performance Overview and Holding Summaries section of this report provide the Funds’ total returns for the five-month, six-month, one-year, five-year and ten-year periods ended November 30, 2014. Each Fund’s total returns at common share net asset value (NAV) are compared with the performance of corresponding market indexes and a Lipper classification average.
For the reporting period ended November 30, 2014, the total return at common share NAV for the six Funds exceeded the return for their respective state’s S&P Municipal Bond Index as well as the national S&P Municipal Bond Index. For the same period, NKG, NMY, NOM, NNC and NPV lagged the average return for the Lipper Other States Municipal Debt Funds Classification Average, while NMS outperformed this same classification average. Shareholders should note that the performance of the Lipper Other States classification represents the overall average of returns for funds from ten states with a wide variety of municipal market conditions, making direct comparisons less meaningful.
Key management factors that influenced the Funds’ returns during this reporting period included duration and yield curve positioning, credit exposure and sector allocation. In addition, the use of regulatory leverage was an important factor affecting the performance of these Funds. Leverage is discussed in more detail later in the Fund Leverage section of this report.
Municipal bonds with longer maturities outperformed those with shorter maturities, as the municipal yield curve flattened somewhat during the reporting period. The Funds were generally positioned with overweights to the longer portions of the yield curve and underweights to the shorter end of the curve, which was beneficial to performance.
In terms of the credit quality spectrum, lower rated municipal bonds performed better than those with higher grade ratings during this reporting period. Investors’ search for yield in the current low rate environment was a boon to lower quality bonds, which tended to offer higher yields in exchange for higher risk. As AAA-rated bonds were the weakest performing category, underweight allocations to these credits in NKG, NMS, NOM and NNC were advantageous to performance. NMS also held an underweight position in AA-rated bonds, which was favorable to results, as this segment also lagged during the reporting period. Additionally, Funds with overweight exposure to medium and lower rated debt, including NMS and NOM, further benefited from the strong relative performance of BBB, BB and non-rated bonds during the reporting period. However, for NPV, credit quality had a neutral impact on performance. NPV’s weighting in U.S. guaranteed bonds, which underperformed because they are primarily short-term bonds with high quality ratings, offset gains made elsewhere in the Fund’s portfolio.
Sectors that outperformed the municipal market during the reporting period included health care, hospitals and transportation, while pre-refunded and GO bonds were the weakest sectors. NMS was aided by overweight allocations in health care (including hospitals and life care), higher education, housing and industrial development credits, together with underweight positions in state and local GO, dedicated tax (primarily sales tax revenue) and pre-refunded bonds. However, NMS’s overweight exposure in public power bonds detracted from performance, as the sector underperformed the benchmark. Positive performance in NPV was driven by an allocation to zero coupon bonds for transportation projects, including toll roads and airports. Because these types of projects are used for long periods of time, their bonds tend to have longer durations, which was favorable during a period when long maturity bonds were in demand from investors. NNC was also positioned with overweight exposure to toll road credits that was beneficial to returns, despite the negative impact of an overweight to pre-refunded bonds. In NKG, overall sector allocation and credit selection hurt performance due to an overweight in pre-refunded bonds and a weak performing health care credit, Ty Cobb Regional Medical Center. NMY’s tobacco holdings dampened performance but tuition revenue bonds were positive contributors.
Another major theme affecting the Funds’ performance during the reporting period was exposure to Puerto Rico bonds. This was the main detractor from performance for NMY and NOM during the reporting period. However, we note that the negative impact of NMY’s Puerto Rico position was somewhat buffered by its holding of American Airlines common stock, which performed well as the company has emerged from bankruptcy. The Fund received American Airlines stock when its holding of bonds issued by Puerto Rico Ports Authority for American Airlines was converted into equity as part of the merger with US Airways, which was completed in December 2013. Over time, we expect to sell these shares and reinvest the proceeds into municipal bonds.
The Puerto Rico bonds were originally added to our portfolios to keep assets fully invested and working for the Funds’ as well as to enhance diversity, duration and credit. The Puerto Rico credits offered higher yields, added diversification and triple exemption (i.e., exemption from most federal, state and local taxes). However, Puerto Rico’s continued economic weakening, escalating debt service obligations and long standing inability to deliver a balanced budget led to multiple downgrades on its debt over the past two years. Following the latest rating reduction by Moody’s in July 2014, Puerto Rico general obligation debt was rated B2/BB+/BB
Portfolio Managers’ Comments (continued)
(below investment grade) by Moody’s, S&P and Fitch, respectively, with negative outlooks. In late June 2014, Puerto Rico approved new legislation creating a judicial framework and formal process that would allow several of the commonwealth’s public corporations to restructure their public debt. As of November 2014, the Nuveen complex held $71 million in bonds backed by public corporations in Puerto Rico that could be restructured under this legislation, representing less than 0.1% of our municipal assets under management. In light of the evolving economic situation in Puerto Rico, Nuveen’s credit analysis of the commonwealth had previously considered the possibility of a default and the restructuring of public corporations and we adjusted our portfolios to prepare for such an outcome, although no such default or restructuring has occurred to date. The Nuveen complex’s entire exposure to obligations of the government of Puerto Rico and other Puerto Rico issuers totals 0.35% of assets under management as of November 30, 2014.
NMY, NOM and NPV were active sellers of Puerto Rico paper during the reporting period. NMY reduced its allocation by half, from 9.7% to 5.5% at period end. We trimmed NOM’s exposure from 3.2% to 0.5%, which represents a single holding in an insured, senior lien COFINA (sales tax) bond. NPV’s weighting was cut from 7.8% to 4.6% by the end of the period. NKG, NMS and NNC did not hold any Puerto Rico bonds during the reporting period.
Fund Leverage
IMPACT OF THE FUNDS’ LEVERAGE STRATEGIES ON PERFORMANCE
One important factor impacting the returns of the Funds relative to their comparative benchmarks was the Funds’ use of leverage through their issuance of preferred shares and/or investments in inverse floating rate securities, which represent leveraged investments in underlying bonds. The Funds use leverage because our research has shown that, over time, leveraging provides opportunities for additional income, particularly in the recent market environment where short-term market rates are at or near historical lows, meaning that the short-term rates the Fund has been paying on its leveraging instruments have been much lower than the interest the Fund has been earning on its portfolio of long-term bonds that it has bought with the proceeds of that leverage. However, use of leverage can expose the Fund to additional price volatility. When a Fund uses leverage, the Fund will experience a greater increase in its net asset value if the municipal bonds acquired through the use of leverage increase in value, but it will also experience a correspondingly larger decline in its net asset value if the bonds acquired through leverage decline in value, which will make the Fund’s net asset value more volatile, and its total return performance more variable over time. In addition, income in levered funds will typically decrease in comparison to unlevered funds when short-term interest rates increase and increase when short-term interest rates decrease. Leverage had a positive impact on the performance of the Funds over the reporting period.
As of November 30, 2014, the Funds’ percentages of leverage are as shown in the accompanying table.
| | | NKG | | NMY | | NMS | | NOM | NNC | | NPV | |
| Effective Leverage* | | 36.06% | | 34.54% | | 33.59% | | 37.79% | 33.46% | | 37.46% | |
| Regulatory Leverage* | | 33.52% | | 32.36% | | 33.59% | | 35.07% | 33.46% | | 32.77% | |
| * | Effective Leverage is a Fund’s effective economic leverage, and includes both regulatory leverage and the leverage effects of certain derivative and other investments in a Fund’s portfolio that increase the Fund’s investment exposure. Currently, the leverage effects of Tender Option Bond (TOB) inverse floater holdings are included in effective leverage values, in addition to any regulatory leverage. Regulatory leverage consists of preferred shares issued or borrowings of a Fund. Both of these are part of a Fund’s capital structure. Regulatory leverage is subject to asset coverage limits set forth in the Investment Company Act of 1940. |
Fund Leverage (continued)
THE FUNDS’ REGULATORY LEVERAGE
As of November 30, 2014, the Funds have issued and outstanding MuniFund Term Preferred (MTP) Shares, Variable Rate MuniFund Term Preferred (VMTP) Shares and Variable Rate Demand Preferred (VRDP) Shares as shown in the accompanying table.
| | MTP Shares | | VMTP Shares | | VRDP Shares | | | |
| | | | | | | | NYSE/ | | | | | | | | | | | |
| | | | Shares Issued at | | Annual | | NYSE MKT | | | | Shares Issued at | | | | Shares Issued at | | | |
| | Series | | Liquidation Value | | Dividend Rate | | Ticker | | Series | | Liquidation Value | | Series | | Liquidation Value | | Total | |
| NKG | | | | | — | | | — | | | — | | | 2017 | | $ | 75,000,000 | | | — | | | — | | $ | 75,000,000 | |
| NMY | | | | | — | | | — | | | — | | | 2017 | | $ | 167,000,000 | | | — | | | — | | $ | 167,000,000 | |
| NMS | | | | | — | | | — | | | — | | | 2017 | * | $ | 44,100,000 | | | — | | | — | | $ | 44,100,000 | |
| NOM | | 2015 | | $ | 17,880,000 | | | 2.10 | % | | NOM PRC | | | — | | | — | | | — | | | — | | $ | 17,880,000 | |
| NNC | | | | | — | | | — | | | — | | | 2017 | | $ | 125,000,000 | | | — | | | — | | $ | 125,000,000 | |
| NPV | | | | | — | | | — | | | — | | | — | | | — | | | 1 | | $ | 128,000,000 | | $ | 128,000,000 | |
* Includes VMTP Shares resulting from the Merger.
Refer to Notes to Financial Statements, Note 1 – General Information and Significant Accounting Policies and Note 4 – Fund Shares for further details on MTP, VMTP and VRDP Shares and each Fund’s respective transactions.
Common Share Information
COMMON SHARE DISTRIBUTION INFORMATION
The following information regarding the Funds’ distributions is current as of November 30, 2014. Each Fund’s distribution levels may vary over time based on each Fund’s investment activity and portfolio investments value changes.
During the current reporting period, each Fund’s monthly distributions to common shareholders were as shown in the accompanying table.
| | | Per Common Share Amounts | |
| Ex-Dividend Date | | | NKG | | | NMY | | | NMS | | | NOM | | | NNC | | | NPV | |
| June 2014 | | $ | 0.0535 | | $ | 0.0555 | | | N/A | | $ | 0.0610 | | $ | 0.0530 | | $ | 0.0615 | |
| July | | | 0.0535 | | | 0.0555 | | $ | 0.0740 | | | 0.0610 | | | 0.0530 | | | 0.0640 | |
| August | | | 0.0535 | | | 0.0555 | | | 0.0715 | | | 0.0610 | | | 0.0530 | | | 0.0640 | |
| September | | | 0.0535 | | | 0.0555 | | | 0.0690 | | | 0.0610 | | | 0.0530 | | | 0.0640 | |
| October | | | 0.0535 | | | 0.0555 | | | 0.1110 | | | 0.0610 | | | 0.0530 | | | 0.0640 | |
| November 2014 | | | 0.0535 | | | 0.0555 | | | 0.0690 | | | 0.0610 | | | 0.0530 | | | 0.0640 | |
| | | | | | | | | | | | | | | | | | | | |
| Market Yield* | | | 5.10 | % | | 5.27 | % | | 5.56 | % | | 4.85 | % | | 4.88 | % | | 5.73 | % |
| Taxable-Equivalent Yield* | | | 7.53 | % | | 7.75 | % | | 8.57 | % | | 7.16 | % | | 7.20 | % | | 8.44 | % |
| * | Market Yield is based on the Fund’s current annualized monthly dividend divided by the Fund’s current market price as of the end of the reporting period. Taxable-Equivalent Yield represents the yield that must be earned on a fully taxable investment in order to equal the yield of the Fund on an after-tax basis. It is based on a combined federal and state income tax rate of 32.3%, 32.0%, 35.1%, 32.3%, 32.2% and 32.1% for Georgia, Maryland, Minnesota, Missouri, North Carolina and Virginia, respectively. When comparing a Fund to investments that generate qualified dividend income, the Taxable-Equivalent Yield would be lower. |
Each Fund in this report seeks to pay regular monthly dividends out of its net investment income at a rate that reflects its past and projected net income performance. To permit each Fund to maintain a more stable monthly dividend, the Fund may pay dividends at a rate that may be more or less than the amount of net income actually earned by the Fund during the period. If a Fund has cumulatively earned more than it has paid in dividends, it will hold the excess in reserve as undistributed net investment income (UNII) as part of the Fund’s net asset value. Conversely, if a Fund has cumulatively paid in dividends more than it has earned, the excess will constitute a negative UNII that will likewise be reflected in the Fund’s net asset value. Each Fund will, over time, pay all its net investment income as dividends to shareholders.
As of November 30, 2014, all the Funds in this report had positive UNII balances, based upon our best estimate, for tax purposes. NMY, NMS, NOM and NPV had positive UNII balances, while NKG and NNC had negative balances for financial reporting purposes.
All monthly dividends paid by the Funds during the period ended November 30, 2014 were paid from net investment income. If a portion of a Fund’s monthly distributions was sourced from or comprised of elements other than net investment income, including capital gains and/or a return of capital, the Funds’ shareholders would have received a notice to that effect. The composition and per share amounts of each Fund’s monthly dividends for the reporting period are presented in the Statement of Changes in Net Assets and Financial Highlights, respectively (for reporting purposes) and in Note 6 — Income Tax Information within the accompany Notes to Financial Statements (for income tax purposes), later in this report.
Common Share Information (continued)
COMMON SHARE EQUITY SHELF PROGRAM
During the current reporting period, NPV was authorized to issue an additional 1,700,000 common shares through its equity shelf program. Under this program, the Fund, subject to market conditions, may raise additional capital from time to time in varying amounts and offering methods at a net price at or above the Fund’s NAV per common share. During the current reporting period NPV did not sell any common shares through its equity shelf program.
As of September 30, 2014 NPV’s shelf offering registration statement is no longer effective. Therefore, the Fund may not issue additional common shares under its equity shelf program until a new registration statement is effective.
Refer to Notes to Financial Statements, Note 1 — General Information and Significant Accounting Policies for further details on the Fund’s equity shelf program.
COMMON SHARE REPURCHASES
During August 2014, the Nuveen Funds’ Board of Trustees reauthorized an open-market share repurchase program, allowing each of NKG, NMY, NOM, NNC and NPV to repurchase an aggregate of up to approximately 10% of its outstanding shares.
During November 2014, NMS’s Board of Trustees authorized the Fund to participate in Nuveen’s closed-end fund complex-wide share repurchase program, allowing the Fund to repurchase an aggregate of up to approximately 10% of its outstanding shares.
As of November 30, 2014, and since the inception of the Funds’ repurchase programs, the Funds have cumulatively repurchased and retired common shares as shown in the accompanying table.
| | | NKG | | NMY | | NMS | | NOM | | NNC | | NPV | |
| Common Shares Cumulatively Repurchased and Retired | | — | | 400,000 | | — | | — | | 105,000 | | — | |
| Common Shares Authorized for Repurchase | | 1,055,000 | | 2,405,000 | | 555,000 | | 235,000 | | 1,655,000 | | 1,795,000 | |
During the current reporting period, the following Funds repurchased and retired their common shares at a weighted average price per common share and a weighted average discount per common share as shown in the accompanying table.
| | | | NMY | | | NNC | |
| Common Shares Repurchased and Retired | | | 400,000 | | | 105,000 | |
| Weighted Average Price per Common Share Repurchased and Retired | | $ | 12.56 | | $ | 13.02 | |
| Weighted Average Discount Price per Common Share Repurchased and Retired | | | 13.89 | % | | 13.78 | % |
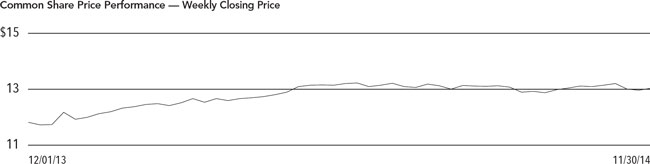
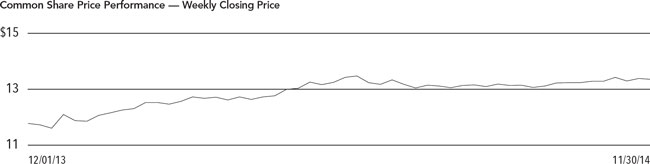
OTHER COMMON SHARE INFORMATION
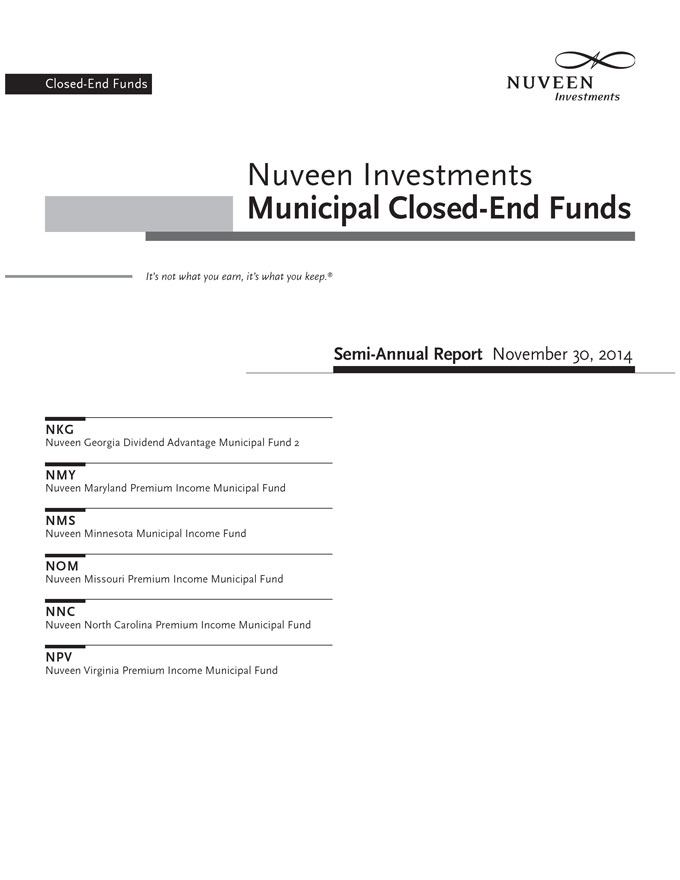
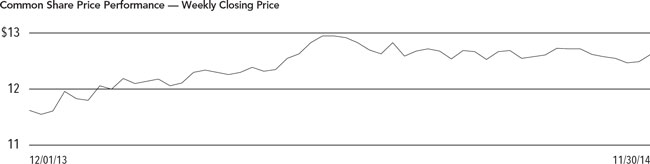
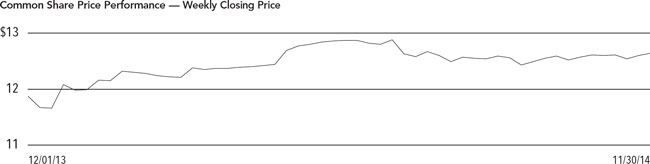
As of November 30, 2014, and during the current reporting period, the Funds’ common share prices were trading at a premium/(discount) to their common share NAVs as shown in the accompanying table.
| | | | NKG | | | NMY | | | NMS | | | NOM | | | NNC | | | NPV | |
| Common Share NAV | | $ | 14.10 | | $ | 14.73 | | $ | 15.65 | | $ | 14.19 | | $ | 15.12 | | $ | 14.65 | |
| Common Share Price | | $ | 12.59 | | $ | 12.64 | | $ | 14.89 | | $ | 15.10 | | $ | 13.03 | | $ | 13.40 | |
| Premium/(Discount) to NAV | | | (10.71 | )% | | (14.19 | )% | | (4.86 | )% | | 6.41 | % | | (13.82 | )% | | (8.53 | )% |
| 6-Month Average Premium/(Discount) to NAV | | | (9.58 | )% | | (13.53 | )% | | (0.39 | )%* | | 5.99 | % | | (12.63 | )% | | (8.69 | )% |
* For the 5-Month period.
Risk Considerations
Fund shares are not guaranteed or endorsed by any bank or other insured depository institution, and are not federally insured by the Federal Deposit Insurance Corporation. Past performance is no guarantee of future results. Fund common shares are subject to a variety of risks, including:
Investment, Price and Market Risk. An investment in shares is subject to investment risk, including the possible loss of the entire principal amount that you invest. Your investment in shares represents an indirect investment in the municipal securities owned by the Fund, which generally trade in the over-the-counter markets. Shares of closed-end investment companies like these Funds frequently trade at a discount to their net asset value (NAV). Your shares at any point in time may be worth less than your original investment, even after taking into account the reinvestment of Fund dividends and distributions.
Leverage Risk. Each Fund’s use of leverage creates the possibility of higher volatility for the Fund’s per share NAV, market price, distributions and returns. There is no assurance that a Fund’s leveraging strategy will be successful. Certain aspects of the recently adopted Volcker Rule may limit the availability of tender option bonds, which are used by the Funds for leveraging and duration management purposes. The effects of this new Rule, expected to take effect in mid-2015, may make it more difficult for a Fund to maintain current or desired levels of leverage and may cause the Fund to incur additional expenses to maintain its leverage.
Tax Risk. The tax treatment of Fund distributions may be affected by new IRS interpretations of the Internal Revenue Code and future changes in tax laws and regulations.
Issuer Credit Risk. This is the risk that a security in a Fund’s portfolio will fail to make dividend or interest payments when due.
Interest Rate Risk. Fixed-income securities such as bonds, preferred, convertible and other debt securities will decline in value if market interest rates rise.
Reinvestment Risk. If market interest rates decline, income earned from a Fund’s portfolio may be reinvested at rates below that of the original bond that generated the income.
Call Risk or Prepayment Risk. Issuers may exercise their option to prepay principal earlier than scheduled, forcing a Fund to reinvest in lower-yielding securities.
Inverse Floater Risk. The Funds may invest in inverse floaters. Due to their leveraged nature, these investments can greatly increase a Fund’s exposure to interest rate risk and credit risk. In addition, investments in inverse floaters involve the risk that the Fund could lose more than its original principal investment.
Municipal Bond Market Liquidity Risk. Inventories of municipal bonds held by brokers and dealers have decreased in recent years, lessening their ability to make a market in these securities. This reduction in market making capacity has the potential to decrease a Fund’s ability to buy or sell bonds, and increase bond price volatility and trading costs, particularly during periods of economic or market stress. In addition, recent federal banking regulations may cause certain dealers to reduce their inventories of municipal bonds, which may further decrease a Fund’s ability to buy or sell bonds. As a result, the Fund may be forced to accept a lower price to sell a security, to sell other securities to raise cash, or to give up an investment opportunity, any of which could have a negative effect on performance. If the Fund needed to sell large blocks of bonds, those sales could further reduce the bonds’ prices and hurt performance.
Derivatives Risk. The Funds may use derivative instruments, which involve a high degree of financial risk, including the risk that the loss on a derivative may be greater than the principal amount investment.
| NKG | |
| | Nuveen Georgia Dividend Advantage Municipal Fund 2 |
| | Performance Overview and Holding Summaries as of November 30, 2014 |
Refer to the Glossary of Terms Used in this Report for further definition of the terms used within this section.
Average Annual Total Returns as of November 30, 2014
| | Cumulative | | | Average Annual |
| | 6-Month | | 1-Year | 5-Year | 10-Year |
| NKG at Common Share NAV | 3.19 | % | | 11.04% | 5.15% | 4.76% |
| NKG at Common Share Price | (0.53 | )% | | 13.92% | 4.90% | 4.37% |
| S&P Municipal Bond Georgia Index | 2.11 | % | | 6.99% | 4.92% | 4.57% |
| S&P Municipal Bond Index | 2.35 | % | | 8.35% | 5.34% | 4.84% |
| Lipper Other States Municipal Debt Funds Classification Average | 4.03 | % | | 14.92% | 7.23% | 5.58% |
Past performance is not predictive of future results. Current performance may be higher or lower than the data shown. Returns do not reflect the deduction of taxes that shareholders may have to pay on Fund distributions or upon the sale of Fund shares. Returns at NAV are net of Fund expenses, and assume reinvestment of distributions. Comparative index and Lipper return information is provided for the Fund’s shares at NAV only. Indexes and Lipper averages are not available for direct investment.
This data relates to the securities held in the Fund’s portfolio of investments as of the end of the reporting period. It should not be construed as a measure of performance for the Fund itself. Holdings are subject to change.
Ratings shown are the highest rating given by one of the following national rating agencies: Standard & Poor’s Group, Moody’s Investors Service, Inc. or Fitch, Inc. Credit ratings are subject to change. AAA, AA, A and BBB are investment grade ratings; BB, B, CCC, CC, C and D are below-investment grade ratings. Certain bonds backed by U.S. Government or agency securities are regarded as having an implied rating equal to the rating of such securities. Holdings designated N/R are not rated by these national rating agencies.
| Fund Allocation | |
| (% of net assets) | |
| Municipal Bonds | 149.9% |
| Floating Rate Obligations | (2.2)% |
| VMTP Shares, at Liquidation Value | (50.4)% |
| Other Assets Less Liabilities | 2.7% |
| Portfolio Composition | |
(% of total investments)1 | |
| Tax Obligation/General | 26.6% |
| Water and Sewer | 15.7% |
| Tax Obligation/Limited | 14.8% |
| Education and Civic Organizations | 11.3% |
| Health Care | 9.9% |
| Transportation | 7.5% |
| Utilities | 6.6% |
| Other | 7.6% |
| Credit Quality | |
(% of total investment exposure)1 | |
| AAA/U.S. Guaranteed | 16.1% |
| AA | 52.1% |
| A | 18.7% |
| BBB | 5.7% |
| BB or Lower | 2.5% |
| N/R (not rated) | 4.9% |
1 Excluding investments in derivatives.
| NMY | |
| | Nuveen Maryland Premium Income Municipal Fund |
| | Performance Overview and Holding Summaries as of November 30, 2014 |
Refer to the Glossary of Terms Used in this Report for further definition of the terms used within this section.
Average Annual Total Returns as of November 30, 2014
| | Cumulative | | Average Annual |
| | 6-Month | | 1-Year | 5-Year | 10-Year |
| NMY at Common Share NAV | 2.93% | | 10.82% | 5.52% | 5.09% |
| NMY at Common Share Price | 0.52% | | 12.11% | 3.46% | 2.88% |
| S&P Municipal Bond Maryland Index | 1.80% | | 6.02% | 4.35% | 4.41% |
| S&P Municipal Bond Index | 2.35% | | 8.35% | 5.34% | 4.84% |
| Lipper Other States Municipal Debt Funds Classification Average | 4.03% | | 14.92% | 7.23% | 5.58% |
Past performance is not predictive of future results. Current performance may be higher or lower than the data shown. Returns do not reflect the deduction of taxes that shareholders may have to pay on Fund distributions or upon the sale of Fund shares. Returns at NAV are net of Fund expenses, and assume reinvestment of distributions. Comparative index and Lipper return information is provided for the Fund’s shares at NAV only. Indexes and Lipper averages are not available for direct investment.
This data relates to the securities held in the Fund’s portfolio of investments as of the end of the reporting period. It should not be construed as a measure of performance for the Fund itself. Holdings are subject to change.
Ratings shown are the highest rating given by one of the following national rating agencies: Standard & Poor’s Group, Moody’s Investors Service, Inc. or Fitch, Inc. Credit ratings are subject to change. AAA, AA, A and BBB are investment grade ratings; BB, B, CCC, CC, C and D are below-investment grade ratings. Certain bonds backed by U.S. Government or agency securities are regarded as having an implied rating equal to the rating of such securities. Holdings designated N/R are not rated by these national rating agencies.
| Fund Allocation | |
| (% of net assets) | |
| Municipal Bonds | 149.4% |
| Common Stocks | 0.8% |
| Floating Rate Obligations | (4.9)% |
| VMTP Shares, at Liquidation Value | (47.8)% |
| Other Assets Less Liabilities | 2.5% |
| Portfolio Composition | |
| (% of total investments) | |
| Health Care | 23.8% |
| Tax Obligation/General | 13.3% |
| U.S. Guaranteed | 13.3% |
| Tax Obligation/Limited | 11.0% |
| Education and Civic Organizations | 8.6% |
| Housing/Single Family | 5.4% |
| Housing/Multifamily | 5.0% |
| Other | 19.6% |
| Credit Quality | |
| (% of total investment exposure) | |
| AAA/U.S. Guaranteed | 29.1% |
| AA | 25.7% |
| A | 19.6% |
| BBB | 15.5% |
| BB or Lower | 5.7% |
| N/R (not rated) | 0.5% |
| N/A (not applicable) | 3.9% |
NMS | |
| | Nuveen Minnesota Municipal Income Fund |
| | Performance Overview and Holding Summaries as of November 30, 2014 |
Refer to the Glossary of Terms Used in this Report for further definition of the terms used within this section.
Average Annual Total Returns as of November 30, 2014
| | Cumulative | | | Average Annual |
| | 5-Month | | 1-Year | 5-Year | 10-Year |
| NMS at Common Share NAV | 3.55 | % | | 13.38% | 8.37% | 6.31% |
| NMS at Common Share Price | (7.32 | )% | | 11.15% | 6.10% | 5.61% |
| S&P Municipal Bond Minnesota Index | 1.88 | % | | 6.61% | 4.84% | 4.78% |
| S&P Municipal Bond Index | 2.44 | % | | 8.35% | 5.34% | 4.84% |
| Lipper Other States Municipal Debt Funds Classification Average | 2.52 | % | | 14.92% | 7.23% | 5.58% |
Past performance is not predictive of future results. Current performance may be higher or lower than the data shown. Returns do not reflect the deduction of taxes that shareholders may have to pay on Fund distributions or upon the sale of Fund shares. Returns at NAV are net of Fund expenses, and assume reinvestment of distributions. Comparative index and Lipper return information is provided for the Fund’s shares at NAV only. Indexes and Lipper averages are not available for direct investment.
This data relates to the securities held in the Fund’s portfolio of investments as of the end of the reporting period. It should not be construed as a measure of performance for the Fund itself. Holdings are subject to change.
Ratings shown are the highest rating given by one of the following national rating agencies: Standard & Poor’s Group, Moody’s Investors Service, Inc. or Fitch, Inc. Credit ratings are subject to change. AAA, AA, A and BBB are investment grade ratings; BB, B, CCC, CC, C and D are below-investment grade ratings. Certain bonds backed by U.S. Government or agency securities are regarded as having an implied rating equal to the rating of such securities. Holdings designated N/R are not rated by these national rating agencies.
| Fund Allocation | |
| (% of net assets) | |
| Municipal Bonds | 150.9% |
| VMTP Shares, at Liquidation Value | (50.6)% |
| Other Assets Less Liabilities | (0.3)% |
| Portfolio Composition | |
| (% of total investments) | |
| Education and Civic Organizations | 21.6% |
| Health Care | 20.8% |
| Utilities | 12.2% |
| Tax Obligation/General | 9.2% |
| Long-Term Care | 7.9% |
| Tax Obligation/Limited | 7.3% |
| Housing/Multifamily | 5.2% |
| Other | 15.8% |
| Credit Quality | |
| (% of total investment exposure) | |
| AAA/U.S. Guaranteed | 6.1% |
| AA | 40.6% |
| A | 16.9% |
| BBB | 16.9% |
| BB or Lower | 5.3% |
| N/R (not rated) | 14.2% |
NOM | |
| | Nuveen Missouri Premium Income Municipal Fund |
| | Performance Overview and Holding Summaries as of November 30, 2014 |
Refer to the Glossary of Terms Used in this Report for further definition of the terms used within this section.
Average Annual Total Returns as of November 30, 2014
| | Cumulative | | Average Annual |
| | 6-Month | | 1-Year | 5-Year | 10-Year |
| NOM at Common Share NAV | 2.62% | | 12.61% | 7.12% | 5.15% |
| NOM at Common Share Price | 2.71% | | 22.08% | 6.95% | 3.52% |
| S&P Municipal Bond Missouri Index | 2.13% | | 7.97% | 5.53% | 4.98% |
| S&P Municipal Bond Index | 2.35% | | 8.35% | 5.34% | 4.84% |
| Lipper Other States Municipal Debt Funds Classification Average | 4.03% | | 14.92% | 7.23% | 5.58% |
Past performance is not predictive of future results. Current performance may be higher or lower than the data shown. Returns do not reflect the deduction of taxes that shareholders may have to pay on Fund distributions or upon the sale of Fund shares. Returns at NAV are net of Fund expenses, and assume reinvestment of distributions. Comparative index and Lipper return information is provided for the Fund’s shares at NAV only. Indexes and Lipper averages are not available for direct investment.
This data relates to the securities held in the Fund’s portfolio of investments as of the end of the reporting period. It should not be construed as a measure of performance for the Fund itself. Holdings are subject to change.
Ratings shown are the highest rating given by one of the following national rating agencies: Standard & Poor’s Group, Moody’s Investors Service, Inc. or Fitch, Inc. Credit ratings are subject to change. AAA, AA, A and BBB are investment grade ratings; BB, B, CCC, CC, C and D are below-investment grade ratings. Certain bonds backed by U.S. Government or agency securities are regarded as having an implied rating equal to the rating of such securities. Holdings designated N/R are not rated by these national rating agencies.
| Fund Allocation | |
| (% of net assets) | |
| Municipal Bonds | 159.2% |
| Floating Rate Obligations | (6.7)% |
| MTP Shares, at Liquidation Value | (54.0)% |
| Other Assets Less Liabilities | 1.5% |
| Portfolio Composition | |
| (% of total investments) | |
| Health Care | 22.7% |
| Tax Obligation/Limited | 13.4% |
| Education and Civic Organizations | 13.0% |
| Tax Obligation/General | 9.7% |
| U.S. Guaranteed | 9.2% |
| Utilities | 8.3% |
| Transportation | 8.1% |
| Long-Term Care | 8.0% |
| Other | 7.6% |
| Credit Quality | |
| (% of total investment exposure) | |
| AAA/U.S. Guaranteed | 15.1% |
| AA | 35.9% |
| A | 24.5% |
| BBB | 17.8% |
| N/R (not rated) | 6.7% |
NNC | |
| | Nuveen North Carolina Premium Income Municipal Fund |
| | Performance Overview and Holding Summaries as of November 30, 2014 |
Refer to the Glossary of Terms Used in this Report for further definition of the terms used within this section.
Average Annual Total Returns as of November 30, 2014
| | Cumulative | | Average Annual |
| | 6-Month | | 1-Year | 5-Year | 10-Year |
| NNC at Common Share NAV | 3.65% | | 14.20% | 5.71% | 5.13% |
| NNC at Common Share Price | 0.83% | | 15.07% | 1.93% | 2.69% |
| S&P Municipal Bond North Carolina Index | 1.86% | | 6.65% | 4.67% | 4.71% |
| S&P Municipal Bond Index | 2.35% | | 8.35% | 5.34% | 4.84% |
| Lipper Other States Municipal Debt Funds Classification Average | 4.03% | | 14.92% | 7.23% | 5.58% |
Past performance is not predictive of future results. Current performance may be higher or lower than the data shown. Returns do not reflect the deduction of taxes that shareholders may have to pay on Fund distributions or upon the sale of Fund shares. Returns at NAV are net of Fund expenses, and assume reinvestment of distributions. Comparative index and Lipper return information is provided for the Fund’s shares at NAV only. Indexes and Lipper averages are not available for direct investment.
This data relates to the securities held in the Fund’s portfolio of investments as of the end of the reporting period. It should not be construed as a measure of performance for the Fund itself. Holdings are subject to change.
Ratings shown are the highest rating given by one of the following national rating agencies: Standard & Poor’s Group, Moody’s Investors Service, Inc. or Fitch, Inc. Credit ratings are subject to change. AAA, AA, A and BBB are investment grade ratings; BB, B, CCC, CC, C and D are below-investment grade ratings. Certain bonds backed by U.S. Government or agency securities are regarded as having an implied rating equal to the rating of such securities. Holdings designated N/R are not rated by these national rating agencies.
| Fund Allocation | |
| (% of net assets) | |
| Municipal Bonds | 149.3% |
| VMTP Shares, at Liquidation Value | (50.3)% |
| Other Assets Less Liabilities | 1.0% |
| Portfolio Composition | |
(% of total investments)1 | |
| Water and Sewer | 17.7% |
| Health Care | 17.4% |
| Tax Obligation/Limited | 14.4% |
| Education and Civic Organizations | 14.3% |
| Transportation | 12.9% |
| U.S. Guaranteed | 7.8% |
| Utilities | 6.8% |
| Other | 8.7% |
| Credit Quality | |
(% of total investment exposure)1 | |
| AAA/U.S. Guaranteed | 23.1% |
| AA | 54.0% |
| A | 18.0% |
| BBB | 2.7% |
| N/R (not rated) | 2.2% |
1 Excluding investments in derivatives.
NPV | |
| | Nuveen Virginia Premium Income Municipal Fund |
| | Performance Overview and Holding Summaries as of November 30, 2014 |
Refer to the Glossary of Terms Used in this Report for further definition of the terms used within this section.
Average Annual Total Returns as of November 30, 2014
| | Cumulative | | Average Annual |
| | 6-Month | | 1-Year | 5-Year | 10-Year |
| NPV at Common Share NAV | 3.93% | | 14.78% | 5.81% | 5.00% |
| NPV at Common Share Price | 2.99% | | 19.66% | 3.82% | 2.72% |
| S&P Municipal Bond Virginia Index | 2.14% | | 7.37% | 4.54% | 4.48% |
| S&P Municipal Bond Index | 2.35% | | 8.35% | 5.34% | 4.84% |
| Lipper Other States Municipal Debt Funds Classification Average | 4.03% | | 14.92% | 7.23% | 5.58% |
Past performance is not predictive of future results. Current performance may be higher or lower than the data shown. Returns do not reflect the deduction of taxes that shareholders may have to pay on Fund distributions or upon the sale of Fund shares. Returns at NAV are net of Fund expenses, and assume reinvestment of distributions. Comparative index and Lipper return information is provided for the Fund’s shares at NAV only. Indexes and Lipper averages are not available for direct investment.
This data relates to the securities held in the Fund’s portfolio of investments as of the end of the reporting period. It should not be construed as a measure of performance for the Fund itself. Holdings are subject to change.
Ratings shown are the highest rating given by one of the following national rating agencies: Standard & Poor’s Group, Moody’s Investors Service, Inc. or Fitch, Inc. Credit ratings are subject to change. AAA, AA, A and BBB are investment grade ratings; BB, B, CCC, CC, C and D are below-investment grade ratings. Certain bonds backed by U.S. Government or agency securities are regarded as having an implied rating equal to the rating of such securities. Holdings designated N/R are not rated by these national rating agencies.
| Fund Allocation | |
| (% of net assets) | |
| Municipal Bonds | 149.9% |
| Floating Rate Obligations | (3.5)% |
| VRDP Shares, at Liquidation Value | (48.7)% |
| Other Assets Less Liabilities | 2.3% |
| Portfolio Composition | |
| (% of total investments) | |
| Health Care | 18.9% |
| Transportation | 18.1% |
| Tax Obligation/Limited | 15.9% |
| U.S. Guaranteed | 10.4% |
| Tax Obligation/General | 8.4% |
| Education and Civic Organizations | 6.5% |
| Water and Sewer | 6.0% |
| Long-Term Care | 5.8% |
| Other | 10.0% |
| Credit Quality | |
| (% of total investment exposure) | |
| AAA/U.S. Guaranteed | 26.6% |
| AA | 40.0% |
| A | 6.7% |
| BBB | 18.8% |
| BB or Lower | 4.5% |
| N/R (not rated) | 3.4% |
Shareholder Meeting Report
A special meeting of shareholders was held in the offices of Nuveen Investments on August 5, 2014 for NKG, NMY, NOM, NNC and NPV; at this meeting the shareholders were asked to vote to approve a new investment management agreement, to approve new sub-advisory agreements and to elect Board Members.
| | | NKG | | NMY | | NOM | | NNC | | NPV | |
| | | Common and | | Common and | | Common and | | Common and | | Common and | |
| | | Preferred shares | | Preferred shares | | Preferred shares | | Preferred shares | | Preferred shares | |
| | | voting together | | voting together | | voting together | | voting together | | voting together | |
| | | as a class | | as a class | | as a class | | as a class | | as a class | |
| To approve a new investment management agreement | | | | | | | | | | | | | | | | |
| For | | | 4,872,647 | | | 10,036,066 | | | 1,896,773 | | | 7,730,261 | | | 8,671,379 | |
| Against | | | 345,014 | | | 633,962 | | | 64,673 | | | 615,319 | | | 349,982 | |
| Abstain | | | 112,545 | | | 446,640 | | | 66,445 | | | 320,237 | | | 361,531 | |
| Broker Non-Votes | | | 1,406,958 | | | 3,281,480 | | | 351,063 | | | 2,205,322 | | | 2,345,377 | |
| Total | | | 6,737,164 | | | 14,398,148 | | | 2,378,954 | | | 10,871,139 | | | 11,728,269 | |
| To approve a new sub-advisory agreement | | | | | | | | | | | | | | | | |
| For | | | 4,873,305 | | | 10,046,765 | | | 1,900,857 | | | 7,742,183 | | | 8,639,338 | |
| Against | | | 355,956 | | | 612,934 | | | 66,306 | | | 620,745 | | | 382,387 | |
| Abstain | | | 100,945 | | | 456,969 | | | 60,728 | | | 302,889 | | | 361,167 | |
| Broker Non-Votes | | | 1,406,958 | | | 3,281,480 | | | 351,063 | | | 2,205,322 | | | 2,345,377 | |
| Total | | | 6,737,164 | | | 14,398,148 | | | 2,378,954 | | | 10,871,139 | | | 11,728,269 | |
| Approval of the Board Members was reached as follows: | | | | | | | | | | | | | | | | |
| William Adams IV | | | | | | | | | | | | | | | | |
| For | | | 6,211,798 | | | 13,480,774 | | | 1,999,764 | | | 10,113,135 | | | 11,179,804 | |
| Withhold | | | 525,366 | | | 917,374 | | | 379,190 | | | 758,004 | | | 548,465 | |
| Total | | | 6,737,164 | | | 14,398,148 | | | 2,378,954 | | | 10,871,139 | | | 11,728,269 | |
| John K. Nelson | | | | | | | | | | | | | | | | |
| For | | | 6,211,806 | | | 13,499,173 | | | 1,994,764 | | | 10,118,298 | | | 11,175,216 | |
| Withhold | | | 525,358 | | | 898,975 | | | 384,190 | | | 752,841 | | | 553,053 | |
| Total | | | 6,737,164 | | | 14,398,148 | | | 2,378,954 | | | 10,871,139 | | | 11,728,269 | |
| Thomas S. Schreier, Jr. | | | | | | | | | | | | | | | | |
| For | | | 6,210,104 | | | 13,478,876 | | | 1,994,555 | | | 10,106,141 | | | 11,190,672 | |
| Withhold | | | 527,060 | | | 919,272 | | �� | 384,399 | | | 764,998 | | | 537,597 | |
| Total | | | 6,737,164 | | | 14,398,148 | | | 2,378,954 | | | 10,871,139 | | | 11,728,269 | |
| NKG | |
| | Nuveen Georgia Dividend Advantage Municipal Fund 2 |
| | Portfolio of Investments | November 30, 2014 (Unaudited) |
| | Principal | | | | Optional Call | | | | | |
| | Amount (000) | | Description (1) | | Provisions (2) | Ratings (3) | | | Value | |
| | | | LONG-TERM INVESTMENTS – 149.9% (100.0% of Total Investments) | | | | | | | |
| | | | MUNICIPAL BONDS – 149.9% (100.0% of Total Investments) | | | | | | | |
| | | | Education and Civic Organizations – 17.0% (11.3% of Total Investments) | | | | | | | |
| $ | 1,760 | | Athens Housing Authority, Georgia, Student Housing Lease Revenue Bonds, UGAREF East Campus Housing LLC Project, Series 2009, 5.250%, 6/15/35 | | 6/19 at 100.00 | Aa2 | | $ | 1,940,118 | |
| | 5,000 | | Atlanta Development Authority, Georgia, Educational Facilities Revenue Bonds, Science Park LLC Project, Series 2007, 5.000%, 7/01/39 | | 7/17 at 100.00 | Aa3 | | | 5,398,050 | |
| | 700 | | Carrollton Payroll Development Authority, Georgia, Student Housing Revenue Bonds, University of West Georgia, Series 2004A, 5.000%, 9/01/21 – SYNCORA GTY Insured | | No Opt. Call | A1 | | | 702,786 | |
| | 1,340 | | Douglas County Development Authority, Georgia, Charter School Revenue Bonds, Brighten Academy Project, Series 2013B, 7.000%, 10/01/43 | | 10/23 at 100.00 | N/R | | | 1,446,986 | |
| | 625 | | Fulton County Development Authority, Georgia, Revenue Bonds, Georgia Tech Foundation Technology Square Project, Refunding Series 2012A, 5.000%, 11/01/31 | | 5/22 at 100.00 | AA+ | | | 716,363 | |
| | 150 | | Georgia Higher Education Facilities Authority, Revenue Bonds, USG Real Estate Foundation I LLC Project, Series 2008, 6.000%, 6/15/28 | | 6/18 at 100.00 | A1 | | | 170,886 | |
| | | | Private Colleges and Universities Authority, Georgia, Revenue Bonds, Emory University, Series 2009, Trust 3404: | | | | | | | |
| | 730 | | 18.236%, 3/01/17 (IF) | | No Opt. Call | AA+ | | | 1,137,019 | |
| | 1,150 | | 18.266%, 3/01/17 (IF) | | No Opt. Call | AA+ | | | 1,754,256 | |
| | 3,000 | | Private Colleges and Universities Authority, Georgia, Revenue Bonds, Emory University, Series 2013A, 5.000%, 10/01/43 | | 10/23 at 100.00 | AA+ | | | 3,421,559 | |
| | 1,325 | | Private Colleges and Universities Authority, Georgia, Revenue Bonds, Mercer University Project, Refunding Series 2012C, 5.250%, 10/01/30 | | 10/22 at 100.00 | Baa2 | | | 1,474,579 | |
| | 1,000 | | Private Colleges and Universities Authority, Georgia, Revenue Bonds, Mercer University, Series 2012A, 5.000%, 10/01/32 | | 10/21 at 100.00 | Baa2 | | | 1,077,580 | |
| | 3,000 | | Private Colleges and Universities Authority, Georgia, Revenue Bonds, Savannah College of Art & Design Projects, Series 2014, 5.000%, 4/01/44 | | 4/24 at 100.00 | Baa2 | | | 3,245,160 | |
| | 1,180 | | Savannah Economic Development Authority, Georgia, Revenue Bonds, Armstrong Atlantic State University, Compass Point LLC Project, Series 2005, 5.000%, 7/01/25 – SYNCORA GTY Insured | | 7/15 at 100.00 | A1 | | | 1,212,544 | |
| | 1,490 | | Savannah Economic Development Authority, Georgia, Revenue Bonds, Armstrong Center LLC, Series 2005A, 5.000%, 12/01/34 – SYNCORA GTY Insured | | 12/15 at 100.00 | A1 | | | 1,545,473 | |
| | 22,450 | | Total Education and Civic Organizations | | | | | | 25,243,359 | |
| | | | Health Care – 14.9% (9.9% of Total Investments) | | | | | | | |
| | | | Baldwin County Hospital Authority, Georgia, Revenue Bonds, Oconee Regional Medical Center, Series 1998: | | | | | | | |
| | 205 | | 5.250%, 12/01/22 | | No Opt. Call | CCC | | | 201,066 | |
| | 745 | | 5.375%, 12/01/28 | | 12/14 at 100.00 | CCC | | | 721,845 | |
| | | | Coffee County Hospital Authority, Georgia, Revenue Bonds, Coffee County Regional Medical Center, Series 2004: | | | | | | | |
| | 285 | | 5.000%, 12/01/19 | | 12/14 at 100.00 | BB– | | | 285,268 | |
| | 2,400 | | 5.250%, 12/01/22 | | 12/14 at 100.00 | BB– | | | 2,401,704 | |
| | 255 | | 5.000%, 12/01/26 | | 12/14 at 100.00 | BB– | | | 255,071 | |
| | 715 | | Coweta County Development Authority, Georgia, Revenue Bonds, Piedmont Healthcare, Inc. Project, Series 2010, 5.000%, 6/15/40 | | 6/20 at 100.00 | AA– | | | 781,259 | |
| | 2,500 | | Franklin County Industrial Building Authority, Georgia, Revenue Bonds, Ty Cobb Regional Medical Center Project, Series 2010, 8.000%, 12/01/40 (4), (5) | | 12/20 at 100.00 | N/R | | | 852,777 | |
| NKG | Nuveen Georgia Dividend Advantage Municipal Fund 2 |
| | Portfolio of Investments (continued) | November 30, 2014 (Unaudited) |
| | Principal | | | | Optional Call | | | | | |
| | Amount (000) | | Description (1) | | Provisions (2) | Ratings (3) | | | Value | |
| | | | Health Care (continued) | | | | | | | |
| | | | Gainesville and Hall County Hospital Authority, Georgia, Revenue Anticipation Certificates, Northeast Georgia Health Services Inc., Series 2010B: | | | | | | | |
| $ | 1,000 | | 5.000%, 2/15/33 | | 2/20 at 100.00 | AA– | | $ | 1,099,120 | |
| | 1,000 | | 5.125%, 2/15/40 | | 2/20 at 100.00 | AA– | | | 1,093,480 | |
| | 3,945 | | 5.250%, 2/15/45 | | 2/41 at 100.00 | AA– | | | 4,339,302 | |
| | 1,620 | | Greene County Development Authority, Georgia, Health System Revenue Bonds, Catholic Health East Issue, Series 2012, 5.000%, 11/15/37 | | No Opt. Call | Aa2 | | | 1,796,515 | |
| | 2,540 | | Houston County Hospital Authority, Georgia, Revenue Bonds, Houston Healthcare Project, Series 2007, 5.250%, 10/01/35 | | 10/17 at 100.00 | A+ | | | 2,698,369 | |
| | | | Macon-Bibb County Hospital Authority, Georgia, Revenue Anticipation Certificates, Medical Center of Central Georgia Inc., Series 2009: | | | | | | | |
| | 425 | | 5.000%, 8/01/32 | | 8/19 at 100.00 | AA | | | 463,063 | |
| | 975 | | 5.000%, 8/01/35 | | 8/19 at 100.00 | AA | | | 1,056,988 | |
| | 1,470 | | Medical Center Hospital Authority, Georgia, Revenue Anticipation Certificates, Columbus Regional Healthcare System, Inc. Project, Series 2010, 5.000%,
8/01/21 – AGM Insured | | No Opt. Call | AA | | | 1,670,008 | |
| | 2,300 | | Valdosta and Lowndes County Hospital Authority, Georgia, Revenue Certificates, South Georgia Medical Center, Series 2007, 5.000%, 10/01/33 | | 10/17 at 100.00 | A+ | | | 2,425,281 | |
| | 22,380 | | Total Health Care | | | | | | 22,141,116 | |
| | | | Housing/Multifamily – 4.9% (3.3% of Total Investments) | | | | | | | |
| | 1,205 | | Atlanta Urban Residential Finance Authority, Georgia, Multifamily Housing Revenue Bonds, Trestletree Village Apartments, Series 2013A, 4.500%, 11/01/35 | | 11/23 at 100.00 | A– | | | 1,231,185 | |
| | 1,600 | | Cobb County Development Authority, Georgia, Revenue Bonds, KSU University II Real Estate Foundation, LLC Project, Series 2011, 5.000%, 7/15/41 – AGM Insured | | 7/21 at 100.00 | AA | | | 1,736,416 | |
| | 1,375 | | Cobb County Development Authority, Georgia, Student Housing Revenue Bonds, KSU Village II Real Estate Foundation LLC Project, Senior Series 2007A, 5.250%, 7/15/38 – AMBAC Insured | | 7/17 at 100.00 | Baa2 | | | 1,407,945 | |
| | | | Savannah Economic Development Authority, Georgia, GNMA Collateralized Multifamily Housing Revenue Bonds, Snap I-II-III Apartments, Series 2002A: | | | | | | | |
| | 500 | | 5.150%, 11/20/22 (Alternative Minimum Tax) | | No Opt. Call | AA+ | | | 500,770 | |
| | 980 | | 5.200%, 11/20/27 (Alternative Minimum Tax) | | No Opt. Call | AA+ | | | 981,215 | |
| | 1,465 | | 5.250%, 11/20/32 (Alternative Minimum Tax) | | No Opt. Call | AA+ | | | 1,466,494 | |
| | 7,125 | | Total Housing/Multifamily | | | | | | 7,324,025 | |
| | | | Housing/Single Family – 0.8% (0.5% of Total Investments) | | | | | | | |
| | | | Georgia Housing and Finance Authority, Single Family Mortgage Bonds, Series 2006C-2: | | | | | | | |
| | 1,000 | | 4.500%, 12/01/27 (Alternative Minimum Tax) | | 12/15 at 100.00 | AAA | | | 1,009,900 | |
| | 170 | | 4.550%, 12/01/31 (Alternative Minimum Tax) | | 12/15 at 100.00 | AAA | | | 171,610 | |
| | 1,170 | | Total Housing/Single Family | | | | | | 1,181,510 | |
| | | | Industrials – 2.9% (1.9% of Total Investments) | | | | | | | |
| | 2,190 | | Cobb County Development Authority, Georgia, Solid Waste Disposal Revenue Bonds, Georgia Waste Management Project, Series 2004A, 5.000%, 4/01/33 (Alternative Minimum Tax) | | 4/16 at 101.00 | A– | | | 2,292,142 | |
| | 2,000 | | Fulton County Development Authority, Georgia, Local District Cooling Authority Revenue Bonds, Maxon Atlantic Station LLC, Series 2005A, 5.125%, 3/01/26 (Mandatory put 3/01/15) (Alternative Minimum Tax) | | 9/15 at 100.00 | BBB | | | 2,005,920 | |
| | 4,190 | | Total Industrials | | | | | | 4,298,062 | |
| | | | Materials – 0.3% (0.2% of Total Investments) | | | | | | | |
| | 390 | | Savannah Economic Development Authority, Georgia, Pollution Control Revenue Bonds, Union Camp Corporation, Series 1995, 6.150%, 3/01/17 | | No Opt. Call | Baa2 | | | 419,090 | |
| | | | Tax Obligation/General – 39.9% (26.6% of Total Investments) | | | | | | | |
| | 2,000 | | Chatham County Hospital Authority, Georgia, Seven Mill Tax Pledge Refunding and Improvement Revenue Bonds, Memorial Health University Medical Center, Inc., Series 2012A, 5.000%, 1/01/31 | | 1/22 at 100.00 | AA | | | 2,239,520 | |
| | 1,500 | | Cherokee County Resource Recovery Development Authority, Georgia, Solid Waste Disposal Revenue Bonds, Ball Ground Recycling LLC Project, Series 2007A, 5.000%, 7/01/37 – AMBAC Insured (Alternative Minimum Tax) | | 7/17 at 100.00 | AA+ | | | 1,554,675 | |
| | Principal | | | | Optional Call | | | | | |
| | Amount (000) | | Description (1) | | Provisions (2) | Ratings (3) | | | Value | |
| | | | Tax Obligation/General (continued) | | | | | | | |
| $ | 1,000 | | Clark County Hospital Authority, Georgia, Hospital Revenue Bonds, Athens Regional Medical Center, Series 2007, 5.000%, 1/01/27 – NPFG Insured | | 1/17 at 100.00 | Aa1 | | $ | 1,073,830 | |
| | 600 | | Clarke County Hospital Authority, Georgia, Hospital Revenue Certificates, Athens Regional Medical Center, Series 2012, 5.000%, 1/01/32 | | 1/22 at 100.00 | Aa1 | | | 672,264 | |
| | 3,315 | | Decatur, Georgia, General Obligation Bonds, Series 2007, 5.000%, 1/01/31 – AGM Insured | | 1/17 at 100.00 | AA+ | | | 3,549,801 | |
| | | | East Point Building Authority, Georgia, Revenue Bonds, Water & Sewer Project Series 2006A: | | | | | | | |
| | 3,000 | | 5.000%, 2/01/30 – SYNCORA GTY Insured | | 2/16 at 100.00 | N/R | | | 3,037,200 | |
| | 2,000 | | 5.000%, 2/01/34 – SYNCORA GTY Insured | | 2/16 at 100.00 | N/R | | | 2,023,200 | |
| | 1,090 | | Floyd County Hospital Authority, Georgia, Revenue Anticipation Certificates, Floyd Medical Center, Series 2003, 5.000%, 7/01/19 – NPFG Insured | | 7/15 at 100.00 | Aa2 | | | 1,099,756 | |
| | 1,135 | | Floyd County Hospital Authority, Georgia, Revenue Anticipation Certificates, Floyd Medical Center, Series 2012B, 5.000%, 7/01/23 | | No Opt. Call | Aa2 | | | 1,324,114 | |
| | 1,500 | | Forsyth County Water and Sewerage Authority, Georgia, Revenue Bonds, Series 2007, 5.000%, 4/01/37 – AGM Insured | | 4/17 at 100.00 | AAA | | | 1,621,515 | |
| | 3,000 | | Gainesville and Hall County Hospital Authority, Georgia, Revenue Anticipation Certificates, Northeast Georgia Health Services Inc., Series 2014A, 5.500%, 8/15/54 (WI/DD, Settling 12/11/14) | | 2/25 at 100.00 | AA– | | | 3,435,060 | |
| | 6,045 | | Georgia Environmental Loan Acquisition Corporation, Local Government Loan Securitization Bonds, Loan Pool Series 2011, 5.125%, 3/15/31 | | 3/21 at 100.00 | Aaa | | | 6,820,150 | |
| | 3,500 | | Georgia State, General Obligation Bonds, Refunding Series 2009I, 5.000%, 7/01/19 | | No Opt. Call | AAA | | | 4,115,545 | |
| | 750 | | Georgia State, General Obligation Bonds, Series 1998D, 5.250%, 10/01/15 | | No Opt. Call | AAA | | | 782,258 | |
| | 2,500 | | Georgia State, General Obligation Bonds, Series 2005B, 5.000%, 7/01/15 | | No Opt. Call | AAA | | | 2,572,350 | |
| | 2,500 | | Georgia State, General Obligation Bonds, Series 2007E, 5.000%, 8/01/24 | | 8/17 at 100.00 | AAA | | | 2,778,200 | |
| | 1,000 | | Georgia State, General Obligation Bonds, Series 2009B, 5.000%, 1/01/26 | | 1/19 at 100.00 | AAA | | | 1,143,310 | |
| | 3,500 | | Gwinnett County School District, Georgia, General Obligation Bonds, Series 2013, 5.000%, 2/01/36 | | 2/23 at 100.00 | AAA | | | 4,063,185 | |
| | 4,900 | | Gwinnett County School District, Georgia, General Obligation Bonds, Series 2008, 5.000%, 2/01/36 (UB) | | 2/18 at 100.00 | AAA | | | 5,420,821 | |
| | 1,500 | | Habersham County Hospital Authority, Georgia, Revenue Anticipation Certificates, Series 2014B, 5.000%, 2/01/37 | | No Opt. Call | Aa3 | | | 1,692,780 | |
| | 445 | | La Grange-Troup County Hospital Authority, Georgia, Revenue Anticipation Certificates, Series 2008A, 5.500%, 7/01/38 | | 7/18 at 100.00 | Aa2 | | | 493,897 | |
| | | | Liberty County Industrial Authority, Georgia, Revenue Bonds, Series 2014: | | | | | | | |
| | 302 | | 5.500%, 7/15/23 | | 7/21 at 100.00 | N/R | | | 306,853 | |
| | 601 | | 5.500%, 7/15/30 | | 7/21 at 100.00 | N/R | | | 609,712 | |
| | 659 | | 5.500%, 1/15/36 | | 7/21 at 100.00 | N/R | | | 669,155 | |
| | 2,260 | | Valdosta and Lowndes County Hospital Authority, Georgia, Revenue Certificates, South Georgia Medical Center Project, Series 2011B, 5.000%, 10/01/41 | | 10/21 at 100.00 | Aa2 | | | 2,473,932 | |
| | 1,450 | | Wayne County Hospital Authority, Georgia, Hospital Revenue Bonds, Series 2006, 5.000%, 3/01/23 – SYNCORA GTY Insured | | 3/16 at 100.00 | N/R | | | 1,469,764 | |
| | 2,000 | | Winder-Barrow Industrial Building Authority, Georgia, Revenue Bonds, City of Winder Project, Refunding Series 2012, 5.000%, 12/01/29 – AGM Insured | | 12/21 at 100.00 | A1 | | | 2,257,200 | |
| | 54,052 | | Total Tax Obligation/General | | | | | | 59,300,047 | |
| | | | Tax Obligation/Limited – 22.1% (14.8% of Total Investments) | | | | | | | |
| | | | Atlanta, Georgia, Tax Allocation Bonds Atlanta Station Project, Series 2007: | | | | | | | |
| | 110 | | 5.250%, 12/01/19 – AGC Insured | | 12/17 at 100.00 | AA | | | 121,286 | |
| | 50 | | 5.250%, 12/01/20 | | No Opt. Call | AA | | | 55,130 | |
| | 80 | | 5.250%, 12/01/21 – AGC Insured | | 12/17 at 100.00 | AA | | | 87,911 | |
| | 1,080 | | 5.000%, 12/01/23 – AGC Insured | | 12/17 at 100.00 | AA | | | 1,171,336 | |
| | 1,500 | | Atlanta, Georgia, Tax Allocation Bonds, Beltline Project Series 2008B. Remarketed, 7.375%, 1/01/31 | | 1/19 at 100.00 | A2 | | | 1,770,195 | |
| NKG | Nuveen Georgia Dividend Advantage Municipal Fund 2 |
| | Portfolio of Investments (continued) | November 30, 2014 (Unaudited) |
| | Principal | | | | Optional Call | | | | | |
| | Amount (000) | | Description (1) | | Provisions (2) | Ratings (3) | | | Value | |
| | | | Tax Obligation/Limited (continued) | | | | | | | |
| $ | 275 | | Atlanta, Georgia, Tax Allocation Bonds, Beltline Project Series 2008C. Remarketed, 7.500%, 1/01/31 | | 1/19 at 100.00 | A2 | | $ | 325,859 | |
| | 595 | | Atlanta, Georgia, Tax Allocation Bonds, Eastside Project, Series 2005A, 5.625%, 1/01/16 (Alternative Minimum Tax) | | 7/15 at 100.00 | A– | | | 609,982 | |
| | | | Atlanta, Georgia, Tax Allocation Bonds, Eastside Project, Series 2005B: | | | | | | | |
| | 2,065 | | 5.400%, 1/01/20 | | 7/15 at 100.00 | A– | | | 2,118,071 | |
| | 2,750 | | 5.600%, 1/01/30 | | 7/15 at 100.00 | A– | | | 2,815,560 | |
| | 725 | | Atlanta, Georgia, Tax Allocation Bonds, Perry Bolton Project Series 2014, 5.000%, 7/01/41 | | 7/23 at 100.00 | A– | | | 771,016 | |
| | 3,420 | | Atlanta, Georgia, Tax Allocation Bonds, Princeton Lakes Project, Series 2006, 5.500%, 1/01/31 | | 1/16 at 100.00 | BBB– | | | 3,459,159 | |
| | 1,725 | | Cobb-Marietta Coliseum and Exhibit Hall Authority, Georgia, Revenue Bonds, Performing Arts Center, Refunding Series 2013, 5.000%, 1/01/21 | | No Opt. Call | AAA | | | 2,080,229 | |
| | 405 | | Cobb-Marietta Coliseum and Exhibit Hall Authority, Georgia, Revenue Bonds, Refunding Series 2005, 5.500%, 10/01/26 – NPFG Insured | | No Opt. Call | AA– | | | 481,699 | |
| | | | Cobb-Marietta Coliseum and Exhibit Hall Authority, Georgia, Revenue Refunding Bonds, Series 1993: | | | | | | | |
| | 325 | | 5.500%, 10/01/18 – NPFG Insured | | No Opt. Call | AA– | | | 343,723 | |
| | 5,745 | | 5.625%, 10/01/26 – NPFG Insured | | 10/19 at 100.00 | AA– | | | 6,482,830 | |
| | 2,961 | | Georgia Local Governments, Certificates of Participation, Georgia Municipal Association, Series 1998A, 4.750%, 6/01/28 – NPFG Insured | | No Opt. Call | AA– | | | 3,195,837 | |
| | 750 | | Georgia Municipal Association Inc., Certificates of Participation, Atlanta Court Project, Series 2002, 5.125%, 12/01/21 – AMBAC Insured | | No Opt. Call | N/R | | | 751,365 | |
| | | | Georgia Municipal Association Inc., Certificates of Participation, Riverdale Public Purpose Project, Series 2009: | | | | | | | |
| | 905 | | 5.375%, 5/01/32 – AGC Insured | | 5/19 at 100.00 | AA | | | 1,024,913 | |
| | 1,165 | | 5.500%, 5/01/38 – AGC Insured | | 5/19 at 100.00 | AA | | | 1,325,467 | |
| | 2,715 | | Metropolitan Atlanta Rapid Transit Authority, Georgia, Sales Tax Revenue Refunding Bonds, Series 1992P, 6.250%, 7/01/20 – AMBAC Insured | | No Opt. Call | Aa2 | | | 3,017,397 | |
| | 810 | | Tift County Hospital Authority, Georgia, Revenue Anticipation Certificates Series 2012, 5.000%, 12/01/38 | | No Opt. Call | Aa2 | | | 899,294 | |
| | 30,156 | | Total Tax Obligation/Limited | | | | | | 32,908,259 | |
| | | | Transportation – 11.2% (7.5% of Total Investments) | | | | | | | |
| | 2,000 | | Atlanta, Georgia, Airport General Revenue Bonds, Refunding Series 2011B, 5.000%, 1/01/30 | | 1/21 at 100.00 | Aa3 | | | 2,199,500 | |
| | 2,000 | | Atlanta, Georgia, Airport General Revenue Bonds, Refunding Series 2012B, 5.000%, 1/01/31 | | No Opt. Call | Aa3 | | | 2,277,740 | |
| | 2,810 | | Atlanta, Georgia, Airport General Revenue Bonds, Series 2012C, 5.000%, 1/01/42 (Alternative Minimum Tax) | | 1/22 at 100.00 | Aa3 | | | 3,029,573 | |
| | | | Atlanta, Georgia, Airport Passenger Facilities Charge and General Revenue Bonds, Refunding Subordinate Lien Series 2014A: | | | | | | | |
| | 2,575 | | 5.000%, 1/01/32 | | 1/24 at 100.00 | A+ | | | 2,967,688 | |
| | 3,750 | | 5.000%, 1/01/34 | | 1/24 at 100.00 | A+ | | | 4,277,138 | |
| | 1,500 | | Clayton County Development Authority, Georgia, Special Facilities Revenue Bonds, Delta Air Lines, Inc. Project, Series 2009A, 8.750%, 6/01/29 | | 6/20 at 100.00 | BB– | | | 1,873,515 | |
| | 14,635 | | Total Transportation | | | | | | 16,625,154 | |
| | Principal | | | | Optional Call | | | | | |
| | Amount (000) | | Description (1) | | Provisions (2) | Ratings (3) | | | Value | |
| | | | U.S. Guaranteed – 2.5% (1.7% of Total Investments) (6) | | | | | | | |
| $ | 1,000 | | Douglasville-Douglas County Water and Sewer Authority, Georgia, Water and Sewer Revenue Bonds, Series 2005, 5.000%, 6/01/29 (Pre-refunded 12/01/15) – NPFG Insured | | 12/15 at 100.00 | AA– (6) | | $ | 1,048,730 | |
| | 10 | | Georgia Municipal Electric Authority, Senior Lien General Power Revenue Bonds, Series 1993Z, 5.500%, 1/01/20 (Pre-refunded 1/01/17) – FGIC Insured | | 1/17 at 100.00 | A+ (6) | | | 10,497 | |
| | 2,475 | | Paulding County School District, Georgia, General Obligation Bonds, Series 2007, 5.000%, 2/01/33 (Pre-refunded 2/01/17) | | 2/17 at 100.00 | AA+ (6) | | | 2,718,243 | |
| | 3,485 | | Total U.S. Guaranteed | | | | | | 3,777,470 | |
| | | | Utilities – 9.8% (6.6% of Total Investments) | | | | | | | |
| | 525 | | Burke County Development Authority, Georgia, Pollution Control Revenue Bonds, Georgia Power Company – Vogtle Plant, First Series 2012, 1.750%, 12/01/49 (Mandatory put 6/01/17) | | No Opt. Call | A | | | 534,424 | |
| | 2,000 | | Georgia Municipal Electric Authority, General Power Revenue Bonds, Project 1, Series 2007A, 5.000%, 1/01/25 – NPFG Insured | | 1/17 at 100.00 | AA– | | | 2,142,520 | |
| | 3,000 | | Georgia Municipal Electric Authority, General Power Revenue Bonds, Series 2012GG, 5.000%, 1/01/43 | | 1/23 at 100.00 | A+ | | | 3,304,620 | |
| | 505 | | Georgia Municipal Electric Authority, Senior Lien General Power Revenue Bonds, Series 1993Z, 5.500%, 1/01/20 – FGIC Insured | | No Opt. Call | A+ | | | 539,754 | |
| | | | Main Street Natural Gas Inc., Georgia, Gas Project Revenue Bonds, Series 2006B: | | | | | | | |
| | 1,055 | | 5.000%, 3/15/20 | | No Opt. Call | A | | | 1,185,060 | |
| | 1,300 | | 5.000%, 3/15/21 | | No Opt. Call | A | | | 1,468,012 | |
| | 1,500 | | 5.000%, 3/15/22 | | No Opt. Call | A | | | 1,702,605 | |
| | | | Main Street Natural Gas Inc., Georgia, Gas Project Revenue Bonds, Series 2007A: | | | | | | | |
| | 350 | | 5.125%, 9/15/17 | | No Opt. Call | A | | | 382,603 | |
| | 950 | | 5.000%, 3/15/18 | | No Opt. Call | A+ | | | 1,045,010 | |
| | 2,000 | | 5.000%, 3/15/22 | | No Opt. Call | A+ | | | 2,315,800 | |
| | 13,185 | | Total Utilities | | | | | | 14,620,408 | |
| | | | Water and Sewer – 23.6% (15.7% of Total Investments) | | | | | | | |
| | | | Atlanta, Georgia, Water and Wastewater Revenue Bonds, Series 2004: | | | | | | | |
| | 260 | | 5.750%, 11/01/30 – AGM Insured | | No Opt. Call | AA | | | 339,352 | |
| | 700 | | 5.000%, 11/01/37 – AGM Insured | | No Opt. Call | AA | | | 702,065 | |
| | 5,105 | | Cherokee County Water and Sewerage Authority, Georgia, Revenue Bonds, Series 2001, 5.000%, 8/01/35 – AGM Insured | | 8/18 at 100.00 | AA | | | 5,657,360 | |
| | 500 | | Columbus, Georgia, Water and Sewerage Revenue Bonds, Refunding Series 2014A, 5.000%, 5/01/31 | | 5/24 at 100.00 | AA | | | 586,715 | |
| | | | Coweta County Water and Sewer Authority, Georgia, Revenue Bonds, Series 2007: | | | | | | | |
| | 1,000 | | 5.000%, 6/01/32 | | 6/18 at 100.00 | Aa2 | | | 1,099,910 | |
| | 2,000 | | 5.000%, 6/01/37 | | 6/18 at 100.00 | Aa2 | | | 2,201,260 | |
| | | | DeKalb County, Georgia, Water and Sewerage Revenue Bonds, Refunding Series 2006B: | | | | | | | |
| | 6,000 | | 5.250%, 10/01/32 – AGM Insured | | 10/26 at 100.00 | AA | | | 7,260,239 | |
| | 300 | | 5.000%, 10/01/35 – AGM Insured | | No Opt. Call | AA | | | 346,932 | |
| | 5,350 | | DeKalb County, Georgia, Water and Sewerage Revenue Bonds, Second Resolution Series 2011A, 5.250%, 10/01/41 | | 10/21 at 100.00 | Aa3 | | | 6,172,616 | |
| | 2,225 | | Douglasville-Douglas County Water and Sewer Authority, Georgia, Water and Sewage Revenue Bonds, Series 2007, 5.000%, 6/01/37 – NPFG Insured | | 6/17 at 100.00 | AA– | | | 2,405,181 | |
| | 1,000 | | Fulton County, Georgia, Water and Sewerage Revenue Bonds, Refunding Series 2013, 5.000%, 1/01/33 | | 1/23 at 100.00 | AA– | | | 1,146,200 | |
| NKG | Nuveen Georgia Dividend Advantage Municipal Fund 2 |
| | Portfolio of Investments (continued) | November 30, 2014 (Unaudited) |
| | Principal | | | | Optional Call | | | | | |
| | Amount (000) | | Description (1) | | Provisions (2) | Ratings (3) | | | Value | |
| | | | Water and Sewer (continued) | | | | | | | |
| $ | 360 | | Georgia Environmental Loan Acquisition Corporation, Local Government Loan Securitization Bonds, Cobb County-Marietta Water Authority Loans, Series 2011, 5.250%, 2/15/36 | | 2/21 at 100.00 | Aaa | | $ | 405,050 | |
| | 1,000 | | Milledgeville, Georgia, Water and Sewerage Revenue Refunding Bonds, Series 1996, 6.000%, 12/01/21 – AGM Insured | | No Opt. Call | AA | | | 1,168,730 | |
| | 2,000 | | South Fulton Municipal Regional Water and Sewer Authority, Georgia, Revenue Bonds, Refunding Series 2014, 5.000%, 1/01/30 | | 1/24 at 100.00 | AA | | | 2,289,620 | |
| | 1,000 | | Unified Government of Athens-Clarke County, Georgia, Water and Sewerage Revenue Bonds, Series 2008, 5.500%, 1/01/38 | | 1/19 at 100.00 | AA+ | | | 1,141,270 | |
| | 1,975 | | Walton County Water and Sewerage Authority, Georgia, Revenue Bonds, The Oconee-Hard Creek Reservoir Project, Series 2008, 5.000%, 2/01/38 – AGM Insured | | 2/18 at 100.00 | Aa2 | | | 2,154,093 | |
| | 30,775 | | Total Water and Sewer | | | | | | 35,076,593 | |
| $ | 203,993 | | Total Long-Term Investments (cost $211,135,347) | | | | | | 222,915,093 | |
| | | | Floating Rate Obligations – (2.2)% | | | | | | (3,245,000 | ) |
| | | | Variable Rate MuniFund Term Preferred Shares, at Liquidation Value – (50.4)% (7) | | | | | | (75,000,000 | ) |
| | | | Other Assets Less Liabilities – 2.7% (8) | | | | | | 4,090,145 | |
| | | | Net Assets Applicable to Common Shares – 100% | | | | | $ | 148,760,238 | |
Investments in Derivatives as of November 30, 2014
Credit Default Swaps outstanding:
| | | | | | | Current | | | | | | | | | | | | | Unrealized | |
| | | | | Buy/Sell | | Credit | | | Notional | | Fixed Rate | | Termination | | | | | | Appreciation | |
| Counterparty | | Reference Entity | | Protection (9) | | Spread (10) | | | Amount | | (Annualized) | | Date | | | Value | | | (Depreciation) (8) | |
| Citibank N.A. | | Commonwealth of Puerto Rico | | Buy | | 25.5% | | $ | 1,810,000 | | 5.000% | | 12/20/19 | | $ | 438,413 | | $ | 1,916 | |
| (1) | All percentages shown in the Portfolio of Investments are based on net assets applicable to common shares unless otherwise noted. |
| (2) | Optional Call Provisions: Dates (month and year) and prices of the earliest optional call or redemption. There may be other call provisions at varying prices at later dates. Certain mortgage-backed securities may be subject to periodic principal paydowns. |
| (3) | Ratings: Using the highest of Standard & Poor’s Group (“Standard & Poor’s”), Moody’s Investors Service, Inc. (“Moody’s”) or Fitch, Inc. (“Fitch”) rating. Ratings below BBB by Standard & Poor’s, Baa by Moody’s or BBB by Fitch are considered to be below investment grade. Holdings designated N/R are not rated by any of these national rating agencies. |
| (4) | At or subsequent to the end of the reporting period, this security is non-income producing. Non-income producing, in the case of a fixed-income security, generally denotes that the issuer has (1) defaulted on the payment of principal or interest, (2) is under the protection of the Federal Bankruptcy Court or (3) the Fund’s Adviser has concluded that the issue is not likely to meet its future interest payment obligations and has directed the Fund’s custodian to cease accruing additional income on the Fund’s records. |
| (5) | Investment valued at fair value using methods determined in good faith by, or at the discretion of, the Board. For fair value measurement disclosure purposes, investment classified as Level 3. See Notes to Financial Statements, Note 2 – Investment Valuation and Fair Value Measurements for more information. |
| (6) | Backed by an escrow or trust containing sufficient U.S. Government or U.S. Government agency securities, which ensure the timely payment of principal and interest. Certain bonds backed by U.S. Government or agency securities are regarded as having an implied rating equal to the rating of such securities. |
| (7) | Variable Rate MuniFund Term Preferred Shares, at Liquidation Value as a percentage of Total Investments is 33.6% |
| (8) | Other Assets Less Liabilities includes the Unrealized Appreciation (Depreciation) of derivative instruments as listed within Investments in Derivatives as of the end of the reporting period. |
| (9) | The Fund entered into the credit default swaps to gain investment exposure to the referenced entity. Selling protection has a similar credit risk position to owning the referenced entity. Buying protection has a similar credit risk position to selling the referenced entity short. |
| (10) | The credit spread generally serves as an indication of the current status of the payment/performance risk and therefore the likelihood of default of the credit derivative. The credit spread also reflects the cost of buying/selling protection and may include upfront payments required to be made to enter into a credit default swap contract. Higher credit spreads are indicative of higher likelihood of performance by the seller of protection. |
| WI/DD | Investment, or portion of investment, purchased on a when-issued or delayed delivery basis. |
| (IF) | Inverse floating rate investment. |
| (UB) | Underlying bond of an inverse floating rate trust reflected as a financing transaction. See Notes to Financial Statements, Note 3 – Portfolio Securities and Investments in Derivatives, Inverse Floating Rate Securities for more information. |
See accompanying notes to financial statements.
| NMY | | |
| | Nuveen Maryland Premium Income Municipal Fund |
| | Portfolio of Investments | November 30, 2014 (Unaudited) |
| | Principal | | | | Optional Call | | | | | |
| | Amount (000) | | Description (1) | | Provisions (2) | Ratings (3) | | | Value | |
| | | | LONG-TERM INVESTMENTS – 150.2% (100.0% of Total Investments) | | | | | | | |
| | | | MUNICIPAL BONDS – 149.4% (99.5% of Total Investments) | | | | | | | |
| | | | Consumer Discretionary – 4.8% (3.2% of Total Investments) | | | | | | | |
| | | | Baltimore, Maryland, Senior Lien Convention Center Hotel Revenue Bonds, Series 2006A: | | | | | | | |
| $ | 540 | | 5.000%, 9/01/16 – SYNCORA GTY Insured | | No Opt. Call | BB+ | | $ | 572,616 | |
| | 400 | | 5.250%, 9/01/19 – SYNCORA GTY Insured | | 9/16 at 100.00 | BB+ | | | 421,592 | |
| | 330 | | 5.250%, 9/01/25 – SYNCORA GTY Insured | | 9/16 at 100.00 | BB+ | | | 341,088 | |
| | 350 | | 5.250%, 9/01/27 – SYNCORA GTY Insured | | 9/16 at 100.00 | BB+ | | | 360,549 | |
| | 535 | | 4.600%, 9/01/30 – SYNCORA GTY Insured | | 9/16 at 100.00 | BB+ | | | 543,416 | |
| | 100 | | 5.000%, 9/01/32 – SYNCORA GTY Insured | | 9/16 at 100.00 | BB+ | | | 102,077 | |
| | 12,165 | | 5.250%, 9/01/39 – SYNCORA GTY Insured | | 9/16 at 100.00 | BB+ | | | 12,437,859 | |
| | 1,000 | | Baltimore, Maryland, Subordinate Lien Convention Center Hotel Revenue Bonds, Series 2006B, 5.875%, 9/01/39 | | 9/16 at 100.00 | Ba2 | | | 1,031,200 | |
| | 2,000 | | Maryland Economic Development Corporation, Revenue Bonds, Chesapeake Bay Hyatt Conference Center, Series 2006A, 5.000%, 12/01/31 (4) | | 12/16 at 100.00 | N/R | | | 913,600 | |
| | 17,420 | | Total Consumer Discretionary | | | | | | 16,723,997 | |
| | | | Consumer Staples – 2.7% (1.8% of Total Investments) | | | | | | | |
| | 1,000 | | Buckeye Tobacco Settlement Financing Authority, Ohio, Tobacco Settlement Asset-Backed Revenue Bonds, Senior Lien, Series 2007A-2, 5.875%, 6/01/30 | | 6/17 at 100.00 | B– | | | 832,300 | |
| | | | Guam Economic Development & Commerce Authority, Tobacco Settlement Asset-Backed Bonds, Series 2007A: | | | | | | | |
| | 2,815 | | 5.250%, 6/01/32 | | 6/17 at 100.00 | B | | | 2,662,117 | |
| | 2,665 | | 5.625%, 6/01/47 | | 6/17 at 100.00 | B | | | 2,043,469 | |
| | 3,270 | | Puerto Rico, The Children’s Trust Fund, Tobacco Settlement Asset-Backed Refunding Bonds, Series 2002, 5.500%, 5/15/39 | | No Opt. Call | BBB | | | 3,118,730 | |
| | 800 | | Tobacco Settlement Financing Corporation, Virgin Islands, Tobacco Settlement Asset-Backed Bonds, Series 2001, 5.000%, 5/15/31 | | 5/15 at 100.00 | A3 | | | 772,048 | |
| | 10,550 | | Total Consumer Staples | | | | | | 9,428,664 | |
| | | | Education and Civic Organizations – 13.0% (8.6% of Total Investments) | | | | | | | |
| | 2,375 | | Frederick County, Maryland, Educational Facilities Revenue Bonds, Mount Saint Mary’s University, Series 2006, 5.625%, 9/01/38 | | 9/16 at 100.00 | BB+ | | | 2,381,460 | |
| | 700 | | Maryland Health and Higher Educational Facilities Authority, Revenue Bonds, Goucher College, Series 2012A, 5.000%, 7/01/34 | | 7/22 at 100.00 | A– | | | 779,072 | |
| | | | Maryland Health and Higher Educational Facilities Authority, Revenue Bonds, Johns Hopkins University, Series 2008A: | | | | | | | |
| | 2,000 | | 5.000%, 7/01/18 | | No Opt. Call | AA+ | | | 2,295,660 | |
| | 530 | | 5.250%, 7/01/38 | | No Opt. Call | AA+ | | | 589,307 | |
| | 1,250 | | Maryland Health and Higher Educational Facilities Authority, Revenue Bonds, Loyola University Maryland, Series 2012A, 5.000%, 10/01/39 | | 10/22 at 100.00 | A | | | 1,383,425 | |
| | | | Maryland Health and Higher Educational Facilities Authority, Revenue Bonds, Loyola University Maryland, Series 2014: | | | | | | | |
| | 1,250 | | 5.000%, 10/01/45 | | 10/24 at 100.00 | A | | | 1,413,250 | |
| | 1,000 | | 4.000%, 10/01/45 | | 10/24 at 100.00 | A | | | 1,024,100 | |
| | 3,500 | | Maryland Health and Higher Educational Facilities Authority, Revenue Bonds, Maryland Institute College of Art, Series 2006, 5.000%, 6/01/30 | | 6/16 at 100.00 | Baa1 | | | 3,595,935 | |
| | 1,130 | | Maryland Health and Higher Educational Facilities Authority, Revenue Bonds, Maryland Institute College of Art, Series 2007, 5.000%, 6/01/36 | | 6/17 at 100.00 | Baa1 | | | 1,174,364 | |
| | | | Maryland Health and Higher Educational Facilities Authority, Revenue Bonds, Maryland Institute College of Art, Series 2012: | | | | | | | |
| | 1,500 | | 5.000%, 6/01/34 | | No Opt. Call | Baa1 | | | 1,638,630 | |
| | 3,000 | | 5.000%, 6/01/47 | | 6/22 at 100.00 | Baa1 | | | 3,237,600 | |
| NMY | Nuveen Maryland Premium Income Municipal Fund |
| | Portfolio of Investments (continued) | November 30, 2014 (Unaudited) |
| | Principal | | | | Optional Call | | | | | |
| | Amount (000) | | Description (1) | | Provisions (2) | Ratings (3) | | | Value | |
| | | | Education and Civic Organizations (continued) | | | | | | | |
| $ | 745 | | Maryland Health and Higher Educational Facilities Authority, Revenue Bonds, Patterson Park Public Charter School Issue, Series 2010, 6.000%, 7/01/40 | | 7/20 at 100.00 | BBB– | | $ | 780,477 | |
| | | | Maryland Health and Higher Educational Facilities Authority, Revenue Bonds, The Johns Hopkins University, Series 2012A: | | | | | | | |
| | 1,145 | | 5.000%, 7/01/30 | | No Opt. Call | AA+ | | | 1,333,616 | |
| | 1,050 | | 5.000%, 7/01/37 | | No Opt. Call | AA+ | | | 1,192,748 | |
| | | | Maryland Health and Higher Educational Facilities Authority, Revenue Bonds, The Johns Hopkins University, Series 2013B: | | | | | | | |
| | 500 | | 5.000%, 7/01/38 | | 7/23 at 100.00 | AA+ | | | 570,150 | |
| | 4,375 | | 4.250%, 7/01/41 | | 7/23 at 100.00 | AA+ | | | 4,648,263 | |
| | 625 | | Morgan State University, Maryland, Student Tuition and Fee Revenue Bonds, Academic Fees and Auxiliary Facilities, Series 2012, 5.000%, 7/01/29 | | 7/22 at 100.00 | A+ | | | 705,894 | |
| | 9,445 | | Morgan State University, Maryland, Student Tuition and Fee Revenue Refunding Bonds, Academic Fees and Auxiliary Facilities, Series 1993, 6.100%, 7/01/20 – NPFG Insured | | No Opt. Call | AA– | | | 10,864,015 | |
| | 265 | | University of Puerto Rico, University System Revenue Bonds, Series 2006P, 5.000%, 6/01/23 | | 6/16 at 100.00 | BB | | | 165,018 | |
| | 1,145 | | University of Puerto Rico, University System Revenue Bonds, Series 2006Q, 5.000%, 6/01/19 | | 6/16 at 100.00 | BB | | | 750,754 | |
| | | | Westminster, Maryland, Educational Facilities Revenue Bonds, McDaniel College, Series 2006: | | | | | | | |
| | 2,000 | | 5.000%, 11/01/31 | | 11/16 at 100.00 | BBB+ | | | 2,049,140 | |
| | 2,750 | | 4.500%, 11/01/36 | | 11/16 at 100.00 | BBB+ | | | 2,777,445 | |
| | 42,280 | | Total Education and Civic Organizations | | | | | | 45,350,323 | |
| | | | Health Care – 35.7% (23.8% of Total Investments) | | | | | | | |
| | 2,445 | | Maryland Health and Higher Educational Facilities Authority, Revenue Bonds Doctors Community Hospital, Refunding Series 2010, 5.750%, 7/01/38 | | 7/20 at 100.00 | Baa3 | | | 2,591,407 | |
| | | | Maryland Health and Higher Educational Facilities Authority, Revenue Bonds, Adventist Healthcare, Series 2011A: | | | | | | | |
| | 1,350 | | 6.250%, 1/01/31 | | 1/22 at 100.00 | Baa2 | | | 1,573,020 | |
| | 375 | | 6.125%, 1/01/36 | | 1/22 at 100.00 | Baa2 | | | 431,254 | |
| | 1,355 | | Maryland Health and Higher Educational Facilities Authority, Revenue Bonds, Anne Arundel Health System Issue, Series 2012, 5.000%, 7/01/24 | | No Opt. Call | A– | | | 1,562,085 | |
| | 2,500 | | Maryland Health and Higher Educational Facilities Authority, Revenue Bonds, Anne Arundel Health System, Series 2010, 5.000%, 7/01/40 | | 7/19 at 100.00 | A– | | | 2,655,525 | |
| | 2,000 | | Maryland Health and Higher Educational Facilities Authority, Revenue Bonds, Calvert Health System Issue, Series 2013, 5.000%, 7/01/38 | | 7/23 at 100.00 | A | | | 2,213,060 | |
| | | | Maryland Health and Higher Educational Facilities Authority, Revenue Bonds, Carroll Hospital Center, Series 2006: | | | | | | | |
| | 1,000 | | 4.500%, 7/01/26 | | 7/16 at 100.00 | A3 | | | 1,023,830 | |
| | 2,550 | | 5.000%, 7/01/40 | | 7/16 at 100.00 | A3 | | | 2,611,022 | |
| | | | Maryland Health and Higher Educational Facilities Authority, Revenue Bonds, Carroll Hospital Center, Series 2012A: | | | | | | | |
| | 1,000 | | 4.000%, 7/01/30 | | 7/22 at 100.00 | A3 | | | 1,037,790 | |
| | 1,775 | | 5.000%, 7/01/37 | | 7/22 at 100.00 | A3 | | | 1,924,011 | |
| | 4,050 | | Maryland Health and Higher Educational Facilities Authority, Revenue Bonds, Doctors Community Hospital, Series 2007A, 5.000%, 7/01/29 | | 7/17 at 100.00 | Baa3 | | | 4,126,140 | |
| | 4,335 | | Maryland Health and Higher Educational Facilities Authority, Revenue Bonds, Frederick Memorial Hospital Issue, Series 2012A, 4.250%, 7/01/32 | | No Opt. Call | Baa1 | | | 4,476,928 | |
| | | | Maryland Health and Higher Educational Facilities Authority, Revenue Bonds, Johns Hopkins Health System Obligated Group Issue, Series 2011A: | | | | | | | |
| | 500 | | 5.000%, 5/15/25 | | 5/21 at 100.00 | AA– | | | 576,800 | |
| | 500 | | 5.000%, 5/15/26 | | 5/21 at 100.00 | AA– | | | 573,375 | |
| | 2,735 | | Maryland Health and Higher Educational Facilities Authority, Revenue Bonds, LifeBridge Health System, Series 2008, 5.000%, 7/01/28 – AGC Insured | | 7/17 at 100.00 | AA | | | 2,896,666 | |
| | Principal | | | | Optional Call | | | | | |
| | Amount (000) | | Description (1) | | Provisions (2) | Ratings (3) | | | Value | |
| | | | Health Care (continued) | | | | | | | |
| | | | Maryland Health and Higher Educational Facilities Authority, Revenue Bonds, LifeBridge Health System, Series 2011: | | | | | | | |
| $ | 500 | | 5.750%, 7/01/31 | | No Opt. Call | A | | $ | 575,535 | |
| | 1,000 | | 6.000%, 7/01/41 | | 7/21 at 100.00 | A | | | 1,151,710 | |
| | 4,060 | | Maryland Health and Higher Educational Facilities Authority, Revenue Bonds, MedStar Health, Series 2004, 5.375%, 8/15/24 | | No Opt. Call | A2 | | | 4,077,499 | |
| | 7,720 | | Maryland Health and Higher Educational Facilities Authority, Revenue Bonds, MedStar Health, Series 2007, 5.250%, 5/15/46 – BHAC Insured | | 5/16 at 100.00 | AA+ | | | 8,159,654 | |
| | | | Maryland Health and Higher Educational Facilities Authority, Revenue Bonds, Mercy Medical Center Project, Series 2007A: | | | | | | | |
| | 2,375 | | 5.000%, 7/01/37 | | 7/17 at 100.00 | BBB | | | 2,460,666 | |
| | 2,905 | | 5.500%, 7/01/42 | | 7/17 at 100.00 | BBB | | | 3,083,222 | |
| | 2,850 | | Maryland Health and Higher Educational Facilities Authority, Revenue Bonds, Mercy Medical Center, Series 2011, 5.000%, 7/01/31 | | 7/22 at 100.00 | BBB | | | 3,058,050 | |
| | 3,950 | | Maryland Health and Higher Educational Facilities Authority, Revenue Bonds, Peninsula Regional Medical Center, Series 2006, 5.000%, 7/01/36 | | 7/16 at 100.00 | A | | | 4,073,359 | |
| | 4,450 | | Maryland Health and Higher Educational Facilities Authority, Revenue Bonds, The Johns Hopkins Health System Obligated Group Issue, Series 2010, 5.000%, 5/15/40 | | 5/20 at 100.00 | AA– | | | 4,884,810 | |
| | | | Maryland Health and Higher Educational Facilities Authority, Revenue Bonds, Union Hospital of Cecil County, Series 2005: | | | | | | | |
| | 1,000 | | 5.000%, 7/01/35 | | 7/15 at 100.00 | A | | | 1,012,000 | |
| | 6,620 | | 5.000%, 7/01/40 | | 7/15 at 100.00 | A | | | 6,693,217 | |
| | | | Maryland Health and Higher Educational Facilities Authority, Revenue Bonds, University of Maryland Medical System Issue, Series 2013A: | | | | | | | |
| | 11,500 | | 5.000%, 7/01/43 | | 7/22 at 100.00 | A2 | | | 12,588,818 | |
| | 3,750 | | 4.000%, 7/01/43 | | 7/22 at 100.00 | A2 | | | 3,843,750 | |
| | | | Maryland Health and Higher Educational Facilities Authority, Revenue Bonds, University of Maryland Medical System, Series 2006: | | | | | | | |
| | 700 | | 5.000%, 7/01/31 | | 7/16 at 100.00 | A2 | | | 724,290 | |
| | 1,325 | | 5.000%, 7/01/36 | | 7/16 at 100.00 | A2 | | | 1,366,380 | |
| | 4,155 | | Maryland Health and Higher Educational Facilities Authority, Revenue Bonds, University of Maryland Medical System, Series 2010, 5.125%, 7/01/39 | | 7/19 at 100.00 | A2 | | | 4,518,895 | |
| | | | Maryland Health and Higher Educational Facilities Authority, Revenue Bonds, Washington County Hospital, Series 2008: | | | | | | | |
| | 135 | | 5.750%, 1/01/33 | | 1/18 at 100.00 | BBB | | | 142,202 | |
| | 7,075 | | 5.750%, 1/01/38 | | 1/18 at 100.00 | BBB | | | 7,439,858 | |
| | 1,950 | | 6.000%, 1/01/43 | | 1/18 at 100.00 | BBB | | | 2,063,451 | |
| | 12,250 | | Maryland Health and Higher Educational Facilities Authority, Revenue Bonds, Western Maryland Health, Series 2014, 5.250%, 7/01/34 | | 7/24 at 100.00 | BBB | | | 13,749,887 | |
| | 8,000 | | Montgomery County, Maryland, Revenue Bonds, Trinity Health Credit Group, Refunding Series 2011MD, 5.000%, 12/01/40 | | 12/21 at 100.00 | Aa2 | | | 8,789,600 | |
| | 116,740 | | Total Health Care | | | | | | 124,729,766 | |
| | | | Housing/Multifamily – 7.5% (5.0% of Total Investments) | | | | | | | |
| | 2,025 | | Anne Arundel County, Maryland, FNMA Multifamily Housing Revenue Bonds, Glenview Gardens Apartments Project, Series 2009, 5.000%, 1/01/28 (Mandatory put 1/01/27) | | 1/20 at 102.00 | AA+ | | | 2,211,847 | |
| | | | Howard County Housing Commission, Maryland, Revenue Bonds, Columbia Commons Apartments, Series 2014A: | | | | | | | |
| | 1,500 | | 4.000%, 6/01/34 | | 6/24 at 100.00 | A+ | | | 1,533,975 | |
| | 1,550 | | 5.000%, 6/01/44 | | 6/24 at 100.00 | A+ | | | 1,682,448 | |
| | | | Howard County Housing Commission, Maryland, Revenue Bonds, The Verona at Oakland Mills Project, Series 2013: | | | | | | | |
| | 3,000 | | 5.000%, 10/01/28 | | 10/23 at 100.00 | A+ | | | 3,352,830 | |
| | 2,000 | | 4.625%, 10/01/28 | | 10/23 at 100.00 | A+ | | | 2,175,300 | |
| | 2,110 | | Maryland Community Development Administration, Multifamily Housing Revenue Bonds, Princess Anne Apartments, Series 2001D, 5.450%, 12/15/33 (Alternative Minimum Tax) | | 12/14 at 100.00 | Aaa | | | 2,112,427 | |
| NMY | Nuveen Maryland Premium Income Municipal Fund |
| | Portfolio of Investments (continued) | November 30, 2014 (Unaudited) |
| | Principal | | | | Optional Call | | | | | |
| | Amount (000) | | Description (1) | | Provisions (2) | Ratings (3) | | | Value | |
| | | | Housing/Multifamily (continued) | | | | | | | |
| | | | Maryland Economic Development Corporation, Senior Lien Student Housing Revenue Bonds, University of Maryland – Baltimore, Series 2003A: | | | | | | | |
| $ | 15 | | 5.000%, 10/01/15 | | No Opt. Call | B3 | | $ | 14,982 | |
| | 3,460 | | 5.625%, 10/01/23 | | No Opt. Call | B3 | | | 3,299,456 | |
| | | | Maryland Economic Development Corporation, Student Housing Revenue Bonds, Salisbury University Project, Refunding Series 2013: | | | | | | | |
| | 500 | | 5.000%, 6/01/27 | | 6/23 at 100.00 | Baa3 | | | 550,310 | |
| | 500 | | 5.000%, 6/01/34 | | 6/23 at 100.00 | Baa3 | | | 540,045 | |
| | 1,500 | | Maryland Economic Development Corporation, Student Housing Revenue Bonds, Sheppard Pratt University Village, Series 2012, 5.000%, 7/01/33 | | No Opt. Call | BBB– | | | 1,620,765 | |
| | 5,115 | | Maryland Economic Development Corporation, Student Housing Revenue Refunding Bonds, University of Maryland College Park Projects, Series 2006, 5.000%,
6/01/33 – CIFG Insured | | 6/16 at 100.00 | AA | | | 5,353,103 | |
| | 85 | | Montgomery County Housing Opportunities Commission, Maryland, GNMA/FHA-Insured Multifamily Housing Revenue Bonds, Series 1995A, 5.900%, 7/01/15 | | 1/15 at 100.00 | Aa2 | | | 85,360 | |
| | 1,500 | | Montgomery County Housing Opportunities Commission, Maryland, Multifamily Housing Development Bonds, Series 2014A, 3.875%, 7/01/39 (WI/DD, Settling 12/10/14) | | 7/24 at 100.00 | Aaa | | | 1,514,340 | |
| | 24,860 | | Total Housing/Multifamily | | | | | | 26,047,188 | |
| | | | Housing/Single Family – 8.1% (5.4% of Total Investments) | | | | | | | |
| | 3,000 | | Maryland Community Development Administration Department of Housing and Community Development, Residential Revenue Bonds, Series 2009B, 4.750%, 9/01/39 | | 9/18 at 100.00 | Aa2 | | | 3,114,210 | |
| | 2,365 | | Maryland Community Development Administration Department of Housing and Community Development, Residential Revenue Bonds, Series 2014A, 4.300%, 9/01/32 | | 9/23 at 100.00 | Aa2 | | | 2,529,580 | |
| | | | Maryland Community Development Administration Department of Housing and Community Development, Residential Revenue Bonds, Series 2014C: | | | | | | | |
| | 3,000 | | 3.400%, 3/01/31 | | 3/24 at 100.00 | Aa2 | | | 3,043,650 | |
| | 1,165 | | 3.750%, 3/01/39 | | 3/24 at 100.00 | Aa2 | | | 1,180,902 | |
| | 1,800 | | Maryland Community Development Administration, Department of Housing and Community Development, Residential Revenue Bonds, Series 2006B, 4.750%, 9/01/25 (Alternative Minimum Tax) (UB) (5) | | 9/15 at 100.00 | AA | | | 1,818,738 | |
| | 550 | | Maryland Community Development Administration, Department of Housing and Community Development, Residential Revenue Bonds, Series 2006F, 4.900%, 9/01/26 (Alternative Minimum Tax) (UB) (5) | | 9/15 at 100.00 | AA | | | 555,760 | |
| | 7,500 | | Maryland Community Development Administration, Department of Housing and Community Development, Residential Revenue Bonds, Series 2006I, 4.875%, 9/01/26 (Alternative Minimum Tax) (UB) (5) | | 3/16 at 100.00 | AA | | | 7,627,650 | |
| | 4,075 | | Maryland Community Development Administration, Department of Housing and Community Development, Residential Revenue Bonds, Series 2006L, 4.900%, 9/01/31 (Alternative Minimum Tax) (UB) (5) | | 9/16 at 100.00 | AA | | | 4,148,675 | |
| | 2,820 | | Maryland Community Development Administration, Department of Housing and Community Development, Residential Revenue Bonds, Series 2007D, 4.850%, 9/01/37 (Alternative Minimum Tax) (UB) (5) | | 3/17 at 100.00 | AA | | | 2,863,796 | |
| | 1,500 | | Maryland Community Development Administration, Department of Housing and Community Development, Residential Revenue Bonds, Series 2007H, 5.000%, 9/01/27 (Alternative Minimum Tax) (UB) (5) | | 3/17 at 100.00 | AA | | | 1,555,094 | |
| | 27,775 | | Total Housing/Single Family | | | | | | 28,438,055 | |
| | | | Industrials – 2.8% (1.9% of Total Investments) | | | | | | | |
| | 5,895 | | Maryland Economic Development Corporation, Economic Development Revenue Bonds, Transportation Facilities Project, Series 2010A, 5.750%, 6/01/35 | | 6/20 at 100.00 | Baa3 | | | 6,364,183 | |
| | 3,340 | | Maryland Economic Development Corporation, Solid Waste Disposal Revenue Bonds, Waste Management Inc., Series 2002, 4.600%, 4/01/16 (Alternative Minimum Tax) | | No Opt. Call | A– | | | 3,493,607 | |
| | 9,235 | | Total Industrials | | | | | | 9,857,790 | |
| | Principal | | | | Optional Call | | | | | |
| | Amount (000) | | Description (1) | | Provisions (2) | Ratings (3) | | | Value | |
| | | | Long-Term Care – 6.3% (4.2% of Total Investments) | | | | | | | |
| $ | 5,215 | | Baltimore County, Maryland, Revenue Bonds, Oak Crest Village, Series 2007A, 5.000%, 1/01/37 | | 1/17 at 100.00 | A | | $ | 5,424,226 | |
| | 2,050 | | Gaithersburg, Maryland, Economic Development Revenue Bonds, Asbury Methodist Homes Inc., Series 2009B, 6.000%, 1/01/23 | | 1/20 at 100.00 | BBB | | | 2,304,836 | |
| | | | Maryland Health and Higher Educational Facilities Authority, Revenue Bonds, Charlestown Community Issue, Series 2010: | | | | | | | |
| | 1,685 | | 6.125%, 1/01/30 | | 1/21 at 100.00 | A | | | 1,909,897 | |
| | 5,060 | | 6.250%, 1/01/45 | | 1/21 at 100.00 | A | | | 5,699,027 | |
| | 1,000 | | Maryland Health and Higher Educational Facilities Authority, Revenue Bonds, Edenwald, Series 2006A, 5.400%, 1/01/31 | | 7/16 at 100.00 | N/R | | | 1,030,390 | |
| | | | Maryland Health and Higher Educational Facilities Authority, Revenue Bonds, King Farm Presbyterian Community, Series 2007A: | | | | | | | |
| | 600 | | 5.000%, 1/01/17 | | No Opt. Call | N/R | | | 632,760 | |
| | 1,460 | | 5.250%, 1/01/27 | | 1/17 at 100.00 | N/R | | | 1,493,565 | |
| | 1,050 | | 5.300%, 1/01/37 | | 1/17 at 100.00 | N/R | | | 1,066,086 | |
| | 2,480 | | Maryland Health and Higher Educational Facilities Authority, Revenue Bonds, Mercy Ridge Retirement Community, Series 2007, 4.750%, 7/01/34 | | 7/17 at 100.00 | A– | | | 2,542,471 | |
| | 20,600 | | Total Long-Term Care | | | | | | 22,103,258 | |
| | | | Tax Obligation/General – 19.9% (13.3% of Total Investments) | | | | | | | |
| | 1,565 | | Anne Arundel County, Maryland, General Obligation Bonds, Series 2006, 5.000%, 3/01/21 | | 3/16 at 100.00 | AAA | | | 1,654,753 | |
| | 685 | | Anne Arundel County, Maryland, Water and Sewer Revenue Bonds, Series 2006, 5.000%, 3/01/17 | | 3/16 at 100.00 | AAA | | | 724,922 | |
| | 1,070 | | Baltimore, Maryland, General Obligation Bonds, Consolidated Public Improvements, Refunding Series 2013B, 5.000%, 10/15/15 | | No Opt. Call | AA | | | 1,115,860 | |
| | | | Baltimore, Maryland, General Obligation Bonds, Consolidated Public Improvements, Series 2011A: | | | | | | | |
| | 1,000 | | 5.000%, 10/15/29 | | 10/21 at 100.00 | AA | | | 1,146,550 | |
| | 1,200 | | 5.000%, 10/15/30 | | 10/21 at 100.00 | AA | | | 1,368,576 | |
| | 805 | | Charles County, Maryland, Consolidated General Obligation Public Improvement Bonds, Series 2006, 5.000%, 3/01/16 | | No Opt. Call | AAA | | | 853,381 | |
| | 1,180 | | Frederick County, Maryland, General Obligation Public Facilities Bonds, Refunding Series 2013, 3.000%, 5/01/15 | | No Opt. Call | AAA | | | 1,194,585 | |
| | 2,305 | | Maryland National Capital Park Planning Commission, Prince George’s County, General Obligation Bonds, Park Acquisition and Development, Series 2004EE-2, 5.000%, 1/15/17 | | No Opt. Call | AAA | | | 2,314,289 | |
| | 1,000 | | Maryland State, General Obligation Bonds, State & Local Facilities Loan, First Series 2011B, 5.000%, 3/15/17 | | No Opt. Call | AAA | | | 1,103,490 | |
| | 1,895 | | Maryland State, General Obligation Bonds, State & Local Facilities Loan, Second Series 2009A, 3.000%, 8/15/17 | | No Opt. Call | AAA | | | 2,019,767 | |
| | | | Maryland State, General Obligation Bonds, State & Local Facilities Loan, Second Series 2009B: | | | | | | | |
| | 4,925 | | 5.250%, 8/15/16 | | No Opt. Call | AAA | | | 5,338,552 | |
| | 3,750 | | 5.250%, 8/15/17 | | No Opt. Call | AAA | | | 4,223,850 | |
| | 1,000 | | Maryland State, General Obligation Bonds, State & Local Facilities Loan, Second Series 2010A, 4.000%, 8/01/15 | | No Opt. Call | AAA | | | 1,026,200 | |
| | 5,705 | | Maryland State, General Obligation Bonds, State and Local Facilities Loan, First Series 2014C, 5.000%, 8/01/15 | | No Opt. Call | AAA | | | 5,892,980 | |
| | 3,435 | | Maryland State, General Obligation Bonds, State and Local Facilities Loan, Refunding Second Series 2011E, 5.000%, 8/01/15 | | No Opt. Call | AAA | | | 3,548,183 | |
| | 5,850 | | Montgomery County, Maryland, Consolidated General Obligation Public Improvement Bonds, Series 2005A, 5.000%, 7/01/15 | | No Opt. Call | AAA | | | 6,019,299 | |
| | 2,800 | | Montgomery County, Maryland, Consolidated General Obligation Public Improvement Bonds, Series 2006A, 5.000%, 5/01/16 | | No Opt. Call | AAA | | | 2,987,740 | |
| | 4,750 | | Montgomery County, Maryland, Consolidated General Obligation Public Improvement Bonds, Series 2008A, 5.000%, 8/01/15 | | No Opt. Call | AAA | | | 4,906,513 | |
| | 4,700 | | Montgomery County, Maryland, Consolidated General Obligation Public Improvement Bonds, Series 2013A, 4.000%, 11/01/15 | | No Opt. Call | AAA | | | 4,867,414 | |
| NMY | Nuveen Maryland Premium Income Municipal Fund |
| | Portfolio of Investments (continued) | November 30, 2014 (Unaudited) |
| | Principal | | | | Optional Call | | | | | |
| | Amount (000) | | Description (1) | | Provisions (2) | Ratings (3) | | | Value | |
| | | | Tax Obligation/General (continued) | | | | | | | |
| | | | Prince George’s County, Maryland, General Obligation Consolidated Public Improvement Bonds, Series 2014A: | | | | | | | |
| $ | 3,000 | | 4.000%, 9/01/30 | | 9/24 at 100.00 | AAA | | $ | 3,296,010 | |
| | 3,000 | | 4.000%, 9/01/31 | | 9/24 at 100.00 | AAA | | | 3,274,620 | |
| | 2,270 | | Puerto Rico, General Obligation and Public Improvement Bonds, Series 2002A, 5.500%, 7/01/20 – NPFG Insured | | No Opt. Call | AA– | | | 2,382,388 | |
| | 2,155 | | Puerto Rico, General Obligation Bonds, Public Improvement Refunding Series 2007A, 5.500%, 7/01/20 – NPFG Insured | | No Opt. Call | AA– | | | 2,261,694 | |
| | 1,025 | | Washington Suburban Sanitary District, Montgomery and Prince George’s Counties, Maryland, General Obligation Bonds, Consolidated Public Improvement, Refunding Series 2009, 5.000%, 6/01/17 | | No Opt. Call | AAA | | | 1,139,605 | |
| | | | Washington Suburban Sanitary District, Montgomery and Prince George’s Counties, Maryland, General Obligation Bonds, Consolidated Public Improvement, Refunding Series 2013: | | | | | | | |
| | 2,000 | | 3.000%, 6/01/15 | | No Opt. Call | AAA | | | 2,029,480 | |
| | 2,700 | | 4.000%, 6/01/17 | | No Opt. Call | AAA | | | 2,934,657 | |
| | 65,770 | | Total Tax Obligation/General | | | | | | 69,625,358 | |
| | | | Tax Obligation/Limited – 16.6% (11.0% of Total Investments) | | | | | | | |
| | 865 | | Anne Arundel County, Maryland, Special Obligation Bonds, National Business Park – North Project, Series 2010, 6.100%, 7/01/40 | | 7/18 at 102.00 | N/R | | | 925,810 | |
| | 1,200 | | Anne Arundel County, Maryland, Special Tax District Revenue Bonds, Villages of Dorchester & Farmington Village Projects, Series 2013, 5.000%, 7/01/32 | | 7/23 at 100.00 | A+ | | | 1,349,112 | |
| | 120 | | Baltimore, Maryland, Revenue Refunding Bonds, Convention Center, Series 1998, 5.000%, 9/01/19 – NPFG Insured | | 3/15 at 100.00 | AA– | | | 120,456 | |
| | 300 | | Baltimore, Maryland, Special Obligation Bonds, North Locust Point Project, Series 2005, 5.500%, 9/01/34 | | 9/15 at 101.00 | N/R | | | 306,735 | |
| | | | Frederick County, Maryland, Lake Linganore Village Community Development Special Obligation Bonds, Series 2001A: | | | | | | | |
| | 99 | | 5.600%, 7/01/20 – RAAI Insured | | No Opt. Call | N/R | | | 99,221 | |
| | 450 | | 5.700%, 7/01/29 – RAAI Insured | | No Opt. Call | N/R | | | 450,531 | |
| | | | Fredrick County, Maryland, Special Obligation Bonds, Urbana Community Development Authority, Series 2010A: | | | | | | | |
| | 5,350 | | 5.000%, 7/01/30 | | 7/20 at 100.00 | A– | | | 5,914,318 | |
| | 2,355 | | 5.000%, 7/01/40 | | 7/20 at 100.00 | A– | | | 2,569,894 | |
| | 1,780 | | Golden State Tobacco Securitization Corporation, California, Enhanced Tobacco Settlement Asset-Backed Revenue Bonds, Series 2005A, 5.000%, 6/01/45 | | 6/15 at 100.00 | A1 | | | 1,819,000 | |
| | 1,000 | | Government of Guam, Business Privilege Tax Bonds, Series 2011A, 5.250%, 1/01/36 | | 1/22 at 100.00 | A | | | 1,114,010 | |
| | 2,050 | | Hyattsville, Maryland, Special Obligation Bonds, University Town Center Project, Series 2004, 5.750%, 7/01/34 | | 7/16 at 100.00 | N/R | | | 2,093,563 | |
| | 11,750 | | Maryland Department of Transportation, Consolidated Transportation Revenue Bonds, Series 2002, 5.500%, 2/01/16 | | No Opt. Call | AAA | | | 12,475,796 | |
| | 6,650 | | Prince George’s County, Maryland, Special Obligation Bonds, National Harbor Project, Series 2005, 5.200%, 7/01/34 | | 7/15 at 100.00 | N/R | | | 6,685,112 | |
| | 1,406 | | Prince George’s County, Maryland, Special Tax District Bonds, Victoria Falls Project, Series 2005, 5.250%, 7/01/35 | | No Opt. Call | N/R | | | 1,407,603 | |
| | 1,100 | | Puerto Rico Highway and Transportation Authority, Highway Revenue Bonds, Series 2007N, 5.500%, 7/01/29 – AMBAC Insured | | No Opt. Call | Caa1 | | | 1,064,591 | |
| | 1,530 | | Puerto Rico Infrastructure Financing Authority, Special Tax Revenue Bonds, Series 2005A, 0.000%, 7/01/44 – AMBAC Insured | | No Opt. Call | BB | | | 179,194 | |
| | 2,100 | | Puerto Rico Municipal Finance Agency, Series 2002A, 5.250%, 8/01/21 – AGM Insured | | No Opt. Call | AA | | | 2,100,273 | |
| | Principal | | | | Optional Call | | | | | |
| | Amount (000) | | Description (1) | | Provisions (2) | Ratings (3) | | | Value | |
| | | | Tax Obligation/Limited (continued) | | | | | | | |
| | | | Puerto Rico Sales Tax Financing Corporation, Sales Tax Revenue Bonds, Series 2007A: | | | | | | | |
| $ | 7,000 | | 0.000%, 8/01/40 – NPFG Insured | | No Opt. Call | AA– | | $ | 1,344,630 | |
| | 8,000 | | 0.000%, 8/01/41 – NPFG Insured | | No Opt. Call | AA– | | | 1,441,120 | |
| | 210 | | 0.000%, 8/01/47 – AMBAC Insured | | No Opt. Call | BBB | | | 25,727 | |
| | | | Puerto Rico, Highway Revenue Bonds, Highway and Transportation Authority, Series 2007CC: | | | | | | | |
| | 765 | | 5.500%, 7/01/28 – NPFG Insured | | No Opt. Call | AA– | | | 803,908 | |
| | 2,300 | | 5.500%, 7/01/30 – AGM Insured | | No Opt. Call | AA | | | 2,428,501 | |
| | 1,750 | | Rhode Island Convention Center Authority, Lease Revenue Bonds, Series 2005A, 5.000%, 5/15/21 – AGM Insured | | 5/15 at 100.00 | AA | | | 1,787,923 | |
| | 2,000 | | Virgin Islands Public Finance Authority, Gross Receipts Taxes Loan Note, Series 2006, 5.000%, 10/01/27 – FGIC Insured | | 10/16 at 100.00 | AA– | | | 2,099,920 | |
| | 300 | | Virgin Islands Public Finance Authority, Gross Receipts Taxes Loan Note, Working Capital Series 2014A, 5.000%, 10/01/34 | | 10/24 at 100.00 | BBB+ | | | 325,083 | |
| | 1,035 | | Virgin Islands Public Finance Authority, Matching Fund Loan Notes Revenue Bonds, Senior Lien Series 2009A-1, 5.000%, 10/01/29 – AGM Insured | | 10/19 at 100.00 | AA | | | 1,152,017 | |
| | 3,500 | | Virgin Islands Public Finance Authority, Matching Fund Loan Notes Revenue Bonds, Senior Lien Series 2010A, 5.000%, 10/01/29 | | 10/20 at 100.00 | BBB | | | 3,845,835 | |
| | 1,825 | | Virgin Islands Public Finance Authority, Matching Fund Loan Notes Revenue Bonds, Subordinate Lien Series 2010B, 5.250%, 10/01/29 | | 10/20 at 100.00 | Baa2 | | | 2,019,235 | |
| | 68,790 | | Total Tax Obligation/Limited | | | | | | 57,949,118 | |
| | | | Transportation – 5.5% (3.6% of Total Investments) | | | | | | | |
| | | | Baltimore, Maryland, Revenue Refunding Bonds, Parking System Facilities, Series 1998A: | | | | | | | |
| | 1,060 | | 5.250%, 7/01/17 – FGIC Insured | | No Opt. Call | AA– | | | 1,124,596 | |
| | 110 | | 5.250%, 7/01/21 – FGIC Insured | | No Opt. Call | AA– | | | 123,908 | |
| | 125 | | Guam International Airport Authority, Revenue Bonds, Series 2013C, 6.375%, 10/01/43 (Alternative Minimum Tax) | | 10/23 at 100.00 | BBB | | | 143,901 | |
| | | | Maryland Health and Higher Educational Facilities Authority, Parking Facilities Revenue Bonds, Johns Hopkins Hospital, Series 2001: | | | | | | | |
| | 1,300 | | 5.000%, 7/01/27 – AMBAC Insured | | 1/15 at 100.00 | N/R | | | 1,301,989 | |
| | 1,000 | | 5.000%, 7/01/34 – AMBAC Insured | | 1/15 at 100.00 | N/R | | | 1,001,180 | |
| | 750 | | Maryland Health and Higher Educational Facilities Authority, Parking Facilities Revenue Bonds, Johns Hopkins Medical Institution, Series 2004B, 5.000%,
7/01/15 – AMBAC Insured | | No Opt. Call | N/R | | | 752,910 | |
| | 460 | | Maryland Health and Higher Educational Facilities Authority, Parking Revenue Bonds, Johns Hopkins Medical Institutions Parking Facilities, Series 1996, 5.500%,
7/01/26 – AMBAC Insured | | No Opt. Call | N/R | | | 460,819 | |
| | | | Maryland Transportation Authority, Revenue Bonds, Grant Anticipation Series 2008: | | | | | | | |
| | 1,000 | | 5.250%, 3/01/15 | | No Opt. Call | AAA | | | 1,013,300 | |
| | 2,000 | | 5.250%, 3/01/16 | | No Opt. Call | AAA | | | 2,125,080 | |
| | 10,110 | | Maryland Transportation Authority, Revenue Bonds, Transportation Facilities Projects, Series 2007, 5.000%, 7/01/30 – AGM Insured (UB) | | 7/17 at 100.00 | AA | | | 10,976,528 | |
| | | | Port Authority of New York and New Jersey, Special Project Bonds, JFK International Air Terminal LLC, Sixth Series 1997: | | | | | | | |
| | 20 | | 5.750%, 12/01/22 – NPFG Insured (Alternative Minimum Tax) | | 12/14 at 100.00 | AA– | | | 20,116 | |
| | 70 | | 5.750%, 12/01/25 – NPFG Insured (Alternative Minimum Tax) | | 12/14 at 100.00 | AA– | | | 70,204 | |
| | 18,005 | | Total Transportation | | | | | | 19,114,531 | |
| | | | U.S. Guaranteed – 20.0% (13.3% of Total Investments) (6) | | | | | | | |
| | 500 | | Baltimore County, Maryland, Revenue Bonds, Catholic Health Initiatives, Series 2006A, 5.000%, 9/01/36 (Pre-refunded 9/01/16) | | 9/16 at 100.00 | A+ (6) | | | 539,745 | |
| | 3,120 | | Baltimore, Maryland, Revenue Refunding Bonds, Water Projects, Series 1998A, 5.000%, 7/01/28 – FGIC Insured (ETM) | | No Opt. Call | AA (6) | | | 3,753,703 | |
| | 2,000 | | Baltimore, Maryland, Revenue Refunding Bonds, Water System Projects, Series 1994A, 5.000%, 7/01/24 – FGIC Insured (ETM) | | No Opt. Call | AA (6) | | | 2,442,540 | |
| NMY | Nuveen Maryland Premium Income Municipal Fund |
| | Portfolio of Investments (continued) | November 30, 2014 (Unaudited) |
| | Principal | | | | Optional Call | | | | | |
| | Amount (000) | | Description (1) | | Provisions (2) | Ratings (3) | | | Value | |
| | | | U.S. Guaranteed (6) (continued) | | | | | | | |
| | | | Baltimore, Maryland, Wastewater Project Revenue Bonds, Series 2006C: | | | | | | | |
| $ | 1,500 | | 5.000%, 7/01/31 (Pre-refunded 7/01/16) – AMBAC Insured | | 7/16 at 100.00 | AA (6) | | $ | 1,609,740 | |
| | 2,570 | | 5.000%, 7/01/31 (Pre-refunded 7/01/16) – AMBAC Insured | | 7/16 at 100.00 | AA (6) | | | 2,761,002 | |
| | 3,000 | | Baltimore, Maryland, Wastewater Project Revenue Bonds, Series 2007D, 5.000%, 7/01/32 (Pre-refunded 7/01/17) – AMBAC Insured | | 7/17 at 100.00 | AA (6) | | | 3,344,280 | |
| | 1,680 | | Carroll County, Maryland, General Obligation Consolidated Public Improvement Bonds, Series 2005A, 5.000%, 12/01/16 (Pre-refunded 12/01/15) | | 12/15 at 100.00 | AAA | | | 1,762,102 | |
| | 15 | | Charles County, Maryland, Consolidated General Obligation Public Improvement Bonds, Series 2006, 5.000%, 3/01/16 (ETM) | | No Opt. Call | Aa1 (6) | | | 15,898 | |
| | 1,910 | | Frederick, Maryland, General Obligation Bonds, Series 2005, 5.000%, 8/01/16 (Pre-refunded 8/01/15) – NPFG Insured | | 8/15 at 100.00 | AA (6) | | | 1,972,705 | |
| | 1,500 | | Maryland Health and Higher Educational Facilities Authority, Revenue Bonds, Anne Arundel Health System, Series 2009A, 6.750%, 7/01/39 (Pre-refunded 7/01/19) | | 7/19 at 100.00 | A– (6) | | | 1,874,235 | |
| | | | Maryland Health and Higher Educational Facilities Authority, Revenue Bonds, Helix Health, Series 1997: | | | | | | | |
| | 970 | | 5.000%, 7/01/17 – AMBAC Insured (ETM) | | No Opt. Call | N/R (6) | | | 1,037,958 | |
| | 3,240 | | 5.000%, 7/01/27 – AMBAC Insured (ETM) | | No Opt. Call | N/R (6) | | | 3,938,836 | |
| | 3,125 | | Maryland Health and Higher Educational Facilities Authority, Revenue Bonds, Howard County General Hospital, Series 1993, 5.500%, 7/01/25 (ETM) | | 2/15 at 100.00 | N/R (6) | | | 3,314,281 | |
| | 3,190 | | Maryland Health and Higher Educational Facilities Authority, Revenue Bonds, Western Maryland Health, Series 2006A, 5.000%, 7/01/34 (Pre-refunded 7/01/16) – NPFG Insured | | 7/16 at 100.00 | AA– (6) | | | 3,423,380 | |
| | 2,910 | | Maryland Health and Higher Educational Facilities Authority, Revenue Bonds, Western Maryland Health, Series 2006A, 4.500%, 1/01/22 (Pre-refunded 7/01/16) – NPFG Insured | | 7/16 at 100.00 | AA– (6) | | | 3,099,819 | |
| | 2,100 | | Maryland Industrial Development Financing Authority, Revenue Bonds, Our Lady of Good Counsel High School, Series 2005A, 6.000%, 5/01/35 (Pre-refunded 5/01/15) | | 5/15 at 100.00 | N/R (6) | | | 2,150,757 | |
| | 5,000 | | Maryland State, General Obligation Bonds, State & Local Facilities Loan, First Series 2005A, 5.000%, 2/15/16 (Pre-refunded 2/15/15) | | 2/15 at 100.00 | AAA | | | 5,052,500 | |
| | 2,110 | | Maryland State, General Obligation Bonds, State & Local Facilities Loan, Second Series 2009B, 5.000%, 8/15/21 (Pre-refunded 8/15/19) | | 8/19 at 100.00 | AAA | | | 2,488,344 | |
| | 1,090 | | Maryland State, General Obligation Bonds, State & Local Facilities Loan, Series 2006A, 5.000%, 3/01/17 (Pre-refunded 3/01/16) | | 3/16 at 100.00 | AAA | | | 1,154,931 | |
| | 825 | | Maryland Transportation Authority, Revenue Refunding Bonds, Transportation Facilities Projects, First Series 1978, 6.800%, 7/01/16 – AMBAC Insured (ETM) | | No Opt. Call | Aaa | | | 878,097 | |
| | | | Montgomery County Revenue Authority, Maryland, Lease Revenue Bonds, Montgomery College Arts Center Project, Series 2005A: | | | | | | | |
| | 1,300 | | 5.000%, 5/01/18 (Pre-refunded 5/01/15) | | 5/15 at 100.00 | AA (6) | | | 1,326,962 | |
| | 1,365 | | 5.000%, 5/01/19 (Pre-refunded 5/01/15) | | 5/15 at 100.00 | AA (6) | | | 1,393,310 | |
| | 615 | | 5.000%, 5/01/20 (Pre-refunded 5/01/15) | | 5/15 at 100.00 | AA (6) | | | 627,755 | |
| | 1,100 | | Puerto Rico Public Finance Corporation, Commonwealth Appropriation Bonds, Series 1998A, 5.125%, 6/01/24 – AMBAC Insured (ETM) | | No Opt. Call | Aaa | | | 1,318,086 | |
| | 1,000 | | Puerto Rico, Highway Revenue Bonds, Highway and Transportation Authority, Series 1996Y, 5.500%, 7/01/36 (Pre-refunded 7/01/16) | | 7/16 at 100.00 | Aaa | | | 1,081,250 | |
| | 1,610 | | Puerto Rico, Highway Revenue Bonds, Highway and Transportation Authority, Series 2003AA, 5.500%, 7/01/19 – NPFG Insured | | No Opt. Call | A3 (6) | | | 1,921,149 | |
| | 650 | | University of Maryland, Auxiliary Facility and Tuition Revenue Bonds, Series 2005A, 5.000%, 4/01/18 (Pre-refunded 4/01/15) | | 4/15 at 100.00 | Aa1 (6) | | | 660,810 | |
| | 3,135 | | University of Maryland, Auxiliary Facility and Tuition Revenue Bonds, Series 2006A, 5.000%, 10/01/22 (Pre-refunded 10/01/16) | | 10/16 at 100.00 | AA+ (6) | | | 3,400,848 | |
| | Principal | | | | Optional Call | | | | | |
| | Amount (000) | | Description (1) | | Provisions (2) | Ratings (3) | | | Value | |
| | | | U.S. Guaranteed (6) (continued) | | | | | | | |
| | | | Washington Suburban Sanitary District, Montgomery and Prince George’s Counties, Maryland, Sewerage Disposal Bonds, Series 2005: | | | | | | | |
| $ | 4,500 | | 5.000%, 6/01/16 (Pre-refunded 6/01/15) | | 6/15 at 100.00 | AAA | | $ | 4,612,005 | |
| | 1,235 | | 5.000%, 6/01/23 (Pre-refunded 6/01/15) | | 6/15 at 100.00 | AAA | | | 1,265,739 | |
| | 1,235 | | 5.000%, 6/01/24 (Pre-refunded 6/01/15) | | 6/15 at 100.00 | AAA | | | 1,265,739 | |
| | 1,235 | | 5.000%, 6/01/25 (Pre-refunded 6/01/15) | | 6/15 at 100.00 | AAA | | | 1,265,739 | |
| | 3,000 | | Wisconsin Public Power Incorporated System, Power Supply System Revenue Bonds, Series 2005A, 5.000%, 7/01/35 (Pre-refunded 7/01/15) – AMBAC Insured | | 7/15 at 100.00 | AA+ (6) | | | 3,084,840 | |
| | 64,335 | | Total U.S. Guaranteed | | | | | | 69,839,085 | |
| | | | Utilities – 2.6% (1.8% of Total Investments) | | | | | | | |
| | 1,250 | | Guam Power Authority, Revenue Bonds, Series 2012A, 5.000%, 10/01/30 – AGM Insured | | 10/22 at 100.00 | AA | | | 1,434,300 | |
| | 575 | | Guam Power Authority, Revenue Bonds, Series 2014A, 5.000%, 10/01/44 | | 10/24 at 100.00 | AA | | | 644,477 | |
| | 3,600 | | Puerto Rico Electric Power Authority, Power Revenue Bonds, Series 2004PP, 5.000%, 7/01/22 – NPFG Insured | | No Opt. Call | AA– | | | 3,566,232 | |
| | 1,570 | | Puerto Rico Electric Power Authority, Power Revenue Bonds, Series 2005RR, 5.000%, 7/01/22 – FGIC Insured | | 7/15 at 100.00 | AA– | | | 1,561,114 | |
| | 1,225 | | Puerto Rico Electric Power Authority, Power Revenue Refunding Bonds, Series 2002JJ, 5.250%, 7/01/15 – NPFG Insured | | No Opt. Call | AA– | | | 1,236,111 | |
| | 730 | | Virgin Islands Water and Power Authority, Electric System Revenue Bonds, Refunding Series 2007A, 5.000%, 7/01/24 | | 7/17 at 100.00 | BB+ | | | 733,665 | |
| | 8,950 | | Total Utilities | | | | | | 9,175,899 | |
| | | | Water and Sewer – 3.9% (2.6% of Total Investments) | | | | | | | |
| | 2,500 | | Baltimore, Maryland, Project and Revenue Refunding Bonds, Water Projects, Series 2013B, 5.000%, 7/01/38 | | 1/24 at 100.00 | AA | | | 2,862,025 | |
| | 2,500 | | Baltimore, Maryland, Revenue Bonds, Water Projects, Series 2014A, 5.000%, 7/01/44 (WI/DD, Settling 12/03/14) | | 1/25 at 100.00 | AA– | | | 2,844,925 | |
| | 1,045 | | Baltimore, Maryland, Revenue Refunding Bonds, Water System Projects, Series 1994A, 5.000%, 7/01/24 – FGIC Insured | | No Opt. Call | AA | | | 1,189,555 | |
| | 2,000 | | Baltimore, Maryland, Wastewater Project Revenue Bonds, Series 2011A, 5.000%, 7/01/41 | | 7/21 at 100.00 | AA | | | 2,210,480 | |
| | 300 | | Guam Waterworks Authority, Water and Wastewater System Revenue Bonds, Refunding Series 2014A, 5.000%, 7/01/35 | | 7/24 at 100.00 | A– | | | 333,417 | |
| | 2,030 | | Guam Waterworks Authority, Water and Wastewater System Revenue Bonds, Series 2013, 5.500%, 7/01/43 | | 7/23 at 100.00 | A– | | | 2,324,898 | |
| | 1,645 | | Maryland Water Quality Financing Administration, Revolving Loan Fund Revenue Bonds, Series 2005A, 5.000%, 9/01/15 | | No Opt. Call | AAA | | | 1,705,635 | |
| | 12,020 | | Total Water and Sewer | | | | | | 13,470,935 | |
| $ | 507,330 | | Total Municipal Bonds (cost $498,549,467) | | | | | | 521,853,967 | |
| NMY | Nuveen Maryland Premium Income Municipal Fund |
| | Portfolio of Investments (continued) | November 30, 2014 (Unaudited) |
| Shares | | Description (1) | | | Value | |
| | | COMMON STOCKS – 0.8% (0.5% of Total Investments) | | | | |
| | | Airlines – 0.8% (0.5% of Total Investments) | | | | |
| 54,607 | | American Airlines Group Inc., (7) | | $ | 2,650,078 | |
| | | Total Common Stocks (cost $1,624,450) | | | 2,650,078 | |
| | | Total Long-Term Investments (cost $500,173,917) | | | 524,504,045 | |
| | | Floating Rate Obligations – (4.9)% | | | (17,170,000 | ) |
| | | Variable Rate MuniFund Term Preferred Shares, at Liquidation Value – (47.8)% (8) | | | (167,000,000 | ) |
| | | Other Assets Less Liabilities – 2.5% | | | 8,718,177 | |
| | | Net Assets Applicable to Common Shares – 100% | | $ | 349,052,222 | |
| (1) | All percentages shown in the Portfolio of Investments are based on net assets applicable to common shares unless otherwise noted. |
| (2) | Optional Call Provisions: Dates (month and year) and prices of the earliest optional call or redemption. There may be other call provisions at varying prices at later dates. Certain mortgage-backed securities may be subject to periodic principal paydowns. |
| (3) | Ratings: Using the highest of Standard & Poor’s Group (“Standard & Poor’s”), Moody’s Investors Service, Inc. (“Moody’s”) or Fitch, Inc. (“Fitch”) rating. Ratings below BBB by Standard & Poor’s, Baa by Moody’s or BBB by Fitch are considered to be below investment grade. Holdings designated N/R are not rated by any of these national rating agencies. |
| (4) | At or subsequent to the end of the reporting period, this security is non-income producing. Non-income producing, in the case of a fixed-income security, generally denotes that the issuer has (1) defaulted on the payment of principal or interest, (2) is under the protection of the Federal Bankruptcy Court or (3) the Fund’s Adviser has concluded that the issue is not likely to meet its future interest payment obligations and has directed the Fund’s custodian to cease accruing additional income on the Fund’s records. |
| (5) | Investment, or portion of investment, has been pledged to collateralize the net payment obligations for investments in inverse floating rate transactions. |
| (6) | Backed by an escrow or trust containing sufficient U.S. Government or U.S. Government agency securities, which ensure the timely payment of principal and interest. Certain bonds backed by U.S. Government or agency securities are regarded as having an implied rating equal to the rating of such securities. |
| (7) | On November 28, 2011, AMR Corp. (“AMR”), the parent company of American Airlines Group, Inc. (“AAL”) filed for federal bankruptcy protection. On December 9, 2013, AMR emerged from federal bankruptcy with the acceptance of its reorganization plan by the bankruptcy court. Under the settlement agreement established to meet AMR’s unsecured bond obligations, the bondholders, including the Fund, received a distribution of AAL preferred stock which was converted to AAL common stock over a 120-day period. Every 30 days, a quarter of the preferred stock was converted to AAL common stock based on the 5-day volume-weighted average price and the amount of preferred shares tendered during the optional preferred conversion period. |
| (8) | Variable Rate MuniFund Term Preferred Shares, at Liquidation Value as a percentage of Total Investments is 31.8% |
| WI/DD | Investment, or portion of investment, purchased on a when-issued or delayed delivery basis. |
| (ETM) | Escrowed to maturity. |
| (UB) | Underlying bond of an inverse floating rate trust reflected as a financing transaction. See Notes to Financial Statements, Note 3 – Portfolio Securities and Investments in Derivatives, Inverse Floating Rate Securities for more information. |
See accompanying notes to financial statements.
| NMS | | |
| | Nuveen Minnesota Municipal Income Fund |
| | Portfolio of Investments | November 30, 2014 (Unaudited) |
| | Principal | | | | Optional Call | | | | | |
| | Amount (000) | | Description (1) | | Provisions (2) | Ratings (3) | | | Value | |
| | | | LONG-TERM INVESTMENTS – 150.9% (100.0% of Total Investments) | | | | | | | |
| | | | MUNICIPAL BONDS – 150.9% (100.0% of Total Investments) | | | | | | | |
| | | | Consumer Staples – 0.9% (0.6% of Total Investments) | | | | | | | |
| $ | 700 | | Moorhead, Minnesota, Recovery Zone Facility Revenue Bonds, American Crystal Sugar Company Project, Series 2010, 5.650%, 6/01/27 | | 7/20 at 100.00 | BBB+ | | $ | 782,684 | |
| | | | Education and Civic Organizations – 32.5% (21.6% of Total Investments) | | | | | | | |
| | 390 | | Anoka County, Minnesota, Charter School Lease Revenue Bonds, Spectrum Building Company, Series 2012A, 5.000%, 6/01/43 | | No Opt. Call | BBB– | | | 398,752 | |
| | 1,250 | | Baytown Township, Minnesota, Lease Revenue Bonds, Saint Croix Preparatory Academy Project, Series 2008A, 7.000%, 8/01/38 | | 8/16 at 102.00 | BB | | | 1,311,663 | |
| | 700 | | City of Woodbury, Minnesota, Charter School Lease Revenue Bonds, Math and Science Academy Building Company, Series 2012A, 5.000%, 12/01/43 | | No Opt. Call | BBB– | | | 723,121 | |
| | 1,000 | | Duluth Housing & Redevelopment Authority, Minnesota, Lease Revenue Bonds, Duluth Public Schools Academy, Series 2010A, 5.600%, 11/01/30 | | 11/18 at 102.00 | BBB– | | | 1,066,000 | |
| | 550 | | Forest Lake, Minnesota, Charter School Lease Revenue Bonds, Lakes International Language Academy, Series 2014A, 5.750%, 8/01/44 | | 8/22 at 100.00 | BBB– | | | 602,245 | |
| | 200 | | Hugo, Minnesota, Charter School Lease Revenue Bonds, Noble Academy Project, Series 2014A, 5.000%, 7/01/44 | | 7/24 at 100.00 | BBB– | | | 207,102 | |
| | 1,400 | | Minneapolis, Minnesota, Charter School Lease Revenue Bonds, Yinghua Academy Charter School, Series 2013A, 6.000%, 7/01/43 | | 7/23 at 100.00 | BB | | | 1,490,706 | |
| | 1,000 | | Minneapolis, Minnesota, Revenue Bonds, National Marrow Donor Program Project, Series 2010, 4.250%, 8/01/20 | | 8/18 at 100.00 | BBB+ | | | 1,042,620 | |
| | 2,000 | | Minneapolis, Minnesota, Revenue Refunding Bonds, University Gateway Project, Series 2006, 4.500%, 12/01/31 | | 12/14 at 101.00 | Aa1 | | | 2,022,160 | |
| | 1,700 | | Minnesota Higher Education Facilities Authority, Revenue Bonds, Augsburg College, Series 2006-J-1, 5.000%, 5/01/28 | | 5/15 at 100.00 | Baa3 | | | 1,709,469 | |
| | | | Minnesota Higher Education Facilities Authority, Revenue Bonds, Bethel University, Refunding Series 2007-6-R: | | | | | | | |
| | 500 | | 5.500%, 5/01/24 | | 5/17 at 100.00 | N/R | | | 517,865 | |
| | 1,000 | | 5.500%, 5/01/27 | | 5/17 at 100.00 | N/R | | | 1,034,560 | |
| | 200 | | 5.500%, 5/01/37 | | 5/17 at 100.00 | N/R | | | 205,792 | |
| | 600 | | Minnesota Higher Education Facilities Authority, Revenue Bonds, Macalester College, Series 2012-7S, 3.250%, 5/01/36 | | No Opt. Call | Aa3 | | | 584,748 | |
| | 1,000 | | Minnesota Higher Education Facilities Authority, Revenue Bonds, Minneapolis College of Art and Design, Refunding Series 2006-6-K, 5.000%, 5/01/26 | | 5/15 at 100.00 | Baa2 | | | 1,005,900 | |
| | 1,000 | | Minnesota Higher Education Facilities Authority, Revenue Bonds, University of Saint Thomas, Series 2009-6X, 5.250%, 4/01/39 | | 4/17 at 100.00 | A2 | | | 1,079,280 | |
| | 2,000 | | Minnesota Higher Education Facilities Authority, Revenue Bonds, University of Saint Thomas, Series 2009-7A, 5.000%, 10/01/39 | | 10/19 at 100.00 | A2 | | | 2,224,480 | |
| | 590 | | Moorhead, Minnesota, Golf Course Revenue Refunding Bonds, Series 1998B, 5.875%, 12/01/21 | | No Opt. Call | N/R | | | 590,183 | |
| | 705 | | Otsego, Minnesota, Charter School Lease Revenue Bonds, Kaleidoscope Charter School Project, Series 2014A, 5.000%, 9/01/44 | | 9/24 at 100.00 | BB+ | | | 708,194 | |
| | 450 | | Ramsey, Anoka County, Minnesota, Lease Revenue Bonds, PACT Charter School Project, Series 2004A, 5.500%, 12/01/33 | | 12/21 at 100.00 | BBB– | | | 494,618 | |
| | 500 | | Saint Paul Housing & Redevelopment Authority , Minnesota, Charter School Lease Revenue Bonds, Hmong Education Reform Company, Series 2012A, 5.250%, 9/01/32 | | No Opt. Call | BB+ | | | 518,290 | |
| | 1,100 | | Saint Paul Housing & Redevelopment Authority, Minnesota, Charter School Lease Revenue Bonds, Nova Classical Academy, Series 2011A, 6.375%, 9/01/31 | | 9/21 at 100.00 | BBB– | | | 1,258,543 | |
| NMS | Nuveen Minnesota Municipal Income Fund |
| | Portfolio of Investments (continued) | November 30, 2014 (Unaudited) |
| | Principal | | | | Optional Call | | | | | |
| | Amount (000) | | Description (1) | | Provisions (2) | Ratings (3) | | | Value | |
| | | | Education and Civic Organizations (continued) | | | | | | | |
| $ | 1,680 | | Saint Paul Housing and Redevelopment Authority, Minnesota, Charter School Lease Revenue Bonds, Twin Cities German Immersion School, Series 2013A, 5.000%, 7/01/44 | | No Opt. Call | BB+ | | $ | 1,669,651 | |
| | 500 | | Saint Paul Housing and Redevelopment Authority, Minnesota, Educational Facility Revenue Refunding Bonds, Saint Paul Academy and Summit School Project, Series 2007, 5.000%, 10/01/24 | | 10/17 at 100.00 | A3 | | | 530,530 | |
| | 1,875 | | Saint Paul Housing and Redevelopment Authority, Minnesota, Lease Revenue Bonds, Community of Peace Academy Project, Series 2006A, 5.000%, 12/01/36 | | 12/15 at 100.00 | BBB– | | | 1,889,831 | |
| | 360 | | Saint Paul Housing and Redevelopment Authority, Minnesota, Lease Revenue Bonds, Saint Paul Conservatory for Performing Artists Charter School Project, Series 2013A, 4.625%, 3/01/43 | | 3/23 at 100.00 | BBB– | | | 362,311 | |
| | 700 | | St. Paul Housing and Redevelopment Authority, Minnesota, Charter School Revenue Bonds, Higher Ground Academy Charter School, Series 2013A, 5.000%, 12/01/33 | | 12/22 at 100.00 | BBB– | | | 727,895 | |
| | 2,000 | | University of Minnesota, General Revenue Bonds, Series 2011A, 5.250%, 12/01/29 | | 12/20 at 100.00 | Aa1 | | | 2,373,400 | |
| | 26,950 | | Total Education and Civic Organizations | | | | | | 28,349,909 | |
| | | | Health Care – 31.3% (20.8% of Total Investments) | | | | | | | |
| | 1,000 | | Cuyuna Range Hospital District, Minnesota, Health Care Facilities Gross Revenue Bonds, Refunding Series 2007, 5.000%, 6/01/29 | | 6/17 at 100.00 | N/R | | | 1,023,400 | |
| | | | Glencoe, Minnesota, Health Care Facilities Revenue Bonds, Glencoe Regional Health Services Project, Series 2013: | | | | | | | |
| | 400 | | 4.000%, 4/01/27 | | 4/22 at 100.00 | BBB | | | 412,052 | |
| | 230 | | 4.000%, 4/01/31 | | 4/22 at 100.00 | BBB | | | 236,330 | |
| | | | Maple Grove, Minnesota, Health Care Facilities Revenue Bonds, Maple Grove Hospital Corporation, Series 2007: | | | | | | | |
| | 20 | | 5.000%, 5/01/20 | | 5/17 at 100.00 | Baa1 | | | 21,058 | |
| | 1,000 | | 5.250%, 5/01/25 | | 5/17 at 100.00 | Baa1 | | | 1,047,290 | |
| | 2,210 | | Maple Grove, Minnesota, Health Care Facility Revenue Bonds, North Memorial Health Care, Series 2005, 5.000%, 9/01/35 | | 9/15 at 100.00 | Baa1 | | | 2,228,365 | |
| | 2,675 | | Minneapolis Health Care System, Minnesota, Revenue Bonds, Fairview Hospital and Healthcare Services, Series 2008A, 6.625%, 11/15/28 | | 11/18 at 100.00 | A | | | 3,151,764 | |
| | 535 | | Minneapolis, Minnesota, Health Care System Revenue Bonds, Fairview Health Services, Series | | 11/18 at 100.00 | AA | | | 627,197 | |
| | | | 2008B, 6.500%, 11/15/38 – AGC Insured | | | | | | | |
| | 3,750 | | Minnesota Agricultural and Economic Development Board, Health Care Facilities Revenue Bonds, Essentia Health Obligated Group, Series 2008E, 5.000%,
2/15/37 – AGC Insured | | 2/18 at 100.00 | AA | | | 3,980,962 | |
| | 35 | | Minnesota Agricultural and Economic Development Board, Healthcare System Revenue Bonds, Fairview Hospital and Healthcare Services, Series 1997A, 5.750%, 11/15/26 – NPFG Insured | | No Opt. Call | AA– | | | 35,077 | |
| | 25 | | Minnesota Agricultural and Economic Development Board, Healthcare System Revenue Bonds, Fairview Hospital and Healthcare Services, Series 2000A, 6.375%, 11/15/29 | | No Opt. Call | A | | | 25,108 | |
| | 710 | | Northern Itasca Hospital District, Minnesota, Health Facilities Gross Revenue Bonds, Refunding Series 2013A, 4.400%, 12/01/33 | | 12/20 at 100.00 | N/R | | | 722,567 | |
| | | | Northern Itasca Hospital District, Minnesota, Health Facilities Gross Revenue Bonds, Series 2013C: | | | | | | | |
| | 240 | | 4.500%, 12/01/25 | | 12/20 at 100.00 | N/R | | | 250,248 | |
| | 190 | | 4.750%, 12/01/27 | | 12/20 at 100.00 | N/R | | | 199,806 | |
| | 160 | | 5.000%, 12/01/28 | | 12/20 at 100.00 | N/R | | | 168,514 | |
| | 310 | | 5.400%, 12/01/33 | | 12/20 at 100.00 | N/R | | | 328,306 | |
| | 500 | | Saint Cloud, Minnesota, Health Care Revenue Bonds, CentraCare Health System Project, Series 2010A, 5.125%, 5/01/30 | | 5/20 at 100.00 | A1 | | | 560,395 | |
| | 2,215 | | Saint Louis Park, Minnesota, Health Care Facilities Revenue Refunding Bonds, Park Nicollet Health Services, Series 2009, 5.750%, 7/01/39 | | 7/19 at 100.00 | A | | | 2,495,153 | |
| | 1,430 | | Saint Paul Housing and Redevelopment Authority, Minnesota, Health Care Facility Revenue Bonds, HealthPartners Obligated Group, Series 2006, 5.250%, 5/15/36 | | 11/16 at 100.00 | A | | | 1,495,494 | |
| | 1,625 | | Saint Paul Housing and Redevelopment Authority, Minnesota, Health Care Revenue Bonds, Allina Health System, Series 2009A-1, 5.250%, 11/15/29 | | 11/19 at 100.00 | AA– | | | 1,855,425 | |
| | Principal | | | | Optional Call | | | | | |
| | Amount (000) | | Description (1) | | Provisions (2) | Ratings (3) | | | Value | |
| | | | Health Care (continued) | | | | | | | |
| | | | Saint Paul Port Authority, Minnesota, Lease Revenue Bonds, HealthEast Midway Campus, Series 2005A: | | | | | | | |
| $ | 700 | | 5.750%, 5/01/25 | | 5/15 at 100.00 | BB+ | | $ | 708,288 | |
| | 500 | | 5.875%, 5/01/30 | | 5/15 at 100.00 | BB+ | | | 505,600 | |
| | 900 | | Saint Paul Port Authority, Minnesota, Lease Revenue Bonds, HealthEast Midway Campus, Series 2005B, 6.000%, 5/01/30 | | 5/15 at 100.00 | N/R | | | 910,593 | |
| | 1,000 | | Saint Paul Port Authority, Minnesota, Lease Revenue Bonds, Regions Hospital Parking Ramp Project, Series 2007-1, 5.000%, 8/01/36 | | 8/16 at 100.00 | N/R | | | 1,008,080 | |
| | | | Shakopee, Minnesota, Health Care Facilities Revenue Bonds, Saint Francis Regional Medical Center, Refunding Series 2014: | | | | | | | |
| | 765 | | 4.000%, 9/01/31 | | 9/24 at 100.00 | A | | | 796,357 | |
| | 600 | | 5.000%, 9/01/34 | | 9/24 at 100.00 | A | | | 678,060 | |
| | 1,750 | | St. Paul Housing and Redevelopment Authority, Minnesota, Revenue Bonds, Healtheast Inc., Series 2005, 6.000%, 11/15/30 | | 11/15 at 100.00 | BBB– | | | 1,820,158 | |
| | 25,475 | | Total Health Care | | | | | | 27,291,647 | |
| | | | Housing/Multifamily – 7.9% (5.2% of Total Investments) | | | | | | | |
| | 1,700 | | Coon Rapids, Minnesota, Multifamily Housing Revenue Bonds, Tralee Terrace Apartments Project, Series 2010, 4.500%, 6/01/26 | | 6/20 at 100.00 | Aaa | | | 1,820,190 | |
| | 960 | | Minneapolis, Minnesota, GNMA Collateralized Multifamily Housing Revenue Bonds, Vantage Flats Project, Series 2007, 5.200%, 10/20/48 (Alternative Minimum Tax) | | 10/15 at 100.00 | Aa1 | | | 968,688 | |
| | 1,155 | | Minneapolis, Minnesota, Multifamily Housing Revenue Bonds, GNMA Collateralized Mortgage Loans – Seward Towers Project, Series 2003, 5.000%, 5/20/36 | | No Opt. Call | Aa1 | | | 1,170,154 | |
| | | | Minnesota Housing Finance Agency, Rental Housing Revenue Bonds, Series 2011: | | | | | | | |
| | 355 | | 5.050%, 8/01/31 | | 8/21 at 100.00 | AA+ | | | 384,866 | |
| | 1,700 | | 5.450%, 8/01/41 | | 8/21 at 100.00 | AA+ | | | 1,878,143 | |
| | 655 | | Saint Paul Housing and Redevelopment Authority, Minnesota, GNMA Collateralized Multifamily Housing Revenue Bonds, Selby Grotto Housing Project, Series 2001A, 5.500%, 9/20/44 (Alternative Minimum Tax) | | No Opt. Call | Aa1 | | | 655,642 | |
| | 6,525 | | Total Housing/Multifamily | | | | | | 6,877,683 | |
| | | | Housing/Single Family – 5.9% (3.9% of Total Investments) | | | | | | | |
| | 161 | | Minneapolis-Saint Paul Housing Finance Board, Minnesota, Single Family Mortgage Revenue Bonds, City Living Series 2006A-4, 5.000%, 11/01/38 (Alternative Minimum Tax) | | 7/16 at 100.00 | AA+ | | | 166,551 | |
| | 235 | | Minnesota Housing Finance Agency, Homeownership Finance Bonds, Mortgage-Backed Securities Program, Series 2011D, 4.700%, 1/01/31 | | 7/21 at 100.00 | Aaa | | | 256,451 | |
| | 2,895 | | Minnesota Housing Finance Agency, Residential Housing Finance Bonds, Series 2007D, 4.700%, 7/01/27 (Alternative Minimum Tax) | | 7/16 at 100.00 | AA+ | | | 2,945,083 | |
| | 10 | | Minnesota Housing Finance Agency, Residential Housing Finance Bonds, Series 2007-I, 4.850%, 7/01/38 (Alternative Minimum Tax) | | 7/16 at 100.00 | AA+ | | | 10,090 | |
| | 285 | | Minnesota Housing Finance Agency, Residential Housing Finance Bonds, Series 2008B, 5.650%, 7/01/33 (Alternative Minimum Tax) | | 1/18 at 100.00 | AA+ | | | 297,366 | |
| | 715 | | Minnesota Housing Finance Agency, Residential Housing Finance Bonds, Series 2009E, 5.100%, 1/01/40 | | 7/19 at 100.00 | AA+ | | | 760,152 | |
| | 715 | | Minnesota Housing Finance Agency, Residential Housing Finance Bonds, Series 2013C, 3.900%, 7/01/43 | | 1/23 at 100.00 | AA+ | | | 723,151 | |
| | 5,016 | | Total Housing/Single Family | | | | | | 5,158,844 | |
| | | | Industrials – 3.9% (2.6% of Total Investments) | | | | | | | |
| | | | Minneapolis, Minnesota, Limited Tax Supported Development Revenue Bonds, Common Bond Fund Series 2006-1A: | | | | | | | |
| | 580 | | 4.850%, 12/01/17 (Alternative Minimum Tax) | | 6/16 at 100.00 | A+ | | | 605,891 | |
| | 610 | | 4.875%, 12/01/18 (Alternative Minimum Tax) | | 6/16 at 100.00 | A+ | | | 634,107 | |
| NMS | Nuveen Minnesota Municipal Income Fund |
| | Portfolio of Investments (continued) | November 30, 2014 (Unaudited) |
| | Principal | | | | Optional Call | | | | | |
| | Amount (000) | | Description (1) | | Provisions (2) | Ratings (3) | | | Value | |
| | | | Industrials (continued) | | | | | | | |
| | | | Minneapolis, Minnesota, Limited Tax Supported Development Revenue Bonds, Common Bond Fund Series 2013-1: | | | | | | | |
| $ | 1,400 | | 4.500%, 6/01/33 | | 6/21 at 100.00 | A+ | | $ | 1,487,136 | |
| | 600 | | 4.750%, 6/01/39 | | 6/21 at 100.00 | A+ | | | 641,334 | |
| | 3,190 | | Total Industrials | | | | | | 3,368,468 | |
| | | | Long-Term Care – 12.0% (7.9% of Total Investments) | | | | | | | |
| | 380 | | Center City, Minnesota, Health Care Facilities Revenue Bonds, Hazelden Betty Ford Foundation Project, Series 2014, 4.000%, 11/01/39 | | 11/24 at 100.00 | A3 | | | 387,171 | |
| | 500 | | Center City, Minnesota, Health Care Facilities Revenue Bonds, Hazelden Foundation Project, Series 2011, 5.000%, 11/01/41 | | 11/19 at 100.00 | A3 | | | 534,115 | |
| | 875 | | Cold Spring, Minnesota, Health Care Facilities Revenue Bonds, Assumption Home, Inc., Refunding Series 2013, 5.200%, 3/01/43 | | 7/20 at 100.00 | N/R | | | 892,859 | |
| | 435 | | Cottage Grove, Minnesota, Senior Housing Revenue Bonds, PHS/Cottage Grove, Inc., Project, Series 2006A, 5.000%, 12/01/31 | | 12/14 at 100.00 | N/R | | | 435,209 | |
| | 700 | | Lake Crystal, Minnesota, Housing and Health Care Revenue Bonds, Ecumen?Second Century & Owatonna Senior Living Project, Refunding Series 2014A, 4.500%, 9/01/44 (Mandatory put 9/01/24) (WI/DD, Settling 12/18/14) | | 9/18 at 100.00 | N/R | | | 705,012 | |
| | 1,350 | | Minneapolis, Minnesota, Revenue Bonds, Walker Minneapolis Campus Project, Refunding Series 2012, 4.750%, 11/15/28 | | 11/22 at 100.00 | N/R | | | 1,375,070 | |
| | 1,000 | | Moorhead Economic Development Authority, Minnesota, Multifamily Revenue Bonds, Eventide Senior Housing, Series 2006A, 5.150%, 6/01/29 | | No Opt. Call | N/R | | | 1,000,550 | |
| | 900 | | Saint Paul Housing & Redevelopment Authority, Minnesota, Revenue Bonds, Rossy & Richard Shaller Family Sholom East Campus, Series 2007A, 5.250%, 10/01/42 | | 10/17 at 100.00 | N/R | | | 909,036 | |
| | 500 | | Saint Paul Housing and Redevelopment Authority Minnesota, Senior Housing and Health Care Revenue Bonds, Episcopal Homes Project, Series 2013, 5.125%, 5/01/48 | | 5/23 at 100.00 | N/R | | | 510,845 | |
| | 1,291 | | Saint Paul Housing and Redevelopment Authority, Minnesota, Nursing Home Revenue Bonds, Episcopal Homes of Minnesota, Series 2006, 5.630%, 10/01/33 | | No Opt. Call | N/R | | | 1,322,723 | |
| | 100 | | Saint Paul Housing and Redevelopment Authority, Minnesota, Senior Housing and Health Care Revenue Bonds, Episcopal Homes Project, Refunding Series 2012A, 5.150%, 11/01/42 | | No Opt. Call | N/R | | | 101,932 | |
| | 315 | | Sauk Rapids, Minnesota, Health Care and Housing Facilities Revenue Bonds, Good Shepherd Luthran Home, Refunding Series 2013, 5.125%, 1/01/39 | | 1/23 at 100.00 | N/R | | | 318,207 | |
| | 330 | | Wayzata, Minnesota, Senior Housing Revenue Bonds, Folkestone Senior Living Community, Series 2012A, 6.000%, 5/01/47 | | 5/19 at 102.00 | N/R | | | 362,713 | |
| | 1,000 | | West St. Paul, Minnesota, Health Care Facilities Revenue Bonds, Walker Thompson Hill LLC Project, Series 2011A, 7.000%, 9/01/46 | | 9/19 at 100.00 | N/R | | | 1,071,360 | |
| | 520 | | Worthington, Minnesota, Housing Revenue Refunding Bonds, Meadows of Worthington Project, Series 2007A, 5.250%, 11/01/28 | | No Opt. Call | N/R | | | 523,427 | |
| | 10,196 | | Total Long-Term Care | | | | | | 10,450,229 | |
| | | | Materials – 3.1% (2.0% of Total Investments) | | | | | | | |
| | 2,650 | | Saint Paul Port Authority, Minnesota, Solid Waste Disposal Revenue Bonds, Gerdau Saint Paul Steel Mill Project, Series 2012-7, 4.500%, 10/01/37 (Alternative Minimum Tax) | | 10/22 at 100.00 | BBB– | | | 2,657,685 | |
| | | | Tax Obligation/General – 13.9% (9.2% of Total Investments) | | | | | | | |
| | 1,600 | | Burnsville Independent School District 191, Dakota and Scott Counties, Minnesota, General Obligation Bonds, Series 2008A, 4.750%, 2/01/24 | | 2/18 at 100.00 | Aa2 | | | 1,767,536 | |
| | 280 | | Fertile Economic Development Authority, Minnesota, General Obligation of the City, Housing Development Revenue Bonds, Series 2012A, 4.000%, 12/01/39 | | 12/22 at 100.00 | A+ | | | 288,616 | |
| | 1,000 | | Hennepin County, Minnesota, General Obligation Bonds, Refunding Series 2008D, 5.000%, 12/01/25 | | 12/16 at 100.00 | AAA | | | 1,086,340 | |
| | 245 | | Jordan Independent School District 717, Scott County, Minnesota, General Obligation Bonds, School Building Series 2014A, 5.000%, 2/01/35 | | 2/23 at 100.00 | Aa2 | | | 281,909 | |
| | Principal | | | | Optional Call | | | | | |
| | Amount (000) | | Description (1) | | Provisions (2) | Ratings (3) | | | Value | |
| | | | Tax Obligation/General (continued) | | | | | | | |
| $ | 1,500 | | Mankato Independent School District 77, Minnesota, General Obligation Bonds, School Building Series 2014A, 4.000%, 2/01/30 | | 2/24 at 100.00 | AA+ | | $ | 1,631,400 | |
| | 1,000 | | Minneapolis, Minnesota, Limited Tax Supported Development Revenue Bonds, Common Bond Fund Series 2007-2A, 5.125%, 6/01/22 (Alternative Minimum Tax) | | 6/17 at 100.00 | A+ | | | 1,053,700 | |
| | 2,935 | | Minnesota State, General Obligation Bonds, Series 2007, 5.000%, 8/01/25 | | 8/17 at 100.00 | AA+ | | | 3,240,122 | |
| | 700 | | South Washington County Independent School District 833, Minnesota, General Obligation Bonds, Alternate Facilities Series 2014A, 3.500%, 2/01/27 | | 2/24 at 100.00 | Aa2 | | | 733,691 | |
| | 1,970 | | Wayzata Independent School District 284, Hennepin County, Minnesota, General Obligation Bonds, School Building Series 2014A, 3.500%, 2/01/31 | | 2/23 at 100.00 | AAA | | | 2,014,286 | |
| | 11,230 | | Total Tax Obligation/General | | | | | | 12,097,600 | |
| | | | Tax Obligation/Limited – 11.0% (7.3% of Total Investments) | | | | | | | |
| | 1,600 | | Duluth Independent School District 709, Minnesota, Certificates of Participation, Capital Appreciation Series 2012A, 0.000%, 2/01/28 – AGM Insured | | 2/22 at 77.70 | Aa2 | | | 976,048 | |
| | 1,000 | | Minneapolis, Minnesota, Tax Increment Revenue Bonds, Grant Park Project, Series 2006, 5.350%, 2/01/30 | | No Opt. Call | N/R | | | 1,000,080 | |
| | 600 | | Minneapolis, Minnesota, Tax Increment Revenue Bonds, Village at St. Anthony Falls Project, Refunding Series 2005, 5.650%, 2/01/27 | | No Opt. Call | N/R | | | 600,462 | |
| | 2,230 | | Minnesota Housing Finance Agency, Nonprofit Housing Bonds, State Appropriation Series 2011, 5.000%, 8/01/31 | | 8/21 at 100.00 | AA | | | 2,514,414 | |
| | 1,100 | | Minnesota State, General Fund Appropriation Refunding Bonds, Series 2012B, 3.000%, 3/01/30 | | No Opt. Call | AA | | | 1,038,488 | |
| | 500 | | Saint Paul Housing and Redevelopment Authority, Minnesota, Recreational Faility Lease Revenue Bonds, Jimmy Lee Recreational Center, Series 2008, 5.000%, 12/01/32 | | 12/17 at 100.00 | AA+ | | | 539,865 | |
| | | | Saint Paul Housing and Redevelopment Authority, Minnesota, Upper Landing Project Tax Increment Revenue Refunding Bonds, Series 2012: | | | | | | | |
| | 450 | | 5.000%, 9/01/26 | | No Opt. Call | N/R | | | 470,808 | |
| | 130 | | 5.000%, 3/01/29 | | No Opt. Call | N/R | | | 135,188 | |
| | 800 | | Saint Paul, Minnesota, Sales Tax Revenue Bonds, Series 2014G, 3.750%, 11/01/33 (WI/DD, Settling 12/09/14) | | 11/24 at 100.00 | A+ | | | 799,992 | |
| | 1,050 | | Virgin Islands Public Finance Authority, Matching Fund Loan Notes Revenue Bonds, Series 2009B, 5.000%, 10/01/25 | | 10/19 at 100.00 | BBB | | | 1,146,663 | |
| | 400 | | Washington County Housing and Redevelopment Authority, Minnesota, Municipal Facility Lease Revenue Bonds, Lower St. Croix Valley Fire Protection District Project, Series 2003, 5.125%, 2/01/24 | | No Opt. Call | Baa2 | | | 400,620 | |
| | 9,860 | | Total Tax Obligation/Limited | | | | | | 9,622,628 | |
| | | | Transportation – 1.9% (1.3% of Total Investments) | | | | | | | |
| | 200 | | Minneapolis-St. Paul Metropolitan Airports Commission, Minnesota, Airport Revenue Bonds, Subordinate Lien Series 2010D, 4.000%, 1/01/23 (Alternative Minimum Tax) | | 1/20 at 100.00 | A | | | 212,336 | |
| | 500 | | Minneapolis-St. Paul Metropolitan Airports Commission, Minnesota, Airport Revenue Bonds, Subordinate Lien, Refunding Series 2014A, 5.000%, 1/01/31 | | 1/24 at 100.00 | A | | | 577,965 | |
| | 800 | | St Paul Housing and Redevelopment Authority, Minnesota, Parking Revenue Bonds, Parking Facilities Project, Refunding Series 2010A, 5.000%, 8/01/30 | | 8/18 at 102.00 | A+ | | | 896,896 | |
| | 1,500 | | Total Transportation | | | | | | 1,687,197 | |
| | | | U.S. Guaranteed – 3.2% (2.1% of Total Investments) (4) | | | | | | | |
| | 550 | | Crow Wing County, Minnesota, General Obligation Bonds, County Jail Series 2004B, 5.000%, 2/01/21 (Pre-refunded 2/01/15) – NPFG Insured | | 2/15 at 100.00 | Aa2 (4) | | | 554,697 | |
| | 65 | | Minnesota State, General Obligation Bonds, Series 2007, 5.000%, 8/01/25 (Pre-refunded 8/01/17) | | 8/17 at 100.00 | N/R (4) | | | 72,663 | |
| | 1,130 | | Moorhead, Minnesota, Senior Housing Facility Revenue Bonds, Sheyenne Crossings Project, Series 2006, 5.650%, 4/01/41 (Pre-refunded 12/31/14) | | 12/14 at 101.00 | N/R (4) | | | 1,142,001 | |
| | 1,000 | | Pine County Housing and Redevelopment Authority, Minnesota, Public Project Revenue Bonds, Series 2005A, 5.000%, 2/01/31 (Pre-refunded 2/01/16) | | 2/16 at 100.00 | AA– (4) | | | 1,053,980 | |
| | 2,745 | | Total U.S. Guaranteed | | | | | | 2,823,341 | |
| NMS | Nuveen Minnesota Municipal Income Fund |
| | Portfolio of Investments (continued) | November 30, 2014 (Unaudited) |
| | Principal | | | | Optional Call | | | | | |
| | Amount (000) | | Description (1) | | Provisions (2) | Ratings (3) | | | Value | |
| | | | Utilities – 18.4% (12.2% of Total Investments) | | | | | | | |
| $ | 500 | | Chaska, Minnesota, Electric Revenue Bonds, Generating Facility Project, Refunding Series 2005A, 5.000%, 10/01/30 | | 10/15 at 100.00 | A2 | | $ | 515,695 | |
| | 10 | | Chaska, Minnesota, Electric Revenue Bonds, Generating Facility Project, Series 2000A, 6.100%, 10/01/30 | | No Opt. Call | A2 | | | 10,042 | |
| | 500 | | Minnesota Municipal Power Agency, Electric Revenue Bonds, Refunding Series 2014A, 4.000%, 10/01/33 (WI/DD, Settling 12/17/14) | | 10/24 at 100.00 | A | | | 514,130 | |
| | | | Northern Municipal Power Agency, Minnesota, Electric System Revenue Bonds, Refunding Series 2008A: | | | | | | | |
| | 300 | | 5.000%, 1/01/18 – AGC Insured | | No Opt. Call | AA | | | 337,761 | |
| | 1,000 | | 5.000%, 1/01/20 – AGC Insured | | 1/18 at 100.00 | AA | | | 1,105,500 | |
| | 1,000 | | 5.000%, 1/01/21 – AGC Insured | | 1/18 at 100.00 | AA | | | 1,109,340 | |
| | | | Southern Minnesota Municipal Power Agency, Power Supply System Revenue Bonds, Series 1994A: | | | | | | | |
| | 8,600 | | 0.000%, 1/01/19 – NPFG Insured | | No Opt. Call | AA– | | | 8,034,288 | |
| | 1,100 | | 0.000%, 1/01/23 – NPFG Insured | | No Opt. Call | AA– | | | 895,367 | |
| | 3,070 | | 0.000%, 1/01/24 – NPFG Insured | | No Opt. Call | AA– | | | 2,397,087 | |
| | 100 | | 0.000%, 1/01/26 – NPFG Insured | | No Opt. Call | AA– | | | 72,742 | |
| | 40 | | 0.000%, 1/01/27 – NPFG Insured | | No Opt. Call | AA– | | | 27,674 | |
| | 1,000 | | Western Minnesota Municipal Power Agency, Power Supply Revenue Bonds, Series 2014A, 4.000%, 1/01/40 | | 1/24 at 100.00 | Aa3 | | | 1,026,460 | |
| | 17,220 | | Total Utilities | | | | | | 16,046,086 | |
| | | | Water and Sewer – 5.0% (3.3% of Total Investments) | | | | | | | |
| | | | Buffalo, Minnesota, Water and Sewer Revenue Bonds, Series 2009B: | | | | | | | |
| | 1,800 | | 0.000%, 10/01/21 | | 4/19 at 89.45 | AA+ | | | 1,515,132 | |
| | 1,800 | | 0.000%, 10/01/22 | | 4/19 at 85.14 | AA+ | | | 1,433,574 | |
| | 1,800 | | 0.000%, 10/01/23 | | 4/19 at 80.85 | AA+ | | | 1,354,212 | |
| | 5,400 | | Total Water and Sewer | | | | | | 4,302,918 | |
| $ | 128,657 | | Total Long-Term Investments (cost $121,584,461) | | | | | | 131,516,919 | |
| | | | Variable Rate MuniFund Term Preferred Shares, at Liquidation Value – (50.6)% (5) | | | | | | (44,100,000 | ) |
| | | | Other Assets Less Liabilities – (0.3)% | | | | | | (235,682 | ) |
| | | | Net Assets Applicable to Common Shares – 100% | | | | | $ | 87,181,237 | |
| (1) | All percentages shown in the Portfolio of Investments are based on net assets applicable to common shares unless otherwise noted. |
| (2) | Optional Call Provisions: Dates (month and year) and prices of the earliest optional call or redemption. There may be other call provisions at varying prices at later dates. Certain mortgage-backed securities may be subject to periodic principal paydowns. |
| (3) | Ratings: Using the highest of Standard & Poor’s Group (“Standard & Poor’s”), Moody’s Investors Service, Inc. (“Moody’s”) or Fitch, Inc. (“Fitch”) rating. Ratings below BBB by Standard & Poor’s, Baa by Moody’s or BBB by Fitch are considered to be below investment grade. Holdings designated N/R are not rated by any of these national rating agencies. |
| (4) | Backed by an escrow or trust containing sufficient U.S. Government or U.S. Government agency securities, which ensure the timely payment of principal and interest. Certain bonds backed by U.S. Government or agency securities are regarded as having an implied rating equal to the rating of such securities. |
| (5) | Variable Rate MuniFund Term Preferred Shares, at Liquidation Value as a percentage of Total Investments is 33.5% |
| WI/DD | Investment, or portion of investment, purchased on a when-issued or delayed delivery basis. |
See accompanying notes to financial statements.
| NOM | | |
| | Nuveen Missouri Premium Income Municipal Fund |
| | Portfolio of Investments | November 30, 2014 (Unaudited) |
| | Principal | | | | Optional Call | | | | | |
| | Amount (000) | | Description (1) | | Provisions (2) | Ratings (3) | | | Value | |
| | | | LONG-TERM INVESTMENTS – 159.2% (100.0% of Total Investments) | | | | | | | |
| | | | MUNICIPAL BONDS – 159.2% (100.0% of Total Investments) | | | | | | | |
| | | | Consumer Staples – 3.9% (2.4% of Total Investments) | | | | | | | |
| $ | 1,055 | | Missouri Development Finance Board, Solid Waste Disposal Revenue Bonds, Procter and Gamble Inc., Series 1999, 5.200%, 3/15/29 (Alternative Minimum Tax) | | No Opt. Call | AA– | | $ | 1,272,963 | |
| | | | Education and Civic Organizations – 20.8% (13.0% of Total Investments) | | | | | | | |
| | 300 | | Curators of the University of Missouri, System Facilities Revenue Bonds, Refunding Series 2014A, 4.000%, 11/01/33 | | 11/24 at 100.00 | AA+ | | | 323,043 | |
| | 250 | | Lincoln University, Missouri, Auxiliary System Revenue Bonds, Series 2007, 5.125%, 6/01/37 – AGC Insured | | 6/17 at 100.00 | AA | | | 261,788 | |
| | 410 | | Missouri Health and Educational Facilities Authority, Educational Facilities Revenue Bonds, Kansas City University of Medicine and Biosciences, Series 2013A, 5.000%, 6/01/33 | | 6/23 at 100.00 | A1 | | | 450,012 | |
| | 750 | | Missouri Health and Educational Facilities Authority, Educational Facilities Revenue Bonds, Saint Louis College of Pharmacy, Series 2013, 5.500%, 5/01/43 | | 5/23 at 100.00 | BBB+ | | | 824,423 | |
| | 600 | | Missouri Health and Educational Facilities Authority, Educational Facilities Revenue Bonds, Southwest Baptist University Project, Series 2012, 5.000%, 10/01/33 | | 10/22 at 100.00 | BBB– | | | 633,192 | |
| | 725 | | Missouri Health and Educational Facilities Authority, Educational Facilities Revenue Bonds, University of Central Missouri, Series 2013C2, 5.000%, 10/01/34 | | 10/23 at 100.00 | A | | | 810,855 | |
| | 630 | | Missouri Health and Educational Facilities Authority, Revenue Bonds, A.T. Still University of Health Sciences, Series 2011, 5.250%, 10/01/41 | | 10/21 at 100.00 | A– | | | 696,333 | |
| | 510 | | Missouri Health and Educational Facilities Authority, Revenue Bonds, A.T. Still University of Health Sciences, Series 2014, 5.000%, 10/01/39 | | 10/23 at 100.00 | A– | | | 562,622 | |
| | 700 | | Missouri Health and Educational Facilities Authority, Revenue Bonds, Rockhurst University, Series 2011A, 6.500%, 10/01/35 | | 10/18 at 103.00 | BBB– | | | 792,666 | |
| | 550 | | Missouri Health and Educational Facilities Authority, Revenue Bonds, Washington University, Series 2011B, 5.000%, 11/15/37 | | 11/21 at 100.00 | AAA | | | 625,510 | |
| | 600 | | Missouri Health and Educational Facilities Authority, Revenue Bonds, Webster University, Series 2011, 5.000%, 4/01/36 | | 4/21 at 100.00 | A2 | | | 657,372 | |
| | 250 | | Northwest Missouri State University, Housing System Revenue Bonds, Refunding Series 2012, 3.125%, 6/01/29 | | No Opt. Call | A3 | | | 237,488 | |
| | 6,275 | | Total Education and Civic Organizations | | | | | | 6,875,304 | |
| | | | Health Care – 36.1% (22.7% of Total Investments) | | | | | | | |
| | 525 | | Cape Girardeau County Industrial Development Authority, Missouri, Health Facilities Revenue Bonds, Saint Francis Medical Center, Series 2009A, 5.750%, 6/01/39 | | 6/19 at 100.00 | AA– | | | 586,982 | |
| | | | Cape Girardeau County Industrial Development Authority, Missouri, Health Facilities Revenue Bonds, Southeast Missouri Hospital Association, Series 2007: | | | | | | | |
| | 760 | | 5.000%, 6/01/27 | | 6/17 at 100.00 | BBB– | | | 775,420 | |
| | 560 | | 5.000%, 6/01/36 | | 6/17 at 100.00 | BBB– | | | 569,358 | |
| | 930 | | Cass County, Missouri, Hospital Revenue Bonds, Series 2007, 5.625%, 5/01/38 | | 11/16 at 100.00 | BBB– | | | 946,814 | |
| | 480 | | Clinton County Industrial Development Authority, Missouri, Revenue Bonds, Cameron Regional Medical Center, Series 2007, 5.000%, 12/01/37 | | 12/17 at 100.00 | N/R | | | 484,195 | |
| | 750 | | Joplin Industrial Development Authority, Missouri, Health Facilities Revenue Bonds, Freeman Health System, Series 2004, 5.500%, 2/15/29 | | 2/15 at 102.00 | BBB+ | | | 768,353 | |
| | 200 | | Joplin Industrial Development Authority, Missouri, Health Facilities Revenue Bonds, Freeman Health System, Series 2011, 5.500%, 2/15/31 | | 2/21 at 100.00 | BBB+ | | | 218,186 | |
| | 500 | | Missouri Health and Educational Facilities Authority, Health Facilities Revenue Bonds, SSM Health Care, Series 2014A, 5.000%, 6/01/31 | | 6/24 at 100.00 | AA– | | | 572,840 | |
| NOM | Nuveen Missouri Premium Income Municipal Fund |
| | Portfolio of Investments (continued) | November 30, 2014 (Unaudited) |
| | Principal | | | | Optional Call | | | | | |
| | Amount (000) | | Description (1) | | Provisions (2) | Ratings (3) | | | Value | |
| | | | Health Care (continued) | | | | | | | |
| $ | 540 | | Missouri Health and Educational Facilities Authority, Health Facilities Revenue Bonds, Capital Region Medical Center, Series 2011, 5.000%, 11/01/27 | | 11/20 at 100.00 | A3 | | $ | 585,997 | |
| | 1,730 | | Missouri Health and Educational Facilities Authority, Health Facilities Revenue Bonds, CoxHealth, Series 2013A, 5.000%, 11/15/44 | | 11/23 at 100.00 | A2 | | | 1,889,176 | |
| | 335 | | Missouri Health and Educational Facilities Authority, Health Facilities Revenue Bonds, Heartland Regional Medical Center, Series 2012, 5.000%, 2/15/37 | | 2/22 at 100.00 | A1 | | | 363,438 | |
| | 250 | | Missouri Health and Educational Facilities Authority, Health Facilities Revenue Bonds, Mercy Health, Series 2012, 4.000%, 11/15/42 | | No Opt. Call | AA– | | | 248,953 | |
| | 500 | | Missouri Health and Educational Facilities Authority, Health Facilities Revenue Bonds, Saint Luke’s Episcopal and Presbyterian Hospitals, Series 2011, 5.000%, 12/01/25 | | 12/21 at 100.00 | A+ | | | 559,985 | |
| | | | Missouri Health and Educational Facilities Authority, Health Facility Revenue Bonds, St. Luke’s Health System, Series 2010A: | | | | | | | |
| | 40 | | 5.250%, 11/15/25 | | 11/20 at 100.00 | A+ | | | 46,314 | |
| | 2,000 | | 5.000%, 11/15/30 | | 11/20 at 100.00 | A+ | | | 2,196,299 | |
| | 720 | | Saline County Industrial Development Authority, Missouri, Health Facilities Revenue Bonds, John Fitzgibbon Memorial Hospital Inc., Series 2010, 5.600%, 12/01/28 | | 12/20 at 100.00 | BBB– | | | 797,796 | |
| | 350 | | St. Louis County Industrial Development Authority, Missouri, Healthcare Facilities Revenue Bonds, Ranken-Jordan Project, Refunding Series 2007, 5.000%, 11/15/27 | | 11/16 at 100.00 | N/R | | | 351,712 | |
| | 11,170 | | Total Health Care | | | | | | 11,961,818 | |
| | | | Housing/Single Family – 0.8% (0.5% of Total Investments) | | | | | | | |
| | 165 | | Missouri Housing Development Commission, Single Family Mortgage Revenue Bonds, Homeownership Loan Program, Series 2007A-1, 4.700%, 9/01/27 (Alternative Minimum Tax) | | 9/16 at 100.00 | AA+ | | | 168,406 | |
| | 85 | | Missouri Housing Development Commission, Single Family Mortgage Revenue Bonds, Homeownership Loan Program, Series 2007C-1, 4.800%, 9/01/38 (Alternative Minimum Tax) | | 3/17 at 100.00 | AA+ | | | 85,052 | |
| | 250 | | Total Housing/Single Family | | | | | | 253,458 | |
| | | | Long-Term Care – 12.7% (8.0% of Total Investments) | | | | | | | |
| | 250 | | Bridgeton Industrial Development Authority, Missouri, Senior Housing Revenue Bonds, The Sarah Community Project, Series 2013, 4.500%, 5/01/28 | | 5/18 at 100.00 | N/R | | | 249,243 | |
| | 500 | | Joplin Industrial Development Authority, Missouri, Revenue Bonds, Christian Homes Inc., Series 2007F, 5.750%, 5/15/31 | | 5/17 at 100.00 | BBB– | | | 516,295 | |
| | 475 | | Lees Summit Industrial Development Authority, Missouri, Revenue Bonds, John Knox Village Obligated Group, Series 2007A, 5.125%, 8/15/32 | | 8/17 at 100.00 | BBB– | | | 487,170 | |
| | 250 | | Lees Summit Industrial Development Authority, Missouri, Revenue Bonds, John Knox Village Obligated Group, Series 2014A, 5.250%, 8/15/39 | | No Opt. Call | BBB– | | | 254,743 | |
| | 250 | | Missouri Health and Educational Facilities Authority, Revenue Bonds, Lutheran Senior Services Projects, Series 2011, 6.000%, 2/01/41 | | 2/21 at 100.00 | BBB+ | | | 277,390 | |
| | 500 | | Missouri Health and Educational Facilities Authority, Revenue Bonds, Lutheran Senior Services Projects, Series 2014A, 5.000%, 2/01/44 | | 2/24 at 100.00 | BBB+ | | | 532,520 | |
| | 100 | | St. Louis County Industrial Development Authority, Missouri, Revenue Bonds, Friendship Village of Chesterfield, Series 2012, 5.000%, 9/01/42 | | No Opt. Call | BBB– | | | 102,382 | |
| | | | St. Louis County Industrial Development Authority, Missouri, Revenue Bonds, Friendship Village of Sunset Hills, Series 2012: | | | | | | | |
| | 250 | | 5.000%, 9/01/32 | | No Opt. Call | A– | | | 269,805 | |
| | 425 | | 5.000%, 9/01/42 | | 9/22 at 100.00 | A– | | | 448,728 | |
| | 430 | | St. Louis County Industrial Development Authority, Missouri, Revenue Bonds, Friendship Village of Sunset Hills, Series 2013A, 5.875%, 9/01/43 | | 9/23 at 100.00 | A– | | | 472,050 | |
| | 570 | | St. Louis County Industrial Development Authority, Missouri, Revenue Bonds, Friendship Village of West County, Series 2007A, 5.500%, 9/01/28 | | 9/17 at 100.00 | BBB– | | | 588,023 | |
| | 4,000 | | Total Long-Term Care | | | | | | 4,198,349 | |
| | Principal | | | | Optional Call | | | | | |
| | Amount (000) | | Description (1) | | Provisions (2) | Ratings (3) | | | Value | |
| | | | Tax Obligation/General – 15.4% (9.7% of Total Investments) | | | | | | | |
| $ | 500 | | Branson Reorganized School District R-4, Taney County, Missouri, General Obligation Bonds, School Building Series 2012, 4.375%, 3/01/32 | | 3/22 at 100.00 | A+ | | $ | 534,920 | |
| | 1,500 | | Camdenton Reorganized School District R3, Camden County, Missouri, General Obligation Bonds, Series 2005, 5.250%, 3/01/24 – AGM Insured | | 3/15 at 100.00 | AA | | | 1,519,320 | |
| | 1,685 | | Independence School District, Jackson County, Missouri, General Obligation Bonds, Series 2010, 5.000%, 3/01/27 | | 3/20 at 100.00 | AA+ | | | 1,948,398 | |
| | 500 | | Jackson County Reorganized School District 4, Blue Springs, Missouri, General Obligation Bonds, School Building Series 2013A, 5.000%, 3/01/31 | | 3/21 at 100.00 | AA | | | 564,715 | |
| | 500 | | Missouri School Boards Association, Lease Participation Certificates, Clay County School District 53 Liberty, Series 2007, 5.250%, 3/01/27 – AGM Insured | | 3/17 at 100.00 | AA | | | 542,025 | |
| | 4,685 | | Total Tax Obligation/General | | | | | | 5,109,378 | |
| | | | Tax Obligation/Limited – 21.3% (13.4% of Total Investments) | | | | | | | |
| | 910 | | Bi-State Development Agency of the Missouri-Illinois Metropolitan District, Mass Transit Sales Tax Appropriation Bonds, Refunding Combined Lien Series 2013A, 5.000%, 10/01/33 | | 10/22 at 100.00 | AA+ | | | 1,040,740 | |
| | 625 | | Excelsior Springs Community Center, Missouri, Sales Tax Revenue Bonds, Series 2014, 4.000%, 3/01/27 – AGM Insured | | 3/23 at 100.00 | AA | | | 667,419 | |
| | 315 | | Fulton, Missouri, Tax Increment Revenue Bonds, Fulton Commons Redevelopment Project, Series 2006, 5.000%, 6/01/28 | | 6/16 at 100.00 | N/R | | | 269,366 | |
| | 430 | | Government of Guam, Business Privilege Tax Bonds, Series 2012B-1, 5.000%, 1/01/42 | | 1/22 at 100.00 | A | | | 466,107 | |
| | | | Howard Bend Levee District, St. Louis County, Missouri, Levee District Improvement Bonds, Series 2013B: | | | | | | | |
| | 180 | | 4.875%, 3/01/33 | | 3/23 at 100.00 | BBB+ | | | 188,586 | |
| | 115 | | 5.000%, 3/01/38 | | 3/23 at 100.00 | BBB+ | | | 120,417 | |
| | 485 | | Jackson County, Missouri, Special Obligation Bonds, Truman Medical Center Project, Series 2011B, 4.350%, 12/01/23 | | 12/21 at 100.00 | Aa3 | | | 543,122 | |
| | 300 | | Kansas City Industrial Development Authority, Missouri, Downtown Redevelopment District Revenue Bonds, Series 2011A, 5.000%, 9/01/32 | | 9/21 at 100.00 | AA– | | | 331,899 | |
| | 475 | | Kansas City Tax Increment Financing Commission, Missouri, Tax Increment Revenue Bonds, Briarcliff West Project, Series 2006A, 5.400%, 6/01/24 | | 6/16 at 100.00 | N/R | | | 485,127 | |
| | 325 | | Kansas City, Missouri, Special Obligation Bonds, Downtown Redevelopment District, Series 2014C, 5.000%, 9/01/33 | | 9/23 at 100.00 | AA– | | | 362,911 | |
| | 360 | | Missouri Development Finance Board, Infrastructure Facilities Revenue Bonds, Branson Landing Project, Series 2005A, 5.000%, 6/01/35 | | 6/15 at 100.00 | A | | | 366,638 | |
| | 245 | | Monarch-Chesterfield Levee District, St. Louis County, Missouri, Levee District Improvement Bonds, Series 1999, 5.750%, 3/01/19 – NPFG Insured | | 3/15 at 100.00 | AA– | | | 246,061 | |
| | 500 | | Osage Beach, Missouri, Tax Increment Revenue Bonds, Prewitts Point Transportation Development District, Series 2006, 5.000%, 5/01/23 | | No Opt. Call | N/R | | | 500,235 | |
| | 1,500 | | Puerto Rico Sales Tax Financing Corporation, Sales Tax Revenue Bonds, Series 2007A, 0.000%, 8/01/41 – NPFG Insured | | No Opt. Call | AA– | | | 270,210 | |
| | 250 | | Saint Louis County Industrial Development Authority, Missouri, Sales Tax Revenue Bonds, Chesterfield Blue Valley Community Improvement District Project, Series 2014A, 5.250%, 7/01/44 | | 7/24 at 100.00 | N/R | | | 253,263 | |
| | | | St. Joseph Industrial Development Authority, Missouri, Tax Increment Bonds, Shoppes at North Village Project, Series 2005A: | | | | | | | |
| | 340 | | 5.375%, 11/01/24 | | No Opt. Call | N/R | | | 340,126 | |
| | 400 | | 5.500%, 11/01/27 | | No Opt. Call | N/R | | | 400,160 | |
| | 200 | | St. Joseph Industrial Development Authority, Missouri, Tax Increment Bonds, Shoppes at North Village Project, Series 2005B, 5.500%, 11/01/27 | | No Opt. Call | N/R | | | 200,216 | |
| | 7,955 | | Total Tax Obligation/Limited | | | | | | 7,052,603 | |
| NOM | Nuveen Missouri Premium Income Municipal Fund |
| | Portfolio of Investments (continued) | November 30, 2014 (Unaudited) |
| | Principal | | | | Optional Call | | | | | |
| | Amount (000) | | Description (1) | | Provisions (2) | Ratings (3) | | | Value | |
| | | | Transportation – 12.9% (8.1% of Total Investments) | | | | | | | |
| $ | 335 | | Guam International Airport Authority, Revenue Bonds, Series 2013B, 5.500%, 10/01/33 – AGM Insured | | 10/23 at 100.00 | AA | | $ | 380,510 | |
| | 1,000 | | St. Louis, Missouri, Airport Revenue Bonds, Lambert-St. Louis International Airport, Series 2005, 5.500%, 7/01/18 – NPFG Insured | | No Opt. Call | AA– | | | 1,154,330 | |
| | 2,500 | | St. Louis, Missouri, Airport Revenue Bonds, Lambert-St. Louis International Airport, Series 2007A, 5.000%, 7/01/21 – AGM Insured | | 7/17 at 100.00 | AA | | | 2,733,022 | |
| | 3,835 | | Total Transportation | | | | | | 4,267,862 | |
| | | | U.S. Guaranteed – 14.7% (9.2% of Total Investments) (4) | | | | | | | |
| | 600 | | Carroll County Public Water Supply District 1, Missouri, Water System Revenue Bonds, Refunding Series 2009, 6.000%, 3/01/39 (Pre-refunded 3/01/18) | | 3/18 at 100.00 | A– (4) | | | 701,178 | |
| | 600 | | Chesterfield, Missouri, Certificates of Participation, Series 2005, 5.000%, 12/01/24 (Pre-refunded 12/01/15) – FGIC Insured | | 12/15 at 100.00 | Aa1 (4) | | | 629,196 | |
| | 110 | | Missouri Joint Municipal Electric Utility Commission, Power Project Revenue Bonds, Iatan 2 Project Series 2006A, 4.125%, 1/01/21 (Pre-refunded 1/01/16) – AMBAC Insured | | 1/16 at 100.00 | A2 (4) | | | 114,470 | |
| | 500 | | Missouri Joint Municipal Electric Utility Commission, Power Project Revenue Bonds, Plum Point Project, Series 2006, 5.000%, 1/01/34 (Pre-refunded 1/01/16) – NPFG Insured | | 1/16 at 100.00 | AA– (4) | | | 525,675 | |
| | 600 | | Riverside, Missouri, L-385 Levee Redevelopment Plan Tax Increment Revenue Bonds, Series 2004, 5.250%, 5/01/20 (Pre-refunded 5/01/15) | | 5/15 at 100.00 | A (4) | | | 613,050 | |
| | 1,395 | | Springfield Public Building Corporation, Missouri, Lease Revenue Bonds, Jordan Valley Park Projects, Series 2000A, 6.125%, 6/01/21 – AMBAC Insured (ETM) | | 2/15 at 100.00 | N/R (4) | | | 1,688,522 | |
| | 500 | | St. Louis County, Missouri, GNMA Collateralized Mortgage Revenue Bonds, Series 1993D, 5.650%, 7/01/20 (Alternative Minimum Tax) (ETM) | | No Opt. Call | AA+ (4) | | | 598,725 | |
| | 4,305 | | Total U.S. Guaranteed | | | | | | 4,870,816 | |
| | | | Utilities – 13.1% (8.3% of Total Investments) | | | | | | | |
| | 2,965 | | Missouri Environmental Improvement and Energy Resources Authority, Water Facility Revenue Bonds, Missouri-American Water Company, Series 2006, 4.600%, 12/01/36 – BHAC Insured (Alternative Minimum Tax) (UB) (5) | | 12/16 at 100.00 | AA+ | | | 3,044,818 | |
| | 350 | | Missouri Joint Municipal Electric Utility Commission, Power Project Revenue Bonds, Plum Point Project, Refunding Series 2014A, 5.000%, 1/01/32 (WI/DD, Settling 12/10/14) | | 1/25 at 100.00 | A– | | | 398,934 | |
| | | | Missouri Joint Municipal Electric Utility Commission, Power Supply System Revenue Bonds, MoPEP Facilities, Series 2012: | | | | | | | |
| | 400 | | 5.000%, 1/01/32 | | 1/21 at 100.00 | A2 | | | 441,764 | |
| | 425 | | 5.000%, 1/01/37 | | 1/21 at 100.00 | A2 | | | 465,668 | |
| | 4,140 | | Total Utilities | | | | | | 4,351,184 | |
| | Principal | | | | Optional Call | | | | | |
| | Amount (000) | | Description (1) | | Provisions (2) | Ratings (3) | | | Value | |
| | | | Water and Sewer – 7.5% (4.7% of Total Investments) | | | | | | | |
| $ | 200 | | Metropolitan St. Louis Sewerage District, Missouri, Wastewater System Revenue Bonds, Series 2006C, 5.000%, 5/01/36 – NPFG Insured | | 5/17 at 100.00 | AAA | | $ | 216,418 | |
| | 2,000 | | Metropolitan St. Louis Sewerage District, Missouri, Wastewater System Revenue Bonds, Series 2012A, 5.000%, 5/01/42 | | 5/22 at 100.00 | AAA | | | 2,266,559 | |
| | 2,200 | | Total Water and Sewer | | | | | | 2,482,977 | |
| $ | 49,870 | | Total Long-Term Investments (cost $49,197,136) | | | | | | 52,696,712 | |
| | | | Floating Rate Obligations – (6.7)% | | | | | | (2,225,000 | ) |
| | | | MuniFund Term Preferred Shares, at Liquidation Value – (54.0)% (6) | | | | | | (17,880,000 | ) |
| | | | Other Assets Less Liabilities – 1.5% | | | | | | 511,260 | |
| | | | Net Assets Applicable to Common Shares – 100% | | | | | $ | 33,102,972 | |
| (1) | All percentages shown in the Portfolio of Investments are based on net assets applicable to common shares unless otherwise noted. |
| (2) | Optional Call Provisions: Dates (month and year) and prices of the earliest optional call or redemption. There may be other call provisions at varying prices at later dates. Certain mortgage-backed securities may be subject to periodic principal paydowns. |
| (3) | Ratings: Using the highest of Standard & Poor’s Group (“Standard & Poor’s”), Moody’s Investors Service, Inc. (“Moody’s”) or Fitch, Inc. (“Fitch”) rating. Ratings below BBB by Standard & Poor’s, Baa by Moody’s or BBB by Fitch are considered to be below investment grade. Holdings designated N/R are not rated by any of these national rating agencies. |
| (4) | Backed by an escrow or trust containing sufficient U.S. Government or U.S. Government agency securities, which ensure the timely payment of principal and interest. Certain bonds backed by U.S. Government or agency securities are regarded as having an implied rating equal to the rating of such securities. |
| (5) | Investment, or portion of investment, has been pledged to collateralize the net payment obligations for investments in inverse floating rate transactions. |
| (6) | MuniFund Term Preferred Shares, at Liquidation Value as a percentage of Total Investments is 33.9% |
| WI/DD | Investment, or portion of investment, purchased on a when-issued or delayed delivery basis. |
| (ETM) | Escrowed to maturity. |
| (UB) | Underlying bond of an inverse floating rate trust reflected as a financing transaction. See Notes to Financial Statements, Note 3 – Portfolio Securities and Investments in Derivatives, Inverse Floating Rate Securities for more information. |
See accompanying notes to financial statements.
| NNC | | |
| | Nuveen North Carolina Premium Income Municipal Fund |
| | Portfolio of Investments | November 30, 2014 (Unaudited) |
| | Principal | | | | Optional Call | | | | | |
| | Amount (000) | | Description (1) | | Provisions (2) | Ratings (3) | | | Value | |
| | | | LONG-TERM INVESTMENTS – 149.3% (100.0% of Total Investments) | | | | | | | |
| | | | MUNICIPAL BONDS – 149.3% (100.0% of Total Investments) | | | | | | | |
| | | | Education and Civic Organizations – 21.4% (14.3% of Total Investments) | | | | | | | |
| $ | 30 | | Appalachian State University, North Carolina, Revenue Bonds, Series 2005, 5.250%, 7/15/17 – NPFG Insured | | 7/15 at 100.00 | Aa3 | | $ | 33,659 | |
| | | | Board of Governors of the University of North Carolina, Winston-Salem State University General Revenue Bonds, Series 2013: | | | | | | | |
| | 2,950 | | 5.000%, 4/01/33 | | 4/22 at 100.00 | A– | | | 3,253,260 | |
| | 1,000 | | 5.125%, 4/01/43 | | 4/22 at 100.00 | A– | | | 1,097,910 | |
| | 5,000 | | East Carolina University, North Carolina, General Revenue Bonds, Series 2014A, 5.000%, 10/01/41 | | 10/23 at 100.00 | Aa2 | | | 5,669,600 | |
| | 1,500 | | Fayetteville State University, North Carolina, Limited Obligation Revenue Bonds, Student Housing Project, Series 2011, 5.000%, 4/01/43 – AGM Insured | | 4/21 at 100.00 | AA | | | 1,614,090 | |
| | | | North Carolina Capital Facilities Finance Agency, Revenue Bonds, Davidson College, Series 2014: | | | | | | | |
| | 500 | | 5.000%, 3/01/26 (WI/DD, Settling 12/03/14) | | 3/22 at 100.00 | AA+ | | | 583,455 | |
| | 250 | | 5.000%, 3/01/28 (WI/DD, Settling 12/03/14) | | 3/22 at 100.00 | AA+ | | | 288,938 | |
| | 500 | | 5.000%, 3/01/29 (WI/DD, Settling 12/03/14) | | 3/22 at 100.00 | AA+ | | | 575,145 | |
| | 500 | | 5.000%, 3/01/32 (WI/DD, Settling 12/03/14) | | 3/22 at 100.00 | AA+ | | | 570,545 | |
| | | | North Carolina Capital Facilities Finance Agency, Revenue Bonds, Johnson & Wales University, Series 2013A: | | | | | | | |
| | 1,560 | | 5.000%, 4/01/32 | | 4/23 at 100.00 | A2 | | | 1,752,551 | |
| | 1,000 | | 5.000%, 4/01/33 | | 4/23 at 100.00 | A2 | | | 1,120,330 | |
| | 4,440 | | North Carolina Capital Facilities Finance Agency, Revenue Bonds, The Methodist University, Series 2012, 5.000%, 3/01/34 | | 3/22 at 100.00 | BBB | | | 4,818,954 | |
| | 2,500 | | North Carolina Capital Facilities Financing Agency, Revenue Bonds, Duke University, Series 2005A, 5.000%, 10/01/41 | | 10/15 at 100.00 | AA+ | | | 2,582,275 | |
| | 2,020 | | North Carolina State University at Raleigh, General Revenue Bonds, Series 2013A, 5.000%, 10/01/42 | | 10/23 at 100.00 | Aa1 | | | 2,322,333 | |
| | | | University of North Carolina System, Pooled Revenue Bonds, Series 2005A: | | | | | | | |
| | 1,530 | | 5.000%, 4/01/15 – AMBAC Insured | | No Opt. Call | A | | | 1,555,597 | |
| | 290 | | 5.000%, 4/01/22 – AMBAC Insured | | 4/15 at 100.00 | A | | | 294,536 | |
| | | | University of North Carolina Wilmington, Certificates of Participation, Student Housing Project Revenue Bonds, Series 2006: | | | | | | | |
| | 1,000 | | 5.000%, 6/01/21 – FGIC Insured | | 6/16 at 100.00 | AA– | | | 1,040,440 | |
| | 1,430 | | 5.000%, 6/01/23 – FGIC Insured | | 6/16 at 100.00 | AA– | | | 1,480,980 | |
| | 1,505 | | 5.000%, 6/01/24 – FGIC Insured | | 6/16 at 100.00 | AA– | | | 1,555,448 | |
| | 10,200 | | University of North Carolina, Chapel Hill, System Net Revenue Bonds, Series 2007, 5.000%, 12/01/36 | | 12/17 at 100.00 | AAA | | | 11,324,448 | |
| | 250 | | University of North Carolina, Charlotte, Certificates of Participation, Student Housing Project, Series 2005, 5.000%, 3/01/21 – AMBAC Insured | | 3/15 at 100.00 | A | | | 253,053 | |
| | | | University of North Carolina, Charlotte, General Revenue Bonds, Series 2014: | | | | | | | |
| | 2,070 | | 5.000%, 4/01/32 | | 4/24 at 100.00 | AA– | | | 2,409,604 | |
| | 1,175 | | 5.000%, 4/01/33 | | 4/24 at 100.00 | AA– | | | 1,364,645 | |
| | 1,385 | | 5.000%, 4/01/35 | | 4/24 at 100.00 | AA– | | | 1,593,927 | |
| | 1,655 | | University of North Carolina, Greensboro, General Revenue Bonds, Series 2014A, 5.000%, 4/01/39 | | 4/24 at 100.00 | Aa3 | | | 1,891,682 | |
| | | | University of North Carolina, System Pooled Revenue Bonds, Series 2009C: | | | | | | | |
| | 1,000 | | 5.250%, 10/01/28 | | 10/19 at 100.00 | A3 | | | 1,107,550 | |
| | 1,000 | | 5.375%, 10/01/29 | | 10/19 at 100.00 | A3 | | | 1,113,160 | |
| | 48,240 | | Total Education and Civic Organizations | | | | | | 53,268,115 | |
| | Principal | | | | Optional Call | | | | | |
| | Amount (000) | | Description (1) | | Provisions (2) | Ratings (3) | | | Value | |
| | | | Health Care – 26.0% (17.4% of Total Investments) | | | | | | | |
| $ | 2,750 | | Charlotte-Mecklenburg Hospital Authority, North Carolina, Health Care Revenue Bonds, DBA Carolinas HealthCare System, Refunding Series 2009A, 5.250%, 1/15/39 | | 1/19 at 100.00 | AA– | | $ | 3,074,803 | |
| | 5,250 | | Charlotte-Mecklenburg Hospital Authority, North Carolina, Health Care Revenue Bonds, DBA Carolinas HealthCare System, Refunding Series 2012A, 5.000%, 1/15/43 | | 1/22 at 100.00 | AA– | | | 5,720,453 | |
| | 4,950 | | Charlotte-Mecklenburg Hospital Authority, North Carolina, Health Care Revenue Bonds, DBA Carolinas HealthCare System, Series 2008A, 5.000%, 1/15/47 | | 1/18 at 100.00 | AA– | | | 5,217,003 | |
| | 2,000 | | Charlotte-Mecklenburg Hospital Authority, North Carolina, Health Care Revenue Bonds, DBA Carolinas HealthCare System, Series 2011A, 5.250%, 1/15/42 | | 1/21 at 100.00 | AA– | | | 2,195,580 | |
| | 2,225 | | Johnston Memorial Hospital Authority, North Carolina, Mortgage Revenue Bonds, Johnston Memorial Hospital Project, Series 2008A, 5.250%, 10/01/36 – AGM Insured | | 4/18 at 100.00 | AA | | | 2,445,075 | |
| | 3,860 | | Nash Health Care Systems, North Carolina, Health Care Facilities Revenue Bonds, Series 2012, 5.000%, 11/01/41 | | 5/22 at 100.00 | A | | | 4,175,285 | |
| | 500 | | New Hanover County, North Carolina, Hospital Revenue Bonds, New Hanover Regional Medical Center, Refunding Series 2013, 5.000%, 10/01/26 | | 10/23 at 100.00 | A+ | | | 570,360 | |
| | 555 | | New Hanover County, North Carolina, Hospital Revenue Bonds, New Hanover Regional Medical Center, Series 2006B, 5.125%, 10/01/31 – AGM Insured | | 10/19 at 100.00 | AA | | | 612,892 | |
| | | | North Carolina Medical Care Commission Health Care Facilities Revenue Bonds Novant Health Inc., Series 2010A: | | | | | | | |
| | 4,750 | | 5.250%, 11/01/40 | | 11/20 at 100.00 | AA– | | | 5,332,919 | |
| | 5,000 | | 5.000%, 11/01/43 | | 11/20 at 100.00 | AA– | | | 5,370,400 | |
| | 2,750 | | North Carolina Medical Care Commission, Health Care Facilities Refunding Revenue Bonds, Blue Ridge HealthCare, Series 2010A, 5.000%, 1/01/36 | | 1/20 at 100.00 | A | | | 2,909,198 | |
| | 2,680 | | North Carolina Medical Care Commission, Health Care Facilities Revenue Bonds, Appalachian Regional HealthCare System, Series 2011A, 6.500%, 7/01/31 | | 7/21 at 100.00 | BBB+ | | | 3,106,790 | |
| | 2,000 | | North Carolina Medical Care Commission, Health Care Facilities Revenue Bonds, Duke University Health System, Series 2012A, 5.000%, 6/01/42 | | 6/22 at 100.00 | AA | | | 2,249,240 | |
| | 2,335 | | North Carolina Medical Care Commission, Health Care Facilities Revenue Bonds, FirstHealth of the Carolinas Project, Refunding Series 2012A, 4.000%, 10/01/39 | | 10/17 at 100.00 | AA | | | 2,353,330 | |
| | 3,000 | | North Carolina Medical Care Commission, Health Care Facilities Revenue Bonds, Wake Forest Baptist Obligated Group, Series 2012A, 5.000%, 12/01/45 | | No Opt. Call | A | | | 3,268,170 | |
| | 2,375 | | North Carolina Medical Care Commission, Health Care Facilities Revenue Refunding Bonds, Cape Fear Valley Health System, Series 2012A, 5.000%, 10/01/27 | | No Opt. Call | A– | | | 2,641,451 | |
| | 2,000 | | North Carolina Medical Care Commission, Health Care Facilities Revenue Refunding Bonds, WakeMed, Series 2012A, 5.000%, 10/01/27 | | 10/22 at 100.00 | AA– | | | 2,273,080 | |
| | 2,000 | | North Carolina Medical Care Commission, Healthcare Facilities Revenue Bonds, Stanly Memorial Hospital, Series 1999, 6.375%, 10/01/29 | | 4/15 at 100.00 | A+ | | | 2,008,720 | |
| | 2,930 | | North Carolina Medical Care Commission, Hospital Revenue Bonds, Southeastern Regional Medical Center, Refunding Series 2012, 5.000%, 6/01/32 | | 6/22 at 100.00 | A | | | 3,201,816 | |
| | 3,295 | | North Carolina Medical Care Commission, Revenue Bonds, Blue Ridge Healthcare System, Series 2005, 5.000%, 1/01/33 – FGIC Insured | | 1/15 at 100.00 | AA– | | | 3,301,096 | |
| | 750 | | Northern Hospital District Surry County, North Carolina, Health Care Facilities Revenue Bonds, Series 2008, 6.250%, 10/01/38 | | 4/18 at 100.00 | BBB | | | 820,665 | |
| | 1,660 | | Onslow County Hospital Authority, North Carolina, FHA Insured Mortgage Revenue Bonds, Onslow Memorial Hospital Project, Series 2006, 5.000%, 4/01/31 – NPFG Insured | | 10/16 at 100.00 | AA– | | | 1,724,889 | |
| | 59,615 | | Total Health Care | | | | | | 64,573,215 | |
| NNC | Nuveen North Carolina Premium Income Municipal Fund |
| | Portfolio of Investments (continued) | November 30, 2014 (Unaudited) |
| | Principal | | | | Optional Call | | | | | |
| | Amount (000) | | Description (1) | | Provisions (2) | Ratings (3) | | | Value | |
| | | | Housing/Multifamily – 3.3% (2.2% of Total Investments) | | | | | | | |
| $ | 3,875 | | Durham Housing Authority, North Carolina, Multifamily Housing Revenue Bonds, JFK Towers Project, Series 2012A, 5.000%, 12/01/47 | | No Opt. Call | A– | | $ | 4,065,418 | |
| | | | Mecklenburg County, North Carolina, FNMA Multifamily Housing Revenue Bonds, Little Rock Apartments, Series 2003: | | | | | | | |
| | 810 | | 5.150%, 1/01/22 (Alternative Minimum Tax) | | 7/18 at 100.00 | N/R | | | 843,874 | |
| | 2,260 | | 5.375%, 1/01/36 (Alternative Minimum Tax) | | 7/18 at 100.00 | N/R | | | 2,327,077 | |
| | 1,000 | | North Carolina Capital Facilities Financing Agency, Housing Revenue Bonds, Elizabeth City State University, Series 2003A, 5.000%, 6/01/28 – AMBAC Insured | | No Opt. Call | N/R | | | 1,000,680 | |
| | 7,945 | | Total Housing/Multifamily | | | | | | 8,237,049 | |
| | | | Housing/Single Family – 2.1% (1.4% of Total Investments) | | | | | | | |
| | 1,225 | | North Carolina Housing Finance Agency, Home Ownership Revenue Bonds, Series 2007-29A, 4.800%, 7/01/33 (Alternative Minimum Tax) | | 1/17 at 100.00 | AA | | | 1,246,401 | |
| | 2,165 | | North Carolina Housing Finance Agency, Home Ownership Revenue Bonds, Series 2011-1, 4.500%, 1/01/28 | | 1/21 at 100.00 | AA | | | 2,317,741 | |
| | 1,730 | | North Carolina Housing Finance Agency, Home Ownership Revenue Bonds, Series 25-A, 4.900%, 7/01/37 (Alternative Minimum Tax) | | 7/16 at 100.00 | AA | | | 1,754,514 | |
| | 5,120 | | Total Housing/Single Family | | | | | | 5,318,656 | |
| | | | Long-Term Care – 1.5% (1.0% of Total Investments) | | | | | | | |
| | | | North Carolina Medical Care Commission, Healthcare Facilities Revenue Bonds, Presbyterian Homes, Series 2006: | | | | | | | |
| | 700 | | 5.400%, 10/01/27 | | 10/16 at 100.00 | N/R | | | 728,700 | |
| | 1,500 | | 5.500%, 10/01/31 | | 10/16 at 100.00 | N/R | | | 1,555,965 | |
| | 900 | | North Carolina Medical Care Commission, Revenue Bonds, Pines at Davidson, Series 2006A, 5.000%, 1/01/36 | | 1/16 at 100.00 | A– | | | 908,433 | |
| | 450 | | North Carolina Medical Care Commission, Revenue Bonds, United Methodist Retirement Homes Inc., Refunding Series 2013A, 5.000%, 10/01/33 | | 10/23 at 100.00 | N/R | | | 460,368 | |
| | 3,550 | | Total Long-Term Care | | | | | | 3,653,466 | |
| | | | Materials – 0.6% (0.4% of Total Investments) | | | | | | | |
| | 1,400 | | Columbus County Industrial Facilities and Pollution Control Financing Authority, North Carolina, Environmental Improvement Revenue Bonds, International Paper Company Project, Series 2007A, 4.625%, 3/01/27 | | 3/17 at 100.00 | BBB | | | 1,423,478 | |
| | | | Tax Obligation/General – 5.6% (3.7% of Total Investments) | | | | | | | |
| | | | Catawba County, North Carolina, General Obligation Bonds, Limited Obligation Series 2014A: | | | | | | | |
| | 1,000 | | 5.000%, 6/01/30 | | 6/24 at 100.00 | Aa2 | | | 1,169,340 | |
| | 730 | | 5.000%, 6/01/31 | | 6/24 at 100.00 | Aa2 | | | 849,669 | |
| | | | Durham, North Carolina, General Obligation Bonds, Series 2007: | | | | | | | |
| | 2,820 | | 5.000%, 4/01/21 | | 4/17 at 100.00 | AAA | | | 3,090,635 | |
| | 1,475 | | 5.000%, 4/01/22 | | 4/17 at 100.00 | AAA | | | 1,620,774 | |
| | 1,050 | | Forsyth County, North Carolina, General Obligation Bonds, Limited Obligation Series 2009, 5.000%, 4/01/30 | | 4/20 at 100.00 | AA+ | | | 1,197,809 | |
| | 5,100 | | Wake County, North Carolina, Limited Obligation Bonds, Series 2010, 5.000%, 1/01/37 | | 1/20 at 100.00 | AA+ | | | 5,886,522 | |
| | 12,175 | | Total Tax Obligation/General | | | | | | 13,814,749 | |
| | | | Tax Obligation/Limited – 21.5% (14.4% of Total Investments) | | | | | | | |
| | | | Buncombe County, North Carolina, Limited Obligation Bonds, Series 2014A: | | | | | | | |
| | 1,085 | | 5.000%, 6/01/33 | | 6/24 at 100.00 | AA+ | | | 1,274,636 | |
| | 1,600 | | 5.000%, 6/01/34 | | 6/24 at 100.00 | AA+ | | | 1,866,608 | |
| | 2,405 | | Charlotte, North Carolina, Certificates of Participation, Transit Projects Phase 2, Series 2008A, 5.000%, 6/01/33 | | 6/18 at 100.00 | AA+ | | | 2,647,015 | |
| | 2,045 | | Charlotte, North Carolina, Storm Water Fee Revenue Bonds, Refunding Series 2014, 5.000%, 12/01/39 | | 12/24 at 100.00 | AAA | | | 2,420,605 | |
| | Principal | | | | Optional Call | | | | | |
| | Amount (000) | | Description (1) | | Provisions (2) | Ratings (3) | | | Value | |
| | | | Tax Obligation/Limited (continued) | | | | | | | |
| $ | 2,085 | | Dare County, North Carolina, Installment Purchase Contract, Limited Obligation Series 2012B, 5.000%, 6/01/28 | | 6/22 at 100.00 | AA– | | $ | 2,385,323 | |
| | 1,390 | | Durham, North Carolina, Certificates of Participation, Series 2005B, 5.000%, 6/01/25 | | 6/15 at 100.00 | AA+ | | | 1,423,416 | |
| | | | Harnett County, North Carolina, Certificates of Participation, Series 2009: | | | | | | | |
| | 1,000 | | 5.000%, 6/01/28 – AGC Insured | | 6/19 at 100.00 | AA | | | 1,108,980 | |
| | 500 | | 5.000%, 6/01/29 – AGC Insured | | 6/19 at 100.00 | AA | | | 552,285 | |
| | 1,051 | | Hillsborough, North Carolina, Special Assessment Revenue Bonds, Series 2013, 7.750%, 2/01/24 | | 2/23 at 100.00 | N/R | | | 1,123,235 | |
| | | | Jacksonville Public Facilities Corporation, North Carolina, Limited Obligation Bonds, Series 2012: | | | | | | | |
| | 1,065 | | 5.000%, 4/01/29 | | 4/22 at 100.00 | A1 | | | 1,197,284 | |
| | 1,165 | | 5.000%, 4/01/30 | | 4/22 at 100.00 | A1 | | | 1,304,019 | |
| | 1,000 | | 5.000%, 4/01/31 | | 4/22 at 100.00 | A1 | | | 1,114,480 | |
| | 200 | | 5.000%, 4/01/32 | | 4/22 at 100.00 | A1 | | | 222,344 | |
| | 400 | | Mecklenburg County, North Carolina, Certificates of Participation, Series 2009A, 5.000%, 2/01/27 | | 2/19 at 100.00 | AA+ | | | 441,740 | |
| | | | North Carolina State, Limited Obligation Bonds, Refunding Series 2014C: | | | | | | | |
| | 3,000 | | 5.000%, 5/01/24 | | No Opt. Call | AA+ | | | 3,707,190 | |
| | 5,000 | | 5.000%, 5/01/25 | | 5/24 at 100.00 | AA+ | | | 6,115,150 | |
| | 8,065 | | North Carolina Turnpike Authority, Monroe Connector System State Appropriation Bonds, Series 2011, 5.000%, 7/01/41 | | 7/21 at 100.00 | AA | | | 9,077,399 | |
| | 1,135 | | Raleigh, North Carolina, Certificates of Participation, Series 2007, 5.000%, 2/01/27 | | 2/17 at 100.00 | AA+ | | | 1,221,328 | |
| | 1,000 | | Raleigh, North Carolina, Limited Obligation Bonds, Series 2013, 5.000%, 10/01/33 | | 10/23 at 100.00 | AA+ | | | 1,163,980 | |
| | | | Raleigh, North Carolina, Limited Obligation Bonds, Series 2014A: | | | | | | | |
| | 1,195 | | 5.000%, 10/01/25 | | 10/24 at 100.00 | AA+ | | | 1,468,524 | |
| | 1,305 | | 5.000%, 10/01/26 | | 10/24 at 100.00 | AA+ | | | 1,588,981 | |
| | 5,000 | | Sampson County, North Carolina, Certificates of Participation, Series 2006, 5.000%, 6/01/34 – AGM Insured | | 6/17 at 100.00 | AA | | | 5,393,400 | |
| | 2,450 | | Wilmington, North Carolina, Certificates of Participation, Series 2008A, 5.000%, 6/01/29 | | 6/18 at 100.00 | AA+ | | | 2,711,293 | |
| | 1,750 | | Wilson County, North Carolina, Certificates of Participation, School Facilities Project, Series 2007, 5.000%, 4/01/25 – AMBAC Insured | | 4/17 at 100.00 | Aa3 | | | 1,908,970 | |
| | 46,891 | | Total Tax Obligation/Limited | | | | | | 53,438,185 | |
| | | | Transportation – 19.2% (12.9% of Total Investments) | | | | | | | |
| | 5,000 | | Charlotte, North Carolina, Airport Revenue Bonds, Charlotte Douglas International Refunding Series 2010A, 5.000%, 7/01/39 | | 7/20 at 100.00 | Aa3 | | | 5,526,599 | |
| | 10 | | Charlotte, North Carolina, Airport Revenue Bonds, Charlotte Douglas International Refunding Series 2010B, 5.375%, 7/01/28 (Alternative Minimum Tax) | | 7/20 at 100.00 | Aa3 | | | 11,195 | |
| | | | Charlotte, North Carolina, Airport Revenue Bonds, Charlotte Douglas International, Refunding Series 2014A: | | | | | | | |
| | 2,865 | | 5.000%, 7/01/27 | | 7/24 at 100.00 | Aa3 | | | 3,405,196 | |
| | 3,000 | | 5.000%, 7/01/28 | | 7/24 at 100.00 | Aa3 | | | 3,542,040 | |
| | 1,400 | | Charlotte, North Carolina, Airport Revenue Bonds, Charlotte Douglas International, Series 2010B, 5.000%, 7/01/36 (Alternative Minimum Tax) | | 7/21 at 100.00 | Aa3 | | | 1,538,614 | |
| | 1,425 | | Charlotte, North Carolina, Airport Revenue Bonds, Refunding Series 2011A, 5.000%, 7/01/41 | | No Opt. Call | Aa3 | | | 1,572,302 | |
| | 2,725 | | North Carolina State Ports Authority, Port Facilities Revenue Bonds, Senior Lien Series 2010A, 5.250%, 2/01/40 | | 2/20 at 100.00 | A3 | | | 3,060,911 | |
| | 515 | | North Carolina State Ports Authority, Port Facilities Revenue Bonds, Senior Lien Series 2010B, 5.000%, 2/01/29 | | 2/20 at 100.00 | A3 | | | 570,939 | |
| | | | North Carolina Turnpike Authority, Triangle Expressway System Revenue Bonds, Series 2009A: | | | | | | | |
| | 140 | | 5.000%, 1/01/21 – AGC Insured | | 1/19 at 100.00 | AA | | | 156,274 | |
| | 265 | | 5.375%, 1/01/26 – AGC Insured | | 1/19 at 100.00 | AA | | | 300,802 | |
| | 1,640 | | 5.500%, 1/01/29 – AGC Insured | | 1/19 at 100.00 | AA | | | 1,853,020 | |
| | 7,335 | | 5.750%, 1/01/39 – AGC Insured | | 1/19 at 100.00 | AA | | | 8,291,630 | |
| NNC | Nuveen North Carolina Premium Income Municipal Fund |
| | Portfolio of Investments (continued) | November 30, 2014 (Unaudited) |
| | Principal | | | | Optional Call | | | | | |
| | Amount (000) | | Description (1) | | Provisions (2) | Ratings (3) | | | Value | |
| | | | Transportation (continued) | | | | | | | |
| | | | North Carolina Turnpike Authority, Triangle Expressway System Senior Lien Revenue Bonds, Series 2009B: | | | | | | | |
| $ | 150 | | 0.000%, 1/01/31 – AGC Insured | | No Opt. Call | AA | | $ | 80,823 | |
| | 4,355 | | 0.000%, 1/01/33 – AGC Insured | | No Opt. Call | AA | | | 2,153,460 | |
| | 2,300 | | 0.000%, 1/01/34 – AGC Insured | | No Opt. Call | AA | | | 1,091,994 | |
| | 2,345 | | 0.000%, 1/01/35 – AGC Insured | | No Opt. Call | AA | | | 1,068,757 | |
| | 7,505 | | 0.000%, 1/01/37 – AGC Insured | | No Opt. Call | AA | | | 3,136,114 | |
| | 1,325 | | 0.000%, 1/01/38 – AGC Insured | | No Opt. Call | AA | | | 529,960 | |
| | 1,235 | | Piedmont Triad Airport Authority, North Carolina, Airport Revenue Bonds, Series 2005A, 5.000%, 7/01/20 – SYNCORA GTY Insured | | 7/15 at 100.00 | A– | | | 1,269,395 | |
| | | | Raleigh Durham Airport Authority, North Carolina, Airport Revenue Bonds, Refunding Series 2010A: | | | | | | | |
| | 2,490 | | 5.000%, 5/01/26 | | No Opt. Call | Aa3 | | | 2,878,465 | |
| | 4,125 | | 5.000%, 5/01/36 | | 5/20 at 100.00 | Aa3 | | | 4,652,216 | |
| | 1,000 | | Raleigh Durham Airport Authority, North Carolina, Airport Revenue Bonds, Series 2007, 5.000%, 5/01/37 – FGIC Insured (Alternative Minimum Tax) | | 5/17 at 100.00 | AA+ | | | 1,052,050 | |
| | 53,150 | | Total Transportation | | | | | | 47,742,756 | |
| | | | U.S. Guaranteed – 11.6% (7.8% of Total Investments) (4) | | | | | | | |
| | | | Albemarle Hospital Authority, North Carolina, Health Care Facilities Revenue Bonds, Series 2007: | | | | | | | |
| | 1,840 | | 5.250%, 10/01/27 (Pre-refunded 10/01/17) | | 10/17 at 100.00 | N/R (4) | | | 2,081,794 | |
| | 1,725 | | 5.250%, 10/01/38 (Pre-refunded 10/01/17) | | 10/17 at 100.00 | N/R (4) | | | 1,951,682 | |
| | 500 | | Charlotte-Mecklenburg Hospital Authority, North Carolina, Healthcare System Revenue Bonds, DBA Carolinas Healthcare System, Series 2005A, 5.000%, 1/15/45 (Pre-refunded 1/15/15) | | 1/15 at 100.00 | AA+ (4) | | | 503,195 | |
| | | | Craven County, North Carolina, Certificates of Participation, Series 2007: | | | | | | | |
| | 160 | | 5.000%, 6/01/23 (Pre-refunded 6/01/17) – NPFG Insured | | 6/17 at 100.00 | AA– (4) | | | 178,016 | |
| | 3,000 | | 5.000%, 6/01/27 (Pre-refunded 6/01/17) – NPFG Insured | | 6/17 at 100.00 | AA– (4) | | | 3,337,800 | |
| | | | Greensboro, North Carolina, Combined Enterprise System Revenue Bonds, Series 2005A: | | | | | | | |
| | 500 | | 5.000%, 6/01/25 (Pre-refunded 6/01/15) | | 6/15 at 100.00 | AAA | | | 512,390 | |
| | 1,295 | | 5.000%, 6/01/26 (Pre-refunded 6/01/15) | | 6/15 at 100.00 | AAA | | | 1,327,090 | |
| | 1,680 | | North Carolina Medical Care Commission, Health Care Facilities Revenue Bonds, Cleveland County Healthcare System, Refunding Series 2011A, 5.750%, 1/01/35 (Pre-refunded 1/01/21) | | 1/21 at 100.00 | N/R (4) | | | 2,091,382 | |
| | | | North Carolina Medical Care Commission, Hospital Revenue Bonds, Wilson Medical Center, Series 2007: | | | | | | | |
| | 500 | | 5.000%, 11/01/20 (Pre-refunded 11/01/17) | | 11/17 at 100.00 | N/R (4) | | | 563,190 | |
| | 3,425 | | 5.000%, 11/01/27 (Pre-refunded 11/01/17) | | 11/17 at 100.00 | N/R (4) | | | 3,857,852 | |
| | 4,260 | | North Carolina Municipal Power Agency 1, Catawba Electric Revenue Bonds, Series 1986, 5.000%, 1/01/20 (ETM) | | No Opt. Call | Aaa | | | 4,991,868 | |
| | 2,990 | | Raleigh, North Carolina, Combined Enterprise System Revenue Bonds, Series 2006A, 5.000%, 3/01/36 (Pre-refunded 3/01/16) | | 3/16 at 100.00 | N/R (4) | | | 3,167,995 | |
| | 2,250 | | Rutherford County, North Carolina, Certificates of Participation, Series 2007, 5.000%, 12/01/27 (Pre-refunded 12/01/17) – AGM Insured | | 12/17 at 100.00 | AA (4) | | | 2,544,458 | |
| | | | University of North Carolina System, Pooled Revenue Bonds, Series 2005A: | | | | | | | |
| | 555 | | 5.000%, 4/01/22 (Pre-refunded 4/01/15) – AMBAC Insured | | 4/15 at 100.00 | N/R (4) | | | 564,241 | |
| | 155 | | 5.000%, 4/01/22 (Pre-refunded 4/01/15) – AMBAC Insured | | 4/15 at 100.00 | N/R (4) | | | 157,581 | |
| | 1,000 | | Wilmington, North Carolina, Water and Sewer Revenue Bonds, Series 2005, 5.000%, 6/01/25 (Pre-refunded 6/01/15) – AGM Insured | | 6/15 at 100.00 | AA+ (4) | | | 1,024,780 | |
| | 25,835 | | Total U.S. Guaranteed | | | | | | 28,855,314 | |
| | | | Utilities – 10.1% (6.8% of Total Investments) | | | | | | | |
| | 5,000 | | North Carolina Capital Facilities Financing Agency, Solid Waste Disposal Revenue Bond, Duke Energy Carolinas Project, Refunding Series 2008B, 4.625%, 11/01/40 | | 11/20 at 100.00 | Aa2 | | | 5,316,399 | |
| | 2,500 | | North Carolina Eastern Municipal Power Agency, Power System Revenue Bonds, Series 2005, 5.250%, 1/01/20 – AMBAC Insured | | 1/16 at 100.00 | A– | | | 2,630,950 | |
| | Principal | | | | Optional Call | | | | | |
| | Amount (000) | | Description (1) | | Provisions (2) | Ratings (3) | | | Value | |
| | | | Utilities (continued) | | | | | | | |
| $ | 1,400 | | North Carolina Eastern Municipal Power Agency, Power System Revenue Bonds, Series 2009B, 5.000%, 1/01/26 | | 1/19 at 100.00 | A– | | $ | 1,589,266 | |
| | 3,500 | | North Carolina Eastern Municipal Power Agency, Power System Revenue Bonds, Series 2012A, 5.000%, 1/01/25 | | 7/22 at 100.00 | A– | | | 4,053,035 | |
| | | | North Carolina Eastern Municipal Power Agency, Power System Revenue Refunding Bonds, Series 1993B: | | | | | | | |
| | 95 | | 6.000%, 1/01/22 | | No Opt. Call | A– | | | 118,547 | |
| | 180 | | 6.000%, 1/01/22 – FGIC Insured | | No Opt. Call | A3 | | | 224,615 | |
| | 1,100 | | North Carolina Municipal Power Agency 1, Catawba Electric Revenue Bonds, Refunding Series 2009A, 5.000%, 1/01/30 | | 1/19 at 100.00 | A | | | 1,228,777 | |
| | | | North Carolina Municipal Power Agency 1, Catawba Electric Revenue Bonds, Refunding Series 2012A: | | | | | | | |
| | 4,000 | | 5.000%, 1/01/18 | | No Opt. Call | A | | | 4,504,800 | |
| | 2,000 | | 5.000%, 1/01/19 | | No Opt. Call | A | | | 2,302,980 | |
| | 1,050 | | 4.000%, 1/01/20 | | No Opt. Call | A | | | 1,177,932 | |
| | 250 | | North Carolina Municipal Power Agency 1, Catawba Electric Revenue Bonds, Series 2008A, 5.250%, 1/01/20 | | 1/18 at 100.00 | A | | | 278,738 | |
| | 1,535 | | North Carolina Municipal Power Agency 1, Catawba Electric Revenue Bonds, Series 2012B, 5.000%, 1/01/21 | | No Opt. Call | A | | | 1,812,804 | |
| | 22,610 | | Total Utilities | | | | | | 25,238,843 | |
| | | | Water and Sewer – 26.4% (17.7% of Total Investments) | | | | | | | |
| | 1,605 | | Broad River Water Authority, North Carolina, Water System Revenue Bonds, Series 2005, 5.000%, 6/01/20 – SYNCORA GTY Insured | | 6/15 at 100.00 | A2 | | | 1,629,685 | |
| | 3,100 | | Brunswick County, North Carolina, Enterprise System Revenue Bonds, Series 2008A, 5.000%, 4/01/31 – AGM Insured | | 4/18 at 100.00 | AA | | | 3,412,325 | |
| | 1,145 | | Brunswick County, North Carolina, Enterprise Systems Revenue Refunding Bonds, Series 2012A, 5.000%, 4/01/25 | | 4/22 at 100.00 | AA– | | | 1,349,978 | |
| | | | Cape Fear Public Utility Authority, North Carolina, Water & Sewer System Revenue Bonds, Series 2008: | | | | | | | |
| | 425 | | 5.000%, 8/01/28 | | 8/18 at 100.00 | AA+ | | | 475,987 | |
| | 1,005 | | 5.000%, 8/01/35 | | 8/18 at 100.00 | AA+ | | | 1,114,495 | |
| | 2,135 | | Cape Fear Public Utility Authority, North Carolina, Water & Sewer System Revenue Bonds, Series 2011, 5.000%, 8/01/31 | | 8/21 at 100.00 | AA+ | | | 2,414,215 | |
| | 1,000 | | Charlotte, North Carolina, Water and Sewerage System Revenue Bonds, Series 2008, 5.000%, 7/01/38 | | 7/18 at 100.00 | AAA | | | 1,110,630 | |
| | | | Dare County, North Carolina, Utilities System Revenue Bonds, Series 2011: | | | | | | | |
| | 3,860 | | 5.000%, 2/01/36 | | 2/21 at 100.00 | AA | | | 4,272,557 | |
| | 1,250 | | 5.000%, 2/01/41 | | 2/21 at 100.00 | AA | | | 1,370,338 | |
| | 8,600 | | Durham, North Carolina, Utility System Revenue Bonds, Refunding Series 2011, 5.000%, 6/01/41 | | 6/21 at 100.00 | AAA | | | 9,548,320 | |
| | 1,535 | | Mooresville, North Carolina, Enterprise System Revenue Bonds, Refunding Series 2012, 5.000%, 5/01/28 | | 5/22 at 100.00 | AA– | | | 1,791,099 | |
| | 1,210 | | Oak Island, North Carolina, Enterprise System Revenue Bonds, Series 2008A, 5.000%, 6/01/23 – NPFG Insured | | 6/18 at 100.00 | AA– | | | 1,359,145 | |
| | | | Oak Island, North Carolina, Enterprise System Revenue Bonds, Series 2009A: | | | | | | | |
| | 2,020 | | 6.000%, 6/01/34 – AGC Insured | | 6/19 at 100.00 | AA | | | 2,368,127 | |
| | 1,020 | | 6.000%, 6/01/36 – AGC Insured | | 6/19 at 100.00 | AA | | | 1,190,034 | |
| | | | Oak Island, North Carolina, Enterprise System Revenue Bonds, Series 2011: | | | | | | | |
| | 600 | | 5.625%, 6/01/30 – AGC Insured | | 6/21 at 100.00 | AA | | | 703,086 | |
| | 2,100 | | 5.750%, 6/01/36 – AGC Insured | | 6/21 at 100.00 | AA | | | 2,454,564 | |
| | 1,400 | | Onslow County, North Carolina, Combined Enterprise System Revenue Bonds, Series 2004B, 5.000%, 6/01/23 – SYNCORA GTY Insured | | No Opt. Call | A+ | | | 1,405,474 | |
| NNC | Nuveen North Carolina Premium Income Municipal Fund |
| | Portfolio of Investments (continued) | November 30, 2014 (Unaudited) |
| | Principal | | | | Optional Call | | | | | |
| | Amount (000) | | Description (1) | | Provisions (2) | Ratings (3) | | | Value | |
| | | | Water and Sewer (continued) | | | | | | | |
| | | | Raleigh, North Carolina, Combined Enterprise System Revenue Bonds, Refunding Series 2012A: | | | | | | | |
| $ | 550 | | 5.000%, 3/01/30 | | 3/22 at 100.00 | AAA | | $ | 637,764 | |
| | 1,600 | | 5.000%, 3/01/31 | | 3/22 at 100.00 | AAA | | | 1,850,736 | |
| | | | Raleigh, North Carolina, Combined Enterprise System Revenue Bonds, Refunding Series 2013A: | | | | | | | |
| | 5,000 | | 5.000%, 3/01/28 | | 3/23 at 100.00 | AAA | | | 5,945,800 | |
| | 3,785 | | 5.000%, 3/01/43 | | 3/23 at 100.00 | AAA | | | 4,303,772 | |
| | 4,010 | | Raleigh, North Carolina, Combined Enterprise System Revenue Bonds, Series 2006A, 5.000%, 3/01/36 | | 3/16 at 100.00 | AAA | | | 4,208,054 | |
| | 9,900 | | Winston-Salem, North Carolina, Water and Sewer System Revenue Bonds, Series 2007A, 5.000%, 6/01/37 | | 6/17 at 100.00 | AAA | | | 10,755,259 | |
| | 58,855 | | Total Water and Sewer | | | | | | 65,671,444 | |
| $ | 345,386 | | Total Long-Term Investments (cost $346,961,801) | | | | | | 371,235,270 | |
| | | | Variable Rate MuniFund Term Preferred Shares, at Liquidation Value – (50.3)% (5) | | | | | | (125,000,000 | ) |
| | | | Other Assets Less Liabilities – 1.0% (6) | | | | | | 2,396,020 | |
| | | | Net Assets Applicable to Common Shares – 100% | | | | | $ | 248,631,290 | |
Investments in Derivatives as of November 30, 2014
Credit Default Swaps outstanding:
| | | | | | | Current | | | | | | | | | | | | | Unrealized | |
| | | | | Buy/Sell | | Credit | | | Notional | | Fixed Rate | | Termination | | | | | | Appreciation | |
| Counterparty | | Reference Entity | | Protection (7) | | Spread (8) | | | Amount | | (Annualized) | | Date | | | Value | | | (Depreciation) (6) | |
| Citibank N.A. | | Commonwealth of Puerto Rico | | Buy | | 25.5% | | $ | 3,020,000 | | 5.000% | | 12/20/19 | | $ | 731,495 | | $ | 1,193 | |
| (1) | All percentages shown in the Portfolio of Investments are based on net assets applicable to common shares unless otherwise noted. |
| (2) | Optional Call Provisions: Dates (month and year) and prices of the earliest optional call or redemption. There may be other call provisions at varying prices at later dates. Certain mortgage-backed securities may be subject to periodic principal paydowns. |
| (3) | Ratings: Using the highest of Standard & Poor’s Group (“Standard & Poor’s”), Moody’s Investors Service, Inc. (“Moody’s”) or Fitch, Inc. (“Fitch”) rating. Ratings below BBB by Standard & Poor’s, Baa by Moody’s or BBB by Fitch are considered to be below investment grade. Holdings designated N/R are not rated by any of these national rating agencies. |
| (4) | Backed by an escrow or trust containing sufficient U.S. Government or U.S. Government agency securities, which ensure the timely payment of principal and interest. Certain bonds backed by U.S. Government or agency securities are regarded as having an implied rating equal to the rating of such securities. |
| (5) | Variable Rate MuniFund Term Preferred Shares, at Liquidation Value as a percentage of Total Investments is 33.7% |
| (6) | Other Assets Less Liabilities includes the Unrealized Appreciation (Depreciation) of derivative instruments as listed within Investments in Derivatives as of the end of the reporting period. |
| (7) | The Fund entered into the credit default swaps to gain investment exposure to the referenced entity. Selling protection has a similar credit risk position to owning the referenced entity. Buying protection has a similar credit risk position to selling the referenced entity short. |
| (8) | The credit spread generally serves as an indication of the current status of the payment/performance risk and therefore the likelihood of default of the credit derivative. The credit spread also reflects the cost of buying/selling protection and may include upfront payments required to be made to enter into a credit default swap contract. Higher credit spreads are indicative of higher likelihood of performance by the seller of protection. |
| WI/DD | Investment, or portion of investment, purchased on a when-issued or delayed delivery basis. |
| (ETM) | Escrowed to maturity. |
See accompanying notes to financial statements.
| NPV | | |
| | Nuveen Virginia Premium Income Municipal Fund |
| | Portfolio of Investments | November 30, 2014 (Unaudited) |
| | Principal | | | | Optional Call | | | | | |
| | Amount (000) | | Description (1) | | Provisions (2) | Ratings (3) | | | Value | |
| | | | LONG-TERM INVESTMENTS – 149.9% (100.0% of Total Investments) | | | | | | | |
| | | | MUNICIPAL BONDS – 149.9% (100.0% of Total Investments) | | | | | | | |
| | | | Consumer Staples – 5.0% (3.3% of Total Investments) | | | | | | | |
| | | | Guam Economic Development & Commerce Authority, Tobacco Settlement Asset-Backed Bonds, Series 2007A: | | | | | | | |
| $ | 795 | | 5.250%, 6/01/32 | | 6/17 at 100.00 | B | | $ | 751,824 | |
| | 700 | | 5.625%, 6/01/47 | | 6/17 at 100.00 | B | | | 536,746 | |
| | 73,500 | | Puerto Rico, The Children’s Trust Fund, Tobacco Settlement Asset-Backed Bonds, Series 2005A, 0.000%, 5/15/50 | | 5/15 at 11.19 | BB– | | | 5,433,855 | |
| | 325 | | Puerto Rico, The Children’s Trust Fund, Tobacco Settlement Asset-Backed Refunding Bonds, Series 2002, 5.500%, 5/15/39 | | No Opt. Call | BBB | | | 309,966 | |
| | 6,425 | | Tobacco Settlement Financing Corporation of Virginia, Tobacco Settlement Asset Backed Bonds, Series 2007B1, 5.000%, 6/01/47 | | 6/17 at 100.00 | B– | | | 4,525,642 | |
| | 2,145 | | Tobacco Settlement Financing Corporation of Virginia, Tobacco Settlement Asset-Backed Bonds, Series 2007B2, 5.200%, 6/01/46 | | 6/17 at 100.00 | B– | | | 1,537,858 | |
| | 83,890 | | Total Consumer Staples | | | | | | 13,095,891 | |
| | | | Education and Civic Organizations – 9.8% (6.5% of Total Investments) | | | | | | | |
| | 1,615 | | Alexandria Industrial Development Authority, Virginia, Educational Facilities Revenue Bonds, Episcopal High School, Series 2012, 3.750%, 1/01/30 | | No Opt. Call | A1 | | | 1,647,558 | |
| | 580 | | Amherst Industrial Development Authority, Virginia, Revenue Bonds, Sweet Briar College, Series 2006, 5.000%, 9/01/26 | | 9/16 at 100.00 | BBB | | | 597,783 | |
| | 1,000 | | Lexington Industrial Development Authority, Virginia, Educational Facilities Revenue Bonds, VMI Development Board Project, Series 2006C, 5.000%, 12/01/36 | | 6/19 at 100.00 | Aa2 | | | 1,116,140 | |
| | 1,630 | | Prince William County Industrial Development Authority, Virginia, Student Housing Revenue Bonds, George Mason University Foundation Prince William Housing LLC Project, Series 2011A, 5.125%, 9/01/41 | | 9/21 at 100.00 | A | | | 1,819,993 | |
| | 1,545 | | Puerto Rico Industrial, Tourist, Educational, Medical and Environmental Control Facilities Financing Authority, Higher Education Revenue Refunding Bonds, Ana G. Mendez University System, Series 2002, 5.375%, 12/01/21 | | No Opt. Call | BBB– | | | 1,489,457 | |
| | 995 | | The Rector and Visitors of the University of Virginia, General Revenue Bonds, Series 2005, 5.000%, 6/01/37 | | 6/15 at 100.00 | AAA | | | 1,017,248 | |
| | 8,500 | | The Rector and Visitors of the University of Virginia, General Revenue Bonds, Series 2008, 5.000%, 6/01/40 | | 6/18 at 100.00 | AAA | | | 9,440,694 | |
| | 3,570 | | Virginia College Building Authority, Educational Facilities Revenue Bonds, Public Higher Education Financing Program, Series 2009A, 5.000%, 9/01/28 | | No Opt. Call | Aa1 | | | 4,005,826 | |
| | 3,000 | | Virginia College Building Authority, Educational Facilities Revenue Bonds, Washington and Lee University, Series 2001, 5.375%, 1/01/21 | | No Opt. Call | AA | | | 3,442,650 | |
| | 500 | | Virginia College Building Authority, Educational Facilities Revenue Refunding Bonds, Marymount University, Series 1998, 5.100%, 7/01/18 – RAAI Insured | | 1/15 at 100.00 | N/R | | | 501,395 | |
| | 500 | | Virginia Small Business Finance Authority, Educational Facilities Revenue Bonds, Roanoke College, Series 2011, 5.750%, 4/01/41 | | 4/20 at 100.00 | A– | | | 558,870 | |
| | 23,435 | | Total Education and Civic Organizations | | | | | | 25,637,614 | |
| | | | Health Care – 28.3% (18.9% of Total Investments) | | | | | | | |
| | 5,000 | | Arlington County Industrial Development Authority, Virginia, Hospital Revenue Bonds, Virginia Hospital Center Arlington Health System, Refunding Series 2010, 5.000%, 7/01/31 | | 7/20 at 100.00 | AA– | | | 5,586,150 | |
| | | | Charlotte County Industrial Development Authority, Virginia, Hospital Revenue Bonds, Halifax Regional Hospital Incorporated, Series 2007: | | | | | | | |
| | 1,545 | | 5.000%, 9/01/27 | | 9/17 at 100.00 | A | | | 1,643,803 | |
| | 250 | | 5.000%, 9/01/37 | | 9/17 at 100.00 | A | | | 265,073 | |
| NPV | Nuveen Virginia Premium Income Municipal Fund |
| | Portfolio of Investments (continued) | November 30, 2014 (Unaudited) |
| | Principal | | | | Optional Call | | | | | |
| | Amount (000) | | Description (1) | | Provisions (2) | Ratings (3) | | | Value | |
| | | | Health Care (continued) | | | | | | | |
| $ | 2,145 | | Chesterfield County Economic Development Authority, Virginia, Revenue Bonds, Bon Secours Health, Series 2010C-2, 5.000%, 11/01/42 – AGC Insured | | 11/20 at 100.00 | AA | | $ | 2,323,936 | |
| | 3,375 | | Colorado Health Facilities Authority, Colorado, Revenue Bonds, Catholic Health Initiatives, Series 2013A, 5.250%, 1/01/40 | | 1/23 at 100.00 | A+ | | | 3,803,153 | |
| | 1,000 | | Fairfax County Industrial Development Authority, Virginia, Healthcare Revenue Bonds, Inova Health System, Series 2012A, 5.000%, 5/15/40 | | 5/22 at 100.00 | AA+ | | | 1,111,990 | |
| | 3,340 | | Fairfax County Industrial Development Authority, Virginia, Healthcare Revenue Bonds, Inova Health System, Series 2009, Trust 11733, 15.266%, 11/15/29 (IF) | | 5/19 at 100.00 | AA+ | | | 4,669,687 | |
| | 4,950 | | Fairfax County Industrial Development Authority, Virginia, Hospital Revenue Refunding Bonds, Inova Health System, Series 1993A, 5.000%, 8/15/23 | | No Opt. Call | AA+ | | | 5,827,289 | |
| | | | Fredericksburg Economic Development Authority, Virginia, Hospital Facilities Revenue Bonds, MediCorp Health System, Series 2007: | | | | | | | |
| | 1,080 | | 5.250%, 6/15/18 | | No Opt. Call | Baa1 | | | 1,193,022 | |
| | 2,500 | | 5.250%, 6/15/23 | | No Opt. Call | Baa1 | | | 2,837,475 | |
| | 560 | | Hanover County Industrial Development Authority, Virginia, Hospital Revenue Bonds, Memorial Regional Medical Center, Series 1995, 6.375%, 8/15/18 – NPFG Insured | | No Opt. Call | AA– | | | 604,834 | |
| | 9,265 | | Harrisonburg Industrial Development Authority, Virginia, Hospital Facilities Revenue Bonds, Rockingham Memorial Hospital, Series 2006, 5.000%, 8/15/31 – AMBAC Insured | | 8/16 at 100.00 | AA | | | 9,607,340 | |
| | 1,500 | | Henrico County Industrial Development Authority, Virginia, Healthcare Revenue Bonds, Bon Secours Health System, Series 1996, 6.250%, 8/15/20 – NPFG Insured | | No Opt. Call | AA– | | | 1,692,390 | |
| | 3,155 | | Prince William County Industrial Development Authority, Virginia, Health Care Facilities Revenue Refunding Bonds, Novant Health Obligated Group-Prince William Hospital, Series 2013B, 5.000%, 11/01/46 | | 11/22 at 100.00 | AA– | | | 3,445,733 | |
| | | | Stafford County Economic Development Authority, Virginia, Hospital Facilities Revenue Bonds, MediCorp Health System, Series 2006: | | | | | | | |
| | 2,000 | | 5.250%, 6/15/25 | | 6/16 at 100.00 | Baa1 | | | 2,067,000 | |
| | 2,000 | | 5.250%, 6/15/26 | | 6/16 at 100.00 | Baa1 | | | 2,064,080 | |
| | 2,025 | | 5.250%, 6/15/31 | | 6/16 at 100.00 | Baa1 | | | 2,082,206 | |
| | 7,395 | | 5.250%, 6/15/37 | | 6/16 at 100.00 | Baa1 | | | 7,583,645 | |
| | 2,550 | | Virginia Small Business Finance Authority, Healthcare Facilities Revenue Bonds, Sentara Healthcare, Refunding Series 2010, 5.000%, 11/01/40 | | 5/20 at 100.00 | AA | | | 2,797,503 | |
| | 4,425 | | Virginia Small Business Financing Authority, Wellmont Health System Project Revenue Bonds, Series 2007A, 5.250%, 9/01/37 | | 9/17 at 100.00 | BBB+ | | | 4,614,833 | |
| | 2,335 | | Winchester Economic Development Authority, Virginia, Hospital Revenue Bonds, Valley Health System Obligated Group, Refunding Series 2014A, 5.000%, 1/01/44 | | 1/24 at 100.00 | A+ | | | 2,594,138 | |
| | 1,620 | | Winchester Industrial Development Authority, Virginia, Hospital Revenue Bonds Valley Health System Obligated Group, Series 2009E, 5.625%, 1/01/44 | | 1/19 at 100.00 | A+ | | | 1,786,163 | |
| | 2,855 | | Winchester Industrial Development Authority, Virginia, Hospital Revenue Bonds, Winchester Medical Center, Series 2007, 5.125%, 1/01/31 | | 1/17 at 100.00 | A+ | | | 2,990,356 | |
| | 1,020 | | Wisconsin Health and Educational Facilities Authority, Revenue Bonds, Aurora Health Care, Inc., Series 2010A, 5.625%, 4/15/39 | | 4/20 at 100.00 | A | | | 1,132,282 | |
| | 67,890 | | Total Health Care | | | | | | 74,324,081 | |
| | | | Housing/Multifamily – 1.3% (0.9% of Total Investments) | | | | | | | |
| | 910 | | Arlington County Industrial Development Authority, Virginia, Multifamily Housing Mortgage Revenue Bonds, Arlington View Terrace Apartments, Series 2001, 5.150%, 11/01/31 (Mandatory put 11/01/19) (Alternative Minimum Tax) | | 3/15 at 100.00 | AA | | | 912,512 | |
| | 400 | | Virginia Housing Development Authority, Rental Housing Bonds, Series 2010A, 5.000%, 4/01/45 | | 10/19 at 100.00 | AA+ | | | 423,292 | |
| | 530 | | Virginia Housing Development Authority, Rental Housing Bonds, Series 2010C, 4.550%, 8/01/32 | | 2/20 at 100.00 | AA+ | | | 563,724 | |
| | 1,420 | | Waynesboro Redevelopment and Housing Authority, Virginia, Multifamily Housing Revenue Bonds, Epworth Manor, GNMA Collateralized Series 2010, 5.000%, 10/20/51 | | 4/20 at 100.00 | AA+ | | | 1,507,685 | |
| | 3,260 | | Total Housing/Multifamily | | | | | | 3,407,213 | |
| | Principal | | | | Optional Call | | | | | |
| | Amount (000) | | Description (1) | | Provisions (2) | Ratings (3) | | | Value | |
| | | | Housing/Single Family – 6.7% (4.5% of Total Investments) | | | | | | | |
| $ | 2,740 | | Virginia Housing Development Authority, Commonwealth Mortgage Bonds, Series 2006, 4.800%, 7/01/29 (Alternative Minimum Tax) | | 7/15 at 100.00 | AAA | | $ | 2,791,156 | |
| | 7,900 | | Virginia Housing Development Authority, Commonwealth Mortgage Bonds, Series 2007B, 4.750%, 7/01/32 (Alternative Minimum Tax) | | 7/16 at 100.00 | AAA | | | 8,028,058 | |
| | | | Virginia Housing Development Authority, Commonwealth Mortgage Bonds, Series 2012C-5: | | | | | | | |
| | 2,500 | | 4.550%, 7/01/31 | | 10/22 at 100.00 | AAA | | | 2,740,500 | |
| | 2,000 | | 4.800%, 7/01/38 | | 10/22 at 100.00 | AAA | | | 2,183,320 | |
| | | | Virginia Housing Development Authority, Commonwealth Mortgage Bonds, Series 2012C-8: | | | | | | | |
| | 715 | | 4.400%, 10/01/31 | | 10/22 at 100.00 | AAA | | | 773,287 | |
| | 1,000 | | 4.750%, 10/01/38 | | 10/22 at 100.00 | AAA | | | 1,088,250 | |
| | 16,855 | | Total Housing/Single Family | | | | | | 17,604,571 | |
| | | | Long-Term Care – 8.7% (5.8% of Total Investments) | | | | | | | |
| | 2,000 | | Albemarle County Industrial Development Authority, Virginia, Residential Care Facilities Mortgage Revenue Bonds, Westminster-Canterbury of the Blue Ridge, Series 2007, 5.000%, 1/01/31 | | 1/17 at 100.00 | N/R | | | 2,028,840 | |
| | 1,000 | | Chesterfield County Health Center Commission, Virginia, Mortgage Revenue Bonds, Lucy Corr Village, Series 2005, 5.625%, 12/01/39 | | 12/15 at 100.00 | N/R | | | 725,170 | |
| | 5,585 | | Fairfax County Economic Development Authority, Virginia, Residential Care Facilities Mortgage Revenue Bonds, Goodwin House, Inc., Series 2007A, 5.125%, 10/01/37 | | 10/17 at 100.00 | BBB | | | 5,794,493 | |
| | | | Fairfax County Economic Development Authority, Virginia, Retirement Center Revenue Bonds, Greenspring Village, Series 2006A: | | | | | | | |
| | 1,000 | | 4.750%, 10/01/26 | | 10/16 at 100.00 | A | | | 1,026,340 | |
| | 800 | | 4.875%, 10/01/36 | | 10/16 at 100.00 | A | | | 817,696 | |
| | 3,870 | | Henrico County Economic Development Authority, Virginia, Residential Care Facility Revenue Bonds, Westminster Canterbury of Richmond, Series 2006, 5.000%, 10/01/35 | | 10/15 at 101.00 | BBB+ | | | 3,937,222 | |
| | 3,590 | | Industrial Development Authority of the County of Prince William, Virginia, Residential Care Facility Revenue Bonds, Westminster at Lake, First Mortgage, Series 2006, 5.125%, 1/01/26 | | 1/17 at 100.00 | N/R | | | 3,602,888 | |
| | 1,000 | | Roanoke Economic Development Authority, Virginia, Residential Care Facility Mortgage Revenue Refunding Bonds, Virginia Lutheran Homes Brandon Oaks Project, Series 2012, 4.625%, 12/01/27 | | 12/22 at 100.00 | N/R | | | 994,680 | |
| | 1,500 | | Roanoke Industrial Development Authority, Virginia, Residential Revenue Bonds, Virginia Lutheran Homes Incorporated, Series 2006, 5.000%, 12/01/39 | | 12/16 at 100.00 | N/R | | | 1,468,545 | |
| | 1,000 | | Suffolk Industrial Development Authority, Virginia, Retirement Facilities First Mortgage Revenue Bonds, Lake Prince Center, Series 2006, 5.300%, 9/01/31 | | 9/16 at 100.00 | N/R | | | 1,008,090 | |
| | 1,000 | | Virginia Beach Development Authority, Virginia, Residential Care Facility Mortgage Revenue Bonds, Westminster Canterbury on Chesapeake Bay, Series 2005, 5.000%, 11/01/22 | | 11/15 at 100.00 | N/R | | | 1,011,780 | |
| | 500 | | Winchester Industrial Development Authority, Virginia, Residential Care Facility Revenue Bonds, Westminster-Canterbury of Winchester Inc., Series 2005A, 5.200%, 1/01/27 | | 1/15 at 100.00 | BBB+ | | | 500,590 | |
| | 22,845 | | Total Long-Term Care | | | | | | 22,916,334 | |
| | | | Tax Obligation/General – 12.5% (8.4% of Total Investments) | | | | | | | |
| | 1,440 | | Bristol, Virginia, General Obligation Bonds, Refunding & Improvement Series 2010, 5.000%, 7/15/25 | | 7/20 at 100.00 | A1 | | | 1,699,430 | |
| | 1,000 | | Chesterfield County, Virginia, General Obligation Bonds, Public Improvement Series 2009A, 5.000%, 1/01/16 | | No Opt. Call | AAA | | | 1,052,140 | |
| | 5,350 | | Chesterfield County, Virginia, General Obligation Bonds, Refunding Public Improvement Series 2014B, 4.000%, 1/01/16 | | No Opt. Call | AAA | | | 5,570,688 | |
| | 1,070 | | Norfolk, Virginia, General Obligation Bonds, Series 2005, 5.000%, 3/01/15 – NPFG Insured | | No Opt. Call | AA+ | | | 1,083,557 | |
| | 6,050 | | Portsmouth, Virginia, General Obligation Bonds, Refunding Series 2010D, 5.000%, 7/15/34 | | 7/20 at 100.00 | AA | | | 6,929,247 | |
| | 1,280 | | Portsmouth, Virginia, General Obligation Bonds, Series 2005A, 5.000%, 4/01/15 – NPFG Insured | | No Opt. Call | AA | | | 1,301,376 | |
| | 610 | | Puerto Rico, General Obligation and Public Improvement Bonds, Series 1998, 6.000%, 7/01/15 – NPFG Insured | | No Opt. Call | AA– | | | 617,466 | |
| | 560 | | Puerto Rico, General Obligation Bonds, Series 2004A, 5.000%, 7/01/15 – AGM Insured | | No Opt. Call | AA | | | 561,271 | |
| NPV | Nuveen Virginia Premium Income Municipal Fund |
| | Portfolio of Investments (continued) | November 30, 2014 (Unaudited) |
| | Principal | | | | Optional Call | | | | | |
| | Amount (000) | | Description (1) | | Provisions (2) | Ratings (3) | | | Value | |
| | | | Tax Obligation/General (continued) | | | | | | | |
| $ | 1,000 | | Richmond, Virginia, General Obligation Bonds, Public Improvement Series 2009A, 5.000%, 7/15/22 | | 7/19 at 100.00 | AA+ | | $ | 1,166,800 | |
| | 1,295 | | Richmond, Virginia, General Obligation Bonds, Refunding & Improvement Series 2012B, 5.000%, 7/15/15 | | No Opt. Call | AA+ | | | 1,334,925 | |
| | 1,535 | | Suffolk, Virginia, General Obligation Bonds, Series 2005, 5.000%, 12/01/15 | | No Opt. Call | AAA | | | 1,609,586 | |
| | | | Virginia Beach, Virginia, General Obligation Bonds, Series 2008: | | | | | | | |
| | 4,500 | | 5.000%, 10/01/27 (UB) | | 10/17 at 100.00 | AAA | | | 4,951,440 | |
| | 4,500 | | 5.000%, 10/01/26 (UB) | | 10/17 at 100.00 | AAA | | | 4,983,390 | |
| | 30,190 | | Total Tax Obligation/General | | | | | | 32,861,316 | |
| | | | Tax Obligation/Limited – 23.9% (15.9% of Total Investments) | | | | | | | |
| | | | Buena Vista Public Recreational Facilities Authority, Virginia, Lease Revenue Bonds, Golf Course Project, Series 2005A: | | | | | | | |
| | 595 | | 5.250%, 7/15/25 – ACA Insured | | 7/15 at 100.00 | N/R | | | 512,557 | |
| | 520 | | 5.500%, 7/15/35 – ACA Insured | | 7/15 at 100.00 | N/R | | | 410,181 | |
| | 880 | | Cumberland County, Virginia, Certificates of Participation, Series 1997, 6.375%, 7/15/17 | | No Opt. Call | N/R | | | 952,301 | |
| | 600 | | Dulles Town Center Community Development Authority, Loudon County, Virginia Special Assessment Refunding Bonds, Dulles Town Center Project, Series 2012, 4.250%, 3/01/26 | | No Opt. Call | N/R | | | 594,672 | |
| | 4,000 | | Fairfax County Economic Development Authority, Virginia, Transportation District Improvement Revenue Bonds, Silver Line Phase 1 Project, Series 2011, 5.000%, 4/01/27 | | No Opt. Call | AA | | | 4,611,560 | |
| | | | Government of Guam, Business Privilege Tax Bonds, Series 2011A: | | | | | | | |
| | 1,020 | | 5.000%, 1/01/31 | | 1/22 at 100.00 | A | | | 1,134,607 | |
| | 500 | | 5.250%, 1/01/36 | | 1/22 at 100.00 | A | | | 557,005 | |
| | | | Greater Richmond Convention Center Authority, Virginia, Hotel Tax Revenue Bonds, Series 2005: | | | | | | | |
| | 2,480 | | 5.000%, 6/15/15 – NPFG Insured | | No Opt. Call | AA– | | | 2,544,083 | |
| | 5,700 | | 5.000%, 6/15/30 – NPFG Insured | | 6/15 at 100.00 | AA– | | | 5,819,529 | |
| | 890 | | Montgomery County Industrial Development Authority, Virginia, Public Facility Lease Revenue Bonds, Public Projects Series 2008, 5.000%, 2/01/29 | | 2/18 at 100.00 | AA– | | | 975,360 | |
| | 645 | | Puerto Rico Highway and Transportation Authority, Highway Revenue Bonds, Series 2007N, 5.500%, 7/01/29 – AMBAC Insured | | No Opt. Call | Caa1 | | | 624,237 | |
| | | | Puerto Rico Infrastructure Financing Authority, Special Tax Revenue Bonds, Series 2005A: | | | | | | | |
| | 5,085 | | 0.000%, 7/01/29 – AMBAC Insured | | No Opt. Call | BB | | | 1,755,800 | |
| | 5,000 | | 0.000%, 7/01/43 – AMBAC Insured | | No Opt. Call | BB | | | 622,700 | |
| | 5,875 | | Puerto Rico Infrastructure Financing Authority, Special Tax Revenue Bonds, Series 2005C, 0.000%, 7/01/28 – AMBAC Insured | | No Opt. Call | BB | | | 2,209,823 | |
| | 10,000 | | Puerto Rico Sales Tax Financing Corporation, Sales Tax Revenue Bonds, Series 2007A, 0.000%, 8/01/41 – NPFG Insured | | No Opt. Call | AA– | | | 1,801,400 | |
| | 5 | | Puerto Rico, Highway Revenue Bonds, Highway and Transportation Authority, Series 2003AA, 5.500%, 7/01/18 – NPFG Insured | | No Opt. Call | AA– | | | 5,068 | |
| | 760 | | Puerto Rico, Highway Revenue Bonds, Highway and Transportation Authority, Series 2007CC, 5.500%, 7/01/28 – NPFG Insured | | No Opt. Call | AA– | | | 798,654 | |
| | 95 | | Stafford County and Staunton Industrial Development Authority, Virginia, Revenue Bonds, Virginia Municipal League and Virginia Association of Counties Finance Program, Series 2007C, 5.000%, 2/01/37 – SYNCORA GTY Insured | | No Opt. Call | N/R | | | 97,523 | |
| | 5,000 | | Stafford County Economic Development Authority, Virginia, Lease Revenue Bonds, Public Facility Projects, Series 2008, 5.000%, 4/01/33 – AGC Insured (UB) | | 4/18 at 100.00 | AA | | | 5,642,112 | |
| | 3,000 | | Virgin Islands Public Finance Authority, Matching Fund Loan Notes Revenue Bonds, Senior Lien Series 2010A, 5.000%, 10/01/29 | | 10/20 at 100.00 | BBB | | | 3,296,430 | |
| | 1,000 | | Virgin Islands Public Finance Authority, Matching Fund Loan Notes Revenue Bonds, Series 2009B, 5.000%, 10/01/25 | | 10/19 at 100.00 | BBB | | | 1,092,060 | |
| | 1,280 | | Virgin Islands Public Finance Authority, Matching Fund Loan Notes Revenue Bonds, Series 2012A, 5.000%, 10/01/32 – AGM Insured | | 10/22 at 100.00 | AA | | | 1,427,802 | |
| | Principal | | | | Optional Call | | | | | |
| | Amount (000) | | Description (1) | | Provisions (2) | Ratings (3) | | | Value | |
| | | | Tax Obligation/Limited (continued) | | | | | | | |
| $ | 1,950 | | Virgin Islands Public Finance Authority, Matching Fund Loan Notes Revenue Bonds, Subordinate Lien Series 2010B, 5.250%, 10/01/29 | | 10/20 at 100.00 | Baa2 | | $ | 2,157,539 | |
| | | | Virginia College Building Authority, Educational Facilities Revenue Bonds, 21st Century College Program, Series 2011A: | | | | | | | |
| | 500 | | 5.000%, 2/01/17 | | No Opt. Call | AA+ | | | 548,950 | |
| | 1,200 | | 4.000%, 2/01/29 | | No Opt. Call | AA+ | | | 1,280,748 | |
| | 1,665 | | Virginia College Building Authority, Educational Facilities Revenue Bonds, 21st Century College Program, Series 2009, Tender Option Bond Trust 09-3B, 13.170%, 2/01/27 (IF) (4) | | 2/19 at 100.00 | AA+ | | | 2,383,697 | |
| | 1,665 | | Virginia College Building Authority, Educational Facilities Revenue Bonds, 21st Century College Program, Series 2009, Tender Option Bond Trust 09-4B, 13.170%, 2/01/28 (IF) (4) | | 2/19 at 100.00 | AA+ | | | 2,327,837 | |
| | 2,000 | | Virginia Public Building Authority, Public Facilities Revenue Bonds, Series 2006, 5.000%, 8/01/15 | | No Opt. Call | AA+ | | | 2,065,800 | |
| | 5,000 | | Virginia Public Building Authority, Public Facilities Revenue Bonds, Series 2007A, 5.000%, 8/01/15 | | No Opt. Call | AA+ | | | 5,164,500 | |
| | 2,055 | | Virginia Public School Authority, Literary Trust Fund State Appropriation Bonds, School Technology Notes, Series 2013-I, 5.000%, 4/15/15 | | No Opt. Call | AA+ | | | 2,093,285 | |
| | 5,260 | | Virginia Resources Authority, Infrastructure Revenue Bonds, Pooled Financing Program, Series 2012A, 5.000%, 11/01/42 | | No Opt. Call | AAA | | | 6,002,975 | |
| | 95 | | Virginia Resources Authority, Infrastructure Revenue Bonds, Prerefunded-Pooled Loan Bond Program, Series 2002A, 5.000%, 5/01/19 | | No Opt. Call | AA | | | 95,380 | |
| | 1,000 | | Virginia Transportation Board, Transportation Revenue Bonds, U.S. Route 58 Corridor Development Program, Series 2006C, 5.000%, 5/15/23 | | No Opt. Call | AA+ | | | 1,062,130 | |
| | 77,320 | | Total Tax Obligation/Limited | | | | | | 62,668,305 | |
| | | | Transportation – 27.2% (18.1% of Total Investments) | | | | | | | |
| | 1,000 | | Chesapeake Bay Bridge and Tunnel Commission, Virginia, General Resolution Revenue Refunding Bonds, Series 1998, 5.500%, 7/01/25 – NPFG Insured | | No Opt. Call | AA– | | | 1,178,640 | |
| | | | Chesapeake, Virginia, Transportation System Senior Toll Road Revenue Bonds, Capital Appreciation Series 2012B: | | | | | | | |
| | 2,000 | | 0.000%, 7/15/32 | | 7/28 at 100.00 | BBB | | | 1,383,800 | |
| | 4,125 | | 0.000%, 7/15/40 | | 7/28 at 100.00 | BBB | | | 2,680,961 | |
| | 1,000 | | 0.000%, 7/15/40 – AGM Insured | | 7/28 at 100.00 | AA | | | 678,960 | |
| | 6,700 | | Metropolitan Washington Airports Authority, Virginia, Dulles Toll Road Second Senior Lien Revenue Bonds, Dulles Metrorail Capital Appreciation, Series 2010B, 0.000%, 10/01/44 | | 10/28 at 100.00 | BBB+ | | | 6,972,154 | |
| | | | Metropolitan Washington Airports Authority, Virginia, Dulles Toll Road Second Senior Lien Revenue Bonds, Series 2009B: | | | | | | | |
| | 4,000 | | 0.000%, 10/01/26 – AGC Insured | | No Opt. Call | AA | | | 2,550,200 | |
| | 11,825 | | 0.000%, 10/01/34 – AGC Insured | | No Opt. Call | AA | | | 4,861,849 | |
| | 1,135 | | 0.000%, 10/01/36 – AGC Insured | | No Opt. Call | AA | | | 420,438 | |
| | 5,010 | | 0.000%, 10/01/39 – AGC Insured | | No Opt. Call | AA | | | 1,558,310 | |
| | 750 | | Metropolitan Washington Airports Authority, Virginia, Airport System Revenue Bonds, Refunding Series 2010B, 5.000%, 10/01/26 (Alternative Minimum Tax) | | 10/20 at 100.00 | AA– | | | 858,975 | |
| | 300 | | Metropolitan Washington Airports Authority, Virginia, Airport System Revenue Bonds, Series 2005A, 5.250%, 10/01/16 – NPFG Insured (Alternative Minimum Tax) | | 10/15 at 100.00 | AA– | | | 312,453 | |
| | | | Metropolitan Washington Airports Authority, Virginia, Airport System Revenue Bonds, Series 2009C: | | | | | | | |
| | 1,380 | | 5.250%, 10/01/22 (WI/DD, Settling 12/01/14) | | 10/18 at 100.00 | AA– | | | 1,586,434 | |
| | 1,200 | | 5.000%, 10/01/28 | | 10/18 at 100.00 | AA– | | | 1,348,068 | |
| | | | Metropolitan Washington Airports Authority, Virginia, Airport System Revenue Bonds, Series 2010A: | | | | | | | |
| | 3,400 | | 5.000%, 10/01/30 | | 10/20 at 100.00 | AA– | | | 3,907,518 | |
| | 420 | | 5.000%, 10/01/35 | | 10/20 at 100.00 | AA– | | | 476,053 | |
| | 2,500 | | Metropolitan Washington Airports Authority, Virginia, System Revenue Bonds, Series 2007B, 5.000%, 10/01/35 – AMBAC Insured (Alternative Minimum Tax) | | 10/17 at 100.00 | AA– | | | 2,664,300 | |
| | 3,000 | | Richmond Metropolitan Authority, Virginia, Revenue Refunding Bonds, Expressway System, Series 2002, 5.250%, 7/15/22 – FGIC Insured | | No Opt. Call | AA– | | | 3,390,810 | |
| NPV | Nuveen Virginia Premium Income Municipal Fund |
| | Portfolio of Investments (continued) | November 30, 2014 (Unaudited) |
| | Principal | | | | Optional Call | | | | | |
| | Amount (000) | | Description (1) | | Provisions (2) | Ratings (3) | | | Value | |
| | | | Transportation (continued) | | | | | | | |
| | | | Route 460 Funding Corporation, Virginia, Toll Road Revenue Bonds, Series 2012A: | | | | | | | |
| $ | 2,000 | | 5.125%, 7/01/49 | | No Opt. Call | BBB– | | $ | 2,153,880 | |
| | 1,075 | | 5.000%, 7/01/52 | | No Opt. Call | BBB– | | | 1,142,747 | |
| | | | Route 460 Funding Corporation, Virginia, Toll Road Revenue Bonds, Series 2012B: | | | | | | | |
| | 1,000 | | 0.000%, 7/01/28 | | No Opt. Call | BBB– | | | 534,670 | |
| | 1,000 | | 0.000%, 7/01/29 | | No Opt. Call | BBB– | | | 506,970 | |
| | 2,000 | | 0.000%, 7/01/30 | | No Opt. Call | BBB– | | | 964,180 | |
| | 6,935 | | 0.000%, 7/01/37 | | No Opt. Call | BBB– | | | 2,271,351 | |
| | 15,285 | | 0.000%, 7/01/45 | | No Opt. Call | BBB– | | | 3,243,171 | |
| | 3,195 | | Virginia Port Authority, Port Facilities Revenue Refunding Bonds Series 2010, 5.000%, 7/01/40 | | 7/19 at 100.00 | Aa3 | | | 3,571,052 | |
| | | | Virginia Port Authority, Revenue Bonds, Port Authority Facilities, Series 2006: | | | | | | | |
| | 3,000 | | 4.750%, 7/01/31 – FGIC Insured (Alternative Minimum Tax) | | No Opt. Call | AA+ | | | 3,003,960 | |
| | 3,415 | | 5.000%, 7/01/36 – FGIC Insured (Alternative Minimum Tax) | | No Opt. Call | AA– | | | 3,420,020 | |
| | 1,500 | | Virginia Small Business Financing Authority, Senior Lien Revenue Bonds, 95 Express Lanes LLC Project, Series 2012, 5.000%, 1/01/40 (Alternative Minimum Tax) | | 1/22 at 100.00 | BBB– | | | 1,568,205 | |
| | | | Virginia Small Business Financing Authority, Senior Lien Revenue Bonds, Elizabeth River Crossing, Opco LLC Project, Series 2012: | | | | | | | |
| | 500 | | 5.250%, 1/01/32 (Alternative Minimum Tax) | | 7/22 at 100.00 | BBB– | | | 546,580 | |
| | 5,000 | | 6.000%, 1/01/37 (Alternative Minimum Tax) | | 7/22 at 100.00 | BBB– | | | 5,689,300 | |
| | 5,500 | | 5.500%, 1/01/42 (Alternative Minimum Tax) | | 7/22 at 100.00 | BBB– | | | 5,986,145 | |
| | 101,150 | | Total Transportation | | | | | | 71,432,154 | |
| | | | U.S. Guaranteed – 15.6% (10.4% of Total Investments) (5) | | | | | | | |
| | 1,750 | | Bristol, Virginia, General Obligation Utility System Revenue Bonds, Series 2002, 5.000%, 11/01/24 – AGM Insured (ETM) | | No Opt. Call | AA (5) | | | 2,087,260 | |
| | 1,000 | | Bristol, Virginia, Utility System Revenue Refunding Bonds, Series 2001, 5.000%, 7/15/21 – AGM Insured (ETM) | | No Opt. Call | AA (5) | | | 1,156,150 | |
| | 1,000 | | Capital Region Airport Commission, Virginia, Airport Revenue Bonds, Refunding Series 2005A, 5.000%, 7/01/18 (Pre-refunded 7/01/15) – AGM Insured | | 7/15 at 100.00 | AA (5) | | | 1,028,760 | |
| | 1,340 | | Culpeper Industrial Development Authority, Virginia, Lease Revenue Bonds, School Facilities Project, Series 2005, 5.000%, 1/01/20 (Pre-refunded 1/01/15) – NPFG Insured | | 1/15 at 100.00 | AA (5) | | | 1,346,003 | |
| | 2,300 | | Fairfax County Economic Development Authority, Virginia, Lease Revenue Bonds, Joint Public Uses Community Project, Series 2006, 5.000%, 5/15/18 (Pre-refunded 5/15/16) | | 5/16 at 100.00 | AA+ (5) | | | 2,457,182 | |
| | 1,270 | | James City County Economic Development Authority, Virginia, Lease Revenue Bonds, County Government Projects, Series 2005, 5.000%, 7/15/19 (Pre-refunded 7/15/15) | | 7/15 at 100.00 | AA+ (5) | | | 1,308,900 | |
| | 1,000 | | Loudoun County Sanitation Authority, Virginia, Water and Sewerage System Revenue Bonds, Series 2004, 5.000%, 1/01/26 (Pre-refunded 1/01/15) | | 1/15 at 100.00 | AAA | | | 1,004,490 | |
| | 500 | | Loudoun County, Virginia, General Obligation Bonds, Public Improvement Series 2005B, 5.000%, 6/01/18 (Pre-refunded 6/01/15) | | 6/15 at 100.00 | AAA | | | 512,415 | |
| | 1,700 | | Loudoun County, Virginia, General Obligation Bonds, Series 2006B, 5.000%, 12/01/25 (Pre-refunded 12/01/16) | | 12/16 at 100.00 | AAA | | | 1,857,165 | |
| | 3,000 | | Norfolk, Virginia, Parking System Revenue Bonds, Series 2005A, 5.000%, 2/01/23 (Pre-refunded 2/01/15) – NPFG Insured | | 2/15 at 100.00 | AA– (5) | | | 3,025,620 | |
| | 580 | | Prince William County, Virginia, Certificates of Participation, County Facilities, Series 2005, 5.000%, 6/01/20 (Pre-refunded 6/01/15) – AMBAC Insured | | 6/15 at 100.00 | Aa1 (5) | | | 594,372 | |
| | 145 | | Puerto Rico, Highway Revenue Bonds, Highway and Transportation Authority, Series 2003AA, 5.500%, 7/01/18 – NPFG Insured (ETM) | | No Opt. Call | A3 (5) | | | 168,268 | |
| | 710 | | Puerto Rico, Highway Revenue Bonds, Highway and Transportation Authority, Series 2005BB, 5.250%, 7/01/22 – AGM Insured (ETM) | | No Opt. Call | A2 (5) | | | 877,709 | |
| | 620 | | Richmond, Virginia, General Obligation Bonds, Refunding Public Improvement Series 2005A, 5.000%, 7/15/17 (Pre-refunded 7/15/15) – AGM Insured | | 7/15 at 100.00 | AA+ (5) | | | 638,829 | |
| | Principal | | | | Optional Call | | | | | |
| | Amount (000) | | Description (1) | | Provisions (2) | Ratings (3) | | | Value | |
| | | | U.S. Guaranteed (5) (continued) | | | | | | | |
| | | | Stafford County and Staunton Industrial Development Authority, Virginia, Revenue Bonds, Virginia Municipal League and Virginia Association of Counties Finance Program, Series 2006A: | | | | | | | |
| $ | 710 | | 5.000%, 8/01/23 (Pre-refunded 8/01/16) – NPFG Insured | | 8/16 at 100.00 | A3 (5) | | $ | 764,400 | |
| | 2,490 | | 5.000%, 8/01/23 (Pre-refunded 8/01/16) – NPFG Insured | | 8/16 at 100.00 | A3 (5) | | | 2,680,784 | |
| | | | Stafford County and Staunton Industrial Development Authority, Virginia, Revenue Bonds, Virginia Municipal League and Virginia Association of Counties Finance Program, Series 2007C: | | | | | | | |
| | 50 | | 5.000%, 2/01/37 (Pre-refunded 2/01/17) – SYNCORA GTY Insured | | 2/17 at 100.00 | N/R (5) | | | 54,847 | |
| | 60 | | 5.000%, 2/01/37 (Pre-refunded 2/01/17) – SYNCORA GTY Insured | | 2/17 at 100.00 | N/R (5) | | | 65,816 | |
| | 105 | | 5.000%, 2/01/37 (Pre-refunded 2/01/17) – SYNCORA GTY Insured | | 2/17 at 100.00 | N/R (5) | | | 115,395 | |
| | 190 | | 5.000%, 2/01/37 (Pre-refunded 2/01/17) – SYNCORA GTY Insured | | 2/17 at 100.00 | N/R (5) | | | 208,419 | |
| | 2,135 | | The Rector and Visitors of the University of Virginia, General Revenue Bonds, Series 2005, 5.000%, 6/01/37 (Pre-refunded 6/01/15) | | 6/15 at 100.00 | N/R (5) | | | 2,187,606 | |
| | | | Tobacco Settlement Financing Corporation of Virginia, Tobacco Settlement Asset-Backed Bonds, Series 2005: | | | | | | | |
| | 3,510 | | 5.500%, 6/01/26 (Pre-refunded 6/01/15) | | 6/15 at 100.00 | Aaa | | | 3,605,893 | |
| | 1,860 | | 5.625%, 6/01/37 (Pre-refunded 6/01/15) | | 6/15 at 100.00 | Aaa | | | 1,912,006 | |
| | 2,295 | | Virginia Beach Development Authority, Public Facilities Revenue Bonds, Series 2005A, 5.000%, 5/01/22 (Pre-refunded 5/01/15) | | 5/15 at 100.00 | AA+ (5) | | | 2,342,598 | |
| | 2,100 | | Virginia Beach, Virginia, General Obligation Bonds, Series 2005, 5.000%, 1/15/20 (Pre-refunded 1/15/16) | | 1/16 at 100.00 | AAA | | | 2,211,552 | |
| | 30 | | Virginia College Building Authority, Educational Facilities Revenue Bonds, Public Higher Education Financing Program, Series 2009A, 5.000%, 9/01/28 (Pre-refunded 9/01/18) | | 9/18 at 100.00 | N/R (5) | | | 34,601 | |
| | 2,540 | | Virginia Public School Authority, School Financing Bonds, 1997 Resolution, Series 2005C, 5.000%, 8/01/17 (Pre-refunded 8/01/15) | | 8/15 at 100.00 | AA+ (5) | | | 2,623,591 | |
| | 1,000 | | Virginia Resources Authority, Clean Water State Revolving Fund Revenue Bonds, Series 2008, 5.000%, 10/01/19 (Pre-refunded 10/01/18) | | 10/18 at 100.00 | AAA | | | 1,155,890 | |
| | 3,000 | | Wisconsin Public Power Incorporated System, Power Supply System Revenue Bonds, Series 2005A, 5.000%, 7/01/35 (Pre-refunded 7/01/15) – AMBAC Insured | | 7/15 at 100.00 | AA+ (5) | | | 3,084,840 | |
| | 38,990 | | Total U.S. Guaranteed | | | | | | 41,111,361 | |
| | | | Utilities – 1.9% (1.3% of Total Investments) | | | | | | | |
| | 395 | | Guam Power Authority, Revenue Bonds, Series 2012A, 5.000%, 10/01/34 | | 10/22 at 100.00 | BBB | | | 438,885 | |
| | 655 | | Puerto Rico Electric Power Authority, Power Revenue Bonds, Series 2007UU, 5.000%, 7/01/19 – NPFG Insured | | No Opt. Call | AA– | | | 661,602 | |
| | 730 | | Virgin Islands Water and Power Authority, Electric System Revenue Bonds, Refunding Series 2007A, 5.000%, 7/01/24 | | 7/17 at 100.00 | BB+ | | | 733,665 | |
| | 3,250 | | York County Economic Development Authority, Virginia, Pollution Control Revenue Bonds, Virginia Electric and Power Company Project, Refunding Series 2009A, 1.875%, 5/01/33 (Mandatory put 5/16/19) | | No Opt. Call | A2 | | | 3,305,673 | |
| | 5,030 | | Total Utilities | | | | | | 5,139,825 | |
| | | | Water and Sewer – 9.0% (6.0% of Total Investments) | | | | | | | |
| | 1,395 | | Fairfax County, Virginia, Sewer Revenue Bonds, Series 2012, 5.000%, 7/15/18 | | No Opt. Call | AAA | | | 1,605,129 | |
| | 810 | | Guam Waterworks Authority, Water and Wastewater System Revenue Bonds, Series 2013, 5.500%, 7/01/43 | | 7/23 at 100.00 | A– | | | 927,669 | |
| | 6,500 | | Hampton Roads Sanitation District, Virginia, Wastewater Revenue Bonds, Series 2012A, 5.000%, 1/01/39 | | No Opt. Call | AA+ | | | 7,260,889 | |
| | | | Henry County Public Service Authority, Virginia, Water and Sewerage Revenue Refunding Bonds, Series 2001: | | | | | | | |
| | 1,265 | | 5.500%, 11/15/17 – AGM Insured | | No Opt. Call | AA | | | 1,391,019 | |
| | 3,000 | | 5.500%, 11/15/19 – AGM Insured | | No Opt. Call | AA | | | 3,460,200 | |
| | 700 | | Upper Occoquan Sewage Authority, Virginia, Regional Sewerage System Revenue Refunding Bonds, Series 2004, 5.000%, 7/01/15 – NPFG Insured | | No Opt. Call | AAA | | | 720,006 | |
| NPV | Nuveen Virginia Premium Income Municipal Fund |
| | Portfolio of Investments (continued) | November 30, 2014 (Unaudited) |
| | Principal | | | | Optional Call | | | | | |
| | Amount (000) | | Description (1) | | Provisions (2) | Ratings (3) | | | Value | |
| | | | Water and Sewer (continued) | | | | | | | |
| $ | 3,300 | | Virginia Beach, Virginia, Water and Sewer System Revenue Bonds, Series 2005, 5.000%, 10/01/30 | | 10/15 at 100.00 | AAA | | $ | 3,416,226 | |
| | 1,000 | | Virginia Resources Authority, Water and Sewerage System Revenue Bonds, Goochland County – Tuckahoe Creek Service District Project, Series 2012, 0.000%, 11/01/34 | | 11/22 at 63.13 | AA | | | 474,670 | |
| | 3,050 | | Virginia State Resources Authority, Clean Water Revenue Bonds, Series 2007, Trust 3036, 13.399%, 10/01/15 (IF) | | No Opt. Call | AAA | | | 4,363,086 | |
| | 21,020 | | Total Water and Sewer | | | | | | 23,618,894 | |
| $ | 491,875 | | Total Long-Term Investments (cost $370,518,039) | | | | | | 393,817,559 | |
| | | | Floating Rate Obligations – (3.5)% | | | | | | (9,250,000 | ) |
| | | | Variable Rate Demand Preferred Shares, at Liquidation Value – (48.7)% (6) | | | | | | (128,000,000 | ) |
| | | | Other Assets Less Liabilities – 2.3% | | | | | | 6,069,394 | |
| | | | Net Assets Applicable to Common Shares – 100% | | | | | $ | 262,636,953 | |
| (1) | All percentages shown in the Portfolio of Investments are based on net assets applicable to common shares unless otherwise noted. |
| (2) | Optional Call Provisions: Dates (month and year) and prices of the earliest optional call or redemption. There may be other call provisions at varying prices at later dates. Certain mortgage-backed securities may be subject to periodic principal paydowns. |
| (3) | Ratings: Using the highest of Standard & Poor’s Group (“Standard & Poor’s”), Moody’s Investors Service, Inc. (“Moody’s”) or Fitch, Inc. (“Fitch”) rating. Ratings below BBB by Standard & Poor’s, Baa by Moody’s or BBB by Fitch are considered to be below investment grade. Holdings designated N/R are not rated by any of these national rating agencies. |
| (4) | Investment, or portion of investment, has been pledged to collateralize the net payment obligations for investments in inverse floating rate transactions. |
| (5) | Backed by an escrow or trust containing sufficient U.S. Government or U.S. Government agency securities, which ensure the timely payment of principal and interest. Certain bonds backed by U.S. Government or agency securities are regarded as having an implied rating equal to the rating of such securities. |
| (6) | Variable Rate Demand Preferred Shares, at Liquidation Value as a percentage of Total Investments is 32.5%. |
| WI/DD | Investment, or portion of investment, purchased on a when-issued or delayed delivery basis. |
| (ETM) | Escrowed to maturity. |
| (IF) | Inverse floating rate investment. |
| (UB) | Underlying bond of an inverse floating rate trust reflected as a financing transaction. See Notes to Financial Statements, Note 3 – Portfolio Securities and Investments in Derivatives, Inverse Floating Rate Securities for more information. |
See accompanying notes to financial statements.
| Statement of | | |
| | Assets and Liabilities | November 30, 2014 (Unaudited) |
| | | Georgia | | Maryland | | Minnesota | |
| | | Dividend | | Premium | | Municipal | |
| | | Advantage 2 | | Income | | Income | |
| | | (NKG | ) | (NMY | ) | (NMS | ) |
| Assets | | | | | | | | | | |
| Long-term investments, at value (cost $211,135,347, $500,173,917 and $121,584,461, respectively) | | $ | 222,915,093 | | $ | 524,504,045 | | $ | 131,516,919 | |
| Cash | | | 4,383,047 | | | — | | | 374,456 | |
| Credit default swaps premiums paid | | | 436,497 | | | — | | | — | |
| Unrealized appreciation on credit default swaps | | | 1,916 | | | — | | | — | |
| Receivable for: | | | | | | | | | | |
| Interest | | | 3,335,554 | | | 8,439,844 | | | 1,586,256 | |
| Investments sold | | | 9,000 | | | 6,422,149 | | | 136,342 | |
| Deferred offering costs | | | 131,867 | | | 152,470 | | | 249,933 | |
| Other assets | | | 3,707 | | | 20,180 | | | 260 | |
| Total assets | | | 231,216,681 | | | 539,538,688 | | | 133,864,166 | |
| Liabilities | | | | | | | | | | |
| Cash overdraft | | | — | | | 191,750 | | | — | |
| Floating rate obligations | | | 3,245,000 | | | 17,170,000 | | | — | |
| Payable for: | | | | | | | | | | |
| Common share dividends | | | 544,579 | | | 1,270,570 | | | 372,676 | |
| Common shares repurchased and retired | | | — | | | 31,650 | | | — | |
| Interest | | | 41 | | | 92 | | | 24 | |
| Investments purchased | | | 3,367,680 | | | 4,311,550 | | | 2,002,127 | |
| Offering costs | | | 50,180 | | | 46,746 | | | 55,527 | |
| MuniFund Term Preferred (“MTP”) Shares, at liquidation value | | | — | | | — | | | — | |
| Variable Rate MuniFund Term Preferred (“VMTP”) Shares, at liquidation value | | | 75,000,000 | | | 167,000,000 | | | 44,100,000 | |
| Variable Rate Demand Preferred (“VRDP”) Shares, at liquidation value | | | — | | | — | | | — | |
| Accrued expenses: | | | | | | | | | | |
| Management fees | | | 114,519 | | | 261,119 | | | 66,125 | |
| Trustees fees | | | 2,340 | | | 14,406 | | | 551 | |
| Other | | | 132,104 | | | 188,583 | | | 85,899 | |
| Total liabilities | | | 82,456,443 | | | 190,486,466 | | | 46,682,929 | |
| Net assets applicable to common shares | | $ | 148,760,238 | | $ | 349,052,222 | | $ | 87,181,237 | |
| Common shares outstanding | | | 10,548,790 | | | 23,704,666 | | | 5,570,806 | |
| Net asset value (“NAV”) per common share outstanding | | $ | 14.10 | | $ | 14.73 | | $ | 15.65 | |
| Net assets applicable to common shares consist of: | | | | | | | | | | |
| Common shares, $.01 par value per share | | $ | 105,488 | | $ | 237,047 | | $ | 55,708 | |
| Paid-in surplus | | | 142,453,986 | | | 333,618,998 | | | 77,895,921 | |
| Undistributed (Over-distribution of) net investment income | | | (141,486 | ) | | 1,687,586 | | | 354,603 | |
| Accumulated net realized gain (loss) | | | (5,439,412 | ) | | (10,821,537 | ) | | (1,057,453 | ) |
| Net unrealized appreciation (depreciation) | | | 11,781,662 | | | 24,330,128 | | | 9,932,458 | |
| Net assets applicable to common shares | | $ | 148,760,238 | | $ | 349,052,222 | | $ | 87,181,237 | |
| Authorized shares: | | | | | | | | | | |
| Common | | | Unlimited | | | Unlimited | | | Unlimited | |
| Preferred | | | Unlimited | | | Unlimited | | | Unlimited | |
See accompanying notes to financial statements.
Statement of Assets and Liabilities (Unaudited) (continued)
| | | | | North | | | |
| | | Missouri | | Carolina | | Virginia | |
| | | Premium | | Premium | | Premium | |
| | | Income | | Income | | Income | |
| | | (NOM | ) | (NNC | ) | (NPV | ) |
| Assets | | | | | | | | | | |
| Long-term investments, at value (cost $49,197,136, $346,961,801 and $370,518,039, respectively) | | $ | 52,696,712 | | $ | 371,235,270 | | $ | 393,817,559 | |
| Cash | | | 346,392 | | | — | | | 1,201,813 | |
| Credit default swaps premiums paid | | | — | | | 730,302 | | | — | |
| Unrealized appreciation on credit default swaps | | | — | | | 1,193 | | | — | |
| Receivable for: | | | | | | | | | | |
| Interest | | | 667,692 | | | 5,285,289 | | | 5,503,653 | |
| Investments sold | | | 15,180 | | | — | | | 1,737,917 | |
| Deferred offering costs | | | 87,725 | | | 112,012 | | | 428,367 | |
| Other assets | | | 2,031 | | | 15,745 | | | 245,935 | |
| Total assets | | | 53,815,732 | | | 377,379,811 | | | 402,935,244 | |
| Liabilities | | | | | | | | | | |
| Cash overdraft | | | — | | | 539,656 | | | — | |
| Floating rate obligations | | | 2,225,000 | | | — | | | 9,250,000 | |
| Payable for: | | | | | | | | | | |
| Common share dividends | | | 134,869 | | | 847,392 | | | 1,066,653 | |
| Common shares repurchased and retired | | | — | | | — | | | — | |
| Interest | | | 31,290 | | | 68 | | | — | |
| Investments purchased | | | 395,766 | | | 2,002,975 | | | 1,601,945 | |
| Offering costs | | | — | | | — | | | — | |
| MuniFund Term Preferred (“MTP”) Shares, at liquidation value | | | 17,880,000 | | | — | | | — | |
| Variable Rate MuniFund Term Preferred (“VMTP”) Shares, at liquidation value | | | — | | | 125,000,000 | | �� | — | |
| Variable Rate Demand Preferred (“VRDP”) Shares, at liquidation value | | | — | | | — | | | 128,000,000 | |
| Accrued expenses: | | | | | | | | | | |
| Management fees | | | 25,701 | | | 184,378 | | | 199,159 | |
| Trustees fees | | | 532 | | | 10,335 | | | 10,723 | |
| Other | | | 19,602 | | | 163,717 | | | 169,811 | |
| Total liabilities | | | 20,712,760 | | | 128,748,521 | | | 140,298,291 | |
| Net assets applicable to common shares | | $ | 33,102,972 | | $ | 248,631,290 | | $ | 262,636,953 | |
| Common shares outstanding | | | 2,332,041 | | | 16,443,509 | | | 17,933,247 | |
| Net asset value (“NAV”) per common share outstanding | | $ | 14.19 | | $ | 15.12 | | $ | 14.65 | |
| Net assets applicable to common shares consist of: | | | | | | | | | | |
| Common shares, $.01 par value per share | | $ | 23,320 | | $ | 164,435 | | $ | 179,332 | |
| Paid-in surplus | | | 30,896,464 | | | 224,295,778 | | | 251,143,822 | |
| Undistributed (Over-distribution of) net investment income | | | 122,585 | | | (249,951 | ) | | 1,236,712 | |
| Accumulated net realized gain (loss) | | | (1,438,973 | ) | | 146,366 | | | (13,222,433 | ) |
| Net unrealized appreciation (depreciation) | | | 3,499,576 | | | 24,274,662 | | | 23,299,520 | |
| Net assets applicable to common shares | | $ | 33,102,972 | | $ | 248,631,290 | | $ | 262,636,953 | |
| Authorized shares: | | | | | | | | | | |
| Common | | | Unlimited | | | Unlimited | | | Unlimited | |
| Preferred | | | Unlimited | | | Unlimited | | | Unlimited | |
See accompanying notes to financial statements.
| Statement of | | |
| | Operations | (Unaudited) |
| | | Georgia | | Maryland | | Minnesota | |
| | | Dividend | | Premium | | Municipal | |
| | | Advantage 2 | | Income | | Income | |
| | | (NKG) | | (NMY) | | (NMS) | |
| | | Six Months | | Six Months | | Five Months | | Ten Months | |
| | | Ended | | Ended | | Ended | | Ended | |
| | | 11/30/14 | | 11/30/14 | | 11/30/14 | | 6/30/14 | |
| Investment Income | | $ | 4,784,218 | | $ | 10,844,204 | | $ | 2,192,810 | | $ | 3,794,393 | |
| Expenses | | | | | | | | | | | | | |
| Management fees | | | 696,798 | | | 1,598,185 | | | 212,524 | | | 269,915 | |
| Shareholder servicing agent fees and expenses | | | 22,810 | | | 39,783 | | | 9,998 | | | 31,538 | |
| Interest expense and amortization of offering costs | | | 389,770 | | | 915,155 | | | 179,165 | | | 92,504 | |
| Administrative fees | | | — | | | — | | | 50,724 | | | 154,237 | |
| Liquidity fees | | | — | | | — | | | — | | | — | |
| Remarketing fees | | | — | | | — | | | — | | | — | |
| Custodian fees and expenses | | | 20,616 | | | 44,224 | | | 8,492 | | | 11,639 | |
| Directors/Trustees fees | | | 3,919 | | | 8,786 | | | 19,096 | | | 52,513 | |
| Professional fees | | | 26,350 | | | 18,685 | | | 32,909 | | | 97,551 | |
| Shareholder reporting expenses | | | 16,907 | | | 25,210 | | | 22,110 | | | 17,504 | |
| Stock exchange listing fees | | | 15,661 | | | 49,549 | | | 2,325 | | | 8,682 | |
| Investor relations expenses | | | 13,341 | | | 30,504 | | | 2,396 | | | — | |
| Other expenses | | | 20,878 | | | 39,464 | | | 20,932 | | | 108,059 | |
| Total expenses | | | 1,227,050 | | | 2,769,545 | | | 560,671 | | | 844,142 | |
| Net investment income (loss) | | | 3,557,168 | | | 8,074,659 | | | 1,632,139 | | | 2,950,251 | |
| Realized and Unrealized Gain (Loss) | | | | | | | | | | | | | |
| Net realized gain (loss) from: | | | | | | | | | | | | | |
| Investments | | | (117,659 | ) | | (344,876 | ) | | 15,403 | | | (616,939 | ) |
| Swaps | | | (5,625 | ) | | — | | | — | | | — | |
| Change in net unrealized appreciation depreciation of: | | | | | | | | | | | | | |
| Investments | | | 1,203,257 | | | 1,323,123 | | | 751,316 | | | 5,934,559 | |
| Swaps | | | 1,916 | | | — | | | — | | | — | |
| Net realized and unrealized gain (loss) | | | 1,081,889 | | | 978,247 | | | 766,719 | | | 5,317,620 | |
| Distributions to Preferred Shareholders | | | | | | | | | | | | | |
| From net investment income | | | — | | | — | | | — | | | (22,615 | ) |
| Net increase (decrease) in net assets applicable to common shares from operations | | $ | 4,639,057 | | $ | 9,052,906 | | $ | 2,398,858 | | $ | 8,245,256 | |
See accompanying notes to financial statements.
Statement of Operations (Unaudited) (continued)
| | | | | North | | | |
| | | Missouri | | Carolina | | Virginia | |
| | | Premium | | Premium | | Premium | |
| | | Income | | Income | | Income | |
| | | (NOM) | | (NNC) | | (NPV) | |
| | | Six Months | | Six Months | | Six Months | |
| | | Ended | | Ended | | Ended | |
| | | 11/30/14 | | 11/30/14 | | 11/30/14 | |
| Investment Income | | $ | 1,189,416 | | $ | 7,026,528 | | $ | 8,696,678 | |
| Expenses | | | | | | | | | | |
| Management fees | | | 156,430 | | | 1,123,894 | | | 1,209,112 | |
| Shareholder servicing agent fees and expenses | | | 9,520 | | | 25,234 | | | 6,279 | |
| Interest expense and amortization of offering costs | | | 234,178 | | | 646,159 | | | 117,257 | |
| Administrative fees | | | — | | | — | | | — | |
| Liquidity fees | | | — | | | — | | | 596,434 | |
| Remarketing fees | | | — | | | — | | | 65,067 | |
| Custodian fees and expenses | | | 7,555 | | | 31,588 | | | 34,691 | |
| Directors/Trustees fees | | | 1,080 | | | 6,272 | | | 6,598 | |
| Professional fees | | | 12,154 | | | 19,063 | | | 38,498 | |
| Shareholder reporting expenses | | | 8,773 | | | 23,841 | | | 23,721 | |
| Stock exchange listing fees | | | 7,640 | | | 42,028 | | | 4,425 | |
| Investor relations expenses | | | 3,298 | | | 21,901 | | | 21,892 | |
| Other expenses | | | 18,315 | | | 25,201 | | | 49,806 | |
| Total expenses | | | 458,943 | | | 1,965,181 | | | 2,173,780 | |
| Net investment income (loss) | | | 730,473 | | | 5,061,347 | | | 6,522,898 | |
| Realized and Unrealized Gain (Loss) | | | | | | | | | | |
| Net realized gain (loss) from: | | | | | | | | | | |
| Investments | | | (507,254 | ) | | (367,910 | ) | | (5,667,958 | ) |
| Swaps | | | — | | | (6,463 | ) | | — | |
| Change in net unrealized appreciation depreciation of: | | | | | | | | | | |
| Investments | | | 636,427 | | | 4,072,170 | | | 9,055,828 | |
| Swaps | | | — | | | 1,193 | | | — | |
| Net realized and unrealized gain (loss) | | | 129,173 | | | 3,698,990 | | | 3,387,870 | |
| Distributions to Preferred Shareholders | | | | | | | | | | |
| From net investment income | | | — | | | — | | | — | |
| Net increase (decrease) in net assets applicable to common shares from operations | | $ | 859,646 | | $ | 8,760,337 | | $ | 9,910,768 | |
See accompanying notes to financial statements.
| Statement of | | |
| | Changes in Net Assets | (Unaudited) |
| | | Georgia Dividend Advantage 2 (NKG) | | Maryland Premium Income (NMY) | |
| | | Six Months | | Year | | Six Months | | Year | |
| | | Ended | | Ended | | Ended | | Ended | |
| | | 11/30/14 | | 5/31/14 | | 11/30/14 | | 5/31/14 | |
| Operations | | | | | | | | | | | | | |
| Net investment income (loss) | | $ | 3,557,168 | | $ | 5,746,078 | | $ | 8,074,659 | | $ | 14,563,755 | |
| Net realized gain (loss) from: | | | | | | | | | | | | | |
| Investments | | | (117,659 | ) | | (1,923,769 | ) | | (344,876 | ) | | (7,174,244 | ) |
| Swaps | | | (5,625 | ) | | — | | | — | | | — | |
| Change in net unrealized appreciation | | | | | | | | | | | | | |
| (depreciation) of: | | | | | | | | | | | | | |
| Investments | | | 1,203,257 | | | (3,375,095 | ) | | 1,323,123 | | | (13,432,561 | ) |
| Swaps | | | 1,916 | | | — | | | — | | | — | |
| Distributions to Preferred Shareholders: | | | | | | | | | | | | | |
| From net investment income | | | — | | | — | | | — | | | — | |
| Net increase (decrease) in net assets applicable to common shares from operations | | | 4,639,057 | | | 447,214 | | | 9,052,906 | | | (6,043,050 | ) |
| Distributions to Common Shareholders | | | | | | | | | | | | | |
| From net investment income | | | (3,386,162 | ) | | (6,772,323 | ) | | (7,977,181 | ) | | (16,109,148 | ) |
| From accumulated net realized gains | | | — | | | — | | | — | | | — | |
| Decrease in net assets applicable to common shares from distributions to common shareholders | | | (3,386,162 | ) | | (6,772,323 | ) | | (7,977,181 | ) | | (16,109,148 | ) |
| Capital Share Transactions | | | | | | | | | | | | | |
| Common shares: | | | | | | | | | | | | | |
| Issued in the Mergers | | | — | | | — | | | — | | | — | |
| Net proceeds from shares issued to shareholders due to reinvestment of distributions | | | — | | | — | | | — | | | — | |
| Cost of shares repurchased and retired | | | — | | | — | | | (5,033,230 | ) | | — | |
| Net increase (decrease) in net assets applicable to common shares from capital share transactions | | | — | | | — | | | (5,033,230 | ) | | — | |
| Net increase (decrease) in net assets applicable to common shares | | | 1,252,895 | | | (6,325,109 | ) | | (3,957,505 | ) | | (22,152,198 | ) |
| Net assets applicable to common shares at the beginning of period | | | 147,507,343 | | | 153,832,452 | | | 353,009,727 | | | 375,161,925 | |
| Net assets applicable to common shares at the end of period | | $ | 148,760,238 | | $ | 147,507,343 | | $ | 349,052,222 | | $ | 353,009,727 | |
| Undistributed (Over-distribution of) net investment income at the end of period | | $ | (141,486 | ) | $ | (312,492 | ) | $ | 1,687,586 | | $ | 1,590,108 | |
See accompanying notes to financial statements.
Statement of Changes in Net Assets (Unaudited) (continued)
| | | Minnesota Municipal Income (NMS) | | Missouri Premium Income (NOM) | |
| | | Five Months | | Ten Months | | Year | | Six Months | | Year | |
| | | Ended | | Ended | | Ended | | Ended | | Ended | |
| | | 11/30/14 | | 6/30/14 | | 8/31/13 | | 11/30/14 | | 5/31/14 | |
| Operations | | | | | | | | | | | | | | | | |
| Net investment income (loss) | | $ | 1,632,139 | | $ | 2,950,251 | | $ | 3,742,771 | | $ | 730,473 | | $ | 1,523,906 | |
| Net realized gain (loss) from: | | | | | | | | | | | | | | | | |
| Investments | | | 15,403 | | | (616,939 | ) | | 400,865 | | | (507,254 | ) | | (762,358 | ) |
| Swaps | | | — | | | — | | | — | | | — | | | — | |
| Change in net unrealized appreciation | | | | | | | | | | | | | | | | |
| (depreciation) of: | | | | | | | | | | | | | | | | |
| Investments | | | 751,316 | | | 5,934,559 | | | (8,325,178 | ) | | 636,427 | | | (33,876 | ) |
| Swaps | | | — | | | — | | | — | | | — | | | — | |
| Distributions to Preferred Shareholders: | | | | | | | | | | | | | | | | |
| From net investment income | | | — | | | (22,615 | ) | | (64,655 | ) | | — | | | — | |
| Net increase (decrease) in net assets applicable to common shares from operations | | | 2,398,858 | | | 8,245,256 | | | (4,246,197 | ) | | 859,646 | | | 727,672 | |
| Distributions to Common Shareholders | | | | | | | | | | | | | | | | |
| From net investment income | | | (1,734,151 | ) | | (3,068,590 | ) | | (3,682,308 | ) | | (853,259 | ) | | (1,704,949 | ) |
| From accumulated net realized gains | | | — | | | — | | | — | | | — | | | — | |
| Decrease in net assets applicable to common shares from distributions to common shareholders | | | (1,734,151 | ) | | (3,068,590 | ) | | (3,682,308 | ) | | (853,259 | ) | | (1,704,949 | ) |
| Capital Share Transactions | | | | | | | | | | | | | | | | |
| Common shares: | | | | | | | | | | | | | | | | |
| Issued in the Mergers | | | 22,239,676 | | | — | | | — | | | — | | | — | |
| Net proceeds from shares issued to shareholders due to reinvestment of distributions | | | — | | | — | | | — | | | 24,938 | | | 38,396 | |
| Cost of shares repurchased and retired | | | — | | | — | | | — | | | — | | | — | |
| Net increase (decrease) in net assets applicable to common shares from capital share transactions | | | 22,239,676 | | | — | | | — | | | 24,938 | | | 38,396 | |
| Net increase (decrease) in net assets applicable to common shares | | | 22,904,383 | | | 5,176,666 | | | (7,928,505 | ) | | 31,325 | | | (938,881 | ) |
| Net assets applicable to common shares at the beginning of period | | | 64,276,854 | | | 59,100,188 | | | 67,028,693 | | | 33,071,647 | | | 34,010,528 | |
| Net assets applicable to common shares at the end of period | | $ | 87,181,237 | | $ | 64,276,854 | | $ | 59,100,188 | | $ | 33,102,972 | | $ | 33,071,647 | |
| Undistributed (Over-distribution of) net investment income at the end of period | | $ | 354,603 | | $ | 456,615 | | $ | 597,569 | | $ | 122,585 | | $ | 245,371 | |
See accompanying notes to financial statements.
| | | North Carolina Premium Income (NNC) | | Virginia Premium Income (NPV) | |
| | | Six Months | | Year | | Six Months | | Year | |
| | | Ended | | Ended | | Ended | | Ended | |
| | | 11/30/14 | | 5/31/14 | | 11/30/14 | | 5/31/14 | |
| Operations | | | | | | | | | | | | | |
| Net investment income (loss) | | $ | 5,061,347 | | $ | 8,942,805 | | $ | 6,522,898 | | $ | 12,751,003 | |
| Net realized gain (loss) from: | | | | | | | | | | | | | |
| Investments | | | (367,910 | ) | | 1,220,196 | | | (5,667,958 | ) | | (7,575,431 | ) |
| Swaps | | | (6,463 | ) | | — | | | — | | | — | |
| Change in net unrealized appreciation | | | | | | | | | | | | | |
| (depreciation) of: | | | | | | | | | | | | | |
| Investments | | | 4,072,170 | | | (2,283,539 | ) | | 9,055,828 | | | (8,340,683 | ) |
| Swaps | | | 1,193 | | | — | | | — | | | — | |
| Distributions to Preferred Shareholders: | | | | | | | | | | | | | |
| From net investment income | | | — | | | — | | | — | | | — | |
| Net increase (decrease) in net assets applicable to common shares from operations | | | 8,760,337 | | | 7,879,462 | | | 9,910,768 | | | (3,165,111 | ) |
| Distributions to Common Shareholders | | | | | | | | | | | | | |
| From net investment income | | | (5,251,545 | ) | | (9,988,679 | ) | | (6,841,534 | ) | | (12,992,638 | ) |
| From accumulated net realized gains | | | — | | | — | | | — | | | (139,879 | ) |
| Decrease in net assets applicable to common shares from distributions to common shareholders | | | (5,251,545 | ) | | (9,988,679 | ) | | (6,841,534 | ) | | (13,132,517 | ) |
| Capital Share Transactions | | | | | | | | | | | | | |
| Common shares: | | | | | | | | | | | | | |
| Issued in the Mergers | | | — | | | — | | | — | | | — | |
| Net proceeds from shares issued to shareholders due to reinvestment of distributions | | | — | | | — | | | — | | | — | |
| Cost of shares repurchased and retired | | | (1,369,083 | ) | | — | | | — | | | — | |
| Net increase (decrease) in net assets applicable to common shares from capital share transactions | | | (1,369,083 | ) | | — | | | — | | | — | |
| Net increase (decrease) in net assets applicable to common shares | | | 2,139,709 | | | (2,109,217 | ) | | 3,069,234 | | | (16,297,628 | ) |
| Net assets applicable to common shares at the beginning of period | | | 246,491,581 | | | 248,600,798 | | | 259,567,719 | | | 275,865,347 | |
| Net assets applicable to common shares at the end of period | | $ | 248,631,290 | | $ | 246,491,581 | | $ | 262,636,953 | | $ | 259,567,719 | |
| Undistributed (Over-distribution of) net investment income at the end of period | | $ | (249,951 | ) | $ | (59,753 | ) | $ | 1,236,712 | | $ | 1,555,348 | |
See accompanying notes to financial statements.
| Statement of | | |
| | Cash Flows | (Unaudited) |
| | | Georgia | | Maryland | | Minnesota | |
| | | Dividend | | Premium | | Municipal | |
| | | Advantage 2 | | Income | | Income | |
| | | (NKG) | | (NMY) | | (NMS) | |
| | | Six Months | | Six Months | | Five Months | | Ten Months | |
| | | Ended | | Ended | | Ended | | Ended | |
| | | 11/30/14 | | 11/30/14 | | 11/30/14 | | 6/30/14 | |
| Cash Flows from Operating Activities: | | | | | | | | | | | | | |
| Net Increase (Decrease) in Net Assets Applicable to Common Shares from Operations | | $ | 4,639,057 | | $ | 9,052,906 | | $ | 2,398,858 | | $ | 8,267,871 | |
| Adjustments to reconcile the net increase (decrease) in net assets applicable to common shares from operations to net cash provided by (used in) operating activities: | | | | | | | | | | | | | |
| Purchases of investments | | | (10,650,979 | ) | | (91,765,988 | ) | | (4,453,409 | ) | | (7,502,193 | ) |
| Proceeds from sales and maturities of investments | | | 10,561,176 | | | 100,856,351 | | | 3,708,610 | | | 8,170,662 | |
| Proceeds from (Purchase of) short-term investments, net | | | — | | | — | | | 181,287 | | | 68,660 | |
| Proceeds from (Payments for) swap contracts, net | | | (5,625 | ) | | — | | | — | | | — | |
| Amortization (Accretion) of premiums and discounts, net | | | 588,953 | | | 1,599,595 | | | (344,476 | ) | | (570,451 | ) |
| Amortization of deferred offering costs | | | 26,402 | | | 30,528 | | | (164,082 | ) | | (85,851 | ) |
| (Increase) Decrease in: | | | | | | | | | | | | | |
| Credit default swaps premiums paid | | | (436,497 | ) | | — | | | — | | | — | |
| Receivable for interest | | | 52,557 | | | 518,513 | | | (159,061 | ) | | 15,132 | |
| Receivable for investments sold | | | (9,000 | ) | | (5,278,022 | ) | | (136,342 | ) | | — | |
| Other assets | | | 14,815 | | | 45,822 | | | 132,563 | | | 35,543 | |
| Increase (Decrease) in: | | | | | | | | | | | | | |
| Payable for common shares repurchased and retired | | | — | | | 31,650 | | | — | | | — | |
| Payable for interest | | | (35,773 | ) | | (81,183 | ) | | 24 | | | — | |
| Payable for investments purchased | | | 3,367,680 | | | 4,311,550 | | | 1,352,127 | | | — | |
| Accrued management fees | | | (3,348 | ) | | (10,608 | ) | | 39,413 | | | — | |
| Accrued Trustees fees | | | (69 | ) | | 2,351 | | | 551 | | | — | |
| Accrued other expenses | | | (1,683 | ) | | (6,826 | ) | | (92,919 | ) | | 9,786 | |
| Net realized gain (loss) from: | | | | | | | | | | | | | |
| Investments | | | 117,659 | | | 344,876 | | | (15,403 | ) | | 616,939 | |
| Paydowns | | | (690 | ) | | — | | | — | | | — | |
| Swaps | | | 5,625 | | | — | | | — | | | — | |
| Change in net unrealized appreciation (depreciation) of: | | | | | | | | | | | | | |
| Investments | | | (1,203,257 | ) | | (1,323,123 | ) | | (751,316 | ) | | (5,934,559 | ) |
| Swaps | | | (1,916 | ) | | — | | | — | | | — | |
| Taxes paid on undistributed capital gains | | | — | | | (384 | ) | | — | | | — | |
| Net cash provided by (used in) operating activities | | | 7,025,087 | | | 18,328,008 | | | 1,696,425 | | | 3,091,539 | |
| Cash Flows from Financing Activities: | | | | | | | | | | | | | |
| Increase (Decrease) in: | | | | | | | | | | | | | |
| Cash overdraft | | | — | | | (392,138 | ) | | (16,021 | ) | | — | |
| Floating rate obligations | | | — | | | (4,765,000 | ) | | — | | | — | |
| Payable for offering costs | | | (109,820 | ) | | (138,254 | ) | | 55,527 | | | — | |
| Remarketed preferred shares, at liquidation value | | | — | | | — | | | — | | | (31,100,000 | ) |
| VMTP Shares, at liquidation value | | | — | | | — | | | — | | | 31,100,000 | |
| Cash distributions paid to common shareholders | | | (3,384,716 | ) | | (7,999,386 | ) | | (1,361,475 | ) | | (3,091,539 | ) |
| Cost of shares repurchased and retired | | | — | | | (5,033,230 | ) | | — | | | — | |
| Net cash provided by (used in) financing activities | | | (3,494,536 | ) | | (18,328,008 | ) | | (1,321,969 | ) | | (3,091,539 | ) |
| Net Increase (Decrease) in Cash | | | 3,530,551 | | | — | | | 374,456 | | | — | |
| Cash at the beginning of period | | | 852,496 | | | — | | | — | | | — | |
| Cash at the end of period | | $ | 4,383,047 | | $ | — | | $ | 374,456 | | $ | — | |
| | | Georgia | | Maryland | | Minnesota | |
| | | Dividend | | Premium | | Municipal | |
| | | Advantage 2 | | Income | | Income | |
| Supplemental Disclosure of Cash Flow Information* | | (NKG) | | (NMY) | | (NMS) | |
| Cash paid for interest (excluding amortization of offering costs) | | $ | 399,141 | | $ | 965,810 | | $ | 163,289 | | $ | 53,807 | |
| Non-cash financing activities not included herein consists of reinvestments of common share distributions | | | — | | | — | | | — | | | — | |
| * | See Notes to Financial Statements, Note 1 – General Information and Significant Accounting Policies, Fund Mergers for more information of the non-cash activities related to Minnesota Municipal Income’s (NMS) Merger. |
See accompanying notes to financial statements.
| | | | | North | | | |
| | | Missouri | | Carolina | | Virginia | |
| | | Premium | | Premium | | Premium | |
| | | Income | | Income | | Income | |
| | | (NOM) | | (NNC) | | (NPV) | |
| | | Six Months | | Six Months | | Six Months | |
| | | Ended | | Ended | | Ended | |
| | | 11/30/14 | | 11/30/14 | | 11/30/14 | |
| Cash Flows from Operating Activities: | | | | | | | | | | |
| Net Increase (Decrease) in Net Assets Applicable to Common Shares from Operations | | $ | 859,646 | | $ | 8,760,337 | | $ | 9,910,768 | |
| Adjustments to reconcile the net increase (decrease) in net assets applicable to common shares from operations to net cash provided by (used in) operating activities: | | | | | | | | | | |
| Purchases of investments | | | (2,214,076 | ) | | (29,021,980 | ) | | (32,506,306 | ) |
| Proceeds from sales and maturities of investments | | | 1,349,752 | | | 26,599,107 | | | 32,838,169 | |
| Proceeds from (Purchase of) short-term investments, net | | | — | | | — | | | — | |
| Proceeds from (Payments for) swap contracts, net | | | — | | | (6,463 | ) | | — | |
| Amortization (Accretion) of premiums and discounts, net | | | 27,736 | | | 1,290,321 | | | 4,902 | |
| Amortization of deferred offering costs | | | 43,860 | | | 1,676 | | | 1,781 | |
| (Increase) Decrease in: | | | | | | | | | | |
| Credit default swaps premiums paid | | | — | | | (730,302 | ) | | — | |
| Receivable for interest | | | (5,278 | ) | | 536,944 | | | 360,806 | |
| Receivable for investments sold | | | 1,767,973 | | | 9,816,210 | | | 1,122,450 | |
| Other assets | | | 7,003 | | | 39,206 | | | (5,214 | ) |
| Increase (Decrease) in: | | | | | | | | | | |
| Payable for common shares repurchased and retired | | | — | | | — | | | — | |
| Payable for interest | | | — | | | 68 | | | — | |
| Payable for investments purchased | | | (394,994 | ) | | 2,002,975 | | | (1,074,976 | ) |
| Accrued management fees | | | (802 | ) | | (6,410 | ) | | (4,783 | ) |
| Accrued Trustees fees | | | (17 | ) | | 1,607 | | | 1,781 | |
| Accrued other expenses | | | (21,631 | ) | | (7,746 | ) | | (65,839 | ) |
| Net realized gain (loss) from: | | | | | | | | | | |
| Investments | | | 507,254 | | | 367,910 | | | 5,667,958 | |
| Paydowns | | | — | | | — | | | — | |
| Swaps | | | — | | | 6,463 | | | — | |
| Change in net unrealized appreciation (depreciation) of: | | | | | | | | | | |
| Investments | | | (636,427 | ) | | (4,072,170 | ) | | (9,055,828 | ) |
| Swaps | | | — | | | (1,193 | ) | | — | |
| Taxes paid on undistributed capital gains | | | — | | | (41,246 | ) | | — | |
| Net cash provided by (used in) operating activities | | | 1,289,999 | | | 15,535,314 | | | 7,195,669 | |
| Cash Flows from Financing Activities: | | | | | | | | | | |
| Increase (Decrease) in: | | | | | | | | | | |
| Cash overdraft | | | (115,500 | ) | | (8,916,651 | ) | | — | |
| Floating rate obligations | | | — | | | — | | | — | |
| Payable for offering costs | | | — | | | (35,979 | ) | | — | |
| Remarketed preferred shares, at liquidation value | | | — | | | — | | | — | |
| VMTP Shares, at liquidation value | | | — | | | — | | | — | |
| Cash distributions paid to common shareholders | | | (828,107 | ) | | (5,213,601 | ) | | (6,802,349 | ) |
| Cost of shares repurchased and retired | | | — | | | (1,369,083 | ) | | — | |
| Net cash provided by (used in) financing activities | | | (943,607 | ) | | (15,535,314 | ) | | (6,802,349 | ) |
| Net Increase (Decrease) in Cash | | | 346,392 | | | — | | | 393,320 | |
| Cash at the beginning of period | | | — | | | — | | | 808,493 | |
| Cash at the end of period | | $ | 346,392 | | $ | — | | $ | 1,201,813 | |
| | | | | North | | | |
| | | Missouri | | Carolina | | Virginia | |
| | | Premium | | Premium | | Premium | |
| | | Income | | Income | | Income | |
| Supplemental Disclosure of Cash Flow Information | | (NOM) | | (NNC) | | (NPV) | |
| Cash paid for interest (excluding amortization of offering costs) | | $ | 190,318 | | $ | 625,274 | | $ | 109,866 | |
| Non-cash financing activities not included herein consists of reinvestments of common share distributions | | | 24,938 | | | — | | | — | |
See accompanying notes to financial statements.
| Financial | |
| | Highlights (Unaudited) |
Selected data for a common share outstanding throughout each period:
| | | | | Investment Operations | | Less Distributions | | | | | | | |
| | | Beginning Common Share NAV | | Net Investment Income (Loss) | | Net Realized/ Unrealized Gain (Loss) | | Distributions from Net Investment Income to Auction Rate Preferred Share- holders | (a) | Distributions from Accumulated Net Realized Gains to Auction Rate Preferred Share- holders | (a) | Total | | From Net Investment Income to Common Share- holders | | From Accumu- lated Net Realized Gains to Common Share- holders | | Total | | Discount from Common Shares Repurchased and Retired | | Ending Common Share NAV | | Ending Market Value | |
| Georgia Dividend Advantage 2 (NKG) | | | | | | | | | | | | | | | | | | | | | | | | | | | | |
| Year Ended 5/31: | | | | | | | | | | | | | | | | | | | | | | | | | | | | | | | | | | |
| 2015(g) | | $ | 13.98 | | $ | 0.34 | | $ | 0.10 | | $ | — | | $ | — | | $ | 0.44 | | $ | (0.32 | ) | $ | — | | $ | (0.32 | ) | $ | — | | $ | 14.10 | | $ | 12.59 | |
| 2014 | | | 14.58 | | | 0.54 | | | (0.50 | ) | | — | | | — | | | 0.04 | | | (0.64 | ) | | — | | | (0.64 | ) | | — | | | 13.98 | | | 12.98 | |
| 2013 | | | 14.71 | | | 0.60 | | | (0.06 | ) | | — | | | — | | | 0.54 | | | (0.67 | ) | | — | | | (0.67 | ) | | — | | | 14.58 | | | 13.39 | |
| 2012 | | | 13.78 | | | 0.61 | | | 1.01 | | | — | | | — | | | 1.62 | | | (0.69 | ) | | — | | | (0.69 | ) | | — | | | 14.71 | | | 14.73 | |
| 2011 | | | 14.21 | | | 0.65 | | | (0.36 | ) | | — | | | — | | | 0.29 | | | (0.72 | ) | | — | | | (0.72 | ) | | — | | | 13.78 | | | 13.92 | |
| 2010 | | | 13.27 | | | 0.78 | | | 0.87 | | | (0.02 | ) | | — | | | 1.63 | | | (0.69 | ) | | — | | | (0.69 | ) | | — | | | 14.21 | | | 14.00 | |
| | | | | | | | | | | | | | | | | | | | | | | | | | | | | | | | | | | | | | |
| Maryland Premium Income (NMY) | | | | | | | | | | | | | | | | | | | | | | | | | | | | |
| Year Ended 5/31: | | | | | | | | | | | | | | | | | | | | | | | | | | | | | | | | | | |
| 2015(g) | | | 14.64 | | | 0.34 | | | 0.05 | | | — | | | — | | | 0.39 | | | (0.33 | ) | | — | | | (0.33 | ) | | 0.03 | | | 14.73 | | | 12.64 | |
| 2014 | | | 15.56 | | | 0.60 | | | (0.85 | ) | | — | | | — | | | (0.25 | ) | | (0.67 | ) | | — | | | (0.67 | ) | | — | | | 14.64 | | | 12.91 | |
| 2013 | | | 15.68 | | | 0.58 | | | 0.07 | | | — | | | — | | | 0.65 | | | (0.77 | ) | | — | | | (0.77 | ) | | — | | | 15.56 | | | 13.82 | |
| 2012 | | | 14.37 | | | 0.68 | | | 1.40 | | | — | | | — | | | 2.08 | | | (0.77 | ) | | — | | | (0.77 | ) | | — | | | 15.68 | | | 15.64 | |
| 2011 | | | 14.77 | | | 0.80 | | | (0.43 | ) | | (0.01 | ) | | — | | | 0.36 | | | (0.76 | ) | | — | | | (0.76 | ) | | — | | | 14.37 | | | 14.00 | |
| 2010 | | | 13.58 | | | 0.84 | | | 1.10 | | | (0.02 | ) | | — | | | 1.92 | | | (0.73 | ) | | — | | | (0.73 | ) | | — | | | 14.77 | | | 14.43 | |
| (a) | The amounts shown are based on common share equivalents. |
| (b) | Total Return Based on Market Value is the combination of changes in the market price per share and the effect of reinvested dividend income and reinvested capital gains distributions, if any, at the average price paid per share at the time of reinvestment. The last dividend declared in the period, which is typically paid on the first business day of the following month, is assumed to be reinvested at the ending market price. The actual reinvestment for the last dividend declared in the period may take place over several days, and in some instances may not be based on the market price, so the actual reinvestment price may be different from the price used in the calculation. Total returns are not annualized. |
| | |
| | Total Return Based on Common Share NAV is the combination of changes in common share NAV, reinvested dividend income at NAV and reinvested capital gains distributions at NAV, if any. The last dividend declared in the period, which is typically paid on the first business day of the following month, is assumed to be reinvested at the ending NAV. The actual reinvest price for the last dividend declared in the period may often be based on the Fund’s market price (and not its NAV), and therefore may be different from the price used in the calculation. Total returns are not annualized. |
| (c) | Ratios do not reflect the effect of dividend payments to Auction Rate Preferred shareholders, where applicable; Net Investment Income (Loss) ratios reflect income earned and expenses incurred on assets attributable to Auction Rate Preferred Shares (“ARPS”), MTP Shares and/or VMTP Shares, where applicable. |
| (d) | After expense reimbursement from the Adviser, where applicable. As of September 30, 2010, the Adviser is no longer reimbursing Georgia Dividend Advantage 2 (NKG) for any fees and expenses. |
| | | | Ratios/Supplemental Data | |
| | Total Returns | | | | Ratios to Average Net Assets Applicable to Common Shares Before Reimbursement(c) | | Ratios to Average Net Assets Applicable to Common Shares After Reimbursement(c)(d) | | | |
| | | | | | | | | | | | | | | | | |
| | Based on Common Share NAV | (b) | Based on Market Value | (b) | Ending Net Assets Applicable to Common Shares (000) | | Expenses | (e) | Net Investment Income (Loss) | | Expenses | (e) | Net Investment Income (Loss) | | Portfolio Turnover Rate | (f) |
| | | | | | | | | | | | | | | | | | | | | | | | | |
| | | | | | | | | | | | | | | | | | | | | | | | | |
| | | 3.19 | % | | (0.53 | )% | $ | 148,760 | | | 1.66 | %* | | 4.81 | %* | | N/A | | | N/A | | | 5 | % |
| | | 0.56 | | | 2.17 | | | 147,507 | | | 3.03 | | | 4.04 | | | N/A | | | N/A | | | 20 | |
| | | 3.68 | | | (4.83 | ) | | 153,832 | | | 2.66 | | | 4.09 | | | N/A | | | N/A | | | 18 | |
| | | 12.04 | | | 11.12 | | | 67,039 | | | 2.95 | | | 4.30 | | | N/A | | | N/A | | | 11 | |
| | | 2.13 | | | 4.84 | | | 62,777 | | | 2.79 | | | 4.64 | | | 2.75 | % | | 4.68 | % | | 4 | |
| | | 12.54 | | | 24.23 | | | 64,721 | | | 1.75 | | | 5.43 | | | 1.59 | | | 5.59 | | | 3 | |
| | | | | | | | | | | | | | | | | | | | | | | | | |
| | | | | | | | | | | | | | | | | | | | | | | | | |
| | | 2.93 | | | 0.52 | | | 349,052 | | | 1.58 | * | | 4.61 | * | | N/A | | | N/A | | | 18 | |
| | | (1.38 | ) | | (1.43 | ) | | 353,010 | | | 2.87 | | | 4.25 | | | N/A | | | N/A | | | 20 | |
| | | 4.18 | | | (7.10 | ) | | 375,162 | | | 2.58 | | | 4.12 | | | N/A | | | N/A | | | 17 | |
| | | 14.82 | | | 17.69 | | | 167,208 | | | 2.91 | | | 4.54 | | | N/A | | | N/A | | | 7 | |
| | | 2.53 | | | 2.32 | | | 153,082 | | | 2.10 | | | 5.48 | | | N/A | | | N/A | | | 6 | |
| | | 14.44 | | | 19.89 | | | 157,243 | | | 1.49 | | | 5.88 | | | N/A | | | N/A | | | 2 | |
| (e) | The expense ratios reflect, among other things, all interest expense and other costs related to MTP Shares, VMTP Shares and/or the interest expense deemed to have been paid by the Fund on the floating rate certificates issued by the special purpose trusts for the self-deposited inverse floaters held by the Fund, where applicable, each as described in Note 1 – General Information and Significant Accounting Policies, Munifund Term Preferred Shares and Variable Rate MuniFund Term Preferred Shares and Note 3 – Portfolio Securities and Investments in Derivatives, Inverse Floating Rate Securities, respectively, as follows: |
| Georgia Dividend Advantage 2 (NKG) | | |
| Year Ended 5/31: | | |
| 2015(g) | 0.53 | %* |
| 2014 | 1.89 | |
| 2013 | 1.51 | |
| 2012 | 1.56 | |
| 2011 | 1.60 | |
| 2010 | 0.55 | |
| Maryland Premium Income (NMY) | | |
| Year Ended 5/31: | | |
| 2015(g) | 0.52 | %* |
| 2014 | 1.81 | |
| 2013 | 1.46 | |
| 2012 | 1.56 | |
| 2011 | 1.00 | |
| 2010 | 0.32 | |
| (f) | Portfolio Turnover Rate is calculated based on the lesser of long-term purchases or sales (as disclosed in Note 5 – Investment Transactions) divided by the average long-term market value during the period. |
| (g) | For the six months ended November 30, 2014. |
| N/A | Fund does not have, or no longer has, a contractual reimbursement agreement with the Adviser. |
| * | Annualized. |
See accompanying notes to financial statements.
Financial Highlights (Unaudited) (continued)
Selected data for a common share outstanding throughout each period:
| | | | | Investment Operations | | Less Distributions | | | | | |
| | | Beginning Common Share NAV | | Net Investment Income (Loss) | | Net Realized/ Unrealized Gain (Loss) | | Distributions from Net Investment Income to Auction Rate Preferred Share- holders | (a) | Distributions from Accumulated Net Realized Gains to Auction Rate Preferred Share- holders | (a) | Total | | From Net Investment Income to Common Share- holders | | From Accumulated Net Realized Gains to Common Share- holders | | Total | | Ending Common Share NAV | | Ending Market Value | |
| Minnesota Municipal Income (NMS) | | | | | | | | | | | | | | | | | | | | | | | | | |
| Year Ended 5/31: | | | | | | | | | | | | | | | | | | | | | | | | | | | | |
| 2015(g) | | $ | 15.50 | | $ | 0.35 | | $ | 0.19 | | $ | — | | $ | — | | $ | 0.54 | | $ | (0.39 | ) | $ | — | | $ | (0.39 | ) | $ | 15.65 | | $ | 14.89 | |
| Year Ended 6/30: | | | | | | | | | | | | | | | | | | | | | | | | | | | | |
| 2014(h) | | | 14.25 | | | 0.71 | | | 1.29 | | | (0.01 | ) | | — | | | 1.99 | | | (0.74 | ) | | — | | | (0.74 | ) | | 15.50 | | | 16.48 | |
| Year Ended 8/31: | | | | | | | | | | | | | | | | | | | | | | | | | | | | | | | |
| 2013 | | | 16.16 | | | 0.90 | | | (1.90 | ) | | (0.02 | ) | | — | | | (1.02 | ) | | (0.89 | ) | | — | | | (0.89 | ) | | 14.25 | | | 14.82 | |
| 2012 | | | 14.56 | | | 0.90 | | | 1.56 | | | (0.02 | ) | | — | | | 2.44 | | | (0.84 | ) | | — | | | (0.84 | ) | | 16.16 | | | 17.52 | |
| 2011 | | | 15.28 | | | 0.88 | | | (0.71 | ) | | (0.03 | ) | | — | | | 0.14 | | | (0.86 | ) | | — | | | (0.86 | ) | | 14.56 | | | 15.37 | |
| 2010 | | | 13.39 | | | 0.92 | | | 1.91 | | | (0.03 | ) | | — | | | 2.80 | | | (0.91 | ) | | — | | | (0.91 | ) | | 15.28 | | | 15.70 | |
| 2009 | | | 13.71 | | | 0.90 | | | (0.22 | ) | | (0.11 | ) | | (0.03 | ) | | 0.54 | | | (0.79 | ) | | (0.07 | ) | | (0.86 | ) | | 13.39 | | | 14.77 | |
| | | | | | | | | | | | | | | | | | | | | | | | | | | | | | | | | | | |
| Missouri Premium Income (NOM) | | | | | | | | | | | | | | | | | | | | | | | | | |
| Year Ended 5/31: | | | | | | | | | | | | | | | | | | | | | | | | | | | | | | | |
| 2015(f) | | | 14.19 | | | 0.31 | | | 0.06 | | | — | | | — | | | 0.37 | | | (0.37 | ) | | — | | | (0.37 | ) | | 14.19 | | | 15.10 | |
| 2014 | | | 14.61 | | | 0.65 | | | (0.34 | ) | | — | | | — | | | 0.31 | | | (0.73 | ) | | — | | | (0.73 | ) | | 14.19 | | | 15.08 | |
| 2013 | | | 14.62 | | | 0.66 | | | 0.06 | | | — | | | — | | | 0.72 | | | (0.73 | ) | | — | | | (0.73 | ) | | 14.61 | | | 16.04 | |
| 2012 | | | 13.19 | | | 0.69 | | | 1.52 | | | — | | | — | | | 2.21 | | | (0.78 | ) | | — | | | (0.78 | ) | | 14.62 | | | 16.90 | |
| 2011 | | | 13.55 | | | 0.78 | | | (0.35 | ) | | (0.01 | ) | | — | | | 0.42 | | | (0.78 | ) | | — | | | (0.78 | ) | | 13.19 | | | 13.88 | |
| 2010 | | | 12.44 | | | 0.83 | | | 0.99 | | | (0.03 | ) | | — | | | 1.79 | | | (0.68 | ) | | — | | | (0.68 | ) | | 13.55 | | | 16.50 | |
| (a) | The amounts shown are based on common share equivalents. |
| (b) | Total Return Based on Market Value is the combination of changes in the market price per share and the effect of reinvested dividend income and reinvested capital gains distributions, if any, at the average price paid per share at the time of reinvestment. The last dividend declared in the period, which is typically paid on the first business day of the following month, is assumed to be reinvested at the ending market price. The actual reinvestment for the last dividend declared in the period may take place over several days, and in some instances may not be based on the market price, so the actual reinvestment price may be different from the price used in the calculation. Total returns are not annualized. |
| | |
| | Total Return Based on Common Share NAV is the combination of changes in common share NAV, reinvested dividend income at NAV and reinvested capital gains distributions at NAV, if any. The last dividend declared in the period, which is typically paid on the first business day of the following month, is assumed to be reinvested at the ending NAV. The actual reinvest price for the last dividend declared in the period may often be based on the Fund’s market price (and not its NAV), and therefore may be different from the price used in the calculation. Total returns are not annualized. |
| | | | Ratios/Supplemental Data | |
| | Total Returns | | | | Ratios to Average Net Assets Applicable to Common Shares(c) | | | |
| | | | | | | | | | | | | |
| | Based on Common Share NAV | (b) | Based on Market Value | (b) | Ending Net Assets Applicable to Common Shares (000) | | Expenses | (d) | Net Investment Income (Loss) | | Portfolio Turnover Rate | (e) |
| | | | | | | | | | | | | | | | | | | |
| | | | | | | | | | | | | | | | | | | |
| | | 3.55 | % | | (7.32 | )% | $ | 87,181 | | | 1.84 | %* | | 5.35 | %* | | 3 | % |
| | | | | | | | | | | | | | | | | | | |
| | | 14.33 | | | 16.61 | | | 64,277 | | | 1.64 | * | | 5.75 | * | | 8 | |
| | | | | | | | | | | | | | | | | | | |
| | | (6.77 | ) | | (10.99 | ) | | 59,100 | | | 1.35 | | | 5.68 | | | 11 | |
| | | 17.25 | | | 19.91 | | | 67,029 | | | 1.42 | | | 5.82 | | | 6 | |
| | | 1.30 | | | 3.73 | | | 60,408 | | | 1.46 | | | 6.25 | | | 10 | |
| | | 21.66 | | | 12.86 | | | 63,358 | | | 1.29 | | | 6.46 | | | 16 | |
| | | 4.85 | | | 20.92 | | | 55,509 | | | 1.42 | | | 7.32 | | | 16 | |
| | | | | | | | | | | | | | | | | | | |
| | | | | | | | | | | | | | | | | | | |
| | | 2.62 | | | 2.71 | | | 33,103 | | | 2.79 | * | | 4.43 | * | | 3 | |
| | | 2.52 | | | (0.83 | ) | | 33,072 | | | 2.86 | | | 4.85 | | | 21 | |
| | | 4.98 | | | (0.67 | ) | | 34,011 | | | 2.77 | | | 4.45 | | | 12 | |
| | | 17.16 | | | 28.21 | | | 33,979 | | | 2.95 | | | 4.93 | | | 13 | |
| | | 3.22 | | | (11.29 | ) | | 30,595 | | | 2.30 | | | 5.90 | | | 11 | |
| | | 14.69 | | | 34.31 | | | 31,348 | | | 1.37 | | | 6.37 | | | 7 | |
| (c) | Ratios do not reflect the effect of dividend payments to Auction Rate Preferred shareholders, where applicable; Net Investment Income (Loss) ratios reflect income earned and expenses incurred on assets attributable to ARPS, MTP Shares and/or VMTP Shares, where applicable. For the years ended June 30, 2014 and prior, Minnesota Municipal Income’s (NMS) APRS includes the Remarket Preferred Shares of Minnesota Municipal Income Portfolio (MXA), where applicable. |
| (d) | The expense ratios reflect, among other things, all interest expense and other costs related to MTP Shares, VMTP Shares and/or the interest expense deemed to have been paid by the Fund on the floating rate certificates issued by the special purpose trusts for the self-deposited inverse floaters held by the Fund, where applicable, each as described in Note 1 – General Information and Significant Accounting Policies, MuniFund Term Preferred Shares and Variable Rate MuniFund Term Preferred Shares and Note 3 – Portfolio Securities and Investments in Derivatives, Inverse Floating Rate Securities, respectively, as follows: |
| Minnesota Municipal Income (NMS) | | |
| Year Ended 5/31: | | |
| 2015(g) | 0.59 | %* |
| Year Ended 6/30: | | |
| 2014(h) | 0.18 | * |
| Year Ended 8/31: | | |
| 2013 | — | |
| 2012 | — | |
| 2011 | — | |
| 2010 | — | |
| 2009 | — | |
| Missouri Premium Income (NOM) | | |
| Year Ended 5/31: | | |
| 2015(f) | 1.42 | %* |
| 2014 | 1.51 | |
| 2013 | 1.45 | |
| 2012 | 1.55 | |
| 2011 | 0.93 | |
| 2010 | 0.03 | |
| (e) | Portfolio Turnover Rate is calculated based on the lesser of long-term purchases or sales (as disclosed in Note 5 – Investment Transactions) divided by the average long-term market value during the period. |
| (f) | For the six months ended November 30, 2014. |
| (g) | For the five months ended November 30, 2014. |
| (h) | For the ten months ended June 30, 2014. |
| * | Annualized. |
See accompanying notes to financial statements.
Financial Highlights (Unaudited) (continued)
Selected data for a common share outstanding throughout each period:
| | | | | Investment Operations | | Less Distributions | | | | | | | |
| | | Beginning Common Share NAV | | Net Investment Income (Loss) | | Net Realized/ Unrealized Gain (Loss) | | Distributions from Net Investment Income to Auction Rate Preferred Share- holders | (a) | Distributions from Accumulated Net Realized Gains to Auction Rate Preferred Share- holders | (a) | Total | | From Net Investment Income to Common Share- holders | | From Accumu- lated Net Realized Gains to Common Share- holders | | Total | | Discount from Common Shares Repurchased and Retired | | Ending Common Share NAV | | Ending Market Value | |
| North Carolina Premium Income (NNC) | | | | | | | | | | | | | | | | | | | | | | | | | | | | |
| Year Ended 5/31: | | | | | | | | | | | | | | | | | | | | | | | | | | | | | | | | | | |
| 2015(f) | | $ | 14.90 | | $ | 0.31 | | $ | 0.22 | | $ | — | | $ | — | | $ | 0.53 | | $ | (0.32 | ) | $ | — | | $ | (0.32 | ) | $ | 0.01 | | $ | 15.12 | | $ | 13.03 | |
| 2014 | | | 15.02 | | | 0.54 | | | (0.06 | ) | | — | | | — | | | 0.48 | | | (0.60 | ) | | — | | | (0.60 | ) | | — | | | 14.90 | | | 13.24 | |
| 2013 | | | 15.30 | | | 0.56 | | | (0.17 | ) | | — | | | — | | | 0.39 | | | (0.67 | ) | | — | | | (0.67 | ) | | — | | | 15.02 | | | 13.88 | |
| 2012 | | | 14.34 | | | 0.57 | | | 1.10 | | | — | | | — | | | 1.67 | | | (0.71 | ) | | — | | | (0.71 | ) | | — | | | 15.30 | | | 15.97 | |
| 2011 | | | 14.72 | | | 0.69 | | | (0.32 | ) | | (0.01 | ) | | — | | | 0.36 | | | (0.74 | ) | | — | | | (0.74 | ) | | — | | | 14.34 | | | 14.41 | |
| 2010 | | | 13.78 | | | 0.81 | | | 0.87 | | | (0.03 | ) | | — | | | 1.65 | | | (0.71 | ) | | — | | | (0.71 | ) | | — | | | 14.72 | | | 15.37 | |
| | | | | | | | | | | | | | | | | | | | | | | | | | | | | | | | | | | | | | |
| Virginia Premium Income (NPV) | | | | | | | | | | | | | | | | | | | | | | | | | | | | |
| Year Ended 5/31: | | | | | | | | | | | | | | | | | | | | | | | | | | | | | | | | | | |
| 2015(f) | | | 14.47 | | | 0.36 | | | 0.20 | | | — | | | — | | | 0.56 | | | (0.38 | ) | | — | | | (0.38 | ) | | — | | | 14.65 | | | 13.40 | |
| 2014 | | | 15.38 | | | 0.71 | | | (0.89 | ) | | — | | | — | | | (0.18 | ) | | (0.72 | ) | | (0.01 | ) | | (0.73 | ) | | — | | | 14.47 | | | 13.39 | |
| 2013 | | | 15.60 | | | 0.66 | | | (0.10 | ) | | — | | | — | | | 0.56 | | | (0.76 | ) | | (0.02 | ) | | (0.78 | ) | | — | | | 15.38 | | | 14.32 | |
| 2012 | | | 14.42 | | | 0.68 | | | 1.32 | | | — | | | — | | | 2.00 | | | (0.80 | ) | | (0.02 | ) | | (0.82 | ) | | — | | | 15.60 | | | 17.05 | |
| 2011 | | | 14.73 | | | 0.77 | | | (0.27 | ) | | (0.01 | ) | | — | | | 0.49 | | | (0.80 | ) | | — | | | (0.80 | ) | | — | | | 14.42 | | | 14.92 | |
| 2010 | | | 13.76 | | | 0.88 | | | 0.93 | | | (0.03 | ) | | — | | | 1.78 | | | (0.81 | ) | | — | | | (0.81 | ) | | — | | | 14.73 | | | 15.85 | |
| (a) | The amounts shown are based on common share equivalents. |
| (b) | Total Return Based on Market Value is the combination of changes in the market price per share and the effect of reinvested dividend income and reinvested capital gains distributions, if any, at the average price paid per share at the time of reinvestment. The last dividend declared in the period, which is typically paid on the first business day of the following month, is assumed to be reinvested at the ending market price. The actual reinvestment for the last dividend declared in the period may take place over several days, and in some instances may not be based on the market price, so the actual reinvestment price may be different from the price used in the calculation. Total returns are not annualized. |
| | |
| | Total Return Based on Common Share NAV is the combination of changes in common share NAV, reinvested dividend income at NAV and reinvested capital gains distributions at NAV, if any. The last dividend declared in the period, which is typically paid on the first business day of the following month, is assumed to be reinvested at the ending NAV. The actual reinvest price for the last dividend declared in the period may often be based on the Fund’s market price (and not its NAV), and therefore may be different from the price used in the calculation. Total returns are not annualized. |
| | | | Ratios/Supplemental Data | |
| | Total Returns | | | | Ratios to Average Net Assets Applicable to Common Shares(c) | | | |
| | | | | | | | | | | | | |
| | Based on Common Share NAV | (b) | Based on Market Value | (b) | Ending Net Assets Applicable to Common Shares (000) | | Expenses | (d) | Net Investment Income (Loss) | | Portfolio Turnover Rate | (e) |
| | | | | | | | | | | | | | | | | | | |
| | | | | | | | | | | | | | | | | | | |
| | | 3.65 | % | | 0.83 | % | $ | 248,631 | | | 1.59 | %* | | 4.09 | %* | | 7 | % |
| | | 3.54 | | | 0.10 | | | 246,492 | | | 2.81 | | | 3.85 | | | 17 | |
| | | 2.50 | | | (9.16 | ) | | 248,601 | | | 2.72 | | | 3.88 | | | 17 | |
| | | 11.88 | | | 16.23 | | | 97,497 | | | 3.28 | | | 3.85 | | | 18 | |
| | | 2.57 | | | (1.27 | ) | | 91,256 | | | 2.49 | | | 4.77 | | | 10 | |
| | | 12.24 | | | 28.20 | | | 93,570 | | | 1.54 | | | 5.68 | | | 6 | |
| | | | | | | | | | | | | | | | | | | |
| | | | | | | | | | | | | | | | | | | |
| | | 3.93 | | | 2.99 | | | 262,637 | | | 1.67 | * | | 5.01 | * | | 8 | |
| | | (0.79 | ) | | (0.93 | ) | | 259,568 | | | 2.25 | | | 5.15 | | | 19 | |
| | | 3.56 | | | (11.76 | ) | | 275,865 | | | 2.57 | | | 4.19 | | | 21 | |
| | | 14.26 | | | 20.61 | | | 141,099 | | | 2.78 | | | 4.49 | | | 12 | |
| | | 3.48 | | | (0.58 | ) | | 130,032 | | | 2.11 | | | 5.36 | | | 12 | |
| | | 13.19 | | | 16.60 | | | 132,302 | | | 1.45 | | | 6.14 | | | 3 | |
| (c) | Ratios do not reflect the effect of dividend payments to Auction Rate Preferred shareholders, where applicable; Net Investment Income (Loss) ratios reflect income earned and expenses incurred on assets attributable to ARPS, MTP Shares, VMTP Shares and/or VRDP Shares, where applicable. |
| (d) | The expense ratios reflect, among other things, all interest expense and other costs related to MTP Shares, VMTP Shares, VRDP Shares and/or the interest expense deemed to have been paid by the Fund on the floating rate certificates issued by the special purpose trusts for the self-deposited inverse floaters held by the Fund, where applicable, each as described in Note 1 – General Information and Significant Accounting Policies, MuniFund Term Preferred Shares, Variable Rate MuniFund Term Preferred Shares and Variable Rate Demand Preferred Shares and Note 3 – Portfolio Securities and Investments in Derivatives, Inverse Floating Rate Securities, respectively, as follows: |
| North Carolina Premium Income (NNC) | | |
| Year Ended 5/31: | | |
| 2015(f) | 0.52 | %* |
| 2014 | 1.70 | |
| 2013 | 1.60 | |
| 2012 | 1.71 | |
| 2011 | 1.29 | |
| 2010 | 0.34 | |
| Virginia Premium Income (NPV) | | |
| Year Ended 5/31: | | |
| 2015(f) | 0.60 | %* |
| 2014 | 1.18 | |
| 2013 | 1.44 | |
| 2012 | 1.41 | |
| 2011 | .93 | |
| 2010 | .29 | |
| (e) | Portfolio Turnover Rate is calculated based on the lesser of long-term purchases or sales (as disclosed in Note 5 – Investment Transactions) divided by the average long-term market value during the period. |
| (f) | For the six months ended November 30, 2014. |
| * | Annualized. |
See accompanying notes to financial statements.
Financial Highlights (Unaudited) (continued)
| | | ARPS at the End of Period | | MTP Shares at the End of Period(a) | | VMTP Shares at the End of Period | | ARPS and MTP Shares at the End of Period | |
| | | Aggregate Amount Outstanding (000 | ) | Asset Coverage Per $25,000 Share | | Aggregate Amount Outstanding (000 | ) | Asset Coverage Per $10 Share | | Aggregate Amount Outstanding (000 | ) | Asset Coverages Per $100,000 Share | | Asset Coverage Per $1 Liquidation Preference | |
| Georgia Dividend Advantage 2 (NKG) | | | | | | | | | | | | | | | | |
| Year Ended 5/31: | | | | | | | | | | | | | | | | | | | | | | |
| 2015(c) | | $ | — | | $ | — | | $ | — | | $ | — | | $ | 75,000 | | $ | 298,347 | | $ | — | |
| 2014 | | | — | | | — | | | — | | | — | | | 75,000 | | | 296,676 | | | — | |
| 2013 | | | — | | | — | | | 74,945 | | | 30.53 | | | — | | | — | | | — | |
| 2012 | | | — | | | — | | | 32,265 | | | 30.78 | | | — | | | — | | | — | |
| 2011 | | | — | | | — | | | 32,265 | | | 29.46 | | | — | | | — | | | — | |
| 2010 | | | — | | | — | | | 32,265 | | | 30.06 | | | — | | | — | | | — | |
| | | | | | | | | | | | | | | | | | | | | | | |
| Maryland Premium Income (NMY) | | | | | | | | | | | | | | | | |
| Year Ended 5/31: | | | | | | | | | | | | | | | | | | | | | | |
| 2015(c) | | | — | | | — | | | — | | | — | | | 167,000 | | | 309,013 | | | — | |
| 2014 | | | — | | | — | | | — | | | — | | | 167,000 | | | 311,383 | | | — | |
| 2013 | | | — | | | — | | | 166,144 | | | 32.58 | | | — | | | — | | | — | |
| 2012 | | | — | | | — | | | 74,593 | | | 32.42 | | | — | | | — | | | — | |
| 2011 | | | — | | | — | | | 74,593 | | | 30.52 | | | — | | | — | | | — | |
| 2010 | | | 32,975 | | | 79,788 | | | 38,775 | | | 31.92 | | | — | | | — | | | 3.19 | |
| (a) | The Ending and Average Market Value Per Share for each Series of the Fund’s MTP Shares were as follows: |
| | | | 2015 | (c) | | 2014 | | | 2013 | | | 2012 | | | 2011 | | | 2010 | |
| Georgia Dividend Advantage 2 (NKG) | | | | | | | | | | | | | | | | |
| Series 2015 (NKG PRC) | | | | | | | | | | | | | | | | | | | |
| Ending Market Value per Share | | $ | — | | $ | — | | $ | 10.08 | | $ | 10.10 | | $ | 10.06 | | $ | 9.99 | |
| Average Market Value per Share | | | — | | | 10.03 | △ | | 10.08 | | | 10.07 | | | 10.02 | | | 9.99 | ^ |
| Series 2015-1 (NKG PRD)(b) | | | | | | | | | | | | | | | | | | | |
| Ending Market Value per Share | | | — | | | — | | | 10.10 | | | — | | | — | | | — | |
| Average Market Value per Share | | | — | | | 10.04 | △ | | 10.07 | Ω | | — | | | — | | | — | |
| Series 2015-2 (NKG PRE)(b) | | | | | | | | | | | | | | | | | | | |
| Ending Market Value per Share | | | — | | | — | | | 10.12 | | | — | | | — | | | — | |
| Average Market Value per Share | | | — | | | 10.03 | △ | | 10.07 | Ω | | — | | | — | | | — | |
| | | | | | | | | | | | | | | | | | | | |
| Maryland Premium Income (NMY) | | | | | | | | | | | | | | | | | | | |
| Series 2015 (NMY PRC) | | | | | | | | | | | | | | | | | | | |
| Ending Market Value per Share | | | — | | | — | | | 10.06 | | | 10.06 | | | 10.09 | | | 10.00 | |
| Average Market Value per Share | | | — | | | 10.04 | △ | | 10.09 | | | 10.10 | | | 10.04 | | | 10.01 | ^ |
| Series 2016 (NMY PRD) | | | | | | | | | | | | | | | | | | | |
| Ending Market Value per Share | | | — | | | — | | | 10.16 | | | 10.11 | | | 10.10 | | | — | |
| Average Market Value per Share | | | — | | | 10.07 | △ | | 10.17 | | | 10.14 | | | 10.04 | ^^ | | — | |
| Series 2015 (NMY PRE)(b) | | | | | | | | | | | | | | | | | | | |
| Ending Market Value per Share | | | — | | | — | | | 10.05 | | | — | | | — | | | — | |
| Average Market Value per Share | | | — | | | 10.03 | △ | | 10.07 | ΩΩ | | — | | | — | | | — | |
| Series 2015-1(NMY PRF)(b) | | | | | | | | | | | | | | | | | | | |
| Ending Market Value per Share | | | — | | | — | | | 10.06 | | | — | | | — | | | — | |
| Average Market Value per Share | | | — | | | 10.03 | △ | | 10.07 | ΩΩ | | — | | | — | | | — | |
| Series 2015-1(NMY PRG)(b) | | | | | | | | | | | | | | | | | | | |
| Ending Market Value per Share | | | — | | | — | | | 10.05 | | | — | | | — | | | — | |
| Average Market Value per Share | | | — | | | 10.04 | △ | | 10.08 | ΩΩ | | — | | | — | | | — | |
| Series 2016 (NMY PRH)(b) | | | | | | | | | | | | | | | | | | | |
| Ending Market Value per Share | | | — | | | — | | | 10.13 | | | — | | | — | | | — | |
| Average Market Value per Share | | | — | | | 10.07 | △ | | 10.14 | ΩΩ | | — | | | — | | | — | |
| (b) | MTP Shares issued in connection with the reorganizations. |
| (c) | For the six months ended November 30, 2014. |
| ^ | For the period January 29, 2010 (first issuance date of shares) through May 31, 2010. |
| ^^ | For the period March 15, 2011 (first issuance date of shares) through May 31, 2011. |
| Ω | For the period July 9, 2012 (effective date of the reorganizations) through May 31, 2013. |
| ΩΩ | For the period August 6, 2012 (effective date of the reorganizations) through May 31, 2013. |
| △ | For the period June 1, 2013 through May 30, 2014. |
See accompanying notes to financial statements.
| | | ARPS at the | | MTP Shares at | | VMTP Shares | |
| | | End of Period | | the End of Period(a) | | at the End of Period | |
| | | Aggregate | | Asset | | Aggregate | | Asset | | Aggregate | | Asset | |
| | | Amount | | Coverage | | Amount | | Coverage | | Amount | | Coverages | |
| | | Outstanding | | Per $25,000 | | Outstanding | | Per $10 | | Outstanding | | Per $100,000 | |
| | | (000 | ) | Share | | (000 | ) | Share | | (000 | ) | Share | |
| Minnesota Municipal Income (NMS) | | | | | | | | | | | | | | | | | | | |
| Year Ended 5/31: | | | | | | | | | | | | | | | | | | | |
| 2015(b) | | $ | — | | $ | — | | $ | — | | $ | — | | $ | 44,100 | | $ | 297,690 | |
| Year Ended 6/30: | | | | | | | | | | | | | | | | | | | |
| 2014(d) | | | — | | | — | | | — | | | — | | | 31,100 | | | 307 | * |
| Year Ended 8/31: | | | | | | | | | | | | | | | | | | | |
| 2013 | | | 31,100 | | | 73 | * | | — | | | — | | | — | | | — | |
| 2012 | | | 31,100 | | | 79 | * | | — | | | — | | | — | | | — | |
| 2011 | | | 31,100 | | | 74 | * | | — | | | — | | | — | | | — | |
| 2010 | | | 31,100 | | | 76 | * | | — | | | — | | | — | | | — | |
| 2009 | | | 31,100 | | | 70 | * | | — | | | — | | | — | | | — | |
| | | | | | | | | | | | | | | | | | | | |
| Missouri Premium Income (NOM) | | | | | | | | | | | | | | | | | | | |
| Year Ended 5/31: | | | | | | | | | | | | | | | | | | | |
| 2015(c) | | | — | | | — | | | 17,880 | | | 28.51 | | | — | | | — | |
| 2014 | | | — | | | — | | | 17,880 | | | 28.50 | | | — | | | — | |
| 2013 | | | — | | | — | | | 17,880 | | | 29.02 | | | — | | | | |
| 2012 | | | — | | | — | | | 17,880 | | | 29.00 | | | — | | | — | |
| 2011 | | | — | | | — | | | 17,880 | | | 27.11 | | | — | | | — | |
| 2010 | | | 16,000 | | | 73,981 | | | — | | | — | | | — | | | — | |
| * | Rounded to the nearest thousand (000). |
| (a) | The Ending and Average Market Value Per Share for each Series of the Fund’s MTP Shares were as follows: |
| | | 2015 | (c) | 2014 | | 2013 | | 2012 | | 2011 | |
| Missouri Premium Income (NOM) | | | | | | | | | | | | | | | | |
| Series 2015 (NOM PRC) | | | | | | | | | | | | | | | | |
| Ending Market Value per Share | | $ | 10.02 | | $ | 10.06 | | $ | 10.03 | | $ | 10.40 | | $ | 13.88 | |
| Average Market Value per Share | | | 10.04 | | | 10.04 | | | 10.08 | | | 9.98 | | | 15.41 | △ |
| (b) | For the five months ended November 30, 2014. |
| (c) | For the six months ended November 30, 2014. |
| (d) | For the ten months ended June 30, 2014. |
| △ | For the period November 9, 2010 (first issuance date of shares) through May 31, 2011. |
See accompanying notes to financial statements.
Financial Highlights (Unaudited) (continued)
| | | | | | | | | | | | | | | | | | | ARPS and | |
| | | | | | | | | | | | | | | | | | | MTP Shares | |
| | | ARPS at the | | MTP Shares at | | VMTP Shares | | VRDP Shares | | at the | |
| | | End of Period | | the End of Period(a) | | at the End of Period | | at the End of Period | | End of Period | |
| | | Aggregate | | Asset | | Aggregate | | Asset | | Aggregate | | Asset | | Aggregate | | Asset | | Asset | |
| | | Amount | | Coverage | | Amount | | Coverage | | Amount | | Coverage | | Amount | | Coverage | | Coverage Per | |
| | | Outstanding | | Per $25,000 | | Outstanding | | Per $10 | | Outstanding | | Per $100,000 | | Outstanding | | Per $100,000 | | $1 Liquidation | |
| | | (000 | ) | Share | | (000 | ) | Share | | (000 | ) | Share | | (000 | ) | Share | | Preference | |
| North Carolina Premium Income (NNC) | | | | | | | | | | | | | | | | | | | | | | |
| Year Ended 5/31: | | | | | | | | | | | | | | | | | | | | | | | | | | | | |
| 2015(c) | | $ | — | | $ | — | | $ | — | | $ | — | | $ | 125,000 | | $ | 298,905 | | $ | — | | $ | — | | $ | — | |
| 2014 | | | — | | | — | | | — | | | — | | | 125,000 | | | 297,193 | | | — | | | — | | | — | |
| 2013 | | | — | | | — | | | 124,860 | | | 29.91 | | | — | | | — | | | — | | | — | | | — | |
| 2012 | | | — | | | — | | | 49,835 | | | 29.56 | | | — | | | — | | | — | | | — | | | — | |
| 2011 | | | — | | | — | | | 49,835 | | | 28.31 | | | — | | | — | | | — | | | — | | | — | |
| 2010 | | | 21,550 | | | 76,020 | | | 24,300 | | | 30.41 | | | — | | | — | | | — | | | — | | | 3.04 | |
| | | | | | | | | | | | | | | | | | | | | | | | | | | | | |
| Virginia Premium Income (NPV) | | | | | | | | | | | | | | | | | | | | | | |
| Year Ended 5/31: | | | | | | | | | | | | | | | | | | | | | | | | | | | | |
| 2015(c) | | | — | | | — | | | — | | | — | | | — | | | — | | | 128,000 | | | 305,185 | | | — | |
| 2014 | | | — | | | — | | | — | | | — | | | — | | | — | | | 128,000 | | | 302,787 | | | — | |
| 2013 | | | — | | | — | | | 127,408 | | | 31.65 | | | — | | | — | | | — | | | — | | | — | |
| 2012 | | | — | | | — | | | 61,408 | | | 32.98 | | | — | | | — | | | — | | | — | | | — | |
| 2011 | | | — | | | — | | | 61,408 | | | 31.18 | | | — | | | — | | | — | | | — | | | — | |
| 2010 | | | 25,550 | | | 82,269 | | | 32,205 | | | 32.91 | | | — | | | — | | | — | | | — | | | 3.29 | |
| (a) | The Ending and Average Market Value Per Share for each Series of the Fund’s MTP Shares were as follows: |
| | | 2015 | (c) | 2014 | | 2013 | | 2012 | | 2011 | | 2010 | |
| North Carolina Premium Income (NNC) | | | | | | | | | | | | | | | | | | | |
| Series 2015 (NNC PRC) | | | | | | | | | | | | | | | | | | | |
| Ending Market Value per Share | | $ | — | | $ | — | | $ | 10.07 | | $ | 10.11 | | $ | 10.04 | | $ | 9.99 | |
| Average Market Value per Share | | | — | | | 10.03 | ^ | | 10.10 | | | 10.09 | | | 10.04 | | | 10.01 | △ |
| Series 2016 (NNC PRD) | | | | | | | | | | | | | | | | | | | |
| Ending Market Value per Share | | | — | | | — | | | 10.08 | | | 10.10 | | | 10.00 | | | — | |
| Average Market Value per Share | | | — | | | 10.04 | ^ | | 10.09 | | | 10.07 | | | 9.94 | △△ | | — | |
| Series 2015 (NNC PRE)(b) | | | | | | | | | | | | | | | | | | | |
| Ending Market Value per Share | | | — | | | — | | | 10.06 | | | — | | | — | | | — | |
| Average Market Value per Share | | | — | | | 10.03 | ^ | | 10.07 | Ω | | — | | | — | | | — | |
| Series 2015-1 (NNC PRF)(b) | | | | | | | | | | | | | | | | | | | |
| Ending Market Value per Share | | | — | | | — | | | 10.06 | | | — | | | — | | | — | |
| Average Market Value per Share | | | — | | | 10.03 | ^ | | 10.07 | Ω | | — | | | — | | | — | |
| Series 2015-1 (NNC PRG)(b) | | | | | | | | | | | | | | | | | | | |
| Ending Market Value per Share | | | — | | | — | | | 10.06 | | | — | | | — | | | — | |
| Average Market Value per Share | | | — | | | 10.03 | ^ | | 10.07 | Ω | | — | | | — | | | — | |
| | | | | | | | | | | | | | | | | | | | |
| Virginia Premium Income (NPV) | | | | | | | | | | | | | | | | | | | |
| Series 2014 (NPV PRA) | | | | | | | | | | | | | | | | | | | |
| Ending Market Value per Share | | | — | | | — | | | 10.03 | | | 10.12 | | | 10.03 | | | — | |
| Average Market Value per Share | | | — | | | 10.01 | ^^ | | 10.08 | | | 10.10 | | | 10.02 | ** | | — | |
| Series 2015 (NPV PRC) | | | | | | | | | | | | | | | | | | | |
| Ending Market Value per Share | | | — | | | — | | | 10.09 | | | 10.13 | | | 10.01 | | | 10.00 | |
| Average Market Value per Share | | | — | | | 10.04 | ^^ | | 10.09 | | | 10.09 | | | 10.07 | | | 10.00 | * |
| Series 2014 (NPV PRD)(b) | | | | | | | | | | | | | | | | | | | |
| Ending Market Value per Share | | | — | | | — | | | 10.06 | | | — | | | — | | | — | |
| Average Market Value per Share | | | — | | | 10.04 | ^^ | | 10.09 | ΩΩ | | — | | | — | | | — | |
| Series 2014-1 (NPV PRE)(b) | | | | | | | | | | | | | | | | | | | |
| Ending Market Value per Share | | | — | | | — | | | 10.09 | | | — | | | — | | | — | |
| Average Market Value per Share | | | — | | | 10.04 | ^^ | | 10.09 | ΩΩ | | — | | | — | | | — | |
| (b) | MTP Shares issued in connection with the reorganizations. |
| (c) | For the six months ended November 30, 2014. |
| △ | For the period January 21, 2010 (first issuance date of shares) through May 31, 2010. |
| △△ | For the period December 14, 2010 (first issuance date of shares) through May 31, 2011. |
| * | For the period January 26, 2010 (first issuance date of shares) through May 31, 2010. |
| ** | For the period March 14, 2011 (first issuance date of shares) through May 31, 2011. |
| Ω | For the period July 9, 2012 (effective date of the reorganizations) through May 31, 2013. |
| ΩΩ | For the period August 6, 2012 (effective date of the reorganizations) through May 31, 2013. |
| ^ | For the period June 1, 2013 through March 3, 2014. |
| ^^ | For the period June 1, 2013 through September 9, 2013. |
See accompanying notes to financial statements.
| Notes to | |
| | Financial Statements (Unaudited) |
1. General Information and Significant Accounting Policies
General Information
Fund Information
The state funds covered in this report and their corresponding New York Stock Exchange (“NYSE”) or NYSE MKT symbols are as follows (each a “Fund” and collectively, the “Funds”):
• Nuveen Georgia Dividend Advantage Municipal Fund 2 (NKG) (“Georgia Dividend Advantage 2 (NKG)”)
• Nuveen Maryland Premium Income Municipal Fund (NMY) (“Maryland Premium Income (NMY)”)
• Nuveen Minnesota Municipal Income Fund (NMS) (“Minnesota Municipal Income (NMS)”)
• Nuveen Missouri Premium Income Municipal Fund (NOM) (“Missouri Premium Income (NOM)”)
• Nuveen North Carolina Premium Income Municipal Fund (NNC) (“North Carolina Premium Income (NNC)”)
• Nuveen Virginia Premium Income Municipal Fund (NPV) (“Virginia Premium Income (NPV)”)
The Funds are registered under the Investment Company Act of 1940, as amended, as diversified closed-end registered investment companies. Common shares of Georgia Dividend Advantage 2 (NKG), Maryland Premium Income (NMY), Minnesota Municipal Income (NMS) North Carolina Premium Income (NNC) and Virginia Premium Income (NPV) are traded on the NYSE while common shares of Missouri Premium Income (NOM) are traded on the NYSE MKT. Georgia Dividend Advantage 2 (NKG), Minnesota Municipal Income (NMS) and Missouri Premium Income (NOM) were organized as Massachusetts business trusts on October 26, 2001, April 28, 2014 and March 29, 1993, respectively. Maryland Premium Income (NMY), North Carolina Premium Income (NNC) and Virginia Premium Income (NPV) were organized as Massachusetts business trusts on January 12, 1993.
Investment Adviser
The Funds’ investment adviser is Nuveen Fund Advisors, LLC (the “Adviser”), a wholly-owned subsidiary of Nuveen Investments, Inc. (“Nuveen”). The Adviser is responsible for each Fund’s overall investment strategy and asset allocation decisions. The Adviser has entered into sub-advisory agreements with Nuveen Asset Management, LLC (the “Sub-Adviser”), a subsidiary of the Adviser, under which the Sub-Adviser manages the investment portfolios of the Funds.
Purchase and Sale Agreement
On October 1, 2014, TIAA-CREF, a national financial services organization, completed its previously announced acquisition of Nuveen, the parent company of the Adviser. The transaction has not resulted in any change in the portfolio management of the Funds or in the Funds’ investment objectives or policies.
Because the consummation of the acquisition resulted in the “assignment” (as defined in the Investment Company Act of 1940) and automatic termination of the Funds’ investment management agreements and investment sub-advisory agreements, Fund shareholders were asked to approve new investment management agreements with the Adviser and new investment sub-advisory agreements with each Fund’s Sub-Adviser. These new agreements were approved by shareholders of each of the Funds, and went into effect on October 1, 2014. The terms of the new agreements, including the fees payable to each Fund’s Adviser and Sub-Adviser, are substantially identical to those of the investment management agreements and investment sub-advisory agreements in place immediately prior to the closing.
Investment Objectives and Principal Investment Strategies
Each Fund seeks to provide current income exempt from both regular federal and designated state income taxes by investing primarily in a portfolio of municipal obligations issued by state and local government authorities within a single state or certain U.S. territories.
Fund Mergers
Minnesota Municipal Income (NMS) was formed from the merger of the following two closed-end funds (each a “Target Fund’ and collectively, the “Target Funds”) advised by U.S. Bancorp Asset Management, Inc. with and into a wholly-owned subsidiary of Minnesota Municipal Income (NMS) (the “Merger Sub”) (the “Mergers”):
• Minnesota Municipal Income Portfolio Inc. (MXA) (“Minnesota Municipal Income Portfolio (MXA)”),
• First American Minnesota Municipal Income Fund II (MXN) (“Minnesota Municipal Income Fund II (MXN)”),
Minnesota Municipal Income Portfolio (MXA) is treated as the survivor of the Mergers for accounting and performance reporting purposes. Accordingly, all performance and other information shown for Minnesota Municipal Income (NMS) for periods prior to October 6, 2014, is that of Minnesota
Notes to Financial Statements (Unaudited) (continued)
Municipal Income Portfolio (MXA). Minnesota Municipal Income Portfolio’s (MXA) previous fiscal year end was June 30, 2014, and therefore Minnesota Municipal Income’s (NMS) reporting period for this report is from July 1, 2014 through November 30, 2014.
The Mergers became effective prior to the opening of business on October 6, 2014. Upon the closing of the Mergers, each Target Fund merged with and into the Merger Sub. Shareholders of each Target Fund received newly issued shares of Minnesota Municipal Income (NMS), the aggregate net asset value (“NAV”) of which was equal to the aggregate NAV of the shares of each Target Fund held immediately prior to the Mergers (including for this purpose fractional Fund shares to which shareholders would have been entitled). Following completion of the Mergers, the Merger Sub distributed its assets to Minnesota Municipal Income (NMS), and Minnesota Municipal Income (NMS), assumed the liabilities of the Merger Sub, in complete liquidation and dissolution of the Merger Sub. As a result of the Mergers, the assets of the Target Funds were combined, and the shareholders of each Target Fund became shareholders of Minnesota Municipal Income (NMS). Details of the Mergers are further described in Note 8 – Fund Mergers.
Significant Accounting Policies
Each Fund is an investment company and follows accounting and reporting guidance under Financial Accounting Standards Board (FASB) Accounting Standards Codification (ASC) Topic 946 “Financial Services – Investment Companies.” The following is a summary of significant accounting policies followed by the Funds in the preparation of their financial statements in accordance with U.S. generally accepted accounting principles (“U.S. GAAP”).
Investment Transactions
Investment transactions are recorded on a trade date basis. Realized gains and losses from transactions are determined on the specific identification method, which is the same basis used for federal income tax purposes. Investments purchased on a when-issued/delayed delivery basis may have extended settlement periods. Any investments so purchased are subject to market fluctuation during this period. The Funds have instructed the custodian to earmark securities in the Funds’ portfolios with a current value at least equal to the amount of the when-issued/delayed delivery purchase commitments.
As of November 30, 2014, the Funds’ outstanding when-issued/delayed delivery purchase commitments were as follows:
| | | | | | | | | | | North | | | |
| | | Georgia | | Maryland | | Minnesota | | Missouri | | Carolina | | Virginia | |
| | | Dividend | | Premium | | Municipal | | Premium | | Premium | | Premium | |
| | | Advantage 2 | | Income | | Income | | Income | | Income | | Income | |
| | | (NKG | ) | (NMY | ) | (NMS | ) | (NOM | ) | (NNC | ) | (NPV | ) |
| Outstanding when-issued/delayed delivery purchase commitments | | $ | 3,367,680 | | $ | 4,311,550 | | $ | 2,002,127 | | $ | 395,766 | | $ | 2,002,975 | | $ | 1,601,945 | |
Investment Income
Investment income, which reflects the amortization of premiums and accretion of discounts for financial reporting purposes, is recorded on an accrual basis. Investment income also reflects paydown gains and losses, if any.
Professional Fees
Professional fees presented on the Statement of Operations consist of legal fees incurred in the normal course of operations, audit fees, tax consulting fees and, in some cases, workout expenditures. Workout expenditures are incurred in an attempt to protect or enhance an investment, or to pursue other claims or legal actions on behalf of Fund shareholders. If a refund is received for workout expenditures paid in a prior reporting period, such amounts will be recognized as “Legal fee refund” on the Statements of Operations.
Dividends and Distributions to Common Shareholders
Dividends from net investment income are declared monthly. Net realized capital gains and/or market discount from investment transactions, if any, are distributed to shareholders at least annually. Furthermore, capital gains are distributed only to the extent they exceed available capital loss carryforwards.
Distributions to common shareholders of net investment income, net realized capital gains and/or market discount, if any, are recorded on the ex-dividend date. The amount and timing of distributions are determined in accordance with federal income tax regulations, which may differ from U.S. GAAP.
MuniFund Term Preferred Shares
During the current fiscal period, Missouri Premium Income (NOM) had issued and outstanding MuniFund Term Preferred (“MTP”) Shares, with a $10 liquidation value per share. The Fund’s MTP Shares were issued in one or more Series and traded on the NYSE MKT.
On November 19, 2014, the Funds’ Board of Trustees (the “Board”) approved a refinancing plan in which Missouri Premium Income (NOM) will redeem all of its outstanding MTP Shares at their $10.00 liquidation value per share, using proceeds from newly issued preferred shares.
As of November 30, 2014, details of Missouri Premium Income’s (NOM) MTP Shares outstanding are as follows:
| | | | | | | | | Shares | | | |
| | | | | | | | | Outstanding | | | |
| | | | | | | Shares | | at $10 Per Share | | Annual | |
| Fund | | Series | | NYSE MKT Ticker | | Outstanding | | Liquidation Value | | Dividend Rate | |
| Missouri Premium Income (NOM) | | | 2015 | | | NOM PRC | | | 1,788,000 | | $ | 17,880,000 | | | 2.10 | % |
The Fund is obligated to redeem its MTP Shares by the date as specified in its offering document (“Term Redemption Date”), unless earlier redeemed or repurchased by the Fund. MTP Shares are subject to optional and mandatory redemption in certain circumstances. MTP Shares were subject to redemption at the option of the Fund (“Optional Redemption Date”), subject to a payment of premium for one year following the Optional Redemption Date (“Premium Expiration Date”), and at par thereafter. MTP Shares also will be subject to redemption, at the option of the Fund, at par in the event of certain changes in the credit rating of the MTP Shares. The Fund may be obligated to redeem certain of the MTP Shares if the Fund fails to maintain certain asset coverage and leverage ratio requirements and such failures are not cured by the applicable cure date. The redemption price per share is equal to the sum of the liquidation value per share plus any accumulated but unpaid dividends. The Term Redemption Date, Optional Redemption Date and Premium Expiration Date for the Fund’s series of MTP Shares are as follows:
| | | | | | | Term | | Optional | | Premium | |
| Fund | | Series | | NYSE MKT Ticker | | Redemption Date | | Redemption Date | | Expiration Date | |
| Missouri Premium Income (NOM) | | 2015 | | | NOM PRC | | December 1, 2015 | | December 1, 2011 | | November 30, 2012 | |
The average liquidation value of MTP Shares outstanding for the Fund during the six months ended November 30, 2014, was as follows:
| | | | Missouri | |
| | | | Premium | |
| | | | Income | |
| | | | (NOM | ) |
| Average liquidation value of MTP Shares outstanding | | $ | 17,880,000 | |
For financial reporting purposes, the liquidation value of MTP Shares is recorded as a liability and recognized as “MuniFund Term Preferred (“MTP”) Shares, at liquidation value” on the Statement of Assets and Liabilities. Dividends on MTP Shares, which are recognized as interest expense for financial reporting purposes, are paid monthly at a fixed annual rate, subject to adjustments in certain circumstances. Unpaid dividends on MTP Shares are recognized as a component of “Interest payable” on the Statement of Assets and Liabilities. Dividends accrued on MTP Shares are recognized as a component of “Interest expense and amortization of offering costs” on the Statement of Operations. Costs incurred by the Funds in connection with their offerings of MTP Shares were recorded as a deferred charge, which are amortized over the life of the shares and are recognized as components of “Deferred offering costs” on the Statement of Assets and Liabilities and “Interest expense and amortization of offering costs” on the Statement of Operations.
Variable Rate MuniFund Term Preferred Shares
The following Funds have issued and outstanding Variable Rate MuniFund Term Preferred (“VMTP”) Shares, with a $100,000 liquidation value per share. VMTP Shares are issued via private placement and are not publically available.
As of November 30, 2014, VMTP Shares outstanding, at liquidation value, for each Fund were as follows:
| | | | | | | Shares | |
| | | | | | | Outstanding at | |
| | | | | Shares | | $100,000 Per Share | |
| Fund | | Series | | Outstanding | | Liquidation Value | |
| Georgia Dividend Advantage 2 (NKG) | | | 2017 | | | 750 | | $ | 75,000,000 | |
| Maryland Premium Income (NMY) | | | 2017 | | | 1,670 | | $ | 167,000,000 | |
| Minnesota Municipal Income (NMS) | | | 2017* | | | 441 | | $ | 44,100,000 | |
| North Carolina Premium Income (NNC) | | | 2017 | | | 1,250 | | $ | 125,000,000 | |
* Includes VMTP Shares resulting from the Mergers, as further described in Note 4 – Fund Shares.
Each Fund is obligated to redeem its VMTP Shares by the date as specified in its offering document (“Term Redemption Date”), unless earlier redeemed or repurchased by the Fund. VMTP Shares are subject to optional and mandatory redemption in certain circumstances. The VMTP Shares are subject to redemption at the option of each Fund (“Optional Redemption Date”), subject to payment of premium for one year following the date of issuance (“Premium Expiration Date”), and at par thereafter. Each Fund may be obligated to redeem certain of the VMTP Shares if the Fund fails to maintain certain asset coverage and leverage ratio requirements and such failures are not cured by the applicable cure date. The redemption price
Notes to Financial Statements (Unaudited) (continued)
per share is equal to the sum of the liquidation value per share plus any accumulated but unpaid dividends. The Term Redemption Date, Optional Redemption Date and Premium Expiration Date for each Fund’s VMTP Shares are as follows:
| | | | | Term | | Optional | | Premium | |
| Fund | | Series | | Redemption Date | | Redemption Date | | Expiration Date | |
| Georgia Dividend Advantage 2 (NKG) | | 2017 | | June 1, 2017 | | June 1, 2015 | | May 31, 2015 | |
| Maryland Premium Income (NMY) | | 2017 | | June 1, 2017 | | June 1, 2015 | | May 31, 2015 | |
| Minnesota Municipal Income (NMS) | | 2017* | | May 1, 2017 | | May 1, 2015 | | April 30, 2015 | |
| North Carolina Premium Income (NNC) | | 2017 | | March 1, 2017 | | March 1, 2015 | | April 30, 2015 | |
* Includes VMTP Shares resulting from the Mergers, as further described in Note 4 – Fund Shares.
The average liquidation value of VMTP Shares outstanding and annualized dividend rate for each Fund during the six months ended November 30, 2014, were as follows:
| | | | | | | | | North | |
| | | Georgia | | Maryland | | Minnesota | | Carolina | |
| | | Dividend | | Premium | | Municipal | | Premium | |
| | | Advantage 2 | | Income | | Income | | Income | |
| | | (NKG | ) | (NMY | ) | (NMS | )* | (NNC | ) |
| Average liquidation value of VMTP Shares outstanding | | $ | 75,000,000 | | $ | 167,000,000 | | $ | 35,636,913 | | $ | 125,000,000 | |
| Annualized dividend rate | | | 0.98 | % | | 1.00 | % | | 0.91 | % | | 1.00 | % |
*�� For the period July 1, 2014 through November 30, 2014.
VMTP Shares generally do not trade, and market quotations are generally not available. VMTP Shares are short-term or short/intermediate-term instruments that pay a variable dividend rate tied to a short-term index, plus an additional fixed “spread” amount established at the time of issuance. The fair value of VMTP Shares is expected to be approximately their liquidation par value so long as the fixed “spread” on the VMTP Shares remains roughly in line with the “spread” rates being demanded by investors on instruments having similar terms in the current market environment. In present market conditions, the Funds’ Adviser has determined that the fair value of VMTP Shares is their liquidation value, but their fair value could vary if market conditions change materially. For financial reporting purposes, the liquidation value of VMTP Shares is a liability and is recognized as “Variable Rate MuniFund Term Preferred (“VMTP”) Shares, at liquidation value” on the Statement of Assets and Liabilities.
Dividends on the VMTP Shares (which are treated as interest payments for financial reporting purposes) are set weekly. Unpaid dividends on VMTP Shares are recognized as a component of “Interest payable” on the Statement of Assets and Liabilities, when applicable. Dividends accrued on VMTP Shares are recognized as a component of “Interest expense and amortization of offering costs” on the Statement of Operations.
Costs incurred by the Funds in connection with their offerings of VMTP Shares, were recorded as a deferred charge which are amortized over the life of the shares and are recognized as components of “Deferred offering costs” on the Statement of Assets and Liabilities and “Interest expense and amortization of offering costs” on the Statement of Operations.
Variable Rate Demand Preferred Shares
Virginia Premium Income (NPV) has issued and outstanding Variable Rate Demand Preferred (“VRDP”) Shares, with a $100,000 liquidation value per share. VRDP Shares are issued via private placement and are not publicly available.
As of November 30, 2014, details of the Fund’s VRDP Shares outstanding are as follows:
| | | | | | | Shares Outstanding at | | | |
| | | | | Shares | | $100,000 Per Share | | | |
| Fund | | Series | | Outstanding | | Liquidation Value | | Maturity | |
| Virginia Premium Income (NPV) | | | 1 | | | 1,280 | | $ | 128,000,000 | | | August 3, 2043 | |
VRDP Shares include a liquidity feature that allows VRDP shareholders to have their shares purchased by a liquidity provider with whom the Fund has contracted in the event that purchase orders for VRDP Shares in a remarketing are not sufficient in number to be matched with the sale orders in that remarketing. The Fund is required to redeem any VRDP Shares that are still owned by the liquidity provider after six months of continuous, unsuccessful remarketing. The Fund pays an annual remarketing fee of 0.10% on the aggregate principal amount of all VRDP Shares outstanding. The Fund’s VRDP Shares have successfully remarketed since issuance.
Dividends on the VRDP Shares (which are treated as interest payments for financial reporting purposes) are set weekly at a rate established by a remarketing agent; therefore, the market value of the VRDP Shares is expected to approximate its liquidation value. If remarketings for VRDP Shares are continuously unsuccessful for six months, the maximum rate is designed to escalate according to a specified schedule in order to enhance the remarketing agent’s ability to successfully remarket the VRDP Shares.
Subject to certain conditions, VRDP Shares may be redeemed, in whole or in part, at any time at the option of the Fund. The Fund may also redeem certain of the VRDP Shares if the Fund fails to maintain certain asset coverage requirements and such failures are not cured by the applicable cure date. The redemption price per share is equal to the sum of the liquidation value per share plus any accumulated but unpaid dividends.
The average liquidation value of VRDP Shares outstanding and annualized dividend rate for the Fund during the six months ended November 30, 2014, were as follows:
| | | | Virginia | |
| | | | Premium | |
| | | | Income | |
| | | | (NPV | ) |
| Average liquidation value of VRDP Shares outstanding | | $ | 128,000,000 | |
| Annualized dividend rate | | | 0.15 | % |
For financial reporting purposes, the liquidation value of VRDP Shares is a liability and is recognized as “Variable Rate Demand Preferred (“VRDP”) Shares, at liquidation value” on the Statement of Assets and Liabilities. Unpaid dividends on VRDP Shares are recognized as a component of “Interest payable” on the Statement of Assets and Liabilities, when applicable. Dividends accrued on VRDP Shares are recognized as a component of “Interest expense and amortization of offering costs” on the Statement of Operations. Costs incurred by the Fund in connection with its offerings of VRDP Shares were recorded as a deferred charge, which are amortized over the life of the shares and are recognized as a component of “Deferred offering costs” on the Statement of Assets and Liabilities and “Interest expense and amortization of offering costs” on the Statement of Operations. In addition to interest expense, the Fund also pays a per annum liquidity fee to the liquidity provider, as well as a remarketing fee, which are recognized as “Liquidity fees” and “Remarketing fees,” respectively, on the Statement of Operations.
Common Shares Equity Shelf Programs and Offering Costs
Virginia Premium Income (NPV) has filed a registration statement with the Securities and Exchange Commission authorizing the Fund to issue 1.7 million additional common shares through an equity shelf program (“Shelf Offering”), which became effective during the prior fiscal period.
Under this Shelf Offering, the Fund, subject to market conditions, may raise additional equity capital from time to time in varying amounts and offering methods at a net price at or above the Fund’s NAV per common share.
Common shares authorized, common shares issued and offering proceeds, net of offering costs under the Fund’s Shelf Offering during the six months ended November 30, 2014 and fiscal year ended May 31, 2014 were as follows:
| | | Virginia | |
| | | Premium Income (NPV) | |
| | | Six Months | | | |
| | | Ended | | Year Ended | |
| | | 11/30/14 | | 5/31/14 | |
| Common shares authorized | | | 1,700,000 | | | 1,700,000 | * |
| Common shares issued | | | — | | | — | |
| Offering proceeds, net of offering costs | | | — | | | — | |
* Shelf Offering declared effective by the SEC during the prior fiscal period.
As of September 30, 2014, Virginia Premium Income’s (NPV) shelf offering registration statement is no longer effective. Therefore, the Fund may not issue additional common shares under its equity shelf program until a new registration statement is filed and declared effective by the SEC.
Costs incurred by the Fund in connection with its Shelf Offering are recorded as a deferred charge and recognized as a component of “Deferred offering costs” on the Statement of Assets and Liabilities. The deferred asset is reduced during the one-year period that additional shares are sold by reducing the proceeds from such sales and is recognized as a component of “Proceeds from shelf offering, net of offering costs” on the Statement of Changes in Net Assets, when applicable. At the end of the one-year life of the Shelf Offering period, any remaining deferred charges will be expensed accordingly and recognized as a component of “Other expenses” on the Statement of Operations. Any additional costs the Fund may incur in connection with its Shelf Offering are expensed as incurred and recognized as a component of “Proceeds from shelf offering, net of offering costs” on the Statement of Changes in Net Assets, when applicable.
Indemnifications
Under the Funds’ organizational documents, their officers and trustees are indemnified against certain liabilities arising out of the performance of their duties to the Funds. In addition, in the normal course of business, the Funds enter into contracts that provide general indemnifications to other parties. The Funds’ maximum exposure under these arrangements is unknown as this would involve future claims that may be made against the Funds that have not yet occurred. However, the Funds have not had prior claims or losses pursuant to these contracts and expect the risk of loss to be remote.
Notes to Financial Statements (Unaudited) (continued)
Netting Agreements
In the ordinary course of business, the Funds may enter into transactions subject to enforceable International Swaps and Derivative Association, Inc. (“ISDA”) master agreements or other similar arrangements (“netting agreements”). Generally, the right to offset in netting agreements allows each Fund to offset certain securities and derivatives with a specific counterparty as well as any collateral received or delivered to that counterparty based on the terms of the agreements. Generally, a Fund manages its cash collateral and securities collateral on a counterparty basis.
The Funds’ investments subject to netting agreements as of the end of the reporting period, if any, are further described in Note 3 – Portfolio Securities and investments in Derivatives.
Use of Estimates
The preparation of financial statements in conformity with U.S. GAAP requires management to make estimates and assumptions that affect the reported amounts of assets and liabilities at the date of the financial statements and the reported amounts of increases and decreases in net assets applicable to common shares from operations during the reporting period. Actual results may differ from those estimates.
2. Investment Valuation and Fair Value Measurements
The fair valuation input levels as described below are for fair value measurement purposes.
Investment Valuation
Prices of fixed income securities are provided by a pricing service approved by the Board. The pricing service establishes a security’s fair value using methods that may include consideration of the following: yields or prices of investments of comparable quality, type of issue, coupon, maturity and rating, market quotes or indications of value from security dealers, evaluations of anticipated cash flows or collateral, general market conditions and other information and analysis, including the obligor’s credit characteristics considered relevant. These securities are generally classified as Level 2. In pricing certain securities, particularly less liquid and lower quality securities, the pricing service may consider information about a security, its issuer or market activity, provided by the Adviser. These securities are generally classified as Level 2 or Level 3 depending on the priority of the significant inputs.
Prices of swap contracts are also provided by a pricing service approved by the Board using the same methods as described above, and are generally classified as Level 2.
Common stocks and other equity-type securities are valued at the last sales price on the securities exchange on which such securities are primarily traded and are generally classified as Level 1. Securities primarily traded on the NASDAQ National Market (“NASDAQ”) are valued at the NASDAQ Official Closing Price and are generally classified as Level 1. However, securities traded on a securities exchange or NASDAQ for which there were no transactions on a given day or securities not listed on a securities exchange or NASDAQ are valued at the quoted bid price and are generally classified as Level 2.
Certain securities may not be able to be priced by the pre-established pricing methods as described above. Such securities may be valued by the Board or its appointee at fair value. These securities generally include, but are not limited to, restricted securities (securities which may not be publicly sold without registration under the Securities Act of 1933, as amended) for which a pricing service is unable to provide a market price; securities whose trading has been formally suspended; debt securities that have gone into default and for which there is no current market quotation; a security whose market price is not available from a pre-established pricing source; a security with respect to which an event has occurred that is likely to materially affect the value of the security after the market has closed but before the calculation of a Fund’s NAV (as may be the case in non-U.S. markets on which the security is primarily traded) or make it difficult or impossible to obtain a reliable market quotation; and a security whose price, as provided by the pricing service, is not deemed to reflect the security’s fair value. As a general principle, the fair value of a security would appear to be the amount that the owner might reasonably expect to receive for it in a current sale. A variety of factors may be considered in determining the fair value of such securities, which may include consideration of the following: yields or prices of investments of comparable quality, type of issue, coupon, maturity and rating, market quotes or indications of value from security dealers, evaluations of anticipated cash flows or collateral, general market conditions and other information and analysis, including the obligor’s credit characteristics considered relevant. These securities are generally classified as Level 2 or Level 3 depending on the priority of the significant inputs. Regardless of the method employed to value a particular security, all valuations are subject to review by the Board or its appointee.
Fair Value Measurements
Fair value is defined as the price that would be received upon selling an investment or transferring a liability in an orderly transaction to an independent buyer in the principal or most advantageous market for the investment. A three-tier hierarchy is used to maximize the use of observable market data and minimize the use of unobservable inputs and to establish classification of fair value measurements for disclosure purposes. Observable inputs reflect the assumptions market participants would use in pricing the asset or liability. Observable inputs are based on market data obtained from sources independent of the reporting entity. Unobservable inputs reflect the reporting entity’s own assumptions about the assumptions market participants would use in pricing the asset or liability. Unobservable inputs are based on the best information available in the circumstances. The following is a summary of the three-tiered hierarchy of valuation input levels.
| Level 1 – | Inputs are unadjusted and prices are determined using quoted prices in active markets for identical securities. |
| | |
| Level 2 – | Prices are determined using other significant observable inputs (including quoted prices for similar securities, interest rates, prepayment speeds, credit risk, etc.). |
| | |
| Level 3 – | Prices are determined using significant unobservable inputs (including management’s assumptions in determining the fair value of investments). |
The inputs or methodologies used for valuing securities are not an indication of the risks associated with investing in those securities. The following is a summary of each Fund’s fair value measurements as of the end of the reporting period:
| Georgia Dividend Advantage 2 (NKG) | | | Level 1 | | | Level 2 | | | Level 3 | *** | | Total | |
| Long-Term Investments*: | | | | | | | | | | | | | |
| Municipal Bonds | | $ | — | | $ | 222,062,316 | | $ | 852,777 | | $ | 222,915,093 | |
| Investments in Derivatives: | | | | | | | | | | | | | |
| Credit Default Swaps** | | | — | | | 1,916 | | | — | | | 1,916 | |
| Total | | $ | — | | $ | 222,064,232 | | $ | 852,777 | | $ | 222,917,009 | |
| | | | | | | | | | | | | | |
| Maryland Premium Income (NMY) | | | | | | | | | | | | | |
| Long-Term Investments*: | | | | | | | | | | | | | |
| Municipal Bonds | | $ | — | | $ | 521,853,967 | | $ | — | | $ | 521,853,967 | |
| Common Stocks | | | 2,650,078 | | | — | | | — | | | 2,650,078 | |
| Total | | $ | 2,650,078 | | $ | 521,853,967 | | $ | — | | $ | 524,504,045 | |
| | | | | | | | | | | | | | |
| Minnesota Municipal Income (NMS) | | | | | | | | | | | | | |
| Long-Term Investments*: | | | | | | | | | | | | | |
| Municipal Bonds | | $ | — | | $ | 131,516,919 | | $ | — | | $ | 131,516,919 | |
| | | | | | | | | | | | | | |
| Missouri Premium Income (NOM) | | | | | | | | | | | | | |
| Long-Term Investments*: | | | | | | | | | | | | | |
| Municipal Bonds | | $ | — | | $ | 52,696,712 | | $ | — | | $ | 52,696,712 | |
| | | | | | | | | | | | | | |
| North Carolina Premium Income (NNC) | | | | | | | | | | | | | |
| Long-Term Investments*: | | | | | | | | | | | | | |
| Municipal Bonds | | $ | — | | $ | 371,235,270 | | $ | — | | $ | 371,235,270 | |
| Investments in Derivatives: | | | | | | | | | | | | | |
| Credit Default Swaps** | | | — | | | 1,193 | | | — | | | 1,193 | |
| Total | | $ | — | | $ | 371,236,463 | | $ | — | | $ | 371,236,463 | |
| | | | | | | | | | | | | | |
| Virginia Premium Income (NPV) | | | | | | | | | | | | | |
| Long-Term Investments*: | | | | | | | | | | | | | |
| Municipal Bonds | | $ | — | | $ | 393,817,559 | | $ | — | | $ | 393,817,559 | |
| * | Refer to the Fund’s Portfolio of Investments for industry classifications. |
| ** | Represents net unrealized appreciation (depreciation) as reported in the Fund’s Portfolio of Investments. |
| *** | Refer to the Fund’s Portfolio of Investments for a breakdown of securities classified as Level 3. |
The Board is responsible for the valuation process and has appointed the oversight of the daily valuation process to the Adviser’s Valuation Committee. The Valuation Committee, pursuant to the valuation policies and procedures adopted by the Board, is responsible for making fair value determinations, evaluating the effectiveness of the Funds’ pricing policies and reporting to the Board. The Valuation Committee is aided in its efforts by the Adviser’s dedicated Securities Valuation Team, which is responsible for administering the daily valuation process and applying fair value methodologies as approved by the Valuation Committee. When determining the reliability of independent pricing services for investments owned by the Funds, the Valuation Committee, among other things, conducts due diligence reviews of the pricing services and monitors the quality of security prices received through various testing reports conducted by the Securities Valuation Team.
The Valuation Committee will consider pricing methodologies it deems relevant and appropriate when making a fair value determination, based on the facts and circumstances specific to the portfolio instrument. Fair value determinations generally will be derived as follows, using public or private market information:
| (i) | If available, fair value determinations shall be derived by extrapolating from recent transactions or quoted prices for identical or comparable securities. |
| | |
| (ii) | If such information is not available, an analytical valuation methodology may be used based on other available information including, but not limited to: analyst appraisals, research reports, corporate action information, issuer financial statements and shelf registration statements. Such analytical valuation methodologies may include, but are not limited to: multiple of earnings, discount from market value of a similar freely-traded security, discounted cash flow analysis, book value or a multiple thereof, risk premium/yield analysis, yield to maturity and/or fundamental investment analysis. |
Notes to Financial Statements (Unaudited) (continued)
The purchase price of a portfolio instrument will be used to fair value the instrument only if no other valuation methodology is available or deemed appropriate, and it is determined that the purchase price fairly reflects the instrument’s current value.
For each portfolio security that has been fair valued pursuant to the policies adopted by the Board, the fair value price is compared against the last available and next available market quotations. The Valuation Committee reviews the results of such testing and fair valuation occurrences are reported to the Board.
3. Portfolio Securities and Investments in Derivatives
Portfolio Securities
Inverse Floating Rate Securities
Each Fund is authorized to invest in inverse floating rate securities. An inverse floating rate security is created by depositing a municipal bond, typically with a fixed interest rate, into a special purpose trust created by a broker-dealer. In turn, this trust (a) issues floating rate certificates, in face amounts equal to some fraction of the deposited bond’s par amount or market value, that typically pay short-term tax-exempt interest rates to third parties, and (b) issues to a long-term investor (such as one of the Funds) an inverse floating rate certificate (sometimes referred to as an “inverse floater”) that represents all remaining or residual interest in the trust. The income received by the inverse floater holder varies inversely with the short-term rate paid to the floating rate certificates’ holders, and in most circumstances the inverse floater holder bears substantially all of the underlying bond’s downside investment risk and also benefits disproportionately from any potential appreciation of the underlying bond’s value. The price of an inverse floating rate security will be more volatile than that of the underlying bond because the interest rate is dependent on not only the fixed coupon rate of the underlying bond but also on the short-term interest paid on the floating rate certificates, and because the inverse floating rate security essentially bears the risk of loss of the greater face value of the underlying bond.
The inverse floater held by a Fund gives the Fund the right (a) to cause the holders of the floating rate certificates to tender their notes at par, and (b) to have the broker transfer the fixed-rate bond held by the trust to the Fund, thereby collapsing the trust.
A Fund may purchase an inverse floating rate security in a secondary market transaction without first owning the underlying bond (referred to as an “externally-deposited inverse floater”), or instead by first selling a fixed-rate bond to a broker-dealer for deposit into the special purpose trust and receiving in turn the residual interest in the trust (referred to as a “self-deposited inverse floater”).
An investment in an externally-deposited inverse floater is identified in the Portfolio of Investments as “(IF) – Inverse floating rate investment.” The Fund’s Statement of Assets and Liabilities shows only the inverse floaters and not the underlying bonds as an asset and does not reflect the short-term floating rate certificates as liabilities. Also, the Fund reflects in “Investment Income” only the net amount of earnings on its inverse floater investment (net of the interest paid to the holders of the short-term floating rate certificates and the expenses of the trust), and does not show the amount of that interest paid as an interest expense on the Statement of Operations.
An investment in a self-deposited inverse floater is accounted for as a financing transaction. In such instances, a fixed-rate bond deposited into a special purpose trust is identified in the Portfolio of Investments as “(UB) – Underlying bond of an inverse floating rate trust reflected as a financing transaction,” with the Fund accounting for the short-term floating rate certificates issued by the trust, at their liquidation value, as “Floating rate obligations” on the Statement of Assets and Liabilities. In addition, the Fund reflects in “Investment Income” the entire earnings of the underlying bond and recognizes the related interest paid to the holders of the short-term floating rate certificates as a component of “Interest expense and amortization of offering costs” on the Statement of Operations.
The average floating rate obligations outstanding and average annual interest rate and fees related to self-deposited inverse floaters during the period ended November 30, 2014, were as follows:
| | | | | | | | | | | North | | | |
| | | Georgia | | Maryland | | Minnesota | | Missouri | | Carolina | | Virginia | |
| | | Dividend | | Premium | | Municipal | | Premium | | Premium | | Premium | |
| | | Advantage 2 | | Income | | Income | | Income | | Income | | Income | |
| | | (NKG | ) | (NMY | ) | (NMS | ) | (NOM | ) | (NNC | ) | (NPV | ) |
| Average floating rate obligations outstanding | | $ | 3,245,000 | | $ | 21,335,191 | | $ | — | | $ | 2,225,000 | | $ | — | | $ | 9,250,000 | |
| Average annual interest rate and fees | | | 0.41 | % | | 0.69 | % | | — | % | | 0.23 | % | | — | % | | 0.33 | % |
As of November 30, 2014, the total amount of floating rate obligations issued by each Fund’s self-deposited inverse floaters and externally-deposited inverse floaters was as follows:
| | | | | | | | | | | North | | | |
| | | Georgia | | Maryland | | Minnesota | | Missouri | | Carolina | | Virginia | |
| | | Dividend | | Premium | | Municipal | | Premium | | Premium | | Premium | |
| | | Advantage 2 | | Income | | Income | | Income | | Income | | Income | |
| | | (NKG | ) | (NMY | ) | (NMS | ) | (NOM | ) | (NNC | ) | (NPV | ) |
| Floating rate obligations: self-deposited inverse floaters | | $ | 3,245,000 | | $ | 17,170,000 | | $ | — | | $ | 2,225,000 | | $ | — | | $ | 9,250,000 | |
| Floating rate obligations: externally-deposited inverse floaters | | | 5,635,000 | | | — | | | — | | | — | | | — | | | 20,070,000 | |
| Total | | $ | 8,880,000 | | $ | 17,170,000 | | $ | — | | $ | 2,225,000 | | $ | — | | $ | 29,320,000 | |
Each Fund may also enter into shortfall and forbearance agreements (sometimes referred to as a “recourse trust” or “credit recovery swap”) (such agreements are referred to herein as “Recourse Trusts”), with a broker-dealer by which a Fund agrees to reimburse the broker-dealer, in certain circumstances, for the difference between the liquidation value of the fixed-rate bond held by the trust and the liquidation value of the floating rate certificates issued by the trust plus any shortfalls in interest cash flows. Under these agreements, a Fund’s potential exposure to losses related to or on inverse floaters may increase beyond the value of a Fund’s inverse floater investments as a Fund may potentially be liable to fulfill all amounts owed to holders of the floating rate certificates. At period end, any such shortfall is recognized as “Unrealized depreciation on Recourse Trusts” on the Statement of Assets and Liabilities.
As of November 30, 2014, each Fund’s maximum exposure to the floating rate obligations issued by externally-deposited Recourse Trusts, was as follows:
| | | | | | | | | | | North | | | |
| | | Georgia | | Maryland | | Minnesota | | Missouri | | Carolina | | Virginia | |
| | | Dividend | | Premium | | Municipal | | Premium | | Premium | | Premium | |
| | | Advantage 2 | | Income | | Income | | Income | | Income | | Income | |
| | | (NKG | ) | (NMY | ) | (NMS | ) | (NOM | ) | (NNC | ) | (NPV | ) |
| Maximum exposure to Recourse Trusts | | $ | — | | $ | — | | $ | — | | $ | — | | $ | — | | $ | 13,330,000 | |
Zero Coupon Securities
A zero coupon security does not pay a regular interest coupon to its holders during the life of the security. Income to the holder of the security comes from accretion of the difference between the original purchase price of the security at issuance and the par value of the security at maturity and is effectively paid at maturity. The market prices of zero coupon securities generally are more volatile than the market prices of securities that pay interest periodically.
Investments in Derivatives
Each Fund is authorized to invest in certain derivative investments, such as futures, options and swap contracts. Each Fund will limit its investments in futures, options on futures and swap contracts to the extent necessary for the Adviser to claim exclusion from registration by the Commodity Futures Trading Commission as a commodity pool operator with respect to the Fund. The Funds record derivative instruments at fair value, with changes in fair value recognized on the Statement of Operations, when applicable. Even though the Funds’ investments in derivatives may represent economic hedges, they are not considered to be hedge transactions for financial reporting purposes.
Credit Default Swaps
A Fund may enter into a credit default swap contract to seek to maintain a total return on a particular investment or portion of its portfolio, or to take an active long or short position with respect to the likelihood of a particular issuer’s default. Credit default swap contracts involve one party making a stream of payments to another party in exchange for the right to receive a specified return if/ when there is a credit event by a third party. Generally, a credit event means bankruptcy, failure to pay, or restructuring. The specific credit events applicable for each credit default swap are stated in the terms of the particular swap agreement. As a purchaser of a credit default swap contract, the Fund pays to the counterparty a periodic interest fee based on the notional amount of the credit default swap. This interest fee is accrued daily and, for over-the-counter swaps, is recognized with the daily change in the market value of the contract as a component of “Unrealized appreciation or depreciation on credit default swaps (, net)” on the Statement of Assets and Liabilities. This interest fee is recorded as a realized loss upon payment. Credit default swap contracts are valued daily.
Upon occurrence of a specific credit event with respect to the underlying referenced entity, the Fund is obligated to deliver that security, or an equivalent amount of cash, to the counterparty in exchange for receipt of the notional amount from the counterparty. The difference between the value of the security delivered and the notional amount received is recorded as a realized gain or loss. Payments received or made at the beginning of the measurement period are recognized as a component of “Credit default swaps premiums paid and/or received” on the Statement of Assets and Liabilities, when applicable. As a seller of a credit default swap contract, the Fund generally receives from the counterparty a periodic interest fee based on the notional amount of the credit default swap. Upon occurrence of a specific credit event with respect to the underlying referenced entity, the Fund will either receive that security, or
Notes to Financial Statements (Unaudited) (continued)
an equivalent amount of cash, from the counterparty in exchange for payment of the notional amount to the counterparty, or pay a net settlement amount of the credit default swap contract less the recovery value of the referenced obligation or underlying securities comprising the referenced index. The difference between the value of the security received and the notional amount paid is recorded as a realized loss.
Changes in the value of a credit default swap during the fiscal period are recognized as a component of “Change in net unrealized appreciation (depreciation) of swaps,” and realized gains and losses are recognized as a component of “Net realized gain (loss) from swaps” on the Statement of Operations. Investments in swaps cleared through an exchange obligate a Fund and the clearing broker to settle monies on a daily basis representing changes in the prior days “mark-to-market” of the swap. If a Fund has unrealized appreciation the clearing broker would credit the Fund’s account with an amount equal to appreciation and conversely if a Fund has unrealized depreciation the clearing broker would debit a Fund’s account with an amount equal to depreciation. These daily cash settlements are also known as “variation margin.” Variation margin is recognized as a receivable and/or payable for “Variation margin on swap contracts” on the Statement of Assets and Liabilities. The maximum potential amount of future payments the Fund could incur as a buyer of protection in a credit default swap contract is limited to the notional amount of the contract. The maximum potential amount would be offset by the recovery value, if any, of the respective referenced entity.
During the period ended November 30, 2014, Georgia Dividend Advantage 2 (NKG) and North Carolina Premium Income (NNC) invested in credit default swaps to manage credit risk by purchasing credit protection.
The average notional amount of credit default swap contracts outstanding during the six months ended November 30, 2014, was as follows:
| | | | | North | |
| | | Georgia | | Carolina | |
| | | Dividend | | Premium | |
| | | Advantage 2 | | Income | |
| | | (NKG | ) | (NNC | ) |
| Average notional amount of credit default swap contracts outstanding* | | $ | 603,333 | | $ | 1,006,667 | |
| * | The average notional amount is calculated based on the outstanding notional at the beginning of the fiscal year and at the end of each fiscal quarter within the current fiscal year. |
The following table presents the fair value of all swap contracts held by the Funds as of the end of the reporting period, the location of these instruments on the Statement of Assets and Liabilities and the primary underlying risk exposure.
| | | | | Location on the Statement of Assets and Liabilities | |
| | | | | Asset Derivatives | | (Liability) Derivatives | |
| Underlying | | Derivative | | | | | | | | | | | |
| Risk Exposure | | Instrument | | Location | | | Value | | Location | | | Value | |
| Georgia Dividend Advantage 2 (NKG) | | | | | | | | | | | | | |
| Credit | | Swaps | | Unrealized appreciation | | $ | 1,916 | | — | | $ | — | |
| | | | | on credit default swaps | | | | | | | | | |
| North Carolina Premium Income (NNC) | | | | | | | | | | | | | |
| Credit | | Swaps | | Unrealized appreciation | | $ | 1,193 | | — | | $ | — | |
| | | | | on credit default swaps | | | | | | | | | |
The following table presents the swap contracts, which are subject to netting agreements, as well as the collateral delivered related to those swap contracts as of the end of the reporting period.
| | | | | | | | | Amounts | | | | | | | |
| | | | | Gross | | Gross | | Netted on | | Net Unrealized | | Collateral | | | |
| | | | | Unrealized | | Unrealized | | Statement of | | Appreciation | | Pledged | | | |
| | | | | Appreciation on | | (Depreciation) on | | Assets and | | (Depreciation) on | | to (from | ) | Net | |
| Fund | | Counterparty | | Credit Default Swaps | ** | Credit Default Swaps | ** | Liabilities | | Credit Default Swaps | | Counterparty | | Exposure | |
| Georgia Dividend Advantage 2 (NKG) | | Citibank N.A. | | $ | 1,916 | | $ | — | | $ | — | | $ | 1,916 | | $ | (1,916 | ) | $ | — | |
| North Carolina Premium Income (NNC) | | Citibank N.A. | | | 1,193 | | | — | | | — | | | 1,193 | | | (1,193 | ) | | — | |
| ** | Represents gross unrealized appreciation (depreciation) for the counterparty as reported in the Fund’s Portfolio of Investments. |
The following table presents the amount of net realized gain (loss) and change in net unrealized appreciation (depreciation) recognized on swap contracts on the Statement of Operations during the period ended November 30, 2014, and the primary underlying risk exposure.
| | | | | | | | | | | Change in Net | |
| | | | | | | | Net Realized | | | Unrealized Appreciation | |
| | | Underlying | | Derivative | | | Gain (Loss) From | | | (Depreciation) of | |
| Fund | | Risk Exposure | | Instrument | | | Swaps | | | Swaps | |
| Georgia Dividend Advantage 2 (NKG) | | Credit | | Swaps | | $ | (5,625) | | $ | 1,916 | |
| North Carolina Premium Income (NNC) | | Credit | | Swaps | | | (6,463) | | | 1,193 | |
Market and Counterparty Credit Risk
In the normal course of business each Fund may invest in financial instruments and enter into financial transactions where risk of potential loss exists due to changes in the market (market risk) or failure of the other party to the transaction to perform (counterparty credit risk). The potential loss could exceed the value of the financial assets recorded on the financial statements. Financial assets, which potentially expose each Fund to counterparty credit risk, consist principally of cash due from counterparties on forward, option and swap transactions, when applicable. The extent of each Fund’s exposure to counterparty credit risk in respect to these financial assets approximates their carrying value as recorded on the Statement of Assets and Liabilities.
Each Fund helps manage counterparty credit risk by entering into agreements only with counterparties the Adviser believes have the financial resources to honor their obligations and by having the Adviser monitor the financial stability of the counterparties. Additionally, counterparties may be required to pledge collateral daily (based on the daily valuation of the financial asset) on behalf of each Fund with a value approximately equal to the amount of any unrealized gain above a pre-determined threshold. Reciprocally, when each Fund has an unrealized loss, the Funds have instructed the custodian to pledge assets of the Funds as collateral with a value approximately equal to the amount of the unrealized loss above a pre-determined threshold. Collateral pledges are monitored and subsequently adjusted if and when the valuations fluctuate, either up or down, by at least the pre-determined threshold amount.
4. Fund Shares
Common Shares
Transactions in common shares for the Funds during the period ended November 30, 2014, the ten months ended June 30, 2014, the fiscal year ended May 31, 2014 and the fiscal year ended August 31, 2013, where applicable were as follows:
| | | Georgia Dividend | | Maryland Premium | | Minnesota Municipal | |
| | | Advantage 2 (NKG) | | Income (NMY) | | Income (NMS) | |
| | | Six Months | | Year | | Six Months | | Year | | Five Months | | Ten Months | | Year | |
| | | Ended | | Ended | | Ended | | Ended | | Ended | | Ended | | Ended | |
| | | 11/30/14 | | 5/31/14 | | 11/30/14 | | 5/31/14 | | 11/30/14 | | 6/30/14 | | 8/31/13 | |
| Common shares: | | | | | | | | | | | | | | | | | | | | | | |
| Issued in the Mergers | | | — | | | — | | | — | | | — | | | 1,424,063 | | | — | | | — | |
| Repurchased and retired | | | — | | | — | | | (400,000 | ) | | — | | | — | | | — | | | — | |
| | | | | | | | | | | | | | | | | | | | | | | |
| Weighted average common share: | | | | | | | | | | | | | | | | | | | | | | |
| Price per share repurchased and retired | | | — | | | — | | $ | 12.56 | | | — | | | — | | | — | | | — | |
| Discount per share repurchased and retired | | | — | | | — | | | 13.89 | % | | — | | | — | | | — | | | — | |
| | | Missouri Premium | | North Carolina | | Virginia Premium | |
| | | Income (NOM) | | Premium Income (NNC) | | Income (NPV) | |
| | | Six Months | | Year | | Six Months | | Year | | Six Months | | Year | |
| | | Ended | | Ended | | Ended | | Ended | | Ended | | Ended | |
| | | 11/30/14 | | 5/31/14 | | 11/30/14 | | 5/31/14 | | 11/30/14 | | 5/31/14 | |
| Common shares: | | | | | | | | | | | | | | | | | | | |
| Issued to shareholders due to reinvestment of distributions | | | 1,746 | | | 2,752 | | | — | | | — | | | — | | | — | |
| Repurchased and retired | | | — | | | — | | | (105,000 | ) | | — | | | — | | | — | |
| | | | | | | | | | | | | | | | | | | | |
| Weighted average common share: | | | | | | | | | | | | | | | | | | | |
| Price per share repurchased and retired | | | — | | | — | | $ | 13.02 | | | — | | | — | | | — | |
| Discount per share repurchased and retired | | | — | | | — | | | 13.78 | % | | — | | | — | | | — | |
Notes to Financial Statements (Unaudited) (continued)
Preferred Shares
Transactions in preferred shares for the Funds during the period ended November 30, 2014, the ten month’s ended June 30, 2014, the fiscal year ended May 31, 2014 and the fiscal year ended August 31, 2013, where applicable, are noted in the following tables.
Transactions in MTP Shares for the Funds were as follows:
| | | Year Ended May 31, 2014 | |
| | | | | NYSE/NYSE | | | | | |
| | | | Series | | MKT Ticker | | Shares | | Amount | |
| Georgia Dividend Advantage 2 (NKG) | | | | | | | | | | | | | |
| MTP Shares redeemed: | | | | | | | | | | | | | |
| | | | 2015 | | | NKG PRC | | | (3,226,500 | ) | $ | (32,265,000 | ) |
| | | | 2015-1 | | | NKG PRD | | | (2,834,000 | ) | | (28,340,000 | ) |
| | | | 2015-2 | | | NKG PRE | | | (1,434,000 | ) | | (14,340,000 | ) |
| Total | | | | | | | | | (7,494,500 | ) | $ | (74,945,000 | ) |
| | | | | | | | | | | | | | |
| Maryland Premium Income (NMY) | | | | | | | | | | | | | |
| MTP Shares redeemed: | | | | | | | | | | | | | |
| | | | 2015 | | | NMY PRC | | | (3,877,500 | ) | $ | (38,775,000 | ) |
| | | | 2016 | | | NMY PRD | | | (3,581,800 | ) | | (35,818,000 | ) |
| | | | 2015 | | | NMY PRE | | | (2,648,500 | ) | | (26,485,000 | ) |
| | | | 2015-1 | | | NMY PRF | | | (2,730,000 | ) | | (27,300,000 | ) |
| | | | 2015-1 | | | NMY PRG | | | (2,070,000 | ) | | (20,700,000 | ) |
| | | | 2016 | | | NMY PRH | | | (1,706,600 | ) | | (17,066,000 | ) |
| Total | | | | | | | | | (16,614,400 | ) | $ | (166,144,000 | ) |
| | | | | | | | | | | | | | |
| North Carolina Premium Income (NNC) | | | | | | | | | | | | | |
| MTP Shares redeemed: | | | | | | | | | | | | | |
| | | | 2015 | | | NNC PRC | | | (2,430,000 | ) | $ | (24,300,000 | ) |
| | | | 2016 | | | NNC PRD | | | (2,553,500 | ) | | (25,535,000 | ) |
| | | | 2015 | | | NNC PRE | | | (1,660,000 | ) | | (16,600,000 | ) |
| | | | 2015-1 | | | NNC PRF | | | (2,970,000 | ) | | (29,700,000 | ) |
| | | | 2015-1 | | | NNC PRG | | | (2,872,500 | ) | | (28,725,000 | ) |
| Total | | | | | | | | | (12,486,000 | ) | $ | (124,860,000 | ) |
| | | | | | | | | | | | | | |
| Virginia Premium Income (NPV) | | | | | | | | | | | | | |
| MTP Shares redeemed: | | | | | | | | | | | | | |
| | | | 2014 | | | NVP PRA | | | (2,920,300 | ) | $ | (29,203,000 | ) |
| | | | 2015 | | | NVP PRC | | | (3,220,500 | ) | | (32,205,000 | ) |
| | | | 2014 | | | NPV PRD | | | (2,280,000 | ) | | (22,800,000 | ) |
| | | | 2014-1 | | | NVP PRE | | | (4,320,000 | ) | | (43,200,000 | ) |
| Total | | | | | | | | | (12,740,800 | ) | $ | (127,408,000 | ) |
Transactions in Remarked Preferred Shares for the Funds were as follows:
| | | Ten Months Ended | |
| | | June 30, 2014 | |
| | | Shares | | Amount | |
| Minnesota Municipal Income (NMS) | | | | | | | |
| Remarked Preferred shares redeemed: | | | | | | | |
| Series M | | | (622 | ) | $ | (15,550,000 | ) |
| Series W | | | (622 | ) | | (15,550,000 | ) |
| Total | | | (1,244 | ) | $ | (31,100,000 | ) |
Transactions in VMTP Shares for the Funds were as follows:
| | | Five Months Ended | |
| | | November 30, 2014 | |
| | | Series | | Shares | | Amount | |
| Minnesota Municipal Income (NMS) | | | | | | | | | | |
| VMTP Shares resulting from the Mergers | | | 2017 | | | 130 | | $ | 13,000,000 | |
| | | Ten Months Ended | |
| | | June 30, 2014 | |
| | | Series | | Shares | | Amount | |
| Minnesota Municipal Income (NMS) | | | | | | | | | | |
| VMTP Shares issued | | | 2017 | | | 311 | | $ | 31,100,000 | |
| | | Year Ended May 31, 2014 | |
| | | Series | | Shares | | Amount | |
| Georgia Dividend Advantage 2 (NKG) | | | | | | | | | | |
| VMTP Shares issued | | | 2017 | | | 750 | | $ | 75,000,000 | |
| Maryland Premium Income (NMY) | | | | | | | | | | |
| VMTP Shares issued | | | 2017 | | | 1,670 | | $ | 167,000,000 | |
| North Carolina Premium Income (NNC) | | | | | | | | | | |
| VMTP Shares issued | | | 2017 | | | 1,250 | | $ | 125,000,000 | |
Transactions in VRDP Shares for the Funds were as follows:
| | | Year Ended May 31, 2014 | |
| | | Series | | Shares | | Amount | |
| Virginia Premium Income (NPV) | | | | | | | | | | |
| VRDP Shares issued | | | 1 | | | 1,280 | | $ | 128,000,000 | |
5. Investment Transactions
Long-term purchases and sales (including maturities but excluding derivative transactions, where applicable) during the period ended November330, 2014, were as follows:
| | | | | | | | | | | North | | | |
| | | Georgia | | Maryland | | Minnesota | | Missouri | | Carolina | | Virginia | |
| | | Dividend | | Premium | | Municipal | | Premium | | Premium | | Premium | |
| | | Advantage 2 | | Income | | Income | | Income | | Income | | Income | |
| | | (NKG | ) | (NMY | ) | (NMS | ) | (NOM | ) | (NNC | ) | (NPV | ) |
| Purchases | | $ | 10,650,979 | | $ | 91,765,988 | | $ | 4,453,409 | | $ | 2,214,076 | | $ | 29,021,980 | | $ | 32,506,306 | |
| Sales and maturities | | | 10,561,176 | | | 100,856,351 | | | 3,708,610 | | | 1,349,752 | | | 26,599,107 | | | 32,838,169 | |
6. Income Tax Information
Each Fund is a separate taxpayer for federal income tax purposes. Each Fund intends to distribute substantially all of its net investment income and net capital gains to shareholders and to otherwise comply with the requirements of Subchapter M of the Internal Revenue Code applicable to regulated investment companies. Therefore, no federal income tax provision is required. Furthermore, each Fund intends to satisfy conditions that will enable interest from municipal securities, which is exempt from regular federal and designated state income taxes, to retain such tax-exempt status when distributed to shareholders of the Funds. Net realized capital gains and ordinary income distributions paid by the Funds are subject to federal taxation.
For all open tax years and all major taxing jurisdictions, management of the Funds has concluded that there are no significant uncertain tax positions that would require recognition in the financial statements. Open tax years are those that are open for examination by taxing authorities (i.e., generally the last four tax year ends and the interim tax period since then). Furthermore, management of the Funds is also not aware of any tax positions for which it is reasonably possible that the total amounts of unrecognized tax benefits will significantly change in the next twelve months.
Notes to Financial Statements (Unaudited) (continued)
The following information is presented on an income tax basis. Differences between amounts for financial statement and federal income tax purposes are primarily due to timing differences in recognizing taxable market discount, timing differences in recognizing certain gains and losses on investment transactions and the treatment of investments in inverse floating rate securities reflected as financing transactions, if any. To the extent that differences arise that are permanent in nature, such amounts are reclassified within the capital accounts as detailed below. Temporary differences do not require reclassification. Temporary and permanent differences do not impact the NAVs of the Funds.
As of November 30, 2014, the cost and unrealized appreciation (depreciation) of investments (excluding investments in derivatives, where applicable), as determined on a federal income tax basis, were as follows:
| | | | | | | | | | | North | | | |
| | | Georgia | | Maryland | | Minnesota | | Missouri | | Carolina | | Virginia | |
| | | Dividend | | Premium | | Municipal | | Premium | | Premium | | Premium | |
| | | Advantage 2 | | Income | | Income | | Income | | Income | | Income | |
| | | (NKG | ) | (NMY | ) | (NMS | ) | (NOM | ) | (NNC | ) | (NPV | ) |
| Cost of investments | | $ | 207,776,788 | | $ | 484,532,055 | | $ | 121,495,651 | | $ | 46,900,610 | | $ | 346,798,482 | | $ | 360,699,217 | |
| Gross unrealized: | | | | | | | | | | | | | | | | | | | |
| Appreciation | | $ | 13,697,723 | | $ | 27,933,391 | | $ | 10,125,897 | | $ | 3,725,951 | | $ | 24,856,794 | | $ | 29,529,302 | |
| Depreciation | | | (1,804,030 | ) | | (5,131,360 | ) | | (104,629 | ) | | (155,013 | ) | | (420,006 | ) | | (5,665,547 | ) |
| Net unrealized appreciation (depreciation) of investments | | $ | 11,893,693 | | $ | 22,802,031 | | $ | 10,021,268 | | $ | 3,570,938 | | $ | 24,436,788 | | $ | 23,863,755 | |
Permanent differences, primarily due to federal taxes paid, nondeductible offering costs, distribution character reclassifications, paydowns and nondeductible reorganization expenses resulted in reclassifications among the Funds’ components of common share net assets as of the periods indicated below, as follows:
| | | | | | | | | North | | | |
| | | Georgia | | Maryland | | Missouri | | Carolina | | Virginia | |
| | | Dividend | | Premium | | Premium | | Premium | | Premium | |
| | | Advantage 2 | | Income | | Income | | Income | | Income | |
| Year ended May 31, 2014 | | (NKG | ) | (NMY | ) | (NOM | ) | (NNC | ) | (NPV | ) |
| Paid-in-surplus | | $ | (577,844 | ) | $ | (1,108,688 | ) | $ | (93,684 | ) | $ | (987,565 | ) | $ | (693,179 | ) |
| Undistributed (Over-distribution of) net investment income | | | 493,915 | | | 1,100,650 | | | 93,681 | | | 977,269 | | | 700,849 | |
| Accumulated net realized gain (loss) | | | 83,929 | | | 8,038 | | | 3 | | | 10,296 | | | (7,670 | ) |
| | | | Minnesota | |
| | | | Municipal | |
| | | | Income | |
| Ten Months ended June 30, 2014 | | | (NMS | ) |
| Paid-in-surplus | | $ | — | |
| Undistributed (Over-distribution of) net investment income | | | — | |
| Accumulated net realized gain (loss) | | | — | |
The tax components of undistributed net tax-exempt income, net ordinary income and net long-term capital gains as of the periods indicated below, were as follows:
| | | | | | | | | North | | | |
| | | Georgia | | Maryland | | Missouri | | Carolina | | Virginia | |
| | | Dividend | | Premium | | Premium | | Premium | | Premium | |
| | | Advantage 2 | | Income | | Income | | Income | | Income | |
| Year ended May 31, 2014 | | (NKG | ) | (NMY | ) | (NOM | ) | (NNC | ) | (NPV | ) |
Undistributed net tax-exempt income1 | | $ | 185,325 | | $ | 1,924,493 | | $ | 354,669 | | $ | 616,922 | | $ | 2,187,299 | |
Undistributed net ordinary income2 | | | — | | | 10,895 | | | — | | | — | | | — | |
| Undistributed net long-term capital gains | | | — | | | — | | | — | | | 496,406 | | | — | |
| | | | Minnesota | |
| | | | Municipal | |
| | | | Income | |
| Ten Months ended June 30, 2014 | | | (NMS | ) |
| Undistributed net tax-exempt income | | $ | 458,133 | |
Undistributed net ordinary income2 | | | 3,029 | |
| Undistributed net long-term capital gains | | | — | |
| 1 | Undistributed net tax-exempt income (on a tax basis) has not been reduced for the dividend declared on May 1, 2014, paid on June 2, 2014. |
| 2 | Net ordinary income consists of taxable market discount income and net short-term capital gains, if any. |
The tax character of distributions paid during the periods indicated below, was designated for purposes of the dividends paid deduction as follows:
| | | | | | | | | North | | | |
| | | Georgia | | Maryland | | Missouri | | Carolina | | Virginia | |
| | | Dividend | | Premium | | Premium | | Premium | | Premium | |
| | | Advantage 2 | | Income | | Income | | Income | | Income | |
| Year ended May 31, 2014 | | (NKG | ) | (NMY | ) | (NOM | ) | (NNC | ) | (NPV | ) |
| Distributions from net tax-exempt income | | $ | 8,917,503 | | $ | 21,036,311 | | $ | 2,080,261 | | $ | 13,080,537 | | $ | 14,297,444 | |
Distributions from net ordinary income2 | | | 819 | | | 55,441 | | | — | | | 3,040 | | | 9,687 | |
| Distributions from net long-term capital gains | | | — | | | — | | | — | | | — | | | 139,974 | |
| | | | Minnesota | |
| | | | Municipal | |
| | | | Income | |
| Ten Months ended June 30, 2014 | | | (NMS | ) |
| Distributions from net tax-exempt income | | $ | 3,066,938 | |
Distributions from net ordinary income2 | | | 24,601 | |
| Distributions from net long-term capital gains | | | — | |
| | | | Minnesota | |
| | | | Municipal | |
| | | | Income | |
| Year ended August 31, 2013 | | | (NMS | ) |
| Distributions from net tax-exempt income | | $ | 3,747,267 | |
Distributions from net ordinary income2 | | | — | |
| Distributions from net long-term capital gains | | | — | |
| 2 | Net ordinary income consists of taxable market discount income and net short-term capital gains, if any. |
As of the periods indicated below, the following Funds had unused capital loss carryforwards available for federal income tax purposes to be applied against future capital gains, if any. If not applied, the carryforwards will expire as shown in the following table. The losses not subject to expiration will be utilized first by a Fund.
| | | Georgia | | Maryland | | Missouri | | Virginia | |
| | | Dividend | | Premium | | Premium | | Premium | |
| | | Advantage 2 | | Income | | Income | | Income | |
| May 31, 2014 | | (NKG | ) | (NMY | )3 | (NOM | ) | (NPV | ) |
| Expiration: | | | | | | | | | | | | | |
| May 31, 2016 | | $ | 462,549 | | $ | 851,610 | | $ | — | | $ | — | |
| May 31, 2017 | | | 1,635,823 | | | 172,377 | | | 77,824 | | | — | |
| May 31, 2018 | | | 1,329,548 | | | — | | | 91,539 | | | — | |
| May 31, 2019 | | | 48,370 | | | — | | | — | | | — | |
| Not subject to expiration | | | 895,118 | | | 6,790,849 | | | 691,272 | | | 6,487,908 | |
| Total | | $ | 4,371,408 | | $ | 7,814,836 | | $ | 860,635 | | $ | 6,487,908 | |
| 3 | A portion of Maryland Premium Income’s (NMY) capital loss carryforward is subject to limitation under the Internal Revenue Code and related regulations. |
| | | | Minnesota | |
| | | | Municipal | |
| | | | Income | |
| June 30, 2014 | | | (NMS | ) |
| Expiration: | | | | |
| June 30, 2018 | | $ | 452,405 | |
| Not subject to expiration | | | 516,691 | |
| Total | | $ | 969,096 | |
During the Funds’ last tax year ended May 31, 2014, the following Fund utilized capital loss carryforwards as follows:
| | | | North | |
| | | | Carolina | |
| | | | Premium | |
| | | | Income | |
| | | | (NNC | ) |
| Utilized capital loss carryforwards | | $ | 734,088 | |
Notes to Financial Statements (Unaudited) (continued)
The Funds have elected to defer late-year losses in accordance with federal income tax rules. These losses are treated as having arisen on the first day of the current fiscal year. The following Funds have elected to defer losses as follows:
| | | Georgia | | Maryland | | Minnesota | | Missouri | | Virginia | |
| | | Dividend | | Premium | | Municipal | | Premium | | Premium | |
| | | Advantage 2 | | Income | | Income | | Income | | Income | |
| | | (NKG | ) | (NMY | ) | (NMS | ) | (NOM | ) | (NPV | ) |
Post-October capital losses4 | | $ | 944,720 | | $ | 375,356 | | $ | 100,248 | * | $ | 71,083 | | $ | 1,057,596 | |
Late-year ordinary losses5 | | | — | | | — | | | — | | | — | | | — | |
| 4 | Capital losses incurred from November 1, 2013 through May 31, 2014, the Funds’ last tax year end. |
| 5 | Ordinary losses incurred from January 1, 2014 through May 31, 2014 and specified losses incurred from November 1, 2013 through May 31, 2014. |
| * | Capital losses incurred from November 1, 2013 through June 30, 2014, the Fund’s last tax year end. |
7. Management Fees and Other Transactions with Affiliates
Each Fund’s management fee compensates the Adviser for overall investment advisory and administrative services and general office facilities. The Sub-Adviser is compensated for its services to the Funds from the management fees paid to the Adviser.
Each Fund’s management fee consists of two components – a fund-level fee, based only on the amount of assets within the Fund, and a complex-level fee, based on the aggregate amount of all eligible fund assets managed by the Adviser. This pricing structure enables Fund shareholders to benefit from growth in the assets within their respective Fund as well as from growth in the amount of complex-wide assets managed by the Adviser.
The annual fund-level fee for each Fund, payable monthly, is calculated according to the following schedules:
| | | Georgia Dividend Advantage 2 (NKG) |
| Average Daily Managed Assets* | | Fund-Level Fee Rate |
| For the first $125 million | | 0.4500 | % |
| For the next $125 million | | 0.4375 | |
| For the next $250 million | | 0.4250 | |
| For the next $500 million | | 0.4125 | |
| For the next $1 billion | | 0.4000 | |
| For managed assets over $2 billion | | 0.3750 | |
| | | Minnesota Municipal Income (NMS) |
| Average Daily Managed Assets* | | Fund-Level Fee Rate |
| For the first $125 million | | 0.4500 | % |
| For the next $125 million | | 0.4375 | |
| For the next $250 million | | 0.4250 | |
| For the next $500 million | | 0.4125 | |
| For managed assets over $1 billion | | 0.4000 | |
| | | Maryland Premium Income (NMY) |
| | | Missouri Premium Income (NOM) |
| | | North Carolina Premium Income (NNC) |
| | | Virginia Premium Income (NPV) |
| Average Daily Managed Assets* | | Fund-Level Fee Rate |
| For the first $125 million. | | 0.4500 | % |
| For the next $125 million | | 0.4375 | |
| For the next $250 million | | 0.4250 | |
| For the next $500 million | | 0.4125 | |
| For the next $1 billion | | 0.4000 | |
| For the next $3 billion | | 0.3875 | |
| For managed assets over $5 billion | | 0.3750 | |
The annual complex-level fee for each Fund, payable monthly, is calculated according to the following schedule:
| Complex-Level Managed Asset Breakpoint Level* | | Effective Rate at Breakpoint Level |
| $55 billion | | 0.2000 | % |
| $56 billion | | 0.1996 | |
| $57 billion | | 0.1989 | |
| $60 billion | | 0.1961 | |
| $63 billion | | 0.1931 | |
| $66 billion | | 0.1900 | |
| $71 billion | | 0.1851 | |
| $76 billion | | 0.1806 | |
| $80 billion | | 0.1773 | |
| $91 billion | | 0.1691 | |
| $125 billion | | 0.1599 | |
| $200 billion | | 0.1505 | |
| $250 billion | | 0.1469 | |
| $300 billion | | 0.1445 | |
| * | For the fund-level and complex-level fees, managed assets include closed-end fund assets managed by the Adviser that are attributable to certain types of leverage. For these purposes, leverage includes the funds’ use of preferred stock and borrowings and certain investments in the residual interest certificates (also called inverse floating rate securities) in tender option bond (TOB) trusts, including the portion of assets held by a TOB trust that has been effectively financed by the trust’s issuance of floating rate securities, subject to an agreement by the Adviser as to certain funds to limit the amount of such assets for determining managed assets in certain circumstances. The complex-level fee is calculated based upon the aggregate daily managed assets of all Nuveen funds that constitute “eligible assets.” Eligible assets do not include assets attributable to investments in other Nuveen funds or assets in excess of $2 billion added to the Nuveen fund complex in connection with the Adviser’s assumption of the management of the former First American Funds effective January 1, 2011. As of November 30, 2014, the complex-level fee rate for each of these Funds was 0.1639%. |
The Funds pay no compensation directly to those of its trustees who are affiliated with the Adviser or to its officers, all of whom receive remuneration for their services to the Funds from the Adviser or its affiliates. The Board has adopted a deferred compensation plan for independent trustees that enables trustees to elect to defer receipt of all or a portion of the annual compensation they are entitled to receive from certain Nuveen-advised funds. Under the plan, deferred amounts are treated as though equal dollar amounts had been invested in shares of select Nuveen-advised funds.
8. Fund Mergers
The Mergers were structured to qualify as tax-free mergers under the Internal Revenue Code for federal income tax purposes, and the Target Funds’ shareholders recognized no gain or loss for federal income tax purposes as a result. Prior to the closing of the Mergers, the Target Funds distributed all of their net investment income and capital gains, if any. Such a distribution may be taxable to the Target Funds’ shareholders for federal income tax purposes.
Investments
The cost, fair value and net unrealized appreciation (depreciation) of the investments of the Target Funds as of the date of the Mergers, were as follows:
| | | | Minnesota | | | Minnesota | |
| | | | Municipal | | | Municipal | |
| | | | Income | | | Income | |
| | | | Portfolio | | | Fund II | |
| | | | (MXA | ) | | (MXN | ) |
| Cost of investments | | $ | 86,735,071 | | $ | 32,798,297 | |
| Fair value of investments | | | 94,862,790 | | | 34,794,031 | |
| Net unrealized appreciation (depreciation) of investments | | | 8,127,719 | | | 1,995,734 | |
For financial reporting purposes, assets received and shares issued by Minnesota Municipal Income (NMS) were recorded at fair value; however, the cost basis of the investments received from the Target Funds were carried forward to align ongoing reporting of Minnesota Municipal Income’s (NMS) realized and unrealized gains and losses with amounts distributable to shareholders for tax purposes.
Notes to Financial Statements (Unaudited) (continued)
Common Shares
The shares outstanding, net assets and NAV per share outstanding immediately prior to and after the Mergers are as follows:
| | | | Minnesota | | | Minnesota | |
| | | | Municipal | | | Municipal | |
| | | | Income | | | Income | |
| | | | Portfolio | | | Fund II | |
| Target Funds – Prior to the Mergers | | | (MXA | ) | | (MXN | ) |
| Shares outstanding | | | 4,146,743 | | | 1,472,506 | |
| Net assets | | $ | 64,760,137 | | $ | 22,239,676 | |
| NAV per share outstanding | | $ | 15.62 | | $ | 15.10 | |
| Minnesota Municipal Income (NMS) – Prior to the Mergers | | | | |
| Shares outstanding | | | 2 | |
| Net assets | | $ | 31 | |
| NAV per share outstanding | | $ | 15.62 | |
| | | | | |
| Minnesota Municipal Income (NMS) – After the Mergers | | | | |
| Shares outstanding | | | 5,570,806 | |
| Net assets | | $ | 86,999,844 | |
| NAV per share outstanding | | $ | 15.62 | |
Preferred Shares
In connection with the Mergers, holders of the VMTP Shares of the Target Funds received on a one-for-one basis newly issued VMTP Shares of Minnesota Municipal Income (NMS), in exchange for VMTP Shares of the Target Funds held immediately prior to the Mergers.
Prior to the closing of the Mergers, details of the Target Funds’ outstanding VMTP Shares were as follows:
| | | | | | | Shares | | | |
| | | | | | | Outstanding | | | |
| | | | | Shares | | at $100,000 Per Share | | | |
| Target Funds | | Series | | Outstanding | | Liquidation Value | | Maturity | |
| Minnesota Municipal Income Portfolio (MXA) | | | 2017 | | | 311 | | $ | 31,100,000 | | | May 1, 2017 | |
| Minnesota Municipal Income Fund II (MXN) | | | 2017 | | | 130 | | | 13,000,000 | | | May 1, 2017 | |
Details of Minnesota Municipal Income’s (NMS) VMTP Shares issued in connection with the Mergers were as follows:
| | | | | | | Shares | | | |
| | | | | | | Outstanding | | | |
| | | | | Shares | | at $100,000 Per Share | | | |
| Fund | | Series | | Outstanding | | Liquidation Value | | Maturity | |
| Minnesota Municipal Income (NMS) | | | 2017 | | | 441 | | $ | 44,100,000 | | | May 1, 2017 | |
Pro Forma Results of Operations
Assuming the Mergers have been completed on July 1, 2014, the beginning of Minnesota Municipal Income’s (NMS) current fiscal period, the pro forma results of operations for the period ended November 30, 2014, are as follows:
| | | | Minnesota | |
| | | | Municipal | |
| | | | Income | |
| Pro Forma results of Operations | | | (NMS | ) |
| Net investment income | | $ | 1,882,798 | |
| Net realized and unrealized gains (losses) | | | 1,235,403 | |
| Change in net assets resulting from operations | | | 3,118,201 | |
Because the combined investment portfolios for the Mergers have been managed as a single integrated portfolio since the Mergers were completed, it is not practicable to separate the amounts of revenue and earnings of the Target Funds that have been included in the Statement of Operations for Minnesota Municipal Income (NMS) since the Mergers were consummated.
Additional Fund Information
| Board of Trustees | | | | | | | | | | |
| William Adams IV* | | Robert P. Bremner** | | Jack B. Evans | | William C. Hunter | | David J. Kundert | | John K. Nelson |
| William J. Schneider | | Thomas S. Schreier, Jr.* | | Judith M. Stockdale | | Carole E. Stone | | Virginia L. Stringer | | Terence J. Toth |
* Interested Board Member.
** Retired from the Funds’ Board of Trustees effective December 31, 2014.
| Fund Manager | | Custodian | | Legal Counsel | | Independent Registered | | Transfer Agent and |
| Nuveen Fund Advisors, LLC | | State Street Bank | | Chapman and Cutler LLP | | Public Accounting Firm*** | | Shareholder Services |
| 333 West Wacker Drive | | & Trust Company | | Chicago, IL 60603 | | KPMG LLP | | State Street Bank |
| Chicago, IL 60606 | | Boston, MA 02111 | | | | Chicago, IL 60601 | | & Trust Company |
| | | | | | | | | Nuveen Funds |
| | | | | | | | | P.O. Box 43071 |
| | | | | | | | | Providence, RI 02940-3071 |
| | | | | | | | | (800) 257-8787 |
| *** | During the fiscal period ended May 31, 2015, the Board of Trustees of Nuveen Georgia Dividend Advantage Municipal Fund 2 (NKG), Nuveen Maryland Premium Income Municipal Fund (NMY), Nuveen Missouri Premium Income Municipal Fund (NOM), Nuveen North Carolina Premium Income Municipal Fund (NNC) and Nuveen Virginia Premium Income Municipal Fund (NPV), upon recommendation of the Audit Committee, engaged KPMG LLP (“KPMG”) as the independent registered public accounting firm to the Funds replacing Ernst & Young LLP (“Ernst & Young”), which resigned as the independent registered public accounting firm effective August 11, 2014 as a result of the then pending acquisition of Nuveen Investments by TIAA-CREF. |
| | |
| | Ernst & Young’s report on the Funds for the two most recent fiscal periods ended May 31, 2014 and May 31, 2013, contained no adverse opinion or disclaimer of opinion, and were not qualified or modified as to uncertainty, audit scope or accounting principles. For the fiscal periods ended May 31, 2014 and May 31, 2013 for the Funds and for the period June 1, 2014 through August 11, 2014, there were no disagreements with Ernst & Young on any matter of accounting principles or practices, financial statement disclosure or auditing scope or procedures, which disagreements, if not resolved to the satisfaction of Ernst & Young, would have caused it to make reference to the subject matter of the disagreements in connection with its reports on the Funds’ financial statements. |
| | |
| | During the fiscal period ended May 31, 2015, the Board of Trustees of Nuveen Minnesota Municipal Income Fund (NMS), upon recommendation of the Audit Committee, engaged KPMG LLP (“KPMG”) as the independent registered public accounting firm to the Fund. Also during the fiscal period ended May 31, 2015, Minnesota Municipal Income Portfolio Inc. (MXA) and First American Minnesota Municipal Income Fund II Inc. (MXN) merged into NMS, with MXA being the accounting survivor. Ernst & Young LLP (“Ernst & Young”) was the independent registered public accounting firm to MXA. |
| | |
| | Ernst & Young’s report on MXA for the two most recent fiscal periods ended June 30, 2014 and August 31, 2013, contained no adverse opinion or disclaimer of opinion, and were not qualified or modified as to uncertainty, audit scope or accounting principles. For the fiscal periods ended June 30, 2014 and August 31, 2013 for the Fund and for the period July 1, 2014 through October 6, 2014 (the date of merger), there were no disagreements with Ernst & Young on any matter of accounting principles or practices, financial statement disclosure or auditing scope or procedures, which disagreements, if not resolved to the satisfaction of Ernst & Young, would have caused it to make reference to the subject matter of the disagreements in connection with its reports on the Fund’s financial statements. |
Quarterly Form N-Q Portfolio of Investments Information
Each Fund is required to file its complete schedule of portfolio holdings with the Securities and Exchange Commission (SEC) for the first and third quarters of each fiscal year on Form N-Q. You may obtain this information directly from the SEC. Visit the SEC on-line at http://www.sec.gov or in person at the SEC’s Public Reference Room in Washington, D.C. Call the SEC toll-free at (800) SEC -0330 for room hours and operation.
Nuveen Funds’ Proxy Voting Information
You may obtain (i) information regarding how each fund voted proxies relating to portfolio securities held during the most recent twelve-month period ended June 30, without charge, upon request, by calling Nuveen Investments toll-free at (800) 257-8787 or on Nuveen’s website at www.nuveen.com and (ii) a description of the policies and procedures that each fund used to determine how to vote proxies relating to portfolio securities without charge, upon request, by calling Nuveen Investments toll free at (800) 257-8787. You may also obtain this information directly from the SEC. Visit the SEC on-line at http://www.sec.gov.
CEO Certification Disclosure
Each Fund’s Chief Executive Officer (CEO) has submitted to the New York Stock Exchange (NYSE) the annual CEO certification as required by Section 303A.12(a) of the NYSE Listed Company Manual. Each Fund has filed with the SEC the certification of its CEO and Chief Financial Officer required by Section 302 of the Sarbanes-Oxley Act.
Common Share Repurchases
Each Fund intends to repurchase, through its open-market share repurchase program, shares of its own common stock at such times and in such amounts as is deemed advisable. During the period covered by this report, each Fund repurchased shares of its common stock, as shown in the accompanying table. Any future repurchases will be reported to shareholders in the next annual or semi-annual report.
| | | NKG | | NMY | | NMS | | NOM | | NNC | | NPV | |
| Common shares repurchased | | — | | 400,000 | | — | | — | | 105,000 | | — | |
FINRA BrokerCheck: The Financial Industry Regulatory Authority (FINRA) provides information regarding the disciplinary history of FINRA member firms and associated investment professionals. This information as well as an investor brochure describing FINRA BrokerCheck is available to the public by calling the FINRA BrokerCheck Hotline number at (800) 289-9999 or by visiting www.FINRA.org.
Glossary of Terms Used in this Report
| ■ | Auction Rate Bond: An auction rate bond is a security whose interest payments are adjusted periodically through an auction process, which process typically also serves as a means for buying and selling the bond. Auctions that fail to attract enough buyers for all the shares offered for sale are deemed to have “failed,” with current holders receiving a formula-based interest rate until the next scheduled auction. |
| | |
| ■ | Average Annual Total Return: This is a commonly used method to express an investment’s performance over a particular, usually multi-year time period. It expresses the return that would have been necessary each year to equal the investment’s actual cumulative performance (including change in NAV or market price and reinvested dividends and capital gains distributions, if any) over the time period being considered. |
| | |
| ■ | Duration: Duration is a measure of the expected period over which a bond’s principal and interest will be paid, and consequently is a measure of the sensitivity of a bond’s or bond fund’s value to changes when market interest rates change. Generally, the longer a bond’s or fund’s duration, the more the price of the bond or fund will change as interest rates change. |
| | |
| ■ | Effective Leverage: Effective leverage is a fund’s effective economic leverage, and includes both regulatory leverage (see Leverage) and the leverage effects of certain derivative investments in the fund’s portfolio. Currently, the leverage effects of Tender Option Bond (TOB) inverse floater holdings are included in effective leverage values, in addition to any regulatory leverage. |
| | |
| ■ | Gross Domestic Product (GDP): The total market value of all final goods and services produced in a country/region in a given year, equal to total consumer, investment and government spending, plus the value of exports, minus the value of imports. |
| | |
| ■ | Inverse Floating Rate Securities: Inverse floating rate securities, also known as inverse floaters or tender option bonds (TOBs), are created by depositing a municipal bond, typically with a fixed interest rate, into a special purpose trust. This trust, in turn, (a) issues floating rate certificates typically paying short-term tax-exempt interest rates to third parties in amounts equal to some fraction of the deposited bond’s par amount or market value, and (b) issues an inverse floating rate certificate (sometimes referred to as an “inverse floater”) to an investor (such as a Fund) interested in gaining investment exposure to a long-term municipal bond. The income received by the holder of the inverse floater varies inversely with the short term rate paid to the floating rate certificates’ holders, and in most circumstances the holder of the inverse floater bears substantially all of the underlying bond’s downside investment risk. The holder of the inverse floater typically also benefits disproportionately from any potential appreciation of the underlying bond’s value. Hence, an inverse floater essentially represents an investment in the underlying bond on a leveraged basis. |
| | |
| ■ | Leverage: Leverage is created whenever a fund has investment exposure (both reward and/or risk) equivalent to more than 100% of the investment capital. |
| | |
| ■ | Lipper Other States Municipal Debt Funds Classification Average: Calculated using the returns of all closed-end funds in this category. Lipper returns account for the effects of management fees and assume reinvestment of distributions, but do not reflect any applicable sales charges. |
| | |
| ■ | Net Asset Value (NAV) Per Share: A fund’s Net Assets is equal to its total assets (securities, cash, accrued earnings and receivables) less its total liabilities. NAV per share is equal to the fund’s Net Assets divided by its number of shares outstanding. |
| | |
| ■ | Pre-Refunding: Pre-Refunding, also known as advanced refundings or refinancings, is a procedure used by state and local governments to refinance municipal bonds to lower interest expenses. The issuer sells new bonds with a lower yield and uses the proceeds to buy U.S. Treasury securities, the interest from which is used to make payments on the higher-yielding bonds. Because of this collateral, pre-refunding generally raises a bond’s credit rating and thus its value. |
| ■ | Regulatory Leverage: Regulatory Leverage consists of preferred shares issued by or borrowings of a fund. Both of these are part of a fund’s capital structure. Regulatory leverage is subject to asset coverage limits set in the Investment Company Act of 1940. |
| | |
| ■ | S&P Municipal Bond Georgia Index: An unleveraged, market value-weighted index designed to measure the performance of the tax-exempt, investment-grade Georgia municipal bond market. Index returns assume reinvestment of distributions, but do not reflect any applicable sales charges or management fees. |
| | |
| ■ | S&P Municipal Bond Index: An unleveraged, market value-weighted index designed to measure the performance of the tax-exempt, investment-grade U.S. municipal bond market. Index returns assume reinvestment of distributions, but do not reflect any applicable sales charges or management fees. |
| | |
| ■ | S&P Municipal Bond Maryland Index: An unleveraged, market value-weighted index designed to measure the performance of the tax-exempt, investment-grade Maryland municipal bond market. Index returns assume reinvestment of distributions, but do not reflect any applicable sales charges or management fees. |
| | |
| ■ | S&P Municipal Bond Minnesota Index: An unleveraged, market value-weighted index designed to measure the performance of the tax-exempt, investment-grade Minnesota municipal bond market. Index returns assume reinvestment of distributions, but do not reflect any applicable sales charges or management fees. |
| | |
| ■ | S&P Municipal Bond Missouri Index: An unleveraged, market value-weighted index designed to measure the performance of the tax-exempt, investment-grade Missouri municipal bond market. Index returns assume reinvestment of distributions, but do not reflect any applicable sales charges or management fees. |
| | |
| ■ | S&P Municipal Bond North Carolina Index: An unleveraged, market value-weighted index designed to measure the performance of the tax-exempt, investment-grade North Carolina municipal bond market. Index returns assume reinvestment of distributions, but do not reflect any applicable sales charges or management fees. |
| | |
| ■ | S&P Municipal Bond Virginia Index: An unleveraged, market value-weighted index designed to measure the performance of the tax-exempt, investment-grade Virginia municipal bond market. Index returns assume reinvestment of distributions, but do not reflect any applicable sales charges or management fees. |
| | |
| ■ | Total Investment Exposure: Total investment exposure is a fund’s assets managed by the Adviser that are attributable to financial leverage. For these purposes, financial leverage includes a fund’s use of preferred stock and borrowings and investments in the residual interest certificates (also called inverse floating rate securities) in tender option bond (TOB) trusts, including the portion of assets held by a TOB trust that has been effectively financed by the trust’s issuance of floating rate securities. |
| | |
| ■ | Zero Coupon Bond: A zero coupon bond does not pay a regular interest coupon to its holders during the life of the bond. Income to the holder of the bond comes from accretion of the difference between the original purchase price of the bond at issuance and the par value of the bond at maturity and is effectively paid at maturity. The market prices of zero coupon bonds generally are more volatile than the market prices of bonds that pays interest periodically. |
Reinvest Automatically, Easily and Conveniently
Nuveen makes reinvesting easy. A phone call is all it takes to set up your reinvestment account.
Nuveen Closed-End Funds Automatic Reinvestment Plan
Nuveen Closed-End Fund allows you to conveniently reinvest distributions in additional Fund shares. By choosing to reinvest, you’ll be able to invest money regularly and automatically, and watch your investment grow through the power of compounding. Just like distributions in cash, there may be times when income or capital gains taxes may be payable on distributions that are reinvested. It is important to note that an automatic reinvestment plan does not ensure a profit, nor does it protect you against loss in a declining market.
Easy and convenient
To make recordkeeping easy and convenient, each month you’ll receive a statement showing your total distributions, the date of investment, the shares acquired and the price per share, and the total number of shares you own.
How shares are purchased
The shares you acquire by reinvesting will either be purchased on the open market or newly issued by the Fund. If the shares are trading at or above net asset value at the time of valuation, the Fund will issue new shares at the greater of the net asset value or 95% of the then-current market price. If the shares are trading at less than net as -set value, shares for your account will be purchased on the open market. If the Plan Agent begins purchasing Fund shares on the open market while shares are trading below net asset value, but the Fund’s shares subsequently trade at or above their net asset value before the Plan Agent is able to complete its purchases, the Plan Agent may cease open-market purchases and may invest the uninvested portion of the distribution in newly-issued Fund shares at a price equal to the greater of the shares’ net asset value or 95% of the shares’ market value on the last business day imme -diately prior to the purchase date. Distributions received to purchase shares in the open market will normally be invested shortly after the distribution payment date. No interest will be paid on distributions awaiting reinvestment. Because the market price of the shares may increase before purchases are completed, the average purchase price per share may exceed the market price at the time of valuation, resulting in the acquisition of fewer shares than if the distribution had been paid in shares issued by the Fund. A pro rata portion of any applicable brokerage commissions on open market purchases will be paid by Plan participants. These commissions usually will be lower than those charged on individual transactions.
Flexible
You may change your distribution option or withdraw from the Plan at any time, should your needs or situation change. You can reinvest whether your shares are registered in your name, or in the name of a brokerage firm, bank, or other nominee. Ask your investment advisor if his or her firm will participate on your behalf. Participants whose shares are registered in the name of one firm may not be able to transfer the shares to another firm and continue to participate in the Plan. The Fund reserves the right to amend or terminate the Plan at any time. Although the Fund reserves the right to amend the Plan to include a service charge payable by the participants, there is no direct service charge to participants in the Plan at this time.
Call today to start reinvesting distributions
For more information on the Nuveen Automatic Reinvestment Plan or to enroll in or withdraw from the Plan, speak with your financial advisor or call us at (800) 257-8787.
Annual Investment Management Agreement Approval Process (Unaudited)
Nuveen Georgia Dividend Advantage Municipal Fund 2 (NKG)
Nuveen Maryland Premium Income Municipal Fund (NMY)
Nuveen Missouri Premium Income Municipal Fund (NOM)
Nuveen North Carolina Premium Income Municipal Fund (NNC)
Nuveen Virginia Premium Income Municipal Fund (NPV)
The board of trustees of each of the above-captioned Funds (collectively, the “Nuveen Fund Board”), including all of the board members who are not parties to the Funds’ advisory or sub-advisory agreements or “interested persons” of any such parties, approved the respective Fund’s existing advisory and sub-advisory agreements at an in-person meeting held on April 30, 2014. A discussion of the approval at such meeting of the advisory and sub-advisory agreements for the above-captioned Funds can be found in the annual report for such Funds for the period ended May 31, 2014.
As discussed below, the current advisory and sub-advisory agreements of Nuveen Minnesota Municipal Income Fund were approved separately by the board of trustees of the Fund existing at the time of such approval. A discussion of the approval of such Fund’s advisory and sub-advisory agreements is set forth below. The members of the Nuveen Fund Board were appointed to the board of trustees of such Fund subsequent to the approval of the Fund’s advisory arrangements.
Nuveen Minnesota Municipal Income Fund (NMS)
Board Considerations in Approving the Fund’s Investment Management and Investment Sub-Advisory Agreements
At meetings held on April 28, 2014 and June 17-18, 2014, the Fund’s Board, which is comprised entirely of Independent Trustees, considered information relating to the proposed Investment Management Agreement between the Fund and Nuveen Fund Advisors, LLC (“NFA”) and the proposed Investment Sub-Advisory Agreement between NFA and Nuveen Asset Management, LLC (“NAM”) with respect to the Fund (collectively, the “Agreements”). In connection with the evaluation of the Agreements, the Board requested and received a substantial amount of information about NFA and NAM and the services to be provided to the Fund, along with other matters believed to be relevant to its deliberations.
In considering the Agreements, the Board, advised by independent legal counsel, reviewed and considered the factors it deemed relevant, including: (1) the nature, quality and extent of the services to be provided by NFA and NAM, (2) the costs of services to be provided by NFA and NAM, (3) the performance and discount history of the predecessor funds which were sub-advised by NFA and NAM, and (4) other benefits that may accrue to NFA and NAM through their relationship with the Fund. In its deliberations, the Board did not identify any single factor which alone was responsible for the Board’s decision to approve the Agreements. Before approving the Agreements, the Board met in executive session with their independent counsel to consider the materials provided by NFA and NAM and the terms of the Agreements. Based on its evaluation of those materials, the Board concluded that the Agreements were in the interest of the Fund. In reaching its conclusions, the Board considered the following factors:
Annual Investment Management Agreement Approval Process (Unaudited) (continued)
Nature, Quality and Extent of Investment Advisory Services
The Board considered information about the nature, quality and extent of the services to be provided to the Fund under the Agreements. The Board considered that the advisory services to be provided to the Fund by NFA and NAM would be substantially similar to the advisory services provided by NFA and NAM to the predecessor funds. The Board noted that the Investment Management Agreement provides for the supervision of the Fund’s investment program, managing risks and leverage, determining dividends and distributions, providing tax advice and pricing the Fund’s securities. The Board further noted that the Investment Sub-Advisory Agreement provides that NAM shall make investment decisions, place purchase and sale orders for portfolio transactions in the Fund and employ professional portfolio managers and securities analysts to provide research services relating to the Fund.
Costs of Services to be Provided by Nuveen Fund Advisors and Nuveen Asset Management
The Board considered the proposed fund-level fee rate and the complex-level fee rate based on managed assets (i.e., the total assets of the Fund, minus the sum of its accrued liabilities (other than Fund liabilities incurred for the express purpose of creating effective leverage)), both of which include breakpoints. The Board noted that NFA had agreed to waive fees or reimburse expenses for the first two years after the closing of the mergers, so that the total annual operating expense ratio (excluding the costs of leverage) of the Fund will be equal to the lower of the total annual expense ratios (excluding the costs of leverage) of the predecessor funds for the period from the first day of the then-current fiscal year through the last day of the month prior to the consummation of the mergers, on an annualized basis.
Investment Performance
The Board considered the predecessor funds’ performance and discount history. The Board considered whether shareholders might benefit from the continuity of management and services to be provided under the Fund’s Agreements, if the mergers were approved by shareholders. The Board considered how the continuity of services provided by NFA and NAM might minimize the Fund’s trading discount in the future.
Other Benefits to Nuveen Fund Advisors and Nuveen Asset Management
In evaluating the benefits that may accrue to NFA and NAM, the Board noted that NFA and NAM served as sub-advisers to the predecessor funds and would continue in similar capacities under the Agreements.
After full consideration of these factors, the Board concluded that approval of the Agreements was in the interest of the Fund.
Board Considerations in connection with the Nuveen Change of Control Agreements
The Board noted that on April 14, 2014, TIAA-CREF entered into a Purchase and Sale Agreement to acquire Nuveen Investments, Inc. (“Nuveen Investments”) from the investor group led by Madison Dearborn Partners. According to the proposed transaction, Nuveen Investments would become a wholly-owned subsidiary of TIAA-CREF and Nuveen Investments would operate as a separate subsidiary within TIAA-CREF’s asset management business (the “Change of Control Transaction”). Therefore, at the April 28, 2014 and June 17-18, 2014 meetings, the Board, all of whom are not “interested persons” as defined in the 1940 Act, also considered whether it would be in the best interests of the Fund to approve a new investment management agreement between the Fund and NFA and a new sub-advisory agreement between NFA and NAM (each, a “Nuveen Change of Control Agreement” and collectively, the “Nuveen Change of Control Agreements”).
In connection with the evaluation of the Nuveen Change of Control Agreements, the Board requested and received a substantial amount of information about NFA and NAM and the services to be provided to the Fund, along with other matters believed to be relevant to its deliberations.
In considering the Nuveen Change of Control Agreements, the Board, advised by independent legal counsel, noted that each Nuveen Change of Control Agreement would take effect only if the closing of the Change of Control Transaction took place after the completion of the mergers. The Board reviewed and considered the factors it deemed relevant, including: (1) the nature, quality and extent of the services to be provided by NFA and NAM, (2) the costs of services to be provided by NFA and NAM, (3) the performance and discount history of the predecessor funds which were sub-advised by NFA and NAM, and (4) other benefits that may accrue to NFA and NAM through their relationship with the Fund. In its deliberations, the Board did not identify any single factor which alone was responsible for the Board’s decision to approve the Nuveen Change of Control Agreements.
Before approving the Nuveen Change of Control Agreements, the Board met in executive session with their independent counsel to consider the materials provided by NFA and NAM and the terms of the Nuveen Change of Control Agreements. Based on its evaluation of those materials, the Board concluded that the Nuveen Change of Control Agreements are fair and in the best interests of the Fund’s shareholders. In reaching its conclusions, the Board considered the following:
Nature, Quality and Extent of Investment Advisory Services
The Board considered information about the nature, quality and extent of the services to be provided to the Fund under the Nuveen Change of Control Agreements. The Board considered that the advisory services to be provided by NFA and NAM to the Fund under the applicable Nuveen Change of Control Agreement would be identical to those advisory services to be provided to the Fund under the Agreements. The Board noted that both the proposed Investment Management Agreement and Nuveen Change of Control Agreement with NFA provide that NFA’s investment advisory responsibilities include the supervision of the Fund’s investment program, managing risks and leverage, determining dividends and distributions, providing tax advice and pricing the Fund’s securities. The Board further noted that both the proposed Investment Sub-Advisory Agreement and Nuveen Change of Control Agreement with NAM provide that NAM’s investment sub-advisory responsibilities include making investment decisions, placing purchase and sale orders for portfolio transactions in the Fund and employing professional portfolio managers and securities analysts to provide research services relating to the Fund.
Costs of Services to be Provided by Nuveen Fund Advisors and Nuveen Asset Management
The Board considered that the fees to be paid to NFA and NAM under the applicable Nuveen Change of Control Agreement will be identical to the fees payable under the Agreements.
Investment Performance of the Fund
The Board considered the predecessor funds’ performance and discount history. The Board considered whether the Fund may benefit from the continuity of management and services to be provided under the Nuveen Change of Control Agreements. The Board considered how the continuity of services provided by NFA and NAM might minimize the Fund’s trading discount in the future.
Annual Investment Management Agreement Approval Process (Unaudited) (continued)
Other Benefits to Nuveen Fund Advisors and Nuveen Asset Management
In evaluating the benefits that may accrue to NFA and NAM, the Board noted that NFA and NAM are proposed to serve as adviser and sub-adviser to the Fund, respectively, and will continue in those capacities under the Nuveen Change of Control Agreements. The Board considered that each service to be provided to the Fund by NFA and NAM is pursuant to a written agreement, which the Board evaluates periodically as required by law.
After full consideration of these factors, the Board approved the Nuveen Change of Control Agreements having concluded that the Nuveen Change of Control Agreements were in the interest of the Fund and its shareholders.
Notes
| Nuveen Investments: |
| | Serving Investors for Generations |
Since 1898, financial advisors and their clients have relied on Nuveen Investments to provide dependable investment solutions through continued adherence to proven, long-term investing principles. Today, we offer a range of high quality equity and fixed-income solutions designed to be integral components of a well-diversified core portfolio.
Focused on meeting investor needs.
Nuveen Investments provides high-quality investment services designed to help secure the long-term goals of institutional and individual investors as well as the consultants and financial advisors who serve them. Nuveen Investments markets a wide range of specialized investment solutions which provide investors access to capabilities of its high-quality boutique investment affiliates—Nuveen Asset Management, Symphony Asset Management, NWQ Investment Management Company, Santa Barbara Asset Management, Tradewinds Global Investors, Winslow Capital Management and Gresham Investment Management. In total, Nuveen Investments managed approximately $229 billion as of September 30, 2014.
Find out how we can help you.
To learn more about how the products and services of Nuveen Investments may be able to help you meet your financial goals, talk to your financial advisor, or call us at (800) 257-8787. Please read the information provided carefully before you invest. Investors should consider the investment objective and policies, risk considerations, charges and expenses of any investment carefully. Where applicable, be sure to obtain a prospectus, which contains this and other relevant information. To obtain a prospectus, please contact your securities representative or Nuveen Investments, 333 W. Wacker Dr., Chicago, IL 60606. Please read the prospectus carefully before you invest or send money.
Learn more about Nuveen Funds at: www.nuveen.com/cef
Distributed by Nuveen Investments, LLC | 333 West Wacker Drive | Chicago, IL 60606 | www.nuveen.com | |
ESA-A-1114D 5383-INV-B01/16
ITEM 2. CODE OF ETHICS.
Not applicable to this filing.
ITEM 3. AUDIT COMMITTEE FINANCIAL EXPERT.
Not applicable to this filing.
ITEM 4. PRINCIPAL ACCOUNTANT FEES AND SERVICES.
Not applicable to this filing.
ITEM 5. AUDIT COMMITTEE OF LISTED REGISTRANTS.
Not applicable to this filing.
ITEM 6. SCHEDULE OF INVESTMENTS.
(a) See Portfolio of Investments in Item 1.
(b) Not applicable.
ITEM 7. DISCLOSURE OF PROXY VOTING POLICIES AND PROCEDURES FOR CLOSED-END MANAGEMENT INVESTMENT COMPANIES.
Not applicable to this filing.
ITEM 8. PORTFOLIO MANAGERS OF CLOSED-END MANAGEMENT INVESTMENT COMPANIES.
Not applicable to this filing.
ITEM 9. PURCHASES OF EQUITY SECURITIES BY CLOSED-END MANAGEMENT INVESTMENT COMPANY AND AFFILIATED PURCHASERS.
Not applicable.
ITEM 10. SUBMISSION OF MATTERS TO A VOTE OF SECURITY HOLDERS.
There have been no material changes to the procedures by which shareholders may recommend nominees to the registrant's Board implemented after the registrant last provided disclosure in response to this Item.
ITEM 11. CONTROLS AND PROCEDURES.
| (a) | The registrant's principal executive and principal financial officers, or persons performing similar functions, have concluded that the registrant's disclosure controls and procedures (as defined in Rule 30a-3(c) under the Investment Company Act of 1940, as amended (the "1940 Act") (17 CFR 270.30a-3(c))) are effective, as of a date within 90 days of the filing date of this report that includes the disclosure required by this paragraph, based on their evaluation of the controls and procedures required by Rule 30a-3(b) under the 1940 Act (17 CFR 270.30a-3(b)) and Rules 13a-15(b) or 15d-15(b) under the Securities Exchange Act of 1934, as amended (the "Exchange Act")(17 CFR 240.13a-15(b) or 240.15d-15(b)). |
| (b) | There were no changes in the registrant's internal control over financial reporting (as defined in Rule 30a-3(d) under the 1940 Act (17 CFR 270.30a-3(d)) that occurred during the second fiscal quarter of the period covered by this report that has materially affected, or is reasonably likely to materially affect, the registrant's internal control over financial reporting. |
ITEM 12. EXHIBITS.
File the exhibits listed below as part of this Form.
| (a)(1) | Any code of ethics, or amendment thereto, that is the subject of the disclosure required by Item 2, to the extent that the registrant intends to satisfy the Item 2 requirements through filing of an exhibit: Not applicable to this filing. |
| (a)(2) | A separate certification for each principal executive officer and principal financial officer of the registrant as required by Rule 30a-2(a) under the 1940 Act (17 CFR 270.30a-2(a)) in the exact form set forth below: See Ex-99.CERT attached hereto. |
| (a)(3) | Any written solicitation to purchase securities under Rule 23c-1 under the 1940 Act (17 CFR 270.23c-1) sent or given during the period covered by the report by or on behalf of the registrant to 10 or more persons: Not applicable. |
| (b) | If the report is filed under Section 13(a) or 15(d) of the Exchange Act, provide the certifications required by Rule 30a-2(b) under the 1940 Act (17 CFR 270.30a-2(b)); Rule 13a-14(b) or Rule 15d-14(b) under the Exchange Act (17 CFR 240.13a-14(b) or 240.15d-14(b)), and Section 1350 of Chapter 63 of Title 18 of the United States Code (18 U.S.C. 1350) as an exhibit. A certification furnished pursuant to this paragraph will not be deemed "filed" for purposes of Section 18 of the Exchange Act (15 U.S.C. 78r), or otherwise subject to the liability of that section. Such certification will not be deemed to be incorporated by reference into any filing under the Securities Act of 1933 or the Exchange Act, except to the extent that the registrant specifically incorporates it by reference: See Ex-99.906 CERT attached hereto. |
SIGNATURES
Pursuant to the requirements of the Securities Exchange Act of 1934 and the Investment Company Act of 1940, the registrant has duly caused this report to be signed on its behalf by the undersigned, thereunto duly authorized.
(Registrant) Nuveen Minnesota Municipal Income Fund
By (Signature and Title) /s/ Kevin J. McCarthy
Kevin J. McCarthy
Vice President and Secretary
Pursuant to the requirements of the Securities Exchange Act of 1934 and the Investment Company Act of 1940, this report has been signed below by the following persons on behalf of the registrant and in the capacities and on the dates indicated.
By (Signature and Title) /s/ Gifford R. Zimmerman
Gifford R. Zimmerman
Chief Administrative Officer
(principal executive officer)
Date: February 5, 2015
By (Signature and Title) /s/ Stephen D. Foy
Stephen D. Foy
Vice President and Controller
(principal financial officer)