Life is Complex
Nuveen makes things e-simple.
It only takes a minute to sign up for e-Reports. Once enrolled, you'll receive an e-mail as soon as your Nuveen Investments Fund information is ready—no more waiting for delivery by regular mail. Just click on the link within the e-mail to see the report and save it on your computer if you wish.
Free e-Reports right to your e-mail!
www.investordelivery.com
If you receive your Nuveen Fund dividends and statements from your financial advisor or brokerage account.
or
www.nuveen.com/accountaccess
If you receive your Nuveen Fund dividends and statements directly from Nuveen.
Table of Contents
| Chairman's Letter to Shareholders | 4 |
| | |
| Portfolio Managers' Comments | 5 |
| | |
| Fund Leverage | 9 |
| | |
| Common Share Information | 10 |
| | |
| Risk Considerations | 12 |
| | |
| Performance Overview and Holding Summaries | 14 |
| | |
| Portfolios of Investments | 20 |
| | |
| Statement of Assets and Liabilities | 63 |
| | |
| Statement of Operations | 65 |
| | |
| Statement of Changes in Net Assets | 67 |
| | |
| Statement of Cash Flows | 70 |
| | |
| Financial Highlights | 72 |
| | |
| Notes to Financial Statements | 81 |
| | |
| Additional Fund Information | 95 |
| | |
| Glossary of Terms Used in this Report | 96 |
| | |
| Reinvest Automatically, Easily and Conveniently | 98 |
Chairman's Letter to Shareholders
Dear Shareholders,
For better or for worse, the financial markets spent most of the past year waiting for the U.S. Federal Reserve (Fed) to end its accommodative monetary policy. The policy has propped up stock and bond markets since the Great Recession, but the question remains: how will markets behave without its influence? This uncertainty was a considerable source of volatility for stock and bond prices for much of 2015, despite the Fed carefully conveying its intention to raise rates slowly and only when the economy shows evidence of readiness.
As was widely expected, the long-awaited Fed rate hike materialized in mid-December. While the move was interpreted as a vote of confidence on the U.S. economy's underlying strength, the Fed emphasized that future rate increases will be gradual and guided by its ongoing assessment of financial conditions. Headwinds including rising borrowing costs, softer commodity prices, low inflation, a strong U.S. dollar and a stagnant global economy could necessitate keeping monetary conditions accommodative for longer. Meanwhile, policy makers in Europe and Japan are deploying their available tools to try to bolster their economies' fragile growth, while Chinese authorities have stepped up efforts to manage China's slowdown.
Although the new year began with a more pessimistic tone to investor sentiment and elevated volatility in the markets, we caution investors from making long-term decisions based on short-term news. In times like these, you can look to a professional investment manager with the experience and discipline to maintain the proper perspective on short-term events. And if the daily headlines do concern you, I encourage you to reach out to your financial advisor. Your financial advisor can help you evaluate your investment strategies in light of current events, your time horizon and risk tolerance.
On behalf of the other members of the Nuveen Fund Board, we look forward to continuing to earn your trust in the months and years ahead.
Sincerely,
William J. Schneider
Chairman of the Board
January 25, 2016
Portfolio Managers' Comments
Nuveen Georgia Dividend Advantage Municipal Fund 2 (NKG)
Nuveen Maryland Premium Income Municipal Fund (NMY)
Nuveen Minnesota Municipal Income Fund (NMS)
Nuveen Missouri Premium Income Municipal Fund (NOM)
Nuveen North Carolina Premium Income Municipal Fund (NNC)
Nuveen Virginia Premium Income Municipal Fund (NPV)
These Funds feature portfolio management by Nuveen Asset Management, LLC, an affiliate of Nuveen Investments, Inc. Portfolio managers Daniel J. Close, CFA, Thomas C. Spalding, CFA, Douglas J. White, CFA and Christopher L. Drahn, CFA, discuss key investment strategies and the six-month performance of these six Nuveen Funds. Dan has managed the Nuveen Georgia and North Carolina Funds since 2007. Tom assumed portfolio management responsibility for the Maryland and Virginia Funds in 2011, Doug has managed the Minnesota Fund since 1993 and Chris has managed the Missouri Fund since 2011.
What key strategies were used to manage the Funds during the six-month reporting period ended November 30, 2015?
Although anticipation of rising interest rates weighed on fixed income markets during this reporting period, favorable technical and fundamental factors helped the broad municipal market deliver a modest gain for the reporting period overall. (As was widely expected, the U.S. Federal Reserve raised its target federal funds rate at the December meeting, after the close of this reporting period.) During this reporting period, we continued to take a bottom-up approach to discovering sectors that appeared undervalued as well as individual credits that we believed had the potential to perform well over the long term.
Our trading activity continued to focus on pursuing the Funds' investment objectives. Generally speaking, throughout the six-month reporting period, the Funds maintained their overall positioning strategies in terms of duration and yield curve positioning, credit quality exposures and sector allocations. We've also continued to be more cautious in selecting individual securities. As investor demand for municipal securities has increased and created a slight supply-demand imbalance, we've started to see underwriters bring new issues to market that are structured with terms more favorable to the issuer and perhaps less advantageous to the investor than in the recent past. We believe this shift in the marketplace merits extra vigilance on our part to ensure that every credit considered for the portfolio offers adequate reward potential for the level of risk to the bondholder. In cases where our convictions have been less certain, we've sought compensation for the additional risk or have passed on the deal all together.
Certain statements in this report are forward-looking statements. Discussions of specific investments are for illustration only and are not intended as recommendations of individual investments. The forward-looking statements and other views expressed herein are those of the portfolio managers as of the date of this report. Actual future results or occurrences may differ significantly from those anticipated in any forward-looking statements, and the views expressed herein are subject to change at any time, due to numerous market and other factors. The Funds disclaim any obligation to update publicly or revise any forward-looking statements or views expressed herein.Ratings shown are the highest rating given by one of the following national rating agencies: Standard & Poor's (S&P), Moody's Investors Service, Inc. (Moody's) or Fitch, Inc. (Fitch). Credit ratings are subject to change. AAA, AA, A and BBB are investment grade ratings; BB, B, CCC, CC, C and D are below investment grade ratings. Certain bonds backed by U.S. government or agency securities are regarded as having an implied rating equal to the rating of such securities. Holdings designated N/R are not rated by these national rating agencies.
Bond insurance guarantees only the payment of principal and interest on the bond when due, and not the value of the bonds themselves, which will fluctuate with the bond market and the financial success of the issuer and the insurer. Insurance relates specifically to the bonds in the portfolio and not to the share prices of a Fund. No representation is made as to the insurers' ability to meet their commitments.
Refer to the Glossary of Terms Used in this Report for further definition of the terms used within this section.
Portfolio Managers' Comments (continued)
To keep the Funds fully invested we continued to focus on purchasing bonds in areas of the market that we expected to perform well as the economy continued to improve. Depending on the issuance and availability of bonds in each state we emphasized intermediate and longer maturities, lower rated credits and sectors offering higher yields. To fund these purchases, we generally reinvested the proceeds from called and maturing bonds. In some cases, we sold bonds that we believed had deteriorating fundamentals or could be traded for a better relative value, as well as selling short-dated, higher quality issues that we tend to hold over short timeframes as a source of liquidity.
During the reporting period, NKG bought two general obligation (GO) bonds (one state GO, one local GO), one appropriation bond and one tax-dedicated bond, all of which offered longer-dated maturities and higher credit quality. We eliminated the Georgia Fund's remaining position in Ty Cobb Regional Medical Center, a troubled credit whose price has been at a distressed level for some time.
NMY added health care credits, including bonds issued for Meritus Medical Center, a hospital outside Washington, D.C., and LifeBridge Health, which operates a group of hospitals outside Baltimore. We also continued to trim NMY's Puerto Rico exposure, as we remained concerned about the Commonwealth's fundamental outlook.
NMS bought health care, charter school and tax increment bonds in the new issue market, including HealthPartners Group in St. Paul and Fairview Health System in Minneapolis, as well as added a charter school credit from the secondary market. Although Minnesota tends to be a low issuance state, its municipal bond market saw a significant increase in supply during this reporting period.
In NOM, we purchased bonds across the ratings spectrum, with the bulk of the additions in the A and AA rated categories. A notable purchase during this reporting period was a split-rated A1/AA St. Louis University revenue bond.
NNC was a relatively active buyer during this period. We added four higher education credits (Davidson College, University of North Carolina Greensboro, Duke University and Western Carolina University), one local GO, two water and sewer bonds and one utility bond. Most of these bonds were dated in the longer end of the maturity spectrum but included some intermediate-dated credits. We also sold a multi-family housing bond due to concerns about its credit fundamentals.
NPV bought a newly issued, A rated Guam credit and a bond issued for Valley Health System in Winchester, VA, which manages hospitals in the City of Winchester, northern Virginia and West Virginia. The Virginia Fund's Puerto Rico exposure continued to decline during this reporting period, due to both selling activity and maturing bonds. NPV's transportation sector weighting also decreased over this reporting period, as a bond issued for Virginia's Route 460 project was called after the highway building project was suspended.
Additionally, in both NKG and NNC, we unwound a portfolio hedge that was managed with a credit default swap on the debt obligations of the U.S. territory of Puerto Rico. During the reporting period, these swaps had a negligible impact on performance.
As of November 30, 2015, NKG, NMY, NOM and NPV continued to use inverse floating rate securities. We employ inverse floaters for a variety of reasons, including duration management, income enhancement and total return enhancement.
How did the Funds perform during the six-month reporting period ended November 30, 2015?
The tables in each Fund's Performance Overview and Holding Summaries section of this report provide the Funds' total returns for the six-month, one-year, five-year and ten-year periods ended November 30, 2015. Each Fund's total returns at common share net asset value (NAV) are compared with the performance of corresponding market indexes and a Lipper classification average.
For the reporting period ended November 30, 2015, the total return at common share NAV for all six Funds exceeded the return for their respective state's S&P Municipal Bond Index as well as the national S&P Municipal Bond Index. For the same period, NOM outperformed the average return for the Lipper Other States Municipal Debt Funds Classification Average, while the remaining five
Funds underperformed the Lipper average. Shareholders should note that the performance of the Lipper Other States classification represents the overall average of returns for funds from ten states with a wide variety of municipal market conditions, making direct comparisons less meaningful.
The Funds' duration and yield curve positioning was generally the most meaningful contributor to relative performance over this reporting period. Generally speaking, we continued to overweight the longer parts of the yield curve with corresponding underweights to the shorter end of the curve, which resulted in longer durations than the municipal market in general. This positioning was advantageous in this reporting period as intermediate- and longer-dated bonds generally outperformed shorter-dated bonds.
Our credit and sector strategies, however, had mixed results among the six Funds. Although the Funds maintained somewhat similar credit and sector profiles, generally a bias toward lower credit quality bonds and overweight positions in higher yielding sectors such as health care and transportation, differences at the Fund and individual state levels influenced each Fund's relative results.
Credit exposures contributed positively to NMY, NMS and NPV during this reporting period. NMY and NPV's gains were driven primarily due to their exposures to lower rated tobacco settlement bonds. NMS benefited from an underweight to AAA rated credits, a category that underperformed in Minnesota, and from its overweightings in A rated and below investment grade bonds, groups which performed well. However, an underweight to AA rated bonds and our selections in BBB rated bonds somewhat detracted from NMS' relative results.
In contrast, NKG and NNC's credit quality positioning dampened relative performance during this reporting period. In NKG, an underweight allocation in A rated credits was particularly disadvantageous, as single A bonds outperformed the Georgia market. NNC was hampered by its allocation to BBB rated bonds. NOM's credit strategy had a negligible impact on relative performance in this reporting period.
The influence of sector positioning during this reporting period also varied by Fund. NKG, NMY and NPV were helped by their sector strategies. In NKG, allocations to local GOs and incremental tax bonds were positive contributors. NMY and NPV benefited from exposure to the health care and tobacco sectors, which were among the better performing sectors during the reporting period. NPV was further bolstered by its position in the transportation sector, which mainly includes holdings in toll roads and airports.
However, the sector strategies of NMS and NNC performed less favorably in this reporting period. Although NMS was aided by overweight allocations to health care and housing, and underweight allocations to dedicated tax and state GOs, the Fund's overweights to corporate-backed and utility credits along with underweights to transportation and tobacco (as Minnesota has no tobacco settlement bonds) were detrimental to relative returns. NNC held underweight positions in the public power and "other transportation" sectors, both of which outperformed in the North Carolina market during this reporting period. For NOM, sector exposures did not have a meaningful impact on relative performance in this period.
Our bottom-up approach to selecting individual credits was another factor driving the Funds' relative performance. NKG's individual credit selection detracted from relative returns over this reporting period, despite the benefit of our use of tender option bonds (TOBs), which added value as interest rates fell during the reporting period.
NMY and NPV's allocations to zero coupon bonds, which are typically in the longest end of the maturity spectrum and offer higher yields, were a positive contributor, as zero coupons bonds performed well during the reporting period. The relative gains from this exposure, as well as from the Funds' allocations to tobacco and lower rated bonds, more than compensated for negative relative results elsewhere. Specifically, both Funds were hurt by their shorter durations than the overall market and their exposure to Puerto Rico bonds, which declined during the reporting period. Additionally, NMY's holding of American Airlines common stock detracted from performance in this reporting period. The Fund received American Airlines stock when its holding of bonds issued by Puerto Rico Ports Authority for American Airlines was converted into equity as part of the merger with US Airways, which was completed in December 2013. Over time, we expect to sell these shares and reinvest the proceeds into municipal bonds.
Portfolio Managers' Comments (continued)
NMS benefited from a health care bond that was advance refunded during the period. The refunded bond's duration shortens and it moves up the quality spectrum, which enables its price to rise, providing a good gain for the Fund. In NNC, individual credit selection was marginally negative for performance as shorter-dated, high quality bonds detracted from performance, offsetting the modest gains from the Fund's longer-dated credits.
An Update Involving Puerto Rico
As noted in the Funds' previous shareholder reports, we continue to monitor situations in the broader municipal market for any impact on the Funds' holdings and performance: the ongoing economic problems of Puerto Rico is one such case. Puerto Rico's continued economic weakening, escalating debt service obligations, and long-standing inability to deliver a balanced budget led to multiple downgrades on its debt over the past two years. Puerto Rico has warned investors since 2014 that the island's debt burden may be unsustainable and the Commonwealth has been exploring various strategies to deal with this burden, including Chapter 9 bankruptcy, which is currently not available by law.
In terms of Puerto Rico holdings, shareholders should note that NMY, NOM and NPV had limited exposure to Puerto Rico debt, 5.25%, 0.54% and 4.16%, respectively, at the end of the reporting period, consisting of insured bonds. NKG, NMS, NNC did not hold any Puerto Rico bonds. The Puerto Rico credits offered higher yields, added diversification and triple exemption (i.e., exemption from most federal, state and local taxes). Puerto Rico general obligation debt is currently rated Caa2/CC/CC (below investment grade) by Moody's, S&P and Fitch, respectively, with negative outlooks.
Fund Leverage
IMPACT OF THE FUNDS' LEVERAGE STRATEGIES ON PERFORMANCE
One important factor impacting the returns of the Funds relative to their comparative benchmarks was the Funds' use of leverage through their issuance of preferred shares and/or investments in inverse floating rate securities, which represent leveraged investments in underlying bonds. The Funds use leverage because our research has shown that, over time, leveraging provides opportunities for additional income, particularly in the recent market environment where short-term market rates are at or near historical lows, meaning that the short-term rates the Fund has been paying on its leveraging instruments have been much lower than the interest the Fund has been earning on its portfolio of long-term bonds that it has bought with the proceeds of that leverage. However, use of leverage can expose the Fund to additional price volatility. When a Fund uses leverage, the Fund will experience a greater increase in its net asset value if the municipal bonds acquired through the use of leverage increase in value, but it will also experience a correspondingly larger decline in its net asset value if the bonds acquired through leverage decline in value, which will make the Fund's net asset value more volatile, and its total return performance more variable over time. In addition, income in levered funds will typically decrease in comparison to unlevered funds when short-term interest rates increase and increase when short-term interest rates decrease. Leverage had a positive impact on the performance of the Funds over the reporting period.
As of November 30, 2015, the Funds' percentages of leverage are as shown in the accompanying table.
| | | | NKG | | | NMY | | | NMS | | | NOM | | | NNC | | | NPV | |
| Effective Leverage* | | | 36.13% | | | 34.75% | | | 33.73% | | | 38.16% | | | 33.46% | | | 37.55% | |
| Regulatory Leverage* | | | 33.59% | | | 32.66% | | | 33.73% | | | 35.45% | | | 33.46% | | | 32.85% | |
| * | Effective Leverage is a Fund's effective economic leverage, and includes both regulatory leverage and the leverage effects of certain derivative and other investments in a Fund's portfolio that increase the Fund's investment exposure. Currently, the leverage effects of Tender Option Bond (TOB) inverse floater holdings are included in effective leverage values, in addition to any regulatory leverage. Regulatory leverage consists of preferred shares issued or borrowings of a Fund. Both of these are part of a Fund's capital structure. Regulatory leverage is subject to asset coverage limits set forth in the Investment Company Act of 1940. |
THE FUNDS' REGULATORY LEVERAGE
As of November 30, 2015, the Funds have issued and outstanding Variable Rate MuniFund Term Preferred (VMTP) Shares and Variable Rate Demand Preferred (VRDP) Shares as shown in the accompanying table.
| | | | VMTP Shares | | | VRDP Shares | | | | |
| | | | | | | Shares Issued at | | | | | | Shares Issued at | | | | |
| | | | Series | | | Liquidation Value | | | Series | | | Liquidation Value | | | Total | |
| NKG | | | 2017 | | $ | 75,000,000 | | | — | | | — | | $ | 75,000,000 | |
| NMY | | | 2017 | | $ | 167,000,000 | | | — | | | — | | $ | 167,000,000 | |
| NMS | | | 2017 | | $ | 44,100,000 | | | — | | | — | | $ | 44,100,000 | |
| NOM | | | 2018 | | $ | 18,000,000 | | | — | | | — | | $ | 18,000,000 | |
| NNC | | | 2017 | | $ | 125,000,000 | | | — | | | — | | $ | 125,000,000 | |
| NPV | | | — | | | — | | | 1 | | $ | 128,000,000 | | $ | 128,000,000 | |
Refer to Notes to Financial Statements, Note 4 – Fund Shares, Preferred Shares for further details on VMTP and VRDP Shares and each Fund's respective transactions.
Common Share Information
COMMON SHARE DISTRIBUTION INFORMATION
The following information regarding the Funds' distributions is current as of November 30, 2015. Each Fund's distribution levels may vary over time based on each Fund's investment activity and portfolio investments value changes.
During the current reporting period, each Fund's distributions to common shareholders were as shown in the accompanying table.
| | | | Per Common Share Amounts | |
| Ex-Dividend Date | | | NKG | | | NMY | | | NMS | | | NOM | | | NNC | | | NPV | |
| June 2015 | | $ | 0.0535 | | $ | 0.0555 | | $ | 0.0690 | | $ | 0.0610 | | $ | 0.0490 | | $ | 0.0610 | |
| July | | | 0.0535 | | | 0.0555 | | | 0.0690 | | | 0.0610 | | | 0.0490 | | | 0.0610 | |
| August | | | 0.0535 | | | 0.0555 | | | 0.0690 | | | 0.0610 | | | 0.0490 | | | 0.0610 | |
| September | | | 0.0535 | | | 0.0555 | | | 0.0665 | | | 0.0610 | | | 0.0490 | | | 0.0570 | |
| October | | | 0.0535 | | | 0.0555 | | | 0.0665 | | | 0.0610 | | | 0.0490 | | | 0.0570 | |
| November 2015 | | | 0.0535 | | | 0.0555 | | | 0.0665 | | | 0.0610 | | | 0.0490 | | | 0.0570 | |
| | | | | | | | | | | | | | | | | | | | |
| Market Yield* | | | 4.88% | | | 5.33% | | | 5.50% | | | 4.77% | | | 4.54% | | | 5.03% | |
| Taxable-Equivalent Yield* | | | 7.21% | | | 7.84% | | | 8.47% | | | 7.05% | | | 6.69% | | | 7.41% | |
| * | Market Yield is based on the Fund's current annualized monthly dividend divided by the Fund's current market price as of the end of the reporting period. Taxable-Equivalent Yield represents the yield that must be earned on a fully taxable investment in order to equal the yield of the Fund on an after-tax basis. It is based on a combined federal and state income tax rate of 32.3%, 32.0%, 35.1%, 32.3%, 32.1% and 32.1% for Georgia, Maryland, Minnesota, Missouri, North Carolina and Virginia, respectively. When comparing a Fund to investments that generate qualified dividend income, the Taxable-Equivalent Yield would be lower. |
Each Fund in this report seeks to pay regular monthly dividends out of its net investment income at a rate that reflects its past and projected net income performance. To permit each Fund to maintain a more stable monthly dividend, the Fund may pay dividends at a rate that may be more or less than the amount of net income actually earned by the Fund during the period. If a Fund has cumulatively earned more than it has paid in dividends, it will hold the excess in reserve as undistributed net investment income (UNII) as part of the Fund's net asset value. Conversely, if a Fund has cumulatively paid in dividends more than it has earned, the excess will constitute a negative UNII that will likewise be reflected in the Fund's net asset value. Each Fund will, over time, pay all its net investment income as dividends to shareholders.
As of November 30, 2015, the Funds had positive UNII balances, based upon our best estimate, for tax purposes. NKG, NMY, NMS, NOM and NPV had positive UNII balances, while NNC had a negative balance for financial reporting purposes.
All monthly dividends paid by each Fund during the current reporting period, were paid from net investment income. If a portion of the Fund's monthly distributions was sourced from or comprised of elements other than net investment income, including capital gains and/or a return of capital, shareholders would have received a notice to that effect. For financial reporting purposes, the composition and per share amounts of each Fund's dividends for the reporting period are presented in this report's Statement of Changes in Net Assets and Financial Highlights, respectively. For income tax purposes, distribution information for each Fund as of its most recent tax year end is presented in Note 6 — Income Tax Information within the Notes to Financial Statements of this report.
COMMON SHARE REPURCHASES
During August 2015, the Funds' Board of Trustees reauthorized an open-market share repurchase program, allowing each Fund to repurchase an aggregate of up to approximately 10% of its outstanding shares.
As of November 30,2015, and since the inception of the Funds' repurchase programs, the Funds have cumulatively repurchased and retired their outstanding common shares as shown in the accompanying table.
| | | NKG | | NMY | | NMS | | NOM | | NNC | | NPV | |
| Common shares cumulatively repurchased and retired | | — | | 720,000 | | — | | — | | 130,000 | | — | |
| Common shares authorized for repurchase | | 1,055,000 | | 2,350,000 | | 555,000 | | 235,000 | | 1,645,000 | | 1,795,000 | |
During the current reporting period, the following Funds repurchased and retired their common shares at a weighted average price per common share and a weighted average discount per common share as shown in the accompanying table.
| | | | NMY | | | NNC | |
| Common shares repurchased and retired | | | 215,900 | | | 22,500 | |
| Weighted average price per common share repurchased and retired | | $ | 12.33 | | $ | 12.75 | |
| Weighted average discount per common share repurchased and retired | | | 15.22 | % | | 15.01 | % |
OTHER COMMON SHARE INFORMATION
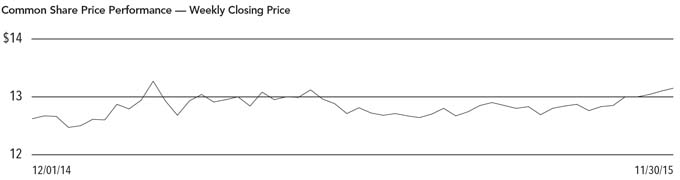
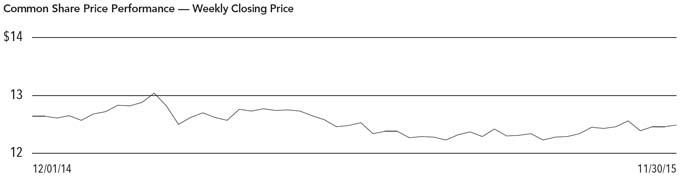
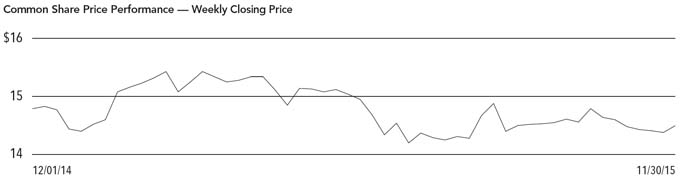
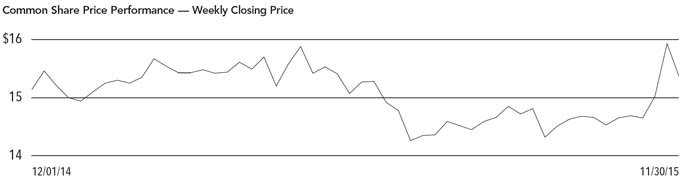
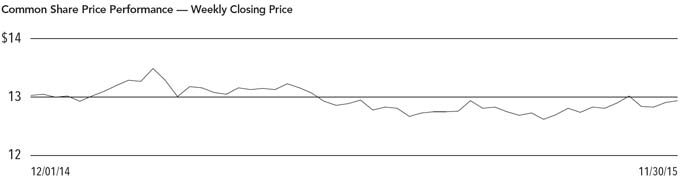
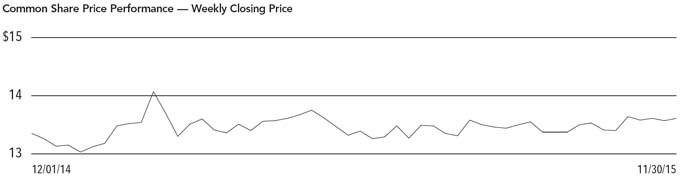
As of November 30, 2015, and during the current reporting period, the Funds' common share prices were trading at a premium/(discount) to their common share NAVs as shown in the accompanying table.
| | | | NKG | | | NMY | | | NMS | | | NOM | | | NNC | | | NPV | |
| Common share NAV | | $ | 14.06 | | $ | 14.73 | | $ | 15.55 | | $ | 14.03 | | $ | 15.14 | | $ | 14.59 | |
| Common share price | | $ | 13.15 | | $ | 12.49 | | $ | 14.50 | | $ | 15.35 | | $ | 12.94 | | $ | 13.61 | |
| Premium/(Discount) to NAV | | | (6.47 | )% | | (15.21 | )% | | (6.75 | )% | | 9.41 | % | | (14.53 | )% | | (6.72 | )% |
| 6-month average premium/(discount) to NAV | | | (7.94 | )% | | (15.20 | )% | | (6.26 | )% | | 5.93 | % | | (14.57 | )% | | (6.84 | )% |
Risk Considerations
Nuveen Georgia Dividend Advantage Municipal Fund 2 (NKG).
Investing in closed-end funds involves risk; principal loss is possible. There is no guarantee the Fund's investment objectives will be achieved. Closed-end fund shares may frequently trade at a discount or premium to their net asset value. Debt or fixed income securities such as those held by the Fund, are subject to market risk, credit risk, interest rate risk, derivatives risk, liquidity risk, and income risk. As interest rates rise, bond prices fall. Leverage increases return volatility and magnifies the Fund's potential return and its risks; there is no guarantee a fund's leverage strategy will be successful. State concentration makes the Fund more susceptible to local adverse economic, political, or regulatory changes affecting municipal bond issuers. These and other risk considerations such as inverse floater risk and tax risk are described in more detail on the Fund's web page at www.nuveen.com/NKG.
Nuveen Maryland Premium Income Municipal Fund (NMY).
Investing in closed-end funds involves risk; principal loss is possible. There is no guarantee the Fund's investment objectives will be achieved. Closed-end fund shares may frequently trade at a discount or premium to their net asset value. Debt or fixed income securities such as those held by the Fund, are subject to market risk, credit risk, interest rate risk, derivatives risk, liquidity risk, and income risk. As interest rates rise, bond prices fall. Leverage increases return volatility and magnifies the Fund's potential return and its risks; there is no guarantee a fund's leverage strategy will be successful. State concentration makes the Fund more susceptible to local adverse economic, political, or regulatory changes affecting municipal bond issuers. These and other risk considerations such as inverse floater risk and tax risk are described in more detail on the Fund's web page at www.nuveen.com/NMY.
Nuveen Minnesota Municipal Income Fund (NMS).
Investing in closed-end funds involves risk; principal loss is possible. There is no guarantee the Fund's investment objectives will be achieved. Closed-end fund shares may frequently trade at a discount or premium to their net asset value. Debt or fixed income securities such as those held by the Fund, are subject to market risk, credit risk, interest rate risk, derivatives risk, liquidity risk, and income risk. As interest rates rise, bond prices fall. Leverage increases return volatility and magnifies the Fund's potential return and its risks; there is no guarantee a fund's leverage strategy will be successful. State concentration makes the Fund more susceptible to local adverse economic, political, or regulatory changes affecting municipal bond issuers. These and other risk considerations such as inverse floater risk and tax risk are described in more detail on the Fund's web page at www.nuveen.com/NMS.
Nuveen Missouri Premium Income Municipal Fund (NOM).
Investing in closed-end funds involves risk; principal loss is possible. There is no guarantee the Fund's investment objectives will be achieved. Closed-end fund shares may frequently trade at a discount or premium to their net asset value. Debt or fixed income securities such as those held by the Fund, are subject to market risk, credit risk, interest rate risk, derivatives risk, liquidity risk, and income risk. As interest rates rise, bond prices fall. Leverage increases return volatility and magnifies the Fund's potential return and its risks; there is no guarantee a fund's leverage strategy will be successful. State concentration makes the Fund more susceptible to local adverse economic, political, or regulatory changes affecting municipal bond issuers. These and other risk considerations such as inverse floater risk and tax risk are described in more detail on the Fund's web page at www.nuveen.com/NOM.
Nuveen North Carolina Premium Income Municipal Fund (NNC).
Investing in closed-end funds involves risk; principal loss is possible. There is no guarantee the Fund's investment objectives will be achieved. Closed-end fund shares may frequently trade at a discount or premium to their net asset value. Debt or fixed income securities such as those held by the Fund, are subject to market risk, credit risk, interest rate risk, derivatives risk, liquidity risk, and income risk. As interest rates rise, bond prices fall. Leverage increases return volatility and magnifies the Fund's potential return and its risks; there is no guarantee a fund's leverage strategy will be successful. State concentration makes the Fund more susceptible to local adverse economic, political, or regulatory changes affecting municipal bond issuers. These and other risk considerations such as inverse floater risk and tax risk are described in more detail on the Fund's web page at www.nuveen.com/NNC.
Nuveen Virginia Premium Income Municipal Fund (NPV).
Investing in closed-end funds involves risk; principal loss is possible. There is no guarantee the Fund's investment objectives will be achieved. Closed-end fund shares may frequently trade at a discount or premium to their net asset value. Debt or fixed income securities such as those held by the Fund, are subject to market risk, credit risk, interest rate risk, derivatives risk, liquidity risk, and income risk. As interest rates rise, bond prices fall. Leverage increases return volatility and magnifies the Fund's potential return and its risks; there is no guarantee a fund's leverage strategy will be successful. State concentration makes the Fund more susceptible to local adverse economic, political, or regulatory changes affecting municipal bond issuers. These and other risk considerations such as inverse floater risk and tax risk are described in more detail on the Fund's web page at www.nuveen.com/NPV.
| NKG | |
| | Nuveen Georgia Dividend Advantage Municipal Fund 2 |
| | Performance Overview and Holding Summaries as of November 30, 2015 |
Refer to the Glossary of Terms Used in this Report for further definition of the terms used within this section.
Average Annual Total Returns as of November 30, 2015
| | | Cumulative | | Average Annual | |
| | | 6-Month | | 1-Year | | 5-Year | | 10-Year | |
| NKG at Common Share NAV | | 2.90% | | 4.37% | | 5.06% | | 4.70% | |
| NKG at Common Share Price | | 5.23% | | 9.77% | | 4.04% | | 5.02% | |
| S&P Municipal Bond Georgia Index | | 2.17% | | 3.01% | | 4.50% | | 4.47% | |
| S&P Municipal Bond Index | | 2.24% | | 3.14% | | 4.95% | | 4.69% | |
| Lipper Other States Municipal Debt Funds Classification Average | | 3.43% | | 4.80% | | 6.88% | | 5.48% | |
Past performance is not predictive of future results. Current performance may be higher or lower than the data shown. Returns do not reflect the deduction of taxes that shareholders may have to pay on Fund distributions or upon the sale of Fund shares. Returns at NAV are net of Fund expenses, and assume reinvestment of distributions. Comparative index and Lipper return information is provided for the Fund's shares at NAV only. Indexes and Lipper averages are not available for direct investment.
This data relates to the securities held in the Fund's portfolio of investments as of the end of the reporting period. It should not be construed as a measure of performance for the Fund itself. Holdings are subject to change.
Ratings shown are the highest rating given by one of the following national rating agencies: Standard & Poor's Group, Moody's Investors Service, Inc. or Fitch, Inc. Credit ratings are subject to change. AAA, AA, A and BBB are investment grade ratings; BB, B, CCC, CC, C and D are below-investment grade ratings. Certain bonds backed by U.S. Government or agency securities are regarded as having an implied rating equal to the rating of such securities. Holdings designated N/R are not rated by these national rating agencies.
| Fund Allocation | |
| (% of net assets) | |
| Long-Term Municipal Bonds | 150.5% |
| Other Assets Less Liabilities | 2.3% |
| Net Assets Plus Floating Rate Obligations & VMTP Shares, at Liquidation Value | 152.8% |
| Floating Rate Obligations | (2.2)% |
| VMTP Shares, at Liquidation Value | (50.6)% |
| Net Assets | 100% |
| Portfolio Composition | |
| (% of total investments) | |
| Tax Obligation/General | 23.8% |
| Tax Obligation/Limited | 17.7% |
| Water and Sewer | 11.5% |
| U.S. Guaranteed | 10.9% |
| Education and Civic Organizations | 10.7% |
| Health Care | 8.2% |
| Transportation | 7.4% |
| Utilities | 6.4% |
| Other | 3.4% |
| Total | 100% |
| Credit Quality | |
| (% of total investment exposure) | |
| AAA/U.S. Guaranteed | 22.7% |
| AA | 52.5% |
| A | 13.5% |
| BBB | 4.7% |
| BB or Lower | 1.2% |
| N/R (not rated) | 5.4% |
| Total | 100% |
| NMY | |
| | Nuveen Maryland Premium Income Municipal Fund |
| | Performance Overview and Holding Summaries as of November 30, 2015 |
Refer to the Glossary of Terms Used in this Report for further definition of the terms used within this section.
Average Annual Total Returns as of November 30, 2015
| | | Cumulative | | Average Annual | |
| | | 6-Month | | 1-Year | | 5-Year | 10-Year | |
| NMY at Common Share NAV | | 3.28% | | 4.64% | | 5.08% | 5.02% | |
| NMY at Common Share Price | | 2.39% | | 4.20% | | 2.03% | 3.79% | |
| S&P Municipal Bond Maryland Index | | 1.93% | | 2.73% | | 3.97% | 4.30% | |
| S&P Municipal Bond Index | | 2.24% | | 3.14% | | 4.95% | 4.69% | |
| Lipper Other States Municipal Debt Funds Classification Average | | 3.43% | | 4.80% | | 6.88% | 5.48% | |
Past performance is not predictive of future results. Current performance may be higher or lower than the data shown. Returns do not reflect the deduction of taxes that shareholders may have to pay on Fund distributions or upon the sale of Fund shares. Returns at NAV are net of Fund expenses, and assume reinvestment of distributions. Comparative index and Lipper return information is provided for the Fund's shares at NAV only. Indexes and Lipper averages are not available for direct investment.
This data relates to the securities held in the Fund's portfolio of investments as of the end of the reporting period. It should not be construed as a measure of performance for the Fund itself. Holdings are subject to change.
Ratings shown are the highest rating given by one of the following national rating agencies: Standard & Poor's Group, Moody's Investors Service, Inc. or Fitch, Inc. Credit ratings are subject to change. AAA, AA, A and BBB are investment grade ratings; BB, B, CCC, CC, C and D are below-investment grade ratings. Certain bonds backed by U.S. Government or agency securities are regarded as having an implied rating equal to the rating of such securities. Holdings designated N/R are not rated by these national rating agencies.
| Fund Allocation | |
| (% of net assets) | |
| Long-Term Municipal Bonds | 150.0% |
| Common Stocks | 0.5% |
| Other Assets Less Liabilities | 2.8% |
| Net Assets Plus Floating Rate Obligations & VMTP Shares, at Liquidation Value | 153.3% |
| Floating Rate Obligations | (4.8)% |
| VMTP Shares, at Liquidation Value | (48.5)% |
| Net Assets | 100% |
| Portfolio Composition | |
| (% of total investments) | |
| Health Care | 22.5% |
| U.S. Guaranteed | 15.4% |
| Tax Obligation/Limited | 12.7% |
| Tax Obligation/General | 10.5% |
| Education and Civic Organizations | 9.8% |
| Housing/Single Family | 5.7% |
| Housing/Multifamily | 4.4% |
| Other | 19.0% |
| Total | 100% |
| Credit Quality | |
| (% of total investment exposure) | |
| AAA/U.S. Guaranteed | 26.2% |
| AA | 29.7% |
| A | 18.8% |
| BBB | 16.1% |
| BB or Lower | 5.3% |
| N/R (not rated) | 3.5% |
| N/A (not applicable) | 0.4% |
| Total | 100% |
| NMS | |
| | Nuveen Minnesota Municipal Income Fund |
| | Performance Overview and Holding Summaries as of November 30, 2015 |
Refer to the Glossary of Terms Used in this Report for further definition of the terms used within this section.
Average Annual Total Returns as of November 30, 2015
| | | Cumulative | | Average Annual | |
| | | 6-Month | | 1-Year | | 5-Year | 10-Year | |
| NMS at Common Share NAV | | 3.25% | | 4.72% | | 7.65% | 6.30% | |
| NMS at Common Share Price | | (0.25)% | | 2.92% | | 4.46% | 5.58% | |
| S&P Municipal Bond Minnesota Index | | 2.09% | | 3.07% | | 4.52% | 4.66% | |
| S&P Municipal Bond Index | | 2.24% | | 3.14% | | 4.95% | 4.69% | |
| Lipper Other States Municipal Debt Funds Classification Average | | 3.43% | | 4.80% | | 6.88% | 5.48% | |
Past performance is not predictive of future results. Current performance may be higher or lower than the data shown. Returns do not reflect the deduction of taxes that shareholders may have to pay on Fund distributions or upon the sale of Fund shares. Returns at NAV are net of Fund expenses, and assume reinvestment of distributions. Comparative index and Lipper return information is provided for the Fund's shares at NAV only. Indexes and Lipper averages are not available for direct investment.
This data relates to the securities held in the Fund's portfolio of investments as of the end of the reporting period. It should not be construed as a measure of performance for the Fund itself. Holdings are subject to change.
Ratings shown are the highest rating given by one of the following national rating agencies: Standard & Poor's Group, Moody's Investors Service, Inc. or Fitch, Inc. Credit ratings are subject to change. AAA, AA, A and BBB are investment grade ratings; BB, B, CCC, CC, C and D are below-investment grade ratings. Certain bonds backed by U.S. Government or agency securities are regarded as having an implied rating equal to the rating of such securities. Holdings designated N/R are not rated by these national rating agencies.
| Fund Allocation | |
| (% of net assets) | |
| Long-Term Municipal Bonds | 148.1% |
| Other Assets Less Liabilities | 2.8% |
| Net Assets Plus VMTP Shares, at Liquidation Value | 150.9% |
| VMTP Shares, at Liquidation Value | (50.9)% |
| Net Assets | 100% |
| Portfolio Composition | |
| (% of total investments) | |
| Education and Civic Organizations | 18.3% |
| Health Care | 15.1% |
| Utilities | 12.3% |
| Long-Term Care | 10.8% |
| Tax Obligation/General | 9.1% |
| Tax Obligation/Limited | 8.8% |
| U.S. Guaranteed | 7.4% |
| Housing/Multifamily | 5.3% |
| Other | 12.9% |
| Total | 100% |
| Credit Quality | |
| (% of total investment exposure) | |
| AAA/U.S. Guaranteed | 11.4% |
| AA | 38.7% |
| A | 16.3% |
| BBB | 9.7% |
| BB or Lower | 7.1% |
| N/R (not rated) | 16.8% |
| Total | 100% |
| NOM | |
| | Nuveen Missouri Premium Income Municipal Fund |
| | Performance Overview and Holding Summaries as of November 30, 2015 |
Refer to the Glossary of Terms Used in this Report for further definition of the terms used within this section.
Average Annual Total Returns as of November 30, 2015
| | | Cumulative | | Average Annual | |
| | | 6-Month | | 1-Year | | 5-Year | 10-Year | |
| NOM at Common Share NAV | | 3.54% | | 4.14% | | 6.60% | 5.10% | |
| NOM at Common Share Price | | 3.15% | | 6.95% | | 4.36% | 3.95% | |
| S&P Municipal Bond Missouri Index | | 2.27% | | 3.22% | | 5.10% | 4.86% | |
| S&P Municipal Bond Index | | 2.24% | | 3.14% | | 4.95% | 4.69% | |
| Lipper Other States Municipal Debt Funds Classification Average | | 3.43% | | 4.80% | | 6.88% | 5.48% | |
Past performance is not predictive of future results. Current performance may be higher or lower than the data shown. Returns do not reflect the deduction of taxes that shareholders may have to pay on Fund distributions or upon the sale of Fund shares. Returns at NAV are net of Fund expenses, and assume reinvestment of distributions. Comparative index and Lipper return information is provided for the Fund's shares at NAV only. Indexes and Lipper averages are not available for direct investment.
This data relates to the securities held in the Fund's portfolio of investments as of the end of the reporting period. It should not be construed as a measure of performance for the Fund itself. Holdings are subject to change.
Ratings shown are the highest rating given by one of the following national rating agencies: Standard & Poor's Group, Moody's Investors Service, Inc. or Fitch, Inc. Credit ratings are subject to change. AAA, AA, A and BBB are investment grade ratings; BB, B, CCC, CC, C and D are below-investment grade ratings. Certain bonds backed by U.S. Government or agency securities are regarded as having an implied rating equal to the rating of such securities. Holdings designated N/R are not rated by these national rating agencies.
| Fund Allocation | |
| (% of net assets) | |
| Long-Term Municipal Bonds | 163.0% |
| Other Assets Less Liabilities | (1.3)% |
| Net Assets Plus Floating Rate Obligations & VMTP Shares, at Liquidation Value | 161.7% |
| Floating Rate Obligations | (6.8)% |
| VMTP Shares, at Liquidation Value | (54.9)% |
| Net Assets | 100% |
| Portfolio Composition | |
| (% of total investments) | |
| Health Care | 22.8% |
| Tax Obligation/Limited | 15.0% |
| Education and Civic Organizations | 14.3% |
| Utilities | 9.0% |
| Long-Term Care | 8.5% |
| Transportation | 7.8% |
| Tax Obligation/General | 7.7% |
| U.S. Guaranteed | 6.8% |
| Water and Sewer | 5.3% |
| Other | 2.8% |
| Total | 100% |
| Credit Quality | |
| (% of total investment exposure) | |
| AAA/U.S. Guaranteed | 12.2% |
| AA | 37.7% |
| A | 25.4% |
| BBB | 14.7% |
| BB or Lower | 2.3% |
| N/R (not rated) | 7.7% |
| Total | 100% |
| NNC | |
| | Nuveen North Carolina Premium Income Municipal Fund |
| | Performance Overview and Holding Summaries as of November 30, 2015 |
Refer to the Glossary of Terms Used in this Report for further definition of the terms used within this section.
Average Annual Total Returns as of November 30, 2015
| | | Cumulative | | Average Annual | |
| | | 6-Month | | 1-Year | | 5-Year | 10-Year | |
| NNC at Common Share NAV | | 3.06% | | 4.32% | | 5.49% | 5.13% | |
| NNC at Common Share Price | | 2.22% | | 4.15% | | 2.42% | 3.84% | |
| S&P Municipal Bond North Carolina Index | | 2.07% | | 2.81% | | 4.28% | 4.59% | |
| S&P Municipal Bond Index | | 2.24% | | 3.14% | | 4.95% | 4.69% | |
| Lipper Other States Municipal Debt Funds Classification Average | | 3.43% | | 4.80% | | 6.88% | 5.48% | |
Past performance is not predictive of future results. Current performance may be higher or lower than the data shown. Returns do not reflect the deduction of taxes that shareholders may have to pay on Fund distributions or upon the sale of Fund shares. Returns at NAV are net of Fund expenses, and assume reinvestment of distributions. Comparative index and Lipper return information is provided for the Fund's shares at NAV only. Indexes and Lipper averages are not available for direct investment.
This data relates to the securities held in the Fund's portfolio of investments as of the end of the reporting period. It should not be construed as a measure of performance for the Fund itself. Holdings are subject to change.
Ratings shown are the highest rating given by one of the following national rating agencies: Standard & Poor's Group, Moody's Investors Service, Inc. or Fitch, Inc. Credit ratings are subject to change. AAA, AA, A and BBB are investment grade ratings; BB, B, CCC, CC, C and D are below-investment grade ratings. Certain bonds backed by U.S. Government or agency securities are regarded as having an implied rating equal to the rating of such securities. Holdings designated N/R are not rated by these national rating agencies.
| Fund Allocation | |
| (% of net assets) | |
| Long-Term Municipal Bonds | 148.3% |
| Other Assets Less Liabilities | 2.0% |
| Net Assets Plus VMTP Shares, at Liquidation Value | 150.3% |
| VMTP Shares, at Liquidation Value | (50.3)% |
| Net Assets | 100% |
| Portfolio Composition | |
| (% of total investments) | |
| Health Care | 17.1% |
| Water and Sewer | 16.3% |
| Transportation | 15.5% |
| Education and Civic Organizations | 14.6% |
| U.S. Guaranteed | 14.5% |
| Tax Obligation/Limited | 12.6% |
| Other | 9.4% |
| Total | 100% |
| Credit Quality | |
| (% of total investment exposure) | |
| AAA/U.S. Guaranteed | 29.9% |
| AA | 52.1% |
| A | 10.6% |
| BBB | 5.6% |
| N/R (not rated) | 1.8% |
| Total | 100% |
| NPV | |
| | Nuveen Virginia Premium Income Municipal Fund |
| | Performance Overview and Holding Summaries as of November 30, 2015 |
Refer to the Glossary of Terms Used in this Report for further definition of the terms used within this section.
Average Annual Total Returns as of November 30, 2015
| | | Cumulative | | Average Annual | |
| | | 6-Month | | 1-Year | | 5-Year | | 10-Year | |
| NPV at Common Share NAV | | 3.11% | | 4.62% | | 5.40% | | 4.99% | |
| NPV at Common Share Price | | 4.33% | | 7.09% | | 3.41% | | 3.86% | |
| S&P Municipal Bond Virginia Index | | 2.33% | | 3.10% | | 4.34% | | 4.32% | |
| S&P Municipal Bond Index | | 2.24% | | 3.14% | | 4.95% | | 4.69% | |
| Lipper Other States Municipal Debt Funds Classification Average | | 3.43% | | 4.80% | | 6.88% | | 5.48% | |
Past performance is not predictive of future results. Current performance may be higher or lower than the data shown. Returns do not reflect the deduction of taxes that shareholders may have to pay on Fund distributions or upon the sale of Fund shares. Returns at NAV are net of Fund expenses, and assume reinvestment of distributions. Comparative index and Lipper return information is provided for the Fund's shares at NAV only. Indexes and Lipper averages are not available for direct investment.
This data relates to the securities held in the Fund's portfolio of investments as of the end of the reporting period. It should not be construed as a measure of performance for the Fund itself. Holdings are subject to change.
Ratings shown are the highest rating given by one of the following national rating agencies: Standard & Poor's Group, Moody's Investors Service, Inc. or Fitch, Inc. Credit ratings are subject to change. AAA, AA, A and BBB are investment grade ratings; BB, B, CCC, CC, C and D are below-investment grade ratings. Certain bonds backed by U.S. Government or agency securities are regarded as having an implied rating equal to the rating of such securities. Holdings designated N/R are not rated by these national rating agencies.
| Fund Allocation | |
| (% of net assets) | |
| Long-Term Municipal Bonds | 149.9% |
| Other Assets Less Liabilities | 2.5% |
| Net Assets Plus Floating Rate Obligations & VRDP Shares, at Liquidation Value | 152.4% |
| Floating Rate Obligations | (3.5)% |
| VRDP Shares, at Liquidation Value | (48.9)% |
| Net Assets | 100% |
| Portfolio Composition | |
| (% of total investments) | |
| Health Care | 20.2% |
| Tax Obligation/Limited | 18.7% |
| Transportation | 14.2% |
| U.S. Guaranteed | 11.1% |
| Tax Obligation/General | 6.8% |
| Water and Sewer | 6.6% |
| Education and Civic Organizations | 6.2% |
| Other | 16.2% |
| Total | 100% |
| Credit Quality | |
| (% of total investment exposure) | |
| AAA/U.S. Guaranteed | 26.6% |
| AA | 40.0% |
| A | 9.0% |
| BBB | 15.2% |
| BB or Lower | 5.3% |
| N/R (not rated) | 3.9% |
| Total | 100% |
| NKG | | |
| | Nuveen Georgia Dividend Advantage Municipal Fund 2 | |
| | Portfolio of Investments | November 30, 2015 (Unaudited) |
| | Principal | | | Optional Call | | | | | | |
| | Amount (000) | | Description (1) | Provisions (2) | | Ratings (3) | | | Value | |
| | | | LONG-TERM INVESTMENTS – 150.5% (100.0% of Total Investments) | | | | | | | |
| | | | MUNICIPAL BONDS – 150.5% (100.0% of Total Investments) | | | | | | | |
| | | | Education and Civic Organizations – 16.1% (10.7% of Total Investments) | | | | | | | |
| $ | 1,760 | | Athens Housing Authority, Georgia, Student Housing Lease Revenue Bonds, UGAREF East Campus Housing LLC Project, Series 2009, 5.250%, 6/15/35 | 6/19 at 100.00 | | Aa2 | | $ | 1,963,051 | |
| | 5,000 | | Atlanta Development Authority, Georgia, Educational Facilities Revenue Bonds, Science Park LLC Project, Series 2007, 5.000%, 7/01/39 | 7/17 at 100.00 | | Aa3 | | | 5,261,149 | |
| | 700 | | Carrollton Payroll Development Authority, Georgia, Student Housing Revenue Bonds, University of West Georgia, Series 2004A, 5.000%, 9/01/21 – SYNCORA GTY Insured | 2/16 at 100.00 | | A1 | | | 702,800 | |
| | 1,600 | | Cobb County Development Authority, Georgia, Revenue Bonds, KSU University II Real Estate Foundation, LLC Project, Series 2011, 5.000%, 7/15/41 – AGM Insured | 7/21 at 100.00 | | AA | | | 1,747,120 | |
| | 1,340 | | Douglas County Development Authority, Georgia, Charter School Revenue Bonds, Brighten Academy Project, Series 2013B, 7.000%, 10/01/43 | 10/23 at 100.00 | | N/R | | | 1,455,776 | |
| | 625 | | Fulton County Development Authority, Georgia, Revenue Bonds, Georgia Tech Foundation Technology Square Project, Refunding Series 2012A, 5.000%, 11/01/31 | 5/22 at 100.00 | | AA+ | | | 728,150 | |
| | 3,000 | | Private Colleges and Universities Authority, Georgia, Revenue Bonds, Emory University, Refunding Series 2013A, 5.000%, 10/01/43 | 10/23 at 100.00 | | AA+ | | | 3,429,600 | |
| | | | Private Colleges and Universities Authority, Georgia, Revenue Bonds, Emory University, Series 2009, Tender Option Bond Trust 2015-XF0073: | | | | | | | |
| | 730 | | 18.017%, 3/01/17 (IF) | No Opt. Call | | Aa2 | | | 1,095,190 | |
| | 1,150 | | 18.047%, 3/01/17 (IF) | No Opt. Call | | Aa2 | | | 1,695,928 | |
| | 1,325 | | Private Colleges and Universities Authority, Georgia, Revenue Bonds, Mercer University, Refunding Series 2012C, 5.250%, 10/01/30 | 10/22 at 100.00 | | Baa2 | | | 1,479,336 | |
| | 1,000 | | Private Colleges and Universities Authority, Georgia, Revenue Bonds, Mercer University, Series 2012A, 5.000%, 10/01/32 | 10/21 at 100.00 | | Baa2 | | | 1,095,650 | |
| | 3,000 | | Private Colleges and Universities Authority, Georgia, Revenue Bonds, Savannah College of Art & Design Projects, Series 2014, 5.000%, 4/01/44 | 4/24 at 100.00 | | Baa2 | | | 3,255,000 | |
| | 21,230 | | Total Education and Civic Organizations | | | | | | 23,908,750 | |
| | | | Health Care – 12.3% (8.2% of Total Investments) | | | | | | | |
| | | | Baldwin County Hospital Authority, Georgia, Revenue Bonds, Oconee Regional Medical Center, Series 1998: | | | | | | | |
| | 205 | | 5.250%, 12/01/22 | 2/16 at 100.00 | | CCC | | | 185,330 | |
| | 745 | | 5.375%, 12/01/28 | 12/15 at 100.00 | | CCC | | | 658,550 | |
| | 715 | | Coweta County Development Authority, Georgia, Revenue Bonds, Piedmont Healthcare, Inc. Project, Series 2010, 5.000%, 6/15/40 | 6/20 at 100.00 | | AA– | | | 787,408 | |
| | | | Gainesville and Hall County Hospital Authority, Georgia, Revenue Anticipation Certificates, Northeast Georgia Health Services Inc., Series 2010B: | | | | | | | |
| | 1,000 | | 5.000%, 2/15/33 | 2/20 at 100.00 | | AA– | | | 1,096,620 | |
| | 1,000 | | 5.125%, 2/15/40 | 2/20 at 100.00 | | AA– | | | 1,090,410 | |
| | 3,945 | | 5.250%, 2/15/45 | 2/41 at 100.00 | | AA– | | | 4,322,733 | |
| | 1,620 | | Greene County Development Authority, Georgia, Health System Revenue Bonds, Catholic Health East Issue, Series 2012, 5.000%, 11/15/37 | No Opt. Call | | AA | | | 1,799,528 | |
| | 2,540 | | Houston County Hospital Authority, Georgia, Revenue Bonds, Houston Healthcare Project, Series 2007, 5.250%, 10/01/35 | 10/17 at 100.00 | | A+ | | | 2,697,988 | |
| | | | Macon-Bibb County Hospital Authority, Georgia, Revenue Anticipation Certificates, Medical Center of Central Georgia Inc., Series 2009: | | | | | | | |
| | 425 | | 5.000%, 8/01/32 | 8/19 at 100.00 | | AA– | | | 466,404 | |
| | 975 | | 5.000%, 8/01/35 | 8/19 at 100.00 | | AA– | | | 1,065,295 | |
| | 1,470 | | Medical Center Hospital Authority, Georgia, Revenue Anticipation Certificates, Columbus Regional Healthcare System, Inc. Project, Series 2010, 5.000%, 8/01/21 – AGM Insured | No Opt. Call | | AA | | | 1,653,177 | |
| | Principal | | | Optional Call | | | | | | |
| | Amount (000) | | Description (1) | Provisions (2) | | Ratings (3) | | | Value | |
| | | | Health Care (continued) | | | | | | | |
| $ | 2,300 | | Valdosta and Lowndes County Hospital Authority, Georgia, Revenue Certificates, South Georgia Medical Center, Series 2007, 5.000%, 10/01/33 | 10/17 at 100.00 | | A | | $ | 2,399,314 | |
| | 16,940 | | Total Health Care | | | | | | 18,222,757 | |
| | | | Housing/Multifamily – 2.8% (1.8% of Total Investments) | | | | | | | |
| | 1,205 | | Atlanta Urban Residential Finance Authority, Georgia, Multifamily Housing Revenue Bonds, Trestletree Village Apartments, Series 2013A, 4.500%, 11/01/35 | 11/23 at 100.00 | | BBB+ | | | 1,197,119 | |
| | | | Savannah Economic Development Authority, Georgia, GNMA Collateralized Multifamily Housing Revenue Bonds, Snap I-II-III Apartments, Series 2002A: | | | | | | | |
| | 450 | | 5.150%, 11/20/22 (Alternative Minimum Tax) | 2/16 at 100.00 | | AA+ | | | 450,837 | |
| | 980 | | 5.200%, 11/20/27 (Alternative Minimum Tax) | 2/16 at 100.00 | | AA+ | | | 981,333 | |
| | 1,465 | | 5.250%, 11/20/32 (Alternative Minimum Tax) | 2/16 at 100.00 | | AA+ | | | 1,466,626 | |
| | 4,100 | | Total Housing/Multifamily | | | | | | 4,095,915 | |
| | | | Housing/Single Family – 0.7% (0.4% of Total Investments) | | | | | | | |
| | | | Georgia Housing and Finance Authority, Single Family Mortgage Bonds, Series 2006C-2: | | | | | | | |
| | 840 | | 4.500%, 12/01/27 (Alternative Minimum Tax) | 12/15 at 100.00 | | AAA | | | 840,764 | |
| | 170 | | 4.550%, 12/01/31 (Alternative Minimum Tax) | 12/15 at 100.00 | | AAA | | | 170,139 | |
| | 1,010 | | Total Housing/Single Family | | | | | | 1,010,903 | |
| | | | Industrials – 1.5% (1.0% of Total Investments) | | | | | | | |
| | 2,190 | | Cobb County Development Authority, Georgia, Solid Waste Disposal Revenue Bonds, Georgia Waste Management Project, Series 2004A, 5.000%, 4/01/33 (Alternative Minimum Tax) | 4/16 at 101.00 | | A– | | | 2,233,034 | |
| | | | Materials – 0.3% (0.2% of Total Investments) | | | | | | | |
| | 390 | | Savannah Economic Development Authority, Georgia, Pollution Control Revenue Bonds, Union Camp Corporation, Series 1995, 6.150%, 3/01/17 | No Opt. Call | | Baa2 | | | 406,840 | |
| | | | Tax Obligation/General – 35.8% (23.8% of Total Investments) | | | | | | | |
| | 2,000 | | Chatham County Hospital Authority, Georgia, Seven Mill Tax Pledge Refunding and Improvement Revenue Bonds, Memorial Health University Medical Center, Inc., Series 2012A, 5.000%, 1/01/31 | 1/22 at 100.00 | | AA | | | 2,257,720 | |
| | 1,500 | | Cherokee County Resource Recovery Development Authority, Georgia, Solid Waste Disposal Revenue Bonds, Ball Ground Recycling LLC Project, Series 2007A, 5.000%, 7/01/37 – AMBAC Insured (Alternative Minimum Tax) | 7/17 at 100.00 | | AA+ | | | 1,572,060 | |
| | 1,000 | | Clark County Hospital Authority, Georgia, Hospital Revenue Bonds, Athens Regional Medical Center, Series 2007, 5.000%, 1/01/27 – NPFG Insured | 1/17 at 100.00 | | Aa1 | | | 1,039,540 | |
| | 600 | | Clarke County Hospital Authority, Georgia, Hospital Revenue Certificates, Athens Regional Medical Center, Series 2012, 5.000%, 1/01/32 | 1/22 at 100.00 | | Aa1 | | | 672,666 | |
| | | | East Point Building Authority, Georgia, Revenue Bonds, Water & Sewer Project Series 2006A: | | | | | | | |
| | 3,000 | | 5.000%, 2/01/30 – SYNCORA GTY Insured | 2/16 at 100.00 | | N/R | | | 3,005,670 | |
| | 2,000 | | 5.000%, 2/01/34 – SYNCORA GTY Insured | 2/16 at 100.00 | | N/R | | | 2,003,300 | |
| | 1,090 | | Floyd County Hospital Authority, Georgia, Revenue Anticipation Certificates, Floyd Medical Center, Series 2003, 5.000%, 7/01/19 – NPFG Insured | 2/16 at 100.00 | | Aa2 | | | 1,094,295 | |
| | 1,135 | | Floyd County Hospital Authority, Georgia, Revenue Anticipation Certificates, Floyd Medical Center, Series 2012B, 5.000%, 7/01/23 | No Opt. Call | | Aa2 | | | 1,333,818 | |
| | 3,000 | | Forsyth County Water and Sewerage Authority, Georgia, Revenue Bonds, Refunding & Improvement Series 2015, 5.000%, 4/01/44 | 4/25 at 100.00 | | AAA | | | 3,482,640 | |
| | 3,000 | | Gainesville and Hall County Hospital Authority, Georgia, Revenue Anticipation Certificates, Northeast Georgia Health Services Inc., Series 2014A, 5.500%, 8/15/54 | 2/25 at 100.00 | | AA– | | | 3,515,070 | |
| | 4,670 | | Georgia Environmental Loan Acquisition Corporation, Local Government Loan Securitization Bonds, Loan Pool Series 2011, 5.125%, 3/15/31 | 3/21 at 100.00 | | Aaa | | | 4,943,101 | |
| | 3,500 | | Georgia State, General Obligation Bonds, Refunding Series 2009I, 5.000%, 7/01/19 | No Opt. Call | | AAA | | | 3,990,595 | |
| | 2,500 | | Georgia State, General Obligation Bonds, Series 2007E, 5.000%, 8/01/24 | 8/17 at 100.00 | | AAA | | | 2,678,025 | |
| | 1,000 | | Georgia State, General Obligation Bonds, Series 2009B, 5.000%, 1/01/26 | 1/19 at 100.00 | | AAA | | | 1,109,950 | |
| NKG | Nuveen Georgia Dividend Advantage Municipal Fund 2 | |
| | Portfolio of Investments (continued) | November 30, 2015 (Unaudited) |
| | Principal | | | Optional Call | | | | | | |
| | Amount (000) | | Description (1) | Provisions (2) | | Ratings (3) | | | Value | |
| | | | Tax Obligation/General (continued) | | | | | | | |
| $ | 3,550 | | Georgia State, General Obligation Bonds, Series 2015A, 5.000%, 2/01/28 | 2/25 at 100.00 | | AAA | | $ | 4,369,801 | |
| | 3,500 | | Gwinnett County School District, Georgia, General Obligation Bonds, Series 2013, 5.000%, 2/01/36 | 2/23 at 100.00 | | AAA | | | 4,014,045 | |
| | 1,500 | | Habersham County Hospital Authority, Georgia, Revenue Anticipation Certificates, Series 2014B, 5.000%, 2/01/37 | No Opt. Call | | Aa3 | | | 1,680,660 | |
| | 445 | | La Grange-Troup County Hospital Authority, Georgia, Revenue Anticipation Certificates, Series 2008A, 5.500%, 7/01/38 | 7/18 at 100.00 | | Aa2 | | | 484,000 | |
| | | | Liberty County Industrial Authority, Georgia, Revenue Bonds, Series 2014: | | | | | | | |
| | 302 | | 5.500%, 7/15/23 | 7/21 at 100.00 | | N/R | | | 307,337 | |
| | 601 | | 5.500%, 7/15/30 | 7/21 at 100.00 | | N/R | | | 610,674 | |
| | 659 | | 5.500%, 1/15/36 | 7/21 at 100.00 | | N/R | | | 670,210 | |
| | 3,000 | | Sandy Springs Public Facilities Authority, Georgia, Revenue Bonds, Sandy Springs City Center Project, Series 2015, 5.000%, 5/01/47 | 5/26 at 100.00 | | | | | 3,471,360 | |
| | 2,260 | | Valdosta and Lowndes County Hospital Authority, Georgia, Revenue Certificates, South Georgia Medical Center Project, Series 2011B, 5.000%, 10/01/41 | 10/21 at 100.00 | | Aa2 | | | 2,481,209 | |
| | 2,000 | | Winder-Barrow Industrial Building Authority, Georgia, Revenue Bonds, City of Winder Project, Refunding Series 2012, 5.000%, 12/01/29 – AGM Insured | 12/21 at 100.00 | | A1 | | | 2,238,060 | |
| | 47,812 | | Total Tax Obligation/General | | | | | | 53,025,806 | |
| | | | Tax Obligation/Limited – 26.6% (17.7% of Total Investments) | | | | | | | |
| | 3,250 | | Atlanta Development Authority, Georgia, Revenue Bonds, New Downtown Atlanta Stadium Project, Senior Lien Series 2015A-1, 5.250%, 7/01/44 | 7/25 at 100.00 | | Aa3 | | | 3,749,753 | |
| | | | Atlanta, Georgia, Tax Allocation Bonds Atlanta Station Project, Series 2007: | | | | | | | |
| | 110 | | 5.250%, 12/01/19 – AGC Insured | 12/17 at 100.00 | | AA | | | 117,928 | |
| | 50 | | 5.250%, 12/01/20 | No Opt. Call | | AA | | | 53,604 | |
| | 80 | | 5.250%, 12/01/21 – AGC Insured | 12/17 at 100.00 | | AA | | | 85,569 | |
| | 1,080 | | 5.000%, 12/01/23 – AGC Insured | 12/17 at 100.00 | | AA | | | 1,144,832 | |
| | 1,500 | | Atlanta, Georgia, Tax Allocation Bonds, Beltline Project Series 2008B. Remarketed, 7.375%, 1/01/31 | 1/19 at 100.00 | | A2 | | | 1,721,145 | |
| | 275 | | Atlanta, Georgia, Tax Allocation Bonds, Beltline Project Series 2008C. Remarketed, 7.500%, 1/01/31 | 1/19 at 100.00 | | A2 | | | 316,558 | |
| | 15 | | Atlanta, Georgia, Tax Allocation Bonds, Eastside Project, Series 2005A, 5.625%, 1/01/16 (Alternative Minimum Tax) | 12/15 at 100.00 | | A– | | | 15,056 | |
| | | | Atlanta, Georgia, Tax Allocation Bonds, Eastside Project, Series 2005B: | | | | | | | |
| | 2,065 | | 5.400%, 1/01/20 | 2/16 at 100.00 | | A– | | | 2,072,723 | |
| | 2,750 | | 5.600%, 1/01/30 | 2/16 at 100.00 | | A– | | | 2,759,873 | |
| | 725 | | Atlanta, Georgia, Tax Allocation Bonds, Perry Bolton Project Series 2014, 5.000%, 7/01/41 | 7/23 at 100.00 | | A– | | | 772,988 | |
| | 3,420 | | Atlanta, Georgia, Tax Allocation Bonds, Princeton Lakes Project, Series 2006, 5.500%, 1/01/31 | 1/16 at 100.00 | | BBB– | | | 3,423,111 | |
| | 1,725 | | Cobb-Marietta Coliseum and Exhibit Hall Authority, Georgia, Revenue Bonds, Performing Arts Center, Refunding Series 2013, 5.000%, 1/01/21 | No Opt. Call | | AAA | | | 2,039,985 | |
| | | | Cobb-Marietta Coliseum and Exhibit Hall Authority, Georgia, Revenue Bonds, Refunding Series 1993: | | | | | | | |
| | 250 | | 5.500%, 10/01/18 – NPFG Insured | No Opt. Call | | AA– | | | 260,878 | |
| | 5,745 | | 5.625%, 10/01/26 – NPFG Insured | 10/19 at 100.00 | | AA– | | | 6,649,492 | |
| | 405 | | Cobb-Marietta Coliseum and Exhibit Hall Authority, Georgia, Revenue Bonds, Refunding Series 2005, 5.500%, 10/01/26 – NPFG Insured | No Opt. Call | | AA– | | | 478,864 | |
| | 2,961 | | Georgia Local Governments, Certificates of Participation, Georgia Municipal Association, Series 1998A, 4.750%, 6/01/28 – NPFG Insured | No Opt. Call | | AA– | | | 3,253,340 | |
| | 750 | | Georgia Municipal Association Inc., Certificates of Participation, Atlanta Court Project, Series 2002, 5.125%, 12/01/21 – AMBAC Insured | 2/16 at 100.00 | | N/R | | | 751,568 | |
| | Principal | | | Optional Call | | | | | | |
| | Amount (000) | | Description (1) | Provisions (2) | | Ratings (3) | | | Value | |
| | | | Tax Obligation/Limited (continued) | | | | | | | |
| | | | Georgia Municipal Association Inc., Certificates of Participation, Riverdale Public Purpose Project, Series 2009: | | | | | | | |
| $ | 905 | | 5.375%, 5/01/32 – AGC Insured | 5/19 at 100.00 | | AA | | $ | 1,007,374 | |
| | 1,165 | | 5.500%, 5/01/38 – AGC Insured | 5/19 at 100.00 | | AA | | | 1,301,992 | |
| | 1,920 | | Metropolitan Atlanta Rapid Transit Authority, Georgia, Sales Tax Revenue Bonds, Refunding Series 1992P, 6.250%, 7/01/20 – AMBAC Insured | No Opt. Call | | Aa1 | | | 2,097,293 | |
| | 1,000 | | Metropolitan Atlanta Rapid Transit Authority, Georgia, Sales Tax Revenue Bonds, Third Indenture, Series 2015B, 5.000%, 7/01/41 (WI/DD, Settling 12/10/15) | 7/26 at 100.00 | | AA+ | | | 1,167,990 | |
| | 3,000 | | The Carroll City-County Hospital Authority, Georgia, Revenue Anticipation Certificates Tanner Medical Center, Inc. Project, Series 2015, 5.000%, 7/01/41 | 7/25 at 100.00 | | AA | | | 3,348,180 | |
| | 810 | | Tift County Hospital Authority, Georgia, Revenue Anticipation Certificates Series 2012, 5.000%, 12/01/38 | No Opt. Call | | Aa2 | | | 892,806 | |
| | 35,956 | | Total Tax Obligation/Limited | | | | | | 39,482,902 | |
| | | | Transportation – 11.1% (7.4% of Total Investments) | | | | | | | |
| | 2,000 | | Atlanta, Georgia, Airport General Revenue Bonds, Refunding Series 2011B, 5.000%, 1/01/30 | 1/21 at 100.00 | | AA– | | | 2,181,420 | |
| | 2,000 | | Atlanta, Georgia, Airport General Revenue Bonds, Refunding Series 2012B, 5.000%, 1/01/31 | No Opt. Call | | AA– | | | 2,266,140 | |
| | 2,810 | | Atlanta, Georgia, Airport General Revenue Bonds, Series 2012C, 5.000%, 1/01/42 (Alternative Minimum Tax) | 1/22 at 100.00 | | AA– | | | 3,023,223 | |
| | | | Atlanta, Georgia, Airport Passenger Facilities Charge and General Revenue Bonds, Refunding Subordinate Lien Series 2014A: | | | | | | | |
| | 2,575 | | 5.000%, 1/01/32 | 1/24 at 100.00 | | AA– | | | 2,946,264 | |
| | 3,750 | | 5.000%, 1/01/34 | 1/24 at 100.00 | | AA– | | | 4,261,800 | |
| | 1,500 | | Clayton County Development Authority, Georgia, Special Facilities Revenue Bonds, Delta Air Lines, Inc. Project, Series 2009A, 8.750%, 6/01/29 | 6/20 at 100.00 | | BB | | | 1,836,645 | |
| | 14,635 | | Total Transportation | | | | | | 16,515,492 | |
| | | | U.S. Guaranteed – 16.4% (10.9% of Total Investments) (4) | | | | | | | |
| | 1,375 | | Cobb County Development Authority, Georgia, Student Housing Revenue Bonds, KSU Village II Real Estate Foundation LLC Project, Senior Series 2007A, 5.250%, 7/15/38 (Pre-refunded 7/15/17) – AMBAC Insured | 7/17 at 100.00 | | N/R (4) | | | 1,472,171 | |
| | | | Coweta County Water and Sewer Authority, Georgia, Revenue Bonds, Series 2007: | | | | | | | |
| | 1,000 | | 5.000%, 6/01/32 (Pre-refunded 6/01/18) | 6/18 at 100.00 | | Aa2 (4) | | | 1,100,190 | |
| | 275 | | 5.000%, 6/01/37 (Pre-refunded 6/01/18) | 6/18 at 100.00 | | N/R (4) | | | 302,552 | |
| | 1,725 | | 5.000%, 6/01/37 (Pre-refunded 6/01/18) | 6/18 at 100.00 | | Aa2 (4) | | | 1,897,828 | |
| | 3,315 | | Decatur, Georgia, General Obligation Bonds, Series 2007, 5.000%, 1/01/31 (Pre-refunded 1/01/17) – AGM Insured | 1/17 at 100.00 | | AA+ (4) | | | 3,474,684 | |
| | 2,225 | | Douglasville-Douglas County Water and Sewer Authority, Georgia, Water and Sewerage Revenue Bonds, Series 2007, 5.000%, 6/01/37 (Pre-refunded 6/01/17) – NPFG Insured | 6/17 at 100.00 | | AA– (4) | | | 2,367,934 | |
| | 1,500 | | Forsyth County Water and Sewerage Authority, Georgia, Revenue Bonds, Series 2007, 5.000%, 4/01/37 (Pre-refunded 4/01/17) – AGM Insured | 4/17 at 100.00 | | AAA | | | 1,587,585 | |
| | | | Georgia Higher Education Facilities Authority, Revenue Bonds, USG Real Estate Foundation I LLC Project, Series 2008: | | | | | | | |
| | 25 | | 6.000%, 6/15/28 (Pre-refunded 6/15/18) | 6/18 at 100.00 | | AA (4) | | | 28,172 | |
| | 125 | | 6.000%, 6/15/28 (Pre-refunded 6/15/18) | 6/18 at 100.00 | | AA (4) | | | 140,858 | |
| | 5 | | Georgia Municipal Electric Authority, Senior Lien General Power Revenue Bonds, Series 1993Z, 5.500%, 1/01/20 – FGIC Insured (ETM) | No Opt. Call | | A+ (4) | | | 5,140 | |
| | 4,900 | | Gwinnett County School District, Georgia, General Obligation Bonds, Series 2008, 5.000%, 2/01/36 (Pre-refunded 2/01/18) (UB) | 2/18 at 100.00 | | AAA | | | 5,334,973 | |
| | 2,475 | | Paulding County School District, Georgia, General Obligation Bonds, Series 2007, 5.000%, 2/01/33 (Pre-refunded 2/01/17) | 2/17 at 100.00 | | AA+ (4) | | | 2,602,735 | |
| NKG | Nuveen Georgia Dividend Advantage Municipal Fund 2 | |
| | Portfolio of Investments (continued) | November 30, 2015 (Unaudited) |
| | Principal | | | Optional Call | | | | | | |
| | Amount (000) | | Description (1) | Provisions (2) | | Ratings (3) | | | Value | |
| | | | U.S. Guaranteed (4) (continued) | | | | | | | |
| $ | 1,000 | | Unified Government of Athens-Clarke County, Georgia, Water and Sewerage Revenue Bonds, Series 2008, 5.500%, 1/01/38 (Pre-refunded 1/01/19) | 1/19 at 100.00 | | Aa1 (4) | | $ | 1,136,570 | |
| | 1,280 | | Walton County Water and Sewerage Authority, Georgia, Revenue Bonds, The Oconee-Hard Creek Reservoir Project, Series 2008, 5.000%, 2/01/38 (Pre-refunded 2/01/18) – AGM Insured | 2/18 at 100.00 | | A2 (4) | | | 1,393,344 | |
| | 1,450 | | Wayne County Hospital Authority, Georgia, Hospital Revenue Bonds, Series 2006, 5.000%, 3/01/23 (Pre-refunded 3/01/16) – SYNCORA GTY Insured | 3/16 at 100.00 | | N/R (4) | | | 1,467,270 | |
| | 22,675 | | Total U.S. Guaranteed | | | | | | 24,312,006 | |
| | | | Utilities – 9.6% (6.4% of Total Investments) | | | | | | | |
| | 525 | | Burke County Development Authority, Georgia, Pollution Control Revenue Bonds, Georgia Power Company – Vogtle Plant, First Series 2012, 1.750%, 12/01/49 (Mandatory put 6/01/17) | No Opt. Call | | A– | | | 530,859 | |
| | 2,000 | | Georgia Municipal Electric Authority, General Power Revenue Bonds, Project 1, Series 2007A, 5.000%, 1/01/25 – NPFG Insured | 1/17 at 100.00 | | AA– | | | 2,076,440 | |
| | 3,000 | | Georgia Municipal Electric Authority, General Power Revenue Bonds, Series 2012GG, 5.000%, 1/01/43 | 1/23 at 100.00 | | A+ | | | 3,323,820 | |
| | 300 | | Georgia Municipal Electric Authority, Senior Lien General Power Revenue Bonds, Series 1993Z, 5.500%, 1/01/20 – FGIC Insured | No Opt. Call | | A+ | | | 314,418 | |
| | | | Main Street Natural Gas Inc., Georgia, Gas Project Revenue Bonds, Series 2006B: | | | | | | | |
| | 1,055 | | 5.000%, 3/15/20 | No Opt. Call | | A | | | 1,179,901 | |
| | 1,300 | | 5.000%, 3/15/21 | No Opt. Call | | A | | | 1,473,199 | |
| | 1,500 | | 5.000%, 3/15/22 | No Opt. Call | | A | | | 1,712,325 | |
| | | | Main Street Natural Gas Inc., Georgia, Gas Project Revenue Bonds, Series 2007A: | | | | | | | |
| | 350 | | 5.125%, 9/15/17 | No Opt. Call | | A | | | 373,370 | |
| | 950 | | 5.000%, 3/15/18 | No Opt. Call | | A+ | | | 1,027,748 | |
| | 2,000 | | 5.000%, 3/15/22 | No Opt. Call | | A+ | | | 2,301,920 | |
| | 12,980 | | Total Utilities | | | | | | 14,314,000 | |
| | | | Water and Sewer – 17.3% (11.5% of Total Investments) | | | | | | | |
| | 260 | | Atlanta, Georgia, Water and Wastewater Revenue Bonds, Series 2004, 5.750%, 11/01/30 – AGM Insured | No Opt. Call | | AA | | | 353,772 | |
| | 5,105 | | Cherokee County Water and Sewerage Authority, Georgia, Revenue Bonds, Series 2001, 5.000%, 8/01/35 – AGM Insured | 8/18 at 100.00 | | AA | | | 5,560,110 | |
| | 500 | | Columbus, Georgia, Water and Sewerage Revenue Bonds, Refunding Series 2014A, 5.000%, 5/01/31 | 5/24 at 100.00 | | AA | | | 581,985 | |
| | | | DeKalb County, Georgia, Water and Sewerage Revenue Bonds, Refunding Series 2006B: | | | | | | | |
| | 6,000 | | 5.250%, 10/01/32 – AGM Insured | 10/26 at 100.00 | | AA | | | 7,290,359 | |
| | 300 | | 5.000%, 10/01/35 – AGM Insured | No Opt. Call | | AA | | | 351,807 | |
| | 5,350 | | DeKalb County, Georgia, Water and Sewerage Revenue Bonds, Second Resolution Series 2011A, 5.250%, 10/01/41 | 10/21 at 100.00 | | Aa3 | | | 6,236,548 | |
| | 1,000 | | Fulton County, Georgia, Water and Sewerage Revenue Bonds, Refunding Series 2013, 5.000%, 1/01/33 | 1/23 at 100.00 | | AA– | | | 1,149,500 | |
| | 1,000 | | Milledgeville, Georgia, Water and Sewerage Revenue Refunding Bonds, Series 1996, 6.000%, 12/01/21 – AGM Insured | No Opt. Call | | AA | | | 1,144,260 | |
| | Principal | | | Optional Call | | | | | | |
| | Amount (000) | | Description (1) | Provisions (2) | | Ratings (3) | | | Value | |
| | | | Water and Sewer (continued) | | | | | | | |
| $ | 2,000 | | South Fulton Municipal Regional Water and Sewer Authority, Georgia, Revenue Bonds, Refunding Series 2014, 5.000%, 1/01/30 | 1/24 at 100.00 | | AA | | $ | 2,277,560 | |
| | 695 | | Walton County Water and Sewerage Authority, Georgia, Revenue Bonds, The Oconee-Hard Creek Reservoir Project, Series 2008, 5.000%, 2/01/38 – AGM Insured | 2/18 at 100.00 | | A2 | | | 744,074 | |
| | 22,210 | | Total Water and Sewer | | | | | | 25,689,975 | |
| $ | 202,128 | | Total Long-Term Investments (cost $210,462,174) | | | | | | 223,218,380 | |
| | | | Floating Rate Obligations – (2.2)% | | | | | | (3,245,000 | ) |
| | | | Variable Rate MuniFund Term Preferred Shares, at Liquidation Value – (50.6)% (5) | | | | | | (75,000,000 | ) |
| | | | Other Assets Less Liabilities – 2.3% | | | | | | 3,322,243 | |
| | | | Net Assets Applicable to Common Shares – 100% | | | | | $ | 148,295,623 | |
| (1) | All percentages shown in the Portfolio of Investments are based on net assets applicable to common shares unless otherwise noted. |
| (2) | Optional Call Provisions: Dates (month and year) and prices of the earliest optional call or redemption. There may be other call provisions at varying prices at later dates. Certain mortgage-backed securities may be subject to periodic principal paydowns. |
| (3) | Ratings: Using the highest of Standard & Poor's Group ("Standard & Poor's"), Moody's Investors Service, Inc. ("Moody's") or Fitch, Inc. ("Fitch") rating. Ratings below BBB by Standard & Poor's, Baa by Moody's or BBB by Fitch are considered to be below investment grade. Holdings designated N/R are not rated by any of these national rating agencies. |
| (4) | Backed by an escrow or trust containing sufficient U.S. Government or U.S. Government agency securities, which ensure the timely payment of principal and interest. Certain bonds backed by U.S. Government or agency securities are regarded as having an implied rating equal to the rating of such securities. |
| (5) | Variable Rate MuniFund Term Preferred Shares, at Liquidation Value as a percentage of Total Investments is 33.6%. |
| (ETM) | Escrowed to maturity. |
| (IF) | Inverse floating rate investment. |
| (UB) | Underlying bond of an inverse floating rate trust reflected as a financing transaction. See Notes to Financial Statements, Note 3 – Portfolio Securities and Investments in Derivatives, Inverse Floating Rate Securities for more information. |
| (WI/DD) | Investment, or portion of investment, purchased on a when-issued or delayed delivery basis. |
See accompanying notes to financial statements.
| NMY | | |
| | Nuveen Maryland Premium Income Municipal Fund | |
| | Portfolio of Investments | November 30, 2015 (Unaudited) |
| | Principal | | | Optional Call | | | | | | |
| | Amount (000) | | Description (1) | Provisions (2) | | Ratings (3) | | | Value | |
| | | | LONG-TERM INVESTMENTS – 150.5% (100.0% of Total Investments) | | | | | | | |
| | | | MUNICIPAL BONDS – 150.0% (99.6% of Total Investments) | | | | | | | |
| | | | Consumer Discretionary – 4.9% (3.2% of Total Investments) | | | | | | | |
| | | | Baltimore, Maryland, Senior Lien Convention Center Hotel Revenue Bonds, Series 2006A: | | | | | | | |
| $ | 540 | | 5.000%, 9/01/16 – SYNCORA GTY Insured | No Opt. Call | | Ba1 | | $ | 553,905 | |
| | 400 | | 5.250%, 9/01/19 – SYNCORA GTY Insured | 9/16 at 100.00 | | Ba1 | | | 409,772 | |
| | 330 | | 5.250%, 9/01/25 – SYNCORA GTY Insured | 9/16 at 100.00 | | Ba1 | | | 336,514 | |
| | 350 | | 5.250%, 9/01/27 – SYNCORA GTY Insured | 9/16 at 100.00 | | Ba1 | | | 356,776 | |
| | 535 | | 4.600%, 9/01/30 – SYNCORA GTY Insured | 9/16 at 100.00 | | Ba1 | | | 542,586 | |
| | 100 | | 5.000%, 9/01/32 – SYNCORA GTY Insured | 9/16 at 100.00 | | Ba1 | | | 101,713 | |
| | 12,165 | | 5.250%, 9/01/39 – SYNCORA GTY Insured | 9/16 at 100.00 | | Ba1 | | | 12,395,891 | |
| | 1,000 | | Baltimore, Maryland, Subordinate Lien Convention Center Hotel Revenue Bonds, Series 2006B, 5.875%, 9/01/39 | 9/16 at 100.00 | | BB | | | 1,018,890 | |
| | 2,000 | | Maryland Economic Development Corporation, Revenue Bonds, Chesapeake Bay Hyatt Conference Center, Series 2006A, 5.000%, 12/01/31 (4) | 12/16 at 100.00 | | N/R | | | 1,139,800 | |
| | 17,420 | | Total Consumer Discretionary | | | | | | 16,855,847 | |
| | | | Consumer Staples – 3.2% (2.1% of Total Investments) | | | | | | | |
| | | | Buckeye Tobacco Settlement Financing Authority, Ohio, Tobacco Settlement Asset-Backed Revenue Bonds, Senior Lien, Series 2007A-2: | | | | | | | |
| | 595 | | 5.125%, 6/01/24 | 6/17 at 100.00 | | B– | | | 533,251 | |
| | 1,445 | | 5.875%, 6/01/30 | 6/17 at 100.00 | | B– | | | 1,292,090 | |
| | 210 | | Buckeye Tobacco Settlement Financing Authority, Ohio, Tobacco Settlement Asset-Backed Revenue Bonds, Senior Lien, Series 2007A-3, 6.250%, 6/01/37 | 6/22 at 100.00 | | B– | | | 191,562 | |
| | | | Guam Economic Development & Commerce Authority, Tobacco Settlement Asset-Backed Bonds, Series 2007A: | | | | | | | |
| | 2,465 | | 5.250%, 6/01/32 | 6/17 at 100.00 | | B | | | 2,449,150 | |
| | 2,665 | | 5.625%, 6/01/47 | 6/17 at 100.00 | | B | | | 2,479,276 | |
| | 3,270 | | Puerto Rico, The Children's Trust Fund, Tobacco Settlement Asset-Backed Refunding Bonds, Series 2002, 5.500%, 5/15/39 | 2/16 at 100.00 | | BBB+ | | | 3,270,523 | |
| | 800 | | Tobacco Settlement Financing Corporation, Virgin Islands, Tobacco Settlement Asset-Backed Bonds, Series 2001, 5.000%, 5/15/31 | 5/16 at 100.00 | | A3 | | | 800,048 | |
| | 11,450 | | Total Consumer Staples | | | | | | 11,015,900 | |
| | | | Education and Civic Organizations – 14.7% (9.8% of Total Investments) | | | | | | | |
| | 2,375 | | Frederick County, Maryland, Educational Facilities Revenue Bonds, Mount Saint Mary's University, Series 2006, 5.625%, 9/01/38 | 9/16 at 100.00 | | BB+ | | | 2,385,545 | |
| | 700 | | Maryland Health and Higher Educational Facilities Authority, Revenue Bonds, Goucher College, Series 2012A, 5.000%, 7/01/34 | 7/22 at 100.00 | | A– | | | 781,760 | |
| | | | Maryland Health and Higher Educational Facilities Authority, Revenue Bonds, Johns Hopkins University, Series 2008A: | | | | | | | |
| | 2,000 | | 5.000%, 7/01/18 | No Opt. Call | | AA+ | | | 2,212,940 | |
| | 530 | | 5.250%, 7/01/38 | No Opt. Call | | AA+ | | | 578,177 | |
| | | | Maryland Health and Higher Educational Facilities Authority, Revenue Bonds, Johns Hopkins University, Series 2012A: | | | | | | | |
| | 1,145 | | 5.000%, 7/01/30 | No Opt. Call | | AA+ | | | 1,336,822 | |
| | 1,050 | | 5.000%, 7/01/37 | No Opt. Call | | AA+ | | | 1,206,083 | |
| | | | Maryland Health and Higher Educational Facilities Authority, Revenue Bonds, Johns Hopkins University, Series 2013B: | | | | | | | |
| | 500 | | 5.000%, 7/01/38 | 7/23 at 100.00 | | AA+ | | | 564,850 | |
| | 4,375 | | 4.250%, 7/01/41 | 7/23 at 100.00 | | AA+ | | | 4,648,788 | |
| | Principal | | | Optional Call | | | | | | |
| | Amount (000) | | Description (1) | Provisions (2) | | Ratings (3) | | | Value | |
| | | | Education and Civic Organizations (continued) | | | | | | | |
| $ | 1,250 | | Maryland Health and Higher Educational Facilities Authority, Revenue Bonds, Loyola University Maryland, Series 2012A, 5.000%, 10/01/39 | 10/22 at 100.00 | | A | | $ | 1,388,738 | |
| | | | Maryland Health and Higher Educational Facilities Authority, Revenue Bonds, Loyola University Maryland, Series 2014: | | | | | | | |
| | 1,250 | | 5.000%, 10/01/45 | 10/24 at 100.00 | | A | | | 1,410,650 | |
| | 1,000 | | 4.000%, 10/01/45 | 10/24 at 100.00 | | A | | | 1,026,950 | |
| | 3,500 | | Maryland Health and Higher Educational Facilities Authority, Revenue Bonds, Maryland Institute College of Art, Series 2006, 5.000%, 6/01/30 | 6/16 at 100.00 | | Baa1 | | | 3,566,850 | |
| | 1,130 | | Maryland Health and Higher Educational Facilities Authority, Revenue Bonds, Maryland Institute College of Art, Series 2007, 5.000%, 6/01/36 | 6/17 at 100.00 | | Baa1 | | | 1,159,109 | |
| | | | Maryland Health and Higher Educational Facilities Authority, Revenue Bonds, Maryland Institute College of Art, Series 2012: | | | | | | | |
| | 1,500 | | 5.000%, 6/01/34 | No Opt. Call | | Baa1 | | | 1,638,045 | |
| | 3,000 | | 5.000%, 6/01/47 | 6/22 at 100.00 | | Baa1 | | | 3,225,900 | |
| | 745 | | Maryland Health and Higher Educational Facilities Authority, Revenue Bonds, Patterson Park Public Charter School Issue, Series 2010, 6.000%, 7/01/40 | 7/20 at 100.00 | | BBB– | | | 778,585 | |
| | 625 | | Morgan State University, Maryland, Student Tuition and Fee Revenue Bonds, Academic Fees and Auxiliary Facilities, Series 2012, 5.000%, 7/01/29 | 7/22 at 100.00 | | A+ | | | 707,963 | |
| | 9,445 | | Morgan State University, Maryland, Student Tuition and Fee Revenue Refunding Bonds, Academic Fees and Auxiliary Facilities, Series 1993, 6.100%, 7/01/20 – NPFG Insured | No Opt. Call | | AA– | | | 10,484,610 | |
| | 5,920 | | University of Maryland, Auxiliary Facility and Tuition Revenue Bonds, Refunding Series 2015A, 5.000%, 4/01/16 | No Opt. Call | | AA+ | | | 6,016,436 | |
| | 265 | | University of Puerto Rico, University System Revenue Bonds, Series 2006P, 5.000%, 6/01/23 | 6/16 at 100.00 | | CC | | | 120,546 | |
| | 1,145 | | University of Puerto Rico, University System Revenue Bonds, Series 2006Q, 5.000%, 6/01/19 | 6/16 at 100.00 | | CC | | | 546,073 | |
| | | | Westminster, Maryland, Educational Facilities Revenue Bonds, McDaniel College, Series 2006: | | | | | | | |
| | 2,000 | | 5.000%, 11/01/31 | 11/16 at 100.00 | | BBB+ | | | 2,029,040 | |
| | 2,750 | | 4.500%, 11/01/36 | 11/16 at 100.00 | | BBB+ | | | 2,767,160 | |
| | 48,200 | | Total Education and Civic Organizations | | | | | | 50,581,620 | |
| | | | Health Care – 33.8% (22.5% of Total Investments) | | | | | | | |
| | | | Maryland Health and Higher Educational Facilities Authority, Maryland, Hospital Revenue Bonds, Meritus Medical Center, Series 2015: | | | | | | | |
| | 990 | | 4.000%, 7/01/32 | 7/25 at 100.00 | | BBB | | | 1,002,177 | |
| | 2,470 | | 4.250%, 7/01/35 | 7/25 at 100.00 | | BBB | | | 2,523,624 | |
| | 1,375 | | 5.000%, 7/01/45 | 7/25 at 100.00 | | BBB | | | 1,485,248 | |
| | 2,445 | | Maryland Health and Higher Educational Facilities Authority, Revenue Bonds Doctors Community Hospital, Refunding Series 2010, 5.750%, 7/01/38 | 7/20 at 100.00 | | Baa3 | | | 2,585,319 | |
| | | | Maryland Health and Higher Educational Facilities Authority, Revenue Bonds, Adventist Healthcare, Series 2011A: | | | | | | | |
| | 1,350 | | 6.250%, 1/01/31 | 1/22 at 100.00 | | Baa2 | | | 1,548,288 | |
| | 375 | | 6.125%, 1/01/36 | 1/22 at 100.00 | | Baa2 | | | 425,775 | |
| | 1,355 | | Maryland Health and Higher Educational Facilities Authority, Revenue Bonds, Anne Arundel Health System Issue, Series 2012, 5.000%, 7/01/24 | No Opt. Call | | A | | | 1,555,526 | |
| | 2,500 | | Maryland Health and Higher Educational Facilities Authority, Revenue Bonds, Anne Arundel Health System, Series 2010, 5.000%, 7/01/40 | 7/19 at 100.00 | | A | | | 2,674,000 | |
| | 2,000 | | Maryland Health and Higher Educational Facilities Authority, Revenue Bonds, Calvert Health System Issue, Series 2013, 5.000%, 7/01/38 | 7/23 at 100.00 | | A | | | 2,199,000 | |
| | | | Maryland Health and Higher Educational Facilities Authority, Revenue Bonds, Carroll Hospital Center, Series 2012A: | | | | | | | |
| | 1,000 | | 4.000%, 7/01/30 | 7/22 at 100.00 | | A1 | | | 1,028,860 | |
| | 1,775 | | 5.000%, 7/01/37 | 7/22 at 100.00 | | A1 | | | 1,912,492 | |
| | 4,050 | | Maryland Health and Higher Educational Facilities Authority, Revenue Bonds, Doctors Community Hospital, Series 2007A, 5.000%, 7/01/29 | 7/17 at 100.00 | | Baa3 | | | 4,104,351 | |
| NMY | Nuveen Maryland Premium Income Municipal Fund | |
| | Portfolio of Investments (continued) | November 30, 2015 (Unaudited) |
| | Principal | | | Optional Call | | | | | | |
| | Amount (000) | | Description (1) | Provisions (2) | | Ratings (3) | | | Value | |
| | | | Health Care (continued) | | | | | | | |
| $ | 4,335 | | Maryland Health and Higher Educational Facilities Authority, Revenue Bonds, Frederick Memorial Hospital Issue, Series 2012A, 4.250%, 7/01/32 | No Opt. Call | | Baa1 | | $ | 4,489,803 | |
| | 2,500 | | Maryland Health and Higher Educational Facilities Authority, Revenue Bonds, Johns Hopkins Health System Issue, Series 2015A, 4.000%, 5/15/40 | 5/25 at 100.00 | | AA– | | | 2,561,375 | |
| | 4,450 | | Maryland Health and Higher Educational Facilities Authority, Revenue Bonds, Johns Hopkins Health System Obligated Group Issue, Series 2010, 5.000%, 5/15/40 | 5/20 at 100.00 | | AA– | | | 4,875,198 | |
| | | | Maryland Health and Higher Educational Facilities Authority, Revenue Bonds, Johns Hopkins Health System Obligated Group Issue, Series 2011A: | | | | | | | |
| | 500 | | 5.000%, 5/15/25 | 5/21 at 100.00 | | AA– | | | 574,495 | |
| | 500 | | 5.000%, 5/15/26 | 5/21 at 100.00 | | AA– | | | 570,540 | |
| | 1,685 | | Maryland Health and Higher Educational Facilities Authority, Revenue Bonds, LifeBridge Health System, Series 2008, 5.000%, 7/01/28 – AGM Insured | 7/17 at 100.00 | | AA | | | 1,766,200 | |
| | | | Maryland Health and Higher Educational Facilities Authority, Revenue Bonds, LifeBridge Health System, Series 2011: | | | | | | | |
| | 500 | | 5.750%, 7/01/31 | No Opt. Call | | A+ | | | 571,185 | |
| | 1,000 | | 6.000%, 7/01/41 | 7/21 at 100.00 | | A+ | | | 1,157,940 | |
| | | | Maryland Health and Higher Educational Facilities Authority, Revenue Bonds, LifeBridge Health System, Series 2015: | | | | | | | |
| | 1,500 | | 4.000%, 7/01/35 | 7/25 at 100.00 | | A+ | | | 1,528,110 | |
| | 1,125 | | 5.000%, 7/01/40 | 7/25 at 100.00 | | A+ | | | 1,251,214 | |
| | 2,975 | | 4.125%, 7/01/47 | 7/25 at 100.00 | | A+ | | | 3,012,277 | |
| | 2,500 | | Maryland Health and Higher Educational Facilities Authority, Revenue Bonds, MedStar Health Issue, Series 2015, 5.000%, 8/15/38 | 2/25 at 100.00 | | A2 | | | 2,793,950 | |
| | | | Maryland Health and Higher Educational Facilities Authority, Revenue Bonds, Mercy Medical Center Project, Series 2007A: | | | | | | | |
| | 2,375 | | 5.000%, 7/01/37 | 7/17 at 100.00 | | BBB | | | 2,470,499 | |
| | 2,905 | | 5.500%, 7/01/42 | 7/17 at 100.00 | | BBB | | | 3,047,055 | |
| | 2,850 | | Maryland Health and Higher Educational Facilities Authority, Revenue Bonds, Mercy Medical Center, Series 2011, 5.000%, 7/01/31 | 7/22 at 100.00 | | BBB | | | 3,041,549 | |
| | | | Maryland Health and Higher Educational Facilities Authority, Revenue Bonds, Peninsula Regional Medical Center Issue, Series 2015: | | | | | | | |
| | 1,185 | | 5.000%, 7/01/39 | 7/24 at 100.00 | | A | | | 1,308,868 | |
| | 4,000 | | 5.000%, 7/01/45 | 7/24 at 100.00 | | A | | | 4,393,280 | |
| | | | Maryland Health and Higher Educational Facilities Authority, Revenue Bonds, University of Maryland Medical System Issue, Series 2013A: | | | | | | | |
| | 11,500 | | 5.000%, 7/01/43 | 7/22 at 100.00 | | A2 | | | 12,595,029 | |
| | 4,665 | | 4.000%, 7/01/43 | 7/22 at 100.00 | | A2 | | | 4,731,010 | |
| | 1,000 | | Maryland Health and Higher Educational Facilities Authority, Revenue Bonds, University of Maryland Medical System Issue, Series 2015, 5.000%, 7/01/35 | 7/25 at 100.00 | | A2 | | | 1,116,490 | |
| | 4,155 | | Maryland Health and Higher Educational Facilities Authority, Revenue Bonds, University of Maryland Medical System, Series 2010, 5.125%, 7/01/39 | 7/19 at 100.00 | | A2 | | | 4,466,168 | |
| | 12,250 | | Maryland Health and Higher Educational Facilities Authority, Revenue Bonds, Western Maryland Health, Series 2014, 5.250%, 7/01/34 | 7/24 at 100.00 | | BBB | | | 13,813,100 | |
| | 8,000 | | Montgomery County, Maryland, Revenue Bonds, Trinity Health Credit Group, Refunding Series 2011MD, 5.000%, 12/01/40 | 12/21 at 100.00 | | AA | | | 8,872,960 | |
| | | | Montgomery County, Maryland, Revenue Bonds, Trinity Health Credit Group, Series 2015: | | | | | | | |
| | 2,000 | | 5.000%, 12/01/44 | 6/25 at 100.00 | | AA | | | 2,247,620 | |
| | 6,000 | | 4.000%, 12/01/44 | 6/25 at 100.00 | | AA | | | 6,157,620 | |
| | 108,140 | | Total Health Care | | | | | | 116,458,195 | |
| | Principal | | | Optional Call | | | | | | |
| | Amount (000) | | Description (1) | Provisions (2) | | Ratings (3) | | | Value | |
| | | | Housing/Multifamily – 6.7% (4.4% of Total Investments) | | | | | | | |
| $ | 2,000 | | Anne Arundel County, Maryland, FNMA Multifamily Housing Revenue Bonds, Glenview Gardens Apartments Project, Series 2009, 5.000%, 1/01/28 (Mandatory put 1/01/27) | 1/20 at 102.00 | | AA+ | | $ | 2,167,920 | |
| | | | Howard County Housing Commission, Maryland, Revenue Bonds, Columbia Commons Apartments, Series 2014A: | | | | | | | |
| | 1,500 | | 4.000%, 6/01/34 | 6/24 at 100.00 | | A+ | | | 1,546,935 | |
| | 1,550 | | 5.000%, 6/01/44 | 6/24 at 100.00 | | A+ | | | 1,672,388 | |
| | | | Howard County Housing Commission, Maryland, Revenue Bonds, The Verona at Oakland Mills Project, Series 2013: | | | | | | | |
| | 3,000 | | 5.000%, 10/01/28 | 10/23 at 100.00 | | A+ | | | 3,396,510 | |
| | 2,000 | | 4.625%, 10/01/28 | 10/23 at 100.00 | | A+ | | | 2,194,980 | |
| | 2,110 | | Maryland Community Development Administration, Multifamily Housing Revenue Bonds, Princess Anne Apartments, Series 2001D, 5.450%, 12/15/33 (Alternative Minimum Tax) | 12/15 at 100.00 | | Aaa | | | 2,112,616 | |
| | 495 | | Maryland Economic Development Corporation, Senior Lien Student Housing Revenue Bonds, University of Maryland – Baltimore Project, Refunding Series 2015, 5.000%, 7/01/39 | 7/25 at 100.00 | | BBB– | | | 525,215 | |
| | | | Maryland Economic Development Corporation, Student Housing Revenue Bonds, Salisbury University Project, Refunding Series 2013: | | | | | | | |
| | 500 | | 5.000%, 6/01/27 | 6/23 at 100.00 | | Baa3 | | | 546,270 | |
| | 500 | | 5.000%, 6/01/34 | 6/23 at 100.00 | | Baa3 | | | 532,715 | |
| | 1,500 | | Maryland Economic Development Corporation, Student Housing Revenue Bonds, Sheppard Pratt University Village, Series 2012, 5.000%, 7/01/33 | No Opt. Call | | BBB– | | | 1,610,295 | |
| | 5,115 | | Maryland Economic Development Corporation, Student Housing Revenue Refunding Bonds, University of Maryland College Park Projects, Series 2006, 5.000%, 6/01/33 – CIFG Insured | 6/16 at 100.00 | | AA | | | 5,204,564 | |
| | 1,500 | | Montgomery County Housing Opportunities Commission, Maryland, Multifamily Housing Development Bonds, Series 2014A, 3.875%, 7/01/39 | 7/24 at 100.00 | | Aaa | | | 1,509,225 | |
| | 21,770 | | Total Housing/Multifamily | | | | | | 23,019,633 | |
| | | | Housing/Single Family – 8.6% (5.7% of Total Investments) | | | | | | | |
| | 3,000 | | Maryland Community Development Administration Department of Housing and Community Development,Residential Revenue Bonds, Series 2009B, 4.750%, 9/01/39 | 9/18 at 100.00 | | Aa2 | | | 3,074,460 | |
| | 2,365 | | Maryland Community Development Administration Department of Housing and Community Development, Residential Revenue Bonds, Series 2014A, 4.300%, 9/01/32 | 9/23 at 100.00 | | Aa2 | | | 2,497,322 | |
| | | | Maryland Community Development Administration Department of Housing and Community Development, Residential Revenue Bonds, Series 2014C: | | | | | | | |
| | 3,000 | | 3.400%, 3/01/31 | 3/24 at 100.00 | | Aa2 | | | 3,021,420 | |
| | 1,165 | | 3.750%, 3/01/39 | 3/24 at 100.00 | | Aa2 | | | 1,168,239 | |
| | 1,000 | | Maryland Community Development Administration Department of Housing and Community Development, Residential Revenue Bonds, Series 2014I, 3.450%, 12/15/31 | 12/24 at 100.00 | | Aaa | | | 1,019,480 | |
| | 1,500 | | Maryland Community Development Administration Department of Housing and Community Development, Residential Revenue Bonds, Series 2015A, 3.800%, 9/01/35 (WI/DD, Settling 12/03/15) | 9/25 at 100.00 | | Aa2 | | | 1,519,470 | |
| | 1,800 | | Maryland Community Development Administration, Department of Housing and Community Development, Residential Revenue Bonds, Series 2006B, 4.750%, 9/01/25 (Alternative Minimum Tax) (UB) (5) | 1/16 at 100.00 | | Aa2 | | | 1,802,322 | |
| | 6,915 | | Maryland Community Development Administration, Department of Housing and Community Development, Residential Revenue Bonds, Series 2006I, 4.875%, 9/01/26 (Alternative Minimum Tax) (UB) (5) | 3/16 at 100.00 | | Aa2 | | | 6,942,315 | |
| | 4,075 | | Maryland Community Development Administration, Department of Housing and Community Development, Residential Revenue Bonds, Series 2006L, 4.900%, 9/01/31 (Alternative Minimum Tax) (UB) (5) | 9/16 at 100.00 | | Aa2 | | | 4,110,207 | |
| | 2,820 | | Maryland Community Development Administration, Department of Housing and Community Development, Residential Revenue Bonds, Series 2007D, 4.850%, 9/01/37 (Alternative Minimum Tax) (UB) (5) | 3/17 at 100.00 | | Aa2 | | | 2,851,076 | |
| NMY | Nuveen Maryland Premium Income Municipal Fund | |
| | Portfolio of Investments (continued) | November 30, 2015 (Unaudited) |
| | Principal | | | Optional Call | | | | | | |
| | Amount (000) | | Description (1) | Provisions (2) | | Ratings (3) | | | Value | |
| | | | Housing/Single Family (continued) | | | | | | | |
| $ | 1,500 | | Maryland Community Development Administration, Department of Housing and Community Development, Residential Revenue Bonds, Series 2007H, 5.000%, 9/01/27 (Alternative Minimum Tax) (UB) (5) | 3/17 at 100.00 | | Aa2 | | $ | 1,533,914 | |
| | 29,140 | | Total Housing/Single Family | | | | | | 29,540,225 | |
| | | | Industrials – 2.9% (1.9% of Total Investments) | | | | | | | |
| | 5,895 | | Maryland Economic Development Corporation, Economic Development Revenue Bonds, Transportation 6/20 at 100.00 Facilities Project, Series 2010A, 5.750%, 6/01/35 | | | Baa3 | | | 6,442,351 | |
| | 3,340 | | Maryland Economic Development Corporation, Solid Waste Disposal Revenue Bonds, Waste Management Inc., Series 2002, 4.600%, 4/01/16 (Alternative Minimum Tax) | No Opt. Call | | A– | | | 3,383,153 | |
| | 9,235 | | Total Industrials | | | | | | 9,825,504 | |
| | | | Long-Term Care – 6.0% (4.0% of Total Investments) | | | | | | | |
| | 5,215 | | Baltimore County, Maryland, Revenue Bonds, Oak Crest Village, Series 2007A, 5.000%, 1/01/37 | 1/17 at 100.00 | | A | | | 5,359,402 | |
| | 2,050 | | Gaithersburg, Maryland, Economic Development Revenue Bonds, Asbury Methodist Homes Inc., Series 2009B, 6.000%, 1/01/23 | 1/20 at 100.00 | | BBB | | | 2,286,037 | |
| | | | Maryland Health and Higher Educational Facilities Authority, Revenue Bonds, Charlestown Community Issue, Series 2010: | | | | | | | |
| | 1,685 | | 6.125%, 1/01/30 | 1/21 at 100.00 | | A | | | 1,879,820 | |
| | 5,060 | | 6.250%, 1/01/45 | 1/21 at 100.00 | | A | | | 5,624,543 | |
| | | | Maryland Health and Higher Educational Facilities Authority, Revenue Bonds, King Farm Presbyterian Community, Series 2007A: | | | | | | | |
| | 410 | | 5.000%, 1/01/17 | No Opt. Call | | N/R | | | 421,218 | |
| | 1,460 | | 5.250%, 1/01/27 | 1/17 at 100.00 | | N/R | | | 1,489,302 | |
| | 1,050 | | 5.300%, 1/01/37 | 1/17 at 100.00 | | N/R | | | 1,067,126 | |
| | 2,480 | | Maryland Health and Higher Educational Facilities Authority, Revenue Bonds, Mercy Ridge Retirement Community, Series 2007, 4.750%, 7/01/34 | 7/17 at 100.00 | | A– | | | 2,520,647 | |
| | 19,410 | | Total Long-Term Care | | | | | | 20,648,095 | |
| | | | Tax Obligation/General – 15.9% (10.5% of Total Investments) | | | | | | | |
| | 685 | | Anne Arundel County, Maryland, General Obligation Bonds, Consolidated Water & Sewer, Refunding Series 2006, 5.000%, 3/01/17 | 3/16 at 100.00 | | AAA | | | 693,371 | |
| | | | Baltimore, Maryland, General Obligation Bonds, Consolidated Public Improvements, Series 2011A: | | | | | | | |
| | 1,000 | | 5.000%, 10/15/29 | 10/21 at 100.00 | | AA | | | 1,165,340 | |
| | 1,200 | | 5.000%, 10/15/30 | 10/21 at 100.00 | | AA | | | 1,406,304 | |
| | 805 | | Charles County, Maryland, General Obligation Bonds, Consolidated Public Improvement, Series 2006, 5.000%, 3/01/16 | No Opt. Call | | AAA | | | 814,918 | |
| | 5,240 | | Huntington Beach Union High School District, Orange County, California, General Obligation Bonds, Series 2005, 0.000%, 8/01/30 – AGM Insured | No Opt. Call | | AA | | | 3,124,925 | |
| | 2,305 | | Maryland National Capital Park Planning Commission, Prince George's County, General Obligation Bonds, Park Acquisition and Development, Series 2004EE-2, 5.000%, 1/15/17 | 2/16 at 100.00 | | AAA | | | 2,314,404 | |
| | 1,000 | | Maryland State, General Obligation Bonds, State & Local Facilities Loan, First Series 2009C, 5.000%, 3/01/16 | No Opt. Call | | AAA | | | 1,012,230 | |
| | 1,000 | | Maryland State, General Obligation Bonds, State & Local Facilities Loan, First Series 2011B, 5.000%, 3/15/17 | No Opt. Call | | AAA | | | 1,058,280 | |
| | 1,895 | | Maryland State, General Obligation Bonds, State & Local Facilities Loan, Second Series 2009A, 3.000%, 8/15/17 | No Opt. Call | | AAA | | | 1,971,198 | |
| | | | Maryland State, General Obligation Bonds, State & Local Facilities Loan, Second Series 2009B: | | | | | | | |
| | 4,925 | | 5.250%, 8/15/16 | No Opt. Call | | AAA | | | 5,098,360 | |
| | 3,750 | | 5.250%, 8/15/17 | No Opt. Call | | AAA | | | 4,043,925 | |
| | 2,800 | | Montgomery County, Maryland, General Obligation Bonds, Consolidated Public Improvement Series 2006A, 5.000%, 5/01/16 | No Opt. Call | | AAA | | | 2,856,308 | |
| | 4,930 | | Patterson Joint Unified School District, Stanislaus County, California, General Obligation Bonds, 2008 Election Series 2009B, 0.000%, 8/01/42 – AGM Insured | No Opt. Call | | AA | | | 1,568,726 | |
| | Principal | | | Optional Call | | | | | | |
| | Amount (000) | | Description (1) | Provisions (2) | | Ratings (3) | | | Value | |
| | | | Tax Obligation/General (continued) | | | | | | | |
| | | | Prince George's County, Maryland, General Obligation Consolidated Public Improvement Bonds, Series 2014A: | | | | | | | |
| $ | 3,000 | | 4.000%, 9/01/30 | 9/24 at 100.00 | | AAA | | $ | 3,319,380 | |
| | 3,000 | | 4.000%, 9/01/31 | 9/24 at 100.00 | | AAA | | | 3,294,750 | |
| | 2,155 | | Puerto Rico, General Obligation Bonds, Public Improvement Refunding Series 2007A, 5.500%, 7/01/20 – NPFG Insured | No Opt. Call | | AA– | | | 2,196,354 | |
| | 2,270 | | Puerto Rico, General Obligation Bonds, Public Improvement Series 2002A, 5.500%, 7/01/20 – NPFG Insured | No Opt. Call | | AA– | | | 2,313,561 | |
| | 14,985 | | San Ysidro School District, San Diego County, California, General Obligation Bonds, 1997 Election Series 2012G, 0.000%, 8/01/40 – AGM Insured | No Opt. Call | | AA | | | 5,102,541 | |
| | 1,025 | | Washington Suburban Sanitary District, Montgomery and Prince George's Counties, Maryland, General Obligation Bonds, Consolidated Public Improvement, Refunding Series 2009, 5.000%, 6/01/17 | No Opt. Call | | AAA | | | 1,092,958 | |
| | 2,700 | | Washington Suburban Sanitary District, Montgomery and Prince George's Counties, Maryland, General Obligation Bonds, Consolidated Public Improvement, Refunding Series 2013, 4.000%, 6/01/17 | No Opt. Call | | AAA | | | 2,838,645 | |
| | 2,500 | | Washington Suburban Sanitary District, Montgomery and Prince George's Counties, Maryland, General Obligation Bonds, Consolidated Public Improvement, Series 2010A, 5.000%, 6/01/16 | No Opt. Call | | AAA | | | 2,560,025 | |
| | 3,000 | | Washington Suburban Sanitary District, Montgomery and Prince George's Counties, Maryland, General Obligation Bonds, Consolidated Public Improvement, Series 2012, 5.000%, 6/01/16 | No Opt. Call | | AAA | | | 3,072,030 | |
| | 7,000 | | Wylie Independent School District, Collin County, Texas, General Obligation Bonds, Capital Appreciation Series 2015, 0.000%, 8/15/50 | 8/25 at 35.55 | | Aaa | | | 1,682,450 | |
| | 73,170 | | Total Tax Obligation/General | | | | | | 54,600,983 | |
| | | | Tax Obligation/Limited – 19.1% (12.7% of Total Investments) | | | | | | | |
| | 990 | | Anne Arundel County, Maryland, Special Obligation Bonds, National Business Park – North Project, Series 2010, 6.100%, 7/01/40 | 7/18 at 102.00 | | N/R | | | 1,048,133 | |
| | 1,200 | | Anne Arundel County, Maryland, Special Tax District Revenue Bonds, Villages of Dorchester & Farmington Village Projects, Series 2013, 5.000%, 7/01/32 | 7/23 at 100.00 | | A+ | | | 1,365,216 | |
| | 120 | | Baltimore, Maryland, Revenue Refunding Bonds, Convention Center, Series 1998, 5.000%, 9/01/19 – NPFG Insured | 3/16 at 100.00 | | AA– | | | 120,462 | |
| | | | Baltimore, Maryland, Special Obligation Bonds, Consolidated Tax Increment Financing, Series 2015: | | | | | | | |
| | 525 | | 5.000%, 6/15/30 | 6/24 at 100.00 | | BBB+ | | | 581,884 | |
| | 425 | | 5.000%, 6/15/33 | 6/24 at 100.00 | | BBB+ | | | 466,773 | |
| | | | Frederick County, Maryland, Lake Linganore Village Community Development Special Obligation Bonds, Series 2001A: | | | | | | | |
| | 85 | | 5.600%, 7/01/20 – RAAI Insured | 7/16 at 100.00 | | AA | | | 85,336 | |
| | 450 | | 5.700%, 7/01/29 – RAAI Insured | 7/16 at 100.00 | | AA | | | 451,814 | |
| | | | Fredrick County, Maryland, Special Obligation Bonds, Urbana Community Development Authority, Series 2010A: | | | | | | | |
| | 5,350 | | 5.000%, 7/01/30 | 7/20 at 100.00 | | A– | | | 5,992,588 | |
| | 2,355 | | 5.000%, 7/01/40 | 7/20 at 100.00 | | A– | | | 2,628,745 | |
| | 1,000 | | Government of Guam, Business Privilege Tax Bonds, Series 2011A, 5.250%, 1/01/36 | 1/22 at 100.00 | | A | | | 1,102,060 | |
| | 1,260 | | Huntington Beach Union High School District, Orange County, California, Certificates of Participation, Capital Project, Series 2007, 0.000%,
9/01/35 – AGM Insured | No Opt. Call | | AA | | | 535,928 | |
| | 2,050 | | Hyattsville, Maryland, Special Obligation Bonds, University Town Center Project, Series 2004, 5.750%, 7/01/34 | 7/16 at 100.00 | | N/R | | | 2,068,594 | |
| | 11,750 | | Maryland Department of Transportation, County Transportation Revenue Bonds, Series 2002, 5.500%, 2/01/16 | No Opt. Call | | AAA | | | 11,856,572 | |
| | 2,000 | | New Jersey Transportation Trust Fund Authority, Transportation System Bonds, Series 2009A, 0.000%, 12/15/32 | No Opt. Call | | A– | | | 826,280 | |
| NMY | Nuveen Maryland Premium Income Municipal Fund | |
| | Portfolio of Investments (continued) | November 30, 2015 (Unaudited) |
| | Principal | | | Optional Call | | | | | | |
| | Amount (000) | | Description (1) | Provisions (2) | | Ratings (3) | | | Value | |
| | | | Tax Obligation/Limited (continued) | | | | | | | |
| $ | 6,650 | | Prince George's County, Maryland, Special Obligation Bonds, National Harbor Project, Series 2005, 5.200%, 7/01/34 | 2/16 at 100.00 | | N/R | | $ | 6,654,988 | |
| | 1,406 | | Prince George's County, Maryland, Special Tax District Bonds, Victoria Falls Project, Series 2005, 5.250%, 7/01/35 | 7/16 at 100.00 | | N/R | | | 1,407,378 | |
| | 1,100 | | Puerto Rico Highway and Transportation Authority, Highway Revenue Bonds, Series 2007N, 5.500%, 7/01/29 – AMBAC Insured | No Opt. Call | | CC | | | 1,026,575 | |
| | 1,530 | | Puerto Rico Infrastructure Financing Authority, Special Tax Revenue Bonds, Series 2005A, 0.000%, 7/01/44 – AMBAC Insured | No Opt. Call | | CC | | | 163,618 | |
| | 2,100 | | Puerto Rico Municipal Finance Agency, Series 2002A, 5.250%, 8/01/21 – AGM Insured | 2/16 at 100.00 | | AA | | | 2,107,518 | |
| | | | Puerto Rico Sales Tax Financing Corporation, Sales Tax Revenue Bonds, Series 2007A: | | | | | | | |
| | 7,000 | | 0.000%, 8/01/40 – NPFG Insured | No Opt. Call | | AA– | | | 1,436,120 | |
| | 8,000 | | 0.000%, 8/01/41 – NPFG Insured | No Opt. Call | | AA– | | | 1,539,200 | |
| | 210 | | 0.000%, 8/01/47 – AMBAC Insured | No Opt. Call | | Caa3 | | | 22,873 | |
| | | | Puerto Rico, Highway Revenue Bonds, Highway and Transportation Authority, Series 2007CC: | | | | | | | |
| | 765 | | 5.500%, 7/01/28 – NPFG Insured | No Opt. Call | | AA– | | | 782,060 | |
| | 2,300 | | 5.500%, 7/01/30 – AGM Insured | No Opt. Call | | AA | | | 2,371,001 | |
| | 2,000 | | Virgin Islands Public Finance Authority, Gross Receipts Taxes Loan Note, Series 2006, 5.000%, 10/01/27 – FGIC Insured | 10/16 at 100.00 | | AA– | | | 2,062,320 | |
| | | | Virgin Islands Public Finance Authority, Gross Receipts Taxes Loan Note, Working Capital Series 2014A: | | | | | | | |
| | 2,580 | | 5.000%, 10/01/29 | 10/24 at 100.00 | | BBB+ | | | 2,830,699 | |
| | 300 | | 5.000%, 10/01/34 | 10/24 at 100.00 | | BBB+ | | | 322,593 | |
| | 2,240 | | 5.000%, 10/01/34 – AGM Insured | 10/24 at 100.00 | | AA | | | 2,513,280 | |
| | 1,035 | | Virgin Islands Public Finance Authority, Matching Fund Loan Notes Revenue Bonds, Senior Lien Series 2009A-1, 5.000%, 10/01/29 – AGM Insured | 10/19 at 100.00 | | AA | | | 1,160,069 | |
| | 3,500 | | Virgin Islands Public Finance Authority, Matching Fund Loan Notes Revenue Bonds, Senior Lien Series 2010A, 5.000%, 10/01/29 | 10/20 at 100.00 | | BBB | | | 3,816,084 | |
| | 2,000 | | Virgin Islands Public Finance Authority, Matching Fund Loan Notes Revenue Bonds, Senior Lien, Series 2013A, 5.000%, 10/01/24 – AGM Insured | No Opt. Call | | AA | | | 2,409,980 | |
| | 2,000 | | Virgin Islands Public Finance Authority, Matching Fund Loan Notes Revenue Bonds, Series 2012A, 5.000%, 10/01/32 | 10/22 at 100.00 | | BBB | | | 2,139,460 | |
| | 1,825 | | Virgin Islands Public Finance Authority, Matching Fund Loan Notes Revenue Bonds, Subordinate Lien Series 2010B, 5.250%, 10/01/29 | 10/20 at 100.00 | | Baa2 | | | 2,001,605 | |
| | 78,101 | | Total Tax Obligation/Limited | | | | | | 65,897,806 | |
| | | | Transportation – 4.9% (3.2% of Total Investments) | | | | | | | |
| | | | Baltimore, Maryland, Revenue Refunding Bonds, Parking System Facilities, Series 1998A: | | | | | | | |
| | 725 | | 5.250%, 7/01/17 – FGIC Insured | No Opt. Call | | AA– | | | 753,993 | |
| | 110 | | 5.250%, 7/01/21 – FGIC Insured | No Opt. Call | | AA– | | | 122,104 | |
| | 125 | | Guam International Airport Authority, Revenue Bonds, Series 2013C, 6.375%, 10/01/43 (Alternative Minimum Tax) | 10/23 at 100.00 | | BBB | | | 146,399 | |
| | | | Maryland Health and Higher Educational Facilities Authority, Parking Facilities Revenue Bonds, Johns Hopkins Hospital, Series 2001: | | | | | | | |
| | 1,300 | | 5.000%, 7/01/27 – AMBAC Insured | 1/16 at 100.00 | | N/R | | | 1,302,262 | |
| | 1,000 | | 5.000%, 7/01/34 – AMBAC Insured | 1/16 at 100.00 | | N/R | | | 1,001,330 | |
| | 460 | | Maryland Health and Higher Educational Facilities Authority, Parking Facilities Revenue Bonds, Johns Hopkins Medical Institutions, Series 1996, 5.500%, 7/01/26 – AMBAC Insured | 2/16 at 100.00 | | N/R | | | 460,938 | |
| | 2,000 | | Maryland Transportation Authority, Revenue Bonds, Grant Anticipation Series 2008, 5.250%, 3/01/16 | No Opt. Call | | AAA | | | 2,025,620 | |
| | 10,110 | | Maryland Transportation Authority, Revenue Bonds, Transportation Facilities Projects, Series 2007, 5.000%, 7/01/30 – AGM Insured (UB) (5) | 7/17 at 100.00 | | AA | | | 10,755,524 | |
| | Principal | | | Optional Call | | | | | | |
| | Amount (000) | | Description (1) | Provisions (2) | | Ratings (3) | | | Value | |
| | | | Transportation (continued) | | | | | | | |
| | | | Port Authority of New York and New Jersey, Special Project Bonds, JFK International Air Terminal LLC, Sixth Series 1997: | | | | | | | |
| $ | 20 | | 5.750%, 12/01/22 – NPFG Insured (Alternative Minimum Tax) | 12/15 at 100.00 | | AA– | | $ | 20,098 | |
| | 70 | | 5.750%, 12/01/25 – NPFG Insured (Alternative Minimum Tax) | 12/15 at 100.00 | | AA– | | | 70,211 | |
| | 15,920 | | Total Transportation | | | | | | 16,658,479 | |
| | | | U.S. Guaranteed – 23.1% (15.4% of Total Investments) (6) | | | | | | | |
| | 1,565 | | Anne Arundel County, Maryland, General Obligation Bonds, Series 2006, 5.000%, 3/01/21 (Pre-refunded 3/01/16) | 3/16 at 100.00 | | AAA | | | 1,583,999 | |
| | 500 | | Baltimore County, Maryland, Revenue Bonds, Catholic Health Initiatives, Series 2006A, 5.000%, 9/01/36 (Pre-refunded 9/01/16) | 9/16 at 100.00 | | A+ (6) | | | 517,245 | |
| | | | Baltimore, Maryland, Revenue Bonds, Wastewater Projects, Series 2006C: | | | | | | | |
| | 1,500 | | 5.000%, 7/01/31 (Pre-refunded 7/01/16) – AMBAC Insured | 7/16 at 100.00 | | AA (6) | | | 1,541,205 | |
| | 2,570 | | 5.000%, 7/01/31 (Pre-refunded 7/01/16) – AMBAC Insured | 7/16 at 100.00 | | AA (6) | | | 2,640,598 | |
| | 3,000 | | Baltimore, Maryland, Revenue Bonds, Wastewater Projects, Series 2007D, 5.000%, 7/01/32 (Pre-refunded 7/01/17) – AMBAC Insured | 7/17 at 100.00 | | AA (6) | | | 3,205,320 | |
| | 2,000 | | Baltimore, Maryland, Revenue Bonds, Water Projects, Refunding Series 1994A, 5.000%, 7/01/24 – FGIC Insured (ETM) | No Opt. Call | | AA (6) | | | 2,377,440 | |
| | 3,120 | | Baltimore, Maryland, Revenue Bonds, Water Projects, Refunding Series 1998A, 5.000%, 7/01/28 – FGIC Insured (ETM) | No Opt. Call | | AA (6) | | | 3,732,955 | |
| | 15 | | Charles County, Maryland, General Obligation Bonds, Consolidated Public Improvement, Series 2006, 5.000%, 3/01/16 (ETM) | No Opt. Call | | Aa1 (6) | | | 15,183 | |
| | 2,230 | | Maryland Department of Transportation, Consolidated Transportation Revenue Bonds, Second Issue Series 2008, 5.000%, 9/01/22 (Pre-refunded 9/01/18) | 9/18 at 100.00 | | AAA | | | 2,475,099 | |
| | 1,500 | | Maryland Health and Higher Educational Facilities Authority, Revenue Bonds, Anne Arundel Health System, Series 2009A, 6.750%, 7/01/39 (Pre-refunded 7/01/19) | 7/19 at 100.00 | | A (6) | | | 1,799,235 | |
| | | | Maryland Health and Higher Educational Facilities Authority, Revenue Bonds, Carroll Hospital Center, Series 2006: | | | | | | | |
| | 1,000 | | 4.500%, 7/01/26 (Pre-refunded 7/01/16) | 7/16 at 100.00 | | A1 (6) | | | 1,024,010 | |
| | 2,550 | | 5.000%, 7/01/40 (Pre-refunded 7/01/16) | 7/16 at 100.00 | | A1 (6) | | | 2,618,672 | |
| | 1,000 | | Maryland Health and Higher Educational Facilities Authority, Revenue Bonds, Edenwald, Series 2006A, 5.400%, 1/01/31 (Pre-refunded 7/01/16) | 7/16 at 100.00 | | N/R (6) | | | 1,029,270 | |
| | | | Maryland Health and Higher Educational Facilities Authority, Revenue Bonds, Helix Health, Series 1997: | | | | | | | |
| | 660 | | 5.000%, 7/01/17 – AMBAC Insured (ETM) | No Opt. Call | | N/R (6) | | | 689,515 | |
| | 3,240 | | 5.000%, 7/01/27 – AMBAC Insured (ETM) | No Opt. Call | | N/R (6) | | | 3,904,038 | |
| | 1,050 | | Maryland Health and Higher Educational Facilities Authority, Revenue Bonds, LifeBridge Health System, Series 2008, 5.000%, 7/01/28 (Pre-refunded 7/01/17) – AGM Insured | 7/17 at 100.00 | | AA (6) | | | 1,121,862 | |
| | | | Maryland Health and Higher Educational Facilities Authority, Revenue Bonds, MedStar Health, Series 2007: | | | | | | | |
| | 2,975 | | 5.250%, 5/15/46 (Pre-refunded 5/15/16) | 5/16 at 100.00 | | A2 (6) | | | 3,041,610 | |
| | 9,720 | | 5.250%, 5/15/46 (Pre-refunded 5/15/16) – BHAC Insured | 5/16 at 100.00 | | AA+ (6) | | | 9,937,631 | |
| | 3,950 | | Maryland Health and Higher Educational Facilities Authority, Revenue Bonds, Peninsula Regional Medical Center, Series 2006, 5.000%, 7/01/36 (Pre-refunded 7/01/16) | 7/16 at 100.00 | | A (6) | | | 4,056,374 | |
| | | | Maryland Health and Higher Educational Facilities Authority, Revenue Bonds, University of Maryland Medical System, Series 2006: | | | | | | | |
| | 700 | | 5.000%, 7/01/31 (Pre-refunded 7/01/16) | 7/16 at 100.00 | | A2 (6) | | | 718,851 | |
| | 1,325 | | 5.000%, 7/01/36 (Pre-refunded 7/01/16) | 7/16 at 100.00 | | A2 (6) | | | 1,360,682 | |
| | 2,910 | | Maryland Health and Higher Educational Facilities Authority, Revenue Bonds, Western Maryland Health, Series 2006A, 4.500%, 1/01/22 (Pre-refunded 7/01/16) – NPFG Insured | 7/16 at 100.00 | | AA– (6) | | | 2,979,869 | |
| | 2,110 | | Maryland State, General Obligation Bonds, State & Local Facilities Loan, Second Series 2009B, 5.000%, 8/15/21 (Pre-refunded 8/15/19) | 8/19 at 100.00 | | AAA | | | 2,406,750 | |
| NMY | Nuveen Maryland Premium Income Municipal Fund | |
| | Portfolio of Investments (continued) | November 30, 2015 (Unaudited) |
| | Principal | | | Optional Call | | | | | | |
| | Amount (000) | | Description (1) | Provisions (2) | | Ratings (3) | | | Value | |
| | | | U.S. Guaranteed (6) (continued) | | | | | | | |
| | | | Maryland State, General Obligation Bonds, State & Local Facilities Loan, Series 2006A: | | | | | | | |
| $ | 1,090 | | 5.000%, 3/01/17 (Pre-refunded 3/01/16) | 3/16 at 100.00 | | AAA | | $ | 1,103,276 | |
| | 2,500 | | 4.150%, 3/01/20 (Pre-refunded 3/01/16) | 3/16 at 100.00 | | AAA | | | 2,525,075 | |
| | | | Maryland Health and Higher Educational Facilities Authority, Revenue Bonds, Washington County Hospital, Series 2008: | | | | | | | |
| | 135 | | 5.750%, 1/01/33 (Pre-refunded 1/01/18) | 1/18 at 100.00 | | BBB (6) | | | 148,545 | |
| | 7,075 | | 5.750%, 1/01/38 (Pre-refunded 1/01/18) | 1/18 at 100.00 | | BBB (6) | | | 7,784,835 | |
| | 1,950 | | 6.000%, 1/01/43 (Pre-refunded 1/01/18) | 1/18 at 100.00 | | BBB (6) | | | 2,155,706 | |
| | 3,190 | | Maryland Health and Higher Educational Facilities Authority, Revenue Bonds, Western Maryland Health, Series 2006A, 5.000%, 7/01/34 (Pre-refunded 7/01/16) – NPFG Insured | 7/16 at 100.00 | | AA– (6) | | | 3,275,907 | |
| | 425 | | Maryland Transportation Authority, Revenue Refunding Bonds, Transportation Facilities Projects, First Series 1978, 6.800%, 7/01/16 – AMBAC Insured (ETM) | No Opt. Call | | Aaa | | | 439,238 | |
| | 1,100 | | Puerto Rico Public Finance Corporation, Commonwealth Appropriation Bonds, Series 1998A, 5.125%, 6/01/24 – AMBAC Insured (ETM) | No Opt. Call | | Aaa | | | 1,311,486 | |
| | 1,000 | | Puerto Rico, Highway Revenue Bonds, Highway and Transportation Authority, Series 1996Y, 5.500%, 7/01/36 (Pre-refunded 7/01/16) | 7/16 at 100.00 | | Aaa | | | 1,029,970 | |
| | 1,610 | | Puerto Rico, Highway Revenue Bonds, Highway and Transportation Authority, Series 2003AA, 5.500%, 7/01/19 – NPFG Insured (ETM) | No Opt. Call | | A3 (6) | | | 1,858,101 | |
| | 3,135 | | University of Maryland, Auxiliary Facility and Tuition Revenue Bonds, Series 2006A, 5.000%, 10/01/22 (Pre-refunded 10/01/16) | 10/16 at 100.00 | | AA+ (6) | | | 3,256,168 | |
| | 74,400 | | Total U.S. Guaranteed | | | | | | 79,665,720 | |
| | | | Utilities – 2.5% (1.7% of Total Investments) | | | | | | | |
| | 1,250 | | Guam Power Authority, Revenue Bonds, Series 2012A, 5.000%, 10/01/30 – AGM Insured | 10/22 at 100.00 | | AA | | | 1,464,050 | |
| | | | Guam Power Authority, Revenue Bonds, Series 2014A: | | | | | | | |
| | 600 | | 5.000%, 10/01/39 | 10/24 at 100.00 | | AA | | | 686,502 | |
| | 575 | | 5.000%, 10/01/44 | 10/24 at 100.00 | | AA | | | 654,091 | |
| | 3,600 | | Puerto Rico Electric Power Authority, Power Revenue Bonds, Series 2004PP, 5.000%, 7/01/22 – NPFG Insured | 2/16 at 100.00 | | AA– | | | 3,547,295 | |
| | 1,570 | | Puerto Rico Electric Power Authority, Power Revenue Bonds, Series 2005RR, 5.000%, 7/01/22 – FGIC Insured | 2/16 at 100.00 | | AA– | | | 1,547,015 | |
| | 730 | | Virgin Islands Water and Power Authority, Electric System Revenue Bonds, Refunding Series 2007A, 5.000%, 7/01/24 | 7/17 at 100.00 | | BB+ | | | 734,614 | |
| | 8,325 | | Total Utilities | | | | | | 8,633,567 | |
| | | | Water and Sewer – 3.7% (2.5% of Total Investments) | | | | | | | |
| | 2,500 | | Baltimore, Maryland, Project and Revenue Refunding Bonds, Water Projects, Series 2013B, 5.000%, 7/01/38 | 1/24 at 100.00 | | AA | | | 2,848,875 | |
| | 2,000 | | Baltimore, Maryland, Revenue Bonds, Wastewater Projects, Series 2011A, 5.000%, 7/01/41 | 7/21 at 100.00 | | AA | | | 2,299,680 | |
| | 1,045 | | Baltimore, Maryland, Revenue Bonds, Water Projects, Refunding Series 1994A, 5.000%, 7/01/24 – FGIC Insured | No Opt. Call | | AA | | | 1,165,656 | |
| | 2,500 | | Baltimore, Maryland, Revenue Bonds, Water Projects, Series 2014A, 5.000%, 7/01/44 | 1/25 at 100.00 | | AA– | | | 2,833,325 | |
| | 1,300 | | Guam Waterworks Authority, Water and Wastewater System Revenue Bonds, Refunding Series 2014A, 5.000%, 7/01/35 | 7/24 at 100.00 | | A– | | | 1,428,323 | |
| | 2,030 | | Guam Waterworks Authority, Water and Wastewater System Revenue Bonds, Series 2013, 5.500%, 7/01/43 | 7/23 at 100.00 | | A– | | | 2,291,180 | |
| | 11,375 | | Total Water and Sewer | | | | | | 12,867,039 | |
| $ | 526,056 | | Total Municipal Bonds (cost $494,170,585) | | | | | | 516,268,613 | |
| Shares | | Description (1) | | | Value | |
| | | COMMON STOCKS – 0.5% (0.4% of Total Investments) | | | | |
| | | Airlines – 0.5% (0.4% of Total Investments) | | | | |
| 44,607 | | American Airlines Group Inc., (7) | | $ | 1,840,485 | |
| | | Total Common Stocks (cost $1,288,472) | | | 1,840,485 | |
| | | Total Long-Term Investments (cost $495,459,057) | | | 518,109,098 | |
| | | Floating Rate Obligations – (4.8)% | | | (16,410,000 | ) |
| | | Variable Rate MuniFund Term Preferred Shares, at Liquidation Value – (48.5)% (8) | | | (167,000,000 | ) |
| | | Other Assets Less Liabilities – 2.8% | | | 9,650,795 | |
| | | Net Assets Applicable to Common Shares – 100% | | $ | 344,349,893 | |
| (1) | All percentages shown in the Portfolio of Investments are based on net assets applicable to common shares unless otherwise noted. |
| (2) | Optional Call Provisions: Dates (month and year) and prices of the earliest optional call or redemption. There may be other call provisions at varying prices at later dates. Certain mortgage-backed securities may be subject to periodic principal paydowns. |
| (3) | Ratings: Using the highest of Standard & Poor's Group ("Standard & Poor's"), Moody's Investors Service, Inc. ("Moody's") or Fitch, Inc. ("Fitch") rating. Ratings below BBB by Standard & Poor's, Baa by Moody's or BBB by Fitch are considered to be below investment grade. Holdings designated N/R are not rated by any of these national rating agencies. |
| (4) | As of, or subsequent to, the end of the reporting period this security is non-income producing. Non-income producing, in the case of a fixed-income security, generally denotes that the issuer has (1) defaulted on the payment of principal or interest, (2) is under the protection of the Federal Bankruptcy Court or (3) the Fund's Adviser has concluded that the issue is not likely to meet its future interest payment obligations and has ceased accruing additional income on the Fund's records. |
| (5) | Investment, or portion of investment, has been pledged to collateralize the net payment obligations for investments in inverse floating rate transactions. |
| (6) | Backed by an escrow or trust containing sufficient U.S. Government or U.S. Government agency securities, which ensure the timely payment of principal and interest. Certain bonds backed by U.S. Government or agency securities are regarded as having an implied rating equal to the rating of such securities. |
| (7) | On November 28, 2011, AMR Corp. ("AMR"), the parent company of American Airlines Group, Inc. ("AAL") filed for federal bankruptcy protection. On December 9, 2013, AMR emerged from federal bankruptcy with the acceptance of its reorganization plan by the bankruptcy court. Under the settlement agreement established to meet AMR's unsecured bond obligations, the bondholders, including the Fund, received a distribution of AAL preferred stock which was converted to AAL common stock over a 120-day period. Every 30 days, a quarter of the preferred stock was converted to AAL common stock based on the 5-day volume-weighted average price and the amount of preferred shares tendered during the optional preferred conversion period. |
| (8) | Variable Rate MuniFund Term Preferred Shares, at Liquidation Value as a percentage of Total Investments is 32.2%. |
| (ETM) | Escrowed to maturity. |
| (UB) | Underlying bond of an inverse floating rate trust reflected as a financing transaction. See Notes to Financial Statements, Note 3 – Portfolio Securities and Investments in Derivatives, Inverse Floating Rate Securities for more information. |
| (WI/DD) | Investment, or portion of investment, purchased on a when-issued or delayed delivery basis. |
See accompanying notes to financial statements.
| NMS | | |
| | Nuveen Minnesota Municipal Income Fund | |
| | Portfolio of Investments | November 30, 2015 (Unaudited) |
| | Principal | | | Optional Call | | | | | | |
| | Amount (000) | | Description (1) | Provisions (2) | | Ratings (3) | | | Value | |
| | | | LONG-TERM INVESTMENTS – 148.1% (100.0% of Total Investments) | | | | | | | |
| | | | MUNICIPAL BONDS – 148.1% (100.0% of Total Investments) | | | | | | | |
| | | | Consumer Staples – 0.9% (0.6% of Total Investments) | | | | | | | |
| $ | 700 | | Moorhead, Minnesota, Recovery Zone Facility Revenue Bonds, American Crystal Sugar Company Project, Series 2010, 5.650%, 6/01/27 | 7/20 at 100.00 | | BBB+ | | $ | 774,851 | |
| | | | Education and Civic Organizations – 27.1% (18.3% of Total Investments) | | | | | | | |
| | 390 | | Anoka County, Minnesota, Charter School Lease Revenue Bonds, Spectrum Building Company, Series 2012A, 5.000%, 6/01/43 | No Opt. Call | | BBB– | | | 396,501 | |
| | 1,250 | | Baytown Township, Minnesota, Lease Revenue Bonds, Saint Croix Preparatory Academy Project, Series 2008A, 7.000%, 8/01/38 | 8/16 at 102.00 | | BB+ | | | 1,293,225 | |
| | 830 | | City of Woodbury, Minnesota, Charter School Lease Revenue Bonds, Math and Science Academy Building Company, Series 2012A, 5.000%, 12/01/43 | No Opt. Call | | BBB– | | | 844,658 | |
| | 1,000 | | Duluth Housing & Redevelopment Authority, Minnesota, Lease Revenue Bonds, Duluth Public Schools Academy, Series 2010A, 5.600%, 11/01/30 | 11/18 at 102.00 | | BBB– | | | 1,058,610 | |
| | 570 | | Forest Lake, Minnesota, Charter School Lease Revenue Bonds, Lakes International Language Academy, Series 2014A, 5.750%, 8/01/44 | 8/22 at 100.00 | | BBB– | | | 611,502 | |
| | 2,200 | | Hugo, Minnesota, Charter School Lease Revenue Bonds, Noble Academy Project, Series 2014A, 5.000%, 7/01/44 | 7/24 at 100.00 | | BB+ | | | 2,173,511 | |
| | 1,425 | | Minneapolis, Minnesota, Charter School Lease Revenue Bonds, Yinghua Academy Charter School, Series 2013A, 6.000%, 7/01/43 | 7/23 at 100.00 | | BB | | | 1,513,977 | |
| | | | Minnesota Higher Education Facilities Authority, Revenue Bonds, Bethel University, Refunding Series 2007-6-R: | | | | | | | |
| | 500 | | 5.500%, 5/01/24 | 5/17 at 100.00 | | N/R | | | 514,345 | |
| | 1,000 | | 5.500%, 5/01/27 | 5/17 at 100.00 | | N/R | | | 1,025,750 | |
| | 200 | | 5.500%, 5/01/37 | 5/17 at 100.00 | | N/R | | | 204,370 | |
| | 600 | | Minnesota Higher Education Facilities Authority, Revenue Bonds, Macalester College, Series 2012-7S, 3.250%, 5/01/36 | No Opt. Call | | Aa3 | | | 601,212 | |
| | 1,000 | | Minnesota Higher Education Facilities Authority, Revenue Bonds, University of Saint Thomas, Series 2009-6X, 5.250%, 4/01/39 | 4/17 at 100.00 | | A2 | | | 1,049,610 | |
| | 2,000 | | Minnesota Higher Education Facilities Authority, Revenue Bonds, University of Saint Thomas, Series 2009-7A, 5.000%, 10/01/39 | 10/19 at 100.00 | | A2 | | | 2,218,680 | |
| | 705 | | Otsego, Minnesota, Charter School Lease Revenue Bonds, Kaleidoscope Charter School Project, Series 2014A, 5.000%, 9/01/44 | 9/24 at 100.00 | | BB+ | | | 717,958 | |
| | 450 | | Ramsey, Anoka County, Minnesota, Lease Revenue Bonds, PACT Charter School Project, Series 2004A, 5.500%, 12/01/33 | 12/21 at 100.00 | | BBB– | | | 479,331 | |
| | 315 | | Rice County, Minnesota Educational Facility Revenue Bonds, Shattuck Saint Mary's School Project, Series 2015, 5.000%, 8/01/22 | No Opt. Call | | BB | | | 327,465 | |
| | 500 | | Saint Paul Housing & Redevelopment Authority, Minnesota, Charter School Lease Revenue Bonds, Hmong Education Reform Company, Series 2012A, 5.250%, 9/01/32 | No Opt. Call | | BB+ | | | 519,460 | |
| | 1,100 | | Saint Paul Housing & Redevelopment Authority, Minnesota, Charter School Lease Revenue Bonds, Nova Classical Academy, Series 2011A, 6.375%, 9/01/31 | 9/21 at 100.00 | | BBB– | | | 1,245,354 | |
| | | | Saint Paul Housing & Redevelopment Authority, Minnesota, Charter School Lease Revenue Bonds, Twin Cities Academy Project, Series 2015A: | | | | | | | |
| | 360 | | 5.300%, 7/01/45 | 7/25 at 100.00 | | BB | | | 362,999 | |
| | 510 | | 5.375%, 7/01/50 | 7/25 at 100.00 | | BB | | | 515,304 | |
| | 1,680 | | Saint Paul Housing & Redevelopment Authority, Minnesota, Charter School Lease Revenue Bonds, Twin Cities German Immersion School, Series 2013A, 5.000%, 7/01/44 | No Opt. Call | | BB+ | | | 1,696,833 | |
| | Principal | | | Optional Call | | | | | | |
| | Amount (000) | | Description (1) | Provisions (2) | | Ratings (3) | | | Value | |
| | | | Education and Civic Organizations (continued) | | | | | | | |
| $ | 500 | | Saint Paul Housing and Redevelopment Authority, Minnesota, Educational Facility Revenue Refunding Bonds, Saint Paul Academy and Summit School Project, Series 2007, 5.000%, 10/01/24 | 10/17 at 100.00 | | A3 | | $ | 533,220 | |
| | 390 | | Saint Paul Housing and Redevelopment Authority, Minnesota, Lease Revenue Bonds, Saint Paul Conservatory for Performing Artists Charter School Project, Series 2013A, 4.625%, 3/01/43 | 3/23 at 100.00 | | BBB– | | | 388,475 | |
| | 800 | | St. Paul Housing and Redevelopment Authority, Minnesota, Charter School Revenue Bonds, Higher Ground Academy Charter School, Series 2013A, 5.000%, 12/01/33 | 12/22 at 100.00 | | BBB– | | | 823,264 | |
| | 2,000 | | University of Minnesota, General Revenue Bonds, Series 2011A, 5.250%, 12/01/29 | 12/20 at 100.00 | | Aa1 | | | 2,354,000 | |
| | 22,275 | | Total Education and Civic Organizations | | | | | | 23,469,614 | |
| | | | Health Care – 22.4% (15.1% of Total Investments) | | | | | | | |
| | 1,000 | | Cuyuna Range Hospital District, Minnesota, Health Care Facilities Gross Revenue Bonds, Refunding Series 2007, 5.000%, 6/01/29 | 6/17 at 100.00 | | N/R | | | 1,016,490 | |
| | | | Glencoe, Minnesota, Health Care Facilities Revenue Bonds, Glencoe Regional Health Services Project, Series 2013: | | | | | | | |
| | 400 | | 4.000%, 4/01/27 | 4/22 at 100.00 | | BBB | | | 414,028 | |
| | 230 | | 4.000%, 4/01/31 | 4/22 at 100.00 | | BBB | | | 236,015 | |
| | 3,000 | | Housing and Redevelopment Authority of the City of Saint Paul, Minnesota, Health Care Facilities Revenue Refunding Bonds, HealthPartners Obligated Group, Series 2015A, 4.000%, 7/01/35 | 7/25 at 100.00 | | A | | | 3,110,040 | |
| | | | Maple Grove, Minnesota, Health Care Facilities Revenue Bonds, Maple Grove Hospital Corporation, Series 2007: | | | | | | | |
| | 20 | | 5.000%, 5/01/20 | 5/17 at 100.00 | | Baa1 | | | 21,139 | |
| | 1,000 | | 5.250%, 5/01/25 | 5/17 at 100.00 | | Baa1 | | | 1,050,100 | |
| | 500 | | Maple Grove, Minnesota, Health Care Facilities Revenue Refunding Bonds, North Memorial Health Care, Series 2015, 4.000%, 9/01/35 | 9/25 at 100.00 | | Baa1 | | | 506,230 | |
| | 450 | | Minneapolis, Minnesota, Health Care System Revenue Bonds, Fairview Health Services, Series 2008B, 6.500%, 11/15/38 – AGC Insured | 11/18 at 100.00 | | AA | | | 509,918 | |
| | | | Minneapolis, Minnesota, Health Care System Revenue Bonds, Fairview Health Services, Series 2015A: | | | | | | | |
| | 265 | | 4.000%, 11/15/40 | 11/25 at 100.00 | | A+ | | | 269,465 | |
| | 1,000 | | 5.000%, 11/15/44 | 11/25 at 100.00 | | A+ | | | 1,111,410 | |
| | 3,750 | | Minnesota Agricultural and Economic Development Board, Health Care Facilities Revenue Bonds, Essentia Health Obligated Group, Series 2008E, 5.000%, 2/15/37 – AGC Insured | 2/18 at 100.00 | | AA | | | 3,942,636 | |
| | 710 | | Northern Itasca Hospital District, Minnesota, Health Facilities Gross Revenue Bonds, Refunding Series 2013A, 4.400%, 12/01/33 | 12/20 at 100.00 | | N/R | | | 717,306 | |
| | | | Northern Itasca Hospital District, Minnesota, Health Facilities Gross Revenue Bonds, Series 2013C: | | | | | | | |
| | 240 | | 4.500%, 12/01/25 | 12/20 at 100.00 | | N/R | | | 251,854 | |
| | 190 | | 4.750%, 12/01/27 | 12/20 at 100.00 | | N/R | | | 200,300 | |
| | 160 | | 5.000%, 12/01/28 | 12/20 at 100.00 | | N/R | | | 168,822 | |
| | 310 | | 5.400%, 12/01/33 | 12/20 at 100.00 | | N/R | | | 328,780 | |
| | 500 | | Saint Cloud, Minnesota, Health Care Revenue Bonds, CentraCare Health System Project, Series 2010A, 5.125%, 5/01/30 | 5/20 at 100.00 | | A1 | | | 563,285 | |
| | 1,625 | | Saint Paul Housing and Redevelopment Authority, Minnesota, Health Care Revenue Bonds, Allina Health System, Series 2009A-1, 5.250%, 11/15/29 | 11/19 at 100.00 | | AA– | | | 1,826,174 | |
| | 1,000 | | Saint Paul Port Authority, Minnesota, Lease Revenue Bonds, Regions Hospital Parking Ramp Project, Series 2007-1, 5.000%, 8/01/36 | 8/16 at 100.00 | | N/R | | | 1,003,630 | |
| | | | Shakopee, Minnesota, Health Care Facilities Revenue Bonds, Saint Francis Regional Medical Center, Refunding Series 2014: | | | | | | | |
| | 765 | | 4.000%, 9/01/31 | 9/24 at 100.00 | | A | | | 796,227 | |
| | 630 | | 5.000%, 9/01/34 | 9/24 at 100.00 | | A | | | 705,978 | |
| | 580 | | St. Paul Housing and Redevelopment Authority, Minnesota, Hospital Revenue Bonds, HealthEast Inc., Series 2015, 5.000%, 11/15/44 | 11/25 at 100.00 | | BBB– | | | 633,476 | |
| | 18,325 | | Total Health Care | | | | | | 19,383,303 | |
| NMS | Nuveen Minnesota Municipal Income Fund | |
| | Portfolio of Investments (continued) | November 30, 2015 (Unaudited) |
| | Principal | | | Optional Call | | | | | | |
| | Amount (000) | | Description (1) | Provisions (2) | | Ratings (3) | | | Value | |
| | | | Housing/Multifamily – 7.8% (5.3% of Total Investments) | | | | | | | |
| $ | 1,700 | | Coon Rapids, Minnesota, Multifamily Housing Revenue Bonds, Tralee Terrace Apartments Project, Series 2010, 4.500%, 6/01/26 | 6/20 at 100.00 | | Aaa | | $ | 1,817,827 | |
| | 950 | | Minneapolis, Minnesota, GNMA Collateralized Multifamily Housing Revenue Bonds, Vantage Flats Project, Series 2007, 5.200%, 10/20/48 (Alternative Minimum Tax) | 2/16 at 100.00 | | Aa1 | | | 950,836 | |
| | 1,125 | | Minneapolis, Minnesota, Multifamily Housing Revenue Bonds, GNMA Collateralized Mortgage Loans – Seward Towers Project, Series 2003, 5.000%, 5/20/36 | 2/16 at 100.00 | | Aa1 | | | 1,128,690 | |
| | | | Minnesota Housing Finance Agency, Rental Housing Revenue Bonds, Series 2011: | | | | | | | |
| | 355 | | 5.050%, 8/01/31 | 8/21 at 100.00 | | AA+ | | | 385,757 | |
| | 1,700 | | 5.450%, 8/01/41 | 8/21 at 100.00 | | AA+ | | | 1,841,763 | |
| | 655 | | Saint Paul Housing and Redevelopment Authority, Minnesota, GNMA Collateralized Multifamily Housing Revenue Bonds, Selby Grotto Housing Project, Series 2001A, 5.500%, 9/20/44 (Alternative Minimum Tax) | 2/16 at 100.00 | | Aa1 | | | 655,694 | |
| | 6,485 | | Total Housing/Multifamily | | | | | | 6,780,567 | |
| | | | Housing/Single Family – 5.0% (3.4% of Total Investments) | | | | | | | |
| | 138 | | Minneapolis-Saint Paul Housing Finance Board, Minnesota, Single Family Mortgage Revenue Bonds, City Living Series 2006A-4, 5.000%, 11/01/38 (Alternative Minimum Tax) | 7/16 at 100.00 | | AA+ | | | 142,385 | |
| | 230 | | Minnesota Housing Finance Agency, Homeownership Finance Bonds, Mortgage-Backed Securities Program, Series 2011D, 4.700%, 1/01/31 | 7/21 at 100.00 | | Aaa | | | 247,027 | |
| | 2,650 | | Minnesota Housing Finance Agency, Residential Housing Finance Bonds, Series 2007D, 4.700%, 7/01/27 (Alternative Minimum Tax) | 7/16 at 100.00 | | AA+ | | | 2,669,610 | |
| | 10 | | Minnesota Housing Finance Agency, Residential Housing Finance Bonds, Series 2007-I, 4.850%, 7/01/38 (Alternative Minimum Tax) | 7/16 at 100.00 | | AA+ | | | 10,026 | |
| | 215 | | Minnesota Housing Finance Agency, Residential Housing Finance Bonds, Series 2008B, 5.650%, 7/01/33 (Alternative Minimum Tax) | 1/18 at 100.00 | | AA+ | | | 222,886 | |
| | 645 | | Minnesota Housing Finance Agency, Residential Housing Finance Bonds, Series 2009E, 5.100%, 1/01/40 | 7/19 at 100.00 | | AA+ | | | 674,160 | |
| | 85 | | Minnesota Housing Finance Agency, Residential Housing Finance Bonds, Series 2013C, 3.900%, 7/01/43 | 1/23 at 100.00 | | AA+ | | | 85,312 | |
| | 70 | | Minnesota Housing Finance Agency, Residential Housing Finance Bonds, Series 2014C, 3.500%, 1/01/32 | 7/24 at 100.00 | | AA+ | | | 71,565 | |
| | 250 | | Minnesota Housing Finance Agency, Residential Housing Finance Bonds, Series 2015F, 3.300%, 7/01/29 (WI/DD, Settling 12/08/15) | 7/25 at 100.00 | | AA+ | | | 251,428 | |
| | 4,293 | | Total Housing/Single Family | | | | | | 4,374,399 | |
| | | | Industrials – 3.8% (2.6% of Total Investments) | | | | | | | |
| | | | Minneapolis, Minnesota, Limited Tax Supported Development Revenue Bonds, Common Bond Fund Series 2006-1A: | | | | | | | |
| | 580 | | 4.850%, 12/01/17 (Alternative Minimum Tax) | 6/16 at 100.00 | | A+ | | | 588,613 | |
| | 610 | | 4.875%, 12/01/18 (Alternative Minimum Tax) | 6/16 at 100.00 | | A+ | | | 618,369 | |
| | | | Minneapolis, Minnesota, Limited Tax Supported Development Revenue Bonds, Common Bond Fund Series 2013-1: | | | | | | | |
| | 1,400 | | 4.500%, 6/01/33 | 6/21 at 100.00 | | A+ | | | 1,487,528 | |
| | 600 | | 4.750%, 6/01/39 | 6/21 at 100.00 | | A+ | | | 642,828 | |
| | 3,190 | | Total Industrials | | | | | | 3,337,338 | |
| | Principal | | | Optional Call | | | | | | |
| | Amount (000) | | Description (1) | Provisions (2) | | Ratings (3) | | | Value | |
| | | | Long-Term Care – 16.1% (10.8% of Total Investments) | | | | | | | |
| $ | 805 | | Anoka, Minnesota, Health Care and Housing Facility Revenue Bonds, The Homestead at Anoka, Inc. Project, Series 2014, 5.125%, 11/01/49 | 11/24 at 100.00 | | N/R | | $ | 816,061 | |
| | 380 | | Center City, Minnesota, Health Care Facilities Revenue Bonds, Hazelden Betty Ford Foundation Project, Series 2014, 4.000%, 11/01/39 | 11/24 at 100.00 | | A3 | | | 389,021 | |
| | 500 | | Center City, Minnesota, Health Care Facilities Revenue Bonds, Hazelden Foundation Project, Series 2011, 5.000%, 11/01/41 | 11/19 at 100.00 | | A3 | | | 529,015 | |
| | 875 | | Cold Spring, Minnesota, Health Care Facilities Revenue Bonds, Assumption Home, Inc., Refunding Series 2013, 5.200%, 3/01/43 | 7/20 at 100.00 | | N/R | | | 897,383 | |
| | | | Columbus, Minnesota, Senior Housing Revenue Bonds, Richfield Senior Housing, Inc., Refunding Series 2015: | | | | | | | |
| | 175 | | 5.250%, 1/01/40 | 1/23 at 100.00 | | N/R | | | 176,899 | |
| | 850 | | 5.250%, 1/01/46 | 1/23 at 100.00 | | N/R | | | 851,700 | |
| | 415 | | Cottage Grove, Minnesota, Senior Housing Revenue Bonds, PHS/Cottage Grove, Inc., Project, Series 2006A, 5.000%, 12/01/31 | 2/16 at 100.00 | | N/R | | | 415,253 | |
| | 700 | | Lake Crystal, Minnesota, Housing and Health Care Revenue Bonds, Ecumen-Second Century & Owatonna Senior Living Project, Refunding Series 2014A, 4.500%, 9/01/44 (Mandatory put 9/01/24) | 9/18 at 100.00 | | N/R | | | 704,095 | |
| | 1,350 | | Minneapolis, Minnesota, Revenue Bonds, Walker Minneapolis Campus Project, Refunding Series 2012, 4.750%, 11/15/28 | 11/22 at 100.00 | | N/R | | | 1,384,547 | |
| | 750 | | Minneapolis, Minnesota, Senior Housing and Healthcare Revenue Bonds, Ecumen ? Abiitan Mill City Project, Series 2015, 5.250%, 11/01/45 | 5/23 at 100.00 | | N/R | | | 758,460 | |
| | 1,000 | | Moorhead Economic Development Authority, Minnesota, Multifamily Revenue Bonds, Eventide Senior Housing, Series 2006A, 5.150%, 6/01/29 | 2/16 at 100.00 | | N/R | | | 1,000,680 | |
| | 660 | | Owatonna, Minnesota, Housing and Health Care Revenue Bonds, Ecumen-Second Century & Owatonna Senior Living Project, Refunding Series 2014B, 4.500%, 9/01/44 (Mandatory put 9/01/24) | 9/18 at 100.00 | | N/R | | | 663,861 | |
| | 900 | | Saint Paul Housing & Redevelopment Authority, Minnesota, Revenue Bonds, Rossy & Richard Shaller Family Sholom East Campus, Series 2007A, 5.250%, 10/01/42 | 10/17 at 100.00 | | N/R | | | 911,160 | |
| | 500 | | Saint Paul Housing and Redevelopment Authority Minnesota, Senior Housing and Health Care Revenue Bonds, Episcopal Homes Project, Series 2013, 5.125%, 5/01/48 | 5/23 at 100.00 | | N/R | | | 515,425 | |
| | 1,252 | | Saint Paul Housing and Redevelopment Authority, Minnesota, Nursing Home Revenue Bonds, Episcopal Homes of Minnesota, Series 2006, 5.630%, 10/01/33 | 4/17 at 100.00 | | N/R | | | 1,271,608 | |
| | 100 | | Saint Paul Housing and Redevelopment Authority, Minnesota, Senior Housing and Health Care Revenue Bonds, Episcopal Homes Project, Refunding Series 2012A, 5.150%, 11/01/42 | No Opt. Call | | N/R | | | 102,433 | |
| | 585 | | Sauk Rapids, Minnesota, Health Care and Housing Facilities Revenue Bonds, Good Shepherd Luthran Home, Refunding Series 2013, 5.125%, 1/01/39 | 1/23 at 100.00 | | N/R | | | 592,985 | |
| | 330 | | Wayzata, Minnesota, Senior Housing Revenue Bonds, Folkestone Senior Living Community, Series 2012A, 6.000%, 5/01/47 | 5/19 at 102.00 | | N/R | | | 357,166 | |
| | 1,000 | | West St. Paul, Minnesota, Health Care Facilities Revenue Bonds, Walker Thompson Hill LLC Project, Series 2011A, 7.000%, 9/01/46 | 9/19 at 100.00 | | N/R | | | 1,060,490 | |
| | 520 | | Worthington, Minnesota, Housing Revenue Refunding Bonds, Meadows of Worthington Project, Series 2007A, 5.250%, 11/01/28 | 2/16 at 100.00 | | N/R | | | 520,343 | |
| | 13,647 | | Total Long-Term Care | | | | | | 13,918,585 | |
| | | | Materials – 3.0% (2.0% of Total Investments) | | | | | | | |
| | 2,650 | | Saint Paul Port Authority, Minnesota, Solid Waste Disposal Revenue Bonds, Gerdau Saint Paul Steel Mill Project, Series 2012-7, 4.500%, 10/01/37 (Alternative Minimum Tax) | 10/22 at 100.00 | | BBB– | | | 2,564,962 | |
| NMS | Nuveen Minnesota Municipal Income Fund | |
| | Portfolio of Investments (continued) | November 30, 2015 (Unaudited) |
| | Principal | | | Optional Call | | | | | | |
| | Amount (000) | | Description (1) | Provisions (2) | | Ratings (3) | | | Value | |
| | | | Tax Obligation/General – 13.5% (9.1% of Total Investments) | | | | | | | |
| $ | 1,600 | | Burnsville Independent School District 191, Dakota and Scott Counties, Minnesota, General Obligation Bonds, Series 2008A, 4.750%, 2/01/24 | 2/18 at 100.00 | | Aa2 | | $ | 1,720,223 | |
| | 300 | | Circle Pines Independent School District 12, Centennial, Minnesota, General Obligation Bonds, School Building Series 2015A, 0.000%, 2/01/35 | 2/25 at 67.23 | | AA+ | | | 148,725 | |
| | 1,000 | | Cloquet Independent School District 94, Carlton and Sant Louis Counties, Minnesota, General Obligation Bonds, School Building Series 2015B, 4.000%, 2/01/36 | 2/25 at 100.00 | | Aa2 | | | 1,042,880 | |
| | 1,000 | | Hennepin County, Minnesota, General Obligation Bonds, Refunding Series 2008D, 5.000%, 12/01/25 | 12/16 at 100.00 | | AAA | | | 1,045,270 | |
| | | | Hermantown Independent School District 700, Minnesota, General Obligation Bonds, School Building Series 2015A: | | | | | | | |
| | 940 | | 0.000%, 2/01/37 | No Opt. Call | | Aa2 | | | 375,925 | |
| | 1,075 | | 0.000%, 2/01/38 | No Opt. Call | | Aa2 | | | 409,747 | |
| | 1,500 | | Independent School District 2310(Sibley East), Minnesota, General Obligation School Building Bonds, Series 2015A, 4.000%, 2/01/40 | 2/25 at 100.00 | | Aa2 | | | 1,551,195 | |
| | 1,500 | | Mankato Independent School District 77, Minnesota, General Obligation Bonds, School Building Series 2014A, 4.000%, 2/01/30 | 2/24 at 100.00 | | AA+ | | | 1,642,065 | |
| | 1,000 | | Minneapolis, Minnesota, Limited Tax Supported Development Revenue Bonds, Common Bond Fund Series 2007-2A, 5.125%, 6/01/22 (Alternative Minimum Tax) | 6/17 at 100.00 | | A+ | | | 1,037,730 | |
| | 350 | | Saint Cloud Independent School District 742, Stearns County, Minnesota, General Obligation Bonds, Series 2015A, 3.125%, 2/01/34 | 2/25 at 100.00 | | Aa2 | | | 347,904 | |
| | 350 | | South Washington County Independent School District 833, Minnesota, General Obligation Bonds, Alternate Facilities Series 2014A, 3.500%, 2/01/27 | 2/24 at 100.00 | | Aa2 | | | 373,702 | |
| | 1,970 | | Wayzata Independent School District 284, Hennepin County, Minnesota, General Obligation Bonds, School Building Series 2014A, 3.500%, 2/01/31 | 2/23 at 100.00 | | AAA | | | 2,045,963 | |
| | 12,585 | | Total Tax Obligation/General | | | | | | 11,741,329 | |
| | | | Tax Obligation/Limited – 13.0% (8.8% of Total Investments) | | | | | | | |
| | 1,000 | | Anoka-Hennepin Independent School District 11, Minnesota, Certificates of Participation, Series 2015A, 4.000%, 2/01/41 | 2/23 at 100.00 | | A+ | | | 1,049,550 | |
| | 1,600 | | Duluth Independent School District 709, Minnesota, Certificates of Participation, Capital Appreciation Series 2012A, 0.000%, 2/01/28 – AGM Insured | 2/22 at 77.70 | | Aa2 | | | 1,032,752 | |
| | 125 | | Minneapolis, Minnesota, Tax Increment Revenue Bonds, Grant Park Project, Refunding Series 2015, 4.000%, 3/01/30 | 3/23 at 100.00 | | N/R | | | 123,058 | |
| | 500 | | Minneapolis, Minnesota, Tax Increment Revenue Bonds, Ivy Tower Project, Series 2015, 5.000%, 3/01/29 | 3/24 at 100.00 | | N/R | | | 530,675 | |
| | 2,230 | | Minnesota Housing Finance Agency, Nonprofit Housing Bonds, State Appropriation Series 2011, 5.000%, 8/01/31 | 8/21 at 100.00 | | AA | | | 2,509,106 | |
| | 520 | | Moorhead, Minnesota, Golf Course Revenue Refunding Bonds, Series 1998B, 5.875%, 12/01/21 | 2/16 at 100.00 | | N/R | | | 520,203 | |
| | | | Northeast Metropolitan Intermediate School District 916, White Bear Lake, Minnesota, Certificates of Participation, Series 2015A: | | | | | | | |
| | 1,000 | | 3.750%, 2/01/36 | 2/25 at 100.00 | | A1 | | | 1,004,190 | |
| | 750 | | 4.000%, 2/01/42 (WI/DD, Settling 12/03/15) | 2/25 at 100.00 | | A1 | | | 762,203 | |
| | | | Saint Paul Housing and Redevelopment Authority, Minnesota, Multifamily Housing Revenue Bonds, 2700 University at Westgate Station, Series 2015B: | | | | | | | |
| | 455 | | 4.875%, 4/01/30 | 4/23 at 100.00 | | N/R | | | 458,599 | |
| | 895 | | 5.250%, 4/01/43 | 4/23 at 100.00 | | N/R | | | 896,548 | |
| | 500 | | Saint Paul Housing and Redevelopment Authority, Minnesota, Recreational Facility Lease Revenue Bonds, Jimmy Lee Recreational Center, Series 2008, 5.000%, 12/01/32 | 12/17 at 100.00 | | AA+ | | | 529,555 | |
| | Principal | | | Optional Call | | | | | | |
| | Amount (000) | | Description (1) | Provisions (2) | | Ratings (3) | | | Value | |
| | | | Tax Obligation/Limited (continued) | | | | | | | |
| | | | Saint Paul Housing and Redevelopment Authority, Minnesota, Upper Landing Project Tax Increment Revenue Refunding Bonds, Series 2012: | | | | | | | |
| $ | 450 | | 5.000%, 9/01/26 | No Opt. Call | | N/R | | $ | 476,496 | |
| | 130 | | 5.000%, 3/01/29 | No Opt. Call | | N/R | | | 136,617 | |
| | 800 | | Saint Paul, Minnesota, Sales Tax Revenue Bonds, Series 2014G, 3.750%, 11/01/33 | 11/24 at 100.00 | | A+ | | | 808,240 | |
| | 400 | | Washington County Housing and Redevelopment Authority, Minnesota, Municipal Facility Lease Revenue Bonds, Lower St. Croix Valley Fire Protection District Project, Series 2003, 5.125%, 2/01/24 | 2/16 at 100.00 | | Baa2 | | | 400,700 | |
| | 11,355 | | Total Tax Obligation/Limited | | | | | | 11,238,492 | |
| | | | Transportation – 1.3% (0.9% of Total Investments) | | | | | | | |
| | 225 | | Minneapolis-St. Paul Metropolitan Airports Commission, Minnesota, Airport Revenue Bonds, Subordinate Lien Series 2010D, 4.000%, 1/01/23 (Alternative Minimum Tax) | 1/20 at 100.00 | | A+ | | | 239,924 | |
| | 800 | | St Paul Housing and Redevelopment Authority, Minnesota, Parking Revenue Bonds, Parking Facilities Project, Refunding Series 2010A, 5.000%, 8/01/30 | 8/18 at 102.00 | | A+ | | | 882,872 | |
| | 1,025 | | Total Transportation | | | | | | 1,122,796 | |
| | | | U.S. Guaranteed – 10.9% (7.4% of Total Investments) (4) | | | | | | | |
| | 85 | | Minneapolis, Minnesota, Health Care System Revenue Bonds, Fairview Health Services, Series 2008B, 6.500%, 11/15/38 (Pre-refunded 11/15/18) – AGC Insured | 11/18 at 100.00 | | AA (4) | | | 98,459 | |
| | 2,675 | | Minneapolis, Minnesota, Health Care System Revenue Bonds, Fairview Hospital and Healthcare Services, Series 2008A, 6.625%, 11/15/28 (Pre-refunded 11/15/18) | 11/18 at 100.00 | | A+ (4) | | | 3,108,270 | |
| | 1,000 | | Minneapolis, Minnesota, Revenue Bonds, National Marrow Donor Program Project, Series 2010, 4.250%, 8/01/20 (Pre-refunded 8/01/18) | 8/18 at 100.00 | | BBB+ (4) | | | 1,085,430 | |
| | 65 | | Minnesota State, General Obligation Bonds, Series 2007, 5.000%, 8/01/25 (Pre-refunded 8/01/17) | 8/17 at 100.00 | | N/R (4) | | | 69,544 | |
| | 1,000 | | Pine County Housing and Redevelopment Authority, Minnesota, Public Project Revenue Bonds, Series 2005A, 5.000%, 2/01/31 (Pre-refunded 2/01/16) | 2/16 at 100.00 | | AA– (4) | | | 1,008,100 | |
| | 2,215 | | Saint Louis Park, Minnesota, Health Care Facilities Revenue Bonds, Park Nicollet Health Services, Refunding Series 2009, 5.750%, 7/01/39 (Pre-refunded 7/01/19) | 7/19 at 100.00 | | Aaa | | | 2,574,052 | |
| | 1,430 | | Saint Paul Housing and Redevelopment Authority, Minnesota, Health Care Facility Revenue Bonds, HealthPartners Obligated Group, Series 2006, 5.250%, 5/15/36 (Pre-refunded 11/15/16) | 11/16 at 100.00 | | Aaa | | | 1,495,952 | |
| | 8,470 | | Total U.S. Guaranteed | | | | | | 9,439,807 | |
| | | | Utilities – 18.2% (12.3% of Total Investments) | | | | | | | |
| | 500 | | Minnesota Municipal Power Agency, Electric Revenue Bonds, Refunding Series 2014A, 4.000%, 10/01/33 | 10/24 at 100.00 | | A2 | | | 516,920 | |
| | | | Northern Municipal Power Agency, Minnesota, Electric System Revenue Bonds, Refunding Series 2008A: | | | | | | | |
| | 300 | | 5.000%, 1/01/18 – AGC Insured | No Opt. Call | | AA | | | 325,101 | |
| | 1,000 | | 5.000%, 1/01/20 – AGC Insured | 1/18 at 100.00 | | AA | | | 1,074,610 | |
| | 1,000 | | 5.000%, 1/01/21 – AGC Insured | 1/18 at 100.00 | | AA | | | 1,076,110 | |
| | | | Southern Minnesota Municipal Power Agency, Power Supply System Revenue Bonds, Series 1994A: | | | | | | | |
| | 8,600 | | 0.000%, 1/01/19 – NPFG Insured | No Opt. Call | | AA– | | | 8,188,490 | |
| | 1,100 | | 0.000%, 1/01/23 – NPFG Insured | No Opt. Call | | AA– | | | 933,801 | |
| | 3,070 | | 0.000%, 1/01/24 – NPFG Insured | No Opt. Call | | AA– | | | 2,528,360 | |
| | 135 | | 0.000%, 1/01/26 – NPFG Insured | No Opt. Call | | AA– | | | 102,851 | |
| | 40 | | 0.000%, 1/01/27 – NPFG Insured | No Opt. Call | | AA– | | | 29,373 | |
| | 1,000 | | Western Minnesota Municipal Power Agency, Power Supply Revenue Bonds, Series 2014A, 4.000%, 1/01/40 | 1/24 at 100.00 | | Aa3 | | | 1,030,660 | |
| | 16,745 | | Total Utilities | | | | | | 15,806,276 | |
| NMS | Nuveen Minnesota Municipal Income Fund | |
| | Portfolio of Investments (continued) | November 30, 2015 (Unaudited) |
| | Principal | | | Optional Call | | | | | | |
| | Amount (000) | | Description (1) | Provisions (2) | | Ratings (3) | | | Value | |
| | | | Water and Sewer – 5.1% (3.4% of Total Investments) | | | | | | | |
| | | | Buffalo, Minnesota, Water and Sewer Revenue Bonds, Series 2009B: | | | | | | | |
| $ | 1,800 | | 0.000%, 10/01/21 | 4/19 at 89.45 | | AA+ | | $ | 1,541,448 | |
| | 1,800 | | 0.000%, 10/01/22 | 4/19 at 85.14 | | AA+ | | | 1,460,250 | |
| | 1,800 | | 0.000%, 10/01/23 | 4/19 at 80.85 | | AA+ | | | 1,381,662 | |
| | 5,400 | | Total Water and Sewer | | | | | | 4,383,360 | |
| $ | 127,145 | | Total Long-Term Investments (cost $119,400,700) | | | | | | 128,335,679 | |
| | | | Variable Rate MuniFund Term Preferred Shares, at Liquidation
Value – (50.9)% (5) | | | | | | (44,100,000 | ) |
| | | | Other Assets Less Liabilities – 2.8% | | | | | | 2,399,683 | |
| | | | Net Assets Applicable to Common Shares – 100% | | | | | $ | 86,635,362 | |
| (1) | All percentages shown in the Portfolio of Investments are based on net assets applicable to common shares unless otherwise noted. |
| (2) | Optional Call Provisions: Dates (month and year) and prices of the earliest optional call or redemption. There may be other call provisions at varying prices at later dates. Certain mortgage-backed securities may be subject to periodic principal paydowns. |
| (3) | Ratings: Using the highest of Standard & Poor's Group ("Standard & Poor's"), Moody's Investors Service, Inc. ("Moody's") or Fitch, Inc. ("Fitch") rating. Ratings below BBB by Standard & Poor's, Baa by Moody's or BBB by Fitch are considered to be below investment grade. Holdings designated N/R are not rated by any of these national rating agencies. |
| (4) | Backed by an escrow or trust containing sufficient U.S. Government or U.S. Government agency securities, which ensure the timely payment of principal and interest. Certain bonds backed by U.S. Government or agency securities are regarded as having an implied rating equal to the rating of such securities. |
| (5) | Variable Rate MuniFund Term Preferred Shares, at Liquidation Value as a percentage of Total Investments is 34.4%. |
| (WI/DD) | Investment, or portion of investment, purchased on a when-issued or delayed delivery basis. |
See accompanying notes to financial statements.
| NOM | | |
| | Nuveen Missouri Premium Income Municipal Fund | |
| | Portfolio of Investments | November 30, 2015 (Unaudited) |
| | Principal | | | Optional Call | | | | | | |
| | Amount (000) | | Description (1) | Provisions (2) | | Ratings (3) | | | Value | |
| | | | LONG-TERM INVESTMENTS – 163.0% (100.0% of Total Investments) | | | | | | | |
| | | | MUNICIPAL BONDS – 163.0% (100.0% of Total Investments) | | | | | | | |
| | | | Consumer Staples – 3.9% (2.4% of Total Investments) | | | | | | | |
| $ | 1,055 | | Missouri Development Finance Board, Solid Waste Disposal Revenue Bonds, Procter and Gamble Inc., Series 1999, 5.200%, 3/15/29 (Alternative Minimum Tax) | No Opt. Call | | AA– | | $ | 1,284,241 | |
| | | | Education and Civic Organizations – 23.3% (14.3% of Total Investments) | | | | | | | |
| | 300 | | Curators of the University of Missouri, System Facilities Revenue Bonds, Refunding Series 2014A, 4.000%, 11/01/33 | 11/24 at 100.00 | | AA+ | | | 325,275 | |
| | 250 | | Lincoln University, Missouri, Auxiliary System Revenue Bonds, Series 2007, 5.125%, 6/01/37 – AGC Insured | 6/17 at 100.00 | | AA | | | 257,415 | |
| | 410 | | Missouri Health and Educational Facilities Authority, Educational Facilities Revenue Bonds, Kansas City University of Medicine and Biosciences, Series 2013A, 5.000%, 6/01/33 | 6/23 at 100.00 | | A1 | | | 451,410 | |
| | 750 | | Missouri Health and Educational Facilities Authority, Educational Facilities Revenue Bonds, Saint Louis College of Pharmacy, Series 2013, 5.500%, 5/01/43 | 5/23 at 100.00 | | BBB+ | | | 823,598 | |
| | 600 | | Missouri Health and Educational Facilities Authority, Educational Facilities Revenue Bonds, Southwest Baptist University Project, Series 2012, 5.000%, 10/01/33 | 10/22 at 100.00 | | BBB– | | | 635,916 | |
| | 725 | | Missouri Health and Educational Facilities Authority, Educational Facilities Revenue Bonds, University of Central Missouri, Series 2013C2, 5.000%, 10/01/34 | 10/23 at 100.00 | | A | | | 821,229 | |
| | 630 | | Missouri Health and Educational Facilities Authority, Revenue Bonds, A.T. Still University of Health Sciences, Series 2011, 5.250%, 10/01/41 | 10/21 at 100.00 | | A– | | | 690,845 | |
| | 510 | | Missouri Health and Educational Facilities Authority, Revenue Bonds, A.T. Still University of Health Sciences, Series 2014, 5.000%, 10/01/39 | 10/23 at 100.00 | | A– | | | 572,031 | |
| | 700 | | Missouri Health and Educational Facilities Authority, Revenue Bonds, Rockhurst University, Series 2011A, 6.500%, 10/01/35 | 10/18 at 103.00 | | BBB– | | | 774,263 | |
| | 1,000 | | Missouri Health and Educational Facilities Authority, Revenue Bonds, Saint Louis University, Series 2015A, 4.000%, 10/01/42 (WI/DD, Settling 12/01/15) | 10/25 at 100.00 | | AA– | | | 1,017,060 | |
| | 550 | | Missouri Health and Educational Facilities Authority, Revenue Bonds, Washington University, Series 2011B, 5.000%, 11/15/37 | 11/21 at 100.00 | | AAA | | | 623,717 | |
| | 600 | | Missouri Health and Educational Facilities Authority, Revenue Bonds, Webster University, Series 2011, 5.000%, 4/01/36 | 4/21 at 100.00 | | A2 | | | 652,872 | |
| | 7,025 | | Total Education and Civic Organizations | | | | | | 7,645,631 | |
| | | | Health Care – 37.2% (22.8% of Total Investments) | | | | | | | |
| | 525 | | Cape Girardeau County Industrial Development Authority, Missouri, Health Facilities Revenue Bonds, Saint Francis Medical Center, Series 2009A, 5.750%, 6/01/39 | 6/19 at 100.00 | | AA– | | | 585,060 | |
| | | | Cape Girardeau County Industrial Development Authority, Missouri, Health Facilities Revenue Bonds, Southeast Missouri Hospital Association, Series 2007: | | | | | | | |
| | 760 | | 5.000%, 6/01/27 | 6/17 at 100.00 | | B | | | 726,051 | |
| | 560 | | 5.000%, 6/01/36 | 6/17 at 100.00 | | B | | | 511,056 | |
| | 930 | | Cass County, Missouri, Hospital Revenue Bonds, Series 2007, 5.625%, 5/01/38 | 11/16 at 100.00 | | BBB– | | | 938,575 | |
| | 480 | | Clinton County Industrial Development Authority, Missouri, Revenue Bonds, Cameron Regional Medical Center, Series 2007, 5.000%, 12/01/37 | 12/17 at 100.00 | | N/R | | | 484,454 | |
| | 200 | | Joplin Industrial Development Authority, Missouri, Health Facilities Revenue Bonds, Freeman Health System, Series 2011, 5.500%, 2/15/31 | 2/21 at 100.00 | | BBB+ | | | 220,132 | |
| | 315 | | Joplin Industrial Development Authority, Missouri, Health Facilities Revenue Bonds, Freeman Health System, Series 2015, 5.000%, 2/15/35 | 2/24 at 100.00 | | BBB+ | | | 344,796 | |
| | 250 | | Missouri Health and Educational Facilities Authority, Health Facilities Revenue Bonds, BJC Health System, Series 2015A, 4.000%, 1/01/45 | No Opt. Call | | AA | | | 255,155 | |
| NOM | Nuveen Missouri Premium Income Municipal Fund | |
| | Portfolio of Investments (continued) | November 30, 2015 (Unaudited) |
| | Principal | | | Optional Call | | | | | | |
| | Amount (000) | | Description (1) | Provisions (2) | | Ratings (3) | | | Value | |
| | | | Health Care (continued) | | | | | | | |
| $ | 540 | | Missouri Health and Educational Facilities Authority, Health Facilities Revenue Bonds, Capital Region Medical Center, Series 2011, 5.000%, 11/01/27 | 11/20 at 100.00 | | A3 | | $ | 602,332 | |
| | 1,730 | | Missouri Health and Educational Facilities Authority, Health Facilities Revenue Bonds, CoxHealth, Series 2013A, 5.000%, 11/15/44 | 11/23 at 100.00 | | A2 | | | 1,896,910 | |
| | 415 | | Missouri Health and Educational Facilities Authority, Health Facilities Revenue Bonds, CoxHealth, Series 2015A, 5.000%, 11/15/32 | 11/25 at 100.00 | | A2 | | | 473,893 | |
| | 335 | | Missouri Health and Educational Facilities Authority, Health Facilities Revenue Bonds, Heartland Regional Medical Center, Series 2012, 5.000%, 2/15/37 | 2/22 at 100.00 | | A1 | | | 360,963 | |
| | 250 | | Missouri Health and Educational Facilities Authority, Health Facilities Revenue Bonds, Mercy Health, Series 2012, 4.000%, 11/15/42 | No Opt. Call | | AA– | | | 253,948 | |
| | 500 | | Missouri Health and Educational Facilities Authority, Health Facilities Revenue Bonds, Saint Luke's Episcopal and Presbyterian Hospitals, Series 2011, 5.000%, 12/01/25 | 12/21 at 100.00 | | A+ | | | 565,725 | |
| | 500 | | Missouri Health and Educational Facilities Authority, Health Facilities Revenue Bonds, SSM Health Care, Series 2014A, 5.000%, 6/01/31 | 6/24 at 100.00 | | AA– | | | 573,145 | |
| | 2,000 | | Missouri Health and Educational Facilities Authority, Health Facility Revenue Bonds, Saint Luke's Health System, Series 2010A, 5.000%, 11/15/30 | 11/20 at 100.00 | | A+ | | | 2,224,880 | |
| | 720 | | Saline County Industrial Development Authority, Missouri, Health Facilities Revenue Bonds, John Fitzgibbon Memorial Hospital Inc., Series 2010, 5.600%, 12/01/28 | 12/20 at 100.00 | | BBB– | | | 813,175 | |
| | 350 | | St. Louis County Industrial Development Authority, Missouri, Healthcare Facilities Revenue Bonds, Ranken-Jordan Project, Refunding Series 2007, 5.000%, 11/15/27 | 11/16 at 100.00 | | N/R | | | 351,372 | |
| | 11,360 | | Total Health Care | | | | | | 12,181,622 | |
| | | | Housing/Single Family – 0.7% (0.4% of Total Investments) | | | | | | | |
| | 155 | | Missouri Housing Development Commission, Single Family Mortgage Revenue Bonds, Homeownership Loan Program, Series 2007A-1, 4.700%, 9/01/27 (Alternative Minimum Tax) | 9/16 at 100.00 | | AA+ | | | 156,569 | |
| | 70 | | Missouri Housing Development Commission, Single Family Mortgage Revenue Bonds, Homeownership Loan Program, Series 2007C-1, 4.800%, 9/01/38 (Alternative Minimum Tax) | 3/17 at 100.00 | | AA+ | | | 70,022 | |
| | 225 | | Total Housing/Single Family | | | | | | 226,591 | |
| | | | Long-Term Care – 13.9% (8.5% of Total Investments) | | | | | | | |
| | 250 | | Bridgeton Industrial Development Authority, Missouri, Senior Housing Revenue Bonds, The Sarah Community Project, Series 2013, 4.500%, 5/01/28 | 5/18 at 100.00 | | N/R | | | 250,673 | |
| | 500 | | Joplin Industrial Development Authority, Missouri, Revenue Bonds, Christian Homes Inc., Series 2007F, 5.750%, 5/15/31 | 5/17 at 100.00 | | BBB– | | | 510,555 | |
| | 475 | | Lees Summit Industrial Development Authority, Missouri, Revenue Bonds, John Knox Village Obligated Group, Series 2007A, 5.125%, 8/15/32 | 8/17 at 100.00 | | BBB– | | | 485,882 | |
| | 250 | | Lees Summit Industrial Development Authority, Missouri, Revenue Bonds, John Knox Village Obligated Group, Series 2014A, 5.250%, 8/15/39 | No Opt. Call | | BBB– | | | 257,195 | |
| | 250 | | Missouri Health and Educational Facilities Authority, Revenue Bonds, Lutheran Senior Services Projects, Series 2011, 6.000%, 2/01/41 | 2/21 at 100.00 | | BBB+ | | | 274,410 | |
| | | | Missouri Health and Educational Facilities Authority, Revenue Bonds, Lutheran Senior Services Projects, Series 2014A: | | | | | | | |
| | 250 | | 5.000%, 2/01/35 | 2/24 at 100.00 | | BBB+ | | | 265,563 | |
| | 500 | | 5.000%, 2/01/44 | 2/24 at 100.00 | | BBB+ | | | 526,155 | |
| | 100 | | St. Louis County Industrial Development Authority, Missouri, Revenue Bonds, Friendship Village of Chesterfield, Series 2012, 5.000%, 9/01/42 | No Opt. Call | | BBB– | | | 102,496 | |
| | | | St. Louis County Industrial Development Authority, Missouri, Revenue Bonds, Friendship Village of Sunset Hills, Series 2012: | | | | | | | |
| | 250 | | 5.000%, 9/01/32 | No Opt. Call | | A– | | | 268,090 | |
| | 425 | | 5.000%, 9/01/42 | 9/22 at 100.00 | | A– | | | 448,490 | |
| | 430 | | St. Louis County Industrial Development Authority, Missouri, Revenue Bonds, Friendship Village of Sunset Hills, Series 2013A, 5.875%, 9/01/43 | 9/23 at 100.00 | | A– | | | 485,552 | |
| | Principal | | | Optional Call | | | | | | |
| | Amount (000) | | Description (1) | Provisions (2) | | Ratings (3) | | | Value | |
| | | | Long-Term Care (continued) | | | | | | | |
| $ | 570 | | St. Louis County Industrial Development Authority, Missouri, Revenue Bonds, Friendship Village of West County, Series 2007A, 5.500%, 9/01/28 | 9/17 at 100.00 | | BBB– | | $ | 582,534 | |
| | 100 | | St. Louis County Industrial Development Authority, Missouri, Revenue Bonds, Saint Andrew's Resources for Seniors, Series 2015A, 5.125%, 12/01/45 | 12/25 at 100.00 | | N/R | | | 100,896 | |
| | 4,350 | | Total Long-Term Care | | | | | | 4,558,491 | |
| | | | Tax Obligation/General – 12.5% (7.7% of Total Investments) | | | | | | | |
| | 500 | | Branson Reorganized School District R-4, Taney County, Missouri, General Obligation Bonds, School Building Series 2012, 4.375%, 3/01/32 | 3/22 at 100.00 | | A+ | | | 534,205 | |
| | 500 | | Fort Zumwalt School District, Callaway County, Missouri, General Obligation Bonds, Refunding & Improvement Series 2015, 4.000%, 3/01/32 | 3/24 at 100.00 | | AA+ | | | 537,050 | |
| | 1,685 | | Independence School District, Jackson County, Missouri, General Obligation Bonds, Series 2010, 5.000%, 3/01/27 | 3/20 at 100.00 | | AA+ | | | 1,914,530 | |
| | 500 | | Jackson County Reorganized School District 4, Blue Springs, Missouri, General Obligation Bonds, School Building Series 2013A, 5.000%, 3/01/31 | 3/21 at 100.00 | | AA | | | 576,180 | |
| | 500 | | Missouri School Boards Association, Lease Participation Certificates, Clay County School District 53 Liberty, Series 2007, 5.250%, 3/01/27 – AGM Insured | 3/17 at 100.00 | | AA | | | 524,870 | |
| | 3,685 | | Total Tax Obligation/General | | | | | | 4,086,835 | |
| | | | Tax Obligation/Limited – 24.4% (15.0% of Total Investments) | | | | | | | |
| | 910 | | Bi-State Development Agency of the Missouri-Illinois Metropolitan District, Mass Transit Sales Tax Appropriation Bonds, Refunding Combined Lien Series 2013A, 5.000%, 10/01/33 | 10/22 at 100.00 | | AA+ | | | 1,045,909 | |
| | 350 | | Blue Springs, Missouri, Special Obligation Tax Increment Bonds, Adams Farm Project, Special Districts Refunding & Improvement Series 2015A, 4.750%, 6/01/30 | 6/24 at 100.00 | | N/R | | | 351,204 | |
| | 625 | | Excelsior Springs Community Center, Missouri, Sales Tax Revenue Bonds, Series 2014, 4.000%, 3/01/27 – AGM Insured | 3/23 at 100.00 | | AA | | | 677,756 | |
| | 315 | | Fulton, Missouri, Tax Increment Revenue Bonds, Fulton Commons Redevelopment Project, Series 2006, 5.000%, 6/01/28 | 6/16 at 100.00 | | N/R | | | 273,247 | |
| | 430 | | Government of Guam, Business Privilege Tax Bonds, Series 2012B-1, 5.000%, 1/01/42 Howard Bend Levee District, St. Louis County, Missouri, Levee District Improvement Bonds, Series 2013B: | 1/22 at 100.00 | | A | | | 462,628 | |
| | 180 | | 4.875%, 3/01/33 | 3/23 at 100.00 | | BBB+ | | | 190,053 | |
| | 115 | | 5.000%, 3/01/38 | 3/23 at 100.00 | | BBB+ | | | 121,061 | |
| | 485 | | Jackson County, Missouri, Special Obligation Bonds, Truman Medical Center Project, Series 2011B, 4.350%, 12/01/23 | 12/21 at 100.00 | | Aa3 | | | 542,225 | |
| | 300 | | Kansas City Industrial Development Authority, Missouri, Downtown Redevelopment District Revenue Bonds, Series 2011A, 5.000%, 9/01/32 | 9/21 at 100.00 | | AA– | | | 329,973 | |
| | 475 | | Kansas City Tax Increment Financing Commission, Missouri, Tax Increment Revenue Bonds, Briarcliff West Project, Series 2006A, 5.400%, 6/01/24 | 6/16 at 100.00 | | N/R | | | 479,247 | |
| | 325 | | Kansas City, Missouri, Special Obligation Bonds, Downtown Redevelopment District, Series 2014C, 5.000%, 9/01/33 | 9/23 at 100.00 | | AA– | | | 368,687 | |
| | 245 | | Missouri Development Finance Board, Infrastructure Facilities Revenue Bonds, City of Branson – Branson Landing Project, Series 2015A, 4.000%, 6/01/34 | 6/23 at 100.00 | | A | | | 246,325 | |
| | 180 | | Monarch-Chesterfield Levee District, Saint Louis County, Missouri, Levee District Improvement Bonds, Series 1999, 5.750%, 3/01/19 – NPFG Insured | 3/16 at 100.00 | | AA– | | | 180,790 | |
| | 500 | | Osage Beach, Missouri, Tax Increment Revenue Bonds, Prewitts Point Transportation Development District, Series 2006, 5.000%, 5/01/23 | 2/16 at 100.00 | | N/R | | | 493,305 | |
| | 140 | | Plaza at Noah's Ark Community Improvement District, Saint Charles, Missouri, Tax Increment and Improvement District Revenue Bonds, Series 2015, 5.000%, 5/01/30 | 5/21 at 100.00 | | N/R | | | 142,521 | |
| | 1,500 | | Puerto Rico Sales Tax Financing Corporation, Sales Tax Revenue Bonds, Series 2007A, 0.000%, 8/01/41 – NPFG Insured | No Opt. Call | | AA– | | | 288,600 | |
| NOM | Nuveen Missouri Premium Income Municipal Fund | |
| | Portfolio of Investments (continued) | November 30, 2015 (Unaudited) |
| | Principal | | | Optional Call | | | | | | |
| | Amount (000) | | Description (1) | Provisions (2) | | Ratings (3) | | | Value | |
| | | | Tax Obligation/Limited (continued) | | | | | | | |
| $ | 250 | | Saint Louis County Industrial Development Authority, Missouri, Sales Tax Revenue Bonds, Chesterfield Blue Valley Community Improvement District Project, Series 2014A, 5.250%, 7/01/44 | 7/24 at 100.00 | | N/R | | $ | 254,260 | |
| | 600 | | Springfield, Missouri, Special Obligation Bonds, Sewer System Improvements Project, Series 2015, 4.000%, 4/01/35 | 4/25 at 100.00 | | Aa2 | | | 622,242 | |
| | | | St. Joseph Industrial Development Authority, Missouri, Tax Increment Bonds, Shoppes at North Village Project, Series 2005A: | | | | | | | |
| | 340 | | 5.375%, 11/01/24 | 2/16 at 100.00 | | N/R | | | 340,112 | |
| | 400 | | 5.500%, 11/01/27 | 2/16 at 100.00 | | N/R | | | 400,148 | |
| | 200 | | St. Joseph Industrial Development Authority, Missouri, Tax Increment Bonds, Shoppes at North Village Project, Series 2005B, 5.500%, 11/01/27 | 2/16 at 100.00 | | N/R | | | 200,210 | |
| | 8,865 | | Total Tax Obligation/Limited | | | | | | 8,010,503 | |
| | | | Transportation – 12.7% (7.8% of Total Investments) | | | | | | | |
| | 335 | | Guam International Airport Authority, Revenue Bonds, Series 2013B, 5.500%, 10/01/33 – AGM Insured | 10/23 at 100.00 | | AA | | | 381,294 | |
| | 1,000 | | Saint Louis, Missouri, Airport Revenue Bonds, Lambert-St. Louis International Airport, Series 2005, 5.500%, 7/01/18 – NPFG Insured | No Opt. Call | | AA– | | | 1,112,960 | |
| | 2,500 | | Saint Louis, Missouri, Airport Revenue Bonds, Lambert-St. Louis International Airport, Series 2007A, 5.000%, 7/01/21 – AGM Insured | 7/17 at 100.00 | | AA | | | 2,657,124 | |
| | 3,835 | | Total Transportation | | | | | | 4,151,378 | |
| | | | U.S. Guaranteed – 11.1% (6.8% of Total Investments) (4) | | | | | | | |
| | 600 | | Carroll County Public Water Supply District 1, Missouri, Water System Revenue Bonds, Refunding Series 2009, 6.000%, 3/01/39 (Pre-refunded 3/01/18) | 3/18 at 100.00 | | A– (4) | | | 668,256 | |
| | 200 | | Metropolitan St. Louis Sewerage District, Missouri, Wastewater System Revenue Bonds, Series 2006C, 5.000%, 5/01/36 (Pre-refunded 5/01/17) – NPFG Insured | 5/17 at 100.00 | | AAA | | | 210,520 | |
| | 110 | | Missouri Joint Municipal Electric Utility Commission, Power Project Revenue Bonds, Iatan 2 Project Series 2006A, 4.125%, 1/01/21 (Pre-refunded 1/01/16) – AMBAC Insured | 1/16 at 100.00 | | A2 (4) | | | 110,377 | |
| | 500 | | Missouri Joint Municipal Electric Utility Commission, Power Project Revenue Bonds, Plum Point Project, Series 2006, 5.000%, 1/01/34 (Pre-refunded 1/01/16) – NPFG Insured | 1/16 at 100.00 | | AA– (4) | | | 502,095 | |
| | 1,320 | | Springfield Public Building Corporation, Missouri, Lease Revenue Bonds, Jordan Valley Park Projects, Series 2000A, 6.125%, 6/01/21 – AMBAC Insured (ETM) | 2/16 at 100.00 | | N/R (4) | | | 1,556,465 | |
| | 500 | | St. Louis County, Missouri, GNMA Collateralized Mortgage Revenue Bonds, Series 1993D, 5.650%, 7/01/20 (Alternative Minimum Tax) (ETM) | No Opt. Call | | AA+ (4) | | | 585,690 | |
| | 3,230 | | Total U.S. Guaranteed | | | | | | 3,633,403 | |
| | | | Utilities – 14.7% (9.0% of Total Investments) | | | | | | | |
| | 2,965 | | Missouri Environmental Improvement and Energy Resources Authority, Water Facility Revenue Bonds, Missouri-American Water Company, Series 2006, 4.600%, 12/01/36 – BHAC Insured (Alternative Minimum Tax) (UB) (5) | 12/16 at 100.00 | | AA+ | | | 3,008,882 | |
| | 350 | | Missouri Joint Municipal Electric Utility Commission, Power Project Revenue Bonds, Plum Point Project, Refunding Series 2014A, 5.000%, 1/01/32 | 1/25 at 100.00 | | A | | | 399,028 | |
| | 500 | | Missouri Joint Municipal Electric Utility Commission, Power Project Revenue Bonds, Plum Point Project, Refunding Series 2015A, 4.000%, 1/01/35 (WI/DD, Settling 12/17/15) | 1/26 at 100.00 | | A | | | 509,950 | |
| | | | Missouri Joint Municipal Electric Utility Commission, Power Supply System Revenue Bonds, MoPEP Facilities, Series 2012: | | | | | | | |
| | 400 | | 5.000%, 1/01/32 | 1/21 at 100.00 | | A2 | | | 437,268 | |
| | 425 | | 5.000%, 1/01/37 | 1/21 at 100.00 | | A2 | | | 460,840 | |
| | 4,640 | | Total Utilities | | | | | | 4,815,968 | |
| | Principal | | | Optional Call | | | | | | |
| | Amount (000) | | Description (1) | Provisions (2) | | Ratings (3) | | | Value | |
| | | | Water and Sewer – 8.6% (5.3% of Total Investments) | | | | | | | |
| $ | 2,000 | | Metropolitan St. Louis Sewerage District, Missouri, Wastewater System Revenue Bonds, Series 2012A, 5.000%, 5/01/42 | 5/22 at 100.00 | | AAA | | $ | 2,256,840 | |
| | 500 | | Missouri Environmental Improvement and Energy Resources Authority, Water Facility Revenue Bonds, Tri-County Water Authority, Series 2015, 5.000%, 1/01/40 | 1/25 at 100.00 | | Aa3 | | | 566,245 | |
| | 2,500 | | Total Water and Sewer | | | | | | 2,823,085 | |
| $ | 50,770 | | Total Long-Term Investments (cost $50,160,355) | | | | | | 53,417,748 | |
| | | | Floating Rate Obligations – (6.8)% | | | | | | (2,225,000 | ) |
| | | | Variable Rate MuniFund Term Preferred Shares, at Liquidation
Value – (54.9)% (6) | | | | | | (18,000,000 | ) |
| | | | Other Assets Less Liabilities – (1.3)% | | | | | | (423,548 | ) |
| | | | Net Assets Applicable to Common Shares – 100% | | | | | $ | 32,769,200 | |
| (1) | All percentages shown in the Portfolio of Investments are based on net assets applicable to common shares unless otherwise noted. |
| (2) | Optional Call Provisions: Dates (month and year) and prices of the earliest optional call or redemption. There may be other call provisions at varying prices at later dates. Certain mortgage-backed securities may be subject to periodic principal paydowns. |
| (3) | Ratings: Using the highest of Standard & Poor's Group ("Standard & Poor's"), Moody's Investors Service, Inc. ("Moody's") or Fitch, Inc. ("Fitch") rating. Ratings below BBB by Standard & Poor's, Baa by Moody's or BBB by Fitch are considered to be below investment grade. Holdings designated N/R are not rated by any of these national rating agencies. |
| (4) | Backed by an escrow or trust containing sufficient U.S. Government or U.S. Government agency securities, which ensure the timely payment of principal and interest. Certain bonds backed by U.S. Government or agency securities are regarded as having an implied rating equal to the rating of such securities. |
| (5) | Investment, or portion of investment, has been pledged to collateralize the net payment obligations for investments in inverse floating rate transactions. |
| (6) | Variable Rate MuniFund Term Preferred Shares, at Liquidation Value as a percentage of Total Investments is 33.7%. |
| (ETM) | Escrowed to maturity. |
| (UB) | Underlying bond of an inverse floating rate trust reflected as a financing transaction. See Notes to Financial Statements, Note 3 – Portfolio Securities and Investments in Derivatives, Inverse Floating Rate Securities for more information. |
| (WI/DD) | Investment, or portion of investment, purchased on a when-issued or delayed delivery basis. |
See accompanying notes to financial statements.
| NNC | | |
| | Nuveen North Carolina Premium Income Municipal Fund | |
| | Portfolio of Investments | November 30, 2015 (Unaudited) |
| | Principal | | | Optional Call | | | | | | |
| | Amount (000) | | Description (1) | Provisions (2) | | Ratings (3) | | | Value | |
| | | | LONG-TERM INVESTMENTS – 148.3% (100.0% of Total Investments) | | | | | | | |
| | | | MUNICIPAL BONDS – 148.3% (100.0% of Total Investments) | | | | | | | |
| | | | Education and Civic Organizations – 21.7% (14.6% of Total Investments) | | | | | | | |
| $ | 30 | | Appalachian State University, North Carolina, Revenue Bonds, Series 2005, 5.250%, 7/15/17 – NPFG Insured | No Opt. Call | | Aa3 | | $ | 32,202 | |
| | | | Board of Governors of the University of North Carolina, Winston-Salem State University General Revenue Bonds, Series 2013: | | | | | | | |
| | 2,950 | | 5.000%, 4/01/33 | 4/22 at 100.00 | | A– | | | 3,246,887 | |
| | 1,000 | | 5.125%, 4/01/43 | 4/22 at 100.00 | | A– | | | 1,090,990 | |
| | 5,000 | | East Carolina University, North Carolina, General Revenue Bonds, Series 2014A, 5.000%, 10/01/41 | 10/23 at 100.00 | | Aa2 | | | 5,634,000 | |
| | 1,500 | | Fayetteville State University, North Carolina, Limited Obligation Revenue Bonds, Student Housing Project, Series 2011, 5.000%, 4/01/43 – AGM Insured | 4/21 at 100.00 | | AA | | | 1,625,295 | |
| | 1,000 | | North Carolina Capital Facilities Finance Agency, General Revenue Bonds, Duke University, Series 2009B, 5.000%, 10/01/38 | 4/19 at 100.00 | | AA+ | | | 1,110,450 | |
| | | | North Carolina Capital Facilities Finance Agency, Revenue Bonds, Davidson College, Series 2014: | | | | | | | |
| | 500 | | 5.000%, 3/01/26 | 3/22 at 100.00 | | AA+ | | | 586,785 | |
| | 250 | | 5.000%, 3/01/28 | 3/22 at 100.00 | | AA+ | | | 290,070 | |
| | 500 | | 5.000%, 3/01/29 | 3/22 at 100.00 | | AA+ | | | 576,615 | |
| | 500 | | 5.000%, 3/01/32 | 3/22 at 100.00 | | AA+ | | | 569,750 | |
| | 1,230 | | 5.000%, 3/01/45 | 3/22 at 100.00 | | AA+ | | | 1,371,475 | |
| | 1,605 | | North Carolina Capital Facilities Finance Agency, Revenue Bonds, Duke University Project, Series 2015 A, 5.000%, 10/01/55 | 10/25 at 100.00 | | AA+ | | | 1,836,874 | |
| | | | North Carolina Capital Facilities Finance Agency, Revenue Bonds, Johnson & Wales University, Series 2013A: | | | | | | | |
| | 1,560 | | 5.000%, 4/01/32 | 4/23 at 100.00 | | A2 | | | 1,764,017 | |
| | 1,000 | | 5.000%, 4/01/33 | 4/23 at 100.00 | | A2 | | | 1,127,970 | |
| | 4,440 | | North Carolina Capital Facilities Finance Agency, Revenue Bonds, The Methodist University, Series 2012, 5.000%, 3/01/34 | 3/22 at 100.00 | | BBB | | | 4,777,307 | |
| | 2,020 | | North Carolina State University at Raleigh, General Revenue Bonds, Series 2013A, 5.000%, 10/01/42 | 10/23 at 100.00 | | Aa1 | | | 2,309,264 | |
| | 290 | | University of North Carolina System, Pooled Revenue Bonds, Series 2005A, 5.000%, 4/01/22 – AMBAC Insured | 2/16 at 100.00 | | A | | | 291,128 | |
| | 10,200 | | University of North Carolina, Chapel Hill, System Net Revenue Bonds, Series 2007, 5.000%, 12/01/36 | 12/17 at 100.00 | | AAA | | | 11,008,043 | |
| | 800 | | University of North Carolina, Charlotte, General Revenue Bonds, Refunding Series 2015, 5.000%, 4/01/45 | 4/25 at 100.00 | | Aa3 | | | 911,232 | |
| | | | University of North Carolina, Charlotte, General Revenue Bonds, Series 2014: | | | | | | | |
| | 2,070 | | 5.000%, 4/01/32 | 4/24 at 100.00 | | Aa3 | | | 2,389,774 | |
| | 1,175 | | 5.000%, 4/01/33 | 4/24 at 100.00 | | Aa3 | | | 1,351,814 | |
| | 1,385 | | 5.000%, 4/01/35 | 4/24 at 100.00 | | Aa3 | | | 1,581,324 | |
| | | | University of North Carolina, Greensboro, General Revenue Bonds, Series 2014A: | | | | | | | |
| | 1,000 | | 5.000%, 4/01/32 | 4/24 at 100.00 | | Aa3 | | | 1,164,130 | |
| | 3,065 | | 5.000%, 4/01/39 | 4/24 at 100.00 | | Aa3 | | | 3,482,545 | |
| | | | University of North Carolina, System Pooled Revenue Bonds, Series 2009C: | | | | | | | |
| | 1,000 | | 5.250%, 10/01/28 | 10/19 at 100.00 | | A3 | | | 1,116,590 | |
| | 1,000 | | 5.375%, 10/01/29 | 10/19 at 100.00 | | A3 | | | 1,118,860 | |
| | 1,250 | | Western Carolina University, North Carolina, General Revenue Bonds, Refunding Series 2015A, 5.000%, 10/01/45 | No Opt. Call | | Aa3 | | | 1,423,813 | |
| | 48,320 | | Total Education and Civic Organizations | | | | | | 53,789,204 | |
| | Principal | | | Optional Call | | | | | | |
| | Amount (000) | | Description (1) | Provisions (2) | | Ratings (3) | | | Value | |
| | | | Health Care – 25.3% (17.1% of Total Investments) | | | | | | | |
| $ | 2,750 | | Charlotte-Mecklenburg Hospital Authority, North Carolina, Health Care Revenue Bonds, DBA Carolinas HealthCare System, Refunding Series 2009A, 5.250%, 1/15/39 | 1/19 at 100.00 | | AA– | | $ | 3,025,908 | |
| | 5,250 | | Charlotte-Mecklenburg Hospital Authority, North Carolina, Health Care Revenue Bonds, DBA Carolinas HealthCare System, Refunding Series 2012A, 5.000%, 1/15/43 | 1/22 at 100.00 | | AA– | | | 5,814,743 | |
| | 4,950 | | Charlotte-Mecklenburg Hospital Authority, North Carolina, Health Care Revenue Bonds, DBA Carolinas HealthCare System, Series 2008A, 5.000%, 1/15/47 | 1/18 at 100.00 | | AA– | | | 5,171,660 | |
| | 2,000 | | Charlotte-Mecklenburg Hospital Authority, North Carolina, Health Care Revenue Bonds, DBA Carolinas HealthCare System, Series 2011A, 5.250%, 1/15/42 | 1/21 at 100.00 | | AA– | | | 2,224,280 | |
| | 4,295 | | Nash Health Care Systems, North Carolina, Health Care Facilities Revenue Bonds, Series 2012, 5.000%, 11/01/41 | 5/22 at 100.00 | | A– | | | 4,630,397 | |
| | 500 | | New Hanover County, North Carolina, Hospital Revenue Bonds, New Hanover Regional Medical Center, Refunding Series 2013, 5.000%, 10/01/26 | 10/23 at 100.00 | | A+ | | | 569,915 | |
| | 555 | | New Hanover County, North Carolina, Hospital Revenue Bonds, New Hanover Regional Medical Center, Series 2006B, 5.125%, 10/01/31 – AGM Insured | 10/19 at 100.00 | | AA | | | 611,377 | |
| | | | North Carolina Medical Care Commission Health Care Facilities Revenue Bonds Novant Health Inc., Series 2010A: | | | | | | | |
| | 4,750 | | 5.250%, 11/01/40 | 11/20 at 100.00 | | AA– | | | 5,285,847 | |
| | 5,000 | | 5.000%, 11/01/43 | 11/20 at 100.00 | | AA– | | | 5,468,450 | |
| | 2,750 | | North Carolina Medical Care Commission, Health Care Facilities Refunding Revenue Bonds, Blue Ridge HealthCare, Series 2010A, 5.000%, 1/01/36 | 1/20 at 100.00 | | A | | | 2,973,163 | |
| | 2,680 | | North Carolina Medical Care Commission, Health Care Facilities Revenue Bonds, Appalachian Regional HealthCare System, Series 2011A, 6.500%, 7/01/31 | 7/21 at 100.00 | | BBB+ | | | 3,113,410 | |
| | 2,000 | | North Carolina Medical Care Commission, Health Care Facilities Revenue Bonds, Duke University Health System, Series 2012A, 5.000%, 6/01/42 | 6/22 at 100.00 | | AA | | | 2,235,980 | |
| | 2,335 | | North Carolina Medical Care Commission, Health Care Facilities Revenue Bonds, FirstHealth of the Carolinas Project, Refunding Series 2012A, 4.000%, 10/01/39 | 10/17 at 100.00 | | AA | | | 2,353,843 | |
| | 2,000 | | North Carolina Medical Care Commission, Health Care Facilities Revenue Bonds, Rex Healthcare, Series 2015A, 5.000%, 7/01/44 | 7/25 at 100.00 | | AA– | | | 2,226,100 | |
| | 3,000 | | North Carolina Medical Care Commission, Health Care Facilities Revenue Bonds, Wake Forest Baptist Obligated Group, Series 2012A, 5.000%, 12/01/45 | No Opt. Call | | A | | | 3,290,040 | |
| | 2,375 | | North Carolina Medical Care Commission, Health Care Facilities Revenue Refunding Bonds, Cape Fear Valley Health System, Series 2012A, 5.000%, 10/01/27 | No Opt. Call | | A– | | | 2,629,386 | |
| | 2,000 | | North Carolina Medical Care Commission, Health Care Facilities Revenue Refunding Bonds, WakeMed, Series 2012A, 5.000%, 10/01/27 | 10/22 at 100.00 | | AA– | | | 2,262,640 | |
| | 2,930 | | North Carolina Medical Care Commission, Hospital Revenue Bonds, Southeastern Regional Medical Center, Refunding Series 2012, 5.000%, 6/01/32 | 6/22 at 100.00 | | A | | | 3,175,651 | |
| | 3,295 | | North Carolina Medical Care Commission, Revenue Bonds, Blue Ridge Healthcare System, Series 2005, 5.000%, 1/01/33 – FGIC Insured | 2/16 at 100.00 | | AA– | | | 3,302,644 | |
| | 750 | | Northern Hospital District Surry County, North Carolina, Health Care Facilities Revenue Bonds, Series 2008, 6.250%, 10/01/38 | 4/18 at 100.00 | | BBB | | | 801,143 | |
| | 1,660 | | Onslow County Hospital Authority, North Carolina, FHA Insured Mortgage Revenue Bonds, Onslow Memorial Hospital Project, Series 2006, 5.000%, 4/01/31 – NPFG Insured | 10/16 at 100.00 | | AA– | | | 1,708,057 | |
| | 57,825 | | Total Health Care | | | | | | 62,874,634 | |
| | | | Housing/Multifamily – 1.2% (0.8% of Total Investments) | | | | | | | |
| | | | Mecklenburg County, North Carolina, FNMA Multifamily Housing Revenue Bonds, Little Rock Apartments, Series 2003: | | | | | | | |
| | 725 | | 5.150%, 1/01/22 (Alternative Minimum Tax) | 7/18 at 100.00 | | N/R | | | 748,258 | |
| | 2,260 | | 5.375%, 1/01/36 (Alternative Minimum Tax) | 7/18 at 100.00 | | N/R | | | 2,315,167 | |
| | 2,985 | | Total Housing/Multifamily | | | | | | 3,063,425 | |
| NNC | Nuveen North Carolina Premium Income Municipal Fund |
| | Portfolio of Investments (continued) | November 30, 2015 (Unaudited) |
| | Principal | | | Optional Call | | | | | | |
| | Amount (000) | | Description (1) | Provisions (2) | | Ratings (3) | | | Value | |
| | | | Housing/Single Family – 1.9% (1.3% of Total Investments) | | | | | | | |
| $ | 1,145 | | North Carolina Housing Finance Agency, Home Ownership Revenue Bonds, Series 2007-29A, 4.800%, 7/01/33 (Alternative Minimum Tax) | 1/17 at 100.00 | | AA | | $ | 1,156,851 | |
| | 2,030 | | North Carolina Housing Finance Agency, Home Ownership Revenue Bonds, Series 2011-1, 4.500%, 1/01/28 | 1/21 at 100.00 | | AA | | | 2,162,721 | |
| | 1,480 | | North Carolina Housing Finance Agency, Home Ownership Revenue Bonds, Series 25-A, 4.900%, 7/01/37 (Alternative Minimum Tax) | 7/16 at 100.00 | | AA | | | 1,488,569 | |
| | 4,655 | | Total Housing/Single Family | | | | | | 4,808,141 | |
| | | | Long-Term Care – 1.1% (0.7% of Total Investments) | | | | | | | |
| | | | North Carolina Medical Care Commission, Healthcare Facilities Revenue Bonds, Presbyterian Homes, Series 2006: | | | | | | | |
| | 700 | | 5.400%, 10/01/27 | 10/16 at 100.00 | | N/R | | | 717,094 | |
| | 1,500 | | 5.500%, 10/01/31 | 10/16 at 100.00 | | N/R | | | 1,527,675 | |
| | 450 | | North Carolina Medical Care Commission, Revenue Bonds, United Methodist Retirement Homes Inc., Refunding Series 2013A, 5.000%, 10/01/33 | 10/23 at 100.00 | | N/R | | | 463,856 | |
| | 2,650 | | Total Long-Term Care | | | | | | 2,708,625 | |
| | | | Materials – 0.6% (0.4% of Total Investments) | | | | | | | |
| | 1,400 | | Columbus County Industrial Facilities and Pollution Control Financing Authority, North Carolina, Environmental Improvement Revenue Bonds, International Paper Company Project, Series 2007A, 4.625%, 3/01/27 | 3/17 at 100.00 | | BBB | | | 1,414,784 | |
| | | | Tax Obligation/General – 5.8% (3.9% of Total Investments) | | | | | | | |
| | | | Catawba County, North Carolina, General Obligation Bonds, Limited Obligation Series 2014A: | | | | | | | |
| | 1,000 | | 5.000%, 6/01/30 | 6/24 at 100.00 | | Aa2 | | | 1,160,510 | |
| | 730 | | 5.000%, 6/01/31 | 6/24 at 100.00 | | Aa2 | | | 844,194 | |
| | 835 | | Durham, North Carolina, General Obligation Bonds, Refunding Series 2015, 5.000%, 10/01/26 | No Opt. Call | | AAA | | | 1,067,406 | |
| | | | Durham, North Carolina, General Obligation Bonds, Series 2007: | | | | | | | |
| | 2,820 | | 5.000%, 4/01/21 | 4/17 at 100.00 | | AAA | | | 2,978,315 | |
| | 1,475 | | 5.000%, 4/01/22 | 4/17 at 100.00 | | AAA | | | 1,559,739 | |
| | 1,050 | | Forsyth County, North Carolina, General Obligation Bonds, Limited Obligation Series 2009, 5.000%, 4/01/30 | 4/20 at 100.00 | | AA+ | | | 1,194,701 | |
| | 5,100 | | Wake County, North Carolina, Limited Obligation Bonds, Series 2010, 5.000%, 1/01/37 | 1/20 at 100.00 | | AA+ | | | 5,733,623 | |
| | 13,010 | | Total Tax Obligation/General | | | | | | 14,538,488 | |
| | | | Tax Obligation/Limited – 18.7% (12.6% of Total Investments) | | | | | | | |
| | | | Buncombe County, North Carolina, Limited Obligation Bonds, Series 2014A: | | | | | | | |
| | 1,085 | | 5.000%, 6/01/33 | 6/24 at 100.00 | | AA+ | | | 1,261,822 | |
| | 1,600 | | 5.000%, 6/01/34 | 6/24 at 100.00 | | AA+ | | | 1,850,288 | |
| | 2,405 | | Charlotte, North Carolina, Certificates of Participation, Transit Projects Phase 2, Refunding Series 2008A, 5.000%, 6/01/33 | 6/18 at 100.00 | | AA+ | | | 2,601,489 | |
| | 2,045 | | Charlotte, North Carolina, Storm Water Fee Revenue Bonds, Refunding Series 2014, 5.000%, 12/01/39 | 12/24 at 100.00 | | AAA | | | 2,383,141 | |
| | 2,085 | | Dare County, North Carolina, Installment Purchase Contract, Limited Obligation Series 2012B, 5.000%, 6/01/28 | 6/22 at 100.00 | | AA– | | | 2,371,792 | |
| | | | Harnett County, North Carolina, Certificates of Participation, Series 2009: | | | | | | | |
| | 1,000 | | 5.000%, 6/01/28 – AGC Insured | 6/19 at 100.00 | | AA | | | 1,096,990 | |
| | 500 | | 5.000%, 6/01/29 – AGC Insured | 6/19 at 100.00 | | AA | | | 548,635 | |
| | 500 | | Henderson County, North Carolina, Limited Obligation Bonds, Series 2015, 5.000%, 10/01/31 | 10/25 at 100.00 | | Aa3 | | | 587,875 | |
| | 946 | | Hillsborough, North Carolina, Special Assessment Revenue Bonds, Series 2013, 7.750%, 2/01/24 | 2/23 at 100.00 | | N/R | | | 1,008,805 | |
| | Principal | | | Optional Call | | | | | | |
| | Amount (000) | | Description (1) | Provisions (2) | | Ratings (3) | | | Value | |
| | | | Tax Obligation/Limited (continued) | | | | | | | |
| | | | Jacksonville Public Facilities Corporation, North Carolina, Limited Obligation Bonds, Series 2012: | | | | | | | |
| $ | 1,065 | | 5.000%, 4/01/29 | 4/22 at 100.00 | | A1 | | $ | 1,214,057 | |
| | 1,165 | | 5.000%, 4/01/30 | 4/22 at 100.00 | | A1 | | | 1,323,685 | |
| | 1,000 | | 5.000%, 4/01/31 | 4/22 at 100.00 | | A1 | | | 1,133,090 | |
| | 200 | | 5.000%, 4/01/32 | 4/22 at 100.00 | | A1 | | | 225,996 | |
| | | | North Carolina State, Limited Obligation Bonds, Refunding Series 2014C: | | | | | | | |
| | 3,000 | | 5.000%, 5/01/24 | No Opt. Call | | AA+ | | | 3,687,240 | |
| | 5,000 | | 5.000%, 5/01/25 | 5/24 at 100.00 | | AA+ | | | 6,113,650 | |
| | 8,065 | | North Carolina Turnpike Authority, Monroe Connector System State Appropriation Bonds, Series 2011, 5.000%, 7/01/41 | 7/21 at 100.00 | | AA | | | 9,093,125 | |
| | 1,135 | | Raleigh, North Carolina, Certificates of Participation, Series 2007, 5.000%, 2/01/27 | 2/17 at 100.00 | | AA+ | | | 1,182,976 | |
| | 1,000 | | Raleigh, North Carolina, Limited Obligation Bonds, Series 2013, 5.000%, 10/01/33 | 10/23 at 100.00 | | AA+ | | | 1,151,510 | |
| | | | Raleigh, North Carolina, Limited Obligation Bonds, Series 2014A: | | | | | | | |
| | 1,195 | | 5.000%, 10/01/25 | 10/24 at 100.00 | | AA+ | | | 1,462,871 | |
| | 1,305 | | 5.000%, 10/01/26 | 10/24 at 100.00 | | AA+ | | | 1,577,132 | |
| | 2,450 | | Wilmington, North Carolina, Certificates of Participation, Series 2008A, 5.000%, 6/01/29 | 6/18 at 100.00 | | AA+ | | | 2,655,212 | |
| | 1,750 | | Wilson County, North Carolina, Certificates of Participation, School Facilities Project, Series 2007, 5.000%, 4/01/25 – AMBAC Insured | 4/17 at 100.00 | | Aa3 | | | 1,843,660 | |
| | 40,496 | | Total Tax Obligation/Limited | | | | | | 46,375,041 | |
| | | | Transportation – 23.0% (15.5% of Total Investments) | | | | | | | |
| | 5,000 | | Charlotte, North Carolina, Airport Revenue Bonds, Charlotte Douglas International Refunding Series 2010A, 5.000%, 7/01/39 | 7/20 at 100.00 | | Aa3 | | | 5,606,350 | |
| | 10 | | Charlotte, North Carolina, Airport Revenue Bonds, Charlotte Douglas International Refunding Series 2010B, 5.375%, 7/01/28 (Alternative Minimum Tax) | 7/20 at 100.00 | | Aa3 | | | 11,236 | |
| | | | Charlotte, North Carolina, Airport Revenue Bonds, Charlotte Douglas International, Refunding Series 2014A: | | | | | | | |
| | 2,865 | | 5.000%, 7/01/27 | 7/24 at 100.00 | | Aa3 | | | 3,412,903 | |
| | 3,000 | | 5.000%, 7/01/28 | 7/24 at 100.00 | | Aa3 | | | 3,539,430 | |
| | 1,400 | | Charlotte, North Carolina, Airport Revenue Bonds, Charlotte Douglas International, Series 2010B, 5.000%, 7/01/36 (Alternative Minimum Tax) | 7/21 at 100.00 | | Aa3 | | | 1,528,688 | |
| | 1,425 | | Charlotte, North Carolina, Airport Revenue Bonds, Refunding Series 2011A, 5.000%, 7/01/41 | No Opt. Call | | Aa3 | | | 1,561,330 | |
| | 10,000 | | North Carolina Department of Transportation, Private Activity Revenue Bonds, I-77 Hot Lanes Project, Series 2015, 5.000%, 6/30/54 (Alternative Minimum Tax) | 6/25 at 100.00 | | BBB– | | | 10,460,700 | |
| | 2,725 | | North Carolina State Ports Authority, Port Facilities Revenue Bonds, Senior Lien Series 2010A, 5.250%, 2/01/40 | 2/20 at 100.00 | | A3 | | | 3,054,752 | |
| | 515 | | North Carolina State Ports Authority, Port Facilities Revenue Bonds, Senior Lien Series 2010B, 5.000%, 2/01/29 | 2/20 at 100.00 | | A3 | | | 572,922 | |
| | | | North Carolina Turnpike Authority, Triangle Expressway System Revenue Bonds, Series 2009A: | | | | | | | |
| | 140 | | 5.000%, 1/01/21 – AGC Insured | 1/19 at 100.00 | | AA | | | 153,432 | |
| | 265 | | 5.375%, 1/01/26 – AGC Insured | 1/19 at 100.00 | | AA | | | 292,388 | |
| | 1,650 | | 5.500%, 1/01/29 – AGC Insured | 1/19 at 100.00 | | AA | | | 1,821,963 | |
| | 7,335 | | 5.750%, 1/01/39 – AGC Insured | 1/19 at 100.00 | | AA | | | 8,126,225 | |
| | | | North Carolina Turnpike Authority, Triangle Expressway System Senior Lien Revenue Bonds, Series 2009B: | | | | | | | |
| | 150 | | 0.000%, 1/01/31 – AGC Insured | No Opt. Call | | AA | | | 85,703 | |
| | 4,375 | | 0.000%, 1/01/33 – AGC Insured | No Opt. Call | | AA | | | 2,293,506 | |
| | 2,300 | | 0.000%, 1/01/34 – AGC Insured | No Opt. Call | | AA | | | 1,140,731 | |
| | 2,380 | | 0.000%, 1/01/35 – AGC Insured | No Opt. Call | | AA | | | 1,112,507 | |
| | 7,575 | | 0.000%, 1/01/37 – AGC Insured | No Opt. Call | | AA | | | 3,242,933 | |
| | 1,470 | | 0.000%, 1/01/38 – AGC Insured | No Opt. Call | | AA | | | 603,215 | |
| NNC | Nuveen North Carolina Premium Income Municipal Fund | |
| | Portfolio of Investments (continued) | November 30, 2015 (Unaudited) |
| | Principal | | | Optional Call | | | | | | |
| | Amount (000) | | Description (1) | Provisions (2) | | Ratings (3) | | | Value | |
| | | | Transportation (continued) | | | | | | | |
| | | | Raleigh Durham Airport Authority, North Carolina, Airport Revenue Bonds, Refunding Series 2010A: | | | | | | | |
| $ | 2,490 | | 5.000%, 5/01/26 | No Opt. Call | | Aa3 | | $ | 2,831,205 | |
| | 4,125 | | 5.000%, 5/01/36 | 5/20 at 100.00 | | Aa3 | | | 4,643,471 | |
| | 1,000 | | Raleigh Durham Airport Authority, North Carolina, Airport Revenue Bonds, Series 2007, 5.000%, 5/01/37 – FGIC Insured (Alternative Minimum Tax) | 5/17 at 100.00 | | AA+ | | | 1,046,230 | |
| | 62,195 | | Total Transportation | | | | | | 57,141,820 | |
| | | | U.S. Guaranteed – 21.5% (14.5% of Total Investments) (4) | | | | | | | |
| | | | Albemarle Hospital Authority, North Carolina, Health Care Facilities Revenue Bonds, Series 2007: | | | | | | | |
| | 1,840 | | 5.250%, 10/01/27 (Pre-refunded 10/01/17) | 10/17 at 100.00 | | N/R (4) | | | 1,988,562 | |
| | 1,725 | | 5.250%, 10/01/38 (Pre-refunded 10/01/17) | 10/17 at 100.00 | | N/R (4) | | | 1,864,277 | |
| | 3,100 | | Brunswick County, North Carolina, Enterprise System Revenue Bonds, Series 2008A, 5.000%, 4/01/31 (Pre-refunded 4/01/18) – AGM Insured | 4/18 at 100.00 | | AA (4) | | | 3,392,392 | |
| | | | Craven County, North Carolina, Certificates of Participation, Series 2007: | | | | | | | |
| | 160 | | 5.000%, 6/01/23 (Pre-refunded 6/01/17) – NPFG Insured | 6/17 at 100.00 | | AA– (4) | | | 170,403 | |
| | 3,000 | | 5.000%, 6/01/27 (Pre-refunded 6/01/17) – NPFG Insured | 6/17 at 100.00 | | AA– (4) | | | 3,195,060 | |
| | 2,225 | | Johnston Memorial Hospital Authority, North Carolina, Mortgage Revenue Bonds, Johnston Memorial Hospital Project, Series 2008A, 5.250%, 10/01/36 (Pre-refunded 4/01/18) – AGM Insured | 4/18 at 100.00 | | AA (4) | | | 2,446,054 | |
| | 400 | | Mecklenburg County, North Carolina, Certificates of Participation, Series 2009A, 5.000%, 2/01/27 (Pre-refunded 2/01/19) | 2/19 at 100.00 | | AA+ (4) | | | 449,960 | |
| | | | North Carolina Eastern Municipal Power Agency, Power System Revenue Bonds, Refunding Series 1993B: | | | | | | | |
| | 100 | | 6.000%, 1/01/22 (ETM) | No Opt. Call | | AAA | | | 126,113 | |
| | 180 | | 6.000%, 1/01/22 – FGIC Insured (ETM) | No Opt. Call | | A3 (4) | | | 220,293 | |
| | 2,500 | | North Carolina Eastern Municipal Power Agency, Power System Revenue Bonds, Series 2005, 5.250%, 1/01/20 (Pre-refunded 1/01/16) – AMBAC Insured | 1/16 at 100.00 | | AAA | | | 2,510,825 | |
| | 1,400 | | North Carolina Eastern Municipal Power Agency, Power System Revenue Bonds, Series 2009B, 5.000%, 1/01/26 (Pre-refunded 1/01/19) | 1/19 at 100.00 | | AAA | | | 1,570,884 | |
| | 3,500 | | North Carolina Eastern Municipal Power Agency, Power System Revenue Bonds, Series 2012A, 5.000%, 1/01/25 (Pre-refunded 7/01/22) | 7/22 at 100.00 | | AAA | | | 4,250,890 | |
| | 1,680 | | North Carolina Medical Care Commission, Health Care Facilities Revenue Bonds, Cleveland County Healthcare System, Refunding Series 2011A, 5.750%, 1/01/35 (Pre-refunded 1/01/21) | 1/21 at 100.00 | | N/R (4) | | | 2,047,231 | |
| | | | North Carolina Medical Care Commission, Hospital Revenue Bonds, Wilson Medical Center, Series 2007: | | | | | | | |
| | 500 | | 5.000%, 11/01/20 (Pre-refunded 11/01/17) | 11/17 at 100.00 | | N/R (4) | | | 540,630 | |
| | 3,425 | | 5.000%, 11/01/27 (Pre-refunded 11/01/17) | 11/17 at 100.00 | | N/R (4) | | | 3,703,316 | |
| | 900 | | North Carolina Medical Care Commission, Revenue Bonds, Pines at Davidson, Series 2006A, 5.000%, 1/01/36 (Pre-refunded 1/01/16) | 1/16 at 100.00 | | N/R (4) | | | 903,753 | |
| | 4,260 | | North Carolina Municipal Power Agency 1, Catawba Electric Revenue Bonds, Series 1986, 5.000%, 1/01/20 (ETM) | No Opt. Call | | Aaa | | | 4,841,149 | |
| | 1,535 | | North Carolina Municipal Power Agency 1, Catawba Electric Revenue Bonds, Series 2012B, 5.000%, 1/01/21 (ETM) | No Opt. Call | | AAA | | | 1,804,945 | |
| | | | Oak Island, North Carolina, Enterprise System Revenue Bonds, Series 2009: | | | | | | | |
| | 2,020 | | 6.000%, 6/01/34 (Pre-refunded 6/01/19) – AGC Insured | 6/19 at 100.00 | | AA (4) | | | 2,362,733 | |
| | 1,020 | | 6.000%, 6/01/36 (Pre-refunded 6/01/19) – AGC Insured | 6/19 at 100.00 | | AA (4) | | | 1,193,063 | |
| | 2,010 | | Raleigh, North Carolina, Combined Enterprise System Revenue Bonds, Series 2006A, 5.000%, 3/01/36 (Pre-refunded 3/01/16) | 3/16 at 100.00 | | AAA | | | 2,034,462 | |
| | 2,250 | | Rutherford County, North Carolina, Certificates of Participation, Series 2007, 5.000%, 12/01/27 (Pre-refunded 12/01/17) – AGM Insured | 12/17 at 100.00 | | AA (4) | | | 2,440,980 | |
| | 5,000 | | Sampson County, North Carolina, Certificates of Participation, Series 2006, 5.000%, 6/01/34 (Pre-refunded 6/01/17) – AGM Insured | 6/17 at 100.00 | | AA (4) | | | 5,324,350 | |
| | | | | | | | | | | |
| | Principal | | | Optional Call | | | | | | |
| | Amount (000) | | Description (1) | Provisions (2) | | Ratings (3) | | | Value | |
| | | | U.S. Guaranteed (4) (continued) | | | | | | | |
| | | | University of North Carolina Wilmington, Certificates of Participation, Student Housing Project Revenue Bonds, Series 2006: | | | | | | | |
| $ | 1,000 | | 5.000%, 6/01/21 (Pre-refunded 6/01/16) – FGIC Insured | 6/16 at 100.00 | | AA– (4) | | $ | 1,023,650 | |
| | 1,430 | | 5.000%, 6/01/23 (Pre-refunded 6/01/16) – FGIC Insured | 6/16 at 100.00 | | AA– (4) | | | 1,463,820 | |
| | 1,505 | | 5.000%, 6/01/24 (Pre-refunded 6/01/16) – FGIC Insured | 6/16 at 100.00 | | AA– (4) | | | 1,540,593 | |
| | 48,665 | | Total U.S. Guaranteed | | | | | | 53,410,388 | |
| | | | Utilities – 3.3% (2.3% of Total Investments) | | | | | | | |
| | 5,000 | | North Carolina Capital Facilities Financing Agency, Solid Waste Disposal Revenue Bond, Duke Energy Carolinas Project, Refunding Series 2008B, 4.625%, 11/01/40 | 11/20 at 100.00 | | Aa2 | | | 5,327,700 | |
| | 1,100 | | North Carolina Municipal Power Agency 1, Catawba Electric Revenue Bonds, Refunding Series 2009A, 5.000%, 1/01/30 | 1/19 at 100.00 | | A | | | 1,210,770 | |
| | 1,500 | | North Carolina Municipal Power Agency 1, Catawba Electric Revenue Bonds, Refunding Series 2015A, 5.000%, 1/01/32 | 1/26 at 100.00 | | A | | | 1,763,670 | |
| | 7,600 | | Total Utilities | | | | | | 8,302,140 | |
| | | | Water and Sewer – 24.2% (16.3% of Total Investments) | | | | | | | |
| | 1,145 | | Brunswick County, North Carolina, Enterprise System Revenue Bonds, Refunding Series 2012A, 5.000%, 4/01/25 | 4/22 at 100.00 | | AA– | | | 1,343,612 | |
| | | | Cape Fear Public Utility Authority, North Carolina, Water & Sewer System Revenue Bonds, Series 2008: | | | | | | | |
| | 425 | | 5.000%, 8/01/28 | 8/18 at 100.00 | | AA+ | | | 468,040 | |
| | 1,005 | | 5.000%, 8/01/35 | 8/18 at 100.00 | | AA+ | | | 1,105,138 | |
| | 2,135 | | Cape Fear Public Utility Authority, North Carolina, Water & Sewer System Revenue Bonds, Series 2011, 5.000%, 8/01/31 | 8/21 at 100.00 | | AA+ | | | 2,480,571 | |
| | | | Charlotte, North Carolina, Water and Sewer System Revenue Bonds, Refunding Series 2015: | | | | | | | |
| | 940 | | 5.000%, 7/01/32 | 7/25 at 100.00 | | AAA | | | 1,134,740 | |
| | 2,325 | | 5.000%, 7/01/40 | 7/25 at 100.00 | | AAA | | | 2,735,270 | |
| | 1,000 | | Charlotte, North Carolina, Water and Sewerage System Revenue Bonds, Series 2008, 5.000%, 7/01/38 | 7/18 at 100.00 | | AAA | | | 1,089,920 | |
| | | | Dare County, North Carolina, Utilities System Revenue Bonds, Series 2011: | | | | | | | |
| | 3,860 | | 5.000%, 2/01/36 | 2/21 at 100.00 | | AA | | | 4,417,924 | |
| | 1,250 | | 5.000%, 2/01/41 | 2/21 at 100.00 | | AA | | | 1,424,700 | |
| | 8,600 | | Durham, North Carolina, Utility System Revenue Bonds, Refunding Series 2011, 5.000%, 6/01/41 | 6/21 at 100.00 | | AAA | | | 9,623,830 | |
| | 1,535 | | Mooresville, North Carolina, Enterprise System Revenue Bonds, Refunding Series 2012, 5.000%, 5/01/28 | 5/22 at 100.00 | | AA– | | | 1,772,434 | |
| | 3,040 | | Oak Island, North Carolina, Enterprise System Revenue Bonds, Refunding Series 2015, 5.000%, 6/01/33 – AGM Insured | 6/25 at 100.00 | | AA | | | 3,515,000 | |
| | 1,210 | | Oak Island, North Carolina, Enterprise System Revenue Bonds, Series 2008A, 5.000%, 6/01/23 – NPFG Insured | 6/18 at 100.00 | | AA– | | | 1,318,936 | |
| | | | Oak Island, North Carolina, Enterprise System Revenue Bonds, Series 2011: | | | | | | | |
| | 600 | | 5.625%, 6/01/30 – AGC Insured | 6/21 at 100.00 | | AA | | | 693,306 | |
| | 2,100 | | 5.750%, 6/01/36 – AGC Insured | 6/21 at 100.00 | | AA | | | 2,430,707 | |
| | 1,400 | | Onslow County, North Carolina, Combined Enterprise System Revenue Bonds, Series 2004B, 5.000%, 6/01/23 – SYNCORA GTY Insured | 2/16 at 100.00 | | A+ | | | 1,405,474 | |
| | | | Raleigh, North Carolina, Combined Enterprise System Revenue Bonds, Refunding Series 2012A: | | | | | | | |
| | 550 | | 5.000%, 3/01/30 | 3/22 at 100.00 | | AAA | | | 640,536 | |
| | 1,600 | | 5.000%, 3/01/31 | 3/22 at 100.00 | | AAA | | | 1,857,280 | |
| NNC | Nuveen North Carolina Premium Income Municipal Fund |
| | Portfolio of Investments (continued) | November 30, 2015 (Unaudited) |
| | Principal | | | Optional Call | | | | | | |
| | Amount (000) | | Description (1) | Provisions (2) | | Ratings (3) | | | Value | |
| | | | Water and Sewer (continued) | | | | | | | |
| | | | Raleigh, North Carolina, Combined Enterprise System Revenue Bonds, Refunding Series 2013A: | | | | | | | |
| $ | 5,000 | | 5.000%, 3/01/28 | 3/23 at 100.00 | | AAA | | $ | 5,923,250 | |
| | 3,785 | | 5.000%, 3/01/43 | 3/23 at 100.00 | | AAA | | | 4,274,968 | |
| | 9,900 | | Winston-Salem, North Carolina, Water and Sewer System Revenue Bonds, Series 2007A, 5.000%, 6/01/37 | 6/17 at 100.00 | | AAA | | | 10,459,449 | |
| | 53,405 | | Total Water and Sewer | | | | | | 60,115,085 | |
| $ | 343,206 | | Total Long-Term Investments (cost $344,300,867) | | | | | | 368,541,775 | |
| | | | Variable Rate MuniFund Term Preferred Shares, at Liquidation
Value – (50.3)% (5) | | | | | | (125,000,000 | ) |
| | | | Other Assets Less Liabilities – 2.0% | | | | | | 4,989,624 | |
| | | | Net Assets Applicable to Common Shares – 100% | | | | | $ | 248,531,399 | |
| (1) | All percentages shown in the Portfolio of Investments are based on net assets applicable to common shares unless otherwise noted. |
| (2) | Optional Call Provisions: Dates (month and year) and prices of the earliest optional call or redemption. There may be other call provisions at varying prices at later dates. Certain mortgage-backed securities may be subject to periodic principal paydowns. |
| (3) | Ratings: Using the highest of Standard & Poor's Group ("Standard & Poor's"), Moody's Investors Service, Inc. ("Moody's") or Fitch, Inc. ("Fitch") rating. Ratings below BBB by Standard & Poor's, Baa by Moody's or BBB by Fitch are considered to be below investment grade. Holdings designated N/R are not rated by any of these national rating agencies. |
| (4) | Backed by an escrow or trust containing sufficient U.S. Government or U.S. Government agency securities, which ensure the timely payment of principal and interest. Certain bonds backed by U.S. Government or agency securities are regarded as having an implied rating equal to the rating of such securities. |
| (5) | Variable Rate MuniFund Term Preferred Shares, at Liquidation Value as a percentage of Total Investments is 33.9%. |
| (ETM) | Escrowed to maturity. |
See accompanying notes to financial statements.
| NPV | | |
| | Nuveen Virginia Premium Income Municipal Fund | |
| | Portfolio of Investments | November 30, 2015 (Unaudited) |
| | Principal | | | Optional Call | | | | | | |
| | Amount (000) | | Description (1) | Provisions (2) | | Ratings (3) | | | Value | |
| | | | LONG-TERM INVESTMENTS – 149.9% (100.0% of Total Investments) | | | | | | | |
| | | | MUNICIPAL BONDS – 149.9% (100.0% of Total Investments) | | | | | | | |
| | | | Consumer Staples – 5.7% (3.8% of Total Investments) | | | | | | | |
| | | | Guam Economic Development & Commerce Authority, Tobacco Settlement Asset-Backed Bonds, Series 2007A: | | | | | | | |
| $ | 700 | | 5.250%, 6/01/32 | 6/17 at 100.00 | | B | | $ | 695,499 | |
| | 700 | | 5.625%, 6/01/47 | 6/17 at 100.00 | | B | | | 651,217 | |
| | 73,500 | | Puerto Rico, The Children's Trust Fund, Tobacco Settlement Asset-Backed Bonds, Series 2005A, 0.000%, 5/15/50 | 2/16 at 11.73 | | BB– | | | 6,387,150 | |
| | 325 | | Puerto Rico, The Children's Trust Fund, Tobacco Settlement Asset-Backed Refunding Bonds, Series 2002, 5.500%, 5/15/39 | 2/16 at 100.00 | | BBB+ | | | 325,052 | |
| | 6,425 | | Tobacco Settlement Financing Corporation of Virginia, Tobacco Settlement Asset Backed Bonds, Series 2007B1, 5.000%, 6/01/47 | 6/17 at 100.00 | | B– | | | 5,006,103 | |
| | 2,145 | | Tobacco Settlement Financing Corporation of Virginia, Tobacco Settlement Asset-Backed Bonds, Series 2007B2, 5.200%, 6/01/46 | 6/17 at 100.00 | | B– | | | 1,719,775 | |
| | 185 | | Tobacco Settlement Financing Corporation, Virgin Islands, Tobacco Settlement Asset-Backed Bonds, Series 2001, 5.000%, 5/15/31 | 5/16 at 100.00 | | A3 | | | 185,011 | |
| | 83,980 | | Total Consumer Staples | | | | | | 14,969,807 | |
| | | | Education and Civic Organizations – 9.2% (6.2% of Total Investments) | | | | | | | |
| | 1,615 | | Alexandria Industrial Development Authority, Virginia, Educational Facilities Revenue Bonds, Episcopal High School, Series 2012, 3.750%, 1/01/30 | No Opt. Call | | A1 | | | 1,657,248 | |
| | 580 | | Amherst Industrial Development Authority, Virginia, Revenue Bonds, Sweet Briar College, Series 2006, 5.000%, 9/01/26 | 9/16 at 100.00 | | CCC | | | 548,535 | |
| | 1,000 | | Lexington Industrial Development Authority, Virginia, Educational Facilities Revenue Bonds, VMI Development Board Project, Series 2006C, 5.000%, 12/01/36 | 6/19 at 100.00 | | Aa2 | | | 1,104,490 | |
| | 1,630 | | Prince William County Industrial Development Authority, Virginia, Student Housing Revenue Bonds, George Mason University Foundation Prince William Housing LLC Project, Series 2011A, 5.125%, 9/01/41 | 9/21 at 100.00 | | A | | | 1,837,173 | |
| | 2,500 | | The Rector and Visitors of the University of Virginia, General Pledge Revenue Bonds, Green Series 2015A-2, 5.000%, 4/01/45 | 4/25 at 100.00 | | AAA | | | 2,922,150 | |
| | 8,500 | | The Rector and Visitors of the University of Virginia, General Revenue Bonds, Series 2008, 5.000%, 6/01/40 | 6/18 at 100.00 | | AAA | | | 9,286,504 | |
| | 1,000 | | Virginia College Building Authority, Educational Facilities Revenue Bonds, Marymount University Project, Green Series 2015B, 5.000%, 7/01/45 | 7/25 at 100.00 | | BB+ | | | 1,026,880 | |
| | 3,150 | | Virginia College Building Authority, Educational Facilities Revenue Bonds, Washington and Lee University, Series 2001, 5.375%, 1/01/21 | No Opt. Call | | AA | | | 3,495,807 | |
| | 1,460 | | Virginia College Building Authority, Educational Facilities Revenue Bonds, Washington and Lee University, Series 2015A, 5.000%, 1/01/40 | 1/25 at 100.00 | | AA | | | 1,680,664 | |
| | 500 | | Virginia Small Business Finance Authority, Educational Facilities Revenue Bonds, Roanoke College, Series 2011, 5.750%, 4/01/41 | 4/20 at 100.00 | | A– | | | 573,070 | |
| | 21,935 | | Total Education and Civic Organizations | | | | | | 24,132,521 | |
| | | | Health Care – 30.2% (20.2% of Total Investments) | | | | | | | |
| | 5,000 | | Arlington County Industrial Development Authority, Virginia, Hospital Facility Revenue Bonds, Virginia Hospital Center Arlington Health System, Refunding Series 2010, 5.000%, 7/01/31 | 7/20 at 100.00 | | AA– | | | 5,499,600 | |
| | | | Charlotte County Industrial Development Authority, Virginia, Hospital Revenue Bonds, Halifax Regional Hospital Incorporated, Series 2007: | | | | | | | |
| | 1,545 | | 5.000%, 9/01/27 | 9/17 at 100.00 | | A | | | 1,617,569 | |
| | 250 | | 5.000%, 9/01/37 | 9/17 at 100.00 | | A | | | 259,770 | |
| | 2,145 | | Chesterfield County Economic Development Authority, Virginia, Revenue Bonds, Bon Secours Health, Series 2010C-2, 5.000%, 11/01/42 – AGC Insured | 11/20 at 100.00 | | AA | | | 2,351,113 | |
| NPV | Nuveen Virginia Premium Income Municipal Fund | |
| | Portfolio of Investments (continued) | November 30, 2015 (Unaudited) |
| | Principal | | | Optional Call | | | | | | |
| | Amount (000) | | Description (1) | Provisions (2) | | Ratings (3) | | | Value | |
| | | | Health Care (continued) | | | | | | | |
| $ | 3,375 | | Colorado Health Facilities Authority, Colorado, Revenue Bonds, Catholic Health Initiatives, Series 2013A, 5.250%, 1/01/40 | 1/23 at 100.00 | | A+ | | $ | 3,743,854 | |
| | 1,000 | | Fairfax County Industrial Development Authority, Virginia, Healthcare Revenue Bonds, Inova Health System, Series 2012A, 5.000%, 5/15/40 | 5/22 at 100.00 | | AA+ | | | 1,111,040 | |
| | 3,340 | | Fairfax County Industrial Development Authority, Virginia, Healthcare Revenue Bonds, Inova Health System, Tender Option Bond Trust 11733, 15.201%, 11/15/29 (IF) | 5/19 at 100.00 | | AA+ | | | 4,589,394 | |
| | 4,950 | | Fairfax County Industrial Development Authority, Virginia, Hospital Revenue Refunding Bonds, Inova Health System, Series 1993A, 5.000%, 8/15/23 | No Opt. Call | | AA+ | | | 5,809,716 | |
| | | | Fredericksburg Economic Development Authority, Virginia, Hospital Facilities Revenue Bonds, MediCorp Health System, Series 2007: | | | | | | | |
| | 1,080 | | 5.250%, 6/15/18 | No Opt. Call | | Baa1 | | | 1,161,572 | |
| | 2,500 | | 5.250%, 6/15/23 | No Opt. Call | | Baa1 | | | 2,847,100 | |
| | 435 | | Hanover County Industrial Development Authority, Virginia, Hospital Revenue Bonds, Memorial Regional Medical Center, Series 1995, 6.375%, 8/15/18 – NPFG Insured | No Opt. Call | | AA– | | | 461,178 | |
| | 9,265 | | Harrisonburg Industrial Development Authority, Virginia, Hospital Facilities Revenue Bonds, Rockingham Memorial Hospital, Series 2006, 5.000%, 8/15/31 – AMBAC Insured | 8/16 at 100.00 | | AA | | | 9,508,392 | |
| | 1,500 | | Henrico County Industrial Development Authority, Virginia, Healthcare Revenue Bonds, Bon Secours Health System, Series 1996, 6.250%, 8/15/20 – NPFG Insured | No Opt. Call | | AA– | | | 1,692,705 | |
| | 3,500 | | Industrial Development Authority of the City of Newport News, Virginia, Health System Revenue Bonds, Riverside Health System, Series 2015A, 5.330%, 7/01/45 | 7/25 at 100.00 | | N/R | | | 3,623,725 | |
| | 3,155 | | Prince William County Industrial Development Authority, Virginia, Health Care Facilities Revenue Bonds, Novant Health Obligated Group-Prince William Hospital, Refunding Series 2013B, 5.000%, 11/01/46 | 11/22 at 100.00 | | AA– | | | 3,447,721 | |
| | | | Stafford County Economic Development Authority, Virginia, Hospital Facilities Revenue Bonds, MediCorp Health System, Series 2006: | | | | | | | |
| | 2,000 | | 5.250%, 6/15/25 | 6/16 at 100.00 | | Baa1 | | | 2,025,840 | |
| | 2,000 | | 5.250%, 6/15/26 | 6/16 at 100.00 | | Baa1 | | | 2,024,600 | |
| | 2,025 | | 5.250%, 6/15/31 | 6/16 at 100.00 | | Baa1 | | | 2,045,716 | |
| | 7,395 | | 5.250%, 6/15/37 | 6/16 at 100.00 | | Baa1 | | | 7,464,291 | |
| | 2,955 | | Virginia Small Business Finance Authority, Healthcare Facilities Revenue Bonds, Sentara Healthcare, Refunding Series 2010, 5.000%, 11/01/40 | 5/20 at 100.00 | | AA | | | 3,267,432 | |
| | 4,425 | | Virginia Small Business Financing Authority, Wellmont Health System Project Revenue Bonds, Series 2007A, 5.250%, 9/01/37 | 9/17 at 100.00 | | BBB+ | | | 4,615,939 | |
| | 2,335 | | Winchester Economic Development Authority, Virginia, Hospital Revenue Bonds, Valley Health System Obligated Group, Refunding Series 2014A, 5.000%, 1/01/44 | 1/24 at 100.00 | | A+ | | | 2,582,347 | |
| | | | Winchester Economic Development Authority, Virginia, Hospital Revenue Bonds, Valley Health System Obligated Group, Refunding Series 2015: | | | | | | | |
| | 1,500 | | 5.000%, 1/01/33 | 1/26 at 100.00 | | A+ | | | 1,701,375 | |
| | 1,000 | | 5.000%, 1/01/35 | 1/26 at 100.00 | | A+ | | | 1,124,260 | |
| | 2,000 | | 4.000%, 1/01/37 | 1/26 at 100.00 | | A+ | | | 2,045,840 | |
| | 1,215 | | 5.000%, 1/01/44 | 1/26 at 100.00 | | A+ | | | 1,349,622 | |
| | 1,020 | | Wisconsin Health and Educational Facilities Authority, Revenue Bonds, Aurora Health Care, Inc., Series 2010A, 5.625%, 4/15/39 | 4/20 at 100.00 | | A2 | | | 1,134,281 | |
| | 72,910 | | Total Health Care | | | | | | 79,105,992 | |
| | | | Housing/Multifamily – 3.3% (2.2% of Total Investments) | | | | | | | |
| | 880 | | Arlington County Industrial Development Authority, Virginia, Multifamily Housing Mortgage Revenue Bonds, Arlington View Terrace Apartments, Series 2001, 5.150%, 11/01/31 (Mandatory put 11/01/19) (Alternative Minimum Tax) | 3/16 at 100.00 | | AA | | | 882,490 | |
| | 400 | | Virginia Housing Development Authority, Rental Housing Bonds, Series 2010A, 5.000%, 4/01/45 | 10/19 at 100.00 | | AA+ | | | 416,528 | |
| | 530 | | Virginia Housing Development Authority, Rental Housing Bonds, Series 2010C, 4.550%, 8/01/32 | 2/20 at 100.00 | | AA+ | | | 554,958 | |
| | 1,000 | | Virginia Housing Development Authority, Rental Housing Bonds, Series 2012A, 3.625%, 3/01/32 | 3/21 at 100.00 | | AA+ | | | 1,016,490 | |
| | | | Virginia Housing Development Authority, Rental Housing Bonds, Series 2015A: | | | | | | | |
| | 1,000 | | 3.500%, 3/01/35 | 3/24 at 100.00 | | AA+ | | | 983,430 | |
| | 1,000 | | 3.625%, 3/01/39 | 3/24 at 100.00 | | AA+ | | | 980,680 | |
| | 900 | | Virginia Housing Development Authority, Rental Housing Bonds, Series 2015C, 4.000%, 8/01/45 | 8/24 at 100.00 | | AA+ | | | 908,505 | |
| | Principal | | | Optional Call | | | | | | |
| | Amount (000) | | Description (1) | Provisions (2) | | Ratings (3) | | | Value | |
| | | | Housing/Multifamily (continued) | | | | | | | |
| $ | 1,250 | | Virginia Housing Development Authority, Rental Housing Bonds, Series 2015E, 3.750%, 12/01/40 (WI/DD, Settling 12/08/15) | 12/24 at 100.00 | | AA+ | | $ | 1,265,225 | |
| | 1,400 | | Waynesboro Redevelopment and Housing Authority, Virginia, Multifamily Housing Revenue Bonds, Epworth Manor, GNMA Collateralized Series 2010, 5.000%, 10/20/51 | 4/20 at 100.00 | | AA+ | | | 1,464,386 | |
| | 8,360 | | Total Housing/Multifamily | | | | | | 8,472,692 | |
| | | | Housing/Single Family – 5.6% (3.7% of Total Investments) | | | | | | | |
| | 7,900 | | Virginia Housing Development Authority, Commonwealth Mortgage Bonds, Series 2007B, 4.750%, 7/01/32 (Alternative Minimum Tax) | 7/16 at 100.00 | | AAA | | | 7,952,693 | |
| | | | Virginia Housing Development Authority, Commonwealth Mortgage Bonds, Series 2012C-5: | | | | | | | |
| | 2,500 | | 4.550%, 7/01/31 | 10/22 at 100.00 | | AAA | | | 2,696,100 | |
| | 2,000 | | 4.800%, 7/01/38 | 10/22 at 100.00 | | AAA | | | 2,146,700 | |
| | | | Virginia Housing Development Authority, Commonwealth Mortgage Bonds, Series 2012C-8: | | | | | | | |
| | 715 | | 4.400%, 10/01/31 | 10/22 at 100.00 | | AAA | | | 764,564 | |
| | 1,000 | | 4.750%, 10/01/38 | 10/22 at 100.00 | | AAA | | | 1,067,220 | |
| | 14,115 | | Total Housing/Single Family | | | | | | 14,627,277 | |
| | | | Long-Term Care – 7.0% (4.7% of Total Investments) | | | | | | | |
| | 2,000 | | Albemarle County Industrial Development Authority, Virginia, Residential Care Facilities Mortgage Revenue Bonds, Westminster-Canterbury of the Blue Ridge, Series 2007, 5.000%, 1/01/31 | 1/17 at 100.00 | | N/R | | | 2,024,380 | |
| | 1,000 | | Chesterfield County Health Center Commission, Virginia, Mortgage Revenue Bonds, Lucy Corr Village, Series 2005, 5.625%, 12/01/39 | 12/15 at 100.00 | | N/R | | | 775,810 | |
| | 5,585 | | Fairfax County Economic Development Authority, Virginia, Residential Care Facilities Mortgage Revenue Bonds, Goodwin House, Inc., Series 2007A, 5.125%, 10/01/37 | 10/17 at 100.00 | | BBB | | | 5,801,363 | |
| | | | Fairfax County Economic Development Authority, Virginia, Retirement Center Revenue Bonds, Greenspring Village, Series 2006A: | | | | | | | |
| | 1,000 | | 4.750%, 10/01/26 | 10/16 at 100.00 | | A+ | | | 1,013,520 | |
| | 800 | | 4.875%, 10/01/36 | 10/16 at 100.00 | | A+ | | | 808,584 | |
| | 875 | | Henrico County Economic Development Authority, Virginia, Residential Care Facility Revenue Bonds, Westminster Canterbury of Richmond, Refunding Series 2015, 4.000%, 10/01/35 | 10/20 at 100.00 | | BBB+ | | | 878,596 | |
| | 3,590 | | Industrial Development Authority of the County of Prince William, Virginia, Residential Care Facility Revenue Bonds, Westminster at Lake, First Mortgage, Series 2006, 5.125%, 1/01/26 | 1/17 at 100.00 | | N/R | | | 3,602,421 | |
| | 1,000 | | Roanoke Economic Development Authority, Virginia, Residential Care Facility Mortgage Revenue Refunding Bonds, Virginia Lutheran Homes Brandon Oaks Project, Series 2012, 4.625%, 12/01/27 | 12/22 at 100.00 | | N/R | | | 1,005,650 | |
| | 1,500 | | Roanoke Industrial Development Authority, Virginia, Residential Revenue Bonds, Virginia Lutheran Homes Incorporated, Series 2006, 5.000%, 12/01/39 | 12/16 at 100.00 | | N/R | | | 1,500,270 | |
| | 1,000 | | Suffolk Industrial Development Authority, Virginia, Retirement Facilities First Mortgage Revenue Bonds, Lake Prince Center, Series 2006, 5.300%, 9/01/31 | 9/16 at 100.00 | | N/R | | | 1,004,600 | |
| | 18,350 | | Total Long-Term Care | | | | | | 18,415,194 | |
| | | | Tax Obligation/General – 10.2% (6.8% of Total Investments) | | | | | | | |
| | 2,000 | | Alexandria, Virginia, General Obligation Bonds, Capital Improvement Series 2013, 5.000%, 6/15/16 | No Opt. Call | | AAA | | | 2,051,620 | |
| | 1,440 | | Bristol, Virginia, General Obligation Bonds, Refunding & Improvement Series 2010, 5.000%, 7/15/25 | 7/20 at 100.00 | | A | | | 1,626,034 | |
| | 1,000 | | Chesterfield County, Virginia, General Obligation Bonds, Public Improvement Series 2009A, 5.000%, 1/01/16 | No Opt. Call | | AAA | | | 1,004,200 | |
| | 5,350 | | Chesterfield County, Virginia, General Obligation Bonds, Refunding Public Improvement Series 2014B, 4.000%, 1/01/16 | No Opt. Call | | AAA | | | 5,367,869 | |
| | 1,505 | | Fairfax County, Virginia, General Obligation Bonds, Public Improvement Series 2011A, 5.000%, 4/01/16 | No Opt. Call | | AAA | | | 1,529,366 | |
| | 2,340 | | Norfolk, Virginia, General Obligation Bonds, Capital Improvement Series 2012C, 4.000%, 10/01/16 | No Opt. Call | | AA+ | | | 2,412,727 | |
| | 6,050 | | Portsmouth, Virginia, General Obligation Bonds, Refunding Series 2010D, 5.000%, 7/15/34 | 7/20 at 100.00 | | AA | | | 6,890,344 | |
| | 1,250 | | Richmond, Virginia, General Obligation Bonds, Refunding Public Improvement Series 2014A, 5.000%, 3/01/19 | No Opt. Call | | AA+ | | | 1,408,638 | |
| | 1,535 | | Suffolk, Virginia, General Obligation Bonds, Series 2005, 5.000%, 12/01/15 | No Opt. Call | | AAA | | | 1,535,215 | |
| NPV | Nuveen Virginia Premium Income Municipal Fund | |
| | Portfolio of Investments (continued) | November 30, 2015 (Unaudited) |
| | Principal | | | Optional Call | | | | | | |
| | Amount (000) | | Description (1) | Provisions (2) | | Ratings (3) | | | Value | |
| | | | Tax Obligation/General (continued) | | | | | | | |
| $ | 1,350 | | Virginia Beach, Virginia, General Obligation Bonds, Series 2004B, 5.000%, 5/01/16 | No Opt. Call | | AAA | | $ | 1,377,149 | |
| | 1,500 | | Virginia Public School Authority, Special Obligation School Financing Bonds, Prince William County, Series 2014, 4.000%, 7/15/16 | No Opt. Call | | AAA | | | 1,535,100 | |
| | 25,320 | | Total Tax Obligation/General | | | | | | 26,738,262 | |
| | | | Tax Obligation/Limited – 28.0% (18.7% of Total Investments) | | | | | | | |
| | | | Buena Vista Public Recreational Facilities Authority, Virginia, Lease Revenue Bonds, Golf Course Project, Series 2005A: | | | | | | | |
| | 555 | | 5.250%, 7/15/25 – ACA Insured | 7/16 at 100.00 | | N/R | | | 486,341 | |
| | 520 | | 5.500%, 7/15/35 – ACA Insured | 7/16 at 100.00 | | N/R | | | 416,598 | |
| | 610 | | Cumberland County, Virginia, Certificates of Participation, Series 1997, 6.375%, 7/15/17 | No Opt. Call | | N/R | | | 642,110 | |
| | 600 | | Dulles Town Center Community Development Authority, Loudon County, Virginia Special Assessment Refunding Bonds, Dulles Town Center Project, Series 2012, 4.250%, 3/01/26 | No Opt. Call | | N/R | | | 601,644 | |
| | 100 | | Embrey Mill Community Development Authority, Virginia, Special Assessment Revenue Bonds, Series 2015, 5.600%, 3/01/45 | 3/25 at 100.00 | | N/R | | | 100,580 | |
| | 2,840 | | Fairfax County Economic Development Authority, Virginia, Lease Revenue Bonds, Joint Public Uses Complex Project, Refunding Series 2014, 5.000%, 5/15/16 | No Opt. Call | | AA+ | | | 2,902,366 | |
| | 4,000 | | Fairfax County Economic Development Authority, Virginia, Transportation District Improvement Revenue Bonds, Silver Line Phase 1 Project, Series 2011, 5.000%, 4/01/27 | No Opt. Call | | AA | | | 4,531,520 | |
| | | | Government of Guam, Business Privilege Tax Bonds, Series 2011A: | | | | | | | |
| | 1,020 | | 5.000%, 1/01/31 | 1/22 at 100.00 | | A | | | 1,124,927 | |
| | 500 | | 5.250%, 1/01/36 | 1/22 at 100.00 | | A | | | 551,030 | |
| | | | Government of Guam, Business Privilege Tax Bonds, Series 2015D: | | | | | | | |
| | 3,000 | | 5.000%, 11/15/31 | 11/25 at 100.00 | | A | | | 3,375,570 | |
| | 3,000 | | 5.000%, 11/15/33 | 11/25 at 100.00 | | A | | | 3,356,820 | |
| | 925 | | Greater Richmond Convention Center Authority, Virginia, Hotel Tax Revenue Bonds, Refunding Series 2015, 5.000%, 6/15/19 | No Opt. Call | | A+ | | | 1,045,389 | |
| | 890 | | Montgomery County Industrial Development Authority, Virginia, Public Facility Lease Revenue Bonds, Public Projects Series 2008, 5.000%, 2/01/29 | 2/18 at 100.00 | | Aa2 | | | 954,427 | |
| | 645 | | Puerto Rico Highway and Transportation Authority, Highway Revenue Bonds, Series 2007N, 5.500%, 7/01/29 – AMBAC Insured | No Opt. Call | | CC | | | 601,946 | |
| | | | Puerto Rico Infrastructure Financing Authority, Special Tax Revenue Bonds, Series 2005A: | | | | | | | |
| | 5,085 | | 0.000%, 7/01/29 – AMBAC Insured | No Opt. Call | | CC | | | 1,780,513 | |
| | 5,000 | | 0.000%, 7/01/43 – AMBAC Insured | No Opt. Call | | CC | | | 604,250 | |
| | 5,875 | | Puerto Rico Infrastructure Financing Authority, Special Tax Revenue Bonds, Series 2005C, 0.000%, 7/01/28 – AMBAC Insured | No Opt. Call | | CC | | | 2,222,336 | |
| | 10,000 | | Puerto Rico Sales Tax Financing Corporation, Sales Tax Revenue Bonds, Series 2007A, 0.000%, 8/01/41 – NPFG Insured | No Opt. Call | | AA– | | | 1,924,000 | |
| | 5 | | Puerto Rico, Highway Revenue Bonds, Highway and Transportation Authority, Series 2003AA, 5.500%, 7/01/18 – NPFG Insured | No Opt. Call | | AA– | | | 5,115 | |
| | 760 | | Puerto Rico, Highway Revenue Bonds, Highway and Transportation Authority, Series 2007CC, 5.500%, 7/01/28 – NPFG Insured | No Opt. Call | | AA– | | | 776,948 | |
| | 95 | | Stafford County and Staunton Industrial Development Authority, Virginia, Revenue Bonds, Virginia Municipal League and Virginia Association of Counties Finance Program, Series 2007C, 5.000%, 2/01/37 – SYNCORA GTY Insured | No Opt. Call | | N/R | | | 96,494 | |
| | 1,000 | | Stafford County Economic Development Authority, Virginia, Public Project Lease Revenue Bonds, Series 2008, 5.000%, 4/01/33 – AGC Insured (UB) | 4/18 at 100.00 | | AA+ | | | 1,075,430 | |
| | 2,240 | | Virgin Islands Public Finance Authority, Gross Receipts Taxes Loan Note, Working Capital Series 2014A, 5.000%, 10/01/34 – AGM Insured | 10/24 at 100.00 | | AA | | | 2,513,280 | |
| | 3,000 | | Virgin Islands Public Finance Authority, Matching Fund Loan Notes Revenue Bonds, Senior Lien Series 2010A, 5.000%, 10/01/29 | 10/20 at 100.00 | | BBB | | | 3,270,930 | |
| | 2,500 | | Virgin Islands Public Finance Authority, Matching Fund Loan Notes Revenue Bonds, Senior Lien, Refunding Series 2013B, 5.000%, 10/01/24 – AGM Insured | No Opt. Call | | AA | | | 3,012,475 | |
| | 1,000 | | Virgin Islands Public Finance Authority, Matching Fund Loan Notes Revenue Bonds, Senior Lien, Series 2013A, 5.000%, 10/01/24 – AGM Insured | No Opt. Call | | AA | | | 1,204,990 | |
| | Principal | | | Optional Call | | | | | | |
| | Amount (000) | | Description (1) | Provisions (2) | | Ratings (3) | | | Value | |
| | | | Tax Obligation/Limited (continued) | | | | | | | |
| $ | 1,000 | | Virgin Islands Public Finance Authority, Matching Fund Loan Notes Revenue Bonds, Series 2009B, 5.000%, 10/01/25 | 10/19 at 100.00 | | BBB | | $ | 1,107,490 | |
| | | | Virgin Islands Public Finance Authority, Matching Fund Loan Notes Revenue Bonds, Series 2012A: | | | | | | | |
| | 600 | | 5.000%, 10/01/32 | 10/22 at 100.00 | | BBB | | | 641,838 | |
| | 1,725 | | 5.000%, 10/01/32 – AGM Insured | 10/22 at 100.00 | | AA | | | 1,899,863 | |
| | 1,950 | | Virgin Islands Public Finance Authority, Matching Fund Loan Notes Revenue Bonds, Subordinate Lien Series 2010B, 5.250%, 10/01/29 | 10/20 at 100.00 | | Baa2 | | | 2,138,702 | |
| | | | Virginia College Building Authority, Educational Facilities Revenue Bonds, 21st Century College Program, Series 2011A: | | | | | | | |
| | 500 | | 5.000%, 2/01/17 | No Opt. Call | | AA+ | | | 526,245 | |
| | 1,200 | | 4.000%, 2/01/29 | No Opt. Call | | AA+ | | | 1,289,760 | |
| | 1,485 | | Virginia College Building Authority, Educational Facilities Revenue Bonds, 21st Century College Program, Series 2014A, 5.000%, 2/01/16 | No Opt. Call | | AA+ | | | 1,497,281 | |
| | 1,665 | | Virginia College Building Authority, Educational Facilities Revenue Bonds, 21st Century College Program, Tender Option Bond Trust 4B, 13.170%, 2/01/28 (IF) (4) | 2/19 at 100.00 | | AA+ | | | 2,214,550 | |
| | 1,195 | | Virginia Commonwealth Transportation Board, Federal Transportation Grant Anticipation Revenue Notes, Series 2012A, 5.000%, 9/15/16 | No Opt. Call | | Aa1 | | | 1,239,442 | |
| | 8,510 | | Virginia Public Building Authority, Public Facilities Revenue Bonds, Refunding Series 2015B, 5.000%, 8/01/16 | No Opt. Call | | AA+ | | | 8,779,851 | |
| | 1,500 | | Virginia Public School Authority, Literary Trust Fund State Appropriation Bonds, School Technology Notes, Series 2011-XI, 5.000%, 4/15/16 | No Opt. Call | | AA+ | | | 1,527,105 | |
| | 1,615 | | Virginia Public School Authority, School Financing Bonds, 1997 Resolution, Series 2012C, 5.000%, 8/01/16 | No Opt. Call | | AA+ | | | 1,666,325 | |
| | 5,260 | | Virginia Resources Authority, Infrastructure Revenue Bonds, Pooled Financing Program, Series 2012A, 5.000%, 11/01/42 | No Opt. Call | | AAA | | | 6,025,961 | |
| | 95 | | Virginia Resources Authority, Infrastructure Revenue Bonds, Pooled Loan Bond Program, Series 2002A, 5.000%, 5/01/19 | 2/16 at 100.00 | | AA | | | 95,388 | |
| | 2,325 | | Virginia Transportation Board, Transportation Revenue Bonds, Capital Projects, Series 2011, 5.000%, 5/15/17 | No Opt. Call | | AA+ | | | 2,473,986 | |
| | 1,000 | | Virginia Transportation Board, Transportation Revenue Bonds, U.S. Route 58 Corridor Development Program, Series 2006C, 5.000%, 5/15/23 | No Opt. Call | | AA+ | | | 1,020,420 | |
| | 87,390 | | Total Tax Obligation/Limited | | | | | | 73,322,236 | |
| | | | Transportation – 21.4% (14.2% of Total Investments) | | | | | | | |
| | 1,000 | | Chesapeake Bay Bridge and Tunnel Commission, Virginia, General Resolution Revenue Refunding Bonds, Series 1998, 5.500%, 7/01/25 – NPFG Insured | No Opt. Call | | AA– | | | 1,190,850 | |
| | | | Chesapeake, Virginia, Transportation System Senior Toll Road Revenue Bonds, Capital Appreciation Series 2012B: | | | | | | | |
| | 2,000 | | 0.000%, 7/15/32 | 7/28 at 100.00 | | BBB | | | 1,551,380 | |
| | 4,125 | | 0.000%, 7/15/40 | 7/28 at 100.00 | | BBB | | | 3,024,863 | |
| | 1,000 | | 0.000%, 7/15/40 – AGM Insured | 7/28 at 100.00 | | AA | | | 759,850 | |
| | 750 | | Metropolitan Washington Airports Authority, Virginia, Airport System Revenue Bonds, Refunding Series 2010B, 5.000%, 10/01/26 (Alternative Minimum Tax) | 10/20 at 100.00 | | AA– | | | 844,350 | |
| | 2,500 | | Metropolitan Washington Airports Authority, Virginia, Airport System Revenue Bonds, Series 2007B, 5.000%, 10/01/35 – AMBAC Insured (Alternative Minimum Tax) | 10/17 at 100.00 | | AA– | | | 2,636,575 | |
| | | | Metropolitan Washington Airports Authority, Virginia, Airport System Revenue Bonds, Series 2009C: | | | | | | | |
| | 1,380 | | 5.250%, 10/01/22 | No Opt. Call | | AA– | | | 1,535,623 | |
| | 1,200 | | 5.000%, 10/01/28 | 10/18 at 100.00 | | AA– | | | 1,317,096 | |
| | | | Metropolitan Washington Airports Authority, Virginia, Airport System Revenue Bonds, Series 2010A: | | | | | | | |
| | 3,400 | | 5.000%, 10/01/30 | 10/20 at 100.00 | | AA– | | | 3,888,104 | |
| | 420 | | 5.000%, 10/01/35 | 10/20 at 100.00 | | AA– | | | 476,288 | |
| | 6,700 | | Metropolitan Washington Airports Authority, Virginia, Dulles Toll Road Revenue Bonds, Dulles Metrorail Capital Appreciation, Second Senior Lien Series 2010B, 0.000%, 10/01/44 | 10/28 at 100.00 | | BBB+ | | | 7,306,953 | |
| NPV | Nuveen Virginia Premium Income Municipal Fund | |
| | Portfolio of Investments (continued) | November 30, 2015 (Unaudited) |
| | Principal | | | Optional Call | | | | | | |
| | Amount (000) | | Description (1) | Provisions (2) | | Ratings (3) | | | Value | |
| | | | Transportation (continued) | | | | | | | |
| | | | Metropolitan Washington Airports Authority, Virginia, Dulles Toll Road Second Senior Lien Revenue Bonds, Series 2009B: | | | | | | | |
| $ | 4,000 | | 0.000%, 10/01/26 – AGC Insured | No Opt. Call | | AA | | $ | 2,709,440 | |
| | 11,825 | | 0.000%, 10/01/34 – AGC Insured | No Opt. Call | | AA | | | 5,480,178 | |
| | 1,135 | | 0.000%, 10/01/36 – AGC Insured | No Opt. Call | | AA | | | 477,994 | |
| | 5,010 | | 0.000%, 10/01/39 – AGC Insured | No Opt. Call | | AA | | | 1,854,401 | |
| | 3,000 | | Richmond Metropolitan Authority, Virginia, Revenue Refunding Bonds, Expressway System, Series 2002, 5.250%, 7/15/22 – FGIC Insured | No Opt. Call | | AA– | | | 3,352,620 | |
| | 3,195 | | Virginia Port Authority, Port Facilities Revenue Refunding Bonds Series 2010, 5.000%, 7/01/40 | 7/19 at 100.00 | | Aa3 | | | 3,535,012 | |
| | 1,500 | | Virginia Small Business Financing Authority, Senior Lien Revenue Bonds, 95 Express Lanes LLC Project, Series 2012, 5.000%, 1/01/40 (Alternative Minimum Tax) | 1/22 at 100.00 | | BBB– | | | 1,571,190 | |
| | | | Virginia Small Business Financing Authority, Senior Lien Revenue Bonds, Elizabeth River Crossing, Opco LLC Project, Series 2012: | | | | | | | |
| | 500 | | 5.250%, 1/01/32 (Alternative Minimum Tax) | 7/22 at 100.00 | | BBB– | | | 554,780 | |
| | 5,000 | | 6.000%, 1/01/37 (Alternative Minimum Tax) | 7/22 at 100.00 | | BBB– | | | 5,751,600 | |
| | 5,500 | | 5.500%, 1/01/42 (Alternative Minimum Tax) | 7/22 at 100.00 | | BBB– | | | 6,077,170 | |
| | 65,140 | | Total Transportation | | | | | | 55,896,317 | |
| | | | U.S. Guaranteed – 16.7% (11.1% of Total Investments) (5) | | | | | | | |
| | 1,750 | | Bristol, Virginia, General Obligation Utility System Revenue Bonds, Series 2002, 5.000%, 11/01/24 – AGM Insured (ETM) | No Opt. Call | | AA (5) | | | 2,066,103 | |
| | 1,000 | | Bristol, Virginia, Utility System Revenue Refunding Bonds, Series 2001, 5.000%, 7/15/21 – AGM Insured (ETM) | No Opt. Call | | AA (5) | | | 1,121,790 | |
| | 2,300 | | Fairfax County Economic Development Authority, Virginia, Lease Revenue Bonds, Joint Public Uses Community Project, Series 2006, 5.000%, 5/15/18 (Pre-refunded 5/15/16) | 5/16 at 100.00 | | AA+ (5) | | | 2,349,749 | |
| | 1,700 | | Loudoun County, Virginia, General Obligation Bonds, Series 2006B, 5.000%, 12/01/25 (Pre-refunded 12/01/16) | 12/16 at 100.00 | | AAA | | | 1,777,945 | |
| | 145 | | Puerto Rico, Highway Revenue Bonds, Highway and Transportation Authority, Series 2003AA, 5.500%, 7/01/18 – NPFG Insured (ETM) | No Opt. Call | | A3 (5) | | | 161,636 | |
| | 710 | | Puerto Rico, Highway Revenue Bonds, Highway and Transportation Authority, Series 2005BB, 5.250%, 7/01/22 – AGM Insured (ETM) | No Opt. Call | | A2 (5) | | | 868,415 | |
| | 1,000 | | Richmond, Virginia, General Obligation Bonds, Public Improvement Series 2009A, 5.000%, 7/15/22 (Pre-refunded 7/15/19) | 7/19 at 100.00 | | AA+ (5) | | | 1,139,400 | |
| | 4,000 | | Stafford County Economic Development Authority, Virginia, Public Project Lease Revenue Bonds, Series 2008, 5.000%, 4/01/33 – AGC Insured (Pre-refunded 4/01/18) (UB) | 4/18 at 100.00 | | AA (5) | | | 4,374,840 | |
| | | | Stafford County and Staunton Industrial Development Authority, Virginia, Revenue Bonds, Virginia Municipal League and Virginia Association of Counties Finance Program, Series 2006A: | | | | | | | |
| | 710 | | 5.000%, 8/01/23 (Pre-refunded 8/01/16) – NPFG Insured | 8/16 at 100.00 | | A3 (5) | | | 732,017 | |
| | 2,490 | | 5.000%, 8/01/23 (Pre-refunded 8/01/16) – NPFG Insured | 8/16 at 100.00 | | A3 (5) | | | 2,567,215 | |
| | | | Stafford County and Staunton Industrial Development Authority, Virginia, Revenue Bonds, Virginia Municipal League and Virginia Association of Counties Finance Program, Series 2007C: | | | | | | | |
| | 50 | | 5.000%, 2/01/37 (Pre-refunded 2/01/17) – SYNCORA GTY Insured | 2/17 at 100.00 | | N/R (5) | | | 52,569 | |
| | 60 | | 5.000%, 2/01/37 (Pre-refunded 2/01/17) – SYNCORA GTY Insured | 2/17 at 100.00 | | N/R (5) | | | 63,082 | |
| | 105 | | 5.000%, 2/01/37 (Pre-refunded 2/01/17) – SYNCORA GTY Insured | 2/17 at 100.00 | | N/R (5) | | | 110,419 | |
| | 190 | | 5.000%, 2/01/37 (Pre-refunded 2/01/17) – SYNCORA GTY Insured | 2/17 at 100.00 | | N/R (5) | | | 199,760 | |
| | 2,100 | | Virginia Beach, Virginia, General Obligation Bonds, Series 2005, 5.000%, 1/15/20 (Pre-refunded 1/15/16) | 1/16 at 100.00 | | AAA | | | 2,112,642 | |
| | | | Virginia Beach, Virginia, General Obligation Bonds, Series 2008: | | | | | | | |
| | 4,500 | | 5.000%, 10/01/27 (Pre-refunded 10/01/17) (UB) | 10/17 at 100.00 | | AAA | | | 4,852,350 | |
| | 4,500 | | 5.000%, 10/01/26 (Pre-refunded 10/01/17) (UB) | 10/17 at 100.00 | | AAA | | | 4,852,350 | |
| | 1,820 | | Virginia College Building Authority, Educational Facilities Revenue Bonds, 21st Century College Program, Series 2009A, 5.000%, 2/01/22 (Pre-refunded 2/01/19) | 2/19 at 100.00 | | AA+ (5) | | | 2,045,498 | |
| | 1,665 | | Virginia College Building Authority, Educational Facilities Revenue Bonds, 21st Century College Program, Tender Option Bond Trust 3B, 13.170%, 2/01/27 (Pre-refunded 2/01/19) (IF) (4) | 2/19 at 100.00 | | AA+ (5) | | | 2,284,497 | |
| | 3,570 | | Virginia College Building Authority, Educational Facilities Revenue Bonds, Public Higher Education Financing Program, Series 2009A, 5.000%, 9/01/28 (Pre-refunded 9/01/18) | 9/18 at 100.00 | | Aa1 (5) | | | 3,964,806 | |
| | Principal | | | Optional Call | | | | | | |
| | Amount (000) | | Description (1) | Provisions (2) | | Ratings (3) | | | Value | |
| | | | U.S. Guaranteed (5) (continued) | | | | | | | |
| $ | 30 | | Virginia College Building Authority, Educational Facilities Revenue Bonds, Public Higher Education Financing Program, Series 2009A, 5.000%, 9/01/28 (Pre-refunded 9/01/18) | 9/18 at 100.00 | | N/R (5) | | $ | 33,318 | |
| | 1,000 | | Virginia Resources Authority, Clean Water State Revolving Fund Revenue Bonds, Series 2008, 5.000%, 10/01/19 (Pre-refunded 10/01/18) | 10/18 at 100.00 | | AAA | | | 1,113,500 | |
| | 1,620 | | Winchester Industrial Development Authority, Virginia, Hospital Revenue Bonds Valley Health System Obligated Group, Series 2009E, 5.625%, 1/01/44 (Pre-refunded 1/01/19) | 1/19 at 100.00 | | A+ (5) | | | 1,846,330 | |
| | 2,855 | | Winchester Industrial Development Authority, Virginia, Hospital Revenue Bonds, Winchester Medical Center, Series 2007, 5.125%, 1/01/31 (Pre-refunded 1/01/17) | 1/17 at 100.00 | | A+ (5) | | | 2,996,066 | |
| | 39,870 | | Total U.S. Guaranteed | | | | | | 43,686,297 | |
| | | | Utilities – 2.7% (1.8% of Total Investments) | | | | | | | |
| | | | Guam Power Authority, Revenue Bonds, Series 2012A: | | | | | | | |
| | 1,500 | | 5.000%, 10/01/30 – AGM Insured | 10/22 at 100.00 | | AA | | | 1,756,860 | |
| | 495 | | 5.000%, 10/01/34 | 10/22 at 100.00 | | BBB | | | 535,085 | |
| | 655 | | Puerto Rico Electric Power Authority, Power Revenue Bonds, Series 2007UU, 5.000%, 7/01/19 – NPFG Insured | No Opt. Call | | AA– | | | 656,140 | |
| | 730 | | Virgin Islands Water and Power Authority, Electric System Revenue Bonds, Refunding Series 2007A, 5.000%, 7/01/24 | 7/17 at 100.00 | | BB+ | | | 734,614 | |
| | 3,250 | | York County Economic Development Authority, Virginia, Pollution Control Revenue Bonds, Virginia Electric and Power Company Project, Refunding Series 2009A, 1.875%, 5/01/33 (Mandatory put 5/16/19) | No Opt. Call | | A2 | | | 3,301,448 | |
| | 6,630 | | Total Utilities | | | | | | 6,984,147 | |
| | | | Water and Sewer – 9.9% (6.6% of Total Investments) | | | | | | | |
| | 1,395 | | Fairfax County, Virginia, Sewer Revenue Bonds, Series 2012, 5.000%, 7/15/18 | No Opt. Call | | AAA | | | 1,544,753 | |
| | 810 | | Guam Waterworks Authority, Water and Wastewater System Revenue Bonds, Series 2013, 5.500%, 7/01/43 | 7/23 at 100.00 | | A– | | | 914,215 | |
| | 6,500 | | Hampton Roads Sanitation District, Virginia, Wastewater Revenue Bonds, Series 2012A, 5.000%, 1/01/39 | No Opt. Call | | AA+ | | | 7,321,990 | |
| | | | Henry County Public Service Authority, Virginia, Water and Sewerage Revenue Refunding Bonds, Series 2001: | | | | | | | |
| | 1,265 | | 5.500%, 11/15/17 – AGM Insured | No Opt. Call | | AA | | | 1,341,596 | |
| | 3,000 | | 5.500%, 11/15/19 – AGM Insured | No Opt. Call | | AA | | | 3,373,170 | |
| | 3,000 | | Norfolk, Virginia, Water Revenue Bonds, Series 2015A, 5.250%, 11/01/44 | 11/24 at 100.00 | | AA+ | | | 3,527,310 | |
| | 3,300 | | Virginia Beach, Virginia, Water and Sewer System Revenue Bonds, Series 2005, 5.000%, 10/01/30 | 2/16 at 100.00 | | AAA | | | 3,312,309 | |
| | 1,000 | | Virginia Resources Authority, Water and Sewerage System Revenue Bonds, Goochland County – Tuckahoe Creek Service District Project, Series 2012, 0.000%, 11/01/34 | 11/22 at 63.13 | | AA | | | 509,190 | |
| | 3,050 | | Virginia State Resources Authority, Clean Water Revenue Bonds, Series 2007, Trust 3036, 13.392%, 4/01/17 (IF) | No Opt. Call | | AAA | | | 3,949,079 | |
| | 23,320 | | Total Water and Sewer | | | | | | 25,793,612 | |
| $ | 467,320 | | Total Long-Term Investments (cost $371,557,571) | | | | | | 392,144,354 | |
| | | | Floating Rate Obligations �� (3.5)% | | | | | | (9,250,000 | ) |
| | | | Variable Rate Demand Preferred Shares, at Liquidation Value – (48.9)% (6) | | | | | | (128,000,000 | ) |
| | | | Other Assets Less Liabilities – 2.5% | | | | | | 6,761,192 | |
| | | | Net Assets Applicable to Common Shares – 100% | | | | | $ | 261,655,546 | |
| NPV | Nuveen Virginia Premium Income Municipal Fund | |
| | Portfolio of Investments (continued) | November 30, 2015 (Unaudited) |
| (1) | All percentages shown in the Portfolio of Investments are based on net assets applicable to common shares unless otherwise noted. |
| (2) | Optional Call Provisions: Dates (month and year) and prices of the earliest optional call or redemption. There may be other call provisions at varying prices at later dates. Certain mortgage-backed securities may be subject to periodic principal paydowns. |
| (3) | Ratings: Using the highest of Standard & Poor's Group ("Standard & Poor's"), Moody's Investors Service, Inc. ("Moody's") or Fitch, Inc. ("Fitch") rating. Ratings below BBB by Standard & Poor's, Baa by Moody's or BBB by Fitch are considered to be below investment grade. Holdings designated N/R are not rated by any of these national rating agencies. |
| (4) | Investment, or portion of investment, has been pledged to collateralize the net payment obligations for investments in inverse floating rate transactions. |
| (5) | Backed by an escrow or trust containing sufficient U.S. Government or U.S. Government agency securities, which ensure the timely payment of principal and interest. Certain bonds backed by U.S. Government or agency securities are regarded as having an implied rating equal to the rating of such securities. |
| (6) | Variable Rate Demand Preferred Shares, at Liquidation Value as a percentage of Total Investments is 32.6%. |
| (ETM) | Escrowed to maturity. |
| (IF) | Inverse floating rate investment. |
| (UB) | Underlying bond of an inverse floating rate trust reflected as a financing transaction. See Notes to Financial Statements, Note 3 – Portfolio Securities and Investments in Derivatives, Inverse Floating Rate Securities for more information. |
| (WI/DD) | Investment, or portion of investment, purchased on a when-issued or delayed delivery basis. |
See accompanying notes to financial statements.
| Statement of | | |
| | Assets and Liabilities | November 30, 2015 (Unaudited) |
| | | | Georgia | | | Maryland | | | Minnesota | |
| | | | Dividend | | | Premium | | | Municipal | |
| | | | Advantage 2 | | | Income | | | Income | |
| | | | (NKG | ) | | (NMY | ) | | (NMS | ) |
| Assets | | | | | | | | | | |
| Long-term investments, at value (cost $210,462,174, $495,459,057 and $119,400,700, respectively) | | $ | 223,218,380 | | $ | 518,109,098 | | $ | 128,335,679 | |
| Cash | | | — | | | 2,772,400 | | | 226,570 | |
| Receivable for: | | | | | | | | | | |
| Interest | | | 3,364,874 | | | 8,411,027 | | | 1,563,972 | |
| Investments sold | | | 2,650,280 | | | 1,700,000 | | | 2,021,375 | |
| Deferred offering costs | | | 40,338 | | | 57,581 | | | 107,978 | |
| Other assets | | | 1,575 | | | 17,454 | | | 1,462 | |
| Total assets | | | 229,275,447 | | | 531,067,560 | | | 132,257,036 | |
| Liabilities | | | | | | | | | | |
| Cash overdraft | | | 787,259 | | | — | | | — | |
| Floating rate obligations | | | 3,245,000 | | | 16,410,000 | | | — | |
| Payable for: | | | | | | | | | | |
| Dividends | | | 549,426 | | | 1,257,175 | | | 360,143 | |
| Interest | | | 57,944 | | | 131,770 | | | 34,796 | |
| Investments purchased | | | 1,151,450 | | | 1,500,000 | | | 991,563 | |
| Variable Rate MuniFund Term Preferred ("VMTP") Shares, at liquidation value | | | 75,000,000 | | | 167,000,000 | | | 44,100,000 | |
| Variable Rate Demand Preferred ("VRDP") Shares, at liquidation value | | | — | | | — | | | — | |
| Accrued expenses: | | | | | | | | | | |
| Management fees | | | 113,780 | | | 257,967 | | | 72,619 | |
| Trustees fees | | | 795 | | | 17,250 | | | 465 | |
| Other | | | 74,170 | | | 143,505 | | | 62,088 | |
| Total liabilities | | | 80,979,824 | | | 186,717,667 | | | 45,621,674 | |
| Net assets applicable to common shares | | $ | 148,295,623 | | $ | 344,349,893 | | $ | 86,635,362 | |
| Common shares outstanding | | | 10,548,790 | | | 23,384,666 | | | 5,570,806 | |
| Net asset value ("NAV") per common share outstanding | | $ | 14.06 | | $ | 14.73 | | $ | 15.55 | |
| Net assets applicable to common shares consist of: | | | | | | | | | | |
| Common shares, $0.01 par value per share | | $ | 105,488 | | $ | 233,847 | | $ | 55,708 | |
| Paid-in surplus | | | 142,400,950 | | | 329,579,850 | | | 78,340,594 | |
| Undistributed (Over-distribution of) net investment income | | | 306,034 | | | 1,630,603 | | | 289,777 | |
| Accumulated net realized gain (loss) | | | (7,273,055 | ) | | (9,744,448 | ) | | (985,696 | ) |
| Net unrealized appreciation (depreciation) | | | 12,756,206 | | | 22,650,041 | | | 8,934,979 | |
| Net assets applicable to common shares | | $ | 148,295,623 | | $ | 344,349,893 | | $ | 86,635,362 | |
| Authorized shares: | | | | | | | | | | |
| Common | | | Unlimited | | | Unlimited | | | Unlimited | |
| Preferred | | | Unlimited | | | Unlimited | | | Unlimited | |
See accompanying notes to financial statements.
Statement of Assets and Liabilities (Unaudited) (continued)
| | | | | | | North | | | | |
| | | | Missouri | | | Carolina | | | Virginia | |
| | | | Premium | | | Premium | | | Premium | |
| | | | Income | | | Income | | | Income | |
| | | | (NOM | ) | | (NNC | ) | | (NPV | ) |
| Assets | | | | | | | | | | |
| Long-term investments, at value (cost $50,160,355, $344,300,867 and $371,557,571, respectively) | | $ | 53,417,748 | | $ | 368,541,775 | | $ | 392,144,354 | |
| Cash | | | 518,144 | | | 752,081 | | | 992,439 | |
| Receivable for: | | | | | | | | | | |
| Interest | | | 656,692 | | | 5,331,150 | | | 5,125,682 | |
| Investments sold | | | — | | | — | | | 2,611,200 | |
| Deferred offering costs | | | 89,050 | | | 62,273 | | | 420,141 | |
| Other assets | | | 736 | | | 12,867 | | | 119,607 | |
| Total assets | | | 54,682,370 | | | 374,700,146 | | | 401,413,423 | |
| Liabilities | | | | | | | | | | |
| Cash overdraft | | | — | | | — | | | — | |
| Floating rate obligations | | | 2,225,000 | | | — | | | 9,250,000 | |
| Payable for: | | | | | | | | | | |
| Dividends | | | 135,083 | | | 781,631 | | | 949,163 | |
| Interest | | | 13,463 | | | 98,630 | | | — | |
| Investments purchased | | | 1,507,435 | | | — | | | 1,246,875 | |
| Variable Rate MuniFund Term Preferred ("VMTP") Shares, at liquidation value | | | 18,000,000 | | | 125,000,000 | | | — | |
| Variable Rate Demand Preferred ("VRDP") Shares, at liquidation value | | | — | | | — | | | 128,000,000 | |
| Accrued expenses: | | | | | | | | | | |
| Management fees | | | 25,455 | | | 183,551 | | | 197,632 | |
| Trustees fees | | | 181 | | | 1,329 | | | 12,896 | |
| Other | | | 6,553 | | | 103,606 | | | 101,311 | |
| Total liabilities | | | 21,913,170 | | | 126,168,747 | | | 139,757,877 | |
| Net assets applicable to common shares | | $ | 32,769,200 | | $ | 248,531,399 | | $ | 261,655,546 | |
| Common shares outstanding | | | 2,335,800 | | | 16,418,508 | | | 17,933,247 | |
| Net asset value ("NAV") per common share outstanding | | $ | 14.03 | | $ | 15.14 | | $ | 14.59 | |
| Net assets applicable to common shares consist of: | | | | | | | | | | |
| Common shares, $0.01 par value per share | | $ | 23,358 | | $ | 164,185 | | $ | 179,332 | |
| Paid-in surplus | | | 30,797,113 | | | 224,035,968 | | | 251,079,554 | |
| Undistributed (Over-distribution of) net investment income | | | 124,439 | | | (161,199 | ) | | 646,118 | |
| Accumulated net realized gain (loss) | | | (1,433,103 | ) | | 251,537 | | | (10,836,241 | ) |
| Net unrealized appreciation (depreciation) | | | 3,257,393 | | | 24,240,908 | | | 20,586,783 | |
| Net assets applicable to common shares | | $ | 32,769,200 | | $ | 248,531,399 | | $ | 261,655,546 | |
| Authorized shares: | | | | | | | | | | |
| Common | | | Unlimited | | | Unlimited | | | Unlimited | |
| Preferred | | | Unlimited | | | Unlimited | | | Unlimited | |
See accompanying notes to financial statements.
| Statement of | | |
| | Operations | Six Months Ended November 30, 2015 (Unaudited) |
| | | | Georgia | | | Maryland | | | Minnesota | |
| | | | Dividend | | | Premium | | | Municipal | |
| | | | Advantage 2 | | | Income | | | Income | |
| | | | (NKG | ) | | (NMY | ) | | (NMS | ) |
| Investment Income | | $ | 4,907,705 | | $ | 10,611,310 | | $ | 2,964,173 | |
| Expenses | | | | | | | | | | |
| Management fees | | | 693,076 | | | 1,572,438 | | | 399,575 | |
| Interest expense and amortization of offering costs | | | 389,176 | | | 898,073 | | | 259,044 | |
| Liquidity fees | | | — | | | — | | | — | |
| Remarketing fees | | | — | | | — | | | — | |
| Custodian fees | | | 16,352 | | | 31,336 | | | 13,002 | |
| Trustees fees | | | 2,803 | | | 6,433 | | | 627 | |
| Professional fees | | | 13,385 | | | 18,263 | | | 20,863 | |
| Shareholder reporting expenses | | | 11,851 | | | 16,905 | | | 4,285 | |
| Shareholder servicing agent fees | | | 9,705 | | | 14,438 | | | 4,631 | |
| Stock exchange listing fees | | | 3,984 | | | 3,984 | | | 1,977 | |
| Investor relations expenses | | | 6,101 | | | 12,017 | | | 6,779 | |
| Other | | | 14,258 | | | 30,469 | | | 9,929 | |
| Total expenses | | | 1,160,691 | | | 2,604,356 | | | 720,712 | |
| Net investment income (loss) | | | 3,747,014 | | | 8,006,954 | | | 2,243,461 | |
| Realized and Unrealized Gain (Loss) | | | | | | | | | | |
| Net realized gain (loss) from: | | | | | | | | | | |
| Investments | | | (1,869,132 | ) | | 287,634 | | | 142,858 | |
| Swaps | | | 30,033 | | | — | | | — | |
| Change in net unrealized appreciation (depreciation) of: | | | | | | | | | | |
| Investments | | | 2,358,589 | | | 2,240,432 | | | 363,485 | |
| Swaps | | | (25,771 | ) | | — | | | — | |
| Net realized and unrealized gain (loss) | | | 493,719 | | | 2,528,066 | | | 506,343 | |
| Net increase (decrease) in net assets applicable to common shares from operations | | $ | 4,240,733 | | $ | 10,535,020 | | $ | 2,749,804 | |
See accompanying notes to financial statements.
Statement of Operations (Unaudited) (continued)
| | | | | | | North | | | | |
| | | | Missouri | | | Carolina | | | Virginia | |
| | | | Premium | | | Premium | | | Premium | |
| | | | Income | | | Income | | | Income | |
| | | | (NOM | ) | | (NNC | ) | | (NPV | ) |
| Investment Income | | $ | 1,159,359 | | $ | 6,847,776 | | $ | 8,067,637 | |
| Expenses | | | | | | | | | | |
| Management fees | | | 154,964 | | | 1,117,473 | | | 1,203,281 | |
| Interest expense and amortization of offering costs | | | 109,004 | | | 639,012 | | | 97,618 | |
| Liquidity fees | | | — | | | — | | | 596,434 | |
| Remarketing fees | | | — | | | — | | | 65,064 | |
| Custodian fees | | | 7,712 | | | 23,365 | | | 25,516 | |
| Trustees fees | | | 636 | | | 4,688 | | | 4,887 | |
| Professional fees | | | 12,214 | | | 12,260 | | | 19,127 | |
| Shareholder reporting expenses | | | 5,138 | | | 17,154 | | | 14,137 | |
| Shareholder servicing agent fees | | | 9,283 | | | 10,618 | | | 5,006 | |
| Stock exchange listing fees | | | 257 | | | 3,984 | | | 3,984 | |
| Investor relations expenses | | | 1,935 | | | 9,507 | | | 10,481 | |
| Other | | | 15,011 | | | 34,871 | | | 45,107 | |
| Total expenses | | | 316,154 | | | 1,872,932 | | | 2,090,642 | |
| Net investment income (loss) | | | 843,205 | | | 4,974,844 | | | 5,976,995 | |
| Realized and Unrealized Gain (Loss) | | | | | | | | | | |
| Net realized gain (loss) from: | | | | | | | | | | |
| Investments | | | 1,637 | | | 407,568 | | | 1,956,268 | |
| Swaps | | | — | | | 50,670 | | | — | |
| Change in net unrealized appreciation depreciation of: | | | | | | | | | | |
| Investments | | | 284,573 | | | 1,939,350 | | | (33,199 | ) |
| Swaps | | | — | | | (43,394 | ) | | — | |
| Net realized and unrealized gain (loss) | | | 286,210 | | | 2,354,194 | | | 1,923,069 | |
| Net increase (decrease) in net assets applicable to common shares from operations | | $ | 1,129,415 | | $ | 7,329,038 | | $ | 7,900,064 | |
See accompanying notes to financial statements.
| Statement of | | |
| | Changes in Net Assets | (Unaudited) |
| | | | Georgia Dividend Advantage 2 (NKG) | | | Maryland Premium Income (NMY) | |
| | | | Six Months | | | Year | | | Six Months | | | Year | |
| | | | Ended | | | Ended | | | Ended | | | Ended | |
| | | | 11/30/15 | | | 5/31/15 | | | 11/30/15 | | | 5/31/15 | |
| Operations | | | | | | | | | | | | | |
| Net investment income (loss) | | $ | 3,747,014 | | $ | 7,079,663 | | $ | 8,006,954 | | $ | 16,259,712 | |
| Net realized gain (loss) from: | | | | | | | | | | | | | |
| Investments | | | (1,869,132 | ) | | (187,934 | ) | | 287,634 | | | (107,770 | ) |
| Swaps | | | 30,033 | | | (26,267 | ) | | — | | | — | |
| Change in net unrealized appreciation (depreciation) of: | | | | | | | | | | | | | |
| Investments | | | 2,358,589 | | | (178,872 | ) | | 2,240,432 | | | (2,597,396 | ) |
| Swaps | | | (25,771 | ) | | 25,771 | | | — | | | — | |
| Distributions to Preferred Shareholders: | | | | | | | | | | | | | |
| From net investment income | | | — | | | — | | | — | | | — | |
| Net increase (decrease) in net assets applicable to common shares from operations | | | 4,240,733 | | | 6,712,361 | | | 10,535,020 | | | 13,554,546 | |
| Distributions to Common Shareholders | | | | | | | | | | | | | |
| From net investment income | | | (3,386,162 | ) | | (6,778,652 | ) | | (7,818,118 | ) | | (15,914,760 | ) |
| From accumulated net realized gains | | | — | | | — | | | — | | | — | |
| Decrease in net assets applicable to common shares from distributions to common shareholders | | | (3,386,162 | ) | | (6,778,652 | ) | | (7,818,118 | ) | | (15,914,760 | ) |
| Capital Share Transactions | | | | | | | | | | | | | |
| Common shares: | | | | | | | | | | | | | |
| Issued in the mergers | | | — | | | — | | | — | | | — | |
| Net proceeds from shares issued to shareholders due to reinvestment of distributions | | | — | | | — | | | — | | | — | |
| Cost of shares repurchased and retired | | | — | | | — | | | (2,667,056 | ) | | (6,349,466 | ) |
| Net increase (decrease) in net assets applicable to common shares from capital share transactions | | | — | | | — | | | (2,667,056 | ) | | (6,349,466 | ) |
| Net increase (decrease) in net assets applicable to common shares | | | 854,571 | | | (66,291 | ) | | 49,846 | | | (8,709,680 | ) |
| Net assets applicable to common shares at the beginning of period | | | 147,441,052 | | | 147,507,343 | | | 344,300,047 | | | 353,009,727 | |
| Net assets applicable to common shares at the end of period | | $ | 148,295,623 | | $ | 147,441,052 | | $ | 344,349,893 | | $ | 344,300,047 | |
| Undistributed (Over-distribution of) net investment income at the end of period | | $ | 306,034 | | $ | (54,818 | ) | $ | 1,630,603 | | $ | 1,441,767 | |
See accompanying notes to financial statements.
Statement of Changes in Net Assets (Unaudited) (continued)
| | | | Minnesota Municipal Income (NMS) | | | Missouri Premium Income (NOM) | |
| | | | Six Months | | Eleven Months | | | Ten Months | | | Six Months | | | Year | |
| | | | Ended | | | Ended | | | Ended | | | Ended | | | Ended | |
| | | | 11/30/15 | | | 5/31/15 | | | 6/30/14 | | | 11/30/15 | | | 5/31/15 | |
| Operations | | | | | | | | | | | | | | | | |
| Net investment income (loss) | | $ | 2,243,461 | | $ | 3,821,718 | | $ | 2,950,251 | | $ | 843,205 | | $ | 1,444,405 | |
| Net realized gain (loss) from: | | | | | | | | | | | | | | | | |
| Investments | | | 142,858 | | | 461,955 | | | (616,939 | ) | | 1,637 | | | (503,022 | ) |
| Swaps | | | — | | | — | | | — | | | — | | | — | |
| Change in net unrealized appreciation (depreciation) of: | | | | | | | | | | | | | | | | |
| Investments | | | 363,485 | | | (609,648 | ) | | 5,934,559 | | | 284,573 | | | 109,671 | |
| Swaps | | | — | | | — | | | — | | | — | | | — | |
| Distributions to Preferred Shareholders: | | | | | | | | | | | | | | | | |
| From net investment income | | | — | | | — | | | (22,615 | ) | | — | | | — | |
| Net increase (decrease) in net assets applicable to common shares from operations | | | 2,749,804 | | | 3,674,025 | | | 8,245,256 | | | 1,129,415 | | | 1,051,054 | |
| Distributions to Common Shareholders | | | | | | | | | | | | | | | | |
| From net investment income | | | (2,264,533 | ) | | (4,040,464 | ) | | (3,068,590 | ) | | (854,607 | ) | | (1,707,170 | ) |
| From accumulated net realized gains | | | — | | | — | | | — | | | — | | | — | |
| Decrease in net assets applicable to common shares from distributions to common shareholders | | | (2,264,533 | ) | | (4,040,464 | ) | | (3,068,590 | ) | | (854,607 | ) | | (1,707,170 | ) |
| Capital Share Transactions | | | | | | | | | | | | | | | | |
| Common shares: | | | | | | | | | | | | | | | | |
| Issued in the mergers | | | — | | | 22,239,676 | | | — | | | — | | | — | |
| Net proceeds from shares issued to shareholders due to reinvestment of distributions | | | — | | | — | | | — | | | 27,351 | | | 51,510 | |
| Cost of shares repurchased and retired | | | — | | | — | | | — | | | — | | | — | |
| Net increase (decrease) in net assets applicable to common shares from capital share transactions | | | — | | | 22,239,676 | | | — | | | 27,351 | | | 51,510 | |
| Net increase (decrease) in net assets applicable to common shares | | | 485,271 | | | 21,873,237 | | | 5,176,666 | | | 302,159 | | | (604,606 | ) |
| Net assets applicable to common shares at the beginning of period | | | 86,150,091 | | | 64,276,854 | | | 59,100,188 | | | 32,467,041 | | | 33,071,647 | |
| Net assets applicable to common shares at the end of period | | $ | 86,635,362 | | $ | 86,150,091 | | $ | 64,276,854 | | $ | 32,769,200 | | $ | 32,467,041 | |
| Undistributed (Over-distribution of) net investment income at the end of period | | $ | 289,777 | | $ | 310,849 | | $ | 456,615 | | $ | 124,439 | | $ | 135,841 | |
See accompanying notes to financial statements.
| | | | North Carolina Premium Income (NNC) | | | Virginia Premium Income (NPV) | |
| | | | Six Months | | | Year | | | Six Months | | | Year | |
| | | | Ended | | | Ended | | | Ended | | | Ended | |
| | | | 11/30/15 | | | 5/31/15 | | | 11/30/15 | | | 5/31/15 | |
| Operations | | | | | | | | | | | | | |
| Net investment income (loss) | | $ | 4,974,844 | | $ | 10,022,650 | | $ | 5,976,995 | | $ | 12,846,517 | |
| Net realized gain (loss) from: | | | | | | | | | | | | | |
| Investments | | | 407,568 | | | (264,727 | ) | | 1,956,268 | | | (5,277,985 | ) |
| Swaps | | | 50,670 | | | (46,000 | ) | | — | | | — | |
| Change in net unrealized appreciation (depreciation) of: | | | | | | | | | | | | | |
| Investments | | | 1,939,350 | | | 2,100,259 | | | (33,199 | ) | | 6,376,290 | |
| Swaps | | | (43,394 | ) | | 43,394 | | | — | | | — | |
| Distributions to Preferred Shareholders: | | | | | | | | | | | | | |
| From net investment income | | | — | | | — | | | — | | | — | |
| Net increase (decrease) in net assets applicable to common shares from operations | | | 7,329,038 | | | 11,855,576 | | | 7,900,064 | | | 13,944,822 | |
| Distributions to Common Shareholders | | | | | | | | | | | | | |
| From net investment income | | | (4,829,432 | ) | | (10,159,312 | ) | | (6,348,370 | ) | | (13,408,689 | ) |
| From accumulated net realized gains | | | — | | | (466,996 | ) | | — | | | — | |
| Decrease in net assets applicable to common shares from distributions to common shareholders | | | (4,829,432 | ) | | (10,626,308 | ) | | (6,348,370 | ) | | (13,408,689 | ) |
| Capital Share Transactions | | | | | | | | | | | | | |
| Common shares: | | | | | | | | | | | | | |
| Issued in the mergers | | | — | | | — | | | — | | | — | |
| Net proceeds from shares issued to shareholders due to reinvestment of distributions | | | — | | | — | | | — | | | — | |
| Cost of shares repurchased and retired | | | (287,244 | ) | | (1,401,812 | ) | | — | | | — | |
| Net increase (decrease) in net assets applicable to common shares from capital share transactions | | | (287,244 | ) | | (1,401,812 | ) | | — | | | — | |
| Net increase (decrease) in net assets applicable to common shares | | | 2,212,362 | | | (172,544 | ) | | 1,551,694 | | | 536,133 | |
| Net assets applicable to common shares at the beginning of period | | | 246,319,037 | | | 246,491,581 | | | 260,103,852 | | | 259,567,719 | |
| Net assets applicable to common shares at the end of period | | $ | 248,531,399 | | $ | 246,319,037 | | $ | 261,655,546 | | $ | 260,103,852 | |
| Undistributed (Over-distribution of) net investment income at the end of period | | $ | (161,199 | ) | $ | (306,611 | ) | $ | 646,118 | | $ | 1,017,493 | |
See accompanying notes to financial statements.
| Statement of | | |
| | Cash Flows | Six Months Ended November 30, 2015 (Unaudited) |
| | | | Georgia | | | Maryland | | | Minnesota | |
| | | | Dividend | | | Premium | | | Municipal | |
| | | | Advantage 2 | | | Income | | | Income | |
| | | | (NKG | ) | | (NMY | ) | | (NMS | ) |
| Cash Flows from Operating Activities: | | | | | | | | | | |
| Net Increase (Decrease) in Net Assets Applicable to Common Shares from Operations | | $ | 4,240,733 | | $ | 10,535,020 | | $ | 2,749,804 | |
| Adjustments to reconcile the net increase (decrease) in net assets applicable to common shares from operations to net cash provided by (used in) operating activities: | | | | | | | | | | |
| Purchases of investments | | | (12,162,638 | ) | | (53,458,164 | ) | | (13,358,596 | ) |
| Proceeds from sales and maturities of investments | | | 11,354,468 | | | 52,196,008 | | | 17,396,221 | |
| Proceeds from (Payments for) swap contracts, net | | | 30,033 | | | — | | | — | |
| Investment transaction adjustments, net | | | (2,354 | ) | | 15,518 | | | 19,584 | |
| Taxes paid on undistributed capital gains | | | (379 | ) | | (729 | ) | | (17,920 | ) |
| Amortization (Accretion) of premiums and discounts, net | | | 628,284 | | | 1,418,802 | | | (318,798 | ) |
| Amortization of deferred offering costs | | | 65,272 | | | 64,528 | | | 90,443 | |
| (Increase) Decrease in: | | | | | | | | | | |
| Credit default swaps premiums paid | | | 195,243 | | | — | | | — | |
| Receivable for interest | | | (36,396 | ) | | 430,855 | | | (99,071 | ) |
| Receivable for investments sold | | | (2,650,280 | ) | | 8,935,000 | | | (1,919,730 | ) |
| Other assets | | | 3,267 | | | 922 | | | 3,197 | |
| Increase (Decrease) in: | | | | | | | | | | |
| Payable for common shares repurchased and retired | | | — | | | (43,645 | ) | | — | |
| Payable for interest | | | (8,076 | ) | | (18,072 | ) | | (4,773 | ) |
| Payable for investments purchased | | | 1,151,450 | | | 473,345 | | | (3,926,295 | ) |
| Accrued management fees | | | (3,743 | ) | | (9,643 | ) | | (4,966 | ) |
| Accrued Trustees fees | | | (26 | ) | | 2,021 | | | (16 | ) |
| Accrued other expenses | | | (28,149 | ) | | (28,659 | ) | | (31,028 | ) |
| Net realized (gain) loss from: | | | | | | | | | | |
| Investments | | | 1,869,132 | | | (287,634 | ) | | (142,858 | ) |
| Swaps | | | (30,033 | ) | | — | | | — | |
| Change in net unrealized (appreciation) depreciation of: | | | | | | | | | | |
| Investments | | | (2,358,589 | ) | | (2,240,432 | ) | | (363,485 | ) |
| Swaps | | | 25,771 | | | — | | | — | |
| Net cash provided by (used in) operating activities | | | 2,282,990 | | | 17,985,041 | | | 71,713 | |
| Cash Flows from Financing Activities: | | | | | | | | | | |
| Increase (Decrease) in: | | | | | | | | | | |
| Cash overdraft | | | 787,259 | | | (4,278,239 | ) | | — | |
| Floating rate obligations | | | — | | | (400,000 | ) | | — | |
| Payable for offering costs | | | (47,791 | ) | | (41,803 | ) | | (48,530 | ) |
| Cash distributions paid to common shareholders | | | (3,380,171 | ) | | (7,825,543 | ) | | (2,276,243 | ) |
| Cost of common shares repurchased and retired | | | — | | | (2,667,056 | ) | | — | |
| Net cash provided by (used in) financing activities | | | (2,640,703 | ) | | (15,212,641 | ) | | (2,324,773 | ) |
| Net Increase (Decrease) in Cash | | | (357,713 | ) | | 2,772,400 | | | (2,253,060 | ) |
| Cash at the beginning of period | | | 357,713 | | | — | | | 2,479,630 | |
| Cash at the end of period | | $ | — | | $ | 2,772,400 | | $ | 226,570 | |
| | | | Georgia | | | Maryland | | | Minnesota | |
| | | | Dividend | | | Premium | | | Municipal | |
| | | | Advantage 2 | | | Income | | | Income | |
| Supplemental Disclosure of Cash Flow Information | | | (NKG | ) | | (NMY | ) | | (NMS | ) |
| Cash paid for interest (excluding amortization of offering costs) | | $ | 379,770 | | $ | 893,420 | | $ | 221,418 | |
| Non-cash financing activities not included herein consists of reinvestments of common share distributions | | | — | | | — | | | — | |
See accompanying notes to financial statements.
| | | | Missouri | | North Carolina | | | Virginia | |
| | | | Premium | | | Premium | | | Premium | |
| | | | Income | | | Income | | | Income | |
| | | | (NOM | ) | | (NNC | ) | | (NPV | ) |
| Cash Flows from Operating Activities: | | | | | | | | | | |
| Net Increase (Decrease) in Net Assets Applicable to Common Shares from Operations | | $ | 1,129,415 | | $ | 7,329,038 | | $ | 7,900,064 | |
| Adjustments to reconcile the net increase (decrease) in net assets applicable to common shares from operations to net cash provided by (used in) operating activities: | | | | | | | | | | |
| Purchases of investments | | $ | (3,421,637 | ) | | (18,447,145 | ) | | (46,700,965 | ) |
| Proceeds from sales and maturities of investments | | | 902,249 | | | 16,243,776 | | | 42,264,713 | |
| Proceeds from (Payments for) swap contracts, net | | | — | | | 50,670 | | | — | |
| Investment transaction adjustments, net | | | (3,046 | ) | | (2,979 | ) | | (55,706 | ) |
| Taxes paid on undistributed capital gains | | | — | | | (11,644 | ) | | (51 | ) |
| Amortization (Accretion) of premiums and discounts, net | | | 45,008 | | | 1,332,229 | | | 528,687 | |
| Amortization of deferred offering costs | | | 89,300 | | | 24,938 | | | 7,608 | |
| (Increase) Decrease in: | | | | | | | | | | |
| Credit default swaps premiums paid | | | — | | | 337,915 | | | — | |
| Receivable for interest | | | (6,404 | ) | | 12,982 | | | 249,597 | |
| Receivable for investments sold | | | 1,954,688 | | | 5,891,621 | | | 12,763,800 | |
| Other assets | | | (336 | ) | | 1,625 | | | (5,192 | ) |
| Increase (Decrease) in: | | | | | | | | | | |
| Payable for common shares repurchased and retired | | | — | | | — | | | — | |
| Payable for interest | | | (1,923 | ) | | (13,528 | ) | | — | |
| Payable for investments purchased | | | 1,046,708 | | | — | | | (7,710,280 | ) |
| Accrued management fees | | | (820 | ) | | (5,716 | ) | | (6,616 | ) |
| Accrued Trustees fees | | | (6 | ) | | (9,587 | ) | | 1,541 | |
| Accrued other expenses | | | (22,468 | ) | | (4,894 | ) | | (25,766 | ) |
| Net realized (gain) loss from: | | | | | | | | | | |
| Investments | | | (1,637 | ) | | (407,568 | ) | | (1,956,268 | ) |
| Swaps | | | — | | | (50,670 | ) | | — | |
| Change in net unrealized (appreciation) depreciation of: | | | | | | | | | | |
| Investments | | | (284,573 | ) | | (1,939,350 | ) | | 33,199 | |
| Swaps | | | — | | | 43,394 | | | — | |
| Net cash provided by (used in) operating activities | | | 1,424,518 | | | 10,375,107 | | | 7,288,365 | |
| Cash Flows from Financing Activities | | | | | | | | | | |
| Increase (Decrease) in: | | | | | | | | | | |
| Cash overdraft | | | — | | | (4,504,811 | ) | | — | |
| Floating rate obligations | | | — | | | — | | | — | |
| Payable for offering costs | | | (128,118 | ) | | — | | | — | |
| Cash distribution paid to common shareholders | | | (826,997 | ) | | (4,830,971 | ) | | (6,417,988 | ) |
| Cost of common shares repurchased and retired | | | — | | | (287,244 | ) | | — | |
| Net cash provided by (used in) financing activities | | | (955,115 | ) | | (9,623,026 | ) | | (6,417,988 | ) |
| Net Increase (Decrease) in Cash | | | 469,403 | | | 752,081 | | | 870,377 | |
| Cash at beginning of period | | | 48,741 | | | — | | | 122,062 | |
| Cash at end of period | | $ | 518,144 | | $ | 752,081 | | $ | 992,439 | |
| | | | Missouri | | North Carolina | | | Virginia | |
| | | | Premium | | | Premium | | | Premium | |
| | | | Income | | | Income | | | Income | |
| Supplemental Disclosure of Cash Flow Information | | | (NOM | ) | | (NNC | ) | | (NPV | ) |
| Cash paid for interest (excluding amortization of offering costs) | | $ | 88,224 | | $ | 627,603 | | $ | 90,011 | |
| Non-cash financing activities not included herein consists of reinvestments of common share distributions | | | 27,351 | | | — | | | — | |
See accompanying notes to financial statements.
| Financial | |
| | Highlights (Unaudited) |
Selected data for a common share outstanding throughout each period:
| | | | | | Investment Operations | | | Less Distributions to Common Shareholders | | | Common Share |
| | | Beginning
Common
Share
NAV | | | Net
Investment
Income
(Loss) | | | Net
Realized/
Unrealized
Gain (Loss) | | | Distributions
from Net
Investment
Income to
ARPS
Share-
holders | (a) | | Distributions
from
Accumulated
Net Realized
Gains to
ARPS
Share-
holders | (a) | | Total | | | From
Net
Investment
Income | | | From
Accumu-
lated Net
Realized
Gains | | | Total | | | Discount
Per
Shares
Repurchased
and Retired | | | Ending
NAV | | | Ending
Share
Price | |
| Georgia Dividend Advantage 2 (NKG) | | | | | | | | | | | | | | | | | | | | | | | | | | | | | | | |
| Year Ended 5/31: | | | | | | | | | | | | | | | | | | | | | | | | | | | | | | | | | | |
| 2016(g) | | $ | 13.98 | | | $ | 0.36 | | | $ | 0.04 | | | $ | — | | | $ | — | | | $ | 0.40 | | | $ | (0.32 | ) | | $ | — | | | $ | (0.32 | ) | | $ | — | | | $ | 14.06 | | | $ | 13.15 | |
| 2015 | | | 13.98 | | | | 0.67 | | | | (0.03 | ) | | | — | | | | — | | | | 0.64 | | | | (0.64 | ) | | | — | | | | (0.64 | ) | | | — | | | | 13.98 | | | | 12.81 | |
| 2014 | | | 14.58 | | | | 0.54 | | | | (0.50 | ) | | | — | | | | — | | | | 0.04 | | | | (0.64 | ) | | | — | | | | (0.64 | ) | | | — | | | | 13.98 | | | | 12.98 | |
| 2013 | | | 14.71 | | | | 0.60 | | | | (0.06 | ) | | | — | | | | — | | | | 0.54 | | | | (0.67 | ) | | | — | | | | (0.67 | ) | | | — | | | | 14.58 | | | | 13.39 | |
| 2012 | | | 13.78 | | | | 0.61 | | | | 1.01 | | | | — | | | | — | | | | 1.62 | | | | (0.69 | ) | | | — | | | | (0.69 | ) | | | — | | | | 14.71 | | | | 14.73 | |
| 2011 | | | 14.21 | | | | 0.65 | | | | (0.36 | ) | | | — | | | | — | | | | 0.29 | | | | (0.72 | ) | | | — | | | | (0.72 | ) | | | — | | | | 13.78 | | | | 13.92 | |
| | | | | | | | | | | | | | | | | | | | | | | | | | | | | | | | | | | | | | | | | | | | | | | | | |
| Maryland Premium Income (NMY) | | | | | | | | | | | | | | | | | | | | | | | | | | | | | | | | | | | | | | | |
| Year Ended 5/31: | | | | | | | | | | | | | | | | | | | | | | | | | | | | | | | | | | | | | | | | | | | | |
| 2016(g) | | | 14.59 | | | | 0.34 | | | | 0.11 | | | | — | | | | — | | | | 0.45 | | | | (0.33 | ) | | | — | | | | (0.33 | ) | | | 0.02 | | | | 14.73 | | | | 12.49 | |
| 2015 | | | 14.64 | | | | 0.68 | | | | (0.10 | ) | | | — | | | | — | | | | 0.58 | | | | (0.67 | ) | | | — | | | | (0.67 | ) | | | 0.04 | | | | 14.59 | | | | 12.53 | |
| 2014 | | | 15.56 | | | | 0.60 | | | | (0.85 | ) | | | — | | | | — | | | | (0.25 | ) | | | (0.67 | ) | | | — | | | | (0.67 | ) | | | — | | | | 14.64 | | | | 12.91 | |
| 2013 | | | 15.68 | | | | 0.58 | | | | 0.07 | | | | — | | | | — | | | | 0.65 | | | | (0.77 | ) | | | — | | | | (0.77 | ) | | | — | | | | 15.56 | | | | 13.82 | |
| 2012 | | | 14.37 | | | | 0.68 | | | | 1.40 | | | | — | | | | — | | | | 2.08 | | | | (0.77 | ) | | | — | | | | (0.77 | ) | | | — | | | | 15.68 | | | | 15.64 | |
| 2011 | | | 14.77 | | | | 0.80 | | | | (0.43 | ) | | | (0.01 | ) | | | — | | | | 0.36 | | | | (0.76 | ) | | | — | | | | (0.76 | ) | | | — | | | | 14.37 | | | | 14.00 | |
| (a) | The amounts shown for Auction Rate Preferred Shares ("ARPS") are based on common share equivalents. |
| (b) | Total Return Based on Common Share NAV is the combination of changes in common share NAV, reinvested dividend income at NAV and reinvested capital gains distributions at NAV, if any. The last dividend declared in the period, which is typically paid on the first business day of the following month, is assumed to be reinvested at the ending NAV. The actual reinvest price for the last dividend declared in the period may often be based on the Fund's market price (and not its NAV), and therefore may be different from the price used in the calculation. Total returns are not annualized. |
| | |
| | Total Return Based on Common Share Price is the combination of changes in the market price per share and the effect of reinvested dividend income and reinvested capital gains distributions, if any, at the average price paid per share at the time of reinvestment. The last dividend declared in the period, which is typically paid on the first business day of the following month, is assumed to be reinvested at the ending market price. The actual reinvestment for the last dividend declared in the period may take place over several days, and in some instances may not be based on the market price, so the actual reinvestment price may be different from the price used in the calculation. Total returns are not annualized. |
| | | | | Common Share Supplemental Data/
Ratios Applicable to Common Shares |
| | Common Share
Total Returns | | | | | | Ratios to Average Net Assets
Before Reimbursement(c) | | | Ratios to Average Net Assets
After Reimbursement(c)(d) | | | | |
| | | | | | | | | | | | | | | | | | | | | | | | |
| | | | | Based | | | Ending | | | | | | Net | | | | | | Net | | | | |
| | Based | | | on | | | Net | | | | | | Investment | | | | | | Investment | | | Portfolio | |
| | on | | | Share | | | Assets | | | | | | Income | | | | | | Income | | | Turnover | |
| | NAV | (b) | | Price | (b) | | | (000 | ) | | Expenses | (e) | | (Loss) | | | Expenses | (e) | | (Loss) | | | Rate | (f) |
| | | | | | | | | | | | | | | | | | | | | | | | | |
| | | | | | | | | | | | | | | | | | | | | | | | | |
| | 2.90 | % | | | 5.23 | % | | $ | 148,296 | | | | 1.58 | %* | | | 5.10 | %* | | | N/A | | | | N/A | | | | 5 | % |
| | 4.65 | | | | 3.76 | | | | 147,441 | | | | 1.62 | | | | 4.77 | | | | N/A | | | | N/A | | | | 7 | |
| | 0.56 | | | | 2.17 | | | | 147,507 | | | | 3.03 | | | | 4.04 | | | | N/A | | | | N/A | | | | 20 | |
| | 3.68 | | | | (4.83 | ) | | | 153,832 | | | | 2.66 | | | | 4.09 | | | | N/A | | | | N/A | | | | 18 | |
| | 12.04 | | | | 11.12 | | | | 67,039 | | | | 2.95 | | | | 4.30 | | | | N/A | | | | N/A | | | | 11 | |
| | 2.13 | | | | 4.84 | | | | 62,777 | | | | 2.79 | | | | 4.64 | | | | 2.75 | % | | | 4.68 | % | | | 4 | |
| | | | | | | | | | | | | | | | | | | | | | | | | | | | | | | |
| | | | | | | | | | | | | | | | | | | | | | | | | | | | | | | |
| | 3.28 | | | | 2.39 | | | | 344,350 | | | | 1.52 | * | | | 4.68 | * | | | N/A | | | | N/A | | | | 10 | |
| | 4.28 | | | | 2.29 | | | | 344,300 | | | | 1.55 | | | | 4.65 | | | | N/A | | | | N/A | | | | 23 | |
| | (1.38 | ) | | | (1.43 | ) | | | 353,010 | | | | 2.87 | | | | 4.25 | | | | N/A | | | | N/A | | | | 20 | |
| | 4.18 | | | | (7.10 | ) | | | 375,162 | | | | 2.58 | | | | 4.12 | | | | N/A | | | | N/A | | | | 17 | |
| | 14.82 | | | | 17.69 | | | | 167,208 | | | | 2.91 | | | | 4.54 | | | | N/A | | | | N/A | | | | 7 | |
| | 2.53 | | | | 2.32 | | | | 153,082 | | | | 2.10 | | | | 5.48 | | | | N/A | | �� | | N/A | | | | 6 | |
| (c) | Ratios do not reflect the effect of dividend payments to ARPS shareholders, during periods when ARPS were outstanding; Net Investment Income (Loss) ratios reflect income earned and expenses incurred on assets attributable to ARPS and other subsequent forms of preferred shares issued by the Fund, where applicable. |
| (d) | After expense reimbursement from the Adviser, where applicable. As of September 30, 2010, the Adviser is no longer reimbursing Georgia Dividend Advantage 2 (NKG) for any fees and expenses. |
| (e) | The expense ratios reflect, among other things, all interest expense and other costs related to preferred shares (as described in Note 4 – Fund Shares, Preferred Shares) and/or the interest expense deemed to have been paid by the Fund on the floating rate certificates issued by the special purpose trusts for the self-deposited inverse floaters held by the Fund (as described in Note 3 – Portfolio Securities and Investments in Derivatives, Inverse Floating Rate Securities), where applicable, as follows: |
| Georgia Dividend Advantage 2 (NKG) | | | | |
| Year Ended 5/31: | | | | |
| 2016(g) | | | 0.53 | %* |
| 2015 | | | 0.54 | |
| 2014 | | | 1.89 | |
| 2013 | | | 1.51 | |
| 2012 | | | 1.56 | |
| 2011 | | | 1.60 | |
| Maryland Premium Income (NMY) | | | | |
| Year Ended 5/31: | | | | |
| 2016(g) | | | 0.52 | %* |
| 2015 | | | 0.52 | |
| 2014 | | | 1.81 | |
| 2013 | | | 1.46 | |
| 2012 | | | 1.56 | |
| 2011 | | | 1.00 | |
| (f) | Portfolio Turnover Rate is calculated based on the lesser of long-term purchases or sales (as disclosed in Note 5 – Investment Transactions) divided by the average long-term market value during the period. |
| (g) | For the six months ended November 30, 2015. |
| N/A | Fund does not have, or no longer has, a contractual reimbursement agreement with the Adviser. |
| * | Annualized. |
See accompanying notes to financial statements.
Financial Highlights (Unaudited) (continued)
Selected data for a common share outstanding throughout each period:
| | | | | | Investment Operations | | | Less Distributions to
Common Shareholders | | | Common Share | |
| | | Beginning
Common
Share
NAV | | | Net
Investment
Income
(Loss) | | | Net
Realized/
Unrealized
Gain (Loss) | | | Distributions
from Net
Investment
Income to
Preferred
Share-
holders | (a) | | Distributions
from
Accumulated
Net Realized
Gains to
Preferred
Share-
holders | (a) | | Total | | | From
Net
Investment
Income | | | From
Accumu-
lated Net
Realized
Gains | | | Total | | | Ending
NAV | | | Ending
Share
Price | |
| Minnesota Municipal Income (NMS) | | | | | | | | | | | | | | | | | | | | | | | | | | | | |
| Year Ended 5/31: | | | | | | | | | | | | | | | | | | | | | | | | | | | | | | | |
| 2016(h) | | $ | 15.46 | | | $ | 0.40 | | | $ | 0.10 | | | $ | — | | | $ | — | | | $ | 0.50 | | | $ | (0.41 | ) | | $ | — | | | $ | (0.41 | ) | | $ | 15.55 | | | $ | 14.50 | |
| 2015(f) | | | 15.50 | | | | 0.74 | | | | 0.03 | | | | — | | | | — | | | | 0.77 | | | | (0.81 | ) | | | — | | | | (0.81 | ) | | | 15.46 | | | | 14.95 | |
| Year Ended 6/30: | | | | | | | | | | | | | | | | | | | | | | | | | | | | | | | | | | | | | | | | | | | | |
| 2014(g) | | | 14.25 | | | | 0.71 | | | | 1.29 | | | | (0.01 | ) | | | — | | | | 1.99 | | | | (0.74 | ) | | | — | | | | (0.74 | ) | | | 15.50 | | | | 16.48 | |
| Year Ended 8/31: | | | | | | | | | | | | | | | | | | | | | | | | | | | | | | | | | | | | | | | | | | | | |
| 2013 | | | 16.16 | | | | 0.90 | | | | (1.90 | ) | | | (0.02 | ) | | | — | | | | (1.02 | ) | | | (0.89 | ) | | | — | | | | (0.89 | ) | | | 14.25 | | | | 14.82 | |
| 2012 | | | 14.56 | | | | 0.90 | | | | 1.56 | | | | (0.02 | ) | | | — | | | | 2.44 | | | | (0.84 | ) | | | — | | | | (0.84 | ) | | | 16.16 | | | | 17.52 | |
| 2011 | | | 15.28 | | | | 0.88 | | | | (0.71 | ) | | | (0.03 | ) | | | — | | | | 0.14 | | | | (0.86 | ) | | | — | | | | (0.86 | ) | | | 14.56 | | | | 15.37 | |
| 2010 | | | 13.39 | | | | 0.92 | | | | 1.91 | | | | (0.03 | ) | | | — | | | | 2.80 | | | | (0.91 | ) | | | — | | | | (0.91 | ) | | | 15.28 | | | | 15.70 | |
| | | | | | | | | | | | | | | | | | | | | | | | | | | | | | | | | | | | | | | | | | | | | |
| Missouri Premium Income (NOM) | | | | | | | | | | | | | | | | | | | | | | | | | | | | | | | | | | | | | |
| Year Ended 5/31: | | | | | | | | | | | | | | | | | | | | | | | | | | | | | | | | | | | | | | | | | | | | |
| 2016(h) | | | 13.91 | | | | 0.36 | | | | 0.13 | | | | — | | | | — | | | | 0.49 | | | | (0.37 | ) | | | — | | | | (0.37 | ) | | | 14.03 | | | | 15.35 | |
| 2015 | | | 14.19 | | | | 0.62 | | | | (0.17 | ) | | | — | | | | — | | | | 0.45 | | | | (0.73 | ) | | | — | | | | (0.73 | ) | | | 13.91 | | | | 15.27 | |
| 2014 | | | 14.61 | | | | 0.65 | | | | (0.34 | ) | | | — | | | | — | | | | 0.31 | | | | (0.73 | ) | | | — | | | | (0.73 | ) | | | 14.19 | | | | 15.08 | |
| 2013 | | | 14.62 | | | | 0.66 | | | | 0.06 | | | | — | | | | — | | | | 0.72 | | | | (0.73 | ) | | | — | | | | (0.73 | ) | | | 14.61 | | | | 16.04 | |
| 2012 | | | 13.19 | | | | 0.69 | | | | 1.52 | | | | — | | | | — | | | | 2.21 | | | | (0.78 | ) | | | — | | | | (0.78 | ) | | | 14.62 | | | | 16.90 | |
| 2011 | | | 13.55 | | | | 0.78 | | | | (0.35 | ) | | | (0.01 | ) | | | — | | | | 0.42 | | | | (0.78 | ) | | | — | | | | (0.78 | ) | | | 13.19 | | | | 13.88 | |
| (a) | The amounts shown are based on common share equivalents. Represents distributions paid on Remarketed Preferred Shares ("RPS") and ARPS for Minnesota Municipal Income (NMS) and Missouri Premium Income (NOM), respectively. |
| (b) | Total Return Based on Common Share NAV is the combination of changes in common share NAV, reinvested dividend income at NAV and reinvested capital gains distributions at NAV, if any. The last dividend declared in the period, which is typically paid on the first business day of the following month, is assumed to be reinvested at the ending NAV. The actual reinvest price for the last dividend declared in the period may often be based on the Fund's market price (and not its NAV), and therefore may be different from the price used in the calculation. Total returns are not annualized. |
| | |
| | Total Return Based on Common Share Price is the combination of changes in the market price per share and the effect of reinvested dividend income and reinvested capital gains distributions, if any, at the average price paid per share at the time of reinvestment. The last dividend declared in the period, which is typically paid on the first business day of the following month, is assumed to be reinvested at the ending market price. The actual reinvestment for the last dividend declared in the period may take place over several days, and in some instances may not be based on the market price, so the actual reinvestment price may be different from the price used in the calculation. Total returns are not annualized. |
| | | | | | | | Common Share Supplemental Data/
Ratios Applicable to Common Share |
| | Common Share
Total Returns | | | | | | Ratios to Average Net Assets(c) | | | | |
| | | | | | | | | | | | | | | | | | |
| | | | | Based | | | Ending | | | | | | Net | | | | |
| | Based | | | on | | | Net | | | | | | Investment | | | Portfolio | |
| | on | | | Share | | | Assets | | | | | | Income | | | Turnover | |
| | NAV | (b) | | Price | (b) | | | (000 | ) | | Expenses | (d) | | (Loss) | | | Rate | (e) |
| | | | | | | | | | | | | | | | | | | |
| | | | | | | | | | | | | | | | | | | |
| | 3.25 | % | | | (0.25 | )% | | $ | 86,635 | | | | 1.68 | %* | | | 5.22 | %* | | | 10 | % |
| | 5.02 | | | | (4.37 | ) | | | 86,150 | | | | 1.80 | * | | | 5.19 | * | | | 14 | |
| | | | | | | | | | | | | | | | | | | | | | | |
| | 14.33 | | | | 16.61 | | | | 64,277 | | | | 1.64 | * | | | 5.75 | * | | | 8 | |
| | | | | | | | | | | | | | | | | | | | | | | |
| | (6.77 | ) | | | (10.99 | ) | | | 59,100 | | | | 1.35 | | | | 5.68 | | | | 11 | |
| | 17.25 | | | | 19.91 | | | | 67,029 | | | | 1.42 | | | | 5.82 | | | | 6 | |
| | 1.30 | | | | 3.73 | | | | 60,408 | | | | 1.46 | | | | 6.25 | | | | 10 | |
| | 21.66 | | | | 12.86 | | | | 63,358 | | | | 1.29 | | | | 6.46 | | | | 16 | |
| | | | | | | | | | | | | | | | | | | | | | | |
| | | | | | | | | | | | | | | | | | | | | | | |
| | 3.54 | | | | 3.15 | | | | 32,769 | | | | 1.95 | * | | | 5.20 | * | | | 2 | |
| | 3.21 | | | | 6.50 | | | | 32,467 | | | | 2.80 | | | | 4.38 | | | | 8 | |
| | 2.52 | | | | (0.83 | ) | | | 33,072 | | | | 2.86 | | | | 4.85 | | | | 21 | |
| | 4.98 | | | | (0.67 | ) | | | 34,011 | | | | 2.77 | | | | 4.45 | | | | 12 | |
| | 17.16 | | | | 28.21 | | | | 33,979 | | | | 2.95 | | | | 4.93 | | | | 13 | |
| | 3.22 | | | | (11.29 | ) | | | 30,595 | | | | 2.30 | | | | 5.90 | | | | 11 | |
| (c) | Ratios do not reflect the effect of dividend payments to RPS and ARPS shareholders, during periods when RPS and ARPS were outstanding; Net Investment Income (Loss) ratios reflect income earned and expenses incurred on assets attributable to RPS, ARPS and other subsequent forms of preferred shares issued by the Fund, where applicable. For the years ended June 30, 2014 and prior, Minnesota Municipal Income's (NMS) includes the RPS of Minnesota Municipal Income Portfolio (MXA). |
| (d) | The expense ratios reflect, among other things, all interest expense and other costs related to preferred shares (as described in Note 4 – Fund Shares, Preferred Shares) and/or the interest expense deemed to have been paid by the Fund on the floating rate certificates issued by the special purpose trusts for the self-deposited inverse floaters held by the Fund (as described in Note 3 – Portfolio Securities and Investments in Derivatives, Inverse Floating Rate Securities), where applicable, as follows: |
| Minnesota Municipal Income (NMS) | | | | |
| Year Ended 5/31: | | | | |
| 2016(h) | | | 0.60 | %* |
| 2015(f) | | | 0.61 | * |
| Year Ended 6/30: | | | | |
| 2014(g) | | | 0.18 | * |
| Year Ended 8/31: | | | | |
| 2013 | | | — | |
| 2012 | | | — | |
| 2011 | | | — | |
| 2010 | | | — | |
| Missouri Premium Income (NOM) | | | | |
| Year Ended 5/31: | | | | |
| 2016(h) | | | 0.67 | %* |
| 2015 | | | 1.44 | |
| 2014 | | | 1.51 | |
| 2013 | | | 1.45 | |
| 2012 | | | 1.55 | |
| 2011 | | | 0.93 | |
| (e) | Portfolio Turnover Rate is calculated based on the lesser of long-term purchases or sales (as disclosed in Note 5 – Investment Transactions) divided by the average long-term market value during the period. |
| (f) | For the eleven months ended May 31, 2015. |
| (g) | For the ten months ended June 30, 2014. |
| (h) | For the six months ended November 30, 2015. |
| * | Annualized. |
See accompanying notes to financial statements.
Financial Highlights (Unaudited) (continued)
Selected data for a common share outstanding throughout each period:
| | | | | | Investment Operations | | | Less Distributions to
Common Shareholders | | | Common Share | |
| | | Beginning
Common
Share
NAV | | | Net
Investment
Income
(Loss) | | | Net
Realized/
Unrealized
Gain (Loss) | | | Distributions
from Net
Investment
Income to
ARPS
Share-
holders | (a) | | Distributions
from
Accumulated
Net Realized
Gains to
ARPS
Share-
holders | (a) | | Total | | | From
Net
Investment
Income | | | From
Accumu-
lated Net
Realized
Gains | | | Total | | | Discount
Per
Share
Repurchased
and Retired | | | Ending
NAV | | | Ending
Share
Price | |
| North Carolina Premium Income (NNC) | | | | | | | | | | | | | | | | | | | | | | | | | | | | | | |
| Year Ended 5/31: | | | | | | | | | | | | | | | | | | | | | | | | | | | | | | | | | | |
| 2016(g) | | $ | 14.98 | | | $ | 0.30 | | | $ | 0.15 | | | $ | — | | | $ | — | | | $ | 0.45 | | | $ | (0.29 | ) | | $ | — | | | $ | (0.29 | ) | | $ | — | * | | $ | 15.14 | | | $ | 12.94 | |
| 2015 | | | 14.90 | | | | 0.61 | | | | 0.11 | | | | — | | | | — | | | | 0.72 | | | | (0.62 | ) | | | (0.03 | ) | | | (0.65 | ) | | | 0.01 | | | | 14.98 | | | | 12.95 | |
| 2014 | | | 15.02 | | | | 0.54 | | | | (0.06 | ) | | | — | | | | — | | | | 0.48 | | | | (0.60 | ) | | | — | | | | (0.60 | ) | | | — | | | | 14.90 | | | | 13.24 | |
| 2013 | | | 15.30 | | | | 0.56 | | | | (0.17 | ) | | | — | | | | — | | | | 0.39 | | | | (0.67 | ) | | | — | | | | (0.67 | ) | | | — | | | | 15.02 | | | | 13.88 | |
| 2012 | | | 14.34 | | | | 0.57 | | | | 1.10 | | | | — | | | | — | | | | 1.67 | | | | (0.71 | ) | | | — | | | | (0.71 | ) | | | — | | | | 15.30 | | | | 15.97 | |
| 2011 | | | 14.72 | | | | 0.69 | | | | (0.32 | ) | | | (0.01 | ) | | | — | | | | 0.36 | | | | (0.74 | ) | | | — | | | | (0.74 | ) | | | — | | | | 14.34 | | | | 14.41 | |
| | | | | | | | | | | | | | | | | | | | | | | | | | | | | | | | | | | | | | | | | | | | | | | | | |
| Virginia Premium Income (NPV) | | | | | | | | | | | | | | | | | | | | | | | | | | | | | | | | | | | | | | | |
| Year Ended 5/31: | | | | | | | | | | | | | | | | | | | | | | | | | | | | | | | | | | | | | | | | | | | | | |
| 2016(g) | | | 14.50 | | | | 0.33 | | | | 0.11 | | | | — | | | | — | | | | 0.44 | | | | (0.35 | ) | | | — | | | | (0.35 | ) | | | — | | | | 14.59 | | | | 13.61 | |
| 2015 | | | 14.47 | | | | 0.72 | | | | 0.06 | | | | — | | | | — | | | | 0.78 | | | | (0.75 | ) | | | — | | | | (0.75 | ) | | | — | | | | 14.50 | | | | 13.39 | |
| 2014 | | | 15.38 | | | | 0.71 | | | | (0.89 | ) | | | — | | | | — | | | | (0.18 | ) | | | (0.72 | ) | | | (0.01 | ) | | | (0.73 | ) | | | — | | | | 14.47 | | | | 13.39 | |
| 2013 | | | 15.60 | | | | 0.66 | | | | (0.10 | ) | | | — | | | | — | | | | 0.56 | | | | (0.76 | ) | | | (0.02 | ) | | | (0.78 | ) | | | — | | | | 15.38 | | | | 14.32 | |
| 2012 | | | 14.42 | | | | 0.68 | | | | 1.32 | | | | — | | | | — | | | | 2.00 | | | | (0.80 | ) | | | (0.02 | ) | | | (0.82 | ) | | | — | | | | 15.60 | | | | 17.05 | |
| 2011 | | | 14.73 | | | | 0.77 | | | | (0.27 | ) | | | (0.01 | ) | | | — | | | | 0.49 | | | | (0.80 | ) | | | — | | | | (0.80 | ) | | | — | | | | 14.42 | | | | 14.92 | |
| (a) | The amounts shown for ARPS are based on common share equivalents. |
| (b) | Total Return Based on Common Share NAV is the combination of changes in common share NAV, reinvested dividend income at NAV and reinvested capital gains distributions at NAV, if any. The last dividend declared in the period, which is typically paid on the first business day of the following month, is assumed to be reinvested at the ending NAV. The actual reinvest price for the last dividend declared in the period may often be based on the Fund's market price (and not its NAV), and therefore may be different from the price used in the calculation. Total returns are not annualized. |
| | |
| | Total Return Based on Common Share Price is the combination of changes in the market price per share and the effect of reinvested dividend income and reinvested capital gains distributions, if any, at the average price paid per share at the time of reinvestment. The last dividend declared in the period, which is typically paid on the first business day of the following month, is assumed to be reinvested at the ending market price. The actual reinvestment for the last dividend declared in the period may take place over several days, and in some instances may not be based on the market price, so the actual reinvestment price may be different from the price used in the calculation. Total returns are not annualized. |
| | | | | | | | Common Share Supplemental Data/
Ratios Applicable to Common Shares |
| | Common Share
Total Returns | | | | | | Ratios to Average Net Assets(c) | | | | |
| | | | | | | | | | | | | | | | | | |
| | | | | Based | | | Ending | | | | | | Net | | | | |
| | Based | | | on | | | Net | | | | | | Investment | | | Portfolio | |
| | on | | | Share | | | Assets | | | | | | Income | | | Turnover | |
| | NAV | (b) | | Price | (b) | | | (000 | ) | | Expenses | (d) | | (Loss) | | | Rate | (f) |
| | | | | | | | | | | | | | | | | | | |
| | | | | | | | | | | | | | | | | | | |
| | 3.06 | % | | | 2.22 | % | | $ | 248,531 | | | | 1.52 | %** | | | 4.04 | %** | | | 4 | % |
| | 4.91 | | | | 2.72 | | | | 246,319 | | | | 1.54 | | | | 4.03 | | | | 12 | |
| | 3.54 | | | | 0.10 | | | | 246,492 | | | | 2.81 | | | | 3.85 | | | | 17 | |
| | 2.50 | | | | (9.16 | ) | | | 248,601 | | | | 2.72 | | | | 3.88 | | | | 17 | |
| | 11.88 | | | | 16.23 | | | | 97,497 | | | | 3.28 | | | | 3.85 | | | | 18 | |
| | 2.57 | | | | (1.27 | ) | | | 91,256 | | | | 2.49 | | | | 4.77 | | | | 10 | |
| | | | | | | | | | | | | | | | | | | | | | | |
| | | | | | | | | | | | | | | | | | | | | | | |
| | 3.11 | | | | 4.33 | | | | 261,656 | | | | 1.61 | ** | | | 4.62 | ** | | | 11 | |
| | 5.45 | | | | 5.72 | | | | 260,104 | | | | 1.67 | (e) | | | 4.91 | (e) | | | 17 | |
| | (0.79 | ) | | | (0.93 | ) | | | 259,568 | | | | 2.25 | | | | 5.15 | | | | 19 | |
| | 3.56 | | | | (11.76 | ) | | | 275,865 | | | | 2.57 | | | | 4.19 | | | | 21 | |
| | 14.26 | | | | 20.61 | | | | 141,099 | | | | 2.78 | | | | 4.49 | | | | 12 | |
| | 3.48 | | | | (0.58 | ) | | | 130,032 | | | | 2.11 | | | | 5.36 | | | | 12 | |
| (c) | Ratios do not reflect the effect of dividend payments to ARPS shareholders, during periods when ARPS were outstanding; Net Investment Income (Loss) ratios reflect income earned and expenses incurred on assets attributable to ARPS and other subsequent forms of preferred shares issued by the Fund, where applicable. |
| | |
| (d) | The expense ratios reflect, among other things, all interest expense and other costs related to preferred shares (as described in Note 4 – Fund Shares, Preferred Shares) and/or the interest expense deemed to have been paid by the Fund on the floating rate certificates issued by the special purpose trusts for the self-deposited inverse floaters held by the Fund, (as described in Note 3 – Portfolio Securities and Investments in Derivatives, Inverse Floating Rate Securities), where applicable, as follows: |
| North Carolina Premium Income (NNC) | | | | |
| Year Ended 5/31: | | | | |
| 2016(g) | | | 0.52 | %** |
| 2015 | | | 0.52 | |
| 2014 | | | 1.70 | |
| 2013 | | | 1.60 | |
| 2012 | | | 1.71 | |
| 2011 | | | 1.29 | |
| Virginia Premium Income (NPV) | | | | |
| Year Ended 5/31: | | | | |
| 2016(g) | | | 0.59 | %** |
| 2015 | | | 0.59 | |
| 2014 | | | 1.18 | |
| 2013 | | | 1.44 | |
| 2012 | | | 1.41 | |
| 2011 | | | 0.93 | |
| (e) | During the period ended May 31, 2015, the Adviser voluntarily reimbursed the Fund for certain expenses incurred in connection with a common shares equity shelf program. As a result, the Expenses and Net Investment Income (Loss) Ratios to Average Net Assets reflect this voluntary expense reimbursement from Adviser. The Expenses and Net Investment Income (Loss) Ratios to Average Net Assets excluding this expense reimbursement from Adviser were as follows: |
| Ratios to Average Net Assets |
| | | | | | | Net Investment | |
| Virginia Premium Income (NPV) | | | Expenses | | | Income (Loss | ) |
| Year Ended 5/31: | | | | | | | |
| 2015 | | | 1.70% | | | 4.88% | |
| (f) | Portfolio Turnover Rate is calculated based on the lesser of long-term purchases or sales (as disclosed in Note 5 – Investment Transactions) divided by the average long-term market value during the period. |
| (g) | For the six months ended November 30, 2015. |
| * | Rounds to less than $0.01 per share. |
| ** | Annualized. |
See accompanying notes to financial statements.
Financial Highlights (Unaudited) (continued)
| | | | MTP Shares at
the End of Period(a) | | | VMTP Shares
at the End of Period | |
| | | | Aggregate | | | Asset | | | Aggregate | | | Asset | |
| | | | Amount | | | Coverage | | | Amount | | | Coverage | |
| | | | Outstanding | | | Per $10 | | | Outstanding | | | Per $100,000 | |
| | | | (000 | ) | | Share | | | (000 | ) | | Share | |
| Georgia Dividend Advantage 2 (NKG) | | | | | | | | | | | | | |
| Year Ended 5/31: | | | | �� | | | | | | | | | |
| 2016(c) | | $ | — | | $ | — | | $ | 75,000 | | $ | 297,727 | |
| 2015 | | | — | | | — | | | 75,000 | | | 296,588 | |
| 2014 | | | — | | | — | | | 75,000 | | | 296,676 | |
| 2013 | | | 74,945 | | | 30.53 | | | — | | | — | |
| 2012 | | | 32,265 | | | 30.78 | | | — | | | — | |
| 2011 | | | 32,265 | | | 29.46 | | | — | | | — | |
| | | | | | | | | | | | | | |
| Maryland Premium Income (NMY) | | | | | | | | | | | | | |
| Year Ended 5/31: | | | | | | | | | | | | | |
| 2016(c) | | | — | | | — | | | 167,000 | | | 306,198 | |
| 2015 | | | — | | | — | | | 167,000 | | | 306,168 | |
| 2014 | | | — | | | — | | | 167,000 | | | 311,383 | |
| 2013 | | | 166,144 | | | 32.58 | | | — | | | — | |
| 2012 | | | 74,593 | | | 32.42 | | | — | | | — | |
| 2011 | | | 74,593 | | | 30.52 | | | — | | | — | |
| (a) | The Ending and Average Market Value Per Share for each Series of the Fund's MTP Shares were as follows: |
| | | | 2014 | | | 2013 | | | 2012 | | | 2011 | |
| Georgia Dividend Advantage 2 (NKG) | | | | | | | | | | | | | |
| Series 2015 (NKG PRC) | | | | | | | | | | | | | |
| Ending Market Value per Share | | $ | — | | $ | 10.08 | | $ | 10.10 | | $ | 10.06 | |
| Average Market Value per Share | | | 10.03 | Δ | | 10.08 | | | 10.07 | | | 10.02 | |
| Series 2015-1 (NKG PRD)(b) | | | | | | | | | | | | | |
| Ending Market Value per Share | | | — | | | 10.10 | | | — | | | — | |
| Average Market Value per Share | | | 10.04 | Δ | | 10.07 | Ω | | — | | | — | |
| Series 2015-2 (NKG PRE)(b) | | | | | | | | | | | | | |
| Ending Market Value per Share | | | — | | | 10.12 | | | — | | | — | |
| Average Market Value per Share | | | 10.03 | Δ | | 10.07 | Ω | | — | | | — | |
| | | | | | | | | | | | | | |
| Maryland Premium Income (NMY) | | | | | | | | | | | | | |
| Series 2015 (NMY PRC) | | | | | | | | | | | | | |
| Ending Market Value per Share | | | — | | | 10.06 | | | 10.06 | | | 10.09 | |
| Average Market Value per Share | | | 10.04 | Δ | | 10.09 | | | 10.10 | | | 10.04 | |
| Series 2016 (NMY PRD) | | | | | | | | | | | | | |
| Ending Market Value per Share | | | — | | | 10.16 | | | 10.11 | | | 10.10 | |
| Average Market Value per Share | | | 10.07 | Δ | | 10.17 | | | 10.14 | | | 10.04 | ^ |
| Series 2015 (NMY PRE)(b) | | | | | | | | | | | | | |
| Ending Market Value per Share | | | — | | | 10.05 | | | — | | | — | |
| Average Market Value per Share | | | 10.03 | Δ | | 10.07 | ΩΩ | | — | | | — | |
| Series 2015-1(NMY PRF)(b) | | | | | | | | | | | | | |
| Ending Market Value per Share | | | — | | | 10.06 | | | — | | | — | |
| Average Market Value per Share | | | 10.03 | Δ | | 10.07 | ΩΩ | | — | | | — | |
| Series 2015-1(NMY PRG)(b) | | | | | | | | | | | | | |
| Ending Market Value per Share | | | — | | | 10.05 | | | — | | | — | |
| Average Market Value per Share | | | 10.04 | Δ | | 10.08 | ΩΩ | | — | | | — | |
| Series 2016 (NMY PRH)(b) | | | | | | | | | | | | | |
| Ending Market Value per Share | | | — | | | 10.13 | | | — | | | — | |
| Average Market Value per Share | | | 10.07 | Δ | | 10.14 | ΩΩ | | — | | | — | |
| (b) | MTP Shares issued in connection with the reorganizations. |
| (c) | For the six months ended November 30, 2015. |
| ^ | For the period March 15, 2011 (first issuance date of shares) through May 31, 2011. |
| Ω | For the period July 9, 2012 (effective date of the reorganizations) through May 31, 2013. |
| ΩΩ | For the period August 6, 2012 (effective date of the reorganizations) through May 31, 2013. |
| Δ | For the period June 1, 2013 through May 30, 2014. |
See accompanying notes to financial statements.
| | | | RPS at the
End of Period | | | MTP Shares at
the End of Period(a) | | | VMTP Shares
at the End of Period | |
| | | | Aggregate | | | Asset | | | Aggregate | | | Asset | | | Aggregate | | | Asset | |
| | | | Amount | | | Coverage | | | Amount | | | Coverage | | | Amount | | | Coverage | |
| | | Outstanding | | Per $25,000 | | Outstanding | | | Per $10 | | Outstanding | | Per $100,000 | |
| | | | (000 | ) | | Share | | | (000 | ) | | Share | | | (000 | ) | | Share | |
| Minnesota Municipal Income (NMS) | | | | | | | | | | | | | | | | | | |
| Year Ended 5/31: | | | | | | | | | | | | | | | | | | | |
| 2016(d) | | $ | — | | $ | — | | $ | — | | $ | — | | $ | 44,100 | | $ | 296,452 | |
| 2015(b) | | | — | | | — | | | — | | | — | | | 44,100 | | | 295,352 | |
| Year Ended 6/30: | | | | | | | | | | | | | | | | | | | |
| 2014(c) | | | — | | | — | | | — | | | — | | | 31,100 | | | 307 | * |
| Year Ended 8/31: | | | | | | | | | | | | | | | | | | | |
| 2013 | | | 31,100 | | | 73 | * | | — | | | — | | | — | | | — | |
| 2012 | | | 31,100 | | | 79 | * | | — | | | — | | | — | | | — | |
| 2011 | | | 31,100 | | | 74 | * | | — | | | — | | | — | | | — | |
| 2010 | | | 31,100 | | | 76 | * | | — | | | — | | | — | | | — | |
| | | | | | | | | | | | | | | | | | | | |
| Missouri Premium Income (NOM) | | | | | | | | | | | | | | | | | | |
| Year Ended 5/31: | | | | | | | | | | | | | | | | | | | |
| 2016(d) | | | — | | | — | | | — | | | — | | | 18,000 | | | 282,051 | |
| 2015 | | | — | | | — | | | — | | | — | | | 18,000 | | | 280,372 | |
| 2014 | | | — | | | — | | | 17,880 | | | 28.50 | | | — | | | — | |
| 2013 | | | — | | | — | | | 17,880 | | | 29.02 | | | — | | | | |
| 2012 | | | — | | | — | | | 17,880 | | | 29.00 | | | — | | | — | |
| 2011 | | | — | | | — | | | 17,880 | | | 27.11 | | | — | | | — | |
| * | Rounded to the nearest thousand (000). |
| (a) | The Ending and Average Market Value Per Share for each Series of the Fund's MTP Shares were as follows: |
| | | | 2015 | | | 2014 | | | 2013 | | | 2012 | | | 2011 | |
| Missouri Premium Income (NOM) | | | | | | | | | | | | | | | | |
| Series 2015 (NOM PRC) | | | | | | | | | | | | | | | | |
| Ending Market Value per Share | | $ | — | | $ | 10.06 | | $ | 10.03 | | $ | 10.40 | | $ | 13.88 | |
| Average Market Value per Share | | | 10.03 | ΔΔ | | 10.04 | | | 10.08 | | | 9.98 | | | 15.41 | Δ |
| (b) | For the eleven months ended May 31, 2015. |
| (c) | For the ten months ended June 30, 2014. |
| (d) | For the six months ended November 30, 2015. |
| Δ | For the period November 9, 2010 (first issuance date of shares) through May 31, 2011. |
| ΔΔ | For the period June 1, 2014, through February 9, 2015. |
See accompanying notes to financial statements.
Financial Highlights (Unaudited) (continued)
| | | | MTP Shares at
the End of Period(a) | | | VMTP Shares
at the End of Period | | | VRDP Shares
at the End of Period | |
| | | | Aggregate | | | Asset | | | Aggregate | | | Asset | | | Aggregate | | | Asset | |
| | | | Amount | | | Coverage | | | Amount | | | Coverage | | | Amount | | | Coverage | |
| | | Outstanding | | | Per $10 | | Outstanding | | Per $100,000 | | Outstanding | | Per $100,000 | |
| | | | (000 | ) | | Share | | | (000 | ) | | Share | | | (000 | ) | | Share | |
| North Carolina Premium Income (NNC) | | | | | | | | | | | | | | | | | | |
| Year Ended 5/31: | | | | | | | | | | | | | | | | | | | |
| 2016(c) | | $ | — | | $ | — | | $ | 125,000 | | $ | 298,825 | | $ | — | | $ | — | |
| 2015 | | | — | | | — | | | 125,000 | | | 297,055 | | | — | | | — | |
| 2014 | | | — | | | — | | | 125,000 | | | 297,193 | | | — | | | — | |
| 2013 | | | 124,860 | | | 29.91 | | | — | | | — | | | — | | | — | |
| 2012 | | | 49,835 | | | 29.56 | | | — | | | — | | | — | | | — | |
| 2011 | | | 49,835 | | | 28.31 | | | — | | | — | | | — | | | — | |
| | | | | | | | | | | | | | | | | | | | |
| Virginia Premium Income (NPV) | | | | | | | | | | | | | | | | | | |
| Year Ended 5/31: | | | | | | | | | | | | | | | | | | | |
| 2016(c) | | | — | | | — | | | — | | | — | | | 128,000 | | | 304,418 | |
| 2015 | | | — | | | — | | | — | | | — | | | 128,000 | | | 303,206 | |
| 2014 | | | — | | | — | | | — | | | — | | | 128,000 | | | 302,787 | |
| 2013 | | | 127,408 | | | 31.65 | | | — | | | — | | | — | | | — | |
| 2012 | | | 61,408 | | | 32.98 | | | — | | | — | | | — | | | — | |
| 2011 | | | 61,408 | | | 31.18 | | | — | | | — | | | — | | | — | |
| (a) | The Ending and Average Market Value Per Share for each Series of the Fund's MTP Shares were as follows: |
| | | | 2014 | | | 2013 | | | 2012 | | | 2011 | |
| North Carolina Premium Income (NNC) | | | | | | | | | | | | | |
| Series 2015 (NNC PRC) | | | | | | | | | | | | | |
| Ending Market Value per Share | | $ | — | | $ | 10.07 | | $ | 10.11 | | $ | 10.04 | |
| Average Market Value per Share | | | 10.03 | ^ | | 10.10 | | | 10.09 | | | 10.04 | |
| Series 2016 (NNC PRD) | | | | | | | | | | | | | |
| Ending Market Value per Share | | | — | | | 10.08 | | | 10.10 | | | 10.00 | |
| Average Market Value per Share | | | 10.04 | ^ | | 10.09 | | | 10.07 | | | 9.94 | Δ |
| Series 2015 (NNC PRE)(b) | | | | | | | | | | | | | |
| Ending Market Value per Share | | | — | | | 10.06 | | | — | | | — | |
| Average Market Value per Share | | | 10.03 | ^ | | 10.073 | | | — | | | — | |
| Series 2015-1 (NNC PRF)(b) | | | | | | | | | | | | | |
| Ending Market Value per Share | | | — | | | 10.06 | | | — | | | — | |
| Average Market Value per Share | | | 10.03 | ^ | | 10.07 | Ω | | — | | | — | |
| Series 2015-1 (NNC PRG)(b) | | | | | | | | | | | | | |
| Ending Market Value per Share | | | — | | | 10.06 | | | — | | | — | |
| Average Market Value per Share | | | 10.03 | ^ | | 10.07 | Ω | | — | | | — | |
| Virginia Premium Income (NPV) | | | | | | | | | | | | | |
| Series 2014 (NPV PRA) | | | | | | | | | | | | | |
| Ending Market Value per Share | | | — | | | 10.03 | | | 10.12 | | | 10.03 | |
| Average Market Value per Share | | | 10.01 | ^^ | | 10.08 | | | 10.10 | | | 10.02 | * |
| Series 2015 (NPV PRC) | | | | | | | | | | | | | |
| Ending Market Value per Share | | | — | | | 10.09 | | | 10.13 | | | 10.01 | |
| Average Market Value per Share | | | 10.04 | ^^ | | 10.09 | | | 10.09 | | | 10.07 | |
| Series 2014 (NPV PRD)(b) | | | | | | | | | | | | | |
| Ending Market Value per Share | | | — | | | 10.06 | | | — | | | — | |
| Average Market Value per Share | | | 10.04 | ^^ | | 10.09 | ΩΩ | | — | | | — | |
| Series 2014-1 (NPV PRE)(b) | | | | | | | | | | | | | |
| Ending Market Value per Share | | | — | | | 10.09 | | | — | | | — | |
| Average Market Value per Share | | | 10.04 | ^^ | | 10.09 | ΩΩ | | — | | | — | |
| (b) | MTP Shares issued in connection with the reorganizations. |
| (c) | For the six months ended November 30, 2015. |
| Δ | For the period December 14, 2010 (first issuance date of shares) through May 31, 2011. |
| * | For the period March 14, 2011 (first issuance date of shares) through May 31, 2011. |
| Ω | For the period July 9, 2012 (effective date of the reorganizations) through May 31, 2013. |
| ΩΩ | For the period August 6, 2012 (effective date of the reorganizations) through May 31, 2013. |
| ^ | For the period June 1, 2013 through March 3, 2014. |
| ^^ | For the period June 1, 2013 through September 9, 2013. |
See accompanying notes to financial statements.
Notes to Financial Statements (Unaudited)
1. General Information and Significant Accounting Policies
General Information
Fund Information
The state funds covered in this report and their corresponding New York Stock Exchange ("NYSE") or NYSE MKT symbols are as follows (each a "Fund" and collectively, the "Funds"):
| | • | Nuveen Georgia Dividend Advantage Municipal Fund 2 (NKG) ("Georgia Dividend Advantage 2 (NKG)") |
| | • | Nuveen Maryland Premium Income Municipal Fund (NMY) ("Maryland Premium Income (NMY)") |
| | • | Nuveen Minnesota Municipal Income Fund (NMS) ("Minnesota Municipal Income (NMS)") |
| | • | Nuveen Missouri Premium Income Municipal Fund (NOM) ("Missouri Premium Income (NOM)") |
| | • | Nuveen North Carolina Premium Income Municipal Fund (NNC) ("North Carolina Premium Income (NNC)") |
| | • | Nuveen Virginia Premium Income Municipal Fund (NPV) ("Virginia Premium Income (NPV)") |
The Funds are registered under the Investment Company Act of 1940, as amended, as diversified, closed-end management investment companies. Common shares of Georgia Dividend Advantage 2 (NKG), Maryland Premium Income (NMY), Minnesota Municipal Income (NMS) North Carolina Premium Income (NNC) and Virginia Premium Income (NPV) are traded on the NYSE while common shares of Missouri Premium Income (NOM) are traded on the NYSE MKT. Georgia Dividend Advantage 2 (NKG), Minnesota Municipal Income (NMS) and Missouri Premium Income (NOM) were organized as Massachusetts business trusts on October 26, 2001, April 28, 2014 and March 29, 1993, respectively. Maryland Premium Income (NMY), North Carolina Premium Income (NNC) and Virginia Premium Income (NPV) were organized as Massachusetts business trusts on January 12, 1993.
The end of the reporting period for the Funds is November 30, 2015, and the period covered by these Notes to Financial Statements is the six months ended November 30, 2015 (the "current fiscal period").
Investment Adviser
The Funds' investment adviser is Nuveen Fund Advisors, LLC (the "Adviser"), a wholly-owned subsidiary of Nuveen Investments, Inc. ("Nuveen"). The Adviser is responsible for each Fund's overall investment strategy and asset allocation decisions. The Adviser has entered into sub-advisory agreements with Nuveen Asset Management, LLC (the "Sub-Adviser"), a subsidiary of the Adviser, under which the Sub-Adviser manages the investment portfolios of the Funds.
Investment Objectives and Principal Investment Strategies
Each Fund seeks to provide current income exempt from both regular federal and designated state income taxes by investing primarily in a portfolio of municipal obligations issued by state and local government authorities within a single state or certain U.S. territories.
Significant Accounting Policies
Each Fund is an investment company and follows accounting and reporting guidance under Financial Accounting Standards Board (FASB) Accounting Standards Codification (ASC) Topic 946 "Financial Services – Investment Companies." The following is a summary of significant accounting policies followed by the Funds in the preparation of their financial statements in accordance with U.S. generally accepted accounting principles ("U.S. GAAP").
Investment Transactions
Investment transactions are recorded on a trade date basis. Realized gains and losses from investment transactions are determined on the specific identification method, which is the same basis used for federal income tax purposes. Investments purchased on a when-issued/delayed delivery basis may have extended settlement periods. Any investments so purchased are subject to market fluctuation during this period. The Funds have earmarked securities in their portfolios with a current value at least equal to the amount of the when-issued/delayed delivery purchase commitments.
Notes to Financial Statements (Unaudited) (continued)
As of the end of the reporting period, the following Funds' outstanding when-issued/delayed delivery purchase commitments were as follows:
| | | | Georgia | | | Maryland | | | Minnesota | | | Missouri | | | Virginia | |
| | | | Dividend | | | Premium | | | Municipal | | | Premium | | | Premium | |
| | | Advantage 2 | | | Income | | | Income | | | Income | | | Income | |
| | | | (NKG | ) | | (NMY | ) | | (NMS | ) | | (NOM | ) | | (NPV | ) |
| Outstanding when-issued/delayed delivery purchase commitments | | $ | 1,151,450 | | $ | 1,500,000 | | $ | 991,563 | | $ | 1,507,435 | | $ | 1,246,875 | |
Investment Income
Investment income, which reflects the amortization of premiums and accretion of discounts for financial reporting purposes, is recorded on an accrual basis. Investment income also reflects paydown gains and losses, if any.
Professional Fees
Professional fees presented on the Statement of Operations consist of legal fees incurred in the normal course of operations, audit fees, tax consulting fees and, in some cases, workout expenditures. Workout expenditures are incurred in an attempt to protect or enhance an investment or to pursue other claims or legal actions on behalf of Fund shareholders. If a refund is received for workout expenditures paid in a prior reporting period, such amounts will be recognized as "Legal fee refund" on the Statements of Operations.
Dividends and Distributions to Common Shareholders
Dividends from net investment income are declared monthly. Net realized capital gains and/or market discount from investment transactions, if any, are distributed to shareholders at least annually. Furthermore, capital gains are distributed only to the extent they exceed available capital loss carryforwards.
Distributions to common shareholders of net investment income, net realized capital gains and/or market discount, if any, are recorded on the ex-dividend date. The amount and timing of distributions are determined in accordance with federal income tax regulations, which may differ from U.S. GAAP.
Indemnifications
Under the Funds' organizational documents, their officers and trustees are indemnified against certain liabilities arising out of the performance of their duties to the Funds. In addition, in the normal course of business, the Funds enter into contracts that provide general indemnifications to other parties. The Funds' maximum exposure under these arrangements is unknown as this would involve future claims that may be made against the Funds that have not yet occurred. However, the Funds have not had prior claims or losses pursuant to these contracts and expect the risk of loss to be remote.
Netting Agreements
In the ordinary course of business, the Funds may enter into transactions subject to enforceable International Swaps and Derivative Association, Inc. ("ISDA") master agreements or other similar arrangements ("netting agreements"). Generally, the right to offset in netting agreements allows each Fund to offset certain securities and derivatives with a specific counterparty as well as any collateral received or delivered to that counterparty based on the terms of the agreements. Generally, each Fund manages its cash collateral and securities collateral on a counterparty basis.
The Funds' investments subject to netting agreements as of the end of the reporting period, if any, are further described in Note 3 – Portfolio Securities and investments in Derivatives.
Use of Estimates
The preparation of financial statements in conformity with U.S. GAAP requires management to make estimates and assumptions that affect the reported amounts of assets and liabilities at the date of the financial statements and the reported amounts of increases and decreases in net assets applicable to common shares from operations during the reporting period. Actual results may differ from those estimates.
2. Investment Valuation and Fair Value Measurements
The fair valuation input levels as described below are for fair value measurement purposes.
Fair value is defined as the price that would be received upon selling an investment or transferring a liability in an orderly transaction to an independent buyer in the principal or most advantageous market for the investment. A three-tier hierarchy is used to maximize the use of observable market data and minimize the use of unobservable inputs and to establish classification of fair value measurements for disclosure purposes. Observable inputs reflect the assumptions market participants would use in pricing the asset or liability. Observable inputs are based on market data obtained from sources independent of the reporting entity. Unobservable inputs reflect the reporting entity's own assumptions about the assumptions market participants would use in pricing the asset or liability. Unobservable inputs are based on the best information available in the circumstances. The following is a summary of the three-tiered hierarchy of valuation input levels.
| Level 1 – | Inputs are unadjusted and prices are determined using quoted prices in active markets for identical securities. |
| Level 2 – | Prices are determined using other significant observable inputs (including quoted prices for similar securities, interest rates, prepayment speeds, credit risk, etc.). |
| Level 3 – | Prices are determined using significant unobservable inputs (including management's assumptions in determining the fair value of investments). |
Prices of fixed income securities are provided by a pricing service approved by the Funds' Board of Trustees (the "Board"). The pricing service establishes a security's fair value using methods that may include consideration of the following: yields or prices of investments of comparable quality, type of issue, coupon, maturity and rating, market quotes or indications of value from security dealers, evaluations of anticipated cash flows or collateral, general market conditions and other information and analysis, including the obligor's credit characteristics considered relevant. These securities are generally classified as Level 2. In pricing certain securities, particularly less liquid and lower quality securities, the pricing service may consider information about a security, its issuer or market activity, provided by the Adviser. These securities are generally classified as Level 2 or Level33 depending on the priority of the significant inputs.
Price of swaps contracts are also provided by a pricing service approved by the Board using the same methods as described above and are generally classified as Level 2.
Common stocks and other equity-type securities are valued at the last sales price on the securities exchange on which such securities are primarily traded and are generally classified as Level 1. Securities primarily traded on the NASDAQ National Market ("NASDAQ") are valued at the NASDAQ Official Closing Price and are generally classified as Level 1. However, securities traded on a securities exchange or NASDAQ for which there were no transactions on a given day or securities not listed on a securities exchange or NASDAQ are valued at the quoted bid price and are generally classified as Level 2.
Certain securities may not be able to be priced by the pre-established pricing methods as described above. Such securities may be valued by the Board and/or its appointee at fair value. These securities generally include, but are not limited to, restricted securities (securities which may not be publicly sold without registration under the Securities Act of 1933, as amended) for which a pricing service is unable to provide a market price; securities whose trading has been formally suspended; debt securities that have gone into default and for which there is no current market quotation; a security whose market price is not available from a pre-established pricing source; a security with respect to which an event has occurred that is likely to materially affect the value of the security after the market has closed but before the calculation of a Fund's NAV (as may be the case in non-U.S. markets on which the security is primarily traded) or make it difficult or impossible to obtain a reliable market quotation; and a security whose price, as provided by the pricing service, is not deemed to reflect the security's fair value. As a general principle, the fair value of a security would appear to be the amount that the owner might reasonably expect to receive for it in a current sale. A variety of factors may be considered in determining the fair value of such securities, which may include consideration of the following: yields or prices of investments of comparable quality, type of issue, coupon, maturity and rating, market quotes or indications of value from security dealers, evaluations of anticipated cash flows or collateral, general market conditions and other information and analysis, including the obligor's credit characteristics considered relevant. These securities are generally classified as Level 2 or Level 3 depending on the priority of the significant inputs. Regardless of the method employed to value a particular security, all valuations are subject to review by the Board and/or its appointee.
The inputs or methodologies used for valuing securities are not an indication of the risks associated with investing in those securities. The following is a summary of each Fund's fair value measurements as of the end of the reporting period:
| Georgia Dividend Advantage 2 (NKG) | | | Level 1 | | | Level 2 | | | Level 3 | | | Total | |
| Long-Term Investments*: | | | | | | | | | | | | | |
| Municipal Bonds | | $ | — | | $ | 223,218,380 | | $ | — | | $ | 223,218,380 | |
| Maryland Premium Income (NMY) | | | | | | | | | | | | | |
| Long-Term Investments*: | | | | | | | | | | | | | |
| Municipal Bonds | | $ | — | | $ | 516,268,613 | | $ | — | | $ | 516,268,613 | |
| Common Stocks | | | 1,840,485 | | | — | | | — | | | 1,840,485 | |
| Total | | $ | 1,840,485 | | $ | 516,268,613 | | $ | — | | $ | 518,109,098 | |
| Minnesota Municipal Income (NMS) | | | | | | | | | | | | | |
| Long-Term Investments*: | | | | | | | | | | | | | |
| Municipal Bonds | | $ | — | | $ | 128,335,679 | | $ | — | | $ | 128,335,679 | |
| Missouri Premium Income (NOM) | | | | | | | | | | | | | |
| Long-Term Investments*: | | | | | | | | | | | | | |
| Municipal Bonds | | $ | — | | $ | 53,417,748 | | $ | — | | $ | 53,417,748 | |
| North Carolina Premium Income (NNC) | | | | | | | | | | | | | |
| Long-Term Investments*: | | | | | | | | | | | | | |
| Municipal Bonds | | $ | — | | $ | 368,541,775 | | $ | — | | $ | 368,541,775 | |
| Virginia Premium Income (NPV) | | | | | | | | | | | | | |
| Long-Term Investments*: | | | | | | | | | | | | | |
| Municipal Bonds | | $ | — | | $ | 392,144,354 | | $ | — | | $ | 392,144,354 | |
| * | Refer to the Fund's Portfolio of Investments for industry classifications. |
Notes to Financial Statements (Unaudited) (continued)
The Board is responsible for the valuation process and has appointed the oversight of the daily valuation process to the Adviser's Valuation Committee. The Valuation Committee, pursuant to the valuation policies and procedures adopted by the Board is responsible for making fair value determinations, evaluating the effectiveness of the Funds' pricing policies and reporting to the Board. The Valuation Committee is aided in its efforts by the Adviser's dedicated Securities Valuation Team, which is responsible for administering the daily valuation process and applying fair value methodologies as approved by the Valuation Committee. When determining the reliability of independent pricing services for investments owned by the Funds, the Valuation Committee, among other things, conducts due diligence reviews of the pricing services and monitors the quality of security prices received through various testing reports conducted by the Securities Valuation Team.
The Valuation Committee will consider pricing methodologies it deems relevant and appropriate when making a fair value determination, based on the facts and circumstances specific to the portfolio instrument. Fair value determinations generally will be derived as follows, using public or private market information:
| | (i) | If available, fair value determinations shall be derived by extrapolating from recent transactions or quoted prices for identical or comparable securities. |
| | (ii) | If such information is not available, an analytical valuation methodology may be used based on other available information including, but not limited to: analyst appraisals, research reports, corporate action information, issuer financial statements and shelf registration statements. Such analytical valuation methodologies may include, but are not limited to: multiple of earnings, discount from market value of a similar freely-traded security, discounted cash flow analysis, book value or a multiple thereof, risk premium/yield analysis, yield to maturity and/or fundamental investment analysis. |
The purchase price of a portfolio instrument will be used to fair value the instrument only if no other valuation methodology is available or deemed appropriate, and it is determined that the purchase price fairly reflects the instrument's current value.
For each portfolio security that has been fair valued pursuant to the policies adopted by the Board, the fair value price is compared against the last available and next available market quotations. The Valuation Committee reviews the results of such testing and fair valuation occurrences are reported to the Board.
3. Portfolio Securities and Investments in Derivatives
Portfolio Securities
Inverse Floating Rate Securities
Each Fund is authorized to invest in inverse floating rate securities. An inverse floating rate security is created by depositing a municipal bond (referred to as an "Underlying Bond"), typically with a fixed interest rate, into a special purpose tender option bond ("TOB") trust (referred to as the "TOB Trust") created by or at the direction of one or more Funds. In turn, the TOB Trust issues (a) floating rate certificates (referred to as "Floaters") in face amounts equal to some fraction of the Underlying Bond's par amount or market value, and (b) an inverse floating rate certificate (referred to as an "Inverse Floater") that represents all remaining or residual interest in the TOB Trust. Floaters typically pay short-term tax-exempt interest rates to third parties who are also provided a right to tender their certificate and receive its par value, which may be paid from the proceeds of a remarketing of the Floaters, by a loan to the TOB Trust from a third party liquidity provider ("Liquidity Provider"), or by the sale of assets from the TOB Trust. The Inverse Floater is issued to a long term investor, such as one or more of the Funds. The income received by the Inverse Floater holder varies inversely with the short-term rate paid to holders of the Floaters, and in most circumstances the Inverse Floater holder bears substantially all of the Underlying Bond's downside investment risk and also benefits disproportionately from any potential appreciation of the Underlying Bond's value. The value of an Inverse Floater will be more volatile than that of the Underlying Bond because the interest rate is dependent on not only the fixed coupon rate of the Underlying Bond but also on the short-term interest paid on the Floaters, and because the Inverse Floater essentially bears the risk of loss (and possible gain) of the greater face value of the Underlying Bond.
The Inverse Floater held by a Fund gives the Fund the right to (a) cause the holders of the Floaters to tender their certificates at par (or slightly more than par in certain circumstances), and (b) have the trustee of the TOB Trust (the "Trustee") transfer the Underlying Bond held by the TOB Trust to the Fund, thereby collapsing the TOB Trust.
The Fund may acquire an Inverse Floater in a transaction where it (a) transfers an Underlying Bond that it owns to a TOB Trust created by a third party or (b) transfers an Underlying Bond that it owns, or that it has purchased in a secondary market transaction for the purpose of creating an Inverse Floater, to a TOB Trust created at its direction, and in return receives the Inverse Floater of the TOB Trust (referred to as a "self-deposited Inverse Floater"). A Fund may also purchase an Inverse Floater in a secondary market transaction from a third party creator of the TOB Trust without first owning the Underlying Bond (referred to as an "externally-deposited Inverse Floater").
An investment in a self-deposited Inverse Floater is accounted for as a "financing" transaction (i.e., a secured borrowing). For a self-deposited Inverse Floater, the Underlying Bond deposited into the TOB Trust is identified in the Fund's Portfolio of Investments as "(UB) – Underlying bond of an inverse floating rate trust reflected as a financing transaction," with the Fund recognizing as liabilities, labeled "Floating rate obligations" on the Statement of Assets and Liabilities, (a) the liquidation value of Floaters issued by the TOB Trust, and (b) the amount of any borrowings by the TOB Trust from a Liquidity Provider to enable the TOB Trust to purchase outstanding Floaters in lieu of a remarketing. In addition, the Fund recognizes in "Investment Income" the entire earnings of the Underlying Bond, and recognizes (a) the interest paid to the holders of the Floaters or on the TOB Trust's
borrowings, and (b) other expenses related to remarketing, administration, trustee, liquidity and other services to a TOB Trust, as a component of "Interest expense and amortization of offering costs" on the Statement of Operations.
In contrast, an investment in an externally-deposited Inverse Floater is accounted for as a purchase of the Inverse Floater and is identified in the Fund's Portfolio of Investments as "(IF) – Inverse floating rate investment." For an externally-deposited Inverse Floater, a Fund's Statement of Assets and Liabilities recognizes the Inverse Floater and not the Underlying Bond as an asset, and the Fund does not recognize the Floaters, or any related borrowings from a Liquidity Provider, as a liability. Additionally, the Fund reflects in "Investment Income" only the net amount of earnings on the Inverse Floater (net of the interest paid to the holders of the Floaters or the Liquidity Provider as lender, and the expenses of the Trust), and does not show the amount of that interest paid or the expenses of the TOB Trust as described above as interest expense on the Statement of Operations.
Fees paid upon the creation of a TOB Trust for self-deposited Inverse Floaters and externally-deposited Inverse Floaters are recognized as part of the cost basis of the Inverse Floater and are capitalized over the term of the TOB Trust.
As of the end of the reporting period, the aggregate value of Floaters issued by each Fund's TOB Trust for self-deposited Inverse Floaters and externally-deposited Inverse Floaters was as follows:
| | | | | | | | | | | | | | | | North | | | | |
| | | | Georgia | | | Maryland | | | Minnesota | | | Missouri | | | Carolina | | | Virginia | |
| | | | Dividend | | | Premium | | | Municipal | | | Premium | | | Premium | | | Premium | |
| | | Advantage 2 | | | Income | | | Income | | | Income | | | Income | | | Income | |
| Floating Rate Obligations Outstanding | | | (NKG | ) | | (NMY | ) | | (NMS | ) | | (NOM | ) | | (NNC | ) | | (NPV | ) |
| Floating rate obligations: self-deposited Inverse Floaters | | $ | 3,245,000 | | $ | 16,410,000 | | $ | — | | $ | 2,225,000 | | $ | — | | $ | 9,250,000 | |
| Floating rate obligations: externally-deposited Inverse Floaters | | | 5,635,000 | | | — | | | — | | | — | | | — | | | 20,070,000 | |
| Total | | $ | 8,880,000 | | $ | 16,410,000 | | $ | — | | $ | 2,225,000 | | $ | — | | $ | 29,320,000 | |
During the current fiscal period, the average amount of Floaters (including any borrowings from a Liquidity Provider) outstanding, and average annual interest rate and fees related to self-deposited Inverse Floaters, were as follows:
| | | | Georgia | | | Maryland | | | Minnesota | | | Missouri | | | Carolina | | | Virginia | |
| | | | Dividend | | | Premium | | | Municipal | | | Premium | | | Premium | | | Premium | |
| | | Advantage 2 | | | Income | | | Income | | | Income | | | Income | | | Income | |
| Self-Deposited Inverse Floaters | | | (NKG | ) | | (NMY | ) | | (NMS | ) | | (NOM | ) | | (NNC | ) | | (NPV | ) |
| Average floating rate obligations outstanding | | $ | 3,245,000 | | $ | 16,807,814 | | $ | — | | $ | 2,225,000 | | $ | — | | $ | 9,250,000 | |
| Average annual interest rate and fees | | | 0.66 | % | | 0.65 | % | | — | % | | 0.21 | % | | — | % | | 0.31 | % |
TOB Trusts are supported by a liquidity facility provided by a Liquidity Provider pursuant to which the Liquidity Provider agrees, in the event that Floaters are (a) tendered to the Trustee for remarketing and the remarketing does not occur, or (b) subject to mandatory tender pursuant to the terms of the TOB Trust agreement, to either purchase Floaters or to provide the Trustee with an advance from a loan facility to fund the purchase of Floaters by the TOB Trust. In certain circumstances, the Liquidity Provider may otherwise elect to have the Trustee sell the Underlying Bond to retire the Floaters that were tendered and not remarketed prior to providing such a loan. In these circumstances, the Liquidity Provider remains obligated to provide a loan to the extent that the proceeds of the sale of the Underlying Bond is not sufficient to pay the purchase price of the Floaters.
The size of the commitment under the loan facility for a given TOB Trust is at least equal to the balance of that TOB Trust's outstanding Floaters plus any accrued interest. In consideration of the loan facility, fee schedules are in place and are charged by the Liquidity Provider(s). Any loans made by the Liquidity Provider will be secured by the purchased Floaters held by the TOB Trust. Interest paid on any outstanding loan balances will be effectively borne by the Fund that owns the Inverse Floaters of the TOB Trust that has incurred the borrowing and may be at a rate that is greater than the rate that would have been paid had the Floaters been successfully remarketed.
As described above, any amounts outstanding under a liquidity facility are recognized as a component of "Floating rate obligations" on the Statement of Assets and Liabilities by the Fund holding the corresponding Inverse Floaters issued by the borrowing TOB Trust. As of the end of the reporting period, there were no loans outstanding under any such facility.
Each Fund may also enter into shortfall and forbearance agreements (sometimes referred to as a "recourse arrangement" or "credit recovery swap") (TOB Trusts involving such agreements are referred to herein as "Recourse Trusts"), under which a Fund agrees to reimburse the Liquidity Provider for the Trust's Floaters, in certain circumstances, for the amount (if any) by which the liquidation value of the Underlying Bond held by the TOB Trust may fall short of the sum of the liquidation value of the Floaters issued by the TOB Trust plus any amounts borrowed by the TOB Trust from the Liquidity Provider, plus any shortfalls in interest cash flows. Under these agreements, a Fund's potential exposure to losses related to or on an Inverse Floater may increase beyond the value of the Inverse Floater as a Fund may potentially be liable to fulfill all amounts owed to holders of the Floaters or the Liquidity Provider. Any such shortfall amount in the aggregate is recognized as "Unrealized depreciation on Recourse Trusts" on the Statement of Assets and Liabilities.
Notes to Financial Statements (Unaudited) (continued)
As of the end of the reporting period, each Fund's maximum exposure to the Floaters issued by Recourse Trusts for self-deposited Inverse Floaters and externally-deposited Inverse Floaters was as follows:
| | | | | | | | | | | | | | | | North | | | | |
| | | | Georgia | | | Maryland | | | Minnesota | | | Missouri | | | Carolina | | | Virginia | |
| | | | Dividend | | | Premium | | | Municipal | | | Premium | | | Premium | | | Premium | |
| | | Advantage 2 | | | Income | | | Income | | | Income | | | Income | | | Income | |
| Floating Rate Obligations – Recourse Trusts | | (NKG | ) | | (NMY | ) | | (NMS | ) | | (NOM | ) | | (NNC | ) | | (NPV | ) |
| Maximum exposure to Recourse Trusts: self-deposted Inverse Floaters | | $ | — | | $ | 10,735,000 | | $ | — | | $ | — | | $ | — | | $ | — | |
| Maximum exposure to Recourse Trusts: externally-deposited Inverse Floaters | | | — | | | — | | | — | | | — | | | — | | | 13,330,000 | |
| Total | | $ | — | | $ | 10,735,000 | | $ | — | | $ | — | | $ | — | | $ | 13,330,000 | |
Zero Coupon Securities
A zero coupon security does not pay a regular interest coupon to its holders during the life of the security. Income to the holder of the security comes from accretion of the difference between the original purchase price of the security at issuance and the par value of the security at maturity and is effectively paid at maturity. The market prices of zero coupon securities generally are more volatile than the market prices of securities that pay interest periodically.
Investments in Derivatives
In addition to the inverse floating rate securities in which each Fund may invest, which are considered portfolio securities for financial reporting purposes, each Fund is authorized to invest in certain derivative investments, such as futures, options and swap contracts. Each Fund limits its investments in futures, options on futures and swap contracts to the extent necessary for the Adviser to claim exclusion from registration by the Commodity Futures Trading Commission as a commodity pool operator with respect to the Fund. The Funds record derivative instruments at fair value, with changes in fair value recognized on the Statement of Operations, when applicable. Even though the Funds' investments in derivatives may represent economic hedges, they are not considered to be hedge transactions for financial reporting purposes.
Credit Default Swaps
A Fund may enter into a credit default swap contract to seek to maintain a total return on a particular investment or portion of its portfolio, or to take an active long or short position with respect to the likelihood of a particular issuer's default. Credit default swap contracts involve one party making a stream of payments to another party in exchange for the right to receive a specified return if/when there is a credit event by a third party. Generally, a credit event means bankruptcy, failure to pay, or restructuring. The specific credit events applicable for each credit default swap are stated in the terms of the particular swap agreement. Upon occurrence of a specific credit event with respect to the underlying referenced entity, the Fund will either (i) receive that security, or an equivalent amount of cash, from the counterparty in exchange for payment of the notional amount to the counterparty, or (ii) pay a net settlement amount of the credit default swap contract less the recovery value of the referenced obligation or underlying securities comprising the referenced index. The difference between the value of the security delivered and the notional amount received is recorded as a realized gain or loss. Payments received or made at the beginning of the measurement period are recognized as a component of "Credit default swaps premiums paid and/or received" on the Statement of Assets and Liabilities, when applicable.
Credit default swap contracts are valued daily. Changes in the value of a credit default swap during the fiscal period are recognized as a component of "Change in net unrealized appreciation (depreciation) of swaps" and realized gains and losses are recognized as a component of "Net realized gain (loss) from swaps" on the Statement of Operations.
For over-the-counter swaps, the daily change in the market value of the swap contract, along with any daily interest fees accrued, are recognized as components of "Unrealized appreciation or depreciation on credit default swaps (, net)" on the Statement of Assets and Liabilities.
Investments in swaps cleared through an exchange obligate a Fund and the clearing broker to settle monies on a daily basis representing changes in the prior days "mark-to-market" of the swap. If a Fund has unrealized appreciation the clearing broker would credit the Fund's account with an amount equal to the appreciation and conversely if a Fund has unrealized depreciation the clearing broker would debit a Fund's account with an amount equal to the depreciation. These daily cash settlements are also known as "variation margin." Variation margin is recognized as a receivable and/or payable for "Variation margin on swap contracts" on the Statement of Assets and Liabilities. The maximum potential amount of future payments the Fund could incur as a seller of protection in a credit default swap contract is limited to the notional amount of the contract. The maximum potential amount would be offset by the recovery value, if any, of the respective referenced entity. In certain instances, a Fund is obligated to deposit cash or eligible securities, also known as "initial margin," into an account at its clearing broker equal to a specified percentage of the contract amount. Cash held by the broker to cover initial margin requirements on open swap contracts, if any, is recognized as "Cash collateral at brokers" on the Statement of Assets and Liabilities.
During the current fiscal period, Georgia Dividend Advantage 2 (NKG) and North Carolina Premium Income (NNC) invested in credit default swaps to manage credit risk by purchasing credit protection. These swap contracts were terminated before the end of the reporting period.
The average notional amount of credit default swap contracts outstanding during the current fiscal period was as follows:
| | | | | | | North | |
| | | | Georgia | | | Carolina | |
| | | | Dividend | | | Premium | |
| | | Advantage 2 | | | Income | |
| | | | (NKG | ) | | (NNC | ) |
| Average notional amount of credit default swap contracts outstanding* | | $ | 303,333 | | $ | 523,333 | |
| * | The average notional amount is calculated based on the outstanding notional at the beginning of the fiscal period and at the end of each fiscal quarter within the current fiscal period. |
The following table presents the amount of net realized gain (loss) and change in net unrealized appreciation (depreciation) recognized on swap contracts on the Statement of Operations during the current fiscal period and the primary underlying risk exposure.
| | | | | | | | | | | | | Change in Net | |
| | | | | | | | | | | | | Unrealized | |
| | | | | | | | | | Net Realized | | | Appreciation | |
| | | | Underlying | | | Derivative | | | Gain (Loss) from | | | (Depreciation) of | |
| Fund | | | Risk Exposure | | | Instrument | | | Swaps | | | Swaps | |
| Georgia Dividend Advantage 2 (NKG) | | | Credit | | | Swaps | | $ | 30,033 | | $ | (25,771 | ) |
| North Carolina Premium Income (NNC) | | | Credit | | | Swaps | | | 50,670 | | | (43,394 | ) |
Market and Counterparty Credit Risk
In the normal course of business each Fund may invest in financial instruments and enter into financial transactions where risk of potential loss exists due to changes in the market (market risk) or failure of the other party to the transaction to perform (counterparty credit risk). The potential loss could exceed the value of the financial assets recorded on the financial statements. Financial assets, which potentially expose each Fund to counterparty credit risk, consist principally of cash due from counterparties on forward, option and swap transactions, when applicable. The extent of each Fund's exposure to counterparty credit risk in respect to these financial assets approximates their carrying value as recorded on the Statement of Assets and Liabilities.
Each Fund helps manage counterparty credit risk by entering into agreements only with counterparties the Adviser believes have the financial resources to honor their obligations and by having the Adviser monitor the financial stability of the counterparties. Additionally, counterparties may be required to pledge collateral daily (based on the daily valuation of the financial asset) on behalf of each Fund with a value approximately equal to the amount of any unrealized gain above a pre-determined threshold. Reciprocally, when each Fund has an unrealized loss, the Funds have instructed the custodian to pledge assets of the Funds as collateral with a value approximately equal to the amount of the unrealized loss above a pre-determined threshold. Collateral pledges are monitored and subsequently adjusted if and when the valuations fluctuate, either up or down, by at least the pre-determined threshold amount.
4. Fund Shares
Common Shares
Common Share Transactions
Transactions in common shares during the Funds' current and prior fiscal period were as follows:
| | | | Georgia Dividend
Advantage 2 (NKG) | | | Maryland Premium
Income (NMY) | | | Minnesota Municipal
Income (NMS) | |
| | | | | | | | | | | | | | | | | | | Eleven | | | | |
| | | | Six Months | | | Year | | | Six Months | | | Year | | | Six Months | | | Months | | | Ten Months | |
| | | | Ended | | | Ended | | | Ended | | | Ended | | | Ended | | | Ended | | | Ended | |
| | | | 11/30/15 | | | 5/31/15 | | | 11/30/15 | | | 5/31/15 | | | 11/30/15 | | | 5/31/15 | | | 6/30/14 | |
| Common shares: | | | | | | | | | | | | | | | | | | | | | | |
| Shares sold | | | — | | | — | | | — | | | — | | | — | | | 2 | | | — | |
| Issued in the mergers | | | — | | | — | | | — | | | — | | | — | | | 1,424,061 | | | — | |
| Repurchased and retired | | | — | | | — | | | (215,900 | ) | | (504,100 | ) | | — | | | — | | | — | |
| | | | | | | | | | | | | | | | | | | | | | | |
| Weighted average common share: | | | | | | | | | | | | | | | | | | | | | | |
| Price per share repurchased and retired | | | — | | | — | | $ | 12.33 | | $ | 12.58 | | | — | | �� | — | | | — | |
| Discount per share repurchased and retired | | | — | | | — | | | 15.22 | % | | 13.98 | % | | — | | | — | | | — | |
Notes to Financial Statements (Unaudited) (continued)
| | | | Missouri Premium
Income (NOM) | | | North Carolina
Premium Income (NNC) | | | Virginia Premium
Income (NPV) | |
| | | | Six Months | | | Year | | | Six Months | | | Year | | | Six Months | | | Year | |
| | | | Ended | | | Ended | | | Ended | | | Ended | | | Ended | | | Ended | |
| | | | 11/30/15 | | | 5/31/15 | | | 11/30/15 | | | 5/31/15 | | | 11/30/15 | | | 5/31/15 | |
| Common shares: | | | | | | | | | | | | | | | | | | | |
| Issued to shareholders due to reinvestment of distributions | | | 1,939 | | | 3,566 | | | — | | | — | | | — | | | — | |
| Repurchased and retired | | | — | | | — | | | (22,500 | ) | | (107,500 | ) | | — | | | — | |
| | | | | | | | | | | | | | | | | | | | |
| Weighted average common share: | | | | | | | | | | | | | | | | | | | |
| Price per share repurchased and retired | | | — | | | — | | $ | 12.75 | | $ | 13.02 | | | — | | | — | |
| Discount per share repurchased and retired | | | — | | | — | | | 15.01 | % | | 13.79 | % | | — | | | — | |
Preferred Shares
Variable Rate MuniFund Term Preferred Shares
The following Funds have issued and outstanding Variable Rate MuniFund Term Preferred ("VMTP") Shares, with a $100,000 liquidation value per share. VMTP Shares are issued via private placement and are not publically available.
As of the end of the reporting period, VMTP Shares outstanding, at liquidation value, for each Fund was as follows:
| | | | | | | | | | Shares | |
| | | | | | | | | | Outstanding at | |
| | | | | | | | | | $100,000 | |
| | | | | | | Shares | | | Per Share | |
| Fund | | | Series | | | Outstanding | | | Liquidation Value | |
| Georgia Dividend Advantage 2 (NKG) | | | 2017 | | | 750 | | $ | 75,000,000 | |
| Maryland Premium Income (NMY) | | | 2017 | | | 1,670 | | $ | 167,000,000 | |
| Minnesota Municipal Income (NMS) | | | 2017 | | | 441 | | $ | 44,100,000 | |
| Missouri Premium Income (NOM) | | | 2018 | | | 180 | | $ | 18,000,000 | |
| North Carolina Premium Income (NNC) | | | 2017 | | | 1,250 | | $ | 125,000,000 | |
Each Fund is obligated to redeem its VMTP Shares by the date as specified in its offering document ("Term Redemption Date"), unless earlier redeemed or repurchased by the Fund. VMTP Shares are subject to optional and mandatory redemption in certain circumstances. The VMTP Shares are subject to redemption at the option of each Fund ("Optional Redemption Date"), subject to payment of premium for one year following the date of issuance ("Premium Expiration Date"), and at par thereafter. Each Fund may be obligated to redeem certain of the VMTP Shares if the Fund fails to maintain certain asset coverage and leverage ratio requirements and such failures are not cured by the applicable cure date. The redemption price per share is equal to the sum of the liquidation value per share plus any accumulated but unpaid dividends. The Term Redemption Date, Optional Redemption Date and Premium Expiration Date for each Fund's series of VMTP Shares are as follows:
| | | | | | | Term | | | Optional | | | Premium | |
| Fund | | | Series | | | Redemption Date | | | Redemption Date | | | Expiration Date | |
| Georgia Dividend Advantage 2 (NKG) | | | 2017 | | | June 1, 2017 | | | June 1, 2015 | | | May 31, 2015 | |
| Maryland Premium Income (NMY) | | | 2017 | | | June 1, 2017 | | | June 1, 2015 | | | May 31, 2015 | |
| Minnesota Municipal Income (NMS) | | | 2017 | | | May 1, 2017 | | | May 1, 2015 | | | April 30, 2015 | |
| Missouri Premium Income (NOM) | | | 2018 | | | March 1, 2018 | | | February 1, 2016 | | | January 31, 2016 | |
| North Carolina Premium Income (NNC) | | | 2017 | | | March 1, 2017 | | | March 1, 2015 | | | April 30, 2015 | |
The average liquidation value of VMTP Shares outstanding and annualized dividend rate for each Fund during the current fiscal period were as follows:
| | | | | | | | | | | | | | | | North | |
| | | | Georgia | | | Maryland | | | Minnesota | | | Missouri | | | Carolina | |
| | | | Dividend | | | Premium | | | Municipal | | | Premium | | | Premium | |
| | | Advantage 2 | | | Income | | | Income | | | Income | | | Income | |
| | | | (NKG | ) | | (NMY | ) | | (NMS | ) | | (NOM | ) | | (NNC | ) |
| Average liquidation value of VMTP Shares outstanding | | $ | 75,000,000 | | $ | 167,000,000 | | $ | 44,100,000 | | $ | 18,000,000 | | $ | 125,000,000 | |
| Annualized dividend rate | | | 0.96 | % | | 0.98 | % | | 0.98 | % | | 0.93 | % | | 0.98 | % |
VMTP Shares generally do not trade, and market quotations are generally not available. VMTP Shares are short-term or short/intermediate-term instruments that pay a variable dividend rate tied to a short-term index, plus an additional fixed "spread" amount established at the time of issuance. The fair value of VMTP Shares is expected to be approximately their liquidation par value so long as the fixed "spread" on the VMTP Shares remains roughly in line with the "spread" rates being demanded by investors on instruments having similar terms in the current market environment. In present market conditions, the Funds' Adviser has determined that the fair value of VMTP Shares is their liquidation value, but their fair value could vary if market conditions change materially. For financial reporting purposes, the liquidation value of VMTP Shares is a liability and is recognized as "Variable Rate MuniFund Term Preferred ("VMTP") Shares, at liquidation value" on the Statement of Assets and Liabilities.
Dividends on the VMTP Shares (which are treated as interest payments for financial reporting purposes) are set weekly. Unpaid dividends on VMTP Shares are recognized as a component of "Interest payable" on the Statement of Assets and Liabilities, when applicable. Dividends accrued on VMTP Shares are recognized as a component of "Interest expense and amortization of offering costs" on the Statement of Operations.
Costs incurred in connection with each Fund's offering of VMTP Shares were recorded as a deferred charges, which are amortized over the life of the shares and are recognized as components of "Deferred offering costs" on the Statement of Assets and Liabilities and "Interest expense and amortization of offering costs" on the Statement of Operations.
Variable Rate Demand Preferred Shares
Virginia Premium Income (NPV) has issued and outstanding Variable Rate Demand Preferred ("VRDP") Shares, with a $100,000 liquidation value per share. VRDP Shares are issued via private placement and are not publicly available.
As of the end of the reporting period, details of the Fund's VRDP Shares outstanding were as follows:
| | | | | | | | | | Shares | | | | |
| | | | | | | | | | Outstanding at | | | | |
| | | | | | | Shares | | | $100,000 Per Share | | | | |
| Fund | | | Series | | | Outstanding | | | Liquidation Value | | | Maturity | |
| Virginia Premium Income (NPV) | | | 1 | | | 1,280 | | $ | 128,000,000 | | | August 3, 2043 | |
VRDP Shares include a liquidity feature that allows VRDP shareholders to have their shares purchased by a liquidity provider with whom the Fund has contracted in the event that purchase orders for VRDP Shares in a remarketing are not sufficient in number to be matched with the sale orders in that remarketing. The Fund is required to redeem any VRDP Shares that are still owned by the liquidity provider after six months of continuous, unsuccessful remarketing. The Fund pays an annual remarketing fee of 0.10% on the aggregate principal amount of all VRDP Shares outstanding. The Fund's VRDP Shares have successfully remarketed since issuance.
Dividends on the VRDP Shares (which are treated as interest payments for financial reporting purposes) are set weekly at a rate established by a remarketing agent; therefore, the market value of the VRDP Shares is expected to approximate its liquidation value. If remarketings for VRDP Shares are continuously unsuccessful for six months, the maximum rate is designed to escalate according to a specified schedule in order to enhance the remarketing agent's ability to successfully remarket the VRDP Shares.
Subject to certain conditions, VRDP Shares may be redeemed, in whole or in part, at any time at the option of the Fund. The Fund may also redeem certain of the VRDP Shares if the Fund fails to maintain certain asset coverage requirements and such failures are not cured by the applicable cure date. The redemption price per share is equal to the sum of the liquidation value per share plus any accumulated but unpaid dividends.
The average liquidation value of VRDP Shares outstanding and annualized dividend rate for the Fund during the current fiscal period were as follows:
| | | | Virginia | |
| | | | Premium | |
| | | | Income | |
| | | | (NPV | ) |
| Average liquidation value of VRDP Shares outstanding | | $ | 128,000,000 | |
| Annualized dividend rate | | | 0.12 | % |
Notes to Financial Statements (Unaudited) (continued)
For financial reporting purposes, the liquidation value of VRDP Shares is a liability and is recognized as "Variable Rate Demand Preferred ("VRDP") Shares, at liquidation value" on the Statement of Assets and Liabilities. Unpaid dividends on VRDP Shares are recognized as a component of "Interest payable" on the Statement of Assets and Liabilities, when applicable. Dividends accrued on VRDP Shares are recognized as a component of "Interest expense and amortization of offering costs" on the Statement of Operations. Costs incurred by the Fund in connection with its offerings of VRDP Shares were recorded as a deferred charge, which are amortized over the life of the shares and are recognized as a component of "Deferred offering costs" on the Statement of Assets and Liabilities and "Interest expense and amortization of offering costs" on the Statement of Operations. In addition to interest expense, the Fund also pays a per annum liquidity fee to the liquidity provider, as well as a remarketing fee, which are recognized as "Liquidity fees" and "Remarketing fees," respectively, on the Statement of Operations.
Preferred Share Transactions
Transactions in preferred shares for the Funds during the Funds' current and prior fiscal period, where applicable, are noted in the following tables.
Transactions in MTP Shares for the Funds, where applicable, were as follows:
| | | | Year Ended May 31, 2015 | |
| | | | | | | NYSE MKT | | | | | | | |
| | | | Series | | | Ticker | | | Shares | | | Amount | |
| Missouri Premium Income (NOM) | | | | | | | | | | | | | |
| MTP Shares redeemed | | | 2015 | | | NOM PRC | | | (1,788,000 | ) | $ | (17,880,000 | ) |
Transactions in Remarketed Preferred Shares for the Funds, where applicable, were as follows:
| | | | Ten Months Ended
June 30, 2014 | |
| | | | Shares | | | Amount | |
| Minnesota Municipal Income (NMS) | | | | | | | |
| Remarketed Preferred Shares redeemed: | | | | | | | |
| Series M | | | (622 | ) | $ | (15,550,000 | ) |
| Series W | | | (622 | ) | | (15,550,000 | ) |
| Total | | | (1,244 | ) | $ | (31,100,000 | ) |
Transactions in VMTP Shares for the Funds, where applicable, were as follows:
| | | | Year Ended
May 31, 2015 | |
| | | | Series | | | Shares | | | Amount | |
| Missouri Premium Income (NOM) | | | | | | | | | | |
| VMTP Shares issued | | | 2018 | | | 180 | | $ | 18,000,000 | |
| | | | Eleven Months Ended
May 31, 2015 | |
| | | | Series | | | Shares | | | Amount | |
| Minnesota Municipal Income (NMS) | | | | | | | | | | |
| VMTP Shares resulting from the Mergers | | | 2017 | | | 130 | | $ | 13,000,000 | |
| | | | Ten Months Ended
June 30, 2014 | |
| | | | Series | | | Shares | | | Amount | |
| Minnesota Municipal Income (NMS) | | | | | | | | | | |
| VMTP Shares issued | | | 2017 | | | 311 | | $ | 31,100,000 | |
5. Investment Transactions
Long-term purchases and sales (including maturities but excluding derivative transactions, where applicable) during the current fiscal period were as follows:
| | | | | | | | | | | | | | | | North | | | | |
| | | | Georgia | | | Maryland | | | Minnesota | | | Missouri | | | Carolina | | | Virginia | |
| | | | Dividend | | | Premium | | | Municipal | | | Premium | | | Premium | | | Premium | |
| | | Advantage 2 | | | Income | | | Income | | | Income | | | Income | | | Income | |
| | | | (NKG | ) | | (NMY | ) | | (NMS | ) | | (NOM | ) | | (NNC | ) | | (NPV | ) |
| Purchases | | $ | 12,162,638 | | $ | 53,458,164 | | $ | 13,358,596 | | $ | 3,421,637 | | $ | 18,447,145 | | $ | 46,700,965 | |
| Sales and maturities | | | 11,354,468 | | | 52,196,008 | | | 17,396,221 | | | 902,249 | | | 16,243,776 | | | 42,264,713 | |
6. Income Tax Information
Each Fund is a separate taxpayer for federal income tax purposes. Each Fund intends to distribute substantially all of its net investment income and net capital gains to shareholders and to otherwise comply with the requirements of Subchapter M of the Internal Revenue Code applicable to regulated investment companies. Therefore, no federal income tax provision is required. Furthermore, each Fund intends to satisfy conditions that will enable interest from municipal securities, which is exempt from regular federal and designated state income taxes, to retain such tax-exempt status when distributed to shareholders of the Funds. Net realized capital gains and ordinary income distributions paid by the Funds are subject to federal taxation.
For all open tax years and all major taxing jurisdictions, management of the Funds has concluded that there are no significant uncertain tax positions that would require recognition in the financial statements. Open tax years are those that are open for examination by taxing authorities (i.e., generally the last four tax year ends and the interim tax period since then). Furthermore, management of the Funds is also not aware of any tax positions for which it is reasonably possible that the total amounts of unrecognized tax benefits will significantly change in the next twelve months.
The following information is presented on an income tax basis. Differences between amounts for financial statement and federal income tax purposes are primarily due to timing differences in recognizing taxable market discount, timing differences in recognizing certain gains and losses on investment transactions and the treatment of investments in inverse floating rate securities reflected as financing transactions, if any. To the extent that differences arise that are permanent in nature, such amounts are reclassified within the capital accounts as detailed below. Temporary differences do not require reclassification. Temporary and permanent differences do not impact the NAVs of the Funds.
As of November 30, 2015, the cost and unrealized appreciation (depreciation) of investments (excluding investments in derivatives, where applicable), as determined on a federal income tax basis, were as follows:
| | | | | | | | | | | | | | | | North | | | | |
| | | | Georgia | | | Maryland | | | Minnesota | | | Missouri | | | Carolina | | | Virginia | |
| | | | Dividend | | | Premium | | | Municipal | | | Premium | | | Premium | | | Premium | |
| | | Advantage 2 | | | Income | | | Income | | | Income | | | Income | | | Income | |
| | | | (NKG | ) | | (NMY | ) | | (NMS | ) | | (NOM | ) | | (NNC | ) | | (NPV | ) |
| Cost of investments | | $ | 207,100,355 | | $ | 480,540,625 | | $ | 119,298,555 | | $ | 47,848,855 | | $ | 344,091,161 | | $ | 361,722,612 | |
| Gross unrealized: | | | | | | | | | | | | | | | | | | | |
| Appreciation | | $ | 12,973,502 | | $ | 26,306,805 | | $ | 9,170,910 | | $ | 3,567,287 | | $ | 24,673,264 | | $ | 26,400,732 | |
| Depreciation | | | (100,152 | ) | | (5,148,346 | ) | | (133,786 | ) | | (223,483 | ) | | (222,650 | ) | | (5,229,010 | ) |
| Net unrealized appreciation (depreciation) of investments | | $ | 12,873,350 | | $ | 21,158,459 | | $ | 9,037,124 | | $ | 3,343,804 | | $ | 24,450,614 | | $ | 21,171,722 | |
Permanent differences, primarily due to federal taxes paid, nondeductible offering costs, reorganization adjustments, paydowns, treatment of notional principal contracts, and nondeductible reorganization expenses resulted in reclassifications among the Funds' components of common share net assets as of the periods indicated below, as follows:
| | | | | | | | | | | | | | | | North | | | | |
| | | | Georgia | | | Maryland | | | Minnesota | | | Missouri | | | Carolina | | | Virginia | |
| | | | Dividend | | | Premium | | | Municipal | | | Premium | | | Premium | | | Premium | |
| | | Advantage 2 | | | Income | | | Income | | | Income | | | Income | | | Income | |
| Year ended May 31, 2015 | | | (NKG | ) | | (NMY | ) | | (NMS | ) | | (NOM | ) | | (NNC | ) | | (NPV | ) |
| Paid-in-surplus | | $ | (52,657 | ) | $ | (58,711 | ) | $ | 462,593 | | $ | (153,236 | ) | $ | 30,311 | | $ | (64,217 | ) |
| Undistributed (Over-distribution of) net investment income | | | (43,337 | ) | | (493,293 | ) | | 72,980 | | | 153,235 | | | (110,196 | ) | | 24,317 | |
| Accumulated net realized gain (loss) | | | 95,994 | | | 552,004 | | | (535,573 | ) | | 1 | | | 79,885 | | | 39,900 | |
| | | | Minnesota | |
| | | | Municipal | |
| | | | Income | |
| Ten Months ended June 30, 2014 | | | (NMS | ) |
| Paid-in-surplus | | $ | — | |
| Undistributed (Over-distribution of) net investment income | | | — | |
| Accumulated net realized gain (loss) | | | — | |
Notes to Financial Statements (Unaudited) (continued)
The tax components of undistributed net tax-exempt income, net ordinary income and net long-term capital gains as of the periods indicated below, were as follows:
| | | | | | | | | | | | | | | | North | | | | |
| | | | Georgia | | | Maryland | | | Minnesota | | | Missouri | | | Carolina | | | Virginia | |
| | | | Dividend | | | Premium | | | Municipal | | | Premium | | | Premium | | | Premium | |
| | | Advantage 2 | | | Income | | | Income | | | Income | | | Income | | | Income | |
| Year ended May 31, 2015 | | | (NKG | ) | | (NMY | ) | | (NMS | ) | | (NOM | ) | | (NNC | ) | | (NPV | ) |
Undistributed net tax-exempt income1 | | $ | 439,396 | | $ | 2,093,232 | | $ | 633,333 | | $ | 214,786 | | $ | 389,376 | | $ | 1,442,203 | |
Undistributed net ordinary income2 | | | 26,676 | | | 48,150 | | | — | | | — | | | 109,712 | | | 25,260 | |
| Undistributed net long-term capital gains | | | — | | | — | | | 50,567 | | | — | | | 28,374 | | | — | |
| | | | Minnesota | |
| | | | Municipal | |
| | | | Income | |
| Ten Months ended June 30, 2014 | | | (NMS | ) |
| Undistributed net tax-exempt income | | $ | 458,133 | |
Undistributed net ordinary income2 | | | 3,029 | |
| Undistributed net long-term capital gains | | | — | |
| 1 | Undistributed net tax-exempt income (on a tax basis) has not been reduced for the dividend declared on May 1, 2015, paid on June 2, 2015. |
| 2 | Net ordinary income consists of taxable market discount income and net short-term capital gains, if any. |
The tax character of distributions paid during the periods indicated below, was designated for purposes of the dividends paid deduction as follows:
| | | | | | | | | | | | | | | | North | | | | |
| | | | Georgia | | | Maryland | | | Minnesota | | | Missouri | | | Carolina | | | Virginia | |
| | | | Dividend | | | Premium | | | Municipal | | | Premium | | | Premium | | | Premium | |
| | | Advantage 2 | | | Income | | | Income | | | Income | | | Income | | | Income | |
| Year ended May 31, 2015 | | | (NKG | ) | | (NMY | ) | | (NMS | ) | | (NOM | ) | | (NNC | ) | | (NPV | ) |
| Distributions from net tax-exempt income | | $ | 7,462,118 | | $ | 17,450,455 | | $ | 3,963,984 | | $ | 2,038,437 | | $ | 11,317,326 | | $ | 13,595,233 | |
Distributions from net ordinary income2 | | | 6,329 | | | 59,243 | | | 9,225 | | | 77 | | | — | | | 3,587 | |
| Distributions from net long-term capital gains | | | — | | | — | | | — | | | — | | | 466,996 | | | — | |
| | | | Minnesota | |
| | | | Municipal | |
| | | | Income | |
| Ten Months ended June 30, 2014 | | | (NMS | ) |
| Distributions from net tax-exempt income | | $ | 3,146,563 | |
Distributions from net ordinary income2 | | | 24,601 | |
| Distributions from net long-term capital gains | | | — | |
| 2 | Net ordinary income consists of taxable market discount income and net short-term capital gains, if any. |
As of the periods indicated below, the following Funds had unused capital loss carryforwards available for federal income tax purposes to be applied against future capital gains, if any. If not applied, the carryforwards will expire as shown in the following table. The losses not subject to expiration will be utilized first by a Fund.
| | | | Georgia | | | Maryland | | | Minnesota | | | Missouri | | | Virginia | |
| | | | Dividend | | | Premium | | | Municipal | | | Premium | | | Premium | |
| | | Advantage 2 | | | Income | | | Income | | | Income | | | Income | |
| May 31, 2015 | | | (NKG | ) | | (NMY | )3 | | (NMS | )3 | | (NOM | ) | | (NPV | ) |
| Expiration: | | | | | | | | | | | | | | | | |
| May 31, 2016 | | $ | 462,549 | | $ | 851,610 | | $ | — | | $ | — | | $ | — | |
| May 31, 2017 | | | 1,635,823 | | | 172,377 | | | 452,405 | | | 77,824 | | | — | |
| May 31, 2018 | | | 1,329,548 | | | — | | | — | | | 91,539 | | | — | |
| May 31, 2019 | | | 48,370 | | | — | | | — | | | — | | | — | |
| Not subject to expiration | | | 1,958,045 | | | 6,731,052 | | | 744,636 | | | 1,265,377 | | | 12,792,560 | |
| Total | | $ | 5,434,335 | | $ | 7,755,039 | | $ | 1,197,041 | | $ | 1,434,740 | | $ | 12,792,560 | |
| 3 | A portion of Maryland Premium Income's (NMY) and Minnesota Municipal Income's (NMS) capital loss carryforward is subject to limitation under the Internal Revenue Code and related regulations. |
| | | | Minnesota | |
| | | | Municipal | |
| | | | Income | |
| June 30, 2014 | | | (NMS | ) |
| Expiration: | | | | |
| June 30, 2018 | | $ | 452,405 | |
| Not subject to expiration | | | 516,691 | |
| Total | | $ | 969,096 | |
During the Funds' last tax year ended May 31, 2015, the following Funds utilized capital loss carryforwards as follows:
| | | | Maryland | | | Minnesota | |
| | | | Premium | | | Municipal | |
| | | | Income | | | Income | |
| | | | (NMY | ) | | (NMS | ) |
| Utilized capital loss carryforwards | | $ | 59,797 | | $ | 404,539 | |
The Funds have elected to defer late-year losses in accordance with federal income tax rules. These losses are treated as having arisen on the first day of the current fiscal year. The following Fund has elected to defer losses as follows:
| | | | North | |
| | | | Carolina | |
| | | | Premium | |
| | | | Income | |
| | | | (NNC | ) |
Post-October capital losses4 | | $ | 339,518 | |
Late-year ordinary losses5 | | | — | |
| 4 | Capital losses incurred from November 1, 2014 through May 31, 2015, the Funds' last tax year end. |
| 5 | Ordinary losses incurred from January 1, 2015 through May 31, 2015 and specified losses incurred from November 1, 2014 through May 31, 2015. |
7. Management Fees and Other Transactions with Affiliates
Each Fund's management fee compensates the Adviser for overall investment advisory and administrative services and general office facilities. The Sub-Adviser is compensated for its services to the Funds from the management fees paid to the Adviser.
Each Fund's management fee consists of two components – a fund-level fee, based only on the amount of assets within the Fund, and a complex-level fee, based on the aggregate amount of all eligible fund assets managed by the Adviser. This pricing structure enables Fund shareholders to benefit from growth in the assets within their respective Fund as well as from growth in the amount of complex-wide assets managed by the Adviser.
The annual Fund-level fee, payable monthly, for each Fund is calculated according to the following schedules:
| | | | Georgia Dividend Advantage 2 (NKG) |
| Average Daily Managed Assets* | | | Fund-Level Fee |
| For the first $125 million | | | 0.4500 | % |
| For the next $125 million | | | 0.4375 | |
| For the next $250 million | | | 0.4250 | |
| For the next $500 million | | | 0.4125 | |
| For the next $1 billion | | | 0.4000 | |
| For managed assets over $2 billion | | | 0.3750 | |
| | | | Minnesota Municipal Income (NMS) |
| Average Daily Managed Assets* | | | Fund-Level Fee |
| For the first $125 million | | | 0.4500 | % |
| For the next $125 million | | | 0.4375 | |
| For the next $250 million | | | 0.4250 | |
| For the next $500 million | | | 0.4125 | |
| For managed assets over $1 billion | | | 0.4000 | |
Notes to Financial Statements (Unaudited) (continued)
| | Maryland Premium Income (NMY) |
| | Missouri Premium Income (NOM) |
| | North Carolina Premium Income (NNC) |
| | Virginia Premium Income (NPV) |
| Average Daily Managed Assets* | Fund-Level Fee |
| For the first $125 million | 0.4500 | % |
| For the next $125 million | 0.4375 | |
| For the next $250 million | 0.4250 | |
| For the next $500 million | 0.4125 | |
| For the next $1 billion | 0.4000 | |
| For the next $3 billion | 0.3875 | |
| For managed assets over $5 billion | 0.3750 | |
The annual complex-level fee, payable monthly, for each Fund is calculated according to the following schedule:
| Complex-Level Managed Asset Breakpoint Level* | Effective Rate at Breakpoint Level |
| $55 billion | 0.2000 | % |
| $56 billion | 0.1996 | |
| $57 billion | 0.1989 | |
| $60 billion | 0.1961 | |
| $63 billion | 0.1931 | |
| $66 billion | 0.1900 | |
| $71 billion | 0.1851 | |
| $76 billion | 0.1806 | |
| $80 billion | 0.1773 | |
| $91 billion | 0.1691 | |
| $125 billion | 0.1599 | |
| $200 billion | 0.1505 | |
| $250 billion | 0.1469 | |
| $300 billion | 0.1445 | |
| * | For the fund-level and complex-level fees, managed assets include closed-end fund assets managed by the Adviser that are attributable to certain types of leverage. For these purposes, leverage includes the funds' use of preferred stock and borrowings and certain investments in the residual interest certificates (also called inverse floating rate securities) in tender option bond (TOB) trusts, including the portion of assets held by a TOB trust that has been effectively financed by the trust's issuance of floating rate securities, subject to an agreement by the Adviser as to certain funds to limit the amount of such assets for determining managed assets in certain circumstances. The complex-level fee is calculated based upon the aggregate daily managed assets of all Nuveen Funds that constitute "eligible assets." Eligible assets do not include assets attributable to investments in other Nuveen Funds or assets in excess of $2 billion added to the Nuveen fund complex in connection with the Adviser's assumption of the management of the former First American Funds effective January 1, 2011. As of November 30, 2015, the complex-level fee for each Fund was 0.1639%. |
The Funds pay no compensation directly to those of its trustees who are affiliated with the Adviser or to its officers, all of whom receive remuneration for their services to the Funds from the Adviser or its affiliates. The Board has adopted a deferred compensation plan for independent trustees that enables trustees to elect to defer receipt of all or a portion of the annual compensation they are entitled to receive from certain Nuveen-advised funds. Under the plan, deferred amounts are treated as though equal dollar amounts had been invested in shares of select Nuveen-advised funds.
8. Borrowing Arrangements
During the current fiscal period, the Funds, along with certain other funds managed by the Adviser ("Participating Funds"), established a 364-day, $2.53 billion standby credit facility with a group of lenders, under which the Participating Funds may borrow for various purposes other than leveraging for investment purposes. A large portion of this facility's capacity (and its associated costs as described below) is currently dedicated for use by a small number of Participating Funds, which does not include any of the Funds covered by this shareholder report. The remaining capacity under the facility (and the corresponding portion of the facility's annual costs) is separately dedicated to most of the other open-end funds in the Nuveen fund family, along with a number of Nuveen closed-end funds, including all of the Funds covered by this shareholder report. The credit facility expires in July 2016 unless extended or renewed.
The credit facility has the following terms: a fee of 0.15% per annum on unused commitment amounts, and interest at a rate equal to the higher of (a) one-month LIBOR (London Inter-Bank Offered Rate) plus 1.25% per annum or (b) the Fed Funds rate plus 1.25% per annum on amounts borrowed. Participating Funds paid administration, legal and arrangement fees, which are recognized as a component of "Other expenses" on the Statement of Operations, and along with commitment fees, have been allocated among such Participating Funds based upon the relative proportions of the facility's aggregate capacity reserved for them and other factors deemed relevant by the Adviser and the Board of each Participating Fund.
During the current fiscal period, none of the Funds utilized this facility.
Additional Fund Information
| Board of Trustees | | | | | | | | | | |
| William Adams IV* | | Jack B. Evans | | William C. Hunter | | David J. Kundert | | John K. Nelson | | William J. Schneider |
| Thomas S. Schreier, Jr.* | | Judith M. Stockdale | | Carole E. Stone | | Virginia L. Stringer** | | Terence J. Toth | | |
| * | Interested Board Member. |
| ** | Retired from the Funds' Board of Directors/Trustees effective December 31, 2015. |
| | |
| Fund Manager | | Custodian | | Legal Counsel | | Independent Registered | | Transfer Agent and |
| Nuveen Fund Advisors, LLC | | State Street Bank | | Chapman and Cutler LLP | | Public Accounting Firm | | Shareholder Services |
| 333 West Wacker Drive | | & Trust Company | | Chicago, IL 60603 | | KPMG LLP | | State Street Bank |
| Chicago, IL 60606 | | Boston, MA 02111 | | | | Chicago, IL 60601 | | & Trust Company |
| | | | | | | | | Nuveen Funds |
| | | | | | | | | P.O. Box 43071 |
| | | | | | | | | Providence, RI 02940-3071 |
| | | | | | | | | (800) 257-8787 |
Quarterly Form N-Q Portfolio of Investments Information
Each Fund is required to file its complete schedule of portfolio holdings with the Securities and Exchange Commission (SEC) for the first and third quarters of each fiscal year on Form N-Q. You may obtain this information directly from the SEC. Visit the SEC on-line at http://www.sec.gov or in person at the SEC's Public Reference Room in Washington, D.C. Call the SEC toll-free at (800) SEC-0330 for room hours and operation.Nuveen Funds' Proxy Voting Information
You may obtain (i) information regarding how each fund voted proxies relating to portfolio securities held during the most recent twelve-month period ended June 30, without charge, upon request, by calling Nuveen Investments toll-free at (800) 257-8787 or on Nuveen's website at www.nuveen.com and (ii) a description of the policies and procedures that each fund used to determine how to vote proxies relating to portfolio securities without charge, upon request, by calling Nuveen Investments toll free at (800) 257-8787. You may also obtain this information directly from the SEC. Visit the SEC on-line at http://www.sec.gov.
CEO Certification Disclosure
Each Fund's Chief Executive Officer (CEO) has submitted to the New York Stock Exchange (NYSE) the annual CEO certification as required by Section 303A.12(a) of the NYSE Listed Company Manual. Each Fund has filed with the SEC the certification of its CEO and Chief Financial Officer required by Section 302 of the Sarbanes-Oxley Act.
Common Share Repurchases
Each Fund intends to repurchase, through its open-market share repurchase program, shares of its own common stock at such times and in such amounts as is deemed advisable. During the period covered by this report, each Fund repurchased shares of its common stock, as shown in the accompanying table. Any future repurchases will be reported to shareholders in the next annual or semi-annual report.
| | | | NKG | | | NMY | | | NMS | | | NOM | | | NNC | | | NPV | |
| Common shares repurchased | | | — | | | 215,900 | | | — | | | — | | | 22,500 | | | — | |
FINRA BrokerCheck
The Financial Industry Regulatory Authority (FINRA) provides information regarding the disciplinary history of FINRA member firms and associated investment professionals. This information as well as an investor brochure describing FINRA BrokerCheck is available to the public by calling the FINRA BrokerCheck Hotline number at (800) 289-9999 or by visiting www.FINRA.org.
Glossary of Terms Used in this Report
| ■ | Auction Rate Bond: An auction rate bond is a security whose interest payments are adjusted periodically through an auction process, which process typically also serves as a means for buying and selling the bond. Auctions that fail to attract enough buyers for all the shares offered for sale are deemed to have "failed," with current holders receiving a formula-based interest rate until the next scheduled auction. |
| | |
| ■ | Average Annual Total Return: This is a commonly used method to express an investment's performance over a particular, usually multi-year time period. It expresses the return that would have been necessary each year to equal the investment's actual cumulative performance (including change in NAV or market price and reinvested dividends and capital gains distributions, if any) over the time period being considered. |
| | |
| ■ | Duration: Duration is a measure of the expected period over which a bond's principal and interest will be paid, and consequently is a measure of the sensitivity of a bond's or bond fund's value to changes when market interest rates change. Generally, the longer a bond's or fund's duration, the more the price of the bond or fund will change as interest rates change. |
| | |
| ■ | Effective Leverage: Effective leverage is a fund's effective economic leverage, and includes both regulatory leverage (see leverage) and the leverage effects of certain derivative investments in the fund's portfolio. Currently, the leverage effects of Tender Option Bond (TOB) inverse floater holdings are included in effective leverage values, in addition to any regulatory leverage. |
| | |
| ■ | Escrowed to Maturity Bond: When proceeds of a refunding issue are deposited in an escrow account for investment in an amount sufficient to pay the principal and interest on the issue being refunded. In some cases, though, an issuer may expressly reserve its right to exercise an early call of bonds that have been escrowed to maturity. |
| | |
| ■ | Inverse Floating Rate Securities: Inverse floating rate securities, also known as inverse floaters or tender option bonds (TOBs), are created by depositing a municipal bond, typically with a fixed interest rate, into a special purpose trust. This trust, in turn, (a) issues floating rate certificates typically paying short-term tax-exempt interest rates to third parties in amounts equal to some fraction of the deposited bond's par amount or market value, and (b) issues an inverse floating rate certificate (sometimes referred to as an "inverse floater") to an investor (such as a Fund) interested in gaining investment exposure to a long-term municipal bond. The income received by the holder of the inverse floater varies inversely with the short term rate paid to the floating rate certificates' holders, and in most circumstances the holder of the inverse floater bears substantially all of the underlying bond's downside investment risk. The holder of the inverse floater typically also benefits disproportionately from any potential appreciation of the underlying bond's value. Hence, an inverse floater essentially represents an investment in the underlying bond on a leveraged basis. |
| | |
| ■ | Leverage: Leverage is created whenever a fund has investment exposure (both reward and/or risk) equivalent to more than 100% of the investment capital. |
| | |
| ■ | Lipper Other States Municipal Debt Funds Classification Average: Calculated using the returns of all closed-end funds in this category. Lipper returns account for the effects of management fees and assume reinvestment of distributions, but do not reflect any applicable sales charges. |
| | |
| ■ | Net Asset Value (NAV) Per Share: A fund's Net Assets is equal to its total assets (securities, cash, accrued earnings and receivables) less its total liabilities. NAV per share is equal to the fund's Net Assets divided by its number of shares outstanding. |
| | |
| ■ | Pre-Refunding: Pre-Refunding, also known as advanced refundings or refinancings, is a procedure used by state and local governments to refinance municipal bonds to lower interest expenses. The issuer sells new bonds with a lower yield and uses the proceeds to buy U.S. Treasury securities, the interest from which is used to make payments on the higher-yielding bonds. Because of this collateral, pre-refunding generally raises a bond's credit rating and thus its value. |
| ■ | Regulatory Leverage: Regulatory Leverage consists of preferred shares issued by or borrowings of a fund. Both of these are part of a fund's capital structure. Regulatory leverage is subject to asset coverage limits set in the Investment Company Act of 1940. |
| | |
| ■ | S&P Municipal Bond Georgia Index: An unleveraged, market value-weighted index designed to measure the performance of the tax-exempt, investment-grade Georgia municipal bond market. Index returns assume reinvestment of distributions, but do not reflect any applicable sales charges or management fees. |
| | |
| ■ | S&P Municipal Bond Index: An unleveraged, market value-weighted index designed to measure the performance of the tax-exempt, investment-grade U.S. municipal bond market. Index returns assume reinvestment of distributions, but do not reflect any applicable sales charges or management fees. |
| | |
| ■ | S&P Municipal Bond Maryland Index: An unleveraged, market value-weighted index designed to measure the performance of the tax-exempt, investment-grade Maryland municipal bond market. Index returns assume reinvestment of distributions, but do not reflect any applicable sales charges or management fees. |
| | |
| ■ | S&P Municipal Bond Minnesota Index: An unleveraged, market value-weighted index designed to measure the performance of the tax-exempt, investment-grade Minnesota municipal bond market. Index returns assume reinvestment of distributions, but do not reflect any applicable sales charges or management fees. |
| | |
| ■ | S&P Municipal Bond Missouri Index: An unleveraged, market value-weighted index designed to measure the performance of the tax-exempt, investment-grade Missouri municipal bond market. Index returns assume reinvestment of distributions, but do not reflect any applicable sales charges or management fees. |
| | |
| ■ | S&P Municipal Bond North Carolina Index: An unleveraged, market value-weighted index designed to measure the performance of the tax-exempt, investment-grade North Carolina municipal bond market. Index returns assume reinvestment of distributions, but do not reflect any applicable sales charges or management fees. |
| | |
| ■ | S&P Municipal Bond Virginia Index: An unleveraged, market value-weighted index designed to measure the performance of the tax-exempt, investment-grade Virginia municipal bond market. Index returns assume reinvestment of distributions, but do not reflect any applicable sales charges or management fees. |
| | |
| ■ | Total Investment Exposure: Total investment exposure is a fund's assets managed by the Adviser that are attributable to financial leverage. For these purposes, financial leverage includes a fund's use of preferred stock and borrowings and investments in the residual interest certificates (also called inverse floating rate securities) in tender option bond (TOB) trusts, including the portion of assets held by a TOB trust that has been effectively financed by the trust's issuance of floating rate securities. |
| | |
| ■ | Zero Coupon Bond: A zero coupon bond does not pay a regular interest coupon to its holders during the life of the bond. Income to the holder of the bond comes from accretion of the difference between the original purchase price of the bond at issuance and the par value of the bond at maturity and is effectively paid at maturity. The market prices of zero coupon bonds generally are more volatile than the market prices of bonds that pay interest periodically. |
Reinvest Automatically, Easily and Conveniently
Nuveen makes reinvesting easy. A phone call is all it takes to set up your reinvestment account.
Nuveen Closed-End Funds Automatic Reinvestment PlanNuveen Closed-End Fund allows you to conveniently reinvest distributions in additional Fund shares. By choosing to reinvest, you'll be able to invest money regularly and automatically, and watch your investment grow through the power of compounding. Just like distributions in cash, there may be times when income or capital gains taxes may be payable on distributions that are reinvested. It is important to note that an automatic reinvestment plan does not ensure a profit, nor does it protect you against loss in a declining market.
Easy and convenient
To make recordkeeping easy and convenient, each month you'll receive a statement showing your total distributions, the date of investment, the shares acquired and the price per share, and the total number of shares you own.
How shares are purchased
The shares you acquire by reinvesting will either be purchased on the open market or newly issued by the Fund. If the shares are trading at or above net asset value at the time of valuation, the Fund will issue new shares at the greater of the net asset value or 95% of the then-current market price. If the shares are trading at less than net as -set value, shares for your account will be purchased on the open market. If the Plan Agent begins purchasing Fund shares on the open market while shares are trading below net asset value, but the Fund's shares subsequently trade at or above their net asset value before the Plan Agent is able to complete its purchases, the Plan Agent may cease open-market purchases and may invest the uninvested portion of the distribution in newly-issued Fund shares at a price equal to the greater of the shares' net asset value or 95% of the shares' market value on the last business day imme -diately prior to the purchase date. Distributions received to purchase shares in the open market will normally be invested shortly after the distribution payment date. No interest will be paid on distributions awaiting reinvestment. Because the market price of the shares may increase before purchases are completed, the average purchase price per share may exceed the market price at the time of valuation, resulting in the acquisition of fewer shares than if the distribution had been paid in shares issued by the Fund. A pro rata portion of any applicable brokerage commissions on open market purchases will be paid by Plan participants. These commissions usually will be lower than those charged on individual transactions.
Flexible
You may change your distribution option or withdraw from the Plan at any time, should your needs or situation change. You can reinvest whether your shares are registered in your name, or in the name of a brokerage firm, bank, or other nominee. Ask your investment advisor if his or her firm will participate on your behalf. Participants whose shares are registered in the name of one firm may not be able to transfer the shares to another firm and continue to participate in the Plan. The Fund reserves the right to amend or terminate the Plan at any time. Although the Fund reserves the right to amend the Plan to include a service charge payable by the participants, there is no direct service charge to participants in the Plan at this time.
Call today to start reinvesting distributions
For more information on the Nuveen Automatic Reinvestment Plan or to enroll in or withdraw from the Plan, speak with your financial advisor or call us at (800) 257-8787.
Notes
Nuveen Investments: |
| Serving Investors for Generations |
Since 1898, financial advisors and their clients have relied on Nuveen Investments to provide dependable investment solutions through continued adherence to proven, long-term investing principles. Today, we offer a range of high quality equity and fixed-income solutions designed to be integral components of a well-diversified core portfolio.
Focused on meeting investor needs.Nuveen Investments provides high-quality investment services designed to help secure the long-term goals of institutional and individual investors as well as the consultants and financial advisors who serve them. Nuveen Investments markets a wide range of specialized investment solutions which provide investors access to capabilities of its high-quality boutique investment affiliates—Nuveen Asset Management, Symphony Asset Management, NWQ Investment Management Company, Santa Barbara Asset Management, Tradewinds Global Investors, Winslow Capital Management and Gresham Investment Management. In total, Nuveen Investments managed approximately $225 billion as of December 31, 2015.
Find out how we can help you.To learn more about how the products and services of Nuveen Investments may be able to help you meet your financial goals, talk to your financial advisor, or call us at (800) 257-8787. Please read the information provided carefully before you invest. Investors should consider the investment objective and policies, risk considerations, charges and expenses of any investment carefully. Where applicable, be sure to obtain a prospectus, which contains this and other relevant information. To obtain a prospectus, please contact your securities representative or Nuveen Investments, 333 W. Wacker Dr., Chicago, IL 60606. Please read the prospectus carefully before you invest or send money.
Learn more about Nuveen Funds at: www.nuveen.com/cef
Distributed by Nuveen Investments, LLC | 333 West Wacker Drive | Chicago, IL 60606 | www.nuveen.com | |
ESA-A-1115D 13130-INV-B-01/17
ITEM 2. CODE OF ETHICS.