UNITED STATES
SECURITIES AND EXCHANGE COMMISSION
Washington, D.C. 20549
FORM N-CSR
CERTIFIED SHAREHOLDER REPORT OF REGISTERED
MANAGEMENT INVESTMENT COMPANIES
| | |
Investment Company Act file number | | 811-22971 |
Nuveen NASDAQ 100 Dynamic Overwrite Fund
(Exact name of registrant as specified in charter)
Nuveen Investments
333 West Wacker Drive
Chicago, IL 60606
(Address of principal executive offices) (Zip code)
Mark L. Winget
Nuveen Investments
333 West Wacker Drive
Chicago, IL 60606
(Name and address of agent for service)
Registrant’s telephone number, including area code: (312) 917-7700
Date of fiscal year end: December 31
Date of reporting period: December 31, 2021
Form N-CSR is to be used by management investment companies to file reports with the Commission not later than 10 days after the transmission to stockholders of any report that is required to be transmitted to stockholders under Rule 30e-1 under the Investment Company Act of 1940 (17 CFR 270.30e-1). The Commission may use the information provided on Form N-CSR in its regulatory, disclosure review, inspection, and policymaking roles.
A registrant is required to disclose the information specified by Form N-CSR, and the Commission will make this information public. A registrant is not required to respond to the collection of information contained in Form N-CSR unless the Form displays a currently valid Office of Management and Budget (“OMB”) control number. Please direct comments concerning the accuracy of the information collection burden estimate and any suggestions for reducing the burden to Secretary, Securities and Exchange Commission, 450 Fifth Street, NW, Washington, DC 20549-0609. The OMB has reviewed this collection of information under the clearance requirements of 44 U.S.C. ss. 3507.
ITEM 1. REPORTS TO STOCKHOLDERS.

Closed-End Funds
31 December
2021
Nuveen
Closed-End Funds
| | |
| BXMX | | Nuveen S&P 500 Buy-Write Income Fund |
| DIAX | | Nuveen Dow 30SM Dynamic Overwrite Fund |
| SPXX | | Nuveen S&P 500 Dynamic Overwrite Fund |
| QQQX | | Nuveen Nasdaq 100 Dynamic Overwrite Fund |
| JCE | | Nuveen Core Equity Alpha Fund |
As permitted by regulations adopted by the Securities and Exchange Commission, paper copies of the Funds’ annual and semi-annual shareholder reports will not be sent to you by mail unless you specifically request paper copies of the reports. Instead, the reports will be made available on the Funds’ website (www.nuveen.com), and you will be notified by mail each time a report is posted and provided with a website link to access the report.
You may elect to receive shareholder reports and other communications from the Funds electronically at any time by contacting the financial intermediary (such as a broker-dealer or bank) through which you hold your Fund shares or, if you are a direct investor, by enrolling at www.nuveen.com/e-reports.
You may elect to receive all future shareholder reports in paper free of charge at any time by contacting your financial intermediary or, if you are a direct investor, by calling 800-257-8787 and selecting option #2 or (ii) by logging into your Investor Center account at www.computershare.com/investor and clicking on “Communication Preferences”. Your election to receive reports in paper will apply to all funds held in your account with your financial intermediary or, if you are a direct investor, to all your directly held Nuveen Funds and any other directly held funds within the same group of related investment companies.
Annual Report
IMPORTANT DISTRIBUTION NOTICE
for Shareholders of the Nuveen S&P 500 Buy-Write Income Fund (BXMX) Nuveen Dow 30SM Dynamic Overwrite Fund (DIAX)
Nuveen S&P 500 Dynamic Overwrite Fund (SPXX)
Nuveen Nasdaq 100 Dynamic Overwrite Fund (QQQX)
Nuveen Core Equity Alpha Fund (JCE)
Annual Shareholder Report for the period ending December 31, 2021
The Nuveen S&P 500 Buy-Write Income Fund (BXMX), Nuveen Dow 30SM Dynamic Overwrite Fund (DIAX), Nuveen S&P 500 Dynamic Overwrite Fund (SPXX), Nuveen Nasdaq 100 Dynamic Overwrite Fund (QQQX) and Nuveen Core Equity Alpha Fund (JCE) seek to offer attractive cash flow to their shareholders, by converting the expected long-term total return potential of the Funds’ portfolio of investments into regular quarterly distributions. Following is a discussion of the Managed Distribution Policy the Funds use to achieve this.
Each Fund pays quarterly common share distributions that seek to convert the Fund’s expected long-term total return potential into regular cash flow. As a result, the Funds’ regular common share distributions (presently $0.2150, $0.2730, $0.2450, $0.4485 and $0.3040 per share, respectively) may be derived from a variety of sources, including:
| | • | | net investment income consisting of regular interest and dividends, |
| | • | | realized capital gains or, |
| | • | | possibly, returns of capital representing in certain cases unrealized capital appreciation. |
Such distributions are sometimes referred to as “managed distributions.” Each Fund seeks to establish a distribution rate that roughly corresponds to the Adviser’s projections of the total return that could reasonably be expected to be generated by each Fund over an extended period of time. The Adviser may consider many factors when making such projections, including, but not limited to, long-term historical returns for the asset classes in which each Fund invests. As portfolio and market conditions change, the distribution amount and distribution rate on the Common Shares under the Funds’ Managed Distribution Policy could change.
When it pays a distribution, each Fund provides holders of its Common Shares a notice of the estimated sources of the Fund’s distributions (i.e., what percentage of the distributions is estimated to constitute ordinary income, short-term capital gains, long-term capital gains, and/or a non-taxable return of capital) on a year-to-date basis. It does this by posting the notice on its website (www.nuveen.com/cef), and by sending it in written form.
You should not draw any conclusions about the Funds’ investment performance from the amount of this distribution or from the terms of the Funds’ Managed Distribution Policy. The Funds’ actual financial performance will likely vary from month-to-month and from year-to-year, and there may be extended periods when the distribution rate will exceed the Funds’ actual total returns. The Managed Distribution Policy provides that the Board may amend or terminate the Policy at any time without prior notice to Fund shareholders. There are presently no reasonably foreseeable circumstances that might cause each Fund to terminate its Managed Distribution Policy.
Table of Contents
3
Chair’s Letter to Shareholders

Dear Shareholders,
We have seen a nearly full recovery in the economy and began to approach more normalcy in our daily lives, enabled by unprecedented help from governments and central banks and the development of effective COVID-19 vaccines and therapies.
As crisis-related monetary and fiscal supports are phasing out, global economic growth is expected to moderate from post-pandemic peak growth toward a more sustainable pace of expansion. In the U.S., the rapid rebound in the economy has pushed consumer prices higher, and ongoing supply chain disruptions have kept the inflation rate elevated for longer than expected. With the economy and employment on strong footing, the Federal Reserve is ending its pandemic bond buying program and will begin raising short-term interest rates in 2022 to help keep inflation in check. The Fed now faces the challenge of counteracting inflation pressures without stifling economic growth, which the markets will be watching closely. On the fiscal side, government spending will be lower from here, but the U.S. will begin funding projects with the $1.2 trillion Infrastructure Investment and Jobs Act enacted on November 15, 2021, and Europe, Japan and China are also expected to roll out fiscal support in 2022.
Inflation levels, the timing of monetary policy normalization and the global economy’s response to tighter financial conditions will be a key focus in the markets. We anticipate periodic volatility as markets digest incoming data on these impacts, as well as COVID-19 headlines, as there is still uncertainty about the course of the pandemic. Short-term market fluctuations can provide your Fund opportunities to invest in new ideas as well as upgrade existing positioning while providing long-term value for shareholders. For more than 120 years, the careful consideration of risk and reward has guided Nuveen’s focus on delivering long-term results to our shareholders.
To learn more about how your portfolio can take advantage of new opportunities arising from the normalizing global economy, we encourage you to review your time horizon, risk tolerance and investment goals with your financial professional.
On behalf of the other members of the Nuveen Fund Board, I look forward to continuing to earn your trust in the months and years ahead.
Sincerely,

Terence J. Toth
Chair of the Board
February 22, 2022
4
Portfolio Managers’ Comments
Nuveen S&P 500 Buy-Write Income Fund (BXMX)
Nuveen Dow 30SM Dynamic Overwrite Fund (DIAX)
Nuveen S&P 500 Dynamic Overwrite Fund (SPXX)
Nuveen Nasdaq 100 Dynamic Overwrite Fund (QQQX)
Nuveen Core Equity Alpha Fund (JCE)
The Nuveen S&P 500 Buy-Write Income Fund (BXMX) features portfolio management by Gateway Investment Advisers, LLC (Gateway). The Fund’s portfolio managers are Kenneth H. Toft, Michael T. Buckius and Daniel M. Ashcraft. Nuveen Dow 30SM Dynamic Overwrite Fund (DIAX), Nuveen S&P 500 Dynamic Overwrite Fund (SPXX) and Nuveen Nasdaq 100 Dynamic Overwrite Fund (QQQX) feature portfolio management by Nuveen Asset Management, LLC (NAM), an affiliate of Nuveen Fund Advisors, LLC, the Funds’ investment adviser. The Funds’ portfolio managers are David A. Friar, James Campagna, CFA, Lei Liao, CFA and Darren Tran, CFA. The Nuveen Core Equity Alpha Fund (JCE) features portfolio management by Nuveen Asset Management, LLC (NAM), an affiliate of Nuveen Fund Advisors, LLC, the Fund’s investment adviser. The Fund’s portfolio managers are David A. Friar, Max A. Kozlov, CFA, and Pei Chen.
Here the Funds’ portfolio management teams review U.S. economic and financial market conditions, key investment strategies and the performance of the Funds for the twelve-month reporting period ended December 31, 2021. For more information on the Funds’ investment objectives and policies, please refer to the Shareholder Update section at the end of the report.
What factors affected the U.S. economy and financial markets during the twelve-month reporting period ended December 31, 2021?
The U.S. economic recovery remained on course over the twelve-month reporting period, despite setbacks from the COVID-19 virus and higher-than-expected inflation readings. Since the pandemic reached the U.S. in early 2020, the federal government has enacted $5.3 trillion in crisis-related aid and the U.S. Federal Reserve (Fed) has kept borrowing rates low for businesses and individuals and kept the credit system stable. These measures, along with increasing vaccinations and improved treatments, helped the economy to reopen and activity to rebound during 2021, despite additional COVID-19 surges caused by new, more contagious variants. U.S. gross domestic product (GDP) rose at an annualized 6.9% in the fourth quarter of 2021, accelerating from 2.3% in the third quarter when the delta variant
This material is not intended to be a recommendation or investment advice, does not constitute a solicitation to buy, sell or hold a security or an investment strategy and is not provided in a fiduciary capacity. The information provided does not take into account the specific objectives or circumstances of any particular investor, or suggest any specific course of action. Investment decisions should be made based on an investor’s objectives and circumstances and in consultation with his or her advisors.
Certain statements in this report are forward-looking statements. Discussions of specific investments are for illustration only and are not intended as recommendations of individual investments. The forward-looking statements and other views expressed herein are those of the portfolio managers as of the date of this report. Actual future results or occurrences may differ significantly from those anticipated in any forward-looking statements and the views expressed herein are subject to change at any time, due to numerous market and other factors. The Fund disclaims any obligation to update publicly or revise any forward-looking statements or views expressed herein.
For financial reporting purposes, the ratings disclosed are the highest rating given by one of the following national rating agencies: Standard & Poor’s (S&P), Moody’s Investors Service, Inc. (Moody’s) or Fitch, Inc. (Fitch). This treatment of split-rated securities may differ from that used for other purposes, such as for Fund investment policies. Credit ratings are subject to change. AAA, AA, A and BBB are investment grade ratings; BB, B, CCC, CC, C and D are below investment grade ratings. Holdings designated N/R are not rated by these national rating agencies. Refer to the Glossary of Terms Used in this Report for further definition of the terms used within this section.
Refer to the Glossary of Terms Used in this Report for further definition of the terms used within this section.
5
Portfolio Managers’ Comments (continued)
weighed on economic activity, according to the Bureau of Economic Analysis “advance” estimate. Also according to the “advance” estimate, in 2021 overall, GDP grew 5.7%, rebounding from the contraction of -3.4% in 2020.
The return of consumer demand to the economy put upward pressure on inflation in 2021. However, as supply chains remained under stress and labor shortages continued, in part because of resurgences of the virus around the world, inflation appeared to be more durable than initially expected. The Fed responded by reducing its pandemic-era support programs and signaled that rate increases were likely in 2022. Financial markets grew more concerned about the timing and size of these monetary policy shifts and their implications for the broader economic outlook, which led to short-term volatility in interest rates and stock prices. However, strong corporate earnings and a lessening economic impact from each subsequent wave of the virus supported a more optimistic view that ultimately drove stock prices and interest rates higher over 2021.
The reporting period marked the third consecutive year of double-digit returns for the S&P 500® Index. Additionally, returns were positive in each quarter of 2021, though the September 2021 equity market pullback brought that streak to the brink. The equity market’s fourth quarter of 2021 was the strongest of all, but not the smoothest as inflation and monetary policy concerns drove a short, but intense bout of volatility mid-quarter. The downtrend in implied volatility that began after the Chicago Board Options Exchange (Cboe) Volatility Index (the VIX®) peaked at record levels in March 2020, continued over the first half of the reporting period. The VIX® spent most of the reporting period ranging from the mid-teens to the low 20s while posting 21 days of closing values above 25, including six days when it closed above 30. The result was an average closing value of 19.7 for 2021, slightly above its long-term average of 19.5.
Nuveen S&P 500 Buy-Write Income Fund (BXMX)
What key strategies were used to manage the Fund during the twelve-month reporting period ended December 31, 2021?
BXMX (or the Fund) seeks attractive total return with less volatility than the S&P 500® Index by investing in an equity portfolio that seeks to substantially replicate the price movements of the S&P 500® Index and by selling index call options covering approximately 100% of the Fund’s equity portfolio value with a goal of enhancing the portfolio’s risk-adjusted returns.
The writing of index call options on a broad equity index, while investing in a portfolio of equities, has the potential to enhance BXMX’s risk-adjusted returns while exposing the Fund to less risk than unhedged equity investments. Hedging the equity portfolio with index call options may limit the Fund’s participation in market advances in exchange for the cash premium received for the written index call options. In addition, market declines are typically buffered by the amount of the cash premium received by the Fund. In flat or declining markets, BXMX’s call option premium can potentially enhance total return relative to the S&P 500® Index. In rising markets, the call options may reduce the Fund’s total return relative to the S&P 500® Index.
During the reporting period, the portfolio management team focused on the higher volatility priced into longer-dated call option contracts and persistently above-average spreads between the implied volatility priced into index options and actual, realized equity market volatility.
How did the Fund perform during the twelve-month reporting period ended December 31, 2021?
For the twelve-month reporting period ended December 31, 2021, BXMX underperformed the Chicago Board Options Exchange (Cboe) S&P 500® BuyWrite Index (BXMSM). For purposes of this Performance Commentary, references to relative performance are in comparison to the Chicago Board Options Exchange (Cboe) S&P 500® BuyWrite Index (BXMSM).
The main factor that contributed to the Fund’s underperformance was the equity portfolio’s return. Most of the equity portfolio’s underperformance occurred in the second half of the reporting period and was primarily driven by security selection in the information technology and real estate sectors. In particular, not owning Accenture PLC and real estate
6
investment trust Prologis, Inc. detracted from relative performance. Additional detractors in the equity portfolio during the reporting period included an underweight to Wells Fargo & Company and not owning Bank of America Corp in the financials sector. As part of the model-driven security selection process, which is designed to optimize the portfolio rather than hold all of the constituents of the S&P 500® Index, the investment team seeks to minimize tracking error while adhering to tax and concentration rules.
The Fund’s underperformance was partially offset by the Fund’s diversified and active index call option writing approach which generated risk mitigating cash flow throughout the reporting period, while delivering equity market participation during periods in which the equity market advanced as well as providing risk mitigation during market declines.
Nuveen Dow 30SM Dynamic Overwrite Fund (DIAX)
What key strategies were used to manage the Fund during the twelve-month reporting period ended December 31, 2021?
DIAX (or the Fund) seeks attractive total return with less volatility than the Dow Jones Industrial Average Index (DJIA) by investing in an equity portfolio that seeks to substantially replicate the price movements of the DJIA, as well as selling call options on 35% to 75% of the notional value of the Fund’s equity portfolio, with a long-term target of 55% overwrite in an effort to enhance the Fund’s risk-adjusted returns. The investment team uses its proprietary view of the market’s return and volatility profile to dynamically adjust the option overwrite percentage and other factors.
Generally, if the investment team expects the equity market to appreciate, the option overwrite percentage will be reduced to offer more potential upside capture. Likewise, if the investment team expects equity markets to be flat or to decline, the option overwrite percentage may be increased, thus managing the Fund to potentially receive additional cash flow from higher sales of call options. This dynamic option overwrite approach offers the potential for greater equity market upside capture than the full option overwrite approach, while still offering a measure of downside risk management. The Fund currently expects to carry out its principal investment strategy by emphasizing options on broad-based indexes, individual stocks in the DJIA, and options on custom baskets of stocks, in addition to exchange-traded funds (ETFs). The Fund also has the opportunity to utilize call spread strategies and sell put options on a portion of the underlying equity portfolio.
During the reporting period, the investment team varied the core option overwrite level between 35% and 75%. The average option overwrite level during the reporting period, which consisted primarily of calls written on the S&P 500® Index, was slightly below its long-term target. The investment team also sold puts on the S&P 500® Index, bought puts on the Chicago Board Options Exchange (Cboe) Volatility Index (the VIX®), wrote call options on the Russell 2000® Index and purchased single name stock options.
How did the Fund perform during the twelve-month reporting period ended December 31, 2021?
For the twelve-month reporting period ended December 31, 2021, the Fund underperformed the DIAX Blended Benchmark, which is a blended return consisting of 1) 55% Chicago Board Options Exchange (Cboe) DJIA BuyWrite Index (BXDSM) and 2) 45% Dow Jones Industrial Average Index (DJIA). For purposes of this Performance Commentary, references to relative performance are in comparison to the respective allocations in the DIAX Blended Benchmark.
The main factor that contributed to the Fund’s underperformance was the selling of call options on the S&P 500® Index. The BXDSM, which is a component of the DIAX Blended Benchmark, sells index call options on the Dow Jones Industrial Average Index (DJIA). Because of its investment policies, the Fund is precluded from selling index call options on the DJIA and instead, primarily sold call options on the S&P 500® Index. This combination detracted from the Fund’s relative performance because the S&P 500® Index significantly outperformed the DJIA for the reporting period.
The Fund’s underperformance was partially offset by the Fund’s option overwrite level which was less than that of the DIAX Blended Benchmark during the reporting period. The lower average option overwrite percentage contributed to
7
Portfolio Managers’ Comments (continued)
benchmark-relative performance as equity markets advanced during the reporting period. Although index call options were primarily written on the S&P 500® Index, the investment team also wrote call options on the Russell 2000® Index, which contributed to relative performance as the Index underperformed other general equity market indexes during the reporting period. In addition, the investment team sold puts on the S&P 500® Index and bought puts on the Chicago Board Options Exchange (Cboe) Volatility Index (the VIX®), which were additive to relative performance. Lastly, single name stock options added to performance, including JPMorgan Chase & Co. and salesforce.com, Inc.
Nuveen S&P 500 Dynamic Overwrite Fund (SPXX)
What key strategies were used to manage the Fund during the twelve-month reporting period ended December 31, 2021?
SPXX (or the Fund) seeks attractive total return with less volatility than the S&P 500® Index by investing in an equity portfolio that seeks to substantially replicate the price movements of the S&P 500® Index, as well as selling call options on 35% to 75% of the notional value of the Fund’s equity portfolio, with a long-run target of 55% overwrite in an effort to enhance the Fund’s risk-adjusted returns. The investment team uses its proprietary view of the market’s return and volatility profile to dynamically adjust the option overwrite percentage and other factors. The strategy will consider the Fund’s tax position and employ techniques to improve after-tax shareholder outcomes.
Generally, if the investment team expects the equity market to appreciate, the option overwrite percentage will be reduced to offer more potential upside capture. Likewise, if the investment team expects equity markets to be flat or to decline, the option overwrite percentage may be increased, thus managing the Fund to potentially receive additional cash flow from higher sales of call options. This dynamic option overwrite approach offers the potential for greater equity market upside capture than the full option overwrite approach, while still offering a measure of downside risk management. The Fund currently expects to emphasize index call options on the S&P 500® Index and can also employ an expanded range of options including index options on other broad-based indexes and options on custom baskets of stocks, in addition to single name options. The Fund also has the opportunity to utilize call spread strategies and sell put options on a portion of the underlying equity portfolio.
During the reporting period, the investment team varied the core option overwrite level between 35% and 75%. The average option overwrite level during the reporting period, which consisted primarily of calls written on the S&P 500® Index, was slightly below its long-term target. The investment team also sold puts on the S&P 500® Index, bought puts on the Chicago Board Options Exchange (Cboe) Volatility Index (the VIX®), wrote call options on the Russell 2000® Index and purchased single name stock options.
How did the Fund perform during the twelve-month reporting period ended December 31, 2021?
For the twelve-month reporting period ended December 31, 2021, the Fund underperformed the SPXX Blended Benchmark, which is a blended return consisting of 1) 55% Chicago Board Options Exchange (Cboe) S&P 500® BuyWrite Index (BXMSM) and 2) 45% S&P 500® Index. For the purposes of this Performance Commentary, references to relative performance are in comparison to the respective allocations in the SPXX Blended Benchmark.
The main factor that contributed to the Fund’s underperformance was the equity portfolio’s return. The underperformance of the equity portfolio was primarily driven by security selection in the information technology sector. In particular, not owning Applied Materials, Broadcom Inc. and Intuit Inc., along with offsetting overweights to other information technology stocks, detracted from relative performance. As part of the model-driven security selection process, which is designed to optimize the portfolio rather than hold all of the constituents of the S&P 500® Index, the investment team seeks to minimize tracking error while adhering to tax and concentration rules.
The equity portfolio’s underperformance was partially offset by positive relative performance from the Fund’s option overwrite level, which averaged less than that of the SPXX Blended Benchmark during the reporting period. The lower
8
average option overwrite percentage contributed to benchmark-relative performance as equity markets advanced during the reporting period. Although index call options were primarily written on the S&P 500® Index, the investment team also wrote call options on the Russell 2000® Index, which contributed to relative performance, as the Index underperformed other general equity market indexes during the reporting period. In addition, the investment team sold puts on the S&P 500® Index and bought puts on the Chicago Board Options Exchange (Cboe) Volatility Index (the VIX®), which were additive to relative performance. Lastly, single name stock options added to performance, including JPMorgan Chase & Co. and salesforce.com, Inc.
Nuveen Nasdaq 100 Dynamic Overwrite Fund (QQQX)
What key strategies were used to manage the Fund during the twelve-month reporting period ended December 31, 2021?
QQQX (or the Fund) seeks attractive total return with less volatility than the Nasdaq 100® Index by investing in an equity portfolio that seeks to substantially replicate the price movements of the Nasdaq 100® Index, as well as selling call options on 35% to 75% of the notional value of the Fund’s equity portfolio, with a long-run target of 55% in an effort to enhance the Fund’s risk-adjusted returns. The investment team uses its proprietary view of the market’s return and volatility profile to dynamically adjust the option overwrite percentage and other factors. The strategy will consider the Fund’s tax position and employ techniques to improve after-tax shareholder outcomes.
Generally, if the investment team expects the equity market to appreciate, the overwrite percentage will be reduced to offer more potential upside capture. Likewise, if the investment team expects equity markets to be flat or to decline, the overwrite percentage may be increased, thus managing the Fund to potentially receive additional cash flow from higher sales of call options. This dynamic option overwrite approach offers potential for greater equity market upside capture than the full overwrite approach, while still offering a measure of downside risk management. The Fund, in carrying out its principal options strategy, expects to primarily write index call options on the Nasdaq 100® Index and other broad-based indexes and can also write call options on a variety of other equity market indexes and options on custom baskets of stocks, in addition to single name options. The Fund also has the opportunity to utilize call spread strategies and sell put options on a portion of the underlying equity portfolio.
During the reporting period, the investment team varied the core option overwrite level between 35% and 75%. The average option overwrite during the reporting period, which consisted primarily of calls written on the Nasdaq 100® Index, was slightly below its long-term target. The investment team also sold puts on the S&P 500® Index and bought puts on the Chicago Board Options Exchange (Cboe) Volatility Index (the VIX®), wrote call options on the Russell 2000® Index and purchased single name stock options.
How did the Fund perform during the twelve-month reporting period ended December 31, 2021?
For the twelve-month reporting period ended December 31, 2021, the Fund outperformed the QQQX Blended Benchmark, which is a blended return consisting of 1) 55% Chicago Board Options Exchange (Cboe) Nasdaq 100 BuyWrite Index (BXNSM) and 2) 45% Nasdaq 100® Index. For the purposes of this Performance Commentary, references to relative performance are in comparison to the respective allocations in the QQQX Blended Benchmark.
One of the main factors that contributed to the Fund’s relative performance was the equity portfolio’s return which outperformed the Nasdaq 100® Index during the reporting period. The outperformance of the equity portfolio was primarily driven by security selection in the communication services sector. In particular, not owning T-Mobile US, Inc., Netflix, Inc. and Activision Blizzard, Inc., along with several offsetting overweights to other communication services stocks, contributed to relative performance. As part of the model-driven security selection process, which is designed to optimize the portfolio rather than hold all of the constituents of the Nasdaq 100® Index, the investment team seeks to minimize tracking error while adhering to tax and concentration rules.
9
Portfolio Managers’ Comments (continued)
The Fund’s lower average option overwrite percentage relative to the QQQX Blended Benchmark also contributed to benchmark-relative performance as equity markets advanced during the reporting period. Although index call options were primarily written on the Nasdaq 100® Index, the investment team also wrote call options on the Russell 2000® Index, which contributed to relative performance as the Index underperformed other general equity market indexes during the reporting period. In addition, the investment team sold puts on the S&P 500® Index and bought puts on the Chicago Board Options Exchange (Cboe) Volatility Index (the VIX®), which were additive to relative performance. Lastly, single name stock options added to performance, including Oracle Corporation and Dollar General Corporation.
Nuveen Core Equity Alpha Fund (JCE)
What key strategies were used to manage the Fund during the twelve-month reporting period ended December 31, 2021?
JCE (or the Fund) seeks to provide an attractive level of total return, primarily through long-term capital appreciation and secondarily through income and gains. The Fund invests in large capitalization common stocks, using a proprietary quantitative process designed to provide the potential for long-term outperformance. The Fund also sells call options with a notional value of up to 50% of the Fund’s equity portfolio in seeking to enhance risk-adjusted performance relative to an all equity portfolio. The investment team uses its proprietary view of the market’s return and volatility profile to dynamically adjust the option overwrite percentage and other factors.
How did the Fund perform during the twelve-month reporting period ended December 31, 2021?
For the twelve-month reporting period ended December 31, 2021, the Fund outperformed the JCE Blended Benchmark, which is a blend of returns consisting of 1) 50% S&P 500® Index and 2) 50% Chicago Board Options Exchange (Cboe) S&P 500® BuyWrite Index (BXMSM). For purposes of this Performance Commentary, references to relative performance are in comparison to the respective allocations in the JCE Blended Benchmark.
One of the main factors that contributed to the Fund’s relative performance was the equity portfolio’s return which outperformed the S&P 500® Index for the reporting period. Individual holdings that were held in the equity portfolio but not in the S&P 500® Index that contributed to relative performance included information technology holding Pure Storage Company and financials sector holding, Rocket Companies, Inc. In addition, an underweight to information technology holding, Pay Pal Holdings, Inc. contributed to performance. As part of the model-driven security selection process, which is designed to select constituents from the S&P 500® Index and the Russell 1000® Index, the investment team seeks to minimize tracking error while adhering to tax and concentration rules.
The Fund’s option overwrite strategy also contributed to relative performance. The option overwrite level varied during the reporting period and averaged less than that of the JCE Blended Benchmark. The lower average option overwrite percentage contributed to benchmark-relative performance as equity markets advanced during the reporting period. Although index call options were primarily written on the S&P 500® Index, the investment team also wrote call options on the Russell 2000® Index, which contributed to relative performance as the Index underperformed other general equity market indexes during the reporting period.
10
Common Share Information
DISTRIBUTION INFORMATION
The following 19(a) Notice presents the Funds’ most current distribution information as of November 30, 2021 as required by certain exempted regulatory relief the Funds have received.
Because the ultimate tax character of your distributions depends on the Funds’ performance for its entire fiscal year (which is the calendar year for the Funds) as well as certain fiscal year-end (FYE) tax adjustments, estimated distribution source information you receive with each distribution may differ from the tax information reported to you on your Funds’ IRS Form 1099 statement.
DISTRIBUTION INFORMATION – AS OF NOVEMBER 30, 2021
This notice provides shareholders with information regarding fund distributions, as required by current securities laws. You should not draw any conclusions about the Funds’ investment performance from the amount of this distribution or from the terms of the Funds’ Managed Distribution Policy.
Each Fund may in certain periods distribute more than its income and net realized capital gains, and BXMX, DIAX, SPXX and QQQX currently estimate that they have done so for the fiscal year-to-date period. In such instances, a portion of the distribution may be a return of capital. A return of capital may occur, for example, when some or all of the money that you invested in the Fund is paid back to you. A return of capital distribution does not necessarily reflect a Fund’s investment performance and should not be confused with “yield” or “income.”
The amounts and sources of distributions set forth below are only estimates and are not being provided for tax reporting purposes. The actual amounts and sources of the amounts for tax reporting purposes will depend upon the Funds’ investment experience during the remainder of its fiscal year and may be subject to changes based on tax regulations. Each Fund will send you a Form 1099-DIV for the calendar year that will tell you how to report these distributions for federal income tax purposes. More details about the Funds’ distributions and the basis for these estimates are available on www.nuveen.com/cef.
The following table provides estimates of the Funds’ distribution sources, reflecting year-to-date cumulative experience through the latest month-end. Each Fund attributes these estimates equally to each regular distribution throughout the year. Consequently, the estimated information shown below is for the current distribution, and also represents an updated estimate for all prior months in the year.
11
Common Share Information (continued)
Data as of November 30, 2021
| | | | | | | | | | | | | | | | | | | | | | | | | | | | | | | | | | | | | | |
| | | | | | | | Estimated Per Share Sources of Distribution1 | | | Estimated Percentage of the Distribution1 | |
| Fund | | Inception
Date | | Per Share
Distribution | | | Net
Investment
Income | | | Long-Term
Gains | | | Short-Term
Gains | | | Return of
Capital | | | Net
Investment
Income | | | Long-Term
Gains | | | Short-Term
Gains | | | Return of
Capital | |
BXMX (FYE 12/31) | | Oct-2004 | | | | | | | | | | | | | | | | | | | | | | | | | | | | | | | | | | | | |
Current Quarter | | | | $ | 0.2150 | | | $ | 0.0110 | | | $ | 0.1284 | | | $ | 0.0000 | | | $ | 0.0756 | | | | 5.10 | % | | | 59.70 | % | | | 0.00 | % | | | 35.20 | % |
Fiscal YTD | | | | $ | 0.8600 | | | $ | 0.0441 | | | $ | 0.5134 | | | $ | 0.0000 | | | $ | 0.3025 | | | | 5.10 | % | | | 59.70 | % | | | 0.00 | % | | | 35.20 | % |
DIAX (FYE 12/31) | | Apr-2005 | | | | | | | | | | | | | | | | | | | | | | | | | | | | | | | | | | | | |
Current Quarter | | | | $ | 0.2730 | | | $ | 0.0431 | | | $ | 0.0301 | | | $ | 0.0000 | | | $ | 0.1997 | | | | 15.80 | % | | | 11.00 | % | | | 0.00 | % | | | 73.20 | % |
Fiscal YTD | | | | $ | 1.0920 | | | $ | 0.1725 | | | $ | 0.1205 | | | $ | 0.0000 | | | $ | 0.7990 | | | | 15.80 | % | | | 11.00 | % | | | 0.00 | % | | | 73.20 | % |
SPXX (FYE 12/31) | | Nov-2005 | | | | | | | | | | | | | | | | | | | | | | | | | | | | | | | | | | | | |
Current Quarter | | | | $ | 0.2450 | | | $ | 0.0263 | | | $ | 0.0000 | | | $ | 0.0000 | | | $ | 0.2187 | | | | 10.80 | % | | | 0.00 | % | | | 0.00 | % | | | 89.20 | % |
Fiscal YTD | | | | $ | 0.9800 | | | $ | 0.1054 | | | $ | 0.0000 | | | $ | 0.0000 | | | $ | 0.8746 | | | | 10.80 | % | | | 0.00 | % | | | 0.00 | % | | | 89.20 | % |
QQQX (FYE 12/31) | | Jan-2007 | | | | | | | | | | | | | | | | | | | | | | | | | | | | | | | | | | | | |
Current Quarter | | | | $ | 0.4485 | | | $ | 0.0000 | | | $ | 0.0586 | | | $ | 0.0000 | | | $ | 0.3899 | | | | 0.00 | % | | | 13.10 | % | | | 0.00 | % | | | 86.90 | % |
Fiscal YTD | | | | $ | 1.7940 | | | $ | 0.0000 | | | $ | 0.2344 | | | $ | 0.0000 | | | $ | 1.5596 | | | | 0.00 | % | | | 13.10 | % | | | 0.00 | % | | | 86.90 | % |
JCE (FYE 12/31) | | Mar-2007 | | | | | | | | | | | | | | | | | | | | | | | | | | | | | | | | | | | | |
Current Quarter | | | | $ | 0.3040 | | | $ | 0.0000 | | | $ | 0.3040 | | | $ | 0.0000 | | | $ | 0.0000 | | | | 0.00 | % | | | 100.00 | % | | | 0.00 | % | | | 0.00 | % |
Fiscal YTD | | | | $ | 1.2160 | | | $ | 0.0000 | | | $ | 1.2160 | | | $ | 0.0000 | | | $ | 0.0000 | | | | 0.00 | % | | | 100.00 | % | | | 0.00 | % | | | 0.00 | % |
| 1 | Net investment income (NII) is a projection through the end of the current calendar quarter using actual data through the stated month-end date above. Capital gain amounts are as of the stated date above. The estimated per share sources above include an allocation of the NII based on prior year attributions which can be expected to differ from the actual final attributions for the current year. |
The following table provides information regarding the Funds’ distributions and total return performance over various time periods. This information is intended to help you better understand whether returns for the specified time periods were sufficient to meet distributions.
Data as of November 30, 2021
| | | | | | | | | | | | | | | | | | | | | | | | | | | | | | |
| | | | | | | | | | | | | | Annualized | | | Cumulative | |
| Fund | | Inception
Date | | Quarterly
Distribution | | | Fiscal YTD
Distribution | | | Net Asset
Value (NAV) | | | 5-Year
Return on NAV | | | Fiscal YTD
Dist Rate on NAV1 | | | Fiscal YTD
Return on NAV | | | Fiscal YTD
Dist Rate on NAV1 | |
BXMX | | Oct-2004 | | $ | 0.2150 | | | $ | 0.8600 | | | $ | 15.07 | | | | 9.19 | % | | | 5.71% | | | | 14.50 | % | | | 5.71% | |
DIAX | | Apr-2005 | | $ | 0.2730 | | | $ | 1.0920 | | | $ | 17.47 | | | | 8.11 | % | | | 6.25% | | | | 9.83 | % | | | 6.25% | |
SPXX | | Nov-2005 | | $ | 0.2450 | | | $ | 0.9800 | | | $ | 18.21 | | | | 10.85 | % | | | 5.38% | | | | 17.41 | % | | | 5.38% | |
QQQX | | Jan-2007 | | $ | 0.4485 | | | $ | 1.7940 | | | $ | 29.52 | | | | 15.90 | % | | | 6.08% | | | | 17.63 | % | | | 6.08% | |
JCE | | Mar-2007 | | $ | 0.3040 | | | $ | 1.2160 | | | $ | 16.86 | | | | 13.67 | % | | | 7.21% | | | | 21.34 | % | | | 7.21% | |
| 1 | As a percentage of 11/30/21 NAV. |
12
DISTRIBUTION INFORMATION – AS OF DECEMBER 31, 2021
The following tables provide information regarding the Funds’ common share distributions and total return performance for the fiscal year ended December 31, 2021. This information is intended to help you better understand whether the Funds’ returns for the specified time period were sufficient to meet its distributions.
Data as of December 31, 2021
| | | | | | | | | | | | | | | | | | | | | | | | | | | | | | | | | | | | |
| | | Per Share Sources of Distribution | | | Percentage of the Distribution | |
| Fund | | Per Share
Distribution | | | Net
Investment
Income | | | Long-Term
Gains | | | Short-Term
Gains | | | Return of
Capital1 | | | Net
Investment
Income | | | Long-Term
Gains | | | Short-Term
Gains | | | Return of
Capital1 | |
BXMX | | | | | | | | | | | | | | | | | | | | | | | | | | | | | | | | | | | | |
Fiscal YTD | | | $0.8600 | | | | $0.0763 | | | | $0.4070 | | | | $0.0000 | | | | $0.3767 | | | | 8.87% | | | | 47.33% | | | | 0.00% | | | | 43.80% | |
DIAX | | | | | | | | | | | | | | | | | | | | | | | | | | | | | | | | | | | | |
Fiscal YTD | | | $1.0920 | | | | $0.1703 | | | | $0.1649 | | | | $0.0000 | | | | $0.7568 | | | | 15.60% | | | | 15.10% | | | | 0.00% | | | | 69.30% | |
SPXX | | | | | | | | | | | | | | | | | | | | | | | | | | | | | | | | | | | | |
Fiscal YTD | | | $0.9800 | | | | $0.1056 | | | | $0.6005 | | | | $0.0000 | | | | $0.2739 | | | | 10.78% | | | | 61.27% | | | | 0.00% | | | | 27.95% | |
QQQX | | | | | | | | | | | | | | | | | | | | | | | | | | | | | | | | | | | | |
Fiscal YTD | | | $1.7940 | | | | $0.0000 | | | | $0.7809 | | | | $0.0000 | | | | $1.0131 | | | | 0.00% | | | | 43.53% | | | | 0.00% | | | | 56.47% | |
JCE | | | | | | | | | | | | | | | | | | | | | | | | | | | | | | | | | | | | |
Fiscal YTD | | | $1.8376 | | | | $0.0675 | | | | $1.5329 | | | | $0.2372 | | | | $0.0000 | | | | 3.67% | | | | 83.42% | | | | 12.91% | | | | 0.00% | |
Data as of December 31, 2021
| | | | | | | | | | | | | | | | | | |
| | | | | | | | Annualized | |
| Fund | | Inception
Date | | Net Asset
Value (NAV) | | | 1-Year
Return on NAV | | | 5-Year
Return on NAV | | | Fiscal YTD
Dist Rate on NAV | |
BXMX | | Oct-2004 | | $ | 15.29 | | | | 17.80 | % | | | 9.56 | % | | | 5.62 | % |
DIAX | | Apr-2005 | | $ | 18.09 | | | | 15.45 | % | | | 8.68 | % | | | 6.04 | % |
SPXX | | Nov-2005 | | $ | 18.70 | | | | 22.15 | % | | | 11.53 | % | | | 5.24 | % |
QQQX | | Jan-2007 | | $ | 29.63 | | | | 19.85 | % | | | 16.22 | % | | | 6.05 | % |
JCE | | Mar-2007 | | $ | 17.33 | | | | 26.91 | % | | | 14.57 | % | | | 10.60 | % |
| 1 | Return of Capital may represent unrealized gains, return of shareholder’s principal, or both. In certain circumstances, all or a portion of the return of capital may be characterized as ordinary income under federal tax law. The actual tax characterization will be provided to shareholders on Form 1099-DIV shortly after calendar year-end. |
NUVEEN CLOSED-END FUND DISTRIBUTION AMOUNTS
The Nuveen Closed-End Funds’ monthly and quarterly periodic distributions to shareholders are posted on www.nuveen.com and can be found on Nuveen’s enhanced closed-end fund resource page, which is at https://www.nuveen.com/resource-center-closed-end-funds, along with other Nuveen closed-end fund product updates. To ensure timely access to the latest information, shareholders may use a subscribe function, which can be activated at this web page (https://www.nuveen.com/subscriptions).
COMMON SHARE EQUITY SHELF PROGRAMS
During the current reporting period, SPXX and QQQX were authorized by the Securities and Exchange Commission to issue additional common shares through an equity shelf program (Shelf Offering). Under these programs, the Funds, subject to market conditions, may raise additional capital from time to time in varying amounts and offering methods at
13
Common Share Information (continued)
a net price at or above each Fund’s NAV per common share. The maximum aggregate offering under these Shelf Offerings are as shown in the accompanying table.
| | | | | | | | |
| | | SPXX | | | QQQX | |
Maximum aggregate offering | | | 4,993,317 | * | | | Unlimited | ** |
| * | Represents maximum aggregate offering for the period July 28, 2021 through December 31, 2021. |
| ** | Represents maximum aggregate offering for the period April 30, 2021 through December 31, 2021. Prior to April 30, 2021, the additional authorized common shares was 11,355,021. |
During the current reporting period, SPXX and QQQX sold common shares through their Shelf Offerings at a weighted average premium to their NAV per common share as shown in the accompanying table.
| | | | | | | | |
| | | SPXX | | | QQQX | |
Common shares sold through shelf offering | | | 100,336 | | | | 3,478,731 | |
Weighted average premium to NAV per common share sold | | | 1.23 | % | | | 1.90 | % |
Refer to Notes to Financial Statements, Note 5 – Fund Shares for further details of Shelf Offerings and each Fund’s respective transactions.
COMMON SHARE REPURCHASES
During August 2021, the Funds’ Board of Trustees reauthorized an open-market share repurchase program, allowing each Fund to repurchase an aggregate of up to approximately 10% of its outstanding common shares.
As of December 31, 2021, and since the inception of the Funds’ repurchase programs, the Funds have cumulatively repurchased and retired their outstanding common shares as shown in the accompanying table.
| | | | | | | | | | | | | | | | | | | | |
| | | BXMX | | | DIAX | | | SPXX | | | QQQX | | | JCE | |
Common shares cumulatively repurchased and retired | | | 460,238 | | | | 0 | | | | 383,763 | | | | 0 | | | | 449,800 | |
Common shares authorized for repurchase | | | 10,405,000 | | | | 3,635,000 | | | | 1,720,000 | | | | 4,355,000 | | | | 1,600,000 | |
During the current reporting period, the Funds did not repurchase any of their outstanding common shares.
OTHER COMMON SHARE INFORMATION
As of December 31, 2021 the Funds’ common share prices were trading at a premium/(discount) to their common share NAVs and trading at an average premium/(discount) to NAV during the current reporting period, as follows:
| | | | | | | | | | | | | | | | | | | | |
| | | BXMX | | | DIAX | | | SPXX | | | QQQX | | | JCE | |
Common share NAV | | $ | 15.29 | | | $ | 18.09 | | | $ | 18.70 | | | $ | 29.63 | | | $ | 17.33 | |
Common share price | | $ | 14.65 | | | $ | 17.77 | | | $ | 18.60 | | | $ | 30.65 | | | $ | 18.58 | |
Premium/(Discount) to NAV | | | (4.19 | )% | | | (1.77 | )% | | | (0.53 | )% | | | 3.44 | % | | | 7.21 | % |
Average premium/(discount) to NAV | | | (4.23 | )% | | | (5.86 | )% | | | (2.03 | )% | | | 0.60 | % | | | (3.00 | )% |
14
| | |
| BXMX | | Nuveen S&P 500 Buy-Write Income Fund Performance Overview and Holding Summaries as of December 31, 2021 |
Refer to the Glossary of Terms Used in this Report for further definition of the terms used within this section.
Average Annual Total Returns as of December 31, 2021
| | | | | | | | | | | | |
| | | Average Annual | |
| | | 1-Year | | | 5-Year | | | 10-Year | |
| BXMX at Common Share NAV | | | 17.80% | | | | 9.56% | | | | 9.19% | |
| BXMX at Common Share Price | | | 20.75% | | | | 10.23% | | | | 10.69% | |
| Cboe S&P 500® BuyWrite Index (BXMSM)1 | | | 20.47% | | | | 7.84% | | | | 7.54% | |
Past performance is not predictive of future results. Current performance may be higher or lower than the data shown. Returns do not reflect the deduction of taxes that shareholders may have to pay on Fund distributions or upon the sale of Fund shares. Returns at NAV are net of Fund expenses, and assume reinvestment of distributions. Comparative index return information is provided for the Fund’s shares at NAV only. Indexes are not available for direct investment.
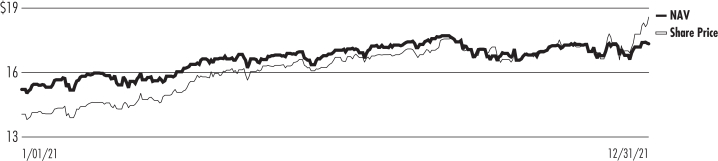
Daily Common Share NAV and Share Price
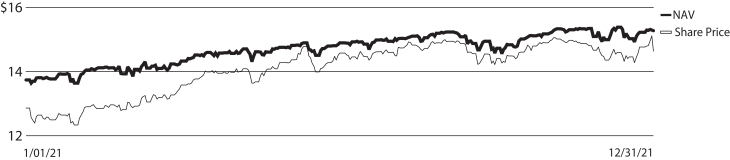
Growth of an Assumed $10,000 Investment as of December 31, 2021 — Common Share Price
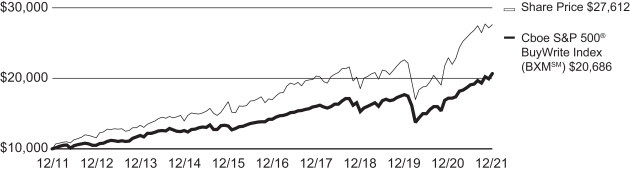
| 1 | For purposes of Fund performance, relative results are measured against this benchmark/index. |
15
This data relates to the securities held in the Fund’s portfolio of investments as of the end of the reporting period. It should not be construed as a measure of performance for the Fund itself. Holdings are subject to change.
Fund Allocation
(% of net assets)
| | | | |
| Common Stocks | | | 99.6% | |
| Investments Purchased with Collateral from Securities Lending | | | 0.1% | |
| Repurchase Agreements | | | 2.8% | |
| Other Assets Less Liabilities | | | (2.5)% | |
Net Assets | | | 100% | |
Top Five Issuers
(% of total long-term investments)
| | | | |
| Apple Inc | | | 7.0% | |
| Microsoft Corp | | | 6.6% | |
| Amazon.com Inc | | | 3.7% | |
| Alphabet Inc, Class A | | | 2.6% | |
| Tesla Inc | | | 2.2% | |
Portfolio Composition
(% of total investments)
| | | | |
| Software | | | 9.5% | |
| Technology Hardware, Storage & Peripherals | | | 7.0% | |
| Interactive Media & Services | | | 6.5% | |
| Semiconductors & Semiconductor Equipment | | | 6.4% | |
| Banks | | | 4.0% | |
| IT Services | | | 3.9% | |
| Pharmaceuticals | | | 3.7% | |
| Internet & Direct Marketing Retail | | | 3.7% | |
| Health Care Providers & Services | | | 2.9% | |
| Equity Real Estate Investment Trust | | | 2.7% | |
| Capital Markets | | | 2.6% | |
| Health Care Equipment & Supplies | | | 2.6% | |
| Automobiles | | | 2.5% | |
| Oil, Gas & Consumable Fuels | | | 2.4% | |
| Specialty Retail | | | 2.3% | |
| Hotels, Restaurants & Leisure | | | 2.0% | |
| Insurance | | | 1.9% | |
| Biotechnology | | | 1.9% | |
| Life Sciences Tools & Services | | | 1.8% | |
| Chemicals | | | 1.7% | |
| Food & Staples Retailing | | | 1.7% | |
| Diversified Financial Services | | | 1.6% | |
| Entertainment | | | 1.6% | |
| Aerospace & Defense | | | 1.5% | |
| Other1 | | | 18.8% | |
| Investments Purchased with Collateral from Securities Lending | | | 0.1% | |
| Repurchase Agreements | | | 2.7% | |
Total | | | 100% | |
| 1 | See the Portfolio of Investments for the remaining industries comprising “Other” and not listed in the Portfolio Composition above. |
16
| | |
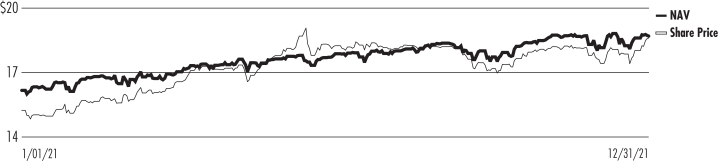
| DIAX | | Nuveen Dow 30SM Dynamic Overwrite Fund Performance Overview and Holding Summaries as of December 31, 2021 |
Refer to the Glossary of Terms Used in this Report for further definition of the terms used within this section.
Average Annual Total Returns as of December 31, 2021
| | | | | | | | | | | | |
| | | Average Annual | |
| | | 1-Year | | | 5-Year | | | 10-Year | |
| DIAX at Common Share NAV | | | 15.45% | | | | 8.68% | | | | 9.43% | |
| DIAX at Common Share Price | | | 24.60% | | | | 10.79% | | | | 10.56% | |
| Dow Jones Industrial Average Index (DJIA) | | | 20.95% | | | | 15.51% | | | | 14.21% | |
| DIAX Blended Benchmark1,2 | | | 20.02% | | | | 11.52% | | | | 10.04% | |
Past performance is not predictive of future results. Current performance may be higher or lower than the data shown. Returns do not reflect the deduction of taxes that shareholders may have to pay on Fund distributions or upon the sale of Fund shares. Returns at NAV are net of Fund expenses, and assume reinvestment of distributions. Comparative index return information is provided for the Fund’s shares at NAV only. Indexes are not available for direct investment.
Daily Common Share NAV and Share Price
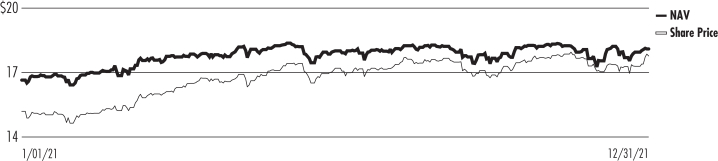
Growth of an Assumed $10,000 Investment as of December 31, 2021 — Common Share Price
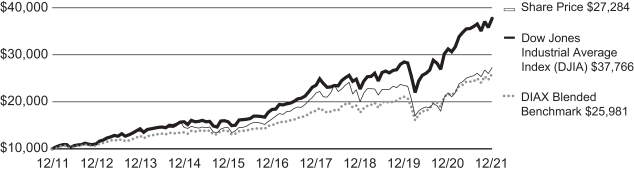
| 1 | For purposes of Fund performance, relative results are measured against this benchmark/index. |
| 2 | DIAX Blended Benchmark consists of: 1) 55% Chicago Board Options Exchange (Cboe) DJIA BuyWrite Index (BXDSM) and 2) 45% Dow Jones Industrial Average Index (DJIA). |
17
This data relates to the securities held in the Fund’s portfolio of investments as of the end of the reporting period. It should not be construed as a measure of performance for the Fund itself. Holdings are subject to change.
Fund Allocation
(% of net assets)
| | | | |
| Common Stocks | | | 100.8% | |
| Exchange-Traded Funds | | | 0.8% | |
| Investments Purchased with Collateral from Securities Lending | | | 0.7% | |
| Repurchase Agreements | | | 0.2% | |
| Other Assets Less Liabilities | | | (2.5)% | |
Net Assets | | | 100% | |
Top Five Issuers
(% of total long-term investments)
| | | | |
| UnitedHealth Group Inc | | | 9.0% | |
| Home Depot Inc | | | 7.5% | |
| Goldman Sachs Group Inc | | | 6.9% | |
| Microsoft Corp | | | 6.1% | |
| McDonald’s Corp | | | 4.8% | |
Portfolio Composition
(% of total investments)
| | | | |
| Software | | | 10.5% | |
| Health Care Providers & Services | | | 9.0% | |
| Specialty Retail | | | 7.4% | |
| Industrial Conglomerates | | | 6.9% | |
| Capital Markets | | | 6.8% | |
| IT Services | | | 6.3% | |
| Hotels, Restaurants & Leisure | | | 4.8% | |
| Pharmaceuticals | | | 4.4% | |
| Biotechnology | | | 4.0% | |
| Machinery | | | 3.7% | |
| Aerospace & Defense | | | 3.6% | |
| Food & Staples Retailing | | | 3.5% | |
| Technology Hardware, Storage & Peripherals | | | 3.2% | |
| Textiles, Apparel & Luxury Goods | | | 3.0% | |
| Consumer Finance | | | 2.9% | |
| Household Products | | | 2.9% | |
| Other1 | | | 15.5% | |
| Exchange-Traded Funds | | | 0.7% | |
| Investments Purchased with Collateral from Securities Lending | | | 0.7% | |
| Repurchase Agreements | | | 0.2% | |
Total | | | 100% | |
| 1 | See the Portfolio of Investments for the remaining industries comprising “Other” and not listed in the Portfolio Composition above. |
18
| | |
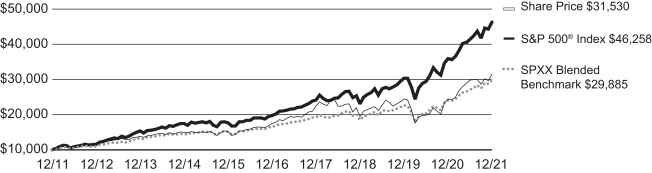
| SPXX | | Nuveen S&P 500 Dynamic Overwrite Fund Performance Overview and Holding Summaries as of December 31, 2021 |
Refer to the Glossary of Terms Used in this Report for further definition of the terms used within this section.
Average Annual Total Returns as of December 31, 2021
| | | | | | | | | | | | |
| | | Average Annual | |
| | | 1-Year | | | 5-Year | | | 10-Year | |
| SPXX at Common Share NAV | | | 22.15% | | | | 11.53% | | | | 10.16% | |
| SPXX at Common Share Price | | | 29.03% | | | | 12.47% | | | | 12.17% | |
| S&P 500® Index | | | 28.71% | | | | 18.47% | | | | 16.55% | |
| SPXX Blended Benchmark1,2 | | | 24.17% | | | | 12.60% | | | | 11.58% | |
Performance prior to December 22, 2014, reflects the Fund’s performance under the management of a sub-adviser using an investment strategy that differed from those currently in place.
Past performance is not predictive of future results. Current performance may be higher or lower than the data shown. Returns do not reflect the deduction of taxes that shareholders may have to pay on Fund distributions or upon the sale of Fund shares. Returns at NAV are net of Fund expenses, and assume reinvestment of distributions. Comparative index return information is provided for the Fund’s shares at NAV only. Indexes are not available for direct investment.
Daily Common Share NAV and Share Price
Growth of an Assumed $10,000 Investment as of December 31, 2021 — Common Share Price
| 1 | For purposes of Fund performance, relative results are measured against this benchmark/index. |
| 2 | SPXX Blended Benchmark consists of: 1) 55% Chicago Board Options Exchange (Cboe) S&P 500® BuyWrite Index (BXMSM) and 2) 45% S&P 500® Index. |
19
This data relates to the securities held in the Fund’s portfolio of investments as of the end of the reporting period. It should not be construed as a measure of performance for the Fund itself. Holdings are subject to change.
Fund Allocation
(% of net assets)
| | | | |
| Common Stocks | | | 100.5% | |
| Exchange-Traded Funds | | | 0.8% | |
| Investments Purchased with Collateral from Securities Lending | | | 0.3% | |
| Repurchase Agreements | | | 0.3% | |
| Other Assets Less Liabilities | | | (1.9)% | |
Net Asset | | | 100% | |
Top Five Issuers
(% of total long-term investments)
| | | | |
| Apple Inc | | | 7.3% | |
| Microsoft Corp | | | 6.8% | |
| Amazon.com Inc | | | 3.9% | |
| Alphabet Inc, Class C | | | 2.3% | |
| Alphabet Inc, Class A | | | 2.3% | |
Portfolio Composition
(% of total investments)
| | | | |
| Software | | | 9.0% | |
| Technology Hardware, Storage & Peripherals | | | 7.3% | |
| Interactive Media & Services | | | 6.7% | |
| Semiconductors & Semiconductor Equipment | | | 5.4% | |
| Banks | | | 5.0% | |
| IT Services | | | 4.3% | |
| Internet & Direct Marketing Retail | | | 4.1% | |
| Pharmaceuticals | | | 3.7% | |
| Health Care Providers & Services | | | 3.3% | |
| Equity Real Estate Investment Trust | | | 3.0% | |
| Specialty Retail | | | 2.8% | |
| Capital Markets | | | 2.5% | |
| Automobiles | | | 2.5% | |
| Health Care Equipment & Supplies | | | 2.4% | |
| | | | |
| Machinery | | | 2.3% | |
| Hotels, Restaurants & Leisure | | | 2.0% | |
| Beverages | | | 2.0% | |
| Household Products | | | 2.0% | |
| Chemicals | | | 1.9% | |
| Entertainment | | | 1.8% | |
| Biotechnology | | | 1.7% | |
| Diversified Financial Services | | | 1.7% | |
| Insurance | | | 1.6% | |
| Oil, Gas & Consumable Fuels | | | 1.6% | |
| Other1 | | | 18.0% | |
| Exchange-Traded Funds | | | 0.8% | |
| Investments Purchased with Collateral from Securities Lending | | | 0.3% | |
| Repurchase Agreements | | | 0.3% | |
Total | | | 100% | |
| 1 | See the Portfolio of Investments for the remaining industries comprising “Other” and not listed in the Portfolio Composition above. |
20
| | |
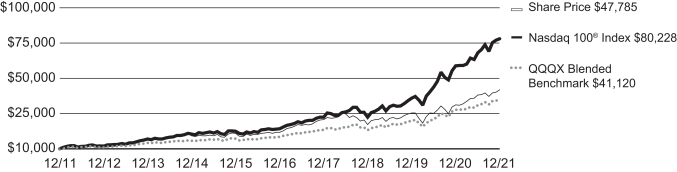
| QQQX | | Nuveen Nasdaq 100 Dynamic Overwrite Fund Performance Overview and Holding Summaries as of December 31, 2021 |
Refer to the Glossary of Terms Used in this Report for further definition of the terms used within this section.
Average Annual Total Returns as of December 31, 2021
| | | | | | | | | | | | |
| | | Average Annual | |
| | | 1-Year | | | 5-Year | | | 10-Year | |
| QQQX at Common Share NAV | | | 19.85% | | | | 16.22% | | | | 15.48% | |
| QQQX at Common Share Price | | | 25.39% | | | | 18.27% | | | | 16.93% | |
| Nasdaq 100® Index | | | 27.51% | | | | 28.63% | | | | 23.15% | |
| QQQX Blended Benchmark1,2 | | | 17.98% | | | | 18.47% | | | | 15.18% | |
Past performance is not predictive of future results. Current performance may be higher or lower than the data shown. Returns do not reflect the deduction of taxes that shareholders may have to pay on Fund distributions or upon the sale of Fund shares. Returns at NAV are net of Fund expenses, and assume reinvestment of distributions. Comparative index return information is provided for the Fund’s shares at NAV only. Indexes are not available for direct investment.
Daily Common Share NAV and Share Price
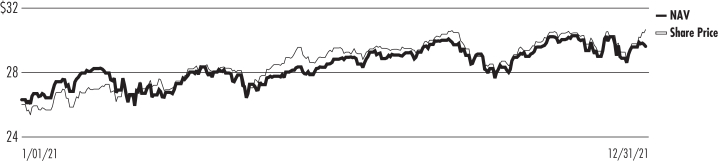
Growth of an Assumed $10,000 Investment as of December 31, 2021 — Common Share Price
| 1 | For purposes of Fund performance, relative results are measured against this benchmark/index. |
| 2 | QQQX Blended Benchmark consists of: 1) 55% Chicago Board Options Exchange (Cboe) Nasdaq 100 BuyWrite Index (BXNSM) and 2) 45% Nasdaq 100® Index. |
21
This data relates to the securities held in the Fund’s portfolio of investments as of the end of the reporting period. It should not be construed as a measure of performance for the Fund itself. Holdings are subject to change.
Fund Allocation
(% of net assets)
| | | | |
| Common Stocks | | | 100.8% | |
| Exchange-Traded Funds | | | 0.9% | |
| Investments Purchased with Collateral from Securities Lending | | | 0.1% | |
| Repurchase Agreements | | | 0.1% | |
| Other Assets Less Liabilities | | | (1.9)% | |
Net Assets | | | 100% | |
Top Five Issuers
(% of total long-term investments)
| | | | |
| Microsoft Corp | | | 13.0% | |
| Apple Inc | | | 12.7% | |
| Amazon.com Inc | | | 7.9% | |
| Alphabet Inc, Class A | | | 5.5% | |
| Alphabet Inc, Class C | | | 3.6% | |
Portfolio Composition
(% of total investments)
| | | | |
| Software | | | 17.1% | |
| Semiconductors & Semiconductor Equipment | | | 14.8% | |
| Interactive Media & Services | | | 14.7% | |
| Technology Hardware, Storage & Peripherals | | | 12.7% | |
| Internet & Direct Marketing Retail | | | 8.9% | |
| Automobiles | | | 5.1% | |
| Biotechnology | | | 4.1% | |
| Media | | | 3.2% | |
| Communications Equipment | | | 2.9% | |
| IT Services | | | 2.9% | |
| Hotels, Restaurants & Leisure | | | 1.5% | |
| Health Care Equipment & Supplies | | | 1.3% | |
| Beverages | | | 1.1% | |
| Food & Staples Retailing | | | 1.1% | |
| Other1 | | | 7.5% | |
| Exchange-Traded Funds | | | 0.9% | |
| Investments Purchased with Collateral from Securities Lending | | | 0.1% | |
| Repurchase Agreements | | | 0.1% | |
Total | | | 100% | |
| 1 | See the Portfolio of Investments for the remaining industries comprising “Other” and not listed in the Portfolio Composition above. |
22
| | |
| JCE | | Nuveen Core Equity Alpha Fund Performance Overview and Holding Summaries as of December 31, 2021 |
Refer to Glossary of Terms Used in this Report for further definition of the terms used within this section.
Average Annual Total Returns as of December 31, 2021
| | | | | | | | | | | | |
| | | Average Annual | |
| | | 1-Year | | | 5-Year | | | 10-Year | |
| JCE at Common Share NAV | | | 26.91 | % | | | 14.57 | % | | | 13.35 | % |
| JCE at Common Share Price | | | 47.15 | % | | | 18.49 | % | | | 15.86 | % |
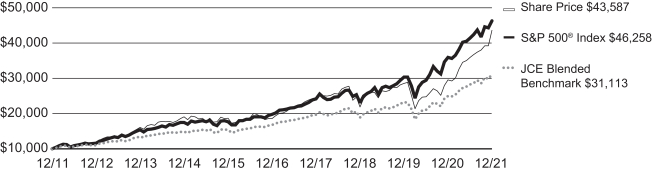
| S&P 500® Index | | | 28.71 | % | | | 18.47 | % | | | 16.55 | % |
| JCE Blended Benchmark1,2 | | | 24.58 | % | | | 13.13 | % | | | 12.03 | % |
Past performance is not predictive of future results. Current performance may be higher or lower than the data shown. Returns do not reflect the deduction of taxes that shareholders may have to pay on Fund distributions or upon the sale of Fund shares. Returns at NAV are net of Fund expenses, and assume reinvestment of distributions. Comparative index return information is provided for the Fund’s shares at NAV only. Indexes are not available for direct investment.
Daily Common Share NAV and Share Price
Growth of an Assumed $10,000 Investment as of December 31, 2021 — Common Share Price
| 1 | For purposes of Fund performance, relative results are measured against this benchmark/index. |
| 2 | JCE Blended Benchmark consists of: 1) 50% S&P 500® Index and 2) 50% Chicago Board Options Exchange (Cboe) S&P 500® BuyWrite Index (BXMSM). |
23
This data relates to the securities held in the Fund’s portfolio of investments as of the end of the reporting period. It should not be construed as a measure of performance for the Fund itself. Holdings are subject to change.
Fund Allocation
(% of net assets)
| | | | |
| Common Stocks | | | 99.5% | |
| Exchange-Traded Funds | | | 0.4% | |
| Investments Purchased with Collateral from Securities Lending | | | 0.0% | |
| Repurchase Agreements | | | 0.3% | |
| Other Assets Less Liabilities | | | (0.2)% | |
Net Asset | | | 100% | |
Top Five Issuers
(% of total long-term investments)
| | | | |
| Microsoft Corp | | | 6.8% | |
| Apple Inc | | | 6.6% | |
| Amazon.com Inc | | | 4.2% | |
| Meta Platforms | | | 2.5% | |
| Alphabet Inc, Class C | | | 2.3% | |
Portfolio Composition
(% of total investments)
| | | | |
| Software | | | 10.2% | |
| Technology Hardware, Storage & Peripherals | | | 7.1% | |
| Interactive Media & Services | | | 6.9% | |
| Semiconductors & Semiconductor Equipment | | | 5.6% | |
| IT Services | | | 5.2% | |
| Pharmaceuticals | | | 4.8% | |
| Internet & Direct Marketing Retail | | | 4.1% | |
| Life Sciences Tools & Services | | | 3.0% | |
| Oil, Gas & Consumable Fuels | | | 2.8% | |
| Banks | | | 2.8% | |
| Capital Markets | | | 2.7% | |
| Health Care Providers & Services | | | 2.5% | |
| Specialty Retail | | | 2.4% | |
| Machinery | | | 2.4% | |
| | | | |
| Health Care Equipment & Supplies | | | 2.4% | |
| Household Products | | | 2.0% | |
| Food Products | | | 1.8% | |
| Road & Rail | | | 1.7% | |
| Air Freight & Logistics | | | 1.6% | |
| Automobiles | | | 1.6% | |
| Equity Real Estate Investment Trust | | | 1.6% | |
| Electrical Equipment | | | 1.5% | |
| Hotels, Restaurants & Leisure | | | 1.5% | |
| Media | | | 1.4% | |
| Biotechnology | | | 1.4% | |
| Other1 | | | 18.3% | |
| Exchange-Traded Funds | | | 0.4% | |
| Investments Purchased with Collateral from Securities Lending | | | 0.0% | |
| Repurchase Agreements | | | 0.3% | |
Total | | | 100% | |
| 1 | See the Portfolio of Investments for the remaining industries comprising “Other” and not listed in the Portfolio Composition above. |
24
Report of Independent Registered Public Accounting Firm
To the Board of Trustees and Shareholders of Nuveen S&P 500 Buy-Write Income Fund, Nuveen Dow 30SM Dynamic Overwrite Fund, Nuveen S&P 500 Dynamic Overwrite Fund, Nuveen Nasdaq 100 Dynamic Overwrite Fund and Nuveen Core Equity Alpha Fund
Opinions on the Financial Statements
We have audited the accompanying statements of assets and liabilities, including the portfolios of investments, of Nuveen S&P 500 Buy-Write Income Fund, Nuveen Dow 30SM Dynamic Overwrite Fund, Nuveen S&P 500 Dynamic Overwrite Fund, Nuveen Nasdaq 100 Dynamic Overwrite Fund and Nuveen Core Equity Alpha Fund (hereafter collectively referred to as the “Funds”) as of December 31, 2021, the related statements of operations for the year ended December 31, 2021, the statements of changes in net assets for each of the two years in the period ended December 31, 2021, including the related notes, and the financial highlights for each of the five years in the period ended December 31, 2021 (collectively referred to as the “financial statements”). In our opinion, the financial statements present fairly, in all material respects, the financial position of each of the Funds as of December 31, 2021, the results of each of their operations for the year then ended, the changes in each of their net assets for each of the two years in the period ended December 31, 2021 and each of the financial highlights for each of the five years in the period ended December 31, 2021 in conformity with accounting principles generally accepted in the United States of America.
Basis for Opinions
These financial statements are the responsibility of the Funds’ management. Our responsibility is to express an opinion on the Funds’ financial statements based on our audits. We are a public accounting firm registered with the Public Company Accounting Oversight Board (United States) (PCAOB) and are required to be independent with respect to the Funds in accordance with the U.S. federal securities laws and the applicable rules and regulations of the Securities and Exchange Commission and the PCAOB.
We conducted our audits of these financial statements in accordance with the standards of the PCAOB. Those standards require that we plan and perform the audit to obtain reasonable assurance about whether the financial statements are free of material misstatement, whether due to error or fraud.
Our audits included performing procedures to assess the risks of material misstatement of the financial statements, whether due to error or fraud, and performing procedures that respond to those risks. Such procedures included examining, on a test basis, evidence regarding the amounts and disclosures in the financial statements. Our audits also included evaluating the accounting principles used and significant estimates made by management, as well as evaluating the overall presentation of the financial statements. Our procedures included confirmation of securities owned as of December 31, 2021 by correspondence with the custodian and brokers. We believe that our audits provide a reasonable basis for our opinions.
/s/ PricewaterhouseCoopers LLP
Chicago, Illinois
February 28, 2022
We have served as the auditor of one or more investment companies in Nuveen Funds since 2002.
25
| | |
| BXMX | | Nuveen S&P 500 Buy-Write
Income Fund Portfolio of Investments December 31, 2021 |
| | | | | | | | | | | | | | | | |
| Shares | | | Description (1) | | | | | | | | Value | |
| | | | |
| | | | LONG-TERM INVESTMENTS – 99.6% | | | | | | | | | | | | |
| | | | |
| | | | COMMON STOCKS – 99.6% (2) | | | | | | | | | | | | |
| | | | |
| | | | Aerospace & Defense – 1.6% | | | | | | | | | |
| | | | |
| | 28,960 | | | Boeing Co, (3) | | | | | | | | | | $ | 5,830,227 | |
| | 9,566 | | | HEICO Corp | | | | | | | | | | | 1,379,609 | |
| | 62,456 | | | Howmet Aerospace Inc | | | | | | | | | | | 1,987,974 | |
| | 10,296 | | | Huntington Ingalls Industries Inc | | | | | | | | | | | 1,922,675 | |
| | 13,748 | | | Northrop Grumman Corp | | | | | | | | | | | 5,321,438 | |
| | 99,428 | | | Raytheon Technologies Corp | | | | | | | | | | | 8,556,774 | |
| | | | Total Aerospace & Defense | | | | | | | | | | | 24,998,697 | |
| | | | |
| | | | Air Freight & Logistics – 0.6% | | | | | | | | | |
| | | | |
| | 40,842 | | | United Parcel Service Inc, Class B | | | | | | | | | | | 8,754,074 | |
| | | | |
| | | | Auto Components – 0.1% | | | | | | | | | |
| | | | |
| | 50,606 | | | Gentex Corp | | | | | | | | | | | 1,763,619 | |
| | 9,851 | | | Goodyear Tire & Rubber Co, (3) | | | | | | | | | | | 210,023 | |
| | | | Total Auto Components | | | | | | | | | | | 1,973,642 | |
| | | | |
| | | | Automobiles – 2.5% | | | | | | | | | |
| | | | |
| | 252,900 | | | Ford Motor Co | | | | | | | | | | | 5,252,733 | |
| | 16,446 | | | Harley-Davidson Inc | | | | | | | | | | | 619,850 | |
| | 32,602 | | | Tesla Inc, (3) | | | | | | | | | | | 34,453,141 | |
| | | | Total Automobiles | | | | | | | | | | | 40,325,724 | |
| | | | |
| | | | Banks – 4.1% | | | | | | | | | |
| | | | |
| | 81,113 | | | Citigroup Inc | | | | | | | | | | | 4,898,414 | |
| | 26,341 | | | Comerica Inc | | | | | | | | | | | 2,291,667 | |
| | 180,724 | | | Fifth Third Bancorp | | | | | | | | | | | 7,870,530 | |
| | 108,513 | | | First Horizon Corp | | | | | | | | | | | 1,772,017 | |
| | 137,798 | | | JPMorgan Chase & Co | | | | | | | | | | | 21,820,313 | |
| | 165,652 | | | KeyCorp | | | | | | | | | | | 3,831,531 | |
| | 119,082 | | | People’s United Financial Inc | | | | | | | | | | | 2,122,041 | |
| | 41,891 | | | PNC Financial Services Group Inc | | | | | | | | | | | 8,399,984 | |
| | 195,504 | | | Wells Fargo & Co | | | | | | | | | | | 9,380,282 | |
| | 56,591 | | | Zions Bancorp | | | | | | | | | | | 3,574,288 | |
| | | | Total Banks | | | | | | | | | | | 65,961,067 | |
| | | | |
| | | | Beverages – 1.4% | | | | | | | | | |
| | | | |
| | 247,954 | | | Coca-Cola Co | | | | | | | | | | | 14,681,356 | |
| | 60,163 | | | Keurig Dr Pepper Inc | | | | | | | | | | | 2,217,608 | |
| | 56,712 | | | Monster Beverage Corp, (3) | | | | | | | | | | | 5,446,621 | |
| | | | Total Beverages | | | | | | | | | | | 22,345,585 | |
| | | | |
| | | | Biotechnology – 1.9% | | | | | | | | | |
| | | | |
| | 80,284 | | | AbbVie Inc | | | | | | | | | | | 10,870,454 | |
| | 3,766 | | | Alnylam Pharmaceuticals Inc, (3) | | | | | | | | | | | 638,638 | |
| | 28,089 | | | Amgen Inc | | | | | | | | | | | 6,319,182 | |
| | 9,647 | | | Biogen Inc, (3) | | | | | | | | | | | 2,314,508 | |
| | 9,243 | | | BioMarin Pharmaceutical Inc, (3) | | | | | | | | | | | 816,619 | |
| | 2,000 | | | Exact Sciences Corp, (3) | | | | | | | | | | | 155,660 | |
| | 67,257 | | | Gilead Sciences Inc | | | | | | | | | | | 4,883,531 | |
| | 15,603 | | | Moderna Inc, (3) | | | | | | | | | | | 3,962,850 | |
| | 1,956 | | | Seagen Inc, (3) | | | | | | | | | | | 302,398 | |
| | | | Total Biotechnology | | | | | | | | | | | 30,263,840 | |
| | | | |
| | | | Building Products – 0.3% | | | | | | | | | |
| | | | |
| | 15,381 | | | Allegion plc | | | | | | | | | | | 2,037,059 | |
26
| | | | | | | | | | | | | | | | |
| Shares | | | Description (1) | | | | | | | | Value | |
| | | | |
| | | | Building Products (continued) | | | | | | | | | |
| | | | |
| | 43,726 | | | Masco Corp | | | | | | | | | | $ | 3,070,440 | |
| | | | Total Building Products | | | | | | | | | | | 5,107,499 | |
| | | | |
| | | | Capital Markets – 2.7% | | | | | | | | | |
| | | | |
| | 93,546 | | | Charles Schwab Corp | | | | | | | | | | | 7,867,219 | |
| | 21,911 | | | CME Group Inc | | | | | | | | | | | 5,005,787 | |
| | 44,488 | | | Intercontinental Exchange Inc | | | | | | | | | | | 6,084,624 | |
| | 53,398 | | | Jefferies Financial Group Inc | | | | | | | | | | | 2,071,842 | |
| | 86,746 | | | Morgan Stanley | | | | | | | | | | | 8,514,987 | |
| | 8,344 | | | MSCI Inc | | | | | | | | | | | 5,112,285 | |
| | 17,437 | | | S&P Global Inc | | | | | | | | | | | 8,229,044 | |
| | | | Total Capital Markets | | | | | | | | | | | 42,885,788 | |
| | | | |
| | | | Chemicals – 1.8% | | | | | | | | | |
| | | | |
| | 16,669 | | | Chemours Co | | | | | | | | | | | 559,412 | |
| | 52,881 | | | Corteva Inc | | | | | | | | | | | 2,500,214 | |
| | 53,214 | | | Dow Inc | | | | | | | | | | | 3,018,298 | |
| | 42,507 | | | DuPont de Nemours Inc | | | | | | | | | | | 3,433,715 | |
| | 34,775 | | | Eastman Chemical Co | | | | | | | | | | | 4,204,645 | |
| | 33,382 | | | Linde PLC | | | | | | | | | | | 11,564,526 | |
| | 20,651 | | | Olin Corp | | | | | | | | | | | 1,187,846 | |
| | 14,399 | | | RPM International Inc | | | | | | | | | | | 1,454,299 | |
| | | | Total Chemicals | | | | | | | | | | | 27,922,955 | |
| | | | |
| | | | Commercial Services & Supplies – 0.6% | | | | | | | | | |
| | | | |
| | 13,228 | | | Waste Connections Inc | | | | | | | | | | | 1,802,580 | |
| | 47,435 | | | Waste Management Inc | | | | | | | | | | | 7,916,901 | |
| | | | Total Commercial Services & Supplies | | | | | | | | | | | 9,719,481 | |
| | | | |
| | | | Communications Equipment – 1.1% | | | | | | | | | |
| | | | |
| | 13,699 | | | Ciena Corp, (3) | | | | | | | | | | | 1,054,412 | |
| | 220,344 | | | Cisco Systems Inc | | | | | | | | | | | 13,963,199 | |
| | 5,140 | | | Lumentum Holdings Inc, (3) | | | | | | | | | | | 543,658 | |
| | 74,070 | | | Viavi Solutions Inc, (3) | | | | | | | | | | | 1,305,113 | |
| | | | Total Communications Equipment | | | | | | | | | | | 16,866,382 | |
| | | | |
| | | | Consumer Finance – 0.4% | | | | | | | | | |
| | | | |
| | 42,085 | | | Discover Financial Services | | | | | | | | | | | 4,863,343 | |
| | 89,957 | | | SLM Corp | | | | | | | | | | | 1,769,454 | |
| | | | Total Consumer Finance | | | | | | | | | | | 6,632,797 | |
| | | | |
| | | | Containers & Packaging – 0.5% | | | | | | | | | |
| | | | |
| | 13,574 | | | Avery Dennison Corp | | | | | | | | | | | 2,939,721 | |
| | 20,677 | | | Crown Holdings Inc | | | | | | | | | | | 2,287,290 | |
| | 15,364 | | | Packaging Corp of America | | | | | | | | | | | 2,091,809 | |
| | 18,945 | | | Sonoco Products Co | | | | | | | | | | | 1,096,726 | |
| | | | Total Containers & Packaging | | | | | | | | | | | 8,415,546 | |
| | | | |
| | | | Diversified Financial Services – 1.6% | | | | | | | | | |
| | | | |
| | 86,707 | | | Berkshire Hathaway Inc, Class B, (3) | | | | | | | | | | | 25,925,393 | |
| | | | |
| | | | Diversified Telecommunication Services – 1.1% | | | | | | | | | |
| | | | |
| | 265,470 | | | AT&T Inc | | | | | | | | | | | 6,530,562 | |
| | 205,832 | | | Verizon Communications Inc | | | | | | | | | | | 10,695,031 | |
| | | | Total Diversified Telecommunication Services | | | | | | | | | | | 17,225,593 | |
| | | | |
| | | | Electric Utilities – 0.5% | | | | | | | | | |
| | | | |
| | 58,152 | | | Evergy Inc | | | | | | | | | | | 3,989,809 | |
| | 52,512 | | | OGE Energy Corp | | | | | | | | | | | 2,015,410 | |
| | 29,198 | | | Pinnacle West Capital Corp | | | | | | | | | | | 2,061,087 | |
| | | | Total Electric Utilities | | | | | | | | | | | 8,066,306 | |
27
| | |
| |
| BXMX | | Nuveen S&P 500 Buy-Write Income Fund (continued) |
| | Portfolio of Investments December 31, 2021 |
| | | | | | | | | | | | | | | | |
| Shares | | | Description (1) | | | | | | | | Value | |
| | | | |
| | | | Electrical Equipment – 0.7% | | | | | | | | | |
| | | | |
| | 54,146 | | | Emerson Electric Co | | | | | | | | | | $ | 5,033,954 | |
| | 8,860 | | | Hubbell Inc | | | | | | | | | | | 1,845,272 | |
| | 13,511 | | | Rockwell Automation Inc | | | | | | | | | | | 4,713,312 | |
| | | | Total Electrical Equipment | | | | | | | | | | | 11,592,538 | |
| | | | |
| | | | Electronic Equipment, Instruments & Components – 0.5% | | | | | | | | | |
| | | | |
| | 20,728 | | | CDW Corp | | | | | | | | | | | 4,244,680 | |
| | 86,143 | | | Corning Inc | | | | | | | | | | | 3,207,104 | |
| | | | Total Electronic Equipment, Instruments & Components | | | | | | | | | | | 7,451,784 | |
| | | | |
| | | | Energy Equipment & Services – 0.3% | | | | | | | | | |
| | | | |
| | 72,910 | | | Halliburton Co | | | | | | | | | | | 1,667,452 | |
| | 77,600 | | | Schlumberger Ltd. | | | | | | | | | | | 2,324,120 | |
| | | | Total Energy Equipment & Services | | | | | | | | | | | 3,991,572 | |
| | | | |
| | | | Entertainment – 1.6% | | | | | | | | | |
| | | | |
| | 20,435 | | | Netflix Inc, (3) | | | | | | | | | | | 12,310,861 | |
| | 1,091 | | | Roku Inc, (3) | | | | | | | | | | | 248,966 | |
| | 83,187 | | | Walt Disney Co, (3) | | | | | | | | | | | 12,884,835 | |
| | | | Total Entertainment | | | | | | | | | | | 25,444,662 | |
| | | | |
| | | | Equity Real Estate Investment Trust – 2.8% | | | | | | | | | |
| | | | |
| | 97,035 | | | American Homes 4 Rent, Class A | | | | | | | | | | | 4,231,696 | |
| | 33,023 | | | American Tower Corp | | | | | | | | | | | 9,659,228 | |
| | 14,342 | | | Apartment Income REIT Corp | | | | | | | | | | | 784,077 | |
| | 73,114 | | | Apartment Investment and Management Co, Class A, (3) | | | | | | | | | | | 564,440 | |
| | 123,846 | | | Brandywine Realty Trust | | | | | | | | | | | 1,662,013 | |
| | 75,722 | | | CubeSmart | | | | | | | | | | | 4,309,339 | |
| | 51,595 | | | Equity Commonwealth, (3) | | | | | | | | | | | 1,336,311 | |
| | 84,268 | | | Healthcare Realty Trust Inc | | | | | | | | | | | 2,666,240 | |
| | 159,619 | | | Invitation Homes Inc | | | | | | | | | | | 7,237,125 | |
| | 19,823 | | | LXP Industrial Trust | | | | | | | | | | | 309,635 | |
| | 51,162 | | | Sabra Health Care REIT Inc | | | | | | | | | | | 692,734 | |
| | 15,931 | | | Sun Communities Inc | | | | | | | | | | | 3,345,032 | |
| | 42,955 | | | Welltower Inc | | | | | | | | | | | 3,684,250 | |
| | 94,015 | | | Weyerhaeuser Co | | | | | | | | | | | 3,871,538 | |
| | | | Total Equity Real Estate Investment Trust | | | | | | | | | | | 44,353,658 | |
| | | | |
| | | | Food & Staples Retailing – 1.7% | | | | | | | | | |
| | | | |
| | 3,640 | | | Casey’s General Stores Inc | | | | | | | | | | | 718,354 | |
| | 24,647 | | | Costco Wholesale Corp | | | | | | | | | | | 13,992,102 | |
| | 55,722 | | | Kroger Co | | | | | | | | | | | 2,521,978 | |
| | 15,913 | | | US Foods Holding Corp, (3) | | | | | | | | | | | 554,250 | |
| | 63,367 | | | Walmart Inc | | | | | | | | | | | 9,168,571 | |
| | | | Total Food & Staples Retailing | | | | | | | | | | | 26,955,255 | |
| | | | |
| | | | Food Products – 0.6% | | | | | | | | | |
| | | | |
| | 132,012 | | | Mondelez International Inc, Class A | | | | | | | | | | | 8,753,716 | |
| | 12,100 | | | Post Holdings Inc, (3) | | | | | | | | | | | 1,364,033 | |
| | | | Total Food Products | | | | | | | | | | | 10,117,749 | |
| | | | |
| | | | Gas Utilities – 0.1% | | | | | | | | | |
| | | | |
| | 12,656 | | | Atmos Energy Corp | | | | | | | | | | | 1,325,969 | |
| | 2,933 | | | National Fuel Gas Co | | | | | | | | | | | 187,536 | |
| | | | Total Gas Utilities | | | | | | | | | | | 1,513,505 | |
| | | | |
| | | | Health Care Equipment & Supplies – 2.7% | | | | | | | | | |
| | | | |
| | 98,976 | | | Abbott Laboratories | | | | | | | | | | | 13,929,882 | |
| | 19,198 | | | Alcon Inc., (4) | | | | | | | | | | | 1,672,530 | |
| | 7,646 | | | Avanos Medical Inc, (3) | | | | | | | | | | | 265,087 | |
| | 49,755 | | | Baxter International Inc | | | | | | | | | | | 4,270,969 | |
| | 130,178 | | | Boston Scientific Corp, (3) | | | | | | | | | | | 5,529,962 | |
28
| | | | | | | | | | | | | | | | |
| Shares | | | Description (1) | | | | | | | | Value | |
| | | | |
| | | | Health Care Equipment & Supplies (continued) | | | | | | | | | |
| | | | |
| | 28,620 | | | Hologic Inc, (3) | | | | | | | | | | $ | 2,191,147 | |
| | 8,009 | | | IDEXX Laboratories Inc, (3) | | | | | | | | | | | 5,273,606 | |
| | 89,338 | | | Medtronic PLC | | | | | | | | | | | 9,242,016 | |
| | | | Total Health Care Equipment & Supplies | | | | | | | | | | | 42,375,199 | |
| | | | |
| | | | Health Care Providers & Services – 3.0% | | | | | | | | | |
| | | | |
| | 15,832 | | | Anthem Inc | | | | | | | | | | | 7,338,765 | |
| | 20,430 | | | Cigna Corp | | | | | | | | | | | 4,691,341 | |
| | 8,265 | | | Covetrus Inc, (3) | | | | | | | | | | | 165,052 | |
| | 69,178 | | | CVS Health Corp | | | | | | | | | | | 7,136,403 | |
| | 20,595 | | | HCA Healthcare | | | | | | | | | | | 5,291,267 | |
| | 45,020 | | | UnitedHealth Group Inc | | | | | | | | | | | 22,606,343 | |
| | | | Total Health Care Providers & Services | | | | | | | | | | | 47,229,171 | |
| | | | |
| | | | Health Care Technology – 0.1% | | | | | | | | | |
| | | | |
| | 5,329 | | | Veeva Systems Inc, Class A, (3) | | | | | | | | | | | 1,361,453 | |
| | | | |
| | | | Hotels, Restaurants & Leisure – 2.1% | | | | | | | | | |
| | | | |
| | 2,484 | | | Booking Holdings Inc, (3) | | | | | | | | | | | 5,959,687 | |
| | 31,485 | | | Marriott International Inc, Class A, (3) | | | | | | | | | | | 5,202,582 | |
| | 41,884 | | | McDonald’s Corp | | | | | | | | | | | 11,227,844 | |
| | 16,077 | | | Restaurant Brands International Inc | | | | | | | | | | | 975,552 | |
| | 74,292 | | | Starbucks Corp | | | | | | | | | | | 8,689,935 | |
| | 15,026 | | | Wynn Resorts Ltd, (3) | | | | | | | | | | | 1,277,811 | |
| | | | Total Hotels, Restaurants & Leisure | | | | | | | | | | | 33,333,411 | |
| | | | |
| | | | Household Durables – 0.4% | | | | | | | | | |
| | | | |
| | 16,552 | | | Garmin Ltd | | | | | | | | | | | 2,253,886 | |
| | 32,919 | | | KB Home | | | | | | | | | | | 1,472,467 | |
| | 6,575 | | | TopBuild Corp, (3) | | | | | | | | | | | 1,814,108 | |
| | | | Total Household Durables | | | | | | | | | | | 5,540,461 | |
| | | | |
| | | | Household Products – 1.6% | | | | | | | | | |
| | | | |
| | 144,112 | | | Procter & Gamble Co | | | | | | | | | | | 23,573,841 | |
| | 13,445 | | | Spectrum Brands Holdings Inc | | | | | | | | | | | 1,367,625 | |
| | | | Total Household Products | | | | | | | | | | | 24,941,466 | |
| | | | |
| | | | Industrial Conglomerates – 1.3% | | | | | | | | | |
| | | | |
| | 38,682 | | | 3M Co | | | | | | | | | | | 6,871,084 | |
| | 50,397 | | | General Electric Co | | | | | | | | | | | 4,761,005 | |
| | 40,807 | | | Honeywell International Inc | | | | | | | | | | | 8,508,667 | |
| | | | Total Industrial Conglomerates | | | | | | | | | | | 20,140,756 | |
| | | | |
| | | | Insurance – 1.9% | | | | | | | | | |
| | | | |
| | 2,535 | | | Alleghany Corp, (3) | | | | | | | | | | | 1,692,341 | |
| | 28,004 | | | Allstate Corp | | | | | | | | | | | 3,294,671 | |
| | 47,396 | | | Arthur J Gallagher & Co | | | | | | | | | | | 8,041,679 | |
| | 37,130 | | | CNO Financial Group Inc | | | | | | | | | | | 885,179 | |
| | 23,577 | | | Fidelity National Financial Inc | | | | | | | | | | | 1,230,248 | |
| | 16,078 | | | Genworth Financial Inc, Class A, (3) | | | | | | | | | | | 65,116 | |
| | 38,545 | | | Hartford Financial Services Group Inc | | | | | | | | | | | 2,661,147 | |
| | 4,703 | | | Kemper Corp | | | | | | | | | | | 276,489 | |
| | 33,540 | | | Lincoln National Corp | | | | | | | | | | | 2,289,440 | |
| | 7,573 | | | RenaissanceRe Holdings Ltd | | | | | | | | | | | 1,282,336 | |
| | 32,951 | | | Travelers Cos Inc | | | | | | | | | | | 5,154,525 | |
| | 47,777 | | | W R Berkley Corp | | | | | | | | | | | 3,936,347 | |
| | | | Total Insurance | | | | | | | | | | | 30,809,518 | |
| | | | |
| | | | Interactive Media & Services – 6.6% | | | | | | | | | |
| | | | |
| | 14,278 | | | Alphabet Inc, Class A, (3) | | | | | | | | | | | 41,363,937 | |
| | 9,974 | | | Alphabet Inc, Class C, (3) | | | | | | | | | | | 28,860,667 | |
| | 99,036 | | | Meta Platforms Inc, Class A, (3) | | | | | | | | | | | 33,310,759 | |
| | 42,710 | | | Twitter Inc, (3) | | | | | | | | | | | 1,845,926 | |
| | | | Total Interactive Media & Services | | | | | | | | | | | 105,381,289 | |
29
| | |
| |
| BXMX | | Nuveen S&P 500 Buy-Write Income Fund (continued) |
| | Portfolio of Investments December 31, 2021 |
| | | | | | | | | | | | | | | | |
| Shares | | | Description (1) | | | | | | | | Value | |
| | | | |
| | | | Internet & Direct Marketing Retail – 3.7% | | | | | | | | | |
| | | | |
| | 17,762 | | | Amazon.com Inc, (3) | | | | | | | | | | $ | 59,224,547 | |
| | 5,685 | | | JD.com Inc, ADR, (3) | | | | | | | | | | | 398,348 | |
| | | | Total Internet & Direct Marketing Retail | | | | | | | | | | | 59,622,895 | |
| | | | |
| | | | IT Services – 4.0% | | | | | | | | | |
| | | | |
| | 20,604 | | | Akamai Technologies Inc, (3) | | | | | | | | | | | 2,411,492 | |
| | 34,973 | | | Automatic Data Processing Inc | | | | | | | | | | | 8,623,642 | |
| | 39,198 | | | Fidelity National Information Services Inc | | | | | | | | | | | 4,278,462 | |
| | 42,887 | | | Mastercard Inc, Class A | | | | | | | | | | | 15,410,157 | |
| | 55,336 | | | PayPal Holdings Inc, (3) | | | | | | | | | | | 10,435,263 | |
| | 1,825 | | | Twilio Inc, Class A, (3) | | | | | | | | | | | 480,595 | |
| | 17,828 | | | VeriSign Inc, (3) | | | | | | | | | | | 4,525,103 | |
| | 81,846 | | | Visa Inc, Class A | | | | | | | | | | | 17,736,847 | |
| | | | Total IT Services | | | | | | | | | | | 63,901,561 | |
| | | | |
| | | | Leisure Products – 0.1% | | | | | | | | | |
| | | | |
| | 25,861 | | | Mattel Inc, (3) | | | | | | | | | | | 557,563 | |
| | 6,048 | | | Polaris Inc | | | | | | | | | | | 664,736 | |
| | | | Total Leisure Products | | | | | | | | | | | 1,222,299 | |
| | | | |
| | | | Life Sciences Tools & Services – 1.8% | | | | | | | | | |
| | | | |
| | 35,671 | | | Danaher Corp | | | | | | | | | | | 11,736,116 | |
| | 9,014 | | | Illumina Inc, (3) | | | | | | | | | | | 3,429,286 | |
| | 21,185 | | | Thermo Fisher Scientific Inc | | | | | | | | | | | 14,135,479 | |
| | | | Total Life Sciences Tools & Services | | | | | | | | | | | 29,300,881 | |
| | | | |
| | | | Machinery – 1.5% | | | | | | | | | |
| | | | |
| | 38,322 | | | Caterpillar Inc | | | | | | | | | | | 7,922,690 | |
| | 31,851 | | | Graco Inc | | | | | | | | | | | 2,567,828 | |
| | 39,784 | | | Otis Worldwide Corp | | | | | | | | | | | 3,463,993 | |
| | 15,767 | | | Parker-Hannifin Corp | | | | | | | | | | | 5,015,798 | |
| | 16,044 | | | Stanley Black & Decker Inc | | | | | | | | | | | 3,026,219 | |
| | 10,383 | | | Timken Co | | | | | | | | | | | 719,438 | |
| | 4,597 | | | Woodward Inc | | | | | | | | | | | 503,188 | |
| | | | Total Machinery | | | | | | | | | | | 23,219,154 | |
| | | | |
| | | | Media – 0.9% | | | | | | | | | |
| | | | |
| | 216,324 | | | Comcast Corp, Class A | | | | | | | | | | | 10,887,587 | |
| | 14,734 | | | Discovery Inc, Series A, (3) | | | | | | | | | | | 346,838 | |
| | 24,300 | | | Discovery Inc, Series C, (3) | | | | | | | | | | | 556,470 | |
| | 17,899 | | | New York Times Co, Class A | | | | | | | | | | | 864,522 | |
| | 78,489 | | | News Corp, Class A | | | | | | | | | | | 1,751,090 | |
| | | | Total Media | | | | | | | | | | | 14,406,507 | |
| | | | |
| | | | Metals & Mining – 0.4% | | | | | | | | | |
| | | | |
| | 15,262 | | | Arconic Corp, (3) | | | | | | | | | | | 503,798 | |
| | 40,850 | | | Newmont Corp | | | | | | | | | | | 2,533,517 | |
| | 29,091 | | | Nucor Corp | | | | | | | | | | | 3,320,738 | |
| | | | Total Metals & Mining | | | | | | | | | | | 6,358,053 | |
| | | | |
| | | | Mortgage Real Estate Investment Trust – 0.0% | | | | | | | | | |
| | | | |
| | 26,802 | | | Annaly Capital Management Inc | | | | | | | | | | | 209,592 | |
| | | | |
| | | | Multiline Retail – 0.5% | | | | | | | | | |
| | | | |
| | 25,320 | | | Macy’s Inc | | | | | | | | | | | 662,878 | |
| | 16,563 | | | Nordstrom Inc, (3) | | | | | | | | | | | 374,655 | |
| | 31,203 | | | Target Corp | | | | | | | | | | | 7,221,622 | |
| | | | Total Multiline Retail | | | | | | | | | | | 8,259,155 | |
| | | | |
| | | | Multi-Utilities – 1.3% | | | | | | | | | |
| | | | |
| | 59,539 | | | Ameren Corp | | | | | | | | | | | 5,299,566 | |
| | 17,519 | | | NorthWestern Corp | | | | | | | | | | | 1,001,386 | |
30
| | | | | | | | | | | | | | | | |
| Shares | | | Description (1) | | | | | | | | Value | |
| | | | |
| | | | Multi-Utilities (continued) | | | | | | | | | |
| | | | |
| | 105,501 | | | Public Service Enterprise Group Inc | | | | | | | | | | $ | 7,040,082 | |
| | 75,663 | | | WEC Energy Group Inc | | | | | | | | | | | 7,344,607 | |
| | | | Total Multi-Utilities | | | | | | | | | | | 20,685,641 | |
| | | | |
| | | | Oil, Gas & Consumable Fuels – 2.4% | | | | | | | | | |
| | | | |
| | 34,337 | | | Cenovus Energy Inc | | | | | | | | | | | 421,658 | |
| | 12,521 | | | Cheniere Energy Inc | | | | | | | | | | | 1,269,880 | |
| | 77,267 | | | Chevron Corp | | | | | | | | | | | 9,067,283 | |
| | 9,675 | | | CNX Resources Corp, (3) | | | | | | | | | | | 133,031 | |
| | 81,811 | | | ConocoPhillips | | | | | | | | | | | 5,905,118 | |
| | 15,719 | | | Continental Resources Inc | | | | | | | | | | | 703,582 | |
| | 183,113 | | | Exxon Mobil Corp | | | | | | | | | | | 11,204,685 | |
| | 29,828 | | | Hess Corp | | | | | | | | | | | 2,208,167 | |
| | 42,055 | | | Marathon Petroleum Corp | | | | | | | | | | | 2,691,099 | |
| | 17,934 | | | Ovintiv Inc | | | | | | | | | | | 604,376 | |
| | 26,554 | | | Phillips 66 | | | | | | | | | | | 1,924,103 | |
| | 26,407 | | | Suncor Energy Inc | | | | | | | | | | | 660,967 | |
| | 25,961 | | | Valero Energy Corp | | | | | | | | | | | 1,949,931 | |
| | | | Total Oil, Gas & Consumable Fuels | | | | | | | | | | | 38,743,880 | |
| | | | |
| | | | Pharmaceuticals – 3.8% | | | | | | | | | |
| | | | |
| | 123,308 | | | Bristol-Myers Squibb Co | | | | | | | | | | | 7,688,254 | |
| | 36,480 | | | Eli Lilly & Co | | | | | | | | | | | 10,076,506 | |
| | 115,829 | | | Johnson & Johnson | | | | | | | | | | | 19,814,867 | |
| | 112,570 | | | Merck & Co Inc | | | | | | | | | | | 8,627,365 | |
| | 241,787 | | | Pfizer Inc | | | | | | | | | | | 14,277,522 | |
| | | | Total Pharmaceuticals | | | | | | | | | | | 60,484,514 | |
| | | | |
| | | | Professional Services – 0.3% | | | | | | | | | |
| | | | |
| | 21,760 | | | CoStar Group Inc, (3) | | | | | | | | | | | 1,719,693 | |
| | 9,803 | | | ManpowerGroup Inc | | | | | | | | | | | 954,126 | |
| | 23,554 | | | TransUnion | | | | | | | | | | | 2,793,033 | |
| | | | Total Professional Services | | | | | | | | | | | 5,466,852 | |
| | | | |
| | | | Road & Rail – 1.1% | | | | | | | | | |
| | | | |
| | 32,442 | | | Canadian Pacific Railway Ltd | | | | | | | | | | | 2,333,878 | |
| | 4,425 | | | Lyft Inc, Class A, (3) | | | | | | | | | | | 189,080 | |
| | 24,761 | | | Norfolk Southern Corp | | | | | | | | | | | 7,371,597 | |
| | 17,586 | | | Old Dominion Freight Line Inc | | | | | | | | | | | 6,302,471 | |
| | 14,397 | | | Uber Technologies Inc, (3) | | | | | | | | | | | 603,666 | |
| | | | Total Road & Rail | | | | | | | | | | | 16,800,692 | |
| | | | |
| | | | Semiconductors & Semiconductor Equipment – 6.6% | | | | | | | | | |
| | | | |
| | 57,354 | | | Advanced Micro Devices Inc, (3) | | | | | | | | | | | 8,253,241 | |
| | 55,271 | | | Applied Materials Inc | | | | | | | | | | | 8,697,444 | |
| | 21,360 | | | Broadcom Inc | | | | | | | | | | | 14,213,158 | |
| | 8,507 | | | Enphase Energy Inc, (3) | | | | | | | | | | | 1,556,271 | |
| | 179,454 | | | Intel Corp | | | | | | | | | | | 9,241,881 | |
| | 10,135 | | | Lam Research Corp | | | | | | | | | | | 7,288,585 | |
| | 29,779 | | | Marvell Technology Inc | | | | | | | | | | | 2,605,365 | |
| | 58,435 | | | Micron Technology Inc | | | | | | | | | | | 5,443,220 | |
| | 104,969 | | | NVIDIA Corp | | | | | | | | | | | 30,872,433 | |
| | 19,103 | | | NXP Semiconductors NV | | | | | | | | | | | 4,351,281 | |
| | 32,756 | | | ON Semiconductor Corp, (3) | | | | | | | | | | | 2,224,787 | |
| | 51,967 | | | QUALCOMM Inc | | | | | | | | | | | 9,503,205 | |
| | | | Total Semiconductors & Semiconductor Equipment | | | | | | | | | | | 104,250,871 | |
| | | | |
| | | | Software – 9.8% | | | | | | | | | |
| | | | |
| | 26,284 | | | Adobe Inc, (3) | | | | | | | | | | | 14,904,605 | |
| | 17,788 | | | Autodesk Inc, (3) | | | | | | | | | | | 5,001,808 | |
| | 16,990 | | | Black Knight Inc, (3) | | | | | | | | | | | 1,408,301 | |
| | 552 | | | CDK Global Inc | | | | | | | | | | | 23,040 | |
| | 10,744 | | | Check Point Software Technologies Ltd, (3) | | | | | | | | | | | 1,252,321 | |
| | 308,740 | | | Microsoft Corp | | | | | | | | | | | 103,835,437 | |
31
| | |
| |
| BXMX | | Nuveen S&P 500 Buy-Write Income Fund (continued) |
| | Portfolio of Investments December 31, 2021 |
| | | | | | | | | | | | | | | | |
| Shares | | | Description (1) | | | | | | | | Value | |
| | | | |
| | | | Software (continued) | | | | | | | | | |
| | | | |
| | 81,715 | | | Oracle Corp | | | | | | | | | | $ | 7,126,365 | |
| | 3,531 | | | Palo Alto Networks Inc, (3) | | | | | | | | | | | 1,965,919 | |
| | 46,556 | | | salesforce.com Inc, (3) | | | | | | | | | | | 11,831,276 | |
| | 12,353 | | | ServiceNow Inc, (3) | | | | | | | | | | | 8,018,456 | |
| | 3,018 | | | VMware Inc, Class A | | | | | | | | | | | 349,726 | |
| | | | Total Software | | | | | | | | | | | 155,717,254 | |
| | | | |
| | | | Specialty Retail – 2.3% | | | | | | | | | |
| | | | |
| | 8,358 | | | American Eagle Outfitters Inc | | | | | | | | | | | 211,625 | |
| | 24,636 | | | Best Buy Co Inc | | | | | | | | | | | 2,503,018 | |
| | 4,047 | | | Burlington Stores Inc, (3) | | | | | | | | | | | 1,179,741 | |
| | 14,810 | | | CarMax Inc, (3) | | | | | | | | | | | 1,928,706 | |
| | 3,114 | | | Five Below Inc, (3) | | | | | | | | | | | 644,255 | |
| | 50,051 | | | Home Depot Inc | | | | | | | | | | | 20,771,665 | |
| | 38,481 | | | Lowe’s Cos Inc | | | | | | | | | | | 9,946,569 | |
| | | | Total Specialty Retail | | | | | | | | | | | 37,185,579 | |
| | | | |
| | | | Technology Hardware, Storage & Peripherals – 7.1% | | | | | | | | | |
| | | | |
| | 625,130 | | | Apple Inc | | | | | | | | | | | 111,004,334 | |
| | 48,016 | | | Dell Technologies Inc, Class C, (3) | | | | | | | | | | | 2,697,059 | |
| | | | Total Technology Hardware, Storage & Peripherals | | | | | | | | | | | 113,701,393 | |
| | | | |
| | | | Textiles, Apparel & Luxury Goods – 0.7% | | | | | | | | | |
| | | | |
| | 6,689 | | | Kontoor Brands Inc | | | | | | | | | | | 342,811 | |
| | 2,201 | | | Lululemon Athletica Inc, (3) | | | | | | | | | | | 861,581 | |
| | 63,640 | | | NIKE Inc, Class B | | | | | | | | | | | 10,606,879 | |
| | | | Total Textiles, Apparel & Luxury Goods | | | | | | | | | | | 11,811,271 | |
| | | | |
| | | | Thrifts & Mortgage Finance – 0.0% | | | | | | | | | |
| | | | |
| | 48,313 | | | MGIC Investment Corp | | | | | | | | | | | 696,673 | |
| | | | |
| | | | Tobacco – 0.5% | | | | | | | | | |
| | | | |
| | 153,069 | | | Altria Group Inc | | | | | | | | | | | 7,253,940 | |
| | | | Total Long-Term Investments (cost $519,220,664) | | | | | | | | | | | 1,585,222,473 | |
| | | | |
| Shares | | | Description (1) | | Coupon | | | | | | Value | |
| | | | |
| | | | INVESTMENTS PURCHASED WITH COLLATERAL FROM SECURITIES LENDING – 0.1% | | | | | | | | | | | | |
| | | | |
| | | | MONEY MARKET FUNDS – 0.1% | | | | | | | | | |
| | | | |
| | 1,710,570 | | | State Street Navigator Securities Lending Government Money Market Portfolio, (5) | | | 0.030% | (6) | | | | | | $ | 1,710,570 | |
| | | | Total Investments Purchased with Collateral from Securities Lending (cost $1,710,570) | | | | | | | | | | | 1,710,570 | |
| | | | |
Principal
Amount (000) | | | Description (1) | | Coupon | | | Maturity | | | Value | |
| | | | |
| | | | SHORT-TERM INVESTMENTS – 2.8% | | | | | | | | | | | | |
| | | | |
| | | | REPURCHASE AGREEMENTS – 2.8% | | | | | | | | | |
| | | | |
| $ | 44,224 | | | Repurchase Agreement with Fixed Income Clearing Corporation, dated 12/31/21, repurchase price $44,223,733, collateralized by $45,411,600, U.S. Treasury Bonds, 1.875%, due 2/15/41, value $45,108,262 | | | 0.000% | | | | 1/03/22 | | | $ | 44,223,733 | |
| | | | Total Short-Term Investments (cost $44,223,733) | | | | | | | | | | | 44,223,733 | |
| | | | Total Investments (cost $565,154,967) – 102.5% | | | | | | | | | | | 1,631,156,776 | |
| | | | Other Assets Less Liabilities – (2.5)% (7) | | | | | | | | | | | (40,012,410 | ) |
| | | | Net Assets – 100% | | | | | | | | | | $ | 1,591,144,366 | |
32
Investments in Derivatives
Options Written
| | | | | | | | | | | | | | | | | | | | | | | | |
| Description (8) | | Type | | | Number of
Contracts | | | Notional
Amount (9) | | | Exercise
Price | | | Expiration
Date | | | Value | |
S&P 500® Index | | | Call | | | | (366 | ) | | $ | (172,020,000 | ) | | $ | 4,700 | | | | 1/21/22 | | | $ | (3,839,340 | ) |
S&P 500® Index | | | Call | | | | (366 | ) | | | (174,765,000 | ) | | | 4,775 | | | | 1/21/22 | | | | (1,873,920 | ) |
S&P 500® Index | | | Call | | | | (366 | ) | | | (168,360,000 | ) | | | 4,600 | | | | 2/18/22 | | | | (8,112,390 | ) |
S&P 500® Index | | | Call | | | | (366 | ) | | | (175,680,000 | ) | | | 4,800 | | | | 2/18/22 | | | | (2,790,750 | ) |
S&P 500® Index | | | Call | | | | (366 | ) | | | (170,190,000 | ) | | | 4,650 | | | | 2/18/22 | | | | (6,631,920 | ) |
S&P 500® Index | | | Call | | | | (366 | ) | | | (172,020,000 | ) | | | 4,700 | | | | 2/18/22 | | | | (5,228,310 | ) |
S&P 500® Index | | | Call | | | | (366 | ) | | | (179,340,000 | ) | | | 4,900 | | | | 3/18/22 | | | | (2,142,930 | ) |
S&P 500® Index | | | Call | | | | (366 | ) | | | (175,680,000 | ) | | | 4,800 | | | | 3/18/22 | | | | (4,000,380 | ) |
S&P 500® Index | | | Call | | | | (366 | ) | | | (177,510,000 | ) | | | 4,850 | | | | 3/18/22 | | | | (2,982,900 | ) |
Total Options Written (premiums received $35,656,611) | | | | (3,294 | ) | | $ | (1,565,565,000 | ) | | | | | | | | | | $ | (37,602,840 | ) |
For Fund portfolio compliance purposes, the Fund’s industry classifications refer to any one or more of the industry sub-classifications used by one or more widely recognized market indexes or ratings group indexes, and/or as defined by Fund management. This definition may not apply for purposes of this report, which may combine industry sub-classifications into sectors for reporting ease.
| (1) | All percentages shown in the Portfolio of Investments are based on net assets applicable to common shares unless otherwise noted. |
| (2) | The Fund may designate up to 100% of its common stock investments to cover outstanding options written. |
| (3) | Non-income producing; issuer has not declared an ex-dividend date within the past twelve months. |
| (4) | Investment, or a portion of investment, is out on loan for securities lending. The total value of the securities out on loan as of the end of the reporting period was $1,655,803. |
| (5) | The Fund may loan securities representing up to one third of the market value of its total assets (which includes collateral for securities on loan) to broker dealers, banks, and other institutions. The collateral maintained by the Fund shall have a market value, at the inception of each loan, equal to not less than 100% of the market value of the loaned securities. The cash collateral received by the Fund is invested in this money market fund. |
| (6) | The rate shown is the one-day yield as of the end of the reporting period. |
| (7) | Other assets less liabilities includes the unrealized appreciation (depreciation) of certain over-the-counter (“OTC”) derivatives as presented on the Statement of Assets and Liabilities, when applicable. The unrealized appreciation (depreciation) of OTC cleared and exchange-traded derivatives is recognized as part of the cash collateral at brokers and/or the receivable or payable for variation margin as presented on the Statement of Assets and Liabilities, when applicable. Other assets less liabilities also includes the value of options as presented on the Statement of Assets and Liabilities. |
| (8) | Exchange-traded, unless otherwise noted. |
| (9) | For disclosure purposes, Notional Amount is calculated by multiplying the Number of Contracts by the Exercise Price by 100. |
| ADR | American Depositary Receipt |
| REIT | Real Estate Investment Trust |
See accompanying notes to financial statements.
33
| | |
| DIAX | | Nuveen Dow 30SM Dynamic
Overwrite Fund Portfolio of Investments December 31, 2021 |
| | | | | | | | | | | | | | | | |
| Shares | | | Description (1) | | | | | | | | Value | |
| | | | |
| | | | LONG-TERM INVESTMENTS – 101.6% | | | | | | | | | | | | |
| | | | |
| | | | COMMON STOCKS – 100.8% | | | | | | | | | | | | |
| | | | |
| | | | Aerospace & Defense – 3.7% | | | | | | | | | |
| | | | |
| | 120,281 | | | Boeing Co, (2) | | | | | | | | | | $ | 24,214,971 | |
| | | | |
| | | | Banks – 2.9% | | | | | | | | | |
| | | | |
| | 120,281 | | | JPMorgan Chase & Co | | | | | | | | | | | 19,046,496 | |
| | | | |
| | | | Beverages – 1.1% | | | | | | | | | |
| | | | |
| | 120,281 | | | Coca-Cola Co, (3) | | | | | | | | | | | 7,121,838 | |
| | | | |
| | | | Biotechnology – 4.1% | | | | | | | | | |
| | | | |
| | 120,281 | | | Amgen Inc, (3) | | | | | | | | | | | 27,059,617 | |
| | | | |
| | | | Capital Markets – 7.0% | | | | | | | | | |
| | | | |
| | 120,281 | | | Goldman Sachs Group Inc | | | | | | | | | | | 46,013,497 | |
| | | | |
| | | | Chemicals – 1.0% | | | | | | | | | |
| | | | |
| | 120,281 | | | Dow Inc, (3) | | | | | | | | | | | 6,822,338 | |
| | | | |
| | | | Communications Equipment – 1.2% | | | | | | | | | |
| | | | |
| | 120,281 | | | Cisco Systems Inc | | | | | | | | | | | 7,622,207 | |
| | | | |
| | | | Consumer Finance – 3.0% | | | | | | | | | |
| | | | |
| | 120,281 | | | American Express Co, (3) | | | | | | | | | | | 19,677,972 | |
| | | | |
| | | | Diversified Telecommunication Services – 1.0% | | | | | | | | | |
| | | | |
| | 120,281 | | | Verizon Communications Inc | | | | | | | | | | | 6,249,801 | |
| | | | |
| | | | Entertainment – 2.8% | | | | | | | | | |
| | | | |
| | 120,281 | | | Walt Disney Co, (2), (3) | | | | | | | | | | | 18,630,324 | |
| | | | |
| | | | Food & Staples Retailing – 3.6% | | | | | | | | | |
| | | | |
| | 120,281 | | | Walgreens Boots Alliance Inc | | | | | | | | | | | 6,273,857 | |
| | 120,281 | | | Walmart Inc | | | | | | | | | | | 17,403,458 | |
| | | | Total Food & Staples Retailing | | | | | | | | | | | 23,677,315 | |
| | | | |
| | | | Health Care Providers & Services – 9.2% | | | | | | | | | |
| | | | |
| | 120,281 | | | UnitedHealth Group Inc | | | | | | | | | | | 60,397,901 | |
| | | | |
| | | | Hotels, Restaurants & Leisure – 4.9% | | | | | | | | | |
| | | | |
| | 120,281 | | | McDonald’s Corp | | | | | | | | | | | 32,243,728 | |
| | | | |
| | | | Household Products – 3.0% | | | | | | | | | |
| | | | |
| | 120,281 | | | Procter & Gamble Co | | | | | | | | | | | 19,675,566 | |
| | | | |
| | | | Industrial Conglomerates – 7.1% | | | | | | | | | |
| | | | |
| | 120,281 | | | 3M Co | | | | | | | | | | | 21,365,514 | |
| | 120,281 | | | Honeywell International Inc | | | | | | | | | | | 25,079,791 | |
| | | | Total Industrial Conglomerates | | | | | | | | | | | 46,445,305 | |
| | | | |
| | | | Insurance – 2.9% | | | | | | | | | |
| | | | |
| | 120,281 | | | Travelers Cos Inc | | | | | | | | | | | 18,815,557 | |
| | | | |
| | | | IT Services – 6.4% | | | | | | | | | |
| | | | |
| | 120,281 | | | International Business Machines Corp | | | | | | | | | | | 16,076,758 | |
34
| | | | | | | | | | | | | | | | |
| Shares | | | Description (1) | | | | | | | | Value | |
| | | | |
| | | | IT Services (continued) | | | | | | | | | |
| | | | |
| | 120,281 | | | Visa Inc, Class A | | | | | | | | | | $ | 26,066,096 | |
| | | | Total IT Services | | | | | | | | | | | 42,142,854 | |
| | | | |
| | | | Machinery – 3.8% | | | | | | | | | |
| | | | |
| | 120,281 | | | Caterpillar Inc | | | | | | | | | | | 24,866,894 | |
| | | | |
| | | | Oil, Gas & Consumable Fuels – 2.1% | | | | | | | | | |
| | | | |
| | 120,281 | | | Chevron Corp | | | | | | | | | | | 14,114,975 | |
| | | | |
| | | | Pharmaceuticals – 4.5% | | | | | | | | | |
| | | | |
| | 120,281 | | | Johnson & Johnson | | | | | | | | | | | 20,576,471 | |
| | 120,281 | | | Merck & Co Inc | | | | | | | | | | | 9,218,336 | |
| | | | Total Pharmaceuticals | | | | | | | | | | | 29,794,807 | |
| | | | |
| | | | Semiconductors & Semiconductor Equipment – 0.9% | | | | | | | | | |
| | | | |
| | 120,281 | | | Intel Corp | | | | | | | | | | | 6,194,471 | |
| | | | |
| | | | Software – 10.8% | | | | | | | | | |
| | | | |
| | 120,281 | | | Microsoft Corp, (3) | | | | | | | | | | | 40,452,906 | |
| | 120,281 | | | salesforce.com Inc, (2) | | | | | | | | | | | 30,567,010 | |
| | | | Total Software | | | | | | | | | | | 71,019,916 | |
| | | | |
| | | | Specialty Retail – 7.6% | | | | | | | | | |
| | | | |
| | 120,281 | | | Home Depot Inc | | | | | | | | | | | 49,917,818 | |
| | | | |
| | | | Technology Hardware, Storage & Peripherals – 3.2% | | | | | | | | | |
| | | | |
| | 120,281 | | | Apple Inc, (3) | | | | | | | | | | | 21,358,297 | |
| | | | |
| | | | Textiles, Apparel & Luxury Goods – 3.0% | | | | | | | | | |
| | | | |
| | 120,281 | | | NIKE Inc, Class B | | | | | | | | | | | 20,047,234 | |
| | | | Total Common Stocks (cost $252,154,750) | | | | | | | | | | | 663,171,699 | |
| | | | |
| Shares | | | Description (1) | | | | | | | | Value | |
| | | | |
| | | | EXCHANGE-TRADED FUNDS – 0.8% | | | | | | | | | |
| | | | |
| | 20,000 | | | Vanguard Total Stock Market ETF, (4) | | | | | | | | | | $ | 4,828,800 | |
| | | | Total Exchange-Traded Funds (cost $4,563,901) | | | | | | | | | | | 4,828,800 | |
| | | | Total Long-Term Investments (cost $256,718,651) | | | | | | | | | | | 668,000,499 | |
| | | | |
| Shares | | | Description (1) | | Coupon | | | | | | Value | |
| | | | |
| | | | INVESTMENTS PURCHASED WITH COLLATERAL FROM SECURITIES LENDING – 0.7% | | | | | | | | | | | | |
| | | | |
| | | | MONEY MARKET FUNDS – 0.7% | | | | | | | | | |
| | | | |
| | 4,895,552 | | | State Street Navigator Securities Lending Government Money Market Portfolio, (5) | | | 0.030% | (6) | | | | | | $ | 4,895,552 | |
| | | | Total Investments Purchased with Collateral from Securities Lending (cost $4,895,552) | | | | | | | | | | | 4,895,552 | |
| | | | |
Principal
Amount (000) | | | Description (1) | | Coupon | | | Maturity | | | Value | |
| | | | |
| | | | SHORT-TERM INVESTMENTS – 0.2% | | | | | | | | | | | | |
| | | | |
| | | | REPURCHASE AGREEMENTS – 0.2% | | | | | | | | | |
| | | | |
| $ | 1,319 | | | Repurchase Agreement with Fixed Income Clearing Corporation, dated 12/31/21, repurchase price $1,319,458, collateralized by $1,354,900, U.S. Treasury Bonds, 1.875%, due 2/15/41, value $1,345,850 | | | 0.000% | | | | 1/03/22 | | | $ | 1,319,458 | |
| | | | Total Short-Term Investments (cost $1,319,458) | | | | | | | | | | | 1,319,458 | |
| | | | Total Investments (cost $262,933,661) – 102.5% | | | | | | | | | | | 674,215,509 | |
| | | | Other Assets Less Liabilities – (2.5)% (7) | | | | | | | | | | | (16,497,293 | ) |
| | | | Net Assets – 100% | | | | | | | | | | $ | 657,718,216 | |
35
| | |
| |
| DIAX | | Nuveen 30SM Dynamic Overwrite Fund (continued) |
| | Portfolio of Investments December 31, 2021 |
Investments in Derivatives
Options Written
| | | | | | | | | | | | | | | | | | | | | | | | |
| Description (8) | | Type | | | Number of
Contracts | | | Notional
Amount (9) | | | Exercise
Price | | | Expiration
Date | | | Value | |
S&P 500® Index (premiums received $6,905,813) | | | Call | | | | (780 | ) | | $ | (363,090,000 | ) | | $ | 4,655 | | | | 1/21/22 | | | $ | (11,076,000 | ) |
For Fund portfolio compliance purposes, the Fund’s industry classifications refer to any one or more of the industry sub-classifications used by one or more widely recognized market indexes or ratings group indexes, and/or as defined by Fund management. This definition may not apply for purposes of this report, which may combine industry sub-classifications into sectors for reporting ease.
| (1) | All percentages shown in the Portfolio of Investments are based on net assets applicable to common shares unless otherwise noted. |
| (2) | Non-income producing; issuer has not declared an ex-dividend date within the past twelve months. |
| (3) | Investment, or portion of investment, has been pledged to collateralize the net payment obligations for investments in derivatives. |
| (4) | Investment, or a portion of investment, is out on loan for securities lending. The total value of the securities out on loan as of the end of the reporting period was $4,780,512. |
| (5) | The Fund may loan securities representing up to one third of the market value of its total assets (which includes collateral for securities on loan) to broker dealers, banks, and other institutions. The collateral maintained by the Fund shall have a market value, at the inception of each loan, equal to not less than 100% of the market value of the loaned securities. The cash collateral received by the Fund is invested in this money market fund. |
| (6) | The rate shown is the one-day yield as of the end of the reporting period. |
| (7) | Other assets less liabilities includes the unrealized appreciation (depreciation) of certain over-the-counter (“OTC”) derivatives as presented on the Statement of Assets and Liabilities, when applicable. The unrealized appreciation (depreciation) of OTC cleared and exchange-traded derivatives is recognized as part of the cash collateral at brokers and/or the receivable or payable for variation margin as presented on the Statement of Assets and Liabilities, when applicable. Other assets less liabilities also includes the value of options as presented on the Statement of Assets and Liabilities. |
| (8) | Exchange-traded, unless otherwise noted. |
| (9) | For disclosure purposes, Notional Amount is calculated by multiplying the Number of Contracts by the Exercise Price by 100. |
See accompanying notes to financial statements.
36
| | |
| SPXX | | Nuveen S&P 500 Dynamic
Overwrite Fund Portfolio of Investments December 31, 2021 |
| | | | | | | | | | | | | | | | |
| Shares | | | Description (1) | | | | | | | | Value | |
| | | | |
| | | | LONG-TERM INVESTMENTS – 101.3% | | | | | | | | | | | | |
| | | | |
| | | | COMMON STOCKS – 100.5% (98.6% of Total Investments) | | | | | | | | | | | | |
| | | | |
| | | | Aerospace & Defense – 1.4% | | | | | | | | | |
| | | | |
| | 5,621 | | | Boeing Co, (2) | | | | | | | | | | $ | 1,131,620 | |
| | 1,033 | | | BWX Technologies Inc | | | | | | | | | | | 49,460 | |
| | 716 | | | Curtiss-Wright Corp | | | | | | | | | | | 99,288 | |
| | 793 | | | HEICO Corp | | | | | | | | | | | 114,366 | |
| | 3,921 | | | Lockheed Martin Corp | | | | | | | | | | | 1,393,562 | |
| | 20,963 | | | Raytheon Technologies Corp | | | | | | | | | | | 1,804,076 | |
| | | | Total Aerospace & Defense | | | | | | | | | | | 4,592,372 | |
| | | | |
| | | | Air Freight & Logistics – 0.6% | | | | | | | | | |
| | | | |
| | 8,775 | | | United Parcel Service Inc, Class B | | | | | | | | | | | 1,880,833 | |
| | | | |
| | | | Airlines – 0.0% | | | | | | | | | |
| | | | |
| | 513 | | | American Airlines Group Inc, (2) | | | | | | | | | | | 9,213 | |
| | 5,123 | | | JetBlue Airways Corp, (2) | | | | | | | | | | | 72,952 | |
| | 2,159 | | | Spirit Airlines Inc, (2) | | | | | | | | | | | 47,174 | |
| | | | Total Airlines | | | | | | | | | | | 129,339 | |
| | | | |
| | | | Auto Components – 0.1% | | | | | | | | | |
| | | | |
| | 3,036 | | | Gentex Corp | | | | | | | | | | | 105,805 | |
| | 6,359 | | | Goodyear Tire & Rubber Co, (2) | | | | | | | | | | | 135,574 | |
| | 519 | | | Lear Corp | | | | | | | | | | | 94,951 | |
| | | | Total Auto Components | | | | | | | | | | | 336,330 | |
| | | | |
| | | | Automobiles – 2.5% | | | | | | | | | |
| | | | |
| | 37,389 | | | Ford Motor Co | | | | | | | | | | | 776,569 | |
| | 1,133 | | | Rivian Automotive Inc, (2) | | | | | | | | | | | 117,481 | |
| | 6,938 | | | Tesla Inc, (2) | | | | | | | | | | | 7,331,940 | |
| | | | Total Automobiles | | | | | | | | | | | 8,225,990 | |
| | | | |
| | | | Banks – 5.1% | | | | | | | | | |
| | | | |
| | 13,874 | | | Associated Banc-Corp | | | | | | | | | | | 313,414 | |
| | 69,901 | | | Bank of America Corp | | | | | | | | | | | 3,109,896 | |
| | 906 | | | Bank of Hawaii Corp | | | | | | | | | | | 75,887 | |
| | 1,569 | | | Bank OZK | | | | | | | | | | | 73,006 | |
| | 1,508 | | | BankUnited Inc | | | | | | | | | | | 63,803 | |
| | 1,063 | | | BOK Financial Corp | | | | | | | | | | | 112,136 | |
| | 2,722 | | | Cadence Bank | | | | | | | | | | | 81,088 | |
| | 2,384 | | | Cathay General Bancorp | | | | | | | | | | | 102,488 | |
| | 24,364 | | | Citigroup Inc | | | | | | | | | | | 1,471,342 | |
| | 5,340 | | | Comerica Inc | | | | | | | | | | | 464,580 | |
| | 1,830 | | | Commerce Bancshares Inc | | | | | | | | | | | 125,794 | |
| | 1,323 | | | Community Bank System Inc | | | | | | | | | | | 98,537 | |
| | 872 | | | Cullen/Frost Bankers Inc | | | | | | | | | | | 109,933 | |
| | 2,667 | | | CVB Financial Corp | | | | | | | | | | | 57,100 | |
| | 1,261 | | | East West Bancorp Inc | | | | | | | | | | | 99,215 | |
| | 1,257 | | | Enterprise Financial Services Corp | | | | | | | | | | | 59,192 | |
| | 74 | | | First Citizens BancShares Inc, Class A | | | | | | | | | | | 61,408 | |
| | 2,715 | | | First Financial Bancorp | | | | | | | | | | | 66,192 | |
| | 7,166 | | | First Hawaiian Inc | | | | | | | | | | | 195,847 | |
| | 9,948 | | | First Horizon Corp | | | | | | | | | | | 162,451 | |
| | 15,312 | | | First Midwest Bancorp Inc | | | | | | | | | | | 313,590 | |
| | 21,881 | | | FNB Corp/PA | | | | | | | | | | | 265,417 | |
| | 3,550 | | | Fulton Financial Corp | | | | | | | | | | | 60,350 | |
| | 1,542 | | | Glacier Bancorp Inc | | | | | | | | | | | 87,431 | |
| | 9,405 | | | Hope Bancorp Inc | | | | | | | | | | | 138,348 | |
37
| | |
| |
| SPXX | | Nuveen S&P 500 Dynamic Overwrite Fund (continued) |
| | Portfolio of Investments December 31, 2021 |
| | | | | | | | | | | | | | | | |
| Shares | | | Description (1) | | | | | | | | Value | |
| | | | |
| | | | Banks (continued) | | | | | | | | | |
| | | | |
| | 730 | | | Independent Bank Corp | | | | | | | | | | $ | 59,517 | |
| | 4,753 | | | Investors Bancorp Inc | | | | | | | | | | | 72,008 | |
| | 32,606 | | | JPMorgan Chase & Co | | | | | | | | | | | 5,163,160 | |
| | 2,579 | | | PacWest Bancorp | | | | | | | | | | | 116,493 | |
| | 1,012 | | | Pinnacle Financial Partners Inc | | | | | | | | | | | 96,646 | |
| | 2,043 | | | Popular Inc | | | | | | | | | | | 167,608 | |
| | 1,205 | | | Renasant Corp | | | | | | | | | | | 45,730 | |
| | 658 | | | SouthState Corp | | | | | | | | | | | 52,712 | |
| | 2,872 | | | Sterling Bancorp/DE | | | | | | | | | | | 74,069 | |
| | 650 | | | Texas Capital Bancshares Inc, (2) | | | | | | | | | | | 39,163 | |
| | 2,690 | | | Towne Bank/Portsmouth VA | | | | | | | | | | | 84,977 | |
| | 2,094 | | | United Community Banks Inc/GA | | | | | | | | | | | 75,258 | |
| | 10,088 | | | Valley National Bancorp | | | | | | | | | | | 138,710 | |
| | 36,733 | | | Wells Fargo & Co | | | | | | | | | | | 1,762,449 | |
| | 660 | | | Western Alliance Bancorp | | | | | | | | | | | 71,049 | |
| | 8,676 | | | Zions Bancorp NA | | | | | | | | | | | 547,976 | |
| | | | Total Banks | | | | | | | | | | | 16,335,970 | |
| | | | |
| | | | Beverages – 2.0% | | | | | | | | | |
| | | | |
| | 51,740 | | | Coca-Cola Co, (3) | | | | | | | | | | | 3,063,526 | |
| | 19,878 | | | PepsiCo Inc | | | | | | | | | | | 3,453,007 | |
| | | | Total Beverages | | | | | | | | | | | 6,516,533 | |
| | | | |
| | | | Biotechnology – 1.8% | | | | | | | | | |
| | | | |
| | 16,944 | | | AbbVie Inc | | | | | | | | | | | 2,294,218 | |
| | 7,117 | | | Amgen Inc | | | | | | | | | | | 1,601,112 | |
| | 1,457 | | | Biogen Inc, (2) | | | | | | | | | | | 349,563 | |
| | 661 | | | BioMarin Pharmaceutical Inc, (2) | | | | | | | | | | | 58,399 | |
| | 551 | | | Horizon Therapeutics Plc, (2) | | | | | | | | | | | 59,376 | |
| | 3,054 | | | Moderna Inc, (2) | | | | | | | | | | | 775,655 | |
| | 2,650 | | | Vertex Pharmaceuticals Inc, (2) | | | | | | | | | | | 581,940 | |
| | | | Total Biotechnology | | | | | | | | | | | 5,720,263 | |
| | | | |
| | | | Building Products – 0.2% | | | | | | | | | |
| | | | |
| | 563 | | | Carlisle Cos Inc | | | | | | | | | | | 139,692 | |
| | 424 | | | Lennox International Inc | | | | | | | | | | | 137,529 | |
| | 1,102 | | | Owens Corning | | | | | | | | | | | 99,731 | |
| | 548 | | | Simpson Manufacturing Co Inc | | | | | | | | | | | 76,210 | |
| | 397 | | | Trex Co Inc, (2) | | | | | | | | | | | 53,607 | |
| | 855 | | | UFP Industries Inc | | | | | | | | | | | 78,668 | |
| | | | Total Building Products | | | | | | | | | | | 585,437 | |
| | | | |
| | | | Capital Markets – 2.6% | | | | | | | | | |
| | | | |
| | 814 | | | Apollo Global Management Inc | | | | | | | | | | | 58,958 | |
| | 771 | | | Ares Management Corp | | | | | | | | | | | 62,659 | |
| | 975 | | | Blackstone Inc | | | | | | | | | | | 126,155 | |
| | 1,778 | | | Carlyle Group Inc | | | | | | | | | | | 97,612 | |
| | 16,181 | | | Charles Schwab Corp | | | | | | | | | | | 1,360,822 | |
| | 4,910 | | | CME Group Inc | | | | | | | | | | | 1,121,739 | |
| | 307 | | | Federated Hermes Inc | | | | | | | | | | | 11,537 | |
| | 4,325 | | | Goldman Sachs Group Inc | | | | | | | | | | | 1,654,529 | |
| | 492 | | | Hamilton Lane Inc, Class A | | | | | | | | | | | 50,981 | |
| | 496 | | | Houlihan Lokey Inc | | | | | | | | | | | 51,346 | |
| | 9,328 | | | Intercontinental Exchange Inc | | | | | | | | | | | 1,275,791 | |
| | 1,228 | | | Janus Henderson Group PLC | | | | | | | | | | | 51,502 | |
| | 1,763 | | | Jefferies Financial Group Inc | | | | | | | | | | | 68,404 | |
| | 1,435 | | | KKR & Co Inc | | | | | | | | | | | 106,908 | |
| | 1,234 | | | Lazard Ltd, Class A | | | | | | | | | | | 53,839 | |
| | 546 | | | LPL Financial Holdings Inc | | | | | | | | | | | 87,409 | |
| | 17,299 | | | Morgan Stanley | | | | | | | | | | | 1,698,070 | |
| | 2,060 | | | SEI Investments Co | | | | | | | | | | | 125,536 | |
| | 1,398 | | | Stifel Financial Corp | | | | | | | | | | | 98,447 | |
| | 954 | | | Tradeweb Markets Inc, Class A | | | | | | | | | | | 95,534 | |
| | | | Total Capital Markets | | | | | | | | | | | 8,257,778 | |
38
| | | | | | | | | | | | | | | | |
| Shares | | | Description (1) | | | | | | | | Value | |
| | | | |
| | | | Chemicals – 2.0% | | | | | | | | | |
| | | | |
| | 722 | | | Ashland Global Holdings Inc | | | | | | | | | | $ | 77,731 | |
| | 1,074 | | | Avient Corp | | | | | | | | | | | 60,090 | |
| | 2,854 | | | Axalta Coating Systems Ltd, (2) | | | | | | | | | | | 94,525 | |
| | 337 | | | Balchem Corp | | | | | | | | | | | 56,818 | |
| | 1,117 | | | Cabot Corp | | | | | | | | | | | 62,775 | |
| | 10,837 | | | Dow Inc | | | | | | | | | | | 614,675 | |
| | 5,047 | | | Eastman Chemical Co | | | | | | | | | | | 610,233 | |
| | 3,516 | | | Ecolab Inc | | | | | | | | | | | 824,818 | |
| | 2,357 | | | Element Solutions Inc | | | | | | | | | | | 57,228 | |
| | 976 | | | HB Fuller Co | | | | | | | | | | | 79,056 | |
| | 5,409 | | | Linde PLC | | | | | | | | | | | 1,873,840 | |
| | 152 | | | NewMarket Corp | | | | | | | | | | | 52,093 | |
| | 1,562 | | | Olin Corp | | | | | | | | | | | 89,846 | |
| | 1,353 | | | RPM International Inc | | | | | | | | | | | 136,653 | |
| | 662 | | | Sensient Technologies Corp | | | | | | | | | | | 66,240 | |
| | 4,312 | | | Sherwin-Williams Co | | | | | | | | | | | 1,518,514 | |
| | 1,434 | | | Valvoline Inc | | | | | | | | | | | 53,474 | |
| | | | Total Chemicals | | | | | | | | | | | 6,328,609 | |
| | | | |
| | | | Commercial Services & Supplies – 0.1% | | | | | | | | | |
| | | | |
| | 903 | | | Casella Waste Systems Inc, (2) | | | | | | | | | | | 77,134 | |
| | 638 | | | Clean Harbors Inc, (2) | | | | | | | | | | | 63,653 | |
| | 8,663 | | | CoreCivic Inc, (2) | | | | | | | | | | | 86,370 | |
| | 409 | | | MSA Safety Inc | | | | | | | | | | | 61,743 | |
| | 1,037 | | | Stericycle Inc, (2) | | | | | | | | | | | 61,847 | |
| | 383 | | | Tetra Tech Inc | | | | | | | | | | | 65,034 | |
| | 258 | | | UniFirst Corp/MA | | | | | | | | | | | 54,283 | |
| | | | Total Commercial Services & Supplies | | | | | | | | | | | 470,064 | |
| | | | |
| | | | Communications Equipment – 1.3% | | | | | | | | | |
| | | | |
| | 1,059 | | | Ciena Corp, (2) | | | | | | | | | | | 81,511 | |
| | 51,860 | | | Cisco Systems Inc | | | | | | | | | | | 3,286,368 | |
| | 2,967 | | | Motorola Solutions Inc | | | | | | | | | | | 806,134 | |
| | 4,298 | | | Viavi Solutions Inc, (2) | | | | | | | | | | | 75,731 | |
| | | | Total Communications Equipment | | | | | | | | | | | 4,249,744 | |
| | | | |
| | | | Construction & Engineering – 0.1% | | | | | | | | | |
| | | | |
| | 740 | | | EMCOR Group Inc | | | | | | | | | | | 94,269 | |
| | 1,196 | | | KBR Inc | | | | | | | | | | | 56,953 | |
| | 595 | | | MasTec Inc, (2) | | | | | | | | | | | 54,907 | |
| | 275 | | | Valmont Industries Inc | | | | | | | | | | | 68,887 | |
| | | | Total Construction & Engineering | | | | | | | | | | | 275,016 | |
| | | | |
| | | | Construction Materials – 0.0% | | | | | | | | | |
| | | | |
| | 546 | | | Eagle Materials Inc | | | | | | | | | | | 90,887 | |
| | | | |
| | | | Consumer Finance – 0.4% | | | | | | | | | |
| | | | |
| | 1,842 | | | Ally Financial Inc | | | | | | | | | | | 87,697 | |
| | 7,538 | | | American Express Co | | | | | | | | | | | 1,233,217 | |
| | 1,250 | | | Santander Consumer USA Holdings Inc | | | | | | | | | | | 52,525 | |
| | | | Total Consumer Finance | | | | | | | | | | | 1,373,439 | |
| | | | |
| | | | Containers & Packaging – 0.5% | | | | | | | | | |
| | | | |
| | 1,196 | | | AptarGroup Inc | | | | | | | | | | | 146,486 | |
| | 8,328 | | | Ardagh Metal Packaging SA, (2) | | | | | | | | | | | 75,202 | |
| | 3,220 | | | Avery Dennison Corp | | | | | | | | | | | 697,355 | |
| | 860 | | | Berry Global Group Inc, (2) | | | | | | | | | | | 63,451 | |
| | 1,261 | | | Crown Holdings Inc | | | | | | | | | | | 139,492 | |
| | 4,826 | | | Graphic Packaging Holding Co | | | | | | | | | | | 94,107 | |
| | 2,023 | | | Silgan Holdings Inc | | | | | | | | | | | 86,665 | |
| | 2,568 | | | Sonoco Products Co | | | | | | | | | | | 148,662 | |
| | | | Total Containers & Packaging | | | | | | | | | | | 1,451,420 | |
39
| | |
| |
| SPXX | | Nuveen S&P 500 Dynamic Overwrite Fund (continued) |
| | Portfolio of Investments December 31, 2021 |
| | | | | | | | | | | | | | | | |
| Shares | | | Description (1) | | | | | | | | Value | |
| | | | |
| | | | Diversified Financial Services – 1.7% | | | | | | | | | |
| | | | |
| | 17,656 | | | Berkshire Hathaway Inc, Class B, (2) | | | | | | | | | | $ | 5,279,144 | |
| | 3,318 | | | Equitable Holdings Inc | | | | | | | | | | | 108,797 | |
| | 1,609 | | | Voya Financial Inc | | | | | | | | | | | 106,693 | |
| | | | Total Diversified Financial Services | | | | | | | | | | | 5,494,634 | |
| | | | |
| | | | Diversified Telecommunication Services – 1.4% | | | | | | | | | |
| | | | |
| | 80,112 | | | AT&T Inc | | | | | | | | | | | 1,970,755 | |
| | 45,978 | | | Verizon Communications Inc | | | | | | | | | | | 2,389,017 | |
| | | | Total Diversified Telecommunication Services | | | | | | | | | | | 4,359,772 | |
| | | | |
| | | | Electric Utilities – 1.0% | | | | | | | | | |
| | | | |
| | 3,632 | | | ALLETE Inc | | | | | | | | | | | 240,983 | |
| | 2,505 | | | Avangrid Inc | | | | | | | | | | | 124,949 | |
| | 13,297 | | | Duke Energy Corp | | | | | | | | | | | 1,394,855 | |
| | 4,531 | | | Hawaiian Electric Industries Inc | | | | | | | | | | | 188,037 | |
| | 3,171 | | | IDACORP Inc | | | | | | | | | | | 359,306 | |
| | 857 | | | MGE Energy Inc | | | | | | | | | | | 70,488 | |
| | 4,414 | | | OGE Energy Corp | | | | | | | | | | | 169,409 | |
| | 1,021 | | | Otter Tail Corp | | | | | | | | | | | 72,920 | |
| | 5,647 | | | PNM Resources Inc | | | | | | | | | | | 257,560 | |
| | 7,150 | | | Portland General Electric Co | | | | | | | | | | | 378,378 | |
| | | | Total Electric Utilities | | | | | | | | | | | 3,256,885 | |
| | | | |
| | | | Electrical Equipment – 1.0% | | | | | | | | | |
| | | | |
| | 5,829 | | | Eaton Corp PLC | | | | | | | | | | | 1,007,368 | |
| | 8,927 | | | Emerson Electric Co | | | | | | | | | | | 829,943 | |
| | 744 | | | Hubbell Inc | | | | | | | | | | | 154,953 | |
| | 4,452 | | | nVent Electric PLC | | | | | | | | | | | 169,176 | |
| | 537 | | | Regal Rexnord Corp | | | | | | | | | | | 91,387 | |
| | 2,492 | | | Rockwell Automation Inc | | | | | | | | | | | 869,334 | |
| | 1,678 | | | Sensata Technologies Holding PLC, (2) | | | | | | | | | | | 103,516 | |
| | | | Total Electrical Equipment | | | | | | | | | | | 3,225,677 | |
| | | | |
| | | | Electronic Equipment, Instruments & Components – 0.4% | | | | | | | | | |
| | | | |
| | 1,177 | | | Arrow Electronics Inc, (2) | | | | | | | | | | | 158,036 | |
| | 1,858 | | | Avnet Inc | | | | | | | | | | | 76,605 | |
| | 914 | | | Cognex Corp | | | | | | | | | | | 71,073 | |
| | 18,044 | | | Corning Inc | | | | | | | | | | | 671,778 | |
| | 1,351 | | | Jabil Inc | | | | | | | | | | | 95,043 | |
| | 422 | | | Littelfuse Inc | | | | | | | | | | | 132,795 | |
| | 1,557 | | | National Instruments Corp | | | | | | | | | | | 67,994 | |
| | 486 | | | TD SYNNEX Corp | | | | | | | | | | | 55,579 | |
| | | | Total Electronic Equipment, Instruments & Components | | | | | | | | | | | 1,328,903 | |
| | | | |
| | | | Energy Equipment & Services – 0.1% | | | | | | | | | |
| | | | |
| | 1,887 | | | ChampionX Corp, (2) | | | | | | | | | | | 38,136 | |
| | 1,072 | | | Dril-Quip Inc, (2) | | | | | | | | | | | 21,097 | |
| | 1,243 | | | Helmerich & Payne Inc | | | | | | | | | | | 29,459 | |
| | 12,922 | | | NOV Inc | | | | | | | | | | | 175,093 | |
| | 4,365 | | | Patterson-UTI Energy Inc | | | | | | | | | | | 36,884 | |
| | 2,888 | | | Technip Energies NV, ADR, (2) | | | | | | | | | | | 41,876 | |
| | 8,230 | | | TechnipFMC PLC, (2) | | | | | | | | | | | 48,722 | |
| | 16,647 | | | Transocean Ltd, (2) | | | | | | | | | | | 45,946 | |
| | | | Total Energy Equipment & Services | | | | | | | | | | | 437,213 | |
| | | | |
| | | | Entertainment – 1.8% | | | | | | | | | |
| | | | |
| | 1,257 | | | AMC Entertainment Holdings Inc, Class, (2) | | | | | | | | | | | 34,190 | |
| | 4,361 | | | Electronic Arts Inc | | | | | | | | | | | 575,216 | |
| | 1,168 | | | Liberty Media Corp-Liberty Formula One, (2) | | | | | | | | | | | 73,864 | |
| | 4,304 | | | Netflix Inc, (2) | | | | | | | | | | | 2,592,902 | |
| | 16,984 | | | Walt Disney Co, (2) | | | | | | | | | | | 2,630,652 | |
| | | | Total Entertainment | | | | | | | | | | | 5,906,824 | |
40
| | | | | | | | | | | | | | | | |
| Shares | | | Description (1) | | | | | | | | Value | |
| | | | |
| | | | Equity Real Estate Investment Trust – 3.1% | | | | | | | | | |
| | | | |
| | 7,301 | | | Acadia Realty Trust | | | | | | | | | | $ | 159,381 | |
| | 1,995 | | | Agree Realty Corp | | | | | | | | | | | 142,363 | |
| | 4,624 | | | American Homes 4 Rent, Class A | | | | | | | | | | | 201,653 | |
| | 4,541 | | | American Tower Corp | | | | | | | | | | | 1,328,242 | |
| | 1,674 | | | Apartment Income REIT Corp | | | | | | | | | | | 91,518 | |
| | 5,269 | | | Apple Hospitality REIT Inc | | | | | | | | | | | 85,094 | |
| | 4,774 | | | Brandywine Realty Trust | | | | | | | | | | | 64,067 | |
| | 4,722 | | | Brixmor Property Group Inc | | | | | | | | | | | 119,986 | |
| | 3,021 | | | Broadstone Net Lease Inc | | | | | | | | | | | 74,981 | |
| | 1,563 | | | Camden Property Trust | | | | | | | | | | | 279,277 | |
| | 2,164 | | | Corporate Office Properties Trust | | | | | | | | | | | 60,527 | |
| | 2,572 | | | Cousins Properties Inc | | | | | | | | | | | 103,600 | |
| | 4,593 | | | Crown Castle International Corp | | | | | | | | | | | 958,743 | |
| | 1,729 | | | CyrusOne Inc | | | | | | | | | | | 155,126 | |
| | 601 | | | EastGroup Properties Inc | | | | | | | | | | | 136,938 | |
| | 14,750 | | | Empire State Realty Trust Inc | | | | | | | | | | | 131,275 | |
| | 947 | | | Equinix Inc | | | | | | | | | | | 801,010 | |
| | 2,548 | | | Equity Commonwealth, (2) | | | | | | | | | | | 65,993 | |
| | 2,806 | | | Equity LifeStyle Properties Inc | | | | | | | | | | | 245,974 | |
| | 2,766 | | | First Industrial Realty Trust Inc | | | | | | | | | | | 183,109 | |
| | 1,529 | | | Gaming and Leisure Properties Inc | | | | | | | | | | | 74,401 | |
| | 2,741 | | | GEO Group Inc | | | | | | | | | | | 21,243 | |
| | 2,811 | | | Healthcare Realty Trust Inc | | | | | | | | | | | 88,940 | |
| | 3,146 | | | Healthcare Trust of America Inc, Class A | | | | | | | | | | | 105,045 | |
| | 2,487 | | | Highwoods Properties Inc | | | | | | | | | | | 110,895 | |
| | 1,750 | | | Hudson Pacific Properties Inc | | | | | | | | | | | 43,243 | |
| | 144 | | | Innovative Industrial Properties Inc | | | | | | | | | | | 37,859 | |
| | 5,001 | | | Invitation Homes Inc | | | | | | | | | | | 226,745 | |
| | 2,704 | | | JBG SMITH Properties | | | | | | | | | | | 77,632 | |
| | 1,482 | | | Kilroy Realty Corp | | | | | | | | | | | 98,494 | |
| | 561 | | | Lamar Advertising Co | | | | | | | | | | | 68,049 | |
| | 2,182 | | | Life Storage Inc | | | | | | | | | | | 334,239 | |
| | 4,548 | | | LXP Industrial Trust | | | | | | | | | | | 71,040 | |
| | 2,787 | | | Macerich Co | | | | | | | | | | | 48,159 | |
| | 3,371 | | | National Retail Properties Inc | | | | | | | | | | | 162,044 | |
| | 1,038 | | | National Storage Affiliates Trust | | | | | | | | | | | 71,830 | |
| | 1,904 | | | Omega Healthcare Investors Inc | | | | | | | | | | | 56,339 | |
| | 27,284 | | | Paramount Group Inc | | | | | | | | | | | 227,549 | |
| | 6,410 | | | Park Hotels & Resorts Inc, (2) | | | | | | | | | | | 121,021 | |
| | 7,431 | | | Pebblebrook Hotel Trust | | | | | | | | | | | 166,231 | |
| | 2,909 | | | Physicians Realty Trust | | | | | | | | | | | 54,776 | |
| | 3,163 | | | Piedmont Office Realty Trust Inc | | | | | | | | | | | 58,136 | |
| | 694 | | | PS Business Parks Inc | | | | | | | | | | | 127,814 | |
| | 7,659 | | | Retail Opportunity Investments Corp | | | | | | | | | | | 150,116 | |
| | 2,204 | | | Rexford Industrial Realty Inc | | | | | | | | | | | 178,766 | |
| | 3,073 | | | RLJ Lodging Trust | | | | | | | | | | | 42,807 | |
| | 6,229 | | | Sabra Health Care REIT Inc | | | | | | | | | | | 84,341 | |
| | 1,070 | | | Seritage Growth Properties, (2) | | | | | | | | | | | 14,199 | |
| | 2,605 | | | Service Properties Trust | | | | | | | | | | | 22,898 | |
| | 4,261 | | | SITE Centers Corp | | | | | | | | | | | 67,452 | |
| | 3,190 | | | SL Green Realty Corp | | | | | | | | | | | 228,723 | |
| | 2,225 | | | Spirit Realty Capital Inc | | | | | | | | | | | 107,223 | |
| | 2,613 | | | STAG Industrial Inc | | | | | | | | | | | 125,319 | |
| | 2,447 | | | STORE Capital Corp | | | | | | | | | | | 84,177 | |
| | 4,169 | | | Summit Hotel Properties Inc, (2) | | | | | | | | | | | 40,689 | |
| | 1,134 | | | Sun Communities Inc | | | | | | | | | | | 238,106 | |
| | 1,471 | | | Terreno Realty Corp | | | | | | | | | | | 125,462 | |
| | 847 | | | Ventas Inc | | | | | | | | | | | 43,299 | |
| | 5,572 | | | Veris Residential Inc, (2) | | | | | | | | | | | 102,413 | |
| | 3,426 | | | VICI Properties Inc | | | | | | | | | | | 103,157 | |
| | 2,890 | | | WP Carey Inc | | | | | | | | | | | 237,125 | |
| | 2,214 | | | Xenia Hotels & Resorts Inc, (2) | | | | | | | | | | | 40,096 | |
| | | | Total Equity Real Estate Investment Trust | | | | | | | | | | | 9,876,949 | |
| | | | |
| | | | Food & Staples Retailing – 0.7% | | | | | | | | | |
| | | | |
| | 362 | | | Casey’s General Stores Inc | | | | | | | | | | | 71,441 | |
41
| | |
| |
| SPXX | | Nuveen S&P 500 Dynamic Overwrite Fund (continued) |
| | Portfolio of Investments December 31, 2021 |
| | | | | | | | | | | | | | | | |
| Shares | | | Description (1) | | | | | | | | Value | |
| | | | |
| | | | Food & Staples Retailing (continued) | | | | | | | | | |
| | 15,426 | | | Walmart Inc | | | | | | | | | | $ | 2,231,988 | |
| | | | Total Food & Staples Retailing | | | | | | | | | | | 2,303,429 | |
| | | | |
| | | | Food Products – 0.4% | | | | | | | | | |
| | | | |
| | 12,387 | | | Archer-Daniels-Midland Co | | | | | | | | | | | 837,237 | |
| | 884 | | | Bunge Ltd | | | | | | | | | | | 82,530 | |
| | 3,774 | | | Flowers Foods Inc | | | | | | | | | | | 103,672 | |
| | 2,671 | | | Hostess Brands Inc, (2) | | | | | | | | | | | 54,542 | |
| | 907 | | | Ingredion Inc | | | | | | | | | | | 87,653 | |
| | 338 | | | J & J Snack Foods Corp | | | | | | | | | | | 53,391 | |
| | 427 | | | Lancaster Colony Corp | | | | | | | | | | | 70,711 | |
| | 880 | | | Post Holdings Inc, (2) | | | | | | | | | | | 99,202 | |
| | | | Total Food Products | | | | | | | | | | | 1,388,938 | |
| | | | |
| | | | Gas Utilities – 0.2% | | | | | | | | | |
| | | | |
| | 464 | | | Chesapeake Utilities Corp | | | | | | | | | | | 67,656 | |
| | 1,299 | | | National Fuel Gas Co | | | | | | | | | | | 83,058 | |
| | 2,125 | | | New Jersey Resources Corp | | | | | | | | | | | 87,252 | |
| | 1,701 | | | ONE Gas Inc | | | | | | | | | | | 131,981 | |
| | 860 | | | Southwest Gas Holdings Inc | | | | | | | | | | | 60,243 | |
| | 1,527 | | | Spire Inc | | | | | | | | | | | 99,591 | |
| | 3,872 | | | UGI Corp | | | | | | | | | | | 177,763 | |
| | | | Total Gas Utilities | | | | | | | | | | | 707,544 | |
| | | | |
| | | | Health Care Equipment & Supplies – 2.4% | | | | | | | | | |
| | | | |
| | 19,910 | | | Abbott Laboratories | | | | | | | | | | | 2,802,133 | |
| | 25,472 | | | Boston Scientific Corp, (2) | | | | | | | | | | | 1,082,051 | |
| | 821 | | | Globus Medical Inc, (2) | | | | | | | | | | | 59,276 | |
| | 216 | | | Insulet Corp, (2) | | | | | | | | | | | 57,471 | |
| | 1,151 | | | Integra LifeSciences Holdings Corp, (2) | | | | | | | | | | | 77,106 | |
| | 4,778 | | | Intuitive Surgical Inc, (2) | | | | | | | | | | | 1,716,735 | |
| | 285 | | | Masimo Corp, (2) | | | | | | | | | | | 83,442 | |
| | 17,840 | | | Medtronic PLC | | | | | | | | | | | 1,845,548 | |
| | | | Total Health Care Equipment & Supplies | | | | | | | | | | | 7,723,762 | |
| | | | |
| | | | Health Care Providers & Services – 3.4% | | | | | | | | | |
| | | | |
| | 31 | | | Acadia Healthcare Co Inc, (2) | | | | | | | | | | | 1,882 | |
| | 4,100 | | | Anthem Inc | | | | | | | | | | | 1,900,514 | |
| | 149 | | | Chemed Corp | | | | | | | | | | | 78,827 | |
| | 13,155 | | | CVS Health Corp | | | | | | | | | | | 1,357,070 | |
| | 989 | | | Encompass Health Corp | | | | | | | | | | | 64,542 | |
| | 2,553 | | | Humana Inc | | | | | | | | | | | 1,184,234 | |
| | 1,646 | | | Laboratory Corp of America Holdings, (2) | | | | | | | | | | | 517,190 | |
| | 93 | | | McKesson Corp | | | | | | | | | | | 23,117 | |
| | 321 | | | Molina Healthcare Inc, (2) | | | | | | | | | | | 102,104 | |
| | 1,213 | | | Tenet Healthcare Corp, (2) | | | | | | | | | | | 99,090 | |
| | 10,938 | | | UnitedHealth Group Inc | | | | | | | | | | | 5,492,407 | |
| | | | Total Health Care Providers & Services | | | | | | | | | | | 10,820,977 | |
| | | | |
| | | | Health Care Technology – 0.1% | | | | | | | | | |
| | | | |
| | 2,831 | | | Change Healthcare Inc, (2) | | | | | | | | | | | 60,527 | |
| | 352 | | | Omnicell Inc, (2) | | | | | | | | | | | 63,515 | |
| | 465 | | | Veeva Systems Inc, Class A | | | | | | | | | | | 118,798 | |
| | | | Total Health Care Technology | | | | | | | | | | | 242,840 | |
| | | | |
| | | | Hotels, Restaurants & Leisure – 2.0% | | | | | | | | | |
| | | | |
| | 344 | | | Airbnb Inc, (2) | | | | | | | | | | | 57,272 | |
| | 1,826 | | | Aramark | | | | | | | | | | | 67,288 | |
| | 481 | | | Booking Holdings Inc, (2) | | | | | | | | | | | 1,154,030 | |
| | 237 | | | Caesars Entertainment Inc, (2) | | | | | | | | | | | 22,167 | |
| | 714 | | | Choice Hotels International Inc | | | | | | | | | | | 111,377 | |
| | 278 | | | Churchill Downs Inc | | | | | | | | | | | 66,970 | |
| | 1,128 | | | Hilton Grand Vacations Inc, (2) | | | | | | | | | | | 58,780 | |
| | 980 | | | Hyatt Hotels Corp, Class A, (2) | | | | | | | | | | | 93,982 | |
| | 10,125 | | | McDonald’s Corp | | | | | | | | | | | 2,714,209 | |
| | 1,094 | | | Penn National Gaming Inc, (2) | | | | | | | | | | | 56,724 | |
| | 714 | | | Royal Caribbean Cruises Ltd, (2) | | | | | | | | | | | 54,906 | |
42
| | | | | | | | | | | | | | | | |
| Shares | | | Description (1) | | | | | | | | Value | |
| | | | |
| | | | Hotels, Restaurants & Leisure (continued) | | | | | | | | | |
| | | | |
| | 15,767 | | | Starbucks Corp | | | | | | | | | | $ | 1,844,266 | |
| | 173 | | | Vail Resorts Inc | | | | | | | | | | | 56,727 | |
| | 2,415 | | | Wendy’s Co | | | | | | | | | | | 57,598 | |
| | 955 | | | Wyndham Hotels & Resorts Inc | | | | | | | | | | | 85,616 | |
| | 1,140 | | | Yum China Holdings Inc | | | | | | | | | | | 56,817 | |
| | | | Total Hotels, Restaurants & Leisure | | | | | | | | | | | 6,558,729 | |
| | | | |
| | | | Household Durables – 0.2% | | | | | | | | | |
| | | | |
| | 5,382 | | | KB Home | | | | | | | | | | | 240,737 | |
| | 1,448 | | | Leggett & Platt Inc | | | | | | | | | | | 59,600 | |
| | 491 | | | Meritage Homes Corp, (2) | | | | | | | | | | | 59,931 | |
| | 559 | | | Taylor Morrison Home Corp, (2) | | | | | | | | | | | 19,543 | |
| | 4,004 | | | Tempur Sealy International Inc | | | | | | | | | | | 188,308 | |
| | 1,454 | | | Toll Brothers Inc | | | | | | | | | | | 105,255 | |
| | 219 | | | TopBuild Corp, (2) | | | | | | | | | | | 60,424 | |
| | | | Total Household Durables | | | | | | | | | | | 733,798 | |
| | | | |
| | | | Household Products – 2.0% | | | | | | | | | |
| | | | |
| | 13,283 | | | Colgate-Palmolive Co | | | | | | | | | | | 1,133,571 | |
| | 8,653 | | | Kimberly-Clark Corp | | | | | | | | | | | 1,236,687 | |
| | 24,802 | | | Procter & Gamble Co | | | | | | | | | | | 4,057,111 | |
| | 1,619 | | | Reynolds Consumer Products Inc | | | | | | | | | | | 50,837 | |
| | | | Total Household Products | | | | | | | | | | | 6,478,206 | |
| | | | |
| | | | Independent Power & Renewable Electricity Producers – 0.1% | | | | | | | | | |
| | | | |
| | 617 | | | Sunnova Energy International Inc, (2) | | | | | | | | | | | 17,227 | |
| | 8,660 | | | Vistra Corp | | | | | | | | | | | 197,188 | |
| | | | Total Independent Power & Renewable Electricity Producers | | | | | | | | | | | 214,415 | |
| | | | |
| | | | Industrial Conglomerates – 1.2% | | | | | | | | | |
| | | | |
| | 9,198 | | | 3M Co | | | | | | | | | | | 1,633,841 | |
| | 11,326 | | | Honeywell International Inc | | | | | | | | | | | 2,361,584 | |
| | | | Total Industrial Conglomerates | | | | | | | | | | | 3,995,425 | |
| | | | |
| | | | Insurance – 1.7% | | | | | | | | | |
| | | | |
| | 226 | | | Alleghany Corp, (2) | | | | | | | | | | | 150,875 | |
| | 683 | | | American Financial Group Inc | | | | | | | | | | | 93,790 | |
| | 3,629 | | | Arch Capital Group Ltd, (2) | | | | | | | | | | | 161,309 | |
| | 5,688 | | | Arthur J Gallagher & Co | | | | | | | | | | | 965,083 | |
| | 694 | | | Athene Holding Ltd, Class, (2) | | | | | | | | | | | 57,831 | |
| | 1,126 | | | Axis Capital Holdings Ltd | | | | | | | | | | | 61,333 | |
| | 2,869 | | | CNA Financial Corp | | | | | | | | | | | 126,466 | |
| | 2,375 | | | CNO Financial Group Inc | | | | | | | | | | | 56,620 | |
| | 774 | | | First American Financial Corp | | | | | | | | | | | 60,550 | |
| | 863 | | | Hanover Insurance Group Inc | | | | | | | | | | | 113,105 | |
| | 134 | | | Markel Corp, (2) | | | | | | | | | | | 165,356 | |
| | 8,946 | | | Marsh & McLennan Cos Inc | | | | | | | | | | | 1,554,994 | |
| | 6,140 | | | Old Republic International Corp | | | | | | | | | | | 150,921 | |
| | 548 | | | Primerica Inc | | | | | | | | | | | 83,992 | |
| | 1,511 | | | Reinsurance Group of America Inc | | | | | | | | | | | 165,439 | |
| | 503 | | | RenaissanceRe Holdings Ltd | | | | | | | | | | | 85,173 | |
| | 654 | | | RLI Corp | | | | | | | | | | | 73,313 | |
| | 1,002 | | | Selective Insurance Group Inc | | | | | | | | | | | 82,104 | |
| | 6,781 | | | Travelers Cos Inc | | | | | | | | | | | 1,060,752 | |
| | 3,092 | | | Unum Group | | | | | | | | | | | 75,970 | |
| | | | Total Insurance | | | | | | | | | | | 5,344,976 | |
| | | | |
| | | | Interactive Media & Services – 6.8% | | | | | | | | | |
| | | | |
| | 2,553 | | | Alphabet Inc, Class A, (2) | | | | | | | | | | | 7,396,143 | |
| | 2,629 | | | Alphabet Inc, Class C, (2) | | | | | | | | | | | 7,607,248 | |
| | 21,101 | | | Meta Platforms Inc, (2), (3) | | | | | | | | | | | 7,097,322 | |
| | | | Total Interactive Media & Services | | | | | | | | | | | 22,100,713 | |
| | | | |
| | | | Internet & Direct Marketing Retail – 4.2% | | | | | | | | | |
| | | | |
| | 3,858 | | | Amazon.com Inc, (2) | | | | | | | | | | | 12,863,884 | |
43
| | |
| |
| SPXX | | Nuveen S&P 500 Dynamic Overwrite Fund (continued) |
| | Portfolio of Investments December 31, 2021 |
| | | | | | | | | | | | | | | | |
| Shares | | | Description (1) | | | | | | | | Value | |
| | | | |
| | | | Internet & Direct Marketing Retail (continued) | | | | | | | | | |
| | | | |
| | 9,207 | | | eBay Inc | | | | | | | | | | $ | 612,265 | |
| | | | Total Internet & Direct Marketing Retail | | | | | | | | | | | 13,476,149 | |
| | | | |
| | | | Internet Software & Services – 0.0% | | | | | | | | | |
| | | | |
| | 151 | | | Snowflake Inc, Class A, (2) | | | | | | | | | | | 51,151 | |
| | | | |
| | | | IT Services – 4.4% | | | | | | | | | |
| | | | |
| | 6,194 | | | Accenture PLC, Class A | | | | | | | | | | | 2,567,723 | |
| | 1,592 | | | Amdocs Ltd | | | | | | | | | | | 119,145 | |
| | 411 | | | Block Inc, (2) | | | | | | | | | | | 66,381 | |
| | 270 | | | CACI International Inc, Class A, (2) | | | | | | | | | | | 72,687 | |
| | 9,519 | | | Fidelity National Information Services Inc | | | | | | | | | | | 1,038,999 | |
| | 789 | | | GoDaddy Inc, Class A, (2) | | | | | | | | | | | 66,954 | |
| | 8,929 | | | Mastercard Inc | | | | | | | | | | | 3,208,368 | |
| | 1,008 | | | Maximus Inc | | | | | | | | | | | 80,307 | |
| | 258 | | | Okta Inc, (2) | | | | | | | | | | | 57,836 | |
| | 11,603 | | | PayPal Holdings Inc, (2) | | | | | | | | | | | 2,188,094 | |
| | 596 | | | Science Applications International Corp | | | | | | | | | | | 49,820 | |
| | 2,401 | | | VeriSign Inc, (2) | | | | | | | | | | | 609,422 | |
| | 17,979 | | | Visa Inc, Class A | | | | | | | | | | | 3,896,229 | |
| | 3,260 | | | Western Union Co | | | | | | | | | | | 58,158 | |
| | | | Total IT Services | | | | | | | | | | | 14,080,123 | |
| | | | |
| | | | Leisure Products – 0.0% | | | | | | | | | |
| | | | |
| | 2,412 | | | Mattel Inc, (2) | | | | | | | | | | | 52,003 | |
| | | | |
| | | | Life Sciences Tools & Services – 1.5% | | | | | | | | | |
| | | | |
| | 3,753 | | | Agilent Technologies Inc | | | | | | | | | | | 599,166 | |
| | 1,708 | | | Avantor Inc, (2) | | | | | | | | | | | 71,975 | |
| | 869 | | | Bio-Techne Corp | | | | | | | | | | | 449,569 | |
| | 1,004 | | | Bruker Corp | | | | | | | | | | | 84,246 | |
| | 1,483 | | | Illumina Inc, (2) | | | | | | | | | | | 564,193 | |
| | 1,171 | | | QIAGEN NV, (2) | | | | | | | | | | | 65,084 | |
| | 4,185 | | | Thermo Fisher Scientific Inc | | | | | | | | | | | 2,792,399 | |
| | 760 | | | Waters Corp, (2) | | | | | | | | | | | 283,176 | |
| | | | Total Life Sciences Tools & Services | | | | | | | | | | | 4,909,808 | |
| | | | |
| | | | Machinery – 2.4% | | | | | | | | | |
| | | | |
| | 697 | | | AGCO Corp | | | | | | | | | | | 80,866 | |
| | 7,025 | | | Caterpillar Inc | | | | | | | | | | | 1,452,349 | |
| | 1,352 | | | Colfax Corp, (2) | | | | | | | | | | | 62,152 | |
| | 864 | | | Crane Co | | | | | | | | | | | 87,895 | |
| | 3,551 | | | Cummins Inc | | | | | | | | | | | 774,615 | |
| | 4,362 | | | Deere & Co | | | | | | | | | | | 1,495,686 | |
| | 1,802 | | | Donaldson Co Inc | | | | | | | | | | | 106,787 | |
| | 1,445 | | | Federal Signal Corp | | | | | | | | | | | 62,626 | |
| | 944 | | | Franklin Electric Co Inc | | | | | | | | | | | 89,265 | |
| | 2,070 | | | Graco Inc | | | | | | | | | | | 166,883 | |
| | 7,660 | | | Illinois Tool Works Inc | | | | | | | | | | | 1,890,488 | |
| | 1,649 | | | ITT Inc | | | | | | | | | | | 168,511 | |
| | 1,020 | | | Lincoln Electric Holdings Inc | | | | | | | | | | | 142,259 | |
| | 464 | | | Nordson Corp | | | | | | | | | | | 118,445 | |
| | 833 | | | Oshkosh Corp | | | | | | | | | | | 93,888 | |
| | 2,194 | | | Snap-on Inc | | | | | | | | | | | 472,544 | |
| | 1,290 | | | Timken Co | | | | | | | | | | | 89,384 | |
| | 1,321 | | | Toro Co | | | | | | | | | | | 131,981 | |
| | 496 | | | Watts Water Technologies Inc | | | | | | | | | | | 96,308 | |
| | 729 | | | Woodward Inc | | | | | | | | | | | 79,796 | |
| | | | Total Machinery | | | | | | | | | | | 7,662,728 | |
| | | | |
| | | | Media – 1.0% | | | | | | | | | |
| | | | |
| | 37 | | | Cable One Inc | | | | | | | | | | | 65,248 | |
| | 52,511 | | | Comcast Corp, Class A, (3) | | | | | | | | | | | 2,642,879 | |
| | 939 | | | Liberty Broadband Corp, (2) | | | | | | | | | | | 151,273 | |
| | 1,733 | | | Liberty Media Corp-Liberty SiriusXM, (2) | | | | | | | | | | | 88,123 | |
| | 369 | | | Nexstar Media Group Inc | | | | | | | | | | | 55,711 | |
| | 15,383 | | | Sirius XM Holdings Inc | | | | | | | | | | | 97,682 | |
44
| | | | | | | | | | | | | | | | |
| Shares | | | Description (1) | | | | | | | | Value | |
| | | | |
| | | | Media (continued) | | | | | | | | | |
| | | | |
| | 7,195 | | | TEGNA Inc | | | | | | | | | | $ | 133,539 | |
| | | | Total Media | | | | | | | | | | | 3,234,455 | |
| | | | |
| | | | Metals & Mining – 0.4% | | | | | | | | | |
| | | | |
| | 18,887 | | | Freeport-McMoRan Inc | | | | | | | | | | | 788,154 | |
| | 555 | | | Reliance Steel & Aluminum Co | | | | | | | | | | | 90,032 | |
| | 714 | | | Royal Gold Inc | | | | | | | | | | | 75,120 | |
| | 2,973 | | | Southern Copper Corp | | | | | | | | | | | 183,464 | |
| | 2,415 | | | Steel Dynamics Inc | | | | | | | | | | | 149,899 | |
| | | | Total Metals & Mining | | | | | | | | | | | 1,286,669 | |
| | | | |
| | | | Mortgage Real Estate Investment Trust – 0.1% | | | | | | | | | |
| | | | |
| | 4,596 | | | AGNC Investment Corp | | | | | | | | | | | 69,124 | |
| | 10,864 | | | Annaly Capital Management Inc | | | | | | | | | | | 84,956 | |
| | 2,490 | | | Starwood Property Trust Inc REIT | | | | | | | | | | | 60,507 | |
| | | | Total Mortgage Real Estate Investment Trust | | | | | | | | | | | 214,587 | |
| | | | |
| | | | Multiline Retail – 0.4% | | | | | | | | | |
| | | | |
| | 6,058 | | | Target Corp | | | | | | | | | | | 1,402,063 | |
| | | | |
| | | | Multi-Utilities – 0.3% | | | | | | | | | |
| | | | |
| | 3,870 | | | Avista Corp | | | | | | | | | | | 164,436 | |
| | 1,438 | | | Black Hills Corp | | | | | | | | | | | 101,480 | |
| | 7,261 | | | Consolidated Edison Inc | | | | | | | | | | | 619,509 | |
| | 3,092 | | | MDU Resources Group Inc | | | | | | | | | | | 95,357 | |
| | 2,312 | | | NorthWestern Corp | | | | | | | | | | | 132,154 | |
| | | | Total Multi-Utilities | | | | | | | | | | | 1,112,936 | |
| | | | |
| | | | Oil, Gas & Consumable Fuels – 1.6% | | | | | | | | | |
| | | | |
| | 4,761 | | | Antero Midstream Corp | | | | | | | | | | | 46,086 | |
| | 2,207 | | | Antero Resources Corp, (2) | | | | | | | | | | | 38,623 | |
| | 1,087 | | | Cheniere Energy Inc | | | | | | | | | | | 110,244 | |
| | 18,598 | | | Chevron Corp | | | | | | | | | | | 2,182,475 | |
| | 4,084 | | | CNX Resources Corp, (2) | | | | | | | | | | | 56,155 | |
| | 5,980 | | | Comstock Resources Inc, (2) | | | | | | | | | | | 48,378 | |
| | 1,025 | | | Continental Resources Inc | | | | | | | | | | | 45,879 | |
| | 2,317 | | | Coterra Energy Inc | | | | | | | | | | | 44,023 | |
| | 6,783 | | | DHT Holdings Inc | | | | | | | | | | | 35,204 | |
| | 1,982 | | | EQT Corp, (2) | | | | | | | | | | | 43,227 | |
| | 4,475 | | | Equitrans Midstream Corp | | | | | | | | | | | 46,272 | |
| | 4,410 | | | Frontline Ltd/Bermuda, (2) | | | | | | | | | | | 31,179 | |
| | 5,508 | | | HollyFrontier Corp | | | | | | | | | | | 180,552 | |
| | 20,994 | | | Marathon Oil Corp | | | | | | | | | | | 344,722 | |
| | 10,200 | | | Marathon Petroleum Corp | | | | | | | | | | | 652,698 | |
| | 6,966 | | | Murphy Oil Corp | | | | | | | | | | | 181,882 | |
| | 4,403 | | | Ovintiv Inc | | | | | | | | | | | 148,381 | |
| | 5,237 | | | PBF Energy Inc, Class A (2) | | | | | | | | | | | 67,924 | |
| | 2,566 | | | PDC Energy Inc | | | | | | | | | | | 125,170 | |
| | 8,289 | | | Phillips 66 | | | | | | | | | | | 600,621 | |
| | 4,093 | | | Range Resources Corp, (2) | | | | | | | | | | | 72,978 | |
| | 192 | | | Renewable Energy Group Inc, (2) | | | | | | | | | | | 8,148 | |
| | 2,100 | | | Scorpio Tankers Inc | | | | | | | | | | | 26,901 | |
| | 2,040 | | | SM Energy Co | | | | | | | | | | | 60,139 | |
| | 14,618 | | | Southwestern Energy Co, (2) | | | | | | | | | | | 68,120 | |
| | 2,864 | | | Talos Energy Inc, (2) | | | | | | | | | | | 28,067 | |
| | | | Total Oil, Gas & Consumable Fuels | | | | | | | | | | | 5,294,048 | |
| | | | |
| | | | Paper & Forest Products – 0.0% | | | | | | | | | |
| | | | |
| | 658 | | | Louisiana-Pacific Corp | | | | | | | | | | | 51,555 | |
| | | | |
| | | | Personal Products – 0.1% | | | | | | | | | |
| | | | |
| | 5,617 | | | Olaplex Holdings Inc, (2) | | | | | | | | | | | 163,623 | |
| | | | |
| | | | Pharmaceuticals – 3.7% | | | | | | | | | |
| | | | |
| | 7,744 | | | Eli Lilly & Co | | | | | | | | | | | 2,139,048 | |
| | 1,326 | | | Jazz Pharmaceuticals PLC, (2) | | | | | | | | | | | 168,932 | |
45
| | |
| |
| SPXX | | Nuveen S&P 500 Dynamic Overwrite Fund (continued) |
| | Portfolio of Investments December 31, 2021 |
| | | | | | | | | | | | | | | | |
| Shares | | | Description (1) | | | | | | | | Value | |
| | | | |
| | | | Pharmaceuticals (continued) | | | | | | | | | |
| | | | |
| | 26,212 | | | Johnson & Johnson | | | | | | | | | | $ | 4,484,087 | |
| | 26,004 | | | Merck & Co Inc | | | | | | | | | | | 1,992,947 | |
| | 54,602 | | | Pfizer Inc, (3) | | | | | | | | | | | 3,224,248 | |
| | 1,490 | | | Royalty Pharma PLC, Class A | | | | | | | | | | | 59,376 | |
| | | | Total Pharmaceuticals | | | | | | | | | | | 12,068,638 | |
| | | | |
| | | | Professional Services – 0.1% | | | | | | | | | |
| | | | |
| | 558 | | | ASGN Inc, (2) | | | | | | | | | | | 68,857 | |
| | 969 | | | Booz Allen Hamilton Holding Corp | | | | | | | | | | | 82,162 | |
| | 1,040 | | | CoStar Group Inc, (2) | | | | | | | | | | | 82,191 | |
| | 488 | | | Exponent Inc | | | | | | | | | | | 56,964 | |
| | 1,386 | | | TransUnion | | | | | | | | | | | 164,352 | |
| | | | Total Professional Services | | | | | | | | | | | 454,526 | |
| | | | |
| | | | Real Estate Management & Development – 0.1% | | | | | | | | | |
| | | | |
| | 588 | | | eXp World Holdings Inc | | | | | | | | | | | 19,810 | |
| | 538 | | | Howard Hughes Corp, (2) | | | | | | | | | | | 54,757 | |
| | 654 | | | Jones Lang LaSalle Inc, (2) | | | | | | | | | | | 176,148 | |
| | 2,209 | | | Kennedy-Wilson Holdings Inc | | | | | | | | | | | 52,751 | |
| | 1,786 | | | Realogy Holdings Corp, (2) | | | | | | | | | | | 30,023 | |
| | | | Total Real Estate Management & Development | | | | | | | | | | | 333,489 | |
| | | | |
| | | | Road & Rail – 0.9% | | | | | | | | | |
| | | | |
| | 121 | | | AMERCO | | | | | | | | | | | 87,874 | |
| | 979 | | | Knight-Swift Transportation Holdings Inc | | | | | | | | | | | 59,660 | |
| | 505 | | | Landstar System Inc | | | | | | | | | | | 90,405 | |
| | 2,429 | | | Schneider National Inc, Class A | | | | | | | | | | | 65,364 | |
| | 1,498 | | | Uber Technologies Inc, (2) | | | | | | | | | | | 62,811 | |
| | 9,444 | | | Union Pacific Corp | | | | | | | | | | | 2,379,227 | |
| | 1,113 | | | Werner Enterprises Inc | | | | | | | | | | | 53,046 | |
| | | | Total Road & Rail | | | | | | | | | | | 2,798,387 | |
| | | | |
| | | | Semiconductors & Semiconductor Equipment – 5.5% | | | | | | | | | |
| | | | |
| | 10,661 | | | Advanced Micro Devices Inc, (2) | | | | | | | | | | | 1,534,118 | |
| | 8,397 | | | Analog Devices Inc | | | | | | | | | | | 1,475,941 | |
| | 196 | | | ASML Holding NV | | | | | | | | | | | 156,043 | |
| | 580 | | | Diodes Inc, (2) | | | | | | | | | | | 63,690 | |
| | 743 | | | Entegris Inc | | | | | | | | | | | 102,965 | |
| | 1,162 | | | GlobalFoundries Inc, (2) | | | | | | | | | | | 75,495 | |
| | 40,583 | | | Intel Corp | | | | | | | | | | | 2,090,025 | |
| | 741 | | | Lattice Semiconductor Corp, (2) | | | | | | | | | | | 57,101 | |
| | 1,025 | | | Marvell Technology Inc | | | | | | | | | | | 89,677 | |
| | 9,964 | | | Microchip Technology Inc | | | | | | | | | | | 867,466 | |
| | 650 | | | MKS Instruments Inc | | | | | | | | | | | 113,211 | |
| | 22,301 | | | NVIDIA Corp | | | | | | | | | | | 6,558,947 | |
| | 973 | | | ON Semiconductor Corp, (2) | | | | | | | | | | | 66,086 | |
| | 11,276 | | | QUALCOMM Inc | | | | | | | | | | | 2,062,042 | |
| | 644 | | | Semtech Corp, (2) | | | | | | | | | | | 57,271 | |
| | 352 | | | Silicon Laboratories Inc, (2) | | | | | | | | | | | 72,660 | |
| | 11,924 | | | Texas Instruments Inc | | | | | | | | | | | 2,247,316 | |
| | | | Total Semiconductors & Semiconductor Equipment | | | | | | | | | | | 17,690,054 | |
| | | | |
| | | | Software – 9.2% | | | | | | | | | |
| | | | |
| | 249 | | | Atlassian Corp PLC, Class A, (2) | | | | | | | | | | | 94,941 | |
| | 2,833 | | | Autodesk Inc, (2) | | | | | | | | | | | 796,611 | |
| | 2,276 | | | Black Knight Inc, (2) | | | | | | | | | | | 188,658 | |
| | 499 | | | Blackline Inc, (2) | | | | | | | | | | | 51,667 | |
| | 5,008 | | | CDK Global Inc | | | | | | | | | | | 209,034 | |
| | 330 | | | Datadog Inc, Class A, (2) | | | | | | | | | | | 58,776 | |
| | 365 | | | DocuSign Inc, (2) | | | | | | | | | | | 55,593 | |
| | 2,055 | | | Dropbox Inc, Class A, (2) | | | | | | | | | | | 50,430 | |
| | 866 | | | Dynatrace Inc, (2) | | | | | | | | | | | 52,263 | |
| | 135 | | | Fair Isaac Corp, (2) | | | | | | | | | | | 58,545 | |
| | 721 | | | Guidewire Software Inc, (2) | | | | | | | | | | | 81,855 | |
| | 79 | | | HubSpot Inc, (2) | | | | | | | | | | | 52,073 | |
| | 66,073 | | | Microsoft Corp | | | | | | | | | | | 22,221,671 | |
46
| | | | | | | | | | | | | | | | |
| Shares | | | Description (1) | | | | | | | | Value | |
| | | | |
| | | | Software (continued) | | | | | | | | | |
| | | | |
| | 55 | | | MicroStrategy Inc, Class A, (2) | | | | | | | | | | $ | 29,947 | |
| | 1,246 | | | Nuance Communications Inc, (2) | | | | | | | | | | | 68,929 | |
| | 16,855 | | | Oracle Corp | | | | | | | | | | | 1,469,925 | |
| | 180 | | | Palo Alto Networks Inc, (2) | | | | | | | | | | | 100,217 | |
| | 592 | | | Pegasystems Inc | | | | | | | | | | | 66,197 | |
| | 454 | | | Rapid7 Inc, (2) | | | | | | | | | | | 53,431 | |
| | 8,882 | | | salesforce.com Inc, (2) | | | | | | | | | | | 2,257,183 | |
| | 1,962 | | | ServiceNow Inc, (2) | | | | | | | | | | | 1,273,554 | |
| | 558 | | | Splunk Inc, (2) | | | | | | | | | | | 64,572 | |
| | 1,934 | | | SS&C Technologies Holdings Inc | | | | | | | | | | | 158,549 | |
| | 1,105 | | | Verint Systems Inc, (2) | | | | | | | | | | | 58,024 | |
| | 474 | | | Workday Inc, Class A, (2) | | | | | | | | | | | 129,487 | |
| | 219 | | | Zscaler Inc, (2) | | | | | | | | | | | 70,371 | |
| | | | Total Software | | | | | | | | | | | 29,772,503 | |
| | | | |
| | | | Specialty Retail – 2.8% | | | | | | | | | |
| | | | |
| | 3,818 | | | Best Buy Co Inc | | | | | | | | | | | 387,909 | |
| | 291 | | | Burlington Stores Inc, (2) | | | | | | | | | | | 84,829 | |
| | 113 | | | Dick’s Sporting Goods Inc | | | | | | | | | | | 12,994 | |
| | 280 | | | Five Below Inc, (2) | | | | | | | | | | | 57,929 | |
| | 517 | | | Floor & Decor Holdings Inc, (2) | | | | | | | | | | | 67,215 | |
| | 11,249 | | | Home Depot Inc | | | | | | | | | | | 4,668,448 | |
| | 8,430 | | | Lowe’s Cos Inc | | | | | | | | | | | 2,178,986 | |
| | 542 | | | Penske Automotive Group Inc | | | | | | | | | | | 58,113 | |
| | 19,493 | | | TJX Cos Inc | | | | | | | | | | | 1,479,909 | |
| | 2,594 | | | Urban Outfitters Inc, (2) | | | | | | | | | | | 76,160 | |
| | | | Total Specialty Retail | | | | | | | | | | | 9,072,492 | |
| | | | |
| | | | Technology Hardware, Storage & Peripherals – 7.4% | | | | | | | | | |
| | | | |
| | 134,273 | | | Apple Inc, (3) | | | | | | | | | | | 23,842,857 | |
| | 1,850 | | | Dell Technologies Inc, (2) | | | | | | | | | | | 103,914 | |
| | | | Total Technology Hardware, Storage & Peripherals | | | | | | | | | | | 23,946,771 | |
| | | | |
| | | | Textiles, Apparel & Luxury Goods – 0.7% | | | | | | | | | |
| | | | |
| | 896 | | | Columbia Sportswear Co | | | | | | | | | | | 87,306 | |
| | 154 | | | Deckers Outdoor Corp, (2) | | | | | | | | | | | 56,412 | |
| | 1,297 | | | Kontoor Brands Inc | | | | | | | | | | | 66,471 | |
| | 12,444 | | | NIKE Inc, Class B | | | | | | | | | | | 2,074,042 | |
| | 1,536 | | | Skechers USA Inc, Class A, (2) | | | | | | | | | | | 66,662 | |
| | | | Total Textiles, Apparel & Luxury Goods | | | | | | | | | | | 2,350,893 | |
| | | | |
| | | | Thrifts & Mortgage Finance – 0.1% | | | | | | | | | |
| | | | |
| | 2,768 | | | MGIC Investment Corp | | | | | | | | | | | 39,914 | |
| | 10,698 | | | New York Community Bancorp Inc | | | | | | | | | | | 130,623 | |
| | 440 | | | PennyMac Financial Services Inc | | | | | | | | | | | 30,703 | |
| | 1,111 | | | Radian Group Inc | | | | | | | | | | | 23,475 | |
| | 3,026 | | | TFS Financial Corp | | | | | | | | | | | 54,075 | |
| | | | Total Thrifts & Mortgage Finance | | | | | | | | | | | 278,790 | |
| | | | |
| | | | Tobacco – 0.8% | | | | | | | | | |
| | | | |
| | 20,615 | | | Altria Group Inc | | | | | | | | | | | 976,945 | |
| | 16,845 | | | Philip Morris International Inc | | | | | | | | | | | 1,600,275 | |
| | | | Total Tobacco | | | | | | | | | | | 2,577,220 | |
| | | | |
| | | | Trading Companies & Distributors – 0.3% | | | | | | | | | |
| | | | |
| | 635 | | | Applied Industrial Technologies Inc | | | | | | | | | | | 65,214 | |
| | 911 | | | MSC Industrial Direct Co Inc | | | | | | | | | | | 76,579 | |
| | 271 | | | SiteOne Landscape Supply Inc, (2) | | | | | | | | | | | 65,658 | |
| | 394 | | | Watsco Inc | | | | | | | | | | | 123,275 | |
| | 1,505 | | | WW Grainger Inc | | | | | | | | | | | 779,951 | |
| | | | Total Trading Companies & Distributors | | | | | | | | | | | 1,110,677 | |
| | | | |
| | | | Water Utilities – 0.1% | | | | | | | | | |
| | | | |
| | 829 | | | American States Water Co | | | | | | | | | | | 85,752 | |
| | 865 | | | California Water Service Group | | | | | | | | | | | 62,159 | |
47
| | |
| |
| SPXX | | Nuveen S&P 500 Dynamic Overwrite Fund (continued) |
| | Portfolio of Investments December 31, 2021 |
| | | | | | | | | | | | | | | | |
| Shares | | | Description (1) | | | | | | | | Value | |
| | | | |
| | | | Water Utilities (continued) | | | | | | | | | |
| | | | |
| | 3,897 | | | Essential Utilities Inc | | | | | | | | | | $ | 209,230 | |
| | | | Total Water Utilities | | | | | | | | | | | 357,141 | |
| | | | |
| | | | Wireless Telecommunication Services – 0.0% | | | | | | | | | |
| | | | |
| | 1,094 | | | United States Cellular Corp, (2) | | | | | | | | | | | 34,483 | |
| | | | Total Common Stocks (cost $117,294,054) | | | | | | | | | | | 325,158,595 | |
| | | | |
| Shares | | | Description (1) | | | | | | | | Value | |
| | | | |
| | | | EXCHANGE-TRADED FUNDS – 0.8% | | | | | | | | | |
| | | | |
| | 10,000 | | | Vanguard Total Stock Market ETF (4) | | | | | | | | | | $ | 2,414,400 | |
| | | | Total Exchange-Traded Funds (cost $1,750,393) | | | | | | | | | | | 2,414,400 | |
| | | | Total Long-Term Investments (cost $119,044,447) | | | | | | | | | | | 327,572,995 | |
| | | | |
| Shares | | | Description (1) | | Coupon | | | | | | Value | |
| | | | |
| | | | INVESTMENTS PURCHASED WITH COLLATERAL FROM SECURITIES LENDING – 0.3% | | | | | | | | | | | | |
| | | | |
| | | | MONEY MARKET FUNDS – 0.3% | | | | | | | | | |
| | | | |
| | 1,013,752 | | | State Street Navigator Securities Lending Government Money Market Portfolio, (5) | | | 0.030% | (6) | | | | | | $ | 1,013,752 | |
| | | | Total Investments Purchased with Collateral from Securities Lending (cost $1,013,752) | | | | | | | | | | | 1,013,752 | |
| | | | |
Principal
Amount (000) | | | Description (1) | | Coupon | | | Maturity | | | Value | |
| | | | |
| | | | SHORT-TERM INVESTMENTS – 0.3% | | | | | | | | | | | | |
| | | | |
| | | | REPURCHASE AGREEMENTS – 0.3% | | | | | | | | | |
| | | | |
| $ | 1,113 | | | Repurchase Agreement with Fixed Income Clearing Corporation, dated 12/31/21, repurchase price $1,113,304, collateralized by $1,143,300, U.S. Treasury bonds, 1.875%, due 2/15/41, value $1,135,663 | | | 0.000% | | | | 1/03/22 | | | $ | 1,113,304 | |
| | | | Total Short-Term Investments (cost $1,113,304) | | | | | | | | | | | 1,113,304 | |
| | | | Total Investments (cost $121,171,503) – 101.9% | | | | | | | | | | | 329,700,051 | |
| | | | Other Assets Less Liabilities – (1.9)% (7) | | | | | | | | | | | (6,284,613 | ) |
| | | | Net Assets – 100% | | | | | | | | | | $ | 323,415,438 | |
Investments in Derivatives
Options Written
| | | | | | | | | | | | | | | | | | | | | | | | |
| Description (8) | | Type | | | Number of
Contracts | | | Notional
Amount (9) | | | Exercise
Price | | | Expiration
Date | | | Value | |
S&P 500® Index (premiums received $3,367,472) | | | Call | | | | (380 | ) | | $ | (176,890,000 | ) | | $ | 4,655 | | | | 1/21/22 | | | $ | (5,396,000 | ) |
For Fund portfolio compliance purposes, the Fund’s industry classifications refer to any one or more of the industry sub-classifications used by one or more widely recognized market indexes or ratings group indexes, and/or as defined by Fund management. This definition may not apply for purposes of this report, which may combine industry sub-classifications into sectors for reporting ease.
| (1) | All percentages shown in the Portfolio of Investments are based on net assets applicable to common shares unless otherwise noted. |
| (2) | Non-income producing; issuer has not declared an ex-dividend date within the past twelve months. |
| (3) | Investment, or portion of investment, has been pledged to collateralize the net payment obligations for investments in derivatives. |
| (4) | Investment, or a portion of investment, is out on loan for securities lending. The total value of the securities out on loan as of the end of the reporting period was $989,904. |
| (5) | The Fund may loan securities representing up to one third of the market value of its total assets (which includes collateral for securities on loan) to broker dealers, banks, and other institutions. The collateral maintained by the Fund shall have a market value, at the inception of each loan, equal to not less than 100% of the market value of the loaned securities. The cash collateral received by the Fund is invested in this money market fund. |
| (6) | The rate shown is the one-day yield as of the end of the reporting period. |
| (7) | Other assets less liabilities includes the unrealized appreciation (depreciation) of certain over-the-counter (“OTC”) derivatives as presented on the Statement of Assets and Liabilities, when applicable. The unrealized appreciation (depreciation) of OTC cleared and exchange-traded derivatives is recognized as part of the cash collateral at brokers and/or the receivable or payable for variation margin as presented on the Statement of Assets and Liabilities, when applicable. Other assets less liabilities also includes the value of options as presented on the Statement of Assets and Liabilities. |
| (8) | Exchange-traded, unless otherwise noted. |
| (9) | For disclosure purposes, Notional Amount is calculated by multiplying the Number of Contracts by the Exercise Price by 100. |
| ADR | American Depositary Receipt |
| REIT | Real Estate Investment Trust |
See accompanying notes to financial statements.
48
| | |
| QQQX | | Nuveen Nasdaq 100 Dynamic
Overwrite Fund Portfolio of Investments December 31, 2021 |
| | | | | | | | | | | | | | | | |
| Shares | | | Description (1) | | | | | | | | Value | |
| | | | |
| | | | LONG-TERM INVESTMENTS – 101.7% | | | | | | | | | | | | |
| | | | |
| | | | COMMON STOCKS – 100.8% | | | | | | | | | | | | |
| | | | |
| | | | Air Freight & Logistics – 0.1% | | | | | | | | | |
| | | | |
| | 2,647 | | | FedEx Corp | | | | | | | | | | $ | 684,620 | |
| | | | |
| | | | Airlines – 0.2% | | | | | | | | | |
| | | | |
| | 11,239 | | | Delta Air Lines Inc, (2) | | | | | | | | | | | 439,220 | |
| | 6,558 | | | Ryanair Holdings PLC, ADR, (2) | | | | | | | | | | | 671,080 | |
| | 25,632 | | | Southwest Airlines Co, (2) | | | | | | | | | | | 1,098,075 | |
| | | | Total Airlines | | | | | | | | | | | 2,208,375 | |
| | | | |
| | | | Auto Components – 0.1% | | | | | | | | | |
| | | | |
| | 23,148 | | | Gentex Corp | | | | | | | | | | | 806,708 | |
| | 4,110 | | | Lear Corp | | | | | | | | | | | 751,924 | |
| | | | Total Auto Components | | | | | | | | | | | 1,558,632 | |
| | | | |
| | | | Automobiles – 5.2% | | | | | | | | | |
| | | | |
| | 101,941 | | | Ford Motor Co | | | | | | | | | | | 2,117,315 | |
| | 64,240 | | | Tesla Inc, (2) | | | | | | | | | | | 67,887,547 | |
| | | | Total Automobiles | | | | | | | | | | | 70,004,862 | |
| | | | |
| | | | Beverages – 1.1% | | | | | | | | | |
| | | | |
| | 28,086 | | | Brown-Forman Corp, Class B | | | | | | | | | | | 2,046,346 | |
| | 132,585 | | | Monster Beverage Corp, (2) | | | | | | | | | | | 12,733,464 | |
| | 126,539 | | | NewAge Inc, (2) | | | | | | | | | | | 130,335 | |
| | | | Total Beverages | | | | | | | | | | | 14,910,145 | |
| | | | |
| | | | Biotechnology – 4.2% | | | | | | | | | |
| | | | |
| | 89,822 | | | Amgen Inc | | | | | | | | | | | 20,207,255 | |
| | 175,364 | | | Gilead Sciences Inc | | | | | | | | | | | 12,733,180 | |
| | 11,093 | | | Ionis Pharmaceuticals Inc, (2) | | | | | | | | | | | 337,560 | |
| | 42,980 | | | Moderna Inc, (2) | | | | | | | | | | | 10,916,061 | |
| | 17,935 | | | Regeneron Pharmaceuticals Inc, (2) | | | | | | | | | | | 11,326,311 | |
| | 3,808 | | | United Therapeutics Corp, (2) | | | | | | | | | | | 822,833 | |
| | | | Total Biotechnology | | | | | | | | | | | 56,343,200 | |
| | | | |
| | | | Capital Markets – 0.6% | | | | | | | | | |
| | | | |
| | 10,021 | | | Moody’s Corp | | | | | | | | | | | 3,914,002 | |
| | 23,851 | | | Morgan Stanley | | | | | | | | | | | 2,341,214 | |
| | 11,348 | | | SEI Investments Co | | | | | | | | | | | 691,547 | |
| | 5,699 | | | T Rowe Price Group Inc | | | | | | | | | | | 1,120,652 | |
| | | | Total Capital Markets | | | | | | | | | | | 8,067,415 | |
| | | | |
| | | | Chemicals – 0.4% | | | | | | | | | |
| | | | |
| | 6,204 | | | Ecolab Inc | | | | | | | | | | | 1,455,396 | |
| | 9,155 | | | Sherwin-Williams Co | | | | | | | | | | | 3,224,025 | |
| | | | Total Chemicals | | | | | | | | | | | 4,679,421 | |
| | | | |
| | | | Commercial Services & Supplies – 0.7% | | | | | | | | | |
| | | | |
| | 20,921 | | | Copart Inc, (2) | | | | | | | | | | | 3,172,042 | |
| | 8,008 | | | IAA Inc, (2) | | | | | | | | | | | 405,365 | |
| | 15,503 | | | Tetra Tech Inc | | | | | | | | | | | 2,632,409 | |
| | 7,562 | | | Waste Connections Inc | | | | | | | | | | | 1,030,474 | |
| | 9,915 | | | Waste Management Inc | | | | | | | | | | | 1,654,814 | |
| | | | Total Commercial Services & Supplies | | | | | | | | | | | 8,895,104 | |
| | | | |
| | | | Communications Equipment – 3.0% | | | | | | | | | |
| | | | |
| | 604,967 | | | Cisco Systems Inc | | | | | | | | | | | 38,336,759 | |
49
| | |
| |
| QQQX | | Nuveen Nasdaq 100 Dynamic Overwrite Fund (continued) |
| | Portfolio of Investments December 31, 2021 |
| | | | | | | | | | | | | | | | |
| Shares | | | Description (1) | | | | | | | | Value | |
| | | | |
| | | | Communications Equipment (continued) | | | | | | | | | |
| | | | |
| | 5,262 | | | F5 Inc, (2) | | | | | | | | | | $ | 1,287,664 | |
| | | | Total Communications Equipment | | | | | | | | | | | 39,624,423 | |
| | | | |
| | | | Containers & Packaging – 0.1% | | | | | | | | | |
| | | | |
| | 20,014 | | | Ball Corp | | | | | | | | | | | 1,926,748 | |
| | | | |
| | | | Distributors – 0.4% | | | | | | | | | |
| | | | |
| | 9,398 | | | Pool Corp | | | | | | | | | | | 5,319,268 | |
| | | | |
| | | | Diversified Consumer Services – 0.2% | | | | | | | | | |
| | | | |
| | 29,461 | | | Aspen Group Inc/CO, (2) | | | | | | | | | | | 69,528 | |
| | 42,126 | | | Service Corp International/US | | | | | | | | | | | 2,990,525 | |
| | | | Total Diversified Consumer Services | | | | | | | | | | | 3,060,053 | |
| | | | |
| | | | Electric Utilities – 0.0% | | | | | | | | | |
| | | | |
| | 26,822 | | | PG&E Corp, (2) | | | | | | | | | | | 325,619 | |
| | | | |
| | | | Electrical Equipment – 0.3% | | | | | | | | | |
| | | | |
| | 9,512 | | | Rockwell Automation Inc | | | | | | | | | | | 3,318,261 | |
| | | | |
| | | | Electronic Equipment, Instruments & Components – 0.2% | | | | | | | | | |
| | | | |
| | 10,486 | | | Keysight Technologies Inc, (2) | | | | | | | | | | | 2,165,464 | |
| | 2,823 | | | National Instruments Corp | | | | | | | | | | | 123,280 | |
| | | | Total Electronic Equipment, Instruments & Components | | | | | | | | | | | 2,288,744 | |
| | | | |
| | | | Energy Equipment & Services – 0.0% | | | | | | | | | |
| | | | |
| | 5,484 | | | Select Energy Services Inc, (2) | | | | | | | | | | | 34,165 | |
| | | | |
| | | | Entertainment – 0.1% | | | | | | | | | |
| | | | |
| | 50,618 | | | AMC Entertainment Holdings Inc, Class, (2) | | | | | | | | | | | 1,376,810 | |
| | | | |
| | | | Equity Real Estate Investment Trust – 0.3% | | | | | | | | | |
| | | | |
| | 62,781 | | | CubeSmart | | | | | | | | | | | 3,572,867 | |
| | 211 | | | Retail Value Inc | | | | | | | | | | | 1,354 | |
| | | | Total Equity Real Estate Investment Trust | | | | | | | | | | | 3,574,221 | |
| | | | |
| | | | Food & Staples Retailing – 1.1% | | | | | | | | | |
| | | | |
| | 4,001 | | | Casey’s General Stores Inc | | | | | | | | | | | 789,597 | |
| | 210,528 | | | HF Foods Group Inc, (2) | | | | | | | | | | | 1,781,067 | |
| | 44,413 | | | Kroger Co | | | | | | | | | | | 2,010,132 | |
| | 22,661 | | | Sysco Corp | | | | | | | | | | | 1,780,022 | |
| | 19,549 | | | US Foods Holding Corp, (2) | | | | | | | | | | | 680,892 | |
| | 50,178 | | | Walmart Inc | | | | | | | | | | | 7,260,255 | |
| | | | Total Food & Staples Retailing | | | | | | | | | | | 14,301,965 | |
| | | | |
| | | | Food Products – 0.6% | | | | | | | | | |
| | | | |
| | 23,113 | | | Beyond Meat Inc, (2), (4) | | | | | | | | | | | 1,506,043 | |
| | 70,834 | | | Bridgford Foods Corp, (2) | | | | | | | | | | | 823,799 | |
| | 1,666 | | | Hormel Foods Corp | | | | | | | | | | | 81,318 | |
| | 22,636 | | | Laird Superfood Inc, (2) | | | | | | | | | | | 295,173 | |
| | 49,425 | | | McCormick & Co Inc/MD | | | | | | | | | | | 4,774,949 | |
| | 12,047 | | | Vital Farms Inc, (2) | | | | | | | | | | | 217,569 | |
| | | | Total Food Products | | | | | | | | | | | 7,698,851 | |
| | | | |
| | | | Health Care Equipment & Supplies – 1.3% | | | | | | | | | |
| | | | |
| | 69,911 | | | Abbott Laboratories | | | | | | | | | | | 9,839,274 | |
| | 3,843 | | | Becton Dickinson and Co | | | | | | | | | | | 966,438 | |
| | 17,865 | | | LENSAR Inc, (2) | | | | | | | | | | | 106,475 | |
| | 200,074 | | | Rockwell Medical Inc, (2) | | | | | | | | | | | 82,030 | |
| | 19,914 | | | Stryker Corp | | | | | | | | | | | 5,325,402 | |
| | 62,738 | | | Venus Concept Inc, (2) | | | | | | | | | | | 106,655 | |
| | 10,688 | | | Zimmer Biomet Holdings Inc | | | | | | | | | | | 1,357,804 | |
| | | | Total Health Care Equipment & Supplies | | | | | | | | | | | 17,784,078 | |
50
| | | | | | | | | | | | | | | | |
| Shares | | | Description (1) | | | | | | | | Value | |
| | | | |
| | | | Health Care Providers & Services – 0.2% | | | | | | | | | |
| | | | |
| | 4,308 | | | McKesson Corp | | | | | | | | | | $ | 1,070,839 | |
| | 7,651 | | | Universal Health Services Inc | | | | | | | | | | | 992,029 | |
| | | | Total Health Care Providers & Services | | | | | | | | | | | 2,062,868 | |
| | | | |
| | | | Hotels, Restaurants & Leisure – 1.6% | | | | | | | | | |
| | | | |
| | 6,611 | | | Booking Holdings Inc, (2) | | | | | | | | | | | 15,861,310 | |
| | 21,002 | | | Darden Restaurants Inc | | | | | | | | | | | 3,163,741 | |
| | 28,119 | | | Restaurant Brands International Inc | | | | | | | | | | | 1,706,261 | |
| | | | Total Hotels, Restaurants & Leisure | | | | | | | | | | | 20,731,312 | |
| | | | |
| | | | Household Durables – 0.1% | | | | | | | | | |
| | | | |
| | 43,730 | | | KB Home | | | | | | | | | | | 1,956,043 | |
| | | | |
| | | | Insurance – 0.1% | | | | | | | | | |
| | | | |
| | 23,048 | | | Fidelity National Financial Inc | | | | | | | | | | | 1,202,645 | |
| | | | |
| | | | Interactive Media & Services – 14.9% | | | | | | | | | |
| | | | |
| | 25,632 | | | Alphabet Inc, Class A, (2) | | | | | | | | | | | 74,256,929 | |
| | 16,904 | | | Alphabet Inc, Class C, (2) | | | | | | | | | | | 48,913,245 | |
| | 40,323 | | | Baidu Inc, Sponsored ADR, (2) | | | | | | | | | | | 5,999,659 | |
| | 17,171 | | | IAC/InterActiveCorp, (2) | | | | | | | | | | | 2,244,422 | |
| | 41,518 | | | Match Group Inc, (2) | | | | | | | | | | | 5,490,756 | |
| | 177,801 | | | Meta Platforms Inc, (2) | | | | | | | | | | | 59,803,366 | |
| | 49,738 | | | Twitter Inc, (2) | | | | | | | | | | | 2,149,676 | |
| | 27,877 | | | Vimeo Inc, (2) | | | | | | | | | | | 500,671 | |
| | | | Total Interactive Media & Services | | | | | | | | | | | 199,358,724 | |
| | | | |
| | | | Internet & Direct Marketing Retail – 9.0% | | | | | | | | | |
| | | | |
| | 32,223 | | | Amazon.com Inc, (2) | | | | | | | | | | | 107,442,438 | |
| | 198,017 | | | eBay Inc | | | | | | | | | | | 13,168,130 | |
| | | | Total Internet & Direct Marketing Retail | | | | | | | | | | | 120,610,568 | |
| | | | |
| | | | IT Services – 2.9% | | | | | | | | | |
| | | | |
| | 18,183 | | | BigCommerce Holdings Inc, (2) | | | | | | | | | | | 643,133 | |
| | 42,378 | | | Jack Henry & Associates Inc | | | | | | | | | | | 7,076,702 | |
| | 165,056 | | | PayPal Holdings Inc, (2) | | | | | | | | | | | 31,126,260 | |
| | | | Total IT Services | | | | | | | | | | | 38,846,095 | |
| | | | |
| | | | Leisure Products – 0.2% | | | | | | | | | |
| | | | |
| | 59,882 | | | Peloton Interactive Inc, (2) | | | | | | | | | | | 2,141,380 | |
| | | | |
| | | | Life Sciences Tools & Services – 1.0% | | | | | | | | | |
| | | | |
| | 16,855 | | | Agilent Technologies Inc | | | | | | | | | | | 2,690,901 | |
| | 8,892 | | | Charles River Laboratories International Inc, (2) | | | | | | | | | | | 3,350,328 | |
| | 21,697 | | | Danaher Corp | | | | | | | | | | | 7,138,530 | |
| | | | Total Life Sciences Tools & Services | | | | | | | | | | | 13,179,759 | |
| | | | |
| | | | Machinery – 0.2% | | | | | | | | | |
| | | | |
| | 10,028 | | | Caterpillar Inc | | | | | | | | | | | 2,073,189 | |
| | 7,766 | | | Fortive Corp | | | | | | | | | | | 592,468 | |
| | | | Total Machinery | | | | | | | | | | | 2,665,657 | |
| | | | |
| | | | Media – 3.3% | | | | | | | | | |
| | | | |
| | 2,283 | | | Cable One Inc | | | | | | | | | | | 4,025,956 | |
| | 688,683 | | | Comcast Corp, Class A | | | | | | | | | | | 34,661,415 | |
| | 168,489 | | | comScore Inc, (2) | | | | | | | | | | | 562,753 | |
| | 79,629 | | | News Corp, Class A | | | | | | | | | | | 1,776,523 | |
| | 62,041 | | | News Corp, Class B | | | | | | | | | | | 1,395,923 | |
| | 45,680 | | | Saga Communications Inc, Class A | | | | | | | | | | | 1,096,777 | |
| | 18,730 | | | ViacomCBS Inc, Class B | | | | | | | | | | | 565,272 | |
| | | | Total Media | | | | | | | | | | | 44,084,619 | |
| | | | |
| | | | Multiline Retail – 0.3% | | | | | | | | | |
| | | | |
| | 19,983 | | | Target Corp | | | | | | | | | | | 4,624,866 | |
51
| | |
| |
| QQQX | | Nuveen Nasdaq 100 Dynamic Overwrite Fund (continued) |
| | Portfolio of Investments December 31, 2021 |
| | | | | | | | | | | | | | | | |
| Shares | | | Description (1) | | | | | | | | Value | |
| | | | |
| | | | Oil, Gas & Consumable Fuels – 0.1% | | | | | | | | | |
| | | | |
| | 44,805 | | | Peabody Energy Corp, (2) | | | | | | | | | | $ | 451,186 | |
| | 13,845 | | | Ranger Oil Corp, (2) | | | | | | | | | | | 372,707 | |
| | 123,234 | | | Tellurian Inc, (2) | | | | | | | | | | | 379,561 | |
| | | | Total Oil, Gas & Consumable Fuels | | | | | | | | | | | 1,203,454 | |
| | | | |
| | | | Personal Products – 0.0% | | | | | | | | | |
| | | | |
| | 20,695 | | | Revlon Inc, (2) | | | | | | | | | | | 234,681 | |
| | | | |
| | | | Pharmaceuticals – 0.0% | | | | | | | | | |
| | | | |
| | 3,794 | | | Bristol-Myers Squibb Co | | | | | | | | | | | 236,556 | |
| | | | |
| | | | Professional Services – 0.6% | | | | | | | | | |
| | | | |
| | 32,543 | | | IHS Markit Ltd | | | | | | | | | | | 4,325,616 | |
| | 11,037 | | | ManpowerGroup Inc | | | | | | | | | | | 1,074,231 | |
| | 25,799 | | | Robert Half International Inc | | | | | | | | | | | 2,877,104 | |
| | | | Total Professional Services | | | | | | | | | | | 8,276,951 | |
| | | | |
| | | | Semiconductors & Semiconductor Equipment – 15.1% | | | | | | | | | |
| | | | |
| | 122,326 | | | Analog Devices Inc | | | | | | | | | | | 21,501,241 | |
| | 199,251 | | | Applied Materials Inc | | | | | | | | | | | 31,354,137 | |
| | 420,371 | | | Intel Corp, (3) | | | | | | | | | | | 21,649,106 | |
| | 209,763 | | | NVIDIA Corp | | | | | | | | | | | 61,693,396 | |
| | 103,235 | | | ON Semiconductor Corp, (2) | | | | | | | | | | | 7,011,721 | |
| | 41,083 | | | Power Integrations Inc | | | | | | | | | | | 3,816,200 | |
| | 214,193 | | | QUALCOMM Inc | | | | | | | | | | | 39,169,474 | |
| | 26,956 | | | Silicon Laboratories Inc, (2) | | | | | | | | | | | 5,564,258 | |
| | 34,851 | | | Skyworks Solutions Inc | | | | | | | | | | | 5,406,784 | |
| | 31,287 | | | Taiwan Semiconductor Manufacturing Co Ltd, ADR | | | | | | | | | | | 3,764,139 | |
| | | | Total Semiconductors & Semiconductor Equipment | | | | | | | | | | | 200,930,456 | |
| | | | |
| | | | Software – 17.4% | | | | | | | | | |
| | | | |
| | 29,879 | | | ANSYS Inc, (2) | | | | | | | | | | | 11,985,064 | |
| | 54,975 | | | Autodesk Inc, (2) | | | | | | | | | | | 15,458,420 | |
| | 39,633 | | | Black Knight Inc, (2) | | | | | | | | | | | 3,285,179 | |
| | 11,614 | | | CDK Global Inc | | | | | | | | | | | 484,768 | |
| | 524,855 | | | Microsoft Corp, (3) | | | | | | | | | | | 176,519,234 | |
| | 115,511 | | | Nutanix Inc, (2) | | | | | | | | | | | 3,680,180 | |
| | 22,586 | | | Open Text Corp | | | | | | | | | | | 1,072,383 | |
| | 67,979 | | | Oracle Corp | | | | | | | | | | | 5,928,449 | |
| | 41,179 | | | PTC Inc, (2) | | | | | | | | | | | 4,988,836 | |
| | 88,342 | | | Sumo Logic Inc, (2) | | | | | | | | | | | 1,197,918 | |
| | 44,126 | | | Zoom Video Communications Inc, (2) | | | | | | | | | | | 8,115,213 | |
| | | | Total Software | | | | | | | | | | | 232,715,644 | |
| | | | |
| | | | Specialty Retail – 0.6% | | | | | | | | | |
| | | | |
| | 4,707 | | | Advance Auto Parts Inc | | | | | | | | | | | 1,129,115 | |
| | 940 | | | AutoZone Inc, (2) | | | | | | | | | | | 1,970,607 | |
| | 1,904 | | | Bed Bath & Beyond Inc, (2) | | | | | | | | | | | 27,760 | |
| | 20,239 | | | CarMax Inc, (2) | | | | | | | | | | | 2,635,725 | |
| | 20,411 | | | Dick’s Sporting Goods Inc | | | | | | | | | | | 2,347,061 | |
| | 17,348 | | | Urban Outfitters Inc, (2) | | | | | | | | | | | 509,337 | |
| | | | Total Specialty Retail | | | | | | | | | | | 8,619,605 | |
| | | | |
| | | | Technology Hardware, Storage & Peripherals – 12.9% | | | | | | | | | |
| | | | |
| | 969,111 | | | Apple Inc | | | | | | | | | | | 172,085,040 | |
| | 6,751 | | | NetApp Inc | | | | | | | | | | | 621,025 | |
| | | | Total Technology Hardware, Storage & Peripherals | | | | | | | | | | | 172,706,065 | |
| | | | |
| | | | Textiles, Apparel & Luxury Goods – 0.1% | | | | | | | | | |
| | | | |
| | 2,284 | | | PVH Corp | | | | | | | | | | | 243,589 | |
| | 18,741 | | | Skechers USA Inc, Class A, (2) | | | | | | | | | | | 813,359 | |
| | | | Total Textiles, Apparel & Luxury Goods | | | | | | | | | | | 1,056,948 | |
52
| | | | | | | | | | | | | | | | |
| Shares | | | Description (1) | | | | | | | | Value | |
| | | | |
| | | | Wireless Telecommunication Services – 0.0% | | | | | | | | | |
| | | | |
| | 25,982 | | | Spok Holdings Inc | | | | | | | | | | $ | 242,412 | |
| | | | Total Common Stocks (cost $350,717,469) | | | | | | | | | | | 1,345,672,288 | |
| | | | |
| Shares | | | Description (1) | | | | | | | | Value | |
| | | | |
| | | | EXCHANGE-TRADED FUNDS – 0.9% | | | | | | | | | | | | |
| | | | |
| | 50,000 | | | Vanguard Total Stock Market ETF | | | | | | | | | | $ | 12,072,000 | |
| | | | Total Exchange-Traded Funds (cost $11,075,408) | | | | | | | | | | | 12,072,000 | |
| | | | Total Long-Term Investments (cost $361,792,877) | | | | | | | | | | | 1,357,744,288 | |
| | | | |
| Shares | | | Description (1) | | Coupon | | | | | | Value | |
| | |
| | | | INVESTMENTS PURCHASED WITH COLLATERAL FROM SECURITIES LENDING – 0.1% | | | | | |
| | | | |
| | | | MONEY MARKET FUNDS – 0.1% | | | | | | | | | |
| | | | |
| | 395,467 | | | State Street Navigator Securities Lending Government Money Market Portfolio, (5) | | | 0.030% (6) | | | | | | | $ | 395,467 | |
| | | | Total Investments Purchased with Collateral from Securities Lending (cost $395,467) | | | | | | | | 395,467 | |
| | | | |
Principal
Amount (000) | | | Description (1) | | Coupon | | | Maturity | | | Value | |
| | | | |
| | | | SHORT-TERM INVESTMENTS – 0.1% | | | | | | | | | | | | |
| | | | |
| | | | REPURCHASE AGREEMENTS – 0.1% | | | | | | | | | |
| | | | |
| $ | 1,594 | | | Repurchase Agreement with Fixed Income Clearing Corporation, dated 12/31/21,
repurchase price $1,594,209, collateralized by $1,408,200, U.S. Treasury Inflation Index Notes, 0.125%, due 4/15/22, value $1,626,161 | | | 0.000% | | | | 1/03/22 | | | $ | 1,594,209 | |
| | | | Total Short-Term Investments (cost $1,594,209) | | | | | | | | | | | 1,594,209 | |
| | | | Total Investments (cost $363,782,553) – 101.9% | | | | | | | | | | | 1,359,733,964 | |
| | | | Other Assets Less Liabilities – (1.9)% (7) | | | | | | | | | | | (24,867,285 | ) |
| | | | Net Assets – 100% | | | | | | | | | | $ | 1,334,866,679 | |
Investments in Derivatives
Options Written
| | | | | | | | | | | | | | | | | | | | | | | | |
| Description (8) | | Type | | | Number of
Contracts | | | Notional
Amount (9) | | | Exercise
Price | | | Expiration
Date | | | Value | |
Invesco China Technology ETF | | | Call | | | | (500 | ) | | $ | (19,500,000 | ) | | $ | 390 | | | | 1/21/22 | | | $ | (592,103 | ) |
Invesco China Technology ETF | | | Call | | | | (500 | ) | | | (19,600,000 | ) | | | 392 | | | | 1/21/22 | | | | (518,051 | ) |
NASDAQ 100® Stock Index | | | Call | | | | (385 | ) | | | (613,112,500 | ) | | | 15,925 | | | | 1/21/22 | | | | (21,132,650 | ) |
S&P 500® Index | | | Call | | | | (170 | ) | | | (79,135,000 | ) | | | 4,655 | | | | 1/21/22 | | | | (2,414,000 | ) |
Total Options Written (premiums received $17,643,828) | | | | (1,555 | ) | | $ | (731,347,500 | ) | | | | | | | | | | $ | (24,656,803 | ) |
53
| | |
| |
| QQQX | | Nuveen Nasdaq 100 Dynamic Overwrite Fund (continued) |
| | Portfolio of Investments December 31, 2021 |
For Fund portfolio compliance purposes, the Fund’s industry classifications refer to any one or more of the industry sub-classifications used by one or more widely recognized market indexes or ratings group indexes, and/or as defined by Fund management. This definition may not apply for purposes of this report, which may combine industry sub-classifications into sectors for reporting ease.
| (1) | All percentages shown in the Portfolio of Investments are based on net assets applicable to common shares unless otherwise noted. |
| (2) | Non-income producing; issuer has not declared an ex-dividend date within the past twelve months. |
| (3) | Investment, or portion of investment, has been pledged to collateralize the net payment obligations for investments in derivatives. |
| (4) | Investment, or a portion of investment, is out on loan for securities lending. The total value of the securities out on loan as of the end of the reporting period was $374,800. |
| (5) | The Fund may loan securities representing up to one third of the market value of its total assets (which includes collateral for securities on loan) to broker dealers, banks, and other institutions. The collateral maintained by the Fund shall have a market value, at the inception of each loan, equal to not less than 100% of the market value of the loaned securities. The cash collateral received by the Fund is invested in this money market fund. |
| (6) | The rate shown is the one-day yield as of the end of the reporting period. |
| (7) | Other assets less liabilities includes the unrealized appreciation (depreciation) of certain over-the-counter (“OTC”) derivatives as presented on the Statement of Assets and Liabilities, when applicable. The unrealized appreciation (depreciation) of OTC cleared and exchange-traded derivatives is recognized as part of the cash collateral at brokers and/or the receivable or payable for variation margin as presented on the Statement of Assets and Liabilities, when applicable. Other assets less liabilities also includes the value of options as presented on the Statement of Assets and Liabilities. |
| (8) | Exchange-traded, unless otherwise noted. |
| (9) | For disclosure purposes, Notional Amount is calculated by multiplying the Number of Contracts by the Exercise Price by 100. |
| ADR | American Depositary Receipt |
See accompanying notes to financial statements.
54
| | |
| JCE | | Nuveen Core Equity Alpha Fund Portfolio of Investments December 31, 2021 |
| | | | | | | | | | | | | | | | |
| Shares | | | Description (1) | | | | | | | | Value | |
| | | | |
| | | | LONG-TERM INVESTMENTS – 99.9% | | | | | | | | | | | | |
| | | | |
| | | | COMMON STOCKS – 99.5% (99.3% of Total Investments) | | | | | | | | | | | | |
| | | | |
| | | | Aerospace & Defense – 0.7% | | | | | | | | | |
| | | | |
| | 5,850 | | | Lockheed Martin Corp | | | | | | | | | | $ | 2,079,149 | |
| | | | |
| | | | Air Freight & Logistics – 1.6% | | | | | | | | | |
| | | | |
| | 6,770 | | | FedEx Corp | | | | | | | | | | | 1,750,993 | |
| | 5,956 | | | United Parcel Service Inc, Class B | | | | | | | | | | | 1,276,609 | |
| | 18,040 | | | XPO Logistics Inc, (2) | | | | | | | | | | | 1,396,837 | |
| | | | Total Air Freight & Logistics | | | | | | | | | | | 4,424,439 | |
| | | | |
| | | | Automobiles – 1.6% | | | | | | | | | |
| | | | |
| | 4,140 | | | Tesla Inc, (2) | | | | | | | | | | | 4,375,069 | |
| | | | |
| | | | Banks – 2.8% | | | | | | | | | |
| | | | |
| | 20,885 | | | Bank of America Corp | | | | | | | | | | | 929,174 | |
| | 35,060 | | | Citigroup Inc | | | | | | | | | | | 2,117,273 | |
| | 10,910 | | | Citizens Financial Group Inc | | | | | | | | | | | 515,498 | |
| | 13,220 | | | JPMorgan Chase & Co | | | | | | | | | | | 2,093,387 | |
| | 34,430 | | | Truist Financial Corp | | | | | | | | | | | 2,015,876 | |
| | | | Total Banks | | | | | | | | | | | 7,671,208 | |
| | | | |
| | | | Beverages – 0.3% | | | | | | | | | |
| | | | |
| | 9,760 | | | Coca-Cola Co | | | | | | | | | | | 577,889 | |
| | 1,160 | | | PepsiCo Inc | | | | | | | | | | | 201,504 | |
| | | | Total Beverages | | | | | | | | | | | 779,393 | |
| | | | |
| | | | Biotechnology – 1.4% | | | | | | | | | |
| | | | |
| | 10,640 | | | Amgen Inc | | | | | | | | | | | 2,393,681 | |
| | 6,510 | | | Vertex Pharmaceuticals Inc, (2) | | | | | | | | | | | 1,429,596 | |
| | | | Total Biotechnology | | | | | | | | | | | 3,823,277 | |
| | | | |
| | | | Building Products – 0.7% | | | | | | | | | |
| | | | |
| | 6,040 | | | Johnson Controls International plc | | | | | | | | | | | 491,112 | |
| | 15,460 | | | Owens Corning | | | | | | | | | | | 1,399,130 | |
| | | | Total Building Products | | | | | | | | | | | 1,890,242 | |
| | | | |
| | | | Capital Markets – 2.7% | | | | | | | | | |
| | | | |
| | 950 | | | Blackstone Inc | | | | | | | | | | | 122,920 | |
| | 27,924 | | | Carlyle Group Inc | | | | | | | | | | | 1,533,028 | |
| | 23,340 | | | Charles Schwab Corp | | | | | | | | | | | 1,962,894 | |
| | 1,420 | | | FactSet Research Systems Inc | | | | | | | | | | | 690,134 | |
| | 43,130 | | | Franklin Resources Inc | | | | | | | | | | | 1,444,424 | |
| | 31,320 | | | Invesco Ltd | | | | | | | | | | | 720,986 | |
| | 2,040 | | | KKR & Co Inc | | | | | | | | | | | 151,980 | |
| | 330 | | | Northern Trust Corp | | | | | | | | | | | 39,471 | |
| | 1,740 | | | State Street Corp | | | | | | | | | | | 161,820 | |
| | 10,006 | | | Stifel Financial Corp | | | | | | | | | | | 704,623 | |
| | | | Total Capital Markets | | | | | | | | | | | 7,532,280 | |
| | | | |
| | | | Chemicals – 1.2% | | | | | | | | | |
| | | | |
| | 30,350 | | | Dow Inc | | | | | | | | | | | 1,721,452 | |
| | 16,970 | | | LyondellBasell Industries NV, Class A | | | | | | | | | | | 1,565,143 | |
| | 2,950 | | | Mosaic Co | | | | | | | | | | | 115,906 | |
| | | | Total Chemicals | | | | | | | | | | | 3,402,501 | |
| | | | |
| | | | Communications Equipment – 0.4% | | | | | | | | | |
| | | | |
| | 16,020 | | | Cisco Systems Inc | | | | | | | | | | | 1,015,187 | |
| | | | |
| | | | Construction & Engineering – 0.1% | | | | | | | | | |
| | | | |
| | 3,370 | | | MasTec Inc, (2) | | | | | | | | | | | 310,984 | |
55
| | |
| |
| JCE | | Nuveen Core Equity Alpha Fund (continued) |
| | Portfolio of Investments December 31, 2021 |
| | | | | | | | | | | | | | | | |
| Shares | | | Description (1) | | | | | | | | Value | |
| | | | |
| | | | Consumer Finance – 0.5% | | | | | | | | | |
| | | | |
| | 5,420 | | | Capital One Financial Corp | | | | | | | | | | $ | 786,388 | |
| | 13,380 | | | OneMain Holdings Inc | | | | | | | | | | | 669,535 | |
| | 90 | | | Upstart Holdings Inc, (2) | | | | | | | | | | | 13,617 | |
| | | | Total Consumer Finance | | | | | | | | | | | 1,469,540 | |
| | | | |
| | | | Containers & Packaging – 0.5% | | | | | | | | | |
| | | | |
| | 32,960 | | | Westrock Co | | | | | | | | | | | 1,462,106 | |
| | | | |
| | | | Distributors – 0.6% | | | | | | | | | |
| | | | |
| | 11,040 | | | Genuine Parts Co | | | | | | | | | | | 1,547,808 | |
| | | | |
| | | | Diversified Consumer Services – 0.1% | | | | | | | | | |
| | | | |
| | 7,640 | | | Frontdoor Inc, (2) | | | | | | | | | | | 280,006 | |
| | | | |
| | | | Diversified Financial Services – 1.3% | | | | | | | | | |
| | | | |
| | 12,270 | | | Berkshire Hathaway Inc, Class B, (2) | | | | | | | | | | | 3,668,730 | |
| | | | |
| | | | Diversified Telecommunication Services – 1.3% | | | | | | | | | |
| | | | |
| | 100,890 | | | AT&T Inc | | | | | | | | | | | 2,481,894 | |
| | 22,249 | | | Verizon Communications Inc | | | | | | | | | | | 1,156,058 | |
| | | | Total Diversified Telecommunication Services | | | | | | | | | | | 3,637,952 | |
| | | | |
| | | | Electric Utilities – 0.6% | | | | | | | | | |
| | | | |
| | 6,030 | | | American Electric Power Co Inc | | | | | | | | | | | 536,489 | |
| | 6,410 | | | Duke Energy Corp | | | | | | | | | | | 672,409 | |
| | 7,700 | | | Xcel Energy Inc | | | | | | | | | | | 521,290 | |
| | | | Total Electric Utilities | | | | | | | | | | | 1,730,188 | |
| | | | |
| | | | Electrical Equipment – 1.5% | | | | | | | | | |
| | | | |
| | 11,280 | | | AMETEK Inc | | | | | | | | | | | 1,658,611 | |
| | 5,550 | | | Eaton Corp PLC | | | | | | | | | | | 959,151 | |
| | 42,740 | | | nVent Electric PLC | | | | | | | | | | | 1,624,120 | |
| | | | Total Electrical Equipment | | | | | | | | | | | 4,241,882 | |
| | | | |
| | | | Entertainment – 1.0% | | | | | | | | | |
| | | | |
| | 12,110 | | | Electronic Arts Inc | | | | | | | | | | | 1,597,309 | |
| | 634 | | | Netflix Inc, (2) | | | | | | | | | | | 381,947 | |
| | 5,440 | | | Walt Disney Co, (2) | | | | | | | | | | | 842,602 | |
| | | | Total Entertainment | | | | | | | | | | | 2,821,858 | |
| | | | |
| | | | Equity Real Estate Investment Trust – 1.6% | | | | | | | | | |
| | | | |
| | 8,610 | | | American Homes 4 Rent, Class A | | | | | | | | | | | 375,482 | |
| | 4,840 | | | Invitation Homes Inc | | | | | | | | | | | 219,446 | |
| | 5,190 | | | Public Storage | | | | | | | | | | | 1,943,966 | |
| | 17,690 | | | Rexford Industrial Realty Inc | | | | | | | | | | | 1,434,836 | |
| | 7,160 | | | Ventas Inc | | | | | | | | | | | 366,019 | |
| | | | Total Equity Real Estate Investment Trust | | | | | | | | | | | 4,339,749 | |
| | | | |
| | | | Food & Staples Retailing – 1.1% | | | | | | | | | |
| | | | |
| | 100 | | | Costco Wholesale Corp | | | | | | | | | | | 56,770 | |
| | 20,039 | | | Walmart Inc | | | | | | | | | | | 2,899,443 | |
| | | | Total Food & Staples Retailing | | | | | | | | | | | 2,956,213 | |
| | | | |
| | | | Food Products – 1.8% | | | | | | | | | |
| | | | |
| | 26,960 | | | Archer-Daniels-Midland Co | | | | | | | | | | | 1,822,227 | |
| | 37,560 | | | Kraft Heinz Co | | | | | | | | | | | 1,348,404 | |
| | 20,440 | | | Tyson Foods Inc, Class A | | | | | | | | | | | 1,781,550 | |
| | | | Total Food Products | | | | | | | | | | | 4,952,181 | |
| | | | |
| | | | Health Care Equipment & Supplies – 2.4% | | | | | | | | | |
| | | | |
| | 23,860 | | | Abbott Laboratories | | | | | | | | | | | 3,358,056 | |
| | 26,120 | | | DENTSPLY SIRONA Inc | | | | | | | | | | | 1,457,235 | |
56
| | | | | | | | | | | | | | | | |
| Shares | | | Description (1) | | | | | | | | Value | |
| | | | |
| | | | Health Care Equipment & Supplies (continued) | | | | | | | | | |
| | | | |
| | 2,830 | | | IDEXX Laboratories Inc, (2) | | | | | | | | | | $ | 1,863,442 | |
| | | | Total Health Care Equipment & Supplies | | | | | | | | | | | 6,678,733 | |
| | | | |
| | | | Health Care Providers & Services – 2.5% | | | | | | | | | |
| | | | |
| | 7,940 | | | McKesson Corp | | | | | | | | | | | 1,973,646 | |
| | 9,760 | | | UnitedHealth Group Inc | | | | | | | | | | | 4,900,886 | |
| | | | Total Health Care Providers & Services | | | | | | | | | | | 6,874,532 | |
| | | | |
| | | | Health Care Technology – 0.1% | | | | | | | | | |
| | | | |
| | 890 | | | Veeva Systems Inc, Class A, (2) | | | | | | | | | | | 227,377 | |
| | | | |
| | | | Hotels, Restaurants & Leisure – 1.5% | | | | | | | | | |
| | | | |
| | 690 | | | Domino’s Pizza Inc | | | | | | | | | | | 389,388 | |
| | 13,550 | | | Penn National Gaming Inc, (2) | | | | | | | | | | | 702,567 | |
| | 35,490 | | | Six Flags Entertainment Corp, (2) | | | | | | | | | | | 1,511,164 | |
| | 16,780 | | | Wyndham Hotels & Resorts Inc | | | | | | | | | | | 1,504,327 | |
| | | | Total Hotels, Restaurants & Leisure | | | | | | | | | | | 4,107,446 | |
| | | | |
| | | | Household Products – 2.0% | | | | | | | | | |
| | | | |
| | 24,310 | | | Colgate-Palmolive Co | | | | | | | | | | | 2,074,615 | |
| | 21,850 | | | Procter & Gamble Co | | | | | | | | | | | 3,574,223 | |
| | | | Total Household Products | | | | | | | | | | | 5,648,838 | |
| | | | |
| | | | Industrial Conglomerates – 1.1% | | | | | | | | | |
| | | | |
| | 4,400 | | | 3M Co | | | | | | | | | | | 781,572 | |
| | 11,160 | | | Honeywell International Inc | | | | | | | | | | | 2,326,972 | |
| | | | Total Industrial Conglomerates | | | | | | | | | | | 3,108,544 | |
| | | | |
| | | | Insurance – 1.0% | | | | | | | | | |
| | | | |
| | 18,660 | | | First American Financial Corp | | | | | | | | | | | 1,459,772 | |
| | 8,110 | | | Marsh & McLennan Cos Inc | | | | | | | | | | | 1,409,680 | |
| | | | Total Insurance | | | | | | | | | | | 2,869,452 | |
| | | | |
| | | | Interactive Media & Services – 6.9% | | | | | | | | | |
| | | | |
| | 1,970 | | | Alphabet Inc, Class A, (2) | | | | | | | | | | | 5,707,169 | |
| | 2,200 | | | Alphabet Inc, Class C, (2) | | | | | | | | | | | 6,365,898 | |
| | 21,050 | | | Meta Platforms Inc, (2) | | | | | | | | | | | 7,080,167 | |
| | | | Total Interactive Media & Services | | | | | | | | | | | 19,153,234 | |
| | | | |
| | | | Internet & Direct Marketing Retail – 4.1% | | | | | | | | | |
| | | | |
| | 3,457 | | | Amazon.com Inc, (2) | | | | | | | | | | | 11,526,813 | |
| | | | |
| | | | IT Services – 5.2% | | | | | | | | | |
| | | | |
| | 8,390 | | | Accenture PLC, Class A | | | | | | | | | | | 3,478,074 | |
| | 2,700 | | | Amdocs Ltd | | | | | | | | | | | 202,068 | |
| | 1,930 | | | Concentrix Corp | | | | | | | | | | | 344,737 | |
| | 110 | | | EPAM Systems Inc, (2) | | | | | | | | | | | 73,530 | |
| | 14,190 | | | Fidelity National Information Services Inc | | | | | | | | | | | 1,548,838 | |
| | 17,520 | | | Fiserv Inc, (2) | | | | | | | | | | | 1,818,401 | |
| | 12,930 | | | Global Payments Inc | | | | | | | | | | | 1,747,877 | |
| | 15,070 | | | International Business Machines Corp | | | | | | | | | | | 2,014,256 | |
| | 12,858 | | | Kyndryl Holdings Inc, (2) | | | | | | | | | | | 232,730 | |
| | 2,061 | | | Mastercard Inc | | | | | | | | | | | 740,559 | |
| | 5,170 | | | PayPal Holdings Inc, (2) | | | | | | | | | | | 974,959 | |
| | 6,100 | | | Visa Inc, Class A | | | | | | | | | | | 1,321,931 | |
| | | | Total IT Services | | | | | | | | | | | 14,497,960 | |
| | | | |
| | | | Life Sciences Tools & Services – 3.0% | | | | | | | | | |
| | | | |
| | 9,400 | | | Danaher Corp | | | | | | | | | | | 3,092,694 | |
| | 4,560 | | | Illumina Inc, (2) | | | | | | | | | | | 1,734,806 | |
| | 5,173 | | | Thermo Fisher Scientific Inc | | | | | | | | | | | 3,451,633 | |
| | | | Total Life Sciences Tools & Services | | | | | | | | | | | 8,279,133 | |
57
| | |
| |
| JCE | | Nuveen Core Equity Alpha Fund (continued) |
| | Portfolio of Investments December 31, 2021 |
| | | | | | | | | | | | | | | | |
| Shares | | | Description (1) | | | | | | | | Value | |
| | | | |
| | | | Machinery – 2.4% | | | | | | | | | |
| | | | |
| | 2,950 | | | Caterpillar Inc | | | | | | | | | | $ | 609,883 | |
| | 2,370 | | | Deere & Co | | | | | | | | | | | 812,649 | |
| | 22,270 | | | Fortive Corp | | | | | | | | | | | 1,698,978 | |
| | 21,000 | | | Otis Worldwide Corp | | | | | | | | | | | 1,828,470 | |
| | 19,610 | | | PACCAR Inc | | | | | | | | | | | 1,730,779 | |
| | | | Total Machinery | | | | | | | | | | | 6,680,759 | |
| | | | |
| | | | Media – 1.5% | | | | | | | | | |
| | | | |
| | 56,880 | | | Comcast Corp, Class A | | | | | | | | | | | 2,862,770 | |
| | 1,230 | | | Discovery Inc, (2), (3) | | | | | | | | | | | 28,954 | |
| | 38,870 | | | ViacomCBS Inc, Class B | | | | | | | | | | | 1,173,097 | |
| | | | Total Media | | | | | | | | | | | 4,064,821 | |
| | | | |
| | | | Multiline Retail – 0.8% | | | | | | | | | |
| | | | |
| | 9,599 | | | Target Corp | | | | | | | | | | | 2,221,593 | |
| | | | |
| | | | Multi-Utilities – 0.6% | | | | | | | | | |
| | | | |
| | 13,470 | | | Sempra Energy | | | | | | | | | | | 1,781,812 | |
| | | | |
| | | | Oil, Gas & Consumable Fuels – 2.8% | | | | | | | | | |
| | | | |
| | 3,830 | | | Chevron Corp | | | | | | | | | | | 449,450 | |
| | 3,720 | | | ConocoPhillips | | | | | | | | | | | 268,510 | |
| | 19,980 | | | EOG Resources Inc | | | | | | | | | | | 1,774,823 | |
| | 24,300 | | | Exxon Mobil Corp | | | | | | | | | | | 1,486,917 | |
| | 44,100 | | | HollyFrontier Corp | | | | | | | | | | | 1,445,598 | |
| | 21,980 | | | Phillips 66 | | | | | | | | | | | 1,592,671 | |
| | 15,650 | | | Targa Resources Corp | | | | | | | | | | | 817,556 | |
| | | | Total Oil, Gas & Consumable Fuels | | | | | | | | | | | 7,835,525 | |
| | | | |
| | | | Pharmaceuticals – 4.8% | | | | | | | | | |
| | 39,970 | | | Bristol-Myers Squibb Co | | | | | | | | | | | 2,492,130 | |
| | 27,620 | | | Johnson & Johnson | | | | | | | | | | | 4,724,953 | |
| | 36,321 | | | Merck & Co Inc | | | | | | | | | | | 2,783,641 | |
| | 55,510 | | | Pfizer Inc | | | | | | | | | | | 3,277,866 | |
| | | | Total Pharmaceuticals | | | | | | | | | | | 13,278,590 | |
| | | | |
| | | | Professional Services – 0.6% | | | | | | | | | |
| | | | |
| | 12,887 | | | Booz Allen Hamilton Holding Corp | | | | | | | | | | | 1,092,689 | |
| | 550 | | | IHS Markit Ltd | | | | | | | | | | | 73,106 | |
| | 5,230 | | | Leidos Holdings Inc | | | | | | | | | | | 464,947 | |
| | | | Total Professional Services | | | | | | | | | | | 1,630,742 | |
| | | | |
| | | | Real Estate Management & Development – 0.8% | | | | | | | | | |
| | | | |
| | 2,260 | | | CBRE Group Inc, (2) | | | | | | | | | | | 245,232 | |
| | 5,782 | | | Jones Lang LaSalle Inc, (2) | | | | | | | | | | | 1,557,324 | |
| | 27,280 | | | Opendoor Technologies Inc, (2) | | | | | | | | | | | 398,561 | |
| | | | Total Real Estate Management & Development | | | | | | | | | | | 2,201,117 | |
| | | | |
| | | | Road & Rail – 1.7% | | | | | | | | | |
| | | | |
| | 6,660 | | | Norfolk Southern Corp | | | | | | | | | | | 1,982,749 | |
| | 10,500 | | | Union Pacific Corp | | | | | | | | | | | 2,645,265 | |
| | | | Total Road & Rail | | | | | | | | | | | 4,628,014 | |
| | | | |
| | | | Semiconductors & Semiconductor Equipment – 5.6% | | | | | | | | | |
| | | | |
| | 18,867 | | | Advanced Micro Devices Inc, (2) | | | | | | | | | | | 2,714,961 | |
| | 16,770 | | | Applied Materials Inc | | | | | | | | | | | 2,638,927 | |
| | 290 | | | Broadcom Inc | | | | | | | | | | | 192,969 | |
| | 55,720 | | | Intel Corp | | | | | | | | | | | 2,869,580 | |
| | 13,110 | | | NVIDIA Corp | | | | | | | | | | | 3,855,782 | |
| | 16,710 | | | QUALCOMM Inc | | | | | | | | | | | 3,055,758 | |
| | 1,770 | | | Skyworks Solutions Inc | | | | | | | | | | | 274,598 | |
| | | | Total Semiconductors & Semiconductor Equipment | | | | | | | | | | | 15,602,575 | |
| | | | |
| | | | Software – 10.2% | | | | | | | | | |
| | | | |
| | 5,150 | | | Adobe Inc, (2) | | | | | | | | | | | 2,920,359 | |
58
| | | | | | | | | | | | | | | | |
| Shares | | | Description (1) | | | | | | | | Value | |
| | | | |
| | | | Software (continued) | | | | | | | | | |
| | | | |
| | 7,610 | | | Manhattan Associates Inc, (2) | | | | | | | | | | $ | 1,183,279 | |
| | 56,445 | | | Microsoft Corp | | | | | | | | | | | 18,983,583 | |
| | 11,951 | | | salesforce.com Inc, (2) | | | | | | | | | | | 3,037,108 | |
| | 17,690 | | | SS&C Technologies Holdings Inc | | | | | | | | | | | 1,450,226 | |
| | 6,349 | | | VMware Inc, Class A | | | | | | | | | | | 735,722 | |
| | 240 | | | Zoom Video Communications Inc, (2) | | | | | | | | | | | 44,138 | |
| | | | Total Software | | | | | | | | | | | 28,354,415 | |
| | | | |
| | | | Specialty Retail – 2.4% | | | | | | | | | |
| | | | |
| | 3,740 | | | Home Depot Inc | | | | | | | | | | | 1,552,137 | |
| | 4,140 | | | Lithia Motors Inc | | | | | | | | | | | 1,229,373 | |
| | 8,360 | | | Lowe’s Cos Inc | | | | | | | | | | | 2,160,893 | |
| | 7,680 | | | Tractor Supply Co | | | | | | | | | | | 1,832,448 | |
| | | | Total Specialty Retail | | | | | | | | | | | 6,774,851 | |
| | | | |
| | | | Technology Hardware, Storage & Peripherals – 7.1% | | | | | | | | | |
| | | | |
| | 102,498 | | | Apple Inc, (4) | | | | | | | | | | | 18,200,570 | |
| | 25,140 | | | Dell Technologies Inc, (2) | | | | | | | | | | | 1,412,114 | |
| | 16,510 | | | Hewlett Packard Enterprise Co | | | | | | | | | | | 260,362 | |
| | | | Total Technology Hardware, Storage & Peripherals | | | | | | | | | | | 19,873,046 | |
| | | | |
| | | | Textiles, Apparel & Luxury Goods – 1.2% | | | | | | | | | |
| | | | |
| | 17,404 | | | NIKE Inc, Class B | | | | | | | | | | | 2,900,725 | |
| | 13,400 | | | Tapestry Inc | | | | | | | | | | | 544,040 | |
| | | | Total Textiles, Apparel & Luxury Goods | | | | | | | | | | | 3,444,765 | |
| | | | |
| | | | Tobacco – 0.6% | | | | | | | | | |
| | | | |
| | 16,290 | | | Altria Group Inc | | | | | | | | | | | 771,983 | |
| | 9,370 | | | Philip Morris International Inc | | | | | | | | | | | 890,150 | |
| | | | Total Tobacco | | | | | | | | | | | 1,662,133 | |
| | | | |
| | | | Trading Companies & Distributors – 0.6% | | | | | | | | | |
| | | | |
| | 57,406 | | | Univar Solutions Inc, (2) | | | | | | | | | | | 1,627,460 | |
| | | | |
| | | | Wireless Telecommunication Services – 0.6% | | | | | | | | | |
| | | | |
| | 13,441 | | | T-Mobile US Inc, (2) | | | | | | | | | | | 1,558,887 | |
| | | | Total Common Stocks (cost $221,640,576) | | | | | | | | | | | 276,605,109 | |
| | | | |
| Shares | | | Description (1) | | | | | | | | Value | |
| | | | |
| | | | EXCHANGE-TRADED FUNDS – 0.4% | | | | | | | | | |
| | | | |
| | 2,400 | | | iShares Core S&P 500 ETF | | | | | | | | | | $ | 1,144,776 | |
| | | | Total Exchange-Traded Funds (cost $855,911) | | | | | | | | | | | 1,144,776 | |
| | | | Total Long-Term Investments (cost $222,496,487) | | | | | | | | | | | 277,749,885 | |
| | | | |
| Shares | | | Description | | Coupon | | | | | | Value | |
| | | | |
| | | | INVESTMENTS PURCHASED WITH COLLATERAL FROM SECURITIES LENDING – 0.0% | | | | | | | | | | | | |
| | | | |
| | | | MONEY MARKET FUNDS – 0.0% | | | | | | | | | |
| | | | |
| | 225 | | | State Street Navigator Securities Lending Government Money Market Portfolio, (5) | | | 0.030% | (6) | | | | | | $ | 225 | |
| | | | Total Investments Purchased with Collateral from Securities Lending (cost $225) | | | | | | | | | | | 225 | |
59
| | |
| |
| JCE | | Nuveen Core Equity Alpha Fund (continued) |
| | Portfolio of Investments December 31, 2021 |
| | | | | | | | | | | | | | | | |
Principal
Amount (000) | | | Description | | Coupon | | | Maturity | | | Value | |
| | | | |
| | | | SHORT-TERM INVESTMENTS – 0.3% | | | | | | | | | | | | |
| | | | |
| | | | REPURCHASE AGREEMENTS – 0.3% | | | | | | | | | |
| | | | |
| $ | 770 | | | Repurchase Agreement with Fixed Income Clearing Corporation, dated 12/31/21, repurchase price $769,957, collateralized by $790,700, U.S. Treasury Bonds, 1.875%, due 2/15/41, value $785,418 | | | 0.000% | | | | 1/03/22 | | | $ | 769,957 | |
| | | | Total Short-Term Investments (cost $769,957) | | | | | | | | | | | 769,957 | |
| | | | Total Investments (cost $223,266,669) – 100.2% | | | | | | | | | | | 278,520,067 | |
| | | | Other Assets Less Liabilities – (0.2)% (7) | | | | | | | | | | | (475,979 | ) |
| | | | Net Assets – 100% | | | | | | | | | | $ | 278,044,088 | |
Investments in Derivatives
Options Written
| | | | | | | | | | | | | | | | | | | | | | | | |
| Description (8) | | | Type | | |
| Number of
Contracts |
| |
| Notional
Amount (9) |
| |
| Exercise
Price |
| |
| Expiration
Date |
| | | Value | |
S&P 500® Index | | | Call | | | | (50 | ) | | $ | (24,500,000 | ) | | $ | 4,900 | | | | 1/21/22 | | | $ | (33,750 | ) |
S&P 500® Index | | | Call | | | | (60 | ) | | | (29,100,000 | ) | | | 4,850 | | | | 1/21/22 | | | | (101,700 | ) |
S&P 500® Index | | | Call | | | | (50 | ) | | | (24,000,000 | ) | | | 4,800 | | | | 1/21/22 | | | | (185,500 | ) |
Total Options Written (premiums received $247,057) | | | | (160 | ) | | $ | (77,600,000 | ) | | | | | | | | | | $ | (320,950 | ) |
For Fund portfolio compliance purposes, the Fund’s industry classifications refer to any one or more of the industry sub-classifications used by one or more widely recognized market indexes or ratings group indexes, and/or as defined by Fund management. This definition may not apply for purposes of this report, which may combine industry sub-classifications into sectors for reporting ease.
| (1) | All percentages shown in the Portfolio of Investments are based on net assets applicable to common shares unless otherwise noted. |
| (2) | Non-income producing; issuer has not declared an ex-dividend date within the past twelve months. |
| (3) | Investment, or a portion of investment, is out on loan for securities lending. The total value of the securities out on loan as of the end of the reporting period was $212. |
| (4) | Investment, or portion of investment, has been pledged to collateralize the net payment obligations for investments in derivatives. |
| (5) | The Fund may loan securities representing up to one third of the market value of its total assets (which includes collateral for securities on loan) to broker dealers, banks, and other institutions. The collateral maintained by the Fund shall have a market value, at the inception of each loan, equal to not less than 100% of the market value of the loaned securities. The cash collateral received by the Fund is invested in this money market fund. |
| (6) | The rate shown is the one-day yield as of the end of the reporting period. |
| (7) | Other assets less liabilities includes the unrealized appreciation (depreciation) of certain over-the-counter (“OTC”) derivatives as presented on the Statement of Assets and Liabilities, when applicable. The unrealized appreciation (depreciation) of OTC cleared and exchange-traded derivatives is recognized as part of the cash collateral at brokers and/or the receivable or payable for variation margin as presented on the Statement of Assets and Liabilities, when applicable. Other assets less liabilities also includes the value of options as presented on the Statement of Assets and Liabilities. |
| (8) | Exchange-traded, unless otherwise noted. |
| (9) | For disclosure purposes, Notional Amount is calculated by multiplying the Number of Contracts by the Exercise Price by 100. |
See accompanying notes to financial statements.
60
Statement of Assets and Liabilities
December 31, 2021
| | | | | | | | | | | | | | | | | | | | |
| | | BXMX | | | DIAX | | | SPXX | | | QQQX | | | JCE | |
Assets | | | | | | | | | | | | | | | | | | | | |
Long-term investments at value (cost $519,220,664, $256,718,651, $119,044,447, $361,792,877 and $222,496,487, respectively)(1) | | $ | 1,585,222,473 | | | $ | 668,000,499 | | | $ | 327,572,995 | | | $ | 1,357,744,288 | | | $ | 277,749,885 | |
Short-term investments, at value (cost approximates value) | | | 44,223,733 | | | | 1,319,458 | | | | 1,113,304 | | | | 1,594,209 | | | | 769,957 | |
Investments purchased with collateral from securities lending, at value (cost approximates value) | | | 1,710,570 | | | | 4,895,552 | | | | 1,013,752 | | | | 395,467 | | | | 225 | |
Cash | | | 792 | | | | — | | | | 55,046 | | | | — | | | | 4,386 | |
Cash collateral at brokers for investments in options contracts | | | — | | | | — | | | | — | | | | 1,320,000 | | | | — | |
Receivable for: | | | | | | | | | | | | | | | | | | | | |
Dividends | | | 875,854 | | | | 149,148 | | | | 224,950 | | | | 157,799 | | | | 173,611 | |
Reclaims | | | — | | | | — | | | | — | | | | 329 | | | | — | |
Deferred offering costs | | | — | | | | — | | | | 195,981 | | | | 108,421 | | | | — | |
Other assets | | | 353,209 | | | | 53,636 | | | | 56,318 | | | | 134,410 | | | | 45,930 | |
Total assets | | | 1,632,386,631 | | | | 674,418,293 | | | | 330,232,346 | | | | 1,361,454,923 | | | | 278,743,994 | |
Liabilities | | | | | | | | | | | | | | | | | | | | |
Options written, at value (premiums received $35,656,611, $6,905,813, $3,367,472, $17,643,828 and $247,057, respectively) | | | 37,602,840 | | | | 11,076,000 | | | | 5,396,000 | | | | 24,656,803 | | | | 320,950 | |
Payable for collateral from securities lending | | | 1,710,570 | | | | 4,895,552 | | | | 1,013,752 | | | | 395,467 | | | | 225 | |
Accrued expenses: | | | | | | | | | | | | | | | | | | | | |
Management fees | | | 1,108,519 | | | | 467,845 | | | | 220,893 | | | | 925,424 | | | | 210,046 | |
Trustees fees | | | 358,725 | | | | 56,436 | | | | 57,427 | | | | 134,359 | | | | 45,433 | |
Shelf offering costs | | | — | | | | — | | | | 13,359 | | | | 54,303 | | | | — | |
Other | | | 461,611 | | | | 204,244 | | | | 115,477 | | | | 421,888 | | | | 123,252 | |
Total liabilities | | | 41,242,265 | | | | 16,700,077 | | | | 6,816,908 | | | | 26,588,244 | | | | 699,906 | |
Net assets applicable to common shares | | $ | 1,591,144,366 | | | $ | 657,718,216 | | | $ | 323,415,438 | | | $ | 1,334,866,679 | | | $ | 278,044,088 | |
Common shares outstanding | | | 104,086,837 | | | | 36,366,913 | | | | 17,296,572 | | | | 45,047,519 | | | | 16,047,602 | |
Net asset value (“NAV”) per common share outstanding | | $ | 15.29 | | | $ | 18.09 | | | $ | 18.70 | | | $ | 29.63 | | | $ | 17.33 | |
Net assets applicable to common shares consist of: | | | | | | | | | | | | | | | | | | | | |
Common shares, $0.01 par value per share | | $ | 1,040,868 | | | $ | 363,669 | | | $ | 172,966 | | | $ | 450,475 | | | $ | 160,476 | |
Paid-in-surplus | | | 524,623,098 | | | | 246,592,305 | | | | 115,001,699 | | | | 344,800,166 | | | | 191,989,805 | |
Total distributable earnings | | | 1,065,480,400 | | | | 410,762,242 | | | | 208,240,773 | | | | 989,616,038 | | | | 85,893,807 | |
Net assets applicable to common shares | | $ | 1,591,144,366 | | | $ | 657,718,216 | | | $ | 323,415,438 | | | $ | 1,334,866,679 | | | $ | 278,044,088 | |
Authorized common shares | | | Unlimited | | | | Unlimited | | | | Unlimited | | | | Unlimited | | | | Unlimited | |
| (1) | Includes securities loaned of $1,655,803, $4,780,512, $989,904, $374,800 and $212 for BXMX, DIAX, SPXX, QQQX and JCE, respectively. |
See accompanying notes to financial statements.
61
Statement of Operations
Year Ended December 31, 2021
| | | | | | | | | | | | | | | | | | | | |
| | | BXMX | | | DIAX | | | SPXX | | | QQQX | | | JCE | |
Investment Income | | | | | | | | | | | | | | | | | | | | |
Dividends | | $ | 18,272,201 | | | $ | 12,141,852 | | | $ | 4,573,449 | | | $ | 8,452,764 | | | $ | 2,833,184 | |
Foreign tax withheld on dividend income | | | (19,332 | ) | | | — | | | | (358 | ) | | | (17,359 | ) | | | (2,529 | ) |
Securities Lending Income, net | | | 428 | | | | 168 | | | | 827 | | | | 25,003 | | | | 24,731 | |
Total Investment Income | | | 18,253,297 | | | | 12,142,020 | | | | 4,573,918 | | | | 8,460,408 | | | | 2,855,386 | |
Expenses | | | | | | | | | | | | | | | | | | | | |
Management fees | | | 12,663,375 | | | | 5,477,541 | | | | 2,470,726 | | | | 10,107,970 | | | | 2,408,706 | |
Interest expense | | | 2,552 | | | | 1,377 | | | | 43 | | | | 1,538 | | | | 668 | |
Custodian fees | | | 119,703 | | | | 55,384 | | | | 43,597 | | | | 91,645 | | | | 56,390 | |
Trustees fees | | | 47,135 | | | | 19,989 | | | | 9,320 | | | | 37,245 | | | | 8,198 | |
Professional fees | | | 144,251 | | | | 88,725 | | | | 47,886 | | | | 130,094 | | | | 63,145 | |
Shareholder reporting expenses | | | 149,813 | | | | 72,755 | | | | 46,596 | | | | 130,414 | | | | 43,203 | |
Shareholder servicing agent fees | | | 1,840 | | | | 1,395 | | | | 1,065 | | | | 1,396 | | | | 1,587 | |
Stock exchange listing fees | | | 28,885 | | | | 10,683 | | | | 7,958 | | | | — | | | | 6,635 | |
Investor relations expenses | | | 175,656 | | | | 73,650 | | | | 36,066 | | | | 141,783 | | | | 27,024 | |
Other | | | 244,259 | | | | 143,881 | | | | 61,463 | | | | 349,733 | | | | 8,050 | |
Total expenses | | | 13,577,469 | | | | 5,945,380 | | | | 2,724,720 | | | | 10,991,818 | | | | 2,623,606 | |
Net investment income (loss) | | | 4,675,828 | | | | 6,196,640 | | | | 1,849,198 | | | | (2,531,410 | ) | | | 231,780 | |
Realized and Unrealized Gain (Loss) | | | | | | | | | | | | | | | | | | | | |
Net realized gain (loss) from: | | | | | | | | | | | | | | | | | | | | |
Investments and foreign currency | | | 177,704,116 | | | | 32,201,967 | | | | 49,477,998 | | | | 166,937,589 | | | | 38,732,097 | |
Options purchased | | | — | | | | 153,278 | | | | 79,037 | | | | 144,380 | | | | (50,655 | ) |
Options written | | | (116,624,336 | ) | | | (23,200,656 | ) | | | (10,788,646 | ) | | | (89,604,711 | ) | | | (3,426,456 | ) |
Change in net unrealized appreciation (depreciation) of: | | | | | | | | | | | | | | | | | | | | |
Investments and foreign currency | | | 174,888,737 | | | | 79,804,076 | | | | 21,506,299 | | | | 151,243,357 | | | | 28,018,209 | |
Options purchased | | | — | | | | 5,632 | | | | 2,816 | | | | 5,632 | | | | — | |
Options written | | | 8,560,570 | | | | (3,331,527 | ) | | | (1,644,623 | ) | | | (6,565,544 | ) | | | (99,154 | ) |
Net realized and unrealized gain (loss) | | | 244,529,087 | | | | 85,632,770 | | | | 58,632,881 | | | | 222,160,703 | | | | 63,174,041 | |
Net increase (decrease) in net assets applicable to common shares from operations | | $ | 249,204,915 | | | $ | 91,829,410 | | | $ | 60,482,079 | | | $ | 219,629,293 | | | $ | 63,405,821 | |
See accompanying notes to financial statements.
62
Statement of Changes in Net Assets
| | | | | | | | | | | | | | | | |
| | | BXMX | | | DIAX | |
| | | Year Ended 12/31/21 | | | Year
Ended
12/31/20 | | | Year Ended 12/31/21 | | | Year
Ended
12/31/20 | |
Operations | | | | | | | | | | | | | | | | |
Net investment income (loss) | | $ | 4,675,828 | | | $ | 15,157,598 | | | $ | 6,196,640 | | | $ | 8,012,926 | |
Net realized gain (loss) from: | | | | | | | | | | | | | | | | |
Investments and foreign currency | | | 177,704,116 | | | | 163,654,804 | | | | 32,201,967 | | | | 100,797,603 | |
Options purchased | | | — | | | | — | | | | 153,278 | | | | 242,705 | |
Options written | | | (116,624,336 | ) | | | (139,222,960 | ) | | | (23,200,656 | ) | | | (60,651,433 | ) |
Change in net unrealized appreciation (depreciation) of: | | | | | | | | | | | | | | | | |
Investments and foreign currency | | | 174,888,737 | | | | 56,243,154 | | | | 79,804,076 | | | | (63,403,549 | ) |
Options purchased | | | — | | | | — | | | | 5,632 | | | | (5,632 | ) |
Options written | | | 8,560,570 | | | | 3,384,501 | | | | (3,331,527 | ) | | | (533,762 | ) |
Net increase (decrease) in net assets applicable to common shares from operations | | | 249,204,915 | | | | 99,217,097 | | | | 91,829,410 | | | | (15,541,142 | ) |
Distributions to Common Shareholders | | | | | | | | | | | | | | | | |
Dividends | | | (50,306,812 | ) | | | (12,431,685 | ) | | | (12,192,825 | ) | | | (37,595,326 | ) |
Return of capital | | | (39,207,868 | ) | | | (78,904,515 | ) | | | (27,519,845 | ) | | | (2,917,416 | ) |
Decrease in net assets applicable to common shares from distributions to common shareholders | | | (89,514,680 | ) | | | (91,336,200 | ) | | | (39,712,670 | ) | | | (40,512,742 | ) |
Capital Share Transactions | | | | | | | | | | | | | | | | |
Proceeds from shelf offering, net of offering costs | | | — | | | | 103,714 | | | | — | | | | 400,448 | |
Net proceeds from common shares issued to shareholders due to reinvestment of distributions | | | — | | | | 797,626 | | | | — | | | | — | |
Net increase (decrease) in net assets applicable to common shares from capital share transactions | | | — | | | | 901,340 | | | | — | | | | 400,448 | |
Net increase (decrease) in net assets applicable to common shares | | | 159,690,235 | | | | 8,782,237 | | | | 52,116,740 | | | | (55,653,436 | ) |
Net assets applicable to common shares at the beginning of period | | | 1,431,454,131 | | | | 1,422,671,894 | | | | 605,601,476 | | | | 661,254,912 | |
Net assets applicable to common shares at the end of period | | $ | 1,591,144,366 | | | $ | 1,431,454,131 | | | $ | 657,718,216 | | | $ | 605,601,476 | |
See accompanying notes to financial statements.
63
Statement of Changes in Net Assets (continued)
| | | | | | | | | | | | | | | | |
| | | SPXX | | | QQQX | |
| | | Year
Ended
12/31/21 | | | Year
Ended
12/31/20 | | | Year
Ended
12/31/21 | | | Year
Ended
12/31/20 | |
Operations | | | | | | | | | | | | | | | | |
Net investment income (loss) | | $ | 1,849,198 | | | $ | 2,617,066 | | | $ | (2,531,410 | ) | | $ | 1,450,538 | |
Net realized gain (loss) from: | | | | | | | | | | | | | | | | |
Investments and foreign currency | | | 49,477,998 | | | | 12,088,482 | | | | 166,937,589 | | | | 158,087,221 | |
Options purchased | | | 79,037 | | | | 119,667 | | | | 144,380 | | | | 252,805 | |
Options written | | | (10,788,646 | ) | | | (27,078,672 | ) | | | (89,604,711 | ) | | | (184,711,099 | ) |
Change in net unrealized appreciation (depreciation) of: | | | | | | | | | | | | | | | | |
Investments and foreign currency | | | 21,506,299 | | | | 28,217,293 | | | | 151,243,357 | | | | 179,485,115 | |
Options purchased | | | 2,816 | | | | (2,816 | ) | | | 5,632 | | | | (5,632 | ) |
Options written | | | (1,644,623 | ) | | | (259,815 | ) | | | (6,565,544 | ) | | | 1,289,113 | |
Net increase (decrease) in net assets applicable to common shares from operations | | | 60,482,079 | | | | 15,701,205 | | | | 219,629,293 | | | | 155,848,061 | |
Distributions to Common Shareholders | | | | | | | | | | | | | | | | |
Dividends | | | (12,176,538 | ) | | | (2,666,875 | ) | | | (33,913,718 | ) | | | (932,061 | ) |
Return of capital | | | (4,722,744 | ) | | | (14,524,883 | ) | | | (44,002,163 | ) | | | (62,802,006 | ) |
Decrease in net assets applicable to common shares from distributions to common shareholders | | | (16,899,282 | ) | | | (17,191,758 | ) | | | (77,915,881 | ) | | | (63,734,067 | ) |
Capital Share Transactions | | | | | | | | | | | | | | | | |
Proceeds from shelf offering, net of offering costs | | | 1,804,279 | | | | 4,087,020 | | | | 99,137,676 | | | | 48,249,296 | |
Net proceeds from common shares issued to shareholders due to reinvestment of distributions | | | 79,716 | | | | 72,207 | | | | 1,707,146 | | | | — | |
Net increase (decrease) in net assets applicable to common shares from capital share transactions | | | 1,883,995 | | | | 4,159,227 | | | | 100,844,822 | | | | 48,249,296 | |
Net increase (decrease) in net assets applicable to common shares | | | 45,466,792 | | | | 2,668,674 | | | | 242,558,234 | | | | 140,363,290 | |
Net assets applicable to common shares at the beginning of period | | | 277,948,646 | | | | 275,279,972 | | | | 1,092,308,445 | | | | 951,945,155 | |
Net assets applicable to common shares at the end of period | | $ | 323,415,438 | | | $ | 277,948,646 | | | $ | 1,334,866,679 | | | $ | 1,092,308,445 | |
See accompanying notes to financial statements.
64
| | | | | | | | |
| | | JCE | |
| | | Year Ended 12/31/21 | | | Year
Ended
12/31/20 | |
Operations | | | | | | | | |
Net investment income (loss) | | $ | 231,780 | | | $ | 2,234,267 | |
Net realized gain (loss) from: | | | | | | | | |
Investments and foreign currency | | | 38,732,097 | | | | 47,360,426 | |
Options purchased | | | (50,655 | ) | | | — | |
Options written | | | (3,426,456 | ) | | | (10,237,281 | ) |
Change in net unrealized appreciation (depreciation) of: | | | | | | | | |
Investments and foreign currency | | | 28,018,209 | | | | (22,037,166 | ) |
Options purchased | | | — | | | | — | |
Options written | | | (99,154 | ) | | | 263,277 | |
Net increase (decrease) in net assets applicable to common shares from operations | | | 63,405,821 | | | | 17,583,523 | |
Distributions to Common Shareholders | | | | | | | | |
Dividends | | | (29,461,455 | ) | | | (14,827,085 | ) |
Return of capital | | | — | | | | — | |
Decrease in net assets applicable to common shares from distributions to common shareholders | | | (29,461,455 | ) | | | (14,827,085 | ) |
Capital Share Transactions | | | | | | | | |
Proceeds from shelf offering, net of offering costs | | | — | | | | 9,093 | |
Net proceeds from common shares issued to shareholders due to reinvestment of distributions | | | 310,105 | | | | — | |
Net increase (decrease) in net assets applicable to common shares from capital share transactions | | | 310,105 | | | | 9,093 | |
Net increase (decrease) in net assets applicable to common shares | | | 34,254,471 | | | | 2,765,531 | |
Net assets applicable to common shares at the beginning of period | | | 243,789,617 | | | | 241,024,086 | |
Net assets applicable to common shares at the end of period | | $ | 278,044,088 | | | $ | 243,789,617 | |
See accompanying notes to financial statements.
65
Financial Highlights
Selected data for a common share outstanding throughout each period:
| | | | | | | | | | | | | | | | | | | | | | | | | | | | | | | | | | | | | | | | | | | | | | | | |
| | | | |
| | | | | | Investment Operations | | | Less Distributions to
Common Shareholders | | | Common Shares | |
| | | Beginning
Common
Share
NAV | | | Net
Investment
Income
(Loss)(a) | | | Net
Realized/
Unrealized
Gain (Loss) | | | Total | | | From
Net
Investment
Income | | | From
Accumulated
Net Realized
Gains | | | Return
of
Capital | | | Total | | | Shelf
Offering
Costs | | | Premium
Per
Shares
Sold
through
Shelf
Offering | | | Ending
NAV | | | Ending
Share
Price | |
|
BXMX | |
Year Ended 12/31: | |
2021 | | $ | 13.75 | | | $ | 0.04 | | | $ | 2.36 | | | $ | 2.40 | | | $ | (0.07 | ) | | $ | (0.41 | ) | | $ | (0.38 | ) | | $ | (0.86 | ) | | $ | — | | | $ | — | | | $ | 15.29 | | | $ | 14.65 | |
2020 | | | 13.68 | | | | 0.15 | | | | 0.80 | | | | 0.95 | | | | (0.12 | ) | | | — | | | | (0.76 | ) | | | (0.88 | ) | | | — | * | | | — | * | | | 13.75 | | | | 12.88 | |
2019 | | | 12.61 | | | | 0.16 | | | | 1.84 | | | | 2.00 | | | | (0.16 | ) | | | — | | | | (0.77 | ) | | | (0.93 | ) | | | — | * | | | — | * | | | 13.68 | | | | 13.75 | |
2018 | | | 14.35 | | | | 0.15 | | | | (0.91 | ) | | | (0.76 | ) | | | (0.16 | ) | | | (0.37 | ) | | | (0.45 | ) | | | (0.98 | ) | | | — | * | | | — | * | | | 12.61 | | | | 12.07 | |
2017 | | | 13.52 | | | | 0.16 | | | | 1.58 | | | | 1.74 | | | | (0.15 | ) | | | — | | | | (0.76 | ) | | | (0.91 | ) | | | — | | | | — | | | | 14.35 | | | | 14.25 | |
|
DIAX | |
Year Ended 12/31: | |
2021 | | | 16.65 | | | | 0.17 | | | | 2.36 | | | | 2.53 | | | | (0.17 | ) | | | (0.16 | ) | | | (0.76 | ) | | | (1.09 | ) | | | — | | | | — | | | | 18.09 | | | | 17.77 | |
2020 | | | 18.20 | | | | 0.22 | | | | (0.66 | ) | | | (0.44 | ) | | | (0.22 | ) | | | (0.81 | ) | | | (0.08 | ) | | | (1.11 | ) | | | — | * | | | — | * | | �� | 16.65 | | | | 15.20 | |
2019 | | | 16.90 | | | | 0.27 | | | | 2.21 | | | | 2.48 | | | | (0.27 | ) | | | — | | | | (0.91 | ) | | | (1.18 | ) | | | — | * | | | — | * | | | 18.20 | | | | 17.66 | |
2018 | | | 19.05 | | | | 0.25 | | | | (1.16 | ) | | | (0.91 | ) | | | (0.25 | ) | | | (0.22 | ) | | | (0.77 | ) | | | (1.24 | ) | | | — | * | | | — | * | | | 16.90 | | | | 16.12 | |
2017 | | | 16.55 | | | | 0.26 | | | | 3.30 | | | | 3.56 | | | | (0.26 | ) | | | — | | | | (0.80 | ) | | | (1.06 | ) | | | — | | | | — | | | | 19.05 | | | | 18.84 | |
|
SPXX | |
Year Ended 12/31: | |
2021 | | | 16.17 | | | | 0.11 | | | | 3.40 | | | | 3.51 | | | | (0.11 | ) | | | (0.60 | ) | | | (0.27 | ) | | | (0.98 | ) | | | — | * | | | — | * | | | 18.70 | | | | 18.60 | |
2020 | | | 16.27 | | | | 0.15 | | | | 0.75 | | | | 0.90 | | | | (0.15 | ) | | | — | | | | (0.85 | ) | | | (1.00 | ) | | | — | * | | | — | * | | | 16.17 | | | | 15.24 | |
2019 | | | 14.42 | | | | 0.17 | | | | 2.74 | | | | 2.91 | | | | (0.18 | ) | | | — | | | | (0.88 | ) | | | (1.06 | ) | | | — | * | | | — | * | | | 16.27 | | | | 16.47 | |
2018 | | | 16.47 | | | | 0.18 | | | | (1.12 | ) | | | (0.94 | ) | | | (0.18 | ) | | | (0.03 | ) | | | (0.91 | ) | | | (1.12 | ) | | | — | * | | | 0.01 | | | | 14.42 | | | | 14.04 | |
2017 | | | 14.98 | | | | 0.19 | | | | 2.29 | | | | 2.48 | | | | (0.19 | ) | | | — | | | | (0.80 | ) | | | (0.99 | ) | | | — | | | | — | | | | 16.47 | | | | 17.31 | |
|
QQQX | |
Year Ended 12/31: | |
2021 | | | 26.32 | | | | (0.06 | ) | | | 5.12 | | | | 5.06 | | | | — | | | | (0.78 | ) | | | (1.01 | ) | | | (1.79 | ) | | | — | * | | | 0.04 | | | | 29.63 | | | | 30.65 | |
2020 | | | 24.12 | | | | 0.04 | | | | 3.70 | | | | 3.74 | | | | (0.01 | ) | | | — | | | | (1.55 | ) | | | (1.56 | ) | | | — | * | | | 0.02 | | | | 26.32 | | | | 26.01 | |
2019 | | | 20.27 | | | | 0.06 | | | | 5.33 | | | | 5.39 | | | | (0.05 | ) | | | — | | | | (1.51 | ) | | | (1.56 | ) | | | — | * | | | 0.02 | | | | 24.12 | | | | 24.05 | |
2018 | | | 22.84 | | | | 0.06 | | | | (0.98 | ) | | | (0.92 | ) | | | (0.06 | ) | | | (1.37 | ) | | | (0.25 | ) | | | (1.68 | ) | | | — | * | | | 0.03 | | | | 20.27 | | | | 20.00 | |
2017 | | | 19.58 | | | | 0.04 | | | | 4.66 | | | | 4.70 | | | | (0.04 | ) | | | (0.50 | ) | | | (0.90 | ) | | | (1.44 | ) | | | — | | | | — | | | | 22.84 | | | | 24.21 | |
66
| | | | | | | | | | | | | | | | | | | | | | |
| | | | | | | Common Share Supplemental Data/
Ratios Applicable to Common Shares | |
Common Share
Total Returns | | | | | | Ratios to Average Net Assets | | | | |
Based
on
NAV(b) | | |
Based
on
Share
Price(b) | | | Ending
Net
Assets
(000) | | | Expenses | | | Net
Investment
Income (Loss) | | | Portfolio
Turnover
Rate(c) | |
| | | | | |
| | | | | | | | | | | | | | | | | | | | | | | |
| | | | | | | | | | | | | | | | | | | | | | |
| | 17.80 | % | | | 20.75 | % | | $ | 1,591,144 | | | | 0.89 | % | | | 0.31 | % | | | 7 | % |
| | 7.92 | | | | 1.16 | | | | 1,431,454 | | | | 0.91 | | | | 1.14 | | | | 22 | |
| | 16.16 | | | | 22.08 | | | | 1,422,672 | | | | 0.91 | | | | 1.18 | | | | 4 | |
| | (5.56 | ) | | | (8.88 | ) | | | 1,307,669 | | | | 0.89 | | | | 1.10 | | | | 5 | |
| | 13.21 | | | | 19.59 | | | | 1,486,003 | | | | 0.91 | | | | 1.12 | | | | 2 | |
| | | | | |
| | | | | | | | | | | | | | | | | | | | | | | |
| | | | | | | | | | | | | | | | | | | | | | |
| | 15.45 | | | | 24.60 | | | | 657,718 | | | | 0.92 | | | | 0.96 | | | | 8 | |
| | (1.49 | ) | | | (6.73 | ) | | | 605,601 | | | | 0.94 | | | | 1.40 | | | | 27 | |
| | 14.94 | | | | 17.07 | | | | 661,255 | | | | 0.95 | | | | 1.49 | | | | 6 | |
| | (5.01 | ) | | | (8.27 | ) | | | 610,220 | | | | 0.92 | | | | 1.37 | | | | 9 | |
| | 22.12 | | | | 33.65 | | | | 687,579 | | | | 0.93 | | | | 1.47 | | | | 5 | |
| | | | | |
| | | | | | | | | | | | | | | | | | | | | | | |
| | | | | | | | | | | | | | | | | | | | | | |
| | 22.15 | | | | 29.03 | | | | 323,415 | | | | 0.90 | | | | 0.61 | | | | 26 | |
| | 6.60 | | | | (0.24 | ) | | | 277,949 | | | | 0.93 | | | | 1.03 | | | | 20 | |
| | 20.62 | | | | 25.40 | | | | 275,280 | | | | 0.99 | | | | 1.11 | | | | 8 | |
| | (6.03 | ) | | | (12.99 | ) | | | 238,344 | | | | 0.91 | | | | 1.08 | | | | 16 | |
| | 16.91 | | | | 27.91 | | | | 266,065 | | | | 0.92 | | | | 1.18 | | | | 11 | |
| | | | | |
| | | | | | | | | | | | | | | | | | | | | | | |
| | | | | | | | | | | | | | | | | | | | | | |
| | 19.85 | | | | 25.39 | | | | 1,334,867 | | | | 0.90 | | | | (0.21 | ) | | | 32 | |
| | 16.61 | | | | 15.66 | | | | 1,092,308 | | | | 0.94 | | | | 0.15 | | | | 20 | |
| | 27.33 | | | | 28.73 | | | | 951,945 | | | | 0.91 | | | | 0.25 | | | | 11 | |
| | (4.39 | ) | | | (11.15 | ) | | | 766,930 | | | | 0.91 | | | | 0.25 | | | | 23 | |
| | 24.63 | | | | 39.24 | | | | 836,161 | | | | 0.93 | | | | 0.17 | | | | 17 | |
| (a) | Per share Net Investment Income (Loss) is calculated using the average daily shares method. |
| (b) | Total Return Based on Common Share NAV is the combination of changes in common share NAV, reinvested dividend income at Common Share NAV and reinvested capital gains distributions at NAV, if any. The last dividend declared in the period, which is typically paid on the first business day of the following month, is assumed to be reinvested at the ending NAV. The actual reinvest price for the last dividend declared in the period may often be based on the Fund’s market price (and not its NAV), and therefore may be different from the price used in the calculation. Total returns are not annualized. |
Total Return Based on Common Share Price is the combination of changes in the market price per share and the effect of reinvested dividend income and reinvested capital gains distributions, if any, at the average price paid per share at the time of reinvestment. The last dividend declared in the period, which is typically paid on the first business day of the following month, is assumed to be reinvested at the ending market price. The actual reinvestment for the last dividend declared in the period may take place over several days, and in some instances may not be based on the market price, so the actual reinvestment price may be different from the price used in the calculation. Total returns are not annualized.
| (c) | Portfolio Turnover Rate is calculated based on the lesser of long-term purchases or sales (as disclosed in Note 4 – Portfolio Securities and Investments in Derivatives) divided by the average long-term market value during the period. |
| * | Rounds to less than $0.01 per share. |
See accompanying notes to financial statements.
67
Financial Highlights (continued)
Selected data for a common share outstanding throughout each period:
| | | | | | | | | | | | | | | | | | | | | | | | | | | | | | | | | | | | | | | | | | | | | | | | |
| | | | |
| | | | | | Investment Operations | | | Less Distributions to
Common Shareholders | | | Common Shares | |
| | | Beginning
Common
Share
NAV | | | Net
Investment
Income
(Loss)(a) | | | Net
Realized/
Unrealized
Gain (Loss) | | | Total | | | From
Net
Investment
Income | | | From
Accumulated
Net Realized
Gains | | | Return
of
Capital | | | Total | | | Shelf
Offering
Costs | | | Premium
Per
Shares
Sold
through
Shelf
Offering | | | Ending
NAV | | | Ending
Share
Price | |
|
JCE | |
Year Ended 12/31: | |
2021 | | $ | 15.21 | | | $ | 0.01 | | | $ | 3.95 | | | $ | 3.96 | | | $ | (0.07 | ) | | $ | (1.77 | ) | | $ | — | | | $ | (1.84 | ) | | $ | — | | | $ | — | | | $ | 17.33 | | | $ | 18.58 | |
2020 | | | 15.04 | | | | 0.14 | | | | 0.96 | | | | 1.10 | | | | (0.10 | ) | | | (0.83 | ) | | | — | | | | (0.93 | ) | | | — | | | | — | * | | | 15.21 | | | | 14.07 | |
2019 | | | 12.68 | | | | 0.09 | | | | 3.27 | | | | 3.36 | | | | (0.10 | ) | | | (0.55 | ) | | | (0.35 | ) | | | (1.00 | ) | | | — | | | | — | | | | 15.04 | | | | 14.62 | |
2018 | | | 14.76 | | | | 0.07 | | | | (1.04 | ) | | | (0.97 | ) | | | (0.07 | ) | | | (1.04 | ) | | | — | | | | (1.11 | ) | | | — | | | | — | | | | 12.68 | | | | 12.03 | |
2017 | | | 14.27 | | | | 0.18 | | | | 2.84 | | | | 3.02 | | | | (0.17 | ) | | | (2.36 | ) | | | — | | | | (2.53 | ) | | | — | | | | — | | | | 14.76 | | | | 14.60 | |
68
| | | | | | | | | | | | | | | | | | | | | | |
| | | | | | | Common Share Supplemental Data/
Ratios Applicable to Common Shares | |
Common Share
Total Returns | | | | | | Ratios to Average Net Assets | | | | |
Based
on
NAV(b) | | |
Based
on
Share
Price(b) | | | Ending
Net
Assets
(000) | | | Expenses | | | Net
Investment
Income (Loss) | | | Portfolio
Turnover
Rate(c) | |
| | | | | |
| | | | | | | | | | | | | | | | | | | | | | | |
| | | | | | | | | | | | | | | | | | | | | | |
| | 26.91 | % | | | 47.15 | % | | $ | 278,044 | | | | 0.98 | % | | | 0.09 | % | | | 104 | % |
| | 8.42 | | | | 3.62 | | | | 243,790 | | | | 1.17 | (d) | | | 1.00 | (d) | | | 169 | |
| | 26.96 | | | | 30.26 | | | | 241,024 | | | | 1.01 | | | | 0.64 | | | | 35 | |
| | (7.17 | ) | | | (10.86 | ) | | | 203,322 | | | | 1.01 | | | | 0.47 | | | | 121 | |
| | 21.72 | | | | 31.85 | | | | 236,475 | | | | 1.02 | | | | 1.18 | | | | 159 | |
| (a) | Per share Net Investment Income (Loss) is calculated using the average daily shares method. |
| (b) | Total Return Based on Common Share NAV is the combination of changes in common share NAV, reinvested dividend income at Common Share NAV and reinvested capital gains distributions at NAV, if any. The last dividend declared in the period, which is typically paid on the first business day of the following month, is assumed to be reinvested at the ending NAV. The actual reinvest price for the last dividend declared in the period may often be based on the Fund’s market price (and not its NAV), and therefore may be different from the price used in the calculation. Total returns are not annualized. |
| | Total Return Based on Common Share Price is the combination of changes in the market price per share and the effect of reinvested dividend income and reinvested capital gains distributions, if any, at the average price paid per share at the time of reinvestment. The last dividend declared in the period, which is typically paid on the first business day of the following month, is assumed to be reinvested at the ending market price. The actual reinvestment for the last dividend declared in the period may take place over several days, and in some instances may not be based on the market price, so the actual reinvestment price may be different from the price used in the calculation. Total returns are not annualized. |
| (c) | Portfolio Turnover Rate is calculated based on the lesser of long-term purchases or sales (as disclosed in Note 4 – Portfolio Securities and Investments in Derivatives) divided by the average long-term market value during the period. |
| (d) | During the period ended December 31, 2020, the Adviser voluntarily reimbursed the Fund for certain expenses incurred in connection with a common shares equity shelf program. As a result, the Expenses and Net Investment Income (Loss) Ratios to Average Net Assets reflect this voluntary expense reimbursement from Adviser. The Expenses and Net Investment Income (Loss) Ratios to Average Net Assets excluding this expense reimbursement from Adviser were as follows: |
| | | | | | | | |
| Ratios to Average Net Assets | |
| | | | Expenses | | |
| Net Investment
Income (Loss) |
|
Year Ended 12/31: | | | | | | | | |
2020 | | | 1.23 | % | | | 0.94 | % |
| * | Rounds to less than $0.01 per share. |
See accompanying notes to financial statements.
69
Notes to Financial Statements
1. General Information
Fund Information
The funds covered in this report and their corresponding New York Stock Exchange (“NYSE”) or Nasdaq National Market (“Nasdaq”) symbols are as follows (each a “Fund” and collectively, the “Funds”):
| | • | | Nuveen S&P 500 Buy-Write Income Fund (BXMX) |
| | • | | Nuveen Dow 30SM Dynamic Overwrite Fund (DIAX) |
| | • | | Nuveen S&P 500 Dynamic Overwrite Fund (SPXX) |
| | • | | Nuveen Nasdaq 100 Dynamic Overwrite Fund (QQQX) |
| | • | | Nuveen Core Equity Alpha Fund (JCE) |
The Funds are registered under the Investment Company Act of 1940 (the “1940 Act”), as amended, as diversified (non-diversified for DIAX and QQQX) closed-end management investment companies. Shares of BXMX, DIAX, SPXX and JCE are traded on the NYSE while shares of QQQX are traded on the Nasdaq. BXMX, DIAX, SPXX, QQQX and JCE were organized as Massachusetts business trusts on July 23, 2004, May 20, 2014, November 11, 2004, May 20, 2014 and January 9, 2007, respectively.
The end of the reporting period for the Funds is December 31, 2021, and the period covered by these Notes to Financial Statements is the fiscal year ended December 31, 2021 (the “current fiscal period”).
Investment Adviser and Sub-Adviser
The Funds’ investment adviser is Nuveen Fund Advisors, LLC (the “Adviser”), a subsidiary of Nuveen, LLC (“Nuveen”). Nuveen is the investment management arm of Teachers Insurance and Annuity Association of America (TIAA). The Adviser has overall responsibility for management of the Funds, oversees the management of the Funds’ portfolios, manages the Funds’ business affairs and provides certain clerical, bookkeeping and other administrative services, and, if necessary, asset allocation decisions. The Adviser has entered into sub-advisory agreements with Gateway Investment Advisers, LLC (“Gateway”), under which Gateway manages BXMX’s investment portfolio and Nuveen Asset Management, LLC (“NAM”), a subsidiary of the Adviser, under which NAM manages the investment portfolios of DIAX, SPXX, QQQX and JCE.
Developments Regarding the Funds’ Control Share By-Law
On October 5, 2020, the Funds and certain other closed-end funds in the Nuveen fund complex amended their by-laws. Among other things, the amended by-laws included provisions pursuant to which, in summary, a shareholder who obtains beneficial ownership of common shares in a Control Share Acquisition (as defined in the by-laws) shall have the same voting rights as other common shareholders only to the extent authorized by the other disinterested shareholders (the “Control Share By-Law”). On January 14, 2021, a shareholder of certain Nuveen closed-end funds filed a civil complaint in the U.S. District Court for the Southern District of New York (the “District Court”) against certain Nuveen funds and their trustees, seeking a declaration that such funds’ Control Share By-Laws violate the 1940 Act, rescission of such fund’s Control Share By-Laws and a permanent injunction against such funds applying the Control Share By-Laws. On February 18, 2022, the District Court granted judgment in favor of the plaintiff’s claim for rescission of such funds’ Control Share By-Laws and the plaintiff’s declaratory judgment claim, and declared that such funds’ Control Share By-Laws violate Section 18(i) of the 1940 Act. Following review of the judgment of the District Court, on February 22, 2022, the Board of Trustees amended the Funds’ by-laws to provide that the Funds’ Control Share By-Law shall be of no force and effect for so long as the judgment of the District Court is effective and that if the judgment of the District Court is reversed, overturned, vacated, stayed, or otherwise nullified, the Funds’ Control Share By-Law will be automatically reinstated and apply to any beneficial owner of common shares acquired in a Control Share Acquisition, regardless of whether such Control Share Acquisition occurs before or after such reinstatement, for the duration of the stay or upon issuance of the mandate reversing, overturning, vacating or otherwise nullifying the judgment of the District Court.
Other Matters
The outbreak of the novel coronavirus (“COVID-19”) and subsequent global pandemic began significantly impacting the U.S. and global financial markets and economies during the calendar quarter ended March 31, 2020. The worldwide spread of COVID-19 has created significant uncertainty in the global economy. The duration and extent of COVID-19 over the long-term cannot be reasonably estimated at this time. The ultimate impact of COVID-19 and the extent to which COVID-19 impacts the Funds normal course of business, results of operations, investments, and cash flows will depend on future developments, which are highly uncertain and difficult to predict. Management continues to monitor and evaluate this situation.
70
2. Significant Accounting Policies
The accompanying financial statements were prepared in accordance with accounting principles generally accepted in the United States of America (“U.S. GAAP”), which may require the use of estimates made by management and the evaluation of subsequent events. Actual results may differ from those estimates. Each Fund is an investment company and follows the accounting guidance in the Financial Accounting Standards Board (“FASB”) Accounting Standards Codification 946, Financial Services – Investment Companies. The net asset value (“NAV”) for financial reporting purposes may differ from the NAV for processing security and common share transactions. The NAV for financial reporting purposes includes security and common share transactions through the date of the report. Total return is computed based on the NAV used for processing security and common share transactions. The following is a summary of the significant accounting policies consistently followed by the Funds.
Compensation
The Funds pay no compensation directly to those of its trustees who are affiliated with the Adviser or to its officers, all of whom receive remuneration for their services to the Funds from the Adviser or its affiliates. The Funds’ Board of Trustees (the “Board”) has adopted a deferred compensation plan for independent trustees that enables trustees to elect to defer receipt of all or a portion of the annual compensation they are entitled to receive from certain Nuveen-advised funds. Under the plan, deferred amounts are treated as though equal dollar amounts had been invested in shares of select Nuveen-advised funds.
Distributions to Common Shareholders
Distributions to common shareholders are recorded on the ex-dividend date. The amount, character and timing of distributions are determined in accordance with federal income tax regulations, which may differ from U.S. GAAP.
Each Fund makes quarterly cash distributions to shareholders of a stated dollar amount per share. Subject to approval and oversight by the Board, each Fund seeks to maintain a stable distribution level designed to deliver the long-term return potential of each Fund’s investment strategy through regular quarterly distributions (a “Managed Distribution Program”). Total distributions during a calendar year generally will be made from each Fund’s net investment income, net realized capital gains and net unrealized capital gains in the Fund’s portfolio, if any. The portion of distributions paid attributed to net unrealized gains, if any, is distributed from the Fund’s assets and is treated by shareholders as a nontaxable distribution (“return of capital”) for tax purposes. In the event that total distributions during a calendar year exceed a Fund’s total return on NAV, the difference will reduce NAV per share. If a Fund’s total return on NAV exceeds total distributions during a calendar year, the excess will be reflected as an increase in NAV per share. The final determination of the source and character of all distributions paid by a Fund during the fiscal year is made after the end of the fiscal year and is reflected in the financial statements contained in the annual report as of December 31 each year.
Foreign Currency Transactions and Translation
To the extent that the Funds invest in securities and/or contracts that are denominated in a currency other than U.S. dollars, the Funds will be subject to currency risk, which is the risk that an increase in the U.S. dollar relative to the foreign currency will reduce returns or portfolio value. Generally, when the U.S. dollar rises in value against a foreign currency, the Funds’ investments denominated in that currency will lose value because their currency is worth fewer U.S. dollars; the opposite effect occurs if the U.S. dollar falls in relative value. Investments and other assets and liabilities denominated in foreign currencies are converted into U.S. dollars on a spot (i.e. cash) basis at the spot rate prevailing in the foreign currency exchange market at the time of valuation. Purchases and sales of investments and income denominated in foreign currencies are translated into U.S. dollars on the respective dates of such transactions.
The books and records of the Funds are maintained in U.S. dollars. Assets, including investments, and liabilities denominated in foreign currencies are translated into U.S. dollars at the end of each day. Purchases and sales of securities, income and expenses are translated into U.S. dollars at the prevailing exchange rate on the respective dates of the transactions.
Net realized foreign currency gains and losses resulting from changes in exchange rates associated with (i) foreign currency, (ii) investments and (iii) derivatives include foreign currency gains and losses between trade date and settlement date of the transactions, foreign currency transactions, and the difference between the amounts of interest and dividends recorded on the books of the Funds and the amounts actually received are recognized as a component of “Net realized gain (loss) from investments and foreign currency” on the Statement of Operations, when applicable.
The unrealized gains and losses resulting from changes in foreign currency exchange rates and changes in foreign exchange rates associated with (i) investments and (ii) other assets and liabilities are recognized as a component of “Change in net unrealized appreciation (depreciation) of investments and foreign currency” on the Statement of Operations, when applicable. The unrealized gains and losses resulting from changes in foreign exchange rates associated with investments in derivatives are recognized as a component of the respective derivative’s related “Change in net unrealized appreciation (depreciation)” on the Statement of Operations, when applicable.
Indemnifications
Under the Funds’ organizational documents, their officers and trustees are indemnified against certain liabilities arising out of the performance of their duties to the Funds. In addition, in the normal course of business, the Funds enter into contracts that provide general indemnifications to other parties. The Funds’ maximum exposure under these arrangements is unknown as this would involve future claims that may be made against the Funds that have not yet occurred. However, the Funds have not had prior claims or losses pursuant to these contracts and expect the risk of loss to be remote.
71
Notes to Financial Statements (continued)
Investments and Investment Income
Securities transactions are accounted for as of the trade date for financial reporting purposes. Realized gains and losses on securities transactions are based upon the specific identification method. Dividend income is recorded on the ex-dividend date or, for certain foreign securities, when information is available. Non-cash dividends received in the form of stock, if any, are recognized on the ex-dividend date and recorded at fair value. Interest income is recorded on an accrual basis. Interest income also reflects payment-in-kind (“PIK”) interest and paydown gains and losses, if any. PIK interest represents income received in the form of securities in lieu of cash. Securities lending income is comprised of fees earned from borrowers and income earned on cash collateral investments.
Netting Agreements
In the ordinary course of business, the Funds may enter into transactions subject to enforceable master repurchase agreements, International Swaps and Derivatives Association, Inc. (ISDA) master agreements or other similar arrangements (“netting agreements”). Generally, the right to offset in netting agreements allows each Fund to offset certain securities and derivatives with a specific counterparty, when applicable, as well as any collateral received or delivered to that counterparty based on the terms of the agreements. Generally, each Fund manages its cash collateral and securities collateral on a counterparty basis.
The Funds’ investments subject to netting agreements as of the end of the reporting period, if any, are further described in Note 4 – Portfolio Securities and Investments in Derivatives.
New Accounting Pronouncements and Rule Issuances
Reference Rate Reform
In March 2020, FASB issued Accounting Standards Update (“ASU”) 2020-04, Reference Rate Reform: Facilitation of the Effects of Reference Rate Reform on Financial Reporting. The main objective of the new guidance is to provide relief to companies that will be impacted by the expected change in benchmark interest rates, when participating banks will no longer be required to submit London Interbank Offered Rate (LIBOR) quotes by the UK Financial Conduct Authority (FCA). The new guidance allows companies to, provided the only changes to existing contracts are a change to an approved benchmark interest rate, account for modifications as a continuance of the existing contract without additional analysis. For new and existing contracts, the Funds may elect to apply the amendments as of March 12, 2020 through December 31, 2022. Management has not yet elected to apply the amendments, is continuously evaluating the potential effect a discontinuation of LIBOR could have on the Funds’ investments and has currently determined that it is unlikely the ASU’s adoption will have a significant impact on the Funds’ financial statements and various filings.
Securities and Exchange Commission (“SEC”) Adopts New Rules to Modernize Fund Valuation Framework
In December 2020, the SEC voted to adopt a new rule governing fund valuation practices. New Rule 2a-5 under the 1940 Act establishes requirements for determining fair value in good faith for purposes of the 1940 Act. Rule 2a-5 will permit fund boards to designate certain parties to perform fair value determinations, subject to board oversight and certain other conditions. Rule 2a-5 also defines when market quotations are “readily available” for purposes of Section 2(a)(41) of the 1940 Act, which requires a fund to fair value a security when market quotations are not readily available. The SEC also adopted new Rule 31a-4 under the 1940 Act, which sets forth the recordkeeping requirements associated with fair value determinations. Finally, the SEC is rescinding previously issued guidance on related issues, including the role of a board in determining fair value and the accounting and auditing of fund investments. Rule 2a-5 and Rule 31a-4 became effective on March 8, 2021, with a compliance date of September 8, 2022. A fund may voluntarily comply with the rules after the effective date, and in advance of the compliance date, under certain conditions. Management is currently assessing the impact of these provisions on the Funds’ financial statements.
3. Investment Valuation and Fair Value Measurements
The Funds’ investments in securities are recorded at their estimated fair value utilizing valuation methods approved by the Board. Fair value is defined as the price that would be received upon selling an investment or transferring a liability in an orderly transaction to an independent buyer in the principal or most advantageous market for the investment. U.S. GAAP establishes the three-tier hierarchy which is used to maximize the use of observable market data and minimize the use of unobservable inputs and to establish classification of fair value measurements for disclosure purposes. Observable inputs reflect the assumptions market participants would use in pricing the asset or liability. Observable inputs are based on market data obtained from sources independent of the reporting entity. Unobservable inputs reflect management’s assumptions about the assumptions market participants would use in pricing the asset or liability. Unobservable inputs are based on the best information available in the circumstances. The following is a summary of the three-tiered hierarchy of valuation input levels.
| | |
| Level 1 – | | Inputs are unadjusted and prices are determined using quoted prices in active markets for identical securities. |
| Level 2 – | | Prices are determined using other significant observable inputs (including quoted prices for similar securities, interest rates, credit spreads, etc.). |
| Level 3 – | | Prices are determined using significant unobservable inputs (including management’s assumptions in determining the fair value of investments). |
72
A description of the valuation techniques applied to the Funds’ major classifications of assets and liabilities measured at fair value follows:
Equity securities and exchange-traded funds listed or traded on a national market or exchange are valued based on their sale price at the official close of business of such market or exchange on the valuation date. Foreign equity securities and registered investment companies that trade on a foreign exchange are valued at the last sale price or official closing price reported on the exchange where traded and converted to U.S. dollars at the prevailing rates of exchange on the date of valuation. To the extent these securities are actively traded and that valuation adjustments are not applied, they are generally classified as Level 1. If there is no official close of business, then the latest available sale price is utilized. If no sales are reported, then the mean of the latest available bid and ask prices is utilized and these securities are generally classified as Level 2.
Prices of certain American Depositary Receipts (“ADR”) held by the Funds that trade in the United States are valued based on the last traded price, official closing price, or an evaluated price provided by the independent pricing service (“pricing service”) and are generally classified as Level 1 or 2.
Purchased and written options traded and listed on a national market or exchange are valued at the mean of the closing bid and asked prices and are generally classified as Level 1.
Over-the-counter (“OTC”) options are marked-to-market daily based upon a price supplied by a pricing service. OTC options are generally classified as Level 2.
Repurchase agreements are valued at contract amount plus accrued interest, which approximates market value. These securities are generally classified as Level 2.
Any portfolio security or derivative for which market quotations are not readily available or for which the above valuation procedures are deemed not to reflect fair value are valued at fair value, as determined in good faith using procedures approved by the Board. As a general principle, the fair value of a security would appear to be the amount that the owner might reasonably expect to receive for it in a current sale. A variety of factors may be considered in determining the fair value of such securities, which may include consideration of the following: yields or prices of investments of comparable quality, type of issue, coupon, maturity and rating, market quotes or indications of value from security dealers, evaluations of anticipated cash flows or collateral, general market conditions and other information and analysis, including the obligor’s credit characteristics considered relevant. To the extent the inputs are observable and timely, the values would be classified as Level 2 of the fair value hierarchy; otherwise they would be classified as Level 3.
The following table summarizes the market value of the Funds’ investments as of the end of the reporting period, based on the inputs used to value them:
| | | | | | | | | | | | | | | | |
| BXMX | | Level 1 | | | Level 2 | | | Level 3 | | | Total | |
Long-Term Investments*: | | | | | | | | | | | | | | | | |
Common Stocks | | $ | 1,585,222,473 | | | $ | — | | | $ | — | | | $ | 1,585,222,473 | |
Investments Purchased with Collateral from Securities Lending | | | 1,710,570 | | | | — | | | | — | | | | 1,710,570 | |
| | | | |
Short-Term Investments: | | | | | | | | | | | | | | | | |
Repurchase Agreements | | | — | | | | 44,223,733 | | | | — | | | | 44,223,733 | |
| | | | |
Investment in Derivatives: | | | | | | | | | | | | | | | | |
Options Written | | | (37,602,840 | ) | | | — | | | | — | | | | (37,602,840 | ) |
Total | | $ | 1,549,330,203 | | | $ | 44,223,733 | | | $ | — | | | $ | 1,593,553,936 | |
| | | | |
| DIAX | | | | | | | | | | | | |
Long-Term Investments*: | | | | | | | | | | | | | | | | |
Common Stocks | | $ | 663,171,699 | | | $ | — | | | $ | — | | | $ | 663,171,699 | |
Exchange-Traded Funds | | | 4,828,800 | | | | — | | | | — | | | | 4,828,800 | |
Investments Purchased with Collateral from Securities Lending | | | 4,895,552 | | | | — | | | | — | | | | 4,895,552 | |
| | | | |
Short-Term Investments: | | | | | | | | | | | | | | | | |
Repurchase Agreements | | | — | | | | 1,319,458 | | | | — | | | | 1,319,458 | |
| | | | |
Investment in Derivatives: | | | | | | | | | | | | | | | | |
Options Written | | | (11,076,000 | ) | | | — | | | | — | | | | (11,076,000 | ) |
Total | | $ | 661,820,051 | | | $ | 1,319,458 | | | $ | — | | | $ | 663,139,509 | |
| | | | |
| SPXX | | | | | | | | | | | | |
Long-Term Investments*: | | | | | | | | | | | | | | | | |
Common Stocks | | $ | 325,158,595 | | | $ | — | | | $ | — | | | $ | 325,158,595 | |
Exchange-Traded Funds | | | 2,414,400 | | | | — | | | | — | | | | 2,414,400 | |
Investments Purchased with Collateral from Securities Lending | | | 1,013,752 | | | | — | | | | — | | | | 1,013,752 | |
| | | | |
Short-Term Investments: | | | | | | | | | | | | | | | | |
Repurchase Agreements | | | — | | | | 1,113,304 | | | | — | | | | 1,113,304 | |
| | | | |
Investment in Derivatives: | | | | | | | | | | | | | | | | |
Options Written | | | (5,396,000 | ) | | | — | | | | — | | | | (5,396,000 | ) |
Total | | $ | 323,190,747 | | | $ | 1,113,304 | | | $ | — | | | $ | 324,304,051 | |
73
Notes to Financial Statements (continued)
| | | | | | | | | | | | | | | | |
| | | | |
| QQQX | | Level 1 | | | Level 2 | | | Level 3 | | | Total | |
Long-Term Investments*: | | | | | | | | | | | | | | | | |
Common Stocks | | $ | 1,345,672,288 | | | $ | — | | | $ | — | | | $ | 1,345,672,288 | |
Exchange-Traded Funds | | | 12,072,000 | | | | — | | | | — | | | | 12,072,000 | |
Investments Purchased with Collateral from Securities Lending | | | 395,467 | | | | — | | | | — | | | | 395,467 | |
| | | | |
Short-Term Investments: | | | | | | | | | | | | | | | | |
Repurchase Agreements | | | — | | | | 1,594,209 | | | | — | | | | 1,594,209 | |
| | | | |
Investment in Derivatives: | | | | | | | | | | | | | | | | |
Options Written | | | (24,656,803 | ) | | | — | | | | — | | | | (24,656,803 | ) |
Total | | $ | 1,333,482,952 | | | $ | 1,594,209 | | | $ | — | | | $ | 1,335,077,161 | |
| | | | |
| JCE | | | | | | | | | | | | |
Long-Term Investments*: | | | | | | | | | | | | | | | | |
Common Stocks | | $ | 276,605,109 | | | $ | — | | | $ | — | | | $ | 276,605,109 | |
Exchange-Traded Funds | | | 1,144,776 | | | | — | | | | — | | | | 1,144,776 | |
Investments Purchased with Collateral from Securities Lending | | | 225 | | | | — | | | | — | | | | 225 | |
| | | | |
Short-Term Investments: | | | | | | | | | | | | | | | | |
Repurchase Agreements | | | — | | | | 769,957 | | | | — | | | | 769,957 | |
| | | | |
Investment in Derivatives: | | | | | | | | | | | | | | | | |
Options Written | | | (320,950 | ) | | | — | | | | — | | | | (320,950 | ) |
Total | | $ | 277,429,160 | | | $ | 769,957 | | | $ | — | | | $ | 278,199,117 | |
| * | Refer to the Fund’s Portfolio of Investments for industry classifications, when applicable. |
4. Portfolio Securities and Investments in Derivatives
Portfolio Securities
Repurchase Agreements
In connection with transactions in repurchase agreements, it is each Fund’s policy that its custodian take possession of the underlying collateral securities, the fair value of which exceeds the principal amount of the repurchase transaction, including accrued interest, at all times. If the counterparty defaults, and the fair value of the collateral declines, realization of the collateral may be delayed or limited.
The following table presents the repurchase agreements for the Funds that are subject to netting agreements as of the end of the reporting period, and the collateral delivered related to those repurchase agreements.
| | | | | | | | | | |
| Fund | | Counterparty | | Short-Term
Investments, at Value | | | Collateral
Pledged (From)
Counterparty | |
| BXMX | | Fixed Income Clearing Corporation | | $ | 44,223,733 | | | $ | (45,108,262 | ) |
| DIAX | | Fixed Income Clearing Corporation | | | 1,319,458 | | | | (1,345,850 | ) |
| SPXX | | Fixed Income Clearing Corporation | | | 1,113,304 | | | | (1,135,663 | ) |
| QQQX | | Fixed Income Clearing Corporation | | | 1,594,209 | | | | (1,626,161 | ) |
| JCE | | Fixed Income Clearing Corporation | | | 769,957 | | | | (785,418 | ) |
Securities Lending
Each Fund may lend securities representing up to one-third of the value of its total assets to broker-dealers, banks, and other institutions in order to generate additional income. When loaning securities, the Fund retains the benefits of owning the securities, including the economic equivalent of dividends or interest generated by the security. The loans are continuous, can be recalled at any time, and have no set maturity. The Funds’ custodian, State Street Bank and Trust Company, serves as the securities lending agent (the “Agent”).
When a Fund loans its portfolio securities, it will receive, at the inception of each loan, cash collateral equal to an amount not less than 100% of the market value of the loaned securities. The actual percentage of the cash collateral will vary depending upon the asset type of the loaned securities. Collateral for the loaned securities is invested in a government money market vehicle maintained by the Agent, which is subject to the requirements of Rule 2a-7 under the 1940 Act. The value of the loaned securities and the liability to return the cash collateral received are recognized on the Statement of Assets and Liabilities. If the market value of the loaned securities increases, the borrower must furnish additional collateral to the Fund, which is also recognized on the Statement of Assets and Liabilities. Securities out on loan are subject to termination at any time at the option of the borrower or the Fund. Upon termination, the borrower is required to return to the Fund securities identical to the securities loaned. During the term of the loan, the Fund bears the market risk with respect to the investment of collateral and the risk that the Agent may default on its contractual obligations to the Fund. The Agent bears the risk that the borrower may default on its obligation to return the loaned securities as the Agent is contractually obligated to indemnify the Fund if at the time of a default by a borrower some or all of the loan securities have not been returned.
74
Securities lending income recognized by a Fund consists of earnings on invested collateral and lending fees, net of any rebates to the borrower and compensation to the Agent. Such income is recognized on the Statement of Operations.
As of the end of the reporting period, the total value of the loaned securities and the total value of collateral received were as follows:
| | | | | | | | | | | | |
| Fund | | Asset Class out on
Loan | | | Long-Term
Investments, at Value | | | Total
Collateral Received | |
| BXMX | | | Common Stock | | | $
| 1,655,803
|
| | $
| 1,710,570
|
|
| DIAX | | | Exchange-Traded Funds | | |
| 4,780,512
|
| |
| 4,895,552
|
|
| SPXX | | | Exchange-Traded Funds | | |
| 989,904
|
| |
| 1,013,752
|
|
| QQQX | | | Common Stock | | |
| 374,800
|
| |
| 395,467
|
|
| JCE | | | Common Stock | | | | 212 | | | | 225 | |
Investment Transactions
Long-term purchases and sales (excluding investments purchased with collateral from securities lending and derivative transactions, where applicable) during the current reporting period were as follows:
| | | | | | | | | | | | | | | | | | | | |
| | | BXMX | | | DIAX | | | SPXX | | | QQQX | | | JCE | |
Purchases | | $ | 103,070,391 | | | $ | 54,814,290 | | | $ | 80,532,410 | | | $ | 396,587,730 | | | $ | 274,329,831 | |
Sales | | | 312,748,068 | | | | 106,594,802 | | | | 102,877,559 | | | | 460,860,211 | | | | 306,660,840 | |
The Funds may purchase securities on a when-issued or delayed-delivery basis. Securities purchased on a when-issued or delayed-delivery basis may have extended settlement periods; interest income is not accrued until settlement date. Any securities so purchased are subject to market fluctuation during this period. The Funds have earmarked securities in their portfolios with a current value at least equal to the amount of the when-issued/delayed-delivery purchase commitments. If a Fund has outstanding when-issued/delayed-delivery purchases commitments as of the end of the reporting period, such amounts are recognized on the Statement of Assets and Liabilities.
Investments in Derivatives
Each Fund is authorized to invest in certain derivative instruments, such as futures, options and swap contracts. Each Fund limits its investments in futures, options on futures and swap contracts to the extent necessary for the Adviser to claim the exclusion from registration by the Commodity Futures Trading Commission as a commodity pool operator with respect to the Fund. The Funds record derivative instruments at fair value, with changes in fair value recognized on the Statement of Operations, when applicable. Even though the Funds’ investments in derivatives may represent economic hedges, they are not considered to be hedge transactions for financial reporting purposes.
Options Transactions
The purchase of options involves the risk of loss of all or a part of the cash paid for the options (the premium). The market risk associated with purchasing options is limited to the premium paid. The counterparty credit risk of purchasing options, however, needs to take into account the current value of the option, as this is the performance expected from the counterparty. When a Fund purchases an option, an amount equal to the premium paid (the premium plus commission) is recognized as a component of “Options purchased, at value” on the Statement of Asset and Liabilities. When a Fund writes an option, an amount equal to the net premium received (the premium less commission) is recognized as a component of “Options written, at value” on the Statement of Assets and Liabilities and is subsequently adjusted to reflect the current value of the written option until the option is exercised or expires or the Fund enters into a closing purchase transaction. The changes in the value of options purchased and/or written during the fiscal period are recognized as a component of “Change in net unrealized appreciation (depreciation) of options purchased and/or written” on the Statement of Operations. When an option is exercised or expires or a Fund enters into a closing purchase transaction, the difference between the net premium received, and any amount paid at expiration or on executing a closing purchase transaction, including commission, is recognized as a component of “Net realized gain (loss) from options purchased and/or written” on the Statement of Operations. The Fund, as writer of an option, has no control over whether the underlying instrument may be sold (called) or purchased (put) and as a result bears the risk of an unfavorable change in the market value of the instrument underlying the written option. There is also the risk the Fund may not be able to enter into a closing transaction because of an illiquid market.
During the current fiscal period, BXMX wrote call options on equity indices as per its stated strategy with the notional amount of these options averaging 99% of the Fund’s assets.
During the current fiscal period, DIAX, SPXX and QQQX, each wrote call options on equity indices as per its stated dynamic overwriting strategy with the notional amounts of these options ranging from approximately 35-75% of each Fund’s assets. DIAX, SPXX and QQQX also wrote put options and purchased put and call options as part of their overwrite strategy.
During the current fiscal period, JCE continued to write call options on equity indexes, while investing in a portfolio that included equities to enhance returns while foregoing some upside potential of its equity portfolio.
75
Notes to Financial Statements (continued)
The average notional amount of outstanding options purchased and options written during the current fiscal period, was as follows:
| | | | | | | | | | | | | | | | | | | | |
| | | | | | DIAX | | | SPXX | | | QQQX | | | JCE | |
Average notional amount of outstanding call options purchased* | | | | | | $ | 4,720,000 | | | $ | 2,130,000 | | | $ | 8,400,000 | | | $ | 4,600,000 | |
| | | | | |
| | | BXMX | | | DIAX | | | SPXX | | | QQQX | | | JCE | |
Average notional amount of outstanding call options written* | | $ | (1,507,675,500 | ) | | $ | (353,513,000 | ) | | $ | (164,796,500 | ) | | $ | (666,972,000 | ) | | $ | (92,016,000 | ) |
| | | | | |
| | | | | | | | | DIAX | | | SPXX | | | QQQX | |
Average notional amount of outstanding put options purchased* | | | | | | | | | | $ | 254,000 | | | $ | 127,000 | | | $ | 254,000 | |
| | | | | |
| | | | | | | | | DIAX | | | SPXX | | | QQQX | |
Average notional amount of outstanding put options written* | | | | | | | | | | $ | (4,140,000 | ) | | $ | (1,840,000 | ) | | $ | (9,430,000 | ) |
| * | The average notional amount is calculated based on the outstanding notional at the beginning of the current fiscal period and at the end of each fiscal quarter within the current fiscal period. |
The following table presents the fair value of all options purchased and options written by the Funds as of the end of the reporting period, the location of these instruments on the Statement of Assets and Liabilities and the primary underlying risk exposure.
| | | | | | | | | | | | | | | | | | |
| | | | | Location on the Statement of Assets and Liabilities | |
Underlying
Risk Exposure | | Derivative
Instrument | | Asset Derivatives | | | | | | (Liability) Derivatives | |
| | Location | | Value | | | | | | Location | | Value | |
| BXMX | |
| Equity price | | Options | | — | | $ | — | | | | | | | Options written, at value | | | $(37,602,840) | |
| DIAX | |
| Equity price | | Options | | — | | $ | — | | | | | | | Options written, at value | | $ | (11,076,000 | ) |
| SPXX | |
| Equity price | | Options | | — | | $ | — | | | | | | | Options written, at value | | $ | (5,396,000 | ) |
| QQQX | |
| Equity price | | Options | | — | | $ | — | | | | | | | Options written, at value | | $ | (24,656,803 | ) |
| JCE | |
| Equity price | | Options | | — | | $ | — | | | | | | | Options written, at value | | $ | (320,950 | ) |
The following table presents the amount of net realized gain (loss) and change in net unrealized appreciation (depreciation) recognized on options purchased and options written on the Statement of Operations during the current fiscal period, and the primary underlying risk exposure.
| | | | | | | | | | | | |
| Fund | | Underlying
Risk Exposure | | Derivative
Instrument | | Net Realized
Gain (Loss)
from Options
Purchased/Written | | | Change in Net
Unrealized
Appreciation
(Depreciation)
of Options
Purchased/Written | |
| BXMX | | Equity price | | Options written | | $ | (116,624,336 | ) | | $ | 8,560,570 | |
| DIAX | | Equity price | | Options purchased | | | 153,278 | | | | 5,632 | |
| DIAX | | Equity price | | Options written | | | (23,200,656 | ) | | | (3,331,527 | ) |
| SPXX | | Equity price | | Options purchased | | | 79,037 | | | | 2,816 | |
| SPXX | | Equity price | | Options written | | | (10,788,646 | ) | | | (1,644,623 | ) |
| QQQX | | Equity price | | Options purchased | | | 144,380 | | | | 5,632 | |
| QQQX | | Equity price | | Options written | | | (89,604,711 | ) | | | (6,565,544 | ) |
| JCE | | Equity price | | Options purchased | | | (50,655 | ) | | | — | |
| JCE | | Equity price | | Options written | | | (3,426,456 | ) | | | (99,154 | ) |
Market and Counterparty Credit Risk
In the normal course of business each Fund may invest in financial instruments and enter into financial transactions where risk of potential loss exists due to changes in the market (market risk) or failure of the other party to the transaction to perform (counterparty credit risk). The potential loss could exceed the value of the financial assets recorded on the financial statements. Financial assets, which potentially expose each Fund to counterparty credit risk, consist principally of cash due from counterparties on forward, option and swap transactions, when applicable. The extent of each Fund’s exposure to counterparty credit risk in respect to these financial assets approximates their carrying value as recorded on the Statement of Assets and Liabilities.
76
Each Fund helps manage counterparty credit risk by entering into agreements only with counterparties the Adviser believes have the financial resources to honor their obligations and by having the Adviser monitor the financial stability of the counterparties. Additionally, counterparties may be required to pledge collateral daily (based on the daily valuation of the financial asset) on behalf of each Fund with a value approximately equal to the amount of any unrealized gain above a pre-determined threshold. Reciprocally, when each Fund has an unrealized loss, the Funds have instructed the custodian to pledge assets of the Funds as collateral with a value approximately equal to the amount of the unrealized loss above a pre-determined threshold. Collateral pledges are monitored and subsequently adjusted if and when the valuations fluctuate, either up or down, by at least the pre-determined threshold amount.
5. Fund Shares
Common Shares
Common Share Equity Shelf Programs and Offering Costs
The Funds have each filed registration statements with the SEC authorizing each Fund to issue additional shares through one or more equity shelf program (“Shelf Offering”), which became effective with the SEC during a prior fiscal period.
Under these Shelf Offerings, the Funds, subject to market conditions, may raise additional equity capital by issuing additional shares from time to time in varying amounts and by different offering methods at a net price at or above each Fund’s NAV per common share. In the event each Fund’s Shelf Offering registration statement is no longer current, the Funds may not issue additional shares until a post-effective amendment to the registration statement has been filed with the SEC.
Maximum aggregate offering, common shares sold and offering proceeds, net of offering costs under each Fund’s Shelf Offering during the Funds’ current and prior fiscal period were as follows:
| | | | | | | | | | | | | | | | | | | | | | | | | | | | | | | | | | | | | | | | |
| | | BXMX | | | DIAX | | | SPXX | | | QQQX | | | JCE | |
| | | Year
Ended
12/31/21 | | | Year
Ended
12/31/20 | | | Year
Ended
12/31/21 | | | Year
Ended
12/31/20 | | | Year
Ended
12/31/21 | | | Year
Ended
12/31/20 | | | Year Ended
12/31/21 | | | Year
Ended
12/31/20 | | | Year
Ended
12/31/21 | | | Year
Ended
12/31/20 | |
Maximum aggregate offering | | | — | | | | 10,400,000 | * | | | — | | | | 3,600,000 | * | | | 4,993,317 | *** | | | 1,600,000 | ** | | | Unlimited | **** | | | 11,355,021 | | | | — | | | | 1,600,000 | * |
Common shares sold | | | — | | | | 7,583 | | | | — | | | | 25,901 | | | | 100,336 | | | | 264,171 | | | | 3,478,731 | | | | 2,039,187 | | | | — | | | | 708 | |
Offering proceeds, net of offering costs | | $ | — | | | $ | 103,714 | | | $ | — | | | $ | 400,448 | | | $ | 1,804,279 | | | $ | 4,087,020 | | | $ | 99,137,676 | | | $ | 48,249,296 | | | $ | — | | | $ | 9,093 | |
| * | Represents maximum aggregate offering for the period January 1, 2020 through October 30, 2020. |
| ** | Represents maximum aggregate offering for the period January 1, 2020 through April 30, 2020. |
| *** | Represents maximum aggregate offering for the period July 28, 2021 through December 31, 2021. |
| **** | Represents maximum aggregate offering for the period April 30, 2021 through December 31, 2021. |
Costs incurred by the Funds in connection with their initial shelf registrations are recorded as a prepaid expense and recognized as “Deferred offering costs” on the Statement of Assets and Liabilities. These costs are amortized pro rata as shares are sold and are recognized as a component of “Proceeds from shelf offering, net of offering costs” on the Statement of Changes in Net Assets. Any deferred offering costs remaining after effectiveness of the initial shelf registration will be expensed. Costs incurred by the Funds to keep the shelf registration current are expensed as incurred and recognized as a component of “Other Expenses” on the Statement of Operations.
Common Share Transactions
Transactions in common shares for the Funds during the Funds’ current and prior fiscal period, where applicable, were as follows:
| | | | | | | | | | | | | | | | | | | | | | | | | | | | | | | | | | | | | | | | |
| | | BXMX | | | DIAX | | | SPXX | | | QQQX | | | JCE | |
| | | Year
Ended
12/31/21 | | | Year
Ended
12/31/20 | | | Year
Ended
12/31/21 | | | Year
Ended
12/31/20 | | | Year
Ended
12/31/21 | | | Year
Ended
12/31/20 | | | Year
Ended
12/31/21 | | | Year
Ended
12/31/20 | | | Year
Ended
12/31/21 | | | Year
Ended
12/31/20 | |
Common shares: | | | | | | | | | | | | | | | | | | | | | | | | | | | | | | | | | | | | | | | | |
Sold through shelf offering | | | — | | | | 7,583 | | | | — | | | | 25,901 | | | | 100,336 | | | | 264,171 | | | | 3,478,731 | | | | 2,039,187 | | | | — | | | | 708 | |
Issued to shareholders due to reinvestment of distributions | | | — | | | | 58,348 | | | | — | | | | — | | | | 4,478 | | | | 4,438 | | | | 60,886 | | | | — | | | | 18,321 | | | | — | |
Weighted average common share: | | | | | | | | | | | | | | | | | | | | | | | | | | | | | | | | | | | | | | | | |
Premium to NAV per shelf offering sold | | | — | % | | | 1.07 | % | | | — | % | | | 1.12 | % | | | 1.23 | % | | | 1.57 | % | | | 1.90 | % | | | 1.80 | % | | | — | % | | | 1.03 | % |
6. Income Tax Information
Each Fund is a separate taxpayer for federal income tax purposes. Each Fund intends to distribute substantially all of its net investment company taxable income to shareholders and to otherwise comply with the requirements of Subchapter M of the Internal Revenue Code applicable to regulated investment companies. In any year when the Funds realize net capital gains, each Fund may choose to distribute all or a portion of its net capital gains to shareholders, or alternatively, to retain all or a portion of its net capital gains and pay federal corporate income taxes on such retained gains.
77
Notes to Financial Statements (continued)
For all open tax years and all major taxing jurisdictions, management of the Funds has concluded that there are no significant uncertain tax positions that would require recognition in the financial statements. Open tax years are those that are open for examination by taxing authorities (i.e., generally the last four tax year ends and the interim tax period since then). Furthermore, management of the Funds is also not aware of any tax positions for which it is reasonably possible that the total amounts of unrecognized tax benefits will significantly change in the next twelve months.
The following information is presented on an income tax basis. Differences between amounts for financial statement and federal income tax purposes are primarily due to timing differences in recording income, timing differences in recognizing certain gains and losses on investment transactions and the recognition of unrealized gain or loss for tax (mark-to-market) on options contracts. To the extent that differences arise that are permanent in nature, such amounts are reclassified within the capital accounts as detailed below. Temporary differences do not require reclassification. Temporary and permanent differences do not impact the NAVs of the Funds.
The table below presents the cost and unrealized appreciation (depreciation) of each Fund’s investment portfolio, as determined on a federal income tax basis, as of December 31, 2021.
For purposes of this disclosure, derivative tax cost is generally the sum of any upfront fees or premiums exchanged and any amounts unrealized for income statement reporting but realized in income and/or capital gains for tax reporting. If a particular derivative category does not disclose any tax unrealized appreciation or depreciation, the change in value of those derivatives have generally been fully realized for tax purposes.
| | | | | | | | | | | | | | | | | | | | |
| | | BXMX | | | DIAX | | | SPXX | | | QQQX | | | JCE | |
Tax cost of investments | | $ | 528,073,536 | | | $ | 252,377,267 | | | $ | 116,063,278 | | | $ | 345,461,123 | | | $ | 223,347,493 | |
Gross unrealized: | | | | | | | | | | | | | | | | | | | | |
Appreciation | | $ | 1,073,798,469 | | | $ | 418,599,888 | | | $ | 209,156,619 | | | $ | 1,003,184,936 | | | $ | 58,720,678 | |
Depreciation | | | (8,318,069 | ) | | | (7,837,646 | ) | | | (915,846 | ) | | | (13,568,898 | ) | | | (3,869,054 | ) |
Net unrealized appreciation (depreciation) of investments | | $ | 1,065,480,400 | | | $ | 410,762,242 | | | $ | 208,240,773 | | | $ | 989,616,038 | | | $ | 54,851,624 | |
| | | | | | | | | | | | | | | | | | | | |
|
| Permanent differences, primarily due to foreign currency transactions, real estate investment trust adjustments, net operating losses, distribution reallocations, and nondeductible organization expenses, resulted in reclassifications among the Funds’ components of net assets as of December 31, 2021, the Funds’ tax year end. | |
|
| The tax components of undistributed net ordinary income and net long-term capital gains as of December 31, 2021, the Funds’ tax year end, were as follows: | |
| | | BXMX | | | DIAX | | | SPXX | | | QQQX | | | JCE | |
Undistributed net ordinary income1 | | | $— | | | | $— | | | | $— | | | | $— | | | $ | 26,089,394 | |
Undistributed net long-term capital gains | | | — | | | | — | | | | — | | | | — | | | | 4,996,407 | |
|
1 Net ordinary income consists of net taxable income derived from dividends, interest and net short-term capital gains, if any. The tax character of distributions paid during the Funds’ tax years ended December 31, 2021 and December 31, 2020 was designated for purposes of the dividends paid deduction as follows: | |
| 2021 | | BXMX | | | DIAX | | | SPXX | | | QQQX | | | JCE | |
Distributions from net ordinary income1 | | $ | 7,941,118 | | | $ | 6,196,646 | | | $ | 1,822,067 | | | $ | — | | | $ | 4,883,323 | |
Distributions from net long-term capital gains2 | | | 42,365,694 | | | | 5,996,179 | | | | 10,354,471 | | | | 33,913,718 | | | | 24,578,132 | |
Return of capital | | | 39,207,868 | | | | 27,519,845 | | | | 4,722,744 | | | | 44,002,163 | | | | — | |
| | | | | |
| 2020 | | BXMX | | | DIAX | | | SPXX | | | QQQX | | | JCE | |
Distributions from net ordinary income1 | | $ | 12,431,685 | | | $ | 8,012,926 | | | $ | 2,666,875 | | | $ | 932,061 | | | $ | 3,625,753 | |
Distributions from net long-term capital gains | | | — | | | | 29,582,400 | | | | — | | | | — | | | | 11,201,332 | |
Return of capital | | | 78,904,515 | | | | 2,917,416 | | | | 14,524,883 | | | | 62,802,006 | | | | — | |
|
1 Net ordinary income consists of net taxable income derived from dividends, interest and net short-term capital gains, if any. 2 The Funds designate as long-term capital gain dividend, pursuant to Internal Revenue Code Section 852(b)(3), the amount necessary to reduce earnings and profits of the Fund related to net capital gain to zero for the tax year ended December 31, 2021. | |
During the Funds’ tax year ended December 31, 2021, the following Funds utilized capital loss carryforward as follows:
| | | | | | | | | | | | |
| | | BXMX | | | SPXX | | | QQQX | |
Utilized capital loss carryforward | | $ | 25,227,047 | | | $ | 26,877,391 | | | $ | 35,888,565 | |
78
7. Management Fees
The management fee compensates the Adviser for overall investment advisory and administrative services and general office facilities. Gateway and NAM are compensated for their services to the Funds from the management fees paid to the Adviser.
Each Fund’s management fee consists of two components – a fund-level fee, based only on the amount of assets within each individual Fund, and a complex-level fee, based on the aggregate amount of all eligible fund assets managed by the Adviser. This pricing structure enables Fund shareholders to benefit from growth in the assets within their respective Fund as well as from growth in the amount of complex-wide assets managed by the Adviser.
The annual fund-level fee, payable monthly, for each Fund is calculated according to the following schedule:
| | | | | | | | | | | | | | | | | | | | |
| Average Daily Managed Assets* | | BXMX | | | DIAX | | | SPXX | | | QQQX | | | JCE | |
For the first $500 million | | | 0.7000 | % | | | 0.7000 | % | | | 0.6600 | % | | | 0.6900 | % | | | 0.7500 | % |
For the next $500 million | | | 0.6750 | | | | 0.6750 | | | | 0.6350 | | | | 0.6650 | | | | 0.7250 | |
For the next $500 million | | | 0.6500 | | | | 0.6500 | | | | 0.6100 | | | | 0.6400 | | | | 0.7000 | |
For the next $500 million | | | 0.6250 | | | | 0.6250 | | | | 0.5850 | | | | 0.6150 | | | | 0.6750 | |
For managed assets over $2 billion | | | 0.6000 | | | | 0.6000 | | | | 0.5600 | | | | 0.5900 | | | | 0.6500 | |
The annual complex-level fee, payable monthly, for each Fund is calculated by multiplying the current complex-wide fee rate, determined according to the following schedule by each Fund’s daily managed assets:
| | | | |
| Complex-Level Eligible Asset Breakpoint Level* | | Effective Complex-Level Fee Rate at Breakpoint Level | |
$55 billion | | | 0.2000 | % |
$56 billion | | | 0.1996 | |
$57 billion | | | 0.1989 | |
$60 billion | | | 0.1961 | |
$63 billion | | | 0.1931 | |
$66 billion | | | 0.1900 | |
$71 billion | | | 0.1851 | |
$76 billion | | | 0.1806 | |
$80 billion | | | 0.1773 | |
$91 billion | | | 0.1691 | |
$125 billion | | | 0.1599 | |
$200 billion | | | 0.1505 | |
$250 billion | | | 0.1469 | |
$300 billion | | | 0.1445 | |
| * | For the complex-level fees, managed assets include closed-end fund assets managed by the Adviser that are attributable to certain types of leverage. For these purposes, leverage includes the funds’ use of preferred stock and borrowings and certain investments in the residual interest certificates (also called inverse floating rate securities) in tender option bond (TOB) trusts, including the portion of assets held by a TOB trust that has been effectively financed by the trust’s issuance of floating rate securities, subject to an agreement by the Adviser as to certain funds to limit the amount of such assets for determining managed assets in certain circumstances. The complex-level fee is calculated based upon the aggregate daily managed assets of all Nuveen open-end and closed-end funds that constitute “eligible assets.” Eligible assets do not include assets attributable to investments in other Nuveen funds or assets in excess of a determined amount (originally $2 billion) added to the Nuveen fund complex in connection with the Adviser’s assumption of the management of the former First American Funds effective January 1, 2011, but do not include certain assets of certain Nuveen funds that were reorganized into funds advised by an affiliate of the Adviser during the 2019 calendar year. As of December 31, 2021, the complex-level fee for each Fund was 0.1531%. |
8. Borrowing Arrangements
Inter-Fund Borrowing and Lending
The SEC has granted an exemptive order permitting registered open-end and closed-end Nuveen funds to participate in an inter-fund lending facility whereby the Nuveen funds may directly lend to and borrow money from each other for temporary purposes (e.g., to satisfy redemption requests or when a sale of securities “fails,” resulting in an unanticipated cash shortfall) (the “Inter-Fund Program”). The closed-end Nuveen funds, including the Funds covered by this shareholder report, will participate only as lenders, and not as borrowers, in the Inter-Fund Program because such closed-end funds rarely, if ever, need to borrow cash to meet redemptions. The Inter-Fund Program is subject to a number of conditions, including, among other things, the requirements that (1) no fund may borrow or lend money through the Inter-Fund Program unless it receives a more favorable interest rate than is typically available from a bank or other financial institution for a comparable transaction; (2) no fund may borrow on an unsecured basis through the Inter-Fund Program unless the fund’s outstanding borrowings from all sources immediately after the inter-fund borrowing total 10% or less of its total assets; provided that if the borrowing fund has a secured borrowing outstanding from any other lender, including but not limited to another fund, the inter-fund loan must be secured on at least an equal priority basis with at least an equivalent percentage of collateral to loan value; (3) if a fund’s total outstanding borrowings immediately after an inter-fund borrowing would be greater than 10% of its total assets, the fund may borrow through the inter-fund loan on a secured basis only; (4) no fund may lend money if the loan would cause its aggregate outstanding loans through the Inter-Fund Program to exceed 15%
79
Notes to Financial Statements (continued)
of its net assets at the time of the loan; (5) a fund’s inter-fund loans to any one fund shall not exceed 5% of the lending fund’s net assets; (6) the duration of inter-fund loans will be limited to the time required to receive payment for securities sold, but in no event more than seven days; and (7) each inter-fund loan may be called on one business day’s notice by a lending fund and may be repaid on any day by a borrowing fund. In addition, a Nuveen fund may participate in the Inter-Fund Program only if and to the extent that such participation is consistent with the fund’s investment objective and investment policies. The Board is responsible for overseeing the Inter-Fund Program.
The limitations detailed above and the other conditions of the SEC exemptive order permitting the Inter-Fund Program are designed to minimize the risks associated with Inter-Fund Program for both the lending fund and the borrowing fund. However, no borrowing or lending activity is without risk. When a fund borrows money from another fund, there is a risk that the loan could be called on one day’s notice or not renewed, in which case the fund may have to borrow from a bank at a higher rate or take other actions to payoff such loan if an inter-fund loan is not available from another fund. Any delay in repayment to a lending fund could result in a lost investment opportunity or additional borrowing costs.
During the current reporting period, none of the Funds covered by this shareholder report have entered into any inter-fund loan activity.
80
Shareholder Update
(Unaudited)
CURRENT INVESTMENT OBJECTIVES, INVESTMENT POLICIES AND PRINCIPAL RISKS OF THE FUNDS
NUVEEN S&P 500 BUY-WRITE INCOME FUND (BXMX)
Investment Objective
The Fund’s investment objective is to seek attractive total return with less volatility than the S&P 500 Index.
Investment Policies
Under normal circumstances, the Fund will invest at least 80% of its Assets (as defined below) in a diversified equity portfolio made up of securities comprising the S&P 500 Index (or securities that have economic characteristics that are similar to those securities comprising the S&P 500 Index) that seeks to substantially replicate price movements of the S&P 500 Index and is designed to support the Fund’s option strategy.
Under normal circumstances, the Fund expects to invest substantially all (at least 90%) of its Managed Assets (as defined below) in its equity portfolio or otherwise in pursuit of its investment objective.
The Fund employs a constant “buy-write” option strategy whereby the Fund’s sub-adviser sells (writes) index call options on a continuous basis on substantially the full value of the Fund’s equity portfolio. The Fund targets a constant overwrite level (i.e., the ratio of the notional value of index call options sold by the Fund to the market value of the Fund’s equity portfolio) of 100% of the value of its equity portfolio. The Fund’s use of a buy-write strategy, which is also commonly referred to as a buy-write income strategy, is intended to produce cash flow for the Fund in the form of premiums on the options written. In exchange for this cash flow (the income component of a buy-write strategy), the Fund’s total return may be reduced relative to the S&P 500 Index in rising markets and may be enhanced relative to the S&P 500 Index in flat or declining markets, in each case consistent with the Fund’s investment objective to seek attractive total return with less volatility than the S&P 500 Index.
“Assets” means net assets of the Fund plus the amount of any borrowings for investment purposes. “Managed Assets” mean the total assets of the Fund, minus the sum of its accrued liabilities (other than Fund liabilities incurred for the express purpose of creating leverage). Total assets for this purpose shall include assets attributable to the Fund’s use of leverage (whether or not those assets are reflected in the Fund’s financial statements for purposes of generally accepted accounting principles), and derivatives will be valued at their market value.
Under normal market conditions:
| | • | | The Fund may invest no more than 10% of its Managed Assets in short-term, high quality fixed-income securities. |
| | • | | The Fund may invest up to 20% of its Managed Assets in securities of non-U.S. issuers that are U.S. dollar denominated, which may include securities of issuers located, or conducting their business, in emerging market countries. |
The foregoing policies apply only at the time of any new investment.
Approving Changes in Investment Policies
The Board of Trustees of the Fund may change the policies described above without a shareholder vote. However, with respect to the Fund’s policy of investing at least 80% of its Assets in its equity portfolio, such policy may not be changed without 60 days’ prior written notice to Common Shareholders.
Portfolio Contents
The Fund expects to invest in a portfolio of individual common stocks designed to replicate the risk and return profile, and thereby substantially replicate price movements, of the S&P 500 Index. The Fund may also invest in other investment companies, including exchange-traded fund (“ETFs”), that provide similar exposure to individual common stocks consistent with the Fund’s investment objective. Common stock generally represents an equity ownership interest in an issuer, without preference over and with a lower priority than any other class of securities, including such issuer’s debt securities, preferred stock and other senior equity securities. Common stocks usually carry voting rights and earn dividends. Common stocks fluctuate in price in response to many factors including historical and prospective earnings of the issuer, the value of its assets, general economic conditions, interest rates, investor perceptions and market liquidity, as such the company may or may not pay dividends. Dividends on common stocks are declared at the discretion of the company’s board. In addition, common stock generally has the greatest appreciation and depreciation potential because increases and decreases in earnings are usually reflected in a company’s stock price.
In carrying out its option strategy, the Fund may write index call options on the S&P 500 Index and other broad-based indices and may, if the Fund’s sub-adviser deems conditions appropriate, write call options on a variety of other equity market indices. As the seller of an index call option, the Fund receives a premium from the purchaser. The purchaser of the index call option has the right to any appreciation in the value of the index over the exercise price upon the exercise of the call option or the expiration date. If, at expiration, the purchaser exercises the index option sold by the Fund, the Fund will pay the purchaser the difference between the cash value of the index and the exercise price of the index option. The premium, the exercise price and the market value of the index determine the gain or loss realized by the Fund as the seller of the index call option.
81
Shareholder Update (continued)
(Unaudited)
The Fund may invest in U.S. Government securities. U.S. Government securities include (1) U.S. Treasury obligations, which differ in their interest rates, maturities and times of issuance: U.S. Treasury bills (maturities of one year or less), U.S. Treasury notes (maturities of one year to ten years) and U.S. Treasury bonds (generally maturities of greater than ten years) and (2) obligations issued or guaranteed by U.S. Government agencies and instrumentalities that are supported by any of the following: (i) the full faith and credit of the U.S. Treasury, (ii) the right of the issuer to borrow an amount limited to a specific line of credit from the U.S. Treasury, (iii) discretionary authority of the U.S. Government to purchase certain obligations of the U.S. Government agency or instrumentality or (iv) the credit of the agency or instrumentality.
The Fund also may invest in any other security or agreement collateralized or otherwise secured by U.S. Government securities. Agencies and instrumentalities of the U.S. Government include but are not limited to: Federal Land Banks, Federal Financing Banks, Banks for Cooperatives, Federal Intermediate Credit Banks, Farm Credit Banks, Federal Home Loan Banks, Federal Home Loan Mortgage Corporation, Federal National Mortgage Association, Government National Mortgage Association, Student Loan Marketing Association, U.S. Postal Service, Small Business Administration, Tennessee Valley Authority and any other enterprise established or sponsored by the U.S. Government. Because the U.S. Government generally is not obligated to provide support to its instrumentalities, the Fund will invest in obligations issued by these instrumentalities only if its sub-adviser determines that the credit risk with respect to such obligations is minimal.
The Fund may invest in commercial paper. Commercial paper represents short-term unsecured promissory notes issued in bearer form by corporations such as banks or bank holding companies and finance companies.
The Fund may enter into repurchase agreements (the purchase of a security coupled with an agreement to resell that security at a higher price) with respect to its permitted investments. The Fund’s repurchase agreements will provide that the value of the collateral underlying the repurchase agreement will always be at least equal to the repurchase price, including any accrued interest earned on the agreement, and will be marked-to-market daily.
The Fund may invest in securities of non-U.S. issuers that are U.S. dollar-denominated, which may include securities of issuers located, or conducting their business, in emerging market countries. The Fund will classify an issuer of a security as being a U.S. or non-U.S. issuer based on the determination of an unaffiliated, recognized financial data provider. Such determinations are based on a number of criteria, such as the issuer’s country of domicile, the primary exchange on which the security predominately trades, the location from which the majority of the issuer’s revenue comes, and the issuer’s reporting currency. Furthermore, a country is considered to be an “emerging market” if it has a relatively low gross national product per capita compared to the world’s major economies and the potential for rapid economic growth. The Fund considers a country an emerging market country based on the determination of an international organization, such as the IMF, or an unaffiliated, recognized financial data provider.
The Fund may buy and sell securities on a when-issued or delayed delivery basis, making payment or taking delivery at a later date, normally within 15 to 45 days of the trade date.
The Fund may invest in illiquid securities (i.e., securities that are not readily marketable), including, but not limited to, restricted securities (securities the disposition of which is restricted under the federal securities laws), securities that may be resold only pursuant to Rule 144A under the Securities Act of 1933, as amended (the “1933 Act”), and repurchase agreements with maturities in excess of seven days.
The Fund may enter into certain derivative instruments in pursuit of its investment objective, including to seek to enhance return, to hedge certain risks of its investments in securities or as a substitute for a position in the underlying asset. Such instruments include financial futures contracts and options thereon, swaps (with varying terms, including interest rate swaps and credit default swaps), options on interest rates, options on indices, options on swaps, options on currencies and other fixed-income derivative instruments that may have the economic effect of leverage.
The Fund may also invest in securities of other open- or closed-end investment companies (including ETFs) that invest primarily in securities of the types in which the Fund may invest directly, to the extent permitted by the Investment Company Act of 1940 Act, as amended (the “1940 Act”), the rules and regulations issued thereunder and applicable exemptive orders issued by the Securities and Exchange Commission (“SEC”).
The Fund may lend securities representing up to one-third of the value of its total assets to broker-dealers, banks, and other institutions to generate additional income. When the Fund loans its portfolio securities, it will receive, at the inception of each loan, cash collateral equal to at least 102% of the value of the loaned securities. Under the Fund’s securities lending agreement, the securities lending agent will generally bear the risk that a borrower may default on its obligation to return loaned securities. The Fund, however, will be responsible for the risks associated with the investment of cash collateral. The Fund may lose money on its investment of cash collateral or may fail to earn sufficient income on its investment to meet its obligations to the borrower.
Use of Leverage
As a non-fundamental policy, the Fund will not leverage its capital structure by issuing senior securities such as the issuance of preferred shares of beneficial interest (“Preferred Shares”) or debt instruments. However, the Fund may borrow for temporary or emergency purposes and may enter into certain derivatives transactions that have the economic effect of leverage.
82
Temporary Defensive Periods
During temporary defensive periods the Fund may deviate from its investment objective and policies, and in order to keep the Fund’s cash fully invested, the Fund may invest any portion of its Managed Assets in investment grade debt securities, including obligations issued or guaranteed by the U.S. government, its agencies and instrumentalities. The Fund may not achieve its investment objectives during such periods.
83
Shareholder Update (continued)
(Unaudited)
NUVEEN DOW 30SM DYNAMIC OVERWRITE FUND (DIAX)
Investment Objective
The Fund’s investment objective is to seek attractive total return with less volatility than the Dow Jones Industrial Average (the “DJIA”).
Investment Policies
Under normal circumstances, the Fund will invest at least 80% of its Assets (as defined below) in the thirty stocks included in the DJIA in approximately the amount such stocks are weighted in the DJIA and/or in other securities or financial instruments with economic characteristics that are similar to the thirty stocks included in the DJIA that are intended to correlate with the price movements of the DJIA.
Under normal circumstances, the Fund expects to invest substantially all (at least 90%) of its Managed Assets (as defined below) in its equity portfolio or otherwise in pursuit of its investment objective.
The Fund’s sub-adviser constructs the Fund’s equity portfolio by purchasing the common stock of each company included in the DJIA in approximately the amounts stocks are weighted in the DJIA. The Fund will periodically rebalance its holdings of DJIA stocks in order to more closely approximate each stock’s weighting in the DJIA. The Fund’s sub-adviser will consider the tax consequences of certain transactions within the Fund’s equity portfolio and intends to manage the portfolio in a tax-efficient manner by taking, for example, capital losses when possible to offset realized capital gains. The Fund’s sub-adviser will rebalance and adjust the Fund’s equity portfolio as necessary for tracking and tax management purposes.
The Fund employs a dynamic options “overwrite” strategy whereby the Fund’s sub-adviser sells (writes) call options on a varying percentage of the market value of the Fund’s equity portfolio based on its market outlook. Pursuant to this option strategy, under normal circumstances, the Fund sells (writes) index call options, call options on custom baskets of securities, and call options on individual securities. In addition to a primary emphasis on writing call options to reduce downside risk and volatility of the Fund’s equity portfolio, the Fund’s option strategy as a secondary emphasis seeks additional return opportunities by capitalizing on inefficiencies in the options market through a variety of means including the use of call spreads, purchasing call options, and selling put options.
The Fund targets an overwrite level (i.e., the ratio of the notional value of call options sold by the Fund to the market value of the Fund’s equity portfolio) of 55% of the value of its equity portfolio over time, and the overwrite level will vary, based on market conditions, between 35% to 75% of the value of its equity portfolio.
“Assets” means net assets of the Fund plus the amount of any borrowings for investment purposes. “Managed Assets” mean the total assets of the Fund, minus the sum of its accrued liabilities (other than Fund liabilities incurred for the express purpose of creating leverage). Total assets for this purpose shall include assets attributable to the Fund’s use of leverage (whether or not those assets are reflected in the Fund’s financial statements for purposes of generally accepted accounting principles), and derivatives will be valued at their market value.
Under normal market conditions:
| | • | | As a fundamental policy, the Fund may not invest more than 25% of its total assets in securities of issuers in any one industry, except that if 25% or more of the securities in the DIJA are issued by companies in one industry, the Fund would concentrate in that industry unless the Fund would need to avoid concentration in order to implement its investment strategy as it relates to avoiding the adverse tax treatment associated with straddle positions (Industry Concentration Policy). |
| | • | | The Fund may invest no more than 10% of its Managed Assets in short-term, high quality fixed-income securities. |
| | • | | The Fund may invest up to 20% of its Managed Assets in securities of non-U.S. issuers that are U.S. dollar denominated, which may include securities of issuers located, or conducting their business, in emerging market countries. |
The foregoing policies apply only at the time of any new investment.
Approving Changes in Investment Policies
The Board of Trustees of the Fund may change the policies described above without a shareholder vote. However, with respect to the Fund’s policy of investing at least 80% of its Assets in its equity portfolio, such policy may not be changed without 60 days’ prior written notice to shareholders.
However, the Fund’s fundamental Industry Concentration Policy may not be changed without the approval of the holders of a majority of the outstanding common shares and Preferred Shares voting together as a single class, and the approval of the holders of a majority of the outstanding Preferred Shares, voting separately as a single class. A “majority of the outstanding” shares means (i) 67% or more of the shares present at a meeting, if the holders of more than 50% of the shares are present or represented by proxy or (ii) more than 50% of the shares, whichever is less.
84
Portfolio Contents
The Fund will invest in the thirty common stocks included in the DJIA in approximately the amount such stocks are weighted in the DJIA. The Fund may also invest in other securities or financial instruments with economic characteristics that are similar to the thirty stocks included in the DJIA that are intended to correlate with the price movements of the DJIA. The Fund may also invest in other investment companies, including ETFs, that provide similar exposure to individual common stocks consistent with the Fund’s investment objective. Common stock generally represents an equity ownership interest in an issuer, without preference over and with a lower priority than any other class of securities, including such issuer’s debt securities, preferred stock and other senior equity securities. Common stocks usually carry voting rights and earn dividends. Common stocks fluctuate in price in response to many factors including historical and prospective earnings of the issuer, the value of its assets, general economic conditions, interest rates, investor perceptions and market liquidity, as such the company may or may not pay dividends. Dividends on common stocks are declared at the discretion of the company’s board. In addition, common stock generally has the greatest appreciation and depreciation potential because increases and decreases in earnings are usually reflected in a company’s stock price.
As part of its option strategy, the Fund sells (writes) index call options, call options on custom baskets of securities, and covered or uncovered call options on individual securities. An option contract is a contract that gives the holder of the option, in return for a premium, the right to buy from (in the case of a call) or sell to (in the case of a put) the writer of the option the reference instrument underlying the option (or the cash value of the index) at a specified exercise price at any time during the term of the option. The writer of an option on a security has the obligation upon exercise of the option to deliver the reference instrument (or the cash) upon payment of the exercise price or to pay the exercise price upon delivery of the reference instrument (or the cash). Upon exercise of an index option, the writer of an option on an index is obligated to pay the difference between the cash value of the index and the exercise price multiplied by the specified multiplier for the index option. Options may be “covered,” meaning that the party required to deliver the reference instrument if the option is exercised owns that instrument (or has set aside sufficient assets to meet its obligation to deliver the instrument). Options may be listed on an exchange or traded in the over-the-counter (“OTC”) market. In general, exchange-traded options have standardized exercise prices and expiration dates and may require the parties to post margin against their obligations, and the performance of the parties’ obligations in connection with such options is guaranteed by the exchange or a related clearing corporation. OTC options have more flexible terms negotiated between the buyer and the seller but are subject to counterparty risk. The ability of the Fund to transact business with any one or any number of counterparties, the lack of any independent evaluation of the counterparties or their financial capabilities, and the absence of a regulated market to facilitate settlement, may increase the potential for losses to the Fund. OTC options also involve greater liquidity risk. This risk may be increased in times of financial stress, if the trading market for OTC derivative contracts becomes limited.
In carrying out its option strategy, the Fund may write index call options on the DJIA and other broad-based indices and may, if the Fund’s sub-adviser deems conditions appropriate, write call options on a variety of other equity market indices. As the seller of an index call option, the Fund receives a premium from the purchaser. The purchaser of the index call option has the right to any appreciation in the value of the index over the exercise price upon the exercise of the call option or the expiration date. If, at expiration, the purchaser exercises the index option sold by the Fund, the Fund will pay the purchaser the difference between the cash value of the index and the exercise price of the index option. The premium, the exercise price and the market value of the index determine the gain or loss realized by the Fund as the seller of the index call option.
The Fund may also write call options on custom baskets of securities. A custom basket call option is an OTC option with a counterparty whose value is linked to the market value of a portfolio of underlying securities and is collateralized by a portion of the Fund’s equity portfolio. In designing the custom basket call options, the Fund’s sub-adviser will primarily select assets not held by the Fund. In order to minimize the difference between the returns of the underlying securities in the custom basket (commonly referred to as a tracking error), the Fund’s sub-adviser will use optimization calculations when selecting the individual securities for inclusion in the custom basket.
The Fund may also write single name call options, both covered and “naked” or uncovered, on individual stocks. A call option written by the Fund on an individual security is “covered” if the Fund owns the security underlying the call or has an absolute and immediate right to acquire that security without additional cash consideration. The Fund, in effect, sells the potential appreciation in the value of the security subject to the call option in exchange for the premium. The Fund may execute a closing purchase transaction with respect to an option it has sold and sell another option (with either a different exercise price or expiration date or both). The Fund’s objective in entering into such a closing transaction will be to optimize net index option premiums. The cost of a closing transaction may reduce the net option premiums realized from the sale of the option. This reduction could be offset, at least in part, by appreciation in the value of the underlying security held in the Fund’s equity portfolio, and by the opportunity to realize additional premium income from selling a new option.
The Fund may also purchase call options. A call option entitles the purchaser, in return for the premium paid, to purchase specified securities at a specified price during the option period. Because the premium paid for a call option is typically a small fraction of the price of the underlying security, a given amount of funds will purchase call options covering a much larger quantity of such security than could be purchased directly. By purchasing call options, the Fund could benefit from any significant increase in the price of the underlying security to a greater extent than if it had invested the same amount in the security directly.
85
Shareholder Update (continued)
(Unaudited)
The Fund may also use call spreads as part of its option strategy. A call spread involves the sale of a call option and the corresponding purchase of a call option on the same underlying instrument with the same expiration date but with different exercise prices. The call spreads utilized by the Fund generally will generate less net option premium than writing calls, but limit the overall risk of the strategy by capping the Fund’s liability from the written call while simultaneously allowing for additional upside above the strike price of the purchased call.
The Fund may also use put options as part of its option strategy. A put option gives the purchaser of the option the right (but not the obligation) to sell, and the writer of the option the obligation to buy, the underlying instrument (or the cash value of the index) at a stated price (the “exercise price”) at any time before the option expires. The purchase price for a put option is the “premium” paid by the purchaser for the right to sell. When the Fund sells a put option on an underlying instrument and the underlying instrument decreases in value, the purchaser of the put option has the right to exercise the option, obligating the Fund to purchase the underlying instrument at an exercise price that is higher than the prevailing market price. The Fund collects option premium income when it sells the put option. If the underlying instrument increases in value, the purchaser of the put option is unlikely to exercise the option since the prevailing market price will be higher than the exercise price. Accordingly, the Fund retains all put premium income collected during market advances.
The Fund may invest in U.S. Government securities. U.S. Government securities include (1) U.S. Treasury obligations, which differ in their interest rates, maturities and times of issuance: U.S. Treasury bills (maturities of one year or less), U.S. Treasury notes (maturities of one year to ten years) and U.S. Treasury bonds (generally maturities of greater than ten years) and (2) obligations issued or guaranteed by U.S. Government agencies and instrumentalities that are supported by any of the following: (i) the full faith and credit of the U.S. Treasury, (ii) the right of the issuer to borrow an amount limited to a specific line of credit from the U.S. Treasury, (iii) discretionary authority of the U.S. Government to purchase certain obligations of the U.S. Government agency or instrumentality or (iv) the credit of the agency or instrumentality.
The Fund also may invest in any other security or agreement collateralized or otherwise secured by U.S. Government securities. Agencies and instrumentalities of the U.S. Government include but are not limited to: Federal Land Banks, Federal Financing Banks, Banks for Cooperatives, Federal Intermediate Credit Banks, Farm Credit Banks, Federal Home Loan Banks, Federal Home Loan Mortgage Corporation, Federal National Mortgage Association, Government National Mortgage Association, Student Loan Marketing Association, U.S. Postal Service, Small Business Administration, Tennessee Valley Authority and any other enterprise established or sponsored by the U.S. Government. Because the U.S. Government generally is not obligated to provide support to its instrumentalities, the Fund will invest in obligations issued by these instrumentalities only if its sub-adviser determines that the credit risk with respect to such obligations is minimal.
The Fund may invest in commercial paper. Commercial paper represents short-term unsecured promissory notes issued in bearer form by corporations such as banks or bank holding companies and finance companies.
The Fund may enter into repurchase agreements (the purchase of a security coupled with an agreement to resell that security at a higher price) with respect to its permitted investments. The Fund’s repurchase agreements will provide that the value of the collateral underlying the repurchase agreement will always be at least equal to the repurchase price, including any accrued interest earned on the agreement, and will be marked-to-market daily.
The Fund may invest in securities of non-U.S. issuers that are U.S. dollar-denominated, which may include securities of issuers located, or conducting their business, in emerging market countries. The Fund will classify an issuer of a security as being a U.S. or non-U.S. issuer based on the determination of an unaffiliated, recognized financial data provider. Such determinations are based on a number of criteria, such as the issuer’s country of domicile, the primary exchange on which the security predominately trades, the location from which the majority of the issuer’s revenue comes, and the issuer’s reporting currency. Furthermore, a country is considered to be an “emerging market” if it has a relatively low gross national product per capita compared to the world’s major economies and the potential for rapid economic growth. The Fund considers a country an emerging market country based on the determination of an international organization, such as the IMF, or an unaffiliated, recognized financial data provider.
The Fund may buy and sell securities on a when-issued or delayed delivery basis, making payment or taking delivery at a later date, normally within 15 to 45 days of the trade date.
The Fund may invest in illiquid securities (i.e., securities that are not readily marketable), including, but not limited to, restricted securities (securities the disposition of which is restricted under the federal securities laws), securities that may be resold only pursuant to Rule 144A under the 1933 Act, and repurchase agreements with maturities in excess of seven days.
The Fund may enter into certain derivative instruments in pursuit of its investment objective, including to seek to enhance return, to hedge certain risks of its investments in securities or as a substitute for a position in the underlying asset. Such instruments include financial futures contracts and options thereon, swaps (with varying terms, including interest rate swaps and credit default swaps), options on interest rates, options on indices, options on swaps, options on currencies and other fixed-income derivative instruments that may have the economic effect of leverage.
The Fund may also invest in securities of other open- or closed-end investment companies (including ETFs) that invest primarily in securities of the types in which the Fund may invest directly, to the extent permitted by the 1940 Act, the rules and regulations issued thereunder and applicable exemptive orders issued by the SEC.
86
The Fund may lend securities representing up to one-third of the value of its total assets to broker-dealers, banks, and other institutions to generate additional income. When the Fund loans its portfolio securities, it will receive, at the inception of each loan, cash collateral equal to at least 102% of the value of the loaned securities. Under the Fund’s securities lending agreement, the securities lending agent will generally bear the risk that a borrower may default on its obligation to return loaned securities. The Fund, however, will be responsible for the risks associated with the investment of cash collateral. The Fund may lose money on its investment of cash collateral or may fail to earn sufficient income on its investment to meet its obligations to the borrower.
Use of Leverage
As a non-fundamental policy, the Fund will not leverage its capital structure by issuing senior securities such as the issuance of Preferred Shares or debt instruments. However, the Fund may borrow for temporary or emergency purposes and may enter into certain derivatives transactions that have the economic effect of leverage.
Temporary Defensive Periods
During temporary defensive periods the Fund may deviate from its investment objective and policies, and in order to keep the Fund’s cash fully invested, the Fund may invest any portion of its Managed Assets in investment grade debt securities, including obligations issued or guaranteed by the U.S. government, its agencies and instrumentalities. The Fund may not achieve its investment objective during such periods.
87
Shareholder Update (continued)
(Unaudited)
NUVEEN S&P 500 DYNAMIC OVERWRITE FUND (SPXX)
Investment Objective
The Fund’s investment objective is to seek attractive total return with less volatility than the S&P 500 Index.
Investment Policies
Under normal circumstances, the Fund will invest at least 80% of its Assets (as defined below) in a diversified equity portfolio made up of securities comprising the S&P 500 Index (or securities that have economic characteristics that are similar to those securities comprising the S&P 500 Index) that seeks to substantially replicate price movements of the S&P 500 Index and is designed to support the Fund’s option strategy.
Under normal circumstances, the Fund expects to invest substantially all (at least 90%) of its Managed Assets (as defined below) in its equity portfolio or otherwise in pursuit of its investment objective.
The Fund’s sub-adviser uses a multi-factor quantitative model, which will consider opportunities to engage in tax-loss harvesting (i.e., periodically selling positions that have depreciated in value to realize capital losses that can be used to offset capital gains realized by the Fund) and other tax management considerations to improve after-tax shareholder outcomes, to construct the Fund’s equity portfolio.
The Fund employs a dynamic options “overwrite” strategy whereby the Fund’s sub-adviser sells (writes) call options on a varying percentage of the market value of the Fund’s equity portfolio based on its market outlook. Pursuant to this option strategy, under normal circumstances, the Fund sells (writes) index call options, call options on custom baskets of securities, and call options on individual securities. In addition to a primary emphasis on writing call options to reduce downside risk and volatility of the Fund’s equity portfolio, the Fund’s option strategy as a secondary emphasis seeks additional return opportunities by capitalizing on inefficiencies in the options market through a variety of means including the use of call spreads and selling put option
The Fund targets an overwrite level (i.e., the ratio of the notional value of call options sold by the Fund to the market value of the Fund’s equity portfolio) of 55% of the value of its equity portfolio over time, and the overwrite level will vary, based on market conditions, between 35% to 75% of the value of its equity portfolio.
“Assets” means net assets of the Fund plus the amount of any borrowings for investment purposes. “Managed Assets” mean the total assets of the Fund, minus the sum of its accrued liabilities (other than Fund liabilities incurred for the express purpose of creating leverage). Total assets for this purpose shall include assets attributable to the Fund’s use of leverage (whether or not those assets are reflected in the Fund’s financial statements for purposes of generally accepted accounting principles), and derivatives will be valued at their market value.
Under normal market conditions:
| | • | | As a fundamental policy, the Fund may not invest more than 25% of its total assets in securities of issuers in any one industry, except that if 25% or more of the securities in the S&P 500 Index are issued by companies in one industry, the Fund would concentrate in that industry unless the Fund would need to avoid concentration in order to implement its investment strategy as it relates to avoiding the adverse tax treatment associated with straddle positions (Industry Concentration Policy). |
| | • | | The Fund may invest no more than 10% of its Managed Assets in short-term, high quality fixed-income securities. |
| | • | | The Fund may invest up to 20% of its Managed Assets in securities of non-U.S. issuers that are U.S. dollar denominated, which may include securities of issuers located, or conducting their business, in emerging market countries. |
The foregoing policies apply only at the time of any new investment.
Approving Changes in Investment Policies
The Board of Trustees of the Fund may change the policies described above without a shareholder vote. However, with respect to the Fund’s policy of investing at least 80% of its Assets in its equity portfolio, such policies may not be changed without 60 days’ prior written notice to shareholders.
However, the Fund’s fundamental Industry Concentration Policy may not be changed without the approval of the holders of a majority of the outstanding common shares and Preferred Shares voting together as a single class, and the approval of the holders of a majority of the outstanding Preferred Shares, voting separately as a single class. A “majority of the outstanding” shares means (i) 67% or more of the shares present at a meeting, if the holders of more than 50% of the shares are present or represented by proxy or (ii) more than 50% of the shares, whichever is less.
Portfolio Contents
The Fund will invest in a portfolio of individual common stocks designed to replicate the risk and return profile, and thereby substantially replicate price movements of the S&P 500 Index. The Fund may also invest in other investment companies, including ETFs, that provide similar exposure to individual common stocks consistent with the Fund’s investment objective. Common stock generally represents an equity ownership interest in an issuer, without preference over and with a lower priority than any other class of securities, including such issuer’s debt securities, preferred stock and other senior equity
88
securities. Common stocks usually carry voting rights and earn dividends. Common stocks fluctuate in price in response to many factors including historical and prospective earnings of the issuer, the value of its assets, general economic conditions, interest rates, investor perceptions and market liquidity, as such the company may or may not pay dividends. Dividends on common stocks are declared at the discretion of the company’s board. In addition, common stock generally has the greatest appreciation and depreciation potential because increases and decreases in earnings are usually reflected in a company’s stock price.
As part of its option strategy, the Fund sells (writes) index call options, call options on custom baskets of securities, and covered or uncovered call options on individual securities. An option contract is a contract that gives the holder of the option, in return for a premium, the right to buy from (in the case of a call) or sell to (in the case of a put) the writer of the option the reference instrument underlying the option (or the cash value of the index) at a specified exercise price at any time during the term of the option. The writer of an option on a security has the obligation upon exercise of the option to deliver the reference instrument (or the cash) upon payment of the exercise price or to pay the exercise price upon delivery of the reference instrument (or the cash). Upon exercise of an index option, the writer of an option on an index is obligated to pay the difference between the cash value of the index and the exercise price multiplied by the specified multiplier for the index option. Options may be “covered,” meaning that the party required to deliver the reference instrument if the option is exercised owns that instrument (or has set aside sufficient assets to meet its obligation to deliver the instrument). Options may be listed on an exchange or traded in the OTC market. In general, exchange-traded options have standardized exercise prices and expiration dates and may require the parties to post margin against their obligations, and the performance of the parties’ obligations in connection with such options is guaranteed by the exchange or a related clearing corporation. OTC options have more flexible terms negotiated between the buyer and the seller but are subject to counterparty risk. The ability of the Fund to transact business with any one or any number of counterparties, the lack of any independent evaluation of the counterparties or their financial capabilities, and the absence of a regulated market to facilitate settlement, may increase the potential for losses to the Fund. OTC options also involve greater liquidity risk. This risk may be increased in times of financial stress, if the trading market for OTC derivative contracts becomes limited.
In carrying out its option strategy, the Fund may write index call options on the S&P 500 Index and other broad-based indices and may, if the Fund’s sub-adviser deems conditions appropriate, write call options on a variety of other equity market indices. As the seller of an index call option, the Fund receives a premium from the purchaser. The purchaser of the index call option has the right to any appreciation in the value of the index over the exercise price upon the exercise of the call option or the expiration date. If, at expiration, the purchaser exercises the index option sold by the Fund, the Fund will pay the purchaser the difference between the cash value of the index and the exercise price of the index option. The premium, the exercise price and the market value of the index determine the gain or loss realized by the Fund as the seller of the index call option.
The Fund may also write call options on custom baskets of securities. A custom basket call option is an OTC option with a counterparty whose value is linked to the market value of a portfolio of underlying securities and is collateralized by a portion of the Fund’s equity portfolio. In designing the custom basket call options, the Fund’s sub-adviser will primarily select assets not held by the Fund. In order to minimize the difference between the returns of the underlying securities in the custom basket (commonly referred to as a tracking error), the Fund’s sub-adviser will use optimization calculations when selecting the individual securities for inclusion in the custom basket.
The Fund may also write single name call options, both covered and “naked” or uncovered, on individual stocks. A call option written by the Fund on an individual security is “covered” if the Fund owns the security underlying the call or has an absolute and immediate right to acquire that security without additional cash consideration. The Fund, in effect, sells the potential appreciation in the value of the security subject to the call option in exchange for the premium. The Fund may execute a closing purchase transaction with respect to an option it has sold and sell another option (with either a different exercise price or expiration date or both). The Fund’s objective in entering into such a closing transaction will be to optimize net index option premiums. The cost of a closing transaction may reduce the net option premiums realized from the sale of the option. This reduction could be offset, at least in part, by appreciation in the value of the underlying security held in the Fund’s equity portfolio, and by the opportunity to realize additional premium income from selling a new option.
The Fund may also use call spreads as part of its option strategy. A call spread involves the sale of a call option and the corresponding purchase of a call option on the same underlying instrument with the same expiration date but with different exercise prices. The call spreads utilized by the Fund generally will generate less net option premium than writing calls, but limit the overall risk of the strategy by capping the Fund’s liability from the written call while simultaneously allowing for additional upside above the strike price of the purchased call.
The Fund may also use put options as part of its option strategy. A put option gives the purchaser of the option the right (but not the obligation) to sell, and the writer of the option the obligation to buy, the underlying instrument (or the cash value of the index) at a stated price (the “exercise price”) at any time before the option expires. The purchase price for a put option is the “premium” paid by the purchaser for the right to sell. When the Fund sells a put option on an underlying instrument and the underlying instrument decreases in value, the purchaser of the put option has the right to exercise the option, obligating the Fund to purchase the underlying instrument at an exercise price that is higher than the prevailing market price. The Fund collects option premium income when it sells the put option. If the underlying instrument increases in value, the purchaser of the put option is unlikely to exercise the option since the prevailing market price will be higher than the exercise price. Accordingly, the Fund retains all put premium income collected during market advances.
89
Shareholder Update (continued)
(Unaudited)
The Fund may invest in U.S. Government securities. U.S. Government securities include (1) U.S. Treasury obligations, which differ in their interest rates, maturities and times of issuance: U.S. Treasury bills (maturities of one year or less), U.S. Treasury notes (maturities of one year to ten years) and U.S. Treasury bonds (generally maturities of greater than ten years) and (2) obligations issued or guaranteed by U.S. Government agencies and instrumentalities that are supported by any of the following: (i) the full faith and credit of the U.S. Treasury, (ii) the right of the issuer to borrow an amount limited to a specific line of credit from the U.S. Treasury, (iii) discretionary authority of the U.S. Government to purchase certain obligations of the U.S. Government agency or instrumentality or (iv) the credit of the agency or instrumentality.
The Fund also may invest in any other security or agreement collateralized or otherwise secured by U.S. Government securities. Agencies and instrumentalities of the U.S. Government include but are not limited to: Federal Land Banks, Federal Financing Banks, Banks for Cooperatives, Federal Intermediate Credit Banks, Farm Credit Banks, Federal Home Loan Banks, Federal Home Loan Mortgage Corporation, Federal National Mortgage Association, Government National Mortgage Association, Student Loan Marketing Association, U.S. Postal Service, Small Business Administration, Tennessee Valley Authority and any other enterprise established or sponsored by the U.S. Government. Because the U.S. Government generally is not obligated to provide support to its instrumentalities, the Fund will invest in obligations issued by these instrumentalities only if its sub-adviser determines that the credit risk with respect to such obligations is minimal.
The Fund may invest in commercial paper. Commercial paper represents short-term unsecured promissory notes issued in bearer form by corporations such as banks or bank holding companies and finance companies.
The Fund may enter into repurchase agreements (the purchase of a security coupled with an agreement to resell that security at a higher price) with respect to its permitted investments. The Fund’s repurchase agreements will provide that the value of the collateral underlying the repurchase agreement will always be at least equal to the repurchase price, including any accrued interest earned on the agreement, and will be marked-to-market daily.
The Fund may invest in securities of non-U.S. issuers that are U.S. dollar-denominated, which may include securities of issuers located, or conducting their business, in emerging market countries. The Fund will classify an issuer of a security as being a U.S. or non-U.S. issuer based on the determination of an unaffiliated, recognized financial data provider. Such determinations are based on a number of criteria, such as the issuer’s country of domicile, the primary exchange on which the security predominately trades, the location from which the majority of the issuer’s revenue comes, and the issuer’s reporting currency. Furthermore, a country is considered to be an “emerging market” if it has a relatively low gross national product per capita compared to the world’s major economies and the potential for rapid economic growth. The Fund considers a country an emerging market country based on the determination of an international organization, such as the IMF, or an unaffiliated, recognized financial data provider.
The Fund may buy and sell securities on a when-issued or delayed delivery basis, making payment or taking delivery at a later date, normally within 15 to 45 days of the trade date.
The Fund may invest in illiquid securities (i.e., securities that are not readily marketable), including, but not limited to, restricted securities (securities the disposition of which is restricted under the federal securities laws), securities that may be resold only pursuant to Rule 144A under the 1933 Act, and repurchase agreements with maturities in excess of seven days.
The Fund may enter into certain derivative instruments in pursuit of its investment objective, including to seek to enhance return, to hedge certain risks of its investments in securities or as a substitute for a position in the underlying asset. Such instruments include financial futures contracts and options thereon, swaps (with varying terms, including interest rate swaps and credit default swaps), options on interest rates, options on indices, options on swaps, options on currencies and other fixed-income derivative instruments that may have the economic effect of leverage.
The Fund may also invest in securities of other open- or closed-end investment companies (including ETFs) that invest primarily in securities of the types in which the Fund may invest directly, to the extent permitted by the 1940 Act, the rules and regulations issued thereunder and applicable exemptive orders issued by the SEC.
The Fund may lend securities representing up to one-third of the value of its total assets to broker-dealers, banks, and other institutions to generate additional income. When the Fund loans its portfolio securities, it will receive, at the inception of each loan, cash collateral equal to at least 102% of the value of the loaned securities. Under the Fund’s securities lending agreement, the securities lending agent will generally bear the risk that a borrower may default on its obligation to return loaned securities. The Fund, however, will be responsible for the risks associated with the investment of cash collateral. The Fund may lose money on its investment of cash collateral or may fail to earn sufficient income on its investment to meet its obligations to the borrower.
Use of Leverage
As a non-fundamental policy, the Fund will not leverage its capital structure by issuing senior securities such as the issuance of Preferred Shares or debt instruments. However, the Fund may borrow for temporary or emergency purposes and may enter into certain derivatives transactions that have the economic effect of leverage.
90
Temporary Defensive Periods
During temporary defensive periods the Fund may deviate from its investment objective and policies, and in order to keep the Fund’s cash fully invested, the Fund may invest any portion of its Managed Assets in investment grade debt securities, including obligations issued or guaranteed by the U.S. government, its agencies and instrumentalities. The Fund may not achieve its investment objective during such periods.
91
Shareholder Update (continued)
(Unaudited)
NUVEEN NASDAQ 100 DYNAMIC OVERWRITE FUND (QQQX)
Investment Objective
The Fund’s investment objective is to seek attractive total return with less volatility than the Nasdaq 100 Index.
Investment Policies
Under normal circumstances, the Fund will invest at least 80% of its Assets (as defined below) in an equity portfolio made up of securities comprising the Nasdaq 100 Index (or securities that have economic characteristics that are similar to those securities comprising the Nasdaq 100 Index) that seeks to substantially replicate price movements of the Nasdaq 100 Index and is designed to support the Fund’s option strategy.
Under normal circumstances, the Fund expects to invest substantially all (at least 90%) of its Managed Assets (as defined below) in its equity portfolio or otherwise in pursuit of its investment objective.
The Fund’s sub-adviser uses a multi-factor quantitative model, which will consider opportunities to engage in tax-loss harvesting (i.e., periodically selling positions that have depreciated in value to realize capital losses that can be used to offset capital gains realized by the Fund) and other tax management considerations to improve after-tax shareholder outcomes, to construct the Fund’s equity portfolio.
The Fund employs a dynamic options “overwrite” strategy whereby the Fund’s sub-adviser sells (writes) call options on a varying percentage of the market value of the Fund’s equity portfolio based on its market outlook. Pursuant to this option strategy, under normal circumstances, the Fund sells (writes) index call options, call options on custom baskets of securities, and call options on individual securities. In addition to a primary emphasis on writing call options to reduce downside risk and volatility of the Fund’s equity portfolio, the Fund’s option strategy as a secondary emphasis seeks additional return opportunities by capitalizing on inefficiencies in the options market through a variety of means including the use of call spreads and selling put options.
The Fund targets an overwrite level (i.e., the ratio of the notional value of call options sold by the Fund to the market value of the Fund’s equity portfolio) of 55% of the value of its equity portfolio over time, and the overwrite level will vary, based on market conditions, between 35% to 75% of the value of its equity portfolio.
“Assets” means net assets of the Fund plus the amount of any borrowings for investment purposes. “Managed Assets” mean the total assets of the Fund, minus the sum of its accrued liabilities (other than Fund liabilities incurred for the express purpose of creating leverage). Total assets for this purpose shall include assets attributable to the Fund’s use of leverage (whether or not those assets are reflected in the Fund’s financial statements for purposes of generally accepted accounting principles), and derivatives will be valued at their market value.
Under normal market conditions:
| | • | | As a fundamental policy, the Fund may not invest more than 25% of its total assets in securities of issuers in any one industry, except that if 25% or more of the securities in the Nasdaq 100 Index are issued by companies in one industry, the Fund would concentrate in that industry unless the Fund would need to avoid concentration in order to implement its investment strategy as it relates to avoiding the adverse tax treatment associated with straddle positions (Industry Concentration Policy). |
| | • | | The Fund may invest no more than 10% of its Managed Assets in short-term, high quality fixed-income securities. |
| | • | | The Fund may invest up to 20% of its Managed Assets in securities of non-U.S. issuers that are U.S. dollar denominated, which may include securities of issuers located, or conducting their business, in emerging market countries. |
The foregoing policies apply only at the time of any new investment.
Approving Changes in Investment Policies
The Board of Trustees of the Fund may change the policies described above without a shareholder vote. However, with respect to the Fund’s policy of investing at least 80% of its Assets in the equity portfolio, such policy may not be changed without 60 days’ prior written notice to shareholders.
However, the Fund’s fundamental Industry Concentration Policy may not be changed without the approval of the holders of a majority of the outstanding common shares and preferred shares voting together as a single class, and the approval of the holders of a majority of the outstanding preferred shares, voting separately as a single class. A “majority of the outstanding” shares means (i) 67% or more of the shares present at a meeting, if the holders of more than 50% of the shares are present or represented by proxy or (ii) more than 50% of the shares, whichever is less.
Portfolio Contents
The Fund will invest in a portfolio of individual common stocks designed to replicate the risk and return profile, and thereby substantially replicate price movements of the Nasdaq 100 Index. The Fund may also invest in other investment companies, including ETFs, that provide similar exposure to individual common stocks consistent with the Fund’s investment objective. Common stock generally represents an equity ownership interest in an issuer, without preference over and with a lower priority than any other class of securities, including such issuer’s debt securities, preferred stock and other senior equity
92
securities. Common stocks usually carry voting rights and earn dividends. Common stocks fluctuate in price in response to many factors including historical and prospective earnings of the issuer, the value of its assets, general economic conditions, interest rates, investor perceptions and market liquidity, as such the company may or may not pay dividends. Dividends on common stocks are declared at the discretion of the company’s board. In addition, common stock generally has the greatest appreciation and depreciation potential because increases and decreases in earnings are usually reflected in a company’s stock price.
As part of its option strategy, the Fund sells (writes) index call options, call options on custom baskets of securities, and covered or uncovered call options on individual securities. An option contract is a contract that gives the holder of the option, in return for a premium, the right to buy from (in the case of a call) or sell to (in the case of a put) the writer of the option the reference instrument underlying the option (or the cash value of the index) at a specified exercise price at any time during the term of the option. The writer of an option on a security has the obligation upon exercise of the option to deliver the reference instrument (or the cash) upon payment of the exercise price or to pay the exercise price upon delivery of the reference instrument (or the cash). Upon exercise of an index option, the writer of an option on an index is obligated to pay the difference between the cash value of the index and the exercise price multiplied by the specified multiplier for the index option. Options may be “covered,” meaning that the party required to deliver the reference instrument if the option is exercised owns that instrument (or has set aside sufficient assets to meet its obligation to deliver the instrument). Options may be listed on an exchange or traded in the OTC market. In general, exchange-traded options have standardized exercise prices and expiration dates and may require the parties to post margin against their obligations, and the performance of the parties’ obligations in connection with such options is guaranteed by the exchange or a related clearing corporation. OTC options have more flexible terms negotiated between the buyer and the seller but are subject to counterparty risk. The ability of the Fund to transact business with any one or any number of counterparties, the lack of any independent evaluation of the counterparties or their financial capabilities, and the absence of a regulated market to facilitate settlement, may increase the potential for losses to the Fund. OTC options also involve greater liquidity risk. This risk may be increased in times of financial stress, if the trading market for OTC derivative contracts becomes limited.
In carrying out its option strategy, the Fund may write index call options on the Nasdaq 100 Index and other broad-based indices and may, if the Fund’s sub-adviser deems conditions appropriate, write call options on a variety of other equity market indices. As the seller of an index call option, the Fund receives a premium from the purchaser. The purchaser of the index call option has the right to any appreciation in the value of the index over the exercise price upon the exercise of the call option or the expiration date. If, at expiration, the purchaser exercises the index option sold by the Fund, the Fund will pay the purchaser the difference between the cash value of the index and the exercise price of the index option. The premium, the exercise price and the market value of the index determine the gain or loss realized by the Fund as the seller of the index call option.
The Fund may also write call options on custom baskets of securities. A custom basket call option is an OTC option with a counterparty whose value is linked to the market value of a portfolio of underlying securities and is collateralized by a portion of the Fund’s equity portfolio. In designing the custom basket call options, the Fund’s sub-adviser will primarily select assets not held by the Fund. In order to minimize the difference between the returns of the underlying securities in the custom basket (commonly referred to as a tracking error), the Fund’s sub-adviser will use optimization calculations when selecting the individual securities for inclusion in the custom basket.
The Fund may also write single name call options, both covered and “naked” or uncovered, on individual stocks. A call option written by the Fund on an individual security is “covered” if the Fund owns the security underlying the call or has an absolute and immediate right to acquire that security without additional cash consideration. The Fund, in effect, sells the potential appreciation in the value of the security subject to the call option in exchange for the premium. The Fund may execute a closing purchase transaction with respect to an option it has sold and sell another option (with either a different exercise price or expiration date or both). The Fund’s objective in entering into such a closing transaction will be to optimize net index option premiums. The cost of a closing transaction may reduce the net option premiums realized from the sale of the option. This reduction could be offset, at least in part, by appreciation in the value of the underlying security held in the Fund’s equity portfolio, and by the opportunity to realize additional premium income from selling a new option.
The Fund may also use call spreads as part of its option strategy. A call spread involves the sale of a call option and the corresponding purchase of a call option on the same underlying instrument with the same expiration date but with different exercise prices. The call spreads utilized by the Fund generally will generate less net option premium than writing calls, but limit the overall risk of the strategy by capping the Fund’s liability from the written call while simultaneously allowing for additional upside above the strike price of the purchased call.
The Fund may also use put options as part of its option strategy. A put option gives the purchaser of the option the right (but not the obligation) to sell, and the writer of the option the obligation to buy, the underlying instrument (or the cash value of the index) at a stated price (the “exercise price”) at any time before the option expires. The purchase price for a put option is the “premium” paid by the purchaser for the right to sell. When the Fund sells a put option on an underlying instrument and the underlying instrument decreases in value, the purchaser of the put option has the right to exercise the option, obligating the Fund to purchase the underlying instrument at an exercise price that is higher than the prevailing market price. The Fund collects option premium income when it sells the put option. If the underlying instrument increases in value, the purchaser of the put option is unlikely to exercise the option since the prevailing market price will be higher than the exercise price. Accordingly, the Fund retains all put premium income collected during market advances.
93
Shareholder Update (continued)
(Unaudited)
The Fund may invest in U.S. Government securities. U.S. Government securities include (1) U.S. Treasury obligations, which differ in their interest rates, maturities and times of issuance: U.S. Treasury bills (maturities of one year or less), U.S. Treasury notes (maturities of one year to ten years) and U.S. Treasury bonds (generally maturities of greater than ten years) and (2) obligations issued or guaranteed by U.S. Government agencies and instrumentalities that are supported by any of the following: (i) the full faith and credit of the U.S. Treasury, (ii) the right of the issuer to borrow an amount limited to a specific line of credit from the U.S. Treasury, (iii) discretionary authority of the U.S. Government to purchase certain obligations of the U.S. Government agency or instrumentality or (iv) the credit of the agency or instrumentality.
The Fund also may invest in any other security or agreement collateralized or otherwise secured by U.S. Government securities. Agencies and instrumentalities of the U.S. Government include but are not limited to: Federal Land Banks, Federal Financing Banks, Banks for Cooperatives, Federal Intermediate Credit Banks, Farm Credit Banks, Federal Home Loan Banks, Federal Home Loan Mortgage Corporation, Federal National Mortgage Association, Government National Mortgage Association, Student Loan Marketing Association, U.S. Postal Service, Small Business Administration, Tennessee Valley Authority and any other enterprise established or sponsored by the U.S. Government. Because the U.S. Government generally is not obligated to provide support to its instrumentalities, the Fund will invest in obligations issued by these instrumentalities only if its sub-adviser determines that the credit risk with respect to such obligations is minimal.
The Fund may invest in commercial paper. Commercial paper represents short-term unsecured promissory notes issued in bearer form by corporations such as banks or bank holding companies and finance companies.
The Fund may enter into repurchase agreements (the purchase of a security coupled with an agreement to resell that security at a higher price) with respect to its permitted investments. The Fund’s repurchase agreements will provide that the value of the collateral underlying the repurchase agreement will always be at least equal to the repurchase price, including any accrued interest earned on the agreement, and will be marked-to-market daily.
The Fund may invest in securities of non-U.S. issuers that are U.S. dollar-denominated, which may include securities of issuers located, or conducting their business, in emerging market countries. The Fund will classify an issuer of a security as being a U.S. or non-U.S. issuer based on the determination of an unaffiliated, recognized financial data provider. Such determinations are based on a number of criteria, such as the issuer’s country of domicile, the primary exchange on which the security predominately trades, the location from which the majority of the issuer’s revenue comes, and the issuer’s reporting currency. Furthermore, a country is considered to be an “emerging market” if it has a relatively low gross national product per capita compared to the world’s major economies and the potential for rapid economic growth. The Fund considers a country an emerging market country based on the determination of an international organization, such as the IMF, or an unaffiliated, recognized financial data provider.
The Fund may buy and sell securities on a when-issued or delayed delivery basis, making payment or taking delivery at a later date, normally within 15 to 45 days of the trade date.
The Fund may invest in illiquid securities (i.e., securities that are not readily marketable), including, but not limited to, restricted securities (securities the disposition of which is restricted under the federal securities laws), securities that may be resold only pursuant to Rule 144A under the 1933 Act, and repurchase agreements with maturities in excess of seven days.
The Fund may enter into certain derivative instruments in pursuit of its investment objective, including to seek to enhance return, to hedge certain risks of its investments in securities or as a substitute for a position in the underlying asset. Such instruments include financial futures contracts and options thereon, swaps (with varying terms, including interest rate swaps and credit default swaps), options on interest rates, options on indices, options on swaps, options on currencies and other fixed-income derivative instruments that may have the economic effect of leverage.
The Fund may also invest in securities of other open- or closed-end investment companies (including ETFs) that invest primarily in securities of the types in which the Fund may invest directly, to the extent permitted by the 1940 Act, the rules and regulations issued thereunder and applicable exemptive orders issued by the SEC.
The Fund may lend securities representing up to one-third of the value of its total assets to broker-dealers, banks, and other institutions to generate additional income. When the Fund loans its portfolio securities, it will receive, at the inception of each loan, cash collateral equal to at least 102% of the value of the loaned securities. Under the Fund’s securities lending agreement, the securities lending agent will generally bear the risk that a borrower may default on its obligation to return loaned securities. The Fund, however, will be responsible for the risks associated with the investment of cash collateral. The Fund may lose money on its investment of cash collateral or may fail to earn sufficient income on its investment to meet its obligations to the borrower.
Use of Leverage
As a non-fundamental policy, the Fund will not leverage its capital structure by issuing senior securities such as the issuance of Preferred Shares or debt instruments. However, the Fund may borrow for temporary or emergency purposes and may enter into certain derivatives transactions that have the economic effect of leverage.
94
Temporary Defensive Periods
During temporary defensive periods the Fund may deviate from its investment objective and policies, and in order to keep the Fund’s cash fully invested, the Fund may invest any portion of its Managed Assets in investment grade debt securities, including obligations issued or guaranteed by the U.S. government, its agencies and instrumentalities. The Fund may not achieve its investment objective during such periods.
95
Shareholder Update (continued)
(Unaudited)
NUVEEN CORE EQUITY ALPHA FUND (JCE)
Investment Objective
The Fund’s investment objective is to provide an attractive level of total return. The Fund seeks to achieve its investment objective primarily through long term capital appreciation and secondarily through income and gains.
Investment Policies
Under normal circumstances, the Fund will invest at least 80% of its Assets (as defined below) in the Equity Portfolio (as defined below).
The Fund invests in a portfolio of actively managed large capitalization common stocks, using the sub-adviser’s proprietary quantitative process designed to provide the potential for long-term outperformance (the “Equity Portfolio”). Additionally, the Fund seeks to reduce the volatility of its returns relative to the returns of the Equity Portfolio over extended periods by writing (selling) index call options and/or call options on custom baskets of securities (the “Options Strategy”).
“Assets” means net assets of the Fund plus the amount of any borrowings for investment purposes. “Managed Assets” mean the total assets of the Fund, minus the sum of its accrued liabilities (other than Fund liabilities incurred for the express purpose of creating leverage). Total assets for this purpose shall include assets attributable to the Fund’s use of leverage (whether or not those assets are reflected in the Fund’s financial statements for purposes of generally accepted accounting principles), and derivatives will be valued at their market value.
Under normal market conditions:
| | • | | The notional value of the call options written by the Fund under its Options Strategy may be up to 50% of the value of the Fund’s Managed Assets. |
| | • | | The Fund intends to limit the overlap between the stocks held in the Equity Portfolio and the stocks underlying the Fund’s call options to less than 70% (generally based on the value of such components). |
| | • | | The Fund may invest up to 10% of is Managed Assets in securities of other open- or closed-end investment companies (including ETFs) that invest primarily in securities of the types in which the Fund may invest directly. In addition, the Fund may invest a portion of its Managed Assets in pooled investment vehicles (other than investment companies) that invest primarily in securities of the types in which the Fund may invest directly. |
The foregoing policies apply only at the time of any new investment.
Approving Changes in Investment Policies
The Board of Trustees of the Fund may change the policies described above without a shareholder vote. However, with respect to the Fund’s policy of investing at least 80% of its Assets in the Equity Portfolio, such policy may not be changed without 60 days’ prior written notice to shareholders.
Portfolio Contents
The Fund generally invests in a portfolio of common stocks. Common stock generally represents an equity ownership interest in an issuer, without preference over and with a lower priority than any other class of securities, including such issuer’s debt securities, preferred stock and other senior equity securities. Common stocks usually carry voting rights and earn dividends. Common stocks fluctuate in price in response to many factors including historical and prospective earnings of the issuer, the value of its assets, general economic conditions, interest rates, investor perceptions and market liquidity, as such the company may or may not pay dividends. Dividends on common stocks are declared at the discretion of the company’s board. In addition, common stock generally has the greatest appreciation and depreciation potential because increases and decreases in earnings are usually reflected in a company’s stock price.
The Fund implements its Option Strategy by writing (selling) index call options and call options on custom baskets of securities.
An option contract is a contract that gives the holder of the option, in return for a premium, the right to buy from (in the case of a call) or sell to (in the case of a put) the writer of the option the reference instrument underlying the option (or the cash value of the index) at a specified exercise price at any time during the term of the option. The writer of an option on a security has the obligation upon exercise of the option to deliver the reference instrument (or the cash) upon payment of the exercise price or to pay the exercise price upon delivery of the reference instrument (or the cash). Upon exercise of an index option, the writer of an option on an index is obligated to pay the difference between the cash value of the index and the exercise price multiplied by the specified multiplier for the index option. Options may be “covered,” meaning that the party required to deliver the reference instrument if the option is exercised owns that instrument (or has set aside sufficient assets to meet its obligation to deliver the instrument). Options may be listed on an exchange or traded in the OTC market. In general, exchange-traded options have standardized exercise prices and expiration dates and may require the parties to post margin against their obligations, and the performance of the parties’ obligations in connection with such options is guaranteed by the exchange or a related clearing corporation. OTC options have more flexible terms negotiated between the buyer and the seller, but generally are subject
96
to counterparty risk. The ability of the Fund to transact business with any one or any number of counterparties, the lack of any independent evaluation of the counterparties or their financial capabilities, and the absence of a regulated market to facilitate settlement, may increase the potential for losses to the Fund. OTC options also involve greater liquidity risk. This risk may be increased in times of financial stress, if the trading market for OTC derivative contracts becomes limited. The staff of the SEC takes the position that certain purchased OTC options, and assets used as cover for certain written OTC options, are illiquid.
The Fund writes index call options on broad-based indices and may, if the sub-adviser deems conditions appropriate, write call options on a variety of other equity market indices. As the seller of an index call option, the Fund receives a premium from the purchaser. The purchaser of the index call option has the right to any appreciation in the value of the index over the exercise price upon the exercise of the call option or the expiration date. If, at expiration, the purchaser exercises the index option sold by the Fund, the Fund will pay the purchaser the difference between the cash value of the index and the exercise price of the index option. The premium, the exercise price and the market value of the index determine the gain or loss realized by the Fund as the seller of the index call option.
The Fund may also write call options on custom baskets of securities. A custom basket call option is an OTC option with a counterparty whose value is linked to the market value of a portfolio of underlying securities and is collateralized by a portion of the Fund’s Equity Portfolio. In order to minimize the difference between the returns of the underlying securities in the custom basket (commonly referred to as a tracking error), the sub-adviser will use optimization calculations when selecting the individual securities for inclusion in the custom basket.
In addition to the use of call options as described above, the Fund may enter into certain derivative instruments in pursuit of its investment objective, including to seek to enhance return, to hedge certain risks of its investments or as a substitute for a position in the underlying asset. Such instruments include options, futures contracts, index futures and total return swaps. In addition, the Fund may invest in other types of derivative instruments that are currently non-principal investments, including forward contracts, interest rate swaps, caps, collars and floors, credit default swaps, and swap options.
The Fund may enter into repurchase agreements (the purchase of a security coupled with an agreement to resell that security at a higher price) with respect to its permitted investments. The Fund’s repurchase agreements will provide that the value of the collateral underlying the repurchase agreement will always be at least equal to the repurchase price, including any accrued interest earned on the agreement, and will be marked-to-market daily.
The Fund may invest in illiquid securities (i.e., securities that are not readily marketable), including, but not limited to, restricted securities (securities the disposition of which is restricted under the federal securities laws), securities that may be resold only pursuant to Rule 144A under the 1933 Act, and repurchase agreements with maturities in excess of seven days.
The Fund may buy and sell securities on a when-issued or delayed delivery basis, making payment or taking delivery at a later date, normally within 15 to 45 days of the trade date.
The Fund may lend securities representing up to one-third of the value of its total assets to broker-dealers, banks, and other institutions to generate additional income. When the Fund loans its portfolio securities, it will receive, at the inception of each loan, cash collateral equal to at least 102% of the value of the loaned securities. Under the Fund’s securities lending agreement, the securities lending agent will generally bear the risk that a borrower may default on its obligation to return loaned securities. The Fund, however, will be responsible for the risks associated with the investment of cash collateral. The Fund may lose money on its investment of cash collateral or may fail to earn sufficient income on its investment to meet its obligations to the borrower.
Use of Leverage
As a non-fundamental policy, the Fund will not leverage its capital structure by issuing senior securities such as the issuance of Preferred Shares or debt instruments. The Fund may, however, borrow up to 7.5% of its Managed Assets for cash management purposes. In addition, the Fund may borrow for temporary or emergency purposes and may enter into certain derivatives transactions that have the economic effect of leverage by creating additional investment exposure.
Temporary Defensive Periods
During temporary defensive periods the Fund may deviate from its investment objective and policies, and in order to keep the Fund’s cash fully invested, the Fund may invest up to 100% of its Managed Assets in investment grade debt securities, including obligations issued or guaranteed by the U.S. government, its agencies and instrumentalities. The Fund may not achieve its investment objective during such periods.
97
Shareholder Update (continued)
(Unaudited)
PRINCIPAL RISKS OF THE FUNDS
The factors that are most likely to have a material effect on a particular Fund’s portfolio as a whole are called “principal risks.” Each Fund is subject to the principal risks indicated below, whether through direct investment or derivative positions. Each Fund may be subject to additional risks other than those identified and described below because the types of investments made by a Fund can change over time.
| | | | | | | | | | |
| Risk | | Nuveen S&P 500 Buy-Write Income Fund (BXMX) | | Nuveen Dow 30SM Dynamic Overwrite Fund
(DIAX) | | Nuveen S&P 500 Dynamic Overwrite Fund
(SPXX) | | Nuveen Nasdaq 100 Dynamic
Overwrite Fund (QQQX) | | Nuveen Core
Equity Alpha
Fund (JCE) |
| | | | | |
| Portfolio Level Risks | | | | | | | | | | |
| | | | | |
Call Option Risk | | X | | X | | X | | X | | X |
Call Spreads Risk | | X | | X | | X | | X | | — |
Common Stock Risk | | X | | X | | X | | X | | X |
Counterparty Risk | | X | | X | | X | | X | | X |
Deflation Risk | | X | | X | | X | | X | | X |
Derivatives Risk | | X | | X | | X | | X | | X |
Dividend Income Risk | | X | | X | | X | | X | | X |
Frequent Trading Risk | | — | | — | | — | | — | | X |
Hedging Risk | | X | | X | | X | | X | | X |
Inflation Risk | | X | | X | | X | | X | | X |
Large-Cap Company Risk | | X | | X | | X | | X | | X |
Non-U.S. Securities Risk | | X | | X | | X | | X | | — |
Option Strategy Risk | | X | | X | | X | | X | | X |
Other Investment Companies Risk | | X | | X | | X | | X | | X |
Put Option Risk | | X | | X | | X | | X | | — |
Quantitative Analysis Risk | | — | | — | | — | | — | | X |
Swap Transactions Risk | | X | | X | | X | | X | | X |
Technology Company Investment Risk | | — | | — | | — | | X | | — |
Valuation Risk | | X | | X | | X | | X | | X |
| | | | | |
| Fund Level and Other Risks | | | | | | | | | | |
| | | | | |
Anti-Takeover Provisions | | X | | X | | X | | X | | X |
Borrowing Risk | | X | | X | | X | | X | | X |
Cybersecurity Risk | | X | | X | | X | | X | | X |
Global Economic Risk | | X | | X | | X | | X | | X |
Investment and Market Risk | | X | | X | | X | | X | | X |
Legislation and Regulatory Risk | | X | | X | | X | | X | | X |
Market Discount from Net Asset Value | | X | | X | | X | | X | | X |
Non-Diversified Status Risk | | — | | X | | — | | X | | — |
Not an Index Fund | | X | | X | | X | | X | | — |
Recent Market Conditions | | X | | X | | X | | X | | X |
Tax Risk | | X | | X | | X | | X | | X |
Portfolio Level Risks:
Call Option Risk. As the writer of a call option, the Fund foregoes, during the option’s life, the opportunity to profit from increases in the market value of the instrument underlying the call option above the sum of the premium and the strike price of the option, but will retain the risk of loss should the market value of the instrument underlying the call option decline. The purchaser of the call option has the right to any appreciation in the value of the underlying
98
instrument over the exercise price upon the exercise of the call option or the expiration date. As the Fund increases the option overlay percentage, its ability to benefit from capital appreciation becomes more limited and the risk of NAV erosion increases. If the Fund experiences NAV erosion, which itself may have a negative effect on the market price of the Fund’s shares, the Fund will have a reduced asset base over which to write call options, which may eventually lead to reduced distributions to shareholders.
In addition, because the exercise of index options is settled in cash, sellers of index call options, such as the Fund, cannot provide in advance for their potential settlement obligations by acquiring and holding the underlying securities. The Fund bears a risk that the value of the securities held by the Fund will vary from the value of the underlying index and relative to the written index call option positions. Accordingly, the Fund may incur losses on the index call options that it has sold that exceed gains on the Fund’s equity portfolio. The value of index options written by the Fund, which will be priced daily, will be affected by changes in the value of and dividend rates of the underlying common stocks in the index, changes in the actual or perceived volatility of the stock market and the remaining time to the options’ expiration. The value of the index options also may be adversely affected if the market for the index options becomes less liquid or smaller.
Call Spreads Risk. The Fund may enter into call spreads. A call spread involves the sale of a call option and the corresponding purchase of a call option on the same underlying instrument with the same expiration date but with different strike prices. The Fund may not be able to enter into (or close out of) these transactions, at times or in the quantities desired by the sub-adviser. The Fund also may not be able to enter into (or close out of) these transactions because of, among other things, the lack of market participants that are willing to take contrary positions to that of the Fund.
Common Stock Risk. Common stocks have experienced significantly more volatility in returns and may significantly underperform relative to fixed-income securities during certain periods. An adverse event, such as an unfavorable earnings report, may depress the value of a particular common stock held by the Fund. Also, the price of common stocks is sensitive to general movements in the stock market, and a drop in the stock market may depress the price of common stocks to which the Fund has exposure. Common stock prices fluctuate for several reasons, including changes in investors’ perceptions of the financial condition of an issuer, the general condition of the relevant stock market or the current and expected future conditions of the broader economy, or when political or economic events affecting the issuer in particular or the stock market in general occur. In addition, common stock prices may be particularly sensitive to rising interest rates, as the cost of capital rises and borrowing costs increase.
Counterparty Risk. The Fund will be subject to credit risk with respect to the counterparties to the derivative transactions entered into by the Fund. Changes in the credit quality of the companies that serve as the Fund’s counterparties with respect to derivatives transactions may affect the value of those instruments. Because certain derivative transactions in which the Fund may engage may be traded between counterparties based on contractual relationships, the Fund is subject to the risk that a counterparty will not perform its obligations under the related contracts. If a counterparty becomes bankrupt or otherwise becomes unable to perform its obligations due to financial difficulties the Fund may sustain losses (including the full amount of its investment), may be unable to liquidate a derivatives position or may experience significant delays in obtaining any recovery in bankruptcy or other reorganization proceedings. By entering into derivatives transactions, the Fund assumes the risk that its counterparties could experience such financial hardships. Although the Fund intends to enter into transactions only with counterparties that the sub-adviser believes to be creditworthy, there can be no assurance that a counterparty will not default and that the Fund will not sustain a loss on a transaction. In the event of a counterparty’s bankruptcy or insolvency, any collateral posted by the Fund in connection with a derivatives transaction may be subject to the conflicting claims of that counterparty’s creditors, and the Fund may be exposed to the risk of a court treating the Fund as a general unsecured creditor of the counterparty, rather than as the owner of the collateral.
Deflation Risk. Deflation risk is the risk that prices throughout the economy decline over time. Deflation may have an adverse effect on the creditworthiness of issuers and may make issuer default more likely, which may result in a decline in the value of the Fund’s portfolio.
Derivatives Risk. The use of derivatives involves additional risks and transaction costs which could leave the Fund in a worse position than if it had not used these instruments. Derivative instruments can be used to acquire or to transfer the risk and returns of a security or other asset without buying or selling the security or asset. These instruments may entail investment exposures that are greater than their cost would suggest. As a result, a small investment in derivatives can result in losses that greatly exceed the original investment. Derivatives can be highly volatile, illiquid and difficult to value. An over-the-counter derivative transaction between the Fund and a counterparty that is not cleared through a central counterparty also involves the risk that a loss may be sustained as a result of the failure of the counterparty to the contract to make required payments. The payment obligation for a cleared derivative transaction is guaranteed by a central counterparty, which exposes the Fund to the creditworthiness of the central counterparty.
It is possible that developments in the derivatives market, including changes in government regulation, could adversely impact the Fund’s ability to invest in certain derivatives.
Dividend Income Risk. A portion of the net investment income paid by the Fund to its shareholders is derived from dividends it receives from the common stocks held in the Fund’s equity portfolio. Dividends paid on securities held by the Fund can vary significantly over the short-term and long-term. Dividends on common stocks are not fixed, but are declared at the discretion of an issuer’s board of directors. There is no guarantee that the issuers of common stocks in which the Fund invests will declare dividends in the future or that if declared they will remain at current levels or increase over time.
99
Shareholder Update (continued)
(Unaudited)
Frequent Trading Risk. The Fund’s portfolio turnover rate may exceed 100%. Frequent trading of portfolio securities may produce capital gains, which are taxable to shareholders when distributed. Frequent trading may also increase the amount of commissions or mark-ups to broker-dealers that a fund pays when it buys and sells securities, which may detract from the fund’s performance.
Hedging Risk. The Fund’s use of derivatives or other transactions to reduce risk involves costs and will be subject to the investment adviser’s and/or the sub-adviser’s ability to predict correctly changes in the relationships of such hedge instruments to the Fund’s portfolio holdings or other factors. No assurance can be given that the investment adviser’s and/or the sub-adviser’s judgment in this respect will be correct, and no assurance can be given that the Fund will enter into hedging or other transactions at times or under circumstances in which it may be advisable to do so. Hedging activities may reduce the Fund’s opportunities for gain by offsetting the positive effects of favorable price movements and may result in net losses.
Inflation Risk. Inflation risk is the risk that the value of assets or income from investments will be worth less in the future as inflation decreases the value of money. As inflation increases, the real value of the common shares and distributions can decline.
Large-Cap Company Risk. While large-cap companies may be less volatile than those of mid-and small-cap companies, they still involve risk. To the extent the Fund invests in large-capitalization securities, the Fund may underperform funds that invest primarily in securities of smaller capitalization companies during periods when the securities of such companies are in favor. Large-capitalization companies may be unable to respond as quickly as smaller capitalization companies to competitive challenges or to changes in business, product, financial or other market conditions.
Non-U.S. Securities Risk. Investments in securities of non-U.S. issuers involve special risks, including: less publicly available information about non-U.S. issuers or markets due to less rigorous disclosure or accounting standards or regulatory practices; many non-U.S. markets are smaller, less liquid and more volatile; the economies of non-U.S. countries may grow at slower rates than expected or may experience a downturn or recession; the impact of economic, political, social or diplomatic events; and withholding and other non-U.S. taxes may decrease the Fund’s return. These risks are more pronounced to the extent that the Fund invests a significant amount of its assets in issuers located in one region.
Option Strategy Risk. The value of call options sold (written) by the Fund will fluctuate. The Fund may not participate in any appreciation of its portfolio as fully as it would if the Fund did not sell call options. In addition, the Fund will continue to bear the risk of declines in the value of its portfolio. In employing the Fund’s option strategy, the sub-adviser seeks to reduce downside risk and volatility of the Fund’s equity portfolio. This strategy may not protect against market declines and may limit the Fund’s participation in market gains, particularly during periods when market values are increasing. This strategy may increase the Fund’s portfolio transaction costs, which could result in losses or reduce gains, and may not be successful.
Other Investment Companies Risk. The Fund may invest in the securities of other investment companies, including ETFs. Investing in an investment company exposes the Fund to all of the risks of that investment company’s investments. The Fund, as a holder of the securities of other investment companies, will bear its pro rata portion of the other investment companies’ expenses, including advisory fees. These expenses are in addition to the direct expenses of the Fund’s own operations. As a result, the cost of investing in investment company shares may exceed the costs of investing directly in its underlying investments. In addition, securities of other investment companies may be leveraged. As a result, the Fund may be indirectly exposed to leverage through an investment in such securities and therefore magnify the Fund’s leverage risk.
With respect to ETF’s, an ETF that is based on a specific index may not be able to replicate and maintain exactly the composition and relative weighting of securities in the index. The value of an ETF based on a specific index is subject to change as the values of its respective component assets fluctuate according to market volatility. ETFs typically rely on a limited pool of authorized participants to create and redeem shares, and an active trading market for ETF shares may not develop or be maintained. The market value of shares of ETFs and closed-end funds may differ from their NAV.
Put Option Risk. By writing put options, the Fund takes on the risk of declines in the value of the underlying instrument, including the possibility of a loss up to the entire strike price of each option it sells but without the corresponding opportunity to benefit from potential increases in the value of the underlying instrument. When the Fund writes a put option, it assumes the risk that it must purchase the underlying instrument at a strike price that may be higher than the market price of the instrument. If there is a broad market decline and the Fund is not able to close out its written put options, it may result in substantial losses to the Fund. The Fund will receive a premium from writing options, but the premium received may not be sufficient to offset any losses sustained from exercised put options.
Quantitative Analysis Risk. The risk that stocks selected using quantitative modeling and analysis could perform differently from the market as a whole and the risk that such quantitative analysis and modeling may not adequately take into account certain factors, may contain design flaws or inaccurate assumptions and may rely on inaccurate data inputs, which may result in losses to the Fund.
Swap Transactions Risk. The Fund may enter into derivative instruments such as swap contracts, credit default swaps, interest rate swaps and forward contracts. Like most derivative instruments, the use of swaps is a highly specialized activity that involves investment techniques and risks different from those associated with ordinary portfolio securities transactions. In addition, the use of swaps requires an understanding by the adviser and/or the sub-adviser of not only the referenced asset, rate or index, but also of the swap itself. If the investment adviser and/or the sub-adviser is incorrect in its forecasts of default risks, market spreads or other applicable factors or events, the investment performance of the Fund would diminish compared with what it would have been if these techniques were not used.
100
Technology Company Investment Risk. A substantial portion of the securities represented in the applicable index are in the technology sector. As a result, the Fund may invest a substantial portion of its assets in technology companies. The market prices of technology-related stocks tend to exhibit a greater degree of market risk and price volatility than other types of investments. These stocks may fall in and out of favor with investors rapidly, which may cause sudden selling and dramatically lower market prices. Technology stocks also may be affected adversely by changes in technology, consumer and business purchasing patterns, government regulation and/or obsolete products or services.
Valuation Risk. The securities in which the Fund invests typically are valued by a pricing service utilizing a range of market-based inputs and assumptions, including readily available market quotations obtained from broker-dealers making markets in such instruments, cash flows and transactions for comparable instruments. There is no assurance that the Fund will be able to sell a portfolio security at the price established by the pricing service, which could result in a loss to the Fund. Pricing services generally price securities assuming orderly transactions of an institutional “round lot” size, but some trades may occur in smaller, “odd lot” sizes, often at lower prices than institutional round lot trades. Different pricing services may incorporate different assumptions and inputs into their valuation methodologies, potentially resulting in different values for the same securities. As a result, if the Fund were to change pricing services, or if the Fund’s pricing service were to change its valuation methodology, there could be a material impact, either positive or negative, on the Fund’s NAV.
Fund Level and Other Risks:
Anti-Takeover Provisions. The Fund’s organizational documents include provisions that could limit the ability of other entities or persons to acquire control of the Fund or convert the Fund to open-end status. These provisions could have the effect of depriving the common shareholders of opportunities to sell their common shares at a premium over the then-current market price of the common shares.
Borrowing Risk. The Fund may borrow for temporary or emergency purposes. Borrowing may exaggerate changes in the NAV of the Fund’s shares and may affect the Fund’s net income. When the Fund borrows money, it must pay interest and other fees, which will reduce the Fund’s returns if such costs exceed the returns on the portfolio securities purchased or retained with such borrowings. Any such borrowings are intended to be temporary. However, under certain market circumstances, such borrowings might be outstanding for longer periods of time.
Cybersecurity Risk. The Fund and its service providers are susceptible to operational and information security risk resulting from cyber incidents. Cyber incidents refer to both intentional attacks and unintentional events including: processing errors, human errors, technical errors including computer glitches and system malfunctions, inadequate or failed internal or external processes, market-wide technical-related disruptions, unauthorized access to digital systems (through “hacking” or malicious software coding), computer viruses, and cyber-attacks which shut down, disable, slow or otherwise disrupt operations, business processes or website access or functionality (including denial of service attacks). Cyber incidents could adversely impact the Fund and cause the Fund to incur financial loss and expense, as well as face exposure to regulatory penalties, reputational damage, and additional compliance costs associated with corrective measures. In addition, substantial costs may be incurred in order to prevent any cyber incidents in the future. Furthermore, the Fund cannot control the cybersecurity plans and systems put in place by its service providers or any other third parties whose operations may affect the Fund.
Global Economic Risk. National and regional economies and financial markets are becoming increasingly interconnected, which increases the possibilities that conditions in one country, region or market might adversely impact issuers in a different country, region or market. Changes in legal, political, regulatory, tax and economic conditions may cause fluctuations in markets and securities prices around the world, which could negatively impact the value of the Fund’s investments. Major economic or political disruptions, particularly in large economies like China’s, may have global negative economic and market repercussions. Additionally, events such as war, terrorism, natural and environmental disasters and the spread of infectious illnesses or other public health emergencies may adversely affect the global economy and the markets and issuers in which the Fund invests. Recent examples of such events include the outbreak of a novel coronavirus known as COVID-19 that was first detected in China in December 2019 and heightened concerns regarding North Korea’s nuclear weapons and long-range ballistic missile programs. These events could reduce consumer demand or economic output, result in market closure, travel restrictions or quarantines, and generally have a significant impact on the economy. These events could also impair the information technology and other operational systems upon which the Fund’s service providers, including the investment adviser and sub-adviser, rely, and could otherwise disrupt the ability of employees of the Fund’s service providers to perform essential tasks on behalf of the Fund. Governmental and quasi-governmental authorities and regulators throughout the world have in the past responded to major economic disruptions with a variety of significant fiscal and monetary policy changes, including but not limited to, direct capital infusions into companies, new monetary programs and dramatically lower interest rates. An unexpected or quick reversal of these policies, or the ineffectiveness of these policies, could increase volatility in securities markets, which could adversely affect the Fund’s investments.
101
Shareholder Update (continued)
(Unaudited)
Investment and Market Risk. An investment in the Fund’s common shares is subject to investment risk, including the possible loss of the entire principal amount that you invest. Common shares frequently trade at a discount to their NAV. An investment in common shares represents an indirect investment in the securities owned by the Fund. Common shares at any point in time may be worth less than your original investment, even after taking into account the reinvestment of Fund dividends and distributions.
Legislation and Regulatory Risk. At any time after the date of this report, legislation or additional regulations may be enacted that could negatively affect the assets of the Fund, securities held by the Fund or the issuers of such securities. Fund shareholders may incur increased costs resulting from such legislation or additional regulation. There can be no assurance that future legislation, regulation or deregulation will not have a material adverse effect on the Fund or will not impair the ability of the Fund to achieve its investment objectives.
The SEC recently adopted rules governing the use of derivatives by registered investment companies, which could affect the nature and extent of derivatives used by the Fund. The full impact of such rules is uncertain at this time. It is possible that such rules, as interpreted, applied and enforced by the SEC, could limit the implementation of the Fund’s use of derivatives, which could have an adverse impact on the Fund.
Market Discount from Net Asset Value. Shares of closed-end investment companies like the Fund frequently trade at prices lower than their NAV. This characteristic is a risk separate and distinct from the risk that the Fund’s NAV could decrease as a result of investment activities. Whether investors will realize gains or losses upon the sale of the common shares will depend not upon the Fund’s NAV but entirely upon whether the market price of the common shares at the time of sale is above or below the investor’s purchase price for the common shares. Furthermore, management may have difficulty meeting the Fund’s investment objectives and managing its portfolio when the underlying securities are redeemed or sold during periods of market turmoil and as investors’ perceptions regarding closed-end funds or their underlying investments change. Because the market price of the common shares will be determined by factors such as relative supply of and demand for the common shares in the market, general market and economic circumstances, and other factors beyond the control of the Fund, the Fund cannot predict whether the common shares will trade at, below or above NAV. The common shares are designed primarily for long-term investors, and you should not view the Fund as a vehicle for short-term trading purposes.
Non-Diversified Status Risk. Because the Fund is classified as “non-diversified” under the 1940 Act, it can invest a greater portion of its assets in obligations of a single issuer than a “diversified” fund. As a result, the Fund will be more susceptible than a diversified fund to fluctuations in the prices of securities of a single issuer.
Not an Index Fund. The Fund is not, nor is it intended to be, an index fund. As a result, the performance of the Fund will differ from the performance of the index as a whole for various reasons, including the fact that the Fund will write call options on a portion of its equity portfolio and the weightings of the securities included in the Fund’s equity portfolio may be different than the weightings of the common stocks in the index. The Fund, by writing call options on its equity portfolio, will give up the opportunity to benefit from potential increases in the value of the Fund’s equity portfolio above the exercise prices of the options, but will continue to bear the risk of declines in the value of the Fund’s equity portfolio.
Recent Market Conditions. In response to the financial crisis and recent market events, policy and legislative changes by the United States government and the Federal Reserve to assist in the ongoing support of financial markets, both domestically and in other countries, are changing many aspects of financial regulation. The impact of these changes on the markets, and the practical implications for market participants, may not be fully known for some time. Withdrawal of government support, failure of efforts in response to the crisis, or investor perception that such efforts are not succeeding, could adversely impact the value and liquidity of certain securities. The severity or duration of adverse economic conditions may also be affected by policy changes made by governments or quasi-governmental organizations, including changes in tax laws and the imposition of trade barriers. The impact of new financial regulation legislation on the markets and the practical implications for market participants may not be fully known for some time. Changes to the Federal Reserve policy may affect the value, volatility and liquidity of dividend and interest paying securities. In addition, the contentious domestic political environment, as well as political and diplomatic events within the United States and abroad, such as the U.S. government’s inability at times to agree on a long-term budget and deficit reduction plan, the threat of a federal government shutdown and threats not to increase the federal government’s debt limit, may affect investor and consumer confidence and may adversely impact financial markets and the broader economy, perhaps suddenly and to a significant degree.
Interest rates have been unusually low in recent years in the United States and abroad but there is consensus that interest rates will increase during the life of the Fund, which could negatively impact the price of debt securities. Because there is little precedent for this situation, it is difficult to predict the impact of a significant rate increase on various markets.
The current political climate has intensified concerns about a potential trade war between China and the United States, as each country has recently imposed tariffs on the other country’s products. These actions may trigger a significant reduction in international trade, the oversupply of certain manufactured goods, substantial price reductions of goods and possible failure of individual companies and/or large segments of China’s export industry, which could have a negative impact on the Fund’s performance.
102
The impact of these developments in the near- and long-term is unknown and could have additional adverse effects on economies, financial markets and asset valuations around the world.
Tax Risk. The Fund has elected to be treated and intends to qualify each year as a Regulated Investment Company (“RIC”) under the Internal Revenue Code of 1986, as amended (the “Code”). As a RIC, the Fund is not expected to be subject to U.S. federal income tax to the extent that it distributes its investment company taxable income and net capital gains. To qualify for the special tax treatment available to a RIC, the Fund must comply with certain investment, distribution, and diversification requirements. Under certain circumstances, the Fund may be forced to sell certain assets when it is not advantageous in order to meet these requirements, which may reduce the Fund’s overall return. If the Fund fails to meet any of these requirements, subject to the opportunity to cure such failures under applicable provisions of the Code, the Fund’s income would be subject to a double level of U.S. federal income tax. The Fund’s income, including its net capital gain, would first be subject to U.S. federal income tax at regular corporate rates, even if such income were distributed to shareholders and, second, all distributions by the Fund from earnings and profits, including distributions of net capital gain (if any), would be taxable to shareholders as dividends.
103
Shareholder Update (continued)
(Unaudited)
DIVIDEND REINVESTMENT PLAN
Nuveen Closed-End Funds Automatic Reinvestment Plan
Your Nuveen Closed-End Fund allows you to conveniently reinvest distributions in additional Fund shares. By choosing to reinvest, you’ll be able to invest money regularly and automatically, and watch your investment grow through the power of compounding. Just like distributions in cash, there may be times when income or capital gains taxes may be payable on distributions that are reinvested. It is important to note that an automatic reinvestment plan does not ensure a profit, nor does it protect you against loss in a declining market.
Easy and convenient
To make recordkeeping easy and convenient, each quarter you’ll receive a statement showing your total distributions, the date of investment, the shares acquired and the price per share, and the total number of shares you own.
How shares are purchased
The shares you acquire by reinvesting will either be purchased on the open market or newly issued by the Fund. If the shares are trading at or above NAV at the time of valuation, the Fund will issue new shares at the greater of the NAV or 95% of the then-current market price. If the shares are trading at less than NAV, shares for your account will be purchased on the open market. If Computershare Trust Company, N.A. (the “Plan Agent”) begins purchasing Fund shares on the open market while shares are trading below NAV, but the Fund’s shares subsequently trade at or above their NAV before the Plan Agent is able to complete its purchases, the Plan Agent may cease open-market purchases and may invest the uninvested portion of the distribution in newly-issued Fund shares at a price equal to the greater of the shares’ NAV or 95% of the shares’ market value on the last business day immediately prior to the purchase date. Distributions received to purchase shares in the open market will normally be invested shortly after the distribution payment date. No interest will be paid on distributions awaiting reinvestment. Because the market price of the shares may increase before purchases are completed, the average purchase price per share may exceed the market price at the time of valuation, resulting in the acquisition of fewer shares than if the distribution had been paid in shares issued by the Fund. A pro rata portion of any applicable brokerage commissions on open market purchases will be paid by Dividend Reinvestment Plan (the “Plan”) participants. These commissions usually will be lower than those charged on individual transactions.
Flexible
You may change your distribution option or withdraw from the Plan at any time, should your needs or situation change. You can reinvest whether your shares are registered in your name, or in the name of a brokerage firm, bank, or other nominee. Ask your investment advisor if his or her firm will participate on your behalf. Participants whose shares are registered in the name of one firm may not be able to transfer the shares to another firm and continue to participate in the Plan. The Fund reserves the right to amend or terminate the Plan at any time. Although the Fund reserves the right to amend the Plan to include a service charge payable by the participants, there is no direct service charge to participants in the Plan at this time.
Call today to start reinvesting distributions
For more information on the Nuveen Automatic Reinvestment Plan or to enroll in or withdraw from the Plan, speak with your financial professional or call us at (800) 257-8787.
104
CHANGES OCCURRING DURING THE FISCAL YEAR
The following information in this annual report is a summary of certain changes during the most recent fiscal year. This information may not reflect all of the changes that have occurred since you purchased shares of a Fund.
During the most recent fiscal year, there have been no changes to: (i) the Funds’ investment objectives and principal investment policies that have not been approved by shareholders, (ii) the principal risks of the Fund, (iii) the portfolio managers of the Funds; (iv) a Fund’s charter or by-laws that would delay or prevent a change of control of the Fund that have not been approved by shareholders, except as follows:
Principal Investment Policies
Effective August 6, 2021, the Board of Trustees of the Funds eliminated the following investment policy with respect to the Nuveen Dow 30SM Dynamic Overwrite Fund (DIAX), Nuveen S&P 500 Dynamic Overwrite Fund (SPXX), and Nuveen Nasdaq 100 Dynamic Overwrite Fund (QQQX):
“With respect to call options written on individual securities, the Fund will not write “naked” or uncovered call options.”
Principal Risks
The following principal risks have been added for the Nuveen S&P 500 Buy-Write Income Fund (BXMX), Nuveen Dow 30SM Dynamic Overwrite Fund (DIAX), Nuveen S&P 500 Dynamic Overwrite Fund (SPXX), and Nuveen Nasdaq 100 Dynamic Overwrite Fund (QQQX):
Illiquid Securities Risk. The Fund may invest in securities and other instruments that, at the time of investment, are illiquid. Illiquid securities are securities that are not readily marketable and may include some restricted securities, which are securities that may not be resold to the public without an effective registration statement under the 1933 Act or, if they are unregistered, may be sold only in a privately negotiated transaction or pursuant to an exemption from registration. Illiquid securities involve the risk that the securities will not be able to be sold at the time desired by the Fund or at prices approximating the value at which the Fund is carrying the securities on its books.
Large-Cap Company Risk. While large-cap companies may be less volatile than those of mid-and small-cap companies, they still involve risk. To the extent the Fund invests in large-capitalization securities, the Fund may underperform funds that invest primarily in securities of smaller capitalization companies during periods when the securities of such companies are in favor. Large-capitalization companies may be unable to respond as quickly as smaller capitalization companies to competitive challenges or to changes in business, product, financial or other market conditions.
The following principal risk has been added for the Nuveen Core Equity Alpha Fund (JCE):
Quantitative Analysis Risk. The risk that stocks selected using quantitative modeling and analysis could perform differently from the market as a whole and the risk that such quantitative analysis and modeling may not adequately take into account certain factors, may contain design flaws or inaccurate assumptions and may rely on inaccurate data inputs, which may result in losses to the Fund.
105
Shareholder Update (continued)
(Unaudited)
UPDATED DISCLOSURES FOR FUNDS WITH AN EFFECTIVE SHELF OFFERING REGISTRATION STATEMENT
The following includes additional disclosures for the Funds in this annual report with an effective shelf offering registration statement as of the fiscal year ended December 31, 2021.
NUVEEN S&P 500 DYNAMIC OVERWRITE FUND (SPXX)
NUVEEN NASDAQ 100 DYNAMIC OVERWRITE FUND (QQQX)
SUMMARY OF FUND EXPENSES
The purpose of the tables and the examples below are to help you understand all fees and expenses that you, as a common shareholder, would bear directly or indirectly. The tables show the expenses of the Fund as a percentage of the average net assets attributable to Common Shares and not as a percentage of total assets or managed assets.
| | | | | | | | |
| Shareholder Transaction Expenses | | Nuveen
S&P 500 Dynamic Overwrite
Fund (SPXX) | | | Nuveen
Nasdaq 100 Dynamic Overwrite
Fund (QQQX) | |
Maximum Sales Charge (as a percentage of offering price) | | | 4.00% | (1) | | | 4.00% | (1) |
Dividend Reinvestment Plan Fees(2) | | $ | 2.50 | | | $ | 2.50 | |
| (1) | A maximum sales charge of 4.00% applies only to offerings pursuant to a syndicated underwriting. The maximum sales charge for offerings made at-the-market is 1.00%. There is no sales charge for offerings pursuant to a private transaction. |
| (2) | You will be charged a $2.50 service charge and pay brokerage charges if you direct Computershare Inc. and Computershare Trust Company, N.A., as agent for the common shareholders, to sell your Common Shares held in a dividend reinvestment account. |
| | | | | | | | |
| | | As a Percentage of Net Assets
Attributable to Common Shares(1) | |
| Annual Expenses | | Nuveen
S&P 500 Dynamic Overwrite
Fund (SPXX) | | | Nuveen
Nasdaq 100 Dynamic Overwrite
Fund (QQQX) | |
Management Fees | | | 0.81% | | | | 0.82% | |
Other Expenses(2) | | | 0.09% | | | | 0.08% | |
Total Annual Expenses | | | 0.90% | | | | 0.90% | |
| (1) | Stated as percentages of average net assets attributable to Common Shares for the fiscal year ended December 31, 2021. |
| (2) | Other Expenses are based on estimated amounts for the current fiscal year. Expenses attributable to the Fund’s investments, if any, in other investment companies are currently estimated not to exceed 0.01%. |
Examples
The following examples illustrate the expenses, including the applicable transaction fees (referred to as the “Maximum Sales Charge” in the Shareholder Transaction Expenses table above), if any, that a common shareholder would pay on a $1,000 investment that is held for the time periods provided in the tables. Each example assumes that all dividends and other distributions are reinvested in the Fund and that the Fund’s Annual Expenses, as provided above, remain the same. The examples also assume a 5% annual return. Actual expenses may be greater or less than those assumed. Moreover, the Fund’s actual rate of return may be greater or less than the hypothetical 5% return shown in the examples.
Example # 1 (At-the-Market Transaction)
The following example assumes a transaction fee of 1.00%, as a percentage of the offering price.
| | | | | | | | |
| | | Nuveen
S&P 500 Dynamic Overwrite
Fund (SPXX) | | | Nuveen
Nasdaq 100 Dynamic Overwrite
Fund (QQQX) | |
1 Year | | $ | 19 | | | $ | 19 | |
3 Years | | $ | 38 | | | $ | 38 | |
5 Years | | $ | 59 | | | $ | 59 | |
10 Years | | $ | 120 | | | $ | 120 | |
106
Example # 2 (Underwriting Syndicate Transaction)
The following example assumes a transaction fee of 4.00%, as a percentage of the offering price.
| | | | | | | | |
| | | Nuveen
S&P 500 Dynamic Overwrite
Fund (SPXX) | | | Nuveen
Nasdaq 100 Dynamic Overwrite
Fund (QQQX) | |
1 Year | | $ | 49 | | | $ | 49 | |
3 Years | | $ | 68 | | | $ | 68 | |
5 Years | | $ | 88 | | | $ | 88 | |
10 Years | | $ | 146 | | | $ | 146 | |
Example # 3 (Privately Negotiated Transaction)
The following example assumes there is no transaction fee.
| | | | | | | | |
| | | Nuveen
S&P 500 Dynamic Overwrite
Fund (SPXX) | | | Nuveen
Nasdaq 100 Dynamic Overwrite
Fund (QQQX) | |
1 Year | | $ | 9 | | | $ | 9 | |
3 Years | | $ | 29 | | | $ | 29 | |
5 Years | | $ | 50 | | | $ | 50 | |
10 Years | | $ | 111 | | | $ | 111 | |
These examples should not be considered a representation of future expenses. Actual expenses may be greater or less than those shown above.
TRADING AND NET ASSET VALUE INFORMATION
The following table shows for the periods indicated: (i) the high and low market prices for the Common Shares of Nuveen S&P 500 Dynamic Overwrite Fund (SPXX) and Nuveen Nasdaq 100 Dynamic Overwrite Fund (QQQX) reported as of the end of the day on the Nasdaq Stock Market LLC (Nasdaq) and on the New York Stock Exchange (NYSE), respectively, (ii) the high and low net asset value (NAV) of the Common Shares, and (iii) the high and low of the premium/(discount) to NAV (expressed as a percentage) of shares of the Common Shares.
Nuveen S&P 500 Dynamic Overwrite Fund (SPXX)
| | | | | | | | | | | | | | | | | | | | | | | | |
| | | Market Price | | | NAV | | | Premium /
(Discount) to NAV | |
| Fiscal Quarter End | | High | | | Low | | | High | | | Low | | | High | | | Low | |
December 2021 | | $ | 18.60 | | | $ | 16.98 | | | $ | 18.81 | | | $ | 17.51 | | | | (0.53 | )% | | | (4.30 | )% |
September 2021 | | $ | 18.42 | | | $ | 17.08 | | | $ | 18.36 | | | $ | 17.47 | | | | 3.50 | % | | | (3.61 | )% |
June 2021 | | $ | 19.07 | | | $ | 16.57 | | | $ | 17.80 | | | $ | 17.04 | | | | 8.72 | % | | | (3.42 | )% |
March 2021 | | $ | 16.53 | | | $ | 14.84 | | | $ | 17.03 | | | $ | 16.00 | | | | (2.36 | )% | | | (8.38 | )% |
December 2020 | | $ | 15.24 | | | $ | 12.77 | | | $ | 16.22 | | | $ | 14.52 | | | | (5.75 | )% | | | (12.80 | )% |
September 2020 | | $ | 14.43 | | | $ | 12.91 | | | $ | 15.68 | | | $ | 14.16 | | | | (7.97 | )% | | | (11.16 | )% |
June 2020 | | $ | 13.63 | | | $ | 11.25 | | | $ | 14.71 | | | $ | 12.07 | | | | (2.76 | )% | | | (10.54 | )% |
March 2020 | | $ | 16.89 | | | $ | 9.44 | | | $ | 16.72 | | | $ | 11.05 | | | | 2.56 | % | | | (16.54 | )% |
Nuveen Nasdaq 100 Dynamic Overwrite Fund (QQQX)
| | | | | | | | | | | | | | | | | | | | | | | | |
| | | Market Price | | | NAV | | | Premium /
(Discount) to NAV | |
| Fiscal Quarter End | | High | | | Low | | | High | | | Low | | | High | | | Low | |
December 2021 | | $ | 30.65 | | | $ | 28.05 | | | $ | 30.28 | | | $ | 27.64 | | | | 3.44 | % | | | 0.03 | % |
September 2021 | | $ | 30.60 | | | $ | 28.37 | | | $ | 30.07 | | | $ | 27.97 | | | | 2.56 | % | | | (0.51 | )% |
June 2021 | | $ | 29.57 | | | $ | 26.57 | | | $ | 28.54 | | | $ | 26.43 | | | | 4.30 | % | | | (0.77 | )% |
March 2021 | | $ | 27.61 | | | $ | 25.38 | | | $ | 28.27 | | | $ | 25.94 | | | | 2.87 | % | | | (4.69 | )% |
December 2020 | | $ | 26.05 | | | $ | 22.30 | | | $ | 26.39 | | | $ | 23.85 | | | | (0.28 | )% | | | (7.65 | )% |
September 2020 | | $ | 26.92 | | | $ | 23.44 | | | $ | 26.53 | | | $ | 23.79 | | | | 1.53 | % | | | (2.67 | )% |
June 2020 | | $ | 24.42 | | | $ | 18.14 | | | $ | 23.93 | | | $ | 19.44 | | | | 2.81 | % | | | (7.02 | )% |
March 2020 | | $ | 25.24 | | | $ | 15.85 | | | $ | 25.30 | | | $ | 18.15 | | | | 0.65 | % | | | (15.65 | )% |
107
Shareholder Update (continued)
(Unaudited)
The following table shows as of December 31, 2021 each Fund’s: (i) NAV per Common Share, (ii) market price, (iii) percentage of premium/(discount) to NAV per Common Share and (iv) net assets attributable to Common Shares.
| | | | | | | | |
| December 31, 2021 | | Nuveen
S&P 500 Dynamic Overwrite
Fund (SPXX) | | | Nuveen
Nasdaq 100 Dynamic Overwrite
Fund (QQQX) | |
NAV per Common Share | | $ | 18.70 | | | $ | 29.63 | |
Market Price | | $ | 18.60 | | | $ | 30.65 | |
Percentage of Premium/(Discount) to NAV per Common Share | | | (0.53)% | | | | 3.44% | |
Net Assets Attributable to Common Shares | | $ | 323,415,438 | | | $ | 1,334,866,679 | |
Shares of closed-end investment companies, including those of the Funds, may frequently trade at prices lower than NAV. The Funds’ Board of Trustees (Board) has currently determined that, at least annually, it will consider action that might be taken to reduce or eliminate any material discount from NAV in respect of Common Shares, which may include the repurchase of such shares in the open market or in private transactions, the making of a tender offer for such shares at NAV, or the conversion of the Fund to an open-end investment company. The Funds cannot assure you that their Board will decide to take any of these actions, or that share repurchases or tender offers will actually reduce market discount.
UNRESOLVED STAFF COMMENTS
Each Fund believes that there are no material unresolved written comments, received 180 days or more before December 31, 2021, from the Staff of the Securities and Exchange Commission (SEC) regarding any of its periodic or current reports under the Securities Exchange Act or 1940 Act, or its registration statement.
108
Additional Fund Information (Unaudited)
| | | | | | | | | | |
| Board of Trustees | | | | | | | | | | |
| Jack B. Evans | | William C. Hunter | | Amy B. R. Lancellotta | | Joanne T. Medero | | Albin F. Moschner | | John K. Nelson |
| Judith M. Stockdale | | Carole E. Stone | | Matthew Thornton III | | Terence J. Toth | | Margaret L. Wolff | | Robert L. Young |
| | | | | | | | |
| | | | | |
Investment Adviser Nuveen Fund Advisors, LLC 333 West Wacker Drive Chicago, IL 60606 | | Custodian State Street Bank & Trust Company One Lincoln Street Boston, MA 02111 | | Legal Counsel Chapman and Cutler LLP Chicago, IL 60603 | | Independent Registered Public Accounting Firm PricewaterhouseCoopers LLP One North Wacker Drive Chicago, IL 60606 | | Transfer Agent and Shareholder Services Computershare Trust Company, N.A. 150 Royall Street Canton, MA 02021 (800) 257-8787 |
Distribution Information
The Funds hereby designate their percentages of dividends paid from net ordinary income as dividends qualifying for the dividends received deduction (“DRD”) for corporations and their percentages as qualified dividend income (“QDI”) for individuals under Section 1(h)(11) of the Internal Revenue Code as shown in the accompanying table. The actual qualified dividend income distributions will be reported to shareholders on Form 1099-DIV which will be sent to shareholders shortly after calendar year end.
| | | | | | | | | | | | | | | | | | | | |
| | | BXMX | | | DIAX | | | SPXX | | | QQQX | | | JCE | |
% DRD | |
| 100.0%
|
| | | 100.0% | | | | 100.0% | | | | 0.0% | | | | 68.0% | |
% QDI | | | 100.0% | | | | 100.0% | | | | 100.0% | | | | 0.0% | | | | 69.7% | |
Portfolio of Investments Information
The Fund is required to file its complete schedule of portfolio holdings with the Securities and Exchange Commission (SEC) for the first and third quarters of each fiscal year as an exhibit to its report on Form N-PORT. You may obtain this information on the SEC’s website at http://www.sec.gov.
Nuveen Funds’ Proxy Voting Information
You may obtain (i) information regarding how each fund voted proxies relating to portfolio securities held during the most recent twelve-month period ended June 30, without charge, upon request, by calling Nuveen toll-free at (800) 257-8787 or on Nuveen’s website at www.nuveen.com and (ii) a description of the policies and procedures that each fund used to determine how to vote proxies relating to portfolio securities without charge, upon request, by calling Nuveen toll free at (800) 257-8787. You may also obtain this information directly from the SEC. Visit the SEC on-line at http://www.sec.gov.
CEO Certification Disclosure
Each Fund’s Chief Executive Officer (CEO) has submitted to the New York Stock Exchange (NYSE) the annual CEO certification as required by Section 303A.12(a) of the NYSE Listed Company Manual. Each Fund has filed with the SEC the certification of its CEO and Chief Financial Officer required by Section 302 of the Sarbanes-Oxley Act.
Common Share Repurchases
Each Fund intends to repurchase through its open-market share repurchase program, shares of its own common stock at such times and in such amounts as is deemed advisable. During the period covered by this report, each Fund repurchased shares of its common stock as shown in the accompanying table. Any future repurchases will be reported in the next annual or semi-annual report.
| | | | | | | | | | | | | | | | | | | | |
| | | BXMX | | | DIAX | | | SPXX | | | QQQX | | | JCE | |
Common Shares repurchased | | | 0 | | | | 0 | | | | 0 | | | | 0 | | | | 0 | |
FINRA BrokerCheck
The Financial Industry Regulatory Authority (FINRA) provides information regarding the disciplinary history of FINRA member firms and associated investment professionals. This information as well as an investor brochure describing FINRA BrokerCheck is available to the public by calling the FINRA BrokerCheck Hotline number at (800) 289-9999 or by visiting www.FlNRA.org.
109
Glossary of Terms Used in this Report
(Unaudited)
| ∎ | | Average Annual Total Return: This is a commonly used method to express an investment’s performance over a particular, usually multi-year time period. It expresses the return that would have been necessary each year to equal the investment’s actual cumulative performance (including change in NAV or market price and reinvested dividends and capital gains distributions, if any) overthe time period being considered. |
| ∎ | | Chicago Board Options Exchange (Cboe) Dow Jones Industrial Average (DJIA) BuyWrite Index (BXDSM): A benchmark index that measures the performance of a theoretical portfolio that sells call options on the Dow Jones Industrial Average (the Dow), against a portfolio of the stocks included in the Dow. Index returns assume reinvestment of distributions, but do not include the effects of any applicable sales charges or management fees. |
| ∎ | | Chicago Board Options Exchange (Cboe) Nasdaq 100 BuyWrite Index (BXNSM): A benchmark index that measures the performance of a theoretical portfolio that owns a basket of the stocks included in the Nasdaq 100® Index, and “writes” (or sells) Nasdaq 100® Index covered call options each month. Index returns assume reinvestment of distributions, but do not include the effects of any applicable sales charges or management fees. |
| ∎ | | Chicago Board Options Exchange (Cboe) S&P 500® BuyWrite Index (BXMSM): An index designed to measure the performance of a hypothetical buy-write strategy on the S&P 500® Index. Index returns assume reinvestment of distributions, but do not reflect any applicable sales charges or management fees. |
| ∎ | | Chicago Board Options Exchange (Cboe) Volatility Index® (VIX®): An index that is a key measure of market expectations of near-term volatility conveyed by S&P 500® option prices. Since its introduction in 1993, VIX has been considered by many to be the world’s premier barometer of investor sentiment and market volatility (www.cboe.com). Index returns assume reinvestment of distributions, but do not include the effects of any applicable sales charges or management fees. |
| ∎ | | DIAX Blended Benchmark: Consists of: 1) 55% Chicago Board Options Exchange (Cboe) DJIA BuyWrite Index (BXDSM), which is designed to measure the performance of a hypothetical buy-write strategy on the Dow Jones Industrial Average, and 2) 45% Dow Jones Industrial Average Index (DJIA), which is designed to measure the performance of 30 actively traded U.S. large-cap stocks. Index returns assume reinvestment of distributions, but do not reflect any applicable sales charges or management fees. |
| ∎ | | Dow Jones Industrial Average Index (DJIA): An index designed to measure the performance of 30 actively traded U.S. large cap stocks. Index returns assume reinvestment of distributions, but do not reflect any applicable sales charges or management fees. |
| ∎ | | Gross Domestic Product (GDP): The total market value of all final goods and services produced in a country/region in a given year, equal to total consumer, investment and government spending, plus the value of exports, minus the value of imports. |
| ∎ | | JCE Blended Benchmark: Consists of: 1) 50% S&P 500® Index, which is an index generally considered representative of the U.S. equity market and includes 500 leading companies and covers approximately 80% of available market capitalization, and 2) 50% Chicago Board Options Exchange (Cboe) S&P 500® BuyWrite Index (BXMSM), which is designed to measure the performance of a hypothetical buy-write strategy on the S&P 500® Index. Index returns assume reinvestment of distributions, but do not reflect any applicable sales charges or management fees. |
| ∎ | | Nasdaq 100® Index: An index that includes 100 of the largest domestic and international non-financial equity securities listed on the Nasdaq Stock Market based on market capitalization. Index returns assume reinvestment of distributions, but do not reflect any applicable sales charges or management fees. |
| ∎ | | Net Asset Value (NAV) Per Share: A fund’s Net Assets is equal to its total assets (securities, cash, accrued earnings and receivables) less its total liabilities. NAV per share is equal to the fund’s Net Assets divided by its number of shares outstanding. |
110
| ∎ | | QQQX Blended Benchmark: Consists of: 1) 55% Chicago Board Options Exchange (Cboe) Nasdaq 100 BuyWrite Index (BXNSM), which is designed to measure the performance of a hypothetical buy-write strategy on the Nasdaq 100® Index, and 2) 45% Nasdaq 100® Index, which includes 100 of the largest domestic and international non-financial equity securities listed on the Nasdaq Stock Market based on market capitalization. Index returns assume reinvestment of distributions, but do not reflect any applicable sales charges or management fees. |
| ∎ | | Russell 1000® Index: An index designed to measure the performance of the large-cap segment of the U.S. equity universe. Index returns assume reinvestment of distributions, but do not reflect any applicable sales charges or management fees. |
| ∎ | | Russell 2000® Index: An index designed to measure the performance of the small-cap segment of the U.S. equity universe. Index returns assume reinvestment of distributions, but do not reflect any applicable sales charges or management fees. |
| ∎ | | S&P 500® Index: An index generally considered representative of the U.S. equity market. The index includes 500 leading companies and covers approximately 80% of available market capitalization. Index returns assume reinvestment of distributions, but do not reflect any applicable sales charges or management fees. |
| ∎ | | SPXX Blended Benchmark: Consists of: 1) 55% Chicago Board Options Exchange (Cboe) S&P 500® BuyWrite Index (BXMSM), which is designed to measure the performance of a hypothetical buy-write strategy on the S&P 500® Index, and 2) 45% S&P 500® Index, which is an index generally considered representative of the U.S. equity market and includes 500 leading companies and covers approximately 80% of available market capitalization. Index returns assume reinvestment of distributions, but do not reflect any applicable sales charges or management fees. |
111
Board Members & Officers
(Unaudited)
The management of the Funds, including general supervision of the duties performed for the Funds by the Adviser, is the responsibility of the Board of Trustees of the Funds. None of the trustees who are not “interested” persons of the Funds (referred to herein as “independent board members”) has ever been a director or employee of, or consultant to, Nuveen or its affiliates. The names and business addresses of the trustees and officers of the Funds, their principal occupations and other affiliations during the past five years, the number of portfolios each Trustee oversees and other directorships they hold are set forth below.
| | | | | | | | |
| | | | | | | | | |
Name, Year of Birth & Address | | Position(s) Held with the Funds | | Year First
Elected or
Appointed
and Term(1) | | Principal Occupation(s) Including other Directorships During Past 5 Years | | Number of Portfolios in Fund Complex Overseen by Board Member |
| | | | |
| | | | | | | | | |
| | |
| Independent Board Members: | | | | |
| | | | |
∎ TERENCE J. TOTH | | | | | | Formerly, a Co-Founding Partner, Promus Capital (investment advisory firm) (2008-2017); Director, Quality Control Corporation (manufacturing) (since 2012); member: Catalyst Schools of Chicago Board (since 2008) and Mather Foundation Board (philanthropy) (since 2012), and chair of its Investment Committee; formerly, Member, Chicago Fellowship Board (philanthropy) (2005-2016); formerly, Director, Fulcrum IT Services LLC (information technology services firm to government entities) (2010-2019); formerly, Director, LogicMark LLC (health services) (2012-2016); formerly, Director, Legal & General Investment Management America, Inc. (asset management) (2008-2013); formerly, CEO and President, Northern Trust Global Investments (financial services) (2004-2007): Executive Vice President, Quantitative Management & Securities Lending (2000-2004); prior thereto, various positions with Northern Trust Company (financial services) (since 1994); formerly, Member, Northern Trust Mutual Funds Board (2005-2007), Northern Trust Global Investments Board (2004-2007), Northern Trust Japan Board (2004-2007), Northern Trust Securities Inc. Board (2003-2007) and Northern Trust Hong Kong Board (1997-2004). | | |
1959 333 W. Wacker Drive Chicago, IL 6o6o6 | | Chairman and Board Member | | 2008 Class II | | 142 |
| | | | |
| | | | |
∎ JACK B. EVANS | | | | | | Chairman (since 2019), formerly, President (1996-2019), The Hall-Perrine Foundation, (private philanthropic corporation); Life Trustee of Coe College; formerly, Member and President Pro-Tem of the Board of Regents for the State of Iowa University System (2007- 2013); Director and Chairman (2009-2021), United Fire Group, a publicly held company; Director, Public Member, American Board of Orthopaedic Surgery (2015-2020); Director (2000-2004), Alliant Energy; Director (1996-2015), The Gazette Company (media and publishing); Director (1997- 2003), Federal Reserve Bank of Chicago; President and Chief Operating Officer (1972-1995), SCI Financial Group, Inc., (regional financial services firm). | | |
1948 333 W. Wacker Drive Chicago, IL 6o6o6 | | Board Member | | 1999 Class III | | 142 |
| | | | | | |
| | | | |
∎ WILLIAM C. HUNTER | | | | | | Dean Emeritus, formerly, Dean, Tippie College of Business, University of (2006-2012); Director of Wellmark, Inc. (since 2009); past Director (2005- 2015), and past President (2010-2014) Beta Gamma Sigma, Inc., The International Business Honor Society; formerly, Director (2004-2018) of Xerox Corporation; formerly, Dean and Distinguished Professor of Finance, School of Business at the University of Connecticut (2003-2006); previously, Senior Vice President and Director of Research at the Federal Reserve Bank of Chicago (1995-2003); formerly, Director (1997-2007), Credit Research Center at Georgetown University. | | |
1948 333 W. Wacker Drive Chicago, IL 6o6o6 | | Board Member | | 2003 Class I | | 142 |
| | | | | | |
| | | | |
∎ AMY B. R. LANCELLOTTA | | | | | | Formerly, Managing Director, Independent Directors Council (IDC) (supports the fund independent director community and is part of the Investment Company Institute (ICI), which represents regulated investment companies) (2006-2019); formerly, various positions with ICI (1989-2006); Member of the Board of Directors, Jewish Coalition Against Domestic Abuse (JCADA) (since 2020). | | |
1959 333 W. Wacker Drive Chicago, IL 6o6o6 | | Board Member | | 2021 Class II | | 142 |
| | | | | | |
112
| | | | | | | | |
| | | | |
| | | | | | | | | |
Name, Year of Birth & Address | | Position(s) Held with the Funds | | Year First
Elected or
Appointed
and Term(1) | | Principal Occupation(s) Including other Directorships During Past 5 Years | | Number of Portfolios in Fund Complex Overseen by Board Member |
| | | | |
| | | | | | | | | |
| | |
| Independent Board Members (continued): | | | | |
| | | | |
∎ JOANNE T. MEDERO | | | | | | Formerly, Managing Director, Government Relations and Public Policy (2009-2020) and Senior Advisor to the Vice Chairman (2018-2020), BlackRock, Inc. (global investment management firm); formerly, Managing (Director, Global Head of Government Relations and Public Policy, Barclays Group (IBIM) (investment banking, investment management and wealth management businesses) (2006-2009); formerly, Managing Director, Global General Counsel and Corporate Secretary, Barclays Global Investors (global investment management firm) (1996-2006); formerly, Partner, Orrick, Herrington & Sutcliffe LLP (law firm) (1993-1995); formerly, General Counsel, Commodity Futures Trading Commission (government agency overseeing U.S. derivatives markets) (1989-1993); formerly, Deputy Associate Director/ Associate Director for Legal and Financial Affairs, Office of Presidential Personnel, The White House (1986-1989); Member of the Board of Directors, Baltic-American Freedom Foundation (seeks to provide opportunities for citizens of the Baltic states to gain education and professional development through exchanges in the U.S.) (since 2019). | | |
1954 333 W. Wacker Drive Chicago, IL 6o6o6 | | Board Member | | 2021 Class III | | 142 |
| | | | | | |
| | | | |
∎ ALBIN F. MOSCHNER | | | | | | Founder and Chief Executive Officer, Northcroft Partners, LLC, (management consulting) (since 2012); formerly, Chairman (2019), and Director (2012-2019), USA Technologies, Inc., (provider of solutions and services to facilitate electronic payment transactions); formerly, Director, Wintrust Financial Corporation (1996-2016); previously, held positions at Leap Wireless International, Inc., (consumer wireless services) including Consultant (2011- 2012), Chief Operating Officer (2008-2011), and Chief Marketing Officer (2004- 2008); formerly, President, Verizon Card Services division of Verizon Communications, Inc. (2000-2003); formerly, President, One Point Services at One Point Communications (telecommunication services) (1999-2000); formerly, Vice Chairman of the Board, Diba, Incorporated (internet technology provider) (1996-1997); formerly, various executive positions (1991-1996) including Chief Executive Officer (1995-1996) of Zenith Electronics Corporation (consumer electronics). | | |
1952 333 W. Wacker Drive Chicago, IL 6o6o6 | | Board Member | | 2016 Class III | | 142 |
| | | | | | |
| | | | |
∎ JOHN K. NELSON | | | | | | Member of Board of Directors of Core12 LLC. (private firm which develops branding, marketing and communications strategies for clients) (since 2008); served on The President’s Council of Fordham University (2010-2019) and previously a Director of the Curran Center for Catholic American Studies (2009- 2018); formerly, senior external advisor to the Financial Services practice of Deloitte Consulting LLP. (2012-2014); former Chair of the Board of Trustees of Marian University (2010-2014 as trustee, 2011-2014 as Chair); formerly Chief Executive Officer of ABN AMRO Bank N.V., North America, and Global Head of the Financial Markets Division (2007-2008), with various executive leadership roles in ABN AMRO Bank N.V. between 1996 and 2007. | | |
1962 333 W. Wacker Drive Chicago, IL 6o6o6 | | Board Member | | 2013 Class II | | 142 |
| | | | | | |
| | | | |
∎ JUDITH M. STOCKDALE | | | | | | Board Member, Land Trust Alliance (national public charity addressing natural land and water conservation in the U.S.) (since 2013); formerly, Board Member, U.S. Endowment for Forestry and Communities (national endowment addressing forest health, sustainable forest production and markets, and economic health of forest-reliant communities in the U.S.) (2013-2019); formerly, Executive Director (1994-2012), Gaylord and Dorothy Donnelley Foundation (private foundation endowed to support both natural land conservation and artistic vitality); prior thereto, Executive Director, Great Lakes Protection Fund (endowment created jointly by seven of the eight Great Lake states’ Governors to take a regional approach to improving the health of the Great Lakes) (1990-1994). | | |
1947 333 W. Wacker Drive Chicago, IL 6o6o6 | | Board Member | | 1997 Class I | | 142 |
| | | | | | |
113
Board Members & Officers (continued)
(Unaudited)
| | | | | | | | |
| | | | |
| | | | | | | | | |
Name, Year of Birth & Address | | Position(s) Held with the Funds | | Year First
Elected or
Appointed
and Term(1) | | Principal Occupation(s) Including other Directorships During Past 5 Years | | Number of Portfolios in Fund Complex Overseen by Board Member |
| | | | |
| | | | | | | | | |
| | |
| Independent Board Members (continued): | | | | |
| | | | |
∎ CAROLE E. STONE | | | | | | Former Director, Chicago Board Options Exchange, Inc. (2006-2017); and C2 Options Exchange, Incorporated (2009-2017); formerly Director, Cboe, Global Markets, Inc., (2010-2020) formerly named CBOE Holdings, Inc.; formerly, Commissioner, New York State Commission on Public Authority Reform (2005-2010). | | |
1947 333 W. Wacker Drive Chicago, IL 6o6o6 | |
Board Member | | 2007 Class I | | 142 |
| | | | | | |
| | | | |
∎ MATTHEW THORNTON III | | | | | | Formerly, Executive Vice President and Chief Operating Officer (2018-2019), FedEx Freight Corporation, a subsidiary of FedEx Corporation (“FedEx”) (provider of transportation, e-commerce and business services through its portfolio of companies); formerly, Senior Vice President, U.S. Operations (2006-2018), Federal Express Corporation, a subsidiary of FedEx; formerly, Member of the Board of Directors (2012-2018), Safe Kids Worldwide® (a non-profit organization dedicated to preventing childhood injuries). Member of the Board of Directors (since 2014), The Sherwin-Williams Company (develops, manufactures, distributes and sells paints, coatings and related products); Director (since 2020), Crown Castle International (provider of communications infrastructure). | | |
1958 333 West Wacker Drive Chicago, IL 60606 | |
Board Member | | 2020 Class III | | 142 |
| | | | | | |
| | | | |
∎ MARGARET L. WOLFF | | | | | | Formerly, member of the Board of Directors (2013-2017) of Travelers Insurance Company of Canada and The Dominion of Canada General Insurance Company (each, a part of Travelers Canada, the Canadian operation of The Travelers Companies, Inc.); formerly, Of Counsel, Skadden, Arps, Slate, Meagher & Flom LLP (Mergers & Acquisitions Group) (legal services) (2005-2014); Member of the Board of Trustees of New York-Presbyterian Hospital (since 2005); Member (since 2004) and Chair (since 2015) of the Board of Trustees of The John A. Hartford Foundation (philanthropy dedicated to improving the care of older adults); formerly, Member (2005-2015) and Vice Chair (2011-2015) of the Board of Trustees of Mt. Holyoke College. | | |
1955 333 W. Wacker Drive Chicago, IL 6o6o6 | |
Board Member | | 2016 Class I | | 142 |
| | | | | | |
| | | | |
∎ ROBERT L. YOUNG | | | | | | Formerly, Chief Operating Officer and Director, J.P.Morgan Investment Management Inc. (financial services) (2010-2016); formerly, President and Principal Executive Officer (2013-2016), and Senior Vice President and Chief Operating Officer (2005-2010), of J.P.Morgan Funds; formerly, Director and various officer positions for J.P.Morgan Investment Management Inc. (formerly, JPMorgan Funds Management, Inc. and formerly, One Group Administrative Services) and JPMorgan Distribution Services, Inc. (financial services) (formerly, One Group Dealer Services, Inc.) (1999-2017). | | |
1963 333 W. Wacker Drive Chicago, IL 6o6o6 | |
Board Member | | 2017 Class II | | 142 |
| | | | | | |
114
| | | | | | |
| | | |
| | | | | | | |
Name, Year of Birth & Address | | Position(s) Held with the Funds | | Year First Elected or Appointed(2) | | Principal Occupation(s) During Past 5 Years |
| | | |
| | | | | | | |
| |
| Officers of the Funds: | | |
| | | |
∎ DAVID J. LAMB | | | | | | Man1aging Director of Nuveen Fund Advisors, LLC (since 2019) Senior Managing Director (since 2021), formerly, Managing Director (2020-2021) of Nuveen Securities, LLC; Senior Managing Director (since 2021), formerly, Managing Director (2017-2021), Senior Vice President of Nuveen (2006-2017), Vice President prior to 2006. |
1963 333 W. Wacker Drive Chicago, IL 6o6o6 | | Chief Administrative Officer | | 2015 |
| | | |
∎ MARK J. CZARNIECKI | | | | | | Vice President and Assistant Secretary of Nuveen Securities, LLC (since 2016) and Nuveen Fund Advisors (since 2017); Managing Director and Associate General Counsel (since January 2022), formerly, Vice President and Associate General Counsel of Nuveen (2013-2021) and Vice President, Assistant Secretary and Associate General Counsel of Nuveen Asset Management LLC (since 2018). |
1979 901 Marquette Avenue Minneapolis, MN 55402 | | Vice President and Assistant Secretary | | 2013 |
| | | |
∎ DIANA R. GONZALEZ | | | | | | Vice President and Assistant Secretary of Nuveen Fund Advisors, LLC (since 2017); Vice President and Associate General Counsel of Nuveen (since 2017); formerly, Associate General Counsel of Jackson National Asset Management (2012-2017). |
1978 333 W. Wacker Drive Chicago, IL 6o6o6 | | Vice President and Assistant Secretary | | 2017 |
| | | |
∎ NATHANIEL T. JONES | | | | | | Senior Managing Director (since 2021), formerly, Managing Director (2017-2021), Senior Vice President (2016-2017), Vice President (2011-2016) of Nuveen; Managing Director (since 2015) of Nuveen Fund Advisors, LLC; Chartered Financial Analyst. |
1979 333 W. Wacker Drive Chicago, IL 6o6o6 | | Vice President and Treasurer | | 2016 |
| | | |
∎ TINA M. LAZAR | | | | | | Managing Director (since 2017), formerly, Senior Vice President (2014-2017) of Nuveen Securities, LLC. |
1961 333 W. Wacker Drive Chicago, IL 6o6o6 | | Vice President | | 2002 |
| | | |
∎ BRIAN J. LOCKHART | | | | | | Managing Director (since 2019) of Nuveen Fund Advisors, LLC; Senior Managing Director (since 2021), formerly, Managing Director (2017-2021), Vice President (2010-2017) of Nuveen; Head of Investment Oversight (since 2017), formerly, Team Leader of Manager Oversight (2015-2017); Chartered Financial Analyst and Certified Financial Risk Manager. |
1974 333 W. Wacker Drive Chicago, IL 6o6o6 | | Vice President | | 2019 |
| | | |
∎ JACQUES M. LONGERSTAEY | | | | | | Senior Managing Director, Chief Risk Officer, Nuveen, LLC (since May 2019); Senior Managing Director (since May 2019) of Nuveen Fund Advisors, LLC; formerly, Chief Investment and Model Risk Officer, Wealth & Investment Management Division, Wells Fargo Bank (NA) (2013-2019). |
1963 8500 Andrew Carnegie Blvd. Charlotte, NC 28262 | | Vice President | | 2019 |
| | | |
∎ KEVIN J. MCCARTHY | | | | | | Senior Managing Director (since 2017) and Secretary and General Counsel (since 2016) of Nuveen Investments, Inc., formerly, Executive Vice President (2016-2017) and Managing Director and Assistant Secretary (2008-2016); Senior Managing Director (since 2017) and Assistant Secretary (since 2008) of Nuveen Securities, LLC, formerly Executive Vice President (2016-2017) and Managing Director (2008- 2016); Senior Managing Director (since 2017), and Secretary (since 2016) of Nuveen Fund Advisors, LLC, formerly, Co-General Counsel (2011-2020), Executive Vice President (2016-2017), Managing Director (2008-2016) and Assistant Secretary (2007-2016); Senior Managing Director (since 2017), Secretary (since 2016) of Nuveen Asset Management, LLC, formerly, Associate General Counsel (2011-2020), Executive Vice President (2016-2017) and Managing Director and Assistant Secretary (2011- 2016); Vice President (since 2007) and Secretary (since 2016), formerly, Assistant Secretary, of NWQ Investment Management Company, LLC, Santa Barbara Asset Management, LLC and Winslow Capital Management, LLC (since 2010). Senior Managing Director (since 2017) and Secretary (since 2016) of Nuveen Alternative Investments, LLC. |
1966 333 W. Wacker Drive Chicago, IL 6o6o6 | | Vice President and Assistant Secretary | | 2007 |
| | | | |
115
Board Members & Officers (continued)
(Unaudited)
| | | | | | |
| | | |
| | | | | | | |
Name, Year of Birth & Address | | Position(s) Held with the Funds | | Year First Elected or Appointed(2) | | Principal Occupation(s) During Past 5 Years |
| | | |
| | | | | | | |
| |
| Officers of the Funds (continued): | | |
| | | |
∎ JON SCOTT MEISSNER | | | | | | Managing Director of Mutual Fund Tax and Financial Reporting groups at Nuveen (since 2017); Managing Director of Nuveen Fund Advisors, LLC (since 2019); Senior Director of Teachers Advisors, LLC and TIAA-CREF Investment Management, LLC (since 2016); Senior Director (since 2015) Mutual Fund Taxation to the TIAA-CREF Funds, the TIAA-CREF Life Funds, the TIAA Separate Account VA-1 and the CREF Accounts; has held various positions with TIAA since 2004. |
1973 8500 Andrew
Carnegie Blvd. Charlotte, NC 28262 | | Vice President and Assistant Secretary | | 2019 |
| | | |
∎ DEANN D. MORGAN | | | | | | President, Nuveen Fund Advisors, LLC (since 2020); Executive Vice President, Global Head of Product at Nuveen (since 2019); Co-Chief Executive Officer of Nuveen Securities, LLC since 2020); Managing Member of MDR Collaboratory LLC (since 2018); formerly,Managing Director, (Head of Wealth Management Product Structuring & COO Multi Asset Investing. The Blackstone Group (2013-2017). |
1969 730 Third Avenue New York, NY 10017 | |
Vice President | | 2020 |
| | | |
∎ CHRISTOPHER M. ROHRBACHER | | | | | | Managing Director and Assistant Secretary (since 2017) of Nuveen Securities, LLC; Managing Director (since 2017) General Counsel (since 2020), and Assistant Secretary (since 2016), formerly, Senior Vice President (2016-2017), of Nuveen Fund Advisors, LLC; Managing Director, Associate General Counsel and Assistant Secretary of Nuveen Asset Management, LLC (since 2020); Managing Director (since 2017), and Associate General Counsel (since 2016), formerly, Senior Vice President (2012-2017) and Assistant General Counsel (2008-2016) of Nuveen. |
1971 333 W. Wacker Drive Chicago, IL 6o6o6 | | Vice President and Assistant Secretary | | 2008 |
| | | | |
| | | |
∎ WILLIAM A. SIFFERMANN | | | | | | Managing Director (since 2017), formerly Senior Vice President (2016-2017) and Vice President (2011-2016) of Nuveen. |
1975 333 W. Wacker Drive Chicago, IL 6o6o6 | |
Vice President | | 2017 |
| | | |
∎ E. SCOTT WICKERHAM | | | | | | Senior Managing Director, Head of Public Investment Finance at Nuveen (since 2019), formerly, Managing Director; Senior Managing Director (since 2019) of Nuveen Fund Advisers, (LLC; Principal Financial Officer, Principal Accounting Officer and Treasurer (since 2017) of the TIAA- CREF Funds, the TIAA-CREF Life Funds, the TIAA Separate Account VA-1 and Principal Financial Officer, Principal Accounting Officer (since 2020) and Treasurer (since 2017) to the CREF Accounts; formerly, Senior Director, TIAA-CREF Fund Administration (2014-2015); has held various positions with TIAA since 2006. |
1973 8500 Andrew
Carnegie Blvd. Charlotte, NC 28262 | | Vice President and Controller | | 2019 |
| | | | |
| | | |
∎ MARK L. WINGET | | | | | | Vice President and Assistant Secretary of Nuveen Securities, LLC (since 2008), and Nuveen Fund Advisors, LLC (since 2019); Vice President, Associate General Counsel and Assistant Secretary of Nuveen Asset Management, LLC (since 2020); Vice President (since 2010) and Associate General Counsel (since 2019), formerly, Assistant General Counsel (2008-2016) of Nuveen. |
1968 333 W. Wacker Drive Chicago, IL 60606 | | Vice President and Secretary | | 2008 |
| | | |
∎ GIFFORD R. ZIMMERMAN | | | | | | Formerly, Managing Director (2002-2020) and Assistant Secretary (2002-2020) of Nuveen Securities, LLC; formerly, Managing Director (2002-2020), Assistant Secretary (1997-2020) and Co-General Counsel (2011- 2020) of Nuveen Fund Advisors, LLC; formerly, Managing Director (2004-2020) and Assistant Secretary (1994-2020) of Nuveen Investments, Inc.; formerly, Managing Director, Assistant Secretary and Associate General Counsel of Nuveen Asset Management, LLC (2011-2020); formerly, Vice President and Assistant Secretary of NWQ Investment Management Company, LLC (2002-2020), Santa Barbara Asset Management, LLC (2006-2020) and Winslow Capital Management, LLC (2010-2020); Chartered Financial Analyst. |
1956 333 W. Wacker Drive Chicago, IL 60606 | | Vice President and Chief Compliance Officer | | 1988 |
| | | | |
| (1) | The Board of Trustees is divided into three classes, Class I, Class II, and Class III, with each being elected to serve until the third succeeding annual shareholders’ meeting subsequent to its election or thereafter in each case when its respective successors are duly elected or appointed, except two board members are elected by the holders of Preferred Shares, when applicable, to serve until the next annual shareholders’ meeting subsequent to its election or thereafter in each case when its respective successors are duly elected or appointed. The year first elected or appointed represents the year in which the board member was first elected or appointed to any fund in the Nuveen complex. |
| (2) | Officers serve indefinite terms until their successor has been duly elected and qualified, their death or their resignation or removal. The year first elected or appointed represents the year in which the Officer was first elected or appointed to any fund in the Nuveen complex. |
116
Notes
117
Notes
118
Notes
119
Nuveen:
Serving Investors for Generations
Since 1898, financial professionals and their clients have relied on Nuveen to provide
dependable investment solutions through continued adherence to proven, long-term investing
principles. Today, we offer a range of high quality solutions designed to
be integral components of a well-diversified core portfolio.
Focused on meeting investor needs.
Nuveen is the investment manager of TIAA. We have grown into one of the world’s premier global asset managers, with specialist knowledge across all major asset classes and particular strength in solutions that provide income for investors and that draw on our expertise in alternatives and responsible investing. Nuveen is driven not only by the independent investment processes across the firm, but also the insights, risk management, analytics and other tools and resources that a truly world-class platform provides. As a global asset manager, our mission is to work in partnership with our clients to create solutions which help them secure their financial future.
Find out how we can help you.
To learn more about how the products and services of Nuveen may be able to help you meet your financial goals, talk to your financial professional, or call us at (800) 257-8787. Please read the information provided carefully before you invest. Investors should consider the investment objective and policies, risk considerations, charges and expenses of any investment carefully.
Where applicable, be sure to obtain a prospectus, which contains this and other relevant information. To obtain a prospectus, please contact your securities representative or Nuveen, 333 W. Wacker Dr., Chicago, IL 60606. Please read the prospectus carefully before you invest or send money.
Learn more about Nuveen Funds at: www.nuveen.com/closed-end-funds
| | | | |
| Nuveen Securities, LLC, member FINRA and SIPC | 333 West Wacker Drive Chicago, IL 60606 | www.nuveen.com | | | |
EAN-A-1221D 2007076-INV-Y-02/23 |
ITEM 2. CODE OF ETHICS.
As of the end of the period covered by this report, the registrant has adopted a code of ethics that applies to the registrant’s principal executive officer, principal financial officer, principal accounting officer or controller, or persons performing similar functions. There were no amendments to or waivers from the Code during the period covered by this report. The registrant has posted the code of ethics on its website at www.nuveen.com/fund-governance. (To view the code, click on Code of Conduct.)
ITEM 3. AUDIT COMMITTEE FINANCIAL EXPERT.
As of the end of the period covered by this report, the registrant’s Board of Directors or Trustees (“Board”) determined that the registrant has at least one “audit committee financial expert” (as defined in Item 3 of Form N-CSR) serving on its Audit Committee. The registrant’s audit committee financial experts are Carole E. Stone, Jack B. Evans,William C. Hunter and Albin F. Moschner who are “independent” for purposes of Item 3 of Form N-CSR.
Ms. Stone served for five years as Director of the New York State Division of the Budget. As part of her role as Director, Ms. Stone was actively involved in overseeing the development of the State’s operating, local assistance and capital budgets, its financial plan and related documents; overseeing the development of the State’s bond-related disclosure documents and certifying that they fairly presented the State’s financial position; reviewing audits of various State and local agencies and programs; and coordinating the State’s system of internal audit and control. Prior to serving as Director, Ms. Stone worked as a budget analyst/examiner with increasing levels of responsibility over a 30 year period, including approximately five years as Deputy Budget Director. Ms. Stone has also served as Chair of the New York State Racing Association Oversight Board, as Chair of the Public Authorities Control Board, as a Commissioner on the New York State Commission on Public Authority Reform and as a member of the Boards of Directors of several New York State public authorities. These positions have involved overseeing operations and finances of certain entities and assessing the adequacy of project/entity financing and financial reporting. Currently, Ms. Stone is on the Board of Directors of CBOE Holdings, Inc., of the Chicago Board Options Exchange, and of C2 Options Exchange. Ms. Stone’s position on the boards of these entities and as a member of both CBOE Holdings’ Audit Committee and its Finance Committee has involved, among other things, the oversight of audits, audit plans and preparation of financial statements.
Mr. Evans was formerly President and Chief Operating Officer of SCI Financial Group, Inc., a full service registered broker-dealer and registered investment adviser (“SCI”). As part of his role as President and Chief Operating Officer, Mr. Evans actively supervised the Chief Financial Officer (the “CFO”) and actively supervised the CFO’s preparation of financial statements and other filings with various regulatory authorities. In such capacity, Mr. Evans was actively involved in the preparation of SCI’s financial statements and the resolution of issues raised in connection therewith. Mr. Evans has also served on the audit committee of various reporting companies. At such companies, Mr. Evans was involved in the oversight of audits, audit plans, and the preparation of financial statements. Mr. Evans also formerly chaired the audit committee of the Federal Reserve Bank of Chicago.
Mr. Hunter was formerly a Senior Vice President at the Federal Reserve Bank of Chicago. As part of his role as Senior Vice President, Mr. Hunter was the senior officer responsible for all operations of each of the Economic Research, Statistics, and Community and Consumer Affairs units at the Federal Reserve Bank of Chicago. In such capacity, Mr. Hunter oversaw the subunits of the Statistics and Community and Consumer Affairs divisions responsible for the analysis and evaluation of bank and bank holding company financial statements and financial filings. Prior to serving as Senior Vice President at the Federal Reserve Bank of Chicago, Mr. Hunter was the Vice President of the Financial Markets unit at the Federal Reserve Bank of Atlanta where he supervised financial staff and bank holding company analysts who analyzed and evaluated bank and bank holding company financial statements. Mr. Hunter also currently serves on the Boards of Directors of Xerox Corporation and Wellmark, Inc. as well as on the Audit Committees of such Boards. As an Audit Committee member, Mr. Hunter’s responsibilities include, among other things, reviewing financial statements, internal audits and internal controls over financial reporting. Mr. Hunter also formerly was a Professor of Finance at the University of Connecticut School of Business and has authored numerous scholarly articles on the topics of finance, accounting and economics.
Mr. Moschner, Founder and Chief Executive Officer, Northcroft Partners, LLC, (management consulting) (since 2012); formerly, Chairman (2019), and Director (2012-2019), USA Technologies, Inc., (provider of solutions and services to facilitate electronic payment transactions); formerly, Director, Wintrust Financial Corporation (1996-2016); previously, held positions at Leap Wireless International, Inc., (consumer wireless services) including Consultant (2011-2012), Chief Operating Officer (2008-2011), and Chief Marketing Officer (2004-2008); formerly, President, Verizon Card Services division of Verizon Communications, Inc. (2000-2003); formerly, President, One Point Services at One Point Communications (telecommunication services) (1999-2000); formerly, Vice Chairman of the Board, Diba, Incorporated (internet technology provider) (1996-1997); formerly, various executive positions (1991-1996), including Chief Executive Officer (1995-1996) of Zenith Electronics Corporation (consumer electronics).
ITEM 4. PRINCIPAL ACCOUNTANT FEES AND SERVICES.
The following tables show the amount of fees that PricewaterhouseCoopers LLP, the Fund’s auditor, billed to the Fund during the Fund’s last two full fiscal years. For engagements with PricewaterhouseCoopers LLP the Audit Committee approved in advance all audit services and non-audit services that PricewaterhouseCoopers LLP provided to the Fund, except for those non-audit services that were subject to the pre-approval exception under Rule 2-01 of Regulation S-X (the “pre-approval exception”). The pre-approval exception for services provided directly to the Fund waives the pre-approval requirement for services other than audit, review or attest services if: (A) the aggregate amount of all such services provided constitutes no more than 5% of the total amount of revenues paid by the Fund to its accountant during the fiscal year in which the services are provided; (B) the Fund did not recognize the services as non-audit services at the time of the engagement; and (C) the services are promptly brought to the Audit Committee’s attention, and the Committee (or its delegate) approves the services before the audit is completed.
The Audit Committee has delegated certain pre-approval responsibilities to its Chair (or, in her absence, any other member of the Audit Committee).
SERVICES THAT THE FUND’S AUDITOR BILLED TO THE FUND
| | | | | | | | | | | | | | | | |
Fiscal Year Ended | | Audit Fees Billed
to Fund 1 | | | Audit-Related Fees
Billed to Fund 2 | | | Tax Fees
Billed to Fund 3 | | | All Other Fees
Billed to Fund 4 | |
December 31, 2021 | | $ | 35,860 | | | $ | 0 | | | $ | 2,430 | | | $ | 0 | |
| | | | | | | | | | | | | | | | |
| | | | | | | | | | | | | | | | |
Percentage approved pursuant to pre-approval exception | | | 0 | % | | | 0 | % | | | 0 | % | | | 0 | % |
| | | | | | | | | | | | | | | | |
| | | | | | | | | | | | | | | | |
December 31, 2020 | | $ | 34,740 | | | $ | 5,500 | | | $ | 4,720 | | | $ | 0 | |
| | | | | | | | | | | | | | | | |
| | | | | | | | | | | | | | | | |
Percentage approved \pursuant to pre-approval exception | | | 0 | % | | | 0 | % | | | 0 | % | | | 0 | % |
| | | | | | | | | | | | | | | | |
1 “Audit Fees” are the aggregate fees billed for professional services for the audit of the Fund’s annual financial statements and services provided in connection with statutory and regulatory filings or engagements.
2 “Audit Related Fees” are the aggregate fees billed for assurance and related services reasonably related to the performance of the audit or review of financial statements that are not reported under “Audit Fees”. These fees include offerings related to the Fund’s common shares and leverage.
3 “Tax Fees” are the aggregate fees billed for professional services for tax advice, tax compliance, and tax planning. These fees include: all global withholding tax services; excise and state tax reviews; capital gain, tax equalization and taxable basis calculation performed by the principal accountant.
4 “All Other Fees” are the aggregate fees billed for products and services other than “Audit Fees”, “Audit-Related Fees” and “Tax Fees”. These fees represent all “Agreed-Upon Procedures” engagements pertaining to the Fund’s use of leverage.
SERVICES THAT THE FUND’S AUDITOR BILLED TO THE
ADVISER AND AFFILIATED FUND SERVICE PROVIDERS
The following tables show the amount of fees billed by PricewaterhouseCoopers LLP to Nuveen Fund Advisors, LLC (formerly Nuveen Fund Advisors, Inc.) (the “Adviser”), and any entity controlling, controlled by or under common control with the Adviser that provides ongoing services to the Fund (“Affiliated Fund Service Provider”), for engagements directly related to the Fund’s operations and financial reporting, during the Fund’s last two full fiscal years.
The tables also show the percentage of fees subject to the pre-approval exception. The pre-approval exception for services provided to the Adviser and any Affiliated Fund Service Provider (other than audit, review or attest services) waives the pre-approval requirement if: (A) the aggregate amount of all such services provided constitutes no more than 5% of the total amount of revenues paid to PricewaterhouseCoopers LLP by the Fund, the Adviser and Affiliated Fund Service Providers during the fiscal year in which the services are provided that would have to be pre-approved by the Audit Committee; (B) the Fund did not recognize the services as non-audit services at the time of the engagement; and (C) the services are promptly brought to the Audit Committee’s attention, and the Committee (or its delegate) approves the services before the Fund’s audit is completed.
| | | | | | | | | | | | |
Fiscal Year Ended | | Audit-Related Fees
Billed to Adviser and
Affiliated Fund
Service Providers | | | Tax Fees Billed to
Adviser and
Affiliated Fund
Service Providers | | | All Other Fees
Billed to Adviser
and Affiliated Fund
Service Providers | |
December 31, 2021 | | $ | 0 | | | $ | 0 | | | $ | 0 | |
| | | | | | | | | | | | |
| | | | | | | | | | | | |
Percentage approved pursuant to pre-approval exception | | | 0 | % | | | 0 | % | | | 0 | % |
| | | | | | | | | | | | |
| | | | | | | | | | | | |
December 31, 2020 | | $ | 0 | | | $ | 0 | | | $ | 0 | |
| | | | | | | | | | | | |
| | | | | | | | | | | | |
Percentage approved pursuant to pre-approval exception | | | 0 | % | | | 0 | % | | | 0 | % |
| | | | | | | | | | | | |
NON-AUDIT SERVICES
The following table shows the amount of fees that PricewaterhouseCoopers LLP billed during the Fund’s last two full fiscal years for non-audit services. The Audit Committee is required to pre-approve non-audit services that PricewaterhouseCoopers LLP provides to the Adviser and any Affiliated Fund Services Provider, if the engagement related directly to the Fund’s operations and financial reporting (except for those subject to the pre-approval exception described above). The Audit Committee requested and received information from PricewaterhouseCoopers LLP about any non-audit services that PricewaterhouseCoopers LLP rendered during the Fund’s last fiscal year to the Adviser and any Affiliated Fund Service Provider. The Committee considered this information in evaluating PricewaterhouseCoopers LLP’s independence.
| | | | | | | | | | | | | | | | |
Fiscal Year Ended | | Total Non-Audit Fees
Billed to Fund | | | Total Non-Audit Fees
billed to Adviser and
Affiliated Fund Service
Providers (engagements
related directly to the
operations and financial
reporting of the Fund) | | | Total Non-Audit Fees
billed to Adviser and
Affiliated Fund Service
Providers (all other
engagements) | | | Total | |
December 31, 2021 | | $ | 2,430 | | | $ | 0 | | | $ | 0 | | | $ | 2,430 | |
December 31, 2020 | | $ | 4,720 | | | $ | 0 | | | $ | 0 | | | $ | 4,720 | |
“Non-Audit Fees billed to Fund” for both fiscal year ends represent “Tax Fees” and “All Other Fees” billed to Fund in their respective amounts from the previous table.
Less than 50 percent of the hours expended on the principal accountant’s engagement to audit the registrant’s financial statements for the most recent fiscal year were attributed to work performed by persons other than the principal accountant’s full-time, permanent employees.
Audit Committee Pre-Approval Policies and Procedures. Generally, the Audit Committee must approve (i) all non-audit services to be performed for the Fund by the Fund’s independent accountants and (ii) all audit and non-audit services to be performed by the Fund’s independent accountants for the Affiliated Fund Service Providers with respect to operations and financial reporting of the Fund. Regarding tax and research projects conducted by the independent accountants for the Fund and Affiliated Fund Service Providers (with respect to operations and financial reports of the Fund) such engagements will be (i) pre-approved by the Audit Committee if they are expected to be for amounts greater than $10,000; (ii) reported to the Audit Committee chair for her verbal approval prior to engagement if they are expected to be for amounts under $10,000 but greater than $5,000; and (iii) reported to the Audit Committee at the next Audit Committee meeting if they are expected to be for an amount under $5,000.
ITEM 5. AUDIT COMMITTEE OF LISTED REGISTRANTS.
The registrant’s Board has a separately designated Audit Committee established in accordance with Section 3(a)(58)(A) of the Securities Exchange Act of 1934, as amended (15 U.S.C. 78c(a)(58)(A)). As of the end of the period covered by this report, the members of the audit committee are Jack B. Evans, William C. Hunter, John K. Nelson, Judith M. Stockdale and Carole E. Stone, Chair.
ITEM 6. SCHEDULE OF INVESTMENTS.
(a) See Portfolio of Investments in Item 1.
(b) Not applicable.
ITEM 7. DISCLOSURE OF PROXY VOTING POLICIES AND PROCEDURES FOR CLOSED-END MANAGEMENT INVESTMENT COMPANIES.
Nuveen Fund Advisors, LLC is the registrant’s investment adviser (also referred to as the “Adviser”). The Adviser is responsible for the on-going monitoring of the Fund’s investment portfolio, managing the Fund’s business affairs and providing certain clerical, bookkeeping and administrative services. The Adviser has engaged Nuveen Asset Management, LLC (“Sub-Adviser”) as Sub-Adviser to provide discretionary investment advisory services. As part of these services, the Adviser has delegated to the Sub-Adviser the full responsibility for proxy voting on securities held in the registrant’s portfolio and related duties in accordance with the Sub-Adviser’s policies and procedures. The Adviser periodically monitors the Sub-Adviser’s voting to ensure that it is carrying out its duties. The Sub-Adviser’s proxy voting policies and procedures are attached to this filing as an exhibit.
ITEM 8. PORTFOLIO MANAGERS OF CLOSED-END MANAGEMENT INVESTMENT COMPANIES
Nuveen Fund Advisors, LLC (“NFALLC”) is the registrant’s investment adviser (NFALLC is also referred to as the “Adviser”.) NFALLC is responsible for the selection and on-going monitoring of the Fund’s investment portfolio, managing the Fund’s business affairs and providing certain clerical, bookkeeping and administrative services. The Adviser has engaged Nuveen Asset Management, LLC (“Nuveen Asset Management” or “Sub-Adviser”), as Sub-Adviser to provide discretionary investment advisory services. The following section provides information on the portfolio managers at the Sub-Adviser:
Item 8(a)(1). PORTFOLIO MANAGER BIOGRAPHIES
As of the date of filing this report, the following individuals at the Sub-Adviser (the “Portfolio Managers”) have primary responsibility for the day-to-day implementation of the Fund’s investment strategy:
David Friar, Managing Director and Portfolio Manager for Nuveen’s multi-asset portfolio management team. He joined the team managing the Equity, Mid-Cap and Small Cap Index Strategies in 2000 and became part of the enhanced equity index team in 2007. Additionally, he is a member of the investment team responsible for several other quantitative products, including the Equity Option Overwrite Strategies. He joined the firm in 1999 as a member of the performance measurement group. Before his role in portfolio management, he provided quantitative analysis for equity portfolios and constructed quantitatively driven portfolios for institutional and taxable clients.
Jim Campagna, CFA, Head of Equity Index Strategies, oversees equity index strategies for Nuveen Quantitative Strategies. He is responsible for all equity index, social choice, and equity ETF strategies. Prior to joining the firm in 2005, he was a portfolio manager at Mellon Capital Management where he was responsible for several funds and was an index strategy leader for the MSCI EAFE mandates.
Lei Liao, CFA, is an equity index portfolio manager for Nuveen Quantitative Strategies. He has portfolio management responsibilities for all equity index strategies, social choice equity portfolios, as well as some of the firm’s ETF product line. Prior to joining the firm in 2012, he was a senior equity portfolio manager at Northern Trust Corp.
Darren Tran, CFA, is a senior director for Nuveen Quantitative Strategies. He has portfolio management responsibilities for all equity index, social choice equity, and equity ETF strategies. Darren joined the firm in 2005 as a foreign currency trader and entered the investment industry in 2000. Prior to joining the firm, he held a position at Morgan Stanley in Corporate Treasury.
Item 8(a)(2). OTHER ACCOUNTS MANAGED BY PORTFOLIO MANAGERS
In addition to the Fund, as of December 31, 2021, the portfolio managers are also primarily responsible for the day-to-day portfolio management of the following accounts:
| | | | | | | | | | | | | | | | | | | | | | | | | | | | | | | | | | | | |
| | | (ii) Number of Other Accounts Managed and Assets by Account Type | | | (iii) Number of Other Accounts and Assets for Which Advisory Fee is Performance-Based | |
(i) Name of Portfolio Manager | | Other
Registered
Investment
Companies | | | Other Pooled
Investment
Vehicles | | | Other
Accounts | | | Other
Registered
Investment
Companies | | | Other Pooled
Investment
Vehicles | | | Other
Accounts | |
David Friar | | | 3 | | | $ | 1.28 billion | | | | 0 | | | $ | 0 | | | | 3 | | | $ | 6.64 million | | | | N/A | | | | N/A | | | | N/A | |
| | | | | | | | | | | 2 | * | | $ | 69 million | | | | | | | | | | | | | | | | | | | | | |
| | | | | | | | | |
Jim Campagna | | | 24 | | | $ | 103 billion | | | | 3 | | | $ | 46.85 billion | | | | 5 | | | $ | 972 million | | | | N/A | | | | N/A | | | | N/A | |
| | | | | | | | | |
Lei Liao | | | 24 | | | $ | 103 billion | | | | 3 | | | $ | 46.85 billion | | | | 3 | | | $ | 911 million | | | | N/A | | | | N/A | | | | N/A | |
| | | | | | | | | |
Darren Tran | | | 10 | | | $ | 88.55 billion | | | | 2 | | | $ | 27.10 billion | | | | 4 | | | $ | 950 million | | | | N/A | | | | N/A | | | | N/A | |
| * | Other Accounts-overlay strategies – The portfolio manager is responsible for the management of overlay strategies employed by this account that use derivative instruments either to obtain, offset or substitute for certain portfolio exposures beyond those provided by the account’s underlying portfolios. |
POTENTIAL MATERIAL CONFLICTS OF INTEREST
Actual or apparent conflicts of interest may arise when a portfolio manager has day-to-day management responsibilities with respect to more than one account. More specifically, portfolio managers who manage multiple accounts are presented a number of potential conflicts, including, among others, those discussed below.
The management of multiple accounts may result in a portfolio manager devoting unequal time and attention to the management of each account. Nuveen Asset Management seeks to manage such competing interests for the time and attention of portfolio managers by having portfolio managers focus on a particular investment discipline. Most accounts managed by a portfolio manager in a particular investment strategy are managed using the same investment models.
If a portfolio manager identifies a limited investment opportunity which may be suitable for more than one account, an account may not be able to take full advantage of that opportunity due to an allocation of filled purchase or sale orders across all eligible accounts. To deal with these situations, Nuveen Asset Management has adopted procedures for allocating limited opportunities across multiple accounts.
With respect to many of its clients’ accounts, Nuveen Asset Management determines which broker to use to execute transaction orders, consistent with its duty to seek best execution of the transaction. However, with respect to certain other accounts, Nuveen Asset Management may be limited by the client with respect to the selection of brokers or may be instructed to direct trades through a particular broker. In these cases, Nuveen Asset Management may place separate, non-simultaneous, transactions for a Fund and other accounts which may temporarily affect the market price of the security or the execution of the transaction, or both, to the detriment of the Fund or the other accounts.
Some clients are subject to different regulations. As a consequence of this difference in regulatory requirements, some clients may not be permitted to engage in all the investment techniques or transactions or to engage in these transactions to the same extent as the other accounts managed by the portfolio manager. Finally, the appearance of a conflict of interest may arise where Nuveen Asset Management has an incentive, such as a performance-based management fee, which relates to the management of some accounts, with respect to which a portfolio manager has day-to-day management responsibilities.
Conflicts of interest may also arise when the Sub-Adviser invests one or more of its client accounts in different or multiple parts of the same issuer’s capital structure, including investments in public versus private securities, debt versus equity, or senior versus junior/subordinated debt, or otherwise where there are different or inconsistent rights or benefits. Decisions or actions such as investing, trading, proxy voting, exercising, waiving or amending rights or covenants, workout activity, or serving on a board, committee or other involvement in governance may result in conflicts of interest between clients holding different securities or investments. Generally, individual portfolio managers will seek to act in a manner that they believe serves the best interest of the accounts they manage. In cases where a portfolio manager or team faces a conflict among its client accounts, it will seek to act in a manner that it believes best reflects its overall fiduciary duty, which may result in relative advantages or disadvantages for particular accounts.
Nuveen Asset Management has adopted certain compliance procedures which are designed to address these types of conflicts common among investment managers. However, there is no guarantee that such procedures will detect each and every situation in which a conflict arises.
Item 8(a)(3). FUND MANAGER COMPENSATION
As of the most recently completed fiscal year end, the primary portfolio managers’ compensation is as follows:
Portfolio manager compensation consists primarily of base salary and variable components consisting of (i) a cash bonus; (ii) a long-term performance award; and (iii) participation in a profits interest plan.
Base salary. A portfolio manager’s base salary is determined based upon an analysis of the portfolio manager’s general performance, experience and market levels of base pay for such position.
Cash bonus. A portfolio manager is eligible to receive an annual cash bonus that is based on three variables: risk-adjusted investment performance relative to benchmark generally measured over the most recent one, three and five year periods (unless the portfolio manager’s tenure is shorter), ranking versus Morningstar peer funds generally measured over the most recent one, three and five year periods (unless the portfolio manager’s tenure is shorter), and management and peer reviews.
Long-term performance award. A portfolio manager is eligible to receive a long-term performance award that vests after three years. The amount of the award when granted is based on the same factors used in determining the cash bonus. The value of the award at the completion of the three-year vesting period is adjusted based on the risk-adjusted investment performance of Fund(s) managed by the portfolio manager during the vesting period and the performance of the TIAA organization as a whole.
Profits interest plan. Portfolio managers are eligible to receive profits interests in Nuveen Asset Management and its affiliate, Teachers Advisors, LLC, which vest over time and entitle their holders to a percentage of the firms’ annual profits. Profits interests are allocated to each portfolio manager based on such person’s overall contribution to the firms.
There are generally no differences between the methods used to determine compensation with respect to the Fund and the Other Accounts shown in the table above.
Item 8(a)(4). OWNERSHIP OF QQQX SECURITIES AS OF DECEMBER 31, 2021
| | | | | | | | | | | | | | | | | | | | | | | | |
Name of Portfolio Manager | | None | | $1 -
$10,000 | | | $10,001-
$50,000 | | $50,001-
$100,000 | | | $100,001-
$500,000 | | | $500,001-
$1,000,000 | | | Over
$1,000,000 | |
David Friar | | X | | | | | | | | | | | | | | | | | | | | | | |
Jim Campagna | | X | | | | | | | | | | | | | | | | | | | | | | |
Lei Liao | | X | | | | | | | | | | | | | | | | | | | | | | |
Darren Tran | | X | | | | | | | | | | | | | | | | | | | | | | |
ITEM 9. PURCHASES OF EQUITY SECURITIES BY CLOSED-END MANAGEMENT INVESTMENT COMPANY AND AFFILIATED PURCHASERS.
Not applicable.
ITEM 10. SUBMISSION OF MATTERS TO A VOTE OF SECURITY HOLDERS.
There have been no material changes to the procedures by which shareholders may recommend nominees to the registrant’s Board implemented after the registrant last provided disclosure in response to this Item.
ITEM 11. CONTROLS AND PROCEDURES.
| | (a) | The registrant’s principal executive and principal financial officers, or persons performing similar functions, have concluded that the registrant’s disclosure controls and procedures (as defined in Rule 30a-3(c) under the Investment Company Act of 1940, as amended (the “1940 Act”) (17 CFR 270.30a-3(c))) are effective, as of a date within 90 days of the filing date of this report that includes the disclosure required by this paragraph, based on their evaluation of the controls and procedures required by Rule 30a-3(b) under the 1940 Act (17 CFR 270.30a-3(b)) and Rules 13a-15(b) or 15d-15 (b) under the Securities Exchange Act of 1934, as amended (the “Exchange Act”) (17 CFR 240.13a-15(b) or 240.15d-15 (b)). |
| | (b) | There were no changes in the registrant’s internal control over financial reporting (as defined in Rule 30a-3(d) under the 1940 Act (17 CFR 270.30a-3(d)) that occurred during the period covered by this report that has materially affected, or is reasonably likely to materially affect, the registrant’s internal control over financial reporting. |
ITEM 12. DISCLOSURE OF SECURITIES LENDING ACTIVITIES FOR CLOSED-END MANAGEMENT INVESTMENT COMPANIES.
| | (a) | The following provides dollar amounts of income and fees/compensation related to securities lending activities of the Fund during the fiscal year ended December 31, 2021: |
| | | | |
Gross income from securities lending activities | | $ | 27,784 | |
Fees and/or compensation paid for securities lending activities and related services: | | | | |
Fees paid to securities lending agent from a revenue split | | | (2,194 | ) |
Fees not included in a revenue split | | | | |
Fees paid for any cash collateral management service (including fees deducted from a pooled cash collateral reinvestment vehicle) that are not included in a revenue split | | | (587 | ) |
Administrative fees not included in a revenue split | | | — | |
Indemnification fees not included in a revenue split | | | — | |
Rebate (paid to borrower) | | | — | |
Other fees not included in a revenue split | | | — | |
Aggregate fees/compensation for securities lending activities | | | (2,781 | ) |
Net income from securities lending activities | | $ | 25,003 | |
| | (b) | The Fund may lend securities representing up to one-third of the value of its total assets to broker-dealers, banks, and other institutions in order to generate additional income. When loaning securities, the Fund retains the benefits of owning the securities, including the economic equivalent of dividends or interest generated by the security. The loans are continuous, can be recalled at any time, and have no set maturity. When the Fund loans its portfolio securities, it will receive, at the inception of each loan, cash collateral equal to an amount not less than 100% of the market value of the loaned securities. The actual percentage of the cash collateral will vary depending on the asset type of the loaned securities. The Fund’s custodian, State Street Bank and Trust Company, serves as the securities lending agent to the Fund. Pursuant to a Securities Lending Authorization Agreement and in accordance with procedures established by the Board of Trustees, State Street Bank and Trust Company effects loans of Fund securities to any firm on a list of approved borrowers, negotiates loan terms, monitors the value of the loaned securities and collateral, requests additional collateral as necessary, manages reinvestment of collateral in a pooled cash collateral reinvestment vehicle, arranges for the return of loaned securities to the Fund, and maintains records and prepares reports regarding loans that are made and the income derived therefrom. |
ITEM 13. EXHIBITS.
File the exhibits listed below as part of this Form.
(a)(1) Any code of ethics, or amendment thereto, that is the subject of the disclosure required by Item 2, to the extent that the registrant intends to satisfy the Item 2 requirements through filing of an exhibit: Not applicable because the code is posted on registrant’s website at www.nuveen.com/fund-governance and there were no amendments during the period covered by this report. (To view the code, click on Code of Conduct.)
(a)(2) A separate certification for each principal executive officer and principal financial officer of the registrant as required by Rule 30a-2(a) under the 1940 Act (17 CFR 270.30a-2(a)) in the exact form set forth below: Ex-99.CERT Attached hereto.
(a)(3) Any written solicitation to purchase securities under Rule 23c-1 under the 1940 Act (17 CFR 270.23c-1) sent or given during the period covered by the report by or on behalf of the registrant to 10 or more persons. Not applicable.
(a)(4) Change in registrant’s independent public accountant. Not applicable.
(b) If the report is filed under Section 13(a) or 15(d) of the Exchange Act, provide the certifications required by Rule 30a-2(b) under the 1940 Act (17 CFR 270.30a-2(b)); Rule 13a-14(b) or Rule 15d-14(b) under the Exchange Act (17 CFR 240.13a-14(b) or 240.15d-14(b)), and Section 1350 of Chapter 63 of Title 18 of the United States Code (18 U.S.C. 1350) as an exhibit. A certification furnished pursuant to this paragraph will not be deemed “filed” for purposes of Section 18 of the Exchange Act (15 U.S.C. 78r), or otherwise subject to the liability of that section. Such certification will not be deemed to be incorporated by reference into any filing under the Securities Act of 1933 or the Exchange Act, except to the extent that the registrant specifically incorporates it by reference. Ex-99.906 CERT attached hereto.
(c)(4) Consent of Independent Registered Public Accounting Firm. EX99.IND PUB ACCT attached hereto.
SIGNATURES
Pursuant to the requirements of the Securities Exchange Act of 1934 and the Investment Company Act of 1940, the registrant has duly caused this report to be signed on its behalf by the undersigned, thereunto duly authorized.
(Registrant) Nuveen NASDAQ 100 Dynamic Overwrite Fund
| | | | |
| By (Signature and Title) | | /s/ Mark L. Winget | | |
| | Mark L. Winget | | |
| | Vice President and Secretary | | |
| |
| Date: March 9, 2022 | | |
Pursuant to the requirements of the Securities Exchange Act of 1934 and the Investment Company Act of 1940, this report has been signed below by the following persons on behalf of the registrant and in the capacities and on the dates indicated.
| | | | |
| By (Signature and Title) | | /s/ David J. Lamb | | |
| | David J. Lamb | | |
| | Chief Administrative Officer | | |
| | (principal executive officer) | | |
| |
| Date: March 9, 2022 | | |
| | |
| By (Signature and Title) | | /s/ E. Scott Wickerham | | |
| | E. Scott Wickerham | | |
| | Vice President and Controller | | |
| | (principal financial officer) | | |
| |
| Date: March 9, 2022 | | |