UNITED STATES
SECURITIES AND EXCHANGE COMMISSION
Washington, D.C. 20549
FORM N-CSR
CERTIFIED SHAREHOLDER REPORT OF REGISTERED
MANAGEMENT INVESTMENT COMPANIES
| | |
| Investment Company Act file number | | 811-22970 |
Nuveen Dow 30SM Dynamic Overwrite Fund
(Exact name of registrant as specified in charter)
Nuveen Investments
333 West Wacker Drive, Chicago, IL 60606
(Address of principal executive offices) (Zip code)
Gifford R. Zimmerman
Nuveen Investments
333 West Wacker Drive, Chicago, IL 60606
(Name and address of agent for service)
Registrant’s telephone number, including area code: (312) 917-7700
Date of fiscal year end: December 31
Date of reporting period: June 30, 2020
Form N-CSR is to be used by management investment companies to file reports with the Commission not later than 10 days after the transmission to stockholders of any report that is required to be transmitted to stockholders under Rule 30e-1 under the Investment Company Act of 1940 (17 CFR 270.30e-1). The Commission may use the information provided on Form N-CSR in its regulatory, disclosure review, inspection, and policy making roles.
A registrant is required to disclose the information specified by Form N-CSR, and the Commission will make this information public. A registrant is not required to respond to the collection of information contained in Form N-CSR unless the Form displays a currently valid Office of Management and Budget (“OMB”) control number. Please direct comments concerning the accuracy of the information collection burden estimate and any suggestions for reducing the burden to Secretary, Securities and Exchange Commission, 450 Fifth Street, NW, Washington, DC 20549-0609. The OMB has reviewed this collection of information under the clearance requirements of 44 U.S.C. ss.3507.
ITEM 1. REPORTS TO STOCKHOLDERS.

Closed-End Funds
30 June
2020
Nuveen
Closed-End Funds
| | |
| BXMX | | Nuveen S&P 500 Buy-Write Income Fund |
| DIAX | | Nuveen Dow 30SM Dynamic Overwrite Fund |
| SPXX | | Nuveen S&P 500 Dynamic Overwrite Fund |
| QQQX | | Nuveen Nasdaq 100 Dynamic Overwrite Fund |
Beginning on January 1, 2021, as permitted by regulations adopted by the Securities and Exchange Commission, paper copies of the Funds’ annual and semi-annual shareholder reports will no longer be sent by mail, unless you specifically request paper copies of the reports. Instead, the reports will be made available on the Funds’ website (www.nuveen.com), and you will be notified by mail each time a report is posted and provided with a website link to access the report.
If you have already elected to receive shareholder reports electronically, you will not be affected by this change and you need not take any action. You may elect to receive shareholder reports and other communications from the Funds electronically anytime by contacting the financial intermediary (such as a broker-dealer or bank) through which you hold your Fund shares or, if you are a direct investor, by enrolling at www.nuveen.com/e-reports.
You may elect to receive all future shareholder reports in paper free of charge at any time by contacting your financial intermediary or, if you are a direct investor, (i) by calling 800-257-8787 and selecting option #2 or (ii) by logging into your Investor Center account at www.computershare.com/investor and clicking on “Communication Preferences.” Your election to receive reports in paper will apply to all funds held in your account with your financial intermediary or, if you are a direct investor, to all your directly held Nuveen Funds and any other directly held funds within the same group of related investment companies.
Semiannual Report
IMPORTANT DISTRIBUTION NOTICE
for Shareholders of the Nuveen S&P 500 Buy-Write Income Fund (BXMX), Nuveen Dow 30SM Dynamic Overwrite Fund (DIAX), Nuveen S&P 500 Dynamic Overwrite Fund (SPXX) and Nuveen Nasdaq 100 Dynamic Overwrite Fund (QQQX)
Semiannual Shareholder Report for the period ending June 30, 2020
The Nuveen S&P 500 Buy-Write Income Fund, Nuveen Dow 30SM Dynamic Overwrite Fund, Nuveen S&P 500 Dynamic Overwrite Fund and Nuveen Nasdaq 100 Dynamic Overwrite Fund seek to offer attractive cash flow to their shareholders, by converting the expected long-term total return potential of the Funds’ portfolio of investments into regular quarterly distributions. Following is a discussion of the Managed Distribution Policy the Funds use to achieve this.
Each Fund pays quarterly common share distributions that seek to convert the Fund’s expected long-term total return potential into regular cash flow. As a result, the Funds’ regular common share distributions (presently $0.2150, $0.2730, $0.2450 and $0.3900 per share, respectively) may be derived from a variety of sources, including:
| | • | | net investment income consisting of regular interest and dividends, |
| | • | | realized capital gains or, |
| | • | | possibly, returns of capital representing in certain cases unrealized capital appreciation. |
Such distributions are sometimes referred to as “managed distributions.” Each Fund seeks to establish a distribution rate that roughly corresponds to the Adviser’s projections of the total return that could reasonably be expected to be generated by each Fund over an extended period of time. The Adviser may consider many factors when making such projections, including, but not limited to, long-term historical returns for the asset classes in which each Fund invests. As portfolio and market conditions change, the distribution amount and distribution rate on the Common Shares under the Funds’ Managed Distribution Policy could change.
When it pays a distribution, each Fund provides holders of its Common Shares a notice of the estimated sources of the Fund’s distributions (i.e., what percentage of the distributions is estimated to constitute ordinary income, short-term capital gains, long-term capital gains, and/or a non-taxable return of capital) on a year-to-date basis. It does this by posting the notice on its website (www.nuveen.com/cef), and by sending it in written form.
You should not draw any conclusions about the Funds’ investment performance from the amount of this distribution or from the terms of the Funds’ Managed Distribution Policy. The Funds’ actual financial performance will likely vary from month-to-month and from year-to-year, and there may be extended periods when the distribution rate will exceed the Funds’ actual total returns. The Managed Distribution Policy provides that the Board may amend or terminate the Policy at any time without prior notice to Fund shareholders. There are presently no reasonably foreseeable circumstances that might cause each Fund to terminate its Managed Distribution Policy.
Table of Contents
3
Chair’s Letter to Shareholders

Dear Shareholders,
The COVID-19 crisis is taking an unprecedented toll on our health, societies, economies and financial markets. Our thoughts are with you during this time of significant disruption caused by the disease and its economic fallout. With many regions of the world suppressing the initial spread of the virus, governments and public health officials face the extraordinary challenge of balancing the resumption of economic activity with public safety. New clusters of infection emerged in the U.S. and other countries following their reopening this summer and a new school year and Northern Hemisphere flu season add new variables. Markets have turned their focus to the potential for an economic recovery, although the timing and magnitude are highly uncertain. Elevated market volatility is likely to continue, with economic data, coronavirus infection rates and the upcoming U.S. presidential election under scrutiny.
While we do not want to understate the dampening effect on the global economy, it is important to differentiate short-term interruptions from the longer-lasting implications to the economy. Prior to the COVID-19 crisis, some areas of the global economy were showing signs of improvement after trade tensions had weighed on economic activity for much of 2019. More recently, countries that have reopened have seen marked improvement in some near-term economic indicators. Central banks and governments around the world have announced economic stimulus measures and pledged to continue doing what it takes to support their economies. In the U.S., the Federal Reserve has cut its benchmark interest rate to near zero and introduced similar programs that helped revive the U.S. economy after the 2008 financial crisis. The U.S. Government has approved three relief packages, including a $2 trillion-dollar package directly supporting businesses and individuals. The Coronavirus Aid, Relief and Economic Security Act, called the CARES Act, provides direct payments and expanded unemployment benefits to individuals, loans and grants to small businesses, loans and other money to large corporations and funding for hospitals, public health, education and state and local governments. In the European Union, the European Central Bank recently increased the size of its Pandemic Emergency Purchase Program, known as PEPP, to €1.35 trillion from €750 billion and extended its duration to June 2021.
In the meantime, patience and a long-term perspective are key for investors. When market fluctuations are the leading headlines day after day, it’s tempting to “do something.” However, your long-term goals can’t be met with short-term thinking. We encourage you to talk to your financial professional, who can review your time horizon, risk tolerance and investment goals. On behalf of the other members of the Nuveen Fund Board, we look forward to continuing to earn your trust in the months and years ahead.
Sincerely,

Terence J. Toth
Chair of the Board
August 24, 2020
4
Portfolio Managers’ Comments
Nuveen S&P 500 Buy-Write Income Fund (BXMX)
Nuveen Dow 30SM Dynamic Overwrite Fund (DIAX)
Nuveen S&P 500 Dynamic Overwrite Fund (SPXX)
Nuveen Nasdaq 100 Dynamic Overwrite Fund (QQQX)
The Nuveen S&P 500 Buy-Write Income Fund (BXMX) features portfolio management by Gateway Investment Advisers, LLC (Gateway). Kenneth H. Toft, Michael T. Buckius and Daniel M. Ashcraft are portfolio managers. Nuveen Dow 30SM Dynamic Overwrite Fund (DIAX), Nuveen S&P 500 Dynamic Overwrite Fund (SPXX) and Nuveen Nasdaq 100 Dynamic Overwrite Fund (QQQX) feature portfolio management by Nuveen Asset Management, LLC (NAM), an affiliate of Nuveen, LLC, Fund Advisors, LLC, the Funds’ investment adviser. David Friar serves as portfolio manager for the Funds.
Effective March 24, 2020, Jody Hrazanek is no longer a portfolio manager of DIAX, SPXX and QQQX.
Effective August 3, 2020 (subsequent to the close of the reporting period), James Campagna, CFA, Lei Liao, CFA and Darren Tran were added as a portfolio managers to DIAX, SPXX and QQQX.
The Board of Trustees of QQQX and SPXX approved a modification to the Funds’ equity portfolio investment strategies. Effective August 3, 2020 (subsequent to the close of the reporting period), DIAX, SPXX and QQQX Fund strategies will take into consideration each Fund’s tax position and employ various techniques, including tax-loss harvesting, to improve after-tax shareholder outcome.
Here the portfolio managers discuss their management strategies and the performance of the Funds for the six-month reporting period ended June 30, 2020
An Update on COVID-19 Coronavirus and its Impact on the Securities Markets
Slowing COVID-19 coronavirus infection rates around the world encouraged authorities to loosen restrictions on business and social activity in recent months. While economic indicators have improved considerably from the depths of the shutdown, some regions, including the U.S., have seen an uptick in infection rates after reopening. This may slow the recovery process and contribute to short-term market volatility in the meantime.
Although the detection of the virus in China was made public in December 2019, markets did not start to fully acknowledge the risks and potential economic impact until the latter portion of February 2020, when outbreaks outside of China were first reported. Global stock markets sold off severely, with the S&P 500® index reaching a bear market (a 20% drop from the previous high) within three weeks, the fastest bear market decline in history. Even certain parts of the bond market suffered; below investment grade municipal and corporate bonds generally dropped the furthest, mostly out of concerns for the continued financial stability of lower quality issuers. Demand for safe-haven assets, along with mounting recession fears, drove the yield on the 10-year U.S. Treasury note to 0.5% in March 2020, an all-time low.
This material is not intended to be a recommendation or investment advice, does not constitute a solicitation to buy, sell or hold a security or an investment strategy and is not provided in a fiduciary capacity. The information provided does not take into account the specific objectives or circumstances of any particular investor, or suggest any specific course of action. Investment decisions should be made based on an investor’s objectives and circumstances and in consultation with his or her advisors.
Certain statements in this report are forward-looking statements. Discussions of specific investments are for illustration only and are not intended as recommendations of individual investments. The forward-looking statements and other views expressed herein are those of the portfolio managers as of the date of this report. Actual future results or occurrences may differ significantly from those anticipated in any forward-looking statements and the views expressed herein are subject to change at any time, due to numerous market and other factors. The Funds disclaim any obligation to update publicly or revise any forward-looking statements or views expressed herein.
Refer to the Glossary of Terms Used in this Report for further definition of the terms used within this section.
5
Portfolio Managers’ Comments (continued)
Additionally, oil prices collapsed to an 18-year low on supply glut concerns, as shutdowns across the global economy sharply reduced oil demand, although oil prices have recovered to well above those lows.
Central banks and governments have responded with liquidity injections to ease the strain on financial systems and stimulus measures to buffer the shock to businesses and consumers. These measures have helped stabilize the markets over the short term, and most markets have recovered most of their losses. But volatility will likely remain elevated until the health crisis itself is under control (via fewer new cases, lower infection rates and/or verified treatments or vaccines). There are still many unknowns and new information is incoming daily, compounding the difficulty of modeling outcomes for epidemiologists and economists alike.
Nuveen, LLC and our portfolio management teams are monitoring the situation carefully and continuously refining our views and approaches to managing the Funds to best pursue investment objectives while mitigating risks through all market environments.
What key strategies were used to manage the Funds during six-month reporting period ended June 30, 2020?
BXMX
The Nuveen S&P 500 Buy-Write Income Fund (BXMX or the Fund) seeks attractive total return with less volatility than the S&P 500® Index. During the six-month reporting period ended June 30, 2020, the Fund invested in an equity portfolio which sought to track the total return of the S&P 500® Index and wrote (sold) listed index call options on approximately 100% of the notional value of its stock portfolio. The cash premium generated by the index call options is intended to supplement the dividend yield on the underlying stock portfolio to support the Fund’s distribution policy and to provide the potential for growth in value during rising markets and/or risk mitigation in the event of a market decline.
The writing of index call options on a broad equity index, while investing in a portfolio of equities, has the potential to enhance the BXMX’s risk-adjusted returns while exposing the Fund to less risk than unhedged equity investments. Hedging the equity portfolio with index call options may limit the Fund’s participation in market advances in exchange for the cash premium received for the written index call options. In addition, market declines are typically buffered by the amount of the cash premium received by the Fund. In flat or declining markets, BXMX’s call option premium can potentially enhance total return relative to the S&P 500® Index. In rising markets, the call options may reduce the Fund’s total return relative to the S&P 500® Index.
DIAX
DIAX seeks attractive total return with less volatility than the Dow Jones Industrial Average (DJIA). NAM varies the level of call option overwrite within a range of approximately 35% to 75%, with a long-run target of 55% overwrite. NAM uses its proprietary view of the market’s return and volatility profile to dynamically adjust the overwrite percentage and other factors. Generally, if NAM expects the equity market to appreciate, the overwrite percentage will be reduced to offer more potential upside capture. Likewise, if NAM expects equity markets to be flat or to decline, the overwrite percentage may be increased, thus managing the Fund to potentially receive additional cash flow from higher sales of call options. This dynamic option overwrite approach offers potential for greater equity market upside capture than the full overwrite approach, while still offering a measure of downside risk management. The Fund currently expects to carry out its principal investment strategy by emphasizing options on broad-based indexes, individual stocks in the DJIA, and options on custom baskets of stocks in addition to ETFs. The Fund also has the opportunity to utilize call spread strategies and sell put options on a portion of the underlying equity portfolio.
SPXX
SPXX seeks attractive total return with less volatility than the S&P 500® Index. NAM varies the level of option overwrite within a range of approximately 35% to 75% overwrite, with a long-run target of 55% overwrite. NAM uses its proprietary view of the market’s return and volatility profile to dynamically adjust the overwrite percentage and other factors.
6
Generally, if NAM expects the equity market to appreciate, the overwrite percentage will be reduced to offer more potential upside capture. Likewise, if NAM expects equity markets to be flat or to decline, the overwrite percentage may be increased, thus managing the Fund to potentially receive additional cash flow from higher sales of call options. This dynamic option overwrite approach offers potential for greater equity market upside capture than the full overwrite approach, while still offering a measure of downside risk management. The Fund currently expects to emphasize index call options on the S&P 500® and can also employ an expanded range of options including index options on other broad-based indexes and options on custom baskets of stocks in addition to single name options. The Fund also has the opportunity to utilize call spread strategies and sell put options on a portion of the underlying equity portfolio.
QQQX
QQQX seeks attractive total return with less volatility than the Nasdaq 100 Index. NAM varies the level of call option overwrite within a range of approximately 35% to 75% overwrite, with a long-run target of 55% overwrite. NAM uses its proprietary view of the market’s return and volatility profile to dynamically adjust the overwrite percentage and other factors. Generally, if NAM expects the equity market to appreciate, the overwrite percentage will be reduced to offer more potential upside capture. Likewise, if NAM expects equity markets to be flat or to decline, the overwrite percentage may be increased, thus managing the Fund to potentially receive additional cash flow from higher sales of call options. This dynamic option overwrite approach offers potential for greater equity market upside capture than the full overwrite approach, while still offering a measure of downside risk management. The Fund, in carrying out its principal options strategy, expects to primarily write index call options on the Nasdaq-100 Index and other broad-based indexes and can also write call options on a variety of other equity market indexes and options on custom baskets of stocks in addition to single name options. The Fund also has the opportunity to utilize call spread strategies and sell put options on a portion of the underlying equity portfolio.
How did the Funds perform during this six-month reporting period ended June 30, 2020?
The tables in the Performance Overview and Holding Summaries section of this report provide total return for the six-month, one-year, five-year and ten-year periods ended June 30, 2020. Each Fund’s total returns at net asset value (NAV) are compared with the performance of its corresponding market index and, as available, a secondary custom blended benchmark.
For the six-month reporting period ended June 30, 2020, BXMX’s shares at NAV outperformed the Cboe S&P 500® BuyWrite Index (BXMSM), its primary index, but underperformed the S&P 500® Index. DIAX underperformed the Dow Jones Industrial Average and its secondary index, which is a blend of 55% Cboe DJIA BuyWrite Index (BXDSM) and 45% Dow Jones Industrial Average. SPXX underperformed the S&P 500® Index, but performed in-line with its secondary index, which is a blend of 55% the Cboe S&P 500® BuyWrite Index (BXMSM) and 45% the S&P 500® Index. QQQX underperformed the Nasdaq-100 Index and its secondary index, which is a blend of 55% Cboe Nasdaq 100 BuyWrite Index (BXNSM) and 45% Nasdaq-100 Index.
BXMX
The S&P 500® Index declined 19.60% in the first half of the reporting period, as the COVID-19 crisis caused the worst start to any year in stock market history. From its all-time high on February 19 through March 23, 2020 the S&P 500® Index rapidly entered bear market territory with a decline of 33.79% before staging a partial recovery. The S&P 500® Index returned 20.54% in the second half of the reporting period. The strong advance was driven by macroeconomic data that was starkly negative, but better than expected, as individual states began to roll back some COVID-19 crisis mitigation efforts.
Implied volatility, as measured by the Cboe® Volatility Index® (the VIX®), began the reporting period below its historical average of 19.37 but quickly reached extreme levels as the COVID-29 crisis unfolded. The VIX® closing high for the
7
Portfolio Managers’ Comments (continued)
reporting period was 82.69 on March 16, 2020, its highest close in history. The intra-day high for the six-month reporting period was 85.47 on March 18, 2020, only slightly off its highest-ever intra-day value of 89.53 recorded on October 24, 2008. The VIX® trended down as the S&P 500® Index staged a partial recovery starting in late March 2020 and reached a low of 24.52 on June 5, 2020. The VIX® averaged 32.87 for the reporting period and closed the reporting period at 30.43.
The above average implied volatility that existed for much of the reporting period generated high levels of cash premium from the index call option writing component of the Fund’s strategy. High premiums and gains from written index call options provided significant downside protection during the first half of the reporting period market decline. The high premiums limited losses on written index call options, which allowed for attractive participation in the equity market’s advance during the second half of the reporting period. Active management of the Fund’s index call option positions created opportunities to derive more benefit from the elevated implied volatility environment than the BXMSM, which has an index construction methodology that provides one opportunity per month for index call option writing. Active management helped the Fund outperform the BXMSM over both the equity market decline and the partial market recovery that followed. The Fund declined 16.07% in the first half of the reporting period while the BXMSM declined 22.22%. The Fund returned 11.56% in the second half of the reporting period while the BXMSM returned 9.14%.
During the first half of the reporting period equity market decline, gains from the Fund’s written index call options provided significant protection from the market’s losses. Specifically, the Fund provided over eight percentage points of protection against the market’s nearly 34% decline from February 19 through March 23, 2020 with a decline of 25.33%. Active management added value to the performance of the Fund relative to the BXMSM. As equity markets climbed at the beginning of the reporting period, the investment team exchanged index call option contracts in advance of their expiration for ones with later expiration dates and higher strike prices. As markets began deteriorating from the COVID-19 crisis, the team made several trades to lower the weighted-average strike price of the written index call option portfolio while taking advantage of extremely high shorter-term implied volatility to increase the cash premiums received by the Fund. The range of strike prices in the Fund’s call option portfolio was widened in response to large intra-day market swings and increased potential for a sharp market move. As the equity market started its partial recovery at the end of March 2020, select index call option positions were adjusted to maintain Fund market exposure.
Additionally, index call writing generated risk-mitigating cash flow for the Fund throughout the reporting period. The Fund’s annualized standard deviation of daily returns for the reporting period was 32.06% as compared to 37.10% for the BXMSM and 46.12% for the S&P 500® Index. The Fund exhibited a beta to the BXMSM of 0.83 for the reporting period.
The Fund’s index-tracking equity portfolio, while holding up better than the S&P 500® Index, detracted from overall performance with a return of -2.19% for the reporting period. During the strong advance later in the second half of the reporting period, writing index call options limited equity market participation, generally detracting from the Fund’s return. Losses on written index call options are expected when the market advances at a well above-average rate. However, the relatively high premiums received by the Fund due to elevated implied volatility kept losses smaller than would have otherwise been the case. Additionally, active management resulted in smaller losses on written call options than the written call option losses generated by the BXMSM. The investment team made active adjustments to the Fund’s portfolio of written index call options by exchanging them ahead of their expiration dates for ones with later expiration dates and higher strike prices as the equity market advanced. These adjustments increased cash premiums received and provided consistent market exposure while maintaining the strategy’s typical risk profile.
DIAX
DIAX’s call option strategy is expected to dampen the beta (a measure of price volatility) of the overall portfolio. Active index call writing generated risk-reducing cash flow throughout the reporting period. In attempting to achieve its low
8
volatility objective, the Fund’s annualized standard deviation of daily returns for the reporting period was 43.94% compared to 49.36% and 40.32% for Dow Jones Industrial Average and the secondary index, which is a blend of 55% Cboe DJIA BuyWrite Index (BXDSM) and 45% Dow Jones Industrial Average, respectively. This overwrite strategy provides incremental cash flow to the Fund and allows the portion of the Fund’s assets that are not overwritten to participate in any equity market rally. Those portions of the Fund that are overwritten have capped upside potential. The downside is buffered by the amount of cash flow premium received. Therefore, in flat or declining markets, the option premiums can enhance total returns relative to the Index. In rising markets, however, the options can hinder the Fund’s total return relative to the Index.
It is important to note the relationship between the market’s implied volatility that is measured by the Chicago Board Options Exchange (Cboe) Volatility Index® (the “VIX®”), and option writing. Implied volatility is a component of an option itself. It is the estimated volatility of an asset underlying an option. Higher implied volatilities result in higher option prices.
During the first half of the reporting period, equity markets, including the Index, rapidly sold off in February 2020, reaching bear market territory (a 20% drop from the previous high) within three weeks—the fastest bear market decline in history. Over the first half of the reporting period, the Index reached a high on February 19, 2020 and declined 34% to its low on March 23, 2020. During the first half of the reporting period, the VIX® averaged 32.87, well above its historical average of 19.24, and on March 16, 2020 closed at 82.67, its highest level in history.
In the second half of the reporting period, NAM took a more dynamic approach to the overwrite strategy. We maintained an approximate 58% overwrite but had periods in May 2020 where the overwrite reached 60% and mid-June 2020 where it reached nearly 70%, which is above its long-term target of 55%. During the second half of the reporting period, the VIX® averaged 30.43, well above its historical average of 19.24 and we took advantage of the VIX’s volatility to add new positions. We also bought and sold call options on single name positions and added strangle positions which involved selling a call and a put option on an index.
Several factors contributed to performance. Early in the reporting period, the Fund wrote call options on the Russell 2000® Index which contributed to performance. Unlike other indexes, the Russell 2000® Index had periods of flat performance in January 2020 and the beginning of February 2020. As a result, the Fund retained more option premium than the blended benchmark call option contract. NAM wrote far out-of-the-money strangles which can be effective during times of heightened volatility. These positions positively contributed to performance. In addition, NAM bought and sold options on single-name positions, including American Express Co, Walmart Inc, Johnson & Johnson, Pfizer Inc and Merck & Co Inc. These positions also contributed to performance. In both instances, the Fund was able to take advantage of the higher levels of volatility and capture additional option premium income. In addition, the Fund’s call-writing strategy provided some risk mitigation during the sell-off.
Several factors contributed the Fund’s underperformance. The February 2020 options contract expiration and roll came just prior to the shift in market volatility. Call options written by the Fund in February 2020 provided relatively modest downside protection compared to equity losses through the market sell-off. This was exacerbated by the March 2020 expiration date being closely aligned with the market bottom. Writing near-the-money call options limited upside participation in the partial recovery through the end of the month. The sudden shift from a low- to high-volatility environment and the timing of the Fund’s options contract expirations had a significant impact on the Fund’s return during the reporting period. In addition, NAM wrote call options on the Russell 2000® Index which detracted from performance during the second half of the reporting period. The Russell 2000® Index rallied sharply during the reporting period, returning 25.42%. As a result, the Fund collected less premium income as it unwound positions in the index at higher prices than was originally received in premium. Lastly, during the strong advance of the second half of the reporting period, writing index call options limited equity market participation, generally detracting from the Fund’s return.
9
Portfolio Managers’ Comments (continued)
SPXX
SPXX’s call option strategy is expected to dampen the beta (a measure of price volatility) of the overall portfolio. Active index call writing generated risk-reducing cash flow throughout the reporting period. In attempting to achieve its low volatility objective, the Fund’s annualized standard deviation of daily returns for the reporting period was 41.22% compared to 45.94% and 40.17% for the S&P 500® Index and its secondary index, which is a blend of 55% the Cboe S&P 500® BuyWrite Index (BXMSM) and 45% the S&P 500® Index, respectively. This overwrite strategy provides incremental cash flow to the Fund and allows the portion of the Fund’s assets that are not overwritten to participate in any equity market rally. Those portions of the Fund that are overwritten have capped upside potential. The downside is buffered by the amount of cash flow premium received. Therefore, in flat or declining markets, the option premiums can enhance total returns relative to the index. In rising markets, however, the options can hinder the Fund’s total return relative to the index.
It is important to note the relationship between market’s implied volatility that is measured by the Chicago Board Options Exchange (Cboe) Volatility Index® (the “VIX®”), and option writing. Implied volatility is a component of an option itself. It is the estimated volatility of an asset underlying an option. Higher implied volatilities result in higher option prices.
During the first half of the reporting period, equity markets, including the Index, rapidly sold off in February 2020, reaching bear market territory (a 20% drop from the previous high) within three weeks – the fastest bear market decline in history. Over the reporting period, the Index reached a high on February 19, 2020 and declined 34% to its low on March 23, 2020. The VIX® averaged 32.87, well above its historical average of 19.24, and on March 16, 2020 closed at 82.67, its highest level in history.
In the second half of the reporting period, NAM took a more dynamic approach to the overwrite strategy. We maintained an approximate 58% overwrite but had periods in May 2020 where the overwrite reached 60% and mid-June 2020 where it reached nearly 70%, which is above its long-term target of 55%. During the second half of the reporting period, the VIX® averaged 30.43, well above its historical average of 19.24 and we took advantage of the VIX®’s volatility to add new positions. We also bought and sold call options on single name positions and added strangle positions which involved selling a call and a put option on an index.
Several factors contributed to performance. Early in the reporting period, the Fund wrote call options on the Russell 2000® Index which contributed to performance. Unlike other indexes, the Russell 2000® Index had periods of flat performance in January 2020 and the beginning of February 2020. As a result, the Fund retained more option premium than the blended benchmark call option contract. NAM wrote far out-of-the-money strangles which can be effective during times of heightened volatility. These positions positively contributed to performance. In addition, NAM bought and sold options on single-name positions, including American Express Co, Walmart Inc, Johnson & Johnson, eBay Inc, Pfizer Inc and Merck & Co Inc. These positions also contributed to performance. In both instances, the Fund was able to take advantage of the higher levels of volatility and capture additional option premium income. In addition, the Fund’s call-writing strategy provided some risk mitigation during the sell-off.
Several factors contributed the Fund’s underperformance. The February 2020 options contract expiration and roll came just prior to the shift in market volatility. Call options written by the Fund in February 2020 provided relatively modest downside protection compared to equity losses through the market sell-off. This was exacerbated by the March 2020 expiration date being closely aligned with the market bottom. Writing near-the-money call options limited upside participation in the partial recovery through the end of the month. The sudden shift from a low- to high-volatility environment and the timing of the Fund’s options contract expirations had a significant impact on the Fund’s return. In addition, NAM wrote call options on the Russell 2000® Index which detracted from performance during the second half of the reporting period. The Russell 2000® Index rallied sharply during the reporting period, returning 25.42%. As a result, the Fund collected less premium income as it unwound positions in the index at higher prices than was originally received in premium. Lastly, during the strong advance of the second half of the reporting period, writing index call options limited equity market participation, generally detracting from the Fund’s return.
10
QQQX
QQQX’s call option strategy is expected to dampen the beta (a measure of price volatility) of the overall portfolio. Active index call writing generated risk-reducing cash flow throughout the reporting period. In attempting to achieve its low volatility objective, the Fund’s annualized standard deviation of daily returns for the reporting period was 40.88% compared to 45.40% and 23.34% for the Nasdaq-100 Index% and its secondary index, which is a blend of 55% Cboe Nasdaq 100 BuyWrite Index (BXNSM) and 45% Nasdaq-100 Index, respectively. This overwrite strategy provides incremental cash flow to the Fund and allows the portion of the Fund’s assets that are not overwritten to participate in any equity market rally. Those portions of the Fund that are overwritten have capped upside potential. The downside is buffered by the amount of cash flow premium received. Therefore, in flat or declining markets, the option premiums can enhance total returns relative to the Index. In rising markets, however, the options can hinder the Fund’s total return relative to the index.
It is important to note the relationship between market’s implied volatility that is measured by the Chicago Board Options Exchange (Cboe) Volatility Index® (the “VIX®”), and option writing. Implied volatility is a component of an option itself. It is the estimated volatility of an asset underlying an option. Higher implied volatilities result in higher option prices.
During the first half of the reporting period, equity markets, including the Index, rapidly sold off in February 2020, reaching bear market territory (a 20% drop from the previous high) within three weeks, resulting in the fastest bear market decline in history. Over the reporting period, the Index reached a high on February 19, 2020 and declined 34% to its low on March 23, 2020. The VIX® averaged 32.87, well above its historical average of 19.24, and on March 16, 2020 closed at 82.67, its highest level in history.
In the second half of the reporting period, NAM took a more dynamic approach to the overwrite strategy. We maintained an approximate 58% overwrite but had periods in May 2020 where the overwrite reached 60% and mid-June 2020 where it reached nearly 70%, which is above its long-term target of 55%. During the second half of the reporting period, the VIX® averaged 30.43, well above its historical average of 19.24. We took advantage of the VIX®’s volatility to add new positions. We also bought and sold call options on single name positions and added strangle positions which involved selling a call and a put option on an index.
Several factors contributed to performance. Early in the reporting period, the Fund wrote call options on the Russell 2000® Index which contributed to performance. Unlike other indexes, the Russell 2000® Index had periods of flat performance in January 2020 and the beginning of February 2020. As a result, the Fund retained more option premium than the blended benchmark call option contract. NAM wrote far out-of-the-money strangles which can be effective during times of heightened volatility. These positions positively contributed to performance. In addition, NAM bought and sold options on single-name positions, including American Express Co, eBay Inc, Pfizer Inc and Merck & Co Inc. These positions also contributed to performance. In both instances, the Fund was able to take advantage of the higher levels of volatility and capture additional option premium income. In addition, the Fund’s call-writing strategy provided some risk mitigation during the sell-off.
Several factors contributed the Fund’s underperformance. The February 2020 options contract expiration and roll came just prior to the shift in market volatility. Call options written by the Fund in February 2020 provided relatively modest downside protection compared to equity losses through the market sell-off. This was exacerbated by the March 2020 expiration date being closely aligned with the market bottom. Writing near-the-money call options limited upside participation in the partial recovery through the end of the month. The sudden shift from a low- to high-volatility environment and the timing of the Fund’s options contract expirations had a significant impact on the Fund’s return. In addition, NAM wrote call options on the Russell 2000® Index which detracted from performance during the second half of the reporting period. The Russell 2000® Index rallied sharply during the reporting period, returning 25.42%. As a result, the Fund collected less premium income as it unwound positions in the index at higher prices than was originally received in premium. Lastly, during the strong advance of the second half of the reporting period, writing index call options limited equity market participation, generally detracting from the Fund’s return.
11
Common Share Information
DISTRIBUTION INFORMATION
The following 19(a) Notice presents the Funds’ most current distribution information as of May 31, 2020 as required by certain exempted regulatory relief the Funds have received.
Because the ultimate tax character of your distributions depends on the Funds’ performance for its entire fiscal year (which is the calendar year for the Funds) as well as certain fiscal year-end (FYE) tax adjustments, estimated distribution source information you receive with each distribution may differ from the tax information reported to you on your Funds’ IRS Form 1099 statement.
DISTRIBUTION INFORMATION – AS OF MAY 31, 2020
This notice provides shareholders with information regarding fund distributions, as required by current securities laws. You should not draw any conclusions about the Funds’ investment performance from the amount of this distribution or from the terms of the Funds’ Managed Distribution Policy.
Each Fund may in certain periods distribute more than its income and net realized capital gains, and the Funds currently estimate that they have done so for the fiscal year-to-date period. In such instances, a portion of the distribution may be a return of capital. A return of capital may occur, for example, when some or all of the money that you invested in the Fund is paid back to you. A return of capital distribution does not necessarily reflect the Funds’ investment performance. For example, if a Fund generates a positive total return during a reporting period that is commensurate with its distribution rate, and realizes net gains by selling portfolio securities, a substantial portion of its distribution will likely be characterized as capital gains; but if the Fund generated such commensurate returns but instead did not realize net gains by selling portfolio securities during that period, then a substantial portion of its distributions in most cases would largely be characterized as a “return of capital”, despite the fact that the distributions were commensurate with those positive returns. Neither a capital gain distribution nor a return of capital distribution should be confused with “yield” or “income.”
The amounts and sources of distributions set forth below are only estimates and are not being provided for tax reporting purposes. The actual amounts and sources of the amounts for tax reporting purposes will depend upon the Funds’ investment experience during the remainder of its fiscal year and may be subject to changes based on tax regulations. Each Fund will send you a Form 1099-DIV for the calendar year that will tell you how to report these distributions for federal income tax purposes. More details about the Funds’ distributions and the basis for these estimates are available on www.nuveen.com/cef.
The following table provides estimates of the Funds’ distribution sources, reflecting year-to-date cumulative experience through the latest month-end. Each Fund attributes these estimates equally to each regular distribution throughout the year. Consequently, the estimated information shown below is for the current distribution, and also represents an updated estimate for all prior months in the year.
12
Data as of May 31, 2020
| | | | | | | | | | | | | | | | | | | | | | | | | | | | | | | | | | | | | | | | |
| | | | | | | | | Estimated Per Share Sources of Distribution1 | | | Estimated Percentage of the Distribution1 | |
| Fund | | Inception
Date | | | Per Share
Distribution | | | Net
Investment
Income | | | Long-Term
Gains | | | Short-Term
Gains | | | Return of
Capital | | | Net
Investment
Income | | | Long-Term
Gains | | | Short-Term
Gains | | | Return of
Capital | |
BXMX (FYE 12/31) | | | 10/2004 | | | | | | | | | | | | | | | | | | | | | | | | | | | | | | | | | | | | | |
Current Quarter | | | | | | $ | 0.2150 | | | $ | 0.0342 | | | $ | 0.0990 | | | $ | 0.0000 | | | $ | 0.0818 | | | | 15.90 | % | | | 46.10 | % | | | 0.00 | % | | | 38.00 | % |
Fiscal YTD | | | | | | $ | 0.4475 | | | $ | 0.0711 | | | $ | 0.2061 | | | $ | 0.0000 | | | $ | 0.1702 | | | | 15.90 | % | | | 46.10 | % | | | 0.00 | % | | | 38.00 | % |
DIAX (FYE 12/31) | | | 04/2005 | | | | | | | | | | | | | | | | | | | | | | | | | | | | | | | | | | | | | |
Current Quarter | | | | | | $ | 0.2730 | | | $ | 0.0667 | | | $ | 0.0000 | | | $ | 0.0000 | | | $ | 0.2063 | | | | 24.40 | % | | | 0.00 | % | | | 0.00 | % | | | 75.60 | % |
Fiscal YTD | | | | | | $ | 0.5680 | | | $ | 0.1387 | | | $ | 0.0000 | | | $ | 0.0000 | | | $ | 0.4293 | | | | 24.40 | % | | | 0.00 | % | | | 0.00 | % | | | 75.60 | % |
SPXX (FYE 12/31) | | | 11/2005 | | | | | | | | | | | | | | | | | | | | | | | | | | | | | | | | | | | | | |
Current Quarter | | | | | | $ | 0.2450 | | | $ | 0.0453 | | | $ | 0.0000 | | | $ | 0.0000 | | | $ | 0.1997 | | | | 18.50 | % | | | 0.00 | % | | | 0.00 | % | | | 81.50 | % |
Fiscal YTD | | | | | | $ | 0.5100 | | | $ | 0.0942 | | | $ | 0.0000 | | | $ | 0.0000 | | | $ | 0.4158 | | | | 18.50 | % | | | 0.00 | % | | | 0.00 | % | | | 81.50 | % |
QQQX (FYE 12/31) | | | 01/2007 | | | | | | | | | | | | | | | | | | | | | | | | | | | | | | | | | | | | | |
Current Quarter | | | | | | $ | 0.3900 | | | $ | 0.0131 | | | $ | 0.0000 | | | $ | 0.0000 | | | $ | 0.3769 | | | | 3.40 | % | | | 0.00 | % | | | 0.00 | % | | | 96.60 | % |
Fiscal YTD | | | | | | $ | 0.7800 | | | $ | 0.0263 | | | $ | 0.0000 | | | $ | 0.0000 | | | $ | 0.7537 | | | | 3.40 | % | | | 0.00 | % | | | 0.00 | % | | | 96.60 | % |
| 1 | Net investment income (NII) is a projection through the end of the current calendar quarter using actual data through the stated month-end date above. Capital gain amounts are as of the stated date above. The estimated per share sources above include an allocation of the NII based on prior year attributions which can be expected to differ from the actual final attributions for the current year. |
The following table provides information regarding the Funds’ distributions and total return performance over various time periods. This information is intended to help you better understand whether returns for the specified time periods were sufficient to meet distributions.
Data as of May 31, 2020
| | | | | | | | | | | | | | | | | | | | | | | | | | | | | | | | |
| | | | | | | | | | | | | | | Annualized | | | Cumulative | |
| Fund | | Inception
Date | | | Quarterly
Distribution | | | Fiscal YTD
Distribution | | | Net Asset
Value (NAV) | | | 5-Year
Return on NAV | | | Fiscal YTD
Dist. Rate on NAV1 | | | Fiscal YTD
Return on NAV | | | Fiscal YTD
Dist. Rate on NAV1 | |
BXMX | | | 10/2004 | | | $ | 0.2150 | | | $ | 0.4475 | | | $ | 12.31 | | | | 4.55 | % | | | 7.27 | % | | | (8.04 | )% | | | 3.64 | % |
DIAX | | | 04/2005 | | | $ | 0.2730 | | | $ | 0.5680 | | | $ | 15.07 | | | | 4.38 | % | | | 7.54 | % | | | (15.34 | )% | | | 3.77 | % |
SPXX | | | 11/2005 | | | $ | 0.2450 | | | $ | 0.5100 | | | $ | 14.16 | | | | 4.77 | % | | | 7.20 | % | | | (11.06 | )% | | | 3.60 | % |
QQQX | | | 01/2007 | | | $ | 0.3900 | | | $ | 0.7800 | | | $ | 23.23 | | | | 9.93 | % | | | 6.72 | % | | | (1.76 | )% | | | 3.36 | % |
| 1 | As a percentage of 5/31/20 NAV. |
NUVEEN CLOSED-END FUND DISTRIBUTION AMOUNTS
The Nuveen Closed-End Funds’ monthly and quarterly periodic distributions to shareholders are posted on www.nuveen.com and can be found on Nuveen’s enhanced closed-end fund resource page, which is at https://www.nuveen.com/resource-center-closed-end-funds, along with other Nuveen closed-end fund product updates. To ensure timely access to the latest information, shareholders may use a subscribe function, which can be activated at this web page (https://www.nuveen.com/subscriptions).
COMMON SHARE EQUITY SHELF PROGRAMS
During the current reporting period, the Funds were authorized by the Securities and Exchange Commission to issue additional common shares through an equity shelf program (Shelf Offering). Under these programs, the Funds, subject to market conditions, may raise additional capital from time to time in varying amounts and offering methods at a net price at or above each Fund’s NAV per common share. The total amount of common shares authorized under these Shelf Offerings are as shown in the accompanying table.
| | | | | | | | | | | | | | | | |
| | | BXMX | | | DIAX | | | SPXX | | | QQQX | |
Additional authorized common shares | | | 10,400,000 | | | | 3,600,000 | | | | 1,600,000 | * | | | 11,355,021 | |
| * | Represents additional authorized common shares for the period January 1, 2020 through April 30, 2020. |
13
Common Share Information (continued)
During the current reporting period, the following Funds sold common shares through their Shelf Offerings at a weighted average premium to their NAV per common share as shown in the accompanying table.
| | | | | | | | | | | | | | | | |
| | | BXMX | | | DIAX | | | SPXX | | | QQQX | |
Common shares sold through shelf offering | | | 7,583 | | | | 25,901 | | | | 264,171 | | | | 1,487,960 | |
Weighted average premium to NAV per common share sold | | | 1.07 | % | | | 1.12 | % | | | 1.57 | % | | | 1.91 | % |
Refer to Notes to Financial Statements, Note 4 – Fund Shares, Common Share Equity Shelf Programs and Offering Costs for further details of Shelf Offerings and each Fund’s respective transactions.
COMMON SHARE REPURCHASES
During August 2020 (subsequent to the close of the reporting period), the Funds’ Board of Trustees reauthorized an open-market share repurchase program, allowing each Fund to repurchase an aggregate of up to approximately 10% of its outstanding common shares.
As of June 30, 2020, and since the inception of the Funds’ repurchase programs, the Funds have cumulatively repurchased and retired their outstanding common shares as shown in the accompanying table.
| | | | | | | | | | | | | | | | |
| | | BXMX | | | DIAX | | | SPXX | | | QQQX | |
Common shares cumulatively repurchased and retired | | | 460,238 | | | | — | | | | 383,763 | | | | — | |
Common shares authorized for repurchase | | | 10,405,000 | | | | 3,635,000 | | | | 1,715,000 | | | | 4,105,000 | |
During the current reporting period, the Funds did not repurchase any of their outstanding common shares.
OTHER COMMON SHARE INFORMATION
As of June 30, 2020, and during the current reporting period, the Funds’ common share prices were trading at a premium/(discount) to their common share NAVs as shown in the accompanying table.
| | | | | | | | | | | | | | | | |
| | | BXMX | | | DIAX | | | SPXX | | | QQQX | |
Common share NAV | | $ | 12.32 | | | $ | 14.93 | | | $ | 14.11 | | | $ | 23.64 | |
Common share price | | $ | 11.00 | | | $ | 13.61 | | | $ | 12.84 | | | $ | 23.01 | |
Premium/(Discount) to NAV | | | (10.71 | )% | | | (8.84 | )% | | | (9.00 | )% | | | (2.66 | )% |
6-month average premium/(discount) to NAV | | | (6.77 | )% | | | (6.60 | )% | | | (4.54 | )% | | | (1.56 | )% |
14
Risk
Considerations
Risk Considerations
Fund shares are not guaranteed or endorsed by any bank or other insured depository institution, and are not federally insured by the Federal Deposit Insurance Corporation.
Nuveen S&P 500 Buy-Write Income Fund (BXMX)
Investing in closed-end funds involves risk; principal loss is possible. There is no guarantee the Fund’s investment objectives will be achieved. Closed-end fund shares may frequently trade at a discount or premium to their net asset value. Common stock returns often have experienced significant volatility. The Fund may not participate in any appreciation of its equity portfolio as fully as it would if the Fund did not sell call options. In addition, the Fund will continue to bear the risk of declines in the value of the equity portfolio. Because index options are settled in cash, sellers of index call options, such as the Fund, cannot provide in advance for their potential settlement obligations by acquiring and holding the underlying securities. For these and other risks, including tax risk, please see the Fund’s web page at www.nuveen.com/BXMX.
Nuveen Dow 30SM Dynamic Overwrite Fund (DIAX)
Investing in closed-end funds involves risk; principal loss is possible. There is no guarantee the Fund’s investment objectives will be achieved. Closed-end fund shares may frequently trade at a discount or premium to their net asset value. Common stock returns often have experienced significant volatility. The Fund may not participate in any appreciation of its equity portfolio as fully as it would if the Fund did not sell call options. In addition, the Fund will continue to bear the risk of declines in the value of the equity portfolio. Because index options are settled in cash, sellers of index call options, such as the Fund, cannot provide in advance for their potential settlement obligations by acquiring and holding the underlying securities. For these and other risks, including tax risk, please see the Fund’s web page at www.nuveen.com/DIAX.
Nuveen S&P 500 Dynamic Overwrite Fund (SPXX)
Investing in closed-end funds involves risk; principal loss is possible. There is no guarantee the Fund’s investment objectives will be achieved. Closed-end fund shares may frequently trade at a discount or premium to their net asset value. Common stock returns often have experienced significant volatility. The Fund may not participate in any appreciation of its equity portfolio as fully as it would if the Fund did not sell call options. In addition, the Fund will continue to bear the risk of declines in the value of the equity portfolio. Because index options are settled in cash, sellers of index call options, such as the Fund, cannot provide in advance for their potential settlement obligations by acquiring and holding the underlying securities. For these and other risks, including tax risk, please see the Fund’s web page at www.nuveen.com/SPXX.
Nuveen Nasdaq 100 Dynamic Overwrite Fund (QQQX)
Investing in closed-end funds involves risk; principal loss is possible. There is no guarantee the Fund’s investment objectives will be achieved. Closed-end fund shares may frequently trade at a discount or premium to their net asset value. Common stock returns often have experienced significant volatility. The Fund may not participate in any appreciation of its equity portfolio as fully as it would if the Fund did not sell call options. In addition, the Fund will continue to bear the risk of declines in the value of the equity portfolio. Because index options are settled in cash, sellers of index call options, such as the Fund, cannot provide in advance for their potential settlement obligations by acquiring and holding the underlying securities. For these and other risks, including tax risk, please see the Fund’s web page at www.nuveen.com/QQQX.
15
| | |
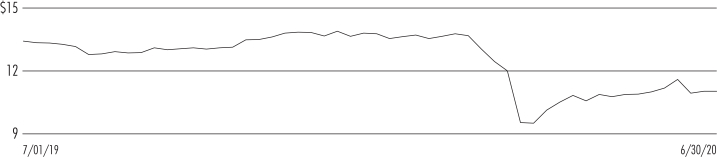
| BXMX | | Nuveen S&P 500 Buy-Write Income Fund Performance Overview and Holding Summaries as of June 30, 2020 |
Refer to the Glossary of Terms Used in this Report for further definition of the terms used within this section.
Average Annual Total Returns as of June 30, 2020
| | | | | | | | | | | | | | | | |
| | | Cumulative | | | Average Annual | |
| | | 6-Month | | | 1-Year | | | 5-Year | | | 10-Year | |
| BXMX at Common Share NAV | | | (6.36)% | | | | (0.01)% | | | | 5.04% | | | | 8.05% | |
| BXMX at Common Share Price | | | (16.63)% | | | | (10.92)% | | | | 4.24% | | | | 7.24% | |
| Cboe S&P 500® BuyWrite Index (BXMSM) | | | (15.11)% | | | | (10.94)% | | | | 2.81% | | | | 6.34% | |
Past performance is not predictive of future results. Current performance may be higher or lower than the data shown. Returns do not reflect the deduction of taxes that shareholders may have to pay on Fund distributions or upon the sale of Fund shares. Returns at NAV are net of Fund expenses, and assume reinvestment of distributions. Comparative index return information is provided for the Fund’s shares at NAV only. Indexes are not available for direct investment.
Common Share Price Performance — Weekly Closing Price
16
This data relates to the securities held in the Fund’s portfolio of investments as of the end of the reporting period. It should not be construed as a measure of performance for the Fund itself. Holdings are subject to change.
Fund Allocation
(% of net assets)
| | | | |
| Common Stocks | | | 99.6% | |
| Repurchase Agreements | | | 5.1% | |
| Other Assets Less Liabilities | | | (4.7)% | |
Net Assets | | | 100% | |
Top Five Issuers
(% of total long-term investments)
| | | | |
| Apple Inc | | | 6.5% | |
| Microsoft Corp | | | 6.1% | |
| Amazon.com Inc | | | 4.5% | |
| Alphabet Inc | | | 3.4% | |
| Facebook Inc | | | 2.4% | |
Portfolio Composition
(% of total investments)
| | | | |
| Software | | | 9.0% | |
| Technology Hardware, Storage & Peripherals | | | 6.3% | |
| Interactive Media & Services | | | 5.5% | |
| IT Services | | | 5.2% | |
| Internet & Direct Marketing Retail | | | 4.7% | |
| Semiconductors & Semiconductor Equipment | | | 4.6% | |
| Pharmaceuticals | | | 4.6% | |
| Banks | | | 3.5% | |
| Health Care Equipment & Supplies | | | 3.4% | |
| Specialty Retail | | | 2.7% | |
| Health Care Providers & Services | | | 2.6% | |
| Oil, Gas & Consumable Fuels | | | 2.4% | |
| Equity Real Estate Investment Trust | | | 2.3% | |
| Biotechnology | | | 2.2% | |
| | | | |
| Household Products | | | 2.0% | |
| Entertainment | | | 1.9% | |
| Insurance | | | 1.9% | |
| Capital Markets | | | 1.8% | |
| Diversified Telecommunication Services | | | 1.8% | |
| Electric Utilities | | | 1.7% | |
| Diversified Financial Services | | | 1.7% | |
| Food & Staples Retailing | | | 1.7% | |
| Aerospace & Defense | | | 1.6% | |
| Chemicals | | | 1.6% | |
| Repurchase Agreements | | | 4.9% | |
| Other | | | 18.4% | |
Total | | | 100.0% | |
17
| | |
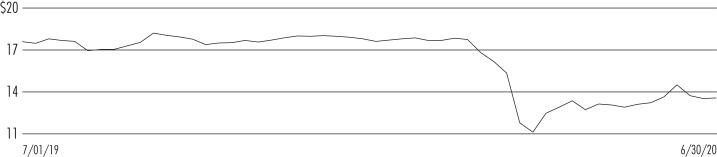
| DIAX | | Nuveen Dow 30SM Dynamic Overwrite Fund Performance Overview and Holding Summaries as of June 30, 2020 |
Refer to the Glossary of Terms Used in this Report for further definition of the terms used within this section.
Average Annual Total Returns as of June 30, 2020
| | | | | | | | | | | | | | | | |
| | | Cumulative | | | Average Annual | |
| | | 6-Month | | | 1-Year | | | 5-Year | | | 10-Year | |
| DIAX at Common Share NAV | | | (14.59)% | | | | (10.52)% | | | | 4.91% | | | | 8.87% | |
| DIAX at Common Share Price | | | (19.56)% | | | | (16.63)% | | | | 5.42% | | | | 7.98% | |
| Dow Jones Industrial Average (DJIA) | | | (8.43)% | | | | (0.54)% | | | | 10.62% | | | | 12.99% | |
| DIAX Blended Benchmark1 | | | (13.76)% | | | | (8.44)% | | | | 5.76% | | | | 8.73% | |
Past performance is not predictive of future results. Current performance may be higher or lower than the data shown. Returns do not reflect the deduction of taxes that shareholders may have to pay on Fund distributions or upon the sale of Fund shares. Returns at NAV are net of Fund expenses, and assume reinvestment of distributions. Comparative index return information is provided for the Fund’s shares at NAV only. Indexes are not available for direct investment.
Common Share Price Performance — Weekly Closing Price
| 1 | The DIAX Blended Benchmark consists of: 1) 55% Chicago Board Options Exchange (Cboe) DJIA BuyWrite Index (BXD), 2) 45% Dow Jones Industrial Average (DJIA). |
18
This data relates to the securities held in the Fund’s portfolio of investments as of the end of the reporting period. It should not be construed as a measure of performance for the Fund itself. Holdings are subject to change.
Fund Allocation
(% of net assets)
| | | | |
| Common Stocks | | | 100.5% | |
| Repurchase Agreements | | | 0.0% | |
| Other Assets Less Liabilities | | | (0.5)% | |
Net Assets | | | 100% | |
Top Five Issuers
(% of total long-term investments)
| | | | |
| Apple Inc | | | 9.7% | |
| UnitedHealth Group Inc | | | 7.8% | |
| Home Depot Inc | | | 6.7% | |
| Microsoft Corp | | | 5.4% | |
| Goldman Sachs Group Inc | | | 5.3% | |
Portfolio Composition
(% of total investments)
| | | | |
| Technology Hardware, Storage & Peripherals | | | 9.7% | |
| IT Services | | | 8.3% | |
| Health Care Providers & Services | | | 7.8% | |
| Pharmaceuticals | | | 6.7% | |
| Specialty Retail | | | 6.7% | |
| Aerospace & Defense | | | 6.5% | |
| Software | | | 5.4% | |
| Capital Markets | | | 5.2% | |
| Hotels, Restaurants & Leisure | | | 4.9% | |
| Food & Staples Retailing | | | 4.3% | |
| Industrial Conglomerates | | | 4.1% | |
| Oil, Gas & Consumable Fuels | | | 3.6% | |
| Machinery | | | 3.4% | |
| Household Products | | | 3.2% | |
| Insurance | | | 3.0% | |
| Repurchase Agreements | | | 0.0% | |
| Other | | | 17.2% | |
Total | | | 100.0% | |
19
| | |
| SPXX | | Nuveen S&P 500 Dynamic Overwrite Fund Performance Overview and Holding Summaries as of June 30, 2020 |
Refer to the Glossary of Terms Used in this Report for further definition of the terms used within this section.
Average Annual Total Returns as of June 30, 2020
| | | | | | | | | | | | | | | | |
| | | Cumulative | | | Average Annual | |
| | | 6-Month | | | 1-Year | | | 5-Year | | | 10-Year | |
| SPXX at Common Share NAV | | | (9.77)% | | | | (3.08)% | | | | 5.38% | | | | 8.37% | |
| SPXX at Common Share Price | | | (18.77)% | | | | (12.46)% | | | | 5.94% | | | | 7.96% | |
| S&P 500® Index | | | (3.08)% | | | | 7.51% | | | | 10.73% | | | | 13.99% | |
| SPXX Blended Benchmark1 | | | (9.70)% | | | | (2.85)% | | | | 6.38% | | | | 9.79% | |
Performance prior to December 22, 2014, reflects the Fund’s performance under the management of a sub-adviser using an investment strategy that differed from those currently in place.
Past performance is not predictive of future results. Current performance may be higher or lower than the data shown. Returns do not reflect the deduction of taxes that shareholders may have to pay on Fund distributions or upon the sale of Fund shares. Returns at NAV are net of Fund expenses, and assume reinvestment of distributions. Comparative index return information is provided for the Fund’s shares at NAV only. Indexes are not available for direct investment.
Common Share Price Performance — Weekly Closing Price
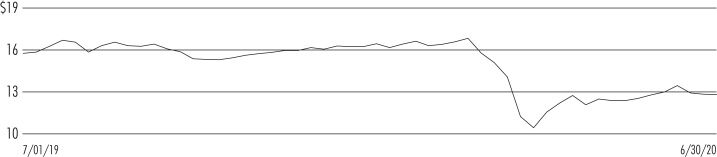
| 1 | The SPXX Blended Benchmark consists of: 1) 55% Chicago Board Options Exchange (Cboe) S&P 500 BuyWrite Index (BXMSM), 2) 45% S&P 500®. |
20
This data relates to the securities held in the Fund’s portfolio of investments as of the end of the reporting period. It should not be construed as a measure of performance for the Fund itself. Holdings are subject to change.
Fund Allocation
(% of net assets)
| | | | |
| Common Stocks | | | 100.5% | |
| Common Stock Rights | | | 0.0% | |
| Repurchase Agreements | | | 0.2% | |
| Other Assets Less Liabilities | | | (0.7)% | |
| Net Assets | | | 100% | |
Top Five Issuers
(% of total long-term investments)
| | | | |
| Microsoft Corp | | | 6.6% | |
| Apple Inc | | | 6.5% | |
| Amazon.com Inc | | | 4.4% | |
| Alphabet Inc | | | 3.4% | |
| Facebook Inc | | | 2.4% | |
Portfolio Composition
(% of total investments)
| | | | |
| Software | | | 7.9% | |
| IT Services | | | 6.6% | |
| Technology Hardware, Storage & Peripherals | | | 6.5% | |
| Interactive Media & Services | | | 5.9% | |
| Internet & Direct Marketing Retail | | | 5.3% | |
| Semiconductors & Semiconductor Equipment | | | 5.3% | |
| Pharmaceuticals | | | 4.8% | |
| Banks | | | 4.6% | |
| Specialty Retail | | | 3.6% | |
| Health Care Providers & Services | | | 3.4% | |
| Oil, Gas & Consumable Fuels | | | 3.1% | |
| Capital Markets | | | 2.8% | |
| | | | |
| Health Care Equipment & Supplies | | | 2.8% | |
| Machinery | | | 2.4% | |
| Beverages | | | 2.3% | |
| Insurance | | | 2.2% | |
| Household Products | | | 2.2% | |
| Entertainment | | | 2.2% | |
| Aerospace & Defense | | | 1.9% | |
| Hotels, Restaurants & Leisure | | | 1.8% | |
| Biotechnology | | | 1.8% | |
| Chemicals | | | 1.8% | |
| Repurchase Agreements | | | 0.2% | |
| Other | | | 18.6% | |
Total | | | 100.0% | |
21
| | |
| QQQX | | Nuveen Nasdaq 100 Dynamic Overwrite Fund Performance Overview and Holding Summaries as of June 30, 2020 |
Refer to the Glossary of Terms Used in this Report for further definition of the terms used within this section.
Average Annual Total Returns as of June 30, 2020
| | | | | | | | | | | | | | | | |
| | | Cumulative | | | Average Annual | |
| | | 6-Month | | | 1-Year | | | 5-Year | | | 10-Year | |
| QQQX at Common Share NAV | | | 1.63% | | | | 13.14% | | | | 11.05% | | | | 14.64% | |
| QQQX at Common Share Price | | | (0.75)% | | | | 10.28% | | | | 12.26% | | | | 15.11% | |
| Nasdaq 100® Index | | | 16.89% | | | | 33.78% | | | | 19.58% | | | | 20.69% | |
| QQQX Blended Benchmark1 | | | 5.19% | | | | 16.02% | | | | 13.31% | | | | 13.98% | |
Past performance is not predictive of future results. Current performance may be higher or lower than the data shown. Returns do not reflect the deduction of taxes that shareholders may have to pay on Fund distributions or upon the sale of Fund shares. Returns at NAV are net of Fund expenses, and assume reinvestment of distributions. Comparative index return information is provided for the Fund’s shares at NAV only. Indexes are not available for direct investment.
Common Share Price Performance — Weekly Closing Price
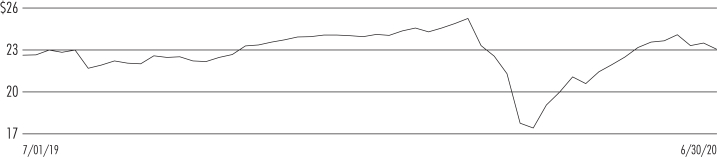
| 1 | The QQQX Blended Benchmark consists of: 1) 55% Chicago Board of Exchange (Cboe) Nasdaq 100 BuyWrite Index (BXNSM), 2) 45% Nasdaq-100 Index. |
22
This data relates to the securities held in the Fund’s portfolio of investments as of the end of the reporting period. It should not be construed as a measure of performance for the Fund itself. Holdings are subject to change.
Fund Allocation
(% of net assets)
| | | | |
| Common Stocks | | | 101.1% | |
| Common Stock Rights | | | 0.1% | |
| Repurchase Agreements | | | 0.2% | |
| Other Assets Less Liabilities | | | (1.4)% | |
Net Assets | | | 100% | |
Top Five Issuers
(% of total long-term investments)
| | | | |
| Apple Inc | | | 13.7% | |
| Microsoft Corp | | | 13.4% | |
| Amazon.com Inc | | | 11.8% | |
| Alphabet Inc | | | 9.1% | |
| Facebook Inc | | | 3.9% | |
Portfolio Composition
(% of total investments)
| | | | |
| Software | | | 15.9% | |
| Internet & Direct Marketing Retail | | | 14.4% | |
| Interactive Media & Services | | | 14.3% | |
| Technology Hardware, Storage & Peripherals | | | 13.8% | |
| Semiconductors & Semiconductor Equipment | | | 13.0% | |
| Biotechnology | | | 6.9% | |
| IT Services | | | 5.5% | |
| Repurchase Agreements | | | 0.2% | |
| Other | | | 16.0% | |
Total | | | 100.0% | |
23
Shareholder Meeting Report
The annual meeting of shareholders, originally scheduled to be held on April 8, 2020 in person, was postponed to April 22, 2020 for BXMX, SPXX, DIAX and QQQX. The meeting was held virtually due to public health concerns regarding the ongoing COVID-19 pandemic; at this meeting the shareholders were asked to elect Board members.
| | | | | | | | | | | | | | | | |
| | | BXMX | | | SPXX | | | DIAX | | | QQQX | |
| | | Common
Shares | | | Common
Shares | | | Common
Shares | | | Common
Shares | |
Approval of the Board Members was reached as follows: | | | | | | | | | | | | | | | | |
John K. Nelson | | | | | | | | | | | | | | | | |
For | | | 91,775,085 | | | | 14,914,196 | | | | 31,331,811 | | | | 33,087,295 | |
Withhold | | | 1,918,978 | | | | 379,746 | | | | 700,891 | | | | 916,995 | |
Total | | | 93,694,063 | | | | 15,293,942 | | | | 32,032,702 | | | | 34,004,290 | |
Terence J. Toth | | | | | | | | | | | | | | | | |
For | | | 90,959,048 | | | | 14,895,755 | | | | 31,240,762 | | | | 33,028,238 | |
Withhold | | | 2,735,015 | | | | 398,187 | | | | 791,940 | | | | 976,052 | |
Total | | | 93,694,063 | | | | 15,293,942 | | | | 32,032,702 | | | | 34,004,290 | |
Robert L. Young | | | | | | | | | | | | | | | | |
For | | | 91,871,975 | | | | 14,907,607 | | | | 31,331,217 | | | | 33,100,017 | |
Withhold | | | 1,822,088 | | | | 386,335 | | | | 701,485 | | | | 904,273 | |
Total | | | 93,694,063 | | | | 15,293,942 | | | | 32,032,702 | | | | 34,004,290 | |
24
| | |
| BXMX | | Nuveen S&P 500 Buy-Write
Income Fund Portfolio of Investments June 30, 2020 |
| | | (Unaudited) |
| | | | | | | | | | | | | | | | |
| Shares | | | Description (1) | | | | | | | | Value | |
| | | | |
| | | | LONG-TERM INVESTMENTS – 99.6% | | | | | | | | | | | | |
| | | | |
| | | | COMMON STOCKS – 99.6% (2) | | | | | | | | | | | | |
| | | | |
| | | | Aerospace & Defense – 1.6% | | | | | | | | | |
| | | | |
| | 28,960 | | | Boeing Co | | | | | | | | | | $ | 5,308,368 | |
| | 9,566 | | | HEICO Corp | | | | | | | | | | | 953,252 | |
| | 62,456 | | | Howmet Aerospace Inc | | | | | | | | | | | 989,928 | |
| | 12,552 | | | Huntington Ingalls Industries Inc | | | | | | | | | | | 2,190,199 | |
| | 13,748 | | | Northrop Grumman Corp | | | | | | | | | | | 4,226,685 | |
| | 118,674 | | | Raytheon Technologies Corp | | | | | | | | | | | 7,312,692 | |
| | | | Total Aerospace & Defense | | | | | | | | | | | 20,981,124 | |
| | | | |
| | | | Air Freight & Logistics – 0.5% | | | | | | | | | |
| | | | |
| | 52,845 | | | United Parcel Service Inc, Class B | | | | | | | | | | | 5,875,307 | |
| | | | |
| | | | Airlines – 0.1% | | | | | | | | | |
| | | | |
| | 33,335 | | | United Airlines Holdings Inc, (3) | | | | | | | | | | | 1,153,724 | |
| | | | |
| | | | Auto Components – 0.1% | | | | | | | | | |
| | | | |
| | 10,862 | | | Cooper Tire & Rubber Co | | | | | | | | | | | 299,900 | |
| | 50,606 | | | Gentex Corp | | | | | | | | | | | 1,304,116 | |
| | | | Total Auto Components | | | | | | | | | | | 1,604,016 | |
| | | | |
| | | | Automobiles – 0.3% | | | | | | | | | |
| | | | |
| | 422,587 | | | Ford Motor Co | | | | | | | | | | | 2,569,329 | |
| | 24,260 | | | Harley-Davidson Inc | | | | | | | | | | | 576,660 | |
| | 427 | | | Tesla Inc, (3) | | | | | | | | | | | 461,079 | |
| | | | Total Automobiles | | | | | | | | | | | 3,607,068 | |
| | | | |
| | | | Banks – 3.7% | | | | | | | | | |
| | | | |
| | 527,984 | | | Bank of America Corp | | | | | | | | | | | 12,539,620 | |
| | 153,773 | | | Citigroup Inc | | | | | | | | | | | 7,857,800 | |
| | 26,341 | | | Comerica Inc | | | | | | | | | | | 1,003,592 | |
| | 98,788 | | | Fifth Third Bancorp | | | | | | | | | | | 1,904,633 | |
| | 108,513 | | | First Horizon National Corp | | | | | | | | | | | 1,080,789 | |
| | 168,863 | | | JPMorgan Chase & Co | | | | | | | | | | | 15,883,254 | |
| | 166,049 | | | KeyCorp | | | | | | | | | | | 2,022,477 | |
| | 119,082 | | | People’s United Financial Inc | | | | | | | | | | | 1,377,779 | |
| | 172,561 | | | Regions Financial Corp | | | | | | | | | | | 1,918,878 | |
| | 60,439 | | | Zions Bancorp NA | | | | | | | | | | | 2,054,926 | |
| | | | Total Banks | | | | | | | | | | | 47,643,748 | |
| | | | |
| | | | Beverages – 1.4% | | | | | | | | | |
| | | | |
| | 307,680 | | | Coca-Cola Co | | | | | | | | | | | 13,747,142 | |
| | 23,448 | | | Keurig Dr Pepper Inc | | | | | | | | | | | 665,923 | |
| | 56,712 | | | Monster Beverage Corp, (3) | | | | | | | | | | | 3,931,276 | |
| | | | Total Beverages | | | | | | | | | | | 18,344,341 | |
| | | | |
| | | | Biotechnology – 2.3% | | | | | | | | | |
| | | | |
| | 103,252 | | | AbbVie Inc | | | | | | | | | | | 10,137,281 | |
| | 3,766 | | | Alnylam Pharmaceuticals Inc, (3) | | | | | | | | | | | 557,782 | |
| | 34,141 | | | Amgen Inc | | | | | | | | | | | 8,052,496 | |
| | 11,274 | | | Biogen Inc, (3) | | | | | | | | | | | 3,016,359 | |
| | 9,243 | | | BioMarin Pharmaceutical Inc, (3) | | | | | | | | | | | 1,140,032 | |
| | 4,402 | | | Exact Sciences Corp, (3) | | | | | | | | | | | 382,710 | |
| | 67,257 | | | Gilead Sciences Inc | | | | | | | | | | | 5,174,753 | |
25
| | |
| |
| BXMX | | Nuveen S&P 500 Buy-Write Income Fund (continued) |
| | Portfolio of Investments June 30, 2020 |
| | (Unaudited) |
| | | | | | | | | | | | | | | | |
| Shares | | | Description (1) | | | | | | | | Value | |
| | | | |
| | | | Biotechnology (continued) | | | | | | | | | |
| | | | |
| | 7,342 | | | Seattle Genetics Inc, (3) | | | | | | | | | | $ | 1,247,553 | |
| | | | Total Biotechnology | | | | | | | | | | | 29,708,966 | |
| | | | |
| | | | Building Products – 0.5% | | | | | | | | | |
| | | | |
| | 15,381 | | | Allegion plc | | | | | | | | | | | 1,572,246 | |
| | 77,134 | | | Carrier Global Corp | | | | | | | | | | | 1,713,917 | |
| | 48,429 | | | Masco Corp | | | | | | | | | | | 2,431,620 | |
| | | | Total Building Products | | | | | | | | | | | 5,717,783 | |
| | | | |
| | | | Capital Markets – 1.9% | | | | | | | | | |
| | | | |
| | 75,510 | | | Charles Schwab Corp | | | | | | | | | | | 2,547,708 | |
| | 21,911 | | | CME Group Inc | | | | | | | | | | | 3,561,414 | |
| | 42,992 | | | Eaton Vance Corp | | | | | | | | | | | 1,659,491 | |
| | 44,488 | | | Intercontinental Exchange Inc | | | | | | | | | | | 4,075,101 | |
| | 9,912 | | | Legg Mason Inc | | | | | | | | | | | 493,122 | |
| | 8,344 | | | MSCI Inc | | | | | | | | | | | 2,785,394 | |
| | 21,694 | | | S&P Global Inc | | | | | | | | | | | 7,147,739 | |
| | 34,832 | | | TD Ameritrade Holding Corp | | | | | | | | | | | 1,267,188 | |
| | 82,975 | | | Waddell & Reed Financial Inc, Class A | | | | | | | | | | | 1,286,942 | |
| | | | Total Capital Markets | | | | | | | | | | | 24,824,099 | |
| | | | |
| | | | Chemicals – 1.6% | | | | | | | | | |
| | | | |
| | 13,380 | | | AdvanSix Inc, (3) | | | | | | | | | | | 157,081 | |
| | 16,669 | | | Chemours Co | | | | | | | | | | | 255,869 | |
| | 52,881 | | | Corteva Inc | | | | | | | | | | | 1,416,682 | |
| | 53,214 | | | Dow Inc | | | | | | | | | | | 2,169,003 | |
| | 79,715 | | | DuPont de Nemours Inc | | | | | | | | | | | 4,235,258 | |
| | 57,446 | | | Eastman Chemical Co | | | | | | | | | | | 4,000,539 | |
| | 33,382 | | | Linde PLC | | | | | | | | | | | 7,080,656 | |
| | 36,183 | | | Olin Corp | | | | | | | | | | | 415,743 | |
| | 14,399 | | | RPM International Inc | | | | | | | | | | | 1,080,789 | |
| | | | Total Chemicals | | | | | | | | | | | 20,811,620 | |
| | | | |
| | | | Commercial Services & Supplies – 0.5% | | | | | | | | | |
| | | | |
| | 13,228 | | | Waste Connections Inc | | | | | | | | | | | 1,240,654 | |
| | 47,435 | | | Waste Management Inc | | | | | | | | | | | 5,023,841 | |
| | | | Total Commercial Services & Supplies | | | | | | | | | | | 6,264,495 | |
| | | | |
| | | | Communications Equipment – 1.2% | | | | | | | | | |
| | | | |
| | 13,699 | | | Ciena Corp, (3) | | | | | | | | | | | 741,938 | |
| | 296,535 | | | Cisco Systems Inc | | | | | | | | | | | 13,830,392 | |
| | 5,140 | | | Lumentum Holdings Inc, (3) | | | | | | | | | | | 418,550 | |
| | 27,916 | | | Viavi Solutions Inc, (3) | | | | | | | | | | | 355,650 | |
| | | | Total Communications Equipment | | | | | | | | | | | 15,346,530 | |
| | | | |
| | | | Consumer Finance – 0.4% | | | | | | | | | |
| | | | |
| | 50,167 | | | Discover Financial Services | | | | | | | | | | | 2,512,865 | |
| | 98,887 | | | SLM Corp | | | | | | | | | | | 695,176 | |
| | 111,921 | | | Synchrony Financial | | | | | | | | | | | 2,480,169 | |
| | | | Total Consumer Finance | | | | | | | | | | | 5,688,210 | |
| | | | |
| | | | Containers & Packaging – 0.4% | | | | | | | | | |
| | | | |
| | 13,574 | | | Avery Dennison Corp | | | | | | | | | | | 1,548,658 | |
| | 22,123 | | | Crown Holdings Inc, (3) | | | | | | | | | | | 1,440,871 | |
| | 15,364 | | | Packaging Corp of America | | | | | | | | | | | 1,533,327 | |
| | 18,945 | | | Sonoco Products Co | | | | | | | | | | | 990,634 | |
| | | | Total Containers & Packaging | | | | | | | | | | | 5,513,490 | |
| | | | |
| | | | Diversified Financial Services – 1.8% | | | | | | | | | |
| | | | |
| | 105,638 | | | Berkshire Hathaway Inc, Class B, (3) | | | | | | | | | | | 18,857,440 | |
| | 53,398 | | | Jefferies Financial Group Inc | | | | | | | | | | | 830,339 | |
26
| | | | | | | | | | | | | | | | |
| Shares | | | Description (1) | | | | | | | | Value | |
| | | | |
| | | | Diversified Financial Services (continued) | | | | | | | | | |
| | | | |
| | 59,639 | | | Voya Financial Inc | | | | | | | | | | $ | 2,782,159 | |
| | | | Total Diversified Financial Services | | | | | | | | | | | 22,469,938 | |
| | | | |
| | | | Diversified Telecommunication Services – 1.9% | | | | | | | | | |
| | | | |
| | 402,841 | | | AT&T Inc | | | | | | | | | | | 12,177,883 | |
| | 228,346 | | | Verizon Communications Inc | | | | | | | | | | | 12,588,715 | |
| | | | Total Diversified Telecommunication Services | | | | | | | | | | | 24,766,598 | |
| | | | |
| | | | Electric Utilities – 1.8% | | | | | | | | | |
| | | | |
| | 136,982 | | | Duke Energy Corp | | | | | | | | | | | 10,943,492 | |
| | 49,088 | | | Entergy Corp | | | | | | | | | | | 4,604,945 | |
| | 61,129 | | | Evergy Inc | | | | | | | | | | | 3,624,338 | |
| | 52,512 | | | OGE Energy Corp | | | | | | | | | | | 1,594,264 | |
| | 29,198 | | | Pinnacle West Capital Corp | | | | | | | | | | | 2,139,922 | |
| | | | Total Electric Utilities | | | | | | | | | | | 22,906,961 | |
| | | | |
| | | | Electrical Equipment – 0.6% | | | | | | | | | |
| | | | |
| | 64,438 | | | Emerson Electric Co | | | | | | | | | | | 3,997,089 | |
| | 8,860 | | | Hubbell Inc | | | | | | | | | | | 1,110,690 | |
| | 13,511 | | | Rockwell Automation Inc | | | | | | | | | | | 2,877,843 | |
| | | | Total Electrical Equipment | | | | | | | | | | | 7,985,622 | |
| | | | |
| | | | Electronic Equipment, Instruments & Components – 0.4% | | | | | | | | | |
| | | | |
| | 20,728 | | | CDW Corp | | | | | | | | | | | 2,408,179 | |
| | 86,143 | | | Corning Inc | | | | | | | | | | | 2,231,104 | |
| | | | Total Electronic Equipment, Instruments & Components | | | | | | | | | | | 4,639,283 | |
| | | | |
| | | | Energy Equipment & Services – 0.3% | | | | | | | | | |
| | | | |
| | 80,854 | | | Halliburton Co | | | | | | | | | | | 1,049,485 | |
| | 134,181 | | | Schlumberger Ltd | | | | | | | | | | | 2,467,589 | |
| | | | Total Energy Equipment & Services | | | | | | | | | | | 3,517,074 | |
| | | | |
| | | | Entertainment – 2.0% | | | | | | | | | |
| | | | |
| | 46,851 | | | Activision Blizzard Inc | | | | | | | | | | | 3,555,991 | |
| | 23,833 | | | Netflix Inc, (3) | | | | | | | | | | | 10,844,968 | |
| | 1,607 | | | Roku Inc, (3) | | | | | | | | | | | 187,264 | |
| | 99,744 | | | Walt Disney Co | | | | | | | | | | | 11,122,453 | |
| | | | Total Entertainment | | | | | | | | | | | 25,710,676 | |
| | | | |
| | | | Equity Real Estate Investment Trust – 2.4% | | | | | | | | | |
| | | | |
| | 97,035 | | | American Homes 4 Rent, Class A | | | | | | | | | | | 2,610,241 | |
| | 73,515 | | | Apartment Investment and Management Co, Class A | | | | | | | | | | | 2,767,105 | |
| | 123,846 | | | Brandywine Realty Trust | | | | | | | | | | | 1,348,683 | |
| | 81,089 | | | CubeSmart | | | | | | | | | | | 2,188,592 | |
| | 51,595 | | | Equity Commonwealth | | | | | | | | | | | 1,661,359 | |
| | 84,268 | | | Healthcare Realty Trust Inc | | | | | | | | | | | 2,468,210 | |
| | 88,255 | | | Invitation Homes Inc | | | | | | | | | | | 2,429,660 | |
| | 19,823 | | | Lexington Realty Trust | | | | | | | | | | | 209,133 | |
| | 72,585 | | | Prologis Inc | | | | | | | | | | | 6,774,358 | |
| | 51,162 | | | Sabra Health Care REIT Inc | | | | | | | | | | | 738,268 | |
| | 15,931 | | | Sun Communities Inc | | | | | | | | | | | 2,161,518 | |
| | 21,307 | | | Ventas Inc | | | | | | | | | | | 780,262 | |
| | 42,955 | | | Welltower Inc | | | | | | | | | | | 2,222,921 | |
| | 125,241 | | | Weyerhaeuser Co | | | | | | | | | | | 2,812,913 | |
| | | | Total Equity Real Estate Investment Trust | | | | | | | | | | | 31,173,223 | |
| | | | |
| | | | Food & Staples Retailing – 1.7% | | | | | | | | | |
| | | | |
| | 3,640 | | | Casey’s General Stores Inc | | | | | | | | | | | 544,253 | |
| | 32,746 | | | Costco Wholesale Corp | | | | | | | | | | | 9,928,915 | |
| | 55,722 | | | Kroger Co | | | | | | | | | | | 1,886,190 | |
| | 15,913 | | | US Foods Holding Corp, (3) | | | | | | | | | | | 313,804 | |
27
| | |
| |
| BXMX | | Nuveen S&P 500 Buy-Write Income Fund (continued) |
| | Portfolio of Investments June 30, 2020 |
| | (Unaudited) |
| | | | | | | | | | | | | | | | |
| Shares | | | Description (1) | | | | | | | | Value | |
| | | | |
| | | | Food & Staples Retailing (continued) | | | | | | | | | |
| | | | |
| | 80,123 | | | Walmart Inc | | | | | | | | | | $ | 9,597,133 | |
| | | | Total Food & Staples Retailing | | | | | | | | | | | 22,270,295 | |
| | | | |
| | | | Food Products – 0.7% | | | | | | | | | |
| | | | |
| | 19,945 | | | Lamb Weston Holdings Inc | | | | | | | | | | | 1,275,084 | |
| | 132,012 | | | Mondelez International Inc, Class A | | | | | | | | | | | 6,749,773 | |
| | 12,100 | | | Post Holdings Inc, (3) | | | | | | | | | | | 1,060,202 | |
| | | | Total Food Products | | | | | | | | | | | 9,085,059 | |
| | | | |
| | | | Gas Utilities – 0.2% | | | | | | | | | |
| | | | |
| | 30,465 | | | Atmos Energy Corp | | | | | | | | | | | 3,033,705 | |
| | 2,933 | | | National Fuel Gas Co | | | | | | | | | | | 122,980 | |
| | | | Total Gas Utilities | | | | | | | | | | | 3,156,685 | |
| | | | |
| | | | Health Care Equipment & Supplies – 3.5% | | | | | | | | | |
| | | | |
| | 119,195 | | | Abbott Laboratories | | | | | | | | | | | 10,897,999 | |
| | 19,198 | | | Alcon Inc, (3) | | | | | | | | | | | 1,100,429 | |
| | 7,646 | | | Avanos Medical Inc, (3) | | | | | | | | | | | 224,716 | |
| | 49,755 | | | Baxter International Inc | | | | | | | | | | | 4,283,906 | |
| | 166,239 | | | Boston Scientific Corp, (3) | | | | | | | | | | | 5,836,651 | |
| | 12,930 | | | Hill-Rom Holdings Inc | | | | | | | | | | | 1,419,455 | |
| | 52,566 | | | Hologic Inc, (3) | | | | | | | | | | | 2,996,262 | |
| | 12,607 | | | IDEXX Laboratories Inc, (3) | | | | | | | | | | | 4,162,327 | |
| | 10,914 | | | Intuitive Surgical Inc, (3) | | | | | | | | | | | 6,219,125 | |
| | 91,175 | | | Medtronic PLC | | | | | | | | | | | 8,360,748 | |
| | | | Total Health Care Equipment & Supplies | | | | | | | | | | | 45,501,618 | |
| | | | |
| | | | Health Care Providers & Services – 2.8% | | | | | | | | | |
| | | | |
| | 16,199 | | | Anthem Inc | | | | | | | | | | | 4,260,013 | |
| | 40,790 | | | Centene Corp, (3) | | | | | | | | | | | 2,592,205 | |
| | 31,579 | | | Cigna Corp | | | | | | | | | | | 5,925,799 | |
| | 8,265 | | | Covetrus Inc, (3) | | | | | | | | | | | 147,861 | |
| | 85,692 | | | CVS Health Corp | | | | | | | | | | | 5,567,409 | |
| | 20,595 | | | HCA Healthcare Inc | | | | | | | | | | | 1,998,951 | |
| | 50,660 | | | UnitedHealth Group Inc | | | | | | | | | | | 14,942,167 | |
| | | | Total Health Care Providers & Services | | | | | | | | | | | 35,434,405 | |
| | | | |
| | | | Health Care Technology – 0.1% | | | | | | | | | |
| | | | |
| | 6,150 | | | Veeva Systems Inc, (3) | | | | | | | | | | | 1,441,683 | |
| | | | |
| | | | Hotels, Restaurants & Leisure – 1.4% | | | | | | | | | |
| | | | |
| | 1,826 | | | Domino’s Pizza Inc | | | | | | | | | | | 674,597 | |
| | 33,747 | | | Dunkin’ Brands Group Inc | | | | | | | | | | | 2,201,317 | |
| | 33,299 | | | Marriott International Inc, Class A | | | | | | | | | | | 2,854,723 | |
| | 54,028 | | | McDonald’s Corp | | | | | | | | | | | 9,966,545 | |
| | 16,077 | | | Restaurant Brands International Inc | | | | | | | | | | | 878,287 | |
| | 17,028 | | | Wynn Resorts Ltd | | | | | | | | | | | 1,268,416 | |
| | | | Total Hotels, Restaurants & Leisure | | | | | | | | | | | 17,843,885 | |
| | | | |
| | | | Household Durables – 0.5% | | | | | | | | | |
| | | | |
| | 20,159 | | | Garmin Ltd | | | | | | | | | | | 1,965,502 | |
| | 32,967 | | | KB Home | | | | | | | | | | | 1,011,428 | |
| | 60,892 | | | Newell Brands Inc | | | | | | | | | | | 966,965 | |
| | 8,123 | | | TopBuild Corp, (3) | | | | | | | | | | | 924,154 | |
| | 10,026 | | | Whirlpool Corp | | | | | | | | | | | 1,298,668 | |
| | | | Total Household Durables | | | | | | | | | | | 6,166,717 | |
| | | | |
| | | | Household Products – 2.1% | | | | | | | | | |
| | | | |
| | 99,150 | | | Colgate-Palmolive Co | | | | | | | | | | | 7,263,729 | |
| | 168,391 | | | Procter & Gamble Co | | | | | | | | | | | 20,134,512 | |
28
| | | | | | | | | | | | | | | | |
| Shares | | | Description (1) | | | | | | | | Value | |
| | | | |
| | | | Household Products (continued) | | | | | | | | | |
| | | | |
| | 1,338 | | | Spectrum Brands Holdings Inc | | | | | | | | | | $ | 61,414 | |
| | | | Total Household Products | | | | | | | | | | | 27,459,655 | |
| | | | |
| | | | Industrial Conglomerates – 1.4% | | | | | | | | | |
| | | | |
| | 38,682 | | | 3M Co | | | | | | | | | | | 6,034,005 | |
| | 547,039 | | | General Electric Co | | | | | | | | | | | 3,736,276 | |
| | 59,111 | | | Honeywell International Inc | | | | | | | | | | | 8,546,860 | |
| | | | Total Industrial Conglomerates | | | | | | | | | | | 18,317,141 | |
| | | | |
| | | | Insurance – 2.0% | | | | | | | | | |
| | | | |
| | 2,535 | | | Alleghany Corp | | | | | | | | | | | 1,239,970 | |
| | 49,044 | | | Allstate Corp | | | | | | | | | | | 4,756,778 | |
| | 49,370 | | | Arthur J Gallagher & Co | | | | | | | | | | | 4,813,081 | |
| | 37,130 | | | CNO Financial Group Inc | | | | | | | | | | | 578,114 | |
| | 23,577 | | | Fidelity National Financial Inc | | | | | | | | | | | 722,871 | |
| | 32,421 | | | Genworth Financial Inc, Class A, (3) | | | | | | | | | | | 74,892 | |
| | 38,545 | | | Hartford Financial Services Group Inc | | | | | | | | | | | 1,485,910 | |
| | 4,703 | | | Kemper Corp | | | | | | | | | | | 341,062 | |
| | 36,418 | | | Lincoln National Corp | | | | | | | | | | | 1,339,818 | |
| | 58,537 | | | Loews Corp | | | | | | | | | | | 2,007,234 | |
| | 7,573 | | | RenaissanceRe Holdings Ltd | | | | | | | | | | | 1,295,210 | |
| | 35,640 | | | Travelers Cos Inc | | | | | | | | | | | 4,064,742 | |
| | 48,100 | | | W R Berkley Corp | | | | | | | | | | | 2,755,649 | |
| | | | Total Insurance | | | | | | | | | | | 25,475,331 | |
| | | | |
| | | | Interactive Media & Services – 5.7% | | | | | | | | | |
| | | | |
| | 17,158 | | | Alphabet Inc, Class A (3) | | | | | | | | | | | 24,330,902 | |
| | 13,564 | | | Alphabet Inc, Class B (3) | | | | | | | | | | | 19,174,206 | |
| | 132,220 | | | Facebook Inc, Class A (3) | | | | | | | | | | | 30,023,195 | |
| | | | Total Interactive Media & Services | | | | | | | | | | | 73,528,303 | |
| | | | |
| | | | Internet & Direct Marketing Retail – 4.9% | | | | | | | | | |
| | | | |
| | 20,942 | | | Amazon.com Inc, (3) | | | | | | | | | | | 57,775,208 | |
| | 2,808 | | | Booking Holdings Inc, (3) | | | | | | | | | | | 4,471,291 | |
| | 13,807 | | | JD.com Inc, ADR (3) | | | | | | | | | | | 830,905 | |
| | | | Total Internet & Direct Marketing Retail | | | | | | | | | | | 63,077,404 | |
| | | | |
| | | | IT Services – 5.5% | | | | | | | | | |
| | | | |
| | 24,108 | | | Akamai Technologies Inc, (3) | | | | | | | | | | | 2,581,726 | |
| | 46,162 | | | Automatic Data Processing Inc | | | | | | | | | | | 6,873,060 | |
| | 16,990 | | | Black Knight Inc, (3) | | | | | | | | | | | 1,232,794 | |
| | 48,062 | | | Fidelity National Information Services Inc | | | | | | | | | | | 6,444,634 | |
| | 58,770 | | | Mastercard Inc, Class A | | | | | | | | | | | 17,378,289 | |
| | 68,770 | | | PayPal Holdings Inc, (3) | | | | | | | | | | | 11,981,797 | |
| | 808 | | | Shopify Inc, (3) | | | | | | | | | | | 766,954 | |
| | 3,537 | | | Twilio Inc, Class A (3) | | | | | | | | | | | 776,088 | |
| | 17,828 | | | VeriSign Inc, (3) | | | | | | | | | | | 3,687,365 | |
| | 96,311 | | | Visa Inc, Class A | | | | | | | | | | | 18,604,396 | |
| | | | Total IT Services | | | | | | | | | | | 70,327,103 | |
| | | | |
| | | | Leisure Products – 0.1% | | | | | | | | | |
| | | | |
| | 25,861 | | | Mattel Inc, (3) | | | | | | | | | | | 250,076 | |
| | 6,048 | | | Polaris Inc | | | | | | | | | | | 559,742 | |
| | | | Total Leisure Products | | | | | | | | | | | 809,818 | |
| | | | |
| | | | Life Sciences Tools & Services – 1.1% | | | | | | | | | |
| | | | |
| | 10,876 | | | Illumina Inc, (3) | | | | | | | | | | | 4,027,927 | |
| | 26,382 | | | Thermo Fisher Scientific Inc | | | | | | | | | | | 9,559,254 | |
| | | | Total Life Sciences Tools & Services | | | | | | | | | | | 13,587,181 | |
29
| | |
| |
| BXMX | | Nuveen S&P 500 Buy-Write Income Fund (continued) |
| | Portfolio of Investments June 30, 2020 |
| | (Unaudited) |
| | | | | | | | | | | | | | | | |
| Shares | | | Description (1) | | | | | | | | Value | |
| | | | |
| | | | Machinery – 1.3% | | | | | | | | | |
| | | | |
| | 39,124 | | | Caterpillar Inc | | | | | | | | | | $ | 4,949,186 | |
| | 53,690 | | | Graco Inc | | | | | | | | | | | 2,576,583 | |
| | 39,784 | | | Otis Worldwide Corp | | | | | | | | | | | 2,262,118 | |
| | 19,491 | | | Parker-Hannifin Corp | | | | | | | | | | | 3,572,116 | |
| | 16,044 | | | Stanley Black & Decker Inc | | | | | | | | | | | 2,236,213 | |
| | 10,383 | | | Timken Co | | | | | | | | | | | 472,323 | |
| | 4,597 | | | Woodward Inc | | | | | | | | | | | 356,497 | |
| | | | Total Machinery | | | | | | | | | | | 16,425,036 | |
| | | | |
| | | | Media – 1.1% | | | | | | | | | |
| | | | |
| | 260,291 | | | Comcast Corp, Class A | | | | | | | | | | | 10,146,143 | |
| | 25,183 | | | New York Times Co, Class A | | | | | | | | | | | 1,058,441 | |
| | 79,467 | | | News Corp, Class A | | | | | | | | | | | 942,479 | |
| | 41,813 | | | Omnicom Group Inc | | | | | | | | | | | 2,282,990 | |
| | | | Total Media | | | | | | | | | | | 14,430,053 | |
| | | | |
| | | | Metals & Mining – 0.4% | | | | | | | | | |
| | | | |
| | 15,614 | | | Arconic Corp, (3) | | | | | | | | | | | 217,503 | |
| | 13,907 | | | Barrick Gold Corp | | | | | | | | | | | 374,655 | |
| | 55,044 | | | Newmont Corp | | | | | | | | | | | 3,398,416 | |
| | 38,277 | | | Nucor Corp | | | | | | | | | | | 1,585,051 | |
| | | | Total Metals & Mining | | | | | | | | | | | 5,575,625 | |
| | | | |
| | | | Mortgage Real Estate Investment Trust – 0.0% | | | | | | | | | |
| | | | |
| | 26,802 | | | Annaly Capital Management Inc | | | | | | | | | | | 175,821 | |
| | | | |
| | | | Multiline Retail – 0.4% | | | | | | | | | |
| | | | |
| | 25,320 | | | Macy’s Inc | | | | | | | | | | | 174,202 | |
| | 16,563 | | | Nordstrom Inc | | | | | | | | | | | 256,561 | |
| | 35,449 | | | Target Corp | | | | | | | | | | | 4,251,398 | |
| | | | Total Multiline Retail | | | | | | | | | | | 4,682,161 | |
| | | | |
| | | | Multi-Utilities – 1.0% | | | | | | | | | |
| | | | |
| | 59,539 | | | Ameren Corp | | | | | | | | | | | 4,189,164 | |
| | 17,519 | | | NorthWestern Corp | | | | | | | | | | | 955,136 | |
| | 60,957 | | | Public Service Enterprise Group Inc | | | | | | | | | | | 2,996,646 | |
| | 49,765 | | | WEC Energy Group Inc | | | | | | | | | | | 4,361,902 | |
| | | | Total Multi-Utilities | | | | | | | | | | | 12,502,848 | |
| | | | |
| | | | Oil, Gas & Consumable Fuels – 2.5% | | | | | | | | | |
| | | | |
| | 34,337 | | | Cenovus Energy Inc | | | | | | | | | | | 160,354 | |
| | 18,536 | | | Cheniere Energy Inc, (3) | | | | | | | | | | | 895,660 | |
| | 102,809 | | | Chevron Corp | | | | | | | | | | | 9,173,647 | |
| | 18,691 | | | CNX Resources Corp, (3) | | | | | | | | | | | 161,677 | |
| | 81,811 | | | ConocoPhillips | | | | | | | | | | | 3,437,698 | |
| | 18,701 | | | Continental Resources Inc | | | | | | | | | | | 327,829 | |
| | 234,625 | | | Exxon Mobil Corp | | | | | | | | | | | 10,492,430 | |
| | 32,046 | | | Hess Corp | | | | | | | | | | | 1,660,303 | |
| | 42,055 | | | Marathon Petroleum Corp | | | | | | | | | | | 1,572,016 | |
| | 17,934 | | | Ovintiv Inc | | | | | | | | | | | 171,270 | |
| | 33,181 | | | Phillips 66 | | | | | | | | | | | 2,385,714 | |
| | 26,407 | | | Suncor Energy Inc | | | | | | | | | | | 445,222 | |
| | 27,570 | | | Valero Energy Corp | | | | | | | | | | | 1,621,667 | |
| | | | Total Oil, Gas & Consumable Fuels | | | | | | | | | | | 32,505,487 | |
| | | | |
| | | | Pharmaceuticals – 4.8% | | | | | | | | | |
| | | | |
| | 142,852 | | | Bristol-Myers Squibb Co | | | | | | | | | | | 8,399,698 | |
| | 51,917 | | | Eli Lilly and Co | | | | | | | | | | | 8,523,733 | |
| | 158,366 | | | Johnson & Johnson | | | | | | | | | | | 22,271,011 | |
| | 135,529 | | | Merck & Co Inc | | | | | | | | | | | 10,480,457 | |
| | 349,586 | | | Pfizer Inc | | | | | | | | | | | 11,431,462 | |
| | | | Total Pharmaceuticals | | | | | | | | | | | 61,106,361 | |
30
| | | | | | | | | | | | | | | | |
| Shares | | | Description (1) | | | | | | | | Value | |
| | | | |
| | | | Professional Services – 0.4% | | | | | | | | | |
| | | | |
| | 2,577 | | | CoStar Group Inc, (3) | | | | | | | | | | $ | 1,831,397 | |
| | 9,803 | | | ManpowerGroup Inc | | | | | | | | | | | 673,956 | |
| | 25,509 | | | TransUnion | | | | | | | | | | | 2,220,303 | |
| | | | Total Professional Services | | | | | | | | | | | 4,725,656 | |
| | | | |
| | | | Road & Rail – 0.9% | | | | | | | | | |
| | | | |
| | 8,512 | | | Canadian Pacific Railway Ltd | | | | | | | | | | | 2,173,454 | |
| | 4,425 | | | Lyft Inc, Class A (3) | | | | | | | | | | | 146,069 | |
| | 30,044 | | | Norfolk Southern Corp | | | | | | | | | | | 5,274,825 | |
| | 19,748 | | | Old Dominion Freight Line Inc | | | | | | | | | | | 3,349,064 | |
| | 14,397 | | | Uber Technologies Inc, (3) | | | | | | | | | | | 447,459 | |
| | | | Total Road & Rail | | | | | | | | | | | 11,390,871 | |
| | | | |
| | | | Semiconductors & Semiconductor Equipment – 4.8% | | | | | | | | | |
| | | | |
| | 72,738 | | | Advanced Micro Devices Inc, (3) | | | | | | | | | | | 3,826,746 | |
| | 81,004 | | | Applied Materials Inc | | | | | | | | | | | 4,896,692 | |
| | 24,355 | | | Broadcom Inc | | | | | | | | | | | 7,686,682 | |
| | 233,743 | | | Intel Corp | | | | | | | | | | | 13,984,844 | |
| | 12,579 | | | Lam Research Corp | | | | | | | | | | | 4,068,803 | |
| | 30,694 | | | Marvell Technology Group Ltd | | | | | | | | | | | 1,076,132 | |
| | 80,261 | | | Micron Technology Inc, (3) | | | | | | | | | | | 4,135,047 | |
| | 35,196 | | | NVIDIA Corp | | | | | | | | | | | 13,371,312 | |
| | 5,962 | | | NXP Semiconductors NV | | | | | | | | | | | 679,906 | |
| | 673 | | | ON Semiconductor Corp, (3) | | | | | | | | | | | 13,339 | |
| | 84,082 | | | QUALCOMM Inc | | | | | | | | | | | 7,669,119 | |
| | | | Total Semiconductors & Semiconductor Equipment | | | | | | | | | | | 61,408,622 | |
| | | | |
| | | | Software – 9.5% | | | | | | | | | |
| | | | |
| | 31,621 | | | Adobe Inc, (3) | | | | | | | | | | | 13,764,937 | |
| | 18,116 | | | Autodesk Inc, (3) | | | | | | | | | | | 4,333,166 | |
| | 552 | | | CDK Global Inc | | | | | | | | | | | 22,864 | |
| | 10,744 | | | Check Point Software Technologies Ltd, (3) | | | | | | | | | | | 1,154,228 | |
| | 384,441 | | | Microsoft Corp | | | | | | | | | | | 78,237,588 | |
| | 138,264 | | | Oracle Corp | | | | | | | | | | | 7,641,851 | |
| | 3,531 | | | Palo Alto Networks Inc, (3) | | | | | | | | | | | 810,965 | |
| | 53,766 | | | salesforce.com Inc, (3) | | | | | | | | | | | 10,071,985 | |
| | 12,353 | | | ServiceNow Inc, (3) | | | | | | | | | | | 5,003,706 | |
| | 1,277 | | | Zoom Video Communications Inc, Class A (3) | | | | | | | | | | | 323,771 | |
| | | | Total Software | | | | | | | | | | | 121,365,061 | |
| | | | |
| | | | Specialty Retail – 2.9% | | | | | | | | | |
| | | | |
| | 8,358 | | | American Eagle Outfitters Inc | | | | | | | | | | | 91,102 | |
| | 27,950 | | | Best Buy Co Inc | | | | | | | | | | | 2,439,196 | |
| | 4,047 | | | Burlington Stores Inc, (3) | | | | | | | | | | | 796,976 | |
| | 21,763 | | | CarMax Inc, (3) | | | | | | | | | | | 1,948,876 | |
| | 3,114 | | | Five Below Inc, (3) | | | | | | | | | | | 332,918 | |
| | 61,386 | | | Home Depot Inc | | | | | | | | | | | 15,377,807 | |
| | 65,156 | | | Lowe’s Cos Inc | | | | | | | | | | | 8,803,879 | |
| | 23,778 | | | Ross Stores Inc | | | | | | | | | | | 2,026,837 | |
| | 96,004 | | | TJX Cos Inc | | | | | | | | | | | 4,853,962 | |
| | | | Total Specialty Retail | | | | | | | | | | | 36,671,553 | |
| | | | |
| | | | Technology Hardware, Storage & Peripherals – 6.6% | | | | | | | | | |
| | | | |
| | 228,113 | | | Apple Inc | | | | | | | | | | | 83,215,622 | |
| | 6,851 | | | Dell Technologies Inc, Class C (3) | | | | | | | | | | | 376,394 | |
| | 18,578 | | | NetApp Inc | | | | | | | | | | | 824,306 | |
| | | | Total Technology Hardware, Storage & Peripherals | | | | | | | | | | | 84,416,322 | |
| | | | |
| | | | Textiles, Apparel & Luxury Goods – 0.4% | | | | | | | | | |
| | | | |
| | 6,689 | | | Kontoor Brands Inc | | | | | | | | | | | 119,131 | |
| | 5,239 | | | Lululemon Athletica Inc, (3) | | | | | | | | | | | 1,634,620 | |
31
| | |
| |
| BXMX | | Nuveen S&P 500 Buy-Write Income Fund (continued) |
| | Portfolio of Investments June 30, 2020 |
| | (Unaudited) |
| | | | | | | | | | | | | | | | |
| Shares | | | Description (1) | | | | | | | | Value | |
| | | | |
| | | | Textiles, Apparel & Luxury Goods (continued) | | | | | | | | | |
| | | | |
| | 45,834 | | | VF Corp | | | | | | | | | | $ | 2,793,124 | |
| | | | Total Textiles, Apparel & Luxury Goods | | | | | | | | | | | 4,546,875 | |
| | | | |
| | | | Thrifts & Mortgage Finance – 0.0% | | | | | | | | | |
| | | | |
| | 48,313 | | | MGIC Investment Corp | | | | | | | | | | | 395,684 | |
| | | | |
| | | | Tobacco – 1.1% | | | | | | | | | |
| | | | |
| | 153,069 | | | Altria Group Inc | | | | | | | | | | | 6,007,958 | |
| | 29,443 | | | British American Tobacco PLC | | | | | | | | | | | 1,142,977 | |
| | 93,721 | | | Philip Morris International Inc | | | | | | | | | | | 6,566,094 | |
| | | | Total Tobacco | | | | | | | | | | | 13,717,029 | |
| | | | |
| | | | Trading Companies & Distributors – 0.1% | | | | | | | | | |
| | | | |
| | 40,519 | | | HD Supply Holdings Inc, (3) | | | | | | | | | | | 1,403,983 | |
| | | | Total Long-Term Investments (cost $591,537,113) | | | | | | | | | | | 1,277,181,227 | |
| | | | |
Principal
Amount (000) | | | Description (1) | | Coupon | | | Maturity | | | Value | |
| | | | |
| | | | SHORT-TERM INVESTMENTS – 5.1% | | | | | | | | | | | | |
| | | | |
| | | | REPURCHASE AGREEMENTS – 5.1% | | | | | | | | | |
| | | | |
| $ | 65,503 | | | Repurchase Agreement with Fixed Income Clearing Corporation, dated 6/30/20,
repurchase price $65,503,311, collateralized by $57,017,700, U.S. Treasury Notes,
0.625%, due 1/15/26, value $66,813,449 | | | 0.000% | | | | 7/01/20 | | | $ | 65,503,311 | |
|
| | | | Total Short-Term Investments (cost $65,503,311) | | | | | | | | | | | 65,503,311 | |
| | | | Total Investments (cost $657,040,424) – 104.7% | | | | | | | | | | | 1,342,684,538 | |
| | | | Other Assets Less Liabilities – (4.7)% (4) | | | | | | | | | | | (59,841,831 | ) |
| | | | Net Assets – 100% | | | | | | | | | | $ | 1,282,842,707 | |
Investments in Derivatives
Options Written
| | | | | | | | | | | | | | | | | | | | | | | | |
| Description (5) | | Type | | | Number of
Contracts | | | Notional
Amount (6) | | | Exercise
Price | | | Expiration
Date | | | Value | |
S&P 500® Index | | | Call | | | | (453 | ) | | $ | (137,032,500 | ) | | $ | 3,025 | | | | 7/17/20 | | | $ | (4,998,855 | ) |
S&P 500® Index | | | Call | | | | (453 | ) | | | (138,165,000 | ) | | | 3,050 | | | | 7/17/20 | | | | (4,176,660 | ) |
S&P 500® Index | | | Call | | | | (453 | ) | | | (139,297,500 | ) | | | 3,075 | | | | 7/17/20 | | | | (3,411,090 | ) |
S&P 500® Index | | | Call | | | | (454 | ) | | | (140,740,000 | ) | | | 3,100 | | | | 7/17/20 | | | | (2,712,650 | ) |
S&P 500® Index | | | Call | | | | (453 | ) | | | (146,092,500 | ) | | | 3,225 | | | | 7/31/20 | | | | (1,186,860 | ) |
S&P 500® Index | | | Call | | | | (454 | ) | | | (141,875,000 | ) | | | 3,125 | | | | 8/21/20 | | | | (4,269,870 | ) |
S&P 500® Index | | | Call | | | | (454 | ) | | | (143,010,000 | ) | | | 3,150 | | | | 8/21/20 | | | | (3,645,620 | ) |
S&P 500® Index | | | Call | | | | (451 | ) | | | (148,830,000 | ) | | | 3,300 | | | | 8/21/20 | | | | (1,062,105 | ) |
S&P 500® Index | | | Call | | | | (453 | ) | | | (144,960,000 | ) | | | 3,200 | | | | 8/21/20 | | | | (2,536,800 | ) |
Total Options Written (premiums received $38,420,215) | | | | (4,078 | ) | | $ | (1,280,002,500 | ) | | | | | | | | | | $ | (28,000,510 | ) |
32
For Fund portfolio compliance purposes, the Fund’s industry classifications refer to any one or more of the industry sub-classifications used by one or more widely recognized market indexes or ratings group indexes, and/or as defined by Fund management. This definition may not apply for purposes of this report, which may combine industry sub-classifications into sectors for reporting ease.
| (1) | All percentages shown in the Portfolio of Investments are based on net assets applicable to common shares unless otherwise noted. |
| (2) | The Fund may designate up to 100% of its common stock investments to cover outstanding options written. |
| (3) | Non-income producing; issuer has not declared a dividend within the past twelve months. |
| (4) | Other assets less liabilities includes the unrealized appreciation (depreciation) of certain over-the-counter (“OTC”) derivatives as resented on the Statement of Assets and Liabilities, when applicable. The unrealized appreciation (depreciation) of OTC cleared and exchange-traded derivatives is recognized as part of the cash collateral at brokers and/or the receivable or payable for variation margin as presented on the Statement of Assets and Liabilities, when applicable. Other assets less liabilities also includes the value of options as resented on the Statement of Assets and Liabilities. |
| (5) | Exchange-traded, unless otherwise noted. |
| (6) | For disclosure purposes, Notional Amount is calculated by multiplying the Number of Contracts by the Exercise Price by 100. |
| REIT | Real Estate Investment Trust. |
| ADR | American Depositary Receipt |
See accompanying notes to financial statements.
33
| | |
| DIAX | | Nuveen Dow 30SM Dynamic
Overwrite Fund Portfolio of Investments June 30, 2020 |
| | | (Unaudited) |
| | | | | | | | | | | | | | | | |
| Shares | | | Description (1) | | | | | | | | Value | |
| | | | |
| | | | LONG-TERM INVESTMENTS – 100.5% | | | | | | | | | | | | |
| | | | |
| | | | COMMON STOCKS – 100.5% | | | | | | | | | | | | |
| | | | |
| | | | Aerospace & Defense – 6.5% | | | | | | | | | |
| | | | |
| | 145,000 | | | Boeing Co, (2), (3) | | | | | | | | | | $ | 26,578,500 | |
| | 145,000 | | | Raytheon Technologies Corp, (3) | | | | | | | | | | | 8,934,900 | |
| | | | Total Aerospace & Defense | | | | | | | | | | | 35,513,400 | |
| | | | |
| | | | Banks – 2.5% | | | | | | | | | |
| | | | |
| | 145,000 | | | JPMorgan Chase & Co | | | | | | | | | | | 13,638,700 | |
| | | | |
| | | | Beverages – 1.2% | | | | | | | | | |
| | | | |
| | 145,000 | | | Coca-Cola Co | | | | | | | | | | | 6,478,600 | |
| | | | |
| | | | Capital Markets – 5.3% | | | | | | | | | |
| | | | |
| | 145,000 | | | Goldman Sachs Group Inc, (3) | | | | | | | | | | | 28,654,900 | |
| | | | |
| | | | Chemicals – 1.1% | | | | | | | | | |
| | | | |
| | 145,000 | | | Dow Inc | | | | | | | | | | | 5,910,200 | |
| | | | |
| | | | Communications Equipment – 1.2% | | | | | | | | | |
| | | | |
| | 145,000 | | | Cisco Systems Inc | | | | | | | | | | | 6,762,800 | |
| | | | |
| | | | Consumer Finance – 2.5% | | | | | | | | | |
| | | | |
| | 145,000 | | | American Express Co, (3) | | | | | | | | | | | 13,804,000 | |
| | | | |
| | | | Diversified Telecommunication Services – 1.5% | | | | | | | | | |
| | | | |
| | 145,000 | | | Verizon Communications Inc, (3) | | | | | | | | | | | 7,993,850 | |
| | | | |
| | | | Entertainment – 3.0% | | | | | | | | | |
| | | | |
| | 145,000 | | | Walt Disney Co, (2), (3) | | | | | | | | | | | 16,168,950 | |
| | | | |
| | | | Food & Staples Retailing – 4.3% | | | | | | | | | |
| | | | |
| | 145,000 | | | Walgreens Boots Alliance Inc | | | | | | | | | | | 6,146,550 | |
| | 145,000 | | | Walmart Inc, (3) | | | | | | | | | | | 17,368,100 | |
| | | | Total Food & Staples Retailing | | | | | | | | | | | 23,514,650 | |
| | | | |
| | | | Health Care Providers & Services – 7.9% | | | | | | | | | |
| | | | |
| | 145,000 | | | UnitedHealth Group Inc, (3) | | | | | | | | | | | 42,767,750 | |
| | | | |
| | | | Hotels, Restaurants & Leisure – 4.9% | | | | | | | | | |
| | | | |
| | 145,000 | | | McDonald’s Corp, (3) | | | | | | | | | | | 26,748,150 | |
| | | | |
| | | | Household Products – 3.2% | | | | | | | | | |
| | | | |
| | 145,000 | | | Procter & Gamble Co, (3) | | | | | | | | | | | 17,337,650 | |
| | | | |
| | | | Industrial Conglomerates – 4.2% | | | | | | | | | |
| | | | |
| | 145,000 | | | 3M Co, (3) | | | | | | | | | | | 22,618,550 | |
| | | | |
| | | | Insurance – 3.1% | | | | | | | | | |
| | | | |
| | 145,000 | | | Travelers Cos Inc, (3) | | | | | | | | | | | 16,537,250 | |
| | | | |
| | | | IT Services – 8.4% | | | | | | | | | |
| | | | |
| | 145,000 | | | International Business Machines Corp, (3) | | | | | | | | | | | 17,511,650 | |
34
| | | | | | | | | | | | | | | | |
| Shares | | | Description (1) | | | | | | | | Value | |
| | | | |
| | | | IT Services (continued) | | | | | | | | | |
| | | | |
| | 145,000 | | | Visa Inc, Class A, (3) | | | | | | | | | | $ | 28,009,650 | |
| | | | Total IT Services | | | | | | | | | | | 45,521,300 | |
| | | | |
| | | | Machinery – 3.4% | | | | | | | | | |
| | | | |
| | 145,000 | | | Caterpillar Inc | | | | | | | | | | | 18,342,500 | |
| | | | |
| | | | Oil, Gas & Consumable Fuels – 3.6% | | | | | | | | | |
| | | | |
| | 145,000 | | | Chevron Corp, (3) | | | | | | | | | | | 12,938,350 | |
| | 145,000 | | | Exxon Mobil Corp | | | | | | | | | | | 6,484,400 | |
| | | | Total Oil, Gas & Consumable Fuels | | | | | | | | | | | 19,422,750 | |
| | | | |
| | | | Pharmaceuticals – 6.7% | | | | | | | | | |
| | | | |
| | 145,000 | | | Johnson & Johnson | | | | | | | | | | | 20,391,350 | |
| | 145,000 | | | Merck & Co Inc | | | | | | | | | | | 11,212,850 | |
| | 145,000 | | | Pfizer Inc, (3) | | | | | | | | | | | 4,741,500 | |
| | | | Total Pharmaceuticals | | | | | | | | | | | 36,345,700 | |
| | | | |
| | | | Semiconductors & Semiconductor Equipment – 1.6% | | | | | | | | | |
| | | | |
| | 145,000 | | | Intel Corp | | | | | | | | | | | 8,675,350 | |
| | | | |
| | | | Software – 5.4% | | | | | | | | | |
| | | | |
| | 145,000 | | | Microsoft Corp | | | | | | | | | | | 29,508,950 | |
| | | | |
| | | | Specialty Retail – 6.7% | | | | | | | | | |
| | | | |
| | 145,000 | | | Home Depot Inc | | | | | | | | | | | 36,323,950 | |
| | | | |
| | | | Technology Hardware, Storage & Peripherals – 9.7% | | | | | | | | | |
| | | | |
| | 145,000 | | | Apple Inc, (3) | | | | | | | | | | | 52,896,000 | |
| | | | |
| | | | Textiles, Apparel & Luxury Goods – 2.6% | | | | | | | | | |
| | | | |
| | 145,000 | | | NIKE Inc, Class A | | | | | | | | | | | 14,217,250 | |
| | | | Total Long-Term Investments (cost $241,110,540) | | | | | | | | | | | 545,703,150 | |
| | | | |
Principal
Amount (000) | | | Description (1) | | Coupon | | | Maturity | | | Value | |
| | | | |
| | | | SHORT-TERM INVESTMENTS – 0.0% | | | | | | | | | | | | |
| | | | |
| | | | REPURCHASE AGREEMENTS – 0.0% | | | | | | | | | |
| | | | |
| $ | 188 | | | Repurchase Agreement with Fixed Income Clearing Corporation, dated 6/30/20,
repurchase price $188,323, collateralized by $170,900, U.S. Treasury Notes,
2.625%, due 12/31/25, value $192,156 | | | 0.000% | | | | 7/01/20 | | | $ | 188,323 | |
| | | | Total Short-Term Investments (cost $188,323) | | | | | | | | | | | 188,323 | |
| | | | Total Investments (cost $241,298,863) – 100.5% | | | | | | | | | | | 545,891,473 | |
| | | | Other Assets Less Liabilities – (0.5)% (4) | | | | | | | | | | | (2,875,357 | ) |
| | | | Net Assets – 100% | | | | | | | | | | $ | 543,016,116 | |
35
| | |
| |
| DIAX | | Nuveen Dow 30SM Dynamic Overwrite Fund (continued) |
| | Portfolio of Investments June 30, 2020 |
| | (Unaudited) |
Investments in Derivatives
Options Purchased
| | | | | | | | | | | | | | | | | | | | | | | | |
| Description (5) | | Type | | | Number of
Contracts | | | Notional
Amount (6) | | | Exercise
Price | | | Expiration
Date | | | Value | |
Merck + Co Inc | | | Call | | | | 100 | | | $ | 825,000 | | | $ | 82.5 | | | | 7/17/20 | | | $ | 2,150 | |
Pfizer Inc | | | Call | | | | 100 | | | | 350,000 | | | | 35.0 | | | | 7/17/20 | | | | 1,850 | |
Total Options Purchased (premiums paid $11,602) | | | | 200 | | | $ | 1,175,000 | | | | | | | | | | | $ | 4,000 | |
Options Written
| | | | | | | | | | | | | | | | | | | | | | | | |
| Description (5) | | Type | | | Number of
Contracts | | | Notional
Amount (6) | | | Exercise
Price | | | Expiration
Date | | | Value | |
S&P 500® Index | | | Put | | | | (55 | ) | | $ | (14,850,000 | ) | | $ | 2,700 | | | | 7/17/20 | | | $ | (33,000 | ) |
S&P 500® Index | | | Call | | | | (975 | ) | | | (305,662,500 | ) | | | 3,135 | | | | 7/17/20 | | | | (3,978,000 | ) |
Total Options Written (premiums received $7,608,172) | | | | (1,030 | ) | | $ | (320,512,500 | ) | | | | | | | | | | $ | (4,011,000 | ) |
For Fund portfolio compliance purposes, the Fund’s industry classifications refer to any one or more of the industry sub-classifications used by one or more widely recognized market indexes or ratings group indexes, and/or as defined by Fund management. This definition may not apply for purposes of this report, which may combine industry sub-classifications into sectors for reporting ease.
| (1) | All percentages shown in the Portfolio of Investments are based on net assets applicable to common shares unless otherwise noted. |
| (2) | Non-income producing; issuer has not declared a dividend within the past twelve months. |
| (3) | Investment, or portion of investment, has been pledged to collateralized the net payment obligations for investments in derivatives. |
| (4) | Other assets less liabilities includes the unrealized appreciation (depreciation) of certain over-the-counter (“OTC”) derivatives as presented on the Statement of Assets and Liabilities, when applicable. The unrealized appreciation (depreciation) of OTC cleared and exchange-traded derivatives is recognized as part of the cash collateral at brokers and/or the receivable or payable for variation margin as presented on the Statement of Assets and Liabilities, when applicable. Other assets less liabilities also includes the value of options as presented on the Statement of Assets and Liabilities. |
| (5) | Exchange-traded, unless otherwise noted. |
| (6) | For disclosure purposes, Notional Amount is calculated by multiplying the Number of Contracts by the Exercise Price by 100. |
See accompanying notes to financial statements.
36
| | |
| SPXX | | Nuveen S&P 500 Dynamic
Overwrite Fund Portfolio of Investments June 30, 2020 |
| | | (Unaudited) |
| | | | | | | | | | | | | | | | |
| Shares | | | Description (1) | | | | | | | | Value | |
| | | | |
| | | | LONG-TERM INVESTMENTS – 100.5% | | | | | | | | | | | | |
| | | | |
| | | | COMMON STOCKS – 100.5% | | | | | | | | | | | | |
| | | | |
| | | | Aerospace & Defense – 1.9% | | | | | | | | | |
| | | | |
| | 7,744 | | | Boeing Co, (2) | | | | | | | | | | $ | 1,419,475 | |
| | 10,748 | | | Carrier Global Corp, (2) | | | | | | | | | | | 238,821 | |
| | 3,921 | | | Lockheed Martin Corp | | | | | | | | | | | 1,430,851 | |
| | 23,937 | | | Raytheon Technologies Corp | | | | | | | | | | | 1,474,998 | |
| | | | Total Aerospace & Defense | | | | | | | | | | | 4,564,145 | |
| | | | |
| | | | Air Freight & Logistics – 0.6% | | | | | | | | | |
| | | | |
| | 13,373 | | | United Parcel Service Inc, Class B | | | | | | | | | | | 1,486,810 | |
| | | | |
| | | | Airlines – 0.2% | | | | | | | | | |
| | | | |
| | 7,923 | | | Alaska Air Group Inc, (2) | | | | | | | | | | | 287,288 | |
| | 6,558 | | | JetBlue Airways Corp, (2) | | | | | | | | | | | 71,482 | |
| | | | Total Airlines | | | | | | | | | | | 358,770 | |
| | | | |
| | | | Auto Components – 0.1% | | | | | | | | | |
| | | | |
| | 7,012 | | | Cooper Tire & Rubber Co | | | | | | | | | | | 193,601 | |
| | | | |
| | | | Automobiles – 0.2% | | | | | | | | | |
| | | | |
| | 70,870 | | | Ford Motor Co, (2), (3) | | | | | | | | | | | 430,890 | |
| | | | |
| | | | Banks – 4.6% | | | | | | | | | |
| | | | |
| | 107,486 | | | Bank of America Corp, (3) | | | | | | | | | | | 2,552,793 | |
| | 27,326 | | | Citigroup Inc | | | | | | | | | | | 1,396,359 | |
| | 11,203 | | | Comerica Inc | | | | | | | | | | | 426,834 | |
| | 11,385 | | | Fifth Third Bancorp | | | | | | | | | | | 219,503 | |
| | 43,724 | | | Huntington Bancshares Inc/OH, (3) | | | | | | | | | | | 395,046 | |
| | 40,080 | | | JPMorgan Chase & Co | | | | | | | | | | | 3,769,925 | |
| | 29,969 | | | Regions Financial Corp | | | | | | | | | | | 333,255 | |
| | 28,601 | | | US Bancorp | | | | | | | | | | | 1,053,089 | |
| | 38,257 | | | Wells Fargo & Co | | | | | | | | | | | 979,379 | |
| | | | Total Banks | | | | | | | | | | | 11,126,183 | |
| | | | |
| | | | Beverages – 2.3% | | | | | | | | | |
| | | | |
| | 6,192 | | | Brown-Forman Corp, Class B | | | | | | | | | | | 394,183 | |
| | 51,740 | | | Coca-Cola Co, (3) | | | | | | | | | | | 2,311,743 | |
| | 21,860 | | | PepsiCo Inc | | | | | | | | | | | 2,891,204 | |
| | | | Total Beverages | | | | | | | | | | | 5,597,130 | |
| | | | |
| | | | Biotechnology – 1.8% | | | | | | | | | |
| | | | |
| | 20,295 | | | AbbVie Inc, (3) | | | | | | | | | | | 1,992,563 | |
| | 10,022 | | | Amgen Inc | | | | | | | | | | | 2,363,789 | |
| | | | Total Biotechnology | | | | | | | | | | | 4,356,352 | |
| | | | |
| | | | Capital Markets – 2.8% | | | | | | | | | |
| | | | |
| | 20,949 | | | Charles Schwab Corp | | | | | | | | | | | 706,819 | |
| | 6,924 | | | CME Group Inc | | | | | | | | | | | 1,125,427 | |
| | 14,208 | | | Federated Hermes Inc | | | | | | | | | | | 336,730 | |
| | 6,744 | | | Goldman Sachs Group Inc | | | | | | | | | | | 1,332,749 | |
| | 12,113 | | | Intercontinental Exchange Inc | | | | | | | | | | | 1,109,551 | |
| | 26,689 | | | Morgan Stanley | | | | | | | | | | | 1,289,079 | |
| | 7,127 | | | T Rowe Price Group Inc | | | | | | | | | | | 880,184 | |
| | | | Total Capital Markets | | | | | | | | | | | 6,780,539 | |
37
| | |
| |
| SPXX | | Nuveen S&P 500 Dynamic Overwrite Fund (continued) |
| | Portfolio of Investments June 30, 2020 |
| | (Unaudited) |
| | | | | | | | | | | | | | | | |
| Shares | | | Description (1) | | | | | | | | Value | |
| | | | |
| | | | Chemicals – 1.8% | | | | | | | | | |
| | | | |
| | 10,836 | | | Corteva Inc | | | | | | | | | | $ | 290,296 | |
| | 10,837 | | | Dow Inc | | | | | | | | | | | 441,716 | |
| | 10,837 | | | DuPont de Nemours Inc | | | | | | | | | | | 575,770 | |
| | 7,833 | | | Eastman Chemical Co | | | | | | | | | | | 545,490 | |
| | 6,378 | | | Ecolab Inc | | | | | | | | | | | 1,268,903 | |
| | 7,286 | | | Olin Corp | | | | | | | | | | | 83,716 | |
| | 1,937 | | | Sherwin-Williams Co | | | | | | | | | | | 1,119,296 | |
| | | | Total Chemicals | | | | | | | | | | | 4,325,187 | |
| | | | |
| | | | Communications Equipment – 1.8% | | | | | | | | | |
| | | | |
| | 65,585 | | | Cisco Systems Inc, (3) | | | | | | | | | | | 3,058,885 | |
| | 1,729 | | | F5 Networks Inc, (2) | | | | | | | | | | | 241,161 | |
| | 7,286 | | | Motorola Solutions Inc | | | | | | | | | | | 1,020,987 | |
| | | | Total Communications Equipment | | | | | | | | | | | 4,321,033 | |
| | | | |
| | | | Consumer Finance – 0.5% | | | | | | | | | |
| | | | |
| | 13,662 | | | American Express Co | | | | | | | | | | | 1,300,622 | |
| | | | |
| | | | Containers & Packaging – 0.5% | | | | | | | | | |
| | | | |
| | 8,107 | | | Avery Dennison Corp | | | | | | | | | | | 924,928 | |
| | 8,835 | | | International Paper Co | | | | | | | | | | | 311,080 | |
| | | | Total Containers & Packaging | | | | | | | | | | | 1,236,008 | |
| | | | |
| | | | Diversified Financial Services – 1.2% | | | | | | | | | |
| | | | |
| | 16,034 | | | Berkshire Hathaway Inc, Class B, (2) | | | | | | | | | | | 2,862,229 | |
| | | | |
| | | | Diversified Telecommunication Services – 1.7% | | | | | | | | | |
| | | | |
| | 67,133 | | | AT&T Inc, (3) | | | | | | | | | | | 2,029,431 | |
| | 39,169 | | | Verizon Communications Inc, (3) | | | | | | | | | | | 2,159,387 | |
| | | | Total Diversified Telecommunication Services | | | | | | | | | | | 4,188,818 | |
| | | | |
| | | | Electric Utilities – 0.6% | | | | | | | | | |
| | | | |
| | 13,297 | | | Duke Energy Corp | | | | | | | | | | | 1,062,297 | |
| | 2,549 | | | IDACORP Inc | | | | | | | | | | | 222,706 | |
| | 5,647 | | | PNM Resources Inc | | | | | | | | | | | 217,071 | |
| | | | Total Electric Utilities | | | | | | | | | | | 1,502,074 | |
| | | | |
| | | | Electrical Equipment – 1.0% | | | | | | | | | |
| | | | |
| | 5,829 | | | Eaton Corp PLC | | | | | | | | | | | 509,921 | |
| | 8,927 | | | Emerson Electric Co | | | | | | | | | | | 553,742 | |
| | 8,378 | | | nVent Electric PLC | | | | | | | | | | | 156,920 | |
| | 6,015 | | | Rockwell Automation Inc | | | | | | | | | | | 1,281,195 | |
| | | | Total Electrical Equipment | | | | | | | | | | | 2,501,778 | |
| | | | |
| | | | Electronic Equipment, Instruments & Components – 0.3% | | | | | | | | | |
| | | | |
| | 31,607 | | | Corning Inc, (3) | | | | | | | | | | | 818,621 | |
| | | | |
| | | | Energy Equipment & Services – 0.1% | | | | | | | | | |
| | | | |
| | 16,030 | | | Schlumberger Ltd | | | | | | | | | | | 294,792 | |
| | 3,707 | | | Valaris plc, (2) | | | | | | | | | | | 2,416 | |
| | | | Total Energy Equipment & Services | | | | | | | | | | | 297,208 | |
| | | | |
| | | | Entertainment – 2.2% | | | | | | | | | |
| | | | |
| | 6,011 | | | Electronic Arts Inc, (2) | | | | | | | | | | | 793,753 | |
| | 5,558 | | | Netflix Inc, (2) | | | | | | | | | | | 2,529,112 | |
| | 17,760 | | | Walt Disney Co, (2) | | | | | | | | | | | 1,980,418 | |
| | | | Total Entertainment | | | | | | | | | | | 5,303,283 | |
| | | | |
| | | | Equity Real Estate Investment Trust – 0.7% | | | | | | | | | |
| | | | |
| | 4,007 | | | Corporate Office Properties Trust | | | | | | | | | | | 101,537 | |
| | 1,729 | | | CyrusOne Inc | | | | | | | | | | | 125,785 | |
38
| | | | | | | | | | | | | | | | |
| Shares | | | Description (1) | | | | | | | | Value | |
| | | | |
| | | | Equity Real Estate Investment Trust (continued) | | | | | | | | | |
| | | | |
| | 4,007 | | | Douglas Emmett Inc | | | | | | | | | | $ | 122,855 | |
| | 2,548 | | | EPR Properties | | | | | | | | | | | 84,415 | |
| | 4,463 | | | Healthcare Realty Trust Inc | | | | | | | | | | | 130,721 | |
| | 3,188 | | | JBG SMITH Properties | | | | | | | | | | | 94,269 | |
| | 1,455 | | | Life Storage Inc | | | | | | | | | | | 138,152 | |
| | 3,371 | | | National Retail Properties Inc | | | | | | | | | | | 119,603 | |
| | 3,188 | | | Prologis Inc | | | | | | | | | | | 297,536 | |
| | 12,113 | | | Sabra Health Care REIT Inc | | | | | | | | | | | 174,791 | |
| | 8,653 | | | Tanger Factory Outlet Centers Inc | | | | | | | | | | | 61,696 | |
| | 3,005 | | | Taubman Centers Inc | | | | | | | | | | | 113,469 | |
| | 5,465 | | | Urban Edge Properties | | | | | | | | | | | 64,870 | |
| | 17,241 | | | Washington Prime Group Inc | | | | | | | | | | | 14,496 | |
| | 7,833 | | | Weingarten Realty Investors | | | | | | | | | | | 148,279 | |
| | | | Total Equity Real Estate Investment Trust | | | | | | | | | | | 1,792,474 | |
| | | | |
| | | | Food & Staples Retailing – 0.7% | | | | | | | | | |
| | | | |
| | 13,662 | | | Walmart Inc | | | | | | | | | | | 1,636,434 | |
| | | | |
| | | | Food Products – 0.4% | | | | | | | | | |
| | | | |
| | 12,387 | | | Archer-Daniels-Midland Co | | | | | | | | | | | 494,241 | |
| | 15,667 | | | Conagra Brands Inc | | | | | | | | | | | 551,009 | |
| | | | Total Food Products | | | | | | | | | | | 1,045,250 | |
| | | | |
| | | | Health Care Equipment & Supplies – 2.8% | | | | | | | | | |
| | | | |
| | 24,047 | | | Abbott Laboratories | | | | | | | | | | | 2,198,617 | |
| | 36,435 | | | Boston Scientific Corp, (2), (3) | | | | | | | | | | | 1,279,233 | |
| | 2,189 | | | Intuitive Surgical Inc, (2) | | | | | | | | | | | 1,247,358 | |
| | 22,225 | | | Medtronic PLC | | | | | | | | | | | 2,038,033 | |
| | | | Total Health Care Equipment & Supplies | | | | | | | | | | | 6,763,241 | |
| | | | |
| | | | Health Care Providers & Services – 3.5% | | | | | | | | | |
| | | | |
| | 1,388 | | | Acadia Healthcare Co Inc, (2) | | | | | | | | | | | 34,867 | |
| | 4,100 | | | Anthem Inc | | | | | | | | | | | 1,078,218 | |
| | 14,028 | | | CVS Health Corp | | | | | | | | | | | 911,399 | |
| | 2,553 | | | Humana Inc | | | | | | | | | | | 989,926 | |
| | 6,192 | | | Laboratory Corp of America Holdings, (2) | | | | | | | | | | | 1,028,553 | |
| | 4,279 | | | McKesson Corp | | | | | | | | | | | 656,484 | |
| | 3,057 | | | Tenet Healthcare Corp, (2) | | | | | | | | | | | 55,362 | |
| | 12,300 | | | UnitedHealth Group Inc | | | | | | | | | | | 3,627,885 | |
| | | | Total Health Care Providers & Services | | | | | | | | | | | 8,382,694 | |
| | | | |
| | | | Hotels, Restaurants & Leisure – 1.8% | | | | | | | | | |
| | | | |
| | 3,551 | | | Darden Restaurants Inc, (2) | | | | | | | | | | | 269,059 | |
| | 12,756 | | | McDonald’s Corp | | | | | | | | | | | 2,353,099 | |
| | 23,681 | | | Starbucks Corp | | | | | | | | | | | 1,742,685 | |
| | | | Total Hotels, Restaurants & Leisure | | | | | | | | | | | 4,364,843 | |
| | | | |
| | | | Household Durables – 0.3% | | | | | | | | | |
| | | | |
| | 6,557 | | | KB Home | | | | | | | | | | | 201,169 | |
| | 1,001 | | | Tempur Sealy International Inc, (2) | | | | | | | | | | | 72,022 | |
| | 3,643 | | | Whirlpool Corp | | | | | | | | | | | 471,878 | |
| | | | Total Household Durables | | | | | | | | | | | 745,069 | |
| | | | |
| | | | Household Products – 2.2% | | | | | | | | | |
| | | | |
| | 15,211 | | | Colgate-Palmolive Co | | | | | | | | | | | 1,114,358 | |
| | 8,653 | | | Kimberly-Clark Corp | | | | | | | | | | | 1,223,101 | |
| | 24,866 | | | Procter & Gamble Co | | | | | | | | | | | 2,973,228 | |
| | | | Total Household Products | | | | | | | | | | | 5,310,687 | |
| | | | |
| | | | Industrial Conglomerates – 1.5% | | | | | | | | | |
| | | | |
| | 9,198 | | | 3M Co | | | | | | | | | | | 1,434,796 | |
| | 82,165 | | | General Electric Co, (3) | | | | | | | | | | | 561,187 | |
| | 11,839 | | | Honeywell International Inc | | | | | | | | | | | 1,711,801 | |
| | | | Total Industrial Conglomerates | | | | | | | | | | | 3,707,784 | |
39
| | |
| |
| SPXX | | Nuveen S&P 500 Dynamic Overwrite Fund (continued) |
| | Portfolio of Investments June 30, 2020 |
| | (Unaudited) |
| | | | | | | | | | | | | | | | |
| Shares | | | Description (1) | | | | | | | | Value | |
| | | | |
| | | | Insurance – 2.2% | | | | | | | | | |
| | | | |
| | 13,662 | | | Arthur J Gallagher & Co | | | | | | | | | | $ | 1,331,908 | |
| | 7,559 | | | Fidelity National Financial Inc | | | | | | | | | | | 231,759 | |
| | 15,393 | | | Marsh & McLennan Cos Inc | | | | | | | | | | | 1,652,747 | |
| | 13,297 | | | MetLife Inc | | | | | | | | | | | 485,607 | |
| | 9,017 | | | Prudential Financial Inc | | | | | | | | | | | 549,135 | |
| | 1,511 | | | Reinsurance Group of America Inc | | | | | | | | | | | 118,523 | |
| | 9,108 | | | Travelers Cos Inc | | | | | | | | | | | 1,038,767 | |
| | | | Total Insurance | | | | | | | | | | | 5,408,446 | |
| | | | |
| | | | Interactive Media & Services – 5.9% | | | | | | | | | |
| | | | |
| | 2,553 | | | Alphabet Inc, Class A, (2) | | | | | | | | | | | 3,620,282 | |
| | 3,281 | | | Alphabet Inc, Class C, (2), (3) | | | | | | | | | | | 4,638,054 | |
| | 25,550 | | | Facebook Inc, Class A, (2) | | | | | | | | | | | 5,801,638 | |
| | 8,835 | | | Twitter Inc, (2) | | | | | | | | | | | 263,195 | |
| | | | Total Interactive Media & Services | | | | | | | | | | | 14,323,169 | |
| | | | |
| | | | Internet & Direct Marketing Retail – 5.4% | | | | | | | | | |
| | | | |
| | 3,931 | | | Amazon.com Inc, (2), (3) | | | | | | | | | | | 10,844,922 | |
| | 704 | | | Booking Holdings Inc, (2) | | | | | | | | | | | 1,121,007 | |
| | 20,403 | | | eBay Inc | | | | | | | | | | | 1,070,137 | |
| | | | Total Internet & Direct Marketing Retail | | | | | | | | | | | 13,036,066 | |
| | | | |
| | | | IT Services – 6.6% | | | | | | | | | |
| | | | |
| | 5,465 | | | Akamai Technologies Inc, (2) | | | | | | | | | | | 585,247 | |
| | 2,276 | | | Black Knight Inc, (2) | | | | | | | | | | | 165,146 | |
| | 11,386 | | | Fidelity National Information Services Inc | | | | | | | | | | | 1,526,749 | |
| | 7,650 | | | International Business Machines Corp, (3) | | | | | | | | | | | 923,890 | |
| | 1,729 | | | Jack Henry & Associates Inc | | | | | | | | | | | 318,188 | |
| | 14,578 | | | Mastercard Inc | | | | | | | | | | | 4,310,715 | |
| | 14,755 | | | PayPal Holdings Inc, (2) | | | | | | | | | | | 2,570,764 | |
| | 4,374 | | | VeriSign Inc, (2) | | | | | | | | | | | 904,674 | |
| | 24,566 | | | Visa Inc, Class A, (3) | | | | | | | | | | | 4,745,414 | |
| | | | Total IT Services | | | | | | | | | | | 16,050,787 | |
| | | | |
| | | | Life Sciences Tools & Services – 1.3% | | | | | | | | | |
| | | | |
| | 1,733 | | | Bio-Techne Corp | | | | | | | | | | | 457,633 | |
| | 7,291 | | | Thermo Fisher Scientific Inc | | | | | | | | | | | 2,641,821 | |
| | | | Total Life Sciences Tools & Services | | | | | | | | | | | 3,099,454 | |
| | | | |
| | | | Machinery – 2.5% | | | | | | | | | |
| | | | |
| | 11,020 | | | Caterpillar Inc | | | | | | | | | | | 1,394,030 | |
| | 3,551 | | | Cummins Inc | | | | | | | | | | | 615,246 | |
| | 6,285 | | | Deere & Co | | | | | | | | | | | 987,688 | |
| | 8,744 | | | Illinois Tool Works Inc, (3) | | | | | | | | | | | 1,528,888 | |
| | 5,373 | | | Otis Worldwide Corp | | | | | | | | | | | 305,509 | |
| | 8,470 | | | Pentair PLC | | | | | | | | | | | 321,775 | |
| | 2,913 | | | Snap-on Inc | | | | | | | | | | | 403,480 | |
| | 2,640 | | | Stanley Black & Decker Inc | | | | | | | | | | | 367,963 | |
| | 444 | | | Westinghouse Air Brake Technologies Corp | | | | | | | | | | | 25,561 | |
| | | | Total Machinery | | | | | | | | | | | 5,950,140 | |
| | | | |
| | | | Media – 1.2% | | | | | | | | | |
| | | | |
| | 67,408 | | | Comcast Corp, Class A, (3) | | | | | | | | | | | 2,627,564 | |
| | 7,195 | | | TEGNA Inc | | | | | | | | | | | 80,152 | |
| | 11,110 | | | ViacomCBS Inc, Class B | | | | | | | | | | | 259,085 | |
| | | | Total Media | | | | | | | | | | | 2,966,801 | |
| | | | |
| | | | Metals & Mining – 0.2% | | | | | | | | | |
| | | | |
| | 32,882 | | | Freeport-McMoRan Inc, (2) | | | | | | | | | | | 380,445 | |
| | 2,973 | | | Southern Copper Corp | | | | | | | | | | | 118,236 | |
| | | | Total Metals & Mining | | | | | | | | | | | 498,681 | |
40
| | | | | | | | | | | | | | | | |
| Shares | | | Description (1) | | | | | | | | Value | |
| | | | |
| | | | Multiline Retail – 0.6% | | | | | | | | | |
| | | | |
| | 12,659 | | | Target Corp | | | | | | | | | | $ | 1,518,194 | |
| | | | |
| | | | Multi-Utilities – 0.4% | | | | | | | | | |
| | | | |
| | 12,113 | | | Consolidated Edison Inc | | | | | | | | | | | 871,288 | |
| | | | |
| | | | Oil, Gas & Consumable Fuels – 3.1% | | | | | | | | | |
| | | | |
| | 21,678 | | | Chevron Corp, (3) | | | | | | | | | | | 1,934,328 | |
| | 19,311 | | | ConocoPhillips | | | | | | | | | | | 811,448 | |
| | 9,746 | | | EOG Resources Inc | | | | | | | | | | | 493,732 | |
| | 39,987 | | | Exxon Mobil Corp, (3) | | | | | | | | | | | 1,788,219 | |
| | 7,104 | | | Hess Corp | | | | | | | | | | | 368,058 | |
| | 27,600 | | | Marathon Oil Corp, (2) | | | | | | | | | | | 168,912 | |
| | 10,200 | | | Marathon Petroleum Corp | | | | | | | | | | | 381,276 | |
| | 16,942 | | | Occidental Petroleum Corp | | | | | | | | | | | 310,039 | |
| | 6,285 | | | ONEOK Inc | | | | | | | | | | | 208,788 | |
| | 8,289 | | | Phillips 66 | | | | | | | | | | | 595,979 | |
| | 8,470 | | | Valero Energy Corp | | | | | | | | | | | 498,205 | |
| | 6,116 | | | WPX Energy Inc, (2) | | | | | | | | | | | 39,020 | |
| | | | Total Oil, Gas & Consumable Fuels | | | | | | | | | | | 7,598,004 | |
| | | | |
| | | | Pharmaceuticals – 4.8% | | | | | | | | | |
| | | | |
| | 20,222 | | | Bristol-Myers Squibb Co | | | | | | | | | | | 1,189,054 | |
| | 13,208 | | | Eli Lilly and Co | | | | | | | | | | | 2,168,489 | |
| | 1,729 | | | Jazz Pharmaceuticals PLC, (2) | | | | | | | | | | | 190,778 | |
| | 26,689 | | | Johnson & Johnson, (3) | | | | | | | | | | | 3,753,274 | |
| | 26,780 | | | Merck & Co Inc | | | | | | | | | | | 2,070,897 | |
| | 70,230 | | | Pfizer Inc, (3) | | | | | | | | | | | 2,296,521 | |
| | | | Total Pharmaceuticals | | | | | | | | | | | 11,669,013 | |
| | | | |
| | | | Real Estate Management & Development – 0.1% | | | | | | | | | |
| | | | |
| | 1,638 | | | Jones Lang LaSalle Inc, (2) | | | | | | | | | | | 169,468 | |
| | | | |
| | | | Road & Rail – 0.9% | | | | | | | | | |
| | | | |
| | 1,667 | | | Avis Budget Group Inc, (2) | | | | | | | | | | | 38,157 | |
| | 12,754 | | | Union Pacific Corp, (3) | | | | | | | | | | | 2,156,319 | |
| | | | Total Road & Rail | | | | | | | | | | | 2,194,476 | |
| | | | |
| | | | Semiconductors & Semiconductor Equipment – 5.4% | | | | | | | | | |
| | | | |
| | 11,295 | | | Analog Devices Inc | | | | | | | | | | | 1,385,219 | |
| | 55,202 | | | Intel Corp, (3) | | | | | | | | | | | 3,302,736 | |
| | 10,838 | | | Microchip Technology Inc | | | | | | | | | | | 1,141,350 | |
| | 8,199 | | | NVIDIA Corp | | | | | | | | | | | 3,114,882 | |
| | 20,312 | | | QUALCOMM Inc | | | | | | | | | | | 1,852,657 | |
| | 17,306 | | | Texas Instruments Inc | | | | | | | | | | | 2,197,343 | |
| | | | Total Semiconductors & Semiconductor Equipment | | | | | | | | | | | 12,994,187 | |
| | | | |
| | | | Software – 8.0% | | | | | | | | | |
| | | | |
| | 6,194 | | | Autodesk Inc, (2) | | | | | | | | | | | 1,481,543 | |
| | 5,008 | | | CDK Global Inc | | | | | | | | | | | 207,431 | |
| | 78,613 | | | Microsoft Corp, (3) | | | | | | | | | | | 15,998,532 | |
| | 31,425 | | | Oracle Corp, (3) | | | | | | | | | | | 1,736,860 | |
| | | | Total Software | | | | | | | | | | | 19,424,366 | |
| | | | |
| | | | Specialty Retail – 3.6% | | | | | | | | | |
| | | | |
| | 6,065 | | | Best Buy Co Inc | | | | | | | | | | | 529,292 | |
| | 5,191 | | | Dick’s Sporting Goods Inc | | | | | | | | | | | 214,181 | |
| | 16,399 | | | Home Depot Inc, (3) | | | | | | | | | | | 4,108,113 | |
| | 17,306 | | | Lowe’s Cos Inc | | | | | | | | | | | 2,338,387 | |
| | 4,370 | | | Tiffany & Co | | | | | | | | | | | 532,878 | |
| | 19,493 | | | TJX Cos Inc, (2) | | | | | | | | | | | 985,566 | |
| | 2,594 | | | Urban Outfitters Inc, (2) | | | | | | | | | | | 39,481 | |
| | | | Total Specialty Retail | | | | | | | | | | | 8,747,898 | |
41
| | |
| |
| SPXX | | Nuveen S&P 500 Dynamic Overwrite Fund (continued) |
| | Portfolio of Investments June 30, 2020 |
| | (Unaudited) |
| | | | | | | | | | | | | | | | |
| Shares | | | Description (1) | | | | | | | | Value | |
| | | | |
| | | | Technology Hardware, Storage & Peripherals – 6.5% | | | | | | | | | |
| | | | |
| | 43,238 | | | Apple Inc | | | | | | | | | | $ | 15,773,222 | |
| | | | |
| | | | Textiles, Apparel & Luxury Goods – 0.7% | | | | | | | | | |
| | | | |
| | 1,297 | | | Kontoor Brands Inc, (2) | | | | | | | | | | | 23,100 | |
| | 10,201 | | | NIKE Inc, Class B | | | | | | | | | | | 1,000,208 | |
| | 14,029 | | | Under Armour Inc, Class C, (2) | | | | | | | | | | | 124,016 | |
| | 9,381 | | | VF Corp, (3) | | | | | | | | | | | 571,678 | |
| | | | Total Textiles, Apparel & Luxury Goods | | | | | | | | | | | 1,719,002 | |
| | | | |
| | | | Tobacco – 0.6% | | | | | | | | | |
| | | | |
| | 17,306 | | | Altria Group Inc | | | | | | | | | | | 679,260 | |
| | 12,113 | | | Philip Morris International Inc | | | | | | | | | | | 848,637 | |
| | | | Total Tobacco | | | | | | | | | | | 1,527,897 | |
| | | | |
| | | | Trading Companies & Distributors – 0.4% | | | | | | | | | |
| | | | |
| | 3,193 | | | WW Grainger Inc | | | | | | | | | | | 1,003,113 | |
| | | | Total Common Stocks (cost $105,671,832) | | | | | | | | | | | 243,843,429 | |
| | | | |
| Shares | | | Description | | | | | | | | Value | |
| | | | |
| | | | COMMON STOCK RIGHTS – 0.0% | | | | | | | | | | | | |
| | | | |
| | | | Pharmaceuticals – 0.0% | | | | | | | | | |
| | | | |
| | 13,500 | | | Bristol-Myers Squibb Co | | | | | | | | | | $ | 48,330 | |
| | | | Total Common Stock Rights (cost $28,755) | | | | | | | | | | | 48,330 | |
| | | | Total Long-Term Investments (cost $105,700,587) | | | | | | | | | | | 243,891,759 | |
| | | | |
Principal
Amount (000) | | | Description (1) | | Coupon | | | Maturity | | | Value | |
| | | | |
| | | | SHORT-TERM INVESTMENTS – 0.2% | | | | | | | | | | | | |
| | | | |
| | | | REPURCHASE AGREEMENTS – 0.2% | | | | | | | | | |
| | | | |
| $ | 486 | | | Repurchase Agreement with Fixed Income Clearing Corporation, dated 6/30/20,
repurchase price $485,827, collateralized by $422,900 U.S. Treasury Notes,
0.625%, due 1/15/26, value $495,555 | | | 0.000% | | | | 7/01/20 | | | $ | 485,827 | |
| | | | Total Short-Term Investments (cost $485,827) | | | | | | | | | | | 485,827 | |
| | | | Total Investments (cost $106,186,414) – 100.7% | | | | | | | | | | | 244,377,586 | |
| | | | Other Assets Less Liabilities – (0.7)% (4) | | | | | | | | | | | (1,725,095 | ) |
| | | | Net Assets – 100% | | | | | | | | | | $ | 242,652,491 | |
Investments in Derivatives
Options Purchased
| | | | | | | | | | | | | | | | | | | | | | | | |
| Description (5) | | Type | | | Number of
Contracts | | | Notional
Amount (6) | | | Exercise
Price | | | Expiration
Date | | | Value | |
Merck + Co Inc | | | Call | | | | 50 | | | $ | 412,500 | | | $ | 82.5 | | | | 7/17/20 | | | $ | 1,075 | |
Pfizer Inc | | | Call | | | | 50 | | | | 175,000 | | | | 35.0 | | | | 7/17/20 | | | | 925 | |
Total Options Purchased (premiums paid $5,801) | | | | | | | 100 | | | $ | 587,500 | | | | | | | | | | | $ | 2,000 | |
Options Written
| | | | | | | | | | | | | | | | | | | | | | | | |
| Description (5) | | Type | | | Number of
Contracts | | | Notional
Amount (6) | | | Exercise
Price | | | Expiration
Date | | | Value | |
S&P 500® Index | | | Put | | | | (25 | ) | | $ | (6,750,000 | ) | | $ | 2,700 | | | | 7/17/20 | | | $ | (15,000 | ) |
S&P 500® Index | | | Call | | | | (440 | ) | | | (137,940,000 | ) | | $ | 3,135 | | | | 7/17/20 | | | | (1,795,200 | ) |
Total Options Written (premiums received $3,433,729) | | | | | | | (465 | ) | | $ | (144,690,000 | ) | | | | | | | | | | $ | (1,810,200 | ) |
42
For Fund portfolio compliance purposes, the Fund’s industry classifications refer to any one or more of the industry sub-classifications used by one or more widely recognized market indexes or ratings group indexes, and/or as defined by Fund management. This definition may not apply for purposes of this report, which may combine industry sub-classifications into sectors for reporting ease.
| (1) | All percentages shown in the Portfolio of Investments are based on net assets applicable to common shares unless otherwise noted. |
| (2) | Non-income producing; issuer has not declared a dividend within the past twelve months. |
| (3) | Investment, or portion of investment, has been pledged to collateralized the net payment obligations for investments in derivatives. |
| (4) | Other assets less liabilities includes the unrealized appreciation (depreciation) of certain over-the counter (“OTC”) derivatives as presented on the Statement of Assets and Liabilities, when applicable. The unrealized appreciation (depreciation) of OTC cleared and exchange-traded derivatives is recognized as part of the cash collateral at brokers and/or the receivable or payable for variation margin as presented on the Statement of Assets and Liabilities, when applicable. Other assets less liabilities also includes the value of options as presented on the Statement of Assets and Liabilities. |
| (5) | Exchange-traded, unless otherwise noted. |
| (6) | For disclosure purposes, Notional Amount is calculated by multiplying the Number of Contracts by the Exercise Price by 100. |
| REIT | Real Estate Investment Trust. |
See accompanying notes to financial statements.
43
| | |
| QQQX | | Nuveen Nasdaq 100 Dynamic
Overwrite Fund Portfolio of Investments June 30, 2020 |
| | | (Unaudited) |
| | | | | | | | | | | | | | | | |
| Shares | | | Description (1) | | | | | | | | Value | |
| | | | |
| | | | LONG-TERM INVESTMENTS – 101.1% | | | | | | | | | | | | |
| | | | |
| | | | COMMON STOCKS – 101.1% | | | | | | | | | | | | |
| | | | |
| | | | Air Freight & Logistics – 0.0% | | | | | | | | | |
| | | | |
| | 2,896 | | | FedEx Corp | | | | | | | | | | $ | 406,077 | |
| | | | |
| | | | Airlines – 0.2% | | | | | | | | | |
| | | | |
| | 32,639 | | | Delta Air Lines Inc, (2) | | | | | | | | | | | 915,524 | |
| | 7,099 | | | Ryanair Holdings PLC | | | | | | | | | | | 470,948 | |
| | 27,690 | | | Southwest Airlines Co, (2) | | | | | | | | | | | 946,444 | |
| | | | Total Airlines | | | | | | | | | | | 2,332,916 | |
| | | | |
| | | | Auto Components – 0.1% | | | | | | | | | |
| | | | |
| | 28,008 | | | American Axle & Manufacturing Holdings Inc, (2) | | | | | | | | | | | 212,861 | |
| | 23,148 | | | Gentex Corp | | | | | | | | | | | 596,524 | |
| | 4,440 | | | Lear Corp, (2) | | | | | | | | | | | 484,049 | |
| | | | Total Auto Components | | | | | | | | | | | 1,293,434 | |
| | | | |
| | | | Automobiles – 0.0% | | | | | | | | | |
| | | | |
| | 51,765 | | | Ford Motor Co, (2) | | | | | | | | | | | 314,731 | |
| | | | |
| | | | Banks – 0.1% | | | | | | | | | |
| | | | |
| | 5,265 | | | JPMorgan Chase & Co | | | | | | | | | | | 495,226 | |
| | | | |
| | | | Beverages – 0.8% | | | | | | | | | |
| | | | |
| | 24,003 | | | Brown-Forman Corp, Class B | | | | | | | | | | | 1,528,031 | |
| | 95,731 | | | Monster Beverage Corp, (2) | | | | | | | | | | | 6,636,073 | |
| | | | Total Beverages | | | | | | | | | | | 8,164,104 | |
| | | | |
| | | | Biotechnology – 7.0% | | | | | | | | | |
| | | | |
| | 8,740 | | | Agios Pharmaceuticals Inc, (2) | | | | | | | | | | | 467,415 | |
| | 14,795 | | | Alkermes PLC, (2) | | | | | | | | | | | 287,097 | |
| | 115,804 | | | Amgen Inc, (3) | | | | | | | | | | | 27,313,532 | |
| | 29,864 | | | Biogen Inc, (2) | | | | | | | | | | | 7,990,113 | |
| | 212,245 | | | Gilead Sciences Inc, (3) | | | | | | | | | | | 16,330,130 | |
| | 65,227 | | | ImmunoGen Inc, (2) | | | | | | | | | | | 300,044 | |
| | 11,093 | | | Ionis Pharmaceuticals Inc, (2) | | | | | | | | | | | 654,043 | |
| | 13,511 | | | Myriad Genetics Inc, (2) | | | | | | | | | | | 153,215 | |
| | 18,529 | | | Regeneron Pharmaceuticals Inc, (2) | | | | | | | | | | | 11,555,611 | |
| | 12,821 | | | Seattle Genetics Inc, (2) | | | | | | | | | | | 2,178,544 | |
| | 3,808 | | | United Therapeutics Corp, (2) | | | | | | | | | | | 460,768 | |
| | | | Total Biotechnology | | | | | | | | | | | 67,690,512 | |
| | | | |
| | | | Capital Markets – 0.6% | | | | | | | | | |
| | | | |
| | 10,425 | | | Moody’s Corp | | | | | | | | | | | 2,864,060 | |
| | 25,767 | | | Morgan Stanley | | | | | | | | | | | 1,244,546 | |
| | 12,243 | | | SEI Investments Co | | | | | | | | | | | 673,120 | |
| | 7,690 | | | T Rowe Price Group Inc | | | | | | | | | | | 949,715 | |
| | | | Total Capital Markets | | | | | | | | | | | 5,731,441 | |
| | | | |
| | | | Chemicals – 0.3% | | | | | | | | | |
| | | | |
| | 6,204 | | | Ecolab Inc | | | | | | | | | | | 1,234,286 | |
| | 3,175 | | | Sherwin-Williams Co | | | | | | | | | | | 1,834,674 | |
| | | | Total Chemicals | | | | | | | | | | | 3,068,960 | |
44
| | | | | | | | | | | | | | | | |
| Shares | | | Description (1) | | | | | | | | Value | |
| | | | |
| | | | Commercial Services & Supplies – 0.4% | | | | | | | | | |
| | | | |
| | 10,872 | | | Copart Inc, (2) | | | | | | | | | | $ | 905,311 | |
| | 8,008 | | | IAA Inc, (2) | | | | | | | | | | | 308,869 | |
| | 8,008 | | | KAR Auction Services Inc, (2) | | | | | | | | | | | 110,190 | |
| | 15,793 | | | Tetra Tech Inc | | | | | | | | | | | 1,249,542 | |
| | 7,562 | | | Waste Connections Inc | | | | | | | | | | | 709,240 | |
| | 9,915 | | | Waste Management Inc | | | | | | | | | | | 1,050,098 | |
| | | | Total Commercial Services & Supplies | | | | | | | | | | | 4,333,250 | |
| | | | |
| | | | Communications Equipment – 3.3% | | | | | | | | | |
| | | | |
| | 670,000 | | | Cisco Systems Inc, (3) | | | | | | | | | | | 31,248,800 | |
| | 5,262 | | | F5 Networks Inc, (2) | | | | | | | | | | | 733,944 | |
| | | | Total Communications Equipment | | | | | | | | | | | 31,982,744 | |
| | | | |
| | | | Containers & Packaging – 0.1% | | | | | | | | | |
| | | | |
| | 4,212 | | | Ball Corp | | | | | | | | | | | 292,692 | |
| | 10,528 | | | International Paper Co | | | | | | | | | | | 370,691 | |
| | | | Total Containers & Packaging | | | | | | | | | | | 663,383 | |
| | | | |
| | | | Distributors – 0.3% | | | | | | | | | |
| | | | |
| | 3,632 | | | Genuine Parts Co | | | | | | | | | | | 315,839 | |
| | 8,210 | | | Pool Corp | | | | | | | | | | | 2,232,052 | |
| | | | Total Distributors | | | | | | | | | | | 2,547,891 | |
| | | | |
| | | | Diversified Consumer Services – 0.2% | | | | | | | | | |
| | | | |
| | 45,483 | | | Service Corp International/US | | | | | | | | | | | 1,768,834 | |
| | | | |
| | | | Electrical Equipment – 0.2% | | | | | | | | | |
| | | | |
| | 9,896 | | | Rockwell Automation Inc | | | | | | | | | | | 2,107,848 | |
| | | | |
| | | | Electronic Equipment, Instruments & Components – 0.4% | | | | | | | | | |
| | | | |
| | 12,790 | | | Amphenol Corp, Class A | | | | | | | | | | | 1,225,410 | |
| | 3,870 | | | Arrow Electronics Inc, (2) | | | | | | | | | | | 265,830 | |
| | 6,276 | | | Avnet Inc | | | | | | | | | | | 175,006 | |
| | 31,913 | | | Corning Inc | | | | | | | | | | | 826,547 | |
| | 8,100 | | | Keysight Technologies Inc, (2) | | | | | | | | | | | 816,318 | |
| | 14,485 | | | National Instruments Corp | | | | | | | | | | | 560,715 | |
| | | | Total Electronic Equipment, Instruments & Components | | | | | | | | | | | 3,869,826 | |
| | | | |
| | | | Energy Equipment & Services – 0.0% | | | | | | | | | |
| | | | |
| | 685 | | | Nabors Industries Ltd, (2) | | | | | | | | | | | 25,358 | |
| | 39,272 | | | Transocean Ltd, (2) | | | | | | | | | | | 71,868 | |
| | | | Total Energy Equipment & Services | | | | | | | | | | | 97,226 | |
| | | | |
| | | | Entertainment – 0.0% | | | | | | | | | |
| | | | |
| | 10,213 | | | Cinemark Holdings Inc, (2) | | | | | | | | | | | 117,960 | |
| | | | |
| | | | Equity Real Estate Investment Trust – 0.3% | | | | | | | | | |
| | | | |
| | 19,395 | | | Apartment Investment and Management Co | | | | | | | | | | | 730,028 | |
| | 57,484 | | | CubeSmart | | | | | | | | | | | 1,551,493 | |
| | 3,390 | | | Retail Value Inc | | | | | | | | | | | 41,900 | |
| | 31,377 | | | SITE Centers Corp | | | | | | | | | | | 254,154 | |
| | | | Total Equity Real Estate Investment Trust | | | | | | | | | | | 2,577,575 | |
| | | | |
| | | | Food & Staples Retailing – 0.3% | | | | | | | | | |
| | | | |
| | 4,001 | | | Casey’s General Stores Inc | | | | | | | | | | | 598,230 | |
| | 26,637 | | | Kroger Co | | | | | | | | | | | 901,662 | |
| | 9,160 | | | Sysco Corp | | | | | | | | | | | 500,686 | |
| | 21,374 | | | US Foods Holding Corp, (2) | | | | | | | | | | | 421,495 | |
| | | | Total Food & Staples Retailing | | | | | | | | | | | 2,422,073 | |
| | | | |
| | | | Food Products – 0.1% | | | | | | | | | |
| | | | |
| | 16,004 | | | Conagra Brands Inc | | | | | | | | | | | 562,861 | |
45
| | |
| |
| QQQX | | Nuveen Nasdaq 100 Dynamic Overwrite Fund (continued) |
| | Portfolio of Investments June 30, 2020 |
| | (Unaudited) |
| | | | | | | | | | | | | | | | |
| Shares | | | Description (1) | | | | | | | | Value | |
| | | | |
| | | | Food Products (continued) | | | | | | | | | |
| | | | |
| | 5,580 | | | Hain Celestial Group Inc, (2) | | | | | | | | | | $ | 175,826 | |
| | 11,581 | | | Pilgrim’s Pride Corp, (2) | | | | | | | | | | | 195,603 | |
| | 4,002 | | | Post Holdings Inc, (2) | | | | | | | | | | | 350,655 | |
| | | | Total Food Products | | | | | | | | | | | 1,284,945 | |
| | | | |
| | | | Health Care Equipment & Supplies – 1.4% | | | | | | | | | |
| | | | |
| | 72,225 | | | Abbott Laboratories, (3) | | | | | | | | | | | 6,603,532 | |
| | 3,843 | | | Becton Dickinson and Co, (3) | | | | | | | | | | | 919,515 | |
| | 16,846 | | | Danaher Corp | | | | | | | | | | | 2,978,878 | |
| | 8,881 | | | Hill-Rom Holdings Inc | | | | | | | | | | | 974,956 | |
| | 3,909 | | | Stryker Corp, (3) | | | | | | | | | | | 704,363 | |
| | 11,687 | | | Zimmer Biomet Holdings Inc, (3) | | | | | | | | | | | 1,394,960 | |
| | | | Total Health Care Equipment & Supplies | | | | | | | | | | | 13,576,204 | |
| | | | |
| | | | Health Care Providers & Services – 0.1% | | | | | | | | | |
| | | | |
| | 4,308 | | | McKesson Corp, (3) | | | | | | | | | | | 660,933 | |
| | 8,366 | | | Universal Health Services Inc, (2) | | | | | | | | | | | 777,118 | |
| | | | Total Health Care Providers & Services | | | | | | | | | | | 1,438,051 | |
| | | | |
| | | | Hotels, Restaurants & Leisure – 0.3% | | | | | | | | | |
| | | | |
| | 21,808 | | | Carnival Corp, (2) | | | | | | | | | | | 358,087 | |
| | 10,528 | | | Darden Restaurants Inc, (2) | | | | | | | | | | | 797,707 | |
| | 30,743 | | | Restaurant Brands International Inc | | | | | | | | | | | 1,679,490 | |
| | | | Total Hotels, Restaurants & Leisure | | | | | | | | | | | 2,835,284 | |
| | | | |
| | | | Household Durables – 0.1% | | | | | | | | | |
| | | | |
| | 43,730 | | | KB Home | | | | | | | | | | | 1,341,636 | |
| | | | |
| | | | Industrial Conglomerates – 0.1% | | | | | | | | | |
| | | | |
| | 6,042 | | | Honeywell International Inc | | | | | | | | | | | 873,613 | |
| | | | |
| | | | Insurance – 0.2% | | | | | | | | | |
| | | | |
| | 24,898 | | | Fidelity National Financial Inc | | | | | | | | | | | 763,373 | |
| | 12,635 | | | Globe Life Inc | | | | | | | | | | | 937,896 | |
| | | | Total Insurance | | | | | | | | | | | 1,701,269 | |
| | | | |
| | | | Interactive Media & Services – 14.5% | | | | | | | | | |
| | | | |
| | 31,000 | | | Alphabet Inc, Class A, (2), (3) | | | | | | | | | | | 43,959,550 | |
| | 32,000 | | | Alphabet Inc, Class C, (2), (3) | | | | | | | | | | | 45,235,520 | |
| | 45,270 | | | Baidu Inc, (2), (3) | | | | | | | | | | | 5,427,420 | |
| | 170,000 | | | Facebook Inc, Class A, (2) | | | | | | | | | | | 38,601,900 | |
| | 18,530 | | | IAC/interactivecorp, (2) | | | | | | | | | | | 5,992,602 | |
| | 31,584 | | | Twitter Inc, (2) | | | | | | | | | | | 940,888 | |
| | | | Total Interactive Media & Services | | | | | | | | | | | 140,157,880 | |
| | | | |
| | | | Internet & Direct Marketing Retail – 14.6% | | | | | | | | | |
| | | | |
| | 42,000 | | | Amazon.com Inc, (2) | | | | | | | | | | | 115,870,440 | |
| | 8,950 | | | Booking Holdings Inc, (2) | | | | | | | | | | | 14,251,443 | |
| | 221,092 | | | eBay Inc, (3) | | | | | | | | | | | 11,596,275 | |
| | | | Total Internet & Direct Marketing Retail | | | | | | | | | | | 141,718,158 | |
| | | | |
| | | | IT Services – 5.6% | | | | | | | | | |
| | | | |
| | 7,635 | | | Black Knight Inc, (2) | | | | | | | | | | | 553,996 | |
| | 12,993 | | | DXC Technology Co, (2) | | | | | | | | | | | 214,384 | |
| | 24,995 | | | Fidelity National Information Services Inc | | | | | | | | | | | 3,351,580 | |
| | 20,170 | | | Genpact Ltd | | | | | | | | | | | 736,608 | |
| | 24,497 | | | Global Payments Inc | | | | | | | | | | | 4,155,181 | |
| | 62,009 | | | Infosys Ltd | | | | | | | | | | | 599,007 | |
| | 47,376 | | | Jack Henry & Associates Inc | | | | | | | | | | | 8,718,605 | |
| | 5,212 | | | Leidos Holdings Inc | | | | | | | | | | | 488,208 | |
| | 200,000 | | | PayPal Holdings Inc, (2) | | | | | | | | | | | 34,846,000 | |
| | 6,498 | | | Perspecta Inc | | | | | | | | | | | 150,949 | |
| | | | Total IT Services | | | | | | | | | | | 53,814,518 | |
46
| | | | | | | | | | | | | | | | |
| Shares | | | Description (1) | | | | | | | | Value | |
| | | | |
| | | | Life Sciences Tools & Services – 0.6% | | | | | | | | | |
| | | | |
| | 61,064 | | | Agilent Technologies Inc | | | | | | | | | | $ | 5,396,226 | |
| | 5,019 | | | Charles River Laboratories International Inc, (2) | | | | | | | | | | | 875,062 | |
| | | | Total Life Sciences Tools & Services | | | | | | | | | | | 6,271,288 | |
| | | | |
| | | | Machinery – 0.2% | | | | | | | | | |
| | | | |
| | 10,028 | | | Caterpillar Inc | | | | | | | | | | | 1,268,542 | |
| | 8,396 | | | Fortive Corp | | | | | | | | | | | 568,073 | |
| | | | Total Machinery | | | | | | | | | | | 1,836,615 | |
| | | | |
| | | | Media – 3.2% | | | | | | | | | |
| | | | |
| | 5,160 | | | AMC Networks Inc, (2) | | | | | | | | | | | 120,692 | |
| | 714,120 | | | Comcast Corp, Class A, (3) | | | | | | | | | | | 27,836,398 | |
| | 83,840 | | | News Corp, Class A | | | | | | | | | | | 994,342 | |
| | 69,579 | | | News Corp, Class B | | | | | | | | | | | 831,469 | |
| | 20,215 | | | ViacomCBS Inc, Class B | | | | | | | | | | | 471,414 | |
| | 7,198 | | | WPP PLC | | | | | | | | | | | 281,658 | |
| | | | Total Media | | | | | | | | | | | 30,535,973 | |
| | | | |
| | | | Multiline Retail – 0.2% | | | | | | | | | |
| | | | |
| | 67,075 | | | JC Penney Co Inc, (2) | | | | | | | | | | | 22,460 | |
| | 7,265 | | | Kohl’s Corp, (2) | | | | | | | | | | | 150,894 | |
| | 10,635 | | | Target Corp | | | | | | | | | | | 1,275,456 | |
| | | | Total Multiline Retail | | | | | | | | | | | 1,448,810 | |
| | | | |
| | | | Oil, Gas & Consumable Fuels – 0.1% | | | | | | | | | |
| | | | |
| | 9,160 | | | Continental Resources Inc, (2) | | | | | | | | | | | 160,575 | |
| | 9,792 | | | Devon Energy Corp | | | | | | | | | | | 111,041 | |
| | 25,091 | | | Marathon Oil Corp, (2) | | | | | | | | | | | 153,557 | |
| | 11,899 | | | Noble Energy Inc | | | | | | | | | | | 106,615 | |
| | 27,061 | | | QEP Resources Inc, (2) | | | | | | | | | | | 34,909 | |
| | 16,215 | | | Range Resources Corp, (2) | | | | | | | | | | | 91,290 | |
| | | | Total Oil, Gas & Consumable Fuels | | | | | | | | | | | 657,987 | |
| | | | |
| | | | Pharmaceuticals – 0.9% | | | | | | | | | |
| | | | |
| | 132,340 | | | Bristol-Myers Squibb Co, (3) | | | | | | | | | | | 7,781,592 | |
| | 6,272 | | | Jazz Pharmaceuticals PLC, (2) | | | | | | | | | | | 692,052 | |
| | | | Total Pharmaceuticals | | | | | | | | | | | 8,473,644 | |
| | | | |
| | | | Professional Services – 0.3% | | | | | | | | | |
| | | | |
| | 10,853 | | | IHS Markit Ltd | | | | | | | | | | | 819,402 | |
| | 12,068 | | | ManpowerGroup Inc | | | | | | | | | | | 829,675 | |
| | 20,634 | | | Robert Half International Inc | | | | | | | | | | | 1,090,094 | |
| | | | Total Professional Services | | | | | | | | | | | 2,739,171 | |
| | | | |
| | | | Semiconductors & Semiconductor Equipment – 13.1% | | | | | | | | | |
| | | | |
| | 96,860 | | | Analog Devices Inc | | | | | | | | | | | 11,878,910 | |
| | 289,508 | | | Applied Materials Inc, (3) | | | | | | | | | | | 17,500,759 | |
| | 600,000 | | | Intel Corp, (3) | | | | | | | | | | | 35,898,000 | |
| | 86,857 | | | NVIDIA Corp | | | | | | | | | | | 32,997,843 | |
| | 29,359 | | | ON Semiconductor Corp, (2) | | | | | | | | | | | 581,895 | |
| | 6,247 | | | Power Integrations Inc | | | | | | | | | | | 737,958 | |
| | 248,466 | | | QUALCOMM Inc | | | | | | | | | | | 22,662,584 | |
| | 10,683 | | | Silicon Laboratories Inc, (2) | | | | | | | | | | | 1,071,184 | |
| | 21,231 | | | Skyworks Solutions Inc | | | | | | | | | | | 2,714,596 | |
| | 21,056 | | | Taiwan Semiconductor Manufacturing Co Ltd | | | | | | | | | | | 1,195,349 | |
| | | | Total Semiconductors & Semiconductor Equipment | | | | | | | | | | | 127,239,078 | |
| | | | |
| | | | Software – 16.1% | | | | | | | | | |
| | | | |
| | 18,951 | | | ANSYS Inc, (2) | | | | | | | | | | | 5,528,575 | |
| | 56,850 | | | Autodesk Inc, (2) | | | | | | | | | | | 13,597,951 | |
| | 12,546 | | | CDK Global Inc | | | | | | | | | | | 519,655 | |
| | 5,062 | | | J2 Global Inc, (2), (3) | | | | | | | | | | | 319,969 | |
| | 645,000 | | | Microsoft Corp, (3) | | | | | | | | | | | 131,263,950 | |
| | 1,668 | | | MicroStrategy Inc, Class A, (2), (3) | | | | | | | | | | | 197,308 | |
47
| | |
| |
| QQQX | | Nuveen Nasdaq 100 Dynamic Overwrite Fund (continued) |
| | Portfolio of Investments June 30, 2020 |
| | (Unaudited) |
| | | | | | | | | | | | | | | | |
| Shares | | | Description (1) | | | | | | | | Value | |
| | | | |
| | | | Software (continued) | | | | | | | | | |
| | | | |
| | 23,399 | | | Open Text Corp | | | | | | | | | | $ | 993,990 | |
| | 42,113 | | | Oracle Corp | | | | | | | | | | | 2,327,586 | |
| | 13,058 | | | PTC Inc, (2) | | | | | | | | | | | 1,015,782 | |
| | | | Total Software | | | | | | | | | | | 155,764,766 | |
| | | | |
| | | | Specialty Retail – 0.6% | | | | | | | | | |
| | | | |
| | 15,690 | | | Aaron’s Inc | | | | | | | | | | | 712,326 | |
| | 4,707 | | | Advance Auto Parts Inc | | | | | | | | | | | 670,512 | |
| | 843 | | | AutoZone Inc, (2) | | | | | | | | | | | 951,005 | |
| | 17,372 | | | Bed Bath & Beyond Inc, (2) | | | | | | | | | | | 184,143 | |
| | 21,056 | | | CarMax Inc, (2) | | | | | | | | | | | 1,885,565 | |
| | 18,467 | | | Dick’s Sporting Goods Inc | | | | | | | | | | | 761,948 | |
| | 9,792 | | | Foot Locker Inc, (2) | | | | | | | | | | | 285,535 | |
| | 15,249 | | | Michaels Cos Inc, (2) | | | | | | | | | | | 107,811 | |
| | 14,740 | | | Sally Beauty Holdings Inc, (2) | | | | | | | | | | | 184,692 | |
| | 18,741 | | | Urban Outfitters Inc, (2) | | | | | | | | | | | 285,238 | |
| | | | Total Specialty Retail | | | | | | | | | | | 6,028,775 | |
| | | | |
| | | | Technology Hardware, Storage & Peripherals – 14.0% | | | | | | | | | |
| | | | |
| | 367,000 | | | Apple Inc, (3) | | | | | | | | | | | 133,881,600 | |
| | 20,051 | | | Hewlett Packard Enterprise Co | | | | | | | | | | | 195,096 | |
| | 27,986 | | | NetApp Inc | | | | | | | | | | | 1,241,739 | |
| | | | Total Technology Hardware, Storage & Peripherals | | | | | | | | | | | 135,318,435 | |
| | | | |
| | | | Textiles, Apparel & Luxury Goods – 0.1% | | | | | | | | | |
| | | | |
| | 7,785 | | | PVH Corp, (2) | | | | | | | | | | | 374,069 | |
| | 4,000 | | | Ralph Lauren Corp, (2) | | | | | | | | | | | 290,080 | |
| | 18,741 | | | Skechers USA Inc, Class A, (2) | | | | | | | | | | | 588,093 | |
| | | | Total Textiles, Apparel & Luxury Goods | | | | | | | | | | | 1,252,242 | |
| | | | |
| | | | Wireless Telecommunication Services – 0.1% | | | | | | | | | |
| | | | |
| | 20,261 | | | Telephone and Data Systems Inc | | | | | | | | | | | 402,789 | |
| | 3,089 | | | T-Mobile US Inc, (2) | | | | | | | | | | | 321,719 | |
| | 13,699 | | | United States Cellular Corp, (2) | | | | | | | | | | | 422,888 | |
| | | | Total Wireless Telecommunication Services | | | | | | | | | | | 1,147,396 | |
| | | | Total Common Stocks (cost $259,295,324) | | | | | | | | | | | 979,441,749 | |
| | | | |
| Shares | | | Description (1) | | | | | | | | Value | |
| | | | |
| | | | COMMON STOCK RIGHTS – 0.1% | | | | | | | | | | | | |
| | | | |
| | | | Pharmaceuticals – 0.1% | | | | | | | | | |
| | | | |
| | 137,136 | | | Bristol-Myers Squibb Co | | | | | | | | | | $ | 490,947 | |
| | | | |
| | | | Wireless Telecommunication Services – 0.0% | | | | | | | | | |
| | | | |
| | 3,089 | | | T-Mobile US Inc | | | | | | | | | | | 519 | |
| | | | Total Common Stock Rights (cost $293,243) | | | | | | | | | | | 491,466 | |
| | | | Total Long-Term Investments (cost $259,588,567) | | | | | | | | | | | 979,933,215 | |
| | | | |
Principal
Amount (000) | | | Description (1) | | Coupon | | | Maturity | | | Value | |
| | | | |
| | | | SHORT-TERM INVESTMENTS – 0.2% | | | | | | | | | |
| | | | |
| | | | REPURCHASE AGREEMENTS – 0.2% | | | | | | | | | |
| | | | |
| $ | 1,878 | | | Repurchase Agreement with Fixed Income Clearing Corporation, dated 6/30/20,
repurchase price $1,877,727, collateralized by $1,703,500 U.S. Treasury Notes,
2.625%, due 12/31/25, value $1,915,373 | | | 0.000% | | | | 7/01/20 | | | $ | 1,877,727 | |
| | | | Total Short-Term Investments (cost $1,877,727) | | | | | | | | | | | 1,877,727 | |
| | | | Total Investments (cost $261,466,294) – 101.4% | | | | | | | | | | | 981,810,942 | |
| | | | Other Assets Less Liabilities – (1.4)% (4) | | | | | | | | | | | (13,566,776 | ) |
| | | | Net Assets – 100% | | | | | | | | | | $ | 968,244,166 | |
48
Investments in Derivatives
Options Purchased
| | | | | | | | | | | | | | | | | | | | | | |
| Description (5) | | Type | | Number of
Contracts | | | Notional
Amount (6) | | | Exercise
Price | | | Expiration
Date | | | Value | |
| Merck + Co Inc | | Call | | | 100 | | | $ | 825,000 | | | $ | 82.5 | | | | 7/17/20 | | | $ | 2,150 | |
| Pfizer Inc | | Call | | | 100 | | | | 350,000 | | | | 35.0 | | | | 7/17/20 | | | | 1,850 | |
Total Options Purchased (premiums paid $11,602) | | | 200 | | | $ | 1,175,000 | | | | | | | | | | | $ | 4,000 | |
Options Written
| | | | | | | | | | | | | | | | | | | | | | |
| Description (5) | | Type | | Number of
Contracts | | | Notional
Amount (6) | | | Exercise
Price | | | Expiration
Date | | | Value | |
| S&P 500® Index | | Put | | | (95 | ) | | $ | (25,650,000 | ) | | $ | 2,700 | | | | 7/17/20 | | | $ | (57,000 | ) |
| Nasdaq 100® Stock Index | | Call | | | (530 | ) | | | (535,300,000 | ) | | | 10,100 | | | | 7/17/20 | | | | (12,863,100 | ) |
Total Options Written (premiums received $14,283,489) | | | (625 | ) | | $ | (560,950,000 | ) | | | | | | | | | | $ | (12,920,100 | ) |
For Fund portfolio compliance purposes, the Fund’s industry classifications refer to any one or more of the industry sub-classifications used by one or more widely recognized market indexes or ratings group indexes, and/or as defined by Fund management. This definition may not apply for purposes of this report, which may combine industry sub-classifications into sectors for reporting ease.
| (1) | All percentages shown in the Portfolio of Investments are based on net assets applicable to common shares unless otherwise noted. |
| (2) | Non-income producing; issuer has not declared a dividend within the past twelve months. |
| (3) | Investment, or portion of investment, has been pledged to collateralized the net payment obligations for investments in derivatives. |
| (4) | Other assets less liabilities includes the unrealized appreciation (depreciation) of certain over-the counter (“OTC”) derivatives as presented on the Statement of Assets and Liabilities, when applicable. The unrealized appreciation (depreciation) of OTC cleared and exchange-traded derivatives is recognized as part of the cash collateral at brokers and/or the receivable or payable for variation margin as presented on the Statement of Assets and Liabilities, when applicable. Other assets less liabilities also includes the value of options as presented on the Statement of Assets and Liabilities. |
| (5) | Exchange-traded, unless otherwise noted. |
| (6) | For disclosure purposes, Notional Amount is calculated by multiplying the Number of Contracts by the Exercise Price by 100. |
See accompanying notes to financial statements.
49
Statement of Assets and Liabilities
June 30, 2020
(Unaudited)
| | | | | | | | | | | | | | | | |
| | | BXMX | | | DIAX | | | SPXX | | | QQQX | |
Assets | | | | | | | | | | | | | | | | |
Long-term investments at value (cost $591,537,113, $241,110,540, $105,700,587 and $259,588,567, respectively) | | $ | 1,277,181,227 | | | $ | 545,703,150 | | | $ | 243,891,759 | | | $ | 979,933,215 | |
Short-term investments, at value (cost approximates value) | | | 65,503,311 | | | | 188,323 | | | | 485,827 | | | | 1,877,727 | |
Cash | | | 12,703 | | | | — | | | | 2,540 | | | | 8,217 | |
Options purchased, at value (cost $—, $11,602, $5,801 and $11,602, respectively) | | | — | | | | 4,000 | | | | 2,000 | | | | 4,000 | |
Receivable for: | | | | | | | | | | | | | | | | |
Dividends | | | 1,024,411 | | | | 214,436 | | | | 200,843 | | | | 251,463 | |
Investment sold | | | 791,334 | | | | 11,202,413 | | | | 4,261,253 | | | | 15,459,357 | |
Reclaims | | | — | | | | — | | | | — | | | | 329 | |
Other assets | | | 275,834 | | | | 42,911 | | | | 45,538 | | | | 90,864 | |
Total assets | | | 1,344,788,820 | | | | 557,355,233 | | | | 248,889,760 | | | | 997,625,172 | |
Liabilities | | | | | | | | | | | | | | | | |
Options written, at value (premiums received $38,420,215, $7,608,172, $3,433,729 and $14,283,489, respectively) | | | 28,000,510 | | | | 4,011,000 | | | | 1,810,200 | | | | 12,920,100 | |
Payable for: | | | | | | | | | | | | | | | | |
Dividends | | | 21,641,213 | | | | 9,733,546 | | | | 4,144,701 | | | | 15,499,437 | |
Investments purchased – regular settlement | | | 10,810,516 | | | | — | | | | — | | | | — | |
Accrued expenses: | | | | | | | | | | | | | | | | |
Management fees | | | 878,636 | | | | 387,147 | | | | 163,850 | | | | 653,995 | |
Trustees fees | | | 266,896 | | | | 39,448 | | | | 41,826 | | | | 94,340 | |
Other | | | 348,342 | | | | 167,976 | | | | 76,692 | | | | 213,134 | |
Total liabilities | | | 61,946,113 | | | | 14,339,117 | | | | 6,237,269 | | | | 29,381,006 | |
Net Assets applicable to common shares | | $ | 1,282,842,707 | | | $ | 543,016,116 | | | $ | 242,652,491 | | | $ | 968,244,166 | |
Common shares outstanding | | | 104,086,837 | | | | 36,366,913 | | | | 17,191,758 | | | | 40,956,675 | |
Net asset value ("NAV") per common share outstanding | | $ | 12.32 | | | $ | 14.93 | | | $ | 14.11 | | | $ | 23.64 | |
Net assets applicable to common shares consist of: | | | | | | | | | | | | | | | | |
Common shares, $0.01 par value per share | | $ | 1,040,868 | | | $ | 363,669 | | | $ | 171,918 | | | $ | 409,567 | |
Paid-in-surplus | | | 642,735,481 | | | | 277,029,573 | | | | 132,366,379 | | | | 338,793,545 | |
Total Distributable earnings | | | 639,066,358 | | | | 265,622,874 | | | | 110,114,194 | | | | 629,041,054 | |
Net assets applicable to common shares | | $ | 1,282,842,707 | | | $ | 543,016,116 | | | $ | 242,652,491 | | | $ | 968,244,166 | |
Authorized common shares | | | Unlimited | | | | Unlimited | | | | Unlimited | | | | Unlimited | |
See accompanying notes to financial statements.
50
Statement of Operations
Six Months Ended June 30, 2020
(Unaudited)
| | | | | | | | | | | | | | | | |
| | | BXMX | | | DIAX | | | SPXX | | | QQQX | |
Investment Income | | | | | | | | | | | | | | | | |
Dividends | | $ | 11,897,609 | | | $ | 7,191,523 | | | $ | 2,557,103 | | | $ | 5,162,770 | |
Foreign tax withheld on dividend income | | | (5,400 | ) | | | — | | | | — | | | | (12,616 | ) |
Interest | | | 28,794 | | | | 1,855 | | | | 1,201 | | | | 1,725 | |
Total Investment Income | | | 11,921,003 | | | | 7,193,378 | | | | 2,558,304 | | | | 5,151,879 | |
Expenses | | | | | | | | | | | | | | | | |
Management fees | | | 5,411,152 | | | | 2,431,426 | | | | 1,004,631 | | | | 3,759,233 | |
Custodian fees | | | 61,467 | | | | 29,685 | | | | 22,871 | | | | 42,813 | |
Trustees fees | | | 15,191 | | | | 6,587 | | | | 2,844 | | | | 10,319 | |
Professional fees | | | 70,861 | | | | 39,913 | | | | 29,625 | | | | 43,903 | |
Shareholder reporting expenses | | | 90,027 | | | | 63,465 | | | | 20,965 | | | | 61,921 | |
Shareholder servicing agent fees | | | 651 | | | | 280 | | | | 85 | | | | 298 | |
Shelf offering expenses | | | — | | | | — | | | | — | | | | 243,584 | |
Stock exchange listing fees | | | 14,364 | | | | 5,313 | | | | 3,957 | | | | — | |
Investor relations expenses | | | 131,664 | | | | 60,897 | | | | 27,158 | | | | 88,281 | |
Other | | | 126,369 | | | | 71,845 | | | | 27,313 | | | | 145,756 | |
Total expenses | | | 5,921,746 | | | | 2,709,411 | | | | 1,139,449 | | | | 4,396,108 | |
Net investment income (loss) | | | 5,999,257 | | | | 4,483,967 | | | | 1,418,855 | | | | 755,771 | |
Realized and Unrealized Gain (Loss) | | | | | | | | | | | | | | | | |
Net realized gain (loss) from: | | | | | | | | | | | | | | | | |
Investments and foreign currency | | | 102,679,594 | | | | 27,903,224 | | | | 9,028,897 | | | | 76,921,235 | |
Options purchased | | | — | | | | 187,057 | | | | 90,933 | | | | 197,158 | |
Options written | | | (77,915,744 | ) | | | (44,162,842 | ) | | | (19,687,630 | ) | | | (122,696,369 | ) |
Change in net unrealized appreciation (depreciation) of: | | | | | | | | | | | | | | | | |
Investments and foreign currency | | | (149,225,779 | ) | | | (90,288,711 | ) | | | (20,613,784 | ) | | | 55,121,709 | |
Options purchased | | | — | | | | (7,602 | ) | | | (3,801 | ) | | | (7,602 | ) |
Options written | | | 24,311,005 | | | | 3,902,070 | | | | 1,747,619 | | | | 3,099,933 | |
Net realized and unrealized gain (loss) | | | (100,150,924 | ) | | | (102,466,804 | ) | | | (29,437,766 | ) | | | 12,636,064 | |
Net increase (decrease) in net assets from operations | | $ | (94,151,667 | ) | | $ | (97,982,837 | ) | | $ | (28,018,911 | ) | | $ | 13,391,835 | |
See accompanying notes to financial statements.
51
Statement of Changes in Net Assets
(Unaudited)
| | | | | | | | | | | | | | | | |
| | | BXMX | | | DIAX | |
| | | Six Months
Ended
6/30/20 | | | Year
Ended
12/31/19 | | | Six Months
Ended
6/30/20 | | | Year
Ended
12/31/19 | |
Operations | | | | | | | | | | | | | | | | |
Net investment income (loss) | | $ | 5,999,257 | | | $ | 16,266,625 | | | $ | 4,483,967 | | | $ | 9,685,597 | |
Net realized gain (loss) from: | | | | | | | | | | | | | | | | |
Investments and foreign currency | | | 102,679,594 | | | | 91,040,904 | | | | 27,903,224 | | | | 41,997,130 | |
Options purchased | | | — | | | | — | | | | 187,057 | | | | 107,085 | |
Options written | | | (77,915,744 | ) | | | (128,468,045 | ) | | | (44,162,842 | ) | | | (53,907,750 | ) |
Change in net unrealized appreciation (depreciation) of: | | | | | | | | | | | | | | | | |
Investments and foreign currency | | | (149,225,779 | ) | | | 246,272,851 | | | | (90,288,711 | ) | | | 89,858,633 | |
Options purchased | | | — | | | | — | | | | (7,602 | ) | | | — | |
Options written | | | 24,311,005 | | | | (17,672,868 | ) | | | 3,902,070 | | | | 1,993,945 | |
Net increase (decrease) in net assets applicable to common shares from operations | | | (94,151,667 | ) | | | 207,439,467 | | | | (97,982,837 | ) | | | 89,734,640 | |
Distributions to Common Shareholders | | | | | | | | | | | | | | | | |
Dividends | | | (46,578,860 | ) | | | (16,177,307 | ) | | | (20,656,407 | ) | | | (9,874,342 | ) |
Return of capital | | | — | | | | (80,354,319 | ) | | | — | | | | (32,911,527 | ) |
Decrease in net assets applicable to common shares from distributions to shareholders | | | (46,578,860 | ) | | | (96,531,626 | ) | | | (20,656,407 | ) | | | (42,785,869 | ) |
Capital Share Transactions | | | | | | | | | | | | | | | | |
Proceeds from shelf offering, net of offering costs | | | 103,714 | | | | 3,299,488 | | | | 400,448 | | | | 3,692,490 | |
Net proceeds from common shares issued to shareholders due to reinvestment of distributions | | | 797,626 | | | | 795,979 | | | | — | | | | 393,733 | |
Net increase (decrease) in net assets applicable to common shares from capital share transactions | | | 901,340 | | | | 4,095,467 | | | | 400,448 | | | | 4,086,223 | |
Net increase (decrease) in net assets applicable to common shares | | | (139,829,187 | ) | | | 115,003,308 | | | | (118,238,796 | ) | | | 51,034,994 | |
Net assets applicable to common shares at the beginning of period | | | 1,422,671,894 | | | | 1,307,668,586 | | | | 661,254,912 | | | | 610,219,918 | |
Net assets applicable to common shares at the end of period | | $ | 1,282,842,707 | | | $ | 1,422,671,894 | | | $ | 543,016,116 | | | $ | 661,254,912 | |
See accompanying notes to financial statements.
52
| | | | | | | | | | | | | | | | |
| | | SPXX | | | QQQX | |
| | | Six Months
Ended
6/30/20 | | | Year
Ended
12/31/19 | | | Six Months
Ended
6/30/20 | | | Year
Ended
12/31/19 | |
Operations | | | | | | | | | | | | | | | | |
Net investment income (loss) | | $ | 1,418,855 | | | $ | 2,890,348 | | | $ | 755,771 | | | $ | 2,189,322 | |
Net realized gain (loss) from: | | | | | | | | | | | | | | | | |
Investments and foreign currency | | | 9,028,897 | | | | 8,946,838 | | | | 76,921,235 | | | | 76,537,118 | |
Options purchased | | | 90,933 | | | | 38,407 | | | | 197,158 | | | | 145,883 | |
Options written | | | (19,687,630 | ) | | | (21,461,425 | ) | | | (122,696,369 | ) | | | (87,367,839 | ) |
Change in net unrealized appreciation (depreciation) of: | | | | | | | | | | | | | | | | |
Investments and foreign currency | | | (20,613,784 | ) | | | 57,362,755 | | | | 55,121,709 | | | | 215,791,192 | |
Options purchased | | | (3,801 | ) | | | — | | | | (7,602 | ) | | | — | |
Options written | | | 1,747,619 | | | | 782,286 | | | | 3,099,933 | | | | 2,970,469 | |
Net increase (decrease) in net assets applicable to common shares from operations | | | (28,018,911 | ) | | | 48,559,209 | | | | 13,391,835 | | | | 210,266,145 | |
Distributions to Common Shareholders | | | | | | | | | | | | | | | | |
Dividends | | | (8,767,797 | ) | | | (3,025,188 | ) | | | (31,376,158 | ) | | | (2,259,594 | ) |
Return of capital | | | — | | | | (14,715,470 | ) | | | — | | | | (58,953,342 | ) |
Decrease in net assets applicable to common shares from distributions to shareholders | | | (8,767,797 | ) | | | (17,740,658 | ) | | | (31,376,158 | ) | | | (61,212,936 | ) |
Capital Share Transactions | | | | | | | | | | | | | | | | |
Proceeds from shelf offering, net of offering costs | | | 4,087,020 | | | | 5,909,430 | | | | 34,283,334 | | | | 35,551,397 | |
Net proceeds from common shares issued to shareholders due to reinvestment of distributions | | | 72,207 | | | | 208,444 | | | | — | | | | 410,076 | |
Net increase (decrease) in net assets applicable to common shares from capital share transactions | | | 4,159,227 | | | | 6,117,874 | | | | 34,283,334 | | | | 35,961,473 | |
Net increase (decrease) in net assets applicable to common shares | | | (32,627,481 | ) | | | 36,936,425 | | | | 16,299,011 | | | | 185,014,682 | |
Net assets applicable to common shares at the beginning of period | | | 275,279,972 | | | | 238,343,547 | | | | 951,945,155 | | | | 766,930,473 | |
Net assets applicable to common shares at the end of period | | $ | 242,652,491 | | | $ | 275,279,972 | | | $ | 968,244,166 | | | $ | 951,945,155 | |
See accompanying notes to financial statements.
53
Financial Highlights
(Unaudited)
Selected data for a share outstanding throughout each period:
| | | | | | | | | | | | | | | | | | | | | | | | | | | | | | | | | | | | | | | | | | | | | | | | |
| | | | |
| | | | | | Investment Operations | | | Less Distributions to
Common Shareholders | | | Common Shares | |
| | | Beginning
Common
Share
NAV | | | Net
Investment
Income
(Loss)(a) | | | Net
Realized/
Unrealized
Gain (Loss) | | | Total | | | From
Net
Investment
Income | | | From
Accumulated
Net Realized
Gains | | | Return
of
Capital | | | Total | | | Shelf
Offering
Costs | | | Premium
from
Shares
Sold
through
Shelf
Offering | | | Ending
NAV | | | Ending
Share
Price | |
|
BXMX | |
Year Ended 12/31: | |
2020(d) | | $ | 13.68 | | | $ | 0.06 | | | $ | (0.97 | ) | | $ | (0.91 | ) | | $ | (0.45 | ) | | $ | — | | | $ | — | | | $ | (0.45 | ) | | $ | — | | | $ | — | * | | $ | 12.32 | | | $ | 11.00 | |
2019 | | | 12.61 | | | | 0.16 | | | | 1.84 | | | | 2.00 | | | | (0.16 | ) | | | — | | | | (0.77 | ) | | | (0.93 | ) | | | — | * | | | — | * | | | 13.68 | | | | 13.75 | |
2018 | | | 14.35 | | | | 0.15 | | | | (0.91 | ) | | | (0.76 | ) | | | (0.16 | ) | | | (0.37 | ) | | | (0.45 | ) | | | (0.98 | ) | | | — | * | | | — | * | | | 12.61 | | | | 12.07 | |
2017 | | | 13.52 | | | | 0.16 | | | | 1.58 | | | | 1.74 | | | | (0.15 | ) | | | — | | | | (0.76 | ) | | | (0.91 | ) | | | — | | | | — | | | | 14.35 | | | | 14.25 | |
2016 | | | 13.34 | | | | 0.18 | | | | 0.93 | | | | 1.11 | | | | (0.44 | ) | | | (0.29 | ) | | | (0.20 | ) | | | (0.93 | ) | | | — | | | | — | | | | 13.52 | | | | 12.72 | |
2015 | | | 13.65 | | | | 0.17 | | | | 0.52 | | | | 0.69 | | | | (1.00 | ) | | | — | | | | — | | | | (1.00 | ) | | | — | | | | — | | | | 13.34 | | | | 13.43 | |
|
DIAX | |
Year Ended 12/31: | |
2020(d) | | | 18.20 | | | | 0.12 | | | | (2.82 | ) | | | (2.70 | ) | | | (0.57 | ) | | | — | | | | — | | | | (0.57 | ) | | | — | | | | — | * | | | 14.93 | | | | 13.61 | |
2019 | | | 16.90 | | | | 0.27 | | | | 2.21 | | | | 2.48 | | | | (0.27 | ) | | | — | | | | (0.91 | ) | | | (1.18 | ) | | | — | * | | | — | * | | | 18.20 | | | | 17.66 | |
2018 | | | 19.05 | | | | 0.25 | | | | (1.16 | ) | | | (0.91 | ) | | | (0.25 | ) | | | (0.22 | ) | | | (0.77 | ) | | | (1.24 | ) | | | — | * | | | — | * | | | 16.90 | | | | 16.12 | |
2017 | | | 16.55 | | | | 0.26 | | | | 3.30 | | | | 3.56 | | | | (0.26 | ) | | | — | | | | (0.80 | ) | | | (1.06 | ) | | | — | | | | — | | | | 19.05 | | | | 18.84 | |
2016 | | | 15.78 | | | | 0.27 | | | | 1.54 | | | | 1.81 | | | | (0.27 | ) | | | — | | | | (0.77 | ) | | | (1.04 | ) | | | — | | | | — | | | | 16.55 | | | | 15.00 | |
2015 | | | 16.83 | | | | 0.25 | | | | (0.24 | ) | | | 0.01 | | | | (0.65 | ) | | | (0.07 | ) | | | (0.34 | ) | | | (1.06 | ) | | | — | | | | — | | | | 15.78 | | | | 14.36 | |
|
SPXX | |
Year Ended 12/31: | |
2020(d) | | | 16.27 | | | | 0.08 | | | | (1.73 | ) | | | (1.65 | ) | | | (0.51 | ) | | | — | | | | — | | | | (0.51 | ) | | | — | | | | — | * | | | 14.11 | | | | 12.84 | |
2019 | | | 14.42 | | | | 0.17 | | | | 2.74 | | | | 2.91 | | | | (0.18 | ) | | | — | | | | (0.88 | ) | | | (1.06 | ) | | | — | * | | | — | * | | | 16.27 | | | | 16.47 | |
2018 | | | 16.47 | | | | 0.18 | | | | (1.12 | ) | | | (0.94 | ) | | | (0.18 | ) | | | (0.03 | ) | | | (0.91 | ) | | | (1.12 | ) | | | — | * | | | 0.01 | | | | 14.42 | | | | 14.04 | |
2017 | | | 14.98 | | | | 0.19 | | | | 2.29 | | | | 2.48 | | | | (0.19 | ) | | | — | | | | (0.80 | ) | | | (0.99 | ) | | | — | | | | — | | | | 16.47 | | | | 17.31 | |
2016 | | | 14.72 | | | | 0.20 | | | | 1.04 | | | | 1.24 | | | | (0.85 | ) | | | — | | | | (0.13 | ) | | | (0.98 | ) | | | — | | | | — | | | | 14.98 | | | | 14.40 | |
2015 | | | 15.61 | | | | 0.20 | | | | (0.05 | ) | | | 0.15 | | | | (0.70 | ) | | | — | | | | (0.34 | ) | | | (1.04 | ) | | | — | | | | — | | | | 14.72 | | | | 13.47 | |
|
QQQX | |
Year Ended 12/31: | |
2020(d) | | | 24.12 | | | | 0.02 | | | | 0.26 | | | | 0.28 | | | | (0.78 | ) | | | — | | | | — | | | | (0.78 | ) | | | — | * | | | 0.02 | | | | 23.64 | | | | 23.01 | |
2019 | | | 20.27 | | | | 0.06 | | | | 5.33 | | | | 5.39 | | | | (0.05 | ) | | | — | | | | (1.51 | ) | | | (1.56 | ) | | | — | * | | | 0.02 | | | | 24.12 | | | | 24.05 | |
2018 | | | 22.84 | | | | 0.06 | | | | (0.98 | ) | | | (0.92 | ) | | | (0.06 | ) | | | (1.37 | ) | | | (0.25 | ) | | | (1.68 | ) | | | — | * | | | 0.03 | | | | 20.27 | | | | 20.00 | |
2017 | | | 19.58 | | | | 0.04 | | | | 4.66 | | | | 4.70 | | | | (0.04 | ) | | | (0.50 | ) | | | (0.90 | ) | | | (1.44 | ) | | | — | | | | — | | | | 22.84 | | | | 24.21 | |
2016 | | | 19.98 | | | | 0.09 | | | | 0.91 | | | | 1.00 | | | | (0.09 | ) | | | (0.81 | ) | | | (0.50 | ) | | | (1.40 | ) | | | — | | | | — | | | | 19.58 | | | | 18.56 | |
2015 | | | 19.86 | | | | 0.11 | | | | 1.41 | | | | 1.52 | | | | (0.43 | ) | | | (0.97 | ) | | | — | | | | (1.40 | ) | | | — | | | | — | | | | 19.98 | | | | 19.37 | |
54
| | | | | | | | | | | | | | | | | | | | | | |
| | | | | | | Common Share Supplemental Data/
Ratios Applicable to Common Shares | |
Common Share
Total Returns | | | | | | Ratios to Average Net Assets | | | | |
Based
on
NAV(b) | | |
Based
on
Share
Price(b) | | | Ending
Net Assets
(000) | | | Expenses | | | Net
Investment
Income (Loss) | | | Portfolio
Turnover
Rate(c) | |
| | | | | |
| | | | | | | | | | | | | | | | | | | | | | | |
| | | | | | | | | | | | | | | | | | | | | | |
| | (6.36 | )% | | | (16.63 | )% | | $ | 1,282,843 | | | | 0.92 | % | | | 0.93 | % | | | 18 | % |
| | 16.16 | | | | 22.08 | | | | 1,422,672 | | | | 0.91 | | | | 1.18 | | | | 4 | |
| | (5.56 | ) | | | (8.88 | ) | | | 1,307,669 | | | | 0.89 | | | | 1.10 | | | | 5 | |
| | 13.21 | | | | 19.59 | | | | 1,486,003 | | | | 0.91 | | | | 1.12 | | | | 2 | |
| | 8.68 | | | | 1.75 | | | | 1,399,863 | | | | 0.93 | | | | 1.34 | | | | 5 | |
| | 5.17 | | | | 19.80 | | | | 1,381,889 | | | | 0.91 | | | | 1.24 | | | | 8 | |
| | | | | |
| | | | | | | | | | | | | | | | | | | | | | | |
| | | | | | | | | | | | | | | | | | | | | | |
| | (14.59 | ) | | | (19.56 | ) | | | 543,016 | | | | 0.95 | | | | 1.58 | | | | 8 | |
| | 14.94 | | | | 17.07 | | | | 661,255 | | | | 0.95 | | | | 1.49 | | | | 6 | |
| | (5.01 | ) | | | (8.27 | ) | | | 610,220 | | | | 0.92 | | | | 1.37 | | | | 9 | |
| | 22.12 | | | | 33.65 | | | | 687,579 | | | | 0.93 | | | | 1.47 | | | | 5 | |
| | 11.95 | | | | 12.18 | | | | 597,216 | | | | 0.94 | | | | 1.73 | | | | 6 | |
| | 0.17 | | | | 0.18 | | | | 569,604 | | | | 0.93 | | | | 1.52 | | | | 18 | |
| | | | | |
| | | | | | | | | | | | | | | | | | | | | | | |
| | | | | | | | | | | | | | | | | | | | | | |
| | (9.77 | ) | | | (18.77 | ) | | | 242,652 | | | | 0.93 | | | | 1.15 | | | | 8 | |
| | 20.62 | | | | 25.40 | | | | 275,280 | | | | 0.99 | | | | 1.11 | | | | 8 | |
| | (6.03 | ) | | | (12.99 | ) | | | 238,344 | | | | 0.91 | | | | 1.08 | | | | 16 | |
| | 16.91 | | | | 27.91 | | | | 266,065 | | | | 0.92 | | | | 1.18 | | | | 11 | |
| | 8.73 | | | | 14.75 | | | | 242,003 | | | | 0.93 | | | | 1.39 | | | | 13 | |
| | 1.09 | | | | 1.70 | | | | 237,809 | | | | 0.92 | | | | 1.32 | | | | 21 | |
| | | | | |
| | | | | | | | | | | | | | | | | | | | | | | |
| | | | | | | | | | | | | | | | | | | | | | |
| | 1.63 | | | | (0.75 | ) | | | 968,244 | | | | 0.95 | | | | 0.17 | | | | 8 | |
| | 27.33 | | | | 28.73 | | | | 951,945 | | | | 0.91 | | | | 0.25 | | | | 11 | |
| | (4.39 | ) | | | (11.15 | ) | | | 766,930 | | | | 0.91 | | | | 0.25 | | | | 23 | |
| | 24.63 | | | | 39.24 | | | | 836,161 | | | | 0.93 | | | | 0.17 | | | | 17 | |
| | 5.28 | | | | 3.30 | | | | 715,835 | | | | 0.94 | | | | 0.49 | | | | 17 | |
| | 7.97 | | | | 8.47 | | | | 730,622 | | | | 0.93 | | | | 0.54 | | | | 15 | |
| (a) | Per share Net Investment Income (Loss) is calculated using the average daily shares method. |
| (b) | Total Return Based on Common Share NAV is the combination of changes in common share NAV, reinvested dividend income at Common Share NAV and reinvested capital gains distributions at NAV, if any. The last dividend declared in the period, which is typically paid on the first business day of the following month, is assumed to be reinvested at the ending NAV. The actual reinvest price for the last dividend declared in the period may often be based on the Fund’s market price (and not its NAV), and therefore may be different from the price used in the calculation. Total returns are not annualized. |
Total Return Based on Common Share Price is the combination of changes in the market price per share and the effect of reinvested dividend income and reinvested capital gains distributions, if any, at the average price paid per share at the time of reinvestment. The last dividend declared in the period, which is typically paid on the first business day of the following month, is assumed to be reinvested at the ending market price. The actual reinvestment for the last dividend declared in the period may take place over several days, and in some instances may not be based on the market price, so the actual reinvestment price may be different from the price used in the calculation. Total returns are not annualized.
| (c) | Portfolio Turnover Rate is calculated based on the lesser of long-term purchases or sales (as disclosed in Note 5 – Portfolio Securities and Investments in Derivatives, Investment Transactions) divided by the average long-term market value during the period. |
| (d) | For the six months ended June 30, 2020. |
| * | Rounds to less than $0.01. |
See accompanying notes to financial statements.
55
Notes to Financial Statements
(Unaudited)
1. General Information
Fund Information
The funds covered in this report and their corresponding New York Stock Exchange (“NYSE”) or Nasdaq National Market (“Nasdaq”) symbols are as follows (each a “Fund” and collectively, the “Funds”):
| | • | | Nuveen S&P 500 Buy-Write Income Fund (BXMX) |
| | • | | Nuveen Dow 30SM Dynamic Overwrite Fund (DIAX) |
| | • | | Nuveen S&P 500 Dynamic Overwrite Fund (SPXX) |
| | • | | Nuveen Nasdaq 100 Dynamic Overwrite Fund (QQQX) |
The Funds are registered under the Investment Company Act of 1940 (the “1940 Act”), as amended, as diversified (non-diversified for DIAX and QQQX) closed-end management investment companies. Shares of BXMX, DIAX and SPXX are traded on the NYSE while shares of QQQX are traded on the Nasdaq. BXMX, DIAX, SPXX and QQQX were organized as Massachusetts business trusts on July 23, 2004, May 20, 2014, November 11, 2004 and May 20, 2014, respectively.
The end of the reporting period for the Funds is June 30, 2020, and the period covered by these Notes to Financial Statements is the six months ended June 30, 2020 (the “current fiscal period”).
Investment Adviser and Sub-Adviser
The Funds’ investment adviser is Nuveen Fund Advisors, LLC (the “Adviser”), a subsidiary of Nuveen, LLC (“Nuveen”). Nuveen is the investment management arm of Teachers Insurance and Annuity Association of America (TIAA). The Adviser has overall responsibility for management of the Funds, oversees the management of the Funds’ portfolios, manages the Funds’ business affairs and provides certain clerical, bookkeeping and other administrative services, and, if necessary, asset allocation decisions. The Adviser has entered into sub-advisory agreements with Gateway Investment Advisers, LLC (“Gateway”), under which Gateway manages BXMX’s investment portfolio and Nuveen Asset Management, LLC (“NAM”), a subsidiary of the Adviser, under which NAM manages the investment portfolios of DIAX, SPXX and QQQX.
Other Matters
The outbreak of the novel coronavirus (“COVID-19”) and subsequent global pandemic began significantly impacting the U.S. and global financial markets and economies during the calendar quarter ended March 31, 2020. The worldwide spread of COVID-19 has created significant uncertainty in the global economy. The duration and extent of COVID-19 over the long-term cannot be reasonably estimated at this time. The ultimate impact of COVID-19 and the extent to which COVID-19 impacts the Funds’ normal course of business, results of operations, investments, and cash flows will depend on future developments, which are highly uncertain and difficult to predict. Management continues to monitor and evaluate this situation.
2. Significant Accounting Policies
The accompanying financial statements were prepared in accordance with accounting principles generally accepted in the United States of America (“U.S. GAAP”), which may require the use of estimates made by management and the evaluation of subsequent events. Actual results may differ from those estimates. Each Fund is an investment company and follows the accounting guidance in the Financial Accounting Standards Board (“FASB”) Accounting Standards Codification 946, Financial Services – Investment Companies. The net asset value (“NAV”) for financial reporting purposes may differ from the NAV for processing security and common share transactions. The NAV for financial reporting purposes includes security and common share transactions through the date of the report. Total return is computed based on the NAV used for processing security and common share transactions. The following is a summary of the significant accounting policies consistently followed by the Funds.
Compensation
The Funds pay no compensation directly to those of its trustees who are affiliated with the Adviser or to its officers, all of whom receive remuneration for their services to the Funds from the Adviser or its affiliates. The Funds’ Board of Trustees (the “Board”) has adopted a deferred compensation plan for independent trustees that enables trustees to elect to defer receipt of all or a portion of the annual compensation they are entitled to receive from certain Nuveen-advised funds. Under the plan, deferred amounts are treated as though equal dollar amounts had been invested in shares of select Nuveen-advised funds.
56
Distributions to Common Shareholders
Distributions to shareholders are recorded on the ex-dividend date. The amount and timing of distributions are determined in accordance with federal income tax regulations, which may differ from U.S. GAAP.
Each Fund makes quarterly cash distributions to shareholders of a stated dollar amount per share. Subject to approval and oversight by the Board, each Fund seeks to maintain a stable distribution level designed to deliver the long-term return potential of each Fund’s investment strategy through regular quarterly distributions (a “Managed Distribution Program”). Total distributions during a calendar year generally will be made from each Fund’s net investment income, net realized capital gains and net unrealized capital gains in the Fund’s portfolio, if any. The portion of distributions paid attributed to net unrealized gains, if any, is distributed from the Fund’s assets and is treated by shareholders as a nontaxable distribution (“return of capital”) for tax purposes. In the event that total distributions during a calendar year exceed a Fund’s total return on NAV, the difference will reduce NAV per share. If a Fund’s total return on NAV exceeds total distributions during a calendar year, the excess will be reflected as an increase in NAV per share. The final determination of the source and character of all distributions paid by a Fund during the fiscal year is made after the end of the fiscal year and is reflected in the financial statements contained in the annual report as of December 31 each year.
The tax character of Fund distributions for a fiscal year is dependent upon the amount and tax character of distributions received from securities held in the Fund’s portfolio. Distributions received from certain securities in which the Fund invests, most notably real estate investment trust securities, may be characterized for tax purposes as ordinary income, long-term capital gain and/or a return of capital. The issuer of a security reports the tax character of its distributions only once per year, generally during the first two months after the calendar year end. The distribution is included in the Fund’s ordinary income until such time the Fund is notified by the issuer of the actual tax character. Dividend income, net realized gain (loss) and unrealized appreciation (depreciation) recognized on the Statement of Operations reflect the amounts of income, capital gain, and/or return of capital as reported by the issuers of such securities for distributions during the current fiscal period.
Foreign Currency Transactions and Translation
To the extent that the Funds invest in securities and/or contracts that are denominated in a currency other than U.S. dollars, the Funds will be subject to currency risk, which is the risk that an increase in the U.S. dollar relative to the foreign currency will reduce returns or portfolio value. Generally, when the U.S. dollar rises in value against a foreign currency, the Funds’ investments denominated in that currency will lose value because their currency is worth fewer U.S. dollars; the opposite effect occurs if the U.S. dollar falls in relative value. Investments and other assets and liabilities denominated in foreign currencies are converted into U.S. dollars on a spot (i.e. cash) basis at the spot rate prevailing in the foreign currency exchange market at the time of valuation. Purchases and sales of investments and income denominated in foreign currencies are translated into U.S. dollars on the respective dates of such transactions.
The books and records of the Funds are maintained in U.S. dollars. Assets, including investments, and liabilities denominated in foreign currencies are translated into U.S. dollars at the end of each day. Purchases and sales of securities, income and expenses are translated into U.S. dollars at the prevailing exchange rate on the respective dates of the transactions.
Net realized foreign currency gains and losses resulting from changes in exchange rates associated with (i) foreign currency, (ii) investments and (iii) derivatives include foreign currency gains and losses between trade date and settlement date of the transactions, foreign currency transactions, and the difference between the amounts of interest and dividends recorded on the books of the Funds and the amounts actually received are recognized as a component of “Net realized gain (loss) from investments and foreign currency” on the Statement of Operations, when applicable.
The unrealized gains and losses resulting from changes in foreign currency exchange rates and changes in foreign exchange rates associated with (i) investments and (ii) other assets and liabilities are recognized as a component of “Change in net unrealized appreciation (depreciation) of investments and foreign currency” on the Statement of Operations, when applicable. The unrealized gains and losses resulting from changes in foreign exchange rates associated with investments in derivatives are recognized as a component of the respective derivative’s related “Change in net unrealized appreciation (depreciation)” on the Statement of Operations, when applicable.
Indemnifications
Under the Funds’ organizational documents, their officers and trustees are indemnified against certain liabilities arising out of the performance of their duties to the Funds. In addition, in the normal course of business, the Funds enter into contracts that provide general indemnifications to other parties. The Funds’ maximum exposure under these arrangements is unknown as this would involve future claims that may be made against the Funds that have not yet occurred. However, the Funds have not had prior claims or losses pursuant to these contracts and expect the risk of loss to be remote.
Investments and Investment Income
Securities transactions are accounted for as of the trade date for financial reporting purposes. Realized gains and losses on securities transactions are based upon the specific identification method. Dividend income is recorded on the ex-dividend date or, for certain foreign securities, when information is available. Non-cash dividends received in the form of stock, if any, are recognized on the ex-dividend date and recorded at fair value. Interest income is recorded on an accrual basis.
57
Notes to Financial Statements (continued)
(Unaudited)
Netting Agreements
In the ordinary course of business, the Funds may enter into transactions subject to enforceable International Swaps and Derivatives Association, Inc. (ISDA) master agreements or other similar arrangements (“netting agreements”). Generally, the right to offset in netting agreements allows each Fund to offset certain securities and derivatives with a specific counterparty, when applicable, as well as any collateral received or delivered to that counterparty based on the terms of the agreements. Generally, each Fund manages its cash collateral and securities collateral on a counterparty basis.
The Funds’ investments subject to netting agreements as of the end of the reporting period, if any, are further described in Note 4 – Portfolio Securities and Investments in Derivatives.
New Accounting Pronouncements and Rule Issuances
Fair Value Measurement: Disclosure Framework
During August 2018, the FASB issued Accounting Standards Update (“ASU”) 2018-13 (“ASU 2018-13”), Fair Value Measurement: Disclosure Framework – Changes to the Disclosure Requirements for Fair Value Measurements. ASU 2018-13 modifies the disclosures required by Topic 820, Fair Value Measurements. The amendments in ASU 2018-13 are effective for all entities for fiscal years, and interim periods within those fiscal years, beginning after December 15, 2019. Management has early implemented this guidance and it did not have a material impact on the Funds’ financial statements.
Reference Rate Reform
In March 2020, FASB issued ASU 2020-04, Reference Rate Reform: Facilitation of the Effects of Reference Rate Reform on Financial Reporting. The main objective of the new guidance is to provide relief to companies that will be impacted by the expected change in benchmark interest rates at the end of 2021, when participating banks will no longer be required to submit London Interbank Offered Rate (LIBOR) quotes by the UK Financial Conduct Authority (FCA). The new guidance allows companies to, provided the only changes to existing contracts are a change to an approved benchmark interest rate, account for modifications as a continuance of the existing contract without additional analysis. For new and existing contracts, the Funds may elect to apply the optional expedients as of March 12, 2020 through December 31, 2022. Management has not yet elected to apply the optional expedients, but is currently assessing the impact of the ASU’s adoption to the Funds’ financial statements and various filings.
3. Investment Valuation and Fair Value Measurements
The fair valuation input levels as described below are for fair value measurement purposes.
The Funds’ investments in securities are recorded at their estimated fair value. Fair value is defined as the price that would be received upon selling an investment or transferring a liability in an orderly transaction to an independent buyer in the principal or most advantageous market for the investment. A three-tier hierarchy is used to maximize the use of observable market data and minimize the use of unobservable inputs and to establish classification of fair value measurements for disclosure purposes. Observable inputs reflect the assumptions market participants would use in pricing the asset or liability. Observable inputs are based on market data obtained from sources independent of the reporting entity. Unobservable inputs reflect the reporting entity’s own assumptions about the assumptions market participants would use in pricing the asset or liability. Unobservable inputs are based on the best information available in the circumstances. The following is a summary of the three-tiered hierarchy of valuation input levels.
| | |
| Level 1 – | | Inputs are unadjusted and prices are determined using quoted prices in active markets for identical securities. |
| Level 2 – | | Prices are determined using other significant observable inputs (including quoted prices for similar securities, interest rates, credit spreads, etc.). |
| Level 3 – | | Prices are determined using significant unobservable inputs (including management’s assumptions in determining the fair value of investments). |
Common stocks and other equity-type securities are valued at the last sales price on the securities exchange on which such securities are primarily traded and are generally classified as Level 1. Securities primarily traded on the Nasdaq are valued at the Nasdaq Official Closing Price and are generally classified as Level 1. However, securities traded on a securities exchange or Nasdaq for which there were no transactions on a given day or securities not listed on a securities exchange or Nasdaq are valued at the last quoted bid price and are generally classified as Level 2. Prices of certain American Depositary Receipts (“ADR”) held by the Funds that trade in the United States are valued based on the last traded price, official closing price, or the most recent bid price of the underlying non-U.S.-traded stock, adjusted as appropriate for the underlying-to-ADR conversion ratio and foreign exchange rate, and from time-to-time may also be adjusted further to take into account material events that may take place after the close of the local non-U.S. market but before the close of the NYSE, which may represent a transfer from a Level 1 to a Level 2 security.
Prices of fixed-income securities are provided by an independent pricing service (“pricing service”) approved by the Board. The pricing service establishes a security’s fair value using methods that may include consideration of the following: yields or prices of investments of comparable quality, type of issue, coupon, maturity and rating, market quotes or indications of value from security dealers, evaluations of anticipated cash flows or collateral, general market conditions and other information and analysis, including the obligor’s credit characteristics considered relevant. These securities are generally classified as
58
Level 2. In pricing certain securities, particularly less liquid and lower quality securities, the pricing service may consider information about a security, its issuer or market activity, provided by the Adviser. These securities are generally classified as Level 2 or Level 3 depending on the observability of the significant inputs.
Index options are valued at the 4:00 p.m. Eastern Time (ET) close price of the NYSE. The values of exchange-traded options are based on the mean of the closing bid and ask prices. Index and exchange-traded options are generally classified as Level 1. Options traded in the over-the-counter (“OTC”) market are valued using an evaluated mean price and are generally classified as Level 2.
Repurchase agreements are valued at contract amount plus accrued interest, which approximates market value. These securities are generally classified as Level 2.
Investments initially valued in currencies other than the U.S. dollar are converted to the U.S. dollar using exchange rates obtained from pricing services. As a result, the NAV of a Fund’s shares may be affected by changes in the value of currencies in relation to the U.S. dollar. The value of securities traded in markets outside the United States or denominated in currencies other than the U.S. dollar may be affected significantly on a day that the NYSE is closed and an investor is not able to purchase, redeem or exchange shares. If significant market events occur between the time of determination of the closing price of a foreign security on an exchange and the time that the Funds’ NAV is determined, or if under the Funds’ procedures, the closing price of a foreign security is not deemed to be reliable, the security would be valued at fair value as determined in accordance with procedures established in good faith by the Board. These securities are generally classified as Level 2 or Level 3 depending on the observability of the significant inputs.
Certain securities may not be able to be priced by the pre-established pricing methods as described above. Such securities may be valued by the Board and/or its appointee at fair value. These securities generally include, but are not limited to, restricted securities (securities which may not be publicly sold without registration under the Securities Act of 1933, as amended) for which a pricing service is unable to provide a market price; securities whose trading has been formally suspended; debt securities that have gone into default and for which there is no current market quotation; a security whose market price is not available from a pre-established pricing source; a security with respect to which an event has occurred that is likely to materially affect the value of the security after the market has closed but before the calculation of a Fund’s NAV (as may be the case in non-U.S. markets on which the security is primarily traded) or make it difficult or impossible to obtain a reliable market quotation; and a security whose price, as provided by the pricing service, is not deemed to reflect the security’s fair value. As a general principle, the fair value of a security would appear to be the amount that the owner might reasonably expect to receive for it in a current sale. A variety of factors may be considered in determining the fair value of such securities, which may include consideration of the following: yields or prices of investments of comparable quality, type of issue, coupon, maturity and rating, market quotes or indications of value from security dealers, evaluations of anticipated cash flows or collateral, general market conditions and other information and analysis, including the obligor’s credit characteristics considered relevant. These securities are generally classified as Level 2 or Level 3 depending on the observability of the significant inputs. Regardless of the method employed to value a particular security, all valuations are subject to review by the Board and/or its appointee.
The inputs or methodologies used for valuing securities are not an indication of the risks associated with investing in those securities. The following is a summary of each Fund’s fair value measurements as of the end of the reporting period:
| | | | | | | | | | | | | | | | |
| BXMX | | Level 1 | | | Level 2 | | | Level 3 | | | Total | |
Long-Term Investments*: | | | | | | | | | | | | | | | | |
Common Stocks | | $ | 1,277,181,227 | | | $ | — | | | $ | — | | | $ | 1,277,181,227 | |
| | | | |
Short-Term Investments: | | | | | | | | | | | | | | | | |
Repurchase Agreements | | | — | | | | 65,503,311 | | | | — | | | | 65,503,311 | |
| | | | |
Investment in Derivatives: | | | | | | | | | | | | | | | | |
Option Written | | | (28,000,510 | ) | | | — | | | | — | | | | (28,000,510 | ) |
Total | | $ | 1,249,180,717 | | | $ | 65,503,311 | | | $ | — | | | $ | 1,314,684,028 | |
| DIAX | | | | | | | | | | | | |
Long-Term Investments*: | | | | | | | | | | | | | | | | |
Common Stocks | | $ | 545,703,150 | | | $ | — | | | $ | — | | | $ | 545,703,150 | |
| | | | |
Short-Term Investments: | | | | | | | | | | | | | | | | |
Repurchase Agreements | | | — | | | | 188,323 | | | | — | | | | 188,323 | |
| | | | |
Investment in Derivatives: | | | | | | | | | | | | | | | | |
Option Purchased | | | 4,000 | | | | — | | | | — | | | | 4,000 | |
Option Written | | | (4,011,000 | ) | | | — | | | | — | | | | (4,011,000 | ) |
Total | | $ | 541,696,150 | | | $ | 188,323 | | | $ | — | | | $ | 541,884,473 | |
59
Notes to Financial Statements (continued)
(Unaudited)
| | | | | | | | | | | | | | | | |
| SPXX | | Level 1 | | | Level 2 | | | Level 3 | | | Total | |
Long-Term Investments*: | | | | | | | | | | | | | | | | |
Common Stocks | | $ | 243,843,429 | | | $ | — | | | $ | — | | | $ | 243,843,429 | |
Common Stock Rights | | | 48,330 | | | | — | | | | — | | | | 48,330 | |
| | | | |
Short-Term Investments: | | | | | | | | | | | | | | | | |
Repurchase Agreements | | | — | | | | 485,827 | | | | — | | | | 485,827 | |
| | | | |
Investment in Derivatives: | | | | | | | | | | | | | | | | |
Option Purchased | | | 2,000 | | | | — | | | | — | | | | 2,000 | |
Option Written | | | (1,810,200 | ) | | | — | | | | — | | | | (1,810,200 | ) |
Total | | $ | 242,083,559 | | | $ | 485,827 | | | $ | — | | | $ | 242,569,386 | |
| QQQX | | | | | | | | | | | | |
Long-Term Investments*: | | | | | | | | | | | | | | | | |
Common Stocks | | $ | 979,441,749 | | | $ | — | | | $ | — | | | $ | 979,441,749 | |
Common Stock Rights | | | 491,466 | | | | — | | | | — | | | | 491,466 | |
| | | | |
Short-Term Investments: | | | | | | | | | | | | | | | | |
Repurchase Agreements | | | — | | | | 1,877,727 | | | | — | | | | 1,877,727 | |
| | | | |
Investment in Derivatives: | | | | | | | | | | | | | | | | |
Option Purchased | | | 4,000 | | | | — | | | | — | | | | 4,000 | |
Option Written | | | (12,920,100 | ) | | | — | | | | — | | | | (12,920,100 | ) |
Total | | $ | 967,017,115 | | | $ | 1,877,727 | | | $ | — | | | $ | 968,894,842 | |
| * | Refer to the Fund’s Portfolio of Investments for industry classifications, when applicable. |
4. Portfolio Securities and Investments in Derivatives
Portfolio Securities
Repurchase Agreements
In connection with transactions in repurchase agreements, it is each Fund’s policy that its custodian take possession of the underlying collateral securities, the fair value of which exceeds the principal amount of the repurchase transaction, including accrued interest, at all times. If the counterparty defaults, and the fair value of the collateral declines, realization of the collateral may be delayed or limited.
The following table presents the repurchase agreements for the Funds that are subject to netting agreements as of the end of the reporting period, and the collateral delivered related to those repurchase agreements.
| | | | | | | | | | | | | | |
| Fund | | Counterparty | | Short-Term
Investments, at Value | | | Collateral
Pledged (From)
Counterparty* | | | Net
Exposure | |
| BXMX | | Fixed Income Clearing Corporation | | $ | 65,503,311 | | | $ | (65,503,311 | ) | | $ | — | |
| DIAX | | Fixed Income Clearing Corporation | | | 188,323 | | | | (188,323 | ) | | | — | |
| SPXX | | Fixed Income Clearing Corporation | | | 485,827 | | | | (485,827 | ) | | | — | |
| QQQX | | Fixed Income Clearing Corporation | | | 1,877,727 | | | | (1,877,727 | ) | | | — | |
| * | As of the end of the reporting period, the value of the collateral pledged from the counterparty exceeded the value of the repurchase agreements. Refer to the Fund’s Portfolio of Investments for details on the repurchase agreements. |
Zero Coupon Securities
A zero coupon security does not pay a regular interest coupon to its holders during the life of the security. Income to the holder of the security comes from accretion of the difference between the original purchase price of the security at issuance and the par value of the security at maturity and is effectively paid at maturity. The market prices of zero coupon securities generally are more volatile than the market prices of securities that pay interest periodically.
Investment Transactions
Long-term purchases and sales (excluding derivative transactions) during the current reporting period were as follows:
| | | | | | | | | | | | | | | | |
| | | BXMX | | | DIAX | | | SPXX | | | QQQX | |
Purchases | | $ | 240,512,442 | | | $ | 44,118,191 | | | $ | 20,699,708 | | | $ | 70,850,326 | |
Sales | | | 348,088,876 | | | | 98,769,078 | | | | 40,415,881 | | | | 181,836,435 | |
60
The Funds may purchase securities on a when-issued or delayed-delivery basis. Securities purchased on a when-issued or delayed-delivery basis may have extended settlement periods; interest income is not accrued until settlement date. Any securities so purchased are subject to market fluctuation during this period. The Funds have earmarked securities in their portfolios with a current value at least equal to the amount of the when-issued/delayed-delivery purchase commitments. If a Fund has outstanding when-issued/delayed-delivery purchases commitments as of the end of the reporting period, such amounts are recognized on the Statement of Assets and Liabilities.
Investments in Derivatives
Each Fund is authorized to invest in certain derivative instruments, such as futures, options and swap contracts. Each Fund limits its investments in futures, options on futures and swap contracts to the extent necessary for the Adviser to claim the exclusion from registration by the Commodity Futures Trading Commission as a commodity pool operator with respect to the Fund. The Funds record derivative instruments at fair value, with changes in fair value recognized on the Statement of Operations, when applicable. Even though the Funds’ investments in derivatives may represent economic hedges, they are not considered to be hedge transactions for financial reporting purposes.
Options Transactions
The purchase of options involves the risk of loss of all or a part of the cash paid for the options (the premium). The market risk associated with purchasing options is limited to the premium paid. The counterparty credit risk of purchasing options, however, needs to take into account the current value of the option, as this is the performance expected from the counterparty. When a Fund purchases an option, an amount equal to the premium paid (the premium plus commission) is recognized as a component of “Options purchased, at value” on the Statement of Asset and Liabilities. When a Fund writes an option, an amount equal to the net premium received (the premium less commission) is recognized as a component of “Options written, at value” on the Statement of Assets and Liabilities and is subsequently adjusted to reflect the current value of the written option until the option is exercised or expires or the Fund enters into a closing purchase transaction. The changes in the value of options purchased and/or written during the fiscal period are recognized as a component of “Change in net unrealized appreciation (depreciation) of options purchased and/or written” on the Statement of Operations. When an option is exercised or expires or a Fund enters into a closing purchase transaction, the difference between the net premium received, and any amount paid at expiration or on executing a closing purchase transaction, including commission, is recognized as a component of “Net realized gain (loss) from options purchased and/or written” on the Statement of Operations. The Fund, as writer of an option, has no control over whether the underlying instrument may be sold (called) or purchased (put) and as a result bears the risk of an unfavorable change in the market value of the instrument underlying the written option. There is also the risk the Fund may not be able to enter into a closing transaction because of an illiquid market.
During the current fiscal period, BXMX sold call options on equity indices as part of its overall investment strategy with the notional amount of these options averaging 99% of the Fund’s assets.
During the current fiscal period, DIAX, SPXX and QQQX, each sold call options on equity indices as part of its overall investment strategy with the notional amounts of these options ranging from approximately 35-75% of each Fund’s assets. Each of these three funds also purchased a small amount of call options and sold a small amount of put options as part of their overwrite strategy.
The average notional amount of outstanding options purchased and options written during the current fiscal period, was as follows:
| | | | | | | | | | | | | | | | |
| | | | | | DIAX | | | SPXX | | | QQQX | |
Average notional amount of outstanding call options purchased* | | | | | | $ | 391,667 | | | $ | 195,833 | | | $ | 391,667 | |
| | | | |
| | | BXMX | | | DIAX | | | SPXX | | | QQQX | |
Average notional amount of outstanding call options written* | | $ | (1,280,058,333 | ) | | $ | (320,626,667 | ) | | $ | (138,982,500 | ) | | $ | (511,246,667 | ) |
| | | | |
| | | | | | DIAX | | | SPXX | | | QQQX | |
Average notional amount of outstanding put options written* | | | | | | $ | (8,616,667 | ) | | $ | (3,716,667 | ) | | $ | (14,416,667 | ) |
| * | The average notional amount is calculated based on the outstanding notional at the beginning of the current fiscal period and at the end of each fiscal quarter within the current fiscal period. |
61
Notes to Financial Statements (continued)
(Unaudited)
The following table presents the fair value of all options written by the Funds as of the end of the reporting period, the location of these instruments on the Statement of Assets and Liabilities and the primary underlying risk exposure.
| | | | | | | | | | | | | | | | | | |
| | | | | Location on the Statement of Assets and Liabilities | |
Underlying
Risk Exposure | | Derivative
Instrument | | Asset Derivatives | | | | | | (Liability) Derivatives | |
| | Location | | Value | | | | | | Location | | Value | |
| BXMX | |
| Equity price | | Options | | — | | $ | — | | | | | | | Options written, at value | | | $(28,000,510) | |
| DIAX | |
| Equity price | | Options | | Options purchased, at value | | $ | 4,000 | | | | | | | Options written, at value | | $ | (4,011,000 | ) |
| SPXX | |
| Equity price | | Options | | Options purchased, at value | | $ | 2,000 | | | | | | | Options written, at value | | $ | (1,810,200 | ) |
| QQQX | |
| Equity price | | Options | | Options purchased, at value | | $ | 4,000 | | | | | | | Options written, at value | | $ | (12,920,100 | ) |
The following table presents the amount of net realized gain (loss) and change in net unrealized appreciation (depreciation) recognized on options purchased and options written on the Statement of Operations during the current fiscal period, and the primary underlying risk exposure.
| | | | | | | | | | | | |
| Fund | | Underlying
Risk Exposure | | Derivative
Instrument | | Net Realized
Gain (Loss)
from Options
Purchased/Written | | | Change in Net
Unrealized
Appreciation
(Depreciation) of
Options
Purchased/Written | |
| BXMX | | Equity price | | Options written | | $ | (77,915,744 | ) | | $ | 24,311,005 | |
| DIAX | | Equity price | | Options purchased | | | 187,057 | | | | (7,602 | ) |
| DIAX | | Equity price | | Options written | | | (44,162,842 | ) | | | 3,902,070 | |
| SPXX | | Equity price | | Options purchased | | | 90,933 | | | | (3,801 | ) |
| SPXX | | Equity price | | Options written | | | (19,687,630 | ) | | | 1,747,619 | |
| QQQX | | Equity price | | Options purchased | | | 197,158 | | | | (7,602 | ) |
| QQQX | | Equity price | | Options written | | | (122,696,369 | ) | | | 3,099,933 | |
Market and Counterparty Credit Risk
In the normal course of business each Fund may invest in financial instruments and enter into financial transactions where risk of potential loss exists due to changes in the market (market risk) or failure of the other party to the transaction to perform (counterparty credit risk). The potential loss could exceed the value of the financial assets recorded on the financial statements. Financial assets, which potentially expose each Fund to counterparty credit risk, consist principally of cash due from counterparties on forward, option and swap transactions, when applicable. The extent of each Fund’s exposure to counterparty credit risk in respect to these financial assets approximates their carrying value as recorded on the Statement of Assets and Liabilities.
Each Fund helps manage counterparty credit risk by entering into agreements only with counterparties the Adviser believes have the financial resources to honor their obligations and by having the Adviser monitor the financial stability of the counterparties. Additionally, counterparties may be required to pledge collateral daily (based on the daily valuation of the financial asset) on behalf of each Fund with a value approximately equal to the amount of any unrealized gain above a pre-determined threshold. Reciprocally, when each Fund has an unrealized loss, the Funds have instructed the custodian to pledge assets of the Funds as collateral with a value approximately equal to the amount of the unrealized loss above a pre-determined threshold. Collateral pledges are monitored and subsequently adjusted if and when the valuations fluctuate, either up or down, by at least the pre-determined threshold amount.
5. Fund Shares
Common Shares
Common Share Equity Shelf Programs and Offering Costs
The Funds have each filed registration statements with the Securities and Exchange Commission (“SEC”) authorizing each Fund to issue additional shares through one or more equity shelf program (“Shelf Offering”), which became effective with the SEC during the prior fiscal period.
Under these Shelf Offerings, the Funds, subject to market conditions, may raise additional equity capital by issuing additional shares from time to time in varying amounts and by different offering methods at a net price at or above each Fund’s NAV per common share. In the event each Fund’s Shelf Offering registration statement is no longer current, the Funds may not issue additional shares until a post-effective amendment to the registration statement has been filed with the SEC.
62
Additional authorized common shares, common shares sold and offering proceeds, net of offering costs under each Fund’s Shelf Offering during the Funds’ current and prior fiscal period were as follows:
| | | | | | | | | | | | | | | | | | | | | | | | | | | | | | | | |
| | | BXMX | | | DIAX | | | SPXX | | | QQQX | |
| | | Six Months
Ended
6/30/20 | | | Year Ended
12/31/19 | | | Six Months
Ended
6/30/20 | | | Year Ended
12/31/19 | | | Six Months
Ended
6/30/20 | | | Year Ended
12/31/19 | | | Six Months
Ended
6/30/20 | | | Year Ended
12/31/19 | |
Additional authorized common shares | | | 10,400,000 | | | | 10,400,000 | | | | 3,600,000 | | | | 3,600,000 | | | | 1,600,000 | | | | 1,600,000 | | | | 11,355,021 | * | | | 11,355,021 | |
Common shares sold | | | 7,583 | | | | 242,725 | | | | 25,901 | | | | 205,606 | | | | 264,171 | | | | 380,562 | | | | 1,487,960 | | | | 1,619,980 | |
Offering proceeds, net of offering costs | | $ | 103,714 | | | $ | 3,299,488 | | | $ | 400,448 | | | $ | 3,692,490 | | | $ | 4,087,020 | | | $ | 5,909,430 | | | $ | 34,283,334 | | | $ | 35,551,397 | |
| * | Represents additional authorized common shares for the period January 1, 2020 through April 30, 2020. |
Costs incurred by the Funds in connection with their initial shelf registrations are recorded as a prepaid expense and recognized as “Deferred offering costs” on the Statement of Assets and Liabilities. These costs are amortized pro rata as shares are sold and are recognized as a component of “Proceeds from shelf offering, net of offering costs” on the Statement of Changes in Net Assets. Any deferred offering costs remaining one year after effectiveness of the initial shelf registration will be expensed. Costs incurred by the Funds to keep the shelf registration current are expensed as incurred and recognized as a component of “Shelf offering expenses” on the Statement of Operations.
Common Share Transactions
Transactions in common shares for the Funds during the Funds’ current and prior fiscal period, where applicable, were as follows:
| | | | | | | | | | | | | | | | | | | | | | | | | | | | | | | | |
| | | BXMX | | | DIAX | | | SPXX | | | QQQX | |
| | | Six Months
Ended
6/30/20 | | | Year Ended
12/31/19 | | | Six Months
Ended
6/30/20 | | | Year Ended
12/31/19 | | | Six Months
Ended
6/30/20 | | | Year Ended
12/31/19 | | | Six Months
Ended
6/30/20 | | | Year Ended
12/31/19 | |
Common shares: | | | | | | | | | | | | | | | | | | | | | | | | | | | | | | | | |
Sold through shelf offering | | | 7,583 | | | | 242,725 | | | | 25,901 | | | | 205,606 | | | | 264,171 | | | | 380,562 | | | | 1,487,960 | | | | 1,619,980 | |
Issued to shareholders due to reinvestment of distributions | | | 58,348 | | | | 60,255 | | | | — | | | | 22,246 | | | | 4,438 | | | | 13,426 | | | | — | | | | 18,331 | |
Weighted average common share: | | | | | | | | | | | | | | | | | | | | | | | | | | | | | | | | |
Premium to NAV per shelf offering sold | | | 1.07 | % | | | 1.18 | % | | | 1.12 | % | | | 1.34 | % | | | 1.57 | % | | | 1.27 | % | | | 1.91 | % | | | 1.78 | % |
6. Income Tax Information
Each Fund is a separate taxpayer for federal income tax purposes. Each Fund intends to distribute substantially all of its net investment company taxable income to shareholders and to otherwise comply with the requirements of Subchapter M of the Internal Revenue Code applicable to regulated investment companies. In any year when the Funds realize net capital gains, each Fund may choose to distribute all or a portion of its net capital gains to shareholders, or alternatively, to retain all or a portion of its net capital gains and pay federal corporate income taxes on such retained gains.
For all open tax years and all major taxing jurisdictions, management of the Funds has concluded that there are no significant uncertain tax positions that would require recognition in the financial statements. Open tax years are those that are open for examination by taxing authorities (i.e., generally the last four tax year ends and the interim tax period since then). Furthermore, management of the Funds is also not aware of any tax positions for which it is reasonably possible that the total amounts of unrecognized tax benefits will significantly change in the next twelve months.
The following information is presented on an income tax basis. Differences between amounts for financial statement and federal income tax purposes are primarily due to timing differences in recording income, timing differences in recognizing certain gains and losses on investment transactions and the recognition of unrealized gain or loss for tax (mark-to-market) on options contracts. To the extent that differences arise that are permanent in nature, such amounts are reclassified within the capital accounts as detailed below. Temporary differences do not require reclassification. Temporary and permanent differences do not impact the NAVs of the Funds.
The table below presents the cost and unrealized appreciation (depreciation) of each Fund’s investment portfolio, as determined on a federal income tax basis, as of June 30, 2020.
63
Notes to Financial Statements (continued)
(Unaudited)
For purposes of this disclosure, derivative tax cost is generally the sum of any upfront fees or premiums exchanged and any amounts unrealized for income statement reporting but realized in income and/or capital gains for tax reporting. If a particular derivative category does not disclose any tax unrealized appreciation or depreciation, the change in value of those derivatives have generally been fully realized for tax purposes.
| | | | | | | | | | | | | | | | |
| | | BXMX | | | DIAX | | | SPXX | | | QQQX | |
Tax cost of investments | | $ | 629,601,209 | | | $ | 237,596,331 | | | $ | 104,382,039 | | | $ | 256,268,937 | |
Gross unrealized: | | | | | | | | | | | | | | | | |
Appreciation | | $ | 718,193,349 | | | $ | 312,947,564 | | | $ | 147,625,735 | | | $ | 729,683,943 | |
Depreciation | | | (33,110,530 | ) | | | (8,659,422 | ) | | | (9,438,388 | ) | | | (17,058,038 | ) |
Net unrealized appreciation (depreciation) of investments | | $ | 685,082,819 | | | $ | 304,288,142 | | | $ | 138,187,347 | | | $ | 712,625,905 | |
Permanent differences, primarily due to foreign currency transactions, real estate investment trust adjustments and nondeductible offering costs, resulted in reclassifications among the Funds’ components of net assets as of December 31, 2019, the Funds’ last tax year end. | |
The tax components of undistributed net ordinary income and net long-term capital gains as of December 31, 2019, the Funds’ last tax year end, were as follows: | |
| | | BXMX | | | DIAX | | | SPXX | | | QQQX | |
Undistributed net ordinary income | | $ | — | | | $ | — | | | $ | — | | | $ | — | |
Undistributed net long-term capital gains | | | — | | | | — | | | | — | | | | — | |
|
The tax character of distributions paid during the Funds’ last tax year ended December 31, 2019 was designated for purposes of the dividends paid deduction as follows: | |
| | | BXMX | | | DIAX | | | SPXX | | | QQQX | |
Distributions from net ordinary income1 | | $ | 16,177,307 | | | $ | 9,874,342 | | | $ | 3,025,188 | | | $ | 2,259,594 | |
Distributions from net long-term capital gains | | | — | | | | — | | | | — | | | | — | |
Return of capital | | | 80,354,319 | | | | 32,911,527 | | | | 14,715,470 | | | | 58,953,342 | |
|
1 Net ordinary income consists of net taxable income derived from dividends, interest and net short-term capital gains, if any. | |
As of December 31, 2019, the Funds’ last tax year end, the Funds had unused capital losses carrying forward available for federal income tax purposes to be applied against future capital gains, if any. The capital losses are not subject to expiration.
| | | | | | | | | | | | | | | | |
| | | BXMX | | | DIAX | | | SPXX | | | QQQX | |
Not subject to expiration: | |
Short-term | | $ | 54,889,322 | | | $ | 10,322,337 | | | $ | 8,287,385 | | | $ | 10,508,636 | |
Long-term | | | — | | | | — | | | | 3,678,354 | | | | — | |
Total | | $ | 54,889,322 | | | $ | 10,322,337 | | | $ | 11,965,739 | | | $ | 10,508,636 | |
7. Management Fees
The management fee compensates the Adviser for overall investment advisory and administrative services and general office facilities. Gateway and NAM are compensated for their services to the Funds from the management fees paid to the Adviser.
Each Fund’s management fee consists of two components – a fund-level fee, based only on the amount of assets within each individual Fund, and a complex-level fee, based on the aggregate amount of all eligible fund assets managed by the Adviser. This pricing structure enables Fund shareholders to benefit from growth in the assets within their respective Fund as well as from growth in the amount of complex-wide assets managed by the Adviser.
The annual fund-level fee, payable monthly, for each Fund is calculated according to the following schedule:
| | | | | | | | | | | | | | | | |
| Average Daily Managed Assets* | | BXMX | | | DIAX | | | SPXX | | | QQQX | |
For the first $500 million | | | 0.7000 | % | | | 0.7000 | % | | | 0.6600 | % | | | 0.6900 | % |
For the next $500 million | | | 0.6750 | | | | 0.6750 | | | | 0.6350 | | | | 0.6650 | |
For the next $500 million | | | 0.6500 | | | | 0.6500 | | | | 0.6100 | | | | 0.6400 | |
For the next $500 million | | | 0.6250 | | | | 0.6250 | | | | 0.5850 | | | | 0.6150 | |
For managed assets over $2 billion | | | 0.6000 | | | | 0.6000 | | | | 0.5600 | | | | 0.5900 | |
64
The annual complex-level fee, payable monthly, for each Fund is calculated by multiplying the current complex-wide fee rate, determined according to the following schedule by each Fund’s daily managed assets:
| | | | |
| Complex-Level Eligible Asset Breakpoint Level* | | Effective Complex-Level Fee Rate at Breakpoint Level | |
$55 billion | | | 0.2000 | % |
$56 billion | | | 0.1996 | |
$57 billion | | | 0.1989 | |
$60 billion | | | 0.1961 | |
$63 billion | | | 0.1931 | |
$66 billion | | | 0.1900 | |
$71 billion | | | 0.1851 | |
$76 billion | | | 0.1806 | |
$80 billion | | | 0.1773 | |
$91 billion | | | 0.1691 | |
$125 billion | | | 0.1599 | |
$200 billion | | | 0.1505 | |
$250 billion | | | 0.1469 | |
$300 billion | | | 0.1445 | |
| * | For the complex-level fees, managed assets include closed-end fund assets managed by the Adviser that are attributable to certain types of leverage. For these purposes, leverage includes the funds’ use of preferred stock and borrowings and certain investments in the residual interest certificates (also called inverse floating rate securities) in tender option bond (TOB) trusts, including the portion of assets held by a TOB trust that has been effectively financed by the trust’s issuance of floating rate securities, subject to an agreement by the Adviser as to certain funds to limit the amount of such assets for determining managed assets in certain circumstances. The complex-level fee is calculated based upon the aggregate daily managed assets of all Nuveen open-end and closed-end funds that constitute “eligible assets.” Eligible assets do not include assets attributable to investments in other Nuveen funds or assets in excess of a determined amount (originally $2 billion) added to the Nuveen fund complex in connection with the Adviser’s assumption of the management of the former First American Funds effective January 1, 2011, but do not include certain assets of certain Nuveen funds that were reorganized into funds advised by an affiliate of the Adviser during the 2019 calendar year. As of June 30, 2020, the complex-level fee for each Fund was 0.1582%. |
8. Borrowing Arrangements
Inter-Fund Borrowing and Lending
The SEC has granted an exemptive order permitting registered open-end and closed-end Nuveen funds to participate in an inter-fund lending facility whereby the Nuveen funds may directly lend to and borrow money from each other for temporary purposes (e.g., to satisfy redemption requests or when a sale of securities “fails,” resulting in an unanticipated cash shortfall) (the “Inter-Fund Program”). The closed-end Nuveen funds, including the Funds covered by this shareholder report, will participate only as lenders, and not as borrowers, in the Inter-Fund Program because such closed-end funds rarely, if ever, need to borrow cash to meet redemptions. The Inter-Fund Program is subject to a number of conditions, including, among other things, the requirements that (1) no fund may borrow or lend money through the Inter-Fund Program unless it receives a more favorable interest rate than is typically available from a bank or other financial institution for a comparable transaction; (2) no fund may borrow on an unsecured basis through the Inter-Fund Program unless the fund’s outstanding borrowings from all sources immediately after the inter-fund borrowing total 10% or less of its total assets; provided that if the borrowing fund has a secured borrowing outstanding from any other lender, including but not limited to another fund, the inter-fund loan must be secured on at least an equal priority basis with at least an equivalent percentage of collateral to loan value; (3) if a fund’s total outstanding borrowings immediately after an inter-fund borrowing would be greater than 10% of its total assets, the fund may borrow through the inter-fund loan on a secured basis only; (4) no fund may lend money if the loan would cause its aggregate outstanding loans through the Inter-Fund Program to exceed 15% of its net assets at the time of the loan; (5) a fund’s inter-fund loans to any one fund shall not exceed 5% of the lending fund’s net assets; (6) the duration of inter-fund loans will be limited to the time required to receive payment for securities sold, but in no event more than seven days; and (7) each inter-fund loan may be called on one business day’s notice by a lending fund and may be repaid on any day by a borrowing fund. In addition, a Nuveen fund may participate in the Inter-Fund Program only if and to the extent that such participation is consistent with the fund’s investment objective and investment policies. The Board is responsible for overseeing the Inter-Fund Program.
The limitations detailed above and the other conditions of the SEC exemptive order permitting the Inter-Fund Program are designed to minimize the risks associated with Inter-Fund Program for both the lending fund and the borrowing fund. However, no borrowing or lending activity is without risk. When a fund borrows money from another fund, there is a risk that the loan could be called on one day’s notice or not renewed, in which case the fund may have to borrow from a bank at a higher rate or take other actions to payoff such loan if an inter-fund loan is not available from another fund. Any delay in repayment to a lending fund could result in a lost investment opportunity or additional borrowing costs.
During the current reporting period, none of the Funds covered by this shareholder report have entered into any inter-fund loan activity.
65
Notes to Financial Statements (continued)
(Unaudited)
9. Subsequent Events
Securities Lending
Effective August 14, 2020, each Fund may lend securities representing up to one-third of the value of its total assets to broker-dealers, banks, and other institutions to generate additional income. When the Fund loans its portfolio securities, it will receive, at the inception of each loan, cash collateral equal to at least 102% of the value of the loaned securities. Under each Fund’s securities lending agreement, the securities lending agent will generally bear the risk that a borrower may default on its obligation to return loaned securities. The Fund, however, will be responsible for the risks associated with the investment of cash collateral. The Fund may lose money on its investment of cash collateral or may fail to earn sufficient income on its investment to meet its obligations to the borrower. For further details on the Funds’ securities lending program, refer to the prospectus supplement dated August 14, 2020 for each Fund’s Prospectus and Statement of Additional Information.
66
Additional Fund Information
| | | | | | | | | | |
| Board of Trustees* | | | | | | | | | | |
| Jack B. Evans | | William C. Hunter | | Albin F. Moschner | | John K. Nelson | | Judith M. Stockdale | | Carole E. Stone |
| Terence J. Toth | | Margaret L. Wolff | | Robert L. Young | | | | | | |
| * | Matthew Thornton III has been appointed to the Board of Trustees effective November 16, 2020. |
| | | | | | | | |
| | | | | |
Investment Adviser Nuveen Fund Advisors, LLC 333 West Wacker Drive Chicago, IL 60606 | | Custodian State Street Bank & Trust Company One Lincoln Street Boston, MA 02111 | | Legal Counsel Chapman and Cutler LLP Chicago, IL 60603 | | Independent Registered Public Accounting Firm PricewaterhouseCoopers LLP One North Wacker Drive Chicago, IL 60606 | | Transfer Agent and Shareholder Services Computershare Trust Company, N.A. 150 Royall Street Canton, MA 02021 (800) 257-8787 |
Portfolio of Investments Information
The Fund is required to file its complete schedule of portfolio holdings with the Securities and Exchange Commission (SEC) for the first and third quarters of each fiscal year as an exhibit to its report on Form N-PORT. You may obtain this information on the SEC’s website at http://www.sec.gov.
Nuveen Funds’ Proxy Voting Information
You may obtain (i) information regarding how each fund voted proxies relating to portfolio securities held during the most recent twelve-month period ended June 30, without charge, upon request, by calling Nuveen toll-free at (800) 257-8787 or on Nuveen’s website at www.nuveen.com and (ii) a description of the policies and procedures that each fund used to determine how to vote proxies relating to portfolio securities without charge, upon request, by calling Nuveen toll free at (800) 257-8787. You may also obtain this information directly from the SEC. Visit the SEC on-line at http://www.sec.gov.
CEO Certification Disclosure
Each Fund’s Chief Executive Officer (CEO) has submitted to the New York Stock Exchange (NYSE) the annual CEO certification as required by Section 303A.12(a) of the NYSE Listed Company Manual. Each Fund has filed with the SEC the certification of its CEO and Chief Financial Officer required by Section 302 of the Sarbanes-Oxley Act.
Common Share Repurchases
Each Fund intends to repurchase through its open-market share repurchase program, shares of its own common stock at such times and in such amounts as is deemed advisable. During the period covered by this report, each Fund repurchased shares of its common stock as shown in the accompanying table. Any future repurchases will be reported in the next annual or semi-annual report.
| | | | | | | | | | | | | | | | |
| | | BXMX | | | DIAX | | | SPXX | | | QQQX | |
Common Shares repurchased | | | — | | | | — | | | | — | | | | — | |
FINRA BrokerCheck
The Financial Industry Regulatory Authority (FINRA) provides information regarding the disciplinary history of FINRA member firms and associated investment professionals. This information as well as an investor brochure describing FINRA BrokerCheck is available to the public by calling the FINRA BrokerCheck Hotline number at (800) 289-9999 or by visiting www.FlNRA.org.
67
Glossary of Terms Used in this Report
| ∎ | | Average Annual Total Return: This is a commonly used method to express an investment’s performance over a particular, usually multi-year time period. It expresses the return that would have been necessary each year to equal the investment’s actual cumulative performance (including change in NAV or market price and reinvested dividends and capital gains distributions, if any) over the time period being considered. |
| ∎ | | Beta: A measure of the variability of the change in the share price for a Fund in relation to a change in the value of the Fund’s market benchmark. Securities with betas higher than 1.0 have been, and are expected to be, more volatile than the benchmark; securities with betas lower than 1.0 have been, and are expected to be, less volatile than the benchmark. |
| ∎ | | Chicago Board Options Exchange (Cboe) S&P 500 BuyWrite Index (BXMSM): An index designed to track the performance of a hypothetical buy-write strategy on the S&P 500®. Index returns assume reinvestment of distributions, but do not include the effects of any applicable sales charges or management fees. |
| ∎ | | Chicago Board Options Exchange (Cboe) Volatility Index® (VIX®): An index that is a key measure of market expectations of near-term volatility conveyed by S&P 500® option prices. Since its introduction in 1993, VIX has been considered by many to be the world’s premier barometer of investor sentiment and market volatility (www.cboe.com). Index returns assume reinvestment of distributions, but do not include the effects of any applicable sales charges or management fees. |
| ∎ | | Chicago Board Options Exchange (Cboe) Dow Jones Industrial Average (DJIA) BuyWrite Index (BXDSM): A benchmark index that measures the performance of a theoretical portfolio that sells call options on the Dow Jones Industrial Average (the Dow), against a portfolio of the stocks included in the Dow. Index returns assume reinvestment of distributions, but do not include the effects of any applicable sales charges or management fees. |
| ∎ | | Chicago Board Options Exchange (Cboe) Nasdaq 100 BuyWrite Index (BXNSM): A benchmark index that measures the performance of a theoretical portfolio that owns a basket of the stocks included in the Nasdaq 100 Index, and “writes” (or sells) Nasdaq 100 Index covered call options each month. Index returns assume reinvestment of distributions, but do not include the effects of any applicable sales charges or management fees. |
| ∎ | | DIAX Blended Benchmark: The DIAX Blended Benchmark is a blended return consisting of 1) 55% Chicago Board Options Exchange (Cboe) DJIA BuyWrite Index (BXD), which is designed to track the performance of a hypothetical buy-write strategy on the Dow Jones Industrial Average and 2) 45% Dow Jones Industrial Average (DJIA), which tracks the performance of 30 large cap companies. Index returns assume reinvestment of distributions, but do not include the effects of any applicable sales charges or management fees. |
| ∎ | | Dow Jones Industrial Average (DJIA): An average that tracks the performance of 30 large cap companies. Index returns assume reinvestment of distributions, but do not reflect any applicable sales charges or management fees. |
| ∎ | | Nasdaq-100 Index: An index that includes 100 of the largest domestic and international nonfinancial securities listed on the Nasdaq Stock Market based on market capitalization. Index returns assume reinvestment of distributions, but do not reflect any applicable sales charges or management fees. |
| ∎ | | Net Asset Value (NAV) Per Share: A fund’s Net Assets is equal to its total assets (securities, cash, accrued earnings and receivables) less its total liabilities. NAV per share is equal to the fund’s Net Assets divided by its number of shares outstanding. |
| ∎ | | QQQX Blended Benchmark: The QQQX Blended Benchmark is a blended return consisting of 1) 55% Chicago Board of Exchange (Cboe) Nasdaq 100 BuyWrite Index (BXNSM), which measures the performance of a theoretical portfolio that owns a basket of the stocks included in the Nasdaq 100 Index, and “writes” (or sells) Nasdaq 100 Index covered call options each month and 2) 45% Nasdaq-100 Index, which includes 100 of the largest domestic and international nonfinancial securities listed on the Nasdaq Stock Market based on market capitalization. Index returns assume reinvestment of distributions, but do not include the effects of any applicable sales charges or management fees. |
68
| ∎ | | S&P 500®: An unmanaged index generally considered representative of the U.S. stock market. Index returns assume reinvestment of distributions, but do not reflect any applicable sales charges or management fees. |
| ∎ | | SPXX Blended Benchmark: The SPXX Blended Benchmark is a blended return consisting of 1) 55% Chicago Board Options Exchange (Cboe) S&P 500 BuyWrite Index (BXMSM), which is designed to track the performance of a hypothetical buy-write strategy on the S&P 500® and 2) 45% S&P 500®, an unmanaged index generally considered representative of the U.S. stock market. Index returns assume reinvestment of distributions, but do not include the effects of any applicable sales charges or management fees. |
| ∎ | | Strangle Position: A strangle is an options strategy where the investor holds a position in both a call and a put option with different strike prices, but with the same expiration date and underlying asset. |
69
Reinvest Automatically, Easily and Conveniently
Nuveen makes reinvesting easy. A phone call is all it takes to set up your reinvestment account.
Nuveen Closed-End Funds Automatic Reinvestment Plan
Your Nuveen Closed-End Fund allows you to conveniently reinvest distributions in additional Fund shares.
By choosing to reinvest, you’ll be able to invest money regularly and automatically, and watch your investment grow through the power of compounding. Just like distributions in cash, there may be times when income or capital gains taxes may be payable on distributions that are reinvested.
It is important to note that an automatic reinvestment plan does not ensure a profit, nor does it protect you against loss in a declining market.
Easy and convenient
To make recordkeeping easy and convenient, each quarter you’ll receive a statement showing your total distributions, the date of investment, the shares acquired and the price per share, and the total number of shares you own.
How shares are purchased
The shares you acquire by reinvesting will either be purchased on the open market or newly issued by the Fund. If the shares are trading at or above net asset value at the time of valuation, the Fund will issue new shares at the greater of the net asset value or 95% of the then-current market price. If the shares are trading at less than net asset value, shares for your account will be purchased on the open market. If the Plan Agent begins purchasing Fund shares on the open market while shares are trading below net asset value, but the Fund’s shares subsequently trade at or above their net asset value before the Plan Agent is able to complete its purchases, the Plan Agent may cease open-market purchases and may invest the uninvested portion of the distribution in newly-issued Fund shares at a price equal to the greater of the shares’ net asset value or 95% of the shares’ market value on the last business day immediately prior to the purchase date, Distributions received to purchase shares in the open market will normally be invested shortly after the distribution payment date. No interest will be paid on distributions awaiting reinvestment. Because the market price of the shares may increase before purchases are completed, the average purchase price per share may exceed the market price at the time of valuation, resulting in the acquisition of fewer shares than if the distribution had been paid in shares issued by the Fund. A pro rata portion of any applicable brokerage commissions on open market purchases will be paid by Plan participants. These commissions usually will be lower than those charged on individual transactions.
Flexible
You may change your distribution option or withdraw from the Plan at any time, should your needs or situation change.
You can reinvest whether your shares are registered in your name, or in the name of a brokerage firm, bank, or other nominee. Ask your investment advisor if his or her firm will participate on your behalf. Participants whose shares are registered in the name of one firm may not be able to transfer the shares to another firm and continue to participate in the Plan.
The Fund reserves the right to amend or terminate the Plan at any time. Although the Fund reserves the right to amend the Plan to include a service charge payable by the participants, there is no direct service charge to participants in the Plan at this time.
Call today to start reinvesting distributions
For more information on the Nuveen Automatic Reinvestment Plan or to enroll in or withdraw from the Plan, speak with your financial professional or call us at (800) 257-8787.
70
Annual Investment Management Agreement Approval Process
(Unaudited)
The Approval Process
At a meeting held on May 19-21, 2020 (the “May Meeting”), the Boards of Trustees (collectively, the “Board” and each Trustee, a “Board Member”) of the Funds, which are comprised entirely of Board Members who are not “interested persons” (as defined under the Investment Company Act of 1940 (the “1940 Act”)) (the “Independent Board Members”), approved, for their respective Fund, the renewal of the management agreement (each, an “Investment Management Agreement”) with Nuveen Fund Advisors, LLC (the “Adviser”) pursuant to which the Adviser serves as investment adviser to such Fund and the sub-advisory agreement (each, a “Sub-Advisory Agreement”) with (a) in the case of Nuveen S&P 500 Buy-Write Income Fund (the “S&P Buy-Write Fund”), Gateway Investment Advisers, LLC (“Gateway”), pursuant to which Gateway serves as the investment sub-adviser to such Fund, and (b) in the case of Nuveen Dow 30sm Dynamic Overwrite Fund (the “Dow Fund”), Nuveen S&P 500 Dynamic Overwrite Fund (the “S&P Dynamic Fund”) and Nuveen Nasdaq 100 Dynamic Overwrite Fund (the “Nasdaq Fund”), Nuveen Asset Management, LLC (“NAM,” and Gateway and NAM each, a “Sub-Adviser”), pursuant to which NAM serves as the investment sub-adviser to each such Fund. Although the 1940 Act requires that continuances of the Advisory Agreements (as defined below) be approved by the in-person vote of a majority of the Independent Board Members, the May Meeting was held virtually through the internet in view of the health risks associated with holding an in-person meeting during the COVID-19 pandemic and governmental restrictions on gatherings. The May Meeting was held in reliance on an order issued by the Securities and Exchange Commission on March 13, 2020, as extended on March 25, 2020, which provided registered investment companies temporary relief from the in-person voting requirements of the 1940 Act with respect to the approval of a fund’s advisory agreement in response to the challenges arising in connection with the COVID-19 pandemic.
Following up to an initial two-year period, the Board considers the renewal of each Investment Management Agreement and Sub-Advisory Agreement on behalf of the applicable Fund on an annual basis. The Investment Management Agreements and Sub-Advisory Agreements are collectively referred to as the “Advisory Agreements” and the Adviser and each Sub-Adviser are collectively, the “Fund Advisers” and each, a “Fund Adviser.” Throughout the year, the Board and its committees meet regularly and, at these meetings, review an extensive array of topics and information that are relevant to its annual consideration of the renewal of the advisory agreements for the Nuveen funds. Such information may address, among other things, fund performance; the Adviser’s strategic plans; the review of the funds and investment teams; compliance, regulatory and risk management matters; the trading practices of the various sub-advisers to the funds; valuation of securities; fund expenses; overall market and regulatory developments; the management of leverage financing; and the secondary market trading of the closed-end funds and any actions to address discounts.
In addition to the information and materials received during the year, the Board, in response to a request made on its behalf by independent legal counsel, received extensive materials and information prepared specifically for its annual consideration of the renewal of the advisory agreements for the Nuveen funds by the Adviser and by Broadridge Financial Solutions, Inc. (“Broadridge”), an independent provider of investment company data. The materials cover a wide range of topics including, but not limited to, a description of the nature, extent and quality of services provided by the Fund Advisers; a review of each sub-adviser to the Nuveen funds and the applicable investment teams; an analysis of fund performance in absolute terms and as compared to the performance of certain peer funds and benchmarks with a focus on any performance outliers; an analysis of the fees and expense ratios of the Nuveen funds in absolute terms and as compared to those of certain peer funds with a focus on any expense outliers; a description of portfolio manager compensation; a review of the secondary market trading of shares of the Nuveen closed-end funds (including, among other things, an analysis of performance, distribution and valuation and capital raising trends in the broader closed-end fund market and in particular with respect to Nuveen closed-end funds; a review of the leverage management actions taken on behalf of the Nuveen closed-end funds and their resulting impact on performance; and a description of the distribution management process and any capital management activities); a review of the performance of various service providers; a description of various initiatives Nuveen had undertaken or continued during the year for the benefit of particular fund(s) and/or the complex; a description of the profitability or financial data of Nuveen and the sub-advisers to the Nuveen funds; and a description of indirect benefits received by the Adviser and the sub-advisers as a result of their relationships with the Nuveen funds.
71
Annual Investment Management Agreement Approval Process (continued)
(Unaudited)
In continuing its practice, the Board met prior to the May Meeting to begin its considerations of the renewal of the Advisory Agreements. Accordingly, on April 27-28, 2020 (the “April Meeting”), the Board met to review and discuss, in part, the performance of the Nuveen funds and the Adviser’s evaluation of each sub-adviser to the Nuveen funds. In its review, the Board recognized the volatile market conditions occurring during the first half of 2020 arising, in part, from the public health crisis caused by the novel coronavirus known as COVID-19 and the resulting impact on fund performance. Accordingly, the Board reviewed, among other things, fund performance reflecting the more volatile periods, including for various time periods ended the first quarter of 2020 and for various time periods ended April 17, 2020. At the April Meeting, the Board Members asked questions and requested additional information that was provided for the May Meeting. In continuing its review of the Nuveen funds in light of the extraordinary market conditions experienced in early 2020, the Board received updated fund performance data reflecting various time periods ended May 8, 2020 for its May Meeting. The Board also continued its practice of seeking to meet periodically with the various sub-advisers to the Nuveen funds and their investment teams, when feasible.
The Independent Board Members considered the review of the advisory agreements for the Nuveen funds to be an ongoing process and employed the accumulated information, knowledge, and experience the Board Members had gained during their tenure on the boards governing the Nuveen funds and working with the Adviser and sub-advisers in their review of the advisory agreements. The contractual arrangements are a result of multiple years of review, negotiation and information provided in connection with the boards’ annual review of the Nuveen funds’ advisory arrangements and oversight of the Nuveen funds.
The Independent Board Members were advised by independent legal counsel during the annual review process as well as throughout the year, including meeting in executive sessions with such counsel at which no representatives from the Adviser or the Sub-Advisers were present. In connection with their annual review, the Independent Board Members also received a memorandum from independent legal counsel outlining their fiduciary duties and legal standards in reviewing the Advisory Agreements.
The Board’s decision to renew the Advisory Agreements was not based on a single identified factor, but rather the decision reflected the comprehensive consideration of all the information provided throughout the year and at the April and May Meetings, and each Board Member may have attributed different levels of importance to the various factors and information considered in connection with the approval process. The following summarizes the principal factors and information, but not all the factors, the Board considered in deciding to renew the Advisory Agreements and its conclusions.
| A. | | Nature, Extent and Quality of Services |
In evaluating the renewal of the Advisory Agreements, the Independent Board Members received and considered information regarding the nature, extent and quality of the applicable Fund Adviser’s services provided to the respective Fund with particular focus on the services and enhancements to such services provided during the last year. The Independent Board Members considered the Investment Management Agreements and the Sub-Advisory Agreements separately in the course of their review. With this approach, they considered the respective roles of the Adviser and the Sub-Advisers in providing services to the respective Funds.
With respect to the Adviser, the Board recognized that the Adviser has provided a vast array of services the scope of which has expanded over the years in light of regulatory, market and other developments, such as the development of expanded compliance programs for the Nuveen funds. The Board also noted the extensive resources, tools and capabilities the Adviser and its affiliates devoted to the various operations of the Nuveen funds. These services include, but are not limited to: investment oversight, risk management and securities valuation services (such as analyzing investment performance and risk data; overseeing and reviewing the various sub-advisers to the Nuveen funds and their investment teams; overseeing trade execution, soft dollar practices and securities lending activities; providing daily valuation services and developing related valuation policies, procedures and methodologies; overseeing risk disclosure; periodic testing of investment and liquidity risks; participating in financial statement and marketing disclosures; participating in product development; and participating in leverage management and liquidity monitoring); product management (such as analyzing a fund’s position in the marketplace, setting dividends, preparing shareholder and intermediary communications and other due diligence support); fund administration (such as preparing fund tax returns and other tax compliance services, overseeing the funds’ independent public accountants and other service providers; managing fund budgets and expenses; and helping to fulfill the
72
funds’ regulatory filing requirements); oversight of shareholder services and transfer agency functions (such as overseeing transfer agent service providers which include registered shareholder customer service and transaction processing; and overseeing proxy solicitation and tabulation services); Board relations services (such as organizing and administering Board and committee meetings, preparing various reports to the Board and committees and providing other support services); compliance and regulatory oversight services (such as devising compliance programs; managing compliance policies; monitoring compliance with applicable fund policies and laws and regulations; and evaluating the compliance programs of the various sub-advisers to the Nuveen funds and certain other service providers); legal support and oversight of outside law firms (such as helping to prepare and file registration statements and proxy statements; overseeing fund activities and providing legal interpretations regarding such activities; and negotiating agreements with other fund service providers); and providing leverage, capital and distribution management services.
The Board also recognized that the Adviser and its affiliates have undertaken a number of initiatives over the previous year that benefited the complex and/or particular Nuveen funds including, but not limited to:
| | • | | Fund Improvements and Product Management Initiatives – continuing to proactively manage the Nuveen fund complex as a whole and at the individual fund level with an aim to enhance the shareholder outcomes through, among other things, rationalizing the product line and gaining efficiencies through mergers, repositionings and liquidations; reviewing and updating investment policies and benchmarks; and integrating certain investment teams and changing the portfolio managers serving various funds; |
| | • | | Capital Initiatives – continuing to invest capital to support new Nuveen funds with initial capital as well as to facilitate modifications to the strategies or structure of existing funds; |
| | • | | Compliance Program Initiatives – continuing efforts to mitigate compliance risk, increase operating efficiencies, strengthen key compliance program elements and support international business growth and other objectives through, among other things, integrating various investment teams across affiliates, consolidating marketing review functions, enhancing compliance related technologies and establishing and maintaining shared broad-based compliance policies throughout the organization and its affiliates; |
| | • | | Risk Management and Valuation Services – continuing efforts to provide Nuveen with a more disciplined and consistent approach to identifying and mitigating the firm’s operational risks through, among other things, enhancing the interaction and reporting between the investment risk management team and various affiliates and adopting a risk operational framework across the complex; |
| | • | | Regulatory Matters – continuing efforts to monitor regulatory trends and advocate on behalf of the Nuveen funds, to implement and comply with new or revised rules and mandates and to respond to regulatory inquiries and exams; |
| | • | | Government Relations – continuing efforts of various Nuveen teams and affiliates to develop policy positions on a broad range of issues that may impact the Nuveen funds, advocate and communicate these positions to lawmakers and other regulatory authorities and work with trade associations to ensure these positions are represented; |
| | • | | Business Continuity, Disaster Recovery and Information Services – continuing to periodically test business continuity and disaster recovery plans, maintain an information security program designed to identify and manage information security risks, and provide reports to the Board, at least annually, addressing, among other things, management’s security risk assessment, cyber risk profile, potential impact of new or revised laws and regulations, incident tracking and other relevant information technology risk-related reports; |
| | • | | Expanded Dividend Management Services – continuing to manage the dividends among the varying types of Nuveen funds within the Nuveen complex to be consistent with the respective fund’s product design and investing resources to develop systems to assist in the process for newer products such as target term funds; and |
73
Annual Investment Management Agreement Approval Process (continued)
(Unaudited)
| | • | | with respect specifically to closed-end funds, such initiatives also included: |
| | • | | Leverage Management Services – continuing to actively manage leverage including developing new leverage instruments, managing leverage exposure and costs through various providers, and managing and adapting tender option bond structures to comply with regulations and developing further relationships with leverage providers; |
| | • | | Capital Management, Market Intelligence and Secondary Market Services – ongoing capital management efforts through shelf offerings, share repurchases as appropriate to address discounts, tender offers and capital return programs as well as providing market data analysis to help understand closed-end fund ownership cycles and their impact on secondary market trading as well as to improve proxy solicitation efforts; and |
| | • | | Closed-end Fund Investor Relations Program – maintaining the closed-end fund investor relations program which, among other things, raises awareness, provides educational materials and cultivates advocacy for closed-end funds and the Nuveen closed-end fund product line. |
The Board also noted the benefits to shareholders of investing in a Nuveen fund, as each Nuveen fund is a part of a large fund complex with a variety of investment disciplines, capabilities, expertise and resources available to navigate and support the funds including during stressed times as occurred in the market in the first half of 2020. In addition to the services provided by the Adviser, the Board also considered the risks borne by the Adviser and its affiliates in managing the Nuveen funds, including entrepreneurial, operational, reputational, regulatory and litigation risks.
The Board further considered the division of responsibilities between the Adviser and the respective Sub-Adviser and recognized that the Sub-Advisers and their investment personnel generally are responsible for the management of the applicable Fund’s portfolio under the oversight of the Adviser and the Board. The Board considered an analysis of each Sub-Adviser provided by the Adviser which included, among other things, the respective Sub-Adviser’s assets under management and changes thereto, a summary of the applicable investment team and changes thereto, the investment approach of the team and the performance of the Nuveen fund(s) sub-advised by such Sub-Adviser over various periods. The Board further considered at the May Meeting or prior meetings evaluations of each Sub-Adviser’s compliance program and trade execution. The Board also considered the structure of investment personnel compensation programs and whether this structure provides appropriate incentives to act in the best interests of the respective Nuveen funds. The Board noted that the Adviser recommended the renewal of the Sub-Advisory Agreements.
Based on its review, the Board determined, in the exercise of its reasonable business judgment, that it was satisfied with the nature, extent and quality of services provided to the respective Funds under each applicable Advisory Agreement.
| B. | | The Investment Performance of the Funds and Fund Advisers |
In evaluating the quality of the services provided by the Fund Advisers, the Board also received and considered a variety of investment performance data of the Nuveen funds they advise. In this regard, the Board reviewed, among other things, Fund performance over the quarter, one-, three- and five-year periods ending December 31, 2019. Unless otherwise indicated, the performance data referenced below reflects the periods ended December 31, 2019. In general, the year 2019 was a period of strong market performance. However, as noted above, the Board recognized the unprecedented market volatility and decline that occurred in early 2020 and the significant impact it would have on fund performance. As a result, the Board reviewed performance data capturing more recent time periods, including performance data reflecting the first quarter of 2020 as well as performance data for various periods ended April 17, 2020 for its April Meeting and May 8, 2020 for its May Meeting.
The Board reviewed both absolute and relative fund performance during the annual review over the various time periods. With respect to the latter, the Board considered fund performance in comparison to the performance of peer funds (the “Performance Peer Group”) and recognized and/or customized benchmarks (i.e., generally benchmarks derived from multiple recognized benchmarks). For funds that had changes in portfolio managers, the Board considered performance data of such funds before and after such changes. In considering performance data, the Board is aware of certain inherent limitations with such data, including that differences between the objective(s), strategies and other characteristics of the Nuveen funds compared to the respective Performance Peer Group and/or benchmark(s) (such as differences in the use of leverage) as well as differences in the composition of the Performance Peer Group over time will necessarily contribute to differences in
74
performance results and limit the value of the comparative information. To assist the Board in its review of the comparability of the relative performance, the Adviser has ranked the relevancy of the peer group to the funds as low, medium or high.
As noted above, the Board reviewed fund performance over various periods ended December 31, 2019 as well as the first quarter of 2020 and various time periods ended April 17, 2020 and May 8, 2020. In light of the significant market decline in the early part of 2020, the Board noted that a shorter period of underperformance may significantly impact longer term performance. Further, the Board recognized that performance data may differ significantly depending on the ending date selected and accordingly, performance results for periods ended at the year-end of 2019 may vary significantly from performance results for periods ended in the first quarter of 2020, particularly given the extraordinary market conditions at that time as the impact of COVID-19 and other market developments unfolded. The Board considered a fund’s performance in light of the overall financial market conditions. In addition, the Board recognized that shareholders may evaluate performance based on their own holding periods which may differ from the periods reviewed by the Board and lead to differing results.
The secondary market trading of shares of the Nuveen closed-end funds continues to be a priority for the Board given its importance to shareholders, and therefore data reflecting the premiums and discounts at which the shares of the closed-end funds trade is reviewed by the Board during its annual review and by the Board and/or its Closed-end Fund committee during its respective quarterly meetings throughout the year.
In addition to the performance data prepared in connection with the annual review of the advisory agreements of the Nuveen funds, the Board reviewed fund performance throughout the year at its quarterly meetings representing differing time periods and took into account the discussions that occurred at these Board meetings in evaluating a fund’s overall performance. The Board also considered, among other things, the Adviser’s analysis of each Nuveen fund’s performance, with particular focus on funds that were considered performance outliers (both overperformance and underperformance), the factors contributing to the performance and any steps taken to address any performance concerns. Given the volatile market conditions of early 2020, the Board considered the Adviser’s analysis of the impact of such conditions on the Nuveen funds’ performance.
The Board evaluated performance in light of various factors, including general market conditions, issuer-specific information, asset class information, fund cash flows and other factors. Accordingly, depending on the facts and circumstances, the Board may be satisfied with a fund’s performance notwithstanding that its performance may be below its benchmark or peer group for certain periods. However, with respect to any Nuveen funds for which the Board had identified performance issues, the Board monitors such funds closely until performance improves, discusses with the Adviser the reasons for such results, considers whether any steps are necessary or appropriate to address such issues, and reviews the results of any efforts undertaken.
The Board’s determinations with respect to each Fund are summarized below.
For the S&P Buy-Write Fund, the Board noted that the Fund ranked in the third quartile of its Performance Peer Group for the one-, three- and five-year periods ended December 31, 2019, and although the Fund’s performance was below the performance of its benchmark for the three-year period, the Fund outperformed its benchmark for the one- and five-year periods ended December 31, 2019. With the market decline in the first quarter of 2020, the Fund outperformed its benchmark and ranked in the second quartile of its Performance Peer Group for the one-, three- and five-year periods ended March 31, 2020. The Board was satisfied with the Fund’s overall performance.
For the Dow Fund, the Board noted that although the Fund’s performance was below the performance of its blended benchmark for the one-, three- and five-year periods ended December 31, 2019, the Fund ranked in the third quartile of its Performance Peer Group for the one-year period ended December 31, 2019 and second quartile for the three- and five-year periods ended December 31, 2019. With the market decline in the first quarter of 2020, the Fund’s performance was below the performance of its blended benchmark for the one-, three- and five-year periods ended March 31, 2020 and the Fund ranked in the fourth quartile of its Performance Peer Group for the one-year period ended March 31 2020, the third quartile for the three-year period ended March 31, 2020 and the second quartile for the five-year period ended March 31, 2020. The Board was satisfied with the Fund’s overall performance.
75
Annual Investment Management Agreement Approval Process (continued)
(Unaudited)
For the S&P Dynamic Fund, the Board noted that although the Fund’s performance was below the performance of its blended benchmark for the one-, three- and five-year periods ended December 31, 2019, the Fund ranked in the second quartile of its Performance Peer Group for such periods. With the market decline in the first quarter of 2020, the Fund’s performance was below the performance of its blended benchmark for the one-, three- and five-year periods ended March 31, 2020 and the Fund ranked in the third quartile of its Performance Peer Group for such periods. The Board was satisfied with the Fund’s overall performance.
For the Nasdaq Fund, the Board noted that although the Fund’s performance was below the performance of its blended benchmark for the one-, three- and five-year periods ended December 31, 2019, the Fund ranked in the first quartile of its Performance Peer Group for such periods. With the market decline in the first quarter of 2020, although the Fund’s performance was below the performance of its blended benchmark for the one-, three- and five-year periods ended March 31, 2020, the Fund ranked in the first quartile of its Performance Peer Group for such periods. The Board was satisfied with the Fund’s overall performance.
| C. | | Fees, Expenses and Profitability |
As part of its annual review, the Board considered the contractual management fee and net management fee (the management fee after taking into consideration fee waivers and/or expense reimbursements, if any) paid by a Nuveen fund to the Adviser in light of the nature, extent and quality of the services provided. The Board also considered the total operating expense ratio of each Nuveen fund before and after any fee waivers and/or expense reimbursements. More specifically, the Independent Board Members reviewed, among other things, each fund’s gross and net management fee rates (i.e., before and after expense reimbursements and/or fee waivers, if any) and net total expense ratio in relation to those of a comparable universe of funds (the “Peer Universe”) established by Broadridge. The Independent Board Members reviewed the methodology Broadridge employed to establish its Peer Universe and recognized that differences between the applicable fund and its respective Peer Universe as well as changes to the composition of the Peer Universe from year to year may limit some of the value of the comparative data. The Independent Board Members also considered a fund’s operating expense ratio as it more directly reflected the shareholder’s costs in investing in the respective fund.
In their review, the Independent Board Members considered, in particular, each Nuveen fund with a net expense ratio (excluding investment-related costs of leverage) of six basis points or higher compared to that of its peer average (each, an “Expense Outlier Fund”) and an analysis as to the factors contributing to each such fund’s higher relative net expense ratio. In addition, although the Board reviewed a fund’s total net expenses both including and excluding investment-related expenses (i.e., leverage costs) and taxes for certain of the closed-end funds, the Board recognized that leverage expenses will vary across the Nuveen funds and in comparison to peers because of differences in the forms and terms of leverage employed by the respective fund. Accordingly, in reviewing the comparative data between a fund and its peers, the Board generally considered the fund’s net expense ratio and fees (excluding leverage costs and leveraged assets) to be higher if they were over 10 basis points higher, slightly higher if they were 6 to 10 basis points higher, in line if they were within approximately 5 basis points higher than the peer average and below if they were below the peer average of the Peer Universe. The Independent Board Members also considered, in relevant part, a fund’s net management fee and net total expense ratio in light of its performance history.
In their review of the fee arrangements for the Nuveen funds, the Independent Board Members considered the management fee schedules, including the complex-wide and fund-level breakpoint schedules, as applicable. The Board noted that across the Nuveen fund complex, the complex-wide fee breakpoints reduced fees by $56.6 million and fund-level breakpoints reduced fees by $66.8 million in 2019.
With respect to the Sub-Advisers, the Board also considered the sub-advisory fee schedule paid to each Sub-Adviser in light of the sub-advisory services provided to the respective Fund, the breakpoint schedule and comparative data of the fees such Sub-Adviser charges to other clients, if any. In its review, the Board recognized that the compensation paid to the Sub-Advisers is the responsibility of the Adviser, not the Funds.
76
The Independent Board Members noted that each Fund had a net management fee and a net expense ratio that were below its respective peer averages.
Based on its review of the information provided, the Board determined that each Fund’s management fees (as applicable) to a Fund Adviser were reasonable in light of the nature, extent and quality of services provided to the Fund.
| | 2. | | Comparisons with the Fees of Other Clients |
In determining the appropriateness of fees, the Board also considered information regarding the fee rates the respective Fund Advisers charged to certain other types of clients and the type of services provided to these other clients. With respect to the Adviser and/or NAM, such other clients may include retail and institutional managed accounts advised by such Sub-Adviser; investment companies offered outside the Nuveen family and sub-advised by such Sub-Adviser; foreign investment companies offered by Nuveen and sub-advised by such Sub-Adviser; and collective investment trusts sub-advised by such Sub-Adviser. The Board further noted that the Adviser also advised certain exchange-traded funds (“ETFs”) sponsored by Nuveen.
The Board recognized that NAM was an affiliated sub-adviser and, with respect to affiliated sub-advisers, reviewed, among other things, the range of fees assessed for managed accounts and foreign investment companies offered by Nuveen. The Board also reviewed the fee range and average fee rate of certain selected investment strategies offered in retail and institutional managed accounts advised by NAM and non-Nuveen investment companies sub-advised by certain affiliated sub-advisers.
In considering the fee data of other clients, the Board considered, among other things, the differences in the amount, type and level of services provided to the Nuveen funds relative to other clients as well as the differences in portfolio investment policies, investor profiles, account sizes and regulatory requirements, all of which contribute to the variations in the fee schedules. The Board recognized the complexity and myriad of services the Adviser had provided to the Nuveen funds compared to the other types of clients as the Adviser is principally responsible for all aspects of operating the funds, including complying with the increased regulatory requirements required when managing the funds as well as the increased entrepreneurial, legal and regulatory risks that the Adviser incurs in sponsoring and managing the funds. Further, with respect to ETFs, the Board considered that Nuveen ETFs are passively managed compared to the active management of the other Nuveen funds which contributed to the differences in fee levels between the Nuveen ETFs and other Nuveen funds. In general, higher fee levels reflect higher levels of service provided by the Adviser, increased investment management complexity, greater product management requirements, and higher levels of business risk or some combination of these factors. The Board further considered that each Sub-Adviser’s fee is essentially for portfolio management services and therefore, as applicable, more comparable to the fees it receives for retail wrap accounts and other external sub-advisory mandates. The Board concluded the varying levels of fees were justified given, among other things, the inherent differences in the products and the level of services provided to the Nuveen funds versus other clients, the differing regulatory requirements and legal liabilities and the entrepreneurial, legal and regulatory risks incurred in sponsoring and advising a registered investment company.
The Board recognized that Gateway was an unaffiliated sub-adviser. With respect to Gateway, the Independent Board Members reviewed the average fee rates that such Sub-Adviser charges for other clients. The Independent Board Members noted that the Sub-Advisory Agreement with Gateway, including the fees thereunder, was the result of arm’s length negotiations and that Gateway’s fees were reasonable in relation to the fees it assessed other clients.
| | 3. | | Profitability of Fund Advisers |
In their review, the Independent Board Members considered information regarding Nuveen’s level of profitability for its advisory services to the Nuveen funds for the calendar years 2019 and 2018. The Board reviewed, among other things, Nuveen’s net margins (pre-tax) (both including and excluding distribution expenses); gross and net revenue margins (pre- and post-tax); revenues, expenses, and net income (pre-tax and after-tax and before distribution) of Nuveen for fund advisory services; and comparative profitability data comparing the margins of Nuveen compared to the adjusted margins of certain peers with publicly available data and with the most comparable assets under management (based on asset size and asset composition) for each of the last two calendar years. The Board also reviewed the revenues and expenses the Adviser derived from its ETF product line for the 2018 and 2019 calendar years.
77
Annual Investment Management Agreement Approval Process (continued)
(Unaudited)
In reviewing the profitability data, the Independent Board Members recognized the subjective nature of calculating profitability as the information is not audited and is dependent on cost allocation methodologies to allocate expenses of Nuveen and its affiliates between the fund and non-fund businesses. The expenses to be allocated include direct expenses in servicing the Nuveen funds as well as indirect and/or shared costs (such as overhead, legal and compliance) some of which are attributed to the Nuveen funds pursuant to the cost allocation methodologies. The Independent Board Members reviewed a description of the cost allocation methodologies employed to develop the financial information and a summary of the history of changes to the methodology over the eleven-year period from 2008 to 2019. The Board had also appointed three Independent Board Members, along with the assistance of independent counsel, to serve as the Board’s liaisons to review the development of the profitability data and any proposed changes to the cost allocation methodology prior to incorporating any such changes and to report to the full Board. The Board recognized that other reasonable and valid allocation methodologies could be employed and could lead to significantly different results. Based on the data, the Independent Board Members noted that Nuveen’s net margins were higher in 2019 than the previous year and considered the key drivers behind the revenue and expense changes that impacted Nuveen’s net margins between the years. The Board also noted the reinvestments of some of the profits into the business through, among other things, the investment of seed capital in certain funds and continued investments in enhancements to information technology, internal infrastructure and data management improvements and global investment and innovation projects.
As noted above, the Independent Board Members also considered Nuveen’s margins from its relationship to the Nuveen funds compared to the adjusted margins of certain peers with publicly available data and with the most comparable assets under management (based on asset size and asset composition) to Nuveen for the calendar years 2019 and 2018. The Independent Board Members noted that Nuveen’s margins from its relationships with the Nuveen funds were on the low range compared to the adjusted margins of the peers. The Independent Board Members, however, recognized that it is difficult to make comparisons of profitability with other investment adviser peers given that comparative data is not generally public and the calculation of profitability is subjective and affected by numerous factors (such as types of funds a peer manages, its business mix, its cost of capital, the numerous assumptions underlying the methodology used to allocate expenses and other factors) which can have a significant impact on the results.
Aside from Nuveen’s profitability, the Board recognized that the Adviser is a subsidiary of Nuveen, LLC, the investment management arm of Teachers Insurance and Annuity Association of America (“TIAA”). As such, the Board also reviewed a balance sheet for TIAA reflecting its assets, liabilities and capital and contingency reserves for the 2019 and 2018 calendar years to consider the financial strength of TIAA. The Board recognized the benefit of having an investment adviser and its parent with significant resources, particularly during periods of market stress.
In addition to Nuveen, the Independent Board Members also considered the profitability of the Sub-Advisers from their relationships with the Nuveen funds. With respect to NAM, the Independent Board Members reviewed, among other things, such Sub-Adviser’s revenues, expenses and net revenue margins (pre- and post-tax) for its advisory activities for the calendar year ended December 31, 2019 as well as its pre-tax and after-tax net revenue margins for 2019 compared to such margins for 2018. The Independent Board Members also reviewed a profitability analysis reflecting the revenues, expenses and revenue margin (pre- and post-tax) by asset type for NAM for the calendar year ended December 31, 2019 and the pre- and post-tax revenue margins from 2019 and 2018. With respect to Gateway, the Independent Board Members considered a profitability and margin analysis for such Sub-Adviser, generally including revenues, expenses and operating margins for the calendar years 2019 and 2018.
In evaluating the reasonableness of the compensation, the Independent Board Members also considered any other ancillary benefits derived by the respective Fund Adviser from its relationship with the Nuveen funds as discussed in further detail below.
Based on a consideration of all the information provided, the Board noted that Nuveen’s and each Sub-Adviser’s level of profitability was acceptable and not unreasonable in light of the services provided.
78
| D. | | Economies of Scale and Whether Fee Levels Reflect These Economies of Scale |
The Board considered whether there have been economies of scale with respect to the management of the Nuveen funds and whether these economies of scale have been appropriately shared with the funds. The Board recognized that although economies of scale are difficult to measure, there are several methods to help share the benefits of economies of scale, including breakpoints in the management fee schedule, fee waivers and/or expense limitations, the pricing of Nuveen funds at scale at inception and investments in Nuveen’s business which can enhance the services provided to the funds for the fees paid. The Board noted that Nuveen generally has employed these various methods. In this regard, the Board noted that the management fee of the Adviser is generally comprised of a fund-level component and a complex-level component each with its own breakpoint schedule, subject to certain exceptions. The Board reviewed the fund-level and complex-level fee schedules. The Board considered that the fund-level breakpoint schedules are designed to share economies of scale with shareholders if the particular fund grows, and the complex-level breakpoint schedule is designed to deliver the benefits of economies of scale to shareholders when the eligible assets in the complex pass certain thresholds even if the assets of a particular fund are unchanged or have declined. With respect to the Nuveen closed-end funds, the Board noted that, although such funds may from time to time make additional share offerings, the growth of their assets would occur primarily through the appreciation of such funds’ investment portfolios. Further, in the calculation of the complex-level component, the Board noted that it had approved the acquisition of several Nuveen funds by similar TIAA-CREF funds in 2019. However, to mitigate the loss of the assets of these Nuveen funds deemed eligible to be included in the calculation of the complex-wide fee when these Nuveen funds left the complex upon acquisition, Nuveen agreed to credit approximately $460 million to assets under management to the Nuveen complex in calculating the complex-wide component.
The Independent Board Members also recognized the Adviser’s continued reinvestment in its business through, among other things, investments in its business infrastructure and information technology, portfolio accounting system and other systems and platforms that will, among other things, support growth, simplify and enhance information sharing, and enhance the investment process to the benefit of all of the Nuveen funds.
Based on its review, the Board concluded that the current fee arrangements together with the Adviser’s reinvestment in its business appropriately shared any economies of scale with shareholders.
The Independent Board Members received and considered information regarding other benefits the respective Fund Adviser or its affiliates may receive as a result of their relationship with the Nuveen funds. The Board considered the compensation that an affiliate of the Adviser received for serving as co-manager in the initial public offerings of new closed-end funds and for serving as an underwriter on shelf offerings of existing closed-end funds. In addition, the Independent Board Members also noted that various sub-advisers (including NAM) may engage in soft dollar transactions pursuant to which they may receive the benefit of research products and other services provided by broker-dealers executing portfolio transactions on behalf of the applicable Nuveen funds, although the Board recognized that certain sub-advisers may be phasing out the use of soft dollars over time. The Board, however, noted that the benefits for NAM when transacting in fixed-income securities may be more limited as such securities generally trade on a principal basis and therefore do not generate brokerage commissions. Further, the Board considered that although NAM may benefit from the receipt of research and other services that it may otherwise have to pay for out of its own resources, the research may also benefit the Nuveen funds to the extent it enhances NAM’s ability to manage such funds or is acquired through the commissions paid on portfolio transactions of other clients.
The Board noted that, with regard to the S&P Buy-Write Fund, Gateway does not participate in soft dollar arrangements with respect to Fund portfolio transactions.
Based on its review, the Board concluded that any indirect benefits received by a Fund Adviser as a result of its relationship with the Funds were reasonable and within acceptable parameters.
79
Annual Investment Management Agreement Approval Process (continued)
(Unaudited)
The Board Members did not identify any single factor discussed previously as all-important or controlling. The Board Members, including the Independent Board Members, concluded that the terms of each Advisory Agreement were fair and reasonable, that the respective Fund Adviser’s fees were reasonable in light of the services provided to each Fund and that the Advisory Agreements be renewed.
80
Notes
81
Notes
82
Notes
83
Nuveen:
Serving Investors for Generations
Since 1898, financial professionals and their clients have relied on Nuveen to provide
dependable investment solutions through continued adherence to proven, long-term investing
principles. Today, we offer a range of high quality solutions designed to
be integral components of a well-diversified core portfolio.
Focused on meeting investor needs.
Nuveen is the investment manager of TIAA. We have grown into one of the world’s premier global asset managers, with specialist knowledge across all major asset classes and particular strength in solutions that provide income for investors and that draw on our expertise in alternatives and responsible investing. Nuveen is driven not only by the independent investment processes across the firm, but also the insights, risk management, analytics and other tools and resources that a truly world-class platform provides. As a global asset manager, our mission is to work in partnership with our clients to create solutions which help them secure their financial future.
Find out how we can help you.
To learn more about how the products and services of Nuveen may be able to help you meet your financial goals, talk to your financial professional, or call us at (800) 257-8787. Please read the information provided carefully before you invest. Investors should consider the investment objective and policies, risk considerations, charges and expenses of any investment carefully.
Where applicable, be sure to obtain a prospectus, which contains this and other relevant information. To obtain a prospectus, please contact your securities representative or Nuveen, 333 W. Wacker Dr., Chicago, IL 60606. Please read the prospectus carefully before you invest or send money.
Learn more about Nuveen Funds at: www.nuveen.com/closed-end-funds
| | | | |
| Nuveen Securities, LLC, member FINRA and SIPC | 333 West Wacker Drive Chicago, IL 60606 | www.nuveen.com | | | |
ESA-D-0620D 1300439-INV-B-08/21 |
Item 2. Code of Ethics.
Not applicable to this filing.
Item 3. Audit Committee Financial Expert.
Not applicable to this filing.
Item 4. Principal Accountant Fees and Services.
Not applicable to this filing.
Item 5. Audit Committee of Listed Registrants.
Not applicable to this filing.
Item 6. Schedule of Investments.
(a) See Portfolio of Investments in Item 1.
(b) Not applicable.
Item 7. Disclosure of Proxy Voting Policies and Procedures for Closed-End Management Investment Companies.
Not applicable to this filing.
Item 8. Portfolio Managers of Closed-End Management Investment Companies.
Not applicable to this filing.
Item 9. Purchases of Equity Securities by Closed-End Management Investment Company and Affiliated Purchasers.
Not applicable.
Item 10. Submission of Matters to a Vote of Security Holders.
There have been no material changes to the procedures by which shareholders may recommend nominees to the registrant’s Board implemented after the registrant last provided disclosure in response to this item.
Item 11. Controls and Procedures.
| (a) | The registrant’s principal executive and principal financial officers, or persons performing similar functions, have concluded that the registrant’s disclosure controls and procedures (as defined in Rule 30a-3(c) under the Investment Company Act of 1940, as amended (the “1940 Act”) (17 CFR 270.30a-3(c))) are effective, as of a date within 90 days of the filing date of this report that includes the disclosure required by this paragraph, based on their evaluation of the controls and procedures required by Rule 30a-3(b) under the 1940 Act (17 CFR 270.30a-3(b)) and Rules 13a-15(b) or 15d-15(b) under the Securities Exchange Act of 1934, as amended (the “Exchange Act”) (17 CFR 240.13a-15(b) or 240.15d-15(b)). |
| (b) | There were no changes in the registrant’s internal control over financial reporting (as defined in Rule 30a-3(d) under the 1940 Act (17 CFR 270.30a-3(d)) that occurred during the period covered by this report that has materially affected, or is reasonably likely to materially affect, the registrant’s internal control over financial reporting. |
Item 12. Disclosure of Securities Lending Activities for Closed-End Management Investment Companies.
Not applicable.
Item 13. Exhibits.
File the exhibits listed below as part of this Form.
(a)(1) Any code of ethics, or amendment thereto, that is the subject of the disclosure required by Item 2, to the extent that the registrant intends to satisfy the Item 2 requirements through filing of an exhibit: Not applicable to this filing.
(a)(2) A separate certification for each principal executive officer and principal financial officer of the registrant as required by Rule 30a-2(a) under the 1940 Act (17 CFR 270.30a-2(a)) in the exact form set forth below: See EX-99.CERT attached hereto.
(a)(3) Any written solicitation to purchase securities under Rule 23c-1 under the 1940 Act (17 CFR 270.23c-1) sent or given during the period covered by the report by or on behalf of the registrant to 10 or more persons: Not applicable.
(a)(4) Change in the registrant’s independent public accountant. Not applicable.
(b) If the report is filed under Section 13(a) or 15(d) of the Exchange Act, provide the certifications required by Rule 30a-2 (b) under the 1940 Act (17 CFR 270.30a-2(b)), Rule 13a-14(b) or Rule 15d-14(b) under the Exchange Act (17 CFR 240.13a-14(b) or 240.15d-14(b)), and Section 1350 of Chapter 63 of Title 18 of the United States Code (18 U.S.C. 1350) as an Exhibit. A certification furnished pursuant to this paragraph will not be deemed “filed” for purposes of Section 18 of the Exchange Act (15 U.S.C. 78r), or otherwise subject to the liability of that section. Such certification will not be deemed to be incorporated by reference into any filing under the Securities Act of 1933 or the Exchange Act, except to the extent that the registration specifically incorporates it by reference: See EX-99.906 CERT attached hereto.
SIGNATURES
Pursuant to the requirements of the Securities Exchange Act of 1934 and the Investment Company Act of 1940, the registrant has duly caused this report to be signed on its behalf by the undersigned, thereunto duly authorized.
(Registrant) Nuveen Dow 30SM Dynamic Overwrite Fund
| | | | |
| By (Signature and Title) | | /s/ Gifford R. Zimmerman | | |
| | Gifford R. Zimmerman | | |
| | Vice President and Secretary | | |
Date: September 4, 2020
Pursuant to the requirements of the Securities Exchange Act of 1934 and the Investment Company Act of 1940, this report has been signed below by the following persons on behalf of the registrant and in the capacities and on the dates indicated.
| | | | |
| By (Signature and Title) | | /s/ David J. Lamb | | |
| | David J. Lamb | | |
| | Chief Administrative Officer | | |
| | (principal executive officer) | | |
Date: September 4, 2020
| | | | |
| By (Signature and Title) | | /s/ E. Scott Wickerham | | |
| | E. Scott Wickerham | | |
| | Vice President and Controller | | |
| | (principal financial officer) | | |
Date: September 4, 2020