UNITED STATES
SECURITIES AND EXCHANGE COMMISSION
Washington, D.C. 20549
FORM N-CSR
CERTIFIED SHAREHOLDER REPORT OF REGISTERED
MANAGEMENT INVESTMENT COMPANIES
| | |
| Investment Company Act file number | | 811-22970 |
Nuveen Dow 30SM Dynamic Overwrite Fund
(Exact name of registrant as specified in charter)
Nuveen Investments
333 West Wacker Drive, Chicago, IL 60606
(Address of principal executive offices) (Zip code)
Gifford R. Zimmerman
Nuveen Investments
333 West Wacker Drive, Chicago, IL 60606
(Name and address of agent for service)
Registrant’s telephone number, including area code: (312) 917-7700
Date of fiscal year end: December 31
Date of reporting period: June 30, 2017
Form N-CSR is to be used by management investment companies to file reports with the Commission not later than 10 days after the transmission to stockholders of any report that is required to be transmitted to stockholders under Rule 30e-1 under the Investment Company Act of 1940 (17 CFR 270.30e-1). The Commission may use the information provided on Form N-CSR in its regulatory, disclosure review, inspection, and policy making roles.
A registrant is required to disclose the information specified by Form N-CSR, and the Commission will make this information public. A registrant is not required to respond to the collection of information contained in Form N-CSR unless the Form displays a currently valid Office of Management and Budget (“OMB”) control number. Please direct comments concerning the accuracy of the information collection burden estimate and any suggestions for reducing the burden to Secretary, Securities and Exchange Commission, 450 Fifth Street, NW, Washington, DC 20549-0609. The OMB has reviewed this collection of information under the clearance requirements of 44 U.S.C. ss.3507.
ITEM 1. REPORTS TO STOCKHOLDERS.
| | |
| | |  |
| Closed-End Funds | |
| | | | | | |
| | | | | | | Semi-Annual Report June 30, 2017 |
| | | |
| | | | | | |
| | | | | | | |
| BXMX | | | | | | |
| Nuveen S&P 500 Buy-Write Income Fund | | |
| | | | | | | |
| DIAX | | | | | | |
| Nuveen Dow 30SM Dynamic Overwrite Fund | | |
| | | | | | | |
| SPXX | | | | | | |
| Nuveen S&P 500 Dynamic Overwrite Fund | | |
| | | | | | | |
| QQQX | | | | | | |
| Nuveen Nasdaq 100 Dynamic Overwrite Fund | | |
| | | | | | | | | | | | |
| | | | | | |
| | | | |
| | | | | | | | |
| |
| | Life is Complex |
| |
| | Nuveen makes things e-simple. It only takes a minute to sign up for e-Reports. Once enrolled, you’ll receive an e-mail as soon as your Nuveen Fund information is ready – no more waiting for delivery by regular mail. Just click on the link within the e-mail to see the report and save it on your computer if you wish. |
| | |
| | Free e-Reports right to your e-mail! |
| |
| | www.investordelivery.com If you receive your Nuveen Fund distributions and statements from your financial advisor or brokerage account. |
| |
| or | | www.nuveen.com/accountaccess If you receive your Nuveen Fund distributions and statements directly from Nuveen. |
Table
of Contents
Chairman’s Letter
to Shareholders

Dear Shareholders,
Some of the key assumptions driving the markets higher at the beginning of 2017 have recently come into question. Following the collapse of the health care reform bill in the Senate, progress on the rest of the White House’s pro-growth fiscal agenda, including tax reform and large infrastructure projects, is expected to be delayed. Economic growth projections, in turn, have been lowered, and with inflation recently waning, the markets are expecting fewer rate hikes from the Federal Reserve (Fed) than the Fed itself had predicted. Yet, asset prices continued to rise.
Investors have largely looked beyond policy disappointments and focused instead on the healthy profits reported by U.S. companies during the first two quarters of 2017. U.S. growth has remained slow and steady, European growth has surprised to the upside and concern that China would decelerate too rapidly has eased, further contributing to an optimistic tone in the markets. Additionally, political risk in Europe has moderated, with the election of mainstream candidates in the Dutch and French elections earlier this year.
The remainder of the year could bring challenges to this benign macro environment. The debt ceiling looms, with a vote needed from Congress to raise or suspend the nation’s borrowing limit before the Treasury is unable to pay its bills in full or on time (likely in early October). The mechanics of the U.K.’s separation from the European Union remain to be seen, as “Brexit” negotiations develop. A tightening of financial conditions in China or a more aggressive-than-expected policy action from the Fed, European Central Bank or Bank of Japan could also turn into headwinds.
Market volatility readings have been remarkably low lately, but conditions can change quickly. As market conditions evolve, Nuveen remains committed to rigorously assessing opportunities and risks. If you’re concerned about how resilient your investment portfolio might be, we encourage you to talk to your financial advisor. On behalf of the other members of the Nuveen Fund Board, we look forward to continuing to earn your trust in the months and years ahead.
Sincerely,

William J. Schneider
Chairman of the Board
August 23, 2017
Portfolio Managers’
Comments
Nuveen S&P 500 Buy-Write Income Fund (BXMX)
Nuveen Dow 30SM Dynamic Overwrite Fund (DIAX)
Nuveen S&P 500 Dynamic Overwrite Fund (SPXX)
Nuveen Nasdaq 100 Dynamic Overwrite Fund (QQQX)
The Nuveen S&P 500 Buy-Write Income Fund (BXMX) features portfolio management by Gateway Investment Advisers, LLC (Gateway). Kenneth H. Toft, Michael T. Buckius and Daniel M. Ashcraft are portfolio managers. Nuveen Dow 30SM Dynamic Overwrite Fund (DIAX), Nuveen S&P 500 Dynamic Overwrite Fund (SPXX) and Nuveen Nasdaq 100 Dynamic Overwrite Fund (QQQX) feature portfolio management by Nuveen Asset Management, LLC (NAM), an affiliate of Nuveen, LLC. Keith B. Hembre, CFA, and David Friar serve as portfolio managers for the Funds.
Here the portfolio managers discuss management strategies and the performance of the Funds for the six-month reporting period ended June 30, 2017.
What key strategies were used to manage the Funds during this six-month reporting period ended June 30, 2017?
BXMX
BXMX seeks attractive total return with less volatility than the S&P 500® Index. During the six-month reporting period ended June 30, 2017, the Fund invested in an equity portfolio which sought to track the price movements of the S&P 500® Index and wrote (sold) listed index call options on approximately 100% of the notional value of its stock portfolio. The cash premium generated by the index call options is intended to supplement the dividend yield on the underlying stock portfolio to support the Fund’s distribution policy and to provide the potential for growth in value during rising markets and/or risk mitigation in the event of a market decline.
The writing of index call options on a broad equity index, while investing in a portfolio of equities, has the potential to enhance the BXMX’s risk-adjusted returns while exposing the Fund to less risk than unhedged equity investments. The portion of the Fund subject to the overwrite potentially forgoes some of its upside equity return in exchange for the cash premiums received for the written index call options. In addition, market declines are typically buffered by the amount of the cash premium BXMX receives. In flat or declining markets, BXMX’s call option premium can potentially enhance total return relative to the S&P 500® Index. In rising markets, such as the one seen during this six-month reporting period, written call options can reduce the Fund’s total return relative to the S&P 500® Index.
This material is not intended to be a recommendation or investment advice, does not constitute a solicitation to buy or sell securities, and is not provided in a fiduciary. The information provided does not take into account the specific objectives or circumstances of any particular investor, or suggest any specific course of action. Investment decisions should be made based on an investor’s objectives or circumstances and in consultation with his or her advisors.
Certain statements in this report are forward-looking statements. Discussions of specific investments are for illustration only and are not intended as recommendations of individual investments. The forward-looking statements and other views expressed herein are those of the portfolio managers as of the date of this report. Actual future results or occurrences may differ significantly from those anticipated in any forward-looking statements and the views expressed herein are subject to change at any time, due to numerous market and other factors. The Funds disclaim any obligation to update publicly or revise any forward-looking statements or views expressed herein.
Refer to the Glossary of Terms Used in this Report for further definition of the terms used within this section.
Portfolio Managers’ Comments (continued)
DIAX
DIAX seeks attractive total return with less volatility than the Dow Jones Industrial Average (DJIA). NAM varies the level of call option overwrite within a range of approximately 35% to 75%, with a long-run target of 55% overwrite. NAM uses its proprietary view of the market’s return and volatility profile to dynamically adjust the overwrite percentage and other factors. Generally, if NAM expects the equity market to appreciate, the overwrite percentage will be reduced to offer more potential upside capture. Likewise, if NAM expects equity markets to be flat or to decline, the overwrite percentage may be increased, thus managing the Fund to potentially receive additional cash flow from higher sales of call options. This dynamic option overwrite approach offers potential for greater equity market upside capture than the full overwrite approach, while still offering a measure of downside risk management. The Fund currently expects to carry out its principal investment strategy by emphasizing options on broad-based indexes, individual stocks in the DJIA, and options on custom baskets of stocks in addition to ETFs. The Fund also has the opportunity to utilize call spread strategies and sell put options on a portion of the underlying equity portfolio.
SPXX
SPXX seeks attractive total return with less volatility than the S&P 500® Index. NAM varies the level of option overwrite within a range of approximately 35% to 75% overwrite, with a long-run target of 55% overwrite. NAM uses its proprietary view of the market’s return and volatility profile to dynamically adjust the overwrite percentage and other factors. Generally, if NAM expects the equity market to appreciate, the overwrite percentage will be reduced to offer more potential upside capture. Likewise, if NAM expects equity markets to be flat or to decline, the overwrite percentage may be increased, thus managing the Fund to potentially receive additional cash flow from higher sales of call options. This dynamic option overwrite approach offers potential for greater equity market upside capture than the full overwrite approach, while still offering a measure of downside risk management. The Fund currently expects to emphasize index call options on the S&P 500® Index and can also employ an expanded range of options including index options on other broad-based indexes and options on custom baskets of stocks in addition to single name options. The Fund also has the opportunity to utilize call spread strategies and sell put options on a portion of the underlying equity portfolio.
QQQX
QQQX seeks attractive total return with less volatility than the NASDAQ 100 Index. NAM varies the level of call option overwrite within a range of approximately 35% to 75% overwrite, with a long-run target of 55% overwrite. NAM uses its proprietary view of the market’s return and volatility profile to dynamically adjust the overwrite percentage and other factors. Generally, if NAM expects the equity market to appreciate, the overwrite percentage will be reduced to offer more potential upside capture. Likewise, if NAM expects equity markets to be flat or to decline, the overwrite percentage may be increased, thus managing the Fund to potentially receive additional cash flow from higher sales of call options. This dynamic option overwrite approach offers potential for greater equity market upside capture than the full overwrite approach, while still offering a measure of downside risk management. The Fund, in carrying out its principal options strategy, expects to primarily write index call options on the NASDAQ 100 Index and other broad-based indexes and can also write call options on a variety of other equity market indexes and options on custom baskets of stocks in addition to single name options. The Fund also has the opportunity to utilize call spread strategies and sell put options on a portion of the underlying equity portfolio.
How did the Funds perform during this six-month reporting period ended June 30, 2017?
The tables in the Performance Overview and Holding Summaries section of this report provide total return for the six-month, one-year, five-year and ten-year periods ended June 30, 2017. Each Fund’s total returns at net asset value (NAV) are compared with the performance of its corresponding market index and, as available, a secondary custom blended benchmark.
For the six-month reporting period ended June 30, 2017, BXMX’s shares at NAV underperformed the CBOE S&P 500® BuyWrite Index (BXMSM) as well as its previous primary index, the S&P 500® Index. DIAX underperformed the Dow Jones Industrial Average but outperformed its secondary index, which is a blend of 55% CBOE DJIA BuyWrite Index (BXD) and 45% Dow Jones Industrial Average. SPXX underperformed the S&P 500® Index and performed in line with its secondary index, which is a blend of 55% the CBOE S&P 500® BuyWrite Index (BXMSM) and 45% the S&P 500® Index. QQQX underperformed the NASDAQ 100 Index and its secondary index, which is a blend of 55% CBOE Nasdaq 100 BuyWrite Index (BXN) and 45% NASDAQ 100 Index.
BXMX
During the reporting period ended June 30, 2017, BXMX invested in an equity portfolio which sought to track the total return of the S&P 500® Index and wrote (sold) listed index call options on over 95% of the Fund’s assets. The premium generated by the index call options is intended to supplement the dividend yield on the underlying stock portfolio to support the Fund’s distribution policy and to provide risk mitigation in the event of a market decline.
Though collecting premiums from writing index call options generally allows BXMX to generate a positive return when the S&P 500® Index advances, call option positions that expire or are closed out when the S&P 500® Index is well above the option’s strike price may generate realized losses. A relatively sharp equity market advance during January and February drove losses in written call option positions. A more modest equity market advance over the last four months of the reporting period allowed the cash premium BXMX received from written index call options to keep pace with the market return.
BXMX underperformed the BXMSM (the Fund’s benchmark) for the reporting period primarily due to lagging performance in January and May 2017. The Fund’s active approach to index call option management outperformed the BXMSM in the other four months of the reporting period. In January, the Fund returned 1.26% while the BXMSM returned 2.22%. The Fund’s underperformance in January was primarily due to the BXM’sSM index call option having a higher strike price than the weighted-average strike price of the Fund’s index call option portfolio at the beginning of the month. The BXM’sSM index call option was nearly 1.4% out-of-the-money while the weighted-average of the Fund’s index call option portfolio was more than 0.5% in-the-money, which resulted in the BXMSM having more market exposure and more participation in the market’s advance over the first half of the month. From January 31st to April 30th, the Fund returned 3.52% while the BXMSM returned 2.69%. In May, the Fund returned 0.93% while the BXMSM returned 1.78%. The Fund’s underperformance of the BXMSM for May was primarily due to relative performance during the market pullback on May 17th. On that day, the weighted-average strike price of the Fund’s index call option portfolio was higher than the strike price of the BXM’sSM May index call option, resulting in the Fund having more market exposure than its benchmark. The Fund declined 1.21% on May 17th, underperforming the BXMSM by 81 basis points. In June, the Fund returned 0.63% while the BXMSM returned 0.35%.
Consistent with its investment objective, the measured risk of the Fund was lower than that of the U.S. equity market as its standard deviation for the reporting period was 3.89% versus 7.14% for the S&P 500® Index.
DIAX
DIAX seeks to dampen the beta (a measure of price volatility) of the overall portfolio by selling call options on a portion of the Fund’s underlying equity portfolio. This overwrite strategy provides incremental cash flow to the Fund and allows the portion of the Fund’s assets that are not overwritten to participate in any equity market rally. Those portions of the Fund that are overwritten have capped upside potential. The downside is buffered by the amount of cash flow premium received. Therefore, in flat or declining markets, the option premiums can enhance total returns relative to the Index. In rising markets, however, the options can hinder the Fund’s total return relative to the Index.
During the first half of the reporting period, the market’s implied volatility, as measured by the Chicago Board Options Exchange (CBOE) Volatility Index (the “VIX”), hit record low levels during the first quarter of 2017, ranging between
Portfolio Managers’ Comments (continued)
10.60 and 13.10, and averaging 11.75. During the second half of the reporting period, the VIX continued near record lows from the previous quarter, ranging between 9.75 and 15.96, and averaging 11.44, with two brief periods in April and again in May where it spiked to just below 16.
Given the low levels of implied and realized volatility, trading remained extremely light. In general, there was very little reward for option writing. We kept the Fund’s option strategy closely tied to the DIAX Blended Benchmark. The option overwrite level ranged from 35% to 70%, but averaged 55%, identical to the Blended Benchmark, for the six-month reporting period. At the outset of the first quarter of 2017, the Fund held a modest number of options, and therefore, was well positioned when the markets rose, capturing most of the upside of the Index. Because of its option strategy, however, the Fund was not able to capture all the upside. Throughout the second half of the reporting period, we continue to keep our option writing extremely light. On the options we did write, we opted for ones that were further out of the money than BXDSM which uses options that are at the money. We purposely avoided NASDAQ 100 Index options as that Index continued to perform exceptionally well returning 3.98% for the quarter and 16.78% year to date. We continued to sell call options on the S&P 500® Index and Russell 2000® Small Cap Index, which had a negative effect on performance given the low volatility and premiums during the quarter. We purchased call options on a small number single-name option trades which had a positive impact on performance as well as purchased put options, which had a negative effect on performance during the period.
SPXX
SPXX seeks to dampen the beta (a measure of price volatility) of the overall portfolio by selling call options on a portion of the Fund’s underlying equity portfolio. This overwrite strategy provides incremental cash flow to the Fund and allows the portion of the Fund’s assets that are not overwritten to participate in any equity market rally. Those portions of the Fund that are overwritten have capped upside potential. The downside is buffered by the amount of cash flow premium received. Therefore, in flat or declining markets, the option premiums can enhance total returns relative to the index. In rising markets, however, the options can hinder the Fund’s total return relative to the index.
During the first half of the reporting period, the market’s implied volatility, as measured by the Chicago Board Options Exchange (CBOE) Volatility Index (the “VIX”), hit record low levels during the first quarter of 2017, ranging between 10.60 and 13.10, and averaging 11.75. During the second half of the reporting period, the VIX continued near record lows from the previous quarter, ranging between 9.75 and 15.96, and averaging 11.44, with two brief periods in April and again in May where it spiked to just below 16.
Given the low levels of implied and realized volatility, trading remained extremely light. In general, there was very little reward for option writing. We kept the Fund’s option strategy closely tied to the SPXX Blended Benchmark. The option overwrite level ranged from 35% to 70%, but averaged 55% for the quarter, identical to the Blended Benchmark, for the six-month reporting period. At the outset of the first quarter of 2017, the Fund held a modest number of options, and therefore, was well positioned when the markets rose, capturing most of the upside of the Index. Because of its option strategy, however, the Fund was not able to capture all the upside. Throughout the second half of the reporting period, we continued to keep our option writing extremely light. On the options we did write, we opted for ones that were further out of the money than BXMSM which uses options that are at the money. This contributed to the Fund’s performance. We purposely avoided NASDAQ 100 Index options as that Index continued to perform exceptionally well returning 3.98% for the quarter and 16.78% year to date. We continued to sell call options on the S&P 500® Index and Russell 2000® Small Cap Index, which had a negative effect on performance given the low volatility and premiums. We purchased call options on a small number single-name option trades which had a positive impact on performance as well as purchased put options, which had a negative effect on performance during the period.
QQQX
QQQX seeks to dampen the beta (a measure of price volatility) of the overall portfolio by selling call options on a portion of the Fund’s underlying equity portfolio. This overwrite strategy provides incremental cash flow to the Fund and allows the portion of the Fund’s assets that are not overwritten to participate in any equity market rally. Those portions of the Fund that are overwritten have capped upside potential. The downside is buffered by the amount of cash flow premium received. Therefore, in flat or declining markets, the option premiums can enhance total returns relative to the Index. In rising markets, however, the options can hinder the Fund’s total return relative to the index.
During the first half of the reporting period, the Fund’s equity portfolio has a less than 70% overlap with the NASDAQ 100 Index because of tax constraints. For the first half of the reporting period, the names in the Index not held by the portfolio performed particularly well. Consequently, Fund performance in January represented the worst single-month relative results since its inception.
In addition, the market’s implied volatility, as measured by the Chicago Board Options Exchange (CBOE) Volatility Index (the “VIX”), hit record low levels during the first quarter of 2017, ranging between 10.60 and 13.10, and averaging 11.75. During the second half of the reporting period, the VIX continued near record lows from the previous quarter, ranging between 9.75 and 15.96, and averaging 11.44, with two brief periods in April and again in May where it spiked to just below 16.
Given the low levels of implied and realized volatility, trading remained extremely light. In general, there was very little reward for option writing. We continued to sell call options on the Index, but this had a negligible effect on performance given the low volatility and premiums during the reporting period. We kept the Fund’s option strategy closely tied to the QQQX Blended Benchmark. The option overwrite level ranged from 35% to 70% but averaged 55% for the quarter, identical to the Blended Benchmark, for the six-month reporting period.
During the second half of the reporting period, we continued to keep our option writing extremely light. On the options we did write, we opted for ones that were further out of the money than BXNSM which uses options that are at the money. This contributed to the Fund’s performance. We opted to sell a greater amount of call options on the S&P 500® Index and Russell 2000® Small Cap Index than on the NASDAQ 100 Index as it continued to exhibit strong momentum. The net effect of these call options positions had a negative effect on performance given the low volatility and premiums. We purchased call options on a small number of single-name option trades which had a positive impact on performance as well as purchased put options, which had a negative effect on performance during the period.
Share
Information
DISTRIBUTION INFORMATION
The following information regarding each Fund’s distributions is current as of May 31, 2017, the date of the distribution data included within the Fund’s most recent distribution notice at the time this report was prepared. Each Fund’s distribution level may vary over time based on the Fund’s investment activities and portfolio investment value changes.
Each Fund has adopted a managed distribution program. The goal of a Fund’s managed distribution program is to provide shareholders relatively consistent and predictable cash flow by systematically converting its expected long-term return potential into regular distributions. As a result, regular distributions throughout the year will likely include a portion of expected long-term and/or short-term gains (both realized and unrealized), along with net investment income.
Important points to understand about Nuveen fund managed distributions are:
| • | | Each Fund seeks to establish a relatively stable common share distribution rate that roughly corresponds to the projected total return from its investment strategy over an extended period of time. However, you should not draw any conclusions about a Fund’s past or future investment performance from its current distribution rate. |
| • | | Actual share returns will differ from projected long-term returns (and therefore a Fund’s distribution rate), at least over shorter time periods. Over a specific timeframe, the difference between actual returns and total distributions will be reflected in an increasing (returns exceed distributions) or a decreasing (distributions exceed returns) Fund net asset value. |
| • | | Each period’s distributions are expected to be paid from some or all of the following sources: |
| | • | | net investment income consisting of regular interest and dividends, |
| | • | | net realized gains from portfolio investments, and |
| | ��� | | unrealized gains, or, in certain cases, a return of principal (non-taxable distributions). |
| • | | A non-taxable distribution is a payment of a portion of a Fund’s capital. When a Fund’s returns exceed distributions, it may represent portfolio gains generated, but not realized as a taxable capital gain. In periods when the Fund’s returns fall short of distributions, it will represent a portion of your original principal unless the shortfall is offset during other time periods over the life of your investment (previous or subsequent) when the Fund’s total return exceeds distributions. |
| • | | Because distribution source estimates are updated throughout the current fiscal year based on a Fund’s performance, these estimates may differ from both the tax information reported to you in each Fund’s 1099 statement, as well as the ultimate economic sources of distributions over the life of your investment. |
The following table provides information regarding each Fund’s distributions and total return performance over various time periods. This information is intended to help you better understand whether each Fund’s returns for the specified time periods were sufficient to meet their distributions.
Data as of May 31, 2017
| | | | | | | | | | | | | | | | | | | | | | | | | | | | | | | | | | | | | | | | | | | | |
| | | | | | Per Share
Distributions | | | | | | | | | | | | | | | Annualized Total
Return on NAV | | | | |
| Fund | | Inception
Date | | | Quarterly | | | Monthly
Equivalent | | | Monthly
Net Investment
Income1 | | | YTD Net
Realized
Gain/Loss2 | | | Inception
Unrealized
Gain/Loss2 | | | Current
Distribution
Rate on NAV3 | | | 1-Year | | | 5-Year | | | YTD | | | YTD
Distribution
Rate on NAV4 | |
BXMX | | | 10/2004 | | | $ | 0.2285 | | | $ | 0.0762 | | | $ | 0.0127 | | | $ | 0.0528 | | | $ | 6.0681 | | | | 6.50 | % | | | 13.00 | % | | | 9.33 | % | | | 5.79 | % | | | 3.25 | % |
DIAX | | | 04/2005 | | | $ | 0.2555 | | | $ | 0.0852 | | | $ | 0.0207 | | | $ | 0.1740 | | | $ | 7.6240 | | | | 5.91 | % | | | 16.89 | % | | | 11.06 | % | | | 6.05 | % | | | 2.96 | % |
SPXX | | | 11/2005 | | | $ | 0.2400 | | | $ | 0.0800 | | | $ | 0.0150 | | | $ | (0.0048 | ) | | $ | 6.9283 | | | | 6.07 | % | | | 14.33 | % | | | 9.63 | % | | | 7.19 | % | | | 3.04 | % |
QQQX | | | 01/2007 | | | $ | 0.3500 | | | $ | 0.1167 | | | $ | 0.0054 | | | $ | 0.0740 | | | $ | 13.1145 | | | | 6.44 | % | | | 20.58 | % | | | 15.45 | % | | | 12.93 | % | | | 3.22 | % |
| 1 | Net investment income is expressed as a monthly amount using a six-month average. |
| 2 | These are approximations. Actual amounts may be more or less than amounts listed above. |
| 3 | Current distribution, annualized, expressed over the most recent month-end NAV. |
| 4 | Sum of year-to-date distributions expressed over the most recent month-end NAV. |
The following table provides estimates of the Fund’s distribution sources, reflecting year-to-date cumulative experience through the latest month-end. These estimates are for informational purposes only. The Fund attributes these estimates equally to each regular distribution throughout the year. Consequently, the estimated information shown below is for the current distribution, and also represents an updated estimate for all prior months in the year.
The amounts and sources of distributions reported in this notice are only estimates and are not being provided for tax reporting purposes. The actual amounts and character of the distributions for tax reporting purposes will be reported to shareholders on Form 1099-DIV which will be sent to shareholders shortly after calendar year-end. More details about the Fund’s distributions and the basis for these estimates are available on www.nuveen.com/cef.
Data as of May 31, 2017
| | | | | | | | | | | | | | | | | | | | | | | | | | | | | | | | |
| | | Current Quarter | | | Calendar YTD | |
| | | Estimated Source of Distribution | | | Estimated Per Share Amounts | |
| Fund | | Per Share
Distribution | | | Net
Investment
Income1 | | | Realized
Gains | | | Return of
Capital2 | | | Distributions3 | | | Net
Investment
Income1 | | | Realized
Gains | | | Return of
Capital2 | |
BXMX | | $ | 0.2285 | | | | 16.9 | % | | | 11.6 | % | | | 71.5 | % | | $ | 0.4570 | | | $ | 0.0773 | | | $ | 0.0528 | | | $ | 0.3269 | |
DIAX | | $ | 0.2555 | | | | 28.1 | % | | | 34.1 | % | | | 37.9 | % | | $ | 0.5110 | | | $ | 0.1435 | | | $ | 0.1740 | | | $ | 0.1935 | |
SPXX | | $ | 0.2400 | | | | 19.5 | % | | | 0.0 | % | | | 80.5 | % | | $ | 0.4800 | | | $ | 0.0934 | | | $ | — | | | $ | 0.3866 | |
QQQX | | $ | 0.3500 | | | | 6.1 | % | | | 10.6 | % | | | 83.4 | % | | $ | 0.7000 | | | $ | 0.0425 | | | $ | 0.0740 | | | $ | 0.5835 | |
| 1 | Net investment income is a projection through the end of the current quarter based on the most recent month-end data. |
| 2 | Return of capital may represent unrealized gains, return of shareholder's principal, or both. In certain circumstances, all or a portion of the return of capital may be characterized as ordinary income under federal tax law. The actual tax characterization will be provided to shareholders on Form 1099-DIV shortly after calendar year-end. |
| 3 | Includes the most recent quarterly distribution declaration. |
SHARE REPURCHASES
During August 2017 (subsequent to the close of the reporting period), the Funds’ Board of Trustees reauthorized an open-market share repurchase program, allowing each Fund to repurchase an aggregate of up to approximately 10% of its outstanding shares.
As of June 30, 2017, and since the inception of the Funds’ repurchase programs, the Funds have cumulatively repurchased and retired their outstanding shares as shown in the accompanying table.
| | | | | | | | | | | | | | | | |
| | | BXMX | | | DIAX | | | SPXX | | | QQQX | |
Shares cumulatively repurchased and retired | | | 460,238 | | | | 0 | | | | 383,763 | | | | 0 | |
Shares authorized for repurchase | | | 10,355,000 | | | | 3,610,000 | | | | 1,615,000 | | | | 3,655,000 | |
During the current reporting period, the Funds did not repurchase any of their outstanding shares.
Share Information (continued)
OTHER SHARE INFORMATION
As of June 30, 2017, and during the current reporting period, the Funds’ share prices were trading at a premium/(discount) to their NAVs as shown in the accompanying table.
| | | | | | | | | | | | | | | | |
| | | BXMX | | | DIAX | | | SPXX | | | QQQX | |
NAV | | | $13.93 | | | $ | 17.32 | | | $ | 15.71 | | | $ | 21.10 | |
Share price | | | $13.85 | | | $ | 16.52 | | | $ | 15.36 | | | $ | 21.71 | |
Premium/(Discount) to NAV | | | (0.57 | )% | | | (4.62 | )% | | | (2.23 | )% | | | 2.89 | % |
6-month average premium/(discount) to NAV | | | (2.44 | )% | | | (6.67 | )% | | | (2.54 | )% | | | 0.73 | % |
Risk
Considerations
Fund shares are not guaranteed or endorsed by any bank or other insured depository institution, and are not federally insured by the Federal Deposit Insurance Corporation.
Nuveen S&P 500 Buy-Write Income Fund (BXMX)
Investing in closed-end funds involves risk; principal loss is possible. There is no guarantee the Fund’s investment objectives will be achieved. Closed-end fund shares may frequently trade at a discount or premium to their net asset value. Common stock returns often have experienced significant volatility. The Fund may not participate in any appreciation of its equity portfolio as fully as it would if the Fund did not sell call options. In addition, the Fund will continue to bear the risk of declines in the value of the equity portfolio. Because index options are settled in cash, sellers of index call options, such as the Fund, cannot provide in advance for their potential settlement obligations by acquiring and holding the underlying securities. For these and other risks, including tax risk, please see the Fund’s web page at www.nuveen.com/BXMX.
Nuveen Dow 30SM Dynamic Overwrite Fund (DIAX)
Investing in closed-end funds involves risk; principal loss is possible. There is no guarantee the Fund’s investment objectives will be achieved. Closed-end fund shares may frequently trade at a discount or premium to their net asset value. Common stock returns often have experienced significant volatility. The Fund may not participate in any appreciation of its equity portfolio as fully as it would if the Fund did not sell call options. In addition, the Fund will continue to bear the risk of declines in the value of the equity portfolio. Because index options are settled in cash, sellers of index call options, such as the Fund, cannot provide in advance for their potential settlement obligations by acquiring and holding the underlying securities. For these and other risks, including tax risk, please see the Fund’s web page at www.nuveen.com/DIAX.
Nuveen S&P 500 Dynamic Overwrite Fund (SPXX)
Investing in closed-end funds involves risk; principal loss is possible. There is no guarantee the Fund’s investment objectives will be achieved. Closed-end fund shares may frequently trade at a discount or premium to their net asset value. Common stock returns often have experienced significant volatility. The Fund may not participate in any appreciation of its equity portfolio as fully as it would if the Fund did not sell call options. In addition, the Fund will continue to bear the risk of declines in the value of the equity portfolio. Because index options are settled in cash, sellers of index call options, such as the Fund, cannot provide in advance for their potential settlement obligations by acquiring and holding the underlying securities. For these and other risks, including tax risk, please see the Fund’s web page at www.nuveen.com/SPXX.
Nuveen Nasdaq 100 Dynamic Overwrite Fund (QQQX)
Investing in closed-end funds involves risk; principal loss is possible. There is no guarantee the Fund’s investment objectives will be achieved. Closed-end fund shares may frequently trade at a discount or premium to their net asset value. Common stock returns often have experienced significant volatility. The Fund may not participate in any appreciation of its equity portfolio as fully as it would if the Fund did not sell call options. In addition, the Fund will continue to bear the risk of declines in the value of the equity portfolio. Because index options are settled in cash, sellers of index call options, such as the Fund, cannot provide in advance for their potential settlement obligations by acquiring and holding the underlying securities. For these and other risks, including tax risk, please see the Fund’s web page at www.nuveen.com/QQQX.
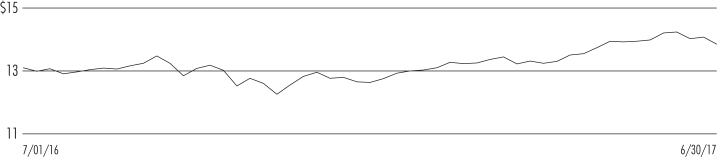
BXMX
Nuveen S&P 500 Buy-Write Income Fund
Performance Overview and Holding Summaries as of June 30, 2017
Refer to the Glossary of Terms Used in this Report for further definition of the terms used within this section.
Average Annual Total Returns as of June 30, 2017
| | | | | | | | | | | | | | | | |
| | | Cumulative | | | Average Annual | |
| | | 6-month | | | 1-Year | | | 5-Year | | | 10-Year | |
| BXMX at NAV | | | 6.46% | | | | 13.14% | | | | 8.76% | | | | 5.60% | |
| BXMX at Share Price | | | 12.57% | | | | 13.82% | | | | 11.04% | | | | 6.44% | |
| CBOE S&P 500® BuyWrite Index (BXMSM) | | | 7.21% | | | | 12.06% | | | | 7.73% | | | | 4.62% | |
| S&P 500® Index | | | 9.34% | | | | 17.90% | | | | 14.63% | | | | 7.18% | |
Past performance is not predictive of future results. Current performance may be higher or lower than the data shown. Returns do not reflect the deduction of taxes that shareholders may have to pay on Fund distributions or upon the sale of Fund shares. Returns at NAV are net of Fund expenses, and assume reinvestment of distributions. Comparative index return information is provided for the Fund’s shares at NAV only. Indexes are not available for direct investment.
Share Price Performance — Weekly Closing Price
This data relates to the securities held in the Fund’s portfolio of investments as of the end of the reporting period. It should not be construed as a measure of performance for the Fund itself. Holdings are subject to change.
Fund Allocation
(% of net assets)
| | | | |
| Common Stocks | | | 99.6% | |
| Repurchase Agreements | | | 3.1% | |
| Other Assets Less Liabilities | | | (2.7)% | |
| Net Assets | | | 100% | |
Top Five Issuers
(% of total long-term investments)
| | | | |
Apple, Inc. | | | 3.7% | |
Microsoft Corporation | | | 2.7% | |
| Amazon.com, Inc. | | | 2.0% | |
Facebook Inc., Class A | | | 2.0% | |
Berkshire Hathaway Inc., Class B | | | 2.0% | |
Portfolio Composition
(% of total investments)
| | | | |
| Banks | | | 6.6% | |
| Internet Software & Services | | | 5.4% | |
| Pharmaceuticals | | | 5.1% | |
| Software | | | 5.1% | |
| Oil, Gas & Consumable Fuels | | | 4.7% | |
| Technology Hardware, Storage & Peripherals | | | 4.1% | |
| Biotechnology | | | 3.3% | |
| Semiconductors & Semiconductor Equipment | | | 3.3% | |
| IT Services | | | 3.0% | |
| Health Care Providers & Services | | | 2.9% | |
| Media | | | 2.9% | |
| Internet and Direct Marketing Retail | | | 2.8% | |
| Industrial Conglomerates | | | 2.7% | |
| Insurance | | | 2.6% | |
| | | | |
| Specialty Retail | | | 2.5% | |
| Equity Real Estate Investment Trusts | | | 2.4% | |
| Health Care Equipment & Supplies | | | 2.3% | |
| Capital Markets | | | 2.2% | |
| Aerospace & Defense | | | 2.2% | |
| Beverages | | | 2.2% | |
| Diversified Telecommunication Services | | | 2.0% | |
| Machinery | | | 2.0% | |
| Diversified Financial Services | | | 2.0% | |
| Tobacco | | | 2.0% | |
| Chemicals | | | 1.9% | |
| Repurchase Agreements | | | 3.0% | |
| Other | | | 18.8% | |
Total | | | 100% | |
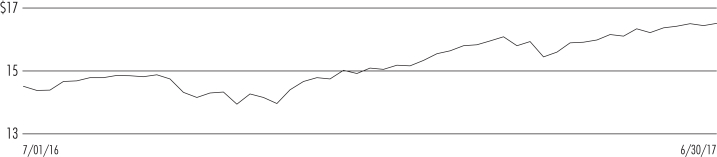
DIAX
Nuveen Dow 30SM Dynamic Overwrite Fund
Performance Overview and Holding Summaries as of June 30, 2017
Refer to the Glossary of Terms Used in this Report for further definition of the terms used within this section.
Average Annual Total Returns as of June 30, 2017
| | | | | | | | | | | | | | | | |
| | | Cumulative | | | Average Annual | |
| | | 6-month | | | 1-Year | | | 5-Year | | | 10-Year | |
| DIAX at NAV | | | 7.80% | | | | 17.28% | | | | 10.68% | | | | 6.72% | |
| DIAX at Share Price | | | 13.66% | | | | 21.45% | | | | 11.74% | | | | 6.34% | |
| Dow Jones Industrial Average (DJIA) | | | 9.35% | | | | 22.12% | | | | 13.45% | | | | 7.57% | |
| DIAX Blended Benchmark | | | 7.57% | | | | 15.24% | | | | 8.97% | | | | 5.99% | |
Past performance is not predictive of future results. Current performance may be higher or lower than the data shown. Returns do not reflect the deduction of taxes that shareholders may have to pay on Fund distributions or upon the sale of Fund shares. Returns at NAV are net of Fund expenses, and assume reinvestment of distributions. Comparative index return information is provided for the Fund’s shares at NAV only. Indexes are not available for direct investment.
Share Price Performance — Weekly Closing Price
This data relates to the securities held in the Fund’s portfolio of investments as of the end of the reporting period. It should not be construed as a measure of performance for the Fund itself. Holdings are subject to change.
Fund Allocation
(% of net assets)
| | | | |
| Common Stocks | | | 99.8% | |
| Repurchase Agreements | | | 0.3% | |
| U.S. Government and Agency Obligations | | | 0.8% | |
| Other Assets Less Liabilities | | | (0.9)% | |
Net Assets | | | 100% | |
Top Five Issuers
(% of total long-term investments)
| | | | |
Goldman Sachs Group, Inc. | | | 7.1% | |
3M Co. | | | 6.7% | |
| Boeing Company | | | 6.3% | |
UnitedHealth Group Incorporated | | | 5.9% | |
| International Business Machines Corporation | | | 4.9% | |
Portfolio Composition
(% of total investments)
| | | | |
| Aerospace & Defense | | | 10.1% | |
| IT Services | | | 7.9% | |
| Industrial Conglomerates | | | 7.5% | |
| Pharmaceuticals | | | 7.3% | |
| Capital Markets | | | 7.0% | |
| Health Care Providers & Services | | | 5.9% | |
| Oil, Gas & Consumable Fuels | | | 5.9% | |
| Specialty Retail | | | 4.9% | |
| Hotels, Restaurants & Leisure | | | 4.9% | |
| Technology Hardware, Storage & Peripherals | | | 4.6% | |
| Insurance | | | 4.0% | |
| Machinery | | | 3.4% | |
| Media | | | 3.4% | |
| Banks | | | 2.9% | |
| Repurchase Agreements | | | 0.3% | |
| U.S. Government and Agency Obligations | | | 0.8% | |
| Other | | | 19.2% | |
Total | | | 100% | |
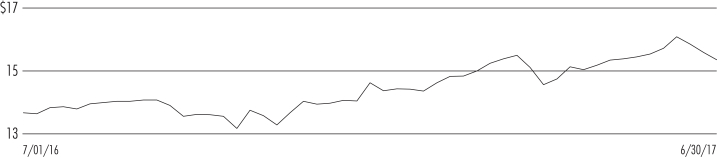
SPXX
Nuveen S&P 500 Dynamic Overwrite Fund
Performance Overview and Holding Summaries as of June 30, 2017
Refer to the Glossary of Terms Used in this Report for further definition of the terms used within this section.
Average Annual Total Returns as of June 30, 2017
| | | | | | | | | | | | | | | | |
| | | Cumulative | | | Average Annual | |
| | | 6-Month | | | 1-Year | | | 5-Year | | | 10-Year | |
| SPXX at NAV | | | 8.13% | | | | 14.73% | | | | 9.08% | | | | 5.32% | |
| SPXX at Share Price | | | 10.09% | | | | 21.27% | | | | 11.76% | | | | 6.33% | |
| S&P 500® Index | | | 9.34% | | | | 17.90% | | | | 14.63% | | | | 7.18% | |
| SPXX Blended Benchmark | | | 8.18% | | | | 14.68% | | | | 10.83% | | | | 5.90% | |
Performance prior to December 22, 2014, reflects the Fund’s performance under the management of a sub-adviser using an investment strategy that differed from those currently in place.
Past performance is not predictive of future results. Current performance may be higher or lower than the data shown. Returns do not reflect the deduction of taxes that shareholders may have to pay on Fund distributions or upon the sale of Fund shares. Returns at NAV are net of Fund expenses, and assume reinvestment of distributions. Comparative index return information is provided for the Fund’s shares at NAV only. Indexes are not available for direct investment.
Share Price Performance — Weekly Closing Price
This data relates to the securities held in the Fund’s portfolio of investments as of the end of the reporting period. It should not be construed as a measure of performance for the Fund itself. Holdings are subject to change.
Fund Allocation
(% of net assets)
| | | | |
| Common Stocks | | | 99.9% | |
| Repurchase Agreements | | | 0.1% | |
| Other Assets Less Liabilities | | | 0.0% | |
| Net Assets | | | 100% | |
Top Five Issuers
(% of total long-term investments)
| | | | |
Apple, Inc. | | | 4.1% | |
Microsoft Corporation | | | 3.0% | |
| Amazon.com Inc. | | | 2.1% | |
JPMorgan Chase & Co. | | | 1.9% | |
Facebook Inc., Class A | | | 1.9% | |
Portfolio Composition
(% of total investments)
| | | | |
| Banks | | | 7.6% | |
| Internet Software & Services | | | 5.9% | |
| Pharmaceuticals | | | 5.6% | |
| Oil, Gas & Consumable Fuels | | | 5.1% | |
| Software | | | 4.9% | |
| Technology Hardware, Storage & Peripherals | | | 4.6% | |
| IT Services | | | 3.8% | |
| Semiconductors & Semiconductor Equipment | | | 3.5% | |
| Biotechnology | | | 3.2% | |
| Internet and Direct Marketing Retail | | | 3.2% | |
| Industrial Conglomerates | | | 3.0% | |
| Specialty Retail | | | 3.0% | |
| Health Care Providers & Services | | | 3.0% | |
| | | | |
| Insurance | | | 2.9% | |
| Media | | | 2.8% | |
| Capital Markets | | | 2.7% | |
| Machinery | | | 2.5% | |
| Tobacco | | | 2.3% | |
| Aerospace & Defense | | | 2.3% | |
| Chemicals | | | 2.3% | |
| Beverages | | | 2.2% | |
| Diversified Telecommunication Services | | | 2.1% | |
| Household Products | | | 2.1% | |
| Repurchase Agreements | | | 0.1% | |
| Other | | | 19.3% | |
Total | | | 100% | |
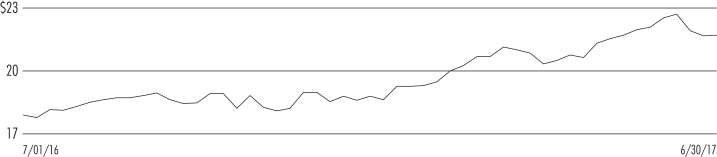
QQQX
Nuveen Nasdaq 100 Dynamic Overwrite Fund
Performance Overview and Holding Summaries as of June 30, 2017
Refer to the Glossary of Terms Used in this Report for further definition of the terms used within this section.
Average Annual Total Returns as of June 30, 2017
| | | | | | | | | | | | | | |
| | | Cumulative | | Average Annual | |
| | | 6-month | | 1-Year | | | 5-Year | | | 10-Year | |
| QQQX at NAV | | 11.42% | | | 20.53% | | | | 14.38% | | | | 9.84% | |
| QQQX at Share Price | | 20.89% | | | 30.35% | | | | 15.41% | | | | 10.97% | |
| Nasdaq 100® Index | | 16.78% | | | 29.39% | | | | 18.17% | | | | 12.46% | |
| QQQX Blended Benchmark | | 12.80% | | | 22.73% | | | | 12.38% | | | | 7.99% | |
Past performance is not predictive of future results. Current performance may be higher or lower than the data shown. Returns do not reflect the deduction of taxes that shareholders may have to pay on Fund distributions or upon the sale of Fund shares. Returns at NAV are net of Fund expenses, and assume reinvestment of distributions. Comparative index return information is provided for the Fund’s shares at NAV only. Indexes are not available for direct investment.
Share Price Performance — Weekly Closing Price
This data relates to the securities held in the Fund’s portfolio of investments as of the end of the reporting period. It should not be construed as a measure of performance for the Fund itself. Holdings are subject to change.
Fund Allocation
(% of net assets)
| | | | |
| Common Stocks | | | 99.7% | |
Exchange-Traded Funds | | | 1.2% | |
| Repurchase Agreements | | | 0.4% | |
| Other Assets Less Liabilities | | | (1.3)% | |
| Net Assets | | | 100% | |
Top Five Issuers
(% of total long-term investments)
| | | | |
Apple, Inc. | | | 12.8% | |
Microsoft Corporation | | | 9.6% | |
Amazon.com, Inc. | | | 8.3% | |
Facebook Inc., Class A | | | 6.3% | |
Alphabet Inc., Class C | | | 5.7% | |
Portfolio Composition
(% of total investments)
| | | | |
| Internet Software & Services | | | 19.3% | |
| Software | | | 12.9% | |
| Technology Hardware, Storage & Peripherals | | | 12.8% | |
| Semiconductors & Semiconductor Equipment | | | 10.4% | |
| Internet and Direct Marketing Retail | | | 10.4% | |
| Biotechnology | | | 10.0% | |
| Media | | | 4.1% | |
| Exchange-Traded Funds | | | 1.2% | |
| Repurchase Agreements | | | 0.4% | |
| Other | | | 18.5% | |
Total | | | 100% | |
Shareholder
Meeting Report
The annual meeting of shareholders was held in the offices of Nuveen on April 6, 2017 for BXMX, SPXX, DIAX and QQQX; at this meeting the shareholders were asked to elect Board Members.
| | | | | | | | | | | | | | | | |
| | | BXMX | | | SPXX | | | DIAX | | | QQQX | |
| | | Common
Shares | | | Common
Shares | | | Common
Shares | | | Common
Shares | |
Approval of the Board Members was reached as follows: | | | | | | | | | | | | | | | | |
William Adams IV | | | | | | | | | | | | | | | | |
For | | | 88,859,293 | | | | 14,895,746 | | | | 30,920,184 | | | | 31,730,324 | |
Withhold | | | 1,839,126 | | | | 171,420 | | | | 653,772 | | | | 687,705 | |
Total | | | 90,698,419 | | | | 15,067,166 | | | | 31,573,956 | | | | 32,418,029 | |
David J. Kundert | | | | | | | | | | | | | | | | |
For | | | 88,345,441 | | | | 14,889,040 | | | | 30,455,890 | | | | 31,714,191 | |
Withhold | | | 2,352,978 | | | | 178,126 | | | | 1,118,066 | | | | 703,838 | |
Total | | | 90,698,419 | | | | 15,067,166 | | | | 31,573,956 | | | | 32,418,029 | |
John K. Nelson | | | | | | | | | | | | | | | | |
For | | | 88,862,287 | | | | 14,898,048 | | | | 30,903,919 | | | | 31,742,575 | |
Withhold | | | 1,836,132 | | | | 169,118 | | | | 670,037 | | | | 675,454 | |
Total | | | 90,698,419 | | | | 15,067,166 | | | | 31,573,956 | | | | 32,418,029 | |
Terence J. Toth | | | | | | | | | | | | | | | | |
For | | | 88,876,270 | | | | 14,895,734 | | | | 30,859,118 | | | | 31,682,247 | |
Withhold | | | 1,822,149 | | | | 171,432 | | | | 714,838 | | | | 735,782 | |
Total | | | 90,698,419 | | | | 15,067,166 | | | | 31,573,956 | | | | 32,418,029 | |
BXMX
| | |
Nuveen S&P 500 Buy-Write Income Fund | | |
Portfolio of Investments | | June 30, 2017 (Unaudited) |
| | | | | | | | | | | | | | | | |
| Shares | | | Description (1) | | | | | | | | Value | |
| | | | |
| | | | LONG-TERM INVESTMENTS – 99.6% | | | | | | | | | | | | |
| | | | |
| | | | COMMON STOCKS – 99.6% (2) | | | | | | | | | | | | |
| | | | |
| | | | Aerospace & Defense – 2.3% | | | | | | | | | |
| | | | |
| | 57,364 | | | Arconic, Inc. | | | | | | | | | | $ | 1,299,295 | |
| | 54,410 | | | Boeing Company | | | | | | | | | | | 10,759,578 | |
| | 8,874 | | | Huntington Ingalls Industries Inc. | | | | | | | | | | | 1,651,984 | |
| | 21,569 | | | Northrop Grumman Corporation | | | | | | | | | | | 5,536,978 | |
| | 36,207 | | | Raytheon Company | | | | | | | | | | | 5,846,706 | |
| | 63,296 | | | United Technologies Corporation | | | | | | | | | | | 7,729,075 | |
| | | | Total Aerospace & Defense | | | | | | | | | | | 32,823,616 | |
| | | | |
| | | | Air Freight & Logistics – 0.7% | | | | | | | | | |
| | | | |
| | 89,366 | | | United Parcel Service, Inc., Class B | | | | | | | | | | | 9,882,986 | |
| | | | |
| | | | Airlines – 0.4% | | | | | | | | | |
| | | | |
| | 81,380 | | | United Continental Holdings Inc., (3) | | | | | | | | | | | 6,123,845 | |
| | | | |
| | | | Auto Components – 0.2% | | | | | | | | | |
| | | | |
| | 25,665 | | | Cooper Tire & Rubber Company | | | | | | | | | | | 926,507 | |
| | 85,832 | | | Gentex Corporation | | | | | | | | | | | 1,628,233 | |
| | | | Total Auto Components | | | | | | | | | | | 2,554,740 | |
| | | | |
| | | | Automobiles – 0.4% | | | | | | | | | |
| | | | |
| | 324,831 | | | Ford Motor Company | | | | | | | | | | | 3,634,859 | |
| | 39,370 | | | Harley-Davidson, Inc. | | | | | | | | | | | 2,126,767 | |
| | | | Total Automobiles | | | | | | | | | | | 5,761,626 | |
| | | | |
| | | | Banks – 6.8% | | | | | | | | | |
| | | | |
| | 789,532 | | | Bank of America Corporation | | | | | | | | | | | 19,154,046 | |
| | 226,558 | | | Citigroup Inc. | | | | | | | | | | | 15,152,199 | |
| | 33,724 | | | Comerica Incorporated | | | | | | | | | | | 2,469,946 | |
| | 71,851 | | | Fifth Third Bancorp. | | | | | | | | | | | 1,865,252 | |
| | 108,513 | | | First Horizon National Corporation | | | | | | | | | | | 1,890,296 | |
| | 275,180 | | | JPMorgan Chase & Co. | | | | | | | | | | | 25,151,452 | |
| | 27,680 | | | Lloyds Banking Group PLC, ADR | | | | | | | | | | | 97,710 | |
| | 20,320 | | | M&T Bank Corporation | | | | | | | | | | | 3,290,824 | |
| | 168,139 | | | U.S. Bancorp | | | | | | | | | | | 8,729,777 | |
| | 358,966 | | | Wells Fargo & Company | | | | | | | | | | | 19,890,306 | |
| | | | Total Banks | | | | | | | | | | | 97,691,808 | |
| | | | |
| | | | Beverages – 2.2% | | | | | | | | | |
| | | | |
| | 298,211 | | | Coca-Cola Company | | | | | | | | | | | 13,374,763 | |
| | 72,441 | | | Monster Beverage Corporation, (3) | | | | | | | | | | | 3,598,869 | |
| | 133,358 | | | PepsiCo, Inc. | | | | | | | | | | | 15,401,515 | |
| | | | Total Beverages | | | | | | | | | | | 32,375,147 | |
| | | | |
| | | | Biotechnology – 3.4% | | | | | | | | | |
| | | | |
| | 133,643 | | | AbbVie Inc. | | | | | | | | | | | 9,690,454 | |
| | 63,704 | | | Amgen Inc. | | | | | | | | | | | 10,971,740 | |
| | 23,813 | | | Biogen Inc., (3) | | | | | | | | | | | 6,461,896 | |
| | 28,327 | | | Bioverativ, Inc., (3) | | | | | | | | | | | 1,704,436 | |
| | 78,645 | | | Celgene Corporation, (3) | | | | | | | | | | | 10,213,626 | |
| | 122,751 | | | Gilead Sciences, Inc. | | | | | | | | | | | 8,688,316 | |
| | 11,117 | | | Shire plc, ADR | | | | | | | | | | | 1,837,307 | |
| | | | Total Biotechnology | | | | | | | | | | | 49,567,775 | |
| | | | |
| BXMX | | Nuveen S&P 500 Buy-Write Income Fund |
| | Portfolio of Investments (continued) | | June 30, 2017 (Unaudited) |
| | | | | | | | | | | | | | | | |
| Shares | | | Description (1) | | | | | | | | Value | |
| | | | |
| | | | Building Products – 0.4% | | | | | | | | | |
| | | | |
| | 28,365 | | | Allegion PLC | | | | | | | | | | $ | 2,300,969 | |
| | 88,587 | | | Masco Corporation | | | | | | | | | | | 3,384,909 | |
| | | | Total Building Products | | | | | | | | | | | 5,685,878 | |
| | | | |
| | | | Capital Markets – 2.3% | | | | | | | | | |
| | | | |
| | 153,441 | | | Charles Schwab Corporation | | | | | | | | | | | 6,591,825 | |
| | 31,680 | | | CME Group, Inc. | | | | | | | | | | | 3,967,603 | |
| | 3,613 | | | Donnelley Financial Solutions, Inc., (3) | | | | | | | | | | | 82,954 | |
| | 28,291 | | | Eaton Vance Corporation | | | | | | | | | | | 1,338,730 | |
| | 33,938 | | | Goldman Sachs Group, Inc. | | | | | | | | | | | 7,530,842 | |
| | 73,621 | | | Intercontinental Exchange, Inc. | | | | | | | | | | | 4,853,096 | |
| | 45,643 | | | Legg Mason, Inc. | | | | | | | | | | | 1,741,737 | |
| | 140,827 | | | Morgan Stanley | | | | | | | | | | | 6,275,251 | |
| | 26,522 | | | Waddell & Reed Financial, Inc., Class A | | | | | | | | | | | 500,735 | |
| | | | Total Capital Markets | | | | | | | | | | | 32,882,773 | |
| | | | |
| | | | Chemicals – 1.9% | | | | | | | | | |
| | | | |
| | 4,418 | | | AdvanSix, Inc., (3) | | | | | | | | | | | 138,018 | |
| | 8,444 | | | Chemours Company | | | | | | | | | | | 320,196 | |
| | 125,443 | | | Dow Chemical Company | | | | | | | | | | | 7,911,690 | |
| | 74,838 | | | E.I. Du Pont de Nemours and Company | | | | | | | | | | | 6,040,175 | |
| | 32,774 | | | Eastman Chemical Company | | | | | | | | | | | 2,752,688 | |
| | 48,505 | | | Monsanto Company | | | | | | | | | | | 5,741,052 | |
| | 25,424 | | | Olin Corporation | | | | | | | | | | | 769,839 | |
| | 80,712 | | | RPM International, Inc. | | | | | | | | | | | 4,402,840 | |
| | | | Total Chemicals | | | | | | | | | | | 28,076,498 | |
| | | | |
| | | | Commercial Services & Supplies – 0.4% | | | | | | | | | |
| | | | |
| | 14,145 | | | Deluxe Corporation | | | | | | | | | | | 979,117 | |
| | 3,613 | | | LSC Communications, Inc. | | | | | | | | | | | 77,318 | |
| | 26,475 | | | Pitney Bowes Inc. | | | | | | | | | | | 399,772 | |
| | 21,852 | | | R.R. Donnelley & Sons Company | | | | | | | | | | | 274,024 | |
| | 56,182 | | | Waste Management, Inc. | | | | | | | | | | | 4,120,950 | |
| | | | Total Commercial Services & Supplies | | | | | | | | | | | 5,851,181 | |
| | | | |
| | | | Communications Equipment – 1.1% | | | | | | | | | |
| | | | |
| | 4,101 | | | ADTRAN, Inc. | | | | | | | | | | | 84,686 | |
| | 24,808 | | | Ciena Corporation, (3) | | | | | | | | | | | 620,696 | |
| | 386,220 | | | Cisco Systems, Inc. | | | | | | | | | | | 12,088,686 | |
| | 5,462 | | | Lumentum Holdings Inc., (3) | | | | | | | | | | | 311,607 | |
| | 27,205 | | | Motorola Solutions Inc. | | | | | | | | | | | 2,359,762 | |
| | 27,916 | | | Viavi Solutions Inc., (3) | | | | | | | | | | | 293,955 | |
| | | | Total Communications Equipment | | | | | | | | | | | 15,759,392 | |
| | | | |
| | | | Consumer Finance – 0.9% | | | | | | | | | |
| | | | |
| | 81,418 | | | American Express Company | | | | | | | | | | | 6,858,652 | |
| | 61,037 | | | Discover Financial Services | | | | | | | | | | | 3,795,891 | |
| | 35,850 | | | Navient Corporation | | | | | | | | | | | 596,903 | |
| | 93,115 | | | SLM Corporation, (3) | | | | | | | | | | | 1,070,823 | |
| | | | Total Consumer Finance | | | | | | | | | | | 12,322,269 | |
| | | | |
| | | | Containers & Packaging – 0.3% | | | | | | | | | |
| | | | |
| | 20,788 | | | Avery Dennison Corporation | | | | | | | | | | | 1,837,036 | |
| | 21,019 | | | Packaging Corp. of America | | | | | | | | | | | 2,341,306 | |
| | 5,718 | | | Sonoco Products Company | | | | | | | | | | | 294,020 | |
| | | | Total Containers & Packaging | | | | | | | | | | | 4,472,362 | |
| | | | | | | | | | | | | | | | |
| Shares | | | Description (1) | | | | | | | | Value | |
| | | | |
| | | | Distributors – 0.1% | | | | | | | | | |
| | | | |
| | 23,190 | | | Genuine Parts Company | | | | | | | | | | $ | 2,151,104 | |
| | | | |
| | | | Diversified Financial Services – 2.1% | | | | | | | | | |
| | | | |
| | 166,579 | | | Berkshire Hathaway Inc., Class B, (3) | | | | | | | | | | | 28,213,485 | |
| | 53,398 | | | Leucadia National Corporation | | | | | | | | | | | 1,396,892 | |
| | | | Total Diversified Financial Services | | | | | | | | | | | 29,610,377 | |
| | | | |
| | | | Diversified Telecommunication Services – 2.1% | | | | | | | | | |
| | | | |
| | 422,493 | | | AT&T Inc. | | | | | | | | | | | 15,940,661 | |
| | 41,144 | | | CenturyLink Inc. | | | | | | | | | | | 982,519 | |
| | 261,993 | | | Frontier Communications Corporation | | | | | | | | | | | 303,912 | |
| | 290,257 | | | Verizon Communications Inc. | | | | | | | | | | | 12,962,878 | |
| | 3,033 | | | Windstream Holdings Inc. | | | | | | | | | | | 11,768 | |
| | | | Total Diversified Telecommunication Services | | | | | | | | | | | 30,201,738 | |
| | | | |
| | | | Electric Utilities – 1.6% | | | | | | | | | |
| | | | |
| | 76,701 | | | Duke Energy Corporation | | | | | | | | | | | 6,411,437 | |
| | 98,619 | | | Great Plains Energy Incorporated | | | | | | | | | | | 2,887,564 | |
| | 66,117 | | | OGE Energy Corporation | | | | | | | | | | | 2,300,210 | |
| | 76,389 | | | Pinnacle West Capital Corporation | | | | | | | | | | | 6,505,287 | |
| | 116,253 | | | Southern Company | | | | | | | | | | | 5,566,194 | |
| | | | Total Electric Utilities | | | | | | | | | | | 23,670,692 | |
| | | | |
| | | | Electrical Equipment – 0.9% | | | | | | | | | |
| | | | |
| | 43,382 | | | Eaton Corporation PLC | | | | | | | | | | | 3,376,421 | |
| | 71,526 | | | Emerson Electric Company | | | | | | | | | | | 4,264,380 | |
| | 11,240 | | | Hubbell Inc. | | | | | | | | | | | 1,272,031 | |
| | 25,015 | | | Rockwell Automation, Inc. | | | | | | | | | | | 4,051,429 | |
| | | | Total Electrical Equipment | | | | | | | | | | | 12,964,261 | |
| | | | |
| | | | Electronic Equipment, Instruments & Components – 0.3% | | | | | | | | | |
| | | | |
| | 134,315 | | | Corning Incorporated | | | | | | | | | | | 4,036,166 | |
| | | | |
| | | | Energy Equipment & Services – 1.1% | | | | | | | | | |
| | | | |
| | 32,409 | | | Diamond Offshore Drilling, Inc., (3) | | | | | | | | | | | 350,989 | |
| | 131,642 | | | Halliburton Company | | | | | | | | | | | 5,622,430 | |
| | 67,650 | | | Patterson-UTI Energy, Inc. | | | | | | | | | | | 1,365,853 | |
| | 126,589 | | | Schlumberger Limited | | | | | | | | | | | 8,334,620 | |
| | | | Total Energy Equipment & Services | | | | | | | | | | | 15,673,892 | |
| | | | |
| | | | Equity Real Estate Investment Trusts – 2.4% | | | | | | | | | |
| | | | |
| | 84,230 | | | Apartment Investment & Management Company, Class A | | | | | | | | | | | 3,619,363 | |
| | 109,496 | | | Brandywine Realty Trust | | | | | | | | | | | 1,919,465 | |
| | 10,613 | | | Care Capital Properties, Inc. | | | | | | | | | | | 283,367 | |
| | 34,687 | | | CBL & Associates Properties Inc. | | | | | | | | | | | 292,411 | |
| | 110,050 | | | CubeSmart | | | | | | | | | | | 2,645,602 | |
| | 108,072 | | | DCT Industrial Trust Inc. | | | | | | | | | | | 5,775,368 | |
| | 110,016 | | | Equity Commonwealth, (3) | | | | | | | | | | | 3,476,506 | |
| | 68,970 | | | Healthcare Realty Trust, Inc. | | | | | | | | | | | 2,355,326 | |
| | 111,415 | | | Lexington Realty Trust | | | | | | | | | | | 1,104,123 | |
| | 55,742 | | | Liberty Property Trust | | | | | | | | | | | 2,269,257 | |
| | 26,716 | | | Senior Housing Properties Trust | | | | | | | | | | | 546,075 | |
| | 49,503 | | | Ventas Inc. | | | | | | | | | | | 3,439,468 | |
| | 58,810 | | | Welltower Inc. | | | | | | | | | | | 4,401,929 | |
| | 80,210 | | | Weyerhaeuser Company | | | | | | | | | | | 2,687,035 | |
| | | | Total Equity Real Estate Investment Trusts | | | | | | | | | | | 34,815,295 | |
| | | | |
| BXMX | | Nuveen S&P 500 Buy-Write Income Fund |
| | Portfolio of Investments (continued) | | June 30, 2017 (Unaudited) |
| | | | | | | | | | | | | | | | |
| Shares | | | Description (1) | | | | | | | | Value | |
| | | | |
| | | | Food & Staples Retailing – 1.8% | | | | | | | | | |
| | | | |
| | 104,623 | | | CVS Health Corporation | | | | | | | | | | $ | 8,417,967 | |
| | 138,598 | | | Kroger Co. | | | | | | | | | | | 3,232,105 | |
| | 105,123 | | | SUPERVALU INC., (3) | | | | | | | | | | | 345,855 | |
| | 81,324 | | | Walgreens Boots Alliance Inc. | | | | | | | | | | | 6,368,482 | |
| | 103,755 | | | Wal-Mart Stores, Inc. | | | | | | | | | | | 7,852,178 | |
| | | | Total Food & Staples Retailing | | | | | | | | | | | 26,216,587 | |
| | | | |
| | | | Food Products – 0.6% | | | | | | | | | |
| | | | |
| | 203,608 | | | Mondelez International Inc., Class A | | | | | | | | | | | 8,793,830 | |
| | | | |
| | | | Gas Utilities – 0.3% | | | | | | | | | |
| | | | |
| | 33,764 | | | Atmos Energy Corporation | | | | | | | | | | | 2,800,724 | |
| | 29,951 | | | National Fuel Gas Company | | | | | | | | | | | 1,672,464 | |
| | 2,398 | | | ONE Gas Inc. | | | | | | | | | | | 167,404 | |
| | | | Total Gas Utilities | | | | | | | | | | | 4,640,592 | |
| | | | |
| | | | Health Care Equipment & Supplies – 2.4% | | | | | | | | | |
| | | | |
| | 159,160 | | | Abbott Laboratories | | | | | | | | | | | 7,736,768 | |
| | 47,152 | | | Baxter International, Inc. | | | | | | | | | | | 2,854,582 | |
| | 13,397 | | | Halyard Health Inc., (3) | | | | | | | | | | | 526,234 | |
| | 28,632 | | | Hill-Rom Holdings Inc. | | | | | | | | | | | 2,279,394 | |
| | 67,993 | | | Hologic Inc., (3) | | | | | | | | | | | 3,085,522 | |
| | 5,117 | | | Intuitive Surgical, Inc., (3) | | | | | | | | | | | 4,786,288 | |
| | 148,378 | | | Medtronic, PLC | | | | | | | | | | | 13,168,548 | |
| | | | Total Health Care Equipment & Supplies | | | | | | | | | | | 34,437,336 | |
| | | | |
| | | | Health Care Providers & Services – 3.0% | | | | | | | | | |
| | | | |
| | 46,319 | | | Aetna Inc. | | | | | | | | | | | 7,032,614 | |
| | 30,249 | | | Anthem Inc. | | | | | | | | | | | 5,690,744 | |
| | 69,194 | | | Brookdale Senior Living Inc., (3) | | | | | | | | | | | 1,017,844 | |
| | 77,789 | | | Express Scripts Holding Company, (3) | | | | | | | | | | | 4,966,050 | |
| | 45,526 | | | HCA Holdings Inc., (3) | | | | | | | | | | | 3,969,867 | |
| | 27,123 | | | Henry Schein Inc., (3) | | | | | | | | | | | 4,964,051 | |
| | 15,942 | | | Kindred Healthcare Inc. | | | | | | | | | | | 185,724 | |
| | 82,065 | | | UnitedHealth Group Incorporated | | | | | | | | | | | 15,216,492 | |
| | | | Total Health Care Providers & Services | | | | | | | | | | | 43,043,386 | |
| | | | |
| | | | Health Care Technology – 0.2% | | | | | | | | | |
| | | | |
| | 47,111 | | | Cerner Corporation, (3) | | | | | | | | | | | 3,131,468 | |
| | | | |
| | | | Hotels, Restaurants & Leisure – 1.7% | | | | | | | | | |
| | | | |
| | 54,924 | | | Carnival Corporation | | | | | | | | | | | 3,601,367 | |
| | 34,368 | | | ILG, Inc. | | | | | | | | | | | 944,776 | |
| | 3,590 | | | Las Vegas Sands Corp. | | | | | | | | | | | 229,365 | |
| | 40,887 | | | Marriott International, Inc., Class A | | | | | | | | | | | 4,101,375 | |
| | 90,446 | | | McDonald’s Corporation | | | | | | | | | | | 13,852,709 | |
| | 10,623 | | | Wynn Resorts Ltd | | | | | | | | | | | 1,424,757 | |
| | | | Total Hotels, Restaurants & Leisure | | | | | | | | | | | 24,154,349 | |
| | | | |
| | | | Household Durables – 0.7% | | | | | | | | | |
| | | | |
| | 13,039 | | | Garmin Limited | | | | | | | | | | | 665,380 | |
| | 75,087 | | | KB Home | | | | | | | | | | | 1,799,835 | |
| | 62,853 | | | Newell Brands Inc. | | | | | | | | | | | 3,370,178 | |
| | 16,680 | | | TopBuild Corporation, (3) | | | | | | | | | | | 885,208 | |
| | 1,285 | | | Tupperware Brands Corporation | | | | | | | | | | | 90,246 | |
| | 13,756 | | | Whirlpool Corporation | | | | | | | | | | | 2,635,925 | |
| | | | Total Household Durables | | | | | | | | | | | 9,446,772 | |
| | | | | | | | | | | | | | | | |
| Shares | | | Description (1) | | | | | | | | Value | |
| | | | |
| | | | Household Products – 1.6% | | | | | | | | | |
| | | | |
| | 101,528 | | | Colgate-Palmolive Company | | | | | | | | | | $ | 7,526,271 | |
| | 184,511 | | | Procter & Gamble Company | | | | | | | | | | | 16,080,134 | |
| | | | Total Household Products | | | | | | | | | | | 23,606,405 | |
| | | | |
| | | | Industrial Conglomerates – 2.8% | | | | | | | | | |
| | | | |
| | 53,106 | | | 3M Co. | | | | | | | | | | | 11,056,138 | |
| | 610,296 | | | General Electric Company | | | | | | | | | | | 16,484,095 | |
| | 74,527 | | | Honeywell International Inc. | | | | | | | | | | | 9,933,704 | |
| | 10,808 | | | Roper Technologies, Inc. | | | | | | | | | | | 2,502,376 | |
| | | | Total Industrial Conglomerates | | | | | | | | | | | 39,976,313 | |
| | | | |
| | | | Insurance – 2.6% | | | | | | | | | |
| | | | |
| | 68,887 | | | Allstate Corporation | | | | | | | | | | | 6,092,366 | |
| | 101,177 | | | American International Group, Inc. | | | | | | | | | | | 6,325,586 | |
| | 41,209 | | | Arthur J. Gallagher & Co. | | | | | | | | | | | 2,359,215 | |
| | 40,755 | | | CNO Financial Group Inc. | | | | | | | | | | | 850,964 | |
| | 29,385 | | | FNF Group | | | | | | | | | | | 1,317,330 | |
| | 65,958 | | | Genworth Financial Inc., Class A, (3) | | | | | | | | | | | 248,662 | |
| | 74,204 | | | Hartford Financial Services Group, Inc. | | | | | | | | | | | 3,900,904 | |
| | 2,764 | | | Kemper Corporation | | | | | | | | | | | 106,690 | |
| | 59,222 | | | Lincoln National Corporation | | | | | | | | | | | 4,002,223 | |
| | 92,040 | | | Marsh & McLennan Companies, Inc. | | | | | | | | | | | 7,175,438 | |
| | 43,987 | | | Travelers Companies, Inc. | | | | | | | | | | | 5,565,675 | |
| | | | Total Insurance | | | | | | | | | | | 37,945,053 | |
| | | | |
| | | | Internet and Direct Marketing Retail – 2.9% | | | | | | | | | |
| | | | |
| | 29,593 | | | Amazon.com, Inc., (3) | | | | | | | | | | | 28,646,024 | |
| | 5,279 | | | HSN, Inc. | | | | | | | | | | | 168,400 | |
| | 35,153 | | | Netflix.com Inc., (3) | | | | | | | | | | | 5,252,210 | |
| | 4,199 | | | Priceline Group Inc. (The), (3) | | | | | | | | | | | 7,854,313 | |
| | | | Total Internet and Direct Marketing Retail | | | | | | | | | | | 41,920,947 | |
| | | | |
| | | | Internet Software & Services – 5.5% | | | | | | | | | |
| | | | |
| | 32,153 | | | Akamai Technologies, Inc., (3) | | | | | | | | | | | 1,601,541 | |
| | 28,546 | | | Alphabet Inc., Class A, (3) | | | | | | | | | | | 26,538,645 | |
| | 17,807 | | | Alphabet Inc., Class C, (3) | | | | | | | | | | | 16,181,755 | |
| | 103,770 | | | eBay Inc., (3) | | | | | | | | | | | 3,623,648 | |
| | 188,920 | | | Facebook Inc., Class A, (3) | | | | | | | | | | | 28,523,142 | |
| | 7,034 | | | IAC/InterActiveCorp, (3) | | | | | | | | | | | 726,190 | |
| | 29,336 | | | VeriSign, Inc., (3) | | | | | | | | | | | 2,727,075 | |
| | | | Total Internet Software & Services | | | | | | | | | | | 79,921,996 | |
| | | | |
| | | | IT Services – 3.1% | | | | | | | | | |
| | | | |
| | 8,906 | | | Alliance Data Systems Corporation | | | | | | | | | | | 2,286,081 | |
| | 53,324 | | | Automatic Data Processing, Inc. | | | | | | | | | | | 5,463,577 | |
| | 22,729 | | | DXC Technology Company | | | | | | | | | | | 1,743,769 | |
| | 53,917 | | | Fidelity National Information Services, Inc. | | | | | | | | | | | 4,604,512 | |
| | 58,645 | | | International Business Machines Corporation | | | | | | | | | | | 9,021,360 | |
| | 104,028 | | | PayPal Holdings, Inc., (3) | | | | | | | | | | | 5,583,183 | |
| | 171,913 | | | Visa Inc., Class A | | | | | | | | | | | 16,122,001 | |
| | | | Total IT Services | | | | | | | | | | | 44,824,483 | |
| | | | |
| | | | Leisure Products – 0.2% | | | | | | | | | |
| | | | |
| | 50,711 | | | Mattel, Inc. | | | | | | | | | | | 1,091,808 | |
| | 15,646 | | | Polaris Industries Inc. | | | | | | | | | | | 1,443,031 | |
| | | | Total Leisure Products | | | | | | | | | | | 2,534,839 | |
| | | | |
| BXMX | | Nuveen S&P 500 Buy-Write Income Fund |
| | Portfolio of Investments (continued) | | June 30, 2017 (Unaudited) |
| | | | | | | | | | | | | | | | |
| Shares | | | Description (1) | | | | | | | | Value | |
| | | | |
| | | | Machinery – 2.1% | | | | | | | | | |
| | | | |
| | 59,877 | | | Caterpillar Inc. | | | | | | | | | | $ | 6,434,382 | |
| | 25,476 | | | Cummins Inc. | | | | | | | | | | | 4,132,717 | |
| | 27,031 | | | Deere & Company | | | | | | | | | | | 3,340,761 | |
| | 16,343 | | | Graco Inc. | | | | | | | | | | | 1,785,963 | |
| | 31,693 | | | Hillenbrand Inc. | | | | | | | | | | | 1,144,117 | |
| | 36,751 | | | Ingersoll-Rand PLC | | | | | | | | | | | 3,358,674 | |
| | 16,893 | | | Parker Hannifin Corporation | | | | | | | | | | | 2,699,839 | |
| | 10,877 | | | Snap-on Incorporated | | | | | | | | | | | 1,718,566 | |
| | 34,008 | | | Stanley Black & Decker Inc. | | | | | | | | | | | 4,785,946 | |
| | 16,863 | | | Timken Company | | | | | | | | | | | 779,914 | |
| | | | Total Machinery | | | | | | | | | | | 30,180,879 | |
| | | | |
| | | | Media – 2.9% | | | | | | | | | |
| | | | |
| | 51,987 | | | CBS Corporation, Class B | | | | | | | | | | | 3,315,731 | |
| | 384,642 | | | Comcast Corporation, Class A | | | | | | | | | | | 14,970,267 | |
| | 32,173 | | | DISH Network Corporation, Class A, (3) | | | | | | | | | | | 2,019,177 | |
| | 73,819 | | | New York Times Company (The), Class A | | | | | | | | | | | 1,306,596 | |
| | 124,653 | | | News Corporation, Class A | | | | | | | | | | | 1,707,746 | |
| | 46,679 | | | Omnicom Group, Inc. | | | | | | | | | | | 3,869,689 | |
| | 31,371 | | | Regal Entertainment Group, Class A | | | | | | | | | | | 641,851 | |
| | 135,561 | | | Walt Disney Company | | | | | | | | | | | 14,403,356 | |
| | | | Total Media | | | | | | | | | | | 42,234,413 | |
| | | | |
| | | | Metals & Mining – 0.3% | | | | | | | | | |
| | | | |
| | 16,757 | | | Alcoa Corporation | | | | | | | | | | | 547,116 | |
| | 20,083 | | | Barrick Gold Corporation | | | | | | | | | | | 319,521 | |
| | 53,920 | | | Newmont Mining Corporation | | | | | | | | | | | 1,746,469 | |
| | 27,776 | | | Nucor Corporation | | | | | | | | | | | 1,607,397 | |
| | 9,542 | | | Southern Copper Corporation | | | | | | | | | | | 330,439 | |
| | | | Total Metals & Mining | | | | | | | | | | | 4,550,942 | |
| | | | |
| | | | Mortgage Real Estate Investment Trusts – 0.0% | | | | | | | | | |
| | | | |
| | 10,398 | | | Annaly Capital Management Inc. | | | | | | | | | | | 125,296 | |
| | | | |
| | | | Multiline Retail – 0.5% | | | | | | | | | |
| | | | |
| | 29,494 | | | Dollar Tree Inc., (3) | | | | | | | | | | | 2,062,220 | |
| | 35,478 | | | Macy’s, Inc. | | | | | | | | | | | 824,509 | |
| | 30,449 | | | Nordstrom, Inc. | | | | | | | | | | | 1,456,376 | |
| | 23,907 | | | Sears Holding Corporation, (3) | | | | | | | | | | | 211,816 | |
| | 52,729 | | | Target Corporation | | | | | | | | | | | 2,757,199 | |
| | | | Total Multiline Retail | | | | | | | | | | | 7,312,120 | |
| | | | |
| | | | Multi-Utilities – 1.4% | | | | | | | | | |
| | | | |
| | 54,853 | | | Ameren Corporation | | | | | | | | | | | 2,998,814 | |
| | 57,390 | | | Consolidated Edison, Inc. | | | | | | | | | | | 4,638,260 | |
| | 18,999 | | | NorthWestern Corporation | | | | | | | | | | | 1,159,319 | |
| | 126,000 | | | Public Service Enterprise Group Incorporated | | | | | | | | | | | 5,419,260 | |
| | 93,975 | | | WEC Energy Group, Inc. | | | | | | | | | | | 5,768,186 | |
| | | | Total Multi-Utilities | | | | | | | | | | | 19,983,839 | |
| | | | |
| | | | Oil, Gas & Consumable Fuels – 4.8% | | | | | | | | | |
| | | | |
| | 74,927 | | | Cenovus Energy Inc. | | | | | | | | | | | 552,212 | |
| | 142,026 | | | Chevron Corporation | | | | | | | | | | | 14,817,573 | |
| | 160,165 | | | ConocoPhillips | | | | | | | | | | | 7,040,853 | |
| | 28,455 | | | CONSOL Energy Inc., (3) | | | | | | | | | | | 425,118 | |
| | 48,000 | | | Continental Resources Inc., (3) | | | | | | | | | | | 1,551,840 | |
| | 136,678 | | | Encana Corporation | | | | | | | | | | | 1,202,766 | |
| | 303,531 | | | Exxon Mobil Corporation | | | | | | | | | | | 24,504,058 | |
| | 77,129 | | | Hess Corporation | | | | | | | | | | | 3,383,649 | |
| | | | | | | | | | | | | | | | |
| Shares | | | Description (1) | | | | | | | | Value | |
| | | | |
| | | | Oil, Gas & Consumable Fuels (continued) | | | | | | | | | |
| | | | |
| | 96,063 | | | Occidental Petroleum Corporation | | | | | | | | | | $ | 5,751,292 | |
| | 25,543 | | | ONEOK, Inc. | | | | | | | | | | | 1,332,323 | |
| | 2,376 | | | PetroChina Company Limited, ADR | | | | | | | | | | | 145,601 | |
| | 62,743 | | | Phillips 66 | | | | | | | | | | | 5,188,219 | |
| | 17,453 | | | Suncor Energy, Inc. | | | | | | | | | | | 509,628 | |
| | 42,524 | | | Valero Energy Corporation | | | | | | | | | | | 2,868,669 | |
| | | | Total Oil, Gas & Consumable Fuels | | | | | | | | | | | 69,273,801 | |
| | | | |
| | | | Pharmaceuticals – 5.3% | | | | | | | | | |
| | | | |
| | 29,566 | | | Allergan PLC | | | | | | | | | | | 7,187,199 | |
| | 128,075 | | | Bristol-Myers Squibb Company | | | | | | | | | | | 7,136,339 | |
| | 83,783 | | | Eli Lilly and Company | | | | | | | | | | | 6,895,341 | |
| | 201,132 | | | Johnson & Johnson | | | | | | | | | | | 26,607,752 | |
| | 207,746 | | | Merck & Company Inc. | | | | | | | | | | | 13,314,441 | |
| | 450,551 | | | Pfizer Inc. | | | | | | | | | | | 15,134,008 | |
| | | | Total Pharmaceuticals | | | | | | | | | | | 76,275,080 | |
| | | | |
| | | | Professional Services – 0.1% | | | | | | | | | |
| | | | |
| | 16,524 | | | ManpowerGroup Inc. | | | | | | | | | | | 1,844,905 | |
| | | | |
| | | | Road & Rail – 0.5% | | | | | | | | | |
| | | | |
| | 58,324 | | | Norfolk Southern Corporation | | | | | | | | | | | 7,098,031 | |
| | | | |
| | | | Semiconductors & Semiconductor Equipment – 3.4% | | | | | | | | | |
| | | | |
| | 73,163 | | | Analog Devices, Inc. | | | | | | | | | | | 5,692,081 | |
| | 36,381 | | | Broadcom Limited | | | | | | | | | | | 8,478,592 | |
| | 373,690 | | | Intel Corporation | | | | | | | | | | | 12,608,301 | |
| | 31,154 | | | Lam Research Corporation | | | | | | | | | | | 4,406,110 | |
| | 50,716 | | | Microchip Technology Incorporated | | | | | | | | | | | 3,914,261 | |
| | 50,086 | | | NVIDIA Corporation | | | | | | | | | | | 7,240,432 | |
| | 113,968 | | | QUALCOMM, Inc. | | | | | | | | | | | 6,293,313 | |
| | | | Total Semiconductors & Semiconductor Equipment | | | | | | | | | | | 48,633,090 | |
| | | | |
| | | | Software – 5.3% | | | | | | | | | |
| | | | |
| | 78,973 | | | Activision Blizzard Inc. | | | | | | | | | | | 4,546,476 | |
| | 61,623 | | | Adobe Systems Incorporated, (3) | | | | | | | | | | | 8,715,957 | |
| | 28,560 | | | Autodesk, Inc., (3) | | | | | | | | | | | 2,879,419 | |
| | 24,616 | | | CDK Global Inc. | | | | | | | | | | | 1,527,669 | |
| | 6,526 | | | Dell Technologies Incorporated, Class V, (3) | | | | | | | | | | | 398,804 | |
| | 562,484 | | | Microsoft Corporation | | | | | | | | | | | 38,772,022 | |
| | 251,120 | | | Oracle Corporation | | | | | | | | | | | 12,591,157 | |
| | 78,950 | | | Salesforce.com, Inc., (3) | | | | | | | | | | | 6,837,070 | |
| | | | Total Software | | | | | | | | | | | 76,268,574 | |
| | | | |
| | | | Specialty Retail – 2.6% | | | | | | | | | |
| | | | |
| | 5,637 | | | Abercrombie & Fitch Co., Class A | | | | | | | | | | | 70,124 | |
| | 32,842 | | | American Eagle Outfitters, Inc. | | | | | | | | | | | 395,746 | |
| | 37,023 | | | Best Buy Co., Inc. | | | | | | | | | | | 2,122,529 | |
| | 38,320 | | | CarMax, Inc., (3) | | | | | | | | | | | 2,416,459 | |
| | 41,959 | | | Gap, Inc. | | | | | | | | | | | 922,678 | |
| | 99,016 | | | Home Depot, Inc. | | | | | | | | | | | 15,189,054 | |
| | 29,789 | | | L Brands Inc. | | | | | | | | | | | 1,605,329 | |
| | 89,576 | | | Lowe’s Companies, Inc. | | | | | | | | | | | 6,944,827 | |
| | 32,953 | | | Ross Stores, Inc. | | | | | | | | | | | 1,902,377 | |
| | 21,051 | | | Tiffany & Co. | | | | | | | | | | | 1,976,057 | |
| | 52,140 | | | TJX Companies, Inc. | | | | | | | | | | | 3,762,944 | |
| | | | Total Specialty Retail | | | | | | | | | | | 37,308,124 | |
| | | | |
| BXMX | | Nuveen S&P 500 Buy-Write Income Fund |
| | Portfolio of Investments (continued) | | June 30, 2017 (Unaudited) |
| | | | | | | | | | | | | | | | |
| Shares | | | Description (1) | | | | | | | | Value | |
| | | | |
| | | | Technology Hardware, Storage & Peripherals – 4.2% | | | | | | | | | |
| | | | |
| | 372,504 | | | Apple, Inc. | | | | | | | | | | $ | 53,648,026 | |
| | 118,686 | | | Hewlett Packard Enterprise Company | | | | | | | | | | | 1,969,001 | |
| | 152,670 | | | HP Inc. | | | | | | | | | | | 2,668,672 | |
| | 47,725 | | | NetApp, Inc. | | | | | | | | | | | 1,911,386 | |
| | | | Total Technology Hardware, Storage & Peripherals | | | | | | | | | | | 60,197,085 | |
| | | | |
| | | | Textiles, Apparel & Luxury Goods – 0.3% | | | | | | | | | |
| | | | |
| | 87,301 | | | VF Corporation | | | | | | | | | | | 5,028,538 | |
| | | | |
| | | | Thrifts & Mortgage Finance – 0.1% | | | | | | | | | |
| | | | |
| | 116,659 | | | MGIC Investment Corporation, (3) | | | | | | | | | | | 1,306,581 | |
| | | | |
| | | | Tobacco – 2.1% | | | | | | | | | |
| | | | |
| | 159,153 | | | Altria Group, Inc. | | | | | | | | | | | 11,852,124 | |
| | 110,843 | | | Philip Morris International, Inc. | | | | | | | | | | | 13,018,510 | |
| | 65,880 | | | Reynolds American Inc. | | | | | | | | | | | 4,284,835 | |
| | 21,260 | | | Vector Group Ltd. | | | | | | | | | | | 453,263 | |
| | | | Total Tobacco | | | | | | | | | | | 29,608,732 | |
| | | | |
| | | | Wireless Telecommunication Services – 0.0% | | | | | | | | | |
| | | | |
| | 21,183 | | | Sprint Corporation, (3) | | | | | | | | | | | 173,912 | |
| | | | Total Long-Term Investments (cost $813,907,114) | | | | | | | | | | | 1,436,953,719 | |
| | | | |
Principal
Amount (000) | | | Description (1) | | Coupon | | | Maturity | | | Value | |
| | | | |
| | | | SHORT-TERM INVESTMENTS – 3.1% | | | | | | | | | |
| | | | |
| | | | REPURCHASES AGREEMENTS – 3.1% | | | | | | | | | |
| | | | |
| $ | 44,606 | | | Repurchase Agreement with Fixed Income Clearing Corporation, dated 6/30/17, repurchase price $44,606,595, collateralized by $44,280,000 U.S. Treasury Notes, 0.375%, due 7/15/25, value $45,502,704 | | | 0.120% | | | | 7/03/17 | | | $ | 44,606,149 | |
| | | | Total Short-Term Investments (cost $44,606,149) | | | | | | | | | | | 44,606,149 | |
| | | | Total Investments (cost $858,513,263) – 102.7% | | | | | | | | | | | 1,481,559,868 | |
| | | | Other Assets Less Liabilities – (2.7)% (4) | | | | | | | | | | | (39,378,142 | ) |
| | | | Net Assets – 100% | | | | | | | | | | $ | 1,442,181,726 | |
Investments in Derivatives as of June 30, 2017
Call Options Written
| | | | | | | | | | | | | | | | | | | | |
Number of
Contracts | | | Description (5) | | Notional
Amount (6) | | | Expiration
Date | | | Strike
Price | | | Value | |
| | (642 | ) | | S&P 500® Index | | $ | (157,290,000 | ) | | | 7/14/17 | | | $ | 2,450 | | | $ | (250,380 | ) |
| | (615 | ) | | S&P 500® Index | | | (146,985,000 | ) | | | 7/21/17 | | | | 2,390 | | | | (2,736,750 | ) |
| | (683 | ) | | S&P 500® Index | | | (163,920,000 | ) | | | 7/21/17 | | | | 2,400 | | | | (2,499,780 | ) |
| | (660 | ) | | S&P 500® Index | | | (160,050,000 | ) | | | 7/21/17 | | | | 2,425 | | | | (1,263,900 | ) |
| | (686 | ) | | S&P 500® Index | | | (167,384,000 | ) | | | 7/28/17 | | | | 2,440 | | | | (977,550 | ) |
| | (645 | ) | | S&P 500® Index | | | (153,187,500 | ) | | | 8/18/17 | | | | 2,375 | | | | (4,282,800 | ) |
| | (663 | ) | | S&P 500® Index | | | (160,777,500 | ) | | | 8/18/17 | | | | 2,425 | | | | (2,005,575 | ) |
| | (617 | ) | | S&P 500® Index | | | (151,165,000 | ) | | | 8/18/17 | | | | 2,450 | | | | (1,024,220 | ) |
| | (666 | ) | | S&P 500® Index | | | (163,170,000 | ) | | | 9/15/17 | | | | 2,450 | | | | (1,781,550 | ) |
| | (5,877 | ) | | Total Call Options Written (premiums received $20,518,517) | | $ | (1,423,929,000 | ) | | | | | | | | | | $ | (16,822,505 | ) |
For Fund portfolio compliance purposes, the Fund’s industry classifications refer to any one or more of the industry sub-classifications used by one or more widely recognized market indexes or ratings group indexes, and/or as defined by Fund management. This definition may not apply for purposes of this report, which may combine industry sub-classifications into sectors for reporting ease.
| (1) | All percentages shown in the Portfolio of Investments are based on net assets. |
| (2) | The Fund may designate up to 100% of its common stock investments to cover outstanding options written. |
| (3) | Non-income producing; issuer has not declared a dividend within the past twelve months. |
| (4) | Other assets less liabilities includes the unrealized appreciation (depreciation) of certain over-the-counter (“OTC”) derivatives as presented on the Statement of Assets and Liabilities, when applicable. The unrealized appreciation (depreciation) of OTC cleared and exchange-traded derivatives is recognized as part of the cash collateral at brokers and/or the receivable or payable for variation margin as presented on the Statement of Assets and Liabilities, when applicable. Other assets less liabilities also includes the value of options as presented on the Statement of Assets and Liabilities. |
| (5) | Exchange-traded, unless otherwise noted. |
| (6) | For disclosure purposes, Notional Amount is calculated by multiplying the Number of Contracts by the Strike Price by 100. |
| ADR | American Depositary Receipt |
See accompanying notes to financial statements.
DIAX
| | |
Nuveen Dow 30SM Dynamic Overwrite Fund | | |
Portfolio of Investments | | June 30, 2017 (Unaudited) |
| | | | | | | | | | | | | | | | | | | | |
| Shares | | | Description (1) | | | | | | | | | | | Value | |
| | | | | |
| | | | LONG-TERM INVESTMENTS – 99.8% | | | | | | | | | | | | | | | | |
| | | | | |
| | | | COMMON STOCKS – 99.8% | | | | | | | | | | | | | | | | |
| | | | | |
| | | | Aerospace & Defense – 10.2% | | | | | | | | | | | | |
| | | | | |
| | 200,000 | | | Boeing Company, (2) | | | | | | | | | | | | | | $ | 39,550,000 | |
| | 200,000 | | | United Technologies Corporation | | | | | | | | | | | | | | | 24,422,000 | |
| | | | Total Aerospace & Defense | | | | | | | | | | | | | | | 63,972,000 | |
| | | | | |
| | | | Banks – 2.9% | | | | | | | | | | | | |
| | | | | |
| | 200,000 | | | JPMorgan Chase & Co. | | | | | | | | | | | | | | | 18,280,000 | |
| | | | | |
| | | | Beverages – 1.5% | | | | | | | | | | | | |
| | | | | |
| | 200,000 | | | Coca-Cola Company | | | | | | | | | | | | | | | 8,970,000 | |
| | | | | |
| | | | Capital Markets – 7.1% | | | | | | | | | | | | |
| | | | | |
| | 200,000 | | | Goldman Sachs Group, Inc. | | | | | | | | | | | | | | | 44,380,000 | |
| | | | | |
| | | | Chemicals – 2.6% | | | | | | | | | | | | |
| | | | | |
| | 200,000 | | | E.I. Du Pont de Nemours and Company | | | | | | | | | | | | | | | 16,142,000 | |
| | | | | |
| | | | Communications Equipment – 1.0% | | | | | | | | | | | | |
| | | | | |
| | 200,000 | | | Cisco Systems, Inc. | | | | | | | | | | | | | | | 6,260,000 | |
| | | | | |
| | | | Consumer Finance – 2.7% | | | | | | | | | | | | |
| | | | | |
| | 200,000 | | | American Express Company, (2) | | | | | | | | | | | | | | | 16,848,000 | |
| | | | | |
| | | | Diversified Telecommunication Services – 1.4% | | | | | | | | | | | | |
| | | | | |
| | 200,000 | | | Verizon Communications Inc., (2) | | | | | | | | | | | | | | | 8,932,000 | |
| | | | | |
| | | | Food & Staples Retailing – 2.4% | | | | | | | | | | | | |
| | | | | |
| | 200,000 | | | Wal-Mart Stores, Inc., (2) | | | | | | | | | | | | | | | 15,136,000 | |
| | | | | |
| | | | Health Care Providers & Services – 5.9% | | | | | | | | | | | | |
| | | | | |
| | 200,000 | | | UnitedHealth Group Incorporated, (2) | | | | | | | | | | | | | | | 37,084,000 | |
| | | | | |
| | | | Hotels, Restaurants & Leisure – 4.9% | | | | | | | | | | | | |
| | | | | |
| | 200,000 | | | McDonald’s Corporation | | | | | | | | | | | | | | | 30,632,000 | |
| | | | | |
| | | | Household Products – 2.8% | | | | | | | | | | | | |
| | | | | |
| | 200,000 | | | Procter & Gamble Company | | | | | | | | | | | | | | | 17,430,000 | |
| | | | | |
| | | | Industrial Conglomerates – 7.5% | | | | | | | | | | | | |
| | | | | |
| | 200,000 | | | 3M Co. | | | | | | | | | | | | | | | 41,638,000 | |
| | 200,000 | | | General Electric Company | | | | | | | | | | | | | | | 5,402,000 | |
| | | | Total Industrial Conglomerates | | | | | | | | | | | | | | | 47,040,000 | |
| | | | | |
| | | | Insurance – 4.1% | | | | | | | | | | | | |
| | | | | |
| | 200,000 | | | Travelers Companies, Inc. | | | | | | | | | | | | | | | 25,306,000 | |
| | | | | |
| | | | IT Services – 7.9% | | | | | | | | | | | | |
| | | | | |
| | 200,000 | | | International Business Machines Corporation, (2) | | | | | | | | | | | | | | | 30,766,000 | |
| | 200,000 | | | Visa Inc., Class A | | | | | | | | | | | | | | | 18,756,000 | |
| | | | Total IT Services | | | | | | | | | | | | | | | 49,522,000 | |
| | | | | |
| | | | Machinery – 3.5% | | | | | | | | | | | | |
| | | | | |
| | 200,000 | | | Caterpillar Inc., (2) | | | | | | | | | | | | | | | 21,492,000 | |
| | | | | | | | | | | | | | | | | | | | |
| Shares | | | Description (1) | | | | | | | | | | | Value | |
| | | | | |
| | | | Media – 3.4% | | | | | | | | | | | | |
| | | | | |
| | 200,000 | | | Walt Disney Company | | | | | | | | | | | | | | $ | 21,250,000 | |
| | | | | |
| | | | Oil, Gas & Consumable Fuels – 5.9% | | | | | | | | | | | | |
| | | | | |
| | 200,000 | | | Chevron Corporation, (2) | | | | | | | | | | | | | | | 20,866,000 | |
| | 200,000 | | | Exxon Mobil Corporation | | | | | | | | | | | | | | | 16,146,000 | |
| | | | Total Oil, Gas & Consumable Fuels | | | | | | | | | | | | | | | 37,012,000 | |
| | | | | |
| | | | Pharmaceuticals – 7.4% | | | | | | | | | | | | |
| | | | | |
| | 200,000 | | | Johnson & Johnson | | | | | | | | | | | | | | | 26,458,000 | |
| | 200,000 | | | Merck & Company Inc. | | | | | | | | | | | | | | | 12,818,000 | |
| | 200,000 | | | Pfizer Inc. | | | | | | | | | | | | | | | 6,718,000 | |
| | | | Total Pharmaceuticals | | | | | | | | | | | | | | | 45,994,000 | |
| | | | | |
| | | | Semiconductors & Semiconductor Equipment – 1.1% | | | | | | | | | | | | |
| | | | | |
| | 200,000 | | | Intel Corporation | | | | | | | | | | | | | | | 6,748,000 | |
| | | | | |
| | | | Software – 2.2% | | | | | | | | | | | | |
| | | | | |
| | 200,000 | | | Microsoft Corporation | | | | | | | | | | | | | | | 13,786,000 | |
| | | | | |
| | | | Specialty Retail – 4.9% | | | | | | | | | | | | |
| | | | | |
| | 200,000 | | | Home Depot, Inc. | | | | | | | | | | | | | | | 30,680,000 | |
| | | | | |
| | | | Technology Hardware, Storage & Peripherals – 4.6% | | | | | | | | | | | | |
| | | | | |
| | 200,000 | | | Apple, Inc., (2) | | | | | | | | | | | | | | | 28,804,000 | |
| | | | | |
| | | | Textiles, Apparel & Luxury Goods – 1.9% | | | | | | | | | | | | |
| | | | | |
| | 200,000 | | | Nike, Inc., Class B | | | | | | | | | | | | | | | 11,800,000 | |
| | | | Total Long-Term Investments (cost $339,691,638) | | | | | | | | | | | | | | | 623,500,000 | |
| | | | | |
Principal
Amount (000) | | | Description (1) | | Coupon | | | Maturity | | | Ratings (3) | | | Value | |
| | | | | |
| | | | SHORT-TERM INVESTMENTS – 1.1% | | | | | | | | | | | | |
| | | | | |
| | | | REPURCHASE AGREEMENTS – 0.3% | | | | | | | | | | | | |
| | | | | |
| $ | 1,886 | | | Repurchase Agreement with Fixed Income Clearing Corporation,
dated 6/30/17, repurchase price $1,886,038,
collateralized by $1,850,000 U.S. Treasury Bonds,
3.000%, due 11/15/44, value $1,924,598 | | | 0.120% | | | | 7/03/17 | | | | N/A | | | $ | 1,886,019 | |
| | | | | |
| | | | U.S. GOVERNMENT AND AGENCY OBLIGATIONS – 0.8% | | | | | | | | | | | | |
| | | | | |
| | 5,000 | | | U.S. Treasury Bills | | | 0.000% | | | | 7/20/17 | | | | AAA | | | | 4,998,115 | |
| | | | Total Short-Term Investments (cost $6,884,396) | | | | | | | | | | | | | | | 6,884,134 | |
| | | | Total Investments (cost $346,576,034) – 100.9% | | | | | | | | | | | | | | | 630,384,134 | |
| | | | Other Assets Less Liabilities – (0.9)% (4) | | | | | | | | | | | | | | | (5,325,792 | ) |
| | | | Net Assets – 100% | | | | | | | | | | | | | | $ | 625,058,342 | |
| | | | |
| DIAX | | Nuveen Dow 30SM Dynamic Overwrite Fund | | |
| | Portfolio of Investments (continued) | | June 30, 2017 (Unaudited) |
Investments in Derivatives as of June 30, 2017
Options Purchased
| | | | | | | | | | | | | | | | | | | | | | |
| Option Type | | Number of
Contracts | | | Description (5) | | Notional
Amount (6) | | | Expiration
Date | | | Strike
Price | | | Value | |
Call | | | 400 | | | United States Oil Fund LP | | $ | 400,000 | | | | 7/21/17 | | | $ | 10 | | | $ | 2,600 | |
Call | | | 200 | | | Verizon Communications Inc. | | | 960,000 | | | | 7/21/17 | | | | 48 | | | | 700 | |
| | | | 600 | | | Total Options Purchased (premiums paid $14,460) | | $ | 1,360,000 | | | | | | | | | | | $ | 3,300 | |
Options Written
| | | | | | | | | | | | | | | | | | | | | | |
| Option Type | | Number of
Contracts | | | Description (5) | | Notional
Amount (6) | | | Expiration
Date | | | Strike
Price | | | Value | |
Call | | | (350 | ) | | S&P 500® Index | | $ | (85,050,000 | ) | | | 7/21/17 | | | $ | 2,430 | | | $ | (563,500 | ) |
Call | | | (1,070 | ) | | S&P 500® Index | | | (259,475,000 | ) | | | 7/21/17 | | | | 2,425 | | | | (2,049,050 | ) |
| | | | (1,420) | | | Total Options Written (premiums received $3,801,409) | | $ | (344,525,000 | ) | | | | | | | | | | $ | (2,612,550 | ) |
For Fund portfolio compliance purposes, the Fund’s industry classifications refer to any one or more of the industry sub-classifications used by one or more widely recognized market indexes or ratings group indexes, and/or as defined by Fund management. This definition may not apply for purposes of this report, which may combine industry sub-classifications into sectors for reporting ease.
| (1) | All percentages shown in the Portfolio of Investments are based on net assets. |
| (2) | Investment, or portion of investment, has been pledged to collateralize the net payment obligations for investments in derivatives. |
| (3) | For financial reporting purposes, the ratings disclosed are the highest of Standard & Poor’s Group (“Standard & Poor’s”), Moody’s Investors Service, Inc. (“Moody’s”) or Fitch, Inc. (“Fitch”) rating. This treatment of split-rated securities may differ from that used for other purposes, such as for Fund investment policies. Ratings below BBB by Standard & Poor’s, Baa by Moody’s or BBB by Fitch are considered to be below investment grade. Holdings designated N/R are not rated by any of these national rating agencies. |
| (4) | Other assets less liabilities includes the unrealized appreciation (depreciation) of certain over-the-counter (“OTC”) derivatives as presented on the Statement of Assets and Liabilities, when applicable. The unrealized appreciation (depreciation) of OTC cleared and exchange-traded derivatives is recognized as part of the cash collateral at brokers and/or the receivable or payable for variation margin as presented on the Statement of Assets and Liabilities, when applicable. Other assets less liabilities also includes the value of options as presented on the Statement of Assets and Liabilities. |
| (5) | Exchange-traded, unless otherwise noted. |
| (6) | For disclosure purposes, Notional Amount is calculated by multiplying the Number of Contracts by the Strike Price by 100. |
See accompanying notes to financial statements.
SPXX
| | |
Nuveen S&P 500 Dynamic Overwrite Fund | | |
Portfolio of Investments | | June 30, 2017 (Unaudited) |
| | | | | | | | | | | | | | | | |
| Shares | | | Description (1) | | | | | | | | Value | |
| | | | |
| | | | LONG-TERM INVESTMENTS – 99.9% | | | | | | | | | | | | |
| | | | |
| | | | COMMON STOCKS – 99.9% | | | | | | | | | | | | |
| | | | |
| | | | Aerospace & Defense – 2.3% | | | | | | | | | |
| | | | |
| | 10,660 | | | Boeing Company | | | | | | | | | | $ | 2,108,015 | |
| | 4,500 | | | Lockheed Martin Corporation | | | | | | | | | | | 1,249,245 | |
| | 6,361 | | | Raytheon Company | | | | | | | | | | | 1,027,174 | |
| | 12,156 | | | United Technologies Corporation, (2) | | | | | | | | | | | 1,484,369 | |
| | | | Total Aerospace & Defense | | | | | | | | | | | 5,868,803 | |
| | | | |
| | | | Air Freight & Logistics – 0.7% | | | | | | | | | |
| | | | |
| | 15,007 | | | United Parcel Service, Inc., Class B | | | | | | | | | | | 1,659,624 | |
| | | | |
| | | | Airlines – 0.4% | | | | | | | | | |
| | | | |
| | 9,015 | | | Alaska Air Group, Inc. | | | | | | | | | | | 809,186 | |
| | 7,400 | | | JetBlue Airways Corporation, (3) | | | | | | | | | | | 168,942 | |
| | | | Total Airlines | | | | | | | | | | | 978,128 | |
| | | | |
| | | | Auto Components – 0.1% | | | | | | | | | |
| | | | |
| | 9,310 | | | Cooper Tire & Rubber Company | | | | | | | | | | | 336,091 | |
| | | | |
| | | | Automobiles – 0.4% | | | | | | | | | |
| | | | |
| | 79,596 | | | Ford Motor Company, (2) | | | | | | | | | | | 890,679 | |
| | 1,396 | | | Tesla Motors Inc. | | | | | | | | | | | 504,808 | |
| | | | Total Automobiles | | | | | | | | | | | 1,395,487 | |
| | | | |
| | | | Banks – 7.6% | | | | | | | | | |
| | | | |
| | 160,000 | | | Bank of America Corporation | | | | | | | | | | | 3,881,600 | |
| | 44,900 | | | Citigroup Inc. | | | | | | | | | | | 3,002,912 | |
| | 12,743 | | | Comerica Incorporated | | | | | | | | | | | 933,297 | |
| | 12,783 | | | Fifth Third Bancorp. | | | | | | | | | | | 331,847 | |
| | 49,105 | | | Huntington BancShares Inc. | | | | | | | | | | | 663,900 | |
| | 53,900 | | | JPMorgan Chase & Co. | | | | | | | | | | | 4,926,460 | |
| | 33,673 | | | Regions Financial Corporation | | | | | | | | | | | 492,973 | |
| | 33,569 | | | U.S. Bancorp | | | | | | | | | | | 1,742,902 | |
| | 58,700 | | | Wells Fargo & Company | | | | | | | | | | | 3,252,567 | |
| | | | Total Banks | | | | | | | | | | | 19,228,458 | |
| | | | |
| | | | Beverages – 2.2% | | | | | | | | | |
| | | | |
| | 58,100 | | | Coca-Cola Company, (2) | | | | | | | | | | | 2,605,785 | |
| | 24,800 | | | PepsiCo, Inc. | | | | | | | | | | | 2,864,152 | |
| | | | Total Beverages | | | | | | | | | | | 5,469,937 | |
| | | | |
| | | | Biotechnology – 3.2% | | | | | | | | | |
| | | | |
| | 20,942 | | | AbbVie Inc. | | | | | | | | | | | 1,518,504 | |
| | 4,000 | | | Alexion Pharmaceuticals Inc. | | | | | | | | | | | 486,680 | |
| | 11,602 | | | Amgen Inc., (2) | | | | | | | | | | | 1,998,212 | |
| | 16,000 | | | Celgene Corporation | | | | | | | | | | | 2,077,920 | |
| | 29,000 | | | Gilead Sciences, Inc., (2) | | | | | | | | | | | 2,052,620 | |
| | | | Total Biotechnology | | | | | | | | | | | 8,133,936 | |
| | | | |
| | | | Capital Markets – 2.7% | | | | | | | | | |
| | | | |
| | 39,000 | | | Charles Schwab Corporation | | | | | | | | | | | 1,675,440 | |
| | 5,681 | | | CME Group, Inc. | | | | | | | | | | | 711,488 | |
| | 16,013 | | | Federated Investors Inc. | | | | | | | | | | | 452,367 | |
| | 7,670 | | | Goldman Sachs Group, Inc. | | | | | | | | | | | 1,701,973 | |
| | 13,620 | | | Intercontinental Exchange, Inc. | | | | | | | | | | | 897,830 | |
| | | | |
| SPXX | | Nuveen S&P 500 Dynamic Overwrite Fund | | |
| | Portfolio of Investments (continued) | | June 30, 2017 (Unaudited) |
| | | | | | | | | | | | | | | | |
| Shares | | | Description (1) | | | | | | | | Value | |
| | | | |
| | | | Capital Markets (continued) | | | | | | | | | |
| | 30,033 | | | Morgan Stanley | | | | | | | | | | $ | 1,338,270 | |
| | | | Total Capital Markets | | | | | | | | | | | 6,777,368 | |
| | | | |
| | | | Chemicals – 2.3% | | | | | | | | | |
| | | | |
| | 17,900 | | | Dow Chemical Company | | | | | | | | | | | 1,128,953 | |
| | 14,703 | | | E.I. Du Pont de Nemours and Company | | | | | | | | | | | 1,186,679 | |
| | 8,790 | | | Eastman Chemical Company | | | | | | | | | | | 738,272 | |
| | 10,340 | | | Monsanto Company | | | | | | | | | | | 1,223,842 | |
| | 11,726 | | | Olin Corporation | | | | | | | | | | | 355,063 | |
| | 10,420 | | | PPG Industries, Inc. | | | | | | | | | | | 1,145,783 | |
| | | | Total Chemicals | | | | | | | | | | | 5,778,592 | |
| | | | |
| | | | Commercial Services & Supplies – 0.3% | | | | | | | | | |
| | | | |
| | 10,103 | | | Deluxe Corporation | | | | | | | | | | | 699,330 | |
| | | | |
| | | | Communications Equipment – 1.2% | | | | | | | | | |
| | | | |
| | 73,500 | | | Cisco Systems, Inc., (2) | | | | | | | | | | | 2,300,550 | |
| | 8,442 | | | Motorola Solutions Inc. | | | | | | | | | | | 732,259 | |
| | | | Total Communications Equipment | | | | | | | | | | | 3,032,809 | |
| | | | |
| | | | Consumer Finance – 0.5% | | | | | | | | | |
| | | | |
| | 15,373 | | | American Express Company | | | | | | | | | | | 1,295,022 | |
| | | | |
| | | | Containers & Packaging – 0.3% | | | | | | | | | |
| | | | |
| | 9,130 | | | Avery Dennison Corporation | | | | | | | | | | | 806,818 | |
| | | | |
| | | | Distributors – 0.0% | | | | | | | | | |
| | | | |
| | 3,543 | | | LKQ Corporation | | | | | | | | | | | 116,742 | |
| | | | |
| | | | Diversified Financial Services – 1.3% | | | | | | | | | |
| | | | |
| | 20,000 | | | Berkshire Hathaway Inc., Class B | | | | | | | | | | | 3,387,400 | |
| | | | |
| | | | Diversified Telecommunication Services – 2.1% | | | | | | | | | |
| | | | |
| | 75,400 | | | AT&T Inc., (2) | | | | | | | | | | | 2,844,842 | |
| | 55,000 | | | Verizon Communications Inc., (2) | | | | | | | | | | | 2,456,300 | |
| | | | Total Diversified Telecommunication Services | | | | | | | | | | | 5,301,142 | |
| | | | |
| | | | Electric Utilities – 0.7% | | | | | | | | | |
| | | | |
| | 20,000 | | | Duke Energy Corporation | | | | | | | | | | | 1,671,800 | |
| | | | |
| | | | Electrical Equipment – 0.9% | | | | | | | | | |
| | | | |
| | 6,600 | | | Eaton Corporation PLC | | | | | | | | | | | 513,678 | |
| | 10,100 | | | Emerson Electric Company | | | | | | | | | | | 602,162 | |
| | 6,854 | | | Rockwell Automation, Inc. | | | | | | | | | | | 1,110,074 | |
| | | | Total Electrical Equipment | | | | | | | | | | | 2,225,914 | |
| | | | |
| | | | Electronic Equipment, Instruments & Components – 0.4% | | | | | | | | | |
| | | | |
| | 35,466 | | | Corning Incorporated | | | | | | | | | | | 1,065,753 | |
| | | | |
| | | | Energy Equipment & Services – 0.5% | | | | | | | | | |
| | | | |
| | 18,006 | | | Schlumberger Limited | | | | | | | | | | | 1,185,515 | |
| | | | |
| | | | Equity Real Estate Investment Trusts – 0.7% | | | | | | | | | |
| | | | |
| | 12,111 | | | Care Capital Properties, Inc. | | | | | | | | | | | 323,364 | |
| | 20,277 | | | Omega Healthcare Investors Inc. | | | | | | | | | | | 669,547 | |
| | 11,600 | | | Ventas Inc. | | | | | | | | | | | 805,968 | |
| | | | Total Equity Real Estate Investment Trusts | | | | | | | | | | | 1,798,879 | |
| | | | | | | | | | | | | | | | |
| Shares | | | Description (1) | | | | | | | | Value | |
| | | | |
| | | | Food & Staples Retailing – 1.9% | | | | | | | | | |
| | | | |
| | 18,974 | | | CVS Health Corporation | | | | | | | | | | $ | 1,526,648 | |
| | 17,716 | | | Walgreens Boots Alliance Inc. | | | | | | | | | | | 1,387,340 | |
| | 23,802 | | | Wal-Mart Stores, Inc. | | | | | | | | | | | 1,801,335 | |
| | | | Total Food & Staples Retailing | | | | | | | | | | | 4,715,323 | |
| | | | |
| | | | Food Products – 0.5% | | | | | | | | | |
| | | | |
| | 13,960 | | | Archer-Daniels-Midland Company | | | | | | | | | | | 577,665 | |
| | 17,628 | | | ConAgra Foods, Inc. | | | | | | | | | | | 630,377 | |
| | | | Total Food Products | | | | | | | | | | | 1,208,042 | |
| | | | |
| | | | Health Care Equipment & Supplies – 1.8% | | | | | | | | | |
| | | | |
| | 27,082 | | | Abbott Laboratories | | | | | | | | | | | 1,316,456 | |
| | 41,253 | | | Boston Scientific Corporation, (3) | | | | | | | | | | | 1,143,533 | |
| | 25,000 | | | Medtronic, PLC | | | | | | | | | | | 2,218,750 | |
| | | | Total Health Care Equipment & Supplies | | | | | | | | | | | 4,678,739 | |
| | | | |
| | | | Health Care Providers & Services – 3.0% | | | | | | | | | |
| | | | |
| | 9,358 | | | Aetna Inc. | | | | | | | | | | | 1,420,825 | |
| | 4,648 | | | Anthem Inc. | | | | | | | | | | | 874,428 | |
| | 2,896 | | | Humana Inc. | | | | | | | | | | | 696,836 | |
| | 7,874 | | | Laboratory Corporation of America Holdings | | | | | | | | | | | 1,213,698 | |
| | 4,815 | | | McKesson HBOC Inc. | | | | | | | | | | | 792,260 | |
| | 13,800 | | | UnitedHealth Group Incorporated | | | | | | | | | | | 2,558,796 | |
| | | | Total Health Care Providers & Services | | | | | | | | | | | 7,556,843 | |
| | | | |
| | | | Hotels, Restaurants & Leisure – 1.9% | | | | | | | | | |
| | | | |
| | 3,678 | | | Dominos Pizza Inc. | | | | | | | | | | | 778,007 | |
| | 15,000 | | | McDonald’s Corporation | | | | | | | | | | | 2,297,400 | |
| | 32,208 | | | Starbucks Corporation | | | | | | | | | | | 1,878,048 | |
| | | | Total Hotels, Restaurants & Leisure | | | | | | | | | | | 4,953,455 | |
| | | | |
| | | | Household Durables – 0.7% | | | | | | | | | |
| | | | |
| | 18,964 | | | Newell Brands Inc. | | | | | | | | | | | 1,016,850 | |
| | 4,241 | | | Whirlpool Corporation | | | | | | | | | | | 812,660 | |
| | | | Total Household Durables | | | | | | | | | | | 1,829,510 | |
| | | | |
| | | | Household Products – 2.1% | | | | | | | | | |
| | | | |
| | 17,234 | | | Colgate-Palmolive Company | | | | | | | | | | | 1,277,556 | |
| | 9,737 | | | Kimberly-Clark Corporation | | | | | | | | | | | 1,257,144 | |
| | 31,000 | | | Procter & Gamble Company | | | | | | | | | | | 2,701,650 | |
| | | | Total Household Products | | | | | | | | | | | 5,236,350 | |
| | | | |
| | | | Industrial Conglomerates – 3.0% | | | | | | | | | |
| | | | |
| | 10,404 | | | 3M Co. | | | | | | | | | | | 2,166,009 | |
| | 135,400 | | | General Electric Company | | | | | | | | | | | 3,657,154 | |
| | 13,978 | | | Honeywell International Inc. | | | | | | | | | | | 1,863,128 | |
| | | | Total Industrial Conglomerates | | | | | | | | | | | 7,686,291 | |
| | | | |
| | | | Insurance – 2.9% | | | | | | | | | |
| | | | |
| | 19,900 | | | American International Group, Inc. | | | | | | | | | | | 1,244,148 | |
| | 15,990 | | | Arthur J. Gallagher & Co. | | | | | | | | | | | 915,428 | |
| | 8,555 | | | FNF Group | | | | | | | | | | | 383,521 | |
| | 17,377 | | | Marsh & McLennan Companies, Inc. | | | | | | | | | | | 1,354,711 | |
| | 15,000 | | | MetLife, Inc. | | | | | | | | | | | 824,100 | |
| | 10,189 | | | Prudential Financial, Inc. | | | | | | | | | | | 1,101,838 | |
| | 1,700 | | | Reinsurance Group of America Inc. | | | | | | | | | | | 218,263 | |
| | 11,000 | | | Travelers Companies, Inc. | | | | | | | | | | | 1,391,830 | |
| | | | Total Insurance | | | | | | | | | | | 7,433,839 | |
| | | | |
| SPXX | | Nuveen S&P 500 Dynamic Overwrite Fund | | |
| | Portfolio of Investments (continued) | | June 30, 2017 (Unaudited) |
| | | | | | | | | | | | | | | | |
| Shares | | | Description (1) | | | | | | | | Value | |
| | | | |
| | | | Internet and Direct Marketing Retail – 3.2% | | | | | | | | | |
| | | | |
| | 5,580 | | | Amazon.com, Inc. | | | | | | | | | | $ | 5,401,440 | |
| | 7,700 | | | Netflix.com Inc. | | | | | | | | | | | 1,150,457 | |
| | 790 | | | Priceline Group Inc. (The), (3) | | | | | | | | | | | 1,477,711 | |
| | | | Total Internet and Direct Marketing Retail | | | | | | | | | | | 8,029,608 | |
| | | | |
| | | | Internet Software & Services – 5.9% | | | | | | | | | |
| | | | |
| | 9,911 | | | Akamai Technologies, Inc. | | | | | | | | | | | 493,667 | |
| | 4,120 | | | Alphabet Inc., Class A | | | | | | | | | | | 3,830,282 | |
| | 4,320 | | | Alphabet Inc., Class C | | | | | | | | | | | 3,925,714 | |
| | 2,708 | | | Cars.com Incorporated, (3) | | | | | | | | | | | 72,114 | |
| | 30,000 | | | eBay Inc. | | | | | | | | | | | 1,047,600 | |
| | 32,400 | | | Facebook Inc., Class A, (2) | | | | | | | | | | | 4,891,752 | |
| | 7,424 | | | VeriSign, Inc. | | | | | | | | | | | 690,135 | |
| | | | Total Internet Software & Services | | | | | | | | | | | 14,951,264 | |
| | | | |
| | | | IT Services – 3.8% | | | | | | | | | |
| | | | |
| | 2,575 | | | DXC Technology Company | | | | | | | | | | | 197,554 | |
| | 12,964 | | | Fidelity National Information Services, Inc. | | | | | | | | | | | 1,107,126 | |
| | 2,000 | | | Henry Jack and Associates Inc. | | | | | | | | | | | 207,740 | |
| | 10,000 | | | International Business Machines Corporation, (2) | | | | | | | | | | | 1,538,300 | |
| | 20,000 | | | MasterCard, Inc. | | | | | | | | | | | 2,429,000 | |
| | 20,000 | | | PayPal Holdings, Inc. | | | | | | | | | | | 1,073,400 | |
| | 33,900 | | | Visa Inc., Class A | | | | | | | | | | | 3,179,142 | |
| | | | Total IT Services | | | | | | | | | | | 9,732,262 | |
| | | | |
| | | | Life Sciences Tools & Services – 0.7% | | | | | | | | | |
| | | | |
| | 1,983 | | | Bio-Techne Corporation | | | | | | | | | | | 233,003 | |
| | 9,377 | | | Thermo Fisher Scientific, Inc. | | | | | | | | | | | 1,636,005 | |
| | | | Total Life Sciences Tools & Services | | | | | | | | | | | 1,869,008 | |
| | | | |
| | | | Machinery – 2.5% | | | | | | | | | |
| | | | |
| | 12,391 | | | Caterpillar Inc. | | | | | | | | | | | 1,331,537 | |
| | 4,049 | | | Cummins Inc. | | | | | | | | | | | 656,829 | |
| | 10,446 | | | Deere & Company | | | | | | | | | | | 1,291,021 | |
| | 9,843 | | | Illinois Tool Works, Inc., (2) | | | | | | | | | | | 1,410,010 | |
| | 9,551 | | | Pentair Limited | | | | | | | | | | | 635,524 | |
| | 3,300 | | | Snap-on Incorporated | | | | | | | | | | | 521,400 | |
| | 3,000 | | | Stanley Black & Decker Inc. | | | | | | | | | | | 422,190 | |
| | | | Total Machinery | | | | | | | | | | | 6,268,511 | |
| | | | |
| | | | Media – 2.8% | | | | | | | | | |
| | | | |
| | 12,544 | | | CBS Corporation, Class B | | | | | | | | | | | 800,056 | |
| | 83,290 | | | Comcast Corporation, Class A, (2) | | | | | | | | | | | 3,241,647 | |
| | 19,635 | | | Regal Entertainment Group, Class A | | | | | | | | | | | 401,732 | |
| | 8,126 | | | TEGNA Inc. | | | | | | | | | | | 117,096 | |
| | 25,000 | | | Walt Disney Company | | | | | | | | | | | 2,656,250 | |
| | | | Total Media | | | | | | | | | | | 7,216,781 | |
| | | | |
| | | | Metals & Mining – 0.2% | | | | | | | | | |
| | | | |
| | 38,558 | | | Freeport-McMoRan, Inc. | | | | | | | | | | | 463,082 | |
| | 3,337 | | | Southern Copper Corporation | | | | | | | | | | | 115,560 | |
| | | | Total Metals & Mining | | | | | | | | | | | 578,642 | |
| | | | |
| | | | Multiline Retail – 0.3% | | | | | | | | | |
| | | | |
| | 14,208 | | | Target Corporation | | | | | | | | | | | 742,936 | |
| | | | |
| | | | Multi-Utilities – 1.3% | | | | | | | | | |
| | | | |
| | 20,000 | | | CenterPoint Energy, Inc., (2) | | | | | | | | | | | 547,600 | |
| | 13,676 | | | Consolidated Edison, Inc. | | | | | | | | | | | 1,105,294 | |
| | 20,000 | | | Dominion Resources, Inc. | | | | | | | | | | | 1,532,600 | |
| | | | Total Multi-Utilities | | | | | | | | | | | 3,185,494 | |
| | | | | | | | | | | | | | | | |
| Shares | | | Description (1) | | | | | | | | Value | |
| | | | |
| | | | Oil, Gas & Consumable Fuels – 5.1% | | | | | | | | | |
| | | | |
| | 24,500 | | | Chevron Corporation, (2) | | | | | | | | | | $ | 2,556,085 | |
| | 20,462 | | | ConocoPhillips | | | | | | | | | | | 899,510 | |
| | 10,972 | | | EOG Resources, Inc. | | | | | | | | | | | 993,186 | |
| | 55,300 | | | Exxon Mobil Corporation | | | | | | | | | | | 4,464,369 | |
| | 8,000 | | | Hess Corporation | | | | | | | | | | | 350,960 | |
| | 31,000 | | | Marathon Oil Corporation | | | | | | | | | | | 367,350 | |
| | 11,172 | | | Marathon Petroleum Corporation | | | | | | | | | | | 584,631 | |
| | 16,016 | | | Occidental Petroleum Corporation | | | | | | | | | | | 958,878 | |
| | 7,102 | | | ONEOK, Inc. | | | | | | | | | | | 370,440 | |
| | 9,273 | | | Phillips 66 | | | | | | | | | | | 766,784 | |
| | 8,856 | | | Valero Energy Corporation | | | | | | | | | | | 597,426 | |
| | | | Total Oil, Gas & Consumable Fuels | | | | | | | | | | | 12,909,619 | |
| | | | |
| | | | Pharmaceuticals – 5.6% | | | | | | | | | |
| | | | |
| | 5,900 | | | Allergan PLC, (2) | | | | | | | | | | | 1,434,231 | |
| | 24,190 | | | Bristol-Myers Squibb Company | | | | | | | | | | | 1,347,867 | |
| | 14,900 | | | Eli Lilly and Company | | | | | | | | | | | 1,226,270 | |
| | 2,000 | | | Jazz Pharmaceuticals, Inc. | | | | | | | | | | | 311,000 | |
| | 34,700 | | | Johnson & Johnson | | | | | | | | | | | 4,590,463 | |
| | 35,860 | | | Merck & Company Inc. | | | | | | | | | | | 2,298,267 | |
| | 9,340 | | | Mylan NV, (3) | | | | | | | | | | | 362,579 | |
| | 78,800 | | | Pfizer Inc. | | | | | | | | | | | 2,646,892 | |
| | | | Total Pharmaceuticals | | | | | | | | | | | 14,217,569 | |
| | | | |
| | | | Real Estate Management & Development – 0.1% | | | | | | | | | |
| | | | |
| | 1,900 | | | Jones Lang LaSalle Inc. | | | | | | | | | | | 237,500 | |
| | | | |
| | | | Road & Rail – 0.7% | | | | | | | | | |
| | | | |
| | 16,145 | | | Union Pacific Corporation, (2) | | | | | | | | | | | 1,758,352 | |
| | | | |
| | | | Semiconductors & Semiconductor Equipment – 3.5% | | | | | | | | | |
| | | | |
| | 12,690 | | | Analog Devices, Inc. | | | | | | | | | | | 987,282 | |
| | 62,800 | | | Intel Corporation, (2) | | | | | | | | | | | 2,118,872 | |
| | 12,219 | | | Microchip Technology Incorporated | | | | | | | | | | | 943,062 | |
| | 12,115 | | | NVIDIA Corporation | | | | | | | | | | | 1,751,344 | |
| | 25,096 | | | QUALCOMM, Inc. | | | | | | | | | | | 1,385,801 | |
| | 21,784 | | | Texas Instruments Incorporated | | | | | | | | | | | 1,675,843 | |
| | | | Total Semiconductors & Semiconductor Equipment | | | | | | | | | | | 8,862,204 | |
| | | | |
| | | | Software – 4.9% | | | | | | | | | |
| | | | |
| | 9,786 | | | Autodesk, Inc. | | | | | | | | | | | 986,625 | |
| | 5,653 | | | CDK Global Inc. | | | | | | | | | | | 350,825 | |
| | 7,433 | | | Electronic Arts Inc. | | | | | | | | | | | 785,817 | |
| | 109,000 | | | Microsoft Corporation, (2) | | | | | | | | | | | 7,513,370 | |
| | 49,970 | | | Oracle Corporation, (2) | | | | | | | | | | | 2,505,496 | |
| | 2,500 | | | ServiceNow Inc. | | | | | | | | | | | 265,000 | |
| | | | Total Software | | | | | | | | | | | 12,407,133 | |
| | | | |
| | | | Specialty Retail – 3.0% | | | | | | | | | |
| | | | |
| | 13,107 | | | Best Buy Co., Inc. | | | | | | | | | | | 751,424 | |
| | 5,900 | | | Dick’s Sporting Goods Inc. | | | | | | | | | | | 234,997 | |
| | 20,000 | | | Home Depot, Inc., (2) | | | | | | | | | | | 3,068,000 | |
| | 8,369 | | | L Brands Inc. | | | | | | | | | | | 451,005 | |
| | 20,000 | | | Lowe’s Companies, Inc. | | | | | | | | | | | 1,550,600 | |
| | 8,025 | | | Tiffany & Co. | | | | | | | | | | | 753,307 | |
| | 10,968 | | | TJX Companies, Inc. | | | | | | | | | | | 791,561 | |
| | | | Total Specialty Retail | | | | | | | | | | | 7,600,894 | |
| | | | |
| SPXX | | Nuveen S&P 500 Dynamic Overwrite Fund | | |
| | Portfolio of Investments (continued) | | June 30, 2017 (Unaudited) |
| | | | | | | | | | | | | | | | |
| Shares | | | Description (1) | | | | | | | | Value | |
| | | | |
| | | | Technology Hardware, Storage & Peripherals – 4.6% | | | | | | | | | |
| | | | |
| | 72,000 | | | Apple, Inc., (2) | | | | | | | | | | $ | 10,369,440 | |
| | 29,981 | | | Hewlett Packard Enterprise Company | | | | | | | | | | | 497,386 | |
| | 46,853 | | | HP Inc., (2) | | | | | | | | | | | 818,990 | |
| | | | Total Technology Hardware, Storage & Peripherals | | | | | | | | | | | 11,685,816 | |
| | | | |
| | | | Textiles, Apparel & Luxury Goods – 0.5% | | | | | | | | | |
| | | | |
| | 10,000 | | | Nike, Inc., Class B | | | | | | | | | | | 590,000 | |
| | 10,552 | | | VF Corporation, (2) | | | | | | | | | | | 607,795 | |
| | | | Total Textiles, Apparel & Luxury Goods | | | | | | | | | | | 1,197,795 | |
| | | | |
| | | | Tobacco – 2.3% | | | | | | | | | |
| | | | |
| | 26,349 | | | Altria Group, Inc. | | | | | | | | | | | 1,962,210 | |
| | 23,490 | | | Philip Morris International, Inc. | | | | | | | | | | | 2,758,901 | |
| | 18,574 | | | Reynolds American Inc. | | | | | | | | | | | 1,208,053 | |
| | | | Total Tobacco | | | | | | | | | | | 5,929,164 | |
| | | | |
| | | | Trading Companies & Distributors – 0.3% | | | | | | | | | |
| | | | |
| | 3,613 | | | W.W. Grainger, Inc. | | | | | | | | | | | 652,255 | |
| | | | Total Long-Term Investments (cost $140,262,541) | | | | | | | | | | | 253,544,747 | |
| | | | |
Principal
Amount (000) | | | Description (1) | | Coupon | | | Maturity | | | Value | |
| | | | |
| | | | SHORT-TERM INVESTMENTS – 0.1% | | | | | | | | | |
| | | | |
| | | | REPURCHASE AGREEMENTS – 0.1% | | | | | | | | | |
| | | | |
| $ | 185 | | | Repurchase Agreement with Fixed Income Clearing Corporation, dated 6/30/17,
repurchase price $184,722, collateralized by $195,000 U.S. Treaury Notes,
2.000%, due 11/15/26, value $191,191 | | | 0.120% | | | | 7/03/17 | | | $ | 184,720 | |
| | | | Total Short-Term Investments (cost $184,720) | | | | | | | | | | | 184,720 | |
| | | | Total Investments (cost $140,447,261) – 100% | | | | | | | | | | | 253,729,467 | |
| | | | Other Assets Less Liabilities – 0.0% (4) | | | | | | | | | | | 5,643 | |
| | | | Net Assets – 100% | | | | | | | | | | $ | 253,735,110 | |
Investments in Derivatives as of June 30, 2017
Options Purchased
| | | | | | | | | | | | | | | | | | | | | | |
| Options Type | | Number of
Contracts | | | Description (5) | | Notional
Amount (6) | | | Expiration
Date | | | Strike
Price | | | Value | |
Call | | | 200 | | | United States Oil Fund LP | | $ | 200,000 | | | | 7/21/17 | | | $ | 10 | | | $ | 1,300 | |
Call | | | 100 | | | Verizon Communications Inc. | | | 480,000 | | | | 7/21/17 | | | | 48 | | | | 350 | |
| | | | 300 | | | Total Options Purchased (premiums paid $7,230) | | $ | 680,000 | | | | | | | | | | | $ | 1,650 | |
Options Written
| | | | | | | | | | | | | | | | | | | | | | |
| Options Type | | Number of
Contracts | | | Description (5) | | Notional
Amount (6) | | | Expiration
Date | | | Strike
Price | | | Value | |
Call | | | (150 | ) | | S&P 500® Index | | $ | (36,450,000 | ) | | | 7/21/17 | | | $ | 2,430 | | | $ | (241,500 | ) |
Call | | | (428 | ) | | S&P 500® Index | | | (103,790,000 | ) | | | 7/21/17 | | | | 2,425 | | | | (819,620 | ) |
| | | | (578 | ) | | Total Options Written (premiums received $1,545,479) | | $ | (140,240,000 | ) | | | | | | | | | | $ | (1,061,120 | ) |
For Fund portfolio compliance purposes, the Fund’s industry classifications refer to any one or more of the industry sub-classifications used by one or more widely recognized market indexes or ratings group indexes, and/or as defined by Fund management. This definition may not apply for purposes of this report, which may combine industry sub-classifications into sectors for reporting ease.
| (1) | All percentages in the Portfolio of Investments are based on net assets. |
| (2) | Investment, or portion of investment, has been pledged to collateralize the net payment obligations for investments in derivatives. |
| (3) | Non-income producing; issuer has not declared a dividend within the past twelve months. |
| (4) | Other assets less liabilities includes the unrealized appreciation (depreciation) of certain over-the counter (“OTC”) derivatives as presented on the Statement of Assets and Liabilities, when applicable. The unrealized appreciation (depreciation) of OTC cleared and exchange-traded derivatives is recognized as part of the cash collateral at brokers and/or the receivable or payable for variation margin as presented on the Statement of Assets and Liabilities, when applicable. Other assets less liabilities also includes the value of options as presented on the Statement of Assets and Liabilities. |
| (5) | Exchange-traded, unless otherwise noted. |
| (6) | For disclosure purposes, Notional Amount is calculated by multiplying the Number of Contracts by the Strike Price by 100. |
See accompanying notes to financial statements.
QQQX
| | |
Nuveen Nasdaq 100 Dynamic Overwrite Fund |
Portfolio of Investments | | June 30, 2017 (Unaudited) |
| | | | | | | | | | | | | | | | |
| Shares | | | Description (1) | | | | | | | | Value | |
| | | | |
| | | | LONG-TERM INVESTMENTS – 100.9% | | | | | | | | | | | | |
| | | | |
| | | | COMMON STOCKS – 99.7% | | | | | | | | | | | | |
| | | | |
| | | | Aerospace & Defense – 0.1% | | | | | | | | | |
| | | | |
| | 4,954 | | | Boeing Company | | | | | | | | | | $ | 979,654 | |
| | | | |
| | | | Air Freight & Logistics – 0.1% | | | | | | | | | |
| | | | |
| | 2,768 | | | FedEx Corporation | | | | | | | | | | | 601,569 | |
| | | | |
| | | | Airlines – 0.5% | | | | | | | | | |
| | | | |
| | 31,000 | | | Delta Air Lines, Inc. | | | | | | | | | | | 1,665,940 | |
| | 6,742 | | | Ryanair Holdings PLC, Sponsored ADR | | | | | | | | | | | 725,507 | |
| | 26,300 | | | Southwest Airlines Co. | | | | | | | | | | | 1,634,282 | |
| | | | Total Airlines | | | | | | | | | | | 4,025,729 | |
| | | | |
| | | | Auto Components – 0.2% | | | | | | | | | |
| | | | |
| | 26,602 | | | American Axle and Manufacturing Holdings Inc. | | | | | | | | | | | 414,991 | |
| | 21,986 | | | Gentex Corporation | | | | | | | | | | | 417,074 | |
| | 4,227 | | | Lear Corporation | | | | | | | | | | | 600,572 | |
| | | | Total Auto Components | | | | | | | | | | | 1,432,637 | |
| | | | |
| | | | Automobiles – 1.3% | | | | | | | | | |
| | | | |
| | 49,165 | | | Ford Motor Company | | | | | | | | | | | 550,156 | |
| | 14,597 | | | Harley-Davidson, Inc. | | | | | | | | | | | 788,530 | |
| | 23,900 | | | Tesla Motors Inc., (2) | | | | | | | | | | | 8,642,479 | |
| | | | Total Automobiles | | | | | | | | | | | 9,981,165 | |
| | | | |
| | | | Beverages – 0.6% | | | | | | | | | |
| | | | |
| | 8,894 | | | Brown-Forman Corporation | | | | | | | | | | | 432,248 | |
| | 91,000 | | | Monster Beverage Corporation | | | | | | | | | | | 4,520,880 | |
| | | | Total Beverages | | | | | | | | | | | 4,953,128 | |
| | | | |
| | | | Biotechnology – 10.2% | | | | | | | | | |
| | | | |
| | 7,091 | | | AbbVie Inc. | | | | | | | | | | | 514,168 | |
| | 12,000 | | | Agios Pharmaceutical Inc., (2) | | | | | | | | | | | 617,400 | |
| | 35,000 | | | Alexion Pharmaceuticals Inc., (2) | | | | | | | | | | | 4,258,450 | |
| | 14,052 | | | Alkermes PLC, (2) | | | | | | | | | | | 814,595 | |
| | 115,000 | | | Amgen Inc. | | | | | | | | | | | 19,806,450 | |
| | 176,000 | | | Celgene Corporation, (3) | | | | | | | | | | | 22,857,120 | |
| | 235,000 | | | Gilead Sciences, Inc., (3) | | | | | | | | | | | 16,633,300 | |
| | 64,749 | | | Immunogen, Inc., (2) | | | | | | | | | | | 460,365 | |
| | 22,236 | | | Ionis Pharmaceuticals, Inc., (2) | | | | | | | | | | | 1,131,145 | |
| | 12,904 | | | Myriad Genetics Inc., (2) | | | | | | | | | | | 333,439 | |
| | 20,000 | | | Regeneron Pharmaceuticals, Inc., (2) | | | | | | | | | | | 9,822,800 | |
| | 12,177 | | | Seattle Genetics, Inc., (2) | | | | | | | | | | | 630,038 | |
| | 3,617 | | | United Therapeutics Corporation, (2) | | | | | | | | | | | 469,233 | |
| | | | Total Biotechnology | | | | | | | | | | | 78,348,503 | |
| | | | |
| | | | Capital Markets – 0.4% | | | | | | | | | |
| | | | |
| | 9,902 | | | Moody’s Corporation | | | | | | | | | | | 1,204,875 | |
| | 24,475 | | | Morgan Stanley | | | | | | | | | | | 1,090,606 | |
| | 11,627 | | | SEI Investments Company | | | | | | | | | | | 625,300 | |
| | 5,883 | | | T. Rowe Price Group Inc. | | | | | | | | | | | 436,577 | |
| | | | Total Capital Markets | | | | | | | | | | | 3,357,358 | |
| | | | | | | | | | | | | | | | |
| Shares | | | Description (1) | | | | | | | | Value | |
| | | | |
| | | | Commercial Services & Supplies – 0.3% | | | | | | | | | |
| | | | |
| | 10,324 | | | Copart Inc., (2) | | | | | | | | | | $ | 328,200 | |
| | 7,605 | | | KAR Auction Services Inc. | | | | | | | | | | | 319,182 | |
| | 15,000 | | | Tetra Tech, Inc. | | | | | | | | | | | 686,250 | |
| | 7,182 | | | Waste Connections Inc. | | | | | | | | | | | 462,665 | |
| | 9,417 | | | Waste Management, Inc. | | | | | | | | | | | 690,737 | |
| | | | Total Commercial Services & Supplies | | | | | | | | | | | 2,487,034 | |
| | | | |
| | | | Communications Equipment – 3.3% | | | | | | | | | |
| | | | |
| | 810,000 | | | Cisco Systems, Inc. | | | | | | | | | | | 25,353,000 | |
| | | | |
| | | | Distributors – 0.3% | | | | | | | | | |
| | | | |
| | 3,449 | | | Genuine Parts Company | | | | | | | | | | | 319,929 | |
| | 40,570 | | | LKQ Corporation, (2) | | | | | | | | | | | 1,336,782 | |
| | 7,800 | | | Pool Corporation | | | | | | | | | | | 917,046 | |
| | | | Total Distributors | | | | | | | | | | | 2,573,757 | |
| | | | |
| | | | Diversified Consumer Services – 0.2% | | | | | | | | | |
| | | | |
| | 43,200 | | | Service Corporation International | | | | | | | | | | | 1,445,040 | |
| | | | |
| | | | Electrical Equipment – 0.2% | | | | | | | | | |
| | | | |
| | 9,400 | | | Rockwell Automation, Inc. | | | | | | | | | | | 1,522,424 | |
| | | | |
| | | | Electronic Equipment, Instruments & Components – 0.4% | | | | | | | | | |
| | | | |
| | 12,148 | | | Amphenol Corporation, Class A | | | | | | | | | | | 896,765 | |
| | 3,675 | | | Arrow Electronics, Inc., (2) | | | | | | | | | | | 288,194 | |
| | 5,960 | | | Avnet Inc. | | | | | | | | | | | 231,725 | |
| | 30,310 | | | Corning Incorporated | | | | | | | | | | | 910,816 | |
| | 7,692 | | | Keysight Technologies, Inc., (2) | | | | | | | | | | | 299,450 | |
| | 13,756 | | | National Instruments Corporation | | | | | | | | | | | 553,266 | |
| | | | Total Electronic Equipment, Instruments & Components | | | | | | | | | | | 3,180,216 | |
| | | | |
| | | | Equity Real Estate Investment Trusts – 0.4% | | | | | | | | | |
| | | | |
| | 18,413 | | | Apartment Investment & Management Company, Class A | | | | | | | | | | | 791,207 | |
| | 54,600 | | | CubeSmart | | | | | | | | | | | 1,312,584 | |
| | 12,035 | | | Ventas Inc. | | | | | | | | | | | 836,192 | |
| | | | Total Equity Real Estate Investment Trusts | | | | | | | | | | | 2,939,983 | |
| | | | |
| | | | Food & Staples Retailing – 1.7% | | | | | | | | | |
| | | | |
| | 165,000 | | | Walgreens Boots Alliance Inc., (3) | | | | | | | | | | | 12,921,150 | |
| | | | |
| | | | Health Care Equipment & Supplies – 1.1% | | | | | | | | | |
| | | | |
| | 68,600 | | | Abbott Laboratories | | | | | | | | | | | 3,334,646 | |
| | 8,796 | | | Baxter International, Inc. | | | | | | | | | | | 532,510 | |
| | 3,650 | | | Becton, Dickinson and Company, (3) | | | | | | | | | | | 712,152 | |
| | 16,000 | | | Danaher Corporation | | | | | | | | | | | 1,350,240 | |
| | 8,434 | | | Hill-Rom Holdings Inc. | | | | | | | | | | | 671,431 | |
| | 3,714 | | | Stryker Corporation, (3) | | | | | | | | | | | 515,429 | |
| | 11,100 | | | Zimmer Biomet Holdings, Inc., (3) | | | | | | | | | | | 1,425,240 | |
| | | | Total Health Care Equipment & Supplies | | | | | | | | | | | 8,541,648 | |
| | | | |
| | | | Health Care Providers & Services – 0.3% | | | | | | | | | |
| | 11,171 | | | Cardinal Health, Inc. | | | | | | | | | | | 870,444 | |
| | 4,093 | | | McKesson HBOC Inc., (3) | | | | | | | | | | | 673,462 | |
| | 7,946 | | | Universal Health Services, Inc., Class B | | | | | | | | | | | 970,048 | |
| | | | Total Health Care Providers & Services | | | | | | | | | | | 2,513,954 | |
| | | | |
| | | | Hotels, Restaurants & Leisure – 0.5% | | | | | | | | | |
| | | | |
| | 20,714 | | | Carnival Corporation | | | | | | | | | | | 1,358,217 | |
| | 3,000 | | | Dominos Pizza Inc. | | | | | | | | | | | 634,590 | |
| | 29,200 | | | Restaurant Brands International Inc. | | | | | | | | | | | 1,826,168 | |
| | | | Total Hotels, Restaurants & Leisure | | | | | | | | | | | 3,818,975 | |
| | | | |
| QQQX | | Nuveen Nasdaq 100 Dynamic Overwrite Fund | | |
| | Portfolio of Investments (continued) | | June 30, 2017 (Unaudited) |
| | | | | | | | | | | | | | | | |
| Shares | | | Description (1) | | | | | | | | Value | |
| | | | |
| | | | Household Durables – 0.1% | | | | | | | | | |
| | | | |
| | 41,536 | | | KB Home | | | | | | | | | | $ | 995,618 | |
| | | | |
| | | | Industrial Conglomerates – 0.2% | | | | | | | | | |
| | | | |
| | 40,028 | | | General Electric Company | | | | | | | | | | | 1,081,156 | |
| | 5,740 | | | Honeywell International Inc. | | | | | | | | | | | 765,085 | |
| | | | Total Industrial Conglomerates | | | | | | | | | | | 1,846,241 | |
| | | | |
| | | | Insurance – 0.4% | | | | | | | | | |
| | | | |
| | 12,439 | | | American International Group, Inc. | | | | | | | | | | | 777,686 | |
| | 23,648 | | | FNF Group | | | | | | | | | | | 1,060,140 | |
| | 12,000 | | | Torchmark Corporation | | | | | | | | | | | 918,000 | |
| | | | Total Insurance | | | | | | | | | | | 2,755,826 | |
| | | | |
| | | | Internet and Direct Marketing Retail – 10.5% | | | | | | | | | |
| | | | |
| | 67,000 | | | Amazon.com, Inc. | | | | | | | | | | | 64,856,000 | |
| | 11,995 | | | HSN, Inc. | | | | | | | | | | | 382,641 | |
| | 8,500 | | | Priceline Group Inc. (The), (2) | | | | | | | | | | | 15,899,420 | |
| | | | Total Internet and Direct Marketing Retail | | | | | | | | | | | 81,138,061 | |
| | | | |
| | | | Internet Software & Services – 19.6% | | | | | | | | | |
| | | | |
| | 43,000 | | | Alphabet Inc., Class A | | | | | | | | | | | 39,976,240 | |
| | 49,000 | | | Alphabet Inc., Class C, (3) | | | | | | | | | | | 44,527,770 | |
| | 43,000 | | | Baidu Inc., Sponsored ADR, (2), (3) | | | | | | | | | | | 7,690,980 | |
| | 210,000 | | | eBay Inc., (3) | | | | | | | | | | | 7,333,200 | |
| | 325,000 | | | Facebook Inc., Class A, (3) | | | | | | | | | | | 49,068,500 | |
| | 17,600 | | | IAC/InterActiveCorp. | | | | | | | | | | | 1,817,024 | |
| | 4,807 | | | J2 Global Inc. | | | | | | | | | | | 409,028 | |
| | 5,270 | | | WebMD Health Corporation, Class A, (2) | | | | | | | | | | | 309,086 | |
| | | | Total Internet Software & Services | | | | | | | | | | | 151,131,828 | |
| | | | |
| | | | IT Services – 2.8% | | | | | | | | | |
| | | | |
| | 10,704 | | | CSRA Inc. | | | | | | | | | | | 339,852 | |
| | 12,340 | | | DXC Technology Company | | | | | | | | | | | 946,725 | |
| | 23,800 | | | Fidelity National Information Services, Inc. | | | | | | | | | | | 2,032,520 | |
| | 19,208 | | | Genpact Limited | | | | | | | | | | | 534,559 | |
| | 16,316 | | | Global Payments Inc. | | | | | | | | | | | 1,473,661 | |
| | 45,000 | | | Henry Jack and Associates Inc. | | | | | | | | | | | 4,674,150 | |
| | 29,448 | | | Infosys Technologies Limited, Sponsored ADR | | | | | | | | | | | 442,309 | |
| | 5,008 | | | Leidos Holdings Inc. | | | | | | | | | | | 258,864 | |
| | 200,000 | | | PayPal Holdings, Inc. | | | | | | | | | | | 10,734,000 | |
| | 8,580 | | | Total System Services Inc. | | | | | | | | | | | 499,785 | |
| | | | Total IT Services | | | | | | | | | | | 21,936,425 | |
| | | | |
| | | | Life Sciences Tools & Services – 0.5% | | | | | | | | | |
| | | | |
| | 58,000 | | | Agilent Technologies, Inc. | | | | | | | | | | | 3,439,980 | |
| | 4,788 | | | Charles River Laboratories International, Inc. | | | | | | | | | | | 484,306 | |
| | | | Total Life Sciences Tools & Services | | | | | | | | | | | 3,924,286 | |
| | | | |
| | | | Machinery – 0.2% | | | | | | | | | |
| | | | |
| | 9,526 | | | Caterpillar Inc. | | | | | | | | | | | 1,023,664 | |
| | 8,005 | | | Fortive Corporation | | | | | | | | | | | 507,117 | |
| | | | Total Machinery | | | | | | | | | | | 1,530,781 | |
| | | | |
| | | | Media – 4.2% | | | | | | | | | |
| | | | |
| | 19,200 | | | CBS Corporation, Class B | | | | | | | | | | | 1,224,576 | |
| | 680,000 | | | Comcast Corporation, Class A | | | | | | | | | | | 26,465,600 | |
| | 66,088 | | | News Corporation Class B | | | | | | | | | | | 935,145 | |
| | 79,632 | | | News Corporation, Class A | | | | | | | | | | | 1,090,958 | |
| | 20,100 | | | Omnicom Group, Inc. | | | | | | | | | | | 1,666,290 | |
| | 6,836 | | | WPP Group PLC, Sponsored ADR | | | | | | | | | | | 720,583 | |
| | | | Total Media | | | | | | | | | | | 32,103,152 | |
| | | | | | | | | | | | | | | | |
| Shares | | | Description (1) | | | | | | | | Value | |
| | | | |
| | | | Multiline Retail – 0.0% | | | | | | | | | |
| | | | |
| | 63,200 | | | J.C. Penney Company, Inc. | | | | | | | | | | $ | 293,880 | |
| | | | |
| | | | Pharmaceuticals – 0.3% | | | | | | | | | |
| | | | |
| | 3,505 | | | Allergan PLC | | | | | | | | | | | 852,030 | |
| | 22,511 | | | Endo International PLC, (2) | | | | | | | | | | | 251,448 | |
| | 5,960 | | | Jazz Pharmaceuticals, Inc., (2) | | | | | | | | | | | 926,780 | |
| | | | Total Pharmaceuticals | | | | | | | | | | | 2,030,258 | |
| | | | |
| | | | Professional Services – 0.7% | | | | | | | | | |
| | | | |
| | 10,307 | | | IHS Markit Limited | | | | | | | | | | | 453,920 | |
| | 11,461 | | | ManpowerGroup Inc. | | | | | | | | | | | 1,279,621 | |
| | 19,598 | | | Robert Half International Inc. | | | | | | | | | | | 939,332 | |
| | 31,000 | | | Verisk Analytics Inc., Class A | | | | | | | | | | | 2,615,470 | |
| | | | Total Professional Services | | | | | | | | | | | 5,288,343 | |
| | | | |
| | | | Semiconductors & Semiconductor Equipment – 10.5% | | | | | | | | | |
| | | | |
| | 92,000 | | | Analog Devices, Inc. | | | | | | | | | | | 7,157,600 | |
| | 160,000 | | | Applied Materials, Inc., (3) | | | | | | | | | | | 6,609,600 | |
| | 17,789 | | | Integrated Device Technology, Inc. | | | | | | | | | | | 458,778 | |
| | 750,000 | | | Intel Corporation, (3) | | | | | | | | | | | 25,305,000 | |
| | 55,000 | | | Lam Research Corporation | | | | | | | | | | | 7,778,650 | |
| | 8,107 | | | Microsemi Corporation | | | | | | | | | | | 379,408 | |
| | 105,000 | | | NVIDIA Corporation | | | | | | | | | | | 15,178,800 | |
| | 27,886 | | | ON Semiconductor Corporation, (2) | | | | | | | | | | | 391,519 | |
| | 5,933 | | | Power Integrations Inc. | | | | | | | | | | | 432,516 | |
| | 236,000 | | | QUALCOMM, Inc., (3) | | | | | | | | | | | 13,031,920 | |
| | 10,146 | | | Silicon Laboratories Inc., (2) | | | | | | | | | | | 693,479 | |
| | 30,440 | | | Skyworks Solutions Inc. | | | | | | | | | | | 2,920,718 | |
| | 20,000 | | | Taiwan Semiconductor Manufacturing Company Limited, Sponsored ADR | | | | | | | | | | | 699,200 | |
| | 7,657 | | | Xperi Corporation | | | | | | | | | | | 228,179 | |
| | | | Total Semiconductors & Semiconductor Equipment | | | | | | | | | | | 81,265,367 | |
| | | | |
| | | | Software – 13.1% | | | | | | | | | |
| | | | |
| | 18,000 | | | Ansys Inc., (2) | | | | | | | | | | | 2,190,240 | |
| | 53,500 | | | Autodesk, Inc. | | | | | | | | | | | 5,393,870 | |
| | 51,700 | | | Cadence Design Systems, Inc., (2) | | | | | | | | | | | 1,731,433 | |
| | 11,986 | | | CDK Global Inc. | | | | | | | | | | | 743,851 | |
| | 54,000 | | | Electronic Arts Inc. | | | | | | | | | | | 5,708,880 | |
| | 16,040 | | | Imperva Incorporated, (2) | | | | | | | | | | | 767,514 | |
| | 1,080,000 | | | Microsoft Corporation, (3) | | | | | | | | | | | 74,444,400 | |
| | 1,584 | | | Microstrategy Inc., (2) | | | | | | | | | | | 303,605 | |
| | 22,224 | | | Open Text Corporation | | | | | | | | | | | 700,945 | |
| | 49,900 | | | Oracle Corporation | | | | | | | | | | | 2,501,986 | |
| | 12,402 | | | Parametric Technology Corporation | | | | | | | | | | | 683,598 | |
| | 15,600 | | | Red Hat, Inc. | | | | | | | | | | | 1,493,700 | |
| | 7,500 | | | ServiceNow Inc., (2) | | | | | | | | | | | 795,000 | |
| | 76,447 | | | Snap Incorporated, (2) | | | | | | | | | | | 1,358,463 | |
| | 25,700 | | | Synopsys Inc., (3) | | | | | | | | | | | 1,874,301 | |
| | 5,000 | | | Workday Inc., Class A, (2) | | | | | | | | | | | 485,000 | |
| | | | Total Software | | | | | | | | | | | 101,176,786 | |
| | | | |
| | | | Specialty Retail – 0.7% | | | | | | | | | |
| | | | |
| | 14,900 | | | Aaron Rents Inc. | | | | | | | | | | | 579,610 | |
| | 4,472 | | | Advance Auto Parts, Inc. | | | | | | | | | | | 521,390 | |
| | 28,400 | | | CarMax, Inc. | | | | | | | | | | | 1,790,904 | |
| | 17,540 | | | Dick’s Sporting Goods Inc. | | | | | | | | | | | 698,618 | |
| | 25,551 | | | L Brands Inc. | | | | | | | | | | | 1,376,943 | |
| | | | Total Specialty Retail | | | | | | | | | | | 4,967,465 | |
| | | | |
| QQQX | | Nuveen Nasdaq 100 Dynamic Overwrite Fund | | |
| | Portfolio of Investments (continued) | | June 30, 2017 (Unaudited) |
| | | | | | | | | | | | | | | | |
| Shares | | | Description (1) | | | | | | | | Value | |
| | | | |
| | | | Technology Hardware, Storage & Peripherals – 13.0% | | | | | | | | | |
| | | | |
| | 690,000 | | | Apple, Inc., (3) | | | | | | | | | | $ | 99,373,800 | |
| | 19,045 | | | Hewlett Packard Enterprise Company | | | | | | | | | | | 315,957 | |
| | 19,045 | | | HP Inc. | | | | | | | | | | | 332,907 | |
| | | | Total Technology Hardware, Storage & Peripherals | | | | | | | | | | | 100,022,664 | |
| | | | |
| | | | Textiles, Apparel & Luxury Goods – 0.4% | | | | | | | | | |
| | | | |
| | 7,396 | | | PVH Corporation | | | | | | | | | | | 846,842 | |
| | 17,800 | | | Skechers USA Inc., (2) | | | | | | | | | | | 525,100 | |
| | 26,889 | | | Under Armour Inc., Class C, (2) | | | | | | | | | | | 542,082 | |
| | 42,700 | | | Under Armour, Inc. | | | | | | | | | | | 929,152 | |
| | | | Total Textiles, Apparel & Luxury Goods | | | | | | | | | | | 2,843,176 | |
| | | | |
| | | | Tobacco – 0.3% | | | | | | | | | |
| | | | |
| | 12,975 | | | Altria Group, Inc. | | | | | | | | | | | 966,248 | |
| | 10,023 | | | Philip Morris International, Inc. | | | | | | | | | | | 1,177,201 | |
| | | | Total Tobacco | | | | | | | | | | | 2,143,449 | |
| | | | |
| | | | Wireless Telecommunication Services – 0.1% | | | | | | | | | |
| | | | |
| | 19,244 | | | Telephone and Data Systems Inc. | | | | | | | | | | | 534,021 | |
| | 13,012 | | | United States Cellular Corporation, (2) | | | | | | | | | | | 498,620 | |
| | | | Total Wireless Telecommunication Services | | | | | | | | | | | 1,032,641 | |
| | | | Total Common Stocks (cost $303,234,971) | | | | | | | | | | | 769,403,171 | |
| | | | |
| Shares | | | Description (1), (4) | | | | | | | | Value | |
| | | | |
| | | | EXCHANGE-TRADED FUNDS – 1.2% | | | | | | | | | |
| | | | |
| | 70,000 | | | PowerShares QQQ Trust, Series 1 | | | | | | | | | | $ | 9,634,800 | |
| | | | Total Exchange-Traded Funds (cost $8,850,676) | | | | | | | | | | | 9,634,800 | |
| | | | Total Long-Term Investments (cost $312,085,647) | | | | | | | | | | | 779,037,971 | |
| | | | |
Principal
Amount (000) | | | Description (1) | | Coupon | | | Maturity | | | Value | |
| | | | |
| | | | SHORT-TERM INVESTMENTS – 0.4% | | | | | | | | | |
| | | | |
| | | | REPURCHASE AGREEMENTS – 0.4% | | | | | | | | | |
| | | | |
| $ | 2,934 | | | Repurchase Agreement with Fixed Income Clearing Corporation, dated 6/30/17,
repurchase price $2,934,480, collateralized by $3,020,000 U.S. Treasury Notes,
2.000%, due 6/30/24, value $2,997,350 | | | 0.120% | | | | 7/03/17 | | | $ | 2,934,451 | |
| | | | Total Short-Term Investments (cost $2,934,451) | | | | | | | | | | | 2,934,451 | |
| | | | Total Investments (cost $315,020,098) – 101.3% | | | | | | | | | | | 781,972,422 | |
| | | | Other Assets Less Liabilities – (1.3)% (5) | | | | | | | | | | | (9,960,929 | ) |
| | | | Net Assets – 100% | | | | | | | | | | $ | 772,011,493 | |
Investments in Derivatives as of June 30, 2017
Options Purchased
| | | | | | | | | | | | | | | | | | | | | | |
| Options Type | | Number of
Contracts | | | Description (6) | | Notional
Amount (7) | | | Expiration
Date | | | Strike
Price | | | Value | |
Call | | | 400 | | | United States Oil Fund LP | | $ | 400,000 | | | | 7/21/17 | | | $ | 10 | | | $ | 2,600 | |
Call | | | 200 | | | Verizon Communications Inc. | | | 960,000 | | | | 7/21/17 | | | | 48 | | | | 700 | |
| | | | 600 | | | Total Options Purchased (premiums paid $14,460) | | $ | 1,360,000 | | | | | | | | | | | $ | 3,300 | |
Options Written
| | | | | | | | | | | | | | | | | | | | | | |
| Options Type | | Number of
Contracts | | | Description (6) | | Notional
Amount (7) | | | Expiration
Date | | | Strike
Price | | | Value | |
Call | | | (580 | ) | | NASDAQ 100® Index | | $ | (329,150,000 | ) | | | 7/21/17 | | | $ | 5,675 | | | $ | (4,297,800 | ) |
Call | | | (175 | ) | | NASDAQ 100® Index | | | (99,750,000 | ) | | | 7/21/17 | | | | 5,700 | | | | (1,064,875 | ) |
| | | | (755 | ) | | Total Options Written (premiums received $8,007,152) | | $ | (428,900,000 | ) | | | | | | | | | | $ | (5,362,675 | ) |
For Fund portfolio compliance purposes, the Fund’s industry classifications refer to any one or more of the industry sub-classifications used by one or more widely recognized market indexes or ratings group indexes, and/or as defined by Fund management. This definition may not apply for purposes of this report, which may combine industry sub-classifications into sectors for reporting ease.
| (1) | All percentages shown in the Portfolio of Investments are based on net assets. |
| (2) | Non-income producing; issuer has not declared a dividend within the past twelve months. |
| (3) | Investment, or portion of investment, has been pledged to collateralize the net payment obligations for investments in derivatives. |
| (4) | A copy of the most recent financial statements for these exchange-traded funds can be obtained directly from the Securities and Exchange Commission or on its website http://www.sec.gov. |
| (5) | Other assets less liabilities includes the unrealized appreciation (depreciation) of certain over-the-counter (“OTC”) derivatives as presented on the Statement of Assets and Liabilities, when applicable. The unrealized appreciation (depreciation) of OTC cleared and exchange-traded derivatives is recognized as part of the cash collateral at brokers and/or the receivable or payable for variation margin as presented on the Statement of Assets and Liabilities, when applicable. Other assets less liabilities also includes the value of options as presented on the Statement of Assets and Liabilities. |
| (6) | Exchange-traded, unless otherwise noted. |
| (7) | For disclosure purposes, Notional Amount is calculated by multiplying the Number of Contracts by the Strike Price by 100. |
| ADR | American Depositary Receipt |
See accompanying notes to financial statements.
| | | | | | |
Statement of Assets and Liabilities | | June 30, 2017 (Unaudited) |
| | | | | | | | | | | | | | | | |
| | | BXMX | | | DIAX | | | SPXX | | | QQQX | |
Assets | | | | | | | | | | | | | | | | |
Long-term investments, at value (cost $813,907,114, $339,691,638, $140,262,541 and $312,085,647, respectively) | | $ | 1,436,953,719 | | | $ | 623,500,000 | | | $ | 253,544,747 | | | $ | 779,037,971 | |
Short-term investments, at value ($44,606,149, $6,884,396, $184,720 and $2,934,451, respectively) | | | 44,606,149 | | | | 6,884,134 | | | | 184,720 | | | | 2,934,451 | |
Cash | | | 12,776 | | | | — | | | | — | | | | 6,139 | |
Options purchased, at value (premiums paid $ -, $14,460, $7,230 and $14,460, respectively) | | | — | | | | 3,300 | | | | 1,650 | | | | 3,300 | |
Receivable for: | | | | | | | | | | | | | | | | |
Dividends | | | 1,460,936 | | | | 271,013 | | | | 266,715 | | | | 291,346 | |
Investments sold | | | 4,509,675 | | | | 6,783,836 | | | | 4,865,652 | | | | 8,349,070 | |
Reclaims | | | 1,330 | | | | — | | | | — | | | | 329 | |
Other assets | | | 203,412 | | | | 30,429 | | | | 32,932 | | | | 60,820 | |
Total assets | | | 1,487,747,997 | | | | 637,472,712 | | | | 258,896,416 | | | | 790,683,426 | |
Liabilities | | | | | | | | | | | | | | | | |
Options written, at value (premiums received $20,518,517, $3,801,409, $1,545,479 and $8,007,152, respectively) | | | 16,822,505 | | | | 2,612,550 | | | | 1,061,120 | | | | 5,362,675 | |
Payable for: | | | | | | | | | | | | | | | | |
Dividends | | | 22,815,223 | | | | 9,091,528 | | | | 3,824,490 | | | | 12,472,278 | |
Investments purchased | | | 4,387,062 | | | | — | | | | — | | | | — | |
Accrued expenses: | | | | | | | | | | | | | | | | |
Management fees | | | 997,729 | | | | 440,138 | | | | 172,242 | | | | 544,814 | |
Trustees fees | | | 195,429 | | | | 27,955 | | | | 30,222 | | | | 66,782 | |
Other | | | 348,323 | | | | 242,199 | | | | 73,232 | | | | 225,384 | |
Total liabilities | | | 45,566,271 | | | | 12,414,370 | | | | 5,161,306 | | | | 18,671,933 | |
Net assets | | $ | 1,442,181,726 | | | $ | 625,058,342 | | | $ | 253,735,110 | | | $ | 772,011,493 | |
Shares outstanding | | | 103,554,549 | | | | 36,085,350 | | | | 16,152,579 | | | | 36,579,815 | |
Net asset value (“NAV”) per share outstanding | | $ | 13.93 | | | $ | 17.32 | | | $ | 15.71 | | | $ | 21.10 | |
Net assets consist of: | | | | | | | | | | | | | | | | |
Shares, $0.01 par value per share | | $ | 1,035,545 | | | $ | 360,854 | | | $ | 161,526 | | | $ | 365,798 | |
Paid-in surplus | | | 841,697,575 | | | | 361,894,459 | | | | 170,311,541 | | | | 339,516,341 | |
Undistributed (Over-distribution of) net investment income | | | (39,492,484 | ) | | | (13,804,911 | ) | | | (6,315,481 | ) | | | (24,359,753 | ) |
Accumulated net realized gain (loss) | | | 12,198,473 | | | | (8,377,859 | ) | | | (24,183,461 | ) | | | (13,096,534 | ) |
Net unrealized appreciation (depreciation) | | | 626,742,617 | | | | 284,985,799 | | | | 113,760,985 | | | | 469,585,641 | |
Net assets | | $ | 1,442,181,726 | | | $ | 625,058,342 | | | $ | 253,735,110 | | | $ | 772,011,493 | |
Authorized shares | | | Unlimited | | | | Unlimited | | | | Unlimited | | | | Unlimited | |
See accompanying notes to financial statements.
| | | | | | |
Statement of Operations | | Six Months Ended June 30, 2017 (Unaudited) |
| | | | | | | | | | | | | | | | |
| | | BXMX | | | DIAX | | | SPXX | | | QQQX | |
Investment Income | | | | | | | | | | | | | | | | |
Dividends (net of foreign tax withheld of $4,016, $—, $— and $7,342, respectively) | | $ | 14,286,343 | | | $ | 7,445,373 | | | $ | 2,569,016 | | | $ | 4,726,546 | |
Interest | | | 57,144 | | | | 30,506 | | | | 17,998 | | | | 19,801 | |
Total investment income | | | 14,343,487 | | | | 7,475,879 | | | | 2,587,014 | | | | 4,746,347 | |
Expenses | | | | | | | | | | | | | | | | |
Management fees | | | 5,958,643 | | | | 2,612,425 | | | | 1,020,823 | | | | 3,167,514 | |
Custodian fees | | | 63,076 | | | | 32,453 | | | | 20,125 | | | | 41,199 | |
Trustees fees | | | 21,438 | | | | 9,336 | | | | 3,783 | | | | 11,360 | |
Professional fees | | | 42,131 | | | | 28,985 | | | | 22,006 | | | | 30,169 | |
Shareholder reporting expenses | | | 101,743 | | | | 47,366 | | | | 20,710 | | | | 52,132 | |
Shareholder servicing agent fees | | | 991 | | | | 335 | | | | 125 | | | | 368 | |
Stock exchange listing fees | | | 14,647 | | | | 5,104 | | | | 3,449 | | | | — | |
Investor relations expenses | | | 183,927 | | | | 79,660 | | | | 31,385 | | | | 91,608 | |
Other | | | 124,946 | | | | 25,512 | | | | 26,851 | | | | 111,270 | |
Total expenses | | | 6,511,542 | | | | 2,841,176 | | | | 1,149,257 | | | | 3,505,620 | |
Net investment income (loss) | | | 7,831,945 | | | | 4,634,703 | | | | 1,437,757 | | | | 1,240,727 | |
Realized and Unrealized Gain (Loss) | | | | | | | | | | | | | | | | |
Net realized gain (loss) from: | | | | | | | | | | | | | | | | |
Investments and foreign currency | | | 52,591,941 | | | | 10,861,618 | | | | 2,279,573 | | | | 31,057,301 | |
Options purchased | | | — | | | | (18,698 | ) | | | (12,536 | ) | | | (3,423 | ) |
Options written | | | (42,545,348 | ) | | | (5,319,569 | ) | | | (2,210,307 | ) | | | (28,608,573 | ) |
Change in net unrealized appreciation (depreciation) of: | | | | | | | | | | | | | | | | |
Investments and foreign currency | | | 65,766,964 | | | | 36,793,005 | | | | 18,262,380 | | | | 78,352,226 | |
Options purchased | | | — | | | | (11,160 | ) | | | (5,580 | ) | | | (11,160 | ) |
Options written | | | 5,997,322 | | | | (658,127 | ) | | | (265,657 | ) | | | (566,049 | ) |
Net realized and unrealized gain (loss) | | | 81,810,879 | | | | 41,647,069 | | | | 18,047,873 | | | | 80,220,322 | |
Net increase (decrease) in net assets from operations | | $ | 89,642,824 | | | $ | 46,281,772 | | | $ | 19,485,630 | | | $ | 81,461,049 | |
See accompanying notes to financial statements.
| | | | | | |
Statement of Changes in Net Assets | | (Unaudited) |
| | | | | | | | | | | | | | | | |
| | | BXMX | | | DIAX | |
| | | Six Months
Ended
6/30/17 | | | Year
Ended
12/31/16 | | | Six Months
Ended
6/30/17 | | | Year
Ended
12/31/16 | |
Operations | | | | | | | | | | | | | | | | |
Net investment income (loss) | | $ | 7,831,945 | | | $ | 18,296,299 | | | $ | 4,634,703 | | | $ | 9,788,573 | |
Net realized gain (loss) from: | | | | | | | | | | | | | | | | |
Investments and foreign currency | | | 52,591,941 | | | | 108,322,515 | | | | 10,861,618 | | | | 6,763,435 | |
Options purchased | | | — | | | | — | | | | (18,698 | ) | | | (194,772 | ) |
Options written | | | (42,545,348 | ) | | | (30,985,514 | ) | | | (5,319,569 | ) | | | (19,988,381 | ) |
Change in net unrealized appreciation (depreciation) of: | | | | | | | | | | | | | | | | |
Investments and foreign currency | | | 65,766,964 | | | | 38,544,438 | | | | 36,793,005 | | | | 67,394,790 | |
Options purchased | | | — | | | | — | | | | (11,160 | ) | | | — | |
Options written | | | 5,997,322 | | | | (19,587,212 | ) | | | (658,127 | ) | | | 1,485,590 | |
Net increase (decrease) in net assets from operations | | | 89,642,824 | | | | 114,590,526 | | | | 46,281,772 | | | | 65,249,235 | |
Distributions to Shareholders | | | | | | | | | | | | | | | | |
From and in excess of net investment income | | | (47,324,429 | ) | | | — | | | | (18,439,614 | ) | | | — | |
From net investment income | | | — | | | | (45,243,344 | ) | | | — | | | | (9,744,691 | ) |
From accumulated net realized gains | | | — | | | | (30,335,359 | ) | | | — | | | | — | |
Return of capital | | | — | | | | (21,037,691 | ) | | | — | | | | (27,892,330 | ) |
Decrease in net assets from distributions to shareholders | | | (47,324,429 | ) | | | (96,616,394 | ) | | | (18,439,614 | ) | | | (37,637,021 | ) |
Capital Share Transactions | | | | | | | | | | | | | | | | |
Net proceeds from shares issued to shareholders to reinvestment of distributions | | | — | | | | — | | | | — | | | | — | |
Increase in net assets from capital share transactions | | | — | | | | — | | | | — | | | | — | |
Net increase (decrease) in net assets | | | 42,318,395 | | | | 17,974,132 | | | | 27,842,158 | | | | 27,612,214 | |
Net assets at the beginning of period | | | 1,399,863,331 | | | | 1,381,889,199 | | | | 597,216,184 | | | | 569,603,970 | |
Net assets at the end of period | | $ | 1,442,181,726 | | | $ | 1,399,863,331 | | | $ | 625,058,342 | | | $ | 597,216,184 | |
Undistributed (Over-distribution of) net investment income at the end of period | | $ | (39,492,484 | ) | | $ | — | | | $ | (13,804,911 | ) | | $ | — | |
See accompanying notes to financial statements.
| | | | | | | | | | | | | | | | |
| | | SPXX | | | QQQX | |
| | | Six Months
Ended
6/30/17 | | | Year
Ended
12/31/16 | | | Six Months
Ended
6/30/17 | | | Year
Ended
12/31/16 | |
Operations | | | | | | | | | | | | | | | | |
Net investment income (loss) | | $ | 1,437,757 | | | $ | 3,277,471 | | | $ | 1,240,727 | | | $ | 3,441,843 | |
Net realized gain (loss) from: | | | | | | | | | | | | | | | | |
Investments and foreign currency | | | 2,279,573 | | | | 13,877,052 | | | | 31,057,301 | | | | 43,375,119 | |
Options purchased | | | (12,536 | ) | | | (118,872 | ) | | | (3,423 | ) | | | (214,293 | ) |
Options written | | | (2,210,307 | ) | | | (7,743,997 | ) | | | (28,608,573 | ) | | | (15,073,275 | ) |
Change in net unrealized appreciation (depreciation) of: | | | | | | | | | | | | | | | | |
Investments and foreign currency | | | 18,262,380 | | | | 10,158,684 | | | | 78,352,226 | | | | 2,340,409 | |
Options purchased | | | (5,580 | ) | | | — | | | | (11,160 | ) | | | — | |
Options written | | | (265,657 | ) | | | 572,506 | | | | (566,049 | ) | | | 2,534,032 | |
Net increase (decrease) in net assets from operations | | | 19,485,630 | | | | 20,022,844 | | | | 81,461,049 | | | | 36,403,835 | |
Distributions to Shareholders | | | | | | | | | | | | | | | | |
From and in excess of net investment income | | | (7,753,238 | ) | | | — | | | | (25,600,480 | ) | | | — | |
From net investment income | | | — | | | | (13,792,349 | ) | | | — | | | | (3,365,619 | ) |
From accumulated net realized gains | | | — | | | | — | | | | — | | | | (29,687,599 | ) |
Return of capital | | | — | | | | (2,037,178 | ) | | | — | | | | (18,136,961 | ) |
Decrease in net assets from distributions to shareholders | | | (7,753,238 | ) | | | (15,829,527 | ) | | | (25,600,480 | ) | | | (51,190,179 | ) |
Capital Share Transactions | | | | | | | | | | | | | | | | |
Net proceeds from shares issued to shareholders to reinvestment of distributions | | | — | | | | — | | | | 315,576 | | | | — | |
Increase in net assets from capital share transactions | | | — | | | | — | | | | 315,576 | | | | — | |
Net increase (decrease) in net assets | | | 11,732,392 | | | | 4,193,317 | | | | 56,176,145 | | | | (14,786,344 | ) |
Net assets at the beginning of period | | | 242,002,718 | | | | 237,809,401 | | | | 715,835,348 | | | | 730,621,692 | |
Net assets at the end of period | | $ | 253,735,110 | | | $ | 242,002,718 | | | $ | 772,011,493 | | | $ | 715,835,348 | |
Undistributed (Over-distribution of) net investment
income at the end of period | | $ | (6,315,481 | ) | | $ | — | | | $ | (24,359,753 | ) | | $ | — | |
See accompanying notes to financial statements.
Financial
Highlights
Selected data for a share outstanding throughout each period:
| | | | | | | | | | | | | | | | | | | | | | | | | | | | | | | | | | | | | | | | | | | | |
| | | | | | |
| | | | | | Investment Operations | | | Less Distributions | | | | | | | | | | |
| | | Beginning
NAV | | | Net
Investment
Income
(Loss)(a) | | | Net
Realized/
Unrealized
Gain (Loss) | | | Total | | | From
Net
Investment
Income | | | From
Accumulated
Net Realized
Gains | | | Return
of
Capital | | | Total | | | Discount
From Shares
Repurchased
and Retired | | | Ending
NAV | | | Ending
Share
Price | |
|
BXMX | |
Year Ended 12/31: | |
2017(e) | | $ | 13.52 | | | $ | 0.08 | | | $ | 0.79 | | | $ | 0.87 | | | $ | (0.46 | )**** | | $ | — | | | $ | — | | | $ | (0.46 | ) | | $ | — | | | $ | 13.93 | | | $ | 13.85 | |
2016 | | | 13.34 | | | | 0.18 | | | | 0.93 | | | | 1.11 | | | | (0.44 | ) | | | (0.29 | ) | | | (0.20 | ) | | | (0.93 | ) | | | — | | | | 13.52 | | | | 12.72 | |
2015 | | | 13.65 | | | | 0.17 | | | | 0.52 | | | | 0.69 | | | | (1.00 | ) | | | — | | | | — | | | | (1.00 | ) | | | — | | | | 13.34 | | | | 13.43 | |
2014 | | | 13.81 | | | | 0.17 | | | | 0.67 | | | | 0.84 | | | | (0.19 | ) | | | — | | | | (0.81 | ) | | | (1.00 | ) | | | — | | | | 13.65 | | | | 12.11 | |
2013 | | | 13.13 | | | | 0.20 | | | | 1.56 | | | | 1.76 | | | | (0.20 | ) | | | — | | | | (0.88 | ) | | | (1.08 | ) | | | — | | | | 13.81 | | | | 12.55 | |
2012 | | | 12.89 | | | | 0.24 | | | | 1.08 | | | | 1.32 | | | | (0.25 | ) | | | — | | | | (0.83 | ) | | | (1.08 | ) | | | — | * | | | 13.13 | | | | 11.83 | |
|
DIAX | |
Year Ended 12/31: | |
2017(e) | | | 16.55 | | | | 0.13 | | | | 1.15 | | | | 1.28 | | | | (0.51 | )**** | | | — | | | | — | | | | (0.51 | ) | | | — | | | | 17.32 | | | | 16.52 | |
2016 | | | 15.78 | | | | 0.27 | | | | 1.54 | | | | 1.81 | | | | (0.27 | ) | | | — | | | | (0.77 | ) | | | (1.04 | ) | | | — | | | | 16.55 | | | | 15.00 | |
2015 | | | 16.83 | | | | 0.25 | | | | (0.24 | ) | | | 0.01 | | | | (0.65 | ) | | | (0.07 | ) | | | (0.34 | ) | | | (1.06 | ) | | | — | | | | 15.78 | | | | 14.36 | |
2014 | | | 16.62 | | | | 0.18 | | | | 1.09 | | | | 1.27 | | | | (0.22 | ) | | | (0.09 | ) | | | (0.75 | ) | | | (1.06 | ) | | | — | | | | 16.83 | | | | 15.42 | |
2013 | | | 14.34 | | | | 0.22 | | | | 3.12 | | | | 3.34 | | | | (0.54 | ) | | | (0.43 | ) | | | (0.09 | ) | | | (1.06 | ) | | | — | | | | 16.62 | | | | 15.57 | |
2012 | | | 14.23 | | | | 0.25 | | | | 0.92 | | | | 1.17 | | | | (0.53 | ) | | | — | | | | (0.53 | ) | | | (1.06 | ) | | | — | | | | 14.34 | | | | 13.25 | |
|
SPXX | |
Year Ended 12/31: | |
2017(e) | | | 14.98 | | | | 0.09 | | | | 1.12 | | | | 1.21 | | | | (0.48 | )**** | | | — | | | | — | | | | (0.48 | ) | | | — | | | | 15.71 | | | | 15.36 | |
2016 | | | 14.72 | | | | 0.20 | | | | 1.04 | | | | 1.24 | | | | (0.85 | ) | | | — | | | | (0.13 | ) | | | (0.98 | ) | | | — | | | | 14.98 | | | | 14.40 | |
2015 | | | 15.61 | | | | 0.20 | | | | (0.05 | ) | | | 0.15 | | | | (0.70 | ) | | | — | | | | (0.34 | ) | | | (1.04 | ) | | | — | | | | 14.72 | | | | 13.47 | |
2014 | | | 15.68 | | | | 0.19 | | | | 0.78 | | | | 0.97 | | | | (0.19 | ) | | | — | | | | (0.85 | ) | | | (1.04 | ) | | | — | | | | 15.61 | | | | 14.30 | |
2013 | | | 14.36 | | | | 0.22 | | | | 2.22 | | | | 2.44 | | | | (0.22 | ) | | | — | | | | (0.90 | ) | | | (1.12 | ) | | | — | | | | 15.68 | | | | 14.12 | |
2012 | | | 13.96 | | | | 0.25 | | | | 1.27 | | | | 1.52 | | | | (0.26 | ) | | | — | | | | (0.86 | ) | | | (1.12 | ) | | | — | * | | | 14.36 | | | | 12.93 | |
|
QQQX | |
Year Ended 12/31: | |
2017(e) | | | 19.58 | | | | 0.03 | | | | 2.19 | | | | 2.22 | | | | (0.70 | )**** | | | — | | | | — | | | | (0.70 | ) | | | — | | | | 21.10 | | | | 21.71 | |
2016 | | | 19.98 | | | | 0.09 | | | | 0.91 | | | | 1.00 | | | | (0.09 | ) | | | (0.81 | ) | | | (0.50 | ) | | | (1.40 | ) | | | — | | | | 19.58 | | | | 18.56 | |
2015 | | | 19.86 | | | | 0.11 | | | | 1.41 | | | | 1.52 | | | | (0.43 | ) | | | (0.97 | ) | | | — | | | | (1.40 | ) | | | — | | | | 19.98 | | | | 19.37 | |
2014 | | | 18.54 | | | | 0.06 | | | | 2.62 | | | | 2.68 | | | | (0.07 | ) | | | (0.48 | ) | | | (0.81 | ) | | | (1.36 | ) | | | — | | | | 19.86 | | | | 19.25 | |
2013 | | | 15.17 | | | | 0.07 | | | | 4.51 | | | | 4.58 | | | | (0.07 | ) | | | — | | | | (1.14 | ) | | | (1.21 | ) | | | — | | | | 18.54 | | | | 17.80 | |
2012 | | | 14.11 | | | | 0.06 | | | | 2.21 | | | | 2.27 | | | | (0.06 | ) | | | — | | | | (1.15 | ) | | | (1.21 | ) | | | — | | | | 15.17 | | | | 15.08 | |
| (a) | Per share Net Investment Income (Loss) is calculated using the average daily shares method. |
| (b) | Total Return Based on NAV is the combination of changes in NAV, reinvested dividend income at NAV and reinvested capital gains distributions at NAV, if any. The last dividend declared in the period, which is typically paid on the first business day of the following month, is assumed to be reinvested at the ending NAV. The actual reinvest price for the last dividend declared in the period may often be based on the Fund’s market price (and not its NAV), and therefore may be different from the price used in the calculation. Total returns are not annualized. |
Total Return Based on Share Price is the combination of changes in the market price per share and the effect of reinvested dividend income and reinvested capital gains distributions, if any, at the average price paid per share at the time of reinvestment. The last dividend declared in the period, which is typically paid on the first business day of the following month, is assumed to be reinvested at the ending market price. The actual reinvestment for the last dividend declared in the period may take place over several days, and in some instances may not be based on the market price, so the actual reinvestment price may be different from the price used in the calculation. Total returns are not annualized.
| | | | | | | | | | | | | | | | | | | | | | | | | | | | | | |
| | | | | | | Ratios/Supplemental Data | |
| Total Returns | | | | | | Ratios to Average Net Assets
Before Reimbursement | | | Ratios to Average Net Assets
After Reimbursement(c) | | | | |
Based
on
NAV(b) | | | Based
on
Share
Price(b) | | | Ending
Net
Assets
(000) | | | Expenses | | | Net
Investment
Income (Loss) | | | Expenses | | | Net
Investment
Income (Loss) | | | Portfolio
Turnover
Rate(d) | |
| | | | | | | |
| | | | | | | | | | | | | | | | | | | | | | | | | | | | | | | |
| | | | | | | | | | | | | | | | | | | | | | | | | | | | | | |
| | 6.46 | % | | | 12.57 | % | | $ | 1,442,182 | | | | 0.92 | %*** | | | 1.10 | %*** | | | N/A | | | | N/A | | | | 1 | % |
| | 8.68 | | | | 1.75 | | | | 1,399,863 | | | | 0.93 | | | | 1.34 | | | | N/A | | | | N/A | | | | 5 | |
| | 5.17 | | | | 19.80 | | | | 1,381,889 | | | | 0.91 | | | | 1.24 | | | | N/A | | | | N/A | | | | 8 | |
| | 6.20 | | | | 4.31 | | | | 1,413,549 | | | | 1.02 | | | | 1.21 | | | | N/A | | | | N/A | | | | 14 | |
| | 13.85 | | | | 15.53 | | | | 531,112 | | | | 0.96 | | | | 1.48 | | | | N/A | | | | N/A | | | | — | ** |
| | 10.43 | | | | 15.58 | | | | 504,982 | | | | 0.96 | | | | 1.78 | | | | 0.91 | % | | | 1.84 | % | | | 3 | |
| | | | | | | |
| | | | | | | | | | | | | | | | | | | | | | | | | | | | | | | |
| | | | | | | | | | | | | | | | | | | | | | | | | | | | | | |
| | 7.80 | | | | 13.66 | | | | 625,058 | | | | 0.93 | *** | | | 1.52 | *** | | | N/A | | | | N/A | | | | 2 | |
| | 11.95 | | | | 12.18 | | | | 597,216 | | | | 0.94 | | | | 1.73 | | | | N/A | | | | N/A | | | | 6 | |
| | 0.17 | | | | 0.18 | | | | 569,604 | | | | 0.93 | | | | 1.52 | | | | N/A | | | | N/A | | | | 18 | |
| | 7.93 | | | | 5.89 | | | | 607,309 | | | | 1.12 | | | | 1.08 | | | | N/A | | | | N/A | | | | 6 | |
| | 23.93 | | | | 26.09 | | | | 199,699 | | | | 1.01 | | | | 1.42 | | | | N/A | | | | N/A | | | | 21 | |
| | 8.27 | | | | 9.04 | | | | 172,266 | | | | 1.00 | | | | 1.73 | | | | N/A | | | | N/A | | | | 3 | |
| | | | | | | |
| | | | | | | | | | | | | | | | | | | | | | | | | | | | | | | |
| | | | | | | | | | | | | | | | | | | | | | | | | | | | | | |
| | 8.13 | | | | 10.09 | | | | 253,735 | | | | 0.92 | *** | | | 1.16 | *** | | | N/A | | | | N/A | | | | 3 | |
| | 8.73 | | | | 14.75 | | | | 242,003 | | | | 0.93 | | | | 1.39 | | | | N/A | | | | N/A | | | | 13 | |
| | 1.09 | | | | 1.70 | | | | 237,809 | | | | 0.92 | | | | 1.32 | | | | N/A | | | | N/A | | | | 21 | |
| | 6.37 | | | | 8.88 | | | | 252,080 | | | | 0.96 | | | | 1.23 | | | | N/A | | | | N/A | | | | 8 | |
| | 17.47 | | | | 18.32 | | | | 253,216 | | | | 0.96 | | | | 1.43 | | | | N/A | | | | N/A | | | | 1 | |
| | 11.03 | | | | 16.58 | | | | 232,005 | | | | 0.96 | | | | 1.74 | | | | N/A | | | | N/A | | | | 1 | |
| | | | | | | |
| | | | | | | | | | | | | | | | | | | | | | | | | | | | | | | |
| | | | | | | | | | | | | | | | | | | | | | | | | | | | | | |
| | 11.42 | | | | 20.89 | | | | 772,011 | | | | 0.93 | *** | | | 0.33 | *** | | | N/A | | | | N/A | | | | 7 | |
| | 5.28 | | | | 3.30 | | | | 715,835 | | | | 0.94 | | | | 0.49 | | | | N/A | | | | N/A | | | | 17 | |
| | 7.97 | | | | 8.47 | | | | 730,622 | | | | 0.93 | | | | 0.54 | | | | N/A | | | | N/A | | | | 15 | |
| | 14.94 | | | | 16.12 | | | | 726,282 | | | | 1.00 | | | | 0.32 | | | | N/A | | | | N/A | | | | 17 | |
| | 31.30 | | | | 27.04 | | | | 343,130 | | | | 1.00 | | | | 0.44 | | | | N/A | | | | N/A | | | | 9 | |
| | 15.98 | | | | 25.05 | | | | 280,033 | | | | 1.01 | | | | 0.40 | | | | N/A | | | | N/A | | | | 1 | |
| (c) | After expense reimbursement from Adviser, where applicable. As of October 31, 2012, the Adviser is no longer reimbursing BXMX, for any fees or expenses. |
| (d) | Portfolio Turnover Rate is calculated based on the lesser of long-term purchases or sales (as disclosed in Note 5 – Investment Transactions) divided by the average long-term market value during the period. |
| (e) | For the six months ended June 30, 2017. |
| N/A | Fund does not have, or no longer has, a contractual reimbursement agreement with the Adviser. |
| * | Rounds to less than $0.01 per share. |
| ** | Rounds to less than 1%. |
| **** | Represents distributions paid “From and in excess of net investment income” for the six months ended June 30, 2017 (as described in Note 1 – General Information and Significant Accounting Policies, Dividends and Distributions to Shareholders). |
See accompanying notes to financial statements.
Notes to
Financial Statements (Unaudited)
1. General Information and Significant Accounting Policies
General Information
Fund Information
The funds covered in this report and their corresponding New York Stock Exchange (“NYSE”) or NASDAQ National Market (“NASDAQ”) symbols are as follows (each a “Fund” and collectively, the “Funds”):
| | • | | Nuveen S&P 500 Buy-Write Income Fund (BXMX) |
| | • | | Nuveen Dow 30SM Dynamic Overwrite Fund (DIAX) |
| | • | | Nuveen S&P 500 Dynamic Overwrite Fund (SPXX) |
| | • | | Nuveen Nasdaq 100 Dynamic Overwrite Fund (QQQX) |
The Funds are registered under the Investment Company Act of 1940, as amended, as diversified (non-diversified for DIAX and QQQX) closed-end management investment companies. Shares of BXMX, DIAX and SPXX are traded on the NYSE while shares of QQQX are traded on the NASDAQ. BXMX, DIAX, SPXX and QQQX were organized as Massachusetts business trusts on July 23, 2004, May 20, 2014, November 11, 2004 and May 20, 2014, respectively.
The end of the reporting period for the Funds is June 30, 2017, and the period covered by these Notes to Financial Statements is the six months ended June 30, 2017 (the “current fiscal period”).
Investment Adviser
The Funds’ investment adviser is Nuveen Fund Advisors, LLC (the “Adviser”), a subsidiary of Nuveen, LLC (“Nuveen”). Nuveen is the investment management arm of Teachers Insurance and Annuity Association of America (TIAA). The Adviser has overall responsibility for management of the Funds, oversees the management of the Funds’ portfolios, manages the Funds’ business affairs and provides certain clerical, bookkeeping and other administrative services, and, if necessary, asset allocation decisions. The Adviser has entered into sub-advisory agreements with Gateway Investment Advisers, LLC (“Gateway”), under which Gateway manages BXMX’s investment portfolio and Nuveen Asset Management, LLC (“NAM”), a subsidiary of the Adviser, under which NAM manages the investment portfolios of DIAX, SPXX and QQQX.
Investment Objectives and Principal Investment Strategies
BXMX’s investment objective is to provide a high level of current income and gains. The Fund invests its managed assets in a diversified equity portfolio that seeks to substantially replicate price movements of the S&P 500 Buy-Write Index (BXM). The Fund also uses an index option strategy of writing (selling) index call options in seeking to moderate the volatility of returns relative to an all equity portfolio.
DIAX’s investment objective is to seek attractive total return with less volatility than the Dow Jones Industrial AverageSM (“DJIA”). The Fund pursues its investment strategy by emphasizing single name options on individual stocks in the DJIA, as well as a range of options including index options on the DJIA and other broad-based indexes and options on custom baskets of stocks in addition to exchange-traded funds (ETFs). The Fund uses a dynamic call option overwrite strategy within a range of approximately 35% to 75%, with a long-run target of 55% overwrite of the value of the Fund’s equity portfolio, in seeking to enhance the portfolio’s risk-adjusted returns.
SPXX’s investment objective is to seek attractive total returns with less volatility than the S&P 500® Index. The Fund pursues its investment strategy by emphasizing index call options on the S&P 500® Index, as well as a range of options including index options on other broad-based indexes and options on custom baskets of stocks in addition to exchange-traded funds (ETFs). The Fund uses a dynamic call option overwrite strategy within a range of approximately 35% to 75%, with a long-run target of 55% overwrite of the value of the Fund’s equity portfolio, in seeking to enhance the portfolio’s risk-adjusted returns.
QQQX’s investment objective is to seek attractive total return with less volatility than the NASDAQ 100® Index. The Fund pursues its investment strategy by emphasizing index call options on the NASDQ-100® Index, as well other broad-based indexes and options on a variety of other equity market indexes and options on custom baskets of stocks in addition to exchange-traded funds (ETFs) and single name options. The Fund uses a dynamic call option overwrite strategy within a range of approximately 35% to 75%, with a long-run target of 55% overwrite of the value of the Fund’s equity portfolio, in seeking to enhance the portfolio’s risk-adjusted returns. The Fund also has the opportunity to utilize call spread strategies and sell put options on a portion of the underlying equity portfolio.
Significant Accounting Policies
Each Fund is an investment company and follows accounting and reporting guidance under Financial Accounting Standards Board (FASB) Accounting Standards Codification (ASC) Topic 946 “Financial Services – Investment Companies.” The following is a summary of significant accounting policies followed by the Funds in the preparation of their financial statements in accordance with accounting principles generally accepted in the United States of America (“U.S. GAAP”).
Investment Transactions
Investment transactions are recorded on a trade date basis. Realized gains and losses from transactions are determined on the specific identification method, which is the same basis used for federal income tax purposes. Investments purchased on a when-issued/delayed delivery basis may have extended settlement periods. Any investments so purchased are subject to market fluctuation during this period. The Funds have earmarked securities in their portfolios with a current value at least equal to the amount of the when-issued/delayed delivery purchase commitments.
As of the end of the reporting period, the Funds did not have any outstanding when-issued/delayed delivery purchase commitments.
Investment Income
Dividend income is recorded on the ex-dividend date or, for foreign securities, when information is available. Interest income is recorded on an accrual basis.
Professional Fees
Professional fees presented on the Statement of Operations consist of legal fees incurred in the normal course of operations, audit fees, tax consulting fees and, in some cases, workout expenditures. Workout expenditures are incurred in an attempt to protect or enhance an investment, or to pursue other claims or legal actions on behalf of Fund shareholders. If a refund is received for workout expenditures paid in a prior reporting period, such amounts will be recognized as “Legal fee refund” on the Statement of Operations.
Dividends and Distributions to Shareholders
Distributions to shareholders are recorded on the ex-dividend date. The amount and timing of distributions are determined in accordance with federal income tax regulations, which may differ from U.S. GAAP.
Each Fund makes quarterly cash distributions to shareholders of a stated dollar amount per share. Subject to approval and oversight by the Funds’ Board of Trustees (the “Board”), each Fund seeks to maintain a stable distribution level designed to deliver the long-term return potential of each Fund’s investment strategy through regular quarterly distributions (a “Managed Distribution Program”). Total distributions during a calendar year generally will be made from each Fund’s net investment income, net realized capital gains and net unrealized capital gains in the Fund’s portfolio, if any. The portion of distributions paid attributed to net unrealized gains, if any, is distributed from the Fund’s assets and is treated by shareholders as a nontaxable distribution (“return of capital”) for tax purposes. In the event that total distributions during a calendar year exceed a Fund’s total return on net asset value (“NAV”), the difference will reduce NAV per share. If a Fund’s total return on NAV exceeds total distributions during a calendar year, the excess will be reflected as an increase in NAV per share. The final determination of the source and character of all distributions paid by a Fund during the fiscal year is made after the end of the fiscal year and is reflected in the financial statements contained in the annual report as of December 31 each year.
The distributions made by the Fund during the current fiscal period are provisionally classified as being “From and in excess of net investment income,” and those distributions will be classified as being from net investment income, net realized capital gains and/or a return of capital for tax purposes after the fiscal year end. For purposes of calculating “Undistributed (Overdistribution of) net investment income” as of the end of the reporting period, the distribution amounts provisionally classified as “From and in excess of net investment income” were treated as being entirely from net investment income. Consequently, the financial statements as of the end of the reporting period, reflect an over-distribution of net investment income.
Compensation
The Funds pay no compensation directly to those of its trustees who are affiliated with the Adviser or to its officers, all of whom receive remuneration for their services to the Funds from the Adviser or its affiliates. The Board has adopted a deferred compensation plan for independent trustees that enables trustees to elect to defer receipt of all or a portion of the annual compensation they are entitled to receive from certain Nuveen-advised funds. Under the plan, deferred amounts are treated as though equal dollar amounts had been invested in shares of select Nuveen advised funds.
Indemnifications
Under the Funds’ organizational documents, their officers and trustees are indemnified against certain liabilities arising out of the performance of their duties to the Funds. In addition, in the normal course of business, the Funds enter into contracts that provide general indemnifications to other parties. The Funds’ maximum exposure under these arrangements is unknown as this would involve future claims that may be made against the Funds that have not yet occurred. However, the Funds have not had prior claims or losses pursuant to these contracts and expect the risk of loss to be remote.
Notes to Financial Statements (Unaudited) (continued)
Netting Agreements
In the ordinary course of business, the Funds may enter into transactions subject to enforceable master repurchase agreements, International Swaps and Derivatives Association, Inc. (“ISDA”) master agreements or other similar arrangements (“netting agreements”). Generally, the right to offset in netting agreements allows each Fund to offset certain securities and derivatives with a specific counterparty, when applicable, as well as any collateral received or delivered to that counterparty based on the terms of the agreements. Generally, each Fund manages its cash collateral and securities collateral on a counterparty basis.
The Funds’ investments subject to netting agreements as of the end of the reporting period, if any, are further described in Note 3 – Portfolio Securities and Investments in Derivatives.
Use of Estimates
The preparation of financial statements in conformity with U.S. GAAP requires management to make estimates and assumptions that affect the reported amounts of assets and liabilities at the date of the financial statements and the reported amounts of increases and decreases in net assets from operations during the current fiscal period. Actual results may differ from those estimates.
2. Investment Valuation and Fair Value Measurements
The fair valuation input levels as described below are for fair value measurement purposes.
Fair value is defined as the price that would be received upon selling an investment or transferring a liability in an orderly transaction to an independent buyer in the principal or most advantageous market for the investment. A three-tier hierarchy is used to maximize the use of observable market data and minimize the use of unobservable inputs and to establish classification of fair value measurements for disclosure purposes. Observable inputs reflect the assumptions market participants would use in pricing the asset or liability. Observable inputs are based on market data obtained from sources independent of the reporting entity. Unobservable inputs reflect the reporting entity’s own assumptions about the assumptions market participants would use in pricing the asset or liability. Unobservable inputs are based on the best information available in the circumstances. The following is a summary of the three-tiered hierarchy of valuation input levels.
| | |
| Level 1 – | | Inputs are unadjusted and prices are determined using quoted prices in active markets for identical securities. |
| Level 2 – | | Prices are determined using other significant observable inputs (including quoted prices for similar securities, interest rates, prepayment speeds, credit risk, etc.). |
| Level 3 – | | Prices are determined using significant unobservable inputs (including management’s assumptions in determining the fair value of investments). |
Common stocks and other equity-type securities are valued at the last sales price on the securities exchange on which such securities are primarily traded and are generally classified as Level 1. Securities primarily traded on the NASDAQ National Market (“NASDAQ”) are valued at the NASDAQ Official Closing Price and are generally classified as Level 1. However, securities traded on a securities exchange or NASDAQ for which there were no transactions on a given day or securities not listed on a securities exchange or NASDAQ are valued at the last quoted bid price and are generally classified as Level 2. Prices of certain American Depositary Receipts (“ADR”) held by the Funds that trade in the United States are valued based on the last traded price, official closing price, or the most recent bid price of the underlying non-U.S.-traded stock, adjusted as appropriate for the underlying-to-ADR conversion ratio and foreign exchange rate, and from time-to-time may also be adjusted further to take into account material events that may take place after the close of the local non-U.S. market but before the close of the NYSE, which may represent a transfer from a Level 1 to a Level 2 security.
Prices of fixed-income securities are provided by an independent pricing service (“pricing service”) approved by the Board. The pricing service establishes a security’s fair value using methods that may include consideration of the following: yields or prices of investments of comparable quality, type of issue, coupon, maturity and rating, market quotes or indications of value from security dealers, evaluations of anticipated cash flows or collateral, general market conditions and other information and analysis, including the obligor’s credit characteristics considered relevant. These securities are generally classified as Level 2. In pricing certain securities, particularly less liquid and lower quality securities, the pricing service may consider information about a security, its issuer or market activity, provided by the Adviser. These securities are generally classified as Level 2 or Level 3 depending on the observability of the significant inputs.
Exchange-traded funds are valued at the last sales price on the securities exchange on which such securities are primarily traded and are generally classified as Level 1.
Index options are valued at the 4:00 p.m. Eastern Time (ET) close price of the NYSE. The values of exchange-traded options are based on the mean of the closing bid and ask prices. Index and exchange-traded options are generally classified as Level 1. Options traded in the over-the-counter (“OTC”) market are valued using an evaluated mean price and are generally classified as Level 2.
Repurchase agreements are valued at contract amount plus accrued interest, which approximates market value. These securities are generally classified as Level 2.
Investments initially valued in currencies other than the U.S. dollar are converted to the U.S. dollar using exchange rates obtained from pricing services. As a result, the NAV of a Fund’s shares may be affected by changes in the value of currencies in relation to the U.S. dollar. The value of securities traded in markets outside the United States or denominated in currencies other than the U.S. dollar may be affected significantly on a day that the NYSE is closed and an investor is not able to purchase, redeem or exchange shares. If significant market events occur between the time of determination of the closing price of a foreign security on an exchange and the time that the Funds’ NAV is determined, or if under the Funds’ procedures, the closing price of a foreign security is not deemed to be reliable, the security would be valued at fair value as determined in accordance with procedures established in good faith by the Board. These securities are generally classified as Level 2 or Level 3 depending on the observability of the significant inputs.
Certain securities may not be able to be priced by the pre-established pricing methods as described above. Such securities may be valued by the Board and/or its appointee at fair value. These securities generally include, but are not limited to, restricted securities (securities which may not be publicly sold without registration under the Securities Act of 1933, as amended) for which a pricing service is unable to provide a market price; securities whose trading has been formally suspended; debt securities that have gone into default and for which there is no current market quotation; a security whose market price is not available from a pre-established pricing source; a security with respect to which an event has occurred that is likely to materially affect the value of the security after the market has closed but before the calculation of a Fund’s NAV (as may be the case in non-U.S. markets on which the security is primarily traded) or make it difficult or impossible to obtain a reliable market quotation; and a security whose price, as provided by the pricing service, is not deemed to reflect the security’s fair value. As a general principle, the fair value of a security would appear to be the amount that the owner might reasonably expect to receive for it in a current sale. A variety of factors may be considered in determining the fair value of such securities, which may include consideration of the following: yields or prices of investments of comparable quality, type of issue, coupon, maturity and rating, market quotes or indications of value from security dealers, evaluations of anticipated cash flows or collateral, general market conditions and other information and analysis, including the obligor’s credit characteristics considered relevant. These securities are generally classified as Level 2 or Level 3 depending on the observability of the significant inputs. Regardless of the method employed to value a particular security, all valuations are subject to review by the Board and/or its appointee.
The inputs or methodologies used for valuing securities are not an indication of the risks associated with investing in those securities. The following is a summary of each Fund’s fair value measurements as of the end of the reporting period:
| | | | | | | | | | | | | | | | |
| BXMX | | Level 1 | | | Level 2 | | | Level 3 | | | Total | |
Long-Term Investments*: | | | | | | | | | | | | | | | | |
Common Stocks | | $ | 1,436,953,719 | | | $ | — | | | $ | — | | | $ | 1,436,953,719 | |
| | | | |
Short-Term Investments: | | | | | | | | | | | | | | | | |
Repurchase Agreements | | | — | | | | 44,606,149 | | | | — | | | | 44,606,149 | |
| | | | |
Investments in Derivatives: | | | | | | | | | | | | | | | | |
Options Written | | | (16,822,505 | ) | | | — | | | | — | | | | (16,822,505 | ) |
Total | | $ | 1,420,131,214 | | | $ | 44,606,149 | | | $ | — | | | $ | 1,464,737,363 | |
| DIAX | | | | | | | | | | | | |
Long-Term Investments*: | | | | | | | | | | | | | | | | |
Common Stocks | | $ | 623,500,000 | | | $ | — | | | $ | — | | | $ | 623,500,000 | |
| | | | |
Short-Term Investments: | | | | | | | | | | | | | | | | |
Repurchase Agreements | | | — | | | | 1,886,019 | | | | — | | | | 1,886,019 | |
U.S. Government and Agency Obligations | | | — | | | | 4,998,115 | | | | — | | | | 4,998,115 | |
| | | | |
Investments in Derivatives: | | | | | | | | | | | | | | | | |
Options Purchased | | | 3,300 | | | | — | | | | — | | | | 3,300 | |
Options Written | | | (2,612,550 | ) | | | — | | | | — | | | | (2,612,550 | ) |
Total | | $ | 620,890,750 | | | $ | 6,884,134 | | | $ | — | | | $ | 627,774,884 | |
| SPXX | | | | | | | | | | | | |
Long-Term Investments*: | | | | | | | | | | | | | | | | |
Common Stocks | | $ | 253,544,747 | | | $ | — | | | $ | — | | | $ | 253,544,747 | |
| | | | |
Short-Term Investments: | | | | | | | | | | | | | | | | |
Repurchase Agreements | | | — | | | | 184,720 | | | | — | | | | 184,720 | |
| | | | |
Investments in Derivatives: | | | | | | | | | | | | | | | | |
Options Purchased | | | 1,650 | | | | — | | | | — | | | | 1,650 | |
Options Written | | | (1,061,120 | ) | | | — | | | | — | | | | (1,061,120 | ) |
Total | | $ | 252,485,277 | | | $ | 184,720 | | | $ | — | | | $ | 252,669,997 | |
Notes to Financial Statements (Unaudited) (continued)
| | | | | | | | | | | | | | | | |
| QQQX | | Level 1 | | | Level 2 | | | Level 3 | | | Total | |
Long-Term Investments*: | | | | | | | | | | | | | | | | |
Common Stocks | | $ | 769,403,171 | | | $ | — | | | $ | — | | | $ | 769,403,171 | |
Exchange-Traded Funds | | | 9,634,800 | | | | — | | | | — | | | | 9,634,800 | |
| | | | |
Short-Term Investments: | | | | | | | | | | | | | | | | |
Repurchase Agreements | | | — | | | | 2,934,451 | | | | — | | | | 2,934,451 | |
| | | | |
Investments in Derivatives: | | | | | | | | | | | | | | | | |
Options Purchased | | | 3,300 | | | | — | | | | — | | | | 3,300 | |
Options Written | | | (5,362,675 | ) | | | — | | | | — | | | | (5,362,675 | ) |
Total | | $ | 773,678,596 | | | $ | 2,934,451 | | | $ | — | | | $ | 776,613,047 | |
| * | Refer to the Fund’s Portfolio of Investments for industry classifications, when applicable. |
The Board is responsible for the valuation process and has appointed the oversight of the daily valuation process to the Adviser’s Valuation Committee. The Valuation Committee, pursuant to the valuation policies and procedures adopted by the Board, is responsible for making fair value determinations, evaluating the effectiveness of the Funds’ pricing policies and reporting to the Board. The Valuation Committee is aided in its efforts by the Adviser’s dedicated Securities Valuation Team, which is responsible for administering the daily valuation process and applying fair value methodologies as approved by the Valuation Committee. When determining the reliability of independent pricing services for investments owned by the Funds, the Valuation Committee, among other things, conducts due diligence reviews of the pricing services and monitors the quality of security prices received through various testing reports conducted by the Securities Valuation Team.
The Valuation Committee will consider pricing methodologies it deems relevant and appropriate when making a fair value determination, based on the facts and circumstances specific to the portfolio instrument. Fair value determinations generally will be derived as follows, using public or private market information:
| | (i) | If available, fair value determinations shall be derived by extrapolating from recent transactions or quoted prices for identical or comparable securities. |
| | (ii) | If such information is not available, an analytical valuation methodology may be used based on other available information including, but not limited to: analyst appraisals, research reports, corporate action information, issuer financial statements and shelf registration statements. Such analytical valuation methodologies may include, but are not limited to: multiple of earnings, discount from market value of a similar freely-traded security, discounted cash flow analysis, book value or a multiple thereof, risk premium/yield analysis, yield to maturity and/or fundamental investment analysis. |
The purchase price of a portfolio instrument will be used to fair value the instrument only if no other valuation methodology is available or deemed appropriate, and it is determined that the purchase price fairly reflects the instrument’s current value.
For each portfolio security that has been fair valued pursuant to the policies adopted by the Board, the fair value price is compared against the last available and next available market quotations. The Valuation Committee reviews the results of such testing and fair valuation occurrences are reported to the Board.
3. Portfolio Securities and Investments in Derivatives
Portfolio Securities
Foreign Currency Transactions
To the extent that the Funds may invest in securities and/or contracts that are denominated in a currency other than U.S. dollars, the Funds will be subject to currency risk, which is the risk that an increase in the U.S. dollar relative to the foreign currency will reduce returns or portfolio value. Generally, when the U.S. dollar rises in value against a foreign currency, the Funds’ investments denominated in that currency will lose value because their currency is worth fewer U.S. dollars; the opposite effect occurs if the U.S. dollar falls in relative value. Investments and other assets and liabilities denominated in foreign currencies are converted into U.S. dollars on a spot (i.e. cash) basis at the spot rate prevailing in the foreign currency exchange market at the time of valuation. Purchases and sales of investments and income denominated in foreign currencies are translated into U.S. dollars on the respective dates of such transactions.
The books and records of the Funds are maintained in U.S. dollars. Foreign currencies, assets and liabilities are translated into U.S. dollars at 4:00 p.m. ET. Investment transactions, income and expenses are translated on the respective dates of such transactions. Net realized foreign currency gains and losses resulting from changes in exchange rates include foreign currency gains and losses between trade date and settlement date of the transactions, foreign currency transactions, and the difference between the amounts of interest and dividends recorded on the books of the Funds and the amounts actually received.
The realized gains and losses resulting from changes in foreign currency exchange rates and changes in foreign exchange rates associated with (i) foreign currency, (ii) investments, (iii) investments in derivatives and (iv) other assets and liabilities are recognized as a component of “Net realized gain (loss) from investments and foreign currency” on the Statement of Operations, when applicable.
The unrealized gains and losses resulting from changes in foreign currency exchange rates and changes in foreign exchange rates associated with (i) investments and (ii) other assets and liabilities are recognized as a component of “Change in unrealized appreciation (depreciation) of investments and foreign currency” on the Statement of Operations, when applicable. The unrealized gains and losses resulting from changes in foreign exchange rates associated with investments in derivatives are recognized as a component of the respective derivative’s related “Change in net unrealized appreciation (depreciation)” on the Statement of Operations, when applicable.
Repurchase Agreements
In connection with transactions in repurchase agreements, it is each Fund’s policy that its custodian take possession of the underlying collateral securities, the fair value of which exceeds the principal amount of the repurchase transaction, including accrued interest, at all times. If the counterparty defaults, and the fair value of the collateral declines, realization of the collateral may be delayed or limited.
The following table presents the repurchase agreements for the Funds that are subject to netting agreements as of the end of the reporting period, and the collateral delivered related to those repurchase agreements.
| | | | | | | | | | | | | | |
| Fund | | Counterparty | | Short-Term
Investments, at Value | | | Collateral
Pledged (From)
Counterparty* | | | Net
Exposure | |
| BXMX | | Fixed Income Clearing Corporation | | $ | 44,606,149 | | | $ | (44,606,149 | ) | | $ | — | |
| DIAX | | Fixed Income Clearing Corporation | | | 1,886,019 | | | | (1,886,019 | ) | | | — | |
| SPXX | | Fixed Income Clearing Corporation | | | 184,720 | | | | (184,720 | ) | | | — | |
| QQQX | | Fixed Income Clearing Corporation | | | 2,934,451 | | | | (2,934,451 | ) | | | — | |
| * | As of the end of the reporting period, the value of the collateral pledged from the counterparty exceeded the value of the repurchase agreements. Refer to the Fund’s Portfolio of Investments for details on the repurchase agreements. |
Zero Coupon Securities
A zero coupon security does not pay a regular interest coupon to its holders during the life of the security. Income to the holder of the security comes from accretion of the difference between the original purchase price of the security at issuance and the par value of the security at maturity and is effectively paid at maturity. The market prices of zero coupon securities generally are more volatile than the market prices of securities that pay interest periodically.
Investments in Derivatives
Each Fund is authorized to invest in certain derivative instruments, such as futures, options and swap contracts. Each Fund limits its investments in futures, options on futures and swap contracts to the extent necessary for the Adviser to claim the exclusion from registration by the Commodity Futures Trading Commission as a commodity pool operator with respect to the Fund. The Funds record derivative instruments at fair value, with changes in fair value recognized on the Statement of Operations, when applicable. Even though the Funds’ investments in derivatives may represent economic hedges, they are not considered to be hedge transactions for financial reporting purposes.
Options Transactions
The purchase of options involves the risk of loss of all or a part of the cash paid for the options (the premium). The market risk associated with purchasing options is limited to the premium paid. The counterparty credit risk of purchasing options, however, needs to take into account the current value of the option, as this is the performance expected from the counterparty. When a Fund purchases an option, an amount equal to the premium paid (the premium plus commission) is recognized as a component of “Options purchased, at value” on the Statement of Asset and Liabilities. When a Fund writes an option, an amount equal to the net premium received (the premium less commission) is recognized as a component of “Options written, at value” on the Statement of Assets and Liabilities and is subsequently adjusted to reflect the current value of the written option until the option is exercised or expires or the Fund enters into a closing purchase transaction. The changes in the value of options purchased and/or written during the fiscal period are recognized as a component of “Change in net unrealized appreciation (depreciation) of options purchased and/or written” on the Statement of Operations. When an option is exercised or expires or a Fund enters into a closing purchase transaction, the difference between the net premium received, and any amount paid at expiration or on executing a closing purchase transaction, including commission, is recognized as a component of “Net realized gain (loss) from options purchased and/or written” on the Statement of Operations. The Fund, as writer of an option, has no control over whether the underlying instrument may be sold (called) or purchased (put) and as a result bears the risk of an unfavorable change in the market value of the instrument underlying the written option. There is also the risk the Fund may not be able to enter into a closing transaction because of an illiquid market.
During the current fiscal period, BXMX sold call options on equity indices as part of its overall investment strategy with the notional amount of these options averaging 99% of the Fund’s assets.
Notes to Financial Statements (Unaudited) (continued)
During the current fiscal period, DIAX, SPXX and QQQX, each sold call options on equity indices as part of its overall investment strategy with the notional amounts of these options averaging 55% of each Fund’s assets. Each Fund also purchased a small amount of call options and put options as part of its overwrite strategy and sold put options on up to 5% of its portfolio.
The average notional amount of outstanding options purchased and options written during the current fiscal period, was as follows:
| | | | | | | | | | | | | | | | |
| | | | | | DIAX | | | SPXX | | | QQQX | |
Average notional amount of outstanding call options purchased* | | | | | | $ | 1,296,667 | | | $ | 648,333 | | | $ | 1,296,667 | |
| | | | |
| | | BXMX | | | DIAX | | | SPXX | | | QQQX | |
Average notional amount of outstanding call options written* | | $ | (1,396,410,333 | ) | | $ | (322,361,833 | ) | | $ | (130,908,167 | ) | | $ | (406,934,500 | ) |
| | | | |
| | | | | | DIAX | | | SPXX | | | QQQX | |
Average notional amount of outstanding put options purchased* | | | | | | $ | 260,000 | | | $ | 130,000 | | | $ | 260,000 | |
| | | | |
| | | | | | DIAX | | | SPXX | | | QQQX | |
Average notional amount of outstanding put options written* | | | | | | $ | (180,000 | ) | | $ | (90,000 | ) | | $ | (180,000 | ) |
| * | The average notional amount is calculated based on the outstanding notional at the beginning of the fiscal period and at the end of each fiscal quarter within the current fiscal period. |
The following table presents the fair value of all options purchased and written by the Funds as of the end of the reporting period, the location of these instruments on the Statement of Assets and Liabilities and the primary underlying risk exposure.
| | | | | | | | | | | | | | | | | | |
| | | | | Location on the Statement of Assets and Liabilities | |
Underlying
Risk Exposure | | Derivative
Instrument | | Asset Derivatives | | | | | | (Liability) Derivatives | |
| | | Location | | Value | | | | | | Location | | Value | |
| BXMX | |
| Equity price | | Options | | — | | $ | — | | | | | | | Options written, at value | | $ | (16,822,505 | ) |
| DIAX | |
| Equity price | | Options | | Options purchased, at value | | $ | 3,300 | | | | | | | Options written, at value | | $ | (2,612,550 | ) |
| SPXX | |
| Equity price | | Options | | Options purchased, at value | | $ | 1,650 | | | | | | | Options written, at value | | $ | (1,061,120 | ) |
| QQQX | |
| Equity price | | Options | | Options purchased, at value | | $ | 3,300 | | | | | | | Options written, at value | | $ | (5,362,675 | ) |
The following table presents the amount of net realized gain (loss) and change in net unrealized appreciation (depreciation) recognized on options purchased and options written on the Statement of Operations during the current fiscal period, and the primary underlying risk exposure.
| | | | | | | | | | | | |
| Fund | | Underlying
Risk Exposure | | Derivative
Instrument | | Net Realized
Gain (Loss)
from Options
Purchased/Written | | | Change in Net
Unrealized
Appreciation
(Depreciation) of
Options
Purchased/Written | |
| BXMX | | Equity price | | Options Written | | $ | (42,545,348 | ) | | $ | 5,997,322 | |
DIAX | | Equity price | | Options Purchased | | | (18,698 | ) | | | (11,160 | ) |
DIAX | | Equity price | | Options Written | | | (5,319,569 | ) | | | (658,127 | ) |
| SPXX | | Equity price | | Options Purchased | | | (12,536 | ) | | | (5,580 | ) |
| SPXX | | Equity price | | Options Written | | | (2,210,307 | ) | | | (265,657 | ) |
| QQQX | | Equity price | | Options Purchased | | | (3,423 | ) | | | (11,160 | ) |
| QQQX | | Equity price | | Options Written | | | (28,608,573 | ) | | | (566,049 | ) |
Market and Counterparty Credit Risk
In the normal course of business each Fund may invest in financial instruments and enter into financial transactions where risk of potential loss exists due to changes in the market (market risk) or failure of the other party to the transaction to perform (counterparty credit risk). The potential loss could exceed the value of the financial assets recorded on the financial statements. Financial assets, which potentially expose each Fund to counterparty credit risk, consist principally of cash due from counterparties on forward, option and swap transactions, when applicable. The extent of each Fund’s exposure to counterparty credit risk in respect to these financial assets approximates their carrying value as recorded on the Statement of Assets and Liabilities.
Each Fund helps manage counterparty credit risk by entering into agreements only with counterparties the Adviser believes have the financial resources to honor their obligations and by having the Adviser monitor the financial stability of the counterparties. Additionally, counterparties may be required to pledge collateral daily (based on the daily valuation of the financial asset) on behalf of each Fund with a value approximately equal to the amount of any unrealized gain above a pre-determined threshold. Reciprocally, when each Fund has an unrealized loss, the Funds have instructed the custodian to pledge assets of the Funds as collateral with a value approximately equal to the amount of the unrealized loss above a pre-determined threshold. Collateral pledges are monitored and subsequently adjusted if and when the valuations fluctuate, either up or down, by at least the pre-determined threshold amount.
4. Fund Shares
Share Transactions
Transactions in shares for the Funds during the current and prior fiscal period, where applicable, were as follows:
| | | | | | | | |
| | | QQQX | |
| | | Six Months Ended 6/30/17 | | | Year
Ended
12/31/16 | |
Shares issued to shareholders due to reinvestment of distributions | | | 15,401 | | | | — | |
5. Investment Transactions
Long-term purchases and sales (excluding derivative transactions) during the current reporting period were as follows:
| | | | | | | | | | | | | | | | |
| | | BXMX | | | DIAX | | | SPXX | | | QQQX | |
Purchases | | $ | 17,425,515 | | | $ | 11,436,255 | | | $ | 8,730,741 | | | $ | 52,035,550 | |
Sales | | | 85,536,372 | | | | 38,526,495 | | | | 21,688,649 | | | | 111,871,365 | |
Transactions in options written during the current reporting period were as follows:
| | | | | | | | | | | | | | | | |
| | | BXMX | | | DIAX | |
| | | Number of
Contracts | | | Premiums
Received | | | Number of
Contracts | | | Premiums
Received | |
Options outstanding, beginning of period | | | 6,139 | | | $ | 24,380,085 | | | | 1,874 | | | $ | 3,328,616 | |
Options written | | | 28,556 | | | | 80,354,734 | | | | 15,208 | | | | 24,258,273 | |
Options terminated in closing purchase transactions | | | (28,818 | ) | | | (84,216,302 | ) | | | (15,619 | ) | | | (23,783,891 | ) |
Options expired | | | — | | | | — | | | | (43 | ) | | | (1,589 | ) |
Options outstanding, end of period | | | 5,877 | | | $ | 20,518,517 | | | | 1,420 | | | $ | 3,801,409 | |
| | | | | | | | | | | | | | | | |
| | | SPXX | | | QQQX | |
| | | Number of
Contracts | | | Premiums
Received | | | Number of
Contracts | | | Premiums
Received | |
Options outstanding, beginning of period | | | 796 | | | $ | 1,350,536 | | | | 1,217 | | | $ | 5,472,276 | |
Options written | | | 6,455 | | | | 9,919,273 | | | | 11,617 | | | | 34,391,245 | |
Options terminated in closing purchase transactions | | | (6,651 | ) | | | (9,723,517 | ) | | | (12,036 | ) | | | (31,854,780 | ) |
Options expired | | | (22 | ) | | | (813 | ) | | | (43 | ) | | | (1,589 | ) |
Options outstanding, end of period | | | 578 | | | $ | 1,545,479 | | | | 755 | | | $ | 8,007,152 | |
6. Income Tax Information
Each Fund is a separate taxpayer for federal income tax purposes. Each Fund intends to distribute substantially all of its net investment company taxable income to shareholders and to otherwise comply with the requirements of Subchapter M of the Internal Revenue Code applicable to regulated investment companies. In any year when the Funds realize net capital gains, each Fund may choose to distribute all or a portion of its net capital gains to shareholders, or alternatively, to retain all or a portion of its net capital gains and pay federal corporate income taxes on such retained gains.
For all open tax years and all major taxing jurisdictions, management of the Funds has concluded that there are no significant uncertain tax positions that would require recognition in the financial statements. Open tax years are those that are open for examination by taxing authorities (i.e., generally the last four tax year ends and the interim tax period since then). Furthermore, management of the Funds is also not aware of any tax positions for which it is reasonably possible that the total amounts of unrecognized tax benefits will significantly change in the next twelve months.
Notes to Financial Statements (Unaudited) (continued)
The following information is presented on an income tax basis. Differences between amounts for financial statement and federal income tax purposes are primarily due to timing differences in recording income, timing differences in recognizing certain gains and losses on investment transactions and the recognition of unrealized gain or loss for tax (mark-to-market) on options contracts. To the extent that differences arise that are permanent in nature, such amounts are reclassified within the capital accounts as detailed below. Temporary differences do not require reclassification. Temporary and permanent differences do not impact the NAVs of the Funds.
As of June 30, 2017, the cost and unrealized appreciation (depreciation) of investments (excluding investments in derivatives), as determined on a federal income tax basis, were as follows:
| | | | | | | | | | | | | | | | |
| | | BXMX | | | DIAX | | | SPXX | | | QQQX | |
Cost of investments | | $ | 859,060,974 | | | $ | 346,791,723 | | | $ | 140,447,261 | | | $ | 315,053,219 | |
Gross unrealized: | | | | | | | | | | | | | | | | |
Appreciation | | $ | 656,787,005 | | | $ | 285,602,959 | | | $ | 119,226,796 | | | $ | 471,376,294 | |
Depreciation | | | (34,288,111 | ) | | | (2,010,548 | ) | | | (5,944,590 | ) | | | (4,457,091 | ) |
Net unrealized appreciation (depreciation) of investments | | $ | 622,498,894 | | | $ | 283,592,411 | | | $ | 113,282,206 | | | $ | 466,919,203 | |
|
| Permanent differences, primarily due to foreign currency transactions, nondeductible reorganization expenses, real estate investment trust adjustments, and tax basis earnings and profits adjustments, resulted in reclassifications among the Funds’ components of net assets as of December 31, 2016, the Funds’ last tax year end, as follows: | |
| | | BXMX | | | DIAX | | | SPXX | | | QQQX | |
Paid-in surplus | | $ | (27,666,148 | ) | | $ | 43,882 | | | $ | (10,616,693 | ) | | $ | — | |
Undistributed (Over-distribution of) net investment income | | | 26,947,045 | | | | (43,882 | ) | | | 10,514,878 | | | | (76,224 | ) |
Accumulated net realized gain (loss) | | | 719,103 | | | | — | | | | 101,815 | | | | 76,224 | |
|
| The tax components of undistributed net ordinary income and net long-term capital gains as of December 31, 2016, the Funds’ last tax year end, were as follows: | |
| | | BXMX | | | DIAX | | | SPXX | | | QQQX | |
Undistributed net ordinary income | | $ | — | | | $ | — | | | $ | — | | | $ | — | |
Undistributed net long-term capital gains | | | — | | | | — | | | | — | | | | — | |
|
| The tax character of distributions paid during the Funds’ last tax year ended December 31, 2016, was designated for purposes of the dividends paid deduction as follows: | |
| | | BXMX | | | DIAX | | | SPXX | | | QQQX | |
Distributions from net ordinary income1 | | $ | 45,243,344 | | | $ | 9,744,691 | | | $ | 13,792,349 | | | $ | 3,365,619 | |
Distributions from net long-term capital gains | | | 30,335,359 | | | | — | | | | — | | | | 29,687,599 | |
Return of capital | | | 21,037,691 | | | | 27,892,330 | | | | 2,037,178 | | | | 18,136,961 | |
1 Net ordinary income consists of net taxable income derived from dividends, interest and current year earnings and profits attributed to realized gains. | |
As of December 31, 2016, the Funds’ last tax year end, the following Funds had unused capital loss carryforwards available for federal income tax purposes to be applied against future capital gains, if any. If not applied, the carryforwards will expire as shown in the following table. The losses not subject to expiration will be utilized first by a Fund.
| | | | | | | | |
| | | DIAX | | | SPXX | |
Expiration: | | | | | | | | |
December 31, 2017 | | $ | — | | | $ | 11,865,274 | |
December 31, 2018 | | | — | | | | 7,655,485 | |
Not subject to expiration | | | 11,838,535 | | | | — | |
Total | | $ | 11,838,535 | | | $ | 19,520,759 | |
During the Funds’ last tax year ended December 31, 2016, the following Funds utilized capital loss carryforwards as follows:
| | | | | | | | |
| | | BXMX | | | SPXX | |
Utilized capital loss carryforwards | | $ | 27,666,148 | | | $ | 10,616,693 | |
The Funds have elected to defer late-year losses in accordance with federal income tax rules. These losses are treated as having arisen on the first day of the current fiscal year. The following Fund has elected to defer losses as follows:
| | | | |
| | | SPXX | |
Post-October capital losses2 | | $ | 3,996,540 | |
Late-year ordinary losses3 | | | — | |
2 Capital losses incurred from November 1, 2016 through December 31, 2016, the Fund’s last tax year end. | |
3 Specified losses incurred from November 1, 2016 through December 31, 2016. | |
7. Management Fees
Management Fees
The management fee compensates the Adviser for overall investment advisory and administrative services and general office facilities. Gateway and NAM are compensated for their services to the Funds from the management fees paid to the Adviser.
Each Fund’s management fee consists of two components – a fund-level fee, based only on the amount of assets within the Fund, and a complex-level fee, based on the aggregate amount of all eligible fund assets managed by the Adviser. This pricing structure enables Fund shareholders to benefit from growth in the assets within their respective Fund as well as from growth in the amount of complex-wide assets managed by the Adviser.
The annual Fund-level fee, payable monthly, for each Fund is calculated according to the following schedule:
| | | | | | | | | | | | | | | | |
| Average Daily Managed Assets* | | BXMX | | | DIAX | | | SPXX | | | QQQX | |
For the first $500 million | | | 0.7000 | % | | | 0.7000 | % | | | 0.6600 | % | | | 0.6900 | % |
For the next $500 million | | | 0.6750 | | | | 0.6750 | | | | 0.6350 | | | | 0.6650 | |
For the next $500 million | | | 0.6500 | | | | 0.6500 | | | | 0.6100 | | | | 0.6400 | |
For the next $500 million | | | 0.6250 | | | | 0.6250 | | | | 0.5850 | | | | 0.6150 | |
For managed assets over $2 billion | | | 0.6000 | | | | 0.6000 | | | | 0.5600 | | | | 0.5900 | |
The annual complex-level fee, payable monthly, for each Fund is calculated by multiplying the current complex-wide fee rate, determined according to the following schedule by each Fund’s daily managed assets:
| | | | |
| Complex-Level Managed Asset Breakpoint Level* | | Effective Rate at Breakpoint Level | |
$55 billion | | | 0.2000 | % |
$56 billion | | | 0.1996 | |
$57 billion | | | 0.1989 | |
$60 billion | | | 0.1961 | |
$63 billion | | | 0.1931 | |
$66 billion | | | 0.1900 | |
$71 billion | | | 0.1851 | |
$76 billion | | | 0.1806 | |
$80 billion | | | 0.1773 | |
$91 billion | | | 0.1691 | |
$125 billion | | | 0.1599 | |
$200 billion | | | 0.1505 | |
$250 billion | | | 0.1469 | |
$300 billion | | | 0.1445 | |
| * | For the complex-level fees, managed assets include closed-end fund assets managed by the Adviser that are attributable to certain types of leverage. For these purposes, leverage includes the funds’ use of preferred stock and borrowings and certain investments in the residual interest certificates (also called inverse floating rate securities) in tender option bond (TOB) trusts, including the portion of assets held by a TOB trust that has been effectively financed by the trust’s issuance of floating rate securities, subject to an agreement by the Adviser as to certain funds to limit the amount of such assets for determining managed assets in certain circumstances. The complex-level fee is calculated based upon the aggregate daily managed assets of all Nuveen Funds that constitute “eligible assets.” Eligible assets do not include assets attributable to investments in other Nuveen Funds or assets in excess of a determined amount (originally $2 billion) added to the Nuveen fund complex in connection with the Adviser’s assumption of the management of the former First American Funds effective January 1, 2011. As of June 30, 2017, the complex-level fee rate for each Fund was 0.1606%. |
8. Borrowing Arrangements
Inter-Fund Borrowing and Lending
The Securities and Exchange Commission (“SEC”) has granted an exemptive order permitting registered open-end and closed-end Nuveen funds to participate in an inter-fund lending facility whereby the Nuveen funds may directly lend to and borrow money from each other for temporary purposes (e.g., to satisfy redemption requests or when a sale of securities “fails,” resulting in an unanticipated cash shortfall) (the “Inter-Fund Program”). The closed-end Nuveen funds, including the Funds covered by this shareholder report, will participate only as lenders, and not as borrowers, in the Inter-Fund Program because such closed-end funds rarely, if ever, need to borrow cash to meet redemptions. The Inter-Fund Program is subject to a number of
Notes to Financial Statements (Unaudited) (continued)
conditions, including, among other things, the requirements that (1) no fund may borrow or lend money through the Inter-Fund Program unless it receives a more favorable interest rate than is typically available from a bank or other financial institution for a comparable transaction; (2) no fund may borrow on an unsecured basis through the Inter-Fund Program unless the fund’s outstanding borrowings from all sources immediately after the inter-fund borrowing total 10% or less of its total assets; provided that if the borrowing fund has a secured borrowing outstanding from any other lender, including but not limited to another fund, the inter-fund loan must be secured on at least an equal priority basis with at least an equivalent percentage of collateral to loan value; (3) if a fund’s total outstanding borrowings immediately after an inter-fund borrowing would be greater than 10% of its total assets, the fund may borrow through the inter-fund loan on a secured basis only; (4) no fund may lend money if the loan would cause its aggregate outstanding loans through the Inter-Fund Program to exceed 15% of its net assets at the time of the loan; (5) a fund’s inter-fund loans to any one fund shall not exceed 5% of the lending fund’s net assets; (6) the duration of inter-fund loans will be limited to the time required to receive payment for securities sold, but in no event more than seven days; and (7) each interfund loan may be called on one business day’s notice by a lending fund and may be repaid on any day by a borrowing fund. In addition, a Nuveen fund may participate in the Inter-Fund Program only if and to the extent that such participation is consistent with the fund’s investment objective and investment policies. The Board is responsible for overseeing the Inter-Fund Program.
The limitations detailed above and the other conditions of the SEC exemptive order permitting the Inter-Fund Program are designed to minimize the risks associated with Inter-Fund Program for both the lending fund and the borrowing fund. However, no borrowing or lending activity is without risk. When a fund borrows money from another fund, there is a risk that the loan could be called on one day’s notice or not renewed, in which case the fund may have to borrow from a bank at a higher rate or take other actions to payoff such loan if an inter-fund loan is not available from another fund. Any delay in repayment to a lending fund could result in a lost investment opportunity or additional borrowing costs.
During May 2017, the Board approved the Nuveen funds participation in the Inter-Fund Program. During the current reporting period, the Funds did not enter into any inter-fund loan activity.
9. New Accounting Pronouncements
Amendments to Regulation S-X
In October 2016, the SEC adopted new rules and amended existing rules (together, the “final rules”) intended to modernize the reporting and disclosure of information by registered investment companies. In part, the final rules amend Regulation S-X and require standardized, enhanced disclosure about derivatives in investment company financial statements, as well as other amendments. The compliance date of the amendments to Regulation S-X is August 1, 2017. Management is still evaluating the impact of the final rules, if any.
Additional
Fund Information
| | | | | | | | | | |
| Board of Trustees | | | | | | | | | | |
Margo Cook* | | Jack B. Evans | | William C. Hunter | | David J. Kundert | | Albin F. Moschner | | John K. Nelson |
William J. Schneider | | Judith M. Stockdale | | Carole E. Stone | | Terence J. Toth | | Margaret L. Wolff | | Robert C. Young** |
| * | Interested Board Member. |
| ** | Effective July 1, 2017. |
| | | | | | | | |
| | | | | |
Fund Manager Nuveen Fund Advisors, LLC 333 West Wacker Drive Chicago, IL 60606 | | Custodian State Street Bank & Trust Company One Lincoln Street Boston, MA 02111 | | Legal Counsel Chapman and Cutler LLP Chicago, IL 60603 | | Independent Registered
Public Accounting Firm PricewaterhouseCoopers LLP One North Wacker Drive Chicago, IL 60606 | | Transfer Agent and
Shareholder Services Computershare Trust Company, N.A. 250 Royal Street Canton, MA 02021 (800) 257-8787 |
Quarterly Form N-Q Portfolio of Investments Information
Each Fund is required to file its complete schedule of portfolio holdings with the Securities and Exchange Commission (SEC) for the first and third quarters of each fiscal year on Form N-Q. You may obtain this information directly from the SEC. Visit the SEC on-line at http://www.sec.gov or in person at the SEC’s Public Reference Room in Washington, D.C. Call the SEC toll-free at (800) SEC-0330 for room hours and operation.
Nuveen Funds’ Proxy Voting Information
You may obtain (i) information regarding how each fund voted proxies relating to portfolio securities held during the most recent twelve-month period ended June 30, without charge, upon request, by calling Nuveen toll-free at (800) 257-8787 or on Nuveen’s website at www.nuveen.com and (ii) a description of the policies and procedures that each fund used to determine how to vote proxies relating to portfolio securities without charge, upon request, by calling Nuveen toll free at (800) 257-8787. You may also obtain this information directly from the SEC. Visit the SEC on-line at http://www.sec.gov.
CEO Certification Disclosure
Each Fund’s Chief Executive Officer (CEO) has submitted to the New York Stock Exchange (NYSE) the annual CEO certification as required by Section 303A.12(a) of the NYSE Listed Company Manual. Each Fund has filed with the SEC the certification of its CEO and Chief Financial Officer required by Section 302 of the Sarbanes-Oxley Act.
Share Repurchases
Each Fund intends to repurchase through its open-market share repurchase program, shares of its own common stock at such times and in such amounts as is deemed advisable. During the period covered by this report, each Fund repurchased shares of its common stock as shown in the accompanying table. Any future repurchases will be reported in the next annual or semi-annual report.
| | | | | | | | | | | | | | | | |
| | | BXMX | | | DIAX | | | SPXX | | | QQQX | |
Shares repurchased | | | — | | | | — | | | | — | | | | — | |
FINRA BrokerCheck
The Financial Industry Regulatory Authority (FINRA) provides information regarding the disciplinary history of FINRA member firms and associated investment professionals. This information as well as an investor brochure describing FINRA BrokerCheck is available to the public by calling the FINRA BrokerCheck Hotline number at (800) 289-9999 or by visiting www.FlNRA.org.
Glossary of Terms
Used in this Report
| ∎ | | Average Annual Total Return: This is a commonly used method to express an investment’s performance over a particular, usually multi-year time period. It expresses the return that would have been necessary each year to equal the investment’s actual cumulative performance (including change in NAV or market price and reinvested dividends and capital gains distributions, if any) over the time period being considered. |
| ∎ | | Beta: A measure of the variability of the change in the share price for a Fund in relation to a change in the value of the Fund’s market benchmark. Securities with betas higher than 1.0 have been, and are expected to be, more volatile than the benchmark; securities with betas lower than 1.0 have been, and are expected to be, less volatile than the benchmark. |
| ∎ | | Chicago Board Options Exchange (CBOE) S&P 500 BuyWrite Index (BXMSM): An index designed to track the performance of a hypothetical buy-write strategy on the S&P 500® Index. Index returns assume reinvestment of distributions, but do not include the effects of any applicable sales charges or management fees. |
| ∎ | | Chicago Board of Exchange (CBOE) Volatility Index® (VIX®): An index that is a key measure of market expectations of near-term volatility conveyed by S&P 500® Index option prices. Since its introduction in 1993, VIX has been considered by many to be the world’s premier barometer of investor sentiment and market volatility (www.cboe.com). Index returns assume reinvestment of distributions, but do not include the effects of any applicable sales charges or management fees. |
| ∎ | | Chicago Board of Exchange (CBOE) Dow Jones Industrial Average (DJIA) BuyWrite Index (BXDSM): A benchmark index that measures the performance of a theoretical portfolio that sells call options on the Dow Jones Industrial Average (the Dow), against a portfolio of the stocks included in the Dow. Index returns assume reinvestment of distributions, but do not include the effects of any applicable sales charges or management fees. |
| ∎ | | Chicago Board of Exchange (CBOE) Nasdaq 100 BuyWrite Index (BXNSM): A benchmark index that measures the performance of a theoretical portfolio that owns a basket of the stocks included in the Nasdaq 100 Index, and “writes” (or sells) Nasdaq 100 Index covered call options each month. Index returns assume reinvestment of distributions, but do not include the effects of any applicable sales charges or management fees. |
| ∎ | | DIAX Blended Benchmark: The DIAX Blended Benchmark is a blended return consisting of 1) 55% Chicago Board Options Exchange (CBOE) DJIA BuyWrite Index (BXD), which is designed to track the performance of a hypothetical buy-write strategy on the Dow Jones Industrial Average and 2) 45% Dow Jones Industrial Average (DJIA), which tracks the performance of 30 large cap companies. Index returns assume reinvestment of distributions, but do not include the effects of any applicable sales charges or management fees. |
| ∎ | | Dow Jones Industrial Average (DJIA): An average that tracks the performance of 30 large cap companies. Index returns assume reinvestment of distributions, but do not reflect any applicable sales charges or management fees. |
| ∎ | | Effective Leverage: Effective leverage is a fund’s effective economic leverage, and includes both regulatory leverage (see below) and the leverage effects of certain derivative investments in the fund’s portfolio that increase the fund’s investment exposure. |
| ∎ | | Leverage: Leverage is created whenever a fund has investment exposure (both reward and/or risk) equivalent to more than 100% of the investment capital. |
| ∎ | | NASDAQ-100 Index: An index that includes 100 of the largest domestic and international nonfinancial securities listed on the NASDAQ Stock Market based on market capitalization. Index returns assume reinvestment of distributions, but do not reflect any applicable sales charges or management fees. |
| ∎ | | Net Asset Value (NAV) Per Share: A fund’s Net Assets is equal to its total assets (securities, cash, accrued earnings and receivables) less its total liabilities. NAV per share is equal to the fund’s Net Assets divided by its number of shares outstanding. |
| ∎ | | QQQX Blended Benchmark: The QQQX Blended Benchmark is a blended return consisting of 1) 55% Chicago Board of Exchange (CBOE) Nasdaq 100 BuyWrite Index (BXNSM), which measures the performance of a theoretical portfolio that owns a basket of the stocks included in the Nasdaq 100 Index, and “writes” (or sells) Nasdaq 100 Index covered call options each month and 2) 45% NASDAQ-100 Index, which includes 100 of the largest domestic and international nonfinancial securities listed on the NASDAQ Stock Market based on market capitalization. Index returns assume reinvestment of distributions, but do not include the effects of any applicable sales charges or management fees. |
| ∎ | | Regulatory Leverage: Regulatory leverage consists of preferred shares issued by or borrowings of a fund. Both of these are part of a fund’s capital structure. Regulatory leverage is subject to asset coverage limits set in the Investment Company Act of 1940. |
| ∎ | | S&P 500® Index: An unmanaged index generally considered representative of the U.S. stock market. Index returns assume reinvestment of distributions, but do not reflect any applicable sales charges or management fees. |
| ∎ | | SPXX Blended Benchmark: The SPXX Blended Benchmark is a blended return consisting of 1) 55% Chicago Board Options Exchange (CBOE) S&P 500 BuyWrite Index (BXMSM), which is designed to track the performance of a hypothetical buy-write strategy on the S&P 500® Index and 2) 45% S&P 500® Index, an unmanaged index generally considered representative of the U.S. stock market. Index returns assume reinvestment of distributions, but do not include the effects of any applicable sales charges or management fees. |
Reinvest Automatically,
Easily and Conveniently
Nuveen makes reinvesting easy. A phone call is all it takes to set up your reinvestment account.
Nuveen Closed-End Funds Automatic Reinvestment Plan
Your Nuveen Closed-End Fund allows you to conveniently reinvest distributions in additional Fund shares.
By choosing to reinvest, you’ll be able to invest money regularly and automatically, and watch your investment grow through the power of compounding. Just like distributions in cash, there may be times when income or capital gains taxes may be payable on distributions that are reinvested.
It is important to note that an automatic reinvestment plan does not ensure a profit, nor does it protect you against loss in a declining market.
Easy and convenient
To make recordkeeping easy and convenient, each quarter you’ll receive a statement showing your total distributions, the date of investment, the shares acquired and the price per share, and the total number of shares you own.
How shares are purchased
The shares you acquire by reinvesting will either be purchased on the open market or newly issued by the Fund. If the shares are trading at or above net asset value at the time of valuation, the Fund will issue new shares at the greater of the net asset value or 95% of the then-current market price. If the shares are trading at less than net asset value, shares for your account will be purchased on the open market. If the Plan Agent begins purchasing Fund shares on the open market while shares are trading below net asset value, but the Fund’s shares subsequently trade at or above their net asset value before the Plan Agent is able to complete its purchases, the Plan Agent may cease open-market purchases and may invest the uninvested portion of the distribution in newly-issued Fund shares at a price equal to the greater of the shares’ net asset value or 95% of the shares’ market value on the last business day immediately prior to the purchase date, Distributions received to purchase shares in the open market will normally be invested shortly after the distribution payment date. No interest will be paid on distributions awaiting reinvestment. Because the market price of the shares may increase before purchases are completed, the average purchase price per share may exceed the market price at the time of valuation, resulting in the acquisition of fewer shares than if the distribution had been paid in shares issued by the Fund. A pro rata portion of any applicable brokerage commissions on open market purchases will be paid by Plan participants. These commissions usually will be lower than those charged on individual transactions.
Flexible
You may change your distribution option or withdraw from the Plan at any time, should your needs or situation change.
You can reinvest whether your shares are registered in your name, or in the name of a brokerage firm, bank, or other nominee. Ask your investment advisor if his or her firm will participate on your behalf. Participants whose shares are registered in the name of one firm may not be able to transfer the shares to another firm and continue to participate in the Plan.
The Fund reserves the right to amend or terminate the Plan at any time. Although the Fund reserves the right to amend the Plan to include a service charge payable by the participants, there is no direct service charge to participants in the Plan at this time.
Call today to start reinvesting distributions
For more information on the Nuveen Automatic Reinvestment Plan or to enroll in or withdraw from the Plan, speak with your financial advisor or call us at (800) 257-8787.
Annual Investment
Management Agreement Approval Process
The Board of Trustees (each, a “Board,” and each Trustee, a “Board Member”) of each Fund, including the Board Members who are not parties to the applicable advisory or sub-advisory agreements or “interested persons” of any such parties (the “Independent Board Members”), oversees the management of its respective Fund, including the performance of Nuveen Fund Advisors, LLC, the Funds’ investment adviser (the “Adviser”), and, in the case of Nuveen S&P 500 Buy-Write Income Fund (the “S&P Buy-Write Fund”), Gateway Investment Advisers, LLC, such Fund’s sub-adviser (“Gateway”), and, in the case of Nuveen Dow 30SM Dynamic Overwrite Fund (the “Dow Fund”), Nuveen S&P 500 Dynamic Overwrite Fund (the “S&P Dynamic Fund”) and Nuveen Nasdaq 100 Dynamic Overwrite Fund (the “Nasdaq Fund”), Nuveen Asset Management, LLC, such Funds’ sub-adviser (“NAM” and, each of Gateway and NAM, a “Sub-Adviser”). As required by applicable law, after the initial term of the respective Fund following commencement of its operations, the Board is required to consider annually whether to renew the Fund’s management agreement with the Adviser (the “Investment Management Agreement”) and its sub-advisory agreement with the applicable Sub-Adviser (the “Sub-Advisory Agreement” and, together with the Investment Management Agreement, the “Advisory Agreements”). Accordingly, the Board met in person on April 11-12, 2017 (the “April Meeting”) and May 23-25, 2017 (the “May Meeting”) to consider the approval of each Advisory Agreement that was up for renewal for an additional one-year period.
The Board considered its review of the Advisory Agreements as an ongoing process encompassing the information received and the deliberations the Board and its committees have had throughout the year. The Board met regularly during the year and received materials and discussed topics that were relevant to the annual consideration of the renewal of the Advisory Agreements, including, among other things, overall market performance and developments; fund investment performance; investment team review; valuation of securities; compliance, regulatory and risk management matters; and other developments. The Board had also established several standing committees, including the Open-end Fund Committee and Closed-end Fund Committee, which met regularly throughout the year to permit the Board Members to delve deeper into the topics particularly relevant to the respective product line. The Board further continued its practice of seeking to meet periodically with the sub-advisers and their investment teams. The accumulated information, knowledge, and experience the Board Members had gained during their tenure on the Board governing the Funds and working with the Fund Advisers (as defined below) were taken into account in their review of the Advisory Agreements.
In addition to the materials received by the Board or its committees throughout the year, the Board reviewed extensive additional materials prepared specifically for its annual review of the Advisory Agreements in response to a request by independent legal counsel on behalf of the Independent Board Members. The materials addressed a variety of topics, including, but not limited to, a description of the services provided by the Adviser and the respective Sub-Adviser (the Adviser and the Sub-Advisers are each a “Fund Adviser”); an analysis of fund performance including comparative industry data and a detailed focus on performance outliers; an analysis of the respective Sub-Adviser; an analysis of the fees and expense ratios of the Nuveen funds in absolute terms and in comparison to the fees and expenses of peers with a focus on any expense outliers; an assessment of shareholder services for the Nuveen funds and of the performance of certain service providers; a review of initiatives instituted or continued during the past year; a review of premium/discount trends and leverage management for the closed-end funds; and information regarding the profitability of the Fund Advisers, the compensation of portfolio managers, and compliance and risk matters. The materials provided in connection with the annual review included information compiled and prepared by Broadridge Financial Solutions, Inc. (“Broadridge” or “Lipper”), an independent provider of investment company data, comparing, in relevant part, each Fund’s fees and expenses with those of a comparable universe of funds (the “Peer Universe”), as selected by Broadridge (the “Broadridge Report”). The Independent Board Members also received a memorandum from independent legal counsel outlining their fiduciary duties and legal standards in reviewing the Advisory Agreements.
As part of its annual review, the Board met at the April Meeting to review the investment performance of each Fund and to consider the Adviser’s analysis of the respective Sub-Adviser evaluating, among other things, the Sub-Adviser’s assets under management, investment team, performance, organizational stability, and investment approach. During the review, the Independent Board Members requested and received additional information from management. At the May Meeting, the Board, including the Independent Board Members, continued its review and ultimately approved the continuation of the Advisory
Annual Investment Management Agreement Approval Process (continued)
Agreements for an additional year. Throughout the year and throughout their review of the Advisory Agreements, the Independent Board Members were assisted by independent legal counsel and met with counsel separately without management present. In deciding to renew the Advisory Agreements, the Independent Board Members did not identify a particular factor as determinative, but rather the decision reflected the comprehensive consideration of all the information presented, and each Board Member may have attributed different weights to the various factors and information considered in connection with the approval process. The following summarizes the principal factors, but not all the factors, the Board considered in its review of the Advisory Agreements and its conclusions.
| A. | | Nature, Extent and Quality of Services |
In evaluating the renewal of the Advisory Agreements, the Independent Board Members received and considered information regarding the nature, extent and quality of the applicable Fund Adviser’s services provided to the respective Fund and the resulting performance of each Fund. The Board recognized the myriad of services the Adviser and its affiliates provided to manage and operate the Nuveen funds, including (a) product management (such as managing distributions, positioning the product in the marketplace, maintaining and enhancing shareholder communications and reporting to the Board); (b) investment oversight, risk management and securities valuation (such as overseeing the sub-advisers and other service providers, analyzing investment performance and risks, overseeing risk management and disclosure, executing the daily valuation of securities, and analyzing trade execution); (c) fund administration (such as helping to prepare fund tax returns and complete other tax compliance matters and helping to prepare regulatory filings and shareholder reports); (d) fund board administration (such as preparing board materials and organizing and providing assistance for board meetings); (e) compliance (such as helping to devise and maintain the Nuveen funds’ compliance program and test for adherence); (f) legal support (such as helping to prepare registration statements and proxy statements, interpreting regulations and policies and overseeing fund activities); (g) with respect to certain closed-end funds, providing leverage, capital and distribution management services; and (h) with respect to certain open-end funds with portfolios that have a leverage component, providing such leverage management services.
The Board further noted the Adviser’s continued dedication to investing in its business to enhance the quality and breadth of the services provided to the Funds. The Board recognized the Adviser’s investment in staffing over recent years to support the services provided to the Nuveen funds in key areas, including in investment services, product management, retail distribution and information technology, closed-end funds and structured products, as well as in fund administration, operations and risk management. The Board further noted the Adviser’s continued commitment to enhancing its compliance program by, among other things, restructuring the compliance organization, developing a unified compliance program, adding compliance staff, and developing and/or revising policies and procedures as well as building further infrastructure to address new regulatory requirements or guidance and the growth of the complex. The Board also considered the enhancements to Nuveen’s cybersecurity capabilities, systems and processes to value securities, stress test reporting and risk and control self-assessments.
In addition, the Independent Board Members considered information highlighting the various initiatives that the Adviser had implemented or continued over recent years to benefit the open-end fund and closed-end fund product lines and/or particular Nuveen funds. The Board noted the Adviser’s continued efforts to rationalize the open-end fund and closed-end fund product lines through, among other things, mergers, liquidations and repositionings in seeking to provide enhanced shareholder value over the years through increased efficiency, reduced costs, improved performance and revised investment approaches that are more relevant to current shareholder needs. With respect to closed-end Nuveen funds, such initiatives included (a) an increased level of leverage management activities in 2016 and 2017 resulting from the rollover of existing facilities, the negotiation of improved terms and pricing to reduce leverage costs, the innovation of new leverage structures, the rebalancing of leverage of various funds as a result of mergers or new investment mandates, and the restructuring of tender option bonds to be compliant with new regulatory requirements; (b) an increased level of capital management activities (i.e., the management of the issuance and repurchase of shares of certain closed-end funds) during 2016 as a result of market demand as well as an implementation of a cross department review system for shares trading at certain discount levels; (c) continued refinements to a database to permit further analysis of the closed-end fund marketplace and shareholder base; (d) the development of enhanced secondary market board reporting and commentary; (e) the reconfiguration of the framework for determining and maintaining closed-end fund benchmarks to permit more consistency across the complex;
and (f) the development of product innovations for new closed-end offerings, including target term funds. The Board also recognized the Adviser’s continued commitment to supporting the closed-end product line through its award winning investor relations support program through which Nuveen seeks to educate investors and financial advisers regarding closed-end funds.
In its review, the Board recognized that initiatives that attracted assets to the Nuveen family of funds generally benefited the Nuveen funds in the complex as fixed costs would be spread over a larger asset base and, as described below, through the complex-wide fee arrangement which generally provides that the management fees of the Nuveen funds (subject to limited exceptions) are reduced as asset levels in the complex reach certain breakpoints in the fee schedule.
Similarly, the Board considered the sub-advisory services provided by the respective Sub-Adviser to the Funds. The applicable Sub-Adviser generally provided portfolio advisory services for its respective Fund(s). The Board reviewed the Adviser’s analysis of each Sub-Adviser which evaluated, among other things, the investment team of such Sub-Adviser and any changes thereto, the stability and history of the organization, the assets under management, the investment approach and the performance of the Nuveen funds it sub-advises. The Board noted that the Adviser recommended the renewal of the Sub-Advisory Agreements.
Based on its review, the Board determined, in the exercise of its reasonable business judgment, that it was satisfied with the nature, extent and quality of services provided to the respective Funds under each applicable Advisory Agreement.
| B. | | The Investment Performance of the Funds and Fund Advisers |
As part of its evaluation of the services provided by the Fund Advisers, the Board reviewed Fund performance over the quarter, one-, three- and five-year periods ending December 31, 2016 as well as performance data for the first quarter of 2017 ending March 31, 2017. The Board reviewed performance on an absolute basis and in comparison to the performance of peer funds (the “Performance Peer Group”) and recognized and/or customized benchmarks (i.e., generally benchmarks derived from multiple recognized benchmarks). For closed-end funds, the Board (or the Closed-end Fund Committee) also reviewed, among other things, the premium or discount to net asset value of the Nuveen closed-end funds as of a specified date and over various periods as well as in comparison to the premium/discount average in their respective Lipper peer category. The Independent Board Members continued to recognize the importance of secondary market trading for the shares of the closed-end funds and the evaluation of the premium and discount levels was a continuing priority for them. The review and analysis of performance information during the annual review of Advisory Agreements incorporated the discussions and performance information the Board Members have had at each of their quarterly meetings throughout the year.
In evaluating performance data, the Independent Board Members recognized some of the limitations of such data and the difficulty in establishing appropriate peer groups and benchmarks for certain of the Nuveen funds. They recognized that each fund operates pursuant to its own investment objective(s), parameters and restrictions which may differ from that of the Performance Peer Group or benchmark. Certain funds may also utilize leverage which may provide benefits or risks to their portfolio compared to an unlevered benchmark. The Independent Board Members had noted that management had classified the Performance Peer Groups as low, medium and high in relevancy to the applicable fund as a result of these differences or other factors. The Independent Board Members recognized that the variations between the Performance Peer Group or benchmark and the applicable Fund will lead to differing performance results and may limit the value of the comparative performance data in assessing the particular Fund’s performance.
In addition, the Independent Board Members recognized that the performance data is a snapshot in time, in this case as of the end of the 2016 calendar year or end of the first quarter of 2017. A different period may generate significantly different results and longer term performance can be adversely affected by even one period of significant underperformance. Further, a shareholder’s experience in a Fund depends on his or her own holding period which may differ from that reviewed by the Independent Board Members.
In their review of performance, the Independent Board Members focused, in particular, on the Adviser’s analysis of Nuveen funds determined to be underperforming performance outliers and the factors contributing to the respective fund’s performance and any efforts to address performance concerns. With respect to any Nuveen funds for which the Board has identified performance issues, the Board monitors such funds closely until performance improves, discusses with the Adviser
Annual Investment Management Agreement Approval Process (continued)
the reasons for such results, considers any steps necessary or appropriate to address such issues, and reviews the results of any efforts undertaken. The Board, however, acknowledged that shareholders chose to invest or remain invested in a fund knowing that the Adviser and applicable sub-adviser manage the fund, knowing the fund’s investment strategy and seeking exposure to that strategy (even if the strategy was “out of favor” in the marketplace) and knowing the fund’s fee structure.
For the S&P Buy-Write Fund, the Board noted that the Fund had performed well against its Performance Peer Group ranking in the second quartile for the one- and five-year periods and the first quartile for the three-year period. The Fund also outperformed its primary buywrite benchmark for the one-, three- and five-year periods. The Board was satisfied with the Fund’s overall performance.
For the Dow Fund, the Board noted that the Fund’s performance compared favorably to its peers, performing in the first quartile in the one-year period and the second quartile in the three- and five-year periods. The Fund also outperformed its blended benchmark in the one-, three- and five-year periods. The Board was satisfied with the Fund’s overall performance.
For the S&P Dynamic Fund, the Board noted that although the Fund underperformed its benchmarks in the one-, three- and five-year periods, the Fund ranked in the third quartile in its Performance Peer Group for the five-year period and the second quartile in the one- and three-year periods. Notwithstanding the foregoing, the Board recognized that the Fund was repositioned and its sub-adviser changed in 2014 and therefore the past performance prior to such time reflected performance under a different sub-adviser and investment parameters. The Board was satisfied with the Fund’s overall performance.
For the Nasdaq Fund, the Board noted that although the Fund performed in the third quartile and underperformed its blended benchmark in the one-year period, the Fund’s performance compared favorably to its peers in the longer periods ranking in the first quartile over the three- and five-year periods. The Fund also outperformed its blended benchmark in the three- and five-year periods. The Board was satisfied with the Fund’s overall performance.
| C. | | Fees, Expenses and Profitability |
The Board evaluated the management fees and other fees and expenses of each Fund. The Board reviewed and considered, among other things, the gross and net management fees paid by the Funds. The Board further considered the net total expense ratio of each Fund (expressed as a percentage of average net assets) as the expense ratio is most reflective of the investors’ net experience in a Fund as it directly reflected the costs of investing in the respective Fund.
In addition, the Board reviewed the Broadridge Report comparing, in relevant part, each Fund’s gross and net advisory fees and net total expense ratio with those of a Peer Universe. The Independent Board Members also reviewed the methodology regarding the construction of the applicable Peer Universe by Broadridge. In reviewing the comparative data, the Board was aware that various factors may limit some of the usefulness of the data, such as differences in size of the peers; the composition of the Peer Universe; changes each year of funds comprising the Peer Universe; levels of expense reimbursements and fee waivers; and differences in the type and use of leverage. Nevertheless, in reviewing a fund’s fees and expenses compared to the fees and expenses of its peers (excluding leverage costs and leveraged assets), the Board generally considered a fund’s expenses and fees to be higher if they were over 10 basis points higher, slightly higher if they were 6 to 10 basis points higher, in line if they were within approximately 5 basis points higher than the peer average and below if they were below the peer average of the Peer Universe. The Board noted that the substantial majority of the Nuveen funds had a net expense ratio that was near or below their respective peer average.
The Independent Board Members noted that the Funds each had a net management fee and a net expense ratio below its respective peer average.
In their evaluation of the management fee schedule, the Independent Board Members also reviewed the fund-level and complex-wide breakpoint schedules, as described in further detail below. With respect to closed-end funds, the Board considered the effects of leverage on fees and expenses, including the calculation of management fees for funds with tender option bonds.
Based on their review of the information provided, the Board determined that each Fund’s management fees (as applicable) to a Fund Adviser were reasonable in light of the nature, extent and quality of services provided to the Fund.
| | 2. | | Comparisons with the Fees of Other Clients |
The Board also reviewed information regarding the respective Fund Adviser’s fee rates for providing advisory services to other types of clients. For the Adviser and/or NAM (an affiliated Sub-Adviser), such other clients may include: separately managed accounts (such as retail, institutional or wrap accounts), other investment companies that are not offered by Nuveen but are sub-advised by NAM, foreign investment companies offered by Nuveen, and collective investment trusts. The Board further noted that the Adviser also advises certain exchange-traded funds (“ETFs”) sponsored by Nuveen.
In reviewing the fee rates assessed to other clients, with respect to NAM, the Board reviewed, among other things, the range of fees assessed for managed accounts and the foreign investment companies offered by Nuveen. With respect to foreign funds, the Board noted that unlike the management fees for the Nuveen funds, the management fees for the foreign funds may include distribution fees paid to intermediaries. The Board also reviewed the average fee rate for certain strategies offered by NAM. With respect to Gateway (an unaffiliated Sub-Adviser), the Independent Board Members reviewed the pricing schedule or fee rates that such Sub-Adviser charges for other clients.
The Board recognized the inherent differences between the Nuveen funds and the other types of clients. The Board considered information regarding these various differences which included, among other things, the services required, average account sizes, types of investors targeted, legal structure and operations, and applicable laws and regulations. The Independent Board Members recognized that the foregoing variations resulted in different economics among the product structures and culminated in varying management fees among the types of clients and the Nuveen funds. In general, the Board noted that higher fee levels reflected higher levels of service provided by the Fund Adviser, increased investment management complexity, greater product management requirements and higher levels of business risk or some combination of the foregoing. The Board recognized the breadth of services the Adviser provided to support the Nuveen funds as summarized above and noted that many of such administrative services may not be required to the same extent or at all for the institutional clients or other clients. The Board further recognized the passive management of ETFs compared to the active management required of other Nuveen funds would contribute to differing fee levels.
The Independent Board Members noted that the sub-advisory fees paid by the Adviser to the respective Sub-Adviser, however, were generally for portfolio management services. With respect to NAM, the Board noted such sub-advisory fees were more comparable to the fees of retail wrap accounts and other external sub-advisory mandates. With respect to Gateway, the Independent Board Members noted that such fee was the result of arm’s length negotiations and was reasonable in relation to the fees assessed other clients.
Given the inherent differences in the various products, particularly the extensive services provided to the Funds, the Board concluded that such facts justify the different levels of fees.
| | 3. | | Profitability of Fund Advisers |
In conjunction with their review of fees, the Independent Board Members also considered Nuveen’s level of profitability for its advisory services to the Nuveen funds for the calendar years 2016 and 2015. In considering profitability, the Independent Board Members considered the level of profitability realized by Nuveen before the imposition of any distribution and marketing expenses incurred by the firm from its own resources. In evaluating the profitability, the Independent Board Members evaluated the analysis employed in developing the profitability figures, including the assumptions and methodology employed in allocating expenses. The Independent Board Members recognized the inherent limitations to any cost allocation methodology as different and reasonable approaches may be used and yet yield differing results. The Independent Board Members further reviewed an analysis of the history of the profitability methodology used explaining any changes to the methodology over the years. The Board has appointed two Independent Board Members, who along with independent legal counsel, helped to review and discuss the methodology employed to develop the profitability analysis each year and any proposed changes thereto and to keep the Board apprised of such changes during the year.
In their review, the Independent Board Members evaluated, among other things, Nuveen’s adjusted operating margins, the gross and net revenue margins (pre-tax and after-tax) for advisory activities for the Nuveen funds, and the revenues,
Annual Investment Management Agreement Approval Process (continued)
expenses, and net income (pre-tax and after-tax) of Nuveen for each of the last two calendar years. The Independent Board Members also reviewed an analysis of the key drivers behind the changes in revenues and expenses that impacted profitability in 2016 versus 2015. The Board, however, observed that Nuveen’s operating margins for its advisory activities in 2016 were similar to that of 2015.
In addition to reviewing Nuveen’s profitability in absolute terms, the Independent Board Members also reviewed the adjusted total company margins of other advisory firms that had publicly available information and comparable assets under management (based on asset size and asset composition). The Independent Board Members, however, noted that the usefulness of the comparative data may be limited as the other firms may have a different business mix and their profitability data may be affected by numerous other factors such as the types of funds managed, the cost allocation methodology used, and their capital structure. Nevertheless, the Board noted that Nuveen’s adjusted operating margins appeared comparable to the adjusted margins of the peers.
Further, the Adviser is a subsidiary of Nuveen, LLC, the investment management arm of Teachers Insurance and Annuity Association of America (“TIAA”). To have a fuller picture of the financial condition and strength of the TIAA complex, together with Nuveen, the Board reviewed a balance sheet for TIAA reflecting its assets, liabilities and capital and contingency reserves for the 2016 and 2015 calendar years.
In addition to the Adviser’s profitability, the Independent Board Members also considered the profitability of each Sub-Adviser from its relationship with the Nuveen fund(s). With respect to NAM, the Independent Board Members reviewed the Sub-Adviser’s revenues, expenses and revenue margins (pre- and post-tax) for its advisory activities for the calendar year ended December 31, 2016. The Independent Board Members also reviewed a profitability analysis reflecting the revenues, expenses and revenue margin (pre- and post-tax) by asset type for such Sub-Adviser for the calendar year ending December 31, 2016.
With respect to Gateway, the Independent Board Members considered the Sub-Adviser’s level of profitability for its advisory services to the applicable Fund for the calendar years 2016 and 2015. More specifically, the Independent Board Members considered such Sub-Adviser’s revenues, expenses and profitability margins (pre-tax and after-tax) for its advisory activities with such Fund for the 2015 and 2016 calendar years.
In evaluating the reasonableness of the compensation, the Independent Board Members also considered other amounts paid to a Fund Adviser for its services to the Funds as well as indirect benefits (such as soft dollar arrangements), if any, the Fund Adviser and its affiliates received or were expected to receive that were directly attributable to the management of a Fund. See Section E below for additional information on indirect benefits a Fund Adviser may receive as a result of its relationship with the Funds.
Based on a consideration of all the information provided, the Board noted that Nuveen’s and each Sub-Adviser’s level of profitability was acceptable and not unreasonable in light of the services provided.
| D. | | Economies of Scale and Whether Fee Levels Reflect These Economies of Scale |
When evaluating the level of the advisory fees, the Independent Board Members considered whether there will be any economies of scale that may be realized by the Fund Adviser as a Fund grows and the extent to which these economies were shared with the Funds and shareholders. The Board recognized that economies of scale are difficult to measure with precision; however, the Board considered that there were several ways the Fund Adviser may share the benefits of economies of scale with the Nuveen funds, including through breakpoints in the management fee schedule reducing the fee rates as asset levels grow, fee waivers and/or expense limitation agreements and the Adviser’s investment in its business which can enhance the services provided to the Nuveen funds. With respect to the fee structure, the Independent Board Members have recognized that economies of scale may be realized when a particular fund grows, but also when the total size of the fund complex grows (even if the assets of a particular fund in the complex have not changed or have decreased). Accordingly, subject to certain exceptions, the funds in the Nuveen complex pay a management fee to the Adviser which is generally comprised of a fund-level component and complex-level component, each of which has a breakpoint schedule. Subject to certain exceptions, the fund-level fee component declines as the assets of the particular fund grow and the complex-level fee component declines when eligible assets of all the Nuveen funds (except for Nuveen ETFs which are subject to a unitary fee)
in the Nuveen complex combined grow. In addition, with respect to closed-end funds, the Independent Board Members noted that, although such funds may from time-to-time make additional share offerings, the growth of their assets would occur primarily through the appreciation of such funds’ investment portfolios.
The Independent Board Members reviewed the breakpoint and complex-wide schedules and any savings achieved from fee reductions as a result of the fund-level and complex-level breakpoints for the 2016 calendar year.
In addition, the Independent Board Members recognized the Adviser’s ongoing investment in its business to expand or enhance the services provided to the benefit of all of the Nuveen funds.
Based on their review, the Board concluded that the current fee structure was acceptable and reflected economies of scale to be shared with shareholders when assets under management increase.
The Independent Board Members received and considered information regarding other benefits the respective Fund Adviser or its affiliates may receive as a result of their relationship with the Nuveen funds, including compensation paid to affiliates of a Fund Adviser for services rendered to the funds and research services received by a Fund Adviser from broker-dealers that execute fund trades. The Independent Board Members noted that affiliates of the Adviser may receive compensation for serving as a co-manager for initial public offerings of new Nuveen closed-end funds and as underwriter on shelf offerings for certain existing funds. The Independent Board Members considered the compensation paid for such services in 2016.
In addition to the above, the Independent Board Members considered that the Funds’ portfolio transactions are allocated by the respective Sub-Adviser and, in the case of the Dow Fund, the S&P Dynamic Fund and the Nasdaq Fund, NAM, the Sub-Adviser of such Funds, may benefit from research received from broker-dealers that execute Fund portfolio transactions. The Board noted, however, that with respect to transactions in fixed income securities, such securities generally trade on a principal basis and do not generate soft dollar credits. Although the Board recognized the Sub-Adviser of such Funds may benefit from a soft dollar arrangement if it does not have to pay for this research out of its own assets, the Board also recognized that the research may benefit such Funds to the extent it enhances the ability of the Sub-Adviser to manage the Funds.
With respect to the S&P Buy-Write Fund, Gateway, the Sub-Adviser of such Fund, has not participated in soft dollar arrangements with respect to Fund portfolio transactions.
Based on their review, the Board concluded that any indirect benefits received by a Fund Adviser as a result of its relationship with the Funds were reasonable and within acceptable parameters.
The Board Members did not identify any single factor discussed previously as all-important or controlling. The Board Members, including the Independent Board Members, concluded that the terms of each Advisory Agreement were fair and reasonable, that the respective Fund Adviser’s fees were reasonable in light of the services provided to each Fund and that the Advisory Agreements be renewed.
| | | | | | | | | | | | | | |
| | | | | | | | |
| | | | |
| | | | | | | | |
| | | | | | | | |
| | |
| | Nuveen: | | |
| | | | Serving Investors for Generations | | |
| | |
| | | | |
| | | | Since 1898, financial advisors and their clients have relied on Nuveen to provide dependable investment solutions through continued adherence to proven, long-term investing principles. Today, we offer a range of high quality solutions designed to be integral components of a well-diversified core portfolio. | | |
| | | |
| | | | | | |
| | | | | | Focused on meeting investor needs. Nuveen is the investment management arm of TIAA. We have grown into one of the world’s premier global asset managers, with specialist knowledge across all major asset classes and particular strength in solutions that provide income for investors and that draw on our expertise in alternatives and responsible investing. Nuveen is driven not only by the independent investment processes across the firm, but also the insights, risk management, analytics and other tools and resources that a truly world-class platform provides. As a global asset manager, our mission is to work in partnership with our clients to create solutions which help them secure their financial future. | | |
| | | | |
| | | | | | | | |
| | | | | | Find out how we can help you.
To learn more about how the products and services of Nuveen
may be able to help you meet your financial goals, talk to your financial advisor, or call us at (800) 257-8787. Please read the information provided carefully before you invest. Investors should consider the investment objective and policies, risk considerations, charges and expenses of any investment carefully. Where applicable, be sure to obtain a prospectus, which contains this and other relevant information. To obtain a prospectus, please contact your securities representative or Nuveen, 333 W. Wacker Dr., Chicago, IL 60606. Please read the prospectus carefully before you invest or send money. Learn more about Nuveen Funds at: www.nuveen.com/cef
| | |
| | | | | | |
| | | | | | | | | | | | |
| | Securities offered through Nuveen Securities, LLC, member FINRA and SIPC | 333 West Wacker Drive Chicago, IL 60606 | www.nuveen.com | | |
ESA-D-0617D 243968-INV-B-08/18
Item 2. Code of Ethics.
Not applicable to this filing.
Item 3. Audit Committee Financial Expert.
Not applicable to this filing.
Item 4. Principal Accountant Fees and Services.
Not applicable to this filing.
Item 5. Audit Committee of Listed Registrants.
Not applicable to this filing.
Item 6. Schedule of Investments.
(a) See Portfolio of Investments in Item 1.
(b) Not applicable.
Item 7. Disclosure of Proxy Voting Policies and Procedures for Closed-End Management Investment Companies.
Not applicable to this filing.
Item 8. Portfolio Managers of Closed-End Management Investment Companies.
Not applicable to this filing.
Item 9. Purchases of Equity Securities by Closed-End Management Investment Company and Affiliated Purchasers.
Not applicable.
Item 10. Submission of Matters to a Vote of Security Holders.
There have been no material changes to the procedures by which shareholders may recommend nominees to the registrant’s Board implemented after the registrant last provided disclosure in response to this item.
Item 11. Controls and Procedures.
| (a) | The registrant’s principal executive and principal financial officers, or persons performing similar functions, have concluded that the registrant’s disclosure controls and procedures (as defined in Rule 30a-3(c) under the Investment Company Act of 1940, as amended (the “1940 Act”) (17 CFR 270.30a-3(c))) are effective, as of a date within 90 days of the filing date of this report that includes the disclosure required by this paragraph, based on their evaluation of the controls and procedures required by Rule 30a-3(b) under the 1940 Act (17 CFR 270.30a-3(b)) and Rules 13a-15(b) or 15d-15(b) under the Securities Exchange Act of 1934, as amended (the “Exchange Act”) (17 CFR 240.13a-15(b) or 240.15d-15(b)). |
| (b) | There were no changes in the registrant’s internal control over financial reporting (as defined in Rule 30a-3(d) under the 1940 Act (17 CFR 270.30a-3(d)) that occurred during the second fiscal quarter of the period covered by this report that has materially affected, or is reasonably likely to materially affect, the registrant’s internal control over financial reporting. |
Item 12. Exhibits.
File the exhibits listed below as part of this Form.
(a)(1) Any code of ethics, or amendment thereto, that is the subject of the disclosure required by Item 2, to the extent that the registrant intends to satisfy the Item 2 requirements through filing of an exhibit: Not applicable to this filing.
(a)(2) A separate certification for each principal executive officer and principal financial officer of the registrant as required by Rule 30a-2(a) under the 1940 Act (17 CFR 270.30a-2(a)) in the exact form set forth below: See EX-99.CERT attached hereto.
(a)(3) Any written solicitation to purchase securities under Rule 23c-1 under the 1940 Act (17 CFR 270.23c-1) sent or given during the period covered by the report by or on behalf of the registrant to 10 or more persons: Not applicable.
(b) If the report is filed under Section 13(a) or 15(d) of the Exchange Act, provide the certifications required by Rule 30a-2 (b) under the 1940 Act (17 CFR 270.30a-2(b)), Rule 13a-14(b) or Rule 15d-14(b) under the Exchange Act (17 CFR 240.13a-14(b) or 240.15d-14(b)), and Section 1350 of Chapter 63 of Title 18 of the United States Code (18 U.S.C. 1350) as an Exhibit. A certification furnished pursuant to this paragraph will not be deemed “filed” for purposes of Section 18 of the Exchange Act (15 U.S.C. 78r), or otherwise subject to the liability of that section. Such certification will not be deemed to be incorporated by reference into any filing under the Securities Act of 1933 or the Exchange Act, except to the extent that the registration specifically incorporates it by reference: See EX-99.906 CERT attached hereto.
SIGNATURES
Pursuant to the requirements of the Securities Exchange Act of 1934 and the Investment Company Act of 1940, the registrant has duly caused this report to be signed on its behalf by the undersigned, thereunto duly authorized.
(Registrant) Nuveen Dow 30SM Dynamic Overwrite Fund
| | | | |
| By (Signature and Title) | | /s/ Gifford R. Zimmerman | | |
| | Gifford R. Zimmerman | | |
| | Vice President and Secretary | | |
Date: September 7, 2017
Pursuant to the requirements of the Securities Exchange Act of 1934 and the Investment Company Act of 1940, this report has been signed below by the following persons on behalf of the registrant and in the capacities and on the dates indicated.
| | | | |
| By (Signature and Title) | | /s/ Cedric H. Antosiewicz | | |
| | Cedric H. Antosiewicz | | |
| | Chief Administrative Officer | | |
| | (principal executive officer) | | |
Date: September 7, 2017
| | | | |
| By (Signature and Title) | | /s/ Stephen D. Foy | | |
| | Stephen D. Foy | | |
| | Vice President and Controller | | |
| | (principal financial officer) | | |
Date: September 7, 2017