Exhibit (c)(6)
Valuation analysis - For the attention of the Transaction Committee of Cnova N.V. 11 May 2016 Strictly Private and Confidential Transactions Restructuring Transformation Project Delphes Fairness Opinion on the Merger
EIGHT ADVISORY 40, rue de Courcelles 75008 PARIS Tél : +33 (0)1 45 61 88 88 Fax : +33 (0)1 45 61 72 00 www.8advisory.com Cnova N.V. WTC Schiphol Airport Tower D, 7th Floor Schiphol Boulevard 273 1118 BH Schiphol The Netherlands 11 May 2016 For the attention of the Transaction Committee of Cnova N.V. in relation to the project Delphes Dear Sirs, In accordance with our engagement letter dated 14 March 2016 (the “Engagement letter”), we are pleased to provide the Transaction Committee of Cnova N.V. with our Fairness Opinion related to the Merger contemplated by Via Varejo and Cnova Brazil and the combination of their businesses in the framework of project Delphes. Context and Purpose of the Fairness Opinion In 2014, the following Group entities combined their e - commerce assets: - Casino Guichard Perrachon (“CGP”); - Almacenes Éxito S.A. (“Éxito”), a controlled subsidiary of Casino listed in Colombia; - Companhia Brasileira de Distribuiçao (“CBD” or “GPA”), a controlled subsidiary of CGP and Éxito, listed in Brazil and in the United States; - Via Varejo S.A. (“Via Varejo” or “VV”), a controlled subsidiary of GPA listed in Brazil. These entities agreed on 4 June 2014 to transfer their respective e - commerce businesses in France, Latin America and Asia to Cnova N.V. (“Cnova” or the “Company”). As Cnova is a holding company, these e - commerce businesses are mainly operated through the following subsidiaries: - Cdiscount S.A. (“Cdiscount”) in France as well as in selected international countries; - Cnova Comércio Eletrônico S.A. (“Nova”, “Cnova Brazil”) in Brazil. In 2015, Cnova consolidated net sales reached € 3.42bn. Because of the global disturbed situation in Brazil and the commercial and financial difficulties encountered by Nova, the Casino group is contemplating a reorganization in which Nova Pontocom Comércio Eletrônico S.A., held by Cnova N.V., would be merged with Via Varejo S.A. through the creation of a new subsidiary (“NewCo”) wholly owned by Via Varejo(the“Transaction”). In connection with this contemplated transaction, Cnova Board of Directors has created a transaction committee (the "Transaction Committee") to assess the benefits of the Transaction for Cnova’s shareholders. This document (the “Presentation”, “the Fairness Opinion” or the “Document”) was prepared by Eight Advisory France S.A.S. (“Eight Advisory”) for the benefit and use of the Transaction Committee, in connection with its analysis of the Transaction. The purpose of this Report is to provide the Transaction Committee of Cnova with our independent opinion on the financial fairness for Cnova’s shareholders of the contemplated Transaction(Merger of Via Varejo and Nova businesses). Valuation analysis - Project Delphes - 11 May 2016 Transactions Restructuring Transformation 2

EIGHT ADVISORY 40, rue de Courcelles 75008 PARIS Tél : +33 (0)1 45 61 88 88 Fax : +33 (0)1 45 61 72 00 www.8advisory.com Eight Advisory and Declaration of Independence Founded in 2009 by several partners and directors from international audit and consulting firms and also from the business world, Eight Advisory is an independent financial and operational firm, gathering expert professionals in their respective fields. With 21 partners boasting an average of 22 years of experience in the business and over 200 employees, Eight Advisory performed more than 1,000 assignments in supporting large corporate groups, investment funds, financial institutions and family - owned groups in making decisions in the context of transactions, litigation, financial appraisal, restructuring and operational performance. With two offices in Paris and in London and about 15 international partners, Eight Advisory is a firm well - known for its trusted signature, on both national and international engagements. Eight Advisory France S.A.S. has neither legal nor financial relationships with entities involved in the Transaction or its advisors and holds neither financial interest in the success of the Transaction, nor receivables or debts to any companies involved in the Transaction or any individual or entity that it controls within the meaning of Article l.233 - 3 of the French commercial code. Eight Advisory confirms there is no past, present or future link with any entities involved in the Transaction or its advisors, which are likely to affect its independence or impartiality of its judgment in the context of this Transaction. For the realization of the Fairness Opinion related to the present Transaction, we inform the Transaction Committee and Cnova’s shareholders that our fees are not relying on the success of the Transaction. Scope of work and Diligences In the context of the Transaction, we were mandated by the Transaction Committee of Cnova N.V. in order to appraise the value of Cnova N.V., Nova and Cdiscount, and deliver our opinion on the fairness of the contemplated Transaction. For this purpose, our work consisted of the following steps: - Analyze the available historical financial data for Cnova N.V., Nova and Cdiscount; - Review and understand the Transaction context and process as well as the key drivers of the valuation of each entity; - Review the available business plans at the Transaction date; - Review BNPP valuation report dated 10 May 2016; - Interviews with the management of Cnova N.V., Nova, Cdiscount with regard to the historical performances and the business plans; - Implement a multi - criteria approach to appraise the equity values of Cnova N.V., Nova and Cdiscount; - Estimate the value of the potential synergies arising from the business combination of Nova and Via Varejo; - Review the non - binding Memorandum of Understanding (“MoU”) as of 6 May 2016; - Deliver our Fairness Opinion to the Transaction Committee on the financial Terms and Conditions as defined in the non - binding MoU as of 6 May 2016. According to our quality risk management procedure, an independent review of this Document was performed by one of our Directors. Valuation analysis - Project Delphes - 11 May 2016 Transactions Restructuring Transformation 3

EIGHT ADVISORY 40, rue de Courcelles 75008 PARIS Tél : +33 (0)1 45 61 88 88 Fax : +33 (0)1 45 61 72 00 www.8advisory.com Valuation approaches Our work relied on a multi - criteria approach, based on the generally accepted valuation methods: - The Income Approach indicates the Enterprise Value of a business based on the present value of the cash flows that the business can be expected to generate in the future. Such cash flows are discounted at a discount rate(the Weighted Average Cost of Capital) that reflects the time value of money and the risks associated with the cash flows. This approach relies on forecasts prepared by the management teams. - The Market approach indicates the value of a business based on a comparison with comparable firms in similar lines of business that are publicly traded or which are part of a public or private transaction. This approach can be estimated through the Trading Multiples Method and the Market Transaction Method. - The analysis of the historical evolution of the share price and its liquidity. - The analysis of recent transactions on the companie’s capital. - The Sum - of - the - Parts approach indicates the Equity Value of a company by adding the company assets and deducting its liabilities, estimated at their fair market values. The assets fair market values may be estimated according to the methods presented before. By nature, valuation is not an exact science. Therefore, conclusions from our work are inevitably subjective and rely on the appreciation and judgment of the appraiser. Source of information and limits For the purpose of our Fairness Opinion, we have relied upon financial and other information from various public, financial, and industry sources. This information has not be verified and accordingly, the accuracy of the information is not warranted. In addition to this information, our work was based on financial and other information and explanations provided to us by Cnova management team, which has confirmed to us that all information relevant to our work has been communicated to us during our engagement, and that it is not aware of any facts or circumstances that would make such information or data inaccurate or misleading in any material aspect. All forecasts are the sole responsibility of Cnova management team. We will accept no responsibility for the achievement of forecasts. We assume that they have been prepared on bases reflecting the best currently available estimates of the future financial performance and have performed analysis to assess whether the forecasts underlying assumptions were consistent with the information available. We relied on the assumption that the intragroup agreements conditions were at arm’s length. We note that they have been reviewed by an independent expert. Our work is based on conditions prevailing as of 6 May 2016. Any evolution in the prospects of the Company or the market conditions (currencies, credit and stock markets conditions, macroeconomic and geopolitical risks, market and regulatory trends, etc.), or any change in operating conditions, and any information that is incorrect, incomplete or not communicated could have a significant impact on our conclusions and might require our analysis to be updated. Valuation analysis - Project Delphes - 11 May 2016 Transactions Restructuring Transformation 4

EIGHT ADVISORY 40, rue de Courcelles 75008 PARIS Tél : +33 (0)1 45 61 88 88 Fax : +33 (0)1 45 61 72 00 www.8advisory.com We relied on information available as of 10 May 2016 which may be subject to revisions that could impact our findings and conclusions. Please note that according to the paragraph 4.3 of the non - binding MoU as of 6 May 2016: “[…] the Parties in the Definitive Documents, the Parties agree that for the purpose of determining the amount of the Cash Disbursement pursuant to Section 4.1 above, the Agreed Equity Values with respect to Cnova NV and Cnova Brazil shall be adjusted in good faith by the Parties to take into account the effective impact on the valuation of the differences between (i) the Cnova’s 2015 Preliminary Financial Statements, and (ii) the audited financial statements of Cnova Brazil as of and for the year ended 31 December 2015, when released following the completion of the accounting investigation into certain accounting practices of Cnova Brazil currently ongoing, and in any event before entering into the Definitive Documents (the “Final Cnova Brazil Financial Statements”).” In addition, we understand that following the discovery of fraudulent activity in Brazil, a forensic accounting investigation is currently taking place. As a consequence, the 2015 accounts have not been audited yet and the Company has had to explain that the accounts for 2014 and 2013 could not be relied upon and would have to be restated. At the time of our assignment, the consequences of this investigation were not known to us and therefore could not be taken into account in our analyses. Our document was prepared for the benefit and use of the Transaction Committee, and is not rendered to, or for the benefit of, and shall not confer rights or remedies upon, any person other than the Transaction Committee. We express no view or opinion on the relative merits of the Transaction in comparison to other strategies available to Cnova, or on strategies Cnova’s shareholders should apply in this context. We understand that as part of the reorganization, a Tender Offer (the “Offer”) on Cnova free float is currently considered. We do not express any opinion on this Offer at this stage. Our work did not consist in performing audit procedures which would be necessary in order to express an opinion in respect of the Company’s financial statements. Date of our work This Document presents our conclusions based on the work performed and the information available as of 10 May 2016. We would like to thank you for providing us with this opportunity to work with you and remain at your disposal for any question. Yours Faithfully, Alexis Karklins - Marchay Partner For Eight Advisory SAS Valuation analysis - Project Delphes - 11 May 2016 Transactions Restructuring Transformation 5
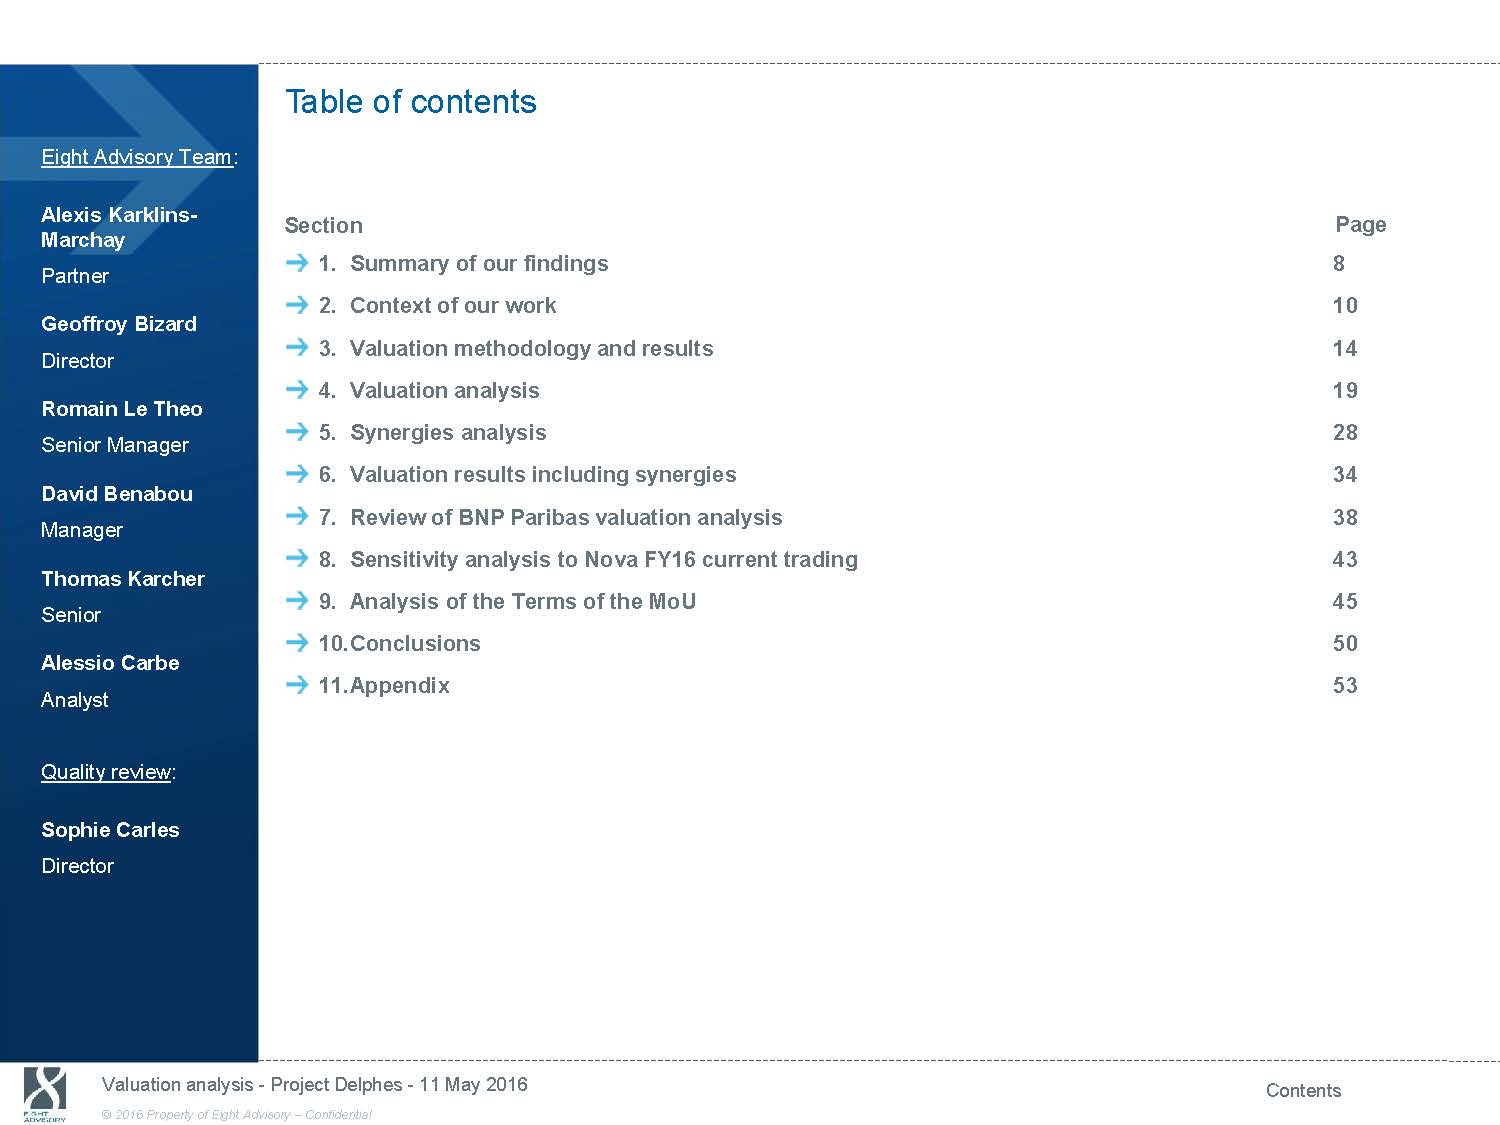
Table of contents Eight Advisory Team: Alexis Karklins - Marchay Partner Geoffroy Bizard Director Romain Le Theo Senior Manager David Benabou Manager Thomas Karcher Senior Alessio Carbe Analyst Quality review: Sophie Carles Director Section Page 1. Summary of our findings 8 2. Context of our work 10 3. Valuation methodology and results 14 4. Valuation analysis 19 5. Synergies analysis 28 6. Valuation results including synergies 34 7. Review of BNP Paribas valuation analysis 38 8. Sensitivity analysis to Nova FY16 current trading 43 9. Analysis of the Terms of the MoU 45 10.Conclusions 50 11.Appendix 53 Valuation analysis - Project Delphes - 11 May 2016 Contents © 2016 Property of Eight Advisory - Confidential
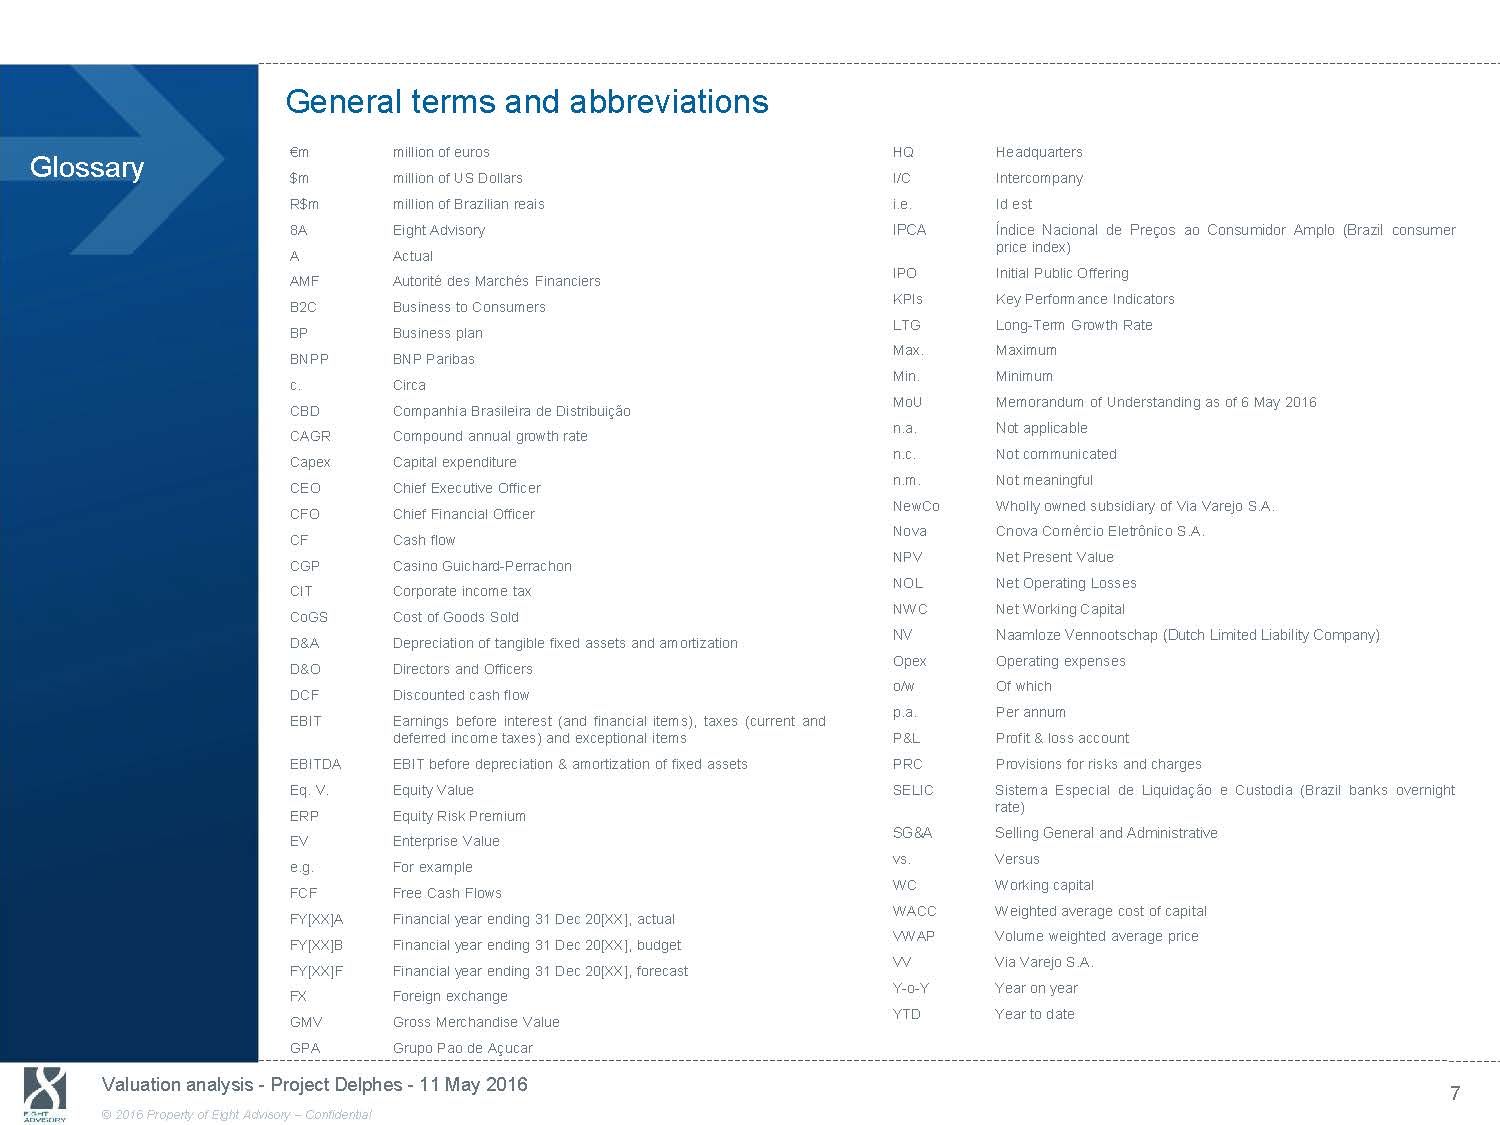
General terms and abbreviations Glossary € m million of euros $m million of US Dollars R$m million of Brazilian reais 8A Eight Advisory A Actual AMF Autorité des Marchés Financiers B2C Business to Consumers BP Business plan BNPP BNP Paribas c. Circa CBD Companhia Brasileira de Distribuição CAGR Compound annual growth rate Capex Capital expenditure CEO Chief Executive Officer CFO Chief Financial Officer CF Cash flow CGP Casino Guichard - Perrachon CIT Corporate income tax CoGS Cost of Goods Sold D&A Depreciation of tangible fixed assets and amortization D&O Directors and Officers DCF Discounted cash flow EBIT Earnings before interest (and financial items), taxes(current deferred income taxes) and exceptional items EBITDA EBIT before depreciation & amortization of fixed assets Eq. V. Equity Value ERP Equity Risk Premium EV Enterprise Value e.g. For example FCF Free Cash Flows FY[XX]A Financial year ending 31 Dec 20[XX], actual FY[XX]B Financial year ending 31 Dec 20[XX], budget FY[XX]F Financial year ending 31 Dec 20[XX], forecast FX Foreign exchange GMV Gross Merchandise Value GPA Grupo Pao de Açucar HQ Headquarters I/C Intercompany i.e. Id est IPCA Índice Nacional de Preços ao Consumidor Amplo(Brazilconsumer price index) IPO Initial Public Offering KPIs Key Performance Indicators LTG Long - Term Growth Rate Max. Maximum Min. Minimum MoU Memorandum of Understanding as of 6 May 2016 n.a. Not applicable n.c. Not communicated n.m. Not meaningful NewCo Wholly owned subsidiary of Via Varejo S.A. Nova Cnova Comércio Eletrônico S.A. NPV Net Present Value NOL Net Operating Losses NWC Net Working Capital NV Naamloze Vennootschap (Dutch Limited Liability Company) Opex Operating expenses o/w Of which p.a. Per annum and P&L Profit & loss account PRC Provisions for risks and charges SELIC Sistema Especial de Liquidação eCustodia(Brazilbanks overnight rate) SG&A Selling General and Administrative vs. Versus WC Working capital WACC Weighted average cost of capital VWAP Volume weighted average price VV Via Varejo S.A. Y - o - Y Year on year YTD Year to date Valuation analysis - Project Delphes - 11 May 2016 7 © 2016 Property of Eight Advisory - Confidential
1. Summary of our findings

Based on the standalone equity values estimated by Eight Advisory, the financial terms of the MoU lead to an implied “premium” on Nova standalone value, which What are the key findings of our appears to be fair for Cnova’s shareholders. analyses? 1. MoU vs. 8A and BNPP - Cnova per share MoU Cnova (mid - point) $2,206m $5.00 per share 1. 8A standalone (central) $1,814m $4.11 per share Implied premium 22% 2. 8A including 100% synergies $4.65 per share (standalone central value) Implied premium 8% 2. MoU vs. 8A and BNPP - Standalone values in $m Nova Cdiscount Min Max Min Max MoU 492 557 1,598 1,766 BNPP standalone 413 478 1,496 1,654 8A standalone (central) 375 1,443 Hold.Interco. costs debt Cnova Min Max n.a. n.a. 2,090 2,323 (91) 127 1,945 2,168 (130) 127 1,814 3. 8A standalone (high) $2,045m Implied premium For information: 8A $4.63 per share standalone (high) 8% 415 1,634 (130) 127 2,045 For information: 8A including 100% $5.17 per share synergies (standalone high value) Premium MoU / 8A (central) 31% 8A vs. BNPP (9)% 49% 11% 23% 15% 28% (22)% (4)% (13)% (7)% (16)% Reminder: BNPP standalone $4.41 - $4.91 per share Source: MoU dated 6 May 2016, Management, Eight Advisory analysis 8A estimate of BNPP including synergies $4.47 - $5.04 per share Source: MoU dated 6 May 2016, Management, Eight Advisory analysis Note: Eight Advisory range based on sensitivity to WACC 3. Analysis of the terms of the MoU ᇄ Financial terms of the MoU as of 6 May 2016 are correctly estimated . For illustration purposes, based on the MoU mid - point values: 22% * $2,206m + $167m = 100% * $525m + $127m (Cnova) (Cash Portion & (Nova) (Interco. debt) Interco. debt) ᇄ With Eight Advisory intrinsic standalone values and mid - point Cash Portion: 22% * $1,814m + $167m > 100% * $375m + $127m $565m $502m ᇄ Implied “premium” of $64m (difference between price paid of $565m and value of Nova plus repayment of the intercompany debt), corresponding to: 17% premium over Nova standalone value , or 45% of Nova estimated net synergies attributable to Cnova’s shareholders. ᇄ The financial terms of the MoU lead to an implied “premium” on Nova standalone value, which appears to be fair for Cnova’s sh ar eholders, subject to Section 4.3 of the MoU. Valuation analysis - Project Delphes - 11 May 2016 Summary of our findings 9 © 2016 Property of Eight Advisory - Confidential
2. Context of our work

We performed our valuation analysis in the context of a reorganization plan contemplated by the Casino group to improve Nova operating performance and What is the context of our work ? synergies generation with Via Varejo. Evolution of Cnova NV. share price ($), Bovespa index, Brazilian Bricks & Mortar electronics retailers and B2W share prices (basis100 as of 19.11.2014) 140 120 100 96.8 80 12 April 2016 60 49.3 49.3 42.1 Context of our work ᇄ Creation in July 2014 of Cnova, following Cdiscount and Nova contributions to Cnova NV. by Casino subsidiaries. Prior to the creation of Cnova NV., Nova was a 51% subsidiary of Via Varejo until November 2013, when Via Varejo sold a6% stake in Nova to Grupo Pão de Açucar, while keeping the management of Nova. ᇄ Cnova IPO on 19 November 2014 at $7.0 ($13.45 initially expected). ᇄ Significant share price decrease since the IPO due to: The recession in Brazil (4% GDP decrease in 2015), impacting Cnova but also Brazilian e - Commerce as well as Bricks & Mortar peers share prices. Significant headwinds in FY15 at Nova: A commercial downturn, with net sales +18.3% in Q1 (y - o - y) but - 14% in Q4 y - o - y (compared to +5.9% for 40 20 0 19/11/2014 19/02/2015 19/05/2015 Cnova US$ Bovespa Source: Bloomberg as of 06.05.2016 44.3 19/08/2015 19/11/2015 19/02/2016 Bricks & Mortar Brazil* B2W B2W), A poor operating performance and fraud investigations inducing management replacement, An € (117.3)m operating loss. ᇄ Reorganization plan set up by the Casino group to improve Nova operating performance and to generate additional synergies with Via Varejo. *Market cap. - weighted average of Via Varejo, Magazine Luiza and Unicasa Valuation analysis - Project Delphes - 11 May 2016 Context of our work 11 © 2016 Property of Eight Advisory - Confidential

According to the Transaction structuring presented by BNP Paribas, Nova will be transferred to a new subsidiary (NewCo) of Via Varejo against cash and shares. What are the main steps of the contemplated Transaction? Via Varejo will have previously transferred its 22.0% stake in Cnova to NewCo. After transfer of 22.0% stake in Cnova to NewCo After Transaction execution 54.8% 54.8% CGP 50.0% 22.5% GPA 62.6% 43.3% 43.3% 26.2% 99.8% Cdiscount Exito 50.0% 18.8% Klein Family 17.9% 27.3% VV NewCo 22.0% Cnova Free Float CGP 0.0% 58.7% 50.0% 22.5% Free Float GPA 19.5% 29.3% Free Float 8.5% 100.0% Nova Exito 50.0% 18.8% Klein Family VV 100% NewCo Cross shareholding elimination Cnova 99.8% Cdiscount Free Float 0.0% 58.7% Free Float Free Float Cash settlement 100.0% Nova Casino listed subsidiaries X % Economic interest Casino listed subsidiaries X % Economic interest Non controlling interests X % Voting rights Non controlling interests X % Voting rights Source: Indicative organization chart provided by BNP Paribas Valuation analysis - Project Delphes - 11 May 2016 Context of our work 12 © 2016 Property of Eight Advisory - Confidential
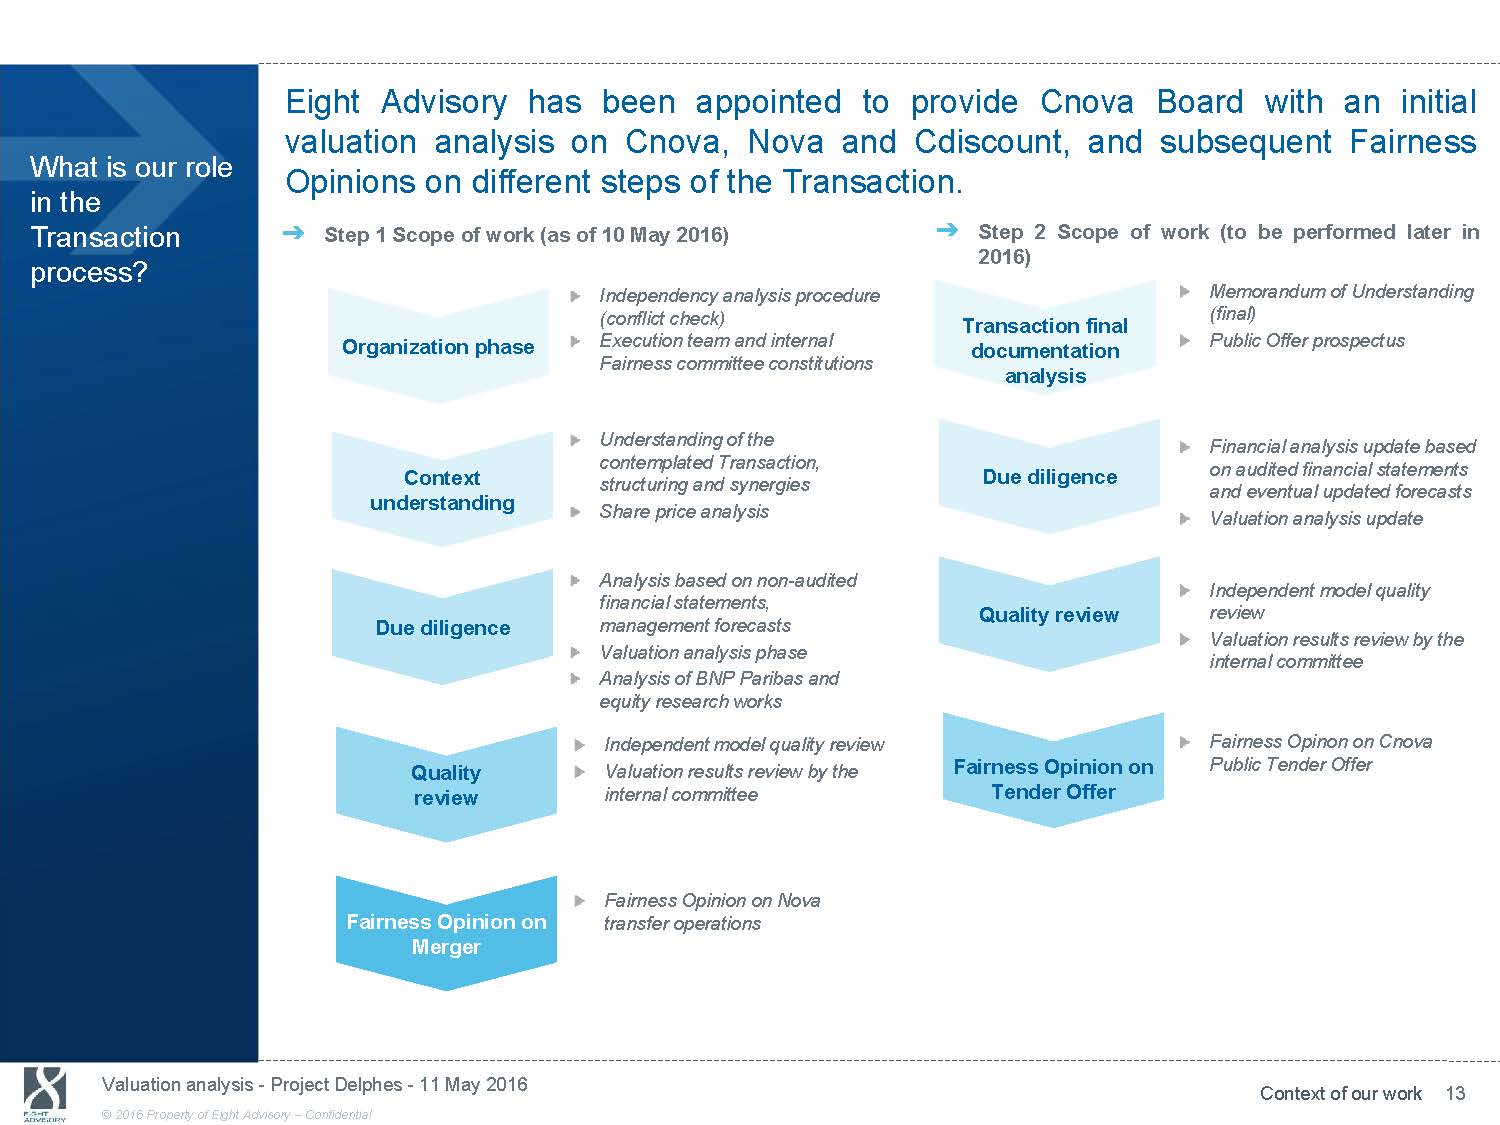
Eight Advisory has been appointed to provide Cnova Board with an initial valuation analysis on Cnova, Nova and Cdiscount, and subsequent Fairness What is our role in the Transaction process? Opinions on different steps of the Transaction. ᇄ Step 1 Scope of work (as of 10 May 2016) ᇄ Step 2 Scope of work (to be performed later in 2016) Independency analysis procedure Memorandum of Understanding (conflict check) (final) Organization phase Context understanding Due diligence Quality review Fairness Opinion on Merger Execution team and internal Fairness committee constitutions Understanding of the contemplated Transaction, structuring and synergies Share price analysis Analysis based on non - audited financial statements, management forecasts Valuation analysis phase Analysis of BNP Paribas and equity research works Independent model quality review Valuation results review by the internal committee Fairness Opinion on Nova transfer operations Transaction final documentation analysis Due diligence Quality review Fairness Opinion on Tender Offer Public Offer prospectus Financial analysis update based on audited financial statements and eventual updated forecasts Valuation analysis update Independent model quality review Valuation results review by the internal committee Fairness Opinon on Cnova Public Tender Offer Valuation analysis - Project Delphes - 11 May 2016 Context of our work 13 © 2016 Property of Eight Advisory - Confidential

3. Valuation methodology and results
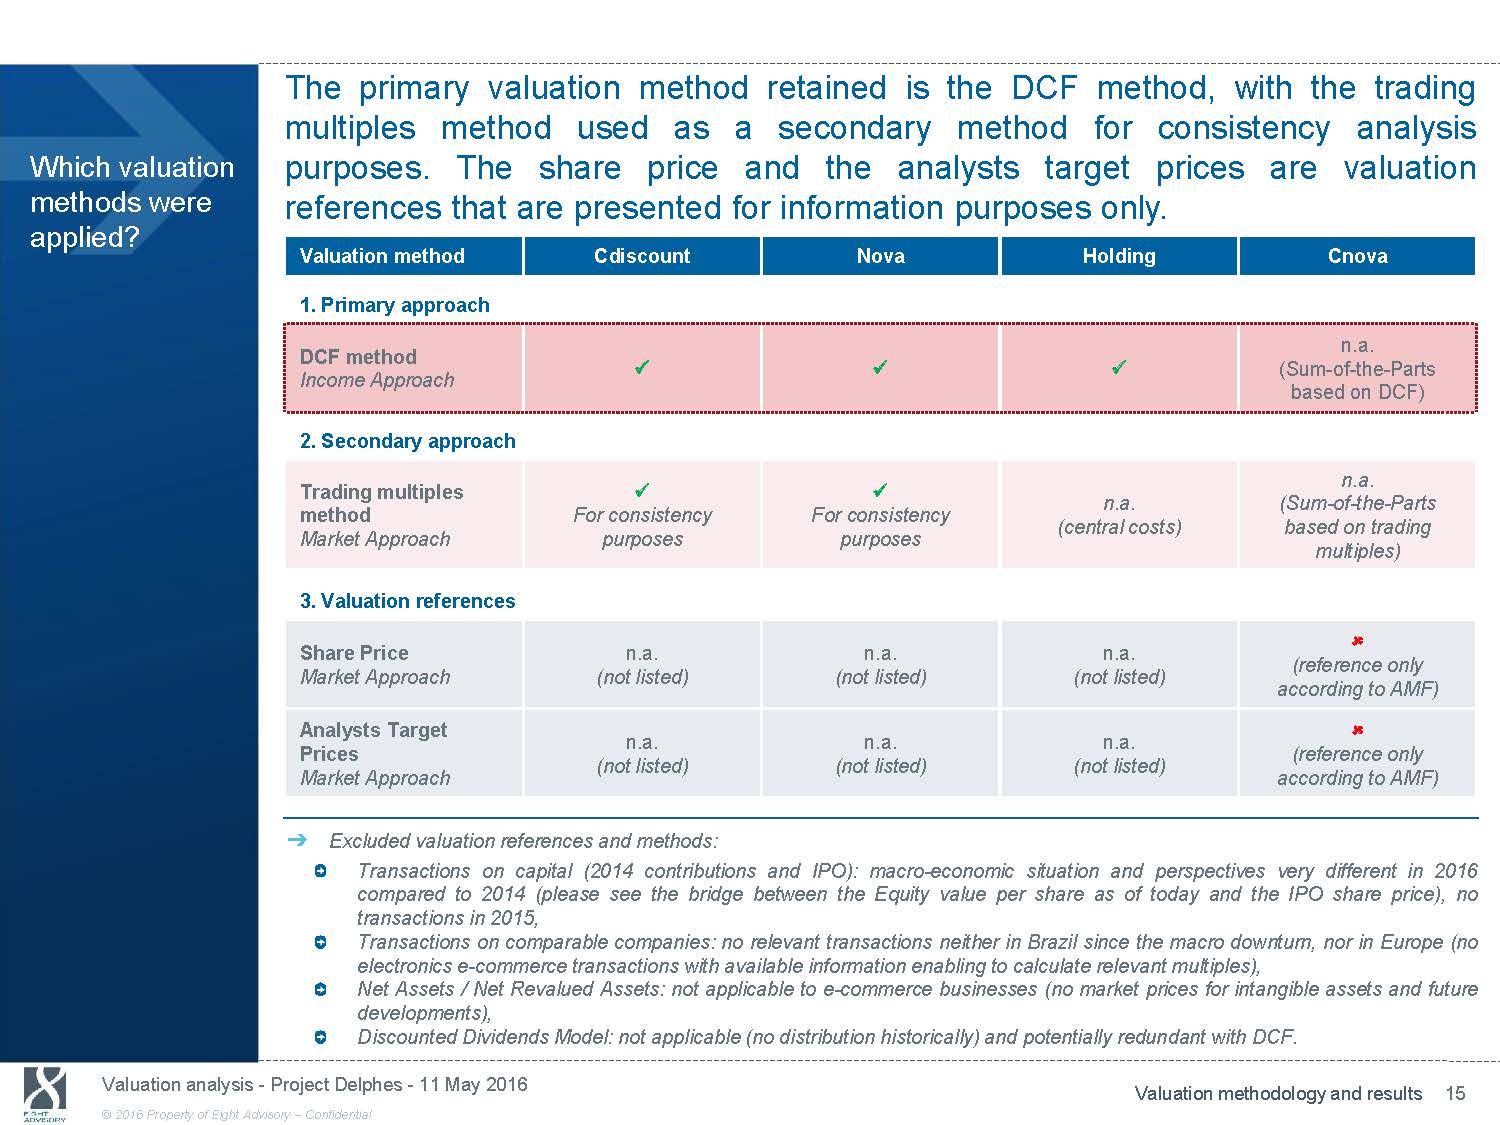
The primary valuation method retained is the DCF method, with the trading Which valuation methods were applied? multiples method used as a secondary method for consistency analysis purposes. The share price and the analysts target pricesare valuation references that are presented for information purposes only. Valuation method Cdiscount Nova Holding Cnova 1. Primary approach DCF method Income Approach x x n.a. x (Sum - of - the - Parts based on DCF) 2. Secondary approach Trading multiples x x method For consistency For consistency Market Approach purposes purposes n.a. n.a. (Sum - of - the - Parts (central costs) based on trading multiples) 3. Valuation references Share Price n.a. Market Approach (not listed) n.a. n.a. (not listed) (not listed) (reference only according to AMF) Analysts Target Prices Market Approach n.a. n.a. n.a. (not listed) (not listed) (not listed) (reference only according to AMF) ᇄ Excluded valuation references and methods: Transactions on capital (2014 contributions and IPO): macro - economic situation and perspectives very different in 201 6 compared to 2014 (please see the bridge between the Equity value per share as of today and the IPO share price), no transactions in 2015, Transactions on comparable companies: no relevant transactions neither in Brazil since the macro downturn, nor in Europe (no electronics e - commerce transactions with available information enabling to calculate relevant multiples), Net Assets / Net Revalued Assets: not applicable to e - commerce businesses (no market prices for intangible assets and future developments), Discounted Dividends Model: not applicable (no distribution historically) and potentially redundant with DCF. Valuation analysis - Project Delphes - 11 May 2016 Valuation methodology and results 15 © 2016 Property of Eight Advisory - Confidential
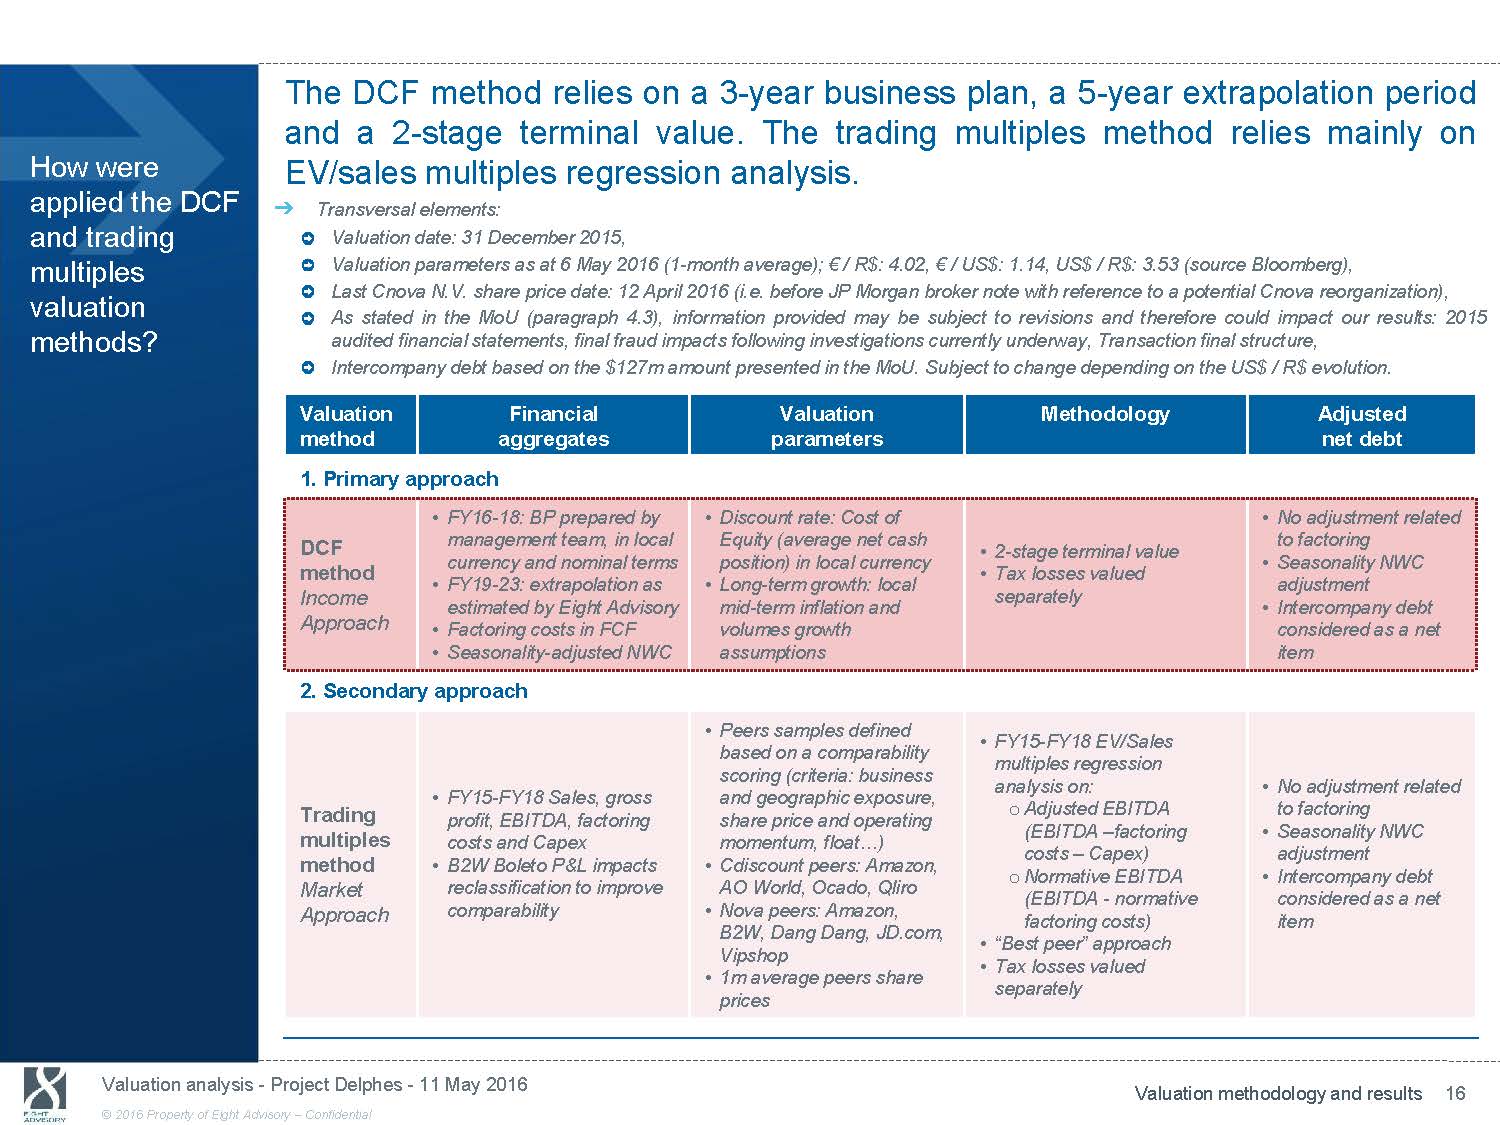
The DCF method relies on a 3 - year business plan, a 5 - year extrapolation period and a 2 - stage terminal value. The trading multiples method relies mainly on How were applied the DCF and trading multiples valuation methods? EV/sales multiples regression analysis. ᇄ Transversal elements: Valuation date: 31 December 2015, Valuation parameters as at 6 May 2016 (1 - month average); € / R$: 4.02, € / US$: 1.14, US$ / R$: 3.53 (source Bloomberg), Last Cnova N.V. share price date: 12 April 2016 (i.e. before JP Morgan broker note with reference to a potential Cnova reorga niz ation), As stated in the MoU (paragraph 4.3), information provided may be subject to revisions and therefore could impact our results : 2 015 audited financial statements, final fraud impacts following investigations currently underway, Transaction final structure, Intercompany debt based on the $127m amount presented in the MoU. Subject to change depending on the US$ / R$ evolution. Valuation Financial Valuation Methodology Adjusted method aggregates parameters net debt 1. Primary approach • FY16 - 18: BP prepared by • Discount rate: Cost of • No adjustment related DCF management team, in local Equity (average net cash • 2 - stage terminal value to factoring method Income Approach currency and nominal terms • FY19 - 23: extrapolation as estimated by Eight Advisory • Factoring costs in FCF • Seasonality - adjusted NWC position) in local currency • Long - term growth: local mid - term inflation and volumes growth assumptions • Tax losses valued separately • Seasonality NWC adjustment • Intercompany debt considered as a net item 2. Secondary approach • FY15 - FY18 Sales, gross Trading profit, EBITDA, factoring multiples costs and Capex method • B2W Boleto P&L impacts Market reclassification to improve Approach comparability • Peers samples defined based on a comparability scoring (criteria: business and geographic exposure, share price and operating momentum, float…) • Cdiscount peers: Amazon, AO World, Ocado, Qliro • Nova peers: Amazon, B2W, Dang Dang, JD.com, Vipshop • 1m average peers share prices • FY15 - FY18 EV/Sales multiples regression analysis on: • No adjustment related o Adjusted EBITDA to factoring (EBITDA - factoring • Seasonality NWC costs - Capex) adjustment o Normative EBITDA • Intercompany debt (EBITDA - normative considered as a net factoring costs) item • “Best peer” approach • Tax losses valued separately Valuation analysis - Project Delphes - 11 May 2016 Valuation methodology and results 16 © 2016 Property of Eight Advisory - Confidential

Excluding synergies and with intercompany debt not capitalized , Cnova NV Equity Value defined with the DCF method ranges from $1,618m to $2,045m. What are the results of our valuation analysis? 1. Cnova Equity Value ($m) Cnova Equity Value Before Synergies 1,814 DCF method 1,618 2,045 Interco. debt not cap. Relative weights excl. Holding Cdiscount 79% - 80% Note: DCF method range is Nova 20% - 21% based on sensitivity to WACC Trading multiples - Intercompany debt not Current view 1,164 (regression) Trading multiples - Best view (Best peer) 1,298 2,164 2,475 Cdiscount 85% - 86% Nova 14% - 15% Cdiscount 75% - 75% Nova 25% - 25% capitalized Analysts target price Average 706 1,214 1,765 Market capitalization (1 - month) 984 1,358 (1/2) Market capitalization (since IPO) - 12 April 2016 (1) 954 1,136 1 Mar. 2016 500 1,000 1,500 2,000 In $m IPO market cap. 3,089 3,732 Source: Bloomberg, 13 Jan. 2015 Eight Advisory analysis 2,500 3,000 3,500 4,000 Note (1): 1 - month average 2. Cdiscount and Nova Equity Values ($m) DCF Method Trading multiples - Current view (regression) Trading multiples - Best view (Best peer) Cdiscount Equity Value Intercompany debt not capitalized 1,443 1,285 1,634 990 1,117 1,618 Nova Equity Value Before Nova Synergies - Interco. debt not capitalized 375 338 415 179 186 1,871 550 608 NPV Holding Costs Before Holding Synergies (130) (130) (130) Intercompany debt Intercompany debt not capitalized 127 127 127 750 1,250 1,750 - 200 400 600 800 (200) (150) (100) (50) - 100 150 200 In $m In $m In $m In $m Valuation analysis - Project Delphes - 11 May 2016 Valuation methodology and results 17 © 2016 Property of Eight Advisory - Confidential

Excluding synergies and with intercompany debt not capitalized , Cnova NV What are the results of our Equity Value per share defined with the DCF method ranges $4.63. Interco. debt not cap. from $3.67 to valuation 1. Cnova Equity Value per share ($) Cnova Equity Value per share Relative weights Before Synergies excl. Holding analysis? Intercompany debt not 4.11 DCF method 3.67 4.63 Trading multiples - Current view 2.64 2.94 (regression) Trading multiples - Best view 4.90 5.61 (Best peer) Cdiscount 79% - 80% Note: DCF method range is Nova 20% - 21% based on sensitivity to WACC Cdiscount 85% - 86% Nova 14% - 15% Cdiscount 75% - 75% Nova 25% - 25% capitalized Analysts target price Average 1.60 2.75 4.00 Market capitalization (1 - month) 2.23 3.08 (2/2) Market capitalization (since IPO) 12 April 2016 (1) IPO market cap. 2.16 2.58 7.00 1 Mar. 2016 8.46 13 Jan. 2015 Source: Bloomberg, - 1.00 2.00 3.00 4.00 5.00 In $ 2. Cdiscount and Nova Equity Values per share ($) Cdiscount contribution to Cnova Equity Nova contribution to Cnova Value per share Equity Value per share Intercompany debt not capitalized 6.00 7.00 8.00 9.00 NPV Holding Costs contribution to Cnova Equity Value per share Eight Advisory analysis 10.00 Note (1): 1 - month average Interco. debt contribution to Cnova Equity Value per share DCF Method Trading multiples - Current view 2.24 (regression) Trading multiples - Best view (Best peer) 1.00 2.00 3.27 2.91 3.70 2.53 0.40 3.67 4.24 3.00 4.00 5.00 0.25 In $ Before Nova Synergies - Interco. debt not capitalized 0.85 0.77 0.94 0.42 1.25 1.38 0.75 1.25 In $ Before Holding Synergies (0.30) (0.30) (0.30) (0.40) (0.30) (0.20) (0.10) In $ Intercompany debt not capitalized 0.29 0.29 0.29 - 0.20 0.25 0.30 0.35 0.40 In $ Valuation analysis - Project Delphes - 11 May 2016 Valuation methodology and results 18 © 2016 Property of Eight Advisory - Confidential
4. Valuation analysis

Excluding synergies, Cdiscount Enterprise Value defined with the DCF method ranges from $1,453m to $1,800m, while Nova’s ranges from $461m to $537m. What are the key assumptions retained in our DCF analysis? Excluding synergies, the NPV of Holding costs is $(130)m. Cdiscount Enterprise Value Nova Enterprise Value • Perimeter : Standalone. • (1/2) • • • • • • • • Perimeter : Standalone, excluding holding costs, including Cdiscount International. Net sales CAGR FY15 - FY23 : +8.4%, with an acceleration beyond FY18 to compensate conservative management forecasts(company current trading and peers expected trends above company forecasts). Marketplace weight in FY23 : 51.5% of GMV B2C. EBITDA ( - ) factoring costs in FY23 : 7.2% of net sales. Capex in FY23 : (2.6)% of net sales. NWC : seasonality - adjusted NWC slight improvement. Terminal value : two - stage growth terminal value (3 - year transition period between the FY23and the long - term growth rate). Discount rate : 8.00% Cost of Equity (central). Long - term growth rate : 2.5%. • Net sales CAGR FY15 - FY23 : +14.2%, with a return to pre - crisis growth level. • Marketplace weight in FY23 : 50.4% of GMV B2C. • EBITDA ( - ) factoring costs in FY23 : 6.2% of net sales. • Capex in FY23 : (2.1)% of net sales. • NWC : seasonality - adjusted NWC slight improvement and including fraud - related adjustment. • Terminal value : two - stage growth terminal value (3 - year transition period between the FY23 and the long - term growth rate). • Discount rate : 17.75% Cost of Equity (central). • Long - term growth rate : 5.75%. Holding costs • Holding costs : € 15m excluding transaction impacts, with 2.0% long - term growth rate. • Discount rate : 11.3% corresponding to Cdiscount and Nova average discount rates in € . Valuation analysis - Project Delphes - 11 May 2016 Valuation analysis 20 © 2016 Property of Eight Advisory - Confidential

Excluding synergies and inter - company debt, Cdiscount Equity Value defined with the DCF method ranges from $1,285m to $1,634m, and Nova Equity Value What are the key from $338m to $415m. assumptions retained in our DCF analysis? (2/2) Cdiscount Equity value bridge • Net cash : $21m net cash position as of 31 December 2015 ($127m receivable held by Cnova NV on Nova, which will not be capitalized). • NWC adjustment : $(222)m NWC seasonality adjustment based on the average of the NWC days observed by month over the year. • Other items : $34m as of 31 December 2015 (tax losses, provisions for contingencies, impact of Thailand and Vietnam disposals, financial assets). Nova Equity value bridge • Net cash : $277m net cash position as of 31 December 2015 and $(127)m payable to Cnova NV, which will not be capitalized. • NWC adjustment : $(269)m NWC seasonality adjustment based on the average of the NWC days observed by month over the year. • Other items : $(3)m as of 31 December 2015 (tax losses, provisions for contingencies, fraud impacts - which could be revised following the investigations end, financial statements audit and D&O insurer position). Valuation analysis - Project Delphes - 11 May 2016 Valuation analysis 21 © 2016 Property of Eight Advisory - Confidential

Cdiscount and Nova DCF Equity Values mainly rely on a c.14% marketplace commissions on GMV ratio assumption, the Nova reduction in factoring costs What are the key sensitivities on Cdiscount and Nova DCF Equity Values ? beyond 2018 and the top line growth beyond 2018. Cdiscount - Equity Value sensitivities (excl. synergies) Nova - Equity Value sensitivities (excl. synergies) 1. Marketplace commissions 1. Marketplace commissions In $m Cdiscount Equity Value in $m In $m Nova Equity Value in $m 1 600 400 375 (56)% 1 400 1 200 1 000 800 600 400 200 - 1 443 (35)% 300 942 200 100 - Business plan Com.% 15% lower than BP Marketplace commissions as % of GMV Marketplace 165 Business plan Com.% 15% lower than BP Marketplace commissions as % of GMV Marketplace 2. Extrapolation period net sales growth In $m Cdiscount Equity Value in $m 1 600 1 443 (28)% 1 400 1 200 2. Factoring costs In $m Nova Equity Value in $m 400 375 (72)% 300 1 038 1 000 800 600 400 200 - Extrapolation 75% only of the net sales growth beyond FY18 Sensitivity on net sales growth over the extrapolation period Source: Eight Advisory analysis 200 103 100 - Extrapolation No improvement (c. 30% improvement on # installments and % sales factored) Factoring costs based on installments (in months) and % sales factored Valuation analysis - Project Delphes - 11 May 2016 Valuation analysis 22 © 2016 Property of Eight Advisory - Confidential

The value decrease between the IPO and today is mainly driven by the sales forecasts downward revisions. What are the drivers of the DCF value Share price bridge 20 1 20. decrease between the IPO and today? In $ 18 16 14 6.45 13.45 12 10 8 7.00 6 4.49 17.95 Business impact of which: (2.34) 2 Valuation parameters (6.53) (1.23) 30% 34% 3 Valuation methodology Sales growth 36% Capex/D&A % Change in NWC % 4 Net debt (0.40) 15. 10. 5.0 5 - FX 4 2 - IPO price Discount Initial * 27% Initial DCF Sales BP (1.73) 0.29 Delta: $13.83 Long - term WACC Factor 0.48 (1.29) (0.76) 2 - stage Net debt NWC R$ / € 4.11 (0.32) € / $ DCF (5. (10 @ IPO IPO price Discount analysis basis forecasts growth discount. growth season. Equity applied * @ IPO * rate period TV adjust. Value Source: Management, Eight Advisory analysis * : not publicly available information - Data based on “Project Arcachon Update” supporting information dated 30 October 2014 rega rding Cnova’s IPO Key impacts explaining the $13.83 share price delta 1 Business impacts: $(8.9), mainly driven by the 2015 and beyond sales forecasts downward revisions, 2 Valuation parameters: $(3.0), with a (Cost of Equity - Long - term growth) couple at 8.2%, vs 5.5% applied to define the $17.95 Equity value per share at the time of the IPO, 3 Valuation methodology: $0.8, 4 Net debt: $(1.7), 5 Foreign exchange: $(1.1). Valuation analysis - Project Delphes - 11 May 2016 Valuation analysis 23 © 2016 Property of Eight Advisory - Confidential
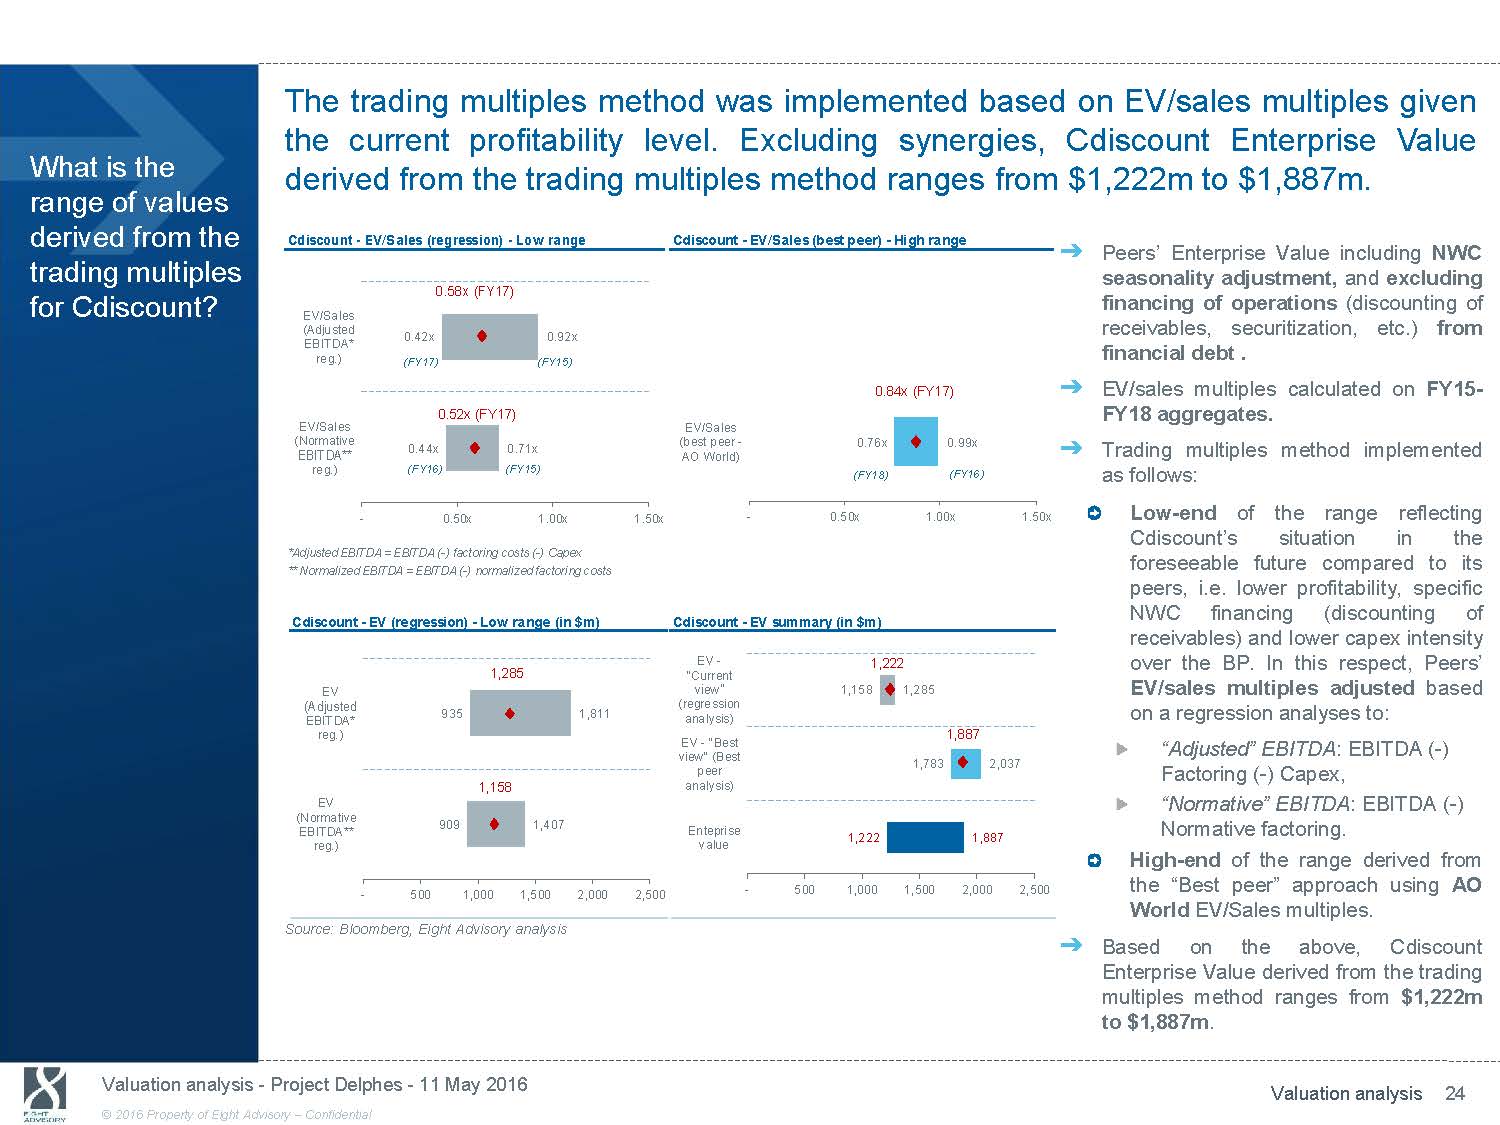
The trading multiples method was implemented based on EV/sales multiples given the current profitability level. Excluding synergies, Cdiscount Enterprise Value What is the range of values derived from the derived from the trading multiples method ranges from $1,222m to $1,887m. Cdiscount - EV/Sales (regression) - Low range Cdiscount - EV/Sales (best peer) - High range trading multiples for Cdiscount? 0.58x (FY17) EV/Sales ᇄ Peers’ Enterprise Value including NWC seasonality adjustment, and excluding financing of operations (discounting of (Adjusted EBITDA* reg.) EV/Sales (Normative EBITDA** reg.) - 0.42x 0.92x (FY17) (FY15) 0.52x (FY17) 0.44x 0.71x (FY16) (FY15) 0.50x 1.00x 1.50x 0.84x (FY17) EV/Sales (best peer - 0.76x 0.99x AO World) (FY18) (FY16) - 0.50x 1.00x 1.50x receivables, securitization, etc.) from financial debt . ᇄ EV/sales multiples calculated on FY15 - FY18 aggregates. ᇄ Trading multiples method implemented as follows: Low - end of the range reflecting Cdiscount’s situation in the *Adjusted EBITDA = EBITDA ( - ) factoring costs ( - ) Capex ** Normalized EBITDA = EBITDA ( - ) normalized factoring costs Cdiscount - EV (regression) - Low range (in $m) 1,285 EV (Adjusted Cdiscount - EV summary (in $m) EV - 1,222 "Current view" 1,158 1,285 (regression foreseeable future compared to its peers, i.e. lower profitability, specific NWC financing (discounting of receivables) and lower capex intensity over the BP. In this respect, Peers’ EV/sales multiples adjusted based EBITDA* reg.) EV (Normative EBITDA** reg.) - 500 935 1,811 1,158 909 1,407 1,000 1,500 2,000 2,500 analysis) EV - "Best view" (Best peer analysis) Enteprise value - 500 1,887 1,783 2,037 1,222 1,887 1,000 1,500 2,000 2,500 on a regression analyses to: “Adjusted” EBITDA: EBITDA ( - ) Factoring ( - ) Capex, “Normative” EBITDA: EBITDA ( - ) Normative factoring. High - end of the range derived from the “Best peer” approach using AO World EV/Sales multiples. Source: Bloomberg, Eight Advisory analysis ᇄ Based on the above, Cdiscount Enterprise Value derived from the trading multiples method ranges from $1,222m to $1,887m . Valuation analysis - Project Delphes - 11 May 2016 Valuation analysis 24 © 2016 Property of Eight Advisory - Confidential
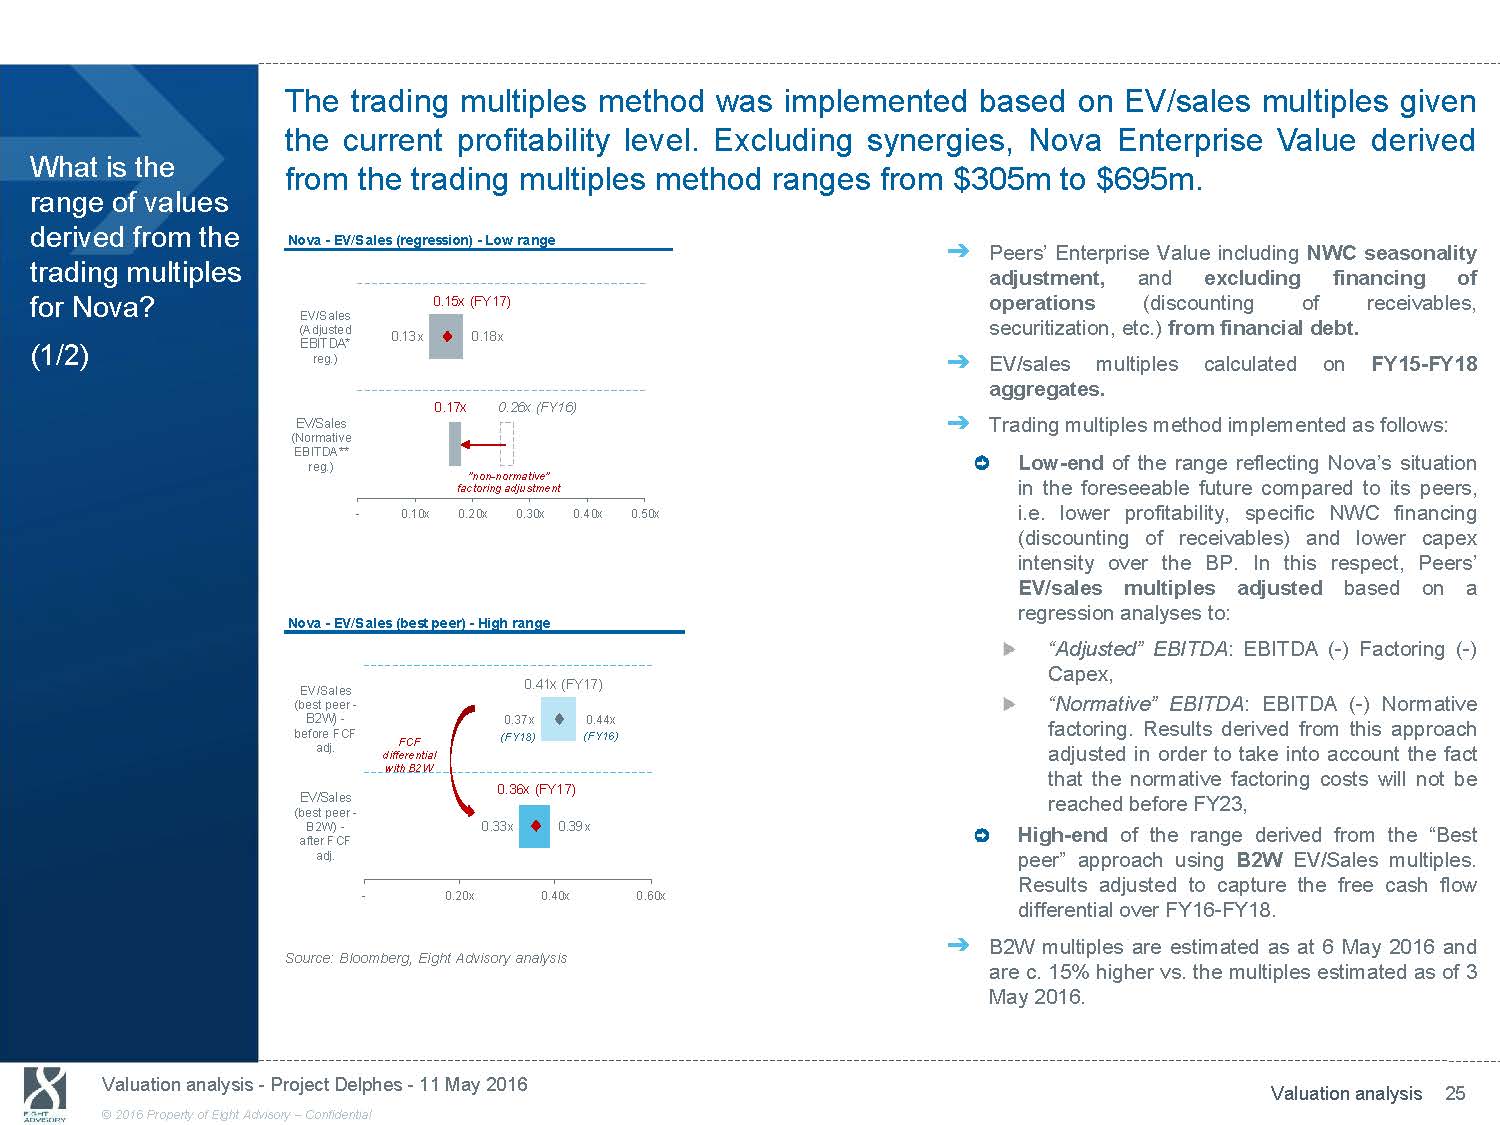
The trading multiples method was implemented based on EV/sales multiples given the current profitability level. Excluding synergies, Nova Enterprise Value derived What is the range of values derived from the from the trading multiples method ranges from $305m to $695m. Nova - EV/Sales (regression) - Low range trading multiples for Nova? 0.15x (FY17) EV/Sales ᇄ Peers’ Enterprise Value including NWC seasonality adjustment, and excluding financing of operations (discounting of receivables, (1/2) (Adjusted EBITDA* reg.) EV/Sales (Normative EBITDA** reg.) - 0.13x 0.18x 0.17x 0.26x (FY16) "non - normative" factoring adjustment 0.10x 0.20x 0.30x 0.40x 0.50x securitization, etc.) from financial debt. ᇄ EV/sales multiples calculated on FY15 - FY18 aggregates. ᇄ Trading multiples method implemented as follows: Low - end of the range reflecting Nova’s situation in the foreseeable future compared to its peers, i.e. lower profitability, specific NWC financing (discounting of receivables) and lower capex intensity over the BP. In this respect, Peers’ EV/sales multiples adjusted based on a regression analyses to: Nova - EV/Sales (best peer) - High range “Adjusted” EBITDA: EBITDA ( - ) Factoring ( - ) EV/Sales (best peer - B2W) - before FCF adj. EV/Sales (best peer - B2W) - after FCF adj. - FCF differential with B2W 0.20x 0.41x (FY17) 0.37x 0.44x (FY18) (FY16) 0.36x (FY17) 0.33x 0.39x 0.40x 0.60x Capex, “Normative” EBITDA: EBITDA ( - ) Normative factoring. Results derived from this approach adjusted in order to take into account the fact that the normative factoring costs will not be reached before FY23, High - end of the range derived from the “Best peer” approach using B2W EV/Sales multiples. Results adjusted to capture the free cash flow differential over FY16 - FY18. ᇄ B2W multiples are estimated as at 6 May 2016 and Source: Bloomberg, Eight Advisory analysis are c. 15% higher vs. the multiples estimated as of 3 May 2016. Valuation analysis - Project Delphes - 11 May 2016 Valuation analysis 25 © 2016 Property of Eight Advisory - Confidential

The trading multiples method was implemented based on EV/sales multiples given the current profitability level. Excluding synergies, Nova Enterprise Value derived What is the range of values derived from the from the trading multiples method ranges from $305m to $695m. Nova - EV (regression) - Low range Nova - EV (Best Peer) - High range (in $m) trading multiples for Nova? (2/2) EV (Adjusted EBITDA* reg.) 301 279 323 EV (best peer) - before FCF adj. FCF 794 771 829 ᇄ Based on the above, Nova Enterprise Value derived from the trading multiples method ranges from $305m to $695m . differential with B2W 308 457 EV (Normative EBITDA** reg.) "non - normative" factoring adjustment - 200 400 Nova - EV summary (in $m) EV - 695 EV (best peer) - after 672 730 FCF adj. 600 800 300 500 700 900 "Current view" (regression analysis) EV - "Best view" (Best peer analysis) Enteprise value - 305 301 308 695 672 730 305 695 200 400 600 800 1,000 Source: Bloomberg, Eight Advisory analysis Valuation analysis - Project Delphes - 11 May 2016 Valuation analysis 26 © 2016 Property of Eight Advisory - Confidential
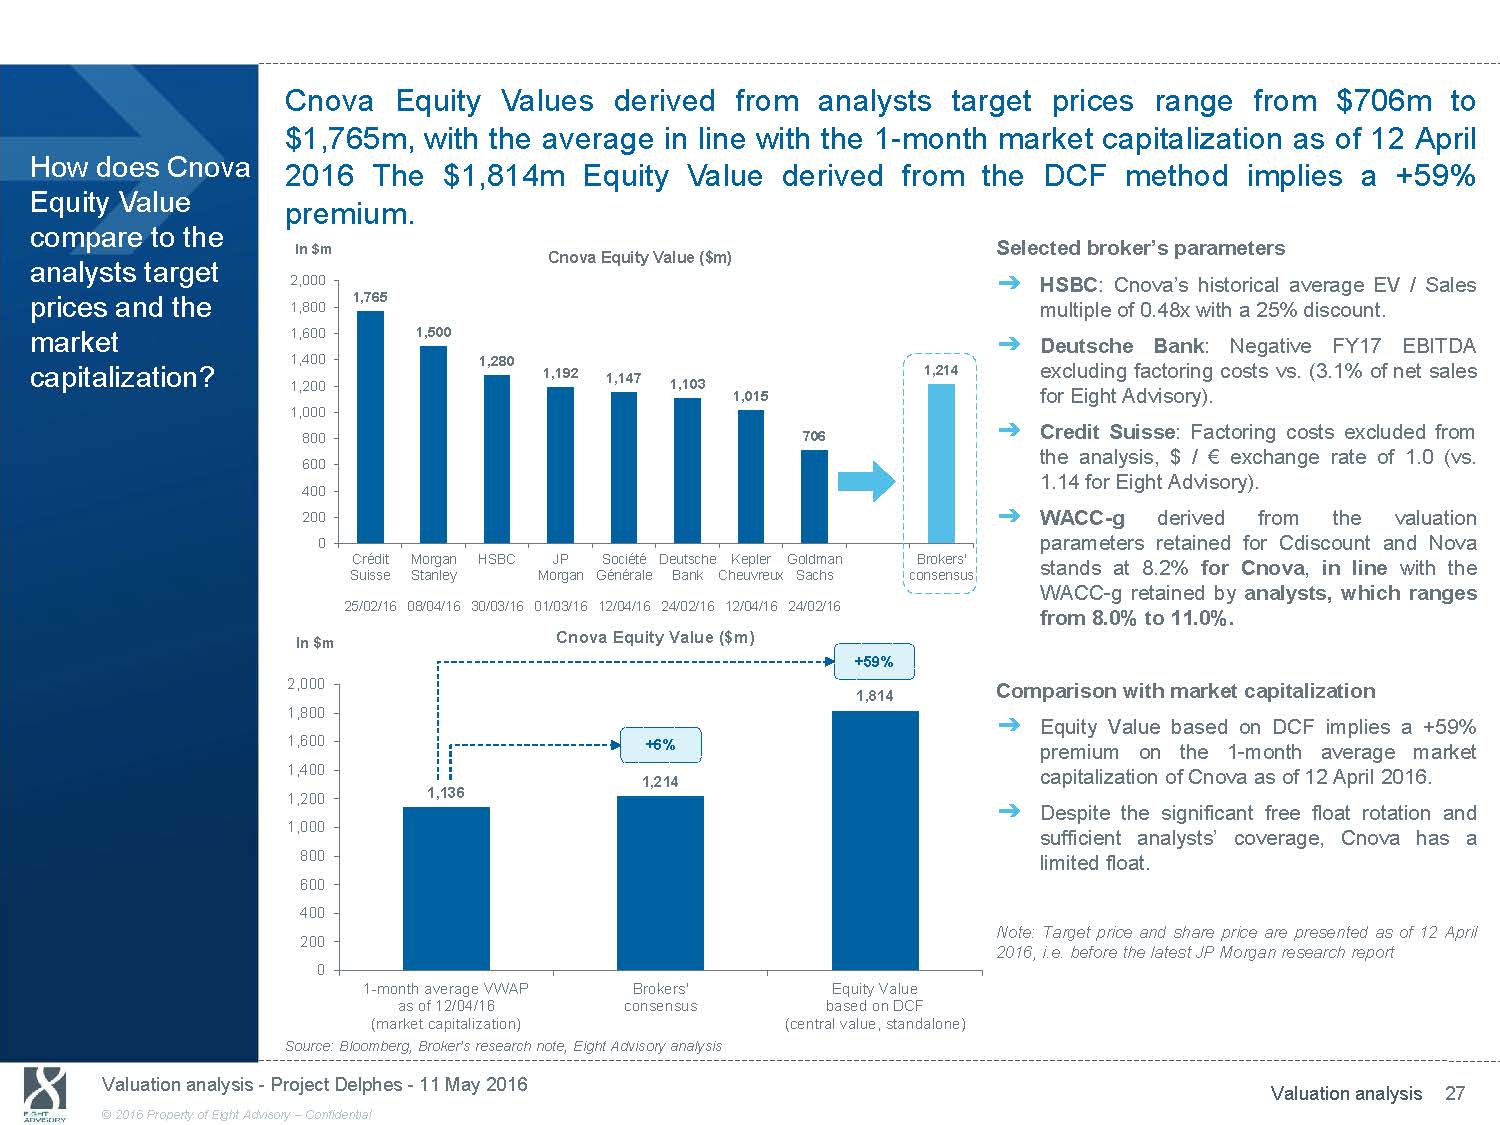
Cnova Equity Values derived from analysts target prices range from $706m to $1,765m, with the average in line with the 1 - month market capitalization as of 12 April How does Cnova Equity Value compare to the 2016 The $1,814m Equity Value derived premium. In $m from the DCF method implies a +59% Selected broker’s parameters analysts target prices and the market 2,000 1,800 1,600 1,400 Cnova Equity Value ($m) 1,765 1,500 1,280 1,192 1,214 ᇄ HSBC : Cnova’s historical average EV / Sales multiple of 0.48x with a 25% discount. ᇄ Deutsche Bank : Negative FY17 EBITDA excluding factoring costs vs. (3.1% of net sales capitalization? 1,200 1,000 800 600 400 200 0 Crédit Morgan HSBC Suisse Stanley 25/02/16 08/04/16 30/03/16 1,147 JP Société MorganGénérale 01/03/16 12/04/16 1,103 1,015 706 Deutsche Kepler Goldman Brokers' Bank Cheuvreux Sachs consensus 24/02/16 12/04/16 24/02/16 for Eight Advisory). ᇄ Credit Suisse : Factoring costs excluded from the analysis, $ / € exchange rate of 1.0 (vs. 1.14 for Eight Advisory). ᇄ WACC - g derived from the valuation parameters retained for Cdiscount and Nova stands at 8.2% for Cnova , in line with the WACC - g retained by analysts, which ranges from 8.0% to 11.0%. In $m 2,000 1,800 1,600 1,400 1,200 1,136 1,000 800 600 400 200 0 1 - month average VWAP as of 12/04/16 (market capitalization) Cnova Equity Value ($m) +59% 1,814 +6% 1,214 Brokers' Equity Value consensus based on DCF (central value, standalone) Comparison with market capitalization ᇄ Equity Value based on DCF implies a +59% premium on the1 - month average market capitalization of Cnova as of 12 April 2016. ᇄ Despite the significant free float rotation and sufficient analysts’ coverage, Cnova has a limited float. Note: Target price and share price are presented as of 12 April 2016, i.e. before the latest JP Morgan research report Source: Bloomberg, Broker’s research note, Eight Advisory analysis Valuation analysis - Project Delphes - 11 May 2016 Valuation analysis 27 © 2016 Property of Eight Advisory - Confidential

5. Synergies analysis
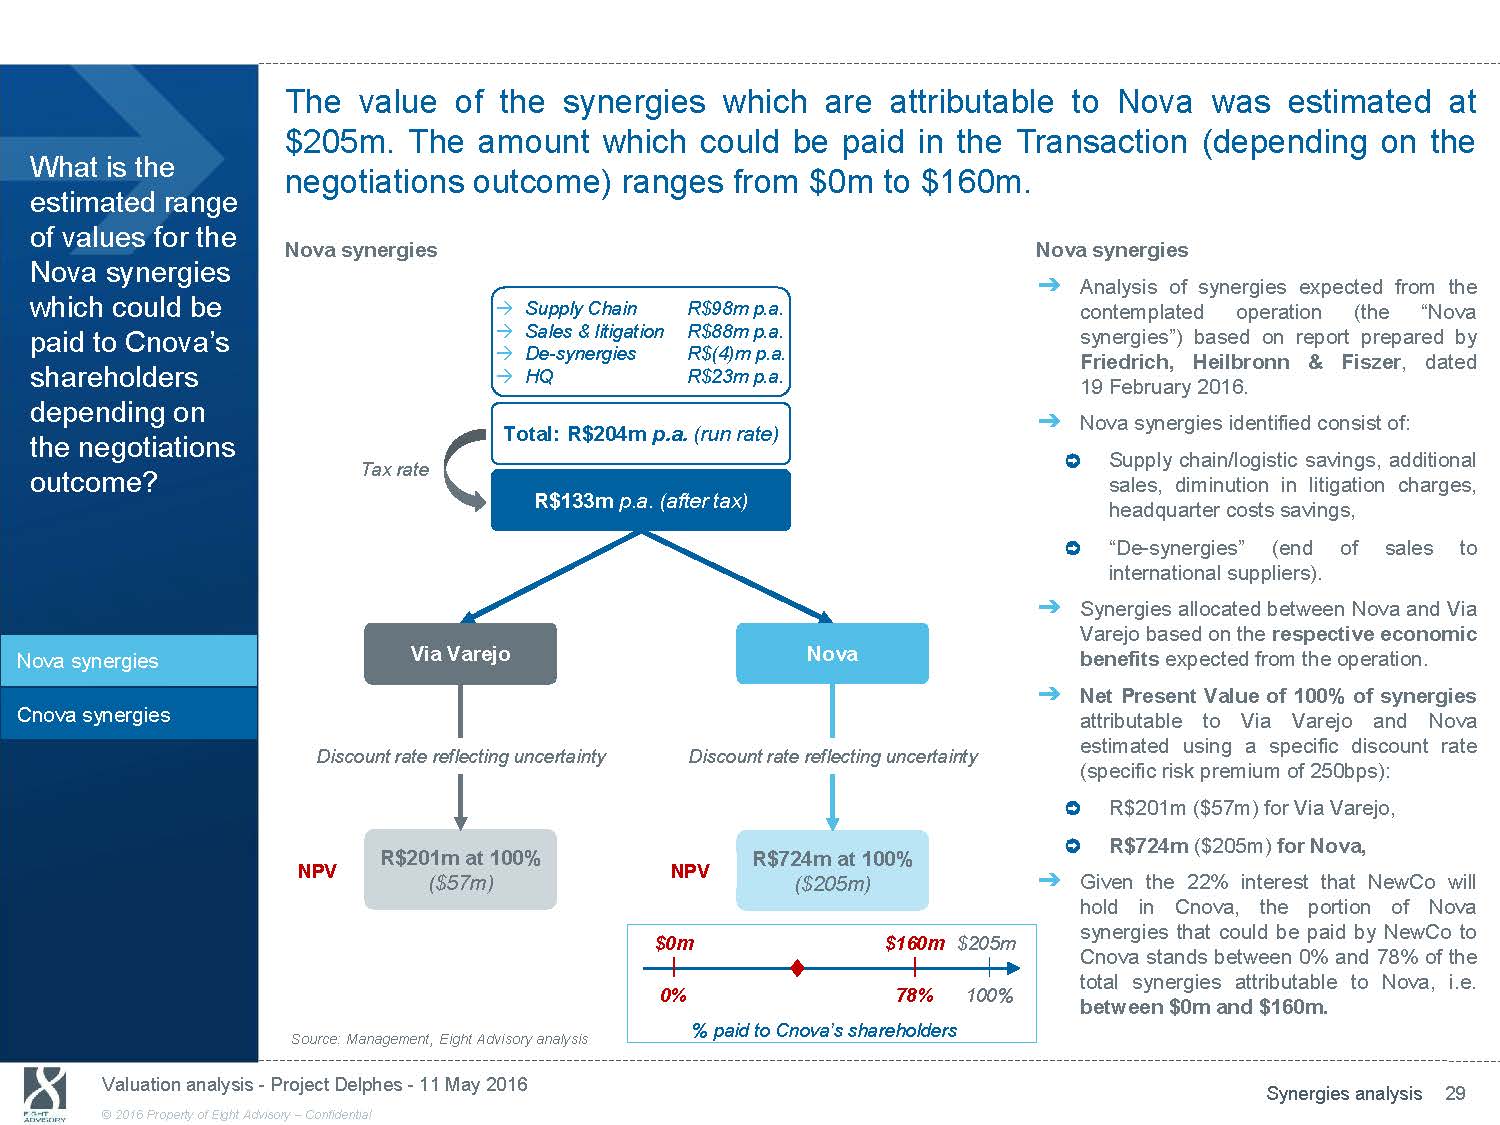
The value of the synergies which are attributable to Nova was estimated at $205m. The amount which could be paid in the Transaction (depending on the What is the estimated range of values for the Nova synergies which could be paid to Cnova’s shareholders depending on the negotiations outcome? Nova synergies Cnova synergies negotiations outcome) ranges from $0m to $160m. Nova synergies Supply Chain R$98m p.a. Sales & litigation R$88m p.a. De - synergies R$(4)m p.a. HQ R$23m p.a. Total: R$204m p.a. (run rate) Tax rate R$133m p.a. (after tax) Via Varejo Nova Discount rate reflecting uncertainty Discount rate reflecting uncertainty R$201m at 100% R$724m at 100% Nova synergies ᇄ Analysis of synergies expected from the contemplated operation (the “Nova synergies”) based on report prepared by Friedrich, Heilbronn & Fiszer , dated 19 February 2016. ᇄ Nova synergies identified consist of: Supply chain/logistic savings, additional sales, diminution in litigation charges, headquarter costs savings, “De - synergies” (end of sales to international suppliers). ᇄ Synergies allocated between Nova and Via Varejo based on the respective economic benefits expected from the operation. ᇄ Net Present Value of 100% of synergies attributable to Via Varejo and Nova estimated using a specific discount rate (specific risk premium of 250bps): R$201m ($57m) for Via Varejo, R$724m ($205m) for Nova, NPV ($57m) NPV ($205m) ᇄ Given the 22% interest that NewCo will hold in Cnova, the portion of Nova Source: Management, Eight Advisory analysis $0m $160m $205m 0% 78% 100% % paid to Cnova’s shareholders synergies that could be paid by NewCo to Cnova stands between 0% and 78% of the total synergies attributable to Nova, i.e. between $0m and $160m. Valuation analysis - Project Delphes - 11 May 2016 Synergies analysis 29 © 2016 Property of Eight Advisory - Confidential
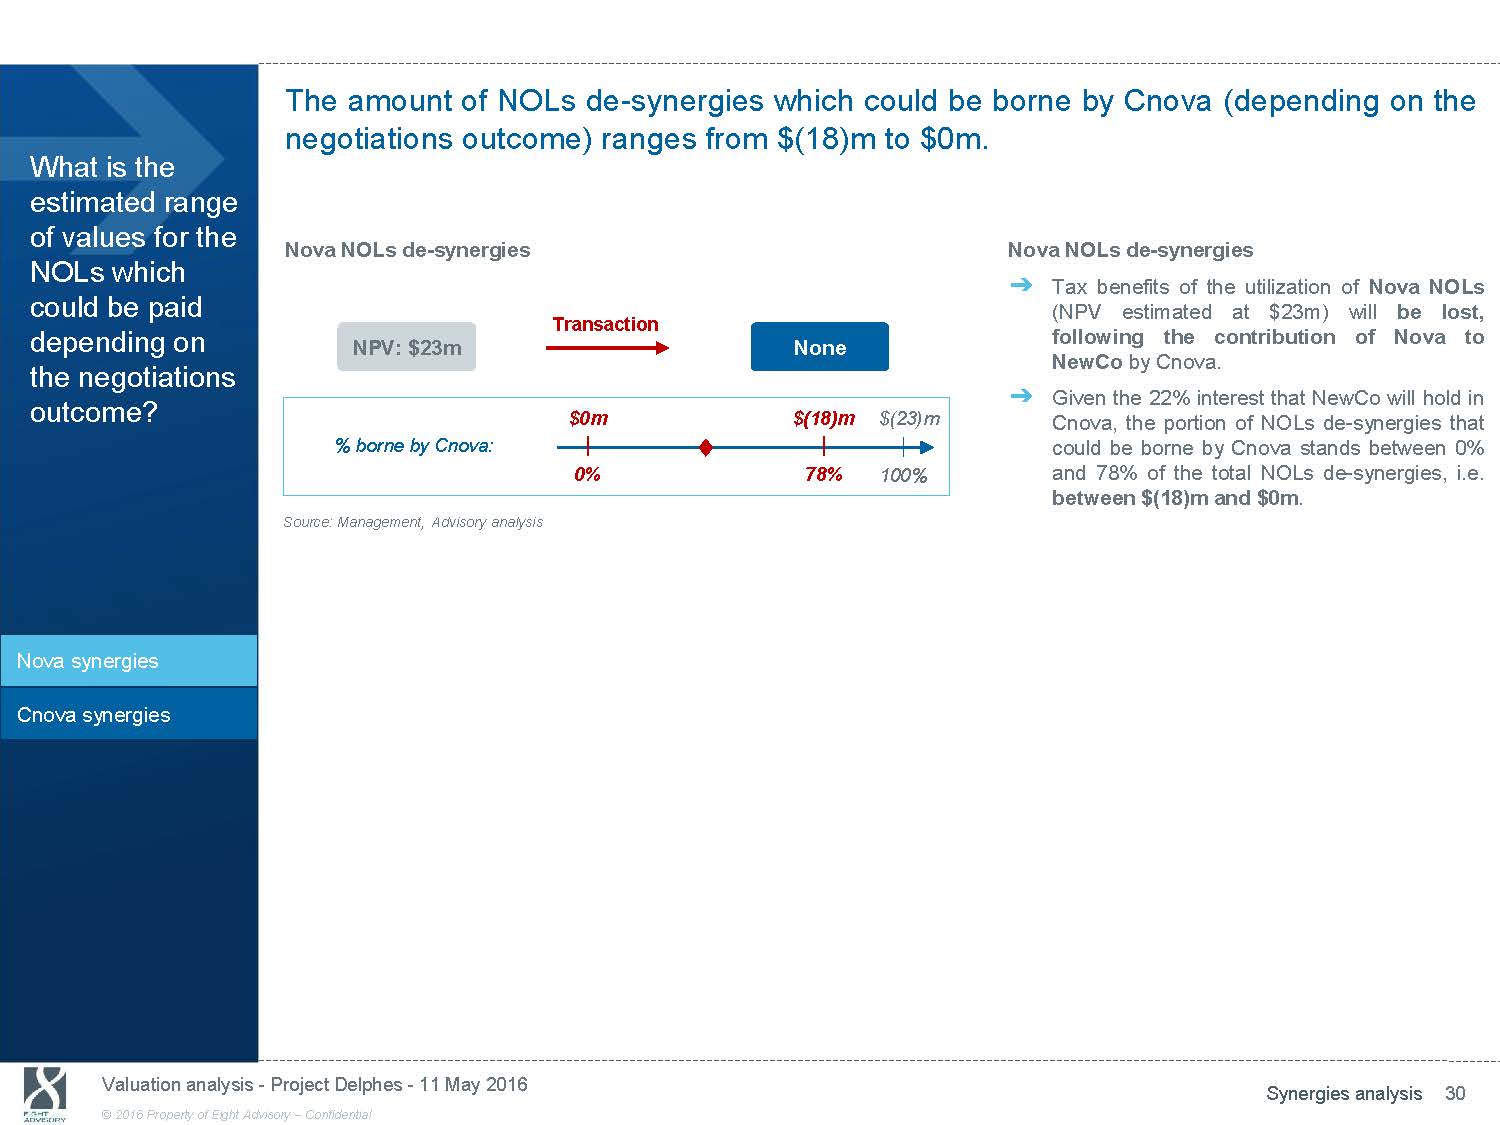
The amount of NOLs de - synergies which could be borne by Cnova (depending on the negotiations outcome) ranges from $(18)m to $0m. What is the estimated range of values for the NOLs which could be paid depending on the negotiations outcome? Nova synergies Cnova synergies Nova NOLs de - synergies NPV: $23m % borne by Cnova: Source: Management, Advisory analysis Transaction None $0m $(18)m $(23)m 0% 78% 100% Nova NOLs de - synergies ᇄ Tax benefits of the utilization of Nova NOLs (NPV estimated at$23m) will be lost, following the contribution of Nova to NewCo by Cnova. ᇄ Given the 22% interest that NewCo will hold in Cnova, the portion of NOLs de - synergies that could be borne by Cnova stands between 0% and 78% of the total NOLs de - synergies, i.e. between $(18)m and $0m . Valuation analysis - Project Delphes - 11 May 2016 Synergies analysis 30 © 2016 Property of Eight Advisory - Confidential
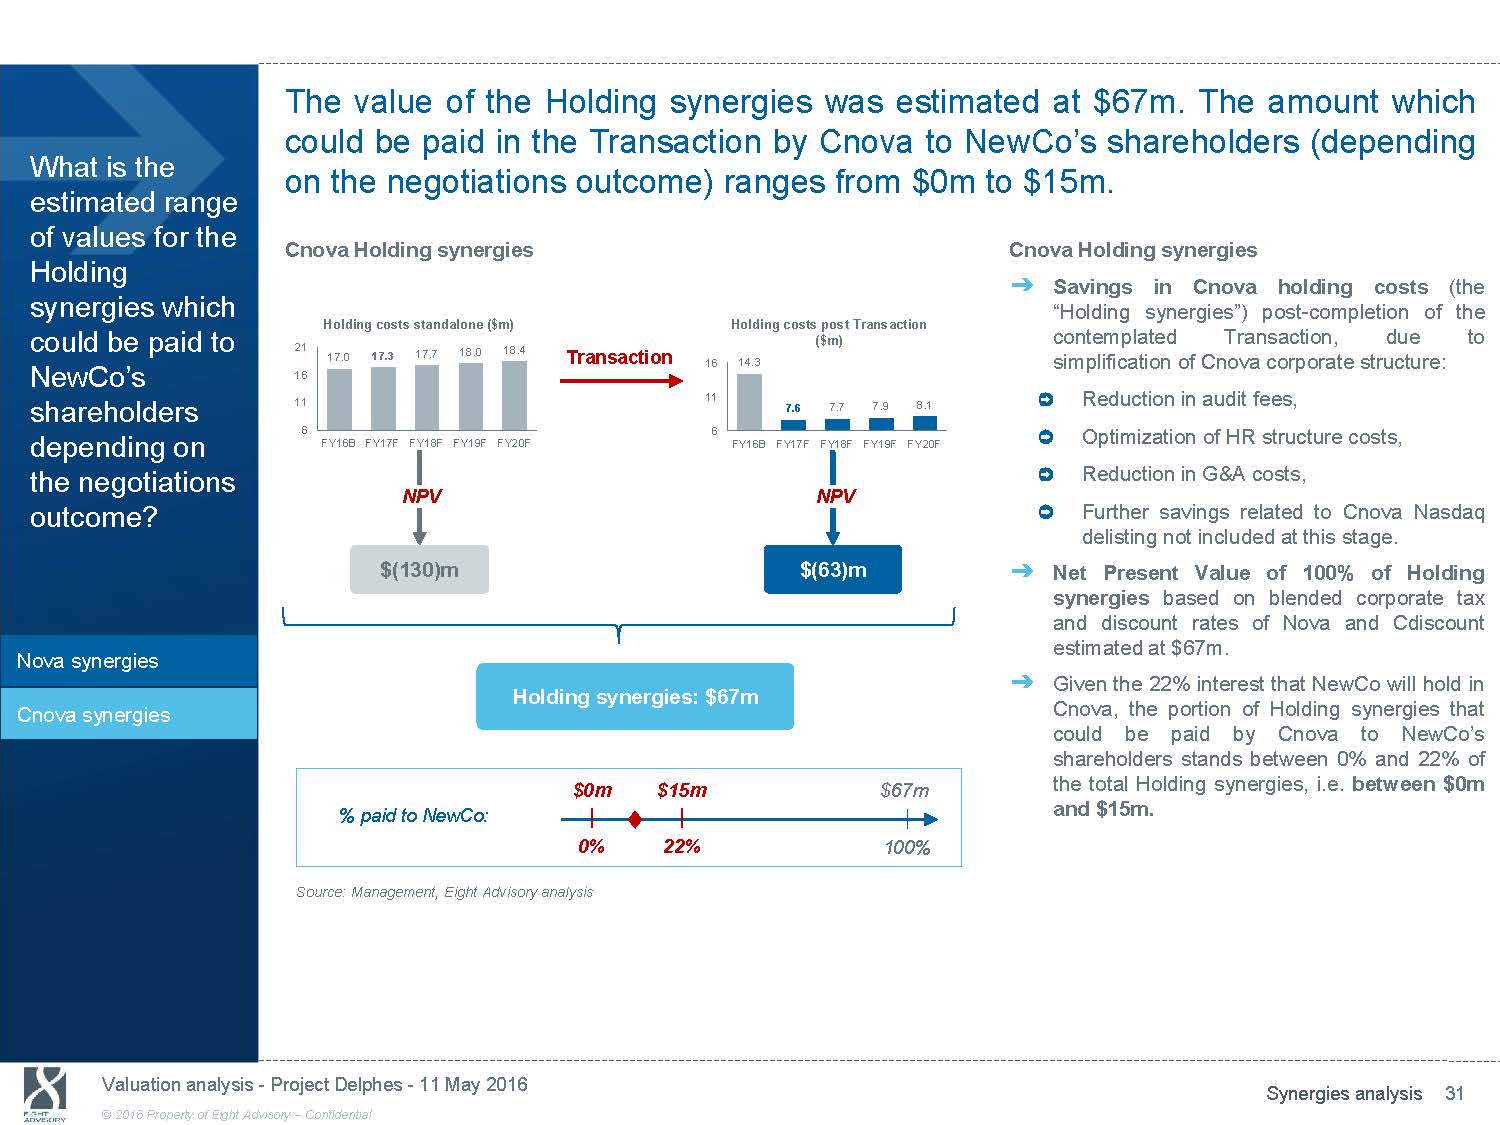
The value of the Holding synergies was estimated at $67m. The amount which could be paid in the Transaction by Cnova to NewCo’s shareholders (depending What is the estimated range of values for the Holding synergies which on the negotiations outcome) ranges from $0m to $15m. Cnova Holding synergies Cnova Holding synergies ᇄ Savings in Cnova holding costs (the “Holding synergies”) post - completion of the Holding costs standalone ($m) Holding costs post Transaction could be paid to 21 18.4 17.3 17.7 18.0 ($m) contemplated Transaction, due to NewCo’s shareholders depending on the negotiations outcome? Nova synergies Cnova synergies 17.0 16 11 6 FY16B FY17F FY18F FY19F NPV $(130)m Transaction 16 14.3 11 7.6 7.7 7.9 8.1 6 FY20F FY16B FY17F FY18F FY19F FY20F NPV $(63)m Holding synergies: $67m simplification of Cnova corporate structure: Reduction in audit fees, Optimization of HR structure costs, Reduction in G&A costs, Further savings related to Cnova Nasdaq delisting not included at this stage. ᇄ Net Present Value of 100% of Holding synergies based on blended corporate tax and discount rates of Nova and Cdiscount estimated at $67m. ᇄ Given the 22% interest that NewCo will hold in Cnova, the portion of Holding synergies that could be paid by Cnova to NewCo’s shareholders stands between 0% and 22% of $0m $15m $67m the total Holding synergies, i.e. between $0m % paid to NewCo: and $15m. 0% 22% 100% Source: Management, Eight Advisory analysis Valuation analysis - Project Delphes - 11 May 2016 Synergies analysis 31 © 2016 Property of Eight Advisory - Confidential
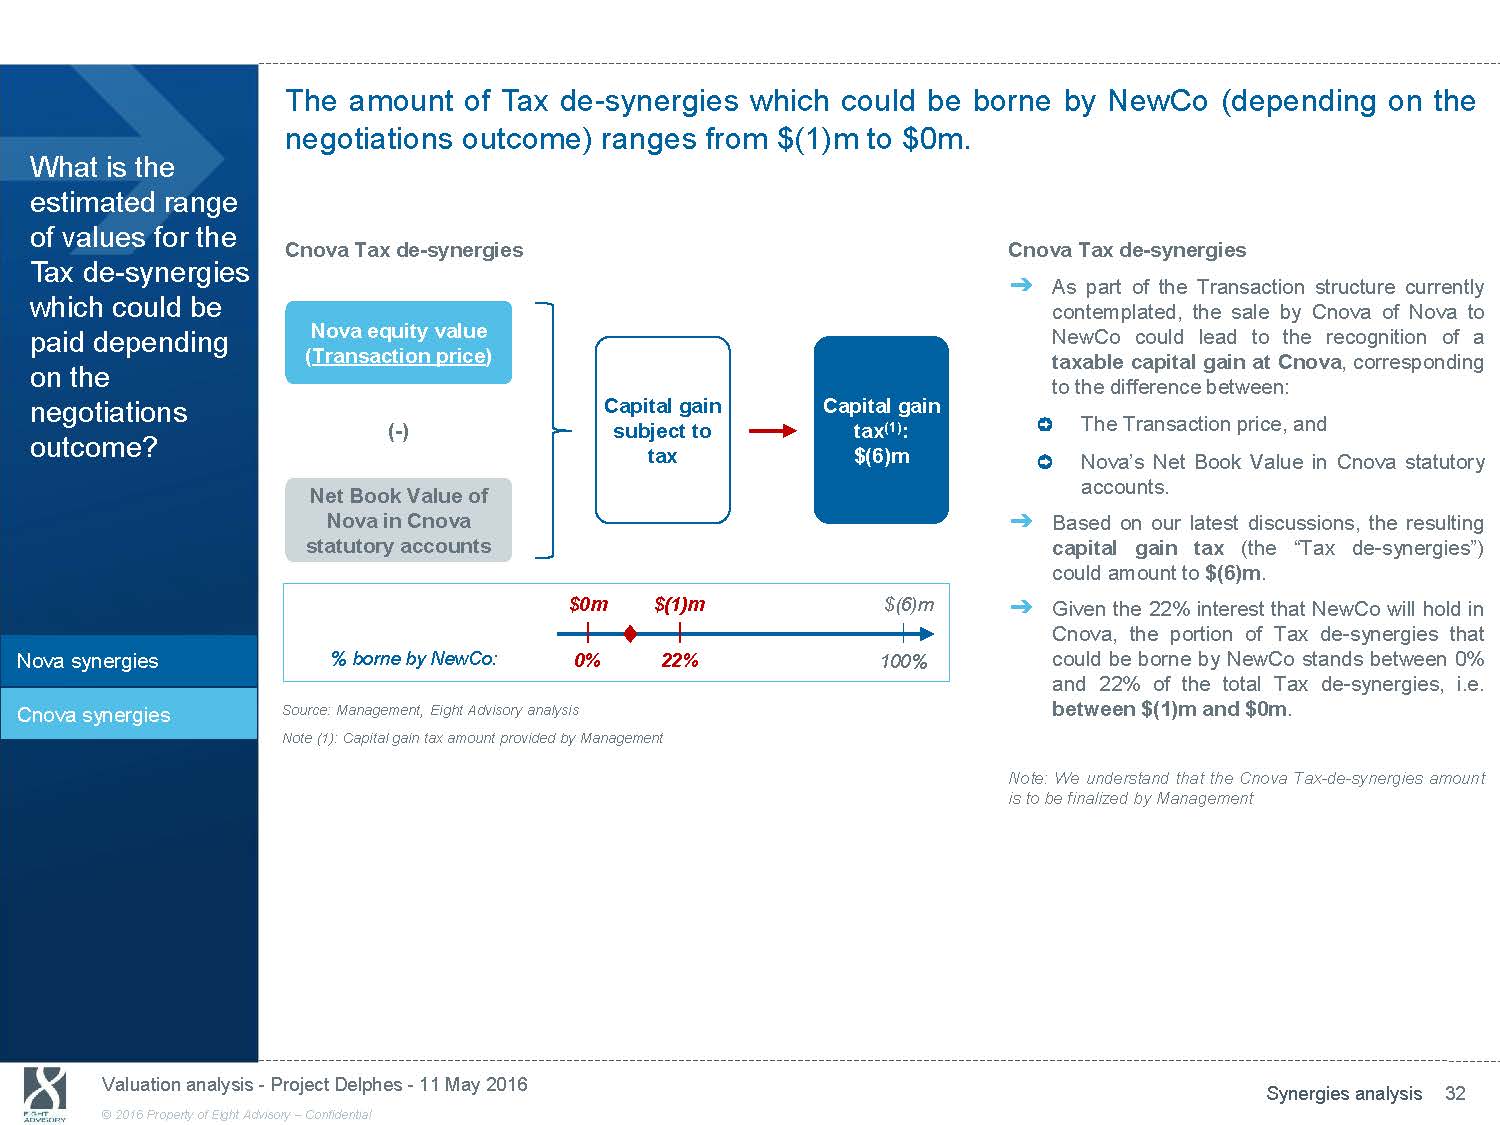
The amount of Tax de - synergies which could be borne by NewCo (depending on the negotiations outcome) ranges from $(1)m to $0m. What is the estimated range of values for the Tax de - synergies which could be paid depending on the negotiations outcome? Cnova Tax de - synergies Nova equity value (Transaction price) ( - ) Net Book Value of Nova in Cnova statutory accounts Capital gain Capital gain subject to tax (1) : tax $(6)m Cnova Tax de - synergies ᇄ As part of the Transaction structure currently contemplated, the sale by Cnova of Nova to NewCo could lead to the recognition of a taxable capital gain at Cnova , corresponding to the difference between: The Transaction price, and Nova’s Net Book Value in Cnova statutory accounts. ᇄ Based on our latest discussions, the resulting capital gain tax (the“Tax de - synergies”) could amount to $(6)m . $0m $(1)m $(6)m ᇄ Given the 22% interest that NewCo will hold in Cnova, the portion of Tax de - synergies that Nova synergies % borne by NewCo: 0% 22% 100% could be borne by NewCo stands between 0% and 22% of the total Tax de - synergies, i.e. Cnova synergies Source: Management, Eight Advisory analysis between $(1)m and $0m . Note (1): Capital gain tax amount provided by Management Note: We understand that the Cnova Tax - de - synergies amount is to be finalized by Management Valuation analysis - Project Delphes - 11 May 2016 Synergies analysis 32 © 2016 Property of Eight Advisory - Confidential
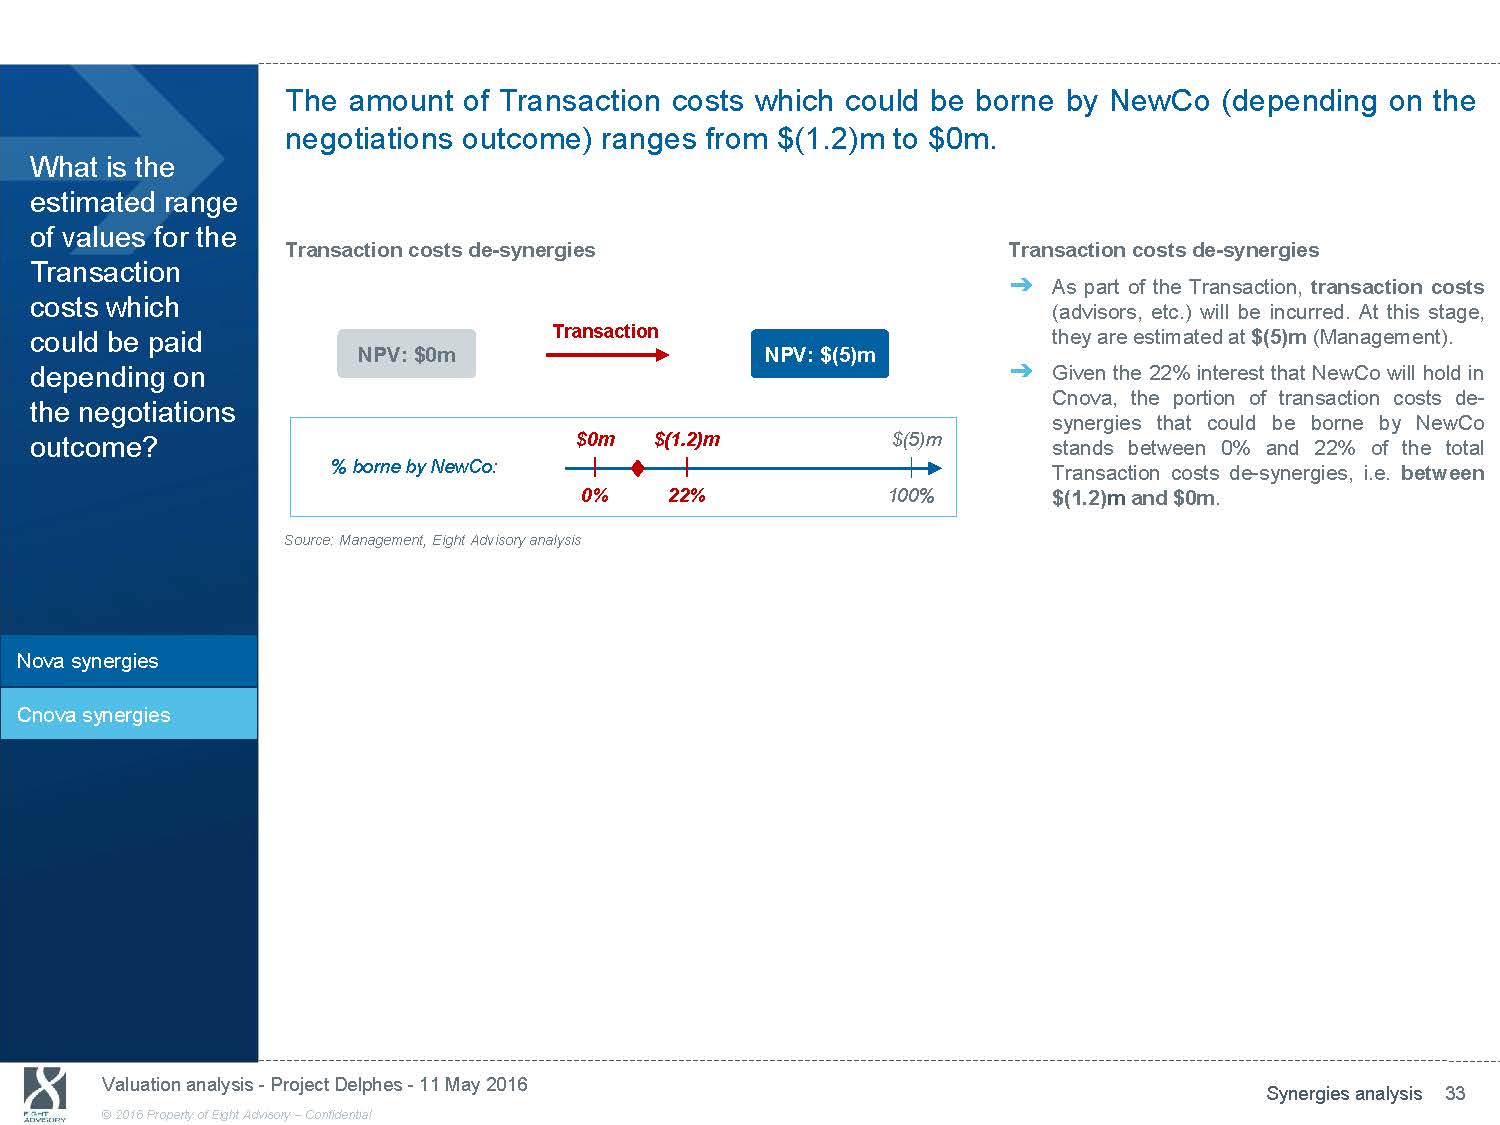
The amount of Transaction costs which could be borne by NewCo (depending on the negotiations outcome) ranges from $(1.2)m to $0m. What is the estimated range of values for the Transaction costs which could be paid depending on the negotiations outcome? Transaction costs de - synergies Transaction NPV: $0m NPV: $(5)m $0m $(1.2)m $(5)m % borne by NewCo: 0% 22% 100% Transaction costs de - synergies ᇄ As part of the Transaction, transaction costs (advisors, etc.) will be incurred. At this stage, they are estimated at $(5)m (Management). ᇄ Given the 22% interest that NewCo will hold in Cnova, the portion of transaction costs de - synergies that could be borne by NewCo stands between0% and 22% of the total Transaction costs de - synergies, i.e. between $(1.2) m and $0m . Source: Management, Eight Advisory analysis Nova synergies Cnova synergies Valuation analysis - Project Delphes - 11 May 2016 Synergies analysis 33 © 2016 Property of Eight Advisory - Confidential
6. Valuation results including synergies
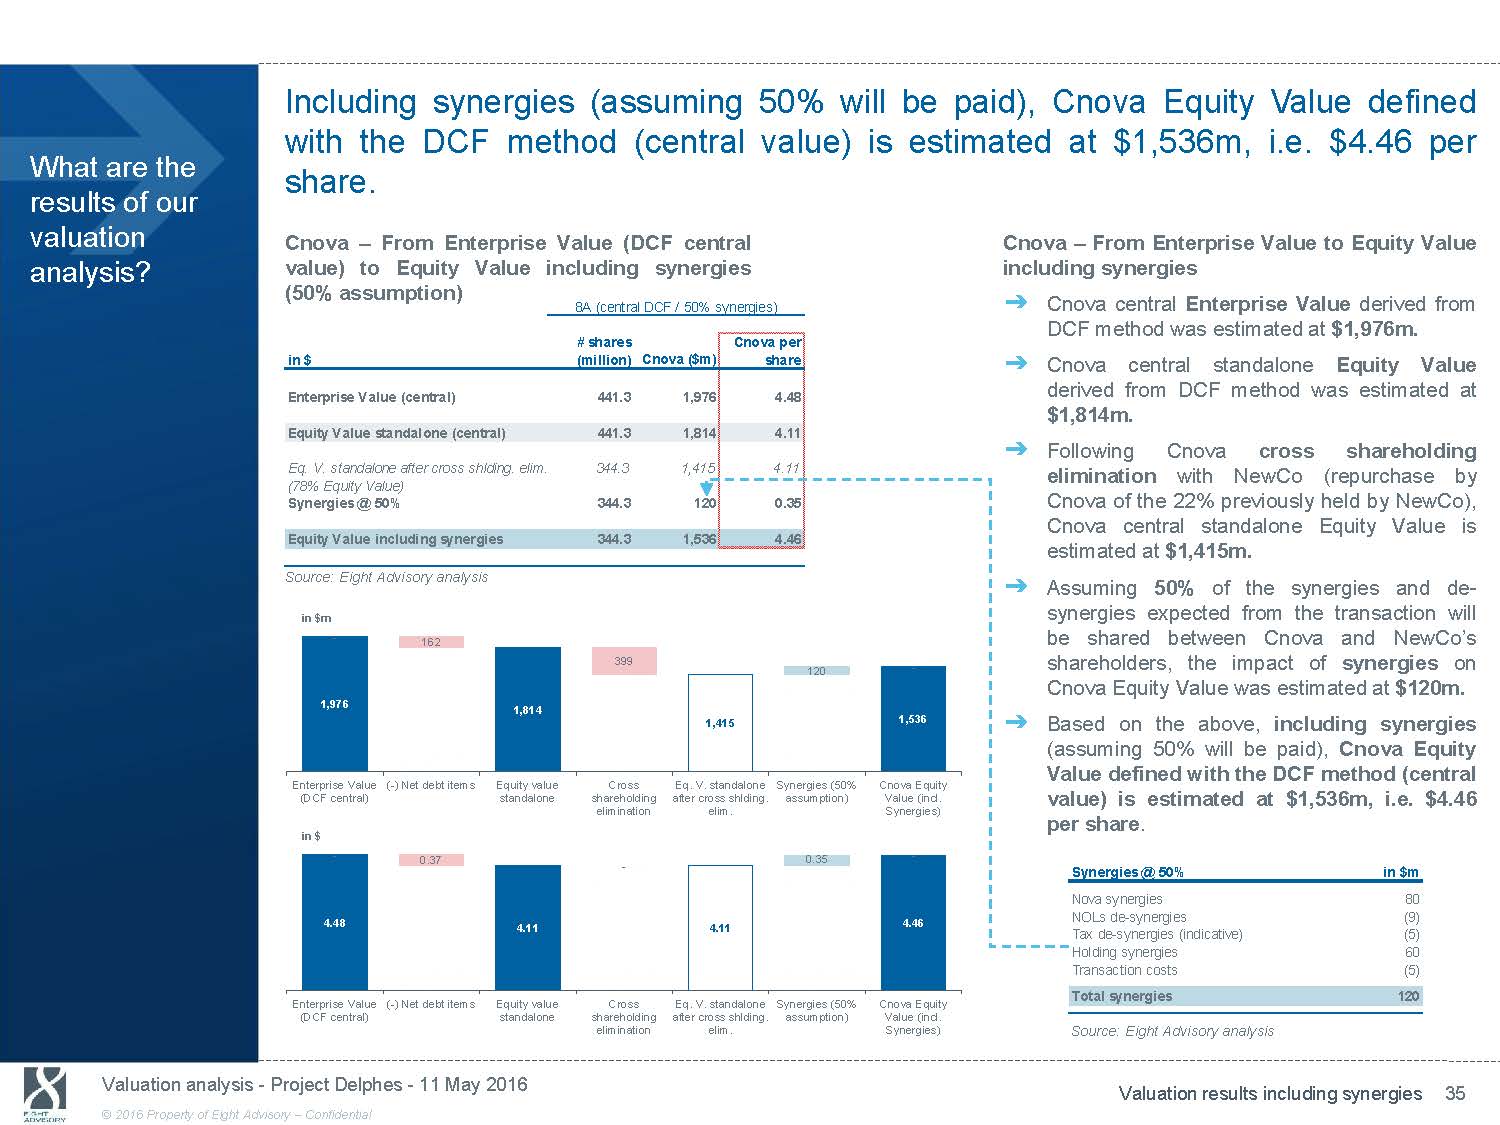
Including synergies (assuming 50% will be paid), Cnova Equity Value defined What are the results of our valuation analysis? with the DCF method (central value) is share. Cnova - From Enterprise Value (DCF central value) to Equity Value including synergies (50% assumption) 8A (central DCF / 50% synergies) # shares Cnova per in $ (million) Cnova ($m) share Enterprise Value (central) 441.3 1,976 4.48 Equity Value standalone (central) 441.3 1,814 4.11 Eq. V. standalone after cross shlding. elim. 344.3 1,415 4.11 (78% Equity Value) Synergies @ 50% 344.3 120 0.35 Equity Value including synergies 344.3 1,536 4.46 Source: Eight Advisory analysis in $m - 162 399 120 1,976 estimated at $1,536m, i.e. $4.46 per Cnova - From Enterprise Value to Equity Value including synergies ᇄ Cnova central Enterprise Value derived from DCF method was estimated at $1,976m. ᇄ Cnova central standalone Equity Value derived from DCF method was estimated at $1,814m. ᇄ Following Cnova cross shareholding elimination with NewCo(repurchase by Cnova of the 22% previously held by NewCo), Cnova central standalone Equity Value is estimated at $1,415m. ᇄ Assuming 50% of the synergies and de - synergies expected from the transaction will be shared between Cnova and NewCo’s - shareholders, the impact of synergies on Cnova Equity Value was estimated at $120m. 1,814 1,415 1,536 ᇄ Based on the above, including synergies (assuming 50% will be paid), Cnova Equity Value defined with the DCF method (central Enterprise Value ( - ) Net debt items Equity value (DCF central) standalone in $ - 0.37 4.48 4.11 Enterprise Value ( - ) Net debt items Equity value (DCF central) standalone Cross Eq. V. standalone shareholding after cross shlding. elimination elim. - 4.11 Cross Eq. V. standalone shareholding after cross shlding. elimination elim. Synergies (50% Cnova Equity assumption) Value (incl. Synergies) 0.35 - 4.46 Synergies (50% Cnova Equity assumption) Value (incl. Synergies) value) is estimated at $1,536m, i.e. $4.46 per share . Synergies @ 50% in $m Nova synergies 80 NOLs de - synergies (9) Tax de - synergies (indicative) (5) Holding synergies 60 Transaction costs (5) Total synergies 120 Source: Eight Advisory analysis Valuation analysis - Project Delphes - 11 May 2016 Valuation results including synergies 35 © 2016 Property of Eight Advisory - Confidential
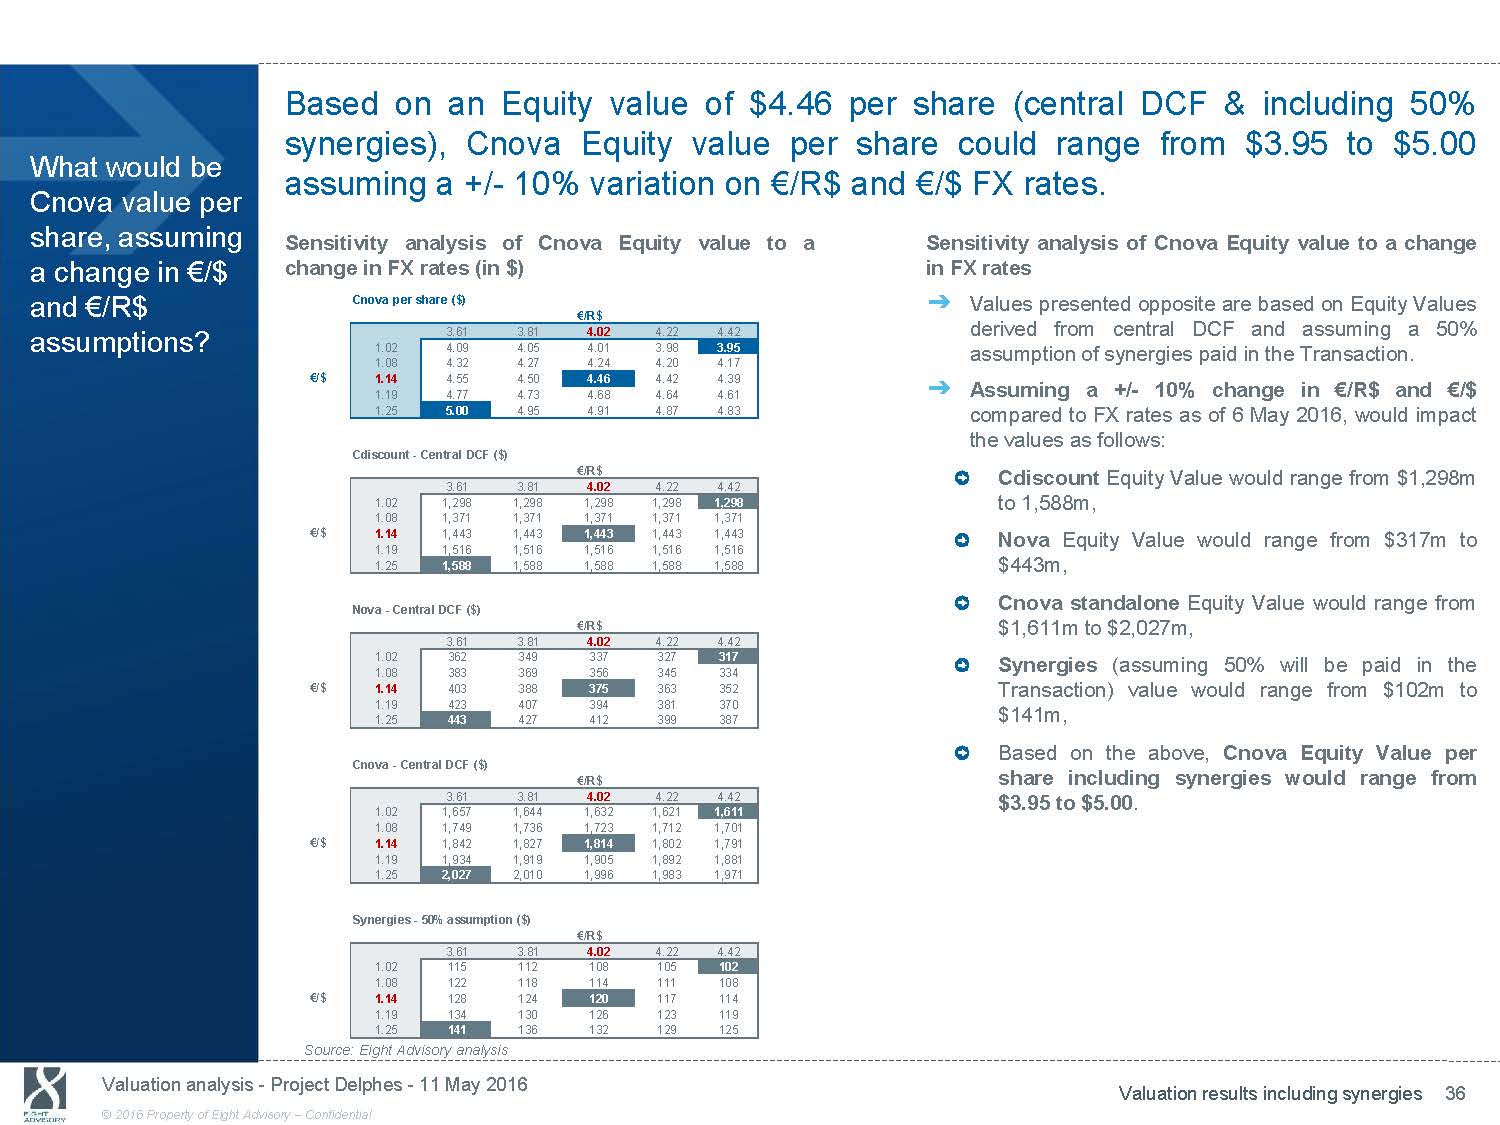
Based on an Equity value of $4.46 synergies), Cnova Equity value per What would be per share (central DCF & including 50% share could range from $3.95 to $5.00 Cnova value per share, assuming a change in € /$ assuming a +/ - 10% variation on € /R$ and € /$ FX rates. Sensitivity analysis of Cnova Equity value to a Sensitivity analysis of Cnova Equity value to a change change in FX rates (in $) in FX rates Cnova per share ($) and € /R$ assumptions? € /R$ 1,814.0 3.61 3.81 4.02 4.22 4.42 1.02 4.09 4.05 4.01 3.98 3.95 1.08 4.32 4.27 4.24 4.20 4.17 € /$ 1.14 4.55 4.50 4.46 4.42 4.39 1.19 4.77 4.73 4.68 4.64 4.61 1.25 5.00 4.95 4.91 4.87 4.83 Cdiscount - Central DCF ($) € /R$ 1,443.3 3.61 3.81 4.02 4.22 4.42 1.02 1,298 1,298 1,298 1,298 1,298 1.08 1,371 1,371 1,371 1,371 1,371 € /$ 1.14 1,443 1,443 1,443 1,443 1,443 1.19 1,516 1,516 1,516 1,516 1,516 1.25 1,588 1,588 1,588 1,588 1,588 Nova - Central DCF ($) € /R$ 374.8 3.61 3.81 4.02 4.22 4.42 1.02 362 349 337 327 317 1.08 383 369 356 345 334 € /$ 1.14 403 388 375 363 352 1.19 423 407 394 381 370 1.25 443 427 412 399 387 Cnova - Central DCF ($) € /R$ 1,814.0 3.61 3.81 4.02 4.22 4.42 1.02 1,657 1,644 1,632 1,621 1,611 1.08 1,749 1,736 1,723 1,712 1,701 € /$ 1.14 1,842 1,827 1,814 1,802 1,791 1.19 1,934 1,919 1,905 1,892 1,881 1.25 2,027 2,010 1,996 1,983 1,971 Synergies - 50% assumption ($) € /R$ 120.2 3.61 3.81 4.02 4.22 4.42 1.02 115 112 108 105 102 1.08 122 118 114 111 108 € /$ 1.14 128 124 120 117 114 1.19 134 130 126 123 119 1.25 141 136 132 129 125 Source: Eight Advisory analysis ᇄ Values presented opposite are based on Equity Values derived from central DCF and assuming a50% assumption of synergies paid in the Transaction. ᇄ Assuming a +/ - 10% change in € /R$ and € /$ compared to FX rates as of 6 May 2016, would impact the values as follows: Cdiscount Equity Value would range from $1,298m to 1,588m, Nova Equity Value would range from $317m to $443m, Cnova standalone Equity Value would range from $1,611m to $2,027m, Synergies (assuming 50% will be paid in the Transaction) value would range from$102m to $141m, Based on the above, Cnova Equity Value per share including synergies would range from $3.95 to $5.00 . Valuation analysis - Project Delphes - 11 May 2016 Valuation results including synergies 36 © 2016 Property of Eight Advisory - Confidential
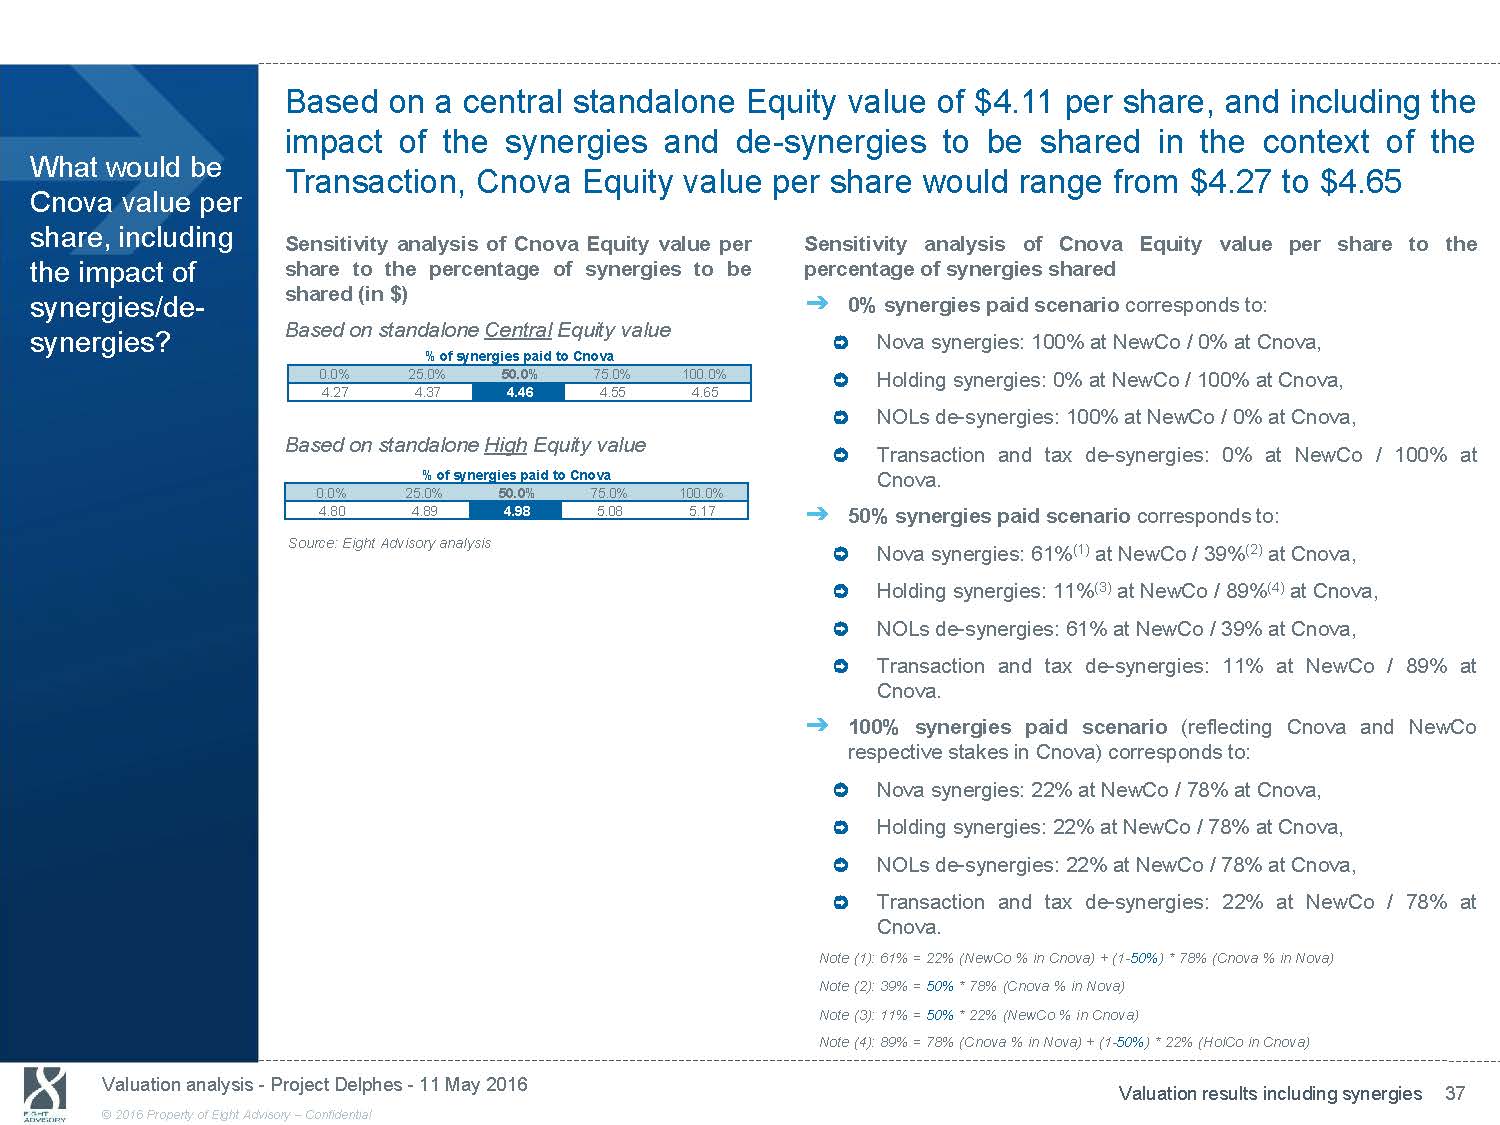
Based on a central standalone Equity value of $4.11 per share, and including the impact of the synergies and de - synergies to be shared in the context of the What would be Cnova value per share, including the impact of Transaction, Cnova Equity value per share would range from $4.27 to $4.65 Sensitivity analysis of Cnova Equity value per Sensitivity analysis of Cnova Equity value per share to the share to the percentage of synergies to be percentage of synergies shared shared (in $) synergies/de - synergies? ᇄ Based on standalone Central Equity value % of synergies paid to Cnova 0.0% 25.0% 50.0% 75.0% 100.0% 4.27 4.37 4.46 4.55 4.65 0% synergies paid scenario corresponds to: Nova synergies: 100% at NewCo / 0% at Cnova, Holding synergies: 0% at NewCo / 100% at Cnova, NOLs de - synergies: 100% at NewCo / 0% at Cnova, Based on standalone High Equity value % of synergies paid to Cnova 0.0% 25.0% 50.0% 75.0% Transaction and tax de - synergies: Cnova. 100.0% 0% at NewCo / 100% at 4.80 4.89 Source: Eight Advisory analysis 4.98 5.08 5.17 ᇄ 50% synergies paid scenario corresponds to: Nova synergies: 61% (1) at NewCo / 39% (2) at Cnova, Holding synergies: 11% (3) at NewCo / 89% (4) at Cnova, NOLs de - synergies: 61% at NewCo / 39% at Cnova, Transaction and tax de - synergies: 11% at NewCo / 89% at Cnova. ᇄ 100% synergies paid scenario (reflecting Cnova and NewCo respective stakes in Cnova) corresponds to: Nova synergies: 22% at NewCo / 78% at Cnova, Holding synergies: 22% at NewCo / 78% at Cnova, NOLs de - synergies: 22% at NewCo / 78% at Cnova, Transaction and tax de - synergies: 22% at NewCo / 78% at Cnova. Note (1): 61% = 22% (NewCo % in Cnova) + (1 - 50% ) * 78% (Cnova % in Nova) Note (2): 39% = 50% * 78% (Cnova % in Nova) Note (3): 11% = 50% * 22% (NewCo % in Cnova) Note (4): 89% = 78% (Cnova % in Nova) + (1 - 50% ) * 22% (HolCo in Cnova) Valuation analysis - Project Delphes - 11 May 2016 Valuation results including synergies 37 © 2016 Property of Eight Advisory - Confidential
7. Review of BNP Paribas valuation analysis
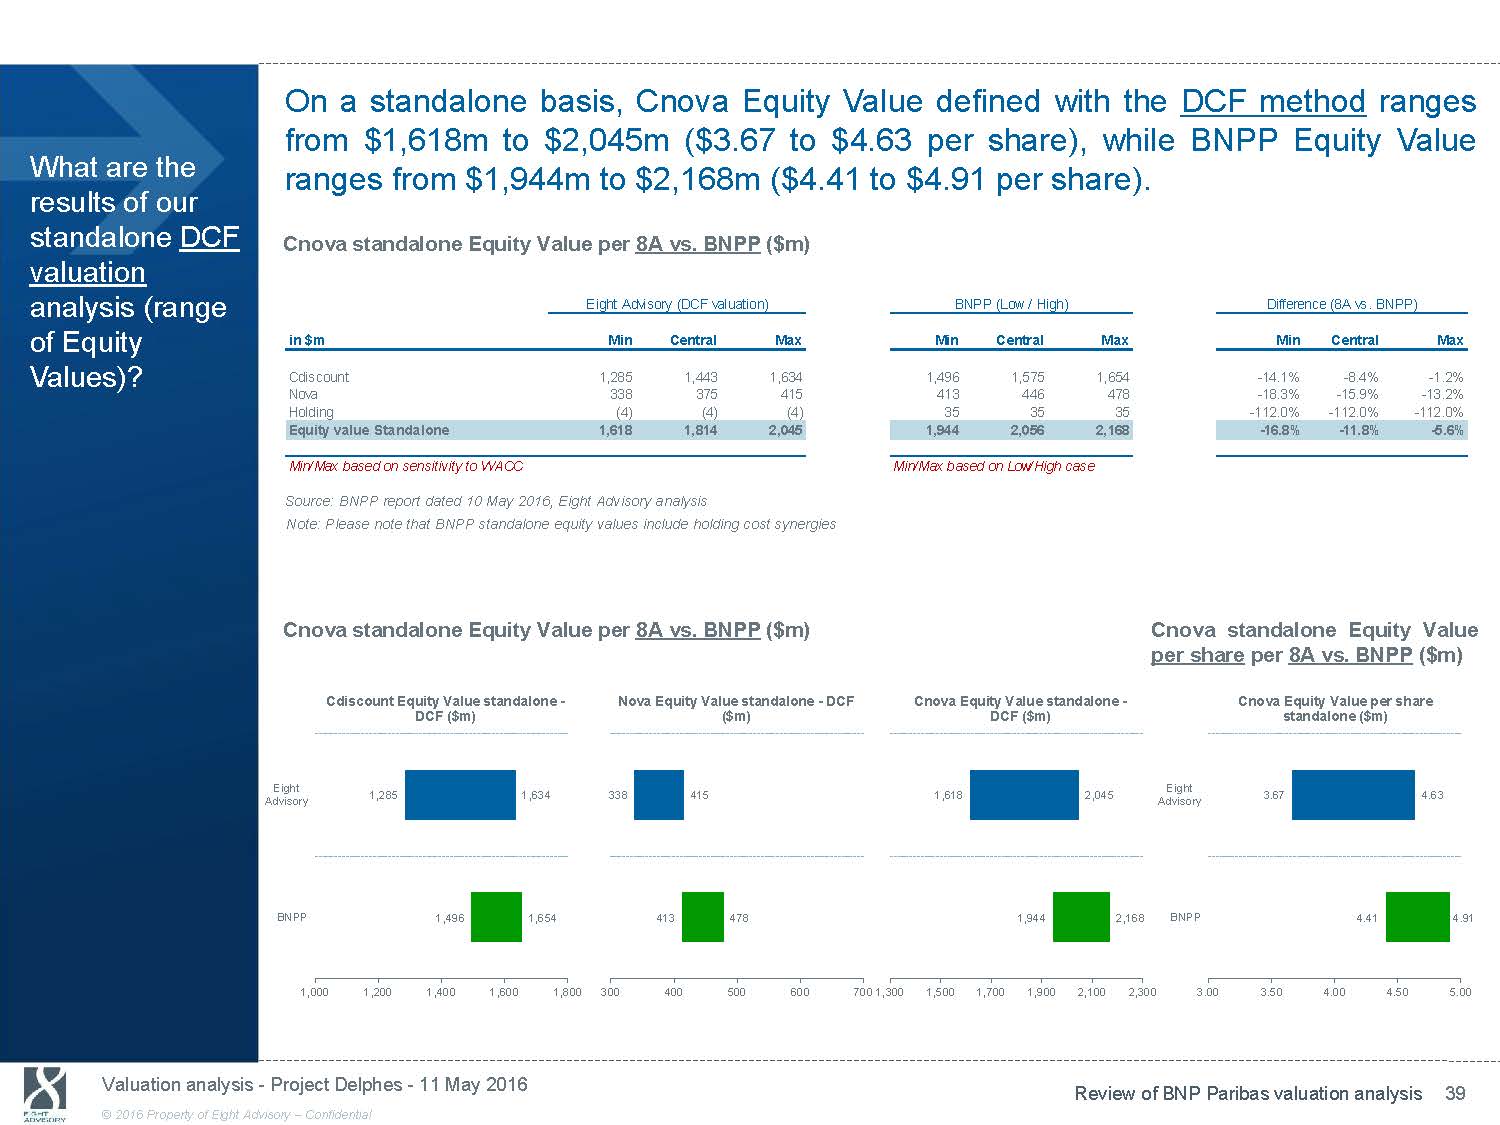
On a standalone basis, Cnova Equity Value defined with the DCF method ranges from $1,618m to $2,045m ($3.67 to $4.63 per share), while BNPP Equity Value What are the results of our standalone DCF valuation ranges from $1,944m to $2,168m ($4.41 to $4.91 per share). Cnova standalone Equity Value per 8A vs. BNPP ($m) analysis (range of Equity Values)? Eight Advisory (DCF valuation) in $m Min Central Max Cdiscount 1,285 1,443 1,634 Nova 338 375 415 Holding (4) (4) (4) Equity value Standalone 1,618 1,814 2,045 BNPP (Low / High) Min Central Max 1,496 1,575 1,654 413 446 478 35 35 35 1,944 2,056 2,168 Difference (8A vs. BNPP) Min Central Max - 14.1% - 8.4% - 1.2% - 18.3% - 15.9% - 13.2% - 112.0% - 112.0% - 112.0% - 16.8% - 11.8% - 5.6% Min/Max based on sensitivity to WACC Source: BNPP report dated 10 May 2016, Eight Advisory analysis Note: Please note that BNPP standalone equity values include holding cost synergies Cnova standalone Equity Value per 8A vs. BNPP ($m) Min/Max based on Low/High case Cnova standalone Equity Value per share per 8A vs. BNPP ($m) Eight Advisory BNPP Cdiscount Equity Value standalone - DCF ($m) 1,285 1,634 1,496 1,654 Nova Equity Value standalone - DCF ($m) 338 415 413 478 Cnova Equity Value standalone - DCF ($m) 1,618 2,045 1,944 2,168 Eight Advisory BNPP Cnova Equity Value per share standalone ($m) 3.67 4.63 4.41 4.91 1,000 1,200 1,400 1,600 1,800 300 400 500 600 700 1,300 1,500 1,700 1,900 2,100 2,300 3.00 3.50 4.00 4.50 5.00 Valuation analysis - Project Delphes - 11 May 2016 Review of BNP Paribas valuation analysis 39 © 2016 Property of Eight Advisory - Confidential

Based on the DCF method, Cnova Equity Value per share including synergies What are the results of our DCF valuation analysis including synergies (range of Equity values per share)? ranges from $4.27 to $4.65, while BNPP’s ranges from $4.47 Cnova Value per share including synergies per 8A vs. BNPP ($m) Eight Advisory (DCF valuation) BNPP in $m Min Central Max Min Central Max Equity value Standalone (central) 1,814 1,814 1,814 1,944 2,056 2,168 Eq. V. standalone after cross shlding. elim. 1,415 1,415 1,415 n.a. n.a. n.a. Synergies 55 120 185 28 39 56 Equity Value including synergies 1,471 1,536 1,600 1,972 * 2,095 * 2,224 # shares outstanding before elim. 441.3 441.3 441.3 441.3 441.3 441.3 # shares outstanding after elim. 344.3 344.3 344.3 n.a. n.a. n.a. Equity value Standalone per share 4.11 4.11 4.11 4.41 4.66 4.91 Synergies per share 0.16 0.35 0.54 0.06 0.09 0.13 Equity value incl. synergies per share 4.27 4.46 4.65 4.47 4.75 * 5.04 Source: BNPP report dated 10 May 2016, Eight Advisory analysis * Eight Advisory estimates Cnova Value per share - 8A vs. BNPP ($m) to $5.04. Difference (8A vs. BNPP) Min Central Max - 6.7% - 11.8% - 16.3% n.a. n.a. n.a. n.m. n.m. n.m. - 25.4% - 26.7% - 28.0% 0.0% 0.0% 0.0% n.a. n.a. n.a. - 6.7% - 11.8% - 16.3% n.m. n.m. n.m. - 4.4% - 6.1% - 7.8% Cnova Equity Value per share Synergies per share ($) Cnova Equity Value per share incl. standalone ($) Synergies ($) 4.11 Eight Advisory 0.16 0.54 4.27 4.65 (central) BNPP 4.41 4.91 0.06 0.13 4.47 5.04 2.80 3.30 3.80 4.30 4.80 - 0.20 0.40 0.60 0.80 1.00 3.00 3.50 4.00 4.50 5.00 5.50 * Eight Advisory estimates Valuation analysis - Project Delphes - 11 May 2016 Review of BNP Paribas valuation analysis 40 © 2016 Property of Eight Advisory - Confidential
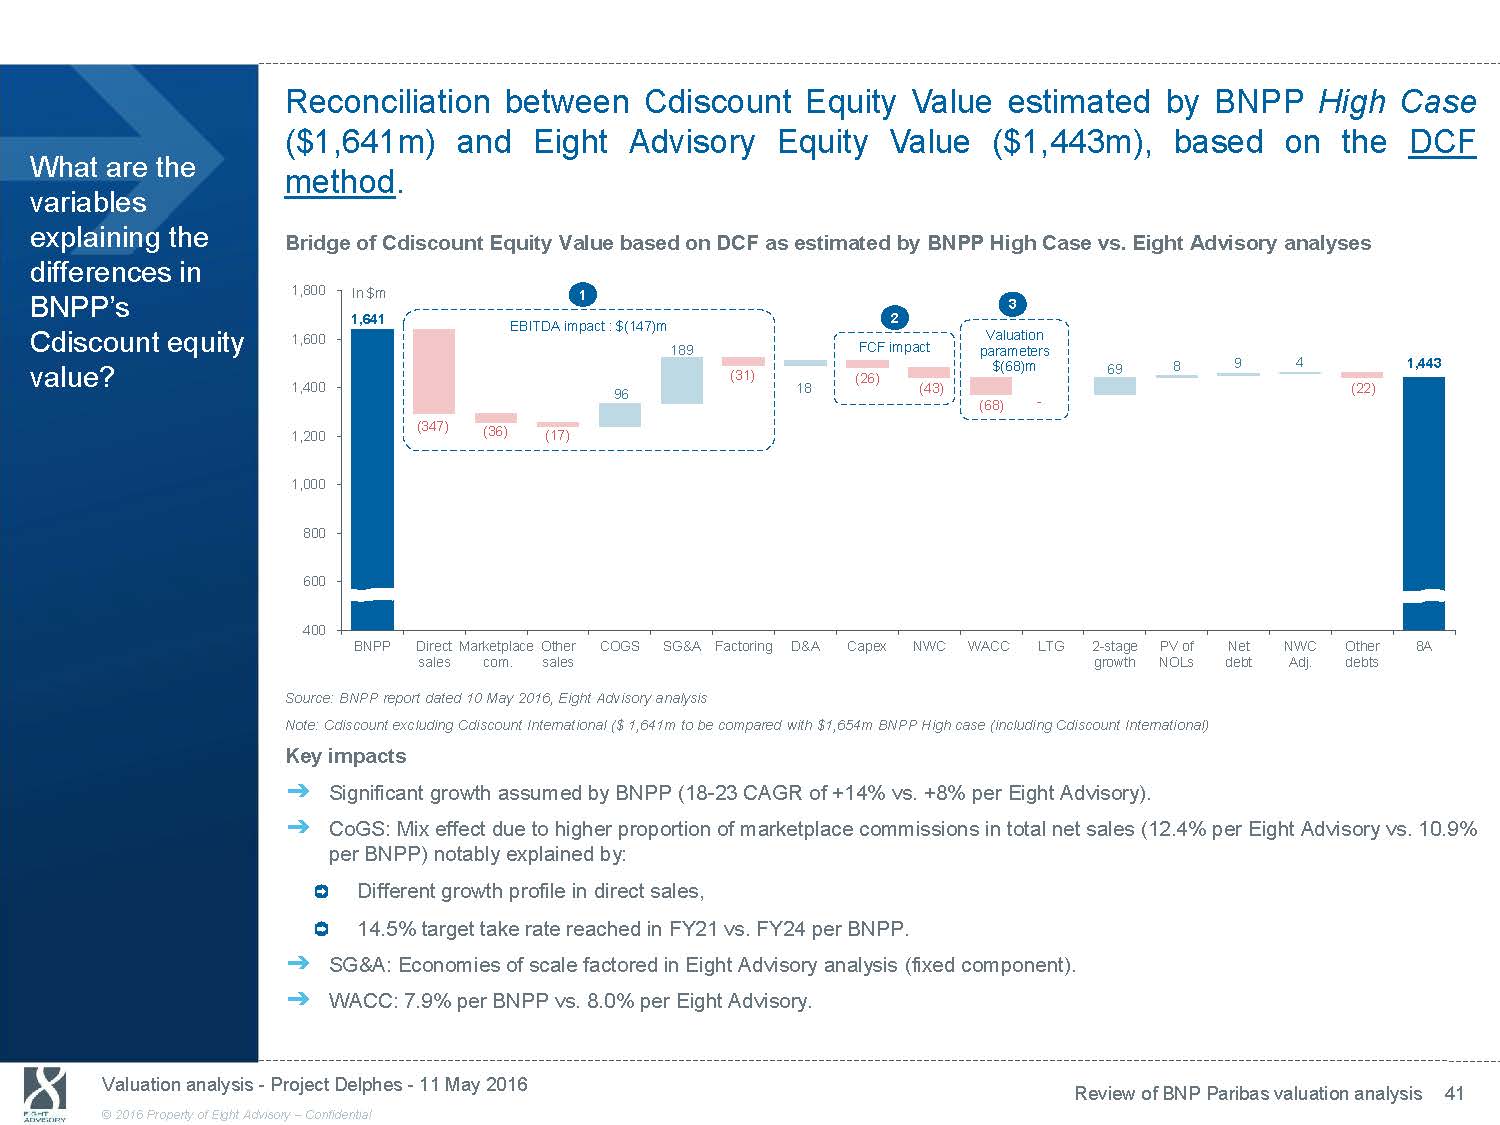
Reconciliation between Cdiscount Equity Value estimated by BNPP High Case What are the variables explaining the differences in ($1,641m) and Eight Advisory Equity Value ($1,443m), based on the DCF method. Bridge of Cdiscount Equity Value based on DCF as estimated by BNPP High Case vs. Eight Advisory analyses 1,800 In $m 1 2,000 BNPP’s Cdiscount equity value? 1,641 EBITDA impact : $(147)m 1,600 2 189 FCF impact (31) (26) 3 Valuation parameters 9 4 1,443 1,500 $(68)m 69 8 1,443 1,400 1,200 1,000 800 600 400 (347) 96 (36) (17) 18 (43) (22) (68) - 1,000 500 - (500) BNPP Direct Marketplace Other COGS SG&A Factoring D&A Capex NWC WACC LTG 2 - stage PV of Net NWC Other 8A sales com. sales growth NOLs debt Adj. debts Source: BNPP report dated 10 May 2016, Eight Advisory analysis Note: Cdiscount excluding Cdiscount International ($ 1,641m to be compared with $1,654m BNPP High case (including Cdiscount I nte rnational) Key impacts ᇄ Significant growth assumed by BNPP (18 - 23 CAGR of +14% vs. +8% per Eight Advisory). ᇄ CoGS: Mix effect due to higher proportion of marketplace commissions in total net sales (12.4% per Eight Advisory vs. 10.9% per BNPP) notably explained by: Different growth profile in direct sales, 14.5% target take rate reached in FY21 vs. FY24 per BNPP. ᇄ SG&A: Economies of scale factored in Eight Advisory analysis (fixed component). ᇄ WACC: 7.9% per BNPP vs. 8.0% per Eight Advisory. Valuation analysis - Project Delphes - 11 May 2016 Review of BNP Paribas valuation analysis 41 © 2016 Property of Eight Advisory - Confidential
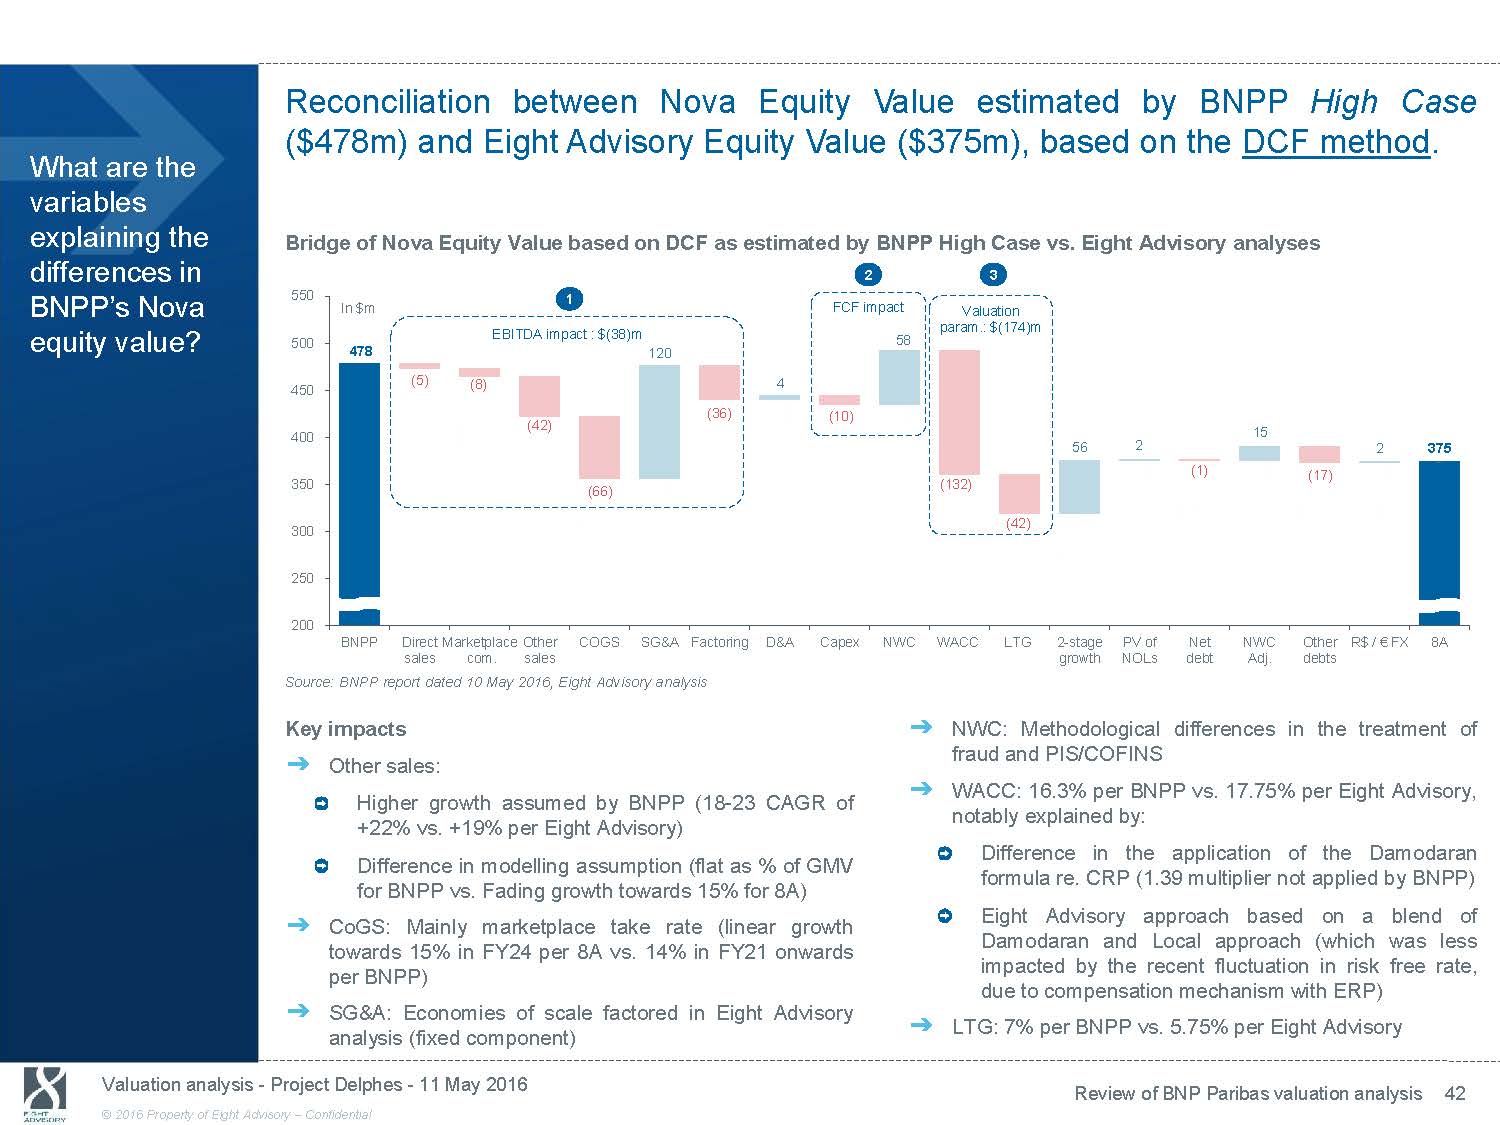
Reconciliation between Nova Equity Value estimated by BNPP High Case ($478m) and Eight Advisory Equity Value ($375m), based on the DCF method. What are the variables explaining the differences in Bridge of Nova Equity Value based on DCF as estimated by BNPP High Case vs. Eight Advisory analyses 2 3 550 1 600 BNPP’s Nova In $m FCF impact Valuation equity value? 500 450 400 478 (5) EBITDA impact : $(38)m 120 (8) (36) (42) param.: $(174)m 58 4 (10) 500 400 300 15 56 2 2 375 350 300 250 200 BNPP Direct sales (66) Marketplace Other COGS SG&A Factoring com. sales (132) (42) D&A Capex NWC WACC LTG (1) (17) 2 - stage PV of Net NWC Other growth NOLs debt Adj. debts - 200 100 - (10 (20 R$ / € FX 8A Source: BNPP report dated 10 May 2016, Eight Advisory analysis Key impacts ᇄ Other sales: Higher growth assumed by BNPP (18 - 23 CAGR of +22% vs. +19% per Eight Advisory) Difference in modelling assumption (flat as % of GMV for BNPP vs. Fading growth towards 15% for 8A) ᇄ CoGS: Mainly marketplace take rate (linear growth towards 15% in FY24 per 8A vs. 14% in FY21 onwards per BNPP) ᇄ SG&A: Economies of scale factored in Eight Advisory analysis (fixed component) ᇄ NWC: Methodological differences in the treatment of fraud and PIS/COFINS ᇄ WACC: 16.3% per BNPP vs. 17.75% per Eight Advisory, notably explained by: Difference in the application of the Damodaran formula re. CRP (1.39 multiplier not applied by BNPP) Eight Advisory approach based on a blend of Damodaran and Local approach (which was less impacted by the recent fluctuation in risk free rate, due to compensation mechanism with ERP) ᇄ LTG: 7% per BNPP vs. 5.75% per Eight Advisory Valuation analysis - Project Delphes - 11 May 2016 Review of BNP Paribas valuation analysis 42 © 2016 Property of Eight Advisory - Confidential

8. Sensitivity analysis to Nova FY16 current trading

Including the impact of Nova FY16 current trading and latest corporate guidance would have a (10)% impact on Nova DCF Equity Value. What is the impact of FY16 current trading on Nova DCF Equity Value ? Nova - Equity Value sensitivity to FY16 current trading In $m Nova Equity Value in $m 400 375 (10)% 339 300 200 100 - Base case business plan FY16 EBITDA at R$(101)m Sensitivity including Nova FY16 current trading Nova Equity value in $m FY16 EBITDA margin (3.0)% (2.5)% (2.0)% (1.7)% (1.0)% (0.5)% 0% 1.0% 322 328 335 339 348 355 361 375 Source: Management, Eight Advisory analysis Nova - Equity Value sensitivity to FY16 current trading ᇄ Sensitivity analysis presented for information purposes only, based on public information disclosed by the Group with regard to Nova’s FY16 financial performance outlook. ᇄ Regarding EBITDA, the latest corporate guidance assumes that:“[…] we believe that we can reach breakeven in the last nine months of the year” (source: Q1 2016 Earnings Conference Call - 26 April 2016). ᇄ Nova’s business plan forecasts R$61m EBITDA for FY16 corresponding to 1.0% of FY16 net sales. Given the estimated R$(101)m EBITDA for Q1 2016, the FY16 EBITDA margin implied by a zero EBITDA generation over the last nine months of the year is (1.7)%. ᇄ This sensitivity analysis leads to a (10)% decrease in Nova DCF Equity Value . Valuation analysis - Project Delphes - 11 May 2016 Sensitivity analysis to Nova FY16 current trading 44 © 2016 Property of Eight Advisory - Confidential
9. Analysis of the Terms of the MoU
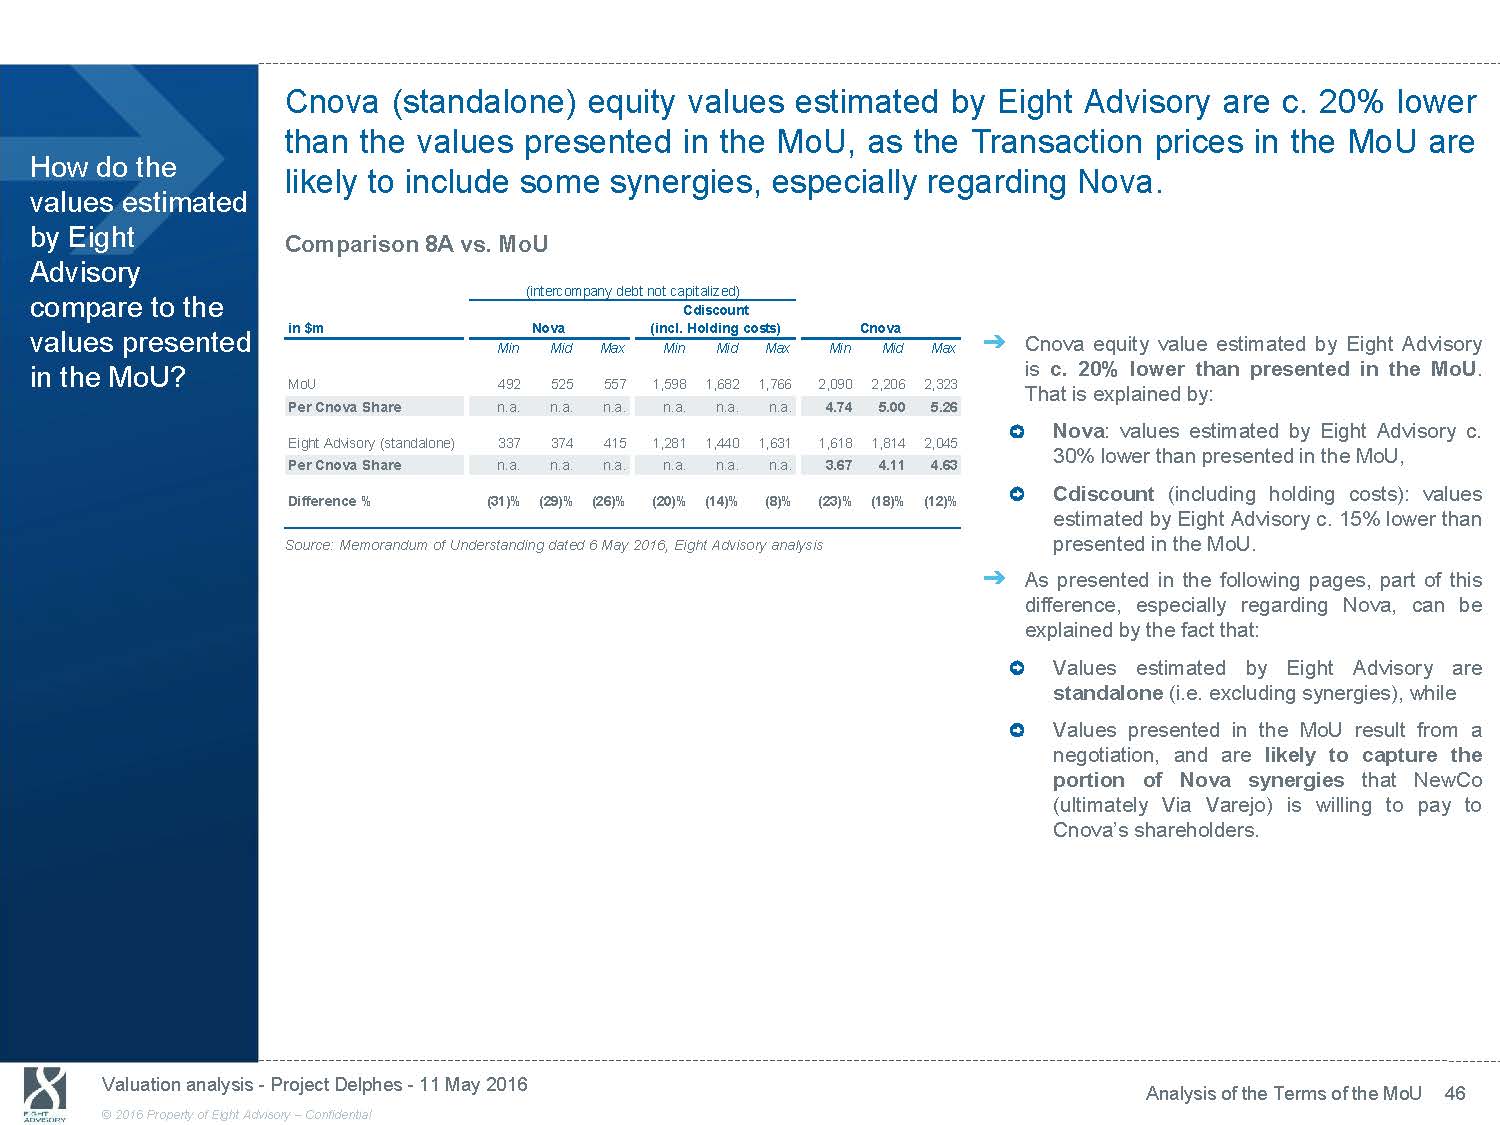
Cnova (standalone) equity values estimated by Eight Advisory are c. 20% lower than the values presented in the MoU, as the Transaction prices in the MoU are How do the values estimated by Eight Advisory compare to the likely to include some synergies, especially regarding Nova. Comparison 8A vs. MoU (intercompany debt not capitalized) Cdiscount values presented in the MoU? in $m Min MoU 492 Per Cnova Share n.a. Eight Advisory (standalone) 337 Per Cnova Share n.a. Difference % (31)% Nova (incl. Holding costs) Cnova Mid Max Min Mid Max Min Mid Max 525 557 1,598 1,682 1,766 2,090 2,206 2,323 n.a. n.a. n.a. n.a. n.a. 4.74 5.00 5.26 374 415 1,281 1,440 1,631 1,618 1,814 2,045 n.a. n.a. n.a. n.a. n.a. 3.67 4.11 4.63 (29)% (26)% (20)% (14)% (8)% (23)% (18)% (12)% ᇄ Cnova equity value estimated by Eight Advisory is c.20% lower than presented in the MoU . That is explained by: Nova : values estimated by Eight Advisory c. 30% lower than presented in the MoU, Cdiscount (including holding costs): values estimated by Eight Advisory c. 15% lower than Source: Memorandum of Understanding dated 6 May 2016, Eight Advisory analysis presented in the MoU. ᇄ As presented in the following pages, part of this difference, especially regarding Nova, can be explained by the fact that: Values estimated by Eight Advisory are standalone (i.e. excluding synergies), while Values presented in the MoU result from a negotiation, and are likely to capture the portion of Nova synergies that NewCo (ultimately Via Varejo) is willing to pay to Cnova’s shareholders. Valuation analysis - Project Delphes - 11 May 2016 Analysis of the Terms of the MoU 46 © 2016 Property of Eight Advisory - Confidential
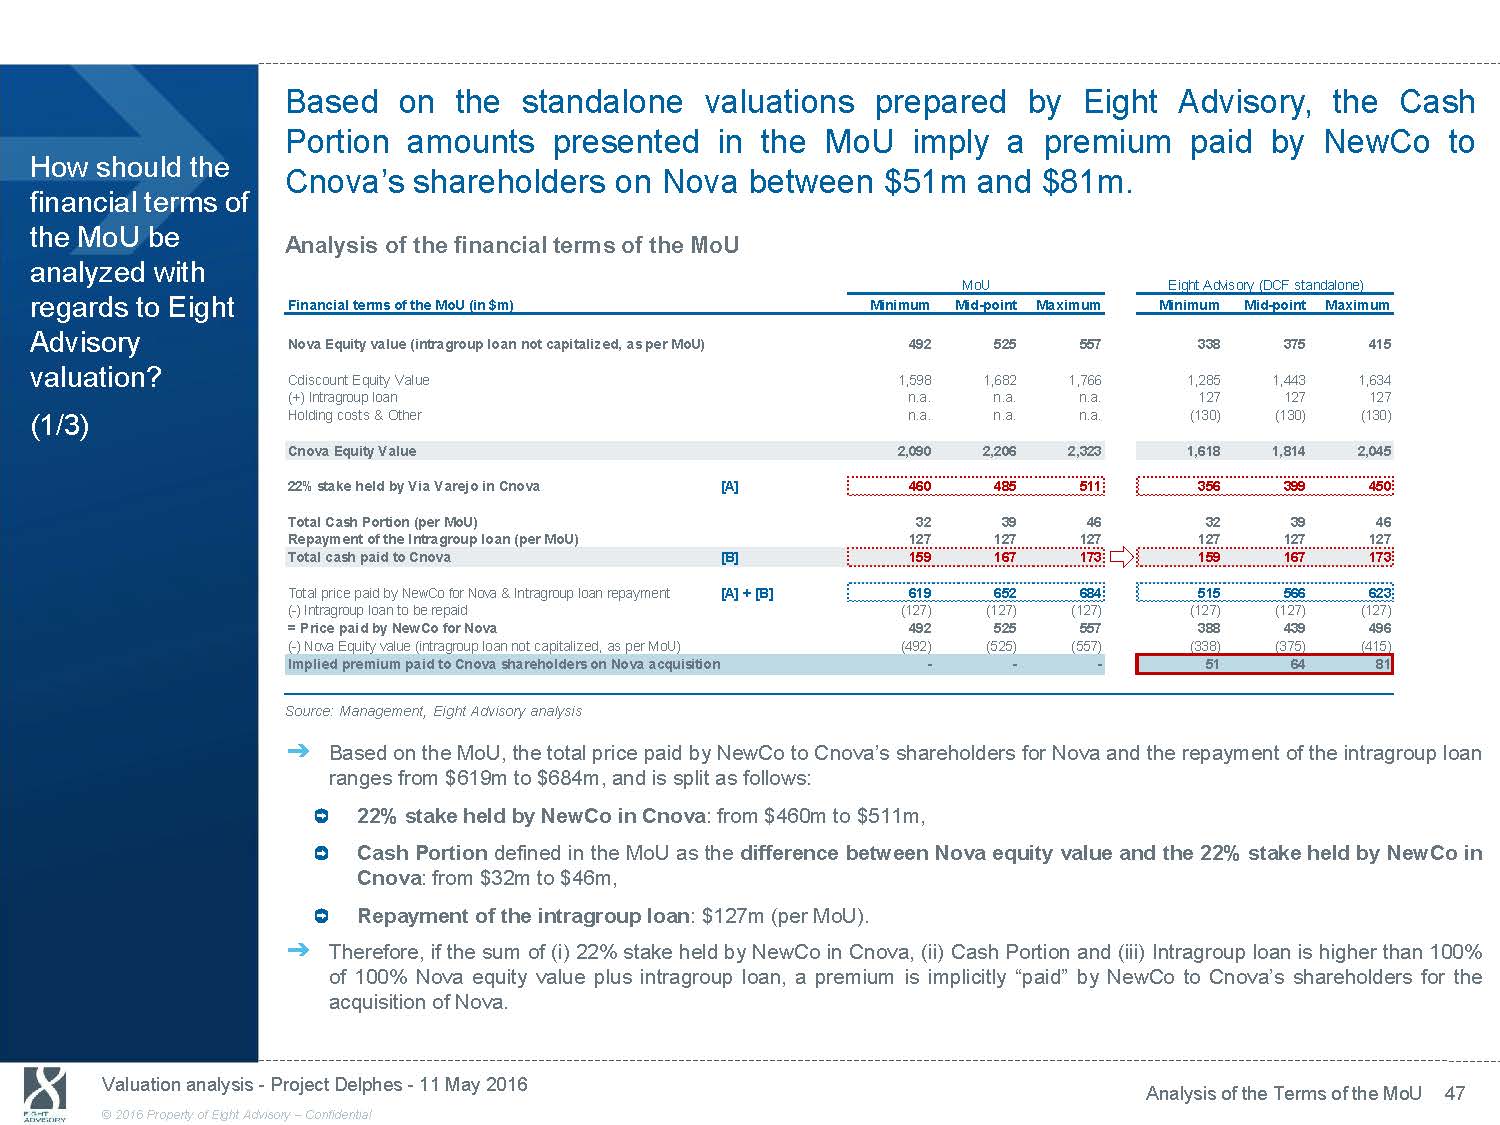
Based on the standalone valuations prepared by Eight Advisory, the Cash How should the financial terms of the MoU be analyzed with Portion amounts presented in the MoU imply a premium paid by NewCo to Cnova’s shareholders on Nova between $51m and $81m. Analysis of the financial terms of the MoU regards to Eight Advisory valuation? (1/3) Financial terms of the MoU (in $m) Nova Equity value (intragroup loan not capitalized, as per MoU) Cdiscount Equity Value (+) Intragroup loan Holding costs & Other Cnova Equity Value 22% stake held by Via Varejo in Cnova Total Cash Portion (per MoU) Repayment of the Intragroup loan (per MoU) Total cash paid to Cnova Total price paid by NewCo for Nova & Intragroup loan repayment MoU Minimum Mid - point Maximum 492 525 557 1,598 1,682 1,766 n.a. n.a. n.a. n.a. n.a. n.a. 2,090 2,206 2,323 [A] 460 485 511 32 39 46 127 127 127 [B] 159 167 173 [A] + [B] 619 652 684 Eight Advisory (DCF standalone) Minimum Mid - point Maximum 338 375 415 1,285 1,443 1,634 127 127 127 (130) (130) (130) 1,618 1,814 2,045 356 399 450 32 39 46 127 127 127 159 167 173 515 566 623 ( - ) Intragroup loan to be repaid (127) (127) (127) (127) (127) (127) = Price paid by NewCo for Nova 492 525 557 388 439 496 ( - ) Nova Equity value (intragroup loan not capitalized, as per MoU) (492) (525) (557) (338) (375) (415) Implied premium paid to Cnova shareholders on Nova acquisition - - - 51 64 81 Source: Management, Eight Advisory analysis ᇄ Based on the MoU, the total price paid by NewCo to Cnova’s shareholders for Nova and the repayment of the intragroup loan ranges from $619m to $684m, and is split as follows: 22% stake held by NewCo in Cnova : from $460m to $511m, Cash Portion defined in the MoU as the difference between Nova equity value and the 22% stake held by NewCo in Cnova : from $32m to $46m, Repayment of the intragroup loan : $127m (per MoU). ᇄ Therefore, if the sum of (i) 22% stake held by NewCo in Cnova, (ii) Cash Portion and (iii) Intragroup loan is higher than 100 % of 100% Nova equity value plus intragroup loan, a premium is implicitly “paid” by NewCo to Cnova’s shareholders for the acquisition of Nova. Valuation analysis - Project Delphes - 11 May 2016 Analysis of the Terms of the MoU 47 © 2016 Property of Eight Advisory - Confidential
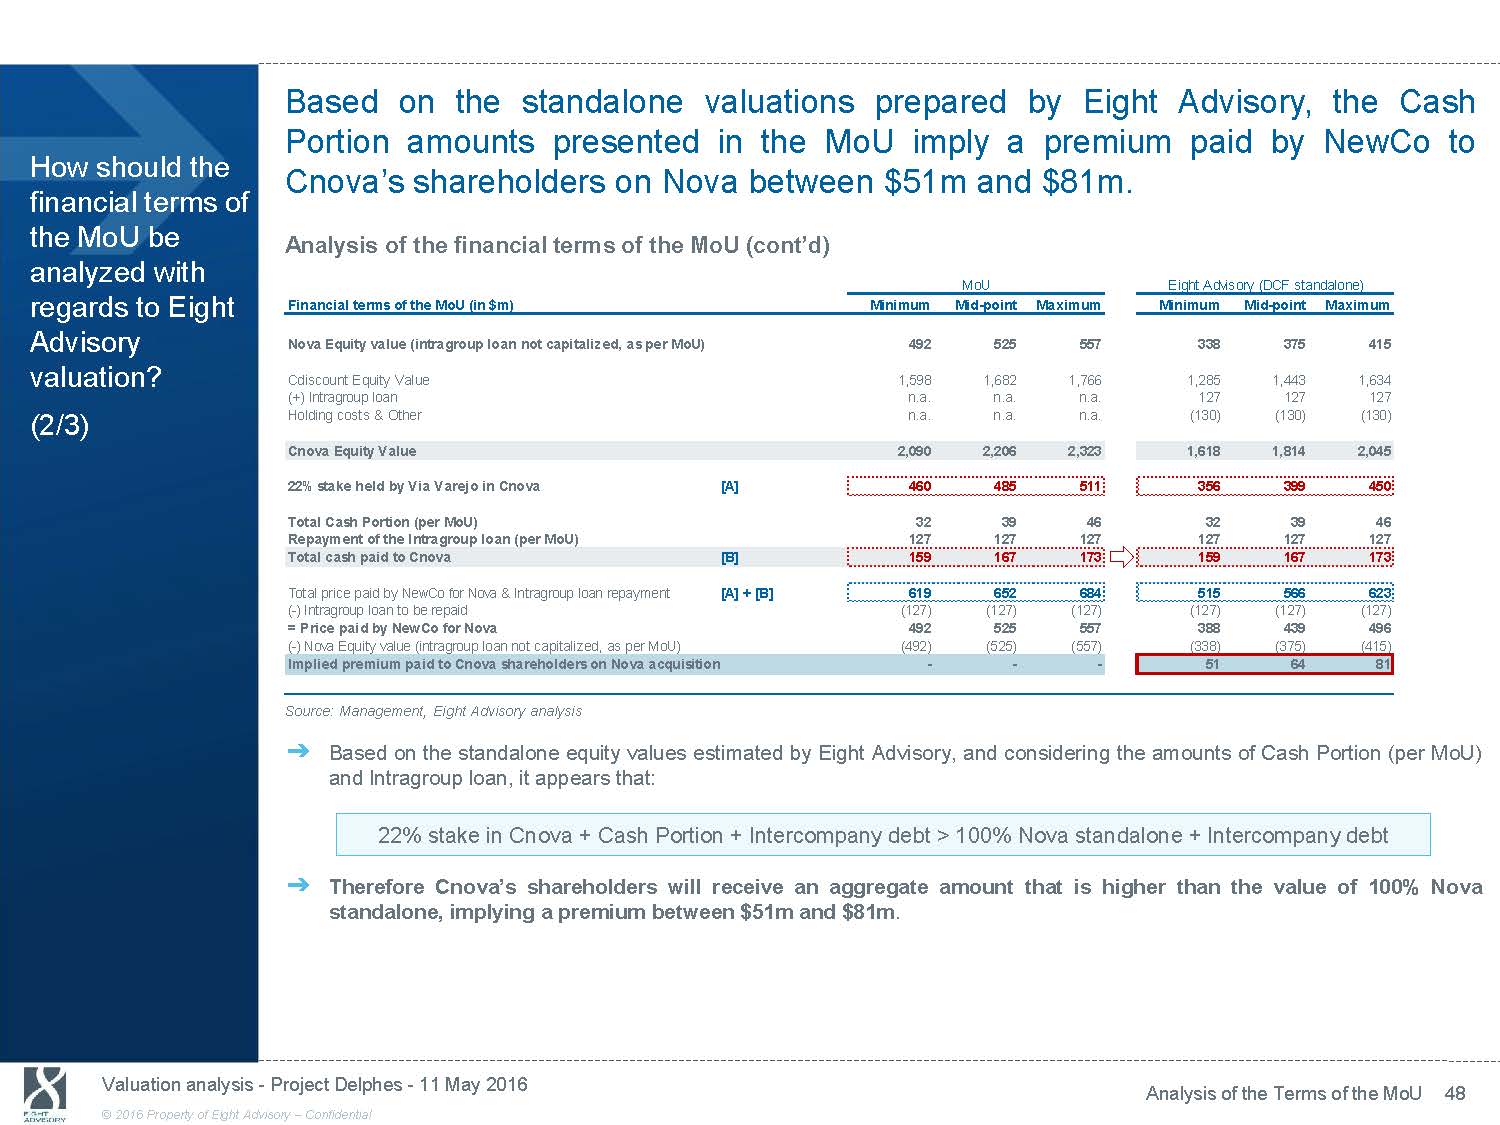
Based on the standalone valuations prepared by Eight Advisory, the Cash How should the financial terms of the MoU be analyzed with Portion amounts presented in the MoU imply a premium paid by NewCo to Cnova’s shareholders on Nova between $51m and $81m. Analysis of the financial terms of the MoU (cont’d) regards to Eight Advisory valuation? (2/3) Financial terms of the MoU (in $m) Nova Equity value (intragroup loan not capitalized, as per MoU) Cdiscount Equity Value (+) Intragroup loan Holding costs & Other Cnova Equity Value 22% stake held by Via Varejo in Cnova Total Cash Portion (per MoU) Repayment of the Intragroup loan (per MoU) Total cash paid to Cnova Total price paid by NewCo for Nova & Intragroup loan repayment MoU Minimum Mid - point Maximum 492 525 557 1,598 1,682 1,766 n.a. n.a. n.a. n.a. n.a. n.a. 2,090 2,206 2,323 [A] 460 485 511 32 39 46 127 127 127 [B] 159 167 173 [A] + [B] 619 652 684 Eight Advisory (DCF standalone) Minimum Mid - point Maximum 338 375 415 1,285 1,443 1,634 127 127 127 (130) (130) (130) 1,618 1,814 2,045 356 399 450 32 39 46 127 127 127 159 167 173 515 566 623 ( - ) Intragroup loan to be repaid (127) (127) (127) (127) (127) (127) = Price paid by NewCo for Nova 492 525 557 388 439 496 ( - ) Nova Equity value (intragroup loan not capitalized, as per MoU) (492) (525) (557) (338) (375) (415) Implied premium paid to Cnova shareholders on Nova acquisition - - - 51 64 81 Source: Management, Eight Advisory analysis ᇄ Based on the standalone equity values estimated by Eight Advisory, and considering the amounts of Cash Portion (per MoU) and Intragroup loan, it appears that: 22% stake in Cnova + Cash Portion + Intercompany debt > 100% Nova standalone + Intercompany debt ᇄ Therefore Cnova’s shareholders will receive an aggregate amount that is higher than the value of 100% Nova standalone, implying a premium between $51m and $81m . Valuation analysis - Project Delphes - 11 May 2016 Analysis of the Terms of the MoU 48 © 2016 Property of Eight Advisory - Confidential

The implied premium paid to Cnova’s shareholders corresponds to a portion of Nova’s net synergies ranging from 36% to 57%. Based on Eight Advisory How should the financial terms of the MoU be analyzed with valuations, the Exchange ratio is c. 75%, compared to c. 90% in the MoU. Analysis of the financial terms of the MoU (cont’d) regards to Eight Advisory valuation? (3/3) Focus on the implied premium paid to Cnova on Nova (in $m) Nova operating synergies Nova NOLs de - synergies Nova net synergies expected from the Transaction @ 100% Nova net synergies @ Cnova max. share (78%) Implied premium paid to Cnova shareholders on Nova acquisition Implied portion of Nova synergies paid by Newco MoU Minimum Mid - point Maximum n.a. n.a. n.a. n.a. n.a. n.a. n.a. n.a. n.a. n.a. n.a. n.a. - - - n.a. n.a. n.a. Eight Advisory (DCF standalone) Minimum Mid - point Maximum 205 205 205 (23) (23) (23) 182 182 182 142 142 142 51 64 81 36% 45% 57% MoU Eight Advisory (DCF standalone) Exchange ratio per MoU (in $m) Minimum Mid - point Maximum Minimum Mid - point Maximum Nova equity value [A] 492 525 557 338 375 415 22% stake held by Via Varejo in Cnova [B] 460 485 511 356 399 450 Total Cash Portion paid by NewCo (as per MoU) [C] 32 39 46 32 39 46 Additional Cash (as per MoU) [D] 54 54 54 54 54 54 Exchange ratio per MoU [A] / ([B]+[C]+[D]) 90% 91% 91% 76% 76% 75% - - - Source: Management, Eight Advisory analysis ᇄ Based on the estimation of the Nova net synergies (cf. pages 29 and 30) expected to arise from the Transaction, the implied premium paid to Cnova’s shareholders on Nova captures 36% to 57% of the Nova synergies (net of NOLs de - synergies) attributable to Cnova’s shareholders (i.e. 78% of total Nova net synergies). ᇄ Based on the values estimated by Eight Advisory and the Cash Portion of the MoU, the Exchange ratio would stand at c. 75% , compared to the c. 90% ratio derived from the values presented in the MoU. This corroborates the fact that NewCo is paying an implied premium on Nova intrinsic value to acquire it. ᇄ Based on the above, the financial terms of the MoU lead to an implied premium on Nova standalone value, which appears to be fair for Cnova’s shareholders. Valuation analysis - Project Delphes - 11 May 2016 Analysis of the Terms of the MoU 49 © 2016 Property of Eight Advisory - Confidential
10. Conclusions
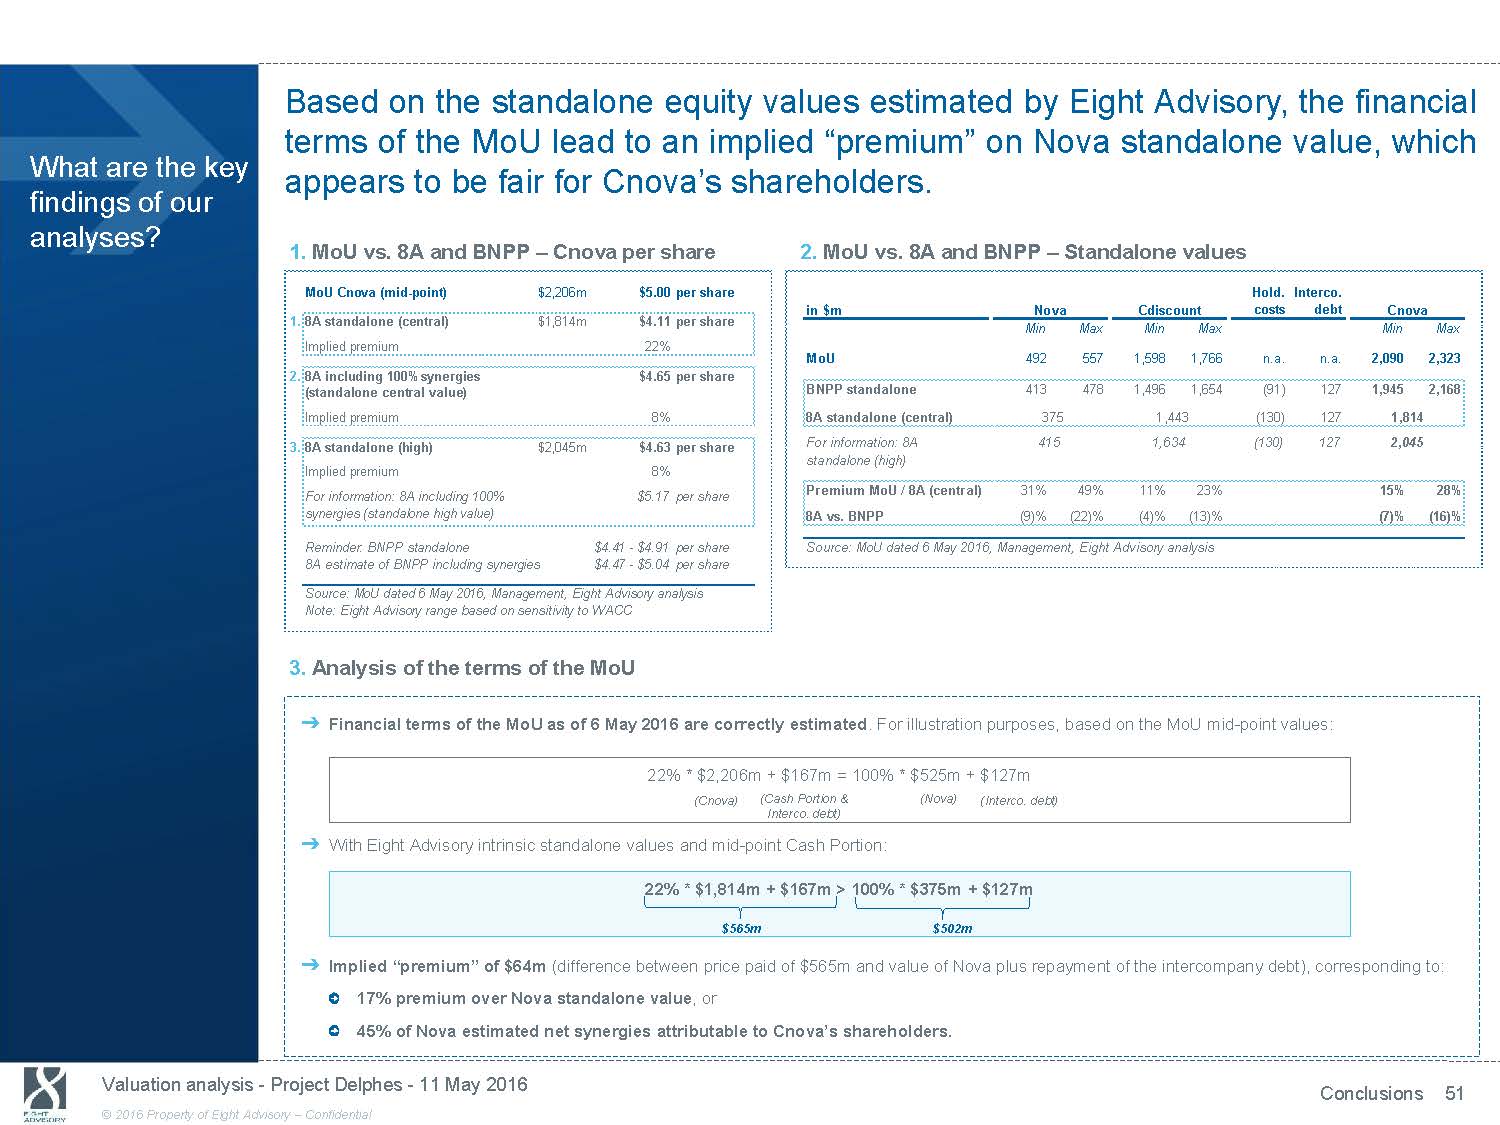
Based on the standalone equity values estimated by Eight Advisory, the financial terms of the MoU lead to an implied “premium” on Nova standalone value, which What are the key findings of our analyses? appears to be fair for Cnova’s shareholders. 1. MoU vs. 8A and BNPP - Cnova per share 2. MoU vs. 8A and BNPP - Standalone values MoU Cnova (mid - point) $2,206m $5.00 per share Hold.Interco. in $m Nova Cdiscount costs debt Cnova 1. 8A standalone (central) $1,814m $4.11 per share Min Max Min Max Min Max Implied premium 22% MoU 492 557 1,598 1,766 n.a. n.a. 2,090 2,323 2. 8A including 100% synergies $4.65 per share (standalone central value) BNPP standalone 413 478 1,496 1,654 (91) 127 1,945 2,168 Implied premium 8% 8A standalone (central) 375 1,443 (130) 127 1,814 3. 8A standalone (high) $2,045m $4.63 per share For information: 8A 415 1,634 (130) 127 2,045 standalone (high) Implied premium 8% For information: 8A including 100% $5.17 per share synergies (standalone high value) Premium MoU / 8A (central) 31% 8A vs. BNPP (9)% 49% 11% 23% 15% 28% (22)% (4)% (13)% (7)% (16)% Reminder: BNPP standalone $4.41 - $4.91 per share Source: MoU dated 6 May 2016, Management, Eight Advisory analysis 8A estimate of BNPP including synergies $4.47 - $5.04 per share Source: MoU dated 6 May 2016, Management, Eight Advisory analysis Note: Eight Advisory range based on sensitivity to WACC 3. Analysis of the terms of the MoU ᇄ Financial terms of the MoU as of 6 May 2016 are correctly estimated . For illustration purposes, based on the MoU mid - point values: 22% * $2,206m + $167m = 100% * $525m + $127m (Cnova) (Cash Portion & (Nova) (Interco. debt) Interco. debt) ᇄ With Eight Advisory intrinsic standalone values and mid - point Cash Portion: 22% * $1,814m + $167m > 100% * $375m + $127m $565m $502m ᇄ Implied “premium” of $64m (difference between price paid of $565m and value of Nova plus repayment of the intercompany debt), corresponding to: 17% premium over Nova standalone value , or 45% of Nova estimated net synergies attributable to Cnova’s shareholders. Valuation analysis - Project Delphes - 11 May 2016 Conclusions 51 © 2016 Property of Eight Advisory - Confidential
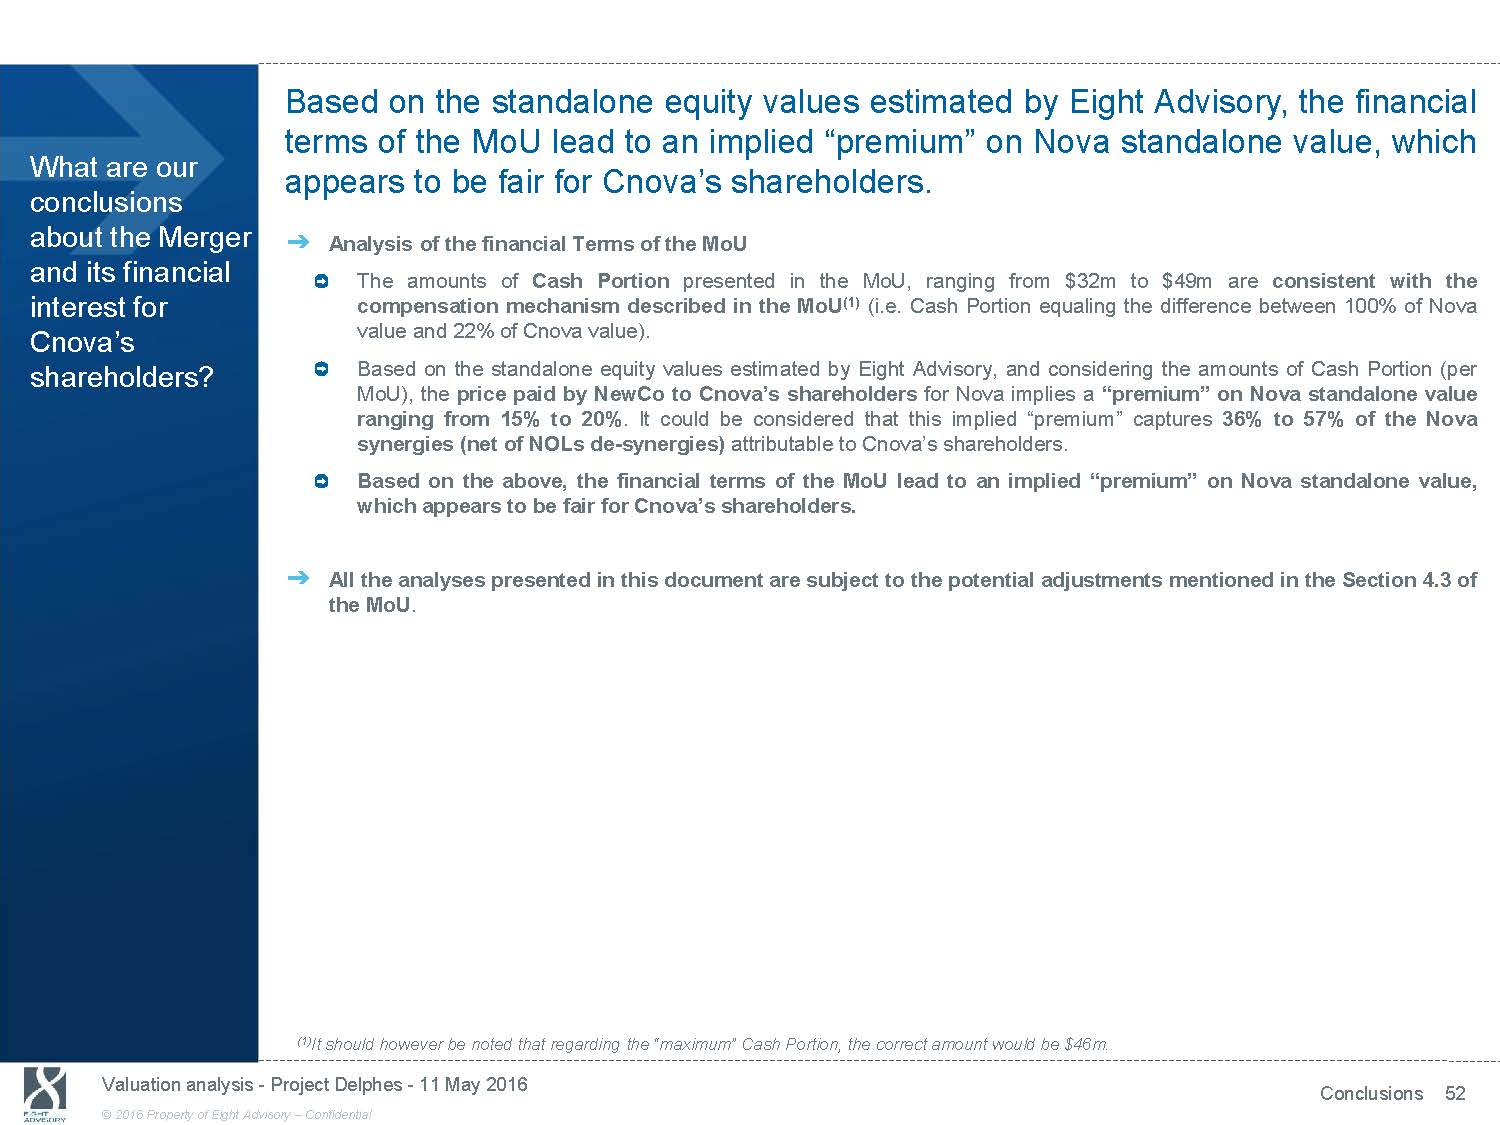
Based on the standalone equity values estimated by Eight Advisory, the financial terms of the MoU lead to an implied “premium” on Nova standalone value, which What are our conclusions about the Merger and its financial appears to be fair for Cnova’s shareholders. ᇄ Analysis of the financial Terms of the MoU The amounts of Cash Portion presented in the MoU, ranging from $32m to $49m are consistent with the interest for Cnova’s shareholders? compensation mechanism described in the MoU (1) (i.e. Cash Portion equaling the difference between 100% of Nova value and 22% of Cnova value). Based on the standalone equity values estimated by Eight Advisory, and considering the amounts of Cash Portion (per MoU), the price paid by NewCo to Cnova’s shareholders for Nova implies a “premium” on Nova standalone value ranging from 15% to 20% . It could be considered that this implied “premium” captures 36% to 57% of the Nova synergies (net of NOLs de - synergies) attributable to Cnova’s shareholders. Based on the above, the financial terms of the MoU lead to an implied “premium” on Nova standalone value, which appears to be fair for Cnova’s shareholders. ᇄ All the analyses presented in this document are subject to the potential adjustments mentioned in the Section 4.3 of the MoU . (1) It should however be noted that regarding the “maximum” Cash Portion, the correct amount would be $46m. Valuation analysis - Project Delphes - 11 May 2016 Conclusions 52 © 2016 Property of Eight Advisory - Confidential
11. Appendix
Appendices: Table of contents Appendices 1. Summary of the Memorandum of Understanding 2. Results of our analyses with the intercompany debt capitalized 3. Additional analysis on BNPP valuation works 4. DCF key assumptions 5. Discount Rates 6. Additional analysis on trading multiples 7. Brazil economic information Valuation analysis - Project Delphes - 11 May 2016 Appendix 54 © 2016 Property of Eight Advisory - Confidential
Appendix 1: Summary of the Memorandum of Understanding Appendix

A non - binding MoU was prepared between Via Varejo, Cnova Brazil and Cnova N.V. as of 6 May 2016, with the interest to implement a potential Memorandum of Understanding What are the main features of the MoU signed by the parties? (1/3) transaction which would combine the businesses of Via Varejo and Cnova Brazil. Memorandum of Understanding ᇄ The MoU outlines: (i) the preliminary terms and conditions of the Combination; (ii) the steps necessary to implement the combination of the e - commerce business currently operated by Cnova Brazil with the brick and mortar activities currently developed by via Varejo; The general proposal to be submitted by the officers of Via Varejo to the Board of Directors of Via Varejo, as well as by the Transaction Committee to the Board of Directors of Cnova NV. ᇄ The Parties have agreed on the economic and financial terms of the Combination based on: (i) the unaudited financial statements of Cnova Brazil as of and for the period ended as December 31, 2015; (ii) the net debt; (iii) the annual average working capital amount for Cnova Brazil for 2015; (iv) Provisions for expenses related to the investigations at Cnova Brazil; and (v) the Parties’ discussions of the respective business plans of Cnova Brazil and Cnova NV. ᇄ The Parties have agreed upon the following valuation ranges with respect to 100% of equity of each entity: Cnova Brazil: $492m (min) - $525m (mid) - $557m (max), Cdiscount: $1,598m (min) - $1,682m (mid) - $1,766m (max), Cnova NV: $2,090m (min) - $2,206m (mid) - $2,323m (max), Implied Cash portion: $32m (min) - $39m (mid) - $49m (max) (1) As reminder a shareholders’ loan amounted to $127m. Note (1): we noticed that the amount of the max Implied Cash Portion should be between $46m and $47m Valuation analysis - Project Delphes - 11 May 2016 Appendix 56 © 2016 Property of Eight Advisory - Confidential
A non - binding MoU was signed between Via Varejo, Cnova Brazil and Cnova NV as of 6 May 2016, with the interest to implement a potential transaction which Memorandum of Understanding What are the main features of the MoU signed by the parties? (2/3) would combine the businesses of Via Varejo and Cnova Brazil. Memorandum of Understanding (continued) ᇄ In order to implement the combination of the two businesses, Parties should achieve the following step plan: Merger of NewCo : as the preliminary step for implementing the combination a NewCo wholly owned by Via Varejo shall receive as a capital increase: (i) all the shares issued by Via Varejo Luxembourg Holding S.à.r.l that will, at the time of the capital increase, indirectly own 96,790,798 shares representing approximately 22% of the capital of Cnova NV; (ii) cash in Brazilian real corresponding to the difference between the equity value of 96,790,798 ordinary shares of Cnova NV and 100% of the equity value of Cnova Brazil, being that, as the Agreed Equity Values, such amount shall be in Brazilian real between $32m and $49m (“Cash Portion”); (iii) an additional cash of R$192,304,721.93 (“Additional Cash”), corresponding to the amount necessary for the net worth value of NewCo to be positive, necessary for the implementation of the Combination. Following the incorporation of NewCo and the completion of the capital increase described above, NewCo shall be immediately merged with and into Cnova Brazil, with Cnova Brazil as the surviving entity in the merger. Merger of NewCo Exchange Ratio : the ratio of the equity value of Cnova Brazil to the equity value of NewCo shall be determined as (A) the equity value of Cnova Brazil divided by (B) the value of (i) the equity value of 96,790,798 ordinary shares of Cnova NV held by Via Varejo plus (ii) the Cash Portion plus (iii) the Additional Cash. Possible adjustments to the Agreed Equity Value : The Agreed Equity Values with respect to Cnova NV and Cnova Brazil shall be adjusted in good faith by the Parties to take into account the effective impact on the valuation of the differences between (i) the Cnova’s 2015 Preliminary Financial Statements, and (ii) the audited financial statements of Cnova Brazil as of and for the year ended 31 December 2015, when released. Valuation analysis - Project Delphes - 11 May 2016 Appendix 57 © 2016 Property of Eight Advisory - Confidential

A non - binding MoU was signed between Via Varejo, Cnova Brazil and Cnova NV as of 6 May 2016, with the interest to implement a potential transaction which Memorandum of Understanding What are the main features of the MoU signed by the parties? (3/3) would combine the businesses of Via Varejo and Cnova Brazil. Memorandum of Understanding (continued) ᇄ In order to implement the combination of the two businesses, Parties will follow the following step plan (cont’d): Cross - shareholding elimination : completion of the Merger of NewCo shall result in an indirect cross - shareholding equity participation between Cnova Brazil and Cnova NV, which pursuant to Brazilian Law must be eliminated within one year of the completion of the merger of the NewCo. To this purpose the Parties agree to undertake the two following steps: Distribution by Cnova NV and repurchase of Cnova NV shares, Cnova Brazil’s share acquisition and elimination of cross - shareholding exchange ratio. As a final step the Parties acknowledge that Cnova Brazil, at this stage already a wholly owned company of Via Varejo, shall be merged into Via Varejo. ᇄ Repayment of Cnova Brazil shareholders’ loan : in accordance with the loan agreement entered between Cnova NV and Cnova Brazil on Marche 24, 2015, pursuant to which Cnova Brazil received from Cnova NV cash proceeds in the amount of BRL 385,000,000, the implementation of the combination is a triggering event for the acceleration of the repayment of the full amount of the loan, including interest and any other accrued amounts. ᇄ Non - binding agreement : This MoU is entered into for information and discussion purposes, as a negotiation aid and does not constitute a binding offer or commitment to carry out the combination or any other transactions contemplated herein ᇄ No other side - agreement at this stage . Valuation analysis - Project Delphes - 11 May 2016 Appendix 58 © 2016 Property of Eight Advisory - Confidential

Appendix 2: Results of our analyses with the intercompany debt capitalized Appendix
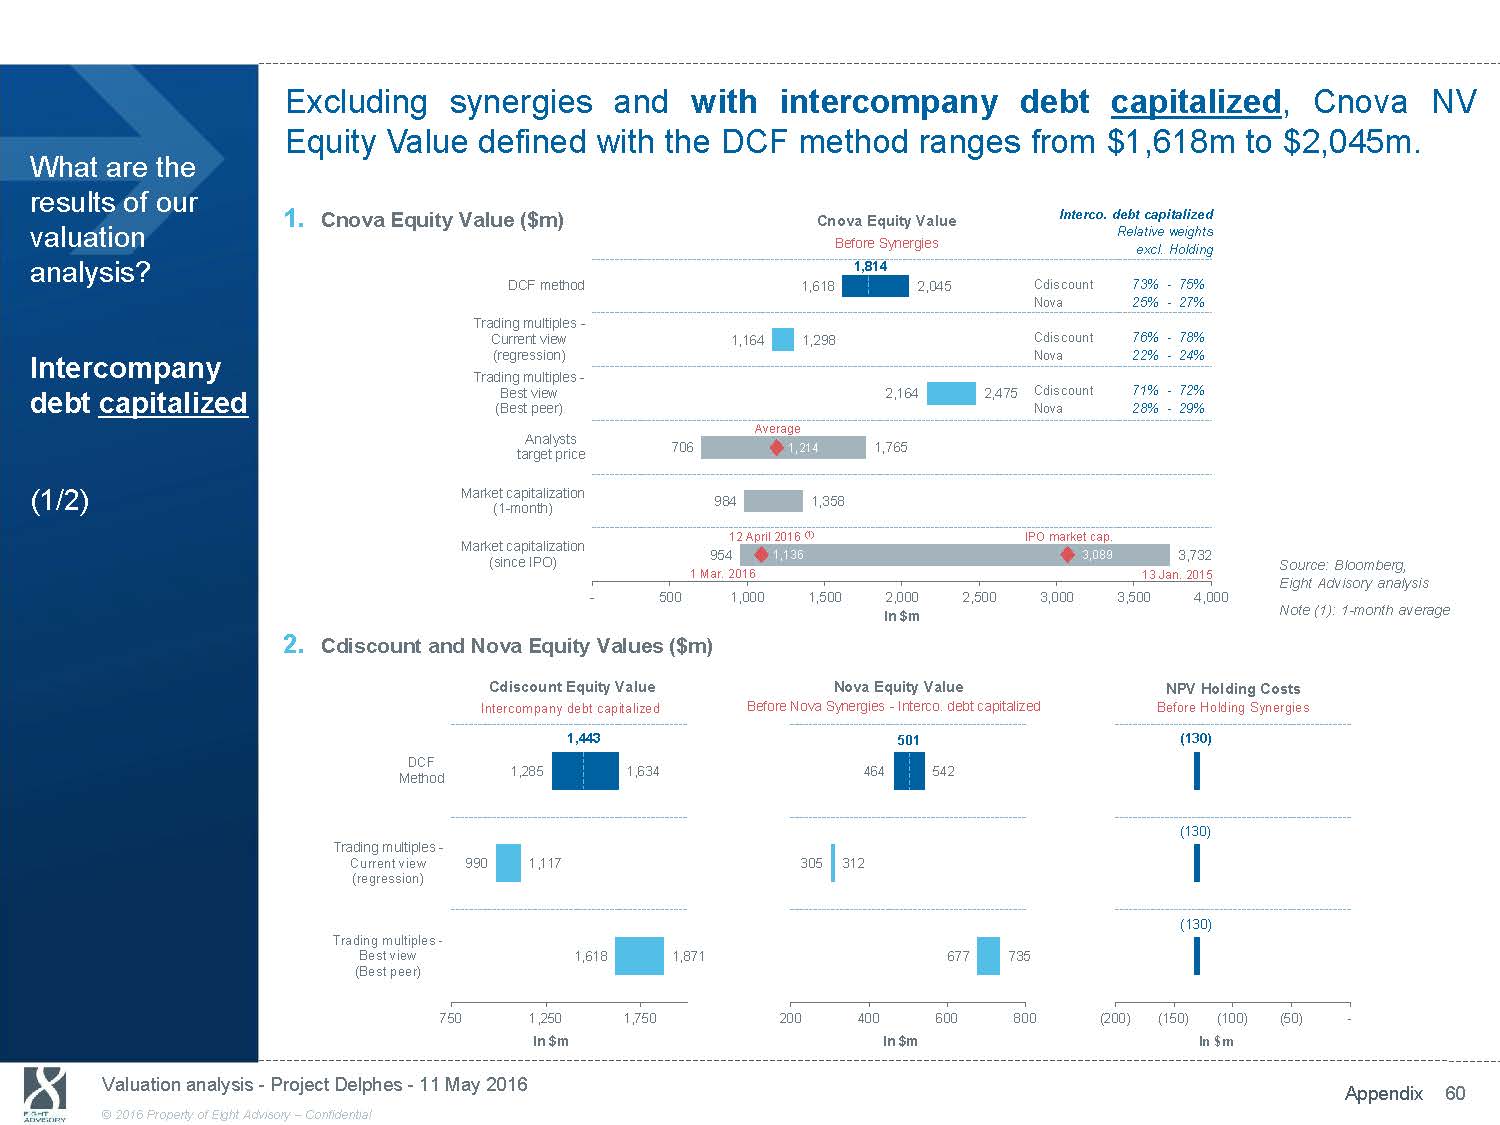
What are the results of our Excluding synergies and with intercompany debt capitalized , Cnova NV Equity Value defined with the DCF method ranges from $1,618m to $2,045m. Interco. debt capitalized 1. valuation Cnova Equity Value ($m) Cnova Equity Value Before Synergies Relative weights excl. Holding analysis? DCF method 1,618 1,814 2,045 Cdiscount 73% - 75% Nova 25% - 27% Trading multiples - Intercompany debt capitalized Current view 1,164 (regression) Trading multiples - Best view (Best peer) 1,298 Cdiscount 76% - 78% Nova 22% - 24% 2,164 2,475 Cdiscount 71% - 72% Nova 28% - 29% Average Analysts target price 706 1,214 1,765 (1/2) Market capitalization (1 - month) 984 1,358 Market capitalization (since IPO) - 500 12 April 2016 (1) 954 1,136 1 Mar. 2016 1,000 1,500 2,000 In $m IPO market cap. 3,089 3,732 Source: Bloomberg, 13 Jan. 2015 Eight Advisory analysis 2,500 3,000 3,500 4,000 Note (1): 1 - month average 2. Cdiscount and Nova Equity Values ($m) DCF Method Trading multiples - Current view (regression) Trading multiples - Best view (Best peer) 750 Cdiscount Equity Value Intercompany debt capitalized 1,443 1,285 1,634 990 1,117 1,618 1,871 1,250 1,750 In $m Nova Equity Value Before Nova Synergies - Interco. debt capitalized 501 464 542 305 312 677 735 200 400 600 800 In $m NPV Holding Costs Before Holding Synergies (130) (130) (130) (200) (150) (100) (50) - In $m Valuation analysis - Project Delphes - 11 May 2016 Appendix 60 © 2016 Property of Eight Advisory - Confidential
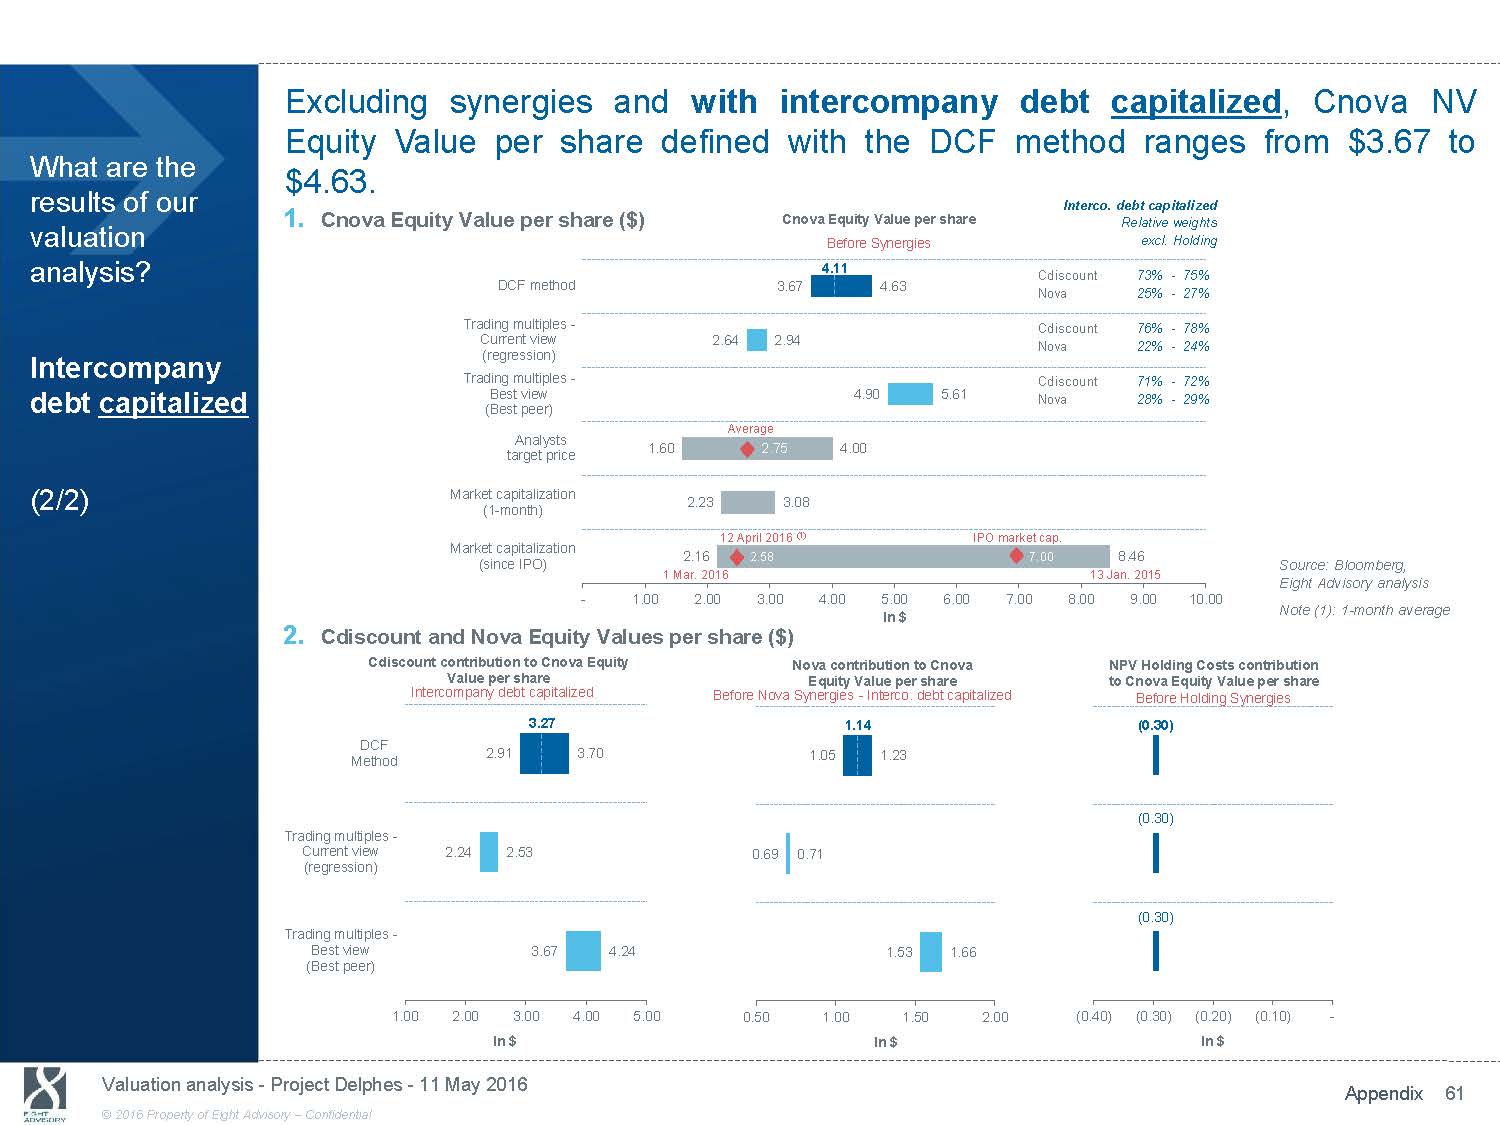
Excluding synergies and with intercompany debt capitalized , Cnova NV What are the results of our Equity Value per share defined with the DCF method ranges $4.63. Interco. debt capitalized from $3.67 to valuation 1. Cnova Equity Value per share ($) Cnova Equity Value per share Relative weights Before Synergies excl. Holding analysis? Intercompany debt capitalized 4.11 DCF method 3.67 4.63 Trading multiples - Current view 2.64 2.94 (regression) Trading multiples - Best view 4.90 5.61 (Best peer) Cdiscount 73% - 75% Nova 25% - 27% Cdiscount 76% - 78% Nova 22% - 24% Cdiscount 71% - 72% Nova 28% - 29% Average Analysts target price 1.60 2.75 4.00 (2/2) Market capitalization (1 - month) 2.23 3.08 Market capitalization (since IPO) - 1.00 12 April 2016 (1) 2.16 2.58 1 Mar. 2016 2.00 3.00 4.00 5.00 In $ IPO market cap. 7.00 8.46 13 Jan. 2015 6.00 7.00 8.00 9.00 Source: Bloomberg, Eight Advisory analysis 10.00 Note (1): 1 - month average 2. Cdiscount and Nova Equity Values per share ($) Cdiscount contribution to Cnova Equity Value per share Intercompany debt capitalized 3.27 Nova contribution to Cnova Equity Value per share Before Nova Synergies - Interco. debt capitalized 1.14 NPV Holding Costs contribution to Cnova Equity Value per share Before Holding Synergies (0.30) DCF Method Trading multiples - Current view 2.24 (regression) Trading multiples - Best view (Best peer) 1.00 2.00 2.91 3.70 2.53 0.69 3.67 4.24 3.00 4.00 5.00 0.50 In $ 1.05 1.23 0.71 1.53 1.66 1.00 1.50 2.00 In $ (0.30) (0.30) (0.40) (0.30) (0.20) (0.10) - In $ Valuation analysis - Project Delphes - 11 May 2016 Appendix 61 © 2016 Property of Eight Advisory - Confidential

Appendix 3: Additional analysis on BNPP valuation works Appendix
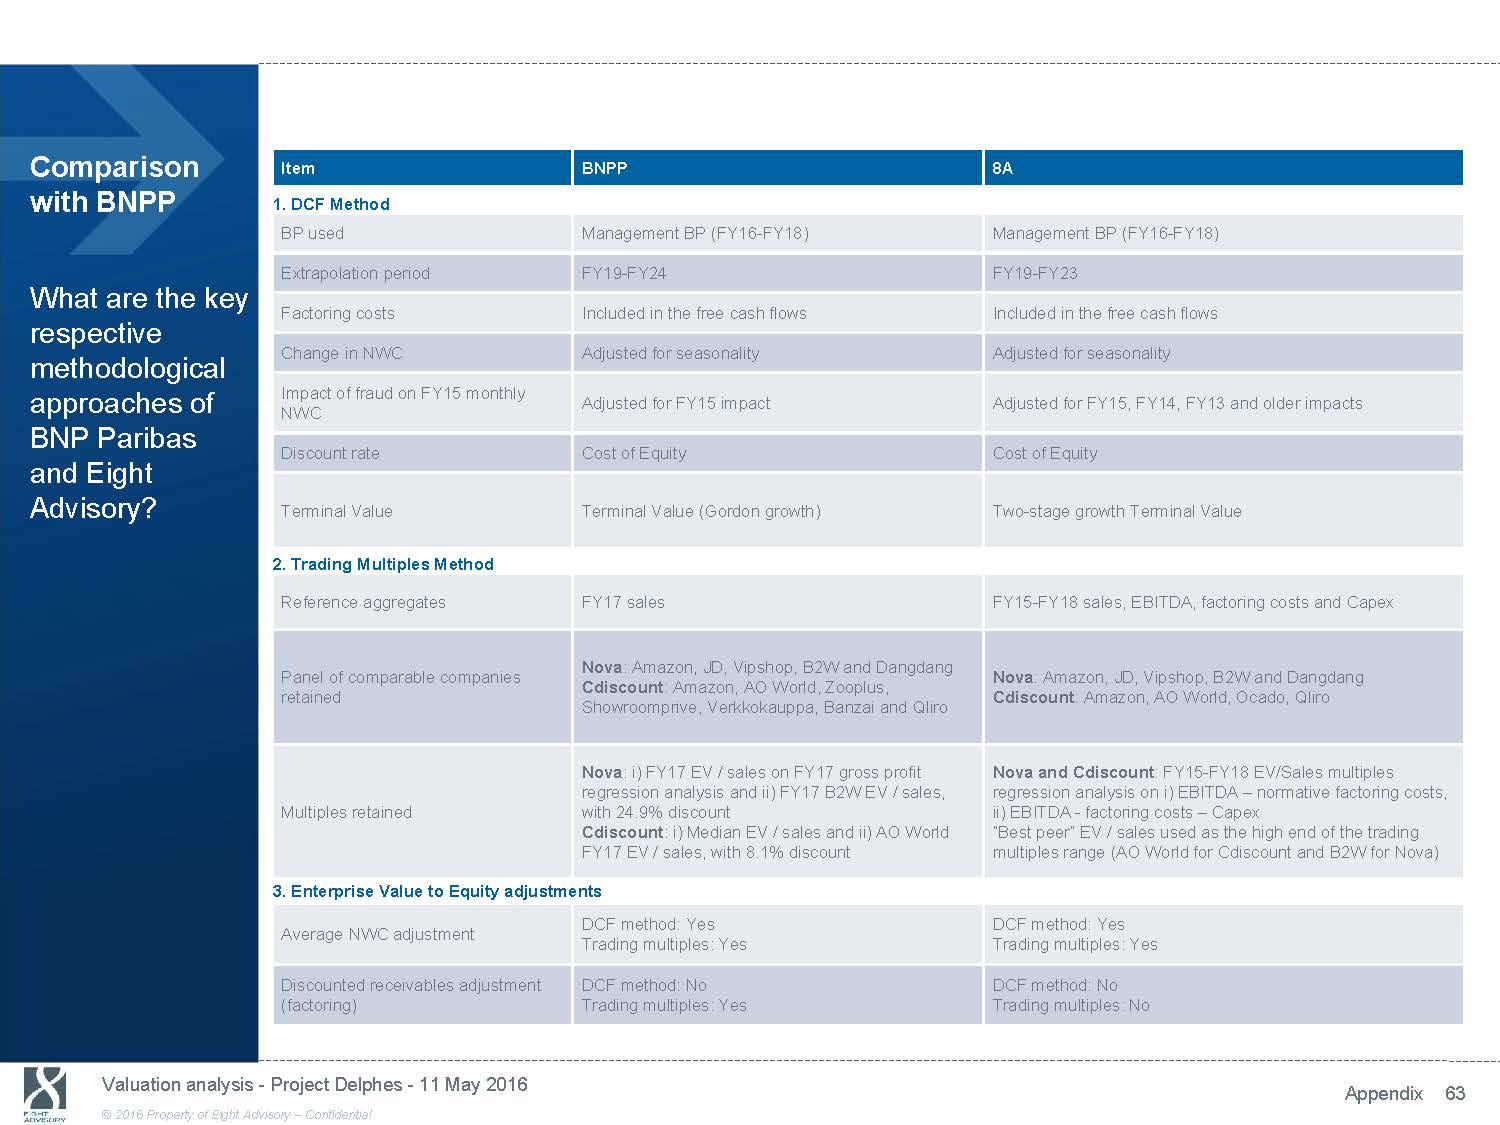
Comparison Item BNPP 8A with BNPP 1. DCF Method BP used Management BP (FY16 - FY18) Management BP (FY16 - FY18) What are the key respective methodological approaches of BNP Paribas and Eight Advisory? Extrapolation period Factoring costs Change in NWC Impact of fraud on FY15 monthly NWC Discount rate Terminal Value FY19 - FY24 Included in the free cash flows Adjusted for seasonality Adjusted for FY15 impact Cost of Equity Terminal Value (Gordon growth) FY19 - FY23 Included in the free cash flows Adjusted for seasonality Adjusted for FY15, FY14, FY13 and older impacts Cost of Equity Two - stage growth Terminal Value 2. Trading Multiples Method Reference aggregates FY17 sales FY15 - FY18 sales, EBITDA, factoring costs and Capex Panel of comparable companies retained Nova : Amazon, JD, Vipshop, B2W and Dangdang Cdiscount : Amazon, AO World, Zooplus, Showroomprive, Verkkokauppa, Banzai and Qliro Nova : Amazon, JD, Vipshop, B2W and Dangdang Cdiscount : Amazon, AO World, Ocado, Qliro Nova : i) FY17 EV / sales on FY17 gross profit regression analysis and ii) FY17 B2W EV / sales, Multiples retained with 24.9% discount Cdiscount : i) Median EV / sales and ii) AO World FY17 EV / sales, with 8.1% discount Nova and Cdiscount : FY15 - FY18 EV/Sales multiples regression analysis on i) EBITDA - normative factoring costs, ii) EBITDA - factoring costs - Capex “Best peer” EV / sales used as the high end of the trading multiples range (AO World for Cdiscount and B2W for Nova) 3. Enterprise Value to Equity adjustments Average NWC adjustment DCF method: Yes DCF method: Yes Trading multiples: Yes Trading multiples: Yes Discounted receivables adjustment DCF method: No DCF method: No (factoring) Trading multiples: Yes Trading multiples: No Valuation analysis - Project Delphes - 11 May 2016 Appendix 63 © 2016 Property of Eight Advisory - Confidential
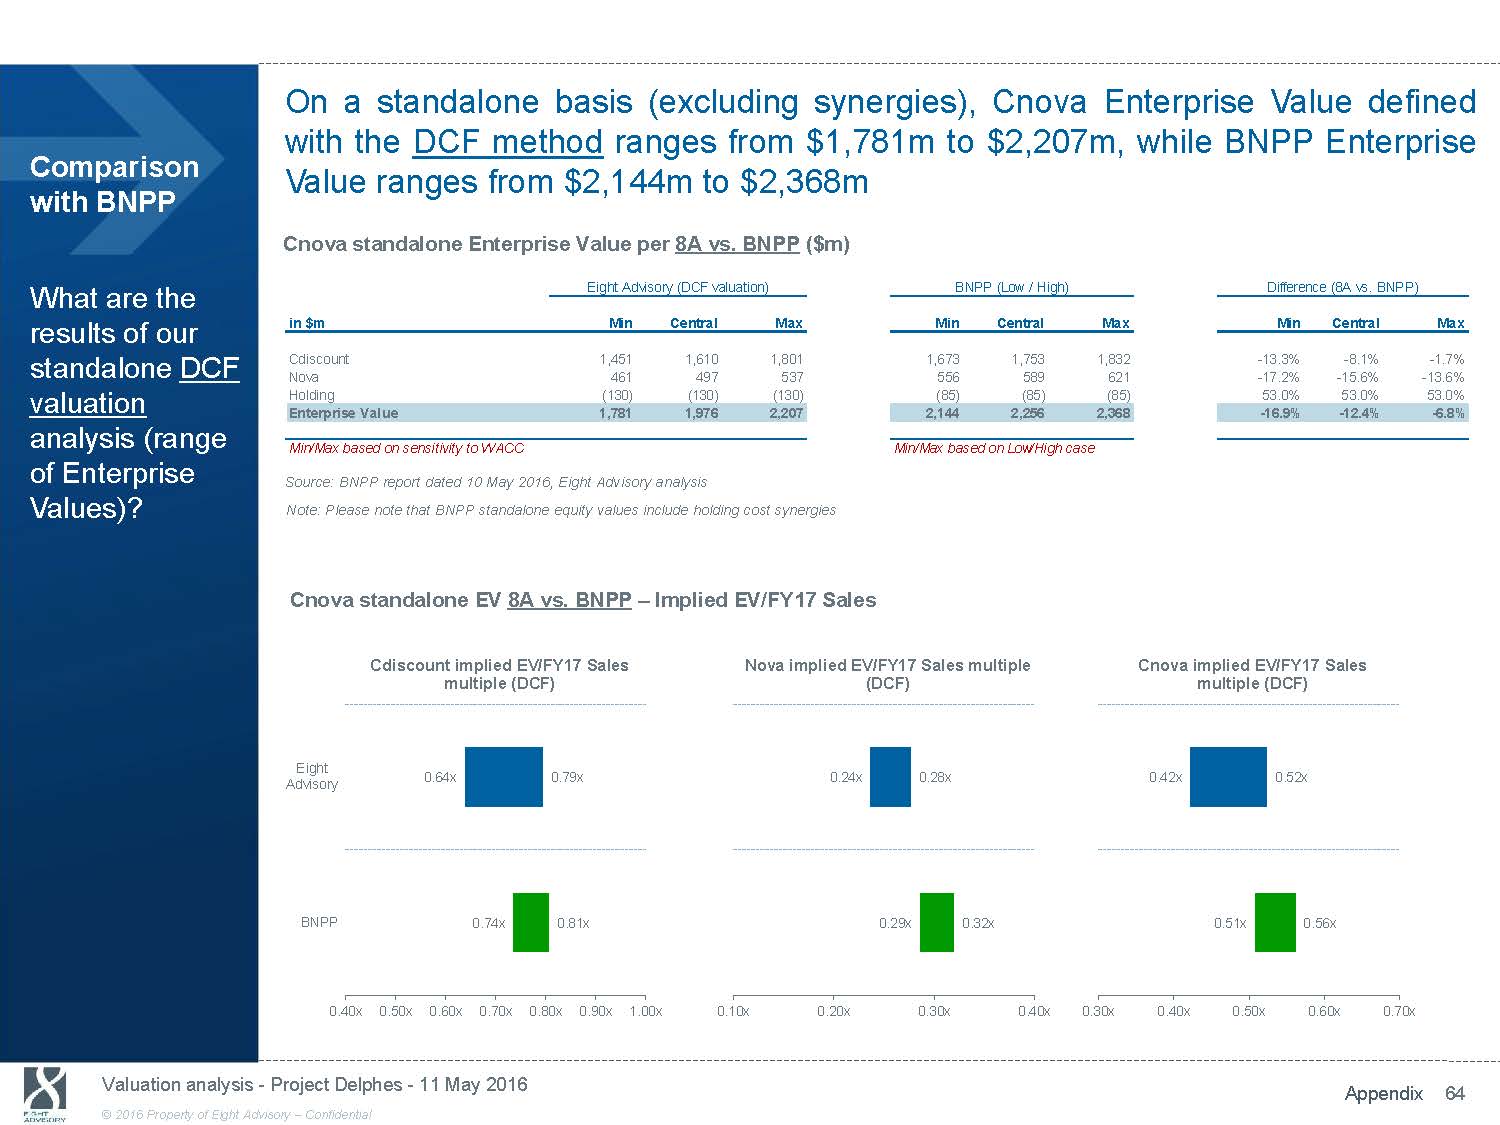
On a standalone basis (excluding synergies), Cnova Enterprise Value defined with the DCF method ranges from $1,781m to $2,207m, while BNPP Enterprise Comparison with BNPP What are the results of our standalone DCF valuation analysis (range of Enterprise Values)? Value ranges from $2,144m to $2,368m Cnova standalone Enterprise Value per 8A vs. BNPP ($m) Eight Advisory (DCF valuation) BNPP (Low / High) in $m Min Central Max Min Central Cdiscount 1,451 1,610 1,801 1,673 1,753 Nova 461 497 537 556 589 Holding (130) (130) (130) (85) (85) Enterprise Value 1,781 1,976 2,207 2,144 2,256 Min/Max based on sensitivity to WACC Min/Max based on Low/High case Source: BNPP report dated 10 May 2016, Eight Advisory analysis Note: Please note that BNPP standalone equity values include holding cost synergies Cnova standalone EV 8A vs. BNPP - Implied EV/FY17 Sales Cdiscount implied EV/FY17 Sales Nova implied EV/FY17 Sales multiple multiple (DCF) (DCF) Eight Difference (8A vs. BNPP) Max Min Central Max 1,832 - 13.3% - 8.1% - 1.7% 621 - 17.2% - 15.6% - 13.6% (85) 53.0% 53.0% 53.0% 2,368 - 16.9% - 12.4% - 6.8% Cnova implied EV/FY17 Sales multiple (DCF) Advisory BNPP 0.40x 0.50x 0.64x 0.79x 0.74x 0.81x 0.60x 0.70x 0.80x 0.90x 1.00x 0.24x 0.28x 0.29x 0.10x 0.20x 0.30x 0.42x 0.52x 0.32x 0.51x 0.56x 0.40x 0.30x 0.40x 0.50x 0.60x 0.70x Valuation analysis - Project Delphes - 11 May 2016 Appendix 64 © 2016 Property of Eight Advisory - Confidential
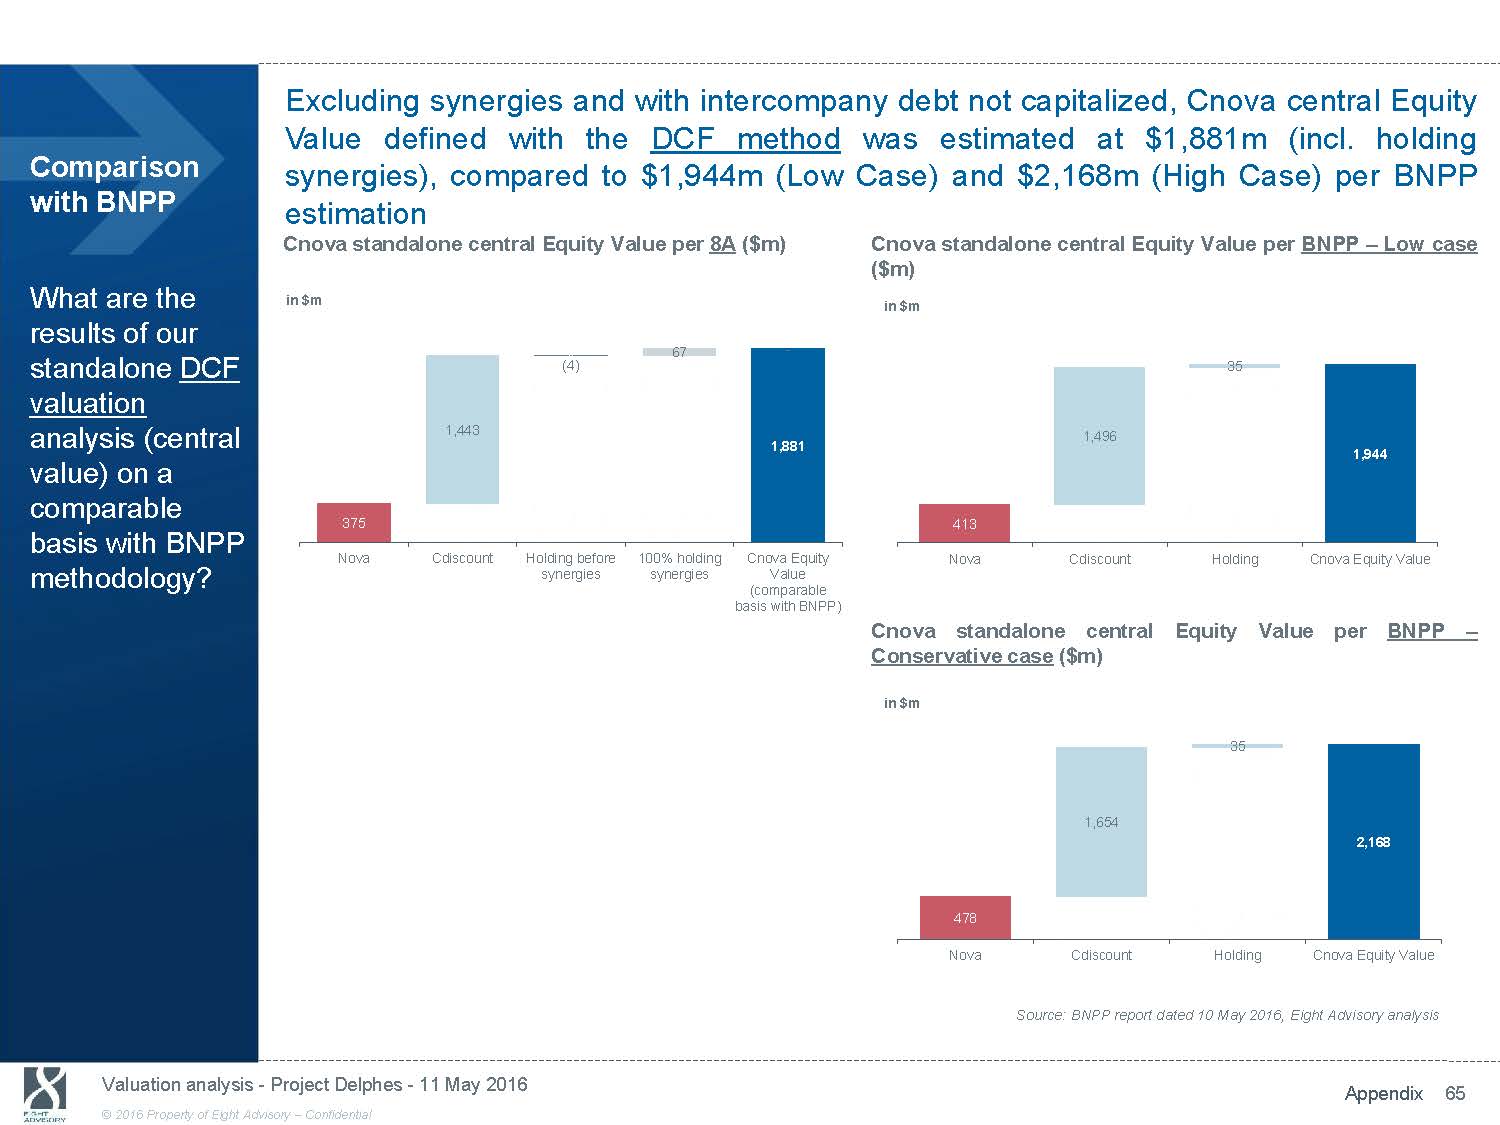
Excluding synergies and with intercompany debt not capitalized, Cnova central Equity Value defined with the DCF method Comparison was estimated at $1,881m (incl. holding synergies), compared to $1,944m (Low Case) and $2,168m (High Case) per BNPP with BNPP estimation Cnova standalone central Equity Value per 8A ($m) Cnova standalone central Equity Value per BNPP - Low case ($m) What are the results of our in $m 4 in $m 67 - standalone DCF valuation analysis (central value) on a comparable basis with BNPP methodology? (4) 1,443 375 Nova Cdiscount Holding before synergies 1,881 100% holding Cnova Equity synergies Value (comparable basis with BNPP) 1,496 413 Nova Cdiscount Cnova standalone central Conservative case ($m) in $m 1,654 478 3 - 5 1,944 Holding Cnova Equity Value Equity Value per BNPP - 35 - 2,168 Nova Cdiscount Holding Cnova Equity Value Source: BNPP report dated 10 May 2016, Eight Advisory analysis Valuation analysis - Project Delphes - 11 May 2016 Appendix 65 © 2016 Property of Eight Advisory - Confidential
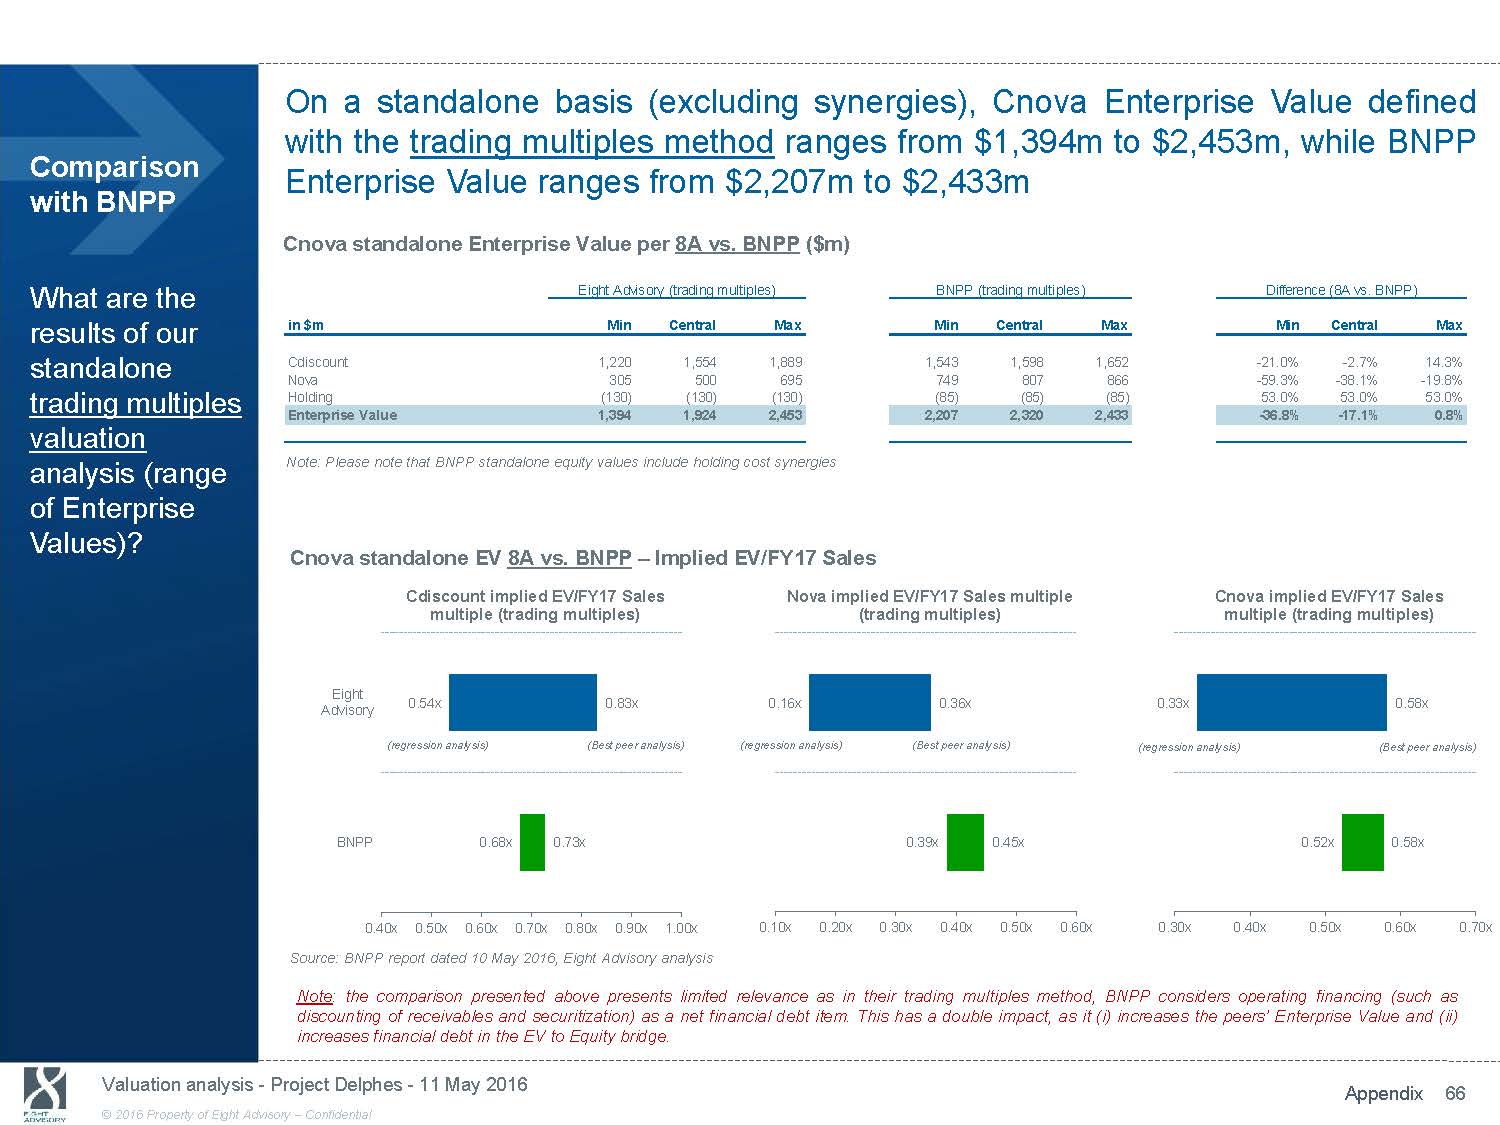
On a standalone basis (excluding synergies), Cnova Enterprise Value defined with the trading multiples method ranges from $1,394m to $2,453m, while BNPP Comparison with BNPP What are the results of our standalone trading multiples valuation analysis (range of Enterprise Values)? Enterprise Value ranges from $2,207m to $2,433m Cnova standalone Enterprise Value per 8A vs. BNPP ($m) Eight Advisory (trading multiples) BNPP (trading multiples) in $m Min Central Max Min Central Cdiscount 1,220 1,554 1,889 1,543 1,598 Nova 305 500 695 749 807 Holding (130) (130) (130) (85) (85) Enterprise Value 1,394 1,924 2,453 2,207 2,320 Note: Please note that BNPP standalone equity values include holding cost synergies Cnova standalone EV 8A vs. BNPP - Implied EV/FY17 Sales Cdiscount implied EV/FY17 Sales Nova implied EV/FY17 Sales multiple multiple (trading multiples) (trading multiples) Eight Difference (8A vs. BNPP) Max Min Central Max 1,652 - 21.0% - 2.7% 14.3% 866 - 59.3% - 38.1% - 19.8% (85) 53.0% 53.0% 53.0% 2,433 - 36.8% - 17.1% 0.8% Cnova implied EV/FY17 Sales multiple (trading multiples) Advisory BNPP 0.54x 0.83x (regression analysis) (Best peer analysis) 0.68x 0.73x 0.16x 0.36x (regression analysis) (Best peer analysis) 0.39x 0.45x 0.33x 0.58x (regression analysis) (Best peer analysis) 0.52x 0.58x 0.40x 0.50x 0.60x 0.70x 0.80x 0.90x 1.00x 0.10x 0.20x 0.30x 0.40x 0.50x 0.60x 0.30x 0.40x 0.50x 0.60x 0.70x Source: BNPP report dated 10 May 2016, Eight Advisory analysis Note: the comparison presented above presents limited relevance as in their trading multiples method, BNPP considers operatin g f inancing (such as discounting of receivables and securitization) as a net financial debt item. This has a double impact, as it (i) increases th e p eers’ Enterprise Value and (ii) increases financial debt in the EV to Equity bridge. Valuation analysis - Project Delphes - 11 May 2016 Appendix 66 © 2016 Property of Eight Advisory - Confidential
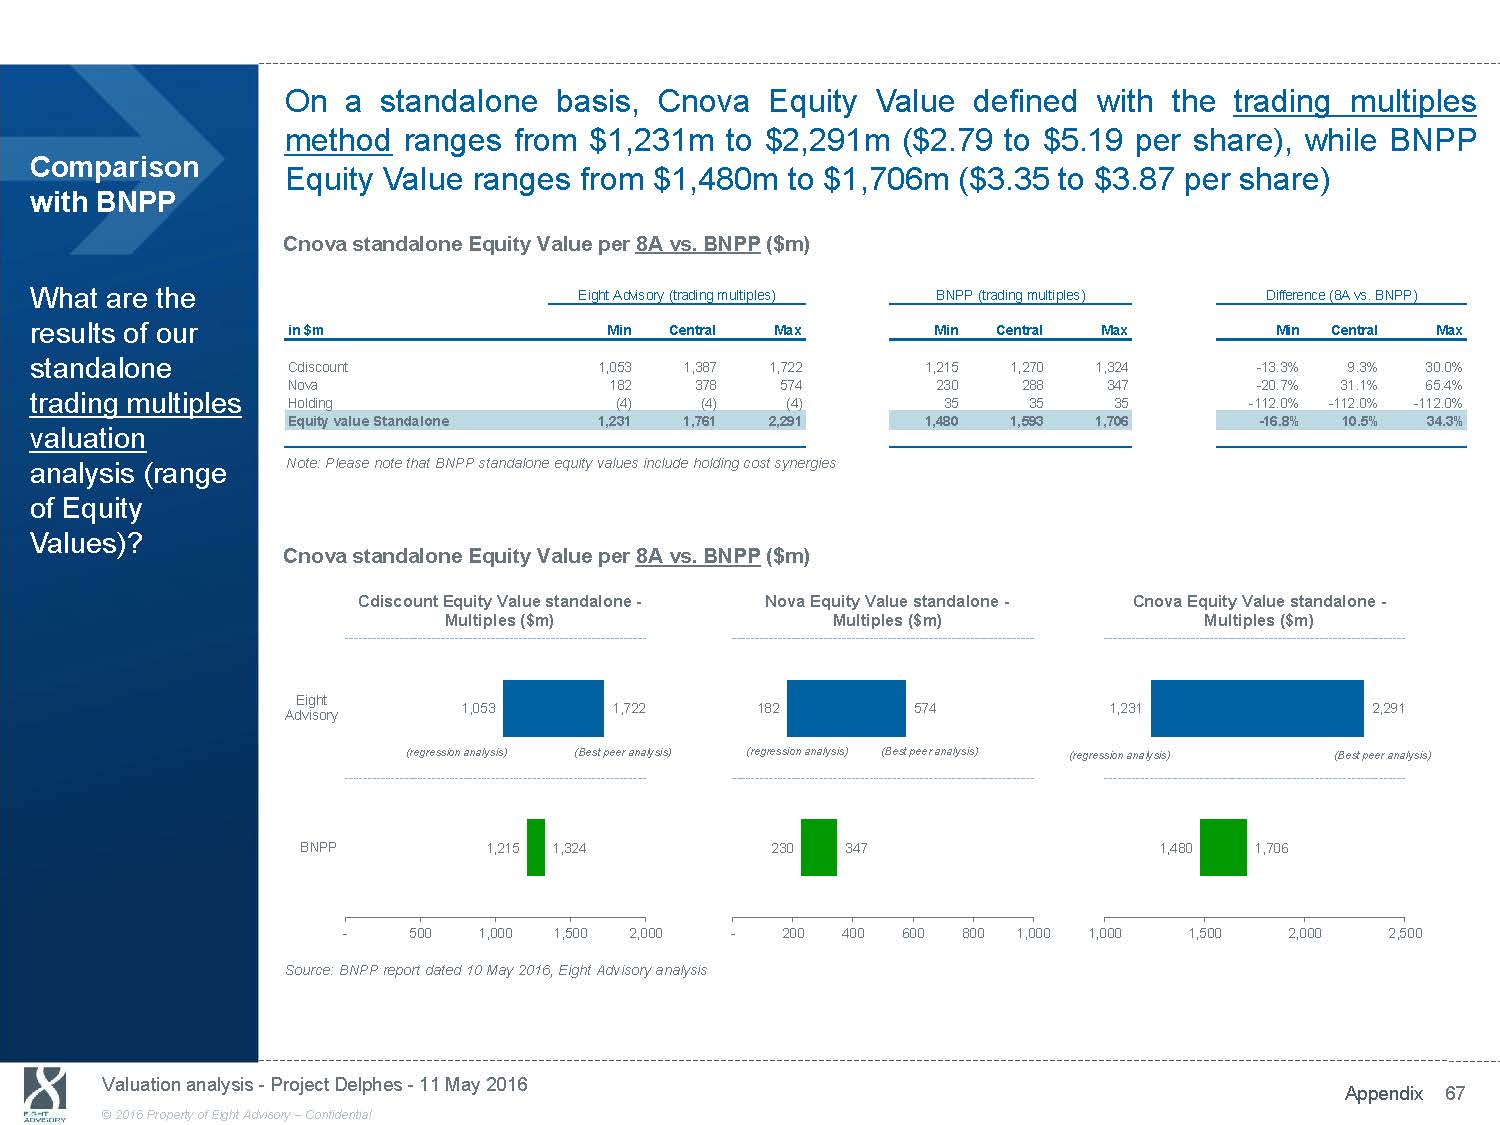
On a standalone basis, Cnova Equity Value defined with the trading multiples method ranges from $1,231m to $2,291m ($2.79 to $5.19 per share), while BNPP Comparison with BNPP Equity Value ranges from $1,480m to $1,706m ($3.35 to $3.87 per share) Cnova standalone Equity Value per 8A vs. BNPP ($m) What are the results of our standalone trading multiples valuation analysis (range of Equity Values)? Eight Advisory (trading multiples) BNPP (trading multiples) in $m Min Central Max Min Central Cdiscount 1,053 1,387 1,722 1,215 1,270 Nova 182 378 574 230 288 Holding (4) (4) (4) 35 35 Equity value Standalone 1,231 1,761 2,291 1,480 1,593 Note: Please note that BNPP standalone equity values include holding cost synergies Cnova standalone Equity Value per 8A vs. BNPP ($m) Cdiscount Equity Value standalone - Nova Equity Value standalone - Multiples ($m) Multiples ($m) Eight Difference (8A vs. BNPP) Max Min Central Max 1,324 - 13.3% 9.3% 30.0% 347 - 20.7% 31.1% 65.4% 35 - 112.0% - 112.0% - 112.0% 1,706 - 16.8% 10.5% 34.3% Cnova Equity Value standalone - Multiples ($m) Advisory BNPP - 1,053 1,722 (regression analysis) (Best peer analysis) 1,215 1,324 500 1,000 1,500 2,000 182 574 (regression analysis) (Best peer analysis) 230 347 - 200 400 600 800 1,231 2,291 (regression analysis) (Best peer analysis) 1,480 1,706 1,000 1,000 1,500 2,000 2,500 Source: BNPP report dated 10 May 2016, Eight Advisory analysis Valuation analysis - Project Delphes - 11 May 2016 Appendix 67 © 2016 Property of Eight Advisory - Confidential

The value for Cnova of the additional synergies (net of de - synergies) expected from Comparison with BNPP What are the results of our estimation of synergies? the Transaction ranges from $(12)m to $133m per per BNPP Synergies per 8A vs. BNPP ($m) Eight Advisory in $m Min Central Max 100% operating synergies (VV & Nova) 262 262 262 o/w 100% operating synergies (Nova part) 205 205 205 ( - ) Part "kept" by NewCo (205) (125) (45) Nova synergies paid to Cnova - 80 160 100% Nova NOLs de - synergies (23) (23) (23) ( - ) Part borne by NewCo 23 14 5 Nova NOLs de - synergies borne by Cnov - (9) (18) 100% Tax de - synergies (6) (6) (6) ( - ) Part borne by NewCo - 1 1 Tax de - synergies borne by Cnova (6) (5) (5) 100% Transaction costs (6) (6) (6) ( - ) Part borne by NewCo - 1 1 Transaction costs borne by Cnova (6) (5) (4) Additional synergies (12) 60 133 Min/Max based on % of synergies paid to Cnova Source: BNPP report dated 10 May 2016, Eight Advisory analysis Eight Advisory in $m Min Central Max 100% Holding costs synergies 67 67 67 ( - ) Part paid to NewCo - (7) (15) Holding synergies (Cnova) 67 60 52 Holding synergies 67 60 52 Key findings 8A, compared to $28m to $56m Additional synergies BNPP BNPP In $m Min Central Max Additional synergies 28 39 56 Source: BNPP MoU indicative terms analysis and synergies analysis Amounts derived from BNPP synergies valuation and rules regarding completion(from50% to 100%) as well as Nova share (50%). ᇄ Synergies per 8A include Holding synergies (vs. captured in the standalone value per BNPP) ᇄ Synergies per 8A include NOLs and Tax de - synergies (vs. not considered by BNPP) ᇄ Operating synergies (Nova & VV) estimated at $262m per 8A vs. ranging from $101m to $201m (“completion” adjustment between 50% and 100%) per BNPP Valuation analysis - Project Delphes - 11 May 2016 Appendix 68 © 2016 Property of Eight Advisory - Confidential

Regarding the “Best peer” approach on Nova, B2W EV/FY17 sales multiple estimated by BNPP stands at 0.60x, while it stands at 0.40x per 8A estimation. This Comparison with BNPP What are the gap is mainly explained by a methodological difference in the way operating financing (discounting, securitization) is factored in the analysis. Application of the “Best peer” approach for Nova per Application of the “Best peer” approach for Nova 8A vs. BNPP (in R$m) per8A vs. BNPP (in R$m) Nova (in R$m) main methodological differences between 8A and BNPP when applying the “Best peer” (B2W) approach in the trading multiples method for Nova? 8A per BNPP Application of B2W multiple to Nova BNPP methodology 8A methodology Market capitalization* 3,467 3,467 3,467 (+) Net debt items excl. discounted receivables* 1,862 1,127 1,127 (+) Discounted receivables as of 31.03.2016 1,569 1,569 - Enterprise Value* 6,897 6,162 4,594 FY17 net sales forecast* 11,570 11,995 11,995 ( - ) Boleto n.a. n.a. (409) FY17 net sales adjusted 11,570 11,995 11,586 Implied EV/FY17 sales multiple 0.60x 0.51x 0.40x Nova FY17 net sales 6,870 6,870 6,870 Nova Enterprise Value 4,095 3,529 2,724 ( - ) Profitability discount (24.9)% (24.9)% - Nova adjusted Enterprise Value 3,075 2,650 2,724 ( - ) Net financial debt 983 977 977 ( - ) NWC seasonality adjustment (556) (556) (951) ( - ) Discounted receivables (1,792) (1,311) - ( - ) Intragroup loan (446) (446) (446) ( - ) Other net debt items (29) (11) (11) ( - ) FCF differential adjustment n.a. n.a. (350) Nova Equity Value 1,234 1,304 1,943 Note: items mark ed with an * in BNPP methodology were extrapolated based on available information for 8A Source: Bloomberg as at 6 May 2016, BNPP report dated 10 May 2016, Eight Advisory analysis ᇄ Main differences between 8A and BNPP: Difference in Net financial debt excluding discounted receivables, BNPP considers operating financing items (such as discounting of receivables) as a net financial debt item, which: Increases the EV/sales multiple estimated for B2W, Increases Nova net financial debt in the EV to Equity bridge. BNPP applies a 24.9% discount to account for Nova’s lower profitability compared to B2W’s, NWC seasonality adjustment lower per BNPP, after reinstatement of discounted receivables in the NWC(cf. treatment of discounted receivables as a net financial debt item). Amount of discounted receivables estimated as of31.12.2015and reinstated in Nova’s financial debt higher per BNPP: alternative computation approach Free cash flow differential adjustment per 8A to account for Nova’s lower recovery pace compared to B2W’s. Valuation analysis - Project Delphes - 11 May 2016 Appendix 69 © 2016 Property of Eight Advisory - Confidential
Appendix 4: DCF key assumptions Appendix
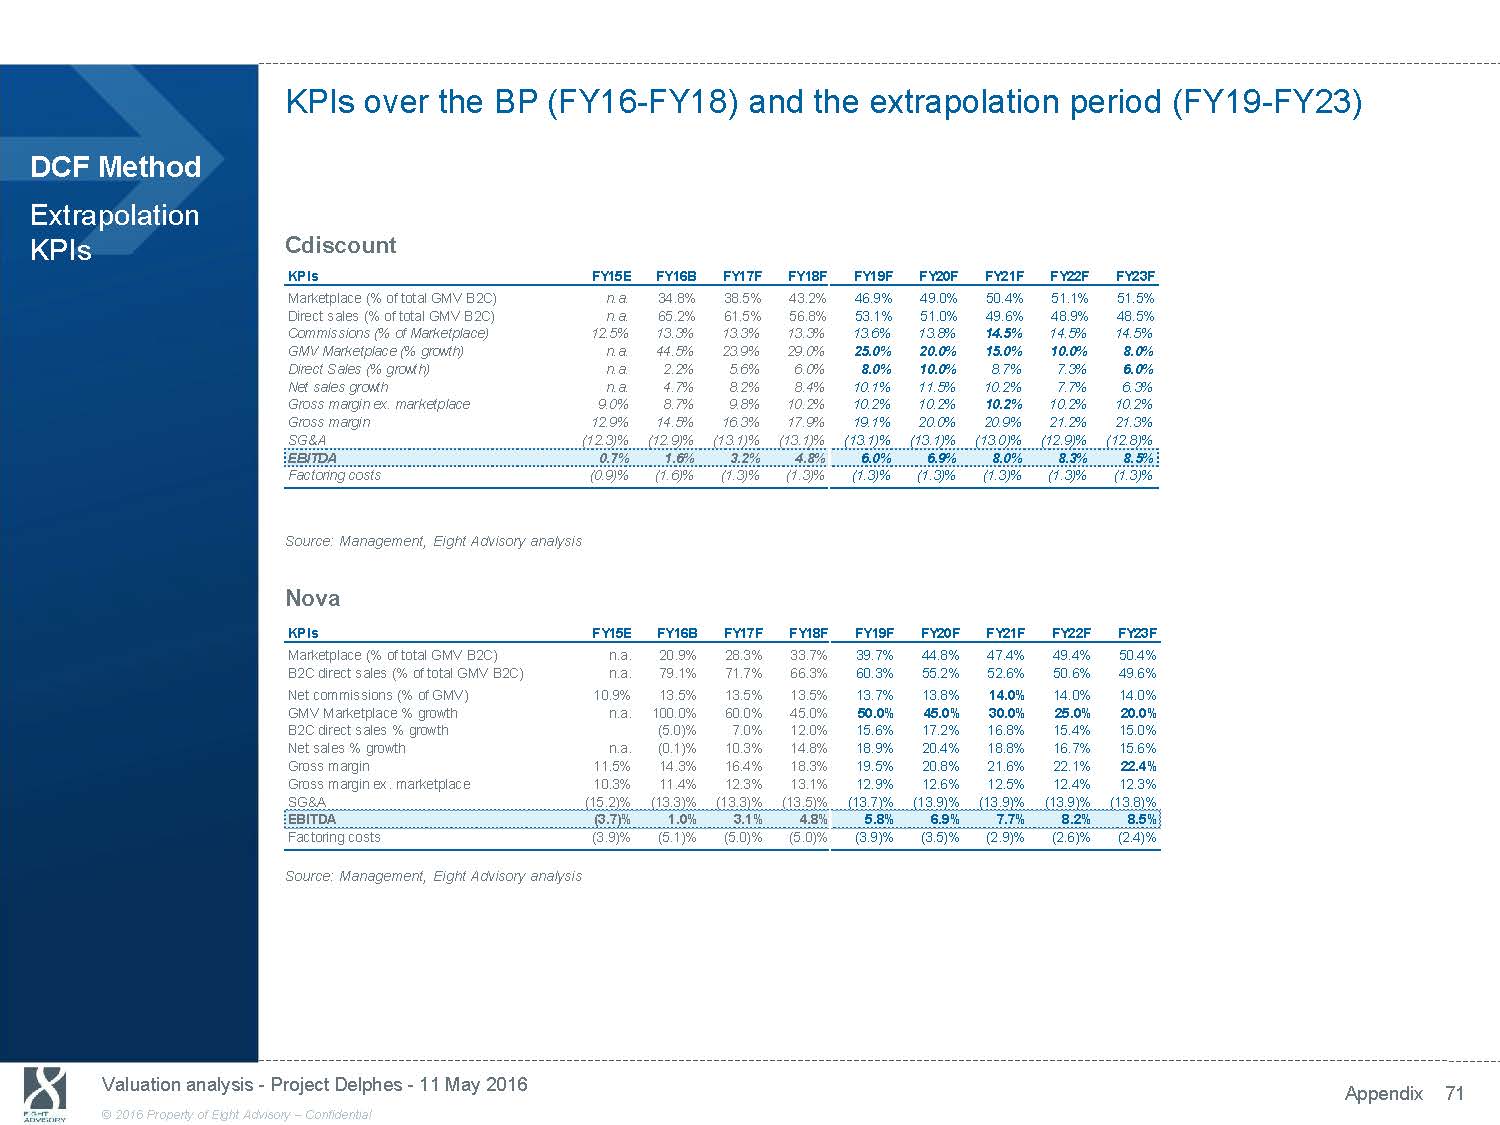
KPIs over the BP (FY16 - FY18) and the extrapolation period (FY19 - FY23) DCF Method Extrapolation KPIs Cdiscount KPIs FY15E FY16B FY17F FY18F FY19F FY20F FY21F FY22F FY23F Marketplace (% of total GMV B2C) n.a. 34.8% 38.5% 43.2% 46.9% 49.0% 50.4% 51.1% 51.5% Direct sales (% of total GMV B2C) n.a. 65.2% 61.5% 56.8% 53.1% 51.0% 49.6% 48.9% 48.5% Commissions (% of Mark etplace) 12.5% 13.3% 13.3% 13.3% 13.6% 13.8% 14.5% 14.5% 14.5% GMV Mark etplace (% growth) n.a. 44.5% 23.9% 29.0% 25.0% 20.0% 15.0% 10.0% 8.0% Direct Sales (% growth) n.a. 2.2% 5.6% 6.0% 8.0% 10.0% 8.7% 7.3% 6.0% Net sales growth n.a. 4.7% 8.2% 8.4% 10.1% 11.5% 10.2% 7.7% 6.3% Gross margin ex. mark etplace 9.0% 8.7% 9.8% 10.2% 10.2% 10.2% 10.2% 10.2% 10.2% Gross margin 12.9% 14.5% 16.3% 17.9% 19.1% 20.0% 20.9% 21.2% 21.3% SG&A (12.3)% (12.9)% (13.1)% (13.1)% (13.1)% (13.1)% (13.0)% (12.9)% (12.8)% EBITDA 0.7% 1.6% 3.2% 4.8% 6.0% 6.9% 8.0% 8.3% 8.5% Factoring costs (0.9)% (1.6)% (1.3)% (1.3)% (1.3)% (1.3)% (1.3)% (1.3)% (1.3)% Source: Management, Eight Advisory analysis Nova KPIs FY15E FY16B FY17F FY18F FY19F FY20F FY21F FY22F FY23F Marketplace (% of total GMV B2C) n.a. 20.9% 28.3% 33.7% 39.7% 44.8% 47.4% 49.4% 50.4% B2C direct sales (% of total GMV B2C) n.a. 79.1% 71.7% 66.3% 60.3% 55.2% 52.6% 50.6% 49.6% Net commissions (% of GMV) 10.9% 13.5% 13.5% 13.5% 13.7% 13.8% 14.0% 14.0% 14.0% GMV Marketplace % growth n.a. 100.0% 60.0% 45.0% 50.0% 45.0% 30.0% 25.0% 20.0% B2C direct sales % growth (5.0)% 7.0% 12.0% 15.6% 17.2% 16.8% 15.4% 15.0% Net sales % growth n.a. (0.1)% 10.3% 14.8% 18.9% 20.4% 18.8% 16.7% 15.6% Gross margin 11.5% 14.3% 16.4% 18.3% 19.5% 20.8% 21.6% 22.1% 22.4% Gross margin ex. marketplace 10.3% 11.4% 12.3% 13.1% 12.9% 12.6% 12.5% 12.4% 12.3% SG&A (15.2)% (13.3)% (13.3)% (13.5)% (13.7)% (13.9)% (13.9)% (13.9)% (13.8)% EBITDA (3.7)% 1.0% 3.1% 4.8% 5.8% 6.9% 7.7% 8.2% 8.5% Factoring costs (3.9)% (5.1)% (5.0)% (5.0)% (3.9)% (3.5)% (2.9)% (2.6)% (2.4)% Source: Management, Eight Advisory analysis Valuation analysis - Project Delphes - 11 May 2016 Appendix 71 © 2016 Property of Eight Advisory - Confidential
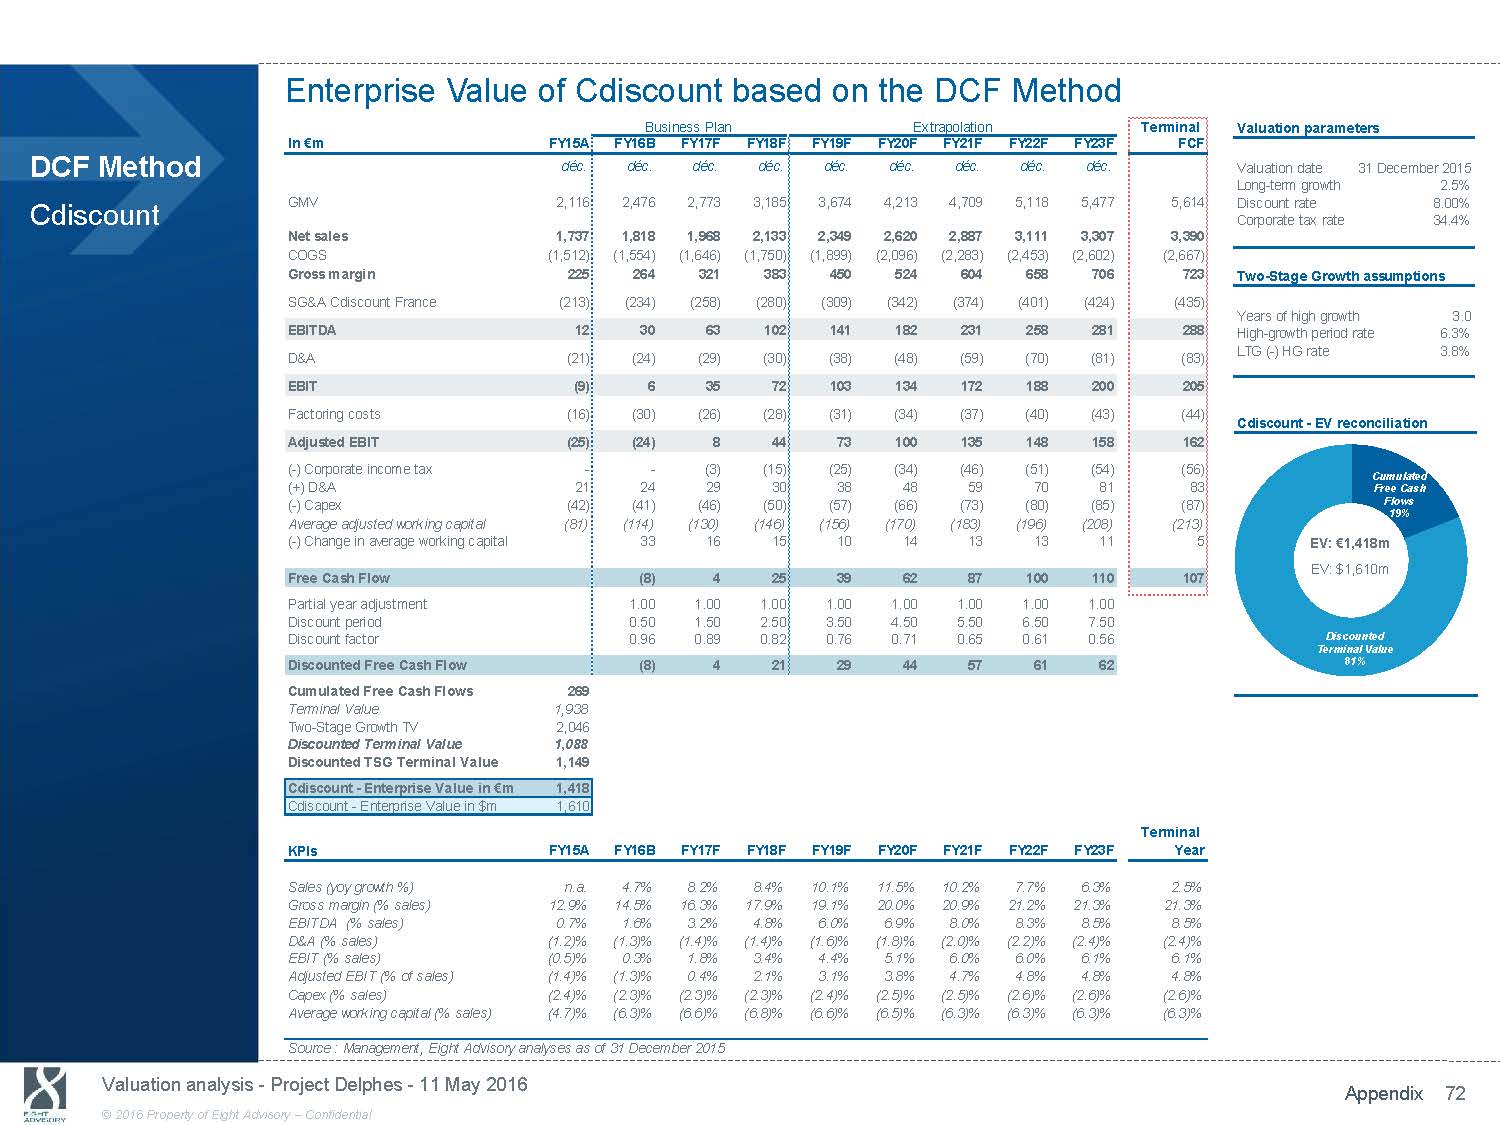
Enterprise Value of Cdiscount based on the DCF Method Business Plan Extrapolation Terminal Valuation parameters DCF Method Cdiscount In € m GMV Net sales COGS Gross margin SG&A Cdiscount France EBITDA D&A EBIT Factoring costs Adjusted EBIT ( - ) Corporate income tax (+) D&A ( - ) Capex Average adjusted work ing capital ( - ) Change in average working capital Free Cash Flow Partial year adjustment Discount period Discount factor Discounted Free Cash Flow Cumulated Free Cash Flows Terminal Value Two - Stage Growth TV Discounted Terminal Value Discounted TSG Terminal Value Cdiscount - Enterprise Value in € m Cdiscount - Enterprise Value in $m KPIs FY15A FY16B FY17F FY18F déc. déc. déc. déc. 2,116 2,476 2,773 3,185 1,737 1,818 1,968 2,133 (1,512) (1,554) (1,646) (1,750) 225 264 321 383 (213) (234) (258) (280) 12 30 63 102 (21) (24) (29) (30) (9) 6 35 72 (16) (30) (26) (28) (25) (24) 8 44 - - (3) (15) 21 24 29 30 (42) (41) (46) (50) (81) (114) (130) (146) 33 16 15 (8) 4 25 1.00 1.00 1.00 0.50 1.50 2.50 0.96 0.89 0.82 (8) 4 21 269 1,938 2,046 1,088 1,149 1,418 1,610 FY15A FY16B FY17F FY18F FY19F FY20F FY21F FY22F FY23F FCF déc. déc. déc. déc. déc. 3,674 4,213 4,709 5,118 5,477 5,614 2,349 2,620 2,887 3,111 3,307 3,390 (1,899) (2,096) (2,283) (2,453) (2,602) (2,667) 450 524 604 658 706 723 (309) (342) (374) (401) (424) (435) 141 182 231 258 281 288 (38) (48) (59) (70) (81) (83) 103 134 172 188 200 205 (31) (34) (37) (40) (43) (44) 73 100 135 148 158 162 (25) (34) (46) (51) (54) (56) 38 48 59 70 81 83 (57) (66) (73) (80) (85) (87) (156) (170) (183) (196) (208) (213) 10 14 13 13 11 5 39 62 87 100 110 107 1.00 1.00 1.00 1.00 1.00 3.50 4.50 5.50 6.50 7.50 0.76 0.71 0.65 0.61 0.56 29 44 57 61 62 Terminal FY19F FY20F FY21F FY22F FY23F Year Valuation date 31 December 2015 Long - term growth 2.5% Discount rate 8.00% Corporate tax rate 34.4% Two - Stage Growth assumptions Years of high growth 3.0 High - growth period rate 6.3% LTG ( - ) HG rate 3.8% Cdiscount - EV reconciliation Cumulated Free Cash Flows 19% EV: € 1,418m EV: $1,610m Discounted Terminal Value 81% Sales (yoy growth %) n.a. 4.7% 8.2% 8.4% 10.1% 11.5% 10.2% 7.7% 6.3% 2.5% Gross margin (% sales) 12.9% 14.5% 16.3% 17.9% 19.1% 20.0% 20.9% 21.2% 21.3% 21.3% EBITDA (% sales) 0.7% 1.6% 3.2% 4.8% 6.0% 6.9% 8.0% 8.3% 8.5% 8.5% D&A (% sales) (1.2)% (1.3)% (1.4)% (1.4)% (1.6)% (1.8)% (2.0)% (2.2)% (2.4)% (2.4)% EBIT (% sales) (0.5)% 0.3% 1.8% 3.4% 4.4% 5.1% 6.0% 6.0% 6.1% 6.1% Adjusted EBIT (% of sales) (1.4)% (1.3)% 0.4% 2.1% 3.1% 3.8% 4.7% 4.8% 4.8% 4.8% Capex (% sales) (2.4)% (2.3)% (2.3)% (2.3)% (2.4)% (2.5)% (2.5)% (2.6)% (2.6)% (2.6)% Average work ing capital (% sales) (4.7)% (6.3)% (6.6)% (6.8)% (6.6)% (6.5)% (6.3)% (6.3)% (6.3)% (6.3)% Source : Management, Eight Advisory analyses as of 31 December 2015 Valuation analysis - Project Delphes - 11 May 2016 Appendix 72 © 2016 Property of Eight Advisory - Confidential

Enterprise Value of Nova based on the DCF Method Business Plan Extrapolation Terminal Valuation parameters DCF Method Nova In R$m GMV Gross sales Net sales COGS Gross margin SG&A Nova EBITDA D&A EBIT Factoring costs Adjusted EBIT ( - ) Corporate income tax (+) D&A ( - ) Capex Average work ing capital ( - ) Change in average working capital (+) Change in PIS/COFINS receivables Free Cash Flow Partial year adjustment Discount period Discount factor Discounted Free Cash Flow Cumulated Free Cash Flows Terminal Value Two - Stage Growth TV Discounted Terminal Value Discounted TSG TV Nova - Enterprise Value in R$m Nova - Enterprise Value in $m KPIs FY15A FY16B FY17F FY18F déc. déc. déc. déc. n.a. 8,649 10,174 12,295 n.a. 7,371 8,129 9,330 6,126 6,228 6,870 7,886 (5,615) (5,337) (5,742) (6,443) 511 891 1,128 1,443 (886) (830) (917) (1,066) (375) 61 211 377 (52) (55) (56) (61) (427) 7 155 316 (242) (316) (340) (397) (669) (309) (185) (81) n.a. - - - n.a. 55 56 61 n.a. (89) (112) (135) (745) (711) (707) (713) (34) (4) 6 100 14 - (277) (231) (149) 1.00 1.00 1.00 0.50 1.50 2.50 0.92 0.78 0.66 (256) (181) (99) 125 4,879 5,558 1,432 1,631 1,756 497 FY15A FY16B FY17F FY18F FY19F FY20F FY21F FY22F FY23F FCF déc. déc. déc. déc. déc. 15,526 19,762 24,181 28,914 33,868 35,816 11,088 13,343 15,854 18,505 21,378 22,607 9,374 11,285 13,411 15,657 18,092 19,132 (7,543) (8,940) (10,518) (12,195) (14,045) (14,853) 1,832 2,345 2,893 3,461 4,047 4,279 (1,287) (1,568) (1,865) (2,177) (2,503) (2,647) 544 777 1,028 1,284 1,544 1,632 (92) (135) (188) (253) (330) (349) 452 642 840 1,031 1,213 1,283 (365) (394) (390) (415) (428) (453) 87 248 449 617 785 830 (30) (84) (153) (210) (267) (282) 92 135 188 253 330 349 (171) (217) (266) (318) (373) (394) (815) (943) (1,092) (1,251) (1,432) (1,514) 102 127 149 159 181 82 - - - - - - 81 209 368 501 657 586 1.00 1.00 1.00 1.00 1.00 3.50 4.50 5.50 6.50 7.50 0.56 0.48 0.41 0.35 0.29 46 100 150 173 193 FY19F FY20F FY21F FY22F FY23F TY Valuation date 31 December 2015 Long - term growth 5.8% Discount rate 17.8% Corporate tax rate 34.0% Two - Stage Growth assumptions Years of high growth 3.0 High - growth period rate 15.6% LTG ( - ) HG rate 9.8% Nova - EV reconciliation Cumulated Free Cash Flows 7% EV: R$1,756m EV: $497m Discounted Terminal Value 93% Sales (yoy growth %) n.a. 1.7% 10.3% 14.8% 18.9% 20.4% 18.8% 16.7% 15.6% 5.8% Gross margin (% sales) 8.3% 14.3% 16.4% 18.3% 19.5% 20.8% 21.6% 22.1% 22.4% 22.4% EBITDA (% sales) (6.1)% 1.0% 3.1% 4.8% 5.8% 6.9% 7.7% 8.2% 8.5% 8.5% D&A (% sales) n.a. (0.9)% (0.8)% (0.8)% (1.0)% (1.2)% (1.4)% (1.6)% (1.8)% (1.8)% EBIT (% sales) (7.0)% 0.1% 2.3% 4.0% 4.8% 5.7% 6.3% 6.6% 6.7% 6.7% Adjusted EBIT (% of sales) (10.9)% (5.0)% (2.7)% (1.0)% 0.9% 2.2% 3.3% 3.9% 4.3% 4.3% Capex (% sales) n.a. (1.4)% (1.6)% (1.7)% (1.8)% (1.9)% (2.0)% (2.0)% (2.1)% (2.1)% Work ing capital (% sales) (12.2)% (11.4)% (10.3)% (9.0)% (8.7)% (8.4)% (8.1)% (8.0)% (7.9)% (7.9)% Source : Eight Advisory analyses as of 31 December 2015 Valuation analysis - Project Delphes - 11 May 2016 Appendix 73 © 2016 Property of Eight Advisory - Confidential

Appendix 5: Discount Rates Appendix
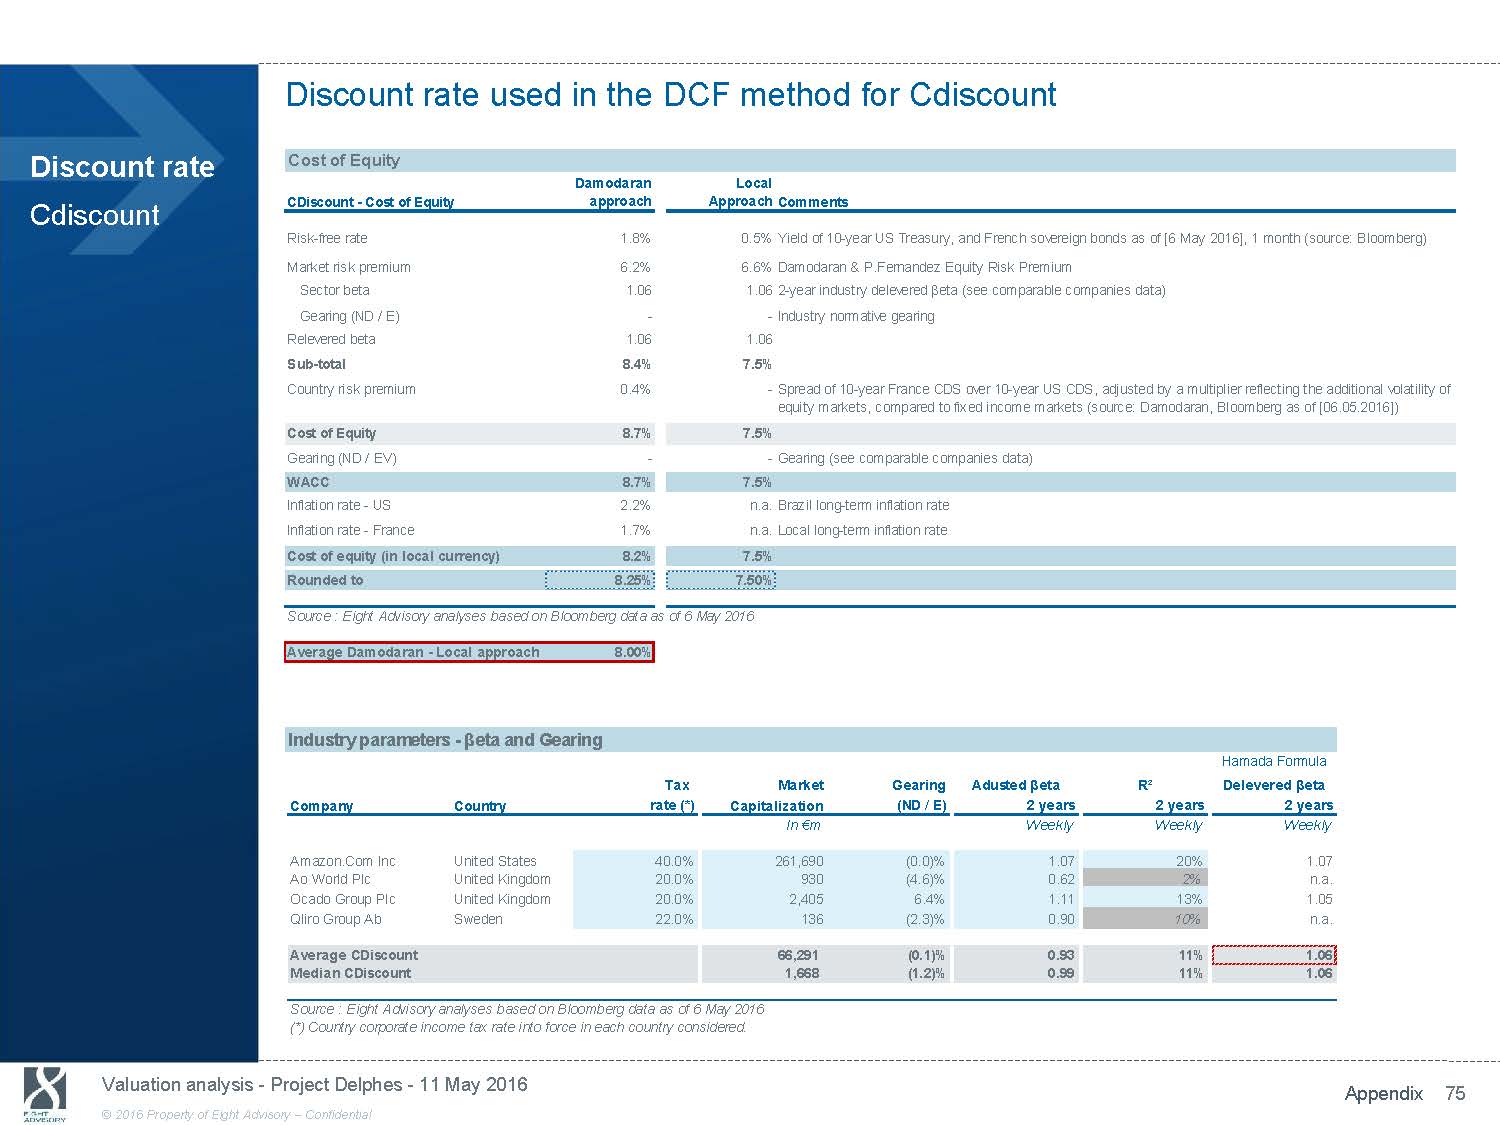
Discount rate used in the DCF method for Cdiscount Discount rate Cdiscount Damodaran CDiscount - Cost of Equity approach Risk - free rate 1.8% Market risk premium 6.2% Sector beta 1.06 Gearing (ND / E) - Relevered beta 1.06 Sub - total 8.4% Country risk premium 0.4% Cost of Equity 8.7% Gearing (ND / EV) - WACC 8.7% Inflation rate - US 2.2% Inflation rate - France 1.7% Cost of equity (in local currency) 8.2% Rounded to 8.25% Local Approach Comments 0.5% Yield of 10 - year US Treasury, and French sovereign bonds as of [6 May 2016], 1 month (source: Bloomberg) 6.6% Damodaran & P.Fernandez Equity Risk Premium 1.06 2 - year industry delevered βeta (see comparable companies data) - Industry normative gearing 1.06 7.5% - Spread of 10 - year France CDS over 10 - year US CDS, adjusted by a multiplier reflecting the additional volatility of equity markets, compared to fixed income markets (source: Damodaran, Bloomberg as of [06.05.2016]) 7.5% - Gearing (see comparable companies data) 7.5% n.a. Brazil long - term inflation rate n.a. Local long - term inflation rate 7.5% 7.50% Source : Eight Advisory analyses based on Bloomberg data as of 6 May 2016 Average Damodaran - Local approach 8.00% Hamada Formula Tax Market Gearing Adusted βeta R² Delevered βeta Company Country rate (*) Capitalization (ND / E) 2 years 2 years 2 years In € m Week ly Week ly Week ly Amazon.Com Inc United States 40.0% 261,690 (0.0)% 1.07 20% 1.07 Ao World Plc United Kingdom 20.0% 930 (4.6)% 0.62 2% n.a. Ocado Group Plc United Kingdom 20.0% 2,405 6.4% 1.11 13% 1.05 Qliro Group Ab Sweden 22.0% 136 (2.3)% 0.90 10% n.a. Average CDiscount 66,291 (0.1)% 0.93 11% 1.06 Median CDiscount 1,668 (1.2)% 0.99 11% 1.06 Source : Eight Advisory analyses based on Bloomberg data as of 6 May 2016 (*) Country corporate income tax rate into force in each country considered. Valuation analysis - Project Delphes - 11 May 2016 Appendix 75 © 2016 Property of Eight Advisory - Confidential
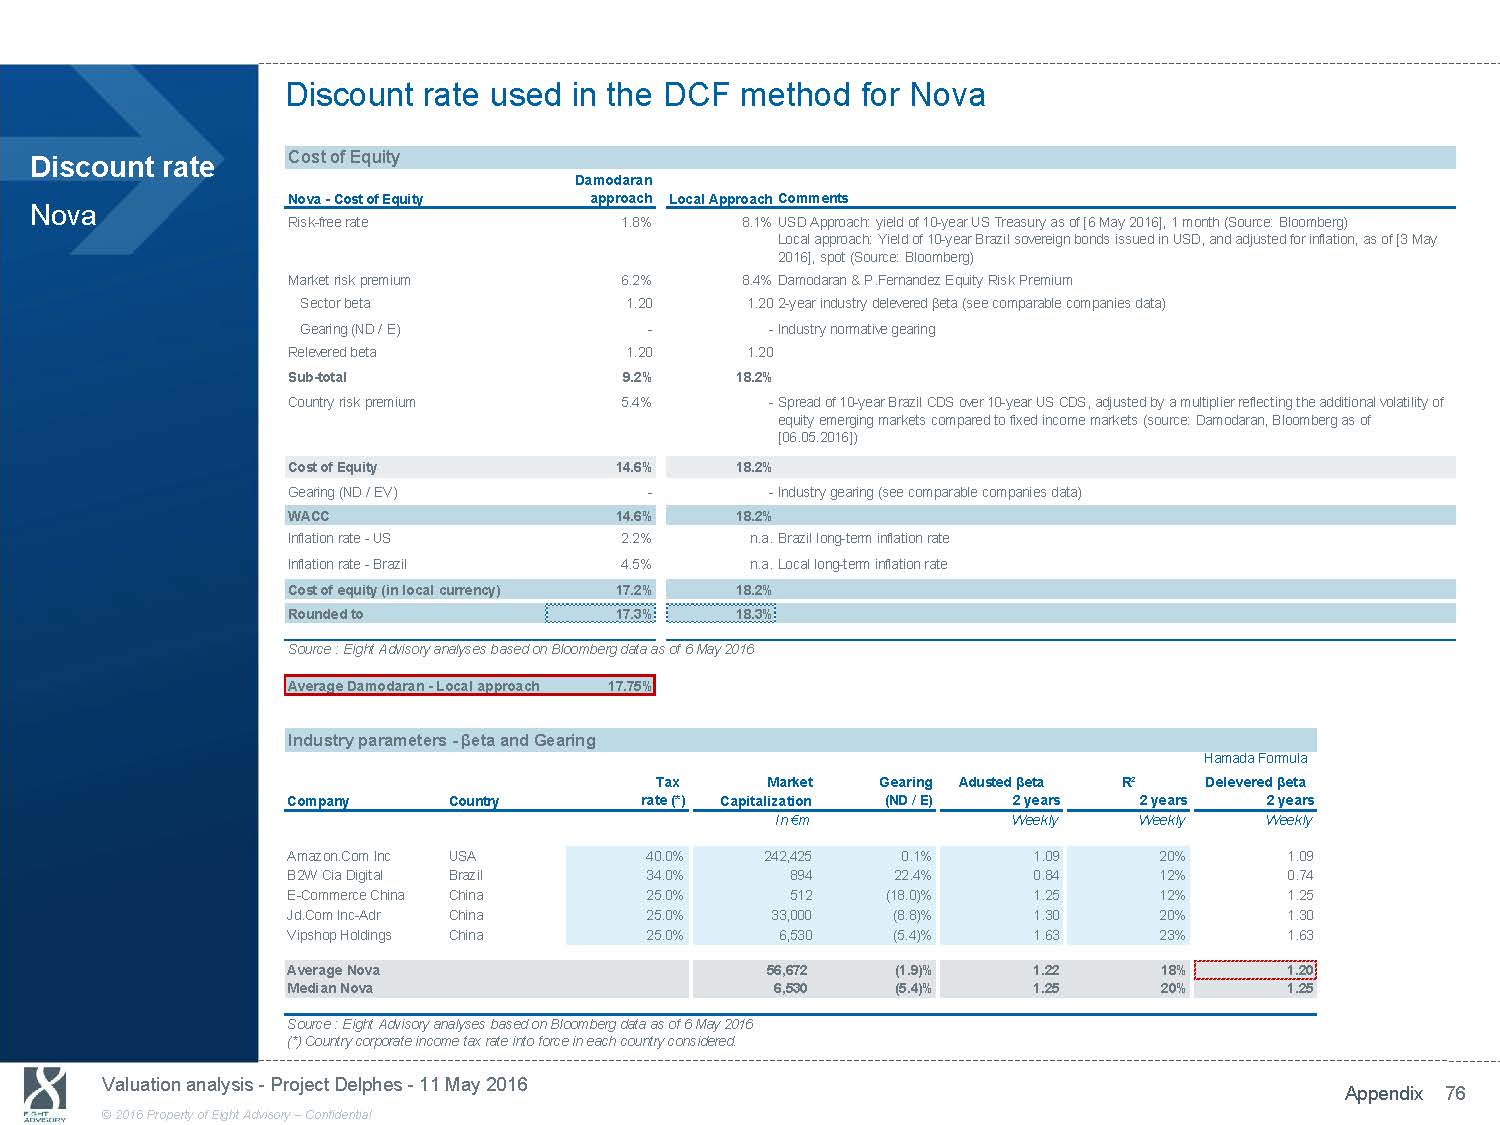
Discount rate used in the DCF method for Nova Discount rate Nova Cost of Equity Damodaran Nova - Cost of Equity approach Risk - free rate 1.8% Market risk premium 6.2% Sector beta 1.20 Gearing (ND / E) - Relevered beta 1.20 Sub - total 9.2% Country risk premium 5.4% Cost of Equity 14.6% Gearing (ND / EV) - WACC 14.6% Inflation rate - US 2.2% Inflation rate - Brazil 4.5% Cost of equity (in local currency) 17.2% Rounded to 17.3% Local Approach Comments 8.1% USD Approach: yield of 10 - year US Treasury as of [6 May 2016], 1 month (Source: Bloomberg) Local approach: Yield of 10 - year Brazil sovereign bonds issued in USD, and adjusted for inflation, as of [3 May 2016], spot (Source: Bloomberg) 8.4% Damodaran & P.Fernandez Equity Risk Premium 1.20 2 - year industry delevered βeta (see comparable companies data) - Industry normative gearing 1.20 18.2% - Spread of 10 - year Brazil CDS over 10 - year US CDS, adjusted by a multiplier reflecting the additional volatility of equity emerging markets compared to fixed income markets (source: Damodaran, Bloomberg as of [06.05.2016]) 18.2% - Industry gearing (see comparable companies data) 18.2% n.a. Brazil long - term inflation rate n.a. Local long - term inflation rate 18.2% 18.3% Source : Eight Advisory analyses based on Bloomberg data as of 6 May 2016 Average Damodaran - Local approach 17.75% Industry parameters - βeta and Gearing Hamada Formula Tax Market Gearing Adusted βeta R² Delevered βeta Company Country rate (*) Capitalization (ND / E) 2 years 2 years 2 years In € m Week ly Week ly Week ly Amazon.Com Inc USA 40.0% 242,425 0.1% 1.09 20% 1.09 B2W Cia Digital Brazil 34.0% 894 22.4% 0.84 12% 0.74 E - Commerce China China 25.0% 512 (18.0)% 1.25 12% 1.25 Jd.Com Inc - Adr China 25.0% 33,000 (8.8)% 1.30 20% 1.30 Vipshop Holdings China 25.0% 6,530 (5.4)% 1.63 23% 1.63 Average Nova 56,672 (1.9)% 1.22 18% 1.20 Median Nova 6,530 (5.4)% 1.25 20% 1.25 Source : Eight Advisory analyses based on Bloomberg data as of 6 May 2016 (*) Country corporate income tax rate into force in each country considered. Valuation analysis - Project Delphes - 11 May 2016 Appendix 76 © 2016 Property of Eight Advisory - Confidential
Appendix 6: Additional analysis on trading multiples Appendix
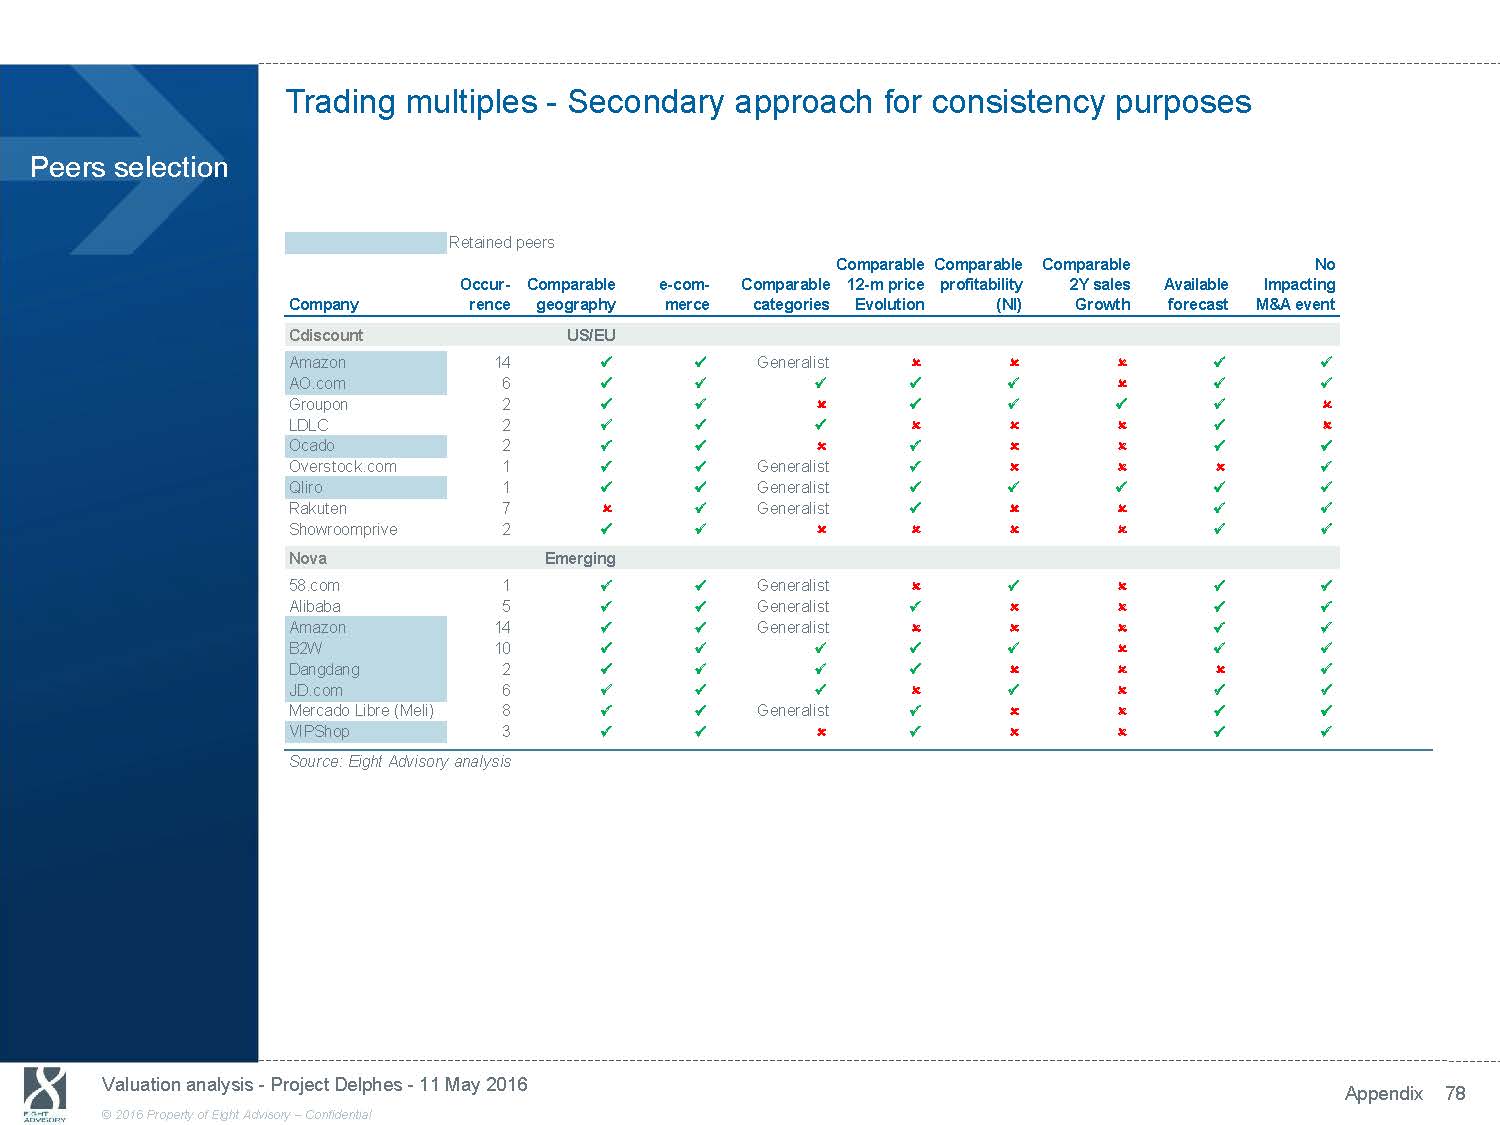
Trading multiples - Secondary approach for consistency purposes Peers selection Retained peers Comparable Comparable Comparable No Occur - Comparable e - com - Comparable 12 - m price profitability 2Y sales Available Impacting Company rence geography merce categories Evolution (NI) Growth forecast M&A event Cdiscount US/EU Amazon 14 P P Generalist O O O P P AO.com 6 P P P P P O P P Groupon 2 P P O P P P P O LDLC 2 P P P O O O P O Ocado 2 P P O P O O P P Overstock.com 1 P P Generalist P O O O P Qliro 1 P P Generalist P P P P P Rakuten 7 O P Generalist P O O P P Showroomprive 2 P P O O O O P P Nova Emerging 58.com 1 P P Generalist O P O P P Alibaba 5 P P Generalist P O O P P Amazon 14 P P Generalist O O O P P B2W 10 P P P P P O P P Dangdang 2 P P P P O O O P JD.com 6 P P P O P O P P Mercado Libre (Meli) 8 P P Generalist P O O P P VIPShop 3 P P O P O O P P Source: Eight Advisory analysis Valuation analysis - Project Delphes - 11 May 2016 Appendix 78 © 2016 Property of Eight Advisory - Confidential
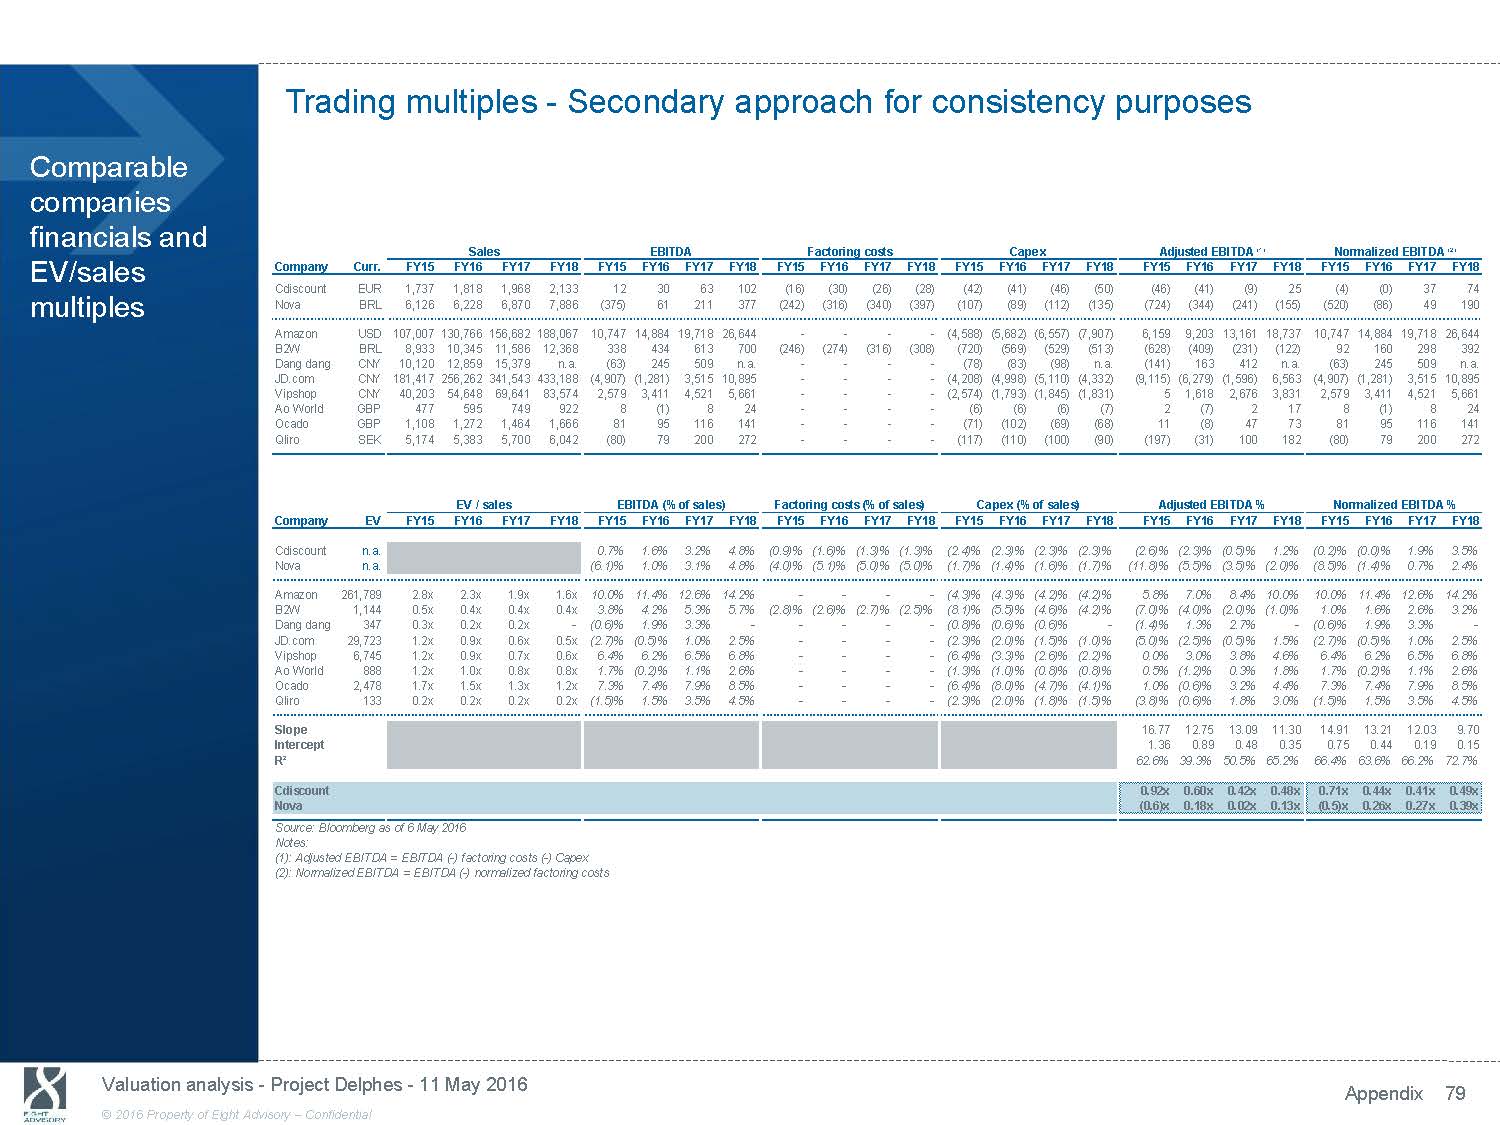
Trading multiples - Secondary approach for consistency purposes Comparable companies financials and Sales EBITDA Factoring costs Capex Adjusted EBITDA (1) Normalized EBITDA (2) EV/sales multiples Company Curr. FY15 FY16 Cdiscount EUR 1,737 1,818 Nova BRL 6,126 6,228 FY17 FY18 FY15 FY16 FY17 1,968 2,133 12 30 63 6,870 7,886 (375) 61 211 FY18 FY15 FY16 FY17 FY18 102 (16) (30) (26) (28) 377 (242) (316) (340) (397) FY15 FY16 FY17 FY18 FY15 (42) (41) (46) (50) (46) (107) (89) (112) (135) (724) FY16 FY17 FY18 FY15 FY16 FY17 FY18 (41) (9) 25 (4) (0) 37 74 (344) (241) (155) (520) (86) 49 190 Amazon USD 107,007 130,766 156,682 188,067 10,747 14,884 19,718 26,644 - - - - (4,588) (5,682) (6,557) (7,907) 6,159 9,203 13,161 18,737 10,747 14,884 19,718 26,644 B2W BRL 8,933 10,345 11,586 12,368 338 434 613 700 (246) (274) (316) (308) (720) (569) (529) (513) (628) (409) (231) (122) 92 160 298 392 Dang dang CNY 10,120 12,859 15,379 n.a. (63) 245 509 n.a. - - - - (78) (83) (98) n.a. (141) 163 412 n.a. (63) 245 509 n.a. JD.com CNY 181,417 256,262 341,543 433,188 (4,907) (1,281) 3,515 10,895 - - - - (4,208) (4,998) (5,110) (4,332) (9,115) (6,279) (1,596) 6,563 (4,907) (1,281) 3,515 10,895 Vipshop CNY 40,203 54,648 69,641 83,574 2,579 3,411 4,521 5,661 - - - - (2,574) (1,793) (1,845) (1,831) 5 1,618 2,676 3,831 2,579 3,411 4,521 5,661 Ao World GBP 477 595 749 922 8 (1) 8 24 - - - - (6) (6) (6) (7) 2 (7) 2 17 8 (1) 8 24 Ocado GBP 1,108 1,272 1,464 1,666 81 95 116 141 - - - - (71) (102) (69) (68) 11 (8) 47 73 81 95 116 141 Qliro SEK 5,174 5,383 5,700 6,042 (80) 79 200 272 - - - - (117) (110) (100) (90) (197) (31) 100 182 (80) 79 200 272 EV / sales EBITDA (% of sales) Factoring costs (% of sales) Capex (% of sales) Adjusted EBITDA % Normalized EBITDA % Company EV FY15 FY16 FY17 FY18 FY15 FY16 FY17 FY18 FY15 FY16 FY17 FY18 FY15 FY16 FY17 FY18 FY15 FY16 FY17 FY18 FY15 FY16 FY17 FY18 Cdiscount n.a. 0.7% 1.6% 3.2% 4.8% (0.9)% (1.6)% (1.3)% (1.3)% (2.4)% (2.3)% (2.3)% (2.3)% (2.6)% (2.3)% (0.5)% 1.2% (0.2)% (0.0)% 1.9% 3.5% Nova n.a. (6.1)% 1.0% 3.1% 4.8% (4.0)% (5.1)% (5.0)% (5.0)% (1.7)% (1.4)% (1.6)% (1.7)% (11.8)% (5.5)% (3.5)% (2.0)% (8.5)% (1.4)% 0.7% 2.4% Amazon 261,789 2.8x 2.3x 1.9x 1.6x 10.0% 11.4% 12.6% 14.2% - - - - (4.3)% (4.3)% (4.2)% (4.2)% 5.8% 7.0% 8.4% 10.0% 10.0% 11.4% 12.6% 14.2% B2W 1,144 0.5x 0.4x 0.4x 0.4x 3.8% 4.2% 5.3% 5.7% (2.8)% (2.6)% (2.7)% (2.5)% (8.1)% (5.5)% (4.6)% (4.2)% (7.0)% (4.0)% (2.0)% (1.0)% 1.0% 1.6% 2.6% 3.2% Dang dang 347 0.3x 0.2x 0.2x - (0.6)% 1.9% 3.3% - - - - - (0.8)% (0.6)% (0.6)% - (1.4)% 1.3% 2.7% - (0.6)% 1.9% 3.3% - JD.com 29,723 1.2x 0.9x 0.6x 0.5x (2.7)% (0.5)% 1.0% 2.5% - - - - (2.3)% (2.0)% (1.5)% (1.0)% (5.0)% (2.5)% (0.5)% 1.5% (2.7)% (0.5)% 1.0% 2.5% Vipshop 6,745 1.2x 0.9x 0.7x 0.6x 6.4% 6.2% 6.5% 6.8% - - - - (6.4)% (3.3)% (2.6)% (2.2)% 0.0% 3.0% 3.8% 4.6% 6.4% 6.2% 6.5% 6.8% Ao World 888 1.2x 1.0x 0.8x 0.8x 1.7% (0.2)% 1.1% 2.6% - - - - (1.3)% (1.0)% (0.8)% (0.8)% 0.5% (1.2)% 0.3% 1.8% 1.7% (0.2)% 1.1% 2.6% Ocado 2,478 1.7x 1.5x 1.3x 1.2x 7.3% 7.4% 7.9% 8.5% - - - - (6.4)% (8.0)% (4.7)% (4.1)% 1.0% (0.6)% 3.2% 4.4% 7.3% 7.4% 7.9% 8.5% Qliro 133 0.2x 0.2x 0.2x 0.2x (1.5)% 1.5% 3.5% 4.5% - - - - (2.3)% (2.0)% (1.8)% (1.5)% (3.8)% (0.6)% 1.8% 3.0% (1.5)% 1.5% 3.5% 4.5% Slope 16.77 12.75 13.09 11.30 14.91 13.21 12.03 9.70 Intercept 1.36 0.89 0.48 0.35 0.75 0.44 0.19 0.15 R² 62.6% 39.3% 50.5% 65.2% 66.4% 63.6% 66.2% 72.7% Cdiscount 0.92x 0.60x 0.42x 0.48x 0.71x 0.44x 0.41x 0.49x Nova (0.6)x 0.18x 0.02x 0.13x (0.5)x 0.26x 0.27x 0.39x Source: Bloomberg as of 6 May 2016 Notes: (1): Adjusted EBITDA = EBITDA ( - ) factoring costs ( - ) Capex (2): Normalized EBITDA = EBITDA ( - ) normalized factoring costs Valuation analysis - Project Delphes - 11 May 2016 Appendix 79 © 2016 Property of Eight Advisory - Confidential
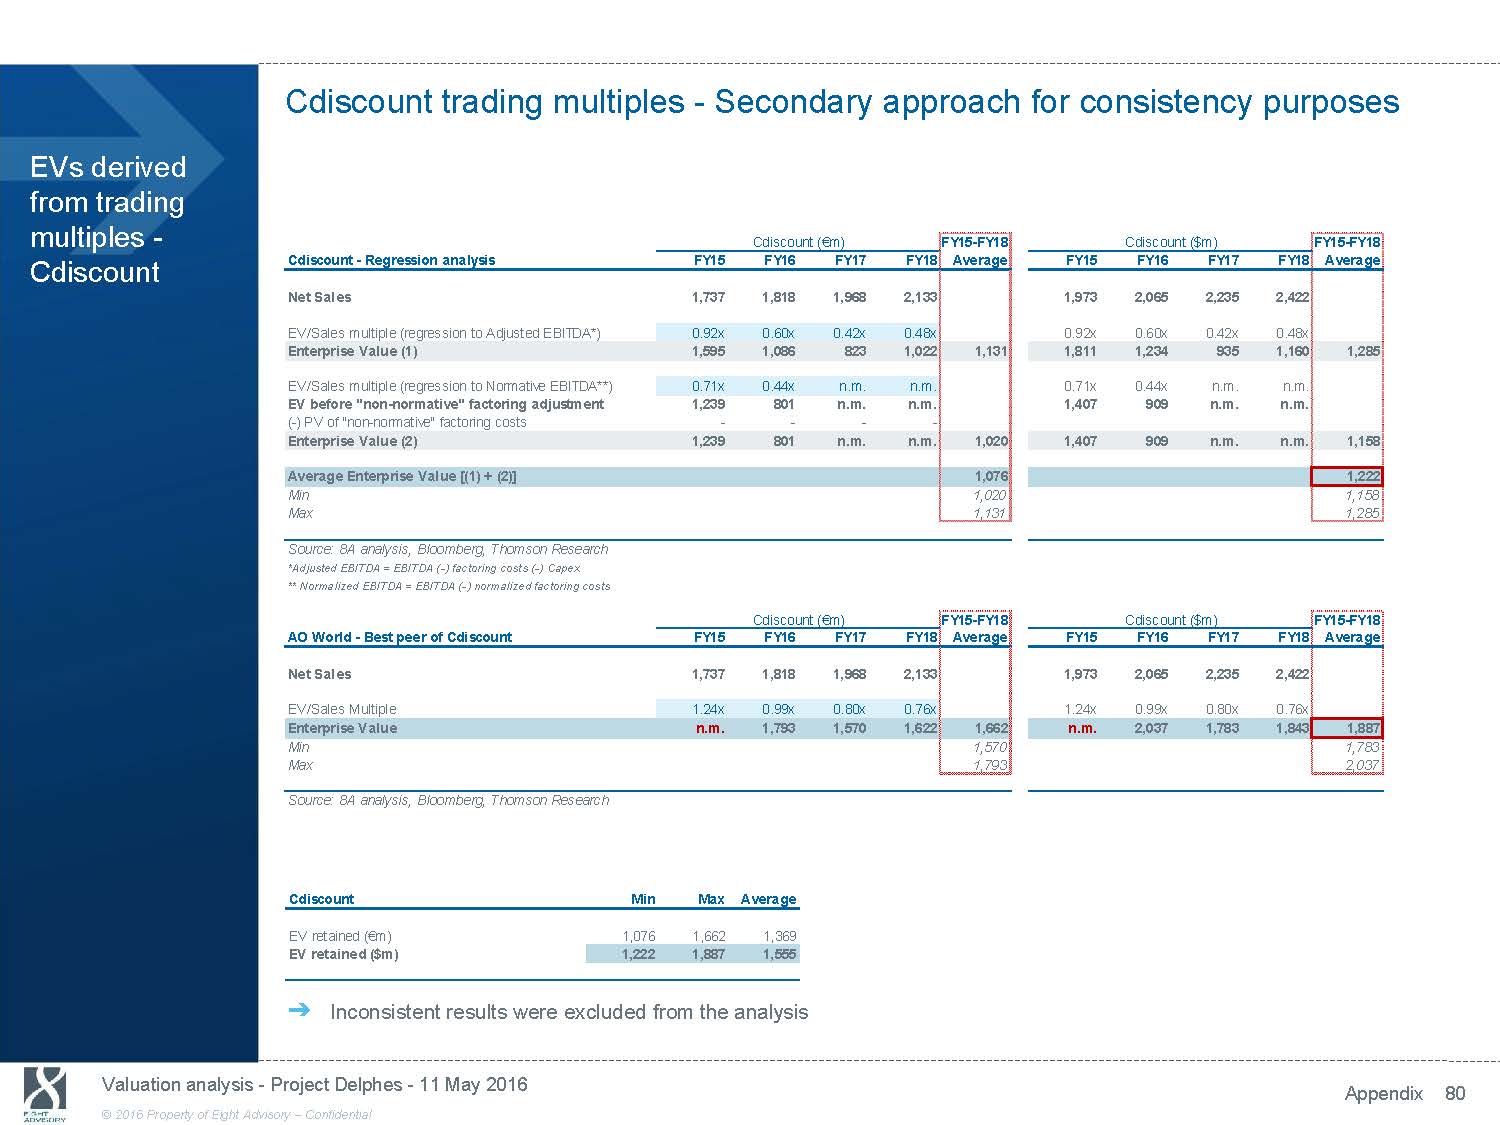
Cdiscount trading multiples - Secondary approach for consistency purposes EVs derived from trading multiples - Cdiscount Cdiscount - Regression analysis Net Sales EV/Sales multiple (regression to Adjusted EBITDA*) Enterprise Value (1) EV/Sales multiple (regression to Normative EBITDA**) EV before "non - normative" factoring adjustment ( - ) PV of "non - normative" factoring costs Enterprise Value (2) Average Enterprise Value [(1) + (2)] Min Max Cdiscount ( € m) FY15 FY16 FY17 FY18 1,737 1,818 1,968 2,133 0.92x 0.60x 0.42x 0.48x 1,595 1,086 823 1,022 0.71x 0.44x n.m. n.m. 1,239 801 n.m. n.m. - - - - 1,239 801 n.m. n.m. FY15 - FY18 Cdiscount ($m) FY15 - FY18 Average FY15 FY16 FY17 FY18 Average 1,973 2,065 2,235 2,422 0.92x 0.60x 0.42x 0.48x 1,131 1,811 1,234 935 1,160 1,285 0.71x 0.44x n.m. n.m. 1,407 909 n.m. n.m. 1,020 1,407 909 n.m. n.m. 1,158 1,076 1,222 1,020 1,158 1,131 1,285 Source: 8A analysis, Bloomberg, Thomson Research *Adjusted EBITDA = EBITDA ( - ) factoring costs ( - ) Capex ** Normalized EBITDA = EBITDA ( - ) normalized factoring costs Cdiscount ( € m) FY15 - FY18 Cdiscount ($m) FY15 - FY18 AO World - Best peer of Cdiscount FY15 FY16 FY17 FY18 Average FY15 FY16 FY17 FY18 Average Net Sales 1,737 1,818 1,968 2,133 1,973 2,065 2,235 2,422 EV/Sales Multiple 1.24x 0.99x 0.80x 0.76x 1.24x 0.99x 0.80x 0.76x Enterprise Value n.m. 1,793 1,570 1,622 1,662 n.m. 2,037 1,783 1,843 1,887 Min 1,570 1,783 Max 1,793 2,037 Source: 8A analysis, Bloomberg, Thomson Research Cdiscount Min Max Average EV retained ( € m) 1,076 1,662 1,369 EV retained ($m) 1,222 1,887 1,555 ᇄ Inconsistent results were excluded from the analysis Valuation analysis - Project Delphes - 11 May 2016 Appendix 80 © 2016 Property of Eight Advisory - Confidential
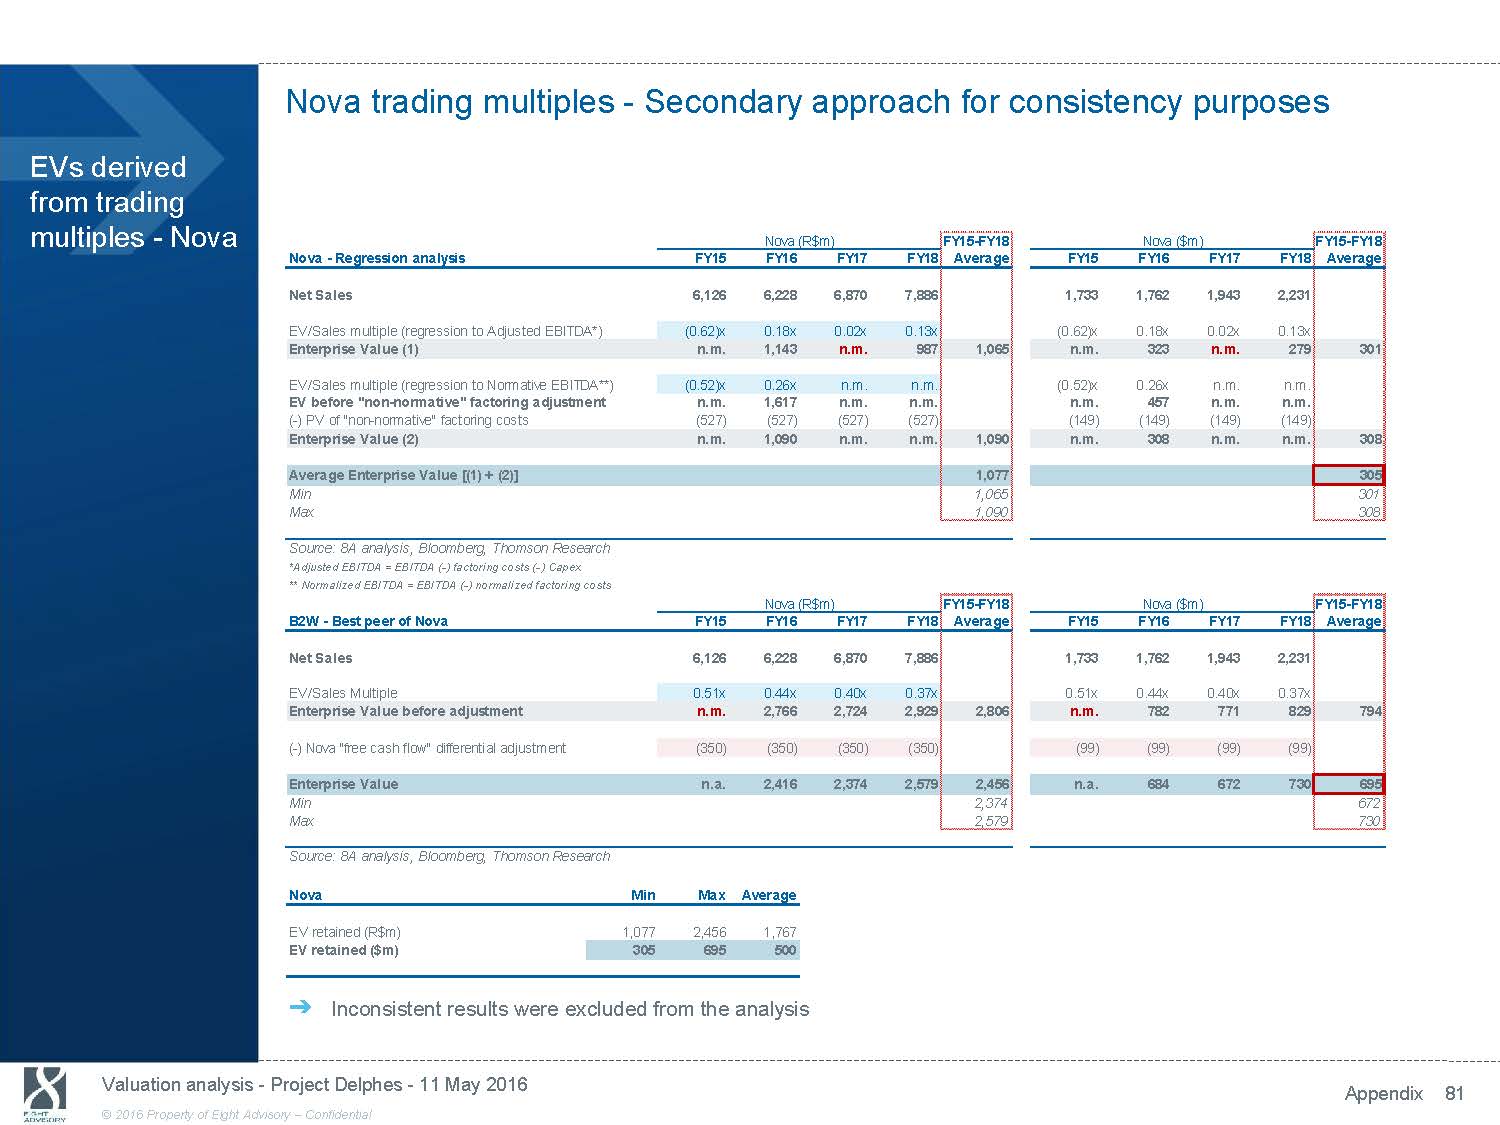
Nova trading multiples - Secondary approach for consistency purposes EVs derived from trading multiples - Nova Nova - Regression analysis FY15 Nova (R$m) FY15 - FY18 FY16 FY17 FY18 Average Nova ($m) FY15 - FY18 FY15 FY16 FY17 FY18 Average Net Sales 6,126 6,228 6,870 7,886 1,733 1,762 1,943 2,231 EV/Sales multiple (regression to Adjusted EBITDA*) (0.62)x 0.18x 0.02x 0.13x (0.62)x 0.18x 0.02x 0.13x Enterprise Value (1) n.m. 1,143 n.m. 987 1,065 n.m. 323 n.m. 279 301 EV/Sales multiple (regression to Normative EBITDA**) (0.52)x 0.26x n.m. n.m. (0.52)x 0.26x n.m. n.m. EV before "non - normative" factoring adjustment n.m. 1,617 n.m. n.m. n.m. 457 n.m. n.m. ( - ) PV of "non - normative" factoring costs (527) (527) (527) (527) (149) (149) (149) (149) Enterprise Value (2) n.m. 1,090 n.m. n.m. 1,090 n.m. 308 n.m. n.m. 308 Average Enterprise Value [(1) + (2)] 1,077 305 Min 1,065 301 Max 1,090 308 Source: 8A analysis, Bloomberg, Thomson Research *Adjusted EBITDA = EBITDA ( - ) factoring costs ( - ) Capex ** Normalized EBITDA = EBITDA ( - ) normalized factoring costs Nova (R$m) FY15 - FY18 Nova ($m) FY15 - FY18 B2W - Best peer of Nova FY15 FY16 FY17 FY18 Average FY15 FY16 FY17 FY18 Average Net Sales 6,126 6,228 6,870 7,886 1,733 1,762 1,943 2,231 EV/Sales Multiple 0.51x 0.44x 0.40x 0.37x 0.51x 0.44x 0.40x 0.37x Enterprise Value before adjustment n.m. 2,766 2,724 2,929 2,806 n.m. 782 771 829 794 ( - ) Nova "free cash flow" differential adjustment (350) (350) (350) (350) (99) (99) (99) (99) Enterprise Value n.a. 2,416 2,374 2,579 2,456 n.a. 684 672 730 695 Min 2,374 672 Max 2,579 730 Source: 8A analysis, Bloomberg, Thomson Research Nova Min Max Average EV retained (R$m) 1,077 2,456 1,767 EV retained ($m) 305 695 500 ᇄ Inconsistent results were excluded from the analysis Valuation analysis - Project Delphes - 11 May 2016 Appendix 81 © 2016 Property of Eight Advisory - Confidential
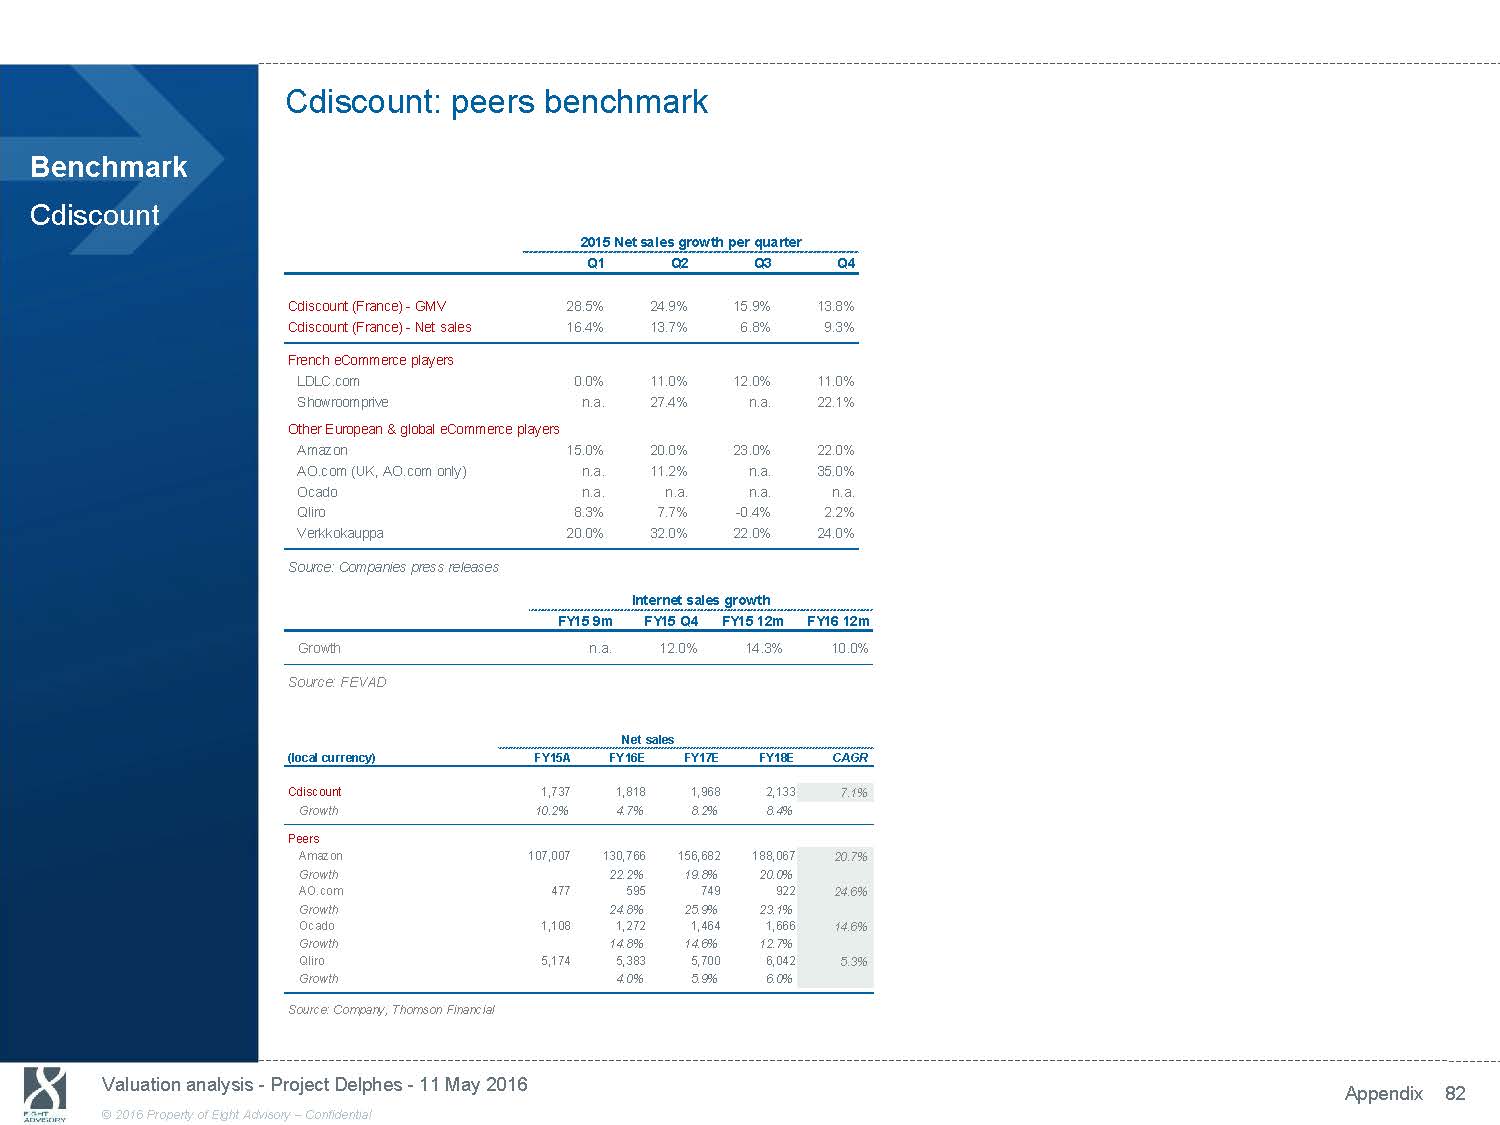
Cdiscount: peers benchmark Benchmark Cdiscount 2015 Net sales growth per quarter Q1 Q2 Q3 Q4 Cdiscount (France) - GMV 28.5% 24.9% 15.9% 13.8% Cdiscount (France) - Net sales 16.4% 13.7% 6.8% 9.3% French eCommerce players LDLC.com 0.0% 11.0% 12.0% 11.0% Showroomprive n.a. 27.4% n.a. 22.1% Other European & global eCommerce players Amazon 15.0% 20.0% 23.0% 22.0% AO.com (UK, AO.com only) n.a. 11.2% n.a. 35.0% Ocado n.a. n.a. n.a. n.a. Qliro 8.3% 7.7% - 0.4% 2.2% Verkkokauppa 20.0% 32.0% 22.0% 24.0% Source: Companies press releases Internet sales growth FY15 9m FY15 Q4 FY15 12m FY16 12m Growth n.a. 12.0% 14.3% 10.0% Source: FEVAD Net sales (local currency) FY15A FY16E FY17E FY18E CAGR Cdiscount 1,737 1,818 1,968 2,133 7.1% Growth 10.2% 4.7% 8.2% 8.4% Peers Amazon 107,007 130,766 156,682 188,067 20.7% Growth 22.2% 19.8% 20.0% AO.com 477 595 749 922 24.6% Growth 24.8% 25.9% 23.1% Ocado 1,108 1,272 1,464 1,666 14.6% Growth 14.8% 14.6% 12.7% Qliro 5,174 5,383 5,700 6,042 5.3% Growth 4.0% 5.9% 6.0% Source: Company, Thomson Financial Valuation analysis - Project Delphes - 11 May 2016 Appendix 82 © 2016 Property of Eight Advisory - Confidential
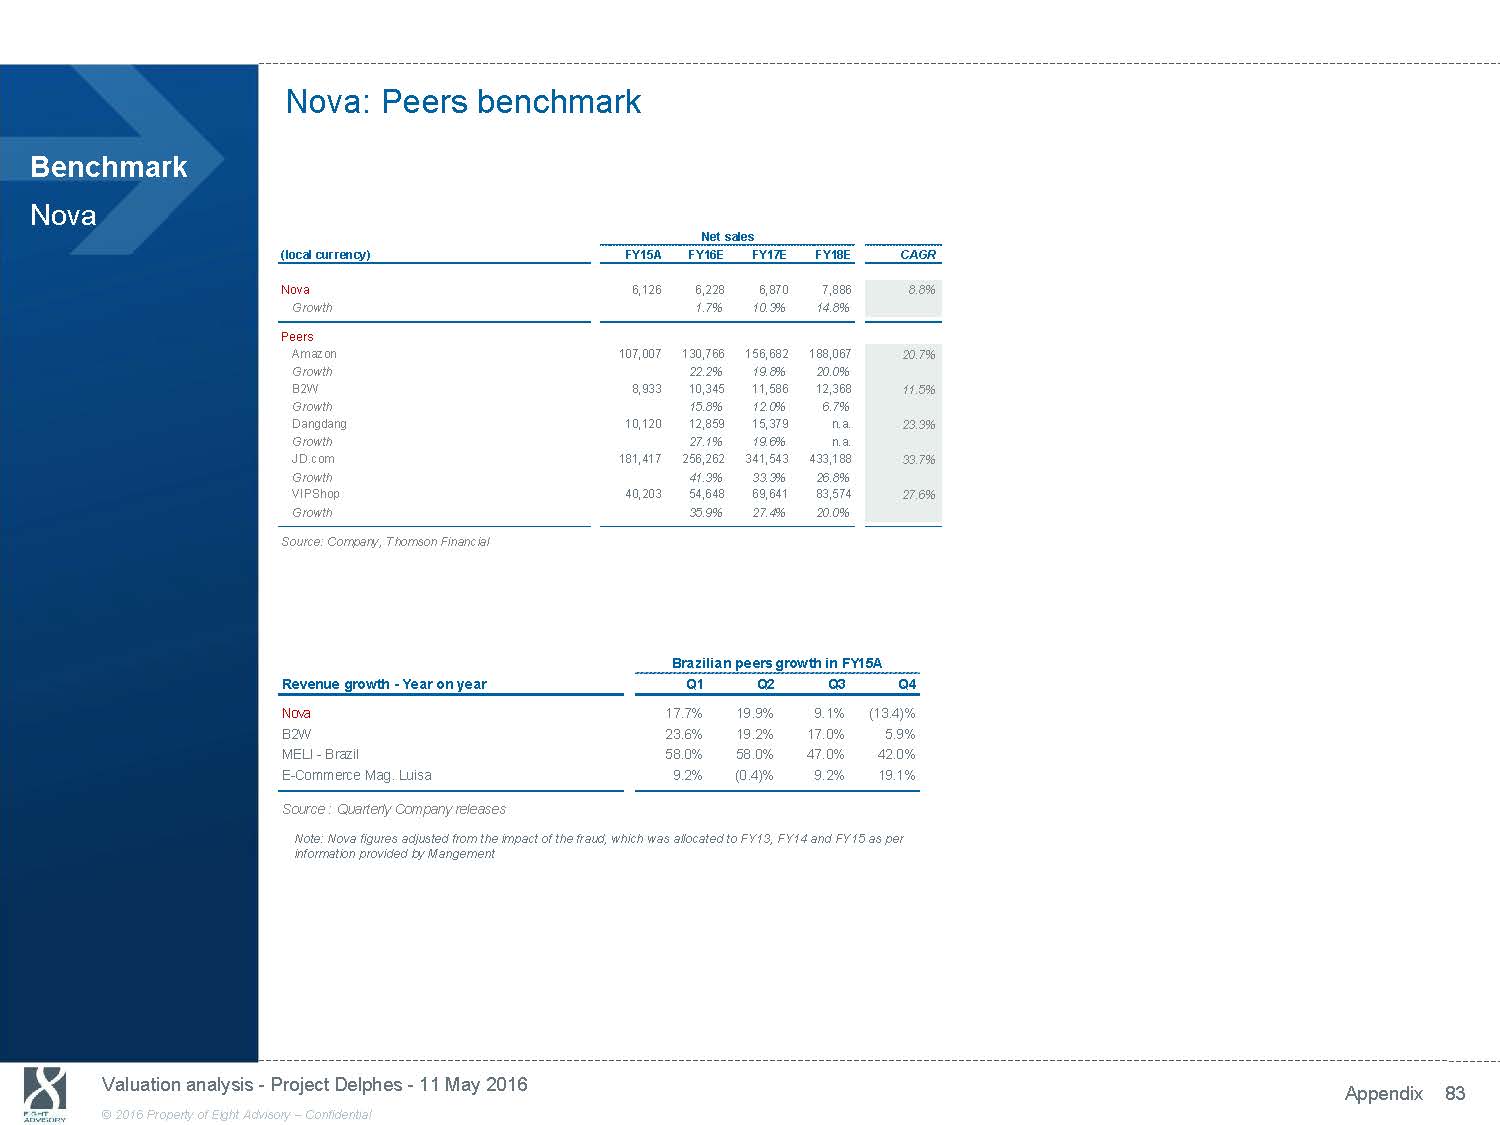
Nova: Peers benchmark Benchmark Nova Net sales (local currency) FY15A FY16E FY17E FY18E CAGR Nova 6,126 6,228 6,870 7,886 8.8% Growth 1.7% 10.3% 14.8% Peers Amazon 107,007 130,766 156,682 188,067 20.7% Growth 22.2% 19.8% 20.0% B2W 8,933 10,345 11,586 12,368 11.5% Growth 15.8% 12.0% 6.7% Dangdang 10,120 12,859 15,379 n.a. 23.3% Growth 27.1% 19.6% n.a. JD.com 181,417 256,262 341,543 433,188 33.7% Growth 41.3% 33.3% 26.8% VIPShop 40,203 54,648 69,641 83,574 27.6% Growth 35.9% 27.4% 20.0% Source: Company, Thomson Financial Brazilian peers growth in FY15A Revenue growth - Year on year Q1 Q2 Q3 Q4 Nova 17.7% 19.9% 9.1% (13.4)% B2W 23.6% 19.2% 17.0% 5.9% MELI - Brazil 58.0% 58.0% 47.0% 42.0% E - Commerce Mag. Luisa 9.2% (0.4)% 9.2% 19.1% Source : Quarterly Company releases Note: Nova figures adjusted from the impact of the fraud, which was allocated to FY13, FY14 and FY15 as per information provided by Mangement Valuation analysis - Project Delphes - 11 May 2016 Appendix 83 © 2016 Property of Eight Advisory - Confidential
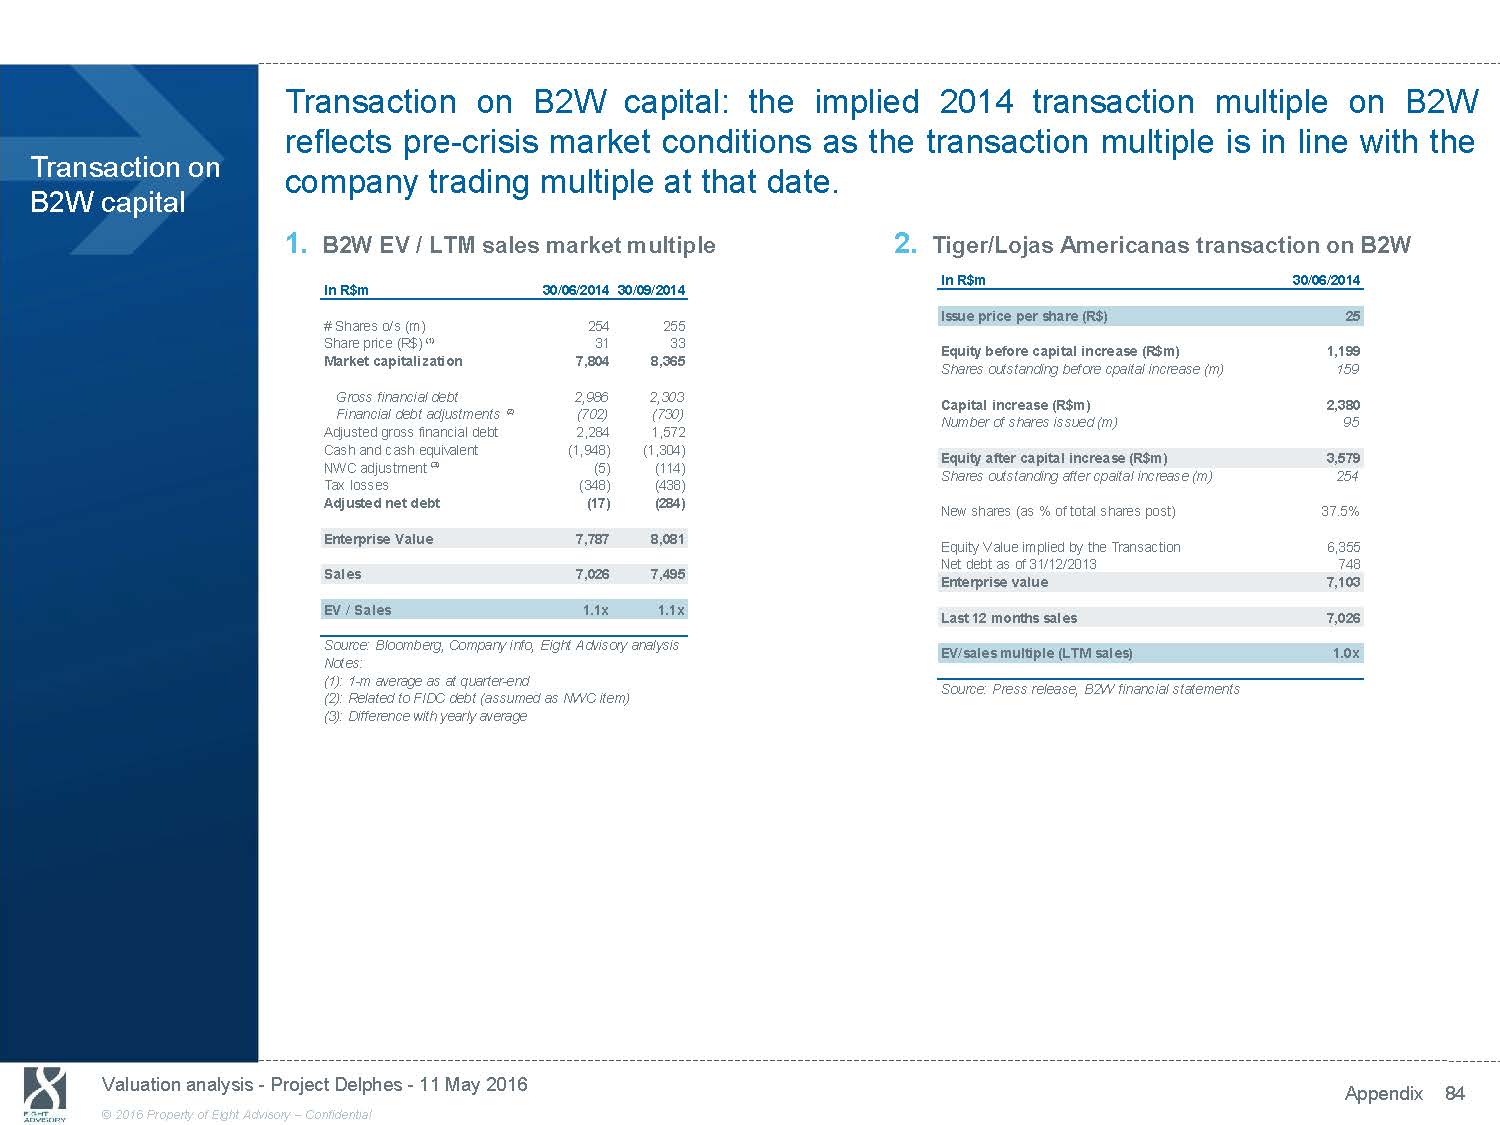
Transaction on B2W capital: the implied 2014 transaction multiple on B2W reflects pre - crisis market conditions as the transaction multiple is in line with the Transaction on B2W capital company trading multiple at that date. 1. B2W EV / LTM sales market multiple 2. Tiger/Lojas Americanas transaction on B2W In R$m 30/06/2014 30/09/2014 # Shares o/s (m) 254 255 Share price (R$) (1) 31 33 Market capitalization 7,804 8,365 Gross financial debt 2,986 2,303 Financial debt adjustments (2) (702) (730) Adjusted gross financial debt 2,284 1,572 Cash and cash equivalent (1,948) (1,304) NWC adjustment (3) (5) (114) Tax losses (348) (438) Adjusted net debt (17) (284) Enterprise Value 7,787 8,081 Sales 7,026 7,495 EV / Sales 1.1x 1.1x Source: Bloomberg, Company info, Eight Advisory analysis Notes: (1): 1 - m average as at quarter - end (2): Related to FIDC debt (assumed as NWC item) (3): Difference with yearly average In R$m 30/06/2014 Issue price per share (R$) 25 Equity before capital increase (R$m) 1,199 Shares outstanding before cpaital increase (m) 159 Capital increase (R$m) 2,380 Number of shares issued (m) 95 Equity after capital increase (R$m) 3,579 Shares outstanding after cpaital increase (m) 254 New shares (as % of total shares post) 37.5% Equity Value implied by the Transaction 6,355 Net debt as of 31/12/2013 748 Enterprise value 7,103 Last 12 months sales 7,026 EV/sales multiple (LTM sales) 1.0x Source: Press release, B2W financial statements Valuation analysis - Project Delphes - 11 May 2016 Appendix 84 © 2016 Property of Eight Advisory - Confidential
Appendix 7: Brazil economic information Appendix
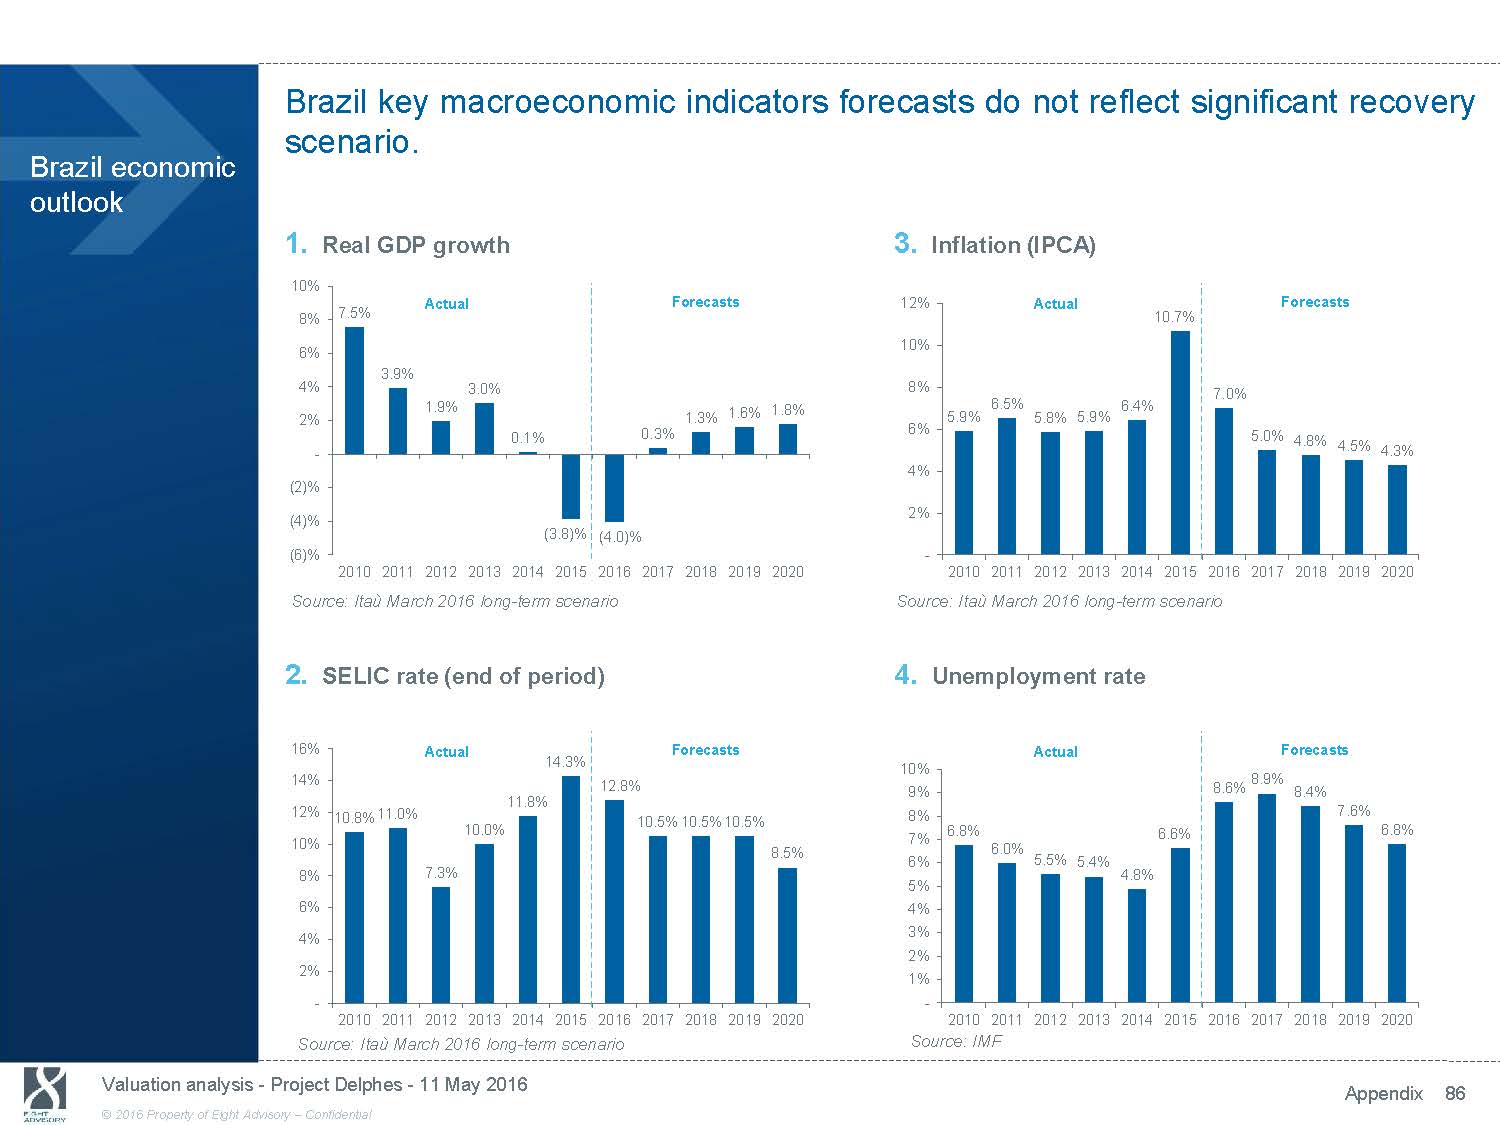
Brazil key macroeconomic indicators forecasts do not reflect significant recovery scenario. Brazil economic outlook 1. Real GDP growth 10% Actual Forecasts 3. Inflation (IPCA) 12% Actual Forecasts 8% 7.5% 6% 3.9% 4% 3.0% 1.9% 2% 0.1% - (2)% (4)% (3.8)% (6)% 2010 2011 2012 2013 2014 2015 1.3% 0.3% (4.0)% 2016 2017 2018 10% 8% 1.6% 1.8% 6% 4% 2% - 2019 2020 10.7% 6.5% 6.4% 5.9% 5.8% 5.9% 2010 2011 2012 2013 2014 2015 7.0% 5.0% 2016 2017 4.8% 2018 4.5% 2019 4.3% 2020 Source: Itaù March 2016 long - term scenario 2. SELIC rate (end of period) 16% Actual Source: Itaù March 2016 long - term scenario 4. Unemployment rate Forecasts Actual Forecasts 14% 12% 10% 8% 6% 4% 2% - 14.3% 11.8% 10.8%11.0% 10.0% 7.3% 2010 2011 2012 2013 2014 2015 12.8% 10.5%10.5% 10.5% 8.5% 2016 2017 2018 2019 2020 10% 9% 8% 7% 6% 5% 4% 3% 2% 1% - 8.6% 6.8% 6.6% 6.0% 5.5% 5.4% 4.8% 2010 2011 2012 2013 2014 2015 2016 8.9% 8.4% 7.6% 6.8% 2017 2018 2019 2020 Source: Itaù March 2016 long - term scenario Source: IMF Valuation analysis - Project Delphes - 11 May 2016 Appendix 86 © 2016 Property of Eight Advisory - Confidential
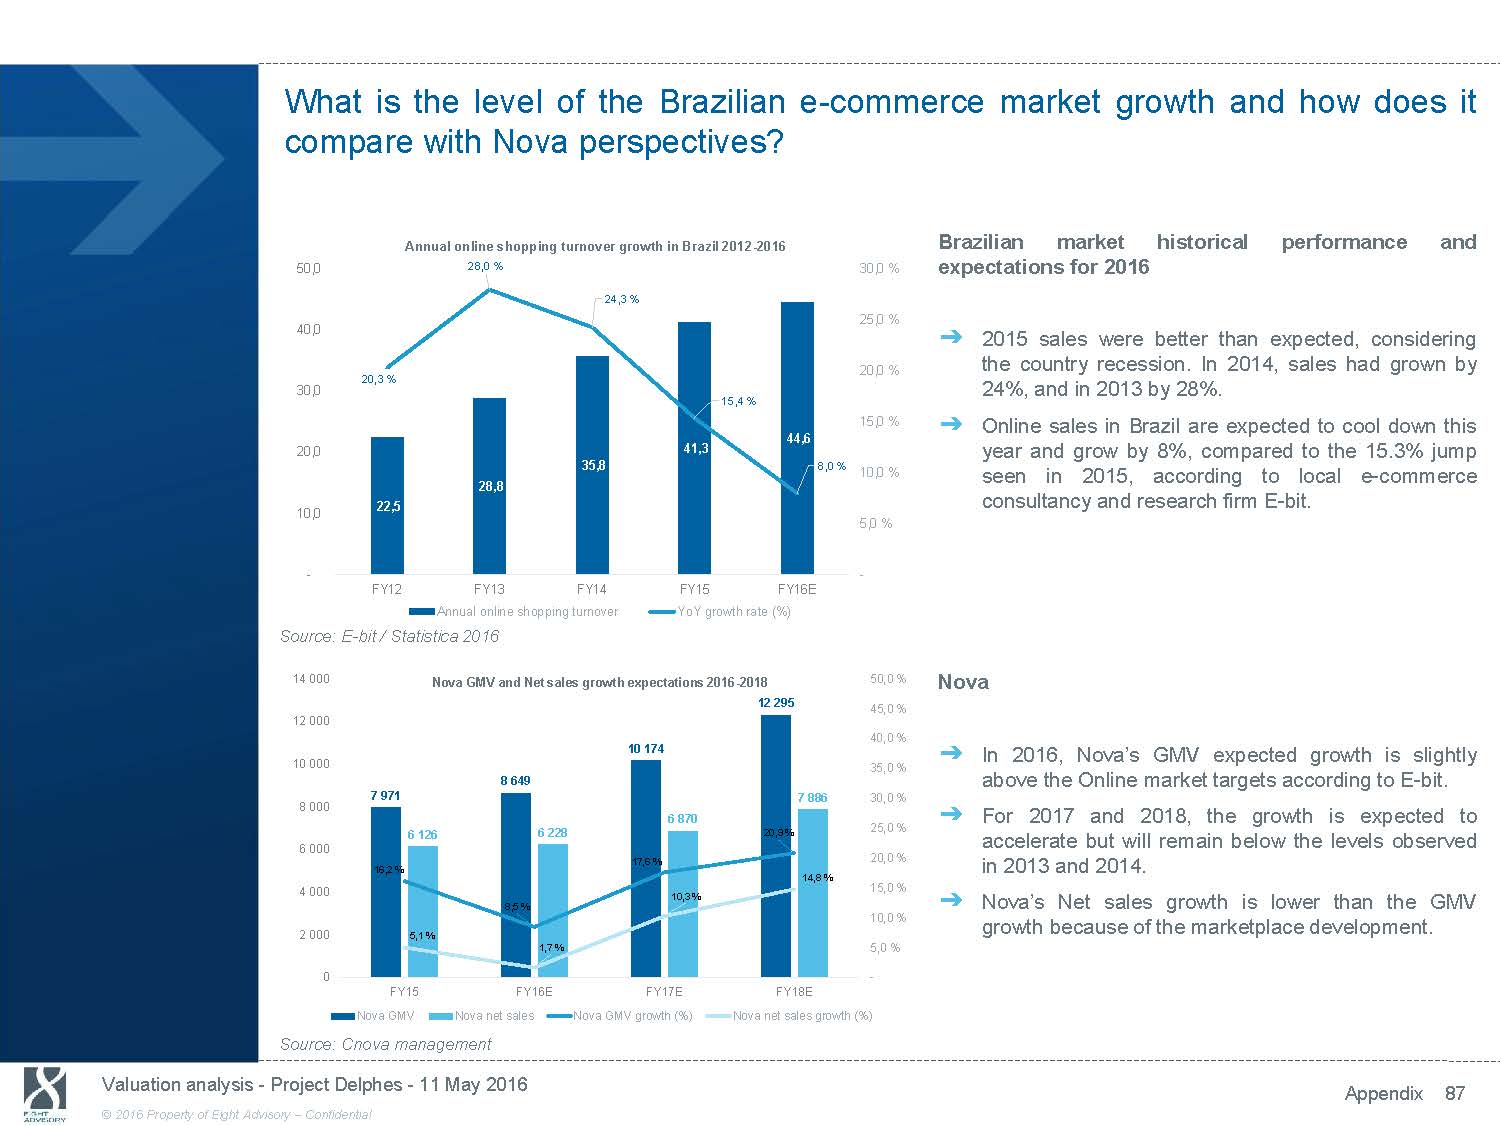
What is the level of the Brazilian e - commerce market growth and how does it compare with Nova perspectives? 50,0 40,0 30,0 20,0 10,0 - Annual online shopping turnover growth in Brazil 2012 - 2016 28,0 % 24,3 % 20,3 % 15,4 % 44,6 41,3 35,8 8,0 % 28,8 22,5 FY12 FY13 FY14 FY15 FY16E Annual online shopping turnover YoY growth rate (%) 30,0 % 25,0 % 20,0 % 15,0 % 10,0 % 5,0 % - Brazilian market historical performance and expectations for 2016 ᇄ 2015 sales were better than expected, considering the country recession. In 2014, sales had grown by 24%, and in 2013 by 28%. ᇄ Online sales in Brazil are expected to cool down this year and grow by 8%, compared to the 15.3% jump seen in 2015, according to local e - commerce consultancy and research firm E - bit. Source: E - bit / Statistica 2016 14 000 12 000 10 000 8 000 6 000 4 000 2 000 0 Nova GMV and Net sales growth expectations 2016 - 2018 12 295 10 174 8 649 7 971 7 886 6 870 6 126 6 228 20,9 % 17,6 % 16,2 % 14,8 % 10,3 % 8,5 % 5,1 % 1,7 % FY15 FY16E FY17E FY18E 50,0 % 45,0 % 40,0 % 35,0 % 30,0 % 25,0 % 20,0 % 15,0 % 10,0 % 5,0 % - Nova ᇄ In 2016, Nova’s GMV expected growth is slightly above the Online market targets according to E - bit. ᇄ For 2017 and 2018, the growth is expected to accelerate but will remain below the levels observed in 2013 and 2014. ᇄ Nova’s Net sales growth is lower than the GMV growth because of the marketplace development. Nova GMV Nova net sales Nova GMV growth (%) Nova net sales growth (%) Source: Cnova management Valuation analysis - Project Delphes - 11 May 2016 Appendix 87 © 2016 Property of Eight Advisory - Confidential

A