Table of Contents
UNITED STATES
SECURITIES AND EXCHANGE COMMISSION
Washington, D.C. 20549
FORM N-CSR
CERTIFIED SHAREHOLDER REPORT OF REGISTERED
MANAGEMENT INVESTMENT COMPANIES
Investment Company Act file number 811-22975
AllianzGI Institutional Multi-Series Trust
(Exact name of registrant as specified in charter)
| 1633 Broadway, New York, New York | 10019 | |
| (Address of principal executive offices) | (Zip code) |
Lawrence G. Altadonna
1633 Broadway,
New York, New York 10019
(Name and address of agent for service)
Registrant’s telephone number, including area code: 212-739-3371
Date of fiscal year end: November 30, 2014
Date of reporting period: November 30, 2014
Table of Contents
Item 1. Report to Shareholders
AllianzGI Institutional Multi-Series Trust
Annual Report
November 30, 2014
Table of Contents
| 2 - 5 | ||||
| 6 | ||||
| 7 - 13 | ||||
| 14 | ||||
| 15 | ||||
| 16 | ||||
| 17 | ||||
| 18 - 27 | ||||
| 28 | ||||
| 29 - 30 | ||||
| 31 | ||||
| 32 | ||||
| 33 | ||||
| 34 | ||||
Table of Contents
AllianzGI Global Small-Cap Opportunities Portfolio
(unaudited)
Since inception on July 23, 2014 through November 30, 2014, as provided by Mark Roemer, Portfolio Manager.
Fund Insights
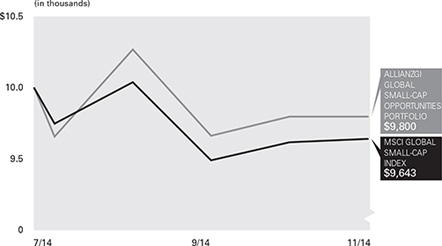
For the period from inception on July 23, 2014 through November 30, 2014, the AllianzGI Global Small-Cap Opportunities Portfolio (the “Portfolio”) returned -2.00%, outperforming the MSCI ACWI Small Cap Index (the “benchmark index”), which returned -3.57%.
Market Environment
During the reporting period, the benchmark index performance was mixed, advancing in three of the five months as investors broadly focused on improving economic figures and a benign inflation environment. However, volatility increased with market declines in July and September amid concerns of slowing economic growth and potential for an upcoming US monetary tightening cycle. Energy prices and US dollar strength led to a divergence among countries and sectors. In this environment, global small cap companies generally lagged their large cap counterparts.
From a regional standpoint, small cap stocks in the United States, which represents greater than 50% of the benchmark index, were higher on the back of improving employment figures, low inflation, and currency strength as the dollar rallied meaningfully during the reporting period. Asia Pacific small cap stocks were led by positive performance in India and
the Philippines, which was generally offset by modestly lower returns for other countries in the region. Meanwhile, European small cap equities declined as a result of a potential slowdown in exports, with Germany and France declining mid-single digits for the reporting period. Latin American stocks underperformed as a result of commodity pricing weakness, with Peru, Colombia and Brazil each posting double-digit losses.
Sector performance was mixed during the annual reporting period. Cyclical stocks, including Energy, Materials and Industrials were lower due to concerns of a potential slowdown in growth, while Health Care and Utilities stocks advanced as a result of higher revenue and earnings visibility.
Performance Driven by Stock Selection
Our investment process seeks to deliver outperformance over time by investing in global small cap companies that are benefiting from change not yet fully reflected in the market. Our team believes investor behavioral biases contribute to market inefficiencies, which can be exploited through the systematic application of fundamental and behavioral factors.
During the reporting period, the Portfolio outperformed the benchmark index as a result of positive stock selection at both the country and sector level. Selections in the United States, South Africa and the United Kingdom added to results thanks to bottom-up stockpicking. Meanwhile, stock selection for the Portfolio in Japan and Switzerland trailed the benchmark index. From a sector standpoint, positive selection in the Energy sector contributed most to results for the Portfolio. In addition, stockpicking in Industrials and an overweight allocation to Health Care stocks also proved beneficial. Conversely, a relative underweight to Consumer Discretionary offset results as did stockpicking in Consumer Staples.
The largest individual active contributor to performance for the Portfolio during the reporting period was InterMune, Inc. Shares of the United States-based biotechnology company advanced following a buyout offer from a Swiss-based pharmaceutical company. Acadia Healthcare Company rallied as a result of higher demand for psychiatric and chemical dependency services. Meanwhile, shares of Gold Resource Corporation, an explorer for gold and other precious metals, was the largest detractor for the reporting period as a result of weakness for metals and mining stocks.
Cumulative Return for the period ended November 30, 2014
| Since Inception† | ||||
AllianzGI Global Small-Cap Opportunities Portfolio | -2.00 | % | ||
MSCI ACWI Small Cap Index†† | -3.57 | % | ||
| † | The Portfolio began operations on 7/23/14. Benchmark return comparisons began on the portfolio inception date. Lipper performance comparisons began on 7/31/14. |
| †† | The MSCI ACWI Small Cap Index captures small cap representation across 23 developed market and 23 emerging market countries, covering about 14% of the free float-adjusted market capitalization in each country (as of December 31, 2014). Unless otherwise noted, index returns reflect the reinvestment of income dividends and capital gains, if any, but do not reflect fees, brokerage commissions or other expenses of investing. It is not possible to invest directly in an index. |
Performance quoted represents past performance and is no guarantee of future results. Current performance may be lower or higher than performance shown. Investment return and the principal value will fluctuate. Shares may be worth more or less than original cost when redeemed. Returns do not reflect deduction of taxes that a shareholder would pay on portfolio distributions or redemption of portfolio shares. Total return performance assumes that all dividends and capital gain distributions were reinvested on the payable date. The Portfolio’s gross expense ratio is 7.78%. This ratio does not include an expense reduction, contractually guaranteed through at least 11/30/15. The Portfolio’s expense ratio net of this reduction is 1.20%. Expense ratio information is as of the Portfolio’s current PPM dated June 30, 2014, as supplemented to date.
| 2 | Annual Report / November 30, 2014 |
Table of Contents
AllianzGI Global Small-Cap Opportunities Portfolio
(unaudited) (continued)
Shareholder Expense Example
| Beginning Account | Ending Account | Expenses Paid During | ||||||||||
| Value | Value | Period | ||||||||||
Actual Performance | $ | 1,000.00 | $ | 980.00 | $ | 4.23 | ||||||
Hypothetical Performance (5% return before expenses) | $ | 1,000.00 | $ | 1,019.05 | $ | 6.07 | ||||||
The Portfolio commenced operations on July 23, 2014. The Actual expense example is based on the period since Portfolio inception; the Hypothetical expense example is based on the six-month period beginning June 1, 2014. If the Hypothetical expense example had been based on the period since inception, the Ending Account Value and Expenses Paid During Period would have been $1,013.53 and $4.30, respectively.
Expenses (net of reimbursement, if any) are equal to the annualized expense ratio (1.20%), multiplied by the average account value over the period, multiplied by 130/365 for the Actual expense example and 183/365 for the Hypothetical expense example.
Country Allocation (as of November 30, 2014)
United States | 52.8 | % | ||
Canada | 8.5 | % | ||
United Kingdom | 6.4 | % | ||
Japan | 6.2 | % | ||
Korea (Republic of) | 4.6 | % | ||
Sweden | 3.0 | % | ||
Taiwan | 2.9 | % | ||
Switzerland | 2.1 | % | ||
Other | 12.8 | % | ||
Cash & Equivalents — Net | 0.7 | % |
Cumulative Returns Through November 30, 2014
| 3 | Annual Report / November 30, 2014 |
Table of Contents
AllianzGI U.S. Unconstrained Equity Portfolio
(unaudited)
Since inception on July 1, 2014 through November 30, 2014, as provided by Jeff Parker, Portfolio Manager.
Fund Insights
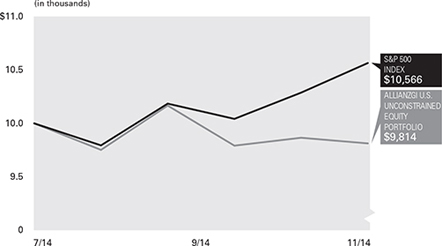
For the period from inception on July 1, 2014 through November 30, 2014, the AllianzGI U.S. Unconstrained Equity Portfolio (the “Portfolio”) returned -1.87%, underperforming the S&P 500 Index (the “benchmark index”), which returned 5.66%.
The U.S. Unconstrained Equity Portfolio is a new product that was launched July 1, 2014. As an unconstrained portfolio, we have the flexibility to invest in any one of the nine style boxes. The Portfolio is also very concentrated, with typically 30-40 equity holdings. Our goal over a full cycle is to outperform the S&P 500. However, in the short term, given the very different characteristics of the Portfolio and the index, we can experience very high tracking error.
The Portfolio launched with an overweight in Healthcare, Industrials and Materials. The underweights were in Financials, Consumer Discretionary and Staples, Utilities, and Telecom Services. Other sectors were essentially in-line with the benchmark index. We believed the US would see an improving economy and we believed cyclical sectors provided the best opportunity for equity outperformance. The Healthcare overweight was driven by our expectations for further increased utilization under Obamacare and stock specific opportunities. Although Consumer Discretionary is cyclical, we believed the sector was richly valued and struggled to find investments that met our criteria for outperformance. Our thinking proved correct as the economy did improve; however, declining
energy prices sent a shock wave through the industrial economy and led Industrials, Energy, and Materials to significant underperformance during this period. Our Healthcare overweight proved correct; however our stock selection was poor. Consumer Discretionary performed in line but Consumer Staples outperformed which was surprising given the strong dollar move during this reporting period.
The Portfolio also had a slight bias towards smaller capitalization equities than the benchmark index. Over a full cycle, we believe this will add meaningful stock-specific outperformance (or “alpha”). During this reporting period, we saw one of the most significant examples of underperformance of small equities versus large capitalization stocks in history. At the peak it was over 1000 basis points of underperformance. This reporting period experienced a very narrow market where only the largest capitalization stocks outperformed. We believe this is not sustainable and expect this trend to reverse.
Specifically, the Portfolio declined slightly in value while the S&P 500 advanced approximately 5%. Most if not all of this underperformance occurred in October and November with the decline in Oil and a couple of stock specific issues. Salix Pharmaceuticals declined 26% due to inventory channel issues that led to a decline in reported and expected sales. Biogen Idec, the Portfolio’s largest holding, declined 5% while the rest of Healthcare and Biotech increased 13%. Most of
this underperformance can be blamed on a lack of news flow as investors wait for upcoming clinical data. We remain large holders of Biogen Idec. In Energy, Pioneer Natural Resources and Sanchez Energy both declined approximately 40% with the sell-off in Oil. Likewise, Lyondell declined 20% in the Materials sector also from the decline of crude.
On the positive side, the Portfolio benefitted from holdings in United Airlines and Union Pacific, which both benefitted from the decline in Oil. Apple continued its strong performance increasing 28% with the launch of new products. Palo Alto Networks increased 50% on great execution in the security software space.
We continue to believe that the US economy represents the best investment opportunities for investors. The economy appears to be improving at a measured pace with GDP, housing, and employment all trending in the right direction. The consumer markets appear to be healthy and benefitting from lower energy prices. We don’t believe energy prices will remain low forever but have been reset for at least the first half of 2015. The Fed continues to be accommodative with policy. The big challenge in 2015 will be to navigate the first of many rate increases by the Fed. Given low inflation, this should be well received by the market. We expect to see a less narrow market in 2015 and expect smaller companies to participate and narrow the performance gap we have seen in 2014. We believe stock selection will be the key to outperformance and we remain committed to executing on this opportunity.
Cumulative Return for the period ended November 30, 2014
| Since Inception† | ||||
AllianzGI U.S. Unconstrained Equity Portfolio | -1.87 | % | ||
S&P 500 Index†† | 5.66 | % | ||
| † | The Portfolio began operations on 7/1/14. Benchmark return comparisons began on the portfolio inception date. Lipper performance comparisons began on 7/31/14. |
| †† | The Standard & Poor’s 500 Index (S&P 500 Index) is an unmanaged index that is generally representative of the US stock market. Unless otherwise noted, index returns reflect the reinvestment of income dividends and capital gains, if any, but do not reflect fees, brokerage commissions or other expenses of investing. It is not possible to invest directly in an index. |
Performance quoted represents past performance and is no guarantee of future results. Current performance may be lower or higher than performance shown. Investment return and the principal value will fluctuate. Shares may be worth more or less than original cost when redeemed. Returns do not reflect deduction of taxes that a shareholder would pay on portfolio distributions or redemption of portfolio shares. Total return performance assumes that all dividends and capital gain distributions were reinvested on the payable date. The Portfolio’s gross expense ratio is 7.34%. This ratio does not include an expense reduction, contractually guaranteed through at least 11/30/15. The Portfolio’s expense ratio net of this reduction is 1.00%. Expense ratio information is as of the Portfolio’s current PPM dated June 30, 2014, as supplemented to date.
| 4 | Annual Report / November 30, 2014 |
Table of Contents
AllianzGI U.S. Unconstrained Equity Portfolio
(unaudited) (continued)
Shareholder Expense Example
| Beginning Account | Ending Account | Expenses Paid During | ||||||||||
| Value | Value | Period | ||||||||||
Actual Performance | $ | 1,000.00 | $ | 981.30 | $ | 4.13 | ||||||
Hypothetical Performance (5% return before expenses) | $ | 1,000.00 | $ | 1,020.05 | $ | 5.06 | ||||||
The Portfolio commenced operations on July 1, 2014. The Actual expense example is based on the period since inception; the Hypothetical expense example is based on the six-month period beginning June 1, 2014. If the Hypothetical expense example had been based on the period since Portfolio inception, the Ending Account Value and Expenses Paid During Period would have been $1,016.66 and $4.20, respectively.
Expenses (net of reimbursement, if any) are equal to the annualized expense ratio (1.00%), multiplied by the average account value over the period, multiplied by 152/365 for the Actual expense example and 183/365 for the Hypothetical expense example.
Industry Allocation (as of November 30, 2014)
Technology Hardware, Storage & Peripherals | 8.2 | % | ||
Biotechnology | 7.8 | % | ||
Road & Rail | 6.4 | % | ||
Pharmaceuticals | 4.5 | % | ||
Chemicals | 4.3 | % | ||
Internet & Catalog Retail | 4.0 | % | ||
Trading Companies & Distributors | 3.9 | % | ||
Internet Software & Services | 3.6 | % | ||
Other | 46.6 | % | ||
Cash & Equivalents — Net (including Options Purchased & Written) | 10.7 | % |
Cumulative Returns Through November 30, 2014
| 5 | Annual Report / November 30, 2014 |
Table of Contents
Important Information (unaudited)
AllianzGI Institutional Multi-Series Trust
AllianzGI Institutional Multi-Series Trust (the “Trust”) currently consists of the AllianzGI Global Small-Cap Opportunities Portfolio and AllianzGI U.S. Unconstrained Equity Portfolio (each a “Portfolio” and collectively the “Portfolios”). The Portfolios each currently offer one share class.
The Cumulative Returns chart for each Portfolio assumes the initial investment was made on the first day of the Portfolio’s initial fiscal year. Results assume that all dividends and capital gain distributions were reinvested. They do not take into account the effect of taxes. The benchmark cumulative return began on the last day of the month of each Portfolio’s inception date.
The following disclosure provides important information regarding each Portfolio’s Shareholder Expense Example, which appears on each Portfolio Summary page in this Annual report. Please refer to this information when reviewing the Shareholder Expense Example for a Portfolio.
Shareholder Expense Example
Shareholders incur two types of costs: (1) transaction costs; and (2) ongoing costs, including investment management fees, distribution and/or service (12b-1) fees, and other Portfolio expenses. The Shareholder Expense Example is intended to help shareholders understand ongoing costs (in dollars) of investing in a Portfolio and to compare these costs with the ongoing costs of investing in other mutual funds. The Shareholder Expense Example is based on an investment of $1,000.00 invested at the beginning of the period, as indicated, and held for the entire period through November 30, 2014.
Actual Expenses
The information in the table for “Actual Performance” provides information about actual account values and actual expenses. You may use the information in these columns, together with the amount you invested, to estimate the expenses that you paid over the period. Simply divide your account value by $1,000.00 (for example, an $8,600.00 account value divided by $1,000.00 = 8.6), then multiply the result by the number in the column entitled “Expenses Paid During Period” to estimate the expenses you paid on your account during this period.
Hypothetical Example for Comparison Purposes
The information in the table for “Hypothetical Performance (5% return before expenses)” provides information about hypothetical account values and hypothetical expenses based on a Portfolio’s actual expense ratio and an assumed rate of return of 5% per year before expenses, which is not the Portfolio’s actual return. The hypothetical account values and expenses may not be used to estimate the actual ending account balance or expenses you paid for the period. You may use this information to compare the ongoing costs of investing in a Portfolio and other funds. To do so, compare this 5% hypothetical example with the 5% hypothetical examples that appear in the shareholder reports of other funds.
Please note that the expenses shown in the table are meant to highlight your ongoing costs only and do not reflect any transactional costs. Therefore, the information for “Hypothetical Performance (5% return before expenses)” is useful in comparing ongoing costs only, and will not help you determine the relative total costs of owning different funds. In addition, if these transactional costs were included, your costs would have been higher.
Proxy Voting
The Trust’s Investment Manager and Sub-Adviser have adopted written proxy voting policies and procedures (“Proxy Policy”) as required by Rule 206(4)-6 under the Investment Advisers Act of 1940. The Proxy Policy has been adopted by the Trust as the policies and procedures that the Sub-Adviser will use when voting proxies on behalf of the Portfolio. Copies of the written Proxy Policy and the factors that the Sub-Adviser may consider in determining how to vote proxies for the Portfolios, and information about how the Portfolios voted proxies relating to portfolio securities held during the most recent twelve-month period ended June 30, are available without charge, upon request, by calling 1-800-498-5413, on the Allianz Global Investors Distributors website at us.allianzgi.com and on the Securities and Exchange Commission’s (“SEC”) website at http://www.sec.gov.
Form N-Q
The Trust files its complete schedule of the portfolio holdings with the SEC on Form N-Q for the first and third quarters of each fiscal year, which are available on the SEC’s website at http://www.sec.gov. A copy of the Trust’s Form N-Q is available without charge, upon request, by calling 1-800-498-5413. In addition, the Trust’s Form N-Q may be reviewed and copied at the SEC’s Public Reference Room in Washington, DC. Information on the operation of the Public Reference Room may be obtained by calling 1-800-SEC-0330.
| 6 | Annual Report / November 30, 2014 |
Table of Contents
November 30, 2014
AllianzGI Global Small-Cap Opportunities Portfolio
| Shares | Value | |||||||
COMMON STOCK—99.3% | ||||||||
Australia—1.9% | ||||||||
Qantas Airways Ltd. (c) | 21,303 | $ | 34,757 | |||||
Sirtex Medical Ltd. | 701 | 15,841 | ||||||
Western Areas Ltd. | 11,423 | 41,244 | ||||||
|
| |||||||
| 91,842 | ||||||||
|
| |||||||
Austria—1.2% | ||||||||
Verbund AG | 3,037 | 60,198 | ||||||
|
| |||||||
Belgium—0.3% | ||||||||
KBC Ancora (c) | 429 | 14,194 | ||||||
|
| |||||||
Brazil—0.4% | ||||||||
Light S.A. | 2,200 | 17,600 | ||||||
|
| |||||||
Canada—8.5% | ||||||||
Canadian Real Estate Investment Trust | 1,870 | 79,575 | ||||||
Cogeco Cable, Inc. | 846 | 48,074 | ||||||
Dream Industrial Real Estate Investment Trust | 3,527 | 27,636 | ||||||
Hudson’s Bay Co. | 1,901 | 40,181 | ||||||
Just Energy Group, Inc. | 4,909 | 24,041 | ||||||
Northland Power, Inc. | 5,918 | 86,791 | ||||||
Veresen, Inc. | 6,995 | 109,436 | ||||||
|
| |||||||
| 415,734 | ||||||||
|
| |||||||
China—0.5% | ||||||||
Shenzhen Expressway Co., Ltd., Class H | 38,000 | 26,205 | ||||||
|
| |||||||
France—0.7% | ||||||||
APERAM SA (c) | 1,128 | 36,187 | ||||||
|
| |||||||
Hong Kong—0.4% | ||||||||
Esprit Holdings Ltd. | 13,700 | 17,813 | ||||||
|
| |||||||
India—0.4% | ||||||||
WNS Holdings Ltd. ADR (c) | 1,000 | 20,430 | ||||||
|
| |||||||
Indonesia—2.0% | ||||||||
Multipolar Tbk PT | 645,100 | 48,644 | ||||||
Salim Ivomas Pratama Tbk PT | 294,700 | 18,110 | ||||||
Wijaya Karya Persero Tbk PT | 126,600 | 31,209 | ||||||
|
| |||||||
| 97,963 | ||||||||
|
| |||||||
Ireland—1.9% | ||||||||
ICON PLC (c) | 1,650 | 91,641 | ||||||
|
| |||||||
Israel—1.1% | ||||||||
Isramco Negev 2 L.P. (c) | 266,000 | 52,692 | ||||||
|
| |||||||
Japan—6.2% | ||||||||
Fancl Corp. | 1,500 | 18,532 | ||||||
Futaba Industrial Co., Ltd. | 8,700 | 44,852 | ||||||
Hokuriku Electric Power Co. | 8,100 | 103,570 | ||||||
Kuroda Electric Co., Ltd. | 2,900 | 37,001 | ||||||
Nippon Steel & Sumikin Bussan Corp. | 7,000 | 25,218 | ||||||
Sankyu, Inc. | 14,000 | 54,663 | ||||||
Yorozu Corp. | 1,200 | 20,753 | ||||||
|
| |||||||
| 304,589 | ||||||||
|
| |||||||
Korea (Republic of)—4.6% | ||||||||
CJ Korea Express Co., Ltd. (c) | 185 | 32,873 | ||||||
GS Engineering & Construction Corp. (c) | 1,605 | 38,725 | ||||||
Hanil Cement Co., Ltd. | 667 | 80,016 | ||||||
Korea Electric Terminal Co., Ltd. | 261 | 14,181 | ||||||
OCI Materials Co., Ltd. | 445 | 22,010 | ||||||
Sungwoo Hitech Co., Ltd. | 2,768 | 35,526 | ||||||
|
| |||||||
| 223,331 | ||||||||
|
| |||||||
New Zealand—0.6% | ||||||||
Kiwi Income Property Trust REIT | 33,868 | 31,862 | ||||||
|
| |||||||
| See accompanying Notes to Financial Statements | 7 | Annual Report / November 30, 2014 |
Table of Contents
| Shares | Value | |||||||
Singapore—0.7% | ||||||||
United Engineers Ltd. | 14,000 | $ | 32,075 | |||||
|
| |||||||
South Africa—0.7% | ||||||||
Hyprop Investments Ltd. | 2,726 | 23,975 | ||||||
Resilient Property Income Fund Ltd. | 1,626 | 12,907 | ||||||
|
| |||||||
| 36,882 | ||||||||
|
| |||||||
Sweden—3.0% | ||||||||
Industrivarden AB, Class A | 2,861 | 54,004 | ||||||
Meda AB, Class A | 4,202 | 60,260 | ||||||
SSAB AB, Class A (c) | 4,383 | 31,026 | ||||||
|
| |||||||
| 145,290 | ||||||||
|
| |||||||
Switzerland—2.1% | ||||||||
Chocoladefabriken Lindt & Sprungli AG | 15 | 75,489 | ||||||
Siegfried Holding AG (c) | 181 | 29,621 | ||||||
|
| |||||||
| 105,110 | ||||||||
|
| |||||||
Taiwan—2.9% | ||||||||
Acer, Inc. (c) | 98,000 | 62,062 | ||||||
Pegatron Corp. | 23,000 | 53,325 | ||||||
Silicon Motion Technology Corp. ADR | 1,050 | 24,528 | ||||||
|
| |||||||
| 139,915 | ||||||||
|
| |||||||
United Kingdom—6.4% | ||||||||
Capital & Counties Properties PLC | 4,590 | 26,976 | ||||||
Derwent London PLC REIT | 1,733 | 82,154 | ||||||
Fresnillo PLC | 3,093 | 34,251 | ||||||
Great Portland Estates PLC REIT | 2,079 | 23,291 | ||||||
Shaftesbury PLC REIT | 6,484 | 80,982 | ||||||
Workspace Group PLC REIT | 3,518 | 37,806 | ||||||
Xchanging PLC | 11,262 | 30,137 | ||||||
|
| |||||||
| 315,597 | ||||||||
|
| |||||||
United States—52.8% | ||||||||
Acadia Healthcare Co., Inc. (c) | 1,750 | 108,517 | ||||||
AG Mortgage Investment Trust, Inc. REIT | 2,970 | 58,658 | ||||||
Albany Molecular Research, Inc. (c) | 1,900 | 30,913 | ||||||
Amsurg Corp. (c) | 1,585 | 81,738 | ||||||
Andersons, Inc. (b) | 1,030 | 55,661 | ||||||
ARRIS Group, Inc. (c) | 1,100 | 32,747 | ||||||
Aruba Networks, Inc. (c) | 1,930 | 36,110 | ||||||
Avis Budget Group, Inc. (c) | 700 | 42,105 | ||||||
Bank of the Ozarks, Inc. | 1,345 | 48,689 | ||||||
Cal-Maine Foods, Inc. (b) | 860 | 36,017 | ||||||
Centene Corp. (c) | 390 | 38,520 | ||||||
Century Aluminum Co. (c) | 3,580 | 98,987 | ||||||
Diamond Foods, Inc. (c) | 1,710 | 50,941 | ||||||
DSW, Inc., Class A | 1,150 | 40,802 | ||||||
Entegris, Inc. (c) | 5,070 | 68,293 | ||||||
FelCor Lodging Trust, Inc. REIT | 4,700 | 48,974 | ||||||
First Bancorp | 3,680 | 62,854 | ||||||
Greenbrier Cos., Inc. | 850 | 47,158 | ||||||
Hanover Insurance Group, Inc. | 400 | 28,512 | ||||||
Health Net, Inc. (c) | 1,110 | 57,032 | ||||||
Huntington Ingalls Industries, Inc. | 1,000 | 108,970 | ||||||
Jazz Pharmaceuticals PLC (c) | 185 | 32,762 | ||||||
Lear Corp. | 300 | 28,773 | ||||||
LifePoint Hospitals, Inc. (c) | 1,220 | 84,412 | ||||||
Mallinckrodt PLC (c) | 920 | 84,842 | ||||||
Meritor, Inc. (c) | 1,590 | 22,387 | ||||||
Methode Electronics, Inc. | 430 | 16,663 | ||||||
Oxford Industries, Inc. | 1,400 | 92,722 | ||||||
Palo Alto Networks, Inc. (c) | 580 | 71,340 | ||||||
Resource Capital Corp. REIT | 2,565 | 13,518 | ||||||
RF Micro Devices, Inc. (c) | 5,480 | 80,063 | ||||||
Salix Pharmaceuticals Ltd. (c) | 330 | 33,888 | ||||||
Sanmina Corp. (c) | 1,410 | 34,686 | ||||||
Select Medical Holdings Corp. (b) | 3,100 | 44,733 | ||||||
Skyworks Solutions, Inc. | 1,950 | 131,566 | ||||||
Spirit Airlines, Inc. (c) | 600 | 49,614 | ||||||
Strategic Hotels & Resorts, Inc. REIT (c) | 8,760 | 116,333 | ||||||
Symetra Financial Corp. | 4,530 | 102,650 | ||||||
Two Harbors Investment Corp. REIT | 7,190 | 75,567 | ||||||
VCA, Inc. (c) | 810 | 38,337 | ||||||
VeriFone Systems, Inc. (c) | 2,300 | 82,018 | ||||||
Wendy’s Co. | 8,920 | 77,782 | ||||||
WhiteWave Foods Co. (c) | 2,450 | 89,744 | ||||||
|
| |||||||
| 2,586,598 | ||||||||
|
| |||||||
| See accompanying Notes to Financial Statements | 8 | Annual Report / November 30, 2014 |
Table of Contents
| Value | ||||
Total Investments (cost-$4,874,281) (a)-99.3% | $ | 4,863,748 | ||
Other assets less liabilities-0.7% | 35,637 | |||
|
| |||
Net Assets-100.0% | $ | 4,899,385 | ||
|
| |||
Notes to Schedule of Investments:
| (a) | Securities with an aggregate value of $1,618,348, representing 33.0% of net assets, were valued utilizing modeling tools provided by a third-party vendor. See Note 1(a) and Note 1(b) in the Notes to Financial Statements. |
| (b) | Affiliated security. |
| (c) | Non-income producing. |
Glossary:
ADR - American Depositary Receipt
REIT - Real Estate Investment Trust
See accompanying Notes to Financial Statements |
9 |
Annual Report / November 30, 2014 |
Table of Contents
Schedule of Investments
November 30, 2014
AllianzGI Global Small-Cap Opportunities Portfolio
The industry classification of portfolio holdings and other assets less liabilities shown as a percentage of net assets were as follows:
Real Estate Investment Trust | 14.5 | % | ||
Health Care Providers & Services | 9.3 | % | ||
Semiconductors & Semiconductor Equipment | 6.2 | % | ||
Food Products | 5.4 | % | ||
Metals & Mining | 5.0 | % | ||
Pharmaceuticals | 4.3 | % | ||
Electric Utilities | 3.7 | % | ||
Oil, Gas & Consumable Fuels | 3.3 | % | ||
Life Sciences Tools & Services | 3.1 | % | ||
Communications Equipment | 2.9 | % | ||
IT Services | 2.7 | % | ||
Insurance | 2.7 | % | ||
Road & Rail | 2.7 | % | ||
Auto Components | 2.6 | % | ||
Technology Hardware, Storage & Peripherals | 2.4 | % | ||
Banks | 2.3 | % | ||
Aerospace & Defense | 2.2 | % | ||
Construction & Engineering | 2.1 | % | ||
Textiles, Apparel & Luxury Goods | 1.9 | % | ||
Multi-line Retail | 1.8 | % | ||
Independent Power Producers & Energy Traders | 1.8 | % | ||
Airlines | 1.7 | % | ||
Construction Materials | 1.6 | % | ||
Hotels, Restaurants & Leisure | 1.6 | % | ||
Machinery | 1.5 | % | ||
Diversified Financial Services | 1.4 | % | ||
Trading Companies & Distributors | 1.3 | % | ||
Specialty Retail | 1.2 | % | ||
Food & Staples Retailing | 1.1 | % | ||
Electronic Equipment, Instruments & Components | 1.0 | % | ||
Media | 1.0 | % | ||
Real Estate Management & Development | 0.5 | % | ||
Transportation Infrastructure | 0.5 | % | ||
Multi-Utilities | 0.5 | % | ||
Chemicals | 0.5 | % | ||
Personal Products | 0.4 | % | ||
Biotechnology | 0.3 | % | ||
Electrical Equipment | 0.3 | % | ||
Other assets less liabilities | 0.7 | % | ||
|
| |||
| 100.0 | % | |||
|
|
| See accompanying Notes to Financial Statements | 10 | Annual Report / November 30, 2014 |
Table of Contents
Schedule of Investments
November 30, 2014
AllianzGI U.S. Unconstrained Equity Portfolio
| Shares | Value | |||||||
COMMON STOCK (a)—89.3% | ||||||||
Airlines—3.1% | ||||||||
United Continental Holdings, Inc. (b) | 1,500 | $ | 91,845 | |||||
|
| |||||||
Auto Components—1.7% | ||||||||
Delphi Automotive PLC | 700 | 51,065 | ||||||
|
| |||||||
Banks—2.3% | ||||||||
First Republic Bank | 1,300 | 66,989 | ||||||
|
| |||||||
Biotechnology—7.8% | ||||||||
Biogen Idec, Inc. (b) | 450 | 138,460 | ||||||
Gilead Sciences, Inc. (b) | 900 | 90,288 | ||||||
|
| |||||||
| 228,748 | ||||||||
|
| |||||||
Capital Markets—2.0% | ||||||||
Ameriprise Financial, Inc. | 450 | 59,297 | ||||||
|
| |||||||
Chemicals—4.3% | ||||||||
Ecolab, Inc. | 700 | 76,265 | ||||||
LyondellBasell Industries NV, Class A | 650 | 51,259 | ||||||
|
| |||||||
| 127,524 | ||||||||
|
| |||||||
Communications Equipment—3.3% | ||||||||
Palo Alto Networks, Inc. (b) | 800 | 98,400 | ||||||
|
| |||||||
Construction & Engineering—1.7% | ||||||||
Tutor Perini Corp. (b) | 2,000 | 50,500 | ||||||
|
| |||||||
Diversified Financial Services—2.0% | ||||||||
CBOE Holdings, Inc. | 1,000 | 59,910 | ||||||
|
| |||||||
Electrical Equipment—2.2% | ||||||||
AMETEK, Inc. | 1,250 | 63,700 | ||||||
|
| |||||||
Energy Equipment & Services—0.9% | ||||||||
Weatherford International PLC (b) | 2,000 | 26,200 | ||||||
|
| |||||||
Food & Staples Retailing—3.1% | ||||||||
CVS Health Corp. | 1,000 | 91,360 | ||||||
|
| |||||||
Health Care Providers & Services—2.4% | ||||||||
HCA Holdings, Inc. (b) | 1,000 | 69,690 | ||||||
|
| |||||||
Hotels, Restaurants & Leisure—2.8% | ||||||||
Burger King Worldwide, Inc. | 1,200 | 43,608 | ||||||
Texas Roadhouse, Inc. | 1,200 | 39,672 | ||||||
|
| |||||||
| 83,280 | ||||||||
|
| |||||||
Insurance—3.4% | ||||||||
American International Group, Inc. | 1,800 | 98,640 | ||||||
|
| |||||||
Internet & Catalog Retail—4.0% | ||||||||
EVINE Live, Inc. (b) | 10,000 | 61,400 | ||||||
HomeAway, Inc. (b) | 1,800 | 56,448 | ||||||
|
| |||||||
| 117,848 | ||||||||
|
| |||||||
Internet Software & Services—3.6% | ||||||||
Facebook, Inc., Class A (b) | 1,000 | 77,700 | ||||||
Yelp, Inc. (b) | 500 | 28,545 | ||||||
|
| |||||||
| 106,245 | ||||||||
|
| |||||||
Machinery—2.1% | ||||||||
WABCO Holdings, Inc. (b) | 600 | 61,572 | ||||||
|
| |||||||
Media—2.7% | ||||||||
Scripps Networks Interactive, Inc., Class A | 1,000 | 78,170 | ||||||
|
| |||||||
Metals & Mining—0.5% | ||||||||
Noranda Aluminum Holding Corp. | 4,000 | 15,240 | ||||||
|
| |||||||
Oil, Gas & Consumable Fuels—3.2% | ||||||||
Pioneer Natural Resources Co. | 300 | 42,969 | ||||||
Range Resources Corp. | 800 | 52,520 | ||||||
|
| |||||||
| 95,489 | ||||||||
|
| |||||||
| See accompanying Notes to Financial Statements | 11 | Annual Report / November 30, 2014 |
Table of Contents
| Shares | Value | |||||||
Pharmaceuticals—4.5% | ||||||||
Mallinckrodt PLC (b) | 700 | $ | 64,554 | |||||
Salix Pharmaceuticals Ltd. (b) | 650 | 66,748 | ||||||
|
| |||||||
| 131,302 | ||||||||
|
| |||||||
Real Estate Investment Trust—3.6% | ||||||||
American Tower Corp. | 1,000 | 105,010 | ||||||
|
| |||||||
Road & Rail—6.4% | ||||||||
Hertz Global Holdings, Inc. (b) | 3,000 | 71,220 | ||||||
Union Pacific Corp. | 1,000 | 116,770 | ||||||
|
| |||||||
| 187,990 | ||||||||
|
| |||||||
Semiconductors & Semiconductor Equipment—2.0% | ||||||||
Tower Semiconductor Ltd. (b) | 4,500 | 57,870 | ||||||
|
| |||||||
Software—1.6% | ||||||||
Microsoft Corp. | 1,000 | 47,810 | ||||||
|
| |||||||
Technology Hardware, Storage & Peripherals—8.2% | ||||||||
Apple, Inc. | 1,300 | 154,609 | ||||||
Hewlett-Packard Co. | 2,250 | 87,885 | ||||||
|
| |||||||
| 242,494 | ||||||||
|
| |||||||
Trading Companies & Distributors—3.9% | ||||||||
Air Lease Corp. | 1,500 | 57,045 | ||||||
United Rentals, Inc. (b) | 500 | 56,655 | ||||||
|
| |||||||
| 113,700 | ||||||||
|
| |||||||
Total Common Stock (cost-$2,581,232) | 2,627,888 | |||||||
|
| |||||||
| Principal | ||||||||
| Amount | ||||||||
| (000s) | ||||||||
Repurchase Agreements—12.6% | ||||||||
State Street Bank and Trust Co., dated 11/28/14, 0.00%, due 12/1/14, proceeds $372,000; collateralized by U.S. Treasury Notes, 2.25%, due 3/31/21, valued at $380,175 including accrued interest (cost-$372,000) | $ | 372 | 372,000 | |||||
|
| |||||||
| Contracts | ||||||||
OPTIONS PURCHASED (b)(c)—1.4% | ||||||||
Call Options—1.4% | ||||||||
Citigroup, Inc., | ||||||||
strike price $55.00, | ||||||||
expires 3/20/15 | 25 | 4,538 | ||||||
strike price $57.50, | ||||||||
expires 3/20/15 | 12 | 1,080 | ||||||
Russell 2000 Index, | ||||||||
strike price $1,150.00, | ||||||||
expires 6/19/15 | 4 | 30,660 | ||||||
WhiteWave Foods Co., | ||||||||
strike price $40.00, | ||||||||
expires 4/17/15 | 18 | 2,880 | ||||||
|
| |||||||
| 39,158 | ||||||||
|
| |||||||
Put Options—0.0% | ||||||||
Palo Alto Networks, Inc., | ||||||||
strike price $107.00, | ||||||||
expires 12/20/14 | 4 | 210 | ||||||
|
| |||||||
Total Options Purchased (cost-$27,096) | 39,368 | |||||||
|
| |||||||
Total Investments, before options written (cost-$2,980,328)-103.3% | 3,039,256 | |||||||
|
| |||||||
OPTIONS WRITTEN (b)(c)—(0.1)% | ||||||||
Put Options—(0.1)% | ||||||||
Palo Alto Networks, Inc., | ||||||||
strike price $101.00, | ||||||||
expires 12/20/14 | 4 | (110 | ) | |||||
WhiteWave Foods Co., | ||||||||
strike price $32.50, | ||||||||
expires 4/17/15 | 18 | (1,710 | ) | |||||
|
| |||||||
Total Options Written (premiums received-$3,272) | (1,820 | ) | ||||||
|
| |||||||
| See accompanying Notes to Financial Statements | 12 | Annual Report / November 30, 2014 |
Table of Contents
| Value | ||||
Total Investments, net of options written (cost-$2,977,056)-103.2% | $ | 3,037,436 | ||
Other liabilities in excess of other assets-(3.2)% | (94,320 | ) | ||
|
| |||
Net Assets-100.0% | $ | 2,943,116 | ||
|
| |||
Notes to Schedule of Investments:
| (a) | All or partial amount segregated for the benefit of the counterparty as collateral for options written. |
| (b) | Non-income producing. |
| (c) | Exchange traded-Chicago Board Options Exchange. |
| See accompanying Notes to Financial Statements | 13 | Annual Report / November 30, 2014 |
Table of Contents
Statements of Assets and Liabilities
November 30, 2014
| AllianzGI Global | AllianzGI U.S. | |||||||
| Small-Cap | Unconstrained | |||||||
| Opportunities | Equity | |||||||
Assets: | ||||||||
Investments, at value | $ | 4,727,337 | $ | 2,667,256 | ||||
Investments in Affiliates, at value | 136,411 | — | ||||||
Repurchase agreements, at value | — | 372,000 | ||||||
Cash | 38,554 | 475 | ||||||
Foreign currency, at value | 32,872 | — | ||||||
Deferred offering costs | 25,753 | 23,342 | ||||||
Receivable from Investment Manager | 15,553 | 15,360 | ||||||
Dividends and interest receivable (net of foreign taxes) | 5,211 | 1,715 | ||||||
Receivable for investments sold | 2,445 | 51,296 | ||||||
Dividends receivable from Affiliates | 310 | — | ||||||
Tax reclaims receivable | 72 | — | ||||||
Prepaid expenses | — | 129 | ||||||
|
|
|
| |||||
Total Assets | 4,984,518 | 3,131,573 | ||||||
|
|
|
| |||||
Liabilities: | ||||||||
Payable for investments purchased | — | 100,573 | ||||||
Due to Investment Manager | 25,753 | 23,342 | ||||||
Options written, at value | — | 1,820 | ||||||
Accrued expenses | 59,380 | 62,722 | ||||||
|
|
|
| |||||
Total Liabilities | 85,133 | 188,457 | ||||||
|
|
|
| |||||
Net Assets | $ | 4,899,385 | $ | 2,943,116 | ||||
|
|
|
| |||||
Net Assets Consist of: | ||||||||
Paid-in-capital | $ | 5,000,000 | $ | 2,995,005 | ||||
Undistributed net investment income | 13,155 | — | ||||||
Accumulated net realized loss | (102,253 | ) | (112,269 | ) | ||||
Net unrealized appreciation (depreciation) | (11,517 | ) | 60,380 | |||||
|
|
|
| |||||
Net Assets | $ | 4,899,385 | $ | 2,943,116 | ||||
|
|
|
| |||||
Cost of Investments | $ | 4,716,930 | $ | 2,608,328 | ||||
Cost of Investments in Affiliates | $ | 157,351 | $ | — | ||||
Cost of Repurchase Agreements | $ | — | $ | 372,000 | ||||
Cost of Foreign Currency | $ | 33,735 | $ | — | ||||
Premiums Received for Options Written | $ | — | $ | 3,272 | ||||
Shares Issued and Outstanding | 333,333 | 200,000 | ||||||
|
|
|
| |||||
Net Asset Value and Redemption Price Per Share* | $ | 14.70 | $ | 14.72 | ||||
|
|
|
| |||||
| * | Net asset value and redemption price per share may not recalculate exactly due to rounding. |
| See accompanying Notes to Financial Statements | 14 | Annual Report / November 30, 2014 |
Table of Contents
Periods ended November 30, 2014
| AllianzGI Global Small-Cap Opportunities (1) | AllianzGI U.S. Unconstrained Equity (2) | |||||||
Investment Income: | ||||||||
Dividends, net of foreign withholding taxes* | $ | 35,116 | $ | 7,263 | ||||
Dividends from investments in Affiliates | 976 | — | ||||||
|
|
|
| |||||
Total Investment Income | 36,092 | 7,263 | ||||||
|
|
|
| |||||
Expenses: | ||||||||
Investment management | 15,633 | 9,194 | ||||||
Organizational | 60,000 | 60,000 | ||||||
Audit and tax services | 31,906 | 33,956 | ||||||
Custodian and accounting agent | 19,926 | 19,659 | ||||||
Offering | 14,247 | 16,658 | ||||||
Legal | 3,562 | 4,165 | ||||||
Transfer agent | 2,350 | 2,748 | ||||||
Shareholder communications | 1,959 | 2,291 | ||||||
Trustees | 213 | 249 | ||||||
Insurance | — | 74 | ||||||
Miscellaneous | 3,340 | 416 | ||||||
|
|
|
| |||||
Total Expenses | 153,136 | 149,410 | ||||||
|
|
|
| |||||
Less: Reimbursement from Investment Manager | (132,292 | ) | (137,152 | ) | ||||
Net Expenses | 20,844 | 12,258 | ||||||
Net Investment Income (Loss) | 15,248 | (4,995 | ) | |||||
Realized and Unrealized Gain (Loss): | ||||||||
Net realized gain (loss) on: | ||||||||
Investments | (96,797 | ) | (112,915 | ) | ||||
Investments in Affiliates | (4,905 | ) | — | |||||
Options written | — | 646 | ||||||
Foreign currency transactions | (2,644 | ) | — | |||||
Net unrealized appreciation/depreciation of: | ||||||||
Investments | 10,407 | 58,928 | ||||||
Investments in Affiliates | (20,940 | ) | — | |||||
Options written | — | 1,452 | ||||||
Foreign currency transactions | (984 | ) | — | |||||
Net realized and unrealized loss | (115,863 | ) | (51,889 | ) | ||||
|
|
|
| |||||
Net Decrease in Net Assets Resulting from Investment Operations | $ | (100,615 | ) | $ | (56,884 | ) | ||
|
|
|
| |||||
*Foreign withholding taxes | $ | 3,272 | — | |||||
|
|
|
| |||||
| (1) | Commencement of operations, July 23, 2014. |
| (2) | Commencement of operations, July 1, 2014. |
| See accompanying Notes to Financial Statements | 15 | Annual Report / November 30, 2014 |
Table of Contents
Statements of Changes in Net Assets
| AllianzGI Global Small-Cap Opportunities | AllianzGI U.S. Unconstrained Equity | |||||||
| Period from July 23, 2014** through November 30, 2014 | Period from July 1, 2014** through November 30, 2014 | |||||||
Increase (Decrease) in Net Assets from: | ||||||||
Investment Operations: | ||||||||
Net investment income (loss) | $ | 15,248 | $ | (4,995 | ) | |||
Net realized loss | (104,346 | ) | (112,269 | ) | ||||
Net unrealized appreciation/depreciation | (11,517 | ) | 60,380 | |||||
Net decrease in net assets resulting from investment operations | (100,615 | ) | (56,884 | ) | ||||
Net Assets: | ||||||||
Beginning of period | 5,000,000 | 3,000,000 | ||||||
End of period* | $ | 4,899,385 | $ | 2,943,116 | ||||
*Including undistributed net investment income of: | $ | 13,155 | $ | — | ||||
| ** | Commencement of operations. |
| See accompanying Notes to Financial Statements | 16 | Annual Report / November 30, 2014 |
Table of Contents
AllianzGI Global Small-Cap Opportunities
For a share outstanding throughout each period:
| For the period July 23, 2014* through November 30, 2014 | ||||
Net asset value, beginning of period | $ | 15.00 | ||
Investment Operations: | ||||
Net investment income (a) | 0.05 | |||
Net realized and unrealized loss | (0.35 | ) | ||
|
| |||
Total from investment operations | (0.30 | ) | ||
|
| |||
Net asset value, end of period | $ | 14.70 | ||
|
| |||
Total Return (b) | (2.00 | )% | ||
|
| |||
RATIOS/SUPPLEMENTAL DATA: | ||||
Net assets, end of period (000’s) | $ | 4,899 | ||
Ratio of expenses to average net assets with fee reimbursement | 1.20 | %(c) | ||
Ratio of expenses to average net assets without fee reimbursement | 4.88 | %(c) | ||
Ratio of net investment income to average net assets | 0.88 | %(c) | ||
Portfolio turnover rate | 56 | % | ||
AllianzGI U.S. Unconstrained Equity
For a share outstanding throughout each period:
| For the period July 1, 2014* through November 30, 2014 | ||||
Net asset value, beginning of period | $ | 15.00 | ||
Investment Operations: | ||||
Net investment loss (a) | (0.02 | ) | ||
Net realized and unrealized loss | (0.26 | ) | ||
|
| |||
Total from investment operations | (0.28 | ) | ||
|
| |||
Net asset value, end of period | $ | 14.72 | ||
|
| |||
Total Return (b) | (1.87 | )% | ||
|
| |||
RATIOS/SUPPLEMENTAL DATA: | ||||
Net assets, end of period (000’s) | $ | 2,943 | ||
Ratio of expenses to average net assets with fee reimbursement | 1.00 | %(c) | ||
Ratio of expenses to average net assets without fee reimbursement | 6.92 | %(c) | ||
Ratio of net investment loss to average net assets | (0.41 | )%(c) | ||
Portfolio turnover rate | 37 | % | ||
| * | Commencement of operations. |
| (a) | Calculated on average shares outstanding. |
| (b) | Total return is calculated assuming a purchase of a share on the first day of the period and a sale of a share on the last day of each period reported. Dividends and distributions, if any, are assumed for purposes of this calculation, to be reinvested. Total return includes the effect of any fee waivers and reimbursements. Total return may reflect adjustments to conform to U.S. GAAP. Total return for a period of less than one year is not annualized. |
| (c) | Annualized. |
| See accompanying Notes to Financial Statements | 17 | Annual Report / November 30, 2014 |
Table of Contents
November 30, 2014
1. ORGANIZATION AND SIGNIFICANT ACCOUNTING POLICIES
AllianzGI Institutional Multi-Series Trust (the “Trust”) was organized on June 3, 2014, as an open-end registered investment company organized as a Massachusetts business trust, and accordingly, follows the investment company accounting and reporting guidance of the Financial Accounting Standards Board (“FASB”) Accounting Standard Codification Topic 946 Financial Services – Investment Companies. As of November 30, 2014, the Trust consisted of two separate investment series (each a “Portfolio” and collectively the “Portfolios”). Allianz Global Investors Fund Management LLC (“AGIFM” or the “Investment Manager”) serves as the Portfolios’ investment manager and Allianz Global Investors U.S. LLC (“AllianzGI U.S.” or the “Sub-Adviser”) serves as the Portfolios’ sub-adviser. AGIFM and AllianzGI U.S. are indirect, wholly-owned subsidiaries of Allianz Asset Management of America L.P. (“AAM”). AAM is an indirect, wholly-owned subsidiary of Allianz SE, a publicly traded European insurance and financial services company. Currently, the Trust offers one class of shares. The following Portfolios sold and issued shares of beneficial interest to Allianz Fund Investments, Inc. (“AFI”), an indirect wholly-owned subsidiary of Allianz SE, during the period ended November 30, 2014:
AllianzGI Global Small-Cap Opportunities
Class | Date | Shares | Amount | |||||||||
Institutional | 7/23/14 | 333,333 | $ | 5,000,000 | ||||||||
AllianzGI U.S. Unconstrained Equity
Class | Date | Shares | Amount | |||||||||
Institutional | 7/1/14 | 200,000 | $ | 3,000,000 | ||||||||
The investment objective of both AllianzGI Global Small-Cap Opportunities and AllianzGI U.S. Unconstrained Equity is to seek long-term capital appreciation. There can be no assurance that the Portfolios will meet their stated objective.
The preparation of the Portfolios’ financial statements in accordance with accounting principles generally accepted in the United States of America (“U.S. GAAP”) requires the Portfolios’ management to make estimates and assumptions that affect the reported amounts and disclosures in each Portfolio’s financial statements. Actual results could differ from those estimates.
In the normal course of business, the Portfolios enter into contracts that contain a variety of representations that provide general indemnifications. The Portfolios’ maximum exposure under these arrangements is unknown as this would involve future claims that may be made against the Portfolios that have not yet occurred.
In June 2014, the FASB issued an Accounting Standards Update (“ASU”) that expands secured borrowing accounting for certain repurchase agreements. The ASU also sets forth additional disclosure requirements for certain transactions accounted for as sales, in order to provide financial statement users with information to compare to similar transactions accounted for as secured borrowings. The ASU is effective prospectively during interim or annual periods beginning after December 15, 2014. At this time, management is evaluating the implications of these changes on the Portfolios’ financial statements.
The following is a summary of significant accounting policies consistently followed by the Portfolios:
(a) Valuation of Investments. Portfolio securities and other financial instruments for which market quotations are readily available are stated at market value. Market value is generally determined on the basis of official closing prices, last reported sales prices, or if no sales or closing prices are reported, on the basis of quotes obtained from a quotation reporting system, established market makers, or independent pricing services. The Portfolios’ investments are valued daily using prices supplied by an independent pricing service or broker/dealer quotations, or by using the last sale or settlement price on the exchange that is the primary market for such securities, or the mean between the last bid and ask quotations. The market value for NASDAQ Global Market and NASDAQ Capital Market securities may also be calculated using the NASDAQ Official Closing Price instead of the last reported sales price. Independent pricing services use information provided by market makers or estimates of market values obtained from yield data relating to investments or securities with similar characteristics.
The Board of Trustees (the “Board”) has adopted procedures for valuing portfolio securities and other financial instruments in circumstances where market quotations are not readily available, and has delegated primary responsibility for applying the valuation methods to the Investment Manager and the Sub-Adviser. The Trust’s Valuation Committee was established by the Board to oversee the implementation of the Portfolios’ valuation methods and to make fair value determinations on behalf of
| 18 | Annual Report / November 30, 2014 |
Table of Contents
Notes to Financial Statements
November 30, 2014 (continued)
the Board, as instructed by the Board. The Sub-Adviser monitors the continued appropriateness of methods applied and determines if adjustments should be made in light of market changes, events affecting the issuer, or other factors. If the Sub-Adviser determines that a valuation method may no longer be appropriate, another valuation method may be selected or the Valuation Committee will be convened to consider the matter and take any appropriate action in accordance with procedures set forth by the Board. The Board shall review and ratify the appropriateness of the valuation methods and these methods may be amended or supplemented from time to time by the Valuation Committee.
Short-term debt instruments maturing in 60 days or less are valued at amortized cost, if their original term to maturity was 60 days or less, or by amortizing premium or discount based on their value on the 61st day prior to maturity, if the original term to maturity exceeded 60 days.
Investments initially valued in currencies other than the U.S. dollar are converted to the U.S. dollar using exchange rates obtained from pricing services. As a result, the net asset value (“NAV”) of each Portfolio may be affected by changes in the value of currencies in relation to the U.S. dollar. The value of securities traded in markets outside the United States or denominated in currencies other than the U.S. dollar may be affected significantly on a day that the New York Stock Exchange (“NYSE”) is closed.
The prices used by the Portfolios to value investments may differ from the value that would be realized if the investments were sold, and these differences could be material to the Portfolios’ financial statements. The NAV of each Portfolio is normally determined as of the close of regular trading (normally, 4:00 p.m. Eastern time) on the NYSE on each day the NYSE is open for business.
The prices of certain portfolio securities or financial instruments may be determined at a time prior to the close of regular trading on the NYSE. When fair-valuing the securities, the Portfolios may, among other things, consider significant events (which may be considered to include changes in the value of U.S. securities or securities indices) that occur after the close of the relevant market and before the time the NAV of a Portfolio is calculated. With respect to certain foreign securities, the Portfolios may fair-value securities using modeling tools provided by third-party vendors. The Portfolios have retained a statistical research service to assist in determining the fair value of foreign securities. This service utilizes statistics and programs based on historical performance of markets and other economic data to assist in making fair value estimates. Fair value estimates used by the Portfolios for foreign securities may differ from the value realized from the sale of those securities and the difference could be material to the financial statements. Fair value pricing may require subjective determinations about the value of a security or other assets, and fair values used to determine the NAV of a Portfolio may differ from quoted or published prices, or from prices that are used by others, for the same investments. In addition, the use of fair value pricing may not always result in adjustments to the prices of securities or other assets held by a Portfolio.
(b) Fair Value Measurements. Fair value is defined as the price that would be received to sell an asset or paid to transfer a liability (i.e. the “exit price”) in an orderly transaction between market participants. The three levels of the fair value hierarchy are described below:
| • | Level 1 – quoted prices in active markets for identical investments that the Portfolios have the ability to access |
| • | Level 2 – valuations based on other significant observable inputs, which may include, but are not limited to, quoted prices for similar assets or liabilities, interest rates, yield curves, volatilities, prepayment speeds, loss severities, credit risks and default rates or other market corroborated inputs |
| • | Level 3 – valuations based on significant unobservable inputs (including the Sub-Adviser’s or Valuation Committee’s own assumptions and securities whose price was determined by using a single broker’s quote) |
The valuation techniques used by the Portfolios to measure fair value during the period ended November 30, 2014 were intended to maximize the use of observable inputs and to minimize the use of unobservable inputs.
The Portfolios’ policy is to recognize transfers between levels at the end of the reporting period. An investment asset’s or liability’s level within the fair value hierarchy is based on the lowest level input, individually or in aggregate, that is significant to the fair value measurement. The objective of fair value measurement remains the same even when there is a significant decrease in the volume and level of activity for an asset or liability and regardless of the valuation techniques used. Investments categorized as Level 1 or 2 as of period end may have been transferred between Levels 1 and 2 since the prior period due to changes in the valuation method utilized in valuing the investments.
| 19 | Annual Report / November 30, 2014 |
Table of Contents
Notes to Financial Statements
November 30, 2014 (continued)
The inputs or methodology used for valuing securities are not necessarily an indication of the risk associated with investing in those securities. The following are certain inputs and techniques that the Portfolios generally use to evaluate how to classify each major category of assets and liabilities within Level 2 and Level 3, in accordance with U.S. GAAP.
Equity Securities (Common and Preferred Stock) — Equity securities traded in inactive markets and certain foreign equity securities are valued using inputs which include broker-dealer quotes, recently executed transactions adjusted for changes in the benchmark index, or evaluated price quotes received from independent pricing services that take into account the integrity of the market sector and issuer, the individual characteristics of the security, and information received from broker-dealers and other market sources pertaining to the issuer or security. To the extent that these inputs are observable, the values of equity securities are categorized as Level 2. To the extent that these inputs are unobservable, the values are categorized as Level 3.
Option Contracts — Option contracts traded over-the-counter (“OTC”) and FLexible EXchange (“FLEX”) options are valued by independent pricing services based on pricing models that incorporate various inputs such as interest rates, credit spreads, currency exchange rates and volatility measurements for in-the-money, at-the-money, and out-of-the-money contracts based on a given strike price. To the extent that these inputs are observable, the values of OTC and FLEX option contracts are categorized as Level 2. To the extent that these inputs are unobservable, the values are categorized as Level 3.
A summary of the inputs used at November 30, 2014 in valuing each Portfolio’s assets and liabilities is listed below (refer to the Schedules of Investments for more detailed information on Investments in Securities):
AllianzGI Global Small-Cap Opportunities:
| Level 1 - Quoted Prices | Level 2 - Other Significant Observable Inputs | Level 3 - Significant Unobservable Inputs | Value at 11/30/14 | |||||||||||||
Investments in Securities—Assets | ||||||||||||||||
Common Stock: | ||||||||||||||||
Australia | $ | — | $ | 91,842 | $ | — | $ | 91,842 | ||||||||
Austria | — | 60,198 | — | 60,198 | ||||||||||||
Belgium | — | 14,194 | — | 14,194 | ||||||||||||
China | — | 26,205 | — | 26,205 | ||||||||||||
France | — | 36,187 | — | 36,187 | ||||||||||||
Hong Kong | — | 17,813 | — | 17,813 | ||||||||||||
Indonesia | — | 97,963 | — | 97,963 | ||||||||||||
Israel | — | 52,692 | — | 52,692 | ||||||||||||
Japan | — | 304,589 | — | 304,589 | ||||||||||||
Korea (Republic of) | 14,181 | 209,150 | — | 223,331 | ||||||||||||
New Zealand | — | 31,862 | — | 31,862 | ||||||||||||
Singapore | — | 32,075 | — | 32,075 | ||||||||||||
Sweden | — | 145,290 | — | 145,290 | ||||||||||||
Switzerland | — | 105,110 | — | 105,110 | ||||||||||||
Taiwan | 24,528 | 115,387 | — | 139,915 | ||||||||||||
United Kingdom | 37,806 | 277,791 | — | 315,597 | ||||||||||||
All Other | 3,168,885 | — | — | 3,168,885 | ||||||||||||
|
|
|
|
|
|
|
| |||||||||
Totals | $ | 3,245,400 | $ | 1,618,348 | $ | — | $ | 4,863,748 | ||||||||
|
|
|
|
|
|
|
| |||||||||
AllianzGI U.S. Unconstrained Equity:
| Level 1 - Quoted Prices | Level 2 - Other Significant Observable Inputs | Level 3 - Significant Unobservable Inputs | Value at 11/30/14 | |||||||||||||
Investments in Securities—Assets | ||||||||||||||||
Common Stock | $ | 2,627,888 | $ | — | $ | — | $ | 2,627,888 | ||||||||
Repurchase Agreements | — | 372,000 | — | 372,000 | ||||||||||||
Options Purchased: | ||||||||||||||||
Market Price | 39,368 | — | — | 39,368 | ||||||||||||
|
|
|
|
|
|
|
| |||||||||
| 2,667,256 | 372,000 | — | 3,039,256 | |||||||||||||
|
|
|
|
|
|
|
| |||||||||
Investment in Securities—Liabilities | ||||||||||||||||
Options Written, at value: | ||||||||||||||||
Market Price | (1,820 | ) | — | — | (1,820 | ) | ||||||||||
|
|
|
|
|
|
|
| |||||||||
Totals | $ | 2,665,436 | $ | 372,000 | $ | — | $ | 3,037,436 | ||||||||
|
|
|
|
|
|
|
| |||||||||
| 20 | Annual Report / November 30, 2014 |
Table of Contents
Notes to Financial Statements
November 30, 2014 (continued)
(c) Investment Transactions and Investment Income. Investment transactions are accounted for on the trade date. Realized gains and losses on investments are determined on an identified cost basis. Interest income is recorded on an accrual basis. Dividend income is recorded on the ex-dividend date, except for certain dividends from foreign securities where the ex-dividend date may have passed, and then are recorded as soon after the ex-dividend date as the Portfolios, using reasonable diligence, become aware of such dividends. Dividend and interest income on the Statements of Operations are shown net of any foreign taxes withheld on income from foreign securities. Payments received from real estate investment trust securities may be comprised of dividends, realized gains and return of capital. The payment may initially be recorded as dividend income and may subsequently be reclassified as realized gains and/or return of capital upon receipt of information from the issuer. Payments considered return of capital reduce the cost basis of the respective security.
(d) Federal Income Taxes. The Portfolios intend to distribute all of their taxable income and to comply with the other requirements of Subchapter M of the U.S. Internal Revenue Code of 1986, as amended, applicable to regulated investment companies. Accordingly, no provision for U.S. federal income taxes is required. The Portfolios may be subject to excise tax based on distributions to shareholders.
Accounting for uncertainty in income taxes establishes for all entities, including pass-through entities such as the Portfolios, a minimum threshold for financial statement recognition of the benefit of positions taken in filing tax returns (including whether an entity is taxable in a particular jurisdiction), and requires certain expanded tax disclosures. In accordance with provisions set forth under U.S. GAAP, the Investment Manager has reviewed the Portfolios’ tax positions for all open tax years. As of November 30, 2014, the Portfolios have recorded no liability for net unrecognized tax benefits relating to uncertain income tax positions they have taken. The Portfolios’ federal income tax returns since inception remain subject to examination by the Internal Revenue Service.
(e) Dividends and Distributions to Shareholders. The Portfolios declare dividends and distributions from net investment income and net realized capital gains, if any, annually. The Portfolios record dividends and distributions to their respective shareholders on the ex-dividend date. The amount of dividends from net investment income and distributions from net realized capital gains is determined in accordance with federal income tax regulations, which may differ from U.S. GAAP. These “book-tax” differences are considered either temporary or permanent in nature. To the extent these differences are permanent in nature, such amounts are reclassified within the capital accounts based on their federal income tax treatment; temporary differences do not require reclassification. To the extent dividends and/or distributions exceed current and accumulated earnings and profits for federal income tax purposes, they are reported as dividends and/or distributions to shareholders from return of capital. The amount of dividends from net investment income and distributions from net realized capital gains is determined in accordance with federal income tax regulations, which may differ from U.S. GAAP. These “book-tax” differences are considered either temporary or permanent in nature. To the extent these differences are permanent in nature, such amounts are reclassified within the capital accounts based on their federal income tax treatment; temporary differences do not require reclassification. To the extent dividends and/or distributions exceed current and accumulated earnings and profits for federal income tax purposes, they are reported as dividends and/or distributions to shareholders from return of capital.
(f) Foreign Currency Translation. The Portfolios’ accounting records are maintained in U.S. dollars as follows: (1) the foreign currency market values of investments and other assets and liabilities denominated in foreign currencies are translated at the prevailing exchange rate at the end of the period; and (2) purchases and sales, income and expenses are translated at the prevailing exchange rate on the respective dates of such transactions. The resulting net foreign currency gain (loss) is included in the Portfolios’ Statements of Operations.
The Portfolios do not generally isolate that portion of the results of operations arising as a result of changes in foreign currency exchange rates from the fluctuations arising from changes in the market prices of securities. Accordingly, such foreign currency gain (loss) is included in net realized and unrealized gain (loss) on investments. However, the Portfolios do isolate the effect of fluctuations in foreign currency exchange rates when determining the gain (loss) upon the sale or maturity of foreign currency denominated debt obligations pursuant to U.S. federal income tax regulations; such amount is categorized as foreign currency gain (loss) for both financial reporting and income tax reporting purposes.
| 21 | Annual Report / November 30, 2014 |
Table of Contents
Notes to Financial Statements
November 30, 2014 (continued)
(g) Repurchase Agreements. The Portfolios are parties to Master Repurchase Agreements (“Master Repo Agreements”) with select counterparties. The Master Repo Agreements maintain provisions for initiation, income payments, events of default, and maintenance of collateral.
The Portfolios enter into transactions, under the Master Repo Agreements, with their custodian bank or securities brokerage firms whereby they purchase securities under agreements to resell such securities at an agreed upon price and date (“repurchase agreements”). The Portfolios, through their custodian, take possession of securities collateralizing the repurchase agreement. Such agreements are carried at the contract amount in the financial statements, which is considered to represent fair value. Collateral pledged (the securities received), which consists primarily of U.S. government obligations and asset-backed securities, is held by the custodian bank for the benefit of the Portfolios until maturity of the repurchase agreement. Provisions of the repurchase agreements and the procedures adopted by the Portfolios require that the market value of the collateral, including accrued interest thereon, be sufficient in the event of default by the counterparty. If the counterparty defaults under the Master Repo Agreements and the value of the collateral declines or if the counterparty enters an insolvency proceeding, realization of the collateral by the Portfolios may be delayed or limited. The gross values are included in the Portfolios’ Schedules of Investments. The value of the related collateral exceeded the value of the repurchase agreements at November 30, 2014.
(h) Organizational and Offering Costs. Organizational costs are expensed at the inception of the Portfolios. Offering costs are amortized over a twelve-month period from the inception of the Portfolios.
2. PRINCIPAL RISKS
In the normal course of business, the Portfolios trade financial instruments and enter into financial transactions where risk of potential loss exists due to, among other things, changes in the market (market risk) or failure of the other party to a transaction to perform (counterparty risk). The Portfolios are also exposed to other risks such as, but not limited to, interest rate, foreign currency, credit and leverage risks.
To the extent the Portfolios directly invest in foreign currencies or in securities that trade in, and receive revenues in, foreign currencies, or in derivatives that provide exposure to foreign currencies, they will be subject to the risk that those currencies will decline in value relative to the U.S. dollar, or, in the case of hedging positions, that the U.S. dollar will decline in value relative to the currency being hedged. Currency rates in foreign countries may fluctuate significantly over short periods of time for a number of reasons, including economic growth, inflation, changes in interest rates, intervention (or the failure to intervene) by U.S. or foreign governments, central banks or supranational entities such as the International Monetary Fund, or the imposition of currency controls or other political developments in the United States or abroad. As a result, the Portfolios’ investments in foreign currency-denominated securities may reduce the returns of the Portfolios.
The Portfolios are subject to elements of risk not typically associated with investments in the U.S., due to concentrated investments in foreign issuers located in a specific country or region. Such concentrations will subject the Portfolios to additional risks resulting from future political or economic conditions in such country or region and the possible imposition of adverse governmental laws or currency exchange restrictions affecting such country or region, which could cause the securities and their markets to be less liquid and prices more volatile than those of comparable U.S. companies.
The market values of securities may decline due to general market conditions (market risk) which are not specifically related to a particular company, such as real or perceived adverse economic conditions, changes in the general outlook for corporate earnings, changes in interest or currency rates, adverse changes to credit markets or adverse investor sentiment. They may also decline due to factors that affect a particular industry or industries, such as labor shortages or increased production costs and competitive conditions within an industry. Equity securities and equity-related investments generally have greater market price volatility than fixed income securities, although under certain market conditions fixed income securities may have comparable or greater price volatility. Credit ratings downgrades may also negatively affect securities held by the Portfolios. Even when markets perform well, there is no assurance that the investments held by the Portfolios will increase in value along with the broader market. In addition, market risk includes the risk that geopolitical events will disrupt the economy on a national or global level.
The Portfolios are exposed to counterparty risk, or the risk that an institution or other entity with which the Portfolios have unsettled or open transactions will default. The potential loss to the Portfolios could exceed the value of the financial assets recorded in the Portfolios’ financial statements. Financial assets, which potentially expose the Portfolios to counterparty risk,
| 22 | Annual Report / November 30, 2014 |
Table of Contents
Notes to Financial Statements
November 30, 2014 (continued)
consist principally of cash due from counterparties and investments. The Sub-Adviser seeks to minimize the Portfolios’ counterparty risk by performing reviews of each counterparty and by minimizing concentration of counterparty risk by undertaking transactions with multiple customers and counterparties on recognized and reputable exchanges. Delivery of securities sold is only made once the Portfolios have received payment. Payment is made on a purchase once the securities have been delivered by the counterparty. The trade will fail if either party fails to meet its obligation.
3. FINANCIAL DERIVATIVE INSTRUMENTS
Disclosure about derivatives and hedging activities requires qualitative disclosure regarding objectives and strategies for using derivatives, quantitative disclosure about fair value amounts of gains and losses on derivatives, and disclosure about credit-risk-related contingent features in derivative agreements. The disclosure requirements distinguish between derivatives, which are accounted for as “hedges”, and those that do not qualify for such accounting. Although the Portfolios at times use derivatives for hedging purposes, the Portfolios reflect derivatives at fair value and recognize changes in fair value through the Portfolios’ Statements of Operations, and such derivatives do not qualify for hedge accounting treatment.
Option Transactions. The Portfolios purchase put and call options on securities and indices for hedging purposes, risk management purposes or otherwise as part of their investment strategies. The risks associated with purchasing an option include the risk that the Portfolios pay a premium whether or not the option is exercised. Additionally, the Portfolios bear the risk of loss of premiums and changes in market value should the counterparty not perform under the contract. Put and call options purchased are accounted for in the same manner as portfolio securities. The cost of securities acquired through the exercise of call options is increased by the premiums paid. The proceeds from securities sold through the exercise of put options are decreased by the premiums paid.
The Portfolios may write (sell) put and call options on securities and indices to earn premiums, for hedging purposes, risk management purposes or otherwise as part of their investment strategies. When an option is written, the premium received is recorded as an asset with an equal liability that is subsequently marked to market to reflect the market value of the option written. These liabilities, if any, are reflected as options written in the Portfolios’ Statements of Assets and Liabilities. Premiums received from writing options which expire unexercised are recorded on the expiration date as a realized gain. The difference between the premium received and the amount paid on effecting a closing purchase transaction, including brokerage commissions, is also treated as a realized gain, or if the premium is less than the amount paid for the closing purchase transaction, as a realized loss. If a call option written is exercised, the premium is added to the proceeds from the sale of the underlying security in determining whether there has been a realized gain or loss. If a put option written is exercised, the premium reduces the cost basis of the security. In writing an option, the Portfolios bear the market risk of an unfavorable change in the price of the security underlying the written option. Exercise of a written option could result in the Portfolios purchasing a security at a price different from its current market value.
Forward Foreign Currency Contracts. A forward foreign currency contract is an agreement between two parties to buy and sell a currency at a set exchange rate on a future date. The Portfolios enter into these contracts for purposes of increasing exposure to a foreign currency or shifting exposure to foreign currency fluctuations from one country to another. The market value of a forward foreign currency contract fluctuates with changes in foreign currency exchange rates. All commitments are marked to market daily at the applicable exchange rates and any resulting unrealized appreciation or depreciation is recorded. Realized gains or losses are recorded at the time the forward contract matures or by delivery of the currency. Risks may arise upon entering into these contracts from the potential inability of counterparties to meet the terms of their contracts and from unanticipated movements in the value of a foreign currency relative to the U.S. dollar. In addition, these contracts may involve market risk in excess of the unrealized appreciation (depreciation) reflected in the Portfolios’ Statements of Assets and Liabilities.
The following is a summary of the Portfolios’ derivatives categorized by risk exposure.
The effect of derivatives on the Statements of Assets and Liabilities at November 30, 2014:
| 23 | Annual Report / November 30, 2014 |
Table of Contents
Notes to Financial Statements
November 30, 2014 (continued)
AllianzGI U.S. Unconstrained Equity:
Location | Market Price | |||
Asset derivatives: | ||||
Investments, at value (options purchased) | $ | 39,368 | ||
Liability derivatives: | ||||
Options written, at value | $ | (1,820 | ) | |
The effect of derivatives on the Statements of Operations for the period ended November 30, 2014:
AllianzGI U.S. Unconstrained Equity:
Location | Market Price | |||
Net realized gain on: | ||||
Options written | $ | 646 | ||
Net unrealized appreciation/depreciation of: | ||||
Investments (options purchased) | $ | 12,272 | ||
Options written | 1,452 | |||
|
| |||
Total net unrealized appreciation/depreciation | $ | 13,724 | ||
|
| |||
The average volume (measured at each fiscal quarter-end) of derivative activity during the period ended November 30, 2014:
| Options | Options | |||||||
| Purchased | Written | |||||||
| Contracts(1) | Contracts(1) | |||||||
AllianzGI U.S. Unconstrained Equity | 32 | 11 | ||||||
| (1) | Number of contracts |
4. INVESTMENT MANAGER/DISTRIBUTOR
Investment Management Fee. Each Portfolio has an Investment Management Agreement (collectively the “Agreements”) with the Investment Manager. Subject to the supervision of the Trust’s Board, the Investment Manager is responsible for managing, either directly or through others selected by it, each Portfolio’s investment activities, business affairs and administrative matters. Pursuant to the Agreements, the Investment Manager receives an annual fee, payable monthly (net of any fee waivers, reimbursements and recoupment), at an annual rate of each Portfolio’s average daily net assets (the “Investment Management Fee”). Pursuant to its Agreement, AllianzGI Global Small-Cap Opportunities Portfolio pays the Investment Manager an annual fee, payable monthly, at an annual rate of 0.90% of its average daily net assets. Pursuant to its Agreement, AllianzGI U.S. Unconstrained Equity Portfolio pays the Investment Manager an annual fee, payable monthly, at an annual rate of 0.75% of its average daily net assets.
The Investment Manager has retained the Sub-Adviser to manage the Portfolios’ investments. Subject to the supervision of the Investment Manager, the Sub-Adviser is responsible for making all of the Portfolios’ investment decisions. The Investment Manager, not the Portfolios, pays a portion of the fees it receives as Investment Manager to the Sub-Adviser in return for its services.
“Due to Investment Manager” on the Statements of Assets and Liabilities represents the remaining payable for the Portfolios’ offering costs that were paid by the Investment Manager.
| 24 | Annual Report / November 30, 2014 |
Table of Contents
Notes to Financial Statements
November 30, 2014 (continued)
Distribution Fees. Allianz Global Investors Distributors LLC (the “Distributor”), an affiliate of AAM, the Investment Manager and the Sub-Adviser serves as the distributor of the Portfolios’ shares pursuant to a Distribution Contract. The Distributor, for each of the Portfolio, currently receives no compensation in connection with the services it provides under the Distribution Contract.
5. EXPENSE LIMITATION
The Trust and the Investment Manager have entered into an Expense Limitation Agreement.
Portfolio | Expense Limitation | |||
AllianzGI Global Small-Cap Opportunities (1) | 1.20 | % | ||
AllianzGI U.S. Unconstrained Equity (2) | 1.00 | % | ||
| (1) | The Investment Manager has contractually agreed, until November 30, 2015, to irrevocably waive its management fee and/or reimburse the Portfolio, to the extent that Total Annual Portfolio Operating Expenses, excluding interest, taxes, and extraordinary expenses, acquired fund expenses, and certain credits and other expenses, exceed 1.20%. Under the Expense Limitation Agreement, the Investment Manager may recoup waived or reimbursed amounts for three years, provided total expenses, including such recoupment, do not exceed the annual expense limit. The Expense Limitation Agreement is terminable by the Trust upon 90 days’ prior written notice to the Investment Manager or at any time by mutual agreement of the parties. |
| (2) | The Investment Manager has contractually agreed, until November 30, 2015, to irrevocably waive its management fee and/or reimburse the Portfolio, to the extent that Total Annual Portfolio Operating Expenses, excluding interest, taxes, and extraordinary expenses, acquired fund expenses, and certain credits and other expenses, exceed 1.00%. Under the Expense Limitation Agreement, the Investment Manager may recoup waived or reimbursed amounts for three years, provided total expenses, including such recoupment, do not exceed the annual expense limit. The Expense Limitation Agreement is terminable by the Trust upon 90 days’ prior written notice to the Investment Manager or at any time by mutual agreement of the parties. |
The Investment Manager, as per the Expense Limitation Agreement, may recoup reimbursed amounts for a period of up to three years, provided total expenses, including such recoupment, do not exceed the annual expense limit. During the period ended November 30, 2014, the Investment Manager did not recoup any expenses from the Portfolios.
| Unrecouped Expenses Reimbursed through Year ended November 30, | ||||
| 2014 | ||||
AllianzGI Global Small-Cap Opportunities | $ | 132,292 | ||
AllianzGI U.S. Unconstrained Equity | 137,152 | |||
6. INVESTMENTS IN SECURITIES
For the period ended November 30, 2014, purchases and sales of investments, other than short-term securities were:
| Purchases | Sales | |||||||
AllianzGI Global Small-Cap Opportunities | $ | 7,686,226 | $ | 2,707,797 | ||||
AllianzGI U.S. Unconstrained Equity | 3,659,077 | 958,960 | ||||||
Transactions in options written for the period ended November 30, 2014:
AllianzGI U.S. Unconstrained Equity:
| Contracts | Premiums | |||||||
Options outstanding, July 1, 2014* | — | $ | — | |||||
Options written | 39 | 7,862 | ||||||
Options terminated in closing transactions | (17 | ) | (4,590 | ) | ||||
|
|
|
| |||||
Options outstanding, November 30, 2014 | 22 | $ | 3,272 | |||||
|
|
|
| |||||
| * | Commencement of operations. |
| 25 | Annual Report / November 30, 2014 |
Table of Contents
Notes to Financial Statements
November 30, 2014 (continued)
7. INCOME TAX INFORMATION
At November 30, 2014, the component of distributable earnings was $14,365 of ordinary income for AllianzGI Global Small-Cap Opportunities Portfolio.
At November 30, 2014, capital loss carryforward amounts were:
| No Expiration(1) | ||||||||
| Short-Term | Long-Term | |||||||
AllianzGI Global Small-Cap Opportunities | $ | 101,927 | $ | — | ||||
AllianzGI U.S. Unconstrained Equity | 68,407 | — | ||||||
| (1) | Carryforward amounts are subject to the provision of the Regulated Investment Company Modernization Act of 2010. |
For the period ended November 30, 2014, permanent “book-tax” adjustments were:
| Undistributed Net | Accumulated Net | Paid-in | ||||||||||
| Investment Income (Loss) | Realized Gain | Capital | ||||||||||
AllianzGI Global Small-Cap Opportunities (a)(c) | $ | (2,093 | ) | $ | 2,093 | $ | — | |||||
AllianzGI U.S. Unconstrained Equity (b) | 4,995 | — | (4,995 | ) | ||||||||
These permanent “book-tax” differences were primarily attributable to:
| (a) | Reclassification of gains from securities classified as Passive Foreign Investment Companies (“PFICs”) for tax purposes |
| (b) | Reclassification of net operating loss |
| (c) | Reclassification of gains and losses from foreign currency transactions |
Net investment income, net realized gains or losses and net assets were not affected by these adjustments.
At November 30, 2014, the aggregate cost basis and the net unrealized appreciation (depreciation) of investments (before options written) for federal income tax purposes were:
| Net Unrealized | ||||||||||||||||
| Federal Tax | Unrealized | Unrealized | Appreciation | |||||||||||||
| Cost Basis(2) | Appreciation | Depreciation | (Depreciation) | |||||||||||||
AllianzGI Global Small-Cap Opportunities | $ | 4,875,817 | $ | 244,238 | $ | 256,307 | $ | (12,069 | ) | |||||||
AllianzGI U.S. Unconstrained Equity | 3,024,190 | 164,829 | 149,763 | 15,066 | ||||||||||||
| (2) | Differences, if any, between book and tax cost basis are primarily attributable to wash sale loss deferrals, PFIC mark-to-market, and mark-to-market of Section 1256 Contracts. |
8. SIGNIFICANT ACCOUNT HOLDERS
From time to time, a Portfolio may have a concentration of shareholders, which may include the Investment Manager or affiliates of the Investment Manager, holding a significant percentage of shares outstanding. Investment activities of these shareholders could have a material impact to a Portfolio.
At November 30, 2014, AFI held 100% of the outstanding shares in AllianzGI Global Small-Cap Opportunities Portfolio and AllianzGI U.S. Unconstrained Equity Portfolio.
| 26 | Annual Report / November 30, 2014 |
Table of Contents
Notes to Financial Statements
November 30, 2014 (continued)
9. AFFILIATED TRANSACTIONS
An affiliate includes any company in which a Sub-Adviser owns 5% or more of a company’s outstanding voting securities at any point during the fiscal year. The table below represents transactions in and earnings from these affiliated issuers during the period ended November 30, 2014:
AllianzGI Global Small-Cap Opportunities:
| Unrealized | ||||||||||||||||||||||||||||
| Market Value | Purchases | Proceeds | Appreciation | Market Value | Dividend | Net Realized | ||||||||||||||||||||||
| 7/23/2014* | at Cost | from Sales | (Depreciation) | 11/30/2014 | Income | Gain(Loss) | ||||||||||||||||||||||
Andersons, Inc. | $ | — | $ | 114,103 | $ | 42,174 | $ | (11,363 | ) | $ | 55,661 | $ | 193 | $ | (4,905 | ) | ||||||||||||
Cal-Maine Foods, Inc. | — | 41,475 | — | (5,458 | ) | 36,017 | 164 | — | ||||||||||||||||||||
Select Medical Holdings Corp. | — | 48,852 | — | (4,119 | ) | 44,733 | 619 | — | ||||||||||||||||||||
|
|
|
|
|
|
|
|
|
|
|
|
|
| |||||||||||||||
Totals | $ | — | $ | 204,430 | $ | 42,174 | $ | (20,940 | ) | $ | 136,411 | $ | 976 | $ | (4,905 | ) | ||||||||||||
|
|
|
|
|
|
|
|
|
|
|
|
|
| |||||||||||||||
| * | Commencement of operations. |
The percentages and market values below represents portfolio holdings that were considered affiliated at November 30, 2014:
| Market Value as a | ||||||||||||
| Sub-Adviser’s | % of Portfolio’s | |||||||||||
Issuer Name | % Holding | Market Value | Net Assets | |||||||||
Andersons, Inc. | 7.44 | % | $ | 55,661 | 1.14 | % | ||||||
Cal-Maine Foods, Inc. | 5.56 | % | 36,017 | 0.74 | % | |||||||
Select Medical Holdings Corp. | 9.50 | % | 44,733 | 0.91 | % | |||||||
|
|
|
| |||||||||
Totals | $ | 136,411 | 2.79 | % | ||||||||
|
|
|
| |||||||||
10. SUBSEQUENT EVENTS
In preparing these financial statements, the Portfolios’ management has evaluated events and transactions for potential recognition or disclosure through the date the financial statements were issued.
On December 18, 2014, the AllianzGI Global Small-Cap Opportunities declared $0.03991 per-share of net investment income dividends to shareholders, payable December 18, 2014 to shareholders of record on December 17, 2014.
There were no other subsequent events identified that require recognition or disclosure.
| 27 | Annual Report / November 30, 2014 |
Table of Contents
Report of Independent Registered Public Accounting Firm
To the Shareholders and the Board of Trustees of AllianzGI Institutional Multi-Series Trust
In our opinion, the accompanying statements of assets and liabilities, including the schedules of investments , and the related statements of operations and of changes in net assets and the financial highlights present fairly, in all material respects, the financial position of the AllianzGI Global Small-Cap Opportunities Portfolio and AllianzGI U.S. Unconstrained Equity Portfolio, each a fund of the AllianzGI Institutional Multi-Series Trust (hereafter referred to as the “Portfolios”) at November 30, 2014, and the results of each of their operations, the changes in each of their net assets and the financial highlights for the periods presented, in conformity with accounting principles generally accepted in the United States of America. These financial statements and financial highlights (hereafter referred to as “financial statements”) are the responsibility of the Portfolios’ management. Our responsibility is to express an opinion on these financial statements based on our audits. We conducted our audits of these financial statements in accordance with the standards of the Public Company Accounting Oversight Board (United States). These standards require that we plan and perform the audit to obtain reasonable assurance about whether the financial statements are free of material misstatement. An audit includes examining, on a test basis, evidence supporting the amounts and disclosures in the financial statements, assessing the accounting principles used and significant estimates made by management, and evaluating the overall financial statement presentation. We believe that our audits, which included confirmation of securities at November 30, 2014 by correspondence with the custodian and brokers, provide a reasonable basis for our opinion.
PricewaterhouseCoopers LLP
New York, New York
January 26, 2015
| 28 | Annual Report / November 30, 2014 |
Table of Contents
(Unaudited)
Matters Relating to the Trustees’ Consideration of the Investment Management and Sub-Advisory Agreements
The Investment Company Act of 1940, as amended, requires that both the full Board of Trustees (the “Board” or the “Trustees”) and a majority of the Trustees who are not interested persons of the Trust (the “Independent Trustees”), voting separately, initially approve the Trust’s Investment Management Agreement (the “Investment Management Agreement”) with Allianz Global Investors Fund Management LLC (the “Investment Manager”) with respect to AllianzGI Global Small-Cap Opportunities Portfolio (the “Global Small-Cap Opportunities Portfolio”) and AllianzGI U.S. Unconstrained Equity Portfolio (the “U.S. Unconstrained Equity Portfolio,” and, together with the Global Small-Cap Opportunities Portfolio, the “Portfolios”) and the Sub-Advisory Agreement (the “Sub-Advisory Agreement”) between the Investment Manager and Allianz Global Investors U.S. LLC (“AllianzGI U.S.” or the “Sub-Adviser”) with respect to the Portfolios. The Investment Management Agreement and the Sub-Advisory Agreement are collectively referred to herein as the “Agreements”. The Trustees met in person on June 23, 2014 (the “contract review meeting”) for the specific purpose of considering whether to approve the Agreements.
The material factors and conclusions that formed the basis of these approvals for the Portfolios are discussed below.
The Independent Trustees were assisted in their evaluation of the Agreements and the factors that they deemed to be material, including those factors described below, by independent legal counsel, from whom they received separate legal advice and with whom they met separately from management during their contract review meeting.
In connection with their deliberations regarding the Agreements, the Trustees, including the Independent Trustees, considered such information and factors as they believed, in light of the legal advice furnished to them and their own business judgment, to be relevant. The Trustees considered the nature, quality, and extent of the various investment management, administrative and other services to be performed with respect to the Portfolios by the Investment Manager and the Sub-Adviser under the Agreements.
In connection with their deliberations, the Trustees received and relied upon materials provided by the Investment Manager which included, among other items: (i) information compiled from Morningstar Direct (“Morningstar”), an independent third party, on the investment performance for various time periods, including annualized return performance information for certain time periods, of groups of funds with investment classifications and/or objectives comparable to those proposed for the Portfolios, (ii) information on each Portfolio’s management fees and other anticipated expenses and information compiled from Morningstar on the management fees and other expenses of comparable funds identified by Morningstar, (iii) information regarding the fees and performance of other accounts managed by the Investment Manager or Sub-Adviser with investment objective(s) and policies similar to those proposed for the Portfolios, if any, (iv) an estimate of the profitability to the Investment Manager from its relationship with each Portfolio during its first year, (v) descriptions of various functions to be performed by the Investment Manager and the Sub-Adviser for the Portfolios, such as portfolio management, compliance monitoring and portfolio trading practices, and (vi) information regarding the overall organization of the Investment Manager and the Sub-Adviser, including information regarding senior management, portfolio managers and other personnel proposed to provide investment management, administrative and other services to the Portfolios.
The Trustees’ conclusions as to the approval of the Agreements were based on a comprehensive consideration of all information provided to the Trustees and not the result of any single factor. Some of the factors that figured particularly in their deliberations are described below, although individual Trustees may have evaluated the information presented differently from one another, giving different weights to various factors. The Trustees also took into account that the Investment Manager had proposed to observe certain management fee waivers and/or expense limitations for the Portfolios. The Trustees also considered the risk profile of each Portfolio.
As part of their review, the Trustees examined the ability of the Investment Manager and the Sub-Adviser to provide high quality investment management and other services to the Portfolios. Among other information, they considered the investment philosophy and research and decision-making processes of AllianzGI U.S.; the experience of key advisory personnel of AllianzGI U.S. or its affiliates who would be responsible for portfolio management of the Portfolios; the ability of the Investment Manager and the Sub-Adviser to attract and retain capable personnel; and the capability of the senior management and staff of the Investment Manager and the Sub-Adviser. In addition, the Trustees reviewed the quality of the Investment Manager’s and the Sub-Adviser’s expected services with respect to regulatory compliance and ability to comply with the investment and compliance policies and procedures of the Portfolios; the nature, extent and quality of certain administrative services the Investment Manager would be responsible for providing to the Portfolios; and conditions that might affect the Investment Manager’s or the Sub-Adviser’s ability to provide high quality services to the Portfolios in the future under the Agreements, including each organization’s respective financial condition and operational stability. Based on
| 29 | Annual Report / November 30, 2014 |
Table of Contents
(Unaudited)
Matters Relating to the Trustees’ Consideration of the Investment Management and Sub-Advisory Agreements (cont’d)
the foregoing, the Trustees concluded that AllianzGI U.S.’s investment processes, research capabilities and philosophy were well suited to the Portfolios, given their investment objectives and policies, and that the Investment Manager and the Sub-Adviser would be able to meet any reasonably foreseeable obligations under the Agreements.
In assessing the reasonableness of each Portfolio’s proposed fees under the Agreements, the Trustees considered, among other information, each Portfolio’s proposed management fee and its expected net expense ratio as a percentage of anticipated average daily net assets, taking into account the management fee waiver and/or expense limitation arrangements that the Investment Manager would observe, and the advisory fees and net expense ratios of a peer group of funds based on information compiled from Morningstar.
The Trustees considered how the net expense ratio of each Portfolio was expected to compare to its Morningstar peers, and considered comparisons of each Portfolio’s proposed management fee with the advisory fees of the peer funds identified by Morningstar. The Trustees took into account that a comparison of each Portfolio’s proposed management fee to the advisory fee of peer funds is complicated because each Portfolio’s proposed management fee includes a component for administrative services while peer funds may have separate advisory and administration agreements with separate fees. The Trustees therefore placed significant emphasis on how the estimated net expense ratio of each Portfolio compared to the net expense ratios of the Morningstar peer funds, recognizing that the fees for investment advisory, administrative services and fund operating expenses would be subsumed within the net expense ratio of all funds.
The Trustees also considered the management fees charged by the Sub-Adviser to an account with similar investment strategies to the Global Small-Cap Opportunities Portfolio. The Trustees noted that the Investment Manager and Sub-Adviser do not offer funds or accounts with similar investment strategies to the U.S. Unconstrained Equity Portfolio.
With respect to each Portfolio, the Independent Trustees considered the proposed allocation of the management fee between the Investment Manager and the Sub-Adviser, and the services to be provided by the Investment Manager, on the one hand, and the Sub-Adviser, on the other hand. They noted that the Investment Manager (and not the Portfolios) would pay the sub-advisory fees.
The Trustees also considered the estimated profitability to the Investment Manager from its relationship with each Portfolio and noted that such profitability was expected to be negative for each Portfolio’s first year of operation.
The Trustees considered the extent to which the Investment Manager and the Sub-Adviser may realize economies of scale or other efficiencies in managing and supporting the Portfolios. The Trustees also took into account that, as open-end investment companies, the Portfolios intend to continuously raise assets, so as the assets of the Portfolios increase over time, certain economies of scale and other efficiencies may be realized through spreading certain fixed costs over a larger asset base or across a variety of products and services. In this regard, they also took into account the management fee waiver and/or expense limitation arrangements proposed to be observed by the Investment Manager for the Portfolios.
Additionally, the Trustees considered so-called “fall-out benefits” to the Investment Manager, the Sub-Adviser and their affiliates, such as reputational value derived from serving as investment manager and sub-adviser to the Portfolios.
After reviewing these and other factors described herein, the Trustees concluded, within the context of their overall conclusions regarding the Agreements, that the proposed fees payable under each of the Agreements represent reasonable compensation in light of the nature, extent and quality of the services to be provided by the Investment Manager or the Sub-Adviser, as the case may be, and should be approved for an initial two-year period. Based on their evaluation of factors they deemed to be material, including those factors described above, the Trustees, including the Independent Trustees, unanimously concluded that the initial approval of the Agreements was in the interests of each Portfolio and its shareholders and should be approved.
| 30 | Annual Report / November 30, 2014 |
Table of Contents
(Unaudited)
The Trust held a special shareholder meeting on December 18, 2014.
Shareholders voted as indicated below:
| Institutional Multi-Series Trust | ||||||||
| Shareholders | Shareholders | |||||||
| Voting in the | Withholding | |||||||
| Affirmative | Authority | |||||||
Election of Deborah A. DeCotis | 533,333 | — | ||||||
Election of F. Ford Drummond | 533,333 | — | ||||||
Election of Bradford K. Gallagher | 533,333 | — | ||||||
Election of James A. Jacobson | 533,333 | — | ||||||
Election of Hans W. Kertess | 533,333 | — | ||||||
Election of Susan M. King* | 533,333 | — | ||||||
Election of James S. MacLeod | 533,333 | — | ||||||
Election of William B. Ogden, IV | 533,333 | — | ||||||
Election of Alan Rappaport | 533,333 | — | ||||||
Election of Davey S. Scoon | 533,333 | — | ||||||
Election of Julian Sluyters* | 533,333 | — | ||||||
| * | Interested Trustee |
| 31 | Annual Report / November 30, 2014 |
Table of Contents
(Unaudited)
Our Commitment to You
We consider customer privacy to be a fundamental aspect of our relationship with shareholders and are committed to maintaining the confidentiality, integrity and security of our current, prospective and former shareholders’ personal information. To ensure our shareholders’ privacy, we have developed policies that are designed to protect this confidentiality, while allowing shareholders’ needs to be served.
Obtaining Personal Information
In the course of providing shareholders with products and services, we may obtain non-public personal information about shareholders, which may come from sources such as account applications and other forms, from other written, electronic or verbal correspondence, from shareholder transactions, from a shareholder’s brokerage or financial advisory firm, financial adviser or consultant, and/or from information captured on our internet websites.
Respecting Your Privacy
As a matter of policy, we do not disclose any personal or account information provided by shareholders or gathered by us to non-affiliated third parties, except as required for our everyday business purposes, such as to process transactions or service a shareholder’s account, or as otherwise permitted by law. As is common in the industry, non-affiliated companies may from time to time be used to provide certain services, such as preparing and mailing prospectuses, reports, account statements and other information, and gathering shareholder proxies. We may also retain non-affiliated financial services providers, such as broker-dealers, to market our shares or products and we may enter into joint-marketing arrangements with them and other financial companies. We may also retain marketing and research service firms to conduct research on shareholder satisfaction. These companies may have access to a shareholder’s personal and account information, but are permitted to use this information solely to provide the specific service or as otherwise permitted by law. We may also provide a shareholder’s personal and account information to their respective brokerage or financial advisory firm, Custodian, and/or to their financial advisor or consultant.
Sharing Information with Third Parties
We reserve the right to disclose or report personal information to non-affiliated third parties, in limited circumstances, where we believe in good faith that disclosure is required under law to cooperate with regulators or law enforcement authorities, to protect our rights or property or upon reasonable request by any Portfolio in which a shareholder has chosen to invest. In addition, we may disclose information about a shareholder or shareholder’s accounts to a non-affiliated third party only if we receive a shareholder’s written request or consent.
Sharing Information with Affiliates
We may share shareholder information with our affiliates in connection with our affiliates’ everyday business purposes, such as servicing a shareholder’s account, but our affiliates may not use this information to market products and services to you except in conformance with applicable laws or regulations. The information we share includes information about our experiences and transactions with a shareholder and may include, for example, a shareholder’s participation in one of the Portfolios or in other investment programs, a shareholder’s ownership of certain types of accounts (such as IRAs), or other data about a shareholder’s transactions or accounts. Our affiliates, in turn, are not permitted to share shareholder information with non-affiliated entities, except as required or permitted by law.
Procedures to Safeguard Private Information
We take seriously the obligation to safeguard shareholder non-public personal information. In addition to this policy, we have also implemented procedures that are designed to restrict access to a shareholder’s non-public personal information only to internal personnel who need to know that information in order to provide products or services to such shareholders. In addition, we have physical, electronic and procedural safeguards in place to guard a shareholder’s non-public personal information.
Disposal of Confidential Records
We will dispose of records, if any, that are knowingly derived from data received from a consumer reporting agency regarding a shareholder that is an individual in a manner that ensures the confidentiality of the data is maintained. Such records include, among other things, copies of consumer reports and notes of conversations with individuals at consumer reporting agencies.
| 32 | Annual Report / November 30, 2014 |
Table of Contents
(Unaudited)
AllianzGI Institutional Multi-Series Trust – Board of Trustees
Name, Year of Birth, Position(s) Held with Trust, Length of Service, Other Trusteeships/Directorships Held by Trustee; Number of Portfolios in Fund Complex/Outside Fund Complexes Currently Overseen by Trustee | Principal Occupation(s) During Past 5 Years: | |
| The address of each trustee is 1633 Broadway, New York, NY 10019. | ||
Deborah A. DeCotis Year of Birth: 1952 Trustee since: 2014 Trustee/Director of 89 funds in Fund Complex Trustee/Director of no funds outside of Fund Complex | Advisory Director, Morgan Stanley & Co., Inc. (since 1996); Co-Chair Special Projects Committee, Memorial Sloan Kettering (since 2005); Member, Circle Financial Group (since 2010); Trustee, Stanford University (since 2010); and Member, Council on Foreign Relations (since 2013). Formerly, Director, Helena Rubenstein Foundation (1997-2012). | |
F. Ford Drummond Year of Birth: 1962 Trustee since: 2014 Trustee/Director of 60 funds in Fund Complex Trustee/Director of no funds outside of Fund Complex Director, BancFirst Corporation | Owner/Operator, Drummond Ranch. Formerly, Director, The Cleveland Bank; and General Counsel, BMI-Health Plans (benefits administration). | |
Bradford K. Gallagher Year of Birth: 1944 Trustee since: 2014 Trustee/Director of 89 funds in Fund Complex Trustee/Director of no funds outside of Fund Complex Formerly, Chairman and Trustee of Grail Advisors ETF Trust (2009-2010) and Trustee of Nicholas-Applegate Institutional Funds (2007-2010) | Retired. Chairman and Trustee, Atlantic Maritime Heritage Foundation (since 2007); Founder, Spyglass Investments LLC, a private investment vehicle (since 2001); and Founder, President and CEO, Cypress Holding Company and Cypress Tree Investment Management Company (since 1995). Formerly, Partner, New Technology Ventures Capital Management LLC, a venture capital fund (2011-2013); and Chairman and Trustee, Commonfund (2005-2014). | |
James A. Jacobson Year of Birth: 1945 Trustee since: 2014 Trustee/Director of 67 funds in Fund Complex Trustee/Director of 18 funds outside the Fund Complex, the 18 funds in Alpine Mutual Funds Complexs | Retired. Formerly, Vice Chairman and Managing Director, Spear, Leeds & Kellogg Specialists, LLC, a specialist firm on the New York Stock Exchange. | |
Hans W. Kertess Year of Birth: 1939 Trustee since: 2014 Trustee/Director of 89 funds in Fund Complex Trustee/Director of no funds outside the Fund Complex | President, H. Kertess & Co., a financial advisory company. Formerly, Managing Director, Royal Bank of Canada Capital Markets. | |
Susan M. King* Year of Birth: 1963 Trustee since: 2014 Trustee/Director of 64 funds in Fund Complex Trustee/Director of no funds outside the Fund Complex | Chief Marketing Officer, Allianz Global Investors U.S. LLC (since 2013). Formerly, Global Head of Marketing for Morgan Stanley Investment Management (2011- 2013). Formerly, Consultant (self-employed) (2009-2011). Formerly, Head of US Distribution Marketing for Legg Mason (2005-2009). | |
James S. MacLeod Year of Birth: 1947 Trustee since: 2014 Trustee/Director of 60 funds in Fund Complex Trustee/Director of no funds outside the Fund Complex Director, Sykes Enterprises, Inc. | Director, Chairman and Chief Executive Officer, CoastalSouth Bancshares, Inc.; Director and President, CoastalStates Bank; and Director, Homeowners Mortgage. Formerly, Executive Vice President, Mortgage Guaranty Insurance Corporation. Formerly, Chief Executive Officer of Homeowners Mortgage | |
William B. Ogden, IV Year of Birth: 1945 Trustee since: 2014 Trustee/Director of 89 funds in Fund Complex; Trustee/Director of no funds outside of Fund Complex | Asset Management Industry Consultant. Formerly, Managing Director, Investment Banking Division of Citigroup Global Markets Inc. | |
Alan Rappaport Year of Birth: 1953 Trustee since: 2014 Trustee/Director of 89 funds in Fund Complex Trustee/Director of no funds outside of Fund Complex | Advisory Director (formerly Vice Chairman) (since 2009), Roundtable Investment Partners; Chairman (formerly President), Private Bank of Bank of America; Vice Chairman, US Trust (2001-2008); Adjunct Professor, New York University Stern School of Business (since 2011); Lecturer, Stanford University Graduate School of Business (since 2013); Trustee, American Museum of Natural History (since 2005) and Trustee, NYU Langone Medical Center (since 2007); Director, Victory Capital Holdings, Inc., an asset management firm (since 2013). | |
Davey S. Scoon Year of Birth: 1946 Trustee since: 2014 Trustee/Director of 60 funds in Fund Complex Trustee/Director of no funds outside the Fund Complex Chairman, Tufts Health Plan; Director, AMAG Pharmaceuticals, Inc.; Director, Orthofix International N.V. and Director, Biodel Inc. Formerly, Director, CardioKine Inc. and Director, NitroMed, Inc. | Adjunct Assistant Professor, Tufts University School of Medicine and Adjunct Professor, University of Wisconsin-Madison. Formerly, Chief Administrative and Financial Officer, Tom’s of Maine (personal care products manufacturing); and Chief Administrative and Financial Officer, SunLife Financial- U.S. (financial services). | |
Julian Sluyters* Year of Birth: 1960 Trustee since: 2014 Trustee/Director of 64 funds in Fund Complex Trustee/Director of no funds outside the Fund Complex | Chairman of the Management Board of Allianz Global Investors Fund Management LLC (since 2013); Chief Operating Officer, Managing Director and member of the Executive Committee of Allianz Global Investors U.S. Holdings LLC (since 2012); President and Chief Executive Officer of 58 funds in the Fund Complex; Trustee of 18 funds in the Fund Complex. Formerly, President and Chief Executive Officer, Old Mutual Capital Inc. (2008-2012). | |
| * | “Interested persons” of the Trust, as defined in Section 2(a)(19) of the 1940 Act, due to his or her positions, set forth in the table above, among others with the Portfolios’ Investment Manager and other various affiliated entities. |
The Portfolios’ Statement of Additional Information contains additional information about the Trustees. The Statement of Additional Information is available without charge, upon request, by calling 1-800-498-5413.
| 33 | Annual Report / November 30, 2014 |
Table of Contents
(Unaudited)
AllianzGI Institutional Multi-Series Trust – Officers
Name, Year of Birth, Position(s) Held with Trust: | Principal Occupation(s) During Past 5 Years: | |
Julian Sluyters Year of Birth: 1960 President since: 2014 | Chairman of the Management Board of Allianz Global Investors Fund Management LLC (since 2013); Chief Operating Officer, Managing Director and member of the Executive Committee of Allianz Global Investors U.S. Holdings LLC (since 2012); President and Chief Executive Officer of 64 funds in the Fund Complex; Trustee of 18 funds in the Fund Complex. Formerly, President and Chief Executive Officer, Old Mutual Capital Inc. (2008-2012). | |
Lawrence G. Altadonna Year of Birth: 1966 Treasurer, Principal Financial and Accounting Officer since: 2014 | Director, Director of Fund Administration of Allianz Global Investors Fund Management LLC; Treasurer, Principal Financial and Accounting Officer of 64 funds in the Fund Complex and of The Korea Fund, Inc. Formerly, Assistant Treasurer of numerous funds in the Fund Complex (2005-2010). | |
Thomas J. Fuccillo Year of Birth: 1968 Vice President, Secretary & Chief Legal Officer since: 2014 | Managing Director, Chief Legal Officer and Secretary of Allianz Global Investors Fund Management LLC and Allianz Global Investors Distributors LLC; Managing Director and Chief Regulatory Counsel of Allianz Global Investors U.S. Holdings LLC; Vice President, Secretary and Chief Legal Officer of 64 funds in the Fund Complex; and Secretary and Chief Legal Officer of The Korea Fund, Inc. | |
Thomas L. Harter, CFA Year of Birth: 1975 Chief Compliance Officer since: 2014 | Director of Allianz Global Investors U.S. Holdings LLC; Chief Compliance Officer of 64 funds in the Fund Complex and of The Korea Fund, Inc. Formerly, Vice President and Compliance Manager (2005- 2012). | |
Scott Whisten Year of Birth: 1971 Assistant Treasurer since: 2014 | Director of Allianz Global Investors Fund Management LLC; and Assistant Treasurer of 64 funds in the Fund Complex. | |
Richard J. Cochran Year of Birth: 1961 Assistant Treasurer since: 2014 | Vice President of Allianz Global Investors Fund Management LLC; Assistant Treasurer of 64 funds in the Fund Complex and of The Korea Fund, Inc. | |
Orhan Dzemaili Year of Birth: 1974 Assistant Treasurer since: 2014 | Director of Allianz Global Investors Fund Management LLC; and Assistant Treasurer of 64 funds in the Fund Complex. | |
Lagan Srivastava Year of Birth: 1977 Assistant Secretary since: 2014 | Vice President of Allianz Global Investors U.S. Holdings LLC; Assistant Secretary of 64 funds in the Fund Complex. | |
Richard H. Kirk Year of Birth: 1961 Assistant Secretary since: 2014 | Director and Senior Counsel of Allianz Global Investors U.S. Holdings LLC; Director and Senior Counsel of Allianz Global Investors Distributors LLC. Assistant Secretary of 59 funds in the Fund Complex. | |
Paul Koo Year of Birth: 1964 Assistant Secretary since: 2014 | Director and Chief Compliance Officer of Allianz Global Investors U.S. LLC; and Assistant Secretary of 59 funds in the Fund Complex. Formerly, Associate Chief Compliance Officer, Dodge & Cox (2010-2011). | |
Officers hold office at the pleasure of the Board and until their successors are appointed and qualified or until their earlier resignation or removal.
| 34 | Annual Report / November 30, 2014 |
Table of Contents
AllianzGI Institutional Multi-Series Trust
Trustees
Davey S. Scoon
Chairman of the Board of Trustees
Deborah A. DeCotis
F. Ford Drummond
Bradford K. Gallagher
James A. Jacobson
Hans W. Kertess
Susan M. King
James S. MacLeod
William B. Ogden, IV
Alan Rappaport
Julian Sluyters
Officers
Julian Sluyters
President & Chief Executive Officer
Lawrence G. Altadonna
Treasurer, Principal Financial & Accounting Officer
Thomas J. Fuccillo
Vice President, Secretary & Chief Legal Officer
Thomas L. Harter
Chief Compliance Officer
Scott Whisten
Assistant Treasurer
Richard J. Cochran
Assistant Treasurer
Orhan Dzemaili
Assistant Treasurer
Lagan Srivastava
Assistant Secretary
Richard H. Kirk
Assistant Secretary
Paul Koo
Assistant Secretary
Investment Manager
Allianz Global Investors Fund Management LLC
1633 Broadway
New York, NY 10019
Sub-Adviser
Allianz Global Investors U.S. LLC
1633 Broadway
New York, NY 10019
Distributor
Allianz Global Investors Distributors LLC
1633 Broadway
New York, NY 10019
Custodian & Accounting Agent
State Street Bank & Trust Co.
801 Pennsylvania Avenue
Kansas City, MO 64105
Transfer Agent
Boston Financial Data Services, Inc.
330 West 9th Street, 5th Floor
Kansas City, MO 64105
Independent Registered Public Accounting Firm
PricewaterhouseCoopers LLP
300 Madison Avenue
New York, NY 10017
Legal Counsel
Ropes & Gray LLC
Prudential Tower
800 Boylston Street
Boston, MA 02199
This report, including the financial information herein, is transmitted to the shareholders of the Trust for their information. It is not a prospectus, circular or representation intended for use in the purchase of shares of each Portfolio or any securities mentioned in this report.
Table of Contents
| ITEM 2. | CODE OF ETHICS |
| (a) | As of the end of the period covered by this report, the registrant has adopted a code of ethics (the “Section 406 Standards for Investment Companies – Ethical Standards for Principal Executive and Financial Officers”) that applies to the registrant’s President and Chief Executive Officer and Principal Financial Officer; the registrant’s Principal Financial Officer also serves as the Principal Accounting Officer. The registrant undertakes to provide a copy of such code of ethics to any person upon request, without charge, by calling 1-800-926-4456. The code of ethics are included as an Exhibit 99.CODE ETH hereto. |
| (b) | During the period covered by this report, there were not any amendments to a provision of the code of ethics adopted in 2(a) above. |
| (c) | During the period covered by this report, there were not any waivers or implicit waivers to a provision of the code of ethics adopted in 2(a) above. |
| ITEM 3. | AUDIT COMMITTEE FINANCIAL EXPERT |
The registrant’s Board has determined that Mr. James A. Jacobson, a member of the Board’s Audit Oversight Committee is an “audit committee financial expert,” and that he is “independent,” for purposes of this Item
| ITEM 4. | PRINCIPAL ACCOUNTANT FEES AND SERVICES |
| a) | Audit fees. The aggregate fees billed for each of the last two fiscal years (the “Reporting Periods”) for professional services rendered by the Registrant’s principal accountant (the “Auditor”) for the audit of the Registrant’s annual financial statements, or services that are normally provided by the Auditor in connection with the statutory and regulatory filings or engagements for the Reporting Period, were $41,200 in 2014. The Registrant commenced operations in July 2014 therefore 2013 information is not applicable. |
| b) | Audit-Related Fees. The aggregate fees billed in the Reporting Periods for assurance and related services by the principal accountants that are reasonably related to the performance of the audit registrant’s financial statements and are not reported under paragraph (e) of this Item were $0 in 2014. The Registrant commenced operations in July 2014 therefore 2013 information is not applicable. |
| c) | Tax Fees. The aggregate fees billed in the Reporting Periods for professional services rendered by the Auditor for tax compliance, tax service and tax planning (“Tax Services”) were $24,280 in 2014. These services consisted of review or preparation of U.S. federal, state, local and excise tax returns and calculations of excise tax distributions. The Registrant commenced operations in July 2014 therefore 2013 information is not applicable. |
| d) | All Other Fees. There were no other Fees billed in the Reporting Periods for products and services provided by the Auditor to the Registrant. |
| e) | 1. Audit Committee Pre-Approval Policies and Procedures. The Registrant’s Audit Committee has established policies and procedures for pre-approval of all audit and permissible non-audit services by the Auditor for the Registrant, as well as the Auditor’s engagements related directly to the operations and financial reporting of the Registrant. The Registrant’s policy is stated below. |
Table of Contents
AllianzGI Institutional Multi-Series Trust (The “Trust”)
AUDIT OVERSIGHT COMMITTEE POLICY
FOR
PRE-APPROVAL OF SERVICES PROVIDED BY THE INDEPENDENT ACCOUNTANTS
The Trust’s Audit Oversight Committee (“Committee”) is charged with the oversight of the Trust’s financial reporting policies and practices and their internal controls. As part of this responsibility, the Committee must pre-approve any independent accounting firm’s engagement to render audit and/or permissible non-audit services, as required by law. In evaluating a proposed engagement by the independent accountants, the Committee will assess the effect that the engagement might reasonably be expected to have on the accountant’s independence. The Committee’s evaluation will be based on:
a review of the nature of the professional services expected to be provided,
the fees to be charged in connection with the services expected to be provided
a review of the safeguards put into place by the accounting firm to safeguard independence, and
periodic meetings with the accounting firm.
POLICY FOR AUDIT AND NON-AUDIT SERVICES TO BE PROVIDED TO THE TRUST
On an annual basis, the Committee of the Trust will review and pre-approve the scope of the audits of the Trust and proposed audit fees, and permitted non-audit (including audit under related) services that may be performed by the Trust’s independent accountants. At least annually, the Committee will receive a report of all audit and non-audit services that were rendered in the previous calendar year pursuant to this Policy.
In addition to the Committee’s pre-approval of services pursuant to this Policy, the engagement of the independent accounting firm for any permitted non-audit service provided to the fund with also require the separate written pre-approval of the President of the Trust, who will confirm, independently that the accounting firm’s engagement will not adversely affect the firm’s independence. All non-audit services performed by the independent accounting firm will be disclosed, as required, in filings with the Securities and Exchange Commission.
AUDIT SERVICES
The categories of audit services and related fees to be reviewed and pre-approved annually by the Committee are:
Annual Trust financial statement audits
Seed audits (related to new product filings, as required)
SEC and regulatory filings and consents
Table of Contents
AUDIT-RELATED SERVICES
The following categories of audit-related services are considered to be consistent with the role of the Trust’s independent accountants and services falling under one of these categories will be pre-approved by the Committee on an annual basis if the Committee deems those services to be consistent with the accounting firm’s independence:
Accounting consultations
Trust merger support services
Agreed upon procedure reports
Other Attestation reports
Comfort letters
Other internal control reports
Individual audit-related services that fall within one of these categories and are not presented to the Committee as part of the annual pre-approval process described above, may be pre-approved, if deemed consistent with the accounting firm’s independence, by the Committee Chair (or any other Committee member who is a disinterested trustee under the Investment Company to whom this responsibility has been delegated) so long as the estimated fee for those services does not exceed $250,000 any such pre-approval shall be reported to the full Committee at its next regularly scheduled meeting.
TAX SERVICES
The following categories of tax services are considered to be consistent with the role of the Trust’s independent accountants and services falling under one of these categories will be pre-approved by the Committee on an annual basis if the Committee deems those services to be consistent with the accounting firm’s independence:
Tax compliance services related to the filing or amendment of the following:
Federal, state and local income tax compliance; and, sales and use tax compliance
Timely RIC qualification reviews
Tax distribution analysis and planning
Tax authority examination services
Tax appeals support services
Accounting methods studies
Trust merger support services
Other tax consulting services and related projects
Individual tax services that fall within one of these categories and are not presented to the Committee as part of the annual pre-approval process described above, may be pre-approved, if deemed consistent with the accounting firm’s independence, by the Committee Chair (or any other Committee member who is a disinterested trustee under the Investment Company Act to whom this responsibility has been delegated) so long as the estimated fee for those services does not exceed $250,000 any such pre-approval shall be reported to the full Committee at its next regularly scheduled meeting.
Table of Contents
PROSCRIBED SERVICES
The Trust’s independent accountants will not render services in the following categories of non-audit services:
Bookkeeping or other services related to the accounting records or financial statements of the Trust
Financial information systems design and implementation
Appraisal or valuation services, fairness opinions, or contribution-in-kind reports
Actuarial services
Internal audit outsourcing services
Management functions or human resources
Broker or dealer, investment adviser or investment banking services
Legal services and expert services unrelated to the audit
Any other service that the Public Company Accounting Oversight Board determines, by regulation, is impermissible.
PRE-APPROVAL OF NON-AUDIT SERVICES PROVIDED TO OTHER ENTITIES WITHIN THE FUND COMPLEX
The Committee will pre-approve annually any permitted non-audit services to be provided to Allianz Global Investors Fund Management LLC or any other investment manager to the Trust (but not including any sub-adviser whose role is primarily portfolio management and is sub-contracted by the investment manager) (the “Investment Manager”) and any entity controlling, controlled by, or under common control with the Investment Manager that provides ongoing services to the Trust (including affiliated sub-advisers to the Trust), provided, in each case, that the engagement relates directly to the operations and financial reporting of the Trust (such entities, including the Investment Manager, shall be referred to herein as the “Accounting Affiliates”). Individual projects that are not presented to the Committee as part of the annual pre-approval process, may be pre-approved, if deemed consistent with the accounting firm’s independence, by the Committee Chairman (or any other Committee member who is a disinterested trustee under the Investment Company Act to whom this responsibility has been delegated) so long as the estimated fee for those services does not exceed $250,000. Any such pre-approval shall be reported to the full Committee at its next regularly scheduled meeting. Although the Committee will not pre-approve all services provided to the Investment Manager and its affiliates, the Committee will receive an annual report from the Trust’s independent accounting firm showing the aggregate fees for all services provided to the Investment Manager and its affiliates.
Table of Contents
DE MINIMUS EXCEPTION TO REQUIREMENT OF PRE-APPROVAL OF NON-AUDIT SERVICES
With respect to the provision of permitted non-audit services to the Trust or Accounting Affiliates, the pre-approval requirement is waived if:
| (1) | The aggregate amount of all such permitted non-audit services provided constitutes no more than (i) with respect to such services provided to the Trust, five percent (5%) of the total amount of revenues paid by the Trust to its independent accountant during the fiscal year in which the services are provided, and (ii) with respect to such services provided to Accounting Affiliates, five percent (5%) of the total amount of revenues paid to the Trust’s independent accountant by the Fund and the Accounting Affiliates during the fiscal year in which the services are provided; |
| (2) | Such services were not recognized by the Trust at the time of the engagement for such services to be non-audit services; and |
| (3) | Such services are promptly brought to the attention of the Committee and approved prior to the completion of the audit by the Committee or by the Committee Chairman (or any other Committee member who is a disinterested trustee under the Investment Company Act to whom this Committee Chairman or other delegate shall be reported to the full Committee at its next regularly scheduled meeting. |
| e) | 2. No services were approved pursuant to the procedures contained in paragraph (C) (7) (i) (C) of Rule 2-01 of Registration S-X. |
| f) | Not applicable. |
| g) | Non-audit fees. The aggregate non-audit fees billed by the Auditor for services rendered to the Registrant, and rendered to the Adviser, for the 2014 Reporting Period was $3,966,727. The Registrant commenced operations in July 2014 therefore 2013 information is not applicable. |
| h) | Auditor Independence. The Registrant’s Audit Oversight Committee has considered whether the provision of non-audit services that were rendered to the Adviser which were not pre-approved is compatible with maintaining the Auditor’s independence. |
| ITEM 5. | AUDIT COMMITTEE OF LISTED REGISTRANT |
Disclosure not required for open-end management investment companies.
| ITEM 6. | INVESTMENTS |
| (a) | Schedule of Investments is included as part of the report to shareholders filed under Item 1 of this form. |
| (b) | Not applicable. |
| ITEM 7. | DISCLOSURE OF PROXY VOTING POLICIES AND PROCEDURES FOR CLOSED-END MANAGEMENT INVESTMENT COMPANIES |
Disclosure not required for open-end management investment companies.
| ITEM 8. | PORTFOLIO MANAGERS OF CLOSED-END MANAGEMENT INVESTMENT COMPANIES |
Disclosure not required for open-end management investment companies.
| ITEM 9. | PURCHASES OF EQUITY SECURITIES BY CLOSED-END MANAGEMENT INVESTMENT COMPANY AND AFFILIATED COMPANIES. |
Disclosure not required for open-end management investment companies.
| ITEM 10. | SUBMISSION OF MATTERS TO A VOTE OF SECURITY HOLDERS |
There have been no material changes to the procedures by which shareholders may recommend nominees to the Trust’s Board of Trustees since the Trust last provided disclosure in response to this item.
Table of Contents
| ITEM 11. | CONTROLS AND PROCEDURES |
| (a) | The registrant’s President & Chief executive Officer and Treasurer, Principal Financial & Accounting Officer have concluded that the registrant’s disclosure controls and procedures (as defined in Rule 30a-3(c) under the Act (17 CFR 270.30a-3(c)), as amended) are effective based on their evaluation of these controls and procedures as of a date within 90 days of the filing date of this document. |
| (b) | There were no significant changes in the registrant’s internal control over financial reporting (as defined in Rule 30a-3(d) under the Act (17 CFR 270.30a-3(d))) that occurred during the second fiscal quarter of the period covered by this report that has materially affected, or is reasonably likely to materially affect, the registrant’s internal control over financial reporting. |
| ITEM 12. | EXHIBITS |
| (a)(1) | Exhibit 99.CODE ETH – Code of Ethics | |
| (a)(2) | Exhibit 99.302 CERT. – Certification pursuant to Section 302 of the Sarbanes-Oxley Act of 2002 | |
| (a)(3) | Not applicable | |
| (b) | Exhibit 99.906 CERT. – Certification pursuant to Section 906 of the Sarbanes-Oxley Act of 2002 | |
Table of Contents
Signatures
Pursuant to the requirements of the Securities Exchange Act of 1934 and the Investment Company Act of 1940, the registrant has duly caused this report to be signed on its behalf by the undersigned, thereunto duly authorized.
| (Registrant) AllianzGI Institutional Multi-Series Trust | ||
| By: | /s/ Julian Sluyters | |
| Julian Sluyters, | ||
| President & Chief Executive Officer | ||
Date: February 4, 2015
| By: | /s/ Lawrence G. Altadonna | |
| Lawrence G. Altadonna | ||
| Treasurer, Principal Financial & Accounting Officer |
Date: February 4, 2015
Pursuant to the requirements of the Securities Exchange Act of 1934 and the Investment Company Act of 1940, this report has been signed below by the following persons on behalf of the registrant and in the capacities and on the dates indicated.
| By: | /s/ Julian Sluyters | |
| Julian Sluyters, | ||
| President & Chief Executive Officer |
Date: February 4, 2015
| By: | /s/ Lawrence G. Altadonna | |
| Lawrence G. Altadonna, | ||
| Treasurer, Principal Financial & Accounting Officer |
Date: February 4, 2015