Table of Contents
UNITED STATES
SECURITIES AND EXCHANGE COMMISSION
Washington, D.C. 20549
FORM N-CSR
CERTIFIED SHAREHOLDER REPORT OF REGISTERED
MANAGEMENT INVESTMENT COMPANIES
Investment Company Act file number 811-22975
AllianzGI Institutional Multi-Series
Trust
(Exact name of registrant as specified in charter)
1633 Broadway, New York, New York 10019
(Address of principal executive offices) (Zip code)
Lawrence G. Altadonna
1633 Broadway,
New York, New York 10019
(Name and address of agent for service)
Registrant’s telephone number, including area code: 212-739-3371
Date of fiscal year end: September 30, 2016
Date of reporting period: September 30, 2016
Table of Contents
Item 1. Report to Shareholders
AllianzGI Institutional Multi-Series Trust
Annual Report
September 30, 2016
Table of Contents
| 2-9 | ||||
| 10-11 | ||||
| 12-41 | ||||
| 42 | ||||
| 43 | ||||
| 44-45 | ||||
| 46-49 | ||||
| 50-66 | ||||
| 67 | ||||
| 68 | ||||
| 69 | ||||
| 70 | ||||
| 71-72 | ||||
| 73-75 | ||||
Table of Contents
AllianzGI Advanced Core Bond Portfolio
(unaudited)
From inception on October 30, 2015 through September 30, 2016, as provided by Dr. Matthias Grein, CFA, Portfolio Manager.
Portfolio Insights
Market Overview
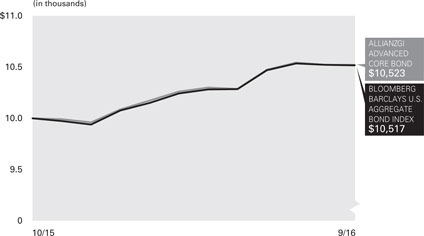
For the period from inception on October 30, 2015 through September 30, 2016, the AllianzGI Advanced Core Bond Portfolio (the “Portfolio”) returned 5.23%, outperforming the Bloomberg Barclays US Aggregate Bond Index (the “benchmark”), which returned 5.17%.
Market Overview
Over the last year, energy prices have been a major drag on inflation. However, the recent stabilization and base effects could lead to an increase in headline inflation. Other price series have also shown an increase. Good labor market conditions could lead to higher wages. The latest Employment Cost Index increased to 2.3% (YoY) in the second quarter of 2016. Average Hourly Earnings increased by 2.6% (YoY) in September 2016. Although the Consumer Price Index (“CPI”) should be contained in the coming months – except for some expected base effects - there are some factors under the surface that could lead to higher prices later. Given improved prospects for consumption, the inflation-risks are increasing. The annual growth rate of consumer prices (CPI) in September 2016,
accelerated to 1.5% (YoY) as expected base effects took effect. Core CPI fell slightly to 2.2% (YoY) in September. While the economy is close to full employment, the US Federal Reserve (“Fed”) now focuses on allowing prices and wages to recover step by step which will include some tolerated overshooting of inflation above its target. At the same time the Fed normalizes interest rates very gradually as long as downside risks to the economy are low.
Portfolio Review
We conducted an attribution analysis for the reporting period using a seven factor attribution model. Duration positioning, curve positioning, sector positioning, credit quality positioning and regional positioning were all positive contributors to performance, while yield positioning was a negative contributor and currency positioning was neutral. In addition to these seven factors, individual bond selection was also a positive contributor to performance, whether it be from bonds which performed well for idiosyncratic reasons on the secondary market or which delivered a premium to others which materialized, such as new issue premia.
Outlook
Generally, we still expect a slight improvement in economic dynamics supported by domestic demand given the good labor market conditions and the low oil prices. In particular, conditions in the housing market are still good and domestic demand in the US appears further on track. Risks stem mainly from slow investment activity, especially as investments in energy-related parts of the industry will further decline, and from global uncertainties. Also, slow wage growth could become a problem for the recovery in the US. The Fed refrained from a rate hike in September 2016, but kept the door wide open for a hike in December 2016 as also indicated by the respective minutes: “The committee judges that the case for an increase in the federal funds rate has strengthened but decided, for the time being, to wait for further evidence of continued progress toward its objectives.” Three dissenters clearly underline a split committee. However, 14 out of 17 Federal Open Market Committee members expect a hike this year. Should no unforeseen event cloud the outlook for the economy, we expect the Fed to hike rates in December 2016. Given complacent market pricing, over the next 18 months the Fed can easily hike somewhat faster than currently priced in.
Cumulative Return for the period ended September 30, 2016
| Since Inception† | |||||
| AllianzGI Advanced Core Bond Portfolio | 5.23% | ||||
| Bloomberg Barclays US Aggregate Bond Index †† | 5.17% | ||||
† The Portfolio began operations on 10/30/15. Benchmark return comparisons began on the portfolio inception date.
†† The Bloomberg Barclays US Aggregate Bond Index is composed of securities from the Bloomberg Barclays Government/Credit Bond Index, Mortgage-Backed Securities Index, and Asset-Backed Securities Index. It is generally considered to be representative of the domestic, investment grade fixed rate, taxable bond market (as of September 30, 2016). Index returns reflect the reinvestment of income dividends and capital gains, if any, but do not reflect fees, brokerage commissions or other expenses of investing. It is not possible to invest directly in an index.
Performance quoted represents past performance and is no guarantee of future results. Current performance may be lower or higher than performance shown. Investment return and the principal value will fluctuate. Shares may be worth more or less than original cost when redeemed. Returns do not reflect deduction of taxes that a shareholder would pay on portfolio distributions or redemption of portfolio shares. Total return performance assumes that all dividends and capital gain distributions were reinvested on the payable date. The Portfolio’s gross expense ratio is 0.67%. This ratio does not include an expense reduction, contractually agreed to through June 30, 2017. The Portfolio’s expense ratio net of this reduction is 0.35%. Expense ratio information is as of the Portfolio’s current Private Placement Memorandum (“PPM”) dated February 1, 2016 (as revised October 1, 2016).
Performance figures in this commentary are based on the Wilshire Axiom Performance Attribution Analysis. Wilshire Axiom uses a position based approach and performance is linked daily. Please note that the different prices and different methodologies used in this attribution report, among others, may cause deviation in return figures to official performance.
| 2 | Annual Report/September 30, 2016 |
Table of Contents
AllianzGI Advanced Core Bond Portfolio
(unaudited) (continued)
Industry/Sectors (as of September 30, 2016) |
| Cumulative Returns Through September 30, 2016
| ||||||||
U.S. Treasury Notes | 42.0% |
| ||||||||
Fannie Mae | 12.5% | |||||||||
Banks | 12.3% | |||||||||
Sovereign Debt Obligations | 9.5% | |||||||||
Ginnie Mae | 7.8% | |||||||||
Freddie Mac | 7.6% | |||||||||
U.S. Treasury Bonds | 7.1% | |||||||||
Supernational Bank | 5.2% | |||||||||
Other | 23.1% | |||||||||
Cash & Equivalents — Net | -27.1% | |||||||||
Moody’s Ratings* (as of September 30, 2016) (as a % of total investments)
|
| |||||||||
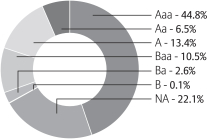
* As a percentage of total investments. Bond ratings refer to the underlying holdings of the Portfolio and are categorized from highest to lowest credit quality using ratings provided by Moody’s. Moody’s ratings have been selected for several reasons, including the access to information and materials provided by Moody’s as well as the Portfolio’s consideration of industry practice. See “Important Information” for more detail on the selection of Moody’s for the Portfolio’s ratings presentation. Bonds not rated by Moody’s and bonds that do not currently have a rating available are designated in the chart above as “NR” and “NA”, respectively.
Shareholder Expense Example
| Actual Performance
| ||||
Beginning Account Value (4/1/16) | $ | 1,000.00 | |||
Ending Account Value (9/30/16) | $ | 1,025.50 | |||
Expenses Paid During Period | $ | 2.03 | |||
Hypothetical Performance
| |||||
| (5% return before expenses) | |||||
Beginning Account Value (4/1/16) | $ | 1,000.00 | |||
Ending Account Value (9/30/16) | $ | 1,023.00 | |||
Expenses Paid During Period | $ | 2.02 | |||
Expenses (net of reimbursement, if any) are equal to the annualized expense ratio of 0.40%, multiplied by the average account value over the period, multiplied by 183/366.
| 3 | Annual Report/September 30, 2016 |
Table of Contents
AllianzGI Best Styles Global Managed Volatility Portfolio
(unaudited)
From inception on April 11, 2016 through September 30, 2016, as provided by Christian McCormick, Senior Product Specialist.
Portfolio Insights
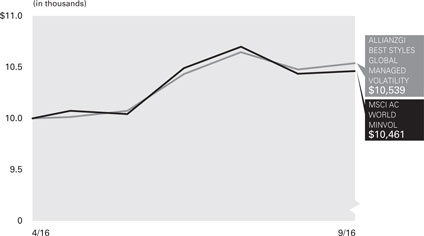
For the period from inception on April 11, 2016 through September 30, 2016, the AllianzGI Best Styles Global Managed Volatility Portfolio (the “Portfolio”) returned 5.40%, outperforming the MSCI ACWI Minimum Volatility Index (the “benchmark”), which returned 4.61%.
Market Overview
The reporting period provided investors with a highly volatile ride, but overall equity markets have been trending upward as the S&P 500 Index, MSCI EAFE Index, and MSCI Emerging Market Index returned 6.64%, 6.48% and 12.37%, respectively. Stocks opened 2016 falling sharply in the opening weeks on renewed fears of economic weakness. Stocks reached their nadir around mid-February, and then recovered through March 2016. Stocks rapidly lost ground again following the UK’s June 23, 2016 vote to leave the European Union (“Brexit”), but quickly rebounded in the final days of June and continued on to have a positive third quarter.
Equity market behavior has been heavily influenced by macroeconomic and political headlines. Examples included Fed policy, negative and zero interest policies in Europe and Japan, the US presidential election, actions in China and the degree of linkages to the global economy, Brexit, along with oil and commodity price volatility.
Portfolio Review
Low volatility and low risk stocks had a roller coaster ride during the short period of existence for the Portfolio. In the second quarter of 2016, the benchmark returned 4.8%, but declined 28 basis points in the third quarter. The Portfolio has a strong tilt to low risk stocks relative to the cap weighted MSCI ACWI Index. Therefore, in absolute terms the fortunes of the Portfolio will be largely driven by the performance of low risk stocks.
Given the regional and sector constraints, country and industry allocation effects were relatively muted. Every sector was in a 10 basis point range relative to the benchmark and overall country allocation was a -25 basis point relative contributor. Stock selection was the overwhelming contributor to the outperformance. In particular, information technology stocks contributed approximately 67 basis points of outperformance and South Korean and US stocks contributed a combined 47 basis points. The primary detractor in stock selection was Canada and the utilities sector, at -20 basis points and -21 basis points, respectively.
Outlook
The Best Styles approach seeks to harvest the long term risk premiums from value, momentum, revisions, growth, and quality. The
primary goal is to effectively manage and mitigate the risks associated with the premiums individually and as a multi style portfolio. However, it is important to remember that these styles do carry additional risks to the benchmark, where the “premium” comes from, and therefore will underperform over certain shorter time periods, especially in shifting, risk-on/risk-off equity markets that are heavily influenced by macro level interest policy. In terms of outlook for Best Styles, the long term investment style allocation of Best Styles with roughly half of the portfolio being invested in the investment style value, and the other half of the portfolio being invested in the investment styles momentum, revisions, growth, and quality remains unchanged.
The Portfolio will remain balanced in terms of the allocation to highest risk and lowest risk stocks, and cyclical versus non-cyclical sectors in order to immunize the portfolio with respect to the impact of risk on/risk off moves and to make the performance of the portfolio independent from the direction of the economic cycle. The balanced and well diversified blend of investment styles of the Best Styles investment approach has proven to succeed in macro-economic conditions comparable to today’s several times in the past and therefore, we will not be deterred in favor of any tempting shorter-term investment style timing efforts.
Cumulative Return for the period ended September 30, 2016
| Since Inception† | |||||
| AllianzGI Best Styles Global Managed Volatility Portfolio | 5.40 | % | |||
| MSCI ACWI Minimum Volatility Index †† | 4.61 | % | |||
† The Portfolio began operations on April 11, 2016. Benchmark return comparisons began on the portfolio inception date.
†† The MSCI ACWI Minimum Volatility Index aims to reflect the performance characteristics of a minimum variance strategy applied to large and mid cap equities across Developed Markets and Emerging Markets countries. The index is calculated by optimizing the MSCI ACWI Index, its parent index, for the lowest absolute risk (within a given set of constraints). Historically, the index has shown lower beta and volatility characteristics relative to the MSCI ACWI Index.
Performance quoted represents past performance and is no guarantee of future results. Current performance may be lower or higher than performance shown. Investment return and the principal value will fluctuate. Shares may be worth more or less than original cost when redeemed. Returns do not reflect deduction of taxes that a shareholder would pay on portfolio distributions or redemption of portfolio shares. Total return performance assumes that all dividends and capital gain distributions were reinvested on the payable date. The Portfolio’s gross expense ratio is 1.22%. This ratio does not include an expense reduction, contractually agreed to through March 31, 2017. The Portfolio’s expense ratio net of this reduction is 0.45%. Expense ratio information is as of the Portfolio’s current PPM dated March 24, 2016 (as revised November 2, 2016).
| 4 | Annual Report/September 30, 2016 |
Table of Contents
AllianzGI Best Styles Global Managed Volatility Portfolio
(unaudited) (continued)
Country Allocation (as of September 30, 2016) |
| Cumulative Returns Through September 30, 2016
| ||||||||
United States | 53.4% |
| ||||||||
Japan | 13.1% | |||||||||
Taiwan | 3.9% | |||||||||
Canada | 2.7% | |||||||||
Korea (Republic of) | 2.7% | |||||||||
Switzerland | 2.2% | |||||||||
Hong Kong | 2.2% | |||||||||
United Kingdom | 1.7% | |||||||||
Other | 12.8% | |||||||||
Cash & Equivalents — Net | 5.3% | |||||||||
Shareholder Expense Example
|
Actual Performance
| ||||
Beginning Account Value (4/11/16) | $ | 1,000.00 | |||
Ending Account Value (9/30/16) | $ | 1,054.00 | |||
Expenses Paid During Period | $ | 2.17 | |||
Hypothetical
| |||||
| (5% return before expenses) | |||||
Beginning Account Value (4/1/16) | $ | 1,000.00 | |||
Ending Account Value (9/30/16) | $ | 1,022.75 | |||
Expenses Paid During Period | $ | 2.28 | |||
The Portfolio commenced operations on April 11, 2016. The Actual expense example is based on the period since inception; the Hypothetical expense example is based on the period beginning April 1, 2016. If the Hypothetical expense example had been based on the period since inception, the Ending Account Value and Expenses Paid During Period would have been: $1,021.38 and $2.14, respectively.
Expenses (net of reimbursement, if any) are equal to the annualized expense ratio of 0.45%, multiplied by the average account value over the period, multiplied by 172/366 for the Actual expense example and 183/366 for the Hypothetical expense example.
| 5 | Annual Report/September 30, 2016 |
Table of Contents
AllianzGI Discovery U.S. Portfolio
(unaudited)
From inception on December 21, 2015 through September 30, 2016, as provided by Raymond Cunha, CFA, Lead Portfolio Manager.
Portfolio Insights
Performance Overview
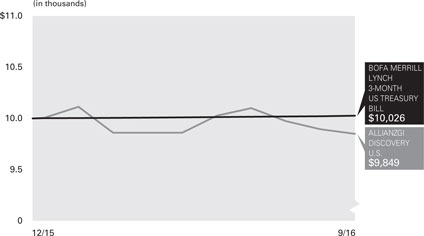
For the period from inception on December 21, 2015 through September 30, 2016, the AllianzGI Discovery U.S. Portfolio (the “Portfolio”) returned -1.53%, underperforming the BofA Merrill Lynch 3-Month US Treasury Bill Index (the “benchmark”), which returned 0.26%.
Market Overview
During the reporting period, the US equity market’s performance was divided into two halves. From September 30, 2015 through mid-February 2016, the S & P 500 Index declined 4.0% and subsequently rebounded 20.2% to finish the reporting period up 15.4%. The first-half decline reflected a myriad of concerns: heightened macro risk from an anticipated Fed tightening; crude prices declining below $30 per barrel; and fears over a significant global growth slowdown emanating from China and other parts of the world. These fears were dispelled in the second-half of the reporting period as oil bottomed in February 2016, the Fed reversed course on the pace of rate hikes for the remainder of 2016 and other parts of the developed world poured on monetary stimulus, including the European Central Bank, the United Kingdom and Japan. For the most part the US economy has performed very resiliently, although the overall worldwide economy remains sluggish. The
International Monetary Fund recently shaved its projection for 2016 worldwide growth to a very modest 3%.
Portfolio Review
The Portfolio’s negative 1.53% return reflected two significant drawdowns in both February 2016 and July-August 2016. February was the largest drawdown and reflected a “mean reversion” trade. The July-August drawdowns also reflected some of the same mean reversion aspects of February. In February, the S&P 500 Index commenced its rally and what we believe are either structurally impaired or cyclically challenged companies that the Portfolio was short, particularly in consumer discretionary and industrials, snapped back.
The Portfolio’s individual GICS sector net exposure is generally limited to the range of +/- 5%. For the reporting period, the largest top three positive net sector contributions were generated (from largest to smallest) in healthcare, energy and consumer discretionary, respectively. Net sector detractors (in the same order) included industrials, financials and consumer staples. In healthcare, the Portfolio benefited from its short exposure in biopharma that was pressured by the greater scrutiny on drug pricing. The negative contribution from
industrials was primarily a result of companies with perceived weak cyclical fundamentals revived with the hope of a bottoming in global construction and mining industries.
During the reporting period, the top long contributor was Continental Resources Inc. and the largest long detractor was L Brands Inc. Continental Resources rose with the surge in oil prices. The largest individual company short contributor was the ETF, the Nasdaq Biotechnology Index (IBB). The largest short detractor was a tie between Qualcomm, Inc. and Cummins Inc. Qualcomm rebounded concurrent with some improvement in company fundamentals.
Outlook
In general, given the Fed’s and other central banks’ dovish monetary policy bias, it has been a relatively more difficult environment for shorting stocks, as the banks’ easy monetary policy has encouraged the “risk on” trade and financial asset inflation. However, as we enter the new reporting period we are hopeful that the environment for shorting improves as the incremental benefits from additional central bank stimulus appear to be possibly waning. As we enter October 2016, the Portfolio is positioned with modest negative net exposure (about 5%), reflecting that outlook.
Cumulative Return for the period ended September 30, 2016
| Since Inception† | |||||
| AllianzGI Discovery U.S. Portfolio | -1.53 | % | |||
| BofA Merrill Lynch 3-Month US Treasury Bill Index †† | 0.26 | % | |||
† The Portfolio began operations on December 21, 2015. Benchmark return comparisons began on the portfolio inception date.
†† The BofA Merrill Lynch 3-Month US Treasury Bill Index tracks the performance of the 3-month US Treasury markets. Index returns reflect the reinvestment of income dividends and capital gains, if any, but do not reflect fees, brokerage commissions or other expenses of investing. It is not possible to invest directly in an index.
Performance quoted represents past performance and is no guarantee of future results. Current performance may be lower or higher than performance shown. Investment return and the principal value will fluctuate. Shares may be worth more or less than original cost when redeemed. Returns do not reflect deduction of taxes that a shareholder would pay on portfolio distributions or redemption of portfolio shares. Total return performance assumes that all dividends and capital gain distributions were reinvested on the payable date. The Portfolio’s gross expense ratio is 6.21%. This ratio does not include an expense reduction, contractually agreed to through January 31, 2017, where the manager agrees to irrevocably waive its management fee and/or reimburse the Portfolio to the extent that gross expense ratio, excluding interest, tax, dividend expenses on short sales, and extraordinary expenses, and certain credits and other expenses , exceed 1.50%. The Portfolio’s expense ratio net of this reduction is 3.23%, which includes dividend expenses on short sales which are estimated to be 1.73%. Expense ratio information is as of the Portfolio’s current PPM dated February 1, 2016 (as revised October 1, 2016).
| 6 | Annual Report/September 30, 2016 |
Table of Contents
AllianzGI Discovery U.S. Portfolio
(unaudited) (continued)
Industry/Sectors (as of September 30, 2016) |
| Cumulative Returns Through September 30, 2016
| ||||||||
Software | 7.1% |
| ||||||||
Biotechnology | 6.9% | |||||||||
Specialty Retail | 5.7% | |||||||||
Banks | 5.7% | |||||||||
Semiconductors & Semiconductor Equipment | 5.4% | |||||||||
Oil, Gas & Consumable Fuels | 5.1% | |||||||||
Pharmaceuticals | 4.8% | |||||||||
Other | 52.7% | |||||||||
Securities Sold Short | -100.9% | |||||||||
Cash & Equivalents — Net | 107.5% | |||||||||
| * Table below details the industry/sectors allocation for securities sold short | ||||||||||
Industry/Sectors —Securities Sold Short |
| |||||||||
Exchange-Traded Funds | -6.7% | |||||||||
| Machinery | -5.5% | |||||||||
Equity Real Estate Investment Trusts (REITS) | -5.2% | |||||||||
Oil, Gas & Consumable Fuels | -5.0% | |||||||||
Capital Markets | -4.8% | |||||||||
Electrical Equipment | -4.1% | |||||||||
Media | -3.7% | |||||||||
Biotechnology | -3.6% | |||||||||
Hotels, Restaurants & Leisure | -3.4% | |||||||||
Other | -58.9% | |||||||||
Shareholder Expense Example
| Actual Performance
| ||||
Beginning Account Value (4/1/16) | $ | 1,000.00 | |||
Ending Account Value (9/30/16) | $ | 998.60 | |||
Expenses Paid During Period | $ | 12.79 | |||
Hypothetical Performance
| |||||
| (5% return before expenses) | |||||
Beginning Account Value (4/1/16) | $ | 1,000.00 | |||
Ending Account Value (9/30/16) | $ | 1,012.20 | |||
Expenses Paid During Period | $ | 12.88 | |||
Expenses (net of reimbursement, if any) are equal to the annualized expense ratio of 2.56%, multiplied by the average account value over the period, multiplied by 183/366.
| 7 | Annual Report/September 30, 2016 |
Table of Contents
AllianzGI Global Small-Cap Opportunities Portfolio
(unaudited)
For the period of October 1, 2015 through September 30, 2016, as provided by Mark P. Roemer, Portfolio Manager.
Portfolio Insights
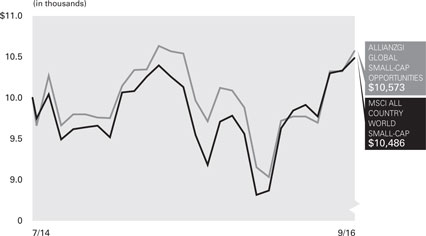
For the twelve-month period ended September 30, 2016, the AllianzGI Global Small-Cap Opportunities Portfolio (the “Portfolio”) returned 8.85%, underperforming the MSCI All Country World Small-Cap Index (the “benchmark”), which returned 14.21%.
Market Overview
During the reporting period, the benchmark’s performance was decidedly positive with investors bidding up the price for small-cap equities globally across developed and emerging markets asset classes. Initially, the benchmark rallied nearly 6% in October 2015 as investor sentiment rapidly improved following declines in the four prior months. The exuberance moderated over the last two months of 2015, with concerns of slowing global growth and the impact from the Fed rate hikes. The new year was met with extreme pessimism, with the asset class declining 14% through the first two weeks of February 2016. Global small-cap equities rebounded amid higher energy prices, a weaker dollar and dovish central bank expectations, posting a modest advance in February 2016 and the positive performance continued into March with a greater than 8% rally. Results moderated in April and May 2016, although still at a positive pace, amid rising concerns about the global economy. The positive performance streak stalled in June 2016 following the UK’s decision to leave the European Union (“Brexit”), resulting in a spike in volatility. Performance advanced in the July through September 2016
period, with investors seeking smaller cap securities with the potential for higher earnings growth as well as their potential to be more isolated from global events which would likely have a greater impact on their larger-cap counterparts.
Country performance was mostly high, led by emerging market small-cap securities, including a triple digit rally in Russia, followed by moderate advances in Brazil and Colombia. Among the developed market securities, New Zealand and Finland were the top performers for the benchmark. Meanwhile, Portugal, Italy and Egypt were among the laggards during the reporting period. Sector results were broadly higher, with 10 out of 11 sectors advancing. Materials, utilities and information technology sectors were each up greater than 20%, while real estate was the lone laggard with a less than 1% decline.
Portfolio Review
The Portfolio’s underperformance compared to the benchmark was primarily due to more conservative stock selection given the market preference for lower-quality, higher-risk and deep-value securities, which the Portfolio is generally underweight.
During the reporting period, bottom-up selections in information technology, consumer staples and financials contributed positively to performance. Conversely, industrials was the primary laggard due to selections in the airlines
sector. Stockpicking in energy, health care and consumer discretionary also trailed the benchmark given the overall market preference for risk. From a country standpoint, bottom-up stockpicking in China, the United Kingdom and Indonesia contributed to performance. Meanwhile, the Portfolio’s developed market exposure, including selections in the United States and Japan, offset results during the reporting period.
Outlook
The expectation for global small-cap equities remains positive, as investors are likely to continue to allocate to the asset class which has shown the potential for higher alpha over time. Monetary policy in the US is likely to shift gears toward gradual rate increases, which we believe is already fully priced by the market. Monetary policy outside the US remains very accommodative, with policymakers using aggressive stimulus measures in Europe and in regions throughout Asia. Global small-cap equities continue to exhibit an attractive growth and valuation mix, particularly within the emerging market segment which had lagged developed market small-cap equities the last several years until recently. In addition, the greater level of insolation in the global small-cap equities, which tend to be singular business models, could help avoid any forthcoming volatility from the Brexit fallout or impact from the US presidential election. As such, we believe the asset class is poised for future gains.
Average Annual Return for the periods ended September 30, 2016
| 1 Year | Since Inception† | |||||||||
| AllianzGI Global Small-Cap Opportunities Portfolio | 8.85% | 2.59 | % | |||||||
| MSCI All Country World Small-Cap Index †† | 14.21% | 2.19 | % | |||||||
† The Portfolio began operations on July 23, 2014. Benchmark return comparisons began on the portfolio inception date.
†† The MSCI All Country World Small-Cap Index captures small-cap representation across developed markets and emerging markets countries. The Index covers about 14% of the free float-adjusted market capitalization in each country (as of September 30, 2016). Index returns reflect the reinvestment of income dividends and capital gains, if any, but do not reflect fees, brokerage commissions or other expenses of investing. It is not possible to invest directly in an index.
Performance quoted represents past performance and is no guarantee of future results. Current performance may be lower or higher than performance shown. Investment return and the principal value will fluctuate. Shares may be worth more or less than original cost when redeemed. Returns do not reflect deduction of taxes that a shareholder would pay on portfolio distributions or redemption of portfolio shares. Total return performance assumes that all dividends and capital gain distributions were reinvested on the payable date. The Portfolio’s gross expense ratio is 7.46%. This ratio does not include an expense reduction, contractually agreed to through January 31, 2017. The Portfolio’s expense ratio net of this reduction is 1.20%. Expense ratio information is as of the Portfolio’s current PPM dated February 1, 2016 (as revised October 1, 2016).
| 8 | Annual Report/September 30, 2016 |
Table of Contents
AllianzGI Global Small-Cap Opportunities Portfolio
(unaudited) (continued)
Country Allocation (as of September 30, 2016) |
| Cumulative Returns Through September 30, 2016
| ||||||||
United States | 51.3% |
| ||||||||
Japan | 7.7% | |||||||||
China | 6.4% | |||||||||
United Kingdom | 3.5% | |||||||||
Korea (Republic of) | 3.1% | |||||||||
Brazil | 2.8% | |||||||||
Australia | 2.8% | |||||||||
Taiwan | 2.7% | |||||||||
Other | 18.2% | |||||||||
Cash & Equivalents — Net | 1.5% | |||||||||
Shareholder Expense Example
|
Actual Performance
| ||||
Beginning Account Value (4/1/16) | $ | 1,000.00 | |||
Ending Account Value (9/30/16) | $ | 1,087.90 | |||
Expenses Paid During Period | $ | 6.26 | |||
Hypothetical Performance
| |||||
| (5% return before expenses) | |||||
Beginning Account Value (4/1/16) | $ | 1,000.00 | |||
Ending Account Value (9/30/16) | $ | 1,019.00 | |||
Expenses Paid During Period | $ | 6.06 | |||
Expenses (net of reimbursement, if any) are equal to the annualized expense ratio of 1.20%, multiplied by the average account value over the period, multiplied by 183/366.
| 9 | Annual Report/September 30, 2016 |
Table of Contents
AllianzGI Institutional Multi-Series Trust
Important Information (unaudited)
As of September 30, 2016, AllianzGI Institutional Multi-Series Trust (the “Trust”) consisted of four investment series, AllianzGI Advanced Core Bond Portfolio, AllianzGI Best Styles Global Managed Volatility Portfolio, AllianzGI Discovery U.S. Portfolio and AllianzGI Global Small-Cap Opportunities Portfolio, (each a “Portfolio” and collectively the “Portfolios”). The Portfolios each currently offer one share class.
The Cumulative Returns charts for each Portfolio assume the initial investment was made on the first day of each Portfolio’s initial fiscal year. Results assume that all dividends and capital gain distributions, if any, were reinvested. They do not take into account the effect of taxes. The benchmark cumulative return began on the last day of the month of each Portfolio’s inception date.
The following disclosure provides important information regarding each Portfolio’s Shareholder Expense Example, which appears on each Portfolio Summary page in this Annual report. Please refer to this information when reviewing the Shareholder Expense Example for each Portfolio.
Shareholder Expense Example
Shareholders incur two types of costs: (1) transaction costs; and (2) ongoing costs, including investment management fees and other Portfolio expenses. The Shareholder Expense Example is intended to help shareholders understand ongoing costs (in dollars) of investing in a Portfolio and to compare these costs with the ongoing costs of investing in other mutual funds. The Shareholder Expense Example is based on $1,000.00 invested at the beginning of the periods, as indicated, and held for the entire period through September 30, 2016.
Actual Expenses
The information in the table under the heading “Actual Performance” provides information about actual account values and actual expenses. You may use the information in this column, together with the amount you invested, to estimate the expenses that you paid over the period. Simply divide your account value by $1,000.00 (for example, an $8,600.00 account value divided by $1,000.00 = 8.6), then multiply the result by the number in the row titled “Expenses Paid During Period” to estimate the expenses you paid on your account during this period.
Hypothetical Example for Comparison Purposes
The information in the tables for “Hypothetical Performance (5% return before expenses)” provides information about hypothetical account values and hypothetical expenses based on a Portfolio’s actual expense ratio and an assumed rate of return of 5% per year before expenses, which is not each Portfolio’s actual return. The hypothetical account values and expenses may not be used to estimate the actual ending account balance or expenses you paid for the period. You may use this information to compare the ongoing costs of investing in a Portfolio and other funds. To do so, compare this 5% hypothetical example with the 5% hypothetical examples that appear in the shareholder reports of other funds.
Please note that the expenses shown in the table are meant to highlight your ongoing costs only and do not reflect any transactional costs. Therefore, the information for “Hypothetical Performance (5% return before expenses)” is useful in comparing ongoing costs only, and will not help you determine the relative total costs of owning different funds. In addition, if these transactional costs were included, your costs would have been higher.
Proxy Voting
The Portfolios’ Investment Manager has adopted written proxy voting policies and procedures (“Proxy Policy”) as required by Rule 206(4)-6 under the Investment Advisers Act of 1940. The Proxy Policy has been adopted by the Trust as the policies and procedures that the Investment Manager will use when voting proxies on behalf of each Portfolio. Copies of the written Proxy Policy and the factors that the Investment Manager may consider in determining how to vote proxies for each Portfolio, and information about how each Portfolio voted proxies relating to portfolio securities held during the most recent twelve-month period ended June 30, are available without charge, upon request, by calling 1-800-498-5413, on the Allianz Global Investors Distributions website at us.allianzgi.com and on the Securities and Exchange Commission’s (“SEC”) website at http://www.sec.gov.
| 10 | Annual Report/September 30, 2016 |
Table of Contents
Form N-Q
The Trust files complete schedules of each Portfolio’s holdings with the SEC on Form N-Q for the first and third quarters of each fiscal year, which are available on the SEC’s website at http://www.sec.gov. A copy of the Trust’s Form N-Q is available without charge, upon request, by calling 1-800-498-5413. In addition, the Trust’s Form N-Q may be reviewed and copied at the SEC’s Public Reference Room in Washington, DC. Information on the operation of the Public Reference Room may be obtained by calling 1-800-SEC-0330.
Credit Ratings
Bond ratings apply to the underlying holdings of a Portfolio and not the Portfolio itself and are divided into categories ranging from highest to lowest credit quality, determined for purposes of presentations in this report by using ratings provided by Moody’s Investors Service, Inc. (“Moody’s”).
Unless otherwise noted, presentations of credit ratings information in this report use ratings provided by Moody’s because of, among other reasons, the access to background information and other materials provided by Moody’s, as well as the Portfolios’ considerations of industry practice.
Bonds not rated by Moody’s or bonds that do not have a rating available are designated as “NR” and “NA”, respectively. Credit quality ratings assigned by a rating agency are subjective opinions, not statements of fact, and are subject to change periodically, even as frequently as daily. Ratings assigned by Moody’s or another rating agency are not absolute standards of credit quality and do not evaluate market risk. Rating agencies may fail to make timely changes in credit ratings, and an issuer’s current financial condition may be better or worse than a rating indicates. In formulating investment decisions for the applicable Portfolios, Allianz Global Investors U.S. LLC, the sub-adviser to the Portfolios, develops its own analysis of the credit quality and risks associated with individual debt instruments, rather than relying exclusively on rating agencies or third-party research.
All the information on the Portfolio Summary pages, including Portfolio Insights, Average Annual Return Tables, Cumulative Return Charts, Shareholder Expense Examples and Allocation/Credit Rating Summaries is unaudited.
Allianz Global Investors Distributors LLC, 1633 Broadway, New York, NY, 10019, us.allianzgi.com, 1-800-498-5413.
| 11 | Annual Report/September 30, 2016 |
Table of Contents
September 30, 2016
AllianzGI Advanced Core Bond Portfolio
| Principal Amount (000s) | Value | |||||||
| ||||||||
U.S. TREASURY OBLIGATIONS - 49.1% | ||||||||
U.S. Treasury Bonds, | ||||||||
2.50%, 2/15/45 | $ | 1,800 | $ | 1,866,445 | ||||
3.125%, 2/15/42 | 1,450 | 1,693,752 | ||||||
3.125%, 2/15/43 | 800 | 935,062 | ||||||
3.50%, 2/15/39 | 1,500 | 1,862,373 | ||||||
4.75%, 2/15/41 | 1,400 | 2,070,687 | ||||||
5.50%, 8/15/28 | 500 | 703,828 | ||||||
6.00%, 2/15/26 | 1,500 | 2,081,250 | ||||||
6.25%, 8/15/23 | 800 | 1,055,687 | ||||||
U.S. Treasury Notes, | ||||||||
1.25%, 10/31/18 (d) | 18,400 | 18,569,630 | ||||||
1.25%, 7/31/23 | 1,500 | 1,484,853 | ||||||
1.375%, 3/31/20 | 1,300 | 1,317,215 | ||||||
1.50%, 12/31/18 | 3,500 | 3,552,909 | ||||||
1.625%, 3/31/19 | 6,000 | 6,114,612 | ||||||
1.625%, 5/15/26 | 1,500 | 1,503,164 | ||||||
1.75%, 10/31/20 | 1,700 | 1,744,991 | ||||||
1.75%, 3/31/22 | 1,300 | 1,333,922 | ||||||
1.75%, 1/31/23 | 3,100 | 3,174,171 | ||||||
1.875%, 10/31/22 | 1,800 | 1,857,656 | ||||||
2.125%, 1/31/21 | 3,600 | 3,752,366 | ||||||
2.125%, 6/30/22 | 1,000 | 1,046,191 | ||||||
2.125%, 5/15/25 | 500 | 523,145 | ||||||
2.25%, 3/31/21 | 3,700 | 3,879,579 | ||||||
2.50%, 5/15/24 | 1,000 | 1,075,137 | ||||||
4.25%, 11/15/17 | 21,100 | 21,934,378 | ||||||
|
| |||||||
Total U.S. Treasury Obligations (cost-$83,972,745) |
| 85,133,003
|
| |||||
|
| |||||||
CORPORATE BONDS & NOTES - 40.6% | ||||||||
Advertising - 0.2% | ||||||||
WPP Finance 2010, | ||||||||
4.75%, 11/21/21 | 300 | 336,924 | ||||||
|
| |||||||
Aerospace & Defense - 0.4% | ||||||||
United Technologies Corp., | ||||||||
6.125%, 2/1/19 | 600 | 665,594 | ||||||
|
| |||||||
Agriculture - 0.2% | ||||||||
Altria Group, Inc., | ||||||||
5.375%, 1/31/44 | 300 | 381,367 | ||||||
|
| |||||||
Auto Manufacturers - 2.7% | ||||||||
Daimler Finance North America LLC, | ||||||||
2.00%, 8/3/18 | 400 | 403,405 | ||||||
2.00%, 7/6/21 (a)(b) | 500 | 501,211 | ||||||
Ford Motor Credit Co. LLC, | ||||||||
1.724%, 12/6/17 | 300 | 300,362 | ||||||
2.375%, 3/12/19 | 800 | 809,962 | ||||||
3.096%, 5/4/23 | 500 | 504,464 | ||||||
General Motors Financial Co., Inc., | ||||||||
3.20%, 7/6/21 | 300 | 304,034 | ||||||
4.375%, 9/25/21 | 300 | 320,797 | ||||||
PACCAR Financial Corp., | ||||||||
1.65%, 8/11/21 | 900 | 894,732 | ||||||
RCI Banque S.A. (a)(b), | ||||||||
3.50%, 4/3/18 | 400 | 411,381 | ||||||
Toyota Motor Credit Corp., | ||||||||
1.70%, 2/19/19 | 300 | 302,427 | ||||||
|
| |||||||
|
| 4,752,775
|
| ||||||
|
| |||||||
Banks - 12.3% | ||||||||
Banco Bilbao Vizcaya Argentaria S.A., | ||||||||
3.00%, 10/20/20 | 1,000 | 1,032,935 | ||||||
Bank Nederlandse Gemeenten NV (a)(b), | ||||||||
1.625%, 4/19/21 | 800 | 807,234 | ||||||
2.375%, 3/16/26 | 500 | 520,617 | ||||||
Bank of America Corp., Ser. L, | ||||||||
2.65%, 4/1/19 | 800 | 817,610 | ||||||
Bank of Montreal, | ||||||||
1.40%, 9/11/17 | 100 | 100,076 | ||||||
2.375%, 1/25/19 | 600 | 611,752 | ||||||
| See accompanying Notes to Financial Statements | 12 | Annual Report/September 30, 2016 |
Table of Contents
Schedule of Investments
September 30, 2016
AllianzGI Advanced Core Bond Portfolio
| Principal Amount (000s) | Value | |||||||
| ||||||||
Bank of Nova Scotia, | ||||||||
2.80%, 7/21/21 | 300 | 312,415 | ||||||
Barclays PLC, | ||||||||
4.375%, 1/12/26 | 550 | 570,124 | ||||||
Citigroup, Inc., | ||||||||
4.50%, 1/14/22 | 500 | 552,914 | ||||||
8.125%, 7/15/39 | 500 | 790,144 | ||||||
Commonwealth Bank of Australia (a)(b), | ||||||||
2.85%, 5/18/26 | 500 | 507,569 | ||||||
Deutsche Bank AG, | ||||||||
3.375%, 5/12/21 | 400 | 391,720 | ||||||
3.70%, 5/30/24 | 450 | 431,846 | ||||||
Dexia Credit Local S.A. (a)(b), | ||||||||
1.875%, 3/28/19 | 400 | 402,354 | ||||||
Goldman Sachs Group, Inc., | ||||||||
2.375%, 1/22/18, Ser. GLOB | 500 | 505,251 | ||||||
2.55%, 10/23/19 | 500 | 511,317 | ||||||
Inter-American Development Bank, | ||||||||
3.20%, 8/7/42 | 400 | 439,812 | ||||||
JPMorgan Chase & Co., | ||||||||
3.625%, 5/13/24 | 450 | 479,301 | ||||||
5.40%, 1/6/42 | 250 | 314,169 | ||||||
KFW, | ||||||||
zero coupon, 6/29/37 | 600 | 356,971 | ||||||
1.125%, 8/6/18 | 650 | 651,700 | ||||||
2.75%, 10/1/20 | 400 | 423,080 | ||||||
Lloyds Bank PLC, | ||||||||
2.00%, 8/17/18 | 400 | 401,845 | ||||||
Macquarie Bank Ltd. (a)(b), | ||||||||
2.35%, 1/15/19 | 300 | 303,395 | ||||||
3.90%, 1/15/26 | 700 | 740,403 | ||||||
Morgan Stanley, | ||||||||
2.375%, 7/23/19 | 550 | 559,901 | ||||||
2.50%, 1/24/19 | 600 | 611,485 | ||||||
2.50%, 4/21/21 | 500 | 505,422 | ||||||
4.75%, 3/22/17 | 400 | 406,650 | ||||||
National Australia Bank Ltd., | ||||||||
2.625%, 1/14/21 | 1,200 | 1,235,881 | ||||||
Svenska Handelsbanken AB, | ||||||||
2.50%, 1/25/19 | 1,000 | 1,022,768 | ||||||
Swedbank AB, | ||||||||
1.75%, 3/12/18 | 400 | 402,129 | ||||||
Toronto-Dominion Bank, | ||||||||
1.80%, 7/13/21 | 900 | 897,103 | ||||||
UBS AG, | ||||||||
2.375%, 8/14/19 | 550 | 561,224 | ||||||
Wells Fargo & Co., | ||||||||
2.50%, 3/4/21 | 600 | 608,688 | ||||||
3.45%, 2/13/23 | 400 | 413,010 | ||||||
3.90%, 5/1/45 | 300 | 310,277 | ||||||
Westpac Banking Corp., | ||||||||
2.00%, 3/3/20 | 350 | 354,385 | ||||||
2.10%, 2/25/21 (a)(b) | 400 | 405,727 | ||||||
|
| |||||||
|
| 21,271,204
|
| ||||||
|
| |||||||
Biotechnology - 0.5% | ||||||||
Amgen, Inc., | ||||||||
2.25%, 8/19/23 | 900 | 898,140 | ||||||
|
| |||||||
Chemicals - 0.2% | ||||||||
Dow Chemical Co., | ||||||||
7.375%, 11/1/29 | 300 | 410,765 | ||||||
|
| |||||||
Diversified Financial Services - 0.4% | ||||||||
General Electric Co., | ||||||||
3.10%, 1/9/23 | 600 | 638,249 | ||||||
|
| |||||||
Electric Utilities - 1.8% | ||||||||
Consolidated Edison Co. of New York, Inc., | ||||||||
4.20%, 3/15/42, Ser. 12-A | 300 | 329,734 | ||||||
4.45%, 3/15/44 | 300 | 345,437 | ||||||
Electricite de France S.A. (a)(b), | ||||||||
2.15%, 1/22/19 | 600 | 608,693 | ||||||
4.875%, 1/22/44 | 600 | 650,522 | ||||||
| See accompanying Notes to Financial Statements | 13 | Annual Report/September 30, 2016 |
Table of Contents
Schedule of Investments
September 30, 2016
AllianzGI Advanced Core Bond Portfolio
| Principal Amount (000s) | Value | |||||||
| ||||||||
Enel Finance International NV, | ||||||||
5.125%, 10/7/19 (a)(b) | 400 | 439,126 | ||||||
6.80%, 9/15/37 | 150 | 199,141 | ||||||
Entergy Corp., | ||||||||
2.95%, 9/1/26 | 250 | 250,640 | ||||||
Pacific Gas & Electric Co., | ||||||||
8.25%, 10/15/18 | 300 | 340,340 | ||||||
|
| |||||||
|
| 3,163,633
|
| ||||||
|
| |||||||
Food & Beverage - 1.7% | ||||||||
Anheuser-Busch InBev Finance, Inc., | ||||||||
1.90%, 2/1/19 | 300 | 303,145 | ||||||
2.65%, 2/1/21 | 500 | 516,499 | ||||||
3.65%, 2/1/26 | 300 | 321,888 | ||||||
4.90%, 2/1/46 | 300 | 361,300 | ||||||
Diageo Capital PLC, | ||||||||
3.875%, 4/29/43 | 400 | 423,757 | ||||||
Mondelez International, Inc., | ||||||||
2.25%, 2/1/19 | 450 | 458,071 | ||||||
PepsiCo, Inc., | ||||||||
2.15%, 10/14/20 | 300 | 308,068 | ||||||
2.75%, 3/1/23 | 200 | 210,072 | ||||||
|
| |||||||
|
| 2,902,800
|
| ||||||
|
| |||||||
Food Products - 0.4% | ||||||||
Unilever Capital Corp., | ||||||||
3.10%, 7/30/25 | 700 | 751,305 | ||||||
|
| |||||||
Healthcare-Products - 0.3% | ||||||||
Thermo Fisher Scientific, Inc., | ||||||||
3.00%, 4/15/23 | 500 | 512,960 | ||||||
|
| |||||||
Insurance - 0.4% | ||||||||
MetLife, Inc., | ||||||||
5.70%, 6/15/35 | 550 | 667,729 | ||||||
|
| |||||||
Internet - 0.3% | ||||||||
Alphabet, Inc., | ||||||||
3.375%, 2/25/24 | 500 | 548,290 | ||||||
|
| |||||||
IT Services - 0.4% | ||||||||
International Business Machines Corp., | ||||||||
1.80%, 5/17/19 | 300 | 304,117 | ||||||
4.70%, 2/19/46 | 300 | 348,388 | ||||||
|
| |||||||
| 652,505 | ||||||||
|
| |||||||
Machinery-Construction & Mining - 0.5% | ||||||||
Caterpillar Financial Services Corp., | ||||||||
2.40%, 8/9/26 | 900 | 895,207 | ||||||
|
| |||||||
Machinery-Diversified - 1.2% | ||||||||
CNH Industrial Capital LLC, | ||||||||
3.875%, 7/16/18 | 600 | 612,000 | ||||||
4.875%, 4/1/21 | 500 | 532,500 | ||||||
John Deere Capital Corp., | ||||||||
2.75%, 3/15/22 | 400 | 416,367 | ||||||
2.80%, 3/6/23 | 500 | 521,097 | ||||||
|
| |||||||
|
| 2,081,964
|
| ||||||
|
| |||||||
Media - 2.3% | ||||||||
CBS Corp., | ||||||||
2.30%, 8/15/19 | 400 | 405,720 | ||||||
Comcast Corp., | ||||||||
2.35%, 1/15/27 | 500 | 492,970 | ||||||
6.45%, 3/15/37 | 300 | 415,800 | ||||||
Discovery Communications LLC, | ||||||||
5.05%, 6/1/20 | 600 | 657,532 | ||||||
6.35%, 6/1/40 | 300 | 326,696 | ||||||
RELX Capital, Inc., | ||||||||
8.625%, 1/15/19 | 300 | 345,796 | ||||||
| See accompanying Notes to Financial Statements | 14 | Annual Report/September 30, 2016 |
Table of Contents
Schedule of Investments
September 30, 2016
AllianzGI Advanced Core Bond Portfolio
| Principal Amount (000s) | Value | |||||||
| ||||||||
Thomson Reuters Corp., | ||||||||
3.35%, 5/15/26 | 400 | 411,647 | ||||||
Time Warner Cable, Inc., | ||||||||
4.00%, 9/1/21 | 300 | 318,756 | ||||||
6.75%, 6/15/39 | 300 | 366,830 | ||||||
Time Warner, Inc., | ||||||||
4.875%, 3/15/20 | 300 | 331,626 | ||||||
|
| |||||||
|
| 4,073,373
|
| ||||||
|
| |||||||
Mining - 0.3% | ||||||||
Barrick Gold Corp., | ||||||||
4.10%, 5/1/23 | 95 | 102,916 | ||||||
BHP Billiton Finance USA Ltd., | ||||||||
6.50%, 4/1/19 | 400 | 448,174 | ||||||
|
| |||||||
|
| 551,090
|
| ||||||
|
| |||||||
Miscellaneous Manufacturing - 0.2% | ||||||||
Siemens Financieringsmaatschappij NV (a)(b), | ||||||||
4.40%, 5/27/45 | 300 | 348,166 | ||||||
|
| |||||||
Oil, Gas & Consumable Fuels - 0.9% | ||||||||
Gazprom OAO Via Gaz Capital S.A. (a)(b), | ||||||||
6.212%, 11/22/16 | 300 | 302,025 | ||||||
Shell International Finance BV, | ||||||||
6.375%, 12/15/38 | 150 | 204,850 | ||||||
Sinopec Group Overseas Development 2012 Ltd., | ||||||||
2.75%, 5/17/17 | 400 | 403,415 | ||||||
Sinopec Group Overseas Development 2016 Ltd. (a)(b), | ||||||||
2.125%, 5/3/19 | 200 | 201,510 | ||||||
Statoil ASA, | ||||||||
2.90%, 11/8/20 | 400 | 419,354 | ||||||
|
| |||||||
|
| 1,531,154
|
| ||||||
|
| |||||||
Pharmaceuticals - 1.0% | ||||||||
AstraZeneca PLC, | ||||||||
1.95%, 9/18/19 | 400 | 406,005 | ||||||
Johnson & Johnson, | ||||||||
4.375%, 12/5/33 | 250 | 299,946 | ||||||
Merck & Co., Inc., | ||||||||
2.75%, 2/10/25 | 700 | 726,580 | ||||||
Sanofi, | ||||||||
4.00%, 3/29/21 | 300 | 330,071 | ||||||
|
| |||||||
|
| 1,762,602
|
| ||||||
|
| |||||||
Pipelines - 0.4% | ||||||||
Enterprise Products Operating LLC, | ||||||||
4.85%, 3/15/44 | 300 | 313,698 | ||||||
TransCanada PipeLines Ltd., | ||||||||
7.125%, 1/15/19 | 350 | 389,818 | ||||||
|
| |||||||
|
| 703,516
|
| ||||||
|
| |||||||
Retail - 1.1% | ||||||||
CVS Health Corp., | ||||||||
4.00%, 12/5/23 | 300 | 331,093 | ||||||
Macy’s Retail Holdings, Inc., | ||||||||
4.50%, 12/15/34 | 300 | 283,098 | ||||||
McDonald’s Corp., | ||||||||
4.875%, 12/9/45 | 500 | 584,139 | ||||||
Walgreens Boots Alliance, Inc., | ||||||||
2.70%, 11/18/19 | 300 | 309,346 | ||||||
4.50%, 11/18/34 | 300 | 321,588 | ||||||
|
| |||||||
|
| 1,829,264
|
| ||||||
|
| |||||||
Software - 0.3% | ||||||||
Oracle Corp., | ||||||||
4.00%, 7/15/46 | 500 | 519,397 | ||||||
|
| |||||||
Supranational Bank - 5.2% | ||||||||
African Development Bank, | ||||||||
1.375%, 12/17/18 | 1,000 | 1,007,836 | ||||||
| See accompanying Notes to Financial Statements | 15 | Annual Report/September 30, 2016 |
Table of Contents
Schedule of Investments
September 30, 2016
AllianzGI Advanced Core Bond Portfolio
| Principal Amount (000s) | Value | |||||||
| ||||||||
Asian Development Bank, | ||||||||
1.375%, 1/15/19 | 200 | 201,564 | ||||||
1.375%, 3/23/20 | 500 | 503,671 | ||||||
1.625%, 3/16/21 | 700 | 709,714 | ||||||
Corp. Andina de Fomento, | ||||||||
2.00%, 5/10/19 | 300 | 303,029 | ||||||
Council of Europe Development Bank, | ||||||||
1.00%, 3/7/18 | 1,000 | 1,000,507 | ||||||
Council Of Europe Development Bank (c), | ||||||||
1.00%, 2/4/19 | 1,400 | 1,396,531 | ||||||
Council of Europe Development Bank, | ||||||||
1.625%, 3/16/21 | 700 | 707,822 | ||||||
European Investment Bank, | ||||||||
1.00%, 3/15/18 | 1,700 | 1,701,093 | ||||||
International Bank for Reconstruction & Development, | ||||||||
1.875%, 10/7/19 | 500 | 511,525 | ||||||
Nordic Investment Bank, | ||||||||
0.75%, 1/17/18 | 1,000 | 999,052 | ||||||
|
| |||||||
|
| 9,042,344
|
| ||||||
|
| |||||||
Technology Hardware, Storage & Peripherals - 1.1% | ||||||||
Apple, Inc., | ||||||||
2.25%, 2/23/21 | 500 | 513,249 | ||||||
2.85%, 2/23/23 | 750 | 790,451 | ||||||
4.65%, 2/23/46 | 500 | 579,915 | ||||||
|
| |||||||
|
| 1,883,615
|
| ||||||
|
| |||||||
Telecommunications - 3.3% | ||||||||
AT&T, Inc., | ||||||||
3.40%, 5/15/25 | 500 | 514,927 | ||||||
3.90%, 3/11/24 | 300 | 321,813 | ||||||
4.125%, 2/17/26 | 500 | 541,654 | ||||||
4.80%, 6/15/44 | 900 | 950,657 | ||||||
5.60%, 5/15/18 | 400 | 426,218 | ||||||
5.65%, 2/15/47 | 400 | 475,509 | ||||||
British Telecommunications PLC, | ||||||||
5.95%, 1/15/18 | 300 | 317,466 | ||||||
Cisco Systems, Inc., | ||||||||
2.45%, 6/15/20 | 700 | 723,137 | ||||||
5.50%, 1/15/40 | 250 | 325,255 | ||||||
Verizon Communications, Inc., | ||||||||
3.50%, 11/1/21 | 550 | 591,180 | ||||||
4.15%, 3/15/24 | 500 | 553,038 | ||||||
|
| |||||||
|
| 5,740,854
|
| ||||||
|
| |||||||
Transportation - 0.6% | ||||||||
CSX Corp., | ||||||||
3.40%, 8/1/24 | 350 | 376,006 | ||||||
FedEx Corp., | ||||||||
4.10%, 4/15/43 | 600 | 625,063 | ||||||
|
| |||||||
|
| 1,001,069
|
| ||||||
|
| |||||||
Total Corporate Bonds & Notes (cost-$68,486,105) |
| 70,517,855
|
| |||||
|
| |||||||
U.S. GOVERNMENT AGENCY SECURITIES - 27.9% | ||||||||
Fannie Mae, MBS (c), | ||||||||
2.50%, 10/18/31 TBA, 15 Year | 1,540 | 1,595,284 | ||||||
3.00%, 10/18/31 TBA, 15 Year | 1,700 | 1,784,934 | ||||||
3.00%, 10/13/46 TBA, 30 Year | 3,800 | 3,951,109 | ||||||
3.50%, 10/18/31 TBA, 15 Year | 1,500 | 1,581,774 | ||||||
3.50%, 10/13/46 TBA, 30 Year | 5,060 | 5,340,277 | ||||||
4.00%, 10/13/46 TBA, 30 Year | 3,500 | 3,759,355 | ||||||
4.50%, 10/13/46 TBA, 30 Year | 1,450 | 1,588,259 | ||||||
5.00%, 10/13/46 TBA, 30 Year | 740 | 822,007 | ||||||
5.50%, 10/13/46 TBA, 30 Year | 1,110 | 1,251,080 | ||||||
Freddie Mac, | ||||||||
2.50%, 10/18/31 TBA, 15 Year (c) | 1,020 | 1,056,736 | ||||||
3.00%, 10/18/46 TBA, 30 Year (c) | 3,370 | 3,514,647 | ||||||
3.50%, 10/18/31 TBA, 15 Year (c) | 820 | 866,012 | ||||||
3.50%, 10/13/46 TBA, 30 Year (c) | 3,190 | 3,365,824 | ||||||
4.00%, 8/1/44 | 187 | 201,183 | ||||||
| See accompanying Notes to Financial Statements | 16 | Annual Report/September 30, 2016 |
Table of Contents
Schedule of Investments
September 30, 2016
AllianzGI Advanced Core Bond Portfolio
| Principal Amount (000s) | Value | |||||||
| ||||||||
4.00%, 10/13/46 TBA, 30 Year (c) | 1,970 | 2,113,364 | ||||||
4.50%, 10/13/46 TBA, 30 Year (c) | 880 | 963,737 | ||||||
5.00%, 10/13/46 TBA, 30 Year (c) | 480 | 531,900 | ||||||
5.50%, 10/13/46 TBA, 30 Year (c) | 640 | 718,637 | ||||||
Ginnie Mae, TBA, 30 Year (c), | ||||||||
3.00%, 10/20/46 | 3,080 | 3,227,263 | ||||||
3.50%, 10/20/46 | 4,850 | 5,151,988 | ||||||
4.00%, 10/20/46 | 2,380 | 2,550,969 | ||||||
4.50%, 10/20/46 | 2,230 | 2,407,092 | ||||||
|
| |||||||
Total U.S. Government Agency Securities (cost-$48,161,982) |
| 48,343,431
|
| |||||
|
| |||||||
SOVEREIGN DEBT OBLIGATIONS - 9.5% | ||||||||
Argentina - 0.2% | ||||||||
Argentine Republic Government International Bond (a)(b), | ||||||||
6.25%, 4/22/19 | 250 | 265,750 | ||||||
|
| |||||||
Brazil - 0.3% | ||||||||
Brazilian Government International Bond, | ||||||||
4.25%, 1/7/25 | 300 | 299,925 | ||||||
5.00%, 1/27/45 | 200 | 182,000 | ||||||
|
| |||||||
|
| 481,925
|
| ||||||
|
| |||||||
Canada - 0.5% | ||||||||
Export Development Canada, | ||||||||
1.25%, 12/10/18 | 350 | 351,845 | ||||||
Province of New Brunswick Canada, | ||||||||
2.75%, 6/15/18 | 500 | 513,657 | ||||||
|
| |||||||
|
| 865,502
|
| ||||||
|
| |||||||
Chile - 0.4% | ||||||||
Chile Government International Bond, | ||||||||
3.25%, 9/14/21 | 400 | 429,400 | ||||||
3.625%, 10/30/42 | 300 | 320,625 | ||||||
|
| |||||||
|
| 750,025
|
| ||||||
|
| |||||||
Colombia - 0.2% | ||||||||
Colombia Government International Bond, | ||||||||
4.00%, 2/26/24 | 400 | 426,000 | ||||||
|
| |||||||
Croatia - 0.7% | ||||||||
Croatia Government International Bond, | ||||||||
6.25%, 4/27/17 | 600 | 615,042 | ||||||
6.75%, 11/5/19 | 500 | 555,160 | ||||||
|
| |||||||
|
| 1,170,202
|
| ||||||
|
| |||||||
Germany - 0.2% | ||||||||
FMS Wertmanagement AoeR, | ||||||||
1.00%, 11/21/17 | 300 | 300,167 | ||||||
|
| |||||||
Hungary - 0.3% | ||||||||
Hungary Government International Bond, | ||||||||
4.00%, 3/25/19 | 500 | 525,190 | ||||||
|
| |||||||
Iceland - 0.4% | ||||||||
Iceland Government International Bond, | ||||||||
5.875%, 5/11/22 | 600 | 705,829 | ||||||
|
| |||||||
Indonesia - 0.8% | ||||||||
Indonesia Government International Bond, | ||||||||
3.75%, 4/25/22 | 550 | 580,629 | ||||||
11.625%, 3/4/19 | 600 | 737,965 | ||||||
|
| |||||||
|
| 1,318,594
|
| ||||||
|
| |||||||
Latvia - 0.4% | ||||||||
Republic of Latvia, | ||||||||
2.75%, 1/12/20 | 700 | 729,638 | ||||||
|
| |||||||
| See accompanying Notes to Financial Statements | 17 | Annual Report/September 30, 2016 |
Table of Contents
Schedule of Investments
September 30, 2016
AllianzGI Advanced Core Bond Portfolio
| Principal Amount (000s) �� | Value | |||||||
| ||||||||
Lithuania - 0.8% | ||||||||
Lithuania Government International Bond (a)(b), | ||||||||
7.375%, 2/11/20 | 500 | 594,437 | ||||||
Republic Of Lithuania, | ||||||||
5.125%, 9/14/17 | 700 | 728,000 | ||||||
|
| |||||||
|
| 1,322,437
|
| ||||||
|
| |||||||
Mexico - 1.0% | ||||||||
Mexico Government International Bond, | ||||||||
4.00%, 10/2/23 | 400 | 428,800 | ||||||
4.125%, 1/21/26 | 200 | 215,800 | ||||||
4.75%, 3/8/44 | 400 | 417,000 | ||||||
5.95%, 3/19/19 | 600 | 666,750 | ||||||
|
| |||||||
|
| 1,728,350
|
| ||||||
|
| |||||||
Morocco - 0.3% | ||||||||
Morocco Government International Bond, | ||||||||
4.25%, 12/11/22 | 550 | 584,947 | ||||||
|
| |||||||
Panama - 0.4% | ||||||||
Panama Government International Bond, | ||||||||
7.125%, 1/29/26 | 550 | 743,875 | ||||||
|
| |||||||
Peru - 0.8% | ||||||||
Peruvian Government International Bond, | ||||||||
4.125%, 8/25/27 | 300 | 344,250 | ||||||
7.125%, 3/30/19 | 500 | 573,750 | ||||||
7.35%, 7/21/25 | 400 | 557,000 | ||||||
|
| |||||||
|
| 1,475,000
|
| ||||||
|
| |||||||
Philippines - 0.2% | ||||||||
Philippine Government International Bond, | ||||||||
6.50%, 1/20/20 | 300 | 346,504 | ||||||
|
| |||||||
Poland - 0.9% | ||||||||
Poland Government International Bond, | ||||||||
5.00%, 3/23/22 | 700 | 799,474 | ||||||
6.375%, 7/15/19 | 600 | 675,906 | ||||||
|
| |||||||
|
| 1,475,380
|
| ||||||
|
| |||||||
South Africa - 0.2% | ||||||||
Republic of South Africa, | ||||||||
4.875%, 4/14/26 | 290 | 305,657 | ||||||
|
| |||||||
Turkey - 0.5% | ||||||||
Turkey Government International Bond, | ||||||||
4.875%, 10/9/26 | 300 | 306,036 | ||||||
6.75%, 4/3/18 | 600 | 635,133 | ||||||
|
| |||||||
|
| 941,169
|
| ||||||
|
| |||||||
Total Sovereign Debt Obligations (cost-$15,841,756) |
| 16,462,141
|
| |||||
|
| |||||||
Repurchase Agreements - 3.3% | ||||||||
State Street Bank and Trust Co., | 5,668 | 5,668,000 | ||||||
|
| |||||||
Total Investments (cost-$222,130,588)-130.4% | 226,124,430 | |||||||
|
| |||||||
Liabilities in excess of other assets (e)-(30.4)% | (52,713,596) | |||||||
|
| |||||||
Net Assets-100.0% | $ | 173,410,834 | ||||||
|
| |||||||
| See accompanying Notes to Financial Statements | 18 | Annual Report/September 30, 2016 |
Table of Contents
Schedule of Investments
September 30, 2016
AllianzGI Advanced Core Bond Portfolio
Notes to Schedule of Investments:
| (a) | Private Placement—Restricted as to resale and may not have a readily available market. Securities with an aggregate value of $8,010,120, representing 4.6% of net assets. |
| (b) | 144A—Exempt from registration under Rule 144A of the Securities Act of 1933. These securities may be resold in transactions exempt from registration, typically only to qualified institutional buyers. Unless otherwise indicated, these securities are not considered to be illiquid. |
| (c) | When-issued or delayed-delivery. To be settled/delivered after September 30, 2016. |
| (d) | All or partial amount segregated for the benefit of the counterparty as collateral for when-issued or delayed delivery securities. |
| (e) | Includes net unrealized appreciation (depreciation) of other financial instruments. See Note 6(a) in the Notes to Financial Statements. |
Glossary:
MBS - Mortgage-Backed Securities
TBA - To Be Announced
| See accompanying Notes to Financial Statements | 19 | Annual Report/September 30, 2016 |
Table of Contents
Schedule of Investments
September 30, 2016
AllianzGI Best Styles Global Managed Volatility Portfolio
| Shares | Value | |||||||
| ||||||||
COMMON STOCK - 94.7% | ||||||||
Australia - 0.6% | ||||||||
Automotive Holdings Group Ltd. | 11,583 | $ | 38,141 | |||||
Qantas Airways Ltd. (d) | 9,012 | 21,645 | ||||||
Regis Resources Ltd. | 50,402 | 147,809 | ||||||
Resolute Mining Ltd. | 41,298 | 61,500 | ||||||
Saracen Mineral Holdings Ltd. (d) | 39,336 | 43,078 | ||||||
St. Barbara Ltd. (d) | 53,562 | 129,915 | ||||||
Tassal Group Ltd. | 11,662 | 36,101 | ||||||
|
| |||||||
|
478,189
|
| ||||||
|
| |||||||
Austria - 0.2% | ||||||||
BUWOG AG (d) | 2,865 | 77,504 | ||||||
Flughafen Wien AG | 1,028 | 25,406 | ||||||
Telekom Austria AG | 2,941 | 16,568 | ||||||
|
| |||||||
|
119,478
|
| ||||||
|
| |||||||
Belgium - 0.3% | ||||||||
Groupe Bruxelles Lambert S.A.
| 2,412 | 214,096 | ||||||
|
| |||||||
Bermuda - 1.3% | ||||||||
Aspen Insurance Holdings Ltd. | 2,674 | 124,582 | ||||||
DHT Holdings, Inc. | 16,014 | 67,099 | ||||||
Enstar Group Ltd. (d) | 473 | 77,794 | ||||||
Everest Re Group Ltd. | 2,764 | 525,077 | ||||||
Genpact Ltd. (d) | 4,500 | 107,775 | ||||||
Maiden Holdings Ltd. | 7,142 | 90,632 | ||||||
|
| |||||||
|
992,959
|
| ||||||
|
| |||||||
Brazil - 0.4% | ||||||||
JBS S.A.
| 75,800 | 275,497 | ||||||
|
| |||||||
Canada - 2.7% | ||||||||
Bank of Montreal | 1,986 | 130,140 | ||||||
BCE, Inc. | 12,492 | 576,920 | ||||||
Canadian Imperial Bank of Commerce | 2,335 | 181,058 | ||||||
Canadian Real Estate Investment Trust REIT | 1,519 | 54,487 | ||||||
Cascades, Inc. | 4,423 | 43,254 | ||||||
Centerra Gold, Inc. | 7,028 | 38,516 | ||||||
Cogeco Communications, Inc. | 1,767 | 87,222 | ||||||
Endeavour Mining Corp. (d) | 3,250 | 63,120 | ||||||
George Weston Ltd. | 2,693 | 224,644 | ||||||
Great-West Lifeco, Inc. | 3,011 | 74,107 | ||||||
Intact Financial Corp. | 1,101 | 79,591 | ||||||
Killam Apartment Real Estate Investment Trust REIT | 2,327 | 21,444 | ||||||
Kirkland Lake Gold, Inc. (d) | 11,587 | 87,877 | ||||||
Laurentian Bank of Canada | 1,376 | 51,413 | ||||||
Martinrea International, Inc. | 2,230 | 13,853 | ||||||
Milestone Apartments Real Estate Investment Trust | 5,524 | 81,263 | ||||||
North West Co., Inc. | 2,474 | 48,728 | ||||||
Power Corp. of Canada | 8,277 | 175,325 | ||||||
Pure Industrial Real Estate Trust REIT | 9,815 | 41,222 | ||||||
Transcontinental, Inc., Class A | 2,559 | 34,368 | ||||||
|
| |||||||
|
2,108,552
|
| ||||||
|
| |||||||
China - 1.1% | ||||||||
China Construction Bank Corp., Class H | 473,000 | 355,241 | ||||||
China Dongxiang Group Co., Ltd. | 138,000 | 27,326 | ||||||
China Evergrande Group | 83,000 | 56,716 | ||||||
Jiangsu Expressway Co., Ltd., Class H | 18,000 | 24,979 | ||||||
Kingboard Chemical Holdings Ltd. | 17,000 | 51,734 | ||||||
Longfor Properties Co., Ltd. | 35,500 | 54,841 | ||||||
Shenzhen Expressway Co., Ltd., Class H | 56,000 | 59,115 | ||||||
Tianneng Power International Ltd. | 96,000 | 82,179 | ||||||
Tong Ren Tang Technologies Co., Ltd., Class H | 11,000 | 21,467 | ||||||
Xinjiang Goldwind Science & Technology Co., Ltd., Class H | 58,000 | 87,327 | ||||||
Yuzhou Properties Co., Ltd. | 118,000 | 43,847 | ||||||
|
| |||||||
|
864,772
|
| ||||||
|
| |||||||
Colombia - 0.0% | ||||||||
Corp. Financiera Colombiana S.A.
| 1,013 | 13,301 | ||||||
|
| |||||||
| See accompanying Notes to Financial Statements | 20 | Annual Report/September 30, 2016 |
Table of Contents
Schedule of Investments
September 30, 2016
AllianzGI Best Styles Global Managed Volatility Portfolio
| Shares | Value | |||||||
| ||||||||
Czech Republic - 0.0% | ||||||||
O2 Czech Republic AS | 1,417 | 13,767 | ||||||
|
| |||||||
Denmark - 0.1% | ||||||||
Matas A/S | 1,416 | 26,539 | ||||||
Solar A/S, Class B | 356 | 20,283 | ||||||
|
| |||||||
|
46,822
|
| ||||||
|
| |||||||
Finland - 0.3% | ||||||||
Neste Oyj | 5,828 | 248,599 | ||||||
|
| |||||||
France - 1.3% | ||||||||
Atos SE | 2,329 | 250,737 | ||||||
Cegereal S.A. REIT | 2,280 | 92,067 | ||||||
Eiffage S.A. | 187 | 14,533 | ||||||
Eutelsat Communications S.A. | 4,830 | 99,968 | ||||||
SCOR SE | 5,432 | 168,924 | ||||||
Vinci S.A. | 4,787 | 366,580 | ||||||
|
| |||||||
|
992,809
|
| ||||||
|
| |||||||
Germany - 0.3% | ||||||||
Muenchener Rueckversicherungs-Gesellschaft AG in Muenchen | 231 | 43,143 | ||||||
Rhoen Klinikum AG | 2,351 | 71,496 | ||||||
Talanx AG (d) | 3,117 | 95,115 | ||||||
TLG Immobilien AG | 1,491 | 33,654 | ||||||
WCM Beteiligungs & Grundbesitz AG (d) | 5,955 | 19,867 | ||||||
|
| |||||||
|
263,275
|
| ||||||
|
| |||||||
Hong Kong - 2.2% | ||||||||
CK Hutchison Holdings Ltd. | 4,500 | 57,520 | ||||||
CLP Holdings Ltd. | 87,500 | 906,242 | ||||||
Link REIT | 68,000 | 501,982 | ||||||
Swire Pacific Ltd., Class A | 17,500 | 189,529 | ||||||
XTEP International Holdings Ltd. | 25,000 | 11,715 | ||||||
Yue Yuen Industrial Holdings Ltd. | 3,000 | 12,399 | ||||||
|
| |||||||
|
1,679,387
|
| ||||||
|
| |||||||
Hungary - 0.4% | ||||||||
Magyar Telekom Telecommunications PLC | 30,292 | 49,716 | ||||||
MOL Hungarian Oil & Gas PLC | 2,962 | 183,504 | ||||||
Richter Gedeon Nyrt | 4,334 | 88,078 | ||||||
|
| |||||||
|
321,298
|
| ||||||
|
| |||||||
Ireland - 0.5% | ||||||||
AerCap Holdings NV (d) | 2,939 | 113,122 | ||||||
Irish Residential Properties REIT PLC | 16,994 | 22,507 | ||||||
Origin Enterprises PLC | 4,844 | 30,603 | ||||||
XL Group Ltd. | 6,501 | 218,629 | ||||||
|
| |||||||
|
384,861
|
| ||||||
|
| |||||||
Israel - 0.9% | ||||||||
Bank Hapoalim BM | 44,398 | 252,099 | ||||||
Bank Leumi Le-Israel BM (d) | 23,226 | 88,394 | ||||||
Elbit Systems Ltd. | 912 | 87,208 | ||||||
Israel Discount Bank Ltd., Class A (d) | 38,177 | 70,280 | ||||||
Mizrahi Tefahot Bank Ltd. | 9,827 | 124,983 | ||||||
Taro Pharmaceutical Industries Ltd. (d) | 273 | 30,169 | ||||||
Teva Pharmaceutical Industries Ltd. | 80 | 3,713 | ||||||
|
| |||||||
|
656,846
|
| ||||||
|
| |||||||
Italy - 0.1% | ||||||||
Fila SpA | 1,735 | 25,088 | ||||||
Societa Iniziative Autostradali e Servizi SpA | 3,859 | 36,884 | ||||||
|
| |||||||
|
61,972
|
| ||||||
|
| |||||||
Japan - 13.1% | ||||||||
Accordia Golf Co., Ltd. | 5,400 | 55,090 | ||||||
ADEKA Corp. | 400 | 5,534 | ||||||
Alpen Co., Ltd. | 1,300 | 23,467 | ||||||
ANA Holdings, Inc. | 128,000 | 347,742 | ||||||
Aoyama Trading Co., Ltd. | 3,200 | 110,675 | ||||||
| See accompanying Notes to Financial Statements | 21 | Annual Report/September 30, 2016 |
Table of Contents
Schedule of Investments
September 30, 2016
AllianzGI Best Styles Global Managed Volatility Portfolio
| Shares | Value | |||||||
| ||||||||
Astellas Pharma, Inc. | 34,700 | 541,981 | ||||||
BML, Inc. | 1,800 | 47,371 | ||||||
Canon, Inc. | 4,700 | 136,452 | ||||||
CMK Corp. (d) | 11,400 | 61,631 | ||||||
Daiichi Sankyo Co., Ltd. | 9,800 | 235,478 | ||||||
Daito Pharmaceutical Co., Ltd. | 800 | 18,832 | ||||||
DCM Holdings Co., Ltd. | 12,500 | 107,419 | ||||||
Doshisha Co., Ltd. | 1,300 | 27,301 | ||||||
Doutor Nichires Holdings Co., Ltd. | 2,300 | 42,263 | ||||||
DTS Corp. | 1,500 | 33,403 | ||||||
Dydo Drinco, Inc. | 400 | 22,231 | ||||||
EDION Corp. | 10,200 | 85,443 | ||||||
FamilyMart UNY Holdings Co., Ltd. | 5,600 | 373,836 | ||||||
Fuji Media Holdings, Inc. | 7,500 | 101,889 | ||||||
Fuji Oil Holdings, Inc. | 6,300 | 129,132 | ||||||
Fuji Soft, Inc. | 1,100 | 30,836 | ||||||
FUJIFILM Holdings Corp. | 9,400 | 348,203 | ||||||
Fukuyama Transporting Co., Ltd. | 11,000 | 64,052 | ||||||
Geo Holdings Corp. | 5,100 | 65,994 | ||||||
Hankyu Hanshin Holdings, Inc. | 5,600 | 193,082 | ||||||
Heiwa Corp. | 4,600 | 102,399 | ||||||
Hitachi Koki Co., Ltd. | 3,600 | 26,198 | ||||||
Hogy Medical Co., Ltd. | 600 | 42,069 | ||||||
Honeys Co., Ltd. | 600 | 7,046 | ||||||
Japan Airlines Co., Ltd. | 10,900 | 320,410 | ||||||
Kato Sangyo Co., Ltd. | 700 | 16,583 | ||||||
Kyoei Steel Ltd. | 2,600 | 49,342 | ||||||
Mirait Holdings Corp. | 5,000 | 42,605 | ||||||
Mitsubishi Shokuhin Co., Ltd. | 900 | 29,240 | ||||||
Mitsubishi Tanabe Pharma Corp. | 22,500 | 481,914 | ||||||
NEC Networks & System Integration Corp. | 2,500 | 42,585 | ||||||
Nichias Corp. | 6,000 | 53,091 | ||||||
Nichiha Corp. | 1,300 | 29,003 | ||||||
Nifco, Inc. | 700 | 37,188 | ||||||
Nihon Unisys Ltd. | 9,400 | 120,842 | ||||||
Nippon Electric Glass Co., Ltd. | 16,000 | 82,847 | ||||||
Nippon Flour Mills Co., Ltd. | 3,000 | 46,116 | ||||||
Nippon Paper Industries Co., Ltd. | 6,500 | 118,921 | ||||||
Nippon Telegraph & Telephone Corp. | 17,500 | 800,379 | ||||||
Nipro Corp. | 11,300 | 143,713 | ||||||
Nisshin Oillio Group Ltd. | 7,000 | 32,553 | ||||||
NTT Data Corp. | 5,200 | 259,711 | ||||||
NTT DoCoMo, Inc. | 38,500 | 978,015 | ||||||
Obayashi Corp. | 9,500 | 94,228 | ||||||
Okamura Corp. | 3,500 | 33,916 | ||||||
Onward Holdings Co., Ltd. | 7,000 | 50,447 | ||||||
Pacific Industrial Co., Ltd. | 3,400 | 39,014 | ||||||
PanaHome Corp. | 6,000 | 47,772 | ||||||
Prima Meat Packers Ltd. | 7,000 | 25,295 | ||||||
Raito Kogyo Co., Ltd. | 5,500 | 66,249 | ||||||
Ricoh Co., Ltd. | 15,300 | 138,456 | ||||||
Right On Co., Ltd. | 3,900 | 40,191 | ||||||
S Foods, Inc. | 1,100 | 28,813 | ||||||
Sakata INX Corp. | 3,000 | 36,416 | ||||||
Sanyo Chemical Industries Ltd. | 600 | 25,618 | ||||||
Sawai Pharmaceutical Co., Ltd. | 1,900 | 135,406 | ||||||
Seiko Epson Corp. | 1,500 | 28,883 | ||||||
Senko Co., Ltd. | 6,000 | 41,804 | ||||||
Shiga Bank Ltd. | 6,000 | 29,238 | ||||||
Shimachu Co., Ltd. | 3,600 | 89,686 | ||||||
Stella Chemifa Corp. | 3,200 | 122,908 | ||||||
Sumitomo Dainippon Pharma Co., Ltd. | 8,600 | 166,571 | ||||||
Takasago Thermal Engineering Co., Ltd. | 4,500 | 66,918 | ||||||
Takashimaya Co., Ltd. | 15,000 | 123,164 | ||||||
Takeda Pharmaceutical Co., Ltd. | 5,200 | 249,234 | ||||||
Tokyo Seimitsu Co., Ltd. | 2,400 | 64,074 | ||||||
Toppan Printing Co., Ltd. | 20,000 | 180,539 | ||||||
Toray Industries, Inc. | 11,000 | 107,134 | ||||||
Towa Pharmaceutical Co., Ltd. | 2,100 | 85,389 | ||||||
Toyo Construction Co., Ltd. | 3,200 | 13,891 | ||||||
Tv Tokyo Holdings Corp. | 1,000 | 21,956 | ||||||
Unipres Corp. | 4,800 | 84,750 | ||||||
Valor Holdings Co., Ltd. | 2,400 | 67,691 | ||||||
Wacoal Holdings Corp. | 6,000 | 67,727 | ||||||
West Japan Railway Co. | 9,100 | 564,511 | ||||||
Yorozu Corp. | 900 | 13,220 | ||||||
Yoshinoya Holdings Co., Ltd. | 7,200 | 103,295 | ||||||
Yurtec Corp. | 2,000 | 11,054 | ||||||
|
| |||||||
|
10,137,565
|
| ||||||
|
| |||||||
| See accompanying Notes to Financial Statements | 22 | Annual Report/September 30, 2016 |
Table of Contents
Schedule of Investments
September 30, 2016
AllianzGI Best Styles Global Managed Volatility Portfolio
| Shares | Value | |||||||
| ||||||||
Korea (Republic of) - 2.7% | ||||||||
CJ Hellovision Co., Ltd. | 2,652 | 21,729 | ||||||
Daekyo Co., Ltd. | 2,318 | 18,288 | ||||||
Easy Bio, Inc. | 13,782 | 78,584 | ||||||
Hansol Paper Co., Ltd. | 1,424 | 26,718 | ||||||
Hyundai Engineering Plastics Co., Ltd. | 2,575 | 22,784 | ||||||
Hyundai Mobis Co., Ltd. | 1,494 | 374,929 | ||||||
Hyundai Motor Co. | 2,713 | 335,277 | ||||||
KC Tech Co., Ltd. | 519 | 8,120 | ||||||
Kia Motors Corp. | 1,778 | 68,314 | ||||||
KT Corp. | 660 | 19,150 | ||||||
KT&G Corp. | 2,684 | 305,652 | ||||||
Kukdo Chemical Co., Ltd. | 388 | 19,525 | ||||||
Macquarie Korea Infrastructure Fund | 9,158 | 73,257 | ||||||
Samjin Pharmaceutical Co., Ltd. | 1,581 | 46,476 | ||||||
Samsung Electronics Co., Ltd. | 434 | 632,235 | ||||||
Samyang Holdings Corp. | 267 | 33,034 | ||||||
Ubiquoss, Inc. | 1,739 | 16,580 | ||||||
|
| |||||||
|
2,100,652
|
| ||||||
|
| |||||||
Luxembourg - 0.2% | ||||||||
RTL Group S.A. (d) | 2,228 | 185,091 | ||||||
|
| |||||||
Malaysia - 0.2% | ||||||||
KNM Group Bhd. (d) | 94,600 | 9,302 | ||||||
Maxis Bhd. | 9,800 | 14,617 | ||||||
MISC Bhd. | 36,800 | 67,184 | ||||||
Supermax Corp. Bhd. | 59,900 | 31,604 | ||||||
|
| |||||||
|
122,707
|
| ||||||
|
| |||||||
Morocco - 0.1% | ||||||||
Douja Promotion Groupe Addoha S.A. | 10,225 | 38,614 | ||||||
|
| |||||||
Netherlands - 0.6% | ||||||||
Koninklijke Ahold Delhaize NV | 11,346 | 258,416 | ||||||
NN Group NV | 6,729 | 206,583 | ||||||
Vastned Retail NV REIT | 638 | 25,801 | ||||||
|
| |||||||
|
490,800
|
| ||||||
|
| |||||||
New Zealand - 0.2% | ||||||||
Air New Zealand Ltd. | 34,588 | 46,917 | ||||||
Auckland International Airport Ltd. | 1,247 | 6,684 | ||||||
Chorus Ltd. | 14,519 | 41,360 | ||||||
Kiwi Property Group Ltd. | 22,078 | 24,113 | ||||||
Summerset Group Holdings Ltd. | 6,733 | 26,027 | ||||||
|
| |||||||
|
145,101
|
| ||||||
|
| |||||||
Norway - 0.4% | ||||||||
Avance Gas Holding Ltd. (a) | 1,481 | 3,568 | ||||||
Marine Harvest ASA (d) | 2,251 | 40,379 | ||||||
Orkla ASA | 22,120 | 229,058 | ||||||
|
| |||||||
|
273,005
|
| ||||||
|
| |||||||
Philippines - 0.1% | ||||||||
Aboitiz Equity Ventures, Inc. | 19,950 | 31,241 | ||||||
Bank of the Philippine Islands | 2,810 | 6,084 | ||||||
BDO Unibank, Inc. | 12,250 | 27,786 | ||||||
|
| |||||||
|
65,111
|
| ||||||
|
| |||||||
Poland - 0.4% | ||||||||
Asseco Poland S.A. | 1,599 | 23,311 | ||||||
Ciech S.A. | 1,821 | 31,506 | ||||||
Grupa Lotos S.A. (d) | 3,499 | 26,059 | ||||||
Polski Koncern Naftowy Orlen S.A. | 12,372 | 210,413 | ||||||
|
| |||||||
|
291,289
|
| ||||||
|
| |||||||
Russian Federation - 0.1% | ||||||||
PhosAgro PJSC GDR | 4,042 | 52,142 | ||||||
|
| |||||||
| See accompanying Notes to Financial Statements | 23 | Annual Report/September 30, 2016 |
Table of Contents
Schedule of Investments
September 30, 2016
AllianzGI Best Styles Global Managed Volatility Portfolio
| Shares | Value | |||||||
| ||||||||
Singapore - 0.8% | ||||||||
Accordia Golf Trust UNIT | 40,100 | 19,848 | ||||||
Mapletree Industrial Trust REIT | 25,700 | 33,670 | ||||||
SATS Ltd. | 34,800 | 127,207 | ||||||
Singapore Airlines Ltd. | 49,600 | 383,194 | ||||||
Sino Grandness Food Industry Group Ltd. | 82,800 | 26,515 | ||||||
Venture Corp. Ltd. | 5,000 | 33,100 | ||||||
|
| |||||||
|
623,534
|
| ||||||
|
| |||||||
South Africa - 0.4% | ||||||||
AngloGold Ashanti Ltd. (d) | 12,404 | 198,245 | ||||||
Harmony Gold Mining Co., Ltd. | 31,029 | 108,102 | ||||||
|
| |||||||
|
306,347
|
| ||||||
|
| |||||||
Spain - 0.2% | ||||||||
Axiare Patrimonio SOCIMI S.A. REIT | 3,327 | 44,056 | ||||||
Ebro Foods S.A. | 5,682 | 132,165 | ||||||
Lar Espana Real Estate Socimi S.A. REIT | 2,084 | 14,996 | ||||||
|
| |||||||
|
191,217
|
| ||||||
|
| |||||||
Sweden - 0.0% | ||||||||
Cloetta AB, Class B | 7,650 | 27,733 | ||||||
|
| |||||||
Switzerland - 2.2% | ||||||||
Bachem Holding AG, Class B | 1,042 | 98,033 | ||||||
Baloise Holding AG | 1,511 | 182,955 | ||||||
Banque Cantonale Vaudoise | 95 | 62,381 | ||||||
BKW AG | 463 | 22,185 | ||||||
Cembra Money Bank AG (d) | 161 | 12,630 | ||||||
Chubb Ltd. | 2,953 | 371,044 | ||||||
Emmi AG (d) | 69 | 47,316 | ||||||
Komax Holding AG | 161 | 39,451 | ||||||
Kudelski S.A. (d) | 1,384 | 25,804 | ||||||
Nestle S.A. | 3,361 | 265,398 | ||||||
Schweiter Technologies AG | 25 | 28,950 | ||||||
Siegfried Holding AG (d) | 150 | 32,748 | ||||||
Swiss Life Holding AG (d) | 723 | 187,490 | ||||||
Swiss Re AG | 3,263 | 294,709 | ||||||
Valora Holding AG | 239 | 68,108 | ||||||
|
| |||||||
|
1,739,202
|
| ||||||
|
| |||||||
Taiwan - 3.9% | ||||||||
Accton Technology Corp. | 84,000 | 131,276 | ||||||
Arcadyan Technology Corp. | 27,000 | 55,945 | ||||||
Asia Vital Components Co., Ltd. | 37,000 | 28,931 | ||||||
Basso Industry Corp. | 28,000 | 89,285 | ||||||
Chang Hwa Commercial Bank Ltd. | 44,520 | 22,856 | ||||||
Cheng Uei Precision Industry Co., Ltd. | 16,000 | 20,012 | ||||||
Chin-Poon Industrial Co., Ltd. | 21,000 | 46,948 | ||||||
China Airlines Ltd. | 169,000 | 50,487 | ||||||
China Metal Products | 25,000 | 24,367 | ||||||
China Motor Corp. | 30,000 | 22,780 | ||||||
Chunghwa Telecom Co., Ltd. | 206,000 | 726,508 | ||||||
Elite Material Co., Ltd. | 46,000 | 126,004 | ||||||
Farglory Land Development Co., Ltd. | 54,000 | 64,253 | ||||||
Formosa Petrochemical Corp. | 125,000 | 376,841 | ||||||
Formosa Plastics Corp. | 27,000 | 67,238 | ||||||
Getac Technology Corp. | 55,000 | 64,185 | ||||||
Gintech Energy Corp. (d) | 19,000 | 13,100 | ||||||
Hon Hai Precision Industry Co., Ltd. | 181,500 | 459,315 | ||||||
Hua Nan Financial Holdings Co., Ltd. | 47,790 | 24,525 | ||||||
King Yuan Electronics Co., Ltd. | 11,000 | 9,780 | ||||||
Kinsus Interconnect Technology Corp. | 20,000 | 46,817 | ||||||
Powertech Technology, Inc. | 47,000 | 122,149 | ||||||
Sercomm Corp. | 34,000 | 81,140 | ||||||
Shin Zu Shing Co., Ltd. | 11,000 | 36,507 | ||||||
Sinbon Electronics Co., Ltd. | 39,139 | 90,389 | ||||||
Taiwan Business Bank | 238,350 | 60,732 | ||||||
TXC Corp. | 47,000 | 64,910 | ||||||
United Microelectronics Corp. | 99,000 | 36,557 | ||||||
Wistron NeWeb Corp. | 15,450 | 48,910 | ||||||
Yageo Corp. | 11,206 | 23,331 | ||||||
|
| |||||||
|
3,036,078
|
| ||||||
|
| |||||||
| See accompanying Notes to Financial Statements | 24 | Annual Report/September 30, 2016 |
Table of Contents
Schedule of Investments
September 30, 2016
AllianzGI Best Styles Global Managed Volatility Portfolio
| Shares | Value | |||||||
| ||||||||
Thailand - 1.3% | ||||||||
Bangchak Petroleum PCL (c) | 75,700 | 66,878 | ||||||
Bangkok Airways Co., Ltd. (c) | 177,400 | 126,725 | ||||||
Bangkok Bank PCL | 48,100 | 226,469 | ||||||
IRPC PCL (c) | 1,386,500 | 195,850 | ||||||
Kiatnakin Bank PCL (c) | 58,800 | 90,128 | ||||||
Siam Cement PCL | 4,500 | 67,435 | ||||||
Sri Trang Agro-Industry PCL (c) | 26,400 | 8,928 | ||||||
Thai Oil PCL (c) | 59,800 | 118,567 | ||||||
Tipco Asphalt PCL (c) | 131,200 | 72,507 | ||||||
|
| |||||||
|
973,487
|
| ||||||
|
| |||||||
United Kingdom - 1.7% | ||||||||
Assura PLC REIT | 27,516 | 20,793 | ||||||
British American Tobacco PLC | 7,077 | 451,343 | ||||||
Burford Capital Ltd. | 4,554 | 24,496 | ||||||
Gamma Communications PLC | 8,153 | 53,313 | ||||||
Imperial Brands PLC | 6,550 | 337,133 | ||||||
Johnson Service Group PLC | 18,723 | 26,452 | ||||||
Marston’s PLC | 16,473 | 31,255 | ||||||
Northgate PLC | 6,507 | 36,435 | ||||||
Novae Group PLC | 2,157 | 21,402 | ||||||
Primary Health Properties PLC REIT | 15,990 | 23,212 | ||||||
Royal Mail PLC | 28,133 | 178,521 | ||||||
Wizz Air Holdings PLC (a)(d) | 1,114 | 23,659 | ||||||
WM Morrison Supermarkets PLC | 26,979 | 76,179 | ||||||
|
| |||||||
|
1,304,193
|
| ||||||
|
| |||||||
United States - 53.4% | ||||||||
AbbVie, Inc. | 6,661 | 420,109 | ||||||
Aflac, Inc. | 4,170 | 299,698 | ||||||
Agree Realty Corp. REIT | 2,412 | 119,249 | ||||||
Ally Financial, Inc. | 11,102 | 216,156 | ||||||
Almost Family, Inc. (d) | 1,311 | 48,205 | ||||||
Altria Group, Inc. | 13,752 | 869,539 | ||||||
American Capital Agency Corp. REIT | 24,845 | 485,471 | ||||||
American Electric Power Co., Inc. | 4,776 | 306,667 | ||||||
American Financial Group, Inc. | 2,865 | 214,875 | ||||||
American Public Education, Inc. (d) | 2,839 | 56,241 | ||||||
AMERISAFE, Inc. | 1,337 | 78,589 | ||||||
AmerisourceBergen Corp. | 689 | 55,657 | ||||||
Amgen, Inc. | 2,715 | 452,889 | ||||||
Annaly Capital Management, Inc. REIT | 58,560 | 614,880 | ||||||
Anthem, Inc. | 2,187 | 274,053 | ||||||
Anworth Mortgage Asset Corp. REIT | 11,341 | 55,798 | ||||||
Apollo Commercial Real Estate Finance, Inc. REIT | 5,850 | 95,765 | ||||||
Ares Commercial Real Estate Corp. REIT | 1,910 | 24,066 | ||||||
Argan, Inc. | 1,934 | 114,473 | ||||||
ARMOUR Residential REIT, Inc. | 4,248 | 95,750 | ||||||
AT&T, Inc. | 33,363 | 1,354,871 | ||||||
Atmos Energy Corp. | 2,669 | 198,760 | ||||||
Automatic Data Processing, Inc. | 6,855 | 604,611 | ||||||
AutoZone, Inc. (d) | 761 | 584,707 | ||||||
AvalonBay Communities, Inc. REIT | 533 | 94,789 | ||||||
AVX Corp. | 3,201 | 44,142 | ||||||
Axis Capital Holdings Ltd. | 7,559 | 410,680 | ||||||
Banc of California, Inc. | 5,203 | 90,844 | ||||||
Becton Dickinson and Co. | 48 | 8,627 | ||||||
Bemis Co., Inc. | 163 | 8,315 | ||||||
Berkshire Hills Bancorp, Inc. | 1,588 | 44,003 | ||||||
Blackstone Mortgage Trust, Inc., Class A REIT | 4,633 | 136,442 | ||||||
Brixmor Property Group, Inc. REIT | 627 | 17,424 | ||||||
Bunge Ltd. | 1,688 | 99,980 | ||||||
Camden National Corp. | 514 | 24,538 | ||||||
Campbell Soup Co. | 7,486 | 409,484 | ||||||
Capitol Federal Financial, Inc. | 9,557 | 134,467 | ||||||
Capstead Mortgage Corp. REIT | 9,537 | 89,934 | ||||||
Cardinal Health, Inc. | 5,207 | 404,584 | ||||||
Carriage Services, Inc. | 1,357 | 32,093 | ||||||
CBIZ, Inc. (d) | 2,255 | 25,233 | ||||||
Centene Corp. (d) | 3,991 | 267,237 | ||||||
CenturyLink, Inc. | 8,643 | 237,078 | ||||||
Chimera Investment Corp. REIT | 9,001 | 143,566 | ||||||
Cincinnati Financial Corp. | 3,598 | 271,361 | ||||||
Cisco Systems, Inc. | 19,993 | 634,178 | ||||||
Clorox Co. | 6,491 | 812,543 | ||||||
| See accompanying Notes to Financial Statements | 25 | Annual Report/September 30, 2016 |
Table of Contents
Schedule of Investments
September 30, 2016
AllianzGI Best Styles Global Managed Volatility Portfolio
| Shares | Value | |||||||
| ||||||||
CMS Energy Corp. | 5,717 | 240,171 | ||||||
Colgate-Palmolive Co. | 3,159 | 234,208 | ||||||
Computer Sciences Corp. | 4,763 | 248,676 | ||||||
Consolidated Edison, Inc. | 14,243 | 1,072,498 | ||||||
Convergys Corp. | 2,740 | 83,351 | ||||||
Cooper-Standard Holding, Inc. (d) | 1,636 | 161,637 | ||||||
CorEnergy Infrastructure Trust, Inc. REIT | 2,736 | 80,247 | ||||||
Cracker Barrel Old Country Store, Inc. | 1,045 | 138,170 | ||||||
CVS Health Corp. | 763 | 67,899 | ||||||
CYS Investments, Inc. REIT | 15,053 | 131,262 | ||||||
Darden Restaurants, Inc. | 3,002 | 184,083 | ||||||
Dean Foods Co. | 7,229 | 118,556 | ||||||
DineEquity, Inc. | 1,353 | 107,144 | ||||||
Dominion Resources, Inc. | 191 | 14,186 | ||||||
Dr. Pepper Snapple Group, Inc. | 3,062 | 279,591 | ||||||
DTE Energy Co. | 2,667 | 249,818 | ||||||
Duke Energy Corp. | 12,303 | 984,732 | ||||||
Dynex Capital, Inc. REIT | 3,826 | 28,389 | ||||||
Eldorado Resorts, Inc. (d) | 2,998 | 42,152 | ||||||
Ennis, Inc. | 4,014 | 67,636 | ||||||
Enviva Partners L.P. | 1,111 | 29,986 | ||||||
Equity LifeStyle Properties, Inc. REIT | 2,786 | 215,023 | ||||||
Exelon Corp. | 9,032 | 300,675 | ||||||
Express Scripts Holding Co. (d) | 8,047 | 567,555 | ||||||
Exxon Mobil Corp. | 1,183 | 103,252 | ||||||
FairPoint Communications, Inc. (d) | 2,066 | 31,052 | ||||||
Federal Agricultural Mortgage Corp., Class C | 1,639 | 64,741 | ||||||
Fidelity & Guaranty Life | 4,676 | 108,436 | ||||||
First Busey Corp. | 1,133 | 25,606 | ||||||
First NBC Bank Holding Co. (d) | 3,323 | 31,369 | ||||||
FirstEnergy Corp. | 6,618 | 218,923 | ||||||
Ford Motor Co. | 27,021 | 326,143 | ||||||
General Mills, Inc. | 9,715 | 620,594 | ||||||
General Motors Co. | 11,543 | 366,721 | ||||||
German American Bancorp, Inc. | 724 | 28,185 | ||||||
Getty Realty Corp. REIT | 1,369 | 32,760 | ||||||
Gilead Sciences, Inc. | 4,453 | 352,321 | ||||||
Global Brass & Copper Holdings, Inc. | 1,797 | 51,915 | ||||||
Great Southern Bancorp, Inc. | 517 | 21,042 | ||||||
Hanover Insurance Group, Inc. | 1,418 | 106,946 | ||||||
HCA Holdings, Inc. (d) | 2,708 | 204,806 | ||||||
Helen of Troy Ltd. (d) | 985 | 84,877 | ||||||
Henry Schein, Inc. (d) | 118 | 19,232 | ||||||
Hewlett Packard Enterprise Co. | 12,485 | 284,034 | ||||||
Hooker Furniture Corp. | 2,362 | 57,845 | ||||||
Huntington Ingalls Industries, Inc. | 250 | 38,355 | ||||||
Independence Realty Trust, Inc. REIT | 3,543 | 31,887 | ||||||
Ingles Markets, Inc., Class A | 503 | 19,889 | ||||||
Ingredion, Inc. | 1,796 | 238,976 | ||||||
Insight Enterprises, Inc. (d) | 196 | 6,380 | ||||||
Intel Corp. | 15,427 | 582,369 | ||||||
Invesco Mortgage Capital, Inc. REIT | 2,020 | 30,765 | ||||||
JetBlue Airways Corp. (d) | 4,546 | 78,373 | ||||||
John B Sanfilippo & Son, Inc. | 181 | 9,291 | ||||||
Johnson & Johnson | 13,730 | 1,621,925 | ||||||
Kellogg Co. | 1,007 | 78,012 | ||||||
Kelly Services, Inc., Class A | 2,708 | 52,048 | ||||||
Kimberly-Clark Corp. | 5,097 | 642,936 | ||||||
Laboratory Corp. of America Holdings (d) | 4,589 | 630,896 | ||||||
LHC Group, Inc. (d) | 2,438 | 89,913 | ||||||
Mallinckrodt PLC (d) | 3,037 | 211,922 | ||||||
McDonald’s Corp. | 9,656 | 1,113,916 | ||||||
MFA Financial, Inc. REIT | 18,186 | 136,031 | ||||||
Mid-America Apartment Communities, Inc. REIT | 1,947 | 182,999 | ||||||
Monmouth Real Estate Investment Corp. | 2,656 | 37,901 | ||||||
Motorola Solutions, Inc. | 2,881 | 219,763 | ||||||
MTGE Investment Corp. | 6,260 | 107,609 | ||||||
Navigant Consulting, Inc. (d) | 3,259 | 65,897 | ||||||
Net 1 UEPS Technologies, Inc. (d) | 1,996 | 17,086 | ||||||
Newmont Mining Corp. | 3,348 | 131,543 | ||||||
NextEra Energy, Inc. | 3,932 | 480,962 | ||||||
Northfield Bancorp, Inc. | 2,120 | 34,132 | ||||||
NVR, Inc. (d) | 40 | 65,595 | ||||||
Old Republic International Corp. | 6,851 | 120,715 | ||||||
Omega Protein Corp. (d) | 5,443 | 127,203 | ||||||
Omnicom Group, Inc. | 3,272 | 278,120 | ||||||
Opus Bank | 2,050 | 72,509 | ||||||
| See accompanying Notes to Financial Statements | 26 | Annual Report/September 30, 2016 |
Table of Contents
Schedule of Investments
September 30, 2016
AllianzGI Best Styles Global Managed Volatility Portfolio
| Shares | Value | |||||||
| ||||||||
Orchid Island Capital, Inc. REIT | 1,081 | 11,264 | ||||||
Oritani Financial Corp. | 4,555 | 71,605 | ||||||
Owens & Minor, Inc. | 3,081 | 107,003 | ||||||
Paychex, Inc. | 2,056 | 118,981 | ||||||
PDL BioPharma, Inc. | 26,454 | 88,621 | ||||||
PepsiCo, Inc. | 1,734 | 188,607 | ||||||
PG&E Corp. | 6,516 | 398,584 | ||||||
PharMerica Corp. (d) | 4,113 | 115,452 | ||||||
Pinnacle Foods, Inc. | 4,450 | 223,257 | ||||||
Pinnacle West Capital Corp. | 2,650 | 201,374 | ||||||
PPL Corp. | 7,429 | 256,821 | ||||||
Procter & Gamble Co. | 5,085 | 456,379 | ||||||
Progressive Corp. | 7,971 | 251,087 | ||||||
Public Service Enterprise Group, Inc. | 6,008 | 251,555 | ||||||
Public Storage REIT | 3,405 | 759,792 | ||||||
Quest Diagnostics, Inc. | 3,220 | 272,509 | ||||||
Republic Services, Inc. | 13,760 | 694,192 | ||||||
Reynolds American, Inc. | 9,318 | 439,344 | ||||||
Schweitzer-Mauduit International, Inc. | 2,988 | 115,217 | ||||||
Southern Co. | 17,870 | 916,731 | ||||||
State National Cos., Inc. | 1,708 | 18,993 | ||||||
STORE Capital Corp. REIT | 4,687 | 138,126 | ||||||
Stryker Corp. | 5,357 | 623,608 | ||||||
SunTrust Banks, Inc. | 7,274 | 318,601 | ||||||
Target Corp. | 11,436 | 785,425 | ||||||
Teleflex, Inc. | 1,257 | 211,239 | ||||||
Tesoro Corp. | 324 | 25,777 | ||||||
TJX Cos., Inc. | 355 | 26,547 | ||||||
Towne Bank | 2,072 | 49,790 | ||||||
Travelers Cos., Inc. | 5,538 | 634,378 | ||||||
Trico Bancshares | 752 | 20,131 | ||||||
Triple-S Management Corp., Class B (d) | 2,529 | 55,461 | ||||||
Two Harbors Investment Corp. REIT | 4,588 | 39,136 | ||||||
Unifi, Inc. (d) | 1,205 | 35,463 | ||||||
United Financial Bancorp, Inc. | 1,491 | 20,635 | ||||||
UnitedHealth Group, Inc. | 5,550 | 777,000 | ||||||
Unum Group | 6,093 | 215,144 | ||||||
Validus Holdings Ltd. | 2,693 | 134,165 | ||||||
Verizon Communications, Inc. | 24,067 | 1,251,003 | ||||||
Walker & Dunlop, Inc. (d) | 3,468 | 87,602 | ||||||
Waste Management, Inc. | 457 | 29,138 | ||||||
WEC Energy Group, Inc. | 12,838 | 768,739 | ||||||
World Acceptance Corp. (d) | 285 | 13,976 | ||||||
Xcel Energy, Inc. | 16,796 | 690,987 | ||||||
|
| |||||||
|
41,336,423
|
| ||||||
|
| |||||||
Total Common Stock (cost-$70,787,198) |
|
73,176,771
|
| |||||
|
| |||||||
PREFERRED STOCK - 0.0% | ||||||||
Colombia - 0.0% | ||||||||
Grupo Aval Acciones y Valores S.A. (cost-$10,562) | 27,464 | 12,002 | ||||||
|
| |||||||
| Principal Amount (000s) | ||||||||
Repurchase Agreements - 5.8% | ||||||||
State Street Bank and Trust Co., | $ | 4,512 | 4,512,000 | |||||
|
| |||||||
Total Investments (cost-$75,309,760) (b)-100.5% | 77,700,773 | |||||||
|
| |||||||
Liabilities in excess of other assets (e)-(0.5)% |
|
(361,470)
|
| |||||
|
| |||||||
Net Assets-100.0% | $ 77,339,303 | |||||||
|
| |||||||
| See accompanying Notes to Financial Statements | 27 | Annual Report/September 30, 2016 |
Table of Contents
Schedule of Investments
September 30, 2016
AllianzGI Best Styles Global Managed Volatility Portfolio
Notes to Schedule of Investments:
| (a) | 144A—Exempt from registration under Rule 144A of the Securities Act of 1933. These securities may be resold in transactions exempt from registration, typically only to qualified institutional buyers. Unless otherwise indicated, these securities are not considered to be illiquid. |
| (b) | Securities with an aggregate value of $26,165,305, representing 33.8% of net assets, were valued utilizing modeling tools provided by a third-party vendor. See Note 1(a) and Note 1(b) in the Notes to Financial Statements. |
| (c) | Fair-Valued—Securities with an aggregate value of $679,583, representing 0.9% of net assets. See Note 1(a) and Note 1(b) in the Notes to Financial Statements. |
| (d) | Non-income producing. |
| (e) | Includes net unrealized appreciation (depreciation) of other financial instruments. See Note 5(a) in the Notes to Financial Statements. |
Glossary:
GDR - Global Depositary Receipt
REIT - Real Estate Investment Trust
UNIT - More than one class of securities traded together.
| See accompanying Notes to Financial Statements | 28 | Annual Report/September 30, 2016 |
Table of Contents
Schedule of Investments
September 30, 2016
AllianzGI Best Styles Global Managed Volatility Portfolio
The industry classification of portfolio holdings and liabilities in excess of other assets shown as a percentage of net assets were as follows:
Insurance | 7.5% | |||
Electric Utilities | 7.4% | |||
Diversified Telecommunication Services | 6.7% | |||
Equity Real Estate Investment Trusts (REITs) | 6.2% | |||
Health Care Providers & Services | 5.2% | |||
Pharmaceuticals | 5.1% | |||
Food Products | 4.4% | |||
Multi-Utilities | 3.4% | |||
Banks | 3.3% | |||
Tobacco | 3.1% | |||
Household Products | 2.8% | |||
IT Services | 2.4% | |||
Hotels, Restaurants & Leisure | 2.4% | |||
Technology Hardware, Storage & Peripherals | 2.2% | |||
Oil, Gas & Consumable Fuels | 2.1% | |||
Airlines | 1.8% | |||
Biotechnology | 1.7% | |||
Specialty Retail | 1.7% | |||
Communications Equipment | 1.5% | |||
Food & Staples Retailing | 1.5% | |||
Electronic Equipment, Instruments & Components | 1.5% | |||
Automobiles | 1.5% | |||
Commercial Services & Supplies | 1.4% | |||
Metals & Mining | 1.4% | |||
Health Care Equipment & Supplies | 1.4% | |||
Wireless Telecommunication Services | 1.3% | |||
Multi-line Retail | 1.2% | |||
Road & Rail | 1.2% | |||
Semiconductors & Semiconductor Equipment | 1.1% | |||
Auto Components | 1.1% | |||
Media | 1.0% | |||
Construction & Engineering | 0.9% | |||
Real Estate Management & Development | 0.8% | |||
Beverages | 0.6% | |||
Chemicals | 0.6% | |||
Thrifts & Mortgage Finance | 0.5% | |||
Household Durables | 0.4% | |||
Transportation Infrastructure | 0.4% | |||
Paper & Forest Products | 0.3% | |||
Consumer Finance | 0.3% | |||
Diversified Financial Services | 0.3% | |||
Textiles, Apparel & Luxury Goods | 0.3% | |||
Gas Utilities | 0.3% | |||
Air Freight & Logistics | 0.2% | |||
Building Products | 0.2% | |||
Machinery | 0.2% | |||
Professional Services | 0.2% | |||
Construction Materials | 0.2% | |||
Trading Companies & Distributors | 0.2% | |||
Life Sciences Tools & Services | 0.2% | |||
Aerospace & Defense | 0.2% | |||
Mortgage Real Estate Investment Trusts (REITs) | 0.1% | |||
Diversified Consumer Services | 0.1% | |||
Leisure Products | 0.1% | |||
Capital Markets | 0.1% | |||
Industrial Conglomerates | 0.1% | |||
Electrical Equipment | 0.1% | |||
Marine | 0.1% | |||
Software | 0.1% | |||
Containers & Packaging | 0.1% | |||
Repurchase Agreements | 5.8% | |||
Liabilities in excess of other assets | (0.5)% | |||
|
| |||
| 100.0% | ||||
|
|
| See accompanying Notes to Financial Statements | 29 | Annual Report/September 30, 2016 |
Table of Contents
Schedule of Investments
September 30, 2016
AllianzGI Discovery U.S. Portfolio
| Shares | Value | |||||||
| ||||||||
COMMON STOCK - 93.4% | ||||||||
Air Freight & Logistics - 1.9% | ||||||||
United Parcel Service, Inc., Class B (a) | 1,668 | $ | 182,413 | |||||
|
| |||||||
Automobiles - 1.1% | ||||||||
Tesla Motors, Inc. (a)(b) | 530 | 108,136 | ||||||
|
| |||||||
Banks - 5.7% | ||||||||
Citigroup, Inc. (a) | 5,373 | 253,767 | ||||||
JPMorgan Chase & Co. (a) | 4,559 | 303,584 | ||||||
|
| |||||||
|
557,351
|
| ||||||
|
| |||||||
Beverages - 2.0% | ||||||||
PepsiCo, Inc. (a) | 1,800 | 195,786 | ||||||
|
| |||||||
Biotechnology - 6.9% | ||||||||
Amgen, Inc. (a) | 1,344 | 224,193 | ||||||
BioMarin Pharmaceutical, Inc. (a)(b) | 2,223 | 205,672 | ||||||
Celgene Corp. (a)(b) | 1,776 | 185,645 | ||||||
Regeneron Pharmaceuticals, Inc. (a)(b) | 162 | 65,127 | ||||||
|
| |||||||
|
680,637
|
| ||||||
|
| |||||||
Capital Markets - 2.1% | ||||||||
BlackRock, Inc. (a) | 564 | 204,427 | ||||||
|
| |||||||
Chemicals - 3.4% | ||||||||
Ashland Global Holdings, Inc. (a) | 1,501 | 174,041 | ||||||
Axalta Coating Systems Ltd. (a)(b) | 5,777 | 163,316 | ||||||
|
| |||||||
|
337,357
|
| ||||||
|
| |||||||
Communications Equipment - 4.2% | ||||||||
Cisco Systems, Inc. (a) | 5,622 | 178,330 | ||||||
Palo Alto Networks, Inc. (a)(b) | 1,462 | 232,940 | ||||||
|
| |||||||
|
411,270
|
| ||||||
|
| |||||||
Diversified Financial Services - 4.0% | ||||||||
CME Group, Inc. (a) | 1,357 | 141,833 | ||||||
Intercontinental Exchange, Inc. (a) | 938 | 252,660 | ||||||
|
| |||||||
|
394,493
|
| ||||||
|
| |||||||
Energy Equipment & Services - 2.4% | ||||||||
Schlumberger Ltd. (a) | 1,920 | 150,989 | ||||||
Weatherford International PLC (a)(b) | 15,201 | 85,429 | ||||||
|
| |||||||
|
236,418
|
| ||||||
|
| |||||||
Food & Staples Retailing - 2.3% | ||||||||
Walgreens Boots Alliance, Inc. (a) | 2,787 | 224,688 | ||||||
|
| |||||||
Food Products - 3.5% | ||||||||
Hain Celestial Group, Inc. (a)(b) | 4,219 | 150,112 | ||||||
Mondelez International, Inc., Class A (a) | 4,532 | 198,955 | ||||||
|
| |||||||
|
349,067
|
| ||||||
|
| |||||||
Health Care Equipment & Supplies - 3.4% | ||||||||
DexCom, Inc. (a)(b) | 1,763 | 154,545 | ||||||
Intuitive Surgical, Inc. (a)(b) | 244 | 176,858 | ||||||
|
| |||||||
|
331,403
|
| ||||||
|
| |||||||
Health Care Providers & Services - 2.6% | ||||||||
UnitedHealth Group, Inc. (a) | 1,821 | 254,940 | ||||||
|
| |||||||
Hotels, Restaurants & Leisure - 2.9% | ||||||||
McDonald’s Corp. (a) | 1,767 | 203,841 | ||||||
Royal Caribbean Cruises Ltd. (a) | 1,060 | 79,447 | ||||||
|
| |||||||
|
283,288
|
| ||||||
|
| |||||||
Industrial Conglomerates - 2.9% | ||||||||
General Electric Co. (a) | 9,794 | 290,098 | ||||||
|
| |||||||
| See accompanying Notes to Financial Statements | 30 | Annual Report/September 30, 2016 |
Table of Contents
Schedule of Investments
September 30, 2016
AllianzGI Discovery U.S. Portfolio
| Shares | Value | |||||||
| ||||||||
Internet Software & Services - 4.1% | ||||||||
Akamai Technologies, Inc. (a)(b) | 3,336 | 176,775 | ||||||
Alphabet, Inc., Class A (a)(b) | 276 | 221,920 | ||||||
|
| |||||||
|
398,695
|
| ||||||
|
| |||||||
Machinery - 2.7% | ||||||||
Fortive Corp. (a) | 2,577 | 131,169 | ||||||
Stanley Black & Decker, Inc. (a) | 1,105 | 135,893 | ||||||
|
| |||||||
|
267,062
|
| ||||||
|
| |||||||
Media - 4.0% | ||||||||
AMC Networks, Inc., Class A (a)(b) | 2,733 | 141,733 | ||||||
Comcast Corp., Class A (a) | 3,797 | 251,893 | ||||||
|
| |||||||
|
393,626
|
| ||||||
|
| |||||||
Oil, Gas & Consumable Fuels - 5.1% | ||||||||
Continental Resources, Inc. (a)(b) | 2,352 | 122,210 | ||||||
PDC Energy, Inc. (a)(b) | 1,706 | 114,404 | ||||||
Pioneer Natural Resources Co. (a) | 1,024 | 190,106 | ||||||
Range Resources Corp. (a) | �� | 1,980 | 76,725 | |||||
|
| |||||||
|
503,445
|
| ||||||
|
| |||||||
Pharmaceuticals - 4.8% | ||||||||
Allergan PLC (a)(b) | 929 | 213,958 | ||||||
Merck & Co., Inc. (a) | 4,126 | 257,504 | ||||||
|
| |||||||
|
471,462
|
| ||||||
|
| |||||||
Road & Rail - 1.8% | ||||||||
Kansas City Southern (a) | 1,895 | 176,841 | ||||||
|
| |||||||
Semiconductors & Semiconductor Equipment - 5.4% | ||||||||
Applied Materials, Inc. (a) | 6,016 | 181,382 | ||||||
Intel Corp. (a) | 5,245 | 197,999 | ||||||
Skyworks Solutions, Inc. (a) | 1,990 | 151,519 | ||||||
|
| |||||||
|
530,900
|
| ||||||
|
| |||||||
Software - 7.1% | ||||||||
Microsoft Corp. (a) | 6,268 | 361,037 | ||||||
Mobileye NV (b) | 5,190 | 220,938 | ||||||
Oracle Corp. (a) | 1,093 | 42,933 | ||||||
salesforce.com, Inc. (a)(b) | 1,065 | 75,967 | ||||||
|
| |||||||
|
700,875
|
| ||||||
|
| |||||||
Specialty Retail - 5.7% | ||||||||
GameStop Corp., Class A (a) | 5,085 | 140,295 | ||||||
Home Depot, Inc. (a) | 2,065 | 265,724 | ||||||
L Brands, Inc. (a) | 2,194 | 155,270 | ||||||
|
| |||||||
|
561,289
|
| ||||||
|
| |||||||
Technology Hardware, Storage & Peripherals - 1.4% | ||||||||
Apple, Inc. (a) | 1,254 | 141,765 | ||||||
|
| |||||||
Total Common Stock (cost-$8,619,054) |
|
9,187,732
|
| |||||
|
| |||||||
| Principal Amount (000s) | ||||||||
Repurchase Agreements - 73.5% | ||||||||
State Street Bank and Trust Co., | $ | 7,241 | 7,241,000 | |||||
|
| |||||||
Total Investments, before securities sold short (cost-$15,860,054)-166.9% |
|
16,428,732
|
| |||||
|
| |||||||
| See accompanying Notes to Financial Statements | 31 | Annual Report/September 30, 2016 |
Table of Contents
Schedule of Investments
September 30, 2016
AllianzGI Discovery U.S. Portfolio
| Shares | ||||||||
|
| |||||||
SECURITIES SOLD SHORT - (100.9)% | ||||||||
Common Stock - (94.2)% | ||||||||
Air Freight & Logistics - (2.6)% | ||||||||
Expeditors International of Washington, Inc. | 1,993 | (102,679) | ||||||
FedEx Corp. | 897 | (156,688) | ||||||
|
| |||||||
|
| (259,367)
|
| ||||||
|
| |||||||
Airlines - (2.0)% | ||||||||
American Airlines Group, Inc. | 2,489 | (91,122) | ||||||
United Continental Holdings, Inc. (b) | 1,930 | (101,267) | ||||||
|
| |||||||
|
| (192,389)
|
| ||||||
|
| |||||||
Auto Components - (1.0)% | ||||||||
BorgWarner, Inc. | 2,747 | (96,640) | ||||||
|
| |||||||
Automobiles - (1.5)% | ||||||||
Ford Motor Co. | 12,032 | (145,226) | ||||||
|
| |||||||
Banks - (1.0)% | ||||||||
M&T Bank Corp. | 845 | (98,105) | ||||||
|
| |||||||
Beverages - (1.7)% | ||||||||
Coca-Cola Co. | 4,009 | (169,661) | ||||||
|
| |||||||
Biotechnology - (3.6)% | ||||||||
Alexion Pharmaceuticals, Inc. (b) | 1,230 | (150,724) | ||||||
Gilead Sciences, Inc. | 2,575 | (203,734) | ||||||
|
| |||||||
|
| (354,458)
|
| ||||||
|
| |||||||
Building Products - (0.5)% | ||||||||
USG Corp. (b) | 1,770 | (45,755) | ||||||
|
| |||||||
Capital Markets - (4.8)% | ||||||||
Affiliated Managers Group, Inc. (b) | 512 | (74,086) | ||||||
Ameriprise Financial, Inc. | 726 | (72,433) | ||||||
Franklin Resources, Inc. | 2,989 | (106,319) | ||||||
Moody’s Corp. | 916 | (99,184) | ||||||
Morgan Stanley | 1,537 | (49,276) | ||||||
T Rowe Price Group, Inc. | 1,043 | (69,360) | ||||||
|
| |||||||
|
| (470,658)
|
| ||||||
|
| |||||||
Chemicals - (1.9)% | ||||||||
Eastman Chemical Co. | 1,492 | (100,979) | ||||||
PPG Industries, Inc. | 843 | (87,132) | ||||||
|
| |||||||
|
| (188,111)
|
| ||||||
|
| |||||||
Commercial Services & Supplies - (1.0)% | ||||||||
Stericycle, Inc. (b) | 1,288 | (103,220) | ||||||
|
| |||||||
Communications Equipment - (1.5)% | ||||||||
Brocade Communications Systems, Inc. | 5,767 | (53,230) | ||||||
Juniper Networks, Inc. | 3,937 | (94,724) | ||||||
|
| |||||||
|
| (147,954)
|
| ||||||
|
| |||||||
Construction Materials - (0.9)% | ||||||||
Martin Marietta Materials, Inc. | 507 | (90,809) | ||||||
|
| |||||||
Consumer Finance - (0.7)% | ||||||||
Synchrony Financial | 2,448 | (68,544) | ||||||
|
| |||||||
Containers & Packaging - (1.1)% | ||||||||
Ball Corp. | 1,271 | (104,158) | ||||||
|
| |||||||
Distributors - (0.5)% | ||||||||
Genuine Parts Co. | 483 | (48,517) | ||||||
|
| |||||||
Diversified Financial Services - (0.9)% | ||||||||
Berkshire Hathaway, Inc., Class B (b) | 631 | (91,161) | ||||||
|
| |||||||
| See accompanying Notes to Financial Statements | 32 | Annual Report/September 30, 2016 |
Table of Contents
Schedule of Investments
September 30, 2016
AllianzGI Discovery U.S. Portfolio
| Shares | Value | |||||||
| ||||||||
Diversified Telecommunication Services - (0.9)% | ||||||||
Level 3 Communications, Inc. (b) | 1,955 | (90,673) | ||||||
|
| |||||||
Electrical Equipment - (4.1)% | ||||||||
Eaton Corp. PLC | 2,351 | (154,484) | ||||||
Emerson Electric Co. | 2,825 | (153,991) | ||||||
Rockwell Automation, Inc. | 795 | (97,260) | ||||||
|
| |||||||
|
| (405,735)
|
| ||||||
|
| |||||||
Electronic Equipment, Instruments & Components - (1.0)% | ||||||||
TE Connectivity Ltd. | 1,556 | (100,175) | ||||||
|
| |||||||
Energy Equipment & Services - (1.4)% | ||||||||
FMC Technologies, Inc. (b) | 2,634 | (78,151) | ||||||
Nabors Industries Ltd. | 4,774 | (58,052) | ||||||
|
| |||||||
|
| (136,203)
|
| ||||||
|
| |||||||
Equity Real Estate Investment Trusts (REITs) - (5.2)% | ||||||||
AvalonBay Communities, Inc. | 726 | (129,112) | ||||||
Boston Properties, Inc. | 770 | (104,943) | ||||||
General Growth Properties, Inc. | 3,278 | (90,473) | ||||||
SL Green Realty Corp. | 861 | (93,074) | ||||||
Weyerhaeuser Co. | 3,098 | (98,950) | ||||||
|
| |||||||
|
| (516,552)
|
| ||||||
|
| |||||||
Food & Staples Retailing - (2.2)% | ||||||||
Kroger Co. | 4,446 | (131,957) | ||||||
Whole Foods Market, Inc. | 2,944 | (83,463) | ||||||
|
| |||||||
|
| (215,420)
|
| ||||||
|
| |||||||
Health Care Equipment & Supplies - (2.3)% | ||||||||
Danaher Corp. | 825 | (64,672) | ||||||
Medtronic PLC | 1,121 | (96,855) | ||||||
Stryker Corp. | 591 | (68,798) | ||||||
|
| |||||||
|
| (230,325)
|
| ||||||
|
| |||||||
Health Care Providers & Services - (2.8)% | ||||||||
AmerisourceBergen Corp. | 1,064 | (85,950) | ||||||
Brookdale Senior Living, Inc. (b) | 2,980 | (52,001) | ||||||
DaVita HealthCare Partners, Inc. (b) | 1,502 | (99,237) | ||||||
Envision Healthcare Holdings, Inc. (b) | 1,957 | (43,582) | ||||||
|
| |||||||
|
| (280,770)
|
| ||||||
|
| |||||||
Health Care Technology - (0.9)% | ||||||||
athenahealth, Inc. (b) | 694 | (87,527) | ||||||
|
| |||||||
Hotels, Restaurants & Leisure - (3.4)% | ||||||||
Darden Restaurants, Inc. | 1,545 | (94,739) | ||||||
Las Vegas Sands Corp. | 1,300 | (74,802) | ||||||
Marriott International, Inc., Class A | 1,493 | (100,524) | ||||||
Wynn Resorts Ltd. | 705 | (68,681) | ||||||
|
| |||||||
|
| (338,746)
|
| ||||||
|
| |||||||
Household Durables - (1.9)% | ||||||||
Harman International Industries, Inc. | 1,141 | (96,357) | ||||||
Lennar Corp., Class A | 2,105 | (89,126) | ||||||
|
| |||||||
|
| (185,483)
|
| ||||||
|
| |||||||
Household Products - (1.1)% | ||||||||
Procter & Gamble Co. | 1,155 | (103,661) | ||||||
|
| |||||||
Internet & Catalog Retail - (3.1)% | ||||||||
Netflix, Inc. (b) | 1,533 | (151,077) | ||||||
Priceline Group, Inc. (b) | 105 | (154,507) | ||||||
|
| |||||||
|
| (305,584)
|
| ||||||
|
| |||||||
Internet Software & Services - (2.6)% | ||||||||
Baidu, Inc. ADR (b) | 852 | (155,124) | ||||||
Facebook, Inc., Class A (b) | 771 | (98,896) | ||||||
|
| |||||||
|
| (254,020)
|
| ||||||
|
| |||||||
| See accompanying Notes to Financial Statements | 33 | Annual Report/September 30, 2016 |
Table of Contents
Schedule of Investments
September 30, 2016
AllianzGI Discovery U.S. Portfolio
| Shares | Value | |||||||
| ||||||||
IT Services - (3.0)% | ||||||||
Alliance Data Systems Corp. (b) | 467 | (100,186) | ||||||
International Business Machines Corp. | 1,218 | (193,479) | ||||||
|
| |||||||
|
| (293,665)
|
| ||||||
|
| |||||||
Machinery - (5.5)% | ||||||||
AGCO Corp. | 1,019 | (50,257) | ||||||
Caterpillar, Inc. | 1,809 | (160,585) | ||||||
Cummins, Inc. | 911 | (116,745) | ||||||
PACCAR, Inc. | 1,917 | (112,681) | ||||||
WABCO Holdings, Inc. (b) | 852 | (96,728) | ||||||
|
| |||||||
|
| (536,996)
|
| ||||||
|
| |||||||
Media - (3.7)% | ||||||||
Interpublic Group of Cos., Inc. | 3,846 | (85,958) | ||||||
Twenty-First Century Fox, Inc., Class A | 4,558 | (110,395) | ||||||
Walt Disney Co. | 1,826 | (169,562) | ||||||
|
| |||||||
|
| (365,915)
|
| ||||||
|
| |||||||
Metals & Mining - (1.0)% | ||||||||
Freeport-McMoRan, Inc. | 8,991 | (97,642) | ||||||
|
| |||||||
Multi-line Retail - (1.4)% | ||||||||
Target Corp. | 1,966 | (135,025) | ||||||
|
| |||||||
Oil, Gas & Consumable Fuels - (5.0)% | ||||||||
Antero Resources Corp. (b) | 2,789 | (75,164) | ||||||
Canadian Natural Resources Ltd. | 1,758 | (56,326) | ||||||
Exxon Mobil Corp. | 2,178 | (190,096) | ||||||
Noble Energy, Inc. | 2,057 | (73,517) | ||||||
Occidental Petroleum Corp. | 1,326 | (96,692) | ||||||
|
| |||||||
|
| (491,795)
|
| ||||||
|
| |||||||
Pharmaceuticals - (2.2)% | ||||||||
Bristol-Myers Squibb Co. | 2,715 | (146,393) | ||||||
Teva Pharmaceutical Industries Ltd. ADR | 1,523 | (70,073) | ||||||
|
| |||||||
|
| (216,466)
|
| ||||||
|
| |||||||
Professional Services - (1.0)% | ||||||||
Verisk Analytics, Inc., Class A (b) | 1,208 |
| (98,186)
|
| ||||
|
| |||||||
Semiconductors & Semiconductor Equipment - (2.5)% | ||||||||
Integrated Device Technology, Inc. (b) | 2,384 | (55,070) | ||||||
Teradyne, Inc. | 2,264 | (48,857) | ||||||
Texas Instruments, Inc. | 2,070 | (145,273) | ||||||
|
| |||||||
|
| (249,200)
|
| ||||||
|
| |||||||
Software - (1.0)% | ||||||||
Check Point Software Technologies Ltd. (b) | 1,297 | (100,660) | ||||||
|
| |||||||
Specialty Retail - (2.5)% | ||||||||
AutoZone, Inc. (b) | 130 | (99,884) | ||||||
CarMax, Inc. (b) | 1,745 | (93,096) | ||||||
Williams-Sonoma, Inc. | 980 | (50,058) | ||||||
|
| |||||||
|
| (243,038)
|
| ||||||
|
| |||||||
Textiles, Apparel & Luxury Goods - (3.3)% | ||||||||
NIKE, Inc., Class B | 2,566 | (135,100) | ||||||
Ralph Lauren Corp. | 937 | (94,768) | ||||||
VF Corp. | 1,775 | (99,489) | ||||||
|
| |||||||
|
| (329,357)
|
| ||||||
|
| |||||||
Trading Companies & Distributors - (1.0)% | ||||||||
United Rentals, Inc. (b) | 1,249 | (98,034) | ||||||
|
| |||||||
Water Utilities - (1.0)% | ||||||||
Aqua America, Inc. | 3,076 | (93,757) | ||||||
|
| |||||||
Total Common Stock (proceeds received-$8,976,744) |
|
(9,275,343)
|
| |||||
|
| |||||||
| See accompanying Notes to Financial Statements | 34 | Annual Report/September 30, 2016 |
Table of Contents
Schedule of Investments
September 30, 2016
AllianzGI Discovery U.S. Portfolio
| Shares | Value | |||||||
| ||||||||
Exchange-Traded Funds - (6.7)% | ||||||||
Health Care Select Sector SPDR Fund | 4,190 | (302,141) | ||||||
iShares Nasdaq Biotechnology Index | 708 | (204,938) | ||||||
iShares PHLX Semiconductor | 1,340 | (151,406) | ||||||
|
| |||||||
Total Exchange-Traded Funds (proceeds received-$639,189)
|
| (658,485)
|
| |||||
|
| |||||||
Total Securities Sold Short (proceeds received-$9,615,933) |
| (9,933,828)
|
| |||||
|
| |||||||
Total Investments, net of securities sold short (cost-$6,244,121)-66.0% |
| 6,494,904
|
| |||||
|
| |||||||
Other assets less other liabilities-34.0%
|
| 3,352,148
|
| |||||
|
| |||||||
Net Assets-100.0% | $
| 9,847,052
|
| |||||
|
| |||||||
| See accompanying Notes to Financial Statements | 35 | Annual Report/September 30, 2016 |
Table of Contents
Schedule of Investments
September 30, 2016
AllianzGI Discovery U.S. Portfolio
Notes to Schedule of Investments:
| (a) | All or partial amount segregated for the benefit of the counterparty as collateral for securities sold short. |
| (b) | Non-income producing. |
Glossary:
ADR - American Depositary Receipt
| See accompanying Notes to Financial Statements | 36 | Annual Report/September 30, 2016 |
Table of Contents
Schedule of Investments
September 30, 2016
AllianzGI Global Small-Cap Opportunities Portfolio
| Shares | Value | |||||||
| ||||||||
COMMON STOCK - 98.5% | ||||||||
Australia - 2.8% | ||||||||
BlueScope Steel Ltd. | 16,539 | $ | 98,738 | |||||
Evolution Mining Ltd. | 13,070 | 24,858 | ||||||
Saracen Mineral Holdings Ltd. (c) | 22,000 | 24,093 | ||||||
|
| |||||||
|
| 147,689
|
| ||||||
|
| |||||||
Brazil - 2.8% | ||||||||
Cia de Saneamento Basico do Estado de Sao Paulo | 9,800 | 90,974 | ||||||
Cia Paranaense de Energia, Class P ADR | 5,495 | 56,983 | ||||||
|
| |||||||
|
| 147,957
|
| ||||||
|
| |||||||
Canada - 1.1% | ||||||||
Cascades, Inc. | 4,972 | 48,623 | ||||||
OceanaGold Corp. | 3,148 | 9,454 | ||||||
|
| |||||||
|
| 58,077
|
| ||||||
|
| |||||||
China - 6.4% | ||||||||
Chongqing Rural Commercial Bank Co., Ltd., Class H | 36,000 | 22,326 | ||||||
Fantasia Holdings Group Co., Ltd. (c) | 87,000 | 13,354 | ||||||
Far East Horizon Ltd. | 98,000 | 93,227 | ||||||
Kingboard Chemical Holdings Ltd. | 23,000 | 69,993 | ||||||
Powerlong Real Estate Holdings Ltd. | 67,000 | 22,408 | ||||||
Yuzhou Properties Co., Ltd. | 311,000 | 115,562 | ||||||
|
| |||||||
|
| 336,870
|
| ||||||
|
| |||||||
France - 0.9% | ||||||||
Altran Technologies S.A. (c) | 3,214 | 47,528 | ||||||
|
| |||||||
India - 0.2% | ||||||||
WNS Holdings Ltd. ADR (c) | 350 | 10,482 | ||||||
|
| |||||||
Indonesia - 2.0% | ||||||||
Bank Bukopin Tbk PT | 484,600 | 22,680 | ||||||
Japfa Comfeed Indonesia Tbk PT | 626,400 | 83,437 | ||||||
|
| |||||||
|
| 106,117
|
| ||||||
|
| |||||||
Israel - 0.8% | ||||||||
Orbotech Ltd. (c) | 1,505 | 44,563 | ||||||
|
| |||||||
Italy - 0.3% | ||||||||
ASTM SpA | 1,385 | 15,128 | ||||||
|
| |||||||
Japan - 7.7% | ||||||||
Gunma Bank Ltd. | 22,600 | 102,668 | ||||||
Okamura Corp. | 2,400 | 23,257 | ||||||
Sankyu, Inc. | 14,000 | 80,399 | ||||||
Ship Healthcare Holdings, Inc. | 2,800 | 86,052 | ||||||
Sumitomo Forestry Co., Ltd. | 6,100 | 81,640 | ||||||
Tokuyama Corp. (c) | 5,000 | 20,957 | ||||||
Tokyo Steel Manufacturing Co., Ltd. | 1,700 | 11,483 | ||||||
|
| |||||||
|
| 406,456
|
| ||||||
|
| |||||||
Korea (Republic of) - 3.1% | ||||||||
DGB Financial Group, Inc. | 3,251 | 26,769 | ||||||
Hanwha Techwin Co., Ltd. | 600 | 34,815 | ||||||
KB Insurance Co., Ltd. | 768 | 19,049 | ||||||
Poongsan Corp. | 2,282 | 70,525 | ||||||
Samchully Co., Ltd. | 119 | 10,880 | ||||||
|
| |||||||
|
| 162,038
|
| ||||||
|
| |||||||
Malaysia - 0.4% | ||||||||
Padini Holdings Bhd. | 30,000 | 20,675 | ||||||
|
| |||||||
New Zealand - 1.8% | ||||||||
Kiwi Property Group Ltd. | 85,583 | 93,471 | ||||||
|
| |||||||
Norway - 0.9% | ||||||||
Grieg Seafood ASA | 6,000 | 47,922 | ||||||
|
| |||||||
| See accompanying Notes to Financial Statements | 37 | Annual Report/September 30, 2016 |
Table of Contents
Schedule of Investments
September 30, 2016
AllianzGI Global Small-Cap Opportunities Portfolio
| Shares | Value | |||||||
| ||||||||
Peru - 0.3% | ||||||||
Cia de Minas Buenaventura SAA ADR (c) | 1,050 | 14,532 | ||||||
|
| |||||||
Philippines - 0.3% | ||||||||
First Philippine Holdings Corp. | 11,990 | 18,012 | ||||||
|
| |||||||
Poland - 1.3% | ||||||||
PGE Polska Grupa Energetyczna S.A. | 25,741 | 68,386 | ||||||
|
| |||||||
Russian Federation - 1.9% | ||||||||
Severstal PJSC | 8,370 | 101,100 | ||||||
|
| |||||||
Singapore - 2.0% | ||||||||
Yanlord Land Group Ltd. | 103,400 | 106,356 | ||||||
|
| |||||||
South Africa - 0.8% | ||||||||
Astral Foods Ltd. | 2,336 | 20,069 | ||||||
Rebosis Property Fund Ltd. REIT | 26,861 | 22,287 | ||||||
|
| |||||||
|
| 42,356
|
| ||||||
|
| |||||||
Switzerland - 2.5% | ||||||||
BKW AG | 2,547 | 122,041 | ||||||
Bobst Group S.A. | 198 | 11,057 | ||||||
|
| |||||||
|
| 133,098
|
| ||||||
|
| |||||||
Taiwan - 2.7% | ||||||||
China Life Insurance Co., Ltd. | 16,000 | 14,698 | ||||||
Chong Hong Construction Co., Ltd. | 35,000 | 59,245 | ||||||
King’s Town Bank Co., Ltd. | 45,000 | 38,077 | ||||||
Sinmag Equipment Corp. | 3,000 | 13,630 | ||||||
Taiwan Union Technology Corp. | 13,000 | 15,592 | ||||||
|
| |||||||
|
| 141,242
|
| ||||||
|
| |||||||
Thailand - 0.7% | ||||||||
Thai Vegetable Oil PCL | 44,400 | 39,122 | ||||||
|
| |||||||
United Kingdom - 3.5% | ||||||||
Auto Trader Group PLC (a) | 16,825 | 88,449 | ||||||
JD Sports Fashion PLC | 5,228 | 99,956 | ||||||
|
| |||||||
|
| 188,405
|
| ||||||
|
| |||||||
United States - 51.3% | ||||||||
Advanced Energy Industries, Inc. (c) | 2,465 | 116,644 | ||||||
American Axle & Manufacturing Holdings, Inc. (c) | 3,860 | 66,469 | ||||||
ANI Pharmaceuticals, Inc. (c) | 1,440 | 95,544 | ||||||
Banc of California, Inc. | 2,575 | 44,959 | ||||||
Bazaarvoice, Inc. (c) | 17,275 | 102,095 | ||||||
Blucora, Inc. (c) | 8,670 | 97,104 | ||||||
BWX Technologies, Inc. | 1,655 | 63,502 | ||||||
Carbonite, Inc. (c) | 3,285 | 50,458 | ||||||
CBIZ, Inc. (c) | 4,435 | 49,628 | ||||||
CenterState Banks, Inc. | 2,125 | 37,676 | ||||||
Central Garden & Pet Co. (c) | 2,465 | 64,090 | ||||||
Colony Capital, Inc., Class A REIT | 1,275 | 23,243 | ||||||
Cooper Cos., Inc. | 110 | 19,719 | ||||||
EnerSys | 160 | 11,070 | ||||||
Exactech, Inc. (c) | 2,335 | 63,115 | ||||||
Federal-Mogul Holdings Corp. (c) | 3,175 | 30,512 | ||||||
Franklin Street Properties Corp. REIT | 4,765 | 60,039 | ||||||
Halyard Health, Inc. (c) | 1,025 | 35,526 | ||||||
HD Supply Holdings, Inc. (c) | 2,470 | 78,991 | ||||||
Hill-Rom Holdings, Inc. | 2,010 | 124,580 | ||||||
HNI Corp. | 845 | 33,631 | ||||||
Innospec, Inc. | 750 | 45,607 | ||||||
KBR, Inc. | 6,355 | 96,151 | ||||||
Knoll, Inc. | 1,350 | 30,847 | ||||||
Koppers Holdings, Inc. (c) | 1,250 | 40,225 | ||||||
Lear Corp. | 250 | 30,305 | ||||||
Lydall, Inc. (c) | 2,005 | 102,516 | ||||||
Masimo Corp. (c) | 1,060 | 63,059 | ||||||
Navigant Consulting, Inc. (c) | 5,130 | 103,729 | ||||||
Pennsylvania Real Estate Investment Trust | 2,765 | 63,678 | ||||||
Perry Ellis International, Inc. (c) | 2,775 | 53,502 | ||||||
Plantronics, Inc. | 1,200 | 62,352 | ||||||
Quad/Graphics, Inc. | 1,435 | 38,343 | ||||||
| See accompanying Notes to Financial Statements | 38 | Annual Report/September 30, 2016 |
Table of Contents
Schedule of Investments
September 30, 2016
AllianzGI Global Small-Cap Opportunities Portfolio
| Shares | Value | |||||||
| ||||||||
Quintiles IMS Holdings, Inc. (c) | 1,195 | 96,867 | ||||||
Rogers Corp. (c) | 1,285 | 78,488 | ||||||
Rudolph Technologies, Inc. (c) | 610 | 10,821 | ||||||
Sanmina Corp. (c) | 4,110 | 117,012 | ||||||
Seacoast Banking Corp. of Florida (c) | 1,350 | 21,722 | ||||||
Seadrill Partners LLC | 3,215 | 11,349 | ||||||
Steel Dynamics, Inc. | 1,930 | 48,231 | ||||||
Summit Hotel Properties, Inc. REIT | 4,895 | 64,418 | ||||||
Telephone & Data Systems, Inc. | 1,250 | 33,975 | ||||||
Tenet Healthcare Corp. (c) | 3,185 | 72,172 | ||||||
TTM Technologies, Inc. (c) | 6,655 | 76,200 | ||||||
Viad Corp. | 2,180 | 80,377 | ||||||
|
| |||||||
|
2,710,541
|
| ||||||
|
| |||||||
Total Common Stock (cost-$4,638,832) |
|
5,208,123
|
| |||||
|
| |||||||
| Principal Amount (000s) | ||||||||
Repurchase Agreements - 2.0% | ||||||||
State Street Bank and Trust Co., | $ | 106 | 106,000 | |||||
|
| |||||||
Total Investments (cost-$4,744,832) (b)-100.5% | 5,314,123 | |||||||
|
| |||||||
Liabilities in excess of other assets-(0.5)% | (26,711) | |||||||
|
| |||||||
Net Assets-100.0% | $ | 5,287,412 | ||||||
|
| |||||||
| See accompanying Notes to Financial Statements | 39 | Annual Report/September 30, 2016 |
Table of Contents
Schedule of Investments
September 30, 2016
AllianzGI Global Small-Cap Opportunities Portfolio
Notes to Schedule of Investments:
| (a) | 144A—Exempt from registration under Rule 144A of the Securities Act of 1933. These securities may be resold in transactions exempt from registration, typically only to qualified institutional buyers. Unless otherwise indicated, these securities are not considered to be illiquid. |
| (b) | Securities with an aggregate value of $2,050,186, representing 38.8% of net assets, were valued utilizing modeling tools provided by a third-party vendor. See Note 1(a) and Note 1(b) in the Notes to Financial Statements. |
| (c) | Non-income producing. |
Glossary:
ADR - American Depositary Receipt
REIT - Real Estate Investment Trust
| See accompanying Notes to Financial Statements | 40 | Annual Report/September 30, 2016 |
Table of Contents
Schedule of Investments
September 30, 2016
AllianzGI Global Small-Cap Opportunities Portfolio
The industry classification of portfolio holdings and liabilities in excess of other assets shown as a percentage of net assets were as follows:
Metals & Mining | 7.6% | |||
Electronic Equipment, Instruments & Components | 7.6% | |||
Internet Software & Services | 6.4% | |||
Equity Real Estate Investment Trusts (REITs) | 6.2% | |||
Real Estate Management & Development | 6.0% | |||
Banks | 6.0% | |||
Health Care Equipment & Supplies | 5.8% | |||
Electric Utilities | 5.0% | |||
Commercial Services & Supplies | 3.9% | |||
Food Products | 3.6% | |||
Health Care Providers & Services | 3.0% | |||
Professional Services | 2.9% | |||
Semiconductors & Semiconductor Equipment | 2.4% | |||
Auto Components | 2.4% | |||
Machinery | 2.4% | |||
Specialty Retail | 2.3% | |||
Chemicals | 2.0% | |||
Aerospace & Defense | 1.9% | |||
Life Sciences Tools & Services | 1.8% | |||
Construction & Engineering | 1.8% | |||
Pharmaceuticals | 1.8% | |||
Diversified Financial Services | 1.8% | |||
Water Utilities | 1.7% | |||
Household Durables | 1.6% | |||
Road & Rail | 1.5% | |||
Trading Companies & Distributors | 1.5% | |||
Household Products | 1.2% | |||
Communications Equipment | 1.2% | |||
IT Services | 1.1% | |||
Textiles, Apparel & Luxury Goods | 1.0% | |||
Containers & Packaging | 0.9% | |||
Wireless Telecommunication Services | 0.7% | |||
Insurance | 0.6% | |||
Transportation Infrastructure | 0.3% | |||
Energy Equipment & Services | 0.2% | |||
Electrical Equipment | 0.2% | |||
Gas Utilities | 0.2% | |||
Repurchase Agreements | 2.0% | |||
Liabilities in excess of other assets | (0.5)% | |||
|
| |||
| 100.0% | ||||
|
|
| See accompanying Notes to Financial Statements | 41 | Annual Report/September 30, 2016 |
Table of Contents
Statements of Assets and Liabilities
September 30, 2016
| AllianzGI Advanced Core Bond | AllianzGI Best Styles Global Managed Volatility | AllianzGI Discovery U.S. | AllianzGI Global Small-Cap Opportunities | |||||||||||||
Assets: | ||||||||||||||||
Investments, at value | $220,456,430 | $73,188,773 | $9,187,732 | $5,208,123 | ||||||||||||
|
|
|
|
|
|
|
|
| ||||||||
Repurchase agreements, at value | 5,668,000 | 4,512,000 | 7,241,000 | 106,000 | ||||||||||||
|
|
|
|
|
|
|
|
| ||||||||
Cash | 701 | 526 | 729 | 87 | ||||||||||||
|
|
|
|
|
|
|
|
| ||||||||
Foreign currency, at value | – | 157,826 | – | 11,134 | ||||||||||||
|
|
|
|
|
|
|
|
| ||||||||
Dividends and interest receivable (net of foreign withholding taxes) | 1,258,440 | 236,821 | 6,525 | 10,607 | ||||||||||||
|
|
|
|
|
|
|
|
| ||||||||
Receivable for investments sold | 324,870 | – | 869,014 | – | ||||||||||||
|
|
|
|
|
|
|
|
| ||||||||
Receivable for Fund shares sold | 136,146 | – | – | – | ||||||||||||
|
|
|
|
|
|
|
|
| ||||||||
Deposits with brokers for derivatives collateral | 16,310 | 537,392 | – | – | ||||||||||||
|
|
|
|
|
|
|
|
| ||||||||
Receivable from Investment Manager | 11,477 | 32,790 | 15,616 | 10,705 | ||||||||||||
|
|
|
|
|
|
|
|
| ||||||||
Deferred offering costs | 4,583 | 9,518 | 5,495 | – | ||||||||||||
|
|
|
|
|
|
|
|
| ||||||||
Receivable for variation margin on futures contracts | 4,394 | 59,016 | – | – | ||||||||||||
|
|
|
|
|
|
|
|
| ||||||||
Investments in Affiliated Funds - Trustee Deferred Compensation Plan (see Note 4) | 3,476 | 897 | 189 | 210 | ||||||||||||
|
|
|
|
|
|
|
|
| ||||||||
Tax reclaims receivable | – | 14,768 | – | 1,315 | ||||||||||||
|
|
|
|
|
|
|
|
| ||||||||
Deposits with brokers for securities sold short collateral | – | – | 3,322,176 | – | ||||||||||||
|
|
|
|
|
|
|
|
| ||||||||
Prepaid expenses and other assets | 7,088 | 5,246 | 3,977 | 3,755 | ||||||||||||
|
|
|
|
|
|
|
|
| ||||||||
Total Assets | 227,891,915 | 78,755,573 | 20,652,453 | 5,351,936 | ||||||||||||
|
|
|
|
|
|
|
|
| ||||||||
Liabilities: | ||||||||||||||||
Payable for investments purchased | 49,361,080 | 24 | 787,829 | – | ||||||||||||
|
|
|
|
|
|
|
|
| ||||||||
Payable for Fund shares redeemed | 5,020,919 | 1,325,082 | – | – | ||||||||||||
|
|
|
|
|
|
|
|
| ||||||||
Payable for securities sold short expenses | – | – | 10,023 | – | ||||||||||||
|
|
|
|
|
|
|
|
| ||||||||
Due to Investment Manager | 4,583 | 9,518 | 5,495 | – | ||||||||||||
|
|
|
|
|
|
|
|
| ||||||||
Trustees Deferred Compensation Plan payable (see Note 4) | 3,476 | 897 | 189 | 210 | ||||||||||||
|
|
|
|
|
|
|
|
| ||||||||
Securities sold short, at value | – | – | 9,933,828 | – | ||||||||||||
|
|
|
|
|
|
|
|
| ||||||||
Dividends payable on securities sold short | – | – | 9,791 | – | ||||||||||||
|
|
|
|
|
|
|
|
| ||||||||
Accrued expenses and other liabilities | 91,023 | 80,749 | 58,246 | 64,314 | ||||||||||||
|
|
|
|
|
|
|
|
| ||||||||
Total Liabilities | 54,481,081 | 1,416,270 | 10,805,401 | 64,524 | ||||||||||||
|
|
|
|
|
|
|
|
| ||||||||
Net Assets | $173,410,834 | $77,339,303 | $9,847,052 | $5,287,412 | ||||||||||||
|
|
|
|
|
|
|
|
| ||||||||
Net Assets Consist of: | ||||||||||||||||
Paid-in-capital | $166,768,043 | $73,836,688 | $9,999,395 | $5,044,083 | ||||||||||||
|
|
|
|
|
|
|
|
| ||||||||
Undistributed (dividends in excess of) net investment income | 1,589,804 | 978,380 | (104,450) | 46,368 | ||||||||||||
|
|
|
|
|
|
|
|
| ||||||||
Accumulated net realized gain (loss) | 1,054,751 | 97,585 | (298,673) | (371,779) | ||||||||||||
|
|
|
|
|
|
|
|
| ||||||||
Net unrealized appreciation | 3,998,236 | 2,426,650 | 250,780 | 568,740 | ||||||||||||
|
|
|
|
|
|
|
|
| ||||||||
Net Assets | $173,410,834 | $77,339,303 | $9,847,052 | $5,287,412 | ||||||||||||
|
|
|
|
|
|
|
|
| ||||||||
Cost of Investments | $216,462,588 | $70,797,760 | $8,619,054 | $4,638,832 | ||||||||||||
|
|
|
|
|
|
|
|
| ||||||||
Cost of Repurchase Agreements | $5,668,000 | $4,512,000 | $7,241,000 | $106,000 | ||||||||||||
|
|
|
|
|
|
|
|
| ||||||||
Cost of Foreign Currency | $– | $155,348 | $– | $11,116 | ||||||||||||
|
|
|
|
|
|
|
|
| ||||||||
Proceeds Received on Securities Sold Short | $– | $– | $9,615,933 | $– | ||||||||||||
|
|
|
|
|
|
|
|
| ||||||||
Shares Issued and Outstanding | 11,037,556 | 4,893,216 | 666,667 | 336,356 | ||||||||||||
|
|
|
|
|
|
|
|
| ||||||||
Net Asset Value Per Share* | $15.71 | $15.81 | $14.77 | $15.72 | ||||||||||||
|
|
|
|
|
|
|
|
| ||||||||
| * | Net asset value and redemption price per share may not recalculate exactly due to rounding. |
| See accompanying Notes to Financial Statements | 42 | Annual Report/September 30, 2016 |
Table of Contents
Year or period ended September 30, 2016
| AllianzGI Advanced Core Bond (1) | AllianzGI Best Styles Global Managed Volatility (2) | AllianzGI Discovery U.S. (3) | AllianzGI Global Small-Cap Opportunities | |||||||||||||
Investment Income: | ||||||||||||||||
Interest | $2,391,368 | $241 | $1,150 | $– | ||||||||||||
|
|
|
|
|
|
|
|
| ||||||||
Dividends, net of foreign withholding taxes* | – | 1,123,893 | 127,750 | 109,720 | ||||||||||||
|
|
|
|
|
|
|
|
| ||||||||
Total Investment Income | 2,391,368 | 1,124,134 | 128,900 | 109,720 | ||||||||||||
|
|
|
|
|
|
|
|
| ||||||||
Expenses: | ||||||||||||||||
Investment management | 370,816 | 131,746 | 77,369 | 44,106 | ||||||||||||
|
|
|
|
|
|
|
|
| ||||||||
Legal | 164,194 | 32,498 | 34,710 | 68,928 | ||||||||||||
|
|
|
|
|
|
|
|
| ||||||||
Custodian and accounting agent | 63,128 | 119,490 | 49,130 | 89,516 | ||||||||||||
|
|
|
|
|
|
|
|
| ||||||||
Offering | 49,379 | 8,482 | 19,267 | – | ||||||||||||
|
|
|
|
|
|
|
|
| ||||||||
Organizational | 45,391 | 12,000 | 84,238 | – | ||||||||||||
|
|
|
|
|
|
|
|
| ||||||||
Audit and tax services | 41,712 | 35,620 | 35,395 | 43,734 | ||||||||||||
|
|
|
|
|
|
|
|
| ||||||||
Shareholder communications | 23,131 | 5,071 | 7,331 | 8,048 | ||||||||||||
|
|
|
|
|
|
|
|
| ||||||||
Trustees | 13,912 | 3,153 | 1,202 | 607 | ||||||||||||
|
|
|
|
|
|
|
|
| ||||||||
Transfer agent | 9,393 | 2,565 | 4,051 | 3,949 | ||||||||||||
|
|
|
|
|
|
|
|
| ||||||||
Insurance | 1,505 | 1,115 | 845 | 4,966 | ||||||||||||
|
|
|
|
|
|
|
|
| ||||||||
Excise tax | – | – | – | 71 | ||||||||||||
|
|
|
|
|
|
|
|
| ||||||||
Dividends on securities sold short | – | – | 132,890 | – | ||||||||||||
|
|
|
|
|
|
|
|
| ||||||||
Securities sold short | – | – | 86,918 | – | ||||||||||||
|
|
|
|
|
|
|
|
| ||||||||
Line of credit commitment | – | – | �� | 56 | ||||||||||||
|
|
|
|
|
|
|
|
| ||||||||
Miscellaneous | 4,774 | 1,905 | 4,826 | 4,627 | ||||||||||||
|
|
|
|
|
|
|
|
| ||||||||
Total Expenses | 787,335 | 353,645 | 538,172 | 268,608 | ||||||||||||
|
|
|
|
|
|
|
|
| ||||||||
Less: Fee Waiver/Reimbursement from Investment Manager | (275,685) | (205,431) | (289,229) | (209,673) | ||||||||||||
|
|
|
|
|
|
|
|
| ||||||||
Net Expenses | 511,650 | 148,214 | 248,943 | 58,935 | ||||||||||||
|
|
|
|
|
|
|
|
| ||||||||
Net Investment Income (Loss) | 1,879,718 | 975,920 | (120,043) | 50,785 | ||||||||||||
|
|
|
|
|
|
|
|
| ||||||||
Realized and Change in Unrealized Gain (Loss): |
| |||||||||||||||
Net realized gain (loss) on: | ||||||||||||||||
Investments | 1,278,119 | 11,373 | 353,003 | (125,225) | ||||||||||||
|
|
|
|
|
|
|
|
| ||||||||
Securities sold short | – | – | (636,688) | – | ||||||||||||
|
|
|
|
|
|
|
|
| ||||||||
Futures contracts | (145,504) | 87,798 | – | – | ||||||||||||
|
|
|
|
|
|
|
|
| ||||||||
Foreign currency transactions | – | (24,473) | – | (15,836) | ||||||||||||
|
|
|
|
|
|
|
|
| ||||||||
Net change in unrealized appreciation/depreciation of: Investments | 3,993,842 | 2,391,013 | 568,678 | 520,421 | ||||||||||||
|
|
|
|
|
|
|
|
| ||||||||
Investments in Affiliates | – | – | – | (3,208) | ||||||||||||
|
|
|
|
|
|
|
|
| ||||||||
Securities sold short | – | – | (317,895) | – | ||||||||||||
|
|
|
|
|
|
|
|
| ||||||||
Futures contracts | 4,394 | 59,016 | – | – | ||||||||||||
|
|
|
|
|
|
|
|
| ||||||||
Foreign currency transactions | – | 1,968 | (3) | 4,074 | ||||||||||||
|
|
|
|
|
|
|
|
| ||||||||
Net realized and change in unrealized gain (loss) | 5,130,851 | 2,526,695 | (32,905) | 380,226 | ||||||||||||
|
|
|
|
|
|
|
|
| ||||||||
Net Increase (Decrease) in Net Assets Resulting from Investment Operations | $7,010,569 | $3,502,615 | $(152,948) | $431,011 | ||||||||||||
|
|
|
|
|
|
|
|
| ||||||||
*Foreign withholding taxes | $– | $69,350 | $– | $7,683 | ||||||||||||
|
|
|
|
|
|
|
|
| ||||||||
| (1) | The portfolio commenced operations on October 30, 2015. |
| (2) | The Portfolio commenced operations on April 11, 2016. |
| (3) | The Portfolio commenced operations on December 21, 2015. |
| See accompanying Notes to Financial Statements | 43 | Annual Report/September 30, 2016 |
Table of Contents
Statements of Changes in Net Assets
| AllianzGI Advanced Core Bond | AllianzGI Best Styles Global Managed Volatility | AllianzGI Discovery U.S. | ||||||||||
| Period from 10/30/2015(1) through 9/30/2016 | Period from 4/11/2016(1) through 9/30/2016 | Period from 12/21/2015(1) through 9/30/2016 | ||||||||||
Increase (Decrease) in Net Assets from: | ||||||||||||
Investment Operations: | ||||||||||||
Net investment income (loss) | $1,879,718 | $975,920 | $(120,043) | |||||||||
|
|
|
|
|
|
| ||||||
Net realized gain (loss) | 1,132,615 | 74,698 | (283,685) | |||||||||
|
|
|
|
|
|
| ||||||
Net unrealized appreciation | 3,998,236 | 2,451,997 | 250,780 | |||||||||
|
|
|
|
|
|
| ||||||
Net increase (decrease) in net assets resulting from investment operations | 7,010,569 | 3,502,615 | (152,948) | |||||||||
|
|
|
|
|
|
| ||||||
Dividends to Shareholders from: | ||||||||||||
Net Investment Income | (367,778) | – | – | |||||||||
|
|
|
|
|
|
| ||||||
Fund Share Transactions: | ||||||||||||
Net proceeds from the sale of shares | 181,178,096 | 75,229,813 | – | |||||||||
|
|
|
|
|
|
| ||||||
Issued in reinvestment of dividends | 367,778 | – | – | |||||||||
|
|
|
|
|
|
| ||||||
Cost of shares redeemed | (14,827,831) | (1,443,125) | – | |||||||||
|
|
|
|
|
|
| ||||||
Total increase (decrease) in net assets | 173,360,834 | 77,289,303 | (152,948) | |||||||||
|
|
|
|
|
|
| ||||||
Net Assets: | ||||||||||||
Beginning of period | 50,000 | 50,000 | 10,000,000 | |||||||||
|
|
|
|
|
|
| ||||||
End of period* | $173,410,834 | $77,339,303 | $9,847,052 | |||||||||
|
|
|
|
|
|
| ||||||
*Including undistributed (dividends in excess of) net investment income of: | $1,589,804 | $978,380 | $(104,450) | |||||||||
|
|
|
|
|
|
| ||||||
Shares Activity: | ||||||||||||
Issued | 11,957,770 | 4,984,429 | 666,667 | |||||||||
|
|
|
|
|
|
| ||||||
Issued in Reinvestment of Dividends | 24,700 | – | – | |||||||||
|
|
|
|
|
|
| ||||||
Shares redeemed | (944,914) | (91,213) | – | |||||||||
|
|
|
|
|
|
| ||||||
Net Increase | 11,037,556 | 4,893,216 | 666,667 | |||||||||
|
|
|
|
|
|
| ||||||
| (1) | Commencement of operations. |
| See accompanying Notes to Financial Statements | 44 | Annual Report/September 30, 2016 |
Table of Contents
Statements of Changes in Net Assets
| AllianzGI Global Small-Cap Opportunities | ||||||||||||
| Year ended 9/30/2016 | Period from 12/1/2014 through 9/30/2015(2) | Period from 7/23/2014(1) through 11/30/2014 | ||||||||||
Increase (Decrease) in Net Assets from: | ||||||||||||
Investment Operations: | ||||||||||||
Net investment income | $50,785 | $38,702 | $15,248 | |||||||||
|
|
|
|
|
|
| ||||||
Net realized loss | (141,061 | ) | (141,304 | ) | (104,346 | ) | ||||||
|
|
|
|
|
|
| ||||||
Net change in unrealized appreciation/depreciation | 521,287 | 59,618 | (11,517 | ) | ||||||||
|
|
|
|
|
|
| ||||||
Net increase (decrease) in net assets resulting from investment operations | 431,011 | (42,984 | ) | (100,615 | ) | |||||||
|
|
|
|
|
|
| ||||||
Dividends to Shareholders from: | ||||||||||||
Net Investment Income | (29,791 | ) | (14,423 | ) | – | |||||||
|
|
|
|
|
|
| ||||||
Fund Share Transactions: | ||||||||||||
Issued in reinvestment of dividends | 29,791 | 14,423 | – | |||||||||
|
|
|
|
|
|
| ||||||
Total increase (decrease) in net assets | 431,011 | (42,984 | ) | (100,615 | ) | |||||||
|
|
|
|
|
|
| ||||||
Net Assets: | ||||||||||||
Beginning of period | 4,856,401 | 4,899,385 | 5,000,000 | |||||||||
|
|
|
|
|
|
| ||||||
End of period* | $5,287,412 | $4,856,401 | $4,899,385 | |||||||||
|
|
|
|
|
|
| ||||||
*Including undistributed net investment income of: | $46,368 | $29,877 | $13,155 | |||||||||
|
|
|
|
|
|
| ||||||
Shares Issued in Reinvestment of Dividends | 2,035 | 988 | – | |||||||||
|
|
|
|
|
|
| ||||||
| (1) | Commencement of operations. |
| (2) | Fiscal year end changed from November 30th to September 30th. |
| See accompanying Notes to Financial Statements | 45 | Annual Report/September 30, 2016 |
Table of Contents
AllianzGI Advanced Core Bond Portfolio
Financial Highlights
For a share of common stock outstanding throughout each period:
| Period from 10/30/2015* through 9/30/2016 | ||
Net asset value, beginning of period | $15.00 | |
| ||
Investment Operations: | ||
Net investment income(a) | $0.21 | |
| ||
Net realized and unrealized gain | $0.57 | |
| ||
Total from investment operations | $0.78 | |
| ||
Dividends to Shareholders from net investment income | $(0.07) | |
| ||
Net asset value, end of period | $15.71 | |
| ||
Total Return(b) | 5.23% | |
| ||
RATIOS/SUPPLEMENTAL DATA: | ||
Net assets, end of period (000s) | $173,411 | |
| ||
Ratio of expenses to average net assets with fee reimbursement(c)(d) | 0.41% | |
| ||
Ratio of expenses to average net assets without fee | 0.62% | |
| ||
Ratio of net investment income to average net assets(c)(d) | 1.52% | |
| ||
Portfolio Turnover Rate | 260% | |
| ||
| * | Commencement of operations. |
| (a) | Calculated on average shares outstanding during the period. |
| (b) | Total return is calculated assuming a purchase of a share on the first day of the period and a sale of a share on the last day of each period reported. Dividends and distributions, if any, are assumed, for purposes of this calculation, to be reinvested. Total return does not reflect sales charges and includes the effect of expense reimbursements. Total return may reflect adjustments to conform to U.S. GAAP. Total return for a period of less than one year is not annualized. |
| (c) | Annualized, unless otherwise noted. |
| (d) | Certain expenses incurred were not annualized. |
| See accompanying Notes to Financial Statements | 46 | Annual Report/September 30, 2016 |
Table of Contents
AllianzGI Best Styles Global Managed Volatility Portfolio
Financial Highlights
For a share of common stock outstanding throughout each period:
| Period from 4/11/2016* through 9/30/2016 | ||||
Net asset value, beginning of period | $15.00 | |||
| ||||
Investment Operations: | ||||
Net investment income(a) | $0.22 | |||
| ||||
Net realized and unrealized gain | $0.59 | |||
| ||||
Total from investment operations | $0.81 | |||
| ||||
Net asset value, end of period | $15.81 | |||
| ||||
Total Return(b) | 5.40% | |||
| ||||
RATIOS/SUPPLEMENTAL DATA: | ||||
Net assets, end of period (000s) | $77,339 | |||
| ||||
Ratio of expenses to average net assets with fee | 0.45% | |||
| ||||
Ratio of expenses to average net assets without fee | 0.99% | |||
| ||||
Ratio of net investment income to average net assets(c)(d) | 2.96% | |||
| ||||
Portfolio Turnover Rate | 1% | |||
| ||||
| * | Commencement of operations. |
| (a) | Calculated on average shares outstanding during the period. |
| (b) | Total return is calculated assuming a purchase of a share on the first day of the period and a sale of a share on the last day of each period reported. Dividends and distributions, if any, are assumed, for purposes of this calculation, to be reinvested. Total return does not reflect sales charges and includes the effect of expense reimbursements. Total return may reflect adjustments to conform to U.S. GAAP. Total return for a period of less than one year is not annualized. |
| (c) | Annualized, unless otherwise noted. |
| (d) | Certain expenses incurred were not annualized. |
| See accompanying Notes to Financial Statements | 47 | Annual Report/September 30, 2016 |
Table of Contents
AllianzGI Discovery U.S. Portfolio
Financial Highlights
For a share of common stock outstanding throughout each period:
| Period from 12/21/2015* through 9/30/2016 | ||
Net asset value, beginning of period | $15.00 | |
| ||
Investment Operations: | ||
Net investment loss(a) | $(0.18) | |
| ||
Net realized and unrealized loss | $(0.05) | |
| ||
Total from investment operations | $(0.23) | |
| ||
Net asset value, end of period | $14.77 | |
| ||
Total Return(b) | (1.53)% | |
| ||
RATIOS/SUPPLEMENTAL DATA: | ||
Net assets, end of period (000s) | $9,847 | |
| ||
Ratio of expenses to average net assets with fee | 3.22% | |
| ||
Ratio of expenses to average net assets without fee | 6.59% | |
| ||
Ratio of net investment loss to average net assets(c)(d) | (1.55)% | |
| ||
Portfolio Turnover Rate | 214% | |
| ||
| * | Commencement of operations. |
| (a) | Calculated on average shares outstanding during the period. |
| (b) | Total return is calculated assuming a purchase of a share on the first day of the period and a sale of a share on the last day of each period reported. Dividends and distributions, if any, are assumed, for purposes of this calculation, to be reinvested. Total return does not reflect sales charges and includes the effect of expense reimbursements. Total return may reflect adjustments to conform to U.S. GAAP. Total return for a period of less than one year is not annualized. |
| (c) | Annualized, unless otherwise noted. |
| (d) | Certain expenses incurred were not annualized. |
| (e) | Inclusive of dividends on securities sold short of 1.70%. |
| See accompanying Notes to Financial Statements | 48 | Annual Report/September 30, 2016 |
Table of Contents
AllianzGI Global Small-Cap Opportunities Portfolio
Financial Highlights
For a share of common stock outstanding throughout each period:
| Year ended September 30, 2016 | Period from 12/1/2014 through 9/30/2015# | Period from 7/23/2014* through 11/30/2014 | ||||||
Net asset value, beginning of period | $14.53 | $14.70 | $15.00 | |||||
| ||||||||
Investment Operations: | ||||||||
Net investment income(a) | 0.15 | 0.12 | 0.05 | |||||
| ||||||||
Net realized and change in unrealized gain (loss) | 1.13 | (0.25) | (0.35) | |||||
| ||||||||
Total from investment operations | 1.28 | (0.13) | (0.30) | |||||
| ||||||||
Dividends to Shareholders from net investment income | (0.09) | (0.04) | — | |||||
| ||||||||
Net asset value, end of period | $15.72 | $14.53 | $14.70 | |||||
| ||||||||
Total Return(b) | 8.85% | (0.86)% | (2.00)% | |||||
| ||||||||
RATIOS/SUPPLEMENTAL DATA: | ||||||||
Net assets, end of period (000s) | $5,287 | $4,856 | $4,899 | |||||
| ||||||||
Ratio of expenses to average net assets with fee reimbursement | 1.20% | 1.22%(c)(d) | 1.20%(c)(d) | |||||
| ||||||||
Ratio of expenses to average net assets without fee reimbursement | 5.48% | 7.06%(c)(d) | 4.88%(c)(d) | |||||
| ||||||||
Ratio of net investment income to average net assets | 1.04% | 0.91%(c)(d) | 0.88%(c)(d) | |||||
| ||||||||
Portfolio Turnover Rate | 177% | 152% | 56% | |||||
| ||||||||
| * | Commencement of operations. |
| # | Fiscal year end changed from November 30th to September 30th. |
| (a) | Calculated on average shares outstanding during the period. |
| (b) | Total return is calculated assuming a purchase of a share on the first day of the period and a sale of a share on the last day of each period reported. Dividends and distributions, if any, are assumed, for purposes of this calculation, to be reinvested. Total return does not reflect sales charges and includes the effect of expense reimbursements. Total return may reflect adjustments to conform to U.S. GAAP. Total return for a period of less than one year is not annualized. |
| (c) | Annualized, unless otherwise noted. |
| (d) | Certain expenses incurred were not annualized. |
| See accompanying Notes to Financial Statements | 49 | Annual Report/September 30, 2016 |
Table of Contents
AllianzGI Institutional Multi-Series Trust
Notes to Financial Statements
September 30, 2016
1. ORGANIZATION AND SIGNIFICANT ACCOUNTING POLICIES
AllianzGI Institutional Multi-Series Trust (the “Trust”) was organized on June 3, 2014 and is registered under the Investment Company Act of 1940, as amended (the “1940-Act”), as an open-end registered investment company. The Trust follows the investment company accounting and reporting guidance of the Financial Accounting Standards Board (“FASB”) Accounting Standard Codification Topic 946 Financial Services-Investment Companies. As of September 30, 2016, the Trust consisted of four separate investment series, (each a “Portfolio” and collectively the “Portfolios”). Allianz Global Investors Fund Management LLC (“AGIFM” or the “Investment Manager”) and Allianz Global Investors U.S. LLC (“AllianzGI U.S.” or the “Sub-Adviser”) served as the Portfolios’ investment manager and sub-adviser, respectively, during the reporting period. AllianzGI U.S. is, and AGIFM was, prior to its merger with and into AllianzGI U.S. on October 1, 2016, an indirect, wholly-owned subsidiary of Allianz Asset Management of America L.P. (“AAM”). AGIFM and AllianzGI U.S. were affiliates during the reporting period. AAM is an indirect, wholly-owned subsidiary of Allianz SE, a publicly traded European insurance and financial services company. Shares of the Portfolios have not been registered for public sale and are currently offered and sold on a private placement basis in accordance with Rule 506(c) of Regulation D under the Securities Act of 1933, as amended. Currently, the Trust has authorized one class of shares.
Notwithstanding the merger of AGIFM into AllianzGI U.S. on October 1, 2016, these Notes portray that the Portfolios have both an Investment Manager and Sub-Adviser, which was the case during reporting period. Following the merger, AllianzGI U.S. has assumed the services and responsibilities previously provided by AGIFM as Investment Manager, and the Portfolios no longer have a Sub-Adviser.
The following Portfolios sold and issued shares of beneficial interest to Allianz Fund Investments, Inc. (“AFI”), an indirect wholly-owned subsidiary of Allianz SE, during the periods ended September 30, 2016, September 30, 2015 and November 30, 2014:
AllianzGI Advanced Core Bond Portfolio | ||||||||||
| Date | Shares | Amount | ||||||||
10/30/15 | 3,333 | $50,000 | ||||||||
AllianzGI Best Styles Global Managed Volatility Portfolio | ||||||||||
| Date | Shares | Amount | ||||||||
4/11/16 | 3,333 | $50,000 | ||||||||
AllianzGI Discovery U.S. Portfolio | ||||||||||
| Date | Shares | Amount | ||||||||
12/21/15 | 666,667 | $10,000,000 | ||||||||
AllianzGI Global Small-Cap Opportunities Portfolio | ||||||||||
| Date | Shares | Amount | ||||||||
7/23/14 | 333,333 | $5,000,000 | ||||||||
The investment objective of AllianzGI Advanced Core Bond is to seek long-term risk adjusted total net return. The investment objective of AllianzGI Best Styles Global Managed Volatility, AllianzGI Discovery U.S. and AllianzGI Global Small-Cap Opportunities is to seek long-term capital appreciation. There can be no assurance that the Portfolios will meet their stated objective.
The preparation of the Portfolios’ financial statements in accordance with accounting principles generally accepted in the United States of America (“U.S. GAAP”) requires the Portfolios’ management to make estimates and assumptions that affect the reported amounts and disclosures in each Portfolio’s financial statements. Actual results could differ from those estimates.
| 50 | Annual Report/September 30, 2016 |
Table of Contents
AllianzGI Institutional Multi-Series Trust
Notes to Financial Statements
September 30, 2016 (continued)
In the normal course of business, the Portfolios enter into contracts that contain a variety of representations that provide general indemnifications. The Portfolios’ maximum exposure under these arrangements is unknown as this would involve future claims that may be made against the Portfolios that have not yet occurred.
The following is a summary of significant accounting policies consistently followed by the Portfolios:
(a) Valuation of Investments. Portfolio securities and other financial instruments for which market quotations are readily available are stated at market value. Market value is generally determined on the basis of official closing prices, last reported sales prices, or if no sales or closing prices are reported, on the basis of quotes obtained from a quotation reporting system, established market makers, or independent pricing services. The Portfolios’ investments are valued daily using prices supplied by an independent pricing service or broker/dealer quotations, or by using the last sale or settlement price on the exchange that is the primary market for such securities, or the mean between the last bid and ask quotations. The market value for NASDAQ Global Market and NASDAQ Capital Market securities may also be calculated using the NASDAQ Official Closing Price instead of the last reported sales price. Independent pricing services use information provided by market makers or estimates of market values obtained from yield data relating to investments or securities with similar characteristics. Exchange traded futures are valued at the price determined by the relevant exchange. Securities purchased on a when-issued or delayed-delivery basis are marked to market daily until settlement at the forward settlement date.
The Board of Trustees (the “Board”) has adopted procedures for valuing portfolio securities and other financial instruments in circumstances where market quotations are not readily available (including in cases where available market quotations are deemed to be unreliable), and has delegated primary responsibility for applying the valuation methods to the Investment Manager and the Sub-Adviser. The Trust’s Valuation Committee was established by the Board to oversee the implementation of the Portfolios’ valuation methods and to make fair value determinations on behalf of the Board, as instructed by the Board. The Sub-Adviser monitors the continued appropriateness of methods applied and identifies to the Investment Manager circumstances and events that may require fair valuation. The Investment Manager, in turn, determines if adjustments should be made in light of market changes, events affecting the issuer, or other factors. If the Investment Manager (in consultation with the Sub-Adviser) determines that a valuation method may no longer be appropriate, another valuation method may be selected or the Valuation Committee will be convened to consider the matter and take any appropriate action in accordance with procedures set forth by the Board. The Board shall review and ratify the appropriateness of the valuation methods and these methods may be amended or supplemented from time to time by the Valuation Committee.
Short-term debt instruments maturing in 60 days or less are valued at amortized cost, if their original term to maturity was 60 days or less, or by amortizing premiums or discounts based on their value on the 61st day prior to maturity, if the original term to maturity exceeded 60 days.
Investments initially valued in currencies other than the U.S. dollar are converted to the U.S. dollar using exchange rates obtained from pricing services. As a result, the net asset value (“NAV”) of each Portfolio may be affected by changes in the value of currencies in relation to the U.S. dollar. The value of securities traded in markets outside the United States or denominated in currencies other than the U.S. dollar may be affected significantly on a day that the New York Stock Exchange (“NYSE”) is closed.
The prices used by the Portfolios to value investments may differ from the value that would be realized if the investments were sold, and these differences could be material to the Portfolios’ financial statements. The NAV of each Portfolio is normally determined as of the close of regular trading (normally, 4:00 p.m. Eastern Time) on the NYSE on each day the NYSE is open for business.
The prices of certain portfolio securities or financial instruments may be determined at a time prior to the close of regular trading on the NYSE. When fair-valuing the securities, the Portfolios may, among other things, consider significant events (which may be considered to include changes in the value of U.S. securities or securities indices) that occur after the close of the relevant market and before the time the NAV of a Portfolio is calculated. With respect to certain foreign securities, the Portfolios may fair-value securities using modeling tools provided by third-party vendors. The Portfolios have retained a statistical research service to assist in determining the fair value of foreign securities. This service utilizes statistics and programs based on historical performance of markets and other economic data to assist in making fair value estimates. Fair
| 51 | Annual Report/September 30, 2016 |
Table of Contents
AllianzGI Institutional Multi-Series Trust
Notes to Financial Statements
September 30, 2016 (continued)
value estimates used by the Portfolios for foreign securities may differ from the value realized from the sale of those securities and the difference could be material to the financial statements. Fair value pricing may require subjective determinations about the value of a security or other assets, and fair values used to determine the NAV of a Portfolio may differ from quoted or published prices, or from prices that are used by others, for the same investments. In addition, the use of fair value pricing may not always result in adjustments to the prices of securities or other assets held by a Portfolio.
(b) Fair Value Measurements. Fair value is defined as the price that would be received to sell an asset or paid to transfer a liability (i.e., the “exit price”) in an orderly transaction between market participants. The three levels of the fair value hierarchy are described below:
| ● | Level 1 – quoted prices in active markets for identical investments that the Portfolios have the ability to access |
| ● | Level 2 – valuations based on other significant observable inputs, which may include, but are not limited to, quoted prices for similar assets or liabilities, interest rates, yield curves, volatilities, prepayment speeds, loss severities, credit risks and default rates or other market corroborated inputs |
| ● | Level 3 – valuations based on significant unobservable inputs (including the Sub-Adviser’s or Valuation Committee’s own assumptions and securities whose price was determined by using a single broker’s quote) |
The valuation techniques used by the Portfolios to measure fair value during the period or year ended September 30, 2016 were intended to maximize the use of observable inputs and to minimize the use of unobservable inputs.
The Portfolios’ policy is to recognize transfers between levels at the end of the reporting period. An investment asset’s or liability’s level within the fair value hierarchy is based on the lowest level input, individually or in aggregate, that is significant to the fair value measurement. The objective of fair value measurement remains the same even when there is a significant decrease in the volume and level of activity for an asset or liability and regardless of the valuation techniques used. Investments categorized as Level 1 or 2 as of period end may have been transferred between Levels 1 and 2 since the prior period due to changes in the valuation method utilized in valuing the investments.
The inputs or methodology used for valuing securities are not necessarily an indication of the risk associated with investing in those securities. The following are certain inputs and techniques that the Portfolios generally use to evaluate how to classify each major category of assets and liabilities within Level 2 and Level 3, in accordance with U.S. GAAP.
Equity Securities (Common and Preferred Stock) — Equity securities traded in inactive markets and certain foreign equity securities are valued using inputs which include broker-dealer quotes, recently executed transactions adjusted for changes in the benchmark index, or evaluated price quotes received from independent pricing services that take into account the integrity of the market sector and issuer, the individual characteristics of the security, and information received from broker-dealers and other market sources pertaining to the issuer or security. To the extent that these inputs are observable, the values of equity securities are categorized as Level 2. To the extent that these inputs are unobservable, the values are categorized as Level 3.
U.S. Treasury Obligations — U.S. Treasury obligations are valued by independent pricing services based on pricing models that evaluate the mean between the most recently quoted bid and ask price. The models also take into consideration data received from active market makers and broker-dealers, yield curves, and the spread over comparable U.S. Treasury issues. The spreads change daily in response to market conditions and are generally obtained from the new issue market and broker-dealer sources. To the extent that these inputs are observable, the values of U.S. Treasury obligations are categorized as Level 2. To the extent that these inputs are unobservable, the values are categorized as Level 3.
Government Sponsored Enterprise and Mortgage-Backed Securities — Government sponsored enterprise and mortgage-backed securities are valued by independent pricing services using pricing models based on inputs that include issuer type, coupon, cash flows, mortgage prepayment projection tables and Adjustable Rate Mortgage evaluations that incorporate index data, periodic life caps and the next coupon reset date. To the extent that these inputs are observable, the values of government sponsored enterprise and mortgage-backed securities are categorized as Level 2. To the extent that these inputs are unobservable, the values are categorized as Level 3.
| 52 | Annual Report/September 30, 2016 |
Table of Contents
AllianzGI Institutional Multi-Series Trust
Notes to Financial Statements
September 30, 2016 (continued)
Sovereign Debt Obligations — Sovereign debt obligations are valued by independent pricing services based on discounted cash flow models that incorporate option adjusted spreads along with benchmark curves and credit spreads. In addition, international bond markets are monitored regularly for information pertaining to the issuer and/or the specific issue. To the extent that these inputs are observable, the values of sovereign debt obligations are categorized as Level 2. To the extent that these inputs are unobservable, the values are categorized as Level 3.
Corporate Bonds & Notes — Corporate bonds & notes are generally comprised of two main categories: investment grade bonds and high yield bonds. Investment grade bonds are valued by independent pricing services using various inputs and techniques, which include broker-dealer quotations, live trading levels, recently executed transactions in securities of the issuer or comparable issuers, and option adjusted spread models that include base curve and spread curve inputs. Adjustments to individual bonds can be applied to recognize trading differences compared to other bonds issued by the same issuer. High yield bonds are valued by independent pricing services based primarily on broker-dealer quotations from relevant market makers and recently executed transactions in securities of the issuer or comparable issuers. The broker-dealer quotations received are supported by credit analysis of the issuer that takes into consideration credit quality assessments, daily trading activity, and the activity of the underlying equities, listed bonds and sector-specific trends. To the extent that these inputs are observable, the values of corporate bonds & notes are categorized as Level 2. To the extent that these inputs are unobservable, the values are categorized as Level 3.
A summary of the inputs used at September 30, 2016 in valuing each Portfolio’s assets and liabilities is listed below (refer to the Schedules of Investments and Note 6(a) for more detailed information on Investments in Securities and other Financial Instruments.):
AllianzGI Advanced Core Bond:
| Level 1 - Quoted Prices | Level 2 - Inputs | Level 3 - Significant Unobservable Inputs | Value at 9/30/16 | |||||||||||||
| ||||||||||||||||
Investments in Securities - Assets | ||||||||||||||||
U.S. Treasury Obligations | $ | — | $ | 85,133,003 | $ | — | $ | 85,133,003 | ||||||||
Corporate Bonds & Notes | — | 70,517,855 | — | 70,517,855 | ||||||||||||
U.S. Government Agency Securities | — | 48,343,431 | — | 48,343,431 | ||||||||||||
Sovereign Debt Obligations | — | 16,462,141 | — | 16,462,141 | ||||||||||||
Repurchase Agreements | — | 5,668,000 | — | 5,668,000 | ||||||||||||
| ||||||||||||||||
| — | 226,124,430 | — | 226,124,430 | |||||||||||||
| ||||||||||||||||
Other Financial Instruments* – Assets | ||||||||||||||||
Interest Rate Contracts | 4,394 | — | — | 4,394 | ||||||||||||
| ||||||||||||||||
Totals | $ | 4,394 | $ | 226,124,430 | $ | — | $ | 226,128,824 | ||||||||
| ||||||||||||||||
| AllianzGI Best Styles Global Managed Volatility: | ||||||||||||||||
| Level 1 - Quoted Prices | Level 2 - Inputs | Level 3 - Significant Unobservable Inputs | Value at 9/30/16 | |||||||||||||
| ||||||||||||||||
Investments in Securities - Assets | ||||||||||||||||
Common Stock: | ||||||||||||||||
Australia | $ | — | $ | 478,189 | $ | — | $ | 478,189 | ||||||||
Austria | 25,406 | 94,072 | — | 119,478 | ||||||||||||
Belgium | — | 214,096 | — | 214,096 | ||||||||||||
China | — | 864,772 | — | 864,772 | ||||||||||||
Denmark | — | 46,822 | — | 46,822 | ||||||||||||
Finland | — | 248,599 | — | 248,599 | ||||||||||||
France | — | 992,809 | — | 992,809 | ||||||||||||
Germany | — | 263,275 | — | 263,275 | ||||||||||||
Hong Kong | — | 1,679,387 | — | 1,679,387 | ||||||||||||
Hungary | 49,716 | 271,582 | — | 321,298 | ||||||||||||
Israel | 30,169 | 626,677 | — | 656,846 | ||||||||||||
Italy | — | 61,972 | — | 61,972 | ||||||||||||
Japan | — | 10,137,565 | — | 10,137,565 | ||||||||||||
Korea (Republic of) | 73,257 | 2,027,395 | — | 2,100,652 | ||||||||||||
Luxembourg | — | 185,091 | — | 185,091 | ||||||||||||
Malaysia | 67,184 | 55,523 | — | 122,707 | ||||||||||||
Netherlands | 25,801 | 464,999 | — | 490,800 | ||||||||||||
| 53 | Annual Report/September 30, 2016 |
Table of Contents
AllianzGI Institutional Multi-Series Trust
Notes to Financial Statements
September 30, 2016 (continued)
New Zealand | — | 145,101 | — | 145,101 | ||||||||||||
Norway | — | 273,005 | — | 273,005 | ||||||||||||
Philippines | 6,084 | 59,027 | — | 65,111 | ||||||||||||
Poland | 31,506 | 259,783 | — | 291,289 | ||||||||||||
Singapore | 19,848 | 603,686 | — | 623,534 | ||||||||||||
South Africa | — | 306,347 | — | 306,347 | ||||||||||||
Spain | — | 191,217 | — | 191,217 | ||||||||||||
Switzerland | 552,960 | 1,186,242 | — | 1,739,202 | ||||||||||||
Taiwan | — | 3,036,078 | — | 3,036,078 | ||||||||||||
Thailand | — | 293,904 | 679,583 | 973,487 | ||||||||||||
United Kingdom | 206,103 | 1,098,090 | — | 1,304,193 | ||||||||||||
All Other | 45,243,849 | — | — | 45,243,849 | ||||||||||||
Preferred Stock | 12,002 | — | — | 12,002 | ||||||||||||
Repurchase Agreements | — | 4,512,000 | — | 4,512,000 | ||||||||||||
| ||||||||||||||||
| 46,343,885 | 30,677,305 | 679,583 | 77,700,773 | |||||||||||||
| ||||||||||||||||
Other Financial Instruments* – Assets | ||||||||||||||||
Market Price | 59,016 | — | — | 59,016 | ||||||||||||
| ||||||||||||||||
Totals | $ | 46,402,901 | $ | 30,677,305 | $ | 679,583 | $ | 77,759,789 | ||||||||
| ||||||||||||||||
| AllianzGI Discovery U.S.: | ||||||||||||||||
Level 1 - Quoted Prices | Level 2 - Other Significant Observable Inputs | Level 3 - Significant Unobservable Inputs | Value at 9/30/16 | |||||||||||||
| ||||||||||||||||
Investments in Securities - Assets | ||||||||||||||||
Common Stock | $ | 9,187,732 | — | — | $ | 9,187,732 | ||||||||||
Repurchase Agreements | — | $ | 7,241,000 | — | 7,241,000 | |||||||||||
| ||||||||||||||||
| 9,187,732 | 7,241,000 | — | 16,428,732 | |||||||||||||
| ||||||||||||||||
Investments in Securities - Liabilities | ||||||||||||||||
Securities Sold Short, at value | (9,933,828 | ) | — | — | (9,933,828) | |||||||||||
| ||||||||||||||||
Totals | $ | (746,096 | ) | $ | 7,241,000 | — | $ | 6,494,904 | ||||||||
| ||||||||||||||||
| AllianzGI Global Small-Cap Opportunities: | ||||||||||||||||
Level 1 - Quoted Prices | Level 2 - Other Significant Observable Inputs | Level 3 - Significant Unobservable Inputs | Value at 9/30/16 | |||||||||||||
| ||||||||||||||||
Investments in Securities - Assets | ||||||||||||||||
Common Stock: | ||||||||||||||||
Australia | — | $ | 147,689 | — | $ | 147,689 | ||||||||||
China | — | 336,870 | — | 336,870 | ||||||||||||
France | — | 47,528 | — | 47,528 | ||||||||||||
Indonesia | — | 106,117 | — | 106,117 | ||||||||||||
Italy | — | 15,128 | — | 15,128 | ||||||||||||
Japan | — | 406,456 | — | 406,456 | ||||||||||||
Korea (Republic of) | — | 162,038 | — | 162,038 | ||||||||||||
New Zealand | — | 93,471 | — | 93,471 | ||||||||||||
Norway | — | 47,922 | — | 47,922 | ||||||||||||
Poland | — | 68,386 | — | 68,386 | ||||||||||||
Russian Federation | — | 101,100 | — | 101,100 | ||||||||||||
Singapore | — | 106,356 | — | 106,356 | ||||||||||||
South Africa | — | 42,356 | — | 42,356 | ||||||||||||
Taiwan | — | 141,242 | — | 141,242 | ||||||||||||
Thailand | — | 39,122 | — | 39,122 | ||||||||||||
United Kingdom | — | 188,405 | — | 188,405 | ||||||||||||
All Other | $ | 3,157,937 | — | — | 3,157,937 | |||||||||||
Repurchase Agreements | — | 106,000 | — | 106,000 | ||||||||||||
| ||||||||||||||||
Totals | $ | 3,157,937 | $ | 2,156,186 | — | $ | 5,314,123 | |||||||||
| ||||||||||||||||
At September 30, 2016, AllianzGI Global Small-Cap Opportunities had transfers of $99,456 from Level 1 to Level 2. This transfer was the result of securities trading outside the U.S. whose values were not adjusted by the application of a modeling tool at September 30, 2015, which was applied on September 30, 2016.
| 54 | Annual Report/September 30, 2016 |
Table of Contents
AllianzGI Institutional Multi-Series Trust
Notes to Financial Statements
September 30, 2016 (continued)
A roll forward of fair value measurements using significant unobservable inputs (Level 3) for the period ended September 30, 2016, was as follows:
AllianzGI Best Styles Global Managed Volatility:
| Beginning Balance 4/11/16** | Purchases | Sales | Accrued Discount (Premiums) | Net Realized Gain (Loss) | Net Unrealized Depreciation | Transfers into Level 3 | Transfers out of Level 3 | Ending Balance 9/30/16 | ||||||||||||||||||||||||||||||||
Investments in Securities - Assets |
| |||||||||||||||||||||||||||||||||||||||
Common Stock: | ||||||||||||||||||||||||||||||||||||||||
Thailand | $ | — | $ | 687,282 | $ | — | $ | — | $ | — | $ | (7,699) | $ | — | $ | — | $ | 679,583 | ||||||||||||||||||||||
| ||||||||||||||||||||||||||||||||||||||||
The following tables present additional information about valuation techniques and inputs used for investments that are measured at fair value and categorized within Level 3 at September 30, 2016:
AllianzGI Best Styles Global Managed Volatility:
Ending Balance at 9/30/16 | Valuation Technique Used | Unobservable Inputs | Input Values | |||||||||||
| ||||||||||||||
Investments in Securities – Assets | ||||||||||||||
Common Stock |
|
$ 679,583 |
| Value of foreign security traded on Foreign Exchange | Price of Non-Resident Shares on Foreign Exchange | THB 4.89-68.70 | ||||||||
*Other financial instruments are derivatives, such as futures contracts and forward foreign currency contracts, which are valued at the unrealized appreciation (depreciation) of the instrument.
**Commencement of operations.
THB – Thai Baht
The net unrealized appreciation/depreciation of Level 3 investments which AllianzGI Best Styles Global Managed Volatility held at September 30, 2016 was $(7,699).
(c) Investment Transactions and Investment Income. Investment transactions are accounted for on the trade date. Securities purchased and sold on a when-issued or delayed-delivery basis may be settled a month or more after the trade date. Realized gains and losses on investments are determined on an identified cost basis. Interest income adjusted for the accretion of discounts and amortization of premiums is recorded on an accrual basis. Discounts or premiums on debt securities purchased are accreted or amortized, respectively, to interest income. Dividend income is recorded on the ex-dividend date, except for certain dividends from foreign securities where the ex-dividend date may have passed, and then are recorded as soon after the ex-dividend date as the Portfolios, using reasonable diligence, become aware of such dividends. Dividend and interest income on the Statements of Operations are shown net of any foreign taxes withheld on income from foreign securities. Payments received from real estate investment trust securities may be comprised of dividends, realized gains and return of capital. The payment may initially be recorded as dividend income and may subsequently be reclassified as realized gains and/or return of capital upon receipt of information from the issuer. Payments considered return of capital reduce the cost basis of the respective security. Distributions, if any, in excess of the cost basis of a security are recognized as capital gains.
(d) Federal Income Taxes. The Portfolios intend to distribute all of their taxable income and to comply with the other requirements of Subchapter M of the U.S. Internal Revenue Code of 1986, as amended, applicable to regulated investment companies. Accordingly, no provision for U.S. federal income taxes is required. The Portfolios may be subject to excise tax based on distributions to shareholders.
| 55 | Annual Report/September 30, 2016 |
Table of Contents
AllianzGI Institutional Multi-Series Trust
Notes to Financial Statements
September 30, 2016 (continued)
Accounting for uncertainty in income taxes establishes for all entities, including pass-through entities such as the Portfolios, a minimum threshold for financial statement recognition of the benefit of positions taken in filing tax returns (including whether an entity is taxable in a particular jurisdiction), and requires certain expanded tax disclosures. In accordance with provisions set forth under U.S. GAAP, the Investment Manager has reviewed the Portfolios’ tax positions for all open tax years. As of September 30, 2016, the Portfolios have recorded no liability for net unrecognized tax benefits relating to uncertain income tax positions they have taken. The Portfolios’ federal income tax returns since inception remain subject to examination by the Internal Revenue Service.
(e) Dividends and Distributions to Shareholders. The Portfolios declare dividends and distributions from net investment income and net realized capital gains, if any, annually. The Portfolios record dividends and distributions to their respective shareholders on the ex-dividend date. The amount of dividends from net investment income and distributions from net realized capital gains is determined in accordance with federal income tax regulations, which may differ from U.S. GAAP. These “book-tax” differences are considered either temporary or permanent in nature. To the extent these differences are permanent in nature, such amounts are reclassified within the capital accounts based on their federal income tax treatment; temporary differences do not require reclassification. To the extent dividends and/or distributions exceed current and accumulated earnings and profits for federal income tax purposes, they are reported as dividends and/or distributions to shareholders from return of capital.
(f) Foreign Currency Translation. The Portfolios’ accounting records are maintained in U.S. dollars as follows: (1) the foreign currency market values of investments and other assets and liabilities denominated in foreign currencies are translated at the prevailing exchange rate at the end of the period; and (2) purchases and sales, income and expenses are translated at the prevailing exchange rate on the respective dates of such transactions. The resulting net foreign currency gain (loss) is included in the Portfolios’ Statements of Operations.
The Portfolios do not generally isolate that portion of the results of operations arising as a result of changes in foreign currency exchange rates from the fluctuations arising from changes in the market prices of securities. Accordingly, such foreign currency gain (loss) is included in net realized and unrealized gain (loss) on investments. However, the Portfolios do isolate the effect of fluctuations in foreign currency exchange rates when determining the gain (loss) upon the sale or maturity of foreign currency denominated debt obligations pursuant to U.S. federal income tax regulations; such amount is categorized as foreign currency gain (loss) for both financial reporting and income tax reporting purposes.
(g) Repurchase Agreements. The Portfolios are parties to Master Repurchase Agreements (“Master Repo Agreements”) with select counterparties. The Master Repo Agreements maintain provisions for initiation, income payments, events of default, and maintenance of collateral.
The Portfolios enter into transactions, under the Master Repo Agreements, with their custodian bank or securities brokerage firms whereby they purchase securities under agreements to resell such securities at an agreed upon price and date (“repurchase agreements”). The Portfolios, through their custodian, take possession of securities collateralizing the repurchase agreement. Such agreements are carried at the contract amount in the financial statements, which is considered to represent fair value. Collateral pledged (the securities received), which consists primarily of U.S. government obligations and asset-backed securities, is held by the custodian bank for the benefit of the Portfolios until maturity of the repurchase agreement. Provisions of the repurchase agreements and the procedures adopted by the Portfolios require that the market value of the collateral, including accrued interest thereon, be sufficient in the event of default by the counterparty. If the counterparty defaults under the Master Repo Agreements and the value of the collateral declines or if the counterparty enters an insolvency proceeding, realization of the collateral by the Portfolios may be delayed or limited. The gross values are included in the Portfolios’ Schedules of Investments. The value of the related collateral exceeded the value of the repurchase agreements at September 30, 2016.
(h) Rights. The Portfolios may receive rights. A right is a privilege granted to existing shareholders of a corporation to subscribe for shares of a new issue of common stock before it is issued. Rights normally have a short life, usually two to four weeks, are freely transferable and entitle the holder to buy the new common stock at a lower price than the public offering price. Rights may entail greater risks than certain other types of investments. Generally, rights do not carry the right to receive dividends or exercise voting rights with respect to the underlying securities, and they do not represent any rights in
| 56 | Annual Report/September 30, 2016 |
Table of Contents
AllianzGI Institutional Multi-Series Trust
Notes to Financial Statements
September 30, 2016 (continued)
the assets of the issuer. In addition, their value does not necessarily change with the value of the underlying securities, and they cease to have value if they are not exercised on or before their expiration date. If the market price of the underlying stock does not exceed the exercise price during the life of the right, the right will expire worthless. Rights may increase the potential profit or loss to be realized from the investment as compared with investing the same amount in the underlying securities.
(i) Securities Sold Short. Certain Portfolios engage in short sales for investment and risk management purposes. Short sales are transactions in which a Portfolio sells a security or other instrument (such as an option, forward, future or other derivative contract) it does not own. When a Portfolio engages in a short sale, it must borrow the security sold short and deliver it to the counterparty. The Portfolios will ordinarily have to pay a fee or premium to borrow a security and be obligated to repay the lender of the security any dividend or interest that accrues on the security during the period of the loan. Until a short position is closed out, the net proceeds of the short sale will be retained by the lending broker to the extent necessary to meet margin requirements, together with any additional assets the broker requires as collateral. A Portfolio is also required to designate, on its books or the books of its custodian, liquid assets (less any additional collateral held by the broker) to cover the short sale obligation, marked to market daily. Short sales expose the Portfolios to the risk that they will be required to cover the short position at a time when the security or other asset has appreciated in value, thus resulting in losses to the applicable Portfolio. A short sale is “against the box” if a Portfolio holds in its portfolio or has the right to acquire the security sold short at no additional cost. The Portfolios will be subject to additional risks to the extent that they engage in short sales that are not “against the box.” A Portfolio’s loss on a short sale could theoretically be unlimited in cases where the Portfolio is unable, for whatever reason, to close out its short position.
(j) U.S. Government Agencies or Government-Sponsored Enterprises. Securities issued by U.S. Government agencies or government-sponsored enterprises may not be guaranteed by the U.S. Treasury. The Government National Mortgage Association (“GNMA” or “Ginnie Mae”), a wholly-owned U.S. Government corporation, is authorized to guarantee, with the full faith and credit of the U.S. Government, the timely payment of principal and interest on securities issued by institutions approved by GNMA and backed by pools of mortgages insured by the Federal Housing Administration or guaranteed by the Department of Veterans Affairs. Government-related guarantors not backed by the full faith and credit of the U.S. Government include the Federal National Mortgage Association (“FNMA” or “Fannie Mae”) and the Federal Home Loan Mortgage Corporation (“FHLMC” or “Freddie Mac”). Pass-through securities issued by FNMA are guaranteed as to timely payment of principal and interest by FNMA, but are not backed by the full faith and credit of the U.S. Government. FHLMC guarantees the timely payment of interest and ultimate collection of principal, but its participation certificates are not backed by the full faith and credit of the U.S. Government.
(k) Exchange-Traded Funds. Certain Portfolios may invest in exchange-traded-funds (“ETFs”), which typically are index-based investment companies that hold substantially all of their assets in securities representing their specific index, but may also be actively-managed investment companies. Shares of ETFs trade throughout the day on an exchange and represent an investment in a portfolio of securities and other assets. As a shareholder of another investment company, the Portfolios would bear their pro rata portion of the other investment company’s expenses, including advisory fees, in addition to the expenses the Portfolios bear directly in connection with their own operations.
(l) When-Issued/Delayed-Delivery Transactions. When-issued or delayed-delivery transactions involve a commitment to purchase or sell securities for a predetermined price or yield, with payment and delivery taking place beyond the customary settlement period. When delayed-delivery purchases are outstanding, the Portfolios will set aside and maintain until the settlement date in a designated account, liquid assets in an amount sufficient to meet the purchase price. When purchasing a security on a delayed-delivery basis, the Portfolios assume the rights and risks of ownership of the security, including the risk of price and yield fluctuations; consequently, such fluctuations are taken into account when determining the NAV. The Portfolios may dispose of or renegotiate a delayed-delivery transaction after it is entered into, and may sell when-issued securities before they are delivered, which may result in a realized gain or loss. When a security is sold on a delayed-delivery basis, the Portfolios do not participate in future gains and losses with respect to the security.
(m) Organizational and Offering Costs. Organizational costs are expensed at the inception of each Portfolio. Offering costs are amortized over a twelve-month period from the inception of each Portfolio.
| 57 | Annual Report/September 30, 2016 |
Table of Contents
AllianzGI Institutional Multi-Series Trust
Notes to Financial Statements
September 30, 2016 (continued)
2. PRINCIPAL RISKS
In the normal course of business, the Portfolios trade financial instruments and enter into financial transactions where risk of potential loss exists due to, among other things, changes in the market (market risk) or failure of the other party to a transaction to perform (counterparty risk). The Portfolios are also exposed to other risks such as, but not limited to, interest rate, foreign currency, credit and leverage risks.
Interest rate risk is the risk that fixed income securities’ valuations will change because of changes in interest rates. During periods of rising nominal interest rates, the values of fixed income instruments are generally expected to decline. Conversely, during periods of declining nominal interest rates, the values of fixed income instruments are generally expected to rise. A nominal interest rate can be described as the sum of a real interest rate and an expected inflation rate. Fixed income securities with longer durations tend to be more sensitive to changes in interest rates, usually making them more volatile than securities with shorter durations. Duration is used primarily as a measure of the sensitivity of a fixed income security’s market price to interest rate (i.e. yield) movements. Interest rate changes can be sudden and unpredictable, and the Portfolios may lose money as a result of movements in interest rates. The Portfolios may not be able to hedge against changes in interest rates or may choose not to do so for cost or other reasons. In addition, any hedges may not work as intended.
Variable and floating rate securities generally are less sensitive to interest rate changes but may decline in value if their interest rates do not rise as much, or as quickly, as interest rates in general. Conversely, floating rate securities will not generally increase in value if interest rates decline. Inverse floating rate securities may decrease in value if interest rates increase. Inverse floating rate securities may also exhibit greater price volatility than a fixed rate obligation with similar credit quality. When the Portfolios hold variable or floating rate securities, a decrease (or, in the case of inverse floating rate securities, an increase) in market interest rates will adversely affect the income received from such securities and the NAV of the Portfolios’ shares.
The Portfolios are exposed to credit risk, which is the risk of losing money if the issuer or guarantor of a fixed income security is unable or unwilling, or is perceived (whether by market participants, rating agencies, pricing services or otherwise) as unable or unwilling, to make timely principal and/or interest payments, or to otherwise honor its obligations. Securities are subject to varying degrees of credit risk, which are often reflected in credit ratings.
To the extent the Portfolios directly invest in foreign currencies or in securities that trade in, and receive revenues in, foreign currencies, or in derivatives that provide exposure to foreign currencies, they will be subject to the risk that those currencies will decline in value relative to the U.S. dollar, or, in the case of hedging positions, that the U.S. dollar will decline in value relative to the currency being hedged. Currency rates in foreign countries may fluctuate significantly over short periods of time for a number of reasons, including economic growth, inflation, changes in interest rates, intervention (or the failure to intervene) by U.S. or foreign governments, central banks or supranational entities such as the International Monetary Fund, or the imposition of currency controls or other political developments in the United States or abroad. As a result, the Portfolios’ investments in foreign currency-denominated securities may reduce the returns of the Portfolios. The local emerging markets currencies in which the Portfolios may be invested may experience substantially greater volatility against the U.S. dollar than the major convertible currencies in developed countries.
The Portfolios are subject to elements of risk not typically associated with investments in the U.S., due to concentrated investments in foreign issuers located in a specific country or region. Such concentrations will subject the Portfolios to additional risks resulting from future political or economic conditions in such country or region and the possible imposition of adverse governmental laws or currency exchange restrictions affecting such country or region, which could cause the securities and their markets to be less liquid and prices more volatile than those of comparable U.S. companies.
The market values of securities may decline due to general market conditions (market risk) which are not specifically related to a particular company, such as real or perceived adverse economic conditions, changes in the general outlook for corporate earnings, changes in interest or currency rates, adverse changes to credit markets or adverse investor sentiment. They may also decline due to factors that affect a particular industry or industries, such as labor shortages or increased production costs and competitive conditions within an industry. Equity securities and equity-related investments generally have greater market price volatility than fixed income securities, although under certain market conditions fixed income securities may have comparable or greater price volatility. Credit ratings downgrades may also negatively affect securities held by the Portfolios.
| 58 | Annual Report/September 30, 2016 |
Table of Contents
AllianzGI Institutional Multi-Series Trust
Notes to Financial Statements
September 30, 2016 (continued)
Even when markets perform well, there is no assurance that the investments held by the Portfolios will increase in value along with the broader market. In addition, market risk includes the risk that geopolitical events will disrupt the economy on a national or global level.
The Portfolios are exposed to counterparty risk, or the risk that an institution or other entity with which the Portfolios have unsettled or open transactions will default. The potential loss to the Portfolios could exceed the value of the financial assets recorded in the Portfolios’ financial statements. Financial assets, which potentially expose the Portfolios to counterparty risk, consist principally of cash due from counterparties and investments. The Sub-Adviser seeks to minimize the Portfolios’ counterparty risk by performing reviews of each counterparty and by minimizing concentration of counterparty risk by undertaking transactions with multiple customers and counterparties on recognized and reputable exchanges. Delivery of securities sold is only made once the Portfolios’ have received payment. Payment is made on a purchase once the securities have been delivered by the counterparty. The trade will fail if either party fails to meet its obligation.
The Portfolios are exposed to risks associated with leverage. Leverage may cause the value of the Portfolios’ shares to be more volatile than if the Portfolios did not use leverage. This is because leverage tends to exaggerate the effect of any increase or decrease in the value of the Portfolios’ portfolio securities. The Portfolios may engage in transactions or purchase instruments that give rise to forms of leverage. In addition, to the extent the Portfolios employ leverage, dividend and interest costs may not be recovered by any appreciation of the securities purchased with the leverage proceeds and could exceed the Portfolios’ investment returns, resulting in greater losses.
The Portfolios are party to International Swaps and Derivatives Association, Inc. Master Agreements (“ISDA Master Agreements”) with select counterparties that govern transactions, over-the-counter derivatives and foreign exchange contracts entered into by the Portfolios and those counterparties. The ISDA Master Agreements contain provisions for general obligations, representations, agreements, collateral and events of default or termination. Events of termination include conditions that may entitle counterparties to elect to terminate early and cause settlement of all outstanding transactions under the applicable ISDA Master Agreement. Any election to terminate early could be material to the financial statements of the Portfolios.
The considerations and factors surrounding the settlement of certain purchases and sales made on a delayed-delivery basis are governed by Master Securities Forward Transaction Agreements (“Master Forward Agreements”) between the Portfolios and select counterparties. The Master Forward Agreements maintain provisions for, among other things, initiation and confirmation, payment and transfer, events of default, termination, and maintenance of collateral.
3. FINANCIAL DERIVATIVE INSTRUMENTS
Disclosure about derivatives and hedging activities requires qualitative disclosure regarding objectives and strategies for using derivatives, quantitative disclosure about fair value amounts of gains and losses on derivatives, and disclosure about credit-risk-related contingent features in derivative agreements. The disclosure requirements distinguish between derivatives which are accounted for as “hedges”, and those that do not qualify for such accounting. Although the Portfolios at times use derivatives for hedging purposes, the Portfolios reflect derivatives at fair value and recognize changes in fair value through the Portfolios’ Statements of Operations, and such derivatives do not qualify for hedge accounting treatment.
Futures Contracts. The Portfolios use futures contracts to manage their exposure to the securities markets or the movements in interest rates and currency values. A futures contract is an agreement between two parties to buy and sell a financial instrument at a set price on a future date. Upon entering into such a contract, the Portfolios are required to pledge to the broker an amount of cash or securities equal to the minimum “initial margin” requirements of the exchange. Pursuant to the contracts, the Portfolios agree to receive from or pay to the broker an amount of cash or securities equal to the daily fluctuation in the value of the contracts. Such receipts or payments are known as “variation margin” and are recorded by the Portfolios as unrealized appreciation or depreciation. When the contracts are closed, the Portfolios record a realized gain or loss equal to the difference between the value of the contracts at the time they were opened and the value at the time they were closed. Any unrealized appreciation or depreciation recorded is simultaneously reversed. The use of futures transactions involves various risks, including the risk of an imperfect correlation in the movements in the price of futures contracts, interest rates and underlying hedging assets, and possible inability or unwillingness of counterparties to meet the terms of their contracts.
| 59 | Annual Report/September 30, 2016 |
Table of Contents
AllianzGI Institutional Multi-Series Trust
Notes to Financial Statements
September 30, 2016 (continued)
Forward Foreign Currency Contracts. A forward foreign currency contract is an agreement between two parties to buy and sell a currency at a set exchange rate on a future date. The Portfolios enter into these contracts for purposes of increasing exposure to a foreign currency or shifting exposure to foreign currency fluctuations from one country to another. The market value of a forward foreign currency contract fluctuates with changes in foreign currency exchange rates. All commitments are marked to market daily at the applicable exchange rates and any resulting unrealized appreciation or depreciation is recorded. Realized gains or losses are recorded at the time the forward contract matures or by delivery of the currency. Risks may arise upon entering into these contracts from the potential inability of counterparties to meet the terms of their contracts and from unanticipated movements in the value of a foreign currency relative to the U.S. dollar. In addition, these contracts may involve market risk in excess of the unrealized appreciation (depreciation) reflected in the Portfolios’ Statements of Assets and Liabilities.
The following is a summary of the Portfolios’ derivatives categorized by risk exposure.
The effect of derivatives on the Statements of Assets and Liabilities at September 30, 2016:
AllianzGI Advanced Core Bond:
| Location | Interest Rate Contracts | |||
Asset derivatives: | ||||
Receivable for variation margin on futures contracts* | $ | 4,394 | ||
| * | Included in net unrealized appreciation of $4,394 on futures contracts as reported in Note 6(a). |
AllianzGI Best Styles Global Managed Volatility:
| Location | Market Price | |||
Asset derivatives: | ||||
Receivable for variation margin on futures contracts* | $ | 59,016 | ||
| * | Included in net unrealized appreciation of $59,016 on futures contracts as reported in Note 6(a). |
The effect of derivatives on the Statements of Operations for the period or year ended September 30, 2016:
AllianzGI Advanced Core Bond:
| Location | Interest Rate Contracts | |||
Net realized loss on: | ||||
Futures contracts | $ | (145,504) | ||
Net change in unrealized appreciation/depreciation of: | ||||
Futures contracts | $ | 4,394 | ||
AllianzGI Best Styles Global Managed Volatility:
| Location | Market Price | Foreign Exchange Contracts | Total | |||||||||
Net realized gain(loss) on: | ||||||||||||
Futures contracts | $ | 87,798 | — | $ | 87,798 | |||||||
Foreign currency transaction (forward currency contracts) | — | $ | (76,580) | (76,580) | ||||||||
Total net realized gain(loss) | $ | 87,798 | $ | (76,580) | $ | 11,218 | ||||||
| 60 | Annual Report/September 30, 2016 |
Table of Contents
AllianzGI Institutional Multi-Series Trust
Notes to Financial Statements
September 30, 2016 (continued)
Net change in unrealized appreciation/depreciation of: | ||||||||||||
Futures contracts | $ | 59,016 | — | $ | 59,016 |
AllianzGI Global Small-Cap Opportunities:
| Location | Foreign Exchange Contracts | |||
Net realized loss on: | ||||
Foreign currency transaction (forward currency contracts) | $ | (2,348) | ||
The average volume (based on open positions at each fiscal month-end) of derivative activity during the period or year ended September 30, 2016:
Forward Foreign Currency Contracts (2) | Futures Contracts (1) | |||||||||
| Purchased | Sold | Long | Short | |||||||
AllianzGI Advanced Core Bond | — | — | — | 145 | ||||||
AllianzGI Best Styles Global Managed Volatility | — | — | 15 | — | ||||||
AllianzGI Global Small-Cap Opportunities | — | 4,571 | — | — | ||||||
| (1) | U.S. $ value on origination date |
| (2) | Number of contracts |
4. INVESTMENT MANAGER/DISTRIBUTOR FEES/DEFERRED COMPENSATION
Investment Management Fee. During the reporting period, each Portfolio had an Investment Management Agreement (for the purpose of this section, collectively the “Agreements”) with the Investment Manager. Subject to the supervision of the Trust’s Board, the Investment Manager was responsible for managing, either directly or through others selected by it, each Portfolio’s investment activities, business affairs and administrative matters. Pursuant to the Agreements, the Investment Manager received an annual fee, payable monthly, at an annual rate of each Portfolio’s average daily net assets (the “Investment Management Fee”).
“Due to Investment Manager” on the Statements of Assets and Liabilities represents the remaining payable for the Portfolios’ offering costs that were paid by the Investment Manager.
The Investment Manager retained the Sub-Adviser to manage the Portfolios’ investments. Subject to the supervision of the Investment Manager, the Sub-Adviser was responsible for making all of the Portfolios’ investment decisions. The Investment Manager, not the Portfolios, paid a portion of the fees it received as Investment Manager to the Sub-Adviser in return for its services.
The Investment Management fee was charged at an annual rate as indicated in the following table:
| Management Fee | ||
AllianzGI Advanced Core Bond | 0.30% | |
AllianzGI Best Styles Global Managed Volatility | 0.40 | |
AllianzGI Discovery U.S. | 1.00 | |
AllianzGI Global Small-Cap Opportunities | 0.90 |
| 61 | Annual Report/September 30, 2016 |
Table of Contents
AllianzGI Institutional Multi-Series Trust
Notes to Financial Statements
September 30, 2016 (continued)
Effective October 1, 2016, AGIFM merged with and into AllianzGI U.S. by means of a statutory merger, with AllianzGI U.S. succeeding by operation of law to the advisory business of AGIFM under the Investment Management Agreement with each Portfolio. The sub-advisory relationship between AGIFM and AllianzGI U.S. terminated upon consummation of the merger. The merger did not result in any change to the substantive terms of the Agreements, which continued in effect following the merger. The merger also did not result in any change to the manner in which investment advisory services are provided under the Agreements, the personnel responsible for providing investment advisory services to the Portfolios pursuant to the Agreements or the personnel ultimately responsible for overseeing the provision of such services.
Distribution Fees. Allianz Global Investors Distributors LLC (the “Distributor”), an indirect, wholly owned subsidiary of AAM, the Investment Manager and the Sub-Adviser serves as the distributor of the Portfolios’ shares pursuant to a Distribution Contract. The Distributor, for each of the Portfolios, currently receives no compensation in connection with the services it provides under the Distribution Contract.
Deferred Compensation. Trustees do not currently receive any pension or retirement benefits from the Trust. The Trust has adopted a deferred compensation plan (the “Plan”) for the Trustees, which permits the Trustees to defer their receipt of compensation from the Trust, at their election, in accordance with the terms of the Plan. Under the Plan, each Trustee may elect not to receive all or a portion of his or her fees from the Trust on a current basis but to receive in a subsequent period chosen by the Trustee an amount equal to the value of such compensation if such compensation had been invested in one or more series of the Trust or Allianz Funds selected by the Trustees from and after the normal payment dates for such compensation. The deferred compensation program is structured such that the Trust remains in substantially the same financial position whether Trustee fees are paid when earned or deferred.
5. EXPENSE LIMITATION AND RECOUPMENT
The Trust and the Investment Manager have entered into Expense Limitation and Management Fee Waiver Agreements as indicated below:
| Expense Limitation | ||
AllianzGI Advanced Core Bond*(1) | 0.35% | |
AllianzGI Best Styles Global Managed Volatility(2) | 0.45 | |
AllianzGI Discovery U.S(3) | 1.50 | |
AllianzGI Global Small-Cap Opportunities(4) | 1.20 |
*Effective July 1, 2016 the Portfolio reduced the expense cap from 0.45% to 0.35%.
1. The Investment Manager has contractually agreed to irrevocably waive its management fee or reimburse the Portfolio through June 30, 2017, to the extent that Total Annual Portfolio Operating Expenses, including payment of organizational expenses but excluding interest, tax and extraordinary expenses, and certain credits and other expenses, exceed 0.35% . Under the Expense Limitation Agreement, the Investment Manager may recoup waived or reimbursed amounts for three years, provided total expenses, including such recoupment, do not exceed the annual expense limit in effect at the time of such waiver/reimbursement or recoupment. The Expense Limitation Agreement is terminable by the Trust upon 90 days’ prior written notice to the Manager or at any time by mutual agreement of the parties.
2. The Investment Manager has contractually agreed to irrevocably waive its management fee or reimburse the Portfolio through March 31, 2017, to the extent that Total Annual Portfolio Operating Expenses, including payment of organizational expenses but excluding interest, tax and extraordinary expenses, and certain credits and other expenses, exceed 0.45% . Under the Expense Limitation Agreement, the Investment Manager may recoup waived or reimbursed amounts for three years, provided total expenses, including such recoupment, do not exceed the annual expense limit in effect at the time of such waiver/reimbursement or recoupment. The Expense Limitation Agreement is terminable by the Trust upon 90 days’ prior written notice to the Manager or at any time by mutual agreement of the parties.
3. The Investment Manager has contractually agreed to irrevocably waive its management fee or reimburse the Portfolio through January 31, 2017, to the extent that Total Annual Portfolio Operating Expenses, including payment of organizational expenses but excluding interest, tax, dividend expenses on short sales and extraordinary expenses, and certain credits and other expenses, exceed 1.50% . Under the Expense Limitation Agreement, the Investment Manager may recoup waived or reimbursed amounts for three years, provided total expenses, including such recoupment, do not exceed the annual expense limit in effect at the time of such waiver/reimbursement or recoupment. The Expense Limitation Agreement is terminable by the Trust upon 90 days’ prior written notice to the Manager or at any time by mutual agreement of the parties.
| 62 | Annual Report/September 30, 2016 |
Table of Contents
AllianzGI Institutional Multi-Series Trust
Notes to Financial Statements
September 30, 2016 (continued)
4. The Investment Manager has contractually agreed to irrevocably waive its management fee or reimburse the Portfolio through January 31, 2017, to the extent that Total Annual Portfolio Operating Expenses, including payment of organizational expenses but excluding interest, tax and extraordinary expenses, and certain credits and other expenses, exceed 1.20% . Under the Expense Limitation Agreement, the Investment Manager may recoup waived or reimbursed amounts for three years, provided total expenses, including such recoupment, do not exceed the annual expense limit in effect at the time of such waiver/reimbursement or recoupment. The Expense Limitation Agreement is terminable by the Trust upon 90 days’ prior written notice to the Manager or at any time by mutual agreement of the parties.
During the period or year ended September 30, 2016, the Investment Manager did not recoup any expenses from the Portfolios. The following represents the amounts that still can be recouped by the Investment Manager:
Unrecouped Expenses Waived/Reimbursed through Fiscal Period ended | ||||||||
| 11/30/2014 | 9/30/2015 | 9/30/2016 | Totals | |||||
AllianzGI Advanced Core Bond | - | - | $275,685 | $275,685 | ||||
AllianzGI Best Styles Global Managed Volatility | - | - | 205,431 | 205,431 | ||||
AllianzGI Discovery U.S. | - | - | 289,229 | 289,229 | ||||
AllianzGI Global Small-Cap Opportunities | $132,292 | $260,824 | 209,673 | 602,789 | ||||
6. INVESTMENTS IN SECURITIES
For the period or year ended September 30, 2016, purchases and sales of investments, other than short-term securities were:
| Purchases | Sales | |||
AllianzGI Advanced Core Bond | $100,516,454 | $16,648,372 | ||
AllianzGI Best Styles Global Managed Volatility | 71,249,141 | 429,546 | ||
AllianzGI Discovery U.S.* | 40,495,403 | 41,208,597 | ||
AllianzGI Global Small-Cap Opportunities | 8,671,476 | 8,570,508 |
* Securities sold short of $26,793,694; covers on securities sold short of $35,772,938.
Purchases and sales in U.S. government obligations were:
| Purchases | Sales | |||
AllianzGI Advanced Core Bond | $536,862,569 | $405,115,479 |
(a) Futures contracts outstanding at September 30, 2016:
AllianzGI Advanced Core Bond:
| Type | Contracts | Market Value (000s) | Expiration Date | Unrealized Appreciation | ||||||||||||
Short: 2-Year U.S. Treasury Note | (150) | $ | (32,770) | 12/30/16 | $ | 4,394 | ||||||||||
|
| |||||||||||||||
AllianzGI Best Styles Global Managed Volatility:
| Type | Contracts | Market Value (000s) | Expiration Date | Unrealized Appreciation | ||||||||||||
Long: E-mini S&P 500 Index | 18 | $ | 1,944 | 12/16/16 | $ | 33,384 | ||||||||||
MSCI Europe Index | 50 | 1,039 | 12/16/16 | 16,488 | ||||||||||||
TOPIX Index | 3 | 392 | 12/8/16 | 9,144 | ||||||||||||
|
| |||||||||||||||
| $ | 59,016 | |||||||||||||||
|
| |||||||||||||||
| 63 | Annual Report/September 30, 2016 |
Table of Contents
AllianzGI Institutional Multi-Series Trust
Notes to Financial Statements
September 30, 2016 (continued)
At September 30, 2016, the following Portfolios pledged cash as collateral for derivatives:
AllianzGI Advanced Core Bond | $ | 16,310 | ||
AllianzGI Best Styles Global Managed Volatility | 537,392 |
7. INCOME TAX INFORMATION
The tax character of dividends and distributions paid was:
| Period ended September 30, 2016 | Period ended September 30, 2015 | |||||||||
Ordinary Income (1) | Ordinary Income | |||||||||
AllianzGI Advanced Core Bond | $ | 367,778 | - | |||||||
AllianzGI Best Styles Global Managed Volatility | - | - | ||||||||
AllianzGI Discovery U.S. | - | - | ||||||||
AllianzGI Global Small-Cap Opportunities | 29,791 | $ | 14,423 | |||||||
(1) Includes short-term capital gains, if any.
At September 30, 2016, the components of distributable earnings were:
Post-October Capital Loss (Gain) (4) | ||||||||||||||||||||||||
| Ordinary Income | Long-Term Capital Gains | Capital Loss Carryforwards (2) | Late Year Ordinary Loss (3) | Short-Term | Long-Term | |||||||||||||||||||
| AllianzGI Advanced Core Bond | $ | 3,995,303 | $ | 89,772 | - | - | - | - | ||||||||||||||||
| AllianzGI Best Styles Global Managed Volatility | 1,293,601 | 86,151 | - | - | - | - | ||||||||||||||||||
| AllianzGI Discovery U.S. | - | - | - | $ | 104,261 | $ | 237,066 | - | ||||||||||||||||
| AllianzGI Global Small- Cap Opportunities | 79,652 | - | $ | 240,666 | - | 247,616 | $ | (117,642 | ) | |||||||||||||||
(2) Capital loss carryforwards available as a reduction, to the extent provided in the regulations, of any future net realized gains. To the extent that these losses are used to offset future realized capital gains, such gains will not be disbursed.
(3) Certain ordinary losses realized during the period November 1, 2015 through September 30, 2016, and/or other ordinary losses realized during the period January 1, 2016 through September 30, 2016, which the Funds elected to defer to the following taxable year pursuant to income tax regulations.
(4) Capital losses realized during the period November 1, 2015 through September 30, 2016 which the Funds elected to defer to the following taxable year pursuant to income tax regulations.
Under the Regulated Investment Company Modernization Act of 2010, the Funds will be permitted to carry forward capital losses incurred in taxable years beginning after December 22, 2010, for an unlimited period. However, any losses incurred during those future taxable years will be required to be utilized prior to the losses incurred in pre-enactment taxable years. As a result of this, pre-enactment capital loss carryforwards may be more likely to expire unused. Additionally, post-enactment capital losses that are carried forward will retain their character as either short-term or long-term capital losses rather than being considered all short-term capital losses.
At September 30, 2016, capital loss carryforward amounts were:
| No Expiration(5) | ||||||||
Short-Term | Long-Term | |||||||
AllianzGI Global Small-Cap Opportunities | $ | 240,666 | $ | - | ||||
(5) Carryforward amounts are subject to the provision of the Regulated Investment Company Modernization Act of 2010.
| 64 | Annual Report/September 30, 2016 |
Table of Contents
AllianzGI Institutional Multi-Series Trust
Notes to Financial Statements
September 30, 2016 (continued)
For the period or year ended September 30, 2016, permanent “book-tax” adjustments were:
| Undistributed (Dividends in Excess of) Net Investment Income | Accumulated Net Realized Gain(Loss) | Paid-in Capital | Net unrealized appreciation(depreciation) | |||||||||||||
AllianzGI Advanced Core Bond (f) | $ | 77,864 | $ | (77,864) | - | - | ||||||||||
AllianzGI Best Styles Global Managed Volatility (b)(c)(d) | 2,460 | 22,887 | - | $ | (25,347) | |||||||||||
AllianzGI Discovery U.S. (a)(e) | 15,593 | (14,988) | $ | (605) | - | |||||||||||
AllianzGI Global Small-Cap | ||||||||||||||||
Opportunities (a)(b)(c)(d) | (4,503) | 5,221 | (70) | (648) | ||||||||||||
These permanent “book-tax” differences were primarily attributable to:
(a) Reclassification of non-deductible expenses
(b) Reclassifications related to investments in Real Estate Investment Trusts (“REITs”)
(c) Reclassification of gains and losses from foreign currency transactions
(d) Reclassification of gains from securities classified as Passive Foreign Investment Companies (“PFICs”) for tax purposes
(e) Reclassification of dividend expense
(f) Treatment of bond premium amortization
Net investment income, net realized gains or losses and net assets were not affected by these adjustments.
At September 30, 2016, the aggregate cost basis and the net unrealized appreciation (depreciation) of investments (before securities sold short) for federal income tax purposes were:
| Federal Tax Cost Basis(6) | Unrealized Appreciation | Unrealized Depreciation | Net Unrealized Appreciation | |||||||||||||
AllianzGI Advanced Core Bond | $223,263,863 | $3,598,049 | $737,482 | $2,860,567 | ||||||||||||
AllianzGI Best Styles Global Managed Volatility | 75,588,125 | 4,020,109 | 1,907,461 | 2,112,648 | ||||||||||||
AllianzGI Discovery U.S. | 15,921,661 | 602,083 | 95,012 | 507,071 | ||||||||||||
AllianzGI Global Small-Cap Opportunities | 4,779,046 | 641,776 | 106,699 | 535,077 | ||||||||||||
(6) Differences, if any, between book and tax cost basis are primarily attributable to wash sale loss deferrals, return of capital distributions from REITs, PFIC mark-to-market and differing treatment of bond premium amortization.
8. SIGNIFICANT ACCOUNT HOLDERS
From time to time, a Portfolio may have a concentration of shareholders, which may include the Investment Manager or affiliates of the Investment Manager, holding a significant percentage of shares outstanding. Investment activities of these shareholders could have a material impact to a Portfolio.
At September 30, 2016, the significant account-holders, owners of 5% or greater of each respective Portfolio’s outstanding shares, were as follows:
Unaffiliated
| Affiliated Approximate Ownership
| |||||||||||||||||||||||||||
| Number of Account Holders | Approximate Ownership | AFI | AllianzGI Global Allocation | AllianzGI Global Dynamic Allocation | ||||||||||||||||||||||||
AllianzGI Advanced Core Bond | 1 | 10% | — | 72% | — | |||||||||||||||||||||||
AllianzGI Best Styles Global Managed Volatility | 1 | 12% | — | 68% | 6% | |||||||||||||||||||||||
AllianzGI Discovery U.S. | — | — | 100% | — | — | |||||||||||||||||||||||
AllianzGI Global Small-Cap Opportunities | — | — | 100% | — | — | |||||||||||||||||||||||
| 65 | Annual Report/September 30, 2016 |
Table of Contents
AllianzGI Institutional Multi-Series Trust
Notes to Financial Statements
September 30, 2016 (continued)
9. FUND EVENTS
Effective October 30, 2015, AllianzGI Advanced Core Bond Portfolio commenced operations as a series of the Trust.
Effective December 21, 2015, AllianzGI Discovery U.S. Portfolio commenced operations as a series of the Trust.
Effective April 11, 2016, AllianzGI Best Styles Global Managed Volatility Portfolio commenced operations as a series of the Trust.
10. BORROWINGS
During the reporting period, the Global Small-Cap Opportunities Portfolio was a party to a credit agreement (the “Northern Trust Agreement”), along with Allianz Funds Multi-Strategy Trust, Allianz Funds and Premier Multi-Series VIT, as borrowers (collectively, the “AllianzGI Borrowers” and each series thereof, an “AllianzGI Borrower Fund”), and Northern Trust Company, as lender, for a committed line of credit. The Northern Trust Agreement permitted the AllianzGI Borrowers to borrow up to $200 million in aggregate, subject to (i) a requirement that each AllianzGI Borrower Fund’s asset coverage with respect to senior securities representing indebtedness be 300% or higher, and (ii) certain other limitations and conditions. Each AllianzGI Borrower Fund paid interest on any amounts borrowed under the facility at the greater of (i) the federal funds overnight rate plus 1.00% to the extent any payments were outstanding, or (ii) 1.50%, subject to upward adjustment. The AllianzGI Borrowers also paid a usage fee at an annualized rate of 0.15% on undrawn amounts, allocated pro rata among the AllianzGI Borrower Funds on the basis of net assets.
The Portfolio did not utilize the line of credit during the period or year ended September 30, 2016. The Northern Trust Credit Agreement terminated on October 27, 2016. On that date, the entire Trust entered into a new credit agreement with State Street Bank and Trust Company. See “Subsequent Events” in Note 11 below.
11. SUBSEQUENT EVENTS
In preparing these financial statements, the Portfolios’ management has evaluated events and transactions for potential recognition or disclosure through the date the financial statements were issued.
On October 1, 2016, AGIFM merged into AllianzGI U.S., and AllianzGI U.S. assumed responsibility as the Portfolio’s Investment Manager, as described in greater detail in Note 4.
On October 27, 2016, the Trust entered into a credit agreement (the “State Street Agreement”), among the Trust, AllianzGI Institutional Multi-Series Trust, Allianz Funds and Premier Multi-Series VIT, as borrowers (collectively, the “AllianzGI Borrowers” and each series thereof, an “AllianzGI Borrower Fund”), and State Street Bank and Trust Company, as agent and lender, for a committed line of credit. The State Street Agreement replaced the Northern Trust Agreement, which terminated on October 27, 2016. (See Note 10 above.) The State Street Agreement has a 364 day term and permits the AllianzGI Borrowers to borrow up to $200 million in aggregate, subject to (i) a requirement that each AllianzGI Borrower Fund’s asset coverage with respect to senior securities representing indebtedness be 300% or higher, and (ii) certain other limitations and conditions. Each AllianzGI Borrower Fund will pay interest on any amounts borrowed under the facility at a rate per annum equal to 1.25% plus the higher of the then-current federal funds overnight rate or the one-month LIBOR rate, subject to upward adjustment when any past-due payments are outstanding. The AllianzGI Borrowers will also pay a usage fee at an annualized rate of 0.25% on undrawn amounts, allocated pro rata among the AllianzGI Borrower Funds on the basis of net assets. Amounts borrowed may be repaid and reborrowed on a revolving basis during the term of the facility.
There were no other subsequent events identified that require recognition or disclosure.
| 66 | Annual Report/September 30, 2016 |
Table of Contents
AllianzGI Institutional Multi-Series Trust
Report of Independent Registered Public Accounting Firm
To the Board of Trustees and Shareholders of AllianzGI Institutional Multi-Series Trust
In our opinion, the accompanying statements of assets and liabilities, including the schedules of investments, and the related statements of operations and of changes in net assets and the financial highlights present fairly, in all material respects, the financial position of AllianzGI Advanced Core Bond Portfolio, AllianzGI Best Styles Global Managed Volatility Portfolio, AllianzGI Discovery U.S. Portfolio, AllianzGI Global Small-Cap Opportunities Portfolio, each a fund of the AllianzGI Institutional Multi-Series Trust (hereafter referred to as the “Funds”) at September 30, 2016, the results of each of their operations, the changes in each of their net assets and each of their the financial highlights for the periods presented, in conformity with accounting principles generally accepted in the United States of America. These financial statements and financial highlights (hereafter referred to as “financial statements”) are the responsibility of the Funds’ management. Our responsibility is to express an opinion on these financial statements based on our audits. We conducted our audits of these financial statements in accordance with the standards of the Public Company Accounting Oversight Board (United States). Those standards require that we plan and perform the audit to obtain reasonable assurance about whether the financial statements are free of material misstatement. An audit includes examining, on a test basis, evidence supporting the amounts and disclosures in the financial statements, assessing the accounting principles used and significant estimates made by management, and evaluating the overall financial statement presentation. We believe that our audits, which included confirmation of securities at September 30, 2016 by correspondence with the custodian, agent banks, brokers and transfer agents of the underlying funds, provide a reasonable basis for our opinion.
PricewaterhouseCoopers LLP
New York, New York
November 22, 2016
| 67 | Annual Report/September 30, 2016 |
Table of Contents
AllianzGI Institutional Multi-Series Trust
Federal Tax Information (Unaudited)
As required by the Internal Revenue Code, shareholders must be notified regarding certain tax attributes of distributions made by each Fund.
Under the Jobs and Growth Tax Relief Reconciliation Act of 2003, the following percentages of ordinary dividends paid during the fiscal period ended September 30, 2016, are designated as “qualified dividend income”:
AllianzGI Advanced Core Bond | 0 | % | ||
AllianzGI Best Styles Global Managed Volatility | 0 | % | ||
AllianzGI Discovery U.S. | 0 | % | ||
AllianzGI Global Small-Cap Opportunities | 74 | % |
Corporate shareholders are generally entitled to take the dividend received deduction on the portion of a Portfolio’s dividend distribution that qualifies under tax law. The percentage of the following Portfolios’ ordinary income dividends paid during the fiscal period ended September 30, 2016, that qualify for the corporate dividend received deduction is set forth below:
AllianzGI Advanced Core Bond | 0 | % | ||
AllianzGI Best Styles Global Managed Volatility | 0 | % | ||
AllianzGI Discovery U.S. | 0 | % | ||
AllianzGI Global Small-Cap Opportunities | 17 | % |
| 68 | Annual Report/September 30, 2016 |
Table of Contents
AllianzGI Institutional Multi-Series Trust
Matters Relating to the Trustees’ Consideration of the Investment Management and Sub-Advisory Agreement (Unaudited)
The Investment Company Act of 1940, as amended, requires that both the full Board of Trustees (the “Board” or “Trustees”) and a majority of the Trustees who are not interested persons of the Trust (the “Independent Trustees”), voting separately, annually approve the continuation of (i) the Trust’s Investment Management Agreement (the “Investment Management Agreement”) on behalf of the AllianzGI Global Small-Cap Opportunities Portfolio (the “Portfolio”) with Allianz Global Investors Fund Management LLC (the “Investment Manager”) and (ii) the Sub-Advisory Agreement (the “Sub-Advisory Agreement,” and together with the Investment Management Agreement, the “Portfolio Agreements”) between the Investment Manager and Allianz Global Investors U.S. LLC (the “Sub-Adviser”).
At an in-person meeting held on March 22, 2016 (the “March Meeting”) the Board and the Independent Trustees unanimously approved, for a one year period through March 31, 2017, the extension of the Portfolio Agreements.
At an in-person meeting held on June 8, 2016, the Board and the Independent Trustees unanimously approved the Portfolio Agreements for an additional three-month period through June 30, 2017 to align the Trust’s annual approval schedule with that of other trusts overseen by the Investment Manager.
The material factors and conclusions that formed the basis of these approvals for the Portfolio are discussed below.
The Trustees noted that, at the March Meeting, the Trustees, including the Independent Trustees, had considered and unanimously approved the renewal of the Portfolio Agreements for an additional one-year period through March 31, 2017. The Trustees further noted in June that the Investment Manager had requested that the Board approve the extension of the Portfolio Agreements for an additional three-month period (i.e., through June 30, 2017) solely for the purpose of reducing the number of meetings at which the Board must consider annual contract renewals for the Trust and the other investment companies overseen by the Board.
The Trustees were assisted in their evaluation of the Portfolio Agreements and the factors that they deemed to be material by independent legal counsel, from whom they received separate legal advice and with whom they met separately from fund management during their contract review meeting.
In connection with their deliberations regarding the extension of the Portfolio Agreements, the Trustees considered such information and factors as they believed, in light of the legal advice furnished to them and their own business judgment, to be relevant. As described below, the Trustees considered the nature, quality and extent of the various investment management, administrative and other services performed by the Investment Manager and the Sub-Adviser under the Portfolio Agreements.
The Trustees took into account information prepared by the Investment Manager, including, but not limited to, memoranda and other materials addressing the factors set out above, and provided to the Trustees prior to the meeting. The information related to the extension of the Portfolio Agreements provided to the Trustees included, among other things, detailed information about the advisory roles of the Investment Manager and the Sub-Adviser, updated since the March Meeting, and updated performance information for the Portfolio. The Trustees also took into account information provided to the Trustees at prior meetings, including the March Meeting. That information described, among other things, the services to be provided by the Investment Manager, as well as the Investment Manager’s investment personnel, proposed management fee, performance information, estimated profitability and other matters.
After reviewing these materials in relation to their consideration of the factors described herein, the Trustees concluded, within the context of their overall conclusions regarding the Portfolio Agreements, that they were satisfied with the Investment Manager’s and Sub-Adviser’s responses and efforts relating to the investment performance of the Portfolio. The Trustees also concluded that the fees payable under each Portfolio Agreement represent reasonable compensation in light of the nature, quality and extent of services provided by the Investment Manager or the Sub-Adviser, as the case may be, and should be extended. Based on their evaluation of factors that they deemed to be material, including, but not limited to, those factors described above, the Trustees unanimously concluded that the continuation of the Portfolio Agreements with respect to the Portfolio were in the interests of the Portfolio and its shareholders, and determined to recommend that the continuance of the Portfolio Agreements for an additional three-month period through June 30, 2017 be approved.
| 69 | Annual Report/September 30, 2016 |
Table of Contents
AllianzGI Institutional Multi-Series Trust
Changes to the Board of Trustees and Officers (Unaudited)
Effective October 8, 2015, Barbara R. Claussen became a Trustee of the Funds. Ms. Claussen is an “interested person” of the Trust, as defined in Section 2(a) (19) of the 1940 Act, due to her positions with the Investment Manager and its affiliates.
Effective April 15, 2016, Julian Sluyters resigned as a Trustee and as President and Chief Executive Officer of the Trust.
Effective April 25, 2016, A. Douglas Eu became a Trustee of the Funds. Mr. Eu is an “interested person” of the Funds, as defined in Section 2(a) (19) of the 1940 Act, due to his positions with the Investment Manager and its affiliates.
Effective April 25, 2016, Thomas J. Fuccillo, formerly the Vice President, Chief Legal Officer and Secretary to the Funds, was appointed President and Chief Executive Officer of the Funds.
Effective April 25, 2016, Angela Borreggine, formerly an Assistant Secretary to the Funds, was appointed Chief Legal Officer and Secretary of the Funds.
| 70 | Annual Report/September 30, 2016 |
Table of Contents
AllianzGI Institutional Multi-Series Trust
Privacy Policy (Unaudited)
Please read this Policy carefully. It gives you important information about how Allianz Global Investors U.S. and its U.S. affiliates (“AllianzGI U.S.,” “we” or “us”) handle non-public personal information (“Personal Information”) that we may receive about you. It applies to all of our past, present and future clients and shareholders of AllianzGI U.S. and the funds and accounts it manages, advises, sub-advises, administers or distributes, and will continue to apply when you are no longer a client or shareholder. As used throughout this Policy, “AllianzGI U.S.” means Allianz Global Investors U.S. LLC, Allianz Global Investors Distributors LLC, NFJ Investment Group LLC and the family of registered and unregistered funds managed by one or more of these firms. AllianzGI U.S. is part of a global investment management group, and the privacy policies of other Allianz Global Investors entities outside of the United States may have provisions in their policies that differ from this Privacy Policy. Please refer to the website of the specific non-U.S. Allianz Global Investors entity for its policy on privacy.
We Care about Your Privacy
We consider your privacy to be a fundamental aspect of our relationship with you, and we strive to maintain the confidentiality, integrity and security of your Personal Information. To ensure your privacy, we have developed policies that are designed to protect your Personal Information while allowing your needs to be served.
Information We May Collect
In the course of providing you with products and services, we may obtain Personal Information about you, which may come from sources such as account application and other forms, from other written, electronic, or verbal communications, from account transactions, from a brokerage or financial advisory firm, financial advisor or consultant, and/or from information you provide on our website.
You are not required to supply any of the Personal Information that we may request. However, failure to do so may result in us being unable to open and maintain your account, or to provide services to you.
How Your Information Is Shared
We do not disclose your Personal Information to anyone for marketing purposes. We disclose your Personal Information only to those service providers, affiliated and non-affiliated, who need the information for everyday business purposes, such as to respond to your inquiries, to perform services, and/or to service and maintain your account. This applies to all of the categories of Personal Information we collect about you. The affiliated and non-affiliated service providers who receive your Personal Information also may use it to process your transactions, provide you with materials (including preparing and mailing prospectuses and shareholder reports and gathering shareholder proxies), and provide you with account statements and other materials relating to your account. These service providers provide services at our direction, and under their agreements with us, are required to keep your Personal Information confidential and to use it only for providing the contractually required services. Our service providers may not use your Personal Information to market products and services to you except in conformance with applicable laws and regulations. We also may provide your Personal Information to your respective brokerage or financial advisory firm, custodian, and/or to your financial advisor or consultant.
In addition, we reserve the right to disclose or report Personal Information to non-affiliated third parties, in limited circumstances, where we believe in good faith that disclosure is required under law, to cooperate with regulators or law enforcement authorities or pursuant to other legal process, or to protect our rights or property, including to enforce our Privacy Policy or other agreements with you. Personal Information collected by us may also be transferred as part of a corporate sale, restructuring, bankruptcy, or other transfer of assets.
Security of Your Information
We maintain your Personal Information for as long as necessary for legitimate business purposes or otherwise as required by law. In maintaining this information, we have implemented appropriate procedures that are designed to restrict access to your Personal Information only to those who need to know that information in order to provide products and/or services to you. In addition, we have implemented physical, electronic and procedural safeguards to help protect your Personal Information.
| 71 | Annual Report/September 30, 2016 |
Table of Contents
AllianzGI Institutional Multi-Series Trust
Privacy Policy (Unaudited)(continued)
Privacy and the Internet
The Personal Information that you provide through our website, as applicable, is handled in the same way as the Personal Information that you provide by any other means, as described above. This section of the Policy gives you additional information about the way in which Personal Information that is obtained online is handled.
| • | Online Enrollment, Account Access and Transactions: When you visit our website, you can visit pages that are open to the general public, or, where available, log into protected pages to enroll online, access information about your account, or conduct certain transactions. Access to the secure pages of our website is permitted only after you have created a User ID and Password. The User ID and Password must be supplied each time you want to access your account information online. This information serves to verify your identity. When you enter Personal Information into our website (including your Social Security Number or Taxpayer Identification Number and your password) to enroll or access your account online, you will log into secure pages. By using our website, you consent to this Privacy Policy and to the use of your Personal Information in accordance with the practices described in this Policy. If you provide Personal Information to effect transactions on our website, a record of the transactions you have performed while on the site is retained by us. For additional terms and conditions governing your use of our website, please refer to the Investor Mutual Fund Access – Disclaimer which is incorporated herein by reference and is available on our website. |
| • | Cookies and Similar Technologies: Cookies are small text files stored in your computer’s hard drive when you visit certain web pages. Cookies and similar technologies help us to provide customized services and information. We use these technologies on our website to improve our website and services, including to evaluate the effectiveness of our site, and to enhance the site user experience. Because an industry-standard Do-Not-Track protocol is not yet established, our website will continue to operate as described in this Privacy Policy and will not be affected by any Do-Not-Track signals from any browser. |
Changes to Our Privacy Policy
We may modify this Privacy Policy from time-to-time to reflect changes in related practices and procedures, or applicable laws and regulations. If we make changes, we will notify you on our website and the revised Policy will become effective immediately upon posting to our website. We also will provide account owners with a copy of our Privacy Policy annually. We encourage you to visit our website periodically to remain up to date on our Privacy Policy. You acknowledge that by using our website after we have posted changes to this Privacy Policy, you are agreeing to the terms of the Privacy Policy as modified.
Obtaining Additional Information
If you have any questions about this Privacy Policy or our privacy related practices in the United States, you may contact us via our dedicated email at PrivacyUS@allianzgi.com.
| 72 | Annual Report/September 30, 2016 |
Table of Contents
AllianzGI Institutional Multi-Series Trust
Board of Trustees (Unaudited)
Name, Year of Birth, Position(s) Held with Trust, Length of Service, Other Trusteeships/Directorships Held by Trustee; Number of Portfolios in Fund Complex/Outside Fund Complexes Currently Overseen by Trustee
| Principal Occupation(s) During Past 5 Years:
| |
| The address of each trustee is 1633 Broadway, New York, NY 10019. | ||
Deborah A. DeCotis Year of Birth: 1952 Trustee since: 2014 Trustee/Director of 89 funds in Fund Complex Trustee/Director of no funds outside of Fund Complex | Advisory Director, Morgan Stanley & Co., Inc. (since 1996); Member, Circle Financial Group (since 2009); and Member, Council on Foreign Relations (since 2013). Formerly, Co-Chair Special Projects Committee, Memorial Sloan Kettering (2005-2015); Trustee, Stanford University (2010-2015); Principal, LaLoop LLC, a retail accessories company (1999- 2014); Director, Helena Rubenstein Foundation (1997-2010); and Director, Armor Holdings (2002-2010). | |
F. Ford Drummond Year of Birth: 1962 Trustee since: 2014 Trustee/Director of 64 funds in Fund Complex Trustee/Director of no funds outside of Fund Complex Director, BancFirst Corporation | Owner/Operator, Drummond Ranch; and Director, Oklahoma Water Resources Board. Formerly, Director, The Cleveland Bank; and General Counsel, BMI-Health Plans (benefits administration). | |
Bradford K. Gallagher Year of Birth:1944 Trustee since: 2014 Trustee/Director of 89 funds in Fund Complex Trustee/Director of no funds outside of Fund Complex Formerly, Chairman and Trustee of Grail Advisors ETF Trust (2009- 2010) and Trustee of Nicholas-Applegate Institutional Funds (2007- 2010) | Retired. Founder, Spyglass Investments LLC, a private investment vehicle (since 2001). Formerly, Chairman and Trustee, The Common Fund (2005- 2014); Partner, New Technology Ventures Capital Management LLC, a venture capital fund (2011-2013); Chairman and Trustee, Atlantic Maritime Heritage Foundation (2007-2012); and Founder, President and CEO, Cypress Holding Company and Cypress Tree Investment Management Company (1995-2001). | |
James A. Jacobson Year of Birth:1945 Trustee since: 2014 Trustee/Director of 89 funds in Fund Complex Formerly, Trustee, Alpine Mutual Funds Complex consisting of 18 funds (2009-2016). | Retired. Trustee (since 2002) and Chairman of Investment Committee (since 2007), Ronald McDonald House of New York; and Trustee, New Jersey City University (since 2014). Formerly, Vice Chairman and Managing Director, Spear, Leeds & Kellogg Specialists, LLC, a specialist firm on the New York Stock Exchange (2003-2008). | |
Hans W. Kertess Year of Birth: 1939 Trustee since: 2014 Trustee/Director of 89 funds in Fund Complex Trustee/Director of no funds outside the Fund Complex | President, H. Kertess & Co., a financial advisory company; and Senior Adviser (formerly Managing Director), Royal Bank of Canada Capital Markets (since 2004). | |
James S. MacLeod Year of Birth: 1947 Trustee since: 2014 Trustee/Director of 64 funds in Fund Complex Trustee/Director of no funds outside the Fund Complex Non-Executive Chairman (formerly Director), Sykes Enterprises, Inc. | Director, Chairman and Chief Executive Officer, CoastalSouth Bancshares, Inc.; Director and President, CoastalStates Bank; and Chief Executive Officer, Homeowners Mortgage; and Trustee, University of Tampa. Formerly, Executive Vice President, Mortgage Guaranty Insurance Corporation and Chief Executive Officer, Homeowners Mortgage. | |
William B. Ogden, IV Year of Birth: 1945 Trustee since: 2014 Trustee/Director of 89 funds in Fund Complex; Trustee/Director of no funds outside of Fund Complex | Retired. Formerly, Asset Management Industry Consultant; and Managing Director, Investment Banking Division of Citigroup Global Markets Inc. | |
Alan Rappaport Year of Birth: 1953 Trustee since: 2014 Trustee/Director of 89 funds in Fund Complex Trustee/Director of no funds outside of Fund Complex | Advisory Director (formerly Vice Chairman), Roundtable Investment Partners (since 2009); Adjunct Professor, New York University Stern School of Business (since 2011); Lecturer, Stanford University Graduate School of Business (since 2013); Director, Victory Capital Holdings, Inc., an asset management firm (since 2013); and Member of Board of Overseers, NYU Langone Medical Center (since 2015). Formerly, Trustee, American Museum of Natural History (2005-2015); Trustee, NYU Langone Medical Center (2007-2015); and Vice Chairman, US Trust (formerly Chairman and President of Private Bank of Bank of America, the predecessor entity of US Trust) (2001-2008). | |
| 73 | Annual Report/September 30, 2016 |
Table of Contents
AllianzGI Institutional Multi-Series Trust
Board of Trustees (Unaudited)(continued)
Name, Year of Birth, Position(s) Held with Trust, Length of Service, Other Trusteeships/Directorships Held by Trustee; Number of Portfolios in Fund Complex/Outside Fund Complexes Currently Overseen by Trustee
| Principal Occupation(s) During Past 5 Years:
| |
Davey S. Scoon Year of Birth: 1946 Trustee since: 2014 Trustee/Director of 64 funds in Fund Complex Trustee/Director of no funds outside the Fund Complex Chairman, Tufts Health Plan; Director, AMAG Pharmaceuticals, Inc. (since 2006); Director, Orthofix International N.V. (since 2011); and Director, Biodel Inc. (since 2013). Formerly, Director, CardioKine Inc (2005-2011); and Director, NitroMed, Inc. (2003-2009). | Adjunct Professor, University of Wisconsin-Madison (since 2011). Formerly, Chief Administrative and Financial Officer, Tom’s of Maine (personal care products manufacturing) (2003-2005); and Chief Administrative and Financial Officer (formerly Vice President and Chief Financial Officer), Sun Life Financial U.S. (financial services) (2001- 2003). | |
A. Douglas Eu Year of Birth: 1961 Trustee since: 2016 Trustee/Director of 64 funds in Fund Complex Trustee/Director of no funds outside the Fund Complex Formerly, Director, Securities and Futures Commission Advisory Committee Hong Kong (2007-2013). | Chief Executive Officer, Managing Director and Chairman of the Executive Committee of Allianz Global Investors U.S. Holdings LLC (since 2016); and Member of the Global Executive Committee of Allianz Global Investors GmbH (since 2006). Formerly, Chief Executive Officer of Allianz Global Investors Asia Pacific GmbH (2006-2015). | |
Barbara R. Claussen Year of Birth: 1956 Trustee since: 2015 Trustee/Director of 64 funds in Fund Complex Trustee/Director of no funds outside the Fund Complex | Chief Operating Officer (since 2016) and Managing Director and member of the Executive Committee (since 2013) of Allianz Global Investors U.S. Holdings LLC; Managing Director of Allianz Global Investors U.S. LLC; and Chief Operating Officer and Managing Director of NFJ Investment Group LLC (since 2003). Formerly, Chairman of the Management Board of Allianz Global Investors Capital LLC (2012); Chief Administrative Officer of Allianz Global Investors U.S. Holdings LLC (2013-2016); Member of Management Board and Chief Risk Officer (2008-2011); and Interim Global Chief Operating Officer Liaison (2012-2014) of Allianz Global Investors Capital LLC (a predecessor of Allianz Global Investors U.S. LLC). | |
| 74 | Annual Report/September 30, 2016 |
Table of Contents
AllianzGI Institutional Multi-Series Trust
Officers (Unaudited)
Name, Year of Birth, Position(s)* Held with Trust.
| Principal Occupation(s) During Past 5 Years:
| |
Thomas J. Fuccillo 1633 Broadway, 43rd Floor New York, NY 10019 Year of Birth: 1968 President,Chief Executive Officer since: 2016 | Managing Director, Chief Legal Officer and Secretary of Allianz Global Investors Distributors LLC; Managing Director and Chief Regulatory Counsel of Allianz Global Investors U.S. Holdings LLC; Secretary and Chief Legal Officer of The Korea Fund, Inc. President and Chief Executive Officer of 64 funds in the Fund Complex. Formerly Vice President, Secretary and Chief Legal Officer of numerous funds in the Fund Complex (2004-2016). | |
Lawrence G. Altadonna 1633 Broadway, 43rd Floor New York, NY 10019 Year of Birth: 1966 Treasurer, Principal Financial and Accounting Officer | Director, Director of Fund Administration of Allianz Global Investors U.S. LLC; Treasurer, Principal Financial and Accounting Officer of 64 funds in the Fund Complex and of The Korea Fund, Inc. Formerly, Assistant Treasurer of numerous funds in the Fund Complex (2005-2010). | |
Angela Borreggine 1633 Broadway, 43rd Floor New York, NY 10019 Year of Birth: 1964 Chief Legal Officer and Secretary since: 2016 | Director and Senior Counsel of Allianz Global Investors U.S. Holdings LLC; Chief Legal Officer and Secretary of 64 funds in the Fund Complex. Formerly Assistant Secretary of numerous funds in the Fund Complex (2015-2016). | |
Thomas L. Harter, CFA 600 West Broadway, San Diego, CA 92101 Year of Birth: 1975 Chief Compliance Officer since: 2014 | Director of Allianz Global Investors U.S. Holdings LLC; Director, Deputy Chief Compliance Officer of Allianz Global Investors U.S. LLC; Chief Compliance Officer of 64 funds in the Fund Complex and of The Korea Fund, Inc. Formerly, Vice President and 2012). Compliance Manager (2005-2012). | |
Richard J. Cochran 1633 Broadway, 43rd Floor New York, NY 10019 Year of Birth: 1961 Assistant Treasurer since: 2014 | Vice President of Allianz Global Investors U.S. LLC; Assistant Treasurer of 64 funds in the Fund Complex and of The Korea Fund, Inc. | |
Orhan Dzemaili 1633 Broadway, 43rd Floor New York, NY 10019 Year of Birth: 1974 Assistant Treasurer since: 2014 | Director of Allianz Global Investors U.S. LLC; and Assistant Treasurer of 64 funds in the Fund Complex. | |
Scott Whisten 1633 Broadway, 43rd Floor Year of Birth: 1971 Assistant Treasurer since: 2014 | Director of Allianz Global Investors U.S. LLC; and Assistant Treasurer of 64 funds in the Fund Complex. | |
Debra Rubano 1633 Broadway, 43rd Floor New York, NY 10019 Year of Birth: 1975 Assistant Secretary since: 2015 | Director and Senior Counsel of Allianz Global Investors U.S. Holdings LLC; and Assistant Secretary of 64 funds in the Fund Complex. | |
Paul Koo(1) 555 Mission Street, Suite 1700 San Francisco, CA 94105 Year of Birth: 1964 Assistant Secretary since: 2014 | Director, Deputy Head of US Compliance, Chief Compliance Officer of Allianz Global Investors U.S. LLC; Chief Compliance Officer of NFJ Investment Group LLC; and Assistant Secretary of 57 funds in the Fund Complex. Formerly, Associate Chief Compliance Officer, Dodge & Cox (2010-2011). | |
| * | The officers of the Trust are elected annually by the Board of Trustees. |
| (1) | Paul Koo is Assistant Secretary of the Trust with a limited authority to open, maintain and close certain custodial and trading accounts for all series of the Trust. |
| 75 | Annual Report/September 30, 2016 |
Table of Contents
Trustees Davey S. Scoon Chairman of the Board of Trustees Barbara R. Claussen Deborah A. DeCotis F. Ford Drummond A. Douglas Eu Bradford K. Gallagher James A. Jacobson Hans W. Kertess James S. MacLeod William B. Ogden, IV Alan Rappaport
Officers Thomas J. Fuccillo President & Chief Executive Officer Lawrence G. Altadonna Treasurer, Principal Financial & Accounting Officer Angela Borreggine Secretary & Chief Legal Officer Thomas L. Harter Chief Compliance Officer Scott Whisten Assistant Treasurer Richard J. Cochran Assistant Treasurer Orhan Dzemaili Assistant Treasurer Debra Rubano Assistant Secretary Paul Koo Assistant Secretary | Investment Manager* Allianz Global Investors U.S. LLC 1633 Broadway New York, NY 10019
Distributor Allianz Global Investors Distributors LLC 1633 Broadway New York, NY 10019
Custodian & Accounting Agent State Street Bank & Trust Co. 801 Pennsylvania Avenue Kansas City, MO 64105
Transfer Agent Boston Financial Data Services, Inc. 330 West 9th Street, 5th Floor Kansas City, MO 64105
Independent Registered Public Accounting Firm PricewaterhouseCoopers LLP 300 Madison Avenue New York, NY 10017
Legal Counsel Ropes & Gray LLC Prudential Tower 800 Boylston Street Boston, MA 02199 |
*Please note that on October 1, 2016, Allianz Global Investors Fund Management LLC (“AGIFM”), formerly the Portfolios’ Investment Manager, merged with and into Allianz Global Investors U.S. LLC (“AllianzGI U.S.”), formerly the Portfolios’ Sub-Adviser. Simultaneously with the merger, AllianzGI U.S. succeeded AGIFM as the Portfolios’ Investment Manager by operation of Law. The Portfolios no longer have a Sub-Adviser.
This report, including the financial information herein, is transmitted to the shareholders of the Trust for their information. It is not a prospectus, circular or representation intended for use in the purchase of shares of each Portfolio or any securities mentioned in this report.
Table of Contents
ITEM 2. CODE OF ETHICS
| (a) | As of the end of the period covered by this report, the registrant has adopted a code of ethics (the “Section 406 Standards for Investment Companies – Ethical Standards for Principal Executive and Financial Officers”) that applies to the registrant’s President and Chief Executive Officer and Principal Financial Officer; the registrant’s Principal Financial Officer also serves as the Principal Accounting Officer. The registrant undertakes to provide a copy of such code of ethics to any person upon request, without charge, by calling 1-800-926-4456. The code of ethics are included as an Exhibit 99.CODE ETH hereto. |
| (b) | During the period covered by this report, there were not any amendments to a provision of the code of ethics adopted in 2(a) above. |
| (c) | During the period covered by this report, there were not any waivers or implicit waivers to a provision of the code of ethics adopted in 2(a) above. |
ITEM 3. AUDIT COMMITTEE FINANCIAL EXPERT
The registrant’s Board has determined that Messrs. James A. Jacobson and Davey S. Scoon, members of the Board’s Audit Oversight Committee are “audit committee financial experts,” and that they are “independent,” for purposes of this Item.
ITEM 4. PRINCIPAL ACCOUNTANT FEES AND SERVICES
| a) | Audit fees. The aggregate fees billed for each of the last two fiscal years (the “Reporting Periods”) for professional services rendered by the Registrant’s principal accountant (the “Auditor”) for the audit of the Registrant’s annual financial statements, or services that are normally provided by the Auditor in connection with the statutory and regulatory filings or engagements for the Reporting Periods, were $20,600 in 2015 and $93,987 in 2016. |
| b) | Audit-Related Fees. The aggregate fees billed in the Reporting Periods for assurance and related services by the principal accountants that are reasonably related to the performance of the audit registrant’s financial statements and are not reported under paragraph (e) of this Item were $0 in 2015 and $0 in 2016. |
| c) | Tax Fees. The aggregate fees billed in the Reporting Periods for professional services rendered by the Auditor for tax compliance, tax service and tax planning (“Tax Services”) were $11,310 in 2015 and $48,829 in 2016. These services consisted of review or preparation of U.S. federal, state, local and excise tax returns and calculations of excise tax distributions. |
| d) | All Other Fees. There were no other Fees billed in the Reporting Periods for products and services provided by the Auditor to the Registrant. |
| e) | 1. Audit Committee Pre-Approval Policies and Procedures. The Registrant’s Audit Committee has established policies and procedures for pre-approval of all audit and permissible non-audit services by the Auditor for the Registrant, as well as the Auditor’s engagements related directly to the operations and financial reporting of the Registrant. The Registrant’s policy is stated below. |
Table of Contents
AllianzGI Institutional Multi-Series Trust (The “Trust”)
AUDIT OVERSIGHT COMMITTEE POLICY
FOR
PRE-APPROVAL OF SERVICES PROVIDED BY THE INDEPENDENT ACCOUNTANTS
The Trust’s Audit Oversight Committee (“Committee”) is charged with the oversight of the Trust’s financial reporting policies and practices and their internal controls. As part of this responsibility, the Committee must pre-approve any independent accounting firm’s engagement to render audit and/or permissible non-audit services to the Trust as well as to the Trust’s investment adviser(1) or any entity controlling, controlled by or under common control with the investment adviser that provides ongoing services to the Trust (“Applicable Service Providers”), if the engagement relates directly to operations and financial reporting of the Trust. In evaluating a proposed engagement by the independent accountants, the Committee will assess the effect that the engagement might reasonably be expected to have on the accountant’s independence. The Committee’s evaluation will be based on:
a review of the nature of the professional services expected to be provided, the fees to be charged in connection with the services expected to be provided a review of the safeguards put into place by the accounting firm to safeguard independence, and periodic meetings with the accounting firm.
POLICY FOR PRE-APPROVAL OF AUDIT AND NON-AUDIT SERVICES TO BE PROVIDED TO THE TRUST
On an annual basis, the Committee of the Trust will review and if the Committee so determines, pre-approve the scope of the audits of the Trust and proposed audit fees, and permitted non-audit (including audit under related) services that are proposed to be performed by the Trust’s independent accountants for the Trust and its Applicable Service Providers (to the extent the services to be provided to the Applicable Service Providers relate directly to the operations and financial reporting of the Trust). The Committee may also pre-approve services at any other in-person or telephonic Committee meeting. At least annually, the Committee will receive a report of all audit and non-audit services that were rendered in the previous calendar year by the independent accountants for the Trust and its Applicable Service Providers pursuant to this Policy.
In addition to the Committee’s pre-approval of services pursuant to this Policy, the engagement of the independent accounting firm for any permitted non-audit service provided to the fund with also require the separate written pre-approval of the President, Treasurer or Assistant Treasurer of the Trust, who may only grant such approval if he or she believes that the accounting firm’s engagement will not adversely affect the firm’s independence. All non-audit services performed by the independent accounting firm will be disclosed, as required, in filings with the Securities and Exchange Commission.
AUDIT SERVICES
The categories of audit services and related fees to be reviewed and pre-approved annually by the Committee are:
Annual Trust financial statement audits
Seed audits (related to new product filings, as required)
SEC and regulatory filings and consents
Semiannual financial statement reviews
| (1) | For purposes of this requirement, the term “adviser” does not include sub-advisers that are not affiliated with a Trust’s investment adviser, are overseen by that investment adviser, and whose role is primarily portfolio management. |
Table of Contents
AUDIT-RELATED SERVICES
The following categories of audit-related services are considered to be consistent with the role of the Trust’s independent accountants and services falling under one of these categories will be pre-approved by the Committee on an annual basis if the Committee deems those services to be consistent with the accounting firm’s independence:
Accounting consultations
Trust merger support services
Agreed upon procedure reports
Other Attestation reports
Comfort letters
Other internal control reports
Individual audit-related services that fall within one of these categories and are not presented to the Committee as part of the annual pre-approval process described above, may be pre-approved, if deemed consistent with the accounting firm’s independence, by the Committee Chair (or any other Committee member who is a disinterested trustee under the Investment Company to whom this responsibility has been delegated) so long as the estimated fee for those services does not exceed $500,000. Any pre-approval by a Committee member shall be reported to the full Committee at its next regularly scheduled meeting.
TAX SERVICES
The following categories of tax services are considered to be consistent with the role of the Trust’s independent accountants and services falling under one of these categories will be pre-approved by the Committee on an annual basis if the Committee deems those services to be consistent with the accounting firm’s independence:
Tax compliance services related to the filing or amendment of the following:
Federal, state and local income tax compliance; and, sales and use tax compliance
Timely RIC qualification reviews
Tax distribution analysis and planning
Tax authority examination services
Tax appeals support services
Accounting methods studies
Trust merger support services
Other tax consulting services and related projects
Individual tax services that fall within one of these categories and are not presented to the Committee as part of the annual pre-approval process described above, may be pre-approved, if deemed consistent with the accounting firm’s independence, by the Committee at any regular or special meeting. Such services may also be pre-approved by the Committee Chair (or any other Committee member who is a disinterested trustee under the Investment Company Act to whom this responsibility has been delegated) so long as the estimated fee for the particular service for which pre-approval is sought does not exceed $500,000. Any pre-approval by a Committee Member shall be reported to the full Committee at its next regularly scheduled meeting.
OTHER SERVICES
Services that are proposed to be provided to the Trust which are not audit, audit-related or tax services may be pre-approved, if deemed consistent with the accounting firm’s independence, by the Committee at any regular or special meeting. Such services may also be pre-approved by the Committee Chair (or any other Committee member who is a disinterested trustee under the Investment Company Act to whom this responsibility has been delegated) so long as the estimated fee for the particular service for which pre-approval is sought does not exceed the limit assigned within the Policy. Any pre-approval by a Committee member shall be reported to the full Committee at its next regularly scheduled meeting.
Table of Contents
PROHIBITED SERVICES
The Trust’s independent accountants will not render services in the following categories of non-audit services:
Bookkeeping or other services related to the accounting records or financial statements of the Trust
Financial information systems design and implementation
Appraisal or valuation services, fairness opinions, or contribution-in-kind reports
Actuarial services
Internal audit outsourcing services
Management functions or human resources
Broker or dealer, investment adviser or investment banking services
Legal services and expert services unrelated to the audit
Any other service that the Public Company Accounting Oversight Board determines, by regulation, is impermissible.
PRE-APPROVAL OF NON-AUDIT SERVICES PROVIDED TO OTHER ENTITIES WITHIN THE FUND COMPLEX
Rule 2-01(c)(7) of Regulation S-X provides that an accountant is not independent of the Trust unless the Trust’s Committee approves any permitted non-audit services to be provided to the Trust’s Applicable Service Providers, provided, in each case, that the engagement relates directly to the operations and financial reporting of the Trust.
Services to be provided to Applicable Service Providers that are required to be pre-approved, may be pre-approved, if deemed consistent with the accounting firm’s independence, by the Committee at a regular or special meeting or by the Committee Chair (or any other Committee member who is a disinterested trustee under the Investment Company Act to whom this responsibility has been delegated) so long as the estimated fee for those services does not exceed $500,000. If a service is approved by a Committee member, the full Committee is notified of such pre-approval at its next regularly scheduled meeting.
Although the Committee will not be required to pre-approve all services provided to Applicable Service Providers and their affiliates, the Committee will receive an annual report from the Trust’s independent accounting firm showing the aggregate fees for all services provided to Applicable Service Providers and their affiliates.
DE MINIMUS EXCEPTION TO REQUIREMENT OF PRE-APPROVAL OF NON-AUDIT SERVICES
With respect to the provision of permitted non-audit services to the Trust or Accounting Affiliates, the pre-approval requirement is waived if:
| (1) | The aggregate fees and costs of all non-audit services that, but for the limited exception provided by this section, would require pre-approval by the Committee constitutes no more than five percent of the total fees and costs paid by the Trust and Applicable Service Providers to the independent accountant during the fiscal year during which such non-audit services are provided; |
| (2) | At the time of the engagement for such services, the Trust did not recognize that the services were “non-audit services” that required preapproval; and |
| (3) | Each such service is brought promptly to the attention of the Committee and approved prior to the completion of the audit by the Committee, Committee Chair or any other Committee member who is a disinterested trustee under the Investment Company Act to whom this responsibility has been delegated. |
Table of Contents
| e) | 2. No services were approved pursuant to the procedures contained in paragraph (C) (7) (i) (C) of Rule 2-01 of Registration S-X. |
| f) | Not applicable. |
| g) | Non-audit fees. The aggregate non-audit fees billed by the Auditor for services rendered to the Registrant, and rendered to the Adviser, for the 2015 Reporting Period was $5,294,251 and the 2016 Reporting Period was $4,543,386. |
| h) | Auditor Independence. The Registrant’s Audit Oversight Committee has considered whether the provision of non-audit services that were rendered to the Adviser which were not pre-approved is compatible with maintaining the Auditor’s independence. |
ITEM 5. AUDIT COMMITTEE OF LISTED REGISTRANT
Disclosure not required for open-end management investment companies.
ITEM 6. INVESTMENTS
| (a) | Schedule of Investments is included as part of the report to shareholders filed under Item 1 of this form. |
| (b) | Not applicable. |
| ITEM 7. | DISCLOSURE OF PROXY VOTING POLICIES AND PROCEDURES FOR CLOSED-END MANAGEMENT INVESTMENT COMPANIES |
Disclosure not required for open-end management investment companies.
ITEM 8. PORTFOLIO MANAGERS OF CLOSED-END MANAGEMENT INVESTMENT COMPANIES
Disclosure not required for open-end management investment companies.
| ITEM 9. | PURCHASES OF EQUITY SECURITIES BY CLOSED-END MANAGEMENT INVESTMENT COMPANY AND AFFILIATED COMPANIES. |
Disclosure not required for open-end management investment companies.
ITEM 10. SUBMISSION OF MATTERS TO A VOTE OF SECURITY HOLDERS
There have been no material changes to the procedures by which shareholders may recommend nominees to the Trust’s Board of Trustees since the Trust last provided disclosure in response to this item.
Table of Contents
ITEM11. CONTROLS AND PROCEDURES
| (a) | The registrant’s President & Chief executive Officer and Treasurer, Principal Financial & Accounting Officer have concluded that the registrant’s disclosure controls and procedures (as defined in Rule 30a-3(c) under the Act (17 CFR 270.30a-3(c)), as amended) are effective based on their evaluation of these controls and procedures as of a date within 90 days of the filing date of this document. |
| (b) | There were no significant changes in the registrant’s internal control over financial reporting (as defined in Rule 30a-3(d) under the Act (17 CFR 270.30a-3(d))) that occurred during the second fiscal quarter of the period covered by this report that has materially affected, or is reasonably likely to materially affect, the registrant’s internal control over financial reporting. |
ITEM12. EXHIBITS
(a)(1) | Exhibit 99.CODE ETH – Code of Ethics | |
(a)(2) | Exhibit 99.302 CERT. – Certification pursuant to Section 302 of the Sarbanes-Oxley Act of 2002 | |
(a)(3) | Not applicable | |
(b) | Exhibit99.906 CERT. – Certification pursuant to Section 906 of the Sarbanes-Oxley Act of 2002 | |
Table of Contents
Signatures
Pursuant to the requirements of the Securities Exchange Act of 1934 and the Investment Company Act of 1940, the registrant has duly caused this report to be signed on its behalf by the undersigned, thereunto duly authorized.
(Registrant) AllianzGI Institutional Multi-Series Trust
By: | /s/ Thomas J. Fuccillo | |
Thomas J. Fuccillo, President & Chief Executive Officer |
Date: December 1, 2016
By: | /s/ Lawrence G. Altadonna | |||
Lawrence G. Altadonna Treasurer, Principal Financial & Accounting Officer | ||||
Date: December 1, 2016
Pursuant to the requirements of the Securities Exchange Act of 1934 and the Investment Company Act of 1940, this report has been signed below by the following persons on behalf of the registrant and in the capacities and on the dates indicated.
By: | /s/ Thomas J. Fuccillo | |
Thomas J. Fuccillo, President & Chief Executive Officer |
Date: December 1, 2016
By: | /s/ Lawrence G. Altadonna | |||
Lawrence G. Altadonna, Treasurer, Principal Financial & Accounting Officer | ||||
Date: December 1, 2016