Table of Contents
UNITED STATES
SECURITIES AND EXCHANGE COMMISSION
Washington, D.C. 20549
FORMN-CSR
CERTIFIED SHAREHOLDER REPORT OF REGISTERED
MANAGEMENT INVESTMENT COMPANIES
Investment Company Act file number811-22975
AllianzGI Institutional Multi-Series Trust
(Exact name of registrant as specified in charter)
1633 Broadway, New York, New York 10019
(Address of principal executive offices) (Zip code)
Scott Whisten
1633 Broadway
New York, New York 10019
(Name and address of agent for service)
Registrant’s telephone number, including area code:212-739-3367
Date of fiscal year end: September 30
Date of reporting period: September 30, 2019
Table of Contents
Item 1. Report to Shareholders
AllianzGI Institutional Multi-Series Trust
Annual Report
September 30, 2019
Beginning on January 1, 2021, as permitted by regulations adopted by the U.S. Securities and Exchange Commission, paper copies of shareholder reports will no longer be sent by mail, unless you specifically request paper copies of the reports. Instead, the reports will be made available on the Portfolios’ website (us.allianzgi.com), and you will be notified by mail each time a report is posted and provided with a website link to access the report.
If you already elected to receive shareholder reports electronically, you will not be affected by this change and you need not take any action. You may elect to receive shareholder reports and other communications from a Portfolio electronically anytime by contacting your financial intermediary (such as a broker-dealer or bank) or, if you are a direct investor, by enrolling at us.allianzgi.com/edelivery.
If you prefer to receive paper copies of your shareholder reports after January 1, 2021, direct investors may inform a Portfolio at any time. Paper copies are provided free of charge and your election to receive reports in paper will apply to all funds held with the fund complex.
Table of Contents
| 2-9 | ||||
| 10-11 | ||||
| 12-39 | ||||
| 40 | ||||
| 41 | ||||
| 42-43 | ||||
| 44-45 | ||||
| 46-63 | ||||
| 64 | ||||
| 65 | ||||
Matters Relating to the Trustees’ Consideration of the Investment Management Agreements | 66-71 | |||
| 72 | ||||
| 73-75 | ||||
| 76-78 | ||||
Table of Contents
AllianzGI Advanced Core Bond Portfolio
(unaudited)
For the period of October 1, 2018 through September 30, 2019, as provided by Fabian Lutzenberger, CFA, Lead Portfolio Manager.
Portfolio Insights
For the twelve-month period ending September 30, 2019, the AllianzGI Advanced Core Bond Portfolio (the “Portfolio”) returned 9.77%, underperforming the Bloomberg Barclays U.S. Aggregate Bond Index (the “benchmark”), which returned 10.30%.
Market Overview
Over the twelve-month period, the index yield of the benchmark, as provided by Bloomberg Finance L.P., decreased by-119 basis points. Broken down bysub-indices of the benchmark, the strongest decrease in yield was realized in commercial mortgage-backed securities (CMBS) and Covered Bonds(-125 basis points each), followed by US Treasury(-123 basis points). The total return of the benchmark (10.30%) can be broken down into segment performance as follows: the US Treasurysub-index performed 10.48%, the Government-Relatedsub-index returned 10.09%, the Corporate-Relatedsub-index returned 13.00%, and the US Mortgage-Backed Securities (MBS)sub-index realized a total return of 7.80%.
Looking at the various rating segments of the benchmark, we observe that the worst performance was shown byAaa-rated bonds (9.34%), whileBaa-rated bonds had the highest total return (13.48%). Analyzing the maturity segments of the benchmark, we observe that the highest total return was realized by the 10+ Yearsub-index (22.01%), followed by the7-10 Yearsub-index (12.10%). The worst performance was shown by the1-3 Yearsub-index (4.66%), followed by the3-5 Year (7.71%) and5-7 Year (8.91%)sub-indices.
Portfolio Review
According to a performance attribution analysis provided by IDS GmbH*, yield, selection and other factors were positive contributors to the Portfolio’s active return against the benchmark, while effective duration, term structure, sector and quality were negative contributors.
Outlook
At the end of the twelve-month period, the yield of the Portfolio’s investment universe, as
measured by the benchmark’s yield, was 2.26%, as provided by Bloomberg Finance L.P. The benchmark segment with the highest yield was Corporate (2.91%), followed by US MBS with 2.45% and Government-Related with 2.36%. The segment of the benchmark with the lowest yield was US Treasury, which yielded 1.72%.
We expect economic growth in the US to remain supported by the solid employment situation, which we believe supports domestic demand, as well as by positive financial conditions. Risks to economic growth seem to stem mainly from the political spectrum, especially from the ongoing trade dispute between the US and China. Regarding our inflation expectations, we expect a stable development of headline inflation in the US with some signs of wage pressure. Concerning US monetary policy, we expect further easing by the central bank. In particular, we think a 25 basis point cut of the US Federal Funds Rate in December is a likely scenario.
* IDS GmbH is an Analysis and Reporting Service that is a wholly owned subsidiary of Allianz SE offering a full range of managed services encompassing Data Management, Risk Controlling, Performance Analysis and Reporting for investments.
Average Annual Total Return for the period ended September 30, 2019
|
| 1 Year | Since Inception† | |||
AllianzGI Advanced Core Bond Portfolio | 9.77% | 3.24% | ||
Bloomberg Barclays U.S. Aggregate Bond Index†† | 10.30% | 3.56% | ||
† The Portfolio began operations on October 30, 2015. Benchmark return comparisons began on the portfolio inception date.
†† The Bloomberg Barclays U.S. Aggregate Bond Index represents securities that areSEC-registered, taxable, and dollar denominated. The index is composed of securities from the Bloomberg Barclays Capital Government/Credit Bond Index, Mortgage-Backed Securities Index, and Asset-Backed Securities Index. It is generally considered to be representative of the domestic, investment-grade, fixed-rate, taxable bond market. Index returns reflect the reinvestment of income dividends and capital gains, if any, but do not reflect fees, brokerage commissions or other expenses of investing. It is not possible to invest directly in an index.
Performance quoted represents past performance and is no guarantee of future results. Current performance may be lower or higher than performance shown. Investment return and the principal value will fluctuate. Shares may be worth more or less than original cost when redeemed. Returns do not reflect deduction of taxes that a shareholder would pay on portfolio distributions or redemption of portfolio shares. Total return performance assumes that all dividends and capital gain distributions were reinvested on the payable date. The Portfolio’s gross expense ratio is 0.50%. This ratio does not include an expense reduction, contractually agreed to through January 31, 2020. The Portfolio’s expense ratio net of this reduction is 0.35%. Expense ratio information is as of the Portfolio’s current Private Placement Memorandum (“PPM”) dated February 1, 2019, as further revised or supplemented from time to time.
Portfolio Review commentary is based on the Wilshire Axiom Performance Attribution Analysis. Wilshire Axiom uses a position based approach and performance is linked daily. Please note that the different prices and different methodologies used in this attribution report, among others, may cause deviation in return figures to official performance.
| 2 | Annual Report / September 30, 2019 |
Table of Contents
AllianzGI Advanced Core Bond Portfolio
(unaudited) (continued)
Industry/Sectors (as of September 30, 2019)
|
Cumulative Returns through September 30, 2019
| |||||||
U.S. Government Agency Securities | 27.2% | (in thousands)
| ||||||
Banks | 24.5% | |||||||
U.S. Treasury Obligations | 21.2% | |||||||
Sovereign Debt Obligations | 16.4% | |||||||
Auto Manufacturers | 5.4% | |||||||
Oil, Gas & Consumable Fuels | 4.5% | |||||||
Food & Beverage | 2.8% | |||||||
Electric Utilities | 2.2% | |||||||
Other | 20.0% | |||||||
Cash & Equivalents — Net | -24.2% | |||||||
| ||||||||
Moody’s Ratings* (as of September 30, 2019)
|
| |||||||
(as a % of total investments)
| ||||||||

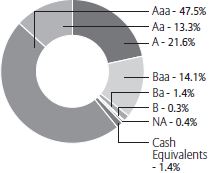
* As a percentage of total investments. Bond ratings refer to the underlying holdings of the Portfolio and are categorized from highest to lowest credit quality using ratings provided by Moody’s. Moody’s ratings have been selected for several reasons, including the access to information and materials provided by Moody’s, as well as the Portfolio’s consideration of industry practice. See “Important Information” for more detail on the selection of Moody’s for the Portfolio’s ratings presentation. Bonds not rated by Moody’s and bonds that do not currently have a rating available are designated in the chart above as “NR” and “NA”, respectively.
Shareholder Expense Example | Actual Performance | |
Beginning Account Value (4/1/19) | $1,000.00 | |
Ending Account Value (9/30/19) | $1,050.30 | |
Expenses Paid During Period | $ 1.85 | |
| Hypothetical Performance | ||
| (5% return before expenses) | ||
Beginning Account Value (4/1/19) | $1,000.00 | |
Ending Account Value (9/30/19) | $1,023.26 | |
Expenses Paid During Period | $ 1.83 | |
Expenses (net of reimbursement, if any) are equal to the annualized expense ratio (0.36%), multiplied by the average account value over the period, multiplied by 183/365.
| 3 | Annual Report / September 30, 2019 |
Table of Contents
AllianzGI Best Styles Global Managed Volatility Portfolio
(unaudited)
For the period of October 1, 2018 through September 30, 2019, as provided by Christian McCormick, Senior Product Specialist.
Portfolio Insights
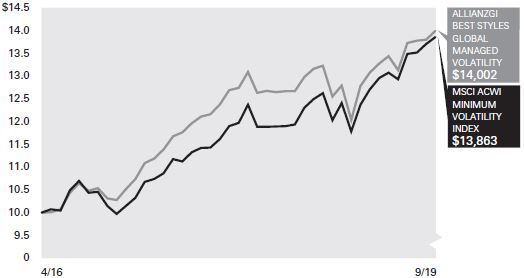
For the twelve-month period ended September 30, 2019, the AllianzGI Best Styles Global Managed Volatility Portfolio (the “Portfolio”) returned 5.84%, underperforming the MSCI ACWI Minimum Volatility Index (the “benchmark”), which returned 9.77%.
Market Overview
It was a volatile twelve-month period for global equities. Despite suffering a sizeable correction in the final quarter of 2018 and two smaller setbacks in May and August 2019, most markets advanced over the review period. The intensifying trade dispute between the US and China continued to unsettle financial markets, with both sides raising tariffs on an ever wider range of each other’s exports. Political risks also caused some concern, mainly due to heightened tensions in the Middle East and the ongoing uncertainty related to Brexit. However, this was countered by an increasingly supportive stance from central banks. Higher yielding, defensive stocks in the utilities and real estate sectors performed the best, while energy stocks retreated sharply as oil prices fell.
Portfolio Review
The Best Styles strategies implement a well-diversified blend of five successful long-term investment styles Value, Price Momentum, Earnings Change, Growth and Quality. Over the twelve-month period, the style Value underperformed globally, driven by underperformance in all developed markets. The trend following styles of Price Momentum and Earnings Change were negative and flat, respectively, on a relative basis, and the Growth style was a lone bright spot, but this was only due to significant outperformance in the emerging market region. Small-caps trailed the benchmark as well.
The Best Styles strategy has only moderate leeway for sector and regional allocation with a maximum deviation of 3% versus the benchmark for active weightings. The overall contribution from active country/sector allocation was benign.
Best Styles holds a broad number of stocks to implement a well-diversified mix of investment
styles and assigns a maximum active weighting of 1% to individual stocks. Therefore, we expect stock selection to be the biggest driver of relative returns and this was the case over the past twelve months. Stock selection in materials and consumer discretionary were detractors, especiallyUS-based companies. Interestingly, the 20 largest holdings were positive contributors to relative performance, but given that defensive, richly valued stocks did well, our underweights, especially stocks to which we had a zero weight, were larger detractors.
Outlook
Subsequent to the surge in Value and small-caps inmid-September 2019, both asset classes retreated and this downturn has continued into October 2019. There were some brief flickers of optimism around the global economic situation and theUS-China trade war, but uncertainty and apprehension appear to have taken over again, especially with the pending impeachment inquiry of President Trump in the US and the impasse between the United Kingdom and European Union over Brexit.
Average Annual Total Return for the period ended September 30, 2019
|
| 1 Year | Since Inception† | |||
AllianzGI Best Styles Global Managed Volatility Portfolio | 5.84% | 10.18% | ||
MSCI ACWI Minimum Volatility Index†† | 9.77% | 9.87% | ||
† The Portfolio began operations on April 11, 2016. Benchmark return comparisons began on the portfolio inception date.
†† The MSCI ACWI Minimum Volatility Index aims to reflect the performance characteristics of a minimum variance strategy applied to large andmid-cap equities across developed markets and emerging markets countries. The index is calculated by optimizing the MSCI ACWI Index, its parent index, for the lowest absolute risk (within a given set of constraints). Historically, the index has shown lower beta and volatility characteristics relative to the MSCI ACWI Index. Index returns reflect the reinvestment of income dividends and capital gains, if any, but do not reflect fees, brokerage commissions or other expenses of investing. It is not possible to invest directly in an index.
Performance quoted represents past performance and is no guarantee of future results. Current performance may be lower or higher than performance shown. Investment return and the principal value will fluctuate. Shares may be worth more or less than original cost when redeemed. Returns do not reflect deduction of taxes that a shareholder would pay on portfolio distributions or redemption of portfolio shares. Total return performance assumes that all dividends and capital gain distributions were reinvested on the payable date. The Portfolio’s gross expense ratio is 0.84%. This ratio does not include an expense reduction, contractually agreed to through January 31, 2020. The Portfolio’s expense ratio net of this reduction is 0.45%. Expense ratio information is as of the Portfolio’s current PPM dated February 1, 2019, as further revised or supplemented from time to time.
| 4 | Annual Report / September 30, 2019 |
Table of Contents
AllianzGI Best Styles Global Managed Volatility Portfolio
(unaudited) (continued)
Country Allocation (as of September 30, 2019)
|
| Cumulative Returns through September 30, 2019
| ||||||||
United States | 54.0% | (in thousands)
| ||||||||
Japan | 12.2% | |||||||||
Taiwan | 4.3% | |||||||||
Switzerland | 4.1% | |||||||||
China | 2.3% | |||||||||
Singapore | 2.0% | |||||||||
Germany | 1.6% | |||||||||
Hong Kong | 1.6% | |||||||||
Other | 16.5% | |||||||||
Cash & Equivalents — Net | 1.4% | |||||||||
| ||||||||||
| Shareholder Expense Example | Actual Performance | |
Beginning Account Value (4/1/19) | $1,000.00 | |
Ending Account Value (9/30/19) | $1,054.30 | |
Expenses Paid During Period | $ 2.32 | |
| Hypothetical Performance | ||
| (5% return before expenses) | ||
Beginning Account Value (4/1/19) | $1,000.00 | |
Ending Account Value (9/30/19) | $1,022.81 | |
Expenses Paid During Period | $ 2.28 | |
Expenses (net of reimbursement, if any) are equal to the annualized expense ratio (0.45%), multiplied by the average account value over the period, multiplied by 183/365.
| 5 | Annual Report / September 30, 2019 |
Table of Contents
AllianzGI GlobalSmall-Cap Opportunities Portfolio
(unaudited)
For the period of October 1, 2018 through September 30, 2019, as provided by Kunal Ghosh, Portfolio Manager.
Portfolio Insights
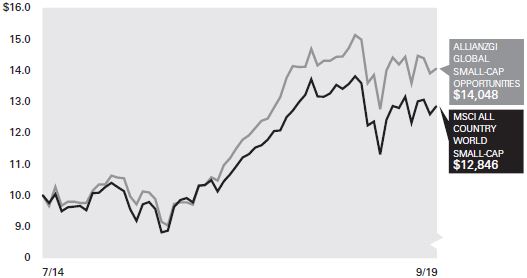
For the twelve-month period ended September 30, 2019, the AllianzGI GlobalSmall-Cap Opportunities Portfolio (the “Portfolio”) returned-6.20%, underperforming the MSCI All Country WorldSmall-Cap Index (the “benchmark”), which returned-5.45%.
Market Overview
Globalsmall-cap equities were impacted by seesawing sentiment and short-term bouts of volatility as investors reacted to concerns of a slowdown in the global economy alongside the impact from central bank rate cuts. The ongoing uncertainty over the trade and tariff war between the United States and China, coupled with Brexit indecision and rising political unrest in Hong Kong, also influenced market performance during the reporting period. In this environment, globalsmall-cap equities trailed theirlarge-cap counterparts due to the higher perceived levels of risk.
The benchmark was broadly lower in the October to December 2018 period as a sudden rise in bond yields provided a catalyst for an equity marketsell-off and global political uncertainty, including riots in France, weighted on performance in developed and emerging markets. The benchmark rebounded in January to April 2019, gaining in three of four months, with sentiment lifted by hopes of improved trade relations between the United States and China and dovish central bank expectations. Globalsmall-cap equity volatility increased in May and June 2019 as trade rhetoric between the US and China intensified. The asset class was slightly lower in July 2019 due to ongoing concerns about slowing global demand. Volatility again spiked in August 2019 as the US imposed additional tariffs on Chinese goods and branded the country a currency manipulator after it allowed its currency to weaken through the psychologically important rate of 7 Chinese renminbi per US dollar. Globalsmall-cap equities were modestly higher in September 2019 amid signs of easing trade tensions as well as by cuts in interest rates from central banks globally. Throughout the reporting period, theon-again,off-again Brexit news and rising political uncertainty in Hong Kong translated to episodic bouts of uncertainty.
Country results were mostly lower, with 15 of 49 countries within the benchmark posting gains during the reporting period. Braziliansmall-cap shares were the top benchmark performers with a 50% gain as investors reacted positively to the election of market-friendly Jair Bolsonaro as the country’s president, and sentiment was further lifted by progress in much needed pension reform. Greece was the next best performer with a 48% advance due to broad-based rally in the country, while Israel, New Zealand and the Czech Republic rounding out the top five performers. The United States, which accounts for more than half of the benchmark weight, was down nearly 5%, while Japan and the United Kingdom, the next two largest benchmark weights, each declined around 6%. Meanwhile,small-cap equities in Peru, Pakistan and Argentina were each up down more than 30% due to a combination of rising risk and stock-specific impacts. South Korea was down close to 27% due to slowing global growth, followed by a 23% decline in Norway amid weakness in energy-related companies. Sector results were skewed to the downside with only three of 11 sectors gaining. Utilities were higher by more than 16% followed by a double-digit gain in real estate and a more modest advance in information technology. Meanwhile, energy was by far the biggest sector laggard, declining more than 40% for the period, followed by underperformance in health care and materials.
Portfolio Review
The Portfolio’s goal is to provide clients with a strategy capitalizing on conviction at the stock level, while limiting other risks including country, industry and market capitalization. The Portfolio trailed the benchmark due primarily to county and sector allocation decisions.
During the twelve-month period,bottom-up stock selection in Japan, Singapore and Denmark contributed to results as did an underweight allocation to South Korea. Alternatively, the United States was the primary laggard due to relative underperformance in higher growth and higher beta names in the country, which rallied at the beginning of the
calendar year.Bottom-up selections in the United Kingdom and Russia trailed more modestly. From a sector perspective, significant stock selection in energy and real-estate contributed positively to results. Meanwhile, materials and consumer discretionary offset performance due tobottom-up selections which trailed the benchmark.
Outlook
The market remains wedged between two conflicting scenarios: a late-cycle and slowing global economy relative to coordinated fiscal and monetary policy responses among central banks. While the former is worrisome to potential equity market returns, the latter may be a catalyst toprop-up markets for the near-term. On average, inflation remains low globally which, in our opinion, can lead to an accommodative monetary policy for the foreseeable future. However, geopolitical crosscurrents from the upcoming US Presidential election, to the trade and tariff war, and the resolution surrounding Brexit, may result in higher bouts of volatility for markets globally, across developed and emerging markets. As such, our proactive focus on building a portfolio with a favorable growth vs. valuation mix alongside a reduction in volatility may help navigate the prevailing market conditions. In addition, the broad investment opportunities in the asset class and historical alpha demonstrated by active management, give us confidence in the potential to outperform the benchmark over time.
We continue to construct the Portfolio on abottom-up basis with conviction at the stock level. In addition, we apply a dual risk-budget, targeting a tracking error of4-6% and lower forecast risk than the benchmark, which may help protect capital during inevitable down market periods and provide our clients with a greater level of return consistency. We believe investment results will be supported by earnings growth and our behavioral finance-focused investment process and focus on higher quality securities with attractive company fundamentals will be a driver of returns for the coming quarters.
Average Annual Total Return for the period ended September 30, 2019 |
| |||||||||||
| 1 Year | 5 Year | Since Inception† | ||||||||||
AllianzGI GlobalSmall-Cap Opportunities Portfolio
|
| -6.20%
|
|
| 7.77%
|
|
| 6.77%
|
| |||
MSCI All Country WorldSmall-Cap Index††
|
| -5.45%
|
|
| 6.24%
|
|
| 4.94%
|
| |||
† The Portfolio began operations on July 23, 2014. Benchmark return comparisons began on the portfolio inception date.
†† The MSCI All Country WorldSmall-Cap Index capturessmall-cap representation across developed markets and emerging markets countries. The Index covers about 14% of the free float-adjusted market capitalization in each country. Index returns reflect the reinvestment of income dividends and capital gains, if any, but do not reflect fees, brokerage commissions or other expenses of investing. It is not possible to invest directly in an index.
Performance quoted represents past performance and is no guarantee of future results. Current performance may be lower or higher than performance shown. Investment return and the principal value will fluctuate. Shares may be worth more or less than original cost when redeemed. Returns do not reflect deduction of taxes that a shareholder would pay on portfolio distributions or redemption of portfolio shares. Total return performance assumes that all dividends and capital gain distributions were reinvested on the payable date. The Portfolio’s gross expense ratio is 3.70%. This ratio does not include an expense reduction, contractually agreed to through January 31, 2020. The Portfolio’s expense ratio net of this reduction is 1.20%. Expense ratio information is as of the Portfolio’s current PPM dated February 1, 2019, as further revised or supplemented from time to time.
| 6 | Annual Report / September 30, 2019 |
Table of Contents
AllianzGI GlobalSmall-Cap Opportunities Portfolio
(unaudited) (continued)
Country Allocation (as of September 30, 2019) |
| Cumulative Returns through September 30, 2019 | ||||||
United States | 53.9 | % |
(in thousands) | |||||
Japan | 11.0 | % |
| |||||
United Kingdom | 5.4 | % | ||||||
Australia | 3.6 | % | ||||||
Canada | 3.0 | % | ||||||
Singapore | 2.5 | % | ||||||
Netherlands | 2.5 | % | ||||||
China | 2.4 | % | ||||||
Other | 15.6 | % | ||||||
Cash & Equivalents — Net | 0.1 | % | ||||||
Shareholder Expense Example | Actual Performance | |
Beginning Account Value (4/1/19) | $ 1,000.00 | |
Ending Account Value (9/30/19) | $ 990.10 | |
Expenses Paid During Period | $ 5.99 | |
Hypothetical Performance | ||
| (5% return before expenses) | ||
Beginning Account Value (4/1/19) | $ 1,000.00 | |
Ending Account Value (9/30/19) | $ 1,019.05 | |
Expenses Paid During Period | $ 6.07 | |
Expenses (net of reimbursement, if any) are equal to the annualized expense ratio (1.20%), multiplied by the average account value over the period, multiplied by 183/365.
| 7 | Annual Report / September 30, 2019 |
Table of Contents
AllianzGI International Growth Portfolio
(unaudited)
From inception on May 15, 2019 through September 30, 2019, as provided by Laura Villani, Associate Product Specialist.
Portfolio Insights
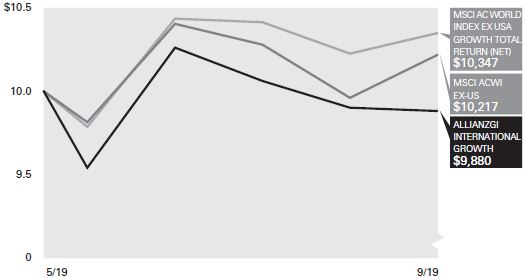
From inception on May 15, 2019 through September 30, 2019, the AllianzGI International Growth Portfolio (the “Portfolio”) returned-1.20%, underperforming the MSCI AC World Index ex USA Index (the “benchmark”), which returned 2.17%.
Market Overview
Global equities overcame twoset-backs in May and August 2019 to close the period with slight gains. The intensifying trade dispute between the US and China continued to weigh on sentiment, with both sides raising tariffs on an ever wider range of each other’s exports. Political risks also caused some concern, mainly due to heightened tensions in the Middle East and the ongoing uncertainty related to Brexit. However, this was countered by an increasingly supportive stance from central banks across both the developed and developing world. At a sector level, information technology (“IT”) companies (where the Portfolio is overweight) were among the best performers, with higher yielding, defensive stocks also benefiting from a sharp fall in bond yields. Energy may be highlighted as a sector that lost ground.
Portfolio Review
The International Growth strategy maintains its strategy that takes a purelybottom-up approach to identifying structural growth, rather than chasing growth momentum.
From a relative perspective, the Portfolio underperformed its benchmark. The Portfolio was underweight of traditionally defensive sectors consumer staples and healthcare detracted, given both sectors were fairly strong in the risk off environment. In general, we believe that the strategy has the potential to perform very well in rising markets, and the high quality bias lends resilience in falling
markets. However a sentimentally driven, risk off environment with rotations to defensive labelled sectors or value areas of the market is unsupportive of the strategy. Unfortunately, the long-term growth profiles, prospects and/or valuations of many names in these current hotspots do not warrant our holding, and we would argue their recent outperformance can instead be attributed to multiple expansion. We remain true to style and approach, and focused on real underlying growth that can likely be compounded successfully over time.
The list of top 10 contributors and detractors is reasonably balanced in terms of regions. Considering countries, stock selection within Brazil was strongest, and in China weakest. By sector, stock picking showed to be particularly strong within industrials, and weaker within consumer discretionary.
The top four contributors were all IT names, which increased between 15% and 33% over the period. However, IT was also well represented in the top 10 detractors list, with the market cutting back many of these names on short term uncertainties. StoneCo (disrupting the payment industry in Brazil) was the top contributor to performance, one of the newest additions to the Portfolio and also a top 5 overweight vs the benchmark. The most significant detractor was Wix (leading website development platform), which had enjoyed a strong run of performanceyear-to-date through to August, and where our conviction in the investment case remains. At this point in the year, we look forward to the upcoming third quarter earnings results to provide insight on company performance and prompt more fundamental views.
Outlook
We believe macro and geopolitical factors, followed by dovish policy decisions from central
banks globally, have been largely responsible for the recent swings in investor sentiment and stock prices. Our team expects more volatility, especially if monetary and fiscal policy continue to struggle to counteract continued macro weakness, and given that several outcomes to major political events will impact shortly. With many management teams confirming fiscal year guidance despite the more challenging environment, the pressure is on the second half, while the market increasingly fears a sharp slowdown or recession. Considering market fundamentals, consensus earnings expectations (a figure based on the combined estimates of analysts covering a public company) of 10% in Europe and abroad (including the US) for fiscal year 2020 look unrealistic, and will likely face downward revisions.
Considering the Portfolio, rather than try to time the markets we have focused on genuine and sustainable growth, and trimmed or removed stocks where the growth profile vs valuation has weakened. With a potentially worsening macro backdrop in mind, we have added emphasis on strong balance sheets, and overall resilience. For example, new portfolio addition Netcompany helps businesses increase their competitive lead or become more efficient, which we believe is relevant in a difficult market environment. Top holdings Alibaba and Tencent continue to diversify their revenue streams and relevance, and build ever higher barriers to scale and competition. SAP’s recurring revenues are set to increase to over 80% in the next five years (from c. 65% in 2018), while the company plans to raise margins 5% until 2023 and pushes into customer relationship management. We remain confident in our high quality, structural growth space, for the winter ahead.
Cumulative Return for the period ended September 30, 2019 |
| |||
| Since Inception† | ||||
AllianzGI International Growth Portfolio | -1.20% | |||
MSCI ACWI ex USA Index†† | 2.17% | |||
MSCI AC World Index ex USA Growth Index | 3.47% | |||
† The Portfolio began operations on May 15, 2019. Benchmark return comparisons began on the portfolio inception date.
†† The MSCI ACWI ex USA Index captures large- andmid-cap representation across Developed Markets countries (excluding the U.S.) and Emerging Markets countries. The index covers approximately 85% of the global equity opportunity set outside the US.
Performance quoted represents past performance and is no guarantee of future results. Current performance may be lower or higher than performance shown. Investment return and the principal value will fluctuate. Shares may be worth more or less than original cost when redeemed. Returns do not reflect deduction of taxes that a shareholder would pay on portfolio distributions or redemption of portfolio shares. Total return performance assumes that all dividends and capital gain distributions were reinvested on the payable date. The Portfolio’s gross expense ratio is 2.28%. This ratio does not include an expense reduction, contractually agreed to through January 31, 2020. The Portfolio’s expense ratio net of this reduction is 0.80%. Expense ratio information is as of the Portfolio’s current Private Placement Memorandum (“PPM”) dated March 29, 2019, as further revised or supplemented from time to time.
| 8 | Annual Report / September 30, 2019 |
Table of Contents
AllianzGI International Growth Portfolio
(unaudited) (continued)
Industry/Sectors (as of September 30, 2019)
|
Cumulative Returns through September 30, 2019
| |||||||
Germany | 12.5% | (in thousands)
| ||||||
China | 12.0% | |||||||
Denmark | 11.3% | |||||||
Canada | 10.3% | |||||||
Sweden | 7.3% | |||||||
Ireland | 4.7% | |||||||
Netherlands | 4.6% | |||||||
Brazil | 4.6% | |||||||
Other | 31.7% | |||||||
Cash & Equivalents — Net | 1.0% | |||||||
Shareholder Expense Example*
|
Actual Performance
| |||
Beginning Account Value (5/15/19) | $1,000.00 | |||
Ending Account Value (9/30/19) | $ 988.00 | |||
Expenses Paid During Period | $ 3.01 | |||
Hypothetical Performance | ||||
|
(5% return before expenses) |
| ||
Beginning Account Value (4/1/19) | $1,000.00 | |||
Ending Account Value (9/30/19) | $1,021.06 | |||
Expenses Paid During Period | $ 4.05 | |||
* The Portfolio commenced operations on May 15, 2019. The Actual expense example is based on the period since inception; the Hypothetical expense example is based on the period beginning April 1, 2019. If the Hypothetical expense example had been based on the period since inception, the Ending Account Value and Expenses Paid During Period would have been $1,015.88 and $3.05, respectively.
Expenses (net of reimbursement, if any) are equal to the annualized expense ratio (0.80%), multiplied by the average account value over the period, multiplied by 138/365 for the Actual example and 183/365 for the Hypothetical expense example.
| 9 | Annual Report / September 30, 2019 |
Table of Contents
AllianzGI Institutional Multi-Series Trust
Important Information(unaudited)
As of September 30, 2019, AllianzGI Institutional Multi-Series Trust (the “Trust”) consisted of four investment series, AllianzGI Advanced Core Bond Portfolio, AllianzGI Best Styles Global Managed Volatility Portfolio, AllianzGI GlobalSmall-Cap Opportunities Portfolio and AllianzGI International Growth (each a “Portfolio” and collectively the “Portfolios”). The Portfolios each currently offer one share class.
The Cumulative Returns charts for each Portfolio assume the initial investment was made on the first day of each Portfolio’s initial fiscal year. Results assume that all dividends and capital gain distributions, if any, were reinvested. They do not take into account the effect of taxes. The benchmark cumulative return began on the last day of the month of each Portfolio’s inception date.
The following disclosure provides important information regarding each Portfolio’s Shareholder Expense Example, which appears on each Portfolio Summary page in this Annual report. “Cash &Equivalents-Net” in the Allocation Summaries may be comprised of cash, repurchase agreements, U.S. Treasury Bills, and other assets net of other liabilities including net unrealized appreciation (depreciation) on futures contracts, and forward foreign currency contracts, as applicable. Please refer to this information when reviewing the Shareholder Expense Example for each Portfolio.
Proxy Voting
The Portfolios’ Investment Manager, Allianz Global Investors U.S. LLC (“AllianzGI U.S.” or the “Investment Manager”), has adopted written proxy voting policies and procedures (“Proxy Policy”) as required by Rule206(4)-6 under the Investment Advisers Act of 1940. The Proxy Policy has been adopted by the Trust as the policies and procedures that the Investment Manager will use when voting proxies on behalf of each Portfolio. Copies of the written Proxy Policy and the factors that the Investment Manager may consider in determining how to vote proxies for each Portfolio, and information about how each Portfolio voted proxies relating to portfolio securities held during the most recent twelve-month period ended June 30, are available without charge, upon request, by calling1-800-498-5413, on the Allianz Global Investors website at us.allianzgi.com and on the Securities and Exchange Commission’s (the “SEC”) website athttp://www.sec.gov.
FormN-PORT
The Trust files complete schedules of each Portfolio’s holdings with the SEC on FormN-PORT for the first and third quarters of the fiscal year; such filings are available on the SEC’s website at http://www.sec.gov.
A copy of the Trust’s FormN-PORT, when available, will be provided without charge, upon request, by calling1-800-498-5413. In addition, the Trust’s FormN-PORT may be reviewed and copied at the SEC’s Public Reference Room in Washington, D.C. Information on the operation of the Public Reference Room may be obtained by calling1-800-SEC-0330. A description of the Trust’s policies and procedures with respect to the disclosure of each Portfolio’s portfolio holdings is available in the Trust’s Statement of Additional Information. The Investment Adviser will post each Portfolio’s holdings information on the Portfolio’s website at us.allianzgi.com. Each Portfolio’s website will contain a complete schedule of portfolio holdings as of the relevant month end. The information will be posted on the website approximately thirty (30) calendar days after the relevant month’s end. Portfolio holdings information for each Portfolio will remain accessible on its website until the Trust files its FormN-CSR, or FormN-PORT for the last month of the Portfolio’s first or third fiscal quarters, with the SEC for the period that includes the date as of which the website information is current. The Trust’s policies with respect to the disclosure of the portfolio holdings are subject to change without notice.
Shareholder Expense Example
Shareholders incur two types of costs: (1) transaction costs; and (2) ongoing costs, including investment management fees and other Portfolio expenses. The Shareholder Expense Example is intended to help shareholders understand ongoing costs (in dollars) of investing in a Portfolio and to compare these costs with the ongoing costs of investing in other mutual funds. The Shareholder Expense Example is based on $1,000.00 invested at the beginning of the period, as indicated, and held for the entire period April 1, 2019 (May 15, 2019 for International Growth Portfolio only) through September 30, 2019.
Actual Expenses
The information in the table under the heading “Actual Performance” provides information about actual account values and actual expenses. You may use the information in this column, together with the amount you invested, to estimate the expenses that you paid over the period. Simply divide your account value by $1,000.00 (for example, an $8,600.00 account value divided by $1,000.00 = 8.6), then multiply the result by the number in the row titled “Expenses Paid During Period” to estimate the expenses you paid on your account during this period.
| 10 | Annual Report / September 30, 2019 |
Table of Contents
Hypothetical Example for Comparison Purposes
The information in the tables for “Hypothetical Performance (5% return before expenses)” provides information about hypothetical account values and hypothetical expenses based on a Portfolio’s actual expense ratio and an assumed rate of return of 5% per year before expenses, which is not each Portfolio’s actual return. The hypothetical account values and expenses may not be used to estimate the actual ending account balance or expenses you paid for the period. You may use this information to compare the ongoing costs of investing in a Portfolio and other funds. To do so, compare this 5% hypothetical example with the 5% hypothetical examples that appear in the shareholder reports of other funds.
Please note that the expenses shown in the table are meant to highlight your ongoing costs only and do not reflect any transactional costs. Therefore, the information for “Hypothetical Performance (5% return before expenses)” is useful in comparing ongoing costs only, and will not help you determine the relative total costs of owning different funds. In addition, if these transactional costs were included, your costs may have been higher.
Credit Ratings
Bond ratings apply to the underlying holdings of a Portfolio and not the Portfolio itself and are divided into categories ranging from highest to lowest credit quality, determined for purposes of presentations in this report by using ratings provided by Moody’s Investors Service, Inc. (“Moody’s”).
Unless otherwise noted, presentations of credit ratings information in this report use ratings provided by Moody’s because of, among other reasons, the access to background information and other materials provided by Moody’s, as well as the Portfolios’ considerations of industry practice.
Bonds not rated by Moody’s or bonds that do not have a rating available are designated as “NR” and “NA”, respectively. Credit quality ratings assigned by a rating agency are subjective opinions, not statements of fact, and are subject to change periodically, even as frequently as daily. Ratings assigned by Moody’s or another rating agency are not absolute standards of credit quality and do not evaluate market risk. Rating agencies may fail to make timely changes in credit ratings, and an issuer’s current financial condition may be better or worse than a rating indicates. In formulating investment decisions for the applicable Portfolios the Investment Manager develops its own analysis of the credit quality and risks associated with individual debt instruments, rather than relying exclusively on rating agencies or third-party research.
All the information on the Portfolio Summary pages, including Portfolio Insights, Average Annual Total Return Tables, Cumulative Return Charts, Shareholder Expense Examples and Allocation/Credit Rating Summaries is unaudited.
Allianz Global Investors Distributors LLC, 1633 Broadway, New York, NY, 10019, us.allianzgi.com,1-800-498-5413.
| 11 | Annual Report / September 30, 2019 |
Table of Contents
September 30, 2019
AllianzGI Advanced Core Bond Portfolio
Principal Amount (000s) | Value | |||||||
CORPORATE BONDS & NOTES - 59.4% | ||||||||
Aerospace & Defense - 1.6% | ||||||||
Northrop Grumman Corp., | ||||||||
2.08%, 10/15/20 | $ | 750 | $ | 750,041 | ||||
United Technologies Corp., | ||||||||
1.90%, 5/4/20 | 350 | 349,685 | ||||||
3.35%, 8/16/21 | 200 | 204,859 | ||||||
4.15%, 5/15/45 | 50 | 57,714 | ||||||
|
|
| ||||||
| 1,362,299 | ||||||||
|
|
| ||||||
Agriculture - 2.2% | ||||||||
Altria Group, Inc., | ||||||||
5.375%, 1/31/44 | 200 | 222,569 | ||||||
Cargill, Inc. (a)(b), | ||||||||
3.05%, 4/19/21 | 500 | 507,947 | ||||||
Philip Morris International, Inc., | ||||||||
2.00%, 2/21/20 | 800 | 799,999 | ||||||
2.375%, 8/17/22 | 200 | 201,383 | ||||||
6.375%, 5/16/38 | 100 | 137,991 | ||||||
|
|
| ||||||
| 1,869,889 | ||||||||
|
|
| ||||||
Auto Manufacturers - 5.4% | ||||||||
American Honda Finance Corp., | ||||||||
1.95%, 7/20/20 | 500 | 500,799 | ||||||
BMW U.S. Capital LLC (a)(b), | ||||||||
3.45%, 4/12/23 | 350 | 364,301 | ||||||
Daimler Finance North America LLC (a)(b), | ||||||||
2.00%, 7/6/21 | 500 | 497,265 | ||||||
2.30%, 2/12/21 | 750 | 750,177 | ||||||
Ford Motor Credit Co. LLC, | ||||||||
2.681%, 1/9/20 | 350 | 349,946 | ||||||
General Motors Co., | ||||||||
5.15%, 4/1/38 | 100 | 101,047 | ||||||
General Motors Financial Co., Inc., | ||||||||
2.65%, 4/13/20 | 350 | 351,201 | ||||||
3.95%, 4/13/24 | 150 | 154,410 | ||||||
4.35%, 4/9/25 | 200 | 208,426 | ||||||
Harley-Davidson Financial Services, Inc., Ser. SR (a)(b), | ||||||||
3.55%, 5/21/21 | 350 | 355,644 | ||||||
Kia Motors Corp. (a)(b), | ||||||||
3.50%, 10/25/27 | 250 | 255,285 | ||||||
PACCAR Financial Corp., | ||||||||
1.65%, 8/11/21 | 500 | 496,982 | ||||||
2.30%, 8/10/22 | 250 | 251,771 | ||||||
|
|
| ||||||
| 4,637,254 | ||||||||
|
|
| ||||||
Banks - 24.5% | ||||||||
Banco Bilbao Vizcaya Argentaria S.A., | ||||||||
3.00%, 10/20/20 | 1,000 | 1,006,952 | ||||||
Banco Santander S.A., | ||||||||
3.80%, 2/23/28 | 200 | 209,826 | ||||||
Bank of America Corp., | ||||||||
4.00%, 4/1/24 | 200 | 214,636 | ||||||
5.625%, 7/1/20 | 600 | 616,347 | ||||||
Bank of New York Mellon Corp., | ||||||||
2.60%, 2/7/22 | 800 | 811,027 | ||||||
Bank of Nova Scotia, | ||||||||
1.85%, 4/14/20 | 350 | 349,631 | ||||||
1.875%, 4/26/21 | 798 | 797,558 | ||||||
2.15%, 7/14/20 | 850 | 850,406 | ||||||
2.80%, 7/21/21 | 300 | 304,194 | ||||||
Barclays PLC, | ||||||||
2.75%, 11/8/19 | 850 | 850,191 | ||||||
4.375%, 1/12/26 | 350 | 370,727 | ||||||
4.95%, 1/10/47 | 300 | 331,241 | ||||||
BNG Bank NV (a)(b), | ||||||||
1.625%, 4/19/21 | 800 | 797,872 | ||||||
2.375%, 3/16/26 | 300 | 311,877 | ||||||
BNZ International Funding Ltd. (a)(b), | ||||||||
3.375%, 3/1/23 | 300 | 310,201 | ||||||
| See accompanying Notes to Financial Statements | 12 | Annual Report / September 30, 2019 |
Table of Contents
Schedule of Investments
September 30, 2019
AllianzGI Advanced Core Bond Portfolio(continued)
Principal Amount (000s) | Value | |||||||
Citigroup, Inc., | ||||||||
4.50%, 1/14/22 | 300 | 315,412 | ||||||
8.125%, 7/15/39 | 200 | 327,414 | ||||||
Commonwealth Bank of Australia (a)(b), | ||||||||
2.85%, 5/18/26 | 500 | 516,297 | ||||||
Deutsche Bank AG, | ||||||||
3.375%, 5/12/21 | 400 | 399,703 | ||||||
Dexia Credit Local S.A. (a)(b), | ||||||||
3.25%, 9/26/23 | 250 | 262,981 | ||||||
Fifth Third Bancorp, | ||||||||
2.60%, 6/15/22 | 200 | 202,315 | ||||||
Goldman Sachs Group, Inc., Ser. D, | ||||||||
6.00%, 6/15/20 | 300 | 307,862 | ||||||
ING Bank NV (a)(b), | ||||||||
2.625%, 12/5/22 | 750 | 767,386 | ||||||
ING Groep NV, | ||||||||
4.10%, 10/2/23 | 250 | 265,830 | ||||||
KeyCorp, | ||||||||
4.10%, 4/30/28 | 200 | 220,494 | ||||||
Landwirtschaftliche Rentenbank, | ||||||||
2.50%, 11/15/27, Ser. 37 | 400 | 422,024 | ||||||
3.125%, 11/14/23 | 400 | 423,493 | ||||||
Lloyds Banking Group PLC, | ||||||||
4.05%, 8/16/23 | 200 | 210,419 | ||||||
4.375%, 3/22/28 | 200 | 217,052 | ||||||
Macquarie Bank Ltd. (a)(b), | ||||||||
3.90%, 1/15/26 | 500 | 533,401 | ||||||
Mitsubishi UFJ Financial Group, Inc., | ||||||||
3.677%, 2/22/27 | 200 | 214,704 | ||||||
Mizuho Financial Group, Inc., | ||||||||
3.17%, 9/11/27 | 200 | 207,622 | ||||||
Morgan Stanley, | ||||||||
2.50%, 4/21/21 | 500 | 502,881 | ||||||
2.80%, 6/16/20 | 850 | 853,957 | ||||||
4.375%, 1/22/47 | 100 | 117,470 | ||||||
National Australia Bank Ltd., | ||||||||
2.625%, 1/14/21 | 200 | 201,533 | ||||||
Royal Bank of Canada, | ||||||||
2.125%, 3/2/20 | 450 | 450,112 | ||||||
2.30%, 3/22/21 | 700 | 703,986 | ||||||
3.35%, 10/22/21 (a)(b) | 350 | 360,302 | ||||||
Royal Bank of Scotland Group PLC, | ||||||||
3.875%, 9/12/23 | 300 | 309,940 | ||||||
Santander UK PLC, | ||||||||
4.00%, 3/13/24 | 400 | 424,225 | ||||||
State Street Corp., | ||||||||
2.55%, 8/18/20 | 850 | 854,327 | ||||||
Toronto-Dominion Bank (a)(b), | ||||||||
2.25%, 3/15/21 | 750 | 753,827 | ||||||
Wells Fargo & Co., | ||||||||
2.50%, 3/4/21 | 600 | 602,934 | ||||||
Ser. M, 3.45%, 2/13/23 | 100 | 103,327 | ||||||
Wells Fargo Bank N.A., | ||||||||
3.625%, 10/22/21 | 250 | 257,493 | ||||||
Westpac Banking Corp., | ||||||||
2.00%, 3/3/20 | 350 | 349,726 | ||||||
2.85%, 5/13/26 | 200 | 207,347 | ||||||
|
|
| ||||||
| 21,000,482 | ||||||||
|
|
| ||||||
Building Materials - 0.4% | ||||||||
CRH America Finance, Inc. (a)(b), | ||||||||
3.95%, 4/4/28 | 350 | 374,529 | ||||||
|
|
| ||||||
Chemicals - 1.4% | ||||||||
Dow Chemical Co., | ||||||||
7.375%, 11/1/29 | 300 | 395,773 | ||||||
Ecolab, Inc., | ||||||||
2.375%, 8/10/22 | 250 | 252,323 | ||||||
Nutrien Ltd., | ||||||||
4.00%, 12/15/26 | 300 | 321,591 | ||||||
Syngenta Finance NV (a)(b), | ||||||||
3.933%, 4/23/21 | 200 | 203,734 | ||||||
|
|
| ||||||
| 1,173,421 | ||||||||
|
|
| ||||||
| See accompanying Notes to Financial Statements | 13 | Annual Report / September 30, 2019 |
Table of Contents
Schedule of Investments
September 30, 2019
AllianzGI Advanced Core Bond Portfolio(continued)
Principal Amount (000s) | Value | |||||||
Computers - 1.1% | ||||||||
Apple, Inc., | ||||||||
2.25%, 2/23/21 | 500 | 502,839 | ||||||
4.65%, 2/23/46 | 200 | 252,313 | ||||||
International Business Machines Corp., | ||||||||
2.50%, 1/27/22 | 200 | 202,216 | ||||||
|
|
| ||||||
| 957,368 | ||||||||
|
|
| ||||||
Consumer Products - 0.6% | ||||||||
Colgate-Palmolive Co., | ||||||||
3.70%, 8/1/47 | 100 | 117,577 | ||||||
Procter & Gamble Co., | ||||||||
1.90%, 10/23/20 | 300 | 300,693 | ||||||
3.50%, 10/25/47 | 100 | 113,847 | ||||||
|
|
| ||||||
| 532,117 | ||||||||
|
|
| ||||||
Electric Utilities - 2.2% | ||||||||
Consolidated Edison Co. of New York, Inc., | ||||||||
4.50%, 5/15/58 | 150 | 179,469 | ||||||
Electricite de France S.A. (a)(b), | ||||||||
4.875%, 1/22/44 | 100 | 116,514 | ||||||
Enel Finance International NV, | ||||||||
6.80%, 9/15/37 | 150 | 201,268 | ||||||
Florida Power & Light Co., | ||||||||
3.70%, 12/1/47 | 200 | 222,281 | ||||||
3.95%, 3/1/48 | 100 | 115,531 | ||||||
Georgia Power Co., Ser. C, | ||||||||
2.00%, 9/8/20 | 500 | 499,651 | ||||||
PPL Electric Utilities Corp., | ||||||||
4.15%, 6/15/48 | 150 | 175,662 | ||||||
State Grid Overseas Investment 2016 Ltd. (a)(b), | ||||||||
3.75%, 5/2/23 | 350 | 366,744 | ||||||
|
|
| ||||||
| 1,877,120 | ||||||||
|
|
| ||||||
Electronics - 0.4% | ||||||||
Tyco Electronics Group S.A., | ||||||||
3.45%, 8/1/24 | 300 | 314,031 | ||||||
|
|
| ||||||
Food & Beverage - 2.8% | ||||||||
Anheuser-Busch Cos. LLC, | ||||||||
4.90%, 2/1/46 | 150 | 178,718 | ||||||
Diageo Capital PLC, | ||||||||
3.00%, 5/18/20 | 350 | 352,107 | ||||||
3.875%, 4/29/43 | 150 | 171,028 | ||||||
General Mills, Inc., | ||||||||
2.60%, 10/12/22 | 150 | 151,728 | ||||||
Kellogg Co., | ||||||||
3.40%, 11/15/27 | 250 | 263,116 | ||||||
Keurig Dr. Pepper, Inc., | ||||||||
4.42%, 12/15/46 | 200 | 215,477 | ||||||
Kraft Heinz Foods Co., | ||||||||
5.375%, 2/10/20 | 400 | 403,942 | ||||||
Kroger Co., | ||||||||
4.65%, 1/15/48 | 100 | 107,312 | ||||||
Nestle Holdings, Inc. (a)(b), | ||||||||
3.50%, 9/24/25 | 250 | 268,387 | ||||||
PepsiCo, Inc., | ||||||||
2.15%, 10/14/20 | 300 | 300,622 | ||||||
|
|
| ||||||
| 2,412,437 | ||||||||
|
|
| ||||||
Healthcare-Products - 0.1% | ||||||||
Thermo Fisher Scientific, Inc., | ||||||||
4.10%, 8/15/47 | 50 | 56,426 | ||||||
|
|
| ||||||
Insurance - 1.0% | ||||||||
Allstate Corp., | ||||||||
3.28%, 12/15/26 | 200 | 213,438 | ||||||
MetLife, Inc., | ||||||||
5.70%, 6/15/35 | 400 | 539,791 | ||||||
| See accompanying Notes to Financial Statements | 14 | Annual Report / September 30, 2019 |
Table of Contents
Schedule of Investments
September 30, 2019
AllianzGI Advanced Core Bond Portfolio(continued)
Principal Amount (000s) | Value | |||||||
Prudential Financial, Inc., | ||||||||
4.35%, 2/25/50 | 100 | 114,892 | ||||||
|
|
| ||||||
| 868,121 | ||||||||
|
|
| ||||||
Internet - 0.4% | ||||||||
Alphabet, Inc., | ||||||||
3.375%, 2/25/24 | 300 | 319,503 | ||||||
|
|
| ||||||
Iron/Steel - 0.3% | ||||||||
ArcelorMittal, | ||||||||
4.55%, 3/11/26 | 150 | 157,625 | ||||||
Nucor Corp., | ||||||||
4.40%, 5/1/48 | 100 | 115,247 | ||||||
|
|
| ||||||
| 272,872 | ||||||||
|
|
| ||||||
Machinery-Construction & Mining - 0.3% | ||||||||
Caterpillar Financial Services Corp., | ||||||||
3.15%, 9/7/21 | 250 | 255,259 | ||||||
|
|
| ||||||
Machinery-Diversified - 1.2% | ||||||||
CNH Industrial Capital LLC, | ||||||||
4.875%, 4/1/21 | 150 | 154,889 | ||||||
John Deere Capital Corp., | ||||||||
1.95%, 6/22/20 | 650 | 650,200 | ||||||
2.65%, 6/24/24 | 250 | 256,142 | ||||||
|
|
| ||||||
| 1,061,231 | ||||||||
|
|
| ||||||
Media - 1.0% | ||||||||
CBS Corp., | ||||||||
3.70%, 6/1/28 | 300 | 314,357 | ||||||
Discovery Communications LLC, | ||||||||
3.80%, 3/13/24 | 300 | 314,574 | ||||||
6.35%, 6/1/40 | 50 | 60,904 | ||||||
Time Warner Cable LLC, | ||||||||
6.75%, 6/15/39 | 150 | 183,832 | ||||||
|
|
| ||||||
| 873,667 | ||||||||
|
|
| ||||||
Mining - 0.8% | ||||||||
BHP Billiton Finance USA Ltd., | ||||||||
2.875%, 2/24/22 | 200 | 204,076 | ||||||
Glencore Funding LLC (a)(b), | ||||||||
3.00%, 10/27/22 | 450 | 455,410 | ||||||
|
|
| ||||||
| 659,486 | ||||||||
|
|
| ||||||
Miscellaneous Manufacturing - 0.4% | ||||||||
Siemens Financieringsmaatschappij NV (a)(b), | ||||||||
4.40%, 5/27/45 | 300 | 357,227 | ||||||
|
|
| ||||||
Oil, Gas & Consumable Fuels - 4.5% | ||||||||
BP Capital Markets PLC, | ||||||||
2.315%, 2/13/20 | 600 | 600,639 | ||||||
3.723%, 11/28/28 | 100 | 109,163 | ||||||
CNOOC Nexen Finance 2014 ULC, | ||||||||
4.25%, 4/30/24 | 300 | 321,796 | ||||||
Equinor ASA, | ||||||||
2.65%, 1/15/24 | 400 | 410,846 | ||||||
2.90%, 11/8/20 | 400 | 404,195 | ||||||
KazMunayGas National Co. JSC (a)(b), | ||||||||
4.75%, 4/24/25 | 200 | 218,559 | ||||||
Occidental Petroleum Corp., | ||||||||
3.00%, 2/15/27 | 300 | 297,523 | ||||||
Phillips 66, | ||||||||
4.875%, 11/15/44 | 150 | 178,567 | ||||||
Shell International Finance BV, | ||||||||
2.125%, 5/11/20 | 850 | 852,161 | ||||||
3.75%, 9/12/46 | 50 | 55,883 | ||||||
6.375%, 12/15/38 | 150 | 219,322 | ||||||
Total Capital International S.A., | ||||||||
3.455%, 2/19/29 | 200 | 216,617 | ||||||
|
|
| ||||||
| 3,885,271 | ||||||||
|
|
| ||||||
| See accompanying Notes to Financial Statements | 15 | Annual Report / September 30, 2019 |
Table of Contents
Schedule of Investments
September 30, 2019
AllianzGI Advanced Core Bond Portfolio(continued)
Principal Amount (000s) | Value | |||||||
Paper & Forest Products - 0.1% | ||||||||
International Paper Co., | ||||||||
4.35%, 8/15/48 | 100 | 103,758 | ||||||
|
|
| ||||||
Pharmaceuticals - 1.9% | ||||||||
CVS Health Corp., | ||||||||
4.10%, 3/25/25 | 250 | 267,050 | ||||||
Eli Lilly & Co., | ||||||||
2.35%, 5/15/22 | 100 | 101,576 | ||||||
GlaxoSmithKline Capital, Inc., | ||||||||
3.625%, 5/15/25 | 200 | 215,043 | ||||||
Johnson & Johnson, | ||||||||
1.95%, 11/10/20 | 300 | 300,360 | ||||||
Merck & Co., Inc., | ||||||||
3.40%, 3/7/29 | 100 | 108,463 | ||||||
Novartis Capital Corp., | ||||||||
1.80%, 2/14/20 | 300 | 299,816 | ||||||
Pfizer, Inc., | ||||||||
2.75%, 6/3/26 | 200 | 207,463 | ||||||
4.00%, 3/15/49 | 100 | 115,568 | ||||||
|
|
| ||||||
| 1,615,339 | ||||||||
|
|
| ||||||
Pipelines - 0.8% | ||||||||
Energy Transfer Partners L.P., Ser. 30Y, | ||||||||
6.00%, 6/15/48 | 150 | 176,593 | ||||||
Enterprise Products Operating LLC, | ||||||||
4.85%, 3/15/44 | 100 | 114,894 | ||||||
Kinder Morgan, Inc., | ||||||||
3.15%, 1/15/23 | 350 | 358,328 | ||||||
|
|
| ||||||
| 649,815 | ||||||||
|
|
| ||||||
Retail - 1.5% | ||||||||
Macy’s Retail Holdings, Inc., | ||||||||
4.50%, 12/15/34 | 200 | 185,513 | ||||||
Walgreens Boots Alliance, Inc., | ||||||||
4.50%, 11/18/34 | 250 | 266,298 | ||||||
Walmart, Inc., | ||||||||
3.125%, 6/23/21 | 800 | 818,357 | ||||||
|
|
| ||||||
| 1,270,168 | ||||||||
|
|
| ||||||
Software - 0.5% | ||||||||
Oracle Corp., | ||||||||
2.625%, 2/15/23 | 450 | 458,456 | ||||||
|
|
| ||||||
Telecommunications - 1.5% | ||||||||
AT&T, Inc., | ||||||||
4.80%, 6/15/44 | 250 | 277,894 | ||||||
Cisco Systems, Inc., | ||||||||
2.45%, 6/15/20 | 200 | 200,792 | ||||||
5.50%, 1/15/40 | 250 | 346,107 | ||||||
Deutsche Telekom International Finance BV (a)(b), | ||||||||
4.75%, 6/21/38 | 150 | 171,407 | ||||||
Verizon Communications, Inc., | ||||||||
5.25%, 3/16/37 | 150 | 186,723 | ||||||
5.50%, 3/16/47 | 100 | 132,682 | ||||||
|
|
| ||||||
| 1,315,605 | ||||||||
|
|
| ||||||
Transportation - 0.5% | ||||||||
CSX Corp., | ||||||||
2.60%, 11/1/26 | 150 | 152,023 | ||||||
FedEx Corp., | ||||||||
3.40%, 2/15/28 | 150 | 154,323 | ||||||
4.10%, 4/15/43 | 150 | 149,781 | ||||||
|
|
| ||||||
| 456,127 | ||||||||
|
|
| ||||||
Total Corporate Bonds & Notes (cost-$49,309,744) | 50,989,278 | |||||||
|
|
| ||||||
| See accompanying Notes to Financial Statements | 16 | Annual Report / September 30, 2019 |
Table of Contents
Schedule of Investments
September 30, 2019
AllianzGI Advanced Core Bond Portfolio(continued)
Principal Amount (000s) | Value | |||||||
U.S. GOVERNMENT AGENCY SECURITIES - 27.2% | ||||||||
Fannie Mae, | ||||||||
2.50%, 10/17/34 MBS, TBA, 15 Year (c) | 3,220 | 3,247,986 | ||||||
3.00%, 10/17/34 MBS, TBA, 15 Year (c) | 1,970 | 2,014,094 | ||||||
3.00%, 10/10/49 MBS, TBA, 30 Year (c) | 4,860 | 4,934,419 | ||||||
3.50%, 10/10/49 MBS, TBA, 30 Year (c) | 4,980 | 5,109,752 | ||||||
4.00%, 10/10/49 MBS, TBA, 30 Year (c) | 775 | 804,365 | ||||||
4.50%, 10/10/49 MBS, TBA, 30 Year (c) | 1,700 | 1,790,445 | ||||||
6.625%, 11/15/30 | 100 | 146,998 | ||||||
Freddie Mac, | ||||||||
4.00%, 8/1/44 | 101 | 106,410 | ||||||
6.25%, 7/15/32 | 100 | 148,234 | ||||||
Ginnie Mae, MBS, TBA, 30 Year (c), | ||||||||
3.00%, 10/21/49 | 4,330 | 4,444,086 | ||||||
3.50%, 10/21/49 | 605 | 626,908 | ||||||
|
|
| ||||||
Total U.S. Government Agency Securities (cost-$23,430,890) | 23,373,697 | |||||||
|
|
| ||||||
U.S. TREASURY OBLIGATIONS - 21.2% | ||||||||
U.S. Treasury Bonds, | ||||||||
2.25%, 8/15/46 | 800 | 820,937 | ||||||
2.25%, 8/15/49 | 300 | 308,906 | ||||||
2.50%, 2/15/45 | 920 | 991,012 | ||||||
2.75%, 8/15/47 | 1,000 | 1,132,969 | ||||||
3.125%, 2/15/42 | 605 | 721,935 | ||||||
3.125%, 2/15/43 | 800 | 954,812 | ||||||
3.375%, 11/15/48 | 900 | 1,147,852 | ||||||
5.50%, 8/15/28 | 100 | 131,703 | ||||||
6.00%, 2/15/26 | 1,250 | 1,581,934 | ||||||
U.S. Treasury Notes, | ||||||||
1.50%, 9/15/22 | 600 | 598,969 | ||||||
1.50%, 8/15/26 | 700 | 694,695 | ||||||
1.625%, 5/15/26 | 1,850 | 1,851,301 | ||||||
1.625%, 8/15/29 | 350 | 348,551 | ||||||
2.00%, 11/15/26 | 50 | 51,281 | ||||||
2.125%, 3/31/24 | 1,100 | 1,126,984 | ||||||
2.125%, 9/30/24 | 400 | 410,625 | ||||||
2.125%, 5/15/25 | 1,400 | 1,440,250 | ||||||
2.25%, 11/15/27 | 200 | 209,266 | ||||||
2.50%, 1/15/22 | 2,100 | 2,141,344 | ||||||
2.625%, 2/15/29 | 1,000 | 1,082,891 | ||||||
2.875%, 5/15/28 | 410 | 450,167 | ||||||
|
|
| ||||||
Total U.S. Treasury Obligations (cost-$17,096,589) | 18,198,384 | |||||||
|
|
| ||||||
SOVEREIGN DEBT OBLIGATIONS - 16.4% | ||||||||
Brazil - 0.4% | ||||||||
Brazilian Government International Bond, | ||||||||
4.25%, 1/7/25 | 300 | 316,693 | ||||||
|
|
| ||||||
Canada - 2.9% | ||||||||
Export Development Canada, | ||||||||
2.50%, 1/24/23 | 700 | 719,400 | ||||||
Province of Alberta Canada, | ||||||||
3.30%, 3/15/28 | 500 | 552,061 | ||||||
Province of British Columbia Canada, | ||||||||
2.25%, 6/2/26 | 300 | 308,176 | ||||||
Province of Ontario Canada, | ||||||||
2.50%, 4/27/26 | 400 | 415,653 | ||||||
Province of Quebec Canada, | ||||||||
2.875%, 10/16/24 | 500 | 527,391 | ||||||
|
|
| ||||||
| 2,522,681 | ||||||||
|
|
| ||||||
Chile - 0.7% | ||||||||
Chile Government International Bond, | ||||||||
3.25%, 9/14/21 | 400 | 409,741 | ||||||
3.86%, 6/21/47 | 200 | 230,770 | ||||||
|
|
| ||||||
| 640,511 | ||||||||
|
|
| ||||||
| See accompanying Notes to Financial Statements | 17 | Annual Report / September 30, 2019 |
Table of Contents
Schedule of Investments
September 30, 2019
AllianzGI Advanced Core Bond Portfolio(continued)
Principal Amount (000s) | Value | |||||||
Croatia - 0.6% | ||||||||
Croatia Government International Bond, | ||||||||
6.75%, 11/5/19 | 500 | 501,506 | ||||||
|
|
| ||||||
Indonesia - 0.4% | ||||||||
Indonesia Government International Bond, | ||||||||
3.75%, 4/25/22 | 350 | 361,189 | ||||||
|
|
| ||||||
Japan - 0.6% | ||||||||
Japan Bank for International Cooperation, | ||||||||
2.125%, 7/21/20 | 500 | 500,533 | ||||||
|
|
| ||||||
Korea (Republic of) - 1.3% | ||||||||
Export-Import Bank of Korea, | ||||||||
2.50%, 11/1/20 | 400 | 401,550 | ||||||
2.625%, 5/26/26 | 400 | 407,688 | ||||||
3.625%, 11/27/23 | 300 | 318,423 | ||||||
|
|
| ||||||
| 1,127,661 | ||||||||
|
|
| ||||||
Latvia - 0.8% | ||||||||
Latvia Government International Bond, | ||||||||
2.75%, 1/12/20 | 700 | 700,463 | ||||||
|
|
| ||||||
Lithuania - 0.6% | ||||||||
Lithuania Government International Bond (a)(b), | ||||||||
7.375%, 2/11/20 | 500 | 509,423 | ||||||
|
|
| ||||||
Mexico - 0.3% | ||||||||
Mexico Government International Bond, | ||||||||
4.60%, 2/10/48 | 250 | 268,159 | ||||||
|
|
| ||||||
Morocco - 0.2% | ||||||||
Morocco Government International Bond, | ||||||||
4.25%, 12/11/22 | 200 | 209,609 | ||||||
|
|
| ||||||
Norway - 0.6% | ||||||||
Kommunalbanken AS (a)(b), | ||||||||
3.125%, 10/18/21 | 500 | 514,285 | ||||||
|
|
| ||||||
Panama - 0.2% | ||||||||
Panama Government International Bond, | ||||||||
7.125%, 1/29/26 | 100 | 125,540 | ||||||
|
|
| ||||||
Peru - 0.1% | ||||||||
Peruvian Government International Bond, | ||||||||
4.125%, 8/25/27 | 100 | 112,069 | ||||||
|
|
| ||||||
Philippines - 0.4% | ||||||||
Philippine Government International Bond, | ||||||||
6.50%, 1/20/20 | 300 | 304,038 | ||||||
|
|
| ||||||
Sri Lanka - 0.4% | ||||||||
Sri Lanka Government International Bond (a)(b), | ||||||||
5.75%, 4/18/23 | 350 | 348,583 | ||||||
|
|
| ||||||
Supranational - 2.9% | ||||||||
Asian Development Bank, | ||||||||
3.125%, 9/26/28 | 300 | 334,742 | ||||||
Corp. Andina de Fomento, | ||||||||
2.20%, 7/18/20 | 850 | 848,297 | ||||||
3.25%, 2/11/22 | 500 | 510,092 | ||||||
European Investment Bank, | ||||||||
4.875%, 2/15/36 | 250 | 346,194 | ||||||
Inter-American Development Bank, | ||||||||
3.125%, 9/18/28 | 400 | 446,468 | ||||||
|
|
| ||||||
| 2,485,793 | ||||||||
|
|
| ||||||
Sweden - 3.0% | ||||||||
Kommuninvest I Sverige AB (a)(b), | ||||||||
2.75%, 10/22/20 | 800 | 807,382 | ||||||
Svensk Exportkredit AB, | ||||||||
1.75%, 5/18/20 | 350 | 349,429 | ||||||
2.875%, 5/22/21 | 800 | 813,796 | ||||||
| See accompanying Notes to Financial Statements | 18 | Annual Report / September 30, 2019 |
Table of Contents
Schedule of Investments
September 30, 2019
AllianzGI Advanced Core Bond Portfolio(continued)
Principal Amount (000s) | Value | |||||||
3.125%, 11/8/21 | 600 | 617,003 | ||||||
|
|
| ||||||
| 2,587,610 | ||||||||
|
|
| ||||||
Total Sovereign Debt Obligations (cost-$13,729,622) | 14,136,346 | |||||||
|
|
| ||||||
Repurchase Agreements - 1.7% | ||||||||
State Street Bank and Trust Co., | 1,464 | 1,464,000 | ||||||
|
|
| ||||||
Total Investments(cost-$105,030,845)-125.9% | 108,161,705 | |||||||
|
|
| ||||||
Liabilities in excess of other assets (d)-(25.9)% | (22,273,895 | ) | ||||||
|
|
| ||||||
NetAssets-100.0% | $ | 85,887,810 | ||||||
|
|
| ||||||
| See accompanying Notes to Financial Statements | 19 | Annual Report / September 30, 2019 |
Table of Contents
Schedule of Investments
September 30, 2019
AllianzGI Advanced Core Bond Portfolio(continued)
Notes to Schedule of Investments:
| (a) | Private Placement—Restricted as to resale and may not have a readily available market. Securities with an aggregate value of $12,056,947, representing 14.0% of net assets. |
| (b) | 144A—Exempt from registration under Rule 144A of the Securities Act of 1933. These securities may be resold in transactions exempt from registration, typically only to qualified institutional buyers. Securities with an aggregate value of $12,056,947, representing 14.0% of net assets. |
| (c) | When-issued or delayed-delivery. To be settled/delivered after September 30, 2019. |
| (d) | Includes net unrealized appreciation (depreciation) of other financial instruments as follows: |
Futures contracts outstanding at September 30, 2019:
| Type | Contracts | Expiration Date | Notional Amount (000s) | Market Value | Unrealized Appreciation | |||||||||||||||
Short position contracts: | ||||||||||||||||||||
2-Year U.S. Treasury Note | (56 | ) | 12/31/19 | $(11,200) | $(12,068) | $27,813 | ||||||||||||||
|
| |||||||||||||||||||
| (e) | At September 30, 2019, the Portfolio pledged $271,314 in cash as collateral for futures contracts. The Portfolio also held U.S. Treasury Obligations valued $181,898 as collateral for TBA securities. Securities held as collateral will not be pledged and are not reflected in the Schedule of Investments. |
Glossary:
MBS - Mortgage-Backed Securities
TBA - To Be Announced
| See accompanying Notes to Financial Statements | 20 | Annual Report / September 30, 2019 |
Table of Contents
Schedule of Investments
September 30, 2019
AllianzGI Best Styles Global Managed Volatility Portfolio
| Shares | Value | |||||||
COMMON STOCK - 97.9% | ||||||||
Australia - 1.2% | ||||||||
Brickworks Ltd. | 6,500 | $ | 77,499 | |||||
Newcrest Mining Ltd. | 7,668 | 176,944 | ||||||
Regis Resources Ltd. | 26,025 | 85,863 | ||||||
Saracen Mineral Holdings Ltd. (e) | 32,229 | 74,894 | ||||||
Silver Lake Resources Ltd. (e) | 34,544 | 21,746 | ||||||
St. Barbara Ltd. | 14,103 | 27,548 | ||||||
Telstra Corp. Ltd. | 64,919 | 153,888 | ||||||
|
|
| ||||||
| 618,382 | ||||||||
|
|
| ||||||
Austria - 0.1% | ||||||||
Flughafen Wien AG | 961 | 40,170 | ||||||
Telekom Austria AG (e) | 3,219 | 23,402 | ||||||
|
|
| ||||||
| 63,572 | ||||||||
|
|
| ||||||
Belgium - 0.6% | ||||||||
Ageas | 1,836 | 101,779 | ||||||
Elia System Operator S.A. | 999 | 81,665 | ||||||
Proximus SADP | 4,701 | 139,685 | ||||||
|
|
| ||||||
| 323,129 | ||||||||
|
|
| ||||||
Bermuda - 0.8% | ||||||||
Arch Capital Group Ltd. (e) | 3,260 | 136,855 | ||||||
RenaissanceRe Holdings Ltd. | 1,493 | 288,821 | ||||||
|
|
| ||||||
| 425,676 | ||||||||
|
|
| ||||||
Brazil - 0.1% | ||||||||
Banco do Brasil S.A. | 5,200 | 56,932 | ||||||
|
|
| ||||||
Canada - 1.1% | ||||||||
Cascades, Inc. | 673 | 5,882 | ||||||
Cogeco Communications, Inc. | 1,235 | 99,529 | ||||||
Dream Global Real Estate Investment Trust REIT | 5,020 | 62,975 | ||||||
Emera, Inc. | 2,585 | 113,480 | ||||||
Empire Co., Ltd., Class A | 2,490 | 67,416 | ||||||
Fairfax Financial Holdings Ltd. | 296 | 130,478 | ||||||
InterRent Real Estate Investment Trust REIT | 2,995 | 36,984 | ||||||
Killam Apartment Real Estate Investment Trust REIT | 2,174 | 32,868 | ||||||
Valener, Inc. | 682 | 13,379 | ||||||
|
|
| ||||||
| 562,991 | ||||||||
|
|
| ||||||
China - 2.3% | ||||||||
BOC Aviation Ltd. (a) | 12,000 | 110,748 | ||||||
China Construction Bank Corp., Class H | 186,748 | 142,294 | ||||||
China Dongxiang Group Co., Ltd. | 68,883 | 7,384 | ||||||
China Everbright Greentech Ltd. (a) | 66,000 | 38,401 | ||||||
China Mobile Ltd. | 30,500 | 252,654 | ||||||
China SCE Group Holdings Ltd. | 198,000 | 91,248 | ||||||
Golden Eagle Retail Group Ltd. | 20,000 | 21,741 | ||||||
Jiangsu Expressway Co., Ltd., Class H | 16,811 | 21,347 | ||||||
Lenovo Group Ltd. | 224,000 | 149,436 | ||||||
Shenzhen Expressway Co., Ltd., Class H | 100,300 | 130,809 | ||||||
Shenzhen Investment Holdings Bay Area Development Co., Ltd. | 41,000 | 20,132 | ||||||
Tencent Holdings Ltd. | 1,500 | 62,742 | ||||||
Yadea Group Holdings Ltd. (a) | 58,000 | 12,587 | ||||||
Yuexiu Real Estate Investment Trust REIT | 43,000 | 27,541 | ||||||
Yuexiu Transport Infrastructure Ltd. | 80,000 | 69,129 | ||||||
Yuzhou Properties Co., Ltd. | 63,204 | 25,163 | ||||||
|
|
| ||||||
| 1,183,356 | ||||||||
|
|
| ||||||
Czech Republic - 0.4% | ||||||||
CEZ AS | 4,782 | 105,631 | ||||||
Moneta Money Bank AS (a) | 14,893 | 45,896 | ||||||
O2 Czech Republic AS | 4,201 | 37,992 | ||||||
|
|
| ||||||
| 189,519 | ||||||||
|
|
| ||||||
Denmark - 0.5% | ||||||||
Scandinavian Tobacco Group A/S, Class A (a) | 884 | 10,344 | ||||||
Solar A/S, Class B | 333 | 14,001 | ||||||
Spar Nord Bank A/S | 733 | 6,602 | ||||||
| See accompanying Notes to Financial Statements | 21 | Annual Report / September 30, 2019 |
Table of Contents
Schedule of Investments
September 30, 2019
AllianzGI Best Styles Global Managed Volatility Portfolio(continued)
| Shares | Value | |||||||
Topdanmark A/S | 787 | 37,990 | ||||||
Tryg A/S | 5,516 | 158,036 | ||||||
|
|
| ||||||
| 226,973 | ||||||||
|
|
| ||||||
Finland - 0.6% | ||||||||
DNA Oyj | 1,267 | 28,841 | ||||||
Elisa Oyj | 2,397 | 123,576 | ||||||
Neste Oyj | 5,064 | 167,541 | ||||||
|
|
| ||||||
| 319,958 | ||||||||
|
|
| ||||||
France - 1.4% | ||||||||
Cegereal S.A. REIT | 1,987 | 89,661 | ||||||
Eiffage S.A. | 1,216 | 126,057 | ||||||
Hermes International | 316 | 218,254 | ||||||
Orpea | 50 | 6,107 | ||||||
SEB S.A. | 36 | 5,464 | ||||||
Sodexo S.A. | 717 | 80,494 | ||||||
Vinci S.A. | 1,913 | 206,066 | ||||||
|
|
| ||||||
| 732,103 | ||||||||
|
|
| ||||||
Germany - 1.6% | ||||||||
Deutsche Telekom AG | 13,864 | 232,541 | ||||||
Muenchener Rueckversicherungs-Gesellschaft AG in Muenchen | 1,060 | 273,796 | ||||||
TAG Immobilien AG | 4,105 | 93,678 | ||||||
Talanx AG (e) | 2,945 | 127,260 | ||||||
TLG Immobilien AG | 1,775 | 48,270 | ||||||
WCM Beteiligungs & Grundbesitz AG | 5,562 | 26,795 | ||||||
|
|
| ||||||
| 802,340 | ||||||||
|
|
| ||||||
Hong Kong - 1.6% | ||||||||
China Telecom Corp., Ltd., Class H | 72,000 | 32,786 | ||||||
China Water Affairs Group Ltd. | 30,000 | 23,317 | ||||||
CITIC Telecom International Holdings Ltd. | 85,000 | 30,892 | ||||||
CK Hutchison Holdings Ltd. | 8,203 | 72,417 | ||||||
CLP Holdings Ltd. | 36,219 | 380,694 | ||||||
Fairwood Holdings Ltd. | 11,000 | 31,100 | ||||||
Hang Seng Bank Ltd. | 2,700 | 58,178 | ||||||
Hui Xian Real Estate Investment Trust REIT | 50,000 | 22,483 | ||||||
NWS Holdings Ltd. | 19,000 | 29,429 | ||||||
Swire Pacific Ltd., Class A | 11,344 | 105,582 | ||||||
Yue Yuen Industrial Holdings Ltd. | 2,802 | 7,655 | ||||||
|
|
| ||||||
| 794,533 | ||||||||
|
|
| ||||||
Hungary - 0.3% | ||||||||
Magyar Telekom Telecommunications PLC | 38,780 | 55,532 | ||||||
MOL Hungarian Oil & Gas PLC | 5,827 | 54,810 | ||||||
OTP Bank Nyrt | 994 | 41,405 | ||||||
|
|
| ||||||
| 151,747 | ||||||||
|
|
| ||||||
Ireland - 0.0% | ||||||||
Irish Residential Properties REIT PLC | 3,629 | 6,795 | ||||||
|
|
| ||||||
Israel - 0.8% | ||||||||
Bank LeumiLe-Israel BM | 20,479 | 145,807 | ||||||
Israel Discount Bank Ltd., Class A | 22,861 | 100,478 | ||||||
Mizrahi Tefahot Bank Ltd. | 5,794 | 143,972 | ||||||
Shufersal Ltd. | 2,678 | 19,574 | ||||||
|
|
| ||||||
| 409,831 | ||||||||
|
|
| ||||||
Italy - 1.2% | ||||||||
Enav SpA (a) | 6,976 | 39,386 | ||||||
Enel SpA | 26,988 | 201,581 | ||||||
Eni SpA | 3,676 | 56,187 | ||||||
Hera SpA | 2,579 | 10,584 | ||||||
Snam SpA | 59,299 | 299,533 | ||||||
|
|
| ||||||
| 607,271 | ||||||||
|
|
| ||||||
Japan - 12.2% | ||||||||
ANA Holdings, Inc. | 5,354 | 180,374 | ||||||
Aoyama Trading Co., Ltd. | 189 | 3,299 | ||||||
| See accompanying Notes to Financial Statements | 22 | Annual Report / September 30, 2019 |
Table of Contents
Schedule of Investments
September 30, 2019
AllianzGI Best Styles Global Managed Volatility Portfolio(continued)
| Shares | Value | |||||||
Asahi Group Holdings Ltd. | 3,800 | 188,720 | ||||||
Astellas Pharma, Inc. | 17,708 | 253,298 | ||||||
Bookoff Group Holdings Ltd. | 1,500 | 16,272 | ||||||
Canon, Inc. | 3,190 | 85,308 | ||||||
Cawachi Ltd. | 900 | 17,392 | ||||||
Daiwa Office Investment Corp. REIT | 8 | 62,119 | ||||||
DCM Holdings Co., Ltd. | 9,875 | 97,008 | ||||||
Doutor Nichires Holdings Co., Ltd. | 3,649 | 72,497 | ||||||
DTS Corp. | 3,502 | 73,217 | ||||||
DyDo Group Holdings, Inc. | 974 | 39,802 | ||||||
FamilyMart Co., Ltd. | 4,700 | 114,837 | ||||||
FUJIFILM Holdings Corp. | 5,579 | 245,757 | ||||||
Fukuyama Transporting Co., Ltd. | 554 | 19,555 | ||||||
Geo Holdings Corp. | 864 | 10,284 | ||||||
Ichigo Office REIT Investment REIT | 14 | 14,566 | ||||||
ITOCHU Corp. | 8,100 | 167,780 | ||||||
Japan Airlines Co., Ltd. | 5,680 | 168,693 | ||||||
Japan Wool Textile Co., Ltd. | 5,300 | 48,599 | ||||||
Kajima Corp. | 9,100 | 119,887 | ||||||
Kamigumi Co., Ltd. | 2,700 | 61,333 | ||||||
Kandenko Co., Ltd. | 3,000 | 26,913 | ||||||
Kato Sangyo Co., Ltd. | 600 | 18,727 | ||||||
KDDI Corp. | 5,900 | 153,947 | ||||||
Kintetsu Group Holdings Co., Ltd. | 2,100 | 109,616 | ||||||
LaSalle Logiport REIT | 68 | 97,407 | ||||||
McDonald’s Holdings Co. Japan Ltd. | 1,700 | 82,343 | ||||||
Mirait Holdings Corp. | 6,200 | 93,761 | ||||||
Mitsubishi Corp. | 4,600 | 113,265 | ||||||
Mitsubishi Research Institute, Inc. | 700 | 23,313 | ||||||
Morinaga Milk Industry Co., Ltd. | 2,800 | 107,027 | ||||||
NEC Corp. | 6,100 | 257,948 | ||||||
NET One Systems Co., Ltd. | 3,600 | 97,663 | ||||||
Nichias Corp. | 1,602 | 28,519 | ||||||
Nihon Unisys Ltd. | 2,079 | 67,199 | ||||||
Nippon REIT Investment Corp. REIT | 16 | 66,811 | ||||||
Nippon Telegraph & Telephone Corp. | 10,644 | 509,248 | ||||||
Nishimatsu Construction Co., Ltd. | 2,300 | 42,992 | ||||||
Nisshin Seifun Group, Inc. | 5,200 | 96,424 | ||||||
NTT DOCOMO, Inc. | 24,657 | 629,607 | ||||||
Obayashi Corp. | 8,373 | 83,738 | ||||||
Okumura Corp. | 2,100 | 56,286 | ||||||
Raito Kogyo Co., Ltd. | 4,537 | 59,793 | ||||||
Rengo Co., Ltd. | 3,800 | 27,462 | ||||||
S Foods, Inc. | 728 | 20,159 | ||||||
Sanki Engineering Co., Ltd. | 1,000 | 11,906 | ||||||
Sankyo Co., Ltd. | 3,100 | 106,675 | ||||||
Sawai Pharmaceutical Co., Ltd. | 1,100 | 56,910 | ||||||
Sekisui House Ltd. | 7,300 | 144,045 | ||||||
Senko Group Holdings Co., Ltd. | 5,604 | 43,793 | ||||||
Shibaura Electronics Co., Ltd. | 200 | 4,996 | ||||||
Sumitomo Corp. | 9,400 | 147,161 | ||||||
Sumitomo Dainippon Pharma Co., Ltd. | 532 | 8,802 | ||||||
Sumitomo Densetsu Co., Ltd. | 1,200 | 24,508 | ||||||
Sushiro Global Holdings Ltd. | 1,600 | 107,713 | ||||||
Suzuken Co., Ltd. | 1,700 | 91,510 | ||||||
Takasago Thermal Engineering Co., Ltd. | 3,503 | 58,155 | ||||||
Toho Co., Ltd. | 1,500 | 65,842 | ||||||
Tokyo Gas Co., Ltd. | 3,700 | 93,584 | ||||||
Tokyu Construction Co., Ltd. | 2,600 | 19,976 | ||||||
Toshiba Plant Systems & Services Corp. | 2,600 | 43,468 | ||||||
Towa Pharmaceutical Co., Ltd. | 1,500 | 34,897 | ||||||
Toyo Seikan Group Holdings Ltd. | 6,400 | 99,870 | ||||||
Toyo Suisan Kaisha Ltd. | 2,700 | 108,423 | ||||||
Tv Tokyo Holdings Corp. | 934 | 19,172 | ||||||
Yurtec Corp. | 1,868 | 11,386 | ||||||
|
|
| ||||||
| 6,233,557 | ||||||||
|
|
| ||||||
Korea (Republic of) - 1.5% | ||||||||
Daeduck Electronics Co. | 5,033 | 45,617 | ||||||
Daekyo Co., Ltd. | 2,318 | 11,735 | ||||||
Easy Bio, Inc. | 1,107 | 5,396 | ||||||
Hansol Paper Co., Ltd. | 1,424 | 18,337 | ||||||
KC Co., Ltd. | 210 | 2,325 | ||||||
KT Corp. | 660 | 15,132 | ||||||
KT&G Corp. | 1,857 | 163,834 | ||||||
Kukdo Chemical Co., Ltd. | 388 | 14,508 | ||||||
| See accompanying Notes to Financial Statements | 23 | Annual Report / September 30, 2019 |
Table of Contents
Schedule of Investments
September 30, 2019
AllianzGI Best Styles Global Managed Volatility Portfolio(continued)
| Shares | Value | |||||||
Macquarie Korea Infrastructure Fund | 8,978 | 88,193 | ||||||
Orange Life Insurance Ltd. (a) | 957 | 21,620 | ||||||
Partron Co., Ltd. | 6,807 | 72,748 | ||||||
Samsung Electronics Co., Ltd. | 3,412 | 139,701 | ||||||
Samsung Fire & Marine Insurance Co., Ltd. | 657 | 122,415 | ||||||
SK Telecom Co., Ltd. | 154 | 31,032 | ||||||
Ubiquoss Holdings, Inc. | 1,318 | 28,051 | ||||||
|
|
| ||||||
| 780,644 | ||||||||
|
|
| ||||||
Malaysia - 0.9% | ||||||||
Axis Real Estate Investment Trust REIT | 36,500 | 16,127 | ||||||
Bermaz Auto Bhd. | 30,800 | 16,772 | ||||||
Hong Leong Bank Bhd. | 21,000 | 82,049 | ||||||
Hong Leong Financial Group Bhd. | 2,400 | 9,316 | ||||||
Malayan Banking Bhd. | 95,900 | 194,843 | ||||||
MISC Bhd. | 15,800 | 29,481 | ||||||
Syarikat Takaful Malaysia Keluarga Bhd. | 13,300 | 18,745 | ||||||
Tenaga Nasional Bhd. | 19,400 | 63,207 | ||||||
VS Industry Bhd. | 38,900 | 12,546 | ||||||
|
|
| ||||||
| 443,086 | ||||||||
|
|
| ||||||
Mexico - 0.1% | ||||||||
Banco del Bajio S.A. (a) | 18,100 | 29,901 | ||||||
Qualitas Controladora S.A.B. de C.V. | 11,600 | 41,394 | ||||||
|
|
| ||||||
| 71,295 | ||||||||
|
|
| ||||||
Morocco - 0.0% | ||||||||
Douja Promotion Groupe Addoha S.A. | 10,225 | 9,970 | ||||||
|
|
| ||||||
Netherlands - 0.7% | ||||||||
ASR Nederland NV | 2,728 | 100,662 | ||||||
Coca-Cola European Partners PLC | 1,317 | 73,028 | ||||||
Koninklijke Ahold Delhaize NV | 6,070 | 151,796 | ||||||
Vastned Retail NV REIT | 1,069 | 31,925 | ||||||
|
|
| ||||||
| 357,411 | ||||||||
|
|
| ||||||
New Zealand - 0.3% | ||||||||
Air New Zealand Ltd. | 32,303 | 56,663 | ||||||
Arvida Group Ltd. | 26,315 | 24,400 | ||||||
Summerset Group Holdings Ltd. | 16,234 | 67,279 | ||||||
Tourism Holdings Ltd. | 3,878 | 10,276 | ||||||
|
|
| ||||||
| 158,618 | ||||||||
|
|
| ||||||
Norway - 0.2% | ||||||||
B2Holding ASA | 5,084 | 3,487 | ||||||
Elkem ASA (a) | 8,219 | 20,028 | ||||||
Mowi ASA | 2,253 | 52,038 | ||||||
|
|
| ||||||
| 75,553 | ||||||||
|
|
| ||||||
Peru - 0.1% | ||||||||
Ferreycorp SAA | 40,342 | 25,256 | ||||||
|
|
| ||||||
Philippines - 0.1% | ||||||||
Altus San Nicolas Corp. (c)(d)(e) | 568 | 57 | ||||||
Globe Telecom, Inc. | 605 | 21,361 | ||||||
PLDT, Inc. | 1,115 | 24,438 | ||||||
Robinsons Land Corp. | 29,500 | 13,945 | ||||||
|
|
| ||||||
| 59,801 | ||||||||
|
|
| ||||||
Poland - 0.2% | ||||||||
Asseco Poland S.A. | 4,650 | 59,234 | ||||||
Ciech S.A. (e) | 1,701 | 14,312 | ||||||
|
|
| ||||||
| 73,546 | ||||||||
|
|
| ||||||
Singapore - 2.0% | ||||||||
Accordia Golf Trust UNIT | 37,500 | 14,516 | ||||||
Cache Logistics Trust REIT | 21,200 | 11,355 | ||||||
CapitaLand Mall Trust REIT | 90,400 | 172,094 | ||||||
China Aviation Oil Singapore Corp., Ltd. | 6,900 | 5,793 | ||||||
ComfortDelGro Corp. Ltd. | 36,200 | 62,896 | ||||||
| See accompanying Notes to Financial Statements | 24 | Annual Report / September 30, 2019 |
Table of Contents
Schedule of Investments
September 30, 2019
AllianzGI Best Styles Global Managed Volatility Portfolio(continued)
| Shares | Value | |||||||
EC World Real Estate Investment Trust Unit REIT | 21,200 | 11,197 | ||||||
Fortune Real Estate Investment Trust REIT | 66,000 | 75,576 | ||||||
Frasers Logistics & Industrial Trust REIT | 106,900 | 95,908 | ||||||
Keppel DC REIT | 37,500 | 51,855 | ||||||
Mapletree Commercial Trust REIT | 44,700 | 74,099 | ||||||
Oversea-Chinese Banking Corp., Ltd. | 15,300 | 120,279 | ||||||
Sheng Siong Group Ltd. | 16,400 | 13,170 | ||||||
Singapore Airlines Ltd. | 26,000 | 171,971 | ||||||
Sino Grandness Food Industry Group Ltd. (e) | 77,400 | 2,576 | ||||||
Wilmar International Ltd. | 52,700 | 142,236 | ||||||
|
|
| ||||||
| 1,025,521 | ||||||||
|
|
| ||||||
South Africa - 0.0% | ||||||||
Astral Foods Ltd. | 1,214 | 11,783 | ||||||
|
|
| ||||||
Spain - 0.5% | ||||||||
Ebro Foods S.A. | 1,610 | 32,180 | ||||||
Iberdrola S.A. | 19,377 | 201,400 | ||||||
Lar Espana Real Estate Socimi S.A. REIT | 1,947 | 16,361 | ||||||
|
|
| ||||||
| 249,941 | ||||||||
|
|
| ||||||
Sweden - 0.1% | ||||||||
Castellum AB | 2,957 | 63,306 | ||||||
|
|
| ||||||
Switzerland - 4.1% | ||||||||
Baloise Holding AG | 678 | 121,480 | ||||||
Banque Cantonale Vaudoise | 30 | 22,956 | ||||||
Barry Callebaut AG | 60 | 123,752 | ||||||
BKW AG | 111 | 8,241 | ||||||
Cembra Money Bank AG | 1,020 | 106,299 | ||||||
Intershop Holding AG | 32 | 17,285 | ||||||
Nestle S.A. | 3,078 | 333,823 | ||||||
PSP Swiss Property AG | 798 | 101,316 | ||||||
Roche Holding AG | 1,239 | 360,753 | ||||||
Swiss Life Holding AG | 402 | 192,196 | ||||||
Swiss Re AG | 1,677 | 174,984 | ||||||
Zurich Insurance Group AG | 1,335 | 511,315 | ||||||
|
|
| ||||||
| 2,074,400 | ||||||||
|
|
| ||||||
Taiwan - 4.3% | ||||||||
Asia Cement Corp. | 47,000 | 65,597 | ||||||
Cheng Loong Corp. | 37,000 | 21,271 | ||||||
China Airlines Ltd. | 69,000 | 20,191 | ||||||
China Motor Corp. (c)(d) | 44,000 | 35,017 | ||||||
China Petrochemical Development Corp. | 117,500 | 37,839 | ||||||
CTBC Financial Holding Co., Ltd. | 221,000 | 146,697 | ||||||
E.Sun Financial Holding Co., Ltd. | 160,665 | 135,913 | ||||||
First Financial Holding Co., Ltd. | 380,659 | 267,305 | ||||||
Formosa Chemicals & Fibre Corp. | 13,000 | 36,345 | ||||||
Formosa Petrochemical Corp. | 52,000 | 164,527 | ||||||
Formosa Plastics Corp. | 31,000 | 94,435 | ||||||
Fulgent Sun International Holding Co., Ltd. | 8,000 | 22,877 | ||||||
Getac Technology Corp. | 49,000 | 73,805 | ||||||
Global Mixed Mode Technology, Inc. | 15,000 | 55,541 | ||||||
Great Wall Enterprise Co., Ltd. | 31,458 | 38,213 | ||||||
HannStar Display Corp. | 439,000 | 90,459 | ||||||
Hua Nan Financial Holdings Co., Ltd. | 90,687 | 61,212 | ||||||
International CSRC Investment Holdings Co. | 68,770 | 72,143 | ||||||
King Yuan Electronics Co., Ltd. | 42,000 | 47,164 | ||||||
Lien Hwa Industrial Holdings Corp. | 70,455 | 76,528 | ||||||
Mega Financial Holding Co., Ltd. | 92,000 | 85,221 | ||||||
Mercuries Life Insurance Co., Ltd. (e) | 48,594 | 16,686 | ||||||
Oriental Union Chemical Corp. | 7,000 | 4,974 | ||||||
Powertech Technology, Inc. | 36,000 | 101,159 | ||||||
Sinbon Electronics Co., Ltd. | 18,139 | 70,403 | ||||||
Taichung Commercial Bank Co., Ltd. (e) | 65,224 | 24,902 | ||||||
Taiwan Fertilizer Co., Ltd. | 18,000 | 26,396 | ||||||
Taiwan PCB Techvest Co., Ltd. | 17,000 | 19,676 | ||||||
Tripod Technology Corp. | 20,000 | 71,904 | ||||||
Uni-President Enterprises Corp. | 29,000 | 69,981 | ||||||
Wisdom Marine Lines Co., Ltd. (e) | 15,000 | 14,505 | ||||||
WT Microelectronics Co., Ltd. | 10,003 | 12,492 | ||||||
Yuanta Financial Holding Co., Ltd. | 142,000 | 84,731 | ||||||
|
|
| ||||||
| 2,166,109 | ||||||||
|
|
| ||||||
| See accompanying Notes to Financial Statements | 25 | Annual Report / September 30, 2019 |
Table of Contents
Schedule of Investments
September 30, 2019
AllianzGI Best Styles Global Managed Volatility Portfolio(continued)
| Shares | Value | |||||||
Thailand - 1.3% | ||||||||
Bangchak Corp. PCL (c)(d) | 50,300 | 44,808 | ||||||
Bangkok Bank PCL | 15,600 | 89,710 | ||||||
Electricity Generating PCL (c)(d) | 7,500 | 88,042 | ||||||
IRPC PCL (c)(d) | 188,900 | 22,716 | ||||||
PTT PCL (c)(d) | 58,600 | 88,622 | ||||||
Siam Cement PCL (c)(d) | 8,900 | 118,682 | ||||||
Siamgas & Petrochemicals PCL (c)(d) | 151,900 | 44,964 | ||||||
Star Petroleum Refining PCL (c)(d) | 179,100 | 54,475 | ||||||
Tisco Financial Group PCL (c)(d) | 32,600 | 109,261 | ||||||
|
|
| ||||||
| 661,280 | ||||||||
|
|
| ||||||
United Kingdom - 1.1% | ||||||||
Berkeley Group Holdings PLC | 1,389 | 71,317 | ||||||
Diageo PLC | 1,594 | 65,115 | ||||||
Gamma Communications PLC | 5,572 | 75,337 | ||||||
Highland Gold Mining Ltd. | 12,952 | 34,344 | ||||||
Johnson Service Group PLC | 17,486 | 37,410 | ||||||
Marston’s PLC | 18,438 | 27,998 | ||||||
Primary Health Properties PLC REIT | 16,812 | 27,410 | ||||||
Regional REIT Ltd. REIT (a) | 20,237 | 25,669 | ||||||
Royal Dutch Shell PLC, Class A | 3,379 | 99,094 | ||||||
Tate & Lyle PLC | 7,359 | 66,578 | ||||||
Unilever PLC | 480 | 28,849 | ||||||
|
|
| ||||||
| 559,121 | ||||||||
|
|
| ||||||
United States - 53.6% | ||||||||
Accenture PLC, Class A | 600 | 115,410 | ||||||
Adobe, Inc. (e) | 352 | 97,240 | ||||||
Aflac, Inc. | 3,841 | 200,961 | ||||||
AG Mortgage Investment Trust, Inc. REIT | 3,004 | 45,511 | ||||||
AGNC Investment Corp. REIT | 12,322 | 198,261 | ||||||
Alleghany Corp. (e) | 271 | 216,193 | ||||||
Allstate Corp. | 3,936 | 427,765 | ||||||
Altria Group, Inc. | 4,155 | 169,940 | ||||||
Amdocs Ltd. | 771 | 50,971 | ||||||
Ameren Corp. | 2,768 | 221,578 | ||||||
American Electric Power Co., Inc. | 3,275 | 306,835 | ||||||
American Financial Group, Inc. | 1,151 | 124,135 | ||||||
American Tower Corp. REIT | 245 | 54,177 | ||||||
Amgen, Inc. | 1,094 | 211,700 | ||||||
Annaly Capital Management, Inc. REIT | 19,125 | 168,300 | ||||||
Anthem, Inc. | 790 | 189,679 | ||||||
Apollo Commercial Real Estate Finance, Inc. REIT | 4,686 | 89,831 | ||||||
Apple, Inc. | 1,602 | 358,800 | ||||||
Ares Commercial Real Estate Corp. REIT | 4,387 | 66,814 | ||||||
AT&T, Inc. | 15,312 | 579,406 | ||||||
Atmos Energy Corp. | 188 | 21,411 | ||||||
Automatic Data Processing, Inc. | 1,632 | 263,437 | ||||||
AutoZone, Inc. (e) | 341 | 369,855 | ||||||
AvalonBay Communities, Inc. REIT | 738 | 158,914 | ||||||
Berkshire Hathaway, Inc., Class B (e) | 499 | 103,802 | ||||||
Bright Horizons Family Solutions, Inc. (e) | 833 | 127,033 | ||||||
Bristol-Myers Squibb Co. | 3,818 | 193,611 | ||||||
Cadence Design Systems, Inc. (e) | 160 | 10,573 | ||||||
Casey’s General Stores, Inc. | 272 | 43,836 | ||||||
CBTX, Inc. | 1,720 | 47,954 | ||||||
Chemed Corp. | 243 | 101,470 | ||||||
Cherry Hill Mortgage Investment Corp. REIT | 845 | 11,070 | ||||||
Chimera Investment Corp. REIT | 3,274 | 64,039 | ||||||
Church & Dwight Co., Inc. | 3,176 | 238,962 | ||||||
Cincinnati Financial Corp. | 1,772 | 206,739 | ||||||
Cisco Systems, Inc. | 7,650 | 377,987 | ||||||
CMS Energy Corp. | 2,406 | 153,864 | ||||||
Coca-Cola Co. | 1,240 | 67,506 | ||||||
Consolidated Edison, Inc. | 7,258 | 685,663 | ||||||
Costco Wholesale Corp. | 1,130 | 325,564 | ||||||
Darden Restaurants, Inc. | 1,336 | 157,942 | ||||||
DTE Energy Co. | 1,782 | 236,935 | ||||||
Duke Energy Corp. | 5,912 | 566,724 | ||||||
Eli Lilly & Co. | 3,364 | 376,196 | ||||||
Ellington Financial, Inc. | 1,999 | 36,122 | ||||||
Encompass Health Corp. | 1,643 | 103,969 | ||||||
Ennis, Inc. | 1,333 | 26,940 | ||||||
| See accompanying Notes to Financial Statements | 26 | Annual Report / September 30, 2019 |
Table of Contents
Schedule of Investments
September 30, 2019
AllianzGI Best Styles Global Managed Volatility Portfolio(continued)
| Shares | Value | |||||||
Entergy Corp. | 1,988 | 233,312 | ||||||
Equity LifeStyle Properties, Inc. REIT | 987 | 131,863 | ||||||
Equity Residential REIT | 4,217 | 363,758 | ||||||
Essex Property Trust, Inc. REIT | 673 | 219,835 | ||||||
Exelon Corp. | 2,634 | 127,249 | ||||||
Exxon Mobil Corp. | 395 | 27,891 | ||||||
Facebook, Inc., Class A (e) | 1,086 | 193,395 | ||||||
frontdoor, Inc. (e) | 2,020 | 98,111 | ||||||
FTI Consulting, Inc. (e) | 848 | 89,880 | ||||||
General Mills, Inc. | 4,642 | 255,867 | ||||||
Global Payments, Inc. | 1,452 | 230,868 | ||||||
Granite Point Mortgage Trust, Inc. REIT | 406 | 7,608 | ||||||
Hershey Co. | 1,654 | 256,353 | ||||||
Humana, Inc. | 710 | 181,526 | ||||||
Intel Corp. | 4,702 | 242,294 | ||||||
Intuit, Inc. | 259 | 68,878 | ||||||
Invesco Mortgage Capital, Inc. REIT | 5,280 | 80,837 | ||||||
Johnson & Johnson | 5,396 | 698,135 | ||||||
Kellogg Co. | 622 | 40,026 | ||||||
Kimberly-Clark Corp. | 2,708 | 384,671 | ||||||
Laboratory Corp. of America Holdings (e) | 927 | 155,736 | ||||||
Leidos Holdings, Inc. | 1,588 | 136,377 | ||||||
Lockheed Martin Corp. | 1,601 | 624,486 | ||||||
ManTech International Corp., Class A | 1,506 | 107,543 | ||||||
Marsh & McLennan Cos., Inc. | 527 | 52,726 | ||||||
Mastercard, Inc., Class A | 1,659 | 450,535 | ||||||
McDonald’s Corp. | 2,441 | 524,107 | ||||||
McGrath RentCorp | 733 | 51,009 | ||||||
Merck & Co., Inc. | 7,240 | 609,463 | ||||||
MFA Financial, Inc. REIT | 8,361 | 61,537 | ||||||
Microsoft Corp. | 2,137 | 297,107 | ||||||
Motorola Solutions, Inc. | 982 | 167,343 | ||||||
National CineMedia, Inc. | 706 | 5,789 | ||||||
NextEra Energy, Inc. | 759 | 176,839 | ||||||
Northfield Bancorp, Inc. | 396 | 6,360 | ||||||
Northrop Grumman Corp. | 719 | 269,474 | ||||||
NVR, Inc. (e) | 8 | 29,739 | ||||||
O’Reilly Automotive, Inc. (e) | 569 | 226,752 | ||||||
Occidental Petroleum Corp. | 3,571 | 158,802 | ||||||
Old Republic International Corp. | 5,636 | 132,841 | ||||||
Omega Healthcare Investors, Inc. REIT | 1,527 | 63,813 | ||||||
Oritani Financial Corp. | 406 | 7,184 | ||||||
Paychex, Inc. | 1,706 | 141,206 | ||||||
Peoples Bancorp, Inc. | 669 | 21,281 | ||||||
PepsiCo, Inc. | 5,105 | 699,896 | ||||||
Pfizer, Inc. | 15,698 | 564,029 | ||||||
Pinnacle West Capital Corp. | 1,607 | 155,992 | ||||||
Portland General Electric Co. | 1,818 | 102,481 | ||||||
Procter & Gamble Co. | 6,510 | 809,714 | ||||||
Progressive Corp. | 4,702 | 363,230 | ||||||
Prospect Capital Corp. | 14,030 | 92,458 | ||||||
PS Business Parks, Inc. REIT | 587 | 106,805 | ||||||
Public Storage REIT | 52 | 12,754 | ||||||
QCR Holdings, Inc. | 286 | 10,862 | ||||||
Quest Diagnostics, Inc. | 1,174 | 125,653 | ||||||
Raytheon Co. | 654 | 128,308 | ||||||
RBB Bancorp | 438 | 8,624 | ||||||
Realty Income Corp. REIT | 1,621 | 124,298 | ||||||
Republic Services, Inc. | 2,733 | 236,541 | ||||||
Retail Properties of America, Inc., Class A REIT | 7,958 | 98,043 | ||||||
Ross Stores, Inc. | 3,021 | 331,857 | ||||||
Royal Caribbean Cruises Ltd. | 871 | 94,355 | ||||||
S&P Global, Inc. | 445 | 109,016 | ||||||
Shockwave Medical, Inc. (e) | 1,609 | 48,157 | ||||||
Southern Co. | 3,223 | 199,085 | ||||||
SP Plus Corp. (e) | 1,429 | 52,873 | ||||||
Starbucks Corp. | 4,937 | 436,530 | ||||||
STORE Capital Corp. REIT | 565 | 21,137 | ||||||
Sysco Corp. | 2,518 | 199,929 | ||||||
T-Mobile U.S., Inc. (e) | 2,160 | 170,143 | ||||||
Target Corp. | 1,754 | 187,520 | ||||||
TCG BDC, Inc. | 1,777 | 25,589 | ||||||
TJX Cos., Inc. | 4,335 | 241,633 | ||||||
TPG RE Finance Trust, Inc. REIT | 1,025 | 20,336 | ||||||
Tyson Foods, Inc., Class A | 1,295 | 111,551 | ||||||
United Therapeutics Corp. (e) | 1,003 | 79,989 | ||||||
UnitedHealth Group, Inc. | 2,183 | 474,410 | ||||||
| See accompanying Notes to Financial Statements | 27 | Annual Report / September 30, 2019 |
Table of Contents
Schedule of Investments
September 30, 2019
AllianzGI Best Styles Global Managed Volatility Portfolio(continued)
| Shares | Value | |||||||||||
Verizon Communications, Inc. | 11,511 | 694,804 | ||||||||||
Visa, Inc., Class A | 541 | 93,057 | ||||||||||
Walmart, Inc. | 2,567 | 304,652 | ||||||||||
Walt Disney Co. | 401 | 52,258 | ||||||||||
Waste Management, Inc. | 7,135 | 820,525 | ||||||||||
Waterstone Financial, Inc. | 1,819 | 31,250 | ||||||||||
WEC Energy Group, Inc. | 5,773 | 549,012 | ||||||||||
WellCare Health Plans, Inc. (e) | 432 | 111,961 | ||||||||||
Western Asset Mortgage Capital Corp. REIT | 3,885 | 37,490 | ||||||||||
Xcel Energy, Inc. | 8,615 | 559,027 | ||||||||||
Zoetis, Inc. | 1,753 | 218,406 | ||||||||||
| 27,298,271 | ||||||||||||
Total Common Stock (cost-$43,419,957) | 49,873,577 | |||||||||||
EXCHANGE-TRADED FUNDS - 0.4% | ||||||||||||
iShares Edge MSCI Min Vol Global (cost-$168,300) | 2,000 | 189,500 | ||||||||||
PREFERRED STOCK - 0.3% | ||||||||||||
Brazil - 0.3% | ||||||||||||
Telefonica Brasil S.A. (cost-$150,213) | 11,400 | 150,740 | ||||||||||
RIGHTS - 0.0% | ||||||||||||
Singapore - 0.0% | ||||||||||||
Keppel DC REIT, exercise price SGD 1.71, expires 10/7/19 (c)(d)(e) (cost-$0) | 3,937 | 569 | ||||||||||
| Principal Amount (000s) | ||||||||||||
Repurchase Agreements - 1.0% | ||||||||||||
State Street Bank and Trust Co., | $ | 512 | 512,000 | |||||||||
Total Investments(cost-$44,250,470) (b)-99.6% | 50,726,386 | |||||||||||
Other assets less liabilities(f)-0.4% | 212,818 | |||||||||||
NetAssets-100.0% | $ | 50,939,204 | ||||||||||
| See accompanying Notes to Financial Statements | 28 | Annual Report / September 30, 2019 |
Table of Contents
Schedule of Investments
September 30, 2019
AllianzGI Best Styles Global Managed Volatility Portfolio(continued)
Notes to Schedule of Investments:
| (a) | 144A—Exempt from registration under Rule 144A of the Securities Act of 1933. These securities may be resold in transactions exempt from registration, typically only to qualified institutional buyers. Securities with an aggregate value of $354,580, representing 0.7% of net assets. |
| (b) | Securities with an aggregate value of $19,743,056, representing 38.8% of net assets, were valued utilizing modeling tools provided by a third-party vendor. See Note 1(a) and Note 1(b) in the Notes to Financial Statements. |
| (c) | Fair-Valued—Securities with an aggregate value of $607,213, representing 1.2% of net assets. See Note 1(a) and Note 1(b) in the Notes to Financial Statements. |
| (d) | Level 3 security. See Note 1(a) and Note 1(b) in the Notes to Financial Statements. |
| (e) | Non-income producing. |
| (f) | Includes net unrealized appreciation (depreciation) of other financial instruments as follows: |
Forward foreign currency contracts outstanding at September 30, 2019:
| Description | Counterparty | U.S.$ Value on Origination Date | U.S.$ Value September 30, 2019 | Unrealized Depreciation | ||||||||||
Sold: | ||||||||||||||
6,225 Yuan Renminbi settling 10/8/19 | State Street Bank and Trust Co. | $871 | $872 | $(1) | ||||||||||
|
|
|
|
| ||||||||||
| Glossary: |
MSCI - Morgan Stanley Capital International |
REIT - Real Estate Investment Trust |
SGD - Singapore Dollar |
UNIT - More than one class of securities traded together |
| See accompanying Notes to Financial Statements | 29 | Annual Report / September 30, 2019 |
Table of Contents
Schedule of Investments
September 30, 2019
AllianzGI Best Styles Global Managed Volatility Portfolio
The industry classification of portfolio holdings and other assets less liabilities shown as a percentage of net assets were as follows:
Insurance | 8.4 | % | ||
Electric Utilities | 7.0 | % | ||
Pharmaceuticals | 6.6 | % | ||
Diversified Telecommunication Services | 5.7 | % | ||
Equity Real Estate Investment Trusts (REITs) | 4.9 | % | ||
Banks | 4.3 | % | ||
Food Products | 3.9 | % | ||
Multi-Utilities | 3.6 | % | ||
IT Services | 3.6 | % | ||
Healthcare Providers & Services | 3.2 | % | ||
Hotels, Restaurants & Leisure | 3.2 | % | ||
Household Products | 2.8 | % | ||
Specialty Retail | 2.6 | % | ||
Technology Hardware, Storage & Peripherals | 2.6 | % | ||
Wireless Telecommunication Services | 2.5 | % | ||
Food & Staples Retailing | 2.5 | % | ||
Commercial Services & Supplies | 2.4 | % | ||
Beverages | 2.2 | % | ||
Aerospace & Defense | 2.0 | % | ||
Oil, Gas & Consumable Fuels | 2.0 | % | ||
Construction & Engineering | 1.8 | % | ||
Mortgage Real Estate Investment Trusts (REITs) | 1.7 | % | ||
Real Estate Management & Development | 1.2 | % | ||
Airlines | 1.2 | % | ||
Trading Companies & Distributors | 1.1 | % | ||
Communications Equipment | 1.1 | % | ||
Software | 1.0 | % | ||
Semiconductors & Semiconductor Equipment | 0.9 | % | ||
Metals & Mining | 0.8 | % | ||
Gas Utilities | 0.8 | % | ||
Electronic Equipment, Instruments & Components | 0.8 | % | ||
Capital Markets | 0.8 | % | ||
Transportation Infrastructure | 0.8 | % | ||
Tobacco | 0.7 | % | ||
Chemicals | 0.6 | % | ||
Textiles, Apparel & Luxury Goods | 0.6 | % | ||
Biotechnology | 0.6 | % | ||
Construction Materials | 0.5 | % | ||
Interactive Media & Services | 0.5 | % | ||
Household Durables | 0.5 | % | ||
Road & Rail | 0.5 | % | ||
Diversified Consumer Services | 0.5 | % | ||
Multi-Line Retail | 0.4 | % | ||
Exchange-Traded Funds | 0.4 | % | ||
Containers & Packaging | 0.3 | % | ||
Diversified Financial Services | 0.3 | % | ||
Independent Power Producers & Energy Traders | 0.3 | % | ||
Media | 0.2 | % | ||
Entertainment | 0.2 | % | ||
Consumer Finance | 0.2 | % | ||
Leisure Equipment & Products | 0.2 | % | ||
Industrial Conglomerates | 0.2 | % | ||
Professional Services | 0.2 | % | ||
Building Products | 0.2 | % | ||
Healthcare Equipment & Supplies | 0.1 | % | ||
Automobiles | 0.1 | % | ||
Thrifts & Mortgage Finance | 0.1 | % | ||
Marine | 0.1 | % | ||
Personal Products | 0.1 | % | ||
Repurchase Agreements | 1.0 | % | ||
Other assets less liabilities | 0.4 | % | ||
| 100.0 | % |
| See accompanying Notes to Financial Statements | 30 | Annual Report / September 30, 2019 |
Table of Contents
Schedule of Investments
September 30, 2019
AllianzGI Global Small-Cap Opportunities Portfolio
| Shares | Value | |||||||
COMMON STOCK - 99.3% | ||||||||
Australia - 3.6% | ||||||||
BWP Trust REIT | 26,491 | $ | 70,656 | |||||
Charter Hall Retail REIT | 10,173 | 29,196 | ||||||
Cromwell Property Group REIT | 34,543 | 29,618 | ||||||
Qantas Airways Ltd. | 31,770 | 135,012 | ||||||
Sandfire Resources NL | 5,733 | 25,413 | ||||||
|
|
| ||||||
| 289,895 | ||||||||
|
|
| ||||||
Austria - 0.5% | ||||||||
Verbund AG | 758 | 41,474 | ||||||
|
|
| ||||||
Brazil - 0.5% | ||||||||
Cia Paranaense de Energia, Class P ADR | 3,130 | 37,591 | ||||||
|
|
| ||||||
Canada - 3.0% | ||||||||
Cogeco Communications, Inc. | 783 | 63,102 | ||||||
Gibson Energy, Inc. | 1,836 | 31,527 | ||||||
Granite Real Estate Investment Trust REIT | 1,992 | 96,454 | ||||||
International Petroleum Corp. (e) | 6,936 | 24,767 | ||||||
OceanaGold Corp. | 9,747 | 25,456 | ||||||
|
|
| ||||||
| 241,306 | ||||||||
|
|
| ||||||
China - 2.4% | ||||||||
China Railway Group Ltd., Class H | 51,000 | 30,957 | ||||||
Huaxin Cement Co., Ltd., Class B | 25,799 | 50,730 | ||||||
Jiangsu Expressway Co., Ltd., Class H | 28,000 | 35,555 | ||||||
Weichai Power Co., Ltd., Class H | 54,000 | 77,901 | ||||||
|
|
| ||||||
| 195,143 | ||||||||
|
|
| ||||||
Denmark - 1.6% | ||||||||
Topdanmark A/S | 2,578 | 124,446 | ||||||
|
|
| ||||||
France - 0.4% | ||||||||
Eutelsat Communications S.A. | 1,530 | 28,461 | ||||||
|
|
| ||||||
Greece - 0.7% | ||||||||
Motor Oil Hellas Corinth Refineries S.A. | 2,555 | 59,626 | ||||||
|
|
| ||||||
Hong Kong - 1.1% | ||||||||
Hysan Development Co., Ltd. | 15,000 | 60,489 | ||||||
Yue Yuen Industrial Holdings Ltd. | 9,000 | 24,589 | ||||||
|
|
| ||||||
| 85,078 | ||||||||
|
|
| ||||||
India - 1.7% | ||||||||
Mphasis Ltd. | 1,698 | 22,869 | ||||||
Oil India Ltd. | 14,303 | 29,492 | ||||||
WNS Holdings Ltd. ADR (e) | 1,405 | 82,544 | ||||||
|
|
| ||||||
| 134,905 | ||||||||
|
|
| ||||||
Israel - 0.3% | ||||||||
Radware Ltd. (e) | 985 | 23,896 | ||||||
|
|
| ||||||
Italy - 1.9% | ||||||||
Unipol Gruppo SpA | 28,422 | 151,340 | ||||||
|
|
| ||||||
Japan - 11.0% | ||||||||
Advance Residence Investment Corp. REIT | 28 | 91,958 | ||||||
AEON REIT Investment Corp. REIT | 42 | 57,839 | ||||||
Daiwa Office Investment Corp. REIT | 6 | 46,589 | ||||||
Fuji Soft, Inc. | 900 | 38,230 | ||||||
GungHo Online Entertainment, Inc. | 1,790 | 40,717 | ||||||
Invincible Investment Corp. REIT | 95 | 58,667 | ||||||
Japan Airlines Co., Ltd. | 1,200 | 35,639 | ||||||
Japan Rental Housing Investments, Inc. REIT | 39 | 35,891 | ||||||
Nippon Accommodations Fund, Inc. REIT | 9 | 56,061 | ||||||
Nippon REIT Investment Corp. REIT | 15 | 62,636 | ||||||
Okamura Corp. | 2,800 | 27,417 | ||||||
Sankyu, Inc. | 3,100 | 161,610 | ||||||
SKY Perfect JSAT Holdings, Inc. | 6,700 | 27,176 | ||||||
Skylark Holdings Co., Ltd. | 1,500 | 27,310 | ||||||
Sumitomo Forestry Co., Ltd. | 4,500 | 60,086 | ||||||
T-Gaia Corp. | 2,600 | 52,659 | ||||||
|
|
| ||||||
| 880,485 | ||||||||
|
|
| ||||||
| See accompanying Notes to Financial Statements | 31 | Annual Report / September 30, 2019 |
Table of Contents
Schedule of Investments
September 30, 2019
AllianzGI Global Small-Cap Opportunities Portfolio(continued)
| Shares | Value | |||||||
Korea (Republic of) - 1.0% | ||||||||
DB HiTek Co., Ltd. | 3,374 | 45,139 | ||||||
Macquarie Korea Infrastructure Fund | 3,324 | 32,652 | ||||||
|
|
| ||||||
| 77,791 | ||||||||
|
|
| ||||||
Netherlands - 2.5% | ||||||||
ASR Nederland NV | 2,182 | 80,515 | ||||||
Signify NV (a) | 4,294 | 118,010 | ||||||
|
|
| ||||||
| 198,525 | ||||||||
|
|
| ||||||
Portugal - 0.7% | ||||||||
NOS SGPS S.A. | 10,504 | 57,349 | ||||||
|
|
| ||||||
Russian Federation - 0.5% | ||||||||
Alrosa PJSC (c)(d)(e) | 38,600 | 44,314 | ||||||
|
|
| ||||||
Singapore - 2.5% | ||||||||
Mapletree Commercial Trust REIT | 43,000 | 71,281 | ||||||
Mapletree Industrial Trust REIT | 36,000 | 63,295 | ||||||
Mapletree North Asia Commercial Trust REIT | 71,400 | 68,232 | ||||||
|
|
| ||||||
| 202,808 | ||||||||
|
|
| ||||||
South Africa - 1.3% | ||||||||
Harmony Gold Mining Co., Ltd. ADR (e) | 12,375 | 35,145 | ||||||
Telkom S.A. SOC Ltd. | 14,732 | 68,677 | ||||||
|
|
| ||||||
| 103,822 | ||||||||
|
|
| ||||||
Taiwan - 1.0% | ||||||||
Radiant Opto-Electronics Corp. | 12,000 | 45,830 | ||||||
Sino-American Silicon Products, Inc. | 12,000 | 31,705 | ||||||
|
|
| ||||||
| 77,535 | ||||||||
|
|
| ||||||
Thailand - 1.2% | ||||||||
Thanachart Capital PCL (c)(d) | 51,200 | 95,457 | ||||||
|
|
| ||||||
Turkey - 0.4% | ||||||||
Turkiye Sinai Kalkinma Bankasi AS (e) | 173,636 | 29,211 | ||||||
|
|
| ||||||
United Arab Emirates - 0.2% | ||||||||
Air Arabia PJSC (e) | 54,315 | 18,484 | ||||||
|
|
| ||||||
United Kingdom - 5.4% | ||||||||
Computacenter PLC | 2,304 | 36,555 | ||||||
Firstgroup PLC (e) | 19,754 | 33,397 | ||||||
Go-Ahead Group PLC | 2,365 | 58,565 | ||||||
Greggs PLC | 4,453 | 114,482 | ||||||
Hays PLC | 15,889 | 29,456 | ||||||
Nomad Foods Ltd. (e) | 2,205 | 45,202 | ||||||
OneSavings Bank PLC | 6,498 | 29,513 | ||||||
QinetiQ Group PLC | 11,295 | 40,103 | ||||||
SSP Group PLC | 6,006 | 45,734 | ||||||
|
|
| ||||||
| 433,007 | ||||||||
|
|
| ||||||
United States - 53.9% | ||||||||
Allied Motion Technologies, Inc. | 670 | 23,658 | ||||||
America’sCar-Mart, Inc. (e) | 780 | 71,526 | ||||||
Arcosa, Inc. | 1,155 | 39,513 | ||||||
Argo Group International Holdings Ltd. | 1,875 | 131,700 | ||||||
Aspen Technology, Inc. (e) | 780 | 96,002 | ||||||
Atkore International Group, Inc. (e) | 3,735 | 113,357 | ||||||
Barrett Business Services, Inc. | 625 | 55,512 | ||||||
Benchmark Electronics, Inc. | 4,385 | 127,428 | ||||||
Bio-Techne Corp. | 570 | 111,532 | ||||||
Bruker Corp. | 660 | 28,994 | ||||||
Charles River Laboratories International, Inc. (e) | 1,360 | 180,023 | ||||||
Clean Harbors, Inc. (e) | 540 | 41,688 | ||||||
Clearway Energy, Inc., Class A | 3,970 | 68,840 | ||||||
Comfort Systems USA, Inc. | 750 | 33,173 | ||||||
| See accompanying Notes to Financial Statements | 32 | Annual Report / September 30, 2019 |
Table of Contents
Schedule of Investments
September 30, 2019
AllianzGI Global Small-Cap Opportunities Portfolio(continued)
| Shares | Value | |||||||
Cubic Corp. | 405 | 28,524 | ||||||
Dana, Inc. | 1,875 | 27,075 | ||||||
EMCOR Group, Inc. | 1,405 | 120,999 | ||||||
Emergent Biosolutions, Inc. (e) | 750 | 39,210 | ||||||
ePlus, Inc. (e) | 310 | 23,588 | ||||||
Exantas Capital Corp. REIT | 1,875 | 21,319 | ||||||
Financial Institutions, Inc. | 605 | 18,259 | ||||||
GMS, Inc. (e) | 1,565 | 44,947 | ||||||
Gold Resource Corp. | 7,760 | 23,668 | ||||||
Group 1 Automotive, Inc. | 1,095 | 101,079 | ||||||
Horizon Therapeutics PLC (e) | 1,180 | 32,131 | ||||||
Integer Holdings Corp. (e) | 1,825 | 137,897 | ||||||
IQVIA Holdings, Inc. (e) | 1,155 | 172,534 | ||||||
Jacobs Engineering Group, Inc. | 265 | 24,248 | ||||||
JELD-WEN Holding, Inc. (e) | 1,440 | 27,778 | ||||||
KB Home | 2,345 | 79,730 | ||||||
Kelly Services, Inc., Class A | 1,570 | 38,025 | ||||||
Keysight Technologies, Inc. (e) | 1,485 | 144,416 | ||||||
Lennar Corp., Class B | 655 | 29,062 | ||||||
Lululemon Athletica, Inc. (e) | 520 | 100,116 | ||||||
M/I Homes, Inc. (e) | 1,150 | 43,297 | ||||||
Malibu Boats, Inc., Class A (e) | 1,875 | 57,525 | ||||||
ManTech International Corp., Class A | 2,905 | 207,446 | ||||||
MasterCraft Boat Holdings, Inc. (e) | 3,050 | 45,521 | ||||||
Matrix Service Co. (e) | 1,965 | 33,680 | ||||||
Methode Electronics, Inc. | 4,385 | 147,511 | ||||||
MGIC Investment Corp. | 12,070 | 151,841 | ||||||
Moog, Inc., Class A | 1,515 | 122,897 | ||||||
MSA Safety, Inc. | 1,300 | 141,843 | ||||||
NRG Energy, Inc. | 640 | 25,344 | ||||||
NVE Corp. | 360 | 23,886 | ||||||
PRA Health Sciences, Inc. (e) | 1,125 | 111,634 | ||||||
Premier, Inc., Class A (e) | 2,440 | 70,565 | ||||||
Progress Software Corp. | 3,155 | 120,079 | ||||||
Rush Enterprises, Inc., Class A | 1,385 | 53,433 | ||||||
SJW Group | 545 | 37,218 | ||||||
Surmodics, Inc. (e) | 1,000 | 45,740 | ||||||
Taylor Morrison Home Corp., Class A (e) | 8,455 | 219,323 | ||||||
Tetra Tech, Inc. | 1,095 | 95,002 | ||||||
Triple-S Management Corp., Class B (e) | 1,677 | 22,472 | ||||||
United Therapeutics Corp. (e) | 600 | 47,850 | ||||||
Vectrus, Inc. (e) | 1,140 | 46,341 | ||||||
Veeco Instruments, Inc. (e) | 2,185 | 25,521 | ||||||
Vishay Intertechnology, Inc. | 3,000 | 50,790 | ||||||
|
|
| ||||||
| 4,304,310 | ||||||||
|
|
| ||||||
Total Common Stock (cost-$7,503,379) | 7,936,259 | |||||||
|
|
| ||||||
PREFERRED STOCK - 0.6% | ||||||||
Brazil - 0.6% | ||||||||
Cia Paranaense de Energia(cost-$39,787) | 3,900 | 46,566 | ||||||
|
|
| ||||||
Total Investments(cost-$7,543,166) (b)-99.9% | 7,982,825 | |||||||
|
|
| ||||||
Other assets less liabilities(f)-0.1% | 9,353 | |||||||
|
|
| ||||||
NetAssets-100.0% | $ | 7,992,178 | ||||||
|
|
| ||||||
| See accompanying Notes to Financial Statements | 33 | Annual Report / September 30, 2019 |
Table of Contents
Schedule of Investments
September 30, 2019
AllianzGI Global Small-Cap Opportunities Portfolio(continued)
Notes to Schedule of Investments:
| (a) | 144A—Exempt from registration under Rule 144A of the Securities Act of 1933. These securities may be resold in transactions exempt from registration, typically only to qualified institutional buyers. Security with a value of $118,010, representing 1.5% of net assets. |
| (b) | Securities with an aggregate value of $2,768,731, representing 34.6% of net assets, were valued utilizing modeling tools provided by a third-party vendor. See Note 1(a) and Note 1(b) in the Notes to Financial Statements. |
| (c) | Fair-Valued—Securities with an aggregate value of $139,771, representing 1.7% of net assets. See Note 1(a) and Note 1(b) in the Notes to Financial Statements. |
| (d) | Level 3 security. See Note 1(a) and Note 1(b) in the Notes to Financial Statements. |
| (e) | Non-income producing. |
| (f) | Includes net unrealized appreciation (depreciation) of other financial instruments as follows: |
Forward foreign currency contracts outstanding at September 30, 2019:
| Counterparty | U.S.$ Value on Origination Date | U.S.$ Value September 30, 2019 | Unrealized Depreciation | |||||||||||
4,218 Yuan Renminbi settling 10/8/19 | State Street Bank and Trust Co. | $590 | $591 | $ | (1) | |||||||||
|
|
|
| |||||||||||
Glossary:
ADR - American Depositary Receipt
REIT - Real Estate Investment Trust
| See accompanying Notes to Financial Statements | 34 | Annual Report / September 30, 2019 |
Table of Contents
Schedule of Investments
September 30, 2019
AllianzGI Global Small-Cap Opportunities Portfolio
The industry classification of portfolio holdings and other assets less liabilities shown as a percentage of net assets were as follows:
Equity Real Estate Investment Trusts (REITs) | 10.5% | |||
Life Sciences Tools & Services | 7.6% | |||
Electronic Equipment, Instruments & Components | 6.2% | |||
Insurance | 6.1% | |||
Household Durables | 5.4% | |||
IT Services | 4.1% | |||
Commercial Services & Supplies | 3.8% | |||
Electrical Equipment | 3.2% | |||
Software | 3.2% | |||
Road & Rail | 3.2% | |||
Construction & Engineering | 3.1% | |||
Aerospace & Defense | 3.0% | |||
Specialty Retail | 2.8% | |||
Airlines | 2.4% | |||
Hotels, Restaurants & Leisure | 2.3% | |||
Healthcare Equipment & Supplies | 2.3% | |||
Thrifts & Mortgage Finance | 2.3% | |||
Media | 2.2% | |||
Semiconductors & Semiconductor Equipment | 2.1% | |||
Metals & Mining | 1.9% | |||
Oil, Gas & Consumable Fuels | 1.8% | |||
Banks | 1.8% | |||
Electric Utilities | 1.6% | |||
Textiles, Apparel & Luxury Goods | 1.6% | |||
Professional Services | 1.5% | |||
Leisure Equipment & Products | 1.3% | |||
Trading Companies & Distributors | 1.2% | |||
Independent Power Producers & Energy Traders | 1.2% | |||
Healthcare Providers & Services | 1.2% | |||
Biotechnology | 1.1% | |||
Machinery | 1.0% | |||
Diversified Telecommunication Services | 0.9% | |||
Real Estate Management & Development | 0.7% | |||
Construction Materials | 0.6% | |||
Food Products | 0.6% | |||
Entertainment | 0.5% | |||
Water Utilities | 0.5% | |||
Transportation Infrastructure | 0.4% | |||
Energy Equipment & Services | 0.4% | |||
Capital Markets | 0.4% | |||
Pharmaceuticals | 0.4% | |||
Building Products | 0.3% | |||
Auto Components | 0.3% | |||
Communications Equipment | 0.3% | |||
Computers | 0.3% | |||
Mortgage Real Estate Investment Trusts (REITs) | 0.3% | |||
Other assets less liabilities | 0.1% | |||
|
|
| ||
| 100.0% | ||||
|
|
|
| See accompanying Notes to Financial Statements | 35 | Annual Report / September 30, 2019 |
Table of Contents
Schedule of Investments
September 30, 2019
AllianzGI International Growth Portfolio
| Shares | Value | |||||||
COMMON STOCK - 99.0% | ||||||||
Australia - 2.2% | ||||||||
CSL Ltd. | 2,995 | $ | 473,545 | |||||
Domino’s Pizza Enterprises Ltd. | 19,252 | 603,528 | ||||||
|
|
| ||||||
| 1,077,073 | ||||||||
|
|
| ||||||
Brazil - 4.6% | ||||||||
Lojas Renner S.A. | 16,220 | 197,024 | ||||||
Raia Drogasil S.A. | 10,506 | 242,260 | ||||||
StoneCo Ltd., Class A (c) | 52,836 | 1,837,636 | ||||||
|
|
| ||||||
| 2,276,920 | ||||||||
|
|
| ||||||
Canada - 10.3% | ||||||||
Alimentation Couche-Tard, Inc., Class B | 44,444 | 1,361,985 | ||||||
Canadian National Railway Co. | 6,830 | 613,275 | ||||||
Constellation Software, Inc. | 1,309 | 1,307,320 | ||||||
Restaurant Brands International, Inc. | 12,535 | 891,269 | ||||||
Shopify, Inc., Class A (c) | 3,103 | 967,081 | ||||||
|
|
| ||||||
| 5,140,930 | ||||||||
|
|
| ||||||
China - 12.0% | ||||||||
Alibaba Group Holding Ltd. ADR (c) | 16,153 | 2,701,266 | ||||||
TAL Education Group ADR (c) | 10,627 | 363,869 | ||||||
Tencent Holdings Ltd. | 55,091 | 2,304,340 | ||||||
Weibo Corp. ADR (c) | 14,022 | 627,485 | ||||||
|
|
| ||||||
| 5,996,960 | ||||||||
|
|
| ||||||
Denmark - 11.3% | ||||||||
Ambu A/S, Class B | 122,639 | 2,028,441 | ||||||
Coloplast A/S, Class B | 2,239 | 269,387 | ||||||
DSV A/S | 14,510 | 1,379,175 | ||||||
Netcompany Group A/S (a)(c) | 31,710 | 1,264,219 | ||||||
Novo Nordisk A/S, Class B | 13,495 | 697,370 | ||||||
|
|
| ||||||
| 5,638,592 | ||||||||
|
|
| ||||||
Germany - 12.5% | ||||||||
Bechtle AG | 7,784 | 792,222 | ||||||
GRENKE AG | 9,502 | 782,776 | ||||||
Infineon Technologies AG | 84,775 | 1,523,132 | ||||||
SAP SE | 13,241 | 1,558,112 | ||||||
Wirecard AG | 6,985 | 1,117,876 | ||||||
Zalando SE (a)(c) | 9,894 | 451,752 | ||||||
|
|
| ||||||
| 6,225,870 | ||||||||
|
|
| ||||||
Hong Kong - 3.9% | ||||||||
AIA Group Ltd. | 205,111 | 1,934,410 | ||||||
|
|
| ||||||
India - 4.3% | ||||||||
HDFC Bank Ltd. ADR | 37,736 | 2,152,839 | ||||||
|
|
| ||||||
Indonesia - 1.8% | ||||||||
Ace Hardware Indonesia Tbk PT | 3,515,218 | 438,446 | ||||||
Bank Central Asia Tbk PT | 217,877 | 465,814 | ||||||
|
|
| ||||||
| 904,260 | ||||||||
|
|
| ||||||
Ireland - 4.7% | ||||||||
DCC PLC | 12,000 | 1,046,571 | ||||||
Kingspan Group PLC | 15,791 | 771,071 | ||||||
Ryanair Holdings PLC ADR (c) | 7,925 | 526,062 | ||||||
|
|
| ||||||
| 2,343,704 | ||||||||
|
|
| ||||||
Israel - 3.7% | ||||||||
Wix.com Ltd. (c) | 15,624 | 1,823,946 | ||||||
|
|
| ||||||
Japan - 3.6% | ||||||||
Keyence Corp. | 1,906 | 1,186,400 | ||||||
MonotaRO Co., Ltd. | 23,939 | 631,467 | ||||||
|
|
| ||||||
| 1,817,867 | ||||||||
|
|
| ||||||
| See accompanying Notes to Financial Statements | 36 | Annual Report / September 30, 2019 |
Table of Contents
Schedule of Investments
September 30, 2019
AllianzGI International Growth Portfolio(continued)
| Shares | Value | |||||||
Korea (Republic of) - 0.9% | ||||||||
LG Household & Health Care Ltd. | 422 | 460,580 | ||||||
|
|
| ||||||
Netherlands - 4.6% | ||||||||
ASML Holding NV | 9,182 | 2,277,260 | ||||||
|
|
| ||||||
New Zealand - 1.5% | ||||||||
Mainfreight Ltd. | 28,988 | 724,522 | ||||||
|
|
| ||||||
Philippines - 0.5% | ||||||||
Jollibee Foods Corp. | 56,736 | 243,077 | ||||||
|
|
| ||||||
South Africa - 2.4% | ||||||||
PSG Group Ltd. | 84,274 | 1,175,067 | ||||||
|
|
| ||||||
Sweden - 7.3% | ||||||||
AddTech AB, Class B | 32,041 | 832,824 | ||||||
Assa Abloy AB, Class B | 18,606 | 413,633 | ||||||
Atlas Copco AB, Class A | 25,185 | 775,525 | ||||||
Hexagon AB, Class B | 12,070 | 581,412 | ||||||
Hexpol AB | 88,397 | 678,484 | ||||||
Trelleborg AB, Class B | 25,162 | 352,784 | ||||||
|
|
| ||||||
| 3,634,662 | ||||||||
|
|
| ||||||
Switzerland - 4.6% | ||||||||
Partners Group Holding AG | 1,014 | 778,708 | ||||||
Sika AG | 4,098 | 599,585 | ||||||
Temenos AG (c) | 2,678 | 448,431 | ||||||
VAT Group AG (a)(c) | 3,639 | 458,931 | ||||||
|
|
| ||||||
| 2,285,655 | ||||||||
|
|
| ||||||
United Kingdom - 2.3% | ||||||||
ASOS PLC (c) | 15,770 | 480,161 | ||||||
Unilever PLC | 11,077 | 665,749 | ||||||
|
|
| ||||||
| 1,145,910 | ||||||||
|
|
| ||||||
Total Common Stock (cost-$49,587,900) | 49,280,104 | |||||||
|
|
| ||||||
| Principal Amount (000s) | ||||||||
Repurchase Agreements - 13.2% | ||||||||
State Street Bank and Trust Co., | $ | 6,557 | 6,557,000 | |||||
|
|
| ||||||
Total Investments(cost-$56,144,900) (b)-112.2% | 55,837,104 | |||||||
|
|
| ||||||
Liabilities in excess of other assets-(12.2)% | (6,083,747 | ) | ||||||
|
|
| ||||||
NetAssets-100.0% | $ | 49,753,357 | ||||||
|
|
| ||||||
| See accompanying Notes to Financial Statements | 37 | Annual Report / September 30, 2019 |
Table of Contents
Schedule of Investments
September 30, 2019
AllianzGI International Growth Portfolio(continued)
Notes to Schedule of Investments:
| (a) | 144A—Exempt from registration under Rule 144A of the Securities Act of 1933. These securities may be resold in transactions exempt from registration, typically only to qualified institutional buyers. Securities with an aggregate value of $2,174,902, representing 4.4% of net assets. |
| (b) | Securities with an aggregate value of $32,895,716, representing 66.1% of net assets, were valued utilizing modeling tools provided by a third-party vendor. See Note 1(a) and Note 1(b) in the Notes to Financial Statements. |
| (c) | Non-income producing. |
Glossary:
ADR - American Depositary Receipt
| See accompanying Notes to Financial Statements | 38 | Annual Report / September 30, 2019 |
Table of Contents
Schedule of Investments
September 30, 2019
AllianzGI International Growth Portfolio
The industry classification of portfolio holdings and liabilities in excess of other assets shown as a percentage of net assets were as follows:
IT Services | 13.1% | |||
Software | 9.2% | |||
Semiconductors & Semiconductor Equipment | 7.6% | |||
Internet & Direct Marketing Retail | 7.3% | |||
Interactive Media & Services | 5.9% | |||
Banks | 5.3% | |||
Healthcare Equipment & Supplies | 4.6% | |||
Road & Rail | 4.0% | |||
Diversified Financial Services | 3.9% | |||
Insurance | 3.9% | |||
Electronic Equipment, Instruments & Components | 3.5% | |||
Hotels, Restaurants & Leisure | 3.5% | |||
Food & Staples Retailing | 3.2% | |||
Machinery | 3.2% | |||
Trading Companies & Distributors | 2.9% | |||
Chemicals | 2.6% | |||
Building Products | 2.4% | |||
Personal Products | 2.3% | |||
Industrial Conglomerates | 2.1% | |||
Capital Markets | 1.6% | |||
Air Freight & Logistics | 1.5% | |||
Pharmaceuticals | 1.4% | |||
Airlines | 1.1% | |||
Biotechnology | 0.9% | |||
Specialty Retail | 0.9% | |||
Diversified Consumer Services | 0.7% | |||
Multi-Line Retail | 0.4% | |||
Repurchase Agreements | 13.2% | |||
Liabilities in excess of other assets | (12.2)% | |||
|
|
| ||
| 100.0% | ||||
|
|
|
| See accompanying Notes to Financial Statements | 39 | Annual Report / September 30, 2019 |
Table of Contents
Statements of Assets and Liabilities
September 30, 2019
AllianzGI Advanced Core Bond | AllianzGI Best Styles Global Managed Volatility | AllianzGI Global Small-Cap Opportunities | AllianzGI International Growth | |||||||||||||
Assets: | ||||||||||||||||
Investments, at value | $106,697,705 | $50,214,386 | $7,982,825 | $49,280,104 | ||||||||||||
|
|
|
|
|
|
|
|
|
|
|
|
| ||||
Repurchase agreements, at value | 1,464,000 | 512,000 | – | 6,557,000 | ||||||||||||
|
|
|
|
|
|
|
|
|
|
|
|
| ||||
Cash | 588 | 1,472 | 51,195 | 787 | ||||||||||||
|
|
|
|
|
|
|
|
|
|
|
|
| ||||
Foreign currency, at value | – | 191,222 | 26,203 | 1,707 | ||||||||||||
|
|
|
|
|
|
|
|
|
|
|
|
| ||||
Dividends and interest receivable (net of foreign withholding taxes) | 623,957 | 149,552 | 13,027 | 10,998 | ||||||||||||
|
|
|
|
|
|
|
|
|
|
|
|
| ||||
Deposits with brokers for derivatives collateral | 271,314 | – | – | – | ||||||||||||
|
|
|
|
|
|
|
|
|
|
|
|
| ||||
Investments in Affiliated Funds - Trustees Deferred Compensation Plan (see Note 4) | 19,896 | 8,484 | 795 | – | ||||||||||||
|
|
|
|
|
|
|
|
|
|
|
|
| ||||
Receivable for variation margin on futures contracts | 1,750 | – | – | – | ||||||||||||
|
|
|
|
|
|
|
|
|
|
|
|
| ||||
Receivable for TBA investments sold | 3,158,557 | – | – | – | ||||||||||||
|
|
|
|
|
|
|
|
|
|
|
|
| ||||
Receivable for investments sold | – | – | 26,350 | – | ||||||||||||
|
|
|
|
|
|
|
|
|
|
|
|
| ||||
Tax reclaims receivable | – | 28,783 | 1,393 | 3,739 | ||||||||||||
|
|
|
|
|
|
|
|
|
|
|
|
| ||||
Receivable from Investment Manager | – | – | – | 10,712 | ||||||||||||
|
|
|
|
|
|
|
|
|
|
|
|
| ||||
Deferred offering costs | – | – | – | 16,872 | ||||||||||||
|
|
|
|
|
|
|
|
|
|
|
|
| ||||
Prepaid expenses and other assets | 5,604 | 4,330 | 3,367 | 3,899 | ||||||||||||
|
|
|
|
|
|
|
|
|
|
|
|
| ||||
Total Assets | 112,243,371 | 51,110,229 | 8,105,155 | 55,885,818 | ||||||||||||
|
|
|
|
|
|
|
|
|
|
|
|
| ||||
Liabilities: | ||||||||||||||||
Payable for TBA investments purchased | 26,234,600 | – | – | – | ||||||||||||
|
|
|
|
|
|
|
|
|
|
|
|
| ||||
Trustees Deferred Compensation Plan payable (see Note 4) | 19,896 | 8,484 | 795 | – | ||||||||||||
|
|
|
|
|
|
|
|
|
|
|
|
| ||||
Investment management fees payable | 11,146 | 74,983 | 17,578 | – | ||||||||||||
|
|
|
|
|
|
|
|
|
|
|
|
| ||||
Unrealized depreciation of forward foreign currency contracts | – | 1 | 1 | – | ||||||||||||
|
|
|
|
|
|
|
|
|
|
|
|
| ||||
Payable for investments purchased | – | – | – | 6,035,888 | ||||||||||||
|
|
|
|
|
|
|
|
|
|
|
|
| ||||
Accrued expenses and other liabilities | 89,919 | 87,557 | 94,603 | 96,573 | ||||||||||||
|
|
|
|
|
|
|
|
|
|
|
|
| ||||
Total Liabilities | 26,355,561 | 171,025 | 112,977 | 6,132,461 | ||||||||||||
|
|
|
|
|
|
|
|
|
|
|
|
| ||||
Net Assets | $85,887,810 | $50,939,204 | $7,992,178 | $49,753,357 | ||||||||||||
|
|
|
|
|
|
|
|
|
|
|
|
| ||||
Net Assets Consist of: | ||||||||||||||||
Paid-in-capital | $87,125,616 | $42,545,271 | $7,638,629 | $50,047,558 | ||||||||||||
|
|
|
|
|
|
|
|
|
|
|
|
| ||||
Total distributable earnings (loss) | (1,237,806 | ) | 8,393,933 | 353,549 | (294,201 | ) | ||||||||||
|
|
|
|
|
|
|
|
|
|
|
|
| ||||
Net Assets | $85,887,810 | $50,939,204 | $7,992,178 | $49,753,357 | ||||||||||||
|
|
|
|
|
|
|
|
|
|
|
|
| ||||
Cost of Investments | $103,566,845 | $43,738,470 | $7,543,166 | $49,587,900 | ||||||||||||
|
|
|
|
|
|
|
|
|
|
|
|
| ||||
Cost of Repurchase Agreements | $1,464,000 | $512,000 | $– | $6,557,000 | ||||||||||||
|
|
|
|
|
|
|
|
|
|
|
|
| ||||
Cost of Foreign Currency | $– | $189,249 | $26,301 | $1,706 | ||||||||||||
|
|
|
|
|
|
|
|
|
|
|
|
| ||||
Shares Issued and Outstanding | 5,642,247 | 3,123,651 | 496,797 | 3,356,631 | ||||||||||||
|
|
|
|
|
|
|
|
|
|
|
|
| ||||
Net Asset Value Per Share* | $15.22 | $16.31 | $16.09 | $14.82 | ||||||||||||
|
|
|
|
|
|
|
|
|
|
|
|
| ||||
| * | Net asset value and redemption price per share may not recalculate exactly due to rounding. |
| See accompanying Notes to Financial Statements | 40 | Annual Report / September 30, 2019 |
Table of Contents
Year ended September 30, 2019
AllianzGI Advanced Core Bond | AllianzGI Best Styles Global Managed Volatility | AllianzGI Global Small-Cap Opportunities | AllianzGI International Growth(1) | |||||||||||||
Investment Income: | ||||||||||||||||
Dividends, net of foreign withholding taxes* | $– | $1,414,675 | $128,383 | $102,751 | ||||||||||||
|
|
|
|
|
|
|
|
|
|
|
|
| ||||
Interest | 2,960,397 | 3,037 | 276 | 1,472 | ||||||||||||
|
|
|
|
|
|
|
|
|
|
|
|
| ||||
Miscellaneous | – | 28 | 14 | – | ||||||||||||
|
|
|
|
|
|
|
|
|
|
|
|
| ||||
Total Investment Income | 2,960,397 | 1,417,740 | 128,673 | 104,223 | ||||||||||||
|
|
|
|
|
|
|
|
|
|
|
|
| ||||
Expenses: | ||||||||||||||||
Investment management | 325,325 | 195,660 | 46,750 | 86,897 | ||||||||||||
|
|
|
|
|
|
|
|
|
|
|
|
| ||||
Custodian and accounting agent | 86,803 | – | – | 43,758 | ||||||||||||
|
|
|
|
|
|
|
|
|
|
|
|
| ||||
Audit and tax services | 43,784 | 46,992 | 42,901 | 36,312 | ||||||||||||
|
|
|
|
|
|
|
|
|
|
|
|
| ||||
Legal | 43,103 | 63,603 | 70,337 | 32,001 | ||||||||||||
|
|
|
|
|
|
|
|
|
|
|
|
| ||||
Shareholder communications | 19,545 | 15,041 | 5,170 | 13,000 | ||||||||||||
|
|
|
|
|
|
|
|
|
|
|
|
| ||||
Trustees | 14,434 | 6,443 | 711 | 2,213 | ||||||||||||
|
|
|
|
|
|
|
|
|
|
|
|
| ||||
Insurance | 8,924 | 6,440 | 4,673 | 1,064 | ||||||||||||
|
|
|
|
|
|
|
|
|
|
|
|
| ||||
Transfer agent | 6,460 | 5,304 | 4,437 | 4,153 | ||||||||||||
|
|
|
|
|
|
|
|
|
|
|
|
| ||||
Line of credit commitment | 3,340 | 1,478 | 153 | 506 | ||||||||||||
|
|
|
|
|
|
|
|
|
|
|
|
| ||||
Organizational | – | – | – | 48,560 | ||||||||||||
|
|
|
|
|
|
|
|
|
|
|
|
| ||||
Offering | – | – | – | 10,211 | ||||||||||||
|
|
|
|
|
|
|
|
|
|
|
|
| ||||
Miscellaneous | 6,736 | 3,486 | 3,691 | 1,748 | ||||||||||||
|
|
|
|
|
|
|
|
|
|
|
|
| ||||
Total Expenses | 558,454 | 344,447 | 178,823 | 280,423 | ||||||||||||
|
|
|
|
|
|
|
|
|
|
|
|
| ||||
Less: Fee Waiver/Reimbursement from Investment Manager | (173,423 | ) | (122,823 | ) | (116,337 | ) | (180,491 | ) | ||||||||
|
|
|
|
|
|
|
|
|
|
|
|
| ||||
Net Expenses | 385,031 | 221,624 | 62,486 | 99,932 | ||||||||||||
|
|
|
|
|
|
|
|
|
|
|
|
| ||||
Net Investment Income | 2,575,366 | 1,196,116 | 66,187 | 4,291 | ||||||||||||
|
|
|
|
|
|
|
|
|
|
|
|
| ||||
Realized and Change in Unrealized Gain (Loss): |
| |||||||||||||||
Net realized gain (loss) on: | ||||||||||||||||
Investments | 1,167,259 | 1,651,402 | (61,898 | ) | 2,319 | |||||||||||
|
|
|
|
|
|
|
|
|
|
|
|
| ||||
Futures contracts | (313,287 | ) | – | – | – | |||||||||||
|
|
|
|
|
|
|
|
|
|
|
|
| ||||
Forward foreign currency contracts | – | (439 | ) | – | (2,141 | ) | ||||||||||
|
|
|
|
|
|
|
|
|
|
|
|
| ||||
Foreign currency transactions | – | (5,392 | ) | (2,673 | ) | 8,964 | ||||||||||
|
|
|
|
|
|
|
|
|
|
|
|
| ||||
Net change in unrealized appreciation/depreciation of: Investments | 6,529,572 | (378,072 | ) | (385,083 | ) | (307,796 | ) | |||||||||
|
|
|
|
|
|
|
|
|
|
|
|
| ||||
Futures contracts | (63,817 | ) | – | – | – | |||||||||||
|
|
|
|
|
|
|
|
|
|
|
|
| ||||
Forward foreign currency contracts | – | (1 | ) | (1 | ) | – | ||||||||||
|
|
|
|
|
|
|
|
|
|
|
|
| ||||
Foreign currency transactions | – | 1,447 | 797 | 162 | ||||||||||||
|
|
|
|
|
|
|
|
|
|
|
|
| ||||
Net realized and change in unrealized gain (loss) | 7,319,727 | 1,268,945 | (448,858 | ) | (298,492 | ) | ||||||||||
|
|
|
|
|
|
|
|
|
|
|
|
| ||||
Net Increase (Decrease) in Net Assets Resulting from Investment Operations | $9,895,093 | $2,465,061 | $(382,671 | ) | $(294,201 | ) | ||||||||||
|
|
|
|
|
|
|
|
|
|
|
|
| ||||
*Foreign withholding taxes | $– | $86,933 | $11,423 | $9,366 | ||||||||||||
|
|
|
|
|
|
|
|
|
|
|
|
| ||||
| (1) | Commencement of operations was May 15, 2019. Information represents the period from May 15, 2019 through September 30, 2019. |
| See accompanying Notes to Financial Statements | 41 | Annual Report / September 30, 2019 |
Table of Contents
Statements of Changes in Net Assets
| AllianzGI Advanced Core Bond | AllianzGI Best Styles Global Managed Volatility | |||||||||||||||
Year ended September 30, 2019 | Year ended September 30, 2018 | Year ended September 30, 2019 | Year ended September 30, 2018 | |||||||||||||
Increase (Decrease) in Net Assets from: |
| |||||||||||||||
Investment Operations: | ||||||||||||||||
Net investment income | $2,575,366 | $3,268,756 | $1,196,116 | $1,480,525 | ||||||||||||
|
|
|
|
|
|
|
|
|
|
|
|
| ||||
Net realized gain (loss) | 853,972 | (1,960,378 | ) | 1,645,571 | 5,294,405 | |||||||||||
|
|
|
|
|
|
|
|
|
|
|
|
| ||||
Net change in unrealized appreciation/depreciation | 6,465,755 | (3,766,078 | ) | (376,626 | ) | (1,619,923 | ) | |||||||||
|
|
|
|
|
|
|
|
|
|
|
|
| ||||
Net increase (decrease) in net assets resulting from investment operations | 9,895,093 | (2,457,700 | ) | 2,465,061 | 5,155,007 | |||||||||||
|
|
|
|
|
|
|
|
|
|
|
|
| ||||
Distributions to Shareholders from: |
| |||||||||||||||
Distributable earnings | (3,098,374 | ) | (3,640,184 | ) | (7,046,627 | ) | (4,309,656 | ) | ||||||||
|
|
|
|
|
|
|
|
|
|
|
|
| ||||
Common Stock Transactions: |
| |||||||||||||||
Net proceeds from the sale of common stock | 2,481,154 | 28,851,924 | 5,548,753 | 3,721,485 | ||||||||||||
|
|
|
|
|
|
|
|
|
|
|
|
| ||||
Issued in reinvestment of distributions | 3,098,374 | 3,640,184 | 7,046,627 | 4,309,656 | ||||||||||||
|
|
|
|
|
|
|
|
|
|
|
|
| ||||
Cost of shares redeemed | (50,996,061 | ) | (46,841,138 | ) | (8,896,535 | ) | (16,171,024 | ) | ||||||||
|
|
|
|
|
|
|
|
|
|
|
|
| ||||
Net increase (decrease) from Portfolio share transactions | (45,416,533 | ) | (14,349,030 | ) | 3,698,845 | (8,139,883 | ) | |||||||||
|
|
|
|
|
|
|
|
|
|
|
|
| ||||
Total decrease in net assets | (38,619,814 | ) | (20,446,914 | ) | (882,721 | ) | (7,294,532 | ) | ||||||||
|
|
|
|
|
|
|
|
|
|
|
|
| ||||
Net Assets: | ||||||||||||||||
Beginning of year | 124,507,624 | 144,954,538 | 51,821,925 | 59,116,457 | ||||||||||||
|
|
|
|
|
|
|
|
|
|
|
|
| ||||
End of year | $85,887,810 | $124,507,624 | $50,939,204 | $51,821,925 | ||||||||||||
|
|
|
|
|
|
|
|
|
|
|
|
| ||||
Shares Activity: | ||||||||||||||||
Issued | 174,308 | 1,962,293 | 338,152 | 210,288 | ||||||||||||
|
|
|
|
|
|
|
|
|
|
|
|
| ||||
Issued in reinvestment of distributions | 211,276 | 252,182 | 506,587 | 248,109 | ||||||||||||
|
|
|
|
|
|
|
|
|
|
|
|
| ||||
Redeemed | (3,462,737 | ) | (3,253,673 | ) | (582,274 | ) | (909,101 | ) | ||||||||
|
|
|
|
|
|
|
|
|
|
|
|
| ||||
Net increase (decrease) | (3,077,153 | ) | (1,039,198 | ) | 262,465 | (450,704 | ) | |||||||||
|
|
|
|
|
|
|
|
|
|
|
|
| ||||
| – | May reflect actual amounts rounding to less than $1. |
| See accompanying Notes to Financial Statements | 42 | Annual Report / September 30, 2019 |
Table of Contents
Statements of Changes in Net Assets
| AllianzGI Global Small-Cap Opportunities | AllianzGI International Growth | |||||||||||
|
|
| ||||||||||
Year ended September 30, 2019 | Year ended September 30, 2018 | Period from May 15, 2019* through September 30, 2019 | ||||||||||
|
|
| ||||||||||
Increase (Decrease) in Net Assets from: |
| |||||||||||
Investment Operations: | ||||||||||||
Net investment income | $66,187 | $61,204 | $4,291 | |||||||||
|
|
|
|
|
|
|
|
|
| |||
Net realized gain (loss) | (64,571 | ) | 351,072 | 9,142 | ||||||||
|
|
|
|
|
|
|
|
|
| |||
Net change in unrealized appreciation/depreciation | (384,287 | ) | 40,320 | (307,634 | ) | |||||||
|
|
|
|
|
|
|
|
|
| |||
Net increase (decrease) in net assets resulting from investment operations | (382,671 | ) | 452,596 | (294,201 | ) | |||||||
|
|
|
|
|
|
|
|
|
| |||
Distributions to Shareholders from: |
| |||||||||||
Distributable earnings | (441,282 | ) | (716,041 | ) | – | |||||||
|
|
|
|
|
|
|
|
|
| |||
Common Stock Transactions: | ||||||||||||
Net proceeds from the sale of common stock | 2,867,171 | – | 47,320,433 | |||||||||
|
|
|
|
|
|
|
|
|
| |||
Issued in reinvestment of distributions | 441,282 | 716,041 | – | |||||||||
|
|
|
|
|
|
|
|
|
| |||
Cost of shares redeemed | – | – | (272,875 | ) | ||||||||
|
|
|
|
|
|
|
|
|
| |||
Net increase from Portfolio share transactions | 3,308,453 | 716,041 | 47,047,558 | |||||||||
|
|
|
|
|
|
|
|
|
| |||
Total increase in net assets | 2,484,500 | 452,596 | 46,753,357 | |||||||||
|
|
|
|
|
|
|
|
|
| |||
Net Assets: | ||||||||||||
Beginning of period | 5,507,678 | 5,055,082 | 3,000,000 | |||||||||
|
|
|
|
|
|
|
|
|
| |||
End of period | $7,992,178 | $5,507,678 | $49,753,357 | |||||||||
|
|
|
|
|
|
|
|
|
| |||
Shares Activity: | ||||||||||||
Issued | 175,792 | – | 3,174,908 | |||||||||
|
|
|
|
|
|
|
|
|
| |||
Issued in reinvestment of distributions | 30,433 | 40,159 | – | |||||||||
|
|
|
|
|
|
|
|
|
| |||
Redeemed | – | – | (18,277 | ) | ||||||||
|
|
|
|
|
|
|
|
|
| |||
Net increase | 206,225 | 40,159 | 3,156,631 | |||||||||
|
|
|
|
|
|
|
|
|
| |||
| – | May reflect actual amounts rounding to less than $1. |
| * | Commencement of operations. |
| See accompanying Notes to Financial Statements | 43 | Annual Report / September 30, 2019 |
Table of Contents
For a share of common stock outstanding throughout each period: ^
| AllianzGI Advanced Core Bond | AllianzGI Best Styles Global Managed Volatility | |||||||||||||||||
Year ended September 30, 2019 | Year ended September 30, 2018 | Year ended September 30, 2017 | Period from October 30, 2015* through September 30, 2016 | Year ended September 30, 2019 | Year ended September 30, 2018 | Year ended September 30, 2017 | Period from April 11, 2016* through September 30, 2016 | |||||||||||
Net asset value, beginning of period | $14.28 | $14.85 | $15.71 | $15.00 | $18.11 | $17.85 | $15.81 | $15.00 | ||||||||||
Investment Operations: | ||||||||||||||||||
Net investment income(a) | 0.35 | 0.31 | 0.25 | 0.21 | 0.39 | 0.42 | 0.40 | 0.22 | ||||||||||
Net realized and change in unrealized gain (loss) | 1.02 | (0.53) | (0.34) | 0.57 | 0.25 | 1.09 | 1.99 | 0.59 | ||||||||||
Total from investment operations | 1.37 | (0.22) | (0.09) | 0.78 | 0.64 | 1.51 | 2.39 | 0.81 | ||||||||||
Dividends and Distributions to Shareholders from: | ||||||||||||||||||
Net investment income | (0.43) | (0.35) | (0.60) | (0.07) | (0.50) | (0.60) | (0.31) | — | ||||||||||
Net realized gains | — | — | (0.17) | — | (1.94) | (0.65) | (0.04) | — | ||||||||||
Total dividends and distributions to shareholders | (0.43) | (0.35) | (0.77) | (0.07) | (2.44) | (1.25) | (0.35) | — | ||||||||||
Net asset value, end of period | $15.22 | $14.28 | $14.85 | $15.71 | $16.31 | $18.11 | $17.85 | $15.81 | ||||||||||
Total Return(b) | 9.77% | (1.48)% | (0.43)% | 5.23% | 5.84% | 8.77% | 15.41% | 5.40% | ||||||||||
RATIOS/SUPPLEMENTAL DATA: | ||||||||||||||||||
Net assets, end of period (000s) | $85,888 | $124,508 | $144,955 | $173,411 | $50,939 | $51,822 | $59,116 | $77,339 | ||||||||||
Ratio of expenses to average net assets with fee reimbursement | 0.35% | 0.35% | 0.35% | 0.41%(c)(d) | 0.45%(e) | 0.45%(e) | 0.45%(e) | 0.45%(c)(d) | ||||||||||
Ratio of expenses to average net assets without fee reimbursement | 0.52% | 0.50% | 0.44% | 0.62%(c)(d) | 0.70%(e)(f) | 0.84%(e) | 0.83%(e) | 0.99%(c)(d) | ||||||||||
Ratio of net investment income to average net assets | 2.37% | 2.13% | 1.67% | 1.52%(c)(d) | 2.45%(e) | 2.37%(e) | 2.42%(e) | 2.96%(c)(d) | ||||||||||
Portfolio turnover rate | 305% | 314% | 319% | 260% | 45% | 59% | 31%(g) | 1% | ||||||||||
| ^ | A “—” may reflect actual amounts rounding to less than $0.01 or 0.01%. |
| * | Commencement of operations. |
| (a) | Calculated on average shares outstanding during the period. |
| (b) | Total return is calculated assuming a purchase of a share on the first day of the period and a sale of a share on the last day of each period reported. |
Dividends and distributions, if any, are assumed, for purposes of this calculation, to be reinvested. Total return does not reflect sales charges and includes the effect of expense reimbursements. Total return may reflect adjustments to conform to U.S. GAAP. Total return for a period of less than one year is not annualized. |
| (c) | Annualized, unless otherwise noted. |
| (d) | Certain expenses incurred were not annualized. |
| (e) | Does not include expenses of the investment in which the Portfolio invests. |
| (f) | Due to a change in accounting estimate, the custodian and accounting agent expense was reduced in the current period as disclosed in Note 9(b). The effect on the Ratio of Expenses to Average Net Assets without Fee Waiver/ Reimbursement was a decrease in the ratio of 0.19%. |
| (g) | Portfolio turnover rate excludes securities received or delivered fromin-kind fund share transactions. |
| See accompanying Notes to Financial Statements | 44 | Annual Report / September 30, 2019 |
Table of Contents
Financial Highlights
For a share of common stock outstanding throughout each period:^
| AllianzGI Global Small-Cap Opportunities | AllianzGI International Growth |
| ||||||||||||||||
| Year ended September 30, 2019 | Year ended September 30, 2018 | Year ended September 30, 2017 | Year ended September 30, 2016 | Period from December 1, 2014 through September 30, 2015# | Period from July 23, 2014* through November 30, 2014 | Period from May 15, 2019* through September 30, 2019 | ||||||||||||
| ||||||||||||||||||
Net asset value, beginning of period | $18.95 | $20.19 | $15.72 | $14.53 | $14.70 | $15.00 | 15.00 | |||||||||||
Investment Operations: | ||||||||||||||||||
Net investment income(a) | 0.21 | 0.22 | 0.19 | 0.15 | 0.12 | 0.05 | — | |||||||||||
Net realized and change in unrealized gain (loss) | (1.55) | 1.40 | 4.49 | 1.13 | (0.25) | (0.35) | (0.18) | |||||||||||
Total from investment operations | (1.34) | 1.62 | 4.68 | 1.28 | (0.13) | (0.30) | (0.18) | |||||||||||
Dividends and Distributions to Shareholders from: | ||||||||||||||||||
Net investment income | (0.31) | (0.43) | (0.21) | (0.09) | (0.04) | — | — | |||||||||||
Net realized gains | (1.21) | (2.43) | — | — | — | — | — | |||||||||||
Total dividends and distributions to shareholders | (1.52) | (2.86) | (0.21) | (0.09) | (0.04) | — | — | |||||||||||
Net asset value, end of period | $16.09 | $18.95 | $20.19 | $15.72 | $14.53 | $14.70 | $14.82 | |||||||||||
Total Return(b) | (6.20)% | 8.91% | 30.06% | 8.85% | (0.86)% | (2.00)% | (1.20)% | |||||||||||
RATIOS/SUPPLEMENTAL DATA: | ||||||||||||||||||
Net assets, end of period (000s) | $7,992 | $5,508 | $5,055 | $5,287 | $4,856 | $4,899 | $49,753 | |||||||||||
Ratio of expenses to average net assets with fee reimbursement | 1.20% | 1.20% | 1.20% | 1.20% | 1.22%(c)(d) | 1.20%(c)(d) | 0.80%(c)(d) | |||||||||||
Ratio of expenses to average net assets without fee reimbursement | 3.44%(e) | 3.70% | 4.24% | 5.48% | 7.06%(c)(d) | 4.88%(c)(d) | 1.83%(c)(d) | |||||||||||
Ratio of net investment income to average net assets | 1.27% | 1.16% | 1.10% | 1.04% | 0.91%(c)(d) | 0.88%(c)(d) | 0.03%(c)(d) | |||||||||||
Portfolio turnover rate | 53% | 98% | 143% | 177% | 152% | 56% | 22%(f) | |||||||||||
| ^ | A “—” may reflect actual amounts rounding to less than $0.01 or 0.01%. |
| * | Commencement of operations. |
| # | Fiscal year end changed from November 30th to September 30th. |
| (a) | Calculated on average shares outstanding during the year. |
| (b) | Total return is calculated assuming a purchase of a share on the first day of the period and a sale of a share on the last day of each period reported. |
Dividends and distributions, if any, are assumed, for purposes of this calculation, to be reinvested. Total return does not reflect sales charges and includes the effect of expense reimbursements. Total return may reflect adjustments to conform to U.S. GAAP. Total return for a period of less than one year is not annualized. |
| (c) | Annualized, unless otherwise noted. |
| (d) | Certain expenses incurred were not annualized. |
| (e) | Due to a change in accounting estimate, the custodian and accounting agent expense was reduced in the current period as disclosed in Note 9(b). The effect on the Ratio of Expenses to Average Net Assets without Fee Waiver/ Reimbursement was a decrease in the ratio of 1.08%. |
| (f) | Portfolio turnover rate excludes securities received or delivered fromin-kind fund share transactions. |
| See accompanying Notes to Financial Statements | 45 | Annual Report / September 30, 2019 |
Table of Contents
AllianzGI Institutional Multi-Series Trust
Notes to Financial Statements
1. ORGANIZATION AND SIGNIFICANT ACCOUNTING POLICIES
AllianzGI Institutional Multi-Series Trust (the “Trust”) was organized on June 3, 2014 and is registered under the Investment Company Act of 1940, as amended (the“1940-Act”), as anopen-end registered investment company. The Trust follows the investment company accounting and reporting guidance of the Financial Accounting Standards Board (“FASB”) Accounting Standard Codification Topic 946 Financial Services-Investment Companies. As of September 30, 2019, the Trust consisted of four separate investment series, (each a “Portfolio” and together the “Portfolios”). Allianz Global Investors U.S. LLC (“AllianzGI U.S.” or the “Investment Manager”) serves as the Portfolios’ investment manager. The Investment Manager is an indirect, wholly-owned subsidiary of Allianz Asset Management of America L.P. (“AAM”). AAM is an indirect, wholly-owned subsidiary of Allianz SE, a publicly traded European insurance and financial services company. Shares of the Portfolios have not been registered for public sale and are currently offered and sold on a private placement basis in accordance with Rule 506(c) of Regulation D under the Securities Act of 1933, as amended. Currently, the Trust has authorized one class of shares.
The following Portfolio sold and issued shares of beneficial interest to Allianz Fund Investments, Inc. (“AFI”) during the period ended September 30, 2019. AFI is an indirect, wholly-owned subsidiary of Allianz SE.
AllianzGI International Growth
| Date | Shares | Amount | ||
5/15/19 | 200,000 | $ 3,000,000 |
The investment objective of AllianzGI Advanced Core Bond is to seek long-term risk adjusted total net return. The investment objective of AllianzGI Best Styles Global Managed Volatility, AllianzGI GlobalSmall-Cap Opportunities and AllianzGI International Growth is to seek long-term capital appreciation. There can be no assurance that the Portfolios will meet their stated objective.
The preparation of the Portfolios’ financial statements in accordance with accounting principles generally accepted in the United States of America (“U.S. GAAP”) requires the Portfolios’ management to make estimates and assumptions that affect the reported amounts and disclosures in each Portfolio’s financial statements. Actual results could differ from those estimates.
In the normal course of business, the Portfolios enter into contracts that contain a variety of representations that provide general indemnifications, including in some of its principal service contracts. The Portfolios’ maximum exposures under these arrangements are unknown as this would involve future claims that may be made against the Portfolios that have not yet occurred. However, based on experience, the risk of loss is expected to be remote.
Like many other companies, the Portfolios’ organizational documents provide that its officers (“Officers”) and the Board of Trustees of the Trust (the “Board”) are indemnified against certain liabilities arising out of the performance of their duties to the Portfolios.
The following is a summary of significant accounting policies consistently followed by the Portfolios:
(a) Valuation of Investments. Portfolio securities and other financial instruments for which market quotations are readily available are valued at market value. Market values for various types of securities and other instruments are determined on the basis of closing prices or last sales prices on an exchange or other market, or based on quotes or other market information obtained from quotation reporting systems, established market makers or pricing services. Investments in mutual funds are valued at the net asset value (“NAV”) as reported on each business day, and, under normal circumstances, ETFs are valued at their current market trading price. The Portfolios’ investments are valued daily using prices supplied by an independent pricing service or broker/dealer quotations, or by using the last sale or settlement price on the exchange that is the primary market for such securities, or the mean between the last bid and ask quotations. The market value for NASDAQ Global Market and NASDAQ Capital Market securities may also be calculated using the NASDAQ Official Closing Price instead of the last reported sales price. Independent pricing services use information provided by market makers or estimates of market values obtained from yield data relating to investments or securities with similar characteristics. Exchange traded futures are valued at the price determined by the relevant exchange. Securities purchased on a when-issued or delayed-delivery basis are marked to market daily until settlement at the forward settlement date.
| 46 | Annual Report / September 30, 2019 |
Table of Contents
AllianzGI Institutional Multi-Series Trust
Notes to Financial Statements(continued)
The Board has adopted procedures for valuing portfolio securities and other financial derivative instruments in circumstances where market quotes are not readily available (including in cases where available market quotes are deemed to be unreliable), and has delegated responsibility for applying the valuation methods to the Investment Manager. The Trust’s Valuation Committee was established by the Board to oversee the implementation of the Portfolios’ valuation methods and to make fair value determinations on behalf of the Board, as instructed. The Investment Manager monitors the continued appropriateness of methods applied and identifies circumstances and events that may require fair valuation. The Investment Manager determines if adjustments should be made in light of market changes, events affecting the issuer, or other factors. If the Investment Manager determines that a valuation method may no longer be appropriate, another valuation method previously approved by the Trust’s Valuation Committee may be selected or the Trust’s Valuation Committee will be convened to consider the matter and take any appropriate action in accordance with procedures set forth by the Board. The Board shall review and ratify the appropriateness of the valuation methods and these methods may be amended or supplemented from time to time by the Trust’s Valuation Committee.
Short-term debt investments having a remaining maturity of 60 days or less are valued at amortized cost unless the Board or its Valuation Committee determines that particular circumstances dictate otherwise.
Investments initially valued in currencies other than the U.S. dollar are converted to the U.S. dollar using exchange rates obtained from pricing services. As a result, the NAV of each Portfolio may be affected by changes in the value of currencies in relation to the U.S. dollar. The value of securities traded in markets outside the United States or denominated in currencies other than the U.S. dollar may be affected significantly on a day that the New York Stock Exchange (“NYSE”) is closed and the NAV of a Fund’s shares may change on days when an investor is not able to purchase or redeem or exchanges shares.
The prices used by the Portfolios to value investments may differ from the value that would be realized if the investments were sold, and these differences could be material to the Portfolios’ financial statements. Each Portfolio’s NAV is normally determined as of the close of regular trading (normally, 4:00 p.m., Eastern Time) on the NYSE on each day the NYSE is open for business. In unusual circumstances, the Board or the Valuation Committee may in good faith determine the NAV as of 4:00 p.m., Eastern Time, notwithstanding an earlier, unscheduled close or halt of trading on the NYSE.
The prices of certain portfolio securities or financial instruments may be determined at a time prior to the close of regular trading on the NYSE. In considering whether fair value pricing is required and in determining fair values, the Portfolios may, among other things, consider significant events (which may be considered to include changes in the value of U.S. securities or securities indices) that occur after the close of the relevant market and before the time the NAV of a Portfolio is calculated. With respect to certain foreign securities, the Portfolios may fair-value securities using modeling tools provided by third-party vendors, where appropriate. The Portfolios have retained a statistical research service to assist in determining the fair value of foreign securities. This service utilizes statistics and programs based on historical performance of markets and other economic data to assist in making fair value estimates. Fair value estimates used by the Portfolios for foreign securities may differ from the value realized from the sale of those securities and the difference could be material to the financial statements. Fair value pricing may require subjective determinations about the value of a security or other assets, and fair values used to determine the NAV of a Portfolio may differ from quoted or published prices, or from prices that are used by others, for the same investments. In addition, the use of fair value pricing may not always result in adjustments to the prices of securities or other assets held by a Portfolio.
(b) Fair Value Measurements.Fair value is defined as the price that would be received to sell an asset or paid to transfer a liability (i.e., the “exit price”) in an orderly transaction between market participants. The three levels of the fair value hierarchy are described below:
| • | Level 1 – quoted prices in active markets for identical investments that the Portfolios have the ability to access |
| • | Level 2 – valuations based on other significant observable inputs, which may include, but are not limited to, quoted prices for similar assets or liabilities, interest rates, yield curves, volatilities, prepayment speeds, loss severities, credit risks and default rates or other market corroborated inputs |
| • | Level 3 – valuations based on significant unobservable inputs (including the Investment Manager’s or the Trust’s Valuation Committee’s own assumptions and securities whose price was determined by using a single broker’s quote) |
| 47 | Annual Report / September 30, 2019 |
Table of Contents
AllianzGI Institutional Multi-Series Trust
Notes to Financial Statements(continued)
The valuation techniques used by the Portfolios to measure fair value during the year ended September 30, 2019 were intended to maximize the use of observable inputs and to minimize the use of unobservable inputs.
An investment asset’s or liability’s level within the fair value hierarchy is based on the lowest level input, individually or in aggregate, that is significant to the fair value measurement. The objective of fair value measurement remains the same even when there is a significant decrease in the volume and level of activity for an asset or liability and regardless of the valuation techniques used.
The inputs or methodology used for valuing securities are not necessarily an indication of the risk associated with investing in those securities. The following are certain inputs and techniques that the Portfolios generally use to evaluate how to classify each major category of assets and liabilities within Level 2 and Level 3, in accordance with U.S. GAAP.
An asset or liability for which market values cannot be measured using the methodologies described above is valued by methods deemed reasonable in good faith by the Valuation Committee, following the procedures established by the Board, to represent fair value. Under these procedures, the Portfolios generally use a market-based approach which may use related or comparable assets or liabilities, recent transactions, market multiples, book values and other relevant information. Fair value determinations involve the consideration of a number of subjective factors, an analysis of applicable facts and circumstances and the exercise of judgment. As a result, it is possible that the fair value for a security determined in good faith in accordance with the Portfolios’ valuation procedures may differ from valuations for the same security determined by other funds using their own valuation procedures. Although the Portfolios’ valuation procedures are designed to value a security at the price the Portfolios may reasonably expect to receive upon the security’s sale in an orderly transaction, there can be no assurance that any fair value determination thereunder would, in fact, approximate the amount that the Portfolios would actually realize upon the sale of the security or the price at which the security would trade if a reliable market price were readily available.
Equity Securities (Common and Preferred Stock and Warrants)— Equity securities traded in inactive markets and certain foreign equity securities are valued using inputs which include broker-dealer quotes, recently executed transactions adjusted for changes in the benchmark index, or evaluated price quotes received from independent pricing services that take into account the integrity of the market sector and issuer, the individual characteristics of the security, and information received from broker-dealers and other market sources pertaining to the issuer or security. To the extent that these inputs are observable, the values of equity securities are categorized as Level 2. To the extent that these inputs are unobservable, the values are categorized as Level 3.
U.S. Treasury Obligations — U.S. Treasury obligations are valued by independent pricing services based on pricing models that evaluate the mean between the most recently quoted bid and ask price. The models also take into consideration data received from active market makers and broker-dealers, yield curves, and the spread over comparable U.S. Treasury issues. The spreads change daily in response to market conditions and are generally obtained from the new issue market and broker-dealer sources. To the extent that these inputs are observable, the values of U.S. Treasury obligations are categorized as Level 2. To the extent that these inputs are unobservable, the values are categorized as Level 3.
Government Sponsored Enterprise and Mortgage-Backed Securities — Government sponsored enterprise and mortgage-backed securities are valued by independent pricing services using pricing models based on inputs that include issuer type, coupon, cash flows, mortgage prepayment projection tables and Adjustable Rate Mortgage evaluations that incorporate index data, periodic life caps and the next coupon reset date. To the extent that these inputs are observable, the values of government sponsored enterprise and mortgage-backed securities are categorized as Level 2. To the extent that these inputs are unobservable, the values are categorized as Level 3.
Sovereign Debt Obligations — Sovereign debt obligations are valued by independent pricing services based on discounted cash flow models that incorporate option adjusted spreads along with benchmark curves and credit spreads. In addition, international bond markets are monitored regularly for information pertaining to the issuer and/or the specific issue. To the extent that these inputs are observable, the values of sovereign debt obligations are categorized as Level 2. To the extent that these inputs are unobservable, the values are categorized as Level 3.
| 48 | Annual Report / September 30, 2019 |
Table of Contents
AllianzGI Institutional Multi-Series Trust
Notes to Financial Statements(continued)
Corporate Bonds & Notes — Corporate bonds & notes are generally comprised of two main categories: investment grade bonds and high yield bonds. Investment grade bonds are valued by independent pricing services using various inputs and techniques, which include broker-dealer quotations, live trading levels, recently executed transactions in securities of the issuer or comparable issuers, and option adjusted spread models that include base curve and spread curve inputs. Adjustments to individual bonds can be applied to recognize trading differences compared to other bonds issued by the same issuer. High yield bonds are valued by independent pricing services based primarily on broker-dealer quotations from relevant market makers and recently executed transactions in securities of the issuer or comparable issuers. The broker-dealer quotations received are supported by credit analysis of the issuer that takes into consideration credit quality assessments, daily trading activity, and the activity of the underlying equities, listed bonds and sector-specific trends. To the extent that these inputs are observable, the values of corporate bonds & notes are categorized as Level 2. To the extent that these inputs are unobservable, the values are categorized as Level 3.
A summary of the inputs used at September 30, 2019 in valuing each Portfolio’s assets and liabilities is listed below (refer to the Schedules of Investments and Notes to the Schedules of Investments for more detailed information on Investments in Securities and Other Financial Instruments):
AllianzGI Advanced Core Bond:
| Level 1 - Quoted Prices | Level 2 - Other Significant Inputs | Level 3 - Significant Inputs | Value at 9/30/19 | |||||||||||||
Investments in Securities - Assets | ||||||||||||||||
Corporate Bonds & Notes | — | $ | 50,989,278 | — | $ | 50,989,278 | ||||||||||
U.S. Government Agency Securities | — | 23,373,697 | — | 23,373,697 | ||||||||||||
U.S. Treasury Obligations | — | 18,198,384 | — | 18,198,384 | ||||||||||||
Sovereign Debt Obligations | — | 14,136,346 | — | 14,136,346 | ||||||||||||
Repurchase Agreements | — | 1,464,000 | — | 1,464,000 | ||||||||||||
| — | 108,161,705 | — | 108,161,705 | |||||||||||||
Other Financial Instruments* – Assets | ||||||||||||||||
Interest Rate Contracts | $ | 27,813 | — | — | 27,813 | |||||||||||
Totals | $ | 27,813 | $ | 108,161,705 | — | $ | 108,189,518 | |||||||||
| AllianzGI Best Styles Global Managed Volatility: | ||||||||||||||||
| Level 1 - Quoted Prices | Level 2 - Inputs | Level 3 - Inputs | Value at 9/30/19 | |||||||||||||
Investments in Securities - Assets | ||||||||||||||||
Common Stock: | ||||||||||||||||
Australia | — | $ | 618,382 | — | $ | 618,382 | ||||||||||
Belgium | $ | 81,665 | 241,464 | — | 323,129 | |||||||||||
China | 21,741 | 1,161,615 | — | 1,183,356 | ||||||||||||
Czech Republic | 37,992 | 151,527 | — | 189,519 | ||||||||||||
Denmark | 30,947 | 196,026 | — | 226,973 | ||||||||||||
Finland | 123,576 | 196,382 | — | 319,958 | ||||||||||||
France | 170,155 | 561,948 | — | 732,103 | ||||||||||||
Germany | 75,065 | 727,275 | — | 802,340 | ||||||||||||
Hong Kong | — | 794,533 | — | 794,533 | ||||||||||||
Hungary | — | 151,747 | — | 151,747 | ||||||||||||
Israel | — | 409,831 | — | 409,831 | ||||||||||||
Italy | 39,386 | 567,885 | — | 607,271 | ||||||||||||
Japan | 14,566 | 6,218,991 | — | 6,233,557 | ||||||||||||
Korea (Republic of) | 88,193 | 692,451 | — | 780,644 | ||||||||||||
Malaysia | 32,899 | 410,187 | — | 443,086 | ||||||||||||
Netherlands | 104,953 | 252,458 | — | 357,411 | ||||||||||||
New Zealand | — | 158,618 | — | 158,618 | ||||||||||||
Norway | — | 75,553 | — | 75,553 | ||||||||||||
Philippines | 35,306 | 24,438 | $ | 57 | 59,801 | |||||||||||
Poland | — | 73,546 | — | 73,546 | ||||||||||||
Singapore | 25,713 | 999,808 | — | 1,025,521 | ||||||||||||
Spain | 16,361 | 233,580 | — | 249,941 | ||||||||||||
Sweden | — | 63,306 | — | 63,306 | ||||||||||||
Switzerland | — | 2,074,400 | — | 2,074,400 | ||||||||||||
Taiwan | — | 2,131,092 | 35,017 | 2,166,109 | ||||||||||||
Thailand | — | 89,710 | 571,570 | 661,280 | ||||||||||||
United Kingdom | 92,818 | 466,303 | — | 559,121 | ||||||||||||
All Other | 28,532,541 | — | — | 28,532,541 | ||||||||||||
Exchange-Traded Funds | 189,500 | — | — | 189,500 | ||||||||||||
Preferred Stock | 150,740 | — | — | 150,740 | ||||||||||||
Rights | — | — | 569 | 569 | ||||||||||||
Repurchase Agreements | — | 512,000 | — | 512,000 | ||||||||||||
| 29,864,117 | 20,255,056 | 607,213 | 50,726,386 | |||||||||||||
Other Financial Instruments* – Liabilities | ||||||||||||||||
Foreign Exchange Contracts | — | (1 | ) | — | (1 | ) | ||||||||||
Totals | $ | 29,864,117 | $ | 20,255,055 | $ | 607,213 | $ | 50,726,385 | ||||||||
| 49 | Annual Report / September 30, 2019 |
Table of Contents
AllianzGI Institutional Multi-Series Trust
Notes to Financial Statements(continued)
AllianzGI GlobalSmall-Cap Opportunities:
Level 1 - Quoted Prices | Level 2 - Inputs | Level 3 - Significant Inputs | Value at 9/30/19 | |||||||||||||
Investments in Securities - Assets | ||||||||||||||||
Common Stock: | ||||||||||||||||
Australia | — | $ | 289,895 | — | $ | 289,895 | ||||||||||
Austria | — | 41,474 | — | 41,474 | ||||||||||||
Canada | $ | 216,539 | 24,767 | — | 241,306 | |||||||||||
China | — | 195,143 | — | 195,143 | ||||||||||||
Denmark | — | 124,446 | — | 124,446 | ||||||||||||
France | — | 28,461 | — | 28,461 | ||||||||||||
Greece | — | 59,626 | — | 59,626 | ||||||||||||
Hong Kong | — | 85,078 | — | 85,078 | ||||||||||||
India | 105,413 | 29,492 | — | 134,905 | ||||||||||||
Italy | — | 151,340 | — | 151,340 | ||||||||||||
Japan | 57,839 | 822,646 | — | 880,485 | ||||||||||||
Korea (Republic of) | 32,652 | 45,139 | — | 77,791 | ||||||||||||
Netherlands | — | 198,525 | — | 198,525 | ||||||||||||
Portugal | — | 57,349 | — | 57,349 | ||||||||||||
Russian Federation | — | — | $ | 44,314 | 44,314 | |||||||||||
Singapore | — | 202,808 | — | 202,808 | ||||||||||||
South Africa | 35,145 | 68,677 | — | 103,822 | ||||||||||||
Taiwan | — | 77,535 | — | 77,535 | ||||||||||||
Thailand | — | — | 95,457 | 95,457 | ||||||||||||
United Kingdom | 166,677 | 266,330 | — | 433,007 | ||||||||||||
All Other | 4,413,492 | — | — | 4,413,492 | ||||||||||||
Preferred Stock | 46,566 | — | — | 46,566 | ||||||||||||
| 5,074,323 | 2,768,731 | 139,771 | 7,982,825 | |||||||||||||
Other Financial Instruments* – Liabilities | ||||||||||||||||
Foreign Exchange Contracts | — | (1 | ) | — | (1 | ) | ||||||||||
Totals | $ | 5,074,323 | $ | 2,768,730 | $ | 139,771 | $ | 7,982,824 | ||||||||
| AllianzGI International Growth: | ||||||||||||||||
Level 1 - Quoted Prices | Level 2 - Other Significant Inputs | Level 3 - Significant Inputs | Value at 9/30/19 | |||||||||||||
Investments in Securities - Assets | ||||||||||||||||
Common Stock: | ||||||||||||||||
Brazil | $ | 2,276,920 | — | — | $ | 2,276,920 | ||||||||||
Canada | 5,140,930 | — | — | 5,140,930 | ||||||||||||
China | 3,692,620 | $ | 2,304,340 | — | 5,996,960 | |||||||||||
India | 2,152,839 | — | — | 2,152,839 | ||||||||||||
Ireland | 1,297,133 | 1,046,571 | — | 2,343,704 | ||||||||||||
Israel | 1,823,946 | — | — | 1,823,946 | ||||||||||||
All Other | — | 29,544,805 | — | 29,544,805 | ||||||||||||
Repurchase Agreements | — | 6,557,000 | — | 6,557,000 | ||||||||||||
Totals | $ | 16,384,388 | $ | 39,452,716 | — | $ | 55,837,104 | |||||||||
| 50 | Annual Report / September 30, 2019 |
Table of Contents
AllianzGI Institutional Multi-Series Trust
Notes to Financial Statements(continued)
A roll forward of fair value measurements using significant unobservable inputs (Level 3) for the year ended September 30, 2019, was as follows:
AllianzGI Best Styles Global Managed Volatility:
Beginning Balance 9/30/18 | Purchases | Sales | Accrued Discount (Premiums) | Net Realized Gain (Loss) | Net Change in Unrealized Appreciation/ Depreciation | Transfers into Level 3 | Transfers out of Level 3 | Ending Balance 9/30/19 | ||||||||||||||||||||||||||||||||
Investments in Securities - Assets |
| |||||||||||||||||||||||||||||||||||||||
Common Stock: | ||||||||||||||||||||||||||||||||||||||||
Philippines | $ | — | $ | 59 | $ | — | $ | — | $ | — | $ | (2) | $ | — | $ | — | $ | 57 | ||||||||||||||||||||||
Taiwan | — | — | — | — | — | — | 35,017†† | — | 35,017 | |||||||||||||||||||||||||||||||
Thailand | 758,135 | 56,504 | (287,343) | — | (9,820) | (381) | 54,475††† | — | 571,570 | |||||||||||||||||||||||||||||||
Rights | — | —† | — | — | — | 569 | — | — | 569 | |||||||||||||||||||||||||||||||
| ||||||||||||||||||||||||||||||||||||||||
Totals | $ | 758,135 | $ | 56,563 | $ | (287,343) | $ | — | $ | (9,820) | $ | 186 | $ | 89,492 | $ | — | $ | 607,213 | ||||||||||||||||||||||
| ||||||||||||||||||||||||||||||||||||||||
AllianzGI GlobalSmall-Cap Opportunities:
Beginning Balance 9/30/18 | Purchases | Sales | Accrued Discount (Premiums) | Net Realized Gain (Loss) | Net Change in Unrealized Appreciation/ Depreciation | Transfers into Level 3 | Transfers out of Level 3 | Ending Balance 9/30/19 | ||||||||||||||||||||||||||||||||
Investments in Securities - Assets |
| |||||||||||||||||||||||||||||||||||||||
Common Stock: | ||||||||||||||||||||||||||||||||||||||||
Russian Federation | $ | 111,656 | $ | 19,303 | $ | (60,861) | $ | — | $ | (9,605 | ) | $ | (16,179 | ) | $ | — | $ | — | $ | 44,314 | ||||||||||||||||||||
Thailand | 54,348 | 34,594 | — | — | — | 6,515 | — | — | 95,457 | |||||||||||||||||||||||||||||||
| ||||||||||||||||||||||||||||||||||||||||
Totals | $ | 166,004 | $ | 53,897 | $ | (60,861) | $ | — | $ | (9,605) | $ | (9,664) | $ | — | $ | — | $ | 139,771 | ||||||||||||||||||||||
| ||||||||||||||||||||||||||||||||||||||||
The tables above may include Level 3 investments that are valued by brokers and independent pricing services. The inputs for these investments are not readily available or cannot be reasonably estimated and are generally those inputs described in Note 1(b).
*Other financial instruments are derivatives, such as futures contracts and forward foreign currency contracts, which are valued at the unrealized appreciation (depreciation) of the instrument.
† Issued via corporate action.
†† Transferred out of Level 2 and into Level 3 because trading on the security was halted.
††† Transferred out of Level 2 and into Level 3 because an exchange traded price was not available in the foreign market at September 30, 2019.
The net change in unrealized appreciation/depreciation of Level 3 investments which the following Portfolios held at September 30, 2019 was:
AllianzGI Best Styles Global Managed Volatility | $ | (23,709 | ) | |
AllianzGI GlobalSmall-Cap Opportunities | (12,089 | ) |
Net realized gain (loss) and net change in unrealized appreciation/depreciation are reflected on the Statements of Operations.
(c) Investment Transactions and Investment Income. Investment transactions are accounted for on the trade date. Securities purchased and sold on a when-issued or delayed-delivery basis may be settled beyond a standard settlement period for the security after the trade date. Realized gains and losses on investments are determined on an identified cost basis. Interest income adjusted for the accretion of discounts and amortization of premiums is recorded on an accrual basis. Discounts or premiums on debt securities purchased are accreted or amortized, respectively, to interest income. Dividend income is recorded on theex-dividend date, except for certain dividends from foreign securities where theex-dividend date may have passed, and then are recorded as soon after theex-dividend date as the Portfolios, using reasonable diligence, become aware of such dividends. Dividend and interest income on the Statements of Operations are shown net of any foreign taxes withheld on income from foreign securities. Payments received from real estate investment trust securities may be comprised of dividends, realized gains and return of capital. The payment may initially be recorded as dividend income and
| 51 | Annual Report / September 30, 2019 |
Table of Contents
AllianzGI Institutional Multi-Series Trust
Notes to Financial Statements(continued)
may subsequently be reclassified as realized gains and/or return of capital upon receipt of information from the issuer. Payments considered return of capital reduce the cost basis of the respective security. Distributions, if any, in excess of the cost basis of a security are recognized as capital gains.
(d) Federal Income Taxes. The Portfolios intend to distribute all of their taxable income and to comply with the other requirements of Subchapter M of the U.S. Internal Revenue Code of 1986, as amended, applicable to regulated investment companies. Accordingly, no provision for U.S. federal income taxes is required. The Portfolios may be subject to excise tax based on distributions to shareholders.
Accounting for uncertainty in income taxes establishes for all entities, including pass-through entities such as the Portfolios, a minimum threshold for financial statement recognition of the benefit of positions taken in filing tax returns (including whether an entity is taxable in a particular jurisdiction), and requires certain expanded tax disclosures. In accordance with provisions set forth under U.S. GAAP, the Investment Manager has reviewed the Portfolios’ tax positions for all open tax years. As of September 30, 2019, the Portfolios have recorded no liability for net unrecognized tax benefits relating to uncertain income tax positions they have taken. The Portfolios’ federal income tax returns for the prior three years, as applicable, remain subject to examination by the Internal Revenue Service.
(e) Dividends and Distributions to Shareholders. The Portfolios (except AllianzGI Advanced Core Bond) declare dividends and distributions from net investment income and net realized capital gains, if any, annually. AllianzGI Advanced Core Bond declares dividends from net investment income quarterly and distributions from net realized capital gains, if any, annually. The Portfolios record dividends and distributions to their respective shareholders on theex-dividend date. The amount of dividends from net investment income and distributions from net realized capital gains is determined in accordance with federal income tax regulations, which may differ from U.S. GAAP. These“book-tax” differences are considered either temporary or permanent in nature. To the extent these differences are permanent in nature, such amounts are reclassified within the capital accounts based on their federal income tax treatment. Temporary differences do not require reclassification. To the extent dividends and/or distributions exceed current and accumulated earnings and profits for federal income tax purposes, they are reported as dividends and/or distributions to shareholders from return of capital.
(f) Foreign Currency Translation. The Portfolios’ accounting records are maintained in U.S. dollars as follows: (1) the foreign currency market values of investments and other assets and liabilities denominated in foreign currencies are translated at the prevailing exchange rate at the end of the period; and (2) purchases and sales, income and expenses are translated at the prevailing exchange rate on the respective dates of such transactions. The resulting net foreign currency gain (loss) is included in the Portfolios’ Statements of Operations.
The Portfolios do not generally isolate that portion of the results of operations arising as a result of changes in foreign currency exchange rates from the fluctuations arising from changes in the market prices of securities. Accordingly, such foreign currency gain (loss) is included in net realized and unrealized gain (loss) on investments. However, the Portfolios do isolate the effect of fluctuations in foreign currency exchange rates when determining the gain (loss) upon the sale or maturity of foreign currency denominated debt obligations pursuant to U.S. federal income tax regulations; such amount is categorized as foreign currency gain (loss) for both financial reporting and income tax reporting purposes.
(g) Repurchase Agreements. The Portfolios are parties to Master Repurchase Agreements (“Master Repo Agreements”) with select counterparties. The Master Repo Agreements include provisions for initiation of repurchase transactions, income payments, events of default, and maintenance of collateral.
The Portfolios enter into transactions, under the Master Repo Agreements, with their custodian bank or securities brokerage firms whereby they purchase securities under agreements (i.e., repurchase agreements) to resell such securities at an agreed upon price and date. The Portfolios, through their custodian, take possession of securities collateralizing the repurchase agreement. Such agreements are carried at the contract amount in the financial statements, which is considered to represent fair value. The collateral that is pledged (i.e. the securities received by the Portfolios), which consists primarily of U.S. government obligations and asset-backed securities, is held by the custodian bank for the benefit of the Portfolios until maturity of the repurchase agreement. Provisions of the repurchase agreements and the procedures adopted by the Portfolios require that the market value of the collateral, including accrued interest thereon, be sufficient in the event of default by the counterparty. If the counterparty defaults under the Master Repo Agreements and the value of the collateral declines or if the
| 52 | Annual Report / September 30, 2019 |
Table of Contents
AllianzGI Institutional Multi-Series Trust
Notes to Financial Statements(continued)
counterparty initiates an insolvency proceeding, realization of the collateral by the Portfolios may be delayed or limited. The gross values are included in the Portfolios’ Schedules of Investments. As of September 30, 2019, the value of the related collateral exceeded the value of the repurchase agreements for each Portfolio.
(h) Rights. The Portfolios may receive rights. A right is a privilege granted to existing shareholders of a corporation to subscribe for shares of a new issue of common stock before it is issued. Rights normally have a short life, usually two to four weeks, are freely transferable and entitle the holder to buy the new common stock at a lower price than the public offering price. Rights may entail greater risks than certain other types of investments. Generally, rights do not carry the right to receive dividends or exercise voting rights with respect to the underlying securities, and they do not represent any rights in the assets of the issuer. In addition, their value does not necessarily change with the value of the underlying securities, and they cease to have value if they are not exercised on or before their expiration date. If the market price of the underlying stock does not exceed the exercise price during the life of the right, the right will expire worthless. Rights may increase the potential profit or loss to be realized from the investment as compared with investing the same amount in the underlying securities.
(i) U.S. Government Agencies or Government-Sponsored Enterprises.Securities issued by U.S. Government agencies or government-sponsored enterprises may not be guaranteed by the U.S. Treasury. The Government National Mortgage Association (“GNMA” or “Ginnie Mae”), a wholly-owned U.S. Government corporation, is authorized to guarantee, with the full faith and credit of the U.S. Government, the timely payment of principal and interest on securities issued by institutions approved by GNMA and backed by pools of mortgages insured by the Federal Housing Administration or guaranteed by the Department of Veterans Affairs. Government-related guarantors not backed by the full faith and credit of the U.S. Government include the Federal National Mortgage Association (“FNMA” or “Fannie Mae”) and the Federal Home Loan Mortgage Corporation (“FHLMC” or “Freddie Mac”). Pass-through securities issued by FNMA are guaranteed as to timely payment of principal and interest by FNMA, but are not backed by the full faith and credit of the U.S. Government. FHLMC guarantees the timely payment of interest and ultimate collection of principal, but its participation certificates are not backed by the full faith and credit of the U.S. Government.
(j) When-Issued/Delayed-Delivery Transactions. When-issued or delayed-delivery transactions involve a commitment to purchase or sell securities for a predetermined price or yield, with payment and delivery taking place beyond the customary settlement period. When delayed-delivery purchases are outstanding, the Portfolios will set aside and maintain until the settlement date in a designated account, liquid assets in an amount sufficient to meet the purchase price. Upon entering into these when-issued or delayed-delivery transactions, the Portfolio and the counterparties are required to pledge to the other party an amount of cash or securities collateral when either party has a net exposure that exceeds the minimum transfer amount of the other party. When purchasing a security on a delayed-delivery basis, the Portfolios assume the rights and risks of ownership of the security, including the risk of price and yield fluctuations; consequently, such fluctuations are taken into account when determining the NAV. The Portfolios may dispose of or renegotiate a delayed-delivery transaction after it is entered into, and may sell when-issued securities before they are delivered, which may result in a realized gain or loss. When a security is sold on a delayed-delivery basis, the Portfolios do not participate in future gains and losses with respect to the security.
(k) Securities Traded onTo-Be-Announced Basis. The Portfolios may from time to time purchase securities on ato-be-announced (“TBA”) basis. In a TBA transaction, the Portfolio commits to purchasing or selling securities for which all specific information is not yet known at the time of the trade, particularly the face amount and maturity date of the underlying security transactions. Securities purchased on a TBA basis are not settled until they are delivered to the Portfolio, normally 15 to 45 days later. Beginning on the date the Portfolio enters into a TBA transaction, cash, U.S. government securities or other liquid securities are segregated in an amount equal in value to the purchase price of the TBA security. These transactions are subject to market fluctuations, and their current value is determined in the same manner as for other securities.
| 53 | Annual Report / September 30, 2019 |
Table of Contents
AllianzGI Institutional Multi-Series Trust
Notes to Financial Statements(continued)
2. PRINCIPAL RISKS
In the normal course of business, the Portfolios trade financial instruments and enter into financial transactions where risk of potential loss exists due to, among other things, changes in the market (market risk) or failure of the other party to a transaction to perform (counterparty risk).
The Portfolios are also exposed to other risks such as, but not limited to, interest rate, foreign currency, credit and leverage risks.
Interest rate risk is the risk that fixed income securities’ valuations will change because of changes in interest rates. During periods of rising nominal interest rates, the values of fixed income instruments are generally expected to decline. Conversely, during periods of declining nominal interest rates, the values of fixed income instruments are generally expected to rise. To the extent that a Portfolio effectively has short positions with respect to fixed income instruments, the values of such short positions would generally be expected to rise when nominal interest rates rise and to decline when nominal interest rates decline. A nominal interest rate can be described as the sum of a real interest rate and an expected inflation rate. Fixed income securities with longer durations tend to be more sensitive to changes in interest rates, usually making them more volatile than securities with shorter durations. Duration is used primarily as a measure of the sensitivity of a fixed income security’s market price to interest rate (i.e., yield) movements. Interest rate changes can be sudden and unpredictable, and the Portfolios may lose money as a result of movements in interest rates. High-yield or junk bonds are subject to greater levels of credit and liquidity risk, may be speculative and may decline in value due to an increase in interest rates or an issuer’s deterioration and/or default. The Portfolios may not be able to hedge against changes in interest rates or may choose not to do so for cost or other reasons. In addition, any hedges may not work as intended. The values of equity and othernon-fixed income securities may also decline due to fluctuations in interest rates.
Variable and floating rate securities generally are less sensitive to interest rate changes but may decline in value if their interest rates do not rise as much, or as quickly, as interest rates in general. Conversely, floating rate securities will not generally increase in value if interest rates decline. Inverse floating rate securities may decrease in value if interest rates increase. Inverse floating rate securities may also exhibit greater price volatility than a fixed rate obligation with similar credit quality. When the Portfolios hold variable or floating rate securities, a decrease (or, in the case of inverse floating rate securities, an increase) in market interest rates will adversely affect the income received from such securities and the NAV of the Portfolios’ shares.
The Portfolios are exposed to credit risk, which is the risk of losing money if the issuer or guarantor of a fixed income security is unable or unwilling, or is perceived (whether by market participants, rating agencies, pricing services or otherwise) as unable or unwilling, to make timely principal and/or interest payments, or to otherwise honor its obligations. Securities are subject to varying degrees of credit risk, which are often reflected in credit ratings.
To the extent the Portfolios directly invest in foreign currencies or in securities that trade in, and receive revenues in, foreign currencies, or in derivatives that provide exposure to foreign currencies, they will be subject to the risk that those currencies will decline in value relative to the U.S. dollar, or, in the case of hedging positions, that the U.S. dollar will decline in value relative to the currency being hedged. Currency rates in foreign countries may fluctuate significantly over short periods of time for a number of reasons, including economic growth, inflation, changes in interest rates, intervention (or the failure to intervene) by U.S. or foreign governments, central banks or supranational entities such as the International Monetary Fund, or the imposition of currency controls or other political developments in the United States or abroad. As a result, the Portfolios’ investments in foreign currency-denominated securities may reduce the returns of the Portfolios.
The Portfolios are subject to elements of risk not typically associated with investments in the U.S., due to concentrated investments in foreign issuers located in a specific country or region. Such concentrations will subject the Portfolios to additional risks resulting from future political or economic conditions in such country or region and the possible imposition of adverse governmental laws or currency exchange restrictions affecting such country or region, which could cause the securities and their markets to be less liquid and prices more volatile than those of comparable U.S. companies.
The market values of securities may decline due to general market conditions (market risk) which are not specifically related to a particular company, such as real or perceived adverse economic conditions, changes in the general outlook for corporate earnings, changes in interest or currency rates, adverse changes to credit markets or adverse investor sentiment. They may also decline due to factors that affect a particular industry or industries, such as labor shortages or increased production costs
| 54 | Annual Report / September 30, 2019 |
Table of Contents
AllianzGI Institutional Multi-Series Trust
Notes to Financial Statements(continued)
and competitive conditions within an industry. Equity securities and equity-related investments generally have greater market price volatility than fixed income securities, although under certain market conditions fixed income securities may have comparable or greater price volatility. Credit ratings downgrades may also negatively affect securities held by the Portfolios. Even when markets perform well, there is no assurance that the investments held by the Portfolios will increase in value along with the broader market. In addition, market risk includes the risk that geopolitical events will disrupt the economy on a national or global level.
The Portfolios are exposed to counterparty risk, or the risk that an institution or other entity with which the Portfolios have unsettled or open transactions will default. The potential loss to the Portfolios could exceed the value of the financial assets recorded in the Portfolios’ financial statements. Financial assets, which potentially expose the Portfolios to counterparty risk, consist principally of cash due from counterparties and investments. The Investment Manager seeks to minimize the Portfolios’ counterparty risk by performing reviews of each counterparty and by minimizing concentration of counterparty risk by undertaking transactions with multiple customers and counterparties on recognized and reputable exchanges. Delivery of securities sold is only made once the Portfolios’ have received payment. Payment is made on a purchase once the securities have been delivered by the counterparty. The trade will fail if either party fails to meet its obligation.
The Portfolios are exposed to risks associated with leverage. Leverage may cause the value of the Portfolios’ shares to be more volatile than if the Portfolios did not use leverage. This is because leverage tends to exaggerate the effect of any increase or decrease in the value of the Portfolios’ portfolio securities. The Portfolios may engage in transactions or purchase instruments that give rise to forms of leverage. In addition, to the extent the Portfolios employ dividend and interest costs on such leverage may not be recovered by any appreciation of the securities purchased with the leverage proceeds and could exceed the Portfolios’ investment returns, resulting in greater losses.
The Portfolios are party to International Swaps and Derivatives Association, Inc. Master Agreements (“ISDA Master Agreements”) with select counterparties that govern transactions,over-the-counter derivatives and foreign exchange contracts entered into by the Portfolios and those counterparties. The ISDA Master Agreements contain provisions for general obligations, representations, agreements, collateral and events of default or termination. Events of termination include conditions that may entitle counterparties to elect to terminate early and cause settlement of all outstanding transactions under the applicable ISDA Master Agreement. Any election to terminate early could be material to the financial statements of the Portfolios.
The considerations and factors surrounding the settlement of certain purchases and sales made on a delayed-delivery basis are governed by Master Securities Forward Transaction Agreements (“Master Forward Agreements”) between the Portfolios and select counterparties. The Master Forward Agreements maintain provisions for, among other things, initiation and confirmation, payment and transfer, events of default, termination, and maintenance of collateral.
3. FINANCIAL DERIVATIVE INSTRUMENTS
Disclosure about derivatives and hedging activities requires qualitative disclosure regarding objectives and strategies for using derivatives, quantitative disclosure about fair value amounts of gains and losses on derivatives, and disclosure about credit-risk-related contingent features in derivative agreements. The disclosure requirements distinguish between derivatives which are accounted for as “hedges”, and those that do not qualify for such accounting. Although the Portfolios at times use derivatives for hedging purposes, the Portfolios reflect derivatives at fair value and recognize changes in fair value through the Portfolios’ Statements of Operations, and such derivatives do not qualify for hedge accounting treatment.
Futures Contracts. The Portfolios use futures contracts to manage their exposure to the securities markets or the movements in interest rates and currency values. A futures contract is an agreement between two parties to buy and sell a financial instrument at a set price on a future date. Upon entering into such a contract, the Portfolios are required to pledge to the broker an amount of cash or securities equal to the minimum “initial margin” requirements of the exchange. Pursuant to the contracts, the Portfolios agree to receive from or pay to the broker an amount of cash or securities equal to the daily fluctuation in the value of the contracts. Such receipts or payments are known as “variation margin” and are recorded by the Portfolios as unrealized appreciation or depreciation. When the contracts are closed, the Portfolios record a realized gain or loss equal to the difference between the value of the contracts at the time they were opened and the value at the time they were closed. Any unrealized appreciation or depreciation recorded is simultaneously reversed. The use of futures transactions involves various risks, including the risk of an imperfect correlation in the movements in the price of futures contracts, interest rates and underlying hedging assets, and possible inability or unwillingness of counterparties to meet the terms of their contracts.
| 55 | Annual Report / September 30, 2019 |
Table of Contents
AllianzGI Institutional Multi-Series Trust
Notes to Financial Statements(continued)
Forward Foreign Currency Contracts. A forward foreign currency contract is an agreement between two parties to buy and sell a currency at a set exchange rate on a future date. The Portfolios enter into forward foreign currency contracts for the purpose of hedging against foreign currency risk arising from the investment or anticipated investment in securities denominated in foreign currencies. The Portfolios also enter into these contracts for purposes of increasing exposure to a foreign currency or shifting exposure to foreign currency fluctuations from one country to another. The market value of a forward foreign currency contract fluctuates with changes in foreign currency exchange rates. All commitments are marked to market daily at the applicable exchange rates and any resulting unrealized appreciation or depreciation is recorded. Realized gains or losses are recorded at the time the forward contract matures or by delivery of the currency. Risks may arise upon entering into these contracts from the potential inability of counterparties to meet the terms of their contracts and from unanticipated movements in the value of a foreign currency relative to the U.S. dollar. In addition, these contracts may involve market risk in excess of the unrealized appreciation (depreciation) reflected in the Portfolios’ Statements of Assets and Liabilities.
The following is a summary of the Portfolios’ derivatives categorized by risk exposure.
The effect of derivatives on the Statements of Assets and Liabilities at September 30, 2019:
| AllianzGI Advanced Core Bond: |
| |||
| Location | Interest Rate Contracts | |||
Asset derivatives: | ||||
Unrealized appreciation on futures contracts* | $ | 27,813 | ||
| * | Included in net unrealized appreciation of $27,813 on futures contracts as reported in the Portfolio’s Notes to Schedule of Investments. Only variation margin is reported within the Statements of Assets and Liabilities. |
| AllianzGI Best Styles Global Managed Volatility: |
| |||
| Location | Foreign Exchange Contracts | |||
Liability derivatives: | ||||
Unrealized depreciation of forward foreign currency contracts | $ | (1) | ||
| AllianzGI Global Small-Cap Opportunities: |
| |||
| Location | Foreign Exchange Contracts | |||
Liability derivatives: | ||||
Unrealized depreciation of forward foreign currency contracts | $ | (1) | ||
| 56 | Annual Report / September 30, 2019 |
Table of Contents
AllianzGI Institutional Multi-Series Trust
Notes to Financial Statements(continued)
The effect of derivatives on the Statements of Operations for the period or year ended September 30, 2019:
| AllianzGI Advanced Core Bond: |
| |||
| Location | Interest Rate Contracts | |||
Net realized loss on: | ||||
Futures contracts | $ | (313,287 | ) | |
Net change in unrealized appreciation/depreciation of: | ||||
Futures contracts | $ | (63,817 | ) | |
| AllianzGI Best Styles Global Managed Volatility: |
| |||
| Location | Foreign Exchange Contracts | |||
Net realized loss on: | ||||
Forward foreign currency contracts | $ | (439 | ) | |
Net change in unrealized appreciation/depreciation of: | ||||
Forward foreign currency contracts | $ | (1 | ) | |
| AllianzGI GlobalSmall-Cap Opportunities: |
| |||
| Location | Foreign Exchange Contracts | |||
Net change in unrealized appreciation/depreciation of: | ||||
Forward foreign currency contracts | $ | (1 | ) | |
| AllianzGI International Growth: |
| |||
| Location | Foreign Exchange Contracts | |||
Net realized loss on: | ||||
Forward foreign currency contracts | $ | (2,141 | ) | |
The average volume (based on open positions at each fiscalmonth-end) of derivative activity during the period or year ended September 30, 2019:
Forward Foreign Currency Contracts (1) | Futures Contracts (2) | |||||||||
| Purchased | Sold | Long | Short | |||||||
AllianzGI Advanced Core Bond | — | — | — | 100 | ||||||
AllianzGI Best Styles Global Managed Volatility | — | $267 | — | — | ||||||
AllianzGI GlobalSmall-Cap Opportunities | — | 45 | — | — | ||||||
AllianzGI International Growth | —† | — | — | — | ||||||
† Portfolio had derivative activity during the period but it did not have open positions at anymonth-end in the period.
(1) U.S. $ value on origination date
(2) Number of contracts
The following tables present by counterparty, the Portfolios’ derivative assets and liabilities net of related collateral held by the Portfolios at September 30, 2019 which has not been offset in the Statements of Assets and Liabilities, but would be available for offset to the extent of a default by the counterparty to the transaction.
| 57 | Annual Report / September 30, 2019 |
Table of Contents
AllianzGI Institutional Multi-Series Trust
Notes to Financial Statements(continued)
Financial Liabilities and Derivative Liabilities, and Collateral Received (Pledged) at September 30, 2019:
AllianzGI Best Styles Global Managed Volatility:
| Gross Amounts Not Offset in the Statement of Assets and Liabilities | ||||||||||||||||
| Counterparty | Gross Liability Derivatives Presented in Statement of Assets and Liabilities | Financial Instrument/ | Cash Collateral Received (Pledged) | Net Amount | ||||||||||||
Foreign Currency Exchange Contracts State Street Bank and Trust Co. | $1 | $— | $— | $1 | ||||||||||||
AllianzGI GlobalSmall-Cap Opportunities:
| Gross Amounts Not Offset in the Statement of Assets and Liabilities | ||||||||||||||||
| Counterparty | Gross Liability Derivatives Presented in Statement of Assets and Liabilities | Financial Instrument/ Derivative Offset | Cash Collateral Received (Pledged) | Net Amount | ||||||||||||
Foreign Currency Exchange Contracts State Street Bank and Trust Co. | $1 | $— | $— | $1 | ||||||||||||
4. INVESTMENT MANAGER/DISTRIBUTOR FEES/DEFERRED COMPENSATION
Investment Management Fee. Each Portfolio has an Investment Management Agreement (for the purpose of this section, the “Agreement”) with the Investment Manager. Subject to the supervision of the Trust’s Board, the Investment Manager was responsible for managing, either directly or through others selected by it, each Portfolio’s investment activities, business affairs and administrative matters. Pursuant to the Agreement, the Investment Manager receives an annual fee, payable monthly, at an annual rate of each Portfolio’s average daily net assets (the “Investment Management Fee”).
The Investment Management fee was charged at an annual rate as indicated in the following table:
| Management Fee | |||||
AllianzGI Advanced Core Bond | 0.30 | % | |||
AllianzGI Best Styles Global Managed Volatility | 0.40 | ||||
AllianzGI GlobalSmall-Cap Opportunities | 0.90 | ||||
AllianzGI International Growth | 0.70 | ||||
Distribution Fees. Allianz Global Investors Distributors LLC (the “Distributor”), an affiliate of AAM and the Investment Manager, serves as the distributor of the Portfolios’ shares pursuant to a Distribution Contract. The Distributor, for each of the Portfolios, currently receives no compensation in connection with the services it provides under the Distribution Contract.
Deferred Compensation. The Trustees do not currently receive any pension or retirement benefits from the Trust. In calendar year 2018 and certain prior periods, the Trust maintained a deferred compensation plan pursuant to which each Independent Trustee had the opportunity to elect not to receive all or a portion of his or her fees from the Trust on a current basis, but instead to receive in a subsequent period chosen by the Trustee an amount equal to the value of such compensation if such compensation had been invested in one or more series of Allianz Funds or Allianz Funds Multi-Strategy Trust selected by the Trustees from and after the normal payment dates for such compensation. The deferred compensation program was closed to new deferrals effective January 1, 2019, and all Trustee fees earned with respect to service in calendar year 2019 and beyond have been or will be paid in cash, on a current basis, unless the Board of Trustees of the Allianz-Sponsored Funds reopens the program to new deferrals. Allianz Funds and Allianz Funds Multi-Strategy Trust still have obligations with respect to Trustee fees deferred in 2018 and in prior periods, and will continue to have such obligations until all deferred Trustee fees are paid out pursuant to the terms of the deferred compensation plan.
| 58 | Annual Report / September 30, 2019 |
Table of Contents
AllianzGI Institutional Multi-Series Trust
Notes to Financial Statements(continued)
5. EXPENSE LIMITATION/MANAGEMENT FEE WAIVER AND RECOUPMENT
The Trust and the Investment Manager have entered into Expense Limitation and Management Fee Waiver Agreements as indicated below:
Expense Limitation | ||
AllianzGI Advanced Core Bond (1) | 0.35% | |
AllianzGI Best Styles Global Managed Volatility (2) | 0.45 | |
AllianzGI GlobalSmall-Cap Opportunities (3) | 1.20 | |
AllianzGI International Growth (4) | 0.80 |
(1) The Investment Manager has contractually agreed to irrevocably waive its management fee and/or reimburse the Portfolio through January 31, 2020, to the extent that Total Annual Portfolio Operating Expenses, including payment of organizational expenses but excluding interest, tax and extraordinary expenses, and certain credits and other expenses, exceed 0.35%. Under the Expense Limitation Agreement, the Investment Manager may recoup waived or reimbursed amounts for three years, provided total expenses, including such recoupment, do not exceed the annual expense limit in effect at the time of such waiver/reimbursement or recoupment. The Expense Limitation Agreement is terminable by the Trust (based on approval by the Board) upon 90 days’ prior written notice to the Investment Manager or at any time by mutual agreement of the parties. (2) The Investment Manager has contractually agreed to irrevocably waive its management fee and/or reimburse the Portfolio through January 31, 2020, to the extent that Total Annual Portfolio Operating Expenses, including payment of organizational expenses but excluding interest, tax and extraordinary expenses, and certain credits and other expenses, exceed 0.45%. Under the Expense Limitation Agreement, the Investment Manager may recoup waived or reimbursed amounts for three years, provided total expenses, including such recoupment, do not exceed the annual expense limit in effect at the time of such waiver/reimbursement or recoupment. The Expense Limitation Agreement is terminable by the Trust (based on approval by the Board) upon 90 days’ prior written notice to the Investment Manager or at any time by mutual agreement of the parties. (3) The Investment Manager has contractually agreed to irrevocably waive its management fee or reimburse the Portfolio through January 31, 2020, to the extent that Total Annual Portfolio Operating Expenses, including payment of organizational expenses but excluding interest, tax and extraordinary expenses, and certain credits and other expenses, exceed 1.20%. Under the Expense Limitation Agreement, the Investment Manager may recoup waived or reimbursed amounts for three years, provided total expenses, including such recoupment, do not exceed the annual expense limit in effect at the time of such waiver/reimbursement or recoupment. The Expense Limitation Agreement is terminable by the Trust (based on approval by the Board) upon 90 days’ prior written notice to the Investment Manager or at any time by mutual agreement of the parties. (4) The Investment Manager has contractually agreed to irrevocably waive its management fee or reimburse the Portfolio through March 31, 2020, to the extent that Total Annual Portfolio Operating Expenses, including payment of organizational expenses but excluding interest, tax and extraordinary expenses, and certain credits and other expenses, exceed 0.80%. Under the Expense Limitation Agreement, the Investment Manager may recoup waived or reimbursed amounts for three years, provided total expenses, including such recoupment, do not exceed the annual expense limit in effect at the time of such waiver/reimbursement or recoupment. The Expense Limitation Agreement is terminable by the Trust (based on approval by the Board) upon 90 days’ prior written notice to the Investment Manager or at any time by mutual agreement of the parties.
During the year ended September 30, 2019, the Investment Manager did not recoup any expenses from the Portfolios. The following represents the amounts that still can be recouped by the Investment Manager:
Unrecouped Expenses Waived/Reimbursed through Fiscal Period or Year ended | ||||||||
| 9/30/2017 | 9/30/2018 | 9/30/2019 | Total | |||||
AllianzGI Advanced Core Bond | $141,917 | $220,446 | $173,423 | $535,786 | ||||
AllianzGI Best Styles Global Managed Volatility | 258,092 | 241,955 | 122,823 | 622,870 | ||||
AllianzGI GlobalSmall-Cap Opportunities | 144,937 | 132,581 | 116,337 | 393,855 | ||||
AllianzGI International Growth | — | — | 180,491 | 180,491 | ||||
6. INVESTMENTS IN SECURITIES
For the period or year ended September 30, 2019, purchases and sales of investments, other than short-term securities, U.S. government obligations andin-kind fund share transactions were:
| Purchases | Sales | |||
AllianzGI Advanced Core Bond | $10,481,837 | $39,164,090 | ||
AllianzGI Best Styles Global Managed Volatility | 21,680,467 | 23,006,172 | ||
AllianzGI GlobalSmall-Cap Opportunities | 5,767,088 | 2,835,093 | ||
AllianzGI International Growth | 30,972,842 | 3,174,814 |
| 59 | Annual Report / September 30, 2019 |
Table of Contents
AllianzGI Institutional Multi-Series Trust
Notes to Financial Statements(continued)
Purchases and sales in U.S. government obligations were:
| Purchases | Sales | |||
AllianzGI Advanced Core Bond | $406,500,651 | $436,245,819 |
7. INCOME TAX INFORMATION
The tax character of dividends and distributions paid was:
| Period ended September 30, 2019 | Period ended September 30, 2018 | |||||||||||||||
Ordinary Income (1) | 20% Long-Term Capital Gain | Ordinary Income (1) | 15% Long- Term Capital Gain | 25% Long- Term Capital Gain | ||||||||||||
AllianzGI Advanced Core Bond | $3,098,374 | - | $3,640,184 | - | - | |||||||||||
AllianzGI Best Styles Global Managed Volatility | 2,330,943 | $4,715,684 | 3,364,381 | $943,960 | $1,315 | |||||||||||
AllianzGI GlobalSmall-Cap Opportunities | 164,409 | 276,873 | 295,168 | 420,871 | 2 | |||||||||||
AllianzGI International Growth | - | - | - | - | - | |||||||||||
(1) Includes short-term capital gains, if any.
At September 30, 2019, the components of distributable earnings were:
Ordinary Income | Long- Term Capital Gains | Capital Loss Carry-forwards (2) | Late Year Ordinary Loss (3) | Post-October Capital Loss (Gain) (4) | ||||||||||
Short-Term |
Long-Term | |||||||||||||
AllianzGI Advanced Core Bond | $119,420 | - | $2,340,939 | - | - | $1,056,001 | ||||||||
AllianzGI Best Styles Global Managed Volatility | 1,229,601 | $1,372,692 | - | - | $318,016 | - | ||||||||
AllianzGI GlobalSmall-Cap Opportunities | 137,308 | - | - | - | 116,532 | 1,214 | ||||||||
AllianzGI International Growth | 42,373 | - | - | - | - | - | ||||||||
| (2) | Capital loss carryforwards available as a reduction, to the extent provided in the regulations, of any future net realized gains. To the extent that these losses are used to offset future realized capital gains, such gains will not be disbursed. |
| (3) | Certain ordinary losses realized during the period November 1, 2018 through September 30, 2019, and/or other ordinary losses realized during the period January 1, 2019 through September 30, 2019, which the Funds elected to defer to the following taxable year pursuant to income tax regulations. |
| (4) | Capital losses realized during the period November 1, 2018 through September 30, 2019 which the Funds elected to defer to the following taxable year pursuant to income tax regulations. |
At September 30, 2019, capital loss carryforward amounts were:
| No Expiration | ||||||
| Short-Term | Long-Term | |||||
AllianzGI Advanced Core Bond | $481,382 | $1,859,557 | ||||
| 60 | Annual Report / September 30, 2019 |
Table of Contents
AllianzGI Institutional Multi-Series Trust
Notes to Financial Statements(continued)
For the year ended September 30, 2019, the Portfolio had capital loss carryforwards which were utilized as follows:
Post-Enactment Utilized | ||||
Short-Term | Long-Term | |||
AllianzGI Advanced Core Bond | $291,392 | - | ||
Under the Regulated Investment Company Modernization Act of 2010, the Portfolios will be permitted to carry forward capital losses incurred in taxable years beginning after December 22, 2010, for an unlimited period. Post-enactment capital losses that are carried forward will retain their character as either short-term or long-term capital losses rather than being considered all short-term capital losses.
For the period ended September 30, 2019, permanent“book-tax” adjustments were:
Undistributed (Dividends in Excess of) Net Investment Income | Accumulated Net Realized Gain(Loss) | Paid-in Capital | Net unrealized appreciation (depreciation) | |||||
AllianzGI Advanced Core Bond (e)(g) | $638,705 | $(638,705) | - | - | ||||
AllianzGI Best Styles Global Managed | (188) | (17,174) | - | $17,362 | ||||
AllianzGI GlobalSmall-Cap Opportunities (a)(b)(c)(f)(h)(i) | 9,691 | (9,011) | - | (680) | ||||
AllianzGI International Growth (b) | 6,822 | (6,822) | - | - |
These permanent“book-tax” differences were primarily attributable to:
| (a) | Reclassifications related to investments in Real Estate Investment Trusts (REITs) |
| (b) | Reclassification of gains and losses from foreign currency transactions |
| (c) | Reclassification of gains from securities classified as Passive Foreign Investment Companies (“PFICs”) for tax purposes |
| (d) | Reclassification from sales of securities with return of capital |
| (e) | Reversal of bond premium amortization |
| (f) | Reclassification of dividends/distributions |
| (g) | Reclassification paydown losses to capital |
| (h) | Reclassification on sale of securities no longer classified as Passive Foreign Investment Companies (“PFICs”) for tax purposes. |
| (i) | Reclassification of income from investments in partnerships |
Net investment income, net realized gains or losses and net assets were not affected by these adjustments.
At September 30, 2019, the aggregate cost basis and the net unrealized appreciation (depreciation) of investments in securities and other financial instruments for federal income tax purposes were:
Federal Tax Cost Basis(5) | Unrealized Appreciation | Unrealized Depreciation | Net Unrealized Appreciation (Depreciation) | |||||
AllianzGI Advanced Core Bond | $105,663,152 | $3,040,233 | $513,867 | $2,526,366 | ||||
AllianzGI Best Styles Global Managed Volatility | 44,611,181 | 7,805,413 | 1,690,209 | 6,115,204 | ||||
AllianzGI GlobalSmall-Cap Opportunities | 7,647,754 | 589,757 | 254,687 | 335,070 | ||||
AllianzGI International Growth | 56,173,840 | 1,261,204 | 1,597,940 | (336,736) |
| 61 | Annual Report / September 30, 2019 |
Table of Contents
AllianzGI Institutional Multi-Series Trust
Notes to Financial Statements(continued)
(5) Differences, if any, between book and tax cost basis are primarily attributable to wash sale loss deferrals, differing treatment of bond premium amortization, basis adjustments from investments in partnerships, PFICmark-to-market, andmark-to-market on Section 1256 futures contracts.
8. SIGNIFICANT ACCOUNT HOLDERS
From time to time, a Portfolio may have a concentration of shareholders, which may include the Investment Manager or affiliates of the Investment Manager, holding a significant percentage of shares outstanding. Investment activities of these shareholders could have a material impact to a Portfolio.
At September 30, 2019, the significant account-holders, owners of 5% or greater of each respective Portfolio’s outstanding shares, were as follows:
Affiliated*
| ||||||||||
Number of Account Holders | Approximate Ownership | AFI | ||||||||
AllianzGI Advanced Core Bond | 2 | 92 | % | — | ||||||
AllianzGI Best Styles Global Managed Volatility | 2 | 90 | % | — | ||||||
AllianzGI GlobalSmall-Cap Opportunities | 1 | 35 | % | 65% | ||||||
AllianzGI International Growth | 5 | 85 | % | 6% | ||||||
* This represents the aggregate percentage of affiliated entities that own 5% or more of the Portfolio’s outstanding shares. These affiliated entities include portfolios of the Trust and Allianz Multi-Series Collective Investment Trust.
9. FUND EVENTS
(a) Fund Commencement
On May 15, 2019, AllianzGI International Growth Portfolio commenced operations as a new series of the Trust.
(b) Change in Estimates
The Portfolios entered into a revised agreement with the Portfolios’ custodian and accounting agent (the “Agreement”), in order to lower costs and seek economies of scale for all Portfolios in the Trust, the terms of which were finalized in the current period. The Agreement resulted in a change in accounting estimate for the custodian and accounting agent expense for the year ended September 30, 2019 as reflected in the Statements of Operations of the Portfolios. For AllianzGI Best Styles Global Managed Volatility and AllianzGI GlobalSmall-Cap Opportunities Portfolios, the effect of this change in estimate was significant and reduced the custody and accounting agent expense for the year ended September 30, 2019 by approximately $91,000 and $56,000, respectively.
10.IN-KIND TRANSACTIONS
During the period ended September 30, 2019, AllianzGI International Growth accepted securities from affiliated entities in connection with subscription in–kind transactions. For financial reporting and tax purposes, the cost of contributed securities is equal to the market value of the securities on the date of contribution. The Portfolio sold 1,465,070 shares in–kind with a subscription value of $21,770,934. The number of shares sold and subscription value are included in the “shares issued” and “Net proceeds from the sale of common stock” on the Statements of Changes in Net Assets.
11. BORROWINGS
The Trust has entered into a credit agreement (the “State Street Agreement”), among the Trust, Allianz Funds Multi-Strategy Trust, Allianz Funds and Premier Multi-Series VIT, as borrowers (collectively, the “AllianzGI Borrowers” and each series thereof, an “AllianzGI Borrower Fund”), and State Street Bank and Trust Company, as agent and lender, for a committed line of credit. The State Street Agreement permits the AllianzGI Borrowers to borrow up to $200 million in aggregate, subject to
| 62 | Annual Report / September 30, 2019 |
Table of Contents
AllianzGI Institutional Multi-Series Trust
Notes to Financial Statements(continued)
(i) a requirement that each AllianzGI Borrower Fund’s asset coverage with respect to senior securities representing indebtedness be 300% or higher, and (ii) certain other limitations and conditions. Each AllianzGI Borrower Fund must pay interest on any amounts borrowed under the facility at a rate per annum equal to 1.25% plus the higher of the then-current federal funds overnight rate or the one month LIBOR rate, subject to upward adjustment when any past due payments are outstanding. The State Street Agreement was extended by an additional364-day period by an amendment effective October 24, 2019, with an expiration date of October 2, 2020 (the “Amendment”). The Amendment changed a 0.25% usage fee on undrawn amounts, which had previously applied, to an annualized rate of 0.20%, to be allocated pro rata among the AllianzGI Borrower Funds on the basis of net assets. Amounts borrowed may be repaid and reborrowed on a revolving basis during the term of the facility.
The Portfolios did not utilize the line of credit during the period or year ended September 30, 2019.
Pursuant to an exemptive order issued by the SEC (the “Order”), the Portfolios are authorized to enter into a master interfund lending agreement (the “Interfund Program”) with each other and certain funds advised by the Investment Manager (each a “Participating Fund”). The Interfund Program allows each Participating Fund, whose policies permit it to do so, to lend money directly to and borrow money directly from other Portfolios for temporary purposes through the Interfund Program.
During the period or year ended September 30, 2019, the Portfolios did not participate as a borrower or lender in the Interfund Program.
12. SUBSEQUENT EVENTS
In preparing these financial statements, the Portfolios’ management has evaluated events and transactions for potential recognition or disclosure through the date the financial statements were issued.
There were no subsequent events identified that require recognition or disclosure.
| 63 | Annual Report / September 30, 2019 |
Table of Contents

Report of Independent Registered Public Accounting Firm
To the Board of Trustees of AllianzGI Institutional Multi-Series Trust and Shareholders of each of the four funds listed in the table below
Opinions on the Financial Statements
We have audited the accompanying statements of assets and liabilities, including the schedules of investments, of each of the funds listed in the table below (constituting AllianzGI Institutional Multi-Series Trust, hereafter collectively referred to as the “Funds”) as of September 30, 2019, the related statements of operations and the statements of changes in net assets for each of the periods indicated in the table below, including the related notes, and the financial highlights for each of the periods indicated therein (collectively referred to as the “financial statements”). In our opinion, the financial statements present fairly, in all material respects, the financial position of each of the Funds as of September 30, 2019, the results of each of their operations and the changes in each of their net assets for each of the periods indicated in the table below and each of the financial highlights for each of the periods indicated therein in conformity with accounting principles generally accepted in the United States of America.
AllianzGI Advanced Core Bond Portfolio (1) | AllianzGI Best Styles Global Managed Volatility Portfolio (1) | |
AllianzGI GlobalSmall-Cap Opportunities Portfolio (1) | AllianzGI International Growth Portfolio (2) |
(1) Statement of operations for the year ended September 30, 2019 and statements of changes in net assets for each of the two years in the period ended September 30, 2019
(2) Statements of operations and changes in net assets for the period May 15, 2019 (commencement of operations) through September 30, 2019
Basis for Opinions
These financial statements are the responsibility of the Funds’ management. Our responsibility is to express an opinion on the Funds’ financial statements based on our audits. We are a public accounting firm registered with the Public Company Accounting Oversight Board (United States) (PCAOB) and are required to be independent with respect to the Funds in accordance with the U.S. federal securities laws and the applicable rules and regulations of the Securities and Exchange Commission and the PCAOB.
We conducted our audits of these financial statements in accordance with the standards of the PCAOB. Those standards require that we plan and perform the audit to obtain reasonable assurance about whether the financial statements are free of material misstatement, whether due to error or fraud.
Our audits included performing procedures to assess the risks of material misstatement of the financial statements, whether due to error or fraud, and performing procedures that respond to those risks. Such procedures included examining, on a test basis, evidence regarding the amounts and disclosures in the financial statements. Our audits also included evaluating the accounting principles used and significant estimates made by management, as well as evaluating the overall presentation of the financial statements. Our procedures included confirmation of securities owned as of September 30, 2019 by correspondence with the custodian and brokers; when replies were not received from brokers, we performed other auditing procedures. We believe that our audits provide a reasonable basis for our opinions.
PricewaterhouseCoopers LLP
New York, New York
November 25, 2019
We have served as the auditor of one or more of the investment companies in the Allianz Global Investors U.S. group of investment companies since at least 1995. We have not been able to determine the specific year we began serving as auditor.
| 64 | Annual Report / September 30, 2019 |
Table of Contents
AllianzGI Institutional Multi-Series Trust
Federal Tax Information (unaudited)
As required by the Internal Revenue Code, shareholders must be notified regarding certain tax attributes of distributions made by each Portfolio.
During the year or period ended September 30, 2019, the following Portfolios distributed long-term capital gains in the amounts indicated (or the maximum amount allowable):
20% Long-Term Capital Gain | ||
AllianzGI Best Styles Global Managed Volatility | $4,715,684 | |
AllianzGI GlobalSmall-Cap Opportunities | 276,873 | |
Under the Jobs and Growth Tax Relief Reconciliation Act of 2003, the following approximate percentages of ordinary dividends paid during the fiscal year or period ended September 30, 2019, are designated as “qualified dividend income” (or the maximum amount allowable):
AllianzGI Advanced Core Bond | 0% | |
AllianzGI Best Styles Global Managed Volatility | 55% | |
AllianzGI GlobalSmall-Cap Opportunities | 64% | |
AllianzGI International Growth | 0% | |
Corporate shareholders are generally entitled to take the dividend received deduction on the portion of a Portfolio’s dividend distribution that qualifies under tax law. The following approximate percentages of the Portfolios’ ordinary income dividends paid during the fiscal year or period ended September 30, 2019, that qualify for the corporate dividend received deduction is set forth below (or the maximum amount allowable):
AllianzGI Advanced Core Bond | 0% | |
AllianzGI Best Styles Global Managed Volatility | 29% | |
AllianzGI GlobalSmall-Cap Opportunities | 12% | |
AllianzGI International Growth | 0% | |
The following Portfolios have elected to pass through the credit for tax paid in foreign countries. The foreign income and foreign tax per share outstanding on September 30, 2019 are as follows (or the maximum amount allowable):
Gross Foreign Dividends | Gross Foreign Dividends Per Share | Foreign Tax | Foreign Tax Per Share | |||||
AllianzGI International Growth | $112,408 | 0.051030 | $9,366 | 0.004252 |
Since the Portfolios’ tax year is not the calendar year, another notification will be sent with respect to calendar year 2019. In January 2020, shareholders will be advised on IRS Form1099-DIV as to the federal tax status of the dividends and distributions received during calendar year 2019. The amount that will be reported will be the amount to use on the shareholder’s 2019 federal income tax return and may differ from the amount which must be reported in connection with the Portfolios’ tax year ended September 30, 2019. Shareholders are advised to consult their tax advisers as to the federal, state and local tax status of the dividend income received from the Portfolios.
| 65 | Annual Report / September 30, 2019 |
Table of Contents
AllianzGI Institutional Multi-Series Trust
Matters Relating to the Trustees’ Consideration of the Investment Management
Agreements (unaudited)
The Investment Company Act of 1940, as amended, (the “1940 Act”) requires that both the full Board of Trustees (the “Board” or the “Trustees”) and a majority of the Trustees who are not interested persons of the Trust (the “Independent Trustees”), voting separately, initially approve any new investment management agreement for a new Portfolio (as defined below), and annually approve the continuation of each existing Portfolio’s Investment Management Agreement (the “Agreement”) with Allianz Global Investors U.S. LLC (the “Investment Manager”).
The Independent Trustees met in executive session on March 21, 2019, and the Board, including the Independent Trustees, unanimously approved an Investment Management Agreement (the “New Portfolio Agreement”) between the Trust and the Investment Manager for an initialtwo-year term with respect to AllianzGI International Growth Portfolio, a new series of the Trust (the “New Portfolio”). At their meeting held on June 19, 2019, the Board and the Independent Trustees unanimously approved the continuation of the Agreement through June 30, 2020 with respect to AllianzGI GlobalSmall-Cap Opportunities Portfolio, AllianzGI Advanced Core Bond Portfolio and AllianzGI Best Styles Global Managed Volatility Portfolio (each a “Renewal Portfolio” together with the New Portfolio, the “Portfolios”). The material factors and conclusions that formed the basis of these approvals are discussed below.
The Independent Trustees met in executive session on June 19, 2019 for the specific purpose of considering whether to approve the continuation of the Agreement for an additional year for the Renewal Portfolios. The Contracts Committee of the Board of Trustees, which is comprised of all of the Independent Trustees, held a conference call on June 5, 2019 and metin-person on June 19, 2019 (the “contract review meetings”) with Independent Counsel to discuss the materials provided by the Investment Manager in response to the Independent Trustees’ written request for information regarding the annual renewal for each Renewal Portfolio. Representatives from portfolio management attended portions of those meetings to, among other topics, review the comparative fee and expense information and comparative performance information prepared and provided by Broadridge Financial Solutions, Inc. (“Broadridge”), an independent third party, for each Renewal Portfolio using its respective Broadridge peer group for performance and expense comparisons.
In connection with their deliberations regarding the approval of the New Portfolio Agreement and the Agreement, the Independent Trustees considered such information and factors as they believed, in light of the legal advice furnished to them and their own business judgment, to be relevant. As described below, the Independent Trustees considered the nature, quality and extent of the various investment management, administrative, and other services to be performed by the Investment Manager under the New Portfolio Agreement and the Agreement. Throughout the process, the Independent Trustees received separate legal advice from independent legal counsel that is experienced in 1940 Act matters and that is independent of the Investment Manager (“Independent Counsel”), and with whom they met separately from the Investment Manager during the contract review meetings.
In evaluating the Agreement with respect to each Renewal Portfolio, the Board, including the Independent Trustees, reviewed extensive materials provided by the Investment Manager in response to questions submitted by the Independent Trustees and Independent Counsel, and met with senior representatives of the Investment Manager regarding its personnel, operations, and financial condition as they relate to the Renewal Portfolios. The Board also considered the broad range of information relevant to the annual contract review that is provided to the Board (including its various standing committees) at meetings throughout the year, including reports on investment performance, portfolio risk, and other portfolio information for each Renewal Portfolio, including the use of derivatives if used as part of the Portfolio’s strategy, as well as periodic reports on, among other matters, pricing and valuation; quality and cost of portfolio trade execution; compliance; and shareholder and other services provided by the Investment Manager and its affiliates. To assist with their review, the Independent Trustees reviewed fact cards for each Renewal Portfolio including, among other information, performance comparisons between the Portfolios and their Broadridge Performance Universe (as defined below), total return investment performance, investment objective, total net assets, annual Renewal Portfolio operating expenses, portfolio managers, total expense ratio and contractual management fee comparisons between each Renewal Portfolio and its Broadridge Expense Group (as defined below), and trends in the Investment Manager’s profitability from its management relationship with each Renewal Portfolio. They also considered summaries assigning a quadrant placement to each Renewal Portfolio based on an average of certain measures of performance (including in relation to risk) and fees/expenses versus peer group medians. The Independent Trustees also considered the risk profiles of the Renewal Portfolios.
| 66 | Annual Report / September 30, 2019 |
Table of Contents
AllianzGI Institutional Multi-Series Trust
Matters Relating to the Trustees’ Consideration of the Investment Management
Agreements (unaudited) (continued)
In connection with their contract review meeting relating to the New Portfolio and the New Portfolio Agreement, the Independent Trustees received and relied upon materials provided by the Investment Manager including, among other items: (i) information compiled from Morningstar Direct (“Morningstar”), an independent third party, on the investment performance, including annualized return performance information for certain time periods, of a group of funds with investment classifications and/or objectives comparable to those proposed for the New Portfolio, (ii) information on the New Portfolio’s management fees and other anticipated expenses and information compiled from Morningstar on the management fees and other expenses of comparable funds, (iii) information regarding the fees and expenses of other funds and/or accounts managed by the Investment Manager with similar investment objective(s) and strategies to those of the New Portfolio, (iv) an estimate of the profitability to the Investment Manager from its relationship with the New Portfolio during its first year, (iv) descriptions of various functions to be performed by the Investment Manager for the New Portfolio, such as portfolio management, compliance monitoring and portfolio trading practices, pricing, and oversight of third-party service providers, and (v) information regarding the overall organization and business functions of the Investment Manager, including, without limitation, information regarding senior management, portfolio managers and other personnel proposed to provide investment management, administrative and other services to the New Portfolio.
The Independent Trustees’ conclusions as to the approval of the New Portfolio Agreement and the Agreement were based on a comprehensive consideration of all information provided to the Independent Trustees and were not the result of any single factor. Individual Independent Trustees may have evaluated the information presented differently from one another, attributing different weights to various factors. The Independent Trustees recognized that the fee arrangements for the Renewal Portfolios are the result of review and discussion in the prior years between the Independent Trustees and the Investment Manager, that certain aspects of such arrangements may receive greater scrutiny in some years than in others, and that the Independent Trustees’ conclusions may be based, in part, on their consideration of these same arrangements during the course of the year and in prior years. The Independent Trustees evaluated information available to them for Renewal Portfolios and for the New Portfolio on afund-by-fund basis, and their determinations were made separately in respect of each Renewal Portfolio and the New Portfolio. However, they also took into account the common interests of all series of the Trust in their review.
Performance Information
With respect to investment performance, the Independent Trustees considered information regarding each Renewal Portfolio’s short- and intermediate-term performance (noting that certain of the Renewal Portfolios have onlyone- or three-years of performance), net of a Renewal Portfolio’s fees and expenses, both on an absolute basis and relative to an appropriate benchmark index that does not deduct the fees or expenses of investing, and compared to the performance of the Broadridge Performance Universe (as defined below). The Independent Trustees considered information provided by Broadridge for the Renewal Portfolios regarding the investment performance of a group of funds with investment classifications and/or objectives comparable to those of the Renewal Portfolios identified by Broadridge (the “Broadridge Performance Universe”), the performance of applicable benchmark indices, and the total return investment performance (based on net assets) of the Renewal Portfolios for various time periods. The Independent Trustees also reviewed performance in relation to certain measures of the degree of investment risk undertaken by the portfolio managers.
For Renewal Portfolios that underperformed, the Board considered the magnitude of that underperformance relative to the Broadridge Performance Universe and/or the benchmark (e.g., the amount by which a Renewal Portfolio underperformed, including, for example, whether a Renewal Portfolio slightly underperformed or significantly underperformed). In the case of those Renewal Portfolios that the Independent Trustees identified as having underperformed their benchmark indices and/or Broadridge Performance Universes to an extent, or over a period of time, that the Independent Trustees felt warranted additional inquiry, the Independent Trustees discussed with the Investment Manager each such Renewal Portfolio’s performance, potential reasons for the underperformance, and, if necessary, steps that the Investment Manager had taken, or intended to take, to improve performance. The Independent Trustees also met with the portfolio managers of certain Renewal Portfolios during the 12 months prior to voting on the contract renewal to discuss the Renewal Portfolios’ performance. The Independent Trustees considered the Investment Manager’s responsiveness with respect to the Renewal Portfolios that experienced lagging performance. The Independent Trustees noted that performance, especially short-term performance is only one of the factors that they deem relevant to their consideration of the Agreement and that, after considering all relevant factors, it may be appropriate to approve the continuation of the Agreement notwithstanding a Renewal Portfolio’s underperformance.
| 67 | Annual Report / September 30, 2019 |
Table of Contents
AllianzGI Institutional Multi-Series Trust
Matters Relating to the Trustees’ Consideration of the Investment Management
Agreements (unaudited) (continued)
The Independent Trustees noted that the New Portfolio’s investment strategies and policies will be substantially identical to those of the AllianzGI International Growth Fund, a prior series of Allianz Funds Multi-Strategy Trust, which was also managed by the Investment Manager at the time of the meeting. They reviewed and considered the Fund’s Institutional Class performance in relation to the Morningstar peer group, noting that the Fund’s average annualized return as of January 31, 2019 was higher than the peer group for the three-year period and slightly higher for theone-year period.
Nature, Extent, and Quality of Services
As part of their review, the Independent Trustees received and considered descriptions of various functions performed by the Investment Manager for the New Portfolio and Renewal Portfolios, such as portfolio management, compliance monitoring, portfolio trading practices and oversight of third party service providers. They also considered information regarding the overall organization and business functions of the Investment Manager, including, without limitation, information regarding senior management, portfolio managers and other personnel providing or proposed to provide investment management, administrative and other services, and corporate ownership and business operations unrelated to the New Portfolio and Renewal Portfolios. The Independent Trustees examined the ability of the Investment Manager to provide high-quality investment management and other services to the New Portfolio and Renewal Portfolios. Among other information, the Independent Trustees considered the investment philosophy and research and decision-making processes of the Investment Manager, as well as the Investment Manager’s broker selection process and trading operations; the experience of key management personnel of the Investment Manager and its affiliates, as applicable, responsible for portfolio management of the New Portfolio and Renewal Portfolios; the ability of the Investment Manager to attract and retain capable personnel; employee compensation; and the operational infrastructure, including technology and systems, of the Investment Manager.
In addition, the Independent Trustees noted the extensive range of services that the Investment Manager would provide or provides to the New Portfolio and Renewal Portfolios, respectively, beyond the investment management services. In this regard, the Independent Trustees reviewed the extent and quality of the Investment Manager’s services with respect to regulatory compliance and ability to comply with the investment policies of each of the Renewal Portfolios and of the New Portfolio; the compliance programs and risk controls of the Investment Manager; the specific contractual obligations of the Investment Manager pursuant to the New Portfolio Agreement and the Agreement; the nature, extent and quality of certain administrative services the Investment Manager would be, or is responsible for, providing to the New Portfolio and Renewal Portfolios; the Investment Manager’s risk management function; and conditions that might affect the ability of the Investment Manager to provide high quality services to the New Portfolio and Renewal Portfolios in the future under the New Portfolio Agreement and the Agreement, including, but not limited to, the organization’s financial condition and operational stability. The Independent Trustees also considered that the Investment Manager assumes significant ongoing risks with respect to each of the Renewal Portfolios and the New Portfolio, including entrepreneurial and business risks the Investment Manager has undertaken or will undertake in serving as Investment Manager and sponsor of the Renewal Portfolios and the New Portfolio, for which it is entitled to reasonable compensation. Specifically, its responsibilities include continual management of investment, operational, enterprise, legal, regulatory, and compliance risks as they relate to the Renewal Portfolios and the New Portfolio. The Independent Trustees also noted the Investment Manager’s activities under its contractual obligation to oversee the Renewal Portfolios’ and the New Portfolio’s various outside service providers, including its negotiation of certain service providers’ fees and its evaluation of service providers’ infrastructure, cybersecurity programs, compliance programs, and business continuity programs, among other matters. It also considered the Investment Manager’s ongoing development of its own infrastructure and information technology to support the Renewal Portfolios and the New Portfolio through, among other things, cybersecurity, business continuity planning, and risk management.
The Independent Trustees considered that the Investment Manager provides or would provide the Renewal Portfolios and the New Portfolio with office space, certain administrative services and personnel to serve as officers for each of the Renewal Portfolios and the New Portfolio, and that the Investment Manager and its affiliates pay or would pay all of the compensation of the Renewal Portfolios’ and the New Portfolio’s interested Trustees and officers (in their capacities as employees of the Investment Manager or such affiliates). Based on the foregoing, the Independent Trustees concluded that the Investment Manager’s investment processes, research capabilities and philosophy were well-suited to each Renewal Portfolio and the New Portfolio given its investment objective and policies, that the Investment Manager would be able to meet any reasonably foreseeable obligations under the New Portfolio Agreement and the Agreement, and that the Investment Manager would otherwise be able to provide services to the Renewal Portfolios of sufficient extent and quality.
| 68 | Annual Report / September 30, 2019 |
Table of Contents
AllianzGI Institutional Multi-Series Trust
Matters Relating to the Trustees’ Consideration of the Investment Management
Agreements (unaudited) (continued)
Fee and Expense Information and Comparisons for the Renewal Portfolios
In assessing the reasonableness of the Renewal Portfolios’ fees and expenses under the Agreement, the Independent Trustees considered, among other information, each Renewal Portfolio’s contractual management fee, each Renewal Portfolio’s total expense ratio, and information regarding the management fees and other expenses of comparable funds identified by Broadridge (the “Broadridge Expense Group”). Where a Renewal Portfolio’s contractual management fee or total expense ratio was higher than the Broadridge Expense Group median, the Independent Trustees considered whether specific portfolio management, administration, or oversight needs contributed to the Renewal Portfolio’s contractual management fees or total expense ratio. The Independent Trustees also noted certain expense limitations for the Renewal Portfolios with various proposed modifications and advisory fee reductions or waivers for certain Renewal Portfolios that had been proposed by the Investment Manager for continuation, or modification. With respect to certain of the Renewal Portfolios that have instituted expense limits and that underperformed for theone- and three-year periods relative to the median of the Broadridge Performance Universe, the Independent Trustees considered and discussed with the Investment Manager whether any additional expense limits were appropriate. The Independent Trustees also considered, among other items: (i) current asset levels of each Renewal Portfolio as compared to prior years, and (ii) certain of the Renewal Portfolios’ “active share,” i.e., the percentage of stock holdings in a Renewal Portfolio that differ from its benchmark index and discussed with the Investment Manager the reasons some Renewal Portfolios may have lower active share than others.
To the extent applicable, the Independent Trustees considered information regarding the investment performance and fees for other funds and/or separately managed accounts, including institutional accounts, managed by the Investment Manager or its affiliates with similar investment objective(s) and policies to those of the Renewal Portfolios, if any (“similar accounts”). Specifically, the Independent Trustees reviewed information showing the contractual advisory fees charged by the Investment Manager to the similar accounts. In comparing these fees, the Independent Trustees considered information provided by the Investment Manager as to the generally broader and more extensive services provided or to be provided to the Renewal Portfolios in comparison to institutional or separate accounts; the higher demands placed on the Investment Manager’s investment personnel and trading infrastructure as a result of the daily cashin-flows andout-flows of the Renewal Portfolios; the greater entrepreneurial risk in managing mutual funds; and the impact on the Investment Manager and expenses associated with the more extensive regulatory regime to which the Renewal Portfolios are subject in comparison to institutional or separate accounts.
The Trustees noted that the Renewal Portfolios were not charged a separate administration fee, recognizing that each of their management fees includes a component for administrative services, while many of the Renewal Portfolios’ Broadridge Expense Groups have separate advisory and administration agreements with separate fees.
Fee and Expense Information and Comparisons for the New Portfolio
In assessing the reasonableness of the New Portfolio’s proposed fees and expenses under the New Portfolio Agreement, the Independent Trustees considered, among other information, the New Portfolio’s proposed management fee and its expected net expense ratio as a percentage of anticipated average daily net assets, taking into account the expense limitation arrangement that the Investment Manager would observe, and the advisory fees and net expense ratios of peer groups of funds based on information provided by Morningstar.
The Independent Trustees considered how the New Portfolio’s proposed management fee and net expense ratio compared to its Morningstar peers. The Independent Trustees noted that the proposed management fees and estimated net expense ratio for Institutional Class shares of the New Portfolio were lower than both the average and median for Institutional Class shares of funds in the Morningstar peer group.
The Independent Trustees also considered the management fees charged by the Investment Manager and/or its affiliates to other funds and accounts with similar investment strategies to the New Portfolio, including the Allianz Funds Multi-Strategy Trust series, the AllianzGI International Growth Fund. The Independent Trustees noted that the proposed management fee to be paid by the New Portfolio is the same as the AllianzGI International Growth Fund, but higher than the management fees paid by asub-advised fund and institutional accounts advised by the Investment Manager using similar investment strategies. The Independent Trustees were advised that the Investment Manager would generally provide broader and more extensive services to the New Portfolio in comparison to separate accounts andsub-advised funds, and would incur additional expenses
| 69 | Annual Report / September 30, 2019 |
Table of Contents
AllianzGI Institutional Multi-Series Trust
Matters Relating to the Trustees’ Consideration of the Investment Management
Agreements (unaudited) (continued)
in connection with the more extensive regulatory regime to which the New Portfolio will be subject in comparison to separate accounts generally. The Independent Trustees also considered various risks AllianzGI U.S. will bear as sponsoring adviser to the New Portfolio, which exceed or are in addition to those associated with the management of institutional accounts, including entrepreneurial, reputational, legal and regulatory risks.
Economies of Scale and“Fall-Out” Benefits
The Independent Trustees considered the extent to which the Investment Manager may realize economies of scale or other efficiencies in managing and supporting the Renewal Portfolios and the New Portfolio. The Independent Trustees took into account that, as anopen-end investment company, each Renewal Portfolio and the New Portfolio intends to raise additional assets, so that, as the assets of each of the Renewal Portfolios and the New Portfolio grows over time, certain economies of scale and other efficiencies may be realized through spreading certain fixed costs across a larger asset base or across a variety of products and services, while also taking into account the expense limitation arrangements observed by the Investment Manager for applicable Renewal Portfolios. The Independent Trustees also took into account that the Investment Manager agreed to contractual expense limitations for certain of the Renewal Portfolios and for the New Portfolio.
Additionally, the Independent Trustees consideredso-called“fall-out benefits” to the Investment Manager and its affiliates, such as research, statistical and quotation services from broker-dealers executing the Renewal Portfolios’ and the New Portfolio’s portfolio transactions on an agency basis, and reputational value derived from serving as Investment Manager to the Renewal Portfolios and the New Portfolio.
Profitability
The Independent Trustees considered the overall estimated profitability to the Investment Manager on aPortfolio-by-Portfolio basis for the twelve months ended December 31, 2018. They also reviewed the Investment Manager’s aggregate profitability with respect to the fund complex and the Investment Manager’s overall profitability with respect to all products globally. As part of its considerations, the Board considered the cost allocation methodology that the Investment Manager used in developing its estimated profitability figures. In this connection, the Independent Trustees considered that for certain Renewal Portfolios profitability had increased as a result of expense reduction efforts, although the Renewal Portfolios’ assets had declined over the last year. The Independent Trustees also considered the estimated profitability to the Investment Manager from its relationship with the New Portfolio and noted that such profitability was expected to be positive for the New Portfolio’s first year of operations based on average net asset assumptions. The Independent Trustees recognized that it is difficult to make comparisons of profitability from mutual Portfolios’ advisory and administration contracts because comparative information is not generally available and is affected by numerous factors, including the structure of the particular adviser, the types of funds it manages, its business mix, numerous assumptions about allocations and the adviser’s capital structure and cost of capital. The Independent Trustees concluded that the Investment Manager’s estimatedpre-tax profitability for advisory services was not excessive or unreasonable, although it was sizeable for certain of the Portfolios, and that estimatedpre-tax profitability for advisory and administrative services combined, including when calculated on a net revenue basis regarding the administrative fee, was sizeable for certain of the Portfolios, but generally not unreasonable under the circumstances. The Independent Trustees recognized that the Investment Manager and its affiliates should be entitled to earn a reasonable level of profits for services they provide to the Portfolios and, based on their review, determined that the estimated profitability to the Investment Manager with respect to its relationship with each of the Portfolios did not, in any case, appear to be excessive.
Portfolio-by-Portfolio Analysis
With regard to the investment performance of each Renewal Portfolio and the fees charged to each Renewal Portfolio, the Independent Trustees considered the following information. The comparative performance, fee, and expense information was prepared and provided by Broadridge and was not independently verified by the Independent Trustees.
With respect to all Renewal Portfolios, the Independent Trustees reviewed, among other information, comparative information showing performance for each Renewal Portfolio against its respective Broadridge Performance Universe for the
| 70 | Annual Report / September 30, 2019 |
Table of Contents
AllianzGI Institutional Multi-Series Trust
Matters Relating to the Trustees’ Consideration of the Investment Management
Agreements (unaudited) (continued)
one-year and three-year periods (to the extent each such Renewal Portfolio had been in existence), each ended March 31, 2019. The inception dates for AllianzGI GlobalSmall-Cap Opportunities Portfolio, AllianzGI Advanced Core Bond Portfolio and AllianzGI Best Styles Global Managed Volatility Portfolio were July 23, 2014, October 30, 2015 and April 11, 2016, respectively, so performance data for longer time periods was not available. The Renewal Portfolio’s performance relative to the median for each Renewal Portfolio’s Broadridge Performance Universe is described below, and for those Renewal Portfolios with performance that ranked below median for their respective Broadridge Performance Universes, the specific quintile rankings are also noted below with respect to the relevant periods of underperformance. With respect to performance quintile rankings for a Renewal Portfolio compared to its Broadridge Performance Universe, the first quintile represents the highest (best) performance and the fifth quintile represents the lowest performance.
The Independent Trustees reviewed, among other information, information provided by Broadridge comparing each Renewal Portfolio’s contractual management fee and ratio of total expenses to net assets (“Total Expense Ratio”) to each Renewal Portfolio’s respective Broadridge Expense Group for the most recently reported fiscal year. The Independent Trustees noted that the Broadridge data takes into account any fee reductions or expense limitations that were in effect during a Renewal Portfolio’s last fiscal year.
AllianzGI Advanced Core Bond Portfolio:As compared to its Broadridge Performance Universe, the Portfolio’s performance was above median for theone-year period and below median for the three-year period (in the fourth quintile). As compared to its Broadridge Expense Group, both the Portfolio’s contractual management fees and total expense ratio were below median (on a net basis).
AllianzGI Best Styles Global Managed Volatility Portfolio:As compared to its Broadridge Performance Universe, the Portfolio’s performance was above median for theone-year period. As compared to its Broadridge Expense Group, both the Portfolio’s contractual management fees and total expense ratio were below median (on a net basis).
AllianzGI GlobalSmall-Cap Opportunities Portfolio: As compared to its Broadridge Performance Universe, the Portfolio’s performance was above median for theone- and three-year periods. As compared to its Broadridge Expense Group, both the Portfolio’s contractual management fees and total expense ratio were below median (on a net basis).
Conclusions
After reviewing these and other factors described herein, the Independent Trustees concluded, with respect to each of the Portfolios, within the context of their overall conclusions regarding the Agreement and in their business judgment, that they were satisfied with the Investment Manager’s responses andon-going efforts relating to the investment performance of the Renewal Portfolios, including efforts to improve performance for underperforming Renewal Portfolios. The Independent Trustees also concluded that the fees payable under the New Portfolio Agreement and the Agreement represent reasonable compensation in light of the nature, extent and quality of services provided by the Investment Manager and should be continued, taking into account the Investment Manager’s agreement to observe waivers for certain of the Portfolios. Based on their evaluation of factors that they deemed to be material, including, but not limited to, those factors described above, the Independent Trustees unanimously concluded that the New Portfolio Agreement and the continuation of the Agreement with respect to the Renewal Portfolios was in the interests of the applicable Portfolios and their shareholders, and determined to recommend that the approval of the New Portfolio Agreement and the continuance of the Agreement be approved by the full Board.
| 71 | Annual Report / September 30, 2019 |
Table of Contents
AllianzGI Institutional Multi-Series Trust
Changes to the Board of Trustees and Officers (unaudited)
Effective January 1, 2019, Alan Rappaport was appointed Chairman of the Board of Trustees of the Trust.
Effective January 1, 2019, Sarah E. Cogan became a Trustee of the Trust.
Effective March 21, 2019, A. Douglas Eu resigned as a Trustee of the Trust and Thomas J. Fuccillo became a Trustee of the Trust. Mr. Fuccillo is an “interested person” of the Trust, as defined in Section 2(a)(19) of the 1940 Act; due to his position with the Investment Manager and its affiliates.
| 72 | Annual Report / September 30, 2019 |
Table of Contents
AllianzGI Institutional Multi-Series Trust
Privacy Policy (unaudited)
Please read this Policy carefully. It gives you important information about how Allianz Global Investors U.S. and its U.S. affiliates (“AllianzGI US,” “we” or “us”) handlenon-public personal information (“Personal Information”) that we may receive about you. It applies to all of our past, present and future clients and shareholders of AllianzGI US and the funds and accounts it manages, advises, administers or distributes, and will continue to apply when you are no longer a client or shareholder. As used throughout this Policy, “AllianzGI US” means Allianz Global Investors U.S. LLC, Allianz Global Investors Distributors LLC, and the family of registered and unregistered funds managed by one or more of these firms. AllianzGI US is part of a global investment management group, and the privacy policies of other Allianz Global Investors entities outside of the United States may have provisions in their policies that differ from this Privacy Policy. Please refer to the website of the specificnon-US Allianz Global Investors entity for its policy on privacy.
We Care about Your Privacy
We consider your privacy to be a fundamental aspect of our relationship with you, and we strive to maintain the confidentiality, integrity and security of your Personal Information. To ensure your privacy, we have developed policies that are designed to protect your Personal Information while allowing your needs to be served.
Information We May Collect
In the course of providing you with products and services, we may obtain Personal Information about you, which may come from sources such as account application and other forms, from other written, electronic, or verbal communications, from account transactions, from a brokerage or financial advisory firm, financial advisor or consultant, and/or from information you provide on our website.
You are not required to supply any of the Personal Information that we may request. However, failure to do so may result in us being unable to open and maintain your account, or to provide services to you.
How Your Information Is Shared
We do not disclose your Personal Information to anyone for marketing purposes. We disclose your Personal Information only to those service providers, affiliated andnon-affiliated, who need the information for everyday business purposes, such as to respond to your inquiries, to perform services, and/or to service and maintain your account. This applies to all of the categories of Personal Information we collect about you. The affiliated andnon-affiliated service providers who receive your Personal Information also may use it to process your transactions, provide you with materials (including preparing and mailing prospectuses and shareholder reports and gathering shareholder proxies), and provide you with account statements and other materials relating to your account. These service providers provide services at our direction, and under their agreements with us, are required to keep your Personal Information confidential and to use it only for providing the contractually required services. Our service providers may not use your Personal Information to market products and services to you except in conformance with applicable laws and regulations. We also may provide your Personal Information to your respective brokerage or financial advisory firm, custodian, and/or to your financial advisor or consultant.
In addition, we reserve the right to disclose or report Personal Information tonon-affiliated third parties, in limited circumstances, where we believe in good faith that disclosure is required under law, to cooperate with regulators or law enforcement authorities or pursuant to other legal process, or to protect our rights or property, including to enforce our Privacy Policy or other agreements with you. Personal Information collected by us may also be transferred as part of a corporate sale, restructuring, bankruptcy, or other transfer of assets.
Security of Your Information
We maintain your Personal Information for as long as necessary for legitimate business purposes or otherwise as required by law. In maintaining this information, we have implemented appropriate procedures that are designed to restrict access to your Personal Information only to those who need to know that information in order to provide products and/or services to you. In addition, we have implemented physical, electronic and procedural safeguards to help protect your Personal Information.
| 73 | Annual Report / September 30, 2019 |
Table of Contents
AllianzGI Institutional Multi-Series Trust
Privacy Policy (unaudited)(continued)
Privacy and the Internet
The Personal Information that you provide through our website, as applicable, is handled in the same way as the Personal Information that you provide by any other means, as described above. This section of the Policy gives you additional information about the way in which Personal Information that is obtained online is handled.
•Online Enrollment, Account Access and Transactions: When you visit our website, you can visit pages that are open to the general public, or, where available, log into protected pages to enroll online, access information about your account, or conduct certain transactions. Access to these secure pages is permitted only after you have created a User ID and Password. The User ID and Password must be supplied each time you want to access your account information online. This information serves to verify your identity. When you enter Personal Information into our website to enroll or access your account online, you will log into secure pages. By using our website, you consent to this Privacy Policy and to the use of your Personal Information in accordance with the practices described in this Policy. If you provide Personal Information to effect transactions, a record of the transactions you have performed while on the site is retained by us. For additional terms and conditions governing your use of our website, please refer to the Investor Mutual Fund Access – Disclaimer which is incorporated herein by reference and is available on our website.
•Cookies and Similar Technologies:Cookies are small text files stored in your computer’s hard drive when you visit certain web pages. Clear GIFs (also known as Web Beacons) are typically transparent very small graphic images (usually 1 pixel x 1 pixel) that are placed on a website that may be included on our services provided via our website and typically work in conjunction with cookies to identify our users and user behavior. We may use cookies and automatically collected information to: (i) personalize our website and the services provided via our website, such as remembering your information so that you will not have tore-enter it during your use of, or the next time you use, our website and the services provided via our website; (ii) provide customized advertisements, content, and information; (iii) monitor and analyze the effectiveness of our website and the services provided via our website and third-party marketing activities; (iv) monitor aggregate site usage metrics such as total number of visitors and pages viewed; and (v) track your entries, submissions, and status in any promotions or other activities offered through our website and the services provided via our website. Tracking technology also helps us manage and improve the usability of our website, (i) detecting whether there has been any contact between your computer and us in the past and (ii) to identify the most popular sections of our website. Because an industry-standardDo-Not-Track protocol is not yet established, our website will continue to operate as described in this Privacy Policy and will not be affected by anyDo-Not-Track signals from any browser.
•Use of Social Media PluginsOur website uses the following Social Media Plugins (“Plugins”):
• Facebook Share Button operated by Facebook Inc., 1601 S. California Ave, Palo Alto, CA 94304, USA
• Tweet Button operated by Twitter Inc., 795 Folsom St., Suite 600, San Francisco, CA 94107, USA
• LinkedIn Share Button operated by LinkedIn Corporation, 2029 Stierlin Court, Mountain View, CA 94043, USA
All Plugins are marked with the brand of the respective operators Facebook, Twitter and LinkedIn (“Operators”). When you visit our website that contains a social plugin, your browser establishes a direct connection to the servers of the Operator. The Operator directly transfers the plugin content to your browser which embeds the latter into our website, enabling the Operator to receive information about you having accessed the respective page of our website. Thus, AllianzGI US has no influence on the data gathered by the plugin and we inform you according to our state of knowledge: The embedded plugins provide the Operator with the information that you have accessed the corresponding page of our website. If you do not wish to have such data transferred to the Operators, you need to log out of your respective account before visiting our website. Please see the Operators’ data privacy statements in order to get further information about purpose and scope of the data collection and the processing and use:
• Facebook:https://de-de.facebook.com/about/privacy
• Twitter: https://twitter.com/privacy
• Linked In: https://www.linkedin.com/legal/privacy-policy
| 74 | Annual Report / September 30, 2019 |
Table of Contents
AllianzGI Institutional Multi-Series Trust
Privacy Policy (unaudited)(continued)
Changes to Our Privacy Policy
We may modify this Privacy Policy fromtime-to-time to reflect changes in related practices and procedures, or applicable laws and regulations. If we make changes, we will notify you on our website and the revised Policy will become effective immediately upon posting to our website. We also will provide account owners with a copy of our Privacy Policy, annually if required. We encourage you to visit our website periodically to remain up to date on our Privacy Policy. You acknowledge that by using our website after we have posted changes to this Privacy Policy, you are agreeing to the terms of the Privacy Policy as modified.
Obtaining Additional Information
If you have any questions about this Privacy Policy or our privacy related practices in the United States, you may contact us via our dedicated email at PrivacyUS@allianzgi.com.
| 75 | Annual Report / September 30, 2019 |
Table of Contents
AllianzGI Institutional Multi-Series Trust - Board of Trustees (unaudited)
Name, Year of Birth, Position(s) Held with Trust, Length of Service, Other Trusteeships/Directorships Held by Trustee; Number of Portfolios in Fund Complex/Outside Fund Complexes Currently Overseen by Trustee
| Principal Occupation(s) During Past 5 Years:
| |
| The address of each trustee is 1633 Broadway, New York, NY 10019 | ||
Sarah E. Cogan Year of Birth: 1956 Trustee since: 2019 Trustee/Director of 92* funds in Fund Complex Trustee/Director of no funds outside of Fund Complex | Of Counsel, Simpson Thacher & Bartlett LLP (law firm) (“STB”); Formerly, Partner, STB (1989-2018); Director, Girl Scouts of Greater New York (since 2016); Trustee, Natural Resources Defense Council, Inc. (since 2013). | |
Deborah A. DeCotis Year of Birth: 1952 Trustee since: 2014 Trustee/Director of 92* funds in Fund Complex Trustee/Director of no funds outside of Fund Complex | Advisory Director, Morgan Stanley & Co., Inc. (since 1996); Member, Circle Financial Group (since 2009); Member, Council on Foreign Relations (since 2013); Trustee, Smith College (since 2017); and Director, Watford Re (Since 2017). Formerly,Co-Chair Special Projects Committee, Memorial Sloan Kettering (2005- 2015); Trustee, Stanford University (2010-2015); and Principal, LaLoop LLC, a retail accessories company (1999-2014). | |
F. Ford Drummond Year of Birth: 1962 Trustee since: 2014 Trustee/Director of 64 funds in Fund Complex Trustee/Director of no funds outside of Fund Complex Director, BancFirst Corporation. | Owner/Operator, Drummond Ranch; and Director, Oklahoma Water Resources Board. Formerly, Director, The Cleveland Bank; and General Counsel,BMI-Health Plans (benefits administration); and Chairman Oklahoma Water Resources Board. | |
Bradford K. Gallagher Year of Birth: 1944 Trustee since: 2014 Trustee/Director of 92* funds in Fund Complex | Retired. Founder, Spyglass Investments LLC, a private investment vehicle (since 2001). Formerly, Chairman and Trustee, The Common Fund (2005-2014); Partner, New Technology Ventures Capital Management LLC, a venture capital fund (2011- 2013). | |
James A. Jacobson Year of Birth: 1945 Trustee since: 2014 Trustee/Director of 92* funds in Fund Complex Formerly, Trustee, Alpine Mutual Funds Complex (consisting of 18 funds) (2009-2016) | Retired. Trustee (since 2002) and Chairman of Investment Committee (since 2007), Ronald McDonald House of New York; and Trustee, New Jersey City University (since 2014). | |
Hans W. Kertess Year of Birth: 1939 Trustee since: 2014 Trustee/Director of 92* funds in Fund Complex Trustee/Director of no funds outside the Fund Complex | President, H. Kertess & Co., a financial advisory company; and Senior Adviser (formerly Managing Director), Royal Bank of Canada Capital Markets (since 2004). | |
James S. MacLeod Year of Birth: 1947 Trustee since: 2014 Trustee/Director of 64 funds in Fund Complex Non-Executive Chairman & Director, Sykes Enterprises, Inc. | Executive Chairman of the Board, CoastalSouth Bancshares, Inc.; Chairman, CoastalStates Bank; Vice Chairman of the Board and Member of Executive Committee, University of Tampa; Trustee, MUSC Foundation and Director, Mortgage Bankers Association of America. Formerly, Executive Vice President, Mortgage Guaranty Insurance Corporation; and Chief Executive Officer, Homeowners Mortgage. | |
William B. Ogden, IV Year of Birth: 1945 Trustee since: 2014 Trustee/Director of 92* funds in Fund Complex; Trustee/Director of no funds outside of Fund Complex | Retired. Formerly, Asset Management Industry Consultant; and Managing Director, Investment Banking Division of Citigroup Global Markets Inc. | |
Alan Rappaport Year of Birth: 1953 Trustee since: 2014 Trustee/Director of 92* funds in Fund Complex Trustee/Director of no funds outside of Fund Complex | Adjunct Professor, New York University Stern School of Business (since 2011); Lecturer, Stanford University Graduate School of Business (since 2013); and Director, Victory Capital Holdings, Inc., an asset management firm (since 2013). Formerly, Trustee, American Museum of Natural History (2005-2015); Trustee and Member of Board of Overseers, NYU Langone Medical Center (2007-2015); and Advisory Director (formerly, Vice Chairman), Roundtable Investment Partners (2009-2018). | |
| 76 | Annual Report / September 30, 2019 |
Table of Contents
AllianzGI Institutional Multi-Series Trust - Board of Trustees (unaudited)(continued)
Davey S. Scoon Year of Birth: 1946 Trustee since: 2014 Trustee/Director of 64 funds in Fund Complex Trustee/Director of no funds outside the Fund Complex Director, Albireo Pharma, Inc. (since 2016); and Director, AMAG Pharmaceuticals, Inc. (since 2006). Formerly, Director, Biodel Inc. (2013- 2016); Director, Orthofix International N.V. (2011-2015). | Adjunct Professor, University of Wisconsin-Madison (since 2011). | |
Thomas J. Fuccillo† Year of Birth: 1968 Trustee since: 2019 Trustee/Director of 64 funds in Fund Complex Trustee/Director of no funds outside the Fund Complex. | Managing Director and Head of US Funds of Allianz Global Investors U.S. Holdings LLC; Managing Director of Allianz Global Investors Distributors LLC; Trustee, President and Chief Executive Officer of 64 funds in the Fund Complex; and President and Chief Executive Officer of The Korea Fund, Inc. and The Taiwan Fund, Inc. Formerly, Associate General Counsel, Head of US Funds and Retail Legal (2004-2019); Chief Legal Officer and Secretary of Allianz Global Investors Distributors LLC (2013-2019); Vice President, Secretary and Chief Legal Officer of numerous funds in the Fund Complex; and Secretary and Chief Legal Officer of The Korea Fund, Inc. | |
Erick R. Holt† Year of Birth: 1952 Trustee since: 2017 Trustee/Director of 92* funds in Fund Complex Trustee/Director of no funds outside the Fund Complex | Board Member, Global Chief Risk Officer, General Counsel and Chief Compliance Officer (2006 – April 2018) of Allianz Asset Management GmbH. | |
The Portfolios’ Statement of Additional Information contains additional information about the Trustees. The Statement of Additional Information is available without charge, upon request, by calling1-800-498-5413.
* Inclusive of 28 funds managed by Pacific Investment Management Company, LLC (“PIMCO”) that the Trustee currently presides over.
† Each of Mr. Holt and Mr. Fuccillo is an Interested Person of the Trust, as defined in Section 2(a)(19) of the 1940 Act, due to her or his affiliation with the Investment Manager and its affiliates.
| 77 | Annual Report / September 30, 2019 |
Table of Contents
AllianzGI Institutional Multi-Series Trust - Officers (unaudited)
Name, Year of Birth, Position(s) Held with Trust | Principal Occupation(s) During Past 5 Years | |
Thomas J. Fuccillo 1968 President and Chief Executive Officer | Managing Director and Head of US Funds of Allianz Global Investors U.S. Holdings LLC; Managing Director of Allianz Global Investors Distributors LLC; Trustee, President and Chief Executive Officer of 64 funds in the Fund Complex; and President and Chief Executive Officer of The Korea Fund, Inc. and The Taiwan Fund, Inc. Formerly, Associate General Counsel, Head of US Funds and Retail Legal; Chief Legal Officer and Secretary of Allianz Global Investors Distributors LLC; Vice President, Secretary and Chief Legal Officer of numerous funds in the Fund Complex; and Secretary and Chief Legal Officer of The Korea Fund, Inc. | |
Scott Whisten 1971 Treasurer, Principal Financial and Accounting Officer | Director of Allianz Global Investors U.S. LLC; and Treasurer, Principal Financial and Accounting Officer of 64 funds in the Fund Complex. Formerly, Assistant Treasurer of numerous funds in the Fund Complex (2007-2018). | |
Angela Borreggine 1964 Chief Legal Officer and Secretary | Director and Senior Counsel of Allianz Global Investors U.S. Holdings LLC; Chief Legal Officer and Secretary of 64 funds in the Fund Complex; and Secretary and Chief Legal Officer of The Korea Fund, Inc. Formerly, Assistant Secretary of numerous funds in the Fund Complex (2007-2018). | |
Thomas L. Harter, CFA 1975 Chief Compliance Officer | Director, Senior Compliance Manager of Allianz Global Investors U.S. Holdings LLC; Director, Deputy Chief Compliance Officer of Allianz Global Investors U.S. LLC; Chief Compliance Officer of 64 funds in the Fund Complex and of the Korea Fund, Inc. Formerly, Vice President and Compliance Manager (2005- 2012). | |
Richard F. Cochran 1961 Assistant Treasurer | Vice President of Allianz Global Investors U.S. LLC; Assistant Treasurer of 64 funds in the Fund Complex and of The Korea Fund, Inc. | |
Orhan Dzemaili 1974 Assistant Treasurer | Director of Allianz Global Investors U.S. LLC; Treasurer, Principal Financial and Accounting Officer of The Korea Fund, Inc. and Assistant Treasurer of 64 funds in the Fund Complex. Formerly, Assistant Treasurer of The Korea Fund, Inc. (2016-2018). | |
Debra Rubano 1975 Assistant Treasurer | Director and Senior Counsel of Allianz Global Investors U.S. Holdings LLC; and Assistant Secretary of 64 funds in the Fund Complex. | |
Craig A. Ruckman 1977 Assistant Secretary | Director and Senior Counsel of Allianz Global Investors U.S. Holdings LLC; and Assistant Secretary of 64 funds in the Fund Complex. Formerly, Associate of K&L Gates LLP (2012-2016). | |
* The officers of the Trust are elected annually by the Board of Trustees.
| 78 | Annual Report / September 30, 2019 |
Table of Contents
| Trustees | Investment Manager | |
| Alan Rappaport | Allianz Global Investors U.S. LLC | |
| Chairman of the Board of Trustees | 1633 Broadway | |
| Sarah E. Cogan | New York, NY 10019 | |
| Deborah A. Decotis | ||
| F. Ford Drummond | Distributor | |
| Thomas J. Fuccillo | Allianz Global Investors Distributors LLC | |
| Bradford K. Gallagher | 1633 Broadway | |
| Erick R. Holt | New York, NY 10019 | |
| James A. Jacobson | ||
| Hans W. Kertess | Custodian & Accounting Agent | |
| James S. MacLeod | State Street Bank and Trust Co. | |
| William B. Ogden, IV | 801 Pennsylvania Avenue | |
| Davey S. Scoon | Kansas City, MO 64105 | |
| Officers | ||
| Thomas J. Fuccillo | Transfer Agent | |
| President and Chief Executive Officer | State Street Bank and Trust Company, which has delegated its obligations as transfer agent to: | |
| Scott Whisten | ||
Treasurer, Principal Financial and Accounting Officer | DST Asset Management Solutions, Inc. P.O. Box 219723 | |
| Angela Borreggine | Kansas City, MO 64121-9723 | |
| Chief Legal Officer and Secretary | ||
| Thomas L. Harter | Independent Registered Public Accounting Firm | |
| Chief Compliance Officer, | PricewaterhouseCoopers LLP | |
| Richard J. Cochran | 300 Madison Avenue | |
| Assistant Treasurer | New York, NY 10017 | |
| Orhan Dzemaili | ||
| Assistant Treasurer | Legal Counsel | |
| Debra Rubano | Ropes & Gray LLC | |
| Assistant Secretary | Prudential Tower | |
| Craig A. Ruckman | 800 Boylston Street | |
| Assistant Secretary | Boston, MA 02199 | |
This report, including the financial information herein, is transmitted to the shareholders of the Trust for their information. It is not a prospectus, circular or representation intended for use in the purchase of shares of each Portfolio or any securities mentioned in this report.
Table of Contents
| ITEM 2. | CODE OF ETHICS |
| (a) | As of the end of the period covered by this report, the registrant has adopted a code of ethics (the “Section 406 Standards for Investment Companies – Ethical Standards for Principal Executive and Financial Officers”) that applies to the registrant’s President and Chief Executive Officer and Principal Financial Officer; the registrant’s Principal Financial Officer also serves as the Principal Accounting Officer. The registrant undertakes to provide a copy of such code of ethics to any person upon request, without charge, by calling1-800-926-4456. The code of ethics are included as an Exhibit 99.CODE ETH hereto. |
| (b) | During the period covered by this report, there were not any amendments to a provision of the code of ethics adopted in 2(a) above. |
| (c) | During the period covered by this report, there were not any waivers or implicit waivers to a provision of the code of ethics adopted in 2(a) above. |
| ITEM 3. | AUDIT COMMITTEE FINANCIAL EXPERT |
The registrant’s Board has determined that Messrs. James A. Jacobson and Davey S. Scoon, both of whom serve on the Trust’s Audit Oversight Committee, qualify as “audit committee financial experts,” and that they are “independent,” for purposes of this Item.
| ITEM 4. | PRINCIPAL ACCOUNTANT FEES AND SERVICES |
| a) | Audit fees. The aggregate fees billed for each of the last two fiscal years (the “Reporting Periods”) for professional services rendered by the Registrant’s principal accountant (the “Auditor”) for the audit of the Registrant’s annual financial statements, or services that are normally provided by the Auditor in connection with the statutory and regulatory filings or engagements for the Reporting Periods, were $73,704 in 2018 and $100,441 in 2019. |
| b) | Audit-Related Fees. The aggregate fees billed in the Reporting Periods for assurance and related services by the principal accountants that are reasonably related to the performance of the audit registrant’s financial statements and are not reported under paragraph (e) of this Item were $0 in 2018 and $0 in 2019. |
| c) | Tax Fees. The aggregate fees billed in the Reporting Periods for professional services rendered by the Auditor for tax compliance, tax service and tax planning (“Tax Services”) were $38,182 in 2018 and $39,327 in 2019. These services consisted of review or preparation of U.S. federal, state, local and excise tax returns and calculations of excise tax distributions. |
| d) | All Other Fees. There were no other Fees billed in the Reporting Periods for products and services provided by the Auditor to the Registrant. |
| e)1. | Audit CommitteePre-Approval Policies and Procedures. The Registrant’s Audit Oversight Committee has established policies and procedures forpre-approval of all audit and permissiblenon-audit services by the Auditor for the Registrant, as well as the Auditor’s engagements related directly to the operations and financial reporting of the Registrant. The Registrant’s policy is stated below. |
AllianzGI Institutional Multi-Series Trust (The “Trust”)
AUDIT OVERSIGHT COMMITTEE POLICY
FOR
PRE-APPROVAL OF SERVICES PROVIDED BY THE INDEPENDENT ACCOUNTANTS
The Trust’s Audit Oversight Committee (“Committee”) is charged with the oversight of the Trust’s financial reporting policies and practices and their internal controls. As part of this responsibility, the Committee mustpre-approve any independent accounting firm’s engagement to render audit and/or permissiblenon-audit services to the Trust as well as to the Trust’s investment adviser(1) or any entity controlling, controlled by or under common control with the investment adviser that provides ongoing services to the Trust (“Applicable Service Providers”), if the engagement relates directly to operations and financial reporting of the Trust. In evaluating a proposed engagement by the independent accountants, the Committee will assess the effect that the engagement might reasonably be expected to have on the accountant’s independence. The Committee’s evaluation will be based on:
a review of the nature of the professional services expected to be provided; the fees to be charged in connection with the services expected to be provided; a review of the safeguards put into place by the accounting firm to safeguard independence; and periodic meetings with the accounting firm.
The Committee need not evaluate all four factors each time itpre-approves a service; it may rely on previous evaluations to the extent it considers appropriate.
POLICY FORPRE-APPROVAL OF AUDIT ANDNON-AUDIT SERVICES TO BE PROVIDED TO THE TRUST
On an annual basis, the Committee of the Trust will review and if the Committee so determines,pre-approve the scope of the audits of the Trust and proposed audit fees, and permittednon-audit (including audit-related) services that are proposed to be performed by the Trust’s independent accountants for the Trust and its Applicable Service Providers (to the extent the services to be provided to the Applicable Service Providers relate directly to the operations and financial reporting of the Trust). The Committee may alsopre-approve services at any otherin-person or telephonic Committee meeting. At least annually, the Committee will receive a report of all audit andnon-audit services that were rendered in the previous calendar year by the independent accountants for the Trust and its Applicable Service Providers pursuant to this Policy.
Table of Contents
In addition to the Committee’spre-approval of services pursuant to this Policy, the engagement of the independent accounting firm for any permittednon-audit service provided to the fund with also require the separatepre-approval of the President, Treasurer or Assistant Treasurer of the Trust, who may only grant such approval if he or she believes that the accounting firm’s engagement will not adversely affect the firm’s independence. Allnon-audit services performed by the independent accounting firm will be disclosed, as required, in filings with the Securities and Exchange Commission.
AUDIT SERVICES
The categories of audit services and related fees to be reviewed andpre-approved annually by the Committee are:
Annual Trust financial statement audits
Seed audits (related to new product filings, as required)
SEC and regulatory filings and consents
Semiannual financial statement reviews
Individual audit services that fall within one of these categories and are not presented to the Committee as part of the annualpre-approval process described above, may bepre-approved, if deemed consistent with the accounting firm’s independence, by the Committee Chair (or any other Committee member who is a disinterested trustee under the Investment Company to whom this responsibility has been delegated) so long as the estimated fee for those services does not exceed $500,000. Anypre-approval by a Committee member shall be reported to the full Committee at its next regularly scheduled meeting.
(1) For purposes of this requirement, the term “adviser” does not includesub-advisers that are not affiliated with a Trust’s investment adviser, are overseen by that investment adviser, and whose role is primarily portfolio management.
AUDIT-RELATED SERVICES
The following categories of audit-related services are considered to be consistent with the role of the Trust’s independent accountants and services falling under one of these categories will bepre-approved by the Committee on an annual basis if the Committee deems those services to be consistent with the accounting firm’s independence:
Accounting consultations Trust
Fund merger support services
Agreed upon procedure reports
Other Attestation reports
Comfort letters
Other internal control reports
Individual audit-related services that fall within one of these categories and are not presented to the Committee as part of the annualpre-approval process described above, may bepre-approved, if deemed consistent with the accounting firm’s independence, by the Committee Chair (or any other Committee member who is a disinterested trustee under the Investment Company to whom this responsibility has been delegated) so long as the estimated fee for those services does not exceed $500,000. Anypre-approval by a Committee member shall be reported to the full Committee at its next regularly scheduled meeting.
TAX SERVICES
The following categories of tax services are considered to be consistent with the role of the Trust’s independent accountants and services falling under one of these categories will bepre-approved by the Committee on an annual basis if the Committee deems those services to be consistent with the accounting firm’s independence:
Federal, state and local income tax compliance; and, sales and use tax compliance, including required filings and amendments
Timely RIC qualification reviews
Tax distribution analysis and planning
Tax authority examination services
Tax appeals support services
Accounting methods studies
Trust merger support services
Other tax consulting services and related projects
Individual tax services that fall within one of these categories and are not presented to the Committee as part of the annualpre-approval process described above, may bepre-approved, if deemed consistent with the accounting firm’s independence, by the Committee at any regular or special meeting. Such services may also bepre-approved by the Committee Chair (or any other Committee member who is a disinterested trustee under the Investment Company Act to whom this responsibility has been delegated) so long as the estimated fee for the particular service for whichpre-approval is sought does not exceed $500,000. Anypre-approval by a Committee Member shall be reported to the full Committee at its next regularly scheduled meeting.
OTHER SERVICES
Services that are proposed to be provided to the Trust which are not audit, audit-related or tax services may bepre-approved, if deemed consistent with the accounting firm’s independence, by the Committee at any regular or special meeting. Such services may also bepre-approved by the Committee Chair (or any other Committee member who is a disinterested trustee under the Investment Company Act to whom this responsibility has been delegated) so long as the estimated fee for the particular service for whichpre-approval is sought does not exceed $500,000. Anypre-approval by a Committee member shall be reported to the full Committee at its next regularly scheduled meeting.
Table of Contents
PROHIBITED SERVICES
The Trust’s independent accountants will not render services in the following categories ofnon-audit services:
Bookkeeping or other services related to the accounting records or financial statements of the Trust
Financial information systems design and implementation
Appraisal or valuation services, fairness opinions, orcontribution-in-kind reports
Actuarial services
Internal audit outsourcing services
Management functions or human resources
Broker or dealer, investment adviser or investment banking services
Legal services and expert services unrelated to the audit
Any other service that the Public Company Accounting Oversight Board determines, by regulation, is impermissible.
PRE-APPROVAL OFNON-AUDIT SERVICES PROVIDED TO OTHER ENTITIES WITHIN THE FUND COMPLEX
Rule2-01(c)(7) of RegulationS-X provides that an accountant is not independent of the Trust unless the Trust’s Committee approves any permittednon-audit services to be provided to the Trust’s Applicable Service Providers, provided, in each case, that the engagement relates directly to the operations and financial reporting of the Trust.
Services to be provided to Applicable Service Providers that are required to bepre-approved, may bepre-approved, if deemed consistent with the accounting firm’s independence, by the Committee at a regular or special meeting or by the Committee Chair (or any other Committee member who is a disinterested trustee under the Investment Company Act to whom this responsibility has been delegated) so long as the estimated fee for those services does not exceed $500,000. If a service is approved by a Committee member, the full Committee is notified of suchpre-approval at its next regularly scheduled meeting.
Although the Committee will not be required topre-approve all services provided to Applicable Service Providers and their affiliates, the Committee will receive an annual report from the Trust’s independent accounting firm showing the aggregate fees for all services provided to Applicable Service Providers and their affiliates.
DE MINIMUS EXCEPTION TO REQUIREMENT OFPRE-APPROVAL OFNON-AUDIT SERVICES
With respect to the provision of permittednon-audit services to the Trust or Accounting Affiliates, thepre-approval requirement is waived if:
(1) The aggregate fees and costs of allnon-audit services that, but for the limited exception provided by this section, would requirepre-approval by the Committee constitutes no more than five percent of the total fees and costs paid by the Trust and Applicable Service Providers to the independent accountant during the fiscal year during which suchnon-audit services are provided;
(2) At the time of the engagement for such services, the Trust did not recognize that the services were“non-audit services” that required preapproval; and
(3) Each such service is brought promptly to the attention of the Committee and approved prior to the completion of the audit by the Committee, Committee Chair or any other Committee member who is a disinterested trustee under the Investment Company Act to whom this responsibility has been delegated.
e)2. No services were approved pursuant to the procedures contained in paragraph (C) (7) (i) (C) of Rule2-01 of RegistrationS-X.
f) Not applicable.
g)Non-audit fees. The aggregatenon-audit fees billed by the Auditor for services rendered to the Registrant, and rendered to the Adviser, for the 2018 Reporting Period was $2,478,407 and the 2019 Reporting Period was $1,119,039.
h) Auditor Independence. The Registrant’s Audit Oversight Committee has considered whether the provision ofnon-audit services that were rendered to the Adviser which were notpre-approved is compatible with maintaining the Auditor’s independence.
| ITEM 5. | AUDIT COMMITTEE OF LISTED REGISTRANT |
Disclosure not required foropen-end management investment companies.
| ITEM 6. | INVESTMENTS |
| (a) | Schedule of Investments is included as part of the report to shareholders filed under Item 1 of this form. |
| (b) | Not applicable. |
| ITEM 7. | DISCLOSURE OF PROXY VOTING POLICIES AND PROCEDURES FORCLOSED-END MANAGEMENT INVESTMENT COMPANIES |
Disclosure not required foropen-end management investment companies.
| ITEM 8. | PORTFOLIO MANAGERS OFCLOSED-END MANAGEMENT INVESTMENT COMPANIES |
Disclosure not required foropen-end management investment companies.
Table of Contents
| ITEM 9. | PURCHASES OF EQUITY SECURITIES BYCLOSED-END MANAGEMENT INVESTMENT COMPANY AND AFFILIATED PURCHASERS |
Disclosure not required foropen-end management investment companies.
| ITEM 10. | SUBMISSION OF MATTERS TO A VOTE OF SECURITY HOLDERS |
There have been no material changes to the procedures by which shareholders may recommend nominees to the Trust’s Board of Trustees since the Trust last provided disclosure in response to this item.
| ITEM 11. | CONTROLS AND PROCEDURES |
| (a) | The registrant’s President & Chief Executive Officer and Treasurer, Principal Financial & Accounting Officer have concluded that the registrant’s disclosure controls and procedures (as defined in Rule30a-3(c) under the Investment Company Act of 1940 (the “1940 Act”) (17 CFR270.30a-3(c)), as amended) are effective based on their evaluation of these controls and procedures as of a date within 90 days of the filing date of this document. |
| (b) | There were no changes in the registrant’s internal control over financial reporting (as defined in Rule30a-3(d) under the 1940 Act (17 CFR270.30a-3(d))) that occurred during the most recent fiscal half-year covered by this report that has materially affected, or is reasonably likely to materially affect, the registrant’s internal control over financial reporting. |
| ITEM 12. | DISCLOSURE OF SECURITIES LENDING ACTIVITIES FORCLOSED-END MANAGEMENT INVESTMENT COMPANIES. |
Disclosure not required foropen-end management investment companies.
| ITEM 13. | EXHIBITS |
(a)(1) Exhibit 99.CODE ETH – Code of Ethics
(a)(2) Exhibit 99_ CERT. – Certification pursuant to Section 302 of the Sarbanes-Oxley Act of 2002
(a)(3) Not applicable
(a)(4) Not applicable
(b) Exhibit 99.906 CERT. – Certification pursuant to Section 906 of the Sarbanes-Oxley Act of 2002
Table of Contents
Signatures
Pursuant to the requirements of the Securities Exchange Act of 1934 and the Investment Company Act of 1940, the registrant has duly caused this report to be signed on its behalf by the undersigned, thereunto duly authorized.
AllianzGI InstitutionalMulti-Series Trust
By: | /s/ Thomas J. Fuccillo | |
Thomas J. Fuccillo | ||
President & Chief Executive Officer | ||
Date: December 4, 2019 | ||
By: | /s/ Scott Whisten | |
Scott Whisten | ||
Treasurer, Principal Financial & | ||
Accounting Officer | ||
Date: December 4, 2019 | ||
Pursuant to the requirements of the Securities Exchange Act of 1934 and the Investment Company Act of 1940, this report has been signed below by the following persons on behalf of the registrant and in the capacities and on the dates indicated.
By: | /s/ Thomas J. Fuccillo | |
Thomas J. Fuccillo | ||
President & Chief Executive Officer | ||
Date: December 4, 2019 | ||
By: | /s/ Scott Whisten | |
Scott Whisten | ||
Treasurer, Principal Financial & | ||
Accounting Officer | ||
Date: December 4, 2019 | ||